UNITED STATES SECURITIES AND EXCHANGE COMMISSION
Washington, D.C. 20549
Form 10-K
(Mark One) | |
ý | ANNUAL REPORT PURSUANT TO SECTION 13 OR 15(d) OF THE SECURITIES EXCHANGE ACT OF 1934 |
| |
| For the fiscal year ended October 1, 2005 |
| |
| or |
| |
o | TRANSITION REPORT PURSUANT TO SECTION 13 OR 15(d) OF THE SECURITIES EXCHANGE ACT OF 1934 |
| |
| For the transition period from to |
Commission file number: 0-21272
Sanmina-SCI Corporation
(Exact name of registrant as specified in its charter)
Delaware | | 77-0228183 |
(State or other jurisdiction of | | (I.R.S. Employer |
incorporation or organization) | | Identification Number) |
| | |
2700 North First Street, San Jose, CA | | 95134 |
(Address of principal executive offices) | | (Zip Code) |
Registrant’s telephone number, including area code:
(408) 964-3500
Securities registered pursuant to Section 12(b) of the Act:
None
Securities registered pursuant to Section 12(g) of the Act:
Common Stock, $0.01 Par Value
(Title of Class)
Indicate by check mark if the registrant is a well-known seasoned issuer, as defined in Rule 405 of the Securities Act. Yes ý No o
Indicate by check mark if the registrant is not required to file reports pursuant to Section 13 or Section 15(d) of the Securities Act. Yes o No ý
Indicate by check mark whether the registrant: (1) has filed all reports required to be filed by Section 13 or 15(d) of the Exchange Act during the preceding 12 months (or for such shorter period that the registrant was required to file such reports), and (2) has been subject to such filing requirements for the past 90 days. Yes ý No o
Indicate by check mark if disclosure of delinquent filers pursuant to Item 405 of Regulation S-K is not contained herein, and will not be contained, to the best of the registrant’s knowledge, in definitive proxy or information statements incorporated by reference in Part III of this Form 10-K or any amendment to this Form 10-K. o
Indicate by check mark whether the registrant is an accelerated filer (as defined in Exchange Act Rule 12b-2). Yes ý No o
Indicate by check mark whether the registrant is a shell company (as defined in Rule 12b-2 of the Exchange Act).
Yes o No ý
The aggregate value of Common Stock held by non-affiliates of the Registrant was approximately $2,675,239,223 as of April 2, 2005, based upon the average of Registrant’s Common Stock reported for such date on the Nasdaq National Market. Shares of Common Stock held by each executive officer and director and by each person who owns 10% or more of the outstanding Common Stock have been excluded in that such persons may be deemed to be affiliates. The determination of affiliate status is not necessarily a conclusive determination for other purposes. As of December 7, 2005, the Registrant had outstanding 529,556,913 shares of Common Stock.
DOCUMENTS INCORPORATED BY REFERENCE
Certain information is incorporated into Part III of this report by reference to the Proxy Statement for the Registrant’s annual meeting of stockholders to be held on February 27, 2006 to be filed with the Securities and Exchange Commission pursuant to Regulation 14A not later than 120 days after the end of the fiscal year covered by this Form 10-K.
SANMINA-SCI CORPORATION
INDEX
1
PART I
Item 1. Business
Overview
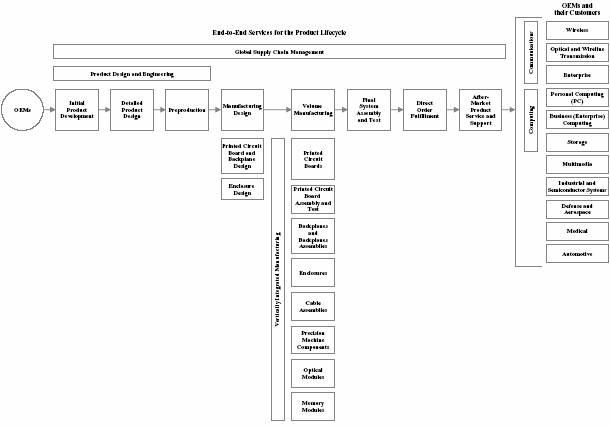
We are a leading independent global provider of customized, integrated electronics manufacturing services, or EMS. We provide these comprehensive services primarily to original equipment manufacturers, or OEMs, in the communications, computing and storage, multimedia, industrial and semiconductor capital equipment, defense and aerospace, medical, and automotive industries. The combination of our advanced technologies, extensive manufacturing expertise and economies of scale enables us to meet the specialized needs of our customers in these markets in a cost-effective manner.
Our end-to-end services in combination with our global expertise in supply chain management enable us to manage our customers’ products throughout their life cycles. These services include:
• product design and engineering, including initial development, detailed design, preproduction services and manufacturing design;
• volume manufacturing of complete systems, components and subassemblies;
• final system assembly and test;
• direct order fulfillment and logistics services; and
• after-market product service and support.
Our high volume manufacturing services are vertically integrated, allowing us to manufacture key system components and subassemblies for our customers. By manufacturing key system components and subassemblies ourselves, we enhance continuity of supply and reduce costs for our customers. In addition, we are able to have greater control over the production of our customers’ products and retain incremental profit opportunities for the company. System components and subassemblies that we manufacture include high volume and high-end printed circuit boards, printed circuit board assemblies, backplanes and backplane assemblies, enclosures, cable assemblies, precision machine components, optical modules and memory modules.
We manufacture products in over 20 countries on five continents. We seek to locate our facilities near our customers and our customers’ end markets in major centers for the electronics industry or in lower cost locations. Many of our plants located near customers and their end markets are focused primarily on final system assembly and test, while our plants located in lower cost areas engage primarily in less complex component and subsystem manufacturing and assembly.
We have become one of the largest global EMS providers by capitalizing on our competitive strengths, including our:
• end-to-end services;
• product design and engineering resources;
• vertically integrated volume manufacturing services;
• advanced technologies;
• global capabilities;
• customer-focused organization;
• expertise in serving diverse end markets; and
• experienced management team.
Our business strategy enables us to win large outsourcing programs from leading multinational OEMs. Our customers primarily consist of OEMs that operate in a range of industries. Our top customers include: Alcatel, S.A., or Alcatel; Applied Materials, Inc., or Applied Materials; EchoStar Communications Corporation, or EchoStar; Hewlett-Packard Company, or HP; International Business Machines Corporation, or IBM; Koninklijke Philips Electronics NV, or Philips Electronics; Lenovo Group, Ltd., or Lenovo; LSI Logic Corporation, or LSI; Nokia Corp., or Nokia; Nortel Networks, or Nortel; Roche Diagnostics Operations, Inc., or Roche; Siemens A.G., or Siemens; Telefonaktiebolaget LM Ericsson, or Ericsson; and Tellabs, Inc., or Tellabs.
2
Industry Overview
EMS companies are the principal beneficiaries of the increased use of outsourced manufacturing services by the electronics and other industries. Outsourced manufacturing refers to an OEMs’ use of EMS companies, rather than internal manufacturing capabilities, to manufacture their products. Historically, EMS companies generally manufactured only components or partial assemblies. As the EMS industry has evolved, OEMs have increased their reliance on EMS companies for additional, more complex manufacturing services, including design services. Some EMS companies now often manufacture and test complete systems and manage the entire supply chains of their customers. Industry leading EMS companies offer end-to-end services, including product design and engineering, volume manufacturing, final system assembly and test, direct order fulfillment, after-market product service and support and global supply chain management.
We believe increased outsourced manufacturing by OEMs will continue because it allows OEMs to:
Reduce Operating Costs and Capital Investment. In the current economic environment, OEMs are under significant pressure to reduce manufacturing costs and capital expenditures. EMS companies can provide OEMs with flexible, cost-efficient manufacturing services. In addition, as OEM products have become more technologically advanced, the manufacturing and system test processes have become increasingly automated and complex, requiring significant capital investments. EMS companies enable OEMs to access technologically advanced manufacturing and test equipment and facilities, without additional capital expenditures.
Focus on Core Competencies. The electronics industry is highly competitive and subject to rapid technological change. As a result, OEMs increasingly are focusing their resources on activities and technologies in which they expect to add the greatest value. By offering comprehensive manufacturing services and supply chain management, EMS companies enable OEMs to focus on their core competencies, including next generation product design and development as well as marketing and sales.
Access Leading Design and Engineering Capabilities. The design and engineering of electronics products has become more complex and sophisticated and in an effort to become more competitive, OEMs are increasingly relying on EMS companies to provide product design and engineering support services. EMS companies’ design and engineering services can provide OEMs with improvements in the performance, cost and time required to bring products to market. EMS companies are providing more sophisticated design and engineering services to OEMs, including the design and engineering of complete products following an OEM’s development of a product concept.
Improve Supply Chain Management and Purchasing Power. OEMs face challenges in planning, procuring and managing their inventories efficiently due to fluctuations in customer demand, product design changes, short product life cycles and component price fluctuations. EMS companies employ sophisticated production management systems to manage their procurement and manufacturing processes in an efficient and cost-effective manner so that, where possible, components arrive on a just-in-time, as-and-when needed basis. EMS companies are significant purchasers of electronic components and other raw materials, and can capitalize on the economies of scale associated with their relationships with suppliers to negotiate price discounts, obtain components and other raw materials that are in short supply, and return excess components. EMS companies’ expertise in supply chain management and their relationships with suppliers across the supply chain enable them to help OEMs reduce their cost of goods sold and inventory exposure.
Access Global Manufacturing Services. OEMs seek to reduce their manufacturing costs by having EMS companies manufacture their products in the lowest cost locations that are appropriate for their products and end customers. OEMs also are increasingly requiring particular products to be manufactured simultaneously in multiple locations, often near end users, to bring products to market more quickly, reduce shipping and logistics costs and meet local product content requirements. Global EMS companies are able to satisfy these requirements by capitalizing on their geographically dispersed manufacturing facilities, including those in lower cost regions.
Accelerate Time to Market. OEMs face increasingly short product life cycles due to increased competition and rapid technological changes. As a result, OEMs need to reduce the time required to bring their products to
3
market. OEMs often can bring a product to market faster by using EMS companies’ expertise in new product introduction, including manufacturing design, engineering support and prototype production. OEMs often can more quickly achieve volume production of their products by capitalizing on EMS companies’ manufacturing expertise and global presence and infrastructure.
Competitive Overview
We offer our OEM customers end-to-end services that span the entire product life cycle:
Competitive Strengths
We believe that our competitive strengths differentiate us from our competitors and enable us to better serve the needs of OEMs. Our competitive strengths include:
• End-to-End Services. We provide services throughout the world to support our customers’ products during their products’ entire life cycles, from product design and engineering, through volume manufacturing, to direct order fulfillment and after-market product service and support. We believe that our end-to-end services are more comprehensive than the services offered by our competitors because of our focus on adding value before and after the actual manufacturing of our customers’ products. Our end-to-end services enable us to provide our customers with a single source of supply for their EMS needs, reduce the time required to bring products to market, lower product costs and allow our customers to focus on those activities in which they expect to add the highest value. We believe that our end-to-end services allow us to develop closer relationships with our customers and more effectively compete for their future business.
• Product Design and Engineering Resources. We provide product design and engineering services to produce advanced electronic systems for both custom and standard (or ODM) designs. Our global design and engineering teams include approximately 600 designers and engineers located in 19 design and new product introduction centers in 11 countries. Our designers and engineers work closely with our customers to develop new products and manage products throughout their life cycles. Our design centers provide both hardware and software engineering services for a range of product technologies, including high-speed digital, analog, radio frequency, wireless, optical and electro-mechanical technologies. We also provide component-level design services in connection with our vertically integrated volume manufacturing services, including the design of complex printed circuit boards and printed circuit board assemblies, backplanes and backplane assemblies, enclosures, cable assemblies and modular memory solutions.
• Vertically Integrated Volume Manufacturing Services. We provide a range of vertically integrated volume manufacturing services. Key system components that we manufacture include complete printed circuit boards and printed circuit board assemblies, backplanes and backplane assemblies, enclosures, cable assemblies,
4
precision machine components, memory modules and optical modules. By manufacturing these system components and subassemblies ourselves, we enhance continuity of supply and reduce costs for our customers. In addition, we are able to have greater control over the production of our customers’ products and retain incremental profit opportunities for us. Examples of products that we manufacture using our full range of services include wireless base stations, network switches, optical switches, enterprise-class servers, photolithography equipment, and equipment used in the semiconductor chip manufacturing process, including equipment for chemical mechanical polishing and physical vapor depositions and automated handling tools and robotics for wafer transfer.
• Advanced Technologies. We are a leader in providing services utilizing advanced technologies, which we believe allows us to differentiate ourselves from our competitors. These advanced technologies include the fabrication of complex printed circuit boards and backplanes having over 60 layers and process capabilities for a range of low signal loss, high performance materials, buried capacitors and resistors, and high density interconnects using micro via holes that are formed using laser drills. Our printed circuit board assembly technologies include micro ball grid arrays, fine pitch discretes, and small form factor radio frequency and optical components, as well as advanced packaging technologies used in high pin count application specific integrated circuits and network processors. We use innovative design solutions and advanced metal forming techniques to develop and fabricate high-performance indoor and outdoor chassis, enclosures and frames. Our assembly services use advanced technologies, including precision optical alignment, multi-axis precision stages and machine vision technologies. We use sophisticated procurement and production management tools to effectively manage inventories for our customers and ourselves. We have also developed build-to-order, or BTO, and configure-to-order, or CTO, systems that enable us to manufacture and ship finished systems within 48 to 72 hours after receipt of an order. To coordinate the development and introduction of new technologies to meet our customers’ needs in various locations and to increase collaboration among our facilities, we have established a centralized global technology group.
• Global Capabilities. Most of our customers compete and sell their products on a global basis. As such, they require global solutions that include regional manufacturing for selected end markets, especially when time to market, local manufacturing or content and low cost solutions are critical objectives. Our global network of facilities in more than 20 countries provides our customers a combination of sites to maximize both the benefits of regional and low cost manufacturing. To manage and coordinate our global operations, we employ an enterprise-wide software system that operates on a single IT platform and provides us with company-wide information regarding component inventories and orders. This system enables us to standardize planning and purchasing at the plant level and to optimize inventory management and utilization. Our systems also enable our customers to receive key information regarding the status of individual programs.
• Customer-Focused Organization. We believe customer relationships are critical to our success, and our organization is focused on providing our customers with responsive services. Our key customer accounts are managed by dedicated account teams, including a global business manager directly responsible for account management. Global business managers coordinate activities across divisions to effectively satisfy our customers’ requirements and have direct access to our senior management to quickly address customer concerns. Local customer account teams further support the global teams and are linked by a comprehensive communications and information management infrastructure.
• Expertise in Serving Diverse End Markets. We have experience in serving our customers in the communications, personal and business computing, enterprise computing and storage, multimedia, industrial and semiconductor capital equipment, defense and aerospace, medical and automotive markets. Our diversification across end markets reduces our dependence upon any one customer or segment. In order to cater to the specialized needs of customers in particular market segments, we have dedicated personnel, and in some cases facilities, with industry-specific capabilities and expertise. We also maintain compliance with industry standards and regulatory requirements applicable to certain markets including, among others, the medical and defense and aerospace sectors.
• Experienced Management Team. We believe that one of our principal assets is our experienced management team. Our chief executive officer, Jure Sola, co-founded Sanmina in 1980. Hari Pillai, President, Global Operations, joined our Company in 1994 and has served in manufacturing management positions since that time. We believe that the significant experience of our management team better enables us to capitalize on opportunities in the current business environment.
5
Our Business Strategy
Our objective is to maintain and enhance our leadership position in the EMS industry. Key elements of our strategy include:
Capitalizing on Our Comprehensive Services. We intend to capitalize on our end-to-end services, which we believe will allow us to both sell additional services to our existing customers and attract new customers. Our end-to-end services include product design and engineering, volume manufacturing, final system assembly and test, direct order fulfillment, after-market product service and support and supply chain management. Our vertically integrated volume manufacturing services enable us to manufacture additional system components and subassemblies for our customers. When we provide a customer with a number of services, such as component manufacturing or higher value-added services, we are often able to improve our margins and profitability. Consequently, our goal is to increase the number of manufacturing programs for which we provide multiple services. To achieve this goal, our sales and marketing organization seeks to cross-sell our services to customers.
Extending Our Technology Leadership. We rely on advanced processes and technologies to provide our vertically integrated volume manufacturing services. We continually strive to improve our manufacturing processes and have adopted a number of quality improvement and measurement techniques to monitor our performance. We work with our customers to anticipate their future manufacturing requirements and align our technology investment activities to meet their needs. We use our design expertise to develop product technology platforms that we can customize by incorporating other components and subassemblies to meet the needs of particular OEMs. These technologies enhance our ability to manufacture complex, high-value added products, allowing us to continue to win business from existing and new customers.
Original Design Manufacturing Solutions. As a result of customer demand, and our customers’ desire to manage research and development expenses, we have begun to offer product designs that our customer can either brand with its own name or integrate into its own system solution. In these cases, we act as the original design manufacturer, or ODM, for our customer. For ODM products, we typically retain the intellectual property rights and realize manufacturing revenue associated with building and shipping the product. Our current ODM portfolio covers several end markets, including enterprise computing, communications, and multimedia. For example, in the enterprise computing market, our two-processor 64-bit Opteron server is currently being shipped to multiple customers. The ODM server product roadmap includes multi-processor designs that will be scalable up to 32-processor systems.
Continuing to Penetrate Diverse End Markets. We focus our marketing efforts on major end markets within the electronics industry. We have targeted markets that we believe offer significant growth opportunities and for which OEMs sell complex products that are subject to rapid technological change because the manufacturing of these products requires higher value-added services. Our approach to our target markets is two-fold: we intend to strengthen our significant presence in the communications and enterprise computing markets, and also focus on under-penetrated target markets, including the medical, industrial and semiconductor capital equipment, automotive, and defense and aerospace industries, many of which have not extensively relied upon EMS companies in the past. We intend to continue our diversification across market segments and customers to reduce our dependence on any particular market.
Pursuing Strategic Transactions. We seek to undertake strategic transactions that give us the opportunity to access new customers, manufacturing and service capabilities, technologies and geographic markets, to lower our manufacturing costs and improve the margins on our product mix, and to further develop existing customer relationships. For example, in October 2004, we completed the acquisition of Pentex-Schweizer Circuits Limited, a printed circuit board manufacturer, in order to provide lower cost manufacturing capacity in China for our customers. In addition, we will continue to pursue OEM divestiture transactions that will augment existing strategic customer relationships with favorable supply agreement terms or build new relationships with customers in attractive end markets. Potential future transactions may include a variety of different business arrangements, including acquisitions, spin-offs, strategic partnerships, joint ventures, restructurings, divestitures, business combinations and equity or debt investments. We intend to continue to evaluate and pursue strategic opportunities on a highly selective basis.
Continuing to Seek Cost Savings and Efficiency Improvements. We seek to optimize our facilities to provide cost-efficient services for our customers. We maintain extensive operations in lower cost locations, including Latin America, Eastern Europe, China and Southeast Asia, and we plan to expand our presence in these lower cost locations, as appropriate, to meet the needs of our customers. We believe that we are well positioned to take advantage of future opportunities on a global basis as a result of our vertically integrated volume manufacturing strategy.
6
Our Products and Services
We offer our OEM customers end-to-end services that span the entire product life cycle. Examples of products that we manufacture for OEMs include wireless and wireline communications switches, personal computers, high-end computers and servers, avionics, medical imaging systems and digital satellite set-top boxes. The manufacture of these products may require us to use all or some of our end-to-end services. Each element of our end-to-end services is described in greater detail below.
Product Design and Engineering. Our design and engineering group, which we believe is one of the strongest in the EMS industry, provides customers with design and engineering services for initial product development, detailed product design and preproduction. This group also complements our vertically integrated volume manufacturing capabilities by providing manufacturing design services for the manufacture of printed circuit boards, backplanes and enclosures. We provide initial product development and detailed product design and engineering services for products such as communications base stations, optical switches and modules, radio frequency amplifier modules, network switches, personal computers and servers.
• Initial Product Development. We provide a range of design and engineering services to customers to complement their initial product development efforts. During this phase, our design engineers work with our customers’ product development engineers to assist with design reviews and product concepts.
• Detailed Product Design. During the detailed product design phase, we work with our customers’ product development engineers to optimize product designs to improve the efficiency of the volume manufacturing of these products and reduce manufacturing costs. We further analyze product design to improve the ability of tests used in the manufacturing process to identify product defects and failures. We provide software development support for product development, including installing operating systems on hardware platforms, developing software drivers for electronic devices, and developing diagnostic, production test and support software. We design components that are incorporated into our customers’ products, including printed circuit boards, backplanes and enclosures.
• Preproduction. After a detailed product design has been completed and the product is released for prototype production, we can build a prototype on a quick turn around basis. We then analyze the feasibility of manufacturing the product prototype and make any necessary design modifications to the prototype and test the prototype to validate its design. We also provide early-stage test development during the prototype phase. We evaluate prototypes to determine if they will meet safety and other standards, such as standards published by Underwriters Laboratories, an independent product safety testing and certification organization, and other similar domestic and international organizations. We also typically provide low-volume manufacturing to satisfy customers’ needs. We review the material and component content of customers’ designs with a view to designing in alternative components that may provide cost savings. Our preproduction services help our customers reduce the time required to bring new products to market.
• Manufacturing Design Services. We provide our own designs for our vertically integrated system components and subassemblies, including:
• Printed Circuit Board and Backplane Design. We have a dedicated printed circuit board design group that designs and engineers complex printed circuit boards and backplanes. These printed circuit boards and backplanes incorporate high layer counts and large form factors and are used in complex products such as optical networking products and communications switches. Our designs also incorporate component miniaturization technologies and other advanced technologies that increase the number and density of components that can be placed on a printed circuit board. These technologies enable OEMs to provide greater functionality in smaller products. We also provide signal integrity engineering services, which involve the maintenance of the quality and integrity of high speed electrical signals as they travel through a system.
• Enclosure Design. We have a dedicated enclosure design group that designs and engineers complex enclosures. We can design custom enclosures to meet customer specifications and offer a range of proprietary designs tailored to particular applications. Our enclosure design services include the design
7
of thermal management systems, which dissipate heat generated by the components within an enclosure. We design enclosures that are used in both indoor and outdoor environments. We also design enclosures that include both stackable and rack mount chassis configurations. In stackable configurations, component modules are stacked on top of each other, while in rack mount configurations, component modules slide into racks within the enclosure. Rack mount configurations often are used for complex products, such as communications switches that are frequently upgraded in the field by inserting new components. Our design engineers work with a range of materials, including metal, plastic and die-cast material. We design indoor and outdoor wireless base station cabinets, enclosures for high-end servers and data storage systems and enclosures for magnetic resonance imaging systems. We have developed a sophisticated proprietary enclosure with a thermal management system for high density servers used for managed hosting in data center applications. We offer this enclosure platform to our customers who can then customize it with modules and subsystems designed and manufactured to their specifications. By using our common platform, customers reduce their enclosure costs.
Volume Manufacturing. Volume manufacturing includes our vertically integrated manufacturing services described in greater detail below.
• Printed Circuit Boards. Our ability to reliably produce printed circuit boards with high layer counts and narrow circuit track widths makes us an industry leader in complex printed circuit board fabrication. Printed circuit boards are made of laminated materials and contain electrical circuits and connectors that interconnect and transmit electrical signals among the components that make up electronic devices. We are among a small number of manufacturers that specialize in manufacturing complex multi-layer printed circuit boards. Multi-layering, which involves incorporating numerous layers of electrical circuitry into a single printed circuit board, expands the number of circuits and components that can be contained on a printed circuit board and increases the operating speed of the system by reducing the distance that electrical signals must travel. Increasing the density of the circuitry in each layer is accomplished by reducing the width of the circuit tracks and placing them closer together in the printed circuit board. We are currently capable of efficiently producing printed circuit boards with up to 60 layers and circuit track widths as narrow as three mils. We use sophisticated circuit interconnections between certain layers to improve the performance of printed circuit boards. We have developed a proprietary material technology known as buried capacitance as well as various other processes that are designed to improve electrical performance and connection densities on printed circuit boards.
• Printed Circuit Board Assembly and Test. Printed circuit board assembly involves attaching electronic components, such as integrated circuits, capacitors, microprocessors, resistors and memory modules, to printed circuit boards. The most common technologies used to attach components to printed circuit boards are surface mount technology, or SMT, and pin-through-hole assembly, or PTH. SMT involves the use of an automated assembly system to solder components to the printed circuit board. In PTH, components are placed on the printed circuit board by insertion into holes punched in the circuit board. Components also may be attached using press-fit technology in which components are pressed into connectors affixed to the printed circuit board. We use SMT, PTH, press-fit as well as new attachment technologies that are focused on miniaturization and increasing the density of component placement on printed circuit boards. These technologies, which support the needs of our OEM customers to provide greater functionality in smaller products, include chip-scale packaging, ball grid array, direct chip attach and high density interconnect. We perform in-circuit and function testing of printed circuit board assemblies. In-circuit testing verifies that all components have been properly inserted and attached and that the electrical circuits are complete. We perform functional tests to confirm that the board or assembly operates in accordance with its final design and manufacturing specifications. We either design and procure test fixtures and develop our own test software, or we use our customers’ test fixtures and test software. In addition, we provide environmental stress tests of the board or assembly that are designed to confirm that the board or assembly will meet the environmental stresses, such as heat, to which it will be subject.
• Backplanes and Backplane Assemblies. Backplanes are very large printed circuit boards that serve as the backbones of sophisticated electronics products and provide interconnections for printed circuit boards, integrated circuits and other electronic components. We fabricate backplanes in our printed circuit board plants. Backplane fabrication is significantly more complex than printed circuit board fabrication due to the large size and thickness of the backplanes. We manufacture backplane assemblies by press fitting high density connectors into plated through holes in the bare backplane. In addition, many of the newer higher technology backplanes
8
require SMT attachment of passive discrete components as well as high pin count Ball Grid Array packages. These advanced assembly processes require specialized equipment and a strong focus on quality and process control. We also perform in-circuit and functional tests on backplane assemblies. We have developed proprietary technology and “know-how” which enables backplanes to run at data rates in excess of 10 gigabits per second, or Gbps. We are investing in research and development to manufacture backplanes with embedded optical channels capable of data rates over 40 Gbps. We currently have capabilities to manufacture backplanes with up to 60 layers in sizes up to 32 ´ 54 inches and 0.500 inches in thickness, utilizing a wide variety of high performance laminate materials. These are among the largest and most complex commercially manufactured backplanes, and we are one of a limited number of manufacturers with these capabilities.
• Enclosures. Enclosures are cabinets that house and protect complex and fragile electronic components, modules and subsystems. Our enclosure manufacturing services include fabrication of cabinets, chassis and racks integrated with various electronic components such as power and thermal management systems. We manufacture a broad range of enclosures with numerous materials including metal, plastics and die cast materials. Enclosures we manufacture range from basic enclosures, such as enclosures for personal computers, to large and highly complex enclosures, such as those for indoor and outdoor communications base station products. Our product offerings include a proprietary enclosure with a thermal management system designed for high density servers for managed hosting in data center applications. Our customers can have their unique products built on this platform by inserting their proprietary modules and subsystems.
• Cable Assemblies. Cable assemblies are used to connect modules, assemblies and subassemblies in electronic devices. We provide a broad range of cable assembly products and services. We design and manufacture a broad range of high-speed data, radio frequency and fiber optic cabling products. Cable assemblies that we manufacture are often used in large rack systems to interconnect subsystems and modules.
• Precision Machine Components. We provide a broad range of manufacturing services for metals and plastics. With some of the largest horizontal milling machines in the United States, we are a preferred supplier of vacuum chamber systems for the semiconductor and flat panel display equipment markets. We are able to support low volume engineering programs and high volume production. We utilize advanced computer numerically controlled machined tools enabling the manufacture of components to very tight tolerance standards.
• Optical Modules. Optical modules are integrated subsystems that use a combination of industry standard and/or custom optical components. We are a leading provider of complete optical systems for customers in telecommunications, networking, and military markets. Our experience in optical communications and networking products spans long haul/ultra long haul and metro regions for transport, access and switching applications, including last mile solutions. Our service offerings for optical communications customers are designed to deliver end-to-end solutions with special focus on system design, optical module assembly, optical test and integration.
• Memory Modules. Memory modules are integrated subsystems that use industry standard integrated circuits including digital signal processors, or DSPs, non-volatile flash memory and random access memory, or RAM. These modules consist of standard products that are sold for a wide range of applications to a broad base of customers and custom modules that are built for use in a particular OEM’s product or system. We design and manufacture a variety of modular solutions, including standard and custom DSP, flash memory modules and DRAM modules. In addition, we are a leading supplier of solutions to increase memory component density on printed circuit boards. We offer advanced NexMod memory modules that contain multiple memory layers vertically stacked and mounted to a printed circuit board. NexMod solutions are tailored for high-end network infrastructure and complex server applications. We also provide innovative DDRI and DDRII DRAM modules utilizing stacked CSP technology offering high densities in ultra small form factors. We provide custom module solutions including mixed memory and our proprietary foldable rigid assembly microelectronics module, or FRAMM. We integrate both standard and custom modules in products that we manufacture.
Final System Assembly and Test. We provide final system assembly and test in which assemblies and modules are combined to form complete, finished products. We often integrate printed circuit board assemblies manufactured by us with enclosures, cables and memory modules that we also produce. Our final assembly activities also may involve integrating components and modules that others manufacture. The complex, finished products that we produce typically require extensive test protocols. Our test services include both functional and environmental tests. We also test products for conformity to
9
applicable industry, product integrity and regulatory standards. Our test engineering expertise enables us to design functional test processes that assess critical performance elements, including hardware, software and reliability. By incorporating rigorous test processes into the manufacturing process, we can help to assure customers that their products will function as designed. Products for which we currently provide final system assembly and test include wireless base stations, wire line communications switches, optical networking products, high-end servers and personal computers.
Direct Order Fulfillment. We provide direct order fulfillment for our OEM customers. Direct order fulfillment involves receiving customer orders, configuring products to quickly fill the orders and delivering the products either to the OEM, a distribution channel (such as a retail outlet) or directly to the end customer. We manage our direct order fulfillment processes using a core set of common systems and processes that receive order information from the customer and provide comprehensive supply chain management, including procurement and production planning. These systems and processes enable us to process orders for multiple system configurations, and varying production quantities, including single units. Our direct order fulfillment services include BTO and CTO capabilities. BTO involves building a system having the particular configuration ordered by the OEM customer. CTO involves configuring systems to an end customer’s order. The end customer typically places this order by choosing from a variety of possible system configurations and options. We are capable of meeting a 48 to 72 hour turn-around-time for BTO and CTO by using advanced manufacturing processes and a real-time warehouse management system and data control on the manufacturing floor. We support our direct order fulfillment services with logistics that include delivery of parts and assemblies to the final assembly site, distribution and shipment of finished systems, and processing of customer returns. Our systems are sufficiently flexible to support direct order fulfillment for a variety of different products, such as desktop and laptop computers, servers, workstations, set-top boxes, medical devices, scanners, printers and monitors.
After-Market Product Service and Support. We provide a wide range of after-market product service and support services, including replacing products at customer locations, product repair, re-manufacturing and maintenance at repair depots, logistics and parts management, returns processing, warehousing and engineering change management. We also provide support services for products that are nearing the end of their life cycles. These end-of-life support services involve both customer support and manufacturing support activities. We support the customer by providing software updates and design modifications that may be necessary to reduce costs or design-in alternative components due to component obsolescence or unavailability. Manufacturing support involves test engineering support and manufacturability enhancements. We also assist with failure product analysis, warranty and repair and field service engineering activities.
Global Supply Chain Management
Supply chain management involves the planning, purchasing and warehousing of product components. The objective of our supply chain management services is to reduce excess component inventory in the supply chain by scheduling deliveries of components on a just-in-time, as-and-when-needed basis. We use sophisticated production management systems to manage our procurement and manufacturing processes in an efficient and cost effective manner. We collaborate with our customers to enable us to respond to their changing component requirements for their products and to reflect any changes in these requirements in our production management systems. These systems often enable us to forecast future supply and demand imbalances and develop strategies to help our customers manage their component requirements. Our enterprise-wide software systems provide us with company-wide information regarding component inventories and orders to standardize planning and purchasing at the plant level. These systems enable us to transfer product components between plants to respond to changes in customer requirements or to address component or other raw material shortages.
We purchase large quantities of electronic components and other raw materials from a range of suppliers. As a result, we often receive volume discounts or other favorable terms from suppliers, which can enable us to provide our customers with greater cost reductions than they can obtain themselves. Our supplier relationships often enable us to obtain electronic components and other raw materials that are in short supply or return excess inventories to suppliers even when they are not contractually obligated to accept them.
Our End Markets
We have targeted markets that offer significant growth opportunities and for which OEMs sell complex products that are subject to rapid technological change. We believe that markets involving complex, rapidly changing products offer us opportunities to produce products with higher margins because these products require higher value added manufacturing services and may also include our advanced vertically integrated components. Our approach to our target markets is two-fold—we intend to strengthen our significant presence in the communications and computing markets, while also focusing on other under-penetrated target markets, including the medical, automotive, industrial and semiconductor capital equipment and
10
defense and aerospace industries, many of which have not extensively relied upon EMS companies in the past. Our diversification across market segments and customers reduces our dependence on any particular market.
Communications: Wireless, Optical and Wireline Transmission and Enterprise. In the communications sector, we focus on wireless transmission systems, optical networking and wireline transmission systems and enterprise networking systems. Our product design and engineering staff has extensive experience designing advanced communications products for these markets. Products we manufacture include point-to-point microwave systems, optical switches, wireless base stations, wireline switches, routers, transceivers, satellite receivers, radio frequency and Bluetooth appliances, among others.
Computing: Personal and Business (Enterprise) Computing and Storage Systems. We provide services for OEMs of personal computer, or PC, systems, enterprise computing, and storage systems.
We provide services to multiple major PC manufacturers. These services include primarily BTO and CTO manufacturing of desktop PC systems serving primarily the enterprise markets. Our PC manufacturing plants can build and configure systems and have them ready for shipment within 48 to 72 hours of receipt of a customer order. These plants are typically located in the geographic region to which the finished system will be shipped to rapidly deliver finished products.
We also provide services to the storage and server markets. Our expertise in manufacturing products for the storage and server markets stems from our technological capabilities and vertical integration. We are also the leading vertically integrated supplier of complex, multilayer printed circuit boards and backplanes, and many high-end computer designs incorporate these components. We have developed a proprietary enclosure design for high density servers used in data center applications. High-end computing products we manufacture include complex, fault tolerant servers and enterprise storage.
Multimedia. We manufacture digital satellite set-top boxes, personal video recorders, digital home gateways and internet protocol entertainment devices. For our multimedia OEM customers, we manage the production process for multimedia products, including product design and engineering, test development, supply chain management, manufacturing of printed circuit boards and assemblies, final system assembly and test, and direct order fulfillment, including our BTO and CTO capabilities.
Industrial and Semiconductor Systems. Our expertise in manufacturing industrial instrumentation products includes production of semiconductor capital equipment, front-end environmental chambers, computer controllers, and test and inspection equipment. We also have significant experience manufacturing scanning equipment and devices, flat panel display test and repair equipment, optical inspection and x-ray equipment for use in the printed circuit board assembly industry, and deep ultraviolet photolithography equipment.
Defense and Aerospace. In December 2001, we merged with SCI Systems, Inc., or SCI. SCI began operations as Space-Craft, Inc., in the early 1960’s and was then principally a supplier to the defense and aerospace industries. We continue to offer our end-to-end services to the defense and aerospace industry. We believe that this industry currently represents a significant growth opportunity due to increased defense spending, as well as the growing desire of defense and aerospace OEMs to outsource non-core manufacturing activities to reduce costs. Our experience in serving the aerospace industry, as well as our product design and engineering capabilities, represent key competitive strengths for us in the defense and aerospace market. Defense and aerospace products that we manufacture include avionics systems, weapons guidance systems, cockpit communications systems, spread spectrum communications systems, and space systems.
Medical. We provide comprehensive manufacturing and related services to the medical industry, including design and regulatory approval support. The manufacturing of products for the medical industry requires compliance with domestic and foreign regulations, including the Food and Drug Administration’s, or FDA’s, quality system regulations and the European Union’s medical device directive. In addition to complying with these standards, our medical manufacturing facilities comply with ISO 13485 (formerly EN 46002) and ISO 9001:2000. Medical products that we manufacture include magnetic resonance imaging equipment, blood glucose meters, computer tomography scanners, respiration monitors, ventilators, anesthesia workstations, infusion pumps, thermo-regulation devices, and cardio-resuscitation systems.
Automotive. In recent years, the electronics content in automobiles has increased substantially as new entertainment, wireless communication and navigation systems are being offered as standard features or factory options. We believe that this increased usage of electronic devices in automobiles will continue, and that there will be significant opportunities for EMS companies to manufacture automotive electronics. Accordingly, we have formed an automotive products group to focus on these opportunities.
11
Customers
A relatively small number of customers historically have been responsible for a significant portion of our net sales. Sales to our ten largest customers accounted for 63.9% of our fiscal 2005 net sales, 69.3% of our fiscal 2004 net sales and 68.5% of our fiscal 2003 net sales. For fiscal 2005, only one customer, IBM, accounted for greater than 10% of our net sales at 23.2%. For fiscal 2004, two customers, IBM and HP, accounted for greater than 10% of our net sales at 28.4% and 12.0%, respectively.
We seek to establish and maintain long-term relationships with our customers and have served many of our principal customers for several years. Historically, we have had substantial recurring sales from existing customers. We have also expanded our customer base through acquisitions and our marketing and sales efforts. We have been successful in broadening relationships with customers by providing vertically integrated products and services, as well as multiple products and services in multiple locations.
We typically enter into supply agreements with our major OEM customers with terms ranging from three to five years. Many of these supply agreements were entered into in connection with divestiture transactions, which are transactions in which we also acquire plants, equipment and inventory from the OEM. In these divestiture-related supply agreements, the customer typically agrees to purchase from us its requirements for particular products in particular geographic areas and for a specific period of time. Our OEM customer supply agreements that were not entered into in connection with divestitures typically do not require the customer to purchase their product requirements from us, and in these cases customers may have alternate sources of supply available to them. Our supply agreements with our OEM customers generally do not obligate the customer to purchase minimum quantities of products. However, the customer typically remains liable for the cost of the materials and components that we have ordered to meet the customer’s production forecast but which are not used, provided that the material was ordered in accordance with an agreed-upon procurement plan. In some cases, the procurement plan contains provisions regarding the types of materials for which our customers will assume responsibility. In particular customers are increasingly requiring EMS companies, including us, to assume responsibility for industry standard components while retaining liability only for components specific to their products. Our supply agreements typically also contain provisions permitting cancellation and rescheduling of orders upon notice and subject, in some cases, to cancellation and rescheduling charges. Order cancellation charges typically vary by product type and depend upon how far in advance of shipment a customer notifies us of the cancellation of an order. In some circumstances, our supply agreements with customers provide for cost reduction objectives during the term of the agreement.
We generally do not obtain firm, long-term commitments from our customers under supply agreements. As a result, customers can cancel their orders, change production quantities or delay orders. Uncertain economic conditions and our general lack of long-term purchase contracts with our customers make it difficult for us to accurately predict revenue over the long term. Even in those cases where customers are contractually obligated to purchase products from us or repurchase unused inventory from us that we have ordered for them, we may elect not to immediately enforce our contractual rights because of the long-term nature of our customer relationships and for other business reasons, and instead may negotiate accommodations with customers regarding particular situations.
Backlog
At October 1, 2005 and October 2, 2004, our backlog was approximately $2.4 billion. Backlog consists of purchase orders received, including, in some instances, forecast requirements released for production under customer contracts. Cancellation and postponement charges generally vary depending upon the time of cancellation or postponement. Substantially all of our backlog as of October 1, 2005, is expected to be shipped in fiscal 2006. However, customers may cancel or postpone substantially all scheduled deliveries without significant penalty and backlog may therefore not be a meaningful indicator of future financial results.
Marketing and Sales
Our corporate marketing, sales and customer service staff consists of approximately 1,000 people. Our sales efforts are organized and managed on a regional basis, with regional sales managers in geographic regions in the United States and internationally.
We develop relationships with our customers and market our vertically integrated volume manufacturing services through our direct sales force and customer support specialists. Our sales resources are directed at multiple management and
12
staff levels within target accounts. Our direct sales personnel work closely with the customers’ engineering and technical personnel to better understand their requirements. Our marketing and sales staff supports our business strategy of providing end-to-end services by encouraging cross-selling of vertically integrated volume manufacturing services and component manufacturing across a broad range of major OEM products. To achieve this objective, our marketing and sales staff works closely with our various manufacturing and design and engineering groups and engages in marketing and sales activities targeted towards key customer opportunities.
Each of our key customer accounts are managed by a dedicated account team, including a global business manager directly responsible for account management. Global business managers coordinate activities across divisions to effectively satisfy customer requirements and have direct access to our senior management to quickly address customer concerns. Local customer account teams further support the global teams and are linked by a comprehensive communications and information management infrastructure.
Competition
We face competition from other major global EMS companies such as Celestica, Inc., Flextronics International Ltd., Hon Hai (FoxConn), Jabil Circuit, Inc. and Solectron Corporation, as well as other EMS companies that often have a regional or product, service or industry specific focus. In addition, our potential customers may also compare the benefits of outsourcing their manufacturing to us with the merits of manufacturing products themselves.
We compete with different companies depending on the type of service or geographic area. We believe that the primary basis of competition in our target markets is manufacturing technology, quality, responsiveness, provision of value-added services and price. To remain competitive, we must continue to provide technologically advanced manufacturing services, maintain quality levels, offer flexible delivery schedules, deliver finished products on a reliable basis and compete favorably on the basis of price. We believe that our primary competitive strengths include our ability to provide global end-to-end services, our product design and engineering resources, our advanced technologies, our high quality manufacturing assembly and test services, our customer focus, our expertise in serving diverse end markets and an experienced management team.
In addition to EMS companies, we also compete, with respect to certain of the EMS services we provide, with ODMs. These companies, typically based in Asia, design products and product platforms that are then sold to OEMs, system integrators and others who configure and resell them to end users. To date, ODM penetration has been greatest in the personal computer, including both desktop and notebook computers, and low-end server markets.
Intellectual Property
We hold various United States and foreign patents primarily related to printed circuit boards, methods of manufacturing printed circuit boards, and enterprise computing. For other proprietary processes, we rely primarily on trade secret protection. We also have registered trademarks in the United States and many other countries throughout the world. As the level of ODM services we provide increases, intellectual property will become of greater importance to our business.
Although we do not believe that our current trademarks, manufacturing processes or patents infringe on the intellectual property rights of third parties, we cannot assure you that third parties will not assert infringement claims against us in the future. If such an assertion were to be made, it may become necessary or useful for us to enter into licensing arrangements or to resolve such an issue through litigation. However, we cannot assure you that such license rights would be available to us on commercially acceptable terms if at all or that any such litigation would be resolved favorably. Additionally, such litigation could be lengthy and costly and could materially affect our financial condition regardless of the outcome of such litigation.
13
Environmental Controls
We are subject to a variety of local, state and federal environmental laws and regulations in the United States, as well as foreign laws and regulations, relating to the treatment, storage, use, discharge, emission and disposal of chemicals, solid waste and other hazardous materials used during our manufacturing processes, as well as occupational safety and health laws, and product take back, product labeling and product content requirements. Proper waste disposal is a major consideration in particular for printed circuit board manufacturers because metals and chemicals are used in the manufacturing process. Water used in the printed circuit board manufacturing process must be treated to remove metal particles and other contaminants before it can be discharged into municipal sanitary sewer systems. We operate on-site wastewater treatment systems at our printed circuit board manufacturing plants in order to treat wastewater generated in the fabrication process.
In addition, although the electronics assembly process generates significantly less wastewater than printed circuit board fabrication, maintenance of environmental controls is also important in the electronics assembly process because such operations can generate lead dust. We are undertaking remediation of lead dust in the interior of manufacturing facilities when vacating those facilities. Although there are no applicable standards for lead dust remediation in manufacturing facilities, we endeavor to make efforts to remove the residues. To date, lead dust remediation costs have not been material to our operations. We also monitor for airborne concentrations of lead in our buildings and are not aware of any significant lead concentrations in excess of the applicable OSHA standards.
We have a range of corporate programs in place with regard to environmental compliance and reduction of the use of hazardous materials in manufacturing. In the environmental compliance area, we are developing corporate-wide standardized environmental management systems, auditing programs and policies to enable us to better manage environmental compliance activities. We are also developing programs to certify our facilities under ISO 14001, a set of standards and procedures relating to environmental compliance management. In addition, the electronics industry is subject to the European Union’s Restrictions of Hazardous Substances, or RoHS, and Waste Electrical and Electronic Equipment, or WEEE, directives which will take effect during 2005 and 2006. Parallel initiatives are being proposed in other jurisdictions, including several states in the United States and the Peoples’ Republic of China. RoHS prohibits the use of lead, mercury and certain other specified substances in electronics products and WEEE requires industry OEMs to assume responsibility for the collection, recycling and management of waste electronic products and components. We are in the process of making our manufacturing process RoHS compliant. In the case of WEEE, the compliance responsibility rests primarily with OEMs rather than with EMS companies. However, OEMs may turn to EMS companies for assistance in meeting their WEEE obligations. We are in the process of developing programs that we can offer to our customers to assist them with WEEE compliance.
Asbestos containing materials, or ACM, are present at several of our manufacturing facilities. Although the ACM is being managed and controls have been put in place pursuant to ACM operations and maintenance plans, the presence of ACM could give rise to affirmative remediation obligations and other liabilities. No third-party claims relating to ACM have been brought at this time.
Each plant, to the extent required by law, operates under environmental permits issued by the appropriate governmental authority. These permits must be renewed periodically and are subject to revocation in the event of violations of environmental laws. Any such revocation could require us to cease or limit production at one or more of our facilities, thereby having an adverse impact on our results of operations.
Primarily as a result of certain of our acquisitions, we have incurred liabilities associated with environmental contamination at facilities, including facilities of companies that we have acquired. These liabilities include ongoing investigation and remediation activities at a number of sites, including our facilities located in Irvine, California (a former facility acquired as part of our acquisition of Elexsys); Owego, New York (a current facility that we acquired with our acquisition of Hadco Corporation); Derry, New Hampshire (a non-operating facility of Hadco) and Fort Lauderdale, Florida (a former facility of Hadco). Currently, we are unable to anticipate whether any third-party claims will be brought against us for the existence of such contamination. There can be no assurance that third-party claims will not arise and will not result in material liability to us. In addition, there are several sites, including our facilities in Wilmington, Massachusetts (acquired from Altron); Brockville, Ontario (acquired from Nortel) and Gunzenhausen, Germany (acquired from Alcatel) that are known to have groundwater contamination caused by a third party, and that third party has provided indemnity to us for the liability. Although we cannot assure you that we will not incur liability for clean-up costs or expenses at any of these sites, we have no reason to believe that such liability will occur and that it will be material to our business.
We have also been named as a potentially responsible party at several contaminated disposal sites operated by other parties, including the Casmalia Resources site, as a result of the past disposal of hazardous waste by companies we have
14
acquired or by our corporate predecessors. Although liabilities for such historic disposal activities have not materially affected our financial condition to date, we cannot assure you that past disposal activities will not result in liability that will materially affect us in the future.
We use an environmental consultant to assist us in evaluating the environmental liabilities of the companies that we acquire as well as those associated with our ongoing operations, site contamination issues and historical disposal activities in order to establish appropriate accruals in our financial statements. In addition to liabilities associated with site contamination and related issues, we could also incur exposures associated with inventories containing restricted substances that we do not consume by the RoHS effective dates. We have also undertaken a process of re-evaluating and updating the reserves over time. As of October 1, 2005, based on the evaluations of our consultants, we have accrued $13.5 million for our environmental liabilities. Although we believe these accruals are adequate, we cannot be certain that environmental liabilities will not exceed the accrued amounts
Employees
As of October 1, 2005, we had 48,621 employees, including 11,600 temporary employees. None of our U.S. employees are represented by a labor union. In certain international locations, particularly in Western Europe, our employees are represented by labor unions on either a national or plant level. Western European countries also often have mandatory legal provisions regarding terms of employment, severance compensation and other conditions of employment that are more restrictive than U.S. laws. We have never experienced a strike or work stoppage and we believe that our relationship with our employees is good.
Available Information
Our Internet address is http://www.sanmina-sci.com. We make available through our website, free of charge, our Annual Reports on Form 10-K, Quarterly Reports on Form 10-Q, Current Reports on Form 8-K and amendments to those reports filed or furnished pursuant to Section 13(a) or 15(d) of the Securities Exchange Act of 1934, as amended, as soon as reasonably practicable after we electronically file such material with, or furnish it to, the Securities and Exchange Commission, or SEC. All reports we file with the SEC are also available free of charge via EDGAR through the SEC’s website at http://www.sec.gov.
Item 1A. Risk Factors
Refer to the “Factors Affecting Operating Results” contained in Item 7 “Management’s Discussion and Analysis of Financial Condition and Results of Operations”
Item 1B. Unresolved Staff Comments
None
15
Item 2. Properties
Facilities. Our customers market numerous products throughout the world and therefore need to access manufacturing services on a global basis. To enhance our EMS offerings, we seek to locate our facilities either near our customers and our customers’ end markets in major centers for the electronics industry or, where appropriate, in lower cost locations. Many of our plants located near customers and their end markets are focused primarily on final system assembly and test, while plants located in lower cost areas are engaged primarily in less complex component and subsystem manufacturing and assembly.
As of October 1, 2005, we manufacture products in 79 plants, consisting of 55 electronics assembly facilities, 9 printed circuit board fabrication facilities, 4 cable assembly facilities, and 11 enclosure assembly facilities, located both domestically and internationally. Our domestic plants are located in key electronics industry centers, including Silicon Valley – (Northern California), Southern California, New England, Texas, Northern Alabama, the Research Park Triangle area and New York, as well as in several other locations. Internationally, we have plants in Australia, Latin America (Brazil and Mexico), Canada, Western Europe (United Kingdom, Ireland, France, Germany, Spain, Sweden, and Finland), Eastern Europe (Hungary), Israel and Asia (Peoples’ Republic of China, Indonesia, Japan, Malaysia, Singapore, and Thailand). For fiscal 2005, approximately 76.2% of our net sales were from operations outside of the United States.
Since the closing of our merger with SCI in December 2001, we have evaluated our global manufacturing operations and restructured our facilities and operations to bring our manufacturing capacity in line with demand and our manufacturing strategy and to provide cost efficient services for our customers. Through this process, we have closed certain facilities not required to satisfy current demand levels, but have retained strategic manufacturing facilities in the United States and Western Europe that focus on higher value added manufacturing activities. We provide extensive operations in lower cost locations, including Latin America, Eastern Europe, China and Southeast Asia, and we plan to expand our presence in these lower cost locations, as appropriate to meet the needs of our customers.
As of October 1, 2005, the approximate square footage of our facilities by country is as follows:
| | Approximate
Square
Footage | |
Australia | | 59,772 | |
Brazil | | 230,685 | |
Canada | | 585,485 | |
China | | 1,502,698 | |
Finland | | 384,769 | |
France | | 530,862 | |
Germany | | 551,025 | |
Hungary | | 966,642 | |
Indonesia | | 66,056 | |
Ireland | | 126,200 | |
Israel | | 253,296 | |
Japan | | 13,870 | |
Malaysia | | 315,000 | |
Mexico | | 1,635,197 | |
Singapore | | 403,313 | |
Spain | | 298,903 | |
Sweden | | 189,200 | |
Thailand | | 138,500 | |
United Kingdom | | 834,203 | |
United States | | 4,865,611 | |
TOTAL | | 13,951,287 | |
We also have manufacturing facilities (not included in the above figure) that are closed or in the process of closing as of October 1, 2005, which include facilities totaling approximately 1,995,820 square feet for domestic locations and approximately 1,137,433 square feet for international locations. We are currently undertaking an aggressive program to sublease or terminate leases for unused facilities and to sell owned properties that are no longer expected to serve our future
16
needs. In addition, we have 337,820 (not included in the above figure) square feet of non-manufacturing space that we no longer expect to use.
As of October 1, 2005, our active manufacturing facilities consist of approximately 9.4 million square feet in facilities that we own, with the remainder in leased facilities under lease terms expiring between fiscal 2006 and fiscal 2021.
We believe that our existing facilities are adequate to meet our reasonably foreseeable requirements. We regularly evaluate our expected future facilities requirements.
Certifications and Registrations. Certifications and registrations under industry standards are important to our business because many customers rely on them to confirm our adherence to manufacturing process and quality standards. Certain markets, such as communications, medical, defense, aerospace and automotive, require adherence to industry-specific standards. Substantially all of our manufacturing facilities are registered under ISO 9001:2000, a set of standards published by the International Organization of Standardization and used to document, implement and demonstrate quality management and assurance systems in design and manufacturing. As part of the ISO 9001:2000 certification process, we have developed a quality systems manual and an internal system of quality controls and audits. ISO 9001:2000 registration is of particular importance to the companies doing business in the European Community, and we believe that United States electronics manufacturers are increasing their use of ISO 9001:2000 registration as a criteria for suppliers.
In addition to ISO 9001:2000, many of our facilities have been TL 9000 registered. TL 9000 is a relatively new telecommunications standard. The TL 9000 quality system requirements and quality system metrics are designed specifically for the telecommunications industry to promote consistency, efficiency, and improved customer satisfaction. Included in the TL 9000 system are performance-based metrics that measure the reliability and quality performance of the product. The majority of our facilities are also Underwriters Laboratory compliant. These standards define requirements for quality, manufacturing process control and manufacturing documentation and are required by many OEMs in the communications sector of the electronics industry.
Our medical products division has identified certain manufacturing facilities to be centers of excellence for medical products manufacturing. Currently most of those facilities are FDA and ISO 13485 registered and fully compliant to the FDA’s quality systems regulations.
Our defense and aerospace operations are headquartered in the Huntsville, Alabama area and are housed in dedicated facilities to meet the specialized needs of our defense and aerospace customers. Our defense and aerospace facilities are AS9100 registered and also certified under various U.S. military specifications as well as under ANSI and other standards appropriate for defense and aerospace suppliers.
Our automotive facilities are strategically located worldwide. Substantially all of our automotive facilities are QS 9000 and/or TS 16949 registered and also certified under the Automotive Industry Standard.
Item 3. Legal Proceedings
We are a party to certain legal proceedings that have arisen in the ordinary course of our business. We believe that the resolution of these proceedings will not have a material adverse effect on our business, financial condition or results of operations.
Item 4. Submission of Matters to a Vote of Security Holders
None.
17
EXECUTIVES OF SANMINA-SCI
Pursuant to General Instruction G(3), the information regarding our executive officers required by Item 401(b) of Regulation S-K is hereby included in Part I of this report.
The following table sets forth the name of each executive officer of Sanmina-SCI, the office held by such officer and the age, as of December 7, 2005, of such officer.
Name | | Age | | Position |
Jure Sola | | 54 | | Chairman of the Board and Chief Executive Officer |
Hari Pillai | | 45 | | President, Global Operations |
David L. White | | 50 | | Executive Vice President of Finance and Chief Financial Officer |
Dennis Young | | 54 | | Executive Vice President of Worldwide Sales and Marketing |
Steve Bruton | | 53 | | President and General Manager, Printed Circuit Board Fabrication Division |
Michael Clarke | | 51 | | President and General Manager, Enclosures Division |
Jure Sola has served as our chief executive officer since April 1991, as chairman of our board of directors from April 1991 to December 2001 and from December 2002 to present, and co-chairman of our board of directors from December 2001 to December 2002. In 1980, Mr. Sola co-founded Sanmina and initially held the position of vice president of sales. In October 1987, he became vice president and general manager of Sanmina, responsible for manufacturing operations and sales and marketing and was president from October 1989 to March 1996.
Hari Pillai joined our company in 1994 and has served in manufacturing management positions since that time. In January 2002, Mr. Pillai was appointed president and general manager of the EMS division of our company and in October 2004 was appointed president, global operations.
David L. White has served as our executive vice president of finance and chief financial officer since August 2004. Prior to joining us, he was senior vice president and chief financial officer of Asyst Technologies, a provider of integrated automation solutions that enhance semiconductor and flat-panel display (FPD) manufacturing productivity. Previously, he was president and chief executive officer of Candescent Technologies, a developer of field emission display (FED) technology for next-generation thin FPDs.
Dennis Young joined our company in March 2003. Prior to joining our company, Mr. Young was senior vice president sales from May 2002 to March 2003 and vice president sales from March 1998 to May 2002 of Pioneer-Standard Electronics.
Steve Bruton joined our company in 1982 and has served in printed circuit board fabrication management since that time. In December 2001, Mr. Bruton was appointed president and general manager of the printed circuit board fabrication division of our company.
Michael Clarke joined our company in 1999 as a result of our acquisition of Devtek Electronic Packaging Systems, or Devtek, a manufacturer of electronic and metal components that was established in 1992. Prior to joining our company, Mr. Clarke was president and chief executive officer of Devtek. In December 2001, Mr. Clarke was appointed president and general manager of the enclosures division of our company.
Former Executive Officer
Randy W. Furr served as our President and Chief Operating Officer from 1996 through October 24, 2005 at which time he resigned these positions. Mr. Furr initially joined us in November 1992 and served as our Chief Financial Officer until his promotion to the position of President and Chief Operating Officer.
18
PART II
Item 5. Market for Registrant’s Common Equity and Related Stockholder Matters
Market Information
Our common stock is traded on the Nasdaq National Market under the symbol SANM. The following table lists the high and low intra-day prices for our common stock as reported on Nasdaq.
Fiscal 2005 | | High | | Low | |
First quarter | | $ | 9.35 | | $ | 6.95 | |
Second quarter | | $ | 8.68 | | $ | 4.64 | |
Third quarter | | $ | 5.82 | | $ | 3.74 | |
Fourth quarter | | $ | 6.02 | | $ | 4.03 | |
Fiscal 2004 | | High | | Low | |
First quarter | | $ | 12.65 | | $ | 9.11 | |
Second quarter | | $ | 15.51 | | $ | 10.19 | |
Third quarter | | $ | 12.03 | | $ | 8.65 | |
Fourth quarter | | $ | 9.20 | | $ | 6.30 | |
Stockholders
As of December 7, 2005, we had approximately 2,251 common stockholders of record. On December 7, 2005, the last reported sales price of our common stock on the Nasdaq National Market was $4.29 per share.
Dividends
We have never declared or paid any cash dividends on our common stock. We currently expect to retain future earnings for use in the operation and expansion of our business and do not anticipate paying any cash dividends in the foreseeable future. The indentures governing our 10.375% Notes and 6.75.% Senior Subordinated Notes and the agreement governing our Senior Secured Credit Facility contain covenants that limit our ability to pay dividends; see also “Item 7—Management’s Discussion and Analysis of Financial Condition and Results of Operations—Liquidity and Capital Resources.”
19
Item 6. Selected Financial Data
The following selected financial data should be read in conjunction with “Item 7—Management’s Discussion and Analysis of Financial Condition and Results of Operations” and “Item 8—Financial Statements and Supplementary Data.”
FIVE YEAR SELECTED FINANCIAL HIGHLIGHTS
Consolidated Statements Of Operations Data:
| | Fiscal Year Ended | |
| | 2005(4) | | 2004 | | 2003(1) | | 2002(2)(3) | | 2001 | |
| | (In thousands, except per share data) | |
Net sales | | $ | 11,734,674 | | $ | 12,204,607 | | $ | 10,361,434 | | $ | 8,761,630 | | $ | 4,054,048 | |
Operating income (loss) | | (465,900 | ) | 105,701 | | (77,876 | ) | (2,764,183 | ) | 63,473 | |
Income (loss) before income taxes and extraordinary gain | | (593,863 | ) | (15,581 | ) | (198,207 | ) | (2,814,892 | ) | 82,792 | |
Provision for (benefit from) income taxes | | 412,139 | | (600 | ) | (61,050 | ) | (118,139 | ) | 42,346 | |
Extraordinary gain, net of tax of $0 | | — | | 3,583 | | — | | — | | — | |
Net income (loss) | | $ | (1,006,002 | ) | $ | (11,398 | ) | $ | (137,157 | ) | $ | (2,696,753 | ) | $ | 40,446 | |
Basic net income (loss) per share | | $ | (1.93 | ) | $ | (0.02 | ) | $ | (0.27 | ) | $ | (5.60 | ) | $ | 0.13 | |
Diluted net income (loss) per share | | $ | (1.93 | ) | $ | (0.02 | ) | $ | (0.27 | ) | $ | (5.60 | ) | $ | 0.12 | |
Shares used in computing diluted per share amount | | 520,574 | | 515,803 | | 510,102 | | 481,985 | | 330,229 | |
(1) Includes an impairment of long-lived assets loss of $95.6 million.
(2) Includes goodwill impairment loss of $2.7 billion.
(3) On December 6, 2001, we merged with SCI in a purchase business combination. The consolidated financial statements include the operating results of SCI from December 3, 2001, the accounting period close nearest to the acquisition date of December 6, 2001.
(4) Includes goodwill impairment loss of $600 million and increase in deferred tax valuation allowance. For additional information,, refer to” Item 7—Management’s Discussion and Analysis of Financial Condition and Results of Operations—Critical Accounting Policies and Estimates—Goodwill and Other Intangible assets” and “—Income taxes”.
Consolidated Balance Sheet Data:
| | As of Fiscal Year Ended | |
| | 2005 | | 2004 | | 2003 | | 2002 | | 2001 | |
| | (In thousands) | |
Cash and cash equivalents(1) | | $ | 1,068,053 | | $ | 1,069,447 | | $ | 889,574 | | $ | 1,064,534 | | $ | 567,649 | |
Net working capital | | 1,672,939 | | 1,437,085 | | 2,073,112 | | 2,105,049 | | 2,090,956 | |
Total assets | | 6,241,775 | | 7,532,596 | | 7,390,902 | | 7,518,057 | | 3,640,331 | |
Long-term debt | | 1,644,666 | | 1,297,337 | | 1,925,630 | | 1,975,331 | | 1,218,608 | |
Stockholders’ equity | | 2,379,018 | | 3,354,711 | | 3,323,254 | | 3,414,715 | | 1,840,980 | |
Ratio of earnings to fixed charges | | — | | 1.0 | x | — | | — | | 2.2 | x |
| | | | | | | | | | | | | | | | |
(1) Refer to footnote 1 of the Notes to Consolidated Financial Statements — “Organization of Sanmina-SCI”, “Reclassifications”.
20
Item 7. Management’s Discussion and Analysis of Financial Condition and Results of Operations
This report contains forward-looking statements within the meaning of Section 27A of the Securities Act of 1933 and Section 21E of the Securities Exchange Act of 1934. These statements relate to our expectations for future events and time periods. All statements other than statements of historical fact are statements that could be deemed to be forward-looking statements, including any statements regarding trends in future revenues or results of operations, gross margin or operating margin, expenses, earnings or losses from operations, synergies or other financial items; any statements of the plans, strategies and objectives of management for future operations; any statements concerning developments, performance or industry ranking; any statements regarding future economic conditions or performance; any statements regarding pending investigations, claims or disputes; any statements of expectation or belief; and any statements of assumptions underlying any of the foregoing. Generally, the words “anticipate,” “believe,” “plan,” “expect,” “future,” “intend,” “may,” “will,” “should,” “estimate,” “predict,” “potential,” “continue” and similar expressions identify forward-looking statements. Our forward-looking statements are based on current expectations, forecasts and assumptions and are subject to risks, uncertainties and changes in condition, significance, value and effect. As a result of the factors described herein, and in the documents incorporated herein by reference, including, in particular, those factors described under “Factors Affecting Operating Results,” we undertake no obligation to publicly disclose any revisions to these forward-looking statements to reflect events or circumstances occurring subsequent to filing this report with the Securities and Exchange Commission.
Overview
We are a leading independent global provider of customized, integrated electronics manufacturing services, or EMS. Our revenue is generated from sales of our services primarily to original equipment manufacturers, or OEMs, in the communications, personal and business computing, enterprise computing and storage, multimedia, industrial and semiconductor capital equipment, defense and aerospace, medical and automotive industries. We also generate sales from our original design manufacturing, or ODM, products where we design and develop servers and storage systems targeted to major OEMs. Our engineering services mainly focus on high-end products and we provide end-to-end design capacities for printed circuit board design, backplane design, enclosure design, full system and final system design.
A relatively small number of customers historically have been responsible for a significant portion of our net sales. Sales to our ten largest customers accounted for 63.9%, 69.3% and 68.5% of our net sales for fiscal 2005, 2004 and 2003, respectively, and our largest customer, IBM accounted for 10% or more of our net sales for fiscal 2005 and 2003. Two customers, IBM and HP, accounted for 10% or more of our net sales for fiscal 2004.
In recent periods, we have generated a more significant portion of our net sales from international operations. During fiscal 2005, 2004 and 2003, 76.2%, 72.7% and 69.6%, respectively, of our consolidated net sales were derived from non-U.S. operations. The continued shift toward international operations has resulted from overseas acquisitions and a desire on the part of many of our customers to move production to lower cost locations in regions such as Asia, Latin America and Eastern Europe. We expect this trend to continue.
Historically, we have had substantial recurring sales from existing customers. We have also expanded our customer base through acquisitions. We typically enter into supply agreements with our major OEM customers. These agreements generally have terms ranging from three to five years and cover the manufacture of a range of products. Under these agreements, a customer typically agrees to purchase its requirements for particular products in particular geographic areas from us. These agreements generally do not obligate the customer to purchase minimum quantities of products. In some circumstances our supply agreements with customers provide for cost reduction objectives during the term of the agreement.
We have experienced fluctuations in gross margins in the past and may continue to in the future. Fluctuations in our gross margins may be caused by a number of factors, including pricing, changes in product mix, competitive pressures and transition of manufacturing to lower cost locations.
21
Summary Results of Operations
Net sales for fiscal 2005 decreased by 3.9% to $11.7 billion from $12.2 billion in fiscal 2004. The decrease in sales was primarily due to a decrease in sales to customers in the personal and business computing and multimedia sectors of the electronic industry.
The following table sets forth, for the periods indicated, key operating results:
| | | | Fiscal Year Ended | |
| | | | (In thousands) | |
| | | | October 1, 2005 | | October 2, 2004 | | September 27, 2003 | |
Net sales | | | | $ | 11,734,674 | | $ | 12,204,607 | | $ | 10,361,434 | |
Gross profit | | | | $ | 641,043 | | $ | 616,089 | | $ | 462,470 | |
Operating income (loss) | | | | $ | (465,900 | ) | $ | 105,701 | | $ | (77,876 | ) |
Net loss | | | | $ | (1,006,002 | ) | $ | (11,398 | ) | $ | (137,157 | ) |
Key performance measures
The following table sets forth, for the periods indicated, certain key performance measures that management utilizes to assess operating results:
| | Three Months Ended | |
| | October 1, 2005 | | July 2, 2005 | | April 2, 2005 | | January 1, 2005 | |
Days sales outstanding(1) | | 48 | | 51 | | 50 | | 50 | |
Inventory turns(2) | | 10.3 | | 11.3 | | 11.4 | | 12.3 | |
Accounts payable days(3) | | 54 | | 51 | | 50 | | 48 | |
Cash cycle days(4) | | 29 | | 32 | | 31 | | 31 | |
| | | | | | | | | |
| | Three Months Ended | |
| | October 2, 2004 | | June 26, 2004 | | March 27, 2004 | | December 27, 2003 | |
Days sales outstanding(1) | | 46 | | 49 | | 49 | | 53 | |
Inventory turns(2) | | 11.7 | | 10.4 | | 9.3 | | 10.6 | |
Accounts payable days(3) | | 48 | | 51 | | 58 | | 58 | |
Cash cycle days(4) | | 29 | | 33 | | 30 | | 29 | |
(1) Days sales outstanding, or DSO, is calculated as the ratio of ending accounts receivable, net, for the quarter divided by average daily net sales for the quarter.
(2) Inventory turns are calculated as the ratio of four times our cost of sales for the quarter divided by inventory, net, at period end.
(3) Accounts payable days is calculated as the ratio of 365 days divided by accounts payable turns, in which accounts payable turns is calculated as the ratio of four times our cost of sales for the quarter divided by accounts payable at period end.
(4) Cash cycle days is calculated as the ratio of 365 days divided by inventory turns plus days sales outstanding minus accounts payable days.
Critical Accounting Policies and Estimates
Management’s discussion and analysis of our financial condition and results of operations are based upon our consolidated financial statements which have been prepared in accordance with accounting principles generally accepted in the United States. We review the accounting policies used in reporting our financial results on a regular basis. The preparation of these financial statements requires us to make estimates and judgments that affect the reported amounts of assets, liabilities, net sales and expenses and related disclosure of contingent assets and liabilities. On an ongoing basis, we evaluate the process used to develop estimates for certain reserves and contingent liabilities, including those related to product returns, accounts
22
receivable, inventories, investments, intangible assets, income taxes, warranty obligations, restructuring, contingencies and litigation. We base our estimates on historical experience and on various other assumptions that are believed to be reasonable for making judgments about the carrying value of assets and liabilities that are not readily apparent from other sources. Our actual results may differ from these estimates.
We believe the following critical accounting policies reflect our more significant judgments and estimates used in preparing our consolidated financial statements:
Revenue Recognition—We generally recognize revenue at the point of shipment to our customers, under the contractual terms which in general are FOB shipping point or when services have been performed. We also derive revenues from sales of certain inventory, including raw materials, to customers who reschedule, amend or cancel purchase orders after we have procured inventory to fulfill their purchase orders. Specifically, we recognize revenue when there exists a persuasive arrangement between us and the buyer, the price is fixed or determined, title to the product or the inventory is transferred to the customer, the customer assumes the risks and rewards of ownership of the product and collectibility is reasonably assured. Except in specific circumstances, there are no formal customer acceptance requirements or further Sanmina-SCI obligations to the product or the inventory subsequent to shipment. In specific circumstances in which there are such customer acceptance requirements or further Sanmina-SCI obligations, with the exception of our standard warranty, revenue is recognized at the point of formal acceptance and upon completion of obligations. Provisions are made for estimated, sales returns and adjustments at the time revenue is recognized. The provisions were not material to the financial statements.
Accounts Receivable and Other Related Allowances—We estimate product returns, warranty costs, and other adjustments related to current period net sales to establish related allowances. In making these estimates, we analyze the creditworthiness of our customers, past experience, changes in customer demand, and the overall economic climate in industries that we serve. If actual product returns, warranty claims or other adjustments differ significantly from our estimates, the amount of revenue or operating expenses we report would be affected. One of our most significant credit risks is the ultimate realization of our accounts receivable. This risk is mitigated by (i) sales to well-established companies, (ii) ongoing credit evaluation of our customers, and (iii) frequent contact with our customers, especially our most significant customers, which enables us to monitor current changes in business operations and to respond accordingly. To establish our allowance for doubtful accounts, we regularly estimate the credit risk associated with accounts receivable and consider concentrations of credit risks. We evaluate credit risk related to specific customers based on the current economic environment; however, we are not able to predict the inability of our customers to meet their financial obligations to us. Our two largest customers represented approximately 16% and 11% of our gross accounts receivable as of October 1, 2005. We believe the allowances that we have established are adequate under the circumstances; however, a change in the economic environment or a customer’s financial condition could cause our estimates of allowances, and consequently the provision for doubtful accounts, to change which could have a significant adverse impact on our results of operations.
Inventories—We state inventories at the lower of cost (first-in, first-out method) or market value. We regularly evaluate the carrying value of our inventories. Cost includes material, labor and manufacturing overhead incurred for finished goods and work-in-process. We determine expected inventory usage based on demand forecasts received from our customers. When required, provisions are made to reduce excess inventories to their estimated net realizable values. In addition, the ultimate realization of inventory carrying amounts is affected by our exposure related to changes in customer demand for inventory that they are not contractually obligated to purchase and raw materials held for specific customers who are experiencing financial difficulty. Inventory reserves are established based on forecasted demand, past experience with the specific customers, the ability to redistribute inventory to other programs or back to our suppliers, and the presence of contractual language obligating the customers to pay for the related inventory.
We procure inventory based on specific customer orders and forecasts. Customers have limited rights of modification with respect to these orders. Correspondingly, customer modifications to orders affecting inventory previously procured by us (for example, cancellations or rescheduling of orders, as well as inventory that is highly customized and therefore not available for use by other customers) and our purchases of inventory beyond customer needs may result in excess and obsolete inventory for the related customers. Although we may be able to use some excess components and raw materials in our inventory for other products we manufacture, a portion of the cost of this excess inventory may not be returned to the vendors or recovered from customers. Write offs or write downs of inventory could relate to:
• declines in the market value of inventory;
• raw materials held for specific customers who are experiencing financial difficulty; and
23
• changes in customer demand for inventory, such as cancellation of orders and our purchases of inventory beyond customer needs that result in excess quantities on hand that we are not able to return to the vendor or charge back to the customer.
Our practice is to dispose of excess and obsolete inventory as soon as practicable after such inventory has been identified as having no value. Sales of such inventory have not been significant and have not had a material impact on our gross margins to date.
Exit Costs—We recognize restructuring charges related to our plans to exit certain activities resulting from the identification of excess manufacturing and administrative facilities that we choose to close or consolidate. In connection with our exit activities, we record restructuring charges for employee termination costs, long-lived asset impairments, costs related to leased facilities to be abandoned or subleased, and other exit-related costs. These charges were incurred pursuant to formal plans developed by management and accounted for in accordance with SFAS No. 146, “Accounting for Costs Associated with Exit or Disposal Activities, and EITF 95-3, “Recognition of Liabilities in Connection with a Purchase Business Combination.” Where applicable, employee termination costs are recorded pursuant to SFAS No. 112, “Employer’s Accounting for Postemployment Benefits.” Fixed assets that are written off or impaired as a result of restructuring plans are typically held for sale or scrapped. The remaining carrying value of such assets was not material at October 1, 2005 and October 2, 2004. The recognition of restructuring charges requires our management to make judgments and estimates regarding the nature, timing, and amount of costs associated with the planned exit activity, including estimating sublease income and the fair value, less selling costs, of property, plant and equipment to be disposed of. Management’s estimates of future liabilities may change, requiring us to record additional restructuring charges or reduce the amount of liabilities already recorded. At the end of each reporting period, we evaluate the remaining accrued balances to ensure their adequacy, that no excess accruals are retained, and the utilization of the provisions are for their intended purposes in accordance with developed exit plans.
Goodwill and Other Intangibles assets—Costs in excess of the fair value of tangible and other intangible assets acquired and liabilities assumed in a purchase business combination are recorded as goodwill. SFAS No. 142, “Goodwill and Other Intangible Assets,” requires that companies no longer amortize goodwill, but instead test for impairment at least annually using a two-step approach. We adopted SFAS No. 142 on September 30, 2001 and evaluated goodwill, at a minimum, on an annual basis and whenever events and changes in circumstances suggest that the carrying amount may not be recoverable. Impairment of goodwill is tested at the reporting unit level by comparing the reporting unit’s carrying amount, including goodwill, to the fair value of the reporting unit. The fair values of the reporting units are estimated using a combination of the income, or discounted cash flows, approach and the market approach, which utilizes comparable companies’ data. If the carrying amount of the reporting unit exceeds its fair value, goodwill is considered impaired and a second step is performed to measure the amount of impairment loss.
The preparation of the goodwill and other intangible assets impairment analysis requires management to make significant estimates and assumptions with respect to the determination of fair values of reporting units and long-lived assets. These estimates and assumptions may significantly differ from period to period. During the second quarter ended April 2, 2005, we recorded a goodwill impairment loss of $600 million for our domestic reporting unit. The factors that caused us to record a write-off of our deferred tax assets, which primarily related to U.S. operations coupled with the then-recent decline in the market price of our common stock, led us to record this goodwill impairment loss during our second fiscal quarter. In particular, the shift of operations from U.S. facilities and other facilities in high cost locations to facilities in lower-cost locations has resulted in restructuring charges and a decline in sales with respect to our U.S. operations. The fair market valuation of the reporting units was based on an income and market approach. As of the time we performed this analysis, there was no impairment of goodwill or long-lived assets associated with our international operations. In addition at July 1, of fiscal 2005, as well as at July 1, 2004 and 2003, we performed our annual impairment test pursuant to SFAS No. 142 and these tests did not identify any impairment losses.
Income taxes—We estimate our income tax provision or benefit in each of the jurisdictions in which we operate, including estimating exposures related to examinations by taxing authorities. We must also make judgments regarding the realizability of deferred tax assets. The carrying value of our net deferred tax asset is based on our belief that it is more likely than not that we will generate sufficient future taxable income in certain jurisdictions to realize these deferred tax assets. A valuation allowance has been established for deferred tax assets which we do not believe meet the more likely than not criteria established by SFAS No. 109, “Accounting for Income Taxes.” Our judgments regarding future taxable income may change due to changes in market conditions, changes in tax laws, tax planning strategies or other factors. If our assumptions and consequently our estimates change in the future, the valuation allowances we have established may be increased or decreased, impacting future income tax expense. The effective tax rate is highly dependent upon the geographic distribution of our
24
worldwide earnings or loss, tax regulations in each geographic region, the availability of tax credits and carryforwards, and the effectiveness of our tax planning strategies. We regularly monitor the assumptions used in estimating our annual effective tax rate and adjust our estimates accordingly. If actual results differ from our estimates, future income tax expense could be materially affected.
At October 1, 2005, we believe it is more likely than not that we will not realize a portion of the benefit of our U.S. and certain foreign deferred tax assets, and accordingly, have provided a valuation allowance for them. In determining the need for a valuation allowance, we consider both positive and negative evidence. Our valuation allowance increased by $613.5 million from fiscal year 2004 to fiscal year 2005, which included a discrete expense of $379.2 million during the quarter ended April 2, 2005 primarily related to U.S. operations.
Results of Operations
Fiscal Years Ended October 1, 2005, October 2, 2004 and September 27, 2003
The following table sets forth, for the fiscal years indicated, certain statement of operations data expressed as a percentage of net sales.
| | Fiscal Year Ended | |
| | October 1,
2005 | | October 2,
2004 | | September 27,
2003 | |
Net sales | | 100.0 | % | 100.0 | % | 100.0 | % |
Cost of sales | | 94.5 | | 95.0 | | 95.5 | |
Gross margin | | 5.5 | | 5.0 | | 4.5 | |
Operating expenses: | | | | | | | |
Selling, general and administrative | | 3.0 | | 2.7 | | 3.0 | |
Research and development | | 0.3 | | 0.2 | | 0.1 | |
Amortization of intangible assets | | — | | 0.1 | | 0.1 | |
Goodwill impairment | | 5.1 | | — | | 0.9 | |
Integration costs | | — | | — | | 0.1 | |
Restructuring costs | | 1.0 | | 1.1 | | 1.0 | |
Total operating expenses | | 9.4 | | 4.1 | | 5.2 | |
Operating income (loss) | | (3.9 | ) | 0.9 | | (0.7 | ) |
Interest income | | 0.2 | | 0.1 | | 0.1 | |
Interest expense | | (1.2 | ) | (1.0 | ) | (1.2 | ) |
Other expense, net | | (0.1 | ) | (0.1 | ) | (0.1 | ) |
Interest and other expense, net | | (1.1 | ) | (1.0 | ) | (1.2 | ) |
Loss before income taxes and extraordinary item | | (5.0 | ) | (0.1 | ) | (1.9 | ) |
Provision for (benefit from) income taxes | | 3.5 | | — | | (0.6 | ) |
Loss before extraordinary item | | (8.5 | ) | (0.1 | ) | (1.3 | ) |
Extraordinary gain, net of tax | | — | | — | | — | |
Net loss | | (8.5 | )% | (0.1 | )% | (1.3 | )% |
Net Sales
Net sales in fiscal 2005 decreased 3.9% to $11.7 billion from $12.2 billion in fiscal 2004. The decrease in sales was primarily due to a decrease in sales in the personal and business computing sector of the electronics industry of $556 million, a decrease in sales in the high end computing sector of $245 million and a decrease in sales in the multimedia sector of $84 million, partially offset by increased sales in the communications sector of $225 million, increased sales in the medical sector of $168 million and increased sales in the defense sector of $21 million. The decrease in the personal and business computing and multimedia sectors was primarily attributable to decreased demand from our existing customers in these sectors. The decrease in the high end computing sector was primarily attributable to our decision to terminate certain manufacturing programs. Our sales to IBM accounted for approximately 23% and 28% of total net consolidated sales for years ended October 1, 2005 and October 2, 2004, respectively.
25
Net sales in fiscal 2004 increased 17.8% to $12.2 billion from $10.4 billion in fiscal 2003. The increase in sales was primarily due to an increase in sales to customers in the personal and business computing, communications and multimedia sectors of the electronic industry. Expanded sales to customers in the medical, defense and industrial and semiconductor capital equipment sectors also contributed to the increase in net sales. The increased sales level was primarily attributable to new manufacturing programs and increased demand from our existing customers in these sectors as well as business combinations. The increase in the personal and business computing sector was primarily attributable to the inclusion of a full year of sales resulting from the acquisition of certain personal and business computing operations of IBM during the second quarter of fiscal 2003. Sales to IBM in fiscal 2004 accounted for 28.4% of our consolidated net sales.
Gross Margin
Gross margin was 5.5% in fiscal 2005, 5.0% in fiscal 2004 and 4.5% in fiscal 2003. The increase in gross margin from fiscal 2004 to fiscal 2005 was primarily attributable to changes in product mix as discussed above in Net Sales. We expect gross margins to continue to fluctuate based on overall production and shipment volumes as well as changes in the mix of products demanded by our major customers. The increase in gross margin in fiscal 2004 from fiscal 2003 was primarily attributable to the positive effects of restructuring activities and cost reductions, particularly with respect to our printed circuit board fabrication activities.
Fluctuations in our gross margins may be caused by a number of factors, including:
• Greater competition in the EMS industry requiring us to reduce prices for our services;
• Changes in the mix of high and low margin products demanded by our customers;
• Changes in customer demand and sales volumes, including demand for our vertically integrated key system components and subassemblies;
• Pricing pressures from OEMs due to the greater cost reduction focus of global OEMs;
• Charges or write offs of excess and obsolete inventory that we are not able to charge back to a customer or sales of inventories previously written down;
• Pricing pressure on electronic components resulting from economic conditions in the electronics industry, with EMS companies competing more aggressively on cost to obtain new or maintain existing business; and
• Our ability to transition manufacturing and assembly operations to lower cost regions in an efficient manner.
We have experienced fluctuations in gross margin in the past and may continue to do so in the future.
Selling, General and Administrative
Selling, general and administrative expenses were $350.5 million for fiscal 2005, $335.0 million for fiscal 2004, and $306.7 million for fiscal 2003. As a percentage of net sales, selling, general and administrative expenses were 3.0% for fiscal 2005, 2.7% for fiscal 2004, and 3.0% for fiscal 2003. The increase in terms of both dollars and percentage of sales from fiscal 2004 to fiscal 2005 was primarily attributable to additional expenses we incurred in connection with the implementation of new internal controls and evaluation and testing of our internal controls over financial reporting as required by Section 404 of the Sarbanes-Oxley Act of 2002 aggregating to approximately $12 million and increases due to various items totaling $8.9 million, none of which are individually significant, partially offset by a recovery of reserves previously established for uncollectible accounts receivable of $5.4 million
Our allowance for doubtful accounts decreased by approximately $16 million and $23 million for fiscal 2004 and fiscal 2005, respectively. The decreases were predominately the result of utilization of charges.
While the level of general and administrative expense in terms of dollars increased in fiscal 2004 as compared to fiscal 2003, selling, general and administrative expenses as a percentage of sales decreased in fiscal 2004 primarily as a result of having a higher level of net sales in the respective years. In addition, cost reduction programs and economies of scale contributed to reductions to certain expenses. In fiscal 2004, we received $2.3 million from the bankrupt estate of Metricom, Inc., a former customer that filed a voluntary petition for reorganization under Chapter 11 of the United States Bankruptcy Code in July 2001. We recorded this amount as a reduction of bad debt expense. In the first half of fiscal 2004, the compensation committee of the Board of Directors approved awards of restricted stock to executive officers, directors and employees. The restricted stock awards vest after four years, except that certain shares of restricted stock may vest earlier if
26
specified performance criteria are met. We recorded $7.2 million of compensation expense in selling, general and administrative expenses in fiscal 2004 relating to these restricted stock awards. We also recorded $2.4 million of selling, general and administrative expense in fiscal 2004, that is not expected to recur, related to certain other stock-based compensation arrangements.
Research and Development
Research and development expenses were $29.7 million for fiscal 2005, $29.4 million for fiscal 2004 and $15.0 million for fiscal 2003. As a percentage of net sales, research and development expenses were 0.3% for fiscal 2005 and 0.2% for fiscal 2004 and 0.1% for fiscal 2003. The increase in research and development expenses as a percentage of net sales was primarily attributable to the decrease of net sales from fiscal 2004 to fiscal 2005. The increase in terms of dollars in fiscal 2004 was largely due to our acquisition of Newisys, Inc. a developer of enterprise-class servers, during fiscal 2003. The Newisys team of hardware and software design engineers engages in research and development activities focused on our ODM business developing server and storage systems.
Goodwill Impairment and Write Down of Long-lived and Other Intangible Assets
During the second quarter ended April 2, 2005, we recorded a goodwill impairment loss of $600 million for our domestic reporting unit. The factors that caused us to record a write-off of our deferred tax assets, which primarily related to U.S. operations coupled with the then-recent decline in the market price of our common stock, led us to record this goodwill impairment loss during our second fiscal quarter. In particular, the shift of operations from U.S. facilities and other facilities in high cost locations to facilities in lower-cost locations has resulted in restructuring charges and a decline in sales with respect to our U.S. operations. The fair market valuation of the reporting units was based on an income and market approach. As of the time we performed this analysis, there was no impairment of goodwill or long-lived assets associated with our international operations. In addition at July 1, of fiscal 2005, as well as at July 1, 2004 and 2003, we performed our annual impairment test pursuant to SFAS No. 142 and these tests did not identify any impairment losses.
During fiscal 2003, the carrying value of certain tangible long-lived assets became impaired as a result of restructuring activities. Accordingly, the related write downs are accounted for as restructuring costs in accordance with the accounting policies described below. In addition, we recorded an impairment loss relating to property, plant and equipment of approximately $65.1 million for the domestic reporting unit and $24.1 million for the international reporting unit in connection with impairment tests pursuant to SFAS No. 144. Due to the continued weakness in the electronic industry, particularly in the communications sector, and the capital intensive nature of our printed circuit board and enclosure manufacturing operations, it was determined that a triggering event occurred and an impairment test was performed pursuant to SFAS No. 144. The results indicated that an impairment of long-lived assets occurred and the assets were written down to fair value. Fair value was determined using the cost approach which measures the value of an asset by the cost to reconstruct or replace it with another of like utility and also incorporates market data. The impairment loss was primarily related to equipment and buildings.
During fiscal 2003 an evaluation under SFAS No. 144 indicated that the fair value of certain intangible assets originally acquired as part of the June 2000 Hadco merger was less than their carrying value. Accordingly, we recorded an adjustment to write down $6.4 million of intangible assets. The fair value of the intangible assets at the time of the original acquisition by us was based on expected future cash flows to be generated from the assets based on the facts and circumstances that existed at the date the acquisition was completed. The Hadco customer relationship intangible asset was impaired in the quarter ended September 27, 2003 due to extended decline in economic conditions in the electronics industry and the resulting loss of business from a specific group of customers. As a result, based on future expected discounted cash flows from the customer base, we wrote down the carrying value of these Hadco intangible assets.
Restructuring Costs
In recent periods, we have initiated restructuring plans as a result of the slowdown in the global electronics industry and the worldwide economy. These plans were designed to reduce excess capacity and affected facilities across all services offered in our vertically integrated manufacturing organization. The majority of the restructuring charges recorded as a result of these plans related to facilities located in North America and Europe, and in general, manufacturing activities at these plants were transferred to other facilities.
Costs associated with restructuring activities initiated on or after January 1, 2003, other than those activities related to purchase business combinations, are accounted for in accordance with SFAS No. 146 and SFAS No. 112 where applicable.
27
Accordingly, costs associated with such plans are recorded as restructuring costs in the consolidated statements of operations when a liability is incurred, pursuant to SFAS No. 146 and pursuant to SFAS No. 112, restructuring costs are recorded when probable and estimatable. Accrued restructuring costs are included in “accrued liabilities” in the consolidated balance sheets. Below is a summary of the activity related to restructuring costs recorded pursuant to SFAS No. 146 and SFAS No. 112 for fiscal 2004 and 2005:
| | Employee
Termination
Benefits | | Lease and
Contract
Termination
Costs | | Other
Restructuring
Costs | | Impairment
of Fixed
Assets | | Total | |
| | (In thousands) | |
| | Cash | | Cash | | Cash | | Non-Cash | | | |
Balance at September 27, 2003 | | $ | 3,870 | | $ | 1,462 | | $ | — | | $ | — | | $ | 5,332 | |
Charges to operations | | 59,076 | | 11,186 | | 18,890 | | 18,079 | | 107,231 | |
Charges utilized | | (45,618 | ) | (9,677 | ) | (18,848 | ) | (18,079 | ) | (92,222 | ) |
Reversal of accrual | | (1,832 | ) | (1,384 | ) | — | | — | | (3,216 | ) |
Balance at October 2, 2004 | | 15,496 | | 1,587 | | 42 | | — | | 17,125 | |
Charges to operations | | 84,651 | | 14,070 | | 6,404 | | 6,932 | | 112,057 | |
Charges utilized | | (64,823 | ) | (12,533 | ) | (6,446 | ) | (6,932 | ) | (90,734 | ) |
Reversal of accrual | | (2,508 | ) | — | | — | | — | | (2,508 | ) |
Balance at October 1, 2005 | | $ | 32,816 | | $ | 3,124 | | $ | — | | $ | — | | $ | 35,940 | |
In fiscal 2003, we approved actions pursuant to SFAS No. 146 to close and consolidate certain of our manufacturing facilities in North America and Europe as a result of the ongoing slowdown in the electronics industry. During fiscal year 2003, we recorded charges to operations of $6.0 million for termination benefits related to the involuntary termination of approximately 1,100 employees, and approximately $2.1 million of the charges had been utilized as of September 27, 2003. A total of approximately 880 employees had been terminated as of September 27, 2003. We also recorded charges to operations of $10.3 million for the termination of non-cancelable leases, lease payments for permanently vacated properties and other contract termination costs, and utilized $8.9 million related to these charges. We incurred charges to operations of $8.1 million during fiscal 2003 for the impairment of excess equipment at the vacated facilities, all of which were utilized as of September 27, 2003.
In fiscal 2004, we recorded restructuring charges of approximately $107.2 million related to restructuring activities initiated after January 1, 2003. With the exception of $7.8 million of restructuring charges associated with our phase three restructuring plan announced in July 2004, these restructuring charges were incurred in connection with our phase two restructuring plan announced in October 2002. These charges included employee termination benefits of approximately $59.0 million, lease and contract termination costs of approximately $11.2 million, other restructuring costs of approximately $18.9 million, primarily costs incurred to prepare facilities for closure, and impairment of fixed assets of $18.1 million consisting of excess facilities and equipment to be disposed of. The employee termination benefits were related to the involuntarily termination of approximately 2,000 employees, the majority of which were involved in manufacturing activities. Approximately $45.6 million of employee termination benefits were utilized during fiscal 2004 for the termination of approximately 1,900 employees. We also utilized $9.7 million of lease and contract termination costs and $18.8 million of the other restructuring costs during fiscal 2004. In fiscal 2004, we reversed approximately $1.8 million of accrued employee termination benefits and approximately $1.4 million of accrued lease costs due to revisions of estimates.
During fiscal 2005, we recorded charges of approximately $109.5 million (net of $2.5 million reversal of accrual) related to restructuring activities pursuant to SFAS No. 146 and SFAS No. 112, of which $106.5 million related to our phase three restructuring plan and $3.0 million related to our phase two restructuring plan. These charges included employee termination benefits of approximately $84.7 million, lease and contract termination costs of approximately $14.1 million, other restructuring costs of approximately $6.4 million, incurred primarily to prepare facilities for closure, and impairment of fixed assets of approximately $6.9 million consisting of excess facilities and equipment to be disposed of. The employee termination benefits were related to the involuntary termination of employees, the majority of which were involved in manufacturing activities. Approximately $64.8 million of employee termination benefits were utilized and total of approximately 11,800 employees were terminated during fiscal 2005. We also utilized $12.5 million of lease and contract termination costs and $6.4 million of the other restructuring costs during fiscal 2005. We incurred charges to operations of $6.9 million during fiscal 2005 for the impairment of excess fixed assets at the vacated facilities, all of which were utilized as of October 1, 2005. We reversed approximately $2.5 million of accrued employee termination benefits. The reversal of accrual was a result of the changes in estimates and economic circumstances in one of our European entities.
28
Costs associated with restructuring activities initiated prior to January 1, 2003, other than those activities related to purchase business combinations, are accounted for in accordance with EITF 94-3 and SFAS 112 where applicable. Accordingly, costs associated with such plans are recorded as restructuring costs in the consolidated statements of operations generally at the commitment date. The accrued restructuring costs are included in “accrued liabilities” in the consolidated balance sheet. Below is a summary of the activity related to restructuring costs recorded pursuant to EITF 94-3 and SFAS No. 112 for fiscal 2004 and 2005:
| | Employee
Severance
and
Related
Expenses | | Facilities
Shutdown
and
Consolidation
Costs | | Write-off
Impaired or
Redundant
Fixed Assets | | Total | |
| | (In thousands) | |
| | Cash | | Cash | | Non-cash | | | |
| | | | | | | | | |
Balance at September 27, 2003 | | $ | 9,739 | | $ | 14,490 | | $ | — | | $ | 24,229 | |
Charges to operations | | 4,071 | | 35,730 | | 3,500 | | 43,301 | |
Charges utilized | | (5,533 | ) | (28,279 | ) | (3,500 | ) | (37,312 | ) |
Reversal of accrual | | (7,050 | ) | (7,016 | ) | — | | (14,066 | ) |
Balance at October 2, 2004 | | 1,227 | | 14,925 | | — | | 16,152 | |
Charges to operations | | 2,285 | | 2,522 | | 4,107 | | 8,914 | |
Charges utilized | | (3,010 | ) | (7,890 | ) | (4,107 | ) | (15,007 | ) |
Balance at October 1, 2005 | | $ | 502 | | $ | 9,557 | | $ | — | | $ | 10,059 | |
The following sections separately present the charges to the restructuring liability and charges utilized that are set forth in the above table on an aggregate basis.
Fiscal 2002 Plans
September 2002 Restructuring. In fiscal 2003, we recorded charges to operations of $7.0 million for employee severance expenses related to the expected termination of 265 employees, and $18.1 million for non-cancelable lease payments and related costs for the shutdown of facilities. In fiscal 2003, we also incurred and utilized charges to operations of $36.0 million related to the impairment of buildings and excess equipment and leasehold improvements at permanently vacated facilities. We utilized $4.1 million of accrued severance charges and $17.6 million of accrued facilities related charges in fiscal 2003. As of September 27, 2003, 790 employees have been terminated under this exit plan.
In fiscal 2004, we recorded charges to operations of approximately $1.9 million and utilized $2.6 million for employee severance expenses. Approximately 10 employees were terminated during fiscal 2004. In fiscal 2004, we also recorded charges to operations of approximately $26.7 million and utilized approximately $16.1 million for non-cancelable lease payments, lease termination costs and related costs for the shutdown of facilities. In addition, in fiscal 2004 we reversed approximately $3.6 million of accrued employee severance due to lower than anticipated payments at various plants and approximately $5.8 million of accrued facilities shutdown costs due to a change in use of the facilities or we achieving greater sublease income than anticipated. We also incurred and utilized charges to operations of $3.7 million related to the impairment of buildings and leasehold improvements at permanently vacated facilities in fiscal 2004.
During fiscal 2005, we recorded charges to operations of approximately $203,000 and utilized $216,000 for employee severance expenses. There was no reduction of work force during fiscal 2005 pursuant to this restructuring plan. During fiscal 2005, we also recorded charges to operations of approximately $544,000 and utilized approximately $2.7 million for non-cancelable lease payments, lease termination costs and related costs for the shutdown of facilities. In addition, $800,000 was charged to operations and utilized due to the impairment of fixed assets to be disposed of. The closing of the plants discussed above as well as employee terminations and other related activities have been completed, however, the leases of the related facilities expire in 2009; therefore, the remaining accrual will be reduced over time as the lease payments, net of sublease income, are made.
October 2001 Restructuring. In fiscal 2003, we recorded charges to operations of $11.1 million for employee severance costs related to the expected involuntary termination of 2,690 employees, and $13.8 million for non-cancelable lease payments and other costs related to the shutdown of facilities. We utilized accrued severance charges of $6.8 million and accrued facilities shutdown related charges of $18.5 million in fiscal 2003. In fiscal 2003 we reversed accrued severance charges of $6.3 million and accrued lease cancellation charges of $700,000 due to lower than estimated settlement costs at three European sites. We also incurred and utilized charges of $2.4 million in fiscal 2003 related to write-offs of fixed assets
29
consisting of excess equipment and leasehold improvements to facilities that were permanently vacated. As of September 27, 2003, 5,046 employees had been terminated under this exit plan.
In fiscal 2004, we recorded charges to operations of approximately $1.1 million for employee severance costs and approximately $4.8 million for non-cancelable lease payments and other costs related to the shutdown of facilities. We utilized accrued severance charges of approximately $2.5 million and accrued facilities shutdown related charges of $3.7 million during fiscal 2004. In fiscal 2004, we reversed approximately $1.3 million of accrued severance and approximately $530,000 of accrued lease costs due to lower than expected payments at various sites. Approximately 5,400 employees were associated with these plant closures and we had terminated all employees affected under this plan.
During fiscal 2005, we recorded charges to operations of approximately $2.0 million for employee severance costs, of which $1.9 million was related to the settlement of pension plan at a Canadian site. We also recorded approximately $82,000 for non-cancelable lease payments and other costs related to the shutdown of facilities. We utilized accrued severance charges of approximately $2.7 million and accrued facilities shutdown related charges of $811,000 during fiscal 2005. In addition, we incurred and utilized charges of $633,000 in fiscal 2005 related to write-offs of fixed assets consisting of excess equipment and leasehold improvements to facilities that were permanently vacated. Manufacturing activities at the facilities affected by this plan ceased in fiscal year 2003 or prior; however, final payments of accrued costs may not occur until later periods.
Fiscal 2001 Plans
Segerström Restructuring. In March 2001, we acquired Segerström in a pooling of interests business combination and announced our restructuring plan. In fiscal 2003, we utilized accrued charges of $600,000 with respect to employee severance. We also recorded charges of $108,000 and utilized accrued charges of $1.8 million with respect to the shutdown and consolidation of facilities.
In fiscal 2004, we utilized approximately $300,000 of accrued severance charges. In addition, in fiscal 2004 we recorded charges to operations of approximately $103,000 and utilized approximately $818,000 with respect to the shutdown and consolidation of facilities. We also reversed $642,000 of accrued facilities shutdown costs due to lower than expected payments during fiscal 2004.
During fiscal 2005, we completed the restructuring activities at a cost of $835,000 which was related to accrued facility charges.
July 2001 Restructuring. In fiscal 2003, we utilized $947,000 of accrued severance costs related to the termination of 12 employees, $14.0 million of accrued costs related to the shutdown of facilities and $779,000 of other accrued restructuring costs. In fiscal 2003, we reversed accrued facility costs of $768,000 due to the early termination of the related lease.
In fiscal 2004, we recorded approximately $4.1 million and utilized approximately $7.7 million of accrued costs related to the shutdown of facilities. In addition, we recorded charges to operations of approximately $1.1 million, utilized $164,000 and reversed approximately $2.1 million of accrued severance due to lower than anticipated payments in fiscal 2004.
During fiscal 2005, we recorded approximately $43,000 and utilized approximately $100,000 of accrued severance. In addition, we recorded approximately $1.9 million and utilized approximately $3.5 million of accrued costs related to the shutdown of facilities. We also incurred and utilized $2.7 million for the impairment of fixed assets to be disposed of. Manufacturing activities at the plants affected by this plan had ceased by the fourth quarter of fiscal 2002; however, the leases of the related facilities expire between 2005 and 2010, therefore, the remaining accrual will be reduced over time as the lease payments, net of sublease income, are made.
Cost associated with restructuring activities related to purchase business combinations are accounted for in accordance with EITF 95-3. Below is a summary of the activity related to restructuring costs recorded pursuant to EITF 95-3 for fiscal 2004 and 2005:
30
| | Employee
Severance and
Related
Expenses | | Facilities
Shutdown and
Consolidation
Costs | | Write-off
Impaired or
Redundant
Fixed Assets | | Total | |
| | (In thousands) | |
| | Cash | | Cash | | Non-cash | | | |
Balance at September 27, 2003 | | $ | 12,052 | | $ | 13,612 | | $ | — | | $ | 25,664 | |
Additions to restructuring accrual | | 10,858 | | — | | 6,024 | | 16,882 | |
Accrual utilized | | (20,826 | ) | (11,434 | ) | (6,024 | ) | (38,284 | ) |
Balance at October 2, 2004 | | 2,084 | | 2,178 | | — | | 4,262 | |
Accrued utilized | | (773 | ) | (393 | ) | — | | (1,166 | ) |
Balance at October 1, 2005 | | $ | 1,311 | | $ | 1,785 | | $ | — | | $ | 3,096 | |
The following sections separately present the charges to the restructuring liability and charges utilized that are set forth in the above table on an aggregate basis.
Other Acquisition-Related Restructuring Actions. In fiscal 2003, as part of an insignificant business acquisition completed in December 2002, we closed an acquired manufacturing facility in Texas as of the acquisition date and transferred the business to an existing Sanmina-SCI plant. We recorded and utilized total charges to the restructuring liability of $2.4 million relating to the closure of this plant. The charges consisted of $311,000 for salary related costs for employees participating in the closure of the plant and $2.1 million for excess equipment, all of which were utilized during the year. Also, in the fourth quarter of fiscal 2003, we recorded charges to the restructuring liability of $7.5 million related to a manufacturing facility in Germany acquired in the third quarter of fiscal 2002. The charges consisted of severance costs for involuntary employee terminations of approximately 210 employees. We utilized $897,000 of the accrued severance in fiscal 2003 to terminate 145 employees.
In fiscal 2004, we utilized $6.6 million of accrued severance to terminate 60 employees related to manufacturing facility in Germany acquired in fiscal 2002. In addition, we recorded charges to the restructuring liability of $10.9 million, and utilized $10.8 million, related to employee terminations at manufacturing facilities in Europe and Mexico acquired in fiscal 2003 due to the transfer of a portion of the manufacturing activities to an existing plant. The charges were related to the elimination of approximately 340 employees. We also recorded and utilized charges to the restructuring liability of approximately $6.0 million related to excess machinery and equipment to be disposed of.
SCI Acquisition Restructuring. In December 2001, we merged with SCI in a purchase business combination and formally changed its name to Sanmina-SCI Corporation. In fiscal 2003, we recorded restructuring charges of $22.8 million for severance costs and utilized $33.4 million for 2,042 employee terminations. In fiscal 2003, we reversed a total of $24.0 million of accrued severance costs, approximately $18.4 million of which was due to lower than anticipated settlement costs at a major European site, and approximately $5.6 million of which related to two plants that were not closed as initially planned due to a change in business circumstances. As of September 27, 2003, 8,488 employees had been terminated under this plan. In fiscal 2003, we recorded restructuring charges of $7.2 million and utilized $14.2 million for lease payments for permanently vacated properties and other costs, We also reversed $1.0 million of accrued facility shutdown costs due to lower than estimates at various sites. In fiscal 2003, we also recorded $1.2 million and utilized $5.3 million for the impairment of excess equipment at closed plants.
In fiscal 2004, we utilized a total of approximately $11.4 million of facilities-related accruals and $3.4 million of accrued severance. During fiscal 2005, we utilized $731,000 related to employee severance and utilized $393,000 due to facilities shutdown.
Ongoing Restructuring Activities. In January 2005, we revised our projected costs for our phase three restructuring cost an estimated amount of approximately $175 million. The recognition of restructuring charges requires our management to make judgments and estimates regarding the nature, timing, and amount of costs associated with the planned exit activity, including estimating sublease income and the fair value, less selling costs, of property, plant and equipment to be disposed of. Management’s estimates of future liabilities may change, requiring us to record additional restructuring charges or reduce the amount of liabilities already recorded. As of October 1, 2005, we had incurred approximately $114.3 million of restructuring cost under this plan. As initially planned, we incurred approximately 92% of the charges as cash charges and approximately 8% as non-cash charges. As a result of our phase three restructuring plan, we expect to achieve reductions in non-cash and cash costs, including depreciation, payroll and related benefits, and rent expense.
We continue to rationalize manufacturing facilities and headcount to more efficiently scale capacity to current market and operating conditions. We anticipate incurring additional restructuring charges in the first half of fiscal 2006 under
31
our phase three restructuring plan which was approved by management in the fourth quarter of fiscal 2005. On October 12, 2005, we announced the restructuring of several European entities in our phase three restructuring plan.
During fiscal 2005 year end, we realigned our structure based on different types of manufacturing services offered to our customers. As a result, our operating segments have changed resulting in the identification of two new reportable segments (Standard Electronic Manufacturing Services and Personal Computing). In the previous fiscal year, we reported our segmented information based on geographical locations (refer to footnote 22 of the Notes to Consolidated Financial Statements). The following table summarizes the total restructuring costs incurred with respect to our reported segments:
| | Fiscal Year Ended | |
| | October 1,
2005 | | October 2,
2004 | | September 27,
2003 | | Total | |
| | (In thousands) | |
Personal computing | | $ | 41,673 | | $ | 7,561 | | $ | 34,636 | | $ | 83,870 | |
Standard electronic manufacturing services | | 74,771 | | 125,689 | | 71,108 | | 271,568 | |
Total | | $ | 116,444 | | $ | 133,250 | | $ | 105,744 | | $ | 355,438 | |
| | | | | | | | | |
Cash | | $ | 107,422 | | $ | 111,671 | | $ | 59,259 | | $ | 278,352 | |
Non-cash | | 9,022 | | 21,579 | | 46,485 | | 77,086 | |
Total | | $ | 116,444 | | $ | 133,250 | | $ | 105,744 | | $ | 355,438 | |
We plan to fund cash restructuring costs with cash flows generated by operating activities.
Interest Expense
Interest expense was $142.3 million in fiscal 2005, $115.3 million in fiscal 2004 and $128.5 million in fiscal 2003. Although, average debt balances were down, interest expense increased in fiscal 2005 from fiscal 2004, primarily due to higher interest rates from our interest rate swap on our 10.375% Notes (see discussion below) higher interest rates on our 6.75% Notes which replaced the Zero Coupon Debentures (4%), and the write-off of deferred financing costs of $6.1 million in connection with the redemption of our Zero Coupon Debentures.
We entered into an interest rate swap transaction with an independent third party to effectively convert the fixed interest rate on our 10.375% Notes to a variable rate. Under the terms of this swap agreement, we pay the independent third party an interest rate equal to the six-month LIBOR rate plus 6.2162%. In exchange, we receive a fixed rate of 10.375%. We have also entered into interest rate swap transactions with independent third parties to effectively convert the fixed interest rate on our 6.75% Notes to a variable rate. Under the terms of these swap agreements, we pay the independent third parties an interest rate equal to the six-month LIBOR rate plus a spread ranging from 2.214% to 2.250%. In exchange, we receive a fixed rate of 6.75%.
Interest expense decreased to $115.3 million in fiscal 2004 from $128.5 million in fiscal 2003, primarily due to lower debt balances.
32
Other Expense, net
Other expense, net was $(8.2) million in fiscal 2005, $(13.9) million in fiscal 2004 and $(7.8) million in fiscal 2003. The following table summarizes the major component of other expense, net:
| | Fiscal Year Ended | |
| | October 1,
2005 | | October 2,
2004 | | September 27,
2003 | |
Foreign exchange losses | | $ | (6.2 | ) | $ | (2.3 | ) | $ | (10.3 | ) |
Loss from early retirement/purchases of debt, net | | (3.1 | ) | — | | (3.5 | ) |
Loss from equity investment | | — | | (15.8 | ) | (6.4 | ) |
Gain from sale of available-for-sale securities/investments | | — | | 1.1 | | 8.1 | |
Other, net | | 1.1 | | 3.1 | | 4.3 | |
Total other expense, net | | $ | (8.2 | ) | $ | (13.9 | ) | $ | (7.8 | ) |
Provision for (Benefit from) Income Taxes
Our effective tax rate was 69.4% during fiscal 2005, (3.9)% during fiscal 2004 and (30.8)% during fiscal 2003. The effective tax rate for fiscal 2005 is substantially higher than a blended statutory rate due primarily to the establishment of a valuation allowance for deferred tax assets of the U.S. and selected foreign jurisdictions and the impact of non-deductible goodwill impairment during fiscal 2005. Excluding the effect of these charges, the effective tax rate for fiscal 2005 was approximately 18%.
At October 1, 2005, we believe it is more likely than not that we will not realize a portion of the benefit of our U.S. and certain foreign deferred tax assets, and accordingly, have provided a valuation allowance for them. In determining the need for a valuation allowance, we consider both positive and negative evidence. Our valuation allowance increased by $613.5 million from fiscal year 2004 to fiscal year 2005, which included a discrete expense of $379.2 million during the quarter ended April 2, 2005 primarily related to U.S. operations.
The effective tax rate for fiscal 2004 is substantially lower than a blended statutory rate due primarily to the reduced tax benefit of certain losses and restructuring costs incurred by non-U.S. operations during fiscal 2004. Excluding the effect of restructuring charges, the effective tax rate for fiscal 2004 was approximately 28%.
Liquidity and Capital Resources
Cash, cash equivalents and short-term investments were $1.2 billion at October 1, 2005 and $1.1 billion at October 2, 2004, including restricted cash of $25.5 million at October 1, 2005 and October 2, 2004.
Net cash provided by operating activities was $416.0 million for fiscal 2005, $216.0 million for fiscal 2004, and $527.0 million for fiscal 2003. Cash provided by operating activities of $416.0 million for fiscal 2005 was a primarily the result of $223 million in proceeds from the sales of accounts receivable and cash generated from a reduction in inventory balances, partially offset by an increase in accounts receivable (excluding the impact of the sales) and a decrease in accounts payable from fiscal 2004. Cash provided by operating activities in fiscal 2004 was primarily the result of improved working capital management as evidenced by reduced cash cycle days in fiscal 2004 as compared to fiscal 2003. Absent the improvement in cash cycle days, we would have used cash from operating activities in fiscal 2004 due to growth in sales and business activities. While accounts receivable increased in fiscal 2004, this increase was offset by a $121.3 million accounts receivable payment acceleration by a customer. Working capital was $1.7 billion and $1.4 billion at October 1, 2005 and October 2, 2004, respectively.
Net cash used in investing activities was $170.0 million for fiscal 2005, $116.4 million for fiscal 2004, and $223.6 million for fiscal 2003. Net cash used in investing activities for fiscal 2005 primarily related to our payment of $77 million to acquire Pentex Schweizer Circuits Limited, or Pentex. As a result of cash provided by operating activities, we had increased our holdings of short-term investments by $37.3 million. Our capital expenditures, net of proceeds from sale of assets, in fiscal 2005 were $34.4 million. The decrease in cash used for investing activities in fiscal 2004 compared to fiscal 2003 was primarily due to less cash being expended for business acquisitions and decreased purchases of short-term investments, offset by increased capital expenditures and purchases of long-term investments and decreased proceeds from maturities of short-term investments.
33
Net cash provided by (used in) financing activities was $(239.2) million for fiscal 2005, $86.8 million for fiscal 2004 and $(448.7) million for fiscal 2003. Net cash used in financing activities for fiscal 2005 primarily related to the repurchase of $224.8 million of the Zero Coupon Subordinated Debentures in September 2005. Net cash provided by financing activities for fiscal 2004 primarily related to the relief of restricted cash of $90.4 million into cash and cash equivalents and proceeds from the sale of common stock of $35.7 million, partially offset by payments of long-term debt and notes and credit facilities, net of $21.8 million and $17.4 million, respectively. During fiscal 2003, we repaid long-term debt of $324.5 million, lines of credit of $606.2 million, repurchased convertible notes of $442.0 million and provided restricted cash of $78.2 million for accounts collateralizing letters of credit. These payments were offset by proceeds from notes and credit facilities, net of $988.5 million.
10.375% Senior Secured Notes due 2010. On December 23, 2002, we issued $750.0 million of 10.375% Senior Secured Notes due January 15, 2010 (the “Original Notes”) in a private placement to qualified investors as part of a refinancing transaction pursuant to which we also entered into a $275.0 million senior secured credit facility (the “Credit Facility”). A portion of the net proceeds of the Original Notes and Credit Facility was used to repay all outstanding amounts under an existing three-year revolving credit facility and to repurchase all outstanding receivables sold under an existing receivables securitization facility. These transactions are referred to collectively as the Refinancing. In July 2003, we completed an exchange offer pursuant to which substantially all of the Original Notes were exchanged for notes registered under the Securities Act of 1933, or the 10.375% Notes. The 10.375% Notes evidence the same debt as the Original Notes and are issued under and entitled to the benefits of the same indenture that governs the Original Notes except that they are not subject to transfer restrictions.
The 10.375% Notes are fully and unconditionally guaranteed by substantially all of our United States subsidiaries and are secured by a second priority security interest in substantially all of the personal property assets of Sanmina-SCI and its United States subsidiaries located in the United States, a pledge of the capital stock of substantially all of our United States subsidiaries, a pledge of 65% of the capital stock of certain of our first-tier foreign subsidiaries, and mortgages on certain domestic real estate. We may redeem the 10.375% Notes, in whole or in part, at anytime beginning on January 15, 2007 at a redemption price initially of 105.188%, declining to 102.594% on January 15, 2008 and 100.000% on January 15, 2009. We may also redeem the 10.375% Notes, in whole or in part, at any time prior to January 15, 2007 at a redemption price equal to the principal amount plus accrued interest to the redemption date plus a make-whole premium specified in the indenture. In the event of a change of control of Sanmina-SCI, we will be required to offer to repurchase the 10.375% Notes at a repurchase price of 101% of the principal amount plus accrued interest to the repurchase date. Before January 15, 2006, we may redeem up to a maximum of 35% of the aggregate principal amount of the 10.375% Notes in an amount not to exceed the net proceeds of one or more equity offerings, as defined in the indenture, at a redemption price equal to 110.375% of the principal amount plus accrued interest. The indenture includes covenants that, among other things, limit in certain respects Sanmina-SCI and its restricted subsidiaries from incurring debt, making investments and other restricted payments, paying dividends on capital stock, redeeming capital stock or subordinated obligations and creating liens. In the event that we obtain the investment grade rating specified in the indenture and certain other conditions are met, the collateral securing the 10.375% Notes will be permanently released, and we will no longer be required to comply with certain of the indenture covenants specified above for as long as we retain the investment grade rating specified in the indenture.
During fiscal 2003, we repaid the $275.0 million Credit Facility and recorded an $18.3 million loss from the early extinguishment of this debt, including the write-off of $10.1 million of unamortized financing fees and a redemption premium of $8.2 million. The loss is reflected in other expense in the accompanying consolidated statement of operations.
We entered into interest rate swaps to hedge our mix of short-term and long-term interest rate exposures resulting from certain of our outstanding debt obligations. During fiscal 2003, we entered into an interest rate swap transaction with an independent third party related to the 10.375% Notes pursuant to which we paid the third party a variable rate and received a fixed rate from the third party. The interest rate swap had a total notional amount of $525.0 million. Under the swap agreement, we paid an interest rate equal to the six-month LIBOR rate plus 6.125%, determined semi-annually in arrears. In exchange, we received a fixed interest rate of 10.375%. During the fourth quarter of fiscal 2003, we terminated the swap agreement. In consideration for the termination, we paid a termination payment, which is recorded as deferred financing cost and amortized over the remaining life of the 10.375% Notes. Concurrent with the termination of the swap agreement, we entered into a new swap agreement with the third party with identical terms except for the floating rate spread. Under this swap agreement, we paid an interest rate equal to the six-month LIBOR rate plus 5.6375%, determined semi-annually in arrears. In addition we entered into an interest rate swap transaction related to $225.0 million principal amount of the 10.375% Notes. Under this swap agreement, we paid an interest rate equal to the six-month LIBOR rate plus 5.62%, determined semi-annually in arrears. During the first quarter of fiscal 2005, we terminated these swap agreements. In consideration for the termination, we received a termination payment, which is recorded in other long term debt and
34
amortized over the remaining life of the 10.375% Notes. Concurrent with the termination of these swap agreements, we entered into a new swap agreement with a notional amount of $750.0 million with the third party with identical terms except for the floating rate spread. Under this swap agreement, we pay an interest rate equal to the six-month LIBOR rate plus 6.2162%, determined semi-annually in arrears. The swap agreement effectively replaces the fixed interest rate that we pay on 10.375% Notes with variable interest rates. Both parties to the agreements have the right to terminate the agreements on or after January 15, 2007. The swaps were designated as fair value hedges under SFAS No. 133. Management believes that the interest rate swaps meet the criteria established by SFAS No. 133 for short cut accounting; therefore, no portion of the swaps are treated as ineffective. At October 1, 2005, $22.1 million has been recorded in other long-term liabilities to record the fair value of the interest rate swap transactions, with a corresponding decrease to the carrying value of the 10.375% Notes.
6.75% Senior Subordinated Notes. On February 24, 2005, we entered into an indenture among the Company, the Guarantors (as defined below) and U.S. Bank National Association as trustee, or the 6.75% Notes Indenture, relating to the issuance by the Company of $400 million aggregate principal amount of our 6.75% Senior Subordinated Notes due 2013, or the 6.75% Notes in a private placement to qualified investors. Interest is payable on the 6.75% Notes on March 1 and September 1 of each year, beginning on September 1, 2005. The maturity date of the 6.75% Notes is March 1, 2013. In June 2005, we completed an exchange offer pursuant to which substantially all of the 6.75% Notes were exchanged for notes registered under the Securities Act of 1933. These notes evidence the same debt as the original 6.75% Notes and are issued and entitled to the benefits of the same indenture that governs the original the 6.75% Notes except that they are not subject to transfer restrictions.
The 6.75% Notes are unsecured, senior subordinated obligations and will be subordinated in right of payment to all of our existing and future senior debt. The 6.75% Notes are fully and unconditionally guaranteed, jointly and severally, on a senior subordinated unsecured basis by substantially all of our domestic restricted subsidiaries, or the Guarantors, for so long as those subsidiaries guarantee any of our other debt (other than unregistered senior debt and debt under our senior secured credit facility).
We may redeem the 6.75% Notes, in whole or in part, at any time prior to March 1, 2009, at a redemption price that is equal to the sum of (1) the amount of the 6.75% Notes to be redeemed, (2) accrued and unpaid interest on those 6.75% Notes and (3) a make-whole premium calculated in the manner specified in the 6.75% Notes Indenture. We may redeem the 6.75% Notes, in whole or in part, beginning on March 1, 2009, at declining redemption prices ranging from 103.375% to 100% of the principal amount, plus accrued and unpaid interest to, but excluding, the redemption date, with the actual redemption price to be determined based on the date of redemption. At any time prior to March 1, 2008, we may redeem up to 35% of the 6.75% Notes with the proceeds of certain equity offerings at a redemption price equal to 106.75% of the principal amount of the 6.75% Notes, plus accrued and unpaid interest to, but excluding, the redemption date.
Following a change of control, as defined in the 6.75% Notes Indenture, we will be required to make an offer to repurchase all or any portion of the 6.75% Notes at a purchase price of 101% of the principal amount, plus accrued and unpaid interest to, but excluding, the date of repurchase.
The 6.75% Notes Indenture includes covenants that limit our ability and the ability of our restricted subsidiaries to, among other things: incur additional debt, make investments and other restricted payments, pay dividends on capital stock, or redeem or repurchase capital stock or subordinated obligations; create specified liens; sell assets; create or permit restrictions on the ability of our restricted subsidiaries to pay dividends or make other distributions to us; engage in transactions with affiliates; incur layered debt; and consolidate or merge with or into other companies or sell all or substantially all of our assets. The restricted covenants are subject to a number of important exceptions and qualifications set forth in the 6.75% Notes Indenture. The Company was not in violation of any of the covenants.
The 6.75% Notes Indenture provides for customary events of default, including payment defaults, breaches of covenants, certain payment defaults at final maturity or acceleration of other indebtedness, failure to pay certain judgments, certain events of bankruptcy, insolvency and reorganization and certain instances in which a guarantee ceases to be in full force and effect. If any event of default occurs and is continuing, subject to certain exceptions, the trustee or the holders of at least 25% in aggregate principal amount of the then outstanding 6.75% Notes may declare all the 6.75% Notes to be due and payable immediately, together with any accrued and unpaid interest, if any, to the acceleration date. In the case of an event of default resulting from certain events of bankruptcy, insolvency or reorganization, such amounts with respect to the 6.75% Notes will be due and payable immediately without any declaration or other act on the part of the trustee or the holders of the 6.75% Notes.
35
We entered into interest rate swap transactions with independent third parties to effectively convert the fixed interest rate to a variable rate. The interest rate swap agreements, which expire in 2013, are accounted for as fair value hedges under SFAS No. 133. The aggregate notional amount of the combined interest rate swap transactions is $400.0 million. Under the terms of the interest rate swap agreements, we pay the independent third parties an interest rate equal to the six-month LIBOR rate plus an interest rate spread ranging from 2.214% to 2.250%. In exchange, we receive a fixed rate of 6.75%. At October 1, 2005, $10.6 million has been recorded in other long-term liabilities to record the fair value of the interest rate swap transaction, with a corresponding decrease to the carrying value of the 6.75% Notes on the Consolidated Balance Sheet.
Zero Coupon Convertible Subordinated Debentures due 2020. On September 12, 2000, we issued $1.66 billion in aggregate principal amount at maturity of zero coupon convertible subordinated debentures, or Zero Coupon Debentures, due on September 12, 2020 at an issue price of $452.89 per $1,000 debenture, resulting in gross proceeds of $751.8 million. The Zero Coupon Debentures are subordinated to the prior payment of all senior indebtedness, as defined, of Sanmina-SCI. There will be no cash interest payments prior to maturity. The issue price of each Zero Coupon Debenture represents a yield to maturity of 4% per year, computed on a semi-annual basis. The issue discount is amortized using the effective interest method over the term of the notes. The Zero Coupon Debentures are convertible into common stock, at any time at the option of the note holder, at the conversion ratio of approximately 6.48 shares per $1,000 principal amount at maturity, subject to adjustment in certain events. The Zero Coupon Debentures are redeemable at our option on or after September 12, 2005. The Zero Coupon Debentures may also be subject to repurchase, at the option of the holder, on September 12, 2005, September 12, 2010, and September 12, 2015 at $552.08, $672.98, and $820.35, respectively per $1,000 note.
During fiscal 2003, we repurchased approximately $210.6 million aggregate principal amount at maturity (having an accreted value of $104.4 million) of the Zero Coupon Debentures through unsolicited privately negotiated transactions. As a result of the transactions, we recorded an $18.7 million gain, net of $1.9 million in unamortized financing fees, from the early extinguishment of this debt. The gain was reflected in other expense, net in the accompanying consolidated statements of operations.
On March 25, 2005, we completed a tender offer for approximately $400 million accreted value of our outstanding Zero Coupon Convertible Subordinated Debentures due 2020, or the Zero Coupon Debentures, at a tender price of $543.75 per $1,000 principal amount at maturity of the Zero Coupon Debentures. Net proceeds from the sale of our 6.75% Notes of approximately $389.5 million in the aggregate after deducting the discounts and estimated expenses of this offering, together with cash on hand, were utilized to repurchase the Zero Coupon Debentures. We accepted $735.6 million aggregate principal amount at maturity of the Zero Coupon Debentures that were validly tendered in response to the tender offer, representing approximately 64.3% of the total outstanding Zero Coupon Debentures. The redemption of the Zero Coupon Debentures resulted in a loss on extinguishment of debt of $3.1 million in the quarter ended April 2, 2005, which is included in other expense, net in the accompanying consolidated statements of operations.
On September 12, 2005, we repurchased $407.2 million in aggregate principal amount at maturity of the Zero Coupon Debentures. The repurchase was made pursuant to the terms of the indenture under which the Zero Coupon Debentures were issued. The indenture gave the holders the right to require that we repurchase their Zero Coupon Debentures on September 12, 2005 at a fixed price. The purchase price for the Debentures was $552.08 per $1,000 principal amount at maturity. The aggregate purchase price for all the Debentures surrendered for repurchase was $224.8 million. The aggregate remaining outstanding principal amount at maturity of the Debentures is $0.5 million.
3% Convertible Subordinated Notes due 2007. In March 2000, SCI issued $575.0 million aggregate principal amount of 3% Convertible Subordinated Notes due March 15, 2007, or 3% Notes. Interest on the 3% Notes is payable semi-annually on each March 15 and September 15. In connection with the merger with SCI, we entered into a supplemental indenture with respect to the 3% Notes providing a guaranty for the 3% Notes and allowing for the conversion of the 3% Notes into shares of our common stock, at a conversion price of $41.35 per share, subject to adjustment in certain events. The 3% Notes are subordinated in right of payment to all existing and future senior debt, as defined, of Sanmina-SCI. The 3% Notes were redeemable at SCI’s option at any time on or after March 20, 2003, although there is no mandatory redemption prior to final maturity. During fiscal 2003, we repurchased approximately $50.0 million aggregate principal amount of our 3% Convertible Subordinated Notes due 2007 through unsolicited privately negotiated transactions. As a result of the transactions, we recorded an $8.1 million gain, net of $690,000 in unamortized financing fees, from the early extinguishment of this debt. The gain was reflected in other expense, net in the accompanying consolidated statement of operations.
Senior Credit Facility. On October 26, 2004, we entered into a senior secured credit facility providing for a $500 million revolving credit facility, with a $150 million letter of credit sub-limit. The senior secured credit facility expires on October 26, 2007. There are currently no loans outstanding under the senior secured credit facility.
36
All of our existing and future domestic subsidiaries guaranty the obligations under the credit facility, subject to some limited exceptions. Our obligations and the obligations of our subsidiaries under the credit facility are secured by substantially all of our assets; substantially all of the assets of substantially all of our United States subsidiaries located in the United States; a pledge of all capital stock of substantially all of our United States subsidiaries; a pledge of 65% of the capital stock of certain of our and our United States subsidiaries’ first-tier foreign subsidiaries; and mortgages on certain domestic real estate.
The Senior Credit Facility provides for the collateral to be released at such time as our 10.375% Notes have been substantially paid in full, we have satisfied our obligations with respect to the Zero Coupon Subordinated Debentures described above, our long-term unsecured noncredit enhanced debt is rated not less than BB by Standard & Poor’s and Ba2 by Moody’s and we are in pro forma compliance with the financial covenants contained in the credit facility.
The credit facility requires us to comply with a fixed charge coverage ratio and a ratio of total debt to EBITDA. Additionally, the credit facility contains numerous affirmative covenants, including covenants regarding the payment of taxes and other obligations, maintenance of insurance, reporting requirements and compliance with applicable laws and regulations. Further, the credit facility contains negative covenants limiting the ability of us and our subsidiaries, among other things, to incur debt, grant liens, make acquisitions, make certain restricted payments, sell assets and enter into sale and lease back transactions. The events of default under the credit facility include payment defaults, cross defaults with certain other indebtedness, breaches of covenants and bankruptcy events.
On December 16, 2005, we entered into a new senior credit facility which replaces this facility. For additional detail regarding this new facility, refer to “Item 9B — Other Information” at page 53 of this report.
Sale of Accounts Receivable. On April 1, 2005, Sanmina-SCI UK Limited and Sanmina-SCI Hungary Electronics Limited Liability Company each a wholly-owned subsidiary of Sanmina-SCI, (“Subsidiaries”) each entered into a Committed Account Receivable Purchase Agreement (collectively, the “Receivables Agreements”). The Receivables Agreements have a term of one year and permit the Subsidiaries to sell specified accounts receivable to the bank from time to time.
On September 23, 2005, our Subsidiary in Hungary and Mexico entered into a Revolving Trade Receivables Purchase Agreement (collectively, the “Bank Receivables Agreements”) with banks and financial institutions (“the Purchasers”). The Receivables Agreements have a term of two years and permit the Subsidiaries to sell specified accounts receivable to the Purchasers from time to time. The amount of the face/invoice amount of receivable sold to the Purchasers and outstanding may not exceed $100.0 million. The Bank Receivables Agreement allows for the designation of additional subsidiaries and the increase of the aggregate investment limits of the Purchasers to up to $400.0 million, in each case subject to the satisfaction of the conditions set forth in the Bank Receivables Agreement including the agreement of the Purchasers to increase their respective investment limits.
We are currently limited by the senior secured credit facility which was amended on June 6, 2005 to the amount of foreign accounts receivable that may be sold under factoring or similar arrangements, including the Receivables Agreements. The revised credit facility amends the aggregate face amount of accounts receivable that may be sold and outstanding at any time from $200 million to $400 million. The obligations of the Subsidiaries under the Receivables Agreements are guaranteed by Sanmina-SCI. Each Subsidiary has provided a lien in favor of the Bank and the Purchasers in the account in which the proceeds of the sold receivables are remitted.
The purchase price for a receivable under the April 1, 2005 Receivables Agreement is equal to 100% of its face amount less a discount charge (based on LIBOR plus a spread) for the period from the date the receivable is sold to its maturity date. The purchase price for a receivable under the September 23, 2005 Receivables Agreement is equal to 100% of its invoice/face amount. The Subsidiaries pay the Purchasers interest during the period from the date the receivable is sold to its maturity date. Both the Receivables Agreements provide for a commitment fee based on the unused portion of the facility. Interest and discounting fees associated with these sales were not considered significant. Accounts receivable sales under the Receivables Agreements was $407.7 million for the year ended October 1, 2005. The sold receivables are subject to certain limited recourse provisions. In accordance with SFAS No. 140, “Accounting for Transfers and Servicing of Financial Assets and Extinguishments of Liability,” the accounts receivable that were sold were removed from the consolidated balance sheets and are reflected as cash provided by operating activities in the consolidated statements of cash flows. As of October 1, 2005, $223.6 million of sold accounts receivable remain subject to certain recourse provisions. We have not experienced any credit losses under these recourse provisions.
37
As of October 1, 2005, we also have $1.3 million of other term loans at interest rates that fluctuate. The average interest rates for the fiscal year ended October 1, 2005 were 5.25% for other term loans. As of October 2, 2004, we had $8.0 million of other term loans at interest rates that fluctuate. The average interest rates for the fiscal year ended October 2, 2004 were 3.55% for other term loans.
Contractual Obligations
The following is a summary of our long-term debt, and capital and operating lease obligations and commitments as of October 1, 2005:
| | | | Fiscal Year(s) | |
Dollars in thousands | | Total | | 2006 | | 2007 | | 2008 | | 2009 | | 2010 | | Thereafter | |
Long-term debt and capital lease obligations(1) | | $ | 1,646,105 | | $ | 1,439 | | $ | 523,564 | | $ | 907 | | $ | 844 | | $ | 717,525 | | $ | 401,826 | |
Operating leases(2) | | 85,753 | | 24,812 | | 17,273 | | 12,845 | | 6,200 | | 3,566 | | 21,057 | |
Total contractual obligations | | $ | 1,731,858 | | $ | 26,251 | | $ | 540,837 | | $ | 13,752 | | $ | 7,044 | | $ | 721,091 | | $ | 422,883 | |
(1) In September 2005, we repurchased $224.8 million accreted value of Zero Coupon Subordinated Debentures due 2020. Accordingly, the accreted value of our remaining Zero Coupon Subordinated Debentures due 2020 as of October 1, 2005 of $0.5 million is included in the fiscal 2005 maturities in the table above.
(2) Future operating lease payments include the obligations for closed facilities (totaling approximately $14.2 million) which have been fully or partially accrued in restructuring costs.
We also have outstanding firm purchase orders with certain suppliers for the purchase of inventory. These purchase orders are generally short-term in nature. Orders for standard, or catalog, items can typically be canceled with little or no financial penalty. Our policy regarding non-standard or customized items dictates that such items are only ordered specifically for customers who have contractually assumed liability for the inventory. In addition, a substantial portion of the catalog items covered by our purchase orders were procured for specific customers based on their purchase orders or a forecast under which the customer has contractually assumed liability for such material. Accordingly, the amount of liability from purchase obligations under these purchase orders is not significant or meaningful.
Certain acquisition agreements that we entered into in connection with purchase business combinations may require us to pay additional consideration determined by the future performance of the acquired entity. The amount and likelihood of the payments are not determinable as of October 1, 2005.
We provided guarantees to various third parties in the form of letters of credit totaling $30.5 million as of October 1, 2005. The letters of credit cover various guarantees including interest rate swap agreements, workers’ compensation claims and customs duties.
We have defined benefit pension plans – (refer to footnote 17 of the Notes to Consolidated Financial Statements).
Our future needs for financial resources include increases in working capital to support anticipated sales growth, investments in manufacturing facilities and equipment, and repayments of outstanding indebtedness. We have evaluated and will continue to evaluate possible business acquisitions within the parameters of the restrictions set forth in the agreements governing certain of our debt obligations. These possible business acquisitions could require substantial cash payments. Additionally, we anticipate incurring additional expenditures in connection with the integration of our recently acquired businesses and our restructuring activities.
We believe that our existing cash resources, together with cash generated from operations, will be sufficient to meet our working capital requirements through at least the next 12 months. Should demand for our products decrease over the next 12 months, the available cash provided by operations could be negatively impacted. We may seek to raise additional capital through the issuance of either debt or equity securities. Our senior secured credit facility and the indentures governing our 10.375% Notes and our 6.75% Notes include covenants that, among other things, limit in certain respects us and our restricted subsidiaries from incurring debt, making investments and other restricted payments, paying dividends on capital stock, redeeming capital stock or subordinated obligations and creating liens. In addition to existing collateral and covenant requirements, future debt financing may require us to pledge assets as collateral and comply with financial ratios and covenants. Equity financing may result in dilution to stockholders.
38
Recent Accounting Pronouncements
FASB Staff Position (“FSP”) No. 109-2 “Accounting and Disclosure Guidance for the Foreign Earnings Repatriation Provision within the American Jobs Creation Act of 2004” (“FSP 109-2), provides guidance under SFAS No. 109, “Accounting for Income Taxes”, with respect to recording the potential impact of the repatriation provisions of the American Jobs Creation Act of 2004 (the “Jobs Act”) on income tax expense and deferred tax liabilities. The Jobs Act was enacted on October 22, 2004. FSP 109-2 states that an enterprise is allowed time beyond the financial reporting period of enactment to evaluate the effect of the Jobs Act on it plan for reinvestment or repatriation of foreign earnings for purposes of applying SFAS No. 109. The Company believes the application of FSP No. 109-2 will not have a material effect on the income tax provision.
In November 2004, the FASB issued SFAS No. 151, Inventory Costs, an amendment of ARB No. 43, Chapter 4, to clarify that abnormal amounts of idle facility expense, freight, handling costs, and wasted material (spoilage) should be recognized as current period charges, and that fixed production overheads should be allocated to inventory based on normal capacity of production facilities. This statement is effective for inventory costs incurred during fiscal years beginning after June 15, 2005. The adoption of SFAS No. 151 is not expected to have a significant impact on the Company’s results of operations or financial position.
In December 2004, FASB issued SFAS No. 123 (revised 2004) “Share-based Payment,” which requires companies to recognize in the statement of operations grant date fair value of stock options and other equity-based compensation issued to employees. This statement supersedes Accounting Principles Board Opinion (“APB”) No. 25, “Accounting for Stock Issued to Employees,” but does not change the accounting guidance for share-based payment transactions with parties other than employees provided in SFAS No. 123 as originally issued. SFAS No. 123 (revised 2004) is effective as of the beginning of our first quarter of fiscal 2006. We have not concluded our evaluation of SFAS 123R. The impact of adoption of SFAS 123R cannot be predicted at this time because it will depend on levels of share-based payments granted in the future. In addition, assessment of the estimated compensation charges is affected by the Company’s stock price as well as assumptions regarding a number of complex and subjective variables and the related tax impact. These variables include, but are not limited to, the Company’s stock price volatility, estimated forfeiture rate and employee stock option exercise behaviors. See footnote 2 of the Notes to Consolidated Financial Statements “Stock-based Compensation” for information related to the pro forma effects on our reported net loss and net loss per share of applying the fair value recognition provision of the previous SFAS 123 to stock-based compensation.
In December 2004, FASB issued Statement of Financial Accounting Standards No. 153, Exchanges of Nonmonetary Assets, an amendment of APB Opinion No. 29, Accounting for Nonmonetary Transactions (“SFAS 153”). This statement amends APB Opinion 29 to eliminate the exception for nonmonetary exchanges of similar productive assets and replaces it with a general exception for exchanges of nonmonetary assets that do not have commercial substance. Under SFAS 153, if a nonmonetary exchange of similar productive assets meets a commercial-substance criterion and the fair value is determinable, the transaction must be accounted for at fair value resulting in recognition of any gain or loss. The provisions of SFAS 153 are effective for nonmonetary transactions in fiscal periods that begin after June 15, 2005. We do not anticipate that the adoption of this standard will have a material impact on our financial position or results of operations.
In March 2005, the FASB issued FIN 47 as an interpretation of FASB Statement No. 143, “Accounting for Asset Retirement Obligations” (“SFAS 143”). This interpretation clarifies that the term conditional asset retirement obligation as used in SFAS 143, refers to a legal obligation to perform an asset retirement activity in which the timing and/or method of settlement are conditional on a future event that may or may not be within the control of the entity. The obligation to perform the asset retirement activity is unconditional even though uncertainty exists about the timing and/or method of settlement. Accordingly, an entity is required to recognize a liability for the fair value of a conditional asset retirement obligation if the fair value of the liability can be reasonably estimated. This interpretation also clarifies when an entity would have sufficient information to reasonably estimate the fair value of an asset retirement obligation. FIN 47 is effective no later than the end of fiscal years ending after December 15, 2005. We do not anticipate that the adoption of this standard will have a material impact on our financial position or results of operations.
39
Quarterly Results (Unaudited)
The following table contains selected unaudited quarterly financial data for the eight fiscal quarters in the period ended October 1, 2005. In management’s opinion, the unaudited data has been prepared on the same basis as the audited information and includes all adjustments (consisting only of normal recurring adjustments) necessary for a fair presentation of the data for the periods presented. Our results of operations have varied and may continue to fluctuate significantly from quarter to quarter. The results of operations in any period should not be considered indicative of the results to be expected from any future period.
2005 | | First
Quarter (3a) | | Second
Quarter(2)(3b) | | Third
Quarter(3c) | | Fourth
Quarter(3d) | |
| | (In thousands, except percentages and per share amounts) | |
Net sales | | $ | 3,252,706 | | $ | 2,885,402 | | $ | 2,831,264 | | $ | 2,765,302 | |
Gross profit | | $ | 176,967 | | $ | 150,167 | | $ | 160,826 | | $ | 153,083 | |
Gross margin | | 5.4 | % | 5.2 | % | 5.7 | % | 5.5 | % |
Operating income (loss) | | $ | 59,599 | | $ | (604,071 | ) | $ | 39,283 | | $ | 39,289 | |
Operating margin (loss) | | 1.8 | % | (20.9 | )% | 1.4 | % | 1.4 | % |
Net income (loss) | | $ | 24,366 | | $ | (1,035,508 | ) | $ | (202 | ) | $ | 5,342 | |
Basic net income (loss) per share | | $ | 0.05 | | $ | (1.99 | ) | $ | (0.00 | ) | $ | 0.01 | |
Diluted net income (loss) per share | | $ | 0.05 | | $ | (1.99 | ) | $ | (0.00 | ) | $ | 0.01 | |
| | | | | | | | | |
2004 | | First
Quarter | | Second
Quarter | | Third
Quarter | | Fourth
Quarter(1) | |
| | (In thousands, except percentages and per share amounts) | |
Net sales | | $ | 2,970,281 | | $ | 2,862,386 | | $ | 3,069,783 | | $ | 3,302,157 | |
Gross profit | | $ | 141,191 | | $ | 145,099 | | $ | 158,523 | | $ | 171,276 | |
Gross margin | | 4.8 | % | 5.1 | % | 5.2 | % | 5.2 | % |
Operating income (loss) | | $ | 46,189 | | $ | (31,461 | ) | $ | 46,500 | | $ | 44,473 | |
Operating margin (loss) | | 1.6 | % | (1.1 | )% | 1.5 | % | 1.3 | % |
Net income (loss) | | $ | 15,769 | | $ | (43,856 | ) | $ | 11,351 | | $ | 5,338 | |
Basic net income (loss) per share | | $ | 0.03 | | $ | (0.09 | ) | $ | 0.02 | | $ | 0.01 | |
Diluted net income (loss) per share | | $ | 0.03 | | $ | (0.09 | ) | $ | 0.02 | | $ | 0.01 | |
(1) Includes an extraordinary gain of $3.6 million.
(2) Includes a goodwill impairment charge $600 million and $379 million of deferred tax asset valuation allowance.
(3) As a result of our ongoing efforts to remediate the conditions that resulted in the material weakness disclosed in Item 9A of the Company’s 2004 Annual Report on Form 10-K, several adjustments were identified and recorded in the condensed consolidated statement of operations for the three month periods ended July 2, 2005 and October 1, 2005 which relate to previous periods. The cumulative effect on the quarterly result of operations is as follows:
(a) Three month period ended January 1, 2005: (1) our reported gross margin of 5.44% would have been approximately 4.66%, (2) the reported operating income of $60 million would have been approximately $ 34 million, (3) the reported tax provision of $9 million would have been approximately $1 million benefit and (4) the reported net income of $24.3 million would have been approximately $8.3 million.
(b) Three month period ended April 2, 2005: (1) our reported gross margin of 5.20% would have been approximately 4.78%, (2) the reported operating loss of $604 million would have been approximately $614 million loss, (3) the reported tax provision of $390 million would have been approximately $395 million and (4) the reported net loss of $1,036.0 million would have been approximately $1,046.5 million.
(c) Three month period ended July 2, 2005: (1) our reported gross margin of 5.69% would have been approximately 6.09%, (2) the reported operating income of $39 million would have been approximately $50 million, (3) the reported tax provision of $6 million would have been approximately $19 million and (4) the reported net loss of $202,000 would have been approximately $3 million loss.
40
(d) Three month period ended October 2, 2005: (1) our reported gross margin of 5.5% would have been approximately 6.5%, (which represents a level of gross margin we do not expect to sustain in the next several quarters primarily due to anticipated changes in product mix), (2) the reported operating income of $39 million would have been approximately $65 million, (3) the reported tax benefit of $4 million would have been approximately $13 million benefit and (4) the reported net income of $5.3 million would have been approximately $42.6 million.
We concluded that these adjustments were not material to any of the periods affected pursuant to Accounting Principles Board Bulletin No. 28 “Interim Financial Reporting” and Staff Accounting Bulletin No. 99 “Materiality”.
Factors Affecting Operating Results
We are exposed to general market conditions in the electronics industry which could have a material adverse impact on our business, operating results and financial condition.
As a result of the downturn in the electronics industry, demand for our manufacturing services declined significantly during our 2001, 2002, and 2003 fiscal years. The decrease in demand for manufacturing services by OEMs resulted primarily from reduced capital spending by communications service providers. Consequently, our operating results were adversely affected as a result of the deterioration in the communications market and the other markets that we serve. Although we have begun to see evidence of a recovery in several markets that we serve, if capital spending in these markets does not continue to improve, or improves at a slower pace than we anticipate, our revenue and profitability will be adversely affected. In addition, even as many of these markets begin to recover, OEMs are likely to continue to be highly sensitive to costs and will likely continue to place pressure on EMS companies to minimize costs. This will likely result in continued significant price competition among EMS companies, and this competition will likely continue to affect our results of operations. In addition, OEM customers are increasingly requiring us and other EMS companies to move production of their products to lower-cost locations and away from high cost locations such as the United States and Western Europe. As a result, we have had to close facilities in the U.S. and Europe and incur costs for facilities closure, employee severance and related items. These trends are likely to continue, and we may therefore need to close additional facilities and incur related closure costs in future fiscal periods.
We cannot accurately predict future levels of demand for our customers’ electronics products. As a result of this uncertainty, we cannot accurately predict if the improvement in the electronics industry will continue. Consequently, our past operating results, earnings and cash flows may not be indicative of our future operating results, earnings and cash flows. In particular, if the economic recovery in the electronics industry does not demonstrate sustained momentum, and if price competition for EMS services continues to be intense, our operating results may be adversely affected.
If demand for our higher-end, higher margin manufacturing services does not improve, our future gross margins and operating results may be lower than expected.
Before the economic downturn in the communications sector and before our merger with SCI Systems, Inc., sales of our services to OEMs in the communications sector accounted for a substantially greater portion of our net sales and earnings than in recent periods. As a result of reduced sales to OEMs in the communications sector, our gross margins have declined because the services that we provided to these OEMs often were more complex, thereby generating higher margins than those that we provided to OEMs in other sectors of the electronics industry. For example, a substantial portion of our net sales are currently derived from sales of personal computers. Margins on personal computers are typically lower than margins that we have historically realized on communication products. OEMs are continuing to seek price decreases from us and other EMS companies and competition for this business remains intense. Although the electronics industry has begun to show indications of a recovery, pricing pressure on EMS companies continues to be strong and there continues to be intense price competition for EMS services. This price competition has affected, and could continue to adversely affect, our gross margins. If demand for our higher-end, higher margin manufacturing services does not improve in the future, our gross margins and operating results in future periods may be adversely affected.
Our operating results are subject to significant uncertainties.
Our operating results are subject to significant uncertainties, including the following:
• economic conditions in the electronics industry;
• the timing of orders from major customers and the accuracy of their forecasts;
• the timing of expenditures in anticipation of increased sales, customer product delivery requirements and shortages of components or labor;
41
• the mix of products ordered by and shipped to major customers, as high volume and low complexity manufacturing services typically have lower gross margins than more complex and lower volume services;
• the degree to which we are able to utilize our available manufacturing capacity;
• our ability to effectively plan production and manage our inventory and fixed assets;
• customer insolvencies resulting in bad debt exposures that are in excess of our accounts receivable reserves;
• our ability to efficiently move manufacturing activities to lower cost regions without adversely affecting customer relationships and while controlling facilities closure and employee severance costs;
• pricing and other competitive pressures;
• seasonality in customers’ product requirements;
• fluctuations in component prices;
• political and economic developments in countries in which we have operations;
• component shortages, which could cause us to be unable to meet customer delivery schedules; and
• new product development by our customers.
A portion of our operating expenses is relatively fixed in nature, and planned expenditures are based, in part, on anticipated orders, which are difficult to estimate. If we do not receive anticipated orders as expected, our operating results will be adversely impacted. Moreover, our ability to reduce our costs as a result of current or future restructuring efforts may be limited because consolidation of operations can be costly and a lengthy process to complete.
If in a future fiscal period, we were to identify a material weakness in our internal controls over financial reporting, investors could lose confidence in the reliability of our financial statements, which could result in a decrease in the value of our securities; we will also likely continue to incur substantial expenditures in connection with the Sarbanes-Oxley Section 404 process.
As directed by Section 404 of the Sarbanes-Oxley Act of 2002, the Securities and Exchange Commission adopted rules requiring public companies to include a report of management on the company’s internal control over financial reporting in their annual reports on Form 10-K that contains an assessment by management of the effectiveness of the company’s internal control over financial reporting. In addition, the independent registered public accounting firm auditing the company’s financial statements must attest to and report on management’s assessment of the effectiveness of the company’s internal controls over financial reporting. We are subject to these requirements beginning in our 2005 fiscal year. Although this process did not identify any material weaknesses in our internal controls over financial reporting at October 1, 2005, in the future, we will need to continue to evaluate, and possibly upgrade and enhance, our internal controls in response to changes in our business, possible future acquisitions, geographic expansion and other factors that affect our business. In addition, because of inherent limitations, our internal control over financial reporting may not prevent or detect misstatements, errors or omissions, and any projections of any evaluation of effectiveness of internal controls to future periods are subject to the risk that controls may become inadequate because of changes in conditions or that the degree of compliance with our policies or procedures may deteriorate. If we fail to maintain the adequacy of our internal controls, including any failure to implement or difficulty in implementing required new or improved controls, our business and results of operations could be harmed, we could fail to be able to provide reasonable assurance as to our financial results or meet our reporting obligations and there could be a material adverse effect on the price of our securities.
In addition, during fiscal 2005, we expended significant resources in connection with the Section 404 process. In future periods, we will likely continue to expend substantial amounts in connection with the Section 404 process and with ongoing evaluation of, and potential improvements and enhancements to, our internal control over financial reporting. These expenditures may make it difficult for us to control or reduce the growth of our selling, general and administrative expenses, which could adversely affect our results of operations and the price of our securities.
42
Adverse changes in the key end markets we target could harm our business
We are dependent on the communications, computing and storage, multimedia, industrial and semiconductor systems, defense and aerospace , medical and automotive sectors of the electronics industry. Adverse changes in the end markets that we serve can reduce demand from our customers in those end markets and make customers in these end markets more price sensitive, either of which could adversely affect our business and results of operations. For example, in calendar year 2001, the communications equipment industry was afflicted by a significant downturn, which caused a substantial reduction in demand for our services from these customers. In addition, the declining financial performance of these customers made them more price sensitive which resulted in increased competition and pricing pressures on us. Future developments of this nature in end markets we serve, particularly in those markets which account for more significant portions of our revenues, could harm our business and our results of operations.
We may not be able to finance future needs or adapt our business plan to changes because of restrictions contained in the terms of our 10.375% Notes, our 6.75% Notes and our senior secured credit facility.
Our senior secured credit facility and the indentures for the 10.375% Notes and the 6.75 % Notes contain various covenants that limit our ability to, among other things:
• incur additional debt, including guarantees by us or our restricted subsidiaries;
• make investments, pay dividends on our capital stock, or redeem or repurchase our capital stock or subordinated obligations, subject to certain exceptions;
• create specified liens;
• make capital expenditures;
• sell assets;
• make acquisitions;
• create or permit restrictions on the ability of our restricted subsidiaries to pay dividends or make other distributions to us;
• engage in transactions with affiliates;
• engage in sale and leaseback transactions;
• incur layered indebtedness; and
• consolidate or merge with or into other companies or sell all or substantially all of our assets.
Our ability to comply with covenants contained in the 10.375% Notes, the 6.75% Notes, the senior secured credit facility and agreements governing other debt to which we are or may become a party may be affected by events beyond our control, including prevailing economic, financial and industry conditions. In particular, an interest coverage covenant in the 10.375% Notes may adversely affect our ability to issue new capitalized debt during the remainder of fiscal 2006. The senior secured credit facility requires us to comply with a fixed charge coverage ratio and a leverage ratio. Additional debt we incur in the future may subject us to further covenants.
Our failure to comply with these covenants could result in a default under the agreements governing the relevant debt. In addition, if any such default is not cured or waived, the default could result in an acceleration of debt under our other debt instruments that contain cross acceleration or cross-default provisions, which could require us to repay or repurchase debt, together with accrued interest, prior to the date it otherwise is due and that could adversely affect our financial condition. If a default occurs under our senior secured credit facility, we would be unable to borrow under our revolving credit facility and the lenders could cause all of the outstanding debt obligations under the senior secured credit facility to become due and payable, which could result in a default under the 10.375% Notes and the 6.75% Notes and could lead to an acceleration of these respective obligations. Upon a default or cross-default, the collateral agent, at the direction of the lenders under the senior secured credit facility could proceed against the collateral. Even if we are able to comply with all of the applicable covenants, the restrictions on our ability to manage our business in our sole discretion could adversely affect our business by, among other things, limiting our ability to take advantage of financings, mergers, acquisitions and other corporate opportunities that we believe would be beneficial to us.
An adverse change in the interest rates for our borrowings could adversely affect our financial condition.
Interest to be paid by us on any borrowings under any of our credit facilities and other long-term debt obligations may be at interest rates that fluctuate based upon changes in various base interest rates. Recently, interest rates have trended upwards
43
in major global financial markets. These interest rate trends have resulted in increases in the base rates upon which our interest rates are determined. Continued increases in interest rates could have a material adverse effect on our financial position, results of operations and cash flows, particularly if such increases are substantial. In addition, interest rate trends could affect global economic conditions.
We generally do not obtain long-term volume purchase commitments from customers, and, therefore, cancellations, reductions in production quantities and delays in production by our customers could adversely affect our operating results.
We generally do not obtain firm, long-term purchase commitments from our customers. Customers may cancel their orders, reduce production quantities or delay production for a number of reasons. In the event our customers experience significant decreases in demand for their products and services, our customers may cancel orders, delay the delivery of some of the products that we manufacture or place purchase orders for fewer products than we previously anticipated. Even when our customers are contractually obligated to purchase products from us, we may be unable or, for other business reasons, choose not to enforce our contractual rights. Cancellations, reductions or delays of orders by customers would:
• adversely affect our operating results by reducing the volumes of products that we manufacture for our customers;
• delay or eliminate recoupment of our expenditures for inventory purchased in preparation for customer orders; and
• lower our asset utilization, which would result in lower gross margins.
In addition, customers may require that we transfer the manufacture of their products from one facility to another to achieve cost reductions and other objectives. These transfers may result in increased costs to us due to resulting facility downtime or less than optimal utilization of our manufacturing capacity. These transfers may also require us to close or reduce operations at certain facilities, particularly those in high cost locations, and as a result we could incur increased costs for facilities closure, employee severance and related matters.
We rely on a small number of customers for a substantial portion of our net sales, and declines in sales to these customers could adversely affect our operating results.
Sales to our ten largest customers accounted for 63.9% of our net sales in fiscal 2005 and sales to our largest customer, IBM, accounted for more than 10% of our net sales for that period. We depend on the continued growth, viability and financial stability of our customers, substantially all of which operate in an environment characterized by rapid technological change, short product life cycles, consolidation, and pricing and margin pressures. We expect to continue to depend upon a relatively small number of customers for a significant percentage of our revenue. Consolidation among our customers may further concentrate our business in a limited number of customers and expose us to increased risks relating to dependence on a small number of customers. In addition, a significant reduction in sales to any of our large customers or significant pricing and margin pressures exerted by a key customer would adversely affect our operating results. In December 2004, IBM announced that it was selling its personal computer business to Lenovo Group, Ltd., or Lenovo, a China-based manufacturer of personal computers. A substantial portion of our sales to IBM relate to personal computer products. In May 2005, we entered into a new supply agreement with Lenovo and IBM for personal computer manufacturing, which expires in the first half of fiscal 2006. In the event that we are unable to enter into new supply agreements with Lenovo for the former IBM personal computer business that was sold to Lenovo, our net sales and operating results could be adversely affected. In the past, some of our large customers have significantly reduced or delayed the volume of manufacturing services ordered from us as a result of changes in their business, consolidations or divestitures or for other reasons. In particular, certain of our customers have from time to time entered into manufacturing divestiture transactions with other EMS companies, and such transactions could adversely affect our revenues with these customers. We cannot assure you that present or future large customers will not terminate their manufacturing arrangements with us or significantly change, reduce or delay the amount of manufacturing services ordered from us, any of which would adversely affect our operating results.
If our business declines or improves at a slower pace than we anticipate, we may further restructure our operations, which may adversely affect our financial condition and operating results.
In January 2005, we revised our projected costs for our phase three restructuring initially planned to cost approximately $175 million. During the fourth quarter of fiscal 2004 and fiscal 2005, we incurred approximately $114.3 million of restructuring cost associated with this plan. As initially planned, we incurred approximately 92% of the charges as cash charges and approximately 8% as non-cash charges. We anticipate incurring additional restructuring charges in the first half of fiscal 2006 under our phase three restructuring plan which was approved by management in the fourth quarter of fiscal 2005. On October 12, 2005, we announced the restructuring of several European entities. We cannot be certain as to the actual amount of these restructuring charges or the timing of their recognition for financial reporting purposes. We may need to take additional restructuring charges in the future if our business declines or improves at a slower pace than we anticipate
44
or if the expected benefits of recently completed and currently planned restructuring activities do not materialize. These benefits may not materialize if we incur unanticipated costs in closing facilities or transitioning operations from closed facilities to other facilities or if customers cancel orders as a result of facility closures. If we are unsuccessful in implementing our restructuring plans, we may experience disruptions in our operations and higher ongoing costs, which may adversely affect our operating results.
We are implementing our original design manufacturer, or ODM, strategy, which we expect will be a critical element of our future growth and profitability, and we may encounter difficulties in growing this business.
We are implementing a strategy of offering original design manufacturer, or ODM, products and product platforms. ODM products and product platforms are either substantially finished products or product platforms that contain the electronics critical to the functionality of a finished product, such as a personal computer motherboard and chassis. By developing ODM products, we can increase the level of proprietary technology content we provide to our customers and our technologies can be designed into our customers’ products. We began our ODM efforts in the area of server technology with our acquisition of Newisys and are now moving into other end markets. We may encounter unforeseen difficulties in connection with our ODM strategy including difficulties in identifying and targeting ODM opportunities, difficulties in achieving development timelines and difficulties in hiring and retaining qualified engineering and technical personnel. These or other factors could slow or impair our ODM initiatives, which would adversely affect our growth and profitability.
We are subject to intense competition in the EMS industry, and our business may be adversely affected by these competitive pressures.
The EMS industry is highly competitive. We compete on a worldwide basis to provide electronics manufacturing services to OEMs in the communications, personal and business computing, enterprise computing and storage, multimedia, industrial and semiconductor capital equipment, defense and aerospace, medical and automotive industries. Our competitors include major global EMS providers such as Celestica, Inc., Flextronics International Ltd., Hon Hai (FoxConn), Jabil Circuit, Inc., and Solectron Corporation, as well as other EMS companies that often have a regional or product, service or industry specific focus. Some of these companies have greater manufacturing and financial resources than we do. We also face competition from current and potential OEM customers, who may elect to manufacture their own products internally rather than outsource the manufacturing to EMS providers.
In addition to EMS companies, we also compete, with respect to certain of the EMS services we provide, with original design manufacturers, or ODMs. These companies, many of which are based in Asia, design products and product platforms that are then sold to OEMs, system integrators and others who configure and resell them to end users. To date, ODM penetration has been greatest in the personal computer, including both desktop and notebook computers, and server markets. However, the trend towards the use of ODM product platforms is moving into other segments of the electronics industry, including multimedia and other products. As we implement our ODM strategies, the extent to which we compete with both established and emerging ODMs in multiple end-customer markets is likely to increase.
We expect competition to intensify further as more companies enter markets in which we operate and the OEMs we serve continue to consolidate. To remain competitive, we must continue to provide technologically advanced manufacturing services, high quality service, flexible and reliable delivery schedules, and competitive prices. Our failure to compete effectively could adversely affect our business and results of operations.
Consolidation in the electronics industry may adversely affect our business.
In the current economic climate, consolidation in the electronics industry may increase as companies combine to achieve further economies of scale and other synergies. Consolidation in the electronics industry could result in an increase in excess manufacturing capacity as companies seek to divest manufacturing operations or eliminate duplicative product lines. Excess manufacturing capacity has increased, and may continue to increase, pricing and competitive pressures for the EMS industry as a whole and for us in particular. Consolidation could also result in an increasing number of very large electronics companies offering products in multiple sectors of the electronics industry. The significant purchasing power and market power of these large companies could increase pricing and competitive pressures for us. If one of our customers is acquired by another company that does not rely on us to provide services and has its own production facilities or relies on another provider of similar services, we may lose that customer’s business. Any of the foregoing results of industry consolidation could adversely affect our business.
Our failure to comply with applicable environmental laws could adversely affect our business.
We are subject to various federal, state, local and foreign environmental laws and regulations, including those governing the use, storage, discharge and disposal of hazardous substances and wastes in the ordinary course of our manufacturing operations. We also are subject to laws and regulations governing the recyclability of products, the materials that may be included in products, and the obligations of a manufacturer to dispose of these products after end users have finished using
45
them. If we violate environmental laws, we may be held liable for damages and the costs of remedial actions and may be subject to revocation of permits necessary to conduct our businesses. We cannot assure you that we will not violate environmental laws and regulations in the future as a result of our inability to obtain permits, human error, equipment failure or other causes. Any permit revocations could require us to cease or limit production at one or more of our facilities, which could adversely affect our business, financial condition and operating results. Although we estimate our potential liability with respect to violations or alleged violations and reserve for such liability, we cannot assure you that any accruals will be sufficient to cover the actual costs that we incur as a result of these violations or alleged violations. Our failure to comply with applicable environmental laws and regulations could limit our ability to expand facilities or could require us to acquire costly equipment or to incur other significant expenses to comply with these laws and regulations.
Over the years, environmental laws have become, and in the future may become, more stringent, imposing greater compliance costs and increasing risks and penalties associated with violations. We operate in several environmentally sensitive locations and are subject to potentially conflicting and changing regulatory agendas of political, business and environmental groups. Changes in or restrictions on discharge limits, emissions levels, permitting requirements and material storage or handling could require a higher than anticipated level of operating expenses and capital investment or, depending on the severity of the impact of the foregoing factors, costly plant relocation.
In addition, the electronics industry will become subject to the European Union’s Restrictions of Hazardous Substances, or RoHS, and Waste Electrical and Electronic Equipment, or WEEE, directives which will take effect during 2005 and 2006. Parallel initiatives are being proposed in other jurisdictions, including several states in the United States and the Peoples’ Republic of China. RoHS prohibits the use of lead, mercury and certain other specified substances in electronics products and WEEE requires industry OEMs to assume responsibility for the collection, recycling and management of waste electronic products and components. We are in the process of making our manufacturing process RoHs compliant. In the case of WEEE, the compliance responsibility rests primarily with OEMs rather than with EMS companies. However, OEMs may turn to EMS companies for assistance in meeting their WEEE obligations. In the event we are not able to make our manufacturing obligations fully RoHS compliant by the applicable deadlines, we could be unable to certify compliance to our customers and could incur substantial costs, including fines and penalties, as well as liability to our customers. In addition, we may incur costs related to inventories containing restricted substances that are not consumed by the RoHS effective dates.
We are potentially liable for contamination of our current and former facilities, including those of the companies we have acquired, which could adversely affect our business and operating results in the future.
We are potentially liable for contamination at our current and former facilities, including those of the companies we have acquired. These liabilities include ongoing investigation and remediation activities at a number of sites, including our facilities located in Irvine, California, (a non-operating facility acquired as part of our acquisition of Elexsys); Owego, New York (a current facility of our Hadco subsidiary); Derry, New Hampshire (a non-operating facility of our Hadco subsidiary); and Fort Lauderdale, Florida (a former facility of our Hadco subsidiary). Currently, we are unable to anticipate whether any third-party claims will be brought against us for this contamination. We cannot assure you that third-party claims will not arise and will not result in material liability to us. In addition, there are several sites, including our facilities in Wilmington, Massachusetts; Clinton, North Carolina; and Gunzenhausen, Germany that are known to have groundwater contamination caused by a third party, and that third party has provided indemnity to us for the liability. Although we do not currently expect to incur liability for clean-up costs or expenses at any of these sites, we cannot assure you that we will not incur such liability or that any such liability would not be material to our business and operating results in the future.
Our key personnel are critical to our business, and we cannot assure you that they will remain with us.
Our success depends upon the continued service of our executive officers and other key personnel. Generally, these employees are not bound by employment or non-competition agreements. We cannot assure you that we will retain our officers and key employees, particularly our highly skilled design, process and test engineers involved in the manufacture of existing products and development of new products and processes. The competition for these employees is intense. In addition, if Jure Sola, our chairman and chief executive officer, or one or more of our other executive officers or key employees, were to join a competitor or otherwise compete directly or indirectly with us or otherwise be unavailable to us, our business, operating results and financial condition could be adversely affected.
Unanticipated changes in our tax rates or in our assessment of the realizability of our deferred tax assets or exposure to additional income tax liabilities could affect our operating results and financial condition.
We are subject to income taxes in both the United States and various foreign jurisdictions. Significant judgment is required in determining our worldwide provision for income taxes and, in the ordinary course of business, there are many transactions and calculations where the ultimate tax determination is uncertain. Our effective tax rates could be adversely affected by changes in the mix of earnings in countries with differing statutory tax rates, changes in the valuation of deferred tax assets and liabilities, changes in tax laws as well as other factors. For example, as a result of our continuous migration of
46
certain operating activities from high-cost to low-cost regions, we determined during the second fiscal quarter of 2005 that it was more likely than not that certain of our deferred tax assets primarily relating to our U.S. operations would not be realized. As a result of this analysis, during the second quarter of fiscal 2005, we recorded an increase in our deferred tax asset valuation allowance of $379.2 million in accordance with Statement of Financial Accounting Standards No. 109 (SFAS 109). Our tax determinations are regularly subject to audit by tax authorities and developments in those audits could adversely affect our income tax provision. Although we believe that our tax estimates are reasonable, the final determination of tax audits or tax disputes may be different from what is reflected in our historical income tax provisions which could affect our operating results.
During the second quarter of fiscal 2005, we recorded a goodwill impairment loss of $600 million, and there can be no assurance that it will not be necessary to record additional goodwill impairment or long-lived asset impairment charges in the future.
During the quarter ended April 2, 2005, we recorded a goodwill impairment loss of $600 million. The factors that led us to record a write-off of our deferred tax assets, which primarily related to U.S. operations, coupled with the recent decline in the market price of our common stock, led us to record this goodwill impairment loss. In particular, the shift of operations from U.S. facilities and other facilities in high cost locations to facilities in lower-cost locations has resulted in restructuring charges and a decline in sales with respect to our U.S. operations. In the event that the results of operations do not stabilize or improve, or the market price of our common stock declines further or does not rise, we could be required to record additional goodwill impairment or other long-lived asset impairment charges during fiscal 2006 or in future fiscal periods. Although these goodwill impairment charges are of a non-cash nature, they do adversely affect our results of operations in the periods in which such charges are recorded.
We are subject to risks arising from our international operations.
We conduct our international operations primarily in Asia, Latin America, Canada and Europe and we continue to consider additional opportunities to make foreign acquisitions and construct new foreign facilities. We generated 76.2% of our net sales from non-U.S. operations during the fiscal year ended October 1, 2005, and a significant portion of our manufacturing material was provided by international suppliers during this period. During fiscal 2004, we generated 72.7% of our net sales from non-U.S. operations. As a result of our international operations, we are affected by economic and political conditions in foreign countries, including:
• the imposition of government controls;
• export license requirements;
• political and economic instability;
• trade restrictions;
• changes in tariffs;
• labor unrest and difficulties in staffing;
• coordinating communications among and managing international operations;
• fluctuations in currency exchange rates;
• increases in duty and/or income tax rates;
• earnings repatriation restrictions;
• difficulties in obtaining export licenses;
• misappropriation of intellectual property; and
• constraints on our ability to maintain or increase prices.
To respond to competitive pressures and customer requirements, we may further expand internationally in lower cost locations, particularly in Asia, Eastern Europe and Latin America. As we pursue continued expansion in these locations, we may incur additional capital expenditures. In addition, the cost structure in certain countries that are now viewed as low-cost may increase as economies develop or as such countries join multinational economic communities or organizations. For example, Hungary, in which we have operations, is in the process of joining the European Union, and it is possible that costs in Hungary could therefore increase. As a result, we may need to continue to seek out new locations with lower costs and the employee and infrastructure base to support electronics manufacturing. We cannot assure you that we will realize the
47
anticipated strategic benefits of our international operations or that our international operations will contribute positively to, and not adversely affect, our business and operating results.
In addition, during fiscal 2004 and fiscal 2005, the decline in the value of the U.S. dollar as compared to the Euro and many other currencies has resulted in foreign exchange losses. To date, these losses have not been material to our results of operations. However, continued fluctuations in the value of the U.S. dollar as compared to the Euro and other currencies in which we transact business could adversely affect our operating results.
We are subject to risks of currency fluctuations and related hedging operations.
A portion of our business is conducted in currencies other than the U.S. dollar. Changes in exchange rates among other currencies and the U.S. dollar will affect our cost of sales, operating margins and revenues. We cannot predict the impact of future exchange rate fluctuations. In addition, certain of our subsidiaries that have non-U.S. dollar functional currencies transact business in U.S. dollars. We use financial instruments, primarily short-term foreign currency forward contracts, to hedge U.S. dollar and other currency commitments arising from trade accounts receivable, trade accounts payable and fixed purchase obligations. If these hedging activities are not successful or we change or reduce these hedging activities in the future, we may experience significant unexpected expenses from fluctuations in exchange rates.
We may not be successful in implementing strategic transactions, including business acquisitions, and we may encounter difficulties in completing and integrating acquired businesses or in realizing anticipated benefits of strategic transactions, which could adversely affect our operating results.
We seek to undertake strategic transactions that give us the opportunity to access new customers and new end-customer markets, to obtain new manufacturing and service capabilities and technologies, to enter new geographic manufacturing locations markets, to lower our manufacturing costs and improve the margins on our product mix, and to further develop existing customer relationships. For example, early in fiscal 2005, we completed the acquisition of Pentex-Schweizer Circuits in order to provide lower cost printed circuit board manufacturing capacity in China. In addition, we will continue to pursue OEM divestiture transactions. Strategic transactions may involve difficulties, including the following:
• integrating acquired operations and businesses;
• allocating management resources;
• scaling up production and coordinating management of operations at new sites;
• managing and integrating operations in geographically dispersed locations;
• maintaining customer, supplier or other favorable business relationships of acquired operations and terminating unfavorable relationships;
• integrating the acquired company’s systems into our management information systems;
• addressing unforeseen liabilities of acquired businesses;
• lack of experience operating in the geographic market or industry sector of the business acquired;
• improving and expanding our management information systems to accommodate expanded operations; and
• losing key employees of acquired operations.
Any of these factors could prevent us from realizing the anticipated benefits of a strategic transaction, and our failure to realize these benefits could adversely affect our business and operating results. In addition, we may not be successful in identifying future strategic opportunities or in consummating any strategic transactions that we pursue on favorable terms, if at all. Although our goal is to improve our business and maximize stockholder value, any transactions that we complete may impair stockholder or debtholder value or otherwise adversely affect our business and the market price of our stock. Moreover, any such transaction may require us to incur related charges, and may pose significant integration challenges and/or management and business disruptions, any of which could harm our operating results and business.
If we are unable to protect our intellectual property or infringe or are alleged to infringe upon intellectual property of others, our operating results may be adversely affected.
We rely on a combination of copyright, patent, trademark and trade secret laws and restrictions on disclosure to protect our intellectual property rights. As ODM services assume a greater degree of importance to our business, the extent to which we rely on intellectual property rights will increase. We cannot be certain that the steps we have taken will prevent unauthorized use of our technology. Our inability to protect our intellectual property rights could diminish or eliminate the competitive advantages that we derive from our proprietary technology.
48
We may become involved in litigation in the future to protect our intellectual property or because others may allege that we infringe on their intellectual property. The likelihood of any such claims may increase as we increase the ODM aspects of our business. These claims and any resulting lawsuits could subject us to significant liability for damages and invalidate our proprietary rights. In addition, these lawsuits, regardless of their merits, likely would be time consuming and expensive to resolve and would divert management’s time and attention. Any potential intellectual property litigation alleging our infringement of a third-party’s intellectual property also could force us or our customers to:
• stop producing products that use the challenged intellectual property;
• obtain from the owner of the infringed intellectual property a license to sell the relevant technology at an additional cost, which license may not be available on reasonable terms, or at all; and
• redesign those products or services that use the infringed technology.
Any costs we incur from having to take any of these actions could be substantial.
We and the customers we serve are vulnerable to technological changes in the electronics industry.
Our customers are primarily OEMs in the communications, high-end computing, personal computing, aerospace and defense, medical, industrial controls and multimedia sectors. These industry sectors, and the electronics industry as a whole, are subject to rapid technological change and product obsolescence. If our customers are unable to develop products that keep pace with the changing technological environment, our customers’ products could become obsolete, and the demand for our services could decline significantly. In addition, our customers may discontinue or modify products containing components that we manufacture, or develop products requiring new manufacturing processes. If we are unable to offer technologically advanced, easily adaptable and cost effective manufacturing services in response to changing customer requirements, demand for our services will decline. If our customers terminate their purchase orders with us or do not select us to manufacture their new products, our operating results could be adversely affected.
We may experience component shortages, which could cause us to delay shipments to customers and reduce our revenue and operating results.
In the past from time to time, a number of components purchased by us and incorporated into assemblies and subassemblies produced by us have been subject to shortages. These components include application-specific integrated circuits, capacitors and connectors. As our business begins to improve following the economic downturn, we may experience component shortages from time to time. Unanticipated component shortages have prevented us from making scheduled shipments to customers in the past and may do so in the future. Our inability to make scheduled shipments could cause us to experience a shortfall in revenue, increase our costs and adversely affect our relationship with the affected customer and our reputation generally as a reliable service provider. Component shortages may also increase our cost of goods sold because we may be required to pay higher prices for components in short supply and redesign or reconfigure products to accommodate substitute components. In addition, we may purchase components in advance of our requirements for those components as a result of a threatened or anticipated shortage. In this event, we will incur additional inventory carrying costs, for which we may not be compensated, and have a heightened risk of exposure to inventory obsolescence. As a result, component shortages could adversely affect our operating results for a particular period due to the resulting revenue shortfall and increased manufacturing or component costs.
If we manufacture or design defective products, or if our manufacturing processes do not comply with applicable statutory and regulatory requirements, demand for our services may decline and we may be subject to liability claims.
We manufacture products to our customers’ specifications, and, in some cases, our manufacturing processes and facilities may need to comply with applicable statutory and regulatory requirements. For example, medical devices that we manufacture, as well as the facilities and manufacturing processes that we use to produce them, are regulated by the Food and Drug Administration. In addition, our customers’ products and the manufacturing processes that we use to produce them often are highly complex. As a result, products that we manufacture or design may at times contain design or manufacturing defects, and our manufacturing processes may be subject to errors or not in compliance with applicable statutory and regulatory requirements. In addition, we are also involved in product and component design, and as we seek to grow our original design manufacturer business, this activity as well as the risk of design defects will increase. Defects in the products we manufacture or design may result in delayed shipments to customers or reduced or cancelled customer orders. If these defects or deficiencies are significant, our business reputation may also be damaged. The failure of the products that we manufacture or design or of our manufacturing processes and facilities to comply with applicable statutory and regulatory requirements may subject us to legal fines or penalties and, in some cases, require us to shut down or incur considerable expense to correct a manufacturing program or facility. In addition, these defects may result in liability claims against us. The magnitude of such claims may increase as we expand our medical, automotive, and aerospace and defense manufacturing services because defects in medical devices, automotive components, and aerospace and defense systems could seriously harm users of these
49
products. Even if our customers are responsible for the defects, they may not, or may not have the resources to, assume responsibility for any costs or liabilities arising from these defects.
Recently enacted changes in the securities laws and regulations have increased, and are likely to continue to increase, our costs.
The Sarbanes-Oxley Act of 2002 that became law in July 2002 has required changes in some of our corporate governance, securities disclosure and compliance practices. In response to the requirements of that Act, the Securities and Exchange Commission and the NASDAQ National Market have promulgated new rules on a variety of subjects. Compliance with these new rules, particularly Section 404 of The Sarbanes-Oxley Act of 2002 regarding management’s assessment of our internal control over financial reporting, has increased our legal and financial and accounting costs, and we expect these increased costs to continue indefinitely. We also expect these developments to make it more difficult and more expensive for us to obtain director and officer liability insurance, and we may be forced to accept reduced coverage or incur substantially higher costs to obtain coverage. Likewise, these developments may make it more difficult for us to attract and retain qualified members of our board of directors or qualified executive officers.
We are subject to risks associated with natural disasters and global events
We conduct a significant portion of our activities including manufacturing, administration and data processing at facilities located in the State of California and other seismically active areas that have experienced major earthquakes in the past, as well as other natural disasters. Our insurance coverage with respect to natural disasters is limited and is subject to deductibles and coverage limits. Such coverage may not be adequate or continue to be available at commercially reasonable rates and terms. In the event of a major earthquake or other disaster affecting one or more of our facilities, it could significantly disrupt our operations, delay or prevent product manufacture and shipment for the time required to transfer production, repair, rebuild or replace the affected manufacturing facilities. This time frame could be lengthy, and result in significant expenses for repair and related costs. In addition, concerns about terrorism or an outbreak of epidemic diseases such as avian influenza or severe acute respiratory syndrome, or SARS could have a negative effect on travel and our business operations, and result in adverse consequences on our business and results of operations.
50
Item 7A. Quantitative and Qualitative Disclosures About Market Risk
Interest Rate Risk
Our exposures to market risk for changes in interest rates relate primarily to our investment portfolio and certain debt obligations. Currently, we do not use derivative financial instruments in our investment portfolio. We invest in high credit quality issuers and, by policy, limit the amount of principal exposure to any one issuer. As stated in our policy, we seek to ensure the safety and preservation of our invested principal funds by limiting default and market risk.
We seek to mitigate default risk by investing in high-credit quality securities and by positioning our investment portfolio to respond to a significant reduction in a credit rating of any investment issuer, guarantor or depository. We seek to mitigate market risk by limiting the principal and investment term of funds held with any one issuer and by investing funds in marketable securities with active secondary or resale markets.
The table below presents carrying amounts and related average interest rates by year of maturity for our investment portfolio as of October 1, 2005:
| | 2006 | | 2007 | | Total | |
| | (In thousands, except percentages) | |
Cash equivalents and short-term investments | | $ | 175,385 | | $ | — | | $ | 175,385 | |
Average interest rate | | 3.68 | % | — | % | 3.68 | % |
| | | | | | | | | | |
We have issued the 10.375% Notes with a principal balance of $750.0 million due in 2010. We entered into an interest rate swap transaction with an independent third party to effectively convert the fixed interest rate to variable rates. The swap agreement, which expires in 2010, is accounted for as a fair value hedge under SFAS No. 133. The aggregate notional amount of the swap transaction is $750.0 million. Under the terms of the swap agreement, we pay the independent third party an interest rate equal to the six-month LIBOR rate plus 6.2162%. In exchange, we receive a fixed rate of 10.375%. At October 1, 2005 and October 2, 2004 respectively, ($22.1) million and $13.0 million have been recorded in other non-current assets (long-term liabilities) to record the fair value of the interest rate swap transactions, with a corresponding increase (decrease) to the carrying value of the 10.375% Notes on the consolidated balance sheet.
We have issued the 6.75% Notes with a principal balance of $400.0 million due in 2013. We entered into interest rate swap transactions with independent third parties to effectively convert the fixed interest rate to a variable rate. The swap agreements, which expire in 2013, are accounted for as fair value hedges under SFAS No. 133. The aggregate notional amount of the combined swap transactions is $400.0 million. Under the terms of the swap agreements, we pay the independent third parties an interest rate equal to the six-month LIBOR rate plus a spread ranging from 2.214% to 2.250%. In exchange, we receive a fixed rate of 6.75%. At October 1, 2005, $10.6 million has been recorded in other long-term liabilities to record the fair value of the interest rate swap transactions, with a corresponding decrease to the carrying value of the 6.75% Notes on the consolidated balance sheet.
As of October 1, 2005, we have $1.3 million of other term loans at interest rates that fluctuate. The average interest rates for the year ended October 1, 2005 was 5.25%.
An increase in the average interest rates under our credit facilities of 0.25% would, at these levels of outstanding indebtedness, increase our quarterly interest expense by approximately $720,000.
Foreign Currency Exchange Risk
We transact business in foreign countries. Our primary foreign currency cash flows are in certain Asian and European countries, Australia, Brazil, Canada, and Mexico. We enter into short-term foreign currency forward contracts to hedge those currency exposures associated with certain assets and liabilities denominated in foreign currencies. At October 1, 2005, we had forward contracts to exchange various foreign currencies for U.S. dollars in the aggregate notional amount of $519.9 million. The net unrealized gain on the contracts at October 1, 2005 is not material and is recorded in prepaid expenses and other current assets on the consolidated balance sheets. Market value gains and losses on forward exchange contracts are recognized in the consolidated statement of operations as offsets to the exchange gains and losses on the hedged transactions. The impact of these foreign exchange contracts was not material to the results for fiscal year 2005. We also utilize foreign currency forward and option contracts to hedge certain forecasted foreign currency sales and cost of sales
51
(“cash flow hedges”). Gains and losses on these contracts related to the effective portion of the hedges are recorded in other comprehensive income until the forecasted transactions occur. Gains and losses related to the ineffective portion of the hedges are immediately recognized in the Consolidated Statement of Operations. At October 1, 2005, we had forward and option contracts related to cash flow hedges in various foreign currencies in the aggregate notional amount of $58.9 million. The net unrealized gain on the contracts at October 1, 2005 is not material and is recorded in prepaid expenses and other on the consolidated balance sheets. The impact of these foreign exchange contracts was not material to the results of operations for fiscal year 2005.
Item 8. Financial Statements and Supplementary Data
The information required by this item is incorporated by reference to the financial statements included in “Part IV—Item 15(a)(1),” the financial statement schedule included in “Part IV—Item 15(a)(2)” and the selected quarterly financial data included in “Part II—Item 7—Management’s Discussion and Analysis of Financial Condition and Results of Operations—Quarterly Results (Unaudited).”
Item 9. Changes In and Disagreements With Accountants on Accounting and Financial Disclosure
Not applicable.
Item 9A. Controls and Procedures
(a) Evaluation of Disclosure Controls and Procedures
Based on an evaluation under the supervision and with the participation of our management, our Chief Executive Officer and Chief Financial Officer have concluded that the our disclosure controls and procedures as defined in rules 13a-15(e) and 15d-15(e) under the Securities Exchange Act of 1934, as amended (Exchange Act) were effective as of October 1, 2005 to ensure that information required to be disclosed by us in reports that we file or submit under the Exchange Act is (i) recorded, processed, summarized and reported within the time periods specified by the Securities and Exchange Commission rules and forms and (ii) accumulated and communicated to our management, including our Chief Executive Officer and Chief Financial Officer, in a timely manner.
(b) Limitations on the Effectiveness of Controls
Our management, including our CEO and CFO, do not expect that our disclosure controls and procedures or our internal control over financial reporting will prevent or detect all errors and all occurrences of fraud. A control system, no matter how well designed and operated, can provide only reasonable, not absolute, assurance that the objectives of the control system are met. Further, the design of a control system must reflect the fact that there are resource constraints, and the benefits of all controls must be considered relative to their costs. Because of the inherent limitations in all control systems, no evaluation of controls can provide absolute assurance that all control issues and instances of fraud, if any, will be detected.
(c) Management’s Report on Internal Control over Financial Reporting
Our management is responsible for establishing and maintaining adequate internal control over financial reporting (as defined in Exchange Act Rule 13(a)-15(f) under the Securities Exchange Act of 1934, as amended). Our management assessed the effectiveness of our internal control over financial reporting as of October 1, 2005. In making this assessment, our management used the criteria established in Internal Control—Integrated Framework, issued by The Committee of Sponsoring Organizations of the Treadway Commission (COSO). Our management has concluded that, as of October 1, 2005, our internal control over financial reporting is effective based on these criteria. Our independent registered public accounting firm, KPMG LLP, has issued an audit report on our assessment of our internal control over financial reporting, which is included herein.
52
(d) Changes in Internal Control Over Financial Reporting
There were several changes in our internal control over financial reporting which were identified in management’s evaluation during the fourth quarter of fiscal 2005 that have materially affected, or are reasonably likely to materially affect, the Company’s internal control over financial reporting. These changes relate to internal controls that were designed and implemented to address the material weakness that existed as of October 2, 2004 through July 2, 2005 and include:
Intercompany Accounting: new processes, procedures and systems were implemented to properly record intercompany transactions and reconcile intercompany accounts in a timely and accurate manner.
Account Reconciliations and Review: new accounting policies, procedures and systems were implemented for reconciling all of our balance sheet accounts, and resolving in a timely manner, any reconciling items identified in the reconciliation process. Under our new reconciliation processes, every balance sheet account, including intercompany accounts, has an individual that is responsible for the timely and periodic balancing and reconciliation of such accounts along with the identification of a second individual who is responsible for reviewing the accuracy of such reconciliations and compliance with the associated procedures. These new systems and procedures as implemented are designed to provide these individuals, and our overall finance organization with the ability to monitor and facilitate on a global basis timely account reconciliations and transaction recording.
Tax Processes: we strengthened the controls surrounding the processes and use of spreadsheets used in the calculation of our tax provision, engaged outside tax experts to assist us in analyzing and documenting our intercompany transfer pricing practices and we enhanced documentation on our income tax exposures.
Personnel: throughout the course of the fiscal year, we hired additional qualified personnel (accountants and tax personnel) many of whom are certified public accountants. Additionally, we have provided extensive training to both new and existing personnel on our policies, procedures, and the tools relevant to their areas of responsibility, including training to enable our personnel to use our new systems and procedures.
We completed the process of implementing the aforementioned changes during the fourth quarter of fiscal 2005.
Item 9B. Other Information
Refer to “Subsequent Events”, footnote 23 of the Notes to Consolidated Financial Statements.
PART III
Information called for by Items 10, 11, 12, 13 and 14 of Part III are incorporated by reference from the Company’s definitive Proxy Statement to be filed in connection with its 2006 Annual Meeting of Stockholders pursuant to Regulation 14A, except that the information regarding the Company’s executive officers called for by Item 401(b) of Regulation S-K has been included in Part I of this report.
53
PART IV
Item 15. Exhibits and Financial Statement Schedules
(a) 1. Financial Statements
The following financial statements are filed as part of this report:
| Page |
Reports of Independent Registered Public Accounting Firm | 60-61 |
Financial Statements: | |
Consolidated Balance Sheets, As of October 1, 2005 and October 2, 2004 | 62 |
Consolidated Statements of operations, Years Ended October 1, 2005, October 2, 2004, and September 27, 2003 | 63 |
Consolidated Statements of Comprehensive Income (Loss), Years Ended October 1, 2005, October 2, 2004, and September 27, 2003 | 64 |
Consolidated Statements of Stockholders’ Equity, Years Ended October 1, 2005, October 2, 2004, and September 27, 2003 | 65 |
Consolidated Statements of Cash Flows, Years Ended October 1, 2005, October 2, 2004, and September 27, 2003 | 66 |
Notes to Consolidated Financial Statements | 67 |
2. Financial Statement Schedule
The following financial statement schedule of Sanmina-SCI Corporation is filed as part of this report on Form 10-K and should be read in conjunction with our Financial Statements included in this Item 15:
Schedule II—Valuation and Qualifying Accounts
All other schedules are omitted because they are not applicable or the required information is shown in the Financial Statements or the notes thereto.
3. Exhibits
Refer to (b) below.
(b) Exhibits
Exhibit
Number | | Description |
3.1(1) | | Restated Certificate of Incorporation of the Registrant, dated January 31, 1996. |
| | |
3.1.1(2) | | Certificate of Amendment of the Restated Certificate of Incorporation of the Registrant, dated March 9, 2001. |
| | |
3.1.2(3) | | Certificate of Designation of Rights, Preferences and Privileges of Series A Participating Preferred Stock of the Registrant, dated May 31, 2001 |
| | |
3.1.3(4) | | Certificate of Amendment of the Restated Certificate of Incorporation of the Registrant, dated December 7, 2001. |
| | |
3.2(33) | | Amended and Restated Bylaws of the Registrant, dated December 1, 2003. |
| | |
4.2(6) | | Preferred Stock Rights Agreement, dated as of May 17, 2001 between the Registrant and Wells Fargo National Bank, Minnesota, N.A., including the form of Certificate of Determination, the form of Rights Certificate and the Summary of Rights attached thereto as Exhibits A, B, and C. |
| | |
4.5(8) | | Subordinated Indenture dated March 15, 2000, between SCI Systems, Inc. and Bank One Trust Company, National Association, as Trustee (“Subordinated Indenture”). |
54
Exhibit
Number | | Description |
4.5.1(9) | | Supplemental Indenture No. 1, dated as of March 15, 2000, to the Subordinated Indenture, between SCI Systems, Inc. and Bank One Trust Company, National Association, as Trustee. |
| | |
4.5.2(5) | | Supplemental Indenture No. 2, dated as of December 7, 2001, to the Subordinated Indenture, by and among SCI Systems, Inc., Sanmina Corporation, as Guarantor, and Bank One Trust Company, National Association, as Trustee. |
| | |
4.2.3 | | Supplemental Indenture No. 3, dated as of October 7, 2005, to the Subordinated Indenture, by and among SCI Systems, Inc., Sanmina-SCI USA, Inc. and J.P. Morgan Trust Company, National Association, as Trustee |
| | |
4.7(25) | | Indenture, dated as of December 23, 2002, among the Registrant, the Guarantors Party thereto and State Street Bank and Trust Company California, N.A., as trustee. |
| | |
4.7.1 | | First Supplemental Indenture, dated as of July 21, 2003, among Newisys, Inc., the Registrant and U.S. Bank National Association, as trustee. |
| | |
4.7.2 | | Second Supplemental Indenture, dated as of September 30, 2005, among Sanmina-SCI USA, Inc., the Registrant and U.S. Bank National Association, as trustee. |
| | |
4.9(27) | | Intercreditor Agreement, dated as of December 23, 2002, by and among, as second lien collateral trustees, LaSalle Business Credit, Inc., as collateral agent, State Street Bank and Trust Company of California, N.A. and each New First Lien Claimholder Representative which may become a party from time to time, and the Registrant. |
| | |
4.10(28) | | Sanmina-SCI Corporation Second Lien Collateral Trust Agreement, dated as of December 23, 2002, by and among the Registrant, the subsidiaries of the Registrant party thereto and State Street Bank and Trust Company of California, N.A., as second lien collateral trustee. |
| | |
4.12(36) | | Credit and Guaranty Agreement, dated as of October 26, 2004, among the Registrant, certain Subsidiaries of the Registrant from time to time party thereto, various Lenders party thereto, Banc of America Securities LLC, as Syndication Agent, Citibank, N.A., as Collateral Agent, and Citicorp USA, Inc., as Administrative Agent. |
| | |
4.12.1 | | Amendment No. 1 to Credit and Guaranty Agreement, dated as of February 15, 2005, made by the Registrant, certain Subsidiaries of the Registrant, the lenders party thereto, Citibank, N.A., as Collateral Agent, and Citicorp USA, Inc., as Administrative Agent. |
| | |
4.12.2(38) | | Amendment No. 1 to Credit and Guaranty Agreement, dated as of June 6, 2005, made by the Registrant, certain Subsidiaries of the Registrant, the lenders party thereto, Citibank, N.A., as Collateral Agent, and Citicorp USA, Inc., as Administrative Agent. |
| | |
4.13(37) | | Indenture, dated as of February 24, 2005, among the Registrant, the guarantors party thereto and U.S. Bank National Association, as trustee. |
| | |
4.13.1 | | First Supplemental Indenture, dated as of September 30, 2005, among Sanmina-SCI USA, Inc., the Registrant and U.S. Bank National Association, as trustee. |
| | |
10.2(10) | | Amended 1990 Incentive Stock Plan. |
| | |
10.29(12) | | 1999 Stock Plan. |
| | |
10.29.1(5) | | Addendum to the 1999 Stock Plan (Additional Terms and Conditions for Employees of the French subsidiary(ies)), dated February 21, 2001. |
| | |
10.30(13) | | 1995 Director Option Plan. |
| | |
10.31(14) | | 1996 Supplemental Stock Plan. |
| | |
10.32(15) | | Hadco Corporation 1998 Stock Plan, as Amended and Restated March 3, 1999. |
| | |
10.33(16) | | Hadco Corporation Non-Qualified Stock Option Plan, as Amended and Restated July 1, 1998. |
| | |
10.34(17) | | Hadco Corporation Non-Qualified Stock Option Plan, as Amended and Restated April 7, 1998. |
| | |
10.35(18) | | SCI Systems, Inc. 1994 Stock Option Incentive Plan. |
| | |
10.36(19) | | SCI Systems, Inc. 2000 Stock Incentive Plan. |
| | |
10.37(20) | | SCI Systems, Inc. Board of Directors Deferred Compensation Plan. |
55
Exhibit
Number | | Description |
10.42(21) | | Form of Indemnification Agreement executed by the Registrant and its officers and directors pursuant to the Delaware reincorporation. |
| | |
10.49(5) | | Deferred Compensation Plan for Outside Directors. |
| | |
10.50(5) | | Rules of the Sanmina-SCI Corporation Stock Option Plan 2000 (Sweden). |
| | |
10.50.1(5) | | Rules of the Sanmina-SCI Corporation Stock Option Plan 2000 (Finland). |
| | |
10.51(29) | | Executive Deferred Compensation Plan |
| | |
10.53(31) | | 2003 Employee Stock Purchase Plan. |
| | |
10.55(34) | | Committed Account Receivable Purchase Agreement, dated April 1, 2005, between Sanmina-SCI UK Limited and Citibank International Plc |
| | |
10.56(35) | | Committed Account Receivable Purchase Agreement, dated April 1, 2005, between Sanmina-SCI Magyarorszag Elektronikai Gyarto Kft and Citibank International Plc |
| | |
10.57* | | Revolving Receivables Purchase Agreement, dated as of September 23, 2005, among Sanmina-SCI Magyarorszag Elektronikai Gyarto Kft, Sanmina-SCI Systems de Mexico S.A. de C.V., as Originators, the Registrant and Sanmina-SCI UK Ltd., as Servicers, the banks and financial institutions party thereto from time to time, and Deutsche Bank AG New York, as Administrative Agent. |
| | |
10.58 | | Randy Furr separation agreement |
| | |
14.1(32) | | Sanmina-SCI Corporation Code of Business Conduct and Ethics |
| | |
21.1 | | Subsidiaries of the Registrant. |
| | |
23.1 | | Consent of KPMG LLP, independent registered public accounting firm. |
| | |
31.1 | | Certification of the Principal Executive Officer pursuant to 18 U.S.C. Section 1350, as adopted pursuant to Section 302 of the Sarbanes-Oxley Act of 2002 (filed herewith). |
| | |
31.2 | | Certification of the Principal Financial Officer pursuant to 18 U.S.C. Section 1350, as adopted pursuant to Section 302 of the Sarbanes-Oxley Act of 2002 (filed herewith). |
| | |
32.1 | | Certification of the Chief Executive Officer pursuant to 18 U.S.C. Section 1350, as adopted pursuant to Section 906 of the Sarbanes-Oxley Act of 2002 (furnished herewith). |
| | |
32.2 | | Certification of the Chief Financial Officer pursuant to 18 U.S.C. Section 1350, as adopted pursuant to Section 906 of the Sarbanes-Oxley Act of 2002 (furnished herewith). |
(1) Incorporated by reference to Exhibit 3.2 to the Registrant’s Report on Form 10-K for the fiscal year ended September 30, 1996, SEC File No. 000-21272, filed with the Securities and Exchange Commission (“SEC”) on December 24, 1996.
(2) Incorporated by reference to Exhibit 3.1(a) to the Registrant’s Quarterly Report on Form 10-Q for the fiscal quarter ended March 31, 2001, filed with the SEC on May 11, 2001.
(3) Incorporated by reference to Exhibit 3.1.3 to the Registrant’s Report on Form 10-K for the fiscal year ended September 30, 2001, filed with the SEC on December 21, 2001.
(4) Incorporated by reference to Exhibit 3.1.2 to the Registrant’s Registration Statement on Form S-4 filed with the SEC on August 10, 2001.
(5) Incorporated by reference to the Registrant’s Annual Report on Form 10-K for the fiscal year ended September 28, 2002, filed on December 4, 2002.
(6) Incorporated by reference to Exhibit 4.2 to the Registrant’s Registration Statement on Form 8-A filed with the SEC on May 25, 2001.
(7) Intentionally Omitted.
(8) Incorporated by reference to Exhibit 2.2 to SCI Systems, Inc.’s Registration Statement on Form 8-A12B, SEC File No. 001-12821, filed with the SEC on March 9, 2000.
(9) Incorporated by reference to Exhibit 4.1 to SCI Systems, Inc.’s Report on Form 8-K, SEC File No. 001-12821, filed with the SEC on April 5, 2000.
(10) Incorporated by reference to Exhibit 10.2 to the Registrant’s Report on Form 10-K, SEC File No. 000-21272, filed with the SEC on December 29, 1994.
(11) Incorporated by reference to Exhibit 10.3 to the Registrant’s Registration Statement on Form S-1, SEC File No. 33-70700, filed with the SEC on February 19, 1993.
56
(12) Incorporated by reference to Exhibit 4.3 to the Registrant’s Report on Form S-8, filed with the SEC on May 25, 1999.
(13) Incorporated by reference to Exhibit 10.4 to the Registrant’s Registration Statement on Form S-8, SEC File No. 333-23565, filed with the SEC on March 19, 1997.
(14) Incorporated by reference to Exhibit 10.1 to the Registrant’s Registration Statement on Form S-8, SEC File No. 333-23565, filed with the SEC on March 19, 1997.
(15) Incorporated by reference to Exhibit 4.1 to the Registrant’s Registration Statement on Form S-8, filed with the SEC on June 23, 2000.
(16) Incorporated by reference to Exhibit 4.2 to the Registrant’s Registration Statement on Form S-8, filed with the SEC on June 23, 2000.
(17) Incorporated by reference to Exhibit 4.3 to the Registrant’s Registration Statement on Form S-8, filed with the SEC on June 23, 2000.
(18) Incorporated by reference to Exhibit 4.1 to the Registrant’s Registration Statement on Form S-8, filed with the SEC on December 20, 2001.
(19) Incorporated by reference to Exhibit 4.2 to the Registrant’s Registration Statement on Form S-8, filed with the SEC on December 20, 2001.
(20) Incorporated by reference to Exhibit 4.3 to the Registrant’s Registration Statement on Form S-8, filed with the SEC on December 20, 2001.
(21) Incorporated by reference to Exhibit 10.42 to the Registrant’s Registration Statement on Form S-1, SEC File No. 33-70700, filed with the SEC on February 19, 1993.
(22) Intentionally Omitted.
(23) Incorporated by reference to Exhibit 2.1 to the Registrant’s Registration Statement on Form S-4 filed with the SEC on August 10, 2001.
(24) Incorporated by reference to Exhibit 99.1 to the Registrant’s Report on Form 8-K, filed with the SEC on April 23, 2002.
(25) Incorporated by reference to Exhibit 4.7 to the Registrant’s Quarterly Report on Form 10-Q for the fiscal quarter ended December 28, 2002, filed February 11, 2003.
(26) Intentionally Omitted.
(27) Incorporated by reference to Exhibit 4.9 to the Registrant’s Quarterly Report on Form 10-Q for the fiscal quarter ended December 28, 2002, filed February 11, 2003.
(28) Incorporated by reference to Exhibit 4.10 to the Registrant’s Quarterly Report on Form 10-Q for the fiscal quarter ended December 28, 2002, filed February 11, 2003.
(29) Incorporated by reference to Exhibit 10.51 to the Registrant’s Quarterly Report on Form 10-Q for the fiscal quarter ended December 28, 2002, filed February 11, 2003.
(30) Incorporated by reference to Exhibit 10.52 to the Registrant’s Quarterly Report on Form 10-Q for the fiscal quarter ended December 28, 2002, filed February 11, 2003.
(31) Incorporated by reference to Exhibit 4.1 to the Registrant’s Registration Statement on Form S-8, filed with the SEC on April 23, 2003.
(32) Incorporated by reference to Exhibit 14.1 to the Registrant’s Annual Report on Form 10-K for the fiscal year ended September 27, 2003, filed December 9, 2003.
(33) Incorporated by reference to Exhibit 3.2 to the Registrant’s Annual Report on Form 10-K for the fiscal year ended September 27, 2003, filed December 9, 2003
(34) Incorporated by reference to Exhibit 10.1 to the Registrant’s Quarterly Report on Form 10-Q for the fiscal quarter ended April 2, 2005, filed on May 12, 2005.
57
(35) Incorporated by reference to Exhibit 10.2 to the Registrant’s Quarterly Report on Form 10-Q for the fiscal quarter ended April 2, 2005, filed on May 12, 2005.
(36) Incorporated by reference to Exhibit 4.12 to the Registrant’s Annual Report on Form 10-K for the fiscal year ended October 2, 2004, filed December 29, 2004.
(37) Incorporated by reference to Exhibit 4.1 to the Registrant’s Current Report on Form 8-K filed on February 24, 2005.
(38) Incorporated by reference to Exhibit 10.1 to the Registrant’s Current Report on Form 8-K filed on June 8, 2005.
(39) Incorporated by reference to Exhibit 10.1 to the Registrant’s Current Report on Form 8-K filed on December 16, 2005.
* Certain information in this exhibit has been omitted and filed separately with the commission. Confidential treatment has been requested with respect to the omitted portions.
(c) Financial Statement Schedule
Refer to (a) above.
58
REPORT OF INDEPENDENT REGISTERED PUBLIC ACCOUNTING FIRM
The Board of Directors and Stockholders
Sanmina-SCI Corporation:
We have audited the accompanying consolidated balance sheets of Sanmina-SCI Corporation and subsidiaries as of October 1, 2005 and October 2, 2004, and the related consolidated statements of operations, stockholders’ equity, comprehensive income (loss), and cash flows for each of the years in the three-year period ended October 1, 2005. In connection with our audits of the consolidated financial statements, we also have audited the financial statement schedule. These consolidated financial statements and financial statement schedule are the responsibility of the Company’s management. Our responsibility is to express an opinion on these consolidated financial statements and financial statement schedule based on our audits.
We conducted our audits in accordance with the standards of the Public Company Accounting Oversight Board (United States). Those standards require that we plan and perform the audit to obtain reasonable assurance about whether the financial statements are free of material misstatement. An audit includes examining, on a test basis, evidence supporting the amounts and disclosures in the financial statements. An audit also includes assessing the accounting principles used and significant estimates made by management, as well as evaluating the overall financial statement presentation. We believe that our audits provide a reasonable basis for our opinion.
In our opinion, the consolidated financial statements referred to above present fairly in all material respects, the financial position of Sanmina-SCI Corporation and subsidiaries as of October 1, 2005 and October 2, 2004, and the results of their operations and their cash flows for each of the years in the three-year period ended October 1, 2005, in conformity with U.S. generally accepted accounting principles. Also in our opinion, the related financial statement schedule, when considered in relation to the basic consolidated financial statements taken as a whole, presents fairly, in all material respects, the information set forth therein.
We also have audited, in accordance with the standards of the Public Company Accounting Oversight Board (United States), the effectiveness of Sanmina-SCI Corporation’s internal control over financial reporting as of October 1, 2005, based on criteria established in Internal Control-Integrated Framework issued by the Committee of Sponsoring Organizations of the Treadway Commission (COSO), and our report dated December 28, 2005 expressed an unqualified opinion on management’s assessment of, and the effective operation of, internal control over financial reporting.
| /s/ KPMG LLP | |
|
Mountain View, California |
December 28, 2005 |
60
REPORT OF INDEPENDENT REGISTERED PUBLIC ACCOUNTING FIRM
The Board of Directors and Stockholders
Sanmina-SCI Corporation:
We have audited management’s assessment, included in Item 9A(c), “Management’s Report on Internal Control Over Financial Reporting”, that Sanmina-SCI Corporation maintained effective internal control over financial reporting as of October 1, 2005, based on criteria established in Internal Control — Integrated Framework issued by the Committee of Sponsoring Organizations of the Treadway Commission (COSO). Sanmina-SCI Corporation’s management is responsible for maintaining effective internal control over financial reporting and for its assessment of the effectiveness of internal control over financial reporting. Our responsibility is to express an opinion on management’s assessment and an opinion on the effectiveness of the Company’s internal control over financial reporting based on our audit.
We conducted our audit in accordance with the standards of the Public Company Accounting Oversight Board (United States). Those standards require that we plan and perform the audit to obtain reasonable assurance about whether effective internal control over financial reporting was maintained in all material respects. Our audit included obtaining an understanding of internal control over financial reporting, evaluating management’s assessment, testing and evaluating the design and operating effectiveness of internal control, and performing such other procedures as we considered necessary in the circumstances. We believe that our audit provides a reasonable basis for our opinion.
A company’s internal control over financial reporting is a process designed to provide reasonable assurance regarding the reliability of financial reporting and the preparation of financial statements for external purposes in accordance with generally accepted accounting principles. A company’s internal control over financial reporting includes those policies and procedures that (1) pertain to the maintenance of records that, in reasonable detail, accurately and fairly reflect the transactions and dispositions of the assets of the company; (2) provide reasonable assurance that transactions are recorded as necessary to permit preparation of financial statements in accordance with generally accepted accounting principles, and that receipts and expenditures of the company are being made only in accordance with authorizations of management and directors of the company; and (3) provide reasonable assurance regarding prevention or timely detection of unauthorized acquisition, use, or disposition of the company’s assets that could have a material effect on the financial statements.
Because of its inherent limitations, internal control over financial reporting may not prevent or detect misstatements. Also, projections of any evaluation of effectiveness to future periods are subject to the risk that controls may become inadequate because of changes in conditions, or that the degree of compliance with the policies or procedures may deteriorate.
In our opinion, management’s assessment that Sanmina-SCI Corporation maintained effective internal control over financial reporting as of October 1, 2005, is fairly stated, in all material respects, based on criteria established in Internal Control — Integrated Framework issued by the Committee of Sponsoring Organizations of the Treadway Commission (COSO). Also, in our opinion, Sanmina-SCI Corporation maintained, in all material respects, effective internal control over financial reporting as of October 1, 2005, based on criteria established in Internal Control — Integrated Framework issued by the Committee of Sponsoring Organizations of the Treadway Commission (COSO).
We also have audited, in accordance with the standards of the Public Company Accounting Oversight Board (United States), the consolidated balance sheets of Sanmina-SCI Corporation and subsidiaries as of October 1, 2005 and October 2, 2004, and the related consolidated statements of operations, stockholders’ equity, comprehensive income (loss), and cash flows for each of the years in the three-year period ended October 1, 2005, and related financial statement schedule. Our report dated December 28, 2005 expressed an unqualified opinion on those consolidated financial statements and financial statement schedule.
| /s/ KPMG LLP | |
|
Mountain View, California |
December 28, 2005 |
61
SANMINA-SCI CORPORATION
CONSOLIDATED BALANCE SHEETS
| | As of | |
| | October 1,
2005 | | October 2,
2004 | |
| | (In thousands, except par value) | |
ASSETS: | | | | | |
Current assets: | | | | | |
Cash and cash equivalents | | $ | 1,068,053 | | $ | 1,069,447 | |
Short-term investments | | 57,281 | | 19,718 | |
Accounts receivable, net of allowances of $12,429 and $35,406 in 2005 and 2004, respectively | | 1,477,401 | | 1,668,973 | |
Inventories | | 1,015,035 | | 1,064,518 | |
Deferred income taxes | | 42,767 | | 303,965 | |
Prepaid expenses and other current assets | | 86,620 | | 96,523 | |
Total current assets | | 3,747,157 | | 4,223,144 | |
Property, plant and equipment, net | | 662,101 | | 782,642 | |
Goodwill | | 1,689,198 | | 2,254,979 | |
Other intangible assets, net | | 35,907 | | 35,891 | |
Other non-current assets | | 81,874 | | 210,478 | |
Restricted cash | | 25,538 | | 25,462 | |
Total assets | | $ | 6,241,775 | | $ | 7,532,596 | |
| | | | | |
LIABILITIES AND STOCKHOLDERS’ EQUITY: | | | | | |
Current liabilities: | | | | | |
Current portion of long-term debt | | $ | 1,439 | | $ | 609,746 | |
Accounts payable | | 1,559,172 | | 1,630,833 | |
Accrued liabilities | | 366,920 | | 381,123 | |
Accrued payroll and related benefits | | 146,687 | | 164,357 | |
Total current liabilities | | 2,074,218 | | 2,786,059 | |
Long-term liabilities: | | | | | |
Long-term debt, net of current portion | | 1,644,666 | | 1,297,337 | |
Other | | 143,873 | | 94,489 | |
Total long-term liabilities | | 1,788,539 | | 1,391,826 | |
Commitments and contingencies (Note 16) | | | | | |
Stockholders’ equity: | | | | | |
Preferred stock, $.01 par value, authorized 5,000 shares, none issued and outstanding | | — | | — | |
Common stock, $.01 par value, authorized 1,000,000 shares, 526,837 and 522,478 shares, issued and outstanding, respectively | | 5,457 | | 5,420 | |
Treasury stock, 18,853 and 18,827 shares, respectively, at cost | | (188,519 | ) | (188,607 | ) |
Additional paid-in capital | | 5,745,125 | | 5,719,137 | |
Accumulated other comprehensive income | | 36,886 | | 32,690 | |
Accumulated deficit | | (3,219,931 | ) | (2,213,929 | ) |
Total stockholders’ equity | | 2,379,018 | | 3,354,711 | |
Total liabilities and stockholders’ equity | | $ | 6,241,775 | | $ | 7,532,596 | |
See accompanying notes to the consolidated financial statements.
62
SANMINA-SCI CORPORATION
CONSOLIDATED STATEMENTS OF OPERATIONS
| | Year Ended | |
| | October 1,
2005 | | October 2,
2004 | | September 27,
2003 | |
| | (In thousands, except per share amounts) | |
| | | | | | | |
Net sales | | $ | 11,734,674 | | $ | 12,204,607 | | $ | 10,361,434 | |
Cost of sales | | 11,093,631 | | 11,588,518 | | 9,898,964 | |
Gross profit | | 641,043 | | 616,089 | | 462,470 | |
Operating expenses: | | | | | | | |
Selling, general and administrative | | 350,474 | | 334,986 | | 306,734 | |
Research and development | | 29,731 | | 29,402 | | 14,952 | |
Amortization of intangible assets | | 8,685 | | 8,547 | | 6,596 | |
Goodwill impairment | | 600,000 | | — | | — | |
Write down of long-lived assets | | — | | — | | 95,600 | |
Integration costs | | 1,609 | | 4,203 | | 10,720 | |
Restructuring costs | | 116,444 | | 133,250 | | 105,744 | |
Total operating expenses | | 1,106,943 | | 510,388 | | 540,346 | |
Operating income (loss) | | (465,900 | ) | 105,701 | | (77,876 | ) |
Interest income | | 22,536 | | 7,885 | | 15,938 | |
Interest expense | | (142,319 | ) | (115,304 | ) | (128,501 | ) |
Other expense, net | | (8,180 | ) | (13,863 | ) | (7,768 | ) |
Interest and other expense, net | | (127,963 | ) | (121,282 | ) | (120,331 | ) |
Loss before income taxes and extraordinary item | | (593,863 | ) | (15,581 | ) | (198,207 | ) |
Provision for (benefit from) income taxes | | 412,139 | | (600 | ) | (61,050 | ) |
Loss before extraordinary item | | (1,006,002 | ) | (14,981 | ) | (137,157 | ) |
Extraordinary gain, net of tax (Note 6) | | — | | 3,583 | | — | |
Net loss | | $ | (1,006,002 | ) | $ | (11,398 | ) | $ | (137,157 | ) |
Basic and diluted earnings (loss) per share: | | | | | | | |
Loss before extraordinary item | | $ | (1.93 | ) | $ | (0.03 | ) | $ | (0.27 | ) |
Extraordinary gain, net of tax | | — | | 0.01 | | — | |
Basic and diluted loss per share | | $ | (1.93 | ) | $ | (0.02 | ) | $ | (0.27 | ) |
Weighted average shares used in computing per share amounts: | | | | | | | |
Basic | | 520,574 | | 515,803 | | 510,102 | |
Diluted | | 520,574 | | 515,803 | | 510,102 | |
See accompanying notes to the consolidated financial statements.
63
CONSOLIDATED STATEMENTS OF COMPREHENSIVE INCOME (LOSS)
| | Year Ended | |
| | October 1,
2005 | | October 2,
2004 | | September 27,
2003 | |
| | (In thousands) | |
Net loss | | $ | (1,006,002 | ) | $ | (11,398 | ) | $ | (137,157 | ) |
Other comprehensive income (loss): | | | | | | | |
Net unrealized gain (loss) on investments and derivative financial instruments, net of tax | | 201 | | (1,360 | ) | 703 | |
Foreign currency translation adjustments, | | 7,821 | | 17,414 | | 31,997 | |
Minimum pension liability, net of tax | | (3,826 | ) | 301 | | (6,060 | ) |
Comprehensive income (loss) | | $ | (1,001,806 | ) | $ | 4,957 | | $ | (110,517 | ) |
See accompanying notes to the consolidated financial statements.
64
SANMINA-SCI CORPORATION
CONSOLIDATED STATEMENTS OF STOCKHOLDERS’ EQUITY
| | Common Stock,
Additional
Paid-in-Capital and
Deferred Compensation | | Treasury Stock | | Accumulated
Other | | | | | |
| | Number of
Shares | | Amount | | Number of
Shares | | Amount | | Comprehensive
Income (Loss) | | Accumulated
Deficit | | Total | |
| | (In thousands) | |
BALANCE AT SEPTEMBER 28, 2002 | | 525,032 | | $ | 5,680,655 | | (18,880 | ) | $ | (190,261 | ) | $ | (10,305 | ) | $ | (2,065,374 | ) | $ | 3,414,715 | |
Exercise of common stock options | | 1,022 | | 3,883 | | — | | — | | — | | — | | 3,883 | |
Issuance of common stock under employee stock purchase plan | | 3,992 | | 9,702 | | — | | — | | — | | — | | 9,702 | |
Cumulative translation adjustment | | — | | — | | — | | — | | 31,997 | | — | | 31,997 | |
Unrealized gain on investments | | — | | — | | — | | — | | 703 | | — | | 703 | |
Minimum pension liability in excess of plan assets | | — | | — | | — | | — | | (6,060 | ) | — | | (6,060 | ) |
Income tax benefit of disqualified dispositions | | — | | 1,351 | | — | | — | | — | | — | | 1,351 | |
Amortization of deferred compensation | | — | | 2,477 | | — | | — | | — | | — | | 2,477 | |
Repurchase of common stock | | — | | — | | (22 | ) | (89 | ) | — | | — | | (89 | ) |
Retirement of treasury stock | | — | | — | | 55 | | 1,732 | | — | | — | | 1,732 | |
Net loss | | — | | — | | — | | — | | — | | (137,157 | ) | (137,157 | ) |
BALANCE AT SEPTEMBER 27, 2003 | | 530,046 | | 5,698,068 | | (18,847 | ) | (188,618 | ) | 16,335 | | (2,202,531 | ) | 3,323,254 | |
Exercise of common stock options | | 3,670 | | 16,437 | | — | | — | | — | | — | | 16,437 | |
Issuance of common stock under employee stock purchase plan | | 4,392 | | 19,243 | | — | | — | | — | | — | | 19,243 | |
Issuance of restricted stock | | 3,507 | | — | | — | | — | | — | | — | | — | |
Segerstrom 6% shares settlement | | — | | (31,780 | ) | — | | — | | — | | — | | (31,780 | ) |
Cumulative translation adjustment | | — | | — | | — | | — | | 17,414 | | — | | 17,414 | |
Unrealized loss on investments | | — | | — | | — | | — | | (1,360 | ) | — | | (1,360 | ) |
Minimum pension liability in excess of plan assets | | — | | — | | — | | — | | 301 | | — | | 301 | |
Income tax benefit of disqualified dispositions | | — | | 9,751 | | — | | — | | — | | — | | 9,751 | |
Amortization of deferred compensation | | — | | 12,843 | | — | | — | | — | | — | | 12,843 | |
Retirement of treasury stock | | — | | — | | 20 | | 11 | | — | | — | | 11 | |
Other | | (310 | ) | (5 | ) | — | | — | | — | | — | | (5 | ) |
Net loss | | — | | — | | — | | — | | — | | (11,398 | ) | (11,398 | ) |
BALANCE AT OCTOBER 2, 2004 | | 541,305 | | 5,724,557 | | (18,827 | ) | (188,607 | ) | 32,690 | | (2,213,929 | ) | 3,354,711 | |
| | | | | | | | | | | | | | | |
Exercise of common stock options | | 1,341 | | 4,736 | | — | | — | | — | | — | | 4,736 | |
Issuance of common stock under employee stock purchase plan | | 2,976 | | 12,032 | | — | | — | | — | | — | | 12,032 | |
Issuance of restricted stock | | 68 | | — | | — | | — | | — | | — | | — | |
Segerstrom 6% shares settlement | | — | | (70 | ) | — | | — | | — | | — | | (70 | ) |
Cumulative translation adjustment | | — | | — | | — | | — | | 7,821 | | — | | 7,821 | |
Unrealized gain on investments, net | | — | | — | | — | | — | | 201 | | — | | 201 | |
Minimum pension liability in excess of plan assets, net of tax | | — | | — | | — | | — | | (3,826 | ) | — | | (3,826 | ) |
Amortization of deferred compensation | | — | | 9,327 | | — | | — | | — | | — | | 9,327 | |
Repurchase of treasury stock | | — | | — | | (26 | ) | 88 | | — | | — | | 88 | |
Net loss | | — | | — | | — | | — | | — | | (1,006,002 | ) | (1,006,002 | ) |
BALANCE AT OCTOBER 1, 2005 | | 545,690 | | $ | 5,750,582 | | (18,853 | ) | $ | (188,519 | ) | $ | 36,886 | | $ | (3,219,931 | ) | $ | 2,379,018 | |
See accompanying notes to the consolidated financial statements.
65
SANMINA-SCI CORPORATION
CONSOLIDATED STATEMENTS OF CASH FLOWS
| | Year Ended | | |
| | October 1,
2005 | | October 2,
2004 | | September 27,
2003 | | |
| | (In thousands) | | |
CASH FLOWS PROVIDED BY (USED IN) OPERATING ACTIVITIES: | | | | | | | | |
Net loss | | $ | (1,006,002 | ) | $ | (11,398 | ) | $ | (137,157 | ) |
Adjustments to reconcile net loss to cash provided by operating activities: | | | | | | | | |
Depreciation and amortization | | 178,324 | | 190,904 | | 222,600 | | |
Restructuring non-cash costs | | 9,022 | | 21,579 | | 46,485 | | |
Recovery of provision for doubtful accounts | | (5,410 | ) | (3,776 | ) | (11,682 | ) | |
Deferred compensation | | 9,257 | | 12,312 | | 114 | | |
Deferred income taxes | | 367,239 | | (57,373 | ) | (46,541 | ) | |
Tax benefit of disqualified dispositions | | — | | 9,751 | | 1,351 | | |
Loss on disposal of property, plant and equipment, net | | 61 | | 4,428 | | 25,969 | | |
Loss from investment in 50% or less owned companies | | — | | 15,526 | | 6,351 | | |
Gain from repurchase and repayment of debts | | — | | — | | (4,204 | ) | |
Gain from extraordinary item | | — | | (3,583 | ) | — | | |
Write-off deferred financing costs in connection with bond redemption | | 6,127 | | — | | — | | |
Goodwill impairment | | 600,000 | | — | | — | | |
Proceeds from sale of accounts receivable | | 407,705 | | — | | — | | |
Write down of long-lived assets | | — | | — | | 95,600 | | |
Other, net | | 1,103 | | 250 | | 1,783 | | |
Changes in operating assets and liabilities, net of acquisitions: | | | | | | | | |
Accounts receivable | | (194,612 | ) | (71,640 | ) | (150,286 | ) | |
Inventories | | 57,889 | | (61,107 | ) | 214,048 | | |
Prepaid expenses and other current and non current assets | | 32,647 | | 18,683 | | 19,105 | | |
Accounts payable and accrued liabilities | | (72,532 | ) | 63,006 | | 144,972 | | |
Restricted cash | | 1,000 | | 22,000 | | (25,000 | ) | |
Income tax accounts | | 24,176 | | 66,282 | | 122,947 | | |
Cash provided by operating activities | | 415,994 | | 215,844 | | 526,455 | | |
CASH FLOWS PROVIDED BY (USED IN) INVESTING ACTIVITES: | | | | | | | | |
Purchases of short-term investments | | (77,789 | ) | (74,489 | ) | (127,533 | ) | |
Proceeds from maturities of short-term investments | | 40,426 | | 109,005 | | 171,782 | | |
Purchases of long-term investments | | (3,015 | ) | (12,903 | ) | (500 | ) | |
Purchases of property, plant and equipment | | (74,549 | ) | (87,198 | ) | (70,747 | ) | |
Proceeds from sale of property, plant and equipment | | 40,112 | | 27,667 | | 27,100 | | |
Cash paid for businesses acquired, net of cash acquired | | (95,235 | ) | (78,475 | ) | (223,748 | ) | |
Cash used in investing activities | | (170,050 | ) | (116,393 | ) | (223,646 | ) | |
CASH FLOWS PROVIDED BY (USED IN) FINANCING ACTIVITIES: | | | | | | | | |
Change in restricted cash | | (1,076 | ) | 90,358 | | (78,182 | ) | |
Payments on line of credit | | — | | — | | (606,192 | ) | |
Repurchase of convertible notes | | (623,558 | ) | — | | (441,965 | ) | |
Payments of long-term debt | | (21,490 | ) | (21,779 | ) | (324,510 | ) | |
Proceeds from long-term debt, net of issuance costs | | 403,307 | | — | | — | | |
(Payments of) additions to notes and credit facilities, net | | (13,197 | ) | (17,436 | ) | 988,535 | | |
Proceeds from sale of common stock, net of issuance costs | | 16,767 | | 35,680 | | 13,585 | | |
Cash provided by (used in) financing activities | | (239,247 | ) | 86,823 | | (448,729 | ) | |
Effect of exchange rate changes | | (8,091 | ) | (6,401 | ) | 5,598 | | |
Increase (decrease) in cash and cash equivalents | | (1,394 | ) | 179,873 | | (140,322 | ) | |
Cash and cash equivalents at beginning of year | | 1,069,447 | | 889,574 | | 1,029,896 | | |
Cash and cash equivalents at end of year | | $ | 1,068,053 | | $ | 1,069,447 | | $ | 889,574 | | |
| | | | | | | | |
Supplemental disclosures of cash flow information: | | | | | | | | |
Cash paid during the year | | | | | | | | |
Interest | | $ | 109,968 | | $ | 90,739 | | $ | 96,860 | | |
Income taxes | | $ | 20,826 | | $ | 53,125 | | $ | 64,874 | | |
| | | | | | | | |
Non-cash investing information: | | | | | | | | |
Acquisition of property, plant and equipment with long-term investments | | $ | — | | $ | — | | $ | 52,850 | | |
| | | | | | | | | | | | | | | | |
See accompanying notes to the consolidated financial statements.
66
SANMINA-SCI CORPORATION
NOTES TO CONSOLIDATED FINANCIAL STATEMENTS
Note 1. Organization of Sanmina-SCI
Sanmina-SCI Corporation (“Sanmina-SCI,” “we,” “us,” the “Company”) was incorporated in Delaware in 1989 to acquire its predecessor company, which had been in the printed circuit board and backplane business since 1980. On December 6, 2001, we merged with SCI Systems, Inc. (“SCI”), in a purchase business combination whereby SCI was merged into a wholly owned subsidiary. We are a leading independent global provider of customized, integrated electronics manufacturing services, or EMS. We provide these services to original equipment manufacturers, or OEMs, primarily in the communications, personal and business computing, enterprise computing and storage, multimedia, industrial and semiconductor capital equipment, defense and aerospace, medical and automotive industries. Our services consist primarily of product design and engineering, including initial development, detailed design, preproduction services and manufacturing design, volume manufacturing of complete systems, components and subassemblies, final system assembly and test, direct order fulfillment and logistic services and after-market product service and support. System components and subassemblies that we manufacture include volume and high-end printed circuit boards, backplanes and backplane assemblies, enclosures, cable assemblies, precision machine components, optical modules and memory modules.
Reclassifications
Auction rate securities in the amount of $7.2 million have been reclassified from cash and cash equivalents to short-term investments in the October 2, 2004 consolidated balance sheet to conform to the fiscal 2005 financial statement presentation. The purchases and sales of these auction rate securities have been reclassified in the consolidated statements of cash flows, which decreased and increased cash flows used in investing activities by $9.3 million and $16.5 million for the years ended October 2, 2004 and September 27, 2003, respectively.
Cash and cash equivalents was decreased and long-term debt was increased by approximately $24 million and $14 million at October 1, 2005 and October 2, 2004, which subsequently increased payments of notes and credit facilities in the consolidated statements of cash flows by approximately $14 million for the year ended October 2, 2004. Additionally, $4.1 million of pension benefits was reclassified which increased cost of sales and reduced restructuring costs for the year ended October 2, 2004.
In addition, we have reclassified certain other prior year balances to conform to the current year’s presentation.
Note 2. Summary of Significant Accounting Policies
Fiscal Year. We operate on a 52 or 53 week year ending on the Saturday nearest September 30. Accordingly, the 2003 fiscal year ended on September 27 – (52 weeks), the 2004 fiscal year ended on October 2 — (53 weeks), and the 2005 fiscal year ended on October 1 – (52 weeks). All general references to years relate to fiscal years unless otherwise noted.
Principles of Consolidation. The consolidated financial statements include our accounts and our wholly-owned subsidiaries. All intercompany accounts and transactions have been eliminated.
Foreign Currency Translation. For foreign subsidiaries using the local currency as their functional currency, assets and liabilities are translated at exchange rates in effect at the balance sheet date and income and expenses are translated at average exchange rates. The effects of these translation adjustments are reported as a separate component of stockholders’ equity, net of tax. Remeasurement adjustments for non-functional currency monetary assets and liabilities are included in other expense, net in the accompanying consolidated statements of operations. Additionally, remeasurement gains/losses with respect to long-term intercompany loans denominated in currency other than the functional currency are charged or credited to other comprehensive income (loss) as the repayment of the loan is not anticipated in the foreseeable future.
Derivative Instruments and Hedging Activities. We account for derivative instruments and hedging activities in accordance with Statement of Financial Accounting Standards (“SFAS”) No. 133, “Accounting for Derivative Instruments and Hedging Activities,” as amended by SFAS No. 138, “Accounting for Certain Derivative Instruments and Hedging Activities—an Amendment of SFAS 133” and SFAS 149, “Amendment of Statement 133 on Derivative Instruments and Hedging Activities.” In accordance with these standards, every derivative instrument is recorded in the balance sheets as either an asset or liability measured at its fair value. If the derivative is designated as a cash flow hedge, the effective portion
67
of changes in the fair value of the derivative is recorded in stockholders’ equity as a separate component of accumulated other comprehensive income and is recognized in the statement of operations when the hedged item affects earnings. Ineffective portions of changes in fair value of cash flow hedges are immediately recognized in earnings. If the derivative is designated as a fair value hedge, the changes in the fair value of the derivative and of the hedged item attributable to the hedged risk are recognized in earnings in the current period. We conduct business on a global basis in several currencies. As such, we are exposed to adverse movements in foreign currency exchange rates. We use various derivatives, such as foreign currency forward contracts and foreign currency option contracts, to reduce foreign exchange risks. Our objective in holding derivatives is to minimize the volatility of earnings and cash flows associated with changes in foreign currency. Derivatives are not used for trading or speculative purposes.
Management Estimates and Uncertainties. The preparation of consolidated financial statements in conformity with generally accepted accounting principles in the United States of America requires management to make estimates and assumptions that affect the reported amounts of assets and liabilities and disclosures of contingent assets and liabilities at the date of the consolidated financial statements and the reported amounts of revenues and expenses during the reporting period. Significant estimates made in preparing the consolidated financial statements relate to the allowances for accounts receivable, provisions for inventories, warranties, restructuring costs, environmental matters, determining the realizability of deferred tax assets, determining fair values of reporting units for purposes of goodwill impairment tests and determining fair value of long-lived assets for purposes of impairment tests. Actual results could materially differ from these estimates.
Financial Instruments and Concentration of Credit Risk. Financial instruments consist of cash and cash equivalents, short-term investments, foreign currency forward and option contracts, interest rate swap agreements, accounts receivable, accounts payable and short and long-term debt obligations. With the exception of certain of our long-term debt obligations, (refer to Note 4) the fair value of these financial instruments approximates their carrying amount as of October 1, 2005 and October 2, 2004 due to the nature of or the short maturity of those instruments.
Cash and Cash Equivalents. We consider all highly liquid investments with an original maturity of three months or less to be cash equivalents.
Cash and cash equivalents consisted of the following:
| | As of | |
| | October 1, 2005 | | October 2, 2004 | |
| | (In thousands) | |
Cash and bank balances | | $ | 737,839 | | $ | 481,755 | |
Money market funds | | 291,565 | | 587,692 | |
Other security funds | | 38,649 | | — | |
Total | | $ | 1,068,053 | | $ | 1,069,447 | |
Restricted Cash. These assets are carried at fair values and are restricted as collateral for specified obligations under certain financing agreements and letters of credit. The restricted cash also relates to our worker’s compensation. Changes in the restricted cash balance related to worker’s compensation is classified as an operating activity in the consolidated statements of cash flows. At October 1, 2005, and October 2, 2004, we had restricted cash of approximately $25.5 million.
Investments. Our marketable debt and equity securities are included in short-term investment and considered as available-for-sale and are recorded at their fair value, as determined by quoted market price, with unrealized holding gains or losses, net of tax, classified as a separate component of stockholders’ equity. Upon sale of the investments, any previously unrealized holding gains or losses are recognized in the statements of operations. The specific identification method is used to determine the cost of securities sold. Our policy is to review our equity holdings on a regular basis to evaluate whether or not such securities have experienced an other-than-temporary decline in fair value. Our policy includes, but is not limited to, reviewing the investee’s cash position, earnings or revenue outlook, stock price performance over the past six months, and liquidity. If we believe that an other-than-temporary decline in value exists, it is our policy to write down these investments to the market value and record the related write-down in our consolidated statement of operations.
Investments in nonpublic companies are carried at cost. We monitor these investments for impairment and record appropriate reductions in carrying values when necessary. Our holdings of investments in nonpublic companies is not material to the consolidated balance sheets.
68
Accounts Receivable and Other Related Allowances. We estimate product returns, warranty costs, and other adjustments related to current period net sales to establish related allowances. In making these estimates, we analyze the creditworthiness of our customers, past experience, changes in customer demand, and the overall economic climate in industries that we serve. If actual product returns, warranty claims or other adjustments differ significantly from our estimates, the amount of revenue or operating expenses we report would be affected. One of our most significant credit risks is the ultimate realization of our accounts receivable. This risk is mitigated by (i) ongoing credit evaluation of our customers, and (ii) frequent contact with our customers, especially our most significant customers, which enables us to monitor current changes in business operations and to respond accordingly. To establish our allowance for doubtful accounts, we regularly estimate the credit risk associated with accounts receivable and consider concentrations of credit risks. We evaluate credit risk related to specific customers based on the current economic environment. As of October 1, 2005, we have two customers that accounted for greater than 10% of gross accounts receivable at 16% and 11%, respectively. As of October 2, 2004, only one customer accounted for greater than 10% of gross accounts receivable at 36%.
Sale of Accounts Receivables. The Company accounts for the sales of accounts receivable in accordance with SFAS No. 140, “Accounting for Transfers and Servicing of Financial Assets and Extinguishments of Liabilities.” When we sell receivables, we retain the servicing rights to the underlying accounts receivable. The fair value of the retained servicing rights is not material to the statement of operations.
The accounts receivable balances that are sold are removed from the consolidated balance sheets and are reflected as cash provided by operating activities in the consolidated statement of cash flows.
Inventories. Inventories are stated at the lower of cost (first-in, first-out method) or market. Cost includes labor, material and manufacturing overhead.
When required, provisions are made to reduce excess inventories to their estimated net realizable values. In addition, the ultimate realization of inventory carrying amounts is primarily affected by our exposure related to changes in customer demand for inventory. Inventory reserves are established based on forecasted demand, past experience with the specific customers, the ability to redistribute inventory to other programs or back to our suppliers, and the presence of contractual language obligating the customers to pay for the related inventory. It is possible that estimates of net realizable values can change in the near term.
Property, Plant and Equipment, net. Property, plant, and equipment are stated at cost or, in the case of property and equipment acquired through business combinations accounted for as a purchase, initially at fair value based upon the allocated purchase price at the acquisition date. Depreciation and amortization are provided on a straight-line basis over 20 to 40 years for buildings, five years for machinery and equipment and five years for furniture and fixtures or in the case of leasehold improvements, over the term of the related lease, if shorter.
Restructured properties pursuant to SFAS 144 “Impairment of long-lived assets” that are held for sale are included in prepaid expenses and other current assets in our consolidated balance sheets.
Exit Costs. We recognize restructuring charges based on our plans to exit certain activities resulting from the identification of excess manufacturing and administrative facilities that we choose to close or consolidate. In connection with our exit activities, we record restructuring charges for employee termination costs, long-lived asset impairments, costs related to leased facilities to be abandoned or subleased, and other exit-related costs. These charges were incurred pursuant to formal plans developed and approved by management and accounted for in accordance with SFAS No. 146, “Accounting for Costs Associated with Exit or Disposal Activities, and EITF 95-3, “Recognition of Liabilities in Connection with a Purchase Business Combination.” Where applicable, employee termination costs are recorded pursuant to SFAS No. 112, “Employer’s Accounting for Postemployment Benefits.” Fixed assets that are written off or impaired as a result of restructuring plans are typically accounted for as held for sale or abandon. The remaining carrying value of such assets was not material at October 1, 2005 and October 2, 2004. The recognition of restructuring charges requires our management to make judgments and estimates regarding the nature, timing, and amount of costs associated with the planned exit activity, including estimating sublease income and the fair value, less selling costs, of property, plant and equipment to be disposed of. Management’s estimates of future liabilities may change, requiring us to record additional restructuring charges or reduce the amount of liabilities already recorded. At the end of each reporting period, we evaluate the remaining accrued balances to ensure their adequacy, that no excess accruals are retained, and the utilization of the provisions are for their intended purposes in accordance with developed exit plans. In the event circumstances change and the provision is no longer required, the provision is reversed.
69
Goodwill and Other Intangibles assets. Costs in excess of the fair value of tangible and other intangible assets acquired and liabilities assumed in a purchase business combination are recorded as goodwill. SFAS No. 142, “Goodwill and Other Intangible Assets,” requires that companies no longer amortize goodwill, but instead test for impairment at least annually using a two-step approach. We evaluate goodwill, at a minimum, on an annual basis and whenever events and changes in circumstances suggest that the carrying amount may not be recoverable. Impairment of goodwill is tested at the reporting unit level by comparing the reporting unit’s carrying amount, including goodwill, to the fair value of the reporting unit. The fair values of the reporting units are estimated using a combination of the income, or discounted cash flows, approach and the market approach, which utilizes comparable companies’ data. If the carrying amount of the reporting unit exceeds its fair value, goodwill is considered impaired and a second step is performed to measure the amount of impairment loss, if any.
We have certain other intangible assets that are subject to amortization. Intangible assets consist primarily of intellectual property and customer relationships obtained in acquisitions. These assets are carried at cost less accumulated amortization. These intangible assets are amortized over estimated useful lives ranging from five to eight years.
We review other intangible assets for impairment whenever events or changes in circumstances indicate that the carrying amount of an asset or asset group may not be recoverable in accordance with SFAS No. 144, “Accounting for the Impairment or Disposal of Long-Lived Assets.” An asset is considered impaired if its carrying amount exceeds the undiscounted future net cash flow the asset is expected to generate. If an asset or asset group is considered to be impaired, the impairment to be recognized is measured by the amount by which the carrying amount of the asset exceeds its fair value. We assess the recoverability of the intangible assets by determining whether the unamortized balances can be recovered through undiscounted future net cash flows of the related assets. The amount of impairment, if any, is measured based on projected discounted future net cash flows using a discount rate reflecting our average cost of capital, or other appropriate methods of determining fair value.
Revenue Recognition. We generally recognize revenue at the point of shipment to our customers, under the contractual terms which in general are FOB shipping point or when services have been performed. We also derive revenues from sales of certain inventory, including raw materials, to customers who reschedule, amend or cancel purchase orders after we have procured inventory to fulfill their purchase orders. Specifically, we recognize revenue when there exists a persuasive arrangement between us and the buyer, the price is fixed or determinable, title to the product or the inventory is transferred to the customer, the customers assumes the risks and rewards of ownership of the product and collectibility is reasonably assured. Except in specific circumstances, there are no formal customer acceptance requirements or further Sanmina-SCI obligations to the product or the inventory subsequent to shipment. In specific circumstances in which there are such customer acceptance requirements or further Sanmina-SCI obligations, with the exception of our standard warranty, revenue is recognized at the point of formal acceptance and upon completion of obligations. Provisions are made for estimated sales returns and adjustments at the point of revenue recognition. Provisions were not material for the years ended October 1, 2005, October 2, 2004 and September 27, 2003.
Warranty Reserve. We establish a warranty provision on shipped products based on individual manufacturing contract requirements and past warranty experience. For each period end, the balance is reviewed to ensure its adequacy.
Income taxes. We estimate our income tax provision or benefit in each of the jurisdictions in which we operate, including estimating exposures related to examinations by taxing authorities. We must also make judgments regarding the realizability of deferred tax assets. The carrying value of our net deferred tax asset is based on our belief that it is more likely than not that we will generate sufficient future taxable income in certain jurisdictions to realize these deferred tax assets. A valuation allowance has been established for deferred tax assets which we do not believe meet the more likely than not criteria established by SFAS No. 109, “Accounting for Income Taxes.” Our judgments regarding future taxable income may change due to changes in market conditions, changes in tax laws, tax planning strategies or other factors. If our assumptions and consequently our estimates change in the future, the valuation allowances we have established may be increased or decreased, impacting future income tax expense. The effective tax rate is highly dependent upon the geographic distribution of our worldwide earnings or loss, tax regulations in each geographic region, the availability of tax credits and carryforwards, and the effectiveness of our tax planning strategies. We regularly monitor the assumptions used in estimating our annual effective tax rate and adjust our estimates accordingly. If actual results differ from our estimates, future income tax expense could be materially affected.
Earnings Per Share. Basic loss per share is computed by dividing net loss by the weighted average number of shares of common stock outstanding during the period. Diluted loss per share includes dilutive common stock equivalents, using the
70
treasury stock method, and assumes that the convertible debt instruments were converted into common stock upon issuance, if dilutive.
Stock-Based Compensation. SFAS No. 123, as amended by SFAS No. 148, permits companies to (i) recognize as expense the fair value of stock-based awards, or (ii) continue to apply the provisions of Accounting Principles Board Opinion No. 25, “Accounting for Stock Issued to Employees” and related interpretations (“APB 25”), and provide pro forma net income (loss) and earnings (loss) per share disclosures for employee stock-based compensation as if the fair-value-based method defined in SFAS No. 123 had been applied. We continue to apply the provisions of APB 25 and provide the pro forma disclosures with respect to our stock-based compensation plans in accordance with the provisions of SFAS Nos. 123 and 148.
We use the Black-Scholes option-pricing model to determine the pro forma impact under SFAS Nos. 123 and 148 on our net loss and loss per share. The model utilizes certain information, such as the interest rate on a risk-free security maturing generally at the same time as the option being valued, and requires certain assumptions, such as the expected amount of time an option will be outstanding until it is exercised or it expires, to calculate the fair value of stock options granted.
The assumptions used for fiscal years ended October 1, 2005, October 2, 2004 and September 27, 2003 are presented below:
| | Year Ended | |
Stock Options | | October 1,
2005 | | October 2,
2004 | | September 27,
2003 | |
Volatility | | 61 | % | 75 | % | 75 | % |
Risk-free interest rate | | 3.96 | % | 3.44 | % | 2.95 | % |
Dividend yield | | 0 | % | 0 | % | 0 | % |
| | | | | | | |
Expected life of option | | 4.8 years | | 4.4 years | | 4.5 years | |
| | Year Ended | |
Employee Stock Purchase Plan | | October 1,
2005 | | October 2,
2004 | | September 27,
2003 | |
Volatility | | 59.0 | % | 75 | % | 75 | % |
Risk-free interest rate | | 3.78 | % | 3.44 | % | 2.95 | % |
Dividend yield | | 0 | % | 0 | % | 0 | % |
Expected life of option | | 0.5 years | | 0.5 years | | 0.5 years | |
Had compensation cost for all plans been determined consistent with SFAS Nos. 123 and 148, our net loss and loss per share would have been the following pro forma amounts:
| | Year Ended | |
| | October 1,
2005 | | October 2,
2004 | | September 27,
2003 | |
| | (In thousands, except per share amounts) | |
Net loss: | | | | | | | |
As reported | | $ | (1,006,002 | ) | $ | (11,398 | ) | $ | (137,157 | ) |
Stock-based employee compensation expense included in reported net loss, net of tax | | 9,327 | | 12,349 | | 1,709 | |
Stock-based employee compensation expense determined under fair value method, net of tax | | (163,561 | ) | (59,898 | ) | (55,373 | ) |
Pro forma net loss | | $ | (1,160,236 | ) | $ | (58,947 | ) | $ | (190,821 | ) |
Basic loss per share: | | | | | | | |
As reported | | $ | (1.93 | ) | $ | (0.02 | ) | $ | (0.27 | ) |
Pro forma | | $ | (2.23 | ) | $ | (0.11 | ) | $ | (0.37 | ) |
Diluted loss per share: | | | | | | | |
As reported | | $ | (1.93 | ) | $ | (0.02 | ) | $ | (0.27 | ) |
Pro forma | | $ | (2.23 | ) | $ | (0.11 | ) | $ | (0.37 | ) |
| | | | | | | | | | | | |
71
The Company reevaluated the volatility used to estimate the value of employee stock options granted during the third quarter of fiscal 2005. Management determined that volatility derived using a blend of publicly traded options and historical volatility is more reflective of market conditions and a better indicator of expected volatility than using only historical volatility. Concurrently, the Company recomputed the weighted-average expected term of options using historical information on vesting periods, options exercised and employee termination patterns.
Recent Accounting Pronouncements. FASB Staff Position (“FSP”) No. 109-2 “Accounting and Disclosure Guidance for the Foreign Earnings Repatriation Provision within the American Jobs Creation Act of 2004” (“FSP 109-2”), provides guidance under SFAS No. 109, “Accounting for Income Taxes”, with respect to recording the potential impact of the repatriation provisions of the American Jobs Creation Act of 2004 (the “Jobs Act”) on income tax expense and deferred tax liabilities. The Jobs Act was enacted on October 22, 2004. FSP 109-2 states that an enterprise is allowed time beyond the financial reporting period of enactment to evaluate the effect of the Jobs Act on its plan for reinvestment or repatriation of foreign earnings for purposes of applying SFAS No. 109. We believe the application of FSP No. 109-2 will not have a material effect on the income tax provision.
In November 2004, the FASB issued SFAS No. 151, Inventory Costs, an amendment of ARB No. 43, Chapter 4, to clarify that abnormal amounts of idle facility expense, freight, handling costs, and wasted material (spoilage) should be recognized as current period charges, and that fixed production overheads should be allocated to inventory based on normal capacity of production facilities. This statement is effective for inventory costs incurred during fiscal years beginning after June 15, 2005. The adoption of SFAS No. 151 is not expected to have a significant impact on our results of operations or financial position.
In December 2004, FASB issued SFAS No. 123 (revised 2004) “Share-based Payment,” which requires companies to recognize in the statement of operations the fair value of stock options and other equity-based compensation issued to employees on the grant date. This statement supersedes Accounting Principles Board Opinion (“APB”) No. 25, “Accounting for Stock Issued to Employees,” but does not change the accounting guidance for share-based payment transactions with parties other than employees provided in SFAS No. 123 as originally issued. SFAS No. 123 (revised 2004) is effective as of the beginning of our first quarter of fiscal 2006. We have not concluded our evaluation of SFAS 123R. The impact of adoption of SFAS 123R cannot be predicted at this time because it will depend on levels of share-based payments granted in the future. In addition, assessment of the estimated compensation charges is affected by the Company’s stock price as well as assumptions regarding a number of complex and subjective variables and the related tax impact. These variables include, but are not limited to, the Company’s stock price volatility, estimated forfeiture rate and employee stock option exercise behaviors. See Note 2 — Stock-based Compensation for information related to the pro forma effects on our reported net loss and net loss per share of applying the fair value recognition provision of the previous SFAS 123 to stock-based compensation.
In December 2004, FASB issued Statement of Financial Accounting Standards No. 153, Exchanges of Nonmonetary Assets, an amendment of APB Opinion No. 29, Accounting for Nonmonetary Transactions (“SFAS 153”). This statement amends APB Opinion 29 to eliminate the exception for nonmonetary exchanges of similar productive assets and replaces it with a general exception for exchanges of nonmonetary assets that do not have commercial substance. Under SFAS 153, if a nonmonetary exchange of similar productive assets meets a commercial-substance criterion and the fair value is determinable, the transaction must be accounted for at fair value resulting in recognition of any gain or loss. The provisions of SFAS 153 are effective for nonmonetary transactions in fiscal periods that begin after June 15, 2005. We do not anticipate that the adoption of this standard will have a material impact on our financial position or results of operations.
In March 2005, the FASB issued FIN 47 as an interpretation of FASB Statement No. 143, “Accounting for Asset Retirement Obligations” (“SFAS 143”). This interpretation clarifies that the term conditional asset retirement obligation as used in SFAS 143, refers to a legal obligation to perform an asset retirement activity in which the timing and/or method of settlement are conditional on a future event that may or may not be within the control of the entity. The obligation to perform the asset retirement activity is unconditional even though uncertainty exists about the timing and/or method of settlement. Accordingly, an entity is required to recognize a liability for the fair value of a conditional asset retirement obligation if the fair value of the liability can be reasonably estimated. This interpretation also clarifies when an entity would have sufficient information to reasonably estimate the fair value of an asset retirement obligation. FIN 47 is effective no later than the end of fiscal years ending after December 15, 2005. We do not anticipate that the adoption of this standard will have a material impact on our financial position or results of operations.
72
Note 3. Derivative Instruments and Hedging Activities
We enter into short-term foreign currency forward contracts to hedge only those currency exposures associated with certain assets and liabilities denominated in foreign currencies. These contracts typically have maturities of three months or less. At October 1, 2005 and October 2, 2004, we had open forward contracts to exchange various foreign currencies for U.S. dollars in the aggregate notional amount of $519.9 million and $363.5 million, respectively. The net unrealized gain on the contracts at October 1, 2005 is not material and is recorded in prepaid expenses and other current assets on the consolidated balance sheets. Market value gains and losses on forward exchange contracts are recognized in the consolidated statement of operations as offsets to the exchange gains and losses on the hedged transactions. The impact of these foreign exchange contracts was not material to the results of operations for fiscal 2005, 2004 and 2003.
During fiscal 2005, we also utilized foreign currency forward and option contracts to hedge certain forecasted foreign currency sales and cost of sales referred to as cash flow hedges and these contracts typically expire within 12 months. Gains and losses on these contracts related to the effective portion of the hedges are recorded in other comprehensive income until the forecasted transactions occur. When the contracts expire, any amounts recorded in comprehensive income are reclassified to earnings. Gains and losses related to the ineffective portion of the hedges are immediately recognized in the consolidated statement of operations. At October 1, 2005, we had forward and option contracts related to cash flow hedges in various foreign currencies in the aggregate notional amount of $58.9 million. The net unrealized gain on the contracts at October 1, 2005 is not material and is recorded in prepaid expenses and other current assets on the consolidated balance sheets. The impact of the foreign currency forward and option contracts was not material to the results of operations for fiscal year 2005.
During fiscal 2005, we entered into interest rate swaps with a total notional amount of $1,150.0 million to hedge the short-term and long-term interest rate exposures with respect to certain outstanding debt obligations. The swaps were designated as fair value hedges under SFAS No. 133. The fair value of interest rate swap transactions were recorded in noncurrent assets (long-term liabilities) with the corresponding increase (decrease) in the carrying value of long-term debt at October 1, 2005 and October 2, 2004, was ($32.7) million and $13.0 million, respectively.
Our foreign exchange forward and option contracts expose us to credit risk to the extent that the counterparties may be unable to meet the terms of the agreement. We minimize such risk by limiting our counterparties to major financial institutions. Management does not expect material losses as a result of default by counterparties.
Note 4. Financial Instruments and Concentration of Credit Risk
The estimated fair values of certain of our long-term debt obligations, based on quoted market prices, as of October 1, 2005 are as follows:
| | Carrying
Amount | | Fair Value | |
| | (In thousands) | |
10.375% Senior Secured Notes | | $ | 750,000 | | $ | 830,625 | |
6.75% Senior Subordinated Notes due 2013 | | $ | 400,000 | | $ | 380,000 | |
3% Convertible Subordinated Notes due 2007 | | $ | 522,572 | | $ | 504,053 | |
Financial instruments that potentially subject us to credit risk consist of cash and cash equivalents, short-term investments and trade accounts receivable. We maintain the majority of our cash, cash equivalents and short-term investment balances with recognized financial institutions which follow our investment policy. We have not experienced any significant losses on these investments to date. One of the most significant credit risks is the ultimate realization of accounts receivable. This risk is mitigated by (i) ongoing credit evaluation of our customers, and (ii) frequent contact with our customers, especially our most significant customers, thus enabling us to monitor current changes in business operations and to respond accordingly. We generally do not require collateral for sales on credit. We consider these concentrations of credit risks in establishing our allowance for doubtful accounts and management believes these allowances are adequate.
Sales to the following customers, expressed as a percentage of consolidated net sales, and the percentage of gross accounts receivable for each customer, were as follows:
73
| | Percentage of Net Sales Year Ended | | Percentage of Gross
Accounts Receivable As of | |
| | October 1,
2005 | | October 2,
2004 | | September 27,
2003 | | October 1,
2005 | | October 2,
2004 | |
IBM | | 23.2 | % | 28.4 | % | 28.8 | % | 11.1 | % | 35.8 | % |
HP | | | * | 12.0 | % | | * | | * | | * |
Lenovo | | | * | | * | | * | 15.7 | % | | * |
* Amount was less than 10% of the total
Note 5. Short-Term Investments
As of October 1, 2005 and October 2, 2004, the difference between the aggregate fair value and cost basis was not significant. The values of our investments by major security type are as follows:
| | As of October 1, 2005 | |
| | Cost | | Aggregate
Fair Value | |
| | (In thousands) | |
U.S. government and agency securities | | $ | 53,331 | | $ | 53,304 | |
Money market securities | | 3,977 | | 3,977 | |
| | $ | 57,308 | | $ | 57,281 | |
| | As of October 2, 2004 | |
| | Cost | | Aggregate
Fair Value | |
| | (In thousands) | |
U.S. government and agency securities | | $ | 12,523 | | $ | 12,518 | |
State and municipal securities(1) | | 4,500 | | 4,500 | |
U.S. corporate and bank debt(1) | | 2,700 | | 2,700 | |
| | $ | 19,723 | | $ | 19,718 | |
(1) Reclassified auction rate securities – refer to footnote 1 of the Notes to Consolidated Financial Statements.
Investments with unrealized losses at October 1, 2005 and October 2, 2004 primarily related to our U.S. Government Agency Securities. The fair value of the U.S. Government Agency Securities at October 1, 2005 and October 2, 2004 were $53.3 million and $12.5 million, respectively. The unrealized losses at October 1, 2005 and October 2, 2004 were not material. Market values are determined for each individual security in the investment portfolio. The declines in value of these investments are primarily related to changes in interest rates and are considered to be temporary in nature.
During fiscal 2005 and 2004, the reclassified amounts from accumulated other comprehensive income into earnings were not material. As of October 1, 2005 and October 2, 2004, the average maturity period of our debt securities was approximately 209 and 315 days, respectively. The available-for-sale investments at October 1, 2005, by contractual maturity, were due in one year or less.
Note 6. Long-Term Investments.
In fiscal 2004, we acquired the remaining 50.1% ownership interest from Siemens AG in INBOARD, a manufacturer of complex printed circuit boards located in Germany. The completed acquisition resulted in a cash payment from Siemens AG and an extraordinary gain of $3.6 million after allocation of the purchase price to the fair values of the assets and liabilities acquired. The fair values of the liabilities assumed exceeded the fair value of assets acquired.
As of October 1, 2005 and October 2, 2004, the total minority equity investments were $12.3 million and $9.3 million, respectively.
Long-term investments are classified in the consolidated balance sheets as part of other non-current assets.
74
Note 7. Inventories
The components of inventories, net of provisions, are as follows:
| | As of | |
| | October 1,
2005 | | October 2,
2004 | |
| | (In thousands) | |
Raw materials | | $ | 654,384 | | $ | 673,815 | |
Work-in-process | | 242,659 | | 189,077 | |
Finished goods | | 117,992 | | 201,626 | |
Total | | $ | 1,015,035 | | $ | 1,064,518 | |
Note 8. Property, Plant and Equipment, net
As of October 1, 2005 and October 2, 2004, property, plant and equipment consist of the following:
| | As of | |
| | October 1,
2005 | | October 2,
2004 | |
| | (In thousands) | |
Machinery and equipment | | $ | 1,488,932 | | $ | 1,521,809 | |
Furniture and fixtures | | 25,364 | | 27,261 | |
Leasehold improvements | | 53,060 | | 51,516 | |
Land and buildings | | 563,848 | | 615,494 | |
| | 2,131,204 | | 2,216,080 | |
Less: Accumulated depreciation and amortization | | (1,480,694 | ) | (1,475,607 | ) |
| | 650,510 | | 740,473 | |
Construction in progress | | 11,591 | | 42,169 | |
Property, plant and equipment, net | | $ | 662,101 | | $ | 782,642 | |
Depreciation expense on property, plant and equipment for the year ended October 1, 2005, October 2, 2004 and September 27, 2003 were approximately $168.7 million, $182.4 million and $216.0 million, respectively.
Restructured properties pursuant to SFAS 144 “Impairment of long-lived assets” that are considered held for sale are included in prepaid expenses and other current assets in our consolidated balance sheets. As of October 1, 2005 and October 2, 2004, assets held for sale were $33.1 million and $19.6 million, respectively.
During 2003, we recorded an impairment loss relating to property, plant and equipment of approximately $65.1 million for the domestic reporting unit and $24.1 million for the international reporting unit in connection with the impairment tests pursuant to SFAS No. 144. Due to the weakness in the electronic industry, particularly in the communications sector, and the capital intensive nature of our printed circuit board and enclosure manufacturing operations, it was determined that a triggering event occurred and an impairment test was performed pursuant to SFAS No. 144. The results indicated that an impairment of long-lived assets occurred and the assets were written down to fair value. Fair value was determined using the cost approach which measures the value of an asset by the cost to reconstruct or replace it with another of like utility. The impairment loss was primarily related to equipment and buildings.
75
Note 9. Goodwill and Other Intangibles assets
During the second quarter ended April 2, 2005, we recorded a goodwill impairment loss of $600 million for our domestic reporting unit. The factors that caused us to record a write-off of our deferred tax assets, which primarily related to U.S. operations coupled with the then-recent decline in the market price of our common stock, led us to record this goodwill impairment loss during our second fiscal quarter. In particular, the shift of operations from U.S. facilities and other facilities in high cost locations to facilities in lower-cost locations has resulted in restructuring charges and a decline in sales with respect to our U.S. operations. The fair market valuation of the reporting units was based on an income and market approach. As of the time we performed this analysis, there was no impairment of goodwill or long-lived assets associated with our international operations. In addition at July 1, of fiscal 2005, as well as at July 1, 2004 and 2003, we performed our annual impairment test pursuant to SFAS No. 142 and these tests did not identify any impairment losses.
Goodwill information for each reporting unit is as follows (in thousands):
| | As of
October 2,
2004 | | Additions
to
Goodwill | | Goodwill
Impairment | | Adjustments
to
Goodwill | | As of
October 1,
2005 | |
Reporting units: | | | | | | | | | | | |
Domestic | | $ | 1,221,406 | | $ | 16,168 | | $ | (600,000 | ) | $ | (17,493 | ) | $ | 620,081 | |
International | | 1,033,573 | | 38,112 | | — | | (2,568 | ) | 1,069,117 | |
Total | | $ | 2,254,979 | | $ | 54,280 | | $ | (600,000 | ) | $ | (20,061 | ) | $ | 1,689,198 | |
Adjustments to goodwill primarily represent purchase price allocation adjustments related to prior year acquisitions which includes a reduction of certain tax accruals as a result of settlement with tax authorities. The additions to goodwill are primarily due to the Pentex acquisition and various other smaller acquisitions as discussed in footnote 18 “Acquisitions and Divestitures” of the Notes to Consolidated Financial Statements.
The gross and net carrying values of other intangible assets at October 1, 2005 and October 2, 2004 are as follows:
| | As of October 1, 2005 | | As of October 2, 2004 | |
| | Gross
Carrying
Amount | | Accumulated
Amortization | | Net
Carrying
Amount | | Gross
Carrying
Amount | | Accumulated
Amortization | | Net
Carrying
Amount | |
| | (In thousands) | |
Other intangible assets | | $ | 59,977 | | $ | (24,070 | ) | $ | 35,907 | | $ | 49,723 | | $ | (13,832 | ) | $ | 35,891 | |
| | | | | | | | | | | | | | | | | | | |
The increase in other intangible assets from 2004 to 2005 was primarily due to the acquisition of intangible assets in a business combination during 2005, refer to footnote 18 “Acquisitions and Divestitures” of the Notes to Consolidated Financial Statements.
Intangible asset amortization expense for the years ended October 1, 2005, October 2, 2004 and September 27, 2003 was approximately $9.6 million (including $1.0 million amortization included in cost of sales), $8.5 million and $6.6 million, respectively.
Estimated annual amortization expense for other intangible assets at October 1, 2005 is as follows:
Fiscal Years: | | (In thousands) | |
2006 | | $ | 8,330 | |
2007 | | 8,113 | |
2008 | | 8,113 | |
2009 | | 3,865 | |
2010 | | 2,209 | |
Thereafter | | 5,277 | |
| | $ | 35,907 | |
76
Note 10. Comprehensive Income
Accumulated other comprehensive income, net of tax as applicable, consists of the following:
| | Year Ended | |
| | October 1,
2005 | | October 2,
2004 | |
| | (In thousands) | |
Foreign currency translation adjustment | | $ | 46,231 | | $ | 38,410 | |
Unrealized holding gains on investments and derivative financial instruments | | 240 | | 39 | |
Minimum pension liability | | (9,585 | ) | (5,759 | ) |
Total accumulated other comprehensive income | | $ | 36,886 | | $ | 32,690 | |
Note 11. Earnings Per Share
The following table sets forth the calculation of basic and diluted loss per share:
| | Year Ended | |
| | October 1,
2005 | | October 2,
2004 | | September 27,
2003 | |
| | (In thousands, except per share amounts) | |
Numerator: | | | | | | | |
Net loss | | $ | (1,006,002 | ) | $ | (11,398 | ) | $ | (137,157 | ) |
Denominator: | | | | | | | |
Weighted average number of shares—basic and diluted | | 520,574 | | 515,803 | | 510,102 | |
Net loss per share—basic | | $ | (1.93 | ) | $ | (0.02 | ) | $ | (0.27 | ) |
Net loss per share—diluted | | $ | (1.93 | ) | $ | (0.02 | ) | $ | (0.27 | ) |
We recorded an extraordinary gain of $3.6 million in fiscal 2004. This was due to receipt of a cash payment from Siemens A.G. related to the acquisition of Siemens A.G.’s 50.1% ownership interest in INBOARD, a manufacturer of complex printed circuit boards located in Germany. Excluding the extraordinary gain, the basic and diluted net loss per share for fiscal 2004 is $(0.03).
The following table summarizes the weighted average dilutive securities that were excluded from the above computation of diluted net loss per share because their inclusion would have an anti-dilutive effect (in thousands):
| | 2005 | | 2004 | | 2003 | |
| | | | | | | |
Dilutive securities: | | | | | | | |
Employee stock options | | 58,440,384 | | 57,143,973 | | 43,335,722 | |
Restricted stock | | 3,893,995 | | 529,633 | | — | |
Shares issuable upon conversion of 4.25% notes | | — | | — | | 10,225,698 | |
Shares issuable upon conversion of 4% notes | | 3,178,476 | | 7,415,070 | | 7,530,866 | |
Shares issuable upon conversion of 3% notes | | 12,697,848 | | 12,697,848 | | 12,697,848 | |
Total anti-dilutive shares | | 78,210,703 | | 77,786,524 | | 73,790,134 | |
After-tax interest expense of $26.5 million, $44.4 million, and $36.7 million (related to the Zero Coupon Convertible Subordinated Debentures), respectively, were not included in the computation of diluted loss per share because to do so would be anti-dilutive. In addition, the related share equivalents on conversion of the debt were not included as to do so would be anti-dilutive.
77
Note 12. Stock-Based Compensation
On May 2, 2005 and September 30, 2005, respectively, our Board of Directors approved the acceleration of vesting of “underwater” unvested stock options held by approximately 4,500 and 4,400 employees, executive officers and non-employee directors, respectively. This approval was based on the recommendation of the Compensation Committee of the Board of Directors. A stock option was considered “underwater” on May 2, 2005 and September 30, 2005 if the option exercise price was greater than $7.00 for grant dates prior to November 2, 2004 and $5.00 per share for grant dates prior to April 1, 2005, respectively. The closing stock price at the dates the accelerations were approved by the Company’s Board of Directors were $4.00 and $4.29, respectively. The total number of options accelerated was approximately 22 million. The Compensation Committee, which consists entirely of independent directors, as well as the independent directors on the full Board of Directors unanimously approved the acceleration of vesting of underwater stock options including those underwater stock options held by the Chief Executive Officer and the other executive officers of the Company. These actions were taken in accordance with the applicable provisions of all of the Company’s stock option plans.
The decision to accelerate vesting of these underwater stock options was made primarily to minimize recognizing compensation expense in future financial statements upon the adoption of Statement of Financial Accounting Standards No. 123R (revised 2004), “Share-Based Payment” because the Company believes underwater stock options may not be offering the affected employees sufficient incentive when compared to the potential future compensation expense that would have been attributable to these stock options. As the exercise price of all the stock options affected was greater than their fair market price on the date of vesting acceleration, there will be no impact under APB 25 on our consolidated statements of operations. The future estimated compensation expense that will be avoided, based on the Company’s implementation of SFAS 123R, is approximately $36.0 million, $16.9 million, and $7.1 million in fiscal 2006, 2007, and 2008, respectively. As the options were accelerated to vest immediately, an additional compensation cost amounting to approximately $107.6 million, which represented the unamortized cost of accelerated unvested options, was recognized in the pro forma income statements (refer to footnote 2 of the Notes to Consolidated Financial Statements) for the year ended October 1, 2005.
Note 13. Debt
Long-term debt and revolving credit agreements consist of the following:
| | As of | |
| | October 1,
2005 | | October 2,
2004 | |
| | (In thousands) | |
10.375% Senior Secured Notes due 2010 | | $ | 750,000 | | $ | 750,000 | |
6.75% Senior Subordinated Notes due 2013 | | 400,000 | | — | |
Zero Coupon Convertible Subordinated Debentures due 2020 | | 535 | | 608,092 | |
3% Convertible Subordinated Notes due 2007 | | 522,572 | | 520,818 | |
Interest Rate Swaps | | (29,163 | ) | 12,986 | |
Other long-term debt due through August 2012, at rates ranging from 3.48% to 10.0% | | 1,712 | | 14,326 | |
Other | | 449 | | 861 | |
Total | | 1,646,105 | | 1,907,083 | |
Less: current portion | | (1,439 | ) | (609,746 | ) |
Total long-term debt | | $ | 1,644,666 | | $ | 1,297,377 | |
10.375% Senior Secured Notes due 2010. On December 23, 2002, Sanmina-SCI issued $750.0 million of 10.375% Senior Secured Notes due January 15, 2010 (the “Original Notes”) in a private placement to qualified investors as part of a refinancing transaction pursuant to which Sanmina-SCI also entered into a $275.0 million senior secured credit facility (the “Credit Facility”). A portion of the net proceeds of the Original Notes and Credit Facility was used to repay all outstanding amounts under an existing three-year revolving credit facility and to repurchase all outstanding receivables sold under an existing receivables securitization facility. These transactions are referred to collectively as the Refinancing. In July 2003, Sanmina-SCI completed an exchange offer pursuant to which substantially all of the Original Notes were exchanged for notes registered under the Securities Act of 1933, or the 10.375% Notes. The 10.375% Notes evidence the same debt as the Original Notes and are issued under and entitled to the benefits of the same indenture that governs the Original Notes except that they are not subject to transfer restrictions.
78
The 10.375% Notes are fully and unconditionally guaranteed by substantially all of Sanmina-SCI’s United States subsidiaries and are secured by a second priority security interest in substantially all of the personal property assets of Sanmina-SCI and its United States subsidiaries located in the United States, a pledge of the capital stock of substantially all of Sanmina-SCI’s United States subsidiaries, a pledge of 65% of the capital stock of certain of Sanmina-SCI’s first-tier foreign subsidiaries, and mortgages on certain domestic real estate. Sanmina-SCI may redeem the 10.375% Notes, in whole or in part, at anytime beginning on January 15, 2007 at a redemption price initially of 105.188%, declining to 102.594% on January 15, 2008 and 100.000% on January 15, 2009. Sanmina-SCI may also redeem the 10.375% Notes, in whole or in part, at any time prior to January 15, 2007 at a redemption price equal to the principal amount plus accrued interest to the redemption date plus a make-whole premium specified in the indenture. In the event of a change of control of Sanmina-SCI, Sanmina-SCI will be required to offer to repurchase the 10.375% Notes at a repurchase price of 101% of the principal amount plus accrued interest to the repurchase date. Before January 15, 2006, Sanmina-SCI may redeem up to a maximum of 35% of the aggregate principal amount of the 10.375% Notes in an amount not to exceed the net proceeds of one or more equity offerings, as defined in the indenture, at a redemption price equal to 110.375% of the principal amount plus accrued interest. The indenture includes covenants that, among other things, limit in certain respects Sanmina-SCI and its restricted subsidiaries from incurring debt, making investments and other restricted payments, paying dividends on capital stock, redeeming capital stock or subordinated obligations and creating liens. In the event that Sanmina-SCI obtains the investment grade rating specified in the indenture and certain other conditions are met, the collateral securing the 10.375% Notes will be permanently released, and Sanmina-SCI will no longer be required to comply with certain of the indenture covenants specified above for as long as Sanmina-SCI retains the investment grade rating specified in the indenture.
During fiscal 2003, we repaid the $275.0 million Credit Facility and recorded an $18.3 million loss from the early extinguishment of this debt, including the write-off of $10.1 million of unamortized financing fees and a redemption premium of $8.2 million. The loss is reflected in other expense in the accompanying consolidated statement of operations.
We entered into interest rate swaps to hedge our mix of short-term and long-term interest rate exposures resulting from certain of our outstanding debt obligations. During fiscal 2003, we entered into an interest rate swap transaction with an independent third party related to the 10.375% Notes pursuant to which it paid the third party a variable rate and received a fixed rate from the third party. The interest rate swap had a total notional amount of $525.0 million. Under the swap agreement, Sanmina-SCI paid an interest rate equal to the six-month LIBOR rate plus 6.125%, determined semi-annually in arrears. In exchange, Sanmina-SCI received a fixed interest rate of 10.375%. During the fourth quarter of fiscal 2003, Sanmina-SCI terminated the swap agreement. In consideration for the termination, Sanmina-SCI paid a termination payment, which is recorded as deferred financing cost and amortized over the remaining life of the 10.375% Notes. Concurrent with the termination of the swap agreement, Sanmina-SCI entered into a new swap agreement with the third party with identical terms except for the floating rate spread. Under this swap agreement, Sanmina-SCI paid an interest rate equal to the six-month LIBOR rate plus 5.6375%, determined semi-annually in arrears. In addition, Sanmina-SCI entered into an interest rate swap transaction related to $225.0 million principal amount of the 10.375% Notes. Under this swap agreement, we paid an interest rate equal to the six-month LIBOR rate plus 5.62%, determined semi-annually in arrears. During the first quarter of fiscal 2005, we terminated these swap agreements. In consideration for the termination, we received a termination payment, which is recorded in other long term debt and amortized over the remaining life of the 10.375% Notes. Concurrent with the termination of these swap agreements, we entered into a new swap agreement with a notional amount of $750.0 million with the third party with identical terms except for the floating rate spread. Under this swap agreement, we pay an interest rate equal to the six-month LIBOR rate plus 6.2162%, determined semi-annually in arrears. The swap agreement effectively replaces the fixed interest rate that we pay on 10.375% Notes with variable interest rates. Both parties to the agreements have the right to terminate the agreements on or after January 15, 2007. The swaps were designated as fair value hedges under SFAS No. 133. Management believes that the interest rate swaps meet the criteria established by SFAS No. 133 for short cut accounting; therefore, no portion of the swaps are treated as ineffective. At October 1, 2005, $22.1 million has been recorded in other long-term liabilities to record the fair value of the interest rate swap transactions, with a corresponding decrease to the carrying value of the 10.375% Notes.
6.75% Senior Subordinated Notes. On February 24, 2005, we entered into an indenture among the Company, the Guarantors (as defined below) and U.S. Bank National Association as trustee, or the 6.75% Notes Indenture, relating to the issuance by the Company of $400 million aggregate principal amount of its 6.75% Senior Subordinated Notes due 2013, or the 6.75% Notes, in a private placement to qualified investors. Interest is payable on the 6.75% Notes on March 1 and September 1 of each year, beginning on September 1, 2005. The maturity date of the 6.75% Notes is March 1, 2013. In June 2005, Sanmina-SCI completed an exchange offer pursuant to which substantially all of the 6.75% Notes were exchanged for notes registered under the Securities Act of 1933. These notes evidence the same debt as the original 6.75% Notes and are
79
issued and entitled to the benefits of the same indenture that governs the original 6.75% Notes except that they are not subject to transfer restrictions.
The 6.75% Notes are unsecured, senior subordinated obligations and will be subordinated in right of payment to all of our existing and future senior debt. The 6.75% Notes are fully and unconditionally guaranteed, jointly and severally, on a senior subordinated unsecured basis by substantially all of our domestic restricted subsidiaries, or the Guarantors, for so long as those subsidiaries guarantee any of our other debt (other than unregistered senior debt and debt under our senior secured credit facility).
The Company can redeem the 6.75% Notes, in whole or in part, at any time prior to March 1, 2009, at a redemption price that is equal to the sum of (1) the amount of the 6.75% Notes to be redeemed, (2) accrued and unpaid interest on those 6.75% Notes and (3) a make-whole premium calculated in the manner specified in the 6.75% Notes Indenture. The Company can redeem the 6.75% Notes, in whole or in part, beginning on March 1, 2009, at declining redemption prices ranging from 103.375% to 100% of the principal amount, plus accrued and unpaid interest to, but excluding, the redemption date, with the actual redemption price to be determined based on the date of redemption. At any time prior to March 1, 2008, the Company may redeem up to 35% of the 6.75% Notes with the proceeds of certain equity offerings at a redemption price equal to 106.75% of the principal amount of the 6.75% Notes, plus accrued and unpaid interest to, but excluding, the redemption date.
Following a change of control, as defined in the 6.75% Notes Indenture, we will be required to make an offer to repurchase all or any portion of the 6.75% Notes at a purchase price of 101% of the principal amount, plus accrued and unpaid interest to, but excluding, the date of repurchase.
The 6.75% Notes Indenture includes covenants that limit our ability and the ability of our restricted subsidiaries to, among other things: incur additional debt, make investments and other restricted payments, pay dividends on capital stock, or redeem or repurchase capital stock or subordinated obligations; create specified liens; sell assets; create or permit restrictions on the ability of our restricted subsidiaries to pay dividends or make other distributions to us; engage in transactions with affiliates; incur layered debt; and consolidate or merge with or into other companies or sell all or substantially all of our assets. The restricted covenants are subject to a number of important exceptions and qualifications set forth in the 6.75% Notes Indenture. The Company was not in violation of any of the debt covenants.
The 6.75% Notes Indenture provides for customary events of default, including payment defaults, breaches of covenants, certain payment defaults at final maturity or acceleration of other indebtedness, failure to pay certain judgments, certain events of bankruptcy, insolvency and reorganization and certain instances in which a guarantee ceases to be in full force and effect. If any event of default occurs and is continuing, subject to certain exceptions, the trustee or the holders of at least 25% in aggregate principal amount of the then outstanding 6.75% Notes may declare all the 6.75% Notes to be due and payable immediately, together with any accrued and unpaid interest, if any, to the acceleration date. In the case of an event of default resulting from certain events of bankruptcy, insolvency or reorganization, such amounts with respect to the 6.75% Notes will be due and payable immediately without any declaration or other act on the part of the trustee or the holders of the 6.75% Notes.
We entered into interest rate swap transactions with independent third parties to effectively convert the fixed interest rate to a variable rate. The interest rate swap agreements, which expire in 2013, are accounted for as fair value hedges under SFAS No. 133. The aggregate notional amount of the combined interest rate swap transactions is $400.0 million. Under the terms of the interest rate swap agreements, we pay the independent third parties an interest rate equal to the six-month LIBOR rate plus an interest rate spread ranging from 2.214% to 2.250%. In exchange, we receive a fixed rate of 6.75%. At October 1, 2005, $10.6 million has been recorded in other long-term liabilities to record the fair value of the interest rate swap transaction, with a corresponding decrease to the carrying value of the 6.75% Notes on the Consolidated Balance Sheet.
Zero Coupon Convertible Subordinated Debentures due 2020. On September 12, 2000, we issued $1.66 billion in aggregate principal amount at maturity of zero coupon convertible subordinated debentures, or Zero Coupon Debentures, due on September 12, 2020 at an issue price of $452.89 per $1,000 debenture, resulting in gross proceeds of $751.8 million. The Zero Coupon Debentures are subordinated to the prior payment of all senior indebtedness, as defined, of Sanmina-SCI. There will be no cash interest payments prior to maturity. The issue price of each Zero Coupon Debenture represents a yield to maturity of 4% per year, computed on a semi-annual basis. The issue discount is amortized using the effective interest method over the term of the notes. The Zero Coupon Debentures are convertible into common stock, at any time at the option of the note holder, at the conversion ratio of approximately 6.48 shares per $1,000 principal amount at maturity, subject to adjustment in certain events. The Zero Coupon Debentures are redeemable at the option of Sanmina-SCI on or after September 12, 2005. The Zero Coupon Debentures may also be subject to repurchase, at the option of the holder, on
80
September 12, 2005, September 12, 2010, and September 12, 2015 at $552.08, $672.98, and $820.35, respectively per $1,000 note.
During fiscal 2003, we repurchased approximately $210.6 million aggregate principal amount at maturity (having an accreted value of $104.4 million) of the Zero Coupon Debentures through unsolicited privately negotiated transactions. As a result of the transactions, Sanmina-SCI recorded an $18.7 million gain, net of $1.9 million in unamortized financing fees, from the early extinguishment of this debt. The gain was reflected in other income in the accompanying consolidated statement of operations.
On March 25, 2005, we completed a tender offer for approximately $400 million accreted value of our outstanding Zero Coupon Convertible Subordinated Debentures due 2020, or the Zero Coupon Debentures, at a tender price of $543.75 per $1,000 principal amount at maturity of the Zero Coupon Debentures. Net proceeds from the sale of our 6.75% Notes of approximately $389.5 million in the aggregate after deducting the discounts and estimated expenses of this offering, together with cash on hand, were utilized to repurchase the Zero Coupon Debentures. We accepted $735,629,000 aggregate principal amount at maturity of the Zero Coupon Debentures that were validly tendered in response to the tender offer, representing approximately 64.3% of the total outstanding Zero Coupon Debentures. The redemption of the Zero Coupon Debentures resulted in a loss on extinguishment of debt of $3.1 million in the quarter ended April 2, 2005, which is included in other expense, net in the accompanying consolidated statement of operations.
On September 12, 2005, we repurchased $407.2 million in aggregate principal amount at maturity of the Zero Coupon Debentures. The repurchase was made pursuant to the terms of the indenture under which the Zero Coupon Debentures were issued. The indenture gave the holders the right to require Sanmina-SCI to repurchase their Zero Coupon Debentures on September 12, 2005 at a fixed price. The purchase price for the Debentures was $552.08 per $1,000 principal amount at maturity. The aggregate purchase price for all the Debentures surrendered for repurchase was $224.8 million. The aggregate remaining outstanding principal amount at maturity of the Debentures is $0.5 million.
3% Convertible Subordinated Notes due 2007. In March 2000, SCI issued $575.0 million aggregate principal amount of 3% Convertible Subordinated Notes due March 15, 2007, or 3% Notes. Interest on the 3% Notes is payable semi-annually on each March 15 and September 15. In connection with the merger with SCI, Sanmina-SCI entered into a supplemental indenture with respect to the 3% Notes providing a guaranty for the 3% Notes and allowing for the conversion of the 3% Notes into shares of Sanmina-SCI common stock, at a conversion price of $41.35 per share, subject to adjustment in certain events. The 3% Notes are subordinated in right of payment to all existing and future senior debt, as defined, of Sanmina-SCI. The 3% Notes are redeemable at SCI’s option at any time on or after March 20, 2003, although there is no mandatory redemption prior to final maturity. During fiscal 2003, Sanmina-SCI repurchased approximately $50.0 million aggregate principal amount of its 3% Convertible Subordinated Notes due 2007 through unsolicited privately negotiated transactions. As a result of the transactions, Sanmina-SCI recorded an $8.1 million gain, net of $690,000 in unamortized financing fees, from the early extinguishment of this debt. The gain was reflected in other expense, net in the accompanying consolidated statements of operations.
Senior Credit Facility. On October 26, 2004, we entered into a senior secured credit facility providing for a $500 million revolving credit facility, with a $150 million letter of credit sub-limit. The senior secured credit facility expires on October 26, 2007. There are currently no loans outstanding under the senior secured credit facility.
All of our existing and future domestic subsidiaries will guaranty the obligations under the credit facility, subject to some limited exceptions. Our obligations and the obligations of our subsidiaries under the credit facility are secured by substantially all of our assets; substantially all of the assets of substantially all of our United States subsidiaries located in the United States; a pledge of all capital stock of substantially all of our United States subsidiaries; a pledge of 65% of the capital stock of certain of our and our United States subsidiaries’ first-tier foreign subsidiaries; and mortgages on certain domestic real estate.
The Senior Credit Facility provides for the collateral to be released at such time as our 10.375% Notes have been paid in full, we have satisfied our obligations with respect to the Zero Coupon Subordinated Debentures described above, our long-term unsecured noncredit enhanced debt is rated not less than BB by Standard & Poor’s and Ba2 by Moody’s and we are in pro forma compliance with the financial covenants contained in the credit facility.
The credit facility requires us to comply with a fixed charge coverage ratio and a ratio of total debt to EBITDA. Additionally, the credit facility contains numerous affirmative covenants, including covenants regarding the payment of taxes and other obligations, maintenance of insurance, reporting requirements and compliance with applicable laws and regulations.
81
Further, the credit facility contains negative covenants limiting the ability of us and our subsidiaries, among other things, to incur debt, grant liens, make acquisitions, make certain restricted payments, sell assets and enter into sale and lease back transactions. The events of default under the credit facility include payment defaults, cross defaults with certain other indebtedness, breaches of covenants and bankruptcy events.
On December 16, 2005, we entered into a new senior credit facility which replaces this facility. For additional details regarding this new facility, refer to footnote 23 of the Notes to Consolidated Financial Statements — “Subsequent Events”.
As of October 1, 2005, we also have $1.3 million of other term loans at interest rates that fluctuate. The average interest rates for the fiscal year ended October 1, 2005 were 5.25% for other term loans. As of October 2, 2004, we had $8.0 million of other term loans at interest rates that fluctuate. The average interest rates for the fiscal year ended October 2, 2004 were 3.55% for other term loans.
Maturities of long-term debt, including capital lease obligations as of October 1, 2005 is as follows:
Fiscal Year Ending | | | (In thousands) | |
2006 | | $ | 1,439 | |
2007 | | 523,564 | |
2008 | | 907 | |
2009 | | 844 | |
2010 | | 717,525 | |
Thereafter | | 401,826 | |
Total | | $ | 1,646,105 | |
| | | | | | |
Note 14. Sales of Accounts Receivable
On April 1, 2005, Sanmina-SCI UK Limited and Sanmina-SCI Hungary Electronics Limited Liability Company each a wholly-owned subsidiary of Sanmina-SCI, (“Subsidiaries”) each entered into a Committed Account Receivable Purchase Agreement (collectively, the “Receivables Agreements”). The Receivables Agreements have a term of one year and permit the Subsidiaries to sell specified accounts receivable to the bank from time to time.
On September 23, 2005, our Subsidiary in Hungary and Mexico entered into a Revolving Trade Receivables Purchase Agreement (collectively, the “Bank Receivables Agreements”) with banks and financial institutions (“the Purchasers”) The Bank Receivables Agreements have a term of two years and permit the Subsidiaries to sell specified accounts receivable to the Purchasers from time to time. The amount of the face/invoice amount of receivable sold to the Purchasers and outstanding may not exceed $100.0 million. The Bank Receivables Agreements allow for the designation of additional subsidiaries and the increase of the aggregate investment limits of the Purchasers to up to $400.0 million, in each case subject to the satisfaction of the conditions set forth in the Bank Receivables Agreement including the agreement of the Purchasers to increase their respective investment limits.
We are currently limited by the senior secured credit facility which was amended on June 6, 2005 to the amount of foreign accounts receivable that may be sold under factoring or similar arrangements, including the Bank Receivables Agreements. The revised credit facility amends the aggregate face amount of accounts receivable that may be sold and outstanding at any time from $200 million to $400 million. The obligations of the Subsidiaries under the Bank Receivables Agreements are guaranteed by the Company.
The purchase price for a receivable under the April 1, 2005 Receivables Agreement is equal to 100% of its face amount less a discount charge (based on LIBOR plus a spread) for the period from the date the receivable is sold to its maturity date. The purchase price for a receivable under the September 23, 2005 Receivables Agreement is equal to 100% of its invoice/face amount. The Subsidiaries pay the Purchasers interest during the period from the date the receivable is sold to its maturity date. Both the Bank Receivables Agreements provide for a commitment fee based on the unused portion of the facility. Accounts receivable sales under the Bank Receivables Agreements was $407.7 million for the year ended October 1, 2005. The sold receivables are subject to certain limited recourse provisions. As of October 1, 2005, $223.6 million of sold accounts receivable remain subject to certain recourse provisions. We have not experienced any credit losses under these recourse provisions.
82
Note 15. Accrued Liabilities
Accrued liabilities consist of the following:
| | As of | |
| | October 1,
2005 | | October 2,
2004 | |
| | (In thousands) | |
Income tax payable and deferred income tax | | $ | 170,255 | | $ | 183,577 | |
Restructuring accrual | | 46,067 | | 31,978 | |
Other taxes payable | | 24,282 | | 32,466 | |
Warranty reserve | | 20,867 | | 15,827 | |
Interest payable | | 19,307 | | 14,495 | |
Other | | 86,142 | | 102,780 | |
Total accrued liabilities | | $ | 366,920 | | $ | 381,123 | |
Note 16. Commitments and Contingencies
Operating Leases. We lease certain of our facilities and various equipment under operating leases expiring at various dates through 2021. Sanmina-SCI is responsible for utilities, maintenance, insurance and property taxes under the leases. Future minimum lease payments under operating leases are as follows:
Fiscal Year Ending | | | (In thousands) | |
2006 | | $ | 24,812 | |
2007 | | 17,273 | |
2008 | | 12,845 | |
2009 | | 6,200 | |
2010 | | 3,566 | |
Thereafter | | 21,057 | |
Total | | $ | 85,753 | |
Rent expense under operating leases was approximately $42.3 million, $49.2 million and $54.1 million for the years ended October 1, 2005, October 2, 2004 and September 27, 2003, respectively.
Environmental Matters. Primarily as a result of certain of our acquisitions, Sanmina-SCI has exposures associated with environmental contamination at facilities. These exposures include ongoing investigation and remediation activities at a number of sites.
We use an environmental consultant to assist in evaluating the environmental costs of the companies that it acquires as well as those associated with our ongoing operations, site contamination issues and historical disposal activities in order to establish appropriate accruals in Sanmina-SCI’s financial statements. As of October 1, 2005 and October 2, 2004, respectively, Sanmina-SCI has accrued $13.5 million and $16.9 million for such environmental liabilities, which is recorded as other long-term liabilities in the consolidated balance sheets.
Litigation and other contingencies. From time to time, we are a party to litigation and other contingencies, including examinations by taxing authorities, which arise in the ordinary course of business. We believe that the resolution of such litigation and other contingencies will not materially harm Sanmina-SCI’s business, financial condition or results of operations.
83
Warranty Reserve. The following table is a rollforward of the warranty reserve balance:
Balance as
of
September 27,
2003 | | Additions to
Accrual | | Accrual
Utilized | | Balance as
of October
2,
2004 | | Additions to
Accrual | | Accrual
Utilized | | Balance as
of October
1,
2005 |
(In thousands) |
$ | 16,538 | | $ | 7,084 | | $ | (7,795) | | $ | 15,827 | | $ | 21,541 | | $ | (16,501 | ) | $ | 20,867 |
| | | | | | | | | | | | | | | | | | | |
Pensions. We are obligated to fund our defined benefit pension plans as discussed in footnote 17 of the Notes to Consolidated Financial Statements.
Note 17. Employee Benefit Plans
We adopted SFAS No. 132 (revised 2003), “Employers’ Disclosures about Pensions and Other Postretirement Benefits” in fiscal 2004.
We have various retirement plans that cover the majority of our employees. Our retirement plans permit participants to elect to have contributions made to the retirement plans in the form of reductions in salary under Section 401(k) of the Internal Revenue Code. Under the Sanmina-SCI retirement plans, we match a portion of employee contributions. The amounts contributed by us as 401(k) matches against employee contributions were approximately $10.3 million, $11.4 million and $11.3 million during the fiscal years ended October 1, 2005, October 2, 2004 and, September 27, 2003, respectively.
We sponsor a deferred compensation plan for non-employee members of our board of directors. The plan allows eligible Sanmina-SCI outside directors to defer payment of all or part of the compensation payable to them for serving as Directors of Sanmina-SCI. Deferrals under this plan for the years ended October 1, 2005 and October 2, 2004 were $45,000 and $44,000, respectively.
On January 1, 2003, we adopted a deferred compensation plan for the benefit of eligible employees. The plan allows eligible employees to defer payment of part of their compensation. Deferrals under this plan for the years ended October 1, 2005 and October 2, 2004 were $2.2 million and $2.0 million, respectively.
SCI Systems had defined benefit pension plans covering substantially all employees in the United States and Brockville, Ontario, Canada. These plans generally provide pension benefits that are based on compensation levels and years of service. Annual contributions to the plans are made according to the established laws and regulations of the applicable countries, and were funded annually at amounts that approximate the maximum deductible for income taxes. As a result of the merger between Sanmina Corporation and SCI Systems in December 2001, these plans were frozen. Sanmina Corporation did not have a defined benefit retirement plan; therefore the merger resulted in a plan curtailment as described in SFAS No. 88. Defined benefits were calculated and frozen as of December 31, 2001. Employees who had not yet vested will continue to be credited with service until vesting occurs, but no additional benefits will accrue.
In fiscal 2003, we terminated the Brockville, Canada Plan and the participants received benefits by either: (i) receiving distributions in fiscal 2004 and 2005 if they elect to receive cash, or (ii) having annuities purchased for them through an insurance company for the participants who elect not to receive a cash distribution. In fiscal 2005, we settled with the Canadian government regarding the final amount due to plan participants. The final settlement was not material to the statement of operations.
We also provide defined benefit pension plans in certain other countries. The assumptions used in calculating the obligation for the non-U.S. plans depend on the local economic environment.
84
As of the end of fiscal 2005 and fiscal 2004, we had accrued pension liabilities based on actuarial computations, as follows:
| | U.S. Pensions | | Non-U.S. Pensions | |
| | As of | | As of | |
| | October 1,
2005 | | October 2,
2004 | | October 1,
2005 | | October 2,
2004 | |
| | (In thousands) | | (In thousands) | |
Accumulated benefit obligation | | $ | 42,402 | | $ | 44,115 | | $ | 22,582 | | $ | 19,181 | |
Fair value of assets | | 22,825 | | 28,032 | | — | | — | |
Accrued pension liability and funded status | | $ | 19,577 | | $ | 16,083 | | $ | 22,582 | | $ | 19,181 | |
| | | | | | | | | | | | | | |
In fiscal 2005, we increased the minimum pension liability by $3.8 million, which is included in statement of comprehensive income (loss). The minimum pension liability included in accumulated other comprehensive income in the consolidated balance sheets was $9.6 million and $5.8 million at October 1, 2005 and October 2, 2004, respectively. The pension expense for fiscal 2005, 2004 and 2003 were not material to the statements of operations.
Our pension plan weighted-average asset allocations by asset category for the US Plan are as follows:
| | As of | |
| | October 1,
2005 | | October 2,
2004 | |
Equity securities | | 47 | % | 52 | % |
Debt securities | | 53 | % | 48 | % |
Total | | 100 | % | 100 | % |
We assumed the SCI Systems, Inc. Supplemental Retirement Plan (“U.S. Pension Plan”), a defined benefit plan, from SCI Systems, Inc. on December 6, 2001, when SCI was acquired. Benefits accruals were frozen shortly thereafter on December 31, 2001. During fiscal 2004, the investment allocation consisted primarily of investments in equity instruments and bonds. In general, the investment strategy followed for all plans is designed to assure that the pension assets are available to pay benefits as they come due and minimize market risk. During fiscal 2005, the investment allocation consisted primarily of investments in the State Street Passive Bond Market Index and in the S&P 500 Index for the U.S. plan. The non-U.S. plans are managed consistent with regulations or market practice of the country where the assets are invested.
Weighted-average actuarial assumptions used to determine the benefit obligations for the plan were as follows:
| | U.S. Pensions | | Non-U.S. Pensions | |
| | As of | | As of | |
| | October 1,
2005 | | October 2,
2004 | | October 1,
2005 | | October 2,
2004 | |
Discount rate | | 5.3 | % | 6.0 | % | 4.3 | % | 5.4 | % |
Rate of compensation increases | | — | % | — | % | 2.0 | % | 2.1 | % |
We evaluate these assumptions on a regular basis taking into consideration current market conditions and historical market data. The discount rate is used to state expected future cash flows at a present value on the measurement date. This rate represents the market rate for high-quality fixed income investments. A lower discount rate would increase the present value of the benefit obligation. Other assumptions include demographic factors such as retirement, mortality, and turnover.
85
Weighted-average assumptions used for determining benefit cost were as follows:
| | U.S. Pensions | | Non-U.S. Pensions | |
| | As of | | As of | |
| | October 1,
2005 | | October 2,
2004 | | October 1,
2005 | | October 2,
2004 | |
Discount rate | | 6.0 | % | 6.0 | % | 4.3 | % | 5.4 | % |
Expected return on plan assets | | 8.5 | % | 9.0 | % | — | % | — | % |
Rate of compensation increases | | — | % | — | % | 2.0 | % | 2.1 | % |
The long-term rate of return on assets for the U.S. and non-U.S. pension plans used in these calculations is assumed to be 8.5% and 3.0%, respectively. Several factors, including historical rates of returns, expectations of future returns and projected rates of return from investment managers are considered in developing the asset return assumption for all plans.
Estimated future benefit payments are as follows:
| | Pension Benefits
October 1,
2005 | |
| | (In thousands) | |
2006 | | $ | 3,668 | |
2007 | | $ | 3,477 | |
2008 | | $ | 3,344 | |
2009 | | $ | 3,354 | |
2010 | | $ | 3,511 | |
Years 2011-2015 | | $ | 15,999 | |
Note 18. Acquisitions and Divestitures
Business Combinations
All of our acquisitions subsequent to 2002 that qualified as business combinations have been accounted for using the purchase method of accounting. Consideration includes the cash paid less any cash acquired.
Fiscal 2005
On October 26, 2004, Sanmina-SCI completed the acquisition of 100% of the voting equity interest in Pentex-Schweizer Circuits Limited, or Pentex, a printed circuit board fabrication provider with operations in China and Singapore. The acquisition of Pentex provides Sanmina-SCI with manufacturing facilities to support its customers’ requirements in this region and with the opportunity to leverage its vertical integration strategy. The total purchase price was approximately $77 million, paid in cash. The Company has finalized the allocation of the purchase price to the assets acquired, including goodwill and the liabilities assumed based on management’s estimate of the fair value for purchase accounting purposes at the date of acquisition. The results of Pentex were included in the Company’s consolidated statements of operations from the date of acquisition.
Pro forma results of operations have not been presented for the fiscal 2005 acquisitions because the effect of these acquisitions were not material either on an individual or aggregate basis. Goodwill recognized in the above transaction amounted to approximately $33 million and that amount is not deductible for tax purposes. Goodwill was assigned to the international reporting unit.
Fiscal 2004
During fiscal 2004, Sanmina-SCI completed certain acquisitions that were not individually significant to the Company’s results of operations and financial position. The aggregate cash purchase price for the acquisitions amounted to $33.0 million, net of cash acquired. All of the fiscal 2004 acquisitions were accounted for as purchase business combinations, and accordingly, the results of the acquired businesses were included in the Company’s consolidated statements of operations from the date of acquisition. The purchase price allocations for the above acquisitions are based on management’s estimate of the fair value for purchase accounting purposes at the date of acquisition. Management does not expect significant revisions to the purchase price allocations for the acquired businesses. Certain acquisition agreements that Sanmina-SCI entered into in
86
connection with purchase business combinations may require the Company to pay additional consideration determined by future performance of the acquired entity. Any additional consideration will be reflected in goodwill and intangible assets.
Pro forma results of operations have not been presented for the fiscal 2004 acquisitions because the effects of these acquisitions were not material either on an individual or aggregate basis. Goodwill resulting from the fiscal 2004 acquisitions was approximately $15.1 million. The majority of this goodwill is deductible for tax purposes.
Fiscal 2003
IBM Transaction
In January 2003, Sanmina-SCI entered into an agreement with IBM under which IBM agreed to outsource the manufacturing of a portion of its low and midrange servers, workstations and ThinkPad notebooks to Sanmina-SCI and Sanmina-SCI agreed to acquire IBM’s related manufacturing facilities in Greenock, Scotland and Guadalajara, Mexico. The transaction closed in February 2003 for a cash purchase price of $173.8 million, and was accounted for as a purchase business combination. The purchase price was allocated to the fair value of the net assets acquired, including primarily inventory ($57.2 million), buildings and equipment ($50.2 million) and goodwill ($64.9 million). This goodwill is partially deductible for tax purposes. The purchase price allocation is based on management’s estimate of the fair value for purchase accounting purposes at the date of acquisition. Sanmina-SCI’s results of operations for fiscal 2003 include the results of this business from the date of acquisition.
In fiscal 2004, the allocation of purchase price was revised as management obtained additional information regarding the acquired business. The revision resulted in reduction of building and equipment of $18.1 million and increases in accrued liabilities of $10.9 million, goodwill of $30.9 million and additional cash purchase price of $1.9 million. Management does not expect further significant revisions to the purchase price allocation.
Other Acquisitions
During fiscal 2003, Sanmina-SCI also completed several other acquisitions that were immaterial individually and in the aggregate for an aggregate purchase price of $49.9 million, including a manufacturer of high-end complex medical systems and other high-end industrial products, a wireless communication equipment assembly facility and a developer of enterprise-class servers. The purchase price allocations for the above acquisitions are based on management’s estimate of the fair value for purchase accounting purposes at the date of acquisition. Certain acquisition agreements that Sanmina-SCI entered into in connection with purchase business combinations may require the Company to pay additional consideration determined by future performance of the acquired entity. No significant additional consideration was determined during fiscal 2003, 2004 and 2005.
Pro forma results of operations have not been presented for the fiscal 2003 acquisitions because the effects of these acquisitions were not material either on an individual or aggregate basis. Goodwill resulting from the fiscal 2003 acquisitions was approximately $90.3 million. The majority of this goodwill is deductible for tax purposes.
87
Note 19. Restructuring Costs
In recent periods, we have initiated restructuring plans as a result of the slowdown in the global electronics industry and the worldwide economy. These plans were designed to reduce excess capacity and affected facilities across all services offered in our vertically integrated manufacturing organization. The majority of the restructuring charges recorded as a result of these plans related to facilities located in North America and Europe, and in general, manufacturing activities at these plants were transferred to other facilities.
Costs associated with restructuring activities initiated on or after January 1, 2003, other than those activities related to purchase business combinations, are accounted for in accordance with SFAS No. 146 and SFAS No. 112 where applicable. Accordingly, costs associated with such plans are recorded as restructuring costs in the consolidated statements of operations when a liability is incurred, pursuant to SFAS No. 146 and pursuant to SFAS No. 112, restructuring costs are recorded when probable and estimatable. Restructuring costs are recorded when a liability is incurred and recognized in the consolidated statements of operations as restructuring costs. Accrued restructuring costs are included in «accrued liabilities» in the consolidated balance sheets. Below is a summary of the activity related to restructuring costs recorded pursuant to SFAS No. 146 and SFAS No. 112 for fiscal 2004 and 2005:
| | Employee
Termination
Benefits | | Lease and
Contract
Termination
Costs | | Other
Restructuring
Costs | | Impairment
of Fixed
Assets | | Total | |
| | (In thousands) | |
| | Cash | | Cash | | Cash | | Non-Cash | | | |
Balance at September 27, 2003 | | $ | 3,870 | | $ | 1,462 | | $ | — | | $ | — | | $ | 5,332 | |
Charges to operations | | 59,076 | | 11,186 | | 18,890 | | 18,079 | | 107,231 | |
Charges utilized | | (45,618 | ) | (9,677 | ) | (18,848 | ) | (18,079 | ) | (92,222 | ) |
Reversal of accrual | | (1,832 | ) | (1,384 | ) | — | | — | | (3,216 | ) |
Balance at October 2, 2004 | | 15,496 | | 1,587 | | 42 | | — | | 17,125 | |
Charges to operations | | 84,651 | | 14,070 | | 6,404 | | 6,932 | | 112,057 | |
Charges utilized | | (64,823 | ) | (12,533 | ) | (6,446 | ) | (6,932 | ) | (90,734 | ) |
Reversal of accrual | | (2,508 | ) | — | | — | | — | | (2,508 | ) |
Balance at October 1, 2005 | | $ | 32,816 | | $ | 3,124 | | $ | — | | $ | — | | $ | 35,940 | |
In fiscal 2003, we approved actions pursuant to SFAS No. 146 to close and consolidate certain of our manufacturing facilities in North America and Europe as a result of the ongoing slowdown in the electronics industry. During fiscal year 2003, we recorded charges to operations of $6.0 million for termination benefits related to the involuntary termination of approximately 1,100 employees, and approximately $2.1 million of the charges had been utilized as of September 27, 2003. A total of approximately 880 employees had been terminated as of September 27, 2003. We also recorded charges to operations of $10.3 million for the termination of non-cancelable leases, lease payments for permanently vacated properties and other contract termination costs, and utilized $8.9 million related to these charges. We incurred charges to operations of $8.1 million during fiscal 2003 for the impairment of excess equipment at the vacated facilities, all of which were utilized as of September 27, 2003.
In fiscal 2004, we recorded restructuring charges of approximately $107.2 million related to restructuring activities initiated after January 1, 2003. With the exception of $7.8 million of restructuring charges associated with our phase three restructuring plan announced in July 2004, these restructuring charges were incurred in connection with our phase two restructuring plan announced in October 2002. These charges included employee termination benefits of approximately $59.0 million, lease and contract termination costs of approximately $11.2 million, other restructuring costs of approximately $18.9 million, primarily costs incurred to prepare facilities for closure, and impairment of fixed assets of $18.1 million consisting of excess facilities and equipment to be disposed of. The employee termination benefits were related to the involuntarily termination of approximately 2,000 employees, the majority of which were involved in manufacturing activities. Approximately $45.6 million of employee termination benefits were utilized during fiscal 2004 for the termination of approximately 1,900 employees. We also utilized $9.7 million of lease and contract termination costs and $18.8 million of the other restructuring costs during fiscal 2004. In fiscal 2004, we reversed approximately $1.8 million of accrued employee termination benefits and approximately $1.4 million of accrued lease costs due to revisions of estimates.
88
During fiscal 2005, we recorded charges of approximately $109.5 million (net of $2.5 million reversal of accrual) related to restructuring activities pursuant to SFAS No. 146 and SFAS No. 112, of which $106.5 million related to our phase three restructuring plan and $3.0 million related to our phase two restructuring plan. These charges included employee termination benefits of approximately $84.7 million, lease and contract termination costs of approximately $14.1 million, other restructuring costs of approximately $6.4 million, incurred primarily to prepare facilities for closure, and impairment of fixed assets of approximately $6.9 million consisting of excess facilities and equipment to be disposed of. The employee termination benefits were related to the involuntary termination of employees, the majority of which were involved in manufacturing activities. Approximately $64.8 million of employee termination benefits were utilized and a total of approximately 11,800 employees were terminated during fiscal 2005. We also utilized $12.5 million of lease and contract termination costs and $6.4 million of the other restructuring costs (other facilities charges) during fiscal 2005. We incurred charges to operations of $6.9 million during fiscal 2005 for the impairment of excess fixed assets at the vacated facilities, all of which were utilized as of October 1, 2005. We reversed approximately $2.5 million of accrued employee termination benefits. The reversal of accrual was a result of the changes in estimates and economic circumstances in one of our European entities.
Costs associated with restructuring activities initiated prior to January 1, 2003, other than those activities related to purchase business combinations, are accounted for in accordance with EITF 94-3 and SFAS 112 where applicable. Accordingly, costs associated with such plans are recorded as restructuring costs in the consolidated statements of operations generally at the commitment date. The accrued restructuring costs are included in “accrued liabilities” in the consolidated balance sheet. Below is a summary of the activity related to restructuring costs recorded pursuant to EITF 94-3 and SFAS No. 112 for fiscal 2004 and 2005:
| | Employee
Severance
and
Related
Expenses | | Facilities
Shutdown
and
Consolidation
Costs | | Write-off
Impaired or
Redundant
Fixed Assets | | Total | |
| | (In thousands) | |
| | Cash | | Cash | | Non-cash | | | |
Balance at September 27, 2003 | | $ | 9,739 | | $ | 14,490 | | $ | — | | $ | 24,229 | |
Charges to operations | | 4,071 | | 35,730 | | 3,500 | | 43,301 | |
Charges utilized | | (5,533 | ) | (28,279 | ) | (3,500 | ) | (37,312 | ) |
Reversal of accrual | | (7,050 | ) | (7,016 | ) | — | | (14,066 | ) |
Balance at October 2, 2004 | | 1,227 | | 14,925 | | — | | 16,152 | |
Charges to operations | | 2,285 | | 2,522 | | 4,107 | | 8,914 | |
Charges utilized | | (3,010 | ) | (7,890 | ) | (4,107 | ) | (15,007 | ) |
Balance at October 1, 2005 | | $ | 502 | | $ | 9,557 | | $ | — | | $ | 10,059 | |
| | | | | | | | | | | | | | |
The following sections separately present the charges to the restructuring liability and charges utilized that are set forth in the above table on an aggregate basis.
Fiscal 2002 Plans
September 2002 Restructuring. In fiscal 2003, we recorded charges to operations of $7.0 million for employee severance expenses related to the expected termination of 265 employees, and $18.1 million for non-cancelable lease payments and related costs for the shutdown of facilities. In fiscal 2003, we also incurred and utilized charges to operations of $36.0 million related to the impairment of buildings and excess equipment and leasehold improvements at permanently vacated facilities. We utilized $4.1 million of accrued severance charges and $17.6 million of accrued facilities related charges in fiscal 2003. As of September 27, 2003, 790 employees have been terminated under this exit plan.
In fiscal 2004, we recorded charges to operations of approximately $1.9 million and utilized $2.6 million for employee severance expenses. Approximately 10 employees were terminated during fiscal 2004. In fiscal 2004, we also recorded charges to operations of approximately $26.7 million and utilized approximately $16.1 million for non-cancelable lease payments, lease termination costs and related costs for the shutdown of facilities. In addition, in fiscal 2004 we reversed approximately $3.6 million of accrued employee severance due to lower than anticipated payments at various plants and approximately $5.8 million of accrued facilities shutdown costs due to a change in use of the facilities or we achieving greater sublease income than anticipated. We also incurred and utilized charges to operations of $3.7 million related to the impairment of buildings and leasehold improvements at permanently vacated facilities in fiscal 2004.
89
During fiscal 2005, we recorded charges to operations of approximately $203,000 and utilized $216,000 for employee severance expenses. There was no reduction of work force during fiscal 2005 pursuant to this restructuring plan. During fiscal 2005, we also recorded charges to operations of approximately $544,000 and utilized approximately $2.7 million for non-cancelable lease payments, lease termination costs and related costs for the shutdown of facilities. In addition, $800,000 was charged to operations and utilized due to the impairment of fixed assets to be disposed of. The closing of the plants discussed above as well as employee terminations and other related activities have been completed, however, the leases of the related facilities expire in 2009; therefore, the remaining accrual will be reduced over time as the lease payments, net of sublease income, are made.
October 2001 Restructuring. In fiscal 2003, we recorded charges to operations of $11.1 million for employee severance costs related to the expected involuntary termination of 2,690 employees, and $13.8 million for non-cancelable lease payments and other costs related to the shutdown of facilities. We utilized accrued severance charges of $6.8 million and accrued facilities shutdown related charges of $18.5 million in fiscal 2003. In fiscal 2003 we reversed accrued severance charges of $6.3 million and accrued lease cancellation charges of $700,000 due to lower than estimated settlement costs at three European sites. We also incurred and utilized charges of $2.4 million in fiscal 2003 related to write-offs of fixed assets consisting of excess equipment and leasehold improvements to facilities that were permanently vacated. As of September 27, 2003, 5,046 employees had been terminated under this exit plan.
In fiscal 2004, we recorded charges to operations of approximately $1.1 million for employee severance costs and approximately $4.8 million for non-cancelable lease payments and other costs related to the shutdown of facilities. We utilized accrued severance charges of approximately $2.5 million and accrued facilities shutdown related charges of $3.7 million during fiscal 2004. In fiscal 2004, we reversed approximately $1.3 million of accrued severance and approximately $530,000 of accrued lease costs due to lower than expected payments at various sites. Approximately 5,400 employees were associated with these plant closures and we had terminated all employees affected under this plan.
During fiscal 2005, we recorded charges to operations of approximately $2.0 million for employee severance costs, of which $1.9 million was related to the settlement of pension plan at a Canadian site. We also recorded approximately $82,000 for non-cancelable lease payments and other costs related to the shutdown of facilities. We utilized accrued severance charges of approximately $2.7 million and accrued facilities shutdown related charges of $811,000 during fiscal 2005. In addition, we incurred and utilized charges of $633,000 in fiscal 2005 related to write-offs of fixed assets consisting of excess equipment and leasehold improvements to facilities that were permanently vacated. Manufacturing activities at the facilities affected by this plan ceased in fiscal year 2003 or prior; however, final payments of accrued costs may not occur until later periods.
Fiscal 2001 Plans
Segerström Restructuring. In March 2001, we acquired Segerström in a pooling of interests business combination and announced our restructuring plan. In fiscal 2003, we utilized accrued charges of $600,000 with respect to employee severance. We also recorded charges of $108,000 and utilized accrued charges of $1.8 million with respect to the shutdown and consolidation of facilities.
In fiscal 2004, we utilized approximately $300,000 of accrued severance charges. In addition, in fiscal 2004 we recorded charges to operations of approximately $103,000 and utilized approximately $818,000 with respect to the shutdown and consolidation of facilities. We also reversed $642,000 of accrued facilities shutdown costs due to lower than expected payments during fiscal 2004.
During fiscal 2005, we completed the restructuring activities at a cost of $835,000 which was related to accrued facility charges.
July 2001 Restructuring. In fiscal 2003, we utilized $947,000 of accrued severance costs related to the termination of 12 employees, $14.0 million of accrued costs related to the shutdown of facilities and $779,000 of other accrued restructuring costs. In fiscal 2003, we reversed accrued facility costs of $768,000 due to the early termination of the related lease.
In fiscal 2004, we recorded approximately $4.1 million and utilized approximately $7.7 million of accrued costs related to the shutdown of facilities. In addition, we recorded charges to operations of approximately $1.1 million, utilized $164,000 and reversed approximately $2.1 million of accrued severance due to lower than anticipated payments in fiscal 2004.
90
During fiscal 2005, we recorded approximately $43,000 and utilized approximately $100,000 of accrued severance. In addition, we recorded approximately $1.9 million and utilized approximately $3.5 million of accrued costs related to the shutdown of facilities. We also incurred and utilized $2.7 million for the impairment of fixed assets to be disposed of. Manufacturing activities at the plants affected by this plan had ceased by the fourth quarter of fiscal 2002; however, the leases of the related facilities expire between 2005 and 2010, therefore, the remaining accrual will be reduced over time as the lease payments, net of sublease income, are made.
Cost associated with restructuring activities related to purchase business combinations are accounted for in accordance with EITF 95-3. Below is a summary of the activity related to restructuring costs recorded pursuant to EITF 95-3 for fiscal 2004 and 2005:
| | Employee
Severance and
Related
Expenses | | Facilities
Shutdown and
Consolidation
Costs | | Write-off
Impaired or
Redundant
Fixed Assets | | Total | |
| | (In thousands) | |
| | Cash | | Cash | | Non-cash | | | |
Balance at September 27, 2003 | | $ | 12,052 | | $ | 13,612 | | $ | — | | $ | 25,664 | |
Additions to restructuring accrual | | 10,858 | | — | | 6,024 | | 16,882 | |
Accrual utilized | | (20,826 | ) | (11,434 | ) | (6,024 | ) | (38,284 | ) |
Balance at October 2, 2004 | | 2,084 | | 2,178 | | — | | 4,262 | |
Accrued utilized | | (773 | ) | (393 | ) | — | | (1,166 | ) |
Balance at October 1, 2005 | | $ | 1,311 | | $ | 1,785 | | $ | — | | $ | 3,096 | |
| | | | | | | | | | | | | | |
The following sections separately present the charges to the restructuring liability and charges utilized that are set forth in the above table on an aggregate basis.
Other Acquisition-Related Restructuring Actions. In fiscal 2003, as part of an insignificant business acquisition completed in December 2002, we closed an acquired manufacturing facility in Texas as of the acquisition date and transferred the business to an existing Sanmina-SCI plant. We recorded and utilized total charges to the restructuring liability of $2.4 million relating to the closure of this plant. The charges consisted of $311,000 for salary related costs for employees participating in the closure of the plant and $2.1 million for excess equipment, all of which were utilized during the year. Also, in the fourth quarter of fiscal 2003, we recorded charges to the restructuring liability of $7.5 million related to a manufacturing facility in Germany acquired in the third quarter of fiscal 2002. The charges consisted of severance costs for involuntary employee terminations of approximately 210 employees. We utilized $897,000 of the accrued severance in fiscal 2003 to terminate 145 employees.
In fiscal 2004, we utilized $6.6 million of accrued severance to terminate 60 employees related to a manufacturing facility in Germany acquired in fiscal 2002. In addition, we recorded charges to the restructuring liability of $10.9 million, and utilized $10.8 million, related to employee terminations at manufacturing facilities in Europe and Mexico acquired in fiscal 2003 due to the transfer of a portion of the manufacturing activities to an existing plant. The charges were related to the elimination of approximately 340 employees. We also recorded and utilized charges to the restructuring liability of approximately $6.0 million related to excess machinery and equipment to be disposed of.
SCI Acquisition Restructuring. In December 2001, we merged with SCI in a purchase business combination and formally changed our name to Sanmina-SCI Corporation. In fiscal 2003, we recorded restructuring charges of $22.8 million for severance costs and utilized $33.4 million for 2,042 employee terminations. In fiscal 2003, we reversed a total of $24.0 million of accrued severance costs, approximately $18.4 million of which was due to lower than anticipated settlement costs at a major European site, and approximately $5.6 million of which related to two plants that were not closed as initially planned due to a change in business circumstances. As of September 27, 2003, 8,488 employees had been terminated under this plan. In fiscal 2003, we recorded restructuring charges of $7.2 million and utilized $14.2 million for lease payments for permanently vacated properties and other costs. We also reversed $1.0 million of accrued facility shutdown costs due to lower than estimates at various sites. In fiscal 2003, we also recorded $1.2 million and utilized $5.3 million for the impairment of excess equipment at closed plants.
91
In fiscal 2004, we utilized a total of approximately $11.4 million of facilities-related accruals and $3.4 million of accrued severance. During fiscal 2005, we utilized $731,000 related to employee severance and utilized $393,000 due to facilities shutdown.
During fiscal 2005 year end, we realigned our structure based on different types of manufacturing services offered to our customers. As a result, our operating segments have changed resulting in the identification of two new reportable segments (Standard Electronic Manufacturing Services and Personal Computing). In the previous fiscal year, we reported our segmented information based on geographical locations (refer to footnote 22 of the Notes to Consolidated Financial Statements). The following table summarizes the total restructuring costs incurred with respect to our reported segments:
| | Fiscal Year Ended | | | |
| | October 1, | | October 2, | | September 27, | | | |
| | 2005 | | 2004 | | 2003 | | Total | |
| | (In thousands) | |
Personal computing | | $ | 41,673 | | $ | 7,561 | | $ | 34,636 | | $ | 83,870 | |
| | | | | | | | | |
Standard electronic manufacturing
services | | 74,771 | | 125,689 | | 71,108 | | 271,568 | |
Total | | $ | 116,444 | | $ | 133,250 | | $ | 105,744 | | $ | 355,438 | |
| | | | | | | | | |
Cash | | $ | 107,422 | | $ | 111,671 | | $ | 59,259 | | $ | 278,352 | |
Non-cash | | 9,022 | | 21,579 | | 46,485 | | 77,086 | |
Total | | $ | 116,444 | | $ | 133,250 | | $ | 105,744 | | $ | 355,438 | |
In January 2005, we revised our projected costs for our phase three restructuring planned to cost an estimated amount of approximately $175 million. The recognition of restructuring charges requires our management to make judgments and estimates regarding the nature, timing, and amount of costs associated with the planned exit activity, including estimating sublease income and the fair value, less selling costs, of property, plant and equipment to be disposed of. Management’s estimates of future liabilities may change, requiring us to record additional restructuring charges or reduce the amount of liabilities already recorded. As of October 1, 2005, we had incurred approximately $114.3 million of restructuring cost under this plan. During October 2005, we initiated restructuring activities in several of our European entities in our phase three restructuring plan.
Note 20. Stockholders’ Equity
Treasury Stock. In September 2001, our Board of Directors authorized Sanmina-SCI to repurchase up to 5% of the outstanding common stock at market price. The timing of the stock purchases is at the discretion of management.
The repurchases and retirements were not material for the years ended 2005, 2004, 2003, respectively.
Sanmina-SCI Stock Option Plans
Stock Option Plans. The 1990 Incentive Stock Plan (the “Plan”) provides for the grant of incentive stock options, non-statutory stock options, and stock purchase rights to employees and other qualified individuals to purchase shares of Sanmina-SCI’s common stock at amounts not less than 100% of the fair market value of the shares on the date of the grant.
On January 29, 1999, stockholders approved an amendment to adopt Sanmina-SCI’s 1999 Stock Plan (the “1999 Plan”). The 1999 Plan provides for the grant of incentive stock options, non-statutory stock options, and stock purchase rights to employees and other qualified individuals to purchase shares of Sanmina-SCI’s common stock generally at amounts not less than 100% of the fair market value of the shares on the date of the grant.
The 1995 Director Option Plan (the “Director Plan”) provides for the automatic grant of stock options to outside directors of Sanmina-SCI or any subsidiary of Sanmina-SCI at amounts not less than 100% of the fair market value of the shares on the date of grant.
The 1996 Supplemental Stock Option Plan (the “Supplemental Plan”) permits only the grant of non-statutory options and provides that options must have an exercise price at least equal to the fair market value of Sanmina-SCI’s common stock on the date of the grant. Options under the Supplemental Plan may be granted to employees and consultants, but executive officers and directors may not be granted options under the Supplemental Plan.
92
The Sanmina-SCI Corporation Stock Option Plan 2000 (the «2000 Plan») provides for the grant of non-statutory stock options to employees of our subsidiaries in Sweden and Finland. The exercise price of options granted under the 2000 Plan can be less than the market value of a share, but shall not be less than the market value of a share on the day before the date on which invitations to apply for options were issued.
The French Addendum to the 1999 Stock Plan (the «French Addendum») provides for the grant of non-statutory options to employees of the subsidiaries of Sanmina-SCI in France. For French tax purposes, the French Addendum is a qualifying plan which will avoid social security charges to the employee provided the shares acquired are not sold within four years of the date on which the option is granted and the option price of the newly issued shares cannot be lower than 95% of the average stock exchange price during the 20 days preceding the grant. Options issued pursuant to this plan are issued at 100% of the market price on the date of grant.
Options vest as determined by the Compensation Committee of the Board of Directors and in no event may an option have a term exceeding ten years from the date of the grant. Option activity under the Sanmina-SCI option plans is as follows:
| | Shares | | Weighted
Average
Exercise Price | |
Balance at September 28, 2002 | | 54,411,764 | | $ | 13.99 | |
Granted | | 23,114,998 | | 8.43 | |
Exercised | | (1,021,818 | ) | 3.80 | |
Cancelled | | (23,650,334 | ) | 19.67 | |
Balance at September 27, 2003 | | 52,854,610 | | 7.29 | |
Granted | | 11,771,500 | | 10.37 | |
Exercised | | (3,667,607 | ) | 4.19 | |
Cancelled | | (5,054,136 | ) | 11.58 | |
Balance at October 2, 2004 | | 55,904,367 | | 9.42 | |
Granted | | 9,105,752 | | 6.42 | |
Exercised | | (1,341,900 | ) | 3.53 | |
Cancelled | | (6,430,153 | ) | 10.76 | |
Balance at October 1, 2005 | | 57,238,066 | | $ | 8.98 | |
On February 3, 2003, Sanmina-SCI implemented a voluntary stock option exchange program, whereby eligible employees could exchange their outstanding options to purchase shares of common stock with an exercise price per share of $11.00 or more granted under the Company’s employee stock option plans. The exchange program allowed employees to choose whether to keep their current stock options at their current price, or to rescind those options in exchange for a new option for the same number of shares to be granted on or about September 12, 2003. The new options have terms and conditions that are substantially the same as those of the cancelled options. Non-employee members of the board of directors and executive officers were not eligible for the exchange program. The total number of shares exchanged under this stock option exchange program was 20,648,641. The average price per share of the options cancelled was $20.59 and the new option price granted under this exchange program was $8.85 per share. This exchange program had no impact on our financial results.
The following table summarizes information regarding stock options outstanding under the Sanmina-SCI option plans at October 1, 2005:
Options Outstanding | | Option Vested and
Exercisable | |
Range of
Weighted
Exercise Prices | | Number
Outstanding | | Weighted Average
Remaining
Contractual Life | | Weighted
Average
Exercise Price | | Number
Outstanding | | Weighted
Average
Exercise Price | |
$ 1.63 - $5.51 | | 13,420,230 | | 6.06 | | $ | 4.46 | | 10,628,704 | | $ | 4.54 | |
$ 5.53 - $8.83 | | 9,607,172 | | 5.15 | | $ | 7.33 | | 9,501,972 | | $ | 7.34 | |
$ 8.84 - $8.85 | | 15,573,905 | | 7.95 | | $ | 8.85 | | 15,568,905 | | $ | 8.85 | |
$ 8.88 - $10.64 | | 11,625,106 | | 7.47 | | $ | 10.26 | | 10,526,926 | | $ | 10.23 | |
$ 10.66 - $56.57 | | 7,011,653 | | 4.80 | | $ | 18.02 | | 6,995,463 | | $ | 18.04 | |
| | | | | | | | | | | |
$ 1.63 - $56.57 | | 57,238,066 | | 6.56 | | $ | 8.98 | | 53,221,970 | | $ | 9.20 | |
93
The number of exercisable options and the weighted average exercise price as of October 2, 2004 and September 27, 2003 were 29,618,067 shares at $9.63 per share and 24,219,067 shares at $8.71 per share, respectively. The weighted average fair values of options granted by Sanmina-SCI during fiscal 2005, 2004, and 2003 were $4.08, $5.97, and $2.22 per share, respectively.
Sanmina-SCI Employee Stock Purchase Plan. Employees participated in the 1993 Employee Stock Purchase Plan (the “1993 ESPP”) from its inception in April 1993 until the 1993 ESPP terminated pursuant to its own terms in March 2003. In fiscal 2003, the Board of Directors and stockholders of the Company approved the 2003 Employee Stock Purchase Plan (the “2003 ESPP”), which replaced the 1993 ESPP. The total number of shares of common stock available to be issued under the 2003 ESPP is 9,000,000 shares. Under the 1993 ESPP and the 2003 ESPP, employees may purchase, on a periodic basis, a limited number of shares of common stock through payroll deductions over a six-month period. The per share purchase price is 85% of the fair market value of the stock at the beginning or end of the offering period, whichever is lower. As of October 1, 2005, 14,197,220 shares had been issued under the 1993 ESPP and 7,367,324 shares had been issued under the 2003 ESPP.
Restricted Stock Awards. We grant awards of restricted stock to executive officers, directors and certain management employees. The restricted stock awards vest after four years, except that certain shares of restricted stock may vest earlier if specified performance criteria are met. During fiscal years 2005 and 2004, we issued restricted stock awards of 260,061 and 4,199,280 shares of common stock to certain eligible executives at a purchase price of $0.00 per share. At October 1, 2005, unamortized deferred compensation expense, net of reversals, (refer to consolidated statements of stockholders’ equity — common stock, additional paid-in capital and deferred compensation) was approximately $33.8 million. Compensation expense resulting from the difference between the market value on the date of the restricted stock award granted and the purchase price is being amortized over the vesting period and was $8.4 million and $9.0 million during the fiscal years 2005 and 2004, respectively. The weighted average grant-date fair value of the restricted stock granted in fiscal 2005 and 2006 was $6.00 and $10.06 per share, respectively.
Authorized Shares. As of October 1, 2005, we have reserved the following shares of authorized but unissued common stock:
Convertible subordinated debt | | 15,876,324 | |
Stock option plans | | 91,469,540 | |
Employee stock purchase plan | | 1,632,676 | |
| | 108,978,540 | |
A total of 34,231,474 shares of common stock were available for grant under our stock option plans as of October 1, 2005.
94
Note 21. Income Taxes
The provision for (benefit from) income taxes is based upon loss before income taxes as follows:
| | Year Ended
October 1,
2005 | | October 2,
2004 | | September 27,
2003 | |
| | (In thousands) | |
Income (loss) before income taxes | | | | | | | |
Domestic | | $ | (741,037 | ) | $ | (61,866 | ) | $ | (219,006 | ) |
International | | 147,174 | | 46,285 | | 20,799 | |
| | $ | (593,863 | ) | $ | (15,581 | ) | $ | (198,207 | ) |
The provision for (benefit from) income taxes consists of the following:
| | Year Ended | |
| | October 1,
2005 | | October 2,
2004 | | September 27,
2003 | |
| | (In thousands) | |
Federal | | | | | | | |
Current | | $ | (6,898 | ) | $ | 24,751 | | $ | (47,700 | ) |
Deferred | | 290,734 | | (25,479 | ) | (43,726 | ) |
| | 283,836 | | (728 | ) | (91,426 | ) |
State | | | | | | | |
Current | | (6,005 | ) | — | | — | |
Deferred | | 37,098 | | (11,325 | ) | (8,058 | ) |
| | 31,093 | | (11,325 | ) | (8,058 | ) |
Foreign taxes | | | | | | | |
Current | | 21,710 | | 32,022 | | 33,191 | |
Deferred | | 75,500 | | (20,569 | ) | 5,243 | |
| | 97,210 | | 11,453 | | 38,434 | |
Total provision for (benefit from) income taxes | | $ | 412,139 | | $ | (600 | ) | $ | (61,050 | ) |
95
The components of the deferred income tax assets and liabilities are as follows:
| | As of | |
| | October 1,
2005 | | October 2,
2004 | |
| | (In thousands) | |
Deferred tax assets: | | | | | |
Reserves and accruals not currently deductible | | $ | 161,189 | | $ | 209,197 | |
Net operating loss carryforwards | | 487,676 | | 288,007 | |
Deferred compensation | | 8,229 | | 7,331 | |
Acquisition related intangibles | | 115,861 | | 41,587 | |
Credit carryforwards | | 7,349 | | 19,932 | |
Unrealized losses on investments | | 3,587 | | — | |
Other | | 106 | | 45,065 | |
Valuation allowance | | (687,487 | ) | (74,023 | ) |
Total deferred tax assets | | $ | 96,510 | | $ | 537,096 | |
| | | | | |
Deferred tax liabilities: | | | | | |
Depreciation differences | | $ | (3,786 | ) | $ | (48,616 | ) |
Foreign earnings | | (73,882 | ) | (72,577 | ) |
Total deferred tax liabilities | | $ | (77,668 | ) | $ | (121,193 | ) |
| | | | | |
Net deferred tax assets | | $ | 18,842 | | $ | 415,903 | |
| | | | | |
Recorded as: | | | | | |
Current deferred tax assets | | $ | 42,767 | | $ | 303,965 | |
Current deferred tax liabilities | | (7,244 | ) | — | |
Non-current deferred tax assets | | — | | 111,938 | |
Non-current deferred tax liabilities | | (16,681 | ) | — | |
Net deferred tax assets | | $ | 18,842 | | $ | 415,903 | |
The net non-current deferred tax liability at October 1, 2005 is included in other liabilities on the consolidated balance sheet. In accordance with SFAS No. 109 “Accounting for Income Taxes,” we believe it is more likely than not that we will not realize a portion of the benefits of certain deferred tax assets, and accordingly, have provided a valuation allowance for them. As of October 1, 2005, approximately $1.4 million of the valuation allowance relates to income tax benefits arising from the exercise of stock options, the benefit from which will be allocated to stockholders’ equity when and if subsequently realized. Our valuation allowance increased by $613.5 million from fiscal year 2004 to fiscal year 2005, which includes a discrete expense of $379.2 million during the quarter ended April 2, 2005 primarily related to U.S. operations.
We have no present intention of remitting undistributed earnings of foreign subsidiaries aggregating approximately $551 million as of October 1, 2005, and, accordingly, no deferred tax liability has been established relative to these earnings. The American Jobs Creation Act of 2004 creates a temporary incentive for U.S. companies to repatriate accumulated foreign earnings by providing an elective 85% dividends received deduction for certain dividends from controlled foreign corporations. As of October 1, 2005, we have determined that we will not repatriate accumulated foreign earnings in light of this legislative change.
As of October 1, 2005, we had cumulative net operating loss carryforwards for federal, state and foreign tax purposes of approximately $763 million, $1,259 million and $435 million, respectively. The net operating loss carryforwards will begin expiring in 2007. The Tax Reform Act of 1986 and similar state provisions impose restrictions on the utilization of net operating loss and tax credit carryforwards in the event of an “ownership change” as defined in the Internal Revenue
96
Code. We have determined that the utilization of the net operating losses that were recorded as part of the acquisition of Newisys Inc. will be subject to an annual limitation. As of October 1, 2005, we had approximately $20.7 million of federal net operating losses recorded from the acquisition and may utilize approximately $1.7 million of these net operating losses each year.
We have been granted tax holidays for certain of our subsidiaries in China, India, Malaysia and Singapore. The tax benefit arising from these tax holidays was approximately $7.4 million ($0.01 per diluted share) for fiscal 2005, $16.8 million ($0.03 per diluted share) for fiscal 2004 and $13.9 million ($0.03 per diluted share) for fiscal 2003. The tax holidays expire through 2009, excluding potential renewals, and are subject to certain conditions with which we expect to comply.
Following is a reconciliation of statutory federal tax rate to the effective tax rate resulting from the computation of the provision for (benefit from) income taxes:
| | Year Ended | |
| | October 1,
2005 | | October 2,
2004 | | September 27,
2003 | |
Federal tax at statutory rate | | (35.00 | )% | (35.00 | )% | (35.00 | )% |
State income taxes, net of federal benefit | | (6.08 | ) | (5.75 | ) | (0.66 | ) |
Foreign loss at other than U.S. rates | | (11.48 | ) | (154.29 | ) | (5.00 | ) |
Non-deductible goodwill impairment | | 24.13 | | — | | — | |
Foreign sales benefit | | (0.28 | ) | (18.20 | ) | (0.66 | ) |
Tax credits | | 0.77 | | (31.00 | ) | 0.88 | |
Change in valuation allowance | | 103.78 | | 229.72 | | 10.24 | |
Other | | (6.44 | ) | 10.67 | | (0.60 | ) |
Provision for (benefit from) income taxes | | 69.40 | % | (3.85 | )% | (30.80 | )% |
Note 22. Business Segment, Geographic and Customer Information
Statement of Financial Accounting Standard No. 131, “Disclosure about Segments of an Enterprise and Related Information” – (“SFAS No. 131”) establishes standards for reporting information about operating segments, products and services, geographic areas of operations and major customers. Operating segments are defined as components of an enterprise about which separate financial information is available that is evaluated regularly by the chief operating decision maker or decision making group in deciding how to allocate resources and in assessing performance.
During fiscal 2005 year end, we realigned our structure based on different types of manufacturing services offered to our customers as a result our operating segments have changed resulting in the identification of two new reportable segments. (Standard Electronic Manufacturing Services and Personal Computing). Certain of our segments have been aggregated. In the previous fiscal year, we reported our segmented information based on geographical locations – (domestic and international). As required by SFAS 131, the prior year information in this footnote has been restated to conform to the current year’s presentation.
97
The following table presents information about reportable segments for the following fiscal years:
| | Year Ended | |
| | October 1,
2005 | | October 2,
2004(restated) | | September 27,
2003(restated) | |
| | (In thousands) | |
Net sales | | | | | | | |
Standard Electronic Manufacturing Services | | $ | 7,721,043 | | $ | 7,721,047 | | $ | 6,967,634 | |
Personal Computing | | 4,013,631 | | 4,483,560 | | 3,393,800 | |
Total Sales | | $ | 11,734,674 | | $ | 12,204,607 | | $ | 10,361,434 | |
Gross Profit | | | | | | | |
Standard Electronic Manufacturing Services | | $ | 572,074 | | $ | 512,251 | | $ | 381,055 | |
Personal Computing | | 68,969 | | 103,838 | | 81,415 | |
Total Gross Profit | | $ | 641,043 | | $ | 616,089 | | $ | 462,470 | |
For the years ended October 1, 2005, October 2, 2004, and September 27, 2003, there were no inter-segment sales between Standard Electronic Manufacturing Services and Personal Computing.
| | As of | |
| | October 1,
2005 | | October 2,
2004 | |
Long-lived assets (excludes goodwill, intangibles
and deferred tax assets): | | | | | |
Standard Electronic Manufacturing Services | | $ | 634,849 | | $ | 738,041 | |
Personal Computing | | 60,332 | | 64,249 | |
Total | | $ | 695,181 | | $ | 802,290 | |
Depreciation and amortization: | | | | | |
Standard Electronic Manufacturing Services | | $ | 154,704 | | $ | 160,472 | |
Personal Computing | | 23,620 | | 30,432 | |
Total | | $ | 178,324 | | $ | 190,904 | |
Capital expenditures: | | | | | |
Standard Electronic Manufacturing Services | | $ | 61,543 | | $ | 73,753 | |
Personal Computing | | 13,006 | | 13,445 | |
Total | | $ | 74,549 | | $ | 87,198 | |
As of September 27, 2003, the Company did not identify or allocate its assets including capital expenditures by operating segment. Accordingly, assets are not being reported by reportable segment because the information was not available.
Revenues are attributable to the country in which the product is manufactured. For fiscal year 2005, 2004 and, 2003 and 2002, two foreign countries, Mexico and Hungary, represented greater than 10% of net sales on a consolidated basis. Revenue derived from Mexican operations was approximately $2.9 billion for fiscal year 2005, $2.4 billion for fiscal year 2004 and, $1.9 billion for fiscal year 2003. Revenue derived from Hungarian operations was approximately $1.8 billion for fiscal year 2005, $1.4 billion for fiscal year 2004 and $0.6 billion for fiscal year 2003. Long-lived assets related to our operations in Mexico accounted for 15.7% and 14.8% of consolidated long-lived assets as of October 1, 2005 and October 2, 2004, respectively. Long-lived assets related to our operations in China accounted for 10.0% and 6.5% of consolidated long-lived assets as of October 1, 2005 and October 2, 2004, respectively. No other foreign country's assets accounted for more than 10% of consolidated long-lived assets as of October 1, 2005 and October 2, 2004.
98
The following summarizes financial information by geographic segment:
| | Year Ended | |
| | October 1,
2005 | | October 2,
2004 | | September 27,
2003 | |
| | (In thousands) | |
Net sales | | | | | | | |
Domestic | | $ | 2,787,710 | | $ | 3,336,940 | | $ | 3,150,340 | |
International | | 8,946,965 | | 8,867,667 | | 7,211,094 | |
Total | | $ | 11,734,674 | | $ | 12,204,607 | | $ | 10,361,434 | |
Operating income (loss) | | | | | | | |
Domestic | | $ | (623,250 | ) | $ | 10,377 | | $ | (142,886 | ) |
International | | 157,350 | | 95,324 | | 65,010 | |
Total | | (465,900 | ) | $ | 105,701 | | $ | (77,876 | ) |
| | As of | |
| | October 1,
2005 | | October 2,
2004 | | September 27,
2003 | |
| | (In thousands) | |
Long-lived assets (excludes goodwill, intangibles and deferred tax assets): | | | | | | | |
Domestic | | $ | 238,015 | | $ | 309,571 | | $ | 382,712 | |
International | | 457,166 | | 492,719 | | 546,157 | |
Total | | $ | 695,181 | | $ | 802,290 | | $ | 928,869 | |
Depreciation and amortization: | | | | | | | |
Domestic | | $ | 71,176 | | $ | 87,255 | | $ | 115,687 | |
International | | 107,147 | | 103,649 | | 106,913 | |
Total | | $ | 178,323 | | $ | 190,904 | | $ | 222,600 | |
Capital expenditures: | | | | | | | |
Domestic | | $ | 23,958 | | $ | 39,653 | | $ | 41,850 | |
International | | 50,591 | | 47,545 | | 28,897 | |
Total | | $ | 74,549 | | $ | 87,198 | | $ | 70,747 | |
A small number of customers are responsible for a significant portion of the Company’s net sales. During fiscal 2005, 2004, and 2003, sales to the Company’s ten largest customers accounted for 63.9%, 69.3%, and 68.5%, respectively, of the Company’s consolidated net sales. In fiscal 2005 and fiscal 2003, sales to the Company’s largest customers accounted for 23.2% and 28.80%, respectively, of the Company’s net sales. No other customer in fiscal 2005 and fiscal 2003 has sales greater than of 10.0% of the Company’s net sales. In fiscal 2004, sales to our two largest customers accounted for 28.4% and 12.0%, respectively of the Company’s net sales.
99
Note 23. Subsequent events
Income taxes. Sanmina-SCI and Subsidiaries is currently under examination by the Internal Revenue Service (“IRS”) for fiscal years 1996 to 2003. The IRS proposed certain adjustments, subject to approval by the Congressional Joint Committee on Taxation (“Joint Committee.”) On December 8, 2005, we received notification from the IRS that the Joint Committee approved the proposed adjustments for Sanmina, the Parent Company, but are waiting for final approval by the Joint Committee for certain of our subsidiaries that were also under examination. The amount will not be determinable until the Joint Committee’s review is complete for certain of our subsidiaries and until we receive the final computation from the IRS.
New credit facility. We entered into an Amended and Restated Credit and Guaranty Agreement, dated as of December 16, 2005, among us, certain of our subsidiaries, as guarantors, and the lenders that are parties thereto from time to time (the “Restated Credit Agreement”). The Restated Credit Agreement amended and restated our Credit and Guaranty Agreement, dated as of October 26, 2004 (the “Original Credit Agreement”) among other things, to:
• Extend the maturity date from October 26, 2007 to December 16, 2008;
• Amend the leverage ratio;
• Permit us and the guarantors to sell domestic receivables pursuant to factoring or similar arrangements if certain conditions are met; and
• Revise the collateral release provisions.
At any time the aggregate face amount of domestic receivables sold by us and the guarantors together with any outstanding amounts exceeds the thresholds set forth in the Restated Credit Agreement, the revolving credit commitments for purposes of making loans and issuing letters of credit will be $0. The Restated Credit Agreement provides for the release of the security interests in our and the guarantors’ accounts receivable at such time as specified conditions are met, including that we have paid at least 85% of the original principal amount of our 10.375% Senior Secured Notes due 2010, the liens granted there under have been released and our credit ratings meet specified thresholds. The Restated Credit Agreement provides for the collateral (other than stock pledges and other collateral we request not to be released) to be released at such time as specified conditions are met, including that we have paid at least 85% of the principal amount of the SCI Systems 3% Convertible Subordinated Notes due 2007 and our credit ratings meet specified thresholds. If following the release of any portion of the collateral pursuant to the provisions of the credit agreement described above, our credit ratings fall below specified thresholds, then we are required to take such actions as are necessary to grant and perfect a security interest in the assets and properties that would at that time comprise the collateral if the relevant collateral documents were still in effect.
100
Note 24. Supplemental Guarantors Condensed Consolidating Financial Information
On December 23, 2002, Sanmina-SCI issued $750.0 million of its 10.375% Notes as part of a refinancing transaction. See Note 13 for a more complete description of the 10.375% Notes.
The condensed consolidating financial statements are presented below and should be read in connection with the Consolidated Financial Statements of Sanmina-SCI. Separate financial statements of the Guarantors are not presented because (i) the Guarantors are wholly-owned and have fully and unconditionally guaranteed the 10.375% Notes on a joint and several basis, and (ii) Sanmina-SCI’s management has determined such separate financial statements are not material to investors. There are no significant restrictions on the ability of Sanmina-SCI or any Guarantor to obtain funds from its subsidiaries by dividend or loan.
The following condensed consolidating financial information presents: the condensed consolidating balance sheets as of October 1, 2005 and October 2, 2004, and the condensed consolidating statements of operations and statements of cash flows for fiscal years ended October 1, 2005, October 2, 2004 and September 27, 2003, of (a) Sanmina-SCI, the parent; (b) the guarantor subsidiaries; (c) the non-guarantor subsidiaries; (d) elimination entries necessary to consolidate Sanmina-SCI with the guarantor subsidiaries and the non-guarantor subsidiaries; and (e) Sanmina-SCI, the guarantor subsidiaries and the non-guarantor subsidiaries on a consolidated basis.
Investments in subsidiaries are accounted for on the equity method. The principal elimination entries eliminate investments in subsidiaries, intercompany balances and intercompany sales.
101
CONDENSED CONSOLIDATING BALANCE SHEET
As of October 1, 2005
| | Sanmina-SCI | | Guarantor
Subsidiaries | | Non.Guarantor
Subsidiaries | | Consolidating
Eliminations | | Consolidated
Total | |
| | (In thousands) | |
ASSETS: | | | | | | | | | | | |
Current assets : | | | | | | | | | | | |
Cash and cash equivalents | | $ | 303,510 | | $ | 6,674 | | $ | 757,869 | | $ | — | | $ | 1,068,053 | |
Short-term investments | | 57,281 | | — | | — | | — | | 57,281 | |
Accounts receivable, net | | 35,125 | | 286,304 | | 1,155,972 | | — | | 1,477,401 | |
Accounts receivable—intercompany | | 226,786 | | — | | — | | (226,786 | ) | — | |
Inventories | | 100,291 | | 303,989 | | 610,755 | | — | | 1,015,035 | |
Deferred income taxes | | — | | — | | 42,767 | | — | | 42,767 | |
Prepaid expenses and other cuurent assets | | 32,876 | | 7,278 | | 46,466 | | — | | 86,620 | |
Total current assets | | 755,869 | | 604,245 | | 2,613,829 | | (226,786 | ) | 3,747,157 | |
Property, plant and equipment, net | | 124,869 | | 94,308 | | 442,924 | | — | | 662,101 | |
Goodwill | | 15,463 | | 604,618 | | 1,069,117 | | — | | 1,689,198 | |
Other intangible assets, net | | 214 | | 31,546 | | 4,147 | | — | | 35,907 | |
Intercompany accounts | | 589,306 | | 477,857 | | — | | (1,067,163 | ) | — | |
Investment in subsidiaries | | 2,356,523 | | 1,534,381 | | — | | (3,890,904 | ) | — | |
Other non-current assets | | 39,856 | | 24,755 | | 17,263 | | — | | 81,874 | |
Restricted cash | | 25,538 | | — | | — | | — | | 25,538 | |
Total assets | | $ | 3,907,638 | | $ | 3,371,710 | | $ | 4,147,280 | | $ | (5,184,853 | ) | $ | 6,241,775 | |
| | | | | | | | | | | |
LIABILITIES AND STOCKHOLDERS’ EQUITY: | | | | | | | | | | | |
Current liabilities: | | | | | | | | | | | |
Current portion of long-term debt | | $ | 830 | | $ | — | | $ | 609 | | $ | — | | $ | 1,439 | |
Accounts payable | | 207,878 | | 380,756 | | 970,538 | | — | | 1,559,172 | |
Accounts payable—intercompany | | — | | 199,309 | | 27,477 | | (226,786 | ) | — | |
Accrued liabilities | | 100,069 | | 94,280 | | 172,571 | | — | | 366,920 | |
Accrued payroll and related benefits | | 50,567 | | 17,363 | | 78,757 | | — | | 146,687 | |
Total current liabilities | | 359,344 | | 691,708 | | 1,249,952 | | (226,786 | ) | 2,074,218 | |
Long-term liabilities: | | | | | | | | | | | |
Long-term debt, net of current portion | | 1,120,542 | | 522,572 | | 1,552 | | — | | 1,644,666 | |
Intercompany accounts noncurrent | | — | | — | | 1,067,163 | | (1,067,163 | ) | — | |
Other | | 48,734 | | 52,157 | | 42,982 | | — | | 143,873 | |
Total long-term liabilities | | 1,169,276 | | 574,729 | | 1,111,697 | | (1,067,163 | ) | 1,788,539 | |
Stockholders’ equity: | | | | | | | | | | | |
Common stock | | 5,457 | | 70,558 | | 337,115 | | (407,673 | ) | 5,457 | |
Other stockholders’ equity accounts | | 2,373,561 | | 2,034,715 | | 1,448,516 | | (3,483,231 | ) | 2,373,561 | |
Total stockholders’ equity | | 2,379,018 | | 2,105,273 | | 1,785,631 | | (3,890,904 | ) | 2,379,018 | |
Total liabilities and stockholders’ equity | | $ | 3,907,638 | | $ | 3,371,710 | | $ | 4,147,280 | | $ | (5,184,853 | ) | $ | 6,241,775 | |
102
CONDENSED CONSOLIDATING STATEMENT OF OPERATIONS
For the Year Ended October 1, 2005
| | Sanmina-SCI | | Guarantor
Subsidiaries | | Non-Guarantor
Subsidiaries | | Consolidating
Eliminations | | Consolidated
Total | |
| | (In thousands) | |
Net sales | | $ | 755,403 | | $ | 3,690,414 | | $ | 9,277,206 | | $ | (1,988,349 | ) | $ | 11,734,674 | |
Cost of sales | | 702,680 | | 3,569,135 | | 8,810,165 | | (1,988,349 | ) | 11,093,631 | |
Gross profit | | 52,723 | | 121,279 | | 467,041 | | — | | 641,043 | |
Operating expenses: | | | | | | | | | | | |
| | | | | | | | | | | |
Selling, general and administrative and research and development | | 25,925 | | 131,387 | | 222,893 | | — | | 380,205 | |
Amortization of intangible assets | | 3,459 | | 4,731 | | 495 | | — | | 8,685 | |
Integration costs | | — | | 1,155 | | 454 | | — | | 1,609 | |
Goodwill impairment | | 15,000 | | 585,000 | | — | | — | | 600,000 | |
Restructuring costs | | 23,002 | | 7,593 | | 85,849 | | — | | 116,444 | |
Total operating expenses | | 67,386 | | 729,866 | | 309,691 | | — | | 1,106,943 | |
Operating income (loss) | | (14,663 | ) | (608,587 | ) | 157,350 | | — | | (465,900 | ) |
Interest income | | 10,952 | | 958 | | 10,626 | | — | | 22,536 | |
Interest expense | | (116,618 | ) | (18,102 | ) | (7,599 | ) | — | | (142,319 | ) |
Interest income (expense)—intercompany | | 35,031 | | (22,984 | ) | (12,047 | ) | — | | 0 | |
Other income (expense) | | (7,175 | ) | (1,785 | ) | 780 | | — | | (8,180 | ) |
Interest and other expense, net | | (77,810 | ) | (41,913 | ) | (8,240 | ) | — | | (127,963 | ) |
| | | | | | | | | | | |
Income (loss) before income taxes, extraordinary gain and equity in income (loss) of subsidiaries | | (92,473 | ) | (650,500 | ) | 149,110 | | — | | (593,863 | ) |
Provision for (benefit from) income taxes | | 265,649 | | (22,552 | ) | 169,042 | | — | | 412,139 | |
Extraordinary gain, net of tax | | — | | — | | — | | — | | 0 | |
Equity in income (loss) of subsidiaries | | (647,880 | ) | 183,826 | | — | | 464,054 | | 0 | |
Net income (loss) | | $ | (1,006,002 | ) | $ | (444,122 | ) | $ | (19,932 | ) | $ | 464,054 | | $ | (1,006,002 | ) |
103
CONDENSED CONSOLIDATING STATEMENT OF CASH FLOWS
For the Year Ended October 1, 2005
| | Sanmina-SCI | | Guarantor
Subsidiaries | | Non-Guarantor
Subsidiaries | | Consolidating
Eliminations | | Consolidated
Total | |
| | (In thousands) | |
Cash provided by (used in) operating activities | | $ | 119,965 | | $ | (74,875 | ) | $ | 370,904 | | $ | — | | $ | 415,994 | |
Cash flows provided by (used in) investing activities: | | | | | | | | | | | |
Purchases of short-term investments | | (77,789 | ) | — | | — | | — | | (77,789 | ) |
Proceeds from maturities of short-term investments | | 40,426 | | — | | — | | — | | 40,426 | |
Purchases of long term investments | | (3,015 | ) | — | | — | | — | | (3,015 | ) |
Purchases of property, plant and equipment | | (13,003 | ) | (10,955 | ) | (50,591 | ) | — | | (74,549 | ) |
Proceeds from sale of property, plant and equipment | | 6,682 | | 11,745 | | 21,685 | | — | | 40,112 | |
Cash paid for businesses acquired, net | | (6,210 | ) | (9,737 | ) | (79,288 | ) | — | | (95,235 | ) |
Cash used in investing activities | | (52,909 | ) | (8,947 | ) | (108,194 | ) | — | | (170,050 | ) |
Cash flows provided by (used in) financing activities: | | | | | | | | | | | |
Change in restricted cash | | (1,076 | ) | — | | — | | — | | (1,076 | ) |
Repurchase of convertible notes | | (623,558 | ) | — | | — | | — | | (623,558 | ) |
Payments of notes and credit facilities, net | | — | | (599 | ) | (12,598 | ) | — | | (13,197 | ) |
Payments of long-term debt | | (675 | ) | (1,446 | ) | (19,369 | ) | — | | (21,490 | ) |
Proceeds from long-term debt, net of issuance costs | | 389,609 | | — | | 13,698 | | — | | 403,307 | |
Proceeds from sale of common stock, net of issuance costs | | 16,767 | | — | | — | | — | | 16,767 | |
Proceeds from (repayment of) intercompany debt | | 6,923 | | 23,578 | | (30,501 | ) | — | | — | |
Cash provided by (used in) financing activities | | (212,010 | ) | 21,533 | | (48,770 | ) | — | | (239,247 | ) |
Effect of exchange rate changes | | — | | — | | (8,091 | ) | — | | (8,091 | ) |
Increase (decrease) in cash and cash equivalents | | (144,954 | ) | (62,289 | ) | 205,849 | | — | | (1,394 | ) |
Cash and cash equivalents at beginning of period | | 448,464 | | 68,963 | | 552,020 | | — | | 1,069,447 | |
Cash and cash equivalents at end of period | | $ | 303,510 | | $ | 6,674 | | $ | 757,869 | | $ | — | | $ | 1,068,053 | |
104
CONDENSED CONSOLIDATING BALANCE SHEET
As of October 2, 2004
| | Sanmina-SCI | | Guarantor
Subsidiaries | | Non-Guarantor
Subsidiaries | | Consolidating
Eliminations | | Consolidated
Total | |
| | (In thousands) | |
ASSETS: | | | | | | | | | | | |
Current assets : | | | | | | | | | | | |
Cash and cash equivalents | | $ | 448,464 | | $ | 68,963 | | $ | 552,020 | | $ | — | | $ | 1,069,447 | |
Short-term investments | | 19,718 | | — | | — | | — | | 19,718 | |
Accounts receivable, net | | 169,105 | | 207,392 | | 1,292,476 | | — | | 1,668,973 | |
Accounts receivable—intercompany | | 151,181 | | 188,657 | | 1,242 | | (341,080 | ) | — | |
Inventories | | 121,131 | | 286,494 | | 656,893 | | — | | 1,064,518 | |
Deferred income taxes | | 159,598 | | 78,121 | | 66,246 | | — | | 303,965 | |
Prepaid expenses and other current assets | | 17,873 | | 21,681 | | 56,969 | | — | | 96,523 | |
Total current assets | | 1,087,070 | | 851,308 | | 2,625,846 | | (341,080 | ) | 4,223,144 | |
Property, plant and equipment, net | | 178,013 | | 113,154 | | 491,475 | | — | | 782,642 | |
Goodwill | | 25,598 | | 1,159,959 | | 1,033,531 | | — | | 2,219,088 | |
Other intangible assets, net | | 1,628 | | 34,221 | | 42 | | — | | 35,891 | |
Intercompany accounts | | 695,549 | | 305,779 | | — | | (1,001,328 | ) | — | |
Investment in subsidiaries | | 2,975,063 | | 1,355,746 | | — | | (4,330,809 | ) | — | |
Other non-current assets | | 196,383 | | 60,179 | | 128,498 | | (138,691 | ) | 246,369 | |
Restricted cash | | 25,462 | | — | | — | | — | | 25,462 | |
Total assets | | $ | 5,184,766 | | $ | 3,880,346 | | $ | 4,279,392 | | $ | (5,811,908 | ) | $ | 7,532,596 | |
| | | | | | | | | | | |
LIABILITIES AND STOCKHOLDERS’ EQUITY: | | | | | | | | | | | |
Current liabilities: | | | | | | | | | | | |
Current portion of long-term debt | | $ | 608,092 | | $ | 534 | | $ | 1,120 | | $ | — | | $ | 609,746 | |
Accounts payable | | 197,357 | | 343,881 | | 1,089,595 | | — | | 1,630,833 | |
Accounts payable—intercompany | | — | | 198,077 | | 143,003 | | (341,080 | ) | — | |
Accrued liabilities | | 198,149 | | 46,370 | | 136,604 | | — | | 381,123 | |
Accrued payroll and related benefits | | 43,401 | | 31,726 | | 89,230 | | — | | 164,357 | |
Total current liabilities | | 1,046,999 | | 620,588 | | 1,459,552 | | (341,080 | ) | 2,786,059 | |
Long-term liabilities: | | | | | | | | | | | |
Long-term debt, net of current portion | | 762,986 | | 520,818 | | 13,533 | | — | | 1,297,337 | |
Intercompany accounts noncurrent | | — | | — | | 1,001,328 | | (1,001,328 | ) | — | |
Other | | 20,070 | | 189,870 | | 23,240 | | (138,691 | ) | 94,489 | |
Total long-term liabilities | | 783,056 | | 710,688 | | 1,038,101 | | (1,140,019 | ) | 1,391,826 | |
Stockholders’ equity: | | | | | | | | | | | |
Common stock | | 5,420 | | 70,558 | | 310,186 | | (380,744 | ) | 5,420 | |
Other stockholders’ equity accounts | | 3,349,291 | | 2,478,512 | | 1,471,553 | | (3,950,065 | ) | 3,349,291 | |
Total stockholders’ equity | | 3,354,711 | | 2,549,070 | | 1,781,739 | | (4,330,809 | ) | 3,354,711 | |
Total liabilities and stockholders’ equity | | $ | 5,184,766 | | $ | 3,880,346 | | $ | 4,279,392 | | $ | (5,811,908 | ) | $ | 7,532,596 | |
105
CONDENSED CONSOLIDATING STATEMENT OF OPERATIONS
For the Year Ended October 2, 2004
| | Sanmina-SCI | | Guarantor
Subsidiaries | | Non-Guarantor
Subsidiaries | | Consolidating
Eliminations | | Consolidated
Total | |
| | (In thousands) | |
Net sales | | $ | 1,257,105 | | $ | 3,795,928 | | $ | 9,372,974 | | $ | (2,221,400 | ) | $ | 12,204,607 | |
Cost of sales | | 1,191,718 | | 3,613,757 | | 9,004,443 | | (2,221,400 | ) | 11,588,518 | |
Gross profit | | 65,387 | | 182,171 | | 368,531 | | — | | 616,089 | |
Operating expenses: | | | | | | | | | | | |
Selling, general and administrative and research and development | | 57,355 | | 121,761 | | 185,272 | | — | | 364,388 | |
Amortization of intangible assets | | 3,817 | | 4,730 | | — | | — | | 8,547 | |
Integration costs | | — | | 2,373 | | 1,830 | | — | | 4,203 | |
Restructuring costs | | 12,329 | | 34,816 | | 86,105 | | — | | 133,250 | |
Total operating expenses | | 73,501 | | 163,680 | | 273,207 | | — | | 510,388 | |
Operating income (loss) | | (8,114 | ) | 18,491 | | 95,324 | | — | | 105,701 | |
Interest income | | 3,468 | | 604 | | 3,813 | | — | | 7,885 | |
Interest expense | | (92,651 | ) | (18,190 | ) | (4,463 | ) | — | | (115,304 | ) |
Interest income (expense)—intercompany | | 34,925 | | (15,247 | ) | (19,678 | ) | — | | — | |
Other income (expense) | | 3,829 | | 1,585 | | (19,277 | ) | — | | (13,863 | ) |
Interest and other expense, net | | (50,429 | ) | (31,248 | ) | (39,605 | ) | — | | (121,282 | ) |
| | | | | | | | | | | |
Income (loss) before income taxes, extraordinary gain and equity in income (loss) of subsidiaries | | (58,543 | ) | (12,757 | ) | 55,719 | | — | | (15,581 | ) |
Provision for (benefit from) income taxes | | (16,907 | ) | (3,684 | ) | 19,991 | | — | | (600 | ) |
Extraordinary gain, net of tax | | — | | — | | 3,583 | | — | | 3,583 | |
Equity in income (loss) of subsidiaries | | 30,238 | | (24,869 | ) | — | | (5,369 | ) | — | |
Net income (loss) | | $ | (11,398 | ) | $ | (33,942 | ) | $ | 39,311 | | $ | (5,369 | ) | $ | (11,398 | ) |
106
CONDENSED CONSOLIDATING STATEMENT OF CASH FLOWS
For the Year Ended October 2, 2004
| | Sanmina-SCI | | Guarantor
Subsidiaries | | Non-Guarantor
Subsidiaries | | Consolidating
Eliminations | | Consolidated
Total | |
| | (In thousands) | |
Cash provided by (used in) operating activities | | $ | (3,069 | ) | $ | 78,306 | | $ | 140,607 | | $ | — | | $ | 215,844 | |
Cash flows provided by (used in) investing activities: | | | | | | | | | | | |
Purchases of short-term investments | | (74,489 | ) | — | | — | | — | | (74,489 | ) |
Proceeds from maturities of short-term investments | | 109,005 | | — | | — | | — | | 109,005 | |
Purchases of long term investments | | (1,148 | ) | — | | (11,755 | ) | — | | (12,903 | ) |
Purchases of property, plant and equipment | | (18,092 | ) | (21,561 | ) | (47,545 | ) | — | | (87,198 | ) |
Proceeds from sale of property, plant and equipment | | 3,565 | | 18,944 | | 5,158 | | — | | 27,667 | |
Cash paid for businesses acquired, net | | (32,699 | ) | (15,379 | ) | (30,397 | ) | — | | (78,475 | ) |
Cash used in investing activities | | (13,858 | ) | (17,996 | ) | (84,539 | ) | — | | (116,393 | ) |
Cash flows provided by (used in) financing activities: | | | | | | | | | | | |
Change in restricted cash | | 90,358 | | — | | — | | — | | 90,358 | |
Payments of notes and credit facilities, net | | (612 | ) | (14 | ) | (16,810 | ) | — | | (17,436 | ) |
Payments of long-term debt | | — | | (358 | ) | (21,421 | ) | — | | (21,779 | ) |
Proceeds from sale of common stock, net of issuance costs | | 35,680 | | — | | — | | — | | 35,680 | |
Proceeds from (repayment of) intercompany debt | | 103,125 | | (103,137 | ) | 12 | | — | | — | |
Cash provided by (used in) financing activities | | 228,551 | | (103,509 | ) | (38,219 | ) | — | | 86,823 | |
Effect of exchange rate changes | | — | | — | | (6,401 | ) | — | | (6,401 | ) |
Increase (decrease) in cash and cash equivalents | | 211,624 | | (43,199 | ) | 11,448 | | — | | 179,873 | |
Cash and cash equivalents at beginning of period | | 236,840 | | 112,162 | | 540,572 | | — | | 889,574 | |
Cash and cash equivalents at end of period | | $ | 448,464 | | $ | 68,963 | | $ | 552,020 | | $ | — | | $ | 1,069,447 | |
107
CONDENSED CONSOLIDATING STATEMENT OF OPERATIONS
For the Year Ended September 27, 2003
| | Sanmina-SCI | | Guarantor
Subsidiaries | | Non-Guarantor
Subsidiaries | | Consolidating
Eliminations | | Consolidated
Total | |
| | (In thousands) | |
Net sales | | $ | 820,585 | | $ | 3,535,193 | | $ | 7,621,291 | | $ | (1,615,635 | ) | $ | 10,361,434 | |
Cost of sales | | 792,733 | | 3,378,591 | | 7,343,275 | | (1,615,635 | ) | 9,898,964 | |
Gross profit | | 27,852 | | 156,602 | | 278,016 | | — | | 462,470 | |
Operating expenses: | | | | | | | | | | | |
Selling, general and administrative and research and Development | | 60,237 | | 112,816 | | 148,633 | | — | | 321,686 | |
Amortization of intangible assets | | 1,416 | | 5,180 | | — | | — | | 6,596 | |
Write down of long-lived assets | | 19,261 | | 52,219 | | 24,120 | | — | | 95,600 | |
Integration costs | | — | | 6,775 | | 3,945 | | — | | 10,720 | |
Restructuring costs | | 44,839 | | 24,808 | | 36,097 | | — | | 105,744 | |
Total operating expenses | | 125,753 | | 201,798 | | 212,795 | | — | | 540,346 | |
Operating income (loss) | | (97,901 | ) | (45,196 | ) | 65,221 | | — | | (77,876 | ) |
Interest income | | 7,256 | | 5,811 | | 2,871 | | — | | 15,938 | |
Interest expense | | (99,511 | ) | (18,761 | ) | (10,229 | ) | — | | (128,501 | ) |
Interest income (expense)—intercompany | | 12,048 | | 11,364 | | (23,412 | ) | — | | — | |
Other income (expense) | | (24,306 | ) | 23,023 | | (6,485 | ) | — | | (7,768 | ) |
Interest and other income (expense), net | | (104,513 | ) | 21,437 | | (37,255 | ) | — | | (120,331 | ) |
Income (loss) before income taxes and equity in income (loss) of subsidiaries | | (202,414 | ) | (23,759 | ) | 27,966 | | — | | (198,207 | ) |
Provision for (benefit from) income taxes | | (76,503 | ) | (3,279 | ) | 18,732 | | — | | (61,050 | ) |
Equity in income (loss) of subsidiaries | | (11,246 | ) | 1,001 | | — | | 10,245 | | — | |
Net income (loss) | | $ | (137,157 | ) | $ | (19,479 | ) | $ | 9,234 | | $ | 10,245 | | $ | (137,157 | ) |
108
CONDENSED CONSOLIDATING STATEMENT OF CASH FLOWS
For the Year Ended September 27, 2003
| | Sanmina-SCI | | Guarantor
Subsidiaries | | Non-Guarantor
Subsidiaries | | Consolidating
Eliminations | | Consolidated
Total | |
| | (In thousands) | |
Cash provided by (used in) operating activities | | $ | (59,757 | ) | $ | 93,057 | | $ | 493,155 | | $ | — | | $ | 526,455 | |
Cash flows provided by (used in) investing activities: | | | | | | | | | | | |
Purchases of short-term investments | | (127,533 | ) | — | | — | | — | | (127,533 | ) |
Proceeds from maturities of short-term investments | | 171,782 | | — | | — | | — | | 171,782 | |
Purchases of long term investment | | (500 | ) | — | | — | | — | | (500 | ) |
Purchases of property, plant and equipment | | (23,016 | ) | (18,834 | ) | (28,897 | ) | — | | (70,747 | ) |
Proceeds from sale of property, plant and equipment | | 2,920 | | 14,378 | | 9,802 | | — | | 27,100 | |
Cash paid for businesses acquired, net | | — | | (24,503 | ) | (199,245 | ) | — | | (223,748 | ) |
Cash provided by (used in) investing activities | | 23,653 | | (28,959 | ) | (218,340 | ) | — | | (223,646 | ) |
Cash flows provided by (used in) financing activities: | | | | | | | | | | | |
Change in restricted cash | | (78,182 | ) | — | | — | | — | | (78,182 | ) |
Repurchase of convertible notes | | (400,717 | ) | (41,248 | ) | — | | — | | (441,965 | ) |
Additions to notes and credit facilities, net | | 983,137 | | — | | 5,398 | | — | | 988,535 | |
Payment on line of credit, net | | (400,650 | ) | (202,430 | ) | (3,112 | ) | — | | (606,192 | ) |
Payments of long-term debt | | (283,210 | ) | (510 | ) | (40,790 | ) | — | | (324,510 | ) |
Proceeds from sale of common stock, net of issuance costs | | 13,585 | | — | | — | | — | | 13,585 | |
Proceeds from (repayment of) intercompany debt | | 18,827 | | 157,682 | | (176,509 | ) | — | | — | |
Cash used in financing activities | | (147,210 | ) | (86,506 | ) | (215,013 | ) | — | | (448,729 | ) |
Effect of exchange rate changes | | — | | — | | 5,598 | | — | | 5,598 | |
Increase (decrease) in cash and cash equivalents | | (183,314 | ) | (22,408 | ) | 65,400 | | — | | (140,322 | ) |
Cash and cash equivalents at beginning of period | | 420,154 | | 134,570 | | 475,172 | | — | | 1,029,896 | |
Cash and cash equivalents at end of period | | $ | 236,840 | | $ | 112,162 | | $ | 540,572 | | $ | — | | $ | 889,574 | |
109
FINANCIAL STATEMENT SCHEDULE
The financial statement Schedule II—VALUATION AND QUALIFYING ACCOUNTS is filed as part of this Form 10-K.
SANMINA-SCI CORPORATION
SCHEDULE II—VALUATION AND QUALIFYING ACCOUNTS
| | Balance at
Beginning of
Period | | Charged
(Credited) to
Operations | | Charges
Utilized | | Balance at End
of Period | |
| | (In thousands) | |
Allowance for Doubtful Accounts | | | | | | | | | |
Fiscal year ended September 27, 2003 | | $ | 86,224 | | $ | (11,682 | ) | $ | (23,211 | ) | $ | 51,331 | |
Fiscal year ended October 2, 2004 | | $ | 51,331 | | $ | (3,776 | ) | $ | (12,149 | ) | $ | 35,406 | |
Fiscal year ended October 1, 2005 | | $ | 35,406 | | $ | (5,410 | ) | $ | (17,567 | ) | $ | 12,429 | |
110
SIGNATURES
Pursuant to the requirements of Section 13 or 15(d) of the Securities Exchange Act of 1934, the registrant has duly caused this report to be signed on its behalf by the undersigned, thereunto duly authorized.
| SANMINA-SCI CORPORATION |
| (Registrant) |
| |
| |
| By: | /s/ Jure Sola |
| | Jure Sola |
| | Chairman and Chief Executive Officer |
Date: December 28, 2005 | | |
Pursuant to the requirements of the Securities Exchange Act of 1934, this report has been signed below by the following persons on behalf of the registrant and in the capacities and on the dates indicated.
Signature | | Title | | Date |
| | | |
/s/ Jure Sola | | Chief Executive Officer and Director
(Principal Executive Officer) | |
Jure Sola | | December 28, 2005 |
| | | |
/s/ David L. White | | Chief Financial Officer (Principal Financial
Officer) | |
David L. White | | December 28, 2005 |
| | | |
/s/ Todd Schull | | Senior Vice-President and Corporate
Controller (Principal Accounting Officer) | |
Todd Schull | | December 28, 2005 |
| | | |
/s/ Neil Bonke | | | |
Neil Bonke | | Director | December 28, 2005 |
| | | |
/s/ ALAIN COUDER | | | |
Alain Couder | | Director | December 28, 2005 |
| | | |
/s/ Mario M. Rosati | | | |
Mario M. Rosati | | Director | December 28, 2005 |
| | | |
/s/ A. Eugene Sapp, Jr. | | | |
A. Eugene Sapp, Jr. | | Director | December 28, 2005 |
| | | |
/s/ Wayne Shortridge | | | |
Wayne Shortridge | | Director | December 28, 2005 |
| | | |
/s/ Peter J. Simone | | | |
Peter J. Simone | | Director | December 28, 2005 |
| | | |
/s/ Jacquelyn M. Ward | | | |
Jacquelyn M. Ward | | Director | December 28, 2005 |
111
Exhibit
Number | | Description |
3.1(1) | | Restated Certificate of Incorporation of the Registrant, dated January 31, 1996. |
| | |
3.1.1(2) | | Certificate of Amendment of the Restated Certificate of Incorporation of the Registrant, dated March 9, 2001. |
| | |
3.1.2(3) | | Certificate of Designation of Rights, Preferences and Privileges of Series A Participating Preferred Stock of the Registrant, dated May 31, 2001 |
| | |
3.1.3(4) | | Certificate of Amendment of the Restated Certificate of Incorporation of the Registrant, dated December 7, 2001. |
| | |
3.2(33) | | Amended and Restated Bylaws of the Registrant, dated December 1, 2003. |
| | |
4.2(6) | | Preferred Stock Rights Agreement, dated as of May 17, 2001 between the Registrant and Wells Fargo National Bank, Minnesota, N.A., including the form of Certificate of Determination, the form of Rights Certificate and the Summary of Rights attached thereto as Exhibits A, B, and C. |
| | |
4.5(8) | | Subordinated Indenture dated March 15, 2000, between SCI Systems, Inc. and Bank One Trust Company, National Association, as Trustee (“Subordinated Indenture”). |
Exhibit
Number | | Description |
4.5.1(9) | | Supplemental Indenture No. 1, dated as of March 15, 2000, to the Subordinated Indenture, between SCI Systems, Inc. and Bank One Trust Company, National Association, as Trustee. |
| | |
4.5.2(5) | | Supplemental Indenture No. 2, dated as of December 7, 2001, to the Subordinated Indenture, by and among SCI Systems, Inc., Sanmina Corporation, as Guarantor, and Bank One Trust Company, National Association, as Trustee. |
| | |
4.2.3 | | Supplemental Indenture No. 3, dated as of October 7, 2005, to the Subordinated Indenture, by and among SCI Systems, Inc., Sanmina-SCI USA, Inc. and J.P. Morgan Trust Company, National Association, as Trustee |
| | |
4.7(25) | | Indenture, dated as of December 23, 2002, among the Registrant, the Guarantors Party thereto and State Street Bank and Trust Company California, N.A., as trustee. |
| | |
4.7.1 | | First Supplemental Indenture, dated as of July 21, 2003, among Newisys, Inc., the Registrant and U.S. Bank National Association, as trustee. |
| | |
4.7.2 | | Second Supplemental Indenture, dated as of September 30, 2005, among Sanmina-SCI USA, Inc., the Registrant and U.S. Bank National Association, as trustee. |
| | |
4.9(27) | | Intercreditor Agreement, dated as of December 23, 2002, by and among, as second lien collateral trustees, LaSalle Business Credit, Inc., as collateral agent, State Street Bank and Trust Company of California, N.A. and each New First Lien Claimholder Representative which may become a party from time to time, and the Registrant. |
| | |
4.10(28) | | Sanmina-SCI Corporation Second Lien Collateral Trust Agreement, dated as of December 23, 2002, by and among the Registrant, the subsidiaries of the Registrant party thereto and State Street Bank and Trust Company of California, N.A., as second lien collateral trustee. |
| | |
4.12(36) | | Credit and Guaranty Agreement, dated as of October 26, 2004, among the Registrant, certain Subsidiaries of the Registrant from time to time party thereto, various Lenders party thereto, Banc of America Securities LLC, as Syndication Agent, Citibank, N.A., as Collateral Agent, and Citicorp USA, Inc., as Administrative Agent. |
| | |
4.12.1 | | Amendment No. 1 to Credit and Guaranty Agreement, dated as of February 15, 2005, made by the Registrant, certain Subsidiaries of the Registrant, the lenders party thereto, Citibank, N.A., as Collateral Agent, and Citicorp USA, Inc., as Administrative Agent. |
| | |
4.12.2(38) | | Amendment No. 1 to Credit and Guaranty Agreement, dated as of June 6, 2005, made by the Registrant, certain Subsidiaries of the Registrant, the lenders party thereto, Citibank, N.A., as Collateral Agent, and Citicorp USA, Inc., as Administrative Agent. |
| | |
4.13(37) | | Indenture, dated as of February 24, 2005, among the Registrant, the guarantors party thereto and U.S. Bank National Association, as trustee. |
| | |
4.13.1 | | First Supplemental Indenture, dated as of September 30, 2005, among Sanmina-SCI USA, Inc., the Registrant and U.S. Bank National Association, as trustee. |
| | |
10.2(10) | | Amended 1990 Incentive Stock Plan. |
| | |
10.29(12) | | 1999 Stock Plan. |
| | |
10.29.1(5) | | Addendum to the 1999 Stock Plan (Additional Terms and Conditions for Employees of the French subsidiary(ies)), dated February 21, 2001. |
| | |
10.30(13) | | 1995 Director Option Plan. |
| | |
10.31(14) | | 1996 Supplemental Stock Plan. |
| | |
10.32(15) | | Hadco Corporation 1998 Stock Plan, as Amended and Restated March 3, 1999. |
| | |
10.33(16) | | Hadco Corporation Non-Qualified Stock Option Plan, as Amended and Restated July 1, 1998. |
| | |
10.34(17) | | Hadco Corporation Non-Qualified Stock Option Plan, as Amended and Restated April 7, 1998. |
| | |
10.35(18) | | SCI Systems, Inc. 1994 Stock Option Incentive Plan. |
| | |
10.36(19) | | SCI Systems, Inc. 2000 Stock Incentive Plan. |
| | |
10.37(20) | | SCI Systems, Inc. Board of Directors Deferred Compensation Plan. |
Exhibit
Number | | Description |
10.42(21) | | Form of Indemnification Agreement executed by the Registrant and its officers and directors pursuant to the Delaware reincorporation. |
| | |
10.49(5) | | Deferred Compensation Plan for Outside Directors. |
| | |
10.50(5) | | Rules of the Sanmina-SCI Corporation Stock Option Plan 2000 (Sweden). |
| | |
10.50.1(5) | | Rules of the Sanmina-SCI Corporation Stock Option Plan 2000 (Finland). |
| | |
10.51(29) | | Executive Deferred Compensation Plan |
| | |
10.53(31) | | 2003 Employee Stock Purchase Plan. |
| | |
10.55(34) | | Committed Account Receivable Purchase Agreement, dated April 1, 2005, between Sanmina-SCI UK Limited and Citibank International Plc |
| | |
10.56(35) | | Committed Account Receivable Purchase Agreement, dated April 1, 2005, between Sanmina-SCI Magyarorszag Elektronikai Gyarto Kft and Citibank International Plc |
| | |
10.57* | | Revolving Receivables Purchase Agreement, dated as of September 23, 2005, among Sanmina-SCI Magyarorszag Elektronikai Gyarto Kft, Sanmina-SCI Systems de Mexico S.A. de C.V., as Originators, the Registrant and Sanmina-SCI UK Ltd., as Servicers, the banks and financial institutions party thereto from time to time, and Deutsche Bank AG New York, as Administrative Agent. |
| | |
10.58 | | Randy Furr separation agreement |
| | |
14.1(32) | | Sanmina-SCI Corporation Code of Business Conduct and Ethics |
| | |
21.1 | | Subsidiaries of the Registrant. |
| | |
23.1 | | Consent of KPMG LLP, independent registered public accounting firm. |
| | |
31.1 | | Certification of the Principal Executive Officer pursuant to 18 U.S.C. Section 1350, as adopted pursuant to Section 302 of the Sarbanes-Oxley Act of 2002 (filed herewith). |
| | |
31.2 | | Certification of the Principal Financial Officer pursuant to 18 U.S.C. Section 1350, as adopted pursuant to Section 302 of the Sarbanes-Oxley Act of 2002 (filed herewith). |
| | |
32.1 | | Certification of the Chief Executive Officer pursuant to 18 U.S.C. Section 1350, as adopted pursuant to Section 906 of the Sarbanes-Oxley Act of 2002 (furnished herewith). |
| | |
32.2 | | Certification of the Chief Financial Officer pursuant to 18 U.S.C. Section 1350, as adopted pursuant to Section 906 of the Sarbanes-Oxley Act of 2002 (furnished herewith). |
(1) Incorporated by reference to Exhibit 3.2 to the Registrant’s Report on Form 10-K for the fiscal year ended September 30, 1996, SEC File No. 000-21272, filed with the Securities and Exchange Commission (“SEC”) on December 24, 1996.
(2) Incorporated by reference to Exhibit 3.1(a) to the Registrant’s Quarterly Report on Form 10-Q for the fiscal quarter ended March 31, 2001, filed with the SEC on May 11, 2001.
(3) Incorporated by reference to Exhibit 3.1.3 to the Registrant’s Report on Form 10-K for the fiscal year ended September 30, 2001, filed with the SEC on December 21, 2001.
(4) Incorporated by reference to Exhibit 3.1.2 to the Registrant’s Registration Statement on Form S-4 filed with the SEC on August 10, 2001.
(5) Incorporated by reference to the Registrant’s Annual Report on Form 10-K for the fiscal year ended September 28, 2002, filed on December 4, 2002.
(6) Incorporated by reference to Exhibit 4.2 to the Registrant’s Registration Statement on Form 8-A filed with the SEC on May 25, 2001.
(7) Intentionally Omitted.
(8) Incorporated by reference to Exhibit 2.2 to SCI Systems, Inc.’s Registration Statement on Form 8-A12B, SEC File No. 001-12821, filed with the SEC on March 9, 2000.
(9) Incorporated by reference to Exhibit 4.1 to SCI Systems, Inc.’s Report on Form 8-K, SEC File No. 001-12821, filed with the SEC on April 5, 2000.
(10) Incorporated by reference to Exhibit 10.2 to the Registrant’s Report on Form 10-K, SEC File No. 000-21272, filed with the SEC on December 29, 1994.
(11) Incorporated by reference to Exhibit 10.3 to the Registrant’s Registration Statement on Form S-1, SEC File No. 33-70700, filed with the SEC on February 19, 1993.
(12) Incorporated by reference to Exhibit 4.3 to the Registrant’s Report on Form S-8, filed with the SEC on May 25, 1999.
(13) Incorporated by reference to Exhibit 10.4 to the Registrant’s Registration Statement on Form S-8, SEC File No. 333-23565, filed with the SEC on March 19, 1997.
(14) Incorporated by reference to Exhibit 10.1 to the Registrant’s Registration Statement on Form S-8, SEC File No. 333-23565, filed with the SEC on March 19, 1997.
(15) Incorporated by reference to Exhibit 4.1 to the Registrant’s Registration Statement on Form S-8, filed with the SEC on June 23, 2000.
(16) Incorporated by reference to Exhibit 4.2 to the Registrant’s Registration Statement on Form S-8, filed with the SEC on June 23, 2000.
(17) Incorporated by reference to Exhibit 4.3 to the Registrant’s Registration Statement on Form S-8, filed with the SEC on June 23, 2000.
(18) Incorporated by reference to Exhibit 4.1 to the Registrant’s Registration Statement on Form S-8, filed with the SEC on December 20, 2001.
(19) Incorporated by reference to Exhibit 4.2 to the Registrant’s Registration Statement on Form S-8, filed with the SEC on December 20, 2001.
(20) Incorporated by reference to Exhibit 4.3 to the Registrant’s Registration Statement on Form S-8, filed with the SEC on December 20, 2001.
(21) Incorporated by reference to Exhibit 10.42 to the Registrant’s Registration Statement on Form S-1, SEC File No. 33-70700, filed with the SEC on February 19, 1993.
(22) Intentionally Omitted.
(23) Incorporated by reference to Exhibit 2.1 to the Registrant’s Registration Statement on Form S-4 filed with the SEC on August 10, 2001.
(24) Incorporated by reference to Exhibit 99.1 to the Registrant’s Report on Form 8-K, filed with the SEC on April 23, 2002.
(25) Incorporated by reference to Exhibit 4.7 to the Registrant’s Quarterly Report on Form 10-Q for the fiscal quarter ended December 28, 2002, filed February 11, 2003.
(26) Intentionally Omitted.
(27) Incorporated by reference to Exhibit 4.9 to the Registrant’s Quarterly Report on Form 10-Q for the fiscal quarter ended December 28, 2002, filed February 11, 2003.
(28) Incorporated by reference to Exhibit 4.10 to the Registrant’s Quarterly Report on Form 10-Q for the fiscal quarter ended December 28, 2002, filed February 11, 2003.
(29) Incorporated by reference to Exhibit 10.51 to the Registrant’s Quarterly Report on Form 10-Q for the fiscal quarter ended December 28, 2002, filed February 11, 2003.
(30) Incorporated by reference to Exhibit 10.52 to the Registrant’s Quarterly Report on Form 10-Q for the fiscal quarter ended December 28, 2002, filed February 11, 2003.
(31) Incorporated by reference to Exhibit 4.1 to the Registrant’s Registration Statement on Form S-8, filed with the SEC on April 23, 2003.
(32) Incorporated by reference to Exhibit 14.1 to the Registrant’s Annual Report on Form 10-K for the fiscal year ended September 27, 2003, filed December 9, 2003.
(33) Incorporated by reference to Exhibit 3.2 to the Registrant’s Annual Report on Form 10-K for the fiscal year ended September 27, 2003, filed December 9, 2003
(34) Incorporated by reference to Exhibit 10.1 to the Registrant’s Quarterly Report on Form 10-Q for the fiscal quarter ended April 2, 2005, filed on May 12, 2005.
(35) Incorporated by reference to Exhibit 10.2 to the Registrant’s Quarterly Report on Form 10-Q for the fiscal quarter ended April 2, 2005, filed on May 12, 2005.
(36) Incorporated by reference to Exhibit 4.12 to the Registrant’s Annual Report on Form 10-K for the fiscal year ended October 2, 2004, filed December 29, 2004.
(37) Incorporated by reference to Exhibit 4.1 to the Registrant’s Current Report on Form 8-K filed on February 24, 2005.
(38) Incorporated by reference to Exhibit 10.1 to the Registrant’s Current Report on Form 8-K filed on June 8, 2005.
(39) Incorporated by reference to Exhibit 10.1 to the Registrant’s Current Report on Form 8-K filed on December 16, 2005.
* Certain information in this exhibit has been omitted and filed separately with the commission. Confidential treatment has been requested with respect to the omitted portions.