| The Sherwin-Williams Company 2005 Annual Report |
FINANCIAL HIGHLIGHTS
| | | | | | | | | | | | | |
| (thousands of dollars except per share data) | | 2003 | | 2004 | | 2005 |
| | | |
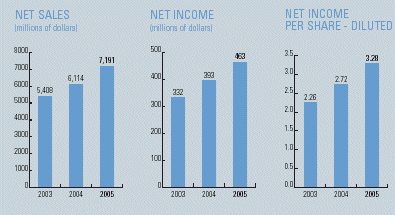
| Net sales | | $ | 5,407,764 | | | $ | 6,113,789 | | | $ | 7,190,661 | |
| |
| Net income | | $ | 332,058 | | | $ | 393,254 | | | $ | 463,258 | |
| |
| Per common share: | | | | | | | | | | | | |
| Net income — diluted | | $ | 2.26 | | | $ | 2.72 | | | $ | 3.28 | |
| Net income — basic | | $ | 2.29 | | | $ | 2.79 | | | $ | 3.39 | |
| Cash dividends | | $ | .62 | | | $ | .68 | | | $ | .82 | |
| Book value | | $ | 10.17 | | | $ | 11.70 | | | $ | 12.81 | |
| |
| Average common shares outstanding (thousands) | | | 144,847 | | | | 140,802 | | | | 136,817 | |
| Return on sales | | | 6.1 | % | | | 6.4 | % | | | 6.4 | % |
| Return on beginning shareholders’ equity | | | 24.7 | % | | | 27.0 | % | | | 28.1 | % |
| Total debt to capitalization | | | 26.0 | % | | | 30.9 | % | | | 26.4 | % |
| Interest coverage (1) | | | 14.5 | x | | | 15.5 | x | | | 14.2 | x |
| Current ratio | | | 1.5 | | | | 1.2 | | | | 1.2 | |
| Total technical expenditures (2) | | $ | 88,369 | | | $ | 91,310 | | | $ | 95,430 | |
| NET SALES NET INCOME NET INCOME (millions of dollars) (millions of dollars) PER SHARE — DILUTED |
| 8000 500 3.5 463 3.28 7,191 7000 3.0 6,114 400 393 2.72 6000 5,408 332 2.5 2.26 5000 300 2.0 4000 1.5 200 3000 1.0 2000 100 1000 0.5 |
| 0 0 0.0 2003 2004 2005 2003 2004 2005 2003 2004 2005 |
(1) Ratio of income before income taxes, minority interest and interest expense to interest expense.
(2) See Note 1, page 48 of this report, for a description of technical expenditures.
| | | | | |
| | | ON THE COVER: In 1890, the original concept for the Sherwin-Williams “Cover The Earth” logo was developed for use in advertising materials. The logo was registered as a trademark in 1905, and has been used in various forms as the primary trademark of The Sherwin-Williams Company for the past 100 years. | |  |
| | | | | |
| | | | | |
| TABLE OF CONTENTS | | | | |
| | | | | |
| Letter to Shareholders | | | 2 | |
| | | | | |
| Company Overview | | | 6 | |
| | | | | |
| Strength In Numbers | | | 14 | |
| | | | | |
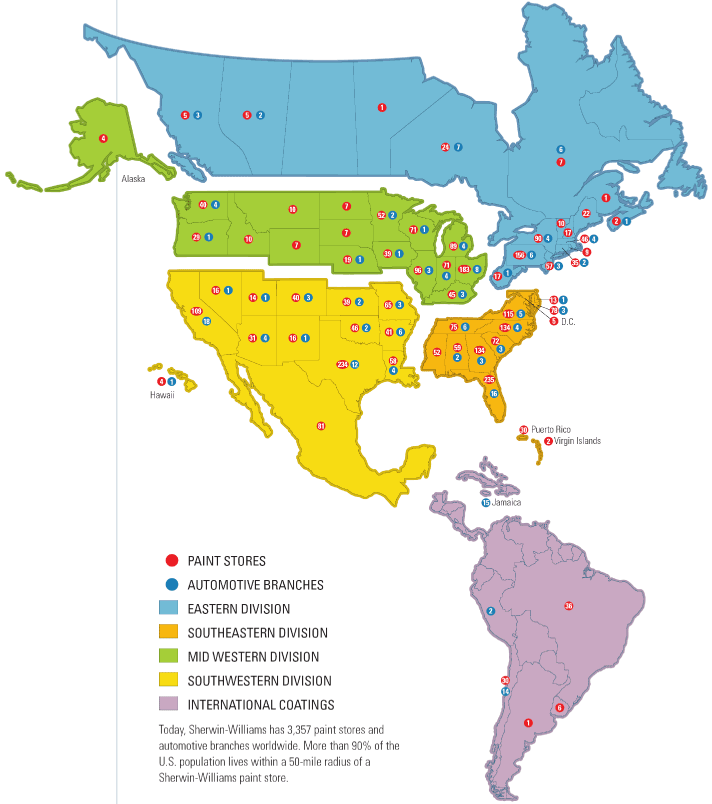
| Stores Map | | | 16 | |
| | | | | |
| Financial Performance | | | 17 | |
The Sherwin-Williams Company is an equal opportunity employer that recruits, selects and hires on the basis of individual qualifications and prohibits unlawful discrimination based on race, color, religion, sex, national origin, protected veteran status, disability, age, sexual orientation or any other consideration made unlawful by federal, state or local laws.
1
Christopher M. Connor
Chairman, President and Chief Executive Officer
EACH YEAR, WE MEASURE
our success by the results we achieve and by our progress in positioning the company for even stronger performance in the future. By both of these measures, 2005 was a very good year for The Sherwin-Williams Company.
For the second consecutive year, we achieved strong double-digit growth in sales volume, revenues and earnings. Consolidated net sales increased by more than one billion dollars, finishing the year at $7.19 billion. Net income increased 17.8 percent to $463.3 million and diluted net income per common share rose more than 20 percent to a record $3.28 per share.
The combination of earnings growth, improved operating efficiency and effective integration of acquired businesses helped to strengthen the Company’s financial position in 2005. We reduced our working capital, defined as accounts receivable plus inventories minus accounts payable, to 12.5 percent of sales in 2005 from 13.8 percent of sales in 2004. On the strength of our earnings performance and working capital management, we generated $717 million in net operating cash, or roughly 10 percent of sales.
Throughout the year, we used this cash to reduce debt, enhance productivity, increase manufacturing capacity, purchase our stock for treasury and increase our dividend. We retired $114 million in debt, reducing our total debt as a percentage of total capitalization to 26.4 percent at the end of 2005 from 30.9 percent at the end of 2004. In November, Standard & Poors upgraded Sherwin-Williams’ debt rating to A+ from A, and in December Moodys changed their outlook on our company to “Positive” from “Stable.” Both of these moves were the result of our strengthening financial position, their confidence in management and their outlook on our prospects going forward.
During the year, we invested $143.1 million in capital expenditures to increase manufacturing capacity, enhance productivity of our existing facilities and begin the construction of a new paint manufacturing plant in the western United States that will be completed and operational late in 2006.
We continued our long-standing practice of returning a
2
LETTER TO SHAREHOLDERS
portion of the cash we generate to shareholders through treasury stock purchases and dividends. In 2005, the Company purchased 8.1 million shares of its common stock in the open market. We increased our cash dividend for the year by fourteen cents to $.82 per share, marking the 27th consecutive year of dividend increases. In 2006, I will recommend to the Board of Directors that we continue our policy of paying out 30 percent of prior year’s diluted net income per share in the form of a cash dividend. Pending Board approval, this will result in a quarterly dividend of $.25 per share, or $1.00 per share for the year, an increase of 22 percent over 2005.
We are proud of our performance in 2005, particularly in light of the unrelenting raw material cost pressures that have plagued our industry over the past two years. Our 2005 results are a testament to the hard work and dedication of our 30,000 employees around the world.
PAINT STORES SEGMENT
Net sales for our Paint Stores Segment increased 21.9 percent to $4.85 billion from $3.98 billion in 2004. Comparable store sales grew by 13.6 percent during the year, marking the second consecutive year of double-digit growth. Operating profit for the Segment increased 23.4 percent to $592.5 million.
Our paint stores serve three major market segments in the North American coatings market: architectural paint customers, OEM product finishers and industrial maintenance and marine coatings users. We achieved solid growth in all three of these segments during the year, and we made progress on several initiatives that will position us well for the future.
In 2005, we opened 98 net new stores, ending the year with 3,081 stores in operation in North America compared to 2,983 stores at the end of 2004. In 2006, we will continue to aggressively pursue our goal of 3 percent annual growth in store count, opening in the range of 100-plus net new stores.
We made significant progress during the year integrating Duron, Inc., which we acquired in September 2004. The 229 Duron paint stores now share a common systems platform with Sherwin-Williams stores, including order management, inventory management and financial reporting. These systems will further improve the productivity and efficiency of Duron stores that were already performing well.
Our Paint Stores Segment introduced 18 new products for the architectural, OEM product finishes and industrial maintenance and marine markets in 2005. The focus of our product development effort is on formulating coatings that require less labor to apply, look better and protect longer than the generation of products they are replacing. We are also an industry leader in the sale of coatings products that comply with increasingly stringent air quality regulations that limit the volume of Volatile Organic Compound (VOC) emissions. You will find many examples of new products featured in this annual report.
THE SHERWIN-WILLIAMS COMPANY INCREASED SALES BY $1 BILLION, SURPASSING THE $7 BILLION MARK.
CONSUMER SEGMENT
External net sales in the Consumer Segment increased 7.7 percent to $1.40 billion for the year versus the same period last year. Acquisitions accounted for all of the sales increase in the Consumer Segment. Operating profit for the year declined $18.6 million, or 9.9 percent, to $169.1 million. Consumer Segment operating profit for the year was adversely affected by increased raw material costs and a $22.0 million goodwill impairment charge reflecting an anticipated reduction in business with a major retail customer beginning in 2006.
GENERATED $717 MILLION IN CASH FROM OPERATIONS.
Our Consumer Segment fulfills a dual mission. It supplies name brand and private label products to retailers
3
throughout North America. It also provides manufacturing, distribution and new product development support to our Paint Stores Segment.
27 CONSECUTIVE YEARS OF DIVIDEND GROWTH.
There are roughly 56,000 retail outlets in the U.S. that sell coatings or coatings related products. Today, about 35,000 of these outlets offer one or more product lines manufactured by our Consumer Segment and sold under such brand names as Dutch Boy®, Pratt & Lambert®, Krylon®, Minwax®, Thompson’s®WaterSeal®, Purdy®and various private and associate labels.
Product and marketing innovation keeps our brands strong and vital. In 2005, our revolutionary Ready To Roll™paint container was recognized as “The Most Innovative Package of the Year” by the Institute of Packaging Professionals and received special recognition from several of our major customers. Krylon H2O™, a latex paint in aerosol form, is ideal for indoor use and cleans up with soap and water. And the launch of our new Pratt & Lambert™Never Compromise Color™Color Sample Selector lets customers explore color palettes and preview color combinations before they paint an entire room.
AUTOMOTIVE FINISHES SEGMENT
Net Sales for our Automotive Finishes Segment increased 7.1 percent to $550.8 million for the year. The majority of this increase came from strong international sales, new product line introductions and favorable currency fluctuations. Operating profit for the full year declined $800,000, or 1.4 percent, to $57.2 million.
During the third quarter of 2005, the Automotive Finishes Segment sold its majority interest in an automotive coatings joint venture in China, resulting in a loss of $7.9 million, which impacted operating profit. After just 18 months in the joint venture, disposition was the most practical solution to the diverging strategic visions for the business by the two owners. Our Automotive management team realized that continuing the joint venture would add significant risk to the venture without a commensurate return for Sherwin-Williams shareholders and decided to take the short term loss.
In 2005, the Automotive Finishes Segment opened seven new branches, bringing the total to 203 in the U.S., Canada, Jamaica, Chile and Peru. During the year the Segment introduced a new automotive water-borne basecoat/clearcoat system called AWX™that is formulated to comply with stringent European Union VOC regulations scheduled to take effect in 2007. We also launched Planet Color™, a collection of optically enhanced automotive coatings for the custom finishing market.
INTERNATIONAL COATINGS SEGMENT
Net sales for the International Coatings Segment grew 21.8 percent to $388.0 million in 2005. Favorable currency fluctuations increased sales for the Segment by 9.8 percent in the year.
Operating profit in this segment for the year grew to $23.6 million from $18.0 million in 2004—an increase of 30.6 percent. This was primarily the result of higher sales volumes, operating efficiencies resulting from manufacturing volume increases and tight expense control.
International Coatings Segment made great strides during the year in strengthening our brand identity and expanding distribution outside North America. In Brazil, we completed an extensive overhaul of our packaging to better align the images of our various brands and strengthen their association with Sherwin-Williams. In Argentina, we were listed among the top 60 companies to work for based on an annual survey by Great Places to Work Institute published in the Clarin Newspaper. And in Italy, we partnered with an established distributor to re-launch our Ronseal™brand wood care coatings line.
MANAGEMENT CHANGES
In July, David F. Hodnik, retired President and Chief Executive Officer of Ace Hardware Corporation, was elected to our Board of Directors. Dave brings a wealth of financial and management experience in a retail environment to the Board, and we look forward to receiving many years of his valuable insight and counsel. This appointment brings the total number of board members to 11 and the number of independent directors to 10.
4
This past year, we realigned our management structure and elevated three key executives to oversee significant portions of our business, reporting to the Chief Executive Officer. John Morkis will continue in his role as Group President, Paint Stores Segment. As Group President, Consumer Segment, Tom Seitz has assumed responsibility for the entire Consumer business, including Diversified Brands and Wood Care Divisions. Tim Knight has been promoted to the new position of Group President, Global Group, overseeing all divisions of the company whose activities extend beyond the boundaries of North America. These gentlemen have proven themselves to be savvy business managers and outstanding leaders over there long tenures with the company. Each brings an impressive record of accomplishment to their new role.
LEAD PIGMENT LITIGATION
Given the heightened publicity that lead pigment litigation has received over the past year, I feel it is appropriate to offer some perspective.
The historical record is clear that the industry, and specifically Sherwin-Williams, has always acted responsibly and within the law. The industry played an important role in funding research that identified the risks associated with poorly maintained lead paint and in disseminating that information to health officials. In 1955, these efforts resulted in the adoption of a voluntary standard by hundreds of paint companies, which essentially removed lead from interior residential paint. Over twenty years later, in 1978, the federal government banned the use of lead pigments in paint for residential and most commercial purposes.
We are joined in most of these lead pigment cases with several other defendants with whom we have maintained an excellent working relationship. Our arguments, and more importantly our actions, are solid and on the right side of the law, and we will continue to vigorously defend the Company against these misguided attacks.
Because we recognize that elevated blood lead levels in children is an important public health issue, we are working with various community-based organizations to help address it. Most of these organizations concentrate their efforts on public education, training and lead hazard control through effective property maintenance.
OUTLOOK FOR 2006
We are encouraged by the strength of our business throughout 2005. Strong demand for architectural products coupled with positive trends in the global OEM finishes, industrial maintenance and automotive refinish markets give us good reason to be optimistic as we enter 2006.
Raw material cost pressures remain a concern, but a manageable one. Recent improvements in the availability of oil, natural gas and petrochemicals have somewhat tempered the sharp rise in raw material pricing we saw in 2004 and 2005. Barring an unforeseen political or natural disaster we would expect this trend to continue in 2006, resulting in a more stable raw material cost environment as the year unfolds.
AGAIN NAMED AS ONE OF THE BEST 100 COMPANIES TO WORK FOR BY FORTUNE MAGAZINE.
Once again, FORTUNE Magazine named Sherwin-Williams to their list of the “100 Best Companies to Work for.” We are committed to the values and principles that helped us gain this recognition, and we will continue to foster a work environment that recognizes and rewards hard work and innovative thinking.
On behalf of the men and women of The Sherwin-Williams Company around the world, we offer our thanks and appreciation to our customers, suppliers and shareholders for their continued trust and confidence.
 Christopher M. ConnorChairman, President And Chief Executive Officer
5
SURPASSING THE $4 BILLION MARK IN SALES
for the first time, the Paint Stores Segment again led the way to a record year for Sherwin-Williams. We opened our 3,000th store in April and ended the year with a total of 3,081, solidifying our position as the largest operator of specialty paint stores in North America.
Sherwin-Williams paint stores are the exclusive outlets for Sherwin-Williams®branded architectural and industrial coatings and related products. We serve a diverse customer base, which includes architectural and industrial painting contractors, residential and commercial builders, property owners and managers, OEM product finishers and do-it-yourself homeowners.
Many companies aspire to be guided by the “voice of the customer.” We hear that voice first hand through literally tens of millions of direct customer interactions each year in our stores and through our field sales organization. The intimate, consultative sales relationships we build through this direct interaction enable us to be highly responsive to customer needs and provide us with constant input and feedback from the end-users of our products.
Each year, the new products we introduce apply the latest technological advancements
6
PAINT STORES SEGMENT
to maximize coatings appearance, performance and ease of use for specific market applications. For example, the patented technology in Duration Home™Interior Paint actually prevents stains from penetrating and enables easy cleaning with a damp sponge. A single coat of our new ProMar 200 XP™Paint is equal to two coats of traditional egshel and flat finishes, saving contractors time and labor cost. Builders Solution™Interior Paint is a two-coat system that starts with a high-build surfacer that masks drywall imperfections and establishes a smooth, even surface for topcoat. Loxon XP™Waterproofing Masonry Coating applies directly to concrete, eliminating the need for primer.
In the paint business, superior color matching and color delivery are important competitive advantages. Our exclusive Sher-Color™computerized color match technology sets a new standard for speed and accuracy in custom color matching. With our Color To Go™Paint Samples, customers can take home samples of custom tinted paint to preview virtually any color for their decorating project. In 2005, we launched an upgraded website with a Color Visualizer that allows the user to experiment with various color combinations in room settings.
We made significant progress during the year on the integration of Duron, Inc., which we acquired in September 2004. All Duron paint stores now share a common systems platform with Sherwin-Williams stores, including order management, financial reporting and inventory management. Our recent acquisition of Purdy has enabled us to offer the brand of brushes and rollers most preferred by professional painters.
INDUSTRIAL MAINTENANCE AND MARINE coatings are formulated to protect steel and masonry infrastructures in the harshest of corrosive environments. Once dominated by solvent-based coatings, this market is rapidly shifting to low-VOC, environmentally friendly waterborne products that are often required by governmental and publicly financed projects. Sherwin-Williams is at the forefront of waterborne technologies formulated to deliver equal or better performance than their solvent- based predecessors. We are taking the lead in customer support by equipping our corrosion specialists with Site Survey™, a proprietary software program used by facility managers to better plan their maintenance painting through long-term budgetary analysis based on a database of on-site coatings performance survey data.
CHEMICAL COATINGS product finishes are used in a variety of wood, plastic and metal applications. In 2005, we completed the first division-wide customer survey, which resulted in a 96 percent satisfaction rating. We introduced several new technologically advanced products in 2005, including Sher-Wood®BAC Wiping Stain for wood finishing, Polane®SP Polyurethane Enamel for heavy equipment, Sher-Nar™PVDF Fluorocarbon Paint for coil and extrusions, Sher-Wood®KemVar®Varnish LF for kitchen cabinets, Waterborne CARC for military equipment and Ultra-Cure®Waterborne UV for multiple wood markets. In addition to a strong performance in North America, we saw dramatic sales growth in Asia during the past year. To support this growth, we recently broke ground on a main distribution center in Shanghai where we already have a manufacturing plant. We also opened new facilities in the Texas cities of El Paso, San Antonio and Longview.
PRODUCTS SOLD: Paints, stains, coatings, caulks, applicators, wallcoverings, floorcoverings, spray equipment and related products
MARKETS SERVED: Do-It-Yourselfers, professional painting contractors, home builders, property managers, architects, interior designers, industrial, marine, flooring and original equipment manufacturer (OEM) product finishes
MAJOR BRANDS SOLD: Sherwin-Williams®, ProMar®, SuperPaint®, A-100®, PrepRite®, Classic 99®, Duration®, Master Hide®, Sher-Wood®, Powdura®, Polane®, ExpressTech®and Duron®
OUTLETS: 3,081 Sherwin-Williams stores in the United States, Canada, Mexico, Puerto Rico, the Virgin Islands and China
7
THE POWERFUL BRANDS that comprise our Consumer Segment faithfully keep their promise of superior product and service performance.
Trusted brand names like Dutch Boy®, Minwax®, Krylon®, Thompson’s®WaterSeal®, Pratt & Lambert®, and Purdy®continue to provide consumers with innovative products that provide long-lasting beauty and durability to their decorating projects. These brands are widely distributed through leading retail outlets, including home centers, mass merchandisers, hardware stores, independent paint stores and home improvement stores.
CONSUMER BRANDS – With our innovative Pratt & Lambert™Never Compromise Color™ Color Sample Selector, customers can now see the actual paint color as it will appear in its intended environment. This wet paint sampling system is a simple, inexpensive way to explore color palettes and color combinations before committing to the time and expense of painting an entire room. The convenient two-ounce containers can accommodate a full two-inch brush for ease of application and are available in 288 colors of our highest quality Accolade®Interior Velvet Finish paint. The sampling system is our newest addition to the Never Compromise Color™Color System, which also includes the
8
Williamsburg Color Collection — showcasing 184 historically accurate colors — and Ovation®Faux Finishes.
Our revolutionary new Dutch Boy™, Ready To Roll™— a project-sized paint container with a built-in roller tray — received additional industry recognition by winning “The Most Innovative Package of the Year” award presented by the Institute of Packaging Professionals. Dutch Boy®Ceiling Solutions™Color Transforming Ceiling Paint applies in a violet shade to ensure complete coverage by revealing missed spots and dries to a bright white in 30 minutes.
WOOD CARE PRODUCTS – The Minwax®brand is synonymous with making and keeping wood beautiful. We are the recognized leader in the interior wood finish category with our complete line of wood stains and clear protective finishes. In 2005, we introduced two new Minwax®Wood Finish colors, Red Chestnut and Gunstock. Our new Minwax®High-Build Polyurethane is designed for use on all interior wood surfaces and provides long-lasting protection and beauty with only two coats. The Minwax®brand is highly visible through television and print advertising and our support of The New Yankee Workshop, hosted by television personality Norm Abram. In addition, DIY Network host and author, Bruce Johnson, continues to be the Minwax®spokesperson.
Thompson’s®WaterSeal®has long been the leading brand of exterior waterproofing products and continues to define the category with innovative new products and technologies. Our new Thompson’s®WaterSeal™No Drip Exterior Gel Stain is formulated for more control and ease of use, fast dry time and less mess for smaller size exterior projects. We also introduced the Thompson’s™WaterSeal™Certified Contractor Program to help professional applicators build added trust with their customers. A regular on Home & Garden Television (HGTV) and the DIY Network, Jeff Wilson has been added to the Thompson’s WaterSeal team as a brand spokesperson.
DIVERSIFIED BRANDS — The introduction of our Krylon H2O™Latex Aerosol Paint marks another breakthrough in paint technology. We have developed a true latex formulation in aerosol paint, which means that it can be used indoors, is exceptionally low-odor and cleans up with soap and water. It is also the only aerosol paint that is safe for use on Styrofoam™. We are also benefiting from the strong growth of the scrapbook market with the introduction of Krylon®Paper Finishes. These products can transform ordinary paper into unique presentations and are designed to protect, adhere, add color and add texture. All are acid-free formulas for optimal performance and protection and are packaged in three-ounce sizes for project size use.
Many of the nation’s leading automotive aftermarket retailers offer our Dupli-Color®High Performance Finishes. This collection of unique products targets specific market segments and features finishes that are night-time reflective and light absorbing and present brilliant glitter and shimmering metallic effects.
PRODUCTS SOLD: Branded, private label and licensed brand paints, stains, varnishes, industrial products, wood finishing products, wood preservatives, applicators, corrosion inhibitors, aerosols and related products
MARKETS SERVED: Do-It-Yourselfers, professional painting contractors, industrial maintenance and flooring contractors
MAJOR BRANDS SOLD: Dutch Boy®, Krylon®, Minwax®, Cuprinol®, Thompson’s®WaterSeal®, Pratt & Lambert®, Martin Senour®, H&C®, White Lightning®, Dupli-Color®, Rubberset®, Purdy®, Bestt Liebco®, Accurate Dispersions™, Kool Seal®and Snow Roof®
OUTLETS: Leading mass merchandisers, home centers, independent paint dealers, hardware stores, automotive retailers and industrial distributors in the United States, Canada and Mexico
9
IN THE WORLD OF NASCAR AND CHAMP CAR RACING, speed and finish mean everything. For that reason, it’s not surprising that Sherwin-Williams is the coatings supplier of choice for a majority of NASCAR teams and the official automotive finishes of the Champ Car Series. Speed and finish also determine success in the collision repair and vehicle refinish markets.
Our automotive finishing customer base is diverse. However, customers in all of our markets, from passenger car to commercial vehicle to aircraft, share common goals —speeding up production time, improving finish quality and satisfying their customers. Our line-up of new and existing products is formulated with those goals in mind. A new waterborne basecoat/clearcoat system called AWX™was introduced in 2005, and already complies with European Union VOC legislation scheduled to take effect January 1, 2007, and new California regulations to be effective January 1, 2009. Extensive testing in five European countries has confirmed that AWX™Waterborne Coatings achieve faster drying times, easier application, superior hiding, coverage and color matching, and improve shop productivity.
10
| |
AUTOMOTIVE FINISHES SEGMENT |
The launch of Planet Color™, an innovative collection of optically enhanced automotive coatings, targets the growing custom finishing market where craftspeople are creating edgy, one-of-a-kind paint jobs. The dramatic colors available in the Planet Color™Coating system have inspired the description, “Where Art And Science Collide™.” For added durability, Planet Color™Coatings are based upon our OEM-approved Ultra 7000®Coatings technology.
We take these technologically advanced products to market through our diverse and constantly expanding distribution platform. In 2005, we opened seven new branches, bringing our total to 172 in North America. Including our branches in the Caribbean and South America, we have over 200 company-operated facilities. This is the largest such network in the automotive finishes industry. As part of our commitment to improve our operations and maximize the customer experience, we are beginning to remodel all of our North American branches to comply with a uniform standard. Additionally, our products are distributed by automotive jobbers, independent distributors and through foreign licensing agreements and subsidiaries.
Sherwin-Williams Automotive Mexico and Volkswagen of Mexico have signed an agreement to offer Volkswagen and Audi licensee networks a solution to their collision repair and automotive paint needs on a national level. This means that we will supply the network of Volkswagen and Audi licensees with the ULTRA 7000®Basecoat/Clearcoat System. In addition, Sherwin-Williams Automotive Mexico will provide ongoing training and support to ensure that we continue to meet the quality requirements of these two car companies on both a national and international level.
We continue to be the paint of choice for a majority of the most well-known NASCAR teams and currently enjoy partnerships with more than 30 cars in the Nextel Cup Series. In 2005, we were recognized as the official automotive finishes of the Champ Car World Series. This is a multi-year agreement that will provide us with an opportunity to showcase our new Planet Color™Coating system in a high-profile environment.
Our FormulaExpress™Internet Scale is an innovative system that enables customers around the world to select color formulas in real time from the database at our World Automotive Center in Warrensville Heights, Ohio. Currently, there are more than 800 scales in place, and more than 200,000 formulas are viewed each month.
Breakthrough systems and product technologies like these, which are sold through our diverse distribution channels and industry alliances, give our customers the speed and finish quality they need to succeed in the highly competitive vehicle refinish industry.
PRODUCTS SOLD: High performance interior and exterior coatings for the automotive, aviation, fleet and heavy truck markets, as well as associated products
MARKETS SERVED:
Automotive jobbers, wholesale distributors, collision repair facilities, dealerships, fleet owners and refinishers, production shops, body builders, aviation and OEM product finishers
MAJOR BRANDS SOLD:
Sherwin-Williams®, Martin Senour®, Western™, Lazzuril™, Excelo™, Baco™and Planet Color™
OUTLETS: 203 company-operated branches in the United States, Canada, Jamaica, Chile and Peru, and other operations throughout North and South America, the Caribbean Islands, Europe and China
11
SALES IN OUR INTERNATIONAL COATINGS SEGMENT grew by more than 20 percent in 2005 as we expanded our offering of innovative coatings products, broadened our distribution, strengthened our market share and built our brands. As a result, profits in this Segment posted a gain of more than 30 percent for the year.
In 2005, we opened three new stores for a total of 74 company-operated stores in Chile, Brazil, Uruguay and Argentina. We distribute the Sherwin-Williams®brand, as well as other well-known regional brands, in 26 countries through wholly-owned subsidiaries, joint ventures, licensing agreements and independent distributors.
BRAZIL — An extensive overhaul of our packaging in Brazil was initiated to modernize and unify our brand image at point-of-sale and facilitate the decision-making process for the consumer, while maintaining a strong connection to the Sherwin-Williams heritage. The rollout began with the unveiling of our leading brands — Metalatex®, Kem Tone®, Acquacryl®and Novacor®— at the premiere national trade show. Metalatex®was recognized as the fastest growing brand of acrylic paint in Brazil in 2005. In addition to the new packaging, three new products were launched
12
| |
| INTERNATIONAL COATINGS SEGMENT |
to the construction market. Expanding on the strong consumer acceptance of our revolutionary Twist and Pour®containers in the U.S., we introduced the concept in Brazil.
At a popular national trade show for hobbyists, we launched several new products in our market-leading Colorgin®aerosol brand geared towards the do-it-yourself customer. In the industrial maintenance category, our Sumaré®brand remains the market leader and is sold through our company-operated stores and direct to end-users. The Sumaré®brand was recognized by sugar producers as the leading supplier of protective coatings in Brazil.
CHILE — In addition to our existing solid distribution platform, the Sherwin-Williams®brand was launched in the Chilean retail channel, which includes home centers, mass retailers and hardware stores. This important event has significantly increased our national retail opportunity and adds to our current retail, wholesale and direct sales mix of architectural, aerosol, industrial and marine, wood and chemical coatings products. In support of this launch, a completely new product line with distinctive new labeling was developed, as well as innovative point-of-purchase displays intended to enhance our image and leverage Sherwin-Williams awareness and perception.
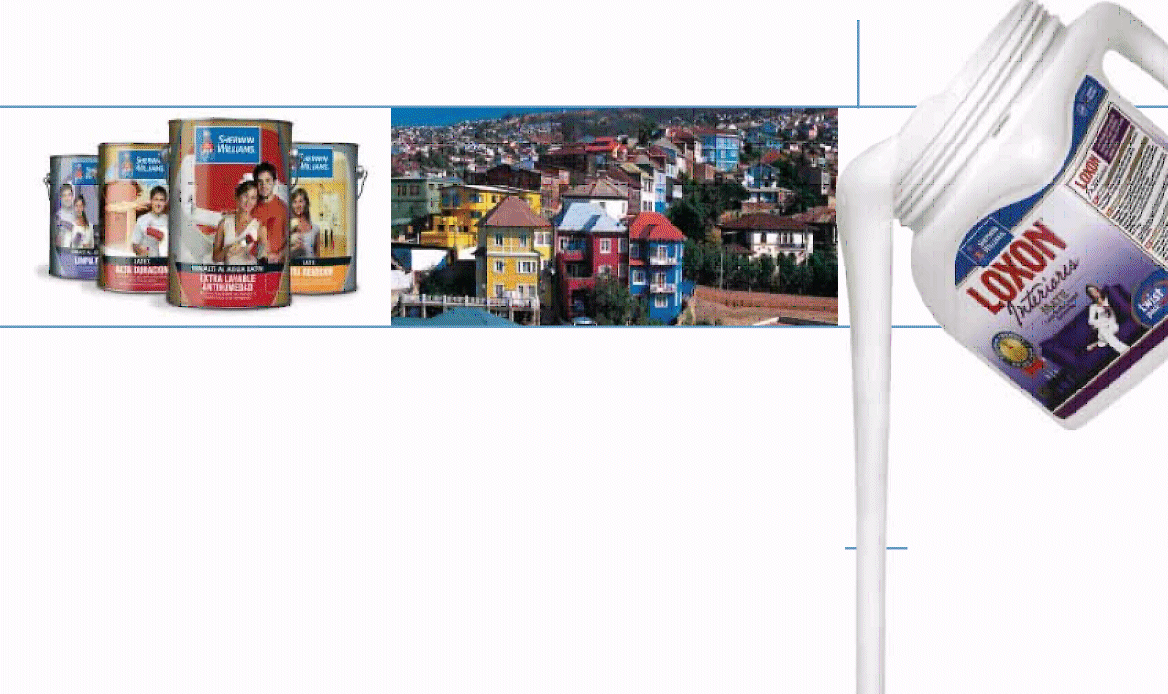
In Valparaíso City, the most important port in Chile, we have partnered with the local municipality to paint 83,000 residences with Sherwin-Williams®paint and restore this historic seaport city to its late 19th century splendor.
ARGENTINA — For the second consecutive year, Clarín Newspaper listed Sherwin-Williams among its annual top 60 of “The Best Companies to Work For” survey. The survey rankings are compiled by Great Places to Work Institute Inc., and the results are published in 20 countries.
The award winning design of our Twist and Pour®container has been modified for local use and is now available in our Loxon®product line. This launch is consistent with our desire to penetrate the do-it-yourself home market, where we also introduced “SherwinManía,” an integrated color concept designed to connect with end-users.
In Rosario City, we opened a new color studio, which attracted more than 600 attendees to its grand opening, including architects, designers, engineers, contractors, painters and consumers.
UNITED KINGDOM — During 2005, Ronseal received accreditation as an “Investor in People,” a UK quality standard that establishes a set of best practices for improving an organization’s performance through its employees.
In the U.K., Ronseal grew market share levels to all-time highs and experienced growth in 16 of the 17 product categories in which it competes. We also successfully introduced a new product called 5 Minute Fence Finish. The creation of a 90,000-square-foot warehousing and distribution center will consolidate our U.K. operations and facilitate our continued growth.
As part of its international business development strategy, Ronseal Limited is re-launching its line of wood care coatings into the Italian market. We have partnered with a strong distributor in Italy and have already established a solid distribution platform for our products.
PRODUCTS SOLD: Architectural paints, stains, varnishes, industrial maintenance products, aerosols, product finishes, wood finishing products and related products
MARKETS SERVED: Do-It-Yourselfers, professional painting contractors, independent dealers, industrial maintenance and OEM product finishes
MAJOR BRANDS SOLD: Sherwin-Williams®, Dutch Boy®, Krylon®, Kem Tone®, Martin Senour®, Pratt & Lambert®, Minwax®, Sumaré®, Ronseal®, Pulverlack®, Colorgin®, Andina®, Tri-Flow®, Thompson’s®WaterSeal®, Marson®, Metalatex®, Novacor®and Loxon®
OUTLETS: Distribution in 26 countries through wholly-owned subsidiaries, joint ventures and licensees of technology, trademarks and tradenames, including 74 company-operated architectural and industrial stores in Chile, Brazil, Uruguay and Argentina
13
WORKING CAPITAL TO SALES – Working capital, defined as accounts receivables plus inventories minus accounts payable, improved to 12.5% of sales in 2005, a reduction of 1.3% from the previous year. Reducing working capital favorably impacts net operating cash. Management believes the Company’s optimal working capital level is approximately 11% of sales.
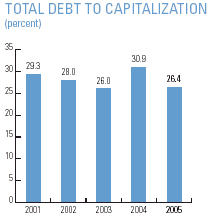
TOTAL DEBT TO CAPITALIZATION – By retiring $114 million in debt in 2005, we reduced our total debt as a percentage of total capitalization to 26.4%. This low level of debt as a percentage of total capitalization provides the Company financial flexibility to grow through capital expansion or acquisitions.
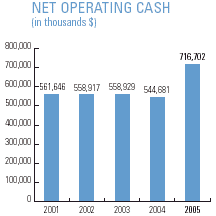
NET OPERATING CASH – In 2005, we increased net operating cash by more than $172 million to $717 million. This cash helped add manufacturing capacity, enhance productivity, strengthen our financial condition, support the Company’s continued growth and return additional cash to our shareholders.
14
IN ADDITION TO GROWING SALES VOLUME
and net income in 2005, we are also pleased with our overall performance as measured by certain key financial indicators. The success we achieved in these areas reflects our continued focus on demonstrating good stewardship of the cash we generate and maximizing shareholder return.
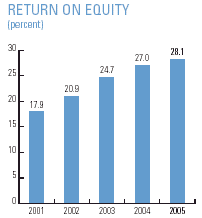
RETURN ON EQUITY – Return on equity is based on income before cumulative effect of change in accounting principle divided by shareholder’s equity at the start of the year. As a measure of our profitability achieved for each dollar invested by shareholders, increasing return on equity is indicative of the Company’s ability to maximize shareholder return.
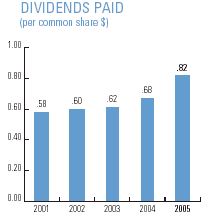
DIVIDENDS PAID – For the 27th year in a row, we increased cash dividends on common stock paid to our shareholders. In 2005, we increased our cash dividend by fourteen cents to $.82 per share – a 20.6% increase in the amount of net operating cash returned to our shareholders through dividends.
STOCK PURCHASE – We believe that Sherwin-Williams stock is a good investment, and in 2005, again supported that belief by purchasing 8.1 million shares on the open market. This stock purchase strategy benefits shareholders by returning their investment at market value and maximizes the ownership value of the remaining outstanding shares.
15
STORES MAP/SUBSIDIARIES
SUBSIDIARIES
FOREIGN
Coatings S.R.L.
Compañia Sherwin-Williams, S.A. de C.V.
Eurofinish S.r.l.
Productos Quimicos y Pinturas, S.A. de C.V.
Quetzal Pinturas, S.A. de C.V.
Ronseal (Ireland) Limited
Ronseal Limited
Sherwin-Williams (Caribbean) N.V.
Sherwin-Williams (West Indies) Limited
Sherwin-Williams Argentina I.y C.S.A.
Sherwin-Williams Automotive Europe S.P.A.
Sherwin-Williams Automotive France S.r.l.
Sherwin-Williams Automotive Mexico S. de R.L. de D.V.
Sherwin-Williams Canada Inc.
Sherwin-Williams Cayman Islands Limited
Sherwin-Williams Chile S.A.
Sherwin-Williams do Brasil Industria e Comercio Ltda.
Sherwin-Williams Japan Co., Ltd.
Sherwin-Williams Paints LLC
Sherwin-Williams Paints (Dongguan) Company Limited
Sherwin-Williams Pinturas de Venezuela S.R.L.
Sherwin-Williams (Shanghai) Paints Company Limited
Sherwin-Williams Uruguay S.A.
The Sherwin-Williams Company Resources Limited
DOMESTIC
Contract Transportation Systems Co.
Omega Specialty Products & Services LLC
Sherwin-Williams Automotive Finishes Corp.
Sherwin-Williams Realty Holdings, Inc.
SWIMC, Inc.
The Sherwin-Williams Acceptance Corporation
Thompson Minwax International Corp.
16
| | | |
| COMMITTED TO FINANCIAL EXCELLENCE | | FINANCIAL PERFORMANCE |
FINANCIAL TABLE OF CONTENTS
Cautionary Statement Regarding Forward-Looking Information
18
Financial Summary
19
Management’s Discussion and Analysis of Financial Condition and Results of Operations
20
Reports of Management
37
Reports of the Independent Registered Public Accounting Firm
39
Consolidated Financial Statements and Notes
42
Shareholder Information
73
Corporate Officers and Operating Presidents
74
17
CAUTIONARY STATEMENT REGARDING
FORWARD-LOOKING INFORMATION
Certain statements contained in “Management’s Discussion and Analysis of Financial Condition and Results of Operations,” “Business” and elsewhere in this report constitute “forward-looking statements” within the meaning of Section 27A of the Securities Act of 1933 and Section 21E of the Securities Exchange Act of 1934. These forward-looking statements are based upon management’s current expectations, estimates, assumptions and beliefs concerning future events and conditions and may discuss, among other things, anticipated future performance (including sales and earnings), expected growth, future business plans and the costs and potential liability for environmental-related matters and the lead pigment and lead-based paint litigation. Any statement that is not historical in nature is a forward-looking statement and may be identified by the use of words and phrases such as “expects,” “anticipates,” “believes,” “will,” “will likely result,” “will continue,” “plans to” and similar expressions. Readers are cautioned not to place undue reliance on any forward-looking statements. Forward-looking statements are necessarily subject to risks, uncertainties and other factors, many of which are outside the control of the Company, that could cause actual results to differ materially from such statements and from the Company’s historical results and experience.
These risks, uncertainties and other factors include such things as: (a) general business conditions, strengths of retail and manufacturing economies and the growth in the coatings industry; (b) competitive factors, including pricing pressures and product innovation and quality; (c) changes in raw material and energy supplies and pricing; (d) changes in the Company’s relationships with customers and suppliers; (e) the ability of the Company to attain cost savings from productivity initiatives; (f) the ability of the Company to successfully integrate past and future acquisitions into its existing operations, as well as the performance of the businesses acquired, including the acquisitions of KST Coatings Manufacturing, Inc., KST Coatings LLC, Uniflex LLC, Duron, Inc. and Paint Sundry Brands Corporation; (g) changes in general domestic economic conditions such as inflation rates, interest rates, tax rates, unemployment rates, higher labor and healthcare costs, recessions, and changing government policies, laws and regulations; (h) risks and uncertainties associated with the Company’s expansion into and its operations in China, South America and other foreign markets, including general economic conditions, inflation rates, recessions, foreign currency exchange rates, foreign investment and repatriation restrictions, legal and regulatory constraints, civil unrest and other external economic and political factors; (i) the achievement of growth in developing markets, such as China, Mexico and South America; (j) increasingly stringent domestic and foreign governmental regulations including those affecting the environment; (k) inherent uncertainties involved in assessing the Company’s potential liability for environmental-related activities; (l) other changes in governmental policies, laws and regulations, including changes in accounting policies and standards and taxation requirements (such as new tax laws and new or revised tax law interpretations); (m) the nature, cost, quantity and outcome of pending and future litigation and other claims, including the lead pigment and lead-based paint litigation and the affect of any legislation and administrative regulations relating thereto; and (n) unusual weather conditions.
Readers are cautioned that it is not possible to predict or identify all of the risks, uncertainties and other factors that may affect future results and that the above list should not be considered to be a complete list. Any forward-looking statement speaks only as of the date on which such statement is made, and the Company undertakes no obligation to update or revise any forward-looking statement, whether as a result of new information, future events or otherwise.
18
FINANCIAL SUMMARY
(millions of dollars except as noted and per common share data)
| | | | | | | | | | | | | | | | | | | | | |
| | | 2005 | | | 2004 | | | 2003 | | | 2002 | | | 2001 | |
Operations | | | | | | | | | | | | | | | | | | | | |
| Net sales | | $ | 7,191 | | | $ | 6,114 | | | $ | 5,408 | | | $ | 5,185 | | | $ | 5,066 | |
| Cost of goods sold | | | 4,110 | | | | 3,412 | | | | 2,952 | | | | 2,846 | | | | 2,846 | |
| Selling, general and administrative expenses | | | 2,326 | | | | 2,069 | | | | 1,882 | | | | 1,785 | | | | 1,730 | |
| Goodwill impairment | | | 22 | | | | | | | | | | | | | | | | | |
| Interest expense | | | 50 | | | | 40 | | | | 39 | | | | 40 | | | | 55 | |
| Income before income taxes, minority interest and cumulative effect of change in accounting principle | | | 656 | | | | 580 | | | | 523 | | | | 497 | | | | 424 | |
| Income before cumulative effect of change in accounting principle | | | 463 | | | | 393 | | | | 332 | | | | 311 | | | | 263 | |
| Net income | | | 463 | | | | 393 | | | | 332 | | | | 128 | | | | 263 | |
Financial Position | | | | | | | | | | | | | | | | | | | | |
| Inventories | | $ | 809 | | | $ | 773 | | | $ | 638 | | | $ | 625 | | | $ | 633 | |
| Accounts receivable — net | | | 809 | | | | 724 | | | | 544 | | | | 494 | | | | 523 | |
| Working capital — net | | | 340 | | | | 262 | | | | 561 | | | | 422 | | | | 366 | |
| Property, plant and equipment — net | | | 745 | | | | 720 | | | | 650 | | | | 665 | | | | 673 | |
| Total assets | | | 4,369 | | | | 4,274 | | | | 3,683 | | | | 3,432 | | | | 3,628 | |
| Long-term debt | | | 487 | | | | 488 | | | | 503 | | | | 507 | | | | 504 | |
| Total debt | | | 621 | | | | 738 | | | | 514 | | | | 522 | | | | 615 | |
| Shareholders’ equity | | | 1,731 | | | | 1,647 | | | | 1,459 | | | | 1,342 | | | | 1,488 | |
Per Common Share Information | | | | | | | | | | | | | | | | | | | | |
| Average shares outstanding (thousands) | | | 136,817 | | | | 140,802 | | | | 144,847 | | | | 150,438 | | | | 155,557 | |
| Book value | | $ | 12.81 | | | $ | 11.70 | | | $ | 10.17 | | | $ | 9.01 | | | $ | 9.66 | |
| Income before cumulative effect of change in accounting principle — diluted | | | 3.28 | | | | 2.72 | | | | 2.26 | | | | 2.04 | | | | 1.68 | |
| Income before cumulative effect of change in accounting principle — basic | | | 3.39 | | | | 2.79 | | | | 2.29 | | | | 2.07 | | | | 1.69 | |
| Net income — diluted | | | 3.28 | | | | 2.72 | | | | 2.26 | | | | .84 | | | | 1.68 | |
| Net income — basic | | | 3.39 | | | | 2.79 | | | | 2.29 | | | | .85 | | | | 1.69 | |
| Cash dividends | | | .82 | | | | .68 | | | | .62 | | | | .60 | | | | .58 | |
Financial Ratios | | | | | | | | | | | | | | | | | | | | |
| Return on sales (1) | | | 6.4 | % | | | 6.4 | % | | | 6.1 | % | | | 6.0 | % | | | 5.2 | % |
| Asset turnover | | | 1.6 | ´ | | | 1.4 | ´ | | | 1.5 | ´ | | | 1.5 | ´ | | | 1.4 | ´ |
| Return on assets (1) | | | 10.6 | % | | | 9.2 | % | | | 9.0 | % | | | 9.1 | % | | | 7.3 | % |
| Return on equity (2) | | | 28.1 | % | | | 27.0 | % | | | 24.7 | % | | | 20.9 | % | | | 17.9 | % |
| Dividend payout ratio (1) | | | 24.5 | % | | | 24.6 | % | | | 27.3 | % | | | 29.3 | % | | | 34.6 | % |
| Total debt to capitalization | | | 26.4 | % | | | 30.9 | % | | | 26.0 | % | | | 28.0 | % | | | 29.3 | % |
| Current ratio | | | 1.2 | | | | 1.2 | | | | 1.5 | | | | 1.4 | | | | 1.3 | |
| Interest coverage (3) | | | 14.2 | ´ | | | 15.5 | ´ | | | 14.5 | ´ | | | 13.3 | ´ | | | 8.8 | ´ |
| Net working capital to sales | | | 4.7 | % | | | 4.3 | % | | | 10.4 | % | | | 8.1 | % | | | 7.2 | % |
| Effective income tax rate (4) | | | 29.2 | % | | | 32.0 | % | | | 36.5 | % | | | 37.5 | % | | | 38.0 | % |
General | | | | | | | | | | | | | | | | | | | | |
| Capital expenditures | | $ | 143 | | | $ | 107 | | | $ | 117 | | | $ | 127 | | | $ | 83 | |
| Total technical expenditures (5) | | | 95 | | | | 91 | | | | 88 | | | | 89 | | | | 86 | |
| Advertising expenditures | | | 257 | | | | 240 | | | | 239 | | | | 222 | | | | 236 | |
| Repairs and maintenance | | | 62 | | | | 55 | | | | 52 | | | | 52 | | | | 48 | |
| Depreciation | | | 120 | | | | 109 | | | | 105 | | | | 104 | | | | 109 | |
| Amortization of intangible assets | | | 23 | | | | 17 | | | | 12 | | | | 12 | | | | 39 | |
| Shareholders of record (total count) | | | 10,625 | | | | 11,056 | | | | 11,472 | | | | 11,936 | | | | 12,687 | |
| Number of employees (total count) | | | 29,434 | | | | 28,690 | | | | 25,777 | | | | 25,752 | | | | 25,789 | |
| Sales per employee (thousands of dollars) | | $ | 244 | | | $ | 213 | | | $ | 210 | | | $ | 201 | | | $ | 196 | |
| Sales per dollar of assets | | | 1.65 | | | | 1.43 | | | | 1.47 | | | | 1.51 | | | | 1.40 | |
| | |
| (1) | | Based on income before cumulative effect of change in accounting principle. |
| |
| (2) | | Based on income before cumulative effect of change in accounting principle and shareholders’ equity at beginning of year. |
| |
| (3) | | Ratio of income before income taxes, minority interest, cumulative effect of change in accounting principle and interest expense to interest expense. |
| |
| (4) | | Based on income before income taxes, minority interest and cumulative effect of change in accounting principle. |
| |
| (5) | | See Note 1, page 48 of this report, for a description of technical expenditures. |
19
MANAGEMENT’S DISCUSSION AND ANALYSIS OF
FINANCIAL CONDITION AND RESULTS OF OPERATIONS
SUMMARY
The Sherwin-Williams Company, founded in 1866, and its consolidated subsidiaries (collectively, the “Company”) are engaged in the manufacture, distribution and sale of paint, coatings and related products to professional, industrial, commercial and retail customers primarily in North and South America. The Company is structured into five reportable segments – Paint Stores, Consumer, Automotive Finishes, International Coatings (collectively, the “Operating Segments”) and Administrative – in the same way that management internally organizes its business for assessing performance and making decisions regarding allocation of resources. See pages 6 through 13 of this report and Note 17, on pages 69 through 71 of this report, for more information concerning the Company’s reportable segments.
The Company’s financial condition, liquidity and cash flow remained strong in 2005 and continued to improve in many areas. The Company’s current ratio improved to 1.22 at December 31, 2005 from 1.17 at December 31, 2004. Total debt decreased to $621.2 million at December 31, 2005 and decreased as a percentage of total capitalization to 26.4 percent from 30.9 percent at the end of 2004. Net operating cash increased to $716.7 million in 2005 versus $544.7 million in 2004. Net operating cash in 2005 provided the funds necessary to support the Company’s continued growth. In 2005, the Company extinguished $114.4 million of total debt, invested $23.3 million in acquisitions, increased annual capital expenditures to $143.1 million, purchased treasury stock for $356.5 million and paid $113.6 million in cash dividends.
Results of operations for the Company were also strong and improved in many areas in 2005. Consolidated net sales increased 17.6 percent in 2005 to $7.19 billion from $6.11 billion in 2004. Acquisitions, primarily Duron, Inc. (Duron) and Paint Sundry Brands Corporation (PSB) acquired in September 2004, increased consolidated net sales 6.0 percent in 2005. During 2005, sales volume increases in the Paint Stores Segment primarily came from continuing strong domestic architectural paint sales to contractor and do-it-yourself (DIY) customers. Sales from acquisitions contributed to sales increases in the Paint Stores and Consumer Segments. Strong international automotive refinish sales and new product introductions improved sales in the Automotive Finishes Segment. Favorable foreign currency exchange rates and pricing improvements in most South American countries contributed to improved International Coatings Segment sales. Gross profit as a percent of consolidated net sales declined in 2005 from 2004 levels primarily due to raw material cost increases that were partially offset by price increases and better factory utilization resulting from higher volume. Selling, general and administrative expenses decreased as a percent of consolidated net sales in 2005 as compared to 2004 due primarily to good expense control. Diluted net income per common share increased 20.6 percent to $3.28 per share for 2005 from $2.72 per share a year ago. Acquisitions increased diluted net income per common share approximately $.14 per share in 2005.
CRITICAL ACCOUNTING POLICIES AND ESTIMATES
The preparation and fair presentation of the consolidated financial statements, accompanying notes and related financial information included in this report are the responsibility of management. The consolidated financial statements, notes and related information have been prepared in accordance with accounting principles generally accepted in the United States and include amounts that were based upon management’s best estimates and judgments that were believed to be reasonable under the circumstances. Management used assumptions based on historical results and other assumptions to form the basis for determining appropriate carrying values of assets and liabilities that were not readily available from other sources. Actual results could differ from those estimates. Also, materially different amounts may result under materially different conditions or from using materially different assumptions. However, management believes that any materially different amounts resulting from materially different conditions or material changes in facts or circumstances are unlikely.
All of the significant accounting policies that were followed in the preparation of the consolidated financial statements are disclosed in Note 1, on pages 46 through 51 of this report. The following procedures and assumptions utilized by management directly impacted many of the reported amounts in the consolidated financial statements.
Revenue Recognition
The Company’s revenue was primarily generated from the sale of products. All revenues were recognized when products were shipped and title had passed to unaffiliated customers. Collectibility of amounts recorded as revenue is reasonably assured. Discounts were
20
MANAGEMENT’S DISCUSSION AND ANALYSIS OF
FINANCIAL CONDITION AND RESULTS OF OPERATIONS
recorded as a reduction of net sales in the same period as the sale. Standard sales terms are final and returns or exchanges are not permitted unless expressly stated; estimated provisions for returns or exchanges, recorded as a reduction of net sales, were established in cases where the right of return existed. The Company offered a variety of programs, primarily to its retail customers, designed to promote sales of its products. Such programs required periodic payments and allowances based on estimated results of specific programs and were recorded as a reduction to net sales. The Company accrued the estimated total payments and allowances associated with each transaction at the time of sale. Additionally, the Company offered programs directly to consumers to promote the sale of its products. Promotions that reduced the ultimate consumer sale prices were recorded as a reduction of net sales at the time the promotional offer was made, generally using estimated redemption and participation levels. The Company continually assesses the adequacy of accruals for customer and consumer promotional program costs earned but not yet paid. To the extent total program payments differ from estimates, adjustments may be necessary. Historically, these total program payments and adjustments have not been material.
Accounts Receivable
The Company recorded accounts receivable net of provisions for sales returns and allowances, and net of provisions for doubtful accounts that were included in Selling, general and administrative expenses. Provisions for doubtful accounts were accrued based on management’s assessment of accounts receivable. Judgment was required in order to make this assessment including an analysis of historical bad debts, a review of the aging of accounts receivable and a review of the current credit-worthiness of customers. Management recorded allowances for receivables which were believed to be uncollectible, including amounts for the resolution of potential credit and other collection issues such as disputed invoices, customer satisfaction claims and pricing discrepancies. However, depending on how such potential issues are resolved, or if the financial condition of any of our customers were to deteriorate and their ability to make required payments became impaired, increases in these allowances may be required. As of December 31, 2005, no individual customer constituted more than 5 percent of accounts receivable.
Inventories
Inventories were stated at the lower of cost or market with cost determined principally on the last-in, first-out method. Inventory quantities were adjusted during the fourth quarter of 2005 as a result of annual physical inventory counts taken at all locations. Management recorded the best estimate of net realizable value for obsolete and discontinued inventories based on historical experience and current trends through reductions to inventory cost by recording a provision included in Cost of goods sold. Where management determined that future demand was lower than current inventory levels, a reduction in inventory cost to estimated net realizable value was made.
Goodwill and Intangible Assets
The business and technical judgment of management was used in determining which intangible assets have indefinite lives and in determining the useful lives of finite-lived intangible assets in accordance with Statement of Financial Accounting Standards (FAS) No. 142, “Goodwill and Other Intangible Assets.” As required by FAS No. 142, management performed annual impairment testing of goodwill and indefinite-lived intangible assets during the fourth quarters of 2005, 2004 and 2003. Management estimated the fair values of goodwill and indefinite-lived intangible assets using a discounted cash flow valuation model, incorporating discount rates commensurate with the risks involved for each reporting unit. Growth models were developed using both industry and Company historical results and forecasts. Such models required management to make certain assumptions based upon information available at the time the valuation was performed, which could differ from actual results. See Notes 2 and 3, pages 51 through 54 of this report, for a discussion of the reductions in carrying value of goodwill and indefinite-lived intangible assets recorded in accordance with FAS No. 142.
Property, Plant and Equipment and Impairment of Long Lived Assets
Property, plant and equipment was stated on the basis of cost and depreciated principally on a straight-line basis using industry standards and historical experience to estimate useful lives. In accordance with FAS No. 144, “Accounting for the Impairment or Disposal of Long-Lived Assets,” if events or changes in circumstances indicated that the carrying value of long-lived assets may not be recoverable or the useful life has changed, impairment
21
MANAGEMENT’S DISCUSSION AND ANALYSIS OF
FINANCIAL CONDITION AND RESULTS OF OPERATIONS
tests were performed. Undiscounted future cash flows were used to calculate the recoverable value of long-lived assets to determine if such assets were impaired. Where impairment was identified, management determined fair values for assets using a discounted cash flow valuation model, incorporating discount rates commensurate with the risks involved for each group of assets. Growth models were developed using both industry and Company historical results and forecasts. Such models required management to make certain assumptions based upon information available at the time the valuation was performed, which could differ from actual results. See Note 3, pages 52 and 54 of this report, for a discussion of the reductions in carrying value of long-lived assets in accordance with FAS No. 144.
Pension and Other Postretirement Benefits
To determine the Company’s ultimate obligation under its defined benefit pension plans and other postretirement benefit plans, management must estimate the future cost of benefits and attribute that cost to the time period during which each covered employee works. To record the related net assets and obligations of such benefit plans, management relied upon third-party actuaries to determine such amounts using key assumptions such as discount rates, inflation, investment returns, mortality, employee turnover, rate of compensation increases and medical and prescription drug costs. Management, along with third-party actuaries, reviews all of these assumptions on an ongoing basis to ensure that the most reasonable information available is being considered. An increase or decrease in the assumptions or economic events outside management’s control could have a direct impact on reported results of operations. In determining the expected long-term rate of return on defined benefit pension plan assets, management considered the historical rates of return, the nature of investments and an expectation for future investment strategies. For 2006 expense recognition, the Company will use a discount rate of 5.5 percent, an expected rate of return on defined benefit pension plan assets of 7.5 percent and a rate of compensation increase of 4.0 percent. Use of these assumptions will result in a net pension credit in 2006 that is expected to be lower than 2005. See Note 6, pages 56 through 59 of this report, for information concerning the Company’s defined benefit pension plans and other postretirement benefit plans.
Environmental Matters
The Company is involved with environmental investigation and remediation activities at some of its current and former sites and at a number of third-party sites. The Company accrues for environmental-related activities for which commitments or clean-up plans have been developed and for which costs can be reasonably estimated based on industry standards and historical experience. All accrued amounts were recorded on an undiscounted basis. Environmental-related expenses included direct costs of investigation and remediation and indirect costs such as compensation and benefits for employees directly involved in the investigation and remediation activities and fees paid to outside engineering, actuarial, consulting and law firms. See Note 8, on pages 61 and 62 of this report, for information concerning the accrual for extended environmental-related activities. Due to uncertainties surrounding environmental investigations and remediation activities, the Company’s ultimate liability may result in costs that are significantly higher than currently accrued. See pages 26 through 28 of this report for a discussion concerning unaccrued future loss contingencies.
Exit or Disposal Activities
Management is continually re-evaluating the Company’s operating facilities against its long-term strategic goals. Liabilities associated with exit or disposal activities are recognized as incurred in accordance with FAS No. 146, “Accounting for Costs from Exit or Disposal Activities.” Provisions for qualified exit costs include amounts estimated by management and primarily represent post-closure rent expenses, incremental post-closure costs and costs of employee terminations. Adjustments may be made to accrued qualified exit costs if information becomes available upon which more accurate amounts can be reasonably estimated. Long-lived assets are tested for impairment in accordance with FAS No. 144 and, if impairment exists, the remaining useful life or the carrying value of the long-lived assets is reduced to a useful life or fair value estimated by management. Additional impairment may be recorded for subsequent revisions in estimated useful life or fair value. See Note 5, pages 54 and 55 of this report, for information concerning accrued qualified exit costs and impairments of long-lived assets.
22
MANAGEMENT’S DISCUSSION AND ANALYSIS OF
FINANCIAL CONDITION AND RESULTS OF OPERATIONS
Purchase Accounting
In accordance with FAS No. 141, “Business Combinations,” the Company used the purchase method of accounting to allocate costs of acquired businesses to the assets acquired and liabilities assumed based on their estimated fair values at the dates of acquisition. The excess costs of acquired businesses over the fair values of the assets acquired and liabilities assumed were recognized as goodwill. The valuations of the acquired assets and liabilities will impact the determination of future operating results. In addition to using management estimates and negotiated amounts, the Company used a variety of information sources to determine the estimated values of acquired assets and liabilities including: third-party appraisals for the estimated value and lives of identifiable intangible assets and property, plant and equipment; third-party actuaries for the estimated obligations of defined benefit pension plans; and legal counsel or other experts to assess the obligations associated with legal, environmental and other contingent liabilities.
Income Taxes
The Company estimated income taxes in each jurisdiction that it operated. This involved estimating taxable earnings, specific taxable and deductible items, the likelihood of generating sufficient future taxable income to utilize deferred tax assets and possible exposures related to future tax audits. To the extent these estimates change, adjustments to deferred and accrued income taxes will be made in the period in which the changes occur.
Other Investments and Liabilities
The Company was invested in the United States affordable housing and historic renovation real estate markets. These investments have been identified as variable interest entities. However, the Company is not the primary beneficiary and did not consolidate the operations of the investments. The carrying amounts of these non-traded investments, which approximate market value, were determined based on cost less related income tax credits determined by the effective yield method. See Note 1, on page 46 of this report, for more information on non-traded investments. The Company’s risk of loss from the partnership interests is limited to the amount of its investment. The Company has no ongoing capital commitments, loan requirements or guarantees with the general partners that would require any future cash contributions other than the contractually committed capital contributions that are disclosed in the contractual obligations table on page 28 of this report.
The Company is self-insured for certain liabilities, primarily worker’s compensation claims, employee medical and disability benefits, and automobile, property and general liability claims. Estimated amounts for self-insured liabilities are accrued for claims filed but unsettled and estimated claims incurred but not reported based upon management’s estimated aggregate liability for claims incurred using historical experience and actuarial assumptions followed in the insurance industry. Certain estimated general liability claims filed but unsettled and estimated claims incurred but not reported were accrued based on third-party actuarial calculations of potential liability using industry experience and actuarial assumptions developed for similar types of claims.
Accounting for Stock-Based Compensation
At December 31, 2005, the Company had two stock-based compensation plans accounted for under the recognition and measurement principles of Accounting Principles Board Opinion No. 25, “Accounting for Stock Issued to Employees,” and related interpretations. Effective January 1, 2006, FAS No. 123R, “Share-Based Payments” must be adopted by the Company. The Company expects to utilize the “modified prospective” method as described in FAS No. 123R. In the “modified prospective” method, compensation cost is recognized for all share-based payments granted after the effective date and for all unvested awards granted prior to the effective date. The adoption of FAS No. 123R will have an impact on the Company’s results of operations and financial condition although it will have no impact on the Company’s cash flow. The impact on the results of operations of adoption of FAS No. 123R cannot be predicted with certainty at this time because it will depend on levels of share-based payments granted in the future. However, had the Company adopted FAS No. 123R in prior periods, the impact would have approximated the effect of FAS No. 123 reflected in the disclosure of pro-forma net income and net income per common share in the Stock-based compensation section of Note 1 on page 49 of this report.
23
MANAGEMENT’S DISCUSSION AND ANALYSIS OF
FINANCIAL CONDITION AND RESULTS OF OPERATIONS
FINANCIAL CONDITION, LIQUIDITY AND CASH FLOW
Overview
The Company’s financial condition, liquidity and cash flow remained strong in 2005 and continued to improve in many areas. The Company’s current ratio improved to 1.22 at December 31, 2005 from 1.17 at December 31, 2004. The growth in current assets outpaced current liabilities due primarily to a reduction in short-term borrowings. Total debt decreased to $621.2 million at December 31, 2005 and decreased as a percentage of total capitalization to 26.4 percent at the end of 2005 from 30.9 percent at the end of 2004. The improvement in the current ratio and reduction in total debt in 2005 was primarily related to the cash flow associated with and the assimilation of Duron and PSB acquired in September 2004. Net operating cash increased to $716.7 million in 2005 versus $544.7 million in 2004. The increase in net operating cash related primarily to higher net income and a reduction of working capital relating primarily to the improvement in working capital ratios of the acquired businesses. Net operating cash in 2005 provided the funds necessary to support the Company’s continued growth. In 2005, the Company extinguished $114.4 million of total debt, invested $23.3 million in acquisitions, increased annual capital expenditures to $143.1 million, purchased treasury stock for $356.5 million and paid $113.6 million in cash dividends. The Consolidated Balance Sheets and Statements of Consolidated Cash Flows, on pages 42 and 44 of this report, provide more information concerning the Company’s financial condition, liquidity and cash flow.
Net Working Capital
Total current assets less total current liabilities (net working capital) increased $78.2 million to $340.0 million at December 31, 2005 from $261.8 million at December 31, 2004. The majority of the increase in net working capital related to a reduction in short-term borrowings of $115.1 million that was partially offset by increases in accounts receivable, inventories and other current assets and liabilities. Account receivable as a percent of annual net sales for 2005 improved to 11.3 percent from 11.8 percent in 2004. Inventories also improved as a percent of annual net sales, declining to 11.2 percent in 2005 from 12.6 percent in 2004. Days receivable outstanding and days inventory outstanding both improved in 2005 compared to 2004.
On February 1, 2006, the Company sold or contributed certain of its accounts receivable to SWC Receivables Funding LLC (SWC), a consolidated wholly-owned subsidiary. SWC entered into an accounts receivable securitization borrowing facility with a third-party program agent. Under this program, SWC may borrow up to $500.0 million and will secure such borrowings by granting a security interest in the accounts receivable, related security and the cash collections and proceeds of the receivables. SWC currently has no borrowings outstanding under this program.
Goodwill and Intangible Assets
Goodwill, which represents the excess of cost over the fair value of net assets acquired in purchase business combinations, decreased by a net $13.1 million during 2005. The majority of the decrease was caused by a $22.0 million impairment charge recognized in the Consumer Segment due to lower-than-anticipated projected sales of certain acquired domestic brands and relating to business with a major retailer starting in 2006. The impairment was recorded in accordance with FAS No. 142 and reported as a separate line item in the Consolidated Statement of Income. Further reducing goodwill in 2005 by $4.9 million was the sale of the Company’s majority interest in a Chinese joint venture, Sherwin-Williams Kinlita Co., Ltd (Kinlita). Partially offsetting these reductions was the addition of $14.5 million in goodwill resulting from the acquisition of KST Coatings Manufacturing, Inc., KST Coatings LLC and Uniflex LLC (collectively KST).
Intangible assets decreased by a net $17.0 million during 2005 primarily attributable to amortization of $23.3 million and an impairment of $1.0 million as required by FAS No. 142 and FAS No. 144. This decrease was partially offset by $2.8 million of intangible assets recognized in the acquisition of KST. Intangible assets with finite lives include costs related to designing, developing, obtaining and implementing internal use software that are capitalized and amortized in accordance with Statement of Position (SOP) 98-1, “Accounting for the Cost of Computer Software Developed or Obtained for Internal Use.” See Note 3, pages 52 through 54 of this report, for a description of the asset impairments recorded in accordance with FAS No. 142 and FAS No. 144 during 2005 and a summary of the carrying values of goodwill and intangible assets.
24
MANAGEMENT’S DISCUSSION AND ANALYSIS OF
FINANCIAL CONDITION AND RESULTS OF OPERATIONS
Deferred Pension Assets
Deferred pension assets recognized in the Consolidated Balance Sheets of $409.3 million at December 31, 2005, which represent the recognized excess of the fair market value of assets over the actuarially-determined projected benefit obligations of certain defined benefit pension plans, declined $20.9 million. This decline was due primarily to the recognition of a minimum pension liability in one of the Company’s domestic defined benefit pension plans as the actuarially-determined accumulated pension obligations exceeded the fair value of that plan’s assets at December 31, 2005. The amount of the excess pension obligations over the fair value of plan assets was $4.8 million at December 31, 2005. In accordance with FAS No. 87, “Employer’s Accounting for Pensions,” deferred pension assets relating to the under-funded plan representing previously unrecognized actuarial losses were removed, a $4.8 million benefit liability was recorded and a minimum pension liability of $18.8 million (net of taxes of $12.1 million) was included in Cumulative other comprehensive loss. Actuarial losses relating to the Company’s domestic and foreign defined benefit pension plans of $122.3 million at December 31, 2005 will be amortized to expense over future periods. These unrecognized actuarial losses related primarily to lower actual returns on defined benefit pension plan assets compared to the expected returns and the effects of changes in actuarial assumptions used in determining pension benefit obligations. The expected long-term rate of return on assets remained at 7.5 percent in 2005 and 2004 for domestic plans and was slightly lower on most foreign plans in 2005. The assumed discount rate used to compute the actuarial present value of projected benefit obligations was decreased from 5.75 percent to 5.50 percent at December 31, 2005 for domestic plans due to reduced rates of high-quality, long-term investments and was slightly lower for foreign plans. The combined net pension credit is expected to decrease in 2006 due to the impact of decreasing the assumed discount rates and amortization of defined benefit pension plan asset returns that did not meet the expected returns on plan assets in 2005 and prior years. See Note 6, on pages 56 through 59 of this report, for a detailed description of the defined benefit pension plans and for more financial information concerning the domestic and foreign defined benefit pension plans’ obligations, assets and net pension credit.
Property, Plant and Equipment
Net property, plant and equipment increased $24.8 million to $745.1 million at December 31, 2005. The increase was due primarily to capital expenditures of $143.1 million and $3.5 million related to an acquisition that were partially offset by depreciation expense of $120.2 million. Capital expenditures during 2005 in the Paint Stores Segment were primarily attributable to the opening of new paint stores, the purchase of new automated color matching equipment, the relocation of certain stores and the normal replacement and upgrading of store equipment. In the Consumer, Automotive Finishes and International Coatings Segments, capital expenditures during 2005 were primarily related to efficiency improvements in production and distribution facilities, construction of a new emulsion plant in the western United States and the purchase of information systems hardware. The Administrative Segment incurred capital expenditures primarily for upgrading the Company’s headquarters building and information systems hardware. In 2006, the Company expects to spend approximately 10 percent more for capital expenditures than in 2005. The predominant share of the capital expenditures will be due to the completion of the new emulsion plant, various capacity and productivity improvement projects at existing manufacturing and distribution facilities, new store openings, additional point-of-sale devices in paint stores and automotive branches and new or upgraded information systems hardware. The Company does not anticipate the need for any specific long-term external financing to support these capital expenditures.
Debt
At December 31, 2005, borrowings outstanding under the domestic commercial paper program totaled $74.7 million. The weighted-average interest rate related to these borrowings was 4.2 percent at December 31, 2005. Borrowings outstanding under the domestic commercial paper program were $231.2 million with a weighed-average interest rate of 2.3 percent at December 31, 2004. There were no borrowings outstanding under the Company’s commercial paper program at December 31, 2003. Borrowings outstanding under various foreign programs at December 31, 2005 were $49.0 million with a weighted-average interest rate of 5.4 percent and at December 31, 2004 were $7.6 million with a weighted-average interest rate of 5.0 percent. Long-term debt, including the current portion,
25
MANAGEMENT’S DISCUSSION AND ANALYSIS OF
FINANCIAL CONDITION AND RESULTS OF OPERATIONS
decreased $2.0 million during 2005 due primarily to the payment of various promissory notes and other obligations during the year. During 2005, Standard & Poor’s Ratings Services upgraded the Company’s credit rating from A to A+.
Effective July 19, 2005, the Company amended its five-year senior unsecured revolving credit agreement increasing the amount to $910.0 million. The Company’s commercial paper program was increased to $910.0 million effective September 26, 2005. Effective December 8, 2005, a $500.0 million letter of credit subfacility amendment was added to the revolving credit agreement. The Company uses the revolving credit agreement to satisfy its commercial paper program’s dollar for dollar liquidity requirement. Due to the seasonality of the Company’s business and the need for available cash prior to the primary selling season and collecting accounts receivable, the Company expects to continue to borrow under the commercial paper program during 2006. See Note 7, on pages 60 and 61 of this report, for a detailed description of the Company’s debt outstanding and other available financing programs.
Other Postretirement Benefits
The Company’s long-term liability for postretirement benefits other than pensions increased $4.5 million to $226.5 million at December 31, 2005 from $222.0 million due to the excess of the actuarially-determined postretirement benefit obligation over benefit payments. The assumed discount rate used to calculate the actuarial present value of the obligation for postretirement benefits other than pensions was decreased from 5.75 percent to 5.50 percent at December 31, 2005 due to the reduced rates of high-quality, long-term investments. The assumed health care cost trend rates for 2006 through 2015 reflect health care cost increase assumptions established in 2003. Separate assumptions are utilized for prescription drug costs. The assumed rates used for 2005 were 9.0 percent for heath care and 12.0 percent for prescription drugs, both decreasing gradually to 4.0 percent in 2016. See Note 6, on pages 58 and 59 of this report, for further information on the Company’s obligation for postretirement benefits other than pensions.
Other Long-Term Liabilities
Other long-term liabilities decreased $22.2 million during 2005 due primarily to a reduction in general product liabilities and settlements of certain tax liabilities during 2005 that were partially offset by an increase of $8.8 million in long-term environmental-related liabilities discussed below. See Note 8, on pages 61 and 62 of this report, for further information on the Company’s long-term liabilities.
Environmental-Related Liabilities
The operations of the Company, like those of other companies in the same industry, are subject to various federal, state and local environmental laws and regulations. These laws and regulations not only govern current operations and products, but also impose potential liability on the Company for past operations. Management expects environmental laws and regulations to impose increasingly stringent requirements upon the Company and the industry in the future. Management believes that the Company conducts its operations in compliance with applicable environmental laws and regulations and has implemented various programs designed to protect the environment and promote continued compliance.
Depreciation of capital expenditures and other expenses related to ongoing environmental compliance measures were included in the normal operating expenses of conducting business. The Company’s capital expenditures, depreciation and other expenses related to ongoing environmental compliance measures were not material to the Company’s financial condition, liquidity, cash flow or results of operations during 2005. Management does not expect that such capital expenditures, depreciation and other expenses will be material to the Company’s financial condition, liquidity, cash flow or results of operations in 2006.
The Company is involved with environmental investigation and remediation activities at some of its current and former sites (including sites which were previously owned and/or operated by businesses acquired by the Company). In addition, the Company, together with other parties, has been designated a potentially responsible party under federal and state environmental protection laws for the investigation and remediation of environmental contamination and hazardous waste at a number of third-party sites, primarily Superfund sites. The Company may be similarly designated with respect to additional third-party sites in the future.
The Company accrues for estimated costs of investigation and remediation activities at its current, former and third party sites for which commitments or clean-up plans have been developed and when such costs can be
26
MANAGEMENT’S DISCUSSION AND ANALYSIS OF
FINANCIAL CONDITION AND RESULTS OF OPERATIONS
reasonably estimated based on industry standards and professional judgment. These estimated costs are based on currently available facts regarding each site. The Company accrues a specific estimated amount when such an amount and a time frame in which the costs will be incurred can be reasonably determined. If the best estimate of costs can only be identified as a range and no specific amount within that range can be determined more likely than any other amount within the range, the minimum of the range is accrued by the Company in accordance with applicable accounting rules and interpretations. The Company continuously assesses its potential liability for investigation and remediation activities and adjusts its environmental-related accruals as information becomes available upon which more accurate costs can be reasonably estimated. At December 31, 2005, 2004 and 2003, the Company had accruals for environmental-related activities of $158.9 million, $141.5 million and $133.4 million, respectively.
Due to the uncertainties surrounding environmental investigation and remediation activities, the Company’s ultimate liability may result in costs that are significantly higher than currently accrued. If the Company’s future loss contingency is ultimately determined to be at the maximum of the range of possible outcomes for every site for which costs can be reasonably estimated, the Company’s aggregate accruals for environmental-related activities would be $139.5 million higher than the accruals at December 31, 2005.
Four of the Company’s current and former manufacturing sites, described below, accounted for the majority of the accruals for environmental-related activities and the unaccrued maximum of the estimated range of possible outcomes at December 31, 2005. Included in the accruals of $158.8 million at December 31, 2005 was $103.6 million related directly to these four sites. Of the aggregate unaccrued exposure of $139.5 million at December 31, 2005, $71.5 million related to the four manufacturing sites. While environmental investigations and remedial actions are in different stages at these sites, additional investigations, remedial actions and monitoring will likely be required at each site.
The first of the four sites is a former manufacturing facility in New Jersey that is in the early investigative stage of the environmental-related process. Although contamination exists at the site and adjacent areas, the extent and magnitude of the contamination has not yet been fully quantified. Due to the uncertainties of the scope and magnitude of contamination and the degree of remediation that may be necessary relating to this site, it is reasonably likely that further extensive investigation may be required and that extensive remedial actions may be necessary not only at the former manufacturing site but along an adjacent waterway. Depending on the extent of the additional investigation and remedial actions necessary, the ultimate liability for this site may exceed the amount currently accrued and the maximum of the range of reasonably possible outcomes currently estimated by management.
Two additional sites relate to a current manufacturing facility located in Illinois and a contiguous property. The environmental issues at these sites have been determined to be associated with historical operations of the Company. While the majority of the investigative work has been completed at these sites and some remedial actions taken, agreement on a proposed remedial action plan has not been obtained from the appropriate governmental agency.
The fourth site is a current manufacturing facility in California. Similar to the Illinois sites noted above, the environmental issues at this site have been determined to be associated with historical operations. Most of the anticipated investigative activities have been completed at this site, some remedial actions have been taken and a proposed remedial action plan has been formulated but currently no clean up goals have been approved by the lead governmental agency. In both the Illinois and California sites, the potential liabilities relate to clean-up goals that have not yet been established and the degree of remedial actions that may be necessary to achieve these goals.
Management cannot presently estimate the ultimate potential loss contingencies related to these four sites or other less significant sites until such time as a substantial portion of the investigation at the sites is completed and remedial action plans are developed.
In accordance with FASB Interpretation No. 47 (FIN No. 47), “Accounting for Conditional Asset Retirement Obligations – an interpretation of FASB Statement No. 143”, the Company has identified certain conditional asset retirement obligations at various current manufacturing, distribution and store facilities. These obligations relate primarily to asbestos abatement and closures of hazardous waste containment devices. Using investigative, remediation and disposal methods that are currently available to the Company, the estimated cost of these obligations is not significant.
In the event any future loss contingency of environ-
27
MANAGEMENT’S DISCUSSION AND ANALYSIS OF
FINANCIAL CONDITION AND RESULTS OF OPERATIONS
mental-related matters or conditional asset retirement obligations significantly exceeds the current amount accrued or estimated, the recording of the ultimate liability may result in a material impact on net income for the annual or interim period during which the additional costs are accrued. Management does not believe that any potential liability ultimately attributed to the Company for its environmental-related matters or conditional asset retirement obligations will have a material adverse effect on the Company’s financial condition, liquidity, or cash flow due to the extended period of time during which environmental investigation and remediation takes place. An estimate of the potential impact on the Company’s operations cannot be made due to the aforementioned uncertainties.
Management expects these contingent environmental-related liabilities and conditional asset retirement obligations to be resolved over an extended period of time. Management is unable to provide a more specific time frame due to the indefinite amount of time to conduct investigation activities at any site, the indefinite amount of time to obtain governmental agency approval, as necessary, with respect to investigation and remediation activities, and the indefinite amount of time necessary to conduct remediation activities.
Contractual Obligations and Commercial Commitments
The Company has certain obligations and commitments to make future payments under contractual obligations and commercial commitments. The following table summarizes such obligations and commitments as of December 31, 2005:
| | | | | | | | | | | | | | | | | | | | | |
| (thousands of dollars) | | | |
| | | Payments Due by Period | |
| Contractual Obligations | | Total | | | Within 1 Year | | | 2–3 Years | | | 4–5 Years | | | After 5 Years | |
| Long-term debt | | $ | 497,489 | | | $ | 10,493 | | | $ | 197,470 | | | $ | 130 | | | $ | 289,396 | |
| Operating leases | | | 709,403 | | | | 169,398 | | | | 266,812 | | | | 157,135 | | | | 116,058 | |
| Short-term borrowings | | | 123,681 | | | | 123,681 | | | | | | | | | | | | | |
Purchase obligations1 | | | 130,454 | | | | 130,454 | | | | | | | | | | | | | |
Other contractual obligations2 | | | 63,101 | | | | 45,458 | | | | 16,904 | | | | 723 | | | | 16 | |
| | | | | | | | | | | | | | | | |
| Total contractual cash obligations | | $ | 1,524,128 | | | $ | 479,484 | | | $ | 481,186 | | | $ | 157,988 | | | $ | 405,470 | |
| | | | | | | | | | | | | | | | |
| | |
| 1 | | Relate to open purchase orders for raw materials at December 31, 2005. |
| |
| 2 | | Relate primarily to estimated future capital commitments to investments in the U.S. affordable housing and historic renovation real estate partnerships, information technology maintenance contracts and various other contractual obligations. |
| | | | | | | | | | | | | | | | | | | | | |
| | | Amount of Commitment Expiration Per Period | |
| Commercial Commitments | | Total | | | Within 1 Year | | | 2–3 Years | | | 4–5 Years | | | After 5 Years | |
| Standby letters of credit | | $ | 17,000 | | | $ | 17,000 | | | | | | | | | | | | | |
| Surety bonds | | | 25,625 | | | | 25,625 | | | | | | | | | | | | | |
| Other commercial commitments | | | 24,035 | | | | 22,805 | | | $ | 526 | | | $ | 473 | | | $ | 231 | |
| | | | | | | | | | | | | | | | |
| Total commercial commitments | | $ | 66,660 | | | $ | 65,430 | | | $ | 526 | | | $ | 473 | | | $ | 231 | |
| | | | | | | | | | | | | | | | |
28
MANAGEMENT’S DISCUSSION AND ANALYSIS OF
FINANCIAL CONDITION AND RESULTS OF OPERATIONS
Warranties
The Company offers product warranties for certain products. The specific terms and conditions of such warranties vary depending on the product or customer contract requirements. Management estimated and accrued the costs of unsettled product warranty claims based on historical results and experience. Management periodically assesses the adequacy of the accrual for product warranty claims and adjusts the accrual as necessary. Changes in the accrual for product warranty claims during 2005, 2004 and 2003, which included customer satisfaction settlements, were as follows:
| | | | | | | | | | | | | |
| (thousands of dollars) | | | | | | | | | |
| | | 2005 | | | 2004 | | | 20032 | |
| Balance at January 1 | | $ | 18,098 | | | $ | 16,555 | | | $ | 15,510 | |
| Charges to expense | | | 35,654 | | | | 32,541 | | | | 28,745 | |
| Settlements | | | (30,749 | ) | | | (30,998 | ) | | | (27,700 | ) |
| | | | | | | | | | |
| Balance at December 31 | | $ | 23,003 | | | $ | 18,098 | | | $ | 16,555 | |
| | | | | | | | | | |
Shareholders’ Equity
Shareholders’ equity increased $83.4 million to $1.73 billion at December 31, 2005 from $1.65 billion last year. The increase in shareholders’ equity resulted primarily from increased retained earnings, common stock and other capital. Retained earnings increased $349.7 million during 2005 due to net income of $463.3 million partially offset by $113.6 million in cash dividends paid. Net increases in common stock and other capital of $98.3 million were due primarily to stock option exercises and the tax impact of certain ESOP transactions.
Reducing shareholders’ equity was the increase in treasury stock and an increase in cumulative other comprehensive loss. The Company purchased 8.1 million shares of its common stock during 2005 for treasury at a cost of $356.5 million. The Company acquires its common stock for general corporate purposes and, depending on its cash position and market conditions, it may acquire additional shares in the future. The Company had remaining authorization from its Board of Directors at December 31, 2005 to purchase 18.4 million shares of its common stock. The changes in Cumulative other comprehensive loss consisted mainly of the recognition of a minimum pension liability for one of the Company’s domestic defined benefit pension plans of $18.8 million, net of taxes, that was partially offset by favorable foreign currency translation adjustments in the Consolidated Balance Sheets. The favorable foreign currency translation effects of $14.3 million in 2005, $17.8 million in 2004 and $31.8 million in 2003 were attributable to the strengthening of most foreign operations’ functional currencies against the U.S. dollar. See the Statements of Consolidated Shareholders’ Equity and Comprehensive Income, on page 45 of this report, and Notes 9, 10 and 11, on pages 63 through 65 of this report, for more information concerning shareholders’ equity.
The Company’s cash dividend per common share payout target is 30.0 percent of the prior year’s diluted net income per common share. The 2005 annual cash dividend of $.82 per common share represented 30.1 percent of 2004 diluted net income per common share. The 2005 annual dividend represented the twenty-seventh consecutive year of dividend payments since the dividend was suspended in 1978. At a meeting held on February 22, 2006, the Board of Directors increased the quarterly cash dividend to $.25 per common share. This quarterly dividend, if approved in each of the remaining quarters of 2006, would result in an annual dividend for 2006 of $1.00 per common share or a 30.5 percent pay-out of 2005 diluted net income per common share.
Cash Flow
Net operating cash increased $172.0 million to $716.7 million during 2005 from $544.7 million during 2004. Cash generation of $88.0 million from changes in working capital items and the increase in net income of $70.0 million in 2005 over 2004 were the primary contributors to increased net operating cash. The additional net operating cash in 2005 was used to invest in incremental capital expenditures ($36.3 million), increase cash dividends ($16.7 million), purchase additional treasury stock ($89.1 million) and lower short-term borrowings ($112.4 million). The interest coverage ratio based on cash flows increased to 18.9 from 17.6 in 2004. Additionally, operating cash to total liabilities increased to .25 from .22 in 2004.
Management considers a measurement of cash flow that is not in accordance with accounting principles generally accepted in the United States to be a useful tool in determining the discretionary portion of the Company’s net operating cash. Management reduces net operating cash, as shown in the Statements of Consolidated Cash Flows, by the amount reinvested in the business for capital expenditures and the return of investment to its shareholders by the payment of cash dividends. The resulting value is referred to by management as “Free Cash Flow” which may not be comparable to values
29
MANAGEMENT’S DISCUSSION AND ANALYSIS OF
FINANCIAL CONDITION AND RESULTS OF OPERATIONS
considered by other entities using the same terminology. The reader is cautioned that the following value should not be compared to other entities unknowingly. The amount shown below should not be considered an alternative to net operating cash or other cash flow amounts in accordance with accounting principles generally accepted in the United States disclosed in the Statements of Consolidated Cash Flows, on page 44 of this report. Free Cash Flow as defined and used by management is determined as follows:
| | | | | | | | | | | | | |
| (thousands of dollars) | | | | | | | | | |
| | | 2005 | | | 2004 | | | 2003 | |
| Net operating cash (Page 44) | | $ | 716,702 | | | $ | 544,681 | | | $ | 558,929 | |
| Capital expenditures (Page 44) | | | (143,072 | ) | | | (106,822 | ) | | | (116,507 | ) |
| Payments of cash dividends (Page 44) | | | (113,588 | ) | | | (96,915 | ) | | | (90,689 | ) |
| | | | | | | | | | |
| Free cash flow | | $ | 460,042 | | | $ | 340,944 | | | $ | 351,733 | |
| | | | | | | | | | |
Contingent Liabilities
Management believes that it properly recorded all known liabilities that existed for which a fair value was available or an amount could be reasonably estimated in accordance with all present accounting principles generally accepted in the United States. In addition, the Company may be subject to potential liabilities, as described in the following, for which no fair value was available or an amount could not be reasonably estimated due to uncertainties involved.
In October 2005, a wholly-owned subsidiary of the Company acquired a 25 percent interest in Life Shield Engineered Systems, LLC (Life Shield) and became obligated to acquire an additional 24 percent interest in Life Shield in October 2007. Life Shield is a start-up company that develops and manufactures blast and fragment mitigating systems and ballistic resistant systems. The blast and fragment mitigating systems and ballistic resistant systems create a potentially higher level of product liability for the Company (as an owner of and raw material supplier to Life Shield and as the exclusive distributor of Life Shield’s systems) than is normally associated with coatings and related products currently manufactured, distributed and sold by the Company.
Certain of Life Shield’s technology has been designated as Qualified Anti-Terrorism Technology and granted a Designation under the Support Anti-terrorism by Fostering Effective Technologies Act of 2002 (SAFETY Act) and the regulations adopted pursuant to the SAFETY Act. Under the SAFETY Act, the potentially higher level of possible product liability for Life Shield relating to the technology granted the Designation is limited to $6.0 million per occurrence in the event any such liability arises from an Act of Terrorism (as defined in the SAFETY Act). The limitation of liability provided for under the SAFETY Act does not apply to any technology not granted a designation or certification as a Qualified Anti-Terrorism Technology, nor in the event that any such liability arises from an act or event other than an Act of Terrorism. Life Shield maintains insurance for liabilities up to the $6.0 million per occurrence limitation caused by failure of its products in the event of an Act of Terrorism. This commercial insurance is also expected to cover product liability claims asserted against the Company as the distributor of Life Shield’s systems. The Company expects to seek Designation and Certification under the SAFETY Act for certain products supplied by the Company to Life Shield.
Management of the Company has reviewed the potential increased liabilities associated with Life Shield’s systems and determined that potential liabilities arising from an Act of Terrorism that could ultimately affect the Company will be appropriately insured or limited by current regulations. However, due to the uncertainties involved in the future development, usage and application of Life Shield’s systems, the number or nature of possible future claims and legal proceedings, or the affect that any change in legislation and/or administrative regulations may have on the limitations of potential liabilities, management cannot reasonably determine the scope or amount of any potential costs and liabilities for the Company related to Life Shield or to Life Shield’s systems. Any potential liability for the Company that may result from Life Shield or Life Shield’s systems cannot reasonably be estimated. However, based upon, among other things, the limitation of liability under the SAFETY Act in the event of an Act of Terrorism, management does not currently believe that the costs or potential liability ultimately determined to be attributable to the Company through its ownership of Life Shield, as a supplier to Life Shield or as a distributor of Life Shield’s systems arising from the use of Life Shield’s systems will have a material adverse effect on the Company’s results of operations, liquidity or financial conditions.
30
MANAGEMENT’S DISCUSSION AND ANALYSIS OF
FINANCIAL CONDITION AND RESULTS OF OPERATIONS
Litigation
In the course of its business, the Company is subject to a variety of claims and lawsuits, including litigation relating to product liability and warranty, personal injury, environmental, intellectual property, commercial, contractual and antitrust claims. The Company accrues for these contingencies consistent with the policy stated under “Contingent Liabilities.” However, because litigation is inherently subject to many uncertainties and the ultimate result of any present or future litigation is unpredictable, the Company’s ultimate liability may result in costs that are significantly higher than currently accrued. In the event that the Company’s loss contingency is ultimately determined to be significantly higher than currently accrued, the recording of the liability may result in a material impact on net income for the annual or interim period during which such liability is accrued. Additionally, due to the uncertainties involved, any potential liability determined to be attributable to the Company arising out of such litigation may have a material adverse effect on the Company’s results of operations, liquidity or financial condition.
The Company’s past operations included the manufacture and sale of lead pigments and lead-based paints. The Company, along with other companies, is a defendant in a number of legal proceedings, including purported class actions, separate actions brought by the State of Rhode Island, and actions brought by various counties, cities, school districts and other government-related entities, arising from the manufacture and sale of lead pigments and lead-based paints. The plaintiffs are seeking recovery based upon various legal theories, including negligence, strict liability, breach of warranty, negligent misrepresentations and omissions, fraudulent misrepresentations and omissions, concert of action, civil conspiracy, violations of unfair trade practices and consumer protection laws, enterprise liability, market share liability, nuisance, unjust enrichment and other theories. The plaintiffs seek various damages and relief, including personal injury and property damage, costs relating to the detection and abatement of lead-based paint from buildings, costs associated with a public education campaign, medical monitoring costs and others. The Company is also a defendant in legal proceedings arising from the manufacture and sale of non-lead-based paints which seek recovery based upon various legal theories, including the failure to adequately warn of potential exposure to lead during surface preparation when using non-lead-based paint on surfaces previously painted with lead-based paint. The Company believes that the litigation is without merit and is vigorously defending such litigation. The Company expects that additional lead pigment and lead-based paint litigation may be filed against the Company in the future asserting similar or different legal theories and seeking similar or different types of damages and relief.
During September 2002, a jury trial commenced in the first phase of the action brought by the State of Rhode Island against the Company and the other defendants. The sole issue before the court in this first phase was whether lead pigment in paint constitutes a public nuisance under Rhode Island law. In October 2002, the court declared a mistrial as the jury, which was split four to two in favor of the defendants, was unable to reach a unanimous decision.
The State of Rhode Island retried the case and on February 22, 2006, the jury returned a verdict, finding that (i) the cumulative presence of lead pigment in paints and coatings on buildings in the State of Rhode Island constitutes a public nuisance, (ii) the Company, along with two other defendants, caused or substantially contributed to the creation of the public nuisance, and (iii) the Company and two other defendants should be ordered to abate the public nuisance. The Court will determine the scope of the abatement remedy. Various other matters remain before the Court. The Company intends to appeal the jury’s verdict.
This was the first legal proceeding against the Company to go to trial relating to the Company’s lead pigment and lead-based paint litigation. The Company believes it is possible that additional legal proceedings could be scheduled for trial in 2006 and in subsequent years in other jurisdictions.
Litigation is inherently subject to many uncertainties. Adverse court rulings, such as the Rhode Island jury verdict and the Wisconsin State Supreme Court’s determination in July 2005 that Wisconsin’s risk contribution theory applies to the lead pigment litigation, or determinations of liability, among other factors, could affect the lead pigment and lead-based paint litigation against the Company and encourage an increase in the number and nature of future claims and proceedings. In addition, from time to time, various legislation and administrative regulations have been enacted or proposed to impose obligations on present and former manufacturers of lead pigments and lead-based paints respecting asserted health concerns associated with such products and to overturn court decisions in which the Company and other manufacturers have been
31
MANAGEMENT’S DISCUSSION AND ANALYSIS OF
FINANCIAL CONDITION AND RESULTS OF OPERATIONS
successful. The Company cannot reasonably determine the impact that the State of Rhode Island decision and determination of liability will have on the number or nature of present or future claims and proceedings against the Company.
Due to the uncertainties involved, management is unable to predict the outcome of the lead pigment and lead-based paint litigation, the number or nature of possible future claims and proceedings, or the effect that any legislation and/or administrative regulations may have on the litigation or against the Company. In addition, management cannot reasonably determine the scope or amount of the potential costs and liabilities related to such litigation, or any such legislation and regulations. The Company has not accrued any amounts for such litigation. Any potential liability that may result from such litigation or such legislation and regulations cannot reasonably be estimated. In the event any significant liability is determined to be attributable to the Company relating to such litigation, the recording of the liability may result in a material impact on net income for the annual or interim period during which such liability is accrued. Additionally, due to the uncertainties associated with the amount of any such liability and/or the nature of any other remedy which may be imposed in such litigation, any potential liability determined to be attributable to the Company arising out of such litigation may have a material adverse effect on the Company’s results of operations, liquidity or financial condition. An estimate of the potential impact on the Company’s results of operations, liquidity or financial condition cannot be made due to the aforementioned uncertainties.
Market Risk
The Company is exposed to market risk associated with interest rate and foreign currency fluctuations. The Company occasionally utilizes derivative instruments as part of its overall financial risk management policy, but does not use derivative instruments for speculative or trading purposes. During 2003, the Company entered into two separate interest rate swap contracts with a bank to hedge against changes in the fair value of a portion of the Company’s 6.85% Notes. During 2004, the Company paid $1.1 million to the bank for discontinuation of the contracts. The net payment decreased the carrying amount of the 6.85% Notes and is being amortized to expense over the remaining maturity of the Notes. The Company had foreign currency option and forward contracts outstanding at December 31, 2003 to hedge against value changes in foreign currency (see Note 12, on page 66 of this report) that were settled in 2004. The Company believes it may experience continuing losses from foreign currency translation. However, the Company does not expect currency translation, transaction or hedging contract losses will have a material adverse effect on the Company’s financial condition, results of operations or cash flows.
Financial Covenant
Certain borrowings contain a consolidated leverage covenant. At December 31, 2005, the Company was in compliance with the covenant. The Company’s Notes, Debentures and revolving credit agreement (see Note 7, on pages 60 and 61 of this report) contain various default and cross-default provisions. In the event of default under any one of these arrangements, acceleration of the maturity of any one or more of these borrowings may result. In particular, the Company’s revolving credit agreement provides that one or more judgments against the Company or any subsidiary for the payment of money in excess of $75.0 million and not covered by insurance constitutes a default. Such a judgment would become an event of default if it remains undischarged for a period of 60 days during which the execution of the judgment is not stayed, vacated or bonded pending appeal. If a default or an event of default occurs, the lenders may terminate any borrowing commitments. If an event of default occurs at the end of such 60 day period, the lenders may accelerate the payment of any borrowings outstanding and such event of default may also constitute an event of default under other borrowing facilities.
RESULTS OF OPERATIONS – 2005 vs. 2004
Shown below are net sales and the percentage change for the current period by reportable segment for 2005 and 2004:
| | | | | | | | | | | | | |
| | | | | | | | | | |
| (thousands of dollars) | | 2005 | | | Change | | | 2004 | |
| Paint Stores | | $ | 4,848,070 | | | | 21.9 | % | | $ | 3,976,979 | |
| Consumer | | | 1,396,183 | | | | 7.7 | % | | | 1,296,251 | |
| Automotive Finishes | | | 550,777 | | | | 7.1 | % | | | 514,304 | |
| International Coatings | | | 388,005 | | | | 21.8 | % | | | 318,627 | |
| Administrative | | | 7,626 | | | | 0.0 | % | | | 7,628 | |
| | | | | | | | | | |
| | | $ | 7,190,661 | | | | 17.6 | % | | $ | 6,113,789 | |
| | | | | | | | | | |
32
MANAGEMENT’S DISCUSSION AND ANALYSIS OF
FINANCIAL CONDITION AND RESULTS OF OPERATIONS
Consolidated net sales for 2005 increased due primarily to volume increases from continuing strong domestic architectural paint sales to contractor and DIY customers and improved international sales. Consolidated net sales include the operations of four acquisitions completed at various times after April 2004 including the operations of two larger acquisitions, Duron and PSB, beginning with the month of September 2004. The acquisitions increased consolidated net sales $369.7 million, or 6.0 percent, in 2005. Favorable currency exchange fluctuations increased consolidated net sales approximately 1.1 percent.
Net sales in the Paint Stores Segment in 2005 increased due primarily to continuing strong domestic architectural paint sales to contractor and DIY customers. The acquisition of Duron added 229 stores to this Segment in 2004 and increased 2005 net sales approximately 6.7 percent. Net sales from stores opened more than twelve calendar months increased 13.6 percent for the full year. During 2005, the Paint Stores Segment opened 98 net new stores. At the end of 2005, this Segment had 3,081 stores in operation in the United States, Canada, Mexico, Puerto Rico and the Virgin Islands. The Paint Stores Segment’s objective is to expand its store base an average of three percent each year, primarily by internal growth.
Consumer Segment net sales increased 7.7 percent due primarily to sales from acquisitions that increased net sales 7.7 percent. In 2006, this Segment plans to continue its aggressive promotions of new and existing products and expanding its customer base.
The Automotive Finishes Segment’s net sales increase for the year resulted primarily from strong international sales and favorable currency fluctuations that increased net sales approximately 4.5 percent and new product line introductions. The Segment was negatively impacted by the disposition of Kinlita during the third quarter of 2005. There were 203 automotive branches open at the end of 2005 in the United States, Canada, Chile, Jamaica and Peru. In 2006, this Segment expects to continue opening new branches, increasing sales in strengthening international markets and improving its customer base in a soft domestic market.
Net sales in the International Coatings Segment increased due primarily to favorable currency exchange fluctuations that increased net sales approximately 9.8 percent and pricing improvements in South America. Partially offsetting these increases were lower volume sales in the United Kingdom.
Shown below are operating profit and the percent change for the current period by reportable segment:
| | | | | | | | | | | | | |
| | | | | | | | | | |
| (thousands of dollars) | | 2005 | | | Change | | | 2004 | |
| Paint Stores | | $ | 592,508 | | | | 23.4 | % | | $ | 480,213 | |
| Consumer | | | 169,136 | | | | (9.9 | %) | | | 187,717 | |
| Automotive Finishes | | | 57,244 | | | | (1.4 | %) | | | 58,056 | |
| International Coatings | | | 23,559 | | | | 30.6 | % | | | 18,041 | |
| Administrative | | | (186,232 | ) | | | (13.7 | %) | | | (163,832 | ) |
| | | | | | | | | | |
| | | $ | 656,215 | | | | 13.1 | % | | $ | 580,195 | |
| | | | | | | | | | |
Consolidated operating profit in 2005 increased primarily due to increased sales volume generating an increase in gross profit of $379.0 million that more than offset increased selling, general and administrative expenses of $257.3 million. As a percent of sales, consolidated gross profit decreased to 42.8 percent from 44.2 percent in 2004. The decrease in gross profit as a percent of sales was due primarily to raw material cost increases that could not be completely offset by price increases or manufacturing efficiencies.
The Paint Stores Segment’s gross profit for 2005 increased $343.0 million due primarily to increased sales volume, but decreased as a percent of sales approximately 1.6 percent due to significantly increased raw material costs. In the Consumer Segment, gross profit for 2005 increased due primarily to the PSB acquisition and manufacturing efficiencies. Gross profit as a percent of sales declined due to increasing raw material costs that could not be recovered through selling price increases. The Automotive Finishes Segment’s gross profit increased over 2004 due primarily to increased selling prices and foreign sales volume increases that were partially offset by rising raw material costs. The International Coatings Segment’s gross profit increased due to the net sales gain, and improved operating efficiencies related to additional manufacturing volume in South America partially offset by continued raw material cost increases and a reduction in gross profit caused by lower volume sales in the U.K.
Consolidated selling, general and administrative expenses (SG&A), increased $257.3 million due primarily to expenses associated with the sales growth but decreased as a percent of sales to 32.4 percent in 2005 from 33.8 percent in 2004 due to good expense control. In the Paint Stores Segment, SG&A increased $232.0 million, and declined as a percent of sales approximately 1.5 percent, due primarily to incremental expenses
33
MANAGEMENT’S DISCUSSION AND ANALYSIS OF
FINANCIAL CONDITION AND RESULTS OF OPERATIONS
associated with increased sales volume, including continued investments in new stores and acquisitions. The Consumer Segment’s SG&A increased $12.7 million and declined as a percent of sales due primarily to the PSB acquisition. In the Automotive Segment, SG&A decreased in dollars as well as a percent of sales due to good expense control. In the International Coatings Segment, SG&A increased $13.1 million due to increased sales but declined as a percent of sales due to tight expense control.
The annual impairment review performed as of October 1, 2005 in accordance with FAS No. 142 and an additional impairment review performed in the fourth quarter due to updated cash flow projections, resulted in reductions in the carrying value of trademarks with indefinite lives of $.8 million and goodwill of $22.0 million. The impairment of trademarks with indefinite lives was charged to Cost of goods sold in the Consumer Segment ($.7 million) and SG&A in the Paint Stores Segment ($.1 million). The impairment related to lower-than-anticipated projected sales of certain acquired domestic brands. The goodwill impairment was related to a projected decline in business with a major retailer starting in 2006 and was recorded as a separate line item in the Consolidated Statement of Income in accordance with FAS No. 142. The expense is included in the Consumer Segment. In addition, the Company also recorded impairments due to change in circumstances in accordance with FAS No. 144 for capitalized software of $.3 million, which was charged to the Automotive Finishes Segment’s SG&A and a customer sales incentive program of $1.7 million, which was charged to Net sales in the Consumer Segment. See Note 3, on pages 52 through 54 of this report, for more information concerning the impairment of goodwill, intangible assets and long-lived assets.
Interest expense increased $9.6 million in 2005 versus 2004 due to increased short-term borrowings for the full year 2005 versus a portion of 2004 and rates that were approximately 200 average basis points higher in 2005 than in 2004.
Other expense – net increased $13.1 million in 2005 compared to 2004. An increase in the provision for environmental matters of $11.0 million included in the Administrative Segment and a loss on the disposition of Kinlita of $7.9 million included in the Automotive Finishes Segment, were partially offset by a gain on the disposition of various long-lived assets of $3.6 million. See Note 12, on page 66 of this report, for more information concerning the Other expense – net caption.
Income before income taxes and minority interest increased $76.0 million primarily as a result of increased sales volume and good expense control resulting in gross profit that exceeded SG&A by $121.7 million. Partially offsetting the excess gross profit was increased interest expense and other expenses. Net income increased $70.0 million in 2005 due primarily to the increased sales volume, good expense control, accretive earnings from acquisitions of $19.6 million and the favorable effect of a reduction in the effective tax rate to 29.2 percent in 2005 from 32.0 percent last year. The reduction in the effective tax rate was due to favorable settlement of various federal and state audit issues and favorable tax legislation. For the year, diluted net income per common share increased to $3.28 per share from $2.72 per share in 2004.
Management considers a measurement that is not in accordance with accounting principles generally accepted in the United States a useful measurement of the operational profitability of the Company. Some investment professionals also utilize such a measurement as an indicator of the value of profits and cash that are generated strictly from operating activities, putting aside working capital and certain other balance sheet changes. For this measurement, management increases net income for significant non-operating and non-cash expense items to arrive at an amount known as “Earnings Before Interest, Taxes, Depreciation and Amortization” (EBITDA). The reader is cautioned that the following value for EBITDA should not be compared to other entities unknowingly. EBITDA should not be considered an alternative to net income or cash flows from operating activities as an indicator of operating performance or as a measure of liquidity. The reader should refer to the determination of net income and cash flows from operating activities in accordance with accounting principles generally accepted in the United States disclosed in the Statements of Consolidated Income and Statements of Consolidated Cash Flows, on pages 43 and 44 of this report. EBITDA as used by management is calculated as follows:
34
MANAGEMENT’S DISCUSSION AND ANALYSIS OF FINANCIAL
CONDITION AND RESULTS OF OPERATIONS
| | | | | | | | | | | | | |
| | | | | | | | | | |
| (thousands of dollars) | | 2005 | | | 2004 | | | 2003 | |
| Net income (Page 43) | | $ | 463,258 | | | $ | 393,254 | | | $ | 332,058 | |
| | | | | | | | | | | | | |
| Interest expense (Page 43) | | | 49,586 | | | | 39,948 | | | | 38,742 | |
| Income taxes (Page 43) | | | 191,601 | | | | 185,662 | | | | 190,868 | |
| Depreciation (Page 44) | | | 120,247 | | | | 109,058 | | | | 104,803 | |
| Amortization (Page 44) | | | 23,270 | | | | 16,584 | | | | 11,761 | |
| | | | | | | | | | |
| | | | | | | | | | | | | |
| EBITDA | | $ | 847,962 | | | $ | 744,506 | | | $ | 678,232 | |
| | | | | | | | | | |
RESULTS OF OPERATIONS — 2004 vs. 2003
Shown below are net sales and the percentage change for the current period by reportable segment for 2004 and 2003:
| | | | | | | | | | | | | |
| | | | | | | | | | |
| (thousands of dollars) | | 2004 | | | Change | | | 2003 | |
| Paint Stores | | $ | 3,976,979 | | | | 14.6 | % | | $ | 3,468,857 | |
| Consumer | | | 1,296,251 | | | | 9.0 | % | | | 1,189,666 | |
| Automotive Finishes | | | 514,304 | | | | 12.6 | % | | | 456,739 | |
| International Coatings | | | 318,627 | | | | 11.7 | % | | | 285,282 | |
| Administrative | | | 7,628 | | | | 5.7 | % | | | 7,220 | |
| | | | | | | | | | |
| | | $ | 6,113,789 | | | | 13.1 | % | | $ | 5,407,764 | |
| | | | | | | | | | |
Consolidated net sales for 2004 increased due primarily to volume increases from continuing strong domestic architectural paint sales to contractor and DIY customers, improving sales and market conditions in domestic industrial maintenance and product finishes and improved international sales. Consolidated net sales include the operations of five acquisitions completed at various times after November 2003 including the operations of two larger acquisitions, Duron and PSB, beginning with the month of September 2004. The acquisitions increased consolidated net sales $222.6 million, or 4.1 percent, in 2004.
Net sales in the Paint Stores Segment in 2004 increased due primarily to continuing strong domestic architectural paint sales to contractor and DIY customers. Continued improvement of industrial maintenance and product finishes sales and market conditions also contributed to this Segment’s net sales increase. The acquisition of Duron added 229 stores to this Segment, increased full year 2004 net sales approximately 3.5 percent and was slightly accretive to operating profit. Net sales from stores opened more than twelve calendar months increased 10.1 percent for the full year. During 2004, the Paint Stores Segment opened 67 net new stores. At the end of 2004, this Segment had 2,983 stores in operation in the United States, Canada, Mexico, Puerto Rico and the Virgin Islands. In 2004, the Paint Stores Segment completed its three-year project to remerchandise and refresh the interior design of 2,265 outdated existing stores. The cost of the refresh project was charged to current operations and was accomplished primarily by in-store personnel resulting in a high-impact, low-cost method of enhancing the shopping environment in the stores.
Consumer Segment net sales increased in 2004 due primarily to sales from acquisitions that increased net sales 7.2 percent and new product programs. Partially offsetting these increases was the elimination of a paint program at one of the Segment’s retail customers and a charge against net sales of $9.8 million due to the impairment of a customer sales incentive program.
The Automotive Finishes Segment’s net sales increase for 2004 resulted primarily from new product line introductions, improving international sales and the April 2004 acquisition of a majority interest in Kinlita. Currency exchange fluctuations relative to 2003 had a negligible impact on net sales of this Segment in 2004. There were 200 automotive branches open at the end of 2004 in the United States, Canada, Chile, Jamaica and Peru.
Net sales in the International Coatings Segment in 2004 increased due primarily to favorable currency exchange fluctuations and sales in local currency that continued to build during each quarter of 2004 by improving sales trends in South America and the United Kingdom. During 2003, a change in fiscal year to a calendar year basis by South American subsidiaries, added an additional month sales to that year’s results. The net impact of favorable currency exchange fluctuations in 2004 more than offset the additional month sales in 2003 due to the fiscal year change increasing net sales of this Segment by $9.9 million, or 3.5 percent.
Shown below are operating profit and the percent change for the current period by reportable segment for 2004 and 2003:
| | | | | | | | | | | | | |
| | | | | | | | | | |
| (thousands of dollars) | | 2004 | | | Change | | | 2003 | |
| Paint Stores | | $ | 480,213 | | | | 19.0 | % | | $ | 403,379 | |
| Consumer | | | 187,717 | | | | (5.7 | %) | | | 198,984 | |
| Automotive Finishes | | | 58,056 | | | | 10.8 | % | | | 52,375 | |
| International Coatings | | | 18,041 | | | | 115.5 | % | | | 8,370 | |
| Administrative | | | (163,832 | ) | | | (16.9 | %) | | | (140,182 | ) |
| | | | | | | | | | |
| | | $ | 580,195 | | | | 11.0 | % | | $ | 522,926 | |
| | | | | | | | | | |
Consolidated operating profit in 2004 increased primarily due to increased sales volume generating an increase in gross profit of $246.1 million that more than
35
MANAGEMENT’S DISCUSSION AND ANALYSIS OF
FINANCIAL CONDITION AND RESULTS OF OPERATIONS
offset increased selling, general and administrative expenses of $187.3 million. The increased gross profit was adversely affected by rising raw material prices. As a percent of sales, consolidated gross profit in 2004 decreased to 44.2 percent from 45.4 percent in 2003. The decrease in gross profit as a percent of sales was due primarily to raw material cost increases and $12.3 million in impairment charges that included a $9.8 million charge for a customer sales incentive program.
The Paint Stores Segment’s gross profit for 2004 increased $238.8 million due primarily to increased sales volume and the acquisition of Duron. In the Consumer Segment, gross profit for 2004 decreased due primarily to the year-over-year impact of a $12.3 million impairment charge in 2004 for certain intangible assets and a customer sales incentive program and sharply increasing raw material costs. The Automotive Finishes Segment’s gross profit improved over 2003 due to domestic and foreign sales volume increases, sales of higher margin new products and profits of the Kinlita acquisition. The International Coatings Segment’s 2004 gross profit increased due to the net sales gain and operating efficiencies related to additional manufacturing volume.
Consolidated SG&A increased $187.3 million in 2004 due primarily to expenses associated with additional investment in our businesses but decreased as a percent of sales to 33.8 percent in 2004 from 34.8 percent in 2003. In the Paint Stores Segment, SG&A increased $162.0 million in 2004 due primarily to incremental expenses associated with increased sales volume, continued investments in new stores and acquisitions. The Consumer Segment’s 2004 SG&A decreased and the percentage of sales ratio was favorable to 2003 due primarily to continued cost control. In the Automotive Segment, SG&A as a percent of sales remained flat with 2003. Lower expenses associated with the Kinlita acquisition were offset by incremental expenses associated with the opening of new branches in this Segment. In the International Coatings Segment, SG&A decreased in U.S. dollar spending and declined as a percentage of sales in 2004 due primarily to increased sales levels, favorable currency exchange fluctuations and tight expense control. In addition to an impairment charge of $2.1 million for a reduction in the carrying value of certain capitalized software, the Administrative Segment’s SG&A increased in 2004 due to normal increases in administrative spending and increased expenses of results-related employee benefits. The Administrative Segment’s operating loss was also higher in 2004 due to higher interest expense and more environmental-related provisions.
The annual impairment review performed as of October 1, 2004 in accordance with FAS No. 142, resulted in reductions in the carrying value of certain trademarks with indefinite lives of $2.5 million, which was charged to Cost of goods sold in the Consumer Segment. The impairment of trademarks with indefinite lives was due to a reduction in estimated discounted cash flows for certain product lines. In addition, the Company also recorded impairments due to change in circumstances in accordance with FAS No. 144 for capitalized software of $2.1 million, which was charged to the Administrative Segment’s SG&A, and a customer sales incentive program of $9.8 million, which was charged to Net sales in the Consumer Segment. In 2003, an impairment charge was recorded in SG&A of the Consumer Segment for $1.0 million due to the reduction in fair values of indefinite-lived intangible assets. An impairment charge of $11.4 million for capitalized software was also recorded in 2003 and charged to SG&A in the Consumer and Administrative Segments.
Interest expense increased $1.2 million in 2004 versus 2003 due to increased short-term borrowing and rates that were 125 average basis points higher in 2004 than in 2003.
Other expense – net decreased $.8 million in 2004 compared to 2003. A decrease in net expense of financing and investing activities and an increase in other miscellaneous income items more than offset a $3.7 million increase in provisions for environmental-related matters.
Income before income taxes, minority interest and cumulative effect of change in accounting principle increased $57.3 million primarily as a result of increased gross profit exceeding SG&A by $58.9 million. Net income increased $61.2 million in 2004 due primarily to the increased sales volume, the accretion to net income by acquisitions of $4.7 million and the favorable effect of a reduction in the effective tax rate to 32.0 percent in 2004 from 36.5 percent in 2003. The reduction in the effective tax rate was due to better performance in the foreign operations which are taxed at lower rates, favorable changes in the tax laws, increases in the favorable effect of tax credit investments and an increase in deductible dividends under the Company’s ESOP. For the year, diluted net income per common share increased to $2.72 per share from $2.26 per share in 2003.
36
REPORT OF MANAGEMENT ON THE
CONSOLIDATED FINANCIAL STATEMENTS
Shareholders
The Sherwin-Williams Company
We are responsible for the preparation and fair presentation of the consolidated financial statements, accompanying notes and related financial information included in this report of The Sherwin-Williams Company and its consolidated subsidiaries (collectively, the “Company”) as of December 31, 2005, 2004 and 2003 and for the years then ended in accordance with accounting principles generally accepted in the United States. The consolidated financial information included in this report contains certain amounts that were based upon our best estimates, judgments and assumptions that we believe were reasonable under the circumstances.
We have conducted an assessment of the effectiveness of internal control over financial reporting based on criteria established in Internal Control — Integrated Framework issued by the Committee of Sponsoring Organizations of the Treadway Commission. As discussed in the Report of Management on Internal Control Over Financial Reporting, we concluded that the Company’s internal control over financial reporting was effective as of December 31, 2005.
The Board of Directors pursues its responsibility for the oversight of the Company’s accounting policies and procedures, financial statement preparation and internal control over financial reporting through the Audit Committee, comprised exclusively of independent directors. The Audit Committee is responsible for the appointment and compensation of the independent registered public accounting firm. The Audit Committee meets at least quarterly with financial management, internal auditors and the independent registered public accounting firm to review the adequacy of financial controls, the effectiveness of the Company’s internal control over financial reporting and the nature, extent and results of the audit effort. Both the internal auditors and the independent registered public accounting firm have private and confidential access to the Audit Committee at all times.
We believe that the consolidated financial statements, accompanying notes and related financial information included in this report fairly reflect the form and substance of all material financial transactions and fairly present, in all material respects, the consolidated financial position, results of operations and cash flows as of and for the periods presented.

C. M. Connor
Chairman, President and Chief Executive Officer

S. P. Hennessy
Senior Vice President — Finance and Chief Financial Officer

J. L. Ault
Vice President — Corporate Controller
37
REPORT OF MANAGEMENT ON INTERNAL CONTROL
OVER FINANCIAL REPORTING
Shareholders
The Sherwin-Williams Company
We are responsible for establishing and maintaining accounting and control systems over financial reporting which are designed to provide reasonable assurance that the Company has the ability to record, process, summarize and report reliable financial information. We recognize that internal control over financial reporting cannot provide absolute assurance of achieving financial reporting objectives because of its inherent limitations. Internal control over financial reporting is a process that involves human diligence and is subject to the possibility of human error or the circumvention or the overriding of internal control. Therefore, there is a risk that material misstatements may not be prevented or detected on a timely basis by internal control over financial reporting. However, we believe we have designed into the process safeguards to reduce, though not eliminate, this risk. Projections of any evaluation of effectiveness to future periods are subject to the risk that controls may become inadequate because of changes in conditions, or that the degree of compliance with the policies or procedures may deteriorate.
In order to ensure that the Company’s internal control over financial reporting was effective as of December 31, 2005, we conducted an assessment of its effectiveness under the supervision and with the participation of our management group. This assessment was based on criteria established in Internal Control — Integrated Framework issued by the Committee of Sponsoring Organizations of the Treadway Commission.
Based on our assessment of internal control over financial reporting under the criteria established in Internal Control — Integrated Framework, we have concluded that, as of December 31, 2005, the Company’s internal control over financial reporting was effective to provide reasonable assurance regarding the reliability of financial reporting and the preparation of financial statements for external purposes in accordance with accounting principles generally accepted in the United States. Our assessment of the effectiveness of the Company’s internal control over financial reporting as of December 31, 2005 has been audited by Ernst & Young LLP, an independent registered public accounting firm, and their report on our assessment is included on pages 39 and 40 of this report.
C. M. Connor
Chairman, President and Chief Executive Officer
S. P. Hennessy
Senior Vice President — Finance and Chief Financial Officer
J. L. Ault
Vice President — Corporate Controller
38
REPORT OF THE INDEPENDENT REGISTERED PUBLIC ACCOUNTING
FIRM ON INTERNAL CONTROL OVER FINANCIAL REPORTING
Shareholders and Board of Directors
The Sherwin-Williams Company
Cleveland, Ohio
We have audited management’s assessment, included in the accompanying Report of Management on Internal Control Over Financial Reporting, that The Sherwin-Williams Company maintained effective internal control over financial reporting as of December 31, 2005, based on criteria established in Internal Control-Integrated Framework issued by the Committee of Sponsoring Organizations of the Treadway Commission (the COSO criteria). The Sherwin-Williams Company’s management is responsible for maintaining effective internal control over financial reporting and for its assessment of the effectiveness of internal control over financial reporting. Our responsibility is to express an opinion on management’s assessment and an opinion on the effectiveness of the company’s internal control over financial reporting based on our audit.
We conducted our audit in accordance with the standards of the Public Company Accounting Oversight Board (United States). Those standards require that we plan and perform the audit to obtain reasonable assurance about whether effective internal control over financial reporting was maintained in all material respects. Our audit included obtaining an understanding of internal control over financial reporting, evaluating management’s assessment, testing and evaluating the design and operating effectiveness of internal control, and performing such other procedures as we considered necessary in the circumstances. We believe that our audit provides a reasonable basis for our opinion.
A company’s internal control over financial reporting is a process designed to provide reasonable assurance regarding the reliability of financial reporting and the preparation of financial statements for external purposes in accordance with generally accepted accounting principles. A company’s internal control over financial reporting includes those policies and procedures that (1) pertain to the maintenance of records that, in reasonable detail, accurately and fairly reflect the transactions and dispositions of the assets of the company; (2) provide reasonable assurance that transactions are recorded as necessary to permit preparation of financial statements in accordance with generally accepted accounting principles, and that receipts and expenditures of the company are being made only in accordance with authorizations of management and directors of the company; and (3) provide reasonable assurance regarding prevention or timely detection of unauthorized acquisition, use, or disposition of the company’s assets that could have a material effect on the financial statements.
Because of its inherent limitations, internal control over financial reporting may not prevent or detect misstatements. Also, projections of any evaluation of effectiveness to future periods are subject to the risk that controls may become inadequate because of changes in conditions, or that the degree of compliance with the policies or procedures may deteriorate.
39
REPORT OF THE INDEPENDENT REGISTERED PUBLIC ACCOUNTING FIRM
ON INTERNAL CONTROL OVER FINANCIAL REPORTING (CONTINUED)
In our opinion, management’s assessment that The Sherwin-Williams Company maintained effective internal control over financial reporting as of December 31, 2005, is fairly stated, in all material respects, based on the COSO criteria. Also, in our opinion, The Sherwin-Williams Company maintained, in all material respects, effective internal control over financial reporting as of December 31, 2005, based on the COSO criteria.
We also have audited, in accordance with the standards of the Public Company Accounting Oversight Board (United States), the consolidated balance sheets of The Sherwin-Williams Company as of December 31, 2005, 2004, and 2003, and the related statements of consolidated income, cash flows and shareholders’ equity and comprehensive income for each of the three years in the period ended December 31, 2005, and our report dated February 10, 2006, except for Note 18, as to which the date is February 28, 2006, expressed an unqualified opinion thereon.

Cleveland, Ohio
February 10, 2006
40
REPORT OF THE INDEPENDENT REGISTERED PUBLIC ACCOUNTING
FIRM ON THE CONSOLIDATED FINANCIAL STATEMENTS
Shareholders and Board of Directors
The Sherwin-Williams Company
Cleveland, Ohio
We have audited the accompanying consolidated balance sheets of The Sherwin-Williams Company as of December 31, 2005, 2004 and 2003, and the related statements of consolidated income, cash flows and shareholders’ equity and comprehensive income for each of the three years in the period ended December 31, 2005. These financial statements are the responsibility of the Company’s management. Our responsibility is to express an opinion on these financial statements based on our audits.
We conducted our audits in accordance with the standards of the Public Company Accounting Oversight Board (United States). Those standards require that we plan and perform the audit to obtain reasonable assurance about whether the financial statements are free of material misstatement. An audit includes examining, on a test basis, evidence supporting the amounts and disclosures in the financial statements. An audit also includes assessing the accounting principles used and significant estimates made by management, as well as evaluating the overall financial statement presentation. We believe that our audits provide a reasonable basis for our opinion.
In our opinion, the financial statements referred to above present fairly, in all material respects, the consolidated financial position of The Sherwin-Williams Company at December 31, 2005, 2004 and 2003, and the consolidated results of their operations and their cash flows for each of the three years in the period ended December 31, 2005, in conformity with U.S. generally accepted accounting principles.
We also have audited, in accordance with the standards of the Public Company Accounting Oversight Board (United States), the effectiveness of The Sherwin-Williams Company’s internal control over financial reporting as of December 31, 2005, based on criteria established in Internal Control-Integrated Framework issued by the Committee of Sponsoring Organizations of the Treadway Commission and our report dated February 10, 2006 expressed an unqualified opinion thereon.
Cleveland, Ohio
February 10, 2006,
except for Note 18, as to which the date is February 28, 2006
41
CONSOLIDATED BALANCE SHEETS
(thousands of dollars)
| | | | | | | | | | | | | |
| | | December 31, | |
| | | 2005 | | | 2004 | | | 2003 | |
Assets | | | | | | | | | | | | |
| Current assets: | | | | | | | | | | | | |
| Cash and cash equivalents | | $ | 36,041 | | | $ | 45,932 | | | $ | 302,813 | |
| Accounts receivable, less allowance | | | 809,277 | | | | 724,385 | | | | 544,070 | |
| Inventories: | | | | | | | | | | | | |
| Finished goods | | | 686,913 | | | | 651,095 | | | | 552,657 | |
| Work in process and raw materials | | | 121,631 | | | | 121,757 | | | | 85,580 | |
| | | | | | | | | | |
| | | | 808,544 | | | | 772,852 | | | | 638,237 | |
| Deferred income taxes | | | 107,739 | | | | 88,985 | | | | 86,616 | |
| Other current assets | | | 132,784 | | | | 149,774 | | | | 143,408 | |
| | | | | | | | | | |
| Total current assets | | | 1,894,385 | | | | 1,781,928 | | | | 1,715,144 | |
| | | | | | | | | | | | | |
| Goodwill | | | 887,374 | | | | 900,444 | | | | 563,531 | |
| Intangible assets | | | 290,943 | | | | 307,900 | | | | 187,202 | |
| Deferred pension assets | | | 409,308 | | | | 430,238 | | | | 420,133 | |
| Other assets | | | 142,037 | | | | 133,281 | | | | 146,348 | |
| Property, plant and equipment: | | | | | | | | | | | | |
| Land | | | 73,754 | | | | 70,231 | | | | 58,514 | |
| Buildings | | | 474,094 | | | | 462,964 | | | | 425,712 | |
| Machinery and equipment | | | 1,276,857 | | | | 1,185,420 | | | | 1,091,215 | |
| Construction in progress | | | 55,723 | | | | 33,013 | | | | 36,353 | |
| | | | | | | | | | |
| | | | 1,880,428 | | | | 1,751,628 | | | | 1,611,794 | |
| Less allowances for depreciation | | | 1,135,280 | | | | 1,031,268 | | | | 961,544 | |
| | | | | | | | | | |
| | | | 745,148 | | | | 720,360 | | | | 650,250 | |
| | | | | | | | | | |
| Total Assets | | $ | 4,369,195 | | | $ | 4,274,151 | | | $ | 3,682,608 | |
| | | | | | | | | | |
| | | | | | | | | | | | | |
Liabilities and Shareholders’ Equity | | | | | | | | | | | | |
| Current liabilities: | | | | | | | | | | | | |
| Short-term borrowings | | $ | 123,681 | | | $ | 238,815 | | | | | |
| Accounts payable | | | 719,977 | | | | 650,977 | | | $ | 587,935 | |
| Compensation and taxes withheld | | | 224,760 | | | | 195,739 | | | | 168,758 | |
| Accrued taxes | | | 80,987 | | | | 95,558 | | | | 89,081 | |
| Current portion of long-term debt | | | 10,493 | | | | 11,214 | | | | 10,596 | |
| Other accruals | | | 394,473 | | | | 327,834 | | | | 297,800 | |
| | | | | | | | | | |
| Total current liabilities | | | 1,554,371 | | | | 1,520,137 | | | | 1,154,170 | |
| | | | | | | | | | | | | |
| Long-term debt | | | 486,996 | | | | 488,239 | | | | 502,992 | |
| Postretirement benefits other than pensions | | | 226,526 | | | | 221,975 | | | | 216,853 | |
| Other long-term liabilities | | | 370,690 | | | | 392,849 | | | | 349,736 | |
| Minority interest | | | | | | | 3,705 | | | | | |
| Shareholders’ equity: | | | | | | | | | | | | |
| | | | | | | | | | | | | |
| Common stock — $1.00 par value: 135,139,381, 140,777,115 and 143,406,707 shares outstanding at December 31, 2005, 2004 and 2003, respectively | | | 218,935 | | | | 216,396 | | | | 212,409 | |
| Preferred stock — convertible, participating, no par value: 34,702, 171,819 and 284,657 shares outstanding at December 31, 2005, 2004 and 2003, respectively | | | 34,702 | | | | 171,819 | | | | 284,657 | |
| Unearned ESOP compensation | | | (34,702 | ) | | | (171,819 | ) | | | (284,657 | ) |
| Other capital | | | 570,394 | | | | 474,594 | | | | 347,779 | |
| Retained earnings | | | 3,044,863 | | | | 2,695,193 | | | | 2,398,854 | |
| Treasury stock, at cost | | | (1,890,040 | ) | | | (1,529,355 | ) | | | (1,270,917 | ) |
| Cumulative other comprehensive loss | | | (213,540 | ) | | | (209,582 | ) | | | (229,268 | ) |
| | | | | | | | | | |
| Total shareholders’ equity | | | 1,730,612 | | | | 1,647,246 | | | | 1,458,857 | |
| | | | | | | | | | |
| | | | | | | | | | | | | |
| Total Liabilities and Shareholders’ Equity | | $ | 4,369,195 | | | $ | 4,274,151 | | | $ | 3,682,608 | |
| | | | | | | | | | |
See notes to consolidated financial statements.
42
STATEMENTS OF CONSOLIDATED INCOME
(thousands of dollars except per common share data)
| | | | | | | | | | | | | |
| | | Year ended December 31, | |
| | | 2005 | | | 2004 | | | 2003 | |
| Net sales | | $ | 7,190,661 | | | $ | 6,113,789 | | | $ | 5,407,764 | |
| Cost of goods sold | | | 4,110,296 | | | | 3,412,378 | | | | 2,952,469 | |
| Gross profit | | | 3,080,365 | | | | 2,701,411 | | | | 2,455,295 | |
| Percent to net sales | | | 42.8 | % | | | 44.2 | % | | | 45.4 | % |
| Selling, general and administrative expenses | | | 2,326,220 | | | | 2,068,936 | | | | 1,881,664 | |
| Percent to net sales | | | 32.4 | % | | | 33.8 | % | | | 34.8 | % |
| Goodwill impairment | | | 22,000 | | | | | | | | | |
| Interest expense | | | 49,586 | | | | 39,948 | | | | 38,742 | |
| Interest and net investment income | | | (4,595 | ) | | | (5,533 | ) | | | (6,668 | ) |
| Other expense — net | | | 30,939 | | | | 17,865 | | | | 18,631 | |
| | | | | | | | | | |
| Income before income taxes and minority interest | | | 656,215 | | | | 580,195 | | | | 522,926 | |
| Income taxes | | | 191,601 | | | | 185,662 | | | | 190,868 | |
| Minority interest | | | 1,356 | | | | 1,279 | | | | | |
| | | | | | | | | | |
| Net income | | $ | 463,258 | | | $ | 393,254 | | | $ | 332,058 | |
| | | | | | | | | | |
| Net income per common share: | | | | | | | | | | | | |
| Basic | | $ | 3.39 | | | $ | 2.79 | | | $ | 2.29 | |
| | | | | | | | | | |
| Diluted | | $ | 3.28 | | | $ | 2.72 | | | $ | 2.26 | |
| | | | | | | | | | |
See notes to consolidated financial statements.
43
STATEMENTS OF CONSOLIDATED CASH FLOWS
(thousands of dollars)
| | | | | | | | | | | | | |
| | | Year Ended December 31, | |
| | | 2005 | | | 2004 | | | 2003 | |
Operating Activities | | | | | | | | | | | | |
| Net income | | $ | 463,258 | | | $ | 393,254 | | | $ | 332,058 | |
| Adjustments to reconcile net income to net operating cash: | | | | | | | | | | | | |
| Depreciation | | | 120,247 | | | | 109,058 | | | | 104,803 | |
| Amortization of intangible assets | | | 23,270 | | | | 16,584 | | | | 11,761 | |
| Impairment of goodwill | | | 22,000 | | | | | | | | | |
| Impairment of intangible assets | | | 2,670 | | | | 14,556 | | | | 12,454 | |
| Provisions for qualified exit costs | | | 1,957 | | | | 2,737 | | | | 14 | |
| Provisions for environmental-related matters | | | 24,920 | | | | 13,953 | | | | 10,237 | |
| Deferred income taxes | | | (16,048 | ) | | | 17,227 | | | | 39,872 | |
| Defined benefit pension plans net credit | | | (6,422 | ) | | | (5,992 | ) | | | (2,072 | ) |
| Income tax effect of ESOP on other capital | | | 14,054 | | | | 19,304 | | | | 24,665 | |
| Amortization of restricted stock expense | | | 8,723 | | | | 11,642 | | | | 5,641 | |
| Income tax effect of non-qualified stock option exercises | | | 17,480 | | | | 20,932 | | | | 6,944 | |
| Net increase in postretirement liability | | | 4,551 | | | | 5,122 | | | | 3,904 | |
| Foreign currency related (gains) losses | | | (96 | ) | | | 1,699 | | | | 1,460 | |
| Decrease in non-traded investments | | | 28,638 | | | | 24,331 | | | | 20,276 | |
| Loss on disposition of joint venture investment | | | 7,858 | | | | | | | | | |
| Other | | | (5,006 | ) | | | 959 | | | | (2,069 | ) |
| Change in working capital accounts: | | | | | | | | | | | | |
| Increase in accounts receivable | | | (81,631 | ) | | | (89,039 | ) | | | (39,361 | ) |
| Increase in inventories | | | (33,464 | ) | | | (62,702 | ) | | | (153 | ) |
| Increase in accounts payable | | | 67,280 | | | | 33,419 | | | | 60,149 | |
| (Decrease) increase in accrued taxes | | | (15,042 | ) | | | 6,135 | | | | (12,117 | ) |
| Increase in accrued compensation and taxes withheld | | | 28,324 | | | | 26,634 | | | | 20,779 | |
| Other | | | 32,131 | | | | (4,855 | ) | | | (24,806 | ) |
| Costs incurred for environmental-related matters | | | (9,224 | ) | | | (8,712 | ) | | | (7,005 | ) |
| Costs incurred for qualified exit costs | | | (1,783 | ) | | | (3,514 | ) | | | (1,580 | ) |
| Increase in accrued self-insured liabilities | | | 14,200 | | | | | | | | | |
| Other | | | 3,857 | | | | 1,949 | | | | (6,925 | ) |
| | | | | | | | | | |
| Net operating cash | | | 716,702 | | | | 544,681 | | | | 558,929 | |
Investing Activities | | | | | | | | | | | | |
| Capital expenditures | | | (143,072 | ) | | | (106,822 | ) | | | (116,507 | ) |
| Acquisitions of businesses | | | (23,285 | ) | | | (554,478 | ) | | | (48,374 | ) |
| Increase in other investments | | | (37,134 | ) | | | (12,739 | ) | | | (27,875 | ) |
| Proceeds from sale of assets | | | 13,462 | | | | 605 | | | | 47,847 | |
| Other | | | (9,718 | ) | | | (8,447 | ) | | | 8,856 | |
| | | | | | | | | | |
| Net investing cash | | | (199,747 | ) | | | (681,881 | ) | | | (136,053 | ) |
Financing Activities | | | | | | | | | | | | |
| Net (decrease) increase in short-term borrowings | | | (112,420 | ) | | | 238,815 | | | | | |
| Payments of long-term debt | | | (1,972 | ) | | | (14,135 | ) | | | (8,095 | ) |
| Payments of acquired debt | | | | | | | (67,131 | ) | | | | |
| Payments of cash dividends | | | (113,588 | ) | | | (96,915 | ) | | | (90,689 | ) |
| Proceeds from stock options exercised | | | 58,377 | | | | 88,489 | | | | 47,468 | |
| Treasury stock purchased | | | (356,493 | ) | | | (267,358 | ) | | | (238,148 | ) |
| Other | | | (3,910 | ) | | | (5,157 | ) | | | (1,310 | ) |
| | | | | | | | | | |
| Net financing cash | | | (530,006 | ) | | | (123,392 | ) | | | (290,774 | ) |
| Effect of exchange rate changes on cash | | | 3,160 | | | | 3,711 | | | | 6,699 | |
| | | | | | | | | | |
| Net (decrease) increase in cash and cash equivalents | | | (9,891 | ) | | | (256,881 | ) | | | 138,801 | |
| Cash and cash equivalents at beginning of year | | | 45,932 | | | | 302,813 | | | | 164,012 | |
| | | | | | | | | | |
| Cash and cash equivalents at end of year | | $ | 36,041 | | | $ | 45,932 | | | $ | 302,813 | |
| | | | | | | | | | |
| Taxes paid on income | | $ | 164,279 | | | $ | 114,908 | | | $ | 106,950 | |
| Interest paid on debt | | | 49,273 | | | | 39,731 | | | | 39,029 | |
See notes to consolidated financial statements.
44
STATEMENTS OF CONSOLIDATED SHAREHOLDERS’ EQUITY AND
COMPREHENSIVE INCOME (thousands of dollars except per common share data)
| | | | | | | | | | | | | | | | | | | | | | | | | | | | | | | | | |
| | | | | | | | | | | | | | | | | | | | | | | | | | | Cumulative | | | | |
| | | | | | | | | | | Unearned | | | | | | | | | | | | | | | Other | | | | |
| | | | | | | | | | | ESOP | | | | | | | | | | | | | | | Comprehensive | | | | |
| | | Common | | | Preferred | | | Compen- | | | Other | | | Retained | | | Treasury | | | Income | | | | |
| | | Stock | | | Stock | | | sation | | | Capital | | | Earnings | | | Stock | | | (Loss) | | | Total | |
| Balance at January 1, 2003 | | $ | 209,836 | | | $ | 41,806 | | | $ | (41,806 | ) | | $ | 265,635 | | | $ | 2,157,485 | | | $ | (1,029,894 | ) | | $ | (261,172 | ) | | $ | 1,341,890 | |
| Comprehensive income: | | | | | | | | | | | | | | | | | | | | | | | | | | | | | | | | |
| Net income | | | | | | | | | | | | | | | | | | | 332,058 | | | | | | | | | | | | 332,058 | |
| Foreign currency translation | | | | | | | | | | | | | | | | | | | | | | | | | | | 31,822 | | | | 31,822 | |
| Minimum pension liability, net of taxes of ($35) | | | | | | | | | | | | | | | | | | | | | | | | | | | 82 | | | | 82 | |
| | | | | | | | | | | | | | | | | | | | | | | | | | | | | | | | |
| Comprehensive income | | | | | | | | | | | | | | | | | | | | | | | | | | | | | | | 363,962 | |
| Treasury stock purchased | | | | | | | | | | | | | | | | | | | | | | | (238,148 | ) | | | | | | | (238,148 | ) |
| Issuance of preferred stock to pre-fund ESOP | | | | | | | 350,000 | | | | (350,000 | ) | | | | | | | | | | | | | | | | | | | | |
| Redemption of preferred stock | | | | | | | (107,149 | ) | | | 107,149 | | | | | | | | | | | | | | | | | | | | | |
| Income tax effect of ESOP | | | | | | | | | | | | | | | 24,665 | | | | | | | | | | | | | | | | 24,665 | |
| Stock issued (tendered) for exercise of options | | | 2,172 | | | | | | | | | | | | 52,239 | | | | | | | | (743 | ) | | | | | | | 53,668 | |
| Stock tendered in connection with restricted stock grants | | | | | | | | | | | | | | | | | | | | | | | (2,132 | ) | | | | | | | (2,132 | ) |
| Restricted stock grants (net activity) | | | 401 | | | | | | | | | | | | 5,240 | | | | | | | | | | | | | | | | 5,641 | |
| Cash dividends–$.62 per common share | | | | | | | | | | | | | | | | | | | (90,689 | ) | | | | | | | | | | | (90,689 | ) |
| | | | | | | | | | | | | | | | | | | | | | | | | |
| Balance at December 31, 2003 | | | 212,409 | | | | 284,657 | | | | (284,657 | ) | | | 347,779 | | | | 2,398,854 | | | | (1,270,917 | ) | | | (229,268 | ) | | | 1,458,857 | |
| Comprehensive income: | | | | | | | | | | | | | | | | | | | | | | | | | | | | | | | | |
| Net income | | | | | | | | | | | | | | | | | | | 393,254 | | | | | | | | | | | | 393,254 | |
| Foreign currency translation | | | | | | | | | | | | | | | | | | | | | | | | | | | 17,782 | | | | 17,782 | |
| Minimum pension liability, net of taxes of ($597) | | | | | | | | | | | | | | | | | | | | | | | | | | | 1,394 | | | | 1,394 | |
| Unrealized gain on marketable equity securities, net of taxes of ($328) | | | | | | | | | | | | | | | | | | | | | | | | | | | 510 | | | | 510 | |
| | | | | | | | | | | | | | | | | | | | | | | | | | | | | | | | |
| Comprehensive income | | | | | | | | | | | | | | | | | | | | | | | | | | | | | | | 412,940 | |
| Treasury stock purchased | | | | | | | | | | | | | | | (9,565 | ) | | | | | | | (257,793 | ) | | | | | | | (267,358 | ) |
| Redemption of preferred stock | | | | | | | (112,838 | ) | | | 112,838 | | | | | | | | | | | | | | | | | | | | | |
| Income tax effect of ESOP | | | | | | | | | | | | | | | 19,304 | | | | | | | | | | | | | | | | 19,304 | |
| Stock issued (tendered) for exercise of options | | | 3,702 | | | | | | | | | | | | 105,719 | | | | | | | | (645 | ) | | | | | | | 108,776 | |
| Restricted stock grants (net activity) | | | 285 | | | | | | | | | | | | 11,357 | | | | | | | | | | | | | | | | 11,642 | |
| Cash dividends–$.68 per common share | | | | | | | | | | | | | | | | | | | (96,915 | ) | | | | | | | | | | | (96,915 | ) |
| | | | | | | | | | | | | | | | | | | | | | | | | |
| Balance at December 31, 2004 | | | 216,396 | | | | 171,819 | | | | (171,819 | ) | | | 474,594 | | | | 2,695,193 | | | | (1,529,355 | ) | | | (209,582 | ) | | | 1,647,246 | |
| Comprehensive income: | | | | | | | | | | | | | | | | | | | | | | | | | | | | | | | | |
| Net income | | | | | | | | | | | | | | | | | | | 463,258 | | | | | | | | | | | | 463,258 | |
| Foreign currency translation | | | | | | | | | | | | | | | | | | | | | | | | | | | 14,255 | | | | 14,255 | |
| Minimum pension liabilities, net of taxes of $11,980 | | | | | | | | | | | | | | | | | | | | | | | | | | | (18,508 | ) | | | (18,508 | ) |
| Unrealized gain on marketable equity securities and derivative instruments used in cash flow hedges, net of taxes of ($190) | | | | | | | | | | | | | | | | | | | | | | | | | | | 295 | | | | 295 | |
| | | | | | | | | | | | | | | | | | | | | | | | | | | | | | | | |
| Comprehensive income | | | | | | | | | | | | | | | | | | | | | | | | | | | | | | | 459,300 | |
| Treasury stock purchased | | | | | | | | | | | | | | | (296 | ) | | | | | | | (356,197 | ) | | | | | | | (356,493 | ) |
| Redemption of preferred stock | | | | | | | (137,117 | ) | | | 137,117 | | | | | | | | | | | | | | | | | | | | | |
| Income tax effect of ESOP | | | | | | | | | | | | | | | 14,054 | | | | | | | | | | | | | | | | 14,054 | |
| Stock issued (tendered) for exercise of options | | | 2,345 | | | | | | | | | | | | 73,512 | | | | | | | | (4,488 | ) | | | | | | | 71,369 | |
| Restricted stock grants (net activity) | | | 194 | | | | | | | | | | | | 8,530 | | | | | | | | | | | | | | | | 8,724 | |
| Cash dividends–$.82 per common share | | | | | | | | | | | | | | | | | | | (113,588 | ) | | | | | | | | | | | (113,588 | ) |
| | | | | | | | | | | | | | | | | | | | | | | | | |
| Balance at December 31, 2005 | | $ | 218,935 | | | $ | 34,702 | | | $ | (34,702 | ) | | $ | 570,394 | | | $ | 3,044,863 | | | $ | (1,890,040 | ) | | $ | (213,540 | ) | | $ | 1,730,612 | |
| | | | | | | | | | | | | | | | | | | | | | | | | |
See notes to consolidated financial statements.
45
NOTES TO CONSOLIDATED FINANCIAL STATEMENTS
(thousands of dollars unless otherwise indicated)
NOTE 1 – SIGNIFICANT ACCOUNTING POLICIES
Consolidation.The consolidated financial statements include the accounts of The Sherwin-Williams Company, its wholly-owned subsidiaries and its majority-owned equity investments. Inter-company accounts and transactions have been eliminated.
Use of estimates.The preparation of consolidated financial statements in conformity with accounting principles generally accepted in the United States requires management to make estimates, judgments and assumptions that affect the amounts reported in the consolidated financial statements and accompanying notes. Actual results could differ from those amounts.
Nature of operations.The Company is engaged in the manufacture, distribution and sale of coatings and related products to professional, industrial, commercial and retail customers primarily in North and South America.
Reportable segments.See Note 17.
Cash flows.Management considers all highly liquid investments with a maturity of three months or less when purchased to be cash equivalents.
Fair value of financial instruments.The following methods and assumptions were used by the Company in estimating its fair value disclosures for financial instruments:
Cash and cash equivalents:The carrying amounts reported in the consolidated balance sheets for cash and cash equivalents approximate fair value.
Investments in securities:One fund maintained for the payment of non-qualified benefits includes investments classified as available for sale securities. The fair value of such investments, based on quoted market prices, was $10,801, $9,853 and $20,643 at December 31, 2005, 2004 and 2003, respectively. The fair value of investments in the fund not classified as available for sale securities, based on quoted market prices, was $5,705, $6,568 and $1,910 at December 31, 2005, 2004 and 2003, respectively. This fund is reported in Other assets.
Non-traded investments:The Company has invested in the U.S. affordable housing and historic renovation real estate markets. These investments have been identified as variable interest entities. However, the Company is not the primary beneficiary and does not consolidate the operations of the investments in accordance with Financial Accounting Standards Board (FASB) Interpretation No. 46, “Consolidation of Variable Interest Entities.” The Company’s risk of loss from these non-traded investments is limited to the amount of its contributed capital. The carrying amounts of these non-traded investments, included in Other assets, were $34,154, $24,356 and $20,695 at December 31, 2005, 2004 and 2003, respectively. The carrying amounts of these investments, which approximate market value, are determined based on cost less related income tax credits determined by the effective yield method.
Short-term borrowings:The carrying amounts reported in the consolidated balance sheets for short-term borrowings approximate fair value.
Long-term debt (including current portion):The fair values of the Company’s publicly traded debt, shown below, are based on quoted market prices. The fair values of the Company’s non-traded debt, also shown below, are estimated using discounted cash flow analyses, based on the Company’s current incremental borrowing rates for similar types of borrowing arrangements. See Note 7.
| | | | | | | | | | | | | | | | | | | | | | | | | |
| | | December 31, | |
| | | 2005 | | | 2004 | | | 2003 | |
| | | Carrying | | | Fair | | | Carrying | | | Fair | | | Carrying | | | Fair | |
| | | Amount | | | Value | | | Amount | | | Value | | | Amount | | | Value | |
| Publicly traded debt | | $ | 489,070 | | | $ | 580,324 | | | $ | 489,609 | | | $ | 557,798 | | | $ | 505,621 | | | $ | 574,106 | |
| Non-traded debt | | | 8,419 | | | | 7,178 | | | | 9,844 | | | | 8,553 | | | | 8,786 | | | | 8,068 | |
46
NOTES TO CONSOLIDATED FINANCIAL STATEMENTS
(thousands of dollars unless otherwise indicated)
Derivative instruments:The Company utilizes derivative instruments as part of its overall financial risk management policy. The Company entered into interest rate swap contracts during 2003 primarily to hedge against interest rate risks. See Note 7. The Company also entered into option and forward currency exchange contracts in 2005, 2004 and 2003 primarily to hedge against foreign currency risk exposure. See Note 12. During 2005, the Company entered into swaps to partially hedge forecasted future purchases of unleaded gasoline. These hedges were designated as cash flow hedges under Statement of Financial Accounting Standards (FAS) No. 133, “Accounting for Derivative Instruments and Hedging Activity.” At December 31, 2005, the unleaded gasoline swaps were in a favorable position of $140, which is included in Other current assets. Gains of $84 included in Other comprehensive loss (net of taxes) are expected to be reclassified into earnings during 2006. The Company does not use derivative instruments for speculative or trading purposes.
Goodwill.Goodwill represents the cost in excess of fair value of net assets acquired in business combinations accounted for by the purchase method. In accordance with FAS No. 142, goodwill is not amortized and is tested periodically for impairment. See Note 3.
Intangible assets.Intangible assets include trademarks, non-compete covenants and certain intangible property rights. As required by FAS No. 142, trademarks have been classified as indefinite-lived assets and not amortized. An annual test for impairment is performed. The cost of non-compete covenants and certain intangible property rights are amortized on a straight-line basis over the expected period of benefit as follows:
| | | | | |
| | | Useful Life | |
| Non-compete covenants | | 2 – 7 years |
| Certain intangible property rights | | 3 – 20 years |
Accumulated amortization of intangible assets was $147,102, $130,865 and $114,833 at December 31, 2005, 2004 and 2003, respectively. See Note 4.
Investment in life insurance.On October 1, 2003, the Company surrendered its broad-based corporate owned life insurance policies. The net expense associated with such investment during 2003 was included in Other expense — net. Such expense was immaterial to Income before income taxes and minority interest.
Impairment of long-lived assets.In accordance with FAS No. 144, management evaluates the recoverability and estimated remaining lives of long-lived assets whenever events or changes in circumstances indicate that the carrying amount may not be recoverable or the useful life has changed. See Note 3.
Property, plant and equipment.Property, plant and equipment is stated on the basis of cost. Depreciation is provided by the straight-line method. The major classes of assets and ranges of annual depreciation rates are:
| | | | | |
| Buildings | | | 2-1/2% – 20 | % |
| Machinery and equipment | | | 5% – 33-1/3 | % |
| Furniture and fixtures | | | 10% – 20 | % |
| Automobiles and trucks | | | 10% – 33-1/3 | % |
Letters of credit.The Company occasionally enters into standby letter of credit agreements to guarantee various operating activities. These agreements, which substantially all expire in 2006, provide credit availability to the various beneficiaries if certain contractual events occur. Amounts outstanding under these agreements totaled $17,000, $15,633 and $13,282 at December 31, 2005, 2004 and 2003, respectively.
Foreign currency translation.All consolidated non-highly inflationary foreign operations use the local currency of the country of operation as the functional currency and translated the local currency asset and liability accounts at year-end exchange rates while income and expense accounts were translated at average exchange rates. The resulting translation adjustments were included in Cumulative other comprehensive loss, a component of Shareholders’ equity.
Comprehensive income.At December 31, 2005, 2004 and 2003, the ending accumulated balance of Cumulative other comprehensive loss included adjustments for foreign currency translation of $188,979, $203,234 and $221,016, respectively, a minimum pension liability of $25,366, $6,858 and $8,252, respectively, and at December 31, 2005 and 2004, an adjustment for unrealized gains on marketable equity securities and derivative instruments used in cash flow hedges of $805 and $510, respectively.
47
NOTES TO CONSOLIDATED FINANCIAL STATEMENTS
(thousands of dollars unless otherwise indicated)
Revenue recognition.All revenues were recognized when products were shipped and title had passed to unaffiliated customers. Collectibility of amounts recorded as revenue is reasonably assured.
Customer and vendor consideration.The Company offered certain customers rebate and sales incentive programs which were classified as reductions in Net sales. Such programs were in the form of volume rebates, rebates that constituted a percentage of sales or rebates for attaining certain sales goals. The Company received consideration from certain suppliers of raw materials in the form of volume rebates or rebates that constituted a percentage of purchases. These rebates were recognized on an accrual basis by the Company as a reduction of the purchase price of the raw materials and a subsequent reduction of Cost of goods sold when the related product was sold.
Allowance for doubtful accounts.The Company has recorded an allowance for doubtful accounts of $22,734, $30,742 and $26,978 at December 31, 2005, 2004 and 2003, respectively to reduce accounts receivable to their net realizable value. The allowance was based upon an analysis of historical bad debts, a review of the aging of accounts receivable and the current creditworthiness of customers.
Shipping and handling costs.All costs the Company incurred to ship products were included in Cost of goods sold in the Statements of Consolidated Income.
Technical expenditures.Total technical expenditures included research and development costs, quality control, product formulation expenditures and other similar items. Research and development costs included in technical expenditures were $32,338, $34,313 and $34,391 for 2005, 2004 and 2003, respectively.
Advertising expenses.The cost of advertising was expensed as incurred. The Company incurred $257,132, $239,953 and $238,754 in advertising costs during 2005, 2004 and 2003, respectively.
Minority interest.Minority interest reflects the minority shareholders’ interest in the net income and equity of Sherwin-Williams Kinlita Co., Ltd (Kinlita) operating in the People’s Republic of China. During 2005, the Company’s majority investment in the joint venture was sold. See Notes 2 and 3.
Environmental matters.Capital expenditures for ongoing environmental compliance measures were recorded in the Consolidated Balance Sheets, and related expenses were included in the normal operating expenses of conducting business. The Company is involved with environmental investigation and remediation activities at some of its current and former sites and at a number of third-party sites. The Company accrued for environmental-related activities for which commitments or clean-up plans have been developed and for which costs could be reasonably estimated based on industry standards and historical experience. All accrued amounts were recorded on an undiscounted basis. Environmental-related expenses included direct costs of investigation and remediation and indirect costs such as compensation and benefits for employees directly involved in the investigation and remediation activities and fees paid to outside engineering, consulting and law firms. See Notes 8 and 12.
Employee Stock Purchase and Savings Plan and Preferred Stock.The Company accounts for the employee stock purchase and savings plan (ESOP) in accordance with Statement of Position (SOP) No. 93-6, “Employers’ Accounting for Employee Stock Ownership Plans.” The Company recognized compensation expense for amounts contributed to the ESOP and the ESOP used dividends on unallocated preferred shares to service debt. Unallocated preferred shares held by the ESOP were not considered outstanding in calculating earnings per share of the Company. See Note 10.
Stock-based compensation.At December 31, 2005, the Company had two stock-based compensation plans, as more fully described in Note 11, accounted for under the recognition and measurement principles of Accounting Principles Board Opinion (APBO) No. 25, “Accounting for Stock Issued to Employees,” and related interpretations. Pro-forma information regarding the impact of stock-based compensation on net income and income per share is required by FAS No. 123, “Accounting for Stock-Based Compensation.” Such pro-forma information, determined as if the Company had accounted for its employee stock options under the fair value method of that statement, is illustrated in the following table:
48
NOTES TO CONSOLIDATED FINANCIAL STATEMENTS
(thousands of dollars unless otherwise indicated)
| | | | | | | | | | | | | |
| | | 2005 | | | 2004 | | | 2003 | |
| Net income, as reported | | $ | 463,258 | | | $ | 393,254 | | | $ | 332,058 | |
| Add: Total stock-based compensation expense included in the determination of net income as reported, net of related tax effects | | | 5,671 | | | | 7,778 | | | | 3,667 | |
| Less: Total stock-based compensation expense determined under fair value based method for all awards, net of related tax effects | | | (12,313 | ) | | | (14,576 | ) | | | (12,138 | ) |
| | | | | | | | | | |
| Pro-forma net income | | $ | 456,616 | | | $ | 386,456 | | | $ | 323,587 | |
| | | | | | | | | | |
| Income per share: | | | | | | | | | | | | |
| Basic — as reported | | $ | 3.39 | | | $ | 2.79 | | | $ | 2.29 | |
| Basic — pro-forma | | $ | 3.34 | | | $ | 2.74 | | | $ | 2.23 | |
| Diluted — as reported | | $ | 3.28 | | | $ | 2.72 | | | $ | 2.26 | |
| Diluted — pro-forma | | $ | 3.23 | | | $ | 2.67 | | | $ | 2.20 | |
The fair value of the Company’s employee stock options was estimated at the date of grant using a Black-Scholes option-pricing model with the following weighted-average assumptions for all options granted:
| | | | | | | | | | | | | |
| | | 2005 | | 2004 | | 2003 |
| Risk-free interest rate | | | 4.15 | % | | | 2.87 | % | | | 2.24 | % |
| Expected life of options | | 4.33 years | | 3.00 years | | 3.00 years |
| Expected dividend yield of stock | | | 1.86 | % | | | 2.28 | % | | | 2.28 | % |
| Expected volatility of stock | | | .240 | | | | .225 | | | | .290 | |
The Black-Scholes option-pricing model was developed for use in estimating the fair value of traded options which have no vesting restrictions and are fully transferable. Because the Company’s employee stock options have characteristics significantly different from those of traded options, and because changes in the subjective input assumptions can materially affect the fair value estimate, it is management’s opinion that the existing models do not necessarily provide a reliable single measure of the fair value of its employee stock options.
In December 2004, the FASB issued FAS No. 123R, “Share-Based Payment,” that addresses the accounting transactions in which a company exchanges its equity instruments for goods or services. Additionally, in March 2005, the Securities and Exchange Commission (SEC) issued Staff Accounting Bulletin No. 107, which provided further guidance on certain valuation techniques utilized for FAS No. 123R. Based on this additional guidance, the Company reviewed its assumptions used in calculating pro-forma expense and applied enhanced assumptions in determining a fair value for options granted during 2005.
The risk-free interest rate is based upon the U.S. Treasury yield curve at the time of grant. The expected life of options was calculated using a Monte Carlo simulation model. Historical data was used to develop a post-vest termination rate of 4.77 percent, which was applied to the expected life of option calculation for the 2005 grants. The expected dividend yield of stock is the Company’s best estimate of the expected future dividend yield. Expected volatility of stock was calculated using historical and implied volatilities. The Company applied an estimated forfeiture rate of 4.22 percent to the 2005 grants. This rate was calculated based upon historical activity and is an estimate of granted shares not expected to vest. If actual forfeitures differ from the expected rate, the Company may be required to make additional adjustments to pro-forma compensation expense in future periods.
The pro-forma stock-based compensation expense disclosed above is calculated based upon historical option grant behavior and assumptions. The pro-forma amount is not necessarily indicative of future compensation expense.
Earnings per share.Shares of preferred stock held in an unallocated account of the ESOP (see Note 10) and common stock held in a revocable trust (see Note 9) were not considered outstanding shares for basic or diluted income per share calculations. All references to “shares” or “per share” information throughout this report relate to common shares, unless otherwise indicated. Basic net income per common share amounts were computed based on the weighted-average number of common shares outstanding during the year. Diluted net income per common share amounts were computed based on the weighted-average number of common shares outstanding plus all dilutive securities potentially outstanding during the year. See Note 14. All references to income or losses per common share throughout this report are stated on a diluted per common share basis, unless otherwise indicated.
Product warranties.The Company offers product warranties for certain products. The specific terms and conditions of such warranties vary depending on the product or customer contract requirements. Management estimated and accrued the costs of unsettled product warranty claims based on historical results and
49
NOTES TO CONSOLIDATED FINANCIAL STATEMENTS
(thousands of dollars unless otherwise indicated)
experience. Management periodically assesses the adequacy of the accrual for product warranty claims and adjusts the accrual as necessary.
Changes in the Company’s accrual for product warranty claims during 2005, 2004 and 2003, including customer satisfaction settlements during the year, were as follows:
| | | | | | | | | | | | | |
| | | 2005 | | | 2004 | | | 2003 | |
| Balance at January 1 | | $ | 18,098 | | | $ | 16,555 | | | $ | 15,510 | |
| Charges to expense | | | 35,654 | | | | 32,541 | | | | 28,745 | |
| Settlements | | | (30,749 | ) | | | (30,998 | ) | | | (27,700 | ) |
| | | | | | | | | | |
| Balance at December 31 | | $ | 23,003 | | | $ | 18,098 | | | $ | 16,555 | |
| | | | | | | | | | |
Impact of recently issued accounting standards.In April 2004, the Emerging Issues Task Force (EITF) issued EITF No. 03-6, “Participating Securities and the Two-Class Method Under FASB Statement No. 128, Earnings Per Share.” EITF No. 03-6 addresses a number of questions regarding the computation of earnings per share by companies that have issued securities other than common stock that contractually entitle the holder to participate in dividends and earnings of the Company when, and if, it declares dividends on its common stock. The pronouncement also provides further guidance in applying the two-class method of calculating earnings per share, clarifying what constitutes a participating security and how to apply the two-class method of computing earnings per share once it is determined that a security is participating, including how to allocate undistributed earnings to such a security. EITF No. 03-6 was effective for fiscal periods beginning after March 31, 2004. Adoption of this pronouncement had no effect on the Company’s reported earnings per share.
In December 2004, the FASB issued FAS No. 123R that eliminates the alternative to account for share-based compensation transactions using APBO No. 25 and requires instead that such transactions be accounted for using a fair-value-based method. In April 2005, the SEC adopted a rule that amends the compliance date of FAS No. 123R to fiscal years beginning after June 15, 2005. The Company expects to adopt FAS No. 123R effective January 1, 2006 under the “modified prospective” method as described in FAS No. 123R. In the “modified prospective” method, compensation cost is recognized beginning with the effective date, based on the requirements of FAS No. 123R for all share-based payments granted after the effective date and for all unvested awards granted prior to the effective date. The adoption of the fair value method of FAS No. 123R will have an impact on the Company’s results of operations and financial condition, although it will have no impact on the Company’s cash flow. The impact on the results of operations cannot be predicted with certainty at this time because it will depend on levels of share-based payments granted in the future. However, had the Company adopted FAS No. 123R in prior periods, the impact would have approximated the effect of FAS No. 123 as described in the disclosure of pro-forma net income and net income per common share in Stock-based compensation above. FAS No. 123R also requires the tax benefits associated with these share-based payments to be classified as financing activities in the Statements of consolidated cash flows, rather than as an operating cash flow as required under current regulations. The amount of operating cash flows recognized for such excess tax deductions were $17,480, $20,932 and $6,944 in 2005, 2004 and 2003, respectively.
In December 2004, the FASB issued FAS No. 151, “Inventory Costs, an amendment of Accounting Research Bulletin No. 43, Chapter 4,” which requires that abnormal amounts of idle facility expense, freight, handling costs and wasted material (spoilage) be recognized as current-period charges. In addition, the statement requires that allocation of fixed production overheads to the costs of conversion be based on the normal capacity of the production facilities. FAS No. 151 is effective for fiscal years beginning after June 15, 2005. The Company will adopt this statement as required. Management does not believe the adoption will have a material effect on the Company’s results of operations, financial condition or liquidity.
In August 2005, the FASB issued Staff Position (FSP) FAS No. 123R-1, “Classification and Measurement of Freestanding Financial Instruments Originally Issued in Exchange for Employee Services under FASB Statement No. 123R.” FSP FAS No. 123R-1 indefinitely defers the requirement as stated in FAS No. 123R that a share-based payment to an employee be subject to other applicable generally accepted accounting principles when the employee becomes a non-employee. Such share-based payments will be subject to FAS No. 123R throughout the life of the instrument, unless its terms are modified when the holder is no longer an employee. FSP FAS No. 123R-1 will be applied upon adoption of FAS No. 123R, it will not have any impact on the Company’s liquidity and it is not expected to have a material impact on the Company’s results of operations or financial condition.
50
NOTES TO CONSOLIDATED FINANCIAL STATEMENTS
(thousands of dollars unless otherwise indicated)
In October 2005, the FASB issued FSP FAS No. 123R-2, “Practical Accommodation to the Application of a Grant Date as Defined in FAS No. 123R.” FSP FAS No. 123R-2 allows companies to measure compensation costs for equity awards on the board approval date if the communication to employees occurs within a relatively short period of time from the approval date. FSP FAS No. 123R-2 will be applied upon adoption of FAS No. 123R, it will not have any impact on the Company’s liquidity and it is not expected to have a material impact on the Company’s results of operations or financial condition.
In October 2005, the FASB issued FSP FAS No. 13-1, “Accounting for Rental Costs Incurred during a Construction Period.” FSP FAS No. 13-1 requires that rental costs associated with ground or building operating leases that are incurred during a construction period be recognized as rental expense. FSP FAS No. 13-1 is effective for the first reporting period beginning after December 15, 2005. The Company will adopt FSP FAS No. 13-1 as required, and it is not expected to have a material impact on the Company’s results of operations, financial condition, or liquidity.
In November 2005, the FASB issued FSP FAS No. 123R-3, “Transition Election Related to Accounting for the Tax Effects of Share-Based Payment Awards,” which provides for a simplified method of calculating the initial pool of excess tax benefits. FSP FAS No. 123R-3 will be applied upon adoption of FAS No. 123R and it is not expected to have a material impact on the Company’s results of operations, financial condition or liquidity.
Reclassification.Certain amounts in the 2004 and 2003 consolidated financial statements have been reclassified to conform with the 2005 presentation.
NOTE 2 – ACQUISITIONS AND DIVESTITURE
In January 2005, the Company acquired substantially all of the assets and business of KST Coatings Manufacturing, Inc., KST Coatings LLC and Uniflex LLC (collectively, KST) for $23.1 million paid in cash. KST, included in the Consumer Segment, provides roof coatings and roof, deck and wall sealants to professional paint contractors and do-it-yourself users in the United States under the Kool Seal®and the Snow Roof®brands. KST was acquired primarily to assist with the implementation of the Company’s growth strategy of supplying high quality products and services to professional paint contractors and do-it-yourself users through various channels of distribution. The acquisition was accounted for as a purchase, with results of operations included in the consolidated financial statements beginning with the month of January 2005. The KST acquisition resulted in the recognition of goodwill and identifiable intangible assets.
During the third quarter of 2005, the Company sold its majority interest in Kinlita for $6,000 in cash and realized a loss of $7,858 on the divestiture. The Company disposed of its interest in the joint venture due to different management perspectives on the future methodology of meeting long-term strategies. The Company acquired its majority interest in Kinlita for $7,000 paid in cash during the second quarter of 2004. The acquisition was accounted for as a purchase. Kinlita supplies coatings to original equipment truck and bus manufacturers in the People’s Republic of China and was part of the Automotive Finishes Segment. Kinlita’s results of operations were included in the consolidated financial statements from April 2004 through September 2005.
During the third quarter of 2004, the Company completed its acquisitions of 100% of the stock of Duron, Inc. (Duron) and Paint Sundry Brands Corporation (PSB) for an aggregate consideration of $640,625, and the assumption of certain financial obligations. Both acquisitions were financed through the use of cash, liquidated short-term investments and $350,000 in proceeds from the sale of commercial paper under the Company’s existing commercial paper program. Both acquisitions were accounted for as purchases, with results of operations included in the consolidated financial statements beginning with the month of September 2004.
Duron, included in the Paint Stores Segment, is a leading coatings company in the eastern and southeastern portion of the United States servicing the professional painting contractor, builder and do-it-yourself markets. PSB, included in the Consumer Segment, provides high quality paint applicators to professional paint contractors and do-it-yourself users in the United States, Canada and the United Kingdom under the Purdy®, Bestt Liebco®and other brands. The Duron and PSB acquisitions resulted in the recognition of goodwill and were completed primarily to assist with the continued implementation of the Company’s growth strategy of supplying high quality products and services to professional paint contractors and do-it-yourself users through various channels of distribution.
51
NOTES TO CONSOLIDATED FINANCIAL STATEMENTS
(thousands of dollars unless otherwise indicated)
See Note 3 for a discussion of goodwill and intangible assets recorded with the acquisitions of KST, Duron and PSB.
The following unaudited pro-forma summary presents consolidated financial information as if KST, Duron, PSB and Kinlita had been acquired at the beginning of each period presented. The pro-forma consolidated financial information does not necessarily reflect the actual results that would have occurred had the acquisitions of KST, Duron, PSB and Kinlita taken place on January 1, 2003 or the future results of operations of the combined companies under ownership and operation of the Company.
| | | | | | | | | | | | | |
| | | 2005 | | | 2004 | | | 2003 | |
| Net sales | | $ | 7,190,661 | | | $ | 6,485,003 | | | $ | 5,914,530 | |
Net income1 | | | 463,258 | | | | 383,170 | | | | 367,754 | |
| Net income per common share: | | | | | | | | | | | | |
Basic1 | | | 3.39 | | | | 2.72 | | | | 2.54 | |
Diluted1 | | | 3.28 | | | | 2.65 | | | | 2.50 | |
| | |
| 1 | | Included in the reported pro-forma net income for 2004 are charges of $30,500 paid by Duron for settlement of certain compensation arrangements incurred prior to closing and $4,781 paid by PSB for loan origination fees written off prior to closing. |
NOTE 3 – GOODWILL, INTANGIBLE AND LONG-LIVED ASSETS
During 2005, the Company recognized goodwill in the acquisition of KST of $14,476. Identifiable intangible assets of $2,800, consisting of trademarks of $2,500 and a covenant not to compete of $300, were also recognized in the acquisition of KST. Acquired intangible assets subject to amortization are being amortized over 3 years. No significant residual value was estimated for these assets. In 2005 goodwill was reduced by $4,944 relating to the disposition of the Company’s majority interest in Kinlita (see Note 2).
During 2004, the Company recognized goodwill in the acquisitions of Duron, PSB and Kinlita of $116,208, $212,082 and $4,944, respectively. Identifiable intangible assets valued in the acquisitions were trademarks of $41,300, a covenant not to compete of $33,000 and a customer list of $10,600 for Duron and trademarks of $44,300, a customer list of $8,800 and a patent of $1,550 for PSB. Acquired intangible assets subject to amortization are being amortized over weighted-average periods of 3 years for the non-compete covenant, 11 years for the customer lists and 13.5 years for the patent. No significant residual value was estimated for these assets.
During 2003, the Company recognized goodwill of $11,855 in the acquisition of Accurate Dispersions. Identifiable intangible assets of $19,555 were also recognized in the acquisition, primarily related to $17,540 of technology-based assets. Acquired intangible assets subject to amortization are being amortized over weighted-average periods of 7 years for software and 17 years for all other intangible assets. No significant residual value was estimated for these assets.
In accordance with FAS No. 144, whenever events or changes in circumstances indicated that the carrying value of long-lived assets may not be recoverable or the useful life had changed, impairment tests were performed. Undiscounted cash flows were used to calculate the recoverable value of long-lived assets to determine if such assets were impaired. Where impairment was identified, a discounted cash flow valuation model, incorporating discount rates commensurate with the risks involved for each group of assets, was used to determine the fair value for the assets.
During 2005, an impairment test was performed for capitalized software costs due to the replacement and significant changes in the utilization of certain software. A reduction in the carrying value of capitalized software costs of $259 was charged to Selling, general and administrative expenses in the Automotive Finishes Segment. Assets related to a customer sales incentive program were tested for impairment due to lower than anticipated sales performance, resulting in a reduction in carrying value and a charge of $1,656 to Net sales in the Consumer Segment.
During 2004, an impairment test was performed for capitalized software costs due to the replacement and significant changes in the utilization of certain software. A reduction in the carrying value of capitalized software costs of $2,085 was charged to Selling, general and administrative expenses in the Administrative Segment. Assets related to a customer sales incentive program were tested for impairment due to lower than anticipated sales performance, resulting in a reduction in carrying value and a charge of $9,790 to Net sales in the Consumer Segment. A reduction in the carrying value of certain manufacturing equipment in the Consumer Segment of $133 was charged to Cost of goods sold.
During 2003, an impairment test was performed for capitalized software costs due to the replacement and significant changes in the utilization of certain software.
52
NOTES TO CONSOLIDATED FINANCIAL STATEMENTS
(thousands of dollars unless otherwise indicated)
A reduction in the carrying value of capitalized software costs of $3,784 and $7,657 was charged to Selling, general and administrative expenses in the Consumer and Administrative Segments, respectively.
Goodwill and trademarks with indefinite lives are required by FAS No. 142 to be periodically tested for impairment. October 1 has been established for the annual impairment review. Fair values are estimated separately for goodwill and trademarks with indefinite lives using a discounted cash flow valuation model, incorporating discount rates commensurate with the risks involved for each group of assets. The annual impairment review performed as of October 1, 2005 and an additional impairment review performed in the fourth quarter due to updated cash flow projections, resulted in a reduction in the carrying value of goodwill of $22,000 and trademarks with indefinite lives of $755. The goodwill impairment was recorded as a separate line item in the Consolidated Statement of Income in accordance with FAS No. 142 and is included in the Consumer Segment. The impairment of trademarks with indefinite lives of $755 was charged to Cost of goods sold in the Consumer Segment ($653) and Selling, general and administrative expenses in the Stores Segment ($102). The impairment of goodwill and trademarks with indefinite lives was due to lower-than-anticipated projected sales of certain acquired domestic brands and relating to business with a major retailer starting in 2006.
The annual impairment review performed as of October 1, 2004 resulted in reductions in the carrying value of certain trademarks with indefinite lives of $2,548, which was charged to Cost of goods sold in the Consumer Segment. The impairment of trademarks with indefinite lives related to reduction in estimated discounted cash flows.
The annual impairment review performed as of October 1, 2003 resulted in reductions in the carrying value of certain trademarks with indefinite lives of $1,013, which was charged to Selling, general and administrative expenses in the Consumer Segment. The impairment of trademarks with indefinite lives related to lower-than-anticipated sales of certain acquired domestic brands.
Amortization of finite-lived intangible assets is as follows for the next five years: $23,200 in 2006, $17,759 in 2007, $9,304 in 2008, $7,716 in 2009 and $7,306 in 2010.
The International Coatings Segment has no carrying value of goodwill. A summary of changes in the Company’s carrying value of goodwill by the other reportable operating segments is as follows:
| | | | | | | | | | | | | | | | | |
| | | | | | | | | | | Automotive | | | Consolidated | |
| Goodwill | | Paint Stores | | | Consumer | | | Finishes | | | Totals | |
| Balance at January 1, 2003 | | $ | 89,729 | | | $ | 450,054 | | | $ | 28,249 | | | $ | 552,207 | |
| Acquisitions | | | | | | | 11,855 | | | | | | | | 11,855 | |
| Currency and other adjustments | | | 74 | | | | 42 | | | | (647 | ) | | | (531 | ) |
| | | | | | | | | | | | | |
| Balance at December 31, 2003 | | | 89,803 | | | | 446,126 | | | | 27,602 | | | | 563,531 | |
| Acquisitions | | | 116,208 | | | | 212,082 | | | | 4,944 | | | | 336,514 | |
| Currency and other adjustments | | | 3 | | | | 3,298 | | | | 378 | | | | 399 | |
| | | | | | | | | | | | | |
Balance at December 31, 2004 | | | 206,014 | | | | 661,506 | | | | 32,924 | | | | 900,444 | |
Acquisitions | | | | | | | 14,476 | | | | | | | | 14,476 | |
Impairment charged to operations | | | | | | | (22,000 | ) | | | | | | | (22,000 | ) |
Sale of operations | | | | | | | | | | | (4,944 | ) | | | (4,944 | ) |
Currency and other adjustments | | | (538 | ) | | | (1,615 | ) | | | 1,551 | | | | (602 | ) |
| | | | | | | | | | | | | |
Balance at December 31, 2005 | | $ | 205,476 | | | $ | 652,367 | | | $ | 29,531 | | | $ | 887,374 | |
| | | | | | | | | | | | | |
53
NOTES TO CONSOLIDATED FINANCIAL STATEMENTS
(thousands of dollars unless otherwise indicated)
A summary of the Company’s carrying value of intangible assets is as follows:
| | | | | | | | | | | | | | | | | | | | | |
| | | | | | | | | | | | | | | Trademarks | | | Total | |
| | | Finite-lived intangible assets | | | with indefinite | | | intangible | |
| | | Software | | | All other | | | Subtotal | | | lives | | | assets | |
December 31, 2005 | | | | | | | | | | | | | | | | | | | | |
Weighted-average amortization period | | 10 years | | 8 years | | 9 years | | | | | | | | |
Gross | | $ | 63,853 | | | $ | 141,561 | | | $ | 205,414 | | | $ | 232,631 | | | $ | 438,045 | |
Accumulated amortization | | | (25,324 | ) | | | (87,250 | ) | | | (112,574 | ) | | | (34,528 | ) | | | (147,102 | ) |
| | | | | | | | | | | | | | | | |
Net value | | $ | 38,529 | | | $ | 54,311 | | | $ | 92,840 | | | $ | 198,103 | | | $ | 290,943 | |
| | | | | | | | | | | | | | | | |
| December 31, 2004 | | | | | | | | | | | | | | | | | | | | |
| Weighted-average amortization period | | 10 years | | 9 years | | 10 years | | | | | | | | |
| Gross | | $ | 61,405 | | | $ | 141,192 | | | $ | 202,597 | | | $ | 236,168 | | | $ | 438,765 | |
| Accumulated amortization | | | (22,468 | ) | | | (70,009 | ) | | | (92,477 | ) | | | (38,388 | ) | | | (130,865 | ) |
| | | | | | | | | | | | | | | | |
| Net value | | $ | 38,937 | | | $ | 71,183 | | | $ | 110,120 | | | $ | 197,780 | | | $ | 307,900 | |
| | | | | | | | | | | | | | | | |
| December 31, 2003 | | | | | | | | | | | | | | | | | | | | |
| Weighted-average amortization period | | 11 years | | 15 years | | 12 years | | | | | | | | |
| Gross | | $ | 60,820 | | | $ | 90,318 | | | $ | 151,138 | | | $ | 150,897 | | | $ | 302,035 | |
| Accumulated amortization | | | (17,960 | ) | | | (59,295 | ) | | | (77,255 | ) | | | (37,578 | ) | | | (114,833 | ) |
| | | | | | | | | | | | | | | | |
| Net value | | $ | 42,860 | | | $ | 31,023 | | | $ | 73,883 | | | $ | 113,319 | | | $ | 187,202 | |
| | | | | | | | | | | | | | | | |
NOTE 4 – INVENTORIES
Inventories were stated at the lower of cost or market with cost determined principally on the last-in, first-out (LIFO) method. The following presents the effect on inventories, net income and net income per common share had the Company used the first-in, first-out (FIFO) inventory valuation method adjusted for income taxes at the statutory rate and assuming no other adjustments. This information is presented to enable the reader to make comparisons with companies using the FIFO method of inventory valuation.
| | | | | | | | | | | | | |
| | | 2005 | | | 2004 | | | 2003 | |
| Percentage of total inventories on LIFO | | | 89 | % | | | 81 | % | | | 88 | % |
| Excess of FIFO over LIFO | | $ | 187,425 | | | $ | 125,212 | | | $ | 96,591 | |
| (Decrease) increase in net income due to LIFO | | | (40,855 | ) | | | (18,580 | ) | | | 2,213 | |
| (Decrease) increase in net income per common share due to LIFO | | | (.29 | ) | | | (.13 | ) | | | .02 | |
NOTE 5 – EXIT OR DISPOSAL ACTIVITIES
Management is continually re-evaluating the Company’s operating facilities, including acquired operating facilities, against its long-term strategic goals. Liabilities associated with exit or disposal activities are recognized as incurred in accordance with FAS No. 146. Provisions for qualified exit costs are made at the time a facility is no longer operational or an adjustment to the purchase price is made for acquired facilities planned at acquisition to be exited or disposed. Qualified exit costs primarily include post-closure rent expenses, incremental post-closure costs and costs of employee terminations. Adjustments may be made to liabilities accrued for qualified exit costs if information becomes available upon which more accurate amounts can be reasonably estimated. Concurrently, property, plant and equipment is tested for impairment in accordance with FAS No. 144 and, if impairment exists, the carrying value of the related assets is reduced to estimated fair value. Additional impairment may be recorded for subsequent revisions in estimated fair value. No significant impairments or increased impairment charges occurred during 2005, 2004 or 2003.
During 2005, two manufacturing facilities were closed and one manufacturing facility was exited in the Consumer Segment. The closed facilities were included in the recent acquisitions of KST and PSB. The total acquired qualified exit costs were $1,132, included as part of the purchase price allocations in accordance with FAS No. 141. Provisions for severance and related costs resulting from the sale of a Consumer manufacturing facility were made in 2005. During 2004, a leased distribution facility in the Automotive Finishes Segment was closed. During 2003, a manufacturing facility in the Consumer Segment was determined impaired due to an
54
NOTES TO CONSOLIDATED FINANCIAL STATEMENTS
(thousands of dollars unless otherwise indicated)
impending closure and the remaining useful lives of the assets were reduced in accordance with FAS No. 144. The facility was closed during 2004. In accordance with FAS No. 146, noncancelable rent, post-closure severance and other qualified exit costs were accrued at the time of closing.
Less than 6 percent of the ending accrual for qualified exit costs at December 31, 2005, related to facilities shutdown prior to 2003, are expected to be incurred by the end of 2006. The remaining portion of the ending accrual for facilities shutdown prior to 2003 primarily represented post-closure contractual and demolition expenses related to certain owned facilities which are closed and being held for disposal or involved in ongoing environmental-related activities. The Company cannot reasonably estimate when such matters will be concluded to permit disposition.
The following table summarizes the activity and remaining liabilities associated with qualified exit costs:
| | | | | | | | | | | | | | | | | | | | | |
| | | | | | | Provisions in | | | Actual | | | Adjustments to | | | | |
| | | Balance at | | | Cost of goods | | | expenditures | | | prior provisions | | | Balance at | |
| | | December 31, | | | sold or | | | charged to | | | in Other | | | December 31, | |
| Exit Plan | | 2004 | | | acquired | | | accrual | | | expense - net | | | 2005 | |
Consumer manufacturing facilities shutdown in 2005: | | | | | | | | | | | | | | | | | | | | |
Severance and related costs | | | | | | $ | 1,472 | | | $ | (535 | ) | | $ | (15 | ) | | $ | 922 | |
Other qualified exit costs | | | | | | | 1,016 | | | | (30 | ) | | | | | | | 986 | |
Automotive Finishes distribution facility shutdown in 2004: | | | | | | | | | | | | | | | | | | | | |
Other qualified exit costs | | $ | 316 | | | | | | | | (266 | ) | | | (50 | ) | | | | |
Consumer manufacturing facility shutdown in 2004: | | | | | | | | | | | | | | | | | | | | |
Other qualified exit costs | | | | | | | 836 | | | | (186 | ) | | | | | | | 650 | |
Other qualified exit costs for facilities shutdown prior to 2003 | | | 13,819 | | | | | | | | (766 | ) | | | (170 | ) | | | 12,883 | |
| | | | | | | | | | | | | | | | |
Totals | | $ | 14,135 | | | $ | 3,324 | | | $ | (1,783 | ) | | $ | (235 | ) | | $ | 15,441 | |
| | | | | | | | | | | | | | | | |
| | | | | | | | | | | | | | | | | | | | | |
| | | | | | | | | | | Actual | | | Adjustments to | | | | |
| | | Balance at | | | Provisions in | | | expenditures | | | prior provisions | | | Balance at | |
| | | December 31, | | | Cost of goods | | | charged to | | | in Other | | | December 31, | |
| Exit Plan | | 2003 | | | sold | | | accrual | | | expense - net | | | 2004 | |
| Automotive Finishes distribution facility shutdown in 2004: | | | | | | | | | | | | | | | | | | | | |
| Severance and related costs | | | | | | $ | 297 | | | $ | (185 | ) | | $ | (112 | ) | | | | |
| Other qualified exit costs | | | | | | | 903 | | | | (683 | ) | | | 96 | | | $ | 316 | |
| Consumer manufacturing facility shutdown in 2004: | | | | | | | | | | | | | | | | | | | | |
| Other qualified exit costs | | | | | | | 1,500 | | | | (1,810 | ) | | | 310 | | | | | |
| Other qualified exit costs for facilities shutdown prior to 2003 | | $ | 14,912 | | | | | | | | (836 | ) | | | (257 | ) | | | 13,818 | |
| | | | | | | | | | | | | | | | |
| Totals | | $ | 14,912 | | | $ | 2,700 | | | $ | (3,514 | ) | | $ | 37 | | | $ | 14,135 | |
| | | | | | | | | | | | | | | | |
| | | | | | | | | | | | | | | | | | | | | |
| | | | | | | | | | | Actual | | | Adjustments to | | | | |
| | | Balance at | | | Provisions in | | | expenditures | | | prior provisions | | | Balance at | |
| | | December 31, | | | Cost of goods | | | charged to | | | in Other | | | December 31, | |
| Exit Plan | | 2002 | | | sold | | | accrual | | | expense - net | | | 2003 | |
| Other qualified exit costs for facilities shutdown prior to 2003 | | $ | 16,477 | | | | | | | $ | (1,579 | ) | | $ | 14 | | | $ | 14,912 | |
| | | | | | | | | | | | | | | | | |
55
NOTES TO CONSOLIDATED FINANCIAL STATEMENTS
(thousands of dollars unless otherwise indicated)
NOTE 6 – HEALTH CARE, PENSION AND OTHER BENEFITS
The Company provides pension benefits to substantially all employees through noncontributory defined contribution or defined benefit plans.
In connection with the acquisition of Duron, the Company acquired a domestic defined benefit pension plan (Duron Plan). The Duron Plan covered all employees who met certain eligibility requirements based primarily on age, length of service and hours worked per year. The Company operated the Duron Plan independently from the date of acquisition until December 31, 2004, at which time it was frozen and merged into the Company’s domestic salaried defined benefit pension plan. The decision to freeze the Duron Plan and merge it with the Company’s domestic salaried defined benefit pension plan effective December 31, 2004 was made at the acquisition date. Accrued benefits and vesting service under the Duron Plan were credited under the Company’s domestic salaried defined benefit pension plan. At December 31, 2004, the Duron Plan was under-funded by $2,574 with a projected benefit obligation and an accumulated benefit obligation of $18,307 and a fair value of plan assets of $15,733. The Company made contributions of $1,175 to the Duron Plan in 2004.
Effective January 1, 2002, the domestic salaried defined benefit pension plan was revised. All participants in the domestic salaried defined benefit pension plan prior to the revision retain the previous defined benefit formula for computing benefits with certain modifications for active employees. Eligible domestic salaried employees hired or re-hired on or after January 1, 2002 become participants in the revised domestic salaried defined benefit pension plan upon completion of six months of service. All employees who become participants subsequent to the plan’s revision will be credited with certain contribution credits that range from two percent to seven percent based on hire date or a combination of age and service with the Company. Contribution credits will be converted into units to account for each participant’s benefits. These participants will receive a variable annuity benefit upon retirement or a distribution upon termination (if vested). The variable annuity benefit is subject to the hypothetical returns achieved on each participant’s allocation of units from investments in various mutual funds as directed by the participant. Contribution credits to the revised domestic salaried defined benefit pension plan will be initially funded through the existing excess plan assets.
The Company employs a total return investment approach for the domestic and foreign defined benefit pension plan assets. A mix of equities and fixed income investments are used to maximize the long-term return of assets for a prudent level of risk. In determining the expected long-term rate of return on defined benefit pension plan assets, management considers the historical rates of return, the nature of investments and an expectation of future investment strategies. At December 31, 2005, defined benefit pension plan assets were invested as follows:
| | | | | | | | | |
| | | Domestic | | Foreign |
| | | Plans | | Plans |
| Equity investments | | | 66 | % | | | 66 | % |
| Fixed income investments | | | 31 | % | | | 26 | % |
| Cash and other investments | | | 3 | % | | | 8 | % |
Included as equity investments in the domestic defined benefit pension plan at December 31, 2005 were 1,255,000 shares of the Company’s common stock with a market value of $57,002, which was 9.3 percent of total domestic defined benefit pension plan assets. During 2005, no shares of the Company’s common stock were sold and dividends received on the Company’s common stock were $1,029.
At December 31, 2005, one of the Company’s domestic defined benefit pension plans was under-funded by $4,786 with a projected benefit obligation and an accumulated benefit obligation of $98,999 and a fair value of plan assets of $94,213. A foreign defined benefit pension plan was also under-funded by $7,480 with a projected benefit obligation of $48,394, an accumulated benefit obligation of $34,076, and a fair value of plan assets of $26,596. In addition, the Company has one unfunded foreign defined benefit pension plan with an accumulated benefit obligation of $672. Contributions to the foreign defined benefit pension plans are expected to be $3,240 in 2006.
The Company expects to make the following benefit payments for all domestic and foreign defined benefit pension plans: $17,822 in 2006; $19,570 in 2007; $22,031 in 2008; $24,557 in 2009; $25,360 in 2010; and $140,016 in 2011 through 2015.
The following table summarizes the obligations and assets of the defined benefit pension plans, which are all measured as of December 31.
56
NOTES TO CONSOLIDATED FINANCIAL STATEMENTS
(thousands of dollars unless otherwise indicated)
| | | | | | | | | | | | | | | | | | | | | | | | | |
| | | Domestic | | | Foreign | |
| | | Defined Benefit Pension Plans | | | Defined Benefit Pension Plans | |
| | | 2005 | | | 2004 | | | 2003 | | | 2005 | | | 2004 | | | 2003 | |
| Accumulated benefit obligation at end of year | | $ | 254,103 | | | $ | 230,912 | | | $ | 218,804 | | | $ | 40,136 | | | $ | 36,437 | | | $ | 32,323 | |
| | | | | | | | | | | | | | | | | | | |
| Projected benefit obligation: | | | | | | | | | | | | | | | | | | | | | | | | |
| Balance at beginning of year | | $ | 246,639 | | | $ | 224,265 | | | $ | 190,711 | | | $ | 51,873 | | | $ | 40,182 | | | $ | 30,089 | |
| Service cost | | | 15,207 | | | | 10,992 | | | | 7,036 | | | | 2,340 | | | | 1,520 | | | | 1,358 | |
| Interest cost | | | 14,164 | | | | 12,777 | | | | 12,066 | | | | 2,689 | | | | 2,354 | | | | 1,959 | |
| Actuarial loss (gain) | | | 15,220 | | | | (2,295 | ) | | | 30,276 | | | | 7,048 | | | | 5,123 | | | | (368 | ) |
| Plan amendments, merger and other | | | 1,275 | | | | 18,026 | | | | | | | | 493 | | | | 487 | | | | 4,646 | |
| Effect of foreign exchange | | | | | | | | | | | | | | | (5,183 | ) | | | 3,074 | | | | 3,373 | |
| Benefits paid | | | (15,518 | ) | | | (17,126 | ) | | | (15,824 | ) | | | (1,740 | ) | | | (866 | ) | | | (875 | ) |
| | | | | | | | | | | | | | | | | | | |
| Balance at end of year | | | 276,987 | | | | 246,639 | | | | 224,265 | | | | 57,520 | | | | 51,874 | | | | 40,182 | |
| Plan assets: | | | | | | | | | | | | | | | | | | | | | | | | |
| Balance at beginning of year | | | 596,097 | | | | 533,340 | | | | 464,110 | | | | 28,524 | | | | 23,133 | | | | 15,732 | |
| Actual return on plan assets | | | 34,228 | | | | 67,612 | | | | 88,023 | | | | 5,342 | | | | 2,179 | | | | 4,765 | |
| Plan merger and other — net | | | (2,136 | ) | | | 12,271 | | | | (2,969 | ) | | | 2,966 | | | | 2,354 | | | | 1,842 | |
| Effect of foreign exchange | | | | | | | | | | | | | | | (2,905 | ) | | | 1,724 | | | | 1,669 | |
| Benefits paid | | | (15,518 | ) | | | (17,126 | ) | | | (15,824 | ) | | | (1,740 | ) | | | (866 | ) | | | (875 | ) |
| | | | | | | | | | | | | | | | | | | |
| Balance at end of year | | | 612,671 | | | | 596,097 | | | | 533,340 | | | | 32,187 | | | | 28,524 | | | | 23,133 | |
| Excess (deficiency) of plan assets over projected benefit obligation: | | | | | | | | | | | | | | | | | | | | | | | | |
| Balance at end of year | | | 335,684 | | | | 349,458 | | | | 309,075 | | | | (25,333 | ) | | | (23,350 | ) | | | (17,049 | ) |
| Unrecognized actuarial loss | | | 98,142 | | | | 74,290 | | | | 108,297 | | | | 24,202 | | | | 24,602 | | | | 18,922 | |
| Unrecognized prior service cost | | | 2,168 | | | | 1,506 | | | | 1,726 | | | | 283 | | | | 328 | | | | 388 | |
| | | | | | | | | | | | | | | | | | | |
| Excess (deficit) recognized in the Consolidated Balance Sheets | | $ | 435,994 | | | $ | 425,254 | | | $ | 419,098 | | | $ | (848 | ) | | $ | 1,580 | | | $ | 2,261 | |
| | | | | | | | | | | | | | | | | | | |
| Excess (deficit) recognized in the Consolidated Balance Sheets: | | | | | | | | | | | | | | | | | | | | | | | | |
| Deferred pension assets | | $ | 407,895 | | | $ | 428,714 | | | $ | 419,098 | | | $ | 1,413 | | | $ | 1,524 | | | $ | 1,069 | |
| Unrecognized prior service costs included in Other assets | | | 1,995 | | | | | | | | | | | | | | | | | | | | | |
| Benefit liability included in Other accruals | | | | | | | | | | | | | | | (7,465 | ) | | | (6,235 | ) | | | (6,982 | ) |
| Benefit liability included in Other long-term liabilities | | | (4,786 | ) | | | (3,460 | ) | | | | | | | (3,194 | ) | | | (3,507 | ) | | | (3,615 | ) |
| Cumulative other comprehensive loss | | | 30,890 | | | | | | | | | | | | 8,398 | | | | 9,798 | | | | 11,789 | |
| | | | | | | | | | | | | | | | | | | | | |
| | | $ | 435,994 | | | $ | 425,254 | | | $ | 419,098 | | | $ | (848 | ) | | $ | 1,580 | | | $ | 2,261 | |
| | | | | | | | | | | | | | | | | | | |
| Weighted-average assumptions used to determine projected benefit obligation: | | | | | | | | | | | | | | | | | | | | | | | | |
| Discount rate | | | 5.50 | % | | | 5.75 | % | | | 6.00 | % | | | 4.91 | % | | | 5.49 | % | | | 5.73 | % |
| Rate of compensation increase | | | 4.00 | % | | | 4.00 | % | | | 4.00 | % | | | 3.97 | % | | | 3.98 | % | | | 3.67 | % |
| Weighted-average assumptions used to determine net pension (credit) cost: | | | | | | | | | | | | | | | | | | | | | | | | |
| Discount rate | | | 5.75 | % | | | 5.98 | % | | | 6.55 | % | | | 5.49 | % | | | 5.73 | % | | | 5.50 | % |
| Expected long-term rate of return on assets | | | 7.50 | % | | | 7.50 | % | | | 8.00 | % | | | 7.18 | % | | | 8.00 | % | | | 8.00 | % |
| Rate of compensation increase | | | 4.00 | % | | | 4.00 | % | | | 4.00 | % | | | 3.98 | % | | | 3.67 | % | | | 3.50 | % |
| Net pension (credit) cost: | | | | | | | | | | | | | | | | | | | | | | | | |
| Service cost | | $ | 15,207 | | | $ | 10,992 | | | $ | 7,036 | | | $ | 2,340 | | | $ | 1,520 | | | $ | 1,358 | |
| Interest cost | | | 14,164 | | | | 12,777 | | | | 12,066 | | | | 2,689 | | | | 2,354 | | | | 1,959 | |
| Expected return on assets | | | (44,054 | ) | | | (39,695 | ) | | | (36,485 | ) | | | (1,987 | ) | | | (1,934 | ) | | | (1,465 | ) |
| Recognition of: | | | | | | | | | | | | | | | | | | | | | | | | |
| Unrecognized prior service cost | | | 612 | | | | 788 | | | | 958 | | | | 61 | | | | 59 | | | | 294 | |
| Unrecognized actuarial loss | | | 3,337 | | | | 6,047 | | | | 11,100 | | | | 1,209 | | | | 1,100 | | | | 1,107 | |
| | | | | | | | | | | | | | | | | | | |
| Net pension (credit) cost | | $ | (10,734 | ) | | $ | (9,091 | ) | | $ | (5,325 | ) | | $ | 4,312 | | | $ | 3,099 | | | $ | 3,253 | |
| | | | | | | | | | | | | | | | | | | |
57
NOTES TO CONSOLIDATED FINANCIAL STATEMENTS
(thousands of dollars unless otherwise indicated)
The Company’s annual contribution for its domestic defined contribution pension plan, which is based on six percent of compensation for covered employees, was $41,937, $41,040 and $41,531 for 2005, 2004 and 2003, respectively. Assets in employee accounts of the domestic defined contribution pension plan are invested in various mutual funds as directed by the participants. These mutual funds did not own a significant number of shares of the Company’s common stock.
The Company’s annual contribution for its foreign defined contribution pension plans, which is based on various percentages of compensation for covered employees up to certain limits, was $2,333, $1,049 and $1,236 for 2005, 2004 and 2003, respectively. Assets in employee accounts of the foreign defined contribution pension plans are invested in various mutual funds. These mutual funds did not own a significant number of shares of the Company’s common stock.
The Company provides certain health care benefits for active employees. The plans are contributory and contain cost-sharing features such as deductibles and coinsurance. There were 18,959, 16,725 and 16,286 active employees entitled to receive benefits under these plans as of December 31, 2005, 2004 and 2003, respectively. The cost of these benefits for active employees, which includes claims incurred and claims incurred but not reported, amounted to $94,890, $82,980 and $80,888 for 2005, 2004 and 2003, respectively. The Company had a fund that provided for payment of health care benefits of qualified employees. The fund ceased operations and there were no distributions in 2005. Distributions from the fund were $4,273 and $8,542 in 2004 and 2003, respectively. In connection with the acquisitions of Duron and PSB, the Company acquired certain health care benefit plans for employees who met certain eligibility requirements. The Company operated the acquired plans independently from the date of acquisition until December 31, 2004. Beginning January 1, 2005, the participants of these acquired plans became participants in the Company’s health care benefit plan.
Employees of the Company hired prior to January 1, 1993 who are not members of a collective bargaining unit, and certain groups of employees added through acquisitions, are eligible for health care and life insurance benefits upon retirement, subject to the terms of the unfunded plans. There were 4,617, 4,658 and 4,727 retired employees entitled to receive benefits as of December 31, 2005, 2004 and 2003, respectively.
On December 8, 2003, the Medicare Prescription Drug, Improvement and Modernization Act of 2003 (the Medicare Act) was signed into law. The Medicare Act introduces a prescription drug benefit under Medicare (Medicare Part D) as well as a federal subsidy to sponsors of retiree health care benefit plans that provide a benefit that is at least actuarially equivalent to Medicare Part D. In accordance with FSP FAS No. 106-2, “Accounting and Disclosure Requirements Related to the Medicare Prescription Drug, Improvement and Modernization Act of 2003,” the effects of the federal subsidy resulted in a $21,400 reduction of the accumulated postretirement benefit obligation for benefits attributed to past service, which is being recognized prospectively beginning July 1, 2004. During 2005, this recognition resulted in a $4,030 reduction of the net periodic postretirement benefit cost, which consisted of $2,371 amortization of the actuarial experience gain and a $1,659 reduction in interest cost. During the last half of 2004, this recognition resulted in a $1,550 reduction of the net periodic postretirement benefit cost, which consisted of $880 amortization of the actuarial experience gain, a $640 reduction in interest cost and a $30 reduction in service cost.
The Company expects to make gross postretirement benefit cash payments and to receive Medicare Part D prescription cash reimbursements as follows:
| | | | | | | | | |
| | | Postretirement | | | Medicare | |
| | | Benefits Other | | | Prescription | |
| | | than Pensions | | | Reimbursement | |
| 2006 | | $ | 23,379 | | | $ | (2,888 | ) |
| 2007 | | | 25,572 | | | | (3,074 | ) |
| 2008 | | | 27,221 | | | | (3,265 | ) |
| 2009 | | | 28,463 | | | | (3,504 | ) |
| 2010 | | | 29,456 | | | | (3,778 | ) |
| 2011 through 2015 | | | 150,310 | | | | (23,491 | ) |
| | | | | | | |
| Total expected benefit cash payments | | $ | 284,401 | | | $ | (40,000 | ) |
| | | | | | | |
A summary of the obligation for postretirement health care and life insurance benefits is shown in the following table.
58
NOTES TO CONSOLIDATED FINANCIAL STATEMENTS
(thousands of dollars unless otherwise indicated)
| | | | | | | | | | | | | |
| | | Postretirement Benefits Other than Pensions | |
| | | 2005 | | | 2004 | | | 2003 | |
| Benefit obligation: | | | | | | | | | | | | |
| Balance at beginning of year | | $ | 311,794 | | | $ | 302,449 | | | $ | 261,807 | |
| Service cost | | | 4,445 | | | | 4,339 | | | | 4,334 | |
| Interest cost | | | 17,380 | | | | 16,725 | | | | 16,787 | |
| Actuarial (gain) loss | | | (14,290 | ) | | | 8,745 | | | | 35,495 | |
| Plan amendments | | | | | | | (4,787 | ) | | | | |
| Benefits paid | | | (16,644 | ) | | | (15,677 | ) | | | (15,974 | ) |
| | | | | | | | | | |
| Balance at end of year | | | 302,685 | | | | 311,794 | | | | 302,449 | |
| Unfunded benefit obligation recognized in the Consolidated Balance Sheets: | | | | | | | | | | | | |
| Unfunded benefit obligation at end of year | | | (302,685 | ) | | | (311,794 | ) | | | (302,449 | ) |
| Unrecognized actuarial loss | | | 64,371 | | | | 83,720 | | | | 78,559 | |
| Unrecognized prior service credit | | | (4,853 | ) | | | (9,301 | ) | | | (8,963 | ) |
| | | | | | | | | | |
| Unfunded benefit obligation recognized in the Consolidated Balance Sheets | | $ | (243,167 | ) | | $ | (237,375 | ) | | $ | (232,853 | ) |
| | | | | | | | | | |
| Unfunded benefit obligation recognized in the Consolidated Balance Sheets consisted of: | | | | | | | | | | | | |
| Postretirement benefits other than pensions | | $ | (226,526 | ) | | $ | (221,975 | ) | | $ | (216,853 | ) |
| Benefit liability included in Other accruals | | | (16,641 | ) | | | (15,400 | ) | | | (16,000 | ) |
| | | | | | | | | | |
| | | $ | (243,167 | ) | | $ | (237,375 | ) | | $ | (232,853 | ) |
| | | | | | | | | | |
| Weighted-average assumptions used to determine benefit obligation: | | | | | | | | | | | | |
| Discount rate | | | 5.50 | % | | | 5.75 | % | | | 6.00 | % |
| Health care cost trend rate — pre-65 | | | 9.00 | % | | | 9.50 | % | | | 10.00 | % |
| Health care cost trend rate — post-65 | | | 9.00 | % | | | 11.00 | % | | | 12.00 | % |
| Drug cost increases | | | 12.00 | % | | | N/A | | | | N/A | |
| Weighted-average assumptions used to determine net periodic benefit cost: | | | | | | | | | | | | |
| Discount rate | | | 5.75 | % | | | 6.00 | % | | | 6.55 | % |
| Health care cost trend rate — pre-65 | | | 9.50 | % | | | 10.00 | % | | | 8.90 | % |
| Health care cost trend rate — post-65 | | | 11.00 | % | | | 12.00 | % | | | 8.90 | % |
| Net periodic benefit cost: | | | | | | | | | | | | |
| Service cost | | $ | 4,445 | | | $ | 4,339 | | | $ | 4,334 | |
| Interest cost | | | 17,380 | | | | 16,725 | | | | 16,787 | |
| Recognition of: | | | | | | | | | | | | |
| Unrecognized prior service credit | | | (4,448 | ) | | | (4,448 | ) | | | (3,885 | ) |
| Unrecognized actuarial loss | | | 5,060 | | | | 3,568 | | | | 2,546 | |
| | | | | | | | | | |
| Net periodic benefit cost | | $ | 22,437 | | | $ | 20,184 | | | $ | 19,782 | |
| | | | | | | | | | |
The assumed health care cost trend rate to be used to determine the net periodic benefit cost for 2006 is 9.0 percent for all participants. The assumed prescription drug cost trend rate to be used to determine the net periodic benefit cost for 2006 is 12 percent. These trend rate assumptions decrease in each successive year until reaching 4.0 percent in 2016. The assumed health care and prescription drug cost trend rates have a significant effect on the amounts reported for the postretirement health care benefit obligation. A one-percentage-point change in assumed health care and prescription drug cost trend rates would have had the following effects as of December 31, 2005:
| | | | | | | | | |
| | | One-Percentage-Point |
| | | Increase | | (Decrease) |
| Effect on total of service and interest cost components | | $ | 560 | | | $ | (544 | ) |
| | | | | | | | | |
| Effect on the postretirement benefit obligation | | $ | 6,701 | | | $ | (6,160 | ) |
59
NOTES TO CONSOLIDATED FINANCIAL STATEMENTS
(thousands of dollars unless otherwise indicated)
NOTE 7 — DEBT
Maturities of long-term debt are as follows for the next five years: $10,493 in 2006; $197,405 in 2007; $65 in 2008; $65 in 2009, and $65 in 2010. Interest expense on long-term debt was $37,201, $37,315 and $37,460 for 2005, 2004 and 2003, respectively.
Among other restrictions, the Company’s Notes, Debentures and revolving credit agreement contain certain covenants relating to liens, ratings changes, merger and sale of assets, consolidated leverage and change of control as defined in the agreements. In the event of default under any one of these arrangements, acceleration of the maturity of any one or more of these borrowings may result. The Company was in compliance with all covenants for all years presented.
During 2003, the Company entered into two separate interest rate swap contracts. Both interest rate swap contracts were with a bank to hedge against changes in the fair value of a portion of the Company’s 6.85% Notes. Each interest rate swap contract had a notional amount of $25,000. The Company agreed to receive interest at a fixed rate of 6.85% and pay interest at six-month London Interbank Offered Rates plus points that varied by contract. These contracts were designated as perfect fair value hedges of the 6.85% Notes. Accordingly, changes in the fair value of these contracts were recorded as assets or liabilities and offset changes in the carrying value of the 6.85% Notes. During 2004, the Company unwound all of the interest rate swap contracts and paid $1,084 to the bank for discontinuation of the contracts. The net payment decreased the carrying amount of the 6.85% Notes and is being amortized to expense over the remaining maturity of the Notes. At December 31, 2003, the fair value of the two separate interest rate swap contracts represented unrealized losses of $819, which was included in Other long-term liabilities. The weighted average interest rate on these contracts was 5.35 percent at December 31, 2003.
| | | | | | | | | | | | | | | | | |
| | | Due Date | | | 2005 | | | 2004 | | | 2003 | |
| 6.85% Notes | | | 2007 | | | $ | 197,595 | | | $ | 198,143 | | | $ | 203,173 | |
| 7.375% Debentures | | | 2027 | | | | 139,932 | | | | 139,929 | | | | 149,921 | |
| 7.45% Debentures | | | 2097 | | | | 146,948 | | | | 146,942 | | | | 147,932 | |
| 5% to 8.5% Promissory Notes | | Through 2007 | | | 1,021 | | | | 1,725 | | | | 1,285 | |
| 9.875% Debentures | | | 2016 | | | | 1,500 | | | | 1,500 | | | | 1,500 | |
| | | | | | | | | | | | | | |
| Long-term debt before FAS No. 133 adjustments | | | | | | | 486,996 | | | | 488,239 | | | | 503,811 | |
| Fair value adjustments to 6.85% Notes in accordance with FAS No. 133 | | | | | | | | | | | | | | | (819 | ) |
| | | | | | | | | | | | | | |
| | | | | | | $ | 486,996 | | | $ | 488,239 | | | $ | 502,992 | |
| | | | | | | | | | | | | | |
Prior to 2003, the Company entered into interest rate swap contracts with a bank to hedge against changes in the fair value of a portion of the Company’s 6.85% Notes. Prior to 2003, the Company unwound the interest rate swap contracts and received a net premium of $4,762 for discontinuation of the contracts. The net premium increased the carrying amount of the 6.85% Notes and is being amortized to income over the remaining maturity of the Notes. There were no interest rate swap agreements outstanding at December 31, 2005 and 2004.
The Company has a five-year senior unsecured revolving credit agreement. The agreement, aggregating $910,000, was amended effective July 19, 2005 and expires July 20, 2009. Effective December 8, 2005, a $500,000 letter of credit subfacility amendment was added to the agreement. There were no borrowings outstanding under the revolving credit agreement during all years presented.
At December 31, 2005 and 2004, borrowings outstanding under the commercial paper program totaled $74,678 and $231,203, respectively and were included in Short-term borrowings on the balance sheet. The weighted-average interest rate related to these borrowings was 4.2% and 2.3% at December 31, 2005 and 2004, respectively. There were no borrowings outstanding under the Company’s commercial paper program at December 31, 2003. The Company uses the revolving credit agreement primarily to satisfy its commercial paper program’s dollar for dollar liquidity requirement. Effective September 26, 2005, the Company’s commercial paper program maximum borrowing capability was increased to $910,000. Borrowings outstanding under various foreign programs at December 31, 2005 of $49,003 with a weighted-average interest rate of 5.4% and at December 31, 2004 of $7,612 with a weighted-average interest rate of 5.0% were included in Short-term borrowings on the balance sheet. There were no
60
NOTES TO CONSOLIDATED FINANCIAL STATEMENTS
(thousands of dollars unless otherwise indicated)
foreign borrowings outstanding under these programs at December 31, 2003.
On October 6, 1997, the Company issued $50,000 of debt securities consisting of 5.5% notes, due October 15, 2027, with provisions that the holders, individually or in the aggregate, may exercise a put option annually on October 15th that would require the Company to repay the securities. Prior to 2002, individual debt security holders exercised put options requiring the Company to repay $46,905 of these debt securities. The remaining balance of these debt securities of $3,095 was included in Current portion of long-term debt at December 31, 2005, 2004 and 2003.
Effective December 24, 1997, the Company filed a shelf registration with the SEC covering $150,000 of unsecured debt securities with maturities greater than nine months from the date of issue. The Company may issue these securities from time to time in one or more series and will offer the securities on terms determined at the time of sale. There were no borrowings outstanding under this registration at December 31, 2005, 2004 and 2003.
Effective September 8, 1998, the Company filed a universal shelf registration statement with the SEC to issue debt securities, common stock and warrants up to $1,500,000. There were no borrowings outstanding or issuance of common stock or warrants under this registration at December 31, 2005, 2004 and 2003.
NOTE 8 – OTHER LONG-TERM LIABILITIES
The operations of the Company, like those of other companies in our industry, are subject to various federal, state and local environmental laws and regulations. These laws and regulations not only govern current operations and products, but also impose potential liability on the Company for past operations. Management expects environmental laws and regulations to impose increasingly stringent requirements upon the Company and the industry in the future. Management believes that the Company conducts its operations in compliance with applicable environmental laws and regulations and has implemented various programs designed to protect the environment and promote continued compliance.
The Company is involved with environmental investigation and remediation activities at some of its current and former sites (including sites which were previously owned and/or operated by businesses acquired by the Company). In addition, the Company, together with other parties, has been designated a potentially responsible party under federal and state environmental protection laws for the investigation and remediation of environmental contamination and hazardous waste at a number of third-party sites, primarily Superfund sites. In general, these laws provide that potentially responsible parties may be held jointly and severally liable for investigation and remediation costs regardless of fault. The Company may be similarly designated with respect to additional third-party sites in the future.
The Company initially provides for estimated costs of environmental-related activities relating to its past operations and third-party sites for which commitments or clean-up plans have been developed and when such costs can be reasonably estimated based on industry standards and historical experience. These estimated costs are determined based on currently available facts regarding each site. If the best estimate of costs can only be identified as a range and no specific amount within that range can be determined more likely than any other amount within the range, the minimum of the range is provided. The unaccrued maximum of the estimated range of possible outcomes is $139,497 higher than the minimum.
The Company continuously assesses its potential liability for investigation and remediation-related activities and adjusts its environmental-related accruals as information becomes available upon which more accurate costs can be reasonably estimated and as additional accounting guidelines are issued. Actual costs incurred may vary from these estimates due to the inherent uncertainties involved including, among others, the number and financial condition of parties involved with respect to any given site, the volumetric contribution which may be attributed to the Company relative to that attributed to other parties, the nature and magnitude of the wastes involved, the various technologies that can be used for remediation and the determination of acceptable remediation with respect to a particular site.
Included in Other long-term liabilities at December 31, 2005, 2004, and 2003 were accruals for extended environmental-related activities of $125,382, $116,537 and $107,688, respectively. Estimated costs of current investigation and remediation activities of $33,452, $24,953 and $25,697 were included in Other accruals at December 31, 2005, 2004 and 2003, respectively.
Four of the Company’s current and former manufacturing sites accounted for the majority of the accrual for environmental-related activities and the unaccrued maximum of the estimated range of possible outcomes at December 31, 2005. Included in the total accrual of
61
NOTES TO CONSOLIDATED FINANCIAL STATEMENTS
(thousands of dollars unless otherwise indicated)
$158,834 at December 31, 2005 was $103,599 related directly to these four sites. In the aggregate unaccrued exposure of $139,497 at December 31, 2005, $71,511 related to the four manufacturing sites. While environmental investigations and remedial actions are in different stages at these sites, additional investigations, remedial actions and monitoring will likely be required at each site.
Management cannot presently estimate the ultimate potential loss contingencies related to these sites or other less significant sites until such time as a substantial portion of the investigation at the sites is completed and remedial action plans are developed. In the event any future loss contingency significantly exceeds the current amount accrued, the recording of the ultimate liability may result in a material impact on net income for the annual or interim period during which the additional costs are accrued. Management does not believe that any potential liability ultimately attributed to the Company for its environmental-related matters will have a material adverse effect on the Company’s financial condition, liquidity, or cash flow due to the extended period of time during which environmental investigation and remediation takes place. An estimate of the potential impact on the Company’s operations cannot be made due to the aforementioned uncertainties.
Management expects these contingent environmental-related liabilities to be resolved over an extended period of time. Management is unable to provide a more specific time frame due to the indefinite amount of time to conduct investigation activities at any site, the indefinite amount of time to obtain environmental agency approval, as necessary, with respect to investigation and remediation activities, and the indefinite amount of time necessary to conduct remediation activities.
In March 2005, the FASB issued FIN No. 47. FIN 47 was effective December 15, 2005 and requires the Company to recognize a liability for the fair value of a conditional asset retirement obligation if a settlement date and fair value can be reasonably estimated. The Company has identified certain conditional asset retirement obligations at various current manufacturing, distribution and store facilities. These obligations relate primarily to asbestos abatement, hazardous waste Resource Conservation and Recovery Act (RCRA) closures, well abandonment, transformers and used oil disposals and underground storage tank closures. Using investigative, remediation and disposal methods that are currently available to the Company, the estimated cost of these obligations is not significant. The Company will recognize a liability for any significant conditional asset retirement obligation when sufficient information is available to reasonably estimate a settlement date to determine the fair value of such a liability. The recording of any ultimate liability for future conditional asset retirement obligations may result in a material impact on net income for the annual or interim period during which the costs are accrued. Management does not believe that any potential liability ultimately attributed to the Company for its conditional asset retirement obligations will have a material adverse effect on the Company’s financial condition, liquidity, or cash flow due to the extended period of time over which sufficient information may become available regarding the closure or modification of any one or group of the Company’s facilities. An estimate of the potential impact on the Company’s operations cannot be made due to the aforementioned uncertainties.
62
NOTES TO CONSOLIDATED FINANCIAL STATEMENTS
(thousands of dollars unless otherwise indicated)
NOTE 9 – CAPITAL STOCK
At December 31, 2005, there were 300,000,000 shares of common stock and 30,000,000 shares of serial preferred stock authorized for issuance. Of the authorized serial preferred stock, 3,000,000 shares are designated as cumulative redeemable serial preferred stock which may be issued pursuant to the Company’s shareholders’ rights plan if the Company becomes the target of coercive and unfair takeover tactics and 434,702 shares are designated as convertible participating serial preferred stock (see Note 11). An aggregate of 16,241,480, 18,679,746 and 22,646,887 shares of common stock at December 31, 2005, 2004 and 2003, respectively, were reserved for future grants of restricted stock and the exercise and future grants of stock options (see Note 11). Common shares outstanding shown in the following table included 475,628 shares of common stock held in a revocable trust at December 31, 2005, 2004 and 2003, respectively. The revocable trust is used to accumulate assets for the purpose of funding the ultimate obligation of certain non-qualified benefit plans. Transactions between the Company and the trust are accounted for in accordance with Emerging Issues Task Force (EITF) No. 97-14, “Accounting for Deferred Compensation Arrangements Where Amounts Earned Are Held in a Rabbi Trust and Invested,” which requires the assets held by the trust be consolidated with the Company’s accounts.
| | | | | | | | | |
| | | Common shares | | Common shares |
| | | in Treasury | | Outstanding |
| Balance at January 1, 2003 | | | 60,925,312 | | | | 148,910,487 | |
| Shares tendered as payment for options exercised | | | 23,950 | | | | (23,950 | ) |
| Shares issued for exercise of stock options | | | | | | | 2,171,839 | |
| Shares tendered in connection with restricted stock grants | | | 75,669 | | | | (75,669 | ) |
| Net shares issued under restricted stock grants | | | | | | | 401,000 | |
| Treasury stock purchased | | | 7,977,000 | | | | (7,977,000 | ) |
| | | | | | | | | |
| Balance at December 31, 2003 | | | 69,001,931 | | | | 143,406,707 | |
| Shares tendered as payment for options exercised | | | 17,219 | | | | (17,219 | ) |
| Shares issued for exercise of stock options | | | | | | | 3,702,377 | |
| Net shares issued under restricted stock grants | | | | | | | 285,250 | |
| Treasury stock purchased | | | 6,600,000 | | | | (6,600,000 | ) |
| | | | | | | | | |
Balance at December 31, 2004 | | | 75,619,150 | | | | 140,777,115 | |
Shares tendered as payment for options exercised | | | 28,817 | | | | (28,817 | ) |
Shares issued for exercise of stock options | | | | | | | 2,344,543 | |
Shares tendered in connection with restricted stock grants | | | 71,335 | | | | (71,335 | ) |
Net shares issued under restricted stock grants | | | | | | | 193,875 | |
Treasury stock purchased | | | 8,076,000 | | | | (8,076,000 | ) |
| | | | | | | | | |
Balance at December 31, 2005 | | | 83,795,302 | | | | 135,139,381 | |
| | | | | | | | | |
NOTE 10 – STOCK PURCHASE PLAN AND PREFERRED STOCK
As of December 31, 2005, 20,287 employees contributed to the Company’s ESOP, a voluntary defined contribution plan available to all eligible salaried employees. Participants are allowed to contribute, on a pretax basis only, up to the lesser of 20 percent of their annual compensation or the maximum dollar amount allowed under the Internal Revenue Code. Such participant contributions may be invested in a variety of mutual funds or a Company common stock fund. Effective January 1, 2004, the ESOP was amended to permit participants to diversify 100 percent of employee contributions previously allocated to the Company common stock fund into a variety of mutual funds. The Company matches current contributions up to 6 percent of annual compensation. Company matching contributions are required to be invested in the Company common stock fund.
The Company made contributions to the ESOP on behalf of participating employees, representing amounts authorized by employees to be withheld from their earnings on a pre-tax basis, of $58,579, $46,524 and $40,662 in 2005, 2004 and 2003, respectively. The Company’s matching contributions to the ESOP charged to operations were $42,353, $35,573 and $31,331 for 2005, 2004 and 2003, respectively.
63
NOTES TO CONSOLIDATED FINANCIAL STATEMENTS
(thousands of dollars unless otherwise indicated)
At December 31, 2005, there were 22,775,943 shares of the Company’s common stock being held by the ESOP, representing 16.9 percent of the total number of voting shares outstanding. Shares of Company common stock credited to each member’s account under the ESOP are voted by the trustee under instructions from each individual plan member. Shares for which no instructions are received, along with any unallocated shares held in the ESOP, are voted by the trustee in the same proportion as those for which instructions are received.
On August 27, 2003, the Company issued 350,000 shares of convertible participating serial preferred stock, no par value with cumulative quarterly dividends of ten dollars per share (Preferred stock) for $350,000 to the ESOP. The ESOP financed the acquisition of the Preferred stock by borrowing $350,000 from the Company at the rate of 4.5 percent per annum. This borrowing is payable over ten years in equal quarterly installments. Each share of Preferred stock is entitled to one vote upon all matters presented to the Company’s shareholders, and the holder of the Preferred stock and the holders of the common stock generally vote together as one class. The Preferred stock is held in an unallocated account by the ESOP until compensation expense related to the Company’s contributions is earned at which time contributions will be credited to the members’ accounts. The Preferred stock is redeemable and convertible into the Company’s common stock at the option of the ESOP based on the relative fair value of the Preferred stock and common stock at time of conversion. In the event the Preferred stock is redeemed, the Company has the option to pay the redemption amount in cash, common stock or any combination thereof. At December 31, 2005, 2004 and 2003, there were no allocated or committed-to-be-released shares of Preferred stock outstanding. The ESOP redeemed 137,117 shares, 112,838 shares and 65,343 shares of the 2003 issuance of Preferred stock for cash in 2005, 2004 and 2003, respectively. In 2003, the ESOP redeemed for cash the remaining 41,806 shares of a 2001 issuance of Preferred stock to the ESOP.
NOTE 11 – STOCK PLAN
The Company’s 2003 Stock Plan permits the granting of stock options, restricted stock and stock appreciation rights to eligible employees. The 2003 Stock Plan was adopted during 2002 to succeed the Company’s 1994 Stock Plan that expired February 16, 2003, which succeeded the 1984 Stock Plan that expired February 15, 1994. Although no further grants may be made under the 1994 Stock Plan, all rights granted under the plan remain. The number of shares which may be awarded under the 2003 Stock Plan will not exceed 8,500,000 shares, plus the shares authorized but not granted under the 1994 Stock Plan as of the expiration thereof. No stock appreciation rights have been granted.
Grants of restricted stock, which generally require four years of continuous employment from the date of grant before vesting and receiving the shares without restriction, have been awarded to certain officers and key employees under the 2003 and 1994 Stock Plans. The number of shares to be received without restriction under the 2003 Stock Plan is based on the Company’s achievement of specified financial goals relating to average return on average equity and earnings before interest, taxes, depreciation and amortization. The number of shares to be received without restriction under the 1994 Stock Plan is based on the Company’s performance relative to a peer group of companies. During 2005 and 2003, 196,500 and 199,500 shares of restricted stock, respectively, vested and were delivered to certain officers and key employees. No shares of restricted stock vested during 2004. There were 859,125 shares of restricted stock granted to certain officers and key employees outstanding at December 31, 2005. Unamortized deferred compensation expense with respect to restricted stock granted to eligible employees amounted to $18,907, $19,606 and $12,853 at December 31, 2005, 2004, and 2003, respectively, and is being amortized over the four-year vesting period. Deferred compensation expense, recognized in Selling, general and administrative expenses, aggregated $8,105, $11,272 and $5,641 in 2005, 2004 and 2003, respectively.
The Company’s 1997 Stock Plan for Nonemployee Directors provides for the granting of stock options and restricted stock to members of the Board of Directors who are not employees of the Company. There were 400,000 shares authorized as available for grant under the 1997 Stock Plan. The Board of Directors authorizes grants made pursuant to the 1997 Stock Plan. Grants of restricted stock generally vest and are received without restriction to the extent of one-third of the granted shares for each year following the date of grant. There were 26,500 shares of restricted stock granted to non-employee Directors outstanding at December 31, 2005. As of December 31, 2005, there were 185,167 shares available for grant under the 1997 Stock Plan.
64
NOTES TO CONSOLIDATED FINANCIAL STATEMENTS
(thousands of dollars unless otherwise indicated)
Grants of non-qualified and incentive stock options have been awarded to certain officers and key employees under the 1994 and 2003 Stock Plans at prices not less than fair market value of the shares, as defined by the plans, at the date of grant. The options generally become exercisable to the extent of one-third of the optioned shares for each full year following the date of grant and generally expire ten years after the date of grant. The number of options and period of service required before the options may be exercised are determined by the Board of Directors at the time of grant. No options may be exercised more than ten years from the date of the grant.
A summary of restricted stock granted to certain officers, key employees and nonemployee Directors during 2005, 2004, and 2003 is as follows:
| | | | | | | | | | | | | |
| | | 2005 | | 2004 | | 2003 |
| Shares granted | | | 330,625 | | | | 328,250 | | | | 401,000 | |
| | | | | | | | | | | | | |
| Weighted-average fair value of restricted shares granted during year | | $ | 43.27 | | | $ | 33.59 | | | $ | 27.37 | |
A summary of the Company’s non-qualified and incentive stock option activity and related information for the years ended December 31, 2005, 2004 and 2003 is shown in the following table:
| | | | | | | | | | | | | | | | | | | | | | | | | |
| | | 2005 | | | 2004 | | | 2003 | |
| | | | | | | Weighted- | | | | | | | Weighted- | | | | | | | Weighted- | |
| | | | | | | Average | | | | | | | Average | | | | | | | Average | |
| | | Optioned | | | Exercise | | | Optioned | | | Exercise | | | Optioned | | | Exercise | |
| | | Shares | | | Price | | | Shares | | | Price | | | Shares | | | Price | |
| Outstanding beginning of year | | | 13,286,833 | | | $ | 28.14 | | | | 15,099,131 | | | $ | 25.27 | | | | 15,178,222 | | | $ | 23.90 | |
| Granted | | | 2,026,500 | | | | 43.79 | | | | 2,065,900 | | | | 41.40 | | | | 2,431,500 | | | | 30.96 | |
| Exercised | | | (2,344,543 | ) | | | 24.90 | | | | (3,702,377 | ) | | | 23.90 | | | | (2,171,839 | ) | | | 21.86 | |
| Forfeited | | | (352,012 | ) | | | 34.42 | | | | (155,237 | ) | | | 27.25 | | | | (127,604 | ) | | | 24.50 | |
| Expired | | | (7,836 | ) | | | 29.42 | | | | (20,584 | ) | | | 24.01 | | | | (211,148 | ) | | | 27.50 | |
| | | | | | | | | | | | | | | | | | | |
| Outstanding end of year | | | 12,608,942 | | | $ | 31.09 | | | | 13,286,833 | | | $ | 28.14 | | | | 15,099,131 | | | $ | 25.27 | |
| | | | | | | | | | | | | | | | | | | |
| | | | | | | | | | | | | | | | | | | | | | | | | |
| Exercisable at end of year | | | 8,606,343 | | | $ | 26.60 | | | | 8,691,851 | | | $ | 24.78 | | | | 9,716,381 | | | $ | 23.91 | |
| Weighted-average fair value of options granted during year | | $ | 9.57 | | | | | | | $ | 6.24 | | | | | | | $ | 5.76 | | | | | |
| Reserved for future grants | | | 3,632,538 | | | | | | | | 5,392,913 | | | | | | | | 7,547,756 | | | | | |
Exercise prices for optioned shares outstanding as of December 31, 2005 ranged from $17.91 to $48.09. A summary of these options by range of exercise prices is as follows:
| | | | | | | | | | | | | | | | | | | | | |
| | | Outstanding | | | Exercisable | |
| | | | | | | | | | | Weighted- | | | | | | | | |
| | | | | | | | | | | Average | | | | | | | | |
| | | | | | | Weighted- | | | Remaining | | | | | | | Weighted- | |
| Range of | | Optioned | | | Average | | | Contractual | | | Optioned | | | Average | |
| Exercise Prices | | Shares | | | Exercise Price | | | Life (years) | | | Shares | | | Exercise Price | |
| $17.91-$25.94 | | | 5,793,258 | | | $ | 23.61 | | | | 5.3 | | | | 5,793,258 | | | $ | 23.61 | |
| $27.33-$38.53 | | | 2,985,813 | | | | 30.57 | | | | 6.0 | | | | 2,204,450 | | | | 30.28 | |
| $41.33-$48.09 | | | 3,829,871 | | | | 42.81 | | | | 9.3 | | | | 608,635 | | | | 41.72 | |
| | | | | | | | | | | | | | | | |
| | | | 12,608,942 | | | $ | 31.09 | | | | 6.7 | | | | 8,606,343 | | | $ | 26.60 | |
| | | | | | | | | | | | | | | | |
65
NOTES TO CONSOLIDATED FINANCIAL STATEMENTS
(thousands of dollars unless otherwise indicated)
NOTE 12 — OTHER EXPENSE — NET
Included in the Other expense — net caption of the Statements of Consolidated Income were the following:
| | | | | | | | | | | | | |
| | | 2005 | | | 2004 | | | 2003 | |
| Dividend and royalty income | | $ | (3,329 | ) | | $ | (2,498 | ) | | $ | (2,877 | ) |
| Net expense of financing and investing activities | | | 5,762 | | | | 6,614 | | | | 10,383 | |
| (Gain) loss on disposition of assets | | | (3,621 | ) | | | 526 | | | | (1,312 | ) |
| Loss on disposition of joint venture investment | | | 7,858 | | | | | | | | | |
| Foreign currency related losses | | | 1,354 | | | | 1,699 | | | | 1,460 | |
| Provisions for environmental matters — net | | | 24,920 | | | | 13,953 | | | | 10,237 | |
| Other income | | | (4,794 | ) | | | (4,458 | ) | | | (1,429 | ) |
| Other expense | | | 2,789 | | | | 2,029 | | | | 2,169 | |
| | | | | | | | | | |
| | | $ | 30,939 | | | $ | 17,865 | | | $ | 18,631 | |
| | | | | | | | | | |
The net expense from financing and investing activities includes the net gain or loss relating to the change in the Company’s investment in certain long-term asset funds and financing fees and in 2003, the net pretax expense associated with the Company’s investment in broad-based corporate owned life insurance.
The (gain) loss on disposition of assets represents realized gains or losses associated with the disposal of fixed assets.
The loss on disposition of joint venture investment represents a realized loss resulting from the sale at less than carrying value of the Company’s majority ownership of Kinlita, a joint venture in China included in the Automotive Finishes Segment.
Foreign currency related losses included foreign currency transaction gains and losses and realized and unrealized gains and losses from foreign currency option and forward contracts. The Company had no foreign currency option or forward contracts outstanding at December 31, 2005 and 2004. All foreign currency option and forward contracts outstanding at December 31, 2003 had maturity dates of less than twelve months and were undesignated hedges with changes in fair value being recognized in earnings in accordance with FAS No. 133. These derivative instrument values were included in either Other current assets or Other accruals and were immaterial at December 31, 2003.
Provisions for environmental matters represent adjustments to environmental-related accruals as information becomes available upon which more accurate costs can be reasonably estimated and as additional accounting guidelines are issued. See Note 8.
Other income and Other expense included items of revenue, gains, expenses and losses that were unrelated to the primary business purpose of the Company. Each individual item within the other income or other expense caption was immaterial; no single category of items exceeded $1,000.
NOTE 13 — INCOME TAXES
Deferred income taxes reflect the net tax effects of temporary differences between the carrying amounts of assets and liabilities for financial reporting purposes and the amounts used for income tax purposes using the enacted tax rates and laws that are currently in effect. Significant components of the Company’s deferred tax assets and liabilities as of December 31, 2005, 2004 and 2003 were as follows:
| | | | | | | | | | | | | |
| | | 2005 | | | 2004 | | | 2003 | |
| Deferred tax assets: | | | | | | | | | | | | |
| |
| Dispositions, environmental and other similar items | | $ | 54,683 | | | $ | 51,859 | | | $ | 47,941 | |
| |
| Other items (each less than 5 percent of total assets) | | | 135,952 | | | | 110,955 | | | | 105,660 | |
| | | | | | | | | | |
| Total deferred tax assets | | $ | 190,635 | | | $ | 162,814 | | | $ | 153,601 | |
| | | | | | | | | | |
| Deferred tax liabilities: | | | | | | | | | | | | |
| |
| Depreciation and amortization | | $ | 82,931 | | | $ | 75,573 | | | $ | 49,634 | |
| |
| Deferred employee benefit items | | | 46,723 | | | | 59,892 | | | | 61,981 | |
| | | | | | | | | | |
| |
| Total deferred tax liabilities | | $ | 129,654 | | | $ | 135,465 | | | $ | 111,615 | |
| | | | | | | | | | |
Netted against the Company’s other deferred tax assets were valuation reserves of $5,658, $14,930 and $17,643 at December 31, 2005, 2004 and 2003, respectively, resulting from the uncertainty as to the realization of the tax benefits from certain foreign net operating losses and certain other foreign assets.
66
NOTES TO CONSOLIDATED FINANCIAL STATEMENTS
(thousands of dollars unless otherwise indicated)
Significant components of the provisions for income taxes were as follows:
| | | | | | | | | | | | | |
| | | 2005 | | | 2004 | | | 2003 | |
| Current: | | | | | | | | | | | | |
| Federal | | $ | 171,676 | | | $ | 126,199 | | | $ | 129,146 | |
| Foreign | | | 17,321 | | | | 17,994 | | | | 5,719 | |
| State and local | | | 19,860 | | | | 24,242 | | | | 16,131 | |
| | | | | | | | | | |
| Total current | | | 208,857 | | | | 168,435 | | | | 150,996 | |
| | | | | | | | | | | | | |
| Deferred: | | | | | | | | | | | | |
| Federal | | | (4,813 | ) | | | 18,001 | | | | 32,299 | |
| Foreign | | | (7,455 | ) | | | (3,312 | ) | | | 3,554 | |
| State and local | | | (4,988 | ) | | | 2,538 | | | | 4,019 | |
| | | | | | | | | | |
| Total deferred | | | (17,256 | ) | | | 17,227 | | | | 39,872 | |
| | | | | | | | | | |
| | | | | | | | | | | | | |
| Total provisions for income taxes | | $ | 191,601 | | | $ | 185,662 | | | $ | 190,868 | |
| | | | | | | | | | |
The provisions for income taxes included estimated taxes payable on that portion of retained earnings of foreign subsidiaries expected to be received by the Company. The effect of the repatriation provisions of the American Jobs Creation Act of 2004 and the provisions of APBO No. 23, “Accounting for Income Taxes —Special Areas,” was $1,234 in 2005 and $2,693 in 2004. A provision was not made with respect to $13,771 of retained earnings at December 31, 2005 that have been invested by foreign subsidiaries. It was not practicable to estimate the amount of unrecognized deferred tax liability for undistributed foreign earnings.
Significant components of income before income taxes and minority interest as used for income tax purposes, were as follows:
| | | | | | | | | | | | | |
| | | 2005 | | | 2004 | | | 2003 | |
| Domestic | | $ | 583,993 | | | $ | 520,454 | | | $ | 492,592 | |
| Foreign | | | 72,222 | | | | 59,741 | | | | 30,334 | |
| | | | | | | | | | |
| | | $ | 656,215 | | | $ | 580,195 | | | $ | 522,926 | |
| | | | | | | | | | |
A reconciliation of the statutory federal income tax rate to the effective tax rate follows:
| | | | | | | | | | | | | |
| | | 2005 | | 2004 | | 2003 |
| Statutory federal income tax rate | | | 35.0 | % | | | 35.0 | % | | | 35.0 | % |
| Effect of: | | | | | | | | | | | | |
| State and local income taxes | | | 1.5 | | | | 3.0 | | | | 2.5 | |
| Investment vehicles | | | (1.6 | ) | | | (1.6 | ) | | | (0.6 | ) |
| ESOP dividends | | | (5.2 | ) | | | (4.2 | ) | | | (1.0 | ) |
| Other — net | | | (0.5 | ) | | | (0.2 | ) | | | 0.6 | |
| | | | | | | | | | | | | |
| Effective tax rate | | | 29.2 | % | | | 32.0 | % | | | 36.5 | % |
| | | | | | | | | | | | | |
The increase in the ESOP dividends deduction was the result of increases to the annual dividend payable for 2005 and 2004 versus 2003 and changes in plan design which resulted in an increase in deductible dividends. The decrease in the state and local income tax component of the effective tax rate in 2005 versus 2004 was due to the favorable impact of state and local tax settlements.
NOTE 14 — NET INCOME PER COMMON SHARE
| | | | | | | | | | | | | |
| | | 2005 | | | 2004 | | | 2003 | |
Basic | | | | | | | | | | | | |
| Average common shares outstanding | | | 136,816,868 | | | | 140,801,836 | | | | 144,846,933 | |
| | | | | | | | | | |
| | | | | | | | | | | | | |
| Net income | | $ | 463,258 | | | $ | 393,254 | | | $ | 332,058 | |
| | | | | | | | | | |
| | | | | | | | | | | | | |
| Net income per common share | | $ | 3.39 | | | $ | 2.79 | | | $ | 2.29 | |
| | | | | | | | | | |
| | | | | | | | | | | | | |
Diluted | | | | | | | | | | | | |
| | | | | | | | | | | | | |
| Average common shares outstanding | | | 136,816,868 | | | | 140,801,836 | | | | 144,846,933 | |
| Non-vested restricted stock grants | | | 950,182 | | | | 870,313 | | | | 614,458 | |
| Stock options and other contingently issuable shares | | | 3,311,882 | | | | 3,063,440 | | | | 1,543,885 | |
| | | | | | | | | | |
| Average common shares assuming dilution | | | 141,078,932 | | | | 144,735,589 | | | | 147,005,276 | |
| | | | | | | | | | |
| | | | | | | | | | | | | |
| Net income | | $ | 463,258 | | | $ | 393,254 | | | $ | 332,058 | |
| | | | | | | | | | |
| | | | | | | | | | | | | |
| Net income per common share | | $ | 3.28 | | | $ | 2.72 | | | $ | 2.26 | |
| | | | | | | | | | |
67
NOTES TO CONSOLIDATED FINANCIAL STATEMENTS
(thousands of dollars unless otherwise indicated)
NOTE 15 — SUMMARY OF QUARTERLY RESULTS OF OPERATIONS (UNAUDITED)
| | | | | | | | | | | | | | | | | | | | | |
| | | 2005 |
| | | 1st Quarter | | 2nd Quarter | | 3rd Quarter | | 4th Quarter | | Full Year |
| Net sales | | $ | 1,538,545 | | | $ | 1,965,358 | | | $ | 1,976,728 | | | $ | 1,710,030 | | | $ | 7,190,661 | |
| Gross profit | | $ | 660,774 | | | $ | 838,166 | | | $ | 839,745 | | | $ | 741,680 | | | $ | 3,080,365 | |
| Net income | | $ | 83,294 | | | $ | 153,221 | | | $ | 151,608 | | | $ | 75,135 | | | $ | 463,258 | |
| Net income per share — basic | | $ | .60 | | | $ | 1.12 | | | $ | 1.11 | | | $ | .56 | | | $ | 3.39 | |
| Net income per share — diluted | | $ | .58 | | | $ | 1.08 | | | $ | 1.07 | | | $ | .54 | | | $ | 3.28 | |
Net income in the fourth quarter of 2005 was increased by $7,080 ($.05 per share) due primarily to physical inventory adjustments. Gross profit was increased by $9,680 primarily as a result of physical inventory adjustments of $8,605. Selling, general and administrative expenses decreased by $1,212 due primarily to various year-end adjustments.
| | | | | | | | | | | | | | | | | | | | | |
| | | 2004 |
| | | 1st Quarter | | 2nd Quarter | | 3rd Quarter | | 4th Quarter | | Full Year |
| Net sales | | $ | 1,319,522 | | | $ | 1,617,955 | | | $ | 1,677,130 | | | $ | 1,499,182 | | | $ | 6,113,789 | |
| Gross profit | | $ | 571,627 | | | $ | 721,417 | | | $ | 743,545 | | | $ | 664,822 | | | $ | 2,701,411 | |
| Net income | | $ | 51,468 | | | $ | 126,438 | | | $ | 132,863 | | | $ | 82,845 | | | $ | 393,254 | |
| Net income per share — basic | | $ | .36 | | | $ | .89 | | | $ | .95 | | | $ | .59 | | | $ | 2.79 | |
| Net income per share — diluted | | $ | .35 | | | $ | .87 | | | $ | .92 | | | $ | .57 | | | $ | 2.72 | |
Net income in the fourth quarter of 2004 was increased by $6,029 ($.04 per share) due primarily to physical inventory adjustments. Gross profit was increased by $13,540 primarily as a result of physical inventory adjustments of $14,877. Selling, general and administrative expenses were increased by $4,170 due primarily to increased incentive compensation accruals.
NOTE 16 — OPERATING LEASES
The Company leases certain stores, warehouses, manufacturing facilities, office space and equipment. Renewal options are available on the majority of leases and, under certain conditions, options exist to purchase certain properties. Rental expense for operating leases, recognized on a straight-line basis over the lease term in accordance with FASB Technical Bulletin No. 85-3, “Accounting for Operating Leases with Scheduled Rent Increases,” was $197,362, $173,491 and $155,268 for 2005, 2004 and 2003, respectively. Certain store leases require the payment of contingent rentals based on sales in excess of specified minimums. Contingent rentals included in rent expense were $22,472, $18,134 and $12,933 in 2005, 2004 and 2003, respectively. Rental income, as lessor, from real estate leasing activities and sublease rental income for all years presented was not significant.
During 2003, the Company completed sale-leaseback transactions involving two of its warehouses. The warehouses were sold at fair market value resulting in a pre-tax gain of $2,701, which was deferred and is being amortized to offset rent expense over the life of the new operating leases. The Company does not have any retained or contingent interest in the warehouses. The operating leases that resulted from these transactions are included in the table below.
Following is a schedule, by year and in the aggregate, of future minimum lease payments under noncancellable operating leases having initial or remaining terms in excess of one year at December 31, 2005:
| | | | | |
| 2006 | | $ | 169,398 | |
| 2007 | | | 147,475 | |
| 2008 | | | 119,337 | |
| 2009 | | | 93,222 | |
| 2010 | | | 63,913 | |
| Later years | | | 116,058 | |
| | | | |
| Total minimum lease payments | | $ | 709,403 | |
| | | | |
68
NOTES TO CONSOLIDATED FINANCIAL STATEMENTS
(thousands of dollars unless otherwise indicated)
NOTE 17 – REPORTABLE SEGMENT INFORMATION
The Company reports its segment information in five reportable segments – Paint Stores, Consumer, Automotive Finishes, International Coatings (collectively, the “Operating Segments”) and Administrative – in accordance with FAS No. 131, “Disclosures about Segments of an Enterprise and Related Information.” FAS No. 131 requires an enterprise to report segment information in the same way that management internally organizes its business for assessing performance and making decisions regarding allocation of resources. Factors considered in determining the five reportable segments of the Company include the nature of the business activities, existence of managers responsible for the operating and administrative activities and information presented to the Board of Directors. See pages 6 through 13 of this report for more information about the Operating Segments.
The Company’s chief operating decision maker (CODM) has been identified as the Chief Executive Officer because he has final authority over performance assessment and resource allocation decisions. Because of the global, diverse operations of the Company, the CODM regularly receives discrete financial information about each reportable segment as well as a significant amount of additional financial information about certain aggregated divisions, business units and subsidiaries of the Company. The CODM uses all such financial information for performance assessment and resource allocation decisions. The CODM evaluates the performance of the Operating Segments and allocates resources based on profit or loss and cash generated from operations before income taxes, excluding corporate expenses and financing gains and losses. The accounting policies of the reportable segments are the same as those described in Note 1 on pages 46 through 51 of this report.
The Paint Stores Segment consisted of 3,081 company-operated specialty paint stores in the United States, Canada, Virgin Islands, Puerto Rico and Mexico at December 31, 2005. Each division of the Segment is engaged in the related business activity of selling the Company’s own manufactured paint, coatings and related products to end-use customers. During 2005, this Segment opened 98 net new stores, consisting of 91 stores in the United States, 5 in Canada and 2 in Puerto Rico. In 2004, there were 296 net new stores opened or acquired (294 in the United States). In 2003, there were 45 net new stores opened or acquired (41 in the United States). This Segment also manufactures OEM product finishes that are sold through the Segment’s network of paint stores and certain shared or dedicated paint stores (73, 71 and 72 at December 31, 2005, 2004 and 2003, respectively, included above) and sold by direct outside sales representatives. The Paint Stores Segment markets and sells Sherwin-Williams® branded architectural paint and coatings, industrial and marine products, OEM product finishes and related items throughout North America and the Caribbean. These products are produced by this Segment’s manufacturing facilities and those in the Consumer Segment. The loss of any single customer would not have a material adverse effect on the business of this Segment. A map on page 16 of this report shows the number of paint stores and their geographical location.
The Consumer Segment develops, manufactures and distributes a variety of paint, coatings and related products to third party customers and the Paint Stores Segment. The acquisition of KST in 2005 was included in this Segment. Approximately 52 percent of the total sales of the Consumer Segment in 2005, including inter-segment transfers, represented products sold through the Paint Stores Segment. Sales and marketing of certain controlled brand and private labeled products is performed by a direct sales staff. The products distributed through third party customers are intended for resale to the ultimate end-user of the product. The Consumer Segment had sales to certain customers that, individually, may be a significant portion of the sales of the Segment. However, the loss of any single customer would not have a material adverse effect on the overall profitability of the Segment. This Segment incurred most of the Company’s capital expenditures related to ongoing environmental compliance measures.
The Automotive Finishes Segment develops, manufactures and distributes a variety of motor vehicle finish, refinish and touch-up products primarily throughout North and South America, the Caribbean Islands, and Europe. This Segment also licenses certain technology and trade names worldwide. Sherwin-Williams® branded automotive finish and refinish products are distributed throughout North America solely through this Segment’s network of 153 company-operated automotive branches in the United States and 19 in Canada. Additional automotive branches in Jamaica (15), Chile (14) and Peru (2) complete this Segment’s worldwide network. At December 31, 2005, this Segment included consolidated operations in 10 foreign countries and realized income from licensing agreements in 9
69
NOTES TO CONSOLIDATED FINANCIAL STATEMENTS
(thousands of dollars unless otherwise indicated)
foreign countries. A map on page 16 of this report shows the number of automotive branches and their geographical location.
The International Coatings Segment develops, licenses, manufactures and distributes a variety of paint, coatings and related products worldwide. The majority of the sales from licensees and subsidiaries occurred in South America, the Segment’s most important international market. This Segment sold its products through 30 company-operated specialty paint stores in Chile, 36 in Brazil, 6 in Uruguay and 1 in Argentina and by outside selling functions to dealers and other distributors. At December 31, 2005, this Segment included consolidated operations in 7 foreign countries, 4 foreign joint ventures and income from licensing agreements in 12 foreign countries.
The Administrative Segment included the administrative expenses of the Company’s corporate headquarters site. This Segment also included interest expense which was unrelated to retail real estate leasing activities, investment income, certain foreign currency transaction losses related to dollar-denominated debt and foreign currency option and forward contracts, certain expenses related to closed facilities and environmental-related matters, and other expenses which were not directly associated with any Operating Segment. Administrative expenses did not include any significant foreign operations. Also included in the Administrative Segment was a real estate management unit that is responsible for the ownership, management, leasing of non-retail properties held primarily for use by the Company, including the Company’s headquarters site, and disposal of idle facilities. Sales of the Administrative Segment represented external leasing revenue of excess headquarters space or leasing of facilities no longer used by the Company in its operations. Gains and losses from the sale of property were not a significant operating factor in determining the performance of this Segment.
Net external sales of all consolidated foreign subsidiaries were $746,789, $637,137 and $546,472 for 2005, 2004 and 2003, respectively. Operating profits of all consolidated foreign subsidiaries were $44,886, $46,516 and $14,340 for 2005, 2004 and 2003, respectively. Domestic operations account for the remaining net sales and operating profits. Long-lived assets consist of net property, plant and equipment, goodwill, intangibles, deferred pension assets and other long-term assets. Long-lived assets of consolidated foreign subsidiaries totaled $145,689, $149,037 and $130,188 at December 31, 2005, 2004 and 2003, respectively. The consolidated total of long-lived assets for the Company was $2,474,810, $2,492,223 and $1,967,464 at December 31, 2005, 2004 and 2003, respectively. Total assets of consolidated foreign subsidiaries at December 31, 2005 were $440,570, which represented 10.1 percent of the Company’s total assets. No single geographic area outside the United States was significant relative to consolidated net sales or operating profits. Export sales and sales to any individual customer were each less than 10 percent of consolidated sales to unaffiliated customers during all years presented.
In the reportable segment financial information that follows, operating profit was total revenue, including inter-segment transfers, less operating costs and expenses. Identifiable assets were those directly identified with each reportable segment. Administrative Segment assets consisted primarily of cash and cash equivalents, investments, deferred pension assets, and headquarters property, plant and equipment. The operating margin for each Operating Segment was based upon total net sales and inter-segment transfers. Domestic inter-segment transfers were accounted for at the approximate fully absorbed manufactured cost plus distribution costs. International inter-segment transfers were accounted for at values comparable to normal unaffiliated customer sales.
70
NOTES TO CONSOLIDATED FINANCIAL STATEMENTS
(millions of dollars)
| | | | | | | | | | | | | | | | | | | | | |
| | | 2005 | | | 2004 | | | 2003 | | | 2002 | | | 2001 | |
Net External Sales | | | | | | | | | | | | | | | | | | | | |
| Paint Stores | | $ | 4,848 | | | $ | 3,977 | | | $ | 3,469 | | | $ | 3,302 | | | $ | 3,185 | |
| Consumer | | | 1,396 | | | | 1,296 | | | | 1,190 | | | | 1,178 | | | | 1,142 | |
| Automotive Finishes | | | 551 | | | | 514 | | | | 457 | | | | 454 | | | | 464 | |
| International Coatings | | | 388 | | | | 319 | | | | 285 | | | | 244 | | | | 268 | |
| Administrative | | | 8 | | | | 8 | | | | 7 | | | | 7 | | | | 7 | |
| | | | | | | | | | | | | | | | |
| Consolidated totals | | $ | 7,191 | | | $ | 6,114 | | | $ | 5,408 | | | $ | 5,185 | | | $ | 5,066 | |
| | | | | | | | | | | | | | | | | | | | | |
Operating Profits | | | | | | | | | | | | | | | | | | | | |
| Paint Stores | | $ | 593 | | | $ | 480 | | | $ | 403 | | | $ | 399 | | | $ | 388 | |
| Consumer | | | 169 | | | | 188 | | | | 199 | | | | 193 | | | | 110 | * |
| Automotive Finishes | | | 57 | | | | 58 | | | | 52 | | | | 54 | | | | 51 | |
| International Coatings | | | 24 | | | | 18 | | | | 8 | | | | (6 | ) | | | 5 | |
| Administrative: | | | | | | | | | | | | | | | | | | | | |
| Interest expense | | | (50 | ) | | | (40 | ) | | | (38 | ) | | | (40 | ) | | | (54 | ) |
| Corporate expenses and other | | | (137 | ) | | | (124 | ) | | | (101 | ) | | | (103 | ) | | | (76 | ) |
| | | | | | | | | | | | | | | | |
| Income before income taxes, minority interest and cumulative effect of change in accounting principle | | $ | 656 | | | $ | 580 | | | $ | 523 | | | $ | 497 | | | $ | 424 | * |
| | | | | | | | | | | | | | | | | | | | | |
Identifiable Assets | | | | | | | | | | | | | | | | | | | | |
| Paint Stores | | $ | 1,487 | | | $ | 1,400 | | | $ | 1,000 | | | $ | 967 | | | $ | 954 | |
| Consumer | | | 1,619 | | | | 1,597 | | | | 1,218 | | | | 1,162 | | | | 1,272 | |
| Automotive Finishes | | | 303 | | | | 321 | | | | 278 | | | | 274 | | | | 329 | |
| International Coatings | | | 206 | | | | 193 | | | | 156 | | | | 130 | | | | 285 | |
| Administrative | | | 754 | | | | 763 | | | | 1,031 | | | | 899 | | | | 788 | |
| | | | | | | | | | | | | | | | |
| Consolidated totals | | $ | 4,369 | | | $ | 4,274 | | | $ | 3,683 | | | $ | 3,432 | | | $ | 3,628 | |
| | | | | | | | | | | | | | | | | | | | | |
Capital Expenditures | | | | | | | | | | | | | | | | | | | | |
| Paint Stores | | $ | 52 | | | $ | 55 | | | $ | 54 | | | $ | 56 | | | $ | 36 | |
| Consumer | | | 63 | | | | 35 | | | | 36 | | | | 37 | | | | 18 | |
| Automotive Finishes | | | 6 | | | | 4 | | | | 8 | | | | 3 | | | | 11 | |
| International Coatings | | | 5 | | | | 5 | | | | 5 | | | | 10 | | | | 7 | |
| Administrative | | | 17 | | | | 8 | | | | 14 | | | | 21 | | | | 11 | |
| | | | | | | | | | | | | | | | |
| Consolidated totals | | $ | 143 | | | $ | 107 | | | $ | 117 | | | $ | 127 | | | $ | 83 | |
| | | | | | | | | | | | | | | | | | | | | |
Depreciation | | | | | | | | | | | | | | | | | | | | |
| Paint Stores | | $ | 56 | | | $ | 49 | | | $ | 44 | | | $ | 44 | | | $ | 47 | |
| Consumer | | | 35 | | | | 33 | | | | 33 | | | | 33 | | | | 31 | |
| Automotive Finishes | | | 9 | | | | 9 | | | | 9 | | | | 9 | | | | 9 | |
| International Coatings | | | 6 | | | | 5 | | | | 5 | | | | 4 | | | | 6 | |
| Administrative | | | 14 | | | | 13 | | | | 14 | | | | 14 | | | | 16 | |
| | | | | | | | | | | | | | | | |
| Consolidated totals | | $ | 120 | | | $ | 109 | | | $ | 105 | | | $ | 104 | | | $ | 109 | |
| | | | | | | | | | | | | | | | | | | | | |
Operating Segment Margins | | | | | | | | | | | | | | | | | | | | |
| Paint Stores | | | 12.2 | % | | | 12.1 | % | | | 11.6 | % | | | 12.1 | % | | | 12.2 | % |
| Consumer | | | 5.8 | % | | | 7.7 | % | | | 9.0 | % | | | 8.9 | % | | | 5.3 | %* |
| Automotive Finishes | | | 9.2 | % | | | 10.2 | % | | | 10.5 | % | | | 11.1 | % | | | 10.2 | % |
| International Coatings | | | 6.2 | % | | | 5.6 | % | | | 2.8 | % | | | (2.4 | %) | | | 1.9 | % |
| | | | | | | | | | | | | | | | |
| Operating segment totals | | | 9.6 | % | | | 10.2 | % | | | 10.2 | % | | | 10.3 | % | | | 9.2 | %* |
| | | | | | | | | | | | | | | | | | | | | |
Intersegment Transfers | | | | | | | | | | | | | | | | | | | | |
| Paint Stores | | $ | 1 | | | $ | 1 | | | $ | 1 | | | $ | 1 | | | $ | 1 | |
| Consumer | | | 1,522 | | | | 1,138 | | | | 1,024 | | | | 989 | | | | 929 | |
| Automotive Finishes | | | 66 | | | | 57 | | | | 40 | | | | 34 | | | | 34 | |
| International Coatings | | | 1 | | | | 1 | | | | 1 | | | | 1 | | | | | |
| Administrative | | | 5 | | | | 5 | | | | 4 | | | | 4 | | | | 9 | |
| | | | | | | | | | | | | | | | |
| Segment totals | | $ | 1,595 | | | $ | 1,202 | | | $ | 1,070 | | | $ | 1,029 | | | $ | 973 | |
| | |
| * | | Includes amortization expense of $21 in the Consumer Segment and $29 in income before income taxes, minority interest and cumulative effect of change in accounting principle for goodwill and intangible assets that are no longer amortized as of January 1, 2002 in accordance with FAS No. 142. The effect on any other segment was not significant. |
71
NOTES TO CONSOLIDATED FINANCIAL STATEMENTS
(thousands of dollars unless otherwise indicated)
NOTE 18 – SUBSEQUENT EVENTS
Litigation
During September 2002, a jury trial commenced in the first phase of an action brought by the State of Rhode Island against the Company and the other defendants. The sole issue before the court in this first phase was whether lead pigment in paint constitutes a public nuisance under Rhode Island law. In October 2002, the court declared a mistrial as the jury, which was split four to two in favor of the defendants, was unable to reach a unanimous decision.
The State of Rhode Island retried the case and on February 22, 2006, the jury returned a verdict, finding that (i) the cumulative presence of lead pigment in paints and coatings on buildings in the State of Rhode Island constitutes a public nuisance, (ii) the Company, along with two other defendants, caused or substantially contributed to the creation of the public nuisance, and (iii) the Company and two other defendants should be ordered to abate the public nuisance. The Court will determine the scope of the abatement remedy. Various other matters remain before the Court. The Company intends to appeal the jury’s verdict.
The Company’s revolving credit agreement provides that one or more judgments against the Company or any subsidiary for the payment of money in excess of $75,000 and not covered by insurance constitutes a default. Such a judgment would become an event of default if it remains undischarged for a period of 60 days during which the execution of the judgment is not stayed, vacated or bonded pending appeal. If a default or an event of default occurs, the lenders may terminate any borrowing commitments. If an event of default occurs at the end of such 60 day period, the lenders may accelerate the payment of any borrowings outstanding and such event of default may also constitute an event of default under other borrowing facilities.
This was the first legal proceeding against the Company to go to trial relating to the Company’s lead pigment and lead-based paint litigation. The Company cannot reasonably determine the impact that the State of Rhode Island decision and determination of liability will have on the number or nature of present or future claims and proceedings against the Company. The Company believes it is possible that additional legal proceedings could be scheduled for trial in 2006 and in subsequent years in other jurisdictions. Due to the uncertainties involved, management is unable to predict the outcome of the lead pigment and lead-based paint litigation, the number or nature of possible future claims and proceedings, or the effect that any such litigation may have on the Company. In addition, management cannot reasonably determine the scope or amount of the potential costs and liabilities related to such litigation. The Company has not accrued any amounts for such litigation. Any potential liability that may result from such litigation cannot reasonably be estimated. In the event any significant liability is determined to be attributable to the Company relating to such litigation, the recording of the liability may result in a material impact on net income for the annual or interim period during which such liability is accrued. Additionally, due to the uncertainties associated with the amount of any such liability and/or the nature of any other remedy which may be imposed in such litigation, any potential liability determined to be attributable to the Company arising out of such litigation may have a material adverse effect on the Company’s results of operations, liquidity or financial condition. An estimate of the potential impact on the Company’s results of operations, liquidity or financial condition cannot be made due to the aforementioned uncertainties.
Debt (Unaudited)
At February 28, 2006, borrowings outstanding under the domestic commercial paper program totaled $850,000 and cash and cash equivalents totaled $648,000. The higher levels of borrowing and holding of cash were undertaken by the Company primarily to maintain maximum financial flexibility during the period between the Rhode Island jury verdict and final determination of the issues remaining before the Court. An increase of $133,610 in domestic short-term borrowings net of cash from December 31, 2005 through February 28, 2006 was due to the normal seasonality of the Company’s business and the need to invest in working capital prior to the primary selling season and collecting accounts receivable.
72
SHAREHOLDER INFORMATION
Annual Meeting
The annual meeting of shareholders will be held in the Landmark Conference Center, 927 Midland Building, 101 Prospect Avenue, N.W., Cleveland, Ohio on Wednesday, April 19, 2006 at 9:00 A.M., local time.
Investor Relations
Robert J. Wells
The Sherwin-Williams Company
101 Prospect Avenue, N.W.
Cleveland, Ohio 44115-1075
Internet: www.sherwin.com
Dividend Reinvestment Program
A dividend reinvestment program is available to shareholders of common stock. For information, contact our transfer agent, The Bank of New York.
Form 10-K
The Company’s Annual Report on Form 10-K, filed with the Securities and Exchange Commission, is available without charge. To obtain a copy, contact the Investor Relations Office.
Certifications
The Company filed with the Securities and Exchange Commission, as Exhibit 31 to the Company’s Annual Report on Form 10-K for the 2005 fiscal year, certifications of its Chief Executive Officer and Chief Financial Officer regarding the quality of the Company’s public disclosure. The Company also submitted to the New York Stock Exchange the previous year’s certification of its Chief Executive Officer certifying that he was not aware of any violation by the Company of the New York Stock Exchange corporate governance listing standards.
Independent Registered Public Accounting Firm
Ernst & Young LLP
Cleveland, Ohio
Stock Trading
Sherwin-Williams Common Stock—Symbol, SHW—is traded on the New York Stock Exchange.
Transfer Agent & Registrar
The Bank of New York
Investor Services Department
P.O. Box 11258
New York, NY 10286-1258
1-866-537-8703
E-mail address:
shareowners@bankofny.com
Stock Transfer Website:
www.stockbny.com
Headquarters
The Sherwin-Williams Company
101 Prospect Avenue, N.W.
Cleveland, Ohio 44115-1075
(216) 566-2000
COMMON STOCK TRADING STATISTICS
| | | | | | | | | | | | | | | | | | | | | |
| | | 2005 | | 2004 | | 2003 | | 2002 | | 2001 |
| High | | $ | 48.84 | | | $ | 45.61 | | | $ | 34.77 | | | $ | 33.24 | | | $ | 28.23 | |
| Low | | | 40.47 | | | | 32.95 | | | | 24.42 | | | | 21.75 | | | | 19.73 | |
| Close December 31 | | | 45.42 | | | | 44.63 | | | | 34.74 | | | | 28.25 | | | | 27.50 | |
| Shareholders of record | | | 10,625 | | | | 11,056 | | | | 11,472 | | | | 11,936 | | | | 12,687 | |
| Shares traded (thousands) | | | 206,115 | | | | 175,664 | | | | 143,702 | | | | 193,256 | | | | 162,219 | |
QUARTERLY STOCK PRICES AND DIVIDENDS
| | | | | | | | | | | | | |
| 2005 |
| Quarter | | High | | Low | | Dividend |
1st | | $ | 46.51 | | | $ | 42.25 | | | $ | .205 | |
2nd | | | 47.26 | | | | 41.38 | | | | .205 | |
3rd | | | 48.84 | | | | 40.92 | | | | .205 | |
4th | | | 46.67 | | | | 40.47 | | | | .205 | |
| | | | | | | | | | | | | |
| 2004 |
| Quarter | | High | | Low | | Dividend |
| 1st | | $ | 38.54 | | | $ | 32.95 | | | $ | .17 | |
| 2nd | | | 41.63 | | | | 35.55 | | | | .17 | |
| 3rd | | | 44.11 | | | | 37.95 | | | | .17 | |
| 4th | | | 45.61 | | | | 40.36 | | | | .17 | |
73
CORPORATE OFFICERS AND OPERATING PRESIDENTS
Corporate Officers
Christopher M. Connor, 49*
Chairman, President and Chief Executive Officer
Sean P. Hennessy, 48*
Senior Vice President — Finance and
Chief Financial Officer
Thomas E. Hopkins, 48*
Senior Vice President —
Human Resources
Conway G. Ivy, 64*
Senior Vice President — Corporate
Planning and Development
John L. Ault, 60*
Vice President — Corporate Controller
Cynthia D. Brogan, 54
Vice President and Treasurer
Michael T. Cummins, 47
Vice President — Taxes and
Assistant Secretary
Mark J. Dvoroznak, 47
Vice President — Corporate Audit
and Loss Prevention
Louis E. Stellato, 55*
Vice President, General Counsel
and Secretary
Richard M. Weaver, 51
Vice President — Administration
Robert J. Wells, 48*
Vice President — Corporate Communications
and Public Affairs
Operating Presidents
Robert J. Davisson, 45
President & General Manager
Southeastern Division
Paint Stores Group
Timothy J. Drouilhet, 43
President & General Manager
Eastern Division
Paint Stores Group
George E. Heath, 40
President & General Manager
Chemical Coatings Division
Global Group
Timothy A. Knight, 41*
President
Global Group
Blair P. LaCour, 59
President & General Manager
Automotive Division
Global Group
Drew A. McCandless, 45
President & General Manager
Mid Western Division
Paint Stores Group
John G. Morikis, 42*
President
Paint Stores Group
Steven J. Oberfeld, 53
President & General Manager
South Western Division
Paint Stores Group
Harvey P. Sass, 48
President & General Manager
Diversified Brands Division
Consumer Group
Thomas W. Seitz, 57*
President
Consumer Group
Alexander Zalesky, 46
President & General Manager
International Division
Global Group
| | |
| * | | Executive Officer as defined by the Securities Exchange Act of 1934 |
74
2005 BOARD OF DIRECTORS
1 SUSAN J. KROPF, 57
President and Chief Operating Officer
Avon Products, Inc.
2 DAVID F. HODNIK, 58*
Retired, former President and Chief
Executive Officer
Ace Hardware Corporation
3 RICHARD K. SMUCKER, 57*
President and Co-Chief Executive Officer
The J.M. Smucker Company
4 JAMES C. BOLAND, 66*
Vice Chairman
Cavaliers Operating Company, LLC
5 CHRISTOPHER M. CONNOR, 49
Chairman, President and Chief Executive Officer
The Sherwin-Williams Company
6 A. MALACHI MIXON, III, 65
Chairman and Chief Executive Officer
Invacare Corporation
7 CURTIS E. MOLL, 66*
Chairman and Chief Executive Officer
MTD Holdings Inc.
8 DANIEL E. EVANS, 69
Retired, former Chairman, Chief Executive
Officer and Secretary
Bob Evans Farms, Inc.
9 GARY E. MCCULLOUGH, 47*
Senior Vice President,
Abbott Laboratories
President, Ross Products Division
10 DUANE E. COLLINS, 69
Retired, former Chairman, Chief
Executive Officer and President
Parker-Hannifin Corporation
11 ROBERT W. MAHONEY, 69
Retired, former Chairman, Chief Executive
Officer and President
Diebold, Incorporated
| The Sherwin-Williams Company |
| 101 Prospect Avenue, N.W. |
| Cleveland, Ohio 44115-1075 |