Exhibit 13
DIMECO, INC. 2005 ANNUAL REPORT
A lot has changed,
but some things haven’t
relationships
commitment
dedication
success
CONTENTS
| | | | |
| | |
1 | | Financial Highlights | | |
| | |
2 | | President’s Message | | |
| | |
5 | | Relationships | | |
| | |
7 | | Commitment | | |
| | |
9 | | Dedication | | |
| | |
10 | | Success | | |
| | |
11 | | Management’s Discussion and Analysis of Financial Condition and Results of Operation | | |
| | |
26 | | Selected Financial Data | | |
| | |
27 | | Independent Auditor’s Report | | |
| | |
28 | | Financial Statements | | |
| | |
| | - Consolidated Balance Sheet | | |
| | |
| | - Consolidated Statement of Income | | |
| | |
| | - Consolidated Statement of Changes in Stockholders’ Equity | | |
| | |
| | - Consolidated Statement of Cash Flows | | |
| | |
32 | | Notes to Consolidated Financial Statements | | |
| | |
58 | | Shareholder Information | | |
~ The mission of Dimeco, Inc. is the operation of a fully integrated financial services institution through its subsidiary The Dime Bank in a market that is defined by the institution’s ability to provide services consistent with sound, prudent principles and to fulfill the social, economic, moral and political considerations ordinarily associated with a responsible, well-run financial institution.
CONSOLIDATED FINANCIAL HIGHLIGHTS
| | | | | | | | | | | |
| (amounts in thousands, except per share data) | | 2005 | | | 2004 | | | % Increase (decrease) | |
Performance for the year ended December 31, | | | | | | | | | | | |
Interest income | | $ | 19,202 | | | $ | 15,808 | | | 21.5 | % |
Interest expense | | $ | 6,118 | | | $ | 4,412 | | | 38.7 | % |
Net interest income | | $ | 13,084 | | | $ | 11,396 | | | 14.8 | % |
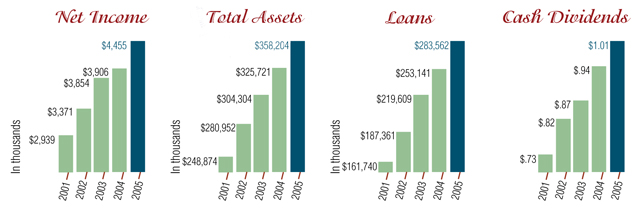
Net income | | $ | 4,455 | | | $ | 3,906 | | | 14.1 | % |
| | | |
Shareholders’ Value (per share) | | | | | | | | | | | |
Net income - basic | | $ | 2.89 | | | $ | 2.54 | | | 13.8 | % |
Net income - diluted | | $ | 2.80 | | | $ | 2.46 | | | 13.8 | % |
Dividends | | $ | 1.01 | | | $ | .94 | | | 7.5 | % |
Book value | | $ | 20.53 | | | $ | 19.17 | | | 7.1 | % |
Market value | | $ | 33.75 | | | $ | 35.05 | | | (3.7 | %) |
Market value/book value ratio | | | 164.4 | % | | | 182.8 | % | | (10.1 | %) |
Price/earnings multiple | | | 11.7 | X | | | 13.8 | X | | (15.2 | %) |
Dividend yield | | | 2.99 | % | | | 2.68 | % | | 11.6 | % |
| | | |
Financial Ratios | | | | | | | | | | | |
Return on average assets | | | 1.30 | % | | | 1.26 | % | | 3.2 | % |
Return on average equity | | | 14.53 | % | | | 13.72 | % | | 5.9 | % |
Shareholders’ equity/asset ratio | | | 8.73 | % | | | 9.12 | % | | (4.3 | %) |
Dividend payout ratio | | | 34.95 | % | | | 37.01 | % | | (5.6 | %) |
Nonperforming assets/total assets | | | .22 | % | | | .17 | % | | 29.4 | % |
Allowance for loan loss as a % of loans | | | 1.40 | % | | | 1.25 | % | | 12.0 | % |
Net charge-offs/average loans | | | .02 | % | | | .41 | % | | (95.1 | %) |
Allowance for loan loss/nonaccrual loans | | | 755.3 | % | | | 1,215.3 | % | | (37.9 | %) |
Allowance for loan loss/non-performing loans | | | 493.5 | % | | | 572.6 | % | | (13.8 | %) |
Risk-based capital | | | 11.6 | % | | | 11.7 | % | | (.9 | %) |
| | | |
Financial Position at December 31, | | | | | | | | | | | |
Assets | | $ | 358,204 | | | $ | 325,721 | | | 10.0 | % |
Loans | | $ | 283,562 | | | $ | 253,141 | | | 12.0 | % |
Deposits | | $ | 294,856 | | | $ | 270,542 | | | 9.0 | % |
Stockholders’ equity | | $ | 31,260 | | | $ | 29,696 | | | 5.3 | % |
Celebrating a century of relationships, commitment, dedication, and success.
Dear shareholder,
~ It is with distinct pleasure that I present the annual report of Dimeco, Inc. Simply stated, 2005 was a year of many accomplishments. Most noteworthy for you, our shareholders, were our financial achievements. Significant strides were made in gathering deposits, originating loans, and maintaining spread. These successes are especially gratifying when compared to peer financial institutions–many of whom struggled with one or more of those activities.
~ Deposits expanded by $24 million, an increase of 9% over last year. While all of our community banking offices grew nicely, we note that our newest office, Dingmans Ferry, contributed almost $10 million of this growth. Total loans outstanding also saw new levels as we finished the year at $284 million, which is 12% above 2004. The growth of this portfolio is largely the result of heightened commercial activity. We believe that this loan growth is indicative of a vibrant local economy and our ability to assess and respond to the credit needs of our marketplace. What all of this translates to is our total assets expanding by 10%, to end the year at $358 million.
~ The growth of the institution was rewarding. Even more exciting were the results of operations. Despite keen competition for deposits and loans, our pricing strategies allowed us to grow both, and at the same time attain double-digit earnings growth. Net profit for the year was a record $4.5 million, an increase of 14% over 2004. The excitement of these accomplishments was shared with you, our shareholders, as we returned almost 35% of income to you in the form of dividends.
~ Success like this doesn’t just happen. It occurs as the result of the dedication, loyalty, and commitment of many. Our staff, which now exceeds 100 full time equivalents, is the lifeblood of our operations and certainly is to be commended. Collectively, this group carries out the mission of our institution every day. Their strong belief in our goals is evidenced by the fact that our ranks now include twenty-three individuals whose tenure is fifteen years or more. During the year, we celebrated the twenty year employment anniversaries of Eileen Jaggars and Eileen Ertel. Furthermore, leadership efforts were rewarded with the promotions of Jan M. Hoadley, to the position of Damascus Community Office Manager, Mary Carol Cicco, to the rank of Community Banking Officer, and Deborah L. Unflat, to the level of Assistant Vice President of Marketing.
~ We are mindful of the communities that we serve and of our responsibility as a corporate citizen to give back to those that assist our marketplace at large. Each year we help numerous organizations by way of donations and voluntary efforts. Among these groups are area fire, ambulance, and rescue units, chambers of commerce, hospitals and health organizations, libraries, economic development agencies, educational foundations, and many, many more. We truly strive to be “Your Total Financial Partner.” Of particular note this past year were our contributions to the American Cancer Society’s Relay for Life and to the Hurricane Katrina Disaster Relief. Through the direct participation of our staff, coupled with employee-run fundraisers like bake sales and car washes, matched by personal donations of our entire group and our directors, we assisted those two humanitarian efforts by $15,538 and $9,275 respectively.
~ Besides being a year of performance, 2005 was also a historic year. It was the year of The Dime Bank’s 100th Anniversary! Our roots began on December 16, 1905 when the bank was chartered, and the opening day of banking business was January 2, 1906. For any business to attain a century of existence is truly a milestone event. But to do so while continuing to grow, flourish, and prosper, is absolutely remarkable. While celebrating this achievement we were able to pause and give praise to the four groups that helped make this all possible–our shareholders, customers, staff, and our directors, both those past for their foresight in creating the bank, and those present whose vision and guidance continues the legacy. What began as a banking alternative for the marketplace is true -then, now, and always. We eagerly anticipate the future with great enthusiasm.
~ With the writing of each annual report comes the quest to do even more. Our plans are to do just that. We have launched a new campaign directed at expanding our deposit base. To complement this effort, we have bundled products and increased interest rates to reward our customers as they increase their overall relationship with us. All other departments have lofty goals as well. Loans, investments, customer service, trust, marketing, title insurance, and operations have all been challenged to attain higher levels of performance. At the same time, we continue to search for new business lines and market areas through which we may grow our franchise.
~ All of our efforts are directed toward producing the best possible results for you, our shareholders. We thank you for your continued confidence and support and we encourage you to make referrals of business to us. As always, we welcome your comments.
|
| Sincerely, |
|
/s/ Gary C. Beilman |
Gary C. Beilman |
President and Chief Executive Officer |
| | |
| Celebrating a | | |
| century of | |
| long lasting relationships. | |
| | |
An early bank pass book. | | ~ At Dimeco we believe in relationships. We’ve helped generations of customers realize their goals and dreams. Bill Roos and his family have been banking with The Dime Bank since we opened our doors January 2, 1906. His great uncle, Jacob Katz, was one of our founders and a member of the original Board of Directors of The Honesdale Dime Bank. The spirit of helping neighbors started with our founding fathers and continues today. Through the years, we became known as The Friendly Honesdale Dime Bank. Our reputation of friendliness grew as we formed partnerships with our customers, ensuring their financial foundation was laid for generations to come. We continue to build stability and strength in our corporation and the community. We’ve been here for one hundred years, and we plan on being here for hundreds more. |
| |
“I was given stock certificates as a child. I believe so strongly in The Dime Bank that I passed my stock on to my heirs and continue to be a customer to this day. Our family business, Katz Bros Department Store, while in operation, was also a customer of The Dime Bank.”
| | |
| Celebrating a | | |
| century of | |
| commitment. | |
~ Dimeco, through its subsidiary The Dime Bank, has been committed to serving the financial requests of the community for the past one hundred years. Alert Hook & Ladder Company #2 has been responding to the fire and rescue needs of the community since 1898. It holds the oldest business checking account currently in use at The Dime Bank. Over the course of the century, owing to the lending and financial advice of The Dime Bank, countless corporations and non-profit operations have grown their businesses, and continue to thrive in the present—looking to a bright future with The Dime Bank as their financial partner. These energetic business development efforts have helped the community prosper and grow. Our loyalty and allegiance to long-term customers brings growth to our communities and thereby returns rewards to Dimeco and The Dime Bank, ultimately bringing value to you, our shareholder.
“Alert Hook & Ladder Company #2 has been responding to the fire and rescue needs of the community since 1898 and holds the oldest business checking account currently in use at The Dime Bank.”
| | |
| Celebrating a | | “I have formed lasting friendships with many wonderful customers and co-workers throughout the years. I have learned a lot and look forward to continuing my career at The Dime Bank.” |
| century of | |
| dedication. | |
~ Our employees are the bedrock of our business. Cindy Theobald, Security Officer, has been with us for 28 years starting as a teller, advancing to head teller and subsequently moving into our electronic data processing department. Due to her longevity and extensive banking knowledge, Cindy now manages the functions of security and bank secrecy and regularly instructs on the importance of both. We are proud to know that Cindy has chosen to be an integral part of our management team. Through the years we’ve had employees who have been with us for thirty, forty and close to fifty years. In an era when long-term employee tenure is uncommon, this high level of dedication is impressive and brings greater knowledge and stability to the daily operation of our corporation. Low turnover means reduced expense to the bottom line and our educated and experienced employees are best able to conduct the most efficient and effective customer interactions. All of this in turn brings greater profits to you, our dedicated shareholders.
BOARD OF DIRECTORS—Left to right: Barbara J. Genzlinger, John F. Spall, John S. Kiesendahl, Robert E. Genirs, Gary C. Beilman, Henry M. Skier, William E. Schwarz, Thomas A. Peifer
Celebrating a century of success.
MANAGEMENT’S DISCUSSION AND ANALYSIS OF FINANCIAL
CONDITION AND RESULTS OF OPERATION
This consolidated review and analysis of Dimeco, Inc. (the “Company”) is intended to assist the reader in evaluating the performance of the Company for the years ended December 31, 2005 and 2004. This information should be read in conjunction with the consolidated financial statements and accompanying notes to the consolidated financial statements.
Dimeco, Inc., headquartered in Honesdale, Pennsylvania, is the one-bank holding company of The Dime Bank (the “Bank”), which is wholly-owned by the Company. The Bank formed and owns 100% of a limited liability company, TDB Insurance Services, LLC, offering title insurance services. Both the Company and the Bank derive their primary income from the operation of a commercial bank, including earning interest on loans and investment securities and providing investment and trust services. The Bank’s main expenses are related to interest paid on deposits and other borrowings along with salary and benefits for employees. The Bank operates five full service branches in Honesdale, Hawley, Damascus, Greentown and Dingmans Ferry, Pennsylvania and two off-site automatic teller machines, one each in Wayne and Pike County, Pennsylvania. Principal market areas include Wayne and Pike Counties, Pennsylvania and Sullivan County, New York. The Bank employed 93 full time employees and 30 part time employees at December 31, 2005.
FORWARD-LOOKING STATEMENT
The Private Securities Litigation Act of 1995 contains safe harbor provisions regarding forward-looking statements. When used in this discussion, the words “believes,” “anticipates,” “contemplated,” “expects” and similar expressions are intended to identify forward-looking statements. Such statements are subject to certain risks and uncertainties that could cause actual results to differ materially from those projected. Those risks and uncertainties include changes in interest rates, the ability to control costs and expenses and general economic conditions. The Company undertakes no obligation to publicly release the results of any revisions to those forward-looking statements that may be made to reflect events or circumstances after the date hereof or to reflect the occurrence of unanticipated events.
CRITICAL ACCOUNTING POLICIES
The Company’s accounting policies are integral to understanding the results reported. The accounting policies are described in detail in Note 1 of the “Notes to Consolidated Financial Statements.” Our most complex accounting policies require management’s judgment to ascertain the valuation of assets, liabilities, commitments and contingencies. We have established detailed policies and control procedures that are intended to ensure that valuation methods are well controlled and applied consistently from period to period. In addition, the policies and procedures are intended to ensure that the process for changing methodologies occurs in an appropriate manner. The following is a brief description of our current accounting policies involving significant management valuation judgments.
Allowance for Loan Losses
Arriving at an appropriate level of allowance for loan losses involves a high degree of judgment. The Company’s allowance for loan losses provides for probable losses based upon evaluations of known and inherent risks in the loan portfolio.
Management uses both historical and current information relating to the loan portfolio, as well as general economic information, in order to determine our estimation of the prevailing business environment. The probability of collection of loans is affected by changing economic conditions and various external factors which may impact the portfolio in ways currently unforeseen. We monitor this information in an effort to assess the adequacy of the allowance for loan losses. The allowance is increased by provisions for loan losses and by recoveries of loans previously charged-off and reduced by loans charged-off. For a full discussion of the Company’s methodology of assessing the adequacy of the reserve for loan losses refer to Note 1.
Mortgage Servicing Rights
The Bank originates residential mortgages that are sold in the secondary market. It is the Bank’s normal practice to retain the servicing of these loans, meaning that the customers whose loans have been sold in the secondary market still make their monthly payments to the Bank. As a result of these mortgage loan sales, the Bank capitalizes a value allocated to the servicing rights categorized in other assets and recognizes other income from the sale and servicing of these loans. The capitalized servicing rights are amortized against noninterest income in proportion to the estimated net servicing income over the remaining periods of the underlying financial assets.
Capitalized servicing rights are evaluated for impairment periodically based upon the fair value of the rights as compared to amortized cost. The rights are deemed to be impaired when the fair value of the rights is less than the amortized cost. The fair value of the servicing rights is estimated using projected, discounted cash flows by means of a computer pricing model, based on objective characteristics of the portfolio and commonly used industry assumptions.
Deferred Tax Assets
The Company uses an estimate of future earnings to support our position that the benefit of our deferred tax assets will be realized. If future income should prove non-existent or less than the amount of the deferred tax assets within the tax years to which they may be applied, the asset may not be realized and our net income will be reduced. Our deferred tax assets are described further in Note 12 of the “Notes to Consolidated Financial Statements.”
Other than Temporary Impairment of Investments
Investments are evaluated periodically to determine whether a decline in their value is other than temporary. Management utilizes criteria such as the magnitude and duration of the decline, in addition to the reasons underlying the decline, to determine whether the loss in value is other than temporary. The term “other than temporary” is not intended to indicate that the decline is permanent. It indicates that the prospects for a near term recovery of value are not necessarily favorable, or that there is a lack of evidence to support fair values equal to, or greater than, the carrying value of the investment. Once a decline in value is determined to be other than temporary, the value of the security is reduced and a corresponding charge to earnings is recognized.
All dollars are stated in thousands, with the exception of per share numbers.
STATEMENT OF CONDITION
Total assets increased $32,483 or 10.0% during 2005, ending the year at $358,204. This increase occurred mainly in the loan portfolio, with the Company encountering another year of quality loan opportunities.
Cash and cash equivalents increased $3,345 or 65.2% from December 31, 2004 to December 31, 2005. Cash and due from bank balances of $5,554 were $1,415 or 34.2% greater in 2005 than in 2004 with the majority of the increase related to the Bank’s balance in the Federal Reserve Bank of Philadelphia (the “Fed”). The Bank clears customer checks through the Fed and is required to maintain balances sufficient to cover the amounts of these items on a daily basis. Fluctuations in drafts presented are normal in this regard. Balances of federal funds sold increased $1,912 or 195.5% due to temporary cash requirements that also fluctuate with changes in deposits and loan demand.
Investment securities available for sale declined $1,533 or 2.8% at December 31, 2005 from balances one year earlier. Due to the high loan demand during the year, funds from maturities and calls of securities in the portfolio were selectively diverted to fund loans in 2005. Traditionally, interest earned on loans is greater than can be recognized in the investment portfolio. As funds become available for reinvestment in the future, we will determine which securities offer an appropriate return commensurate with the interest rate risk. Management expects to return funds to the investment portfolio as deposit growth is recognized and loan demand declines.
Loans increased $30,421 or 12.0% from December 31, 2004 to December 31, 2005 with the majority of the growth centered in loans secured by commercial real estate, which represented $23,817 of the portfolio growth. As in prior years, the Bank continues to capitalize on relationships developed within the recreational camping industry with $9,766 of new loan balances during 2005. Commercial loans to hotels, motels and resorts increased $4,565 and loans to recreational vehicle dealers increased $2,385 with the balance of the loan growth spread over various industries. As a tool to manage loan concentration to any particular industry or individual, the Bank sold $5,295 of loan participations to other financial institutions during 2005. A strong housing market was evident, as real estate loans for construction and development grew by $3,109. Total closed residential mortgages of 118 represented $16,019 of volume compared to 124 residential mortgages amounting to $15,689 in 2004. The vast majority of residential loan originations are sold on the secondary market to Freddie Mac. Loans which were not sold and held in our loan portfolio increased residential mortgage balances by $1,656 or 3.1% during 2005. Installment loans remained stable from year to year with continued competition from low rate financing from auto manufacturers, credit card issuers and special financing programs of consumer goods.
Deposits increased $24,314 or 9.0% in 2005. Contributing to this growth was $9,666 of new deposits garnered in the Dingmans Ferry office, which opened in December 2004. While the majority of deposit growth was centered in interest-bearing accounts, growth of noninterest-bearing accounts was $6,239 or 20.5% from December 31, 2004 to December 31, 2005, with $2,585 of this increase in the Dingmans Ferry office. We have priced deposits on a customer’s total relationship with the Bank in order to increase funds from existing customers which were with other financial institutions and to attract new customers. Balances in the accounts of real estate transfer agents were higher at December 31, 2005 due to real estate closings which happened at the end of the year and for which all payments had not yet cleared the payments system.
Interest-bearing deposits increased $18,075 or 7.5% from December 31, 2004 to December 31, 2005. Total money market account balances declined $5,072 or 16.1%. Customers invested in other higher interest rate certificates of deposit or moved money to other investment products. Balances of passbook savings declined $1,184 or 19.8% with customers reinvesting in other, higher interest rate products. Management dropped the rate paid on these deposits several years ago in an effort to eliminate the burden of maintaining passbooks.
Certificates of deposit continued to grow over the year showing an increase of $27,199 or 21.3%. The Bank offered very competitive interest rates to assure that funds which were invested in a premium rate 36 month certificate of deposit product three years ago would remain on deposit. During the first three quarters of the year, the featured interest rates were on three levels: thirteen months, two years and three years. We experienced great success with these products and in the fourth quarter added a special six month rate in order to maintain our desired interest gap structure while offering customers another product to compete with local institutions and insurance products. Included in this growth was $4,369 of additional deposits placed in the Certificate of Deposit Account Registry Service (“CDARS”) program. Through membership in this elite group of banks, the Bank can offer our customers FDIC insurance coverage on balances up to $20 million. This product offers a way to attract and maintain deposits for customers who must be assured of insurance coverage. We expect to continue to acquire deposits through this program in 2006. During 2005 management bid more aggressively on local municipal certificates of deposit and garnered $6,881 more in 2005 than in 2004.
Other borrowed funds increased $5,199 or 45.8% from December 31, 2004 to December 31, 2005. This category represents long term borrowing from the Federal Home Loan Bank of Pittsburgh (“FHLB”). Management utilized our borrowing capacity with FHLB in order to offer preferred commercial customers long term fixed rate financing with funds at a guaranteed interest rate over similar terms. Management uses this strategy as an effective way to manage the interest rate risk associated with granting long term fixed rate loans in a rising interest rate environment.
CAPITAL RESOURCES
Stockholders’ Equity of $31,260 at December 31, 2005 represented an increase of $1,564 or 5.3% from a year earlier. The primary source of the expansion came from net income of $4,455, representing earnings of $2.89 per share and a return on average equity of 14.5%. The Board of Directors voted to return $1,551, representing $1.01 per share and 35.0% of earnings per share, to shareholders in the form of cash dividends. This level of dividends represents an increase of $.07 per share or 7.5% more than was paid in 2004. The Company did utilize the stock repurchase plan which was implemented in 2004. Purchases of treasury stock amounted to $1,062 and represented 30,000 shares of stock. These purchases mitigate the dilutive effect of both book value and earnings per share which could be caused by the exercise of outstanding stock options. Declines in the market value of investments available for sale resulted in a charge of $348, net of taxes, to accumulated other comprehensive income.
The Company’s capital position at December 31, 2005 as it relates to regulatory guidelines is presented below:
| | | | | | | | | |
| | | Dimeco, Inc. | | | Well-Capitalized | | | Minimum Requirements | |
Leverage Ratio | | 9.16 | % | | 5.00 | % | | 4.00 | % |
Tier I Capital Ratio | | 10.31 | % | | 6.00 | % | | 4.00 | % |
Total Capital Ratio | | 11.57 | % | | 10.00 | % | | 8.00 | % |
LIQUIDITY
Liquidity within the Company is viewed mainly through an analysis of the Consolidated Statement of Cash Flows which is included in the audited financial statements. Companies in the financial service industry are dependent on their ability to maintain proper levels of short and long term liquidity. The key is to maintain appropriate levels of liquidity to allow for customers’ cash needs from both a lending and deposit perspective, to maintain sufficient cash for operating expenses and to have amounts available to take advantage of earning opportunities as they arise.
Dimeco, Inc. defines cash and cash equivalents as cash on hand and in banks along with overnight investments in federal funds sold. Balances of these accounts totaled $8,477 or 2.4% of total assets at December 31, 2005. Operating activities generated $5,076 of cash and financing activities added $27,899 while investing activities used $29,630.
Both short-term and long-term liquidity is generated through principal and interest payments on loans, increases in borrowed funds and deposits, sales and maturities of investment securities, sales of residential loans in the secondary market and from operating income. Uses of this liquidity are originations of loans both for addition to our portfolio and for sales in the secondary market, capital projects, operating expenses and payment of dividends. The deposit base, through our ability to maintain current deposits and garner new funds, has historically been the primary source of liquidity for the Company. It continues to be the main source of funds, but has been augmented by the Bank’s ability to borrow from the FHLB. In 2005, the Bank took advantage of this ability and borrowed $5,725 in order to meet liquidity needs, while maintaining an additional available credit line of $54,000. This line is generally viewed as a long term source of liquidity, but is also used regularly in lower dollar amounts to borrow overnight funds as needed.
Management believes that the Company has sufficient liquidity to meet both its short and long term needs. We understand that liquidity may be adversely affected by many factors including unexpected deposit outflows, aggressive competitive pricing by other financial intermediaries and other cash requirements. We are aware of our dependence on customers’ deposits to sustain our liquidity levels. As mentioned earlier, we believe that people are becoming more comfortable investing in capital markets and insurance products, but through enhanced marketing efforts and deposit pricing we will be able to maintain the majority of current deposits and gain new deposits. Through our investments department we can offer products in capital markets and insurance products. By developing this proficiency we feel that the Company can maintain customer relationships and be positioned to garner deposits when and as investment cycles change.
QUANTITATIVE AND QUALITATIVE DISCLOSURES ABOUT MARKET RISK
Market risk is inherent in the financial services industry, encompassing the risk of loss associated with adverse changes in market interest rates and prices. As an organization, we have placed the management of this risk in the Asset/Liability Committee (“ALCO”). During 2005, this committee was comprised of the President/Chief Executive Officer, Chief Financial Officer, Senior Lending Officer, Vice President, Human Resources/Marketing, Vice President, Deposit Operations, Senior I.T. Officer and Assistant Vice President, Marketing. The committee follows guidelines enumerated in the ALCO policy which was developed to achieve earnings consistent with established goals while maintaining acceptable levels of interest rate risk, adequate levels of liquidity and adherence to regulatory mandates. The committee reports to the Board of Directors on at least a quarterly basis.
Asset market risk is most prevalent in the investment portfolio and to a lesser degree, in mortgage loans held for sale. As interest rates are increasing, it becomes more important that the Company consider the market risk of investments available for sale, particularly if the need to liquidate these assets would be imminent. Investment in long term securities at current rates may provide a lower return if the need arises to sell for liquidity in the future. Management has maintained a portfolio which includes investments in short maturity commercial paper and U.S. Government agencies that contain interest rate step-ups over the life of the investment. Although virtually all investments are held in the available for sale category, management anticipates holding all investments to maturity and has historically not had the need to sell for liquidity needs. Market risk inherent in loans held for sale has been mitigated by controlling the length of time between origination and sale of these loans. The balance of loans in this category is generally less than $1 million.
To address credit risk, both the loan portfolio and the investment portfolio have stringent guidelines as to the quality of acceptable investments.
Liability market risk is associated with the adverse affects of our pricing strategies compared to competitors’ pricing strategies. The markets in which we have offices are located in areas where other financial institutions also operate branches. If there is not enough flexibility in our pricing models to quickly move interest rates of both loans and deposits, we may lose accounts to other financial intermediaries. The ALCO is cognizant of the ability of interest rates to adversely affect assets, liabilities, capital and interest income and expense. In particular, two analytical tools are used to ascertain our ability to manage this market risk. The first is theStatement of Interest Sensitivity Gap. This report matches all interest-earning assets and all interest-bearing liabilities by the time frame in which funds can be reinvested or repriced. The second report is theInterest Rate Shock Analysiswhich attempts to determine the affect on income of various shifts in the interest rate environment. In both reports, there are inherent assumptions that must be used although management is aware that these assumptions affect the results and certainly cannot be absolutely accurate. These assumptions include the maturity or repricing times of deposits, even though all deposits, other than time deposits, have no stated maturity along with the reference that interest rate shifts will be parallel, with the rates of assets and liabilities shifting in the same amount in the same time frame. In reality, various assets and various liabilities will react differently to changes in interest rates, with some lagging behind the change and some anticipating the upcoming change and reacting before any actual change occurs. Each tool also suggests that there is a propensity to replace assets and liabilities with similar assets and liabilities rather than taking into consideration management’s ability to reallocate the Balance Sheet. In addition, the models used do not include any elements to determine how an action by management to increase or decrease interest rates charged on loans or paid on deposits or to increase borrowings at the FHLB will affect the results of the analysis. In spite of these limitations, these analyses are still good tools to assist in management of the Company. Similar versions of these same reports are used by all financial institutions. Both measurements are as of December 31, 2005.
STATEMENT OF INTEREST SENSITIVITY GAP
| | | | | | | | | | | | | | | | | | | |
| | | 90 days
or less | | | >90 days
but < 1 year | | | 1 - 5 years | | | >5 years | | | Total |
Assets: | | | | | | | | | | | | | | | | | | | |
Interest-bearing deposits in other banks and federal funds sold | | $ | 2,923 | | | $ | — | | | $ | — | | | $ | — | | | $ | 2,923 |
Mortgage loans held for sale | | | 211 | | | | — | | | | — | | | | — | | | | 211 |
Investment securities available for sale(1) (4) (6) | | | 27,433 | | | | 11,050 | | | | 11,027 | | | | 5,564 | | | | 55,074 |
Investment securities held to maturity(1) | | | — | | | | 199 | | | | — | | | | — | | | | 199 |
Loans(1) (5) | | | 63,249 | | | | 95,935 | | | | 77,103 | | | | 48,243 | | | | 284,530 |
| | | | | | | | | | | | | | | | | | | |
Rate sensitive assets | | $ | 93,816 | | | $ | 107,184 | | | $ | 88,130 | | | $ | 53,807 | | | $ | 342,937 |
| | | | | | | | | | | | | | | | | | | |
Liabilities: | | | | | | | | | | | | | | | | | | | |
Interest-bearing deposits: | | | | | | | | | | | | | | | | | | | |
Interest-bearing demand(2) | | $ | 2,980 | | | $ | 9,313 | | | $ | 24,958 | | | $ | — | | | $ | 37,251 |
Money market(3) | | | 4,499 | | | | 13,232 | | | | 8,733 | | | | — | | | | 26,464 |
Savings(2) | | | 3,165 | | | | 9,891 | | | | 26,507 | | | | — | | | | 39,563 |
Time deposits | | | 32,625 | | | | 66,055 | | | | 56,279 | | | | — | | | | 154,959 |
Short-term borrowings | | | 12,954 | | | | — | | | | — | | | | — | | | | 12,954 |
Other borrowings | | | — | | | | 2,000 | | | | 3,000 | | | | 11,548 | | | | 16,548 |
| | | | | | | | | | | | | | | | | | | |
Rate sensitive liabilities | | $ | 56,223 | | | $ | 100,491 | | | $ | 119,477 | | | $ | 11,548 | | | $ | 287,739 |
| | | | | | | | | | | | | | | | | | | |
Interest sensitivity gap | | $ | 37,593 | | | $ | 6,693 | | | $ | (31,347 | ) | | $ | 42,259 | | | $ | 55,198 |
Cumulative gap | | $ | 37,593 | | | $ | 44,286 | | | $ | 12,939 | | | $ | 55,198 | | | | |
Cumulative gap to total assets | | | 10.49 | % | | | 12.36 | % | | | 3.61 | % | | | 15.41 | % | | | |
| (1) | Investments and loans are included in the earlier of the period in which interest rates are next scheduled to adjust or in which they are due. No adjustment has been made for scheduled repayments or for anticipated prepayments. |
| (2) | Interest-bearing demand deposits, Passbook savings and Statement savings are segmented based on the percentage of decay method. The decay rates used include 8% “90 days or less”, 12.5% “>90 days but <1 year” and 67% “1-5 years.” |
| (3) | Money market deposits are segmented based on the percentage of decay method. The decay rates used include 17% “90 days or less”, 25% “>90 days but <1 year” and 33% “1-5 years.” |
| (4) | Includes Federal Home Loan Bank and Atlantic Central Bankers Bank stock which is included in Other Assets on the Consolidated Financial Statements. |
| (5) | Does not include loans in nonaccrual status, deposit overdrafts, unposted items or deferred fees on loans. |
| (6) | Among Dimeco’s investment portfolios are step-up securities. These securities are characterized by having tiered (usually increasing) interest rates over their life. Due to this feature these securities have been reallocated from their maturity date to their next step-up date. The specific impact of this policy by timeframe is as follows: “90 days or less” increased $3,977 “>90 days but <1” year increased $7,833 “1 - 5 years” decreased $1,063 and “>5 years” decreased $10,747. |
This report shows the Company to be in an asset sensitive position of $37,593 in less than or equal to three months, meaning that there are more assets which will reprice in this period than liabilities. Traditionally management focuses attention to the net gap of the balance sheet in the second time frame, assets which mature in less than or equal to one year. Our statement shows the Company to be much more asset sensitive in this time frame, with $44,286 of net assets repricing up to this time. The loan portfolio is the main asset category responsible for the higher level of asset sensitivity at this point. Commercial loans have historically been written with a variable interest rate and commercial real estate loans are typically fixed in rate for up to three years and then the interest rate will float with changes to the prime rate. We believe that in a rising interest rate period it is advantageous to be asset sensitive, giving greater opportunity for reinvestment as interest rates rise. The most conservative position is perfectly balanced in any time frame.
The following table presents the Company’s potential sensitivity in net interest income, net income and equity value at risk, or the potential of adverse change in the economic value of equity (“EVE”) with rates up or down 100 and 200 basis points. EVE is the present value of assets minus the present value of liabilities at a point in time.
ANALYSIS OF SENSITIVITY TO CHANGES IN MARKET INTEREST RATES
| | | | | | | | | | | | | | | | | | | | | | | | | | | | |
| | | 100 basis points | | | 200 basis points | |
| | | Up | | | Down | | | Up | | | Down | |
| | | Amount | | | % | | | Amount | | | % | | | Amount | | | % | | | Amount | | | % | |
Net interest income | | $ | 304 | | | 2.03 | % | | $ | (398 | ) | | (2.67 | )% | | $ | 591 | | | 3.96 | % | | $ | (776 | ) | | (5.19 | )% |
Net income | | $ | 211 | | | 3.41 | % | | $ | (273 | ) | | (4.42 | )% | | $ | 412 | | | 6.65 | % | | $ | (533 | ) | | (8.62 | )% |
EVE | | $ | (1,065 | ) | | (2.67 | )% | | $ | 1,069 | | | 2.68 | % | | $ | (3,360 | ) | | (8.42 | )% | | $ | 1,759 | | | 4.41 | % |
The greatest risk to the Company from an income perspective is an immediate decline in market interest rates of 200 basis points. Although possible, management does not believe that interest rates will immediately decline 200 basis points. In the EVE measurement, an increase of 200 basis points would affect the Company by a decline in equity of $3,361 or 8.42%. Although these analyses reflect the possibility of negative effects when interest rates change, all of these measurements are within internal acceptable limits. Management believes that we have the ability to affect the changes in income and equity by taking actions which are not factored in this analysis.
ALLOWANCE FOR LOAN LOSSES
The allowance for loan losses represents the amount that management estimates is adequate to provide for probable losses inherent in the loan portfolio. It is the largest subjective measurement in the financial statements. The balance is derived as losses are charged against the allowance while recoveries are credited to it with charges to provision expense providing the amount necessary to maintain the appropriate balance per our analysis. As of December 31, 2005, the Company’s allowance totaled $3,973 which represented 1.47% of the loan portfolio.
As noted, the allowance is established through a provision for loan losses which is charged to operations. The provision is based on management’s periodic evaluation of the adequacy of the allowance for loan losses, taking into consideration the overall risk characteristics of the portfolio, our specific loan loss experience, current and projected economic conditions, industry loan experience and other relevant factors. The estimates, including the amounts and timing of future cash flows relating to impaired loans, used to determine the adequacy of the allowance are particularly susceptible to significant change. The total allowance for loan losses is a combination of a specific allowance for identified problem loans, a formula allowance and a qualitative allowance. The specific allowance is determined by measuring impairment based upon the practices outlined in Statement of Financial Accounting Standards (“FAS”) No. 114,Accounting by Creditors for Impairment of a Loanand by FAS No. 118,Accounting by Creditors for Impairment of a Loan – Income Recognition and Disclosures.This standard prescribes methods to measure impairment and income recognition as well as documenting disclosure requirements. The formula allowance is calculated by applying factors to outstanding loans by type and risk weighting, excluding those loans for which a specific allowance has been determined. These loss factors are determined by management using historical loss information, current economic factors, portfolio concentration analysis, current delinquency ratios and an evaluation of the experience level of the loan officers in conjunction with evaluations of specific loans during the loan review process. The qualitative portion of the allowance is determined based upon management’s evaluation of a number of factors including: national and local economic business conditions, collateral values within the portfolio, credit quality trends and management’s evaluation of our particular loan portfolio as a whole.
The Company employs an experienced outside professional loan review agency to perform the loan review function. In order to test the majority of the asset category, a review of commercial loan relationships which approximate 65% of the portfolio is performed. This review is based upon current financial information of the customer, an analysis of loan concentrations, financial ratio comparisons, adherence to payment schedule, regulatory evaluations and peer comparisons. Management evaluates all other loans utilizing similar guidelines. After careful evaluation of all factors, a risk rate is assigned and an amount is calculated for each category of reviewed loans. Groups of smaller dollar loans are evaluated as a homogeneous pool with similar factors used to evaluate the appropriateness of the allowance for those loans.
SUMMARY OF LOAN LOSS EXPERIENCE
| | | | | | | | | | | | | | | | | | | | |
| | | 2005 | | | 2004 | | | 2003 | | | 2002 | | | 2001 | |
Balance January 1, | | $ | 3,172 | | | $ | 3,014 | | | $ | 2,818 | | | $ | 2,373 | | | $ | 2,088 | |
Charge-offs: | | | | | | | | | | | | | | | | | | | | |
Commercial | | | 106 | | | | 32 | | | | 69 | | | | 100 | | | | 218 | |
Real estate | | | — | | | | 860 | | | | 558 | | | | 48 | | | | 208 | |
Installment | | | 200 | | | | 226 | | | | 195 | | | | 151 | | | | 199 | |
| | | | | | | | | | | | | | | | | | | | |
Total charge-offs | | | 306 | | | | 1,118 | | | | 822 | | | | 299 | | | | 625 | |
| | | | | | | | | | | | | | | | | | | | |
Recoveries: | | | | | | | | | | | | | | | | | | | | |
Commercial | | | 46 | | | | 4 | | | | 4 | | | | 6 | | | | 11 | |
Real estate | | | 141 | | | | 89 | | | | 2 | | | | 23 | | | | 8 | |
Installment | | | 70 | | | | 57 | | | | 52 | | | | 40 | | | | 24 | |
| | | | | | | | | | | | | | | | | | | | |
Total recoveries | | | 257 | | | | 150 | | | | 58 | | | | 69 | | | | 43 | |
| | | | | | | | | | | | | | | | | | | | |
Net charge-offs | | | 49 | | | | 968 | | | | 764 | | | | 230 | | | | 582 | |
Additions charged to operations | | | 850 | | | | 1,126 | | | | 960 | | | | 675 | | | | 867 | |
| | | | | | | | | | | | | | | | | | | | |
Balance December 31, | | $ | 3,973 | | | $ | 3,172 | | | $ | 3,014 | | | $ | 2,818 | | | $ | 2,373 | |
| | | | | | | | | | | | | | | | | | | | |
Ratio of net charge-offs during the period to average loans outstanding during the period | | | 0.02 | % | | | 0.41 | % | | | 0.37 | % | | | 0.13 | % | | | 0.37 | % |
Allowance for loan loss as a % of average loans outstanding | | | 1.47 | % | | | 1.34 | % | | | 1.47 | % | | | 1.63 | % | | | 1.50 | % |
CONTRACTUAL OBLIGATIONS, COMMITMENTS AND OFF-BALANCE SHEET ARRANGEMENTS
The following table sets forth contractual obligations of the Company which represent required and potential cash outflows as of December 31, 2005. Further discussion of the nature of each obligation is included in the referenced note to the financial statements as of December 31, 2005:
| | | | | | | | | | | | | | | | | |
| | | | | Payments Due In | | |
| | | Note
Reference | | One Year
or Less | | One to
Three
Years | | Three to
Five
Years | | Over
Five
Years | | Total |
Deposits without a stated maturity | | | | $ | 139,897 | | $ | — | | $ | — | | $ | — | | $ | 139,897 |
Time deposits | | 7 | | $ | 98,680 | | $ | 42,113 | | $ | 14,166 | | $ | — | | $ | 154,959 |
Short-term borrowings | | 8 | | $ | 12,954 | | $ | — | | $ | — | | $ | — | | $ | 12,954 |
Other borrowed funds | | 9 | | $ | 2,000 | | $ | 2,000 | | $ | 1,000 | | $ | 11,548 | | $ | 16,548 |
Operating leases | | 13 | | $ | 256 | | $ | 372 | | $ | 92 | | $ | 199 | | $ | 919 |
The following table details the amounts and expected maturities of significant commitments as of December 31, 2005. Further discussion of these commitments is included in Note 13 to the financial statements as of December 31, 2005:
| | | | | | | | | | | | | | | |
| | | One Year
or Less | | One to
Three Years | | Three to
Five Years | | Over
Five Years | | Total |
Commitments to extend credit: | | | | | | | | | | | | | | | |
Commercial | | $ | 25,288 | | $ | 3,495 | | $ | 60 | | $ | 1,783 | | $ | 30,626 |
Residential real estate | | $ | 2,399 | | $ | 72 | | $ | — | | $ | — | | $ | 2,471 |
Revolving home equity | | $ | 126 | | $ | 142 | | $ | 162 | | $ | 2,288 | | $ | 2,718 |
Other | | $ | 6,666 | | $ | — | | $ | — | | $ | — | | $ | 6,666 |
Standby letters of credit | | $ | 3,216 | | $ | — | | $ | — | | $ | — | | $ | 3,216 |
RESULTS OF OPERATIONS
2005 Compared to 2004
Net income for the year ended December 31, 2005 was $4,455, representing an increase of $549 or 14.1% greater than the fiscal year ended December 31, 2004. Growth of net income was attributable to many factors which will be discussed with greater detail to follow.
Net Interest Income
Net interest income is the amount that interest earned on assets exceeds interest paid on deposits and borrowings. The following discussion regarding net interest income should be read in conjunction with the scheduleDistribution of Assets, Liabilities and Stockholders’ Equity: Interest Rates and Interest DifferentialandRate/Volume Analysis of Changes in Net Interest Income.
Interest and fees on loans increased $3,303 or 23.9% in 2005 versus 2004. As demonstrated in the table, the average rate of interest earned in the loan portfolio for 2005 was 6.33%, or 49 basis points greater than that earned in 2004. The higher average rate received is responsible for $1,332 of the increase in income earned. During the year 2005, many variable rate loans which had annual or longer repricing intervals did reprice at higher interest rates. The largest part of the expansion in interest earned, $1,970, is attributable to growth of $33,726 in the average size of the portfolio in the year 2005 as compared to the previous year. The Bank has continued to generate new loans, in particular commercial and commercial real estate loans, in our marketplace and in the children’s camping sector.
Interest earned on investments for the year 2005 was fairly stable from year to year while the types of investments varied during the period. Management did not believe that the risk of extending maturities was evident in the market for the majority of 2005, investing some longer term investment maturities in short term commercial paper. We are confident of this strategy to maintain liquidity for loan activity while remaining positioned to take advantage of increases in long term interest rates as they may occur. Therefore, interest earned on taxable investments increased only slightly, by 21 basis points, in spite of a rise of 200 basis points in federal funds sold over the period. The maturities of corporate bonds during the year came from investments which were purchased in periods which offered much higher long term interest rates which were not available for similar quality investments in 2005. There was much greater activity of maturities and calls of US government agencies during 2004, thereby producing lower average balances of these securities in 2005 as compared to 2004. Interest rates offered on these bonds in 2005 were not comparable to that seen in 2004. The tax exempt investment portfolio also had greater amounts of securities called in 2004, leaving lower average balances for 2005. Management has pursued purchasing some tax exempt bonds to replace some maturities in an effort to offer a stable maturity schedule in the future. We will continue to invest in these longer term securities at a similar pace in 2006 unless market opportunities arise that significantly change the offerings.
DISTRIBUTION OF ASSETS, LIABILITIES AND STOCKHOLDERS’ EQUITY;
INTEREST RATES AND INTEREST DIFFERENTIAL
| | | | | | | | | | | | | | | | | | | | | | | | | | | |
| | | 2005 | | | 2004 | | | 2003 | |
| | | Average
Balance (3) | | Revenue/
Expense | | Yield/
Rate | | | Average
Balance (3) | | Revenue/
Expense | | Yield/
Rate | | | Average
Balance (3) | | Revenue/
Expense | | Yield/
Rate | |
ASSETS | | | | | | | | | | | | | | | | | | | | | | | | | | | |
Interest-earning assets: | | | | | | | | | | | | | | | | | | | | | | | | | | | |
Total loans(1)(4) | | $ | 270,815 | | $ | 17,150 | | 6.33 | % | | $ | 237,089 | | $ | 13,847 | | 5.84 | % | | $ | 205,209 | | $ | 12,864 | | 6.27 | % |
Investment securities: | | | | | | | | | | | | | | | | | | | | | | | | | | | |
Taxable(5) | | | 48,349 | | | 1,776 | | 3.67 | % | | | 48,344 | | | 1,674 | | 3.46 | % | | | 57,454 | | | 2,131 | | 3.71 | % |
Exempt from federal income tax(2) | | | 3,682 | | | 229 | | 6.22 | % | | | 5,422 | | | 352 | | 6.50 | % | | | 6,702 | | | 447 | | 6.67 | % |
Interest-bearing deposits | | | 1,235 | | | 37 | | 3.00 | % | | | 610 | | | 9 | | 1.48 | % | | | 124 | | | 1 | | 0.81 | % |
Federal funds sold | | | 3,007 | | | 88 | | 2.93 | % | | | 3,196 | | | 46 | | 1.44 | % | | | 2,675 | | | 30 | | 1.12 | % |
| | | | | | | | | | | | | | | | | | | | | | | | | | | |
Total interest-earning assets/ interest income | | | 327,088 | | | 19,280 | | 5.89 | % | | | 294,661 | | | 15,928 | | 5.41 | % | | | 272,164 | | | 15,473 | | 5.69 | % |
Cash and due from banks | | | 5,810 | | | | | | | | | 5,608 | | | | | | | | | 7,380 | | | | | | |
Premises and equipment, net | | | 6,129 | | | | | | | | | 4,639 | | | | | | | | | 4,234 | | | | | | |
Other assets, less allowance for loan losses | | | 4,876 | | | | | | | | | 6,320 | | | | | | | | | 3,835 | | | | | | |
| | | | | | | | | | | | | | | | | | | | | | | | | | | |
Total Assets | | $ | 343,903 | | | | | | | | $ | 311,228 | | | | | | | | $ | 287,613 | | | | | | |
| | | | | | | | | | | | | | | | | | | | | | | | | | | |
LIABILITIES AND STOCKHOLDERS’ EQUITY | | | | | | | | | | | | | | | | | | | | | | | | | | | |
Interest-bearing liabilities: | | | | | | | | | | | | | | | | | | | | | | | | | | | |
Savings | | $ | 41,969 | | $ | 294 | | 0.70 | % | | $ | 42,516 | | $ | 248 | | 0.58 | % | | $ | 42,565 | | $ | 348 | | 0.82 | % |
Interest-bearing checking | | | 67,973 | | | 727 | | 1.07 | % | | | 64,304 | | | 520 | | 0.81 | % | | | 45,623 | | | 313 | | 0.69 | % |
Time deposits | | | 138,379 | | | 4,362 | | 3.15 | % | | | 124,913 | | | 3,233 | | 2.59 | % | | | 130,515 | | | 3,724 | | 2.85 | % |
Short-term borrowings | | | 14,856 | | | 207 | | 1.39 | % | | | 13,142 | | | 129 | | 0.98 | % | | | 11,369 | | | 112 | | 0.99 | % |
Other borrowed funds | | | 12,724 | | | 528 | | 4.15 | % | | | 6,873 | | | 282 | | 4.10 | % | | | 3,055 | | | 202 | | 6.61 | % |
| | | | | | | | | | | | | | | | | | | | | | | | | | | |
Total interest-bearing liabilities/ interest expense | | | 275,901 | | | 6,118 | | 2.22 | % | | | 251,748 | | | 4,412 | | 1.75 | % | | | 233,127 | | | 4,699 | | 2.02 | % |
Noninterest-bearing deposits | | | 35,298 | | | | | | | | | 29,264 | | | | | | | | | 26,430 | | | | | | |
Other liabilities | | | 2,036 | | | | | | | | | 1,749 | | | | | | | | | 1,998 | | | | | | |
| | | | | | | | | | | | | | | | | | | | | | | | | | | |
Total Liabilities | | | 313,235 | | | | | | | | | 282,761 | | | | | | | | | 261,555 | | | | | | |
Stockholders’ Equity | | | 30,668 | | | | | | | | | 28,467 | | | | | | | | | 26,058 | | | | | | |
| | | | | | | | | | | | | | | | | | | | | | | | | | | |
Total Liabilities and Stockholders’ Equity | | $ | 343,903 | | | | | | | | $ | 311,228 | | | | | | | | $ | 287,613 | | | | | | |
| | | | | | | | | | | | | | | | | | | | | | | | | | | |
| | | | | | | | | | | | | | | | | | | | | | | | | | | |
Net interest income/interest spread | | | | | $ | 13,162 | | 3.67 | % | | | | | $ | 11,516 | | 3.66 | % | | | | | $ | 10,774 | | 3.67 | % |
| | | | | | | | | | | | | | | | | | | | | | | | | | | |
Margin Analysis: | | | | | | | | | | | | | | | | | | | | | | | | | | | |
Interest income/earning assets | | | | | $ | 19,280 | | 5.89 | % | | | | | $ | 15,928 | | 5.41 | % | | | | | $ | 15,473 | | 5.69 | % |
Interest expense/earning assets | | | | | | 6,118 | | 1.87 | % | | | | | | 4,412 | | 1.50 | % | | | | | | 4,699 | | 1.73 | % |
| | | | | | | | | | | | | | | | | | | | | | | | | | | |
Net interest income/earning assets | | | | | $ | 13,162 | | 4.02 | % | | | | | $ | 11,516 | | 3.91 | % | | | | | $ | 10,774 | | 3.96 | % |
| | | | | | | | | | | | | | | | | | | | | | | | | | | |
Ratio of average interest-earning assets to average interest-bearing liabilities | | | | | | | | 118.55 | % | | | | | | | | 117.05 | % | | | | | | | | 116.74 | % |
| (1) | Nonaccrual loans are not included. |
| (2) | Income on interest-earning assets is based on a taxable equivalent basis using a federal income tax rate of 34%. |
| (3) | Average balances are calculated using daily balances. |
| (4) | Interest on loans includes fee income. |
| (5) | Includes equity investments in FHLB and ACBB. |
Certain amounts for prior years have been reclassified in order to conform to current presentation.
RATE/VOLUME ANALYSIS OF CHANGES IN NET INTEREST INCOME
| | | | | | | | | | | | | | | | | | | | | | | | |
| | | 2005 Compared to 2004 | | | 2004 Compared to 2003 | |
| | | Total Variance | | | Caused by | | | Total Variance | | | Caused by | |
| | | | Rate(1) | | | Volume | | | | Rate(1) | | | Volume | |
Interest income: | | | | | | | | | | | | | | | | | | | | | | | | |
Loans (gross) | | $ | 3,303 | | | $ | 1,333 | | | $ | 1,970 | | | $ | 983 | | | $ | (1,016 | ) | | $ | 1,999 | |
Investment securities: | | | | | | | | | | | | | | | | | | | | | | | | |
Taxable | | | 102 | | | | 102 | | | | — | | | | (457 | ) | | | (119 | ) | | | (338 | ) |
Exempt from federal income tax(2) | | | (123 | ) | | | (10 | ) | | | (113 | ) | | | (95 | ) | | | (10 | ) | | | (85 | ) |
Interest-bearing deposits | | | 28 | | | | 19 | | | | 9 | | | | 8 | | | | 4 | | | | 4 | |
Federal funds sold | | | 42 | | | | 45 | | | | (3 | ) | | | 16 | | | | 10 | | | | 6 | |
| | | | | | | | | | | | | | | | | | | | | | | | |
Total interest-earning assets | | | 3,352 | | | | 1,489 | | | | 1,863 | | | | 455 | | | | (1,131 | ) | | | 1,586 | |
| | | | | | | | | | | | | | | | | | | | | | | | |
Interest expense: | | | | | | | | | | | | | | | | | | | | | | | | |
Savings | | | 46 | | | | 49 | | | | (3 | ) | | | (100 | ) | | | (100 | ) | | | — | |
Interest-bearing checking | | | 207 | | | | 177 | | | | 30 | | | | 207 | | | | 79 | | | | 128 | |
Time deposits | | | 1,129 | | | | 780 | | | | 349 | | | | (491 | ) | | | (331 | ) | | | (160 | ) |
Short-term borrowings | | | 78 | | | | 61 | | | | 17 | | | | 18 | | | | 2 | | | | 17 | |
Other borrowings | | | 246 | | | | 6 | | | | 240 | | | | 79 | | | | (173 | ) | | | 252 | |
| | | | | | | | | | | | | | | | | | | | | | | | |
Total interest-bearing liabilities | | | 1,706 | | | | 1,073 | | | | 633 | | | | (287 | ) | | | (523 | ) | | | 237 | |
| | | | | | | | | | | | | | | | | | | | | | | | |
Net change in net interest income | | $ | 1,646 | | | $ | 416 | | | $ | 1,229 | | | $ | 742 | | | $ | (609 | ) | | $ | 1,349 | |
| | | | | | | | | | | | | | | | | | | | | | | | |
| (1) | Changes in interest income or expense not arising solely as a result of volume or rate variances are allocated to rate variances due to the interest sensitivity of assets and liabilities. |
| (2) | Income on interest-earning assets is based on a taxable equivalent basis using a federal income tax rate of 34%. |
Interest expense increased $1,706 or 38.7% in 2005 over amounts paid in 2004. The majority of the added expense was due to rising interest rates paid for deposits, but also had increases attributable to deposit growth. Savings and interest-bearing checking deposits remained fairly stable during the year while the average interest paid on savings increased 12 basis points and checking 26 basis points. These account types are not as sensitive to rates as other deposits and management did not feel it necessary to offer higher interest rates at this time. Special interest rates were offered during all of 2005 for time deposits, increasing the average balances by $13,466 during 2005. Interest paid for time deposits averaged a rate of 3.15% during the year, greater by 56 basis points than those offered in 2004. Due to short term market rates rising by 200 basis points, management believed that offering higher rates was essential to maintaining deposits. Each pricing decision is made with consideration to interest rates offered for other funding sources. As a community bank, we believe that it is appropriate to develop relationships with our customers and when similar results can be accomplished by offering special rates on deposit products or accessing other sources, we generally will use the deposit route to procure funds. Short-term borrowings are mainly related to sweep accounts offered to select commercial customers. The average rate paid on these borrowings escalated to 1.39% in 2005, representing 42 basis points more than in 2004. These customers are more sensitive to interest rate; therefore, management was more aggressive in pricing these funds. We expect to see these rates fluctuate at similar times, but in smaller increments than short-term market rates. Other borrowed funds increased on average by $5,851 or 85.1% due to the aforementioned FHLB borrowings made in order to facilitate offering fixed, long term interest rates to customers. The average rate of these borrowings was similar to those of 2004 with long term interest rates remaining fairly flat during the year even though short term interest rates increased as discussed above. Management believes that using this source of funding assures long term relationships with quality commercial customers.
Provision for Loan Losses
The provision for loan losses declined $276 or 24.5% in 2005 as compared to 2004. During 2004 the Bank experienced an unusual charge-off of $732 which did not recur in 2005. Rather, the level of collections of previously charged-off loans increased to $257 during 2005 which, combined with charge-offs of $306 for the year, assisted with the decline in provision expense for the year. The delinquency ratio at each quarter continued to remain at low levels, ending the year at .49% of loans. Although the loan portfolio grew by
$30,421 or 12.0%, management continues to review the adequacy of the allowance for loan losses on a quarterly basis and believes that the expense recorded for 2005 presented an adequate balance in the allowance at year end.
Noninterest Income
The greatest source of noninterest income for the Company continues to be derived from service charges on deposit accounts. The balance of $1,298 for 2005 represented an increase of $48 or 3.9% over the previous year. During that time, checking account balances increased $4,349 or 6.3%. While it is usual to expect that this income category would fluctuate somewhat in line with the liability component, management believes that customers are less apt to use the overdraft protection feature of their accounts than in the past. They have increased utilization of electronic and telephone banking products to more accurately track their checking balances and make appropriate balance transfers, eliminating the need for as much overdraft protection. Improving economic conditions have also attributed to less utilization of the overdraft protection product. Gains on mortgage loans held-for-sale declined $172 or 37.4% from income recognized in 2004. Although the general level of loans originated and sold in the secondary market in 2005 is comparable to that of 2004, the opportunity to recognize gains on the sales is not as evident due to a fairly level interest rate scenario in 2005. The opportunity for gain on the sale of loans is greatest when interest rates are declining slowly and management is able to sell loans as rates decline, as experienced in 2004. The opportunity to recognize investment security gains in 2004 was not matched in 2005. Included in the increase of $75 or 13.8% in the category of other income were many unrelated categories of income. The most significant of these are as follows: 1) fees earned in relation to administering the merchant credit card processing program increased $79 or 114.7% with the allocation of a full time employee to the program; 2) income earned in relation to the Bank’s title insurance subsidiary, TDB Insurances Services, LLC increased $46 or 96.2% in 2005 and 3) a decline in market value of $75 relating to the mortgage servicing rights was recorded in the second quarter of 2005 with an increase of $15 recorded in the fourth quarter of 2005, netting to a market value loss of $60 for the year.
Noninterest Expense
Salaries and employee benefits are the largest noninterest cost of operating a financial institution. As such, this expense category increased $590 or 15.0% in 2005 as compared to 2004. Management has hired six employees in the middle management ranks as we see the need for managers to take on more responsibility and train for future advancement. We also employed a full time accountant to work on the requirements of Sarbanes-Oxley Section 404 in 2005. In addition, our fifth banking office and TDB Insurance Services, LLC were open and fully staffed for the entire year of 2005 with employees hired beginning in the second half of 2004. We have faced stiff competition for entry level employees as large national retailers have entered or expanded in our marketplaces, therefore increasing salaries paid to these employees. Health insurance premiums continued to increase in cost per employee, rising 14% in 2005 over 2004 costs. The Bank receives peer analysis of its financial condition from regulatory sources which show that the personnel expense as a percent of average assets was 1.32% as compared to a national average of 1.57%, placing the Bank in the 29thpercentile for this efficiency ratio.
Occupancy expense increased $113 or 17.8% and furniture and fixture expense increased $68 or 13.9% with the majority of these increases attributable to the Dingmans Ferry office expense.
The category of other expense includes many diverse expense items. These expenses increased $190 or 11.5% in 2005 as compared to 2004. Many of these line item accounts increased consistent with the addition of another banking office. The largest variances in this total category have to do with the following: 1) advertising expense increased $111 or 52.6% with the Bank using the services of an outside consultant to assist in attracting deposit accounts and promotion of the Bank’s 100thanniversary at the end of 2005 and beginning of 2006; 2) donations expense increased $38 or 35.9% as a result of our policy of making charitable contributions in the communities we serve, including the newest office in Dingmans Ferry along with $17 as the initial payment of a five year commitment towards the local hospital’s capital campaign; 3) increased PA shares tax expense of $21 or 11.1% which is based on the average equity of the Bank and 4) a decline of $57 or 101.4% in expense relating to other real estate owned since there were no assets in this category during 2005. Other smaller changes accounted for the remaining difference in expense.
2004 Compared to 2003
The year 2004 resulted in growth of $52 or 1.3% in net income as compared to the results of operation for the previous year. Although this rate of growth is somewhat less than has been recognized in previous years, management views the results of operation for 2004 as favorable given several events experienced during the year. The Company experienced elevated overhead expenses relating to expansion of the Company and for expenses relating to extinguishment of a problem loan.
Net Interest Income
Net interest income is the amount that interest earned on assets exceeds interest paid on deposits and borrowings. The following discussion regarding net interest income should be read in conjunction with the scheduleDistribution of Assets, Liabilities and Stockholders’ Equity: Interest Rates and Interest DifferentialandRate/Volume Analysis of Changes in Net Interest Income.
Interest and fees earned on loans increased $983 or 7.6% in 2004 as compared to 2003 as a result of average loan portfolio growth of $31,880 combined with a decline of .43% in the average rate earned on loans. In order to facilitate our customers transition into new borrowings for expansion of their businesses, commercial real estate loans are frequently granted with interest rates fixed for a two to three year period and then reverting to annual adjustment based on changes in the prime interest rate. The timing effects of rate changes on these loans are a main reason for this decrease in the average interest rate. In addition, competitive factors forced interest rate modifications on several large commercial credits.
Interest earned on taxable investment securities declined $457 or 21.4% from 2003 to 2004. Management administers the balance sheet to handle opportunities for investing in assets that offer the highest interest rate while maintaining asset quality. Due to high loan demand combined with slower growth in deposits, management utilized maturities of investments to partially fund loan growth. The average balance of the investment portfolio decreased $9,110 or 15.9% while the average interest rate earned declined from 3.71% to 3.46% during 2004. Various investments which were purchased in prior years, earning higher interest rates, matured during the year and were reinvested at current interest rates or rebalanced to fund loan growth. In an effort to position the portfolio for higher interest rates in the future, during 2004 management purchased securities that were either short term or offered opportunities for rate increases over their lives. This strategy limits the interest rate risk associated with purchasing longer term investments during the current lower interest rate period and offers the potential to lock higher rates in the future.
Interest expense in total declined $287 or 6.1% in 2004 as compared to 2003. Variations in individual components of this change are discussed separately. Interest related to savings deposits declined $100 or 28.7% from 2003 to 2004 with the entire amount related to lowering the average interest rate on all deposits by .24%. Simultaneously, average balances of interest-bearing checking accounts increased $18,681 or 40.9% during the period with the majority of the growth in money market accounts. This growth, coupled with payment of a slightly higher average interest rate of .12% for these deposits, was responsible for the increase in this interest expense of $207. Management priced this particular deposit account higher for larger balance accounts in order to attract new deposits that were potentially leaving financial institutions to be invested in similar type accounts with brokerage firms. Although this interest rate was higher than traditionally paid, it was less than rates paid to borrow from FHLB and offered the potential for deepening relationships with our customers. Interest expense related to time deposits decreased $491 or 13.2% due to a decline of $5,602 or 4.3% in the average balance combined with a decline of .26% in the average rates paid for these deposits. As discussed above, management increased rates paid for money market accounts and some customers transferred balances to this type of account in anticipation of higher interest rates during the first half of 2004. In July 2004 a certificate of deposit product special was offered with a premium interest rate paid on deposits greater than $10 to customers who maintained a checking account with the Bank. This product attracted $11,164 of deposits both from existing customers reinvesting matured deposits and from new customers. The marketplace has been extremely competitive in pricing certificates of deposit and this offering was made to maintain and hopefully increase our market share while locking in rates in this rising rate environment.
Provision for Loan Losses
The provision for loan losses increased $166 or 17.3% in 2004 as compared to 2003. As discussed above, the loan portfolio increased 15.3% over the time period. A commercial loan which was in nonaccrual status continued to experience financial difficulties in 2004. Due to a re-appraisal of the business and accompanying real estate, the Bank found it necessary to charge-off an additional $732. After adjusting the provision expense in prior quarters, management determined that there was no expense necessary in the fourth quarter 2004. The assets on which the problem loan was collateralized were sold in the fourth quarter, a charge was made to the allowance and the loan was removed from the books. This unusual charge-off combined with the increase in the loan portfolio during the year is the primary cause for higher expense in 2004. Management reviews the adequacy of the allowance for loan losses on a quarterly basis and has determined that the allowance, which represented 1.25% of loans at December 31, 2004, was adequate. A positive factor relating to the adequacy is that the delinquency rate at December 31, 2004 was .57% compared to .76% the previous year end.
Noninterest Income
Service charges on deposit accounts remains the largest source of noninterest income for the Company, representing income of $1,250, an increase of $194 or 18.4% over 2003 fees. The majority of this income is the result of fees charged in conjunction with an overdraft protection plan. Although there has been regulatory scrutiny of these type plans, the Bank’s annual examinations have been favorable in relation to this product and we expect to continue to offer it in the future. Gains on sales of mortgage loans in the secondary market decreased $374 or 44.8% in 2004 as compared to 2003, returning to a level similar to 2002 and years before. The year 2003 was a banner year for both refinances and new purchases as customers took advantage of the low interest rate environment. Management anticipated this decline and expects that the current level will be maintained in the future. Brokerage commissions increased $207 or 141.8% in 2004 as compared to 2003. The transition of accounts into a new investment program in the first quarter, attraction of new customers throughout the year with the hiring of an experienced Vice President in 2003 and the availability of new product offerings all combined to produce higher revenues. We expect this level of income to continue and be enhanced as the program matures. As discussed above, management is concerned with the disintermediation of deposits when customers are attracted back to equity and insurance investments. We plan to transition these customers into our investments department in order to maintain the relationship and produce noninterest income.
Noninterest Expense
Salaries and employee benefits increased $406 or 11.5% in 2004 as compared to 2003. Several factors contributed to increase these expenses. The Company hired several key new employees including two Vice Presidents in 2003 in order to expand product offerings. Salaries and the related benefits for these individuals were paid for the entire year of 2004 and only part of 2003. With plans made to open the Dingmans Ferry office in the fourth quarter 2004, eight new employees were hired in the second half of the year in order to train this new team in both operational procedures and philosophical ideals. Annual health insurance rates continued to rise, representing another factor to increase expenses. Regulatory agencies publish peer analysis of similar sized banks across the country on a quarterly basis; according to their analysis at December 31, 2004, our personnel expense as a percent of average assets of 1.27% place the bank in the top 26% of its peers. Average personnel expense per employee of $39 placed it in the top 8% of its peer group in the comparison.
Associated with expansion into a new market area, both occupancy and furniture and equipment expense increased during 2004 as compared to previous years. This increase in expense will continue in future periods and management expects this facility to generate additional income for future periods.
Data processing expenses rose $85 or 29.3% in 2004 as compared to 2003. The addition of new software platforms in the consumer loan, customer service and teller areas accounted for the majority of additional expense. Software upgrades costing $20 were made to personal computers during 2004; these upgrades are not done on an annual basis and the cost per license is less than internal guidelines for capitalizing payments, thus increasing expense for the year.
Other expense increased $171 or 11.6% in 2004 as compared to 2003. Included in this category are many expenses not separately enumerated. Several categories had more pronounced changes and are detailed in particular. Advertising expense increased $37 or 21.0% due to additional exposure and the higher unit cost of advertising in the Dingmans Ferry market. Expense relating to operation of our ATM network increased $33 or 25.8% due to increased usage, generation of new cards and an increase in fees charged by the third party vendor used for processing. Travel and entertainment expenses increased $26 or 48.4% due to attendance at a national convention in 2004 which was unmatched in previous years and an emphasis on officers calling on customers in 2004. Pennsylvania shares tax is based on average equity over a five year period; due to profitability of the Company this tax increased $20 or 12.0% in 2004 as compared to 2003. Other smaller changes accounted for the remaining difference in expense.
MARKET PRICES OF STOCK/DIVIDENDS DECLARED
The Company’s stock is listed on the OTC Bulletin Board under the symbol “DIMC”. The book value per share at December 31, 2005 was $20.53 and represented an increase of 7.1% over the 2004 book value of $19.17. There were approximately 763 shareholders of record at December 31, 2005. This number does not include persons or entities that hold their stock in nominee name through various brokerage firms.
The following table sets forth high and low sale prices per share of the common stock for the calendar quarters indicated, based upon information obtained from published sources:
MARKET PRICES OF STOCK / DIVIDENDS DECLARED
| | | | | | | | | | | | | | | | | | |
| | | 2005 | | 2004 |
| | | High | | Low | | Dividend
Declared | | High | | Low | | Dividend
Declared |
First Quarter | | $ | 39.50 | | $ | 34.75 | | $ | .25 | | $ | 44.50 | | $ | 40.05 | | $ | .23 |
Second Quarter | | $ | 36.85 | | $ | 34.00 | | $ | .25 | | $ | 45.00 | | $ | 41.00 | | $ | .23 |
Third Quarter | | $ | 36.00 | | $ | 33.50 | | $ | .25 | | $ | 42.50 | | $ | 34.50 | | $ | .23 |
Fourth Quarter | | $ | 35.75 | | $ | 33.75 | | $ | .26 | | $ | 36.25 | | $ | 34.00 | | $ | .25 |
The ability of the Company to pay dividends is dependent upon the ability of the Bank to pay dividends to the Company. The Bank is a depository institution insured by the FDIC and therefore it may not pay dividends or distribute capital assets if it is in default on any assessment due the FDIC. Additionally, the Bank is subject to certain state banking regulations that limit the ability of the Bank to pay dividends to the Company. Under Federal Reserve policy, the Company is required to maintain adequate regulatory capital and is expected to act as a source of financial strength to the Bank and to commit resources to support the Bank in circumstances where it might not do so absent such a policy. These regulations may have the effect of reducing the amount of future dividends declarable by the Company.
SUMMARY OF SELECTED FINANCIAL DATA
| | | | | | | | | | | | | | | | | | | | |
| | | 2005 | | | 2004 | | | 2003 | | | 2002 | | | 2001 | |
Summary of operations | | | | | | | | | | | | | | | | | | | | |
Interest Income | | $ | 19,202 | | | $ | 15,808 | | | $ | 15,321 | | | $ | 15,468 | | | $ | 17,320 | |
Interest expense | | $ | 6,118 | | | $ | 4,412 | | | $ | 4,699 | | | $ | 5,618 | | | $ | 7,893 | |
Net interest income | | $ | 13,084 | | | $ | 11,396 | | | $ | 10,622 | | | $ | 9,850 | | | $ | 9,427 | |
Provision for loan losses | | $ | 850 | | | $ | 1,126 | | | $ | 960 | | | $ | 675 | | | $ | 867 | |
Net interest income after provision for loan losses | | $ | 12,234 | | | $ | 10,270 | | | $ | 9,662 | | | $ | 9,175 | | | $ | 8,560 | |
Other income | | $ | 2,801 | | | $ | 2,933 | | | $ | 2,695 | | | $ | 1,719 | | | $ | 1,561 | |
Other expenses | | $ | 8,498 | | | $ | 7,525 | | | $ | 6,803 | | | $ | 5,974 | | | $ | 5,829 | |
Income before income taxes | | $ | 6,537 | | | $ | 5,678 | | | $ | 5,554 | | | $ | 4,920 | | | $ | 4,292 | |
Income taxes | | $ | 2,082 | | | $ | 1,772 | | | $ | 1,700 | | | $ | 1,549 | | | $ | 1,353 | |
Net income | | $ | 4,455 | | | $ | 3,906 | | | $ | 3,854 | | | $ | 3,371 | | | $ | 2,939 | |
| | | | | |
Per common share | | | | | | | | | | | | | | | | | | | | |
Earnings per share - basic* | | $ | 2.89 | | | $ | 2.54 | | | $ | 2.54 | | | $ | 2.24 | | | $ | 1.98 | |
Earnings per share - diluted* | | $ | 2.80 | | | $ | 2.46 | | | $ | 2.45 | | | $ | 2.19 | | | $ | 1.95 | |
Cash dividends* | | $ | 1.01 | | | $ | 0.94 | | | $ | 0.87 | | | $ | 0.82 | | | $ | 0.73 | |
Book value* | | $ | 20.53 | | | $ | 19.17 | | | $ | 17.89 | | | $ | 16.25 | | | $ | 14.70 | |
Shares outstanding at year end | | | 1,522,669 | | | | 1,548,994 | | | | 1,526,134 | | | | 753,600 | | | | 746,285 | |
| | | | | |
Balance sheet data - end of year | | | | | | | | | | | | | | | | | | | | |
Total assets | | $ | 358,204 | | | $ | 325,721 | | | $ | 304,304 | | | $ | 280,952 | | | $ | 248,874 | |
Loans, net of unearned | | $ | 283,562 | | | $ | 253,141 | | | $ | 219,609 | | | $ | 187,361 | | | $ | 161,740 | |
Loans held for sale | | $ | 211 | | | $ | 112 | | | $ | 654 | | | $ | 1,195 | | | $ | 527 | |
Investment securities: | | | | | | | | | | | | | | | | | | | | |
Available for sale | | $ | 54,129 | | | $ | 55,662 | | | $ | 64,357 | | | $ | 78,880 | | | $ | 70,060 | |
Held to maturity | | $ | 199 | | | $ | 198 | | | $ | 197 | | | $ | 426 | | | $ | 414 | |
Deposits | | $ | 294,856 | | | $ | 270,542 | | | $ | 262,207 | | | $ | 239,359 | | | $ | 210,385 | |
Stockholders’ equity | | $ | 31,260 | | | $ | 29,696 | | | $ | 27,308 | | | $ | 24,519 | | | $ | 21,951 | |
| | | | | |
Performance | | | | | | | | | | | | | | | | | | | | |
Return on average assets | | | 1.30 | % | | | 1.26 | % | | | 1.34 | % | | | 1.30 | % | | | 1.27 | % |
Return on average equity | | | 14.53 | % | | | 13.72 | % | | | 14.79 | % | | | 14.49 | % | | | 14.01 | % |
Dividend payout ratio | | | 34.95 | % | | | 37.01 | % | | | 35.51 | % | | | 36.30 | % | | | 36.71 | % |
Average equity to average assets ratio | | | 8.92 | % | | | 9.15 | % | | | 9.06 | % | | | 8.96 | % | | | 9.04 | % |
| * | Years before 2003 adjusted to reflect 100% stock split effected in the form of a dividend on 12/1/03. |

REPORT OF INDEPENDENT REGISTERED PUBLIC ACCOUNTING FIRM
The Board of Directors and Stockholders
Dimeco, Inc.
We have audited the consolidated balance sheet of Dimeco, Inc. and subsidiary as of December 31, 2005 and 2004, and the related consolidated statements of income, changes in stockholders’ equity, and cash flows for each of the three years in the period ended December 31, 2005. These financial statements are the responsibility of the Company’s management. Our responsibility is to express an opinion on these financial statements based on our audits.
We conducted our audits in accordance with the standards of the Public Company Accounting Oversight Board (United States). Those standards require that we plan and perform the audit to obtain reasonable assurance about whether the financial statements are free of material misstatement. An audit includes examining, on a test basis, evidence supporting the amounts and disclosures in the financial statements. An audit also includes assessing the accounting principles used and significant estimates made by management, as well as evaluating the overall financial statement presentation. We believe that our audits provide a reasonable basis for our opinion.
In our opinion, the consolidated financial statements referred to above present fairly, in all material respects, the financial position of Dimeco, Inc. and subsidiary as of December 31, 2005 and 2004, and the consolidated results of their operations and their cash flows for each of the three years in the period ended December 31, 2005, in conformity with U.S. generally accepted accounting principles.
|
|
| /s/ S.R. Snodgrass, A.C. |
Wexford, Pennsylvania February 3, 2006 |
S.R. Snodgrass, A.C. 1000 Stonewood Drive, Suite 200 Wexford, PA 15090-8399 Phone: 724-934-0344 Facsimile: 724-934-0345
CONSOLIDATED BALANCE SHEET
| | | | | | | |
| | | December 31, |
| (In thousands) | | 2005 | | | 2004 |
Assets | | | | | | | |
Cash and due from banks | | $ | 5,554 | | | $ | 4,139 |
Interest-bearing deposits in other banks | | | 33 | | | | 15 |
Federal funds sold | | | 2,890 | | | | 978 |
| | | | | | | |
Total cash and cash equivalents | | | 8,477 | | | | 5,132 |
Mortgage loans held for sale (market value of $211 and $112) | | | 211 | | | | 112 |
Investment securities available for sale | | | 54,129 | | | | 55,662 |
Investment securities held to maturity (market value of $207 and $216) | | | 199 | | | | 198 |
Loans (net of unearned income of $734 and $623) | | | 283,562 | | | | 253,141 |
Less allowance for loan losses | | | 3,973 | | | | 3,172 |
| | | | | | | |
Net loans | | | 279,589 | | | | 249,969 |
Premises and equipment | | | 6,022 | | | | 5,580 |
Accrued interest receivable | | | 1,380 | | | | 1,106 |
Bank-owned life insurance | | | 5,254 | | | | 5,065 |
Other assets | | | 2,943 | | | | 2,897 |
| | | | | | | |
TOTAL ASSETS | | $ | 358,204 | | | $ | 325,721 |
| | | | | | | |
Liabilities | | | | | | | |
Deposits: | | | | | | | |
Noninterest-bearing | | $ | 36,619 | | | $ | 30,380 |
Interest-bearing | | | 258,237 | | | | 240,162 |
| | | | | | | |
Total deposits | | | 294,856 | | | | 270,542 |
Short-term borrowings | | | 12,954 | | | | 12,033 |
Other borrowed funds | | | 16,548 | | | | 11,349 |
Accrued interest payable | | | 952 | | | | 609 |
Other liabilities | | | 1,634 | | | | 1,492 |
| | | | | | | |
TOTAL LIABILITIES | | | 326,944 | | | | 296,025 |
| | | | | | | |
Stockholders’ Equity | | | | | | | |
Common stock, $.50 par value; 5,000,000 shares authorized; 1,552,669 and 1,548,994 shares issued | | | 776 | | | | 774 |
Capital surplus | | | 4,445 | | | | 4,377 |
Retained earnings | | | 27,400 | | | | 24,496 |
Accumulated other comprehensive income (loss) | | | (299 | ) | | | 49 |
Treasury stock, at cost (30,000 shares) | | | (1,062 | ) | | | — |
| | | | | | | |
TOTAL STOCKHOLDERS’ EQUITY | | | 31,260 | | | | 29,696 |
| | | | | | | |
TOTAL LIABILITIES AND STOCKHOLDERS’ EQUITY | | $ | 358,204 | | | $ | 325,721 |
| | | | | | | |
CONSOLIDATED STATEMENT OF INCOME
| | | | | | | | | |
| | | Year Ended December 31, |
| (In thousands, except per share data) | | 2005 | | 2004 | | 2003 |
Interest Income | | | | | | | | | |
Interest and fees on loans | | $ | 17,150 | | $ | 13,847 | | $ | 12,864 |
Interest-bearing deposits in other banks | | | 37 | | | 9 | | | 1 |
Federal funds sold | | | 88 | | | 46 | | | 30 |
Investment securities: | | | | | | | | | |
Taxable | | | 1,776 | | | 1,674 | | | 2,131 |
Exempt from federal income tax | | | 151 | | | 232 | | | 295 |
| | | | | | | | | |
Total interest income | | | 19,202 | | | 15,808 | | | 15,321 |
| | | | | | | | | |
Interest Expense | | | | | | | | | |
Deposits | | | 5,383 | | | 4,001 | | | 4,385 |
Short-term borrowings | | | 207 | | | 129 | | | 112 |
Other borrowed funds | | | 528 | | | 282 | | | 202 |
| | | | | | | | | |
Total interest expense | | | 6,118 | | | 4,412 | | | 4,699 |
| | | | | | | | | |
Net Interest Income | | | 13,084 | | | 11,396 | | | 10,622 |
Provision for loan losses | | | 850 | | | 1,126 | | | 960 |
| | | | | | | | | |
Net Interest Income After Provision for Loan Losses | | | 12,234 | | | 10,270 | | | 9,662 |
| | | | | | | | | |
Noninterest Income | | | | | | | | | |
Service charges on deposit accounts | | | 1,298 | | | 1,250 | | | 1,056 |
Mortgage loans held-for-sale gains, net | | | 288 | | | 460 | | | 834 |
Investment securities gains | | | 2 | | | 95 | | | 13 |
Brokerage commissions | | | 371 | | | 353 | | | 146 |
Earnings on bank-owned life insurance | | | 222 | | | 230 | | | 154 |
Other income | | | 620 | | | 545 | | | 492 |
| | | | | | | | | |
Total noninterest income | | | 2,801 | | | 2,933 | | | 2,695 |
| | | | | | | | | |
Noninterest Expense | | | | | | | | | |
Salaries and employee benefits | | | 4,520 | | | 3,930 | | | 3,524 |
Occupancy expense, net | | | 749 | | | 636 | | | 595 |
Furniture and equipment expense | | | 557 | | | 489 | | | 448 |
Professional fees | | | 482 | | | 447 | | | 469 |
Data processing expense | | | 352 | | | 375 | | | 290 |
Other expense | | | 1,838 | | | 1,648 | | | 1,477 |
| | | | | | | | | |
Total noninterest expense | | | 8,498 | | | 7,525 | | | 6,803 |
| | | | | | | | | |
Income before income taxes | | | 6,537 | | | 5,678 | | | 5,554 |
Income taxes | | | 2,082 | | | 1,772 | | | 1,700 |
| | | | | | | | | |
NET INCOME | | $ | 4,455 | | $ | 3,906 | | $ | 3,854 |
| | | | | | | | | |
Earnings Per Share: | | | | | | | | | |
Basic | | $ | 2.89 | | $ | 2.54 | | $ | 2.54 |
Diluted | | $ | 2.80 | | $ | 2.46 | | $ | 2.45 |
The accompanying notes are an integral part of these consolidated financial statements.
CONSOLIDATED STATEMENT OF CHANGES IN STOCKHOLDERS’ EQUITY
| | | | | | | | | | | | | | | | | | | | | | | | | | |
| (In thousands, except per share data) | | Common
Stock | | Capital
Surplus | | Retained
Earnings | | | Accumulated
Other
Comprehensive
Income (Loss) | | | Treasury
Stock | | | Total
Stockholders’
Equity | | | Comprehensive
Income | |
Balance, December 31, 2002 | | $ | 377 | | $ | 3,648 | | $ | 19,908 | | | $ | 624 | | | $ | (38 | ) | | $ | 24,519 | | | | | |
Net income | | | | | | | | | 3,854 | | | | | | | | | | | | 3,854 | | | $ | 3,854 | |
Other comprehensive loss: | | | | | | | | | | | | | | | | | | | | | | | | | | |
Unrealized loss on available-for-sale securities, net of reclassification adjustment, net of tax benefit of $46 | | | | | | | | | | | | | (90 | ) | | | | | | | (90 | ) | | | (90 | ) |
| | | | | | | | | | | | | | | | | | | | | | | | | | |
Comprehensive income | | | | | | | | | | | | | | | | | | | | | | | | $ | 3,764 | |
| | | | | | | | | | | | | | | | | | | | | | | | | | |
Dividend reinvestment plan | | | 2 | | | 209 | | | | | | | | | | | 80 | | | | 291 | | | | | |
Purchase treasury stock | | | | | | | | | | | | | | | | | (114 | ) | | | (114 | ) | | | | |
Exercise of stock options | | | 3 | | | 116 | | | (23 | ) | | | | | | | 72 | | | | 168 | | | | | |
100% stock split effected in the form of a stock dividend | | | 381 | | | | | | (381 | ) | | | | | | | | | | | — | | | | | |
Cash dividends ($.87 per share) | | | | | | | | | (1,320 | ) | | | | | | | | | | | (1,320 | ) | | | | |
| | | | | | | | | | | | | | | | | | | | | | | | | | |
Balance, December 31, 2003 | | | 763 | | | 3,973 | | | 22,038 | | | | 534 | | | | — | | | | 27,308 | | | | | |
Net income | | | | | | | | | 3,906 | | | | | | | | | | | | 3,906 | | | $ | 3,906 | |
Other comprehensive loss: | | | | | | | | | | | | | | | | | | | | | | | | | | |
Unrealized loss on available-for-sale securities, net of reclassification adjustment, net of tax benefit of $250 | | | | | | | | | | | | | (485 | ) | | | | | | | (485 | ) | | | (485 | ) |
| | | | | | | | | | | | | | | | | | | | | | | | | | |
Comprehensive income | | | | | | | | | | | | | | | | | | | | | | | | $ | 3,421 | |
| | | | | | | | | | | | | | | | | | | | | | | | | | |
Exercise of stock options | | | 11 | | | 404 | | | | | | | | | | | | | | | 415 | | | | | |
Cash dividends ($.94 per share) | | | | | | | | | (1,448 | ) | | | | | | | | | | | (1,448 | ) | | | | |
| | | | | | | | | | | | | | | | | | | | | | | | | | |
Balance, December 31, 2004 | | | 774 | | | 4,377 | | | 24,496 | | | | 49 | | | | — | | | | 29,696 | | | | | |
Net income | | | | | | | | | 4,455 | | | | | | | | | | | | 4,455 | | | $ | 4,455 | |
Other comprehensive loss: | | | | | | | | | | | | | | | | | | | | | | | | | | |
Unrealized loss on available-for-sale securities, net of reclassification adjustment, net of tax benefit of $180 | | | | | | | | | | | | | (348 | ) | | | | | | | (348 | ) | | | (348 | ) |
| | | | | | | | | | | | | | | | | | | | | | | | | | |
Comprehensive income | | | | | | | | | | | | | | | | | | | | | | | | $ | 4,107 | |
| | | | | | | | | | | | | | | | | | | | | | | | | | |
Purchase of treasury stock | | | | | | | | | | | | | | | | | (1,062 | ) | | | (1,062 | ) | | | | |
Exercise of stock options | | | 2 | | | 68 | | | | | | | | | | | | | | | 70 | | | | | |
Cash dividends ($1.01 per share) | | | | | | | | | (1,551 | ) | | | | | | | | | | | (1,551 | ) | | | | |
| | | | | | | | | | | | | | | | | | | | | | | | | | |
Balance, December 31, 2005 | | $ | 776 | | $ | 4,445 | | $ | 27,400 | | | $ | (299 | ) | | $ | (1,062 | ) | | $ | 31,260 | | | | | |
| | | | | | | | | | | | | | | | | | | | | | | | | | |
| | | | | | | | | | | | |
| | | 2005 | | | 2004 | | | 2003 | |
Components of other comprehensive loss: | | | | | | | | | | | | |
Change in net unrealized loss on investment securities available for sale | | $ | (347 | ) | | $ | (422 | ) | | $ | (81 | ) |
Realized gains included in net income, net of taxes of $1, $32, and $ 4 | | | (1 | ) | | | (63 | ) | | | (9 | ) |
| | | | | | | | | | | | |
Total | | $ | (348 | ) | | $ | (485 | ) | | $ | (90 | ) |
| | | | | | | | | | | | |
The accompanying notes are an integral part of these consolidated financial statements.
CONSOLIDATED STATEMENT OF CASH FLOWS
| | | | | | | | | | | | |
| | | Year Ended December 31, | |
| (In thousands) | | 2005 | | | 2004 | | | 2003 | |
Operating Activities | | | | | | | | | | | | |
Net income | | $ | 4,455 | | | $ | 3,906 | | | $ | 3,854 | |
Adjustments to reconcile net income to net cash provided by operating activities: | | | | | | | | | | | | |
Provision for loan losses | | | 850 | | | | 1,126 | | | | 960 | |
Depreciation and amortization | | | 790 | | | | 736 | | | | 576 | |
Amortization of premium and discount on investment securities, net | | | (714 | ) | | | (126 | ) | | | (235 | ) |
Amortization of net deferred loan origination fees | | | (108 | ) | | | (99 | ) | | | (88 | ) |
Investment securities gains | | | (2 | ) | | | (95 | ) | | | (13 | ) |
Origination of loans held for sale | | | (12,430 | ) | | | (12,302 | ) | | | (29,081 | ) |
Proceeds from sale of loans | | | 12,619 | | | | 12,896 | | | | 30,034 | |
Mortgage loans sold gains, net | | | (288 | ) | | | (460 | ) | | | (834 | ) |
Decrease (increase) in accrued interest receivable | | | (274 | ) | | | 189 | | | | (71 | ) |
Increase (decrease) in accrued interest payable | | | 343 | | | | (69 | ) | | | (164 | ) |
Deferred federal income taxes | | | (311 | ) | | | 264 | | | | 6 | |
Increase in cash surrender value | | | (189 | ) | | | (204 | ) | | | (136 | ) |
Other, net | | | 335 | | | | (236 | ) | | | 16 | |
| | | | | | | | | | | | |
Net cash provided by operating activities | | | 5,076 | | | | 5,526 | | | | 4,824 | |
| | | | | | | | | | | | |
Investing Activities | | | | | | | | | | | | |
Investment securities available for sale: | | | | | | | | | | | | |
Proceeds from sales | | | 6 | | | | 174 | | | | 33 | |
Proceeds from maturities or paydown | | | 214,833 | | | | 94,873 | | | | 165,449 | |
Purchases | | | (213,118 | ) | | | (86,868 | ) | | | (152,840 | ) |
Investment securities held to maturity: | | | | | | | | | | | | |
Proceeds from maturities or paydown | | | — | | | | — | | | | 230 | |
Redemption of Federal Home Loan Bank stock | | | 1,021 | | | | 813 | | | | | |
Purchase of Federal Home Loan Bank stock | | | (1,014 | ) | | | (1,236 | ) | | | — | |
Net increase in loans | | | (30,362 | ) | | | (34,901 | ) | | | (32,953 | ) |
Purchase of bank-owned life insurance | | | — | | | | — | | | | (3,000 | ) |
Purchase of premises and equipment | | | (996 | ) | | | (1,887 | ) | | | (560 | ) |
Proceeds from the sale of other real estate | | | — | | | | 500 | | | | 33 | |
| | | | | | | | | | | | |
Net cash used for investing activities | | | (29,630 | ) | | | (28,532 | ) | | | (23,608 | ) |
| | | | | | | | | | | | |
Financing Activities | | | | | | | | | | | | |
Net increase in deposits | | | 24,314 | | | | 8,335 | | | | 22,848 | |
Increase in short-term borrowings | | | 921 | | | | 233 | | | | 2,872 | |
Proceeds from other borrowed funds | | | 5,725 | | | | 10,600 | | | | — | |
Repayment of other borrowed funds | | | (526 | ) | | | (251 | ) | | | (3,000 | ) |
Proceeds from dividend reinvestment plan | | | — | | | | — | | | | 291 | |
Purchase of treasury stock | | | (1,062 | ) | | | — | | | | (114 | ) |
Proceeds from exercise of stock options | | | 70 | | | | 415 | | | | 168 | |
Cash dividends paid | | | (1,543 | ) | | | (1,404 | ) | | | (1,301 | ) |
| | | | | | | | | | | | |
Net cash provided by financing activities | | | 27,899 | | | | 17,928 | | | | 21,764 | |
| | | | | | | | | | | | |
Increase (decrease) in cash and cash equivalents | | | 3,345 | | | | (5,078 | ) | | | 2,980 | |
Cash and cash equivalents at beginning of year | | | 5,132 | | | | 10,210 | | | | 7,230 | |
| | | | | | | | | | | | |
Cash and cash equivalents at end of year | | $ | 8,477 | | | $ | 5,132 | | | $ | 10,210 | |
| | | | | | | | | | | | |
The accompanying notes are an integral part of these consolidated financial statements.
NOTES TO CONSOLIDATED FINANCIAL STATEMENTS
NOTE 1 - SUMMARY OF SIGNIFICANT ACCOUNTING POLICIES
A summary of the significant accounting and reporting policies applied in the presentation of the accompanying financial statements follows:
Nature of Operations and Basis of Presentation
Dimeco, Inc. (the “Company”) is a Pennsylvania company organized as the holding company of The Dime Bank (the “Bank”) and its wholly owned subsidiary, TDB Insurance Services LLC. The Bank is a state-chartered bank and operates from five locations in northeastern Pennsylvania. The Company and its subsidiary derive substantially all of their income from banking and bank-related services that include interest earnings on residential real estate, commercial mortgage, commercial, and consumer financings as well as interest earnings on investment securities. The Company provides deposit services including checking, savings, and certificate of deposit accounts and investment and trust services. The Company is supervised by the Federal Reserve Board, while the Bank is subject to regulation and supervision by the Federal Deposit Insurance Corporation and the Pennsylvania Department of Banking.
The consolidated financial statements of the Company include its wholly owned subsidiary, the Bank. All inter-company items have been eliminated in preparing the consolidated financial statements. The investment in subsidiary on the parent company financial statements is carried at the parent company’s equity in the underlying net assets of the Bank.
The financial statements have been prepared in conformity with U.S. generally accepted accounting principles. In preparing the financial statements, management is required to make estimates and assumptions that affect the reported amounts of assets and liabilities as of the balance sheet date and revenues and expenses for the period. Actual results could differ significantly from those estimates.
Investment Securities
Investment securities are classified at the time of purchase, based on management’s intention and ability, as securities held to maturity or securities available for sale. Debt securities acquired with the intent and ability to hold to maturity are stated at cost adjusted for amortization of premium and accretion of discount, which are computed using the interest method and recognized as adjustments of interest income. Certain other debt and equity securities have been classified as available for sale to serve principally as a source of liquidity. Unrealized holding gains and losses for available-for-sale securities are reported as a separate component of stockholders’ equity, net of tax, until realized. Realized securities gains and losses are computed using the specific identification method. Interest and dividends on investment securities are recognized as income when earned.
Common stock of the Federal Home Loan Bank (“FHLB”) and the Atlantic Central Bankers Bank represents ownership in institutions that are wholly owned by other financial institutions. These securities are accounted for at cost and are classified with other assets.
Mortgage Loans Held for Sale
In general, fixed rate residential mortgage loans originated by the Bank are held for sale and are carried at the aggregate lower of cost or market. Such loans sold are generally serviced by the Bank.
NOTE 1 - SUMMARY OF SIGNIFICANT ACCOUNTING POLICIES (Continued)
Loans
Loans are stated at the principal amount outstanding, net of any unearned income, deferred loan fees, and the allowance for loan losses. Interest on consumer loans is credited to operations over the term of each loan using a method which results in a level yield or the simple interest method. Interest income on mortgage loans is accrued on the amortized balance. Interest income on other loans is accrued on the principal amount outstanding. Loan fees which represent an adjustment to interest yield are deferred and amortized over the life of the loan. Loans on which the accrual of interest has been discontinued are designated as nonaccrual loans. Accrual of interest on loans is generally discontinued when it is determined that a reasonable doubt exists as to the collectibility of additional interest. When a loan is placed on nonaccrual status, unpaid interest is charged against income. Payments received on nonaccrual loans are either applied to principal or reported as interest income according to management’s judgment as to the collectibility of principal. Loans are returned to accrual status when past due interest is collected and the collection of principal is probable.
Allowance for Loan Losses
The allowance for loan losses represents the amount which management estimates is adequate to provide for probable losses inherent in its loan portfolio, as of the balance sheet date. The allowance method is used in providing for loan losses. Accordingly, all loan losses are charged to the allowance, and all recoveries are credited to it. The allowance for loan losses is established through a provision for loan losses charged to operations. The provision for loan losses is based on management’s periodic evaluation of individual loans, economic factors, past loan loss experience, changes in the composition and volume of the portfolio, and other relevant factors. The estimates used in determining the adequacy of the allowance for loan losses, including the amounts and timing of future cash flows expected on impaired loans, are particularly susceptible to changes in the near term.
Impaired loans are commercial and commercial real estate loans for which it is probable that the Company will not be able to collect all amounts due according to the contractual terms of the loan agreement. The Company individually evaluates such loans for impairment and does not aggregate loans by major risk classifications. The definition of “impaired loans” is not the same as the definition of “nonaccrual loans,” although the two categories overlap. The Company may choose to place a loan on nonaccrual status due to payment delinquency or uncertain collectibility, while not classifying the loan as impaired if the loan is not a commercial or commercial real estate loan. Factors considered by management in determining impairment include payment status and collateral value. The amount of impairment for these types of impaired loans is determined by the difference between the present value of the expected cash flows related to the loan, using the original interest rate, and its recorded value, or as a practical expedient in the case of collateralized loans, the difference between the fair value of the collateral and the recorded amount of the loans. When foreclosure is probable, impairment is measured based on the fair value of the collateral.
Mortgage loans on one-to-four family properties and all consumer loans are large groups of smaller-balance homogeneous loans and are measured for impairment collectively. Loans that experience insignificant payment delays, which are defined as 90 days or less, generally are not classified as impaired. Management determines the significance of payment delays on a case-by-case basis taking into consideration all of the circumstances surrounding the loan and the borrower including the length of the delay, the borrower’s prior payment record, and the amount of shortfall in relation to the principal and interest owed.
Premises and Equipment
Premises and equipment are stated at cost less accumulated depreciation. Depreciation is principally computed on the straight-line method over the estimated useful lives of the related assets, which range from 3 to 20 years for furniture and equipment and 5 to 31 years for office buildings and improvements. Leasehold improvements are amortized over the shorter of their estimated useful lives or their respective lease terms, which range from 5 to 20 years. Expenditures for maintenance and repairs are charged against income as incurred. Costs of major additions and improvements are capitalized.
NOTE 1 - SUMMARY OF SIGNIFICANT ACCOUNTING POLICIES (Continued)
Bank-Owned Life Insurance (BOLI)
The Company purchased life insurance policies on certain key employees. BOLI is recorded at its cash surrender value, or the amount that can be realized upon termination of the policies.
Other Real Estate
Real estate acquired by foreclosure is classified on the Consolidated Balance Sheet at the lower of the recorded investment in the property or its fair value minus estimated costs of sale. Prior to foreclosure, the value of the underlying collateral is written down by a charge to the allowance for loan losses, if necessary. Any subsequent write-downs are charged against operating expenses. Operating expenses of such properties, net of related income and losses on their disposition, are included as other expense.
Income Taxes
The Company and the Bank file a consolidated federal income tax return. Deferred tax assets or liabilities are computed based on the difference between the financial statement and the income tax basis of assets and liabilities using the enacted marginal tax rates. Deferred income tax expenses or benefits are based on the changes in the deferred tax asset or liability from period to period.
Earnings Per Share
The Company provides dual presentation of basic and diluted earnings per share. Basic earnings per share are calculated utilizing net income as reported as the numerator and average shares outstanding as the denominator. The computation of diluted earnings per share differs in that the dilutive effects of any options are adjusted for in the denominator.
Stock Options
The Company maintains stock option plans for key officers and nonemployee directors.
The Company accounts for its stock option plan under the provisions of APB Opinion No. 25,Accounting for Stock Issued to Employees, and related interpretations. Under this opinion, no compensation expense has been recognized with respect to the plans because the exercise price of the Company’s employee stock options equals the market price of the underlying stock on the grant date.
NOTE 1 - SUMMARY OF SIGNIFICANT ACCOUNTING POLICIES (Continued)
Stock Options (Continued)
Had compensation expense for the stock option plans been recognized in accordance with the fair value accounting provisions of Statement of Financial Accounting Standards No. 123,Accounting for Stock-Based Compensation,net income applicable to common stock and basic and diluted net income per common share for the years ended December 31 would have been as follows (in thousands, except per share data):
| | | | | | | | | |
| | | 2005 | | 2004 | | 2003 |
Net income as reported | | $ | 4,455 | | $ | 3,906 | | $ | 3,854 |
Less pro forma expense related to options | | | 155 | | | 18 | | | 38 |
| | | | | | | | | |
Pro forma net income | | $ | 4,300 | | $ | 3,888 | | $ | 3,816 |
| | | | | | | | | |
Basic net income per common share: | | | | | | | | | |
As reported | | $ | 2.89 | | $ | 2.54 | | $ | 2.54 |
Pro forma | | $ | 2.79 | | $ | 2.53 | | $ | 2.52 |
Diluted net income per common share: | | | | | | | | | |
As reported | | $ | 2.80 | | $ | 2.46 | | $ | 2.45 |
Pro forma | | $ | 2.70 | | $ | 2.45 | | $ | 2.42 |
For purposes of computing pro forma results, the Company estimated fair values of stock options using the Black-Scholes option-pricing model. The model requires use of subjective assumptions that can materially affect fair value estimates. Therefore, the pro forma results are estimates of results of operations as if compensation expense had been recognized for the stock option plans. The fair value of each stock option granted was estimated using the following weighted-average assumptions for grants in 2005, 2004, and 2003, respectively: (1) expected dividend yields of 2.85 percent, 2.44 percent, and 2.53 percent; (2) risk-free interest rates of 4.19 percent, 4.22 percent, and 3.91 percent; (3) expected volatility of 22 percent, 17 percent, and 25 percent; and (4) expected lives of options of 5.0 years, 9.9 years, and 6.6 years.
Mortgage Servicing Rights (“MSRs”)
The Company has agreements for the express purpose of selling loans in the secondary market. The Company maintains servicing rights for most of these loans. Originated MSRs are recorded by allocating total costs incurred between the loan and servicing rights based on their relative fair values. MSRs are amortized in proportion to the estimated servicing income over the estimated life of the servicing portfolio. MSRs are a component of other assets on the Consolidated Balance Sheet.
Comprehensive Income
The Company is required to present comprehensive income in a full set of general-purpose financial statements for all periods presented. Other comprehensive income is composed of unrealized holding gains (losses) on the available-for-sale securities portfolio. The Company has elected to report the effects of other comprehensive income as part of the Consolidated Statement of Changes in Stockholders’ Equity.
NOTE 1 - SUMMARY OF SIGNIFICANT ACCOUNTING POLICIES (Continued)
Cash Flows
The Company has defined cash and cash equivalents as cash and due from banks, interest-bearing deposits in other banks, and federal funds sold that have original maturities of 90 days or less.
Amounts paid for interest and income taxes are as follows (in thousands):
| | | | | | |
| | | Interest
Paid | | Federal
Income Taxes
Paid |
Year Ended December 31, | | | | | | |
2005 | | $ | 5,775 | | $ | 2,125 |
2004 | | $ | 4,481 | | $ | 1,527 |
2003 | | $ | 4,863 | | $ | 1,973 |
Recent Accounting Pronouncements
In December 2004, the Financial Accounting Standards Board (“FASB”) issued Statement of Financial Accounting Standards No. 123 (revised 2004),Share-Based Payment (“FAS No. 123R”). FAS No. 123R revised FAS No. 123,Accounting for Stock-Based Compensation, and supersedes APB Opinion No. 25,Accounting for Stock Issued to Employees, and its related implementation guidance. FAS No. 123R will require compensation costs related to share-based payment transactions to be recognized in the financial statement (with limited exceptions). The amount of compensation cost will be measured based on the grant-date fair value of the equity or liability instruments issued. Compensation cost will be recognized over the period during which an employee provides service in exchange for the award.
In April 2005, the Securities and Exchange Commission adopted a new rule that amends the compliance dates for FAS No. 123R. The statement requires that compensation cost relating to share-based payment transactions be recognized in financial statements and that this cost be measured based on the fair value of the equity or liability instruments issued. FAS No. 123R covers a wide range of share-based compensation arrangements, including share options, restricted share plans, performance-based awards, share appreciation rights, and employee share purchase plans. The Company will adopt FAS No. 123R on January 1, 2006. Management has determined that unless additional options are granted, there will be no impact on future earnings.
In March 2005, the Securities and Exchange Commission (“SEC”) issued Staff Accounting Bulletin No. 107 (“SAB No. 107”),Share-Based Payment, providing guidance on option valuation methods, the accounting for income tax effects of share-based payment arrangements upon adoption of FAS No. 123R, and the disclosures in Management’s Discussion and Analysis (“MD&A”) subsequent to the adoption. The Company will provide SAB No. 107 required disclosures upon adoption of FAS No. 123R on January 1, 2006, and is currently evaluating the impact the adoption of the standard will have on the Company’s financial condition, results of operations, and cash flows.
NOTE 1 - SUMMARY OF SIGNIFICANT ACCOUNTING POLICIES (Continued)
Recent Accounting Pronouncements (Continued)
In December 2004, FASB issued FAS No. 153,Exchanges of Nonmonetary Assets – An Amendment of APB Opinion No. 29. The guidance in APB Opinion No. 29,Accounting for Nonmonetary Transactions, is based on the principle that exchanges of nonmonetary assets should be measured based on the fair value of the assets exchanged. The guidance in that opinion, however, included certain exceptions to that principle. FAS No. 153 amends Opinion No. 29 to eliminate the exception for nonmonetary exchanges of similar productive assets and replaces it with a general exception for exchanges of nonmonetary assets that do not have commercial substance. A nonmonetary exchange has commercial substance if the future cash flows of the entity are expected to change significantly as a result of the exchange. The provisions of FAS No. 153 are effective for nonmonetary asset exchanges occurring in fiscal periods beginning after June 15, 2005. Early application is permitted and companies must apply the standard prospectively. The adoption of this standard is not expected to have a material effect on the Company’s results of operations or financial position.
In June 2005, the FASB issued FAS No. 154,Accounting Changes and Errors Corrections, a replacement of APB Opinion No. 20 and FAS No. 3. The statement applies to all voluntary changes in accounting principle, and changes the requirements for accounting for and reporting of a change in accounting principle. FAS No. 154 requires retrospective application to prior periods’ financial statements of a voluntary change in accounting principle unless it is impractical. APB Opinion No. 20 previously required that most voluntary changes in accounting principle be recognized by including in net income of the period of the change the cumulative effect of changing to the new accounting principle. FAS No.154 improves the financial reporting because its requirements enhance the consistency of financial reporting between periods.
Reclassification of Comparative Amounts
Certain comparative amounts for prior years have been reclassified to conform to current-year presentations. The reclassified amounts did not affect net income or stockholders’ equity.
NOTE 2 - EARNINGS PER SHARE
There are no convertible securities that would affect the numerator in calculating basic and diluted earnings per share; therefore, net income as presented on the Consolidated Statement of Income will be used as the numerator. The following table sets forth the composition of the weighted-average common shares (denominator) used in the basic and diluted earnings per share computation.
| | | | | | | | |
| | | 2005 | | | 2004 | | 2003 | |
Weighted-average common shares outstanding | | 1,550,616 | | | 1,537,511 | | 1,515,596 | |
Average treasury stock shares | | (9,874 | ) | | — | | (579 | ) |
| | | | | | | | |
Weighted-average common shares and common stock equivalents used to calculate basic earnings per share | | 1,540,742 | | | 1,537,511 | | 1,515,017 | |
Additional common stock equivalents (stock options) used to calculate diluted earnings per share | | 51,325 | | | 48,072 | | 59,578 | |
| | | | | | | | |
Weighted-average common shares and common stock equivalents used to calculate diluted earnings per share | | 1,592,067 | | | 1,585,583 | | 1,574,595 | |
| | | | | | | | |
NOTE 3 - STOCK DIVIDEND
On November 6, 2003, the Board of Directors approved a 100 percent stock split effected in the form of a dividend, payable December 1, 2003, to stockholders of record on November 14, 2003. Average shares outstanding and all per share amounts included in the consolidated financial statements are based on the increased number of shares giving retroactive effect to the stock split effected in the form of a dividend.
NOTE 4 - INVESTMENT SECURITIES
The amortized costs and estimated market value of investment securities are summarized as follows (in thousands):
| | | | | | | | | | | | | |
| | | 2005 |
| | | Amortized
Cost | | Gross
Unrealized
Gains | | Gross
Unrealized
Losses | | | Estimated
Market
Value |
AVAILABLE FOR SALE | | | | | | | | | | | | | |
U.S. government agencies | | $ | 22,968 | | $ | — | | $ | (395 | ) | | $ | 22,573 |
Mortgage-backed securities | | | 1,977 | | | — | | | (63 | ) | | | 1,914 |
Obligations of states and political subdivisions: | | | | | | | | | | | | | |
Taxable | | | 1,697 | | | — | | | (10 | ) | | | 1,687 |
Tax-exempt | | | 4,515 | | | 34 | | | (11 | ) | | | 4,538 |
Corporate securities | | | 1,244 | | | — | | | (73 | ) | | | 1,171 |
Commercial paper | | | 21,971 | | | — | | | — | | | | 21,971 |
| | | | | | | | | | | | | |
Total debt securities | | | 54,372 | | | 34 | | | (552 | ) | | | 53,854 |
Equity securities | | | 209 | | | 71 | | | (5 | ) | | | 275 |
| | | | | | | | | | | | | |
Total | | $ | 54,581 | | $ | 105 | | $ | (557 | ) | | $ | 54,129 |
| | | | | | | | | | | | | |
| |
| | | 2004 |
| | | Amortized
Cost | | Gross
Unrealized
Gains | | Gross
Unrealized
Losses | | | Estimated
Market
Value |
AVAILABLE FOR SALE | | | | | | | | | | | | | |
U.S. government agencies | | $ | 18,461 | | $ | 3 | | $ | (161 | ) | | $ | 18,303 |
Mortgage-backed securities | | | 93 | | | — | | | (1 | ) | | | 92 |
Obligations of states and political subdivisions: | | | | | | | | | | | | | |
Taxable | | | 1,761 | | | — | | | (9 | ) | | | 1,752 |
Tax-exempt | | | 3,408 | | | 68 | | | (4 | ) | | | 3,472 |
Corporate securities | | | 6,192 | | | 102 | | | — | | | | 6,294 |
Commercial paper | | | 25,459 | | | — | | | — | | | | 25,459 |
| | | | | | | | | | | | | |
Total debt securities | | | 55,374 | | | 173 | | | (175 | ) | | | 55,372 |
Equity securities | | | 214 | | | 77 | | | (1 | ) | | | 290 |
| | | | | | | | | | | | | |
Total | | $ | 55,588 | | $ | 250 | | $ | (176 | ) | | $ | 55,662 |
| | | | | | | | | | | | | |
NOTE 4 - INVESTMENT SECURITIES (Continued)
| | | | | | | | | | | | |
| | | 2005 |
| | | Amortized
Cost | | Gross
Unrealized
Gains | | Gross
Unrealized
Losses | | Estimated
Market
Value |
HELD TO MATURITY | | | | | | | | | | | | |
Obligations of states and political subdivisions - tax-exempt | | $ | 199 | | $ | 8 | | $ | — | | $ | 207 |
| | | | | | | | | | | | |
| |
| | | 2004 |
| | | Amortized
Cost | | Gross
Unrealized
Gains | | Gross
Unrealized
Losses | | Estimated
Market
Value |
HELD TO MATURITY | | | | | | | | | | | | |
Obligations of states and political subdivisions - tax-exempt | | $ | 198 | | $ | 18 | | $ | — | | $ | 216 |
| | | | | | | | | | | | |
The following table shows the Company’s fair value and gross unrealized losses, aggregated by investment category and length of time that the individual securities have been in a continuous unrealized loss position as follows (in thousands):
| | | | | | | | | | | | | | | | | | |
| | | 2005 |
| | | Less than Twelve Months | | Twelve Months or Greater | | Total |
| | | Estimated
Market
Value | | Gross
Unrealized
Losses | | Estimated
Market
Value | | Gross
Unrealized
Losses | | Estimated
Market
Value | | Gross
Unrealized
Losses |
U.S. government agencies | | $ | 8,907 | | $ | 76 | | $ | 13,666 | | $ | 319 | | $ | 22,573 | | $ | 395 |
Mortgage-backed securities | | | 1,914 | | | 63 | | | — | | | — | | | 1,914 | | | 63 |
Obligations of states and political subdivisions | | | 1,457 | | | 9 | | | 390 | | | 12 | | | 1,847 | | | 21 |
Corporate securities | | | 1,171 | | | 73 | | | — | | | — | | | 1,171 | | | 73 |
| | | | | | | | | | | | | | | | | | |
Total debt securities | | | 13,449 | | | 221 | | | 14,056 | | | 331 | | | 27,505 | | | 552 |
Equity securities | | | 18 | | | 5 | | | — | | | — | | | 18 | | | 5 |
| | | | | | | | | | | | | | | | | | |
Total | | $ | 13,467 | | $ | 226 | | $ | 14,056 | | $ | 331 | | $ | 27,523 | | $ | 557 |
| | | | | | | | | | | | | | | | | | |
| | | | | | | | | | | | | | | | | | |
| | | 2004 |
| | | Less than Twelve Months | | Twelve Months or Greater | | Total |
| | | Estimated
Market
Value | | Gross
Unrealized
Losses | | Estimated
Market
Value | | Gross
Unrealized
Losses | | Estimated
Market
Value | | Gross
Unrealized
Losses |
U.S. government agencies | | $ | 14,811 | | $ | 161 | | $ | — | | $ | — | | $ | 14,811 | | $ | 161 |
Mortgage-backed securities | | | 70 | | | 1 | | | — | | | — | | | 70 | | | 1 |
Obligations of states and political subdivisions | | | 401 | | | 10 | | | 262 | | | 3 | | | 663 | | | 13 |
| | | | | | | | | | | | | | | | | | |
Total debt securities | | | 15,282 | | | 172 | | | 262 | | | 3 | | | 15,544 | | | 175 |
Equity securities | | | 21 | | | 1 | | | — | | | — | | | 21 | | | 1 |
| | | | | | | | | | | | | | | | | | |
Total | | $ | 15,303 | | $ | 173 | | $ | 262 | | $ | 3 | | $ | 15,565 | | $ | 176 |
| | | | | | | | | | | | | | | | | | |
The policy of the Company is to recognize an other-than-temporary impairment of equity securities where the fair value has been significantly below cost for three consecutive quarters. For fixed maturity investments with unrealized losses due to interest rates where the Company has the positive intent and ability to hold the investment for a period of time sufficient to allow a market recovery, declines in value below cost are not assumed to be other than temporary. There are 41 positions that are temporarily impaired at December 31, 2005. The aggregate carrying amount of those investments at December 31, 2005, was $27,523. The Company reviews its position quarterly and has asserted that at December 31, 2005, the declines outlined in the above table represent temporary declines and the Company does have the intent and ability either to hold those securities to maturity or to allow a market recovery.
The Company has concluded that any impairment of its investment securities portfolio is not other than temporary but is the result of interest rate changes, sector credit changes, or Company-specific rating changes that are not expected to result in the noncollection of principal and interest during the period.
The amortized cost and estimated market values of debt securities at December 31, 2005, by contractual maturity, are shown below. Expected maturities of mortgage-backed securities will differ from contractual maturities because borrowers may have the right to call or prepay obligations with or without call or prepayment penalties (in thousands):
| | | | | | | | | | | | |
| | | Available for Sale | | Held to Maturity |
| | | Amortized
Cost | | Estimated
Market
Value | | Amortized
Cost | | Estimated
Market
Value |
Due in one year or less | | $ | 24,970 | | $ | 24,959 | | $ | 199 | | $ | 207 |
Due after one year through five years | | | 10,569 | | | 10,377 | | | — | | | — |
Due after five years through ten years | | | 7,328 | | | 7,151 | | | — | | | — |
Due after ten years | | | 11,505 | | | 11,367 | | | — | | | — |
| | | | | | | | | | | | |
Total debt securities | | $ | 54,372 | | $ | 53,854 | | $ | 199 | | $ | 207 |
| | | | | | | | | | | | |
Proceeds from sales of investment securities during 2005, 2004, and 2003 were $6, $174, and $33, respectively, and the resulting gross and net gains of $2, $68, and $13 were realized. In 2004, the Company recorded an investment security gain of $27 resulting from a business combination where the Company received a combination of the common stock of the acquirer in a non-monetary exchange and cash proceeds of $73.
NOTE 4 - INVESTMENT SECURITIES (Continued)
Investment securities with an amortized cost of $50,398 and $45,892 and estimated market value of $49,914 and $45,909 at December 31, 2005 and 2004, respectively, were pledged to secure deposits, short-term borrowings, and for other purposes as required by law.
NOTE 5 - LOANS
Major classifications of loans are as follows (in thousands):
| | | | | | |
| | | 2005 | | 2004 |
Loans secured by real estate: | | | | | | |
Construction and development | | $ | 3,771 | | $ | 662 |
Secured by farmland | | | 1,879 | | | 1,786 |
Secured by 1 - 4 family residential properties: | | | | | | |
Revolving, open-end loans secured by 1 - 4 family residential properties | | | 2,535 | | | 1,820 |
All other loans secured by 1 - 4 family residential properties | | | 54,682 | | | 53,026 |
Secured by nonfarm, nonresidential properties | | | 157,076 | | | 133,259 |
Commercial and industrial loans | | | 41,351 | | | 41,848 |
Loans to individuals for household, family, and other personal expenditures: | | | | | | |
Ready credit loans | | | 876 | | | 451 |
Other installment loans | | | 17,686 | | | 17,632 |
Other loans: | | | | | | |
Agricultural loans | | | 863 | | | 606 |
All other loans | | | 3,577 | | | 2,674 |
| | | | | | |
Total loans | | | 284,296 | | | 253,764 |
Less unearned income | | | 734 | | | 623 |
| | | | | | |
Loans, net of unearned income | | $ | 283,562 | | $ | 253,141 |
| | | | | | |
Real estate loans serviced for others which are not included in the Consolidated Balance Sheet totaled $83,391 and $77,542 at December 31, 2005 and 2004, respectively.
Nonperforming loans consist of commercial, mortgage, and consumer loans which are on a nonaccrual basis or contractually past due 90 days or more as to interest or principal payment but are not on nonaccrual status because they are well secured or in process of collection or identified by management to meet the definition of an impaired loan. The following table presents information concerning nonperforming loans (in thousands):
| | | | | | |
| | | 2005 | | 2004 |
Ninety days or more past due and accruing interest | | $ | 279 | | $ | 293 |
Nonaccrual | | | 526 | | | 261 |
Impaired loans | | | — | | | 461 |
| | | | | | |
Total nonperforming loans | | $ | 805 | | $ | 1,015 |
| | | | | | |
Interest income on loans would have been increased by $12, $5, and $57 during 2005, 2004, and 2003, respectively, if nonaccrual loans had performed in accordance with their original terms.
NOTE 5 - LOANS (Continued)
The Company had no impaired loans as of December 31, 2005. Impaired loans as of December 31, 2004, were $461 with a related allowance for loan losses of $14. For the years ended December 31, 2005, 2004, and 2003, average impaired loans were $213, $473, and $2,575, respectively. Interest recognized on impaired loans for the years ended December 31, 2005, 2004, and 2003, was $113, $28, and $66, respectively.
Changes in the allowance for loan losses are as follows (in thousands):
| | | | | | | | | | | | |
| | | 2005 | | | 2004 | | | 2003 | |
Balance, beginning of year | | $ | 3,172 | | | $ | 3,014 | | | $ | 2,818 | |
Provision charged to operations | | | 850 | | | | 1,126 | | | | 960 | |
Recoveries credited to allowance | | | 257 | | | | 150 | | | | 58 | |
Losses charged to allowance | | | (306 | ) | | | (1,118 | ) | | | (822 | ) |
| | | | | | | | | | | | |
Balance, end of year | | $ | 3,973 | | | $ | 3,172 | | | $ | 3,014 | |
| | | | | | | | | | | | |
In the normal course of business, loans are extended to officers and directors and corporations in which they are beneficially interested as stockholders, officers, or directors. A summary of loan activity for those officers and directors with aggregate loan balances in excess of $60,000 for the year ended December 31, 2005, is as follows (in thousands):
| | | | | | | | | |
| 2004 | | Additions | | Amounts
Collected | | 2005 |
| $7,569 | | $ | 3,317 | | $ | 3,170 | | $ | 7,716 |
The Company’s primary business activity is with customers located within its local trade area. Generally, the Company grants commercial, residential, and personal loans. The Company also selectively funds and purchases commercial and residential loans outside of its local trade area provided such loans meet the Company’s credit policy guidelines. At December 31, 2005 and 2004, the Company had approximately $57 million and $49 million, respectively, of outstanding loans to summer camps and recreational facilities in the northeastern United States. Although the Company has a diversified loan portfolio at December 31, 2005 and 2004, loans outstanding to individuals and businesses are dependent upon the local economic conditions in its immediate trade area.
NOTE 6 - PREMISES AND EQUIPMENT
A summary by asset classification is as follows (in thousands):
| | | | | | |
| | | 2005 | | 2004 |
Land | | $ | 814 | | $ | 584 |
Premises and improvements | | | 5,354 | | | 4,983 |
Furniture and equipment | | | 3,267 | | | 3,216 |
Leasehold improvements | | | 1,526 | | | 1,421 |
| | | | | | |
Total, at cost | | | 10,961 | | | 10,204 |
Less accumulated depreciation | | | 4,939 | | | 4,624 |
| | | | | | |
Net premises and equipment | | $ | 6,022 | | $ | 5,580 |
| | | | | | |
Depreciation and amortization expense was $554, $486, and $463, in 2005, 2004, and 2003, respectively.
NOTE 7 - DEPOSITS
Deposits are summarized as follows (in thousands):
| | | | | | |
| | | 2005 | | 2004 |
Demand - non-interest-bearing | | $ | 36,619 | | $ | 30,380 |
Demand - interest-bearing | | | 37,251 | | | 39,141 |
Money market | | | 26,464 | | | 31,536 |
Savings | | | 39,563 | | | 41,725 |
Time deposits of $100,000 or more | | | 54,462 | | | 40,406 |
Other time deposits | | | 100,497 | | | 87,354 |
| | | | | | |
Total | | $ | 294,856 | | $ | 270,542 |
| | | | | | |
The following table summarizes the maturity distribution of time deposits (in thousands):
| | | |
2006 | | $ | 98,680 |
2007 | | | 15,788 |
2008 | | | 26,325 |
2009 | | | 4,150 |
2010 | | | 10,016 |
| | | |
Total | | $ | 154,959 |
| | | |
The following table summarizes the maturity distribution of certificates of deposit of $100,000 or more (in thousands):
| | | |
| | | 2005 |
Three months or less | | $ | 14,497 |
Four through six months | | | 17,174 |
Seven through twelve months | | | 8,696 |
Over twelve months | | | 14,095 |
| | | |
Total | | $ | 54,462 |
| | | |
Interest expense on certificates of deposit of $100,000 or more amounted to $1,434, $946, and $1,081, for the years ended December 31, 2005, 2004, and 2003, respectively.
NOTE 8 - SHORT-TERM BORROWINGS
Short-term borrowings consist of borrowings from the FHLB of Pittsburgh and securities sold under agreements to repurchase. Average amounts outstanding during the year represent daily average balances, and average interest rates represent interest expense divided by the related average balance.
NOTE 8 - SHORT-TERM BORROWINGS (Continued)
The outstanding balances and related information for short-term borrowings are summarized as follows (in thousands):
| | | | | | | | | | | | |
| | | 2005 | | | 2004 | |
| | | Amount | | Rate | | | Amount | | Rate | |
Balance at year-end | | $ | 12,954 | | 2.97 | % | | $ | 12,033 | | 1.22 | % |
Average balance outstanding during the year | | $ | 14,855 | | 1.40 | % | | $ | 13,142 | | 0.98 | % |
Maximum amount outstanding at any month-end | | $ | 20,204 | | | | | $ | 16,087 | | | |
The Bank has pledged, as collateral for the borrowings from the FHLB, all stock in the FHLB and certain other qualifying collateral. Investment securities with amortized costs of $16,157 and $21,132 and market values of $16,121 and $21,148, respectively, at December 31, 2005 and 2004, were pledged as collateral for the securities sold under agreements to repurchase.
The Bank has the capability to borrow additional funds through its credit arrangement with the FHLB. The FHLB borrowings are subject to annual renewal, incur no service charges, and are secured by a blanket security agreement on certain investment securities, qualifying residential mortgages, and the Bank’s investment in FHLB stock. At December 31, 2005, the Bank’s remaining borrowing capacity with the FHLB was approximately $54 million.
NOTE 9 - OTHER BORROWED FUNDS
FHLB advances consist of separate fixed rate and convertible select-fixed to float rate loans as follows (in thousands):
| | | | | | | | | |
Maturity | | Rate | | | 2005 | | 2004 |
June 28, 2006 | | 3.31 | % | | $ | 2,000 | | $ | 2,000 |
June 28, 2007 | | 3.78 | % | | | 2,000 | | | 2,000 |
February 18, 2010 | | 5.91 | % | | | 1,000 | | | 1,000 |
May 5, 2014 | | 4.52 | % | | | 1,740 | | | 1,906 |
June 3, 2015 | | 4.04 | % | | | 1,439 | | | — |
August 4, 2015 | | 4.81 | % | | | 1,461 | | | — |
March 11, 2016 | | 3.47 | % | | | 2,636 | | | 2,847 |
December 9, 2019 | | 4.91 | % | | | 1,500 | | | — |
November 25, 2024 | | 4.87 | % | | | 1,547 | | | 1,596 |
December 16, 2025 | | 5.17 | % | | | 1,225 | | | — |
| | | | | | | | | |
Total | | | | | $ | 16,548 | | $ | 11,349 |
| | | | | | | | | |
The advance maturing in 2010 is convertible to a variable rate advance on specific dates at the discretion of the FHLB. Should the FHLB convert this advance, the Bank has the option of accepting the variable rate or repaying the advance without penalty.
NOTE 10 - DIVIDEND REINVESTMENT AND STOCK PURCHASE PLAN
The Company maintains a Dividend Reinvestment and Stock Purchase Plan (the “Plan”). Participation is available to all common stockholders. The Plan provides each participant with a simple and convenient method of purchasing additional common shares without payment of any brokerage commission or other service fees.
A participant in the Plan may elect to reinvest dividends on all or part of his or her shares to acquire additional common stock. A participant may withdraw from the Plan at any time. Stockholders purchased 15,665 shares in 2005 and 12,848 shares in 2004 through the Plan.
NOTE 11 - EMPLOYEE BENEFITS
Retirement Plan
The Bank maintains a section 401(k) employee savings and investment plan for substantially all employees and officers of the Bank. The Bank’s contribution to the plan is based on 100 percent matching of voluntary contributions up to 3 percent and 50 percent matching on the next 2 percent of individual compensation. Additionally, the Bank may contribute a discretionary amount each year. For each of the years of 2005, 2004, and 2003, the Board of Directors authorized an additional 4 percent, 4 percent, and 5 percent, respectively, of each eligible employee’s compensation. Employee contributions are vested at all times, and Bank contributions are fully vested after five years. Contributions for 2005, 2004, and 2003 to this plan amounted to $207, $199, and $182, respectively.
Supplemental Retirement Plan
The Bank maintains a Salary Continuation Plan for the executive officers of the Bank to provide guaranteed consecutive postretirement payments totaling a predetermined amount over a ten-year period based on a five-year vesting schedule beginning the date of the agreement between the Bank and the executive. Expenses for the years ended December 31, 2005, 2004, and 2003, amounted to $61, $76, and $70, respectively, and are included as a component of salaries and employee benefits.
Stock Option Plan
The Company maintains a stock incentive plan and a stock option plan that provide for granting incentive stock options to key officers and other employees of the Company and Bank, as determined by the Stock Option Committee, and nonqualified stock options to nonemployee directors of the Company. A total of 120,000 and 50,000 shares, respectively, of either authorized and unissued shares or authorized shares issued by and subsequently reacquired by the Company as treasury stock shall be issuable under the plans. The plans shall terminate after the tenth anniversary of the date of shareholder ratification. The per share exercise price of any option granted will not be less than the fair market value of a share of common stock on the date the option is granted. The options granted prior to 2005 are primarily vested 33 percent after one year, 33 percent after two years, and 34 percent after three years. In 2005, options were granted with an immediate vesting schedule. The remaining unvested options granted in the previous years were accelerated whereby all options granted since inception are fully vested.
NOTE 11 - EMPLOYEE BENEFITS (Continued)
Stock Option Plan (Continued)
The following table presents share data related to the stock option plans:
| | | | | | | | | | | | |
| | | 2005 | | | Weighted-
Average
Exercise Price | | 2004 | | | Weighted-
Average
Exercise Price |
Outstanding, beginning | | 99,670 | | | $ | 14.77 | | 121,530 | | | $ | 14.39 |
Granted | | 31,996 | | | | 35.22 | | 1,000 | | | | 35.00 |
Exercised | | (3,675 | ) | | | 13.05 | | (22,860 | ) | | | 13.64 |
Forfeited | | — | | | | — | | — | | | | — |
| | | | | | | | | | | | |
Outstanding, ending | | 127,991 | | | $ | 19.93 | | 99,670 | | | $ | 14.77 |
| | | | | | | | | | | | |
Exercisable at year-end | | 127,991 | | | $ | 19.93 | | 92,620 | | | $ | 13.83 |
| | | | | | | | | | | | |
The following table summarizes characteristics of stock options outstanding at December 31, 2005:
| | | | | | | | | | | | | |
| | | Outstanding | | Exercisable |
| Exercise Price | | Shares | | Average Remaining
Life | | Average Exercise Price | | Shares | | Average Exercise Price |
| $ | 13.00 | | 25,500 | | 4.21 | | $ | 13.00 | | 25,500 | | $ | 13.00 |
| $ | 13.25 | | 54,155 | | 4.21 | | $ | 13.25 | | 54,155 | | $ | 13.25 |
| $ | 16.50 | | 5,000 | | 4.21 | | $ | 16.50 | | 5,000 | | $ | 16.50 |
| $ | 21.30 | | 4,000 | | 4.21 | | $ | 21.30 | | 4,000 | | $ | 21.30 |
| $ | 23.00 | | 2,000 | | 4.21 | | $ | 23.00 | | 2,000 | | $ | 23.00 |
| $ | 25.75 | | 1,340 | | 4.21 | | $ | 25.75 | | 1,340 | | $ | 25.75 |
| $ | 26.50 | | 1,000 | | 4.21 | | $ | 26.50 | | 1,000 | | $ | 26.50 |
| $ | 32.55 | | 2,000 | | 7.86 | | $ | 32.55 | | 2,000 | | $ | 32.55 |
| $ | 34.00 | | 11,996 | | 9.96 | | $ | 34.00 | | 11,996 | | $ | 34.00 |
| $ | 35.00 | | 1,000 | | 8.85 | | $ | 35.00 | | 1,000 | | $ | 35.00 |
| $ | 35.95 | | 20,000 | | 9.73 | | $ | 35.95 | | 20,000 | | $ | 35.95 |
| | | | | | | | | | | | | |
| | | 127,991 | | | | | | | 127,991 | | | |
| | | | | | | | | | | | | |
NOTE 12 - INCOME TAXES
Federal income tax expense consists of the following (in thousands):
| | | | | | | | | | |
| | | 2005 | | | 2004 | | 2003 |
Currently payable | | $ | 2,393 | | | $ | 1,508 | | $ | 1,694 |
Deferred taxes | | | (311 | ) | | | 264 | | | 6 |
| | | | | | | | | | |
Total provision | | $ | 2,082 | | | $ | 1,772 | | $ | 1,700 |
| | | | | | | | | | |
NOTE 12 - INCOME TAXES (Continued)
The components of the net deferred tax assets and liabilities at December 31 are as follows (in thousands):
| | | | | | |
| | | 2005 | | 2004 |
Deferred tax assets: | | | | | | |
Allowance for loan losses | | $ | 1,093 | | $ | 804 |
Deferred compensation | | | 1 | | | 3 |
Salary continuation plan | | | 168 | | | 165 |
Mortgage servicing rights | | | 20 | | | — |
Unrealized loss on investment securities | | | 154 | | | — |
| | | | | | |
Total | | | 1,436 | | | 972 |
| | | | | | |
Deferred tax liabilities: | | | | | | |
Premises and equipment | | | 574 | | | 574 |
Deferred loan origination fees, net | | | 171 | | | 172 |
Unrealized gain on nonmonetary exchange | | | 9 | | | 9 |
Unrealized gain on investment securities | | | — | | | 25 |
| | | | | | |
Total | | | 754 | | | 780 |
| | | | | | |
Net deferred tax assets | | $ | 682 | | $ | 192 |
| | | | | | |
No valuation allowance was established at December 31, 2005 and 2004, in view of the Company’s ability to carryback taxes paid in previous years and certain tax strategies and anticipated future taxable income as evidenced by the Company’s earnings potential.
A reconciliation between the expected statutory income tax rate and the effective income tax rate follows (in thousands):
| | | | | | | | | | | | | | | | | | | | | |
| | | 2005 | | | 2004 | | | 2003 | |
| | | Amount | | | % of
Pretax
Income | | | Amount | | | % of
Pretax
Income | | | Amount | | | % of
Pretax
Income | |
Provision at statutory rate | | $ | 2,222 | | | 34.0 | % | | $ | 1,930 | | | 34.0 | % | | $ | 1,888 | | | 34.0 | % |
Tax-exempt income | | | (93 | ) | | (1.4 | ) | | | (100 | ) | | (1.8 | ) | | | (112 | ) | | (2.0 | ) |
BOLI earnings | | | (76 | ) | | (1.2 | ) | | | (78 | ) | | (1.4 | ) | | | (52 | ) | | (0.9 | ) |
Nondeductible interest | | | 8 | | | 0.1 | | | | 6 | | | 0.1 | | | | 8 | | | 0.1 | |
Other, net | | | 21 | | | 0.3 | | | | 14 | | | 0.3 | | | | (32 | ) | | (0.6 | ) |
| | | | | | | | | | | | | | | | | | | | | |
Effective income tax and rate | | $ | 2,082 | | | 31.8 | % | | $ | 1,772 | | | 31.2 | % | | $ | 1,700 | | | 30.6 | % |
| | | | | | | | | | | | | | | | | | | | | |
NOTE 13 - COMMITMENTS AND CONTINGENT LIABILITIES
Commitments
In the normal course of business, there are outstanding commitments and contingent liabilities such as commitments to extend credit, financial guarantees, and letters of credit that are not reflected in the accompanying consolidated financial statements. The Company does not anticipate any losses as a result of these transactions. These instruments involve, to varying degrees, elements of credit and interest rate risk in excess of the amount recognized in the Consolidated Balance Sheet. The contract or notional amounts of those instruments reflect the extent of involvement the Company has in the particular classes of financial instruments.
Financial instruments whose contract amounts represent credit risk are as follows (in thousands):
| | | | | | |
| | | 2005 | | 2004 |
Commitments to extend credit | | $ | 42,481 | | $ | 31,957 |
Standby letters of credit | | $ | 3,216 | | $ | 2,012 |
Commitments to extend credit are agreements to lend to a customer as long as there is no violation of any condition established in the contract. Commitments generally have fixed expiration dates or other termination clauses and may require payment of a fee. Since many of the commitments are expected to expire without being drawn upon, the total commitment amounts do not necessarily represent future cash requirements.
Standby letters of credit represent conditional commitments issued by the Company to guarantee the performance of a customer to a third party. These instruments are issued primarily to support bid or performance-related contracts. The coverage period for these instruments is typically a one-year period with an annual renewal option subject to prior approval by management. Fees earned from the issuance of these letters are recognized at the expiration of the coverage period. For secured letters of credit, the collateral is typically Bank deposit instruments.
At December 31, 2005, the minimum rental commitments for all noncancelable leases are as follows (in thousands):
| | | |
2006 | | $ | 256 |
2007 | | | 229 |
2008 | | | 143 |
2009 | | | 48 |
2010 | | | 44 |
2011 and thereafter | | | 199 |
| | | |
Total | | $ | 919 |
| | | |
Contingent Liabilities
The Company and its subsidiary are involved in various legal actions from the normal course of business activities. Management believes the liability, if any, arising from such actions will not have a material adverse effect on the Company’s financial position.
NOTE 14 - REGULATORY RESTRICTIONS
Cash and Due From Banks
The district Federal Reserve Bank requires the Bank to maintain certain average reserve balances. As of each of the years ended December 31, 2005 and 2004, the Bank had required reserves of $225, composed of vault cash and a depository amount held directly with the Federal Reserve Bank.
Dividends
The Pennsylvania Banking Code restricts the availability of capital funds for payment of dividends by all state-chartered banks to the surplus of the Bank. Accordingly, at December 31, 2005, the balance in the capital surplus account totaling approximately $1,756 is unavailable for dividends.
NOTE 15 - REGULATORY CAPITAL REQUIREMENTS
Federal regulations require the Company and the Bank to maintain minimum amounts of capital. Specifically, each is required to maintain certain minimum dollar amounts and ratios of Total and Tier I capital to risk-weighted assets and of Tier I capital to average total assets.
In addition to the capital requirements, the Federal Deposit Insurance Corporation Improvement Act (“FDICIA”) established five capital categories ranging from “well capitalized” to “critically undercapitalized.” Should any institution fail to meet the requirements to be considered “adequately capitalized,” it would become subject to a series of increasingly restrictive regulatory actions.
As of December 31, 2005 and 2004, the FDIC categorized the Bank as well capitalized under the regulatory framework for prompt corrective action. To be classified as a well capitalized financial institution, Total risk-based, Tier 1 risk-based, and Tier 1 Leverage capital ratios must be at least 10 percent, 6 percent, and 5 percent, respectively.
The Company’s actual capital ratios are presented in the following table, which shows the Company met all regulatory capital requirements. The capital position of the Bank does not differ significantly from the Company’s (in thousands):
| | | | | | | | | | | | |
| | | 2005 | | | 2004 | |
| | | Amount | | Ratio | | | Amount | | Ratio | |
Total Capital (to Risk-Weighted Assets) | | | | | | | | | | | | |
Actual | | $ | 35,341 | | 11.57 | % | | $ | 32,784 | | 11.71 | % |
For Capital Adequacy Purposes | | $ | 24,438 | | 8.00 | % | | $ | 22,396 | | 8.00 | % |
To Be Well Capitalized | | $ | 30,548 | | 10.00 | % | | $ | 27,995 | | 10.00 | % |
| | | | |
Tier I Capital (to Risk-Weighted Assets) | | | | | | | | | | | | |
Actual | | $ | 31,491 | | 10.31 | % | | $ | 29,577 | | 10.57 | % |
For Capital Adequacy Purposes | | $ | 12,219 | | 4.00 | % | | $ | 11,198 | | 4.00 | % |
To Be Well Capitalized | | $ | 18,329 | | 6.00 | % | | $ | 16,797 | | 6.00 | % |
| | | | |
Tier I Capital (to Average Assets) | | | | | | | | | | | | |
Actual | | $ | 31,491 | | 9.16 | % | | $ | 29,577 | | 9.52 | % |
For Capital Adequacy Purposes | | $ | 13,756 | | 4.00 | % | | $ | 12,433 | | 4.00 | % |
To Be Well Capitalized | | $ | 17,195 | | 5.00 | % | | $ | 15,542 | | 5.00 | % |
NOTE 16 - FAIR VALUE DISCLOSURE
The estimated fair values of the Company’s financial instruments are as follows (in thousands):
| | | | | | | | | | | | |
| | | 2005 | | 2004 |
| | | Carrying Value | | Fair Value | | Carrying Value | | Fair Value |
Financial assets: | | | | | | | | | | | | |
Cash and cash equivalents | | $ | 8,477 | | $ | 8,477 | | $ | 5,132 | | $ | 5,132 |
Mortgage loans held for sale | | | 211 | | | 211 | | | 112 | | | 112 |
Investment securities: | | | | | | | | | | | | |
Available for sale | | | 54,129 | | | 54,129 | | | 55,662 | | | 55,662 |
Held to maturity | | | 199 | | | 207 | | | 198 | | | 216 |
Net loans | | | 279,589 | | | 281,271 | | | 249,969 | | | 253,787 |
Accrued interest receivable | | | 1,380 | | | 1,380 | | | 1,106 | | | 1,106 |
Regulatory stock | | | 945 | | | 945 | | | 951 | | | 951 |
Bank-owned life insurance | | | 5,254 | | | 5,254 | | | 5,065 | | | 5,065 |
Mortgage servicing rights | | | 680 | | | 680 | | | 700 | | | 700 |
Financial liabilities: | | | | | | | | | | | | |
Deposits | | $ | 294,856 | | $ | 293,944 | | $ | 270,542 | | $ | 270,551 |
Short-term borrowings | | | 12,954 | | | 12,954 | | | 12,033 | | | 12,033 |
Other borrowed funds | | | 16,548 | | | 16,388 | | | 11,349 | | | 11,385 |
Accrued interest payable | | | 952 | | | 952 | | | 609 | | | 609 |
Financial instruments are defined as cash, evidence of ownership interest in an entity, or a contract which creates an obligation or right to receive or deliver cash or another financial instrument from/to a second entity on potentially favorable or unfavorable terms.
Fair value is defined as the amount at which a financial instrument could be exchanged in a current transaction between willing parties other than in a forced or liquidation sale. If a quoted market price is available for a financial instrument, the estimated fair value would be calculated based upon the market price per trading unit of the instrument.
If no readily available market exists, the fair value estimates for financial instruments should be based upon management’s judgment regarding current economic conditions, interest rate risk, expected cash flows, future estimated losses, and other factors as determined through various option pricing formulas or simulation modeling. As many of these assumptions result from judgments made by management based upon estimates that are inherently uncertain, the resulting estimated fair values may not be indicative of the amount realizable in the sale of a particular financial instrument. In addition, changes in assumptions on which the estimated fair values are based may have a significant impact on the resulting estimated fair values.
As certain assets such as deferred tax assets and premises and equipment are not considered financial instruments, the estimated fair value of financial instruments would not represent the full value of the Company.
NOTE 16 - FAIR VALUE DISCLOSURE (Continued)
The Company employed simulation modeling in determining the estimated fair value of financial instruments for which quoted market prices were not available based upon the following assumptions:
Cash and Cash Equivalents, Accrued Interest Receivable, Regulatory Stock, Short-Term Borrowings, and Accrued Interest Payable
The fair value is equal to the current carrying value.
Mortgage Loans Held for Sale
The fair value of mortgage loans held for sale is equal to the available quoted market price. If no quoted market price is available, fair value is estimated using the quoted market price for similar securities.
Investment Securities
The fair value of investment securities available for sale and held to maturity is equal to the available quoted market price. If no quoted market price is available, fair value is estimated using the quoted market price for similar securities.
Loans, Deposits, Other Borrowed Funds and Mortgage Servicing Rights
The fair value for loans and mortgage servicing rights is estimated by discounting contractual cash flows and adjusting for prepayment estimates. Discount rates are based upon rates generally charged for such loans with similar characteristics. Demand, savings, and money market deposit accounts are valued at the amount payable on demand as of year-end. Fair values for time deposits and other borrowed funds are estimated using a discounted cash flow calculation that applies contractual costs currently being offered in the existing portfolio to current market rates being offered for deposits of similar remaining maturities.
Bank-Owned Life Insurance
The fair value is equal to the cash surrender value of the life insurance policies.
Commitments to Extend Credit and Standby Letters of Credit
These financial instruments are generally not subject to sale, and estimated fair values are not readily available. The carrying value, represented by the net deferred fee arising from the unrecognized commitment or letter of credit, and the fair value, determined by discounting the remaining contractual fee over the term of the commitment using fees currently charged to enter into similar agreements with similar credit risk, are not considered material for disclosure. The contractual amounts of unfunded commitments and letters of credit are presented in Note 13.
NOTE 17 - PARENT COMPANY
Following are condensed financial statements for the parent company:
CONDENSED BALANCE SHEET
| | | | | | |
| | | December 31, |
| (In thousands) | | 2005 | | 2004 |
Assets | | | | | | |
Cash and due from banks | | $ | 1,374 | | $ | 1,294 |
Investment securities available for sale | | | 275 | | | 290 |
Investment in bank subsidiary | | | 29,484 | | | 27,419 |
Other assets | | | 555 | | | 1,115 |
| | | | | | |
Total Assets | | $ | 31,688 | | $ | 30,118 |
| | | | | | |
Liabilities | | | | | | |
Dividends payable | | $ | 396 | | $ | 387 |
Other liabilities | | | 32 | | | 35 |
| | | | | | |
Total Liabilities | | | 428 | | | 422 |
Stockholders’ Equity | | | 31,260 | | | 29,696 |
| | | | | | |
Total Liabilities and Stockholders’ Equity | | $ | 31,688 | | $ | 30,118 |
| | | | | | |
CONDENSED STATEMENT OF INCOME
| | | | | | | | | | | | |
| | | Year Ended December 31, | |
| (In thousands) | | 2005 | | | 2004 | | | 2003 | |
Dividends from bank subsidiary | | $ | 2,100 | | | $ | 2,050 | | | $ | 1,300 | |
Dividends on investment securities | | | 8 | | | | 9 | | | | 12 | |
Investment securities gains | | | 2 | | | | 95 | | | | 13 | |
| | | | | | | | | | | | |
Total income | | | 2 ,110 | | | | 2,154 | | | | 1,325 | |
Noninterest expense | | | 89 | | | | 103 | | | | 91 | |
| | | | | | | | | | | | |
Net income before undistributed earnings of bank subsidiary and income taxes | | | 2 ,021 | | | | 2,051 | | | | 1,234 | |
Undistributed earnings of bank subsidiary | | | 2,405 | | | | 1,853 | | | | 2,595 | |
Income tax benefit | | | (29 | ) | | | (2 | ) | | | (25 | ) |
| | | | | | | | | | | | |
Net Income | | $ | 4,455 | | | $ | 3,906 | | | $ | 3,854 | |
| | | | | | | | | | | | |
NOTE 17 - PARENT COMPANY (Continued)
CONDENSED STATEMENT OF CASH FLOWS
| | | | | | | | | | | | |
| | | Year Ended December 31, | |
| (In thousands) | | 2005 | | | 2004 | | | 2003 | |
Operating Activities | | | | | | | | | | | | |
Net income | | $ | 4,455 | | | $ | 3,906 | | | $ | 3,854 | |
Adjustments to reconcile net income to net cash provided by operating activities: | | | | | | | | | | | | |
Undistributed earnings of bank subsidiary | | | (2,405 | ) | | | (1,853 | ) | | | (2,595 | ) |
Investment securities gains | | | (2 | ) | | | (95 | ) | | | (13 | ) |
Other, net | | | 561 | | | | (760 | ) | | | (140 | ) |
| | | | | | | | | | | | |
Net cash provided by operating activities | | | 2,609 | | | | 1,198 | | | | 1,106 | |
| | | | | | | | | | | | |
Investing Activities | | | | | | | | | | | | |
Purchases of investment securities | | | — | | | | (6 | ) | | | — | |
Proceeds from sales of investment securities | | | 6 | | | | 174 | | | | 33 | |
| | | | | | | | | | | | |
Net cash provided by investing activities | | | 6 | | | | 168 | | | | 33 | |
| | | | | | | | | | | | |
Financing Activities | | | | | | | | | | | | |
Cash dividends paid | | | (1,543 | ) | | | (1,404 | ) | | | (1,301 | ) |
Purchase of treasury stock | | | (1,062 | ) | | | — | | | | (114 | ) |
Proceeds from exercise of stock options | | | 70 | | | | 415 | | | | 168 | |
Proceeds from dividend reinvestment and stock purchase plan | | | — | | | | — | | | | 291 | |
| | | | | | | | | | | | |
Net cash used for financing activities | | | (2,535 | ) | | | (989 | ) | | | (956 | ) |
| | | | | | | | | | | | |
Increase in cash and cash equivalents | | | 80 | | | | 377 | | | | 183 | |
Cash at beginning of year | | | 1,294 | | | | 917 | | | | 734 | |
| | | | | | | | | | | | |
Cash at end of year | | $ | 1,374 | | | $ | 1,294 | | | $ | 917 | |
| | | | | | | | | | | | |
NOTE 18 - QUARTERLY DATA (Unaudited)
The Company’s selected quarterly financial data is presented in the following tables (in thousands, except per share data):
| | | | | | | | | | | | |
| | | Three Months Ended |
| | | March 2005 | | June 2005 | | September 2005 | | December 2005 |
Total interest income | | $ | 4,175 | | $ | 4,653 | | $ | 4,971 | | $ | 5,403 |
Total interest expense | | | 1,293 | | | 1,422 | | | 1,564 | | | 1,839 |
| | | | | | | | | | | | |
Net interest income | | | 2,882 | | | 3,231 | | | 3,407 | | | 3,564 |
Provision for loan losses | | | 220 | | | 173 | | | 182 | | | 275 |
| | | | | | | | | | | | |
Net interest income after provision for loan losses | | | 2,662 | | | 3,058 | | | 3,225 | | | 3,289 |
Total noninterest income | | | 738 | | | 618 | | | 711 | | | 734 |
Total noninterest expense | | | 2,041 | | | 2,156 | | | 2,104 | | | 2,197 |
| | | | | | | | | | | | |
Income before income taxes | | | 1,359 | | | 1,520 | | | 1,832 | | | 1,826 |
Income taxes | | | 428 | | | 481 | | | 588 | | | 585 |
| | | | | | | | | | | | |
Net income | | $ | 931 | | $ | 1,039 | | $ | 1,244 | | $ | 1,241 |
| | | | | | | | | | | | |
Per share data: | | | | | | | | | | | | |
Net income | | | | | | | | | | | | |
Basic | | $ | 0.60 | | $ | 0.67 | | $ | 0.80 | | $ | 0.82 |
Diluted | | $ | 0.58 | | $ | 0.65 | | $ | 0.78 | | $ | 0.79 |
Weighted-average shares outstanding: | | | | | | | | | | | | |
Basic | | | 1,549,187 | | | 1,549,269 | | | 1,548,204 | | | 1,522,669 |
Diluted | | | 1,603,562 | | | 1,600,212 | | | 1,599,655 | | | 1,571,481 |
NOTE 18 - QUARTERLY DATA (Unaudited) (Continued)
| | | | | | | | | | | | |
| | | Three Months Ended |
| | | March 2004 | | June 2004 | | September 2004 | | December 2004 |
Total interest income | | $ | 3,732 | | $ | 3,820 | | $ | 4,051 | | $ | 4,205 |
Total interest expense | | | 1,028 | | | 1,053 | | | 1,110 | | | 1,221 |
| | | | | | | | | | | | |
Net interest income | | | 2,704 | | | 2,767 | | | 2,941 | | | 2,984 |
Provision for loan losses | | | 377 | | | 488 | | | 261 | | | — |
| | | | | | | | | | | | |
Net interest income after provision for loan losses | | | 2,327 | | | 2,279 | | | 2,680 | | | 2,984 |
Total noninterest income | | | 716 | | | 685 | | | 694 | | | 838 |
Total noninterest expense | | | 1,822 | | | 1,832 | | | 1,871 | | | 2,000 |
| | | | | | | | | | | | |
Income before income taxes | | | 1,221 | | | 1,132 | | | 1,503 | | | 1,822 |
Income taxes | | | 371 | | | 348 | | | 465 | | | 588 |
| | | | | | | | | | | | |
Net income | | $ | 850 | | $ | 784 | | $ | 1,038 | | $ | 1,234 |
| | | | | | | | | | | | |
Per share data: | | | | | | | | | | | | |
Net income | | | | | | | | | | | | |
Basic | | $ | 0.56 | | $ | 0.51 | | $ | 0.67 | | $ | 0.80 |
Diluted | | $ | 0.53 | | $ | 0.49 | | $ | 0.65 | | $ | 0.78 |
Weighted-average shares outstanding: | | | | | | | | | | | | |
Basic | | | 1,529,925 | | | 1,535,347 | | | 1,538,727 | | | 1,545,940 |
Diluted | | | 1,599,794 | | | 1,601,086 | | | 1,599,004 | | | 1,587,911 |
NOTES
Dimeco, Inc. and its subsidiary, The Dime Bank, recognize that an integral component adding to the strength of the Company is the quality of our management team. During 2005, as a result of the hard work, commitment and ability demonstrated by these employees, we announced the following officer promotions:
| | | | |
| | | | |
| | |
| MARY CAROL CICCO | | JAN M. HOADLEY | | DEBORAH L. UNFLAT |
| Community Banking Officer | | Community Office Manager | | Assistant Vice President |
SHAREHOLDER INFORMATION
CORPORATE HEADQUARTERS
PO Box 509
820 Church Street
Honesdale, PA 18431
Phone: 570-253-1970
www.thedimebank.com
INDEPENDENT AUDITORS
S.R. Snodgrass, A.C.
1000 Stonewood Drive, Suite 200
Wexford, PA 15090-8399
Phone: 724-934-0344
www.srsnodgrass.com
TRANSFER AGENT
Registrar and Transfer Company
10 Commerce Drive
Cranford, NJ 07016
Phone: 800-368-5948
email: info@rtco.com
www.rtco.com
For change of name, address, or to replace lost stock certificates, write or call the securities transfer division.
DIVIDEND REINVESTMENT PLAN
The Company offers a plan for stockholders to automatically reinvest their dividends in shares of common stock. There are no brokerage commissions or fees imposed. For more information contact the transfer agent.
ANNUAL MEETING
Shareholders are cordially invited to attend the Annual Meeting of Shareholders, which will be held at 2:00 pm on Thursday April 27, 2006, at The Dime Bank Operations Center, 120 Sunrise Avenue, Honesdale, PA.
Management urges all shareholders to vote their proxies and thus participate in the decisions that will be made at this meeting.
FIRMS KNOWN TO HANDLE DIMECO, INC. STOCK TRANSACTIONS
Ferris, Baker Watts, Inc.*
100 Light Street
Baltimore, MD 21202
Phone: 410-468-2749 or 877-840-0012
RBC Dain Rauscher
2101 Oregon Pike, PO Box 4548
Lancaster, PA 17604-4548
Phone: 717-519-5940 or 866-604-1471
Ryan, Beck & Company*
7111 Fairway Drive, Suite 301
Palm Beach Gardens, FL 33418
Phone: 800-793-7226
Legg Mason Wood Walker, Inc.
330 Montage Mountain Road, Suite 201
Scranton, PA 18507-1762
Phone: 570-346-9300 or 800-346-4346
Boenning & Scattergood, Inc.*
Four Tower Bridge
200 Barr Harbor Drive, Suite 300
West Conshohocken, PA 19428-2979
Phone: 610-862-5360 or 800-842-8928
| | |
| | |
| |
The Dime Bank Executive Officers Maureen Beilman, Gary Beilman, Jill George, Peter Bochnovich | | |
The Dime Bank Officers Front row – left to right: Jerry Theobald, Deb Unflat, Ruth Daniels, Tom Didato, Cindy Theobald, Mary Carol Cicco, Janette Davis Back row – left to right: Joe Adams, Nancy Lavenduski, Jan Hoadley, Melanie Seagraves, Eileen Ertel, Linda Tallman, Cheryl Smith Not pictured: Frank Redington | |
DIMECO, INC. OFFICERS
WILLIAM E. SCHWARZ
Chairman of the Board
JOHN S. KIESENDAHL
Vice Chairman of the Board
GARY C. BEILMAN
President and Chief Executive Officer
MAUREEN H. BEILMAN
Chief Financial Officer,
Treasurer and Assistant Secretary
PETER BOCHNOVICH
Vice President and Assistant Secretary
JOHN F. SPALL
Secretary
THE DIME BANK OFFICERS
WILLIAM E. SCHWARZ
Chairman of the Board
JOHN S. KIESENDAHL
Vice Chairman of the Board
GARY C. BEILMAN
President and Chief Executive Officer
MAUREEN H. BEILMAN
Chief Financial Officer and Treasurer
PETER BOCHNOVICH
Vice President and Assistant Secretary
L. JILL GEORGE
Vice President
JOSEPH W. ADAMS
Vice President
RUTH E. DANIELS
Vice President
JANETTE M. DAVIS
Vice President
THOMAS M. DIDATO
Vice President
FRANK R. REDINGTON
Vice President
CHERYL A. SMITH
Vice President
JEROME D. THEOBALD
Vice President
DEBORAH L. UNFLAT
Assistant Vice President
MARY CAROL CICCO
Community Banking Officer
EILEEN K. ERTEL
Commercial Deposit Officer
JAN M. HOADLEY
Community Office Manager
NANCY M. LAVENDUSKI
Loan Officer
MELANIE F. SEAGRAVES
Community Office Manager
LINDA S. TALLMAN
Secretary
CYNTHIA D. THEOBALD
Bank Security Officer
TDB INSURANCE SERVICES LLC. OFFICERS
GARY C. BEILMAN
President
PETER BOCHNOVICH
Secretary
MAUREEN H. BEILMAN
Treasurer
JOSEPH PIZZO
Vice President
THE DIME BANK AND DIMECO, INC. BOARD OF DIRECTORS
WILLIAM E. SCHWARZ
President, Edw. J. Schwarz, Inc.
GARY C. BEILMAN
President and Chief Executive Officer,
Dimeco, Inc. and The Dime Bank
ROBERT E. GENIRS
Retired Chief Administrative Officer,
Lehman Brothers
BARBARA J. GENZLINGER
Secretary and Treasurer, The Settlers Inn, Ltd.
President, Sayre Mansion, LLC
JOHN S. KIESENDAHL
President and Chief Executive Officer,
Woodloch Pines, Inc.
THOMAS A. PEIFER
Retired Superintendent,
Wallenpaupack Area School District
HENRY M. SKIER
President, A.M. Skier Agency, Inc.
JOHN F. SPALL
Attorney-at-Law
GERALD J. WENIGER
Director Emeritus
www.thedimebank.com
DIMECO, INC. 2005 ANNUAL REPORT
STOCK LISTING: OTC Bulletin Board
DIMC - cusip number 25432W104
HONESDALE OFFICE
P.O. Box 509
820 Church Street
Honesdale, PA 18431
Phone: 570-253-1970
email: honesdale@thedimebank.com
GREENTOWN OFFICE
P.O. Box 946
1586 Route 507
Greentown, PA 18426
Phone: 570-676-8390
email: greentown@thedimebank.com
HAWLEY OFFICE
P.O. Box 290
309 Main Avenue
Hawley, PA 18428
Phone: 570-226-3506
email: hawley@thedimebank.com
DAMASCUS OFFICE
P.O. Box 190
1679 Cochecton Turnpike
Damascus, PA 18415
Phone: 570-224-6300
email: damascus@thedimebank.com
DINGMANS FERRY OFFICE
1824 Route 739
Dingmans Ferry, PA 18328
Phone: 570-828-1200
email: dingmansferry@thedimebank.com
OPERATIONS CENTER
P.O. Box 509
120 Sunrise Avenue
Honesdale, PA 18431
Phone: 570-253-1970
email: operations@thedimebank.com