Exhibit 13

drives you
What drives us drives you.
We all care about profits, about the
community, about partnership and
about building trust. No matter how
you look at it, when it comes to
success, we’re in it together.
The mission of Dimeco, Inc. is the operation of a fully integrated financial services institution through its subsidiary The Dime Bank in a market that is defined by the institution’s ability to provide services consistent with sound, prudent principles and to fulfill the social, economic, moral and political considerations ordinarily associated with a responsible, well-run financial institution.
CONSOLIDATED FINANCIAL HIGHLIGHTS
| | | | | | | | | | | |
| (amounts in thousands, except per share data) | | 2006 | | | 2005 | | | %
Increase (decrease) | |
Performance for the year ended December 31, | | | | | | | | | | | |
Interest income | | $ | 24,646 | | | $ | 19,202 | | | 28.4 | % |
Interest expense | | $ | 9,478 | | | $ | 6,118 | | | 54.9 | % |
Net interest income | | $ | 15,168 | | | $ | 13,084 | | | 15.9 | % |
Net income | | $ | 5,585 | | | $ | 4,455 | | | 25.4 | % |
| | | |
Shareholders' Value (per share) | | | | | | | | | | | |
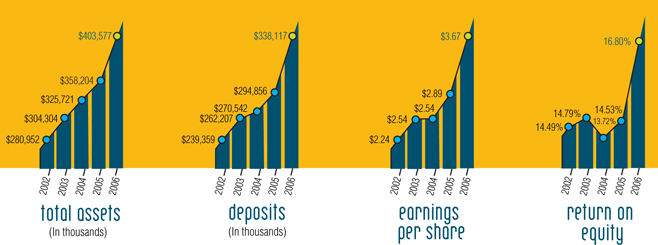
Earnings—basic | | $ | 3.67 | | | $ | 2.89 | | | 27.0 | % |
Earnings—diluted | | $ | 3.55 | | | $ | 2.80 | | | 26.8 | % |
Dividends—year to date | | $ | 1.07 | | | $ | 1.01 | | | 5.9 | % |
Book value | | $ | 23.17 | | | $ | 20.53 | | | 12.9 | % |
Market value | | $ | 41.75 | | | $ | 33.75 | | | 23.7 | % |
Market value/book value ratio | | | 180.2 | % | | | 164.4 | % | | 9.6 | % |
Price/earnings multiple | | | 11.4 | X | | | 11.7 | X | | (2.6 | )% |
Dividend yield | | | 2.56 | % | | | 2.99 | % | | (14.4 | )% |
| | | |
Financial Ratios | | | | | | | | | | | |
Return on average assets | | | 1.50 | % | | | 1.30 | % | | 15.4 | % |
Return on average equity | | | 16.80 | % | | | 14.53 | % | | 15.6 | % |
Shareholders’ equity/asset ratio | | | 8.76 | % | | | 8.73 | % | | .3 | % |
Dividend payout ratio | | | 29.16 | % | | | 34.95 | % | | (16.6 | )% |
Nonperforming assets/total assets | | | .18 | % | | | .22 | % | | (18.2 | )% |
Allowance for loan loss as a % of loans | | | 1.46 | % | | | 1.40 | % | | 4.3 | % |
Net charge-offs/average loans | | | .10 | % | | | .02 | % | | 400.0 | % |
Allowance for loan loss/nonaccrual loans | | | 1,049.1 | % | | | 755.3 | % | | 38.9 | % |
Allowance for loan loss/non-performing loans | | | 624.2 | % | | | 493.5 | % | | 26.5 | % |
Risk-based capital | | | 11.6 | % | | | 11.6 | % | | — | |
| | | |
Financial Position at December 31, | | | | | | | | | | | |
Assets | | $ | 403,577 | | | $ | 358,204 | | | 12.7 | % |
Loans | | $ | 305,291 | | | $ | 283,562 | | | 7.7 | % |
Deposits | | $ | 338,117 | | | $ | 294,856 | | | 14.7 | % |
Stockholders’ equity | | $ | 35,337 | | | $ | 31,260 | | | 13.0 | % |
Dear Shareholder,
Having just celebrated our 100th anniversary last year, I can’t envision a better way to begin our second century as a financial institution than with the performance that was achieved in 2006! What a year it was for Dimeco, Inc. Your company posted the most significant gains in its existence.
positioning
When we position ourselves in the right place at the right time... we can see outstanding results!
Deposits, probably the most competitively sought category in banking in 2006, grew by $43 million, an increase of over 14% from the previous year. All of our five community banking offices contributed to these deposit gathering efforts. Total loans outstanding also posted new highs as this asset class reached $305 million, a growth of more than 7% above 2005. Throughout the entire year, loan originations were being made to assist families and businesses grow and prosper. These areas of activity combined to achieve yet another record high as Dimeco surpassed the $400 million mark in total assets. This overall growth was an impressive increase of more than 12% over the previous year.
The gains in deposits, loans, and total assets were all significant. Yet, even more impressive was the utilization of these funds. During 2006, our interest spread was carefully monitored and managed, and posted handsome results, when many other financial institutions struggled with this important income source. These efforts, together with service fee and investment income, coupled with a strong cost containment strategy, allowed us to attain outstanding results. For 2006, the results of operations produced net income which was more than $5.5 million, an increase of over 25% from the year before. These performance figures are more fully evidenced in our return on average assets of 1.50% and the return on average equity of 16.80%, both of which should elevate us to the level of high performer in our peer group.
These accomplishments are certainly exciting. For you our shareholders, it is equally robust. A direct result of the aforementioned performance can be seen in stockholders’ equity, which increased $4 million, an uptick of 13% over the previous year. Dividends on your investment not only increased almost 6% during the year, but more importantly, your Board of Directors increased the dividend in the fourth quarter by 11.5%. In addition to all of that, the marketplace responded favorably as the per share market value of your Dimeco stock rose well over 23% to end the year at $41.75 per share.
Annual Reports are the perfect venue to recognize each of the groups that contributed so significantly to the successes of the past year. First, accolades must be given to our directors, officers, and staff. Each and every day this collective group carries out our mission of enhancing shareholder value. This dedication is demonstrated by every one of our more than 130 individuals, and can most prominently be seen in the loyal tenure of many. During 2006, William E. Schwarz, our Chairman of the Board, celebrated 35 years of leadership and service. His steadfast, common sense approach is consistently directed toward long term goals. Correspondingly, staff who celebrated 15 or more years of dedication to the institution included Jean Birmelin, Nancy Lavenduski, Linda Tallman, Stacey Williams, and Donna Young. These individuals, and the commitment they demonstrate, are
DIMECO, INC.
the models by which Dimeco’s entire workforce is guided. During the year there were officer recognitions as well. Amy Burke and Tom Onions were both granted officer status as the Community Office Managers of our Dingmans Ferry and Hawley offices, respectively. Additionally, our Board elevated Pete Bochnovich to the rank of Senior Vice President. These three promotions were well deserved and are representative of the quality staff we employ.
Our customer base deserves our praise also. This group – individuals, families, businesses, organizations, non-profits, municipalities, and governments – are the lifeblood by which we grow and prosper. At the end of 2006, Dimeco was serving over 10,500 personal households and more than 2,700 businesses. Although this group is diverse in terms of financial needs and wants, it demonstrates a commonality of satisfaction in, and benefit from, conducting business with the company and continually deepening that relationship.
drives us
Shareholders obviously deserve our compliments. In the most basic business definition, it is our shareholders who provide the means for Dimeco’s very existence. This is the group to whom our staff dedicates its efforts, and for whom we strive to be the best. We extend our sincere thanks for your investment, loyalty, and confidence, and we urge you to continue recommending us to others for all banking, trust, and investment needs.
There is a strong synergy among all of the groups that comprise this company. Shareholders, customers, staff, and the community at large, are dependent on each other for success. This year’s theme highlights this very premise: “What drives us – Drives you” and alternatively, “What drives you – Drives us”!
As we go forward, our immediate attention will be to look “inside the box”. We want to continue the performance trend lines of which we are so proud. We want to have the best products and services, and the best processes in place to deliver both, as we embark on our goals to take the company to the next level.
In closing, please accept our sincere appreciation for your continued confidence and support. As always, we welcome your comments.

Gary C. Beilman
President and Chief Executive Officer

3

DIMECO, INC.
| | |
drives us Our direction & commitment to a common goal make progress inevitable. | | In 2006, we created and deepened many partnerships with local businesses assisting them to start an operation, expand or make capital improvements. These partnerships add value so that organizations continue to grow and prosper. Listening to customer needs and working with them to develop the products and services that will help them, fosters an interdependency. Many customer groups from individuals to various business entities rely on us for support. Through The Dime Bank, we gather deposits to fund the progress of our communities and promote economic development. One aspect which we feel is important in our partnerships is technology. Our systems are state-of-the-art and are ready to expand to the next level of technological progress. This has a two-fold benefit. We bring fast, convenient and efficient financial services to our customers as an incentive for them to maintain and expand their relationship with us. Technology also saves time and expense in our operations departments thereby enhancing our bottom line. |

5

DIMECO, INC.
| | |
It's nice to know that your company puts things in perspective – especially the things that are most important to all of us. drives us | | We care about the growth and welfare of the communities we serve. Playing a part in the development of a thriving economy, a safe and clean environment and first-class cultural and recreational activities is important to us. We believe that by assisting to build a stronger community, we build a better bank. Investment in all of these areas makes our communities a great place to work and live, starting with the education of our youth and continuing across all generations. In 2006, our financial donations helped many non-profit, local associations such as Wayne Memorial Hospital, Wayne County Library and fire companies as well as national organizations such as American Cancer Society, American Red Cross and United Way. Additionally, we gave to many local school events, civic fundraisers and community endeavors to assist in promoting awareness of their cause. Our philanthropy goes beyond that of financial assistance. The directors, officers and staff of Dimeco collectively give thousands of hours of personal time to these and countless other worthy organizations. |

7

DIMECO, INC.
| | | | |
Always moving forward to reach our goals– that is important to our investors and employees. drives us | |  | | We have ambitious goals for the next year. Reaching them is all about positioning, partnership and perspective, but it is also about perseverance. We’re prepared to roll up our sleeves, put in the hard work to achieve these goals and prosper through increasing core deposits as well as maintaining a high quality loan portfolio. In 2007, our business model will focus on the commercial banking segment, concentrating our efforts in finding opportunities to assist small businesses and increasing community awareness of The Dime Bank as a total financial services partner. Our goal is to bring outstanding service to ensure that the business of our customers is handled in the most efficient, professional and accurate manner, while maintaining adherence to all applicable rules and regulations. We look forward to bringing the greatest rewards to shareholders, customers, community and staff. Pictured below is Joseph W. Adams, Vice President, Investments and Financial Services named 2006 Representative of the Year, for his perseverance in achieving the highest professional standards for financial advisors. |

9

DIMECO, INC.
MANAGEMENT’S DISCUSSION AND ANALYSIS OF FINANCIAL CONDITION
AND RESULTS OF OPERATION
This consolidated review and analysis of Dimeco, Inc. (the “Company”) is intended to assist the reader in evaluating the performance of the Company for the years ended December 31, 2006 and 2005. This information should be read in conjunction with the consolidated financial statements and accompanying notes to the consolidated financial statements.
Dimeco, Inc., headquartered in Honesdale, Pennsylvania, is the one-bank holding company of The Dime Bank (the “Bank”), which is wholly-owned by the Company. The Bank formed and owns 100% of a limited liability company, TDB Insurance Services, LLC, offering title insurance services. Both the Company and the Bank derive their primary income from the operation of a commercial bank, including earning interest on loans and investment securities, fees on services performed and providing investment and trust services. The Bank’s main expenses are related to interest paid on deposits and other borrowings along with salary and benefits for employees. The Bank operates five full service branches in Honesdale, Hawley, Damascus, Greentown and Dingmans Ferry, Pennsylvania, two off-site automatic teller machines, one each in Wayne and Pike County, Pennsylvania and an operations center in Wayne County, Pennsylvania. Principal market areas include Wayne and Pike Counties, Pennsylvania and Sullivan County, New York. The Bank employed 96 full time employees and 29 part time employees at December 31, 2006.
FORWARD-LOOKING STATEMENT
The Private Securities Litigation Act of 1995 contains safe harbor provisions regarding forward-looking statements. When used in this discussion, the words “believes,” “anticipates,” “contemplates,” “expects” and similar expressions are intended to identify forward-looking statements. Such statements are subject to certain risks and uncertainties that could cause actual results to differ materially from those projected. Those risks and uncertainties include changes in interest rates, the ability to control costs and expenses and general economic conditions. The Company undertakes no obligation to publicly release the results of any revisions to those forward-looking statements that may be made to reflect events or circumstances after the date hereof or to reflect the occurrence of unanticipated events.
CRITICAL ACCOUNTING POLICIES
The Company’s accounting policies are integral to understanding the results reported. The accounting policies are described in detail in Note 1 of the “Notes to Consolidated Financial Statements.” Our most complex accounting policies require management’s judgment to ascertain the valuation of assets, liabilities, commitments and contingencies. We have established detailed policies and control procedures that are intended to ensure that valuation methods are well controlled and applied consistently from period to period. In addition, the policies and procedures are intended to ensure that the process for changing methodologies occurs in an appropriate manner. The following is a brief description of our current accounting policies involving significant management valuation judgments.
Allowance for Loan Losses
Arriving at an appropriate level of allowance for loan losses involves a high degree of judgment. The Company’s allowance for loan losses provides for probable losses based upon evaluations of known and inherent risks in the loan portfolio.
Management uses both historical and current information relating to the loan portfolio, as well as general economic information, in order to determine our estimation of the prevailing business environment. The probability of collection of loans is affected by changing economic conditions and various external factors which may impact the portfolio in ways currently unforeseen. We monitor this information in an effort to assess the adequacy of the allowance for loan losses. The allowance is increased by provisions for loan losses and by recoveries of loans previously charged-off and reduced by loans charged-off. For a full discussion of the Company’s methodology of assessing the adequacy of the reserve for loan losses refer to Note 1.
Mortgage Servicing Rights
The Bank originates residential mortgages that are sold in the secondary market. It is the Bank’s normal practice to retain the servicing of these loans, meaning that the customers whose loans have been sold in the secondary market still make their monthly payments to the Bank. As a result of these mortgage loan sales, the Bank capitalizes a value allocated to the servicing rights categorized in other assets and recognizes other income from the sale and servicing of these loans. The capitalized servicing rights are amortized against noninterest income in proportion to the estimated net servicing income over the remaining periods of the underlying financial assets.
11
DIMECO, INC.
Capitalized servicing rights are evaluated for impairment periodically based upon the fair value of the rights as compared to amortized cost. The rights are deemed to be impaired when the fair value of the rights is less than the amortized cost. The fair value of the servicing rights is estimated using projected, discounted cash flows by means of a computer pricing model, based on objective characteristics of the portfolio and commonly used industry assumptions.
Deferred Tax Assets
The Company uses an estimate of future earnings to support our position that the benefit of our deferred tax assets will be realized. If future income should prove non-existent or less than the amount of the deferred tax assets within the tax years to which they may be applied, the asset may not be realized and our net income will be reduced. Our deferred tax assets are described further in Note 11 of the “Notes to Consolidated Financial Statements.”
Other than Temporary Impairment of Investments
Investments are evaluated periodically to determine whether a decline in their value is other than temporary. Management utilizes criteria such as the magnitude and duration of the decline, in addition to the reasons underlying the decline, to determine whether the loss in value is other than temporary. The term “other than temporary” is not intended to indicate that the decline is permanent. It indicates that the prospects for a near term recovery of value are not necessarily favorable, or that there is a lack of evidence to support fair values equal to, or greater than, the carrying value of the investment. Once a decline in value is determined to be other than temporary, the value of the security is reduced and a corresponding charge to earnings is recognized.
All dollars are stated in thousands, with the exception of per share numbers.
STATEMENT OF CONDITION
Total assets at December 31, 2006 were $403,577, representing an increase of $45,373 or 12.7% over the previous year end. The largest portion of this growth appeared in the loan and investment portfolios along with higher balances of cash and cash equivalents during the year.
Cash and cash equivalents increased $10,494 or 123.8% from December 31, 2005 to December 31, 2006. Balances of interest-bearing deposits in other banks and in federal funds sold both increased due to temporary cash requirements that fluctuate with changes in deposits and loan demand. Maturities of customers’ large certificates of deposit early in January 2007, historical customer withdrawal trends in the first quarter of each year, seasonal increases in customer deposits at year end and large loan commitments which were expected to close in January 2007 were all factors in maintaining greater balances of cash and cash equivalents at December 31, 2006.
Investment securities available for sale increased $13,137 or 24.3% at December 31, 2006 from balances one year earlier. Although loan demand continued to be favorable in 2006, deposit growth surpassed loan demand enabling management to increase our investment in securities. Investments in U.S. government agency bonds declined $6,732 during 2006 with the primary change due to calls of $4,000 and maturities of $3,000. Rates offered for similar bonds at the time of the calls did not fit our investment strategy. Investments in commercial paper increased $12,803 during 2006 as short term interest rates were typically the highest rates offered and allowed us to be in a position to extend maturities or reinvest dollars as the yield curve changes. In addition, we have invested to a lesser degree in mortgage-backed securities, tax-free municipal bonds and other corporate securities when we saw opportunities to improve the portfolio in adherence to our investment policy. We continue to have solid loan demand and will invest in quality loans as they emerge, which requires investment portfolio liquidity.
Loans of $305,291 at December 31, 2006 represented an increase of $21,729 or 7.7% from balances at December 31, 2005. Loans secured by commercial real estate experienced the greatest gains, increasing $13,834 or 8.8% with balances of $170,910 as of December 31, 2006. This gain included commercial mortgages to real estate developers of $5,929 along with an increase of $2,588 in mortgages to finance restaurants. The remaining growth in this segment of the loan portfolio represents loans to businesses in a variety of other segments. Total balances of conventional residential mortgage loans increased $9,506 or 17.4% during 2006 due to the retention of several large balance adjustable rate mortgages originated during the year along with experiencing great success with a closed-end home equity promotion. The housing market in the areas we serve was slower in 2006 as evidenced by a decline of 25% in conventional residential mortgages originated in 2006 as compared to 2005. The average mortgage balance financed in 2006 increased by 43.4% over the loans originated in 2005 due to origination of those large balance adjustable rate mortgages. It is our policy to sell the majority of residential loan originations in the secondary market to Freddie Mac. Revolving home equity loans increased $1,683 or 66.4% during the year due to continued marketing efforts to promote a restructured home equity line of credit product which allows access through various means including internet, checks
12
DIMECO, INC.
and a home equity line of credit card. Continued competition from nontraditional financing sources, scheduled repayments and early pay-offs caused installment loans to decrease by $1,719 or 10.1% during the year.
Deposits increased $43,261 or 14.7% as of December 31, 2006 as compared to a year earlier. Contributing to this growth was $10,973 of new deposits in the Dingmans Ferry office, which opened in December 2004.
Noninterest-bearing balances declined $2,447 or 6.7% from December 31, 2005 to December 31, 2006. In 2005, as part of our marketing efforts to increase total deposits, we employed an outside consultant to assist in a plan to garner new customers while enhancing current customer relationships. Management examined all transaction accounts, eliminated several types and moved certain balances from noninterest-bearing to interest-bearing status. The plan included reallocation of our product line followed by the launch of a marketing program to acquire new customers. This conversion, which occurred in the first quarter of 2006, resulted in the transfer of two thousand accounts from noninterest-bearing accounts to interest-bearing. We have seen positive results during the year as evidenced by higher cross-sell ratios and significant new deposits. We believe that this conversion should result in greater customer loyalty and long-term profitability.
Interest-bearing deposits increased $45,708 or 17.7% from December 31, 2005 to December 31, 2006. Time deposits continued the trend from the previous year with growth of $40,579 or 26.2% during the year. The Bank maintained very competitive interest rates in 2006 to attempt to retain customer deposits in very aggressive local markets. Savings deposits declined $5,970 or 15.1% during 2006 with customers choosing to move funds from savings accounts to higher yielding certificates of deposit and money market accounts. Total money market account balances increased $8,812 or 33.3%. During the first quarter of 2006, we increased the number of interest rate tiers and added a premium rate tier for the largest balances in our money market product in an effort to maintain current deposit relationships and attract new funds to this type of account.
Other borrowed funds declined $2,785 or 16.8% from December 31, 2005 to December 31, 2006. This category represents long-term borrowing from the Federal Home Loan Bank of Pittsburgh (“FHLB”). In June, a $2,000 borrowing matured and was repaid. The remaining decline is the result of scheduled principal reductions.
CAPITAL RESOURCES
Stockholders’ Equity of $35,337 at December 31, 2006 represented an increase of $4,077 or 13.0% from the previous year end. Net income of $5,585 was the primary source of this increase, representing earnings of $3.67 per share and a return on average equity of 16.8%. Dividends of $1,630 in total, or $1.07 per share, were returned to shareholders in the form of cash dividends. The Company utilized the 2004 Stock Repurchase Plan to purchase 13,000 shares of treasury stock during 2006, using $480 of equity. Although we have not yet used these purchases, when stock options are exercised these purchases will mitigate the dilutive effect of both book value and earnings per share which could be caused by the exercise of these outstanding stock options. Market value appreciation of investments available for sale resulted in a benefit of $264, net of taxes, to accumulated other comprehensive income.
The Company’s capital position at December 31, 2006 as it relates to regulatory guidelines is presented below:
| | | | | | | |
| | | Dimeco, Inc. | | | Well-Capitalized | | Minimum Requirements |
Leverage Ratio | | 9.48 | % | | 5.00% | | 4.00% |
Tier I Capital Ratio | | 10.33 | % | | 6.00% | | 4.00% |
Total Capital Ratio | | 11.59 | % | | 10.00% | | 8.00% |
13
DIMECO, INC.
LIQUIDITY
Liquidity within the Company is viewed mainly through an analysis of the Consolidated Statement of Cash Flows which is included in the audited financial statements. Companies in the financial service industry are dependent on their ability to maintain proper levels of short and long-term liquidity. The key is to maintain appropriate levels of liquidity to allow for customers’ cash needs from both a lending and deposit perspective, to maintain sufficient cash for operating expenses and to have amounts available to take advantage of earning opportunities as they arise.
Dimeco, Inc. defines cash and cash equivalents as cash on hand and in banks along with overnight investments in federal funds sold. Balances of these accounts totaled $18,971 or 4.7% of total assets at December 31, 2006. Operating activities generated $5,844 of cash and financing activities added $38,501 while investing activities used $33,851.
Both short-term and long-term liquidity are generated through principal and interest payments on loans, increases in borrowed funds and deposits, sales and maturities of investment securities, sales of residential loans in the secondary market and from operating income. Uses of liquidity include originations of loans both for addition to our portfolio and for sales in the secondary market, capital projects, operating expenses and payment of dividends. The deposit base, through our ability to maintain current deposits and garner new funds, has historically been the primary source of liquidity for the Company. It continues to be the main source of funds, but has been augmented by the Bank’s ability to borrow from the FHLB. The Bank has an available credit line of $78,372. This line is generally viewed as a long-term source of liquidity, but is also used regularly in lower dollar amounts to borrow overnight funds as needed.
Management believes that the Company has sufficient liquidity to meet both its short and long-term needs. We understand that liquidity may be adversely affected by many factors including unexpected deposit outflows, aggressive competitive pricing by other financial intermediaries and other cash requirements. We are aware of our dependence on customers’ deposits to sustain our liquidity levels. We believe that people are becoming more comfortable investing in capital markets and insurance products, but through enhanced marketing efforts, deposit pricing and opportunities in new market areas, we think that we will be able to maintain the majority of current deposits and gain new deposits. We have been able to add to our product line through our investment department where we offer the ability for investment in capital markets and insurance products, representing our ability to be the total financial resource for customers. Each area of the institution cross sells the abilities of the other departments; therefore, we feel that the Company can maintain customer relationships and be positioned to acquire deposits as investment cycles change.
QUANTITATIVE AND QUALITATIVE DISCLOSURES ABOUT MARKET RISK
Market risk is inherent in the financial services industry, encompassing the risk of loss associated with adverse changes in market interest rates and prices. As an organization, we have placed the management of this risk in the Asset/Liability Committee (“ALCO”). This committee is comprised of senior officers, vice presidents representing each product offering and information technology along with the assistant vice president of marketing. The committee follows guidelines enumerated in the ALCO policy which was developed to achieve earnings consistent with established goals while maintaining acceptable levels of interest rate risk, adequate levels of liquidity and adherence to regulatory mandates. The committee reports to the Board of Directors on at least a quarterly basis.
Asset market risk is most prevalent in the investment portfolio and to a lesser degree, in mortgage loans held for sale. As interest rates are increasing, it becomes more important that the Company consider the market risk of investments available for sale, particularly if the need to liquidate these assets would be imminent. Investment in long-term securities at current rates may provide a lower return if the need arises to sell for liquidity in the future. Management has maintained a portfolio which includes investments in short maturity commercial paper and U.S. government agencies that contain interest rate step-ups over the life of the investment. Although all investments are held in the available for sale category, management anticipates holding all investments to maturity and has historically not had the need to sell for liquidity needs. Market risk inherent in loans held for sale has been mitigated by controlling the length of time between origination and sale of these loans. The balance of loans in this category is generally less than $1 million.
14
DIMECO, INC.
To address credit risk, both the loan portfolio and the investment portfolio have stringent guidelines as to the credit quality of acceptable investments.
Liability market risk is associated with the adverse affects of our pricing strategies compared to competitors’ pricing strategies. The markets in which we have offices are located in areas where other financial institutions also operate branches. If there is not enough flexibility in our pricing models to quickly move interest rates of both loans and deposits, we may lose accounts to other financial intermediaries. The ALCO is cognizant of the ability of interest rates to adversely affect assets, liabilities, capital and interest income and expense. In particular, two analytical tools are used to ascertain our ability to manage this market risk. The first is theStatement of Interest Sensitivity Gap. This report matches all interest-earning assets and all interest-bearing liabilities by the time frame in which funds can be reinvested or repriced. The second report is theAnalysis of Sensitivity to Changes in Market Interest Rateswhich is used to determine the affect on income of various shifts in the interest rate environment. In both reports, there are inherent assumptions that must be used. Management is aware that these assumptions affect the results and cannot be absolutely accurate and include an estimate of the maturity or repricing times of deposits, even though all deposits, other than time deposits, have no stated maturity and the reference that interest rate shifts will be parallel, with the rates of assets and liabilities shifting in the same amount in the same time frame. In reality, various assets and various liabilities will react differently to changes in interest rates, with some lagging behind the change and some anticipating the upcoming change and reacting before any actual change occurs. Each tool also suggests that there is a propensity to replace assets and liabilities with similar assets and liabilities rather than taking into consideration management’s ability to reallocate the balance sheet. In addition, the models used do not include any elements to determine how an action by management to increase or decrease interest rates charged on loans or paid on deposits or to increase borrowings at the FHLB will affect the results of the analysis. In spite of these limitations, these analyses are good tools to assist in the management of the Company. Similar versions of these same reports are used by all financial institutions. Both measurements are as of December 31, 2006.
15
DIMECO, INC.
STATEMENT OF INTEREST SENSITIVITY GAP
| | | | | | | | | | | | | | | | | | | |
| | | 90 days or less | | | >90 days but < 1 year | | | 1 - 5 years | | | >5 years | | | Total |
Assets: | | | | | | | | | | | | | | | | | | | |
Interest-bearing deposits in other banks and federal funds sold | | $ | 12,287 | | | $ | — | | | $ | — | | | $ | — | | | $ | 12,287 |
Mortgage loans held for sale | | | — | | | | — | | | | — | | | | — | | | | — |
Investment securities available for sale(4) (6) | | | 40,061 | | | | 14,653 | | | | 3,161 | | | | 10,305 | | | | 68,180 |
Loans(1) (5) | | | 80,624 | | | | 108,897 | | | | 57,054 | | | | 58,937 | | | | 305,512 |
| | | | | | | | | | | | | | | | | | | |
Rate sensitive assets | | $ | 132,972 | | | $ | 123,550 | | | $ | 60,215 | | | $ | 69,242 | | | $ | 385,979 |
| | | | | | | | | | | | | | | | | | | |
| | | | | |
Liabilities: | | | | | | | | | | | | | | | | | | | |
Interest-bearing deposits: | | | | | | | | | | | | | | | | | | | |
Interest-bearing demand(2) | | $ | 3,163 | | | $ | 9,884 | | | $ | 26,491 | | | $ | — | | | $ | 39,538 |
Money market(3) | | | 5,997 | | | | 17,638 | | | | 11,641 | | | | — | | | | 35,276 |
Savings(2) | | | 2,688 | | | | 8,398 | | | | 22,507 | | | | — | | | | 33,593 |
Time deposits | | | 39,872 | | | | 105,929 | | | | 49,737 | | | | — | | | | 195,538 |
Short-term borrowings | | | 12,705 | | | | — | | | | — | | | | — | | | | 12,705 |
Other borrowings | | | — | | | | 2,000 | | | | 1,000 | | | | 10,763 | | | | 13,763 |
| | | | | | | | | | | | | | | | | | | |
Rate sensitive liabilities | | $ | 64,425 | | | $ | 143,849 | | | $ | 111,376 | | | $ | 10,763 | | | $ | 330,413 |
| | | | | | | | | | | | | | | | | | | |
Interest sensitivity gap | | $ | 68,547 | | | $ | (20,299 | ) | | $ | (51,161 | ) | | $ | 58,479 | | | $ | 55,566 |
Cumulative gap | | $ | 68,547 | | | $ | 48,248 | | | $ | (2,913 | ) | | $ | 55,566 | | | | |
Cumulative gap to total assets | | | 16.98 | % | | | 11.96 | % | | | (.72 | )% | | | 13.77 | % | | | |
(1) | Loans are included in the earlier period in which interest rates are next scheduled to adjust or in which they are due. No adjustment has been made for scheduled repayments or for anticipated prepayments. |
(2) | Interest-bearing demand deposits and savings are segmented based on the percentage of decay method. The decay rates used include 8% “90 days or less,” 25% “ >90 days but <1 year” and 67% “1-5 years.” |
(3) | Money market deposits are segmented based on the percentage of decay method. The decay rates used include 17% “90 days or less,” 50% “>90 days but < 1 year” and 33% “1-5 years.” |
(4) | Includes Federal Home Loan Bank and Atlantic Central Bankers Bank stock which is included in Other Assets on the Consolidated Financial Statements. |
(5) | Does not include loans in nonaccrual status, deposit overdrafts, unposted items or deferred fees on loans. |
(6) | Investments are included in the earlier period in which interest rates are next scheduled to adjust or in which they are due. Included are U.S. Government Agency step-up bonds characterized by having tiered interest rates over their life. Due to this feature these securities have been reallocated from their matuity date to their next step-up date. The specific impact of this policy by timeframe is as follows: “90 days or less” increased $1,995, “>90 days but < 1 year” increased $13,845, “1-5 years” decreased $9,913 and “>5 years” decreased $5,927. |
This report shows the Company to be in an asset sensitive position of $68,547 in less than or equal to three months, meaning that there are more assets which will reprice in this period than liabilities. Traditionally management focuses attention to the net gap of the balance sheet in the second time frame, assets which mature in less than or equal to one year. Our statement shows that the Company remains asset sensitive in this cumulative time frame, with $48,248 of net assets repricing. The loan portfolio is the main asset category responsible for the higher level of asset sensitivity for the one year period. Commercial loans have historically been written with a variable interest rate and commercial real estate loans are typically fixed in rate for up to three years after which the interest rate will float with changes to the prime rate. During 2006, short-term interest rates increased four times for a total of 1.0%. Being in an asset sensitive position was ideal for this scenario, increasing our net interest income. Management is aware that if interest rates start declining, being asset sensitive may not be ideal and is working to decrease the asset sensitivity of the balance sheet. The most conservative position is perfectly balanced in any time frame.
16
DIMECO, INC.
The following table presents the Company’s potential sensitivity in net interest income, net income and equity value at risk, or the potential of adverse change in the economic value of equity (“EVE”) with rates up or down 100 and 200 basis points. EVE is the present value of assets minus the present value of liabilities at a point in time.
ANALYSIS OF SENSITIVITY TO CHANGES IN MARKET INTEREST RATES
| | | | | | | | | | | | | | | | | | | | | | | | | | | | |
| | | 100 basis points | | | 200 basis points | |
| | | Up | | | Down | | | Up | | | Down | |
| | | Amount | | | % | | | Amount | | | % | | | Amount | | | % | | | Amount | | | % | |
Net interest income | | $ | 532 | | | 3.29 | % | | $ | (450 | ) | | (2.78 | )% | | $ | 1,002 | | | 6.20 | % | | $ | (935 | ) | | (5.78 | )% |
Net income | | $ | 368 | | | 6.13 | % | | $ | (314 | ) | | (5.23 | )% | | $ | 695 | | | 11.58 | % | | $ | (651 | ) | | (10.84 | )% |
EVE | | $ | (1,280 | ) | | (2.83 | )% | | $ | 1,201 | | | 2.65 | % | | $ | (3,334 | ) | | (7.36 | )% | | $ | 1,946 | | | 4.30 | % |
The greatest risk to the Company from an income perspective is an immediate decline in market interest rates of 200 basis points. Although possible, management does not believe that interest rates will immediately decline 200 basis points. In the EVE measurement, an increase of 200 basis points would affect the Company by a decline in equity of $3,334 or 7.36%. Although these analyses reflect the possibility of negative effects when interest rates change, all of these measurements are within internal acceptable limits. Management believes that we have the ability to affect the changes in income and equity by taking actions which are not factored in this analysis.
ALLOWANCE FOR LOAN LOSSES
The allowance for loan losses represents the amount that management estimates is adequate to provide for probable losses inherent in the loan portfolio. It is the largest subjective measurement in the financial statements. The balance is derived as losses are charged against the allowance while recoveries are credited to it with charges to provision expense providing the amount necessary to maintain the appropriate balance per our analysis. As of December 31, 2006, the Company’s allowance totaled $4,469 which represented 1.46% of the loan portfolio at that date and 1.53% of the average loans outstanding during 2006.
As noted, the allowance is established through a provision for loan losses which is charged to operations. The provision is based on management’s periodic evaluation of the adequacy of the allowance for loan losses, taking into consideration the overall risk characteristics of the portfolio, our specific loan loss experience, current and projected economic conditions, industry loan experience and other relevant factors. The estimates, including the amounts and timing of future cash flows relating to impaired loans, used to determine the adequacy of the allowance are particularly susceptible to significant change. The total allowance for loan losses is a combination of a specific allowance for identified problem loans, a formula allowance and a qualitative allowance. The specific allowance is determined by measuring impairment based upon the practices outlined in Statement of Financial Accounting Standards (“FAS”) No. 114,Accounting by Creditors for Impairment of a Loanand by FAS No. 118,Accounting by Creditors for Impairment of a Loan – Income Recognition and Disclosures.This standard prescribes methods to measure impairment and income recognition as well as documenting disclosure requirements. The formula allowance is calculated using two separate methods. First, we apply factors to outstanding loans by type and risk weighting, excluding those loans for which a specific allowance has been determined. These loss factors are determined by management using historical loss information, current economic factors, portfolio concentration analysis, current delinquency ratios and the experience level of the loan officers in conjunction with evaluations of specific loans during the loan review process. The second formula evaluates selected loans on an individual basis and allocates specific amounts to the allowance based on our internal risk assessment. The qualitative portion of the allowance is determined based upon management’s evaluation of a number of factors including: national and local economic business conditions, collateral values within the portfolio, credit quality trends and management’s evaluation of our particular loan portfolio as a whole.
The Company employs an experienced outside professional loan review agency to perform the loan review function. In order to test the majority of the asset category, a review of commercial loan relationships which approximate 66% of the portfolio is performed. This review is based upon current financial information of the customer, an analysis of loan concentrations, financial ratio comparisons, adherence to payment schedule, regulatory evaluations and peer comparisons. Management evaluates all other loans utilizing similar guidelines. After careful evaluation of all factors, a risk rate is assigned and an amount is calculated for each category of reviewed loans. Groups of smaller dollar loans are evaluated as a homogeneous pool with similar factors used to evaluate the appropriateness of the allowance for those loans.
17
DIMECO, INC.
SUMMARY OF LOAN LOSS EXPERIENCE
| | | | | | | | | | | | | | | | | | | | |
| | | 2006 | | | 2005 | | | 2004 | | | 2003 | | | 2002 | |
Balance January 1, | | $ | 3,973 | | | $ | 3,172 | | | $ | 3,014 | | | $ | 2,818 | | | $ | 2,373 | |
Charge-offs: | | | | | | | | | | | | | | | | | | | | |
Commercial | | | 37 | | | | 106 | | | | 32 | | | | 69 | | | | 100 | |
Real estate | | | 181 | | | | — | | | | 860 | | | | 558 | | | | 48 | |
Installment | | | 153 | | | | 200 | | | | 226 | | | | 195 | | | | 151 | |
| | | | | | | | | | | | | | | | | | | | |
Total charge-offs | | | 371 | | | | 306 | | | | 1,118 | | | | 822 | | | | 299 | |
| | | | | | | | | | | | | | | | | | | | |
Recoveries: | | | | | | | | | | | | | | | | | | | | |
Commercial | | | 5 | | | | 46 | | | | 4 | | | | 4 | | | | 6 | |
Real estate | | | 6 | | | | 141 | | | | 89 | | | | 2 | | | | 23 | |
Installment | | | 71 | | | | 70 | | | | 57 | | | | 52 | | | | 40 | |
| | | | | | | | | | | | | | | | | | | | |
Total recoveries | | | 82 | | | | 257 | | | | 150 | | | | 58 | | | | 69 | |
| | | | | | | | | | | | | | | | | | | | |
Net charge-offs | | | 289 | | | | 49 | | | | 968 | | | | 764 | | | | 230 | |
| | | | | |
Additions charged to operations | | | 785 | | | | 850 | | | | 1,126 | | | | 960 | | | | 675 | |
| | | | | | | | | | | | | | | | | | | | |
Balance December 31, | | $ | 4,469 | | | $ | 3,973 | | | $ | 3,172 | | | $ | 3,014 | | | $ | 2,818 | |
| | | | | | | | | | | | | | | | | | | | |
Ratio of net charge-offs during the period to average loans outstanding during the period | | | .10 | % | | | .02 | % | | | .41 | % | | | .37 | % | | | .13 | % |
| | | | | |
Allowance for loan loss as a % of average loans outstanding | | | 1.53 | % | | | 1.47 | % | | | 1.34 | % | | | 1.47 | % | | | 1.63 | % |
CONTRACTUAL OBLIGATIONS, COMMITMENTS AND OFF-BALANCE SHEET ARRANGEMENTS
The following table sets forth contractual obligations of the Company which represent required and potential cash outflows as of December 31, 2006. Further discussion of the nature of each obligation is included in the referenced note to the financial statements:
| | | | | | | | | | | | | | | | | |
| | | Payments Due In |
| | | Note
Reference | | One Year
or Less | | One to
Three
Years | | Three to
Five Years | | Over Five
Years | | Total |
Deposits without a stated maturity | | | | $ | 142,579 | | $ | — | | $ | — | | $ | — | | $ | 142,579 |
Time deposits | | 6 | | $ | 145,801 | | $ | 32,052 | | $ | 17,685 | | $ | — | | $ | 195,538 |
Short-term borrowings | | 7 | | $ | 12,705 | | $ | — | | $ | — | | $ | — | | $ | 12,705 |
Other borrowed funds | | 8 | | $ | 2,000 | | $ | — | | $ | 1,000 | | $ | 10,763 | | $ | 13,763 |
Supplemental retirement plan | | 10 | | $ | 50 | | $ | 100 | | $ | 100 | | $ | 2,150 | | $ | 2,400 |
Operating leases | | 12 | | $ | 257 | | $ | 229 | | $ | 97 | | $ | 171 | | $ | 754 |
18
DIMECO, INC.
The following table details the amounts and expected maturities of significant commitments as of December 31, 2006. Further discussion of these commitments is included in Note 12 to the financial statements:
| | | | | | | | | | | | | | | |
| | | One Year or Less | | One to Three Years | | Three to Five Years | | Over Five Years | | Total |
Commitments to extend credit: | | | | | | | | | | | | | | | |
Commercial | | $ | 25,628 | | $ | 4,989 | | $ | — | | $ | 167 | | $ | 30,784 |
Residential real estate | | $ | 4,211 | | $ | 343 | | $ | — | | $ | 5 | | $ | 4,559 |
Revolving home equity | | $ | 55 | | $ | 237 | | $ | 319 | | $ | 3,948 | | $ | 4,559 |
Other | | $ | 7,698 | | $ | 24 | | $ | — | | $ | — | | $ | 7,722 |
Standby letters of credit | | $ | 3,423 | | $ | — | | $ | — | | $ | — | | $ | 3,423 |
RESULTS OF OPERATIONS
2006 Compared to 2005
The year ended December 31, 2006 provided net income of $5,585, recognizing an increase of $1,130 or 25.4% over the previous year end. The majority of the increase in net income is attributable to greater net interest income for the year with efficiency in other cost categories contributing to the growth.
Net Interest Income
Net interest income is the amount that interest earned on assets exceeds interest paid on deposits and borrowings. In 2006, this amount increased $2,084 or 15.9% more than was realized in 2005. The following discussion regarding net interest income should be read in conjunction with the scheduleDistribution of Assets, Liabilities and Stockholders’ Equity: Interest Rates and Interest DifferentialandRate/Volume Analysis of Changes in Net Interest Income.
Interest and fees on loans increased $4,451 or 26.0% over the previous year with interest rate increases being the greatest contribution to this change. Although the average loan portfolio grew by $21,008 or 7.8% over balances at the end of 2005, the average interest rate received on the portfolio increased from 6.33% to 7.40% over the time frame. With over 70% of the loan portfolio invested in variable rate loans, the Company, through its bank subsidiary, recognized greater income while the prime interest rate increased 1.0% during 2006. Commercial real estate loans have been granted with the rate of interest fixed for up to three years, converting to an adjustable rate that is tied to the prime interest rate for the remainder of the loan term. Many of these loans reached the conversion to adjustable rate during 2006, thereby increasing the rates received since prime interest rates have increased substantially over the past three years, in some cases by up to 4.0%. Management has made rate adjustments in some cases in order to maintain relationships with customers ensuring that the rate adjustment remains within current market rates for similar new loan offerings.
Interest earned on taxable investment securities increased $715 or 40.3% from 2005 to 2006. Growth of $3,176 in the average balance of the portfolio contributed to the greater results, but the main reason for higher income is attributable to an increase of 1.16% in the average rate earned on the portfolio in 2006 as compared to 2005, accounting for $598 of the increase. Management has primarily invested in short-term commercial paper rather than extend maturities in the current interest rate environment. Short-term rates offer the ability to reinvest in longer term securities when the interest rate yield curve becomes more traditional while earning a similar or higher rate of interest to those investments. We believe that our primary source of interest income will continue to be generated from loans and have made investments in securities that will support this philosophy by maintaining liquidity. Although a portion of the investment portfolio is invested in longer-term securities, we are willing to wait until the yield curve offers incentives to extend the maturity of more of the portfolio.
19
DIMECO, INC.
DISTRIBUTION OF ASSETS, LIABILITIES AND STOCKHOLDERS’ EQUITY;
INTEREST RATES AND INTEREST DIFFERENTIAL
| | | | | | | | | | | | | | | | | | | | | | | | | | | |
| | | 2006 | | | 2005 | | | 2004 | |
| | | Average
Balance(3) | | Revenue/
Expense | | Yield/
Rate | | | Average
Balance(3) | | Revenue/
Expense | | Yield/
Rate | | | Average
Balance(3) | | Revenue/
Expense | | Yield/
Rate | |
ASSETS | | | | | | | | | | | | | | | | | | | | | | | | | | | |
Interest-earning assets: | | | | | | | | | | | | | | | | | | | | | | | | | | | |
Total loans(1)(4) | | $ | 291,823 | | $ | 21,601 | | 7.40 | % | | $ | 270,815 | | $ | 17,150 | | 6.33 | % | | $ | 237,089 | | $ | 13,847 | | 5.84 | % |
Investment securities: | | | | | | | | | | | | | | | | | | | | | | | | | | | |
Taxable(5) | | | 51,525 | | | 2,491 | | 4.83 | % | | | 48,349 | | | 1,776 | | 3.67 | % | | | 48,344 | | | 1,674 | | 3.46 | % |
Exempt from federal income tax(2) | | | 5,444 | | | 338 | | 6.20 | % | | | 3,682 | | | 229 | | 6.22 | % | | | 5,422 | | | 352 | | 6.50 | % |
Interest-bearing deposits | | | 962 | | | 48 | | 4.99 | % | | | 1,235 | | | 37 | | 3.00 | % | | | 610 | | | 9 | | 1.48 | % |
Federal funds sold | | | 5,570 | | | 283 | | 5.08 | % | | | 3,007 | | | 88 | | 2.93 | % | | | 3,196 | | | 46 | | 1.44 | % |
| | | | | | | | | | | | | | | | | | | | | | | | | | | |
Total interest-earning assets/interest income | | | 355,324 | | | 24,761 | | 6.97 | % | | | 327,088 | | | 19,280 | | 5.89 | % | | | 294,661 | | | 15,928 | | 5.41 | % |
| | | | | | | | | |
Cash and due from banks | | | 5,824 | | | | | | | | | 5,810 | | | | | | | | | 5,608 | | | | | | |
Premises and equipment, net | | | 5,840 | | | | | | | | | 6,129 | | | | | | | | | 4,639 | | | | | | |
Other assets, less allowance for loan losses | | | 5,269 | | | | | | | | | 4,876 | | | | | | | | | 6,320 | | | | | | |
| | | | | | | | | | | | | | | | | | | | | | | | | | | |
Total Assets | | $ | 372,257 | | | | | | | | $ | 343,903 | | | | | | | | $ | 311,228 | | | | | | |
| | | | | | | | | | | | | | | | | | | | | | | | | | | |
| | | | | | | | | |
LIABILITIES AND STOCKHOLDERS’ EQUITY | | | | | | | | | | | | | | | | | | | | | | | | | | | |
Interest-bearing liabilities: | | | | | | | | | | | | | | | | | | | | | | | | | | | |
Savings | | $ | 36,795 | | $ | 265 | | .72 | % | | $ | 41,969 | | $ | 294 | | .70 | % | | $ | 42,516 | | $ | 248 | | .58 | % |
Interest-bearing checking | | | 69,728 | | | 1,215 | | 1.74 | % | | | 67,973 | | | 727 | | 1.07 | % | | | 64,304 | | | 520 | | .81 | % |
Time deposits | | | 166,680 | | | 6,967 | | 4.18 | % | | | 138,379 | | | 4,362 | | 3.15 | % | | | 124,913 | | | 3,233 | | 2.59 | % |
Short-term borrowings | | | 15,734 | | | 371 | | 2.36 | % | | | 14,856 | | | 207 | | 1.39 | % | | | 13,142 | | | 129 | | .98 | % |
Other borrowed funds | | | 15,119 | | | 660 | | 4.37 | % | | | 12,724 | | | 528 | | 4.15 | % | | | 6,873 | | | 282 | | 4.10 | % |
| | | | | | | | | | | | | | | | | | | | | | | | | | | |
Total interest-bearing liabilities/interest expense | | | 304,056 | | | 9,478 | | 3.12 | % | | | 275,901 | | | 6,118 | | 2.22 | % | | | 251,748 | | | 4,412 | | 1.75 | % |
| | | | | | | | | |
Noninterest-bearing deposits | | | 32,242 | | | | | | | | | 35,298 | | | | | | | | | 29,264 | | | | | | |
Other liabilities | | | 2,712 | | | | | | | | | 2,036 | | | | | | | | | 1,749 | | | | | | |
| | | | | | | | | | | | | | | | | | | | | | | | | | | |
Total Liabilities | | | 339,010 | | | | | | | | | 313,235 | | | | | | | | | 282,761 | | | | | | |
| | | | | | | | | |
Stockholders’ Equity | | | 33,247 | | | | | | | | | 30,668 | | | | | | | | | 28,467 | | | | | | |
| | | | | | | | | | | | | | | | | | | | | | | | | | | |
Total Liabilities and Stockholders’ Equity | | $ | 372,257 | | | | | | | | $ | 343,903 | | | | | | | | $ | 311,228 | | | | | | |
| | | | | | | | | | | | | | | | | | | | | | | | | | | |
| | | | | | | | | | | | | | | | | | | | | | | | | | | |
Net interest income/interest spread | | | | | $ | 15,283 | | 3.85 | % | | | | | $ | 13,162 | | 3.67 | % | | | | | $ | 11,516 | | 3.66 | % |
| | | | | | | | | | | | | | | | | | | | | | | | | | | |
Margin Analysis: | | | | | | | | | | | | | | | | | | | | | | | | | | | |
Interest income/earning assets | | | | | $ | 24,761 | | 6.97 | % | | | | | $ | 19,280 | | 5.89 | % | | | | | $ | 15,928 | | 5.41 | % |
Interest expense/earning assets | | | | | | 9,478 | | 2.67 | % | | | | | | 6,118 | | 1.87 | % | | | | | | 4,412 | | 1.50 | % |
| | | | | | | | | | | | | | | | | | | | | | | | | | | |
Net interest income/earning assets | | | | | $ | 15,283 | | 4.30 | % | | | | | $ | 13,162 | | 4.02 | % | | | | | $ | 11,516 | | 3.91 | % |
| | | | | | | | | | | | | | | | | | | | | | | | | | | |
Ratio of average interest-earning to assets average interest-bearing liabilities | | | | | | | | 116.86 | % | | | | | | | | 118.55 | % | | | | | | | | 117.05 | % |
(1) | Nonaccrual loans are not included. |
(2) | Income on interest-earning assets is based on a taxable equivalent basis using a federal income tax rate of 34%. |
(3) | Average balances are calculated using daily balances. |
(4) | Interest on loans includes fee income. |
(5) | Includes equity investments in FHLB and ACBB. |
Certain amounts for prior years have been reclassified in order to conform to current presentation.
20
DIMECO, INC.
RATE/VOLUME ANALYSIS OF CHANGES IN NET INTEREST INCOME
| | | | | | | | | | | | | | | | | | | | | | | | |
| | | 2006 Compared to 2005 | | | 2005 Compared to 2004 | |
| | | Total | | | Caused by | | | Total | | | Caused by | |
| | | Variance | | | Rate(1) | | | Volume | | | Variance | | | Rate(1) | | | Volume | |
Interest income: | | | | | | | | | | | | | | | | | | | | | | | | |
Loans (gross) | | $ | 4,451 | | | $ | 3,121 | | | $ | 1,330 | | | $ | 3,303 | | | $ | 1,333 | | | $ | 1,970 | |
Investment securities: | | | | | | | | | | | | | | | | | | | | | | | | |
Taxable | | | 715 | | | | 598 | | | | 117 | | | | 102 | | | | 102 | | | | — | |
Exempt from federal income tax(2) | | | 109 | | | | (1 | ) | | | 110 | | | | (123 | ) | | | (10 | ) | | | (113 | ) |
Interest-bearing deposits | | | 11 | | | | 20 | | | | (9 | ) | | | 28 | | | | 19 | | | | 9 | |
Federal funds sold | | | 195 | | | | 120 | | | | 75 | | | | 42 | | | | 45 | | | | (3 | ) |
| | | | | | | | | | | | | | | | | | | | | | | | |
Total interest-earning assets | | | 5,481 | | | | 3,858 | | | | 1,623 | | | | 3,352 | | | | 1,489 | | | | 1,863 | |
| | | | | | | | | | | | | | | | | | | | | | | | |
Interest expense: | | | | | | | | | | | | | | | | | | | | | | | | |
Savings | | | (29 | ) | | | 6 | | | | (35 | ) | | | 46 | | | | 49 | | | | (3 | ) |
Interest-bearing checking | | | 488 | | | | 469 | | | | 19 | | | | 207 | | | | 177 | | | | 30 | |
Time deposits | | | 2,605 | | | | 1,713 | | | | 892 | | | | 1,129 | | | | 780 | | | | 349 | |
Short-term borrowings | | | 164 | | | | 152 | | | | 12 | | | | 78 | | | | 61 | | | | 17 | |
Other borrowings | | | 132 | | | | 33 | | | | 99 | | | | 246 | | | | 6 | | | | 240 | |
| | | | | | | | | | | | | | | | | | | | | | | | |
Total interest-bearing liabilities | | | 3,360 | | | | 2,373 | | | | 987 | | | | 1,706 | | | | 1,073 | | | | 633 | |
| | | | | | | | | | | | | | | | | | | | | | | | |
Net change in net interest income | | $ | 2,121 | | | $ | 1,485 | | | $ | 636 | | | $ | 1,646 | | | $ | 416 | | | $ | 1,230 | |
| | | | | | | | | | | | | | | | | | | | | | | | |
(1) | Changes in interest income or expense not arising solely as a result of volume or rate variances are allocated to rate variances due to the interest sensitivity of assets and liabilities. |
(2) | Income on interest-earning assets is based on a taxable equivalent basis using a federal income tax rate of 34%. |
Interest expense increased $3,360 or 54.9% in 2006 as compared to 2005. Although the transfer of many accounts from noninterest-bearing to interest-bearing did increase the expense, volume accounted for only $19 of the $488 in greater expense in 2006. The remaining growth was primarily attributable to the average interest rate paid for money market deposits which increased by 1.45% to 3.19% in 2006. We added an additional, higher interest rate tier to the product in order to compete with other money market providers in the financial services industry for large balance deposits. The primary cause of increased interest expense in 2006 was attributable to the rate of interest paid for certificates of deposit. The average rate paid for these deposits increased by 1.03% over the period to not only keep pace with short-term market rate increases but to keep pace with local competitors’ rate offerings. Each of the markets we serve has multiple financial institutions included, each of which experience pressure to increase their deposit base. This pressure has grown more so now than in recent years as customers are more confident investing in the stock market or in insurance products, adding more competition than from banks alone. While average time deposits increased $28,301 in 2006, only $892 of the interest expense increase was attributable to these higher balances and $1,713 was due to higher interest rates paid.
Provision for Loan Losses
The provision for loan losses declined $65 or 7.6% in 2006 as compared to 2005. Although the decline in expense is not a significant dollar amount, many factors contribute to the expense recorded each year. Loans charged off were $371 in 2006 with recoveries of previously charged off loans amounting to $82. The loan portfolio grew by 7.7% or $21,729 in 2006. After careful analysis of many factors, management determines the appropriate balance for the allowance for loan losses and funds the difference in the allowance account through provision expense. After expensing $785 in 2006, the allowance as a percentage of loans was 1.46% and represented the amount which we believe to be adequate to address possible future losses. Management has succeeded in maintaining a low delinquency average in recent years, with only .71% of the loan portfolio past due 30 days or more at December 31, 2006.
Noninterest Income
Noninterest income increased $355 or 12.7% in 2006 as compared to 2005. The primary source of this increase was related to service charge income of $1,495, showing growth of $197 or 15.2% over the previous year. The main source of service charge income is derived from charges associated with our overdraft protection product which pays overdrafts on checking accounts up to predetermined amounts when needed. The customer pays a flat fee for the privilege of using
21
DIMECO, INC.
this service and their checks are not returned unpaid to the payee. The bank increased the number of checking accounts eligible for this service by 852 during 2006, enabling more customers to use this product along with increasing the fee per transaction by five dollars.
Gains on mortgage loans held for sale declined in 2006 with the number of mortgages sold in the secondary market remaining flat while the gain recognized on each sale declined from levels seen in previous years. The residential mortgage interest rate environment was more favorable in 2005 for recognizing gains on these sales than they were in 2006.
Brokerage commissions increased $105 or 28.3% in 2006 over the $371 earned in 2005 to account for $476 of earnings in 2006. Our investments department recognized substantial activity in the fourth quarter of 2006 with the culmination of several large transactions. After a long introductory period in this business sector and much learning on management’s part, we believe that this area of our business is now in place to continue to grow each year. Our customers are becoming more aware that we can meet or exceed their investment needs and the frontline staff has received extensive training to recognize and refer potential candidates for these products to investment representatives.
Other income encompasses many other smaller sources of revenue that is not related to interest income and accounted for $773 in 2006, an increase of $153 or 24.7% more than in 2005. The largest of these income sources was an increase of $80 in relation to the recovery of market value declines recorded in 2005 on the value of the mortgage servicing rights asset. In addition, fees earned in relation to our debit card portfolio increased $62 or 40.3% to $214 in 2006 with greater penetration of our checking accounts in 2006. We eliminated an annual fee and charged no transaction fee for use of the card while granting incentives to our staff for cross selling this product. With more cards used by our customers we have realized greater fee income from issuing companies. Trust service income grew by $32 or 267.1% with the Bank terminating use of an outside agent to administer the program in 2006 along with additional assets under management. Offsetting these gains in income recognition during 2006 was income relating to the merchant card processing. This activity declined $42 due to challenges associated with the third party administrator for the program. This problem has been addressed and management believes that the program will regain the momentum begun in 2005.
Noninterest Expense
Expenses incurred in relation to salaries and employee benefits increased $752 or 16.6% from 2005 to 2006. Actual payroll expense increased $395 or 11.9% as a result of the net effect of adding one additional full time equivalent employee, along with annual salary adjustments during the year. Employees are paid an incentive based upon goals that are set at the beginning of each year. The incentive rate is based on return on average equity. Due to the successful accomplishment of these goals in 2006, incentives for the year 2006 were $155 or 65.1% greater than in 2005. Employee benefits increased $123 or 16.4% due to higher premiums paid for health insurance along with higher employer payroll taxes based on greater payroll expense. Contributions to the Bank’s 401(k) retirement plan were $78 greater because more employees were eligible for the benefit in addition to the Board of Directors adding an extra 1% toward the discretionary profit sharing segment for 2006 due to the Company’s favorable return this year.
All other categories of noninterest expense showed variations from the previous year, none of which were significant dollar amounts.
2005 Compared to 2004
Net income for the year ended December 31, 2005 was $4,455, representing an increase of $549 or 14.1% greater than the fiscal year ended December 31, 2004.
Net Interest Income
The following discussion regarding net interest income should be read in conjunction with the scheduleDistribution of Assets, Liabilities and Stockholders’ Equity: Interest Rates and Interest DifferentialandRate/Volume Analysis of Changes in Net Interest Income.
Interest and fees on loans increased $3,303 or 23.9% in 2005 versus 2004. As demonstrated in the table, the average rate of interest earned in the loan portfolio for 2005 was 6.33%, or 49 basis points greater than that earned in 2004. The higher average rate received is responsible for $1,332 of the increase in income earned. During the year 2005, many variable rate loans which had annual or longer repricing intervals did reprice at higher interest rates. The largest part of the expansion in interest earned, $1,970, is attributable to growth of $33,726 in the average size of the portfolio in the year 2005 as compared to the previous year. The Bank has continued to generate new loans, in particular commercial and commercial real estate loans, in our marketplace and in the children’s camping sector.
22
DIMECO, INC.
Interest earned on investments for the year 2005 was fairly stable from year to year while the types of investments varied during the period. Management did not believe that the risk of extending maturities was evident in the market for the majority of 2005, investing some longer term investment maturities in short term commercial paper. We are confident of this strategy to maintain liquidity for loan activity while remaining positioned to take advantage of increases in long term interest rates as they may occur. Therefore, interest earned on taxable investments increased only slightly, by 21 basis points, in spite of a rise of 200 basis points in federal funds sold over the period. The maturities of corporate bonds during the year came from investments which were purchased in periods which offered much higher long term interest rates which were not available for similar quality investments in 2005. There was much greater activity of maturities and calls of US government agencies during 2004, thereby producing lower average balances of these securities in 2005 as compared to 2004. Interest rates offered on these bonds in 2005 were not comparable to that seen in 2004. The tax exempt investment portfolio also had greater amounts of securities called in 2004, leaving lower average balances for 2005. Management has pursued purchasing some tax exempt bonds to replace some maturities in an effort to offer a stable maturity schedule in the future.
Interest expense increased $1,706 or 38.7% in 2005 over amounts paid in 2004. The majority of the added expense was due to rising interest rates paid for deposits, but also had increases attributable to deposit growth. Savings and interest-bearing checking deposits remained fairly stable during the year while the average interest paid on savings increased 12 basis points and checking 26 basis points. These account types are not as sensitive to rates as other deposits and management did not feel it necessary to offer higher interest rates at this time. Special interest rates were offered during all of 2005 for time deposits, increasing the average balances by $13,466 during 2005. Interest paid for time deposits averaged a rate of 3.15% during the year, greater by 56 basis points than those offered in 2004. Due to short term market rates rising by 200 basis points, management believed that offering higher rates was essential to maintaining deposits. Each pricing decision is made with consideration to interest rates offered for other funding sources. As a community bank, we believe that it is appropriate to develop relationships with our customers and when similar results can be accomplished by offering special rates on deposit products or accessing other sources, we generally will use the deposit route to procure funds. Short-term borrowings are mainly related to sweep accounts offered to select commercial customers. The average rate paid on these borrowings escalated to 1.39% in 2005, representing 42 basis points more than in 2004. These customers are more sensitive to interest rate; therefore, management was more aggressive in pricing these funds. We expect to see these rates fluctuate at similar times, but in smaller increments than short-term market rates. Other borrowed funds increased on average by $5,851 or 85.1% due to FHLB borrowings made in order to facilitate offering fixed, long term interest rates to customers. The average rate of these borrowings was similar to those of 2004 with long term interest rates remaining fairly flat during the year even though short term interest rates increased as discussed above. Management believes that using this source of funding assures long term relationships with quality commercial customers.
Provision for Loan Losses
The provision for loan losses declined $276 or 24.5% in 2005 as compared to 2004. During 2004 the Bank experienced an unusual charge-off of $732 which did not recur in 2005. Rather, the level of collections of previously charged-off loans increased to $257 during 2005 which, combined with charge-offs of $306 for the year, assisted with the decline in provision expense for the year. The delinquency ratio at each quarter continued to remain at low levels, ending the year at .49% of loans. Although the loan portfolio grew by $30,421 or 12.0%, management continues to review the adequacy of the allowance for loan losses on a quarterly basis and believes that the expense recorded for 2005 presented an adequate balance in the allowance at year end.
Noninterest Income
The greatest source of noninterest income for the Company continues to be derived from service charges on deposit accounts. The balance of $1,298 for 2005 represented an increase of $48 or 3.9% over the previous year. During that time, checking account balances increased $4,349 or 6.3%. While it is usual to expect that this income category would fluctuate somewhat in line with the liability component, management believes that customers are less apt to use the overdraft protection feature of their accounts than in the past. They have increased utilization of electronic and telephone banking products to more accurately track their checking balances and make appropriate balance transfers, eliminating the need for as much overdraft protection. Improving economic conditions have also contributed to less utilization of the overdraft protection product. Gains on mortgage loans held-for-sale declined $172 or 37.4% from income recognized in 2004. Although the general level of loans originated and sold in the secondary market in 2005 is comparable to that of 2004, the opportunity to recognize gains on the sales is not as evident due to a fairly level interest rate scenario in 2005. The opportunity for gain on the sale of loans is greatest when interest rates are declining slowly and management is able to sell loans as rates decline, as experienced in 2004. The opportunity to recognize investment security gains in 2004 was not matched in 2005. Included in the increase of $75 or 13.8% in the category of other
23
DIMECO, INC.
income were many unrelated categories of income. The most significant of these are as follows: 1) fees earned in relation to administering the merchant credit card processing program increased $79 or 114.7% with the allocation of a full time employee to the program; 2) income earned in relation to the Bank’s title insurance subsidiary, TDB Insurances Services, LLC increased $46 or 96.2% in 2005 and 3) a decline in market value of $75 relating to the mortgage servicing rights was recorded in the second quarter of 2005 with an increase of $15 recorded in the fourth quarter of 2005, netting to a market value loss of $60 for the year.
Noninterest Expense
Salaries and employee benefits are the largest noninterest cost of operating a financial institution. As such, this expense category increased $590 or 15.0% in 2005 as compared to 2004. Management has hired six employees in the middle management ranks as we see the need for managers to take on more responsibility and train for future advancement. We also employed a full time accountant to work on the requirements of Sarbanes-Oxley Section 404 in 2005. In addition, our fifth banking office and TDB Insurance Services, LLC were open and fully staffed for the entire year of 2005 with employees hired beginning in the second half of 2004. We have faced stiff competition for entry level employees as large national retailers have entered or expanded in our marketplaces, therefore increasing salaries paid to these employees. Health insurance premiums continued to increase in cost per employee, rising 14% in 2005 over 2004 costs. The Bank receives peer analysis of its financial condition from regulatory sources which show that the personnel expense as a percent of average assets was 1.32% as compared to a national average of 1.57%, placing the Bank in the 29thpercentile for this efficiency ratio.
Occupancy expense increased $113 or 17.8% and furniture and fixture expense increased $68 or 13.9% with the majority of these increases attributable to the Dingmans Ferry office expense.
The category of other expense includes many diverse expense items. These expenses increased $190 or 11.5% in 2005 as compared to 2004. Many of these line item accounts increased consistent with the addition of another banking office. The largest variances in this total category have to do with the following: 1) advertising expense increased $111 or 52.6% with the Bank using the services of an outside consultant to assist in attracting deposit accounts and promotion of the Bank’s 100th anniversary at the end of 2005 and beginning of 2006; 2) donations expense increased $38 or 35.9% as a result of our policy of making charitable contributions in the communities we serve, including the newest office in Dingmans Ferry along with $17 as the initial payment of a five year commitment towards the local hospital’s capital campaign; 3) increased PA shares tax expense of $21 or 11.1% which is based on the average equity of the Bank and 4) a decline of $57 or 101.4% in expense relating to other real estate owned since there were no assets in this category during 2005. Other smaller changes accounted for the remaining difference in expense.
MARKET PRICES OF STOCK/DIVIDENDS DECLARED
The Company’s stock is listed on the OTC Bulletin Board under the symbol “DIMC.” The book value per share at December 31, 2006 was $23.17 and represented an increase of 12.9% over the 2005 book value of $20.53. There were approximately 750 shareholders of record at December 31, 2006. This number does not include persons or entities that hold their stock in nominee name through various brokerage firms.
The following table sets forth high and low sale prices per share of the common stock and dividends declared for the calendar quarters indicated, based upon information obtained from published sources:
MARKET PRICES OF STOCK / DIVIDENDS DECLARED
| | | | | | | | | | | | | | | | | | |
| | | 2006 | | 2005 |
| | | High | | Low | | Dividend Declared | | High | | Low | | Dividend Declared |
First Quarter | | $ | 34.50 | | $ | 33.25 | | $ | .26 | | $ | 39.50 | | $ | 34.75 | | $ | .25 |
Second Quarter | | $ | 37.00 | | $ | 33.81 | | $ | .26 | | $ | 36.85 | | $ | 34.00 | | $ | .25 |
Third Quarter | | $ | 37.00 | | $ | 35.80 | | $ | .26 | | $ | 36.00 | | $ | 33.50 | | $ | .25 |
Fourth Quarter | | $ | 43.00 | | $ | 37.00 | | $ | .29 | | $ | 35.75 | | $ | 33.75 | | $ | .26 |
24
DIMECO, INC.
The ability of the Company to pay dividends is dependent upon the ability of the Bank to pay dividends to the Company. The Bank is a depository institution insured by the FDIC and therefore it may not pay dividends or distribute capital assets if it is in default on any assessment due the FDIC. Additionally, the Bank is subject to certain state banking regulations that limit the ability of the Bank to pay dividends to the Company. Under Federal Reserve policy, the Company is required to maintain adequate regulatory capital and is expected to act as a source of financial strength to the Bank and to commit resources to support the Bank in circumstances where it might not do so absent such a policy. These regulations may have the effect of reducing the amount of future dividends declarable by the Company.
Set forth below is a stock performance graph comparing the cumulative total shareholder return on the Common Stock with (a) the cumulative total return on stocks included in The Nasdaq Stock Market index and (b) the cumulative total return on stocks included in the Nasdaq Bank index, as prepared for Nasdaq by the Center for Research in Securities Prices (“CRSP”) at the University of Chicago. All three investment comparisons assume the investment of $100 at the market close on December 31, 2001 and the reinvestment of dividends paid. The graph provides comparison at December 31, 2002 and each fiscal year through December 31, 2006.
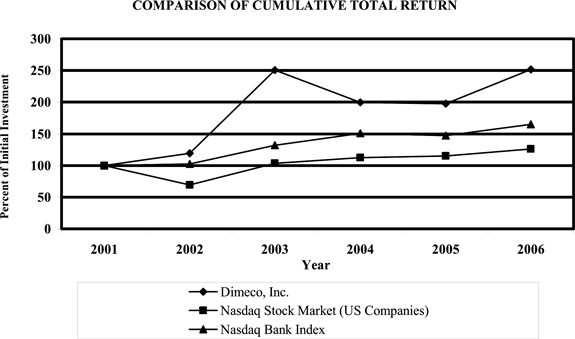
Historical Total Return Values
| | | | | | | | | | | | |
Index | | 12/31/01 | | 12/31/02 | | 12/31/03 | | 12/31/04 | | 12/31/05 | | 12/31/06 |
Dimeco, Inc. | | 100.0 | | 119.1 | | 250.4 | | 199.6 | | 197.7 | | 251.8 |
| | | | | | |
Nasdaq Stock Market (US Companies) | | 100.0 | | 69.1 | | 103.4 | | 112.5 | | 114.9 | | 126.2 |
| | | | | | |
Nasdaq Bank Index | | 100.0 | | 102.4 | | 131.7 | | 150.7 | | 147.2 | | 165.2 |
There can be no assurance that the Company’s future stock performance will be the same or similar to the historical performance shown in the above graph. The Company neither makes nor endorses any predictions as to stock performance.
25
DIMECO, INC.
SUMMARY OF SELECTED FINANCIAL DATA
| | | | | | | | | | | | | | | | | | | | |
| | | 2006 | | | 2005 | | | 2004 | | | 2003 | | | 2002 | |
Summary of operations | | | | | | | | | | | | | | | | | | | | |
Interest income | | $ | 24,646 | | | $ | 19,202 | | | $ | 15,808 | | | $ | 15,321 | | | $ | 15,468 | |
Interest expense | | $ | 9,478 | | | $ | 6,118 | | | $ | 4,412 | | | $ | 4,699 | | | $ | 5,618 | |
Net interest income | | $ | 15,168 | | | $ | 13,084 | | | $ | 11,396 | | | $ | 10,622 | | | $ | 9,850 | |
Provision for loan losses | | $ | 785 | | | $ | 850 | | | $ | 1,126 | | | $ | 960 | | | $ | 675 | |
Net interest income after provision for loan losses | | $ | 14,383 | | | $ | 12,234 | | | $ | 10,270 | | | $ | 9,662 | | | $ | 9,175 | |
Other income | | $ | 3,156 | | | $ | 2,801 | | | $ | 2,933 | | | $ | 2,695 | | | $ | 1,719 | |
Other expenses | | $ | 9,341 | | | $ | 8,498 | | | $ | 7,525 | | | $ | 6,803 | | | $ | 5,974 | |
Income before income taxes | | $ | 8,198 | | | $ | 6,537 | | | $ | 5,678 | | | $ | 5,554 | | | $ | 4,920 | |
Income taxes | | $ | 2,613 | | | $ | 2,082 | | | $ | 1,772 | | | $ | 1,700 | | | $ | 1,549 | |
| | | | | |
Net income | | $ | 5,585 | | | $ | 4,455 | | | $ | 3,906 | | | $ | 3,854 | | | $ | 3,371 | |
| | | | | |
Per common share | | | | | | | | | | | | | | | | | | | | |
Earnings—basic* | | $ | 3.67 | | | $ | 2.89 | | | $ | 2.54 | | | $ | 2.54 | | | $ | 2.24 | |
Earnings—diluted* | | $ | 3.55 | | | $ | 2.80 | | | $ | 2.46 | | | $ | 2.45 | | | $ | 2.19 | |
Cash dividends* | | $ | 1.07 | | | $ | 1.01 | | | $ | 0.94 | | | $ | 0.87 | | | $ | 0.82 | |
Book value* | | $ | 23.17 | | | $ | 20.53 | | | $ | 19.17 | | | $ | 17.89 | | | $ | 16.25 | |
Shares outstanding at year end | | | 1,525,024 | | | | 1,522,669 | | | | 1,548,994 | | | | 1,526,134 | | | | 753,600 | |
| | | | | |
Balance sheet data—end of year | | | | | | | | | | | | | | | | | | | | |
Total assets | | $ | 403,577 | | | $ | 358,204 | | | $ | 325,721 | | | $ | 304,304 | | | $ | 280,952 | |
Loans, net of unearned | | $ | 305,291 | | | $ | 283,562 | | | $ | 253,141 | | | $ | 219,609 | | | $ | 187,361 | |
Loans held for sale | | $ | — | | | $ | 211 | | | $ | 112 | | | $ | 654 | | | $ | 1,195 | |
Investment securities: | | | | | | | | | | | | | | | | | | | | |
Available for sale | | $ | 67,266 | | | $ | 54,129 | | | $ | 55,662 | | | $ | 64,357 | | | $ | 78,880 | |
Held to maturity | | $ | — | | | $ | 199 | | | $ | 198 | | | $ | 197 | | | $ | 426 | |
Deposits | | $ | 338,117 | | | $ | 294,856 | | | $ | 270,542 | | | $ | 262,207 | | | $ | 239,359 | |
Stockholders’ equity | | $ | 35,337 | | | $ | 31,260 | | | $ | 29,696 | | | $ | 27,308 | | | $ | 24,519 | |
| | | | | |
Performance | | | | | | | | | | | | | | | | | | | | |
Return on average assets | | | 1.50 | % | | | 1.30 | % | | | 1.26 | % | | | 1.34 | % | | | 1.30 | % |
Return on average equity | | | 16.80 | % | | | 14.53 | % | | | 13.72 | % | | | 14.79 | % | | | 14.49 | % |
Dividend payout ratio | | | 29.16 | % | | | 34.95 | % | | | 37.01 | % | | | 35.51 | % | | | 36.30 | % |
Average equity to average assets ratio | | | 8.93 | % | | | 8.92 | % | | | 9.15 | % | | | 9.06 | % | | | 8.96 | % |
| * | Years before 2003 adjusted to reflect 100% stock split effected in the form of a dividend on 12/1/03. |
26
DIMECO, INC.

REPORT OF INDEPENDENT REGISTERED PUBLIC ACCOUNTING FIRM
The Board of Directors and Stockholders
Dimeco, Inc.
We have audited the consolidated balance sheet of Dimeco, Inc. and subsidiary as of December 31, 2006 and 2005, and the related consolidated statements of income, changes in stockholders’ equity, and cash flows for each of the three years in the period ended December 31, 2006. These financial statements are the responsibility of the Company’s management. Our responsibility is to express an opinion on these financial statements based on our audits.
We conducted our audits in accordance with the standards of the Public Company Accounting Oversight Board (United States). Those standards require that we plan and perform the audit to obtain reasonable assurance about whether the financial statements are free of material misstatement. An audit includes examining, on a test basis, evidence supporting the amounts and disclosures in the financial statements. An audit also includes assessing the accounting principles used and significant estimates made by management, as well as evaluating the overall financial statement presentation. We believe that our audits provide a reasonable basis for our opinion.
In our opinion, the consolidated financial statements referred to above present fairly, in all material respects, the financial position of Dimeco, Inc. and subsidiary as of December 31, 2006 and 2005, and the consolidated results of their operations and their cash flows for each of the three years in the period ended December 31, 2006, in conformity with U.S. generally accepted accounting principles.
|
/s/ S.R. Snodgrass, A.C. |
Wexford, Pennsylvania |
March 1, 2007 |
S.R. Snodgrass, A.C. 2100 Corporate Drive, Suite 400 Wexford, PA 15090-7647 Phone: 724-934-0344 Facsimile: 724-934-0345
27
DIMECO, INC.
CONSOLIDATED BALANCE SHEET
| | | | | | | | |
| | | December 31, | |
| (In thousands) | | 2006 | | | 2005 | |
Assets | | | | | | | | |
Cash and due from banks | | $ | 6,684 | | | $ | 5,554 | |
Interest-bearing deposits in other banks | | | 2,287 | | | | 33 | |
Federal funds sold | | | 10,000 | | | | 2,890 | |
| | | | | | | | |
Total cash and cash equivalents | | | 18,971 | | | | 8,477 | |
| | |
Mortgage loans held for sale | | | — | | | | 211 | |
Investment securities available for sale | | | 67,266 | | | | 54,129 | |
Investment securities held to maturity (fair value of $ 207) | | | — | | | | 199 | |
| | |
Loans (net of unearned income of $777 and $ 734) | | | 305,291 | | | | 283,562 | |
Less allowance for loan losses | | | 4,469 | | | | 3,973 | |
| | | | | | | | |
Net loans | | | 300,822 | | | | 279,589 | |
| | |
Premises and equipment | | | 5,731 | | | | 6,022 | |
Accrued interest receivable | | | 1,798 | | | | 1,380 | |
Bank-owned life insurance | | | 5,892 | | | | 5,254 | |
Other assets | | | 3,097 | | | | 2,943 | |
| | | | | | | | |
TOTAL ASSETS | | $ | 403,577 | | | $ | 358,204 | |
| | | | | | | | |
Liabilities | | | | | | | | |
Deposits: | | | | | | | | |
Noninterest-bearing | | $ | 34,172 | | | $ | 36,619 | |
Interest-bearing | | | 303,945 | | | | 258,237 | |
| | | | | | | | |
Total deposits | | | 338,117 | | | | 294,856 | |
| | |
Short-term borrowings | | | 12,705 | | | | 12,954 | |
Other borrowed funds | | | 13,763 | | | | 16,548 | |
Accrued interest payable | | | 1,428 | | | | 952 | |
Other liabilities | | | 2,227 | | | | 1,634 | |
| | | | | | | | |
TOTAL LIABILITIES | | | 368,240 | | | | 326,944 | |
| | | | | | | | |
Stockholders’ Equity | | | | | | | | |
Common stock, $.50 par value; 5,000,000 shares authorized; 1,568,024 and 1,552,669 shares issued | | | 784 | | | | 776 | |
Capital surplus | | | 4,775 | | | | 4,445 | |
Retained earnings | | | 31,355 | | | | 27,400 | |
Accumulated other comprehensive loss | | | (35 | ) | | | (299 | ) |
Treasury stock, at cost (43,000 and 30,000 shares) | | | (1,542 | ) | | | (1,062 | ) |
| | | | | | | | |
TOTAL STOCKHOLDERS’ EQUITY | | | 35,337 | | | | 31,260 | |
| | | | | | | | |
TOTAL LIABILITIES AND STOCKHOLDERS’ EQUITY | | $ | 403,577 | | | $ | 358,204 | |
| | | | | | | | |
The accompanying notes are an integral part of these consolidated financial statements.
28
DIMECO, INC.
CONSOLIDATED STATEMENT OF INCOME
| | | | | | | | | |
| | | Year Ended December 31, |
| (In thousands, except per share data) | | 2006 | | 2005 | | 2004 |
Interest Income | | | | | | | | | |
Interest and fees on loans | | $ | 21,601 | | $ | 17,150 | | $ | 13,847 |
Interest-bearing deposits in other banks | | | 48 | | | 37 | | | 9 |
Federal funds sold | | | 283 | | | 88 | | | 46 |
Investment securities: | | | | | | | | | |
Taxable | | | 2,491 | | | 1,776 | | | 1,674 |
Exempt from federal income tax | | | 223 | | | 151 | | | 232 |
| | | | | | | | | |
Total interest income | | | 24,646 | | | 19,202 | | | 15,808 |
| | | | | | | | | |
Interest Expense | | | | | | | | | |
Deposits | | | 8,447 | | | 5,383 | | | 4,001 |
Short-term borrowings | | | 371 | | | 207 | | | 129 |
Other borrowed funds | | | 660 | | | 528 | | | 282 |
| | | | | | | | | |
Total interest expense | | | 9,478 | | | 6,118 | | | 4,412 |
| | | | | | | | | |
Net Interest Income | | | 15,168 | | | 13,084 | | | 11,396 |
| | | |
Provision for loan losses | | | 785 | | | 850 | | | 1,126 |
| | | | | | | | | |
Net Interest Income After Provision for Loan Losses | | | 14,383 | | | 12,234 | | | 10,270 |
| | | | | | | | | |
Noninterest Income | | | | | | | | | |
Service charges on deposit accounts | | | 1,495 | | | 1,298 | | | 1,250 |
Mortgage loans held-for-sale gains, net | | | 182 | | | 288 | | | 460 |
Investment securities gains | | | — | | | 2 | | | 95 |
Brokerage commissions | | | 476 | | | 371 | | | 353 |
Earnings on bank-owned life insurance | | | 230 | | | 222 | | | 230 |
Other income | | | 773 | | | 620 | | | 545 |
| | | | | | | | | |
Total noninterest income | | | 3,156 | | | 2,801 | | | 2,933 |
| | | | | | | | | |
Noninterest Expense | | | | | | | | | |
Salaries and employee benefits | | | 5,272 | | | 4,520 | | | 3,930 |
Occupancy expense, net | | | 786 | | | 749 | | | 636 |
Furniture and equipment expense | | | 512 | | | 557 | | | 489 |
Professional fees | | | 496 | | | 482 | | | 447 |
Data processing expense | | | 391 | | | 352 | | | 375 |
Other expense | | | 1,884 | | | 1,838 | | | 1,648 |
| | | | | | | | | |
Total noninterest expense | | | 9,341 | | | 8,498 | | | 7,525 |
| | | | | | | | | |
Income before income taxes | | | 8,198 | | | 6,537 | | | 5,678 |
Income taxes | | | 2,613 | | | 2,082 | | | 1,772 |
| | | | | | | | | |
NET INCOME | | $ | 5,585 | | $ | 4,455 | | $ | 3,906 |
| | | | | | | | | |
Earnings Per Share: | | | | | | | | | |
Basic | | $ | 3.67 | | $ | 2.89 | | $ | 2.54 |
Diluted | | $ | 3.55 | | $ | 2.80 | | $ | 2.46 |
The accompanying notes are an integral part of these consolidated financial statements.
29
DIMECO, INC.
CONSOLIDATED STATEMENT OF CHANGES IN STOCKHOLDERS’ EQUITY
| | | | | | | | | | | | | | | | | | | | | | | | | | |
| (In thousands, except per share data) | | Common
Stock | | Capital
Surplus | | Retained
Earnings | | | Accumulated
Other
Comprehensive
Income (Loss) | | | Treasury
Stock | | | Total
Stockholders’
Equity | | | Comprehensive
Income | |
Balance, December 31, 2003 | | $ | 763 | | $ | 3,973 | | $ | 22,038 | | | $ | 534 | | | $ | — $ | | | | 27,308 | | | | | |
| | | | | | | |
Net income | | | | | | | | | 3,906 | | | | | | | | | | | | 3,906 | | | $ | 3,906 | |
Other comprehensive loss: | | | | | | | | | | | | | | | | | | | | | | | | | | |
Unrealized loss on available-for-sale securities, net of reclassification adjustment, net of tax benefit of $ 250 | | | | | | | | | | | | | (485 | ) | | | | | | | (485 | ) | | | (485 | ) |
| | | | | | | | | | | | | | | | | | | | | | | | | | |
Comprehensive income | | | | | | | | | | | | | | | | | | | | | | | | $ | 3,421 | |
| | | | | | | | | | | | | | | | | | | | | | | | | | |
Exercise of stock options | | | 11 | | | 404 | | | | | | | | | | | | | | | 415 | | | | | |
Cash dividends ($.94 per share) | | | | | | | | | (1,448 | ) | | | | | | | | | | | (1,448 | ) | | | | |
| | | | | | | | | | | | | | | | | | | | | | | | | | |
Balance, December 31, 2004 | | | 774 | | | 4,377 | | | 24,496 | | | | 49 | | | | — | | | | 29,696 | | | | | |
| | | | | | | |
Net income | | | | | | | | | 4,455 | | | | | | | | | | | | 4,455 | | | $ | 4,455 | |
Other comprehensive loss: | | | | | | | | | | | | | | | | | | | | | | | | | | |
Unrealized loss on available-for-sale securities, net of reclassification adjustment, net of tax benefit of $ 180 | | | | | | | | | | | | | (348 | ) | | | | | | | (348 | ) | | | (348 | ) |
| | | | | | | | | | | | | | | | | | | | | | | | | | |
Comprehensive income | | | | | | | | | | | | | | | | | | | | | | | | $ | 4,107 | |
| | | | | | | | | | | | | | | | | | | | | | | | | | |
Purchase of treasury stock | | | | | | | | | | | | | | | | | (1,062 | ) | | | (1,062 | ) | | | | |
Exercise of stock options | | | 2 | | | 68 | | | | | | | | | | | | | | | 70 | | | | | |
Cash dividends ($1.01 per share) | | | | | | | | | (1,551 | ) | | | | | | | | | | | (1,551 | ) | | | | |
| | | | | | | | | | | | | | | | | | | | | | | | | | |
Balance, December 31, 2005 | | | 776 | | | 4,445 | | | 27,400 | | | | (299 | ) | | | (1,062 | ) | | | 31,260 | | | | | |
| | | | | | | |
Net income | | | | | | | | | 5,585 | | | | | | | | | | | | 5,585 | | | $ | 5,585 | |
Other comprehensive income: | | | | | | | | | | | | | | | | | | | | | | | | | | |
Unrealized gain on available-for-sale securities, net of reclassification adjustment, net of tax expense of $135 | | | | | | | | | | | | | 264 | | | | | | | | 264 | | | | 264 | |
| | | | | | | | | | | | | | | | | | | | | | | | | | |
Comprehensive income | | | | | | | | | | | | | | | | | | | | | | | | $ | 5,849 | |
| | | | | | | | | | | | | | | | | | | | | | | | | | |
Purchase of treasury stock | | | | | | | | | | | | | | | | | (480 | ) | | | (480 | ) | | | | |
Exercise of stock options | | | 8 | | | 330 | | | | | | | | | | | | | | | 338 | | | | | |
Cash dividends ($1.07 per share) | | | | | | | | | (1,630 | ) | | | | | | | | | | | (1,630 | ) | | | | |
| | | | | | | | | | | | | | | | | | | | | | | | | | |
Balance, December 31, 2006 | | $ | 784 | | $ | 4,775 | | $ | 31,355 | | | $ | (35 | ) | | $ | (1,542 | ) | | $ | 35,337 | | | | | |
| | | | | | | | | | | | | | | | | | | | | | | | | | |
| | | | | | | |
| | | | | | | | | | 2006 | | | 2005 | | | 2004 | | | | |
Components of other comprehensive income (loss): | | | | | | | | | | | | | | | | | | | | | | | | | | |
Change in net unrealized gain (loss) on investment securities available for sale | | | | | | | | | | | | $ | 264 | | | $ | (347 | ) | | $ | (422 | ) | | | | |
Realized gains included in net income, net of taxes of $0, $1, and $ 32 | | | | | | | | | | | | | — | | | | (1 | ) | | | (63 | ) | | | | |
| | | | | | | | | | | | | | | | | | | | | | | | | | |
Total | | | | | | | | | | | | $ | 264 | | | $ | (348 | ) | | $ | (485 | ) | | | | |
| | | | | | | | | | | | | | | | | | | | | | | | | | |
The accompanying notes are an integral part of these consolidated financial statements.
30
DIMECO, INC.
CONSOLIDATED STATEMENT OF CASH FLOWS
| | | | | | | | | | | | |
| | | Year Ended December 31, | |
| (In thousands) | | 2006 | | | 2005 | | | 2004 | |
Operating Activities | | | | | | | | | | | | |
Net income | | $ | 5,585 | | | $ | 4,455 | | | $ | 3,906 | |
Adjustments to reconcile net income to net cash provided by operating activities: | | | | | | | | | | | | |
Provision for loan losses | | | 785 | | | | 850 | | | | 1,126 | |
Depreciation and amortization | | | 743 | | | | 790 | | | | 736 | |
Amortization of premium and discount on investment securities, net | | | (1,235 | ) | | | (714 | ) | | | (126 | ) |
Amortization of net deferred loan origination fees | | | (133 | ) | | | (108 | ) | | | (99 | ) |
Investment securities gains | | | — | | | | (2 | ) | | | (95 | ) |
Origination of loans held for sale | | | (6,917 | ) | | | (12,430 | ) | | | (12,302 | ) |
Proceeds from sale of loans | | | 7,310 | | | | 12,619 | | | | 12,896 | |
Mortgage loans sold gains, net | | | (182 | ) | | | (288 | ) | | | (460 | ) |
Decrease (increase) in accrued interest receivable | | | (418 | ) | | | (274 | ) | | | 189 | |
Increase (decrease) in accrued interest payable | | | 476 | | | | 343 | | | | (69 | ) |
Deferred federal income taxes | | | (235 | ) | | | (311 | ) | | | 264 | |
Earnings on bank-owned life insurance | | | (230 | ) | | | (189 | ) | | | (204 | ) |
Other, net | | | 295 | | | | 335 | | | | (236 | ) |
| | | | | | | | | | | | |
Net cash provided by operating activities | | | 5,844 | | | | 5,076 | | | | 5,526 | |
| | | | | | | | | | | | |
Investing Activities | | | | | | | | | | | | |
Investment securities available for sale: | | | | | | | | | | | | |
Proceeds from sales | | | — | | | | 6 | | | | 174 | |
Proceeds from maturities or paydown | | | 252,970 | | | | 214,833 | | | | 94,873 | |
Purchases | | | (264,474 | ) | | | (213,118 | ) | | | (86,868 | ) |
Investment securities held to maturity: | | | | | | | | | | | | |
Proceeds from maturities or paydown | | | 200 | | | | — | | | | — | |
Redemption of Federal Home Loan Bank stock | | | 671 | | | | 1,021 | | | | 813 | |
Purchase of Federal Home Loan Bank stock | | | (641 | ) | | | (1,014 | ) | | | (1,236 | ) |
Net increase in loans | | | (21,885 | ) | | | (30,362 | ) | | | (34,901 | ) |
Purchase of bank-owned life insurance | | | (442 | ) | | | — | | | | — | |
Purchase of premises and equipment | | | (250 | ) | | | (996 | ) | | | (1,887 | ) |
Proceeds from the sale of other real estate | | | — | | | | — | | | | 500 | |
| | | | | | | | | | | | |
Net cash used for investing activities | | | (33,851 | ) | | | (29,630 | ) | | | (28,532 | ) |
| | | | | | | | | | | | |
Financing Activities | | | | | | | | | | | | |
Net increase in deposits | | | 43,261 | | | | 24,314 | | | | 8,335 | |
Increase (decrease) in short-term borrowings | | | (249 | ) | | | 921 | | | | 233 | |
Proceeds from other borrowed funds | | | 1,225 | | | | 5,725 | | | | 10,600 | |
Repayment of other borrowed funds | | | (4,010 | ) | | | (526 | ) | | | (251 | ) |
Purchase of treasury stock | | | (480 | ) | | | (1,062 | ) | | | — | |
Proceeds from exercise of stock options | | | 338 | | | | 70 | | | | 415 | |
Cash dividends paid | | | (1,584 | ) | | | (1,543 | ) | | | (1,404 | ) |
| | | | | | | | | | | | |
Net cash provided by financing activities | | | 38,501 | | | | 27,899 | | | | 17,928 | |
| | | | | | | | | | | | |
Increase (decrease) in cash and cash equivalents | | | 10,494 | | | | 3,345 | | | | (5,078 | ) |
| | | |
Cash and cash equivalents at beginning of year | | | 8,477 | | | | 5,132 | | | | 10,210 | |
| | | | | | | | | | | | |
Cash and cash equivalents at end of year | | $ | 18,971 | | | $ | 8,477 | | | $ | 5,132 | |
| | | | | | | | | | | | |
The accompanying notes are an integral part of these consolidated financial statements.
31
DIMECO, INC.
DIMECO, INC.
NOTES TO CONSOLIDATED FINANCIAL STATEMENTS
NOTE 1—SUMMARY OF SIGNIFICANT ACCOUNTING POLICIES
A summary of the significant accounting and reporting policies applied in the presentation of the accompanying financial statements follows:
Nature of Operations and Basis of Presentation
Dimeco, Inc. (the “Company”) is a Pennsylvania company organized as the holding company of The Dime Bank (the “Bank”) and its wholly owned subsidiary, TDB Insurance Services LLC. The Bank is a state-chartered bank and operates from five locations in northeastern Pennsylvania. The Company and its subsidiary derive substantially all of their income from banking and bank-related services that include interest earnings on residential real estate, commercial mortgage, commercial, and consumer financings as well as interest earnings on investment securities. The Company provides deposit services including checking, savings, and certificate of deposit accounts and investment and trust services. The Company is supervised by the Federal Reserve Board, while the Bank is subject to regulation and supervision by the Federal Deposit Insurance Corporation and the Pennsylvania Department of Banking.
The consolidated financial statements of the Company include its wholly owned subsidiary, the Bank. All inter-company items have been eliminated in preparing the consolidated financial statements. The investment in subsidiary on the parent company financial statements is carried at the parent company’s equity in the underlying net assets of the Bank.
The financial statements have been prepared in conformity with U.S. generally accepted accounting principles. In preparing the financial statements, management is required to make estimates and assumptions that affect the reported amounts of assets and liabilities as of the balance sheet date and revenues and expenses for the period. Actual results could differ significantly from those estimates.
Investment Securities
Investment securities are classified at the time of purchase, based on management’s intention and ability, as securities held to maturity or securities available for sale. Debt securities acquired with the intent and ability to hold to maturity are stated at cost adjusted for amortization of premium and accretion of discount, which are computed using the interest method and recognized as adjustments of interest income. Certain other debt and equity securities have been classified as available for sale to serve principally as a source of liquidity. Unrealized holding gains and losses for available-for-sale securities are reported as a separate component of stockholders’ equity, net of tax, until realized. Realized securities gains and losses are computed using the specific identification method. Interest and dividends on investment securities are recognized as income when earned.
Common stock of the Federal Home Loan Bank (“FHLB”) and the Atlantic Central Bankers Bank represents ownership in institutions that are wholly owned by other financial institutions. These securities are accounted for at cost and are classified with other assets.
Mortgage Loans Held for Sale
In general, fixed rate residential mortgage loans originated by the Bank are held for sale and are carried at the aggregate lower of cost or market. Such loans sold are generally serviced by the Bank.
32
DIMECO, INC.
NOTE 1—SUMMARY OF SIGNIFICANT ACCOUNTING POLICIES (Continued)
Loans
Loans are stated at the principal amount outstanding, net of any unearned income, deferred loan fees, and the allowance for loan losses. Interest on consumer loans is credited to operations over the term of each loan using a method which results in a level yield or the simple interest method. Interest income on mortgage loans is accrued on the amortized balance. Interest income on other loans is accrued on the principal amount outstanding. Loan fees which represent an adjustment to interest yield are deferred and amortized over the life of the loan. Loans on which the accrual of interest has been discontinued are designated as nonaccrual loans. Accrual of interest on loans is generally discontinued when it is determined that a reasonable doubt exists as to the collectibility of additional interest. When a loan is placed on nonaccrual status, unpaid interest is charged against income. Payments received on nonaccrual loans are either applied to principal or reported as interest income according to management’s judgment as to the collectibility of principal. Loans are returned to accrual status when past due interest is collected and the collection of principal is probable.
Allowance for Loan Losses
The allowance for loan losses represents the amount which management estimates is adequate to provide for probable losses inherent in its loan portfolio, as of the balance sheet date. The allowance method is used in providing for loan losses. Accordingly, all loan losses are charged to the allowance, and all recoveries are credited to it. The allowance for loan losses is established through a provision for loan losses charged to operations. The provision for loan losses is based on management’s periodic evaluation of individual loans, economic factors, past loan loss experience, changes in the composition and volume of the portfolio, and other relevant factors. The estimates used in determining the adequacy of the allowance for loan losses, including the amounts and timing of future cash flows expected on impaired loans, are particularly susceptible to changes in the near term.
Impaired loans are commercial and commercial real estate loans for which it is probable that the Company will not be able to collect all amounts due according to the contractual terms of the loan agreement. The Company individually evaluates such loans for impairment and does not aggregate loans by major risk classifications. The definition of “impaired loans” is not the same as the definition of “nonaccrual loans,” although the two categories overlap. The Company may choose to place a loan on nonaccrual status due to payment delinquency or uncertain collectibility, while not classifying the loan as impaired if the loan is not a commercial or commercial real estate loan. Factors considered by management in determining impairment include payment status and collateral value. The amount of impairment for these types of impaired loans is determined by the difference between the present value of the expected cash flows related to the loan, using the original interest rate, and its recorded value, or as a practical expedient in the case of collateralized loans, the difference between the fair value of the collateral and the recorded amount of the loans. When foreclosure is probable, impairment is measured based on the fair value of the collateral.
Mortgage loans on one-to-four family properties and all consumer loans are large groups of smaller-balance homogeneous loans and are measured for impairment collectively. Loans that experience insignificant payment delays, which are defined as 90 days or less, generally are not classified as impaired. Management determines the significance of payment delays on a case-by-case basis taking into consideration all of the circumstances surrounding the loan and the borrower including the length of the delay, the borrower’s prior payment record, and the amount of shortfall in relation to the principal and interest owed.
Premises and Equipment
Premises and equipment are stated at cost less accumulated depreciation. Depreciation is principally computed on the straight-line method over the estimated useful lives of the related assets, which range from 3 to 20 years for furniture and equipment and 5 to 31 years for office buildings and improvements. Leasehold improvements are amortized over the shorter of their estimated useful lives or their respective lease terms, which range from 5 to 20 years. Expenditures for maintenance and repairs are charged against income as incurred. Costs of major additions and improvements are capitalized.
33
DIMECO, INC.
NOTE 1—SUMMARY OF SIGNIFICANT ACCOUNTING POLICIES (Continued)
Bank-Owned Life Insurance (BOLI)
The Company owns insurance on the lives of a certain group of key employees. The policies were purchased to help offset the increase in the costs of various fringe benefit plans including healthcare. The cash surrender value of these policies is included as an asset on the consolidated statements of financial condition, and any increases in cash surrender value are recorded as noninterest income on the consolidated statement of income. In the event of the death of an insured individual under these policies, the Company would receive a death benefit which would be recorded as noninterest income.
Other Real Estate
Real estate acquired by foreclosure is classified on the Consolidated Balance Sheet at the lower of the recorded investment in the property or its fair value minus estimated costs of sale. Prior to foreclosure, the value of the underlying collateral is written down by a charge to the allowance for loan losses, if necessary. Any subsequent write-downs are charged against operating expenses. Operating expenses of such properties, net of related income and losses on their disposition, are included as other expense.
Income Taxes
The Company and the Bank file a consolidated federal income tax return. Deferred tax assets or liabilities are computed based on the difference between the financial statement and the income tax basis of assets and liabilities using the enacted marginal tax rates. Deferred income tax expenses or benefits are based on the changes in the deferred tax asset or liability from period to period.
Earnings Per Share
The Company provides dual presentation of basic and diluted earnings per share. Basic earnings per share are calculated utilizing net income as reported as the numerator and average shares outstanding as the denominator. The computation of diluted earnings per share differs in that the dilutive effects of any options are adjusted for in the denominator.
Stock Options
In December 2004, the FASB issued FAS No. 123R, Share-Based Payment, which revised FAS 123, Accounting for Stock-Based Compensation, and superseded APB Opinion No. 25, Accounting for Stock Issued to Employees (“APB 25”) and related interpretations. FAS 123R requires the grant-date fair value of all share-based payment awards that are expected to vest, including employee share options, to be recognized as employee compensation expense over the requisite service period. The Company adopted FAS 123R on January 1, 2006 and applied the modified prospective transition method. Under this transition method, the Company (1) did not restate any prior periods and (2) are recognizing compensation expense for all share-based payment awards that were outstanding, but not yet vested, as of January 1, 2006, based upon the same estimated grant-date fair values and service periods used to prepare the FAS 123 pro-forma disclosures.
Prior to adopting FAS 123R, the Company accounted for shared-based payment awards using the intrinsic value method of APB 25 and related interpretations. Under APB 25, the Company did not record compensation expense for employee share options, unless the awards were modified, because the share options were granted with exercise prices equal to or greater than the fair value of our stock on the date of grant. The following table illustrates the effect on reported net income and earnings per share applicable to common shareholders for the years ended December 31, 2005 and 2004, had we accounted for share-based compensation plans using the fair value method of FAS 123:
34
DIMECO, INC.
NOTE 1—SUMMARY OF SIGNIFICANT ACCOUNTING POLICIES (Continued)
Stock Options (Continued)
| | | | | | |
| | | 2005 | | 2004 |
Net income as reported | | $ | 4,455 | | $ | 3,906 |
Less pro forma expense related to options | | | 155 | | | 18 |
| | | | | | |
Pro forma net income | | $ | 4,300 | | $ | 3,888 |
| | | | | | |
Basic net income per common share: | | | | | | |
As reported | | $ | 2.89 | | $ | 2.54 |
Pro forma | | $ | 2.79 | | $ | 2.53 |
Diluted net income per common share: | | | | | | |
As reported | | $ | 2.80 | | $ | 2.46 |
Pro forma | | $ | 2.70 | | $ | 2.45 |
For 2006, the Company did not recognize any compensation expense as all outstanding options were vested at January 1, 2006.
For purposes of computing pro forma results, the Company estimated the fair values of stock options using the Black-Scholes option-pricing model. The model requires the use of subjective assumptions that can materially affect fair value estimates. Therefore, the pro forma results are estimates of results of operations as if compensation expense had been recognized for the stock option plans. The fair value of each option is amortized into compensation expense on a straight-line basis between the grant date for the option and each vesting date. The fair value of each stock option granted was estimated using the following weighted-average assumptions:
For purposes of computing pro forma results, the Company estimated fair values of stock options using the Black-Scholes option-pricing model. The model requires use of subjective assumptions that can materially affect fair value estimates. Therefore, the pro forma results are estimates of results of operations as if compensation expense had been recognized for the stock option plans. The fair value of each stock option granted was estimated using the following weighted-average assumptions for grants in 2005, and 2004, respectively: (1) expected dividend yields of 2.85 percent, and 2.44 percent; (2) risk-free interest rates of 4.19 percent, and 4.22 percent; (3) expected volatility of 22 percent, and 17 percent; and (4) expected lives of options of 5.0 years, and 9.9 years.
Mortgage Servicing Rights (“MSRs”)
The Company has agreements for the express purpose of selling loans in the secondary market. The Company maintains servicing rights for most of these loans. Originated MSRs are recorded by allocating total costs incurred between the loan and servicing rights based on their relative fair values. MSRs are amortized in proportion to the estimated servicing income over the estimated life of the servicing portfolio. MSRs are a component of other assets on the Consolidated Balance Sheet.
Comprehensive Income
The Company is required to present comprehensive income in a full set of general-purpose financial statements for all periods presented. Other comprehensive income is composed of unrealized holding gains (losses) on the available-for-sale securities portfolio. The Company has elected to report the effects of other comprehensive income as part of the Consolidated Statement of Changes in Stockholders’ Equity.
35
DIMECO, INC.
NOTE 1—SUMMARY OF SIGNIFICANT ACCOUNTING POLICIES (Continued)
Cash Flows
The Company has defined cash and cash equivalents as cash and due from banks, interest-bearing deposits in other banks, and federal funds sold that have original maturities of 90 days or less.
Amounts paid for interest and income taxes are as follows (in thousands):
| | | | | | |
| | | Interest Paid | | Federal Income Taxes Paid |
Year Ended December 31, | | | | | | |
2006 | | $ | 9,002 | | $ | 2,759 |
2005 | | $ | 5,775 | | $ | 2,125 |
2004 | | $ | 4,481 | | $ | 1,527 |
Recent Accounting Pronouncements
In February 2006, the Financial Accounting Standards Board (“FASB”) issued Statement of Financial Accounting Standards (“FAS”) No. 155,Accounting for Certain Hybrid Instruments, as an amendment of FASB Statements No. 133 and 140. FAS No. 155 allows financial instruments that have embedded derivatives to be accounted for as a whole (eliminating the need to bifurcate the derivative from its host) if the holder elects to account for the whole instrument on a fair value basis. This statement is effective for all financial instruments acquired or issued after the beginning of an entity’s first fiscal year that begins after September 15, 2006. The adoption of this standard is not expected to have a material effect on the Company’s results of operations or financial position.
In March 2006, the FASB issued FAS No. 156,Accounting for Servicing of Financial Assets. This statement, which is an amendment to FAS No. 140, will simplify the accounting for servicing assets and liabilities, such as those common with mortgage securitization activities. Specifically, FAS No. 156 addresses the recognition and measurement of separately recognized servicing assets and liabilities and provides an approach to simplify efforts to obtain hedge-like (offset) accounting. FAS No. 156 also clarifies when an obligation to service financial assets should be separately recognized as a servicing asset or a servicing liability; requires that a separately recognized servicing asset or servicing liability be initially measured at fair value, if practicable; and permits an entity with a separately recognized servicing asset or servicing liability to choose either of the amortization or fair value methods for subsequent measurement. The provisions of FAS No. 156 are effective as of the beginning of the first fiscal year that begins after September 15, 2006. The adoption of this standard is not expected to have a material effect on the Company’s results of operations or financial position.
In September 2006, the FASB issued FAS No. 157,Fair Value Measurements, which provides enhanced guidance for using fair value to measure assets and liabilities. The standard applies whenever other standards require or permit assets or liabilities to be measured at fair value. The standard does not expand the use of fair value in any new circumstances. FAS No. 157 is effective for financial statements issued for fiscal years beginning after November 15, 2007, and interim periods within those fiscal years. Early adoption is permitted. The adoption of this standard is not expected to have a material effect on the Company’s results of operations or financial position.
In June 2006, the FASB issued FASB Interpretation No. 48 (“FIN 48”),Accounting for Uncertainty in Income Taxes. FIN 48 is an interpretation of FAS No. 109,Accounting for Income Taxes, and it seeks to reduce the diversity in practice associated with certain aspects of measurement and recognition in accounting for income taxes. This Interpretation clarifies that management is expected to evaluate an income tax position taken or expected to be taken for likelihood of realization before recording any amounts for such position in the financial statement. FIN 48 also requires expanded disclosure with respect to income tax positions taken that are not certain to be realized. This Interpretation is effective for fiscal years beginning after December 15, 2006, and will require management to evaluate every open tax position that exists in every jurisdiction on the date of initial adoption. The Company is currently evaluating the impact the adoption of the standard will have on the Company’s results of operations.
36
DIMECO, INC.
NOTE 1—SUMMARY OF SIGNIFICANT ACCOUNTING POLICIES (Continued)
Recent Accounting Pronouncements (Continued)
In September 2006, the FASB reached consensus on the guidance provided by Emerging Issues Task Force Issue 06-4 (“EITF 06-4”),Accounting for Deferred Compensation and Postretirement Benefit Aspects of Endorsement Split-Dollar Life Insurance Arrangements. The guidance is applicable to endorsement split-dollar life insurance arrangements, whereby the employer owns and controls the insurance policy, that are associated with a postretirement benefit. EITF 06-4 requires that for a split-dollar life insurance arrangement within the scope of the issue, an employer should recognize a liability for future benefits in accordance with FAS No. 106 (if, in substance, a postretirement benefit plan exists) or Accounting Principles Board Opinion No. 12 (if the arrangement is, in substance, an individual deferred compensation contract) based on the substantive agreement with the employee. EITF 06-4 is effective for fiscal years beginning after December 15, 2007. The Company is currently evaluating the impact the adoption of the standard will have on the Company’s results of operations or financial condition.
In September 2006, the FASB reached consensus on the guidance provided by Emerging Issues Task Force Issue 06-5(“EITF 06-5”),Accounting for Purchases of Life Insurance—Determining the Amount That Could Be Realized in Accordance with FASB Technical Bulletin No. 85-4, Accounting for Purchases of Life Insurance. EITF 06-5 states that a policyholder should consider any additional amounts included in the contractual terms of the insurance policy other than the cash surrender value in determining the amount that could be realized under the insurance contract. EITF 06-5 also states that a policyholder should determine the amount that could be realized under the life insurance contract assuming the surrender of an individual-life by individual-life policy (or certificate by certificate in a group policy). EITF 06-5 is effective for fiscal years beginning after December 15, 2006. The Company is currently evaluating the impact the adoption of the standard will have on the Company’s results of operations or financial condition.
Reclassification of Comparative Amounts
Certain comparative amounts for prior years have been reclassified to conform to current-year presentations. The reclassified amounts did not affect net income or stockholders’ equity.
NOTE 2—EARNINGS PER SHARE
There are no convertible securities that would affect the numerator in calculating basic and diluted earnings per share; therefore, net income as presented on the Consolidated Statement of Income will be used as the numerator. The following table sets forth the composition of the weighted-average common shares (denominator) used in the basic and diluted earnings per share computation.
| | | | | | | | |
| | | 2006 | | | 2005 | | | 2004 |
Weighted-average common shares outstanding | | 1,558,553 | | | 1,550,616 | | | 1,537,511 |
| | | |
Average treasury stock shares | | (34,770 | ) | | (9,874 | ) | | — |
| | | | | | | | |
Weighted-average common shares and common stock equivalents used to calculate basic earnings per share | | 1,523,783 | | | 1,540,742 | | | 1,537,511 |
| | | |
Additional common stock equivalents (stock options) used to calculate diluted earnings per share | | 49,992 | | | 51,325 | | | 48,072 |
| | | | | | | | |
Weighted-average common shares and common stock equivalents used to calculate diluted earnings per share | | 1,573,775 | | | 1,592,067 | | | 1,585,583 |
| | | | | | | | |
37
DIMECO, INC.
NOTE 3—INVESTMENT SECURITIES
The amortized costs and fair value of investment securities are summarized as follows (in thousands):
| | | | | | | | | | | | | |
| | | 2006 |
| | | Amortized Cost | | Gross Unrealized Gains | | Gross Unrealized Losses | | | Fair Value |
AVAILABLE FOR SALE | | | | | | | | | | | | | |
U.S. government agencies | | $ | 15,987 | | $ | — | | $ | (146 | ) | | $ | 15,841 |
Mortgage-backed securities | | | 4,547 | | | 14 | | | (56 | ) | | | 4,505 |
Obligations of states and political subdivisions: | | | | | | | | | | | | | |
Taxable | | | 1,692 | | | — | | | (1 | ) | | | 1,691 |
Tax-exempt | | | 7,308 | | | 37 | | | (10 | ) | | | 7,335 |
Corporate securities | | | 2,745 | | | 1 | | | (4 | ) | | | 2,742 |
Commercial paper | | | 34,774 | | | — | | | — | | | | 34,774 |
| | | | | | | | | | | | | |
Total debt securities | | | 67,053 | | | 52 | | | (217 | ) | | | 66,888 |
| | | | |
Equity securities | | | 266 | | | 116 | | | (4 | ) | | | 378 |
| | | | | | | | | | | | | |
Total | | $ | 67,319 | | $ | 168 | | $ | (221 | ) | | $ | 67,266 |
| | | | | | | | | | | | | |
| |
| | | 2005 |
| | | Amortized Cost | | Gross Unrealized Gains | | Gross Unrealized Losses | | | Fair Value |
AVAILABLE FOR SALE | | | | | | | | | | | | | |
U.S. government agencies | | $ | 22,968 | | $ | — | | $ | (395 | ) | | $ | 22,573 |
Mortgage-backed securities | | | 1,977 | | | — | | | (63 | ) | | | 1,914 |
Obligations of states and political subdivisions: | | | | | | | | | | | | | |
Taxable | | | 1,697 | | | — | | | (10 | ) | | | 1,687 |
Tax-exempt | | | 4,515 | | | 34 | | | (11 | ) | | | 4,538 |
Corporate securities | | | 1,244 | | | — | | | (73 | ) | | | 1,171 |
Commercial paper | | | 21,971 | | | — | | | — | | | | 21,971 |
| | | | | | | | | | | | | |
Total debt securities | | | 54,372 | | | 34 | | | (552 | ) | | | 53,854 |
| | | | |
Equity securities | | | 209 | | | 71 | | | (5 | ) | | | 275 |
| | | | | | | | | | | | | |
Total | | $ | 54,581 | | $ | 105 | | $ | (557 | ) | | $ | 54,129 |
| | | | | | | | | | | | | |
38
DIMECO, INC.
NOTE 3—INVESTMENT SECURITIES (Continued)
| | | | | | | | | | | | |
| | | 2005 |
| | | Amortized Cost | | Gross Unrealized Gains | | Gross Unrealized Losses | | Fair Value |
HELD TO MATURITY | | | | | | | | | | | | |
Obligations of states and political subdivisions—tax-exempt | | $ | 199 | | $ | 8 | | $ | — | | $ | 207 |
| | | | | | | | | | | | |
The following table shows the Company’s fair value and gross unrealized losses, aggregated by investment category and length of time that the individual securities have been in a continuous unrealized loss position, at December 31, (in thousands):
| | | | | | | | | | | | | | | | | | |
| | | 2006 |
| | | Less than Twelve
Months | | Twelve Months or
Greater | | Total |
| | | Fair
Value | | Gross
Unrealized
Losses | | Fair
Value | | Gross
Unrealized
Losses | | Fair
Value | | Gross
Unrealized
Losses |
U.S. government agencies | | $ | — | | $ | — | | $ | 15,841 | | $ | 146 | | $ | 15,841 | | $ | 146 |
Mortgage-backed securities | | | — | | | — | | | 1,790 | | | 56 | | | 1,790 | | | 56 |
Obligations of states and political subdivisions | | | 828 | | | 3 | | | 1,841 | | | 8 | | | 2,669 | | | 11 |
Corporate securities | | | — | | | — | | | 741 | | | 4 | | | 741 | | | 4 |
| | | | | | | | | | | | | | | | | | |
Total debt securities | | | 828 | | | 3 | | | 20,213 | | | 214 | | | 21,041 | | | 217 |
Equity securities | | | 10 | | | 2 | | | 20 | | | 2 | | | 30 | | | 4 |
| | | | | | | | | | | | | | | | | | |
Total | | $ | 838 | | $ | 5 | | $ | 20,233 | | $ | 216 | | $ | 21,071 | | $ | 221 |
| | | | | | | | | | | | | | | | | | |
| |
| | | 2005 |
| | | Less than Twelve
Months | | Twelve Months or
Greater | | Total |
| | | Fair
Value | | Gross
Unrealized
Losses | | Fair
Value | | Gross
Unrealized
Losses | | Fair
Value | | Gross
Unrealized
Losses |
U.S. government agencies | | $ | 8,907 | | $ | 76 | | $ | 13,666 | | $ | 319 | | $ | 22,573 | | $ | 395 |
Mortgage-backed securities | | | 1,914 | | | 63 | | | — | | | — | | | 1,914 | | | 63 |
Obligations of states and political subdivisions | | | 1,457 | | | 9 | | | 390 | | | 12 | | | 1,847 | | | 21 |
Corporate securities | | | 1,171 | | | 73 | | | — | | | — | | | 1,171 | | | 73 |
| | | | | | | | | | | | | | | | | | |
Total debt securities | | | 13,449 | | | 221 | | | 14,056 | | | 331 | | | 27,505 | | | 552 |
| | | | | | |
Equity securities | | | 18 | | | 5 | | | — | | | — | | | 18 | | | 5 |
| | | | | | | | | | | | | | | | | | |
Total | | $ | 13,467 | | $ | 226 | | $ | 14,056 | | $ | 331 | | $ | 27,523 | | $ | 557 |
| | | | | | | | | | | | | | | | | | |
39
DIMECO, INC.
NOTE 3—INVESTMENT SECURITIES (Continued)
The policy of the Company is to recognize an other-than-temporary impairment of equity securities where the fair value has been significantly below cost for three consecutive quarters. For fixed maturity investments with unrealized losses due to interest rates where the Company has the positive intent and ability to hold the investment for a period of time sufficient to allow a market recovery, declines in value below cost are not assumed to be other than temporary. There are 36 positions that are temporarily impaired at December 31, 2006. The aggregate carrying amount of those investments at December 31, 2006, was $21,071. The Company reviews its position quarterly and has asserted that at December 31, 2006, the declines outlined in the above table represent temporary declines and the Company does have the intent and ability either to hold those securities to maturity or to allow a market recovery.
The Company has concluded that any impairment of its investment securities portfolio is not other than temporary but is the result of interest rate changes that are not expected to result in the noncollection of principal and interest during the period.
The amortized cost and fair values of debt securities at December 31, 2006, by contractual maturity, are shown below. Expected maturities of mortgage-backed securities will differ from contractual maturities because borrowers may have the right to call or prepay obligations with or without call or prepayment penalties (in thousands):
| | | | | | |
| | | Available for Sale |
| | | Amortized Cost | | Fair Value |
Due in one year or less | | $ | 36,374 | | $ | 36,372 |
Due after one year through five years | | | 12,015 | | | 11,937 |
Due after five years through ten years | | | 6,077 | | | 6,022 |
Due after ten years | | | 12,587 | | | 12,557 |
| | | | | | |
Total debt securities | | $ | 67,053 | | $ | 66,888 |
| | | | | | |
Proceeds from sales of investment securities during 2005 and 2004 were $6 and $174, respectively, and the resulting gross and net gains of $2 and $68 were realized. Additionally, in 2004, the Company recorded an investment security gain of $27 resulting from a business combination where the Company received a combination of the common stock of the acquirer in a non-monetary exchange and cash proceeds of $73. There were no sales of investment securities during 2006.
Investment securities with amortized costs of $56,506 and $50,398 and fair value of $56,342 and $49,914 at December 31, 2006 and 2005, respectively, were pledged to secure deposits, short-term borrowings, and for other purposes as required by law.
40
DIMECO, INC.
NOTE 4—LOANS
Major classifications of loans are as follows (in thousands):
| | | | | | |
| | | 2006 | | 2005 |
Loans secured by real estate: | | | | | | |
Construction and development | | $ | 3,733 | | $ | 3,771 |
Secured by farmland | | | 1,775 | | | 1,879 |
Secured by 1—4 family residential properties: | | | | | | |
Revolving, open-end loans secured by 1—4 family residential properties | | | 4,218 | | | 2,535 |
All other loans secured by 1—4 family residential properties | | | 64,188 | | | 54,682 |
Secured by nonfarm, nonresidential properties | | | 170,910 | | | 157,076 |
Commercial and industrial loans | | | 38,502 | | | 41,289 |
Loans to individuals for household, family, and other personal expenditures: | | | | | | |
Ready credit loans | | | 958 | | | 876 |
Other installment loans | | | 15,300 | | | 17,019 |
Other loans: | | | | | | |
Agricultural loans | | | 1,132 | | | 858 |
All other loans | | | 4,575 | | | 3,577 |
| | | | | | |
Loans, net of unearned income | | $ | 305,291 | | $ | 283,562 |
| | | | | | |
Real estate loans serviced for others which are not included in the Consolidated Balance Sheet totaled $83,337 and $83,391 at December 31, 2006 and 2005, respectively.
Nonperforming loans consist of commercial, mortgage, and consumer loans which are on a nonaccrual basis or contractually past due 90 days or more as to interest or principal payment but are not on nonaccrual status because they are well secured or in process of collection or identified by management to meet the definition of an impaired loan. The following table presents information concerning nonperforming loans (in thousands):
| | | | | | |
| | | 2006 | | 2005 |
Ninety days or more past due and accruing interest | | $ | 290 | | $ | 279 |
Nonaccrual | | | 426 | | | 526 |
Impaired loans | | | — | | | — |
| | | | | | |
Total nonperforming loans | | $ | 716 | | $ | 805 |
| | | | | | |
Interest income on loans would have been increased by $38, $12, and $5 during 2006, 2005, and 2004, respectively, if nonaccrual loans had performed in accordance with their original terms.
The Company had no impaired loans as of December 31, 2006 and 2005. Impaired loans as of December 31, 2004 were $461 with a related allowance for loan losses of $14. For the years ended December 31, 2005 and 2004, average impaired loans were $213 and $473, respectively. Interest recognized on impaired loans for the years ended December 31, 2005 and 2004, was $113 and $28, respectively. There were no impaired loans at any time during 2006.
41
DIMECO, INC.
NOTE 4—LOANS (Continued)
Changes in the allowance for loan losses are as follows (in thousands):
| | | | | | | | | | | | |
| | | 2006 | | | 2005 | | | 2004 | |
Balance, beginning of year | | $ | 3,973 | | | $ | 3,172 | | | $ | 3,014 | |
Provision charged to operations | | | 785 | | | | 850 | | | | 1,126 | |
Recoveries credited to allowance | | | 82 | | | | 257 | | | | 150 | |
Losses charged to allowance | | | (371 | ) | | | (306 | ) | | | (1,118 | ) |
| | | | | | | | | | | | |
Balance, end of year | | $ | 4,469 | | | $ | 3,973 | | | $ | 3,172 | |
| | | | | | | | | | | | |
In the normal course of business, loans are extended to officers and directors and corporations in which they are beneficially interested as stockholders, officers, or directors. A summary of loan activity for those officers and directors with aggregate loan balances in excess of $120,000 for the year ended December 31, 2006, is as follows (in thousands):
| | | | | | | | | |
| 2005 | | Additions | | Amounts Collected | | 2006 |
| $ 7,716 | | $ | 3,818 | | $ | 3,316 | | $ | 8,218 |
The Company’s primary business activity is with customers located within its local trade area. Generally, the Company grants commercial, residential, and personal loans. The Company also selectively funds and purchases commercial and residential loans outside of its local trade area provided such loans meet the Company’s credit policy guidelines. At December 31, 2006 and 2005, the Company had approximately $61 million and $57 million, respectively, of outstanding loans to summer camps and recreational facilities in the northeastern United States. Although the Company has a diversified loan portfolio at December 31, 2006 and 2005, loans outstanding to individuals and businesses are dependent upon the local economic conditions in its immediate trade area.
NOTE 5—PREMISES AND EQUIPMENT
A summary by asset classification is as follows (in thousands):
| | | | | | |
| | | 2006 | | 2005 |
Land | | $ | 1,184 | | $ | 1,093 |
Premises and improvements | | | 5,106 | | | 5,075 |
Furniture and equipment | | | 3,321 | | | 3,267 |
Leasehold improvements | | | 1,530 | | | 1,526 |
| | | | | | |
Total, at cost | | | 11,141 | | | 10,961 |
Less accumulated depreciation | | | 5,410 | | | 4,939 |
| | | | | | |
Net premises and equipment | | $ | 5,731 | | $ | 6,022 |
| | | | | | |
Depreciation and amortization expense was $541, $554, and $486, in 2006, 2005, and 2004, respectively.
42
DIMECO, INC.
NOTE 6—DEPOSITS
Deposits are summarized as follows (in thousands):
| | | | | | |
| | | 2006 | | 2005 |
Demand—noninterest-bearing | | $ | 34,172 | | $ | 36,619 |
Demand—interest-bearing | | | 39,538 | | | 37,251 |
Money market | | | 35,276 | | | 26,464 |
Savings | | | 33,593 | | | 39,563 |
Time deposits of $100,000 or more | | | 71,063 | | | 54,462 |
Other time deposits | | | 124,475 | | | 100,497 |
| | | | | | |
Total | | $ | 338,117 | | $ | 294,856 |
| | | | | | |
The following table summarizes the maturity distribution of time deposits (in thousands):
| | | |
2007 | | $ | 145,801 |
2008 | | | 27,627 |
2009 | | | 4,425 |
2010 | | | 9,718 |
2011 | | | 7,967 |
| | | |
Total | | $ | 195,538 |
| | | |
The following table summarizes the maturity distribution of certificates of deposit of $100,000 or more (in thousands):
| | | |
| | | 2006 |
Three months or less | | $ | 18,855 |
Four through six months | | | 21,898 |
Seven through twelve months | | | 17,078 |
Over twelve months | | | 13,232 |
| | | |
Total | | $ | 71,063 |
| | | |
Interest expense on certificates of deposit of $100,000 or more amounted to $2,476, $1,434, and $946, for the years ended December 31, 2006, 2005, and 2004, respectively.
NOTE 7—SHORT-TERM BORROWINGS
Short-term borrowings consist of borrowings from the FHLB of Pittsburgh and securities sold under agreements to repurchase. Average amounts outstanding during the year represent daily average balances, and average interest rates represent interest expense divided by the related average balance.
43
DIMECO, INC.
NOTE 7—SHORT-TERM BORROWINGS (Continued)
The outstanding balances and related information for short-term borrowings are summarized as follows (in thousands):
| | | | | | | | | | | | |
| | | 2006 | | | 2005 | |
| | | Amount | | Rate | | | Amount | | Rate | |
Balance at year-end | | $ | 12,705 | | 2.64 | % | | $ | 12,954 | | 2.97 | % |
Average balance outstanding during the year | | $ | 15,733 | | 2.36 | % | | $ | 14,855 | | 1.40 | % |
Maximum amount outstanding at any month-end | | $ | 21,191 | | | | | $ | 20,204 | | | |
The Bank has pledged, as collateral for the borrowings from the FHLB, all stock in the FHLB and certain other qualifying collateral. Investment securities with amortized costs of $18,282 and $16,157 and market values of $18,278 and $16,121, respectively, at December 31, 2006 and 2005, were pledged as collateral for the securities sold under agreements to repurchase.
The Bank has the capability to borrow additional funds through its credit arrangement with the FHLB. The FHLB borrowings are subject to annual renewal, incur no service charges, and are secured by a blanket security agreement on certain investment securities, qualifying residential mortgages, and the Bank’s investment in FHLB stock. At December 31, 2006, the Bank’s remaining borrowing capacity with the FHLB was approximately $65 million.
NOTE 8—OTHER BORROWED FUNDS
FHLB advances consist of separate fixed rate and convertible select-fixed to float rate loans as follows (in thousands):
| | | | | | | | | |
Maturity | | Rate | | | 2006 | | 2005 |
June 28, 2006 | | 3.31 | % | | $ | — | | $ | 2,000 |
June 28, 2007 | | 3.78 | % | | | 2,000 | | | 2,000 |
February 18, 2010 | | 5.91 | % | | | 1,000 | | | 1,000 |
May 5, 2014 | | 4.52 | % | | | 1,566 | | | 1,740 |
June 3, 2015 | | 4.04 | % | | | 1,312 | | | 1,439 |
August 4, 2015 | | 4.81 | % | | | 1,339 | | | 1,461 |
March 11, 2016 | | 3.47 | % | | | 2,418 | | | 2,636 |
December 9, 2019 | | 4.91 | % | | | 1,424 | | | 1,500 |
November 25, 2024 | | 4.87 | % | | | 1,496 | | | 1,547 |
December 16, 2025 | | 5.17 | % | | | — | | | 1,225 |
January 26, 2026 | | 4.91 | % | | | 1,208 | | | — |
| | | | | | | | | |
Total | | | | | $ | 13,763 | | $ | 16,548 |
| | | | | | | | | |
The advance maturing in 2010 is convertible to a variable rate advance on specific dates at the discretion of the FHLB. Should the FHLB convert this advance, the Bank has the option of accepting the variable rate or repaying the advance without penalty.
44
DIMECO, INC.
NOTE 9—DIVIDEND REINVESTMENT AND STOCK PURCHASE PLAN
The Company maintains a Dividend Reinvestment and Stock Purchase Plan (the “Plan”). Participation is available to all common stockholders. The Plan provides each participant with a simple and convenient method of purchasing additional common shares without payment of any brokerage commission or other service fees.
A participant in the Plan may elect to reinvest dividends on all or part of his or her shares to acquire additional common stock. A participant may withdraw from the Plan at any time. Stockholders purchased 15,546 shares in 2006 and 15,665 shares in 2005 through the Plan.
NOTE 10—EMPLOYEE BENEFITS
Retirement Plan
The Bank maintains a section 401(k) employee savings and investment plan for substantially all employees and officers of the Bank. The Bank’s contribution to the plan is based on 100 percent matching of voluntary contributions up to 3 percent and 50 percent matching on the next 2 percent of individual compensation. Additionally, the Bank may contribute a discretionary amount each year. For each of the years of 2006, 2005, and 2004, the Board of Directors authorized an additional 5 percent, 4 percent, and 4 percent, respectively, of each eligible employee’s compensation. Employee contributions are vested at all times, and Bank contributions are fully vested after five years. Contributions for 2006, 2005, and 2004 to this plan amounted to $285, $207, and $199, respectively.
Supplemental Retirement Plan
The Bank maintains a Salary Continuation Plan for the executive officers of the Bank to provide guaranteed consecutive postretirement payments totaling a predetermined amount over a ten-year period based on a five-year vesting schedule beginning the date of the agreement between the Bank and the executive. Expenses for the years ended December 31, 2006, 2005, and 2004, amounted to $59, $61, and $76, respectively, and are included as a component of salaries and employee benefits.
Stock Option Plan
The Company maintains a stock incentive plan and a stock option plan that provide for granting incentive stock options to key officers and other employees of the Company and Bank, as determined by the Stock Option Committee, and nonqualified stock options to nonemployee directors of the Company. A total of 120,000 and 50,000 shares, respectively, of either authorized and unissued shares or authorized shares issued by and subsequently reacquired by the Company as treasury stock shall be issuable under the plans. The plans shall terminate after the tenth anniversary of the date of shareholder ratification. The per share exercise price of any option granted will not be less than the fair market value of a share of common stock on the date the option is granted. The options granted prior to 2005 are primarily vested 33 percent after one year, 33 percent after two years, and 34 percent after three years. In 2005, options were granted with an immediate vesting schedule. The remaining unvested options granted in the previous years were accelerated in 2005 whereby all options granted since inception are fully vested.
45
DIMECO, INC.
NOTE 10—EMPLOYEE BENEFITS (Continued) Stock Option Plan (Continued)
The following table presents share data related to the stock option plans:
| | | | | | | | | | | | |
| | | 2006 | | | Weighted- Average Exercise Price | | 2005 | | | Weighted- Average Exercise Price |
Outstanding, beginning | | 127,991 | | | $ | 19.93 | | 99,670 | | | $ | 14.77 |
Granted | | — | | | | — | | 31,996 | | | | 35.22 |
Exercised | | (15,355 | ) | | | 15.91 | | (3,675 | ) | | | 13.05 |
Forfeited | | — | | | | — | | — | | | | — |
| | | | | | | | | | | | |
Outstanding, ending | | 112,636 | | | $ | 20.48 | | 127,991 | | | $ | 19.93 |
| | | | | | | | | | | | |
Exercisable at year-end | | 112,636 | | | $ | 20.48 | | 127,991 | | | $ | 19.93 |
| | | | | | | | | | | | |
The following table summarizes characteristics of stock options outstanding at December 31, 2006:
| | | | | | | | | | | | |
| | | Outstanding | | Exercisable |
Exercise Price | | Shares | | Average Remaining Life | | Average Exercise Price | | Shares | | Average Exercise Price |
$13.00 | | 14,500 | | 3.21 | | $ | 13.00 | | 14,500 | | $ | 13.00 |
$13.25 | | 53,030 | | 3.21 | | $ | 13.25 | | 53,030 | | $ | 13.25 |
$16.50 | | 4,610 | | 3.21 | | $ | 16.50 | | 4,610 | | $ | 16.50 |
$21.30 | | 4,000 | | 3.21 | | $ | 21.30 | | 4,000 | | $ | 21.30 |
$23.00 | | 1,500 | | 3.21 | | $ | 23.00 | | 1,500 | | $ | 23.00 |
$26.50 | | 1,000 | | 3.21 | | $ | 26.50 | | 1,000 | | $ | 26.50 |
$32.55 | | 2,000 | | 6.86 | | $ | 32.55 | | 2,000 | | $ | 32.55 |
$34.00 | | 10,996 | | 8.96 | | $ | 34.00 | | 10,996 | | $ | 34.00 |
$35.00 | | 1,000 | | 7.85 | | $ | 35.00 | | 1,000 | | $ | 35.00 |
$35.95 | | 20,000 | | 8.73 | | $ | 35.95 | | 20,000 | | $ | 35.95 |
| | | | | | | | | | | | |
Total | | 112,636 | | | | | Total | | 112,636 | | | |
| | | | | | | | | | | | |
NOTE 11—INCOME TAXES
Federal income tax expense consists of the following (in thousands):
| | | | | | | | | | | |
| | | 2006 | | | 2005 | | | 2004 |
Currently payable | | $ | 2,848 | | | $ | 2,393 | | | $ | 1,508 |
Deferred taxes | | | (235 | ) | | | (311 | ) | | | 264 |
| | | | | | | | | | | |
Total provision | | $ | 2,613 | | | $ | 2,082 | | | $ | 1,772 |
| | | | | | | | | | | |
46
DIMECO, INC.
NOTE 11—INCOME TAXES (Continued)
The components of the net deferred tax assets and liabilities at December 31 are as follows (in thousands):
| | | | | | |
| | | 2006 | | 2005 |
Deferred tax assets: | | | | | | |
Allowance for loan losses | | $ | 1,303 | | $ | 1,093 |
Deferred compensation | | | — | | | 1 |
Salary continuation plan | | | 171 | | | 168 |
Mortgage servicing rights | | | 14 | | | 20 |
Unrealized loss on investment securities | | | 18 | | | 154 |
| | | | | | |
Total | | | 1,506 | | | 1,436 |
| | | | | | |
Deferred tax liabilities: | | | | | | |
Premises and equipment | | | 558 | | | 574 |
Deferred loan origination fees, net | | | 158 | | | 171 |
Unrealized gain on nonmonetary exchange | | | 9 | | | 9 |
| | | | | | |
Total | | | 725 | | | 754 |
| | | | | | |
Net deferred tax assets | | $ | 781 | | $ | 682 |
| | | | | | |
No valuation allowance was established at December 31, 2006 and 2005, in view of the Company’s ability to carryback taxes paid in previous years and certain tax strategies and anticipated future taxable income as evidenced by the Company’s earnings potential.
A reconciliation between the expected statutory income tax rate and the effective income tax rate follows (in thousands):
| | | | | | | | | | | | | | | | | | | | | |
| | | 2006 | | | 2005 | | | 2004 | |
| | | Amount | | | % of Pretax Income | | | Amount | | | % of Pretax Income | | | Amount | | | % of Pretax Income | |
Provision at statutory rate | | $ | 2,787 | | | 34.0 | % | | $ | 2,222 | | | 34.0 | % | | $ | 1,930 | | | 34.0 | % |
Tax-exempt income | | | (127 | ) | | (1.6 | ) | | | (93 | ) | | (1.4 | ) | | | (100 | ) | | (1.8 | ) |
BOLI earnings | | | (78 | ) | | (.9 | ) | | | (76 | ) | | (1.2 | ) | | | (78 | ) | | (1.4 | ) |
Nondeductible interest | | | 16 | | | .2 | | | | 8 | | | .1 | | | | 6 | | | .1 | |
Other, net | | | 15 | | | .2 | | | | 21 | | | .3 | | | | 14 | | | .3 | |
| | | | | | | | | | | | | | | | | | | | | |
Effective income tax and rate | | $ | 2,613 | | | 31.9 | % | | $ | 2,082 | | | 31.8 | % | | $ | 1,772 | | | 31.2 | % |
| | | | | | | | | | | | | | | | | | | | | |
47
DIMECO, INC.
NOTE 12—COMMITMENTS AND CONTINGENT LIABILITIES
Commitments
In the normal course of business, there are outstanding commitments and contingent liabilities such as commitments to extend credit, financial guarantees, and letters of credit that are not reflected in the accompanying consolidated financial statements. The Company does not anticipate any losses as a result of these transactions. These instruments involve, to varying degrees, elements of credit and interest rate risk in excess of the amount recognized in the Consolidated Balance Sheet. The contract or notional amounts of those instruments reflect the extent of involvement the Company has in the particular classes of financial instruments.
Financial instruments whose contract amounts represent credit risk are as follows (in thousands):
| | | | | | |
| | | 2006 | | 2005 |
Commitments to extend credit | | $ | 47,624 | | $ | 42,481 |
Standby letters of credit | | $ | 3,423 | | $ | 3,216 |
Commitments to extend credit are agreements to lend to a customer as long as there is no violation of any condition established in the contract. Commitments generally have fixed expiration dates or other termination clauses and may require payment of a fee. Since many of the commitments are expected to expire without being drawn upon, the total commitment amounts do not necessarily represent future cash requirements.
Standby letters of credit represent conditional commitments issued by the Company to guarantee the performance of a customer to a third party. These instruments are issued primarily to support bid or performance-related contracts. The coverage period for these instruments is typically a one-year period with an annual renewal option subject to prior approval by management. Fees earned from the issuance of these letters are recognized at the expiration of the coverage period. For secured letters of credit, the collateral is typically Bank deposit instruments.
48
DIMECO, INC.
NOTE 12—COMMITMENTS AND CONTINGENT LIABILITIES (Continued)
Commitments (Continued)
At December 31, 2006, the minimum rental commitments for all noncancelable leases are as follows (in thousands):
| | | |
2007 | | $ | 257 |
2008 | | | 169 |
2009 | | | 60 |
2010 | | | 49 |
2011 | | | 48 |
2012 and thereafter | | | 171 |
| | | |
Total | | $ | 754 |
| | | |
Contingent Liabilities
The Company and its subsidiary are involved in various legal actions from the normal course of business activities. Management believes the liability, if any, arising from such actions will not have a material adverse effect on the Company’s financial position.
NOTE 13—REGULATORY RESTRICTIONS
Cash and Due From Banks
The district Federal Reserve Bank requires the Bank to maintain certain average reserve balances. As of each of the years ended December 31, 2006 and 2005, the Bank had required reserves of $225, composed of vault cash and a depository amount held directly with the Federal Reserve Bank.
Dividends
The Pennsylvania Banking Code restricts the availability of capital funds for payment of dividends by all state-chartered banks to the surplus of the Bank. Accordingly, at December 31, 2006, the balance in the capital surplus account totaling approximately $1,756 is unavailable for dividends.
49
DIMECO, INC.
NOTE 14—REGULATORY CAPITAL REQUIREMENTS
Federal regulations require the Company and the Bank to maintain minimum amounts of capital. Specifically, each is required to maintain certain minimum dollar amounts and ratios of Total and Tier I capital to risk-weighted assets and of Tier I capital to average total assets.
In addition to the capital requirements, the Federal Deposit Insurance Corporation Improvement Act (“FDICIA”) established five capital categories ranging from “well capitalized” to “critically undercapitalized.” Should any institution fail to meet the requirements to be considered “adequately capitalized,” it would become subject to a series of increasingly restrictive regulatory actions.
As of December 31, 2006 and 2005, the FDIC categorized the Bank as well capitalized under the regulatory framework for prompt corrective action. To be classified as a well capitalized financial institution, Total risk-based, Tier 1 risk-based, and Tier 1 Leverage capital ratios must be at least 10 percent, 6 percent, and 5 percent, respectively.
The Company’s actual capital ratios are presented in the following table, which shows the Company met all regulatory capital requirements. The capital position of the Bank does not differ significantly from the Company’s (in thousands);
| | | | | | | | | | | | |
| | | 2006 | | | 2005 | |
| | | Amount | | Ratio | | | Amount | | Ratio | |
Total Capital | | | | | | | | | | | | |
(to Risk-Weighted Assets) | | | | | | | | | | | | |
| | | | |
Actual | | $ | 39,627 | | 11.59 | % | | $ | 35,341 | | 11.57 | % |
For Capital Adequacy Purposes | | $ | 27,352 | | 8.00 | % | | $ | 24,438 | | 8.00 | % |
To Be Well Capitalized | | $ | 34,189 | | 10.00 | % | | $ | 30,548 | | 10.00 | % |
| | | | |
Tier I Capital | | | | | | | | | | | | |
(to Risk-Weighted Assets) | | | | | | | | | | | | |
| | | | |
Actual | | $ | 35,301 | | 10.33 | % | | $ | 31,491 | | 10.31 | % |
For Capital Adequacy Purposes | | $ | 13,676 | | 4.00 | % | | $ | 12,219 | | 4.00 | % |
To Be Well Capitalized | | $ | 20,514 | | 6.00 | % | | $ | 18,329 | | 6.00 | % |
| | | | |
Tier I Capital | | | | | | | | | | | | |
(to Average Assets) | | | | | | | | | | | | |
| | | | |
Actual | | $ | 35,301 | | 9.48 | % | | $ | 31,491 | | 9.16 | % |
For Capital Adequacy Purposes | | $ | 14,897 | | 4.00 | % | | $ | 13,756 | | 4.00 | % |
To Be Well Capitalized | | $ | 18,621 | | 5.00 | % | | $ | 17,195 | | 5.00 | % |
50
DIMECO, INC.
NOTE 15—FAIR VALUE DISCLOSURE
The estimated fair values of the Company’s financial instruments are as follows (in thousands):
| | | | | | | | | | | | |
| | | 2006 | | 2005 |
| | | Carrying Value | | Fair Value | | Carrying Value | | Fair Value |
Financial assets: | | | | | | | | | | | | |
Cash and cash equivalents | | $ | 18,971 | | $ | 18,971 | | $ | 8,477 | | $ | 8,477 |
Mortgage loans held for sale | | | — | | | — | | | 211 | | | 211 |
Investment securities: | | | | | | | | | | | | |
Available for sale | | | 67,266 | | | 67,266 | | | 54,129 | | | 54,129 |
Held to maturity | | | — | | | — | | | 199 | | | 207 |
Net loans | | | 300,822 | | | 305,486 | | | 279,589 | | | 281,271 |
Accrued interest receivable | | | 1,798 | | | 1,798 | | | 1,380 | | | 1,380 |
Regulatory stock | | | 914 | | | 914 | | | 945 | | | 945 |
Bank-owned life insurance | | | 5,892 | | | 5,892 | | | 5,254 | | | 5,254 |
Mortgage servicing rights | | | 716 | | | 716 | | | 680 | | | 680 |
| | | | |
Financial liabilities: | | | | | | | | | | | | |
Deposits | | $ | 338,117 | | $ | 338,250 | | $ | 294,856 | | $ | 293,944 |
Short-term borrowings | | | 12,705 | | | 12,705 | | | 12,954 | | | 12,954 |
Other borrowed funds | | | 13,763 | | | 13,857 | | | 16,548 | | | 16,388 |
Accrued interest payable | | | 1,428 | | | 1,428 | | | 952 | | | 952 |
Financial instruments are defined as cash, evidence of ownership interest in an entity, or a contract which creates an obligation or right to receive or deliver cash or another financial instrument from/to a second entity on potentially favorable or unfavorable terms.
Fair value is defined as the amount at which a financial instrument could be exchanged in a current transaction between willing parties other than in a forced or liquidation sale. If a quoted market price is available for a financial instrument, the estimated fair value would be calculated based upon the market price per trading unit of the instrument.
If no readily available market exists, the fair value estimates for financial instruments should be based upon management’s judgment regarding current economic conditions, interest rate risk, expected cash flows, future estimated losses, and other factors as determined through various option pricing formulas or simulation modeling. As many of these assumptions result from judgments made by management based upon estimates that are inherently uncertain, the resulting estimated fair values may not be indicative of the amount realizable in the sale of a particular financial instrument. In addition, changes in assumptions on which the estimated fair values are based may have a significant impact on the resulting estimated fair values.
As certain assets such as deferred tax assets and premises and equipment are not considered financial instruments, the estimated fair value of financial instruments would not represent the full value of the Company.
51
DIMECO, INC.
NOTE 15—FAIR VALUE DISCLOSURE (Continued)
The Company employed simulation modeling in determining the estimated fair value of financial instruments for which quoted market prices were not available based upon the following assumptions:
Cash and Cash Equivalents, Accrued Interest Receivable, Regulatory Stock, Short-Term Borrowings, and Accrued Interest Payable
The fair value is equal to the current carrying value.
Mortgage Loans Held for Sale
The fair value of mortgage loans held for sale is equal to the available quoted market price. If no quoted market price is available, fair value is estimated using the quoted market price for similar securities.
Investment Securities
The fair value of investment securities available for sale and held to maturity is equal to the available quoted market price. If no quoted market price is available, fair value is estimated using the quoted market price for similar securities.
Loans, Deposits, Other Borrowed Funds and Mortgage Servicing Rights
The fair value for loans and mortgage servicing rights is estimated by discounting contractual cash flows and adjusting for prepayment estimates. Discount rates are based upon rates generally charged for such loans with similar characteristics. Demand, savings, and money market deposit accounts are valued at the amount payable on demand as of year-end. Fair values for time deposits and other borrowed funds are estimated using a discounted cash flow calculation that applies contractual costs currently being offered in the existing portfolio to current market rates being offered for deposits of similar remaining maturities.
Bank-Owned Life Insurance
The fair value is equal to the cash surrender value of the life insurance policies.
Commitments to Extend Credit and Standby Letters of Credit
These financial instruments are generally not subject to sale, and estimated fair values are not readily available. The carrying value, represented by the net deferred fee arising from the unrecognized commitment or letter of credit, and the fair value, determined by discounting the remaining contractual fee over the term of the commitment using fees currently charged to enter into similar agreements with similar credit risk, are not considered material for disclosure. The contractual amounts of unfunded commitments and letters of credit are presented in Note 12.
52
DIMECO, INC.
NOTE 16—PARENT COMPANY
Following are condensed financial statements for the parent company:
CONDENSED BALANCE SHEET
| | | | | | |
| | | December 31, |
| (In thousands) | | 2006 | | 2005 |
Assets | | | | | | |
Cash and due from banks | | $ | 1,664 | | $ | 1,374 |
Investment securities available for sale | | | 378 | | | 275 |
Investment in bank subsidiary | | | 33,260 | | | 29,484 |
Other assets | | | 531 | | | 555 |
| | | | | | |
Total Assets | | $ | 35,833 | | $ | 31,688 |
| | | | | | |
Liabilities | | | | | | |
Dividends payable | | $ | 442 | | $ | 396 |
Other liabilities | | | 54 | | | 32 |
| | | | | | |
Total Liabilities | | | 496 | | | 428 |
| | |
Stockholders’ Equity | | | 35,337 | | | 31,260 |
| | | | | | |
Total Liabilities and Stockholders’ Equity | | $ | 35,833 | | $ | 31,688 |
| | | | | | |
CONDENSED STATEMENT OF INCOME
| | | | | | | | | | | | |
| | | Year Ended December 31, | |
| (In thousands) | | 2006 | | | 2005 | | | 2004 | |
Dividends from bank subsidiary | | $ | 2,100 | | | $ | 2,100 | | | $ | 2,050 | |
Dividends on investment securities | | | 9 | | | | 8 | | | | 9 | |
Investment securities gains | | | — | | | | 2 | | | | 95 | |
| | | | | | | | | | | | |
Total income | | | 2,109 | | | | 2,110 | | | | 2,154 | |
| | | |
Noninterest expense | | | 101 | | | | 89 | | | | 103 | |
| | | | | | | | | | | | |
Net income before undistributed earnings of bank subsidiary and income taxes | | | 2,008 | | | | 2,021 | | | | 2,051 | |
Undistributed earnings of bank subsidiary | | | 3,544 | | | | 2,405 | | | | 1,853 | |
Income tax benefit | | | (33 | ) | | | (29 | ) | | | (2 | ) |
| | | | | | | | | | | | |
Net Income | | $ | 5,585 | | | $ | 4,455 | | | $ | 3,906 | |
| | | | | | | | | | | | |
53
DIMECO, INC.
NOTE 16—PARENT COMPANY (Continued)
CONDENSED STATEMENT OF CASH FLOWS
| | | | | | | | | | | | |
| | | Year Ended December 31, | |
| (In thousands) | | 2006 | | | 2005 | | | 2004 | |
Operating Activities | | | | | | | | | | | | |
Net income | | $ | 5,585 | | | $ | 4,455 | | | $ | 3,906 | |
Adjustments to reconcile net income to net cash provided by operating activities: | | | | | | | | | | | | |
Undistributed earnings of bank subsidiary | | | (3,544 | ) | | | (2,405 | ) | | | (1,853 | ) |
Investment securities gains | | | — | | | | (2 | ) | | | (95 | ) |
Other, net | | | 32 | | | | 561 | | | | (760 | ) |
| | | | | | | | | | | | |
Net cash provided by operating activities | | | 2,073 | | | | 2,609 | | | | 1,198 | |
| | | | | | | | | | | | |
Investing Activities | | | | | | | | | | | | |
Purchases of investment securities | | | (57 | ) | | | — | | | | (6 | ) |
Proceeds from sales of investment securities | | | — | | | | 6 | | | | 174 | |
| | | | | | | | | | | | |
Net cash provided by (used for) investing activities | | | (57 | ) | | | 6 | | | | 168 | |
| | | | | | | | | | | | |
Financing Activities | | | | | | | | | | | | |
Cash dividends paid | | | (1,584 | ) | | | (1,543 | ) | | | (1,404 | ) |
Purchase of treasury stock | | | (480 | ) | | | (1,062 | ) | | | — | |
Proceeds from exercise of stock options | | | 338 | | | | 70 | | | | 415 | |
| | | | | | | | | | | | |
Net cash used for financing activities | | | (1,726 | ) | | | (2,535 | ) | | | (989 | ) |
| | | | | | | | | | | | |
Increase in cash and cash equivalents | | | 290 | | | | 80 | | | | 377 | |
| | | |
Cash at beginning of year | | | 1,374 | | | | 1,294 | | | | 917 | |
| | | | | | | | | | | | |
Cash at end of year | | $ | 1,664 | | | $ | 1,374 | | | $ | 1,294 | |
| | | | | | | | | | | | |
54
DIMECO, INC.
NOTE 17 – QUARTERLY DATA (Unaudited)
The Company’s selected quarterly financial data is presented in the following tables (in thousands, except per share data):
| | | | | | | | | | | | |
| | | Three Months Ended |
| | | March 2006 | | June 2006 | | September
2006 | | December
2006 |
Total interest income | | $ | 5,457 | | $ | 5,903 | | $ | 6,325 | | $ | 6,961 |
Total interest expense | | | 1,939 | | | 2,210 | | | 2,425 | | | 2,904 |
| | | | | | | | | | | | |
Net interest income | | | 3,518 | | | 3,693 | | | 3,900 | | | 4,057 |
Provision for loan losses | | | 215 | | | — | | | 185 | | | 385 |
| | | | | | | | | | | | |
Net interest income after provision for loan losses | | | 3,303 | | | 3,693 | | | 3,715 | | | 3,672 |
Total noninterest income | | | 739 | | | 783 | | | 758 | | | 875 |
Total noninterest expense | | | 2,294 | | | 2,450 | | | 2,316 | | | 2,281 |
| | | | | | | | | | | | |
Income before income taxes | | | 1,748 | | | 2,026 | | | 2,157 | | | 2,266 |
Income taxes | | | 553 | | | 646 | | | 689 | | | 724 |
| | | | | | | | | | | | |
Net income | | $ | 1,195 | | $ | 1,380 | | $ | 1,468 | | $ | 1,542 |
| | | | | | | | | | | | |
| | | | |
Per share data: | | | | | | | | | | | | |
Net income | | | | | | | | | | | | |
Basic | | $ | .78 | | $ | .90 | | $ | .96 | | $ | 1.01 |
Diluted | | $ | .76 | | $ | .88 | | $ | .93 | | $ | .98 |
| | | | |
Weighted-average shares outstanding: | | | | | | | | | | | | |
Basic | | | 1,522,967 | | | 1,527,395 | | | 1,523,958 | | | 1,521,073 |
Diluted | | | 1,571,149 | | | 1,575,616 | | | 1,573,677 | | | 1,574,918 |
55
DIMECO, INC.
NOTE 17 – QUARTERLY DATA (Unaudited) (Continued)
| | | | | | | | | | | | |
| | | Three Months Ended |
| | | March 2005 | | June 2005 | | September
2005 | | December
2005 |
Total interest income | | $ | 4,175 | | $ | 4,653 | | $ | 4,971 | | $ | 5,403 |
Total interest expense | | | 1,293 | | | 1,422 | | | 1,564 | | | 1,839 |
| | | | | | | | | | | | |
Net interest income | | | 2,882 | | | 3,231 | | | 3,407 | | | 3,564 |
Provision for loan losses | | | 220 | | | 173 | | | 182 | | | 275 |
| | | | | | | | | | | | |
Net interest income after provision for loan losses | | | 2,662 | | | 3,058 | | | 3,225 | | | 3,289 |
Total noninterest income | | | 738 | | | 618 | | | 711 | | | 734 |
Total noninterest expense | | | 2,041 | | | 2,156 | | | 2,104 | | | 2,197 |
| | | | | | | | | | | | |
Income before income taxes | | | 1,359 | | | 1,520 | | | 1,832 | | | 1,826 |
Income taxes | | | 428 | | | 481 | | | 588 | | | 585 |
| | | | | | | | | | | | |
Net income | | $ | 931 | | $ | 1,039 | | $ | 1,244 | | $ | 1,241 |
| | | | | | | | | | | | |
| | | | |
Per share data: | | | | | | | | | | | | |
Net income | | | | | | | | | | | | |
Basic | | $ | .60 | | $ | .67 | | $ | .80 | | $ | .82 |
Diluted | | $ | .58 | | $ | .65 | | $ | .78 | | $ | .79 |
| | | | |
Weighted-average shares outstanding: | | | | | | | | | | | | |
Basic | | | 1,549,187 | | | 1,549,269 | | | 1,548,204 | | | 1,522,669 |
Diluted | | | 1,603,562 | | | 1,600,212 | | | 1,599,655 | | | 1,571,481 |
56
DIMECO, INC.
NOTES
57
DIMECO, INC.
Dimeco, Inc. and its subsidiary, The Dime Bank, recognize that a fundamental component adding to the strength of the Company is the quality of our management team. During 2006, as a result of the dedication, hard work and capability demonstrated by these employees, we announced the following officer promotions:
| | | | |
 | |  | |  |
| | |
| PETER BOCHNOVICH | | AMY L. BURKE | | THOMAS A. ONIONS |
Senior Vice President and | | Community Office Manager | | Community Office Manager |
Senior Lending Officer | | Dingmans Ferry | | Hawley |
SHAREHOLDER INFORMATION
| | |
CORPORATE HEADQUARTERS | | ANNUAL MEETING |
| P.O. Box 509 | | Shareholders are cordially invited to attend |
| 820 Church Street | | the Annual Meeting of Shareholders, which |
| Honesdale, PA 18431 | | will be held at The Community Room of the |
| 570-253-1970 | | Wayne County Chamber of Commerce |
| email: dimeco@thedimebank.com | | Building, 303 Commercial Street, |
| www.thedimebank.com | | Honesdale, PA on Thursday, April 26, |
| | 2007 at 2:00 pm. |
INDEPENDENT AUDITORS | | |
| S.R. Snodgrass, A.C. | | FIRMS KNOWN TO HANDLE DIMECO, INC. |
| 2100 Corporate Drive, Suite 400 | | STOCK TRANSACTIONS |
| Wexford, PA 15090-7647 | | Ferris, Baker Watts, Inc.* |
| 724-934-0344 | | 100 Light Street |
| www.srsnodgrass.com | | Baltimore, MD 21202 |
| | 410-468-2749 or 877-840-0012 |
LEGAL COUNSEL | | |
| Malizia Spidi & Fisch, P.C. | | RBC Dain Rauscher |
| 901 New York Avenue, N.W. | | 2101 Oregon Pike |
| Suite 210 East | | Lancaster, PA 17601-9669 |
| Washington, DC 20001 | | 717-519-5940 or 866-604-1471 |
| 202-434-4660 | | |
| | Ryan, Beck & Company* |
| TRANSFER AGENT | | 7111 Fairway Drive, Suite 301 |
| Registrar and Transfer Company | | Palm Beach Gardens, FL 33418 |
| 10 Commerce Drive | | 800-793-7226 |
| Cranford, NJ 07016 | | |
| 800-368-5948 | | Legg Mason Wood Walker, Inc. |
| email: info@rtco.com | | 330 Montage Mountain Road, Suite 201 |
| www.rtco.com | | Scranton, PA 18507-1762 |
| | 570-346-9300 or 800-346-4346 |
For change of name, address, or to replace lost stock certificates, write or call the | | Boenning & Scattergood, Inc.* |
| securities transfer division. | | Four Tower Bridge |
| | 200 Barr Harbor Drive, Suite 300 |
| DIVIDEND REINVESTMENT PLAN | | West Conshohocken, PA 19428-2979 |
| The Company offers a plan for stockholders | | 610-862-5360 or 800-842-8928 |
to automatically reinvest their dividends in shares of common stock. There are no | | |
| brokerage commissions or fees imposed. | | |
For more information contact the transfer agent. | | |
58
| | |
| The Dime Bank Officers |
 | |  |
| |
Front row – left to right: Thomas Didato, Jill George, Janette Davis, Maureen Beilman | | Front row – left to right: Cynthia Theobald, Jan Hoadley, Deborah Unflat, Melanie Seagraves |
| |
Back row– left to right: Frank Redington, Ruth Daniels, Peter Bochnovich, Gary Beilman, Jerome Theobald, Cheryl Smith, Not pictured: Joseph Adams | | Back row – left to right: Eileen Ertel, Linda Tallman, Nancy Lavenduski, Thomas Onions, Mary Carol Cicco, Amy Burke |
productivity drives us
| | | | | | |
| DIMECO, INC. OFFICERS | | JOSEPH W. ADAMS | | THOMAS A. ONIONS | | |
| | Vice President | | Community Office Manager | | DIMECO, INC. |
| WILLIAM E. SCHWARZ | | | | | | AND THE DIME BANK |
| Chairman of the Board | | RUTH E. DANIELS | | MELANIE F. SEAGRAVES | | BOARD OF DIRECTORS |
| | Vice President | | Community Office Manager | | |
| JOHN S. KIESENDAHL | | | | | | WILLIAM E. SCHWARZ |
| Vice Chairman of the Board | | JANETTE M. DAVIS | | LINDA S. TALLMAN | | President, Edw. J. Schwarz, Inc. |
| | Vice President | | Secretary | | |
| GARY C. BEILMAN | | | | | | GARY C. BEILMAN |
| President and Chief Executive Officer | | THOMAS M. DIDATO | | CYNTHIA D. THEOBALD | | President and Chief Executive Officer, |
| | Vice President | | Bank Security Officer | | Dimeco, Inc. and The Dime Bank |
| MAUREEN H. BEILMAN | | | | | | |
Chief Financial Officer, Treasurer and Assistant Secretary | | FRANK R. REDINGTON Vice President | | TDB INSURANCE SERVICES, LLC.
OFFICERS | | ROBERT E. GENIRS Retired Chief Administrative Officer, |
| | | | | | Lehman Brothers |
| PETER BOCHNOVICH | | CHERYL A. SMITH | | GARY C. BEILMAN | | |
| Senior Vice President and Assistant Secretary | | Vice President | | President | | BARBARA J. GENZLINGER |
| | | | | | Secretary and Treasurer, The Settlers Inn, Ltd. |
| JOHN F. SPALL | | JEROME D. THEOBALD | | PETER BOCHNOVICH | | President, Sayre Mansion, LLC |
| Secretary | | Vice President | | Secretary | | |
| | | | | | JOHN S. KIESENDAHL |
| THE DIME BANK OFFICERS | | | | MAUREEN H. BEILMAN | | President and Chief Executive Officer, |
| | DEBORAH L. UNFLAT | | Treasurer | | Woodloch Pines, Inc. |
| WILLIAM E. SCHWARZ | | Assistant Vice President | | | | |
| Chairman of the Board | | | | JOSEPH PIZZO | | THOMAS A. PEIFER |
| | AMY L. BURKE | | Vice President | | Retired Superintendent, |
| JOHN S. KIESENDAHL | | Community Office Manager | | | | Wallenpaupack Area School District |
| Vice Chairman of the Board | | | | | | |
| | MARY CAROL CICCO | | | | HENRY M. SKIER |
| GARY C. BEILMAN | | Community Banking Officer | | | | President, A.M. Skier Agency, Inc. |
| President and Chief Executive Officer | | | | | | |
| | EILEEN K. ERTEL | | | | JOHN F. SPALL |
| MAUREEN H. BEILMAN | | Assistant Community Office Manager | | | | Attorney-at-Law |
| Chief Financial Officer and Treasurer | | | | | | |
| | JAN M. HOADLEY | | | | GERALD J. WENIGER |
| PETER BOCHNOVICH | | Community Office Manager | | | | Director Emeritus |
| Senior Vice President and Assistant Secretary | | | | | | |
| | NANCY M. LAVENDUSKI | | | | |
| L. JILL GEORGE | | Loan Officer | | | | |
| Vice President | | | | | | |
| | | | | | |
| | | | | | |
| | | | |
 | | HONESDALE OFFICE | | HAWLEY OFFICE |
| | P.O. Box 509 | | P.O. Box 290 |
| | 820 Church Street | | 309 Main Avenue |
| | Honesdale, PA 18431 | | Hawley, PA 18428 |
| | Phone: 570-253-1970 | | Phone: 570-226-3506 |
| | email: honesdale@thedimebank.com | | email: hawley@thedimebank.com |
| | |
| | DAMASCUS OFFICE | | GREENTOWN OFFICE |
| | P.O. Box 190 | | P.O. Box 946 |
| | 1679 Cochecton Turnpike | | 1586 Route 507 |
| www.thedimebank.com | | Damascus, PA 18415 | | Greentown, PA 18426 |
| | Phone: 570-224-6300 | | Phone: 570-676-8390 |
| | email: damascus@thedimebank.com | | email: greentown@thedimebank.com |
| | |
| | DINGMANS FERRY OFFICE | | OPERATIONS CENTER |
| DIMECO, INC. 2006 ANNUAL REPORT | | 1824 Route 739 | | P.O. Box 509 |
| | Dingmans Ferry, PA 18328 | | 120 Sunrise Avenue |
| STOCK LISTING: OTC Bulletin Board | | Phone: 570-828-1200 | | Honesdale, PA 18431 |
| DIMC—cusip number 25432W104 | | email: dingmansferry@thedimebank.com | | Phone: 570-253-1970 |
| | | | email: operations@thedimebank.com |