Exhibit 13
DIMECO, INC. 2007 ANNUAL REPORT
solid

dimeco
CONTENTS
| | |
| 1 | | Financial Highlights |
| |
| 2 | | President’s Message |
| |
| 11 | | Management’s Discussion and Analysis of Financial Condition and Results of Operation |
| |
| 27 | | Selected Financial Data |
| |
| 28 | | Management’s Annual Report on Internal Control Over Financial Reporting |
| |
| 29 | | Independent Auditor’s Report |
| |
| 30 | | Financial Statements |
| |
| | - Consolidated Balance Sheet |
| |
| | - Consolidated Statement of Income |
| |
| | - Consolidated Statement of Changes in Stockholders’ Equity |
| |
| | - Consolidated Statement of Cash Flows |
| |
| 34 | | Notes to Consolidated Financial Statements |
| |
| 60 | | Shareholder Information |
The mission of Dimeco, Inc. is the operation of a fully integrated financial services institution through its subsidiary The Dime Bank in a market that is defined by the institution’s ability to provide services consistent with sound, prudent principles and to fulfill the social, economic, moral and political considerations ordinarily associated with a responsible, well-run financial institution.
FINANCIAL HIGHLIGHTS
| | | | | | | | | | | |
(amounts in thousands, except per share data) | | 2007 | | | 2006 | | | % Increase
(decrease) | |
Performance for the year ended December 31, | | | | | | | | | | | |
Interest income | | $ | 29,951 | | | $ | 24,646 | | | 21.5 | % |
Interest expense | | $ | 12,601 | | | $ | 9,478 | | | 32.9 | % |
Net interest income | | $ | 17,350 | | | $ | 15,168 | | | 14.4 | % |
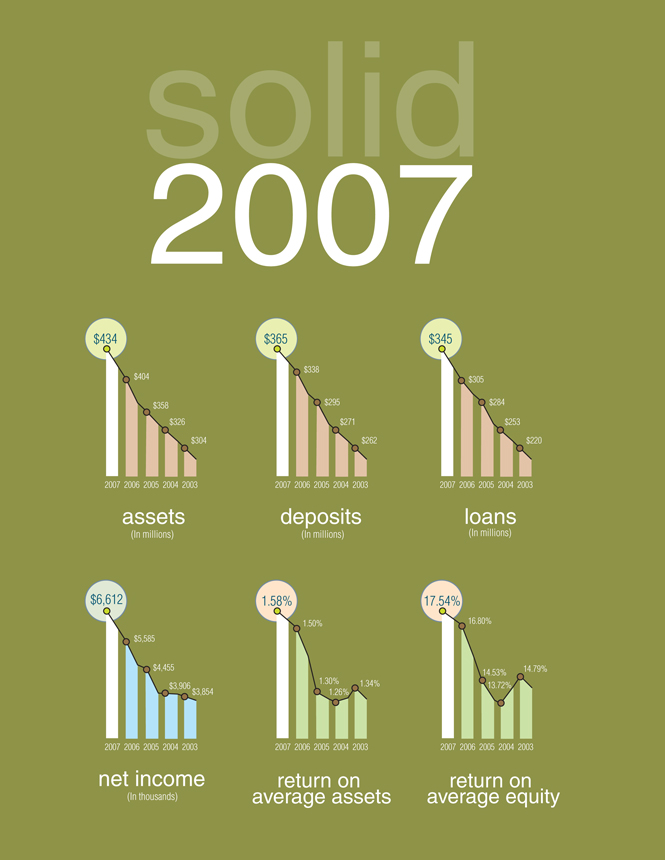
Net income | | $ | 6,612 | | | $ | 5,585 | | | 18.4 | % |
Shareholders’ Value (per share) | | | | | | | | | | | |
Net income - basic | | $ | 4.34 | | | $ | 3.67 | | | 18.3 | % |
Net income - diluted | | $ | 4.18 | | | $ | 3.55 | | | 17.7 | % |
Dividends | | $ | 1.19 | | | $ | 1.07 | | | 11.2 | % |
Book value | | $ | 26.23 | | | $ | 23.17 | | | 13.2 | % |
Market value | | $ | 46.26 | | | $ | 41.75 | | | 10.8 | % |
Market value/book value ratio | | | 176.4 | % | | | 180.2 | % | | (2.1 | %) |
Price/earnings multiple | | | 10.7 | X | | | 11.4 | X | | (6.1 | %) |
Dividend yield | | | 2.57 | % | | | 2.56 | % | | .4 | % |
Financial Ratios | | | | | | | | | | | |
Return on average assets | | | 1.58 | % | | | 1.50 | % | | 5.3 | % |
Return on average equity | | | 17.54 | % | | | 16.80 | % | | 4.4 | % |
Shareholders’ equity/asset ratio | | | 9.19 | % | | | 8.76 | % | | 4.9 | % |
Dividend payout ratio | | | 27.42 | % | | | 29.16 | % | | (6.0 | %) |
Nonperforming assets/total assets | | | .26 | % | | | .18 | % | | 44.4 | % |
Allowance for loan loss as a % of loans | | | 1.56 | % | | | 1.46 | % | | 6.8 | % |
Net charge-offs/average loans | | | .06 | % | | | .10 | % | | (40.0 | %) |
Allowance for loan loss/nonaccrual loans | | | 942.7 | % | | | 1,049.1 | % | | (10.1 | %) |
Allowance for loan loss/nonperforming loans | | | 476.3 | % | | | 624.2 | % | | (23.7 | %) |
Risk-based capital | | | 11.6 | % | | | 11.6 | % | | — | |
Financial Position at December 31, | | | | | | | | | | | |
Assets | | $ | 434,322 | | | $ | 403,577 | | | 7.6 | % |
Loans | | $ | 344,758 | | | $ | 305,291 | | | 12.9 | % |
Deposits | | $ | 364,600 | | | $ | 338,117 | | | 7.8 | % |
Stockholders’ equity | | $ | 39,923 | | | $ | 35,337 | | | 13.0 | % |
PRESIDENT’S MESSAGE
solid growth
Dear Shareholders:
2007 was planned, budgeted, and directed by a set of extremely lofty goals. These challenges triggered an overwhelming spirit of determination and purpose that was embraced by everyone within our organization. The results of our efforts, I am thrilled to report, can only be described as rock solid performance as Dimeco, Inc. posted its best numbers ever!
As reported in our quarterly financial statements, we continued to achieve growth and profitability during 2007. Deposits grew by more than 7% as all of our five community banking offices expanded existing relationships and initiated new ones. We regard this uptick in deposits as a great accomplishment this year, given the difficulty that much of the banking industry experienced in gathering
this important funding source. According to the Federal Deposit Insurance Corporation annual report on all banks in the country, our market share of deposits increased more than twice as much as our nearest competitor in the Pike County market. In Wayne County we moved into the top position. These results pay tribute to the quality of the products and services we provide.
Our loan portfolio expanded handsomely as well, with an overall increase of almost 13%. Continuing our trend of the past several years, commercial loans grew the most, as our lenders assisted entrepreneurs to acquire or expand businesses, which is vitally important to the economy of our marketplace. Commercial loan originations were varied and included real estate mortgages, capital improvement term loans, working capital lines of credit, loans for equipment, inventory, and technology. This increase in loans was accomplished while many other financial institutions struggled just to maintain credits already on their books.
Our growth did not come at the expense of credit quality. Loan delinquencies were held at low levels, being consistently below 1% throughout the year. Proactive loan management resulted in minimal charge-offs and numerous recoveries. To ensure that we are well positioned for the future, our allowance for loan losses is at a healthy 1.56% of total loans.
We are particularly pleased to report that the subprime mortgage problems that plague many other institutions are non-existent here, as we never strayed from our prudent underwriting guidelines. Our loan portfolio, which is both our largest asset class as well as our largest source of income, is diligently managed by practices that have served us well for more than 102 years.
PRESIDENT’S MESSAGE CONTINUED
solid performance
Net income, probably one of our most notable accomplishments for the year, was record-setting at $6.6 million. This amount was 18.4% higher than the net income of the previous year, and was achieved primarily by maintaining spread, monitoring cost, and proper, yet competitive, pricing on both sides of the balance sheet. We were able to hold our margins and maintain our spreads while numerous other institutions lost ground.
With net income of this magnitude, we posted a 1.58% return on average assets and a 17.54% return on average equity. Our efficiency ratio continues to be among the highest of our peers, with the bank ratio at 47.5% compared to a peer average of 61.5%, placing us in the top 12% of our national peer group as published in the Uniform Bank Performance Report for December 31, 2007. When all annual reports are filed, and the comparisons are completed, these ratios should place us near the top of our peer group, both statewide and nationally.
Of particular importance to our shareholders is the manner in which our income was utilized. A large portion of income is prudently placed in retained earnings. This net worth category is extremely strong at over $39.9 million, an increase of 13.0% over the previous year. A significant portion of our income is distributed to you in the form of dividends. For a second year in a row, your Board of Directors increased the dividend by double digits, with this year’s increase being 11.2%.
Also of considerable note is the market’s reaction to the value and strength of Dimeco’s stock. At the beginning of the year, our market price per share was $41.75, and the year ended with a value of $46.26 per share–a growth rate of more than 10% in the market value of Dimeco stock in 2007. We view this as a true accomplishment, especially in light of the recent downturn experienced in the overall securities market and the performance of other financial stocks.
PRESIDENT’S MESSAGE CONTINUED
solid value
Successes like these don’t just happen; they are achieved through the efforts of many. Certainly our Board of Directors and our staff are to be highly commended. Every day this group puts forth its best efforts, displaying pride, dedication, and loyalty to our institution. During the year, eight individuals were recognized as they celebrated employment anniversaries ranging from five to fifteen years. Of special note were Ruth Daniels and Cindy Theobald who attained twenty and thirty year employment milestones, respectively. Both individuals have contributed to our success and intend to help guide us for many years to come. Tenure at all levels provides stability and consistency—the cornerstones of our operating philosophy. Our dedicated directors transform our mission statement into a living document by which all actions are dictated. Director Henry Skier was honored during 2007 for his twenty-five years of guidance, insight, and wisdom. The entire directorate continually exercises vigilance in doing what is right and best for all concerned.
We also thank our customers, long-standing and new alike. This group entrusts its financial well-being to us, a responsibility that we take very seriously. Whether account service, investment strategies, financial planning, or building a dream, the backbone of our business is addressing the desires of our clientele. Our staff listens closely and asks appropriate questions in order to gain a full understanding of the needs, wants, and future plans of our customers. With this knowledge we are able to develop a true relationship and serve the best interests of all.
To you, our shareholders, we offer sincere gratitude and respect. It is through your interest and loyalty that we exist. Please know that the enhancement of your investment is our daily commitment. Our ultimate goal is to reward your trust and faith. As we move forward together, we hope that you will continue to refer others to us for both financial services and stock ownership.
PRESIDENT’S MESSAGE CONTINUED
solid outlook
Looking ahead, we are excited by the view. During the upcoming year we will be introducing new technology geared toward customer convenience and efficiency. Several new services will be rolled out which will enhance banking activities and expand client relationships. Additionally, our service area will grow geographically as we construct and open our new Lake Region Office. Our primary market area of Wayne and Pike Counties, Pennsylvania, and Sullivan County, New York are vibrant and growing. The overall population is increasing, economic development continues to expand, and the area boasts a workforce with a strong work ethic. The strategic placement of our community banking offices provides us the opportunity to be a part of, and significantly contribute to, the well-being of our marketplace.
For the year ahead, we will strive to go even further in achieving outstanding results. The performance of 2007 provides a solid foundation for the future. As always, we thank you for your continued support.
|
| Sincerely, |
|
 |
| Gary C. Beilman |
| President and Chief Executive Officer |
MANAGEMENT’S DISCUSSION AND ANALYSIS OF FINANCIAL CONDITION
AND RESULTS OF OPERATION
This consolidated review and analysis of Dimeco, Inc. (the “Company”) is intended to assist the reader in evaluating the performance of the Company for the years ended December 31, 2007 and 2006. This information should be read in conjunction with the consolidated financial statements and accompanying notes to the consolidated financial statements.
Dimeco, Inc., headquartered in Honesdale, Pennsylvania, is the one-bank holding company of The Dime Bank (the “Bank”), which is wholly-owned by the Company. The Bank formed and owns 100% of a limited liability company, TDB Insurance Services, LLC, offering title insurance services. Both the Company and the Bank derive their primary income from the operation of a commercial bank, including earning interest on loans and investment securities, fees on services performed and providing investment and trust services. The Bank’s main expenses are related to interest paid on deposits and other borrowings along with salary and benefits for employees. The Bank operates five full service branches in Honesdale, Hawley, Damascus, Greentown and Dingmans Ferry, Pennsylvania, two off-site automatic teller machines, one each in Wayne and Pike County, Pennsylvania and an operations center in Wayne County, Pennsylvania. The Bank plans to open a sixth full service office in Palmyra Township, Wayne County, Pennsylvania, in 2008. Principal market areas include Wayne and Pike Counties, Pennsylvania and Sullivan County, New York. The Bank employed 102 full time employees and 27 part time employees at December 31, 2007.
FORWARD-LOOKING STATEMENT
This Management Discussion and Analysis section of the Annual Report contains certain forward-looking statements (as defined in the Private Securities Litigation Reform Act of 1995). In the normal course of business, we, in an effort to help keep our shareholders and the public informed about our operations, may from time to time issue or make certain statements, either in writing or orally, that are or contain forward-looking statements, as that term is defined in the U.S. federal securities laws. Generally, these statements relate to business plans or strategies, projections involving anticipated revenues, earnings, profitability or other aspects of operating results or other future developments in our affairs or the industry in which we conduct business. Forward-looking statements may be identified by reference to a future period or periods or by the use of forward-looking terminology such as “anticipate,” “believe,” “expect,” “intend,” “plan,” “estimate” or similar expressions.
Although we believe that the anticipated results or other expectations reflected in our forward-looking statements are based on reasonable assumptions, we can give no assurance that those results or expectations will be attained. Forward-looking statements involve risks, uncertainties and assumptions (some of which are beyond our control), and as a result actual results may differ materially from those expressed in forward-looking statements. Factors that could cause actual results to differ from forward-looking statements include, but are not limited to, the following, as well as those discussed elsewhere herein:
| | • | | our investments in our businesses and in related technology could require additional incremental spending, and might not produce expected deposit and loan growth and anticipated contributions to our earnings; |
| | • | | general economic or industry conditions could be less favorable than expected, resulting in a deterioration in credit quality, a change in the allowance for loan and lease losses or a reduced demand for credit or fee-based products and services; |
| | • | | changes in the interest rate environment could reduce net interest income and could increase credit losses; |
| | • | | the conditions of the securities markets could change, which could adversely affect, among other things, the value or credit quality of our assets, the availability and terms of funding necessary to meet our liquidity needs and our ability to originate loans and leases; |
| | • | | changes in the extensive laws, regulations and policies governing financial holding companies and their subsidiaries could alter our business environment or affect our operations; |
| | • | | the potential need to adapt to industry changes in information technology systems, on which we are highly dependent, could present operational issues or require significant capital spending; |
11
| | • | | competitive pressures could intensify and affect our profitability, including as a result of continued industry consolidation, the increased availability of financial services from non-banks, technological developments such as the internet or bank regulatory reform; and |
| | • | | acts or threats of terrorism and actions taken by the United States or other governments as a result of such acts or threats, including possible military action, could further adversely affect business and economic conditions in the United States generally and in our principal markets, which could have an adverse effect on our financial performance and that of our borrowers and on the financial markets and the price of our common stock. |
You should not put undue reliance on any forward-looking statements. Forward-looking statements speak only as of the date they are made, and we undertake no obligation to update them in light of new information or future events except to the extent required by federal securities laws.
CRITICAL ACCOUNTING POLICIES
The Company’s accounting policies are integral to understanding the results reported. The accounting policies are described in detail in Note 1 of the “Notes to Consolidated Financial Statements.” Our most complex accounting policies require management’s judgment to ascertain the valuation of assets, liabilities, commitments and contingencies. We have established detailed policies and control procedures that are intended to ensure that valuation methods are well controlled and applied consistently from period to period. In addition, the policies and procedures are intended to ensure that the process for changing methodologies occurs in an appropriate manner. The following is a brief description of our current accounting policies involving significant management valuation judgments.
Allowance for Loan Losses
Arriving at an appropriate level of allowance for loan losses involves a high degree of judgment. The Company’s allowance for loan losses provides for probable losses based upon evaluations of known and inherent risks in the loan portfolio.
Management uses both historical and current information relating to the loan portfolio, as well as general economic information, in order to determine our estimation of the prevailing business environment. The probability of collection of loans is affected by changing economic conditions and various external factors which may impact the portfolio in ways currently unforeseen. We monitor this information in an effort to assess the adequacy of the allowance for loan losses. The allowance is increased by provisions for loan losses and by recoveries of loans previously charged-off and reduced by loans charged-off. For a full discussion of the Company’s methodology of assessing the adequacy of the reserve for loan losses refer to Note 1 of the “Notes to Consolidated Financial Statements.”
Mortgage Servicing Rights
The Bank originates residential mortgages that are sold in the secondary market. It is the Bank’s normal practice to retain the servicing of these loans, meaning that the customers whose loans have been sold in the secondary market still make their monthly payments to the Bank. As a result of these mortgage loan sales, the Bank capitalizes a value allocated to the servicing rights categorized in other assets and recognizes other income from the sale and servicing of these loans. The capitalized servicing rights are amortized against noninterest income in proportion to the estimated net servicing income over the remaining periods of the underlying financial assets.
Capitalized servicing rights are evaluated for impairment periodically based upon the fair value of the rights as compared to amortized cost. The rights are deemed to be impaired when the fair value of the rights is less than the amortized cost. The fair value of the servicing rights is estimated using projected, discounted cash flows by means of a computer pricing model, based on objective characteristics of the portfolio and commonly used industry assumptions.
Deferred Tax Assets
The Company uses an estimate of future earnings to support our position that the benefit of our deferred tax assets will be realized. If future income should prove non-existent or less than the amount of the deferred tax assets within the tax years to which they may be applied, the asset may not be realized and our net income will be reduced. Our deferred tax assets are described further in Note 11 of the “Notes to Consolidated Financial Statements.”
12
Other than Temporary Impairment of Investments
Investments are evaluated periodically to determine whether a decline in their value is other than temporary. Management utilizes criteria such as the magnitude and duration of the decline, in addition to the reasons underlying the decline, to determine whether the loss in value is other than temporary. The term “other than temporary” is not intended to indicate that the decline is permanent. It indicates that the prospects for a near term recovery of value are not necessarily favorable, or that there is a lack of evidence to support fair values equal to, or greater than, the carrying value of the investment. Once a decline in value is determined to be other than temporary, the value of the security is reduced and a corresponding charge to earnings is recognized.
All dollars are stated in thousands, with the exception of per share numbers.
STATEMENT OF CONDITION
Total assets at December 31, 2007 were $434,322 representing an increase of $30,745 or 7.6% over balances at December 31, 2006. Growth for the year was concentrated in loans which had double-digit growth. Many of our competitors found it difficult to grow their portfolios and achieve the same results.
Cash and cash equivalents declined $11,159 or 58.8% from December 31, 2006 to December 31, 2007. Balances of interest-bearing deposits in other banks and federal funds sold declined due to temporary cash requirements that fluctuate with changes in deposits and loan demand. At the end of 2006 we had increased these balances anticipating several maturities of customers’ certificates of deposit and commitments for large loans early in January 2007. At December 31, 2007 we did not have similar maturities of customers’ certificates of deposit and had sufficient liquidity from short-term investments to provide for loan closings in January 2008.
Investment securities available for sale decreased $527 or .8% at December 31, 2007 from balances one year earlier. These cash flows, along with deposit growth, were utilized to fund loan demand. Higher yields are garnered from lending than from investments, in addition to the commitment to fulfill our mission as a community bank to serve the financial needs of our marketplace, both good reasons to invest in quality loans rather than to increase the investment portfolio. During the year, investments in U.S. government agency bonds declined $7,835 or 49.5%, mainly due to calls of $8,000. These bonds included a feature to step-up the interest rate on scheduled dates throughout their lives along with the ability for the issuing agency to call the bond at regular intervals. Given that the interest rates on the bonds were greater than market rates at the time of this year’s step-up, the agencies took the opportunity to call the bonds rather than pay the higher interest rates. With choices for higher yielding investments limited during 2007, management invested funds in tax free municipal bonds during the year, increasing the balances of these securities by $5,107 or 69.6%. Tax equivalent yields received on these bonds compared favorably to those available for other offerings at the time of purchase. Investments in commercial paper increased $2,071 or 6.0% during 2007, as short term interest rates were frequently the highest rates offered, allowing us to be in a position to extend maturities or reinvest dollars as the yield curve changed or as needed to fund loan demand.
The loan portfolio continued to increase again during 2007 with growth of $39,467 or 12.9% over balances at December 31, 2006. As has been the trend, loans secured by commercial real estate experienced the greatest gains, increasing $27,413 or 16.0% with balances of $198,323 as of December 31, 2007. The Bank has continued to expand our niche in children’s summer camps, where total loans to this industry increased by $18,822 during the year. Loans to commercial real estate investors centered in non-owner occupied commercial rental facilities grew by $5,790. Origination of residential mortgages in 2007 totaled $15,066, down slightly from $17,201 in 2006. Total balances of conventional residential mortgage loans increased $5,054 or 7.9% during 2007. While it is our policy to sell the majority of long term fixed rate mortgages originations to Freddie Mac, the Bank selectively retained some 15 year fixed rate and adjustable rate mortgages which conformed to secondary market underwriting guidelines for creditworthiness but included properties that had characteristics that were not within the agency’s guidelines. Balances of construction and development loans increased from $3,733 to $8,385, an increase of $4,652 or 124.6% from December 31, 2006 to December 31, 2007. The Bank financed several large construction projects during the year.
13
As we have noted in previous reports, the bank does not originate subprime mortgage loans and therefore has not had the problems that the industry has been experiencing with this type of lending. Community banks in general, including The Dime Bank, have not participated in this or any other predatory lending. These types of programs are not consistent with Dimeco’s mission statement to provide services consistent with sound, prudent principles and to fulfill the social, economic, moral and political considerations associated with a responsible, well-run financial institution.
Premises and equipment increased $656 or 11.4% due primarily to costs incurred as construction began on a new branch facility in Palmyra Township, Wayne County, Pennsylvania and to improve the current main branch in Honesdale, Pennsylvania. The new branch will be located in close proximity to Lake Wallenpaupack, a very active recreational area. Commercial businesses have grown in this area and management believes that this branch will attract new customers while offering the appropriate physical location to maintain several large commercial customers we currently service from this vicinity. The Honesdale office serves the greatest number of customers of all our branches and is home to our corporate offices. The facility is very attractive but is strained by the number of employees and does not offer sufficient parking for customers or staff. We purchased the commercial property adjacent to this office in 2005 and have begun to modify it to better meet our needs.
Balances of bank-owned life insurance increased by $2,316 or 39.3% during 2007 as a result of the purchase of $2,000 of additional polices in the first quarter of 2007 along with $316 of net earnings on policies during the year. Additional life insurance was purchased in order to offer benefits for new corporate officers that match those offered to existing officers and to place additional insurance on key officers to complement changes in their benefit plans.
Deposits increased by $26,483 or 7.8% as of December 31, 2007 as compared to a year earlier. Noninterest-bearing balances grew slightly by $591 or 1.7% from December 31, 2006 to December 31, 2007. While this change is not significant in dollars, we are pleased that the product had positive growth during this period. Garnering checking accounts has proven to be a considerable challenge for all banks, however, we experienced growth of over 12% in new accounts during 2007. The average balance per account decreased during the period as customers seem to be more cognizant of all funds on deposit, allocating funds to interest-bearing accounts more readily than has been the case historically. Interest-bearing deposits increased $25,892 or 8.5% during 2007 with the greatest increase in time deposits. Time deposits of $100 or greater increased $9,788 or 13.8% while those in amounts less than $100 increased $7,177 or 5.8% over balances at December 31, 2006. The Bank continued to offer very competitive interest rates in 2007 in order to attract new deposits and retain existing deposits in very aggressive local markets. Balances in money market accounts increased by $10,899 or 30.9% from December 31, 2006 to December 31, 2007. These accounts are designed to pay interest on a tiered basis with higher rates paid for greater balances. In so doing, we have attracted larger balance customers to the higher rates without paying a premium for all deposits while continuing to offer a competitive interest rate at every level. Savings deposits declined $2,175 or 6.5% during 2007 with customers choosing to move funds from savings accounts to higher yielding certificates of deposit and money market accounts during the period.
Short-term borrowings declined $4,495 or 35.4% from balances at December 31, 2006. In addition to the seasonal fluctuations in commercial customers’ balances, we have seen a migration to higher yielding certificates of deposit or money market accounts from customers who use this product.
Other borrowed funds increased $3,898 or 28.3% during 2007 due primarily to additional borrowings of $6,900 from the Federal Home Loan Bank of Pittsburgh (“FHLB”) offset by regularly scheduled payments of $3,002 made during the year. In order to meet the needs of our commercial loan customers for fixed rate financing while managing interest rate risk, we borrowed from the FHLB to fund these loans and included a prepayment penalty in the loan documents to equal the penalty which would be incurred for early payment of these borrowings from the FHLB.
14
CAPITAL RESOURCES
Stockholders’ Equity of $39,923 at December 31, 2007 represented an increase of $4,586 or 13.0% from the previous year end. Net income of $6,612 was the primary source of this increase, representing earnings per share of $4.34 and a return on average equity of 17.5%. Dividends of $1,815, or $1.19 per share, were returned to shareholders. The Company utilized the 2004 Stock Repurchase Plan to purchase 10,100 shares of treasury stock during 2007, using $490 of equity. Management believes that the market price of our stock is a worthwhile investment allowing for greater leverage of the balance sheet. Use of treasury shares will offer the opportunity to offset the possible dilutive effect on both book value and earnings per share when stock options are exercised in the future. Market value appreciation of investments available for sale resulted in a benefit of $72, net of taxes, to accumulated other comprehensive income.
The Company’s capital position at December 31, 2007 as it relates to regulatory guidelines is presented below:
| | | | | | | | | |
| | | Dimeco, Inc. | | | Well-Capitalized | | | Minimum Requirements | |
Leverage Ratio | | 9.50 | % | | 5.00 | % | | 4.00 | % |
Tier I Capital Ratio | | 10.35 | % | | 6.00 | % | | 4.00 | % |
Total Capital Ratio | | 11.61 | % | | 10.00 | % | | 8.00 | % |
LIQUIDITY
Liquidity within the Company is viewed mainly through an analysis of the Consolidated Statement of Cash Flows which is included in the audited financial statements. Companies in the financial service industry are dependent on their ability to maintain proper levels of short and long-term liquidity. The key is to maintain appropriate levels of liquidity to allow for customers’ cash needs from both a lending and deposit perspective, to maintain sufficient cash for operating expenses and to have amounts available to take advantage of earning opportunities as they arise.
Dimeco, Inc. defines cash and cash equivalents as cash on hand and in banks along with overnight investments in federal funds sold. Balances of these accounts totaled $7,812 or 1.8% of total assets at December 31, 2007. Operating activities generated $5,184 of cash and financing activities added $23,833 while investing activities used $40,176.
Both short-term and long-term liquidity are generated through principal and interest payments on loans, increases in borrowed funds and deposits, sales and maturities of investment securities, sales of residential loans in the secondary market and from operating income. Another manner that is available to the Company to garner funds is by issuance of additional common stock. This method has not been used in many years, but does offer another source of funds if management decides to increase liquidity in this manner. Uses of liquidity include originations of loans both for addition to our portfolio and for sales in the secondary market, purchases of investment securities, capital projects, treasury stock repurchases, operating expenses and payment of dividends. The deposit base, through our ability to maintain current deposits and garner new funds, has historically been the primary source of liquidity for the Company. It continues to be the main source of funds, but has been augmented by the Bank’s ability to borrow from the FHLB. The Bank has a credit line of $83,403 with $65,741 available at December 31, 2007. This line is generally viewed as a long-term source of liquidity, but is also used regularly in lower dollar amounts to borrow overnight funds as needed.
Management believes that the Company has sufficient liquidity to meet both its short and long-term needs. We understand that liquidity may be adversely affected by many factors including unexpected deposit outflows, aggressive competitive pricing by other financial intermediaries and other cash requirements. We are aware of our dependence on customers’ deposits to sustain our liquidity levels. We believe that people are becoming more comfortable investing in capital markets and insurance products, but through continuing marketing efforts, deposit pricing and opportunities in new markets we think that we will be able to maintain the majority of current deposits and gain new deposits. Our investment department compliments our product line by offering customers the ability to invest in capital markets and insurance products, augmenting our ability to be their total financial resource. Each area of the institution cross sells the abilities of the other departments; therefore, we feel that the Company can maintain customer relationships and be positioned to acquire deposits even as investment cycles change.
15
QUANTITATIVE AND QUALITATIVE DISCLOSURES ABOUT MARKET RISK
Market risk is inherent in the financial services industry, encompassing the risk of loss associated with adverse changes in market interest rates and prices. As an organization, we have placed the management of this risk in the Asset/Liability Committee (“ALCO”). This committee is comprised of all senior officers, vice presidents representing each product offering, information technology along with the community banking officer and the marketing officer. The committee follows guidelines enumerated in the ALCO policy which was developed to achieve earnings consistent with established goals while maintaining acceptable levels of interest rate risk, adequate levels of liquidity and adherence to regulatory mandates. The committee reports to the Board of Directors on at least a quarterly basis.
Asset market risk is most prevalent in the investment portfolio and to a lesser degree, in mortgage loans held for sale. Given the recent declines in interest rates, it becomes more difficult to locate and purchase investments with yields that management believes will offer long term benefit for the Company. Consequently, we have continued our strategy of purchasing short-term bonds that will be available for repricing as market rates fluctuate along with investment in a lesser number of tax-free municipal bonds that are longer term in order to build the tax benefits associated with these bonds. We evaluate the municipal issuers and generally acquire muni bonds that are insured by MBIA, FGIG, and others. Muni bond insurers have been under intense scrutiny by the rating agencies, but their Triple A ratings were reaffirmed in February 2008, reassuring a secure investment product. We expect to extend maturities as opportunities arise, but we do not anticipate that scenario in the near future. Investment in long-term securities at current rates may provide a lower return if the need arises to sell for liquidity in the future. Management has maintained a portfolio which includes investments in short maturity commercial paper and, to a lesser extent, U.S. government agencies that contain interest rate step-ups over the life of the investment. Although all investments are held in the available for sale category, management anticipates holding all investments to maturity and has historically not had the need to sell for liquidity needs. Market risk inherent in loans held for sale has been mitigated by controlling the length of time between origination and sale of these loans. The balance of loans in this category is generally less than $1 million.
To address credit risk, both the loan portfolio and the investment portfolio have stringent guidelines as to the credit quality of acceptable investments. These guidelines are dictated by the safety and soundness provisions of the agencies which govern the Bank and holding company.
Liability market risk is associated with the adverse affects of our pricing strategies compared to competitors’ pricing strategies. The markets in which we have offices are located in areas where other financial institutions also operate branches. If there is not enough flexibility in our pricing models to quickly move interest rates of both loans and deposits, we may lose accounts to other financial intermediaries. The ALCO is cognizant of the ability of interest rates to adversely affect assets, liabilities, capital and interest income and expense. In particular, two analytical tools are used to ascertain our ability to manage this market risk. The first is theStatement of Interest Sensitivity Gap. This report matches all interest-earning assets and all interest-bearing liabilities by the time frame in which funds can be reinvested or repriced. The second report is theAnalysis of Sensitivity to Changes in Market Interest Rates which is used to determine the affect on income of various shifts in the interest rate environment. Both reports include inherent assumptions in order to process the information. Management is aware that these assumptions affect the results and actual results may differ. These assumptions include an estimate of the maturity or repricing times of deposits, even though all deposits, other than time deposits, have no stated maturity and the reference that interest rate shifts will be parallel, with the rates of assets and liabilities shifting in the same amount in the same time frame. In reality, various assets and various liabilities will react differently to changes in interest rates, with some lagging behind the change and some anticipating the upcoming change and reacting before any actual change occurs. Each tool also suggests that there is a propensity to replace assets and liabilities with similar assets and liabilities rather than taking into consideration management’s ability to reallocate the balance sheet. In addition, the models used do not include any elements to determine how an action by management to increase or decrease interest rates charged on loans or paid on deposits or to increase borrowings at the FHLB will affect the results of the analysis. In spite of these limitations, these analyses are good tools to use in a consistent fashion to assist in the management of the Company. Similar versions of these same reports are used by most financial institutions. Both measurements are as of December 31, 2007.
16
STATEMENT OF INTEREST SENSITIVITY GAP
| | | | | | | | | | | | | | | | | | | |
| | | 90 days
or less | | | >90 days
but < 1 year | | | 1 - 5
years | | | >5 years | | | Total |
Assets: | | | | | | | | | | | | | | | | | | | |
Interest-bearing deposits in other banks and federal funds sold | | $ | 934 | | | $ | — | | | $ | — | | | $ | — | | | $ | 934 |
Investment securities available for sale(4)(6) | | | 40,660 | | | | 2,815 | | | | 10,717 | | | | 13,728 | | | | 67,920 |
Loans(1)(5) | | | 69,962 | | | | 98,664 | | | | 102,157 | | | | 74,202 | | | | 344,985 |
| | | | | | | | | | | | | | | | | | | |
Rate sensitive assets | | $ | 111,556 | | | $ | 101,479 | | | $ | 112,874 | | | $ | 87,930 | | | $ | 413,839 |
| | | | | | | | | | | | | | | | | | | |
Liabilities: | | | | | | | | | | | | | | | | | | | |
Interest-bearing deposits: | | | | | | | | | | | | | | | | | | | |
Interest-bearing demand(2) | | $ | 3,180 | | | $ | 9,935 | | | $ | 26,626 | | | $ | — | | | $ | 39,741 |
Money market (3) | | | 7,850 | | | | 23,087 | | | | 15,238 | | | | — | | | | 46,175 |
Savings(2) | | | 2,513 | | | | 7,855 | | | | 21,050 | | | | — | | | | 31,418 |
Time deposits | | | 55,008 | | | | 116,185 | | | | 41,310 | | | | — | | | | 212,503 |
Short-term borrowings | | | 8,210 | | | | — | | | | — | | | | | | | | 8,210 |
Other borrowings | | | 289 | | | | 887 | | | | 6,259 | | | | 10,226 | | | | 17,661 |
| | | | | | | | | | | | | | | | | | | |
Rate sensitive liabilities | | $ | 77,050 | | | $ | 157,949 | | | $ | 110,483 | | | $ | 10,226 | | | $ | 355,708 |
| | | | | | | | | | | | | | | | | | | |
Interest sensitivity gap | | $ | 34,506 | | | $ | (56,470 | ) | | $ | 2,391 | | | $ | 77,704 | | | $ | 58,131 |
Cumulative gap | | $ | 34,506 | | | $ | (21,964 | ) | | $ | (19,573 | ) | | $ | 58,131 | | | | |
Cumulative gap to total assets | | | 7.94 | % | | | (5.06 | %) | | | (4.51 | %) | | | 13.38 | % | | | |
| (1) | Loans are included in the earlier period in which interest rates are next scheduled to adjust or in which they are due. No adjustment has been made for scheduled repayments or for anticipated prepayments. |
| (2) | Interest-bearing demand deposits and savings are segmented based on the percentage of decay method. The decay rates used include 8% “90 days or less,” 25% “ >90 days but <1 year” and 67% “1-5 years.” |
| (3) | Money market deposits are segmented based on the percentage of decay method. The decay rates used include 17% “90 days or less,” 50% “>90 days but <1 year” and 33% “1-5 years.” |
| (4) | Includes Federal Home Loan Bank and Atlantic Central Bankers Bank stock which is included in Other Assets on the Consolidated Financial Statements. |
| (5) | Does not include loans in nonaccrual status, deposit overdrafts, unposted items or deferred fees on loans. |
| (6) | Investments are included in the earlier period in which interest rates are next scheduled to adjust or in which they are due. Included are U.S. Government Agency step-up bonds characterized by having tiered interest rates over their life. Due to this feature these securities have been reallocated from their maturity date to their next step-up date. The specific impact of this policy by timeframe is as follows: “>90 days but <1 year” increased $997, “1-5 years” increased $2,000 and “>5 years” decreased $2,997. |
This report shows the Company to be in an asset sensitive position of $34,506 in 90 days or less, meaning that there are more assets which will reprice in this period than liabilities. Traditionally management focuses the greatest attention to the net gap of the balance sheet in the second time frame, assets which mature in less than or equal to one year. Our statement shows that the Company becomes liability sensitive in this cumulative time frame, with $21,964 of net liabilities repricing in the next twelve months. This scenario is favorable in a declining interest rate period meaning that liabilities will re-price before assets and therefore we should maintain our ability to produce favorable interest spreads. With 73% of our loan portfolio written with variable and adjustable interest rates, those loans will re-price downward, but this reset in rates will trail the repricing of certificates of deposit during the year. During 2007 short-term interest rates decreased four times for a total of 1.0%. Early in 2008 the Federal Reserve Bank has continued this trend and many market analysts believe that the trend will continue or level for the remainder of the year. With the balance sheet being more sensitive to liability changes, our budget suggests that we will continue to show acceptable profit for 2008. Management has established a range of sensitivity that we feel depicts prudent banking practice and we manage the balance sheet to be within that range. The most conservative position is perfectly balanced in any time frame.
17
The following table presents the Company’s potential sensitivity in net interest income, net income and equity value at risk, or the potential of adverse change in the economic value of equity (“EVE”) with rates up or down 100 and 200 basis points. EVE is the present value of assets minus the present value of liabilities at a point in time.
ANALYSIS OF SENSITIVITY TO CHANGES IN MARKET INTEREST RATES
| | | | | | | | | | | | | | | | | | | | | | | | | | | | |
| | | 100 basis points | | | 200 basis points | |
| | | Up | | | Down | | | Up | | | Down | |
| | | Amount | | | % | | | Amount | | | % | | | Amount | | | % | | | Amount | | | % | |
Net interest income | | $ | 157 | | | 0.80 | % | | $ | (51 | ) | | (0.26 | )% | | $ | 230 | | | 1.17 | % | | $ | (343 | ) | | (1.75 | )% |
Net income | | $ | 132 | | | 1.71 | % | | $ | (62 | ) | | (0.80 | )% | | $ | 209 | | | 2.70 | % | | $ | (282 | ) | | (3.68 | )% |
EVE | | $ | (2,825 | ) | | (5.55 | )% | | $ | 1,172 | | | 2.30 | % | | $ | (5,920 | ) | | (11.62 | )% | | $ | 1,367 | | | 2.68 | % |
The greatest risk to the Company from an income perspective is an immediate decline in market interest rates of 200 basis points. With a sudden shift of that magnitude we would experience a decline of $282 or 3.68% in net income, a level that is within our established tolerance limits. In the EVE measurement, an increase of 200 basis points would affect the Company by a decline in equity of $5,920 or 11.62%, again at a level that is within our established tolerance limits. Management believes that we have the ability to affect the changes in income and equity by taking actions which are not factored in this analysis.
ALLOWANCE FOR LOAN LOSSES
The allowance for loan losses represents the amount that management estimates is adequate to provide for probable losses inherent in the loan portfolio. It is the largest subjective measurement in the financial statements. The balance is derived as losses are charged against the allowance while recoveries are credited to it with charges to provision expense providing the amount necessary to maintain the appropriate balance per our analysis. As of December 31, 2007, the Company’s allowance totaled $5,392 which represented 1.56% of the loan portfolio at that date and 1.66% of the average loans outstanding during 2007.
As noted, the allowance is established through a provision for loan losses which is charged to operations. The provision is based on management’s periodic evaluation of the adequacy of the allowance for loan losses, taking into consideration the overall risk characteristics of the portfolio, our specific loan loss experience, current and projected economic conditions, industry loan experience and other relevant factors. The estimates, including the amounts and timing of future cash flows relating to impaired loans, used to determine the adequacy of the allowance are particularly susceptible to significant change. The total allowance for loan losses is a combination of a specific allowance for identified problem loans, a formula allowance and a qualitative allowance. The specific allowance is determined by measuring impairment based upon the practices outlined in Statement of Financial Accounting Standards (“FAS”) No. 114,Accounting by Creditors for Impairment of a Loan and by FAS No. 118,Accounting by Creditors for Impairment of a Loan – Income Recognition and Disclosures. This standard prescribes methods to measure impairment and income recognition as well as documenting disclosure requirements. The formula allowance is calculated using two separate methods. First, we apply factors to outstanding loans by type and risk weighting, excluding those loans for which a specific allowance has been determined. These loss factors are determined by management using historical loss information, current economic factors, portfolio concentration analysis, current delinquency ratios and the experience level of the loan officers in conjunction with evaluations of specific loans during the loan review process. The second formula evaluates selected loans on an individual basis and allocates specific amounts to the allowance based on our internal risk assessment. The qualitative portion of the allowance is determined based upon management’s evaluation of a number of factors including: national and local economic business conditions, collateral values within the portfolio, credit quality trends and management’s evaluation of our particular loan portfolio as a whole.
18
The Company employs an experienced outside professional loan review agency to perform the loan review function. In order to test the majority of the asset category, a review of commercial loan relationships which approximate 67% of the portfolio is performed. This review is based upon current financial information of the customer, an analysis of loan concentrations, financial ratio comparisons, adherence to payment schedule, regulatory evaluations and peer comparisons. Management evaluates all other loans utilizing similar guidelines. After careful evaluation of all factors, a risk rate is assigned and an amount is calculated for each category of reviewed loans. Groups of smaller dollar loans are evaluated as a homogeneous pool with similar factors used to evaluate the appropriateness of the allowance for those loans.
SUMMARY OF LOAN LOSS EXPERIENCE
| | | | | | | | | | | | | | | | | | | | |
| | | 2007 | | | 2006 | | | 2005 | | | 2004 | | | 2003 | |
Balance January 1, | | $ | 4,469 | | | $ | 3,973 | | | $ | 3,172 | | | $ | 3,014 | | | $ | 2,818 | |
Charge-offs: | | | | | | | | | | | | | | | | | | | | |
Commercial | | | 146 | | | | 37 | | | | 106 | | | | 32 | | | | 69 | |
Real estate | | | — | | | | 181 | | | | — | | | | 860 | | | | 558 | |
Installment | | | 214 | | | | 153 | | | | 200 | | | | 226 | | | | 195 | |
| | | | | | | | | | | | | | | | | | | | |
Total charge-offs | | | 360 | | | | 371 | | | | 306 | | | | 1,118 | | | | 822 | |
| | | | | | | | | | | | | | | | | | | | |
Recoveries: | | | | | | | | | | | | | | | | | | | | |
Commercial | | | 4 | | | | 5 | | | | 46 | | | | 4 | | | | 4 | |
Real estate | | | 19 | | | | 6 | | | | 141 | | | | 89 | | | | 2 | |
Installment | | | 130 | | | | 71 | | | | 70 | | | | 57 | | | | 52 | |
| | | | | | | | | | | | | | | | | | | | |
Total recoveries | | | 153 | | | | 82 | | | | 257 | | | | 150 | | | | 58 | |
| | | | | | | | | | | | | | | | | | | | |
Net charge-offs | | | 207 | | | | 289 | | | | 49 | | | | 968 | | | | 764 | |
Additions charged to operations | | | 1,130 | | | | 785 | | | | 850 | | | | 1,126 | | | | 960 | |
| | | | | | | | | | | | | | | | | | | | |
Balance December 31, | | $ | 5,392 | | | $ | 4,469 | | | $ | 3,973 | | | $ | 3,172 | | | $ | 3,014 | |
| | | | | | | | | | | | | | | | | | | | |
Ratio of net charge-offs during the period to average loans outstanding during the period | | | .06 | % | | | .10 | % | | | .02 | % | | | .41 | % | | | .37 | % |
Allowance for loan loss as a % of loans outstanding | | | 1.56 | % | | | 1.46 | % | | | 1.40 | % | | | 1.25 | % | | | 1.37 | % |
Included in the footnotes to the financial statements are schedules which include the total loans which were past due ninety days or more, in nonaccrual status and in impaired status. During 2007 we classified loans to two customers as impaired in the amount of $1,023. There were no loans in impaired status during 2006. The level of loans past due ninety days or more increased $270 or 93.1% with an increase in the number of loans so classified. The majority of these loans are secured by real estate and management does not believe that we have any one loan that would have a material charge to the allowance for loan loss. Loans in nonaccrual status were $572 at December 31, 2007. The majority of these loans were secured by real estate and in the process of collection.
OFF-BALANCE SHEET ARRANGEMENTS
In the normal course of business, the Company engages in a variety of financial transactions, that in accordance with generally accepted accounting principles, are not recorded on its consolidated financial statements. These off-balance sheet arrangements primarily consist of loan commitments and lines of credit, including commercial lines that we use to meet the financing needs of our customers. These off-balance sheet arrangements involve, to varying degrees, elements of credit, interest rate, and liquidity risk. During the year ended December 31, 2007, the Company did not engage in any off-balance sheet transactions reasonably likely to have a material effect on its consolidated financial condition, results of operations or cash flows.
19
RESULTS OF OPERATIONS
2007 Compared to 2006
Net income for the year ended December 31, 2007 was $6,612, representing an increase of $1,027 or 18.4% over income earned in 2006. The majority of the increase in net income is attributable to greater net interest income for the year with efficiencies in other cost categories contributing to the growth.
Net Interest Income
Net interest income is the amount that interest earned on assets exceeds interest paid on deposits and borrowings. In 2007, this amount was $17,350, an increase of $2,182 or 14.4% more than was realized in 2006. The following discussion regarding net interest income should be read in conjunction with the scheduleDistribution of Assets, Liabilities and Stockholders’ Equity: Interest Rates and Interest Differential and Rate/Volume Analysis of Changes in Net Interest Income.
Interest and fees on loans increased $4,506 or 20.9% over the previous year, attributable to greater volume combined with higher interest rates earned during 2007 as compared to 2006. During 2007 the average loan portfolio increased by $32,883 or 11.3% while the average interest rate received on the portfolio increased .64% from 7.40% to 8.04%. With 73% of the loan portfolio invested in variable rate loans, the Company, through its bank subsidiary, recognized greater income when these loans, primarily commercial real estate loans, re-priced even though the prime interest rate declined by 1.0% in the second half of 2007. These commercial real estate loans have been written with the rate of interest fixed for two to three years, generally converting to an annually adjusted rate that is tied to the prime interest rate for the remainder of the loan term. Many of these loans reached the conversion to adjustable rate during 2007, thereby increasing the rates received because the prime interest rate has increased since the loans were granted over the past three years.
Interest earned on taxable investment securities increased $758 or 30.4% from 2006 to 2007. The average balance of the portfolio increased by $10,079 or 19.6%, contributing $487 of the earnings increase and the interest rate earned on the portfolio increased by .44% to a yield of 5.27% in 2007. Management has primarily invested funds from bonds matured and called in short-term commercial paper rather than extend maturities over the past few years. Short-term investments offer the ability to reinvest in longer term securities when the interest rate yield curve becomes more traditional, while earning a similar or higher rate of interest to those investments during 2007. We believe that our primary source of interest income will continue to be generated from loans and have made investments in securities that will support this philosophy by maintaining liquidity.
We extended some maturities by making a net investment of $5,107 in longer-term municipal bonds during 2007, diversifying our holdings, which resulted in an increase of $141 or 63.2% over the previous year in income earned.
20
DISTRIBUTION OF ASSETS, LIABILITIES AND STOCKHOLDERS’ EQUITY;
INTEREST RATES AND INTEREST DIFFERENTIAL
| | | | | | | | | | | | | | | | | | | | | | | | | | | |
| | | 2007 | | | 2006 | | | 2005 | |
| | | Average
Balance (3) | | Revenue/
Expense | | Yield/
Rate | | | Average
Balance (3) | | Revenue/
Expense | | Yield/
Rate | | | Average
Balance (3) | | Revenue/
Expense | | Yield/
Rate | |
ASSETS | | | | | | | | | | | | | | | | | | | | | | | | | | | |
Interest-earning assets: | | | | | | | | | | | | | | | | | | | | | | | | | | | |
Total loans(1)(4) | | $ | 324,706 | | $ | 26,107 | | 8.04 | % | | $ | 291,823 | | $ | 21,601 | | 7.40 | % | | $ | 270,815 | | $ | 17,150 | | 6.33 | % |
Investment securities: | | | | | | | | | | | | | | | | | | | | | | | | | | | |
Taxable(5) | | | 61,604 | | | 3,249 | | 5.27 | % | | | 51,525 | | | 2,491 | | 4.83 | % | | | 48,349 | | | 1,776 | | 3.67 | % |
Exempt from federal income tax(2) | | | 9,105 | | | 552 | | 6.06 | % | | | 5,444 | | | 338 | | 6.20 | % | | | 3,682 | | | 229 | | 6.22 | % |
Interest-bearing deposits | | | 605 | | | 30 | | 4.96 | % | | | 962 | | | 48 | | 4.99 | % | | | 1,235 | | | 37 | | 3.00 | % |
Federal funds sold | | | 3,946 | | | 201 | | 5.09 | % | | | 5,570 | | | 283 | | 5.08 | % | | | 3,007 | | | 88 | | 2.93 | % |
| | | | | | | | | | | | | | | | | | | | | | | | | | | |
Total interest-earning assets/interest income | | | 399,966 | | | 30,139 | | 7.54 | % | | | 355,324 | | | 24,761 | | 6.97 | % | | | 327,088 | | | 19,280 | | 5.89 | % |
Cash and due from banks | | | 5,577 | | | | | | | | | 5,824 | | | | | | | | | 5,810 | | | | | | |
Premises and equipment, net | | | 5,743 | | | | | | | | | 5,840 | | | | | | | | | 6,129 | | | | | | |
Other assets, less allowance for loan losses | | | 7,802 | | | | | | | | | 5,269 | | | | | | | | | 4,876 | | | | | | |
| | | | | | | | | | | | | | | | | | | | | | | | | | | |
Total Assets | | $ | 419,088 | | | | | | | | $ | 372,257 | | | | | | | | $ | 343,903 | | | | | | |
| | | | | | | | | | | | | | | | | | | | | | | | | | | |
LIABILITIES AND STOCKHOLDERS’ EQUITY | | | | | | | | | | | | | | | | | | | | | | | | |
Interest-bearing liabilities: | | | | | | | | | | | | | | | | | | | | | | | | | | | |
Savings | | $ | 33,176 | | $ | 246 | | .74 | % | | $ | 36,795 | | $ | 265 | | .72 | % | | $ | 41,969 | | $ | 294 | | .70 | % |
Interest-bearing checking | | | 80,333 | | | 1,828 | | 2.28 | % | | | 69,728 | | | 1,215 | | 1.74 | % | | | 67,973 | | | 727 | | 1.07 | % |
Time deposits | | | 200,886 | | | 9,403 | | 4.68 | % | | | 166,680 | | | 6,967 | | 4.18 | % | | | 138,379 | | | 4,362 | | 3.15 | % |
Short-term borrowings | | | 13,538 | | | 349 | | 2.58 | % | | | 15,734 | | | 371 | | 2.36 | % | | | 14,856 | | | 207 | | 1.39 | % |
Other borrowed funds | | | 16,410 | | | 775 | | 4.72 | % | | | 15,119 | | | 660 | | 4.37 | % | | | 12,724 | | | 528 | | 4.15 | % |
| | | | | | | | | | | | | | | | | | | | | | | | | | | |
Total interest-bearing liabilities/interest expense | | | 344,343 | | | 12,601 | | 3.66 | % | | | 304,056 | | | 9,478 | | 3.12 | % | | | 275,901 | | | 6,118 | | 2.22 | % |
Noninterest-bearing deposits | | | 33,530 | | | | | | | | | 32,242 | | | | | | | | | 35,298 | | | | | | |
Other liabilities | | | 3,526 | | | | | | | | | 2,712 | | | | | | | | | 2,036 | | | | | | |
| | | | | | | | | | | | | | | | | | | | | | | | | | | |
Total Liabilities | | | 381,399 | | | | | | | | | 339,010 | | | | | | | | | 313,235 | | | | | | |
Stockholders’ Equity | | | 37,689 | | | | | | | | | 33,247 | | | | | | | | | 30,668 | | | | | | |
| | | | | | | | | | | | | | | | | | | | | | | | | | | |
Total Liabilities and Stockholders’ Equity | | $ | 419,088 | | | | | | | | $ | 372,257 | | | | | | | | $ | 343,903 | | | | | | |
| | | | | | | | | | | | | | | | | | | | | | | | | | | |
| | | | | | | | | | | | | | | | | | | | | | | | | | | |
Net interest income/interest spread | | | | | $ | 17,538 | | 3.88 | % | | | | | $ | 15,283 | | 3.85 | % | | | | | $ | 13,162 | | 3.67 | % |
| | | | | | | | | | | | | | | | | | | | | | | | | | | |
Margin Analysis: | | | | | | | | | | | | | | | | | | | | | | | | | | | |
Interest income/earning assets | | | | | $ | 30,139 | | 7.54 | % | | | | | $ | 24,761 | | 6.97 | % | | | | | $ | 19,280 | | 5.89 | % |
Interest expense/earning assets | | | | | | 12,601 | | 3.15 | % | | | | | | 9,478 | | 2.67 | % | | | | | | 6,118 | | 1.87 | % |
| | | | | | | | | | | | | | | | | | | | | | | | | | | |
Net interest income/earning assets | | | | | $ | 17,538 | | 4.39 | % | | | | | $ | 15,283 | | 4.30 | % | | | | | $ | 13,162 | | 4.02 | % |
| | | | | | | | | | | | | | | | | | | | | | | | | | | |
Ratio of average interest-earning assets to average interest-bearing liabilities | | | | | | | | 116.15 | % | | | | | | | | 116.86 | % | | | | | | | | 118.55 | % |
| (1) | Nonaccrual loans are not included. |
| (2) | Income on tax-exempt assets is based on a taxable equivalent basis using a federal income tax rate of 34%. |
| (3) | Average balances are calculated using daily balances. |
| (4) | Interest on loans includes fee income. |
| (5) | Includes equity investments in FHLB and ACBB. |
Certain amounts for prior years have been reclassified in order to conform to current presentation.
21
RATE/VOLUME ANALYSIS OF CHANGES IN NET INTEREST INCOME
| | | | | | | | | | | | | | | | | | | | | | | | |
| | | 2007 Compared to 2006 | | | 2006 Compared to 2005 | |
| | | Total
Variance | | | Caused by | | | Total
Variance | | | Caused by | |
| | | | Rate(1) | | | Volume | | | | Rate(1) | | | Volume | |
Interest income: | | | | | | | | | | | | | | | | | | | | | | | | |
Loans (gross) | | $ | 4,506 | | | $ | 2,072 | | | $ | 2,434 | | | $ | 4,451 | | | $ | 3,121 | | | $ | 1,330 | |
Investment securities: | | | | | | | | | | | | | | | | | | | | | | | | |
Taxable | | | 758 | | | | 271 | | | | 487 | | | | 715 | | | | 598 | | | | 117 | |
Exempt from federal income tax(2) | | | 214 | | | | (13 | ) | | | 227 | | | | 109 | | | | (1 | ) | | | 110 | |
Interest-bearing deposits | | | (18 | ) | | | — | | | | (18 | ) | | | 11 | | | | 20 | | | | (9 | ) |
Federal funds sold | | | (82 | ) | | | 1 | | | | (83 | ) | | | 195 | | | | 120 | | | | 75 | |
| | | | | | | | | | | | | | | | | | | | | | | | |
Total interest-earning assets | | | 5,378 | | | | 2,331 | | | | 3,047 | | | | 5,481 | | | | 3,858 | | | | 1,623 | |
| | | | | | | | | | | | | | | | | | | | | | | | |
Interest expense: | | | | | | | | | | | | | | | | | | | | | | | | |
Savings | | | (19 | ) | | | 7 | | | | (26 | ) | | | (29 | ) | | | 6 | | | | (35 | ) |
Interest-bearing checking | | | 613 | | | | 428 | | | | 185 | | | | 488 | | | | 469 | | | | 19 | |
Time deposits | | | 2,436 | | | | 1,006 | | | | 1,430 | | | | 2,605 | | | | 1,713 | | | | 892 | |
Short-term borrowings | | | (22 | ) | | | 30 | | | | (52 | ) | | | 164 | | | | 152 | | | | 12 | |
Other borrowings | | | 115 | | | | 59 | | | | 56 | | | | 132 | | | | 33 | | | | 99 | |
| | | | | | | | | | | | | | | | | | | | | | | | |
Total interest-bearing liabilities | | | 3,123 | | | | 1,530 | | | | 1,593 | | | | 3,360 | | | | 2,373 | | | | 987 | |
| | | | | | | | | | | | | | | | | | | | | | | | |
Net change in net interest income | | $ | 2,255 | | | $ | 801 | | | $ | 1,454 | | | $ | 2,121 | | | $ | 1,485 | | | $ | 636 | |
| | | | | | | | | | | | | | | | | | | | | | | | |
(1) | Changes in interest income or expense not arising solely as a result of volume or rate variances are allocated to rate variances due to the interest sensitivity of assets and liabilities. |
(2) | Income on interest-earning assets is based on a taxable equivalent basis using a federal income tax rate of 34%. |
Interest expense increased $3,123 or 32.9% in 2007 as compared to 2006 with the primary increase in interest expense on deposits, amounting to an increase of $3,030 or 35.9%. In addition to acquiring more deposits from new customers, we believe that many customers have reallocated their deposits into higher interest paying products in order to gain greater interest income as they become better investors. Interest paid on time deposits, primarily certificates of deposit, represented the greatest increase in interest expense for 2007, with $9,403 paid during the year, an increase of $2,436 or 35.0% more than was paid in 2006. This increase in interest paid was primarily attributable to more time deposits, amounting to $1,430 of the increase while an increase of .50% paid on average during the year accounted for $1,006 of the larger expense. Local competition for these deposits continued to be very aggressive during all of 2007. In order to maintain and build customer relationships our staff was given the opportunity to cross sell other products to customers on visits to the branches while opening these higher interest rate certificates of deposit. Interest paid on checking accounts was the next largest interest expense category with an increase of $613 or 50.5% in 2007 as compared to 2006. Interest paid on money market deposits accounted for the majority of this increase. In the first quarter of 2006 we added an additional, higher interest rate tier to the product in order to compete with other money market providers. This strategy was successful with an average increase of $11,047 or 37.3% in money market accounts during 2007.
22
Provision for Loan Losses
The provision for loan losses increased $345 or 43.9% from 2006 to 2007. Management calculates the appropriate balance for the allowance for loan loss and uses that calculation to determine the annual provision expense. During 2007 the loan portfolio grew by $39,467 or 12.9% while the allowance for loan loss increased $923 or 20.7%. Many factors are considered in the calculation of the appropriate level for the allowance including information collected from the loan review process, current economic indicators both on a local and national level and the rate of delinquency for our loan portfolio along with other statistical and subjective information. In addition, the provision expense is affected by the amount of loans charged off and recoveries of prior loan charge-offs the net amount of which was $207 in 2007. After careful analysis of all factors, management determined that the appropriate balance for the allowance for loan losses and funded the difference in the allowance account through provision expense. As of December 31, 2007, the allowance as a percentage of loans was 1.56%.
Noninterest Income
Noninterest income increased $361 or 11.4% in 2007 as compared to 2006. Service charges on deposit accounts increased $112, or 7.5% over the previous year. The main source of service charge income is derived from charges associated with our overdraft protection product which pays overdrafts on checking accounts up to predetermined amounts when needed. The fee per use of this product has remained constant for the past two years, but more customers used the service in 2007 than in previous years.
Gains on mortgage loans held for sale declined in 2007 with the number of mortgages sold in the secondary market remaining flat however, we recognized less gain on each sale than in previous years.
Earnings on bank-owned life insurance increased by $125 or 54.3% in 2007 as compared to 2006. This increase resulted from the purchase of $2,000 additional life insurance in 2007 and $442 in 2006 combined with a slight increase in the average interest rate earned on the policies.
Other income encompasses many other smaller sources of revenue that are not related to interest income and accounted for $951 in 2007, an increase of $178 or 23.0% more than in 2006. The largest of these income sources was an increase of $80 in relation to fees earned on our debit card portfolio which has grown to over six thousand cards issued and outstanding at December 31, 2007. We have no fees for use of the card and have granted incentives to our staff for cross selling this product. Income relating to merchant card processing grew by $48 or 45.2% with a concerted effort to better manage the program in 2007. No other category of noninterest income showed material changes from the year before.
Noninterest Expense
Expenses incurred in relation to salaries and employee benefits increased $690 or 13.1% from 2006 to 2007. There are many components of this expense category; the largest items are discussed here with smaller changes of other components comprising the remainder. Salaries and wages increased $329 or 8.9% as a result of the net effect of adding six additional full time equivalent employees and granting annual salary adjustments to existing employees during the year. In addition, employees are paid an incentive based upon goals that are set at the beginning of each year, contingent on reaching a predetermined goal for return on average equity. These goals were once again attained or surpassed; therefore, the employees were paid incentives for the year 2007 of $504 which was 28.6% greater than in 2006. Employee benefits increased $63 or 7.7% due mainly to greater payroll taxes which are based on higher payroll expense along with increased cost associated with health insurance due to more employees becoming eligible and a slight increase in the cost per employee. Contributions to the Bank’s 401(k) retirement plan were $83 or 29.1% greater mainly due to the Board of Directors granting an extra 1% toward the discretionary profit sharing segment for 2007 due to the Company’s favorable return this year along with having more employees eligible for the benefit in 2007.
Income Taxes
Income tax expense increased $384 or 14.7% from 2006 to 2007. The increase primarily reflects higher earnings in 2007. The Company’s effective tax rate for 2007 was 31.2% in 2007 compared to 31.9% in 2006. The Company’s effective tax rate differs from statutory rate primarily due to tax exempt income from its municipal bonds and bankowned life insurance investments.
23
2006 Compared to 2005
The year ended December 31, 2006 provided net income of $5,585, recognizing an increase of $1,130 or 25.4% over the previous year end. The majority of the increase in net income is attributable to greater net interest income for the year with efficiency in other cost categories contributing to the growth.
Net Interest Income
Net interest income increased $2,084 or 15.9% in 2006 over 2005. The following discussion regarding net interest income should be read in conjunction with the scheduleDistribution of Assets, Liabilities and Stockholders’ Equity: Interest Rates and Interest Differential and Rate/Volume Analysis of Changes in Net Interest Income.
Interest and fees on loans increased $4,451 or 26.0% over the previous year with interest rate increases being the greatest contribution to this change. Although the average loan portfolio grew by $21,008 or 7.8% over balances at the end of 2005, the average interest rate received on the portfolio increased from 6.33% to 7.40% over the time frame. With over 70% of the loan portfolio invested in variable rate loans, the Company, through its bank subsidiary, recognized greater income while the prime interest rate increased 1.0% during 2006. Commercial real estate loans have been granted with the rate of interest fixed for up to three years, converting to an adjustable rate that is tied to the prime interest rate for the remainder of the loan term. Many of these loans reached the conversion to adjustable rate during 2006, thereby increasing the rates received since prime interest rates have increased substantially over the past three years, in some cases by up to 4.0%. Management has made rate adjustments in some cases in order to maintain relationships with customers ensuring that the rate adjustment remains within current market rates for similar new loan offerings.
Interest earned on taxable investment securities increased $715 or 40.3% from 2005 to 2006. Growth of $3,176 in the average balance of the portfolio contributed to the greater results, but the main reason for higher income is attributable to an increase of 1.16% in the average rate earned on the portfolio in 2006 as compared to 2005, accounting for $598 of the increase. Management primarily invested in short-term commercial paper rather than extend maturities during that interest rate environment. We believe that our primary source of interest income will continue to be generated from loans and made investments in securities to support this philosophy by maintaining liquidity. Although a portion of the investment portfolio is invested in longer-term securities, we were willing to wait until the yield curve offers incentives to extend the maturity of more of the portfolio.
Interest expense increased $3,360 or 54.9% in 2006 as compared to 2005. Although the transfer of many accounts from noninterest-bearing to interest-bearing did increase the expense, volume accounted for only $19 of the $488 in greater expense in 2006. The remaining growth was primarily attributable to the average interest rate paid for money market deposits which increased by 1.45% to 3.19% in 2006. We added an additional, higher interest rate tier to the product in order to compete with other money market providers in the financial services industry for large balance deposits. The primary cause of increased interest expense in 2006 was attributable to the rate of interest paid for certificates of deposit. The average rate paid for these deposits increased by 1.03% over the period to not only keep pace with short-term market rate increases but to keep pace with local competitors’ rate offerings. Each of the markets we serve has multiple financial institutions included, each of which experience pressure to increase their deposit base. This pressure grew as customers became more confident investing in the stock market or in insurance products, adding more competition than from banks alone. While average time deposits increased $28,301 in 2006, only $892 of the interest expense increase was attributable to these higher balances and $1,713 was due to higher interest rates paid.
Provision for Loan Losses
The provision for loan losses declined $65 or 7.6% in 2006 as compared to 2005. Although the decline in expense is not a significant dollar amount, many factors contribute to the expense recorded each year. Loans charged off were $371 in 2006 with recoveries of previously charged off loans amounting to $82. The loan portfolio grew by 7.7% or $21,729 in 2006. After careful analysis of many factors, management determines the appropriate balance for the allowance for loan losses and funds the difference in the allowance account through provision expense. After expensing $785 in 2006, the allowance as a percentage of loans was 1.46% and represented the amount which we believe to be adequate to address possible future losses. Management has succeeded in maintaining a low delinquency average in recent years, with only .71% of the loan portfolio past due 30 days or more at December 31, 2006.
24
Noninterest Income
Noninterest income increased $355 or 12.7% in 2006 as compared to 2005. The primary source of this increase was related to service charge income of $1,495, showing growth of $197 or 15.2% over the previous year. The main source of service charge income is derived from charges associated with our overdraft protection product. The Bank increased the number of checking accounts eligible for this service by 852 during 2006, enabling more customers to use this product along with increasing the fee per transaction by five dollars.
Gains on mortgage loans held for sale declined in 2006 with the number of mortgages sold in the secondary market remaining flat while the gain recognized on each sale declined from levels seen in previous years. The residential mortgage interest rate environment was more favorable in 2005 for recognizing gains on these sales than they were in 2006.
Brokerage commissions increased $105 or 28.3% in 2006 over the $371 earned in 2005 to account for $476 of earnings in 2006. Our investments department recognized substantial activity in the fourth quarter of 2006 with the culmination of several large transactions.
Other income encompasses many other smaller sources of revenue that is not related to interest income and accounted for $773 in 2006, an increase of $153 or 24.7% more than in 2005. The largest of these income sources was an increase of $80 in relation to the recovery of market value declines recorded in 2005 on the value of the mortgage servicing rights asset. In addition, fees earned in relation to our debit card portfolio increased $62 or 40.3% to $214 in 2006 with greater penetration of our checking accounts in 2006. We eliminated an annual fee and charged no transaction fee for use of the card while granting incentives to our staff for cross selling this product. With more cards used by our customers we have realized greater fee income from issuing companies. Trust service income grew by $32 or 267.1% with the Bank terminating use of an outside agent to administer the program in 2006 along with additional assets under management. Offsetting these gains in income recognition during 2006 was income relating to the merchant card processing. This activity declined $42 due to challenges associated with the third party administrator for the program. This problem was addressed in 2005.
Noninterest Expense
Expenses incurred in relation to salaries and employee benefits increased $752 or 16.6% from 2005 to 2006. Actual payroll expense increased $395 or 11.9% as a result of the net effect of adding one additional full time equivalent employee, along with annual salary adjustments during the year. Employees are paid an incentive as described above. Due to the successful accomplishment of these goals in 2006, incentives for the year 2006 were $155 or 65.1% greater than in 2005. Employee benefits increased $123 or 16.4% due to higher premiums paid for health insurance along with higher employer payroll taxes based on greater payroll expense. Contributions to the Bank’s 401(k) retirement plan were $78 greater because more employees were eligible for the benefit in addition to the Board of Directors adding an extra 1% toward the discretionary profit sharing segment for 2006 due to the Company’s favorable return this year.
All other categories of noninterest expense showed variations from the previous year, none of which were significant dollar amounts.
25
MARKET PRICES OF STOCK/DIVIDENDS DECLARED
The Company’s stock is listed on the OTC Bulletin Board under the symbol “DIMC.” The book value per share at December 31, 2007 was $26.23 and represented an increase of 13.2% over the 2006 book value of $23.17. There were approximately 757 shareholders of record at December 31, 2007. This number does not include persons or entities that hold their stock in nominee name through various brokerage firms.
The following table sets forth high and low sale prices per share of the common stock and dividends declared for the calendar quarters indicated, based upon information obtained from published sources:
MARKET PRICES OF STOCK / DIVIDENDS DECLARED
| | | | | | | | | | | | | | | | | | |
| | | 2007 | | 2006 |
| | | High | | Low | | Dividend
Declared | | High | | Low | | Dividend
Declared |
First Quarter | | $ | 43.50 | | $ | 40.60 | | $ | .29 | | $ | 34.50 | | $ | 33.25 | | $ | .26 |
Second Quarter | | $ | 49.00 | | $ | 43.00 | | $ | .29 | | $ | 37.00 | | $ | 33.81 | | $ | .26 |
Third Quarter | | $ | 49.50 | | $ | 47.60 | | $ | .29 | | $ | 37.00 | | $ | 35.80 | | $ | .26 |
Fourth Quarter | | $ | 48.50 | | $ | 46.26 | | $ | .32 | | $ | 43.00 | | $ | 37.00 | | $ | .29 |
The ability of the Company to pay dividends is dependent upon the ability of the Bank to pay dividends to the Company. The Bank is a depository institution insured by the FDIC and therefore it may not pay dividends or distribute capital assets if it is in default on any assessment due the FDIC. Additionally, the Bank is subject to certain state banking regulations that limit the ability of the Bank to pay dividends to the Company. Under Federal Reserve policy, the Company is required to maintain adequate regulatory capital and is expected to act as a source of financial strength to the Bank and to commit resources to support the Bank in circumstances where it might not do so absent such a policy. These regulations may have the effect of reducing the amount of future dividends declarable by the Company.
26
SUMMARY OF SELECTED FINANCIAL DATA
| | | | | | | | | | | | | | | | | | | | |
| | | 2007 | | | 2006 | | | 2005 | | | 2004 | | | 2003 | |
Summary of operations | | | | | | | | | | | | | | | | | | | | |
Interest income | | $ | 29,951 | | | $ | 24,646 | | | $ | 19,202 | | | $ | 15,808 | | | $ | 15,321 | |
Interest expense | | $ | 12,601 | | | $ | 9,478 | | | $ | 6,118 | | | $ | 4,412 | | | $ | 4,699 | |
Net interest income | | $ | 17,350 | | | $ | 15,168 | | | $ | 13,084 | | | $ | 11,396 | | | $ | 10,622 | |
Provision for loan losses | �� | $ | 1,130 | | | $ | 785 | | | $ | 850 | | | $ | 1,126 | | | $ | 960 | |
Net interest income after provision for loan losses | | $ | 16,220 | | | $ | 14,383 | | | $ | 12,234 | | | $ | 10,270 | | | $ | 9,662 | |
Other income | | $ | 3,157 | | | $ | 3,156 | | | $ | 2,801 | | | $ | 2,933 | | | $ | 2,695 | |
Other expenses | | $ | 10,128 | | | $ | 9,341 | | | $ | 8,498 | | | $ | 7,525 | | | $ | 6,803 | |
Income before income taxes | | $ | 9,609 | | | $ | 8,198 | | | $ | 6,537 | | | $ | 5,678 | | | $ | 5,554 | |
Income taxes | | $ | 2,997 | | | $ | 2,613 | | | $ | 2,082 | | | $ | 1,772 | | | $ | 1,700 | |
Net income | | $ | 6,612 | | | $ | 5,585 | | | $ | 4,455 | | | $ | 3,906 | | | $ | 3,854 | |
Per common share | | | | | | | | | | | | | | | | | | | | |
Earnings - basic | | $ | 4.34 | | | $ | 3.67 | | | $ | 2.89 | | | $ | 2.54 | | | $ | 2.54 | |
Earnings - diluted | | $ | 4.18 | | | $ | 3.55 | | | $ | 2.80 | | | $ | 2.46 | | | $ | 2.45 | |
Cash dividends | | $ | 1.19 | | | $ | 1.01 | | | $ | 1.01 | | | $ | .94 | | | $ | .87 | |
Book value | | $ | 26.23 | | | $ | 23.17 | | | $ | 20.53 | | | $ | 19.17 | | | $ | 17.89 | |
Shares outstanding at year end | | | 1,522,200 | | | | 1,525,024 | | | | 1,522,669 | | | | 1,548,994 | | | | 1,526,134 | |
Balance sheet data - end of year | | | | | | | | | | | | | | | | | | | | |
Total assets | | $ | 434,322 | | | $ | 403,577 | | | $ | 358,204 | | | $ | 325,721 | | | $ | 304,304 | |
Loans, net of unearned | | $ | 344,758 | | | $ | 305,291 | | | $ | 283,562 | | | $ | 253,141 | | | $ | 219,609 | |
Loans held for sale | | $ | — | | | $ | — | | | $ | 211 | | | $ | 112 | | | $ | 654 | |
Investment securities: | | | | | | | | | | | | | | | | | | | | |
Available for sale | | $ | 66,739 | | | $ | 67,266 | | | $ | 54,129 | | | $ | 55,662 | | | $ | 64,357 | |
Held to maturity | | $ | — | | | $ | — | | | $ | 199 | | | $ | 198 | | | $ | 197 | |
Deposits | | $ | 364,600 | | | $ | 338,117 | | | $ | 294,856 | | | $ | 270,542 | | | $ | 262,207 | |
Stockholders’ equity | | $ | 39,923 | | | $ | 35,337 | | | $ | 31,260 | | | $ | 29,696 | | | $ | 27,308 | |
Performance | | | | | | | | | | | | | | | | | | | | |
Return on average assets | | | 1.58 | % | | | 1.50 | % | | | 1.30 | % | | | 1.26 | % | | | 1.34 | % |
Return on average equity | | | 17.54 | % | | | 16.80 | % | | | 14.53 | % | | | 13.72 | % | | | 14.79 | % |
Dividend payout ratio | | | 27.42 | % | | | 29.16 | % | | | 34.95 | % | | | 37.01 | % | | | 35.51 | % |
Average equity to average assets ratio | | | 8.99 | % | | | 8.93 | % | | | 8.92 | % | | | 9.15 | % | | | 9.06 | % |
27

MANAGEMENT’S ANNUAL REPORT ON INTERNAL CONTROL OVER FINANCIAL REPORTING
Management of the Company is responsible for establishing and maintaining adequate internal control over financial reporting as defined in Rules 13a-15(f) and 15d-15(f) under the Exchange Act. The Company’s internal control over financial reporting is designed to provide reasonable assurance regarding the reliability of financial reporting and the preparation of financial statements for external purposes in accordance with generally accepted accounting principles.
Because of its inherent limitations, internal control over financial reporting may not prevent or detect misstatements. Also, projections of any evaluation of effectiveness to future periods are subject to the risk that controls may become inadequate because of changes in conditions, or that the degree of compliance with the policies or procedures may deteriorate.
A material weakness is a significant deficiency (as defined in Public Company Accounting Oversight Board Auditing Standard No. 2), or a combination of significant deficiencies, that results in there being more than a remote likelihood that a material misstatement of the annual or interim financial statements will not be prevented or detected on a timely basis by management or employees in the normal course by management or employees in the normal course of performing their assigned functions.
Management assessed the effectiveness of the Company’s internal control over financial reporting as of December 31, 2007. In making this assessment, management used the criteria set forth by the Committee of Sponsoring Organizations of the Treadway Commission (COSO) in Internal Control-Integrated Framework. Based on this assessment, management believes that, as of December 31, 2007, the Company’s internal control over financial reporting was effective.
This annual report does not include an attestation report of the Company’s registered public accounting firm regarding internal control over financial reporting. Management’s report was not subject to attestation by the Company’s registered public accounting firm pursuant to temporary rules of the Securities and Exchange Commission that permit the Company to provide only management’s report in this annual report.

By: Gary C. Beilman
President and Chief Executive Officer
(Principal Executive Officer)
Date: March 6, 2008

By: Maureen H. Beilman
Chief Financial Officer
(Principal Financial & Accounting Officer)
Date: March 6, 2008
28

REPORT OF INDEPENDENT REGISTERED PUBLIC ACCOUNTING FIRM
The Board of Directors and Stockholders
Dimeco, Inc.
We have audited the consolidated balance sheet of Dimeco, Inc. and subsidiary as of December 31, 2007 and 2006, and the related consolidated statements of income, changes in stockholders’ equity, and cash flows for each of the three years in the period ended December 31, 2007. These financial statements are the responsibility of the Company’s management. Our responsibility is to express an opinion on these financial statements based on our audits.
We conducted our audits in accordance with the standards of the Public Company Accounting Oversight Board (United States). Those standards require that we plan and perform the audit to obtain reasonable assurance about whether the financial statements are free of material misstatement. An audit includes examining, on a test basis, evidence supporting the amounts and disclosures in the financial statements. An audit also includes assessing the accounting principles used and significant estimates made by management, as well as evaluating the overall financial statement presentation. We believe that our audits provide a reasonable basis for our opinion.
In our opinion, the consolidated financial statements referred to above present fairly, in all material respects, the financial position of Dimeco, Inc. and subsidiary as of December 31, 2007 and 2006, and the consolidated results of their operations and their cash flows for each of the three years in the period ended December 31, 2007, in conformity with U.S. generally accepted accounting principles.
|
|
 |
| Wexford, Pennsylvania |
| March 10, 2008 |
S.R. Snodgrass, A.C. 2100 Corporate Drive, Suite 400 Wexford, PA 15090-7647 Phone: 724-934-0344 Facsimile: 724-934-0345
29
CONSOLIDATED BALANCE SHEET
| | | | | | | | |
| | | December 31, | |
(In thousands) | | 2007 | | | 2006 | |
Assets | | | | | | | | |
Cash and due from banks | | $ | 6,878 | | | $ | 6,684 | |
Interest-bearing deposits in other banks | | | 39 | | | | 2,287 | |
Federal funds sold | | | 895 | | | | 10,000 | |
| | | | | | | | |
Total cash and cash equivalents | | | 7,812 | | | | 18,971 | |
Investment securities available for sale | | | 66,739 | | | | 67,266 | |
Loans (net of unearned income of $604 and $777) | | | 344,758 | | | | 305,291 | |
Less allowance for loan losses | | | 5,392 | | | | 4,469 | |
| | | | | | | | |
Net loans | | | 339,366 | | | | 300,822 | |
Premises and equipment | | | 6,387 | | | | 5,731 | |
Accrued interest receivable | | | 1,966 | | | | 1,798 | |
Bank-owned life insurance | | | 8,208 | | | | 5,892 | |
Other assets | | | 3,844 | | | | 3,097 | |
| | | | | | | | |
TOTAL ASSETS | | $ | 434,322 | | | $ | 403,577 | |
| | | | | | | | |
Liabilities | | | | | | | | |
Deposits: | | | | | | | | |
Noninterest-bearing | | $ | 34,763 | | | $ | 34,172 | |
Interest-bearing | | | 329,837 | | | | 303,944 | |
| | | | | | | | |
Total deposits | | | 364,600 | | | | 338,117 | |
Short-term borrowings | | | 8,210 | | | | 12,705 | |
Other borrowed funds | | | 17,661 | | | | 13,763 | |
Accrued interest payable | | | 1,691 | | | | 1,428 | |
Other liabilities | | | 2,237 | | | | 2,227 | |
| | | | | | | | |
TOTAL LIABILITIES | | | 394,399 | | | | 368,240 | |
| | | | | | | | |
Stockholders’ Equity | | | | | | | | |
Common stock, $.50 par value; 5,000,000 shares authorized; 1,575,300 and 1,568,024 shares issued | | | 788 | | | | 784 | |
Capital surplus | | | 4,978 | | | | 4,775 | |
Retained earnings | | | 36,152 | | | | 31,355 | |
Accumulated other comprehensive income (loss) | | | 37 | | | | (35 | ) |
Treasury stock, at cost (53,100 and 43,000 shares) | | | (2,032 | ) | | | (1,542 | ) |
| | | | | | | | |
TOTAL STOCKHOLDERS’ EQUITY | | | 39,923 | | | | 35,337 | |
| | | | | | | | |
TOTAL LIABILITIES AND STOCKHOLDERS’ EQUITY | | $ | 434,322 | | | $ | 403,577 | |
| | | | | | | | |
The accompanying notes are an integral part of these consolidated financial statements.
30
CONSOLIDATED STATEMENT OF INCOME
| | | | | | | | | |
| | | Year Ended December 31, |
(In thousands, except per share data) | | 2007 | | 2006 | | 2005 |
Interest Income | | | | | | | | | |
Interest and fees on loans | | $ | 26,107 | | $ | 21,601 | | $ | 17,150 |
Interest-bearing deposits in other banks | | | 30 | | | 48 | | | 37 |
Federal funds sold | | | 201 | | | 283 | | | 88 |
Investment securities: | | | | | | | | | |
Taxable | | | 3,249 | | | 2,491 | | | 1,776 |
Exempt from federal income tax | | | 364 | | | 223 | | | 151 |
| | | | | | | | | |
Total interest income | | | 29,951 | | | 24,646 | | | 19,202 |
| | | | | | | | | |
Interest Expense | | | | | | | | | |
Deposits | | | 11,477 | | | 8,447 | | | 5,383 |
Short-term borrowings | | | 349 | | | 371 | | | 207 |
Other borrowed funds | | | 775 | | | 660 | | | 528 |
| | | | | | | | | |
Total interest expense | | | 12,601 | | | 9,478 | | | 6,118 |
| | | | | | | | | |
Net Interest Income | | | 17,350 | | | 15,168 | | | 13,084 |
Provision for loan losses | | | 1,130 | | | 785 | | | 850 |
| | | | | | | | | |
Net Interest Income After Provision for Loan Losses | | | 16,220 | | | 14,383 | | | 12,234 |
| | | | | | | | | |
Noninterest Income | | | | | | | | | |
Service charges on deposit accounts | | | 1,607 | | | 1,495 | | | 1,298 |
Mortgage loans held-for-sale gains, net | | | 154 | | | 182 | | | 288 |
Investment securities gains | | | — | | | — | | | 2 |
Brokerage commissions | | | 450 | | | 476 | | | 371 |
Earnings on bank-owned life insurance | | | 355 | | | 230 | | | 222 |
Other income | | | 951 | | | 773 | | | 620 |
| | | | | | | | | |
Total noninterest income | | | 3,517 | | | 3,156 | | | 2,801 |
| | | | | | | | | |
Noninterest Expense | | | | | | | | | |
Salaries and employee benefits | | | 5,962 | | | 5,272 | | | 4,520 |
Occupancy expense, net | | | 796 | | | 786 | | | 749 |
Furniture and equipment expense | | | 525 | | | 512 | | | 557 |
Professional fees | | | 519 | | | 496 | | | 482 |
Data processing expense | | | 342 | | | 391 | | | 352 |
Other expense | | | 1,984 | | | 1,884 | | | 1,838 |
| | | | | | | | | |
Total noninterest expense | | | 10,128 | | | 9,341 | | | 8,498 |
| | | | | | | | | |
Income before income taxes | | | 9,609 | | | 8,198 | | | 6,537 |
Income taxes | | | 2,997 | | | 2,613 | | | 2,082 |
| | | | | | | | | |
NET INCOME | | $ | 6,612 | | $ | 5,585 | | $ | 4,455 |
| | | | | | | | | |
Earnings Per Share: | | | | | | | | | |
Basic | | $ | 4.34 | | $ | 3.67 | | $ | 2.89 |
Diluted | | $ | 4.18 | | $ | 3.55 | | $ | 2.80 |
The accompanying notes are an integral part of these consolidated financial statements.
31
CONSOLIDATED STATEMENT OF CHANGES IN STOCKHOLDERS’ EQUITY
| | | | | | | | | | | | | | | | | | | | | | | | | | |
(In thousands, except per share data) | | Common
Stock | | Capital
Surplus | | Retained
Earnings | | | Accumulated
Other
Comprehensive
Income (Loss) | | | Treasury
Stock | | | Total
Stockholders’
Equity | | | Comprehensive
Income | |
Balance, December 31, 2004 | | $ | 774 | | $ | 4,377 | | $ | 24,496 | | | $ | 49 | | | $ | — | | | $ | 29,696 | | | $ | | |
Net income | | | | | | | | | 4,455 | | | | | | | | | | | | 4,455 | | | $ | 4,455 | |
Other comprehensive loss: | | | | | | | | | | | | | | | | | | | | | | | | | | |
Unrealized loss on available-for-sale securities, net of reclassification adjustment, net of tax benefit of $ 180 | | | | | | | | | | | | | (348 | ) | | | | | | | (348 | ) | | | (348 | ) |
| | | | | | | | | | | | | | | | | | | | | | | | | | |
Comprehensive income | | | | | | | | | | | | | | | | | | | | | | | | $ | 4,107 | |
| | | | | | | | | | | | | | | | | | | | | | | | | | |
Purchase of treasury stock | | | | | | | | | | | | | | | | | (1,062 | ) | | | (1,062 | ) | | | | |
Exercise of stock options | | | 2 | | | 68 | | | | | | | | | | | | | | | 70 | | | | | |
Cash dividends ($1.01 per share) | | | | | | | | | (1,551 | ) | | | | | | | | | | | (1,551 | ) | | | | |
| | | | | | | | | | | | | | | | | | | | | | | | | | |
Balance, December 31, 2005 | | | 776 | | | 4,445 | | | 27,400 | | | | (299 | ) | | | (1,062 | ) | | | 31,260 | | | | | |
Net income | | | | | | | | | 5,585 | | | | | | | | | | | | 5,585 | | | $ | 5,585 | |
Other comprehensive income: | | | | | | | | | | | | | | | | | | | | | | | | | | |
Unrealized gain on available-for-sale securities, net of tax expense of $135 | | | | | | | | | | | | | 264 | | | | | | | | 264 | | | | 264 | |
| | | | | | | | | | | | | | | | | | | | | | | | | | |
Comprehensive income | | | | | | | | | | | | | | | | | | | | | | | | $ | 5,849 | |
| | | | | | | | | | | | | | | | | | | | | | | | | | |
Purchase of treasury stock | | | | | | | | | | | | | | | | | (480 | ) | | | (480 | ) | | | | |
Exercise of stock options | | | 8 | | | 330 | | | | | | | | | | | | | | | 338 | | | | | |
Cash dividends ($1.07 per share) | | | | | | | | | (1,630 | ) | | | | | | | | | | | (1,630 | ) | | | | |
| | | | | | | | | | | | | | | | | | | | | | | | | | |
Balance, December 31, 2006 | | | 784 | | | 4,775 | | | 31,355 | | | | (35 | ) | | | (1,542 | ) | | | 35,337 | | | | | |
Net income | | | | | | | | | 6,612 | | | | | | | | | | | | 6,612 | | | $ | 6,612 | |
Other comprehensive income: | | | | | | | | | | | | | | | | | | | | | | | | | | |
Unrealized gain on available-for-sale securities, net of tax expense of $38 | | | | | | | | | | | | | 72 | | | | | | | | 72 | | | | 72 | |
| | | | | | | | | | | | | | | | | | | | | | | | | | |
Comprehensive income | | | | | | | | | | | | | | | | | | | | | | | | $ | 6,684 | |
| | | | | | | | | | | | | | | | | | | | | | | | | | |
Purchase of treasury stock | | | | | | | | | | | | | | | | | (490 | ) | | | (490 | ) | | | | |
Exercise of stock options | | | 4 | | | 203 | | | | | | | | | | | | | | | 207 | | | | | |
Cash dividends ($1.19 per share) | | | | | | | | | (1,815 | ) | | | | | | | | | | | (1,815 | ) | | | | |
| | | | | | | | | | | | | | | | | | | | | | | | | | |
Balance, December 31, 2007 | | $ | 788 | | $ | 4,978 | | $ | 36,152 | | | $ | 37 | | | $ | (2,032 | ) | | $ | 39,923 | | | | | |
| | | | | | | | | | | | | | | | | | | | | | | | | | |
| | | | | | | | | | |
| | | |
| | | 2007 | | 2006 | | 2005 | |
Components of other comprehensive income (loss): | | | | | | | | | | |
Change in net unrealized gain (loss) on investment securities available for sale | | $ | 72 | | $ | 264 | | $ | (347 | ) |
Realized gains included in net income, net of taxes of $1 | | | — | | | — | | | (1 | ) |
| | | | | | | | | | |
Total | | $ | 72 | | $ | 264 | | $ | (348 | ) |
| | | | | | | | | | |
The accompanying notes are an integral part of these consolidated financial statements.
32
CONSOLIDATED STATEMENT OF CASH FLOWS
| | | | | | | | | | | | |
| | | Year Ended December 31, | |
(In thousands) | | 2007 | | | 2006 | | | 2005 | |
Operating Activities | | | | | | | | | | | | |
Net income | | $ | 6,612 | | | $ | 5,585 | | | $ | 4,455 | |
Adjustments to reconcile net income to net cash provided by operating activities: | | | | | | | | | | | | |
Provision for loan losses | | | 1130 | | | | 785 | | | | 850 | |
Depreciation and amortization | | | 705 | | | | 743 | | | | 790 | |
Amortization of premium and discount on investment securities, net | | | (2,146 | ) | | | (1,235 | ) | | | (714 | ) |
Amortization of net deferred loan origination fees | | | (169 | ) | | | (133 | ) | | | (108 | ) |
Investment securities gains | | | — | | | | — | | | | (2 | ) |
Origination of loans held for sale | | | (8,028 | ) | | | (6,917 | ) | | | (12,430 | ) |
Proceeds from sale of loans | | | 8,182 | | | | 7,310 | | | | 12,619 | |
Mortgage loans sold gains, net | | | (154 | ) | | | (182 | ) | | | (288 | ) |
Increase in accrued interest receivable | | | (168 | ) | | | (418 | ) | | | (274 | ) |
Increase in accrued interest payable | | | 263 | | | | 476 | | | | 343 | |
Deferred federal income taxes | | | (414 | ) | | | (235 | ) | | | (311 | ) |
Earnings on bank-owned life insurance | | | (355 | ) | | | (230 | ) | | | (189 | ) |
Other, net | | | (274 | ) | | | 295 | | | | 335 | |
| | | | | | | | | | | | |
Net cash provided by operating activities | | | 5,184 | | | | 5,844 | | | | 5,076 | |
| | | | | | | | | | | | |
Investing Activities | | | | | | | | | | | | |
Investment securities available for sale: | | | | | | | | | | | | |
Proceeds from sales | | | — | | | | — | | | | 6 | |
Proceeds from maturities or paydown | | | 295,220 | | | | 252,970 | | | | 214,833 | |
Purchases | | | (292,436 | ) | | | (264,474 | ) | | | (213,118 | ) |
Investment securities held to maturity: | | | | | | | | | | | | |
Proceeds from maturities or paydown | | | — | | | | 200 | | | | — | |
Redemption of Federal Home Loan Bank stock | | | 797 | | | | 671 | | | | 1,021 | |
Purchase of Federal Home Loan Bank stock | | | (1,063 | ) | | | (641 | ) | | | (1,014 | ) |
Net increase in loans | | | (39,505 | ) | | | (21,885 | ) | | | (30,362 | ) |
Purchase of bank-owned life insurance | | | (2,000 | ) | | | (442 | ) | | | — | |
Purchase of premises and equipment | | | (1,189 | ) | | | (250 | ) | | | (996 | ) |
| | | | | | | | | | | | |
Net cash used for investing activities | | | (40,176 | ) | | | (33,851 | ) | | | (29,630 | ) |
| | | | | | | | | | | | |
Financing Activities | | | | | | | | | | | | |
Net increase in deposits | | | 26,483 | | | | 43,261 | | | | 24,314 | |
Increase (decrease) in short-term borrowings | | | (4,495 | ) | | | (249 | ) | | | 921 | |
Proceeds from other borrowed funds | | | 6,900 | | | | 1,225 | | | | 5,725 | |
Repayment of other borrowed funds | | | (3,002 | ) | | | (4,010 | ) | | | (526 | ) |
Purchase of treasury stock | | | (490 | ) | | | (480 | ) | | | (1,062 | ) |
Proceeds from exercise of stock options | | | 207 | | | | 338 | | | | 70 | |
Cash dividends paid | | | (1,770 | ) | | | (1,584 | ) | | | (1,543 | ) |
| | | | | | | | | | | | |
Net cash provided by financing activities | | | 23,833 | | | | 38,501 | | | | 27,899 | |
| | | | | | | | | | | | |
Increase (decrease) in cash and cash equivalents | | | (11,159 | ) | | | 10,494 | | | | 3,345 | |
Cash and cash equivalents at beginning of year | | | 18,971 | | | | 8,477 | | | | 5,132 | |
| | | | | | | | | | | | |
Cash and cash equivalents at end of year | | $ | 7,812 | | | $ | 18,971 | | | $ | 8,477 | |
| | | | | | | | | | | | |
The accompanying notes are an integral part of these consolidated financial statements.
33
NOTES TO CONSOLIDATED FINANCIAL STATEMENTS
NOTE 1 - SUMMARY OF SIGNIFICANT ACCOUNTING POLICIES
A summary of the significant accounting and reporting policies applied in the presentation of the accompanying financial statements follows:
Nature of Operations and Basis of Presentation
Dimeco, Inc. (the “Company”) is a Pennsylvania company organized as the holding company of The Dime Bank (the “Bank”) and its wholly owned subsidiary, TDB Insurance Services LLC. The Bank is a state-chartered bank and operates from five locations in northeastern Pennsylvania. The Company and its subsidiary derive substantially all of their income from banking and bank-related services that include interest earnings on residential real estate, commercial mortgage, commercial, and consumer financings as well as interest earnings on investment securities. The Company provides deposit services including checking, savings, and certificate of deposit accounts and investment and trust services. The Company is supervised by the Federal Reserve Board, while the Bank is subject to regulation and supervision by the Federal Deposit Insurance Corporation and the Pennsylvania Department of Banking.
The consolidated financial statements of the Company include its wholly owned subsidiary, the Bank. All intercompany items have been eliminated in preparing the consolidated financial statements. The investment in subsidiary on the parent company financial statements is carried at the parent company’s equity in the underlying net assets of the Bank.
The financial statements have been prepared in conformity with U.S. generally accepted accounting principles. In preparing the financial statements, management is required to make estimates and assumptions that affect the reported amounts of assets and liabilities as of the balance sheet date and revenues and expenses for the period. Actual results could differ significantly from those estimates.
Investment Securities
Investment securities are classified at the time of purchase, based on management’s intention and ability, as securities held to maturity or securities available for sale. Debt securities acquired with the intent and ability to hold to maturity are stated at cost adjusted for amortization of premium and accretion of discount, which are computed using the interest method and recognized as adjustments of interest income. Certain other debt and equity securities have been classified as available for sale to serve principally as a source of liquidity. Unrealized holding gains and losses for available-for-sale securities are reported as a separate component of stockholders’ equity, net of tax, until realized. Realized securities gains and losses are computed using the specific identification method. Interest and dividends on investment securities are recognized as income when earned.
Common stock of the Federal Home Loan Bank (“FHLB”) and the Atlantic Central Bankers Bank represents ownership in institutions that are wholly owned by other financial institutions. These securities are accounted for at cost and are classified with other assets.
Mortgage Loans Held for Sale
In general, fixed rate residential mortgage loans originated by the Bank are held for sale and are carried at the aggregate lower of cost or market. Such loans sold are generally serviced by the Bank.
34
NOTE 1 - SUMMARY OF SIGNIFICANT ACCOUNTING POLICIES (Continued)
Loans
Loans are stated at the principal amount outstanding, net of any unearned income, deferred loan fees, and the allowance for loan losses. Interest on consumer loans is credited to operations over the term of each loan using a method which results in a level yield or the simple interest method. Interest income on mortgage loans is accrued on the amortized balance. Interest income on other loans is accrued on the principal amount outstanding. Loan fees which represent an adjustment to interest yield are deferred and amortized over the life of the loan. Loans on which the accrual of interest has been discontinued are designated as nonaccrual loans. Accrual of interest on loans is generally discontinued when it is determined that a reasonable doubt exists as to the collectibility of additional interest. When a loan is placed on nonaccrual status, unpaid interest is charged against income. Payments received on nonaccrual loans are either applied to principal or reported as interest income according to management’s judgment as to the collectibility of principal. Loans are returned to accrual status when past due interest is collected and the collection of principal is probable.
Allowance for Loan Losses
The allowance for loan losses represents the amount which management estimates is adequate to provide for probable losses inherent in its loan portfolio, as of the balance sheet date. The allowance method is used in providing for loan losses. Accordingly, all loan losses are charged to the allowance, and all recoveries are credited to it. The allowance for loan losses is established through a provision for loan losses charged to operations. The provision for loan losses is based on management’s periodic evaluation of individual loans, economic factors, past loan loss experience, changes in the composition and volume of the portfolio, and other relevant factors. The estimates used in determining the adequacy of the allowance for loan losses, including the amounts and timing of future cash flows expected on impaired loans, are particularly susceptible to changes in the near term.
Impaired loans are commercial and commercial real estate loans for which it is probable that the Company will not be able to collect all amounts due according to the contractual terms of the loan agreement. The Company individually evaluates such loans for impairment and does not aggregate loans by major risk classifications. The definition of “impaired loans” is not the same as the definition of “nonaccrual loans,” although the two categories overlap. The Company may choose to place a loan on nonaccrual status due to payment delinquency or uncertain collectibility, while not classifying the loan as impaired if the loan is not a commercial or commercial real estate loan. Factors considered by management in determining impairment include payment status and collateral value. The amount of impairment for these types of impaired loans is determined by the difference between the present value of the expected cash flows related to the loan, using the original interest rate, and its recorded value, or as a practical expedient in the case of collateralized loans, the difference between the fair value of the collateral and the recorded amount of the loans. When foreclosure is probable, impairment is measured based on the fair value of the collateral.
Mortgage loans on one-to-four family properties and all consumer loans are large groups of smaller-balance homogeneous loans and are measured for impairment collectively. Loans that experience insignificant payment delays, which are defined as 90 days or less, generally are not classified as impaired. Management determines the significance of payment delays on a case-by-case basis taking into consideration all of the circumstances surrounding the loan and the borrower including the length of the delay, the borrower’s prior payment record, and the amount of shortfall in relation to the principal and interest owed.
Premises and Equipment
Premises and equipment are stated at cost less accumulated depreciation. Depreciation is principally computed on the straight-line method over the estimated useful lives of the related assets, which range from 3 to 20 years for furniture and equipment and 5 to 31 years for office buildings and improvements. Leasehold improvements are amortized over the shorter of their estimated useful lives or their respective lease terms, which range from 5 to 20 years. Expenditures for maintenance and repairs are charged against income as incurred. Costs of major additions and improvements are capitalized.
35
NOTE 1 - SUMMARY OF SIGNIFICANT ACCOUNTING POLICIES (Continued)
Bank-Owned Life Insurance (BOLI)
The Company owns insurance on the lives of a certain group of key employees. The policies were purchased to help offset the increase in the costs of various fringe benefit plans including healthcare. The cash surrender value of these policies is included as an asset on the consolidated statements of financial condition, and any increases in cash surrender value are recorded as noninterest income on the consolidated statement of income. In the event of the death of an insured individual under these policies, the Company would receive a death benefit which would be recorded as noninterest income.
Other Real Estate
Real estate acquired by foreclosure is classified on the Consolidated Balance Sheet at the lower of the recorded investment in the property or its fair value minus estimated costs of sale. Prior to foreclosure, the value of the underlying collateral is written down by a charge to the allowance for loan losses, if necessary. Any subsequent write-downs are charged against operating expenses. Operating expenses of such properties, net of related income and losses on their disposition, are included as other expense.
Income Taxes
The Company and the Bank file a consolidated federal income tax return. Deferred tax assets or liabilities are computed based on the difference between the financial statement and the income tax basis of assets and liabilities using the enacted marginal tax rates. Deferred income tax expenses or benefits are based on the changes in the deferred tax asset or liability from period to period.
Earnings Per Share
The Company provides dual presentation of basic and diluted earnings per share. Basic earnings per share are calculated utilizing net income as reported as the numerator and average shares outstanding as the denominator. The computation of diluted earnings per share differs in that the dilutive effects of any options are adjusted for in the denominator.
Stock Options
In December 2004, the FASB issued FAS No. 123R,Share-Based Payment, which revised FAS 123,Accounting for Stock-Based Compensation, and superseded APB Opinion No. 25,Accounting for Stock Issued to Employees (“APB 25”) and related interpretations. FAS 123R requires the grant-date fair value of all share-based payment awards that are expected to vest, including employee share options, to be recognized as employee compensation expense over the requisite service period. The Company adopted FAS 123R on January 1, 2006 and applied the modified prospective transition method. Under this transition method, the Company (1) did not restate any prior periods and (2) are recognizing compensation expense for all share-based payment awards that were outstanding, but not yet vested, as of January 1, 2006, based upon the same estimated grant-date fair values and service periods used to prepare the FAS 123 pro-forma disclosures.
Prior to adopting FAS 123R, the Company accounted for shared-based payment awards using the intrinsic value method of APB 25 and related interpretations. Under APB 25, the Company did not record compensation expense for employee share options, unless the awards were modified, because the share options were granted with exercise prices equal to or greater than the fair value of our stock on the date of grant. The following table illustrates the effect on reported net income and earnings per share applicable to common shareholders for the year ended December 31, 2005, had we accounted for share-based compensation plans using the fair value method of FAS 123:
36
NOTE 1 - SUMMARY OF SIGNIFICANT ACCOUNTING POLICIES (Continued)
Stock Options (Continued)
| | | |
| | | 2005 |
Net income as reported | | $ | 4,455 |
Less pro forma expense related to options | | | 155 |
| | | |
Pro forma net income | | $ | 4,300 |
| | | |
Basic net income per common share: | | | |
As reported | | $ | 2.89 |
Pro forma | | $ | 2.79 |
Diluted net income per common share: | | | |
As reported | | $ | 2.80 |
Pro forma | | $ | 2.70 |
For 2007 and 2006, the Company did not recognize any compensation expense as all outstanding options were vested at January 1, 2006.
For purposes of computing pro forma results, the Company estimated fair values of stock options using the Black-Scholes option-pricing model. The model requires use of subjective assumptions that can materially affect fair value estimates. Therefore, the pro forma results are estimates of results of operations as if compensation expense had been recognized for the stock option plans. The fair value of each stock option granted was estimated using the following weighted-average assumptions for grants in 2005: (1) expected dividend yields of 2.85 percent; (2) risk-free interest rates of 4.19 percent; (3) expected volatility of 22 percent; and (4) expected lives of options 5.0 years.
Mortgage Servicing Rights (“MSRs”)
The Company has agreements for the express purpose of selling loans in the secondary market. The Company maintains servicing rights for most of these loans. Originated MSRs are recorded by allocating total costs incurred between the loan and servicing rights based on their relative fair values. MSRs are amortized in proportion to the estimated servicing income over the estimated life of the servicing portfolio. MSRs are a component of other assets on the Consolidated Balance Sheet.
Comprehensive Income
The Company is required to present comprehensive income in a full set of general-purpose financial statements for all periods presented. Other comprehensive income is composed of unrealized holding gains (losses) on the available-for-sale securities portfolio. The Company has elected to report the effects of other comprehensive income as part of the Consolidated Statement of Changes in Stockholders’ Equity.
37
NOTE 1 - SUMMARY OF SIGNIFICANT ACCOUNTING POLICIES (Continued)
Cash Flows
The Company has defined cash and cash equivalents as cash and due from banks, interest-bearing deposits in other banks, and federal funds sold that have original maturities of 90 days or less.
Amounts paid for interest and income taxes are as follows (in thousands):
| | | | | | |
| | | Interest
Paid | | Federal
Income
Taxes
Paid |
Year Ended December 31, | | | | | | |
2007 | | $ | 12,338 | | $ | 3,539 |
2006 | | $ | 9,002 | | $ | 2,759 |
2005 | | $ | 5,775 | | $ | 2,125 |
Recent Accounting Pronouncements
In December 2007, the FASB issued FAS No. 141 (revised 2007),Business Combinations (“FAS 141(R)”), which establishes principles and requirements for how an acquirer recognizes and measures in its financial statements the identifiable assets acquired, the liabilities assumed, and any noncontrolling interest in an acquiree, including the recognition and measurement of goodwill acquired in a business combination. FAS No. 141(R) is effective for fiscal years beginning on or after December 15, 2008. Earlier adoption is prohibited. The adoption of this standard is not expected to have a material effect on the Company’s results of operations or financial position.
In September 2006, the FASB issued FAS No. 157,Fair Value Measurements, which provides enhanced guidance for using fair value to measure assets and liabilities. The standard applies whenever other standards require or permit assets or liabilities to be measured at fair value. The Standard does not expand the use of fair value in any new circumstances. FAS No. 157 is effective for financial statements issued for fiscal years beginning after November 15, 2007 and interim periods within those fiscal years. Early adoption is permitted. The adoption of this standard is not expected to have a material effect on the Company’s results of operations or financial position.
In February 2007, the FASB issued FAS No. 159,The Fair Value Option for Financial Assets and Financial Liabilities –Including an amendment of FASB Statement No. 115, which provides all entities with an option to report selected financial assets and liabilities at fair value. The objective of the FAS No. 159 is to improve financial reporting by providing entities with the opportunity to mitigate volatility in earnings caused by measuring related assets and liabilities differently without having to apply the complex provisions of hedge accounting. FAS No. 159 is effective as of the beginning of an entity’s first fiscal year beginning after November 15, 2007. Early adoption is permitted as of the beginning of a fiscal year that begins on or before November 15, 2007 provided the entity also elects to apply the provisions of FAS No. 157,Fair Value Measurements. The adoption of this standard is not expected to have a material effect on the Company’s results of operations or financial position.
38
NOTE 1 - SUMMARY OF SIGNIFICANT ACCOUNTING POLICIES (Continued)
Recent Accounting Pronouncements (Continued)
In December 2007, the FASB issued FAS No. 160,Noncontrolling Interests in Consolidated Financial Statements — an amendment of ARB No. 51. FAS No. 160 amends ARB No. 51 to establish accounting and reporting standards for the noncontrolling interest in a subsidiary and for the deconsolidation of a subsidiary. It clarifies that a noncontrolling interest in a subsidiary, which is sometimes referred to as minority interest, is an ownership interest in the consolidated entity that should be reported as equity in the consolidated financial statements. Among other requirements, this statement requires consolidated net income to be reported at amounts that include the amounts attributable to both the parent and the noncontrolling interest. It also requires disclosure, on the face of the consolidated income statement, of the amounts of consolidated net income attributable to the parent and to the noncontrolling interest. FAS No. 160 is effective for fiscal years beginning on or after December 15, 2008. Earlier adoption is prohibited. The adoption of this standard is not expected to have a material effect on the Company’s results of operations or financial position.
In September 2006, the FASB reached consensus on the guidance provided by Emerging Issues Task Force Issue 06-4 (“EITF 06-4”),Accounting for Deferred Compensation and Postretirement Benefit Aspects of Endorsement Split-Dollar Life Insurance Arrangements. The guidance is applicable to endorsement split-dollar life insurance arrangements, whereby the employer owns and controls the insurance policy, that are associated with a postretirement benefit. EITF 06-4 requires that for a split-dollar life insurance arrangement within the scope of the Issue, an employer should recognize a liability for future benefits in accordance with FAS No. 106 (if, in substance, a postretirement benefit plan exists) or Accounting Principles Board Opinion No. 12 (if the arrangement is, in substance, an individual deferred compensation contract) based on the substantive agreement with the employee. EITF 06-4 is effective for fiscal years beginning after December 15, 2007. The adoption of this EITF is not going to have a material effect on the Company’s results of operations or financial position.
In March 2007, the FASB ratified Emerging Issues Task Force Issue No. 06-10 (“EITF 06-10”),Accounting for Collateral Assignment Split-Dollar Life Insurance Agreements. EITF 06-10 provides guidance for determining a liability for the postretirement benefit obligation as well as recognition and measurement of the associated asset on the basis of the terms of the collateral assignment agreement. EITF 06-10 is effective for fiscal years beginning after December 15, 2007. The adoption of this EITF is not going to have a material effect on the Company’s results of operations or financial position.
In June 2007, the FASB ratified Emerging Issues Task Force Issue No. 06-11 (“EITF 06-11”),Accounting for Income Tax Benefits of Dividends on Share-Based Payment Awards. EITF 06-11 applies to share-based payment arrangements with dividend protection features that entitle employees to receive (a) dividends on equity-classified nonvested shares, (b) dividend equivalents on equity-classified nonvested share units, or (c) payments equal to the dividends paid on the underlying shares while an equity-classified share option is outstanding, when those dividends or dividend equivalents are charged to retained earnings under FAS No. 123R,Share-Based Payment, and result in an income tax deduction for the employer. A consensus was reached that a realized income tax benefit from dividends or dividend equivalents that are charged to retained earnings and are paid to employees for equity-classified nonvested equity shares, nonvested equity share units, and outstanding equity share options should be recognized as an increase in additional paid-in capital. EITF 06-11 is effective for fiscal years beginning after December 15, 2007, and interim periods within those fiscal years. The adoption of this EITF is not expected to have a material effect on the Company’s results of operations or financial position.
Reclassification of Comparative Amounts
Certain comparative amounts for prior years have been reclassified to conform to current-year presentations. The reclassified amounts did not affect net income or stockholders’ equity.
39
NOTE 2 - EARNINGS PER SHARE
There are no convertible securities that would affect the numerator in calculating basic and diluted earnings per share; therefore, net income as presented on the Consolidated Statement of Income will be used as the numerator. The following table sets forth the composition of the weighted-average common shares (denominator) used in the basic and diluted earnings per share computation.
| | | | | | | | | |
| | | 2007 | | | 2006 | | | 2005 | |
Weighted-average common shares outstanding | | 1,572,604 | | | 1,558,553 | | | 1,550,616 | |
Average treasury stock shares | | (48,068 | ) | | (34,770 | ) | | (9,874 | ) |
| | | | | | | | | |
Weighted-average common shares and common stock equivalents used to calculate basic earnings per share | | 1,524,536 | | | 1,523,783 | | | 1,540,742 | |
Additional common stock equivalents (stock options) used to calculate diluted earnings per share | | 56,598 | | | 49,992 | | | 51,325 | |
| | | | | | | | | |
Weighted-average common shares and common stock equivalents used to calculate diluted earnings per share | | 1,581,134 | | | 1,573,775 | | | 1,592,067 | |
| | | | | | | | | |
40
NOTE 3 - INVESTMENT SECURITIES
The amortized costs and fair value of investment securities are summarized as follows (in thousands):
| | | | | | | | | | | | | |
| | | 2007 |
| | | Amortized
Cost | | Gross
Unrealized
Gains | | Gross
Unrealized
Losses | | | Fair
Value |
AVAILABLE FOR SALE | | | | | | | | | | | | | |
U.S. government agencies | | $ | 7,993 | | $ | 19 | | $ | (6 | ) | | $ | 8,006 |
Mortgage-backed securities | | | 4,101 | | | 30 | | | (39 | ) | | | 4,092 |
Obligations of states and political subdivisions: | | | | | | | | | | | | | |
Taxable | | | 1,340 | | | — | | | — | | | | 1,340 |
Tax-exempt | | | 12,409 | | | 74 | | | (41 | ) | | | 12,442 |
Corporate securities | | | 3,674 | | | 13 | | | (36 | ) | | | 3,651 |
Commercial paper | | | 36,845 | | | — | | | — | | | | 36,845 |
| | | | | | | | | | | | | |
Total debt securities | | | 66,362 | | | 136 | | | (122 | ) | | | 66,376 |
Equity securities | | | 320 | | | 70 | | | (27 | ) | | | 363 |
| | | | | | | | | | | | | |
Total | | $ | 66,682 | | $ | 206 | | $ | (149 | ) | | $ | 66,739 |
| | | | | | | | | | | | | |
| |
| | | 2006 |
| | | Amortized
Cost | | Gross
Unrealized
Gains | | Gross
Unrealized
Losses | | | Fair
Value |
AVAILABLE FOR SALE | | | | | | | | | | | | | |
U.S. government agencies | | $ | 15,987 | | $ | — | | $ | (146 | ) | | $ | 15,841 |
Mortgage-backed securities | | | 4,547 | | | 14 | | | (56 | ) | | | 4,505 |
Obligations of states and political subdivisions: | | | | | | | | | | | | | |
Taxable | | | 1,692 | | | — | | | (1 | ) | | | 1,691 |
Tax-exempt | | | 7,308 | | | 37 | | | (10 | ) | | | 7,335 |
Corporate securities | | | 2,745 | | | 1 | | | (4 | ) | | | 2,742 |
Commercial paper | | | 34,774 | | | — | | | — | | | | 34,774 |
| | | | | | | | | | | | | |
Total debt securities | | | 67,053 | | | 52 | | | (217 | ) | | | 66,888 |
Equity securities | | | 266 | | | 116 | | | (4 | ) | | | 378 |
| | | | | | | | | | | | | |
Total | | $ | 67,319 | | $ | 168 | | $ | (221 | ) | | $ | 67,266 |
| | | | | | | | | | | | | |
41
NOTE 3 - INVESTMENT SECURITIES (Continued)
The following table shows the Company’s fair value and gross unrealized losses, aggregated by investment category and length of time that the individual securities have been in a continuous unrealized loss position, at December 31, (in thousands):
| | | | | | | | | | | | | | | | | | |
| | | 2007 |
| | | Less than Twelve Months | | Twelve Months or Greater | | Total |
| | | Fair
Value | | Gross
Unrealized
Losses | | Fair
Value | | Gross
Unrealized
Losses | | Fair
Value | | Gross
Unrealized
Losses |
U.S. government agencies | | $ | 3,992 | | $ | 6 | | $ | — | | $ | — | | $ | 3,992 | | $ | 6 |
Mortgage-backed securities | | | 802 | | | 6 | | | 1,486 | | | 33 | | | 2,288 | | | 39 |
Obligations of states and political subdivisions | | | 4,649 | | | 40 | | | 232 | | | 1 | | | 4,881 | | | 41 |
Corporate securities | | | 1,210 | | | 36 | | | — | | | — | | | 1,210 | | | 36 |
| | | | | | | | | | | | | | | | | | |
Total debt securities | | | 10,653 | | | 88 | | | 1,718 | | | 34 | | | 12,371 | | | 122 |
Equity securities | | | 102 | | | 13 | | | 20 | | | 14 | | | 122 | | | 27 |
| | | | | | | | | | | | | | | | | | |
Total | | $ | 10,755 | | $ | 101 | | $ | 1,738 | | $ | 48 | | $ | 12,493 | | $ | 149 |
| | | | | | | | | | | | | | | | | | |
| |
| | | 2006 |
| | | Less than Twelve Months | | Twelve Months or Greater | | Total |
| | | Fair
Value | | Gross
Unrealized
Losses | | Fair
Value | | Gross
Unrealized
Losses | | Fair
Value | | Gross
Unrealized
Losses |
U.S. government agencies | | $ | — | | $ | — | | $ | 15,841 | | $ | 146 | | $ | 15,841 | | $ | 146 |
Mortgage-backed securities | | | — | | | — | | | 1,790 | | | 56 | | | 1,790 | | | 56 |
Obligations of states and political subdivisions | | | 828 | | | 3 | | | 1,841 | | | 8 | | | 2,669 | | | 11 |
Corporate securities | | | — | | | — | | | 741 | | | 4 | | | 741 | | | 4 |
| | | | | | | | | | | | | | | | | | |
Total debt securities | | | 828 | | | 3 | | | 20,213 | | | 214 | | | 21,041 | | | 217 |
Equity securities | | | 10 | | | 2 | | | 20 | | | 2 | | | 30 | | | 4 |
| | | | | | | | | | | | | | | | | | |
Total | | $ | 838 | | $ | 5 | | $ | 20,233 | | $ | 216 | | $ | 21,071 | | $ | 221 |
| | | | | | | | | | | | | | | | | | |
42
NOTE 3 - INVESTMENT SECURITIES (Continued)
The policy of the Company is to recognize an other-than-temporary impairment of equity securities where the fair value has been significantly below cost for three consecutive quarters. For fixed maturity investments with unrealized losses due to interest rates where the Company has the positive intent and ability to hold the investment for a period of time sufficient to allow a market recovery, declines in value below cost are not assumed to be other than temporary. There are 33 positions that are temporarily impaired at December 31, 2007. The aggregate carrying amount of those investments at December 31, 2007, was $12,493. The Company reviews its position quarterly and has asserted that at December 31, 2007, the declines outlined in the above table represent temporary declines and the Company does have the intent and ability either to hold those securities to maturity or to allow a market recovery.
The Company has concluded that any impairment of its investment securities portfolio is not other than temporary but is the result of interest rate changes that are not expected to result in the noncollection of principal and interest during the period.
The amortized cost and estimated market values of debt securities at December 31, 2007, by contractual maturity, are shown below. Expected maturities of mortgage-backed securities will differ from contractual maturities because borrowers may have the right to call or prepay obligations with or without call or prepayment penalties (in thousands):
| | | | | | |
| | | Available for Sale |
| | | Amortized
Cost | | Fair
Value |
Due in one year or less | | $ | 39,700 | | $ | 39,692 |
Due after one year through five years | | | 8,933 | | | 8,945 |
Due after five years through ten years | | | 6,476 | | | 6,497 |
Due after ten years | | | 11,253 | | | 11,242 |
| | | | | | |
Total debt securities | | $ | 66,362 | | $ | 66,376 |
| | | | | | |
Proceeds from sales of investment securities during 2005 were $6 and the resulting gross and net gains of $2 were realized. There were no sales of investment securities during 2006 and 2007.
Investment securities with amortized costs of $61,392 and $56,506 and fair value of $61,400 and $56,342 at December 31, 2007 and 2006, respectively, were pledged to secure deposits, short-term borrowings, and for other purposes as required by law.
43
NOTE 4 - LOANS
Major classifications of loans are as follows (in thousands):
| | | | | | |
| | | 2007 | | 2006 |
Loans secured by real estate: | | | | | | |
Construction and development | | $ | 8,385 | | $ | 3,733 |
Secured by farmland | | | 1,869 | | | 1,775 |
Secured by 1- 4 family residential properties: | | | | | | |
Revolving, open-end loans secured by 1- 4 family residential properties | | | 4,718 | | | 4,218 |
All other loans secured by 1- 4 family residential properties | | | 69,242 | | | 64,188 |
Secured by nonfarm, nonresidential properties | | | 198,323 | | | 170,910 |
Commercial and industrial loans | | | 39,337 | | | 38,502 |
Loans to individuals for household, family, and other personal expenditures: | | | | | | |
Ready credit loans | | | 1,045 | | | 958 |
Other installment loans | | | 14,611 | | | 15,300 |
Other loans: | | | | | | |
Agricultural loans | | | 879 | | | 1,132 |
All other loans | | | 6,349 | | | 4,575 |
| | | | | | |
Loans, net of unearned income | | | 344,758 | | | 305,291 |
| | | | | | |
Real estate loans serviced for others which are not included in the Consolidated Balance Sheet totaled $84,114 and $83,337 at December 31, 2007 and 2006, respectively.
Information with respect to impaired loans as of and for the year ended December 31 is as follows (in thousands):
| | | | | | | | | |
| | | 2007 | | 2006 | | 2005 |
Impaired loans without related allowance for loan losses | | $ | 298 | | $ | — | | $ | — |
Impaired loans with related allowance for loan losses | | | 725 | | | — | | | — |
Related allowance for loan losses | | | 410 | | | — | | | — |
Average recorded balance for of impaired loans | | | 1,051 | | | — | | | 213 |
Interest income recognized on impaired loans | | | 61 | | | — | | | 113 |
44
NOTE 4 - LOANS (Continued)
The following is a summary of past due and nonaccrual as of December 31, 2007 and 2006 (in thousands):
| | | | | | |
| | | December 31, 2007 |
| | | Past Due
90 days or more | | Nonaccrual |
Real estate loans | | $ | 509 | | $ | 443 |
Installment loans | | | 1 | | | 13 |
Commercial and all other loans | | | 50 | | | 116 |
| | | | | | |
Total | | $ | 560 | | $ | 572 |
| | | | | | |
| |
| | | December 31, 2006 |
| | | Past Due
90 days or more | | Nonaccrual |
Real estate loans | | $ | 184 | | $ | 366 |
Installment loans | | | 7 | | | 43 |
Commercial and all other loans | | | 99 | | | 15 |
| | | | | | |
Total | | $ | 290 | | $ | 424 |
| | | | | | |
Changes in the allowance for loan losses are as follows (in thousands):
| | | | | | | | | | | | |
| | | 2007 | | | 2006 | | | 2005 | |
Balance, beginning of year | | $ | 4,469 | | | $ | 3,973 | | | $ | 3,172 | |
Provision charged to operations | | | 1,130 | | | | 785 | | | | 850 | |
Recoveries credited to allowance | | | 153 | | | | 82 | | | | 257 | |
Losses charged to allowance | | | (360 | ) | | | (371 | ) | | | (306 | ) |
| | | | | | | | | | | | |
Balance, end of year | | $ | 5,392 | | | $ | 4,469 | | | $ | 3,973 | |
| | | | | | | | | | | | |
In the normal course of business, loans are extended to officers and directors and corporations in which they are beneficially interested as stockholders, officers, or directors. A summary of loan activity for those officers and directors with aggregate loan balances in excess of $120,000 for the year ended December 31, 2007, is as follows (in thousands):
| | | | | | | | | | |
| 2006 | | Additions | | Amounts Collected | | 2007 |
| $ | 8,218 | | $ | 4,897 | | $ | 2,314 | | $ | 10,801 |
The Company’s primary business activity is with customers located within its local trade area. Generally, the Company grants commercial, residential, and personal loans. The Company also selectively funds and purchases commercial and residential loans outside of its local trade area provided such loans meet the Company’s credit policy guidelines. At December 31, 2007 and 2006, the Company had approximately $80 million and $61 million, respectively, of outstanding loans to summer camps and recreational facilities in the northeastern United States. Although the Company has a diversified loan portfolio at December 31, 2007 and 2006, loans outstanding to individuals and businesses are dependent upon the local economic conditions in its immediate trade area.
45
NOTE 5 - PREMISES AND EQUIPMENT
A summary by asset classification is as follows (in thousands):
| | | | | | |
| | | 2007 | | 2006 |
Land | | $ | 1,377 | | $ | 1,184 |
Premises and improvements | | | 5,619 | | | 5,106 |
Furniture and equipment | | | 3,463 | | | 3,321 |
Leasehold improvements | | | 1,625 | | | 1,530 |
| | | | | | |
Total, at cost | | | 12,084 | | | 11,141 |
Less accumulated depreciation | | | 5,697 | | | 5,410 |
| | | | | | |
Net premises and equipment | | $ | 6,387 | | $ | 5,731 |
| | | | | | |
Depreciation and amortization expense was $526, $541, and $554, in 2007, 2006, and 2005, respectively.
NOTE 6 - DEPOSITS
Deposits are summarized as follows (in thousands):
| | | | | | |
| | | 2007 | | 2006 |
Demand - noninterest-bearing | | $ | 34,763 | | $ | 34,172 |
Demand - interest-bearing | | | 39,741 | | | 39,538 |
Money market | | | 46,175 | | | 35,276 |
Savings | | | 31,418 | | | 33,593 |
Time deposits of $100,000 or more | | | 80,851 | | | 71,063 |
Other time deposits | | | 131,652 | | | 124,475 |
| | | | | | |
Total | | $ | 364,600 | | $ | 338,117 |
| | | | | | |
The following table summarizes the maturity distribution of time deposits (in thousands):
| | | |
2008 | | $ | 171,193 |
2009 | | | 11,664 |
2010 | | | 10,640 |
2011 | | | 9,008 |
2012 | | | 9,998 |
| | | |
Total | | $ | 212,503 |
| | | |
The following table summarizes the maturity distribution of certificates of deposit of $100,000 or more excluding IRAs of $250,000 or more (in thousands):
| | | |
| | | 2007 |
Three months or less | | $ | 23,645 |
Four through six months | | | 25,682 |
Seven through twelve months | | | 17,843 |
Over twelve months | | | 11,526 |
| | | |
Total | | $ | 78,696 |
| | | |
Interest expense on certificates of deposit of $100,000 or more excluding IRAs of $250,000 or more amounted to $3,328, $2,432, and $1,403, for the years ended December 31, 2007, 2006, and 2005, respectively.
46
NOTE 6 - DEPOSITS (Continued)
The following table summarizes the maturity distribution of IRAs of $250,000 or more (in thousands):
| | | |
| | | 2007 |
Three months or less | | $ | 367 |
Four through six months | | | — |
Seven through twelve months | | | — |
Over twelve months | | | 1,788 |
| | | |
Total | | $ | 2,155 |
| | | |
Interest expense on IRAs of $250,000 or more amounted to $121, 44, and 31 for the years ended December 31, 2007, 2006, and 2005, respectively.
NOTE 7 - SHORT-TERM BORROWINGS
Short-term borrowings consist of borrowings from the FHLB of Pittsburgh and securities sold under agreements to repurchase. Average amounts outstanding during the year represent daily average balances, and average interest rates represent interest expense divided by the related average balance.
The outstanding balances and related information for short-term borrowings are summarized as follows (in thousands):
| | | | | | | | | | | | |
| | | 2007 | | | 2006 | |
| | | Amount | | Rate | | | Amount | | Rate | |
Balance at year-end | | $ | 8,210 | | 2.22 | % | | $ | 12,705 | | 2.64 | % |
Average balance outstanding during the year | | $ | 13,537 | | 2.58 | % | | $ | 15,733 | | 2.36 | % |
Maximum amount outstanding at any month-end | | $ | 19,165 | | | | | $ | 21,191 | | | |
The Bank has pledged, as collateral for the borrowings from the FHLB, all stock in the FHLB and certain other qualifying collateral. Investment securities with amortized costs of $14,454 and $18,282 and market values of $14,426 and $18,278, respectively, at December 31, 2007 and 2006, were pledged as collateral for the securities sold under agreements to repurchase.
The Bank has the capability to borrow additional funds through its credit arrangement with the FHLB. The FHLB borrowings are subject to annual renewal, incur no service charges, and are secured by a blanket security agreement on certain investment securities, qualifying residential mortgages, and the Bank’s investment in FHLB stock. At December 31, 2007, the Bank’s remaining borrowing capacity with the FHLB was approximately $66 million.
47
NOTE 8 - OTHER BORROWED FUNDS
FHLB advances consist of separate fixed rate and convertible select-fixed to float rate loans as follows (in thousands):
| | | | | | | | | | | | | | | | | | | |
| | | Maturity Range | | Weighted
Average
Rate | | | Stated Interest
Rate Range | | | At December 31, |
Description | | From | | To | | | From | | | To | | | 2007 | | 2006 |
Fixed Rate | | 06/28/07 | | 06/28/07 | | 3.78 | % | | 3.78 | % | | 3.78 | % | | $ | — | | $ | 2,000 |
Fixed Rate Amortizing | | 05/05/14 | | 01/26/26 | | 4.76 | % | | 3.47 | % | | 5.55 | % | | | 16,661 | | | 10,763 |
Convertible select-fixed to float | | 02/18/10 | | 08/18/10 | | 5.91 | % | | 5.91 | % | | 5.91 | % | | | 1,000 | | | 1,000 |
| | | | | | | | | | | | | | | | | | | |
Total | | | | | | | | | | | | | | | $ | 17,661 | | $ | 13,763 |
| | | | | | | | | | | | | | | | | | | |
| | | | | | |
Maturities/repayments Year Ending December 31, | | 2007 | | Weighted
Average Rate | |
2008 | | $ | 1,176 | | 4.85 | % |
2009 | | | 1,231 | | 4.87 | % |
2010 | | | 2,289 | | 4.97 | % |
2011 | | | 1,349 | | 4.93 | % |
2012 | | | 1,412 | | 4.98 | % |
2013 and beyond | | | 10,204 | | 5.02 | % |
| | | | | | |
Total | | $ | 17,661 | | | |
| | | | | | |
The advance maturing in 2010 is convertible to a variable rate advance on specific dates at the discretion of the FHLB. Should the FHLB convert this advance, the Bank has the option of accepting the variable rate or repaying the advance without penalty.
NOTE 9 - DIVIDEND REINVESTMENT AND STOCK PURCHASE PLAN
The Company maintains a Dividend Reinvestment and Stock Purchase Plan (the “Plan”). Participation is available to all common stockholders. The Plan provides each participant with a simple and convenient method of purchasing additional common shares without payment of any brokerage commission or other service fees.
A participant in the Plan may elect to reinvest dividends on all or part of his or her shares to acquire additional common stock. A participant may withdraw from the Plan at any time. Stockholders purchased 12,786 shares in 2007 and 15,546 shares in 2006 through the Plan.
48
NOTE 10 - EMPLOYEE BENEFITS
Retirement Plan
The Bank maintains a section 401(k) employee savings and investment plan for substantially all employees and officers of the Bank. The Bank’s contribution to the plan is based on 100 percent matching of voluntary contributions up to 3 percent and 50 percent matching on the next 2 percent of individual compensation. Additionally, the Bank may contribute a discretionary amount each year. For each of the years of 2007, 2006, and 2005, the Board of Directors authorized an additional 6 percent, 5 percent, and 4 percent, respectively, of each eligible employee’s compensation. Employee contributions are vested at all times, and Bank contributions are fully vested after five years. Contributions for 2007, 2006, and 2005 to this plan amounted to $373, $285, and $207, respectively.
Supplemental Retirement Plan
The Bank maintains a Salary Continuation Plan for the certain officers of the Bank to provide guaranteed consecutive postretirement payments totaling a predetermined amount over a ten or fifteen year period. Expenses for the years ended December 31, 2007, 2006, and 2005, amounted to $144, $59, and $61, respectively, and are included as a component of salaries and employee benefits.
Stock Option Plan
The Company maintains a stock incentive plan and a stock option plan that provide for granting incentive stock options to key officers and other employees of the Company and Bank, as determined by the Stock Option Committee, and nonqualified stock options to nonemployee directors of the Company. A total of 120,000 and 50,000 shares, respectively, of either authorized and unissued shares or authorized shares issued by and subsequently reacquired by the Company as treasury stock shall be issuable under the plans. The plans shall terminate after the tenth anniversary of the date of shareholder ratification. The per share exercise price of any option granted will not be less than the fair market value of a share of common stock on the date the option is granted. The options granted prior to 2005 are primarily vested 33 percent after one year, 33 percent after two years, and 34 percent after three years. In 2005, options were granted with an immediate vesting schedule. The remaining unvested options granted in the previous years were accelerated in 2005 whereby all options granted since inception are fully vested.
The following table presents share data related to the stock option plans:
| | | | | | | | | | | | |
| | | 2007 | | | Weighted-
Average
Exercise
Price | | 2006 | | | Weighted-
Average
Exercise
Price |
Outstanding, beginning | | 112,636 | | | $ | 20.48 | | 127,991 | | | $ | 19.93 |
Granted | | — | | | | — | | — | | | | — |
Exercised | | (7,276 | ) | | | 22.54 | | (15,355 | ) | | | 15.91 |
Forfeited | | — | | | | — | | — | | | | — |
| | | | | | | | | | | | |
Outstanding, ending | | 105,360 | | | $ | 20.33 | | 112,636 | | | $ | 20.48 |
| | | | | | | | | | | | |
Exercisable at year-end | | 105,360 | | | $ | 20.33 | | 112,636 | | | $ | 20.48 |
| | | | | | | | | | | | |
49
NOTE 10 - EMPLOYEE BENEFITS (Continued)
Stock Option Plan (Continued)
The following table summarizes characteristics of stock options outstanding at December 31, 2007:
| | | | | | | | | | | | |
| | | Outstanding | | Exercisable |
Exercise Price | | Shares | | Average
Remaining
Life | | Average
Exercise
Price | | Shares | | Average
Exercise
Price |
$13.00 | | 12,000 | | 2.21 | | $ | 13.00 | | 12,000 | | $ | 13.00 |
$13.25 | | 51,640 | | 2.21 | | $ | 13.25 | | 51,640 | | $ | 13.25 |
$16.50 | | 4,550 | | 2.21 | | $ | 16.50 | | 4,550 | | $ | 16.50 |
$21.30 | | 4,000 | | 2.21 | | $ | 21.30 | | 4,000 | | $ | 21.30 |
$23.00 | | 1,250 | | 2.21 | | $ | 23.00 | | 1,250 | | $ | 23.00 |
$26.50 | | 1,000 | | 2.21 | | $ | 26.50 | | 1,000 | | $ | 26.50 |
$32.55 | | 2,000 | | 5.86 | | $ | 32.55 | | 2,000 | | $ | 32.55 |
$34.00 | | 8,840 | | 7.96 | | $ | 34.00 | | 8,840 | | $ | 34.00 |
$35.00 | | 1,000 | | 6.85 | | $ | 35.00 | | 1,000 | | $ | 35.00 |
$35.95 | | 19,080 | | 7.73 | | $ | 35.95 | | 19,080 | | $ | 35.95 |
| | | | | | | | | | | | |
Total | | 105,360 | | | | | Total | | 105,360 | | | |
| | | | | | | | | | | | |
NOTE 11 - INCOME TAXES
Federal income tax expense consists of the following (in thousands):
| | | | | | | | | | | | |
| | | 2007 | | | 2006 | | | 2005 | |
Currently payable | | $ | 3,411 | | | $ | 2,848 | | | $ | 2,393 | |
Deferred taxes | | | (414 | ) | | | (235 | ) | | | (311 | ) |
| | | | | | | | | | | | |
Total provision | | $ | 2,997 | | | $ | 2,613 | | | $ | 2,082 | |
| | | | | | | | | | | | |
The components of the net deferred tax assets and liabilities at December 31 are as follows (in thousands):
| | | | | | |
| | | 2007 | | 2006 |
Deferred tax assets: | | | | | | |
Allowance for loan losses | | $ | 1,650 | | $ | 1,303 |
Salary continuation plan | | | 204 | | | 171 |
Mortgage servicing rights | | | 7 | | | 14 |
Unrealized loss on investment securities | | | — | | | 18 |
| | | | | | |
Total | | | 1,861 | | | 1,506 |
| | | | | | |
Deferred tax liabilities: | | | | | | |
Premises and equipment | | | 529 | | | 558 |
Deferred loan origination fees, net | | | 146 | | | 158 |
Unrealized gain on nonmonetary exchange | | | 9 | | | 9 |
Unrealized gain on investment securities | | | 19 | | | — |
| | | | | | |
Total | | | 703 | | | 725 |
| | | | | | |
Net deferred tax assets | | $ | 1,158 | | $ | 781 |
| | | | | | |
50
NOTE 11 - INCOME TAXES (Continued)
No valuation allowance was established at December 31, 2007 and 2006, in view of the Company’s ability to carryback taxes paid in previous years and certain tax strategies and anticipated future taxable income as evidenced by the Company’s earnings potential.
A reconciliation between the expected statutory income tax rate and the effective income tax rate follows (in thousands):
| | | | | | | | | | | | | | | | | | | | | |
| | | 2007 | | | 2006 | | | 2005 | |
| | | Amount | | | % of
Pretax
Income | | | Amount | | | % of
Pretax
Income | | | Amount | | | % of
Pretax
Income | |
Provision at statutory rate | | $ | 3,267 | | | 34.0 | % | | $ | 2,787 | | | 34.0 | % | | $ | 2,222 | | | 34.0 | % |
Tax-exempt income | | | (194 | ) | | (2.0 | ) | | | (127 | ) | | (1.6 | ) | | | (93 | ) | | (1.4 | ) |
BOLI earnings | | | (121 | ) | | (1.3 | ) | | | (78 | ) | | (0.9 | ) | | | (76 | ) | | (1.2 | ) |
Nondeductible interest | | | 29 | | | 0.3 | | | | 16 | | | 0.2 | | | | 8 | | | 0.1 | |
Other, net | | | 16 | | | 0.2 | | | | 15 | | | 0.2 | | | | 21 | | | 0.3 | |
| | | | | | | | | | | | | | | | | | | | | |
Effective income tax and rate | | $ | 2,997 | | | 31.2 | % | | $ | 2,613 | | | 31.9 | % | | $ | 2,082 | | | 31.8 | % |
| | | | | | | | | | | | | | | | | | | | | |
The Company adopted the provisions of FIN No. 48,Accounting for Uncertainty in Income Taxes, an interpretation of FASB Statement 109, effective January 1, 2007. FIN No. 48 prescribes a recognition threshold and a measurement attribute for the financial statement recognition and measurement of a tax position taken or expected to be taken in a tax return. Benefits from tax positions should be recognized in the financial statements only when it is more likely than not that the tax position will be sustained upon examination by the appropriate taxing authority that would have full knowledge of all relevant information. A tax position that meets the more-likely-than-not recognition threshold is measured at the largest amount of benefit that is greater than fifty percent likely of being realized upon ultimate settlement. Tax positions that previously failed to meet the more-likely-than-not recognition threshold should be recognized in the first subsequent financial reporting period in which that threshold is met. Previously recognized tax positions that no longer meet the more-likely-than-not recognition threshold should be derecognized in the first subsequent financial reporting period in which that threshold is no longer met. FIN No. 48 also provides guidance on the accounting for and disclosure of unrecognized tax benefits, interest and penalties. The adoption of FIN No. 48 did not have a significant impact on the Company’s financial statements.
NOTE 12 - COMMITMENTS AND CONTINGENT LIABILITIES
Commitments
In the normal course of business, there are outstanding commitments and contingent liabilities such as commitments to extend credit, financial guarantees, and letters of credit that are not reflected in the accompanying consolidated financial statements. The Company does not anticipate any losses as a result of these transactions. These instruments involve, to varying degrees, elements of credit and interest rate risk in excess of the amount recognized in the Consolidated Balance Sheet. The contract or notional amounts of those instruments reflect the extent of involvement the Company has in the particular classes of financial instruments.
51
NOTE 12 - COMMITMENTS AND CONTINGENT LIABILITIES (Continued)
Commitments (Continued)
Financial instruments whose contract amounts represent credit risk are as follows (in thousands):
| | | | | | |
| | | 2007 | | 2006 |
Commitments to extend credit | | $ | 49,985 | | $ | 47,624 |
Standby letters of credit | | $ | 3,296 | | $ | 3,423 |
Commitments to extend credit are agreements to lend to a customer as long as there is no violation of any condition established in the contract. Commitments generally have fixed expiration dates or other termination clauses and may require payment of a fee. Since many of the commitments are expected to expire without being drawn upon, the total commitment amounts do not necessarily represent future cash requirements.
Standby letters of credit represent conditional commitments issued by the Company to guarantee the performance of a customer to a third party. These instruments are issued primarily to support bid or performance-related contracts. The coverage period for these instruments is typically a one-year period with an annual renewal option subject to prior approval by management. Fees earned from the issuance of these letters are recognized at the expiration of the coverage period. For secured letters of credit, the collateral is typically Bank deposit instruments.
At December 31, 2007, the minimum rental commitments for all noncancelable leases are as follows (in thousands):
| | | |
2008 | | $ | 227 |
2009 | | | 119 |
2010 | | | 105 |
2011 | | | 89 |
2012 | | | 86 |
2013 and thereafter | | | 123 |
| | | |
Total | | $ | 749 |
| | | |
Contingent Liabilities
The Company and its subsidiary are involved in various legal actions from the normal course of business activities. Management believes the liability, if any, arising from such actions will not have a material adverse effect on the Company’s financial position.
NOTE 13 - REGULATORY RESTRICTIONS
Cash and Due From Banks
The district Federal Reserve Bank requires the Bank to maintain certain average reserve balances. As of each of the years ended December 31, 2007 and 2006, the Bank had required reserves of $225, composed of vault cash and a depository amount held directly with the Federal Reserve Bank.
Dividends
The Pennsylvania Banking Code restricts the availability of capital funds for payment of dividends by all state-chartered banks to the surplus of the Bank. Accordingly, at December 31, 2007, the balance in the capital surplus account totaling approximately $1,756 is unavailable for dividends.
52
NOTE 14 - REGULATORY CAPITAL REQUIREMENTS
Federal regulations require the Company and the Bank to maintain minimum amounts of capital. Specifically, each is required to maintain certain minimum dollar amounts and ratios of Total and Tier I capital to risk-weighted assets and of Tier I capital to average total assets.
In addition to the capital requirements, the Federal Deposit Insurance Corporation Improvement Act (“FDICIA”) established five capital categories ranging from “well capitalized” to “critically undercapitalized.” Should any institution fail to meet the requirements to be considered “adequately capitalized,” it would become subject to a series of increasingly restrictive regulatory actions.
As of December 31, 2007 and 2006, the FDIC categorized the Bank as well capitalized under the regulatory framework for prompt corrective action. To be classified as a well capitalized financial institution, Total risk-based, Tier 1 risk-based, and Tier 1 Leverage capital ratios must be at least 10 percent, 6 percent, and 5 percent, respectively.
The Company’s actual capital ratios are presented in the following table, which shows the Company met all regulatory capital requirements. The capital position of the Bank does not differ significantly from the Company’s (in thousands);
| | | | | | | | | | | | |
| | | 2007 | | | 2006 | |
| | | Amount | | Ratio | | | Amount | | Ratio | |
Total Capital
(to Risk-Weighted Assets) | | | | | | | | | | | | |
Actual | | $ | 44,651 | | 11.61 | % | | $ | 39,627 | | 11.59 | % |
For Capital Adequacy Purposes | | $ | 30,770 | | 8.00 | % | | $ | 27,352 | | 8.00 | % |
To Be Well Capitalized | | $ | 38,462 | | 10.00 | % | | $ | 34,189 | | 10.00 | % |
Tier I Capital
(to Risk-Weighted Assets) | | | | | | | | | | | | |
Actual | | $ | 39,817 | | 10.35 | % | | $ | 35,301 | | 10.33 | % |
For Capital Adequacy Purposes | | $ | 15,385 | | 4.00 | % | | $ | 13,676 | | 4.00 | % |
To Be Well Capitalized | | $ | 23,077 | | 6.00 | % | | $ | 20,514 | | 6.00 | % |
Tier I Capital
(to Average Assets) | | | | | | | | | | | | |
Actual | | $ | 39,817 | | 9.50 | % | | $ | 35,301 | | 9.48 | % |
For Capital Adequacy Purposes | | $ | 16,762 | | 4.00 | % | | $ | 14,897 | | 4.00 | % |
To Be Well Capitalized | | $ | 20,953 | | 5.00 | % | | $ | 18,621 | | 5.00 | % |
53
NOTE 15 - FAIR VALUE DISCLOSURE
The estimated fair values of the Company’s financial instruments are as follows (in thousands):
| | | | | | | | | | | | |
| | | 2007 | | 2006 |
| | | Carrying
Value | | Fair
Value | | Carrying
Value | | Fair
Value |
Financial assets: | | | | | | | | | | | | |
Cash and cash equivalents | | $ | 7,812 | | $ | 7,812 | | $ | 18,971 | | $ | 18,971 |
Investment securities Available for sale | | | 66,739 | | | 66,739 | | | 67,266 | | | 67,266 |
Net loans | | | 339,366 | | | 352,811 | | | 300,822 | | | 305,486 |
Accrued interest receivable | | | 1,966 | | | 1,966 | | | 1,798 | | | 1,798 |
Regulatory stock | | | 1,181 | | | 1,181 | | | 914 | | | 914 |
Bank-owned life insurance | | | 8,208 | | | 8,208 | | | 5,892 | | | 5,892 |
Mortgage servicing rights | | | 689 | | | 689 | | | 716 | | | 716 |
Financial liabilities: | | | | | | | | | | | | |
Deposits | | $ | 364,600 | | $ | 367,851 | | $ | 338,117 | | $ | 338,250 |
Short-term borrowings | | | 8,210 | | | 8,208 | | | 12,705 | | | 12,705 |
Other borrowed funds | | | 17,661 | | | 18,422 | | | 13,763 | | | 13,857 |
Accrued interest payable | | | 1,691 | | | 1,691 | | | 1,428 | | | 1,428 |
Financial instruments are defined as cash, evidence of ownership interest in an entity, or a contract which creates an obligation or right to receive or deliver cash or another financial instrument from/to a second entity on potentially favorable or unfavorable terms.
Fair value is defined as the amount at which a financial instrument could be exchanged in a current transaction between willing parties other than in a forced or liquidation sale. If a quoted market price is available for a financial instrument, the estimated fair value would be calculated based upon the market price per trading unit of the instrument.
If no readily available market exists, the fair value estimates for financial instruments should be based upon management’s judgment regarding current economic conditions, interest rate risk, expected cash flows, future estimated losses, and other factors as determined through various option pricing formulas or simulation modeling. As many of these assumptions result from judgments made by management based upon estimates that are inherently uncertain, the resulting estimated fair values may not be indicative of the amount realizable in the sale of a particular financial instrument. In addition, changes in assumptions on which the estimated fair values are based may have a significant impact on the resulting estimated fair values.
As certain assets such as deferred tax assets and premises and equipment are not considered financial instruments, the estimated fair value of financial instruments would not represent the full value of the Company.
54
NOTE 15 - FAIR VALUE DISCLOSURE (Continued)
The Company employed simulation modeling in determining the estimated fair value of financial instruments for which quoted market prices were not available based upon the following assumptions:
Cash and Cash Equivalents, Accrued Interest Receivable, Regulatory Stock, and Accrued Interest Payable
The fair value is equal to the current carrying value.
Investment Securities
The fair value of investment securities available for sale and held to maturity is equal to the available quoted market price. If no quoted market price is available, fair value is estimated using the quoted market price for similar securities.
Loans, Deposits, Short Term Borrowings, Other Borrowed Funds, and Mortgage Servicing Rights
The fair value for loans and mortgage servicing rights is estimated by discounting contractual cash flows and adjusting for prepayment estimates. Discount rates are based upon rates generally charged for such loans with similar characteristics. Demand, savings, and money market deposit accounts are valued at the amount payable on demand as of year-end. Fair values for time deposits, short term borrowings and other borrowed funds are estimated using a discounted cash flow calculation that applies contractual costs currently being offered in the existing portfolio to current market rates being offered for deposits of similar remaining maturities.
Bank-Owned Life Insurance
The fair value is equal to the cash surrender value of the life insurance policies.
Commitments to Extend Credit and Standby Letters of Credit
These financial instruments are generally not subject to sale, and estimated fair values are not readily available. The carrying value, represented by the net deferred fee arising from the unrecognized commitment or letter of credit, and the fair value, determined by discounting the remaining contractual fee over the term of the commitment using fees currently charged to enter into similar agreements with similar credit risk, are not considered material for disclosure. The contractual amounts of unfunded commitments and letters of credit are presented in Note 12.
55
NOTE 16 - PARENT COMPANY
Following are condensed financial statements for the parent company:
CONDENSED BALANCE SHEET
| | | | | | |
| | | December 31, |
(In thousands) | | 2007 | | 2006 |
Assets | | | | | | |
Cash and due from banks | | $ | 1,604 | | $ | 1,664 |
Investment securities available for sale | | | 363 | | | 378 |
Investment in bank subsidiary | | | 37,598 | | | 33,260 |
Other assets | | | 878 | | | 531 |
| | | | | | |
Total Assets | | $ | 40,443 | | $ | 35,833 |
| | | | | | |
Liabilities | | | | | | |
Dividends payable | | $ | 487 | | $ | 442 |
Other liabilities | | | 33 | | | 54 |
| | | | | | |
Total Liabilities | | | 520 | | | 496 |
Stockholders’ Equity | | | 39,923 | | | 35,337 |
| | | | | | |
Total Liabilities and Stockholders’ Equity | | $ | 40,443 | | $ | 35,833 |
| | | | | | |
CONDENSED STATEMENT OF INCOME
| | | | | | | | | | | | |
| | | Year Ended December 31, | |
(In thousands) | | 2007 | | | 2006 | | | 2005 | |
Dividends from bank subsidiary | | $ | 2,450 | | | $ | 2,100 | | | $ | 2,100 | |
Dividends on investment securities | | | 10 | | | | 9 | | | | 8 | |
Investment securities gains | | | — | | | | — | | | | 2 | |
| | | | | | | | | | | | |
Total income | | | 2,460 | | | | 2,109 | | | | 2,110 | |
Noninterest expense | | | 101 | | | | 101 | | | | 89 | |
| | | | | | | | | | | | |
Net income before undistributed earnings of bank subsidiary and income taxes | | | 2,359 | | | | 2,008 | | | | 2,021 | |
Undistributed earnings of bank subsidiary | | | 4,220 | | | | 3,544 | | | | 2,405 | |
Income tax benefit | | | (33 | ) | | | (33 | ) | | | (29 | ) |
| | | | | | | | | | | | |
Net Income | | $ | 6,612 | | | $ | 5,585 | | | $ | 4,455 | |
| | | | | | | | | | | | |
56
NOTE 16 - PARENT COMPANY (Continued)
| | | | | | | | | | | | |
| | | Year Ended December 31, | |
(In thousands) | | 2007 | | | 2006 | | | 2005 | |
Operating Activities | | | | | | | | | | | | |
Net income | | $ | 6,612 | | | $ | 5,585 | | | $ | 4,455 | |
Adjustments to reconcile net income to net cash provided by operating activities: | | | | | | | | | | | | |
Undistributed earnings of bank subsidiary | | | (4,220 | ) | | | (3,544 | ) | | | (2,405 | ) |
Investment securities gains | | | — | | | | — | | | | (2 | ) |
Other, net | | | (346 | ) | | | 32 | | | | 561 | |
| | | | | | | | | | | | |
Net cash provided by operating activities | | | 2,046 | | | | 2,073 | | | | 2,609 | |
| | | | | | | | | | | | |
Investing Activities | | | | | | | | | | | | |
Purchases of investment securities | | | (53 | ) | | | (57 | ) | | | — | |
Proceeds from sales of investment securities | | | — | | | | — | | | | 6 | |
| | | | | | | | | | | | |
Net cash provided by (used for) investing activities | | | (53 | ) | | | (57 | ) | | | 6 | |
| | | | | | | | | | | | |
Financing Activities | | | | | | | | | | | | |
Purchase of treasury stock | | | (490 | ) | | | (480 | ) | | | (1,062 | ) |
Proceeds from exercise of stock options | | | 207 | | | | 338 | | | | 70 | |
Cash dividends paid | | | (1,770 | ) | | | (1,584 | ) | | | (1,543 | ) |
| | | | | | | | | | | | |
Net cash used for financing activities | | | (2,053 | ) | | | (1,726 | ) | | | (2,535 | ) |
| | | | | | | | | | | | |
Increase (decrease) in cash and cash equivalents | | | (60 | ) | | | 290 | | | | 80 | |
Cash at beginning of year | | | 1,664 | | | | 1,374 | | | | 1,294 | |
| | | | | | | | | | | | |
Cash at end of year | | $ | 1,604 | | | $ | 1,664 | | | $ | 1,374 | |
| | | | | | | | | | | | |
57
NOTE 17 - QUARTERLY DATA (Unaudited)
The Company’s selected quarterly financial data is presented in the following tables (in thousands, except per share data):
| | | | | | | | | | | | |
| | | Three Months Ended |
| | | March
2007 | | June
2007 | | September
2007 | | December
2007 |
Total interest income | | $ | 6,987 | | $ | 7,388 | | $ | 7,705 | | $ | 7,871 |
Total interest expense | | | 2,976 | | | 3,116 | | | 3,153 | | | 3,356 |
| | | | | | | | | | | | |
Net interest income | | | 4,011 | | | 4,272 | | | 4,552 | | | 4,515 |
Provision for loan losses | | | 225 | | | 225 | | | 300 | | | 380 |
| | | | | | | | | | | | |
Net interest income after provision for loan losses | | | 3,786 | | | 4,047 | | | 4,252 | | | 4,135 |
Total noninterest income | | | 810 | | | 840 | | | 921 | | | 946 |
Total noninterest expense | | | 2,420 | | | 2,562 | | | 2,465 | | | 2,681 |
| | | | | | | | | | | | |
Income before income taxes | | | 2,176 | | | 2,325 | | | 2,708 | | | 2,400 |
Income taxes | | | 679 | | | 726 | | | 851 | | | 741 |
| | | | | | | | | | | | |
Net income | | $ | 1,497 | | $ | 1,599 | | $ | 1,857 | | $ | 1,659 |
| | | | | | | | | | | | |
Per share data: | | | | | | | | | | | | |
Net income | | | | | | | | | | | | |
Basic | | $ | .98 | | $ | 1.05 | | $ | 1.22 | | $ | 1.09 |
Diluted | | $ | .95 | | $ | 1.01 | | $ | 1.18 | | $ | 1.05 |
Weighted-average shares outstanding: | | | | | | | | | | | | |
Basic | | | 1,527,418 | | | 1,529,139 | | | 1,520,024 | | | 1,521,670 |
Diluted | | | 1,580,945 | | | 1,587,416 | | | 1,578,255 | | | 1,578,026 |
58
NOTE 17 - QUARTERLY DATA (Unaudited) (Continued)
| | | | | | | | | | | | |
| | | Three Months Ended |
| | | March
2006 | | June
2006 | | September
2006 | | December
2006 |
Total interest income | | $ | 5,457 | | $ | 5,903 | | $ | 6,325 | | $ | 6,961 |
Total interest expense | | | 1,939 | | | 2,210 | | | 2,425 | | | 2,904 |
| | | | | | | | | | | | |
Net interest income | | | 3,518 | | | 3,693 | | | 3,900 | | | 4,057 |
Provision for loan losses | | | 215 | | | — | | | 185 | | | 385 |
| | | | | | | | | | | | |
Net interest income after provision for loan losses | | | 3,303 | | | 3,693 | | | 3,715 | | | 3,672 |
Total noninterest income | | | 739 | | | 783 | | | 758 | | | 875 |
Total noninterest expense | | | 2,294 | | | 2,450 | | | 2,316 | | | 2,281 |
| | | | | | | | | | | | |
Income before income taxes | | | 1,748 | | | 2,026 | | | 2,157 | | | 2,266 |
Income taxes | | | 553 | | | 646 | | | 689 | | | 724 |
| | | | | | | | | | | | |
Net income | | $ | 1,195 | | $ | 1,380 | | $ | 1,468 | | $ | 1,542 |
| | | | | | | | | | | | |
Per share data: | | | | | | | | | | | | |
Net income | | | | | | | | | | | | |
Basic | | $ | .78 | | $ | .90 | | $ | .96 | | $ | 1.01 |
Diluted | | $ | .76 | | $ | .88 | | $ | .93 | | $ | .98 |
Weighted-average shares outstanding: | | | | | | | | | | | | |
Basic | | | 1,522,967 | | | 1,527,395 | | | 1,523,958 | | | 1,521,073 |
Diluted | | | 1,571,149 | | | 1,575,616 | | | 1,573,677 | | | 1,574,918 |
59
SHAREHOLDER INFORMATION
CORPORATE HEADQUARTERS
P.O. Box 509
820 Church Street
Honesdale, PA 18431
570-253-1970
email: dimeco@thedimebank.com
www.thedimebank.com
INDEPENDENT AUDITORS
S.R. Snodgrass, A.C.
2100 Corporate Drive, Suite 400
Wexford, PA 15090-7647
724-934-0344
www.srsnodgrass.com
LEGAL COUNSEL
Malizia Spidi & Fisch, P.C.
901 New York Avenue, N.W.
Suite 210 East
Washington, DC 20001
202-434-4660
TRANSFER AGENT
Registrar and Transfer Company
10 Commerce Drive
Cranford, NJ 07016
800-368-5948
email: info@rtco.com
www.rtco.com
For change of name, address, or to replace lost stock certificates, write or call the securities transfer division.
DIVIDEND REINVESTMENT PLAN
The Company offers a plan for stockholders to automatically reinvest their dividends in shares of common stock. There are no brokerage commissions or fees imposed. For more information contact the transfer agent.
ANNUAL MEETING
Shareholders are cordially invited to attend the Annual Meeting of Shareholders, which will be held at The Community Room of the Wayne County Chamber of Commerce Building, 303 Commercial Street, Honesdale, PA on Thursday, April 24, 2008 at 2:00 pm.
FIRMS KNOWN TO HANDLE DIMECO, INC. STOCK TRANSACTIONS
Ferris, Baker Watts, Inc.*
100 Light Street
Baltimore, MD 21202
410-468-2749 or 877-840-0012
Howe Barnes Hoefer & Arnett, Inc.*
21B South Main Street
Cohasset, MA 02025
781-383-3350
888-239-4463
www.howebarnes.com
RBC Dain Rauscher
2101 Oregon Pike
Lancaster, PA 17601-9669
717-519-5940 or 866-604-1471
Stifel Nicolaus*
7111 Fairway Drive, Suite 301
Palm Beach Gardens, FL 33418
800-793-7226
Legg Mason Wood Walker, Inc.
330 Montage Mountain Road, Suite 201
Scranton, PA 18507-1762
570-346-9300 or 800-346-4346
Boenning & Scattergood, Inc.*
Four Tower Bridge
200 Barr Harbor Drive, Suite 300
West Conshohocken, PA 19428-2979
610-862-5360 or 800-842-8928
*Denotes Market Makers
THE DIME BANK OFFICERS
WILLIAM E. SCHWARZ
Chairman of the Board
JOHN S. KIESENDAHL
Vice Chairman of the Board
GARY C. BEILMAN
President and Chief Executive Officer
MAUREEN H. BEILMAN
Chief Financial Officer and Treasurer
PETER BOCHNOVICH
Senior Vice President and Assistant Secretary
L. JILL GEORGE
Vice President
JOSEPH W. ADAMS
Vice President
RUTH E. DANIELS
Vice President
JANETTE M. DAVIS
Vice President
THOMAS M. DIDATO
Vice President
FRANK R. REDINGTON
Vice President
CHERYL A. SMITH
Vice President
JEROME D. THEOBALD
Vice President
DEBORAH L. UNFLAT
Assistant Vice President
AMY L. BURKE
Community Office Manager
MARY CAROL CICCO
Community Banking Officer
JAN M. HOADLEY
Community Office Manager
NANCY M. LAVENDUSKI
Loan Officer
THOMAS A. ONIONS
Community Office Manager
MELANIE F. SEAGRAVES
Community Office Manager
LINDA S. TALLMAN
Secretary
CYNTHIA D. THEOBALD
Bank Security Officer
DIMECO, INC. OFFICERS
WILLIAM E. SCHWARZ
Chairman of the Board
JOHN S. KIESENDAHL
Vice Chairman of the Board
GARY C. BEILMAN
President and Chief Executive Officer
MAUREEN H. BEILMAN
Chief Financial Officer,
Treasurer and Assistant Secretary
PETER BOCHNOVICH
Senior Vice President and Assistant Secretary
JOHN F. SPALL
Secretary
TDB INSURANCE SERVICES, LLC OFFICERS
GARY C. BEILMAN
President
PETER BOCHNOVICH
Secretary
MAUREEN H. BEILMAN
Treasurer
JOSEPH PIZZO
Vice President
THE DIME BANK LOCATIONS
HONESDALE OFFICE
P.O. Box 509
820 Church Street
Honesdale, PA 18431
Phone:570-253-1902
email: honesdale@thedimebank.com
GREENTOWN OFFICE
P.O. Box 946
1586 Route 507
Greentown, PA 18426
Phone: 570-676-8390
email: greentown@thedimebank.com
HAWLEY OFFICE
P.O. Box 290
309 Main Avenue
Hawley, PA 18428
Phone: 570-226-3506
email: hawley@thedimebank.com
DAMASCUS OFFICE
P.O. Box 190
1679 Cochecton Turnpike
Damascus, PA 18415
Phone: 570-224-6300
email: damascus@thedimebank.com
DINGMANS FERRY OFFICE
1824 Route 739
Dingmans Ferry, PA 18328
Phone:570-828-1200
email: dingmansferry@thedimebank.com
OPERATIONS CENTER
P.O. Box 509
120 Sunrise Avenue
Honesdale, PA 18431
Phone:570-253-1970
email: operations@thedimebank.com
60
|
THE DIME BANK AND DIMECO, INC. BOARD OF DIRECTORS |
|
WILLIAM E. SCHWARZ President, Edw. J. Schwarz, Inc. |
|
GARY C. BEILMAN President and Chief Executive Officer, Dimeco, Inc. and The Dime Bank |
|
ROBERT E. GENIRS Retired Chief Administrative Officer, Lehman Brothers |
|
BARBARA J. GENZLINGER Secretary and Treasurer, The Settlers Inn, Ltd. President, Sayre Mansion, LLC |
|
JOHN S. KIESENDAHL President and Chief Executive Officer, Woodloch Pines, Inc. |
|
THOMAS A. PEIFER Retired Superintendent, Wallenpaupack Area School District |
|
HENRY M. SKIER President, A.M. Skier Agency, Inc. |
|
JOHN F. SPALL Attorney-at-Law |
Not pictured:GERALD J. WENIGER, Director Emeritus
THE DIME BANK EXECUTIVE OFFICERS
Peter Bochnovich, Gary Beilman, Maureen Beilman,Joseph Adams, Jill George
THE DIME BANK OFFICERS
Melanie Seagraves, Nancy Lavenduski, Thomas Didato, Eileen Ertel, Ruth Daniels, Thomas Onions, Frank Redington, Deborah Unflat, Jerome Theobald, Cynthia Theobald, Linda Tallman, Mary Carol Cicco, Cheryl Smith, Janette Davis, Jan Hoadley
Not pictured: Amy Burke
www.thedimebank.com
DIMECO, INC. 2007 ANNUAL REPORT
STOCK LISTING: OTC Bulletin Board
DIMC - cusip number 25432W104