Exhibit 13


2010 ANNUAL REPORT

C O M M U N I T Y B a n k i n g
T A B L E O F C O N T E N T S
| | | | |
President’s Letter | | | 3 | |
Board of Directors | | | 6 | |
Branch Locations | | | 8 | |
Financial Report Index | | | 9 | |
The mission of Dimeco, Inc. is the operation of a fully integrated financial services institution through its subsidiary The Dime Bank in a market that is defined by the institution’s ability to provide services consistent with sound, prudent principles and to fulfill the social, economic, moral and political considerations ordinarily associated with a responsible, well run financial institution.
F I N A N C I A L H i g h l i g h t s.
| | | | | | | | | | | | |
| | | | | | | | | % Increase | |
| (amounts in thousands, except per share data) | | 2010 | | | 2009 | | | (decrease) | |
| | | |
PERFORMANCE FOR THE YEAR ENDED DECEMBER 31, | | | | | | | | | | | | |
Interest income | | $ | 24,674 | | | $ | 24,517 | | | | .6 | % |
Interest expense | | $ | 7,320 | | | $ | 8,750 | | | | (16.3 | %) |
Net interest income | | $ | 17,354 | | | $ | 15,767 | | | | 10.1 | % |
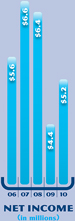
Net income | | $ | 5,159 | | | $ | 4,402 | | | | 17.2 | % |
| | | |
SHAREHOLDERS’ VALUE (PER SHARE) | | | | | | | | | | | | |
Net income - basic | | $ | 3.24 | | | $ | 2.82 | | | | 14.9 | % |
Net income - diluted | | $ | 3.24 | | | $ | 2.79 | | | | 16.1 | % |
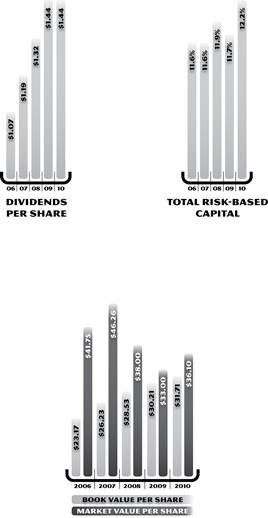
Dividends | | $ | 1.44 | | | $ | 1.44 | | | | - | |
Book value | | $ | 31.71 | | | $ | 30.21 | | | | 5.0 | % |
Market value | | $ | 36.10 | | | $ | 33.00 | | | | 9.4 | % |
Market value/book value ratio | | | 113.8 | % | | | 109.2 | % | | | 4.2 | % |
Price/earnings multiple | | | 11.1 | X | | | 11.7 | X | | | (5.1 | %) |
Dividend yield | | | 3.99 | % | | | 4.36 | % | | | (8.5 | %) |
| | | |
FINANCIAL RATIOS | | | | | | | | | | | | |
Return on average assets | | | .94 | % | | | .90 | % | | | 4.4 | % |
Return on average equity | | | 10.43 | % | | | 9.58 | % | | | 8.9 | % |
Shareholders’ equity/asset ratio | | | 9.35 | % | | | 8.88 | % | | | 5.3 | % |
Dividend payout ratio | | | 44.44 | % | | | 51.06 | % | | | (13.0 | %) |
Nonperforming assets/total assets | | | 3.46 | % | | | 1.90 | % | | | 82.1 | % |
Allowance for loan loss as a % of loans | | | 1.82 | % | | | 1.53 | % | | | 19.0 | % |
Net charge-offs/average loans | | | .06 | % | | | .12 | % | | | (50.0 | %) |
Allowance for loan loss/nonaccrual loans | | | 49.4 | % | | | 83.1 | % | | | (40.6 | %) |
Allowance for loan loss/nonperforming loans | | | 43.6 | % | | | 64.6 | % | | | (32.5 | %) |
Risk-based capital | | | 12.2 | % | | | 11.7 | % | | | 4.3 | % |
| | | |
FINANCIAL POSITION AT DECEMBER 31, | | | | | | | | | | | | |
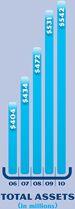
Assets | | $ | 542,214 | | | $ | 530,657 | | | | 2.2 | % |
Loans | | $ | 425,069 | | | $ | 410,012 | | | | 3.7 | % |
Deposits | | $ | 454,734 | | | $ | 443,116 | | | | 2.6 | % |
Stockholders’ equity | | $ | 50,679 | | | $ | 47,117 | | | | 7.6 | % |
1

2
C O M M U N I T Y M a t t e r s.

| | | | |
 | | | | Dear Shareholders: It is my honor to present the annual report of Dimeco, Inc. for the year 2010. |
Gary C. Beilman President & Chief Executive Officer |
FROM SEVERAL PERSPECTIVES, THIS WAS A YEAR OF SOLID ACCOMPLISHMENTS. To begin, our year-long efforts resulted in $5.2 million in net income. This performance, which was an impressive increase of 17% over that of a year earlier, was achieved by focused pricing on both sides of the balance sheet, coupled with the continuation of our usual cost containment efforts. With revenue of this magnitude also came additional benefits. For you, we continued our strong quarterly dividend payment, which resulted in a dividend yield of 3.99% for the year. Equally important was the growth in shareholders’ equity by $3.6 million, an increase of over 7% from a year earlier. For 2010, the return on average equity was 10.43%, an up-tick of almost 9% from the year before. These achievements, together with handsome increases in both the book value and market value of your Company’s stock, all speak well from a return on investment viewpoint. We humbly acknowledge how fortunate we are to post these positive results at a time when our national economy continues its slow recovery.

We encourage you to read the financial section of this Annual Report for a more detailed analysis of the 2010 Dimeco, Inc. financial results.
3

The year 2010 was a busy one for all areas of the institution. Each of our six branches experienced heightened levels of customer activity which contributed to our growth in deposits, loans, and total assets. Managed balance sheet growth was part of a deliberate plan to increase profitability. Also, our wealth management division realized increased business levels. A renewed interest in many areas of the securities’ markets, coupled with new department incentives, drove investment activity significantly higher. At the end of the year we had over $100 million in assets under management within this division. Overall, we expect greater activity levels in all areas of our operation as our economy improves.
“OUR STRONG COMMITMENT TO COMMUNITY DOES NOT WAIVER DESPITE THE CYCLICAL CHANGES IN OUR ECONOMY.”
In keeping with our positive financial report, loan losses were at a minimum during the year, as evidenced by our low net charge-offs to average loans ratio. Unfortunately, however, several of our loan customers are experiencing financial difficulties. High levels of unemployment for some, together with greatly diminished cash flow for others, have resulted in increased loan delinquencies. We continue to monitor credit quality very closely, and are accelerating collection activity where warranted. Ongoing communications with all of our borrowers has always been our primary focus, in particular this year, working diligently with customers who are experiencing problems. Our resolve is to produce the best results for your Company. In recognition of all of these issues, we increased the provision for loan loss expense, thereby raising our allowance for loan loss as a percentage of total loans to 1.82%.
Our strong commitment to community does not waiver despite the cyclical changes in our economy. We have long known the far-reaching importance of the health of our marketplace. For all of us to prosper no matter what the
4
economic climate, we must work together for the betterment of all concerned. To that end, during 2010 we increased our total commitment to and participation in our communities at large. Our directors, officers, and staff showed their support by being actively involved in over 185 local organizations. These groups included professional affiliations as well as civic, non-profit, philanthropic, religious, governmental and quasi-governmental groups. We also stepped up our efforts to operate ‘green’ in our offices, enrolling in a local pilot program that helps protect the environment while keeping costs down. It is our strong belief that the more proactive and cohesive our communities can be, the richer the life that can be created for everyone.
The business of the Company is conducted by a caring group of professionals who each day commit 100% of their efforts to the success of the institution. It is this group that services customers, nurtures relationships, attracts new business, and does all in a manner dedicated to our corporate mission. During the year, we gave pause to recognize those among us who celebrated significant milestone anniversaries. John Kiesendahl, Vice Chairman of the Board, was honored upon his 25th anniversary as a director. Among the staff recognized during the year were Eileen Jaggars, who attained 25 years of tenure, together with seven other employees who attained 15 or 10 year anniversaries. It is through the ongoing dedication, commitment, and loyalty as demonstrated by these individuals, that we have become a special place for customers and associates alike.
Technology and marketing continue to promote efficiency and convenience in our world of banking. During the year we rolled out several new programs. Among the most significant new initiatives wereMobile Dimeand our electronic newsletter.Mobile Dimeallows customers the ability to manage their finances in a timely and secure manner with an application formatted to their cell phone. Additionally, the bank now markets products and services, and delivers financial news and educational materials via e-mailed newsletters. These two new services are examples of our continuing efforts to provide banking opportunities through alternate delivery systems.
5

6
C O M M U N I T Y M e m b e r s.

Our next electronic service will provide for online opening of deposit accounts which will begin in the first quarter of 2011. Initially, this product will be available for existing customers and then offered to the local marketplace soon thereafter.
Economic forecasting models all suggest that 2011 will be a year of continued slow growth as our country seeks its way toward a methodical recovery from the recession. These predictions dictate our actions as we move forward. As such, our primary efforts will be directed at solidifying customer relationships, improving interest margins and spread, maintaining asset quality, and building a strong foundation for the future. We made great strides in 2010 despite a challenging economy. Our resolve is to create an even better 2011.
While challenging times produce obstacles, they also tend to promote solidarity and renewed commitment. These are exactly those times. You, as shareholders, continue to demonstrate faith and trust in your Company. We, in turn, dedicate our efforts to the enhancement of your investment. Thankfully, both of these resolves have never been stronger, and together we look to an even brighter future.
In conclusion, we thank you for your continued loyalty and patronage. We encourage you to promote our banking and investment services as well as stock ownership to others. As always, we welcome your questions and comments.
Sincerely,

Gary C. Beilman
President & Chief Executive Officer
7

8

2010 CONSOLIDATED FINANCIAL REPORT
| | |
| |
Management’s Discussion & Analysis of Financial Condition and Results of Operation | | 11 |
| |
Summary of Selected Financial Data | | 31 |
| |
Management’s Annual Report on Internal Control over Financial Reporting | | 32 |
| |
Report of Independent Registered Public Accounting Firm | | 33 |
| |
Consolidated Balance Sheet | | 34 |
| |
Consolidated Statement of Income | | 35 |
| |
Consolidated Statement of Changes in Stockholders’ Equity | | 36 |
| |
Consolidated Statement of Cash Flows | | 37 |
| |
Notes to Consolidated Financial Statements | | 38 |
| |
Investor Information | | Inside Back Cover |

10

MANAGEMENT’S DISCUSSION AND ANALYSIS OF FINANCIAL CONDITION
AND RESULTS OF OPERATION
This consolidated review and analysis of Dimeco, Inc. (the “Company”) is intended to assist the reader in evaluating the performance of the Company for the years ended December 31, 2010 and 2009. This information should be read in conjunction with the consolidated financial statements and accompanying notes to the consolidated financial statements.
Dimeco, Inc., headquartered in Honesdale, Pennsylvania, is the one-bank holding company of The Dime Bank (the “Bank”), which is wholly-owned by the Company. TDB Insurance Services, LLC (“TDB”), a limited liability company, offering title insurance services, was formed by the Bank and is owned 100% by the Bank. Both the Company and the Bank derive their primary income from the operation of a commercial bank, including earning interest on loans and investment securities, fees on services performed and providing investment and trust services. The Bank’s main expenses are related to interest paid on deposits and other borrowings along with salary and benefits for employees. The Bank operates six full-service branches in Honesdale, Hawley, Damascus, Greentown and Dingmans Ferry, Pennsylvania, two off-site automatic teller machines, one each in Wayne and Pike County, Pennsylvania and an operations center in Honesdale, Pennsylvania. Principal market areas include Wayne and Pike Counties, Pennsylvania and Sullivan County, New York. The Bank employed 113 full-time employees and 17 part-time employees at December 31, 2010.
FORWARD-LOOKING STATEMENT
This Management Discussion and Analysis section of the Annual Report contains certain forward-looking statements (as defined in the Private Securities Litigation Reform Act of 1995). In the normal course of business, we, in an effort to help keep our shareholders and the public informed about our operations, may from time to time issue or make certain statements, either in writing or orally, that are or contain forward-looking statements, as that term is defined in the U.S. federal securities laws. Generally, these statements relate to business plans or strategies, projections involving anticipated revenues, earnings, profitability or other aspects of operating results or other future developments in our affairs or the industry in which we conduct business. Forward-looking statements may be identified by reference to a future period or periods or by the use of forward-looking terminology such as “anticipate,” “believe,” “expect,” “intend,” “plan,” “estimate” or similar expressions.
Although we believe that the anticipated results or other expectations reflected in our forward-looking statements are based on reasonable assumptions, we can give no assurance that those results or expectations will be attained. Forward-looking statements involve risks, uncertainties and assumptions (some of which are beyond our control), and as a result actual results may differ materially from those expressed in forward-looking statements. Factors that could cause actual results to differ from forward-looking statements include, but are not limited to, the following, as well as those discussed elsewhere herein:
| | • | | our investments in our businesses and in related technology could require additional incremental spending, and might not produce expected deposit and loan growth and anticipated contributions to our earnings; |
| | • | | general economic or industry conditions could be less favorable than expected, resulting in a deterioration in credit quality, a change in the allowance for loan and lease losses and/or a reduced demand for credit or fee-based products and services; |
| | • | | changes in the interest rate environment could reduce net interest income and could increase credit losses; |
| | • | | the conditions of the securities markets could change, which could adversely affect, among other things, the value or credit quality of our assets, the availability and terms of funding necessary to meet our liquidity needs and our ability to originate loans and leases; |
| | • | | changes in the extensive laws, regulations and policies governing financial holding companies and their subsidiaries could alter our business environment or affect our operations; |
| | • | | the potential need to adapt to industry changes in information technology systems, on which we are highly dependent, could present operational issues or require significant capital spending; |
11
| | • | | competitive pressures could intensify and affect our profitability, including as a result of continued industry consolidation, the increased availability of financial services from non-banks, technological developments such as the internet or bank regulatory reform; and |
| | • | | acts or threats of terrorism and actions taken by the United States or other governments as a result of such acts or threats, including possible military action, could further adversely affect business and economic conditions in the United States generally and in our principal markets, which could have an adverse effect on our financial performance and that of our borrowers and on the financial markets and the price of our common stock. |
You should not put undue reliance on any forward-looking statements. Forward-looking statements speak only as of the date they are made, and we undertake no obligation to update them in light of new information or future events except to the extent required by federal securities laws.
NON-U.S. GENERALLY ACCEPTED ACCOUNTING PRINCIPLES (“GAAP”) FINANCIAL MEASURES
This annual report contains or references tax-equivalent interest income and yields, which are non-GAAP financial measures. Tax-equivalent interest income and yields are derived from GAAP interest income using an assumed tax rate of 34%. We believe the presentation of interest income and yield on a tax-equivalent basis ensures comparability of interest income and yield arising from both taxable and tax-exempt sources and is consistent with industry practice. Although the Company believes that these non-GAAP financial measures enhance investors’ understanding of our business and performance, these non-GAAP financial measures should not be considered an alternative to GAAP measures.
CRITICAL ACCOUNTING POLICIES
The Company’s accounting policies are integral to understanding the results reported. The accounting policies are described in detail in Note 1 of the “Notes to Consolidated Financial Statements.” Our most complex accounting policies require management’s judgment to ascertain the valuation of assets, liabilities, commitments and contingencies. We have established detailed policies and control procedures that are intended to ensure that valuation methods are well controlled and applied consistently from period to period. In addition, the policies and procedures are intended to ensure that the process for changing methodologies occurs in an appropriate manner. The following is a brief description of our current accounting policies involving significant management valuation judgments.
Allowance for Loan Losses
Arriving at an appropriate level of allowance for loan losses involves a high degree of judgment. The Company’s allowance for loan losses provides for probable losses based upon evaluations of known and inherent risks in the loan portfolio.
Management uses both historical and current information relating to the loan portfolio, as well as economic and other general information, in order to determine our estimation of the prevailing business environment. The probability of collection of loans is affected by changing economic conditions and various external factors which may impact the portfolio in ways currently unforeseen. We monitor this information in an effort to assess the adequacy of the allowance for loan losses. The allowance is increased by provisions for loan losses and by recoveries of loans previously charged-off and reduced by loans charged-off. For a full discussion of the Company’s methodology of assessing the adequacy of the reserve for loan losses refer to Note 1 of the “Notes to Consolidated Financial Statements.”
Mortgage Servicing Rights
The Bank originates residential mortgages that are sold in the secondary market. It is the Bank’s normal practice to retain the servicing of these loans, meaning that the customers whose loans have been sold in the secondary market still make their monthly payments to the Bank. As a result of these mortgage loan sales, the Bank capitalizes a value allocated to the servicing rights categorized in other assets and recognizes other income from the sale and servicing of these loans. The capitalized servicing rights are amortized against noninterest income in proportion to the estimated net servicing income over the remaining periods of the underlying financial assets.
Capitalized servicing rights are evaluated for impairment periodically based upon the fair value of the rights as compared to amortized cost. The rights are deemed to be impaired when the fair value of the rights is less than the amortized cost.
12
The fair value of the servicing rights is estimated using projected, discounted cash flows by means of a computer pricing model, based on objective characteristics of the portfolio and commonly used industry assumptions.
Deferred Tax Assets
The Company uses an estimate of future earnings to support our position that the benefit of our deferred tax assets will be realized. If future income should prove non-existent or less than the amount of the deferred tax assets within the tax years to which they may be applied, the asset may not be realized and our net income will be reduced. Our deferred tax assets are described further in Note 12 of the “Notes to Consolidated Financial Statements.”
Other than Temporary Impairment of Investments
Investments are evaluated periodically to determine whether a decline in their value is other than temporary. Management utilizes criteria such as the magnitude and duration of the decline, in addition to the underlying reasons for the decline, to determine whether the loss in value is other than temporary. The term “other than temporary” is not intended to indicate that the decline is permanent. It indicates that the prospects for a near term recovery of value are not necessarily favorable, or that there is a lack of evidence to support fair values equal to, or greater than, the carrying value of the investment. Once a decline in value is determined to be other than temporary, the value of the security is reduced and a corresponding charge to earnings is recognized.
All dollars are stated in thousands, with the exception of per share numbers.
STATEMENT OF CONDITION
Total assets increased during 2010 by $11,557 or 2.2% from balances a year earlier. Assets shifted between cash and cash equivalents, investments and loans over the course of the year. Repayment of other borrowed funds and an increase in deposits were the major changes on the liability side of the balance sheet.
Cash and cash equivalents declined by $10,635 or 50.0% from December 31, 2009 to December 31, 2010. Balances of cash on hand and noninterest-bearing deposits in correspondent banks increased $1,840 or 46.1%. In particular, the balance on deposit with the Federal Reserve Bank of Philadelphia (“Fed”) increased $1,950 or 87.5% to support the depository clearing process with smaller changes in cash on hand and balances in other correspondent banks. Balances of interest-bearing deposits in other banks and federal funds sold declined $12,475 or 72.1% as funds were used to purchase investments and fund loans, both of which return a higher rate of interest than we receive on these liquid assets.
Investment securities available for sale increased $6,027 or 8.2% in 2010 from balances at the end of 2009. Balances of U.S. government agency bonds declined $9,346 or 42.3% mainly because, as expected, $17,822 of callable and step-up bonds that were in the portfolio on December 31, 2009 which included option dates in 2010 were called. These bonds offered a favorable interest rate at purchase and the ability to step up the interest rate if market rates increased, but as those rates actually declined, all were called during the year. Offsetting this decline of government agency bonds, we purchased several bullet agency bonds along with Small Business Administration (“SBA”) and Federal Home Loan Bank pools which offer variable interest rates along with regularly scheduled principal reductions similar to mortgage-backed bonds. Balances of commercial paper declined $4,946 or 37.9% as the supply of offerings that met our investment strategy decreased. Available funds from both of these categories were reinvested mainly in mortgage-backed securities. With interest rates at such low levels, these investments carry the full faith and credit of the U. S. government and offer a cash stream to assist in liquidity management, allowing for reinvestment of that cash as interest rates move upward. Balances of mortgage-backed securities increased $19,969 or 463.9% during 2010 as a result of this strategy. We also purchased some tax-exempt and taxable municipal bonds during the year as offerings of these types fit most appropriately in our portfolio at the time.
The loan portfolio increased $15,057 or 3.7% from December 31, 2009 to December 31, 2010. Although we have continued to increase the loan portfolio, the growth for the year 2010 was much less robust than in prior years. In these difficult economic times, we have seen fewer qualified loan requests. Commercial real estate loans comprised the majority of the increase with balances growing by $12,837 or 5.3% greater than a year earlier. Included in this growth were loans of $6,637 which were transferred from the real estate construction and development category upon completion of the projects. Commercial loans increased by $2,348 and were 5.5% greater than a year earlier. All commercial and commercial real estate loans were granted to businesses in a variety of industries during the year. Although we have originated some loans to finance non-owner occupied properties from time to time, the vast majority are originated to borrowers who are also tenants of the real estate used as collateral. We believe that loans granted for
13
this use carry less risk than non-owner occupied collateral. Balances of loans secured by one to four family residential properties increased by $5,472 or 7.2% due to increased originations of “non-conforming” loans during the year which we maintain in portfolio. Non-conforming residential real estate loans are those that do not fit the requirements for sale in the secondary market for a number of issues that are not related to credit quality. Some of these issues may include the acreage size of the home site being larger than what is deemed typical for residential dwellings or the total square footage of a home that is deemed to be smaller than that which is considered typical for homes and items of similar nature. The applicants of these loans qualify for residential borrowing in all other aspects. The Company is located in a rural area and therefore it is common for customers to own properties with larger acreage. We continue to underwrite loans using the same credit quality guidelines that we have always followed. In addition, balances of revolving, open-end loans secured by one to four family residential properties or home equity lines of credit increased by $1,278 or 14.8%. Customers have increased their usage of these lines of credit during the year as the interest rates for loans secured by residential real estate are typically lower than for other consumer loans. Balances of construction and real estate development loans declined by $3,814 or 23.4% from December 31, 2009 to December 31, 2010. Of that amount, residential construction loans decreased by $1,365 and commercial real estate development loans declined by $2,449. Originations of residential construction loans were down in 2010 and loans that were in this category at December 31, 2009 have generally been transferred to one to four family residential loans or sold in the secondary market. Commercial real estate development loans declined as projects reached completion and were transferred to the appropriate loan category. Again, new originations of this type loan were slower in 2010 than in prior years. The installment loan portfolio declined by $1,999 or 16.4%, a continuation of the trend of the last five years. We believe that consumer spending is generally lower; this trend, coupled with usage of home equity lines of credit in lieu of installment loans, served to decrease balances of this type of loan. We have maintained our stringent underwriting policies which, compounded with the slow business recovery, resulted in fewer applicants who qualified for loans than we have seen in previous years.
Other real estate owned of $960 at December 31, 2010 included a restaurant, one single family residential property and two residential building lots. The restaurant is under agreement of sale with a closing expected by the end of the second quarter of 2011. No loss is anticipated on this sale. In workouts of nonperforming loans, we expect other real estate owned will increase if properties go to sheriff sale; however, we have already begun discussions with potential buyers if the loan workouts end in foreclosure.
In the fourth quarter of 2009, the Federal Deposit Insurance Corporation (“FDIC”) mandated that all insured financial institutions prepay an estimate of three years assessments as a means for this federal regulatory agency to collect enough cash to meet upcoming liquidity needs to fund future resolutions. The Bank’s assessment was $2,471 at that time. We expensed $694 and $162 of this prepaid amount in 2010 and 2009, respectively, thereby decreasing the prepaid balance.
The balance of other assets increased $2,696 or 36.9% at December 31, 2010 as compared to a year earlier. The largest change in this asset category was the purchase of a fixed annuity insurance contract in the amount of $1,500. This asset was issued by a highly rated insurance company and carries a guaranteed interest rate of 3.0% over the five year term. We believe that this investment offered a better rate of return than other bonds of equal credit quality for the same term at the time of purchase. The balance of deferred taxes increased $749 over balances a year earlier primarily due to a change in the method of calculating the federal income tax deduction for loan losses. The remaining increase in other assets is attributable to smaller changes in different asset categories.
Deposits increased by $11,618 or 2.6% at December 31, 2010 as compared to a year earlier. Noninterest-bearing deposits grew by $3,380 or 8.5%. Many customers are taking advantage of our no fee checking account with over 1,400 of these accounts opened in 2010. Balances of interest-bearing deposits increased by $8,238 or 2.0%. Included in interest-bearing deposits are money market accounts which increased $25,104 or 61.0% during the year. Many customers transferred matured, higher rate certificates of deposit to this more liquid account which offers a tiered interest rate that has continued to pay attractive rates at all levels. Since this product does carry a very competitive interest rate, we have also opened 190 new accounts during the year. Offsetting the increase in money market accounts, balances of certificates of deposit declined by $25,406 or 8.9% during the year as management discontinued the special that carried an aggressive interest rate. We offered an alternative certificate of deposit product that pays a higher interest rate to customers who meet the product minimum balance and activity requirements. This promotion has established relationships with owners of the certificates rather than simply attracting more volatile deposits from customers looking only for the highest rate. To compensate for the decline as customers closed those special certificate of deposit accounts, we purchased non-reciprocated brokered certificates of deposit through the Certificate of Deposit Account Registry Service (“CDARS”) network during 2010, with balances of $19,583 at December 31, 2010. The Bank has been
14
affiliated with this vendor for six years to offer fully insured certificates of deposit to our customers. We were able to meet our cash needs while paying a lower rate of interest than would have been necessary to pay on a promotional offering in our marketplace. We expect to continue to generate additional brokered deposits as the need arises. Balances of interest-bearing checking accounts increased $5,639 or 14.3% with the majority of that growth in the platinum checking product. Customers must utilize the platinum checking account in order to receive premium interest rates on certificates of deposit. Included in our overall growth are new deposits from local landowners who have signed gas leases for their properties in the Marcellus Shale region. This area is expected to offer one of the largest natural gas deposits in the United States and we expect to gather additional deposits as drilling begins and royalties are paid to residents in northern Wayne county and other areas within our market.
Short-term borrowings increased $2,032 or 18.5% from balances at December 31, 2009. These borrowings are entirely comprised of balances in our commercial sweep accounts. Customers use their checking accounts for daily deposits and withdrawals and each night the funds over the minimum of $30 are swept into securities sold under agreement to repurchase. These balances are secured by bonds in the investment portfolio.
Balances of other borrowed funds declined by $4,850 or 19.9% due to regularly scheduled payments on amortizing loans along with $3,000 of borrowings reaching maturity during the year.
CAPITAL RESOURCES
Capital increased by $3,562 or 7.6% in 2010 with the main component of that growth in retained earnings. Net income of $5,159 was posted to retained earnings while dividends of $2,300 offset that increase. The dividend payout ratio of 44.4% in 2010 was less than the 51.1% in 2009. The Board of Directors voted to maintain the dividend rate over the past two years in spite of lower net income because they believe that recent levels of income will increase as the economy comes through the recessionary period. They also took into consideration that, even with this level of dividend payout ratio, we would continue to maintain our status of “well-capitalized”. Additional capital was obtained by directors and officers exercising 38,440 of stock options which were scheduled to expire in 2010. Those exercises resulted in an increase of $19 in common stock and $721 in capital surplus.
The Company’s capital position at December 31, 2010 as it relates to regulatory guidelines is presented below:
| | | | | | |
| | | Dimeco, Inc. | | Well-Capitalized | | Minimum Requirements |
| | | |
Leverage Ratio | | 9.20% | | 5.00% | | 4.00% |
| | | |
Tier I Capital Ratio | | 10.96% | | 6.00% | | 4.00% |
| | | |
Total Capital Ratio | | 12.22% | | 10.00% | | 8.00% |
LIQUIDITY
The liquidity risk in financial institutions is based upon the institution’s ability to have sources of funds available to meet its needs for the outflow of cash at any specific time. Liquidity begins with cash and cash equivalents, which the Company defines as cash on hand and in banks, along with overnight investments in federal funds sold. Balances of these accounts totaled $10,652 or 2.0% of total assets at December 31, 2010. We analyze our liquidity at least quarterly considering cash and cash equivalents along with principal and interest payments on loans and investments, the opportunity to borrow funds, deposit generation, sales and maturities of investment securities, sales of residential loans in the secondary market, sales of participations in commercial loans, access to brokered certificates of deposit and operating income. An integral part of this analysis is our borrowing capacity. The Bank has a credit line of $198,521 at the Federal Home Loan Bank of Pittsburgh (“FHLB”) with $172,797 available at December 31, 2010. We also have the ability to borrow from the Fed discount window and currently have agreements with two correspondent banks that allow us to borrow additional funds if needed. Uses of liquidity include origination of loans for addition to our portfolio and for loans to be sold in the secondary market, purchases of investment securities, capital projects, operating expenses, repayment of borrowed funds and payment of dividends. A review of the Consolidated Statement of Cash Flows indicates the sources of funds generated and used during the past three years. The goal is to maintain appropriate levels of liquidity to allow for customers’ cash needs from both a lending and deposit perspective, to maintain sufficient cash for operating expenses and to have amounts available to take advantage of earning opportunities as they arise.
15
Companies in the financial service industry are dependent on their ability to maintain proper levels of liquidity. Both short-term and long-term liquidity are primarily generated through the methods previously enumerated. The primary source of liquidity for the Company has been deposit generation through the branch network, and more recently, from brokered funds. Short-term liquidity needs are provided through borrowings from FHLB along with lines of credit with correspondent banks. Access to brokered certificates of deposit can fulfill short-term or longer term liquidity needs. Long-term funding is available through the FHLB or purchase of brokered deposits for longer periods of time. In addition, the Company may issue additional stock to supplement long-term funding needs.
Management believes that the Company has sufficient liquidity to meet both its short-term and long-term needs. We understand that liquidity may be adversely affected by many factors including unexpected deposit outflows, aggressive competitive pricing by other financial intermediaries and other cash requirements. We are aware of our dependence on customers’ deposits to sustain our liquidity levels. Customer unease as a result of recent national news of bank failures is also considered as we develop liquidity policies. We believe that the FDIC’s increased insurance levels have assisted us to maintain deposits in light of this increased customer concern regarding the financial services industry. As an additional method for customers to remain apprised of the quality of our institution, we have continued to regularly disseminate information regarding our financial position through quarterly press releases.
QUANTITATIVE AND QUALITATIVE DISCLOSURES ABOUT MARKET RISK
Market risk is inherent in the financial services industry, encompassing the risk of loss associated with adverse changes in market interest rates and prices. As an organization, we have placed the management of this risk in the Asset/Liability Committee (“ALCO”). This committee is comprised of ten members including all senior officers, vice presidents representing each product offering, information technology, community banking and marketing. The committee follows guidelines enumerated in the ALCO policy which was developed to achieve earnings consistent with established goals while maintaining acceptable levels of interest rate risk, adequate levels of liquidity and adherence to regulatory mandates. The committee reports to the Board of Directors on at least a quarterly basis.
Asset market risk is most prevalent in the investment and loan portfolios. With interest rates continuing at low levels, it has continued to be challenging to locate and purchase investments with the credit quality required by our guidelines while offering yields that we believe will offer long term benefit for the Company. We continued to purchase highly rated investments as opportunities occurred. Management has maintained a portfolio which includes investments in short term commercial paper, and in recent years, has added mortgage-backed and SBA securities which offer cash streams over the life of the bonds. All investments are held in the available for sale category even though management anticipates holding all investments to maturity or call date, but may sell securities as specific liquidity needs arise. Interest rates on consumer loans are determined by the Loan Committee and reviewed by the ALCO and are adjusted as warranted. The committees review local rates along with internal rate guidelines to determine the appropriate interest rates to charge. Residential mortgage interest rates are tied to secondary market rates as the majority of these loan originations are sold in the secondary market. Commercial loan rates are determined on a case by case basis and are dependent on the characteristics of each loan and borrower. The Loan Committee instituted interest rates with floors on the majority of all new loans originated in the past two years and continues to negotiate the introduction of floor interest rates as revolving lines of credit are reviewed or loan terms are extended. Market risk inherent in loans held for sale has been mitigated by controlling the length of time between origination and sale of these loans. The balance of loans in this category is generally less than $500.
To address credit risk, both the loan portfolio and the investment portfolio have stringent guidelines as to the credit quality of acceptable assets. These guidelines are dictated by safety and soundness regulatory provisions.
Liability market risk is associated with the adverse affects of our pricing strategies compared to competitors’ pricing strategies. The markets in which we have offices are also served by other financial institutions. If there is not enough flexibility in our pricing models to quickly move interest rates on deposits, we may lose accounts to other financial intermediaries. We have offered special certificate of deposit products at times and at other times borrowed funds from correspondent banks or purchased brokered certificates of deposit at current market rates rather than meet inflated interest rates offered by competitors. We believe that by working within our guidelines we will continue to achieve profitability.
16
The ALCO is cognizant of the ability for interest rates to adversely affect assets, liabilities, capital, and interest income and expense. In particular, two analytical tools are used to ascertain our ability to manage this market risk. The first is theStatement of Interest Sensitivity Gap. This report matches all interest-earning assets and all interest-bearing liabilities by the time frame in which funds can be reinvested or repriced. The second report is theAnalysis of Sensitivity to Changes in Market Interest Rateswhich is used to determine the affect on income of various shifts in the interest rate environment. Both reports include inherent assumptions in order to process the information. Management is aware that these assumptions affect results and that actual results may differ from the projected results suggested by these tools. These assumptions include an estimate of the maturity or repricing times of deposits, even though all deposits, other than time deposits, have no stated maturity and the reference that interest rate shifts will be parallel, with the rates of assets and liabilities shifting in the same amount in the same time frame. In reality, various assets and various liabilities will react differently to changes in interest rates, with some lagging behind the change and some anticipating the upcoming change and reacting before any actual change occurs. Each tool also suggests that there is a propensity to replace assets and liabilities with similar assets and liabilities rather than taking into consideration management’s ability to reallocate the balance sheet. In addition, the models used do not include any elements to determine how an action by management to increase or decrease interest rates charged on loans or paid on deposits or to increase other borrowings will affect the results of the analysis. Despite these limitations, these analyses are good tools to use in a consistent fashion to assist in the management of the Company. Similar versions of these same reports are used by most financial institutions. Both measurements are as of December 31, 2010.
17
STATEMENT OF INTEREST SENSITIVITY GAP
| | | | | | | | | | | | | | | | | | | | |
| | | 90 days
or less | | | >90 days
but < 1 year | | | 1 - 5
years | | | >5 years | | | Total | |
Assets | | | | | | | | | | | | | | | | | | | | |
Interest-bearing deposits in other banks and federal funds sold | | $ | 4,821 | | | $ | - | | | $ | - | | | $ | - | | | $ | 4,821 | |
Investment securities available for sale(5) | | | 20,251 | | | | 5,132 | | | | 25,701 | | | | 28,571 | | | | 79,655 | |
Fixed annuity investment | | | - | | | | - | | | | 1,523 | | | | - | | | | 1,523 | |
Loans(1) (4) | | | 81,027 | | | | 124,994 | | | | 98,647 | | | | 105,718 | | | | 410,386 | |
| | | | | | | | | | | | | | | | | | | | |
| | | | | |
Rate sensitive assets | | $ | 106,099 | | | $ | 130,126 | | | $ | 125,871 | | | $ | 134,289 | | | $ | 496,385 | |
| | | | | | | | | | | | | | | | | | | | |
| | | | | |
Liabilities | | | | | | | | | | | | | | | | | | | | |
Interest-bearing deposits: | | | | | | | | | | | | | | | | | | | | |
Interest-bearing demand(2) | | $ | 3,618 | | | $ | 11,306 | | | $ | 30,299 | | | $ | - | | | $ | 45,223 | |
Money market(3) | | | 11,268 | | | | 33,142 | | | | 21,874 | | | | - | | | | 66,284 | |
Savings(2) | | | 3,215 | | | | 10,047 | | | | 26,927 | | | | - | | | | 40,189 | |
Time deposits | | | 61,729 | | | | 155,535 | | | | 42,707 | | | | - | | | | 259,971 | |
Short-term borrowings | | | 13,006 | | | | - | | | | - | | | | - | | | | 13,006 | |
Other borrowings(6) | | | 475 | | | | 3,958 | | | | 8,503 | | | | 6,616 | | | | 19,552 | |
| | | | | | | | | | | | | | | | | | | | |
| | | | | |
Rate sensitive liabilities | | $ | 93,311 | | | $ | 213,988 | | | $ | 130,310 | | | $ | 6,616 | | | $ | 444,225 | |
| | | | | | | | | | | | | | | | | | | | |
| | | | | |
Interest sensitivity gap | | $ | 12,788 | | | $ | (83,862 | ) | | $ | (4,439 | ) | | $ | 127,673 | | | $ | 52,160 | |
Cumulative gap | | $ | 12,788 | | | $ | (71,074 | ) | | $ | (75,513 | ) | | $ | 52,160 | | | | | |
Cumulative gap to total assets | | | 2.36 | % | | | (13.11% | ) | | | (13.93% | ) | | | 9.62 | % | | | | |
| (1) | Loans are included in the earlier period in which interest rates are next scheduled to adjust or in which they are due. No adjustment has been made for scheduled repayments or for anticipated prepayments. |
| (2) | Interest-bearing demand deposits and savings are segmented based on the percentage of decay method. The decay rates used include 8% “90 days or less,” 25% “ >90 days but <1 year” and 67% “1-5 years.” |
| (3) | Money market deposits are segmented based on the percentage of decay method. The decay rates used include “90 days or less” 17%, “>90 days but < 1 year” 50% and “1-5 years” 33%. |
| (4) | Does not include loans in nonaccrual status, deposit overdrafts, unposted items or deferred fees on loans. |
| (5) | Variable interest rate investments are included in the period in which interest rates are next scheduled to adjust while fixed interest rate investments are included in each period according to the contractual repayment schedule. |
| (6) | Borrowings are included in each period according to the contractual repayment schedule. |
This report shows the Company to be in a liability sensitive position of $71,074 in the period of one year or less, meaning that there are more liabilities than assets which will reprice in this period. Traditionally management focuses the greatest attention to the net gap of the balance sheet in this time frame although we manage levels in all time frames.
This negative position in the less than one year category is fueled mainly by twelve month certificates of deposit on the liability side. With interest rates at historic lows, our customers have shortened the maturities of their deposits in order to be prepared to take advantage of higher interest rates when they are offered. This liability sensitive position offers the opportunity to reprice liabilities to lower rates if the market declines but is typically not the most favorable position to be in for a rising rate forecast. Due to the low interest rate environment, we have been hampered in decreasing liability interest rates since most market rates are nearly as low as possible. In the current low rate environment, interest earned on assets is also at historic low levels and has been sustained since the beginning of the recession in 2008. With the introduction of rate floors on new loan offerings, we are building some lag time in repricing for those loans which may not be evident in this analysis. We expect interest paid on liabilities will lag as asset market rates increase going forward. We have not been able to decrease liability pricing in the same proportion as we have historically since we cannot pay below 0%. Management has established a range of sensitivity that we feel depicts prudent banking practice and we manage the balance sheet to be within that range.
18
The following table presents the Company’s potential sensitivity in net interest income, net income and equity value at risk, or the potential of adverse change in the economic value of equity with rates up or down 100, 200 and 300 basis points. Economic value of equity is the present value of assets minus the present value of liabilities at a point in time.
ANALYSIS OF SENSITIVITY TO CHANGES IN MARKET INTEREST RATES
| | | | | | | | | | | | | | | | |
| | | 100 basis points | |
| | | Up | | | Down | |
| | | Amount | | | % | | | Amount | | | % | |
| | | | | | | | |
| | | | |
Net interest income | | $ | (443 | ) | | | (2.28% | ) | | $ | 264 | | | | 1.36 | % |
Net income | | $ | (286 | ) | | | (4.93% | ) | | $ | 164 | | | | 2.82 | % |
Economic value of equity | | $ | (3,528 | ) | | | (5.63% | ) | | $ | 6,533 | | | | 10.43 | % |
| |
| | | 200 basis points | |
| | | Up | | | Down | |
| | | Amount | | | % | | | Amount | | | % | |
| | | | | | | | |
| | | | |
Net interest income | | $ | (843 | ) | | | (4.35% | ) | | $ | (1,235 | ) | | | (6.37% | ) |
Net income | | $ | (544 | ) | | | (9.37% | ) | | $ | (836 | ) | | | (14.38% | ) |
Economic value of equity | | $ | (6,948 | ) | | | (11.09% | ) | | $ | 13,282 | | | | 21.21 | % |
| |
| | | 300 basis points | |
| | | Up | | | Down | |
| | | Amount | | | % | | | Amount | | | % | |
| | | | | | | | |
| | | | |
Net interest income | | $ | (1,321 | ) | | | (6.82% | ) | | $ | (2,858 | ) | | | (14.75% | ) |
Net income | | $ | (855 | ) | | | (14.71% | ) | | $ | (1,919 | ) | | | (33.00% | ) |
Economic value of equity | | $ | (12,167 | ) | | | (19.43% | ) | | $ | 18,423 | | | | 29.41 | % |
The greatest risk to the Company from an income perspective is an immediate decline in market interest rates of 300 basis points. With a sudden shift of that magnitude we would experience a decline of $1,919 or 33.0% of net income. With market interest rates at their current levels, we believe that a decline of this magnitude is nearly impossible. In the economic value of equity measurement, an increase of 300 basis points would affect the Company by lowering equity by $12,167 or 19.4%, a level that is within our established tolerance limits. Management believes that we have the ability to affect the changes in income and equity by taking actions which are not factored in this analysis.
On each of the parallel interest rate shifts above, the model suggests a loss of income in rising rates. We point out that this model is not realistic in that interest rates do not move in a parallel fashion and as rates do increase, management will certainly adjust the mix of new assets and liabilities relying on our combined experience and knowledge in order to make the best business decisions we can in whatever economic situation exists.
19
ALLOWANCE FOR LOAN LOSSES
The allowance for loan losses represents the amount that management estimates is adequate to provide for potential losses inherent in the loan portfolio. It is the largest subjective measurement in the financial statements. The balance is derived by charging losses against the allowance while recoveries are credited to it with charges to provision expense providing the amount necessary to maintain the appropriate balance per our analysis. As of December 31, 2010, the balance of the Company’s allowance was $7,741 which represented 1.82% of the loan portfolio at that date.
Given the current sustained national economic climate, there has been greater concern regarding higher-risk lending. The Company has no option ARM loans, negative amortizing loans, subprime loans or loans with initial teaser rates. We do, however, grant junior lien residential mortgage loans. Balances of these loans were $16,278 or 3.8% of total loans at December 31, 2010. These loans are made for various reasons capitalizing on the borrower’s home equity values for which the loans are typically granted with a maximum loan to value ratio of 80%. In addition, the Company has granted other loans with residential real estate serving as collateral for which the loan to value ratio is greater than 80%. These loans represent less than 1.0% of total loans at December 31, 2010.
Provision expense is based on management’s periodic evaluation of the adequacy of the allowance for loan losses, taking into consideration the overall risk characteristics of the portfolio, our specific loan loss experience, current and projected economic conditions, industry loan experience and other relevant factors. These estimates, including the amounts and timing of future cash flows relating to impaired loans, used to determine the adequacy of the allowance are particularly susceptible to significant change. The total allowance for loan losses is a combination of a specific allowance for identified problem loans, a formula allowance and a qualitative allowance. The specific allowance is determined by measuring impairment based upon the practices outlined in GAAP.These principles prescribe methods to measure impairment and income recognition as well as documenting disclosure requirements. The formula allowance is calculated using two separate methods. First, we apply factors to outstanding loans by type and risk weighting, excluding those loans for which a specific allowance has been determined. These loss factors are determined by management using historical loss information, current economic factors, portfolio concentration analysis, current delinquency ratios and the experience level of the loan officers in conjunction with evaluations of specific loans during the loan review process. The second formula evaluates selected loans on an individual basis and allocates specific amounts to the allowance based on our internal risk assessment. The qualitative portion of the allowance is determined based upon management’s evaluation of a number of factors including: national and local economic business conditions, collateral values within the portfolio, credit quality trends and management’s evaluation of our particular loan portfolio as a whole.
The Company employs an experienced outside professional loan review agency to perform the loan review function. This review places each evaluated loan in a category ranging from pass quality to loss. In order to test the majority of the commercial loan category, a review of loan relationships is performed to include approximately 70% of the average portfolio. Current financial information of the customer, an analysis of loan concentrations, financial ratio comparisons, adherence to payment schedule, regulatory evaluations and peer comparisons are all considered in the loan review procedure. At the time of origination management evaluates all loans utilizing similar guidelines, many of which are not included in the third party loan review process. Those loan evaluations are adjusted downward if we recognize any deterioration in the quality of the loan, such as delinquencies or a decline in the financial performance of the borrower. After careful evaluation of all factors, a risk rate is assigned and an allowance amount is calculated for each category of reviewed loans. Groups of smaller dollar loans are evaluated as a homogeneous pool with similar factors used to evaluate the appropriateness of the allowance for those loans.
20
SUMMARY OF LOAN LOSS EXPERIENCE
| | | | | | | | | | | | | | | | | | | | |
| | | 2010 | | | 2009 | | | 2008 | | | 2007 | | | 2006 | |
Balance January 1, | | $ | 6,253 | | | $ | 5,416 | | | $ | 5,392 | | | $ | 4,469 | | | $ | 3,973 | |
| | | | | |
Charge-offs: | | | | | | | | | | | | | | | | | | | | |
Commercial, financial and agricultural | | | 35 | | | | 187 | | | | 139 | | | | 146 | | | | 37 | |
Real estate-construction | | | - | | | | - | | | | - | | | | - | | | | - | |
Real estate-mortgage | | | 138 | | | | 144 | | | | 691 | | | | - | | | | 181 | |
Installment loans to individuals | | | 144 | | | | 187 | | | | 178 | | | | 214 | | | | 153 | |
| | | | | | | | | | | | | | | | | | | | |
Total charge-offs | | | 317 | | | | 518 | | | | 1,008 | | | | 360 | | | | 371 | |
| | | | | | | | | | | | | | | | | | | | |
| | | | | |
Recoveries: | | | | | | | | | | | | | | | | | | | | |
Commercial, financial and agricultural | | | 10 | | | | - | | | | 6 | | | | 4 | | | | 5 | |
Real estate-construction | | | - | | | | - | | | | - | | | | - | | | | - | |
Real estate-mortgage | | | - | | | | 5 | | | | 1 | | | | 19 | | | | 6 | |
Installment loans to individuals | | | 45 | | | | 50 | | | | 75 | | | | 130 | | | | 71 | |
| | | | | | | | | | | | | | | | | | | | |
Total recoveries | | | 55 | | | | 55 | | | | 82 | | | | 153 | | | | 82 | |
| | | | | | | | | | | | | | | | | | | | |
| | | | | |
Net charge-offs | | | 262 | | | | 463 | | | | 926 | | | | 207 | | | | 289 | |
| | | | | |
Additions charged to operations | | | 1,750 | | | | 1,300 | | | | 950 | | | | 1,130 | | | | 785 | |
| | | | | | | | | | | | | | | | | | | | |
| | | | | |
Balance at December 31, | | $ | 7,741 | | | $ | 6,253 | | | $ | 5,416 | | | $ | 5,392 | | | $ | 4,469 | |
| | | | | | | | | | | | | | | | | | | | |
| | | | | |
| Ratio of net charge-offs during the period to average loans outstanding during the period | | | .06% | | | | .12% | | | | .26% | | | | .06% | | | | .10% | |
| | | | | |
| Allowance for loan loss as a % of loans outstanding | | | 1.82% | | | | 1.53% | | | | 1.42% | | | | 1.56% | | | | 1.46% | |
Included in the footnotes to the financial statements are schedules which include the total loans which were past due 90 days or more or in nonaccrual and/or impaired status. The definition of impaired loans is not the same as the definition of nonaccrual loans, although the two categories overlap. The Company may choose to place a loan on nonaccrual status due to payment delinquency or uncertain collectability, while not classifying the loan as impaired if the loan is not a commercial or commercial real estate loan. At December 31, 2010, loans of $15,529 were classified as impaired. As troubled economic conditions in our country continue, we have experienced a higher level of nonperforming loans. When commercial loans are ninety days or more past due or management deems it prudent, we include them in impaired status and determine the appropriate value of the allowance for loan loss relating to each of the these loans. We are actively pursuing collection through legal avenues for each of these loans. At December 31, 2010, one loan relationship in the total amount of $5,775 was past due 95 days and was therefore reclassified from pass to impaired status. Loans included in this relationship carry collateral values in excess of the loan amount and therefore no allocation of the allowance for loan losses was considered necessary for these loans. This customer has experienced cash flow issues but we expect to return the relationship to accrual status later in 2011 as they follow a new business plan. This plan includes sales of assets which will generate funds to bring the loans current and, after six months of timely payments, will allow us to return the loans to accrual status. Also included in impaired status are two commercial real estate loans that are collateralized by children’s summer camps. One of the relationships has loan balances of $4,217 for which we are negotiating a settlement that should result in restructuring the debt and eventually returning the loans to accrual status. This workout should take at least a year and a half to turn around. Another camp real estate loan in the amount of $3,746 was scheduled for foreclosure in late February 2011. We acquired this property in sheriff sale and are actively pursuing sales opportunities. We expect to have this nonperforming asset sold by the end of 2011. The final loan relationship classified as impaired is a commercial real estate borrower with total balances of $1,583 at December 31, 2010 who had also experienced cash flow problems. In January 2011, the customer brought the loans to current status as part of a plan to restore cash flow and we believe that this relationship will return to accrual status during 2011. We have evaluated all of these facts in the determination of the appropriate amount in the allowance for loan loss as of December 31, 2010.
21
The level of loans past due 90 days or more and still accruing interest at December 31, 2010 was $2,088. The majority of these loans are secured by real estate and management does not believe that we have any one loan that would have a material charge to the allowance for loan loss. Loans in nonaccrual status were $15,676 at December 31, 2010 compared to $7,418 at December 31, 2009. The majority of those loans were secured by real estate and in the process of collection along with being classified as impaired as of the balance sheet date. Due to the current economic climate, we have experienced a noticeably longer timeframe for loans to be in an adverse position before we are able to take possession of the assets. Local government agencies responsible for enforcing the collection process have experienced a large backlog due to the increase in legal collection actions. We continue to proceed with collection efforts, but expect that each of these actions may take one year or more until economic conditions improve.
OFF-BALANCE SHEET ARRANGEMENTS
In the normal course of business, the Company engages in a variety of financial transactions that in accordance with generally accepted accounting principles are not recorded on its consolidated financial statements. These off-balance sheet arrangements primarily consist of loan commitments, letters of credit and unused lines of credit, including commercial lines for the financing needs of our customers. These off-balance sheet arrangements involve, to varying degrees, elements of credit, interest rate and liquidity risk. During the year ended December 31, 2010, the Company did not engage in any off-balance sheet transactions reasonably likely to have a material effect on its consolidated financial condition, results of operations or cash flows.
RESULTS OF OPERATIONS
2010 Compared to 2009
Net income for the year ended December 31, 2010 was $5,159 or $3.24 per diluted share, an increase of $757 or 17.2% over net income of $4,402 or $2.79 per diluted share a year earlier. During the year 2010, the Company was able to slightly improve the interest spread resulting in greater net interest income. We were able to control many expense items, but continued to struggle with nonperforming loans, thereby necessitating an increase in the provision for loan loss. Noninterest income improved on the whole, but included declines in both service charge income and gains on loans held for sale. FDIC surveys show that the Bank’s ratios based on net income for the year 2010 continued to rank us in the top third of banks of similar size in the country. Discussion of each category in particular follows.
Net Interest Income
This discussion regarding net interest income should be read in conjunction with the scheduleDistribution of Assets, Liabilities and Stockholders’ Equity: Interest Rates and Interest DifferentialandRate/Volume Analysis of Changes in Net Interest Income. Interest income is adjusted to reflect tax equivalent balances; therefore revenue in this statement is slightly greater than reported in the income statement.
Tax equivalent interest income for the year ended December 31, 2010 was $25,339, an increase of $175 or .7% over the year ended December 31, 2009. Tax equivalent interest earned on loans declined by $183 or .8%. Although the average loan portfolio increased by $16,214 or 4.2%, the yield on loans declined from 5.81% in 2009 to 5.53% during 2010. Approximately 75% of our loan portfolio carries an interest rate that adjusts with changes in market rates, generally the prime rate of interest. Although the majority of these loans repriced to lower rates before the current year, there were still loans that were fixed for a period of time that ended in 2010 and therefore repriced downward. Before the current economic slowdown, we did not generally include a floor or ceiling rate of interest on commercial loans. Since 2009, new commercial and commercial real estate loan originations and renewal of most commercial lines of credit are written with interest rate floors of between 4.5% and 6.0%. The average balance of loans in nonaccrual status was $10,266 during 2010, an increase of $3,778 over the previous year. As loans are placed on nonaccrual status, interest receivable is reversed at the time of reclassification and interest recognition is discontinued until the loan is either paid off or is returned to accrual status after making six months of timely payments. If these loans were in accrual status we would have earned an additional $472 in 2010 and $463 in 2009.
Interest earned on taxable investments increased by $176 or 14.7% while the average balance of those investments grew to $64,062 in 2010, 72.7% greater than the average balance for 2009. The average yield earned on these investments declined from 3.22% in 2009 to 2.14% in 2010. During 2010, all callable step-up bonds in portfolio were called at an average interest yield of 3.38% with replacement in other types of bonds that frequently yielded lower rates.
22
To supplement liquidity, during 2010 we continued to invest in mortgage-backed securities and government agency bonds, mainly SBA bonds, to provide a cash stream of monthly principal and interest with the average balances of these bonds increasing by $15,071 and $9,971, respectively. Balances of commercial paper increased by an average of $3,127 or 21.5% while the average interest rate received decreased from 1.28% in 2009 to .43% in 2010. We have continued to purchase only investment grade commercial paper. The market for this type investment was under great stress in 2009, inducing even the highest rated companies to pay higher interest rates than in 2010 when the market stabilized.
Tax equivalent interest income on tax exempt bonds increased $168 or 11.8% in 2010 compared to 2009 while the average balance of this type investment increased $2,757 or 11.4%. We were able to purchase additional tax-exempt bonds which continued to earn a similar interest rate as those in portfolio at the beginning of the year. Over the past two years we have increased our holdings of tax-exempt bonds as they offered higher interest yields than were available for other bonds at the time of purchase. We believe that the market risk associated with the longer nature of these bonds is acceptable for the amount that we have in portfolio and have addressed the credit risk by purchasing only general obligation bonds which are of investment grade. Due to budget issues for many states and municipalities, we will continue to monitor these investments for deterioration and will take appropriate steps if credit issues arise.
Interest expense declined $1,430 or 16.3% in 2010 as compared to 2009. Interest paid on each type of deposit account declined with the majority of the decrease in rates paid for certificates of deposit. During 2009 we offered a premium interest rate on short-term certificates of deposit to coincide with certificates of deposit maturing at that time. The interest rate paid was lower than the rate on maturing certificates but above other rates offered in our market. This premium product attracted new deposits in addition to maintaining most of those that were reaching maturity in that period. Upon analysis of the 2009 promotion, we noted that many of the new certificates of deposit were single service accounts. Our philosophy has always been to build relationships and therefore as the premium certificates that were opened in 2009 matured in 2010, we introduced special pricing on only those certificates of deposit that were opened by customers who also used our platinum checking account. This strategy resulted in many of those single account holders withdrawing their funds but encouraged those customers with whom we have a greater deposit relationship to not only roll the certificates that matured in 2010 but to bring additional funds to the Bank. At the end of 2010, the average balance of time deposits increased by $25,247 or 10.5% while the average interest rate paid on this product declined by 79 basis points. Included in the increase were bank purchased CDARS deposits with an average balance of $3,269. Interest paid on other borrowed funds decreased $134 or 12.2% due to principal balance declines for amortizing issues and the maturity of $3,000 of borrowings. The average interest rate paid for other borrowed funds increased 57 basis points in 2010 over rates paid in 2009 due to repayments of lower priced borrowings in each year.
23
DISTRIBUTION OF ASSETS, LIABILITIES AND STOCKHOLDERS’ EQUITY;
INTEREST RATES AND INTEREST DIFFERENTIAL
| | | | | | | | | | | | | | | | | | | | | | | | | | | | | | | | | | | | |
| | | 2010 | | | 2009 | | | 2008 | |
| | | Average
Balance (3) | | | Revenue/
Expense | | | Yield/
Rate | | | Average
Balance (3) | | | Revenue/
Expense | | | Yield/
Rate | | | Average
Balance (3) | | | Revenue/
Expense | | | Yield/
Rate | |
ASSETS | | | | | | | | | | | | | | | | | | | | | | | | | | | | | | | | | | | | |
Interest-earning assets: | | | | | | | | | | | | | | | | | | | | | | | | | | | | | | | | | | | | |
Loans, net of unearned(1)(2)(4) | | $ | 403,981 | | | $ | 22,347 | | | | 5.53 | % | | $ | 387,767 | | | $ | 22,530 | | | | 5.81 | % | | $ | 359,119 | | | $ | 25,442 | | | | 7.08 | % |
Investment securities: | | | | | | | | | | | | | | | | | | | | | | | | | | | | | | | | | | | | |
Taxable(5) | | | 64,062 | | | | 1,370 | | | | 2.14 | % | | | 37,090 | | | | 1,194 | | | | 3.22 | % | | | 47,955 | | | | 2,036 | | | | 4.25 | % |
Exempt from federal income tax(2) | | | 26,873 | | | | 1,589 | | | | 5.91 | % | | | 24,116 | | | | 1,421 | | | | 5.89 | % | | | 14,432 | | | | 921 | | | | 6.38 | % |
Interest-bearing deposits in other banks | | | 8,612 | | | | 28 | | | | .33 | % | | | 3,971 | | | | 12 | | | | .30 | % | | | 911 | | | | 22 | | | | 2.41 | % |
Federal funds sold | | | 1,957 | | | | 6 | | | | .31 | % | | | 2,549 | | �� | | 7 | | | | .27 | % | | | 3,505 | | | | 67 | | | | 1.91 | % |
| | | | | | | | | | | | | | | | | | | | | | | | | | | | | | | | | | | | |
Total interest-earning assets/ interest income | | | 505,485 | | | | 25,340 | | | | 5.01 | % | | | 455,493 | | | | 25,164 | | | | 5.52 | % | | | 425,922 | | | | 28,488 | | | | 6.69 | % |
| | | | | | | | | |
Cash and due from banks | | | 4,901 | | | | | | | | | | | | 4,947 | | | | | | | | | | | | 5,395 | | | | | | | | | |
Premises and equipment | | | 10,652 | | | | | | | | | | | | 11,099 | | | | | | | | | | | | 8,127 | | | | | | | | | |
Other assets, less allowance for loan losses | | | 25,255 | | | | | | | | | | | | 20,245 | | | | | | | | | | | | 8,534 | | | | | | | | | |
| | | | | | | | | | | | | | | | | | | | | | | | | | | | | | | | | | | | |
Total Assets | | $ | 546,293 | | | | | | | | | | | $ | 491,784 | | | | | | | | | | | $ | 447,978 | | | | | | | | | |
| | | | | | | | | | | | | | | | | | | | | | | | | | | | | | | | | | | | |
|
LIABILITIES AND STOCKHOLDERS’ EQUITY | |
Interest-bearing liabilities: | | | | | | | | | | | | | | | | | | | | | | | | | | | | | | | | | | | | |
Savings | | $ | 39,808 | | | $ | 119 | | | | .30 | % | | $ | 36,446 | | | $ | 116 | | | | .32 | % | | $ | 34,485 | | | $ | 182 | | | | .53 | % |
Demand - interest-bearing | | | 102,340 | | | | 600 | | | | .59 | % | | | 80,369 | | | | 533 | | | | .66 | % | | | 86,305 | | | | 1,078 | | | | 1.25 | % |
Time deposits | | | 266,467 | | | | 5,496 | | | | 2.06 | % | | | 241,220 | | | | 6,882 | | | | 2.85 | % | | | 208,481 | | | | 8,243 | | | | 3.95 | % |
Short-term borrowings | | | 17,423 | | | | 142 | | | | .82 | % | | | 15,488 | | | | 122 | | | | .79 | % | | | 15,626 | | | | 237 | | | | 1.52 | % |
Other borrowed funds | | | 21,378 | | | | 963 | | | | 4.50 | % | | | 27,889 | | | | 1,097 | | | | 3.93 | % | | | 19,283 | | | | 925 | | | | 4.80 | % |
| | | | | | | | | | | | | | | | | | | | | | | | | | | | | | | | | | | | |
Total interest-bearing liabilities/ interest expense | | | 447,416 | | | | 7,320 | | | | 1.64 | % | | | 401,412 | | | | 8,750 | | | | 2.18 | % | | | 364,180 | | | | 10,665 | | | | 2.93 | % |
| | | | | | | | | |
Noninterest-bearing deposits | | | 45,323 | | | | | | | | | | | | 40,489 | | | | | | | | | | | | 38,014 | | | | | | | | | |
Other liabilities | | | 4,090 | | | | | | | | | | | | 3,936 | | | | | | | | | | | | 3,887 | | | | | | | | | |
| | | | | | | | | | | | | | | | | | | | | | | | | | | | | | | | | | | | |
Total Liabilities | | | 496,829 | | | | | | | | | | | | 445,837 | | | | | | | | | | | | 406,081 | | | | | | | | | |
| | | | | | | | | |
Stockholders’ Equity | | | 49,464 | | | | | | | | | | | | 45,947 | | | | | | | | | | | | 41,897 | | | | | | | | | |
| | | | | | | | | | | | | | | | | | | | | | | | | | | | | | | | | | | | |
Total Liabilities and Stockholders’ Equity | | $ | 546,293 | | | | | | | | | | | $ | 491,784 | | | | | | | | | | | $ | 447,978 | | | | | | | | | |
| | | | | | | | | | | | | | | | | | | | | | | | | | | | | | | | | | | | |
| | | | | | | | | | | | | | | | | | | | | | | | | | | | | | | | | | | | |
| | | | | | | | | | | | | | | | | | | | | | | | | | | | | | | | | | | | |
Net interest income/interest spread | | | | | | $ | 18,020 | | | | 3.37 | % | | | | | | $ | 16,414 | | | | 3.34 | % | | | | | | $ | 17,823 | | | | 3.76 | % |
| | | | | | | | | | | | | | | | | | | | | | | | | | | | | | | | | | | | |
| | | | | | | | | |
Margin Analysis: | | | | | | | | | | | | | | | | | | | | | | | | | | | | | | | | | | | | |
Interest income/earning assets | | | | | | $ | 25,340 | | | | 5.01 | % | | | | | | $ | 25,164 | | | | 5.52 | % | | | | | | $ | 28,488 | | | | 6.69 | % |
Interest expense/earning assets | | | | | | | 7,320 | | | | 1.45 | % | | | | | | | 8,750 | | | | 1.92 | % | | | | | | | 10,665 | | | | 2.50 | % |
| | | | | | | | | | | | | | | | | | | | | | | | | | | | | | | | | | | | |
| | | | | | | | | |
Net interest income/earning assets | | | | | | $ | 18,020 | | | | 3.56 | % | | | | | | $ | 16,414 | | | | 3.60 | % | | | | | | $ | 17,823 | | | | 4.19 | % |
| | | | | | | | | | | | | | | | | | | | | | | | | | | | | | | | | | | | |
| | | | | | | | | |
Ratio of average interest-earning assets to average interest-bearing liabilities | | | | | | | | | | | 112.98 | % | | | | | | | | | | | 113.47 | % | | | | | | | | | | | 116.95 | % |
| (1) | Nonaccrual loans are included in other assets. |
| (2) | Income on tax-exempt assets is calculated on a taxable equivalent basis using a federal income tax rate of 34%. |
| (3) | Average balances are calculated using daily balances. |
| (4) | Interest on loans includes fee income. |
| (5) | Includes equity investments in FHLB for 2008 and a fixed annuity investment for 2010. In 2009 and 2010 FHLB paid no dividend and the investment was moved to other assets for those years. |
Certain amounts for prior years have been reclassified in order to conform to current presentation.
24
RATE/VOLUME ANALYSIS OF CHANGES IN NET INTEREST INCOME
| | | | | | | | | | | | | | | | | | | | | | | | |
| | | 2010 Compared to 2009 | | | 2009 Compared to 2008 | |
| | | Total
Variance | | | Caused by | | | Total
Variance | | | Caused by | |
| | | Rate(1) | | | Volume | | | | Rate(1) | | | Volume | |
Interest income: | | | | | | | | | | | | | | | | | | | | | | | | |
Loans (gross) | | $ | (183) | | | $ | (1,125) | | | $ | 942 | | | $ | (2,912) | | | $ | (4,940) | | | $ | 2,028 | |
Investment securities: | | | | | | | | | | | | | | | | | | | | | | | | |
Taxable | | | 176 | | | | (692) | | | | 868 | | | | (842) | | | | (380) | | | | (462) | |
Exempt from federal income tax(2) | | | 168 | | | | 6 | | | | 162 | | | | 500 | | | | (118) | | | | 618 | |
Interest-bearing deposits | | | 16 | | | | 2 | | | | 14 | | | | (10) | | | | (84) | | | | 74 | |
Federal funds sold | | | (1) | | | | 1 | | | | (2) | | | | (60) | | | | (42) | | | | (18) | |
| | | | | | | | | | | | | | | | | | | | | | | | |
Total interest-earning assets | | | 176 | | | | (1,808) | | | | 1,984 | | | | (3,324) | | | | (5,564) | | | | 2,240 | |
| | | | | | | | | | | | | | | | | | | | | | | | |
| | | | | | |
Interest expense: | | | | | | | | | | | | | | | | | | | | | | | | |
Savings | | | 3 | | | | (8) | | | | 11 | | | | (66) | | | | (76) | | | | 10 | |
Interest-bearing checking | | | 67 | | | | (78) | | | | 145 | | | | (545) | | | | (471) | | | | (74) | |
Time deposits | | | (1,386) | | | | (2,106) | | | | 720 | | | | (1,361) | | | | (2,654) | | | | 1,293 | |
Short-term borrowings | | | 20 | | | | 5 | | | | 15 | | | | (115) | | | | (113) | | | | (2) | |
Other borrowed funds | | | (134) | | | | 122 | | | | (256) | | | | 172 | | | | (241) | | | | 413 | |
| | | | | | | | | | | | | | | | | | | | | | | | |
Total interest-bearing liabilities | | | (1,430) | | | | (2,065) | | | | 635 | | | | (1,915) | | | | (3,555) | | | | 1,640 | |
| | | | | | | | | | | | | | | | | | | | | | | | |
Net change in net interest income | | $ | 1,606 | | | $ | 257 | | | $ | 1,349 | | | $ | (1,409) | | | $ | (2,009) | | | $ | 600 | |
| | | | | | | | | | | | | | | | | | | | | | | | |
| (1) | Changes in interest income or expense not arising solely as a result of volume or rate variances are allocated to rate variances due to the interest sensitivity of assets and liabilities. |
| (2) | Income on interest-earning assets is calculated on a taxable equivalent basis using a federal income tax rate of 34%. |
Provision for Loan Losses
The provision for loan loss was $1,750 for 2010, an increase of $450 or 34.6% over the expense for 2009. During 2010, we experienced an average increase of $16,214 in the loan portfolio and reclassified a net amount of $8,112 of loans to impaired status. The economy continued to stall throughout the year and our loan customers found it more difficult to perform according to the original terms of their contracts. We analyze the loan portfolio using various modeling characteristics, including the measures noted here, in an effort to determine the most accurate level for the allowance for loan loss. The allowance is primarily funded through the provision expense, enhanced by recoveries of previously charged-off loans and offset by loans charged off in the current period. Our analysis indicated that the provision expense was appropriate in each year.
Noninterest Income
Service charges on deposit accounts are the greatest source of noninterest income. Income generated in 2010 was $1,292, a decline of $205 or 13.7% from a year earlier. The primary reason for the decrease was two-fold. On August 15, 2010 Regulation E, dealing with electronic funds transfers, was amended. The first item prohibited banks from charging fees for electronic transactions that caused an overdraft unless the customeropted in for this overdraft protection. Each customer was solicited toopt in for this coverage and if they did not, we are prohibited from automatically paying electronically generated overdrafts. Although many of our customers opted to participate in this program, not all did, therefore we were not able to pay the overdraft or charge the associated fee. Also included in the revisions to Regulation E were changes in the disclosures to customers upon checking account opening regarding alternate methods for avoiding overdraft fees. We do offer a service for which a customer may be charged a lower fee given certain circumstances and some customers chose this method, thereby paying a lower fee for their overdrafts. Throughout the year we have seen a general decline in overdrafts on checking accounts, not only in conjunction with this new regulation. We believe that customers are more proactive in monitoring their checking account balance to avoid overdrawing their accounts.
25
Gains on mortgage loans held for sale declined $247 or 41.1% in 2010 as compared to 2009. Under the more stringent guidelines of our secondary mortgage market partners, the first half of 2010 was a slow start for residential mortgage originations. However, during the second half of 2010, mortgage refinance activity increased as more customers met these stricter eligibility requirements.
Net losses on investment securities decreased $129 or 90.8% in 2010 compared to 2009. In 2009 we recognized a loss of $93 on the restructuring of a corporate bond and had no similar activity in 2010. We recognized net gains of $24 on the sale of three bonds in September 2010 which were sold to meet liquidity needs. Also in 2010, we incurred a loss of $6 from the merger of an equity security along with recognizing other than temporary impairment of $31 on three equity positions.
Brokerage commissions increased $242 or 48.4% in 2010 compared to earnings in 2009. Assets under management surpassed the $100,000 mark at the end of 2010, as compared to $84,000 a year earlier. Along with the increase in fees based on balances in the portfolio, our advisors made additional sales to traditional bank deposit customers who were seeking higher yields and were comfortable in the investment marketplace. The relative return to normalcy in the financial markets caused additional confidence in consumers and allowed them to place additional monies in equities and other non-deposit products. 2010 was the first full production year for an additional advisor licensed in the department in March of 2009. In addition, 2010 was the first year of inclusion of investment department referrals in the employees’ incentive goal program, thereby increasing the number of clients opening investment accounts.
Other noninterest income encompasses many types of income that are not directly related to interest-bearing assets, with fees of various types accounting for the majority of this income. In comparing earnings in 2010 to 2009, there were increases in some accounts along with declines on others. The net balance at the end of 2010 was an increase of $168 or 15.4% in 2010 over other noninterest income a year earlier.
Following are our major sources of this income type:
| | • | | The Bank recognizes interchange income from the issuer of our debit cards as deposit customers utilize their cards for purchases. Each year bank customers’ use of debit cards in lieu of checks has increased, thereby adding to fee income. In 2010 the income from these interchange fees was $521, an increase of $95 or 22.4% more than we earned in 2009. Regulatory agencies are currently implementing legislation that potentially would decrease interchange formulas for larger banks which, if adopted, could have a negative effect on this income source for all banks. |
| | • | | GAAP dictates that we book an asset based on the value of mortgage servicing rights associated with residential mortgages that we have sold in the secondary market and for which we maintain servicing of the loan. The value of this asset must be amortized over its estimated life and fully amortized upon early repayment of the underlying loan. This contra income account is included in other noninterest income and had $56 or 32.7% lower amortization charges in 2010 than in 2009, serving to increase income for this activity. As noted earlier, the rate at which borrowers refinanced residential mortgage loans slowed in 2010 from levels experienced in 2009; therefore we had fewer serviced loans payoff in 2010 resulting in lower amortization expense. |
| | • | | Semi-annually we obtain an independent vendor’s assessment of the market value of our mortgage servicing rights, and if necessary, adjust the asset for declines in market value below book value. In 2009 we recognized a decline of $32 in the market value of mortgage servicing rights, but had no similar adjustment in 2010. In addition, the bank earns 25 basis points for servicing those loans. As the portfolio of loans serviced increased, our participation service charge income increased, and in 2010 these fees generated $38 or 19.3% greater fees than in 2009. |
| | • | | In 2009, we invested in a limited partnership with the primary purpose to generate low income housing tax credits. In 2010 the construction of the real property was completed and we recognized those credits as an offset to income tax expense, but also had a loss on the partnership in the amount of $59 which was unmatched in 2009. We expect similar losses in future periods. |
26
| | • | | TDB is our subsidiary that performs title insurance work. As the number of loans originated, both commercial and residential, declined in 2010, opportunities for this subsidiary to generate fees also declined with $58 or 56.8% lower fee income than realized in 2009. As this business is closely related to loan originations, we do not expect TDB to generate substantially more fees until the economy returns to a more normal level. |
Smaller changes in various other accounts were responsible for the remaining variance.
Noninterest Expense
Salaries and employee benefits increased $364 or 5.8% in 2010 as compared to 2009. Salaries paid increased $161 or 3.5% over this expense in 2009. The average annual employee salary increase for 2010 was 2.0%. In addition, we incurred an entire year of salary in 2010 compared to less than one quarter’s salary paid in 2009 for two officers hired in 2009. The Company maintains an employee incentive plan for all employees which align the Company’s strategic goals with individual employees’ ability to contribute toward those goals. In both years the goals were not fully met but employees were granted incentives each year for their efforts put forth. The level of attainment was greater in 2010 than in the previous year and cash incentives were $77 or 112.3% greater than in the previous year. Offsetting those higher expenses, contributions to The Dime Bank 401(k) Plan were $35 or 14.2% less in 2010 than for 2009. While the employer match percentage for this benefit remained constant, the profit sharing portion of contributions declined to 1% for 2010 compared to 2% in 2009. Management believed that year-end profit sharing benefits would be more appreciated in the form of cash than in future retirement benefits considering the current economy. Other employee benefits were $153 or 14.6% greater in 2010 than in 2009 with the primary increase associated with health insurance costs. The Bank joined a consortium of banks organized through the Pennsylvania Bankers Association in 2007 with the goal of controlling future health care costs. Membership affords us greater flexibility with plan design, less administrative costs and greater buying power due to the size of the group. In 2010 we realized the benefit of this membership with premiums increasing only 9.2% on average as compared to a quoted price increase of 19%. Smaller changes in other benefit expense categories accounted for the remaining variance.
Furniture and equipment expense declined $86 or 15.1% in 2010 compared to 2009. We eliminated the need to lease most computer hardware due to outsourcing data processing in March 2009, decreasing this expense by $55 in 2010. In addition, depreciation expense declined as certain furniture and equipment became fully depreciated in 2009 and was not replaced due in part to data processing outsourcing and the good condition of fully depreciated furniture.
Professional fees include legal fees, both internal and external audit expenses, fees related to deposit statement delivery, loan review and various other services provided to the Company. Total professional fees increased $195 or 33.3% in 2010 as compared to a year earlier. This increase was primarily the result of an increase in legal fees of $206 or 199.1% which was associated with loan collection activities. As delinquency increased, management actively pursued collection activities through legal counsel. These services included demanding payment, conducting title and UCC searches, filing judgments and, in some cases, representing the Company in legal negotiations and proceedings.
FDIC insurance assessments decreased $130 or 14.9% in 2010 as compared to 2009. The primary difference was that a special assessment of $224 in 2009 was not repeated in 2010. The assessment is based on deposit size factoring in both the asset size and financial ratio analysis. As the Bank continued to grow, the regular assessment increased.
Income before income taxes increased $863 or 14.5% as a result of changes in the income statement noted above. Federal Income taxes increased $106 or 6.8% in 2010 as compared to 2009. The percentage increase in income was greater than the associated taxes primarily because in 2010 we were able to use a low income housing credit of $155 generated through our investment in a limited partnership in 2009.
2009 Compared to 2008
Net income for the year ended December 31, 2009 was $4,402, a decline of $1,999 or 31.2% from a year earlier. The Company encountered several obstacles to performing at the same level in 2009 as it had in 2008. With interest rates remaining at the same low levels as the year 2008 ended, interest spread was compressed. The FDIC increased its assessment rates for insured financial institutions during the year. In addition, economic conditions made it more difficult for our customers to make timely payments on some loans, driving our delinquency levels higher which resulted in an increase in nonaccrual loans and the provision for loan loss. Offsetting some of those issues, we were able to begin new relationships in all of our branches by offering deposit products at historically low interest rates. We also improved
27
our technological position by instituting new delivery methods and outsourcing computer processing to a third party which we believe will position the Company for future growth and prosperity. Although net income dropped in 2009, the income level of the Bank represented returns in the top third of similar sized banks in the United States. The following discussion will address each area of the income statement.
Net interest income declined $1,743, or 10.0% ($1,409 or 7.9% on a tax-equivalent basis), as interest income declined at a faster rate than interest expense. The decline in interest income reflects the continued downward re-pricing of our interest-earning assets. Reflecting these same factors, our interest rate spread and net interest margin narrowed to 3.34% and 3.60%, respectively from 3.76% and 4.19%, respectively, in 2008.
Interest income declined $3,658 or 13.0% ($3,324 or 11.7% on a tax-equivalent basis) in 2009 as compared to 2008. Interest and fees earned on loans declined $3,076 or 12.1% in 2009 as compared to 2008. The average interest rate earned on loans declined by 1.27% in 2009 as compared to 2008. We had 77% of our loan portfolio invested in variable interest rate loans and we continued to see loans reprice downward in 2009. We typically offer to fix the interest rate on new loans for two to three years at the outset of projects in order to offer customers the ability to project stable cash flows; during 2009 we continued to see interest rates adjust downward as those loans reached their interest reprice date. We still have many loan relationships to reprice in 2010 and expect that interest income may be impacted by approximately $400 if interest rates remain constant.
Simultaneously, as we purchased investments, the interest rates available for new bonds were offered at lower rates than were available in our existing investment portfolio, resulting in a decrease of $842 or 41.4% in taxable interest income investments. The average balance of taxable investments declined by $10,865 due to our inability to purchase qualified commercial paper or corporate bonds as bonds matured throughout 2009. The rates we were able to earn on bonds to replace matured bonds carried lower market rates. We did invest in more tax-exempt bonds throughout 2008 and 2009, thereby increasing the average balance of those investments by $9,684 from 2008 to 2009, resulting in an increase in tax- equivalent interest income of $500 or 54.3%.
As a result of lower market interest rates in each interest-bearing liability account, interest expense declined by $1,915 or 18.0% in 2009 as compared to 2008. This decrease in expense was accomplished in spite of an average increase of $37,232 or 10.2% in interest-paying liabilities. Savings accounts increased $1,961 or 5.7% on average while the average rate paid for those deposits declined by 21 basis points in 2009 as compared to 2008. These changes resulted in a net decline of $66 in expense with the rate attributable for a $76 decline and additional balances adding $10 to the expense. Interest-bearing demand deposits declined $5,936 or 6.9% as customers either used the funds for routine business and personal expenses or transferred the balances to higher interest rate products during 2009. The expense related to these deposits decreased $545 due primarily to a decline of $471 in relation to lower average interest rates paid for these deposits. Time deposits showed the greatest average balance growth of $32,739 or 15.7% during 2009 with the majority of the growth in short term special certificates of deposit. Many higher interest rate certificate of deposit accounts matured in 2009 and were reinvested in these lower interest rate special certificate of deposit accounts. In spite of this growth in the average balances, expense for time deposits decreased $1,361 with a decline of $2,654 related to lower average rates and an increase of $1,293 related to the higher average balance of these deposits. Local competition continued to offer interest rates much higher than national average rates for deposits and, in order to maintain relationships with our customers, we also paid a higher rate than the national average. We expect to further lower rates on certificates of deposit gradually as interest rates remain flat and expect to be slower to increase those rates as market rates move upward. Average balances of other borrowed funds increased $8,606 or 44.6% primarily due to borrowings made during 2008. During 2009, we borrowed $1,850 but repaid $4,746 to decrease the year-end balance of these borrowings. The expense related to these borrowings increased $172 with the primary element being additional expense of $413 related to higher average balances and an offset of $241 related to a decline of 87 basis points in the average rate paid for the borrowings. In an effort to increase profitability, management has continued to offer programs aimed at attracting as many noninterest-bearing deposits as possible and will continue with this effort.
Provision for Loan Losses
The provision for loan losses for 2009 was $1,300, representing an increase of $350 or 36.8% over this expense in 2008. Management analyzes the characteristics of the loan portfolio through the calculation of the allowance for loan loss and determines the appropriate balance for the allowance. The balance is funded through provision expense after adjustments for loans charged off and recoveries of loans that were charged off in previous periods. The net balance of loans charged off during 2009 was $463 compared to $926 in 2008. The calculation of the appropriate balance in the allowance for loan loss results in an acceptable range for the allowance.
28
Noninterest Income
Noninterest income increased $194 or 5.2% in 2009 as compared to 2008 primarily due to the sale of mortgage loans. Service charges on deposit accounts are the largest contributor to noninterest income with income of $1,497 for 2009. Fees charged in relation to overdrafts on checking accounts were $1,385 in 2009, a decrease of $137 or 9.0% less than the previous year. We believe that consumers are taking a more active role in managing their finances and using the overdraft protection feature of their deposit account less frequently. We did not increase the fee charged per use for this privilege from 2008 to 2009. In addition, we eliminated minimum balance fees on many of our checking accounts in 2009 in an effort to increase market penetration for this important funding liability. By eliminating those fees, we saw a decline of $29 or 34.0% in fees earned in 2009 as compared to 2008. We are willing to accept lower minimum balance fees in order to be more competitive for new deposits and to effectively compete with other institutions in our markets.
Mortgage loan originations were much stronger in 2009 than in the previous year and by selling the majority of those loans in the secondary market we were able to increase earnings on those sales by $448 or 292.8%. The majority of the loan originations were for refinances of mortgages not only from loans which we had previously originated but also from those that were previously originated by mortgage brokers, many of whom have either gone out of business or severely limited their operations as the economy deteriorated.
Investment security losses were $142, an increase of $114 or 407.1% in 2009 than in 2008. In the first quarter of 2009, we recognized a loss of $27 on an equity investment in a financial institution that was merged with another institution. In the third quarter of 2009 we sold a corporate bond which had declined in credit quality and market value and partially offset this loss with the sale of two municipal bonds that had an increase in market value, with the net effect of those sales recognizing a net loss of $22 on these sales. In addition, we recognized a loss of $93 on the reorganization of the issuer of a corporate bond that was held in the corporate bond portfolio.
Brokerage commissions declined $117 or 19.0% in 2009 as compared to 2008. Declines in the market values of customers’ equity positions negatively affected the earnings of the investments department as their fee income is partially based on a percentage of the market value of customers’ investment portfolios. In addition, this department saw lower initial interest in customers’ willingness to invest in the stock market during this volatile economic period. We believe that activity will improve for this department in correlation to improvement in the national economy.
Other income increased $119 or 12.2% in 2009 over income in 2008. This category includes many sources of other than interest related items. The most notable of these was an increase of $62 or 17.2% in interchange fees related to the use of debit cards by our customers. In recent years management decided to offer debit cards to nearly all deposit customers with no internal fee attached to usage of the cards, thereby dramatically increasing the number of debit cards issued. We earn a small fee each time a customer uses the credit option for point of sale transactions and have seen a large increase in this income due to this strategy. Smaller changes in various income categories accounted for the remaining increased income.
Noninterest Expense
Salaries and employee benefits decreased $93 or 1.5% in 2009 as compared to 2008. Salaries and wages increased $174 or 3.9% in 2009 over the previous year and were mainly due to percentage wage increases. We tried to maintain staffing rather than hire additional staff as our income level declined during the year. Payroll incentives declined $330 or 82.7% in 2009 as compared to 2008 since these incentives are based on predetermined goals that were not attained in 2009. A 2% across the board incentive was approved for employees in 2009 as a portion of the goals set for the year were attained and management recognized that economic conditions hampered attainment of some goals. Employee benefits expense continued to increase during 2009 with $87 or 9.1% higher costs than the previous year. The primary increase was associated with an increase in the cost of medical insurance per employee along with a greater number of employees becoming eligible for benefits. Contributions to employees’ 401(k) plans decreased $54 or 17.9% in 2009 as compared to 2008 due to the level of profit sharing declining by 2%. The level of employer matching did not change but due to lower net income for the Company, the Board of Directors felt it appropriate to grant a smaller profit sharing benefit for the year. Smaller changes on other payroll expenses accounted for the remaining difference in 2009 as compared to 2008.
Occupancy expense increased $216 or 24.8% in 2009 as compared to 2008 due primarily to the added expenses of operating an additional branch during 2009. The Lake Region branch opened in December 2008 so we recognized the expense of operating that facility for the entire year 2009 as compared to one month in 2008.
29
Furniture and equipment expense increased $49 or 9.4% in 2009 as compared to 2008 with the primary component of the increase related to operation of the Lake Region branch for the entire year.
Data processing expenses increased $305 or 85.0% due to management’s decision to outsource this function in March 2009. By shifting this function we were able to utilize personnel for other electronic banking functions while offering the ability to grow the Company without capacity concerns.
The FDIC insurance assessment for 2009 increased $642 or 279.1% more than in 2008 as that federal agency needed additional funds to weather the economic storm of bank closings and the costs related to those closings. The sudden downturn in the national economy in 2008 resulted in an unprecedented number of bank closings in 2009, leading the FDIC to increase assessments in order to bring the insurance fund’s reserve ratio to the statutorily mandated minimum of 1.15% of insured deposits.
Other expense increased $174 or 7.8% from 2008 to 2009. This category encompasses all remaining expenses associated with the operation of a financial services company. The largest category of increase is in loss on the sale of other real estate which was $144 in 2009 as compared to $27 in 2008. In taking this loss, we were able to put $1,892 of assets back into the interest-earning category and cease to incur additional expenses in relation to ownership of those properties. Those ownership expenses were $63 in 2009 as compared to $18 of expenses in 2008. Telephone expenses were $37 or 17.8% greater in 2009 than the previous year due to the addition of lines for the Lake Region branch and additional usage of all lines for the year. To partially offset those increases we curtailed some other operating expenses in 2009. The largest decline in expenses was in travel and entertainment expense. Travel expense to conferences and seminars was limited in 2009 while replacing several daily courier runs between offices serving to decrease this expense by $55 or 54.4% than in the previous year. The remaining increase was due to smaller changes in various other accounts, none of which are material alone.
Income Taxes
Income taxes decreased $1,194 or 43.5% primarily due to the decline in income before income taxes of $3,193 or 34.9% from 2008 to 2009 but also due to an increase in tax-exempt investments and loans during 2008 and 2009 which served to lower the effective tax rate to 26.1% from 30.1% in 2008.
MARKET PRICES OF STOCK/DIVIDENDS DECLARED
The Company’s stock is listed on the OTC Bulletin Board under the symbol “DIMC.” The book value per share at December 31, 2010 was $31.71, representing an increase of 5.0% over the 2009 book value of $30.21. There were approximately 720 shareholders of record at December 31, 2010. This number does not include persons or entities that hold their stock in nominee name through various brokerage firms.
The following table sets forth high and low sale prices per share of the common stock and dividends declared for the calendar quarters indicated, based upon information obtained from published sources:
| | | | | | | | | | | | | | | | | | | | | | | | |
| | | 2010 | | | 2009 | |
| | | High | | | Low | | | Dividend
Declared | | | High | | | Low | | | Dividend
Declared | |
First Quarter | | $ | 36.00 | | | $ | 30.85 | | | $ | .36 | | | $ | 44.50 | | | $ | 31.00 | | | $ | .36 | |
Second Quarter | | $ | 40.99 | | | $ | 34.00 | | | $ | .36 | | | $ | 38.00 | | | $ | 32.00 | | | $ | .36 | |
Third Quarter | | $ | 39.75 | | | $ | 33.00 | | | $ | .36 | | | $ | 41.00 | | | $ | 35.85 | | | $ | .36 | |
Fourth Quarter | | $ | 39.05 | | | $ | 32.25 | | | $ | .36 | | | $ | 42.00 | | | $ | 31.00 | | | $ | .36 | |
The ability of the Company to pay dividends is dependent upon the ability of the Bank to pay dividends to the Company. The Bank is a depository institution insured by the FDIC and therefore it may not pay dividends or distribute capital assets if it is in default on any assessment due the FDIC. Additionally, the Bank is subject to certain state banking regulations that limit the ability of the Bank to pay dividends to the Company. Under Federal Reserve policy, the Company is required to maintain adequate regulatory capital and is expected to act as a source of financial strength to the Bank and to commit resources to support the Bank in circumstances where it might not do so absent such a policy. These regulations may have the effect of reducing the amount of future dividends declarable by the Company.
30
SUMMARY OF SELECTED FINANCIAL DATA
| | | | | | | | | | | | | | | | | | | | |
| | | 2010 | | | 2009 | | | 2008 | | | 2007 | | | 2006 | |
Summary of operations | | | | | | | | | | | | | | | | | | | | |
Interest income | | $ | 24,674 | | | $ | 24,517 | | | $ | 28,175 | | | $ | 29,951 | | | $ | 24,646 | |
Interest expense | | $ | 7,320 | | | $ | 8,750 | | | $ | 10,665 | | | $ | 12,601 | | | $ | 9,478 | |
Net interest income | | $ | 17,354 | | | $ | 15,767 | | | $ | 17,510 | | | $ | 17,350 | | | $ | 15,168 | |
Provision for loan losses | | $ | 1,750 | | | $ | 1,300 | | | $ | 950 | | | $ | 1,130 | | | $ | 785 | |
Net interest income after provision for loan losses | | $ | 15,604 | | | $ | 14,467 | | | $ | 16,560 | | | $ | 16,220 | | | $ | 14,383 | |
Other income | | $ | 4,060 | | | $ | 3,958 | | | $ | 3,764 | | | $ | 3,517 | | | $ | 3,156 | |
Other expenses | | $ | 12,847 | | | $ | 12,471 | | | $ | 11,177 | | | $ | 10,128 | | | $ | 9,341 | |
Income before income taxes | | $ | 6,817 | | | $ | 5,954 | | | $ | 9,147 | | | $ | 9,609 | | | $ | 8,198 | |
Income taxes | | $ | 1,658 | | | $ | 1,552 | | | $ | 2,746 | | | $ | 2,997 | | | $ | 2,613 | |
| | | | | |
Net income | | $ | 5,159 | | | $ | 4,402 | | | $ | 6,401 | | | $ | 6,612 | | | $ | 5,585 | |
| | | | | |
Per common share | | | | | | | | | | | | | | | | | | | | |
Earnings - basic | | $ | 3.24 | | | $ | 2.82 | | | $ | 4.17 | | | $ | 4.34 | | | $ | 3.67 | |
Earnings - diluted | | $ | 3.24 | | | $ | 2.79 | | | $ | 4.05 | | | $ | 4.18 | | | $ | 3.55 | |
Cash dividends | | $ | 1.44 | | | $ | 1.44 | | | $ | 1.32 | | | $ | 1.19 | | | $ | 1.07 | |
Book value | | $ | 31.71 | | | $ | 30.21 | | | $ | 28.53 | | | $ | 26.23 | | | $ | 23.17 | |
Shares outstanding at year end | | | 1,598,218 | | | | 1,559,778 | | | | 1,558,728 | | | | 1,522,200 | | | | 1,525,024 | |
| | | | | |
Balance sheet data - end of year | | | | | | | | | | | | | | | | | | | | |
Total assets | | $ | 542,214 | | | $ | 530,657 | | | $ | 472,478 | | | $ | 434,322 | | | $ | 403,577 | |
Loans | | $ | 425,069 | | | $ | 410,012 | | | $ | 380,207 | | | $ | 344,758 | | | $ | 305,291 | |
Investment securities available for sale | | $ | 79,655 | | | $ | 73,628 | | | $ | 65,600 | | | $ | 66,739 | | | $ | 67,266 | |
Deposits | | $ | 454,734 | | | $ | 443,116 | | | $ | 381,989 | | | $ | 364,600 | | | $ | 338,117 | |
Stockholders’ equity | | $ | 50,679 | | | $ | 47,117 | | | $ | 44,468 | | | $ | 39,923 | | | $ | 35,337 | |
| | | | | |
Performance | | | | | | | | | | | | | | | | | | | | |
Return on average assets | | | .94% | | | | .90% | | | | 1.43% | | | | 1.58% | | | | 1.50% | |
Return on average equity | | | 10.43% | | | | 9.58% | | | | 15.28% | | | | 17.54% | | | | 16.80% | |
Dividend payout ratio | | | 44.44% | | | | 51.06% | | | | 31.65% | | | | 27.42% | | | | 29.16% | |
Average equity to average assets ratio | | | 9.05% | | | | 9.34% | | | | 9.35% | | | | 8.99% | | | | 8.93% | |
31
MANAGEMENT’S ANNUAL REPORT ON INTERNAL CONTROL OVER FINANCIAL REPORTING
Management of the Company is responsible for establishing and maintaining adequate internal control over financial reporting as defined in Rules 13a-15(f) and 15d-15(f) under the Securities and Exchange Act of 1934. The Company’s internal control over financial reporting is designed to provide reasonable assurance regarding the reliability of financial reporting and the preparation of financial statements for external purposes in accordance with generally accepted accounting principles.
Because of its inherent limitations, internal control over financial reporting may not prevent or detect misstatements. Also, projections of any evaluation of effectiveness to future periods are subject to the risk that controls may become inadequate because of changes in conditions, or that the degree of compliance with the policies or procedures may deteriorate.
A material weakness is a significant deficiency (as defined in Public Company Accounting Oversight Board Auditing Standard No. 5), or a combination of significant deficiencies, that results in there being more than a remote likelihood that a material misstatement of the annual or interim financial statements will not be prevented or detected on a timely basis by management or employees in the normal course of performing their assigned functions.
Management assessed the effectiveness of the Company’s internal control over financial reporting as of December 31, 2010. In making this assessment, management used the criteria set forth by the Committee of Sponsoring Organizations of the Treadway Commission (COSO) in Internal Control-Integrated Framework. Based on this assessment, management believes that, as of December 31, 2010, the Company’s internal control over financial reporting was effective.
This annual report does not include an attestation report of the Company’s registered public accounting firm regarding internal control over financial reporting. Management’s report was not subject to attestation by the Company’s registered public accounting firm pursuant to the rules of the Securities and Exchange Commission that permit the Company to provide only management’s report in this annual report.
|
 |
By: Gary C. Beilman |
President and Chief Executive Officer |
(Principal Executive Officer) |
Date: March 10, 2011
|
 |
By: Maureen H. Beilman |
Chief Financial Officer |
(Principal Financial & Accounting Officer) |
Date: March 10, 2011
32

REPORT OF INDEPENDENT REGISTERED PUBLIC ACCOUNTING FIRM
The Board of Directors and Stockholders
Dimeco, Inc.
We have audited the accompanying consolidated balance sheet of Dimeco, Inc. and subsidiary as of December 31, 2010 and 2009, and the related consolidated statements of income, changes in stockholders’ equity, and cash flows for each of the three years in the period ended December 31, 2010. These financial statements are the responsibility of the Company’s management. Our responsibility is to express an opinion on these financial statements based on our audits.
We conducted our audits in accordance with the standards of the Public Company Accounting Oversight Board (United States). Those standards require that we plan and perform the audit to obtain reasonable assurance about whether the financial statements are free of material misstatement. The Company is not required to have, nor were we engaged to perform an audit of its internal control over financial reporting. Our audit included consideration of internal control over financial reporting as a basis for designing audit procedures that are appropriate in the circumstances, but not for the purpose of expressing an opinion on the effectiveness of the Company’s internal control over financial reporting. Accordingly, we express no such opinion. An audit also includes examining, on a test basis, evidence supporting the amounts and disclosures in the financial statements, assessing the accounting principles used and significant estimates made by management, as well as evaluating the overall financial statement presentation. We believe that our audits provide a reasonable basis for our opinion.
In our opinion, the consolidated financial statements referred to above present fairly, in all material respects, the financial position of Dimeco, Inc. and subsidiary as of December 31, 2010 and 2009, and the consolidated results of their operations and their cash flows for each of the three years in the period ended December 31, 2010, in conformity with U.S. generally accepted accounting principles.
As discussed in Note 1 to the consolidated financial statements, effective January 1, 2008, the Company adopted Emerging Issues Task Force No. 06-4,Accounting for Deferred Compensation and Post-retirement Benefit Aspects of Endorsement Split Dollar Life Insurance Arrangements. This guidance was subsequently codified into Financial Accounting Standards Board ASC Topic 715-60,Compensation - Retirement Benefits.

Wexford, Pennsylvania
March 10, 2011
S.R. Snodgrass, A.C. * 2100 Corporate Drive, Suite 400 * Wexford, Pennsylvania 15090-8399 * Phone: (724) 934-0344 * Facsimile: (724) 934-0345
33
CONSOLIDATED BALANCE SHEET
| | | | | | | | |
| | | December 31, | |
| (In thousands) | | 2010 | | | 2009 | |
Assets | | | | | | | | |
Cash and due from banks | | $ | 5,831 | | | $ | 3,991 | |
Interest-bearing deposits in other banks | | | 4,821 | | | | 14,296 | |
Federal funds sold | | | - | | | | 3,000 | |
| | | | | | | | |
Total cash and cash equivalents | | | 10,652 | | | | 21,287 | |
| | |
Investment securities available for sale | | | 79,655 | | | | 73,628 | |
| | |
Loans (net of unearned income of $25 and $101) | | | 425,069 | | | | 410,012 | |
Less allowance for loan losses | | | 7,741 | | | | 6,253 | |
| | | | | | | | |
Net loans | | | 417,328 | | | | 403,759 | |
| | |
Premises and equipment | | | 10,572 | | | | 10,965 | |
Accrued interest receivable | | | 1,888 | | | | 1,842 | |
Bank-owned life insurance | | | 9,545 | | | | 9,175 | |
Other real estate owned | | | 960 | | | | 389 | |
Prepaid FDIC insurance | | | 1,615 | | | | 2,309 | |
Other assets | | | 9,999 | | | | 7,303 | |
| | | | | | | | |
| | |
TOTAL ASSETS | | $ | 542,214 | | | $ | 530,657 | |
| | | | | | | | |
| | |
Liabilities | | | | | | | | |
Deposits: | | | | | | | | |
Noninterest-bearing | | $ | 43,067 | | | $ | 39,687 | |
Interest-bearing | | | 411,667 | | | | 403,429 | |
| | | | | | | | |
Total deposits | | | 454,734 | | | | 443,116 | |
| | |
Short-term borrowings | | | 13,006 | | | | 10,974 | |
Other borrowed funds | | | 19,552 | | | | 24,402 | |
Accrued interest payable | | | 679 | | | | 1,080 | |
Other liabilities | | | 3,564 | | | | 3,968 | |
| | | | | | | | |
| | |
TOTAL LIABILITIES | | | 491,535 | | | | 483,540 | |
| | | | | | | | |
| | |
Stockholders’ Equity | | | | | | | | |
Common stock, $.50 par value; 5,000,000 shares authorized;
1,652,318 and 1,613,878 shares issued | | | 826 | | | | 807 | |
Capital surplus | | | 6,273 | | | | 5,552 | |
Retained earnings | | | 45,177 | | | | 42,318 | |
Accumulated other comprehensive income | | | 470 | | | | 507 | |
Treasury stock, at cost (54,100 shares) | | | (2,067 | ) | | | (2,067 | ) |
| | | | | | | | |
| | |
TOTAL STOCKHOLDERS’ EQUITY | | | 50,679 | | | | 47,117 | |
| | | | | | | | |
| | |
TOTAL LIABILITIES AND STOCKHOLDERS’ EQUITY | | $ | 542,214 | | | $ | 530,657 | |
| | | | | | | | |
The accompanying notes are an integral part of these consolidated financial statements.
34
CONSOLIDATED STATEMENT OF INCOME
| | | | | | | | | | | | |
| | | Year Ended December 31, | |
| (In thousands, except per share data) | | 2010 | | | 2009 | | | 2008 | |
| | | |
Interest Income | | | | | | | | | | | | |
Interest and fees on loans | | $ | 22,221 | | | $ | 22,366 | | | $ | 25,442 | |
Federal funds sold | | | 6 | | | | 7 | | | | 67 | |
Investment securities: | | | | | | | | | | | | |
Taxable | | | 1,336 | | | | 1,194 | | | | 2,036 | |
Exempt from federal income tax | | | 1,049 | | | | 938 | | | | 608 | |
Other | | | 62 | | | | 12 | | | | 22 | |
| | | | | | | | | | | | |
Total interest income | | | 24,674 | | | | 24,517 | | | | 28,175 | |
| | | | | | | | | | | | |
| | | |
Interest Expense | | | | | | | | | | | | |
Deposits | | | 6,215 | | | | 7,531 | | | | 9,503 | |
Short-term borrowings | | | 142 | | | | 122 | | | | 237 | |
Other borrowed funds | | | 963 | | | | 1,097 | | | | 925 | |
| | | | | | | | | | | | |
Total interest expense | | | 7,320 | | | | 8,750 | | | | 10,665 | |
| | | | | | | | | | | | |
| | | |
Net Interest Income | | | 17,354 | | | | 15,767 | | | | 17,510 | |
| | | |
Provision for loan losses | | | 1,750 | | | | 1,300 | | | | 950 | |
| | | | | | | | | | | | |
| | | |
Net Interest Income After Provision for Loan Losses | | | 15,604 | | | | 14,467 | | | | 16,560 | |
| | | | | | | | | | | | |
| | | |
Noninterest Income | | | | | | | | | | | | |
Service charges on deposit accounts | | | 1,292 | | | | 1,497 | | | | 1,662 | |
Mortgage loans held for sale gains, net | | | 354 | | | | 601 | | | | 153 | |
Investment securities losses, net | | | (13 | ) | | | (142 | ) | | | (28 | ) |
Brokerage commissions | | | 742 | | | | 500 | | | | 617 | |
Earnings on bank-owned life insurance | | | 423 | | | | 408 | | | | 385 | |
Other income | | | 1,262 | | | | 1,094 | | | | 975 | |
| | | | | | | | | | | | |
Total noninterest income | | | 4,060 | | | | 3,958 | | | | 3,764 | |
| | | | | | | | | | | | |
| | | |
Noninterest Expense | | | | | | | | | | | | |
Salaries and employee benefits | | | 6,667 | | | | 6,303 | | | | 6,396 | |
Occupancy expense, net | | | 1,117 | | | | 1,087 | | | | 871 | |
Furniture and equipment expense | | | 483 | | | | 569 | | | | 520 | |
Professional fees | | | 780 | | | | 585 | | | | 584 | |
Data processing expense | | | 713 | | | | 664 | | | | 359 | |
FDIC insurance | | | 742 | | | | 872 | | | | 230 | |
Other expense | | | 2,345 | | | | 2,391 | | | | 2,217 | |
| | | | | | | | | | | | |
Total noninterest expense | | | 12,847 | | | | 12,471 | | | | 11,177 | |
| | | | | | | | | | | | |
| | | |
Income before income taxes | | | 6,817 | | | | 5,954 | | | | 9,147 | |
Income taxes | | | 1,658 | | | | 1,552 | | | | 2,746 | |
| | | | | | | | | | | | |
| | | |
NET INCOME | | $ | 5,159 | | | $ | 4,402 | | | $ | 6,401 | |
| | | | | | | | | | | | |
| | | |
Earnings Per Share: | | | | | | | | | | | | |
Basic | | $ | 3.24 | | | $ | 2.82 | | | $ | 4.17 | |
Diluted | | $ | 3.24 | | | $ | 2.79 | | | $ | 4.05 | |
The accompanying notes are an integral part of these consolidated financial statements.
35
CONSOLIDATED STATEMENT OF CHANGES IN STOCKHOLDERS’ EQUITY
| | | | | | | | | | | | | | | | | | | | | | | | | | | | |
| (In thousands, except per share data) | | Common
Stock | | | Capital
Surplus | | | Retained
Earnings | | | Accumulated
Other
Comprehensive
Income (Loss) | | | Treasury
Stock | | | Total
Stockholders’
Equity | | | Comprehensive
Income | |
Balance, December 31, 2007 | | $ | 788 | | | $ | 4,978 | | | $ | 36,152 | | | $ | 37 | | | $ | (2,032 | ) | | $ | 39,923 | | | | | |
| | | | | | | |
Net income | | | | | | | | | | | 6,401 | | | | | | | | | | | | 6,401 | | | $ | 6,401 | |
Other comprehensive loss: | | | | | | | | | | | | | | | | | | | | | | | | | | | | |
Unrealized loss on available for sale securities, net of tax benefit of $10 | | | | | | | | | | | | | | | (19 | ) | | | | | | | (19 | ) | | | (19 | ) |
| | | | | | | | | | | | | | | | | | | | | | | | | | | | |
Comprehensive income | | | | | | | | | | | | | | | | | | | | | | | | | | $ | 6,382 | |
| | | | | | | | | | | | | | | | | | | | | | | | | | | | |
Exercise of stock options (36,528 shares) | | | 18 | | | | 538 | | | | | | | | | | | | | | | | 556 | | | | | |
Cumulative effect of change in accounting for split dollar life insurance arrangements | | | | | | | | | | | (358 | ) | | | | | | | | | | | (358 | ) | | | | |
Cash dividends ($1.32 per share) | | | | | | | | | | | (2,035 | ) | | | | | | | | | | | (2,035 | ) | | | | |
| | | | | | | | | | | | | | | | | | | | | | | | | | | | |
Balance, December 31, 2008 | | | 806 | | | | 5,516 | | | | 40,160 | | | | 18 | | | | (2,032 | ) | | | 44,468 | | | | | |
| | | | | | | |
Net income | | | | | | | | | | | 4,402 | | | | | | | | | | | | 4,402 | | | $ | 4,402 | |
Other comprehensive income: | | | | | | | | | | | | | | | | | | | | | | | | | | | | |
Unrealized gain on available for sale securities, net of tax expense of $252 | | | | | | | | | | | | | | | 489 | | | | | | | | 489 | | | | 489 | |
| | | | | | | | | | | | | | | | | | | | | | | | | | | | |
Comprehensive income | | | | | | | | | | | | | | | | | | | | | | | | | | $ | 4,891 | |
| | | | | | | | | | | | | | | | | | | | | | | | | | | | |
Exercise of stock options (2,050 shares) | | | 1 | | | | 36 | | | | | | | | | | | | | | | | 37 | | | | | |
Purchase of treasury stock (1,000 shares) | | | | | | | | | | | | | | | | | | | (35 | ) | | | (35 | ) | | | | |
Cash dividends ($1.44 per share) | | | | | | | | | | | (2,244 | ) | | | | | | | | | | | (2,244 | ) | | | | |
| | | | | | | | | | | | | | | | | | | | | | | | | | | | |
Balance, December 31, 2009 | | | 807 | | | | 5,552 | | | | 42,318 | | | | 507 | | | | (2,067 | ) | | | 47,117 | | | | | |
| | | | | | | |
Net income | | | | | | | | | | | 5,159 | | | | | | | | | | | | 5,159 | | | $ | 5,159 | |
Other comprehensive loss: | | | | | | | | | | | | | | | | | | | | | | | | | | | | |
Unrealized loss on available for sale securities, net of tax benefit of $19 | | | | | | | | | | | | | | | (37 | ) | | | | | | | (37 | ) | | | (37 | ) |
| | | | | | | | | | | | | | | | | | | | | | | | | | | | |
Comprehensive income | | | | | | | | | | | | | | | | | | | | | | | | | | $ | 5,122 | |
| | | | | | | | | | | | | | | | | | | | | | | | | | | | |
Exercise of stock options (38,440 shares) | | | 19 | | | | 721 | | | | | | | | | | | | | | | | 740 | | | | | |
Cash dividends ($1.44 per share) | | | | | | | | | | | (2,300 | ) | | | | | | | | | | | (2,300 | ) | | | | |
| | | | | | | | | | | | | | | | | | | | | | | | | | | | |
| | | | | | | |
Balance, December 31, 2010 | | $ | 826 | | | $ | 6,273 | | | $ | 45,177 | | | $ | 470 | | | $ | (2,067 | ) | | $ | 50,679 | | | | | |
| | | | | | | | | | | | | | | | | | | | | | | | | | | | |
| | | | | | | |
| | | | | | | | | 2010 | | | 2009 | | | 2008 | | | | | | | |
Components of other comprehensive income (loss): | | | | | | | | | | | | | | | | | | | | | | | | | | | | |
Change in net unrealized gain (loss) on investment securities available for sale | | | | | | | | | | $ | (46 | ) | | $ | 583 | | | $ | (37 | ) | | | | | | | | |
Realized loss included in net income, net of tax benefit of $4, $48 and $10 | | | | | | | | | | | 9 | | | | 94 | | | | 18 | | | | | | | | | |
| | | | | | | | | | | | | | | | | | | | | | | | | | | | |
Total | | | | | | | | | | $ | (37 | ) | | $ | 489 | | | $ | (19 | ) | | | | | | | | |
| | | | | | | | | | | | | | | | | | | | | | | | | | | | |
The accompanying notes are an integral part of these consolidated financial statements.
36
CONSOLIDATED STATEMENT OF CASH FLOWS
| | | | | | | | | | | | |
| | | Year Ended December 31, | |
| (In thousands) | | 2010 | | | 2009 | | | 2008 | |
Operating Activities | | | | | | | | | | | | |
Net income | | $ | 5,159 | | | $ | 4,402 | | | $ | 6,401 | |
Adjustments to reconcile net income to net cash provided by operating activities: | | | | | | | | | | | | |
Provision for loan losses | | | 1,750 | | | | 1,300 | | | | 950 | |
Depreciation and amortization | | | 1,040 | | | | 1,138 | | | | 726 | |
Amortization (accretion) of premium and discount on investment securities, net | | | 366 | | | | (217 | ) | | | (975 | ) |
Amortization of net deferred loan origination fees | | | (161 | ) | | | (153 | ) | | | (144 | ) |
Investment securities losses, net | | | 13 | | | | 142 | | | | 28 | |
Origination of loans held for sale | | | (11,375 | ) | | | (24,773 | ) | | | (8,059 | ) |
Proceeds from sale of loans | | | 11,729 | | | | 25,374 | | | | 8,212 | |
Mortgage loans held for sale gains, net | | | (354 | ) | | | (601 | ) | | | (153 | ) |
(Increase) decrease in accrued interest receivable | | | (46 | ) | | | 208 | | | | (84 | ) |
Decrease in accrued interest payable | | | (401 | ) | | | (78 | ) | | | (533 | ) |
Deferred federal income taxes | | | (728 | ) | | | (338 | ) | | | 4 | |
Earnings on bank-owned life insurance | | | (423 | ) | | | (408 | ) | | | (385 | ) |
(Increase) decrease in prepaid FDIC insurance | | | 694 | | | | (2,309 | ) | | | - | |
Other, net | | | (135 | ) | | | (810 | ) | | | 796 | |
| | | | | | | | | | | | |
Net cash provided by operating activities | | | 7,128 | | | | 2,877 | | | | 6,784 | |
| | | | | | | | | | | | |
| | | |
Investing Activities | | | | | | | | | | | | |
Investment securities available for sale: | | | | | | | | | | | | |
Proceeds from sales or merger | | | 5,478 | | | | 1,262 | | | | 2 | |
Proceeds from maturities or paydown | | | 239,397 | | | | 194,694 | | | | 286,897 | |
Purchases | | | (252,338 | ) | | | (202,168 | ) | | | (284,843 | ) |
Redemption of Federal Home Loan Bank stock | | | 19 | | | | - | | | | 1,176 | |
Purchase of Federal Home Loan Bank stock | | | (3 | ) | | | (66 | ) | | | (1,670 | ) |
Net increase in loans | | | (16,007 | ) | | | (29,380 | ) | | | (38,396 | ) |
Investment in limited partnership | | | - | | | | (2,729 | ) | | | - | |
Purchase of fixed annuity | | | (1,500 | ) | | | - | | | | - | |
Purchase of bank-owned life insurance | | | - | | | | (279 | ) | | | - | |
Proceeds from sale of other real estate owned | | | 333 | | | | 687 | | | | 182 | |
Purchase of premises and equipment | | | (396 | ) | | | (896 | ) | | | (5,033 | ) |
| | | | | | | | | | | | |
Net cash used for investing activities | | | (25,017 | ) | | | (38,875 | ) | | | (41,685 | ) |
| | | | | | | | | | | | |
| | | |
Financing Activities | | | | | | | | | | | | |
Net increase in deposits | | | 11,618 | | | | 61,127 | | | | 17,389 | |
Increase (decrease) in short-term borrowings | | | 2,032 | | | | (2,697 | ) | | | 8,461 | |
Proceeds from other borrowed funds | | | - | | | | 1,850 | | | | 7,872 | |
Repayment of other borrowed funds | | | (4,850 | ) | | | (4,746 | ) | | | (1,235 | ) |
Purchase of treasury stock | | | - | | | | (35 | ) | | | - | |
Proceeds from exercise of stock options | | | 740 | | | | 37 | | | | 556 | |
Cash dividends paid | | | (2,286 | ) | | | (2,244 | ) | | | (1,961 | ) |
| | | | | | | | | | | | |
Net cash provided by financing activities | | | 7,254 | | | | 53,292 | | | | 31,082 | |
| | | | | | | | | | | | |
| | | |
Increase (decrease) in cash and cash equivalents | | | (10,635 | ) | | | 17,294 | | | | (3,819 | ) |
| | | |
Cash and cash equivalents at beginning of year | | | 21,287 | | | | 3,993 | | | | 7,812 | |
| | | | | | | | | | | | |
| | | |
Cash and cash equivalents at end of year | | $ | 10,652 | | | $ | 21,287 | | | $ | 3,993 | |
| | | | | | | | | | | | |
The accompanying notes are an integral part of these consolidated financial statements.
37
NOTES TO CONSOLIDATED FINANCIAL STATEMENTS
NOTE 1 - SUMMARY OF SIGNIFICANT ACCOUNTING POLICIES
A summary of the significant accounting and reporting policies applied in the presentation of the accompanying financial statements follows:
Nature of Operations and Basis of Presentation
Dimeco, Inc. (the “Company”) is a Pennsylvania company organized as the holding company of The Dime Bank (the “Bank”) and its wholly owned subsidiary, TDB Insurance Services, LLC. The Bank is a state-chartered bank and operates from six locations in northeastern Pennsylvania. The Company and its subsidiary derive substantially all of their income from banking and bank-related services that include interest earnings on residential real estate, commercial mortgage, commercial and consumer financings as well as interest earnings on investment securities. The Company, through its subsidiary, provides deposit services including checking, savings and certificate of deposit accounts and investment and trust services. The Company is supervised by the Federal Reserve Board, while the Bank is subject to regulation and supervision by the Federal Deposit Insurance Corporation (“FDIC”) and the Pennsylvania Department of Banking.
The consolidated financial statements of the Company include its wholly owned subsidiary, the Bank. All inter-company items have been eliminated in preparing the consolidated financial statements. The investment in subsidiary on the parent company financial statements is carried at the parent company’s equity in the underlying net assets of the Bank.
The financial statements have been prepared in conformity with U.S. generally accepted accounting principles. In preparing the financial statements, management is required to make estimates and assumptions that affect the reported amounts of assets and liabilities as of the balance sheet date and revenues and expenses for the period. Actual results could differ significantly from those estimates.
Investment Securities
Investment securities are classified at the time of purchase, based on management’s intention and ability, as securities held to maturity or securities available for sale. Debt and equity securities have been classified as available for sale to serve principally as a source of liquidity. Unrealized holding gains and losses for available for sale securities are reported as a separate component of stockholders’ equity, net of tax, until realized. Realized securities gains and losses are computed using the specific identification method. Interest and dividends on investment securities are recognized as income when earned.
Common stock of the Federal Home Loan Bank of Pittsburgh (“FHLB”) and the Atlantic Central Bankers Bank (“ACBB”) represents ownership in institutions that are wholly owned by other financial institutions. These securities are accounted for at cost and are classified with other assets.
The Bank is a member of FHLB and as such, is required to maintain a minimum investment in stock of FHLB that varies with the level of advances outstanding with FHLB. The stock is bought from and sold to FHLB based upon its $100 par value. The stock does not have a readily determinable fair value and as such is classified as restricted stock, carried at cost and evaluated for impairment by management. The stock’s value is determined by the ultimate recoverability of the par value rather than by recognizing temporary declines. The determination of whether the par value will ultimately be recovered is influenced by criteria such as the following: (a) the significance of the decline in net assets of FHLB as compared to the capital stock amount and the length of time this situation has persisted (b) commitments by FHLB to make payments required by law or regulation and the level of such payments in relation to the operating performance (c) the impact of legislative and regulatory changes on the customer base of FHLB and (d) the liquidity position of FHLB.
38
NOTE 1 - SUMMARY OF SIGNIFICANT ACCOUNTING POLICIES (continued)
FHLB has incurred losses in the prior two years and has suspended the payment of dividends. The losses are primarily attributable to impairment of investment securities associated with the extreme economic conditions in place over the last two years. Management evaluated the stock and concluded that the stock was not impaired for the periods presented herein. More consideration was given to the long-term prospects for FHLB as opposed to the recent stress caused by the extreme economic conditions the world is facing. Management also considered that FHLB’s regulatory capital ratios have increased from the prior year, liquidity appears adequate and new shares of FHLB stock continue to exchange hands at the $100 par value.
Securities are periodically reviewed for other than temporary impairment based upon a number of factors. Those factors include, but are not limited to, the length of time and extent to which the market value has been less than cost, the financial condition of the underlying issuer, the ability of the issuer to meet contractual obligations, the likelihood of the security’s ability to recover any decline in its market value and whether management intends to sell and their belief that they will not be required to sell these securities before recovery of their cost basis, which may be at maturity. A decline in value that is considered to be other than temporary is recorded as a loss within noninterest income in the Consolidated Statement of Income.
Mortgage Loans Held for Sale
In general, fixed rate residential mortgage loans originated by the Bank that qualify for sale in the secondary market are held for sale and are carried at the aggregate lower of cost or market. Such loans sold are generally serviced by the Bank.
Loans
Loans are stated at the principal amount outstanding, net of any unearned income, deferred loan fees and the allowance for loan losses. Interest on consumer loans is credited to operations over the term of each loan using a method which results in a level yield or the simple interest method. Interest income on mortgage loans is accrued on the amortized balance. Interest income on other loans is accrued on the principal amount outstanding. Loan fees which represent an adjustment to interest yield are deferred and amortized over the life of the loan. Loans on which the accrual of interest has been discontinued are designated as nonaccrual loans. Accrual of interest on loans is generally discontinued when it is determined that a reasonable doubt exists as to the collectability of additional interest. When a loan is placed on nonaccrual status, unpaid interest is charged against income. Payments received on nonaccrual loans are either applied to principal or reported as interest income according to management’s judgment as to the collectability of principal. Loans are returned to accrual status when past due interest is collected and the collection of principal is probable.
Allowance for Loan Losses
The allowance for loan losses represents the amount which management estimates is adequate to provide for probable losses inherent in its loan portfolio, as of the balance sheet date. The allowance method is used in providing for loan losses. Accordingly, all loan losses are charged to the allowance and all recoveries are credited to it. The allowance for loan losses is established through a provision for loan losses charged to operations. The provision for loan losses is based on management’s periodic evaluation of individual loans, economic factors, past loan loss experience, changes in the composition and volume of the portfolio and other relevant factors. The estimates used in determining the adequacy of the allowance for loan losses, including the amounts and timing of future cash flows expected on impaired loans, are particularly susceptible to changes in the near term.
39
NOTE 1 - SUMMARY OF SIGNIFICANT ACCOUNTING POLICIES (continued)
Allowance for Loan Losses (continued)
Historical loss percentages for each risk category are calculated and used as the basis for calculating allowance allocations. Certain qualitative factors are then added to the historical allocation percentage to get the adjusted factor to be applied to non-classified loans. The following qualitative factors are analyzed:
| | • | | Levels of and trends in delinquencies |
| | • | | Trends in volume and terms |
| | • | | Changes in lending policies and procedures |
| | • | | Quality of the loan review function |
| | • | | Concentrations of credit |
| | • | | Experience depth and ability of management |
| | • | | Other factors affecting the collectability of the loans |
The Company analyzes its loan portfolio each quarter to determine the appropriateness of its allowance for loan losses.
In situations where, for economic or legal reasons related to a borrower’s financial difficulties, management may grant a concession for other than an insignificant period of time to the borrower that would not otherwise be considered, the related loan is classified as a troubled debt restructuring (“TDR”). Management strives to identify borrowers in financial difficulty early and work with them to modify to more affordable terms before their loan reaches nonaccrual status. These modified terms may include rate reductions, principal forgiveness, payment forbearance and other actions intended to minimize the economic loss and to avoid foreclosure or repossession of the collateral. In cases where borrowers are granted new terms that provide for a reduction of either interest or principal, management measures any impairment on the restructuring and charges down the principal balance as determined in the analysis. This process is completed for all types of loans. If the loan is a commercial or commercial real estate loan then it is further analyzed to determine if the loan should be classified as impaired. Residential mortgages and consumer loans are generally evaluated to determine a fair value of the collateral when 90 days past due and then are fully or partially charged down to reflect that fair value unless the loan is well secured and in the process of collection. Commercial real estate and commercial loans which are 90 days past due are evaluated in the same manner in the analysis for loan impairment.
Impaired loans are commercial and commercial real estate loan relationships for which it is probable that the Company will not be able to collect all amounts due according to the contractual terms of the loan agreement. The Company individually evaluates such loans for impairment and does not aggregate loans by major risk classifications. The definition of “impaired loans” is not the same as the definition of “nonaccrual loans,” although the two categories overlap. The Company may choose to place a loan on nonaccrual status due to payment delinquency or uncertain collectability, while not classifying the loan as impaired if the loan is not a commercial or commercial real estate loan. Factors considered by management in determining impairment include payment status and collateral value. The amount of impairment for these types of impaired loans is determined by the difference between the present value of the expected cash flows related to the loan, using the original interest rate, and its recorded value, or as a practical expedient in the case of collateralized loans, the difference between the fair value of the collateral and the recorded amount of the loans. When foreclosure is probable, impairment is measured based on the fair value of the collateral.
Mortgage loans on one-to-four family properties and all consumer loans are large groups of smaller-balance homogeneous loans and are measured for impairment collectively. Loans that experience insignificant payment delays, which are defined as 90 days or less, generally are not classified as impaired. Management determines the significance of payment delays on a case-by-case basis taking into consideration all of the circumstances surrounding the loan and the borrower including the length of the delay, the borrower’s prior payment record and the amount of shortfall in relation to the principal and interest owed.
40
NOTE 1 - SUMMARY OF SIGNIFICANT ACCOUNTING POLICIES (continued)
Premises and Equipment
Premises and equipment are stated at cost less accumulated depreciation. Depreciation is principally computed on the straight-line method over the estimated useful lives of the related assets, which range from 3 to 20 years for furniture and equipment and 5 to 31 years for office buildings and improvements. Leasehold improvements are amortized over the shorter of their estimated useful lives or their respective lease terms, which range from 5 to 20 years. Expenditures for maintenance and repairs are charged against income as incurred. Costs of major additions and improvements are capitalized.
Bank-Owned Life Insurance (“BOLI”)
The Company owns insurance on the lives of a certain group of key employees. The policies were purchased to help offset the increase in the costs of various fringe benefit plans including healthcare. The cash surrender value of these policies is included as an asset on the consolidated statements of financial condition, and any increases in cash surrender value are recorded as noninterest income on the consolidated statement of income. In the event of the death of an insured individual under these policies, the Company would receive a death benefit which would be recorded as noninterest income.
Other Real Estate Owned
Real estate acquired by foreclosure is classified on the Consolidated Balance Sheet at the lower of the recorded investment in the property or its fair value minus estimated costs of sale. Prior to foreclosure, the value of the underlying collateral is written down by a charge to the allowance for loan losses, if necessary. Any subsequent write-downs are charged against operating expenses. Operating expenses of such properties, net of related income and losses on their disposition, are included as other expense.
Income Taxes
The Company and the Bank file a consolidated federal income tax return. Deferred tax assets or liabilities are computed based on the difference between the financial statement and the income tax basis of assets and liabilities using the enacted marginal tax rates. Deferred income tax expenses or benefits are based on the changes in the deferred tax asset or liability from period to period.
Earnings Per Share
The Company provides dual presentation of basic and diluted earnings per share. Basic earnings per share are calculated utilizing net income as reported as the numerator and average shares outstanding as the denominator. The computation of diluted earnings per share differs in that the dilutive effects of any options are adjusted for in the denominator.
Stock Options
The Company accounts for stock-based compensation issued to employees, and where appropriate non-employees, in accordance with FASB ASC 718, Compensation – Stock Compensation. Under fair value provisions, stock-based compensation cost is measured at the grant date based on the fair value of the award and is recognized as expense over the appropriate vesting period using the straight-line method. The amount of stock-based compensation recognized at any date must at least equal the portion of the grant date fair value of the award that is vested at that date and as a result it may be necessary to recognize the expense using a ratable method. Determining the fair value of stock-based awards at the date of grant requires judgment, including estimating the expected term of the stock options and the expected volatility of the Company’s stock. In addition, judgment is required in estimating the amount of stock-based awards that are expected to be forfeited.
41
NOTE 1 - SUMMARY OF SIGNIFICANT ACCOUNTING POLICIES (continued)
Stock Options (continued)
If actual results differ significantly from these estimates or different key assumptions were used, it could have a material effect on the Company’s Consolidated Financial Statements.
For 2010, 2009 and 2008, the Company did not recognize any compensation expense as all outstanding options were vested at January 1, 2006.
Mortgage Servicing Rights (“MSRs”)
The Company has agreements for the express purpose of selling loans in the secondary market. The Company maintains servicing rights for most of these loans. MSRs are carried at the lower of cost or estimated fair value. Originated MSRs are recorded by allocating total costs incurred between the loan and servicing rights based on their relative fair values. MSRs are amortized in proportion to the estimated servicing income over the estimated life of the servicing portfolio. MSRs are a component of other assets on the Consolidated Balance Sheet.
Comprehensive Income
The Company is required to present comprehensive income in a full set of general-purpose financial statements for all periods presented. Other comprehensive income is composed of unrealized holding gains (losses) on the available for sale securities portfolio. The Company has elected to report the effects of other comprehensive income as part of the Consolidated Statement of Changes in Stockholders’ Equity.
Endorsement Split-Dollar Life Insurance Arrangements
On January 1, 2008, the Company changed its accounting policy and recognized a cumulative-effect adjustment to retained earnings totaling $358,000 related to accounting for certain endorsement split-dollar life insurance arrangements in connection with the adoption of Emerging Issues Task Force Issue No. 06-4,Accounting for Deferred Compensation and Postretirement Benefit Aspects of Endorsement Split Dollar Life Insurance Arrangements.
Cash Flows
The Company has defined cash and cash equivalents as cash and due from banks, interest-bearing deposits in other banks and federal funds sold that have original maturities of 90 days or less.
Amounts paid for interest and income taxes and noncash activities are as follows (in thousands):
| | | | | | | | | | | | |
| | | 2010 | | | 2009 | | | 2008 | |
Cash paid during the year for: | | | | | | | | | | | | |
Interest | | $ | 7,721 | | | $ | 8,828 | | | $ | 11,198 | |
Income taxes | | $ | 2,415 | | | $ | 1,575 | | | $ | 2,745 | |
| | | |
Noncash investing activities: | | | | | | | | | | | | |
Transfer of loans to other real estate owned | | $ | 698 | | | $ | - | | | $ | 1,955 | |
Transfer of other real estate to loans | | $ | 160 | | | $ | 1,125 | | | $ | - | |
Changes in unrealized holding gains and losses on available for sale securities | | $ | (56 | ) | | $ | 741 | | | $ | (30 | ) |
Investment purchases not settled | | $ | - | | | $ | 1,000 | | | $ | 1,196 | |
42
NOTE 1 - SUMMARY OF SIGNIFICANT ACCOUNTING POLICIES (continued)
Recent Accounting Pronouncements
In December 2009, the FASB issued ASU 2009-16,Accounting for Transfer of Financial Assets. ASU 2009-16 provides guidance to improve the relevance, representational faithfulness, and comparability of the information that an entity provides in its financial statements about a transfer of financial assets; the effects of a transfer on its financial position, financial performance, and cash flows; and a transferor’s continuing involvement, if any, in transferred financial assets. ASU 2009-16 is effective for annual periods beginning after November 15, 2009 and for interim periods within those fiscal years. The adoption of this guidance did not have a material impact on the Company’s financial position or results of operation.
In January 2010, the FASB issued ASU 2010-01,Equity (Topic 505): Accounting for Distributions to Shareholders with Components of Stock and Cash – a consensus of the FASB Emerging Issues Task Force. ASU 2010-01 clarifies that the stock portion of a distribution to shareholders that allows them to elect to receive cash or stock with a potential limitation on the total amount of cash that all shareholders can elect to receive in the aggregate is considered a share issuance that is reflected in EPS prospectively and is not a stock dividend. ASU 2010-01 is effective for interim and annual periods ending on or after December 15, 2009 and should be applied on a retrospective basis. The adoption of this guidance did not have a material impact on the Company’s financial position or results of operation.
In January 2010, the FASB issued ASU 2010-05,Compensation – Stock Compensation (Topic 718): Escrowed Share Arrangements and the Presumption of Compensation. ASU 2010-05 updates existing guidance to address the SEC staff’s views on overcoming the presumption that for certain shareholders escrowed share arrangements represent compensation. ASU 2010-05 is effective January 15, 2010. The adoption of this guidance did not have a material impact on the Company’s financial position or results of operation.
In January 2010, the FASB issued ASU 2010-06,Fair Value Measurements and Disclosures (Topic 820): Improving Disclosures about Fair Value Measurements. ASU 2010-06 amends Subtopic 820-10 to clarify existing disclosures, require new disclosures, and includes conforming amendments to guidance on employers’ disclosures about postretirement benefit plan assets. ASU 2010-06 is effective for interim and annual periods beginning after December 15, 2009, except for disclosures about purchases, sales, issuances, and settlements in the roll forward of activity in Level 3 fair value measurements. Those disclosures are effective for fiscal years beginning after December 15, 2010 and for interim periods within those fiscal years. The adoption of this guidance is not expected to have a significant impact on the Company’s financial statements.
In February 2010, the FASB issued ASU 2010-08,Technical Corrections to Various Topics. ASU 2010-08 clarifies guidance on embedded derivatives and hedging. ASU 2010-08 is effective for interim and annual periods beginning after December 15, 2009. The adoption of this guidance did not have a material impact on the Company’s financial position or results of operation.
In March 2010, the FASB issued ASU 2010-11,Derivatives and Hedging. ASU 2010-11 provides clarification and related additional examples to improve financial reporting by resolving potential ambiguity about the breadth of the embedded credit derivative scope exception in ASC 815-15-15-8. ASU 2010-11 is effective at the beginning of the first fiscal quarter beginning after June 15, 2010. The adoption of this guidance did not have a significant impact on the Company’s financial statements.
43
NOTE 1 - SUMMARY OF SIGNIFICANT ACCOUNTING POLICIES (continued)
Recent Accounting Pronouncements (continued)
In April 2010, the FASB issued ASU 2010-18,Receivables (Topic 310): Effect of a Loan Modification When the Loan is a Part of a Pool That is Accounted for as a Single Asset – a consensus of the FASB Emerging Issues Task Force. ASU 2010-18 clarifies the treatment for a modified loan that was acquired as part of a pool of assets. Refinancing or restructuring the loan does not make it eligible for removal from the pool, the FASB said. The amendment will be effective for loans that are part of an asset pool and are modified during financial reporting periods that end July 15, 2010 or later and is not expected to have a significant impact on the Company’s financial statements.
In July 2010, FASB issued ASU 2010-20,Receivables (Topic 310): Disclosures about the Credit Quality of Financing Receivables and the Allowance for Credit Losses. ASU 2010-20 is intended to provide additional information to assist financial statement users in assessing an entity’s credit risk exposures and evaluating the adequacy of its allowance for credit losses. The disclosures as of the end of a reporting period are effective for interim and annual reporting periods ending on or after December 15, 2010. The disclosures about activity that occurs during a reporting period are effective for interim and annual reporting periods beginning on or after December 15, 2010. The amendments in ASU 2010-20 encourage, but do not require, comparative disclosures for earlier reporting periods that ended before initial adoption. However, an entity should provide comparative disclosures for those reporting periods ending after initial adoption. See Note 5 for the necessary disclosure.
In September 2010, the FASB issued ASU 2010-25,Plan Accounting – Defined Contribution Pension Plans. The amendments in this ASU require that participant loans be classified as notes receivable from participants, which are segregated from plan investments and measured at their unpaid principal balance plus any accrued but unpaid interest. The amendments in this update are effective for fiscal years ending after December 15, 2010 and are not expected to have a significant impact on the Company’s financial statements.
In October 2010, the FASB issued ASU 2010-26,Accounting for Costs Associated with Acquiring or Renewing Insurance Contracts. This ASU addresses the diversity in practice regarding the interpretation of which costs relating to the acquisition of new or renewal insurance contracts qualify for deferral. The amendments are effective for fiscal years and interim periods within those fiscal years, beginning after December 15, 2011 and are not expected to have a significant impact on the Company’s financial statements.
In December 2010, the FASB issued ASU 2010-29,Disclosure of Supplementary Pro Forma Information for Business Combinations. The amendments in this update specify that if a public entity presents comparative financial statements, the entity should disclose revenue and earnings of the combined entity as though the business combination(s) that occurred during the current year had occurred as of the beginning of the comparable prior annual reporting period only. The amendments also expand the supplemental pro forma disclosures under Topic 805 to include a description of the nature and amount of material, nonrecurring pro forma adjustments directly attributable to the business combination included in the reported pro forma revenue and earnings. The amendments in this Update are effective prospectively for business combinations for which the acquisition date is on or after the beginning of the first annual reporting period beginning on or after December 15, 2010. Early adoption is permitted. This ASU is not expected to have a significant impact on the Company’s financial statements.
Reclassification of Comparative Amounts
Certain comparative amounts for prior years have been reclassified to conform to current year presentations. The reclassified amounts did not affect net income or stockholders’ equity.
44
NOTE 2 - EARNINGS PER SHARE
There are no convertible securities that would affect the numerator in calculating basic and diluted earnings per share; therefore, net income as presented on the Consolidated Statement of Income will be used as the numerator. The following table sets forth the composition of the weighted-average common shares (denominator) used in the basic and diluted earnings per share computation.
| | | | | | | | | | | | |
| | | 2010 | | | 2009 | | | 2008 | |
| | | |
Weighted-average common shares outstanding | | | 1,646,138 | | | | 1,612,807 | | | | 1,589,258 | |
Average treasury stock shares | | | (54,100) | | | | (53,930) | | | | (53,100) | |
| | | | | | | | | | | | |
Weighted-average common shares and common stock equivalents used to calculate basic earnings per share | | | 1,592,038 | | | | 1,558,877 | | | | 1,536,158 | |
Additional common stock equivalents (stock options) used to calculate diluted earnings per share | | | 997 | | | | 21,125 | | | | 44,112 | |
| | | | | | | | | | | | |
Weighted-average common shares and common stock equivalents used to calculate diluted earnings per share | | | 1,593,035 | | | | 1,580,002 | | | | 1,580,270 | |
| | | | | | | | | | | | |
45
NOTE 3 - INVESTMENT SECURITIES
The amortized costs and fair value of investment securities at December 31 are summarized as follows (in thousands):
| | | | | | | | | | | | | | | | |
| | | 2010 | |
| | | Amortized
Cost | | | Gross
Unrealized
Gains | | | Gross
Unrealized
Losses | | | Fair
Value | |
AVAILABLE FOR SALE | | | | | | | | | | | | | | | | |
U.S. government agencies | | $ | 12,696 | | | $ | 107 | | | $ | (29 | ) | | $ | 12,774 | |
Mortgage-backed securities | | | 24,104 | | | | 218 | | | | (48 | ) | | | 24,274 | |
Obligations of states and political subdivisions: | | | | | | | | | | | | | | | | |
Taxable | | | 1,197 | | | | 13 | | | | (11 | ) | | | 1,199 | |
Tax-exempt | | | 28,026 | | | | 361 | | | | (408 | ) | | | 27,979 | |
Corporate securities | | | 4,265 | | | | 466 | | | | (1 | ) | | | 4,730 | |
Commercial paper | | | 8,099 | | | | - | | | | - | | | | 8,099 | |
| | | | | | | | | | | | | | | | |
Total debt securities | | | 78,387 | | | | 1,165 | | | | (497 | ) | | | 79,055 | |
| | | | |
Equity securities | | | 557 | | | | 114 | | | | (71 | ) | | | 600 | |
| | | | | | | | | | | | | | | | |
Total | | $ | 78,944 | | | $ | 1,279 | | | $ | (568 | ) | | $ | 79,655 | |
| | | | | | | | | | | | | | | | |
| |
| | | 2009 | |
| | | Amortized
Cost | | | Gross
Unrealized
Gains | | | Gross
Unrealized
Losses | | | Fair
Value | |
AVAILABLE FOR SALE | | | | | | | | | | | | | | | | |
U.S. government agencies | | $ | 22,178 | | | $ | 53 | | | $ | (111 | ) | | $ | 22,120 | |
Mortgage-backed securities | | | 4,182 | | | | 143 | | | | (20 | ) | | | 4,305 | |
Obligations of states and political subdivisions: | | | | | | | | | | | | | | | | |
Taxable | | | 400 | | | | 15 | | | | - | | | | 415 | |
Tax-exempt | | | 26,279 | | | | 452 | | | | (58 | ) | | | 26,673 | |
Corporate securities | | | 6,211 | | | | 426 | | | | (1 | ) | | | 6,636 | |
Commercial paper | | | 13,045 | | | | - | | | | - | | | | 13,045 | |
| | | | | | | | | | | | | | | | |
Total debt securities | | | 72,295 | | | | 1,089 | | | | (190 | ) | | | 73,194 | |
| | | | |
Equity securities | | | 565 | | | | 35 | | | | (166 | ) | | | 434 | |
| | | | | | | | | | | | | | | | |
Total | | $ | 72,860 | | | $ | 1,124 | | | $ | (356 | ) | | $ | 73,628 | |
| | | | | | | | | | | | | | | | |
46
NOTE 3 - INVESTMENT SECURITIES (continued)
The following table shows the Company’s fair value and gross unrealized losses, aggregated by investment category and length of time that the individual securities have been in a continuous unrealized loss position, at December 31 (in thousands):
| | | | | | | | | | | | | | | | | | | | | | | | |
| | | 2010 | |
| | | Less than Twelve Months | | | Twelve Months or Greater | | | Total | |
| | | Fair
Value | | | Gross
Unrealized
Losses | | | Fair
Value | | | Gross
Unrealized
Losses | | | Fair
Value | | | Gross
Unrealized
Losses | |
U.S. government agencies | | $ | 2,892 | | | $ | 28 | | | $ | 474 | | | $ | 1 | | | $ | 3,366 | | | $ | 29 | |
Mortgage-backed securities | | | 7,446 | | | | 48 | | | | - | | | | - | | | | 7,446 | | | | 48 | |
Obligations of states and political subdivisions | | | 10,864 | | | | 395 | | | | 223 | | | | 24 | | | | 11,087 | | | | 419 | |
Corporate securities | | | 999 | | | | 1 | | | | - | | | | - | | | | 999 | | | | 1 | |
| | | | | | | | | | | | | | | | | | | | | | | | |
Total debt securities | | | 22,201 | | | | 472 | | | | 697 | | | | 25 | | | | 22,898 | | | | 497 | |
Equity securities | | | 22 | | | | 1 | | | | 138 | | | | 70 | | | | 160 | | | | 71 | |
| | | | | | | | | | | | | | | | | | | | | | | | |
Total | | $ | 22,223 | | | $ | 473 | | | $ | 835 | | | $ | 95 | | | $ | 23,058 | | | $ | 568 | |
| | | | | | | | | | | | | | | | | | | | | | | | |
| |
| | | 2009 | |
| | | Less than Twelve Months | | | Twelve Months or Greater | | | Total | |
| | | Fair
Value | | | Gross
Unrealized
Losses | | | Fair
Value | | | Gross
Unrealized
Losses | | | Fair
Value | | | Gross
Unrealized
Losses | |
U.S. government agencies | | $ | 13,765 | | | $ | 111 | | | $ | - | | | $ | - | | | $ | 13,765 | | | $ | 111 | |
Mortgage-backed securities | | | 976 | | | | 19 | | | | 23 | | | | 1 | | | | 999 | | | | 20 | |
Obligations of states and political subdivisions | | | 4,442 | | | | 53 | | | | 343 | | | | 5 | | | | 4,785 | | | | 58 | |
Corporate securities | | | 131 | | | | 1 | | | | - | | | | - | | | | 131 | | | | 1 | |
| | | | | | | | | | | | | | | | | | | | | | | | |
Total debt securities | | | 19,314 | | | | 184 | | | | 366 | | | | 6 | | | | 19,680 | | | | 190 | |
Equity securities | | | 85 | | | | 4 | | | | 158 | | | | 162 | | | | 243 | | | | 166 | |
| | | | | | | | | | | | | | | | | | | | | | | | |
Total | | $ | 19,399 | | | $ | 188 | | | $ | 524 | | | $ | 168 | | | $ | 19,923 | | | $ | 356 | |
| | | | | | | | | | | | | | | | | | | | | | | | |
47
NOTE 3 - INVESTMENT SECURITIES (continued)
The Company reviews its position quarterly and has asserted that at December 31, 2010, the declines outlined in the above table represent temporary declines and the Company does not intend to sell and does not believe they will be required to sell these securities before recovery of their cost basis, which may be at maturity. There were 55 and 59 positions that were temporarily impaired at December 31, 2010 and December 31, 2009, respectively. The Company has concluded that the unrealized losses disclosed above are not other than temporary, but are the result of interest rate changes, sector credit ratings changes or company-specific ratings changes that are not expected to result in the non-collection of principal and interest during the period.
The amortized cost and estimated market values of debt securities at December 31, 2010, by contractual maturity, are shown below. Expected maturities of mortgage-backed securities will differ from contractual maturities because borrowers may have the right to call or prepay obligations with or without call or prepayment penalties (in thousands):
| | | | | | | | |
| | | Available for Sale | |
| | | Amortized
Cost | | | Fair
Value | |
Due in one year or less | | $ | 18,811 | | | $ | 18,888 | |
Due after one year through five years | | | 25,068 | | | | 25,426 | |
Due after five years through ten years | | | 15,797 | | | | 15,883 | |
Due after ten years | | | 18,711 | | | | 18,858 | |
| | | | | | | | |
| | |
Total debt securities | | $ | 78,387 | | | $ | 79,055 | |
| | | | | | | | |
During the fourth quarter of 2009, the Company recorded a transaction wherein a corporate bond held in the available for sale category was exchanged for various securities of the same issuer in conjunction with the reorganization of the issuer. The Company received five corporate bonds and 3,083 shares of common stock in exchange for the corporate bond. All new securities are held in the available for sale category. At the time of transfer, in accordance with generally accepted accounting principles, the Company recorded a pretax loss of $93 on the exchange.
The Company received proceeds of $5,478 and $1,262 from sales of securities in 2010 and 2009, respectively. Those sales represented gross gains of $24 in 2010, $52 in 2009 and gross losses of $74 in 2009. In addition, the Company recognized losses of $6 in 2010 and $27 in 2009 on equity merger transactions. There were no sales of investment securities during 2008. In 2008, the Company recorded an investment security loss of $3 resulting from a business combination where by the Company received a combination of the common stock of the acquirer in a non-monetary exchange and cash proceeds of $2. The Company recognized other than temporary impairment expense of $31 and $25 in 2010 and 2008, respectively. There were no such impairments in 2009.
Investment securities with amortized costs of $78,043 and $63,534 and estimated market value of $78,669 and $64,448 at December 31, 2010 and 2009, respectively, were pledged to secure deposits, short-term borrowings and for other purposes as required by law.
48
NOTE 4 - LOANS
Major classifications of loans at December 31 are as follows (in thousands):
| | | | | | | | |
| | | 2010 | | | 2009 | |
Loans secured by real estate: | | | | | | | | |
Construction and development | | $ | 12,472 | | | $ | 16,286 | |
Secured by farmland | | | 2,590 | | | | 1,684 | |
Secured by 1 - 4 family residential properties: | | | | | | | | |
Revolving, open-end loans secured by 1 - 4 family residential properties | | | 9,935 | | | | 8,657 | |
All other loans secured by 1 - 4 family residential properties | | | 81,665 | | | | 76,193 | |
Secured by nonfarm, nonresidential properties | | | 255,851 | | | | 243,014 | |
Commercial and industrial loans | | | 44,850 | | | | 42,502 | |
Loans to individuals for household, family, and other personal expenditures: | | | | | | | | |
Ready credit loans | | | 582 | | | | 680 | |
Other installment loans | | | 10,190 | | | | 12,189 | |
Other loans: | | | | | | | | |
Agricultural loans | | | 1,771 | | | | 1,426 | |
All other loans | | | 5,163 | | | | 7,381 | |
| | | | | | | | |
| | |
Loans, net of unearned income | | $ | 425,069 | | | $ | 410,012 | |
| | | | | | | | |
Real estate loans serviced for others which are not included in the Consolidated Balance Sheet totaled $109,662 and $103,986 at December 31, 2010 and 2009, respectively.
The following is a summary of past due and nonaccrual loans as of December 31 (in thousands):
| | | | | | | | |
| | | 2010 | |
| | | Past Due
90 days or more | | | Nonaccrual | |
Commercial real estate | | $ | 952 | | | $ | 15,626 | |
Residential real estate | | | 512 | | | | 35 | |
Commercial loans | | | 541 | | | | - | |
Installment loan | | | 44 | | | | 15 | |
Other loans | | | 39 | | | | - | |
| | | | | | | | |
| | |
Total | | $ | 2,088 | | | $ | 15,676 | |
| | | | | | | | |
| |
| | | 2009 | |
| | | Past Due
90 days or more | | | Nonaccrual | |
Construction and development | | $ | 6 | | | $ | - | |
Commercial real estate | | | 1,069 | | | | 5,667 | |
Residential real estate | | | 919 | | | | 299 | |
Commercial loans | | | 67 | | | | 1,524 | |
Installment loan | | | 61 | | | | 32 | |
Other loans | | | 30 | | | | - | |
| | | | | | | | |
| | |
Total | | $ | 2,152 | | | $ | 7,522 | |
| | | | | | | | |
49
NOTE 4 - LOANS (continued)
In the normal course of business, loans are extended to officers and directors, their families and corporations in which they are beneficially interested as stockholders, officers, or directors. A summary of loan activity for those officers and directors with aggregate loan balances in excess of $60,000 for the year ended December 31, 2010, is as follows (in thousands):
| | | | | | | | | | | | | | |
| 2009 | | | Additions | | | Amounts
Collected | | | 2010 | |
| | | |
| $ | 11,272 | | | $ | 7,829 | | | $ | 4,318 | | | $ | 14,783 | |
The Company’s primary business activity is with customers located within its local trade area. Generally, the Company grants commercial, residential and personal loans. The Company also selectively funds and purchases commercial and residential loans outside of its local trade area provided such loans meet the Company’s credit policy guidelines. At December 31, 2010 and 2009, the Company had approximately $107 million and $110 million, respectively, of outstanding loans to summer camps and recreational facilities in the northeastern United States. Although the Company has a diversified loan portfolio at December 31, 2010 and 2009, loans outstanding to individuals and businesses are dependent upon the local economic conditions in its immediate trade area.
NOTE 5 - ALLOWANCE FOR LOAN LOSSES
The total allowance reflects management’s estimate of loan losses inherent in the loan portfolio at the balance sheet date. The Company considers the allowance for loan losses of $7,741 adequate to cover loan losses inherent in the loan portfolio. The following table presents by portfolio segment, the allowance for loan losses for the year ended December 31, 2010 (in thousands):
| | | | | | | | | | | | | | | | | | | | | | | | |
| | | Commercial | | | Construction &
Development | | | Commercial
Real Estate | | | Consumer | | | Residential
Real Estate | | | Total | |
| | | | | | |
Loans individually evaluated for impairment | | $ | - | | | $ | - | | | $ | 1,774 | | | $ | - | | | $ | - | | | $ | 1,774 | |
| | | | | | |
Loans collectively evaluated for impairment | | | 634 | | | | 223 | | | | 3,945 | | | | 194 | | | | 971 | | | $ | 5,967 | |
| | | | | | | | | | | | | | | | | | | | | | | | |
| | | | | | |
Total balance | | $ | 634 | | | $ | 223 | | | $ | 5,719 | | | $ | 194 | | | $ | 971 | | | $ | 7,741 | |
| | | | | | | | | | | | | | | | | | | | | | | | |
Credit Quality Information
The following tables represent credit exposures by assigned grades for the year ended December 31, 2010. The grading analysis estimates the capability of the borrower to repay the contractual obligations of the loan agreements as scheduled or at all. The Company’s internal credit risk grading system is based on experiences with similarly graded loans.
The Company’s internally assigned grades are as follows:
Pass – loans which are protected by the current net worth and paying capacity of the obligor or by the value of the underlying collateral.
Special Mention – loans where a potential weakness or risk exists, which could cause a more serious problem if not corrected.
Substandard – loans that have a well-defined weakness based on objective evidence and are characterized by the distinct possibility that the Bank will sustain some loss if the deficiencies are not corrected.
50
NOTE 5 - ALLOWANCE FOR LOAN LOSSES (continued)
Credit Quality Information (continued)
Doubtful – loans classified as doubtful have all the weaknesses inherent in a substandard asset. In addition, these weaknesses make collection or liquidation in full highly questionable and improbable, based on existing circumstances.
Loss – loans classified as a loss are considered uncollectable, or of such value that continuance as an asset is not warranted.
Loans are graded by either independent loan review or internal review. Internally reviewed loans were assigned a risk weighting by the loan officer and approved by the loan committee, but have not undergone a formal loan review by an independent party. These loans are typically smaller dollar balances that have not experienced delinquency issues. Balances include gross loan value before unearned income and excluding overdrafts as of December 31, 2010 (in thousands):
| | | | | | | | | | | | | | | | | | | | | | | | |
| | | Loans Independently Reviewed | |
| | | Commercial | | | Construction &
Development | | | Commercial
Real Estate | | | Consumer | | | Residential
Real Estate | | | Total | |
Pass | | $ | 17,454 | | | $ | 3,034 | | | $ | 128,114 | | | $ | 54 | | | $ | 6,457 | | | $ | 155,113 | |
Special mention | | | 307 | | | | - | | | | 10,806 | | | | 31 | | | | 333 | | | | 11,477 | |
Substandard | | | 2,370 | | | | 1,774 | | | | 35,715 | | | | 8 | | | | 2,057 | | | | 41,924 | |
Doubtful | | | - | | | | - | | | | - | | | | 1 | | | | - | | | | 1 | |
Loss | | | - | | | | - | | | | - | | | | - | | | | - | | | | - | |
| | | | | | | | | | | | | | | | | | | | | | | | |
| | | | | | |
Total | | $ | 20,131 | | | $ | 4,808 | | | $ | 174,635 | | | $ | 94 | | | $ | 8,847 | | | $ | 208,515 | |
| | | | | | | | | | | | | | | | | | | | | | | | |
| |
| | | Loans Internally Reviewed | |
| | | Commercial | | | Construction &
Development | | | Commercial
Real Estate | | | Consumer | | | Residential
Real Estate | | | Total | |
Pass | | $ | 31,496 | | | $ | 7,693 | | | $ | 84,709 | | | $ | 10,634 | | | $ | 82,798 | | | $ | 217,330 | |
Special mention | | | - | | | | - | | | | - | | | | 45 | | | | 176 | | | | 221 | |
Substandard | | | - | | | | - | | | | - | | | | 13 | | | | - | | | | 13 | |
Doubtful | | | - | | | | - | | | | - | | | | - | | | | - | | | | - | |
Loss | | | - | | | | - | | | | - | | | | - | | | | - | | | | - | |
| | | | | | | | | | | | | | | | | | | | | | | | |
| | | | | | |
Total | | $ | 31,496 | | | $ | 7,693 | | | $ | 84,709 | | | $ | 10,692 | | | $ | 82,974 | | | $ | 217,564 | |
| | | | | | | | | | | | | | | | | | | | | | | | |
51
NOTE 5 - ALLOWANCE FOR LOAN LOSSES (continued)
Age Analysis of Past Due Loans by Class
The following is a table which includes an aging analysis of the recorded investment of past due loans as of December 31, 2010 including loans which are in nonaccrual status (in thousands):
| | | | | | | | | | | | | | | | | | | | | | | | | | | | |
| | | 30-59 Days
Past Due | | | 60-89 Days
Past Due | | | 90 Days
Or Greater | | | Total Past
Due | | | Total
Current | | | Total
Loans | | | Recorded
Investment >
90 Days and
Accruing | |
| | | | | | | |
Commercial | | $ | 487 | | | $ | 139 | | | $ | 580 | | | $ | 1,206 | | | $ | 50,578 | | | $ | 51,784 | | | $ | 580 | |
Construction and development | | | - | | | | - | | | | - | | | | - | | | | 12,472 | | | | 12,472 | | | | - | |
Commercial real estate | | | 55 | | | | 2,712 | | | | 16,044 | | | | 18,811 | | | | 239,630 | | | | 258,441 | | | | 952 | |
Consumer | | | 128 | | | | 30 | | | | 59 | | | | 217 | | | | 10,555 | | | | 10,772 | | | | 44 | |
Residential real estate | | | 221 | | | | 241 | | | | 547 | | | | 1,009 | | | | 90,591 | | | | 91,600 | | | | 512 | |
| | | | | | | | | | | | | | | | | | | | | | | | | | | | |
| | | | | | | |
Total | | $ | 891 | | | $ | 3,122 | | | $ | 17,230 | | | $ | 21,243 | | | $ | 403,826 | | | $ | 425,069 | | | $ | 2,088 | |
| | | | | | | | | | | | | | | | | | | | | | | | | | | | |
Impaired Loans
Management considers commercial loans and commercial real estate loans which are 90 days or more past due as impaired, and if warranted, includes the entire customer relationship in that status. These loans are analyzed to determine if it is probable that all amounts will not be collected according to the contractual terms of the loan agreement. If management determines that the value of the impaired loan is less than the recorded investment in the loan (net of previous charge-offs, deferred loan fees or costs and unamortized premium or discount), impairment is recognized through an allowance estimate or a charge-off to the allowance.
The following tables include the recorded investment and unpaid principal balances for impaired loans with the associated allowance amount, if applicable, as of December 31 (in thousands):
| | | | | | | | | | | | | | | | |
| | | 2010 | |
| | | Recorded
Investment | | | Unpaid
Principal
Balance | | | Related
Allowance | | | Average
Recorded
Investment | |
With no related allowance recorded: | | | | | | | | | | | | | | | | |
Commercial real estate | | $ | 5,775 | | | $ | 5,775 | | | $ | - | | | $ | 444 | |
| | | | |
With an allowance recorded: | | | | | | | | | | | | | | | | |
Commercial real estate | | $ | 9,754 | | | $ | 9,754 | | | $ | 1,774 | | | $ | 9,822 | |
| | | | |
Total: | | | | | | | | | | | | | | | | |
Commercial real estate | | $ | 15,529 | | | $ | 15,529 | | | $ | 1,774 | | | $ | 10,266 | |
52
NOTE 5 - ALLOWANCE FOR LOAN LOSSES (continued)
| | | | | | | | | | | | | | | | |
| | | 2009 | |
| | | Recorded
Investment | | | Unpaid
Principal
Balance | | | Related
Allowance | | | Average
Recorded
Investment | |
With no related allowance recorded: | | | | | | | | | | | | | | | | |
Commercial real estate | | $ | 1,861 | | | $ | 1,961 | | | $ | - | | | $ | 1,707 | |
| | | | |
With an allowance recorded: | | | | | | | | | | | | | | | | |
Commercial | | $ | 1,453 | | | $ | 1,453 | | | $ | 165 | | | $ | 1,535 | |
Commercial real estate | | $ | 3,806 | | | $ | 3,806 | | | $ | 1,103 | | | $ | 3,221 | |
Consumer | | $ | 155 | | | $ | 155 | | | $ | 5 | | | $ | 161 | |
Residential | | $ | 143 | | | $ | 143 | | | $ | 56 | | | $ | 147 | |
| | | | |
Total: | | | | | | | | | | | | | | | | |
Commercial | | $ | 1,453 | | | $ | 1,453 | | | $ | 165 | | | $ | 1,535 | |
Commercial real estate | | $ | 5,667 | | | $ | 5,767 | | | $ | 1,103 | | | $ | 4,928 | |
Consumer | | $ | 155 | | | $ | 155 | | | $ | 5 | | | $ | 161 | |
Residential | | $ | 143 | | | $ | 143 | | | $ | 56 | | | $ | 147 | |
No interest income was recognized in 2010 and 2009 for loans that were in impaired status.
Nonaccrual Loans
Loans are considered nonaccrual upon reaching 90 days delinquency, although the Company may be receiving partial payments of interest and partial repayments of principal on such loans. Loan that are well secured and in the process of collection may not be placed on nonaccrual status based upon management’s review of the specific loan. When a loan is placed in nonaccrual status, previously accrued but unpaid interest is deducted from interest income.
On the following table are the loans, presented by class, on nonaccrual status as of December 31, 2010 (in thousands):
| | | | |
Commercial real estate | | $ | 15,626 | |
Consumer | | | 15 | |
Residential real estate | | | 35 | |
| | | | |
| |
Total | | $ | 15,676 | |
| | | | |
Changes in the allowance for loan losses are as follows (in thousands):
| | | | | | | | | | | | |
| | | 2010 | | | 2009 | | | 2008 | |
Balance, beginning of year | | $ | 6,253 | | | $ | 5,416 | | | $ | 5,392 | |
Provision charged to operations | | | 1,750 | | | | 1,300 | | | | 950 | |
Recoveries credited to allowance | | | 55 | | | | 55 | | | | 82 | |
Losses charged to allowance | | | (317 | ) | | | (518 | ) | | | (1,008 | ) |
| | | | | | | | | | | | |
| | | |
Balance, end of year | | $ | 7,741 | | | $ | 6,253 | | | $ | 5,416 | |
| | | | | | | | | | | | |
53
NOTE 6 - PREMISES AND EQUIPMENT
A summary by asset classification at December 31 is as follows (in thousands):
| | | | | | | | |
| | | 2010 | | | 2009 | |
| | |
Land | | $ | 1,641 | | | $ | 1,417 | |
Premises and improvements | | | 10,628 | | | | 10,610 | |
Furniture and equipment | | | 4,029 | | | | 4,173 | |
Leasehold improvements | | | 1,683 | | | | 1,649 | |
| | | | | | | | |
Total, at cost | | | 17,981 | | | | 17,849 | |
Less accumulated depreciation | | | 7,409 | | | | 6,884 | |
| | | | | | | | |
| | |
Net premises and equipment | | $ | 10,572 | | | $ | 10,965 | |
| | | | | | | | |
Depreciation and amortization expense was $789, $811 and $533, in 2010, 2009 and 2008, respectively.
NOTE 7 - DEPOSITS
Deposits at December 31 are summarized as follows (in thousands):
| | | | | | | | |
| | | 2010 | | | 2009 | |
| | |
Demand - noninterest-bearing | | $ | 43,067 | | | $ | 39,687 | |
Demand - interest-bearing | | | 45,223 | | | | 39,584 | |
Money market | | | 66,284 | | | | 41,180 | |
Savings | | | 40,189 | | | | 37,288 | |
Time deposits of $100,000 or more | | | 142,170 | | | | 135,621 | |
Other time deposits | | | 117,801 | | | | 149,756 | |
| | | | | | | | |
| | |
Total | | $ | 454,734 | | | $ | 443,116 | |
| | | | | | | | |
The following table summarizes the maturity distribution of time deposits at December 31 (in thousands):
| | | | |
2011 | | $ | 217,264 | |
2012 | | | 19,811 | |
2013 | | | 6,801 | |
2014 | | | 6,326 | |
2015 | | | 9,769 | |
| | | | |
| |
Total | | $ | 259,971 | |
| | | | |
The following table summarizes the maturity distribution of certificates of deposit of $100,000 or more at December 31 (in thousands):
| | | | |
| | | 2010 | |
Three months or less | | $ | 35,754 | |
Four through six months | | | 40,559 | |
Seven through twelve months | | | 47,844 | |
Over twelve months | | | 18,013 | |
| | | | |
| |
Total | | $ | 142,170 | |
| | | | |
Interest expense on certificates of deposit of $100,000 or more amounted to $2,520, $2,859 and $3,073, for the years ended December 31, 2010, 2009 and 2008, respectively.
54
NOTE 8 - SHORT-TERM BORROWINGS
Short-term borrowings consist of borrowings from FHLB, ACBB, Federal Reserve of Philadelphia (“Fed”) and securities sold under agreements to repurchase. Average amounts outstanding during the year represent daily average balances and average interest rates represent interest expense divided by the related average balance.
The outstanding balances and related information for short-term borrowings at December 31 are summarized as follows (in thousands):
| | | | | | | | | | | | | | | | |
| | | 2010 | | | 2009 | |
| | | Amount | | | Rate | | | Amount | | | Rate | |
| | | | |
Balance at year-end | | $ | 13,006 | | | | .66 | % | | $ | 10,974 | | | | .65 | % |
Average balance outstanding during the year | | $ | 17,423 | | | | .82 | % | | $ | 15,488 | | | | .79 | % |
Maximum amount outstanding at any month-end | | $ | 23,371 | | | | | | | $ | 21,003 | | | | | |
The Bank has pledged, as collateral for the borrowings from FHLB, all stock in FHLB and certain other qualifying collateral. Investment securities with amortized costs of $15,781 and $14,452 and market values of $16,181 and $14,857, respectively, at December 31, 2010 and 2009, were pledged as collateral for the securities sold under agreements to repurchase.
The Bank has the capability to borrow additional funds through its credit arrangement with FHLB. FHLB borrowings are subject to annual renewal, incur no service charges and are secured by a blanket security agreement on certain investment securities, qualifying loans and the Bank’s investment in FHLB stock. At December 31, 2010, the Bank’s remaining borrowing capacity with FHLB was approximately $173 million. In addition, the Bank has a line of credit with ACBB in the amount of $5 million. The line is available on an unsecured basis for periods of fourteen calendar days. The Bank also has the ability to borrow overnight at the Fed discount window based on the level of collateral pledged. At December 31, 2010 the balance available was approximately $2.6 million.
NOTE 9 - OTHER BORROWED FUNDS
FHLB advances consist of separate fixed rate and convertible select-fixed to float rate loans at December 31 as follows (in thousands):
| | | | | | | | | | | | | | | | | | | | | | | | | | | | |
| | | Maturity Range | | | Weighted-
Average | | | Stated Interest
Rate Range | | | | | | | |
| Description | | From | | | To | | | Rate | | | From | | | To | | | 2010 | | | 2009 | |
| | |
| | | | | | | |
Fixed rate | | | 09/06/11 | | | | 09/17/12 | | | | 3.75 | % | | | 3.68 | % | | | 3.87 | % | | $ | 4,000 | | | $ | 6,000 | |
Fixed rate amortizing | | | 11/06/13 | | | | 01/26/26 | | | | 4.64 | % | | | 3.20 | % | | | 5.55 | % | | | 15,552 | | | | 17,402 | |
Convertible select-fixed to float | | | 02/18/10 | | | | 02/18/10 | | | | 5.91 | % | | | 5.91 | % | | | 5.91 | % | | | - | | | | 1,000 | |
| | | | | | | | | | | | | | | | | | | | | | | | | | | | |
| | | | | | | |
Total | | | | | | | | | | | | | | | | | | | | | | $ | 19,552 | | | $ | 24,402 | |
| | | | | | | | | | | | | | | | | | | | | | | | | | | | |
55
NOTE 9 - OTHER BORROWED FUNDS (continued)
The following table represents maturities/repayments and weighted average rates of the remaining FHLB advances (in thousands):
| | | | | | | | |
Year Ending December 31, | | Maturities/
Repayments | | | Weighted-
Average Rate | |
| | |
2011 | | $ | 4,434 | | | | 4.62% | |
2012 | | | 3,521 | | | | 4.73% | |
2013 | | | 2,071 | | | | 4.91% | |
2014 | | | 1,551 | | | | 4.99% | |
2015 | | | 1,359 | | | | 5.09% | |
2016 and beyond | | | 6,616 | | | | 5.16% | |
| | | | | | | | |
| | |
Total | | $ | 19,552 | | | | | |
| | | | | | | | |
NOTE 10 - DIVIDEND REINVESTMENT AND STOCK PURCHASE PLAN
The Company maintains a Dividend Reinvestment and Stock Purchase Plan (the “Plan”). Participation is available to all common stockholders. The Plan provides each participant with a simple and convenient method of purchasing additional common shares without payment of any brokerage commission or other service fees.
A participant in the Plan may elect to reinvest dividends on all or part of his or her shares to acquire additional common stock. A participant may withdraw from the Plan at any time. Stockholders purchased 19,805 shares in 2010, 18,824 shares in 2009 and 14,789 shares in 2008 through the Plan.
NOTE 11 - EMPLOYEE BENEFITS
Retirement Plan
The Bank maintains a section 401(k) employee savings and investment plan for substantially all employees and officers of the Bank. The Bank’s contribution to the plan is based on 100 percent matching of voluntary contributions up to 3 percent and 50 percent matching on the next 2 percent of individual compensation. Additionally, the Bank may contribute a discretionary amount each year. For each of the years of 2010, 2009 and 2008, the Board of Directors authorized an additional 1 percent, 2 percent and 4 percent, respectively, of each eligible employee’s compensation. Employee contributions are vested at all times, and Bank contributions are fully vested after five years. Contributions for 2010, 2009 and 2008 to this plan amounted to $212, $247 and $300, respectively.
Supplemental Retirement Plan
The Bank maintains a Salary Continuation Plan for the certain officers of the Bank to provide guaranteed consecutive postretirement payments totaling a predetermined amount over a ten or fifteen year period. Expenses for the years ended December 31, 2010, 2009 and 2008 amounted to $162, $156 and $150, respectively, and are included as a component of salaries and employee benefits.
56
NOTE 11 - EMPLOYEE BENEFITS (continued)
Stock Option Plan
The Company maintains an equity incentive plan that provides for granting incentive stock options and restricted stock awards to key officers and other employees of the Company and Bank, as determined by the Compensation Committee, and nonqualified stock options and restricted stock awards to nonemployee directors of the Company. A total of 125,000 shares of either authorized and unissued shares or authorized shares issued by and subsequently reacquired by the Company as treasury stock shall be issuable under the plans. The plan shall terminate after the tenth anniversary of the date of shareholder ratification. The per share exercise price of any option granted will not be less than the fair market value of a share of common stock on the date the option is granted. No options or restricted stock awards have yet been granted under this plan.
In addition, the Company maintains a stock incentive plan to grant incentive stock options to key officers and other employees of the Company and the Bank and a stock option plan to grant nonqualified stock options to nonemployee directors of the Company. These plans have expired for purposes of granting new options, however, previously granted options outstanding will expire as shown in the table below.
The following table presents share data related to the stock option plans:
| | | | | | | | | | | | | | | | |
| | | 2010 | | | Weighted-
Average
Exercise
Price | | | 2009 | | | Weighted-
Average
Exercise
Price | |
| | | | |
Outstanding, beginning of year | | | 66,782 | | | $ | 24.10 | | | | 68,832 | | | $ | 23.77 | |
Granted | | | - | | | | - | | | | - | | | | - | |
Exercised | | | (38,440 | ) | | | 15.93 | | | | (2,050 | ) | | | 13.10 | |
Forfeited | | | - | | | | - | | | | - | | | | - | |
| | | | | | | | | | | | | | | | |
| | | | |
Outstanding, end of year | | | 28,342 | | | $ | 35.18 | | | | 66,782 | | | $ | 24.10 | |
| | | | | | | | | | | | | | | | |
| | | | |
Exercisable at year-end | | | 28,342 | | | $ | 35.18 | | | | 66,782 | | | $ | 24.10 | |
The following table summarizes characteristics of stock options outstanding at December 31, 2010:
| | | | | | | | | | | | | | | | | | | | | | |
| | | | Outstanding | | | Exercisable | |
Exercise
Price | | | Shares | | | Average
Remaining
Life | | | Average
Exercise
Price | | | Shares | | | Average
Exercise
Price | |
| $ | 32.55 | | | | 2,000 | | | | 2.85 | | | $ | 32.55 | | | | 2,000 | | | $ | 32.55 | |
| $ | 34.00 | | | | 7,712 | | | | 4.96 | | | $ | 34.00 | | | | 7,712 | | | $ | 34.00 | |
| $ | 35.95 | | | | 18,630 | | | | 4.73 | | | $ | 35.95 | | | | 18,630 | | | $ | 35.95 | |
| | | | | | | | | | | | | | | | | | | | | | |
| | | | | |
| | Total | | | | 28,342 | | | | | | | | Total | | | | 28,342 | | | | | |
| | | | | | | | | | | | | | | | | | | | | | |
57
NOTE 12 - INCOME TAXES
Federal income tax expense at December 31 consists of the following (in thousands):
| | | | | | | | | | | | |
| | | 2010 | | | 2009 | | | 2008 | |
| | | |
Currently payable | | $ | 2,386 | | | $ | 1,890 | | | $ | 2,742 | |
Deferred taxes | | | (728 | ) | | | (338 | ) | | | 4 | |
| | | | | | | | | | | | |
| | | |
Total provision | | $ | 1,658 | | | $ | 1,552 | | | $ | 2,746 | |
| | | | | | | | | | | | |
The components of the net deferred tax assets and liabilities at December 31 are as follows (in thousands):
| | | | | | | | |
| | | 2010 | | | 2009 | |
Deferred tax assets: | | | | | | | | |
Allowance for loan losses | | $ | 2,632 | | | $ | 1,923 | |
Salary continuation plan | | | 312 | | | | 273 | |
Mortgage servicing rights | | | 35 | | | | 35 | |
Nonaccrual loans | | | 315 | | | | 157 | |
Unrealized loss on nonmonetary exchange | | | 22 | | | | 10 | |
Reorganization on investment securities | | | 31 | | | | - | |
| | | | | | | | |
Total | | | 3,347 | | | | 2,398 | |
| | | | | | | | |
| | |
Deferred tax liabilities: | | | | | | | | |
Premises and equipment | | | 682 | | | | 753 | |
Deferred loan origination fees, net | | | 86 | | | | 111 | |
PA shares tax | | | 38 | | | | 23 | |
Recapture of previous bad debt | | | 160 | | | | - | |
Partnership investment | | | 140 | | | | - | |
Unrealized gain on investment securities | | | 242 | | | | 261 | |
| | | | | | | | |
Total | | | 1,348 | | | | 1,148 | |
| | | | | | | | |
| | |
Net deferred tax assets | | $ | 1,999 | | | $ | 1,250 | |
| | | | | | | | |
No valuation allowance was established at December 31, 2010 and 2009, in view of the Company’s ability to carryback taxes paid in previous years and certain tax strategies and anticipated future taxable income as evidenced by the Company’s earnings potential.
58
NOTE 12 - INCOME TAXES (continued)
A reconciliation between the expected statutory income tax rate and the effective income tax rate follows (in thousands):
| | | | | | | | | | | | | | | | | | | | | | | | |
| | | 2010 | | | 2009 | | | 2008 | |
| | | Amount | | | % of
Pretax
Income | | | Amount | | | % of
Pretax
Income | | | Amount | | | % of
Pretax
Income | |
| | | | | | |
Provision at statutory rate | | $ | 2,318 | | | | 34.0 | % | | $ | 2,024 | | | | 34.0 | % | | $ | 3,110 | | | | 34.0 | % |
Tax-exempt income | | | (444 | ) | | | (6.5 | ) | | | (428 | ) | | | (7.2 | ) | | | (306 | ) | | | (3.4 | ) |
BOLI earnings | | | (144 | ) | | | (2.1 | ) | | | (139 | ) | | | (2.3 | ) | | | (131 | ) | | | (1.4 | ) |
Nondeductible interest | | | 37 | | | | .5 | | | | 52 | | | | .9 | | | | 42 | | | | .5 | |
Partnership investment tax credit | | | (155 | ) | | | (2.3 | ) | | | - | | | | - | | | | - | | | | - | |
Other, net | | | 46 | | | | .7 | | | | 43 | | | | .7 | | | | 31 | | | | .4 | |
| | | | | | | | | | | | | | | | | | | | | | | | |
| | | | | | |
Effective income tax and rate | | $ | 1,658 | | | | 24.3 | % | | $ | 1,552 | | | | 26.1 | % | | $ | 2,746 | | | | 30.1 | % |
| | | | | | | | | | | | | | | | | | | | | | | | |
U.S. generally accepted accounting principles prescribe a recognition threshold and a measurement attribute for the financial statement recognition and measurement of a tax position taken or expected to be taken in a tax return. Benefits from tax positions should be recognized in the financial statements only when it is more likely than not that the tax position will be sustained upon examination by the appropriate taxing authority that would have full knowledge of all relevant information. A tax position that meets the more-likely-than-not recognition threshold is measured at the largest amount of benefit that is greater than 50 percent likely of being realized upon ultimate settlement. Tax positions that previously failed to meet the more-likely-than-not recognition threshold should be recognized in the first subsequent financial reporting period in which that threshold is met. Previously recognized tax positions that no longer meet the more-likely-than-not recognition threshold should be derecognized in the first subsequent financial reporting period in which that threshold is no longer met.
There is currently no liability for uncertain tax positions and no known unrecognized tax benefits. The Company recognizes, when applicable, interest and penalties related to unrecognized tax benefits in the provision for income taxes in the Consolidated Statement of Income. The Company’s federal and state income tax returns for taxable years through 2006 have been closed for purposes of examination by the Internal Revenue Service and the Pennsylvania Department of Revenue.
NOTE 13 - COMMITMENTS AND CONTINGENT LIABILITIES
Commitments
In the normal course of business, there are outstanding commitments and contingent liabilities such as commitments to extend credit, financial guarantees and letters of credit that are not reflected in the accompanying consolidated financial statements. The Company does not anticipate any losses as a result of these transactions. These instruments involve, to varying degrees, elements of credit and interest rate risk in excess of the amount recognized in the Consolidated Balance Sheet. The contractual or notional amounts of those instruments reflect the extent of involvement the Company has in the particular classes of financial instruments.
59
NOTE 13 - COMMITMENTS AND CONTINGENT LIABILITIES (continued)
Commitments (continued)
Financial instruments whose contractual amounts represent credit risk at December 31 are as follows (in thousands):
| | | | | | | | |
| | | 2010 | | | 2009 | |
Commitments to extend credit | | $ | 54,204 | | | $ | 55,235 | |
Standby letters of credit | | $ | 11,956 | | | $ | 5,782 | |
Commitments to extend credit are agreements to lend to a customer as long as there is no violation of any condition established in the contract. Commitments generally have fixed expiration dates or other termination clauses and may require payment of a fee. Since many of the commitments are expected to expire without being drawn upon, the total commitment amounts do not necessarily represent future cash requirements.
Standby letters of credit represent conditional commitments issued by the Company to guarantee the performance of a customer to a third party. These instruments are issued primarily to support bid or performance-related contracts. The coverage period for these instruments is typically a one year period with an annual renewal option subject to prior approval by management. Fees earned from the issuance of these letters are recognized at the expiration of the coverage period.
At December 18, 2008, the Company entered into an Agreement of Limited Partnership which would generate low income housing credits for use in future periods. The agreement states the Bank will acquire a 33.33% interest in the partnership at a cost of $3,109. The first installment of this investment in the amount of $2,729 was made on January 16, 2009 with the remainder to be paid in 2011.
At December 31, 2010, the minimum rental commitments for all non-cancelable leases are as follows (in thousands):
| | | | |
2011 | | $ | 177 | |
2012 | | | 171 | |
2013 | | | 85 | |
2014 | | | 41 | |
2015 | | | 24 | |
2016 and thereafter | | | - | |
| | | | |
| |
Total | | $ | 498 | |
| | | | |
Contingent Liabilities
The Company and its subsidiary are involved in various legal actions from the normal course of business activities. Management believes the liability, if any, arising from such actions will not have a material adverse effect on the Company’s financial position.
NOTE 14 - REGULATORY RESTRICTIONS
Cash and Due From Banks
The district Federal Reserve Bank requires the Bank to maintain certain average reserve balances. As of each of the years ended December 31, 2010 and 2009, the Bank had required reserves of $225, composed of vault cash and a depository amount held directly with the Federal Reserve Bank.
60
NOTE 14 - REGULATORY RESTRICTIONS (continued)
Dividends
The Pennsylvania Banking Code restricts the availability of capital funds for payment of dividends by all state-chartered banks to the surplus of the Bank. Accordingly, at December 31, 2010, the balance in the capital surplus account totaling approximately $1,756 is unavailable for dividends.
NOTE 15 - REGULATORY CAPITAL REQUIREMENTS
Federal regulations require the Company and the Bank to maintain minimum amounts of capital. Specifically, each is required to maintain certain minimum dollar amounts and ratios of Total and Tier I capital to risk-weighted assets and of Tier I capital to average total assets.
In addition to the capital requirements, the Federal Deposit Insurance Corporation Improvement Act (“FDICIA”) established five capital categories ranging from “well capitalized” to “critically undercapitalized.” Should any institution fail to meet the requirements to be considered “adequately capitalized,” it would become subject to a series of increasingly restrictive regulatory actions.
As of December 31, 2010 and 2009, the FDIC categorized the Bank as well capitalized under the regulatory framework for prompt corrective action. To be classified as a well capitalized financial institution, Total risk-based, Tier 1 risk-based and Tier 1 Leverage capital ratios must be at least 10 percent, 6 percent and 5 percent, respectively.
The Company’s actual capital ratios at December 31 are presented in the following table, which shows the Company met all regulatory capital requirements. The capital position of the Bank does not differ significantly from the Company’s (in thousands):
| | | | | | | | | | | | | | | | |
| | | 2010 | | | 2009 | |
| | | Amount | | | Ratio | | | Amount | | | Ratio | |
| | | | |
Total Capital | | | | | | | | | | | | | | | | |
(to Risk-Weighted Assets) | | | | | | | | | | | | | | | | |
| | | | |
Actual | | $ | 55,933 | | | | 12.22 | % | | $ | 52,116 | | | | 11.73 | % |
For capital adequacy purposes | | $ | 36,616 | | | | 8.00 | % | | $ | 35,556 | | | | 8.00 | % |
To be well capitalized | | $ | 45,770 | | | | 10.00 | % | | $ | 44,445 | | | | 10.00 | % |
| | | | |
Tier I Capital | | | | | | | | | | | | | | | | |
(to Risk-Weighted Assets) | | | | | | | | | | | | | | | | |
| | | | |
Actual | | $ | 50,154 | | | | 10.96 | % | | $ | 46,552 | | | | 10.47 | % |
For capital adequacy purposes | | $ | 18,308 | | | | 4.00 | % | | $ | 17,778 | | | | 4.00 | % |
To be well capitalized | | $ | 27,462 | | | | 6.00 | % | | $ | 26,667 | | | | 6.00 | % |
| | | | |
Tier I Capital | | | | | | | | | | | | | | | | |
(to Average Assets) | | | | | | | | | | | | | | | | |
| | | | |
Actual | | $ | 50,154 | | | | 9.20 | % | | $ | 46,552 | | | | 9.47 | % |
For capital adequacy purposes | | $ | 21,815 | | | | 4.00 | % | | $ | 19,658 | | | | 4.00 | % |
To be well capitalized | | $ | 27,269 | | | | 5.00 | % | | $ | 24,572 | | | | 5.00 | % |
61
NOTE 16 - FAIR VALUE MEASUREMENTS
The following disclosures show the hierarchal disclosure framework associated with the level of pricing observations utilized in measuring assets and liabilities at fair value. The three broad levels defined by U.S. generally accepted accounting principles are as follows:
| | |
| Level I: | | Quoted prices are available in active markets for identical assets or liabilities as of the reported date. |
| |
| Level II: | | Pricing inputs are other than quoted prices in active markets, which are either directly or indirectly observable as of the reported date. The nature of these assets and liabilities include items for which quoted prices are available but traded less frequently, and items that are fair valued using other financial instruments, the parameters of which can be directly observed. |
| |
| Level III: | | Valuations derived from valuation techniques in which one or more significant inputs or significant value drivers are unobservable. |
This hierarchy requires the use of observable market data when available.
The following tables present the assets reported on the Consolidated Balance Sheet at their fair value as of December 31, by level within the fair value hierarchy. Financial assets and liabilities are classified in their entirety based on the lowest level of input that is significant to the fair value measurement (in thousands):
| | | | | | | | | | | | | | | | |
| | | 2010 | |
| | | Level 1 | | | Level II | | | Level III | | | Total | |
Assets: | | | | | | | | | | | | | | | | |
U.S. government agencies | | $ | - | | | $ | 12,774 | | | $ | - | | | $ | 12,774 | |
Mortgage-backed securities | | | - | | | | 24,274 | | | | - | | | | 24,274 | |
Obligations of states and political subdivisions: | | | | | | | | | | | | | | | | |
Taxable | | | - | | | | 1,199 | | | | - | | | | 1,199 | |
Tax-exempt | | | - | | | | 27,979 | | | | - | | | | 27,979 | |
Corporate securities | | | - | | | | 4,730 | | | | - | | | | 4,730 | |
Commerical paper | | | 8,099 | | | | - | | | | - | | | | 8,099 | |
| | | | | | | | | | | | | | | | |
Total debt securities | | | 8,099 | | | | 70,956 | | | | - | | | | 79,055 | |
| | | | |
Equity securities | | | 600 | | | | - | | | | - | | | | 600 | |
| | | | | | | | | | | | | | | | |
| | | | |
Total | | $ | 8,699 | | | $ | 70,956 | | | $ | - | | | $ | 79,655 | |
| | | | | | | | | | | | | | | | |
| |
| | | 2009 | |
| | | Level 1 | | | Level II | | | Level III | | | Total | |
Assets: | | | | | | | | | | | | | | | | |
U.S. government agencies | | $ | - | | | $ | 22,120 | | | $ | - | | | $ | 22,120 | |
Mortgage-backed securities | | | - | | | | 4,305 | | | | - | | | | 4,305 | |
Obligations of states and political subdivisions: | | | | | | | | | | | | | | | | |
Taxable | | | - | | | | 415 | | | | - | | | | 415 | |
Tax-exempt | | | - | | | | 26,673 | | | | - | | | | 26,673 | |
Corporate securities | | | - | | | | 6,636 | | | | - | | | | 6,636 | |
Commerical paper | | | 13,045 | | | | - | | | | - | | | | 13,045 | |
| | | | | | | | | | | | | | | | |
Total debt securities | | | 13,045 | | | | 60,149 | | | | - | | | | 73,194 | |
| | | | |
Equity securities | | | 434 | | | | - | | | | - | | | | 434 | |
| | | | | | | | | | | | | | | | |
| | | | |
Total | | $ | 13,479 | | | $ | 60,149 | | | $ | - | | | $ | 73,628 | |
| | | | | | | | | | | | | | | | |
62
NOTE 16 - FAIR VALUE MEASUREMENTS (continued)
The following tables present the assets measured on a nonrecurring basis on the Consolidated Balance Sheet at their fair value as of December 31 by level within the fair value hierarchy. Impaired loans that are collateral dependent are written down to fair value through the establishment of specific reserves. Techniques used to value the collateral that secure the impaired loan include: quoted market prices for identical assets classified as Level I inputs; observable inputs, employed by certified appraisers, for similar assets classified as Level II inputs. In cases where valuation techniques included inputs that are unobservable and are based on estimates and assumptions developed by management based on the best information available under each circumstance, the asset valuation is classified as Level III inputs (in thousands):
| | | | | | | | | | | | | | | | |
| | | 2010 | |
| | | Level 1 | | | Level II | | | Level III | | | Total | |
Assets measured on a nonrecurring basis: | | | | | | | | | | | | | | | | |
Impaired loans | | $ | - | | | $ | 13,755 | | | $ | - | | | $ | 13,755 | |
Other real estate owned | | $ | - | | | $ | 960 | | | $ | - | | | $ | 960 | |
Mortgage servicing rights | | $ | - | | | $ | - | | | $ | 549 | | | $ | 549 | |
| |
| | | 2009 | |
| | | Level 1 | | | Level II | | | Level III | | | Total | |
Assets measured on a nonrecurring basis: | | | | | | | | | | | | | | | | |
Impaired loans | | $ | - | | | $ | 4,564 | | | $ | 1,525 | | | $ | 6,089 | |
Other real estate owned | | $ | - | | | $ | 389 | | | $ | - | | | $ | 389 | |
Mortgage servicing rights | | $ | - | | | $ | - | | | $ | 583 | | | $ | 583 | |
NOTE 17 - FAIR VALUE DISCLOSURE
The estimated fair values of the Company’s financial instruments at December 31 are as follows (in thousands):
| | | | | | | | | | | | | | | | |
| | | 2010 | | | 2009 | |
| | | Carrying
Value | | | Fair
Value | | | Carrying
Value | | | Fair
Value | |
Financial assets: | | | | | | | | | | | | | | | | |
Cash and cash equivalents | | $ | 10,652 | | | $ | 10,652 | | | $ | 21,287 | | | $ | 21,287 | |
Investment securities | | $ | 79,655 | | | $ | 79,655 | | | $ | 73,628 | | | $ | 73,628 | |
Fixed annuity | | $ | 1,500 | | | $ | 1,500 | | | $ | - | | | $ | - | |
Net loans | | $ | 417,328 | | | $ | 434,472 | | | $ | 403,759 | | | $ | 419,825 | |
Accrued interest receivable | | $ | 1,888 | | | $ | 1,888 | | | $ | 1,842 | | | $ | 1,842 | |
Regulatory stock | | $ | 1,725 | | | $ | 1,725 | | | $ | 1,741 | | | $ | 1,741 | |
Bank-owned life insurance | | $ | 9,545 | | | $ | 9,545 | | | $ | 9,175 | | | $ | 9,175 | |
Mortgage servicing rights | | $ | 549 | | | $ | 549 | | | $ | 583 | | | $ | 583 | |
| | | | |
Financial liabilities: | | | | | | | | | | | | | | | | |
Deposits | | $ | 454,734 | | | $ | 456,991 | | | $ | 443,116 | | | $ | 446,972 | |
Short-term borrowings | | $ | 13,006 | | | $ | 13,006 | | | $ | 10,974 | | | $ | 10,974 | |
Other borrowed funds | | $ | 19,552 | | | $ | 20,923 | | | $ | 24,402 | | | $ | 25,964 | |
Accrued interest payable | | $ | 679 | | | $ | 679 | | | $ | 1,080 | | | $ | 1,080 | |
63
NOTE 17 - FAIR VALUE DISCLOSURE (continued)
Financial instruments are defined as cash, evidence of ownership interest in an entity, or a contract which creates an obligation or right to receive or deliver cash or another financial instrument from/to a second entity on potentially favorable or unfavorable terms.
Fair value is defined as the amount at which a financial instrument could be exchanged in a current transaction between willing parties other than in a forced or liquidation sale. If a quoted market price is available for a financial instrument, the estimated fair value would be calculated based upon the market price per trading unit of the instrument.
If no readily available market exists, the fair value estimates for financial instruments should be based upon management’s judgment regarding current economic conditions, interest rate risk, expected cash flows, future estimated losses and other factors as determined through various option pricing formulas or simulation modeling. As many of these assumptions result from judgments made by management based upon estimates that are inherently uncertain, the resulting estimated fair values may not be indicative of the amount realizable in the sale of a particular financial instrument. In addition, changes in assumptions on which the estimated fair values are based may have a significant impact on the resulting estimated fair values.
As certain assets such as deferred tax assets and premises and equipment are not considered financial instruments, the estimated fair value of financial instruments would not represent the full value of the Company.
The Company employed simulation modeling in determining the estimated fair value of financial instruments for which quoted market prices were not available based upon the following assumptions:
Cash and Cash Equivalents, Accrued Interest Receivable, Regulatory Stock and Accrued Interest Payable
The fair value is equal to the current carrying value.
Investment Securities
The fair value of investment securities available for sale is equal to the available quoted market price. If no quoted market price is available, fair value is estimated using the quoted market price for similar securities.
Fixed Annuity
The fair value is equal to the current carrying value.
Loans and Mortgage Servicing Rights
The fair value is estimated by discounting future cash flows using current market inputs at which loans with similar terms and qualities would be made to borrowers of similar credit quality. Where quoted market prices were available, primarily for certain residential mortgage loans, such market rates were utilized as estimates for fair value.
Deposits, Short-Term Borrowings and Other Borrowed Funds
The fair values of certificates of deposit and other borrowed funds are based on the discounted value of contractual cash flows. The discount rates are estimated using quoted market rates currently offered for similar instruments with similar remaining maturities. Demand, savings and money market deposit accounts are valued at the amount payable on demand as of year-end.
64
NOTE 17 - FAIR VALUE DISCLOSURE (continued)
Bank-Owned Life Insurance
The fair value is equal to the cash surrender value of the life insurance policies.
Commitments to Extend Credit and Standby Letters of Credit
These financial instruments are generally not subject to sale and estimated fair values are not readily available. The carrying value, represented by the net deferred fee arising from the unrecognized commitment or letter of credit and the fair value, determined by discounting the remaining contractual fee over the term of the commitment using fees currently charged to enter into similar agreements with similar credit risk, are not considered material for disclosure. The contractual amounts of unfunded commitments and letters of credit are presented in Note 13.
NOTE 18 - PARENT COMPANY
Following are condensed financial statements for the parent company:
CONDENSED BALANCE SHEET
| | | | | | | | |
| | | December 31, | |
| (In thousands) | | 2010 | | | 2009 | |
Assets | | | | | | | | |
Cash and due from banks | | $ | 1,080 | | | $ | 1,364 | |
Investment securities available for sale | | | 455 | | | | 349 | |
Investment in bank subsidiary | | | 49,025 | | | | 45,379 | |
Other assets | | | 704 | | | | 596 | |
| | | | | | | | |
| | |
Total Assets | | $ | 51,264 | | | $ | 47,688 | |
| | | | | | | | |
| | |
Liabilities | | | | | | | | |
Dividends payable | | $ | 575 | | | $ | 561 | |
Other liabilities | | | 10 | | | | 10 | |
| | | | | | | | |
| | |
Total Liabilities | | | 585 | | | | 571 | |
| | |
Stockholders’ Equity | | | 50,679 | | | | 47,117 | |
| | | | | | | | |
| | |
Total Liabilities and Stockholders’ Equity | | $ | 51,264 | | | $ | 47,688 | |
| | | | | | | | |
65
NOTE 18 - PARENT COMPANY (continued)
CONDENSED STATEMENT OF INCOME
| | | | | | | | | | | | |
| | | Year Ended December 31, | |
| | | 2010 | | | 2009 | | | 2008 | |
(In thousands) | | | | | | | | | | | | |
Dividends from bank subsidiary | | $ | 1,500 | | | $ | 800 | | | $ | 2,575 | |
Dividends on investment securities | | | 8 | | | | 10 | | | | 19 | |
Investment securities losses | | | (37 | ) | | | (27 | ) | | | (28 | ) |
| | | | | | | | | | | | |
Total income | | | 1,471 | | | | 783 | | | | 2,566 | |
| | | |
Noninterest expense | | | 124 | | | | 92 | | | | 89 | |
| | | | | | | | | | | | |
| | | |
Net income before undistributed earnings of bank subsidiary and income taxes | | | 1,347 | | | | 691 | | | | 2,477 | |
Undistributed earnings of bank subsidiary | | | 3,758 | | | | 3,672 | | | | 3,886 | |
Income tax benefit | | | (54 | ) | | | (39 | ) | | | (38 | ) |
| | | | | | | | | | | | |
| | | |
Net Income | | $ | 5,159 | | | $ | 4,402 | | | $ | 6,401 | |
| | | | | | | | | | | | |
CONDENSED STATEMENT OF CASH FLOWS
| | | | | | | | | | | | |
| | | Year Ended December 31, | |
| (In thousands) | | 2010 | | | 2009 | | | 2008 | |
Operating Activities | | | | | | | | | | | | |
Net income | | $ | 5,159 | | | $ | 4,402 | | | $ | 6,401 | |
Adjustments to reconcile net income to net cash provided by operating activities: | | | | | | | | | | | | |
Undistributed earnings of bank subsidiary | | | (3,758 | ) | | | (3,672 | ) | | | (3,886 | ) |
Investment securities losses | | | 37 | | | | 27 | | | | 28 | |
Other, net | | | (148 | ) | | | 107 | | | | 212 | |
| | | | | | | | | | | | |
Net cash provided by operating activities | | | 1,290 | | | | 864 | | | | 2,755 | |
| | | | | | | | | | | | |
| | | |
Investing Activities | | | | | | | | | | | | |
Purchases of investment securities | | | (28 | ) | | | (10 | ) | | | (204 | ) |
Proceeds from merger of investment securities | | | - | | | | - | | | | 2 | |
| | | | | | | | | | | | |
Net cash used for investing activities | | | (28 | ) | | | (10 | ) | | | (202 | ) |
| | | | | | | | | | | | |
| | | |
Financing Activities | | | | | | | | | | | | |
Purchase of treasury stock | | | - | | | | (35 | ) | | | - | |
Proceeds from exercise of stock options | | | 740 | | | | 37 | | | | 556 | |
Cash dividends paid | | | (2,286 | ) | | | (2,244 | ) | | | (1,961 | ) |
| | | | | | | | | | | | |
Net cash used for financing activities | | | (1,546 | ) | | | (2,242 | ) | | | (1,405 | ) |
| | | | | | | | | | | | |
| | | |
Increase (decrease) in cash and cash equivalents | | | (284 | ) | | | (1,388 | ) | | | 1,148 | |
| | | |
Cash at beginning of year | | | 1,364 | | | | 2,752 | | | | 1,604 | |
| | | | | | | | | | | | |
| | | |
Cash at end of year | | $ | 1,080 | | | $ | 1,364 | | | $ | 2,752 | |
| | | | | | | | | | | | |
66
NOTE 19 - QUARTERLY DATA (unaudited)
The Company’s selected quarterly financial data is presented in the following tables (in thousands, except per share data):
| | | | | | | | | | | | | | | | |
| | | Three Months Ended | |
| | | March 31,
2010 | | | June 30,
2010 | | | September 30,
2010 | | | December 31,
2010 | |
Total interest income | | $ | 6,045 | | | $ | 6,108 | | | $ | 6,233 | | | $ | 6,288 | |
Total interest expense | | | 2,078 | | | | 2,001 | | | | 1,737 | | | | 1,504 | |
| | | | | | | | | | | | | | | | |
Net interest income | | | 3,967 | | | | 4,107 | | | | 4,496 | | | | 4,784 | |
Provision for loan losses | | | 250 | | | | 330 | | | | 520 | | | | 650 | |
| | | | | | | | | | | | | | | | |
Net interest income after provision for loan losses | | | 3,717 | | | | 3,777 | | | | 3,976 | | | | 4,134 | |
Total noninterest income | | | 961 | | | | 1,093 | | | | 1,018 | | | | 988 | |
Total noninterest expense | | | 3,200 | | | | 3,259 | | | | 3,248 | | | | 3,140 | |
| | | | | | | | | | | | | | | | |
Income before income taxes | | | 1,478 | | | | 1,611 | | | | 1,746 | | | | 1,982 | |
Income taxes | | | 376 | | | | 426 | | | | 471 | | | | 385 | |
| | | | | | | | | | | | | | | | |
| | | | |
Net income | | $ | 1,102 | | | $ | 1,185 | | | $ | 1,275 | | | $ | 1,597 | |
| | | | | | | | | | | | | | | | |
| | | | |
Per share data: | | | | | | | | | | | | | | | | |
| | | | |
Net income | | | | | | | | | | | | | | | | |
Basic | | $ | .70 | | | $ | .74 | | | $ | .80 | | | $ | 1.00 | |
Diluted | | $ | .70 | | | $ | .74 | | | $ | .80 | | | $ | 1.00 | |
| | | | |
Weighted-average shares outstanding: | | | | | | | | | | | | | | | | |
Basic | | | 1,575,103 | | | | 1,596,768 | | | | 1,597,745 | | | | 1,598,218 | |
Diluted | | | 1,575,150 | | | | 1,598,818 | | | | 1,599,302 | | | | 1,599,933 | |
67
NOTE 19 - QUARTERLY DATA (unaudited) (continued)
| | | | | | | | | | | | | | | | |
| | | Three Months Ended | |
| | | March 31,
2009 | | | June 30,
2009 | | | September 30,
2009 | | | December 31,
2009 | |
| | | | |
Total interest income | | $ | 6,166 | | | $ | 6,135 | | | $ | 6,123 | | | $ | 6,093 | |
Total interest expense | | | 2,185 | | | | 2,212 | | | | 2,208 | | | | 2,145 | |
| | | | | | | | | | | | | | | | |
Net interest income | | | 3,981 | | | | 3,923 | | | | 3,915 | | | | 3,948 | |
Provision for loan losses | | | 368 | | | | 272 | | | | 260 | | | | 400 | |
| | | | | | | | | | | | | | | | |
Net interest income after provision for loan losses | | | 3,613 | | | | 3,651 | | | | 3,655 | | | | 3,548 | |
Total noninterest income | | | 899 | | | | 1,031 | | | | 1,027 | | | | 1,001 | |
Total noninterest expense | | | 3,051 | | | | 3,285 | | | | 3,191 | | | | 2,944 | |
| | | | | | | | | | | | | | | | |
Income before income taxes | | | 1,461 | | | | 1,397 | | | | 1,491 | | | | 1,605 | |
Income taxes | | | 384 | | | | 336 | | | | 405 | | | | 427 | |
| | | | | | | | | | | | | | | | |
| | | | |
Net income | | $ | 1,077 | | | $ | 1,061 | | | $ | 1,086 | | | $ | 1,178 | |
| | | | | | | | | | | | | | | | |
| | | | |
Per share data: | | | | | | | | | | | | | | | | |
Net income | | | | | | | | | | | | | | | | |
Basic | | $ | .69 | | | $ | .68 | | | $ | .70 | | | $ | .75 | |
Diluted | | $ | .68 | | | $ | .67 | | | $ | .69 | | | $ | .75 | |
| | | | |
Weighted-average shares outstanding: | | | | | | | | | | | | | | | | |
Basic | | | 1,558,570 | | | | 1,558,028 | | | | 1,559,115 | | | | 1,559,778 | |
Diluted | | | 1,579,418 | | | | 1,579,644 | | | | 1,582,631 | | | | 1,580,263 | |
68
`