In fact, RGA is the second largest North American life reinsurer, number one in terms of new business written. An important part of our business is facultative. We're the industry leaders in facultative business. These are the difficult cases to underwrite. They're high value-added services provided to the life insurance industry. There are no official statistics, but we feel very confident in claiming we're the largest, because nobody's really even that close to us.
We view that RGA has lots of opportunities. We've been growing at double-digit rates. We have a track record over a long period of time that generates consistent earnings throughout. Quarter-to-quarter you see volatility from mortality experience: who dies in the given quarter. But the track record is strong over time.
Our separation from MetLife will be a net benefit to RGA. We think that independence from MetLife will enhance the ability of RGA stock to take its own course. And we also have a leading management team in the industry.
[Slide 9] You can see the rankings in North America and worldwide. On a couple of different bases in North America, what we collect is life reinsurance and inforce in volume. So, you can see we have about $1.4 trillion of life reinsurance inforce, second to Swiss Re. On a worldwide basis, what you see is premiums and RGA is the third largest, with about $4.7 billion of gross life premium.
[Slide 10] If you take a look at our position in the marketplace that we serve, in North America, as I said, we've been the leading life reinsurer in new business in both the U.S. and Canada last year and the leader in the U.S. in the last couple of years. We are the largest facultative reinsurer by a fair margin.
This is a mature market. Its growth has subsided a bit. We're talking about high single digit growth, sort of like 7% to 8% at this point. And again, this is a market that we have operated in for a long time and the business on our books has generated consistent profit over that period of time.
Profits that we experienced in 2008 come from business written in all prior years. So, all of the past record is relevant here.
The most rapidly growing part of the world for life reinsurance as a growth industry is Asia. And in Asian markets we're the region-wide leader in new business, with about a 26% market share. That's according to NMG surveys that were done. We're the second largest reinsurer of new group business to Swiss Re and we're the market leader in terms of the number of new treaties entered into.
In Europe, we are probably a little bit underrepresented at this point. It provides opportunities for us to expand into Continental Europe in particular. We have established operations in the UK and Spain and everywhere else is fairly early on at this state. With all of the regulatory changes in Europe, there are a lot of opportunities in that market as well.
[Slide 11] You can see in this pie chart the breakdown of our business by geography and how it has evolved over time. The U.S. share of the pie is decreasing as a result of the growth in Asia and Europe.
[Slide 12] We mentioned our facultative business as an important feature. We have been recognized as the leader in this field for some time. We review over 100,000 facultative applications a year, averaging over $1 million per policy. We place a sizeable proportion of these cases. In this part of the market the victories are one case at a time, so there are significant barriers to entry. It is difficult for other reinsurers to encroach upon our position here.
But in addition, it also provides a lot of extra leverage for us in the regular automatic business. In much of the regular automatic life reinsurance business we are able to leverage our facultative position into better shares or better prices.
[Slide 13] There are a lot of growth opportunities left in the life reinsurance business. In North America we are talking, as I said, about high single digit growth, sort of 8% growth. There are not a lot of new entrants into our business. The ones that have entered have not been very effective in making an impact. We also see a changeover into increasing amounts of annuities and
other types of products being written and reinsured. In addition, the stresses in the macro environment are creating a lot of opportunities for reinsurers, who provide a fast, flexible source of capital to companies as well in the life insurance space.
Internationally, Asia, as I said, is a place where life insurance is a growth industry and we're growing along with that. In many of these markets you're talking about high teens in terms of growth rates on an annual recurring basis.
Most of these markets, in particular some of the more developed ones like Japan and Korea, have very low penetration rates. And these have been our largest growth stories for the last several years, because we're not only seeing sizeable opportunities, but we're penetrating the market farther. And companies are reinsuring more than they have in the past.
Other markets, like China and India, are for really the intermediate future. It's not something that's going to make an impact in the near term.
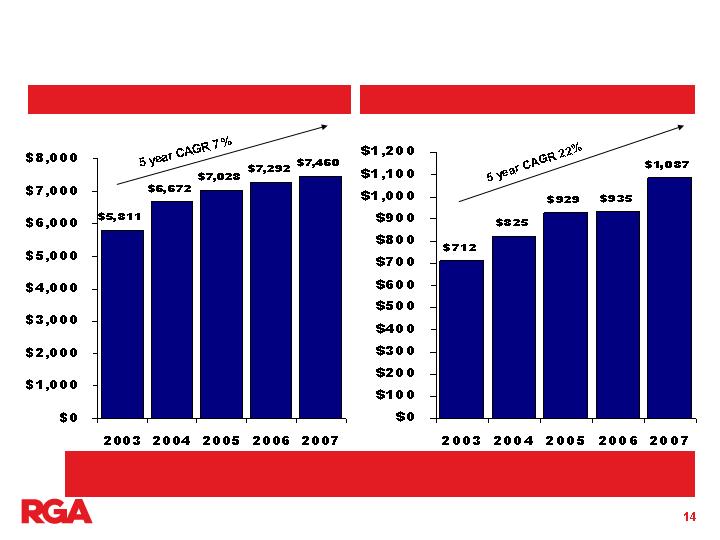
[Slide 14] Here's a chart that shows the growth rate of the life reinsurance inforce in the United States and Canada. You can see in the United States it's slowed down considerably. In the last couple of years, it's been quite level. In fact, new business cession rates have been decreasing somewhat. But remember, our profits come from all the inforce in place and not just from new business. And so, it's really the inforce growth that's important here.
Canada's been growing a little bit faster, continued on high penetration rates and a lot of reasons structurally for companies in Canada to reinsure. Some of
those may change and you might see this fall back more towards the United States level.
[Slide 15] We went public in 1993 and you can see some selected compound growth rate numbers for RGA parameters here. All of them have increased substantially on a compound basis.
[Slide 16] We expect that the independence from MetLife will have a positive effect for RGA stock in particular. We will increase the float available in the marketplace and eliminate the overhang that's always been present when MetLife has owned more than 50% of the stock. They've been generally very good owners for RGA, but we are looking forward to independence and separation in this transaction.
[Slide 17] In the life reinsurance business the scarcest resource tends to be the people and the quality of experience that is warehoused within an organization and RGA has a lot of people that not only have deep experience, but long experience with RGA as well.
* See “Reconciliations of Non-GAAP Measures” at the end of this presentation.
ROE** was 14% last year. That's ex AOCI. Book value per share** growth has been 14% over the last five years or so.
And in terms of goals, we articulate an operating EPS* growth rate target of 14%. We're still comfortable with that number. And an ROE** percentage so to speak of 14%. That's our expectation over the intermediate term, which we typically define as the next two- to three-year period.
[Slide 20] Our next slide represents life reinsurance inforce. And you can see a 14% growth rate over that period of time. This is not a perfect metric in terms of determining the business vitality, but it's one of several that we monitor. And as you can see, we're over $2 trillion, $2.2 trillion at the end of the second quarter of 2008.
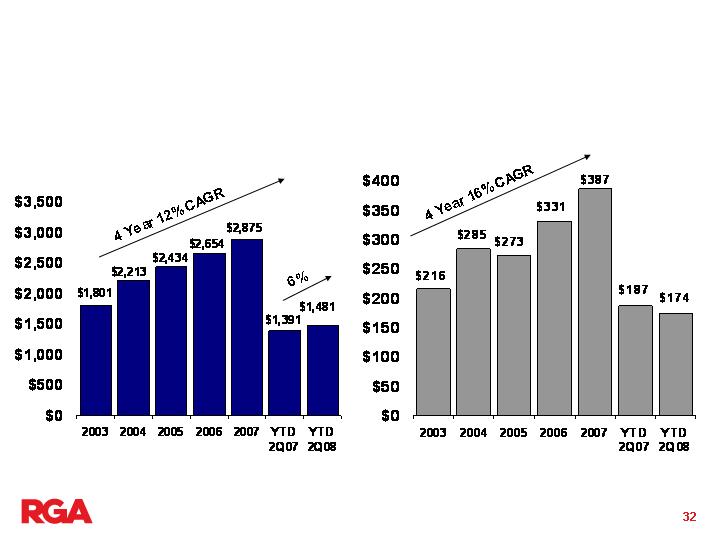
[Slide 21] Our premium growth rate, you see here a compound annual growth rate of 17% over the last four years. You can see about 14% growth rate, 2Q, year-to-date, 2Q '08 versus '07. We expect that to be in the 12 to 14% range for the year. So, that's obviously a little bit towards the high end of that range currently. That's an enterprise-wide growth rate.
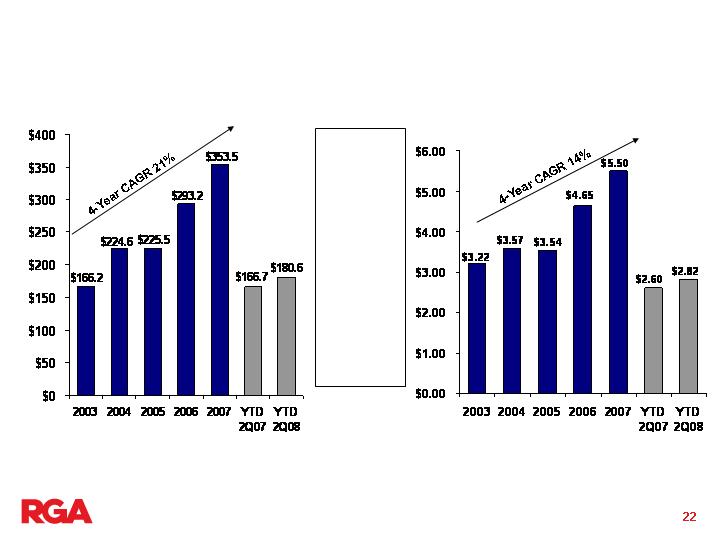
[Slide 22] We reflect consolidated operating income* on this slide. You can see gross dollars on the left and on the right operating income per share.* Also on the right, you see in terms of per share a four-year growth rate of 14%. I commented on our expectations in terms of the intermediate term.
* See “Reconciliations of Non-GAAP Measures” at the end of this presentation.
**Excludes accumulated other comprehensive income. See “Reconciliations of Non-GAAP Measures” at the end of this presentation.
You see we're at $2.82 for the first six months versus $2.60 for the first six months of last year. We had a difficult first quarter in terms of mortality. We expect to have some mortality fluctuations and we did sustain that in the first quarter this year. Mortality was back on track in the second quarter. So, we're still at a point where, in terms of the guidance for the year, it remains to be seen. We have to follow on with a couple more strong quarters, but may still be in that guidance range that we articulated in January, which was $6.00 to $6.50 per share.
[Slide 23] This page reflects, over a five-year period, quarterly mortality volatility. And the takeaway here is even when we have difficult quarters—and I described one earlier—we're not like a P&C reinsurer, even a P&C primary company, where it can wipe out earnings if you do have a difficult quarter in terms of mortality expectations. It's merely a blip for us. And you can see relative, fairly consistent pattern here, that we don't have a lot of volatility, either up or down, as you can see.
[Slide 24] Book value per share***, you see an upward trend there. Five-year compound annual growth rate of 13% or $45.00, ex AOCI at June 30th of 2008. And, as you can see from the slide, we add about a dollar or so per share each quarter, if we have a representative quarter.
[Slide 25] In terms of our capitalization, you can see equity versus debt and hybrids here. We feel we have a little bit of leveragability with respect to the rating agencies currently, several hundred million. Not a whole lot, but at
*** Book value excludes other comprehensive income. See “Reconciliations of Non-GAAP Measures” at the end of this presentation.
least some flexibility with respect to leverage associated with the current capitalization levels.
[Slide 26] Pie charts of our consolidated asset composition. At the end of last year, as well as at the end of the first six months, I would characterize our portfolio as relatively conservative. That is, compared to the typical life insurance company, ours probably is a little more conservative. Not a lot, but a little. It's an A quality, on average, portfolio, with the asset classes that you would normally see in an insurance company. And you can see the breakdown on this page reflecting pretty much the different types of asset classes.
You'll see one called funds withheld at interest. That represents asset portfolios that are on the books of some of our client companies. And because of the treaty structure, they maintain legal ownership of those securities, but the economics pass through to the reinsurer, in this case, RGA.
You can see a reference at the bottom, roughly 3% of our securities are below investment grade.
[Slide 27] With that, Greig, maybe you want to take the conclusion.
We have multiple opportunities to grow because of the nature of our business and the nature of our operations around the world, in particular our strong position in Asia and our growing position in Continental Europe, we have a strong team in place that's delivered impressive results over a long period of time. And we believe that the separation from MetLife will be nothing but beneficial to RGA and RGA's stock price going forward.

Reinsurance Group of America
____________________________________________________________________________________________________________________________________________________________________________________________________________________________________________________________________
RGA / MET Exchange Offer
September 2008

CAUTIONARY STATEMENT REGARDING
FORWARD-LOOKING STATEMENTS
This presentation contains both historical and forward-looking statements. Forward-looking statements are not based on historical facts, but rather reflect the
Company’s current expectations, estimates and projections concerning future results and events. Forward-looking statements generally can be identified by
the fact that they do not relate strictly to historical or current facts and include, without limitation, words such as “believe,” “expect,” “anticipate,” “may,”
“could,” “intend,” “intent,” “belief,” “estimate,” “plan,” “foresee,” “likely,” “will” or other similar words or phrases. These forward-looking statements are not
guarantees of future performance and involve known and unknown risks, uncertainties, assumptions and other factors that are difficult to predict and that
may cause the Company’s actual results, performance or achievements to vary materially from what is expressed in or indicated by such forward-looking
statements. The Company cannot make any assurance that projected results or events will be achieved.
The risk factors set forth in the Company’s prospectus dated August 11, 2008 and proxy statement/prospectus dated August 4, 2008 in the respective
sections entitled “Risk Factors,” and the matters discussed in RGA’s SEC filings, including the “Management’s Discussion and Analysis of Financial
Condition and Results of Operations” sections of RGA’s Annual Report on Form 10-K for the fiscal year ended December 31, 2007 and RGA’s Quarterly
Reports on Form 10-Q for the fiscal quarters ended March 31, 2008 and June 30, 2008, could affect future results, causing these results to differ materially
from those expressed in RGA’s forward-looking statements.
The forward-looking statements included in this document are only made as of the date of this document and RGA has no obligation to publicly update any
forward-looking statement to reflect subsequent events or circumstances.
Numerous important factors could cause actual results and events to differ materially from those expressed or implied by forward-looking statements
including, without limitation, (1) adverse changes in mortality, morbidity, lapsation or claims experience, (2) changes in our financial strength and credit
ratings or those of MetLife, Inc. ("MetLife"), the beneficial owner of a majority of our common shares, or its subsidiaries, and the effect of such changes on
our future results of operations and financial condition, (3) inadequate risk analysis and underwriting, (4) general economic conditions or a prolonged
economic downturn affecting the demand for insurance and reinsurance in our current and planned markets, (5) the availability and cost of collateral
necessary for regulatory reserves and capital, (6) market or economic conditions that adversely affect our ability to make timely sales of investment
securities, (7) risks inherent in our risk management and investment strategy, including changes in investment portfolio yields due to interest rate or credit
quality changes, (8) fluctuations in U.S. or foreign currency exchange rates, interest rates, or securities and real estate markets, (9) adverse litigation or
arbitration results, (10) the adequacy of reserves, resources and accurate information relating to settlements, awards and terminated and discontinued lines
of business, (11) the stability of and actions by governments and economies in the markets in which we operate, (12) competitive factors and competitors'
responses to our initiatives, (13) the success of our clients, (14) successful execution of our entry into new markets, (15) successful development and
introduction of new products and distribution opportunities, (16) our ability to successfully integrate and operate reinsurance business that we acquire, (17)
regulatory action that may be taken by state Departments of Insurance with respect to us, MetLife, or its subsidiaries, (18) our dependence on third parties,
including those insurance companies and reinsurers to which we cede some reinsurance, third-party investment managers and others, (19) the threat of
natural disasters, catastrophes, terrorist attacks, epidemics or pandemics anywhere in the world where we or our clients do business, (20) changes in laws,
regulations, and accounting standards applicable to us, our subsidiaries, or our business, (21) the effect of our status as an insurance holding company and
regulatory restrictions on our ability to pay principal of and interest on our debt obligations, and (22) other risks and uncertainties described in this document
and in our other filings with the Securities and Exchange Commission.

Additional Information and Where You Can Find It
In connection with MetLife’s proposed divestiture of its stake in RGA, on August 11, 2008, RGA filed with the Securities and Exchange Commission (the
“SEC”) a registration statement on Form S-4 (No. 333-152828), as amended, which includes a form of prospectus relating to the exchange offer. On August
14, 2008, MetLife filed with the SEC a statement on Schedule TO. In addition, RGA has filed with the SEC a registration statement on Form S-4 (File No.
333-151390), as amended, which includes a final proxy statement/prospectus dated August 4, 2008 related to the recapitalization. Investors and holders of
RGA and MetLife securities are strongly encouraged to read the registration statements and any other relevant documents filed with the SEC,
including the prospectus dated August 11, 2008 relating to the exchange offer and related exchange offer materials, the tender offer statement on
Schedule TO, and the proxy statement/prospectus dated August 4, 2008 relating to the recapitalization, as well as any amendments and
supplements to those documents, because they contain important information about RGA, MetLife, and the proposed transactions. The
prospectus relating to the exchange offer and related exchange offer materials have been mailed to stockholders of MetLife. The proxy statement/prospectus
relating to the recapitalization and related transactions has been mailed to shareholders of RGA. Investors and security holders can obtain free copies of the
registration statements, the prospectus relating to the exchange offer and related exchange offer materials and the tender offer statement on Schedule TO,
and the proxy statement/prospectus relating to the recapitalization, as well as other filed documents containing information about MetLife and RGA, without
charge, at the SEC’s web site (www.sec.gov). Free copies of RGA’s filings also may be obtained by directing a request to RGA, Investor Relations, by phone
to (636) 736-7243, in writing to Mr. John Hayden, Vice President-Investor Relations, Reinsurance Group of America, Incorporated, 1370 Timberlake Manor
Parkway, Chesterfield, Missouri, 63017, or by email to investrelations@rgare.com. Free copies of MetLife’s filings may be obtained by directing a request to
MetLife, Investor Relations, by phone to (212) 578-2211, in writing to MetLife, Inc., 1 MetLife Plaza, Long Island City, NY 11101, or by email to
metir@metlife.com. Neither RGA, MetLife nor any of their respective directors or executive officers or the dealer managers, with respect to the exchange
offer makes any recommendation as to whether you should participate in the exchange offer.
This communication shall not constitute an offer to sell or the solicitation of an offer to buy securities, nor shall there be any sale of securities in any
jurisdiction in which such solicitation or sale would be unlawful prior to registration or qualification under the securities laws of such jurisdiction. Such an offer
may be made solely by a prospectus meeting the requirements of Section 10 of the U.S. Securities Act of 1933, as amended. The distribution of this
communication may, in some countries, be restricted by law or regulation. Accordingly, persons who come into possession of this document should inform
themselves of and observe these restrictions.
RGA, MetLife and their respective directors and executive officers may be deemed, under SEC rules, to be participants in the solicitation of proxies from RGA’s
shareholders with respect to the proposed recapitalization. Information regarding the directors and executive officers of RGA is included in its definitive proxy
statement for its 2008 Annual Meeting of Shareholders filed with the SEC on April 9, 2008. Information regarding the directors and officers of MetLife is
included in the definitive proxy statement for MetLife’s 2008 Annual Meeting of Shareholders filed with the SEC on March 18, 2008. More detailed information
regarding the identity of potential participants, and their direct or indirect interests, by securities holdings or otherwise, is set forth in the proxy
statement/prospectus dated August 4, 2008 and the prospectus dated August 11, 2008 relating to the exchange offer, each as may be amended from time to
time, and other materials to be filed with the SEC in connection with the proposed transactions.
Participants in the Solicitation

Non-GAAP Measures
RGA uses a non-GAAP financial measure called “operating income” as a basis for analyzing financial results. This measure also serves as
a basis for establishing target levels and awards under RGA’s management incentive programs. Management believes that operating
income, on a pre-tax and after-tax basis, better measures the ongoing profitability and underlying trends of the company’s continuing
operations because that measure excludes the effect of net realized capital gains and losses, changes in the fair value of certain embedded
derivatives and related deferred acquisition costs. These items tend to be highly variable primarily due to the credit market and interest rate
environment and are not necessarily indicative of the performance of our underlying businesses. Additionally, operating income excludes
any net gain or loss from discontinued operations, which management believes is not indicative of the company’s ongoing operations. The
definition of operating income can vary by company and is not considered a substitute for GAAP net income.
Additionally, the Company evaluates its stockholder equity position excluding the impact of “Other Comprehensive Income”. This is also
considered a non-GAAP measure. The Company believes it is important to evaluate its stockholders’ equity position to exclude the effect of
Other Comprehensive Income since the net unrealized gains or losses included in Other Comprehensive Income primarily relate to changes
in interest rates, credit spreads on its investment securities and foreign currency fluctuations that are not permanent and can fluctuate
significantly from period to period.
Reconciliations of non-GAAP measures to the nearest GAAP measures are provided at the end of this presentation.
Effective in 1Q 2006, the Company changed its capital allocation methodology from a regulatory-based approach to an economic-based
approach. To enhance comparability, all prior period segment results in this presentation have been adjusted to reflect the new methodology.
This change in capital allocation does not affect the Company’s reported consolidated financial results.
Capital Allocation

Transaction Summary
___________________________________________________________________________________________________________________________________________________________________________________________________________________________________________________________________
Transaction Summary
(1) Expiration of split-off may be extended to September 15, 2008, if exchange ratio limit is in effect at the end of the
originally contemplated split-off period.
Recapitalization
RGA recapitalizes its single class of stock into two classes of stock (Class
A
–
“low” vote; Class B
–
“high” vote)
Results in 29,243,539 MET
-
owned shares of “High” Vote Class B Common
Stock
RGA Shareholder Vote
September 5, 2008
Shares
to Be
Exchanged (Split
-
Off)
29,243,539 RGA Class B Shares owned by MET
for
outstanding MET
Common Stock
Split
-
Off Fixed Discount
Mechanism
RGA Class B shares offered at a 10% discount to MET shareholders
subject to a limit of 1.3071 shares of RGA Class B
Common Stock per
share of MET
Split
-
Off Expiration
September 11, 2008
(1)
Potential
Conversion of
RGA Dual Class Stock
RGA currently expects that, following the transactions, the RGA
Board of
D
irectors
will consider submitting a proposal to RGA’s sharehol
ders to
convert the dual
-
class structure into a single
-
class st
r
ucture. However,
there is no binding commitment by the RGA B
oard of
D
irectors
to
, and
there can be no assurance that the RGA Board of Directors will, consider
proposing a conversion or resolv
e to
submit such a proposal
to the RGA
shareholders
, and if submitted, there can be no
assurance
that the RGA
shareholders would approve
such a
conversion
Dealer Managers
Goldman Sachs
Merrill Lynch
Information Agent
D.F. King
Split
-
Off Website
http://www.dfking.com/metlife

RGA Investment Highlights
___________________________________________________________________________________________________________________________________________________________________________________________________________________________________________________________________
A. Greig Woodring (CEO)

RGA Investment Highlights
Second largest North American life reinsurer with
established and expanding global presence
A leading facultative reinsurer with high degree of
mortality expertise; provides competitive advantage
Multiple growth opportunities stemming from
on-going industry consolidation and international
expansion
Proven track record of delivering strong top and
bottom-line growth
Increased independence post-separation from
MetLife
Industry-leading management team

A Leading Life Reinsurer
Top Five Life Reinsurers Now Account for 76% of Market, Up From 48% in 1997
Source: 2007 Munich American / Society of Actuaries Reinsurance Survey
1.8
156.2
General Re Life
10
2.3
195.2
Canada Life
9
3.2
274.8
SCOR
8
4.3
362.4
Generali
7
4.8
406.4
ERC
6
9.9
850.0
Transamerica Re
5
11.4
970.0
Scottish Re
4
13.2
1,132.4
Munich American Re
3
16.7
1,429.1
RGA
2
24.5
$2,090.8
Swiss Re
1
($ in billions)
Share
Market
Force
Reinsurance In
Life
Reinsurer
Rank
North America In 2007
Worldwide in 2006
Rank
Reinsurer
Gross Life
Reinsurance
Premiums
($ in millions)
1
Swiss Re
$
10,378
2
Munich Re Group
10,114
3
RGA
4,732
4
Hannover Re
3,686
5
Scor
3,039
6
Berkshire Hathaway
2,476
7
Transamerica Re (Aegon)
2,259
8
Scottish Re Group, Ltd.
1,842
9
Reliastar
675
10
XL Re
597
Source: Standard & Poor's
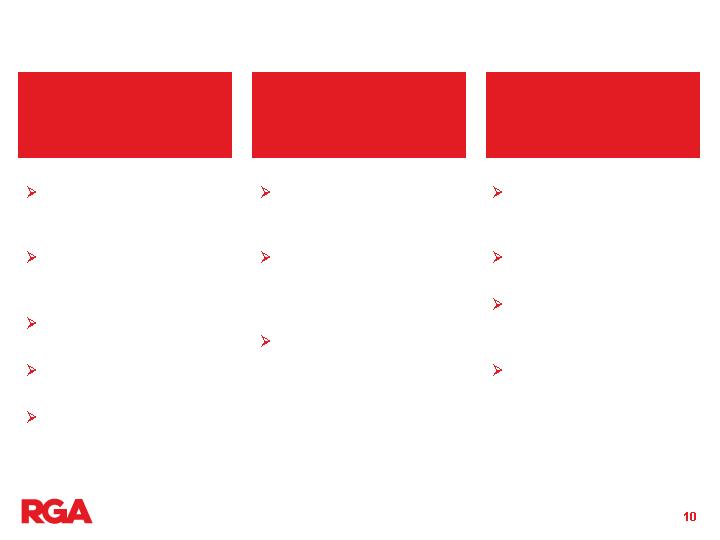
Operational Strength
Leading new business
market share (23%) in
U.S.(1)
Leading new business
market share (35%) in
Canada(1)
Largest facultative
reinsurer(2)
High single-digit
premium growth
Long track record of
profitability
Region-wide leader in
individual new
business (26%)(3)
Second largest
reinsurer of new group
life (20%) market
share(3)
Market leader in new
treaty line acquisition(3)
Strong North American
Market Positions
Third-largest life &
health reinsurer in
the UK&I(4)
Well-established in
Spain
New Offices in Italy,
Germany, France,
and Poland
Changes in
regulation and
solvency measures
expected to provide
opportunities for new
market entrants
Well Positioned in
Rapidly Growing Asian
Markets
Continued Expansion
into Europe Offers
Growth Opportunities
(1) 2007 Munich American / Society of Actuaries Reinsurance Survey
(2) Based on Company estimate
(3) NMG Financial Services Consulting – 2008 Programme (March)
(4) NMG Financial Services Consulting – Risk Premium Monitor 2006
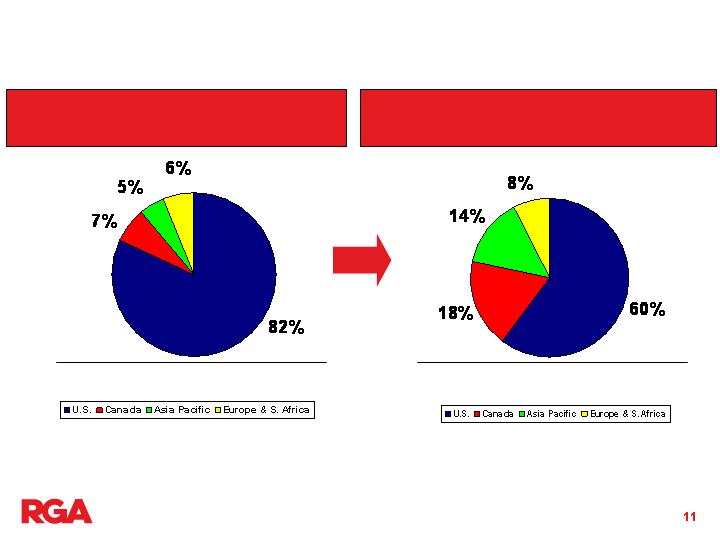
Expanding Global Presence
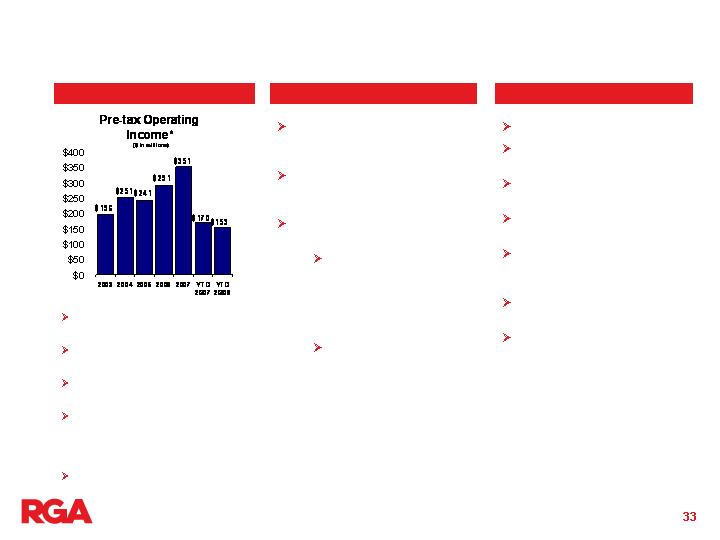
Total 2003 Pre-tax Operating Income = $263M
2003 Pre-tax Operating Income
by Operating Segment
YTD June 30, 2008 Pre-tax Operating
Income by Operating Segment
Note: Figures include results from the U.S., Canada, Asia Pacific and Europe & South
Africa operating segments; exclude Corporate segment. See “Reconciliations of Non-
GAAP Measures” at the end of this presentation.
Total YTD June 30, 2008 Pre-tax
Operating Income = $289M

Leading Facultative
Franchise
Recognized facultative expertise
Provide a market for non-conforming risks
Significant barriers to entry
Fosters closer relationships with cedants
Leverage for additional business opportunities
Provides some pricing power for automatic
business
Frequent entry point for international business
development
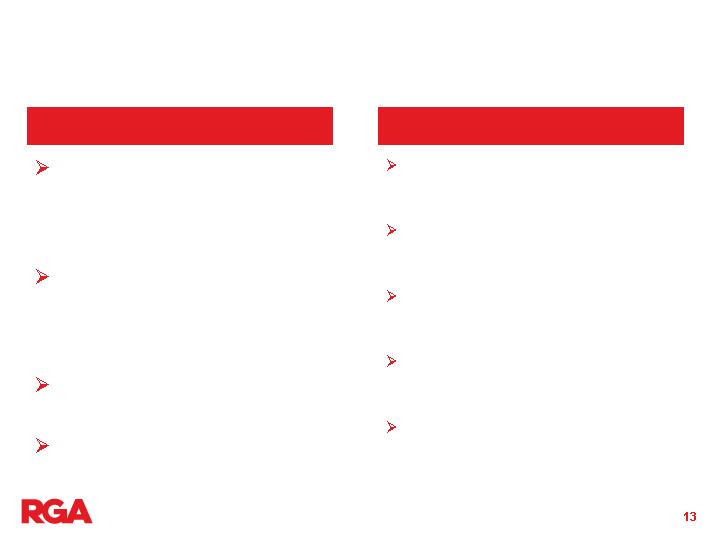
Significant Growth
Opportunities
Expect intermediate
growth of 8%-10% in
traditional market going
forward
Limited number of
competitors; good
pricing environment
expected to continue
Little impact from start-
ups
Some direct companies
retaining more business
Highest growth rates likely to
come from Asia Pacific (primarily
Japan and South Korea)
Penetration rates in most of Asia
Pacific are very low; Australia is
the exception
UK growth is moderating;
increase in number of
competitors
India and China represent
longer-term significant
opportunities
EU solvency and other
regulatory risk based capital
initiatives will likely be a catalyst
for additional reinsurance
opportunities
North America
International
North America Market
Continues to Grow
Source: Munich American / Society of Actuaries Reinsurance Surveys
($ in billions)
+8%
+15%
+5%
+4%
+2%
+76%
+12%
+16%
+1%
+16%
($ in billions)
Although cession rates in the U.S. market have fallen over the past several
years, RGA has continued to grow through market share increases.
United States
Life Reinsurance Inforce
Life Reinsurance Inforce
Canada

Strong Track Record of Growth
Share Price $12.28* $52.48 10.9%
Market Cap $480M $3.3B 14.8%
Assets $1.2B $21.6B 22.9%
Net Income $34.1M $293.8M 16.6%
Premiums $380M 4.9B 20.0%
Employees 198 1,066 12.8%
* Split-adjusted
December 31,
1993
December 31,
2007
CAGR

Increased Independence
Post-Separation from MetLife
Expected to eliminate overhang and increase liquidity and public
float for RGA common stock
Expected to result in wider following by equity research community
Expected to facilitate use of RGA common stock as acquisition
currency and source of capital and enhance the attractiveness of
RGA’s equity-based compensation plans
Expected to allow RGA to pursue future business initiatives free
from constraint of a controlling corporate shareholder
Expected to eliminate potential customer conflicts, given that some
key customers of RGA directly compete with MetLife
Expected to permit RGA shareholders to share in any premium
associated with any subsequent change in control of RGA
For a broader discussion of the potential advantages and
disadvantages of the separation from MetLife, see "RGA's Reasons
for the Recapitalization" in the prospectus dated August 11, 2008

Industry-Leading
Management Team
(1)
Includes experience in life insurance and life reinsurance industries
(2)
Includes experience with RGA’s predecessor, the reinsurance division of General American Life Insurance Company
Years Experience
Name
Position
In Industry
(1)
With RGA
(2)
A. Greig Woodring
President, Chief Executive Officer, and Director
33
29
Jack B. Lay
Senior E.V.P. and Chief Financial Officer
17
14
Paul A. Schuster
Senior E.V.P., U.S. Operations
32
17
Graham S. Watson
Senior E.V.P., International and Chief Marketing Officer
38
12
David B. Atkinson
E.V.P.
33
22
Brendan J. Galligan
E.V.P., Asia Pacific
30
18
John P. Laughlin
E.V.P., U.S. Financial Markets
24
13
Robert M. Musen
E.V.P.
32
8
Paul Nitsou
E.V.P., International
23
12
Alain P. Neemeh
President and Chief Executive Officer, RGA Canada
11
11
A. David Pelletier
E.V.P.
24
13
Michael S. Stein
E.V.P., U.S. Operations
27
10

Overview of Financial
Performance
___________________________________________________________________________________________________________________________________________________________________________________________________________________________________________________________________
Jack B. Lay (CFO)
Financial Highlights
Operating EPS Growth 14% (5-year CAGR, 2003-2007)
Premium Growth 13% (2007 compared to 2006)
Return on Equity* 14% (2007)
BV/Share Growth* 14% (5-year and 14-year CAGR)
Operating EPS Growth 14%
Return on Equity* 14%
Historical Performance
Intermediate Goals
RGA targets debt leverage of 25% or less, commensurate with various rating agency guidelines for
existing ratings.
* Excludes accumulated other comprehensive income. See “Reconciliations of Non-GAAP
Measures” at the end of this presentation.
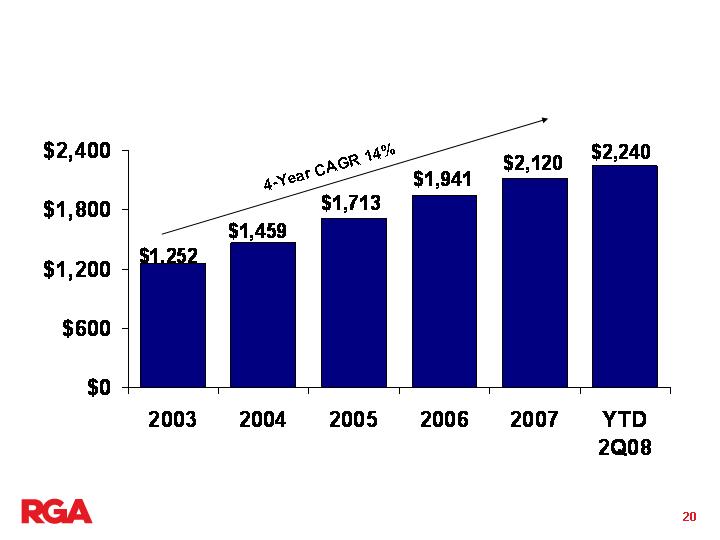
Life Reinsurance In Force
($ in billions)
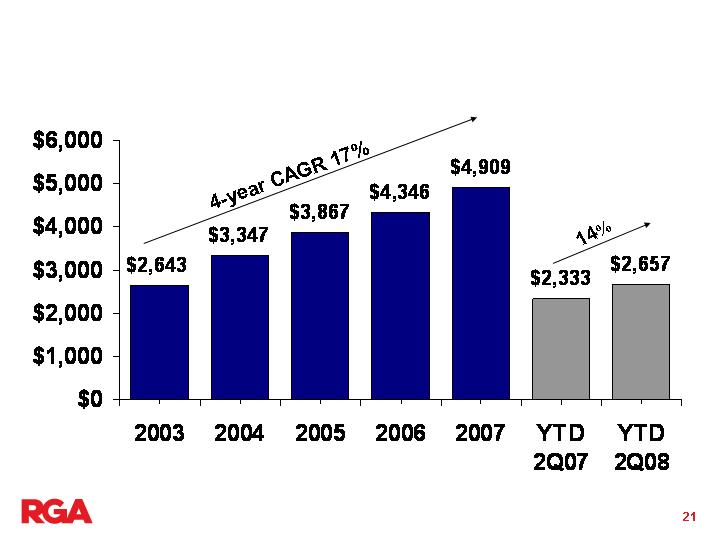
Consolidated Net Premiums
($ in millions)
Consolidated Operating Income
Operating
Return on
Equity(1)
2003…13%
2004…12%
2005…11%
2006…13%
2007…14%
Operating Income
($ in millions)
Operating Income Per Share
(1)
Operating ROE is computed excluding accumulated other comprehensive income,
using quarterly average for equity amounts. See “Reconciliations of Non-GAAP
Measures” at the end of this presentation.
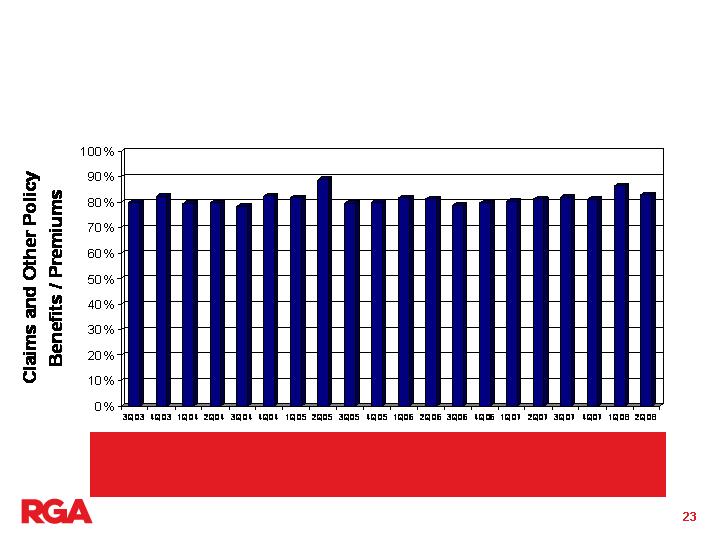
Quarterly Mortality Volatility
5 Year Average = 81.4%
RGA’s results can exhibit quarterly volatility in mortality experience,
but when measured over longer periods of time, mortality experience is
more predictable and stable.
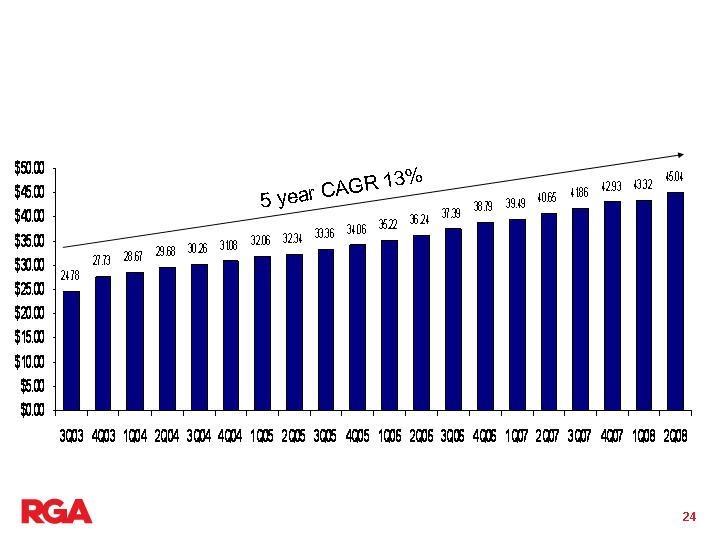
Book Value Per Share*
5 Year Trend
* Book value excludes other comprehensive income. See “Reconciliations of Non-GAAP Measures”
at the end of this presentation.
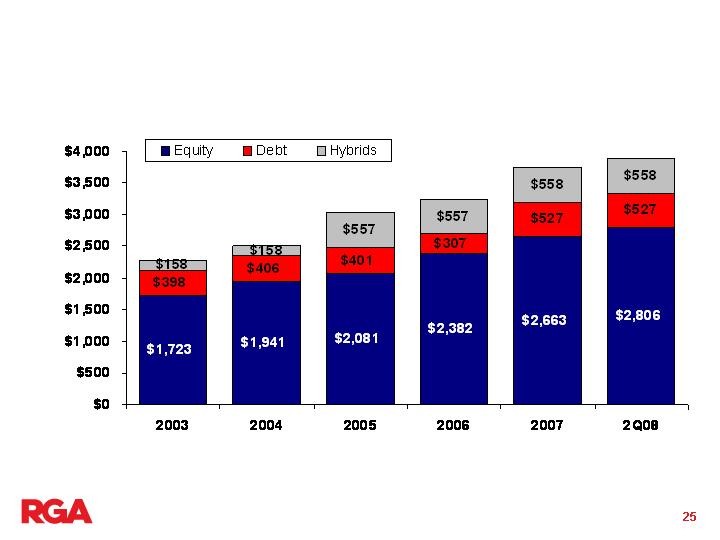
Total Capitalization Levels
(Excluding Other Comprehensive Income)*
($ in millions)
Debt & Hybrids/
Total Capitalization 24.4% 22.5% 31.5% 26.6% 28.9% 27.9%
$2,279
$2,505
$3,039
$3,246
$3,748
$3,891
* See “Reconciliations of Non-GAAP Measures” at the end of this presentation.
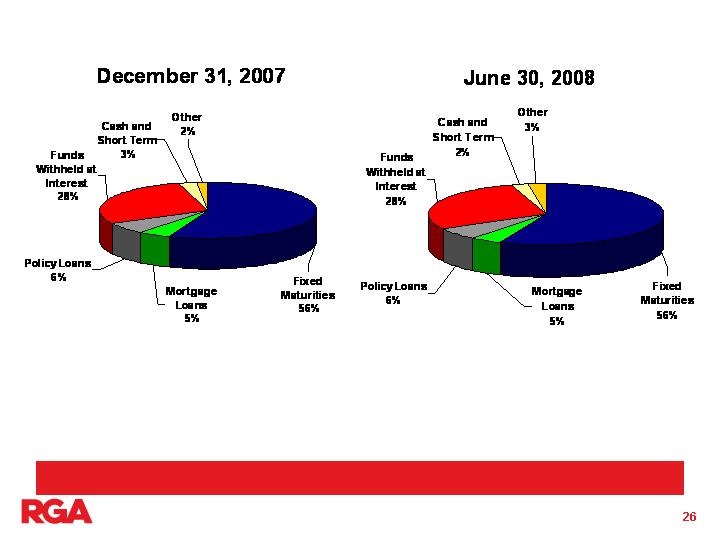
Consolidated Asset Composition
($ in millions) Carrying Value Carrying Value YTD
Asset Type Dec. 31, 2007 June 30, 2008 Change
Fixed Maturities $ 9,398 $ 9,668 $ 270
Mortgage Loans 832 799 (33)
Policy Loans 1,059 1,048 (11)
Funds Withheld at Interest 4,749 4,825 76
Cash and Short Term 479 410 (69)
Other 284 419 135
$ 16,801 $ 17,169 $ 368
Well-diversified fixed maturity portfolio; 97% investment grade as of June 30, 2008

Conclusion
___________________________________________________________________________________________________________________________________________________________________________________________________________________________________________________________________
A. Greig Woodring (CEO)

RGA Investment Highlights
Second largest North American life reinsurer with
established and expanding global presence
A leading facultative reinsurer with high degree of
mortality expertise; provides competitive advantage
Multiple growth opportunities stemming from on-
going industry consolidation and international
expansion
Proven track record of delivering strong top and
bottom-line growth
Increased independence post-separation from
MetLife
Industry-leading management team

Appendix:
RGA’s Operating Segments
Transaction Diagram
Reconciliations of Non-
GAAP Measures
___________________________________________________________________________________________________________________________________________________________________________________________________________________________________________________________________

RGA’s Operating Segments
___________________________________________________________________________________________________________________________________________________________________________________________________________________________________________________________________

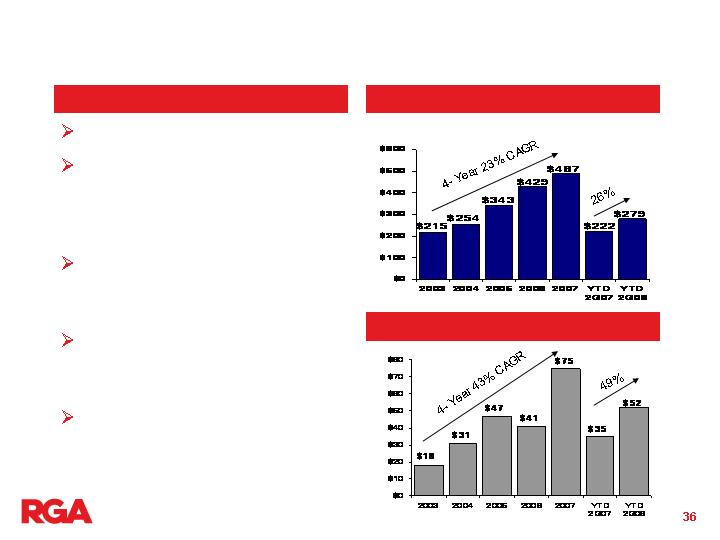
U.S. Operations
___________________________________________________________________________________________________________________________________________________________________________________________________________________________________________________________________
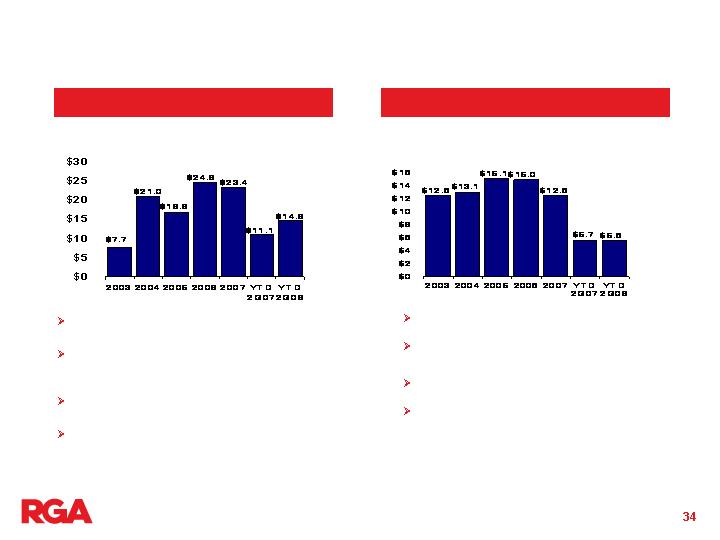
Total U.S. Operations
Pre-tax Operating Income*
($ in millions)
Net Premiums
($ in millions)
* See “Reconciliations of Non-GAAP Measures” at the end of this presentation.
U.S. Traditional Operations
RGA’s goal is to be
among those 3-5 with
very favorable terms
Automatic reinsurance
programs are placed
with 3-5 reinsurers
RGA’s differentiator is
our facultative services
Companies cannot
access these
services unless RGA
is participating
automatically in their
reinsurance
In order to maintain
our industry-leading
facultative position,
we focus on
continually refining
and improving these
services
Competitive offers
Industry-leading time
service
Solid, individual life
capacity
Facultative Application
Console (FAC)
AURA technology-
based rules engine
(ASAP)
Underwriting
“Connection”
Yearly seminars,
newsletters
Approach to the Market
Facultative Excellence
$1.3 trillion of life
reinsurance inforce
Largest source of revenue
and earnings
Quality, long-term, client
base
Recognized leader in
facultative underwriting;
over 100,000 applications in
2007
Adverse claim levels in 1Q
2008
Overview
* See “Reconciliations of Non-GAAP Measures” at the end of this presentation.
U.S. Asset Intensive and Financial
Reinsurance Sub-segments
Primarily annuities and COLI/BOLI; a
spread business
Some volatility in operating income due
to treatment of realized gains/losses for
funds withheld treaties
RGA shares in asset risk for general
account annuity transactions
Opportunistic growth; provides
meaningful diversification from mortality
risk
Pre-tax Operating Income*
($ in millions)
Asset Intensive
Financial Reinsurance
A recognized leader in this highly
specialized market
Limited new opportunities currently
in U.S.; stronger opportunities in
Asia Pacific
Intellectual capital is essential due
to complexity of transactions
Generally a fee-based business for
RGA; rely on retrocession capacity
Pre-tax Operating Income*
($ in millions)
* See “Reconciliations of Non-GAAP Measures” at the end of this presentation.

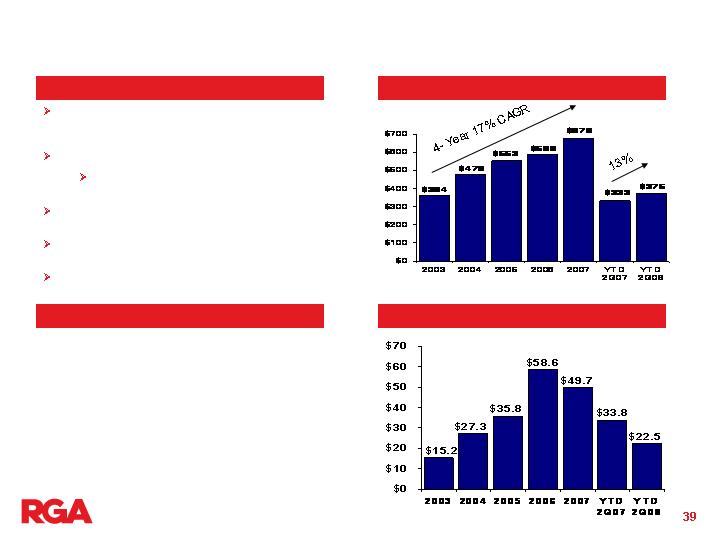
Canada Operations
___________________________________________________________________________________________________________________________________________________________________________________________________________________________________________________________________
Canada Operations
Established in 1992
Traditional individual life
reinsurance, including
preferred classes; some
creditor business
Most of the life insurance
companies in Canada are
clients
A market leader; primary
competitors are Munich
Re and Swiss Re
Strong results and
favorable mortality in 2007
and first half of 2008
Overview
Premiums
$ in millions
Pre-tax Operating Income*
$ in millions
* See “Reconciliations of Non-GAAP Measures” at the end of this presentation.

International Operations
___________________________________________________________________________________________________________________________________________________________________________________________________________________________________________________________________

International Operations Overview
Have demonstrated success
Built green-field operations across the globe;
centrally managed by dedicated team in Toronto
Developed divisional infrastructure and culture
Established as a leading reinsurer in key
markets
Focused on multi-nationals and larger
local companies
Reinsurance products include life and
critical illness
Europe & South Africa Operations
Spain 1995
England 1999
South Africa 1999
India 2002
Ireland 2003
Poland 2006
Germany 2006
France 2007
Italy 2007
UK market has fueled past growth; 12%-
15% premium growth expected going
forward
Increasing continental Europe presence
Offices recently established in France,
Germany, Italy and Poland
Reinsurance products include life YRT and
coinsurance, accelerated critical illness
India viewed as providing long-term
growth opportunities
Adverse claim levels in UK and South
Africa in Q1 2008
Overview
Markets and Date of Entry
Net Premiums
Pre-tax Operating Income*
$ in millions
$ in millions
* See “Reconciliations of Non-GAAP Measures” at the end of this presentation.
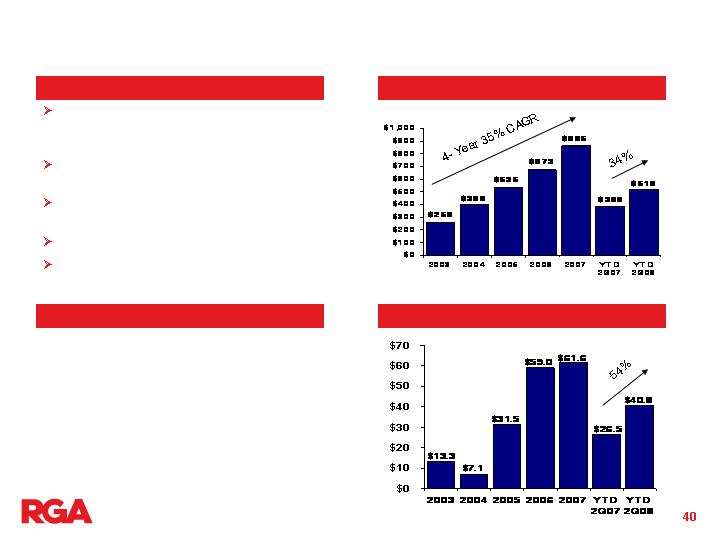
Asia Pacific Operations
Hong Kong 1994
Japan 1995
Australia/New Zealand 1996
Malaysia 1997
Taiwan 1999
South Korea 2002
China 2005
Overview
Markets and Date of Entry
Net Premiums
Pre-tax Operating Income*
$ in millions
$ in millions
Strong results in 2006, 2007 and first
half of 2008 lead by Australia, Japan
and South Korea
A recognized leader in the Asia
Pacific region based on NMG survey
Japan and South Korea should lead
growth in near term
Strong facultative market in Japan
Opened office in China in 2005;
longer-term growth opportunity
* See “Reconciliations of Non-GAAP Measures” at the end of this presentation.

Transaction Diagram
___________________________________________________________________________________________________________________________________________________________________________________________________________________________________________________________________
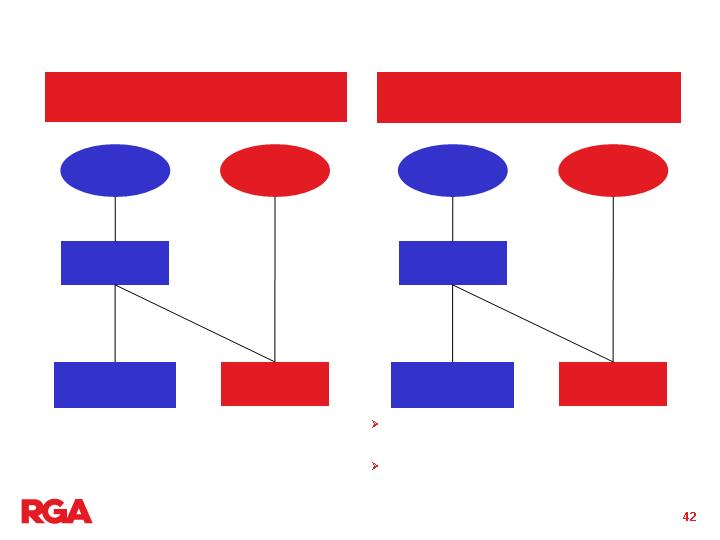
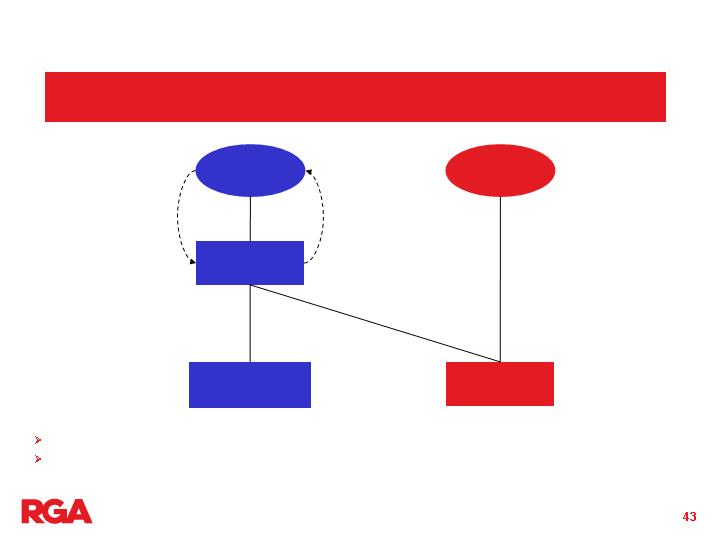
Transaction Diagram
Status Quo
Step 1: Recapitalization of
RGA Stock
RGA recapitalizes its single class of stock into
two classes of stock (Class A – “low” vote;
Class B – “high” vote)
MET exchanges substantially all of its stake for
all Class B shares(1)
RGA
Class A
Shares
(<20% Vote)
RGA
Class A & B
Shares(1)(2)
(>80% Vote)
(1) In addition to the Class B shares, MET will also own 3 million Class A shares which it will dispose of within 60
months of the completion of the split-off.
(2) Class B shares carry “high” vote, having the right to elect at least 80% of the board of directors.
RGA
Other MET
Businesses
MET
Existing MET
Shareholders
48%
Vote
52%
Vote
Existing RGA
Shareholders
RGA
Other MET
Businesses
MET
Existing MET
Shareholders
Existing RGA
Shareholders
Transaction Diagram (Cont’d)
Step 2: Split-Off
(Exchange Offer)
RGA
Other MET
Businesses
MET
Existing MET
Shareholders
Existing RGA
Shareholders
MET splits-off all of its RGA Class B shares in exchange for MET shares
RGA Class B shares offered at a 10% discount subject to a limit of 1.3071 shares of RGA Class B
Common Stock per share of MET
RGA
Class A
Shares
RGA
Class B
Shares
MET
Shares
RGA
Class A
Shares

Reconciliations of Non-
GAAP Measures
___________________________________________________________________________________________________________________________________________________________________________________________________________________________________________________________________

Financial Performance
(1) Net of DAC offset
14.8
11.1
23.4
24.6
16.8
21.0
7.7
Pre-tax Operating Income
47.5
0.9
37.5
(2.8)
(0.5)
2.0
(12.9)
Change in MV of Embedded Derivatives(1)
(1.5)
1.6
8.2
7.2
1.0
7.3
1.4
Realized Capital (Gains) / Losses (1)
(31.2)
8.6
(22.3)
20.2
16.3
11.7
19.2
GAAP Pre-Tax Income - Cont Ops
YTD 2Q08
YTD 2Q07
2007
2006
2005
2004
2003
U.S. ASSET-INTENSIVE
153.2
170.0
351.4
291.2
241.0
251.2
195.7
Pre-tax Operating Income
3.1
4.9
13.8
4.1
8.6
(18.1)
6.6
Realized Capital (Gains) / Losses
150.1
165.1
337.6
287.1
232.4
269.3
189.1
GAAP Pre-Tax Income - Cont Ops
YTD 2Q08
YTD 2Q07
2007
2006
2005
2004
2003
U.S. TRADITIONAL OPERATIONS
(10.0)
(22.8)
(29.6)
(37.6)
(41.8)
(9.0)
(9.3)
Pre-tax Operating Income
0.1
11.8
12.5
(4.0)
(17.4)
(7.8)
(0.9)
Realized Capital (Gains) / Losses
(10.1)
(34.6)
(42.1)
(33.6)
(24.4)
(1.2)
(8.4)
GAAP Pre-Tax Income - Cont Ops
YTD 2Q08
YTD 2Q07
2007
2006
2005
2004
2003
CORPORATE & OTHER SEGMENT
40.8
26.5
61.6
59.0
31.5
7.1
13.3
Pre-tax Operating Income
1.0
0.6
1.5
0.4
0.3
(0.3)
0.1
Realized Capital (Gains) / Losses
39.8
25.9
60.1
58.6
31.2
7.4
13.2
GAAP Pre-Tax Income - Cont Ops
YTD 2Q08
YTD 2Q07
2007
2006
2005
2004
2003
ASIA-PACIFIC OPERATIONS
($ in millions)
Reconciliation of Pre-Tax Income to Pre-Tax Operating Income
22.5
33.8
49.7
58.6
35.8
27.3
15.2
Pre-tax Operating Income
(0.6)
0.8
2.2
0.3
0.3
(2.3)
(2.6)
Realized Capital (Gains) / Losses
23.1
33.0
47.5
58.3
35.5
29.6
17.8
GAAP Pre-Tax Income - Cont Ops
YTD 2Q08
YTD 2Q07
2007
2006
2005
2004
2003
EUROPE & SOUTH AFRICA OPERATIONS
51.9
35.1
74.9
40.6
46.8
31.2
18.2
Pre-tax Operating Income
1.5
(4.1)
(6.6)
(5.2)
(3.4)
(8.1)
(9.9)
Realized Capital (Gains) / Losses
50.4
39.2
81.5
45.8
50.2
39.3
28.1
GAAP Pre-Tax Income - Cont Ops
YTD 2Q08
YTD 2Q07
2007
2006
2005
2004
2003
CANADA OPERATIONS
U.S. FINANCIAL REINSURANCE
2003
2004
2005
2006
2007
YTD 2Q07
YTD 2Q08
GAAP Pre-Tax Income - Cont Ops
12.6
13.1
15.1
15.0
12.6
5.7
5.6
Realized Capital (Gains) / Losses
-
-
-
-
-
-
-
Pre-tax Operating Income
12.6
13.1
15.1
15.0
12.6
5.7
5.6
TOTAL US OPERATIONS SEGMENT
2003
2004
2005
2006
2007
YTD 2Q07
YTD 2Q08
GAAP Pre-Tax Income - Cont Ops
220.9
294.1
263.8
322.3
327.9
179.4
124.5
Realized Capital (Gains) / Losses(1)
8.0
(10.8)
9.6
11.3
22.0
6.5
1.6
Change in MV of Embedded Derivatives(1)
(12.9)
2.0
(0.5)
(2.8)
37.5
0.9
47.5
Pre-tax Operating Income
216.0
285.3
272.9
330.8
387.4
186.8
173.6
(1) Net of DAC offset

Financial Performance
(1) Net of DAC offset
278.8
259.4
544.0
451.4
345.2
341.9
253.4
Pre-tax Operating Income
47.5
0.9
46.5
(2.8)
(0.5)
2.0
(12.9)
Change in MV of Embedded Derivatives(1)
3.6
15.6
22.6
2.8
(10.6)
(29.3)
(5.3)
Realized Capital (Gains) / Losses(1)
227.7
242.9
474.9
451.4
356.3
369.2
271.6
GAAP Pre-Tax Income - Cont Ops
YTD 2Q08
YTD 2Q07
2007
2006
2005
2004
2003
RGA CONSOLIDATED
$
2.82
$
2.60
$
5.50
$
4.65
$
3.54
$
3.57
$
3.22
Operating EPS from Cont. Operations
0.08
0.04
0.22
0.08
0.18
0.37
0.11
Loss from Discontinued Operations
0.48
0.01
0.47
(0.03)
(0.01)
0.02
(0.16)
Change in MV of Embedded Derivatives
0.04
0.16
0.23
0.03
(0.15)
(0.34)
(0.09)
Realized Capital (Gains) / Losses
$
2.22
$
2.39
$
4.57
$
4.57
$
3.52
$
3.52
$
3.36
GAAP Net Income
YTD 2Q08
YTD 2Q07
2007
2006
2005
2004
2003
Per Diluted Share Basis
CONSOLIDATED EPS RECONCILIATION
Stockholders’ Equity Reconciliation
Consolidated EPS Reconciliation
($ in millions)
Reconciliation of Pre-Tax Income to
Pre-Tax Operating Income
2003
2004
2005
2006
2007
YTD 2Q07
YTD 2Q08
GAAP Stockholders' Equity
1,947.7
$
2,279.0
$
2,527.5
$
2,815.4
$
3,189.8
$
2,894.6
$
3,061.4
$
FAS 115 Equity Adjustment
170.6
244.7
361.8
335.6
313.2
204.1
47.5
Foreign Currency Adjustment
53.6
93.7
85.1
109.1
222.0
182.0
215.6
Unrealized Pension
0.0
0.0
0.0
(11.3)
(8.4)
(11.6)
(8.1)
Equity Excluding OCI
1,723.5
$
1,940.6
$
2,080.6
$
2,382.0
$
2,663.0
$
2,520.1
$
2,806.4
$
GAAP Stockholders' Average Equity
1,460.8
$
2,071.7
$
2,423.4
$
2,613.8
$
2,965.8
$
2,866.4
$
3,103.4
$
FAS 115 Average Equity Adjustment
148.5
180.0
310.5
287.9
282.2
293.3
175.9
Foreign Currency Adjustment
26.9
54.6
84.1
102.3
174.9
138.0
213.7
Unrealized Pension
-
-
-
(2.3)
(10.9)
(11.4)
(8.2)
Average Equity Excluding OCI
1,285.4
$
1,837.0
$
2,028.8
$
2,225.8
$
2,519.6
$
2,446.5
$
2,721.9
$
Operating ROE - GAAP Stockholders' Equity
11%
11%
9%
11%
12%
6%
6%
Operating ROE - Excluding OCI
13%
12%
11%
13%
14%
7%
7%
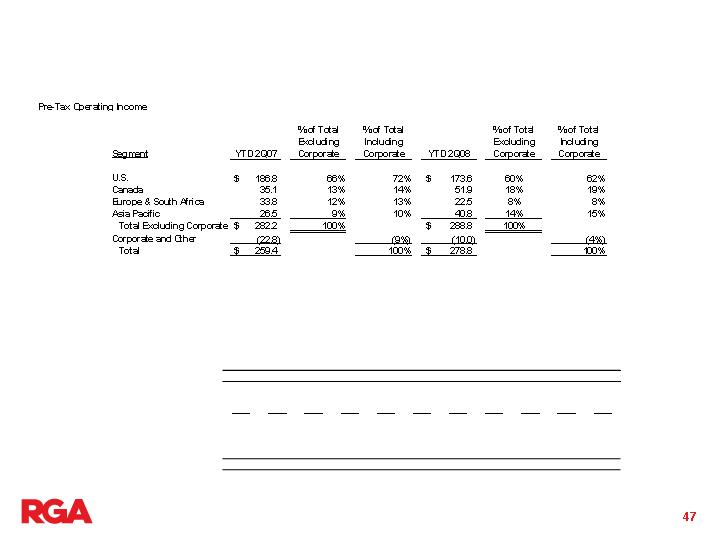
Financial Performance
Pre-Tax Operating Earnings YTD
($ in millions)
Book Value per Share Reconciliation
2Q08
1Q08
4Q07
3Q07
2Q07
1Q07
4Q06
3Q06
2Q06
1Q06
4Q05
Book value per share
49.13
$
49.15
$
51.42
$
49.03
$
46.69
$
46.81
$
45.85
$
45.22
$
40.30
$
40.62
$
41.38
$
Less: effect of FAS 115
0.76
2.69
5.04
3.52
3.29
5.51
5.46
5.93
2.14
4.04
5.92
Less: effect of CTA
3.46
3.27
3.58
3.84
2.94
1.99
1.78
1.90
1.92
1.36
1.40
Less: effect of Pension Benefit
(0.13)
(0.13)
(0.13)
(0.19)
(0.19)
(0.18)
(0.18)
-
-
-
-
Book value per share excluding OCI
45.04
$
43.32
$
42.93
$
41.86
$
40.65
$
39.49
$
38.79
$
37.39
$
36.24
$
35.22
$
34.06
$
3Q05
2Q05
1Q05
4Q04
3Q04
2Q04
1Q04
4Q03
3Q03
2Q03
1Q03
Book value per share
40.33
$
39.60
$
36.79
$
36.50
$
33.92
$
31.38
$
33.11
$
31.33
$
28.92
$
28.93
$
25.18
$
Less: effect of FAS 115
5.52
6.22
3.37
3.92
2.91
1.21
3.67
2.74
3.47
4.19
1.76
Less: effect of CTA
1.45
1.04
1.36
1.50
0.75
0.49
0.77
0.86
0.67
0.73
0.21
Less: effect of Pension Benefit
-
-
-
-
-
-
-
-
-
-
-
Book value per share excluding OCI
33.36
$
32.34
$
32.06
$
31.08
$
30.26
$
29.68
$
28.67
$
27.73
$
24.78
$
24.01
$
23.21
$

Reinsurance Group of America
____________________________________________________________________________________________________________________________________________________________________________________________________________________________________________________________________
RGA / MET Exchange Offer
September 2008