Exhibit 99.1
Fourth Quarter & Fiscal Year 2011 Financial Results September 27, 2011 |
Forward-Looking Statement This presentation contains forward-looking statements, including those regarding our anticipated financial results for our fourth fiscal quarter and fiscal year 2011; our belief that our emphasis on differentiated services in growth markets continues to power growth and earnings; our ability to benefit from diversification, differentiation, and execution; our ability to maintain a keen focus on execution; the demand for expertly managed global supply chain services remaining robust; growth being driven almost exclusively by developing world economies and our currently expected first quarter of fiscal year 2012 net revenue, core operating income, core and GAAP earnings per share results and the components thereof. The statements in this presentation are based on current expectations, forecasts and assumptions involving risks and uncertainties that could cause actual outcomes and results to differ materially. These risks and uncertainties include, but are not limited to: our determination as we finalize our financial results for our fourth fiscal quarter and fiscal year 2011 that our financial results and conditions differ from our current preliminary unaudited numbers set forth herein; adverse changes in the demand, or expected demand, of our customers; the expected new business opportunities in targeted segments failing to arise; adverse changes in current macro-economic conditions, both in the U.S. and internationally; our financial performance during and after the current economic conditions; our ability to maintain and improve costs, quality and delivery for our customers; risks and costs inherent in litigation; whether our realignment of our capacity will adversely affect our cost structure, ability to service customers and labor relations; our ability to take advantage of perceived benefits of offering customers vertically integrated services; changes in technology; competition; anticipated growth for us and our industry that may not occur; managing rapid growth; managing rapid declines in customer demand that may occur; our ability to successfully consummate acquisitions and divestitures; managing the integration of businesses we acquire (including, with respect to the acquisition of the Italian and French sites, potential unknown liabilities and the costs associated with addressing potential reduced business activity at these sites); risks associated with international sales and operations; retaining key personnel; our dependence on a limited number of large customers; business and competitive factors generally affecting the electronic manufacturing services industry, our customers and our business; other factors that we may not have currently identified or quantified; and other risks, relevant factors and uncertainties identified in our Annual Report on Form 10-K for the fiscal year ended August 31, 2010, subsequent Reports on Form 10-Q and Form 8-K and our other securities filings. Jabil disclaims any intention or obligation to update or revise any forward-looking statements, whether as a result of new information, future events or otherwise. 2 |
Three months ended Three months ended Three months ended August 31, 2011 August 31, 2010 % Increase Net revenue $4,280.3 $3,860.9 11% GAAP operating incomeGAAP net incomeGAAP diluted earnings per share $165.6$114.3$0.52 $103.0 $58.7$0.27 61% 95%93% Core operating income1Core earnings4Core diluted earnings per share2 $187.2 $136.3$0.62 $157.0$112.1$0.52 19% 22%19% Fourth Quarter 2011 Income Highlights 3 (In millions, except EPS) |
Twelve months ended Twelve months ended Twelve months ended August 31, 2011 August 31, 2010 % Increase Net revenue $16,518.8 $ 13,409.4 23% GAAP operating incomeGAAP net incomeGAAP diluted earnings per share $578.7$381.1$1.73 $327.6 $168.8$0.78 77% 126%122% Core operating income1Core earnings4Core diluted earnings per share2 $715.2 $516.3$2.34 $490.9$330.4$1.52 46% 56%54% Fiscal Year 2011 Income Highlights 4 (In millions, except EPS) |
Fourth Quarter 2011 Segment Results Diversified Manufacturing - 40% Sequential increase of 10% Core operating income1 6.7%Enterprise & Infrastructure - 32% Sequential increase of 1% Core operating income1 2.6%High Velocity - 28% Sequential decrease of 9% Core operating income1 3.1%Total Company Sequential increase of 1% Core operating income1 4.4% 5 (CHART) Specialized Services 18% Healthcare &Instrumentation9% Industrial & Clean Tech13% |
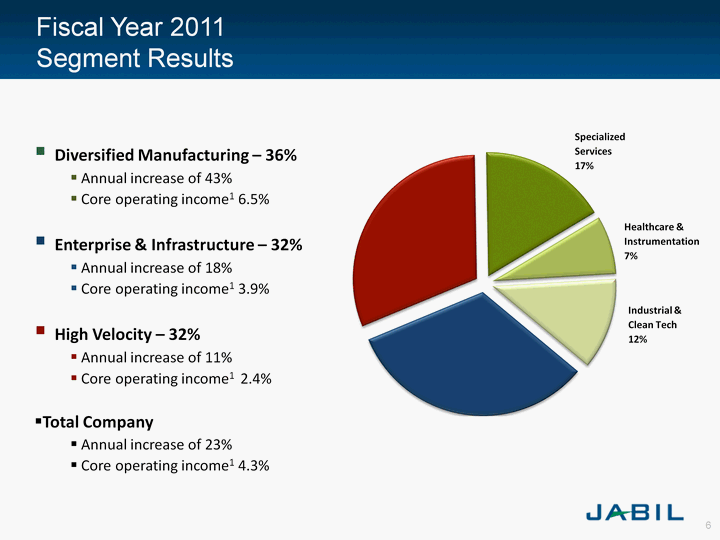
Fiscal Year 2011 Segment Results Diversified Manufacturing - 36% Annual increase of 43% Core operating income1 6.5%Enterprise & Infrastructure - 32% Annual increase of 18% Core operating income1 3.9%High Velocity - 32% Annual increase of 11% Core operating income1 2.4%Total Company Annual increase of 23% Core operating income1 4.3% 6 (CHART) Specialized Services 17% Healthcare &Instrumentation7% Industrial & Clean Tech12% |
Differentiated, Sustainable Portfolio Mix 7 (CHART) |
Differentiated Solutions Fuel Margin Expansion 8 FY 11 FY 10 Diversified Manufacturing 36% 32% Enterprise & Infrastructure 32% 32% High Velocity 32% 36% Core Operating Margin6 4.3% 3.7% Percentage of Total Revenue |
Portfolio Mix Drives Improving Margins 9 FY 11 FY 10 Diversified Manufacturing 6.5% 5.9% Enterprise & Infrastructure 3.9% 4.2% High Velocity 2.4% 1.2% Core Operating Margin6 4.3% 3.7% Core Operating Margin6 |
Investing in Growth, Diversification and Sustainability Investing in Growth, Diversification and Sustainability Based on full fiscal year, capital expenditures were $459M 10 |
Rising Capital Returns Accompany Business Expansion 11 FY 2011 FY 2010 GAAP ROIC 26% 15% Core EBITDA3 $1.0B $748M Cash Flow from Operations $828M $427M Free Cash Flow8 $402M ($13M) Free Cash Flow Yield9 40% n/a Dividends / Share Repurchases $260M $60M Cash Balances $889M $744M |
The GAAP Story: Best in Class 12 Number of years with positive GAAP earnings for US Exchange Traded EMS CompetitorsFiscal Years 2001 - 2010 (CHART) |
First Quarter Outlook |
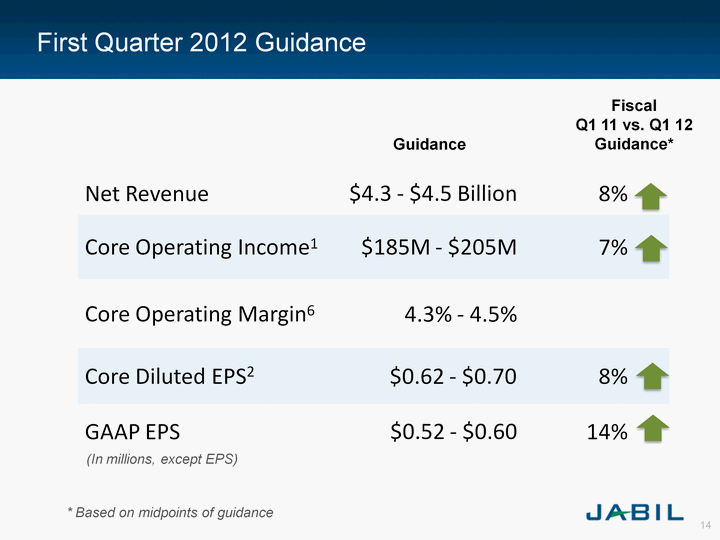
Net Revenue $4.3 - $4.5 Billion 8% Core Operating Income1 $185M - $205M 7% Core Operating Margin6 4.3% - 4.5% Core Diluted EPS2 $0.62 - $0.70 8% GAAP EPS $0.52 - $0.60 14% First Quarter 2012 Guidance 14 (In millions, except EPS) Fiscal Q1 11 vs. Q1 12 Guidance* * Based on midpoints of guidance Guidance |
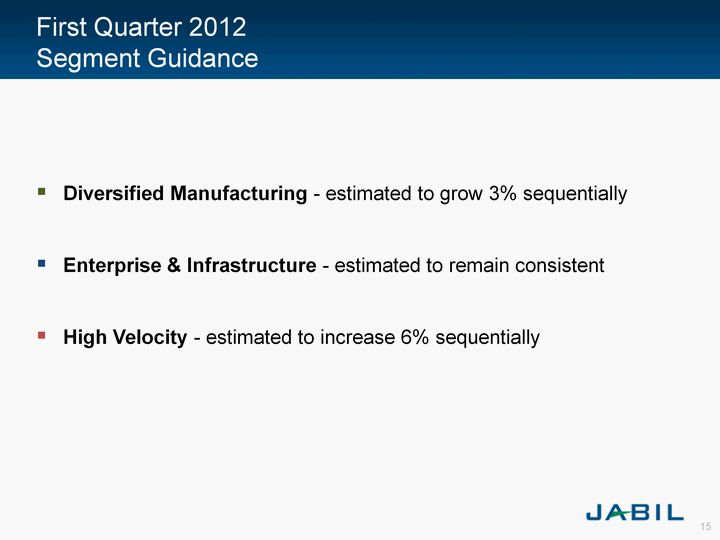
15 First Quarter 2012 Segment Guidance Diversified Manufacturing - estimated to grow 3% sequentiallyEnterprise & Infrastructure - estimated to remain consistentHigh Velocity - estimated to increase 6% sequentially |
Business Update |
Elite, Record-Setting Performance 17 For the three year period since 2008, Jabil's EPS (GAAP) CAGR places ninth among Fortune 500 companies with over $15B in revenue. Amerisource BergenAppleCignaDow Chemical Jabil and... JP Morgan ChaseTyson FoodsWells FargoXerox |
Continuous Improvement Culture Blitz Kaizen Events increased 215% to 14,000 events3,000 enrolled in the Lean Six Sigma Education programExpanded human development and leadership training resourcesDeveloped and deployed proprietary global logistics and planning toolsIncreased depth of critical product engineering capabilityInvesting in IT infrastructure, single instance of SAP worldwide 18 |
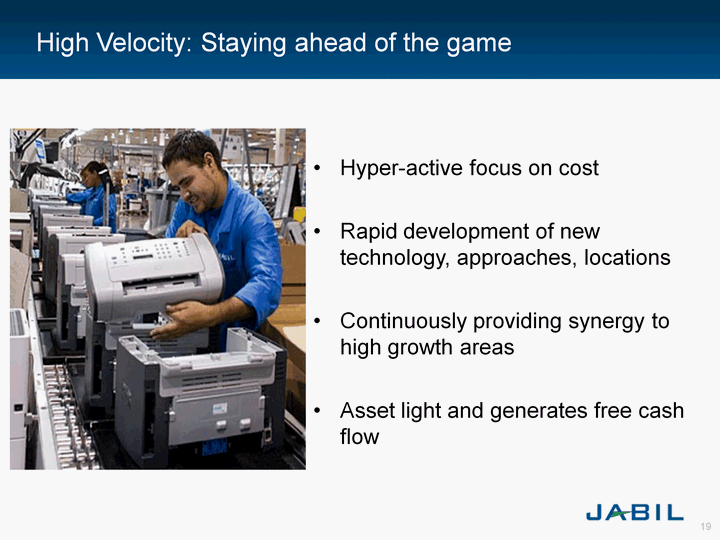
High Velocity: Staying ahead of the game Hyper-active focus on costRapid development of new technology, approaches, locationsContinuously providing synergy to high growth areasAsset light and generates free cash flow 19 |
Enterprise & Infrastructure: Simplicity Masters Complexity Simplify through... Engineering intimacySuperb manufacturing Proprietary planning toolsMore locations, scale, capabilityPlug 'n play systems 20 |
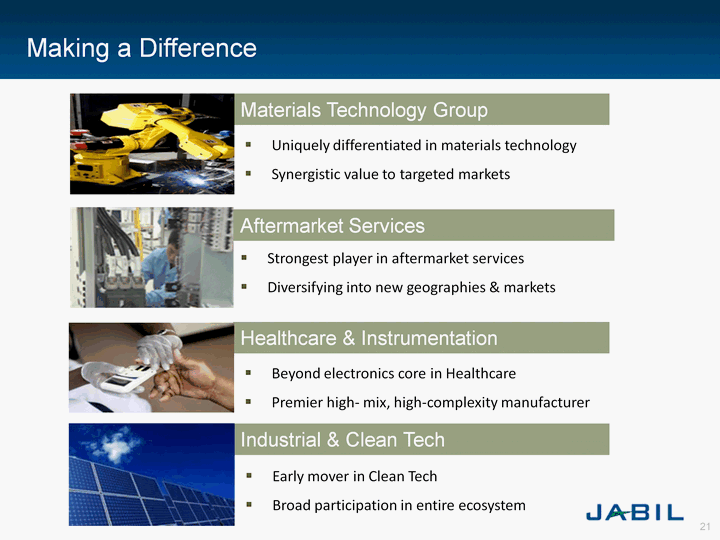
Making a Difference Healthcare & Instrumentation Materials Technology Group Aftermarket Services Uniquely differentiated in materials technologySynergistic value to targeted markets Beyond electronics core in HealthcarePremier high- mix, high-complexity manufacturer Strongest player in aftermarket servicesDiversifying into new geographies & markets Industrial & Clean Tech Early mover in Clean TechBroad participation in entire ecosystem 21 |
The Nature of Our Value 80% of global GDP growth generated in "developing" economiesWhere customers are, what they do and how they do it is in a constant state of change and challengeManaging in a globalizing, urbanizing, resource scarce and socially connected world is a tough task for our customersJabil makes it easier; to get the products developed, made, delivered and serviced around the worldDemand for this value is expected to remain robust 22 |
Appendix |
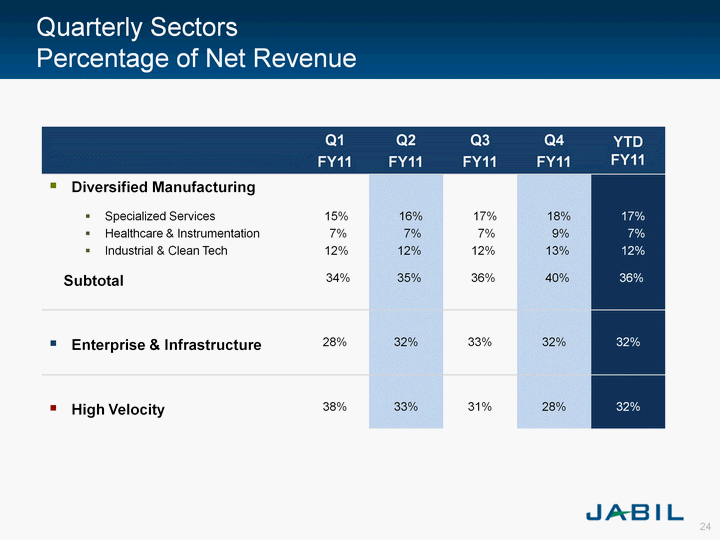
24 Quarterly Sectors Percentage of Net Revenue Q1FY11 Q2FY11 Q3FY11 Q4FY11 YTD FY11 Diversified Manufacturing Specialized Services Healthcare & Instrumentation Industrial & Clean TechSubtotal 15% 7% 12% 34% 16% 7% 12% 35% 17% 7% 12% 36% 18% 9% 13% 40% 17% 7% 12% 36% Enterprise & Infrastructure 28% 32% 33% 32% 32% High Velocity 38% 33% 31% 28% 32% |
Revenue Mix 25 Core Operating Margin6 Increase of 100 BPS USD in thousands (CHART) |
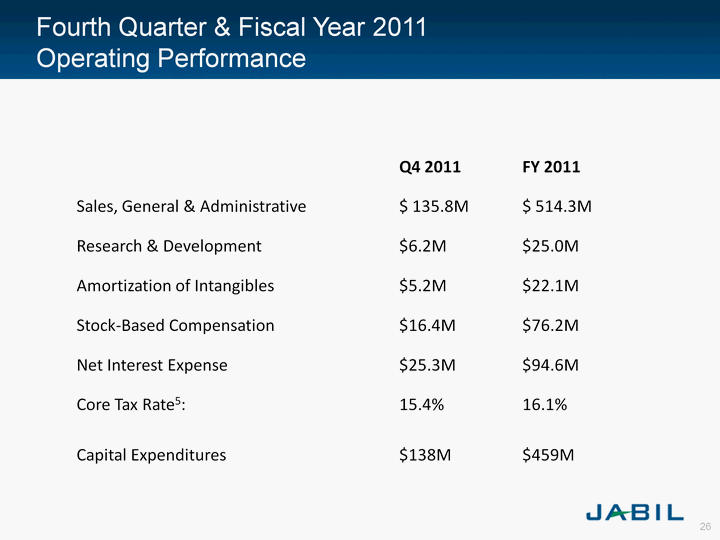
Fourth Quarter & Fiscal Year 2011 Operating Performance 26 Q4 2011 FY 2011 Sales, General & Administrative $ 135.8M $ 514.3M Research & Development $6.2M $25.0M Amortization of Intangibles $5.2M $22.1M Stock-Based Compensation $16.4M $76.2M Net Interest Expense $25.3M $94.6M Core Tax Rate5: 15.4% 16.1% Capital Expenditures $138M $459M |
First Quarter 2012 Operating Guidance 27 Q1 2012 Sales, General & Administrative 3.2% Research & Development $7M Amortization of Intangibles $5M Stock-Based Compensation $18M Net Interest Expense $27M Core Tax Rate5: 17% |
Balance Sheet & Ratio Trends Q4FY10 Q4FY11 Sales cycle* 17 days 8 days Inventory turns 7 7 Core return on invested capital "ROIC"7 26% 30% *Days in accounts receivable + days in inventory - days in accounts payable 28 |
Reconciliation of Non-GAAP Financial Measures 29 Core operating income excludes amortization of intangibles, stock-based compensation expense and related charges, restructuring and impairment charges, goodwill impairment charges, certain distressed customer charges, settlement of receivables and related charges and loss on disposal of subsidiaries.Core EPS excludes amortization of intangibles, stock-based compensation expense and related charges, restructuring and impairment charges, goodwill impairment charges, certain distressed customers charges, settlement of receivables and related charges, loss on disposal of subsidiaries, certain other expenses, net of tax and certain deferred tax valuation allowance charges.Core operating income1 + depreciation expense. The financial results disclosed in this release include certain measures calculated and presented in accordance with GAAP. In addition to the GAAP financial measures, Jabil provides supplemental, non-GAAP financial measures to facilitate evaluation of Jabil's core operating performance. The non- GAAP financial measures disclosed in this presentation exclude certain amounts that are included in the most directly comparable GAAP measures. The non-GAAP or core financial measures disclosed in this presentation do not have standard meaning and may vary from non-GAAP financial measures used by other companies. Management believes core financial measures are a useful measure that facilitates evaluating the past and future performance of Jabil's ongoing operations on a comparable basis. Jabil reports core operating income, core return on invested capital, core earnings and core earnings per share to provide investors an additional method for assessing operating income, earnings and earnings per share from what it believes are its core manufacturing operations. |
Reconciliation of Non-GAAP Financial Measures 30 Core Earnings excludes amortization of intangibles, stock-based compensation expense and related charges, restructuring and impairment charges, goodwill impairment charges, certain distressed customers charges, settlement of receivables and related charges, loss on disposal of subsidiaries, certain other expenses, net of tax and certain deferred tax valuation allowance charges.Core Tax Rate excludes amortization of intangibles, stock-based compensation expense and related charges, restructuring and impairment charges, goodwill impairment charges, certain distressed customers charges, settlement of receivables and related charges, loss on disposal of subsidiaries, certain other expenses, net of tax and certain deferred tax valuation allowance charges.Core operating income1 / net revenueCore Return on Invested Capital (ROIC) is calculated by annualizing the Company's after-tax non- GAAP operating income for its most recently-ended quarter and dividing that by a two quarter average net invested capital asset base. After-tax non-GAAP operating income excludes expenses and charges relating to the amortization of intangibles, stock-based compensation expense and related charges, restructuring and impairment charges, goodwill impairment charges, certain distressed customer charges, settlement of receivables and related charges and loss on disposal of subsidiaries. Net invested capital is defined as the sum of the averages of stockholders' equity and current and non-current portions of notes payable and long term debt, adjusted for the average cash and cash equivalents.Free Cash Flow defined as Cash Provided by Operating Activities less Net Cash used in Investing Activities.FCF Yield defined as Free Cash Flow8 as a percentage of EBITDA. |