
06.16.2022 The Allstate Corporation Special Topic Investor Call Value of Homeowners Insurance
The Allstate Corporation 2022 PAGE 1 Forward-looking Statements and Non-GAAP Financial Information This presentation contains forward-looking statements and information. This presentation also contains non- GAAP measures that are denoted with an asterisk. You can find the reconciliation of those measures to GAAP measures within our most recent earnings release and investor supplement. Additional information on factors that could cause results to differ materially from this presentation is available in the 2021 Form 10-K, Form 10-Q for March 31, 2022, our most recent earnings release, and at the end of these slides. These materials are available on our website, www.allstateinvestors.com, under the “Financials” link.

The Allstate Corporation 2022 PAGE 2 Operating Priorities Improve customer value Achieve target economic returns on capital Grow customer base Proactively manage investments Build long-term growth platforms Increase Personal Property-Liability market share Expand Protection Services Allstate’s Strategy to Deliver Transformative Growth and Higher Valuation Leveraging Allstate brand, customer base and capabilities Homeowners insurance is a growth opportunity with attractive returns and moderate volatilityToday’s discussion
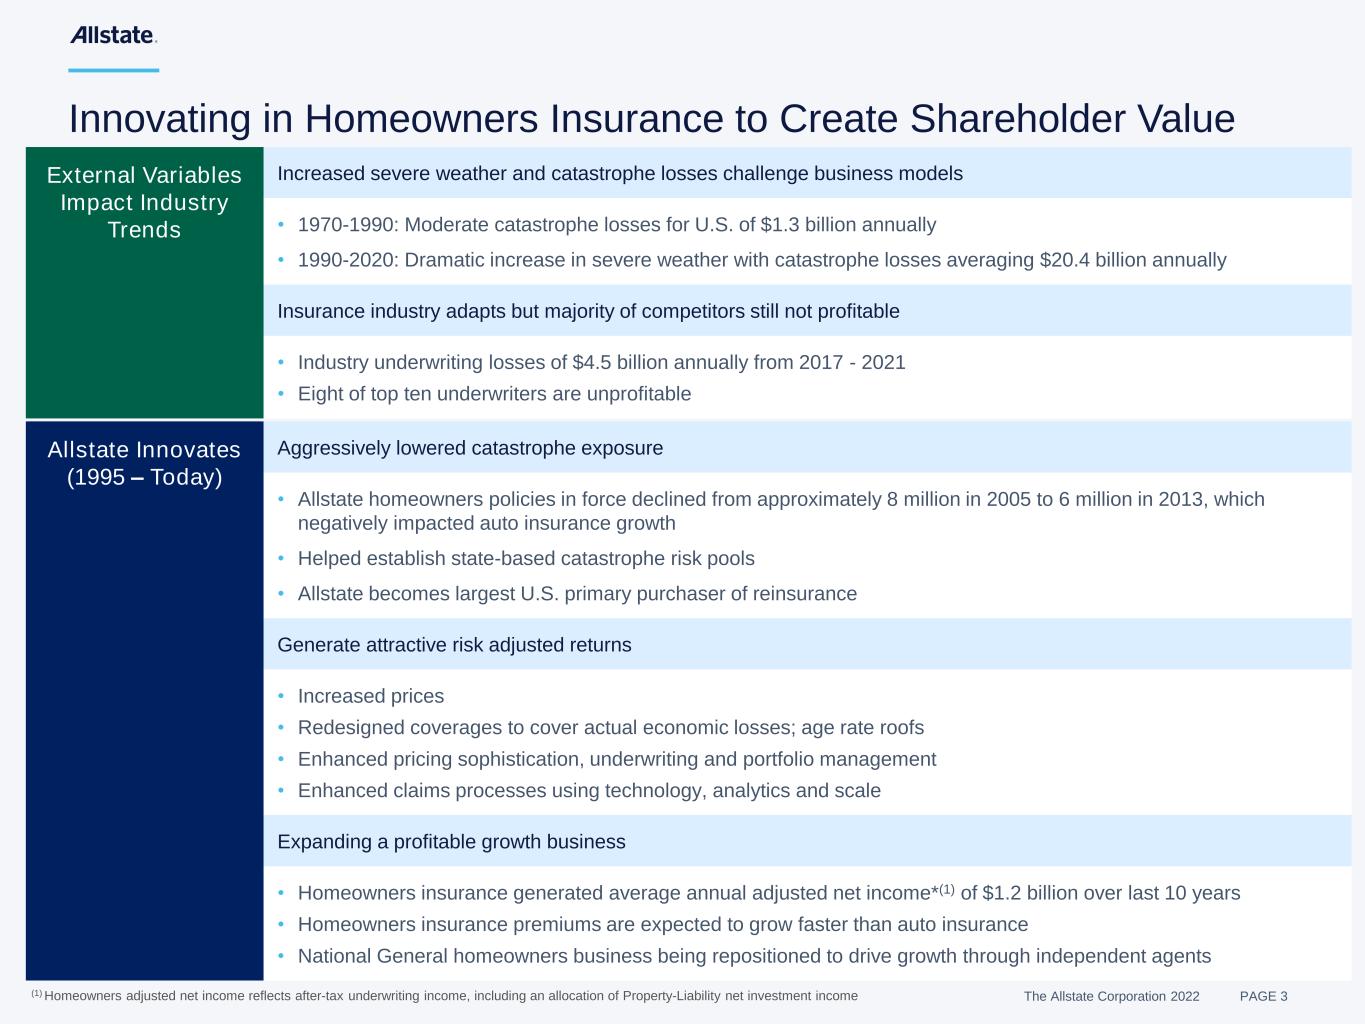
The Allstate Corporation 2022 PAGE 3 Innovating in Homeowners Insurance to Create Shareholder Value Allstate Innovates (1995 – Today) Aggressively lowered catastrophe exposure • Allstate homeowners policies in force declined from approximately 8 million in 2005 to 6 million in 2013, which negatively impacted auto insurance growth • Helped establish state-based catastrophe risk pools • Allstate becomes largest U.S. primary purchaser of reinsurance Generate attractive risk adjusted returns • Increased prices • Redesigned coverages to cover actual economic losses; age rate roofs • Enhanced pricing sophistication, underwriting and portfolio management • Enhanced claims processes using technology, analytics and scale Expanding a profitable growth business • Homeowners insurance generated average annual adjusted net income*(1) of $1.2 billion over last 10 years • Homeowners insurance premiums are expected to grow faster than auto insurance • National General homeowners business being repositioned to drive growth through independent agents External Variables Impact Industry Trends Increased severe weather and catastrophe losses challenge business models • 1970-1990: Moderate catastrophe losses for U.S. of $1.3 billion annually • 1990-2020: Dramatic increase in severe weather with catastrophe losses averaging $20.4 billion annually Insurance industry adapts but majority of competitors still not profitable • Industry underwriting losses of $4.5 billion annually from 2017 - 2021 • Eight of top ten underwriters are unprofitable (1) Homeowners adjusted net income reflects after-tax underwriting income, including an allocation of Property-Liability net investment income
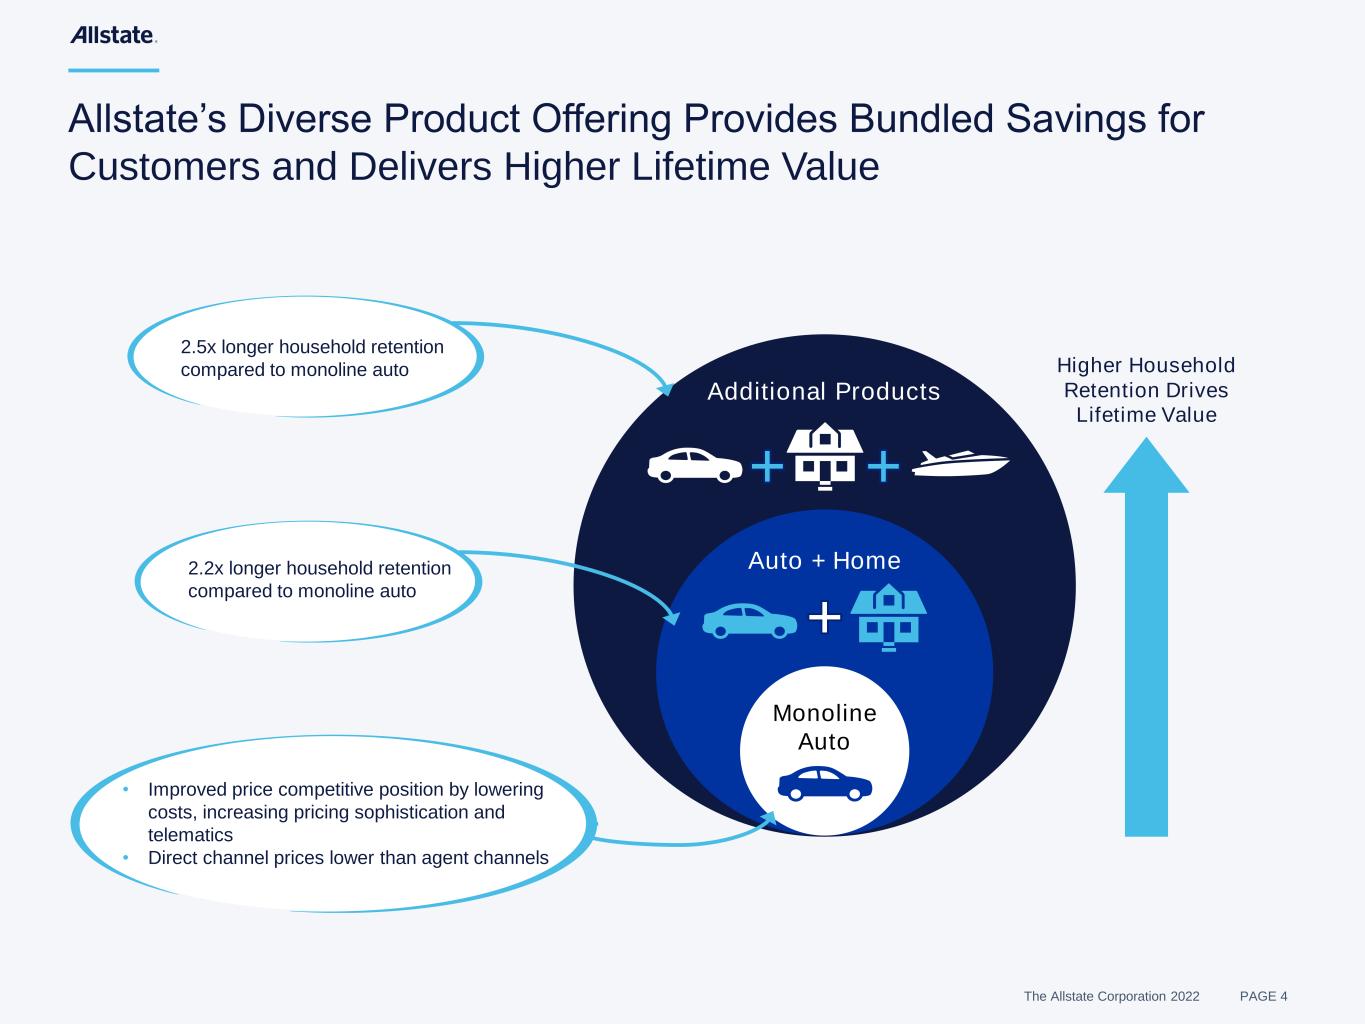
The Allstate Corporation 2022 PAGE 4 Allstate’s Diverse Product Offering Provides Bundled Savings for Customers and Delivers Higher Lifetime Value Monoline Auto Auto + Home Additional Products Higher Household Retention Drives Lifetime Value 2.2x longer household retention compared to monoline auto 2.5x longer household retention compared to monoline auto • Improved price competitive position by lowering costs, increasing pricing sophistication and telematics • Direct channel prices lower than agent channels
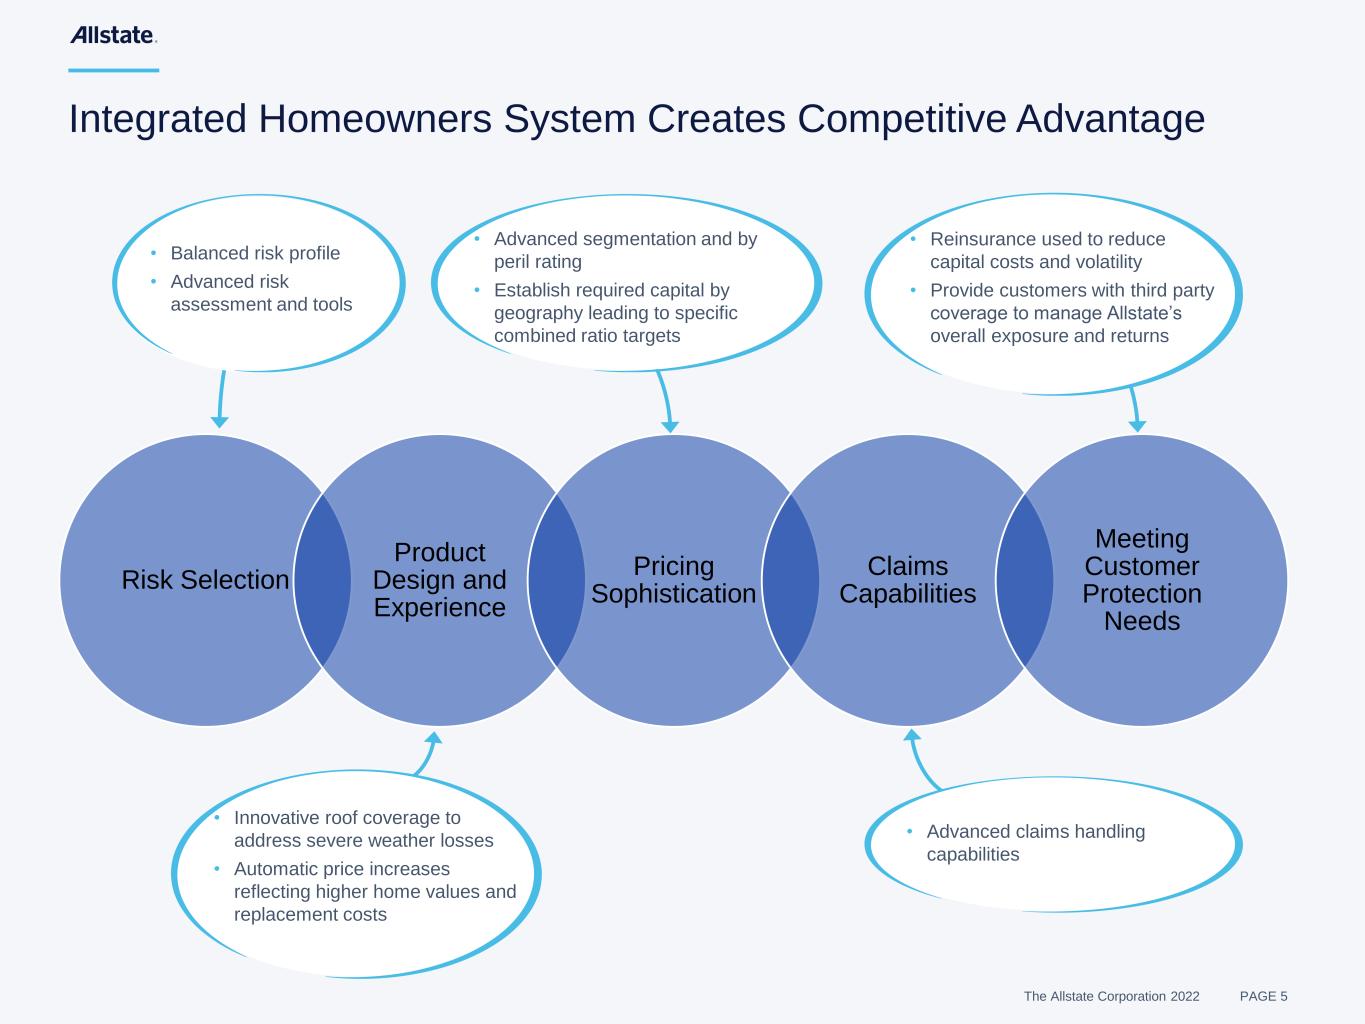
The Allstate Corporation 2022 PAGE 5 Integrated Homeowners System Creates Competitive Advantage Risk Selection Product Design and Experience Pricing Sophistication Claims Capabilities Meeting Customer Protection Needs • Advanced claims handling capabilities • Innovative roof coverage to address severe weather losses • Automatic price increases reflecting higher home values and replacement costs • Reinsurance used to reduce capital costs and volatility • Provide customers with third party coverage to manage Allstate’s overall exposure and returns • Advanced segmentation and by peril rating • Establish required capital by geography leading to specific combined ratio targets • Balanced risk profile • Advanced risk assessment and tools

The Allstate Corporation 2022 PAGE 6 80 90 100 110 120 2017 2018 2019 2020 2021 Allstate brand Homeowners Insurance Generates Attractive Returns (1) Industry and competitor information represents statutory results per S&P Global Market Intelligence. Allstate information represents Allstate brand GAAP results for 2017-2021. (% EP) Long-Term Target of 90 or Lower Homeowners insurance combined ratios(1) State Farm Progressive Industry average TRV SF TRV Travelers TRV SF ALL PGRPGRTRV Target combined ratio below auto insurance given higher capital requirements Superior performance
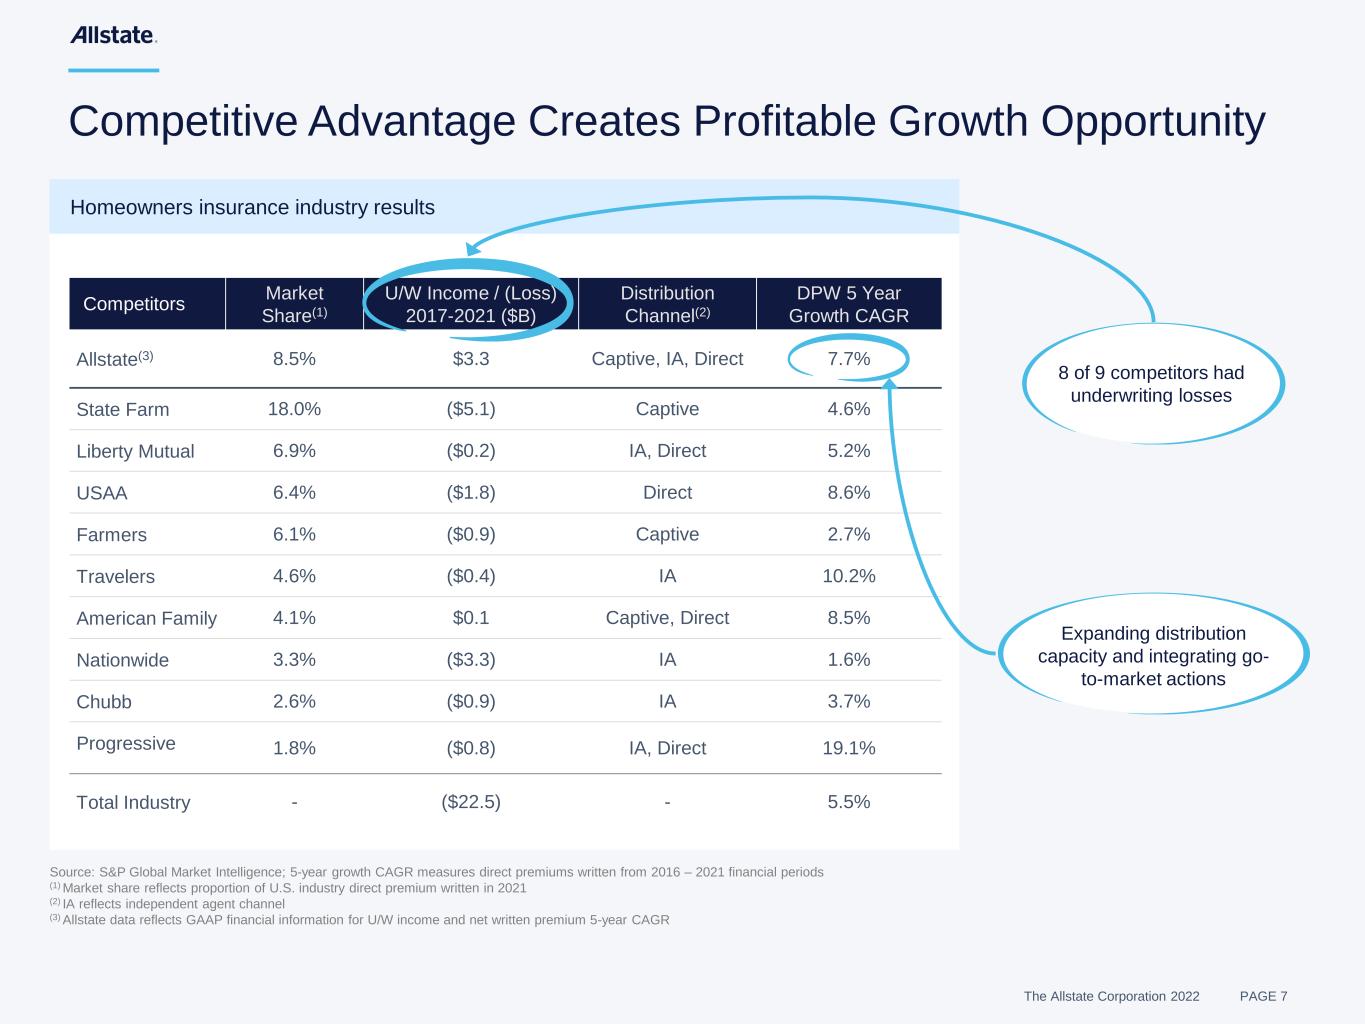
The Allstate Corporation 2022 PAGE 7 Competitors Market Share(1) U/W Income / (Loss) 2017-2021 ($B) Distribution Channel(2) DPW 5 Year Growth CAGR Allstate(3) 8.5% $3.3 Captive, IA, Direct 7.7% State Farm 18.0% ($5.1) Captive 4.6% Liberty Mutual 6.9% ($0.2) IA, Direct 5.2% USAA 6.4% ($1.8) Direct 8.6% Farmers 6.1% ($0.9) Captive 2.7% Travelers 4.6% ($0.4) IA 10.2% American Family 4.1% $0.1 Captive, Direct 8.5% Nationwide 3.3% ($3.3) IA 1.6% Chubb 2.6% ($0.9) IA 3.7% Progressive 1.8% ($0.8) IA, Direct 19.1% Total Industry - ($22.5) - 5.5% Competitive Advantage Creates Profitable Growth Opportunity Homeowners insurance industry results Source: S&P Global Market Intelligence; 5-year growth CAGR measures direct premiums written from 2016 – 2021 financial periods (1) Market share reflects proportion of U.S. industry direct premium written in 2021 (2) IA reflects independent agent channel (3) Allstate data reflects GAAP financial information for U/W income and net written premium 5-year CAGR Expanding distribution capacity and integrating go- to-market actions 8 of 9 competitors had underwriting losses

The Allstate Corporation 2022 PAGE 8 Sustaining Competitive Advantage Through Innovative Product Design and Advanced Risk Selection Enhanced Risk Selection Innovative Product Design and Experience Coastal risk evaluation scoring Aerial imagery incorporated into risk assessment Strategic targeted risk levels by geographic area – Coastal hurricanes – Inland tornados and hailstorms – Wildfires Proprietary risk models inform home inspection decisioning Innovative House & Home product • Coverage options designed for severe weather, including roof options based on age and materials Home replacement cost incorporates specific materials & attributes Simplified quoting experience • Bundling made easy with streamlined quoting process by pre-filling questions leveraging cross-line info and 3rd party data

The Allstate Corporation 2022 PAGE 9 Geocoding & Geographic Rating - Enhancing geographic rating leveraging geospatial variables, extensive historical data and catastrophe insights (wildfire/hurricane) Pricing Sophistication Improves Segmentation and Ease of Business >30K ~250M Geocoded grids (8,000x) Zip codes in US • Galveston • Galveston Where do you live? (zip code / rating territory) Where exactly do you live? (latitude/longitude) TRADITIONAL ADVANCED What can you tell us about your home? What do we know about your home and how is it maintained? What is expected loss across all perils? What is expected loss for each individual peril? By-peril data and modeling capabilities creates advanced foundation for pricing sophistication Cost of reinsurance (where allowed) and tail risk incorporated into overall and segmented pricing 3rd party data and technology is leveraged to improve pricing accuracy and allow for simpler customer experience
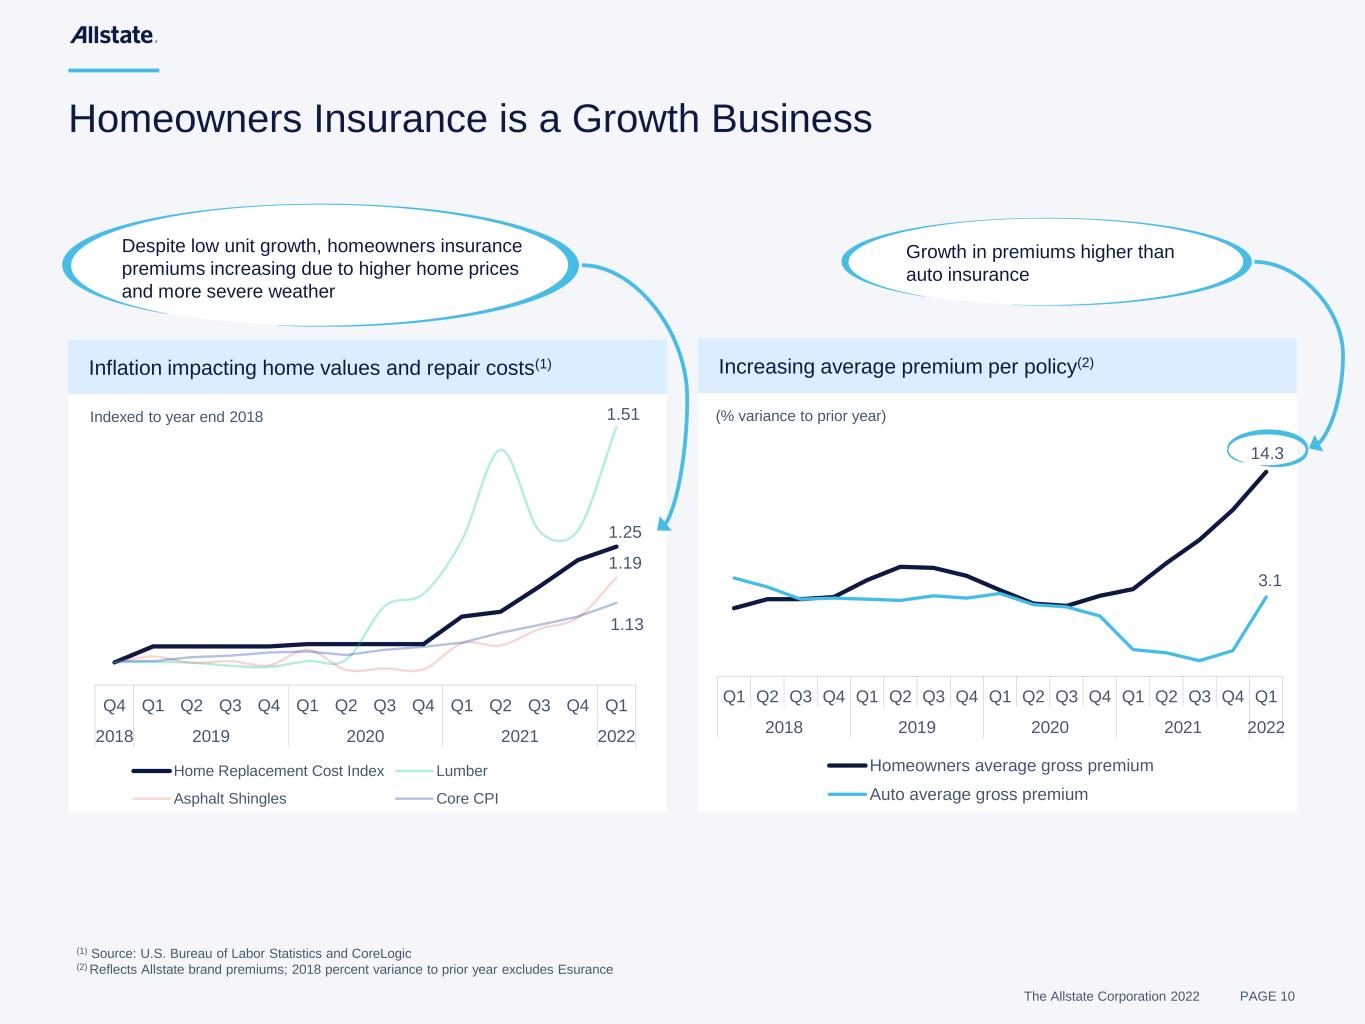
The Allstate Corporation 2022 PAGE 10 1.25 1.51 1.19 1.13 Q4 Q1 Q2 Q3 Q4 Q1 Q2 Q3 Q4 Q1 Q2 Q3 Q4 Q1 2018 2019 2020 2021 2022 Home Replacement Cost Index Lumber Asphalt Shingles Core CPI Homeowners Insurance is a Growth Business Increasing average premium per policy(2) 14.3 3.1 Q1 Q2 Q3 Q4 Q1 Q2 Q3 Q4 Q1 Q2 Q3 Q4 Q1 Q2 Q3 Q4 Q1 2018 2019 2020 2021 2022 Homeowners average gross premium Auto average gross premium (% variance to prior year)Indexed to year end 2018 Inflation impacting home values and repair costs(1) (1) Source: U.S. Bureau of Labor Statistics and CoreLogic (2) Reflects Allstate brand premiums; 2018 percent variance to prior year excludes Esurance Despite low unit growth, homeowners insurance premiums increasing due to higher home prices and more severe weather Growth in premiums higher than auto insurance

The Allstate Corporation 2022 PAGE 11 Allstate Property Market Share Rankings(1) Allstate Meets Customer’s Protection Needs Through Sophisticated Portfolio Management (1) Source: S&P Global Market Intelligence 2021 percent of direct written premiums; Includes homeowners, farmowners, condominium, renters and other personal property lines. Allstate market share excludes third party policies brokered through Ivantage Allstate underwrites risk in areas where return objectives can be achieved and Allstate agents broker $1.6 billion of property premiums for other companies to provide bundled coverage to customers Florida market share less than 3% with separately capitalized companies and stand alone reinsurance program California market share has been reduced by more than 50% since 2007 due to wildfire risk Top 2 Top 5 Outside Top 5

The Allstate Corporation 2022 PAGE 12 Advanced Technology • Satellite Imagery: Advance knowledge of dimensions and features • Aircraft: Survey the area to determine extent of damage • Video: Virtual Assist™ connects us live with contractors, local experts and customers >80% Of wind and hail claims handled virtually Sophisticated Analytics • Weather Data: Damage prediction before claims are reported enables rapid remediation • Predictive Models: Determine best inspection method • Estimating Platform: Incorporates dynamic local material pricing to create most accurate loss estimate 30% Savings per average water claim when utilizing loss mitigation network(1) Leveraging Scale • Supplier network: Contracts with material suppliers and contractors • Rapid Response: Pre-position experts • Operational Scale: Capacity to quickly add resources 95% Vendor coverage(2) Allstate’s Accurate and Efficient Claims Resolution Leverages Technology, Analytics and Scale (1) Average savings on water claims handled in-network versus out of network (2) Countrywide availability of loss mitigation vendors

The Allstate Corporation 2022 PAGE 13 Allstate’s Integrated Response Delivers Speed and Accuracy Weather Data: Wind speed and hail diameter known in real time Imagery: Precise roofing features and dimensions determined Mobile App: Claim reporting, communication and payment preferences all handled on-line Video: Real time collaboration to resolve low touch claims quickly and accurately Claim Resolution Rapid Response: Catastrophe claim team and external partnerships Payments: More than 80% of payments made electronically through Quick Card Pay Technology: Caring experts use data and technology to manage claim cost accurately Scale: Materials discount and vendor network
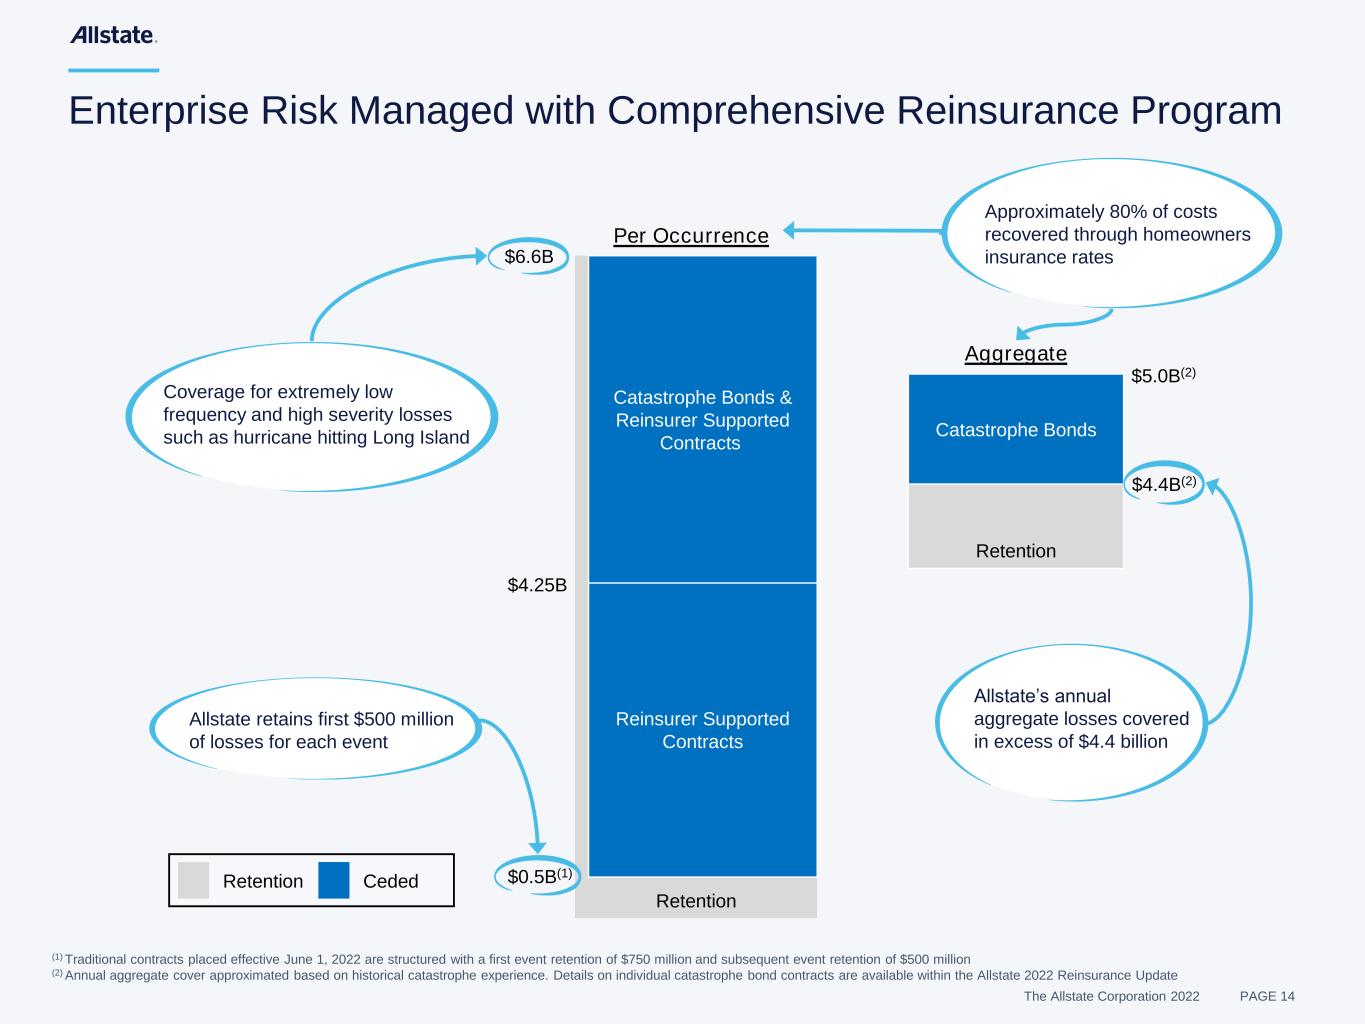
The Allstate Corporation 2022 PAGE 14 Enterprise Risk Managed with Comprehensive Reinsurance Program Retention Ceded $0.5B(1) $4.25B $6.6B Retention Per Occurrence Retention Catastrophe Bonds Reinsurer Supported Contracts Catastrophe Bonds & Reinsurer Supported Contracts Aggregate (1) Traditional contracts placed effective June 1, 2022 are structured with a first event retention of $750 million and subsequent event retention of $500 million (2) Annual aggregate cover approximated based on historical catastrophe experience. Details on individual catastrophe bond contracts are available within the Allstate 2022 Reinsurance Update $4.4B(2) Coverage for extremely low frequency and high severity losses such as hurricane hitting Long Island Approximately 80% of costs recovered through homeowners insurance rates Allstate retains first $500 million of losses for each event Allstate’s annual aggregate losses covered in excess of $4.4 billion $5.0B(2)
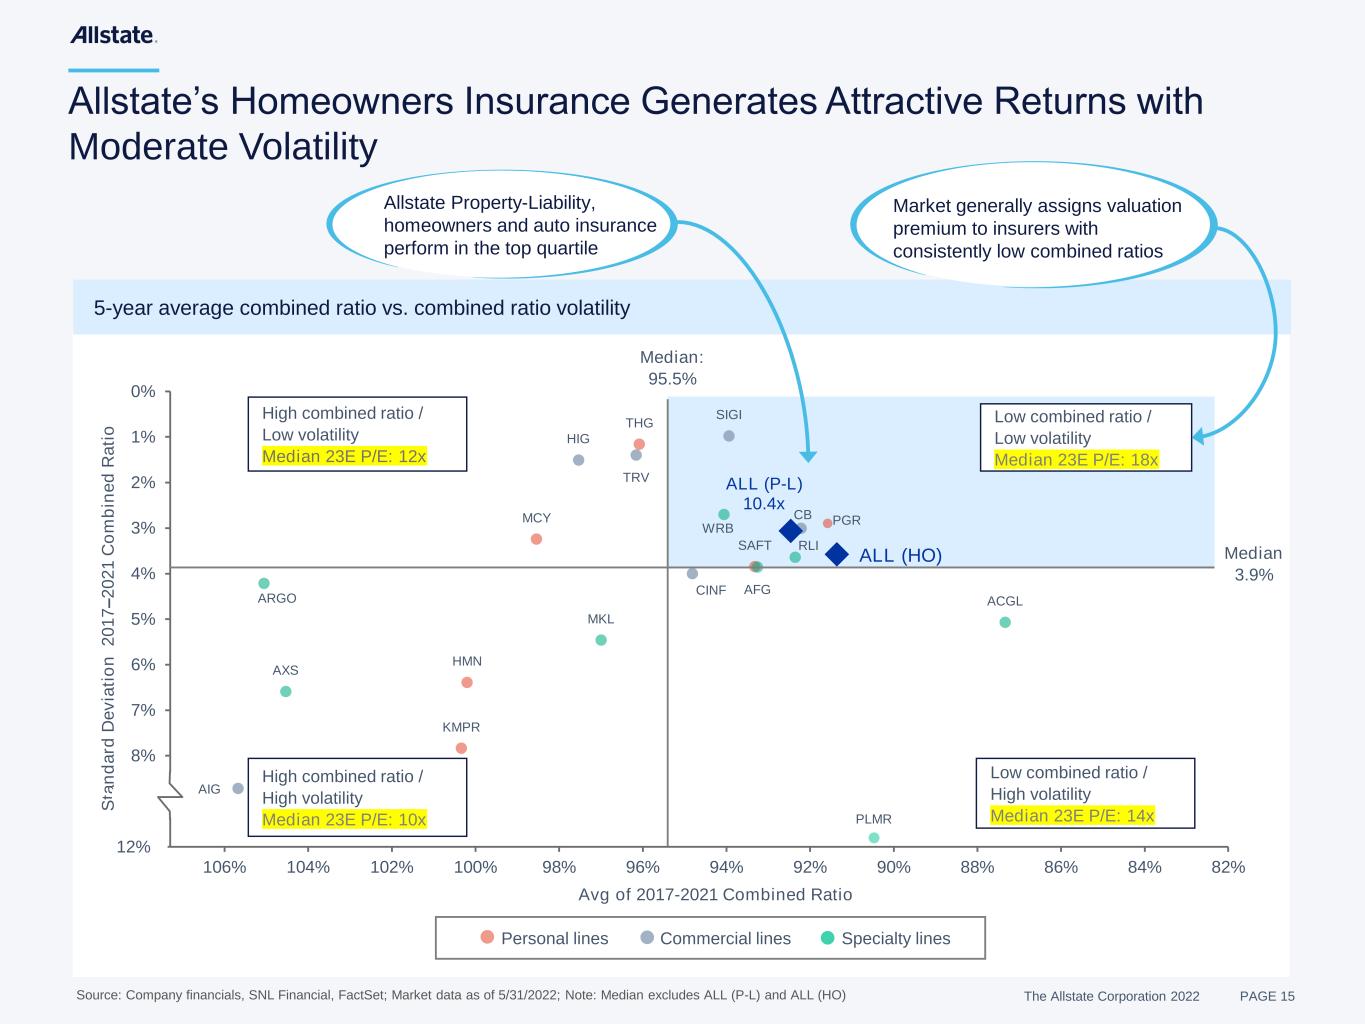
The Allstate Corporation 2022 PAGE 15 CB PGR TRV CINF SIGI SAFT THG HIG MCY HMN KMPR AIG ACGL RLI AFG WRB MKL AXS ARGO ALL (P-L) 10.4x ALL (HO) 0% 1% 2% 3% 4% 5% 6% 7% 8% 9% 10% 82%84%86%88%90%92%94%96%98%100%102%104%106% S ta n d a rd D e v ia ti o n 2 0 1 7 – 2 0 2 1 C o m b in e d R a ti o Avg of 2017-2021 Combined Ratio Allstate’s Homeowners Insurance Generates Attractive Returns with Moderate Volatility Source: Company financials, SNL Financial, FactSet; Market data as of 5/31/2022; Note: Median excludes ALL (P-L) and ALL (HO) 5-year average combined ratio vs. combined ratio volatility Median: 95.5% Median 3.9% 12 Personal lines Specialty lines Commercial lines High combined ratio / Low volatility Median 23E P/E: 12x High combined ratio / High volatility Median 23E P/E: 10x Low combined ratio / High volatility Median 23E P/E: 14x Low combined ratio / Low volatility Median 23E P/E: 18x PLMR Market generally assigns valuation premium to insurers with consistently low combined ratios Allstate Property-Liability, homeowners and auto insurance perform in the top quartile
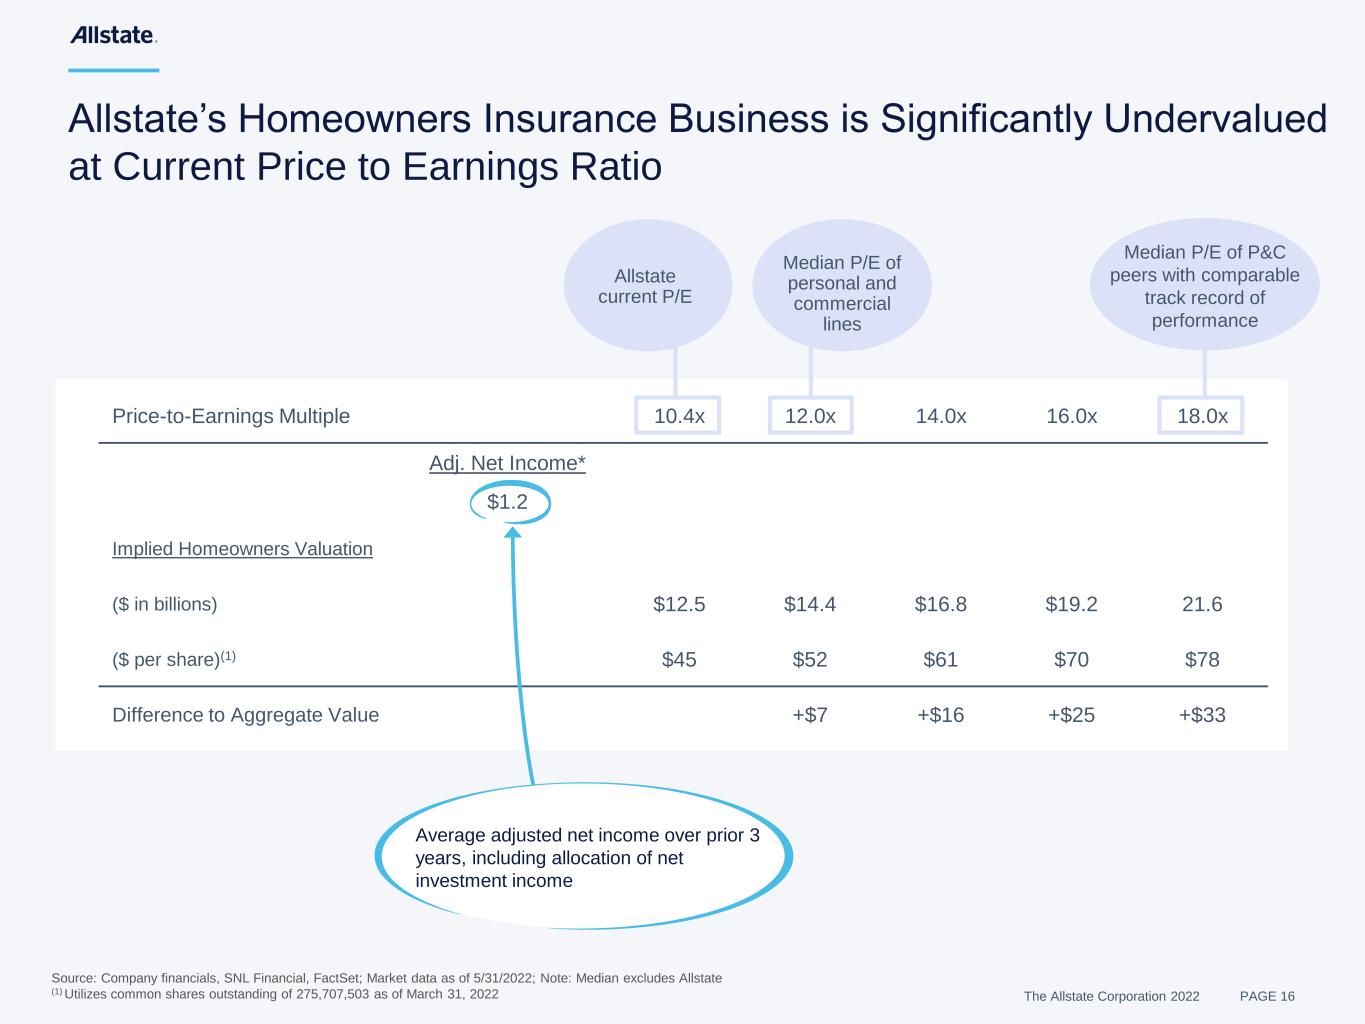
The Allstate Corporation 2022 PAGE 16 Price-to-Earnings Multiple 10.4x 12.0x 14.0x 16.0x 18.0x Adj. Net Income* $1.2 Implied Homeowners Valuation ($ in billions) $12.5 $14.4 $16.8 $19.2 21.6 ($ per share)(1) $45 $52 $61 $70 $78 Difference to Aggregate Value +$7 +$16 +$25 +$33 Allstate’s Homeowners Insurance Business is Significantly Undervalued at Current Price to Earnings Ratio Allstate current P/E Median P/E of personal and commercial lines Median P/E of P&C peers with comparable track record of performance Source: Company financials, SNL Financial, FactSet; Market data as of 5/31/2022; Note: Median excludes Allstate (1) Utilizes common shares outstanding of 275,707,503 as of March 31, 2022 Average adjusted net income over prior 3 years, including allocation of net investment income
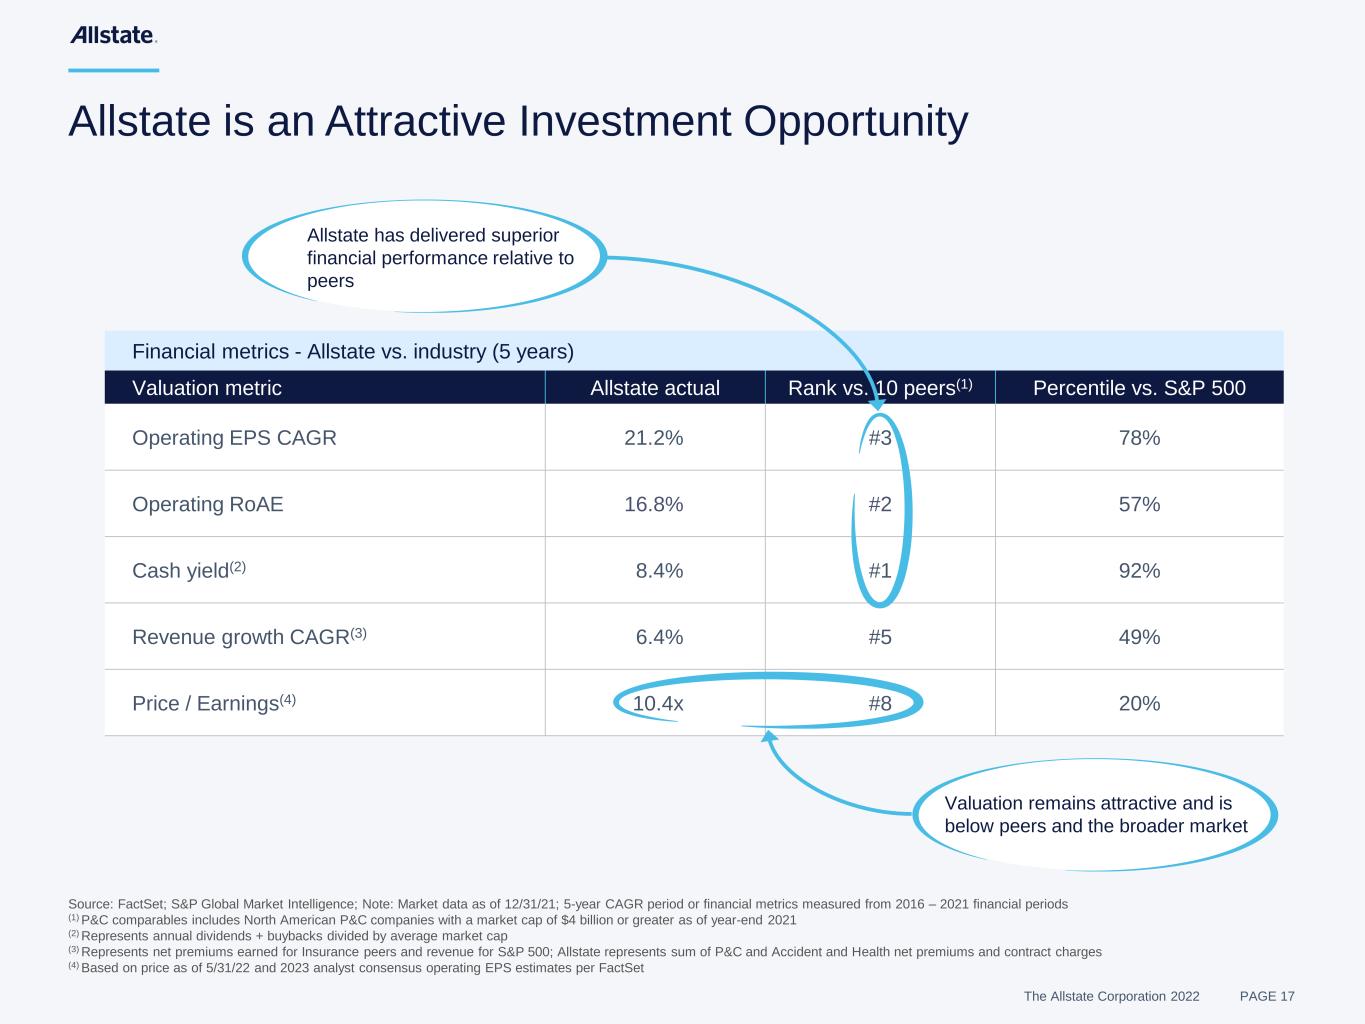
The Allstate Corporation 2022 PAGE 17 Source: FactSet; S&P Global Market Intelligence; Note: Market data as of 12/31/21; 5-year CAGR period or financial metrics measured from 2016 – 2021 financial periods (1) P&C comparables includes North American P&C companies with a market cap of $4 billion or greater as of year-end 2021 (2) Represents annual dividends + buybacks divided by average market cap (3) Represents net premiums earned for Insurance peers and revenue for S&P 500; Allstate represents sum of P&C and Accident and Health net premiums and contract charges (4) Based on price as of 5/31/22 and 2023 analyst consensus operating EPS estimates per FactSet Financial metrics - Allstate vs. industry (5 years) Valuation metric Allstate actual Rank vs. 10 peers(1) Percentile vs. S&P 500 Operating EPS CAGR 21.2% #3 78% Operating RoAE 16.8% #2 57% Cash yield(2) 8.4% #1 92% Revenue growth CAGR(3) 6.4% #5 49% Price / Earnings(4) 10.4x #8 20% Allstate is an Attractive Investment Opportunity Allstate has delivered superior financial performance relative to peers Valuation remains attractive and is below peers and the broader market

The Allstate Corporation 2022 PAGE 19 Forward-looking Statements This presentation contains “forward-looking statements” that anticipate results based on our estimates, assumptions and plans that are subject to uncertainty. These statements are made subject to the safe-harbor provisions of the Private Securities Litigation Reform Act of 1995. Forward-looking statements do not relate strictly to historical or current facts and may be identified by their use of words like “plans,” “seeks,” “expects,” “will,” “should,” “anticipates,” “estimates,” “intends,” “believes,” “likely,” “targets” and other words with similar meanings. These statements may address, among other things, our strategy for growth, catastrophe, exposure management, product development, investment results, regulatory approvals, market position, expenses, financial results, litigation, and reserves. We believe that these statements are based on reasonable estimates, assumptions and plans. Forward-looking statements speak only as of the date on which they are made, and we assume no obligation to update any forward-looking statements as a result of new information or future events or developments. In addition, forward-looking statements are subject to certain risks or uncertainties that could cause actual results to differ materially from those communicated in these forward-looking statements. Factors that could cause actual results to differ materially from those expressed in, or implied by, the forward-looking statements include risks related to: o Insurance and Financial Services (1) unexpected increases in claim frequency and severity; (2) catastrophes and severe weather events; (3) limitations in analytical models used for loss cost estimates; (4) price competition and changes in regulation and underwriting standards; (5) actual claims costs exceeding current reserves; (6) market risk and declines in credit quality of our investment portfolio; (7) our subjective determination of fair value and amount of credit losses for investments; (8) our participation in indemnification programs, including state industry pools and facilities; (9) inability to mitigate the impact associated with changes in capital requirements; (10) a downgrade in financial strength ratings; o Business, Strategy and Operations (11) competition in the industries in which we compete and new or changing technologies; (12) implementation of our transformative growth strategy; (13) our catastrophe management strategy; (14) restrictions on our subsidiaries’ ability to pay dividends; (15) restrictions under terms of certain of our securities on our ability to pay dividends or repurchase our stock; (16) the availability of reinsurance at current levels and prices; (17) counterparty risk related to reinsurance; (18) acquisitions and divestitures of businesses; (19) intellectual property infringement, misappropriation and third-party claims; o Macro, Regulatory and Risk Environment (20) conditions in the global economy and capital markets, including the economic impacts from the recent military conflict between Russia and Ukraine; (21) a large- scale pandemic, the occurrence of terrorism, military actions, or social unrest; (22) the failure in cyber or other information security controls, as well as the occurrence of events unanticipated in our disaster recovery processes and business continuity planning; (23) changing climate and weather conditions; (24) restrictive regulations and regulatory reforms, including limitations on rate increases and requirements to underwrite business and participate in loss sharing arrangements; (25) losses from legal and regulatory actions; (26) changes in or the application of accounting standards; (27) loss of key vendor relationships or failure of a vendor to protect our data, confidential and proprietary information, or personal information of our customers, claimants or employees; (28) our ability to attract, develop and retain talent; and (29) misconduct or fraudulent acts by employees, agents and third parties. Additional information concerning these and other factors may be found in our filings with the Securities and Exchange Commission, including the “Risk Factors” section in our most recent annual report on Form 10-K.


