SEPTEMBER 30, 2007
RYDEX SERIES FUNDS SEMI-ANNUAL REPORT
DOMESTIC EQUITY FUNDS
MULTI-CAP CORE EQUITY FUND
SECTOR ROTATION FUND
ALTERNATIVE INVESTMENT FUNDS
ABSOLUTE RETURN STRATEGIES FUND
COMMODITIES STRATEGY FUND
(Formerly, Commodities Fund)
HEDGED EQUITY FUND
INTERNATIONAL ROTATION FUND
(Formerly, Managed Futures Fund)
MANAGED FUTURES STRATEGY FUND
REAL ESTATE FUND
(Formerly, Dynamic Strengthening Dollar Fund)
STRENGTHENING DOLLAR 2x STRATEGY FUND
(Formerly, Dynamic Weakening Dollar Fund)
WEAKENING DOLLAR 2x STRATEGY FUND
This report and the financial statements contained herein are submitted for the general information of our shareholders. The
report is not authorized for distribution to prospective investors unless preceded or accompanied by an effective prospectus.
Distributed by Rydex Distributors, Inc.
TABLE OF CONTENTS
LETTER TO OUR SHAREHOLDERS
. . . . . . . . . . . . . . . . . . . . . . . . . . . . . . . . . . . . . . . . . . . . . . . . . . . . . . . . . .
2
A BRIEF NOTE ON THE COMPOUNDING OF RETURNS
. . . . . . . . . . . . . . . . . . . . . . . . . . . . . . . . . . . . . . . . .
3
ABOUT SHAREHOLDERS’ FUND EXPENSES
. . . . . . . . . . . . . . . . . . . . . . . . . . . . . . . . . . . . . . . . . . . . . . . . . .
4
FUND PROFILES
. . . . . . . . . . . . . . . . . . . . . . . . . . . . . . . . . . . . . . . . . . . . . . . . . . . . . . . . . . . . . . . . . . . . . . . .
7
SCHEDULES OF INVESTMENTS
. . . . . . . . . . . . . . . . . . . . . . . . . . . . . . . . . . . . . . . . . . . . . . . . . . . . . . . . . . . .
12
STATEMENTS OF ASSETS AND LIABILITIES
. . . . . . . . . . . . . . . . . . . . . . . . . . . . . . . . . . . . . . . . . . . . . . . . . . .
46
STATEMENTS OF OPERATIONS
. . . . . . . . . . . . . . . . . . . . . . . . . . . . . . . . . . . . . . . . . . . . . . . . . . . . . . . . . . . .
48
STATEMENTS OF CHANGES IN NET ASSETS
. . . . . . . . . . . . . . . . . . . . . . . . . . . . . . . . . . . . . . . . . . . . . . . . .
50
FINANCIAL HIGHLIGHTS
. . . . . . . . . . . . . . . . . . . . . . . . . . . . . . . . . . . . . . . . . . . . . . . . . . . . . . . . . . . . . . . . .
54
NOTES TO FINANCIAL STATEMENTS
. . . . . . . . . . . . . . . . . . . . . . . . . . . . . . . . . . . . . . . . . . . . . . . . . . . . . . .
58
OTHER INFORMATION
. . . . . . . . . . . . . . . . . . . . . . . . . . . . . . . . . . . . . . . . . . . . . . . . . . . . . . . . . . . . . . . . . . .
70
INFORMATION ON BOARD OF TRUSTEES AND OFFICERS
. . . . . . . . . . . . . . . . . . . . . . . . . . . . . . . . . . . . . .
74
THE RYDEX SERIES FUNDS SEMI-ANNUAL REPORT
|
1
LETTER TO OUR SHAREHOLDERS
DEAR SHAREHOLDER:
The second and third quarters of 2007 represented one of the most challenging environments for investors
in recent memory. The major market averages started off the period by setting new highs only to
dramatically change course in a four-week period from mid-July to mid-August by staging a gut-wrenching
decline. From there, equity markets embarked on a spectacular rally, retracing almost all of their earlier
losses by the end of September. During this period, global credit markets seized up, and interest rates on
super-safe U.S. Treasury securities fell while interest rates on everything else rose. Investors were right to
ask what was happening.
What was happening was that the democratization of credit and its dispersion throughout the global
financial system was showing its nastier side. Reckless home lending practices here in the U.S. found
their way into financial markets across the globe through an array of highly engineered securities with
acronyms such as CDOs, CLOs and CMOs. Regardless of the moniker, the common thread was that by
over-collateralizing low-quality debt, as if by alchemy, vast pools of low-quality mortgages could be
transformed from junk status into AAA fixed-income securities.
Hedge funds purchased vast quantities of these structured products and leveraged this seemingly secure
income stream in order to maximize returns. The problem was that Wall Street did not fully take into
account how much the creditworthiness of home buyers had deteriorated in an era of loose underwriting
standards. As rising defaults began to eat into collateral, rating agencies rushed to downgrade large
swaths of the mortgage-backed bond market, sparking a stampede for the door.
Hedge funds were unable to meet redemption requests as investors backed away from credit exposure of
all kinds. A classic credit squeeze began to unfold as buyers disappeared and lenders, not knowing where
subprime risk resided, refused to lend.
With hedge funds failing and credit markets beginning to shut down, central banks stepped in to restore
order to the credit markets. Unfortunately, this backfired and the equity markets recoiled. Midcaps,
international stocks, energy, materials and consumer discretionary stocks all declined by double digit rates
as investors attempted to limit their exposure to the global financial system and to the U.S. consumer who
looked to be going into shock.
In this environment, short-term rates came screaming down and credit spreads exploded wider as
investors ran for the safety of short maturity government debt.
The events of August ushered in the most profound development of the period—a change in monetary
policy by the Federal Reserve (“Fed”). For the first time in four years, the Fed cut the benchmark Fed
Funds target rate. Given the events leading up to this, the Fed’s September move was not unanticipated.
What was a surprise, however, was the magnitude of the move. The central bank dropped the Fed Funds
rate by a half-point to 4.75%.
With that, the markets exploded in a massive rally that brought the averages almost back to where they
had started the quarter. Moreover, all the sectors that had been pummeled during the previous four
weeks led the way higher. Having suffered through the roughest market in years, investment managers
were determined not to miss the rebound.
One of the investment themes that strongly reasserted itself after the July-August sell-off was global
growth. With economic growth in the U.S. slowing, investors are favoring sectors—such as energy,
technology and basic materials—that derive much of their revenues and profits from overseas. For
investors who had the fortitude to maintain their exposure to Rydex sector funds representing those areas
over the last six months, they were handsomely rewarded with strong double digit-returns.
We also think it is very reasonable to assume that equity market volatility will be with us for some time.
Low volatility strategies as represented by the Rydex Absolute Return Strategies, Hedged Equity and
Managed Futures Strategy Funds should provide a nice offset to the more dynamic global growth theme.
We appreciate the trust you have placed in our firm’s quality and integrity by investing with us.
Sincerely,
Director of Portfolio Strategies
David Reilly, CFA
2
|
THE RYDEX SERIES FUNDS SEMI-ANNUAL REPORT
A BRIEF NOTE ON THE COMPOUNDING OF RETURNS (Unaudited)
Some of the Rydex Funds described in this report are benchmarked daily to leveraged versions of
published indices. To properly evaluate the performance of these funds, it is essential to understand the
effect of mathematical compounding on their respective returns.
Because of the nonlinear effects of leverage applied over time, it is possible for a fund to perform in line
with its benchmark for several individual periods in a row, yet seem to trail the benchmark over the entire
period. It is also possible that a fund that performs in-line with its benchmark on a daily basis may seem to
outperform its benchmark over longer periods.
An Example of Compounding
For example, consider a hypothetical fund that is designed to produce returns that correspond to 150%
of an index. On the first day of a period, the index rises from a level of 100 to a level of 106, producing a
6.0% gain and an expectation that the fund will rise by 9.0%. On the same day, the fund’s net asset value
(“NAV”) increases from $10.00 to $10.90 for a gain of 9.0%–in line with its benchmark.
On day two, assume the index falls from 106 to 99 for a loss of about 6.6%. The fund, as expected, falls
9.9% to a price of $9.82. On each day, the fund performed exactly in line with its benchmark, but for the
two-day period, the fund was down 1.8%, while the index was down only 1.0%. Without taking into
account the daily compounding of returns, one would expect the fund to lose 1.5% and would see the
fund as trailing by 0.3% when in fact it had performed perfectly. This example is summarized in the table
below.
Index
Index
Fund
Fund
Level
Performance
Expectation
Fund NAV
Performance
Assessment
Start
100
$10.00
Day 1
106
6.0%
9.0%
$10.90
9.0%
In line
Day 2
99
-6.6%
-9.9%
$ 9.82
-9.9%
In line
Cumulative
-1.0%
-1.5%
-1.8%
-0.3%
As illustrated by this simple example, the effect of leverage can make it difficult to form expectations or
judgments about fund performance given only the returns of the unleveraged index.
In general, any change in direction in an index will produce compounding that seems to work against an
investor. Were the index to move in the same direction (either up or down) for two or more periods in a
row, the compounding of those returns would work in an investor’s favor, causing the fund to seemingly
beat its benchmark.
As a general rule of thumb, more leverage in a fund will magnify the compounding effect, while less
leverage will generally produce results that are more in line with expectations. In addition, periods of high
volatility in an underlying index will also cause the effects of compounding to be more pronounced, while
lower volatility will produce a more muted effect.
THE RYDEX SERIES FUNDS SEMI-ANNUAL REPORT
|
3
ABOUT SHAREHOLDERS’ FUND EXPENSES (Unaudited)
All mutual funds have operating expenses and it is important for our shareholders to understand the
impact of costs on their investments. Shareholders of a Fund incur two types of costs: (i) transaction costs,
including sales charges (loads) on purchase payments, reinvested dividends, or other distributions;
redemption fees; and exchange fees; and (ii) ongoing costs, including management fees, administrative
services, and shareholder reports, among others. These ongoing costs, or operating expenses, are
deducted from a fund’s gross income and reduce the investment return of the fund.
A fund’s expenses are expressed as a percentage of its average net assets, which is known as the expense
ratio. The following examples are intended to help investors understand the ongoing costs (in dollars) of
investing in a Fund and to compare these costs with the ongoing costs of investing in other mutual funds.
The examples are based on an investment of $1,000 made at the beginning of the period and held for the
entire six-month period beginning March 31, 2007 and ending September 30, 2007.
The following tables illustrate a Fund’s costs in two ways:
Table 1. Based on actual Fund return. This section helps investors estimate the actual expenses paid over
the period. The “Ending Account Value” shown is derived from the Fund’s actual return, and the fourth
column shows the dollar amount that would have been paid by an investor who started with $1,000 in
the Fund. Investors may use the information here, together with the amount invested, to estimate the
expenses paid over the period. Simply divide the Fund’s account value by $1,000 (for example, an
$8,600 account value divided by $1,000 = 8.6), then multiply the result by the number provided under
the heading “Expenses Paid During Period.”
Table 2. Based on hypothetical 5% return. This section is intended to help investors compare a Fund’s
cost with those of other mutual funds. The table provides information about hypothetical account val-
ues and hypothetical expenses based on the Fund’s actual expense ratio and an assumed rate of return
of 5% per year before expenses, which is not the Fund’s actual return. The hypothetical account values
and expenses may not be used to estimate the actual ending account balance or expenses paid during
the period. The example is useful in making comparisons because the U.S. Securities and Exchange
Commission (the “SEC”) requires all mutual funds to calculate expenses based on the 5% return.
Investors can assess a Fund’s costs by comparing this hypothetical example with the hypothetical
examples that appear in shareholder reports of other funds.
Certain retirement plans such as IRA, SEP, Roth IRA and 403(b) accounts are charged an annual $15
maintenance fee. Upon liquidating a retirement account, a $15 account-closing fee will be taken from
the proceeds of the redemption.
The calculations above assume no shares were bought or sold during the period. Actual costs may have
been higher or lower, depending on the amount of investment and the timing of any purchases or
redemptions.
Note that the expenses shown in the table are meant to highlight and help compare ongoing costs only
and do not reflect any transactional costs which may be incurred by a Fund.
More information about a Fund’s expenses, including annual expense ratios for the past five years, can be
found in the Financial Highlights section of this report. For additional information on operating expenses
and other shareholder costs, please refer to the appropriate Fund prospectus.
4
|
THE RYDEX SERIES FUNDS SEMI-ANNUAL REPORT
ABOUT SHAREHOLDERS’ FUND EXPENSES (Unaudited) (continued)
Beginning
Ending
Expenses
Expense
Account Value
Account Value
Paid During
Ratio†
March 31, 2007
September 30, 2007
Period*
Table 1. Based on actual Fund return
Multi-Cap Core Equity Fund
A-Class
1.26%
$1,000.00
$
999.41
$
6.32
C-Class
2.00%
1,000.00
995.73
10.01
H-Class
1.26%
1,000.00
999.41
6.32
Sector Rotation Fund
A-Class
1.66%
1,000.00
1,174.72
9.05
C-Class
2.41%
1,000.00
1,170.10
13.11
H-Class
1.66%
1,000.00
1,174.22
9.05
Absolute Return Strategies Fund
A-Class
1.80%
1,000.00
1,024.21
9.13
C-Class
2.55%
1,000.00
1,020.66
12.92
H-Class
1.80%
1,000.00
1,024.19
9.13
Commodities Strategy Fund
A-Class
1.52%
1,000.00
1,137.32
8.14
C-Class
2.27%
1,000.00
1,132.49
12.14
H-Class
1.51%
1,000.00
1,136.48
8.09
Hedged Equity Fund
A-Class
1.92%
1,000.00
1,019.40
9.72
C-Class
2.66%
1,000.00
1,015.78
13.44
H-Class
1.92%
1,000.00
1,019.39
9.72
International Rotation Fund**
A-Class
1.68%
1,000.00
1,062.40
1.28
C-Class
2.43%
1,000.00
1,062.40
1.85
H-Class
1.66%
1,000.00
1,062.80
1.27
Managed Futures Strategy Fund
A-Class
1.67%
1,000.00
1,006.39
8.40
C-Class
2.45%
1,000.00
1,002.40
12.30
H-Class
1.71%
1,000.00
1,006.39
8.60
Real Estate Fund
A-Class
1.62%
1,000.00
901.57
7.72
C-Class
2.37%
1,000.00
897.87
11.28
H-Class
1.62%
1,000.00
901.52
7.72
Strengthening Dollar 2x Strategy Fund
A-Class
1.67%
1,000.00
907.30
7.98
C-Class
2.41%
1,000.00
903.96
11.50
H-Class
1.66%
1,000.00
907.22
7.94
Weakening Dollar 2x Strategy Fund
A-Class
1.66%
1,000.00
1,135.22
8.89
C-Class
2.41%
1,000.00
1,130.96
12.87
H-Class
1.66%
1,000.00
1,134.84
8.88
THE RYDEX SERIES FUNDS SEMI-ANNUAL REPORT
|
5
ABOUT SHAREHOLDERS’ FUND EXPENSES (Unaudited) (concluded)
Beginning
Ending
Expenses
Expense
Account Value
Account Value
Paid During
Ratio†
March 31, 2007
September 30, 2007
Period*
Table 2. Based on hypothetical 5% return
Multi-Cap Core Equity Fund
A-Class
1.26%
$1,000.00
$1,018.67
$
6.40
C-Class
2.00%
1,000.00
1,014.92
10.15
H-Class
1.26%
1,000.00
1,018.67
6.40
Sector Rotation Fund
A-Class
1.66%
1,000.00
1,016.64
8.43
C-Class
2.41%
1,000.00
1,012.83
12.23
H-Class
1.66%
1,000.00
1,016.64
8.43
Absolute Return Strategies Fund
A-Class
1.80%
1,000.00
1,015.93
9.14
C-Class
2.55%
1,000.00
1,012.83
12.95
H-Class
1.80%
1,000.00
1,015.93
9.14
Commodities Strategy Fund
A-Class
1.52%
1,000.00
1,017.35
7.72
C-Class
2.27%
1,000.00
1,013.54
11.52
H-Class
1.51%
1,000.00
1,017.40
7.67
Hedged Equity Fund
A-Class
1.92%
1,000.00
1,015.32
9.75
C-Class
2.66%
1,000.00
1,011.56
13.50
H-Class
1.92%
1,000.00
1,015.32
9.75
International Rotation Fund**
A-Class
1.68%
1,000.00
1,016.54
8.53
C-Class
2.43%
1,000.00
1,012.73
12.34
H-Class
1.66%
1,000.00
1,016.64
8.43
Managed Futures Strategy Fund
A-Class
1.67%
1,000.00
1,016.59
8.48
C-Class
2.45%
1,000.00
1,012.63
12.44
H-Class
1.71%
1,000.00
1,016.39
8.68
Real Estate Fund
A-Class
1.62%
1,000.00
1,016.84
8.22
C-Class
2.37%
1,000.00
1,013.04
12.03
H-Class
1.62%
1,000.00
1,016.84
8.22
Strengthening Dollar 2x Strategy Fund
A-Class
1.67%
1,000.00
1,016.59
8.48
C-Class
2.41%
1,000.00
1,012.83
12.23
H-Class
1.66%
1,000.00
1,016.64
8.43
Weakening Dollar 2x Strategy Fund
A-Class
1.66%
1,000.00
1,016.64
8.43
C-Class
2.41%
1,000.00
1,012.83
12.23
H-Class
1.66%
1,000.00
1,016.64
8.43
*
Expenses are equal to the Fund's annualized expense ratio, multiplied by the average account value over the period, multiplied by
the number of days in the most recent fiscal half-year, then divided by 365.
**
Since the commencement of operations: August 31, 2007. Due to the limited length of Fund operations, current expense ratios may
not be indicative of future expense ratios.
†
This ratio represents annualized Total Expenses, which include dividend expense from securities sold short and expenses waived by
Rydex Investments. Excluding short dividend expense, the operating expense ratio would be 0.41%, 0.53% and 0.04% lower in each
class of the Absolute Return Strategies Fund, Hedged Equity Fund and Managed Futures Strategy Fund, respectively. Excluding
waived expenses, the net expense ratio of the Commodities Strategy Fund would be 0.32%, 0.32% and 0.31% lower for A-Class,
C-Class and H-Class, respectively.
6
|
THE RYDEX SERIES FUNDS SEMI-ANNUAL REPORT
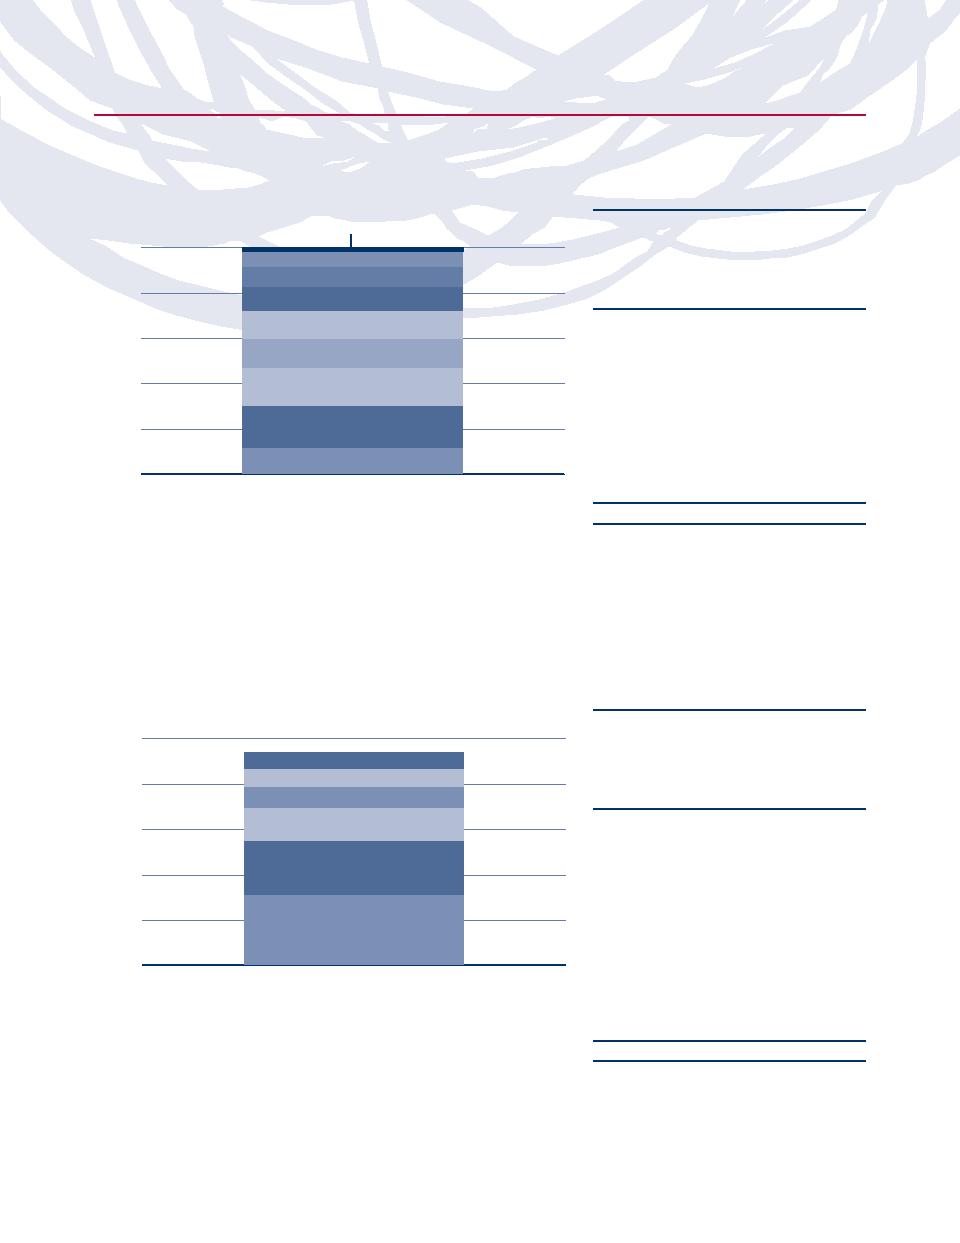
FUND PROFILES (Unaudited)
MULTI-CAP CORE EQUITY FUND
OBJECTIVE: Seeks long-term capital appreciation.
Inception Dates:
Holdings Diversification (Market Exposure as % of Net Assets)
Futures Contracts
A-Class
March 31, 2004
100%
C-Class
September 23, 2002
Consumer Staples
H-Class
September 23, 2002
Energy
80%
Health Care
Ten Largest Holdings (% of Total Net Assets)
Industrials
Exxon Mobil Corp.
1.8%
60%
Consumer
General Electric Co.
1.1%
Discretionary
AT&T, Inc.
1.0%
40%
Information
Bank of America Corp.
0.9%
Technology
Chevron Corp.
0.8%
Cisco Systems, Inc.
0.8%
20%
Financials
International Business Machines Corp.
0.7%
Other
Microsoft Corp.
0.7%
0%
JPMorgan Chase & Co.
0.7%
Multi-Cap Core Equity Fund
Pfizer, Inc.
0.7%
Top Ten Total
9.2%
“Holdings Diversification (Market Exposure as % of Net Assets)” excludes any
temporary cash investments.
“Ten Largest Holdings” exclude any temporary cash
or derivative investments.
SECTOR ROTATION FUND
OBJECTIVE: Seeks long-term capital appreciation.
Holdings Diversification (Market Exposure as % of Net Assets)
Inception Dates:
A-Class
March 31, 2004
100%
C-Class
March 22, 2002
Energy
H-Class
March 22, 2002
80%
Consumer Discretionary
Telecommunication Services
Ten Largest Holdings (% of Total Net Assets)
60%
Information Technology
Amazon.com, Inc.
2.4%
BHP Billiton Ltd. — SP ADR
2.1%
Materials
Fluor Corp.
2.1%
40%
China Mobile Ltd. —
SP ADR
2.1%
20%
Industrials
Foster Wheeler Ltd.
1.8%
Companhia Vale do Rio Doce —
0%
SP ADR
1.8%
Sector Rotation Fund
Jacobs Engineering Group, Inc.
1.8%
ArcelorMittal
1.7%
“Holdings Diversification (Market Exposure as % of Net Assets)” excludes any
KBR, Inc.
1.6%
temporary cash investments.
Kirby Corp.
1.5%
Top Ten Total
18.9%
“Ten Largest Holdings” exclude any temporary cash
or derivative investments.
THE RYDEX SERIES FUNDS SEMI-ANNUAL REPORT
|
7
FUND PROFILES (Unaudited) (continued)
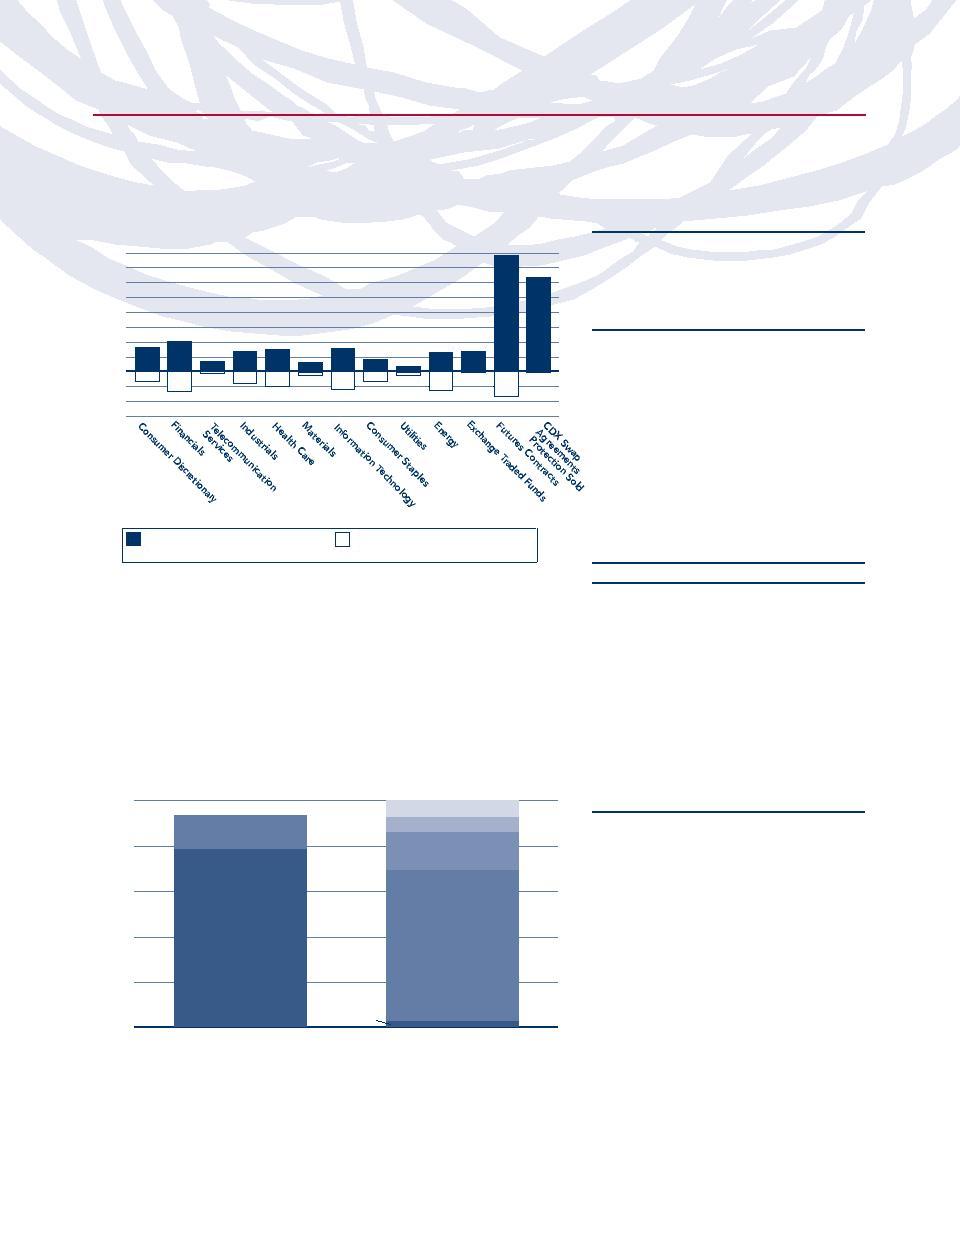
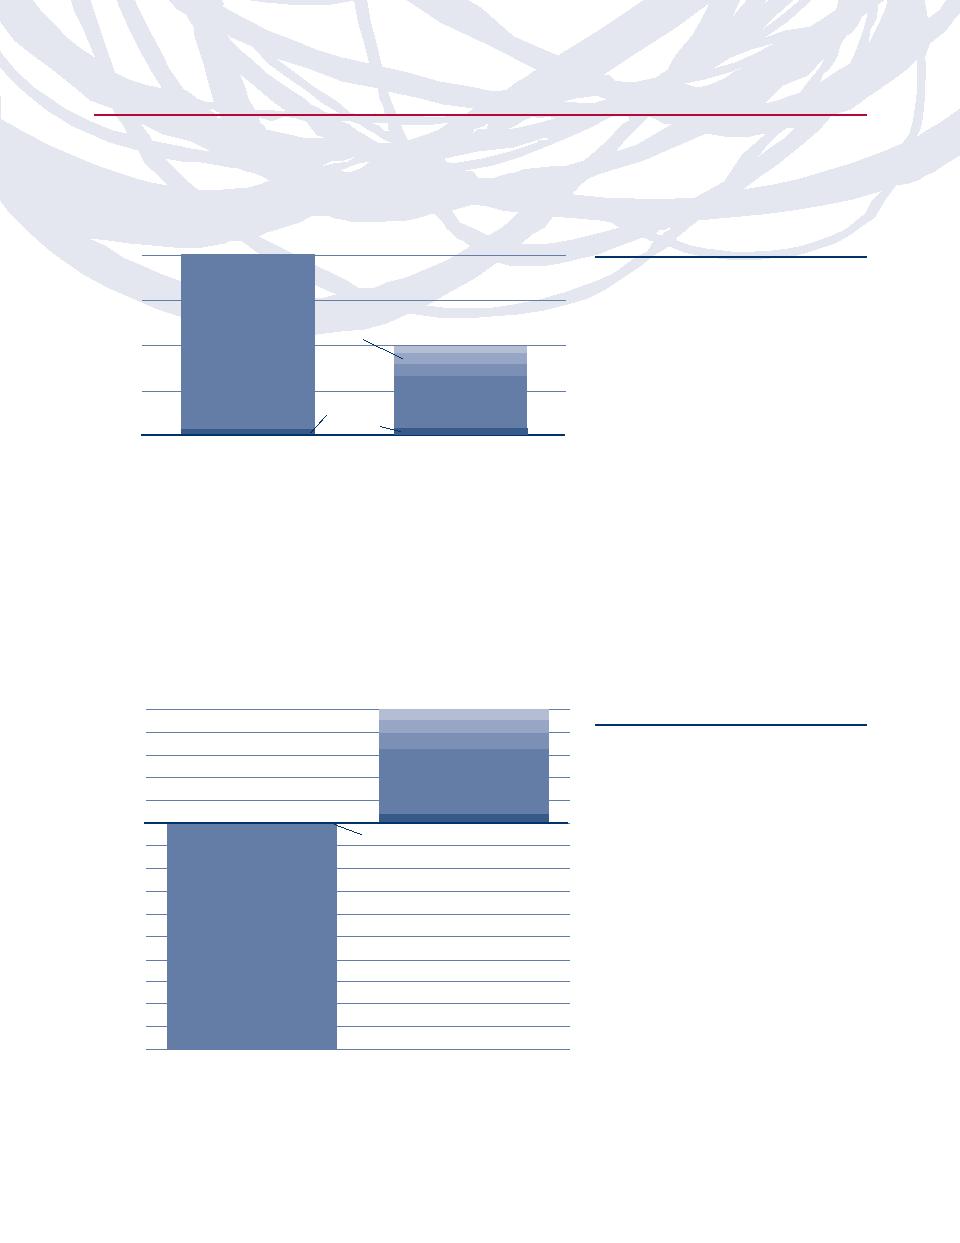
ABSOLUTE RETURN STRATEGIES FUND
OBJECTIVE: To provide capital appreciation consistent with the return and risk characteristics of the hedge fund universe. The
secondary objective is to achieve these returns with low correlation to and less volatility than equity indices.
Holdings Diversification (Market Exposure as % of Net Assets)
Inception Dates:
40%
A-Class
September 19, 2005
35%
C-Class
September 19, 2005
30%
H-Class
September 19, 2005
20%
25%
15%
Ten Largest Holdings (% of Total Net Assets)
5%
10%
iShares MSCI Emerging Markets
0%
Index Fund
4.5%
Indexed Trust
-5%
iShares S&P GSCI Commodity
-10%
2.3%
-15%
Hewlett-Packard Co.
1.0%
AT&T, Inc.
0.9%
ConocoPhillips
0.8%
National-Oilwell Varco, Inc.
0.7%
Goldman Sachs Group, Inc.
0.7%
Safeway, Inc.
0.6%
Long Holdings
Short Holdings
Absolute Return Strategies Fund
Absolute Return Strategies Fund
0.6%
Verizon Communications, Inc.
0.6%
Wal-Mart Stores, Inc.
Top Ten Total
12.7%
“Holdings Diversification (Market Exposure as % of Net Assets)” excludes any
temporary cash investments.
“Ten Largest Holdings” exclude any
temporary cash or derivative investments.
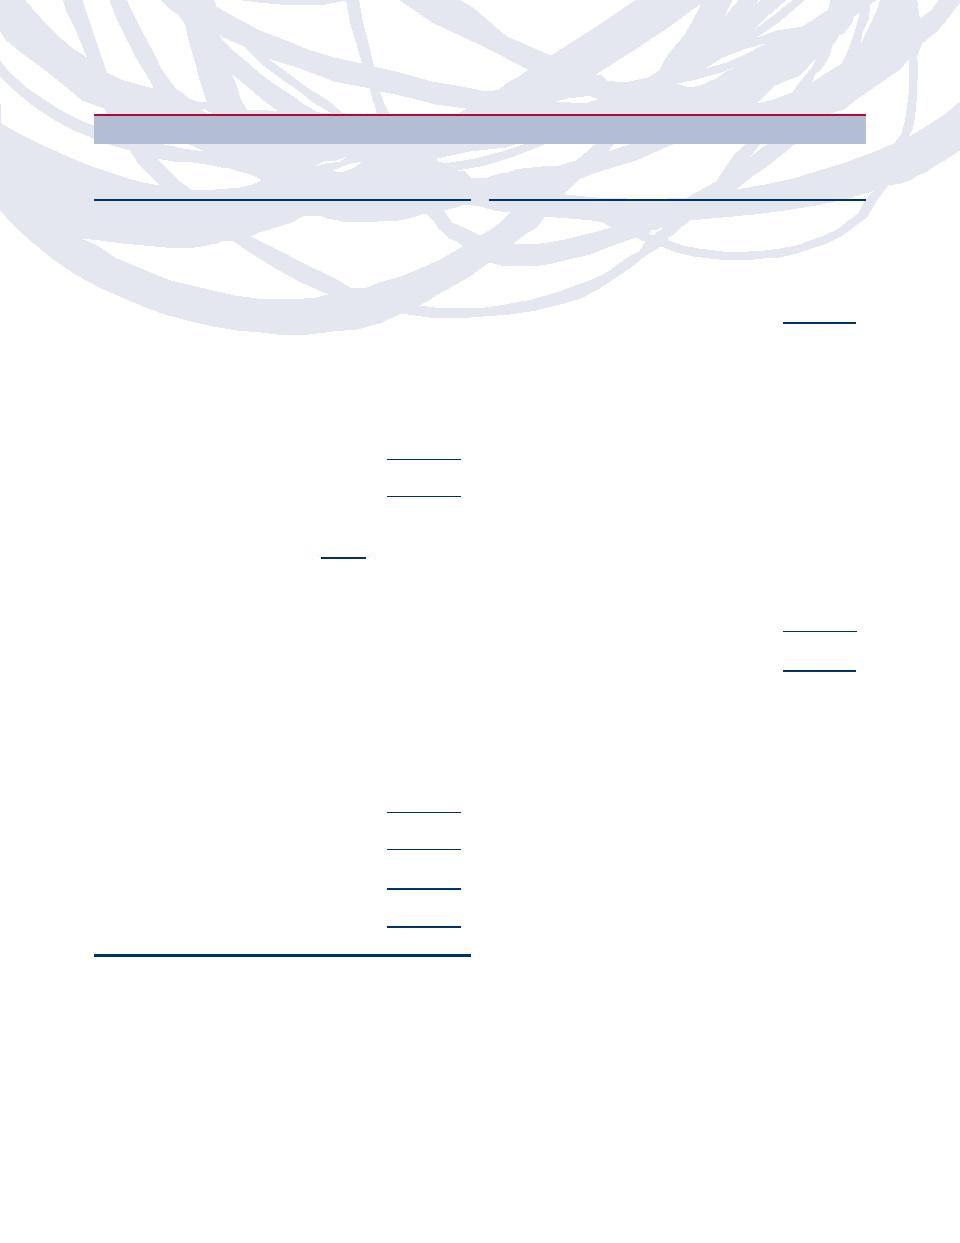
COMMODITIES STRATEGY FUND
OBJECTIVE: Seeks to provide investment results that correlate to the performance of a benchmark for commodities. The
Fund’s current benchmark is the S&P GSCI™ Commodity Index.
Holdings Diversification (Market Exposure as % of Net Assets)
100%
Livestock
Inception Dates:
Traded Funds
Exchange
Industrial Metals
A-Class
May 25, 2005
80%
Agriculture
C-Class
May 25, 2005
H-Class
May 25, 2005
60%
The Fund invests principally in exchange
Structured Notes
traded funds and in derivative instruments
40%
Energy
such as structured notes, futures contracts,
and options on index futures.
20%
0%
Other
Commodities
S&P GSCITM
Strategy Fund
Commodity Index
“Holdings Diversification (Market Exposure as % of Net Assets)” excludes any
temporary cash investments.
8
|
THE RYDEX SERIES FUNDS SEMI-ANNUAL REPORT
FUND PROFILES (Unaudited) (continued)
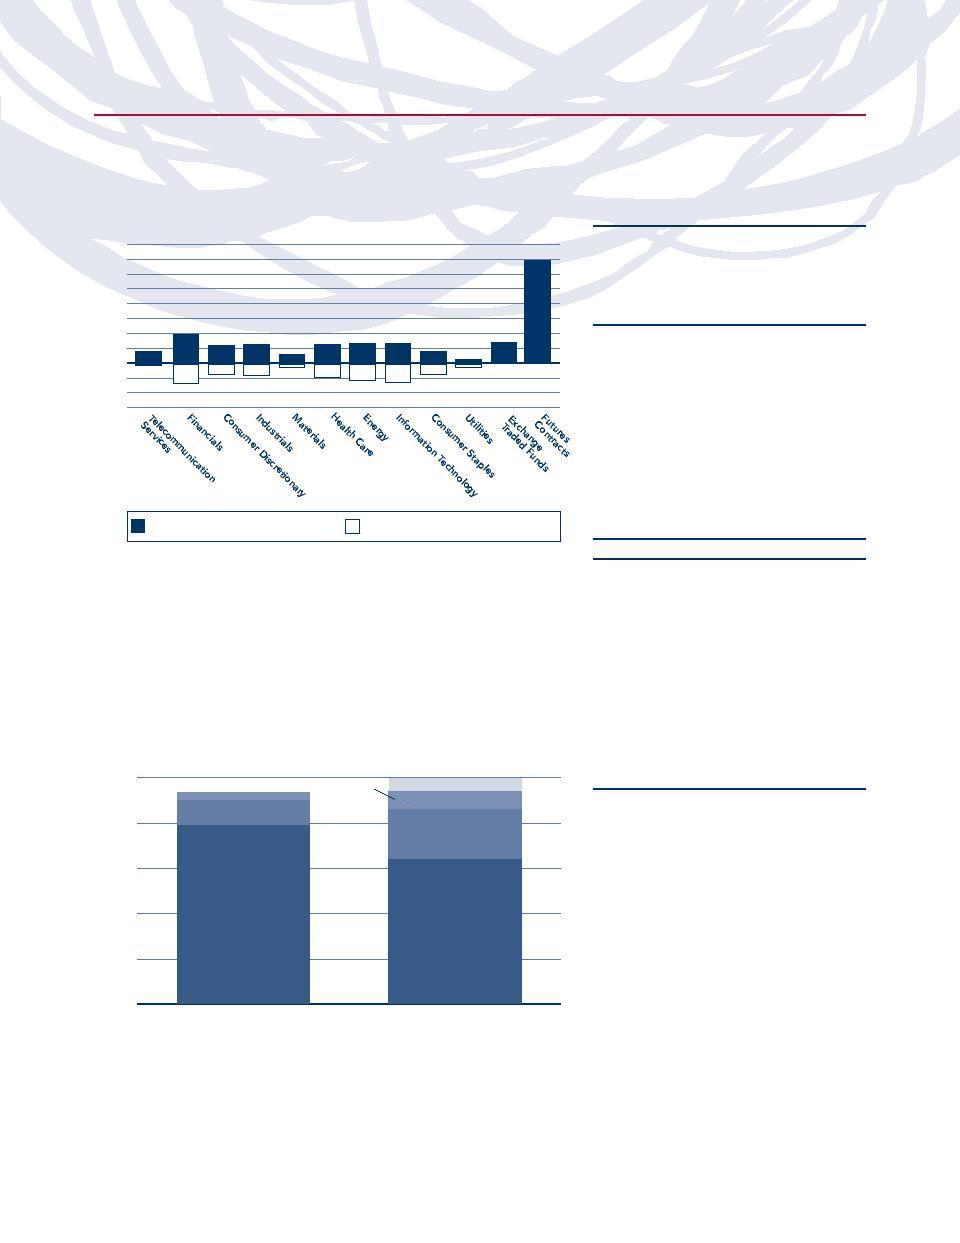
HEDGED EQUITY FUND
OBJECTIVE: To provide capital appreciation consistent with the return and risk characteristics of the long/short hedge fund
universe. The secondary objective is to achieve these returns with low correlation to and less volatility than equity indices.
Holdings Diversification (Market Exposure as % of Net Assets)
Inception Dates:
40%
A-Class
September 19, 2005
35%
C-Class
September 19, 2005
30%
H-Class
September 19, 2005
20%
25%
10%
15%
Ten Largest Long Holdings (% of Total Net Assets)
5%
iShares MSCI Emerging Markets
0%
Index Fund
6.8%
-5%
Hewlett-Packard Co.
1.1%
-15%
-10%
AT&T, Inc.
0.9%
ConocoPhillips
0.8%
National-Oilwell Varco, Inc.
0.7%
Goldman Sachs Group, Inc.
0.7%
Safeway, Inc.
0.7%
Verizon Communications, Inc.
0.6%
Expedia, Inc.
0.6%
Hedged Equity Fund Long Holdings
Hedged Equity Fund Short Holdings
Wal-Mart Stores, Inc.
0.6%
Top Ten Total
13.5%
“Holdings Diversification (Market Exposure as % of Net Assets)” excludes any
“Ten Largest Long Holdings” exclude any
temporary cash investments.
temporary cash or derivative investments.
INTERNATIONAL ROTATION FUND
OBJECTIVE: Seeks long-term capital appreciation.
Holdings Diversification (Market Exposure as % of Net Assets)
100%
North America
Inception Dates:
Australia
(Canada)
Australia
Asia
A-Class
August 31, 2007
80%
Asia
C-Class
August 31, 2007
H-Class
August 31, 2007
60%
The Fund invests principally in exchange
traded funds and derivative investments such
options on currencies.
40%
Europe
as swap agreements, futures contracts and
Europe
20%
International
MSCI World
0%
Rotation Fund
Ex-US Index
“Holdings Diversification (Market Exposure as % of Net Assets)” excludes any
temporary cash investments.
THE RYDEX SERIES FUNDS SEMI-ANNUAL REPORT
|
9
FUND PROFILES (Unaudited) (continued)
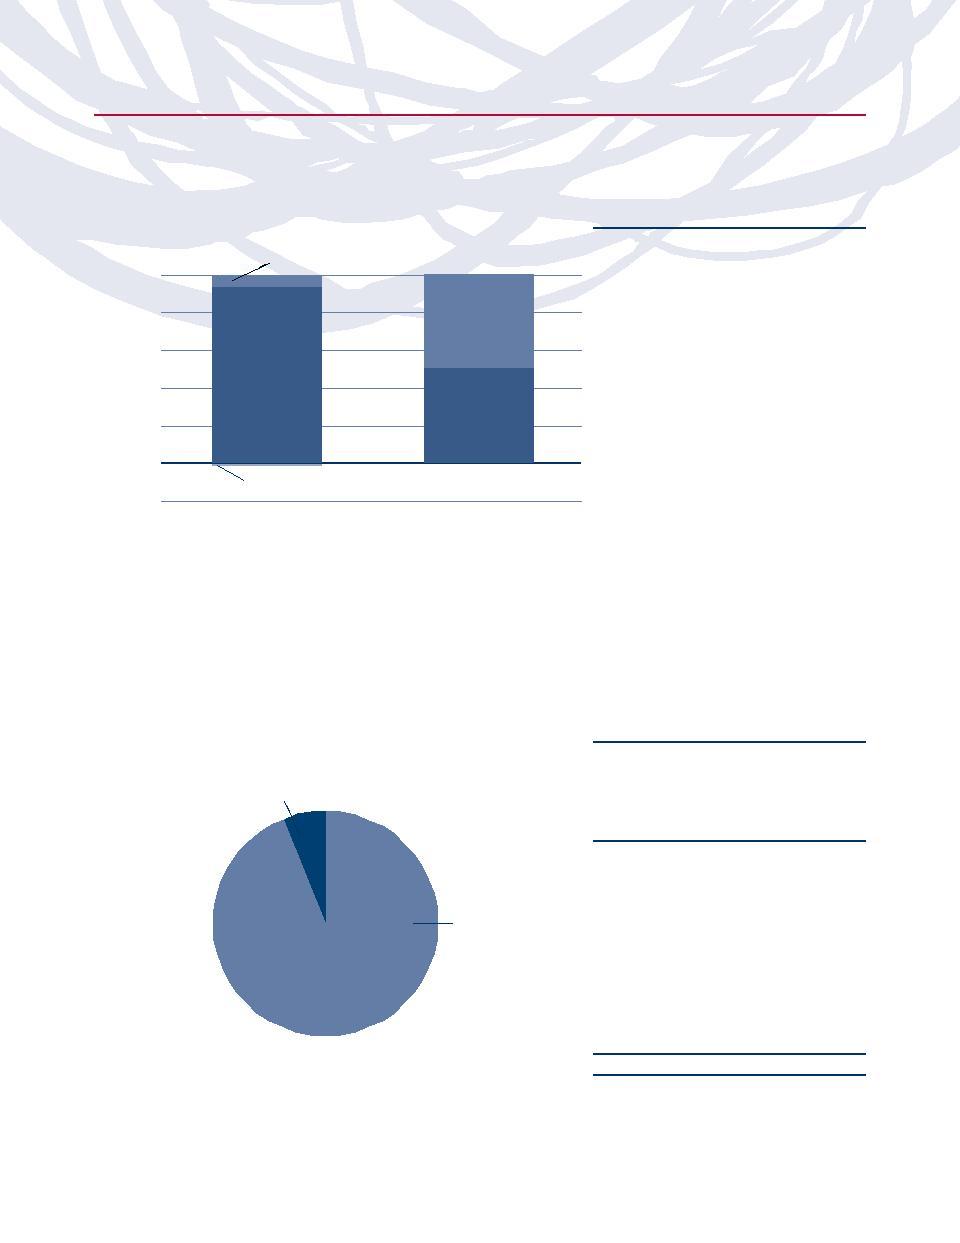
MANAGED FUTURES STRATEGY FUND
OBJECTIVE: To provide investment results that match the performance of a benchmark for measuring trends in the commodity
and financial futures markets. The Fund’s current benchmark is the Standard & Poor’s Diversified Trends Indicator®.
Holdings Diversification (Market Exposure as % of Net Assets)
Inception Dates:
Exchange Traded
A-Class
March 2, 2007
Funds
C-Class
March 2, 2007
100%
H-Class
March 2, 2007
Commodities
80%
Contracts
Futures
The Fund invests principally in exchange
traded funds and derivative investments such
60%
as commodity, currency and financial linked
Structured Notes
notes, futures contracts, and options on index
40%
futures.
Financial
Futures
20%
Contracts
Exchange Traded
0%
-20%
Funds Short Sales
Managed Futures
S&P Diversified
Strategy Fund
Trends Indicator
“Holdings Diversification (Market Exposure as % of Net Assets)” excludes any
temporary cash investments.
REAL ESTATE FUND
OBJECTIVE:
Seeks to provide capital appreciation by investing in companies that are involved in the real estate industry
including real estate investment trusts (“REITs”).
Industry Diversification (Market Exposure as % of Net Assets)
Inception Dates:
Real Estate
A-Class
September 1, 2004
& Development
Management
C-Class
February 20, 2004
H-Class
February 20, 2004
6%
Ten Largest Holdings (% of Total Net Assets)
Simon Property Group, Inc.
2.8%
Brookfield Asset Management,
Real Estate
Inc. — Class A
2.7%
Investment
ProLogis
2.6%
Trusts
Vornado Realty Trust
2.3%
94%
Archstone-Smith Trust
2.2%
Public Storage, Inc.
2.1%
KIMCO Realty Corp.
2.1%
General Growth Properties, Inc.
2.1%
Boston Properties, Inc.
2.0%
Equity Residential
2.0%
Real Estate Fund
Top Ten Total
22.9%
“Industry Diversification (Market Exposure as % of Net Assets)” excludes any
“Ten Largest Holdings” exclude any temporary cash
temporary cash investments.
or derivative investments.
10
|
THE RYDEX SERIES FUNDS SEMI-ANNUAL REPORT
FUND PROFILES (Unaudited) (concluded)
STRENGTHENING DOLLAR 2x STRATEGY FUND
OBJECTIVE: To provide investment results that will match the performance of a specific benchmark on a daily basis. The Fund’s
current benchmark is 200% of the performance of the U.S. Dollar Index®.
Holdings Diversification (Market Exposure as % of Net Assets)
200%
Inception Dates:
A-Class
May 25, 2005
C-Class
May 25, 2005
H-Class
May 25, 2005
150%
100%
Swap Agreements
Canadian Dollar
Currency Index
The Fund invests principally in derivative
British Pound
Japanese Yen
investments such as currency index swap
50%
agreements, futures contracts, and options
Futures
on index futures.
Contracts
Euro
0%
Other
Strengthening Dollar
U.S. Dollar Index
2x Strategy Fund
“Holdings Diversification (Market Exposure as % of Net Assets)” excludes any
temporary cash investments.
WEAKENING DOLLAR 2x STRATEGY FUND
OBJECTIVE: To provide investment results that will match the performance of a specific benchmark on a daily basis. The Fund’s
current benchmark is 200% of the inverse performance of the U.S. Dollar Index.
Holdings Diversification (Market Exposure as % of Net Assets)
British Pound
100%
Canadian Dollar
Inception Dates:
80%
Japanese Yen
A-Class
May 25, 2005
60%
C-Class
May 25, 2005
40%
Euro
H-Class
May 25, 2005
Other
20%
0%
The Fund invests principally in derivative
Futures Contracts
investments such as currency index swap
-20%
Short Sales
agreements, futures contracts, and options
-40%
on index futures.
-60%
Currency Index Swap
-80%
-100%
Agreements Short Sales
-120%
-140%
-160%
-180%
-200%
Weakening Dollar
U.S. Dollar Index
2x Strategy Fund
“Holdings Diversification (Market Exposure as % of Net Assets)” excludes any
temporary cash investments.
THE RYDEX SERIES FUNDS SEMI-ANNUAL REPORT
|
11
SCHEDULE OF INVESTMENTS (Unaudited)
September 30, 2007
MULTI-CAP CORE EQUITY FUND
MARKET
MARKET
SHARES
(NOTE 1)
SHARES
(NOTE 1)
VALUE
VALUE
COMMON STOCKS 97.8%
First Citizens BancShares, Inc. —
Class A
733
$
127,835
FINANCIALS 18.4%
Capital Trust, Inc. — Class A†
3,590
127,445
Bank of America Corp.
11,090
$
557,494
Amerisafe, Inc.*
7,640
126,366
JPMorgan Chase & Co.
9,320
427,042
Reinsurance Group of America,
Wells Fargo & Co.
9,890
352,282
Inc.
2,220
125,852
Citigroup, Inc.
7,200
336,024
Allied World Assurance Holdings
Wachovia Corp.†
6,090
305,413
Ltd
2,420
125,622
Merrill Lynch & Co., Inc.†
3,280
233,798
AmeriCredit Corp.*†
7,070
124,291
ProLogis†
3,190
211,656
Resource Capital Corp.†
11,010
123,973
U.S. Bancorp†
5,790
188,349
Patriot Capital Funding, Inc.†
9,220
123,271
Genworth Financial, Inc. —
Gramercy Capital Corp.
4,870
122,578
Class A
6,000
184,380
Colonial Properties Trust†
3,562
122,177
Travelers Cos, Inc.
3,640
183,238
NYMAGIC, Inc.†
4,380
121,808
Hartford Financial Services
Federal Agricultural Mortgage
Group, Inc.†
1,979
183,156
Corp.
4,145
121,697
KeyCorp†
5,525
178,623
FirstFed Financial Corp.*†
2,440
120,902
American International Group,
Arbor Realty Trust, Inc.
6,390
120,707
Inc.
2,576
174,266
CNA Financial Corp.
2,925
115,011
SunTrust Banks, Inc.
2,200
166,474
Taylor Capital Group, Inc.
4,100
114,513
PNC Financial Services Group,
Capital Southwest Corp.†
920
112,939
Inc.†
2,440
166,164
Hersha Hospitality Trust
11,360
112,464
Lincoln National Corp.
2,460
162,286
Imperial Capital Bancorp, Inc.
3,970
112,152
Aspen Insurance Holdings Ltd.
5,720
159,645
BRT Realty Trust
6,460
112,016
Franklin Resources, Inc.
1,250
159,375
HRPT Properties Trust†
11,240
111,164
Regions Financial Corp.†
5,370
158,308
DiamondRock Hospitality Co.†
6,270
109,161
M&T Bank Corp.
1,510
156,209
UnumProvident Corp.
4,120
100,816
American Capital Strategies,
E*Trade Financial Corp.*†
7,710
100,693
Ltd.†
3,600
153,828
NorthStar Realty Finance Corp.†
9,760
96,917
Zions Bancorporation
2,210
151,761
Deerfield Triarc Capital Corp.†
10,250
92,762
Senior Housing Properties Trust†
6,855
151,221
ACE Ltd.
1,481
89,704
National Retail Properties, Inc.
6,100
148,718
Whitney Holding Corp.
3,380
89,164
Max Capital Group Ltd.
5,250
147,210
Anthracite Capital, Inc.†
8,110
73,801
A.G. Edwards, Inc.
1,740
145,725
MCG Capital Corp.
5,040
72,526
PMI Group, Inc.
4,380
143,226
Capital One Financial Corp.
1,070
71,080
Annaly Mortgage Management,
Radian Group, Inc.†
2,890
67,279
Inc.
8,940
142,414
First Community Bancorp†
1,160
63,464
Philadelphia Consolidated
Community Bancorp*
2,470
62,096
Holding Corp.*
3,420
141,383
NGP Capital Resources Co.
3,630
58,915
Alleghany Corp.*
340
138,040
RAIT Financial Trust†
6,930
57,034
Advanta Corp.
5,030
137,923
ACA Capital Holdings, Inc.*†
9,140
55,663
Hercules Technology Growth
Morgan Stanley
847
53,361
Capital, Inc.†
10,330
137,079
Discover Financial Services*
2,448
50,918
FBL Financial Group, Inc. —
Goldman Sachs Group, Inc.
220
47,683
Class A
3,390
133,871
Cowen Group, Inc.*
3,400
46,988
East-West Bancorp, Inc.†
3,702
133,124
Asta Funding, Inc.†
1,060
40,619
Nationwide Financial Services,
Triad Guaranty, Inc.*†
2,120
40,216
Inc.
2,440
131,321
Assurant, Inc.
695
37,183
Navigators Group, Inc.*
2,420
131,285
Allstate Corp.
310
17,729
Hospitality Properties Trust†
3,180
129,267
Bear Stearns Cos., Inc.
100
12,281
MainSource Financial Group,
American Express Co.†
180
10,687
Inc.†
7,320
129,052
iStar Financial, Inc.
300
10,197
Banco Latinoamericano de
Ocwen Financial Corp.*†
640
6,035
Exportaciones SA
7,060
128,351
Total Financials
11,587,022
Financial Federal Corp.†
4,580
128,286
12
|
THE RYDEX SERIES FUNDS SEMI-ANNUAL REPORT
See Notes to Financial Statements.
SCHEDULE OF INVESTMENTS (Unaudited) (continued)
September 30, 2007
MULTI-CAP CORE EQUITY FUND
MARKET
MARKET
SHARES
(NOTE 1)
SHARES
(NOTE 1)
VALUE
VALUE
INFORMATION TECHNOLOGY 16.6%
Authorize.Net Holdings, Inc.*
6,190
$
109,130
Cisco Systems, Inc.*
15,690
$
519,496
Rudolph Technologies, Inc.*
7,780
107,597
International Business Machines
Convergys Corp.*
6,150
106,764
Corp.
3,880
457,064
Symantec Corp.*†
5,470
106,009
Microsoft Corp.
14,720
433,651
JDA Software Group, Inc.*
5,130
105,986
Hewlett-Packard Co.
7,690
382,885
MKS Instruments, Inc.*
5,420
103,088
Oracle Corp.*
13,290
287,729
Photronics, Inc.*
9,020
102,918
Google, Inc. — Class A*
415
235,417
Intevac, Inc.*
6,735
102,372
eBay, Inc.*†
5,390
210,318
Optium Corp.*†
9,740
101,101
Xerox Corp.*
11,280
195,595
Compuware Corp.*
12,430
99,689
Intel Corp.
6,905
178,563
eSpeed, Inc. — Class A*
11,040
94,171
Applied Materials, Inc.
8,480
175,536
Sybase, Inc.*†
3,950
91,364
Electronic Data Systems Corp.
7,910
172,754
Advanced Energy Industries,
Computer Sciences Corp.*
3,000
167,700
Inc.*
6,020
90,902
Accenture Ltd. — Class A
4,160
167,440
MPS Group, Inc.*†
8,096
90,270
Apple, Inc.*
1,050
161,217
PC Connection, Inc.*
6,970
87,125
Imergent, Inc.†
7,060
158,356
The Knot, Inc.*
2,620
55,701
Western Digital Corp.*
6,250
158,250
Tellabs, Inc.*
5,253
50,009
Lam Research Corp.*†
2,960
157,650
Ciber, Inc.*
5,920
46,235
Avaya, Inc.*
9,250
156,880
Lexmark International, Inc.*
1,050
43,607
Network Appliance, Inc.*
5,770
155,271
Fair Isaac Corp.†
1,095
39,540
Intersil Corp. — Class A
4,630
154,781
Silicon Storage Technology, Inc.*
9,570
30,815
Parametric Technology Corp.*
8,710
151,728
LSI Logic Corp.*
3,470
25,747
Comtech Telecommunications
TIBCO Software, Inc.*†
2,690
19,879
Corp.*
2,830
151,377
Qualcomm, Inc.
390
16,481
Cadence Design Systems, Inc.*†
6,780
150,448
Synopsys, Inc.*
400
10,832
Amkor Technology, Inc.*
13,050
150,336
Total Information Technology
10,477,313
Avnet, Inc.*
3,740
149,076
Fiserv, Inc.*
CONSUMER DISCRETIONARY 13.0%
2,902
147,596
Arrow Electronics, Inc.*
3,470
147,544
Walt Disney Co.†
7,410
254,830
Novellus Systems, Inc.*
5,110
139,299
Time Warner, Inc.
13,650
250,614
McDonald’s Corp.
Insight Enterprises, Inc.*
5,370
138,600
4,550
247,838
Comcast Corp. — Class A*†
9,700
234,546
Brooks Automation, Inc.*
9,700
138,128
Harris Corp.
2,380
Starwood Hotels & Resorts
137,540
EMC Corp*
6,580
Worldwide, Inc.
2,830
171,922
136,864
Brocade Communications Systems,
DIRECTV Group, Inc.*
6,930
168,260
Wynn Resorts Ltd.
1,060
167,014
Inc.*
15,900
136,104
AVX Corp.
8,200
132,020
Genuine Parts Co.
3,260
163,000
CBS Corp.†
THQ, Inc.*
5,280
131,894
5,150
162,225
Expedia, Inc.*
5,070
161,632
SPSS, Inc.*
3,190
131,237
Gannett Co., Inc.
3,550
155,135
Vignette Corp.*
6,470
129,853
Total System Services, Inc.
4,600
127,788
Clear Channel Communications,
Inc.
4,120
154,253
Checkpoint Systems, Inc.*
4,840
127,728
American Greetings Corp. —
Methode Electronics, Inc. —
Class A
8,460
127,323
Class A
5,731
151,298
Sherwin-Williams Co.†
2,290
150,476
SI International, Inc.*
4,450
127,137
ADC Telecommunications, Inc.*
6,430
Mattel, Inc.†
126,092
6,400
150,144
CommScope, Inc.*
2,420
121,581
CBRL Group, Inc.†
3,570
145,656
American Eagle Outfitters, Inc.
5,530
145,494
RealNetworks, Inc.*
17,540
118,921
Vishay Intertechnology, Inc.*
8,880
Black & Decker Corp.
1,740
144,942
115,706
IAC/InterActiveCorp*
4,850
Teradyne, Inc.*†
143,899
8,280
114,264
Entegris, Inc.*
13,140
114,055
Autoliv, Inc.
2,360
141,010
Arris Group, Inc.*†
9,110
112,509
Kohl’s Corp.*
2,440
139,885
Scholastic Corp.*
3,970
138,394
EMS Technologies, Inc.*
4,525
110,998
Macy’s, Inc.
4,240
Mattson Technology, Inc.*
12,680
109,682
137,037
See Notes to Financial Statements.
THE RYDEX SERIES FUNDS SEMI-ANNUAL REPORT
|
13
SCHEDULE OF INVESTMENTS (Unaudited) (continued)
September 30, 2007
MULTI-CAP CORE EQUITY FUND
MARKET
MARKET
SHARES
(NOTE 1)
SHARES
(NOTE 1)
VALUE
VALUE
Mohawk Industries, Inc.*†
1,685
$
136,990
Brinker International, Inc.
245
$
6,723
Dillard’s, Inc. — Class A†
6,170
134,691
Charming Shoppes, Inc.*
610
5,124
Conn’s, Inc.*†
5,610
134,023
Total Consumer Discretionary
8,174,593
Big Lots, Inc.*†
4,450
132,788
INDUSTRIALS 12.2%
Jos. A. Bank Clothiers, Inc.*†
3,970
132,677
Churchill Downs, Inc.
2,630
131,395
General Electric Co.
17,476
723,506
Bob Evans Farms, Inc.
4,340
130,981
CSX Corp.†
5,140
219,632
Eaton Corp.
2,000
198,080
IHOP Corp.†
2,030
128,560
Weyco Group, Inc.
4,070
127,839
Lockheed Martin Corp.
1,810
196,367
AnnTaylor Stores Corp.*
4,036
127,820
General Dynamics Corp.
2,250
190,057
Illinois Tool Works, Inc.
3,090
Staples, Inc.
5,926
127,350
184,288
Union Pacific Corp.
1,620
183,157
News Corp. — Class A
5,740
126,223
Movado Group, Inc.
3,950
126,084
Cummins, Inc.
1,420
181,604
Parker Hannifin Corp.
1,620
181,165
Polo Ralph Lauren Corp.
1,620
125,955
Raytheon Co.†
2,800
178,696
Monarch Casino & Resort, Inc.*
4,350
123,757
L-3 Communications Holdings,
Perry Ellis International, Inc.*
4,460
123,587
Inc.
1,730
176,702
Helen of Troy Ltd.*
6,320
122,039
FedEx Corp.
1,660
173,885
Office Depot, Inc.*
5,790
119,390
Meredith Corp.
2,070
118,611
Northrop Grumman Corp.
2,210
172,380
Books-A-Million, Inc.
8,481
112,204
Norfolk Southern Corp.†
3,140
162,997
Danaher Corp.†
1,950
161,284
Jackson Hewitt Tax Service, Inc.†
3,880
108,485
Cooper Industries Ltd. —
Hasbro, Inc.
3,760
104,829
NVR, Inc.*†
220
103,455
Class A
3,150
160,933
Service Corporation
SPX Corp.
1,735
160,592
AMETEK, Inc.
3,470
149,973
International
7,390
95,331
Stewart Enterprises, Inc. —
Deluxe Corp.
4,070
149,939
Thomas & Betts Corp.*†
2,415
141,616
Class A
11,420
87,020
Dress Barn, Inc.*
4,970
84,540
Perini Corp.*
2,520
140,944
West Marine, Inc.*†
7,270
83,968
DRS Technologies, Inc.†
2,550
140,556
Manitowoc Co., Inc.
3,120
Aftermarket Technology Corp.*
2,620
83,159
138,154
Belden, Inc.†
2,935
137,681
Stanley Works†
1,480
83,072
Kellwood Co.
4,870
83,034
Aerovironment, Inc.*
5,940
136,679
Children’s Place Retail Stores,
Goodman Global, Inc.*
5,720
136,594
Teleflex, Inc.†
1,745
135,970
Inc.*†
3,360
81,581
Continental Airlines, Inc. —
OfficeMax, Inc.
2,200
75,394
Class B*†
4,100
135,423
Core-Mark Holding Co., Inc.*
2,130
75,040
Jarden Corp.*
2,219
68,656
Gardner Denver, Inc.*
3,460
134,940
Steelcase, Inc. — Class A†
7,460
134,131
Standard Motor Products, Inc.
7,280
68,432
URS Corp.*
2,310
130,400
Warnaco Group, Inc.*
1,740
67,982
CDI Corp.
4,650
129,642
Systemax, Inc.†
2,990
61,116
Darden Restaurants, Inc.
1,360
56,930
Columbus McKinnon Corp. —
Class A*
5,130
127,686
Thor Industries, Inc.
930
41,841
Getty Images, Inc.*
1,400
38,976
School Specialty, Inc.*
3,590
124,322
G-III Apparel Group Ltd.*
1,710
33,670
On Assignment, Inc.*
13,120
122,541
Spherion Corp.*
14,710
121,505
Family Dollar Stores, Inc.
970
25,763
ValueVision Media, Inc. —
Republic Airways Holdings, Inc.*
5,655
119,716
Class A*
3,290
24,379
ABM Industries, Inc.
5,850
116,883
Cascade Corp.
1,780
116,003
Marriott International, Inc. —
Tredegar Corp.
Class A
490
21,300
6,636
114,471
Home Depot, Inc.†
653
21,183
Manpower, Inc.
1,740
111,969
Copa Holdings SA
2,620
104,931
J.C. Penney Co., Inc.
320
20,278
NACCO Industries, Inc. —
Starbucks Corp.*†
535
14,017
Class A
930
96,236
CKE Restaurants, Inc.
610
9,888
Snap-On, Inc.
190
9,413
Honeywell International, Inc.
1,590
94,557
WESCO International, Inc.*†
DG FastChannel, Inc.*
320
7,546
1,680
72,139
14
|
THE RYDEX SERIES FUNDS SEMI-ANNUAL REPORT
See Notes to Financial Statements.
SCHEDULE OF INVESTMENTS (Unaudited) (continued)
September 30, 2007
MULTI-CAP CORE EQUITY FUND
MARKET
MARKET
SHARES
(NOTE 1)
SHARES
(NOTE 1)
VALUE
VALUE
Precision Castparts Corp.
410
$
60,672
Analogic Corp.
1,770
$
112,855
Boeing Co.
560
58,794
Greatbatch, Inc.*
4,140
110,083
CBIZ, Inc.*†
6,280
49,926
Healthspring, Inc.*
5,635
109,882
UAL Corp.*†
1,040
48,391
Merck & Co., Inc.
2,090
108,032
Robbins & Myers, Inc.
730
41,822
King Pharmaceuticals, Inc.*
8,460
99,151
Con-way, Inc.
870
40,020
Watson Pharmaceuticals, Inc.*
2,860
92,664
United Technologies Corp.
465
37,423
Viropharma, Inc.*
10,170
90,513
Crane Co.
770
36,937
Bio-Rad Laboratories, Inc. —
Burlington Northern Santa Fe
Class A*
1,000
90,500
Corp.†
390
31,656
Emergent Biosolutions, Inc.*
9,660
85,781
Caterpillar, Inc.†
390
30,588
Medical Action Industries, Inc.*
3,290
77,841
3M Co.†
300
28,074
Air Methods Corp.*
1,550
71,610
Allied Waste Industries, Inc.*†
1,880
23,970
HLTH Corp.*†
4,940
70,000
Tyco International Ltd.
370
16,406
Cubist Pharmaceuticals, Inc.*
3,100
65,503
Atlas Air Worldwide Holdings
DENTSPLY International, Inc.
1,565
65,167
Co., Inc.*
260
13,424
Abbott Laboratories
990
53,084
Beacon Roofing Supply, Inc.*†
1,060
10,833
Genentech, Inc.*
590
46,032
Hardinge, Inc.
245
8,533
Medtronic, Inc.
490
27,641
Robert Half International, Inc.
285
8,510
AmerisourceBergen Corp.
390
17,679
Kelly Services, Inc.
410
8,122
Wyeth
350
15,593
Total Industrials
7,675,027
Millennium Pharmaceuticals,
HEALTH CARE 10.7%
Inc.*†
1,290
13,094
Pfizer, Inc.
17,130
418,486
Total Health Care
6,771,187
Johnson & Johnson, Inc.
4,630
304,191
ENERGY 8.9%
Amgen, Inc.*
4,330
244,948
Exxon Mobil Corp.†
12,410
1,148,669
UnitedHealth Group, Inc.
5,000
242,150
Chevron Corp.†
5,650
528,727
Schering-Plough Corp.
6,920
218,880
ConocoPhillips
4,630
406,375
WellPoint, Inc.*
2,650
209,138
National-Oilwell Varco, Inc.*
1,740
251,430
Baxter International, Inc.
3,557
200,188
Occidental Petroleum Corp.
3,490
223,639
Aetna, Inc.
3,300
179,091
GlobalSantaFe Corp.
2,750
209,055
Humana, Inc.*
2,560
178,893
Marathon Oil Corp.
3,520
200,710
Thermo Fisher Scientific, Inc.*
2,920
168,542
Valero Energy Corp.
2,860
192,135
Biogen Idec, Inc.*
2,440
161,845
ENSCO International, Inc.†
2,897
162,522
Zimmer Holdings, Inc.*
1,970
159,550
Pride International, Inc.*
4,080
149,124
AMERIGROUP Corp.*
4,430
152,746
Golar LNG Ltd.†
6,580
146,866
WellCare Health Plans, Inc.*
1,380
145,493
Tesoro Corp.
3,070
141,281
Steris Corp.†
5,270
144,029
Patterson-UTI Energy, Inc.†
6,140
138,580
Martek Biosciences Corp.*†
4,950
143,698
Global Industries Ltd.*
5,310
136,786
CIGNA Corp.
2,690
143,350
GulfMark Offshore, Inc.*
2,775
135,031
Perrigo Co.
6,680
142,618
Schlumberger Ltd.
1,270
133,350
Cephalon, Inc.*†
1,940
141,736
Tidewater, Inc.†
2,120
133,221
Omnicell, Inc.*
4,940
140,988
SEACOR Holdings, Inc.*
1,390
132,189
Sciele Pharma, Inc.*†
5,210
135,564
Overseas Shipholding Group,
Arrow International, Inc.
2,960
134,650
Inc.†
1,660
127,538
Res-Care, Inc.*
5,880
134,299
Bronco Drilling Co., Inc.*†
8,330
123,284
Zoll Medical Corp.*
5,110
132,451
Holly Corp.
2,030
121,455
Cutera, Inc.*
5,030
131,836
Allis-Chalmers Energy, Inc.*†
6,391
121,045
Conmed Corp.*
4,640
129,874
Delek US Holdings, Inc.
4,650
116,622
Albany Molecular Research, Inc.*
8,130
122,763
Alon USA Energy, Inc.
3,290
111,136
Salix Pharmaceuticals Ltd.*†
9,710
120,598
Trico Marine Services, Inc.*†
3,310
98,638
McKesson Corp.
2,045
120,226
USEC, Inc.*†
7,840
80,360
Affymax, Inc.*
4,350
117,711
Plains Exploration & Production
Noven Pharmaceuticals, Inc.*
7,160
114,059
Co.*†
1,280
56,602
Mylan Laboratories, Inc.
7,136
113,891
Callon Petroleum Co.*
2,630
36,610
See Notes to Financial Statements.
THE RYDEX SERIES FUNDS SEMI-ANNUAL REPORT
|
15
SCHEDULE OF INVESTMENTS (Unaudited) (continued)
September 30, 2007
MULTI-CAP CORE EQUITY FUND
MARKET
VALUE
VALUE
MARKET
SHARES
(NOTE 1)
SHARES
(NOTE 1)
Mariner Energy, Inc.*†
1,655
$
34,275
Celanese Corp.
3,280
$
127,854
T-3 Energy Services, Inc. —
Cabot Corp.
3,540
125,776
Class A*
300
12,792
Headwaters, Inc.*†
7,600
113,088
Total Energy
5,610,047
PolyOne Corp.*
15,110
112,872
CONSUMER STAPLES 6.5%
Reliance Steel & Aluminum Co.
1,940
109,688
Altria Group, Inc.
5,900
410,227
Mercer International, Inc.*†
10,640
100,548
Procter & Gamble Co.
4,685
329,543
AEP Industries, Inc.*
2,170
91,878
CVS Corp.
6,240
247,291
Buckeye Technologies, Inc.*
5,130
77,668
Safeway, Inc.
5,786
191,575
Sonoco Products Co.
2,395
72,281
Kroger Co.†
5,830
166,272
CF Industries Holdings, Inc.
740
56,173
Loews Corp. — Carolina Group
2,000
164,460
Pactiv Corp.*
560
16,050
Molson Coors Brewing Co. —
Total Materials
2,899,227
Class B
1,630
162,462
UTILITIES 3.8%
General Mills, Inc.
2,690
156,047
Mirant Corp.*
4,171
169,651
Coca-Cola Co.
2,620
150,571
FPL Group, Inc.
2,710
164,985
Cal-Maine Foods, Inc.†
5,810
146,644
Duke Energy Corp.†
8,700
162,603
Pepsi Bottling Group, Inc.†
3,920
145,706
DTE Energy Co.†
3,290
159,368
Energizer Holdings, Inc.*
1,310
145,214
FirstEnergy Corp.
2,360
149,482
Church & Dwight Co., Inc.
3,000
141,120
WGL Holdings, Inc.
4,350
147,422
Corn Products International, Inc.
3,030
138,986
Energen Corp.
2,500
142,800
Herbalife Ltd.
3,000
136,380
TECO Energy, Inc.†
8,680
142,612
Village Super Market
2,600
135,200
Alliant Energy Corp.†
3,710
142,167
PepsiCo, Inc.
1,840
134,798
Avista Corp.
6,915
140,720
TreeHouse Foods, Inc.*
4,970
134,439
Energy East Corp.
5,150
139,308
J.M. Smucker Co.
2,480
132,482
Sierra Pacific Resources
8,680
136,536
NBTY, Inc.*
3,260
132,356
Puget Energy, Inc.
5,530
135,319
Winn-Dixie Stores, Inc.*†
6,580
123,178
AGL Resources, Inc.
3,390
134,312
Del Monte Foods Co.
10,260
107,730
Portland General Electric Co.
4,750
132,050
Central Garden and Pet Co. —
Reliant Energy, Inc.*
3,970
101,632
Class A*†
11,350
101,923
Atmos Energy Corp.
2,710
76,747
Prestige Brands Holdings, Inc. —
Allete, Inc.
1,060
47,446
Class A*
8,670
95,197
Wal-Mart Stores, Inc.
2,080
90,792
Total Utilities
2,425,160
Kimberly-Clark Corp.
605
42,507
TELECOMMUNICATION SERVICES 3.1%
Central European Distribution
AT&T, Inc.
15,050
636,766
Corp.*†
540
25,871
Telephone & Data Systems, Inc.
2,320
154,860
Universal Corp.†
315
15,419
CenturyTel, Inc.
3,110
143,744
NTELOS Holdings Corp.
4,840
142,586
Imperial Sugar Co., Inc.
200
5,226
Verizon Communications, Inc.
Total Consumer Staples
4,109,616
3,170
140,368
Atlantic Tele-Network, Inc.
3,640
132,314
MATERIALS 4.6%
U.S. Cellular Corp.*
1,316
129,231
Dow Chemical Co.
4,750
204,535
Shenandoah Telecommunications
Freeport-McMoRan Copper &
Co.†
5,910
128,602
Gold, Inc. — Class B
1,920
201,389
Syniverse Holdings, Inc.*
7,780
123,702
United States Steel Corp.
1,740
184,336
Sprint Nextel Corp.†
5,500
104,500
Albemarle Corp.
3,530
156,026
USA Mobility, Inc.*
5,055
85,278
Nucor Corp.†
2,550
151,648
American Tower Corp. —
International Paper Co.
4,195
150,475
Class A*
1,080
47,023
Cytec Industries, Inc.
2,150
147,038
Total Telecommunication Services
Lubrizol Corp.
2,240
145,734
1,968,974
Total Common Stocks
Rock-Tenn Co. — Class A
4,940
142,766
(Cost $56,329,159)
Ashland, Inc.†
2,315
139,386
61,698,166
Carpenter Technology Corp.
1,060
137,811
Temple-Inland, Inc.†
2,550
134,207
16
|
THE RYDEX SERIES FUNDS SEMI-ANNUAL REPORT
See Notes to Financial Statements.
SCHEDULE OF INVESTMENTS (Unaudited) (concluded)
September 30, 2007
MULTI-CAP CORE EQUITY FUND
FACE
VALUE
MARKET
AMOUNT
(NOTE 1)
REPURCHASE AGREEMENTS 2.1%
Repurchase Agreement (Note 5)
Mizuho Financial Group, Inc.
issued 09/28/07 at 3.96%
due 10/01/07
$
778,841
$
778,841
Lehman Brothers Holdings, Inc.
issued 09/28/07 at 3.90%
due 10/01/07
435,199
435,199
Morgan Stanley
issued 09/28/07 at 3.80%
due 10/01/07
91,628
91,628
Credit Suisse Group
issued 09/28/07 at 3.95%
due 10/01/07
2,749
2,749
Total Repurchase Agreements
(Cost $1,308,417)
1,308,417
SECURITIES LENDING COLLATERAL 12.9%
Investment in Securities Lending Short Term
Investment Portfolio Held by
U.S. Bank (Note 8)
8,163,346
8,163,346
Total Securities Lending Collateral
(Cost $8,163,346)
8,163,346
Total Investments 112.8%
(Cost $65,800,922)
$ 71,169,929
Liabilities in Excess of
Other Assets – (12.8)%
$ (8,093,338)
Net Assets – 100.0%
$ 63,076,591
UNREALIZED
CONTRACTS
(NOTE 1)
LOSS
FUTURES CONTRACTS PURCHASED
December 2007 S&P 500 Index
Mini Futures Contracts
(Aggregate Market Value
of Contracts $1,307,513)
17
$
(4,280)
*
Non-Income Producing Security.
†
All or a portion of this security is on loan at September 30, 2007—See Note 8.
ADR—American Depository Receipt.
See Notes to Financial Statements.
THE RYDEX SERIES FUNDS SEMI-ANNUAL REPORT
|
17
SCHEDULE OF INVESTMENTS (Unaudited)
September 30, 2007
SECTOR ROTATION FUND
VALUE
VALUE
MARKET
MARKET
SHARES
(NOTE 1)
SHARES
(NOTE 1)
COMMON STOCKS 94.3%
Southern Copper Corp.†
31,700
$
3,925,411
Barrick Gold Corp.
85,000
3,423,800
INDUSTRIALS 30.9%
Monsanto Co.†
38,500
3,300,990
Fluor Corp.
53,200
$
7,659,736
Rio Tinto PLC — SP ADR†
9,000
3,090,600
Foster Wheeler Ltd.*
51,400
6,747,792
Alcoa, Inc.
78,300
3,063,096
Jacobs Engineering Group,
E.I. du Pont de Nemours and
Inc.*†
85,200
6,439,416
Co.
58,000
2,874,480
KBR Inc.*
153,899
5,966,664
Potash Corporation of
Kirby Corp.*†
120,898
5,336,438
Saskatchewan†
25,500
2,695,350
Diana Shipping, Inc.†
182,991
5,215,244
Dow Chemical Co.
61,800
2,661,108
Shaw Group, Inc.*†
87,300
5,072,130
Teck Cominco Ltd. — Class B†
53,916
2,572,332
Quanta Services, Inc.*†
191,169
5,056,420
Goldcorp, Inc.†
81,600
2,493,696
ABB Ltd. — SP ADR
186,100
4,881,403
The Mosaic Co.*
42,451
2,271,978
Alexander & Baldwin, Inc.†
95,144
4,769,569
Praxair, Inc.
26,700
2,236,392
Emerson Electric Co.
78,055
4,154,087
Newmont Mining Corp.
48,500
2,169,405
Seaspan Corp.†
125,068
4,114,737
Air Products & Chemicals, Inc.
20,900
2,043,184
DryShips, Inc.†
45,200
4,106,420
Nucor Corp.†
33,300
1,980,351
Chicago Bridge & Iron, Co. NV
92,000
3,961,520
Ecolab, Inc.†
31,600
1,491,520
URS Corp.*
60,700
3,426,515
Lyondell Chemical Co.
31,400
1,455,390
Horizon Lines, Inc. — Class A†
107,925
3,294,950
PPG Industries, Inc.
19,100
1,443,005
Washington Group International,
Rohm & Haas Co.
25,100
1,397,317
Inc.*
36,300
3,187,503
Agrium, Inc.
23,900
1,299,682
EMCOR Group, Inc.*
81,300
2,549,568
Sigma-Aldrich Corp.
21,900
1,067,406
Granite Construction, Inc.
46,800
2,481,336
Huntsman Corp.
39,300
1,041,057
Perini Corp.*
41,798
2,337,762
Eastman Chemical Co.
14,500
967,585
Genco Shipping & Trading Ltd.†
35,419
2,321,007
Freeport-McMoRan Copper &
Rockwell Automation, Inc.
28,546
1,984,232
Gold, Inc. — Class B
7,035
737,901
Cooper Industries Ltd. —
Total Materials
86,486,846
Class A†
34,500
1,762,605
INFORMATION TECHNOLOGY 14.8%
First Solar, Inc.*†
14,900
1,754,326
International Business Machines
Eagle Bulk Shipping, Inc.†
59,648
1,535,340
Suntech Power Holdings Co.
Corp.†
38,100
4,488,180
Apple, Inc.*
28,200
4,329,828
Ltd. — SP ADR*†
38,200
1,524,180
Hewlett-Packard Co.
83,900
4,177,381
Roper Industries, Inc.†
23,200
1,519,600
Cisco Systems, Inc.*
125,800
4,165,238
AMETEK, Inc.
31,300
1,352,786
Quintana Maritime Ltd.†
60,194
1,147,900
Nokia Oyj — SP ADR†
104,200
3,952,306
Dell, Inc.*
100,200
Thomas & Betts Corp.*†
18,500
1,084,840
2,765,520
Hubbell, Inc. — Class B
Qualcomm, Inc.
59,900
2,531,374
18,400
1,051,008
EMC Corp*
119,200
2,479,360
Insituform Technologies, Inc. —
Research In Motion Ltd.*
Class A*†
68,600
1,044,778
25,100
2,473,605
Telefonaktiebolaget LM
General Cable Corp.*†
15,400
1,033,648
Acuity Brands, Inc.†
15,800
797,584
Ericsson — SP ADR†
57,200
2,276,560
Motorola, Inc.
105,600
1,956,768
Belden, Inc.†
16,800
788,088
Corning, Inc.
74,000
1,824,100
Genlyte Group, Inc.*
11,300
726,138
Sun Microsystems, Inc.*
295,300
1,656,633
Baldor Electric Co.†
17,600
703,120
Total Industrials
112,890,390
Juniper Networks, Inc.*
37,100
1,358,231
Seagate Technology†
52,500
1,342,950
MATERIALS 23.7%
Alcatel-Lucent†
128,700
1,310,166
BHP Billiton Ltd. — SP ADR†
97,622
7,673,089
SanDisk Corp.*†
22,400
1,234,240
Companhia Vale do Rio Doce —
Network Appliance, Inc.*†
38,500
1,036,035
SP ADR
198,694
6,741,687
NCR Corp.*
20,400
1,015,920
ArcelorMittal†
77,000
6,033,720
Western Digital Corp.*
35,100
888,732
Anglo American PLC —
Logitech International SA*†
28,900
853,995
SP ADR†
155,199
5,191,407
Harris Corp.
14,200
820,618
POSCO — SP ADR†
28,700
5,130,699
Avaya, Inc.*
47,900
812,384
Alcan, Inc.
40,100
4,013,208
Nortel Networks Corp.*†
43,100
731,838
18
|
THE RYDEX SERIES FUNDS SEMI-ANNUAL REPORT
See Notes to Financial Statements.
SCHEDULE OF INVESTMENTS (Unaudited) (concluded)
September 30, 2007
SECTOR ROTATION FUND
MARKET
MARKET
SHARES
(NOTE 1)
SHARES
(NOTE 1)
VALUE
VALUE
Brocade Communications
Tenaris SA — SP ADR
44,000
$
2,315,280
Systems, Inc.*
82,400
$
705,344
Transocean, Inc.*†
20,200
2,283,610
Lexmark International, Inc.*†
15,900
660,327
Baker Hughes, Inc.†
23,700
2,141,769
Diebold, Inc.†
12,700
576,834
National-Oilwell Varco, Inc.*
14,000
2,023,000
Tellabs, Inc.*
59,700
568,344
Weatherford International Ltd.*
28,500
1,914,630
Ciena Corp.*
13,600
517,888
GlobalSantaFe Corp.
21,800
1,657,236
JDS Uniphase Corp.*
34,300
513,128
Diamond Offshore Drilling, Inc.†
13,900
1,574,731
Total Information Technology
54,023,827
Smith International, Inc.
21,000
1,499,400
TELECOMMUNICATION SERVICES 9.3%
Noble Corp.
29,100
1,427,355
China Mobile Ltd. —
Cameron International Corp.*
13,700
1,264,373
SP ADR†
91,500
7,506,660
ENSCO International, Inc.
20,400
1,144,440
Vodafone Group PLC —
Nabors Industries Ltd.*
37,000
1,138,490
SP ADR†
131,400
4,769,820
BJ Services Co.
41,100
1,091,205
America Movil SAB de CV —
Total Energy
28,265,059
SP ADR†
59,100
3,782,400
Total Common Stocks
Sprint Nextel Corp.†
119,400
2,268,600
(Cost $293,339,156)
344,151,967
Vimpel-Communications —
SP ADR
76,600
2,071,264
Mobile Telesystems — SP ADR
28,400
1,968,404
AMOUNT
FACE
Rogers Communications, Inc. —
Class B
41,700
1,898,601
REPURCHASE AGREEMENTS 4.8%
Alltel Corp.
23,300
1,623,544
Repurchase Agreement (Note 5)
Turkcell Iletisim Hizmet AS,
Mizuho Financial Group, Inc.
Inc. — SP ADR†
68,600
1,459,808
issued 09/28/07 at 3.96%
SK Telecom Co. Ltd. — SP ADR†
45,000
1,336,500
due 10/01/07
$10,525,929
10,525,929
American Tower Corp. —
Lehman Brothers Holdings, Inc.
Class A*
30,200
1,314,908
issued 09/28/07 at 3.90%
NII Holdings, Inc. — Class B*
13,600
1,117,240
due 10/01/07
5,881,645
5,881,645
U.S. Cellular Corp.*
10,742
1,054,864
Morgan Stanley
Philippine Long Distance
issued 09/28/07 at 3.80%
Telephone Co. — SP ADR†
16,200
1,042,308
due 10/01/07
1,238,345
1,238,345
Crown Castle International
Credit Suisse Group
Corp.*†
21,300
865,419
issued 09/28/07 at 3.95%
Total Telecommunication Services
34,080,340
due 10/01/07
37,150
37,150
CONSUMER DISCRETIONARY 7.8%
Total Repurchase Agreements
Amazon.com, Inc.*†
93,872
8,744,177
(Cost $17,683,069)
17,683,069
Expedia, Inc.*
123,200
3,927,616
Liberty Media Corp – Interactive*
181,199
3,480,833
SECURITIES LENDING COLLATERAL 21.9%
IAC/InterActiveCorp*
94,600
2,806,782
Investment in Securities Lending Short Term
Priceline.com, Inc.*†
29,700
2,635,875
Investment Portfolio Held by
GSI Commerce, Inc.*†
52,739
1,402,857
U.S. Bank (Note 8)
79,793,952
79,793,952
Netflix, Inc.*†
64,000
1,326,080
Total Securities Lending Collateral
NutriSystem, Inc.*†
27,500
1,289,475
(Cost $79,793,952)
79,793,952
Systemax, Inc.†
53,397
1,091,435
Total Investments 121.0%
Blue Nile, Inc.*†
10,309
970,283
(Cost $390,816,177)
$ 441,628,988
Gmarket, Inc.*†
31,134
730,092
Liabilities in Excess of
Total Consumer Discretionary
28,405,505
Other Assets – (21.0)%
$ (76,553,415)
ENERGY 7.8%
Net Assets – 100.0%
$ 365,075,573
Schlumberger Ltd.
42,500
4,462,500
Halliburton Co.
60,600
2,327,040
*
Non-Income Producing Security.
†
All or a portion of this security is on loan at September 30, 2007—See Note 8.
ADR—American Depository Receipt.
See Notes to Financial Statements.
THE RYDEX SERIES FUNDS SEMI-ANNUAL REPORT
|
19
SCHEDULE OF INVESTMENTS (Unaudited)
September 30, 2007
ABSOLUTE RETURN STRATEGIES FUND
VALUE
VALUE
MARKET
MARKET
SHARES
(NOTE 1)
SHARES
(NOTE 1)
COMMON STOCKS 58.8%
Fidelity National Financial, Inc. —
Class A†
21,080
$
368,478
FINANCIALS 10.0%
PMI Group, Inc.†
11,150
364,605
Goldman Sachs Group, Inc.†
10,060
$
2,180,404
American Financial Group, Inc.
12,300
350,796
Travelers Cos, Inc.
30,660
1,543,424
Capital One Financial Corp.
5,250
348,758
JPMorgan Chase & Co.
24,470
1,121,215
Protective Life Corp.
7,860
333,578
Allstate Corp.
19,100
1,092,329
Marsh & McLennan Cos., Inc.
12,860
327,930
HSBC Holdings PLC — SP ADR†
11,660
1,079,716
Nuveen Investments, Inc. —
Hartford Financial Services
Class A
5,180
320,849
Group, Inc.†
11,360
1,051,368
Host Hotels & Resorts, Inc.
14,040
315,058
A.G. Edwards, Inc.†
12,380
1,036,825
MGIC Investment Corp.†
9,720
314,053
Chubb Corp.†
16,440
881,842
UnumProvident Corp.
12,500
305,875
ACE Ltd.
14,460
875,842
Credit Suisse Group — SP ADR†
4,520
299,812
Morgan Stanley†
12,450
784,350
Horace Mann Educators Corp.
13,590
267,859
Fannie Mae
12,800
778,368
National City Corp.†
9,700
243,373
Genworth Financial, Inc. —
Commerce Group, Inc.†
8,200
241,654
Class A
22,820
701,259
Apartment Investment &
KNBT Bancorp, Inc.
37,540
620,912
Management Co. — Class A†
4,350
196,316
CIT Group, Inc.
14,970
601,794
Cincinnati Financial Corp.
4,110
178,004
UBS AG — SP ADR
10,660
567,645
W.R. Berkley Corp.
5,490
162,669
Loews Corp.
11,610
561,343
Radian Group, Inc.†
6,240
145,267
Banco Santander Central
Cousins Properties, Inc.†
4,140
121,550
Hispano SA — SP ADR†
28,840
556,900
Potlatch Corp.†
2,690
121,131
Archstone-Smith Trust
9,250
556,295
XL Capital Ltd.†
1,390
110,088
Republic Property Trust
37,840
555,113
Everest Re Group Ltd.
720
79,373
James River Group, Inc.
17,010
551,124
Equity Inns, Inc.
24,180
545,984
Total Financials
33,129,847
CONSUMER DISCRETIONARY 8.1%
First Indiana Corp.
17,410
545,281
Expedia, Inc.*
60,240
1,920,451
Chittenden Corp.
15,400
541,464
Time Warner, Inc.
75,700
1,389,852
International Securities
Exchange Holdings, Inc.
8,110
539,072
Buffalo Wild Wings, Inc.*
35,694
1,346,378
Ambac Financial Group, Inc.†
8,400
528,444
Home Depot, Inc.†
27,930
906,049
Sterling Financial Corp.
Hilton Hotels Corp.†
17,960
834,960
30,480
522,732
Yardville National Corp.
15,330
515,548
Harrah’s Entertainment, Inc.
8,950
778,023
Carnival Corp.†
14,980
725,481
U.S.B. Holding Co.†
22,160
514,777
XM Satellite Radio
Allianz AG – SP ADR
21,560
501,701
Holdings, Inc.*†
49,640
703,399
Banco Bilbao Vizcaya
Tribune Co.
Argentaria SA — SP ADR†
20,310
472,817
24,300
663,876
CKX, Inc.*†
48,910
602,082
Federated Investors, Inc. —
Cumulus Media, Inc. —
Class B†
11,600
460,520
ING Groep NV — SP ADR
10,280
455,507
Class A*†
56,200
574,364
McDonald’s Corp.
10,530
Ameriprise Financial, Inc.†
573,569
7,080
446,819
Cablevision Systems Corp. —
Barclays PLC — SP ADR†
9,140
444,387
Class A*†
16,270
568,474
Lloyds TSB Group PLC —
SP ADR†
9,910
440,599
Guitar Center, Inc.*†
9,580
568,094
Keystone Automotive
AmeriCredit Corp.*†
24,090
423,502
ABN AMRO Holding NV—
Industries, Inc.*†
11,690
558,314
Penn National Gaming, Inc.*
9,410
555,378
SP ADR
7,960
417,900
ProLogis
Riviera Holdings Corp.*
6,180
410,043
19,720
553,146
AXA — SP ADR†
DEB Shops, Inc.
20,360
547,480
9,120
406,843
Deutsche Bank AG— SP ADR†
3,070
394,157
Oakley, Inc.
18,690
542,571
Old Republic International Corp.
20,630
386,606
Station Casinos, Inc.
6,170
539,752
Applebee’s International, Inc.†
21,570
536,662
20
|
THE RYDEX SERIES FUNDS SEMI-ANNUAL REPORT
See Notes to Financial Statements.
SCHEDULE OF INVESTMENTS (Unaudited) (continued)
September 30, 2007
ABSOLUTE RETURN STRATEGIES FUND
VALUE
VALUE
MARKET
MARKET
SHARES
(NOTE 1)
SHARES
(NOTE 1)
Genesco, Inc.*
10,600
$
488,978
Aeropostale, Inc.*†
3,435
$
65,471
Johnson Controls, Inc.
4,030
475,983
LKQ Corp.*†
1,860
64,747
Walt Disney Co.†
13,670
470,111
GSI Commerce, Inc.*†
2,280
60,648
Comcast Corp. — Class A*†
19,100
461,838
Netflix, Inc.*†
2,760
57,187
DaimlerChrysler AG — SP ADR†
4,600
460,920
Cooper Tire & Rubber Co.
2,340
57,096
Catalina Marketing Corp.*
12,240
396,454
NutriSystem, Inc.*†
1,190
55,799
Dow Jones & Co., Inc.†
6,410
382,677
KB HOME†
2,210
55,383
DIRECTV Group, Inc.*
12,980
315,154
Tenneco, Inc.*
1,630
50,546
Whirlpool Corp.†
3,440
306,504
Systemax, Inc.†
2,310
47,216
Lowe’s Cos., Inc.
10,570
296,171
American Axle & Manufacturing
Mohawk Industries, Inc.*†
3,200
260,160
Holdings, Inc.†
1,730
43,683
Big Lots, Inc.*†
8,340
248,866
Blue Nile, Inc.*†
460
43,295
Kohl’s Corp.*
4,210
241,359
Goodyear Tire & Rubber Co.*
1,270
38,621
Office Depot, Inc.*
11,550
238,161
Lee Enterprises, Inc.
2,310
35,967
GameStop Corp. — Class A*
4,220
237,797
Media General, Inc.
1,300
35,763
Sotheby’s Holdings, Inc. —
Gmarket, Inc.*
1,340
31,423
Class A†
4,830
230,826
M.D.C. Holdings, Inc.
740
30,296
Koninklijke Philips Electronics
Visteon Corp.*†
4,560
23,484
NV — SP ADR
4,740
213,016
Lear Corp.*†
590
18,939
Polo Ralph Lauren Corp.
2,630
204,483
Delphi Corp.*
17,940
8,163
AutoZone, Inc.*†
1,700
197,438
Regis Corp.
6,060
193,375
Total Consumer Discretionary
26,849,124
INFORMATION TECHNOLOGY 7.6%
Hanesbrands, Inc.*
6,800
190,808
Hewlett-Packard Co.
68,380
3,404,640
NVR, Inc.*†
360
169,290
Mattel, Inc.
7,090
166,331
EMC Corp*
50,380
1,047,904
Luxottica Group — SP ADR
4,830
163,737
Electronic Data Systems Corp.
45,050
983,892
Avaya, Inc.*
56,530
958,749
Dillard’s, Inc. — Class A†
7,400
161,542
Affiliated Computer
Brunswick Corp.†
6,780
154,991
Services, Inc. — Class A*
18,250
Belo Corp. — Class A
916,880
8,710
151,206
Liberty Media Corp – Interactive*
7,830
150,414
Ceridian Corp.*
24,950
866,763
American Eagle Outfitters, Inc.
5,550
146,021
Alliance Data Systems Corp.*†
10,850
840,224
Nokia Oyj — SP ADR
21,310
808,288
Hasbro, Inc.†
5,080
141,630
Dollar Tree Stores, Inc.*†
3,480
141,079
Tyco Electronics Ltd.
21,260
753,242
Scholastic Corp.*
3,970
138,394
Xerox Corp.*
42,010
728,454
Juniper Networks, Inc.*†
19,740
722,682
Gannett Co., Inc.
3,150
137,655
Magna International, Inc. —
Sun Microsystems, Inc.*
109,990
617,044
Class A
1,410
135,797
Applied Materials, Inc.
28,920
598,644
Sirenza Microdevices, Inc.*
34,370
594,257
Rent-A-Center, Inc.*†
6,780
122,921
Phillips-Van Heusen Corp.†
2,340
122,803
ASE Test Ltd.*
40,360
579,973
ECI Telecom Ltd.*
58,170
IAC/InterActiveCorp*
4,090
121,350
579,373
CDW Corp.*
6,290
548,488
Priceline.com, Inc.*†
1,280
113,600
Charming Shoppes, Inc.*†
13,400
112,560
Novellus Systems, Inc.*†
19,910
542,747
Computer Sciences Corp.*
9,560
534,404
Warnaco Group, Inc.*
2,700
105,489
Andrew Corp.*
38,440
532,394
Ross Stores, Inc.†
4,080
104,611
Authorize.Net Holdings, Inc.*
29,130
513,562
BorgWarner, Inc.†
1,050
96,107
Macy’s, Inc.
2,900
93,728
Vishay Intertechnology, Inc.*
36,370
473,901
Brinker International, Inc.
Acxiom Corp.
22,800
451,212
3,410
93,570
Tupperware Brands Corp.
2,920
91,951
Teradyne, Inc.*
31,350
432,630
WPP Group PLC — SP ADR
1,300
87,750
Micron Technology, Inc.*†
34,680
384,948
Telefonaktiebolaget LM
Autoliv, Inc.
1,430
85,443
Ericsson — SP ADR†
8,560
340,688
Gentex Corp.†
3,500
75,040
LSI Logic Corp.*
Lennar Corp. — Class A†
3,160
71,574
45,580
338,204
TRW Automotive
Avnet, Inc.*
8,340
332,432
Broadridge Financial
Holdings Corp.*
2,190
69,379
Solutions, Inc.†
14,740
279,323
See Notes to Financial Statements.
THE RYDEX SERIES FUNDS SEMI-ANNUAL REPORT
|
21
SCHEDULE OF INVESTMENTS (Unaudited) (continued)
September 30, 2007
ABSOLUTE RETURN STRATEGIES FUND
VALUE
VALUE
MARKET
MARKET
SHARES
(NOTE 1)
SHARES
(NOTE 1)
CheckFree Corp.*†
5,960
$
277,378
McKesson Corp.
10,070
$
592,015
Convergys Corp.*
15,480
268,733
PolyMedica Corp.
11,210
588,749
CommScope, Inc.*†
4,930
247,683
Manor Care, Inc.
8,610
554,484
Palm, Inc.*†
14,430
234,776
Arrow International, Inc.
12,080
549,519
Motorola, Inc.
12,610
233,663
Bausch & Lomb, Inc.
8,560
547,840
Intersil Corp. — Class A
6,590
220,304
DJ Orthopedics, Inc.*
11,140
546,974
SAP AG — SP ADR†
3,700
217,079
FoxHollow Technologies, Inc.*
20,630
544,632
ValueClick, Inc.*†
9,610
215,841
PRA International*
18,460
542,724
Polycom, Inc.*†
7,240
194,466
Sierra Health Services, Inc.*
12,780
539,188
International Business
Bioenvision, Inc.*†
96,660
510,365
Machines Corp.
1,640
193,192
Coventry Health Care, Inc.*
7,610
473,418
Dycom Industries, Inc.*
5,940
181,942
WellCare Health Plans, Inc.*
4,270
450,186
Cisco Systems, Inc.*
5,190
171,841
CIGNA Corp.
8,130
433,248
MPS Group, Inc.*†
15,020
167,473
AstraZeneca PLC — SP ADR
8,410
421,089
Nvidia Corp.*
4,500
163,080
Humana, Inc.*
5,060
353,593
Plantronics, Inc.†
5,620
160,451
Waters Corp.*
4,990
333,931
Mentor Graphics Corp.*†
8,960
135,296
Apria Healthcare Group, Inc.*
9,970
259,320
Macrovision Corp.*†
5,360
132,017
DENTSPLY International, Inc.
6,110
254,420
Advent Software, Inc.*†
2,770
130,107
Community Health
MEMC Electronic Materials, Inc.*
2,190
128,903
Systems, Inc.*†
7,830
246,175
Dell, Inc.*
4,270
117,852
Lincare Holdings, Inc.*
6,700
245,555
Qualcomm, Inc.
2,470
104,382
Health Net, Inc.*
4,340
234,577
Research In Motion Ltd.*
1,050
103,478
Cephalon, Inc.*†
3,130
228,678
Corning, Inc.
3,050
75,183
King Pharmaceuticals, Inc.*†
18,980
222,446
Seagate Technology†
2,250
57,555
Cerner Corp.*†
3,620
216,512
Alcatel-Lucent
5,310
54,056
Quest Diagnostics, Inc.†
3,660
211,438
SanDisk Corp.*
960
52,896
Kyphon, Inc.*
2,940
205,800
Gartner, Inc. — Class A*
2,120
51,855
LifePoint Hospitals, Inc.*†
6,370
191,164
NCR Corp.*
870
43,326
Sanofi-Aventis — SP ADR
4,200
178,164
Western Digital Corp.*
1,510
38,233
Alcon, Inc. — SP ADR†
1,010
145,359
Logitech International SA*†
1,240
36,642
Mylan Laboratories, Inc.†
8,550
136,458
Harris Corp.
590
34,096
Perrigo Co.†
5,810
124,044
Nortel Networks Corp.*†
1,780
30,224
Teva Pharmaceutical
Brocade Communications
Industries Ltd. — SP ADR†
2,510
111,620
Systems, Inc.*
3,520
30,131
Health Management
Diebold, Inc.†
520
23,618
Associates, Inc. — Class A
11,580
80,365
Tellabs, Inc.*
2,470
23,514
Par Pharmaceutical Cos., Inc.*
4,200
77,952
Imation Corp.
750
18,398
Applera Corp. – Applied
Total Information Technology
25,275,606
Biosystems Group
2,120
73,437
HEALTH CARE 7.2%
Covance, Inc.*†
830
64,657
Pfizer, Inc.
75,230
1,837,869
Millipore Corp.*†
780
59,124
Schering-Plough Corp.
43,870
1,387,608
Pharmaceutical Product
Baxter International, Inc.
22,110
1,244,351
Development, Inc.
1,590
56,350
UnitedHealth Group, Inc.
22,510
1,090,159
Charles River Laboratories
WellPoint, Inc.*
11,840
934,413
International, Inc.*†
1,000
56,150
Cytyc Corp.*
18,230
868,660
Invitrogen Corp.*†
680
55,576
Aetna, Inc.
14,490
786,372
PerkinElmer, Inc.
1,830
53,454
Eli Lilly & Co.
13,640
776,525
Illumina, Inc.*
960
49,805
Novartis AG — SP ADR
13,610
748,006
Techne Corp.*
700
44,156
GlaxoSmithKline PLC —
Bio-Rad Laboratories, Inc. —
SP ADR†
13,840
736,288
Class A*
450
40,725
Thermo Fisher Scientific, Inc.*
11,790
680,519
Varian, Inc.*
630
40,074
Inverness Medical
Sepracor, Inc.*
1,150
31,625
Innovations, Inc.*
11,547
638,780
Advanced Medical Optics, Inc.*
860
26,307
22
|
THE RYDEX SERIES FUNDS SEMI-ANNUAL REPORT
See Notes to Financial Statements.
SCHEDULE OF INVESTMENTS (Unaudited) (continued)
September 30, 2007
ABSOLUTE RETURN STRATEGIES FUND
MARKET
MARKET
SHARES
(NOTE 1)
SHARES
(NOTE 1)
VALUE
VALUE
Valeant Pharmaceuticals
Con-way, Inc.
3,260
$
149,960
International*
1,390
$
21,517
Horizon Lines, Inc. — Class A†
4,630
141,354
Kindred Healthcare, Inc.*
940
16,835
Herman Miller, Inc.
5,060
137,328
Total Health Care
23,771,344
EMCOR Group, Inc.*
3,490
109,446
INDUSTRIALS 6.9%
Precision Castparts Corp.
720
106,546
CSX Corp.†
29,560
1,263,099
YRC Worldwide, Inc.*†
3,760
102,723
Paccar, Inc.
11,950
1,018,737
Perini Corp.*
1,800
100,674
Burlington Northern
Genco Shipping & Trading Ltd.†
1,510
98,950
Santa Fe Corp.†
12,130
984,592
Ryanair Holdings PLC —
United Rentals, Inc.*
26,850
863,764
SP ADR*†
2,060
85,511
Norfolk Southern Corp.†
16,510
857,034
Rockwell Automation, Inc.
1,200
83,412
Waste Management, Inc.
22,300
841,602
Cooper Industries Ltd. —
Terex Corp.*
8,560
762,011
Class A†
1,460
74,591
Eaton Corp.
7,620
754,685
First Solar, Inc.*†
620
72,999
Washington Group
Alexander & Baldwin, Inc.†
1,420
71,185
International, Inc.*
8,220
721,798
Eagle Bulk Shipping, Inc.†
2,510
64,607
Caterpillar, Inc.†
9,170
719,203
Suntech Power Holdings Co.
Sequa Corp. — Class A*
4,040
669,751
Ltd. – SP ADR*†
1,610
64,239
1,320
Quanta Services, Inc.*
24,447
646,623
Roper Industries, Inc.†
980
64,190
EDO Corp.
10,480
586,985
AMETEK, Inc.
57,050
Midwest Air Group, Inc.*
33,890
557,490
Quintana Maritime Ltd.†
2,580
49,201
Laidlaw International, Inc.
15,590
549,080
Thomas & Betts Corp.*†
790
46,326
Williams Scotsman
Insituform Technologies, Inc. —
International, Inc.*
19,810
548,935
Class A*†
2,950
44,929
Lamson & Sessions Co., Inc.*
19,835
Acuity Brands, Inc.†
534,752
General Cable Corp.*†
640
42,957
PHH Corp.*
20,080
527,702
660
33,317
FedEx Corp.
780
4,560
477,660
Belden, Inc.
700
32,837
Siemens AG — SP ADR
3,480
477,630
Baldor Electric Co.†
31,161
Cummins, Inc.
3,560
455,288
Genlyte Group, Inc.*
460
29,560
Tyco International Ltd.†
9,620
426,551
Jacobs Engineering
Timken Co.†
9,840
365,556
Group, Inc.*†
330
24,941
ITT Industries, Inc.
5,320
361,388
JetBlue Airways Corp.*†
440
4,057
DRS Technologies, Inc.†
5,630
310,326
Total Industrials
22,984,969
Ryder System, Inc.†
6,140
300,860
ENERGY 6.5%
Foster Wheeler Ltd.*
2,220
291,442
ConocoPhillips
29,200
2,562,884
SPX Corp.
3,090
286,010
National-Oilwell Varco, Inc.*
15,770
2,278,765
Granite Construction, Inc.
5,370
284,717
Marathon Oil Corp.
24,810
1,414,666
GATX Corp.†
6,350
271,462
Valero Energy Corp.
19,580
1,315,384
AGCO Corp.*
5,200
264,004
Anadarko Petroleum Corp.
20,200
1,085,750
Joy Global, Inc.
5,070
257,860
Hess Corp.
15,450
1,027,889
KBR Inc.*
6,580
255,107
BP PLC — SP ADR
14,050
974,368
Flowserve Corp.
3,060
233,111
Total SA — SP ADR
11,850
960,206
Kelly Services, Inc.†
11,680
231,381
Pogo Producing Co.
17,880
949,607
Kirby Corp.*†
5,190
229,087
Chesapeake Energy Corp.†
23,900
842,714
Diana Shipping, Inc.†
7,850
223,725
Cameron International Corp.*†
7,920
730,937
Shaw Group, Inc.*
3,750
217,875
Noble Corp.
13,640
669,042
ABB Ltd. — SP ADR
7,840
205,643
Royal Dutch Shell PLC —
Werner Enterprises, Inc.†
10,990
188,479
SP ADR†
7,780
639,360
Seaspan Corp.†
5,360
176,344
El Paso Corp.†
37,240
631,963
Emerson Electric Co.
3,300
175,626
GlobalSantaFe Corp.
8,110
616,522
DryShips, Inc.†
1,930
175,341
Horizon Offshore, Inc.*
35,090
578,985
Deere & Co.†
1,150
170,683
Exterran Holdings, Inc.*†
6,948
558,202
Chicago Bridge & Iron, Co. NV
3,950
170,087
Markwest Hydrocarbon, Inc.
9,580
556,885
Deluxe Corp.†
4,610
169,832
ENSCO International, Inc.†
9,590
537,999
See Notes to Financial Statements.
THE RYDEX SERIES FUNDS SEMI-ANNUAL REPORT
|
23
SCHEDULE OF INVESTMENTS (Unaudited) (continued)
September 30, 2007
ABSOLUTE RETURN STRATEGIES FUND
VALUE
VALUE
MARKET
MARKET
SHARES
(NOTE 1)
SHARES
(NOTE 1)
Newfield Exploration Co.*
10,890
$
524,462
France Telecom SA — SP ADR
7,290
$
243,778
Grant Prideco, Inc.*†
8,970
489,044
Telecom Italia — SP ADR
6,320
191,306
ENI-Ente Nazionale
America Movil SAB de CV —
Idrocarburi — SP ADR†
6,320
466,163
SP ADR†
2,540
162,560
Tidewater, Inc.†
6,370
400,291
Vimpel-Communications —
Cimarex Energy Co.†
9,890
368,403
SP ADR
3,350
90,584
Superior Energy Services*
8,540
302,658
Mobile Telesystems — SP ADR
1,220
84,558
Patterson-UTI Energy, Inc.†
2,220
50,105
Rogers Communications, Inc. —
Total Energy
21,533,254
Class B
1,790
81,499
CONSUMER STAPLES 4.1%
Turkcell Iletisim Hizmet AS, Inc. —
Safeway, Inc.
61,720
2,043,549
SP ADR†
2,940
62,563
Wal-Mart Stores, Inc.
45,320
1,978,218
SK Telecom Co. Ltd. —
Reynolds American, Inc.†
18,530
1,178,323
SP ADR†
1,930
57,321
SUPERVALU, Inc.
28,140
1,097,741
American Tower Corp. —
Molson Coors
Class A*
1,290
56,167
Brewing Co. — Class B
9,050
902,013
NII Holdings, Inc. — Class B*
610
50,112
NBTY, Inc.*
17,500
710,500
U.S. Cellular Corp.*
480
47,136
Energizer Holdings, Inc.*
5,740
636,279
Philippine Long Distance
Altria Group, Inc.
7,920
550,677
Telephone Co. — SP ADR†
720
46,325
Playtex Products, Inc.*
29,540
539,991
Crown Castle International
Pathmark Stores, Inc.*
41,860
533,715
Corp.*†
920
37,380
Topp
53,320
516,671
Total Telecommunication Services
12,096,328
Reddy Ice Holdings, Inc.
18,510
488,109
MATERIALS 3.1%
Diageo PLC — SP ADR
5,060
443,914
Dow Chemical Co.
18,821
810,526
Pepsi Bottling Group, Inc.†
11,680
434,146
United States Steel Corp.†
6,880
728,867
Unilever NV — SP ADR
13,340
411,539
Huntsman Corp.†
23,640
626,224
Dean Foods Co.
10,000
255,800
Ryerson, Inc.†
16,850
568,519
Walgreen Co.
4,270
201,715
BHP Billiton Ltd. — SP ADR†
6,830
536,838
Cadbury Schweppes PLC —
Myers Industries, Inc.
26,250
520,275
SP ADR
3,630
168,868
Anglo American PLC —
Universal Corp.†
3,220
157,619
SP ADR
15,280
511,116
Hershey Co.†
2,000
92,820
Lyondell Chemical Co.
10,720
496,872
Alberto-Culver Co.†
2,990
74,122
Rio Tinto PLC — SP ADR†
1,440
494,496
Total Consumer Staples
13,416,329
E.I. du Pont de Nemours
TELECOMMUNICATION SERVICES 3.7%
and Co.
9,180
454,961
AT&T, Inc.
Alcoa, Inc.
10,380
68,040
2,878,772
Abitibi — Consolidated Inc.*†
256,830
449,452
Temple-Inland, Inc.†
Verizon Communications, Inc.
45,610
2,019,611
406,066
Vodafone Group PLC —
7,040
370,515
SP ADR†
30,100
1,092,630
Steel Dynamics, Inc.†
6,010
280,667
Telefonica SA — SP ADR
8,590
719,670
Albemarle Corp.
6,030
266,526
Leap Wireless International,
Bemis Co.
6,300
183,393
Inc. — Class B*
7,170
583,423
Valspar Corp.
6,350
172,783
SunCom Wireless Holdings, Inc. —
Companhia Vale do Rio Doce —
Class A*
22,400
577,920
SP ADR
4,640
157,435
Dobson Communications Corp. —
Martin Marietta Materials, Inc.†
1,170
156,253
Class A*
42,770
547,028
Reliance Steel & Aluminum Co.
2,610
147,569
Rural Cellular Corp. — Class A*
12,510
544,185
Lubrizol Corp.
2,200
143,132
Telephone & Data Systems, Inc.
6,370
425,197
ArcelorMittal†
1,780
139,481
BT Group PLC — SP ADR
6,630
416,563
POSCO — SP ADR†
670
119,776
CenturyTel, Inc.
8,650
399,803
Carpenter Technology Corp.
820
106,608
Deutsche Telekom AG —
Potash Corporation of
SP ADR†
18,270
358,640
Saskatchewan†
990
104,643
China Mobile Ltd. —
Pactiv Corp.*
3,580
102,603
SP ADR†
3,920
321,597
Alcan, Inc.
930
93,074
Southern Copper Corp.†
740
91,634
24
|
THE RYDEX SERIES FUNDS SEMI-ANNUAL REPORT
See Notes to Financial Statements.
SCHEDULE OF INVESTMENTS (Unaudited) (continued)
September 30, 2007
ABSOLUTE RETURN STRATEGIES FUND
VALUE
FACE
VALUE
MARKET
MARKET
SHARES
(NOTE 1)
AMOUNT
(NOTE 1)
Ashland, Inc.
1,460
$
87,907
FEDERAL AGENCY DISCOUNT NOTES 2.1%
Praxair, Inc.
1,030
86,273
Freddie Mac**
The Mosaic Co.*
1,520
81,350
4.89% due 11/19/07
$
7,000,000
$
6,953,409
Barrick Gold Corp.
1,970
79,352
Total Federal Agency Discount Notes
Air Products & Chemicals, Inc.
800
78,208
Worthington Industries, Inc.†
2,610
61,492
(Cost $6,953,409)
6,953,409
Teck Cominco Ltd. — Class B†
1,250
59,638
Goldcorp, Inc.†
REPURCHASE AGREEMENTS 28.0%
1,890
57,758
Eastman Chemical Co.†
Repurchase Agreement (Note 5)
860
57,388
Credit Suisse Group
PPG Industries, Inc.†
740
55,907
issued 09/28/07 at 3.95%
Rohm & Haas Co.†
970
54,000
due 10/01/07††
38,007,509
38,007,509
Ferro Corp.
2,620
52,348
Mizuho Financial Group, Inc.
Agrium, Inc.
930
50,573
issued 09/28/07 at 3.96%
Sigma-Aldrich Corp.
840
40,942
due 10/01/07
31,340,979
31,340,979
Freeport-McMoRan Copper &
Lehman Brothers Holdings, Inc.
Gold, Inc. — Class B
310
32,516
issued 09/28/07 at 3.90%
Total Materials
10,175,956
due 10/01/07††
19,812,531
19,812,531
UTILITIES 1.6%
Morgan Stanley
TXU Corp.
12,490
issued 09/28/07 at 3.80%
855,190
due 10/01/07
3,687,174
3,687,174
Aquila, Inc.*†
138,810
556,628
(Cost $92,848,193)
Energy East Corp.
20,500
554,525
Total Repurchase Agreements
PG&E Corp.
9,930
474,654
92,848,193
Xcel Energy, Inc.†
16,370
352,610
Sierra Pacific Resources
20,630
324,510
SECURITIES LENDING COLLATERAL 15.4%
Constellation Energy
Investment in Securities Lending Short Term
Group, Inc.
3,570
306,270
Investment Portfolio Held by
CenterPoint Energy, Inc.†
18,670
299,280
U.S. Bank (Note 8)
50,996,329
50,996,329
SCANA Corp.†
6,380
247,161
Total Securities Lending Collateral
Entergy Corp.
2,250
243,652
(Cost $50,996,329)
50,996,329
Pinnacle West Capital Corp.
5,700
225,207
Total Long Securities 111.2%
Westar Energy, Inc.
6,800
167,008
(Cost $358,369,691)
$ 368,124,404
Northeast Utilities†
5,580
159,421
CMS Energy Corp.
9,110
153,230
SHARES
TECO Energy, Inc.†
5,940
97,594
COMMON STOCKS SOLD SHORT (38.2)%
AGL Resources, Inc.
2,290
90,730
NiSource, Inc.†
4,290
82,111
TELECOMMUNICATION SERVICES (0.5)%
Black Hills Corp.†
1,440
59,069
Alltel Corp.
IDACORP, Inc.
1,250
40,925
1,760
(122,637)
MetroPCS Communications, Inc.*
20,490
(558,967)
Oneok, Inc.
560
26,544
Sprint Nextel Corp.
58,250
(1,106,750)
Total Utilities
5,316,319
Total Telecommunication Services
(1,788,354)
Total Common Stocks
UTILITIES (1.3)%
(Cost $187,868,771)
194,549,076
Hawaiian Electric Industries, Inc.
5,450
(118,320)
Duke Energy Corp.
7,670
(143,352)
EXCHANGE TRADED FUNDS 6.9%
Pepco Holdings, Inc.
5,970
(161,668)
iShares MSCI Emerging Markets
Dynegy, Inc. — Class A*
17,670
(163,271)
Index Fund†
100,690
15,048,121
Aqua America, Inc.
10,900
(247,212)
iShares S&P GSCI Commodity
DPL, Inc.
9,850
(258,661)
Indexed Trust*†
163,860
7,729,276
AES Corp.*
13,160
(263,726)
Total Exchange Traded Funds
Consolidated Edison, Inc.
6,160
(285,208)
Allegheny Energy, Inc.*
(Cost $19,702,989)
22,777,397
Equitable Resources, Inc.
6,730
(349,085)
8,630
(451,004)
Great Plains Energy, Inc.
16,110
(464,129)
Ameren Corp.
9,690
(508,725)
Exelon Corp.
9,650
(727,224)
Total Utilities
(4,141,585)
See Notes to Financial Statements.
THE RYDEX SERIES FUNDS SEMI-ANNUAL REPORT
|
25
SCHEDULE OF INVESTMENTS (Unaudited) (continued)
September 30, 2007
ABSOLUTE RETURN STRATEGIES FUND
VALUE
VALUE
MARKET
MARKET
SHARES
(NOTE 1)
SHARES
(NOTE 1)
MATERIALS (1.4)%
Amazon.Com, Inc.*
1,560
$
(145,314)
Louisiana-Pacific Corp.
4,630
$
(78,571)
Toll Brothers, Inc.*
7,690
(153,723)
Scotts Miracle-Gro Co. —
Centex Corp.
5,970
(158,623)
Class A
2,450
(104,737)
Career Education Corp.*
5,730
(160,383)
Florida Rock Industries, Inc.
1,710
(106,858)
Carmax, Inc.*
9,150
(186,020)
Olin Corp.
6,560
(146,813)
Washington Post Co. —
FMC Corp.
4,880
(253,858)
Class B
240
(192,672)
Newmont Mining Corp.
5,880
(263,012)
Strayer Education, Inc.
1,390
(234,396)
International Flavors &
Eastman Kodak Co.
9,380
(251,009)
Fragrances, Inc.
4,990
(263,771)
Wyndham Worldwide Corp.
7,740
(253,562)
Nucor Corp.
4,650
(276,536)
Urban Outfitters, Inc.*
12,440
(271,192)
Vulcan Materials Co.
3,910
(348,577)
Scientific Games Corp. —
Weyerhaeuser Co.
6,190
(447,537)
Class A*
7,410
(278,616)
Allegheny Technologies, Inc.
4,160
(457,392)
Pulte Homes, Inc.
21,070
(286,763)
Bowater, Inc.
36,770
(548,608)
Interpublic Group of Cos., Inc.*
28,990
(300,916)
Ecolab, Inc.
13,120
(619,264)
Wendy’s International, Inc.
9,170
(320,125)
Monsanto Co.
9,130
(782,806)
Coach, Inc.*
7,000
(330,890)
Total Materials
(4,698,340)
Best Buy Co., Inc.
7,300
(335,946)
CONSUMER STAPLES (3.4)%
Ford Motor Co.*
45,440
(385,786)
Tyson Foods, Inc. — Class A
7,160
(127,806)
CBS Corp.
14,690
(462,735)
Great Atlantic & Pacific Tea Co.*
5,690
(173,317)
H&R Block, Inc.
22,230
(470,831)
Whole Foods Market, Inc.
5,650
(276,624)
Apollo Group, Inc. — Class A*
8,140
(489,621)
Brown-Forman Corp.
4,210
(315,371)
Marriott International, Inc. —
Tootsie Roll Industries, Inc.
13,460
(357,094)
Class A
13,730
(596,843)
Archer-Daniels-Midland Co.
14,590
(482,637)
General Motors Corp.
19,470
(714,549)
Hansen Natural Corp.*
10,040
(569,067)
Sirius Satellite Radio, Inc.*
239,350
(835,332)
(934,554)
Sara Lee Corp.
64,650
(1,079,009)
International Game Technology
21,240
(915,444)
Clorox Co.
19,180
(1,169,788)
Starbucks Corp.*
35,670
WM Wrigley Jr Co.
24,520
(1,574,920)
Total Consumer Discretionary
(11,374,753)
Colgate-Palmolive Co.
32,610
(2,325,745)
INDUSTRIALS (4.1)%
Avon Products, Inc.
77,660
(2,914,580)
Federal Signal Corp.
5,030
(77,261)
Alaska Air Group, Inc.*
Total Consumer Staples
(11,365,958)
Airtran Holdings, Inc.*
9,490
(93,381)
CONSUMER DISCRETIONARY (3.4)%
4,300
(99,287)
Beazer Homes USA, Inc.
950
(7,837)
Mine Safety Appliances Co.
2,370
(111,651)
Dick’s Sporting Goods, Inc.*
600
(40,290)
HNI Corp.
3,660
(131,760)
Furniture Brands
Hubbell, Inc. — Class B
2,360
(134,803)
International, Inc.
4,430
(44,920)
ChoicePoint, Inc.*
3,930
(149,025)
ITT Educational Services, Inc.*
370
(45,025)
URS Corp.*
2,640
(149,028)
Ryland Group, Inc.
2,640
(56,575)
Graco, Inc.
4,010
(156,831)
ArvinMeritor, Inc.
3,990
(67,112)
Pall Corp.
5,070
(197,223)
Circuit City Stores, Inc.
9,010
(71,269)
Stericycle, Inc.*
4,120
(235,499)
Borders Group, Inc.
6,110
(81,446)
Cintas Corp.
6,560
(243,376)
Blyth, Inc.
4,110
(84,050)
Rollins, Inc.
9,830
(262,363)
Chico’s FAS, Inc.*
7,460
(104,813)
American Standard Cos., Inc.
8,670
(308,825)
Coldwater Creek, Inc.*
10,340
(112,292)
CH Robinson Worldwide, Inc.
5,920
(321,397)
AnnTaylor Stores Corp.*
3,620
(114,645)
Avis Budget Group, Inc.*
14,270
(326,640)
Valassis Communications, Inc.*
12,940
(115,425)
Brink’s Co.
6,080
(339,750)
Class A
Foot Locker, Inc.
7,550
(115,742)
MSC Industrial Direct Co. —
DeVry, Inc.
3,330
(123,243)
7,390
(373,860)
Hovnanian Enterprises, Inc. —
Fluor Corp.
2,970
(427,621)
Class A*
11,360
(125,982)
Monster Worldwide, Inc.*
12,760
(434,606)
RadioShack Corp.
6,140
(126,852)
Corporate Executive Board Co.
6,840
(507,802)
DR Horton, Inc.
9,980
(127,844)
Dun & Bradstreet Corp.
5,170
(509,814)
Saks, Inc.
8,370
(143,546)
Fastenal Co.
11,270
(511,771)
26
|
THE RYDEX SERIES FUNDS SEMI-ANNUAL REPORT
See Notes to Financial Statements.
SCHEDULE OF INVESTMENTS (Unaudited) (continued)
September 30, 2007
ABSOLUTE RETURN STRATEGIES FUND
MARKET
MARKET
SHARES
(NOTE 1)
SHARES
(NOTE 1)
VALUE
VALUE
Masco Corp.
24,210
$
(560,946)
National Instruments Corp.
10,980
$
(376,943)
Quanta Services, Inc.
23,010
(608,614)
Ciena Corp.*
10,610
(404,029)
Southwest Airlines Co.
42,220
(624,856)
Cybersource Corp.*
35,450
(414,411)
Rockwell Collins, Inc.
10,370
(757,425)
Akamai Technologies, Inc.*
16,160
(464,277)
United Parcel Service, Inc. —
Cypress Semiconductor Corp.*
16,620
(485,470)
Class B
11,890
(892,939)
Citrix Systems, Inc.*
12,050
(485,856)
Pitney Bowes, Inc.
20,810
(945,190)
Kla-Tencor Corp.
8,900
(496,442)
Expeditors International
Network Appliance, Inc.*
18,530
(498,642)
Washington, Inc.
20,100
(950,730)
Intuit, Inc.*
16,660
(504,798)
General Electric Co.
48,130
(1,992,582)
Activision, Inc.*
25,970
(560,692)
Total Industrials
(13,436,856)
JDS Uniphase Corp.*
46,560
(696,538)
HEALTH CARE (4.9)%
Cognizant Technology
Affymetrix, Inc.*
5,180
(131,417)
Solutions Corp. — Class A*
9,470
(755,422)
Ventana Medical Systems, Inc.*
1,540
(132,301)
Paychex, Inc.
19,580
(802,780)
Omnicare, Inc.
(921,096)
4,960
(164,325)
Apple, Inc.*
5,730
(879,784)
PDL BioPharma, Inc.*
7,810
Adobe Systems, Inc.*
(168,774)
Advanced Micro Devices, Inc.*
69,780
Medicis Pharmaceutical Corp. —
26,450
(1,154,807)
Class A
5,870
(179,094)
Google, Inc. — Class A*
2,650
(1,503,266)
Varian Medical Systems, Inc.*
4,570
(191,437)
Yahoo!, Inc.*
73,340
(1,968,446)
Hillenbrand Industries, Inc.
4,280
(235,486)
Intel Corp.
77,420
(2,002,081)
Genzyme Corp.*
5,530
(342,639)
Electronic Arts, Inc.*
40,590
(2,272,634)
Boston Scientific Corp.*
27,870
(388,786)
Total Information Technology
(20,453,639)
CR Bard, Inc.
4,540
(400,383)
ENERGY (6.3)%
Hologic, Inc.*
7,040
(429,440)
Encore Acquisition Co.*
6,480
(205,092)
Tenet Healthcare Corp.*
129,300
(434,448)
Plains Exploration &
ev3, Inc.*
31,360
(514,931)
Production Co.*
7,750
(342,705)
Stryker Corp.
7,940
(545,954)
Cal Dive International, Inc.*
22,990
(344,850)
Hospira, Inc.*
13,310
(551,699)
Arch Coal, Inc.
10,690
(360,681)
Inverness Medical
Markwest Energy Partners LP
12,790
(392,269)
Innovations, Inc.
11,547
(638,780)
Forest Oil Corp.*
9,930
(427,387)
Vertex Pharmaceuticals, Inc.*
16,910
(649,513)
BJ Services Co.
17,350
(460,642)
Intuitive Surgical, Inc.*
2,990
(687,700)
Nabors Industries Ltd.*
15,710
(483,397)
Amgen, Inc.*
12,320
(696,942)
FMC Technologies, Inc.*
8,660
(499,336)
Allergan, Inc.
14,670
(945,775)
Exterran Holdings, Inc.
7,290
(585,679)
Abbott Laboratories
21,350
(1,144,787)
Peabody Energy Corp.
12,330
(590,237)
Johnson & Johnson
17,590
(1,155,663)
Pioneer Natural Resources Co.
14,250
(640,965)
Celgene Corp.*
16,370
(1,167,345)
Transocean, Inc.*
5,780
(653,429)
Gilead Sciences, Inc.*
32,020
(1,308,657)
Quicksilver Resources, Inc.*
16,270
(765,503)
Merck & Co., Inc.
26,340
(1,361,515)
Sunoco, Inc.
10,860
(768,671)
Bristol-Myers Squibb Co.
55,190
(1,590,576)
Baker Hughes, Inc.
10,040
(907,315)
Total Health Care
(16,158,367)
Murphy Oil Corp.
14,440
(1,009,212)
INFORMATION TECHNOLOGY (6.2)%
Halliburton Co.
26,840
(1,030,656)
RF Micro Devices, Inc.*
7,750
(52,157)
Southwestern Energy Co.*
25,020
(1,047,087)
F5 Networks, Inc.*
4,380
(162,892)
Apache Corp.
16,790
(1,512,107)
MoneyGram International, Inc.
9,980
(225,448)
Smith International, Inc.
21,940
(1,566,516)
Kemet Corp.*
34,970
(257,030)
Tesoro Corp.
35,350
(1,626,807)
Tech Data Corp.*
6,450
(258,774)
Schlumberger Ltd.
44,310
(4,652,550)
Powerwave Technologies, Inc.*
43,120
(265,619)
Total Energy
(20,873,093)
Novell, Inc.*
36,720
(280,541)
FINANCIALS (6.7)%
Lexmark International, Inc. —
Janus Capital Group, Inc.
1,220
(34,501)
Class A*
7,220
(299,847)
SEI Investments Co.
1,310
(35,737)
Global Payments, Inc.
7,320
(323,690)
IndyMac Bancorp, Inc.
2,470
(58,317)
Parametric Technology Corp.*
18,850
(328,367)
Charles Schwab Corp.
3,870
(83,592)
Unisys Corp.*
53,000
(350,860)
Westamerica Bancorporation
3,130
(155,905)
See Notes to Financial Statements.
THE RYDEX SERIES FUNDS SEMI-ANNUAL REPORT
|
27
SCHEDULE OF INVESTMENTS (Unaudited) (continued)
September 30, 2007
ABSOLUTE RETURN STRATEGIES FUND
VALUE
VALUE
MARKET
MARKET
SHARES
(NOTE 1)
(NOTE 1)
First Niagara Financial
Total Common Stocks Sold Short
Group, Inc.
11,610
$
(164,281)
(Proceeds $120,769,361)
$ (126,467,026)
Waddell & Reed Financial, Inc. —
Total Short Sales (38.2)%
Class A
6,800
(183,804)
Astoria Financial Corp.
7,690
(204,016)
(Proceeds $120,769,361)
$ (126,467,026)
Other Assets in Excess
FirstMerit Corp.
10,690
(211,234)
of Liabilities – 27.0%
Cullen/Frost Bankers, Inc.
4,280
(214,514)
$
89,484,170
PNC Financial Services
Net Assets – 100.0%
$ 331,141,548
Group, Inc.
3,280
(223,368)
UNREALIZED
Equity One, Inc.
8,340
(226,848)
GAIN
Brown & Brown, Inc.
8,980
(236,174)
CONTRACTS
(NOTE 1)
Eaton Vance Corp.
6,110
(244,156)
People’s United Financial, Inc.
14,170
(244,858)
FOREIGN CURRENCY FUTURES
Huntington Bancshares, Inc.
15,820
(268,624)
CONTRACTS PURCHASED
First American Corp.
7,810
(286,002)
December 2007 New Zealand
First Horizon National Corp.
11,300
(301,258)
Dollar Futures Contracts
CB Richard Ellis Group, Inc. —
(Aggregate Market Value
Class A*
10,890
(303,178)
of Contracts $5,640,000)
75
$
385,295
Wachovia Corp.
6,630
(332,494)
December 2007 Australian
Keycorp
10,570
(341,728)
Dollar Futures Contracts
Arthur J Gallagher & Co.
11,810
(342,136)
(Aggregate Market Value
Zions Bancorporation
5,030
(345,410)
of Contracts $6,022,760)
68
371,426
Hudson City Bancorp, Inc.
Futures Contracts
24,210
(372,350)
December 2007 British Pound
UDR, Inc.
(Aggregate Market Value
16,640
(404,685)
New York Community
Bancorp, Inc.
21,470
(409,003)
of Contracts $5,870,463)
46
43,281
Progressive Corp.
21,720
(421,585)
(Total Aggregate Market Value
M&T Bank Corp.
4,120
(426,214)
of Contracts $17,533,223)
$
800,002
Countrywide Financial Corp.
23,200
(441,032)
T Rowe Price Group, Inc.
8,010
(446,077)
FUTURES CONTRACTS PURCHASED
Comerica, Inc.
8,800
(451,264)
December 2007 Nikkei 225
Webster Financial Corp.
10,780
(454,054)
Futures Contracts
Sovereign Bancorp, Inc.
29,270
(498,761)
(Aggregate Market Value
Regency Centers Corp.
7,200
(552,600)
of Contracts $16,745,000)
200
$
769,150
Regions Financial Corp.
19,430
(572,796)
December 2007 S&P 500 Index
CME Group, Inc.
987
(579,714)
Mini Futures Contracts
Developers Diversified
(Aggregate Market Value
Realty Corp.
10,930
(610,659)
of Contracts $28,380,713)
369
707,673
Franklin Resources, Inc.
4,900
(624,750)
December 2007 S&P MidCap 400
Fifth Third Bancorp
19,060
(645,753)
Index Mini Futures Contracts
National Penn Bancshares, Inc.
40,180
(657,345)
(Aggregate Market Value
AvalonBay Communities, Inc.
5,870
(693,012)
of Contracts $18,474,750)
207
408,549
Kimco Realty Corp.
17,180
(776,708)
December 2007 Russell 2000®
Moody’s Corp.
16,360
(824,544)
Index Futures Contracts
Macerich Co.
11,050
(967,759)
(Aggregate Market Value
Simon Property Group, Inc.
10,890
(1,089,000)
of Contracts $15,542,400)
192
325,254
SLM Corp.
24,210
(1,202,511)
December 2007 U.S. Dollar 10
Leucadia National Corp.
25,970
(1,252,273)
Year Note Futures Contracts
Washington Mutual, Inc.
49,830
(1,759,497)
(Aggregate Market Value
Total Financials
(22,176,081)
of Contracts $32,784,375)
300
86,268
(Total Aggregate Market Value
of Contracts $111,927,238)
$
2,296,894
28
|
THE RYDEX SERIES FUNDS SEMI-ANNUAL REPORT
See Notes to Financial Statements.
SCHEDULE OF INVESTMENTS (Unaudited) (concluded)
SCHEDULE OF INVESTMENTS (Unaudited) (concluded)
September 30, 2007
September 30, 2007
ABSOLUTE RETURN STRATEGIES FUND
GAIN (LOSS)
GAIN
UNREALIZED
UNREALIZED
CONTRACTS
(NOTE 1)
UNITS
(NOTE 1)
FOREIGN CURRENCY FUTURES
VARIANCE SWAP AGREEMENT 0.1%
CONTRACTS SOLD SHORT
S&P 500 Index Variance Swap,
December 2007 Japanese Yen
Terminating 12/21/07
Futures Contracts
(Notional Market Value
(Aggregate Market Value
$2,744,301)
967
$
185,380
of Contracts $6,149,500)
56
$
54,090
December 2007 Swiss Franc
Futures Contracts
(Aggregate Market Value
of Contracts $5,727,313)
53
(113,439)
December 2007 Swedish Krona
Futures Contracts
(Aggregate Market Value
of Contracts $5,881,640)
19
(224,908)
(Total Aggregate Market Value
of Contracts $17,758,453)
$
(284,257)
FUTURES CONTRACTS SOLD SHORT
December 2007 U.S. Dollar
Index Futures Contracts
(Aggregate Market Value
of Contracts $10,867,500)
140
$
235,353
NOTIONAL
PRINCIPAL
CREDIT DEFAULT SWAP AGREEMENTS
PROTECTION SOLD
Dow Jones CDX North American
Investment Grade Swap
Agreement, Series 8
Protection Premium Rate 0.35%
Terminating 06/20/12
$ 5,000,000
$
(52,496)
Dow Jones CDX North American
Investment Grade Swap
Agreement, Series 6
Protection Premium Rate 0.40%
Terminating 06/20/11
65,000,000
(207,665)
Dow Jones CDX North American
Investment Grade Swap
Agreement, Series 7
Protection Premium Rate 0.40%
Terminating 12/20/11
35,000,000
(288,653)
$
(548,814)
*
Non-Income Producing Security.
**
The issuer is a publicly traded company that operates under a Congressional charter; its securities are neither issued nor guaran-
teed by the U.S. Government.
†
All or a portion of this security is on loan at September 30, 2007—See Note 8.
††
All or a portion of this security is pledged as short security collateral at September 30, 2007.
ADR—American Depository Receipt.
See Notes to Financial Statements.
THE RYDEX SERIES FUNDS SEMI-ANNUAL REPORT
|
29
SCHEDULE OF INVESTMENTS (Unaudited)
September 30, 2007
COMMODITIES STRATEGY FUND
MARKET
VALUE
SHARES
(NOTE 1)
EXCHANGE TRADED FUNDS 14.9%
iShares S&P GSCI
Commodity Indexed Trust*†
281,380
$ 13,272,695
Total Exchange Traded Funds
(Cost $12,204,068)
13,272,695
AMOUNT
FACE
STRUCTURED NOTES†† 31.3%
Credit Suisse,
Goldman Sachs Commodity
Index Total Return Linked
Notes at 5.34%
due 09/30/08
$16,947,700
18,045,531
Swedish Export Credit Corp.,
Goldman Sachs Commodity
Index Total Return Linked
Notes at 5.21%
due 01/18/08
3,500,000
6,035,015
Swedish Export Credit Corp.,
Goldman Sachs Commodity
Index Total Return Linked
Notes at 5.21%
due 04/21/08
3,000,000
3,889,140
Total Structured Notes
(Cost $24,030,692)
27,969,686
REPURCHASE AGREEMENT 60.5%
Repurchase Agreement (Note 5)
Lehman Brothers Holdings, Inc.
issued 09/28/07 at 3.90%
due 10/01/07
54,102,393
54,102,393
Total Repurchase Agreement
(Cost $54,102,393)
54,102,393
SECURITIES LENDING COLLATERAL 3.9%
Investment in Securities Lending Short Term
Investment Portfolio Held by
U.S. Bank (Note 8)
3,484,194
3,484,194
Total Securities Lending Collateral
(Cost $3,484,194)
3,484,194
Total Investments 110.6%
(Cost $93,821,347)
$ 98,828,968
Liabilities in Excess of
Other Assets – (10.6)%
$ (9,472,622)
Net Assets – 100.0%
$ 89,356,346
*
Non-Income Producing Security.
†
All or a portion of this security is on loan at September 30, 2007—See Note 8.
††
Structured Notes are leveraged, providing an exposure to the underlying benchmark of three times the face amount. The total
exposure to the Goldman Sachs Commodity Index is $70,343,100 as of September 30, 2007—See Note 2.
30
|
THE RYDEX SERIES FUNDS SEMI-ANNUAL REPORT
See Notes to Financial Statements.
SCHEDULE OF INVESTMENTS (Unaudited)
September 30, 2007
HEDGED EQUITY FUND
VALUE
VALUE
MARKET
MARKET
SHARES
(NOTE 1)
SHARES
(NOTE 1)
COMMON STOCKS 52.2%
Commerce Group, Inc.
1,330
$
39,195
Apartment Investment &
FINANCIALS 9.4%
Management Co. — Class A†
710
32,042
Goldman Sachs Group, Inc.†
1,630
$
353,286
Cincinnati Financial Corp.
670
29,018
Travelers Cos, Inc.
4,980
250,693
W.R. Berkley Corp.
890
26,371
HSBC Holdings PLC — SP ADR†
2,700
250,020
Radian Group, Inc.†
1,010
23,513
JPMorgan Chase & Co.
3,980
182,364
Potlatch Corp.
440
19,813
Allstate Corp.
3,100
177,289
Cousins Properties, Inc.†
670
19,671
Hartford Financial Services
XL Capital Ltd.†
230
18,216
Group, Inc.†
1,850
171,217
Everest Re Group Ltd.
120
13,229
Chubb Corp.†D
2,670
143,219
Leucadia National Corp.
1
48
ACE Ltd.
2,350
142,339
UBS AG— SP ADR†
2,470
131,527
Total Financials
4,750,512
Banco Santander Central
INFORMATION TECHNOLOGY 6.6%
Hewlett-Packard Co.
11,350
565,116
Hispano SA — SP ADR†
6,680
128,991
Morgan Stanley†
Nokia Oyj — SP ADR
4,930
186,995
2,020
127,260
EMC Corp*
8,530
177,424
Fannie Mae
2,080
126,485
Allianz AG — SP ADR
4,990
116,117
Electronic Data Systems Corp.
7,320
159,869
Tyco Electronics Ltd.
3,450
122,233
Genworth Financial, Inc. —
Juniper Networks, Inc.*†
3,310
121,179
Class A
3,710
114,008
Banco Bilbao Vizcaya Argentaria
Xerox Corp.*
6,820
118,259
SA — SP ADR†
4,710
109,649
Sun Microsystems, Inc.*
18,720
105,019
Applied Materials, Inc.
4,700
97,290
ING Groep NV — SP ADR
2,380
105,458
Novellus Systems, Inc.*†
3,230
88,050
Barclays PLC — SP ADR†
2,120
103,074
Lloyds TSB Group PLC —
Computer Sciences Corp.*
1,550
86,645
SP ADR†
2,300
102,258
Telefonaktiebolaget LM
CIT Group, Inc.
2,430
97,686
Ericsson — SP ADR†
1,980
78,804
Vishay Intertechnology, Inc.*
5,910
77,007
ABN AMRO Holding NV—
Teradyne, Inc.*†
5,090
70,242
SP ADR
1,840
96,600
Avaya, Inc.*
AXA — SP ADR†
2,110
94,127
4,080
69,197
Loews Corp.
1,890
91,381
Micron Technology, Inc.*†
5,630
62,493
Deutsche Bank AG — SP ADR†
710
91,157
Affiliated Computer Services,
Inc. — Class A*
1,240
62,298
Ambac Financial Group, Inc.†
1,360
85,558
A.G. Edwards, Inc.†
970
RF Micro Devices, Inc.*
8,761
58,962
81,238
Federated Investors, Inc. —
LSI Logic Corp.*
7,400
54,908
Class B†
1,880
74,636
Avnet, Inc.*
1,350
53,811
Ameriprise Financial, Inc.†
1,150
72,577
SAP AG — SP ADR†
860
50,456
Ceridian Corp.*†
1,440
50,026
Credit Suisse Group — SP ADR†
1,050
69,647
Broadridge Financial Solutions,
AmeriCredit Corp.*†
3,910
68,738
PNC Financial Services Group,
Inc.†
2,390
45,290
Alliance Data Systems Corp.*†
580
44,915
Inc.
980
66,738
International Business Machines
ProLogis
1,000
66,350
Old Republic International Corp.
3,350
62,779
Corp.
380
44,764
Convergys Corp.*
2,520
43,747
Fidelity National Financial,
Motorola, Inc.
Inc. — Class A†
3,420
59,782
2,340
43,360
PMI Group, Inc.
1,810
59,187
CommScope, Inc.*
800
40,192
Cisco Systems, Inc.*
1,190
39,401
American Financial Group, Inc.
2,000
57,040
Capital One Financial Corp.
Palm, Inc.*†
2,340
38,072
850
56,466
Intersil Corp. — Class A
Protective Life Corp.
1,280
54,323
1,070
35,770
ValueClick, Inc.*†
1,560
35,038
Marsh & McLennan Cos., Inc.
2,090
53,295
Polycom, Inc.*†
1,180
31,695
Host Hotels & Resorts, Inc.
2,280
51,163
MGIC Investment Corp.†
1,580
51,050
Dycom Industries, Inc.*
960
29,405
MPS Group, Inc.*†
2,440
27,206
UnumProvident Corp.†
2,030
49,674
Dell, Inc.*
980
27,048
Horace Mann Educators Corp.
2,210
43,559
National City Corp.†
1,570
Nvidia Corp.*
735
26,636
39,391
Plantronics, Inc.†
910
25,980
See Notes to Financial Statements.
THE RYDEX SERIES FUNDS SEMI-ANNUAL REPORT
|
31
SCHEDULE OF INVESTMENTS (Unaudited) (continued)
September 30, 2007
HEDGED EQUITY FUND
MARKET
MARKET
SHARES
(NOTE 1)
SHARES
(NOTE 1)
VALUE
VALUE
Qualcomm, Inc.
570
$
24,088
Waste Management, Inc.
3,620
$
136,619
Research In Motion Ltd.*
240
23,652
Terex Corp.*
1,390
123,738
Mentor Graphics Corp.*†
1,450
21,895
Eaton Corp.
1,240
122,809
Macrovision Corp.*†
870
21,428
Caterpillar, Inc.
1,490
116,861
MEMC Electronic Materials, Inc.*
360
21,190
Siemens AG — SP ADR
810
111,172
Advent Software, Inc.*†
450
21,136
FedEx Corp.
740
77,515
Corning, Inc.
700
17,255
Cummins, Inc.
580
74,176
Seagate Technology
520
13,302
Tyco International Ltd.†D
1,560
69,170
Alcatel-Lucent
1,220
12,420
Foster Wheeler Ltd.*
510
66,953
SanDisk Corp.*
220
12,122
Timken Co.
1,600
59,440
NCR Corp.*
200
9,960
KBR Inc.*
1,510
58,543
Western Digital Corp.*
350
8,862
ITT Industries, Inc.
860
58,420
Logitech International SA*†
290
8,570
Granite Construction, Inc.
1,010
53,550
Gartner, Inc. — Class A*
340
8,316
Kirby Corp.*†
1,190
52,526
Harris Corp.
130
7,513
Diana Shipping, Inc.
1,810
51,585
Nortel Networks Corp.*†
410
6,962
DRS Technologies, Inc.†
910
50,159
Brocade Communications
Shaw Group, Inc.*
860
49,966
Systems, Inc.*
810
6,934
United Rentals, Inc.*
1,550
49,863
Diebold, Inc.†
120
5,450
Ryder System, Inc.†
1,000
49,000
Tellabs, Inc.*
570
5,426
ABB Ltd. — SP ADR
1,800
47,214
Imation Corp.
120
2,944
SPX Corp.
500
46,280
Total Information Technology
3,354,227
GATX Corp.†
1,030
44,032
ENERGY 6.4%
AGCO Corp.*
840
42,647
ConocoPhillipsD
4,740
416,030
Joy Global, Inc.
820
41,705
National-Oilwell Varco, Inc.*
2,560
369,920
Seaspan Corp.†
1,230
40,467
Marathon Oil Corp.
4,030
229,791
Emerson Electric Co.
760
40,447
BP PLC — SP ADR
3,250
225,387
DryShips, Inc.†
440
39,974
Total SA — SP ADR
2,750
222,832
Chicago Bridge & Iron, Co. NV
910
39,185
Valero Energy Corp.
3,180
213,632
Flowserve Corp.
500
38,090
Anadarko Petroleum Corp.
3,280
176,300
Kelly Services, Inc.
1,900
37,639
Hess Corp.
2,510
166,990
URS Corp.*
600
33,870
Royal Dutch Shell PLC —
Horizon Lines, Inc. — Class A†
1,070
32,667
SP ADR†
Inc.*
1,800
147,924
Washington Group International,
Chesapeake Energy Corp.†
3,880
136,809
360
31,612
Cameron International Corp.*
1,290
119,054
Werner Enterprises, Inc.
1,780
30,527
Noble Corp.
2,220
108,891
Deere & Co.†
190
28,200
ENI-Ente Nazionale
Deluxe Corp.†
750
27,630
Idrocarburi — SP ADR†
1,460
107,690
Alexander & Baldwin, Inc.†
510
25,566
El Paso Corp.
6,050
102,669
Quanta Services, Inc.*†
966
25,551
ENSCO International, Inc.†
1,560
87,516
EMCOR Group, Inc.*
800
25,088
Newfield Exploration Co.*
1,770
85,243
Sequa Corp. — Class A*
150
24,867
Grant Prideco, Inc.*
1,460
79,599
Con-way, Inc.
530
24,380
Tidewater, Inc.†
1,030
64,725
Perini Corp.*
420
23,491
Pogo Producing Co.
1,140
60,545
Genco Shipping & Trading Ltd.†
350
22,935
Cimarex Energy Co.†
Inc.*†
1,610
59,973
Jacobs Engineering Group,
Superior Energy Services*
1,390
49,262
300
22,674
Patterson-UTI Energy, Inc.†
360
8,125
Herman Miller, Inc.
820
22,255
Total Energy
3,238,907
Ryanair Holdings PLC — SP
INDUSTRIALS 6.3%
ADR*†
480
19,925
Rockwell Automation, Inc.
280
19,463
CSX Corp.†
4,800
205,104
Precision Castparts Corp.
120
17,758
Paccar, Inc.
1,940
165,385
Cooper Industries Ltd. —
Burlington Northern Santa Fe
Class A†
340
17,371
Corp.†
1,970
159,905
YRC Worldwide, Inc.*†
610
16,665
Norfolk Southern Corp.D
2,680
139,119
First Solar, Inc.*†
140
16,484
32
|
THE RYDEX SERIES FUNDS SEMI-ANNUAL REPORT
See Notes to Financial Statements.
SCHEDULE OF INVESTMENTS (Unaudited) (continued)
September 30, 2007
HEDGED EQUITY FUND
MARKET
MARKET
SHARES
(NOTE 1)
SHARES
(NOTE 1)
VALUE
VALUE
Roper Industries, Inc.†
230
$
15,065
Applera Corp. — Applied
Eagle Bulk Shipping, Inc.†
580
14,929
Biosystems Group
490
$
16,974
Suntech Power Holdings Co.
Covance, Inc.*†
190
14,801
Ltd. — SP ADR*†
370
14,763
Millipore Corp.*†
180
13,644
AMETEK, Inc.
300
12,966
Pharmaceutical Product
Quintana Maritime Ltd.†
590
11,251
Development, Inc.†
370
13,113
Thomas & Betts Corp.*†
180
10,555
Invitrogen Corp.*†
160
13,077
Insituform Technologies, Inc. —
Health Management Associates,
Class A*†
680
10,356
Inc. — Class A
1,880
13,047
General Cable Corp.*†
150
10,068
Charles River Laboratories
Acuity Brands, Inc.†
150
7,572
International, Inc.*†
230
12,914
Belden, Inc.
160
7,506
Par Pharmaceutical Cos., Inc.*
680
12,621
Baldor Electric Co.†
180
7,191
PerkinElmer, Inc.
420
12,268
Genlyte Group, Inc.*
110
7,069
Illumina, Inc.*
220
11,414
JetBlue Airways Corp.*†
70
645
Techne Corp.*
160
10,093
Total Industrials
3,198,173
Bio-Rad Laboratories, Inc. —
HEALTH CARE 6.0%
Class A*
100
9,050
Pfizer, Inc.
12,220
298,535
Varian, Inc.*
140
8,905
Schering-Plough Corp.†
7,130
225,522
Sepracor, Inc.*
190
5,225
Baxter International, Inc.
3,590
202,045
Advanced Medical Optics, Inc.*
140
4,283
International*
UnitedHealth Group, Inc.
3,660
177,254
Valeant Pharmaceuticals
Novartis AG — SP ADR
3,150
173,124
230
3,560
GlaxoSmithKline PLC — SP
Kindred Healthcare, Inc.*
150
2,686
ADR†
3,210
170,772
Total Health Care
3,040,677
WellPoint, Inc.*
1,920
151,526
CONSUMER DISCRETIONARY 5.9%
Aetna, Inc.
2,350
127,534
Expedia, Inc.*
10,090
321,669
Eli Lilly & Co.
2,220
126,385
Time Warner, Inc.
12,300
225,828
Thermo Fisher Scientific, Inc.*
2,090
120,635
Buffalo Wild Wings, Inc.*
5,758
217,192
AstraZeneca PLC — SP ADR
1,950
97,636
Home Depot, Inc.†
4,540
147,278
McKesson Corp.D
1,640
96,416
Carnival Corp.
2,430
117,685
Coventry Health Care, Inc.*
1,240
77,140
DaimlerChrysler AG— SP ADR†
1,070
107,214
WellCare Health Plans, Inc.*
690
72,747
McDonald’s Corp.
1,710
93,144
CIGNA Corp.
1,320
70,343
Johnson Controls, Inc.
770
90,945
Waters Corp.*
890
59,559
Walt Disney Co.†
2,220
76,346
Humana, Inc.*
820
57,302
Comcast Corp. — Class A*†
3,100
74,958
Apria Healthcare Group, Inc.*
1,620
42,136
DIRECTV Group, Inc.*
2,110
51,231
DENTSPLY International, Inc.
990
41,224
Whirlpool Corp.
560
49,896
Sanofi-Aventis — SP ADR
970
41,147
Koninklijke Philips Electronics
Cytyc Corp.*
860
40,979
NV — SP ADR
1,100
49,434
Lincare Holdings, Inc.*
1,090
39,948
Lowe’s Cos., Inc.
1,720
48,194
Community Health Systems,
Hilton Hotels Corp.†
1,010
46,955
Inc.*†
1,270
39,929
Mohawk Industries, Inc.*†
520
42,276
Health Net, Inc.*
710
38,375
Big Lots, Inc.*†
1,360
40,582
Cephalon, Inc.*†
510
37,261
Kohl’s Corp.*
680
38,984
King Pharmaceuticals, Inc.*†
3,080
36,098
GameStop Corp. — Class A*
690
38,881
Cerner Corp.*†
590
35,288
Office Depot, Inc.*
1,880
38,766
Quest Diagnostics, Inc.†
590
34,084
Luxottica Group — SP ADR
1,120
37,968
Alcon, Inc. — SP ADR†
230
33,102
Sotheby’s Holdings, Inc. —
LifePoint Hospitals, Inc.*†
1,030
30,910
Class A†
780
37,276
Teva Pharmaceutical Industries
Harrah’s Entertainment, Inc.
410
35,641
Ltd. — SP ADR†
580
25,793
Liberty Media Corp —
Mylan Laboratories, Inc.
1,390
22,184
Interactive*
1,800
34,578
Perrigo Co.†
940
20,069
Polo Ralph Lauren Corp.
430
33,433
AutoZone, Inc.*†
280
32,519
See Notes to Financial Statements.
THE RYDEX SERIES FUNDS SEMI-ANNUAL REPORT
|
33
SCHEDULE OF INVESTMENTS (Unaudited) (continued)
September 30, 2007
HEDGED EQUITY FUND
MARKET
MARKET
SHARES
(NOTE 1)
SHARES
(NOTE 1)
VALUE
VALUE
Regis Corp.
980
$
31,272
CONSUMER STAPLES 3.8%
Hanesbrands, Inc.*
1,110
31,147
Safeway, Inc.
10,030
$
332,093
Magna International, Inc. —
Wal-Mart Stores, Inc.
7,360
321,264
Class A
320
30,819
Reynolds American, Inc.†
3,010
191,406
NVR, Inc.*†
60
28,215
SUPERVALU, Inc.
4,570
178,276
IAC/InterActiveCorp*†
940
27,890
Molson Coors Brewing Co. —
Mattel, Inc.
1,150
26,979
Class B
1,470
146,515
Priceline.com, Inc.*†
300
26,625
NBTY, Inc.*
2,840
115,304
Dillard’s, Inc. — Class A†
1,200
26,196
Energizer Holdings, Inc.*
930
103,090
Brunswick Corp.†
1,100
25,146
Diageo PLC — SP ADR
1,170
102,644
Belo Corp. — Class A
1,420
24,651
Unilever NV — SP ADR
3,090
95,326
American Eagle Outfitters, Inc.†
900
23,679
Altria Group, Inc.
1,290
89,694
Hasbro, Inc.†
830
23,140
Pepsi Bottling Group, Inc.†
1,900
70,623
Dollar Tree Stores, Inc.*†
570
23,108
Dean Foods Co.
1,620
41,440
Scholastic Corp.*
650
22,659
Cadbury Schweppes PLC —
Gannett Co., Inc.
510
22,287
SP ADR
840
39,077
BorgWarner, Inc.†
240
21,967
Walgreen Co.
690
32,596
WPP Group PLC — SP ADR
300
20,250
Universal Corp.†
520
25,454
Rent-A-Center, Inc.*†
1,100
19,943
Hershey Co.†
320
14,851
Phillips-Van Heusen Corp.†
380
19,942
Alberto-Culver Co.†
490
12,147
Autoliv, Inc.
330
19,718
Total Consumer Staples
1,911,800
Tribune Co.
710
19,397
TELECOMMUNICATION SERVICES 3.7%
Charming Shoppes, Inc.*
2,180
18,312
Gentex Corp.†
810
17,366
AT&T, Inc.
11,050
467,526
Warnaco Group, Inc.*
440
17,191
Verizon Communications, Inc.D
7,410
328,115
Vodafone Group PLC — SP
Ross Stores, Inc.†
660
16,922
TRW Automotive Holdings
ADR†
6,960
252,648
Telefonica SA — SP ADR
1,990
Corp.*
500
15,840
166,722
BT Group PLC — SP ADR
1,540
96,758
Macy’s, Inc.D
470
15,190
Deutsche Telekom AG — SP
Brinker International, Inc.
550
15,092
LKQ Corp.*†
430
14,968
ADR†
4,230
83,035
Tupperware Brands Corp.
470
14,800
China Mobile Ltd. — SP ADR†
900
73,836
GSI Commerce, Inc.*†
520
13,832
Telephone & Data Systems, Inc.
1,030
68,753
CenturyTel, Inc.
1,410
65,170
Netflix, Inc.*†
640
13,261
Cooper Tire & Rubber Co.
540
13,176
France Telecom SA — SP ADR
1,690
56,514
Telecom Italia — SP ADR†
1,460
44,194
Goodyear Tire & Rubber Co.*
420
12,772
America Movil SAB de CV —
NutriSystem, Inc.*†
270
12,660
Tenneco, Inc.*
380
11,784
SP ADR
580
37,120
Vimpel-Communications —
Lennar Corp. — Class A†
510
11,552
SP ADR
750
20,280
Systemax, Inc.†
530
10,833
Mobile Telesystems — SP ADR
280
19,407
Aeropostale, Inc.*†
555
10,578
Blue Nile, Inc.*†
Rogers Communications,
110
10,353
American Axle & Manufacturing
Inc. — Class B
410
18,667
Turkcell Iletisim Hizmet AS,
Holdings, Inc.†
400
10,100
Inc. — SP ADR†
680
14,470
KB HOME†
360
9,022
SK Telecom Co. Ltd. — SP
Gmarket, Inc.*
310
7,270
Lear Corp.*†
210
6,741
ADR†
440
13,068
Lee Enterprises, Inc.
380
5,917
American Tower Corp. —
Class A*
300
13,062
Media General, Inc.
210
5,777
NII Holdings, Inc. — Class B*
140
11,501
Visteon Corp.*
1,050
5,408
M.D.C. Holdings, Inc.
Philippine Long Distance
120
4,913
Telephone Co. — SP ADR†
170
10,938
Amazon.com, Inc.*†
30
2,795
U.S. Cellular Corp.*†
110
10,802
Delphi Corp.*
4,130
1,879
Crown Castle International
Total Consumer Discretionary
2,970,207
Corp.*
210
8,532
34
|
THE RYDEX SERIES FUNDS SEMI-ANNUAL REPORT
See Notes to Financial Statements.
SCHEDULE OF INVESTMENTS (Unaudited) (continued)
September 30, 2007
HEDGED EQUITY FUND
VALUE
VALUE
MARKET
MARKET
SHARES
(NOTE 1)
SHARES
(NOTE 1)
Sprint Nextel Corp.†
3
$
57
TXU Corp.
690
$
47,244
Total Telecommunication Services
1,881,175
SCANA Corp.†
1,040
40,290
MATERIALS 2.9%
Entergy Corp.
370
40,067
Dow Chemical Co.
3,220
138,653
Pinnacle West Capital Corp.
930
36,744
BHP Billiton Ltd. — SP ADR†
1,580
124,188
Westar Energy, Inc.
1,110
27,262
United States Steel Corp.†
1,120
118,653
Northeast Utilities†
910
25,999
Anglo American PLC — SP
CMS Energy Corp.
1,480
24,894
ADR†
3,530
118,078
TECO Energy, Inc.†
970
15,937
Rio Tinto PLC — SP ADR†
330
113,322
AGL Resources, Inc.
370
14,659
E.I. du Pont de Nemours and
NiSource, Inc.†
700
13,398
Co.
1,640
81,278
Black Hills Corp.†
230
9,435
Alcoa, Inc.
1,810
70,807
IDACORP, Inc.
200
6,548
Temple-Inland, Inc.†
1,140
59,998
Oneok, Inc.
90
4,266
Steel Dynamics, Inc.†
980
45,766
Total Utilities
592,021
Albemarle Corp.
980
43,316
Total Common Stocks
Companhia Vale do Rio
(Cost $25,047,101)
26,386,677
Doce — SP ADR
1,060
35,966
ArcelorMittal†
410
32,128
EXCHANGE TRADED FUNDS 6.8%
Bemis Co.
1,020
29,692
iShares MSCI Emerging Markets
Valspar Corp.
1,030
28,026
Index Fund†
23,171
3,462,906
POSCO — SP ADR†
150
26,816
Total Exchange Traded Funds
Martin Marietta Materials, Inc.†
190
25,375
Potash Corporation of
(Cost $2,953,141)
3,462,906
Saskatchewan†
230
24,311
Reliance Steel & Aluminum Co.
420
23,747
FACE
Lubrizol Corp.
360
23,422
AMOUNT
Southern Copper Corp.†
170
21,051
Alcan, Inc.
210
21,017
REPURCHASE AGREEMENTS 43.1%
Praxair, Inc.
240
Repurchase Agreement (Note 5)
20,102
Credit Suisse Group
The Mosaic Co.*
350
18,732
issued 09/28/07 at 3.95%
Air Products & Chemicals, Inc.
190
18,574
Barrick Gold Corp.
450
18,126
due 10/01/07D
$12,406,077
12,406,077
Carpenter Technology Corp.
130
16,901
Mizuho Financial Group, Inc.
Pactiv Corp.*
580
16,623
issued 09/28/07 at 3.96%
Ashland, Inc.
240
14,450
due 10/01/07
5,621,223
5,621,223
Lehman Brothers Holdings, Inc.
Teck Cominco Ltd. — Class B†
290
13,836
Goldcorp, Inc.†
430
13,141
issued 09/28/07 at 3.90%
due 10/01/07
3,141,009
3,141,009
PPG Industries, Inc.†
170
12,844
Rohm & Haas Co.†
220
12,247
Morgan Stanley
Eastman Chemical Co.†
180
12,011
issued 09/28/07 at 3.80%
Agrium, Inc.
210
11,420
due 10/01/07
661,321
661,321
Worthington Industries, Inc.†
420
9,895
Total Repurchase Agreements
Huntsman Corp.
350
9,272
(Cost $21,829,630)
21,829,630
SECURITIES LENDING COLLATERAL 16.6%
Sigma-Aldrich Corp.
190
9,261
Ferro Corp.
430
8,591
Freeport-McMoRan Copper &
Investment in Securities Lending Short Term
Gold, Inc. — Class B
70
7,342
Investment Portfolio Held by
Total Materials
1,448,978
U.S. Bank (Note 8)
8,396,422
8,396,422
UTILITIES 1.2%
Total Securities Lending Collateral
(Cost $8,396,422)
8,396,422
PG&E Corp.
1,610
76,958
Xcel Energy, Inc.†
2,660
57,296
Total Long Securities 118.7%
Sierra Pacific Resources
3,350
52,695
(Cost $58,226,294)
$ 60,075,635
Constellation Energy Group, Inc.
580
49,758
CenterPoint Energy, Inc.†
3,030
48,571
See Notes to Financial Statements.
THE RYDEX SERIES FUNDS SEMI-ANNUAL REPORT
|
35
SCHEDULE OF INVESTMENTS (Unaudited) (continued)
September 30, 2007
HEDGED EQUITY FUND
MARKET
MARKET
SHARES
(NOTE 1)
SHARES
(NOTE 1)
VALUE
VALUE
COMMON STOCKS SOLD SHORT (37.6)%
AnnTaylor Stores Corp.*
580
$
(18,369)
Valassis Communications, Inc.*
2,060
(18,375)
TELECOMMUNICATION SERVICES (0.6)%
Foot Locker, Inc.
1,210
(18,549)
Alltel Corp.
1,550
$
(108,004)
DeVry, Inc.
530
(19,615)
Sprint Nextel Corp.
8,941
(169,879)
Hovnanian Enterprises, Inc. —
Total Telecommunication Services
(277,883)
Class A*
1,810
(20,073)
UTILITIES (1.2)%
RadioShack Corp.
980
(20,247)
Great Plains Energy, Inc.
580
(16,710)
DR Horton, Inc.
1,590
(20,368)
Hawaiian Electric Industries, Inc.
870
(18,888)
Saks, Inc.
1,340
(22,981)
Duke Energy Corp.
1,220
(22,802)
Toll Brothers, Inc.*
1,230
(24,588)
Pepco Holdings, Inc.
950
(25,726)
Centex Corp.
950
(25,242)
Dynegy, Inc. — Class A*
2,820
(26,057)
Career Education Corp.*
910
(25,471)
Aqua America, Inc.
1,740
(39,463)
Dow Jones & Co., Inc.
440
(26,268)
DPL, Inc.
1,570
(41,228)
Catalina Marketing Corp.*
890
(28,827)
AES Corp.*
2,100
(42,084)
Carmax, Inc.*
1,460
(29,682)
Consolidated Edison, Inc.
980
(45,374)
Washington Post Co. — Class B
40
(32,112)
Equitable Resources, Inc.
1,070
(55,501)
Strayer Education, Inc.
220
(37,099)
Allegheny Energy, Inc.*
Wyndham Worldwide Corp.
1,380
(72,119)
Eastman Kodak Co.
1,500
(40,140)
Ameren Corp.
1,550
(81,375)
1,230
(40,295)
Exelon Corp.
1,540
(116,054)
Urban Outfitters, Inc.*
1,990
(43,382)
Total Utilities
Scientific Games Corp. —
(603,381)
Class A*
1,180
(44,368)
MATERIALS (1.3)%
Pulte Homes, Inc.
3,360
(45,730)
Lyondell Chemical Co.
150
(6,952)
Interpublic Group of Cos., Inc.*
4,620
(47,956)
Bowater, Inc.
690
(10,295)
Harman International Industries,
Louisiana-Pacific Corp.
740
(12,558)
Inc.
560
(48,451)
Scotts Miracle-Gro Co. —
Wendy’s International, Inc.
1,460
(50,969)
Class A
390
(16,673)
Coach, Inc.*
1,120
(52,942)
Florida Rock Industries, Inc.
270
(16,872)
Best Buy Co., Inc.
1,160
(53,383)
Olin Corp.
1,050
(23,499)
Ford Motor Co.*
7,249
(61,544)
Newmont Mining Corp.
860
(38,468)
CBS Corp.
2,340
(73,710)
FMC Corp.
780
(40,576)
H&R Block, Inc.
3,550
(75,189)
Nucor Corp.
690
(41,034)
Apollo Group, Inc. — Class A*
1,300
(78,195)
International Flavors &
Marriott International, Inc. —
Fragrances, Inc.
800
(42,288)
Class A
2,190
(95,199)
Vulcan Materials Co.
620
(55,273)
General Motors Corp.
3,110
(114,137)
Weyerhaeuser Co.
990
(71,577)
International Game Technology
3,390
(146,109)
Allegheny Technologies, Inc.
660
(72,567)
Starbucks Corp.*
5,690
(149,078)
Ecolab, Inc.
2,010
(94,872)
Total Consumer Discretionary
(1,760,554)
CONSUMER STAPLES (3.5)%
Monsanto Co.
1,350
(115,749)
Total Materials
(659,253)
CONSUMER DISCRETIONARY (3.5)%
Tyson Foods, Inc. — Class A
1,140
(20,349)
Whole Foods Market, Inc.
900
(44,064)
Beazer Homes USA, Inc.
150
(1,237)
Brown-Forman Corp.
670
(50,190)
Dick’s Sporting Goods, Inc.*
100
(6,715)
Tootsie Roll Industries, Inc.
2,150
(57,040)
Furniture Brands International,
Archer-Daniels-Midland Co.
2,330
(77,076)
Inc.
710
(7,199)
Hansen Natural Corp.*
1,600
(90,688)
ITT Educational Services, Inc.*
60
(7,301)
Sara Lee Corp.
10,308
(172,041)
ArvinMeritor, Inc.
480
(8,074)
Clorox Co.
3,060
(186,629)
Ryland Group, Inc.
420
(9,001)
WM Wrigley Jr Co.
3,910
(251,139)
Circuit City Stores, Inc.
1,440
(11,390)
Colgate-Palmolive Co.
5,200
(370,864)
Borders Group, Inc.
980
(13,063)
Avon Products, Inc.
12,389
(464,959)
Blyth, Inc.
650
(13,292)
Chico’s FAS, Inc.*
1,190
(16,720)
Total Consumer Staples
(1,785,039)
Coldwater Creek, Inc.*
1,650
(17,919)
36
|
THE RYDEX SERIES FUNDS SEMI-ANNUAL REPORT
See Notes to Financial Statements.
SCHEDULE OF INVESTMENTS (Unaudited) (continued)
September 30, 2007
HEDGED EQUITY FUND
VALUE
VALUE
MARKET
MARKET
SHARES
(NOTE 1)
SHARES
(NOTE 1)
INDUSTRIALS (3.9)%
Abbott Laboratories
3,409
$
(182,791)
Federal Signal Corp.
800
$
(12,288)
Johnson & Johnson
2,810
(184,617)
Airtran Holdings, Inc.*
1,510
(14,858)
Celgene Corp.*
2,610
(186,119)
Alaska Air Group, Inc.*
690
(15,932)
Gilead Sciences, Inc.*
5,110
(208,846)
Mine Safety Appliances Co.
380
(17,902)
Merck & Co., Inc.
4,199
(217,046)
Hubbell, Inc. — Class B
320
(18,278)
Bristol-Myers Squibb Co.
8,800
(253,616)
HNI Corp.
580
(20,880)
Total Health Care
(2,381,375)
ChoicePoint, Inc.*
630
(23,890)
ENERGY (5.9)%
Graco, Inc.
640
(25,030)
Encore Acquisition Co.*
1,030
(32,599)
Pall Corp.
810
(31,509)
Arch Coal, Inc.
1,710
(57,695)
Stericycle, Inc.*
660
(37,726)
Cintas Corp.
1,050
(38,955)
Forest Oil Corp.*
1,580
(68,003)
Rollins, Inc.
1,570
(41,903)
BJ Services Co.
2,770
(73,543)
Fluor Corp.
310
(44,634)
Nabors Industries Ltd.*
2,510
(77,233)
American Standard Cos., Inc.
FMC Technologies, Inc.*
1,380
(79,571)
1,380
(49,156)
Peabody Energy Corp.
1,970
(94,304)
CH Robinson Worldwide, Inc.
950
(51,576)
Pioneer Natural Resources Co.
2,270
(102,105)
Avis Budget Group, Inc.*
2,280
(52,189)
Quicksilver Resources, Inc.*
Brink’s Co.
970
(54,204)
2,600
(122,330)
Sunoco, Inc.
1,730
(122,449)
MSC Industrial Direct Co. —
Class A
1,180
Baker Hughes, Inc.
1,600
(144,592)
(59,696)
Murphy Oil Corp.
2,300
(160,747)
Monster Worldwide, Inc.*
2,040
(69,482)
Halliburton Co.
4,280
(164,352)
Dun & Bradstreet Corp.
820
(80,860)
Corporate Executive Board Co.
1,090
(80,922)
Southwestern Energy Co.*
3,990
(166,982)
Fastenal Co.
1,800
(81,738)
Apache Corp.
2,679
(241,271)
Masco Corp.
3,860
(89,436)
Smith International, Inc.
3,500
(249,900)
Southwest Airlines Co.
6,739
(99,737)
Tesoro Corp.
5,640
(259,553)
Rockwell Collins, Inc.
1,650
(120,516)
Schlumberger Ltd.
7,070
(742,350)
United Parcel Service, Inc. —
Total Energy
(2,959,579)
Class B
1,900
(142,690)
INFORMATION TECHNOLOGY (6.3)%
Pitney Bowes, Inc.
3,320
(150,794)
RF Micro Devices, Inc.*
1
(7)
Expeditors International
F5 Networks, Inc.*
700
(26,033)
Washington, Inc.
3,210
(151,833)
MoneyGram International, Inc.
1,590
(35,918)
General Electric Co.
7,679
(317,911)
Kemet Corp.*
5,579
(41,006)
Total Industrials
(1,996,525)
Tech Data Corp.*
1,030
(41,324)
Powerwave Technologies, Inc.*
6,879
(42,375)
HEALTH CARE (4.7)%
Ventana Medical Systems, Inc.*
Checkfree Corp.*
960
(44,678)
210
(18,041)
Novell, Inc.*
5,859
Affymetrix, Inc.*
730
(18,520)
(44,763)
Omnicare, Inc.
790
(26,173)
Lexmark International, Inc. —
PDL BioPharma, Inc.*
1,250
(27,012)
Class A*
1,100
(45,683)
Global Payments, Inc.
1,170
(51,737)
Medicis Pharmaceutical Corp. —
Class A
940
(28,679)
Parametric Technology Corp.*
3,010
(52,434)
Unisys Corp.*
8,460
(56,005)
Varian Medical Systems, Inc.*
730
(30,580)
National Instruments Corp.
1,750
(60,077)
Hillenbrand Industries, Inc.
680
(37,414)
Ciena Corp.*
1,650
(62,832)
Genzyme Corp.*
880
(54,525)
Akamai Technologies, Inc.*
2,580
(74,123)
Kyphon, Inc.*
870
(60,900)
Boston Scientific Corp.*
4,450
(62,077)
Network Appliance, Inc.*
2,840
(76,424)
CR Bard, Inc.
720
(63,497)
Cypress Semiconductor Corp.*
2,650
(77,407)
Citrix Systems, Inc.*
1,920
(77,414)
Tenet Healthcare Corp.*
20,629
(69,313)
Stryker Corp.
Kla-Tencor Corp.
1,420
(79,208)
1,270
(87,325)
Hospira, Inc.*
Intuit, Inc.*
2,659
(80,568)
2,120
(87,874)
Activision, Inc.*
4,140
(89,383)
Vertex Pharmaceuticals, Inc.*
2,700
(103,707)
Intuitive Surgical, Inc.*
JDS Uniphase Corp.*
7,330
(109,657)
480
(110,400)
Cognizant Technology Solutions
Amgen, Inc.*
1,970
(111,443)
Corp. — Class A*
1,510
(120,453)
Allergan, Inc.
2,340
(150,860)
Apple, Inc.*
830
(127,438)
See Notes to Financial Statements.
THE RYDEX SERIES FUNDS SEMI-ANNUAL REPORT
|
37
SCHEDULE OF INVESTMENTS (Unaudited) (concluded)
September 30, 2007
HEDGED EQUITY FUND
VALUE
VALUE
MARKET
MARKET
SHARES
(NOTE 1)
SHARES
(NOTE 1)
Paychex, Inc.
3,120
$
(127,920)
CME Group, Inc.
159
$
(93,389)
Advanced Micro Devices, Inc.*
11,129
(146,903)
Developers Diversified Realty
Adobe Systems, Inc.*
4,220
(184,245)
Corp.
1,740
(97,214)
Google, Inc. — Class A*
420
(238,253)
Franklin Resources, Inc.
780
(99,450)
Yahoo!, Inc.*
11,700
(314,028)
Fifth Third Bancorp
3,039
(102,961)
Intel Corp.
12,348
(319,319)
AvalonBay Communities, Inc.
940
(110,976)
Electronic Arts, Inc.*
6,480
(362,791)
Kimco Realty Corp.
2,740
(123,875)
Total Information Technology
(3,210,406)
Moody’s Corp.
2,610
(131,544)
FINANCIALS (6.7)%
Macerich Co.
1,760
(154,141)
Janus Capital Group, Inc.
190
(5,373)
Simon Property Group, Inc.
1,740
(174,000)
SEI Investments Co.
210
(5,729)
Leucadia National Corp.
4,151
(200,161)
Charles Schwab Corp.
620
(13,392)
Washington Mutual, Inc.
7,949
(280,679)
IndyMac Bancorp, Inc.
860
(20,305)
SLM Corp.
5,729
(284,559)
Westamerica Bancorporation
500
(24,905)
Total Financials
(3,392,707)
First Niagara Financial Group,
Total Common Stocks Sold Short
Inc.
1,850
(26,177)
(Proceeds $17,968,877)
(19,026,702)
Waddell & Reed Financial,
Inc. — Class A
1,090
(29,463)
Total Short Sales (37.6)%
Astoria Financial Corp.
1,230
(32,632)
(Proceeds $17,968,877)
$(19,026,702)
Other Assets in Excess
FirstMerit Corp.
1,710
(33,790)
of Liabilities – 18.9%
$
9,549,084
Cullen/Frost Bankers, Inc.
680
(34,082)
Equity One, Inc.
1,330
(36,176)
Net Assets – 100.0%
$ 50,598,017
Nuveen Investments, Inc. —
UNREALIZED
Class A
600
(37,164)
GAIN
Brown & Brown, Inc.
1,430
(37,609)
CONTRACTS
(NOTE 1)
Eaton Vance Corp.
970
(38,761)
Huntington Bancshares, Inc.
2,520
(42,790)
FUTURES CONTRACTS PURCHASED
First American Corp.
1,250
(45,775)
December 2007 Nikkei 225 Index
(Aggregate Market Value
First Horizon National Corp.
1,800
(47,988)
Futures Contracts
CB Richard Ellis Group, Inc. —
Class A*
1,740
(48,442)
of Contracts $3,767,625)
45
$
173,059
Arthur J Gallagher & Co.
1,880
(54,464)
December 2007 Russell 2000
Zions Bancorporation
800
(54,936)
Index Mini Futures Contracts
Hudson City Bancorp, Inc.
3,860
(59,367)
(Aggregate Market Value
UDR, Inc.
2,650
(64,448)
of Contracts $5,261,750)
65
137,821
New York Community Bancorp,
December 2007 S&P MidCap 400
Inc.
(Aggregate Market Value
3,429
(65,322)
Index Mini Futures Contracts
Progressive Corp.
3,470
(67,353)
M&T Bank Corp.
660
(68,277)
of Contracts $5,444,250)
61
133,347
Countrywide Financial Corp.
3,700
(70,337)
December 2007 S&P 500
T Rowe Price Group, Inc.
1,280
(71,283)
Index Mini Futures Contracts
Comerica, Inc.
1,400
73,271
(71,792)
(Aggregate Market Value
Webster Financial Corp.
1,720
(72,446)
of Contracts $2,999,588)
39
Sovereign Bancorp, Inc.
4,669
(79,560)
(Total Aggregate Market Value
Regency Centers Corp.
1,150
(88,262)
of Contracts $17,473,213)
$
517,498
Regions Financial Corp.
3,099
(91,358)
*
Non-Income Producing Security.
†
All or a portion of this security is on loan at September 30, 2007—See Note 8.
D
All or a portion of this security is pledged as short security collateral at September 30, 2007.
ADR—American Depository Receipt.
38
|
THE RYDEX SERIES FUNDS SEMI-ANNUAL REPORT
See Notes to Financial Statements.
SCHEDULE OF INVESTMENTS (Unaudited)
September 30, 2007
INTERNATIONAL ROTATION FUND
VALUE
GAIN
MARKET
UNREALIZED
SHARES
(NOTE 1)
CONTRACTS
(NOTE 1)
EXCHANGE TRADED FUNDS 52.1%
FOREIGN CURRENCY FUTURES
iShares MSCI Sweden Index
CONTRACTS PURCHASED
Fund
67,400
$
2,492,452
December 2007 Euro Currency
iShares MSCI Belgium Index
Futures Contracts
Fund
66,300
1,763,580
(Aggregate Market Value
Vanguard European ETF
13,900
1,086,980
of Contracts $4,641,325)
26
$
97,541
iShares MSCI Australia Index
Fund
14,700
467,019
FUTURES CONTRACTS PURCHASED
iShares MSCI Pacific Index Fund
2,100
349,230
October 2007 IBEX 35 Index
iShares MSCI Italy Index Fund
7,800
271,752
Futures Contracts
iShares MSCI Hong Kong Index
(Aggregate Market Value
Fund
11,900
250,257
of Contracts $1,250,539)
6
54,898
iShares MSCI Spain Index Fund
3,300
200,640
December 2007 S&P/MIB
iShares MSCI France Index Fund
1,100
42,306
Index Futures Contracts
Total Exchange Traded Funds
(Aggregate Market Value
(Cost $6,619,026)
6,924,216
of Contracts $2,572,507)
9
41,292
October 2007 CAC 40 Index
FACE
Futures Contracts
AMOUNT
(Aggregate Market Value
of Contracts $814,129)
10
15,138
REPURCHASE AGREEMENTS 30.1%
October 2007 Hang Seng Index
Repurchase Agreement (Note 5)
Futures Contracts
of Contracts $864,686)
Mizuho Financial Group, Inc.
(Aggregate Market Value
issued 09/28/07 at 3.96%
5
12,677
due 10/01/07
$1,000,000
1,000,000
(Total Aggregate Market Value
Credit Suisse Group
of Contracts $5,501,861)
$
124,005
issued 09/28/07 at 3.95%
due 10/01/07
1,000,000
1,000,000
Lehman Brothers Holdings, Inc.
issued 09/28/07 at 3.90%
due 10/01/07
1,000,000
1,000,000
Morgan Stanley
issued 09/28/07 at 3.80%
due 10/01/07
1,000,000
1,000,000
Total Repurchase Agreements
(Cost $4,000,000)
4,000,000
Total Investments 82.2%
(Cost $10,619,026)
$ 10,924,216
Other Assets in Excess
of Liabilities – 17.8%
$
2,357,523
Net Assets – 100.0%
$ 13,281,739
See Notes to Financial Statements.
THE RYDEX SERIES FUNDS SEMI-ANNUAL REPORT
|
39
SCHEDULE OF INVESTMENTS (Unaudited)
September 30, 2007
MANAGED FUTURES STRATEGY FUND
VALUE
MARKET
FACE
VALUE
MARKET
SHARES
(NOTE 1)
AMOUNT
(NOTE 1)
EXCHANGE TRADED FUNDS 7.2%
REPURCHASE AGREEMENTS 62.7%
CurrencyShares Euro TrustD†
17,878
$
2,557,627
Repurchase Agreement (Note 5)
PowerShares DB Agriculture
Mizuho Financial Group, Inc.
Fund*†
79,693
2,350,944
issued 09/28/07 at 3.96%
CurrencyShares Japanese Yen
due 10/01/07
$58,002,189
$
58,002,189
Trust*D
26,048
2,266,176
Lehman Brothers Holdings, Inc.
iShares Lehman 20+ Year
issued 09/28/07 at 3.90%
Treasury Bond Fund†
16,778
1,489,383
due 10/01/07
32,410,277
32,410,277
iShares Lehman 7-10 Year
Morgan Stanley
Treasury Bond Fund†
15,779
1,322,911
issued 09/28/07 at 3.80%
CurrencyShares British Pound
due 10/01/07
6,823,787
6,823,787
Sterling TrustD†
4,660
957,444
Credit Suisse Group
CurrencyShares Swiss Franc
issued 09/28/07 at 3.95%
TrustD†
4,530
389,761
due 10/01/07†††
3,748,324
3,748,324
CurrencyShares Canadian
Dollar TrustD†
1,980
199,861
Total Repurchase Agreements
(Cost $100,984,577)
100,984,577
Total Exchange Traded Funds
(Cost $11,081,355)
11,534,107
SECURITIES LENDING COLLATERAL 2.5%
Investment in Securities Lending Short Term
FACE
Investment Portfolio Held by
AMOUNT
U.S. Bank (Note 8)
4,067,394
4,067,394
Total Securities Lending Collateral
STRUCTURED NOTES†† 29.9%
(Cost $4,067,394)
4,067,394
S&P DTI Index Total Return
Total Long Securities 102.3%
Linked Notes 5.58%
(Cost $166,144,426)
$164,805,314
due 03/13/08
$11,000,000
10,690,638
Swedish Export Credit Corp.,
Goldman Sachs DTI Index
SHARES
Total Return Linked Notes
5.53% due 05/23/08
10,000,000
9,543,636
EXCHANGE TRADED FUNDS SOLD SHORT (0.5)%
S&P DTI Index Total Return
iShares Silver Trust*
740
(101,210)
Linked Notes 5.58%
CurrencyShares Australian
due 06/13/08
9,000,000
8,773,869
Dollar TrustD
1,370
(122,190)
Streettracks Gold Trust*
3,020
(222,000)
Swedish Export Credit Corp.,
PowerShares DB Base Metals
Goldman Sachs DTI Index
Fund*
11,560
(303,335)
Total Return Linked Notes
5.70% due 03/19/08
8,000,000
7,819,606
Total Exchange Traded Funds Sold Short
Swedish Export Credit Corp.,
(Proceeds $690,474)
(748,735)
Goldman Sachs DTI Index
Total Short Sales (0.5)%
Total Return Linked Notes
(Proceeds $690,474)
$
(748,735)
5.36% due 07/25/08
7,000,000
6,559,552
Liabilities in Excess of
Swedish Export Credit Corp.,
Other Assets — (1.8)%
$
(2,908,324)
Goldman Sachs DTI Index
Net Assets — 100.0%
$ 161,148,255
Total Return Linked Notes
5.36% due 04/17/08
5,000,000
4,831,935
Total Structured Notes
(Cost $50,011,100)
48,219,236
*
Non-Income Producing Security.
D
Affiliated Funds
†
All or a portion of this security is on loan at September 30, 2007—See Note 8.
††
Structured Notes are leveraged, providing an exposure to the underlying benchmark of three times the face amount. The total
exposure to the return would be $60,000,000 and $90,000,000 for the Merrill Lynch DTI Index and the Goldman Sachs DTI Index,
respectively, as of September 30, 2007—See Note 2.
†††All or a portion of this security is pledged as structured note collateral at September 30, 2007.
40
|
THE RYDEX SERIES FUNDS SEMI-ANNUAL REPORT
See Notes to Financial Statements.
SCHEDULE OF INVESTMENTS (Unaudited)
September 30, 2007
REAL ESTATE FUND
VALUE
VALUE
MARKET
MARKET
SHARES
(NOTE 1)
SHARES
(NOTE 1)
COMMON STOCKS 99.7%
Nationwide Health Properties,
Inc.†
7,914
$
238,449
Simon Property Group, Inc.†
6,805
$
680,500
Alexandria Real Estate Equities,
Brookfield Asset Management,
Inc.†
2,469
237,666
Inc. — Class A
16,995
654,307
Douglas Emmett, Inc.†
9,446
233,600
ProLogis†
9,300
617,055
BRE Properties, Inc. — Class A
4,122
230,543
Vornado Realty Trust
5,141
562,168
Mack-Cali Realty Corp.
5,529
227,242
Archstone-Smith Trust
8,644
519,850
Digital Realty Trust, Inc.†
5,523
217,551
Public Storage, Inc.
6,517
512,562
CBL & Associates Properties,
KIMCO Realty Corp.
11,290
510,421
Inc.†
5,940
208,197
General Growth Properties, Inc.
9,469
507,728
Equity One, Inc.†
7,498
203,946
Boston Properties, Inc.
4,743
492,798
Highwoods Properties, Inc.
5,424
198,898
Equity Residential
11,187
473,881
Brandywine Realty Trust
7,836
198,329
Host Hotels & Resorts, Inc.†
19,940
447,454
Corporate Office Properties
Brookfield Properties Corp.
17,760
442,224
Trust SBI
4,719
196,452
AvalonBay Communities, Inc.
3,677
434,107
HRPT Properties Trust
19,742
195,248
Plum Creek Timber Co., Inc.
Senior Housing Properties Trust†
8,793
193,974
(REIT)
9,007
403,153
Home Properties, Inc.†
3,647
190,300
HCP, Inc.†
11,621
385,469
The St. Joe Co.†
5,646
189,762
Developers Diversified Realty
Potlatch Corp.
4,192
188,766
Corp.
6,806
380,251
National Retail Properties, Inc.†
7,681
187,263
Macerich Co.
4,108
359,779
First Industrial Realty Trust, Inc.†
4,802
186,654
SL Green Realty Corp.†
3,075
359,068
Kilroy Realty Corp.
3,078
186,619
AMB Property Corp.†
5,982
357,783
DCT Industrial Trust, Inc.†
17,640
184,691
Ventas, Inc.†
8,317
344,324
Cousins Properties, Inc.†
5,857
171,962
Regency Centers Corp.†
4,343
333,325
BioMed Realty Trust, Inc.†
7,119
171,568
Federal Realty Investment Trust†
3,745
331,807
LaSalle Hotel Properties
4,077
171,560
CB Richard Ellis Group, Inc. —
Washington Real Estate
Class A*†
10,932
304,347
Investment Trust†
5,167
171,441
Annaly Mortgage Management,
Colonial Properties Trust†
4,941
169,476
Inc.
18,879
300,742
Sunstone Hotel Investors, Inc.
6,480
166,147
Duke Realty Corp.
8,633
291,882
Tanger Factory Outlet Centers,
Apartment Investment &
Inc.†
4,026
163,415
Management Co. — Class A†
6,180
278,903
Strategic Hotels & Resorts, Inc.
7,930
163,279
Forest City Enterprises, Inc. —
DiamondRock Hospitality Co.†
9,377
163,254
Class A
4,986
275,028
Entertainment Properties Trust
3,184
161,747
Health Care REIT, Inc.†
6,205
274,509
Pennsylvania Real Estate
Rayonier, Inc.†
5,624
270,177
Investment Trust
4,071
158,525
Hospitality Properties Trust†
6,584
267,640
Equity Inns, Inc.
6,979
157,586
Weingarten Realty Investors†
6,422
266,256
Post Properties, Inc.
4,067
157,393
Jones Lang LaSalle, Inc.
2,565
263,579
Equity Lifestyle Properties,
Camden Property Trust
4,065
261,176
Inc.†
3,037
157,317
Liberty Property Trust
6,387
256,821
Lexington Realty Trust†
7,860
157,279
iStar Financial, Inc.
7,478
254,177
Mid-America Apartment
Essex Property Trust, Inc.†
2,141
251,717
Communities, Inc.
3,112
155,133
CapitalSource, Inc.
12,337
249,701
Healthcare Realty Trust, Inc.†
5,787
154,281
Taubman Centers, Inc.†
4,527
247,853
Eastgroup Properties, Inc.
3,317
150,127
Realty Income Corp.†
8,788
245,625
Ashford Hospitality Trust, Inc.†
13,920
139,896
UDR, Inc.†
9,937
241,668
Omega Healthcare Investors,
Inc.†
9,008
139,894
See Notes to Financial Statements.
THE RYDEX SERIES FUNDS SEMI-ANNUAL REPORT
|
41
SCHEDULE OF INVESTMENTS (Unaudited) (concluded)
September 30, 2007
REAL ESTATE FUND
VALUE
MARKET
SHARES
(NOTE 1)
Extra Space Storage, Inc.†
8,843
$
136,094
Sovran Self Storage, Inc.†
2,951
135,274
FelCor Lodging Trust, Inc.†
6,751
134,547
Inland Real Estate Corp.†
8,661
134,159
Maguire Properties, Inc.†
5,160
133,283
Acadia Realty Trust
4,910
133,208
Glimcher Realty Trust†
5,390
126,665
American Financial Realty Trust
15,423
124,155
Thornburg Mortgage, Inc.†
9,459
121,548
Parkway Properties, Inc.
2,620
115,647
Redwood Trust, Inc.†
3,430
113,945
Newcastle Investment Corp.†
6,430
113,297
Friedman Billings Ramsey
Group, Inc. — Class A†
24,390
112,438
U-Store-It Trust†
8,385
110,682
NorthStar Realty Finance Corp.†
9,668
96,003
RAIT Financial Trust†
6,960
57,281
Total Common Stocks
(Cost $19,872,500)
24,105,471
FACE
AMOUNT
REPURCHASE AGREEMENT 0.3%
Repurchase Agreement (Note 5)
Lehman Brothers Holdings, Inc.
issued 09/28/07 at 3.90%
due 10/01/07
$
63,507
63,507
Total Repurchase Agreement
(Cost $63,507)
63,507
SECURITIES LENDING COLLATERAL 22.6%
Investment in Securities Lending Short Term
Investment Portfolio Held by
U.S. Bank (Note 8)
5,449,386
5,449,386
Total Securities Lending Collateral
(Cost $5,449,386)
5,449,386
Total Investments 122.6%
(Cost $25,385,393)
$ 29,618,364
Liabilities in Excess of
Other Assets – (22.6)%
$ (5,453,591)
Net Assets – 100.0%
$ 24,164,773
*
Non-Income Producing Security.
†
All or a portion of this security is on loan at September 30, 2007—See Note 8.
REIT — Real Estate Investment Trust.
42
|
THE RYDEX SERIES FUNDS SEMI-ANNUAL REPORT
See Notes to Financial Statements.
SCHEDULE OF INVESTMENTS (Unaudited)
September 30, 2007
STRENGTHENING DOLLAR 2x STRATEGY FUND
FACE
MARKET
AMOUNT
(NOTE 1)
VALUE
REPURCHASE AGREEMENTS 106.3%
Repurchase Agreement (Note 5)
Mizuho Financial Group, Inc.
issued 09/28/07 at 3.96%
due 10/01/07
$8,977,993
$
8,977,993
Credit Suisse Group
issued 09/28/07 at 3.95%
due 10/01/07†
8,019,607
8,019,607
Lehman Brothers Holdings, Inc.
issued 09/28/07 at 3.90%
due 10/01/07
5,016,694
5,016,694
Morgan Stanley
issued 09/28/07 at 3.80%
due 10/01/07
1,056,235
1,056,235
Total Repurchase Agreements
(Cost $23,070,529)
23,070,529
Total Investments 106.3%
(Cost $23,070,529)
$ 23,070,529
Liabilities in Excess of
Other Assets – (6.3)%
$ (1,365,007)
Net Assets – 100.0%
$ 21,705,522
LOSS
UNREALIZED
CONTRACTS
(NOTE 1)
FUTURES CONTRACTS PURCHASED
December 2007 U.S. Dollar
Index Futures Contracts
(Aggregate Market Value
of Contracts $1,552,500)
20
$
(34,003)
UNITS
CURRENCY INDEX SWAP AGREEMENT
November 2007 U.S. Dollar Index
Swap, Terminating 11/29/07*
(Notional Market Value
$41,870,601)
539,306
$ (1,417,234)
*
Price Return based on U.S. Dollar Index +/- financing at a variable rate.
†
All or a portion of this security is pledged as currency index swap collateral at September 30, 2007.
See Notes to Financial Statements.
THE RYDEX SERIES FUNDS SEMI-ANNUAL REPORT
|
43
SCHEDULE OF INVESTMENTS (Unaudited)
September 30, 2007
WEAKENING DOLLAR 2x STRATEGY FUND
FACE
VALUE
MARKET
AMOUNT
(NOTE 1)
REPURCHASE AGREEMENTS 89.6%
Repurchase Agreement (Note 5)
Mizuho Financial Group, Inc.
issued 09/28/07 at 3.96%
due 10/01/07
$63,565,866
$
63,565,866
Credit Suisse Group
issued 09/28/07 at 3.95%
due 10/01/07†
52,079,180
52,079,180
Lehman Brothers Holdings, Inc.
issued 09/28/07 at 3.90%
due 10/01/07
35,519,131
35,519,131
Morgan Stanley
issued 09/28/07 at 3.80%
due 10/01/07
7,478,337
7,478,337
Total Repurchase Agreements
(Cost $158,642,514)
158,642,514
Total Investments 89.6%
(Cost $158,642,514)
$ 158,642,514
Other Assets in Excess
of Liabilities – 10.4%
$
18,340,649
Net Assets – 100.0%
$ 176,983,163
GAIN
UNREALIZED
CONTRACTS
(NOTE 1)
FUTURES CONTRACTS SOLD SHORT
December 2007 U.S. Dollar
Index Futures Contracts
(Aggregate Market Value of
Contracts $1,940,625)
25
$
21,746
UNITS
CURRENCY INDEX SWAP AGREEMENT
SOLD SHORT
November 2007 U.S. Dollar Index
Swap, Terminating 11/29/07*
(Notional Market Value
$352,464,363)
4,539,843
$
13,575,254
*
Price Return based on U.S. Dollar Index +/- financing at a variable rate.
†
All or a portion of this security is pledged as currency index swap collateral at September 30, 2007.
44
|
THE RYDEX SERIES FUNDS SEMI-ANNUAL REPORT
See Notes to Financial Statements.
This page intentionally left blank.
THE RYDEX SERIES FUNDS SEMI-ANNUAL REPORT
|
45
STATEMENTS OF ASSETS AND LIABILITIES (Unaudited)
Multi-Cap
Sector
Absolute
Core Equity
Rotation
Strategies
Return
Fund
Fund
Fund
ASSETS
Investment Securities* (Notes 1, 2 and 8)
$ 69,861,512
$423,945,919
$275,276,211
Repurchase Agreements* (Note 5)
1,308,417
17,683,069
92,848,193
Segregated Cash with Broker
53,550
—
18,251,780
Cash
—
30,767
—
Receivable for Short Sale
—
—
120,754,125
Receivable for Credit Default/Variance Swap Settlement (Note 1)
—
—
256,629
Receivable for Currency Index Swap Settlement (Note 1)
—
—
—
Receivable for Futures Contracts Settlement (Note 1)
—
—
—
Receivable for Securities Sold (Note 1)
—
—
9,737,876
Receivable for Fund Shares Sold
43,562
4,197,032
327,158
Investment Income Receivable (Note 1)
88,319
167,208
638,984
Total Assets
71,355,360
446,023,995
518,090,956
LIABILITIES
Short Sales at Market Value** (Notes 1 and 2)
—
—
126,467,026
Payable for Credit Default/Variance Swap Settlement (Note 1)
—
—
548,814
Payable for Currency Index Swap Settlement (Note 1)
—
—
—
Payable for Futures Contracts Settlement (Note 1)
5,398
—
549,224
Payable upon Return of Securities Loaned (Note 8)
8,163,346
79,793,952
50,996,329
Payable for Securities Purchased (Note 1)
—
—
7,256,201
Payable for Fund Shares Redeemed
29,659
638,791
692,792
Investment Advisory Fees Payable (Note 3)
18,474
221,929
280,091
Transfer Agent and Administrative Fees Payable (Note 3)
11,665
61,647
—
Distribution and Service Fees Payable (Note 3)
11,004
55,549
39,432
Portfolio Accounting Fees Payable (Note 3)
4,666
23,117
—
Custody Fees Payable
1,681
7,398
—
Cash Due to Custodian Bank
—
—
—
Short Sales Dividends Payable
—
—
119,499
Other Liabilities
32,876
146,039
—
Total Liabilities
8,278,769
80,948,422
186,949,408
NET ASSETS
$ 63,076,591
$365,075,573
$331,141,548
NET ASSETS CONSIST OF
Paid-In Capital
$ 48,655,985
$278,570,944
$319,656,958
Undistributed Net Investment Income (Loss)
33,028
(340,314)
6,749,522
Accumulated Net Realized Gain (Loss) on Investments, Credit Default/
Variance Swaps, Currency Index Swaps and Futures Contracts
9,022,851
36,032,132
(2,006,538)
Net Unrealized Appreciation (Depreciation) on Investments, Credit Default/
Variance Swaps, Currency Index Swaps and Futures Contracts
5,364,727
50,812,811
6,741,606
NET ASSETS
$ 63,076,591
$365,075,573
$331,141,548
A-Class
$
4,490,457
$
50,748,393
$
53,477,006
C-Class
27,309,717
130,973,205
64,709,037
H-Class
31,276,417
183,353,975
212,955,505
SHARES OUTSTANDING
A-Class
263,586
3,068,927
1,974,518
C-Class
1,673,704
8,240,742
2,425,680
H-Class
1,836,107
11,057,131
7,857,467
NET ASSET VALUES
A-Class
$17.04
$16.54
$27.08
A-Class Maximum Offering Price***
17.89
17.36
28.43
C-Class
16.32
15.89
26.68
H-Class
17.03
16.58
27.10
* The cost of investments is $65,800,922, $390,816,177, $358,369,691, $93,821,347, $58,226,294, $10,619,026, $166,144,426, $25,385,393,
$23,070,529 and $158,642,514, respectively.
** The proceeds from short sales is $0, $0, $120,769,361, $0, $17,968,877, $0, $690,474, $0, $0, and $0, respectively.
*** Net asset value adjusted for the maximum sales charge of 4.75% of offering price.
46
|
THE RYDEX SERIES FUNDS SEMI-ANNUAL REPORT
See Notes to Financial Statements.
September 30, 2007
Commodities
Hedged
International
Futures
Dollar 2x
Dollar 2x
Managed
Strengthening
Weakening
Strategy
Equity
Rotation
Strategy
Real Estate
Strategy
Strategy
Fund
Fund
Fund
Fund
Fund
Fund
Fund
$
44,726,575
$38,246,005
$
6,924,216
$
63,820,737
$29,554,857
$
—
$
—
54,102,393
21,829,630
4,000,000
100,984,577
63,507
23,070,529
158,642,514
—
207,578
448,221
—
—
17,000
21,250
—
—
1,616,378
—
1,470
—
—
—
17,959,907
—
690,474
—
—
—
—
—
—
—
—
—
—
—
—
—
—
—
—
13,525,677
—
—
1,259
—
—
—
15,500
11,010,400
1,487,082
—
—
910,844
—
—
983,953
41,577
898,371
807,934
319,371
1,615,708
5,319,980
86,933
102,968
1,301
298,404
96,684
7,567
52,031
110,910,254
79,874,747
13,889,746
166,602,126
30,946,733
24,710,804
177,576,952
—
19,026,702
—
748,735
—
—
—
—
—
—
—
—
—
—
—
—
—
—
—
1,834,725
—
—
155,402
23,383
—
—
12,400
—
3,484,194
8,396,422
—
4,067,394
5,449,386
—
—
17,530,690
1,170,933
495,631
—
—
—
—
460,770
459,298
78,760
379,858
1,297,016
1,125,842
363,739
22,590
43,658
5,548
105,216
14,307
13,458
102,804
13,190
—
1,541
29,227
4,208
3,738
28,557
8,501
5,424
1,449
14,876
2,119
2,472
16,385
5,276
—
616
11,691
1,683
1,495
11,423
1,583
3
185
3,507
505
449
3,427
—
845
—
34,579
—
—
—
—
18,043
—
—
—
—
—
27,114
—
894
58,788
12,736
10,703
67,454
21,553,908
29,276,730
608,007
5,453,871
6,781,960
3,005,282
593,789
$
89,356,346
$50,598,017
$13,281,739
$161,148,255
$24,164,773
$21,705,522
$176,983,163
$
91,100,512
$48,881,875
$12,728,592
$160,490,639
$22,016,683
$24,573,446
$154,005,174
500,611
1,308,614
4,610
2,173,008
213,519
42,421
2,260,305
(7,252,398)
(901,486)
21,801
(118,019)
(2,298,400)
(1,459,108)
7,120,684
5,007,621
1,309,014
526,736
(1,397,373)
4,232,971
(1,451,237)
13,597,000
$
89,356,346
$50,598,017
$13,281,739
$161,148,255
$24,164,773
$21,705,522
$176,983,163
$
13,463,522
$
6,513,067
$
584,457
$
35,984,868
$
5,339,140
$
1,462,076
$
33,646,707
6,640,469
6,892,466
2,846,622
13,191,640
1,139,908
4,402,481
18,954,312
69,252,355
37,192,484
9,850,660
111,971,747
17,685,725
15,840,965
124,382,144
501,668
243,038
22,003
1,428,748
140,460
63,573
1,132,230
252,075
261,115
107,192
525,904
30,802
194,907
649,402
2,581,717
1,387,495
370,707
4,445,603
465,529
689,468
4,186,604
$26.84
$26.80
$26.56
$25.19
$38.01
$23.00
$29.72
28.18
28.14
27.88
26.45
39.91
24.15
31.20
26.34
26.40
26.56
25.08
37.01
22.59
29.19
26.82
26.81
26.57
25.19
37.99
22.98
29.71
See Notes to Financial Statements.
THE RYDEX SERIES FUNDS SEMI-ANNUAL REPORT
|
47
STATEMENTS OF OPERATIONS (Unaudited)
Multi-Cap
Absolute
Core Equity
Sector
Return
Rotation
Strategies
Fund
Fund
Fund
INVESTMENT INCOME
Interest† (Note 1)
$
17,286
$
75,809
$ 5,157,508
Income from Securities Lending, net (Note 8)
17,887
118,830
75,222
Dividends, Net of Foreign Tax Withheld* (Note 1)
564,269
2,495,743
1,367,571
Swap Income
—
—
210,715
Other Income
—
—
240,917
Total Income
599,442
2,690,382
7,051,933
EXPENSES
Investment Advisory Fees (Note 3)
171,981
1,388,566
1,789,082
Transfer Agent and Administrative Fees (Note 3)
89,828
385,713
—
Distribution & Service Fees (Note 3):
A-Class
6,187
53,672
61,163
C-Class
148,931
605,478
303,035
H-Class
46,408
180,670
252,009
Portfolio Accounting Fees (Note 3)
35,931
146,878
—
Short Sales Dividend Expense (Note 1)
—
—
637,155
Trustees’ Fees**
3,236
12,970
11,790
Custody Fees
15,048
43,519
33,000
Miscellaneous
48,864
213,230
(44,790)
Total Expenses
566,414
3,030,696
3,042,444
Less Expenses Waived by Advisor
—
—
—
Total Waived Expenses
—
—
—
Net Expenses
566,414
3,030,696
3,042,444
Net Investment Income (Loss)
33,028
(340,314)
4,009,489
REALIZED AND UNREALIZED GAIN (LOSS) ON INVESTMENTS (NOTE 1)
Net Realized Gain (Loss) on:
Investment Securities
3,780,101
22,714,999
864,664
Currency Index Swaps
—
—
—
Futures Contracts
95,726
—
975,313
Securities Sold Short
—
—
144,869
Total Net Realized Gain (Loss)
3,875,827
22,714,999
1,984,846
Net Change in Unrealized Appreciation (Depreciation) on:
Investment Securities
(3,795,474)
29,056,540
3,082,402
Credit Default Swaps
—
—
(696,287)
Variance Swap
—
—
185,380
Currency Index Swaps
—
—
—
Futures Contracts
(28,290)
—
1,196,586
Securities Sold Short
—
—
(4,187,553)
Net Change in Unrealized Appreciation (Depreciation)
(3,823,764)
29,056,540
(419,472)
Net Gain (Loss) on Investments
52,063
51,771,539
1,565,374
Net Increase (Decrease) in Net Assets from Operations
$
85,091
$51,431,225
$ 5,574,863
* Foreign tax withheld of $0, $77,013, $12,025, $0, $2,457, $0, $0, $1,145, $0, and $0, respectively.
** Relates to Trustees not deemed “interested persons” within the meaning of Section 2(a)(19) of the 1940 Act.
† Includes rebate income on proceeds for securities sold short of $0, $0, $2,181,550, $0, $477,835, $0, $31,162, $0, $0, and $0, respectively.
†† Since commencement of operations: August 31, 2007.
48
|
THE RYDEX SERIES FUNDS SEMI-ANNUAL REPORT
See Notes to Financial Statements.
Period Ended September 30, 2007
Managed
Strengthening
Weakening
Strategy
Equity
Rotation
Strategy
Real Estate
Strategy
Strategy
Commodities
Hedged
International
Futures
Dollar 2x
Dollar 2x
Fund
Fund
Fund††
Fund
Fund
Fund
Fund
$ 1,302,563
$
1,020,819
$
15,674
$ 3,253,907
$
1,649
$
580,986
$
3,441,102
1,439
15,495
—
2,813
11,329
—
—
—
213,137
—
56,993
345,254
—
—
—
—
—
—
—
—
—
13,266
—
—
—
—
—
—
1,317,268
1,249,451
15,674
3,313,713
358,232
580,986
3,441,102
211,412
288,941
5,548
585,784
100,134
101,577
631,776
70,471
—
1,541
162,718
29,451
28,216
175,493
13,909
9,436
52
41,066
7,720
1,475
31,344
36,244
43,233
984
40,511
18,463
15,068
73,427
47,501
42,569
1,243
111,524
17,115
22,974
125,793
28,188
—
617
65,087
11,781
11,286
70,197
—
133,271
—
22,940
—
—
—
2,286
2,028
—
4,941
1,827
998
6,386
7,721
5,350
185
16,931
5,020
2,912
18,288
38,587
(7,378)
894
89,436
15,255
15,368
95,401
456,319
517,450
11,064
1,140,938
206,766
199,874
1,228,105
(90,555)
—
—
—
—
—
—
(90,555)
—
—
—
—
—
—
365,764
517,450
11,064
1,140,938
206,766
199,874
1,228,105
951,504
732,001
4,610
2,172,775
151,466
381,112
2,212,997
5,651,712
1,893,294
28,526
(67,969)
1,179,340
—
—
—
—
—
—
—
(1,364,181)
7,120,683
—
(143,882)
(6,725)
—
—
(67,406)
—
(11,700)
(1,839,957)
—
(42,804)
—
—
—
5,640,012
(90,545)
21,801
(110,773)
1,179,340
(1,431,587)
7,120,683
835,500
90,982
305,190
(1,533,980)
(4,399,248)
—
—
—
—
—
—
—
—
—
—
—
—
—
—
—
—
—
—
—
—
—
(1,171,479)
9,320,003
—
104,517
221,546
—
—
(34,003)
21,746
—
(159,390)
—
(58,261)
—
—
—
835,500
36,109
526,736
(1,592,241)
(4,399,248)
(1,205,482)
9,341,749
6,475,512
(54,436)
548,537
(1,703,014)
(3,219,908)
(2,637,069)
16,462,432
$ 7,427,016
$
677,565
$553,147
$
469,761
$(3,068,442)
$(2,255,957)
$18,675,429
See Notes to Financial Statements.
THE RYDEX SERIES FUNDS SEMI-ANNUAL REPORT
|
49
STATEMENTS OF CHANGES IN NET ASSETS
Core Equity Fund
Fund
Multi-Cap
Sector Rotation
Ended
Ended
Ended
Ended
Period
Year
Period
Year
2007†
2007
2007†
2007
September 30,
March 31,
September 30,
March 31,
FROM OPERATIONS
Net Investment Income (Loss)
$
33,028
$
(75,714)
$
(340,314)
$
(1,406,754)
Net Realized Gain (Loss) on Investments
3,875,827
9,554,278
22,714,999
18,858,466
Net Change in Unrealized Appreciation (Depreciation)
on Investments
(3,823,764)
(4,181,238)
29,056,540
(24,045,159)
Net Increase (Decrease) in Net Assets from Operations
85,091
5,297,326
51,431,225
(6,593,447)
Distributions to Shareholders from: (Note 1)
Net Investment Income
A-Class
—
—
—
—
C-Class
—
—
—
—
H-Class
—
—
—
—
Realized Gain on Investments
A-Class
—
(430,763)
—
(1,452,079)
C-Class
—
(2,032,560)
—
(4,158,598)
H-Class
—
(2,277,933)
—
(5,156,754)
Total Distributions to Shareholders
—
(4,741,256)
—
(10,767,431)
SHARE TRANSACTIONS
Proceeds from Shares Purchased
A-Class
1,556,384
8,596,605
13,668,230
40,385,537
C-Class
5,437,488
14,564,231
17,086,945
77,398,670
H-Class
2,955,689
44,609,359
71,047,812
234,141,195
Redemption Fees Collected
A-Class
695
927
8,300
3,010
C-Class
4,172
4,551
23,324
8,847
H-Class
5,201
5,981
27,724
10,823
Value of Shares Purchased through Dividend Reinvestment
A-Class
—
406,755
—
1,347,139
C-Class
—
1,884,763
—
3,893,664
H-Class
—
2,162,556
—
4,624,777
Cost of Shares Redeemed
A-Class
(2,756,514)
(6,474,290)
(9,836,068)
(31,973,220)
C-Class
(8,156,059)
(17,530,668)
(24,000,369)
(78,313,103)
H-Class
(13,478,456)
(58,746,321)
(53,381,907)
(329,871,105)
Net Increase (Decrease) in Net Assets From Share
Transactions
(14,431,400)
(10,515,551)
14,643,991
(78,343,766)
Net Increase (Decrease) in Net Assets
(14,346,309)
(9,959,481)
66,075,216
(95,704,644)
NET ASSETS—BEGINNING OF PERIOD
77,422,900
87,382,381
299,000,357
394,705,001
NET ASSETS—END OF PERIOD
$ 63,076,591
$ 77,422,900
$365,075,573
$ 299,000,357
Undistributed Net Investment Income (Loss)—
End of Period
$
33,028
$
—
$
(340,314)
$
—
† Unaudited
50
|
THE RYDEX SERIES FUNDS SEMI-ANNUAL REPORT
See Notes to Financial Statements.
Absolute Return
Commodities
Strategies Fund
Strategy Fund
Hedged Equity Fund
Period
Year
Ended
Ended
Ended
Period
Year
Period
Year
September 30,
March 31,
September 30,
March 31,
September 30,
March 31,
Ended
Ended
Ended
2007†
2007
2007†
2007
2007†
2007
$
4,009,489
$
4,590,203
$
951,504
$
1,344,467
$
732,001
$
1,085,188
1,984,846
(120,942)
5,640,012
(13,679,514)
(90,545)
317,869
(419,472)
6,764,082
835,500
3,020,659
36,109
874,283
5,574,863
11,233,343
7,427,016
(9,314,388)
677,565
2,277,340
—
(478,245)
(109,198)
—
—
(82,622)
—
(500,457)
(74,170)
—
—
(158,396)
—
(2,121,298)
(267,525)
—
—
(538,983)
—
(273,932)
—
—
—
(82,314)
—
(286,655)
—
—
—
(157,806)
—
(1,215,050)
—
—
—
(536,976)
—
(4,875,637)
(450,893)
—
—
(1,557,097)
22,849,629
45,204,127
7,460,180
25,271,737
1,975,435
6,721,318
26,012,418
51,153,952
6,617,741
6,542,259
2,268,787
8,243,490
76,333,559
211,575,405
70,004,232
162,904,884
12,708,942
27,782,630
1,684
8,648
12,708
13,773
382
2,035
2,102
12,956
8,116
5,699
439
3,418
6,989
59,838
43,586
41,595
1,747
13,034
—
608,550
104,193
—
—
106,111
—
742,722
68,104
—
—
299,790
—
3,119,023
241,091
—
—
1,060,353
(12,080,033)
(10,745,745)
(5,282,850)
(23,638,576)
(2,656,976)
(1,552,398)
(10,169,226)
(12,164,964)
(5,051,900)
(5,859,323)
(3,755,026)
(3,262,974)
(43,401,244)
(73,860,896)
(40,795,993)
(148,923,479)
(4,968,176)
(17,741,890)
59,555,878
215,713,616
33,429,208
16,358,569
5,575,554
21,674,917
65,130,741
222,071,322
40,405,331
7,044,181
6,253,119
22,395,160
266,010,807
43,939,485
48,951,015
41,906,834
44,344,898
21,949,738
$ 331,141,548
$266,010,807
$ 89,356,346
$
48,951,015
$
50,598,017
$ 44,344,898
$
6,749,522
$
2,740,033
$
500,611
$
—
$
1,308,614
$
576,613
See Notes to Financial Statements.
THE RYDEX SERIES FUNDS SEMI-ANNUAL REPORT
|
51
STATEMENTS OF CHANGES IN NET ASSETS (concluded)
Fund
Strategy Fund
International Rotation
Managed Futures
Ended
Ended
Ended
Period
Period
Year
September 30,
2007*†
2007†
2007**
September 30,
March 31,
FROM OPERATIONS
Net Investment Income
$
4,610
$
2,172,775
$
92,846
Net Realized Gain (Loss) on Investments
21,801
(110,773)
1,145
Net Change in Unrealized Appreciation (Depreciation)
on Investments
526,736
(1,592,241)
194,868
Net Increase (Decrease) in Net Assets from Operations
553,147
469,761
288,859
Distributions to Shareholders from: (Note 1)
Net Investment Income
A-Class
—
—
—
C-Class
—
—
—
H-Class
—
—
—
Realized Gain on Investments
A-Class
—
—
—
C-Class
—
—
—
H-Class
—
—
—
Total Distributions to Shareholders
—
—
—
SHARE TRANSACTIONS
Proceeds from Shares Purchased
A-Class
556,628
21,652,225
23,528,217
C-Class
2,835,216
11,314,613
2,681,996
H-Class
11,008,359
90,781,988
55,688,299
Redemption Fees Collected
A-Class
584
9,857
550
C-Class
910
2,277
43
H-Class
15,085
26,009
1,029
Value of Shares Purchased through Dividend Reinvestment
A-Class
—
—
—
C-Class
—
—
—
H-Class
—
—
—
Cost of Shares Redeemed
A-Class
(52)
(9,418,483)
(23,195)
C-Class
(77,850)
(855,782)
—
H-Class
(1,610,288)
(24,973,570)
(10,026,438)
Net Increase (Decrease) in Net Assets From Share
Transactions
12,728,592
88,539,134
71,850,501
Net Increase (Decrease) in Net Assets
13,281,739
89,008,895
72,139,360
NET ASSETS—BEGINNING OF PERIOD
—
72,139,360
—
NET ASSETS—END OF PERIOD
$ 13,281,739
$161,148,255
$
72,139,360
Undistributed Net Investment Income (Loss)—
End of Period
$
4,610
$
2,173,008
$
233
* Since the commencement of operations: August 31, 2007.
** Since the commencement of operations: March 2, 2007.
† Unaudited
52
|
THE RYDEX SERIES FUNDS SEMI-ANNUAL REPORT
See Notes to Financial Statements.
Real Estate
Strengthening Dollar 2x
Weakening Dollar 2x
Fund
Strategy Fund
Strategy Fund
Period
Ended
Year
Period
Year
Period
Year
September 30,
March 31,
September 30,
March 31,
September 30,
March 31,
Ended
Ended
Ended
Ended
Ended
2007†
2007
2007†
2007
2007†
2007
$
151,466
$
660,727
$
381,112
$
745,433
$
2,212,997
$
5,139,481
1,179,340
4,195,767
(1,431,587)
(1,616,102)
7,120,683
4,258,660
(4,399,248)
2,542,463
(1,205,482)
(365,238)
9,341,749
2,344,942
(3,068,442)
7,398,957
(2,255,957)
(1,235,907)
18,675,429
11,743,083
—
(31,044)
—
—
—
—
—
(29,562)
—
—
—
—
—
(333,111)
—
—
—
—
—
(21,055)
—
—
—
—
—
(20,040)
—
—
—
—
—
(225,942)
—
—
—
—
—
(660,754)
—
—
—
—
3,098,708
22,619,619
3,998,266
1,790,035
18,582,822
32,665,359
10,926,548
19,554,134
11,446,563
18,404,407
9,745,626
26,866,695
141,629,335
637,283,192
88,292,623
213,174,840
107,159,444
435,860,439
—
—
—
—
—
—
—
—
—
—
—
—
—
—
—
—
—
—
—
43,894
—
—
—
—
—
48,762
—
—
—
—
—
549,804
—
—
—
—
(6,119,849)
(14,318,312)
(2,462,038)
(1,758,708)
(9,900,847)
(15,126,440)
(14,747,935)
(18,440,310)
(9,469,724)
(16,631,133)
(6,870,697)
(17,640,979)
(147,867,464)
(667,278,849)
(82,528,073)
(207,190,328)
(106,551,095)
(386,840,467)
(13,080,657)
(19,938,066)
9,277,617
7,789,113
12,165,253
75,784,607
(16,149,099)
(13,199,863)
7,021,660
6,553,206
30,840,682
87,527,690
40,313,872
53,513,735
14,683,862
8,130,656
146,142,481
58,614,791
$
24,164,773
$
40,313,872
$ 21,705,522
$
14,683,862
$ 176,983,163
$146,142,481
$
213,519
$
62,053
$
42,421
$
(338,691)
$
2,260,305
$
47,308
See Notes to Financial Statements.
THE RYDEX SERIES FUNDS SEMI-ANNUAL REPORT
|
53
FINANCIAL HIGHLIGHTS
This table is presented to show selected data for a share outstanding throughout each period, and to assist shareholders in evaluating a Fund’s performance for the periods presented.
Realized
(Decrease)
Net
Net Increase
and
in Net
Net Increase
NET
AVERAGE NET ASSETS:
RATIOS TO
NET ASSET
VALUE,
Investment
Gains
Resulting
from Net
from Net
Redemption
in Net
VALUE,
Total
Net
Portfolio
End of
Net
Unrealized
Asset Value
Distributions
Distributions
(Decrease)
ASSET
Net Assets,
Period Ended
OF PERIOD
(Loss)†
Investments
BEGINNING
Operations
Income
Gains
Distributions
Collected
Value
PERIOD
Return†††
Expenses
Income (Loss)
Rate
omitted)
Income
(Losses) on
from
Investment
Realized
Total
Fees
Asset
END OF
Investment
Total
Investment
Turnover
Period (000’s
Multi-Cap Core Equity Fund A-Class
March 31, 2007
16.72
.05
1.38
1.43
—
(1.10)
(1.10)
—§
.33
17.05
8.89%
1.32%
0.32%
138%
5,680
September 30, 2007D
$17.05
$ .04
$ (.05)
$ (.01)
$
—
$
—
$
—
—§
$ (.01)
$17.04
(0.06)%
1.26%**
0.41%**
64%
$
4,490
March 31, 2005
14.44
.02
1.16
1.18
—
(.61)
(.61)
—
.57
15.01
8.16%
1.57%
0.16%
159%
906
March 31, 2006
15.01
(.01)
2.59
2.58
—
(.87)
(.87)
—
1.71
16.72
17.55%
1.66%
(0.08)%
168%
3,079
Multi-Cap Core Equity Fund C-Class
March 31, 2004*
14.44
—
—
—
—
—
—
—
—
14.44
0.00%
0.00%**à
0.00%**
226%
1
September 30, 2007D
16.39
(.03)
(.04)
(.07)
—
—
—
—§
(.07)
16.32
(0.43)%
2.00%**
(0.34)%**
64%
27,310
March 31, 2006
14.71
(.13)
2.53
2.40
—
(.87)
(.87)
—
1.53
16.24
16.68%
2.40%
(0.87)%
168%
30,981
March 31, 2007
16.24
(.09)
1.34
1.25
—
(1.10)
(1.10)
—§
.15
16.39
8.03%
2.12%
(0.54)%
138%
30,181
March 31, 2004
10.11
(.11)
4.38
4.27
—
(.11)
(.11)
—
4.16
14.27
42.29%
2.24%
(0.87)%
226%
23,811
March 31, 2005
14.27
(.10)
1.15
1.05
—
(.61)
(.61)
—
.44
14.71
7.34%
2.31%
(0.71)%
159%
34,793
Multi-Cap Core Equity Fund H-Class
March 31, 2003*
10.00
(.03)
.14
.11
—
—
—
—
.11
10.11
1.10%
2.41%**
(0.48)%**
123%
5,771
September 30, 2007D
17.04
.03
(.04)
(.01)
—
—
—
—§
(.01)
17.03
(0.06)%
1.26%**
0.40%**
64%
31,276
March 31, 2006
15.01
(.02)
2.60
2.58
—
(.87)
(.87)
—
1.71
16.72
17.55%
1.64%
(0.11)%
168%
53,323
March 31, 2007
16.72
.03
1.39
1.42
—
(1.10)
(1.10)
—§
.32
17.04
8.83%
1.38%
0.18%
138%
41,562
March 31, 2005
14.44
—§
March 31, 2004
10.15
(.01)
4.41
4.40
—
(.11)
(.11)
—
4.29
14.44
43.41%
1.49%
(0.11)%
226%
42,568
1.18
1.18
—
(.61)
(.61)
—
.57
15.01
8.16%
1.56%
0.03%
159%
51,139
Sector Rotation Fund A-Class
March 31, 2003*
10.00
.01
.14
.15
—
—
—
—
.15
10.15
1.50%
1.67%**
0.22%**
123%
18,516
September 30, 2007D
14.08
—§
2.46
March 31, 2007
14.15
(.01)
.38
.37
—
(.44)
(.44)
—§
(.07)
14.08
2.75%
1.64%
(0.09)%
373%
39,804
2.46
—
—
—
—§
2.46
16.54
17.47%
1.66%**
0.06%**
136%
50,748
March 31, 2005
March 31, 2006
10.45
(.02)
.67
.65
—
—
—
—
.65
11.10
6.22%
1.63%
(0.19)%
262%
2,989
11.10
(.04)
3.09
3.05
—
—
—
—
3.05
14.15
27.48%
1.67%
(0.33)%
263%
30,593
Sector Rotation Fund C-Class
March 31, 2004*
10.45
—
—
—
—
—
—
—
—
10.45
0.00%
0.00%**à
0.00%**
253%
5
March 31, 2007
13.76
September 30, 2007D
(.11)
13.58
(.05)
2.36
2.31
—
—
—
—§
2.31
15.89
17.01%
2.41%**
(0.67)%**
136%
130,973
March 31, 2006
10.87
(.12)
3.01
2.89
—
—
—
—
2.89
13.76
26.59%
2.41%
(0.95)%
263%
118,083
.37
.26
—
(.44)
(.44)
—§
(.18)
13.58
2.02%
2.39%
(0.86)%
373%
118,422
March 31, 2005
10.30
(.10)
.67
March 31, 2004
7.53
(.16)
2.93
2.77
—
—
—
—
2.77
10.30
36.79%
2.41%
(1.66)%
253%
59,192
.57
—
—
—
—
.57
10.87
5.53%
2.38%
(1.03)%
262%
54,604
Sector Rotation Fund H-Class
March 31, 2003
9.99
(.07)
(2.39)
(2.46)
—
—
—
—
(2.46)
7.53
(24.62)%
2.44%
(0.83)%
451%
17,538
September 30, 2007D
14.12
.01
2.45
2.46
—
—
—
—§
2.46
16.58
17.42%
1.66%**
0.07%**
136%
183,354
March 31, 2006
11.12
(.03)
3.09
3.06
—
—
—
—
3.06
14.18
27.52%
1.66%
(0.25)%
263%
246,029
March 31, 2007
14.18
(.02)
.40
.38
—
(.44)
(.44)
—§
(.06)
14.12
2.81%
1.65%
(0.16)%
373%
140,774
March 31, 2005
10.45
(.03)
.70
.67
—
—
March 31, 2004
7.58
(.09)
2.96
2.87
—
—
—
—
2.87
10.45
37.86%
1.66%
(0.88)%
253%
86,677
—
—
.67
11.12
6.41%
1.64%
(0.31)%
262%
56,725
March 31, 2003
9.99
(.01)
(2.40)
(2.41)
—
—
—
—
(2.41)
7.58
(24.12)%
1.68%
(0.08)%
451%
34,845
FINANCIAL HIGHLIGHTS (continued)
This table is presented to show selected data for a share outstanding throughout each period, and to assist shareholders in evaluating a Fund’s performance for the periods presented.
Realized
(Decrease)
Net
Net Increase
and
in Net
Net Increase
NET
AVERAGE NET ASSETS:
RATIOS TO
VALUE,
Net
Gains
Resulting
from Net
from Net
Redemption
in Net
VALUE,
Total
Net
Portfolio
End of
NET ASSET
Unrealized
Asset Value
Distributions
Distributions
(Decrease)
ASSET
Net Assets,
Period Ended
OF PERIOD
Income†
Investments
Operations
Income
Gains
Distributions
Collected
Value
PERIOD
Return†††
Expenses
Expenses
Expenses
Income
Rate
omitted)
BEGINNING
Investment
(Losses) on
from
Investment
Realized
Total
Fees
Asset
END OF
Investment
Total
Net
Operating
Investment
Turnover
Period (000’s
September 30, 2007D
$26.44
$ .37
$
.27
$
.64
$
—
$
—
$
—
$ —§
$
.64
$27.08
2.42%
1.80%**
1.80%**
1.39%††**
2.71%**
213%
$
53,477
Absolute Return Strategies Fund A-Class
March 31, 2006*
25.00
.29
.24
.53
(.07)
—
(.07)
.06***
.52
25.52
2.36%
1.87%**
1.87%**
1.45%††**
2.20%**
127%
5,791
March 31, 2007
25.52
.71
.80
1.51
(.38)
(.22)
(.60)
.01
.92
26.44
6.05%
1.93%
1.93%
1.43%††
2.74%
298%
41,771
September 30, 2007D
26.14
.26
.28
.54
—
—
—
—§
.54
26.68
2.07%
2.55%**
2.55%**
2.14%††**
1.96%**
213%
64,709
Absolute Return Strategies Fund C-Class
March 31, 2007
March 31, 2006*
25.00
.19
.24
.43
(.07)
—
(.07)
.06***
.42
25.42
1.96%
2.65%**
2.65%**
2.23%††**
1.42%**
127%
7,352
25.42
.51
.80
1.31
(.38)
(.22)
(.60)
.01
.72
26.14
5.28%
2.66%
2.66%
2.16%††
1.99%
298%
48,052
September 30, 2007D
26.46
.37
.27
.64
—
—
—
—§
.64
27.10
2.42%
1.80%**
1.80%**
1.39%††**
2.71%**
213%
212,956
Absolute Return Strategies Fund H-Class
March 31, 2006*
25.00
March 31, 2007
.29
.25
.54
(.07)
—
(.07)
.06***
.53
25.53
2.40%
1.83%**
1.83%**
1.41%††**
2.18%**
127%
30,796
25.53
.72
.80
1.52
(.38)
(.22)
(.60)
.01
.93
26.46
6.09%
1.90%
1.90%
1.40%††
2.78%
298%
176,187
September 30, 2007D
23.81
.41
2.81
Commodities Strategy Fund A-Class
March 31, 2007
27.29
.63
(4.15)
(3.52)
—
—
—
.04
(3.48)
23.81
(12.75)%
1.46%
1.17%
1.17%
2.57%
672%
9,720
3.22
(.22)
—
(.22)
.03
3.03
26.84
13.73%
1.52%**
1.20%**
1.20%**
3.38%**
197%
13,464
March 31, 2006*
25.00
.61
1.68
2.29
—
—
—
—
2.29
27.29
9.16%
1.71%**
1.71%**
1.71%**
2.76%**
—
8,751
Commodities Strategy Fund C-Class
March 31, 2007
September 30, 2007D
23.47
.33
2.73
3.06
(.22)
—
(.22)
.03
2.87
26.34
13.25%
2.27%**
1.95%**
1.95%**
2.73%**
197%
6,640
March 31, 2006*
25.00
.42
1.68
2.10
—
—
—
—
2.10
27.10
8.40%
2.34%**
2.34%**
2.34%**
1.79%**
—
4,128
27.10
.56
(4.23)
(3.67)
—
—
—
.04
(3.63)
23.47
(13.39)%
2.23%
1.94%
1.94%
2.23%
672%
4,169
September 30, 2007D
23.81
.42
2.78
3.20
(.22)
—
(.22)
.03
3.01
26.82
13.65%
1.51%**
1.20%**
1.20%**
3.47%**
197%
69,252
Commodities Strategy Fund H-Class
March 31, 2007
March 31, 2006*
25.00
.61
1.68
2.29
—
—
—
—
2.29
27.29
9.16%
1.57%**
1.57%**
1.57%**
2.56%**
—
29,028
27.29
.77
(4.28)
(3.51)
—
—
—
.03
(3.48)
23.81
(12.75)%
1.49%
1.20%
1.20%
2.99%
672%
35,062
Hedged Equity Fund A-Class
March 31, 2007
25.86
.82
.63
1.45
(.52)
(.51)
(1.03)
.01
.43
26.29
5.82%
2.13%
2.13%
1.41%††
3.15%
282%
7,086
September 30, 2007D
26.29
.41
.10
.51
—
—
—
—§
.51
26.80
1.94%
1.92%**
1.92%**
1.39%††**
3.04%**
207%
6,513
March 31, 2006*
25.00
.26
.65
.91
(.09)
—
(.09)
.04***
.86
25.86
3.81%
2.10%**
2.10%**
1.44%††**
1.91%**
159%
1,672
September 30, 2007D
25.99
Hedged Equity Fund C-Class
March 31, 2007
25.76
.62
.63
1.25
(.52)
(.51)
(1.03)
.01
.23
25.99
5.05%
2.89%
2.89%
2.17%††
2.40%
282%
8,312
.31
.10
.41
—
—
—
—§
.41
26.40
1.58%
2.66%**
2.66%**
2.13%††**
2.31%**
207%
6,892
March 31, 2006*
25.00
.16
.65
.81
(.09)
—
(.09)
.04***
.76
25.76
3.41%
2.86%**
2.86%**
2.20%††**
1.16%**
159%
2,957
Hedged Equity Fund H-Class
March 31, 2007
September 30, 2007D
26.30
.40
.11
.51
—
—
—
—§
.51
26.81
1.94%
1.92%**
1.92%**
1.39%††**
3.02%**
207%
37,192
March 31, 2006*
25.00
.26
.65
.91
(.09)
—
(.09)
.04***
.86
25.86
3.81%
2.07%**
2.07%**
1.41%††**
1.96%**
159%
17,321
25.86
.81
.65
1.46
(.52)
(.51)
(1.03)
.01
.44
26.30
5.86%
2.13%
2.13%
1.41%††
3.14%
282%
28,947
FINANCIAL HIGHLIGHTS (continued)
This table is presented to show selected data for a share outstanding throughout each period, and to assist shareholders in evaluating a Fund’s performance for the periods presented.
Net
Realized
(Decrease)
RATIOS TO
Net Increase
and
in Net
Net Increase
NET
AVERAGE NET ASSETS:
VALUE,
Investment
Gains
Resulting
from Net
from Net
Redemption
in Net
VALUE,
Total
Investment
Portfolio
End of
NET ASSET
Net
Unrealized
Asset Value
Distributions
Distributions
(Decrease)
ASSET
Net
Net Assets,
Period Ended
OF PERIOD
(Loss)†
Investments
Operations
Income
Gains
Distributions
Collected
Value
PERIOD
Return†††
Expenses
Expenses
Expenses
(Loss)
Rate
omitted)
BEGINNING
Income
(Losses) on
from
Investment
Realized
Total
Fees
Asset
END OF
Investment
Total
Net
Operating
Income
Turnover
Period (000’s
International Rotation Fund A-Class
September 30, 2007D* $25.00
$ .01
$ 1.49
$ 1.50
$
—
$
—
$
—
$ .06
$ 1.56
$26.56
6.24%
1.68%**
1.68%**
1.68%**
0.48%**
30%
$
584
International Rotation Fund C-Class
September 30, 2007D*
25.00
(.01)
1.55
1.54
—
—
—
.02
1.56
26.56
6.24%
2.43%**
2.43%**
2.43%**
(0.32)%**
30%
2,847
International Rotation Fund H-Class
September 30, 2007D*
25.00
.02
1.49
1.51
—
—
—
.06
1.57
26.57
6.28%
1.66%**
1.66%**
1.66%**
0.96%**
30%
9,851
September 30, 2007D
25.03
.42
(.27)
.15
—
—
—
.01
.16
25.19
0.64%
1.67%**
1.67%**
1.63%**††
3.33%**
78%
35,985
Managed Futures Strategy Fund A-Class
March 31, 2007*
25.00
.09
(.06)
.03
—
—
—
—§
.03
25.03
0.12%
1.81%**
1.81%**
1.81%**††
2.06%**
20%
23,655
September 30, 2007D
25.02
.34
(.29)
.05
—
—
—
.01
.06
25.08
0.24%
2.45%**
2.45%**
2.41%**††
2.73%**
78%
13,192
Managed Futures Strategy Fund C-Class
March 31, 2007*
25.00
.05
(.03)
.02
—
—
—
—§
.02
25.02
0.08%
2.60%**
2.60%**
2.60%**††
1.15%**
20%
2,703
September 30, 2007D
25.03
.42
(.27)
.15
—
—
—
.01
.16
25.19
0.64%
1.71%**
1.71%**
1.67%**††
3.38%**
78%
111,972
Managed Futures Strategy Fund H-Class
March 31, 2007*
25.00
.09
(.06)
.03
—
—
—
—§
.03
25.03
0.12%
1.77%**
1.77%**
1.77%**††
2.19%**
20%
45,781
September 30, 2007D
42.16
.30
(4.45)
Real Estate Fund A-Class
March 31, 2007
36.46
.46
(4.15)
—
—
—
—
(4.15)
38.01
(9.84)%
1.62%**
1.62%**
1.62%**
1.49%**
393%
5,339
March 31, 2006
27.84
.64
8.18
8.82
—
(.20)
(.20)
—
8.62
36.46
31.75%
1.57%
1.57%
1.57%
2.02%
1,304%
375
5.53
5.99
(.17)
(.12)
(.29)
—
5.70
42.16
16.43%
1.61%
1.61%
1.61%
1.10%
762%
9,061
March 31, 2005*
26.66
.09
1.24
1.33
(.03)
(.12)
(.15)
—
1.18
27.84
4.98%
1.54%**
1.54%**
1.54%**
0.52%** 1,773%
-->
0.52%**
1,773%
71
Real Estate Fund C-Class
March 31, 2007
35.93
.19
5.39
5.58
(.17)
(.12)
(.29)
—
5.29
41.22
15.53%
2.36%
2.36%
2.36%
0.48%
762%
5,469
September 30, 2007D
41.22
.16
(4.37)
(4.21)
—
—
—
—
(4.21)
37.01 (10.21)%
-->
37.01
(10.21)%
2.37%**
2.37%**
2.37%**
0.78%**
393%
1,140
March 31, 2006
March 31, 2005
26.63
.41
.75
1.16
(.03)
(.12)
(.15)
—
1.01
27.64
4.35%
2.32%
2.32%
2.32%
1.52%
1,773%
1,293
27.64
.43
8.06
8.49
—
(.20)
(.20)
—
8.29
35.93
30.79%
2.36%
2.36%
2.36%
1.35%
1,304%
3,548
March 31, 2004*
25.00
.02
1.61
1.63
—
—
—
—
1.63
26.63
6.52%
2.36%**
2.36%**
2.36%**
0.72%**
102%
7,562
September 30, 2007D
42.14
.26
Real Estate Fund H-Class
March 31, 2007
36.47
.54
5.42
5.96
(.17)
(.12)
(.29)
—
5.67
42.14
16.34%
1.62%
1.62%
1.62%
1.35%
762%
25,784
(4.41)
(4.15)
—
—
—
—
(4.15)
37.99
(9.85)%
1.62%**
1.62%**
1.62%**
1.31%**
393%
17,686
March 31, 2005
26.65
.58
.77
1.35
(.03)
(.12)
(.15)
—
1.20
27.85
5.06%
1.58%
1.58%
1.58%
2.08%
1,773%
8,186
March 31, 2006
27.85
.57
8.25
8.82
—
(.20)
(.20)
—
8.62
36.47
31.74%
1.59%
1.59%
1.59%
1.78%
1,304%
49,591
March 31, 2004*
25.00
.10
1.55
1.65
—
—
—
—
1.65
26.65
6.60%
1.61%**
1.61%**
1.61%**
3.83%**
102%
75,916
FINANCIAL HIGHLIGHTS (concluded)
This table is presented to show selected data for a share outstanding throughout each period, and to assist shareholders in evaluating a Fund’s performance for the periods presented.
Net
Net Increase
and
in Net
Net Increase
NET
AVERAGE NET ASSETS:
Realized
(Decrease)
RATIOS TO
NET ASSET
VALUE,
Net
Gains
Resulting
from Net
from Net
in Net
VALUE,
Total
Net
Portfolio
End of
Unrealized
Asset Value
Distributions
Distributions
(Decrease)
ASSET
Net Assets,
BEGINNING
Investment
(Losses) on
from
Investment
Realized
Total
Asset
END OF
Investment
Total
Investment
Turnover
Period (000’s
Period Ended
OF PERIOD
Income†
Investments
Operations
Income
Gains
Distributions
Value
PERIOD
Return†††
Expenses
Income
Rate
omitted)
September 30, 2007D
$25.35
$
.42
$(2.77)
$(2.35)
$ —
$ —
$ —
$(2.35)
$23.00
(9.27)%
1.67%**
3.38%**
—
$
1,462
Strengthening Dollar 2x Strategy Fund A-Class
March 31, 2006*
25.00
.50
2.37
2.87
(.13)
—
(.13)
2.74
27.74
11.47%
1.68%**
2.17%**
—
91
March 31, 2007
27.74
.91
(3.30)
(2.39)
—
—
—
(2.39)
25.35
(8.62)%
1.66%
3.53%
—
108
September 30, 2007D
24.99
.34
(2.74)
(2.40)
—
—
—
(2.40)
22.59
(9.60)%
2.41%**
2.78%**
—
4,402
Strengthening Dollar 2x Strategy Fund C-Class
March 31, 2006*
25.00
.36
2.33
2.69
(.13)
—
(.13)
2.56
27.56
10.75%
2.41%**
1.51%**
—
769
March 31, 2007
27.56
.70
(3.27)
(2.57)
—
—
—
(2.57)
24.99
(9.33)%
2.40%
2.75%
—
2,630
Strengthening Dollar 2x Strategy Fund H-Class
March 31, 2007
27.71
.90
(3.28)
(2.38)
—
—
—
(2.38)
25.33
(8.59)%
1.66%
3.47%
—
11,946
September 30, 2007D
25.33
.43
(2.78)
(2.35)
—
—
—
(2.35)
22.98
(9.28)%
1.66%**
3.46%**
—
15,841
March 31, 2006*
25.00
.51
2.33
2.84
(.13)
—
(.13)
2.71
27.71
11.35%
1.66%**
2.19%**
—
7,270
Weakening Dollar 2x Strategy Fund A-Class
March 31, 2007
22.70
.91
2.57
3.48
—
—
—
3.48
26.18
15.33%
1.65%
3.63%
—
21,502
September 30, 2007D
26.18
.43
3.11
3.54
—
—
—
3.54
29.72
13.52%
1.66%**
3.20%**
—
33,647
March 31, 2006*
25.00
.51
(2.67)
(2.16)
(.14)
—
(.14)
(2.30)
22.70
(8.65)%
1.70%**
2.66%**
—
2,989
September 30, 2007D
Weakening Dollar 2x Strategy Fund C-Class
March 31, 2007
22.55
.71
2.55
3.26
—
—
—
3.26
25.81
14.46%
2.40%
2.87%
—
14,160
25.81
.33
3.05
3.38
—
—
—
3.38
29.19
13.10%
2.41%**
2.46%**
—
18,954
March 31, 2006*
25.00
.34
(2.65)
(2.31)
(.14)
—
(.14)
(2.45)
22.55
(9.25)%
2.46%**
1.79%**
—
3,916
Weakening Dollar 2x Strategy Fund H-Class
March 31, 2007
22.69
.90
2.59
3.49
—
—
—
3.49
26.18
15.38%
1.65%
3.60%
—
110,480
September 30, 2007D
26.18
.44
3.09
3.53
—
—
—
3.53
29.71
13.48%
1.66%**
3.22%**
—
124,382
March 31, 2006*
25.00
.49
(2.66)
(2.17)
(.14)
—
(.14)
(2.31)
22.69
(8.69)%
1.68%**
2.53%**
—
51,710
September 23, 2002 — Multi-Cap Core Equity Fund C-Class and H-Class;
* Since the commencement of operations:
March 31, 2004 — Multi-Cap Core Equity Fund A-Class and Sector Rotation Fund A-Class;
February 20, 2004 — Real Estate Fund C-Class and H-Class;
May 25, 2005 — Commodities Strategy Fund A-Class, C-Class, and H-Class, Strengthening Dollar 2x Strategy Fund A-Class, C-Class and H-Class, Weakening Dollar 2x Strategy Fund A-Class,
September 1, 2004 — Real Estate Fund A-Class;
September 19, 2005 — Absolute Return Strategies Fund A-Class, C-Class and H-Class and Hedged Equity Fund A-Class, C-Class and H-Class;
C-Class and H-Class;
August 31, 2007 — International Rotation Fund A-Class, C-Class and H-Class.
March 2, 2007 — Managed Futures Fund A-Class, C-Class and H-Class;
*** Values have been restated to reflect reclassification from Net Realized and Unrealized Gains (Losses) on securities to Redemption Fees collected. This reclassification had no effect on
**
Annualized
period.
Absolute Return Strategies and Hedged Equity Funds' net asset value, per share value, net investment income ratios and total increase (decrease) in net assets from operations during any
†† Operating Expenses exclude short dividends expense.
† Calculated using the average daily shares outstanding for the year.
à Expense ratios for the period ended March 31, 2004 are calculated for one day only and are not indicative of future class performance.
††† Total investment return does not reflect the impact of any applicable sales charges and has not been annualized.
D Unaudited
§ Less than $.01 per share.
NOTES TO FINANCIAL STATEMENTS (Unaudited)
1.
Organization and Significant Accounting Policies
Significant Accounting Policies
Organization
The following significant accounting policies are in con-
The Rydex Series Funds (the “Trust”) is registered with
formity with U.S. generally accepted accounting princi-
the SEC under the Investment Company Act of 1940 (the
ples and are consistently followed by the Trust. All time
“1940 Act”) as a non-diversified, open-ended investment
references are based on Eastern Time. The information
company, and is authorized to issue an unlimited number
contained in these notes may not apply to every Fund in
of no par value shares. The Trust offers five separate
the Trust.
classes of shares, Investor Class Shares, Advisor Class
Shares, A-Class Shares, C-Class Shares and H-Class
A. Equity securities listed on an exchange (New York
Shares. C-Class Shares have a 1% contingent deferred
Stock Exchange (“NYSE”) or American Stock Exchange)
sales charge (“CDSC”) if shares are redeemed within
are valued at the last quoted sales price as of the close
12 months of purchase. Sales of shares of each Class are
of business on the NYSE, usually 4:00 p.m. on the valua-
tion date. Equity securities listed on the NASDAQ mar-
made without a front-end sales charge at the net asset
ket system are valued at the NASDAQ Official Closing
value per share, with the exception of A-Class Shares.
A-Class Shares are sold at net asset value, plus the appli-
Price, usually as of 4:00 p.m. on the valuation date.
Listed options held by the Trust are valued at the Official
cable front-end sales charge. The sales charge varies
Settlement Price listed by the exchange, usually as of
depending on the amount purchased, but will not
exceed 4.75%. A-Class Share purchases of $1 million or
4:00 p.m. In the event that a settlement price is not
more are exempt from the front-end sales charge, but
available, fair valuation is enacted. Over-the-counter
options held by the Trust are valued using the average
have a 1% CDSC if shares are redeemed within 18
months of purchase.
bid price obtained from one or more security dealers.
The value of futures contracts purchased and sold by the
At September 30, 2007, the Trust consisted of fifty-three
Trust is accounted for using the unrealized gain or loss
separate Funds: twenty-two Benchmark Funds, one
on the contracts that is determined by marking the con-
Financial futures contracts are valued at the last quoted
Money Market Fund, ten Alternative Strategy Funds,
tracts to their current realized settlement prices.
seventeen Sector Funds and three Essential Portfolio
Funds. This report covers the ten Alternative Strategy
sales price, usually as of 4:00 p.m. on the valuation date.
Funds (the “Funds”), while the Money Market Fund, the
In the event that the exchange for a specific futures con-
Benchmark Funds, the Sector Funds and the Essential
tract closes earlier than 4:00 p.m., the futures contract is
Portfolio Funds are contained in separate reports. As of
valued at the Official Settlement Price of the exchange.
September 30, 2007, only A-Class, C-Class and H-Class
However, the underlying securities from which the futures
Shares had been issued in the Alternative Strategy Funds.
contract value is derived are monitored until 4:00 p.m. to
All share classes of the Multi-Cap Core Equity Fund, the
determine if fair valuation would provide a more accurate
Sector Rotation Fund, the Absolute Return Strategies
valuation. Short-term securities, if any, are valued at
Fund, the Commodities Strategy Fund, the Hedged
amortized cost, which approximates market value.
Equity Fund and the International Rotation Fund are sub-
ject to a 1% redemption fee when shares are redeemed
Structured notes are valued in accordance with the terms
of their agreement at the value of the underlying index
within 30 days of purchase. All share classes of the
close, usually 4:00 p.m., adjusted for any interest accruals
Managed Futures Strategy Fund are subject to a 1%
redemption fee when shares are redeemed within 90
and financing charges. If the securities comprising the
days of purchase.
underlying index cease trading before a Fund’s close of
business, the index will be fair valued with the use of an
Valu-Trac Investment Management Limited serves as the
appropriate market indicator.
investment sub-advisor to the International Rotation
Fund and is responsible for the development and on-
Traditional open-end investment companies (“Mutual
going maintenance of the investment management strat-
Funds”) are valued at their NAV as of the close of busi-
egy utilized by that Fund.
ness, usually 4:00 p.m. on the valuation date. Exchange
Traded Funds (“ETFs”) and closed-end investment com-
Rydex Investments provides advisory, transfer agent and
panies are valued at the last quoted sales price.
administrative services, and accounting services to the
Trust. Rydex Distributors, Inc. (the “Distributor”) acts
The value of domestic equity index and credit default
swap agreements entered into by a Fund is accounted
as principal underwriter for the Trust. Both Rydex
for using the unrealized gain or loss on the agreements
Investments and the Distributor are affiliated entities.
58
|
THE RYDEX SERIES FUNDS SEMI-ANNUAL REPORT
NOTES TO FINANCIAL STATEMENTS (Unaudited) (continued)
that is determined by marking the agreements to the
D. Interest and dividend income, most expenses, all real-
last quoted value of the index that the swap pertains
ized gains and losses, and all unrealized gains and losses
to at the close of the NYSE, usually 4:00 p.m. The swap’s
are allocated to the Classes based upon the value of the
market value is then adjusted to include dividends
outstanding shares in each Class. Certain costs, such as
accrued, financing charges and/or interest associated
distribution fees related to A-Class Shares and H-Class
with the swap agreements.
Shares and service and distribution fees related to
The value of foreign equity index, currency index and
C-Class Shares, are charged directly to those specific
variance swap agreements entered into by a Fund is
Classes. In addition, certain expenses have been allo-
accounted for using the unrealized gain or loss on the
cated to the individual Funds in the Trust on a pro rata
agreements that is determined by marking the agree-
basis upon the respective aggregate net asset value of
ments to the price at which orders are being filled at the
each Fund included in the Trust.
close of the NYSE, usually 4:00 p.m. In the event that no
E. When a Fund engages in a short sale of an equity or
order is filled at 4:00 p.m., the security dealer provides a
fixed income security, an amount equal to the proceeds
fair value quote at which the swap agreement is valued.
is reflected as an asset and an equivalent liability. The
The swap’s market value is then adjusted to include divi-
amount of the liability is subsequently marked-to-market
dends accrued, financing charges and/or interest associ-
to reflect the market value of the short sale. The Fund
ated with the swap agreements.
maintains a segregated account of cash and/or securities
Investments, including structured notes, for which market
as collateral for short sales. The Fund is exposed to mar-
quotations are not readily available, are fair valued as
ket risk based on the amount, if any, that the market
determined in good faith by Rydex Investments under
value of the security exceeds the market value of the
the direction of the Board of Trustees using methods
securities in the segregated account. Fees, if any, paid to
established or ratified by the Board of Trustees. These
brokers to borrow securities in connection with short
methods include, but are not limited to: (i) general infor-
sales are considered part of the cost of short sale trans-
mation as to how these securities and assets trade; (ii) in
actions. In addition, the Fund must pay out the dividend
connection with futures contracts and options there-
rate of the equity or coupon rate of the treasury obliga-
upon, and other derivative investments, information as
tion to the lender and records this as an expense. Short
to how (a) these contracts and other derivative invest-
dividends or interest expense is a cost associated with
ments trade in the futures or other derivative markets,
the investment objective of short sales transactions,
respectively, and (b) the securities underlying these con-
rather than an operational cost associated with the day-
tracts and other derivative investments trade in the cash
to-day management of any mutual fund.
market; and (iii) other information and considerations,
F. Upon the purchase of an option by a Fund, the pre-
including current values in related-markets.
mium paid is recorded as an investment, the value of
B. Securities transactions are recorded on the trade date
which is marked-to-market daily. When a purchased
for financial reporting purposes. Realized gains and
option expires, that Fund will realize a loss in the amount
losses from securities transactions are recorded using the
of the cost of the option. When a Fund enters into a
identified cost basis. Proceeds from lawsuits related to
closing sale transaction, that Fund will realize a gain or
investment holdings are recorded as realized gains in the
loss depending on whether the proceeds from the clos-
respective Fund. Dividend income is recorded on the ex-
ing sale transaction are greater or less than the cost of
dividend date, net of applicable taxes withheld by for-
the option. When a Fund exercises a put option, that
eign countries. Interest income, including amortization of
Fund will realize a gain or loss from the sale of the
premiums and accretion of discount, is accrued on a
underlying security and the proceeds from such sale will
daily basis.
be decreased by the premium originally paid. When a
Fund exercises a call option, the cost of the security pur-
C. Distributions of net investment income and net real-
ized capital gains are recorded on the ex-dividend date
chased by that Fund upon exercise will be increased by
the premium originally paid. When a Fund writes (sells)
and are determined in accordance with income tax regu-
an option, an amount equal to the premium received is
lations which may differ from U.S. generally accepted
entered in that Fund’s accounting records as an asset
accounting principles. These differences are primarily
due to differing treatments for items such as deferral
and equivalent liability. The amount of the liability is sub-
sequently marked-to-market to reflect the current value
of wash sales and post-October losses and regulated
futures contracts and options. Net investment income
of the option written. When a written option expires, or
if a Fund enters into a closing purchase transaction, that
and loss, net realized gains and losses, and net assets
Fund realizes a gain (or loss if the cost of a closing pur-
are not affected by these differences.
THE RYDEX SERIES FUNDS SEMI-ANNUAL REPORT
|
59
NOTES TO FINANCIAL STATEMENTS (Unaudited) (continued)
chase transaction exceeds the premium received when
the contract are recognized, net of a proportional amount
the option was sold).
of the upfront payment, as realized gains or losses.
G. The Trust may enter into stock and bond index
The Trust may enter into variance swap agreements,
futures contracts and options on such futures contracts.
which are agreements between two parties to make pay-
Futures contracts are contracts for delayed delivery of
ments based on changes in the variance of an index over
securities at a specified future delivery date and at a
a stated period of time. Specifically, one party will be
specific price. Upon entering into a contract, a Fund
required to make a payment to the other party if the
deposits and maintains as collateral such initial margin
variance of an index increases over an agreed upon
as required by the exchange on which the transaction is
period of time, but will be entitled to receive a payment
effected. Pursuant to the contract, the Fund agrees to
from the other party if the variance decreases over that
receive from or pay to the broker an amount of cash
time period. A variance swap that requires a single pay-
equal to the daily fluctuation in value of the contract.
ment on a stated future date will be treated as a forward
Such receipts or payments are known as variation margin
contract. Periodic payments received or paid by a Fund
and are recorded by the Fund as unrealized gains or
are recorded as realized gains or losses. The contracts
losses. When the contract is closed, the Fund records a
are marked-to-market daily based upon quotations from
realized gain or loss equal to the difference between the
market makers and the change, if any, is recorded as
value of the contract at the time it was opened and the
unrealized gain or loss. Payments received or made, are
value at the time it was closed.
recognized as realized gains or losses.
H. The Trust may enter into domestic equity index and
I. The Trust may invest in structured notes, which are
domestic currency index swap agreements, which are
over-the-counter contracts linked to the performance of
over-the-counter contracts in which one party agrees to
an underlying benchmark such as interest rates, equity
make periodic payments based on the change in market
markets, equity indices, commodities indices, corporate
value of a specified equity security, basket of equity
credits or foreign exchange markets. A structured note is
securities, equity index, or domestic currency index, in
a type of bond in which an issuer borrows money from
return for periodic payments based on a fixed or variable
investors and pays back the principal, adjusted for per-
interest rate or the change in market value of a different
formance of the underlying benchmark, at a specified
equity security, basket of equity securities, equity index,
maturity date. In addition, the contract may require
or domestic currency index. Swap agreements are used
periodic interest payments. Structured notes are used
to obtain exposure to an equity or market without own-
to obtain exposure to a market without owning or
ing or taking physical custody of securities. The swap
taking physical custody of securities or commodities.
agreements are marked-to-market daily based upon
Fluctuations in value of the structured notes are recorded
quotations from market makers and the change, if any, is
as unrealized gains and losses in the accompanying
recorded as unrealized gain or loss. Payments received
financial statements. Coupon payments are recorded as
or made as a result of the swap agreement or termina-
income while net payments are recorded as net realized
tion of the agreement are recognized as realized gains
gains or losses.
or losses.
J. Investment securities and other assets and liabilities
The Trust may enter into credit default swap agreements
denominated in foreign currencies are translated into
where one party, the protection buyer, makes an upfront
U.S. dollar amounts at the date of valuation. Purchases
or periodic payments to a counterparty, the protection
and sales of investment securities and, income and expense
seller, in exchange for the right to receive a contingent
items denominated in foreign currencies are translated
payment. The maximum amount of the payment may
into U.S. dollar amounts on the respective dates of such
equal the notional amount, at par, of the underlying
transactions. The Trust does not isolate that portion of
index or security as a result of a related credit event.
the results of operations resulting from changes in for-
Upfront payments received or made by a Fund, are
eign exchange rates on investments from the fluctua-
amortized over the expected life of the agreement.
tions arising from changes in market prices of securities
Periodic payments received or paid by a Fund are
held. Such fluctuations are included with the net realized
recorded as realized gains or losses. The credit default
and unrealized gain and loss from investments.
contracts are marked-to-market daily based upon quota-
Reported net realized foreign exchange gains or losses
tions from market makers and the change, if any, is
recorded as unrealized gain or loss. Payments received
arise from sales of foreign currencies and currency gains
or losses realized between the trade and settlement
or made as a result of a credit event or termination of
dates on investment transactions. Net unrealized
60
|
THE RYDEX SERIES FUNDS SEMI-ANNUAL REPORT
NOTES TO FINANCIAL STATEMENTS (Unaudited) (continued)
exchange gains and losses arise from changes in the fair
Throughout the normal course of business, the Funds
values of assets and liabilities other than investments in
enter into contracts that contain a variety of representa-
securities at the fiscal period end, resulting from changes
tions and warranties which provide general indemnifica-
in exchange rates.
tions. The Funds’ maximum exposure under these
claims that may be made against the Funds and/or their
K. The Trust may enter into forward currency contracts
arrangements is unknown, as this would involve future
primarily to hedge against foreign currency exchange
rate risks on its non-U.S. dollar denominated investment
affiliates that have not yet occurred. However, based on
securities. When entering into a forward currency con-
experience, the Funds expect the risk of loss to be remote.
tract, a Fund agrees to receive or deliver a fixed quantity
Short sales are transactions in which a Fund sells an
of foreign currency for an agreed-upon price on an
equity or fixed income security it does not own. If the
agreed future date. These contracts are valued daily
security sold short decreases in price between the time
and the corresponding unrealized gain or loss on the
the Fund sells the security and closes its short position,
contracts, as measured by the difference between the
that Fund will realize a gain on the transaction.
forward foreign exchange rates at the dates of entry
Conversely, if the security increases in price during the
into the contracts and the forward rates at the reporting
period, that Fund will realize a loss on the transaction.
date, is included in the Statement of Assets and
The risk of such price increases is the principal risk of
Liabilities. Realized and unrealized gains and losses are
engaging in short sales.
included in the Statement of Operations.
The risk associated with purchasing options is limited to
L. Certain U.S. Government and Agency Obligations are
the premium originally paid. The risk in writing a covered
traded on a discount basis; the interest rates shown on
call option is that a Fund may forego the opportunity for
the Schedules of Investments reflect the discount rates
profit if the market price of the underlying security
paid at the time of purchase by the Funds. Other securi-
increases and the option is exercised. The risk in writing
ties bear interest at the rates shown, payable at fixed
a covered put option is that a Fund may incur a loss if
dates through maturity. The Funds may also purchase
the market price of the underlying security decreases
American Depository Receipts, U.S. Government securi-
and the option is exercised. In addition, there is the risk
ties, and enter into repurchase agreements.
that a Fund may not be able to enter into a closing
M. The Funds may leave cash overnight in their cash
transaction because of an illiquid secondary market or,
account with the custodian, U.S. Bank. Periodically, a Fund
for over-the-counter options, because of the counter-
may have cash due to custodian bank as an overdraft
party’s inability to perform.
balance. A fee is incurred on this overdraft, calculated by
There are several risks in connection with the use of
multiplying the overdraft by a rate based on the federal
futures contracts. Risks may be caused by an imperfect
funds rate. Segregated cash with the broker is held as
correlation between movements in the price of the
collateral for investments in derivative instruments such
instruments and the price of the underlying securities.
as futures contracts and equity index swap agreements.
In addition, there is the risk that a Fund may not be able
N. The preparation of financial statements, in conformity
to enter into a closing transaction because of an illiquid
with U.S. generally accepted accounting principles,
secondary market.
requires management to make estimates and assump-
There are several risks associated with the use of struc-
tions that affect the reported amount of assets and liabil-
tured notes. Structured securities are leveraged, thereby
ities and disclosure of contingent assets and liabilities at
providing an exposure to the underlying benchmark of
the date of the financial statements and the reported
three times the face amount and increasing the volatility
amounts of revenues and expenses during the reporting
of each note relative to the change in the underlying
period. Actual results could differ from these estimates.
linked financial instrument. A highly liquid secondary
2.
Financial Instruments
market may not exist for the structured notes a Fund
invests in, which may make it difficult for that Fund to
As part of its investment strategy, the Trust may utilize
short sales and a variety of derivative instruments, includ-
sell the structured notes it holds at an acceptable price
or to accurately value them. Tracking error risk refers to
ing options, futures, options on futures, structured notes
the risk that a Fund’s Advisor may not be able to cause
and swap agreements. These investments involve, to
the Fund’s performance to match or correlate to that of
varying degrees, elements of market risk and risks in
excess of the amounts recognized in the Statements of
a Fund’s benchmark, either on a daily or aggregate
Assets and Liabilities.
basis. Factors such as Fund expenses, imperfect correla-
tion between the Fund’s investments and those of its
benchmark, rounding of share prices, changes to the
THE RYDEX SERIES FUNDS SEMI-ANNUAL REPORT
|
61
NOTES TO FINANCIAL STATEMENTS (Unaudited) (continued)
benchmark, regulatory policies, high portfolio turnover
between the price of the instruments and movements in
rate and leverage all contribute to tracking error.
the price of the underlying securities, indices, or futures
Tracking error risk may cause the Fund’s performance to
contracts; iii) the possible absence of a liquid secondary
be less than expected. In addition, structured notes are
market for any particular instrument at any time; and iv)
subject to the risk that the counterparty to the instru-
the potential of counterparty default. The Trust has
ment, or issuer, might not pay interest when due or
established strict counterparty credit guidelines and
repay principal at maturity of the obligation. Although
enters into transactions only with financial institutions of
the Trust will not invest in any structured notes unless
investment grade or better.
Rydex Investments believes that the issuer is credit-
worthy, a Fund does bear the risk of loss of the amount
3.
Fees And Other Transactions With Affiliates
expected to be received in the event of the default or
Under the terms of an investment advisory contract, the
bankruptcy of the issuer.
Trust pays Rydex Investments investment advisory fees
calculated at an annualized rate of 0.85% of the average
There are several risks associated with the use of swap
agreements that are different from those associated with
daily net assets of the Real Estate Fund; 0.90% of the
ordinary portfolio securities transactions. Swap agree-
average daily net assets of the Sector Rotation Fund,
ments may be considered to be illiquid. Although the
International Rotation Fund, Managed Futures Strategy
Fund, the Strengthening Dollar 2x Strategy Fund and the
Trust will not enter into any swap agreement unless
Rydex Investments believes that the other party to the
Weakening Dollar 2x Strategy Fund; and 1.15% of the
transaction is creditworthy, the Funds bear the risk of
average daily net assets of the Absolute Return
Strategies Fund and the Hedged Equity Fund.
loss of the amount expected to be received under a
tract, the Trustees voted to implement a performance
swap agreement in the event of the default or bank-
Also under the terms of the investment advisory con-
ruptcy of the agreement counterparty.
There are several risks associated with credit default
adjustment for the Multi-Cap Core Equity Fund. The
Trust pays Rydex Investments investment advisory fees
swaps. Credit default swaps involve the exchange of
calculated at a basic annual fee rate of 0.70% of the
a fixed-rate premium for protection against the loss in
average daily net assets of this Fund, adding or subtract-
value of an underlying debt instrument in the event of
a defined credit event (such as payment default or bank-
ing a performance rate up to 0.20%. The basic annual
ruptcy). Under the terms of the swap, one party acts as a
fee rate, along with the performance adjustment allows
“guarantor,” receiving a periodic payment that is a fixed
the total fee to increase to a maximum of 0.90% or
percentage applied to a notional principal amount. In
decrease to a minimum of 0.50%, depending on the
return, the party agrees to purchase the notional amount
investment performance of the Fund relative to the
of the underlying instrument, at par, if a credit event
Russell 3000 Index (the “Index”). The performance com-
occurs during the term of the swap. A Fund may enter
parison will be made for a rolling 12-month period, with
performance adjustments made at the end of each
into credit default swaps in which that Fund or its coun-
terparty acts as guarantor. By acting as the guarantor of
month. Because the performance adjustment is applied
a swap, that Fund assumes the market and credit risk of
relative to the performance of the Index, Rydex
the underlying instrument, including liquidity and loss
Investments could receive a positive performance adjust-
ment even during periods where the Fund’s performance
of value.
is negative. At September 30, 2007, the effective man-
In conjunction with the use of short sales, options,
agement fee was 0.50% of the Fund’s average daily
futures, options on futures and swap agreements, the
net assets.
Funds are required to maintain collateral in various
forms. The Funds use, where appropriate, depending on
Effective May 1, 2006, Rydex Investments has contractu-
the financial instrument utilized and the broker involved,
ally agreed to waive its 0.75% investment advisory fee
to the extent necessary to limit the ordinary operating
margin deposits at the broker, cash and/or securities
segregated at the custodian bank, discount notes, or
expenses of the Commodities Strategy Fund (but exclud-
ing interest expenses, brokerage commissions and
the repurchase agreements allocated to each Fund.
extraordinary expenses) to not more than 1.29% per
The risks inherent in the use of short sales, options,
annum of the average monthly net assets of the Fund
futures contracts, options on futures contracts, structured
(the “Contractual Fee Waiver”). The Contractual Fee
notes and swap agreements include i) adverse changes
Waiver was unable to be modified or eliminated prior
in the value of such instruments; ii) imperfect correlation
to August 1, 2007.
62
|
THE RYDEX SERIES FUNDS SEMI-ANNUAL REPORT
NOTES TO FINANCIAL STATEMENTS (Unaudited) (continued)
As part of its agreement with the Trust, Rydex
The Trust has adopted a separate Distribution and
Investments will pay all expenses of the Absolute Return
Shareholder Services Plan applicable to its C-Class
Strategies Fund and Hedged Equity Fund, including the
Shares that allows the Funds to pay annual distribution
cost of transfer agency, custody, fund administration,
and service fees of 1.00% of the Funds’ C-Class Shares
legal, audit and other services, except interest expense,
average daily net assets. The annual 0.25% service fee
taxes (expected to be de minimis), brokerage commis-
compensates the shareholder’s financial advisor for pro-
sions and other expenses connected with execution of
viding on-going services to the shareholder. The annual
portfolio transactions, short dividend expenses, and
0.75% distribution fee reimburses the Distributor for pay-
extraordinary expenses.
ing the shareholder’s financial advisor an on-going sales
Rydex Investments provides transfer agent and adminis-
commission. The Distributor advances the first year’s
trative services to the Funds for fees calculated at an
service and distribution fees to the Financial Advisor.
annualized rate of 0.25% of the average daily net assets
The Distributor retains the service and distribution fees
of each Fund. Fees related to the Absolute Return
on accounts with no authorized dealer of record.
Strategies and Hedged Equity Funds are paid by Rydex
During the period ended September 30, 2007, the
Investments, as previously noted.
Distributor retained sales charges of $370,341 relating to
Rydex Investments provides accounting services to the
sales of A-Class Shares of the Trust.
Trust whose fee is calculated at an annualized rate of
Certain officers and trustees of the Trust are also officers
0.10% on the first $250 million of the average daily net
of Rydex Investments.
assets, 0.075% on the next $250 million of the average
daily net assets, 0.05% on the next $250 million of the
4.
Federal Income Tax Information
average daily net assets, and 0.03% on the average
The Funds intend to comply with the provisions of
daily net assets over $750 million of each Fund. Fees
Subchapter M of the Internal Revenue Code applicable
related to the Absolute Return Strategies and Hedged
to regulated investment companies and will distribute
to shareholders. Therefore, no Federal income tax provi-
Equity Funds are paid by Rydex Investments, as previ-
substantially all net investment income and capital gains
sion has been recorded.
ously noted.
Rydex Investments engages external service providers to
perform other necessary services for the Trust, such as
Income and capital gain distributions are determined in
audit related services, legal services, custody, printing
accordance with Federal income tax regulations, which
and mailing, etc., on a pass-through basis. Such expenses
may differ from U.S. generally accepted accounting prin-
vary from Fund to Fund and are allocated to the Funds
ciples. These differences are primarily due to differing
based on relative net assets. Any of these expenses allo-
treatments for derivatives, foreign currency transactions,
cated to the Absolute Return Strategies and Hedged
losses deferred due to wash sales, losses deferred due
Equity Funds are paid by Rydex Investments, as previ-
to post-October losses, and excise tax regulations.
ously noted. Organizational and setup costs for new
Permanent book and tax basis differences, if any, will
funds are paid by the Trust.
result in reclassifications. This includes reclasses due to
The Trust has adopted a Distribution Plan applicable to
net operating losses, non-deductible expenses, differ-
its A-Class Shares and H-Class Shares for which the
ences in the treatment of certain investments, and the
Distributor and other firms that provide distribution
utilization of earnings and profits distributed to the
and/or shareholder services (“Service Providers”) may
shareholders on redemption of shares as part of the divi-
receive compensation. If a Service Provider provides dis-
dends paid deduction for income tax
tribution services, the Trust will pay distribution fees to
purposes. These reclassifications have no effect on net
the Distributor at an annual rate not to exceed 0.25% of
assets or net asset values per share.
average daily net assets, pursuant to Rule 12b-1 of the
1940 Act. The Distributor, in turn, will pay the Service
Provider out of its fees.
THE RYDEX SERIES FUNDS SEMI-ANNUAL REPORT
|
63
NOTES TO FINANCIAL STATEMENTS (Unaudited) (continued)
At September 30, 2007, the cost of securities for Federal income tax purposes, the aggregate gross unrealized gain for all
securities for which there was an excess of value over tax cost and the aggregate gross unrealized loss for all securities for
which there was an excess of tax cost over value were as follows:
Tax
Tax
Net
Fund
Cost
Gain
Loss
Gain (Loss)
Tax
Unrealized
Unrealized
Unrealized
Multi-Cap Core Equity Fund
$
65,891,880
$
8,864,529
$
(3,586,479)
$
5,278,050
Sector Rotation Fund
390,816,177
56,673,573
(5,860,762)
50,812,811
Absolute Return Strategies Fund
238,215,957
19,436,960
(15,995,539)
3,441,421
Commodities Strategy Fund
93,821,347
5,076,971
(69,350)
5,007,621
Hedged Equity Fund
40,257,417
3,489,524
(2,698,008)
791,516
International Rotation Fund
10,620,121
525,641
—
525,641
Managed Futures Strategy Fund
165,688,311
406,676
(2,038,408)
(1,631,732)
Real Estate Fund
26,504,446
3,137,681
(23,763)
3,113,918
Strengthening Dollar 2x Strategy Fund
23,070,529
—
—
—
Weakening Dollar 2x Strategy Fund
158,642,514
—
—
—
5.
Repurchase Agreements
The Trust transfers uninvested cash balances into a single joint account, the daily aggregate balance of which is invested in
one or more repurchase agreements collateralized by obligations of the U.S. Treasury and U.S. Government Agencies. The
collateral is in the possession of the Trust’s custodian and is evaluated daily to ensure that its market value exceeds by, at
a minimum, 102% of the delivery value of the repurchase agreements at maturity. Each Fund holds a pro rata share of the
collateral based on the dollar amount of the repurchase agreement entered into by each Fund.
The repurchase agreements executed by the joint account and outstanding as of September 30, 2007, were as follows:
Counterparty
Terms of Agreement
Face Value
Market Value
Repurchase Price
Mizuho Financial Group, Inc.
3.96% due 10/01/07
$850,000,000
$
850,000,000
$
850,280,500
Lehman Brothers Holdings, Inc.
Credit Suisse Group
3.90% due 10/01/07
3.95% due 10/01/07
521,019,159
160,971,201
521,019,159
160,971,201
521,188,491
161,024,187
Morgan Stanley
3.80% due 10/01/07
100,000,000
100,000,000
100,031,667
$1,631,990,360
$1,632,524,845
As of September 30, 2007, the collateral for the repurchase agreements in the joint account was as follows:
Security Type
Maturity Dates
Range of Rates
Par Value
Market Value
U.S. Treasury Notes
U.S. Treasury Bills
09/15/07 – 11/15/14
2.63% – 6.00%
-->
2.63% – 6.00%
$821,412,000
$
840,862,329
TIP Notes
01/15/10 – 01/15/14
10/04/07 – 04/27/08
0.00%
458,425,000
457,589,357
U.S. Treasury Bonds
05/15/16 – 05/15/37
1.88% – 4.25%
5.00% – 8.88%
238,718,000
43,298,000
281,318,679
52,816,351
TIP Bonds
01/15/25 – 04/15/29
2.38% – 3.88%
21,420,000
31,858,301
$1,664,445,017
In the event of counterparty default, the Trust has the right to collect the collateral to offset losses incurred. There is poten-
tial loss to the Trust in the event the Trust is delayed or prevented from exercising its rights to dispose of the collateral
securities, including the risk of a possible decline in the value of the underlying securities during the period while the Trust
seeks to assert its rights. The Trust’s investment advisor, acting under the supervision of the Board of Trustees, reviews the
value of the collateral and the creditworthiness of those banks and dealers with which the Trust enters into repurchase
agreements to evaluate potential risks.
64
|
THE RYDEX SERIES FUNDS SEMI-ANNUAL REPORT
NOTES TO FINANCIAL STATEMENTS (Unaudited) (continued)
6.
Securities Transactions
During the period ended September 30, 2007, the cost of purchases and proceeds from sales of investment securities,
excluding short-term and temporary cash investments, were:
Core Equity
Multi-Cap
Sector Rotation
Absolute Return
Strategies
Commodities
Strategy
Hedged Equity
Fund
Fund
Fund
Fund
Fund
Purchases
$45,013,522
$420,140,651
$455,368,783
$61,947,794
$59,849,195
Sales
$58,624,606
$425,913,701
$398,100,988
$51,126,861
$59,510,345
International
Managed
Strengthening Dollar
Weakening Dollar
Rotation
Fund
Futures Strategy
Real Estate
2x Strategy
2x Strategy
Fund
Fund
Fund
Fund
Purchases
$8,693,101
$72,843,777
$
96,996,793
$
—
$
—
Sales
$2,102,601
$35,694,453
$109,583,232
$
—
$
—
THE RYDEX SERIES FUNDS SEMI-ANNUAL REPORT
|
65
NOTES TO FINANCIAL STATEMENTS (continued)
7.
Share Transactions
The Trust is authorized to distribute an unlimited number of no par value shares. Transactions in shares for the periods presented were:
Shares Purchased
Purchased through Dividend Reinvestment
Shares Redeemed
Net Shares Purchased (Redeemed)
Period Ended
Year Ended
Period Ended
Year Ended
Period Ended
Year Ended
Period Ended
Year Ended
September 30,
2007†
March 31,
2007
September 30,
2007†
March 31,
2007
September 30,
2007†
March 31,
2007
September 30,
2007†
March 31,
2007
Multi-Cap Core Equity Fund
A-Class
89,136
512,324
—
25,016
(158,793)
(388,196)
(69,657)
149,144
C-Class
H-Class
169,534
325,788
2,703,163
915,144
—
—
132,999
120,278
(772,088)
(493,894)
(3,585,911)
(1,101,463)
(602,554)
(168,106)
(749,749)
(66,041)
Sector Rotation Fund
A-Class
890,957
2,915,024
—
99,346
(649,483)
(2,349,522)
241,474
664,848
C-Class
H-Class
4,597,174
1,156,130
17,047,675
5,827,906
—
—
340,057
297,000
(3,511,201)
(1,634,222)
(24,762,620)
(5,985,481)
1,085,973
(478,092)
139,425
(7,374,888)
Absolute Return Strategies Fund
A-Class
844,578
1,743,268
—
23,781
(449,716)
(414,314)
394,862
1,352,735
C-Class
H-Class
2,816,629
973,876
8,184,826
1,992,272
—
—
121,837
29,287
(1,617,350)
(386,181)
(2,854,821)
(472,761)
587,695
1,548,798
1,199,279
5,451,842
Commodities Strategy Fund
A-Class
303,840
1,038,828
4,195
—
(214,543)
(951,294)
93,492
87,534
C-Class
H-Class
2,781,757
274,841
6,197,206
257,580
9,710
2,792
—
—
(1,682,375)
(203,154)
(5,788,416)
(232,273)
1,109,092
74,479
408,790
25,307
Hedged Equity Fund
A-Class
72,902
260,802
—
4,214
(99,409)
(60,153)
(26,507)
204,863
C-Class
H-Class
472,509
85,988
1,077,651
320,629
—
—
42,094
12,011
(185,840)
(144,719)
(127,584)
(58,731)
205,056
(688,667)
286,669
431,078
International Rotation Fund*
A-Class
C-Class
22,005
—
—
—
(2)
—
22,003
—
H-Class
435,179
110,125
—
—
—
—
—
—
(64,472)
(2,933)
—
—
370,707
107,192
—
—
Managed Futures Strategy Fund
A-Class
862,783
C-Class
452,309
945,889**
—
—**
(378,988)
(936)**
483,795
944,953**
H-Class
3,618,061
2,234,248**
108,028**
—
—**
(34,433)
—
—**
(1,001,275)
(405,431)**
—**
417,876
108,028**
2,616,786
1,828,817**
Real Estate Fund
A-Class
76,633
564,891
—
1,050
(151,100)
(361,294)
(74,467)
204,647
C-Class
H-Class
3,574,019
277,602
16,747,783
515,598
—
—
13,156
1,190
(3,720,375)
(379,487)
(17,508,928)
(482,847)
(146,356)
(101,885)
(747,989)
33,941
** Since the commencement of operations: March 2, 2007.
* Since the commencement of operations: August 31, 2007.
† Unaudited
NOTES TO FINANCIAL STATEMENTS (continued)
Shares Purchased
Purchased through Dividend Reinvestment
Shares Redeemed
Net Shares Purchased (Redeemed)
Period Ended
Year Ended
Period Ended
Year Ended
Period Ended
Year Ended
Period Ended
Year Ended
September 30,
2007†
March 31,
2007
September 30,
2007†
March 31,
2007
September 30,
2007†
March 31,
September 30,
March 31,
2007
2007†
2007
Strengthening Dollar 2x Strategy Fund
A-Class
C-Class
159,585
475,710
722,596
68,374
—
—
—
—
(100,256)
(386,051)
(645,264)
(67,427)
59,329
89,659
77,332
947
H-Class
3,560,759
8,295,060
—
—
(3,342,972)
(8,085,732)
217,787
209,328
Weakening Dollar 2x Strategy Fund
A-Class
C-Class
679,543
355,878
1,294,478
1,087,128
—
—
—
—
(368,573)
(255,040)
(604,890)
(712,256)
310,970
100,838
689,588
374,872
H-Class
3,891,360
17,478,708
—
—
(3,925,202)
(15,536,958)
(33,842)
1,941,750
† Unaudited
NOTES TO FINANCIAL STATEMENTS (Unaudited) (continued)
8.
Portfolio Securities Loaned
The Trust may lend its securities to approved brokers to earn additional income. Security lending income shown on the
statement of operations is shown net of rebates paid to borrowers and earnings on cash collateral investments shared with
the lending agent. Within this arrangement, the Trust acts as the lender, U.S. Bank acts as the agent, and other approved
registered broker dealers act as the borrowers. The Trust receives cash collateral, valued at 100% of the value of the securi-
ties on loan, which is initially held in a segregated account at U.S. Bank. As agent, U.S. Bank may, for investment purposes,
pool the Trust’s collateral in joint accounts with cash collateral from one or more other securities lending customers of U.S.
Bank. Under the terms of the Trust’s securities lending agreement with U.S. Bank, cash collateral may be invested by U.S.
Bank in certain high quality, liquid investments. At September 30, 2007, the pooled cash collateral investments consisted of
mutual funds (92.02%) and repurchase agreements (7.98%). Collateral is maintained over the life of the loan in an amount
not less than the value of loaned securities, as determined at the close of fund business each day; any additional collateral
required due to changes in security values is delivered to the Fund the next business day. Although the collateral mitigates
risk, the Trust could experience a delay in recovering its securities and a possible loss of income or value if the borrower
fails to return the securities. The Trust has the right under the securities lending agreement to recover the securities from
the borrower on demand.
The following represents a breakdown of the collateral, its rates, and maturities.
Shares
Market Value
MUTUAL FUND
92.02%
Mount Vernon Securities Lending Trust
1,166,989,146
$ 1,166,989,146
TOTAL
$ 1,166,989,146
Cost
Market Value
Repurchase Date
REPURCHASE AGREEMENT
7.98%
Rate
5.05%
Goldman Sachs Group, Inc.
$101,250,000
$
101,250,000
10/01/07
TOTAL
$ 101,250,000
100.00%
GRAND TOTAL
$ 1,268,239,146
As of September 30, 2007, the collateral for the repurchase agreements in the joint account was as follows:
Range of Rates
Security Type
Current Par Value
Market Value
Maturity
0.00% – 6.51%
Federal Mortgage Backed Securities
$156,874,854
$
103,275,001
04/01/33 – 07/25/36
$
103,275,001
At September 30, 2007 the following Funds participated in securities lending and received cash collateral:
Fund
Cash Collateral
Value of Securities Loaned
Multi-Cap Core Equity Fund
$
8,163,346
$
7,803,167
Sector Rotation Fund
Absolute Return Strategies Fund
50,996,329
79,793,952
49,117,574
77,179,907
Commodities Strategy Fund
Hedged Equity Fund
8,396,422
3,484,194
8,127,927
3,354,070
Managed Futures Strategy Fund
4,067,394
Real Estate Fund
5,449,386
3,948,621
5,221,649
68
|
THE RYDEX SERIES FUNDS SEMI-ANNUAL REPORT
NOTES TO FINANCIAL STATEMENTS (Unaudited) (concluded)
9.
New Accounting Pronouncements
On July 13, 2006, the Financial Accounting Standards Board (FASB) released FASB Interpretation No. 48 “Accounting for
Uncertainty in Income Taxes” (FIN 48). FIN 48 provides guidance for how uncertain tax positions should be recognized,
measured, presented and disclosed in the financial statements. FIN 48 requires the evaluation of tax positions taken or
expected to be taken in the course of preparing the Fund’s tax returns to determine whether the tax positions are “more-
likely-than-not” of being sustained by the applicable tax authority. Tax positions not deemed to meet the more-likely-than-
not threshold would be recorded as a tax benefit or expense in the current year. Adoption of FIN 48 is required for fiscal
years beginning after December 15, 2006 and is to be applied to all open tax years as of the effective date. Recent SEC
guidance allows implementing FIN 48 in fund net asset value calculations as late as a fund’s last net asset value calculation
in the first required financial statement reporting period. Management adopted FIN 48 on September 2, 2007. There was
no material impact to the financial statements or disclosures thereto as a result of the adoption of this pronouncement.
On September 15, 2006, the FASB released Statement of Financial Accounting Standard No. 157 (“FAS 157”) Fair Value
Measurement which provided enhanced guidance for using fair value to measure assets and liabilities. The standard
requires companies to provide expanded information about the assets and liabilities measured at fair value and the poten-
tial effect of these fair valuations on an entity’s financial performance. The standard does not expand the use of fair value in
any new circumstances, but provides clarification on acceptable fair valuation methods and applications. Adoption of FAS
157 is required for fiscal years beginning after November 15, 2007. The standard is not expected to materially impact the
Funds’ financial statements.
10
Acquisition of Rydex Investments and the Distributor
On June 28, 2007, Rydex NV, Inc. and Security Benefit Corporation (“Security Benefit”) entered into an agreement pur-
suant to which Rydex Investments, together with several other Rydex entities, will be acquired by Security Benefit, a finan-
cial services firm that provides a broad variety of financial programs to investors in the advisor, banking, education,
government, institutional, and qualified plan markets (the “Transaction”). Upon completion of the Transaction, Rydex
Investments and the Distributor will be wholly-owned subsidiaries of Security Benefit. While the Transaction will have no
material impact on the Funds or their shareholders, it will result in a change of control of Rydex Investments, which in turn
will cause the termination of the investment advisory agreement between Rydex Investments and the Funds.
As a result, a Special Meeting of Shareholders (the “Meeting”) of the Funds was held on October 4, 2007, for the purpose of
asking shareholders of record to approve a new investment advisory agreement between Rydex Investments and the Funds
under substantially the same terms as the previous investment advisory agreement (the “New Agreement”). If approved by
shareholders, the New Agreement will take effect upon the closing of the Transaction, which is currently anticipated to occur
in the 4th Quarter of 2007. Shareholders of the Funds will receive additional, and more detailed, information about the
Transaction as that information becomes available.
The Transaction will have no impact on the day-to-day operations of Rydex Investments, the fees payable to Rydex
Investments under the New Agreement, or the persons responsible for the management of the Funds. Thus, the
Transaction should have no impact on the Funds’ shareholders.
THE RYDEX SERIES FUNDS SEMI-ANNUAL REPORT
|
69
OTHER INFORMATION (Unaudited)
Proxy Voting Information
A description of the policies and procedures that the Trust uses to determine how to vote proxies relating to securities held
in the Funds’ portfolios is available, without charge and upon request, by calling 1-800-820-0888. This information is also
available from the EDGAR database on the SEC’s website at http://www.sec.gov.
Information regarding how the Funds voted proxies relating to portfolio securities during the most recent 12-month period
ended June 30 is available without charge, upon request, by calling 1-800-820-0888. This information is also available from
the EDGAR database on the SEC’s website at http://www.sec.gov.
Quarterly Portfolio Schedules Information
The Trust files its complete schedule of portfolio holdings with the SEC for the first and third quarters of each fiscal year
on Form N-Q, which is available on the SEC’s website at http://www.sec.gov. The Funds’ Forms N-Q may be reviewed and
copied at the SEC’s Public Reference Room in Washington, DC, and that information on the operation of the Public
Reference Room may be obtained by calling 1-800-SEC-0330. Copies of the portfolio holdings are also available to share-
holders, without charge and upon request, by calling 1-800-820-0888.
Rydex Investments Board Review and Approval of the Investment Advisory Agreement
The Investment Company Act of 1940 (the “1940 Act”) requires that the initial approval of, as well as the continuation of, a
fund’s investment advisory agreement be specifically approved by the vote of a majority of the trustees who are not parties
to the investment advisory agreement or “interested persons” of any party (the “Independent Trustees”), cast in person at
a meeting called for the purpose of voting on such approval. In connection with such approvals, the fund’s trustees must
request and evaluate, and the investment adviser is required to furnish, such information as may be reasonably necessary to
evaluate the terms of the advisory agreement. In addition, the Securities and Exchange Commission (the “SEC”) takes the
position that, as part of their fiduciary duties with respect to fund fees, fund boards are required to evaluate the material
factors applicable to a decision to approve an investment advisory agreement.
Consistent with these responsibilities, the Rydex Series Funds Board of Trustees (the “Board”) generally calls and holds one
meeting each year that is dedicated to considering whether to renew the investment advisory agreements between Rydex
Series Funds (the “Trust”) and PADCO Advisors, Inc., which does business under the name Rydex Investments (“Rydex
Investments”), (the “Current Agreements”) with respect to existing funds in the Trust, including the funds discussed in this
Semi-Annual Report (each a “Fund” and collectively, the “Funds”), and to reviewing certain other agreements pursuant to
which Rydex Investments provides investment advisory services to certain other registered investment companies. In prepa-
ration for the meeting, the Board requests and reviews a wide variety of materials provided by Rydex Investments, includ-
ing information about Rydex Investments’ affiliates, personnel and operations. The Board also receives data provided by
third parties. This information is in addition to the detailed information about the Funds that the Board reviews during the
course of each year, including information that relates to Fund operations and performance. The Board also receives a
memorandum from Fund counsel regarding the responsibilities of the Board for the approval of investment advisory agree-
ments. In addition, the Independent Trustees receive advice from independent counsel to the Independent Trustees, meet
in executive session outside the presence of fund management, and participate in question and answer sessions with repre-
sentatives of Rydex Investments.
At a Special Meeting of the Board held on July 10, 2007, and subsequently, during the Board’s regular quarterly meeting
held on August 27 and 28, 2007 (the “Annual Renewal Meeting” and together with the July 10, 2007 Meeting, the
“Meetings”), the Board considered and voted in favor of new investment advisory agreements for Rydex Series Funds
(each, a “New Agreement” and collectively, the “New Agreements”), which, subject to their approval by each Fund’s
shareholders, will enable Rydex Investments to continue to serve as investment adviser to each Fund after the completion
of the acquisition of Rydex Investments’ parent, Rydex Holdings, Inc. (the “Transaction”). During the Annual Renewal
Meeting, the Board also considered and approved the selection of Rydex Investments and the continuance of the Current
Agreements for an additional one-year period or until the closing of the Transaction, based on its review of qualitative and
quantitative information provided by Rydex Investments.
Board Considerations in Approving the New Agreements and the Continuation of the Current Agreements
In preparation for the Annual Renewal Meeting, the Board requested and received written materials from Rydex
Investments about: (a) the quality of Rydex Investments’ investment management and other services; (b) Rydex
70
|
THE RYDEX SERIES FUNDS SEMI-ANNUAL REPORT
OTHER INFORMATION (Unaudited) (continued)
Investments’ investment management personnel; (c) Rydex Investments’ operations and financial condition; (d) Rydex
Investments’ brokerage practices (including any soft dollar arrangements) and investment strategies; (e) the level of the
advisory fees that Rydex Investments charges the Funds compared with the fees it charges to comparable mutual funds or
accounts; (f) each Fund’s overall fees and operating expenses compared with similar mutual funds; (g) the level of Rydex
Investments’ profitability from its Fund-related operations; (h) Rydex Investments’ compliance systems; (i) Rydex
Investments’ policies on and compliance procedures for personal securities transactions; (j) Rydex Investments’ reputation,
expertise and resources in the financial markets; and (k) Fund performance compared with similar mutual funds. Certain of
these considerations are discussed in more detail below.
In its deliberations at the Annual Renewal Meeting, the Board did not identify any single piece of information that was all-
important or controlling. Based on the Board’s deliberations and its evaluation of the information referenced above and
described in more detail below, the Board, including all of the Independent Trustees, unanimously: (a) concluded that
terms of the Current Agreements and New Agreements were fair and reasonable; (b) concluded that Rydex Investments’
fees were reasonable in light of the services that Rydex Investments provides to the Funds; (c) agreed to renew each
Current Agreement for an additional one-year term; and (d) agreed to approve the New Agreements for an initial term of
two years.
In approving the New Agreements and the continuation of the Current Agreements at the Annual Renewal Meeting, the
Board, including the Independent Trustees advised by independent counsel, considered the factors discussed below.
Nature, Extent And Quality Of Services Provided By Rydex Investments
At the Annual Renewal Meeting, the Board reviewed the scope of services to be provided by Rydex Investments
under each Current Agreement and noted that there would be no significant differences between the scope of serv-
ices required to be provided by Rydex Investments for the past year and the scope of services required to be pro-
vided by Rydex Investments for the upcoming year. In reviewing the scope of services provided to the Funds by Rydex
Investments, the Board reviewed and discussed Rydex Investments’ investment experience, noting that Rydex
Investments and its affiliates have committed significant resources over time to the support of the Funds. The Board
also considered Rydex Investments’ compliance program and its compliance record with respect to the Funds. In that
regard, the Board noted that Rydex Investments provides information regarding the portfolio management and com-
pliance to the Board on a periodic basis in connection with regularly scheduled meetings of the Board. In addition to
the above considerations, the Board reviewed and considered Rydex Investments’ investment processes and strate-
gies, and matters related to Rydex Investments’ portfolio transaction policies and procedures. With respect to those
Funds that invest in unaffiliated ETFs in reliance on exemptive orders pursuant to Section 12(d)(1), the Board consid-
ered and determined that the advisory fees charged under the Current Agreements are based on services provided
that will be in addition to, rather than duplicative of, the services provides under the investment advisory agreement
of any ETF in which the Funds are invested. In particular, the Board recognized that Rydex Investments must manage
a Fund’s investment in an unaffiliated ETF in the same manner as other investments in the Fund’s portfolio in order to
ensure that the Fund achieves its investment objective. Thus, a Fund’s investment in an unaffiliated ETF does not alle-
viate Rydex Investments’ duties and responsibilities as investment adviser to the Fund. The Board also noted the sub-
stantial volume of portfolio trades and shareholder transaction activity, in general, processed by Rydex Investments
due to the unlimited exchange policy of the majority of the Funds. The Board further noted that the Funds have con-
sistently met their investment objectives since their respective inception dates. Based on this review, the Board con-
cluded that the nature, extent, and quality of services to be provided by Rydex Investments to the Funds under the
Current Agreements were appropriate and continued to support the Board’s original selection of Rydex Investments
as investment adviser to the Funds.
Fund Expenses And Performance Of The Funds And Rydex Investments
At the Annual Renewal Meeting, the Board reviewed statistical information prepared by Rydex Investments regarding
the expense ratio components, including actual advisory fees, waivers/reimbursements, and gross and net total
expenses of each Fund in comparison with the same information for other funds registered under the 1940 Act deter-
mined by Rydex Investments to comprise each Fund’s applicable peer group. Because few funds seek to provide
unlimited exchange privileges similar to those of the majority of the Funds, each Fund’s applicable peer group is gen-
erally limited to the funds of two unaffiliated mutual fund families. In addition, the Board reviewed statistical informa-
tion prepared by Rydex Investments relating to the performance of each Fund, as well as each Fund’s ability to
successfully track its benchmark over time, and a comparison of each Fund’s performance to funds with similar invest-
THE RYDEX SERIES FUNDS SEMI-ANNUAL REPORT
|
71
OTHER INFORMATION (Unaudited) (continued)
ment objectives for the same periods and to appropriate indices/benchmarks, in light of total return, yield and market
trends. The Board further noted that despite the unique nature of the Funds, the peer fund information presented to
the Board was meaningful because the peer funds’ investment objectives and strategies were closely aligned with
those of the Funds. The Board noted that most of the Funds either outperformed their peer funds or performed in
line with them over relevant periods. The Board also noted that the investment advisory fees for the Funds were
equivalent to those of their peers and that the overall expenses for the Funds were only slightly higher than the total
expenses of the peer funds, due in part to differing share classes and distribution fees. Based on this review, the
Board concluded that the investment advisory fees and expense levels and the historical performance of the Funds, as
managed by Rydex Investments, as compared to the investment advisory fees and expense levels and performance of
the peer funds, were satisfactory for the purposes of approving the continuance of the Current Agreements.
Costs Of Services Provided To The Funds And Profits Realized By Rydex Investments And Its Affiliates
At the Annual Renewal Meeting, the Board reviewed information about the profitability of the Funds to Rydex
Investments based on the advisory fees payable under the Current Agreements for the last calendar year. Rydex
Investments also presented the Board with material discussing its methodology for determining the level of advisory
fees assessable to the Funds. The Board analyzed the Funds’ expenses, including the investment advisory fees paid to
Rydex Investments. The Board also reviewed information regarding direct revenue received by Rydex Investments and
ancillary revenue received by Rydex Investments and/or its affiliates in connection with the services provided to the
Funds by Rydex Investments (as discussed below) and/or its affiliates. The Board also discussed Rydex Investments’
profit margin as reflected in Rydex Investments’ profitability analysis and reviewed information regarding economies of
scale (as discussed below). Based on this review, the Board concluded that the profits to be realized by Rydex
Investments and its affiliates under the Current Agreements and from other relationships between the Funds and
Rydex Investments and/or its affiliates, if any, were within the range the Board considered reasonable and appropriate.
Economies Of Scale
In connection with its review of the Funds’ profitability analysis at the Annual Renewal Meeting, the Board reviewed
information regarding economies of scale or other efficiencies that may result from increases in the Funds’ asset levels.
The Board noted that neither the Current Agreements nor the New Agreements for the Funds provided for any
breakpoints in the investment advisory fees as a result of increases in the asset levels of the Funds. The Board also
noted that though Rydex Investments’ assets under management were significant, the amount is spread among more
than 100 Funds. Further limiting the realization of economies of scale, is the ability of shareholders of many of the
Funds to engage in unlimited trading. The Board also reviewed and considered Rydex Investments’ historic profitabil-
ity as investment adviser to the Funds and determined that reductions in advisory fees or additions of breakpoints
were not warranted at this juncture. Based on this review, the Board, recognizing its responsibility to consider this
issue at least annually, determined that the economies of scale, if any, were de minimis.
Other Benefits To Rydex Investments And/Or Its Affiliates
At the Annual Renewal Meeting, in addition to evaluating the services provided by Rydex Investments, the Board also
considered the nature, extent, quality and cost of the administrative, distribution, and shareholder services performed
by Rydex Investments’ affiliates under separate agreements. The Board noted that Rydex Investments reports its use
of soft dollars to the Board on a quarterly basis, as well as any portfolio transactions on behalf of the Funds placed
through an affiliate of the Funds or Rydex Investments pursuant to Rule 17e-1 under the 1940 Act. Based on its
review, the Board concluded that the nature and quality of the services provided by Rydex Investments’ affiliates to
each Trust will benefit the Funds’ shareholders, and that any ancillary benefits would not be disadvantageous to the
Funds’ shareholders, particularly in light of the Board’s view that the Funds’ shareholders benefit from investing in a
fund that is part of a large family of funds offering a variety of investment strategies and services.
Additional Considerations in Approving the New Agreements
On June 18, 2007, the Trustees met with representatives of Security Benefit and the management of Rydex Investments
for the purpose of learning more about Security Benefit and the proposed Transaction. Immediately following the
announcement that Rydex and Security Benefit entered into a purchase and sale agreement, the Trustees requested that
Rydex Investments provide the Board with additional information pertaining to the effect of the proposed change of con-
trol on Rydex Investments’ personnel and operations and the terms of the New Agreements. Rydex Investments presented
its response to the Board’s request for additional information prior to and at a Special Meeting of the Boards of Trustees
72
|
THE RYDEX SERIES FUNDS SEMI-ANNUAL REPORT
OTHER INFORMATION (Unaudited) (concluded)
held on July 10, 2007. Rydex Investments provided the Board with oral and written information to help the Board evaluate
the impact of the change of control on Rydex Investments, Rydex Investments’ ability to continue to provide investment
advisory services to the Funds under the New Agreements, and informed the Board that the contractual rate of Rydex
Investments’ fees will not change under the New Agreements. Rydex Investments also affirmed that the terms of the New
Agreements were the same in all material respects to those of the Current Agreements.
The Trustees deliberated on the approval of each New Agreement in light of the information provided. The Board deter-
mined that the terms of the New Agreements set forth materially similar rights, duties and obligations on Rydex
Investments with regard to the services to be provided to the Trusts, and provided at least the same level of protection to
each Trust, the Funds and the Funds’ shareholders as the Current Agreements. The Board also noted that Rydex
Investments’ fee for its services to the Funds under the New Agreements would be the same as its fees under the Current
Agreements. The Board further noted that all considerations, determinations and findings related to the approval of the
continuation of the Current Agreements, as discussed above, were equally relevant to their approval of the New
Agreements, along with the additional factors relevant to the proposed change of control discussed below.
Nature, Extent And Quality Of Services Provided By The Advisor
The Board noted that Rydex Investments was taking appropriate steps to maintain its associates through the closing
of the Transaction by, in part, keeping them informed of the potential Transaction and awarding key personnel with
incentives to emphasize their value to Rydex Investments. As a result of these efforts, it is anticipated that the key
investment and management personnel servicing the Funds will remain with Rydex Investments following the
Transaction and that the investment and management services provided to the Funds by Rydex Investments will not
change. The Board also considered Rydex Investments’ and Security Benefit’s representations to the Board that
Security Benefit intends for Rydex Investments to continue to operate following the closing of the Transaction in much
the same manner as it operates today, and that the Transaction should have no impact on the day-to-day operations
of Rydex Investments, or the persons responsible for the management of the Funds. Based on this review, the Board
concluded that the range and quality of services provided by Rydex Investments to the Funds were appropriate and
were expected to continue under the New Agreements, and that there was no reason to expect the consummation of
the Transaction to have any adverse effect on the services provided by Rydex Investments and its affiliates or the
future performance of the Funds.
Fund Expenses
The Board also considered the fact that the fees payable to Rydex Investments and other expenses of the Funds
would be the same under the New Agreements as they are under the Current Agreements, and on this basis, the
Board concluded that these fees and expenses continued to be satisfactory for the purposes of approving the New
Agreements. More detailed information regarding the fees under each New Agreement is contained in the Proxy
Statement and accompanying materials dated September 6, 2007.
Costs Of Services Provided To The Funds And Profits Realized By Rydex Investments And Its Affiliates
Because Rydex Investments’ fees under the New Agreements are the same as those assessed under the Current
Agreements, the Board concluded that the profits to be realized by Rydex Investments and its respective affiliates
under the New Agreements and from other relationships between the Funds and Rydex Investments, if any, should
remain within the range the Board considered reasonable and appropriate. The Board further noted that, although it
is not possible to predict how the Transaction may affect Rydex Investments’ future profitability from its relationship
with the Funds, this matter would be given further consideration on an annual basis going forward.
Economies Of Scale
The Board further considered the potential economies of scale that may result from the Transaction, and concluded
that the extent of such economies of scale could not be predicted in advance of the closing of the Transaction.
THE RYDEX SERIES FUNDS SEMI-ANNUAL REPORT
|
73
INFORMATION ON BOARD OF TRUSTEES AND OFFICERS (Unaudited)
A Board of Trustees oversees all Rydex Investments, in which its members have no stated term of service, and continue to
serve after election until resignation. The Statement of Additional Information includes further information about Fund
Trustees and Officers, and can be obtained without charge by calling 1-800-820-0888.
All Trustees and Officers may be reached c/o Rydex Investments, 9601 Blackwell Rd., Suite 500, Rockville, MD 20850.
TRUSTEES AND OFFICERS
Length of Service
Name, Position and
As Trustee
Number of
––––––––––––––––––––––
Year of Birth
––––––––––––––––––––––––––––––––
(Year Began)
––––––––––——––––––
Funds Overseen
Carl G. Verboncoeur*
Rydex Series Funds – 2004
141
Trustee, President (1952)
Rydex Variable Trust – 2004
Rydex Dynamic Funds – 2004
Rydex ETF Trust – 2004
Principal Occupations During Past Five Years: Chief Executive Officer and Treasurer of Rydex Specialized Products, LLC
(2005 to present); Chief Executive Officer of Rydex Investments and Rydex Distributors, Inc. (2003 to present); Executive
Vice President of Rydex Investments (2000 to 2003)
Michael P. Byrum*
Rydex Series Funds – 2005
141
Trustee, Vice President
Rydex Variable Trust – 2005
(1970)
Rydex Dynamic Funds – 2005
Rydex ETF Trust – 2005
Principal Occupations During Past Five Years: Secretary of Rydex Specialized Products, LLC (2005 to present); Vice
President of Rydex Series Funds (1997 to present); Vice President of Rydex Variable Trust (1998 to present); Vice President
of Rydex Dynamic Funds (1999 to present); Vice President of Rydex ETF Trust (2002 to present); President and Trustee of
Rydex Capital Partners SPhinX Fund (2003 to 2006); President of Rydex Investments (2004 to present); Chief Operating
Officer of Rydex Investments and Rydex Distributors, Inc. (2003 to 2004)
INDEPENDENT TRUSTEES
Length of Service
Name, Position and
As Trustee
Number of
––––––––––––––––––––––
Year of Birth
––––––––––––––––––––––––––––––––
(Year Began)
––––––––––——––––––
Funds Overseen
John O. Demaret
Rydex Series Funds – 1997
133
Trustee, Chairman of the Board (1940)
Rydex Variable Trust – 1998
Rydex Dynamic Funds – 1999
Rydex ETF Trust – 2003
Principal Occupations During Past Five Years: Retired
Corey A. Colehour
Rydex Series Funds – 1993
133
Trustee (1945)
Rydex Variable Trust – 1998
Rydex Dynamic Funds – 1999
Rydex ETF Trust – 2003
Principal Occupations During Past Five Years: Retired (2006-present); Owner and President of Schield Management
Company, registered investment adviser (2005 to 2006); Senior Vice President of Marketing and Co-Owner of Schield
Management Company, registered investment adviser (1985 to 2005)
J. Kenneth Dalton
Rydex Series Funds – 1995
133
Trustee (1941)
Rydex Variable Trust – 1998
Rydex Dynamic Funds – 1999
Rydex ETF Trust – 2003
Principal Occupations During Past Five Years: Mortgage Banking Consultant and Investor, The Dalton Group
74
|
THE RYDEX SERIES FUNDS SEMI-ANNUAL REPORT
INFORMATION ON BOARD OF TRUSTEES AND OFFICERS (Unaudited) (concluded)
Length of Service
Name, Position and
As Trustee
Number of
––––––––––––––––––––––
Year of Birth
––––––––––––––––––––––––––––––––
(Year Began)
––––––––––——––––––
Funds Overseen
Werner E. Keller
Rydex Series Funds – 2005
133
Trustee (1940)
Rydex Variable Trust – 2005
Rydex Dynamic Funds – 2005
Rydex ETF Trust – 2005
Principal Occupations During Past Five Years: Retired (2001 to present); Chairman, Centurion Capital Management (1991 to 2001)
Thomas F. Lydon, Jr.
Rydex Series Funds – 2005
133
Trustee (1960)
Rydex Variable Trust – 2005
Rydex Dynamic Funds – 2005
Rydex ETF Trust – 2005
Principal Occupations During Past Five Years: President, Global Trends Investments
Patrick T. McCarville
Rydex Series Funds – 1997
133
Trustee (1942)
Rydex Variable Trust – 1998
Rydex Dynamic Funds – 1999
Rydex ETF Trust – 2003
Principal Occupations During Past Five Years: Founder and Chief Executive Officer, Par Industries, Inc.
Roger Somers
Rydex Series Funds – 1993
133
Trustee (1944)
Rydex Variable Trust – 1998
Rydex Dynamic Funds – 1999
Rydex ETF Trust – 2003
Principal Occupations During Past Five Years: Owner, Arrow Limousine
EXECUTIVE OFFICERS
Name, Position and
Principal Occupations
––––––––––––––––––––––
Year of Birth
––––––––––––––––––––
During Past Five Years
Nick Bonos*
Chief Financial Officer of Rydex Specialized Products, LLC (2005 to
Vice President and Treasurer (1963)
present); Vice President and Treasurer of Rydex Series Funds, Rydex
Variable Trust, Rydex Dynamic Funds, and Rydex ETF Trust (2003 to
present); Senior Vice President of Rydex Investments (2003 to present);
Vice President and Treasurer of Rydex Capital Partners SPhinX Fund (2003
to 2006); Vice President of Accounting of Rydex Investments (2000 to
2003)
Joanna M. Haigney*
Chief Compliance Officer of Rydex Series Funds, Rydex Variable Trust, and
Chief Compliance Officer and
Rydex Dynamic Funds (2004 to present); Secretary of Rydex Series Funds,
Secretary (1966)
Rydex Variable Trust, and Rydex Dynamic Funds (2000 to present);
Secretary of Rydex ETF Trust (2002 to present); Vice President of
Compliance of Rydex Investments (2000 to present); Secretary of Rydex
Capital Partners SPhinX Fund (2003 to 2006)
Joseph Arruda*
Assistant Treasurer of Rydex Series Funds, Rydex Variable Trust, Rydex
Assistant Treasurer (1966)
Dynamic Funds, Rydex ETF Trust (2006 to present); Vice President of
Rydex Investments (2004 to present); Director of Accounting of Rydex
Investments (2003 to 2004); Vice President of Mutual Funds, State Street
Bank & Trust (2000 to 2003)
Paula Billos*
Controller of Rydex Series Funds, Rydex Variable Trust, Rydex Dynamic
Controller (1974)
Funds, Rydex ETF Trust (2006 to present); Director of Fund Administration
of Rydex Investments (2001 to present)
*
Officers of the Funds are deemed to be “interested persons” of the Trust, within the meaning of Section 2(a)(19) of the 1940 Act, inasmuch as
this person is affiliated with Rydex Investments.
THE RYDEX SERIES FUNDS SEMI-ANNUAL REPORT
|
75
This page intentionally left blank.
This page intentionally left blank.
9601 Blackwell Road, Suite 500
Rockville, MD 20850
www.rydexinvestments.com
800-820-0888
RSTF–SEMI–0907X0308