UNITED STATES
SECURITIES AND EXCHANGE COMMISSION
Washington, D.C. 20549
FORM N-CSR
CERTIFIED SHAREHOLDER REPORT OF REGISTERED
MANAGEMENT INVESTMENT COMPANIES
Investment Company Act file number 811- 07584
Rydex Series Funds
(Exact name of registrant as specified in charter)
805 King Farm Boulevard, Suite 600
Rockville, Maryland 20850
(Address of principal executive offices) (Zip code)
Donald C. Cacciapaglia, President
Rydex Series Funds
805 King Farm Boulevard, Suite 600
Rockville, Maryland 20850
(Name and address of agent for service)
Registrant’s telephone number, including area code: 1-301-296-5100
Date of fiscal year end: March 31
Date of reporting period: March 31, 2012
Form N-CSR is to be used by management investment companies to file reports with the Commission not later than 10 days after the transmission to stockholders of any report that is required to be transmitted to stockholders under Rule 30e-1 under the Investment Company Act of 1940 (17 CFR 270.30e-1). The Commission may use the information provided on Form N-CSR in its regulatory, disclosure review, inspection, and policymaking roles.
A registrant is required to disclose the information specified by Form N-CSR, and the Commission will make this information public. A registrant is not required to respond to the collection of information contained in Form N-CSR unless the Form displays a currently valid Office of Management and Budget (“OMB”) control number. Please direct comments concerning the accuracy of the information collection burden estimate and any suggestions for reducing the burden to Secretary, Securities and Exchange Commission, 450 Fifth Street, NW, Washington, DC 20549-0609. The OMB has reviewed this collection of information under the clearance requirements of 44 U.S.C. § 3507.
Item 1. Report to Stockholders.

| | |
DOMESTIC EQUITY FUNDS | | INTERNATIONAL EQUITY FUNDS EUROPE 1.25x STRATEGY FUND JAPAN 2x STRATEGY FUND SPECIALTY FUNDS STRENGTHENING DOLLAR 2x STRATEGY FUND WEAKENING DOLLAR 2x STRATEGY FUND REAL ESTATE FUND FIXED INCOME FUNDS GOVERNMENT LONG BOND 1.2x STRATEGY FUND INVERSE GOVERNMENT LONG BOND STRATEGY FUND HIGH YIELD STRATEGY FUND INVERSE HIGH YIELD STRATEGY FUND MONEY MARKET FUND U.S. GOVERNMENT MONEY MARKET FUND |
NOVA FUND | |
S&P 500 FUND | |
INVERSE S&P 500 STRATEGY FUND | |
NASDAQ-100® FUND | |
INVERSE NASDAQ-100® STRATEGY FUND | |
MID-CAP 1.5x STRATEGY FUND | |
INVERSE MID-CAP STRATEGY FUND | |
RUSSELL 2000® 1.5x STRATEGY FUND | |
RUSSELL 2000® FUND | |
INVERSE RUSSELL 2000® STRATEGY FUND | |
S&P 500 PURE GROWTH FUND | |
S&P 500 PURE VALUE FUND | |
S&P MIDCAP 400 PURE GROWTH FUND | |
S&P MIDCAP 400 PURE VALUE FUND | |
S&P SMALLCAP 600 PURE GROWTH FUND | |
S&P SMALLCAP 600 PURE VALUE FUND | |
GO GREEN!
ELIMINATE MAILBOX CLUTTER
Go paperless with Guggenheim Investments Go paperless with Guggenheim Investments eDelivery—a service giving you full online access to account information and documents. Save time, cut down on mailbox clutter and be a friend to the environment with eDelivery.
With Guggenheim Investments eDelivery you can:
| | • | | View online confirmations and statements at your convenience. |
| | • | | Receive email notifications when your most recent confirmations, statements and other account documents are available for review. |
| | • | | Access prospectuses, annual reports and semiannual reports online. |

If you have questions about Guggenheim Investments
eDelivery services, contact one of our Shareholder Service
Representatives at 800.820.0888.

This report and the financial statements contained herein are submitted for the general information of our shareholders. The report is not authorized for distribution to prospective investors unless preceded or accompanied by an effective prospectus.
Distributed by Rydex Distributors, LLC.
TABLE OF CONTENTS
THE RYDEX SERIES FUNDS ANNUAL REPORT | 1
LETTER TO OUR SHAREHOLDERS
TO OUR SHAREHOLDERS:
A restructuring of Greece’s massive debt, continued accommodation by the world’s major central banks and better news on the U.S. economy helped support financial markets over the fiscal year ended March 31, 2012, with the S&P 500® Index* rising about 9%. Market optimism peaked in early 2012, when several major equity indices pushed to the highest levels in four years or more. But the mood grew more cautious late in the period after the Federal Reserve (“the Fed”) expressed views that continued weakness in housing and employment may pose a risk to the strength of the recovery.
U.S. equities experienced big intra-year swings. Markets swooned by nearly 20% last summer amid the loss of the U.S. AAA credit rating, the end of the Fed’s second round of quantitative easing and rising oil prices. But after touching the year’s low in early October, improving U.S. economic data and European Central Bank’s injections of three-year loans into the continent’s banking system helped markets make up lost ground, which carried over into a strong first quarter of 2012.
Among the upbeat U.S. economic reports in recent months: more than 600,000 jobs have been added since the beginning of 2012; house prices have fallen enough to start to spur demand, lifting sales and new construction; and the U.S. GDP expanded at an annual rate of 3% in the fourth quarter of 2011, its strongest rate in a year and a half. Consumer confidence climbed in March to its highest level in a year.
While acknowledging the good news, the Fed warned that policymakers cannot be sure the recent pace of improvement will be sustained unless growth picks up. To foster growth, the Fed has said it will leave its key interest rate close to zero at least through 2014, despite arguments by some Fed officials and investors that the Fed may have to consider raising rates much earlier than that to prevent inflation. For now, the Fed’s leadership appears to be committed to keeping rates low, thus reducing borrowing costs for businesses and consumers. Consumer spending remains sluggish, and lackluster forecasts for first-quarter corporate profits were a reminder that the economic recovery remains fragile.
The world’s leading central bankers have continued to take steps to recharge the global economy. Greece’s debt restructuring enabled a new international bailout, while an injection of liquidity from the European Central Bank lessened financial stresses across the continent and contributed to improvement in global financial markets. However, March manufacturing gauges indicated that the eurozone has entered a period of economic contraction, meaning that policy makers may need to do more to revive economic growth across the region. The Bank of England and the Bank of Japan have also increased asset-buying programs. In China, recent strong factory data eased fears that a hard landing could wreak havoc on the global economy. The country cut its annual growth target to 7.5%, as its policymakers are trying to shift the country away from investment and exports and to greater domestic consumption.
Improvement in the U.S. economy is luring investors from ultra-safe, but often low-yielding assets. Falling U.S. Treasury bond prices, for example, boosted yields from a 70-year low last fall to a recent range of around 2% for the 10-year note. After outperforming equities for much of the past decade, and drawing heavy asset flows, many analysts are cautious about certain fixed-income sectors, particularly government debt, as the economy improves and the potential grows for a rise in interest rates. Investment-grade and higher-yielding corporates, however, are expected to continue to outperform.
Likewise, commodities, which had been slumping since mid-2011 due to slowing economic activity and the European debt crisis, rebounded in early 2012 on stronger macroeconomic data, with the price of a barrel of oil surging from last October’s $77 to a peak of $113 in late February. Investors also have been shifting out of gold to assets with greater return potential; after peaking at nearly $2,000 last summer, the price per ounce has fallen back to around $1,600.
The U.S. economy seems to be decoupling from slowing growth in the rest of the world and from ongoing uncertainty in the European debt crisis, as well as the domestic debate over tax and spending policy. In this resiliency, we see potential in U.S. investments, including equities, high yield bonds, bank loans and other risk assets. It appears that the U.S. may have entered a period of self-sustaining, if modest, economic expansion, driven primarily by the aggressive monetary policy of the Fed and reinforced by the ECB, and is increasingly becoming the economic locomotive of the global economy.
2 | THE RYDEX SERIES FUNDS ANNUAL REPORT
LETTER TO OUR SHAREHOLDERS (concluded)
We look forward to continuing our service to you. Thank you for investing in our funds.
Sincerely,

Donald C. Cacciapaglia
President
*S&P 500® Index is a capitalization-weighted index covering 500 industrial, utility, transportation and financial companies of the U.S. markets (mostly NYSE Euronext issues).
Performance displayed represents past performance which is no guarantee of future results. Of course, fund performance is subject to daily market volatility and may be better or worse since the end of the last quarter. For up-to-date fund performance, call us at 800.820.0888 or visit www.rydex-sgi.com.
Read each fund’s prospectus and summary prospectus (if available) carefully before investing. It contains the fund’s investment objectives, risks, charges, expenses and other information, which should be considered carefully before investing. Obtain a prospectus and summary prospectus (if available) at www.rydex-sgi.com or call 800.820.0888
The referenced funds are distributed by Rydex Distributors, LLC. Guggenheim Investments represents the investment management business of Guggenheim Partners, LLC, which includes Security Investors, LLC, the investment advisor to the referenced funds. Rydex Distributors, LLC is affiliated with Guggenheim Partners, LLC and Security Investors, LLC.
THE RYDEX SERIES FUNDS ANNUAL REPORT | 3
A BRIEF NOTE ON THE COMPOUNDING OF RETURNS (Unaudited)
Many of the Funds described in this report are benchmarked daily to leveraged and/or inverse leveraged versions of published indices. To properly evaluate the performance of these funds, it is essential to understand the effect of mathematical compounding on their respective returns.
Because of the nonlinear effects of leverage applied over time, it is possible for a fund to perform in line with its benchmark for several individual periods in a row, yet seem to trail the benchmark over the entire period. It is also possible that a fund that performs in-line with its benchmark on a daily basis may seem to outperform its benchmark over longer periods.
An Example of Compounding
For example, consider a hypothetical fund that is designed to produce returns that correspond to 150% of an index. On the first day of a period, the index rises from a level of 100 to a level of 106, producing a 6.0% gain and an expectation that the fund will rise by 9.0%. On the same day, the fund’s net asset value (“NAV”) increases from $10.00 to $10.90 for a gain of 9.0%— in line with its benchmark.
On day two, assume the index falls from 106 to 99 for a loss of about 6.6%. The fund, as expected, falls 9.9% to a price of $9.82. On each day, the fund performed exactly in line with its benchmark, but for the two-day period, the fund was down 1.8%, while the index was down only 1.0%. Without taking into account the daily compounding of returns, one would expect the fund to lose 1.5% and would see the fund as trailing by 0.3% when in fact it had performed perfectly. This example is summarized in the table below.
| | | | | | | | | | | | | | | | | | | | | | | | |
| | | Index
Level | | | Index
Performance | | | Fund
Expectation | | | Fund
NAV | | | Fund
Performance | | | Assessment | |
Start | | | 100 | | | | | | | | | | | $ | 10.00 | | | | | | | | | |
Day 1 | | | 106 | | | | 6.0 | % | | | 9.0 | % | | $ | 10.90 | | | | 9.0 | % | | | In line | |
Day 2 | | | 99 | | | | -6.6 | % | | | -9.9 | % | | $ | 9.82 | | | | -9.9 | % | | | In line | |
Cumulative | | | | | | | -1.0 | % | | | -1.5 | % | | | | | | | -1.8 | % | | | -0.3 | % |
As illustrated by this simple example, the effect of leverage can make it difficult to form expectations or judgments about fund performance given only the returns of the unleveraged index.
Because certain funds seek to track the performance of their benchmark on a daily basis, mathematical compounding, especially with respect to those funds that use leverage as part of their investment strategy, may prevent a fund from correlating with the monthly, quarterly, annual or other period performance of its benchmark. Due to the compounding of daily returns, leveraged and inverse funds’ returns over periods other than one day will likely differ in amount and possibly direction from the benchmark return for the same period. Investors should monitor their leveraged and inverse funds’ holdings consistent with their strategies, as frequently as daily. For those funds that consistently apply leverage, the value of the fund’s shares will tend to increase or decrease more than the value of any increase or decrease in its benchmark index. For more on correlation, leverage and other risks, please read the prospectus.
In general, any change in direction in an index will produce compounding that seems to work against an investor. Were the index to move in the same direction (either up or down) for two or more periods in a row, the compounding of those returns would work in an investor’s favor, causing the fund to seemingly beat its benchmark.
As a general rule of thumb, more leverage in a fund will magnify the compounding effect, while less leverage will generally produce results that are more in line with expectations. In addition, periods of high volatility in an underlying index will also cause the effects of compounding to be more pronounced, while lower volatility will produce a more muted effect.
4 | THE RYDEX SERIES FUNDS ANNUAL REPORT
ABOUT SHAREHOLDERS’ FUND EXPENSES (Unaudited)
All mutual funds have operating expenses and it is important for our shareholders to understand the impact of costs on their investments. Shareholders of a Fund incur two types of costs: (i) transaction costs, including sales charges (loads) on purchase payments, reinvested dividends, or other distributions; and exchange fees; and (ii) ongoing costs, including management fees, administrative services, and shareholder reports, among others. These ongoing costs, or operating expenses, are deducted from a fund’s gross income and reduce the investment return of the fund.
A fund’s expenses are expressed as a percentage of its average net assets, which is known as the expense ratio. The following examples are intended to help investors understand the ongoing costs (in dollars) of investing in a Fund and to compare these costs with the ongoing costs of investing in other mutual funds.
The examples are based on an investment of $1,000 made at the beginning of the period and held for the entire six-month period beginning September 30, 2011 and ending March 31, 2012.
The following tables illustrate a Fund’s costs in two ways:
Table 1. Based on actual Fund return. This section helps investors estimate the actual expenses paid over the period. The “Ending Account Value” shown is derived from the Fund’s actual return, and the fourth column shows the dollar amount that would have been paid by an investor who started with $1,000 in the Fund. Investors may use the information here, together with the amount invested, to estimate the expenses paid over the period. Simply divide the Fund’s account value by $1,000 (for example, an $8,600 account value divided by $1,000 = 8.6), then multiply the result by the number provided under the heading “Expenses Paid During Period.”
Table 2. Based on hypothetical 5% return. This section is intended to help investors compare a Fund’s cost with those of other mutual funds. The table provides information about hypothetical account values and hypothetical expenses based on the Fund’s actual expense ratio and an assumed rate of return of 5% per year before expenses, which is not the Fund’s actual return. The hypothetical account values and expenses may not be used to estimate the actual ending account balance or expenses paid during the period. The example is useful in making comparisons because the U.S. Securities and Exchange Commission (the “SEC”) requires all mutual funds to calculate expenses based on the 5% return. Investors can assess a Fund’s costs by comparing this hypothetical example with the hypothetical examples that appear in shareholder reports of other funds.
The calculations illustrated above assume no shares were bought or sold during the period. Actual costs may have been higher or lower, depending on the amount of investment and the timing of any purchases or redemptions.
Please note that the expenses shown in the table are meant to highlight your ongoing costs only and do not reflect any transactional costs, such as sales charges (loads) on purchase payments, and contingent deferred sales charges (“CDSC”) on redemptions, if any. Therefore, the second table is useful in comparing ongoing costs only, and will not help you determine the relative total costs of owning different funds. In addition, if these transactional costs were included, your costs would have been higher.
More information about a Fund’s expenses, including annual expense ratios for the past five years, can be found in the Financial Highlights section of this report. For additional information on operating expenses and other shareholder costs, please refer to the appropriate Fund prospectus.
THE RYDEX SERIES FUNDS ANNUAL REPORT | 5
ABOUT SHAREHOLDERS’ FUND EXPENSES (Unaudited) (continued)
| | | | | | | | | | | | | | | | | | | | |
| | | Expense
Ratio1 | | | Fund
Return | | | Beginning
Account Value
September 30, 2011 | | | Ending
Account Value
March 31, 2012 | | | Expenses
Paid During
Period2 | |
Table 1. Based on actual Fund return3 | | | | | | | | | | | | | | | | | | | | |
Nova Fund | | | | | | | | | | | | | | | | | | | | |
Investor Class | | | 1.24 | % | | | 39.40 | % | | $ | 1,000.00 | | | $ | 1,394.00 | | | $ | 7.42 | |
Advisor Class | | | 1.75 | % | | | 39.08 | % | | | 1,000.00 | | | | 1,390.80 | | | | 10.46 | |
A-Class | | | 1.49 | % | | | 39.24 | % | | | 1,000.00 | | | | 1,392.40 | | | | 8.91 | |
C-Class | | | 2.24 | % | | | 38.76 | % | | | 1,000.00 | | | | 1,387.60 | | | | 13.37 | |
S&P 500 Fund | | | | | | | | | | | | | | | | | | | | |
A-Class | | | 1.49 | % | | | 24.89 | % | | | 1,000.00 | | | | 1,248.90 | | | | 8.38 | |
C-Class | | | 2.24 | % | | | 24.41 | % | | | 1,000.00 | | | | 1,244.10 | | | | 12.57 | |
H-Class | | | 1.48 | % | | | 24.94 | % | | | 1,000.00 | | | | 1,249.40 | | | | 8.32 | |
Inverse S&P 500 Strategy Fund | | | | | | | | | | | | | | | | | | | | |
Investor Class | | | 1.41 | % | | | (22.59 | %) | | | 1,000.00 | | | | 774.10 | | | | 6.25 | |
Advisor Class | | | 1.90 | % | | | (22.78 | %) | | | 1,000.00 | | | | 772.20 | | | | 8.42 | |
A-Class | | | 1.65 | % | | | (22.69 | %) | | | 1,000.00 | | | | 773.10 | | | | 7.31 | |
C-Class | | | 2.40 | % | | | (22.97 | %) | | | 1,000.00 | | | | 770.30 | | | | 10.62 | |
NASDAQ-100® Fund | | | | | | | | | | | | | | | | | | | | |
Investor Class | | | 1.25 | % | | | 28.74 | % | | | 1,000.00 | | | | 1,287.40 | | | | 7.15 | |
Advisor Class | | | 1.75 | % | | | 28.36 | % | | | 1,000.00 | | | | 1,283.60 | | | | 9.99 | |
A-Class | | | 1.50 | % | | | 28.53 | % | | | 1,000.00 | | | | 1,285.30 | | | | 8.57 | |
C-Class | | | 2.25 | % | | | 28.07 | % | | | 1,000.00 | | | | 1,280.70 | | | | 12.83 | |
Inverse NASDAQ-100® Strategy Fund | | | | | | | | | | | | | | | | | | | | |
Investor Class | | | 1.43 | % | | | (24.82 | %) | | | 1,000.00 | | | | 751.80 | | | | 6.26 | |
Advisor Class | | | 1.95 | % | | | (24.75 | %) | | | 1,000.00 | | | | 752.50 | | | | 8.54 | |
A-Class | | | 1.67 | % | | | (25.00 | %) | | | 1,000.00 | | | | 750.00 | | | | 7.31 | |
C-Class | | | 2.42 | % | | | (25.27 | %) | | | 1,000.00 | | | | 747.30 | | | | 10.57 | |
Mid-Cap 1.5x Strategy Fund | | | | | | | | | | | | | | | | | | | | |
A-Class | | | 1.63 | % | | | 41.74 | % | | | 1,000.00 | | | | 1,417.40 | | | | 9.88 | |
C-Class | | | 2.39 | % | | | 41.25 | % | | | 1,000.00 | | | | 1,412.50 | | | | 14.41 | |
H-Class | | | 1.64 | % | | | 41.96 | % | | | 1,000.00 | | | | 1,419.60 | | | | 9.92 | |
Inverse Mid-Cap Strategy Fund | | | | | | | | | | | | | | | | | | | | |
A-Class | | | 1.64 | % | | | (24.88 | %) | | | 1,000.00 | | | | 751.20 | | | | 7.18 | |
C-Class | | | 2.40 | % | | | (25.14 | %) | | | 1,000.00 | | | | 748.60 | | | | 10.49 | |
H-Class | | | 1.65 | % | | | (24.87 | %) | | | 1,000.00 | | | | 751.30 | | | | 7.22 | |
Russell 2000® 1.5x Strategy Fund | | | | | | | | | | | | | | | | | | | | |
A-Class | | | 1.74 | % | | | 43.88 | % | | | 1,000.00 | | | | 1,438.80 | | | | 10.61 | |
C-Class | | | 2.50 | % | | | 43.30 | % | | | 1,000.00 | | | | 1,433.00 | | | | 15.21 | |
H-Class | | | 1.74 | % | | | 43.89 | % | | | 1,000.00 | | | | 1,438.90 | | | | 10.61 | |
Russell 2000® Fund | | | | | | | | | | | | | | | | | | | | |
A-Class | | | 1.58 | % | | | 29.54 | % | | | 1,000.00 | | | | 1,295.40 | | | | 9.07 | |
C-Class | | | 2.35 | % | | | 29.02 | % | | | 1,000.00 | | | | 1,290.20 | | | | 13.45 | |
H-Class | | | 1.58 | % | | | 29.47 | % | | | 1,000.00 | | | | 1,294.70 | | | | 9.06 | |
Inverse Russell 2000® Strategy Fund | | | | | | | | | | | | | | | | | | | | |
A-Class | | | 1.75 | % | | | (27.28 | %) | | | 1,000.00 | | | | 727.20 | | | | 7.56 | |
C-Class | | | 2.52 | % | | | (27.52 | %) | | | 1,000.00 | | | | 724.80 | | | | 10.87 | |
H-Class | | | 1.76 | % | | | (27.27 | %) | | | 1,000.00 | | | | 727.30 | | | | 7.60 | |
S&P 500 Pure Growth Fund | | | | | | | | | | | | | | | | | | | | |
A-Class | | | 1.50 | % | | | 23.78 | % | | | 1,000.00 | | | | 1,237.80 | | | | 8.39 | |
C-Class | | | 2.24 | % | | | 23.30 | % | | | 1,000.00 | | | | 1,233.00 | | | | 12.50 | |
H-Class | | | 1.50 | % | | | 23.75 | % | | | 1,000.00 | | | | 1,237.50 | | | | 8.39 | |
S&P 500 Pure Value Fund | | | | | | | | | | | | | | | | | | | | |
A-Class | | | 1.49 | % | | | 28.19 | % | | | 1,000.00 | | | | 1,281.90 | | | | 8.50 | |
C-Class | | | 2.25 | % | | | 27.71 | % | | | 1,000.00 | | | | 1,277.10 | | | | 12.81 | |
H-Class | | | 1.49 | % | | | 28.19 | % | | | 1,000.00 | | | | 1,281.90 | | | | 8.50 | |
S&P MidCap 400 Pure Growth Fund | | | | | | | | | | | | | | | | | | | | |
A-Class | | | 1.48 | % | | | 22.29 | % | | | 1,000.00 | | | | 1,222.90 | | | | 8.22 | |
C-Class | | | 2.23 | % | | | 21.79 | % | | | 1,000.00 | | | | 1,217.90 | | | | 12.36 | |
H-Class | | | 1.48 | % | | | 22.24 | % | | | 1,000.00 | | | | 1,222.40 | | | | 8.22 | |
6 | THE RYDEX SERIES FUNDS ANNUAL REPORT
ABOUT SHAREHOLDERS’ FUND EXPENSES (Unaudited) (continued)
| | | | | | | | | | | | | | | | | | | | |
| | | Expense
Ratio1 | | | Fund
Return | | | Beginning
Account Value
September 30, 2011 | | | Ending
Account Value
March 31, 2012 | | | Expenses
Paid During
Period2 | |
S&P MidCap 400 Pure Value Fund | | | | | | | | | | | | | | | | | | | | |
A-Class | | | 1.47 | % | | | 30.35 | % | | $ | 1,000.00 | | | $ | 1,303.50 | | | $ | 8.47 | |
C-Class | | | 2.24 | % | | | 29.82 | % | | | 1,000.00 | | | | 1,298.20 | | | | 12.87 | |
H-Class | | | 1.48 | % | | | 30.32 | % | | | 1,000.00 | | | | 1,303.20 | | | | 8.52 | |
S&P SmallCap 600 Pure Growth Fund | | | | | | | | | | | | | | | | | | | | |
A-Class | | | 1.50 | % | | | 26.82 | % | | | 1,000.00 | | | | 1,268.20 | | | | 8.51 | |
C-Class | | | 2.23 | % | | | 26.38 | % | | | 1,000.00 | | | | 1,263.80 | | | | 12.62 | |
H-Class | | | 1.49 | % | | | 26.86 | % | | | 1,000.00 | | | | 1,268.60 | | | | 8.45 | |
S&P SmallCap 600 Pure Value Fund | | | | | | | | | | | | | | | | | | | | |
A-Class | | | 1.49 | % | | | 32.43 | % | | | 1,000.00 | | | | 1,324.30 | | | | 8.66 | |
C-Class | | | 2.24 | % | | | 31.85 | % | | | 1,000.00 | | | | 1,318.50 | | | | 12.98 | |
H-Class | | | 1.48 | % | | | 32.30 | % | | | 1,000.00 | | | | 1,323.00 | | | | 8.60 | |
Europe 1.25x Strategy Fund | | | | | | | | | | | | | | | | | | | | |
A-Class | | | 1.63 | % | | | 20.52 | % | | | 1,000.00 | | | | 1,205.20 | | | | 8.99 | |
C-Class | | | 2.41 | % | | | 20.48 | % | | | 1,000.00 | | | | 1,204.80 | | | | 13.30 | |
H-Class | | | 1.64 | % | | | 20.71 | % | | | 1,000.00 | | | | 1,207.10 | | | | 9.07 | |
Japan 2x Strategy Fund | | | | | | | | | | | | | | | | | | | | |
A-Class | | | 1.48 | % | | | 19.86 | % | | | 1,000.00 | | | | 1,198.60 | | | | 8.13 | |
C-Class | | | 2.23 | % | | | 19.54 | % | | | 1,000.00 | | | | 1,195.40 | | | | 12.24 | |
H-Class | | | 1.48 | % | | | 19.89 | % | | | 1,000.00 | | | | 1,198.90 | | | | 8.14 | |
Strengthening Dollar 2x Strategy Fund | | | | | | | | | | | | | | | | | | | | |
A-Class | | | 1.67 | % | | | (4.34 | %) | | | 1,000.00 | | | | 956.60 | | | | 8.17 | |
C-Class | | | 2.42 | % | | | (4.65 | %) | | | 1,000.00 | | | | 953.50 | | | | 11.82 | |
H-Class | | | 1.68 | % | | | (4.29 | %) | | | 1,000.00 | | | | 957.10 | | | | 8.22 | |
Weakening Dollar 2x Strategy Fund | | | | | | | | | | | | | | | | | | | | |
A-Class | | | 1.68 | % | | | 0.85 | % | | | 1,000.00 | | | | 1,008.50 | | | | 8.44 | |
C-Class | | | 2.42 | % | | | 0.57 | % | | | 1,000.00 | | | | 1,005.70 | | | | 12.13 | |
H-Class | | | 1.67 | % | | | 0.85 | % | | | 1,000.00 | | | | 1,008.50 | | | | 8.39 | |
Real Estate Fund | | | | | | | | | | | | | | | | | | | | |
A-Class | | | 1.59 | % | | | 25.45 | % | | | 1,000.00 | | | | 1,254.50 | | | | 8.96 | |
C-Class | | | 2.33 | % | | | 24.95 | % | | | 1,000.00 | | | | 1,249.50 | | | | 13.10 | |
H-Class | | | 1.58 | % | | | 25.48 | % | | | 1,000.00 | | | | 1,254.80 | | | | 8.91 | |
Government Long Bond 1.2x Strategy Fund | | | | | | | | | | | | | | | | | | | | |
Investor Class | | | 0.93 | % | | | (7.61 | %) | | | 1,000.00 | | | | 923.90 | | | | 4.47 | |
Advisor Class | | | 1.44 | % | | | (7.95 | %) | | | 1,000.00 | | | | 920.50 | | | | 6.91 | |
A-Class | | | 1.18 | % | | | (7.77 | %) | | | 1,000.00 | | | | 922.30 | | | | 5.67 | |
C-Class | | | 1.93 | % | | | (8.13 | %) | | | 1,000.00 | | | | 918.70 | | | | 9.26 | |
Inverse Government Long Bond Strategy Fund | | | | | | | | | | | | | | | | | | | | |
Investor Class | | | 3.68 | % | | | 4.09 | % | | | 1,000.00 | | | | 1,040.90 | | | | 18.78 | |
Advisor Class | | | 4.11 | % | | | 3.36 | % | | | 1,000.00 | | | | 1,033.60 | | | | 20.90 | |
A-Class | | | 3.95 | % | | | 3.96 | % | | | 1,000.00 | | | | 1,039.60 | | | | 20.14 | |
C-Class | | | 4.69 | % | | | 3.59 | % | | | 1,000.00 | | | | 1,035.90 | | | | 23.87 | |
High Yield Strategy Fund | | | | | | | | | | | | | | | | | | | | |
A-Class | | | 1.47 | % | | | 13.12 | % | | | 1,000.00 | | | | 1,131.20 | | | | 7.83 | |
C-Class | | | 2.23 | % | | | 12.75 | % | | | 1,000.00 | | | | 1,127.50 | | | | 11.86 | |
H-Class | | | 1.47 | % | | | 13.14 | % | | | 1,000.00 | | | | 1,131.40 | | | | 7.83 | |
Inverse High Yield Strategy Fund | | | | | | | | | | | | | | | | | | | | |
A-Class | | | 1.50 | % | | | (13.99 | %) | | | 1,000.00 | | | | 860.10 | | | | 6.98 | |
C-Class | | | 2.23 | % | | | (14.22 | %) | | | 1,000.00 | | | | 857.80 | | | | 10.36 | |
H-Class | | | 1.50 | % | | | (13.91 | %) | | | 1,000.00 | | | | 860.90 | | | | 6.98 | |
U.S. Government Money Market Fund | | | | | | | | | | | | | | | | | | | | |
Investor Class | | | 0.11 | % | | | 0.00 | % | | | 1,000.00 | | | | 1,000.00 | | | | 0.55 | |
Investor2 Class | | | 0.11 | % | | | 0.00 | % | | | 1,000.00 | | | | 1,000.00 | | | | 0.55 | |
Advisor Class | | | 0.11 | % | | | 0.00 | % | | | 1,000.00 | | | | 1,000.00 | | | | 0.55 | |
A-Class | | | 0.11 | % | | | 0.00 | % | | | 1,000.00 | | | | 1,000.00 | | | | 0.55 | |
C-Class | | | 0.11 | % | | | 0.00 | % | | | 1,000.00 | | | | 1,000.00 | | | | 0.55 | |
THE RYDEX SERIES FUNDS ANNUAL REPORT | 7
ABOUT SHAREHOLDERS’ FUND EXPENSES (Unaudited) (continued)
| | | | | | | | | | | | | | | | | | | | |
| | | Expense
Ratio1 | | | Fund
Return | | | Beginning
Account Value
September 30, 2011 | | | Ending
Account Value
March 31, 2012 | | | Expenses
Paid During
Period2 | |
Table 2. Based on hypothetical 5% return (before expenses) | | | | | | | | | | | | | | | | | | | | |
Nova Fund | | | | | | | | | | | | | | | | | | | | |
Investor Class | | | 1.24 | % | | | 5.00 | % | | $ | 1,000.00 | | | $ | 1,018.80 | | | $ | 6.26 | |
Advisor Class | | | 1.75 | % | | | 5.00 | % | | | 1,000.00 | | | | 1,016.25 | | | | 8.82 | |
A-Class | | | 1.49 | % | | | 5.00 | % | | | 1,000.00 | | | | 1,017.55 | | | | 7.52 | |
C-Class | | | 2.24 | % | | | 5.00 | % | | | 1,000.00 | | | | 1,013.80 | | | | 11.28 | |
S&P 500 Fund | | | | | | | | | | | | | | | | | | | | |
A-Class | | | 1.49 | % | | | 5.00 | % | | | 1,000.00 | | | | 1,017.55 | | | | 7.52 | |
C-Class | | | 2.24 | % | | | 5.00 | % | | | 1,000.00 | | | | 1,013.80 | | | | 11.28 | |
H-Class | | | 1.48 | % | | | 5.00 | % | | | 1,000.00 | | | | 1,017.60 | | | | 7.47 | |
Inverse S&P 500 Strategy Fund | | | | | | | | | | | | | | | | | | | | |
Investor Class | | | 1.41 | % | | | 5.00 | % | | | 1,000.00 | | | | 1,017.95 | | | | 7.11 | |
Advisor Class | | | 1.90 | % | | | 5.00 | % | | | 1,000.00 | | | | 1,015.50 | | | | 9.57 | |
A-Class | | | 1.65 | % | | | 5.00 | % | | | 1,000.00 | | | | 1,016.75 | | | | 8.32 | |
C-Class | | | 2.40 | % | | | 5.00 | % | | | 1,000.00 | | | | 1,013.00 | | | | 12.08 | |
NASDAQ-100® Fund | | | | | | | | | | | | | | | | | | | | |
Investor Class | | | 1.25 | % | | | 5.00 | % | | | 1,000.00 | | | | 1,018.75 | | | | 6.31 | |
Advisor Class | | | 1.75 | % | | | 5.00 | % | | | 1,000.00 | | | | 1,016.25 | | | | 8.82 | |
A-Class | | | 1.50 | % | | | 5.00 | % | | | 1,000.00 | | | | 1,017.50 | | | | 7.57 | |
C-Class | | | 2.25 | % | | | 5.00 | % | | | 1,000.00 | | | | 1,013.75 | | | | 11.33 | |
Inverse NASDAQ-100® Strategy Fund | | | | | | | | | | | | | | | | | | | | |
Investor Class | | | 1.43 | % | | | 5.00 | % | | | 1,000.00 | | | | 1,017.85 | | | | 7.21 | |
Advisor Class | | | 1.95 | % | | | 5.00 | % | | | 1,000.00 | | | | 1,015.25 | | | | 9.82 | |
A-Class | | | 1.67 | % | | | 5.00 | % | | | 1,000.00 | | | | 1,016.65 | | | | 8.42 | |
C-Class | | | 2.42 | % | | | 5.00 | % | | | 1,000.00 | | | | 1,012.90 | | | | 12.18 | |
Mid-Cap 1.5x Strategy Fund | | | | | | | | | | | | | | | | | | | | |
A-Class | | | 1.63 | % | | | 5.00 | % | | | 1,000.00 | | | | 1,016.83 | | | | 8.24 | |
C-Class | | | 2.39 | % | | | 5.00 | % | | | 1,000.00 | | | | 1,013.06 | | | | 12.02 | |
H-Class | | | 1.64 | % | | | 5.00 | % | | | 1,000.00 | | | | 1,016.80 | | | | 8.27 | |
Inverse Mid-Cap Strategy Fund | | | | | | | | | | | | | | | | | | | | |
A-Class | | | 1.64 | % | | | 5.00 | % | | | 1,000.00 | | | | 1,016.80 | | | | 8.27 | |
C-Class | | | 2.40 | % | | | 5.00 | % | | | 1,000.00 | | | | 1,013.00 | | | | 12.08 | |
H-Class | | | 1.65 | % | | | 5.00 | % | | | 1,000.00 | | | | 1,016.75 | | | | 8.32 | |
Russell 2000® 1.5x Strategy Fund | | | | | | | | | | | | | | | | | | | | |
A-Class | | | 1.74 | % | | | 5.00 | % | | | 1,000.00 | | | | 1,016.30 | | | | 8.77 | |
C-Class | | | 2.50 | % | | | 5.00 | % | | | 1,000.00 | | | | 1,012.50 | | | | 12.58 | |
H-Class | | | 1.74 | % | | | 5.00 | % | | | 1,000.00 | | | | 1,016.30 | | | | 8.77 | |
Russell 2000® Fund | | | | | | | | | | | | | | | | | | | | |
A-Class | | | 1.58 | % | | | 5.00 | % | | | 1,000.00 | | | | 1,017.10 | | | | 7.97 | |
C-Class | | | 2.35 | % | | | 5.00 | % | | | 1,000.00 | | | | 1,013.25 | | | | 11.83 | |
H-Class | | | 1.58 | % | | | 5.00 | % | | | 1,000.00 | | | | 1,017.10 | | | | 7.97 | |
Inverse Russell 2000® Strategy Fund | | | | | | | | | | | | | | | | | | | | |
A-Class | | | 1.75 | % | | | 5.00 | % | | | 1,000.00 | | | | 1,016.25 | | | | 8.82 | |
C-Class | | | 2.52 | % | | | 5.00 | % | | | 1,000.00 | | | | 1,012.40 | | | | 12.68 | |
H-Class | | | 1.76 | % | | | 5.00 | % | | | 1,000.00 | | | | 1,016.20 | | | | 8.87 | |
S&P 500 Pure Growth Fund | | | | | | | | | | | | | | | | | | | | |
A-Class | | | 1.50 | % | | | 5.00 | % | | | 1,000.00 | | | | 1,017.50 | | | | 7.57 | |
C-Class | | | 2.24 | % | | | 5.00 | % | | | 1,000.00 | | | | 1,013.80 | | | | 11.28 | |
H-Class | | | 1.50 | % | | | 5.00 | % | | | 1,000.00 | | | | 1,017.50 | | | | 7.57 | |
S&P 500 Pure Value Fund | | | | | | | | | | | | | | | | | | | | |
A-Class | | | 1.49 | % | | | 5.00 | % | | | 1,000.00 | | | | 1,017.55 | | | | 7.52 | |
C-Class | | | 2.25 | % | | | 5.00 | % | | | 1,000.00 | | | | 1,013.75 | | | | 11.33 | |
H-Class | | | 1.49 | % | | | 5.00 | % | | | 1,000.00 | | | | 1,017.55 | | | | 7.52 | |
S&P MidCap 400 Pure Growth Fund | | | | | | | | | | | | | | | | | | | | |
A-Class | | | 1.48 | % | | | 5.00 | % | | | 1,000.00 | | | | 1,017.60 | | | | 7.47 | |
C-Class | | | 2.23 | % | | | 5.00 | % | | | 1,000.00 | | | | 1,013.85 | | | | 11.23 | |
H-Class | | | 1.48 | % | | | 5.00 | % | | | 1,000.00 | | | | 1,017.60 | | | | 7.47 | |
S&P MidCap 400 Pure Value Fund | | | | | | | | | | | | | | | | | | | | |
A-Class | | | 1.47 | % | | | 5.00 | % | | | 1,000.00 | | | | 1,017.65 | | | | 7.41 | |
C-Class | | | 2.24 | % | | | 5.00 | % | | | 1,000.00 | | | | 1,013.80 | | | | 11.28 | |
H-Class | | | 1.48 | % | | | 5.00 | % | | | 1,000.00 | | | | 1,017.60 | | | | 7.47 | |
8 | THE RYDEX SERIES FUNDS ANNUAL REPORT
ABOUT SHAREHOLDERS’ FUND EXPENSES (Unaudited) (concluded)
| | | | | | | | | | | | | | | | | | | | |
| | | Expense
Ratio1 | | | Fund
Return | | | Beginning
Account Value
September
30, 2011 | | | Ending
Account Value
March
31, 2012 | | | Expenses
Paid During
Period2 | |
S&P SmallCap 600 Pure Growth Fund | | | | | | | | | | | | | | | | | | | | |
A-Class | | | 1.50 | % | | | 5.00 | % | | $ | 1,000.00 | | | $ | 1,017.50 | | | $ | 7.57 | |
C-Class | | | 2.23 | % | | | 5.00 | % | | | 1,000.00 | | | | 1,013.85 | | | | 11.23 | |
H-Class | | | 1.49 | % | | | 5.00 | % | | | 1,000.00 | | | | 1,017.55 | | | | 7.52 | |
S&P SmallCap 600 Pure Value Fund | | | | | | | | | | | | | | | | | | | | |
A-Class | | | 1.49 | % | | | 5.00 | % | | | 1,000.00 | | | | 1,017.55 | | | | 7.52 | |
C-Class | | | 2.24 | % | | | 5.00 | % | | | 1,000.00 | | | | 1,013.80 | | | | 11.28 | |
H-Class | | | 1.48 | % | | | 5.00 | % | | | 1,000.00 | | | | 1,017.60 | | | | 7.47 | |
Europe 1.25x Strategy Fund | | | | | | | | | | | | | | | | | | | | |
A-Class | | | 1.63 | % | | | 5.00 | % | | | 1,000.00 | | | | 1,016.85 | | | | 8.22 | |
C-Class | | | 2.41 | % | | | 5.00 | % | | | 1,000.00 | | | | 1,012.94 | | | | 12.14 | |
H-Class | | | 1.64 | % | | | 5.00 | % | | | 1,000.00 | | | | 1,016.78 | | | | 8.29 | |
Japan 2x Strategy Fund | | | | | | | | | | | | | | | | | | | | |
A-Class | | | 1.48 | % | | | 5.00 | % | | | 1,000.00 | | | | 1,017.60 | | | | 7.47 | |
C-Class | | | 2.23 | % | | | 5.00 | % | | | 1,000.00 | | | | 1,013.85 | | | | 11.23 | |
H-Class | | | 1.48 | % | | | 5.00 | % | | | 1,000.00 | | | | 1,017.60 | | | | 7.47 | |
Strengthening Dollar 2x Strategy Fund | | | | | | | | | | | | | | | | | | | | |
A-Class | | | 1.67 | % | | | 5.00 | % | | | 1,000.00 | | | | 1,016.65 | | | | 8.42 | |
C-Class | | | 2.42 | % | | | 5.00 | % | | | 1,000.00 | | | | 1,012.90 | | | | 12.18 | |
H-Class | | | 1.68 | % | | | 5.00 | % | | | 1,000.00 | | | | 1,016.60 | | | | 8.47 | |
Weakening Dollar 2x Strategy Fund | | | | | | | | | | | | | | | | | | | | |
A-Class | | | 1.68 | % | | | 5.00 | % | | | 1,000.00 | | | | 1,016.60 | | | | 8.47 | |
C-Class | | | 2.42 | % | | | 5.00 | % | | | 1,000.00 | | | | 1,012.90 | | | | 12.18 | |
H-Class | | | 1.67 | % | | | 5.00 | % | | | 1,000.00 | | | | 1,016.65 | | | | 8.42 | |
Real Estate Fund | | | | | | | | | | | | | | | | | | | | |
A-Class | | | 1.59 | % | | | 5.00 | % | | | 1,000.00 | | | | 1,017.05 | | | | 8.02 | |
C-Class | | | 2.33 | % | | | 5.00 | % | | | 1,000.00 | | | | 1,013.35 | | | | 11.73 | |
H-Class | | | 1.58 | % | | | 5.00 | % | | | 1,000.00 | | | | 1,017.10 | | | | 7.97 | |
Government Long Bond 1.2x Strategy Fund | | | | | | | | | | | | | | | | | | | | |
Investor Class | | | 0.93 | % | | | 5.00 | % | | | 1,000.00 | | | | 1,020.35 | | | | 4.70 | |
Advisor Class | | | 1.44 | % | | | 5.00 | % | | | 1,000.00 | | | | 1,017.80 | | | | 7.26 | |
A-Class | | | 1.18 | % | | | 5.00 | % | | | 1,000.00 | | | | 1,019.10 | | | | 5.96 | |
C-Class | | | 1.93 | % | | | 5.00 | % | | | 1,000.00 | | | | 1,015.35 | | | | 9.72 | |
Inverse Government Long Bond Strategy Fund | | | | | | | | | | | | | | | | | | | | |
Investor Class | | | 3.68 | % | | | 5.00 | % | | | 1,000.00 | | | | 1,006.60 | | | | 18.46 | |
Advisor Class | | | 4.11 | % | | | 5.00 | % | | | 1,000.00 | | | | 1,004.45 | | | | 20.60 | |
A-Class | | | 3.95 | % | | | 5.00 | % | | | 1,000.00 | | | | 1,005.25 | | | | 19.80 | |
C-Class | | | 4.69 | % | | | 5.00 | % | | | 1,000.00 | | | | 1,001.55 | | | | 23.47 | |
High Yield Strategy Fund | | | | | | | | | | | | | | | | | | | | |
A-Class | | | 1.47 | % | | | 5.00 | % | | | 1,000.00 | | | | 1,017.65 | | | | 7.41 | |
C-Class | | | 2.23 | % | | | 5.00 | % | | | 1,000.00 | | | | 1,013.85 | | | | 11.23 | |
H-Class | | | 1.47 | % | | | 5.00 | % | | | 1,000.00 | | | | 1,017.65 | | | | 7.41 | |
Inverse High Yield Strategy Fund | | | | | | | | | | | | | | | | | | | | |
A-Class | | | 1.50 | % | | | 5.00 | % | | | 1,000.00 | | | | 1,017.50 | | | | 7.57 | |
C-Class | | | 2.23 | % | | | 5.00 | % | | | 1,000.00 | | | | 1,013.85 | | | | 11.23 | |
H-Class | | | 1.50 | % | | | 5.00 | % | | | 1,000.00 | | | | 1,017.50 | | | | 7.57 | |
U.S. Government Money Market Fund | | | | | | | | | | | | | | | | | | | | |
Investor Class | | | 0.11 | % | | | 5.00 | % | | | 1,000.00 | | | | 1,024.45 | | | | 0.56 | |
Investor2 Class | | | 0.11 | % | | | 5.00 | % | | | 1,000.00 | | | | 1,024.45 | | | | 0.56 | |
Advisor Class | | | 0.11 | % | | | 5.00 | % | | | 1,000.00 | | | | 1,024.45 | | | | 0.56 | |
A-Class | | | 0.11 | % | | | 5.00 | % | | | 1,000.00 | | | | 1,024.45 | | | | 0.56 | |
C-Class | | | 0.11 | % | | | 5.00 | % | | | 1,000.00 | | | | 1,024.45 | | | | 0.56 | |
| 1 | This ratio represents annualized Net Expenses, which include interest expense related to securities sold short. Excluding short interest expense, the operating expense ratio of the Inverse Government Long Bond Strategy Fund would be 2.31.%, 2.25%, 2.32%, and 2.31% lower for the Investor Class, Advisor Class, A-Class and C-Class, respectively. |
| 2 | Expenses are equal to the Fund’s annualized expense ratio, net of any applicable fee waivers, multiplied by the average account value over the period, multiplied by 183/366 (to reflect the one-half year period). |
| 3 | Actual cumulative return at net asset value for the period September 30, 2011 to March 31, 2012. |
THE RYDEX SERIES FUNDS ANNUAL REPORT | 9
| | |
| PERFORMANCE REPORT AND FUND PROFILE (Unaudited) | | March 31, 2012 |
NOVA FUND
OBJECTIVE: Seeks to provide investment results that match, before fees and expenses, the performance of a specific benchmark on a daily basis. The Fund’s current benchmark is 150% of the performance of the S&P 500® Index (the “underlying index”). The Fund does not seek to achieve its investment objective over a period of time greater than one day.
For the one-year period ended March 31, 2012, Nova Fund maintained a daily correlation of over 99% to its benchmark of 150% of the daily price movement of the S&P 500 Index*. Nova Fund Investor Class returned 9.07%, while the S&P 500 Index returned 8.54% over the same period.
Sectors contributing most to performance of the index were Information Technology, Health Care, Consumer Discretionary and Consumer Staples. Energy, Financials and Materials detracted from performance of the index for the year.
Apple, Inc., International Business Machines Corp. and Microsoft Corp. were among the stocks which provided the most performance to the index during the year. Schlumberger Ltd., Hewlett-Packard Co. and Bank of America Corp. detracted from performance of the index for the year.
Derivatives in the Fund were used to help provide exposure to the composition of the benchmark in the highest efficient manner and to provide leverage, not for hedging purposes. The results of derivatives use during the period were within our expectations and contributed to the Fund’s performance.
Due to the compounding of daily returns, leveraged and inverse funds’ returns over periods other than one day will likely differ in amount and possibly direction from the benchmark return for the same period. Investors should monitor their leveraged and inverse funds’ holdings to ensure that they are consistent with their strategies, as frequently as daily.
The effects of compounding may cause the longer-term correlation of the fund to its benchmark to diminish. The apparent discrepancy between the leveraged and unleveraged indices is the result of compounding, which is described briefly on page 4 of this report.
*Standard & Poor’s 500 Index (S&P 500®)—a capitalization-weighted index covering 500 industrial, utility, transportation and financial companies of the U.S. markets (mostly NYSE Euronext issues).
Performance displayed represents past performance which is no guarantee of future results.
Holdings Diversification (Market Exposure as % of Net Assets)
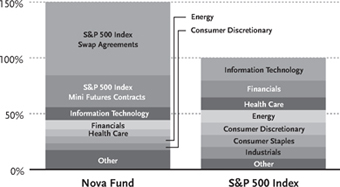
“Holdings Diversification (Market Exposure as % of Net Assets)” excludes any temporary cash investments.
| | | | |
Inception Dates: | | | |
Investor Class | | | July 12, 1993 | |
Advisor Class | | | October 15, 1998 | |
A-Class | | | March 31, 2004 | |
C-Class | | | March 14, 2001 | |
| | | | |
Ten Largest Holdings (% of Total Net Assets) | | | |
Apple, Inc. | | | 2.4 | % |
Exxon Mobil Corp. | | | 1.8 | % |
International Business Machines Corp. | | | 1.1 | % |
Microsoft Corp. | | | 1.1 | % |
General Electric Co. | | | 0.9 | % |
Chevron Corp. | | | 0.9 | % |
AT&T, Inc. | | | 0.8 | % |
Procter & Gamble Co. | | | 0.8 | % |
Johnson & Johnson | | | 0.8 | % |
Wells Fargo & Co. | | | 0.8 | % |
| | | | |
Top Ten Total | | | 11.4 | % |
| | | | |
“Ten Largest Holdings” exclude any temporary cash or derivative investments.
10 | THE RYDEX SERIES FUNDS ANNUAL REPORT
PERFORMANCE REPORT AND FUND PROFILE (Unaudited) (concluded)
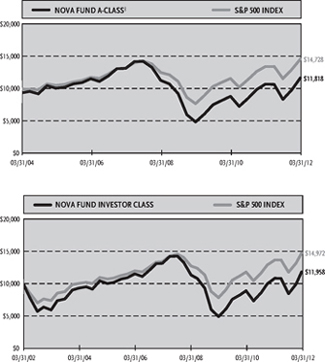
Cumulative Fund Performance*
Average Annual Returns*
Periods Ended 03/31/12
| | | | | | | | | | | | |
| | | 1 Year | | | 5 Year | | | 10 Year | |
Investor Class Shares | | | 9.07 | % | | | -2.08 | % | | | 1.80 | % |
Advisor Class Shares | | | 8.57 | % | | | -2.57 | % | | | 1.27 | % |
C-Class Shares | | | 8.00 | % | | | -3.05 | % | | | 0.78 | % |
C-Class Shares with CDSC† | | | 7.00 | % | | | -3.05 | % | | | 0.78 | % |
S&P 500 Index | | | 8.54 | % | | | 2.01 | % | | | 4.12 | % |
| | | |
| | | | | | | | | Since
Inception
(03/31/04) | |
A-Class Shares | | | 8.79 | % | | | -2.32 | % | | | 2.73 | % |
A-Class Shares with sales charge‡ | | | 3.64 | % | | | -3.27 | % | | | 2.11 | % |
S&P 500 Index | | | 8.54 | % | | | 2.01 | % | | | 4.96 | % |
| * | The performance data above represents past performance that is not predictive of future results. The investment return and principal value of an investment in the Fund will fluctuate so that an investor’s shares, when redeemed, may be worth more or less than their original cost. Returns are historical and include changes in principal and reinvested dividends and capital gains and do not reflect the effect of taxes. The S&P 500 Index is an unmanaged index and, unlike the Fund, has no management fees or operating expenses to reduce its reported return. The graphs are based on Investor Class shares and A-Class shares only; performance for Advisor Class shares and C-Class shares will vary due to differences in fee structures. |
| † | Fund returns include a CDSC of 1% if redeemed within 12 months of purchase. |
| ‡ | Fund returns are calculated using the maximum sales charge of 4.75%. |
THE RYDEX SERIES FUNDS ANNUAL REPORT | 11
| | |
| SCHEDULE OF INVESTMENTS | | March 31, 2012 |
| NOVA FUND | | |
| | | | | | | | |
| | | SHARES | | | VALUE | |
COMMON STOCKS† —55.6% | | | | | | | | |
INFORMATION TECHNOLOGY—11.4% | | | | | | | | |
Apple, Inc.* | | | 3,089 | | | $ | 1,851,763 | |
International Business Machines Corp. | | | 3,841 | | | | 801,425 | |
Microsoft Corp. | | | 24,751 | | | | 798,221 | |
Google, Inc. — Class A* | | | 842 | | | | 539,924 | |
Intel Corp. | | | 16,556 | | | | 465,388 | |
QUALCOMM, Inc. | | | 5,603 | | | | 381,117 | |
Oracle Corp. | | | 12,988 | | | | 378,730 | |
Cisco Systems, Inc. | | | 17,839 | | | | 377,295 | |
EMC Corp.* | | | 6,805 | | | | 203,334 | |
Visa, Inc. — Class A | | | 1,650 | | | | 194,700 | |
Hewlett-Packard Co. | | | 6,552 | | | | 156,134 | |
Mastercard, Inc. — Class A | | | 351 | | | | 147,610 | |
eBay, Inc.* | | | 3,798 | | | | 140,108 | |
Accenture plc — Class A | | | 2,145 | | | | 138,353 | |
Texas Instruments, Inc. | | | 3,805 | | | | 127,886 | |
Automatic Data Processing, Inc. | | | 1,635 | | | | 90,236 | |
Dell, Inc.* | | | 5,073 | | | | 84,212 | |
Cognizant Technology Solutions Corp. — Class A* | | | 1,001 | | | | 77,027 | |
Corning, Inc. | | | 5,047 | | | | 71,062 | |
Salesforce.com, Inc.* | | | 454 | | | | 70,149 | |
Broadcom Corp. — Class A* | | | 1,625 | | | | 63,863 | |
Yahoo!, Inc.* | | | 4,022 | | | | 61,215 | |
Intuit, Inc. | | | 980 | | | | 58,927 | |
Adobe Systems, Inc.* | | | 1,636 | | | | 56,131 | |
NetApp, Inc.* | | | 1,206 | | | | 53,993 | |
Applied Materials, Inc. | | | 4,277 | | | | 53,206 | |
TE Connectivity Ltd. | | | 1,412 | | | | 51,891 | |
Motorola Solutions, Inc. | | | 977 | | | | 49,661 | |
Citrix Systems, Inc.* | | | 617 | | | | 48,687 | |
Symantec Corp.* | | | 2,416 | | | | 45,179 | |
Altera Corp. | | | 1,073 | | | | 42,727 | |
Juniper Networks, Inc.* | | | 1,745 | | | | 39,926 | |
Analog Devices, Inc. | | | 987 | | | | 39,875 | |
SanDisk Corp.* | | | 804 | | | | 39,870 | |
Red Hat, Inc.* | | | 643 | | | | 38,509 | |
Teradata Corp.* | | | 552 | | | | 37,619 | |
Western Union Co. | | | 2,057 | | | | 36,203 | |
Xerox Corp. | | | 4,413 | | | | 35,657 | |
F5 Networks, Inc.* | | | 263 | | | | 35,494 | |
Motorola Mobility Holdings, Inc.* | | | 877 | | | | 34,413 | |
CA, Inc. | | | 1,211 | | | | 33,375 | |
Paychex, Inc. | | | 1,073 | | | | 33,252 | |
Amphenol Corp. — Class A | | | 542 | | | | 32,395 | |
Western Digital Corp.* | | | 775 | | | | 32,077 | |
Autodesk, Inc.* | | | 747 | | | | 31,613 | |
Xilinx, Inc. | | | 867 | | | | 31,585 | |
Fiserv, Inc.* | | | 455 | | | | 31,572 | |
NVIDIA Corp.* | | | 2,025 | | | | 31,165 | |
KLA-Tencor Corp. | | | 559 | | | | 30,421 | |
Micron Technology, Inc.* | | | 3,269 | | | | 26,479 | |
Fidelity National Information Services, Inc. | | | 778 | | | | 25,767 | |
Linear Technology Corp. | | | 760 | | | | 25,612 | |
| | | | | | | | |
| | | SHARES | | | VALUE | |
Microchip Technology, Inc. | | | 641 | | | $ | 23,845 | |
BMC Software, Inc.* | | | 546 | | | | 21,927 | |
Akamai Technologies, Inc.* | | | 590 | | | | 21,653 | |
VeriSign, Inc. | | | 532 | | | | 20,397 | |
Electronic Arts, Inc.* | | | 1,101 | | | | 18,144 | |
Harris Corp. | | | 378 | | | | 17,040 | |
LSI Corp.* | | | 1,877 | | | | 16,292 | |
Computer Sciences Corp. | | | 524 | | | | 15,689 | |
Advanced Micro Devices, Inc.* | | | 1,939 | | | | 15,551 | |
Jabil Circuit, Inc. | | | 616 | | | | 15,474 | |
Molex, Inc. | | | 459 | | | | 12,907 | |
FLIR Systems, Inc. | | | 508 | | | | 12,857 | |
SAIC, Inc.* | | | 926 | | | | 12,223 | |
Total System Services, Inc. | | | 529 | | | | 12,204 | |
Novellus Systems, Inc.* | | | 233 | | | | 11,629 | |
JDS Uniphase Corp.* | | | 758 | | | | 10,983 | |
Teradyne, Inc.* | | | 614 | | | | 10,370 | |
Lexmark International, Inc. — Class A | | | 234 | | | | 7,778 | |
| | | | | | | | |
Total Information Technology | | | | | | | 8,659,996 | |
| | | | | | | | |
FINANCIALS—8.3% | | | | | | | | |
Wells Fargo & Co. | | | 17,473 | | | | 596,528 | |
JPMorgan Chase & Co. | | | 12,659 | | | | 582,062 | |
Berkshire Hathaway, Inc. — Class B* | | | 5,824 | | | | 472,618 | |
Citigroup, Inc. | | | 9,704 | | | | 354,681 | |
Bank of America Corp. | | | 35,570 | | | | 340,405 | |
Goldman Sachs Group, Inc. | | | 1,636 | | | | 203,469 | |
U.S. Bancorp | | | 6,332 | | | | 200,598 | |
American Express Co. | | | 3,362 | | | | 194,526 | |
Simon Property Group, Inc. | | | 1,017 | | | | 148,157 | |
MetLife, Inc. | | | 3,514 | | | | 131,248 | |
PNC Financial Services Group, Inc. | | | 1,749 | | | | 112,793 | |
Capital One Financial Corp. | | | 1,842 | | | | 102,673 | |
Morgan Stanley | | | 5,055 | | | | 99,280 | |
Prudential Financial, Inc. | | | 1,561 | | | | 98,952 | |
Bank of New York Mellon Corp. | | | 3,992 | | | | 96,327 | |
American Tower Corp. — Class A | | | 1,305 | | | | 82,241 | |
ACE Ltd. | | | 1,121 | | | | 82,057 | |
Travelers Companies, Inc. | | | 1,304 | | | | 77,197 | |
State Street Corp. | | | 1,615 | | | | 73,483 | |
BB&T Corp. | | | 2,316 | | | | 72,699 | |
Aflac, Inc. | | | 1,557 | | | | 71,606 | |
BlackRock, Inc. — Class A | | | 333 | | | | 68,232 | |
CME Group, Inc. — Class A | | | 226 | | | | 65,388 | |
Public Storage | | | 468 | | | | 64,664 | |
Equity Residential | | | 995 | | | | 62,307 | |
Chubb Corp. | | | 901 | | | | 62,268 | |
Marsh & McLennan Companies, Inc. | | | 1,802 | | | | 59,087 | |
Franklin Resources, Inc. | | | 473 | | | | 58,666 | |
Discover Financial Services | | | 1,754 | | | | 58,478 | |
American International Group, Inc.* | | | 1,784 | | | | 55,000 | |
ProLogis, Inc. | | | 1,523 | | | | 54,858 | |
T. Rowe Price Group, Inc. | | | 838 | | | | 54,721 | |
Ventas, Inc. | | | 954 | | | | 54,473 | |
Allstate Corp. | | | 1,654 | | | | 54,450 | |
HCP, Inc. | | | 1,354 | | | | 53,429 | |
Aon plc | | | 1,075 | | | | 52,740 | |
| | |
12 | THE RYDEX SERIES FUNDS ANNUAL REPORT | | SEE NOTES TO FINANCIAL STATEMENTS. |
| | |
| SCHEDULE OF INVESTMENTS (continued) | | March 31, 2012 |
| NOVA FUND | | |
| | | | | | | | |
| | | SHARES | | | VALUE | |
Vornado Realty Trust | | | 618 | | | $ | 52,036 | |
Boston Properties, Inc. | | | 493 | | | | 51,760 | |
Charles Schwab Corp. | | | 3,584 | | | | 51,502 | |
Progressive Corp. | | | 2,029 | | | | 47,032 | |
AvalonBay Communities, Inc. | | | 320 | | | | 45,232 | |
Fifth Third Bancorp | | | 3,055 | | | | 42,923 | |
SunTrust Banks, Inc. | | | 1,765 | | | | 42,660 | |
Ameriprise Financial, Inc. | | | 738 | | | | 42,162 | |
Weyerhaeuser Co. | | | 1,894 | | | | 41,516 | |
Loews Corp. | | | 1,023 | | | | 40,787 | |
Invesco Ltd. | | | 1,478 | | | | 39,418 | |
Host Hotels & Resorts, Inc. | | | 2,353 | | | | 38,636 | |
Health Care REIT, Inc. | | | 701 | | | | 38,527 | |
Northern Trust Corp. | | | 801 | | | | 38,007 | |
M&T Bank Corp. | | | 423 | | | | 36,750 | |
IntercontinentalExchange, Inc.* | | | 242 | | | | 33,256 | |
Regions Financial Corp. | | | 4,673 | | | | 30,795 | |
Hartford Financial Services Group, Inc. | | | 1,460 | | | | 30,777 | |
Principal Financial Group, Inc. | | | 994 | | | | 29,333 | |
Moody’s Corp. | | | 657 | | | | 27,660 | |
KeyCorp | | | 3,165 | | | | 26,903 | |
SLM Corp. | | | 1,682 | | | | 26,508 | |
Kimco Realty Corp. | | | 1,348 | | | | 25,962 | |
NYSE Euronext | | | 860 | | | | 25,809 | |
Lincoln National Corp. | | | 966 | | | | 25,464 | |
Unum Group | | | 963 | | | | 23,574 | |
XL Group plc — Class A | | | 1,041 | | | | 22,579 | |
Plum Creek Timber Company, Inc. | | | 538 | | | | 22,359 | |
CBRE Group, Inc. — Class A* | | | 1,085 | | | | 21,657 | |
Comerica, Inc. | | | 660 | | | | 21,358 | |
Cincinnati Financial Corp. | | | 536 | | | | 18,497 | |
Huntington Bancshares, Inc. | | | 2,864 | | | | 18,473 | |
Leucadia National Corp. | | | 663 | | | | 17,304 | |
Torchmark Corp. | | | 335 | | | | 16,700 | |
People’s United Financial, Inc. | | | 1,187 | | | | 15,716 | |
Genworth Financial, Inc. — Class A* | | | 1,624 | | | | 13,512 | |
Zions Bancorporation | | | 608 | | | | 13,048 | |
Hudson City Bancorp, Inc. | | | 1,743 | | | | 12,741 | |
Assurant, Inc. | | | 293 | | | | 11,867 | |
Legg Mason, Inc. | | | 408 | | | | 11,395 | |
Apartment Investment & Management Co.—Class A | | | 410 | | | | 10,828 | |
NASDAQ OMX Group, Inc.* | | | 417 | | | | 10,800 | |
E*Trade Financial Corp.* | | | 839 | | | | 9,187 | |
First Horizon National Corp. | | | 851 | | | | 8,833 | |
Federated Investors, Inc. — Class B | | | 311 | | | | 6,970 | |
| | | | | | | | |
Total Financials | | | | | | | 6,311,174 | |
| | | | | | | | |
HEALTH CARE—6.3% | | | | | | | | |
Johnson & Johnson | | | 9,099 | | | | 600,170 | |
Pfizer, Inc. | | | 24,985 | | | | 566,160 | |
Merck & Company, Inc. | | | 10,086 | | | | 387,302 | |
Abbott Laboratories | | | 5,209 | | | | 319,260 | |
UnitedHealth Group, Inc. | | | 3,464 | | | | 204,168 | |
Bristol-Myers Squibb Co. | | | 5,593 | | | | 188,764 | |
Amgen, Inc. | | | 2,619 | | | | 178,065 | |
| | | | | | | | |
| | | SHARES | | | VALUE | |
Eli Lilly & Co. | | | 3,394 | | | $ | 136,676 | |
Medtronic, Inc. | | | 3,446 | | | | 135,048 | |
Gilead Sciences, Inc.* | | | 2,510 | | | | 122,614 | |
Celgene Corp.* | | | 1,453 | | | | 112,637 | |
Baxter International, Inc. | | | 1,857 | | | | 111,011 | |
Biogen Idec, Inc.* | | | 788 | | | | 99,264 | |
Allergan, Inc. | | | 1,005 | | | | 95,907 | |
Medco Health Solutions, Inc.* | | | 1,288 | | | | 90,546 | |
Covidien plc | | | 1,604 | | | | 87,707 | |
Express Scripts Holding Co. | | | 1,610 | | | | 87,230 | |
WellPoint, Inc. | | | 1,119 | | | | 82,582 | |
McKesson Corp. | | | 816 | | | | 71,620 | |
Intuitive Surgical, Inc.* | | | 126 | | | | 68,261 | |
Thermo Fisher Scientific, Inc. | | | 1,209 | | | | 68,164 | |
Stryker Corp. | | | 1,077 | | | | 59,752 | |
Aetna, Inc. | | | 1,156 | | | | 57,985 | |
Becton Dickinson and Co. | | | 700 | | | | 54,355 | |
Agilent Technologies, Inc. | | | 1,155 | | | | 51,409 | |
Humana, Inc. | | | 546 | | | | 50,494 | |
Cardinal Health, Inc. | | | 1,143 | | | | 49,275 | |
Cigna Corp. | | | 951 | | | | 46,837 | |
St. Jude Medical, Inc. | | | 1,057 | | | | 46,836 | |
Zimmer Holdings, Inc. | | | 592 | | | | 38,054 | |
Cerner Corp.* | | | 484 | | | | 36,861 | |
AmerisourceBergen Corp. | | | 854 | | | | 33,887 | |
Mylan, Inc.* | | | 1,417 | | | | 33,229 | |
Perrigo Co. | | | 312 | | | | 32,233 | |
Quest Diagnostics, Inc. | | | 525 | | | | 32,104 | |
Forest Laboratories, Inc.* | | | 875 | | | | 30,354 | |
Laboratory Corporation of America Holdings* | | | 327 | | | | 29,934 | |
Boston Scientific Corp.* | | | 4,814 | | | | 28,788 | |
Life Technologies Corp.* | | | 588 | | | | 28,706 | |
Watson Pharmaceuticals, Inc.* | | | 423 | | | | 28,366 | |
DaVita, Inc.* | | | 313 | | | | 28,223 | |
Edwards Lifesciences Corp.* | | | 386 | | | | 28,074 | |
Waters Corp.* | | | 298 | | | | 27,613 | |
CR Bard, Inc. | | | 277 | | | | 27,345 | |
Varian Medical Systems, Inc.* | | | 383 | | | | 26,412 | |
Hospira, Inc.* | | | 547 | | | | 20,452 | |
CareFusion Corp.* | | | 741 | | | | 19,214 | |
DENTSPLY International, Inc. | | | 467 | | | | 18,741 | |
Coventry Health Care, Inc. | | | 467 | | | | 16,611 | |
PerkinElmer, Inc. | | | 378 | | | | 10,455 | |
Patterson Companies, Inc. | | | 293 | | | | 9,786 | |
Tenet Healthcare Corp.* | | | 1,362 | | | | 7,232 | |
| | | | | | | | |
Total Health Care | | | | | | | 4,822,773 | |
| | | | | | | | |
ENERGY—6.2% | | | | | | | | |
Exxon Mobil Corp. | | | 15,626 | | | | 1,355,242 | |
Chevron Corp. | | | 6,555 | | | | 702,957 | |
ConocoPhillips | | | 4,243 | | | | 322,510 | |
Schlumberger Ltd. | | | 4,426 | | | | 309,511 | |
Occidental Petroleum Corp. | | | 2,692 | | | | 256,359 | |
Anadarko Petroleum Corp. | | | 1,655 | | | | 129,652 | |
Apache Corp. | | | 1,277 | | | | 128,262 | |
| | |
SEE NOTES TO FINANCIAL STATEMENTS. | | THE RYDEX SERIES FUNDS ANNUAL REPORT | 13 |
| | |
| SCHEDULE OF INVESTMENTS (continued) | | March 31, 2012 |
| NOVA FUND | | |
| | | | | | | | |
| | | SHARES | | | VALUE | |
National Oilwell Varco, Inc. | | | 1,400 | | | $ | 111,258 | |
Halliburton Co. | | | 3,058 | | | | 101,495 | |
EOG Resources, Inc. | | | 890 | | | | 98,879 | |
Devon Energy Corp. | | | 1,338 | | | | 95,159 | |
El Paso Corp. | | | 2,567 | | | | 75,854 | |
Marathon Oil Corp. | | | 2,335 | | | | 74,020 | |
Spectra Energy Corp. | | | 2,152 | | | | 67,896 | |
Williams Companies, Inc. | | | 1,970 | | | | 60,696 | |
Baker Hughes, Inc. | | | 1,444 | | | | 60,561 | |
Hess Corp. | | | 1,010 | | | | 59,540 | |
Noble Energy, Inc. | | | 586 | | | | 57,299 | |
Chesapeake Energy Corp. | | | 2,198 | | | | 50,928 | |
Marathon Petroleum Corp. | | | 1,152 | | | | 49,951 | |
Valero Energy Corp. | | | 1,847 | | | | 47,597 | |
Pioneer Natural Resources Co. | | | 412 | | | | 45,975 | |
Cameron International Corp.* | | | 820 | | | | 43,321 | |
FMC Technologies, Inc.* | | | 794 | | | | 40,033 | |
Murphy Oil Corp. | | | 644 | | | | 36,238 | |
Southwestern Energy Co.* | | | 1,160 | | | | 35,496 | |
Noble Corp.* | | | 839 | | | | 31,438 | |
Range Resources Corp. | | | 527 | | | | 30,640 | |
Peabody Energy Corp. | | | 898 | | | | 26,006 | |
Consol Energy, Inc. | | | 752 | | | | 25,643 | |
Equities Corp. | | | 495 | | | | 23,864 | |
Denbury Resources, Inc.* | | | 1,301 | | | | 23,717 | |
Cabot Oil & Gas Corp. | | | 700 | | | | 21,819 | |
Helmerich & Payne, Inc. | | | 357 | | | | 19,260 | |
QEP Resources, Inc. | | | 587 | | | | 17,904 | |
Nabors Industries Ltd.* | | | 952 | | | | 16,650 | |
Diamond Offshore Drilling, Inc. | | | 233 | | | | 15,553 | |
Newfield Exploration Co.* | | | 435 | | | | 15,086 | |
Rowan Companies, Inc.* | | | 414 | | | | 13,633 | |
Sunoco, Inc. | | | 351 | | | | 13,391 | |
Tesoro Corp.* | | | 457 | | | | 12,266 | |
WPX Energy, Inc.* | | | 661 | | | | 11,905 | |
Alpha Natural Resources, Inc.* | | | 739 | | | | 11,240 | |
| | | | | | | | |
Total Energy | | | | | | | 4,746,704 | |
| | | | | | | | |
CONSUMER DISCRETIONARY—6.1% | | | | | | | | |
McDonald’s Corp. | | | 3,379 | | | | 331,479 | |
Comcast Corp.—Class A | | | 8,944 | | | | 268,410 | |
Walt Disney Co. | | | 5,945 | | | | 260,273 | |
Home Depot, Inc. | | | 5,111 | | | | 257,134 | |
Amazon.com, Inc.* | | | 1,207 | | | | 244,430 | |
Ford Motor Co. | | | 12,593 | | | | 157,287 | |
News Corp.—Class A | | | 7,144 | | | | 140,665 | |
Starbucks Corp. | | | 2,499 | | | | 139,669 | |
NIKE, Inc.—Class B | | | 1,215 | | | | 131,755 | |
Target Corp. | | | 2,231 | | | | 130,001 | |
Lowe’s Companies, Inc. | | | 4,113 | | | | 129,066 | |
Time Warner, Inc. | | | 3,211 | | | | 121,215 | |
Priceline.com, Inc.* | | | 168 | | | | 120,540 | |
DIRECTV—Class A* | | | 2,235 | | | | 110,275 | |
Yum! Brands, Inc. | | | 1,533 | | | | 109,119 | |
TJX Companies, Inc. | | | 2,509 | | | | 99,632 | |
Time Warner Cable, Inc. | | | 1,044 | | | | 85,086 | |
| | | | | | | | |
| | | SHARES | | | VALUE | |
Viacom, Inc.—Class B | | | 1,792 | | | $ | 85,048 | |
Coach, Inc. | | | 957 | | | | 73,957 | |
Johnson Controls, Inc. | | | 2,254 | | | | 73,210 | |
CBS Corp.—Class B | | | 2,154 | | | | 73,042 | |
Macy’s, Inc. | | | 1,374 | | | | 54,590 | |
Bed Bath & Beyond, Inc.* | | | 789 | | | | 51,893 | |
Carnival Corp. | | | 1,502 | | | | 48,183 | |
Omnicom Group, Inc. | | | 899 | | | | 45,534 | |
McGraw-Hill Companies, Inc. | | | 922 | | | | 44,690 | |
Ross Stores, Inc. | | | 760 | | | | 44,156 | |
Discovery Communications, Inc.—Class A* | | | 861 | | | | 43,567 | |
Chipotle Mexican Grill, Inc.—Class A* | | | 104 | | | | 43,472 | |
VF Corp. | | | 293 | | | | 42,772 | |
Kohl’s Corp. | | | 845 | | | | 42,275 | |
Limited Brands, Inc. | | | 812 | | | | 38,976 | |
O’Reilly Automotive, Inc.* | | | 422 | | | | 38,550 | |
Mattel, Inc. | | | 1,131 | | | | 38,069 | |
Harley-Davidson, Inc. | | | 760 | | | | 37,301 | |
Staples, Inc. | | | 2,299 | | | | 37,198 | |
Dollar Tree, Inc.* | | | 392 | | | | 37,040 | |
Ralph Lauren Corp.—Class A | | | 212 | | | | 36,958 | |
Starwood Hotels & Resorts Worldwide, Inc. | | | 653 | | | | 36,836 | |
Wynn Resorts Ltd. | | | 271 | | | | 33,842 | |
Marriott International, Inc.—Class A | | | 889 | | | | 33,649 | |
AutoZone, Inc.* | | | 89 | | | | 33,090 | |
Genuine Parts Co. | | | 515 | | | | 32,316 | |
BorgWarner, Inc.* | | | 366 | | | | 30,868 | |
Nordstrom, Inc. | | | 525 | | | | 29,253 | |
Tiffany & Co. | | | 416 | | | | 28,758 | |
The Gap, Inc. | | | 1,099 | | | | 28,728 | |
CarMax, Inc.* | | | 748 | | | | 25,918 | |
Family Dollar Stores, Inc. | | | 389 | | | | 24,616 | |
Best Buy Company, Inc. | | | 948 | | | | 22,449 | |
Wyndham Worldwide Corp. | | | 480 | | | | 22,325 | |
Darden Restaurants, Inc. | | | 427 | | | | 21,845 | |
Netflix, Inc.* | | | 188 | | | | 21,628 | |
Whirlpool Corp. | | | 252 | | | | 19,369 | |
Newell Rubbermaid, Inc. | | | 960 | | | | 17,098 | |
JC Penney Company, Inc. | | | 480 | | | | 17,006 | |
Interpublic Group of Companies, Inc. | | | 1,478 | | | | 16,864 | |
International Game Technology | | | 992 | | | | 16,656 | |
H&R Block, Inc. | | | 971 | | | | 15,992 | |
Scripps Networks Interactive, Inc.—Class A | | | 321 | | | | 15,629 | |
Lennar Corp.—Class A | | | 536 | | | | 14,568 | |
Apollo Group, Inc.—Class A* | | | 371 | | | | 14,335 | |
Abercrombie & Fitch Co.—Class A | | | 285 | | | | 14,139 | |
Hasbro, Inc. | | | 383 | | | | 14,064 | |
DR Horton, Inc. | | | 927 | | | | 14,063 | |
Gannett Company, Inc. | | | 789 | | | | 12,095 | |
TripAdvisor, Inc.* | | | 317 | | | | 11,307 | |
Harman International Industries, Inc. | | | 233 | | | | 10,907 | |
Urban Outfitters, Inc.* | | | 372 | | | | 10,829 | |
Leggett & Platt, Inc. | | | 469 | | | | 10,792 | |
Expedia, Inc. | | | 317 | | | | 10,600 | |
Cablevision Systems Corp.—Class A | | | 721 | | | | 10,584 | |
| | |
14 | THE RYDEX SERIES FUNDS ANNUAL REPORT | | SEE NOTES TO FINANCIAL STATEMENTS. |
| | |
| SCHEDULE OF INVESTMENTS (continued) | | March 31, 2012 |
| NOVA FUND | | |
| | | | | | | | |
| | | SHARES | | | VALUE | |
GameStop Corp. — Class A | | | 462 | | | $ | 10,090 | |
PulteGroup, Inc.* | | | 1,119 | | | | 9,903 | |
Big Lots, Inc.* | | | 221 | | | | 9,507 | |
Goodyear Tire & Rubber Co.* | | | 807 | | | | 9,055 | |
Sears Holdings Corp.* | | | 131 | | | | 8,679 | |
DeVry, Inc. | | | 202 | | | | 6,842 | |
AutoNation, Inc.* | | | 152 | | | | 5,215 | |
Washington Post Co. — Class B | | | 13 | | | | 4,856 | |
| | | | | | | | |
Total Consumer Discretionary | | | | | | | 4,623,682 | |
| | | | | | | | |
CONSUMER STAPLES—6.0% | | | | | | | | |
Procter & Gamble Co. | | | 9,127 | | | | 613,425 | |
Coca-Cola Co. | | | 7,500 | | | | 555,074 | |
Philip Morris International, Inc. | | | 5,705 | | | | 505,520 | |
Wal-Mart Stores, Inc. | | | 5,778 | | | | 353,614 | |
PepsiCo, Inc. | | | 5,209 | | | | 345,617 | |
Kraft Foods, Inc. — Class A | | | 5,857 | | | | 222,624 | |
Altria Group, Inc. | | | 6,782 | | | | 209,360 | |
CVS Caremark Corp. | | | 4,320 | | | | 193,536 | |
Colgate-Palmolive Co. | | | 1,586 | | | | 155,078 | |
Costco Wholesale Corp. | | | 1,445 | | | | 131,206 | |
Kimberly-Clark Corp. | | | 1,312 | | | | 96,944 | |
Walgreen Co. | | | 2,894 | | | | 96,920 | |
General Mills, Inc. | | | 2,137 | | | | 84,305 | |
Archer-Daniels-Midland Co. | | | 2,186 | | | | 69,209 | |
Sysco Corp. | | | 1,939 | | | | 57,899 | |
Lorillard, Inc. | | | 441 | | | | 57,101 | |
HJ Heinz Co. | | | 1,061 | | | | 56,817 | |
Mead Johnson Nutrition Co. — Class A | | | 678 | | | | 55,921 | |
Kroger Co. | | | 1,906 | | | | 46,182 | |
Estee Lauder Companies, Inc. — Class A | | | 743 | | | | 46,022 | |
Reynolds American, Inc. | | | 1,109 | | | | 45,957 | |
Whole Foods Market, Inc. | | | 541 | | | | 45,011 | |
Kellogg Co. | | | 814 | | | | 43,655 | |
Sara Lee Corp. | | | 1,956 | | | | 42,113 | |
ConAgra Foods, Inc. | | | 1,369 | | | | 35,950 | |
Hershey Co. | | | 510 | | | | 31,278 | |
Beam, Inc. | | | 530 | | | | 31,042 | |
JM Smucker Co. | | | 373 | | | | 30,347 | |
Clorox Co. | | | 433 | | | | 29,769 | |
Coca-Cola Enterprises, Inc. | | | 999 | | | | 28,571 | |
Dr Pepper Snapple Group, Inc. | | | 709 | | | | 28,509 | |
Brown-Forman Corp. — Class B | | | 336 | | | | 28,019 | |
Avon Products, Inc. | | | 1,428 | | | | 27,646 | |
McCormick & Company, Inc. | | | 443 | | | | 24,112 | |
Molson Coors Brewing Co. — Class B | | | 518 | | | | 23,440 | |
Campbell Soup Co. | | | 589 | | | | 19,938 | |
Tyson Foods, Inc. — Class A | | | 967 | | | | 18,518 | |
Safeway, Inc. | | | 893 | | | | 18,048 | |
Constellation Brands, Inc. — Class A* | | | 578 | | | | 13,635 | |
Hormel Foods Corp. | | | 457 | | | | 13,491 | |
Dean Foods Co.* | | | 606 | | | | 7,339 | |
SUPERVALU, Inc. | | | 708 | | | | 4,043 | |
| | | | | | | | |
Total Consumer Staples | | | | | | | 4,542,805 | |
| | | | | | | | |
INDUSTRIALS—5.9% | | | | | | | | |
General Electric Co. | | | 35,058 | | | | 703,615 | |
United Parcel Service, Inc. — Class B | | | 3,177 | | | | 256,447 | |
United Technologies Corp. | | | 3,019 | | | | 250,396 | |
| | | | | | | | |
| | | SHARES | | | VALUE | |
Caterpillar, Inc. | | | 2,145 | | | $ | 228,486 | |
3M Co. | | | 2,302 | | | | 205,361 | |
Boeing Co. | | | 2,473 | | | | 183,917 | |
Union Pacific Corp. | | | 1,588 | | | | 170,678 | |
Honeywell International, Inc. | | | 2,579 | | | | 157,448 | |
Emerson Electric Co. | | | 2,430 | | | | 126,797 | |
Deere & Co. | | | 1,329 | | | | 107,516 | |
Danaher Corp. | | | 1,891 | | | | 105,896 | |
FedEx Corp. | | | 1,046 | | | | 96,190 | |
Illinois Tool Works, Inc. | | | 1,604 | | | | 91,620 | |
General Dynamics Corp. | | | 1,185 | | | | 86,955 | |
Tyco International Ltd. | | | 1,529 | | | | 85,899 | |
Precision Castparts Corp. | | | 489 | | | | 84,548 | |
Lockheed Martin Corp. | | | 887 | | | | 79,706 | |
Cummins, Inc. | | | 637 | | | | 76,465 | |
CSX Corp. | | | 3,488 | | | | 75,062 | |
Norfolk Southern Corp. | | | 1,090 | | | | 71,755 | |
Raytheon Co. | | | 1,126 | | | | 59,430 | |
PACCAR, Inc. | | | 1,186 | | | | 55,540 | |
Eaton Corp. | | | 1,111 | | | | 55,361 | |
Waste Management, Inc. | | | 1,529 | | | | 53,453 | |
Fastenal Co. | | | 975 | | | | 52,748 | |
Goodrich Corp. | | | 420 | | | | 52,685 | |
Northrop Grumman Corp. | | | 841 | | | | 51,368 | |
WW Grainger, Inc. | | | 209 | | | | 44,895 | |
Stanley Black & Decker, Inc. | | | 557 | | | | 42,867 | |
Parker Hannifin Corp. | | | 502 | | | | 42,444 | |
Ingersoll-Rand plc | | | 985 | | | | 40,730 | |
Dover Corp. | | | 608 | | | | 38,268 | |
Rockwell Automation, Inc. | | | 475 | | | | 37,858 | |
CH Robinson Worldwide, Inc. | | | 540 | | | | 35,365 | |
Cooper Industries plc | | | 522 | | | | 33,382 | |
Fluor Corp. | | | 555 | | | | 33,321 | |
Expeditors International of Washington, Inc. | | | 701 | | | | 32,604 | |
Roper Industries, Inc. | | | 325 | | | | 32,227 | |
Republic Services, Inc. — Class A | | | 1,046 | | | | 31,966 | |
Rockwell Collins, Inc. | | | 492 | | | | 28,320 | |
Joy Global, Inc. | | | 353 | | | | 25,946 | |
Textron, Inc. | | | 922 | | | | 25,659 | |
Stericycle, Inc.* | | | 279 | | | | 23,336 | |
L-3 Communications Holdings, Inc. | | | 324 | | | | 22,929 | |
Pall Corp. | | | 378 | | | | 22,540 | |
Southwest Airlines Co. | | | 2,569 | | | | 21,169 | |
Flowserve Corp. | | | 177 | | | | 20,445 | |
Jacobs Engineering Group, Inc.* | | | 423 | | | | 18,769 | |
Equifax, Inc. | | | 396 | | | | 17,527 | |
Xylem, Inc. | | | 610 | | | | 16,928 | |
Iron Mountain, Inc. | | | 568 | | | | 16,358 | |
Masco Corp. | | | 1,186 | | | | 15,857 | |
Quanta Services, Inc.* | | | 705 | | | | 14,735 | |
Cintas Corp. | | | 367 | | | | 14,357 | |
Robert Half International, Inc. | | | 472 | | | | 14,302 | |
Dun & Bradstreet Corp. | | | 159 | | | | 13,472 | |
Snap-on, Inc. | | | 195 | | | | 11,889 | |
Pitney Bowes, Inc. | | | 664 | | | | 11,673 | |
Avery Dennison Corp. | | | 356 | | | | 10,726 | |
| | |
SEE NOTES TO FINANCIAL STATEMENTS. | | THE RYDEX SERIES FUNDS ANNUAL REPORT | 15 |
| | |
| SCHEDULE OF INVESTMENTS (continued) | | March 31, 2012 |
| NOVA FUND | | |
| | | | | | | | |
| | | SHARES | | | VALUE | |
Ryder System, Inc. | | | 173 | | | $ | 9,134 | |
RR Donnelley & Sons Co. | | | 593 | | | | 7,347 | |
First Solar, Inc.* | | | 198 | | | | 4,960 | |
| | | | | | | | |
Total Industrials | | | | | | | 4,459,647 | |
| | | | | | | | |
MATERIALS—2.0% | | | | | | | | |
EI du Pont de Nemours & Co. | | | 3,213 | | | | 169,968 | |
Dow Chemical Co. | | | 4,119 | | | | 142,682 | |
Monsanto Co. | | | 1,779 | | | | 141,893 | |
Freeport-McMoRan Copper & Gold, Inc. | | | 3,323 | | | | 126,407 | |
Praxair, Inc. | | | 997 | | | | 114,297 | |
Newmont Mining Corp. | | | 1,643 | | | | 84,237 | |
Air Products & Chemicals, Inc. | | | 698 | | | | 64,076 | |
Mosaic Co. | | | 1,093 | | | | 60,432 | |
Ecolab, Inc. | �� | | 966 | | | | 59,622 | |
PPG Industries, Inc. | | | 589 | | | | 56,426 | |
International Paper Co. | | | 1,564 | | | | 54,896 | |
Nucor Corp. | | | 1,054 | | | | 45,270 | |
Cliffs Natural Resources, Inc. | | | 574 | | | | 39,755 | |
CF Industries Holdings, Inc. | | | 215 | | | | 39,270 | |
Alcoa, Inc. | | | 3,769 | | | | 37,765 | |
Sherwin-Williams Co. | | | 290 | | | | 31,514 | |
Sigma-Aldrich Corp. | | | 405 | | | | 29,589 | |
Airgas, Inc. | | | 286 | | | | 25,445 | |
FMC Corp. | | | 230 | | | | 24,348 | |
Eastman Chemical Co. | | | 457 | | | | 23,622 | |
Ball Corp. | | | 518 | | | | 22,212 | |
Vulcan Materials Co. | | | 427 | | | | 18,246 | |
MeadWestvaco Corp. | | | 567 | | | | 17,912 | |
United States Steel Corp. | | | 563 | | | | 16,535 | |
International Flavors & Fragrances, Inc. | | | 269 | | | | 15,763 | |
Allegheny Technologies, Inc. | | | 353 | | | | 14,533 | |
Sealed Air Corp. | | | 731 | | | | 14,116 | |
Owens-Illinois, Inc.* | | | 548 | | | | 12,790 | |
Bemis Company, Inc. | | | 346 | | | | 11,172 | |
Titanium Metals Corp. | | | 337 | | | | 4,570 | |
| | | | | | | | |
Total Materials | | | | | | | 1,519,363 | |
| | | | | | | | |
UTILITIES—1.9% | | | | | | | | |
Southern Co. | | | 2,876 | | | | 129,219 | |
Exelon Corp. | | | 2,816 | | | | 110,415 | |
Dominion Resources, Inc. | | | 1,887 | | | | 96,633 | |
Duke Energy Corp. | | | 4,427 | | | | 93,011 | |
NextEra Energy, Inc. | | | 1,376 | | | | 84,046 | |
FirstEnergy Corp. | | | 1,387 | | | | 63,233 | |
American Electric Power Company, Inc. | | | 1,605 | | | | 61,921 | |
PG&E Corp. | | | 1,368 | | | | 59,385 | |
Consolidated Edison, Inc. | | | 973 | | | | 56,843 | |
PPL Corp. | | | 1,914 | | | | 54,090 | |
Progress Energy, Inc. | | | 979 | | | | 51,995 | |
Public Service Enterprise Group, Inc. | | | 1,680 | | | | 51,425 | |
Sempra Energy | | | 793 | | | | 47,548 | |
Edison International | | | 1,085 | | | | 46,123 | |
Xcel Energy, Inc. | | | 1,612 | | | | 42,670 | |
Entergy Corp. | | | 581 | | | | 39,043 | |
DTE Energy Co. | | | 557 | | | | 30,652 | |
| | | | | | | | |
| | | SHARES | | | VALUE | |
ONEOK, Inc. | | | 342 | | | $ | 27,928 | |
CenterPoint Energy, Inc. | | | 1,415 | | | | 27,904 | |
AES Corp.* | | | 2,130 | | | | 27,839 | |
Wisconsin Energy Corp. | | | 765 | | | | 26,913 | |
Ameren Corp. | | | 804 | | | | 26,194 | |
NiSource, Inc. | | | 931 | | | | 22,670 | |
Northeast Utilities | | | 587 | | | | 21,789 | |
CMS Energy Corp. | | | 853 | | | | 18,766 | |
SCANA Corp. | | | 389 | | | | 17,742 | |
Pinnacle West Capital Corp. | | | 370 | | | | 17,723 | |
AGL Resources, Inc. | | | 392 | | | | 15,374 | |
Pepco Holdings, Inc. | | | 758 | | | | 14,319 | |
Integrys Energy Group, Inc. | | | 256 | | | | 13,565 | |
TECO Energy, Inc. | | | 717 | | | | 12,583 | |
NRG Energy, Inc.* | | | 756 | | | | 11,847 | |
| | | | | | | | |
Total Utilities | | | | | | | 1,421,408 | |
| | | | | | | | |
TELECOMMUNICATION SERVICES—1.5% | | | | | | | | |
AT&T, Inc. | | | 19,652 | | | | 613,733 | |
Verizon Communications, Inc. | | | 9,405 | | | | 359,553 | |
CenturyLink, Inc. | | | 2,056 | | | | 79,464 | |
Crown Castle International Corp.* | | | 830 | | | | 44,271 | |
Sprint Nextel Corp.* | | | 9,930 | | | | 28,301 | |
Windstream Corp. | | | 1,940 | | | | 22,717 | |
Frontier Communications Corp. | | | 3,298 | | | | 13,753 | |
MetroPCS Communications, Inc.* | | | 982 | | | | 8,858 | |
| | | | | | | | |
Total Telecommunication Services | | | | | | | 1,170,650 | |
| | | | | | | | |
Total Common Stocks
(Cost $23,152,434) | | | | | | | 42,278,202 | |
| | | | | | | | |
| | | FACE | | | | | |
| | | AMOUNT | | | | |
REPURCHASE AGREEMENTS††,1—34.7% | | | | | | | | |
HSBC Group issued 03/30/12 at 0.01%due 04/02/12 | | $ | 15,030,427 | | | | 15,030,427 | |
Credit Suisse Group issued 03/30/12 at 0.01%due 04/02/122 | | | 5,953,118 | | | | 5,953,118 | |
Mizuho Financial Group, Inc.issued 03/30/12 at 0.01%due 04/02/12 | | | 4,228,800 | | | | 4,228,800 | |
Deutsche Bank issued 03/30/12 at 0.01%due 04/02/12 | | | 1,123,968 | | | | 1,123,968 | |
| | | | | | | | |
Total Repurchase Agreements
(Cost $26,336,313) | | | | | | | 26,336,313 | |
| | | | | | | | |
Total Investments—90.3%
(Cost $49,488,747) | | | | | | $ | 68,614,515 | |
| | | | | | | | |
Other Assets & Liabilities, net—9.7% | | | | | | | 7,396,700 | |
| | | | | | | | |
Total Net Assets—100.0% | | | | | | $ | 76,011,215 | |
| |
| | |
16 | THE RYDEX SERIES FUNDS ANNUAL REPORT | | SEE NOTES TO FINANCIAL STATEMENTS. |
| | |
| SCHEDULE OF INVESTMENTS (continued) | | March 31, 2012 |
NOVA FUND | | |
| | | | | | | | |
| | | CONTRACTS | | | UNREALIZED
GAIN (LOSS) | |
FUTURES CONTRACTS PURCHASED† | | | | | | | | |
June 2012 S&P 500 Index | | | | | | | | |
Mini Futures Contracts | | | | | | | | |
(Aggregate Value of | | | | | | | | |
Contracts $21,731,000) | | | 310 | | | | $53,298 | |
| | |
| | | UNITS | | | | |
EQUITY INDEX SWAP AGREEMENTS†† | | | | | | | | |
Barclays Bank plc | | | | | | | | |
April 2012 S&P 500 Index Swap, | | | | | | | | |
Terminating 04/30/123 | | | | | | | | |
(Notional Value $17,733,108) | | | 12,590 | | | $ | 64,953 | |
Credit Suisse Capital, LLC | | | | | | | | |
April 2012 S&P 500 Index Swap, | | | | | | | | |
Terminating 04/30/123 | | | | | | | | |
(Notional Value $9,340,165) | | | 6,631 | | | | 34,550 | |
Morgan Stanley Capital Services, Inc. | | | | | | | | |
April 2012 S&P 500 Index Swap, | | | | | | | | |
Terminating 04/30/123 | | | | | | | | |
(Notional Value $6,837,677) | | | 4,855 | | | | (18,145 | ) |
Goldman Sachs International | | | | | | | | |
April 2012 S&P 500 Index Swap, | | | | | | | | |
Terminating 04/27/123 | | | | | | | | |
(Notional Value $15,961,391) | | | 11,332 | | | | (85,487 | ) |
(Total Notional Value $49,872,341) | | | | | | $ | (4,129 | ) |
| * | Non-income producing security. |
| † | Value determined based on Level 1 inputs — See Note 4. |
| †† | Value determined based on Level 2 inputs — See Note 4. |
| 1 | Repurchase Agreements — See Note 5. |
| 2 | All or a portion of this security is pledged as equity index swap collateral at March 31, 2012. |
| 3 | Total Return based on S&P 500 Index +/- financing at a variable rate. |
plc — Public Limited Company
REIT — Real Estate Investment Trust
| | |
SEE NOTES TO FINANCIAL STATEMENTS. | | THE RYDEX SERIES FUNDS ANNUAL REPORT | 17 |
NOVA FUND
STATEMENT OF ASSETS AND LIABILITIES
| | | | |
| March 31, 2012 | | | |
| |
ASSETS: | | | | |
Investments, at value
(cost $23,152,434) | | $ | 42,278,202 | |
| |
Repurchase agreements, at value
(cost $26,336,313) | | | 26,336,313 | |
| | | | |
Total investments
(cost $49,488,747) | | | 68,614,515 | |
| |
Segregated cash with broker | | | 1,974,491 | |
Unrealized appreciation on swap agreements | | | 99,503 | |
Cash | | | 844 | |
Receivable for swap settlement | | | 602 | |
Receivables: | | | | |
Securities sold | | | 17,831,655 | |
Fund shares sold | | | 1,276,030 | |
Dividends | | | 69,378 | |
Variation margin | | | 58,900 | |
Interest | | | 15 | |
| | | | |
Total assets | | | 89,925,933 | |
| | | | |
LIABILITIES: | | | | |
Unrealized depreciation on swap agreements | | | 103,632 | |
Payable for: | | | | |
Fund shares redeemed | | | 13,696,574 | |
Management fees | | | 44,997 | |
Transfer agent and administrative fees | | | 14,999 | |
Distribution and service fees | | | 12,743 | |
Portfolio accounting fees | | | 5,999 | |
Miscellaneous | | | 35,774 | |
| | | | |
Total liabilities | | | 13,914,718 | |
| | | | |
NET ASSETS | | $ | 76,011,215 | |
| | | | |
NET ASSETS CONSIST OF: | | | | |
Paid in capital | | $ | 105,969,758 | |
Undistributed net investment income | | | 72,406 | |
Accumulated net realized loss on investments | | | (49,205,886 | ) |
Net unrealized appreciation on investments | | | 19,174,937 | |
| | | | |
Net assets | | $ | 76,011,215 | |
| | | | |
INVESTOR CLASS: | | | | |
Net assets | | $ | 54,597,924 | |
Capital shares outstanding | | | 2,035,570 | |
Net asset value per share | | $ | 26.82 | |
| | | | |
ADVISOR CLASS: | | | | |
Net assets | | $ | 11,111,510 | |
Capital shares outstanding | | | 447,132 | |
Net asset value per share | | $ | 24.85 | |
| | | | |
A-CLASS: | | | | |
Net assets | | $ | 1,472,415 | |
Capital shares outstanding | | | 58,025 | |
Net asset value per share | | $ | 25.38 | |
| | | | |
Maximum offering price per share | | | | |
(Net asset value divided by 95.25%) | | $ | 26.65 | |
| | | | |
C-CLASS: | | | | |
Net assets | | $ | 8,829,366 | |
Capital shares outstanding | | | 371,477 | |
Net asset value per share | | $ | 23.77 | |
| | | | |
STATEMENT OF OPERATIONS
| | | | |
| Year Ended March 31, 2012 | | | |
| |
INVESTMENT INCOME: | | | | |
Dividends (net of foreign withholding tax of $8) | | $ | 1,005,808 | |
Interest | | | 4,162 | |
| | | | |
Total investment income | | | 1,009,970 | |
| | | | |
EXPENSES: | | | | |
Management fees | | | 471,144 | |
Transfer agent and administrative fees | | | 157,048 | |
Distribution and service fees: | | | | |
Advisor Class | | | 60,110 | |
A-Class | | | 4,225 | |
C-Class | | | 84,782 | |
Portfolio accounting fees | | | 62,819 | |
Custodian fees | | | 16,206 | |
Trustees’ fees* | | | 5,790 | |
Miscellaneous | | | 75,440 | |
| | | | |
Total expenses | | | 937,564 | |
| | | | |
Net investment income | | | 72,406 | |
| | | | |
NET REALIZED AND UNREALIZED GAIN (LOSS): | | | | |
Net realized gain (loss) on: | | | | |
Investments | | | 3,732,393 | |
Swap agreements | | | 1,972,026 | |
Futures contracts | | | 1,233,041 | |
| | | | |
Net realized gain | | | 6,937,460 | |
| | | | |
Net change in unrealized appreciation (depreciation) on: | | | | |
Investments | | | (914,534 | ) |
Swap agreements | | | (601,139 | ) |
Futures contracts | | | (60,934 | ) |
| | | | |
Net change in unrealized appreciation (depreciation) | | | (1,576,607 | ) |
| | | | |
Net realized and unrealized gain | | | 5,360,853 | |
| | | | |
Net increase in net assets resulting from operations | | $ | 5,433,259 | |
| | | | |
| * | Relates to Trustees not deemed “interested persons” within the meaning of Section 2(a)(19) of the 1940 Act. |
| | |
18 | THE RYDEX SERIES FUNDS ANNUAL REPORT | | SEE NOTES TO FINANCIAL STATEMENTS. |
NOVA FUND
STATEMENTS OF CHANGES IN NET ASSETS
| | | | | | | | |
| | | Year Ended
March 31,
2012 | | | Year Ended
March 31,
2011 | |
INCREASE (DECREASE) IN NET ASSETS FROM OPERATIONS: | | | | | | | | |
Net investment income (loss) | | $ | 72,406 | | | $ | (49,689 | ) |
Net realized gain on investments | | | 6,937,460 | | | | 10,031,654 | |
Net change in unrealized appreciation (depreciation) on investments | | | (1,576,607 | ) | | | 898,596 | |
| | | | | | | | |
Net increase in net assets resulting from operations | | | 5,433,259 | | | | 10,880,561 | |
| | | | | | | | |
DISTRIBUTIONS TO SHAREHOLDERS FROM: | | | | | | | | |
Net investment income | | | | | | | | |
Investor Class | | | — | | | | (56,523 | ) |
Advisor Class | | | — | | | | (8,341 | ) |
A-Class | | | — | | | | (3,832 | ) |
C-Class | | | — | | | | (10,036 | ) |
| | | | | | | | |
Total distributions to shareholders | | | — | | | | (78,732 | ) |
| | | | | | | | |
CAPITAL SHARE TRANSACTIONS: | | | | | | | | |
PROCEEDS FROM SALE OF SHARES | | | | | | | | |
Investor Class | | | 237,071,389 | | | | 259,708,644 | |
Advisor Class | | | 121,207,207 | | | | 20,373,380 | |
A-Class | | | 3,329,240 | | | | 10,442,997 | |
C-Class | | | 5,615,480 | | | | 5,762,021 | |
DISTRIBUTIONS REINVESTED | | | | | | | | |
Investor Class | | | — | | | | 54,308 | |
Advisor Class | | | — | | | | 8,057 | |
A-Class | | | — | | | | 1,475 | |
C-Class | | | — | | | | 9,479 | |
COST OF SHARES REDEEMED | | | | | | | | |
Investor Class | | | (250,073,204 | ) | | | (279,712,330 | ) |
Advisor Class | | | (118,799,399 | ) | | | (26,778,781 | ) |
A-Class | | | (7,696,519 | ) | | | (7,025,575 | ) |
C-Class | | | (7,800,732 | ) | | | (7,471,647 | ) |
| | | | | | | | |
Net decrease from capital share transactions | | | (17,146,538 | ) | | | (24,627,972 | ) |
| | | | | | | | |
Net decrease in net assets | | | (11,713,279 | ) | | | (13,826,143 | ) |
NET ASSETS: | | | | | | | | |
Beginning of year | | | 87,724,494 | | | | 101,550,637 | |
| | | | | | | | |
End of year | | $ | 76,011,215 | | | $ | 87,724,494 | |
| | | | | | | | |
Undistributed net investment income at end of year | | $ | 72,406 | | | $ | — | |
| | | | | | | | |
CAPITAL SHARE ACTIVITY: | | | | | | | | |
Shares sold | | | | | | | | |
Investor Class | | | 10,119,764 | | | | 12,737,976 | |
Advisor Class | | | 5,689,047 | | | | 1,079,238 | |
A-Class | | | 144,349 | | | | 544,055 | |
C-Class | | | 268,080 | | | | 315,490 | |
Shares issued from reinvestment of distributions | | | | | | | | |
Investor Class | | | — | | | | 2,493 | |
Advisor Class | | | — | | | | 397 | |
A-Class | | | — | | | | 71 | |
C-Class | | | — | | | | 485 | |
Shares redeemed | | | | | | | | |
Investor Class | | | (10,732,141 | ) | | | (13,903,126 | ) |
Advisor Class | | | (5,518,034 | ) | | | (1,422,686 | ) |
A-Class | | | (336,896 | ) | | | (390,827 | ) |
C-Class | | | (371,985 | ) | | | (422,098 | ) |
| | | | | | | | |
Net decrease in shares | | | (737,816 | ) | | | (1,458,532 | ) |
| | | | | | | | |
| | |
SEE NOTES TO FINANCIAL STATEMENTS. | | THE RYDEX SERIES FUNDS ANNUAL REPORT | 19 |
NOVA FUND
FINANCIAL HIGHLIGHTS
This table is presented to show selected data for a share outstanding throughout each period and to assist shareholders in evaluating a Fund’s performance for the periods presented.
| | | | | | | | | | | | | | | | | | | | |
Investor Class | | Year Ended
March 31,
2012 | | | Year Ended
March 31,
2011 | | | Year Ended
March 31,
2010 | | | Year Ended
March 31,
2009 | | | Year Ended
March 31,
2008 | |
Per Share Data | | | | | | | | | | | | | | | | | | | | |
Net asset value, beginning of period | | $ | 24.59 | | | $ | 20.28 | | | $ | 11.40 | | | $ | 26.13 | | | $ | 30.92 | |
| | | | | | | | | | | | | | | | | | | | |
Income (loss) from investment operations: | | | | | | | | | | | | | | | | | | | | |
Net investment incomea | | | .08 | | | | .02 | | | | .06 | | | | .19 | | | | .40 | |
Net gain (loss) on investments (realized and unrealized) | | | 2.15 | | | | 4.31 | | | | 8.97 | | | | (14.83 | ) | | | (4.51 | ) |
| | | | | | | | | | | | | | | | | | | | |
Total from investment operations | | | 2.23 | | | | 4.33 | | | | 9.03 | | | | (14.64 | ) | | | (4.11 | ) |
| | | | | | | | | | | | | | | | | | | | |
Less distributions from: | | | | | | | | | | | | | | | | | | | | |
Net investment income | | | — | | | | (.02 | ) | | | (.15 | ) | | | (.09 | ) | | | (.68 | ) |
| | | | | | | | | | | | | | | | | | | | |
Total distributions | | | — | | | | (.02 | ) | | | (.15 | ) | | | (.09 | ) | | | (.68 | ) |
| | | | | | | | | | | | | | | | | | | | |
Net asset value, end of period | | $ | 26.82 | | | $ | 24.59 | | | $ | 20.28 | | | $ | 11.40 | | | $ | 26.13 | |
| | | | | | | | | | | | | | | | | | | | |
Total Returnb | | | 9.07 | % | | | 21.38 | % | | | 79.36 | % | | | (56.06 | %) | | | (13.71 | %) |
| | | | | | | | | | | | | | | | | | | | |
Ratios/Supplemental Data | | | | | | | | | | | | | | | | | | | | |
Net assets, end of period (in thousands) | | $ | 54,598 | | | $ | 65,102 | | | $ | 77,268 | | | $ | 32,603 | | | $ | 74,674 | |
| | | | | | | | | | | | | | | | | | | | |
Ratios to average net assets: | | | | | | | | | | | | | | | | | | | | |
Net investment income | | | 0.36 | % | | | 0.11 | % | | | 0.33 | % | | | 0.93 | % | | | 1.26 | % |
Total expenses | | | 1.26 | % | | | 1.29 | % | | | 1.28 | % | | | 1.29 | % | | | 1.27 | % |
| | | | | | | | | | | | | | | | | | | | |
Portfolio turnover rate | | | 116 | % | | | 53 | % | | | 68 | % | | | 143 | % | | | 115 | % |
| | | | | | | | | | | | | | | | | | | | |
Advisor Class | | Year Ended
March 31,
2012 | | | Year Ended
March 31,
2011 | | | Year Ended
March 31,
2010 | | | Year Ended
March 31,
2009 | | | Year Ended
March 31,
2008 | |
Per Share Data | | | | | | | | | | | | | | | | | | | | |
Net asset value, beginning of period | | $ | 22.88 | | | $ | 18.97 | | | $ | 10.73 | | | $ | 24.72 | | | $ | 29.44 | |
| | | | | | | | | | | | | | | | | | | | |
Income (loss) from investment operations: | | | | | | | | | | | | | | | | | | | | |
Net investment income (loss)a | | | (.04 | ) | | | (.07 | ) | | | (.01 | ) | | | .08 | | | | .23 | |
Net gain (loss) on investments (realized and unrealized) | | | 2.01 | | | | 4.00 | | | | 8.40 | | | | (13.98 | ) | | | (4.27 | ) |
| | | | | | | | | | | | | | | | | | | | |
Total from investment operations | | | 1.97 | | | | 3.93 | | | | 8.39 | | | | (13.90 | ) | | | (4.04 | ) |
| | | | | | | | | | | | | | | | | | | | |
Less distributions from: | | | | | | | | | | | | | | | | | | | | |
Net investment income | | | — | | | | (.02 | ) | | | (.15 | ) | | | (.09 | ) | | | (.68 | ) |
| | | | | | | | | | | | | | | | | | | | |
Total distributions | | | — | | | | (.02 | ) | | | (.15 | ) | | | (.09 | ) | | | (.68 | ) |
| | | | | | | | | | | | | | | | | | | | |
Net asset value, end of period | | $ | 24.85 | | | $ | 22.88 | | | $ | 18.97 | | | $ | 10.73 | | | $ | 24.72 | |
| | | | | | | | | | | | | | | | | | | | |
Total Returnb | | | 8.57 | % | | | 20.75 | % | | | 78.35 | % | | | (56.26 | %) | | | (14.16 | %) |
| | | | | | | | | | | | | | | | | | | | |
Ratios/Supplemental Data | | | | | | | | | | | | | | | | | | | | |
Net assets, end of period (in thousands) | | $ | 11,112 | | | $ | 6,318 | | | $ | 11,746 | | | $ | 10,853 | | | $ | 19,218 | |
| | | | | | | | | | | | | | | | | | | | |
Ratios to average net assets: | | | | | | | | | | | | | | | | | | | | |
Net investment income (loss) | | | (0.18 | %) | | | (0.37 | %) | | | (0.03 | %) | | | 0.45 | % | | | 0.78 | % |
Total expenses | | | 1.75 | % | | | 1.79 | % | | | 1.78 | % | | | 1.79 | % | | | 1.77 | % |
| | | | | | | | | | | | | | | | | | | | |
Portfolio turnover rate | | | 116 | % | | | 53 | % | | | 68 | % | | | 143 | % | | | 115 | % |
| | |
20 | THE RYDEX SERIES FUNDS ANNUAL REPORT | | SEE NOTES TO FINANCIAL STATEMENTS. |
NOVA FUND
FINANCIAL HIGHLIGHTS (concluded)
This table is presented to show selected data for a share outstanding throughout each period and to assist shareholders in evaluating a Fund’s performance for the periods presented.
| | | | | | | | | | | | | | | | | | | | |
A-Class | | Year Ended
March 31,
2012 | | | Year Ended
March 31,
2011 | | | Year Ended
March 31,
2010 | | | Year Ended
March 31,
2009 | | | Year Ended
March 31,
2008 | |
Per Share Data | | | | | | | | | | | | | | | | | | | | |
Net asset value, beginning of period | | $ | 23.32 | | | $ | 19.28 | | | $ | 10.88 | | | $ | 24.99 | | | $ | 29.67 | |
| | | | | | | | | | | | | | | | | | | | |
Income (loss) from investment operations: | | | | | | | | | | | | | | | | | | | | |
Net investment income (loss)a | | | .01 | | | | (.02 | ) | | | .03 | | | | .13 | | | | .29 | |
Net gain (loss) on investments (realized and unrealized) | | | 2.05 | | | | 4.08 | | | | 8.52 | | | | (14.15 | ) | | | (4.29 | ) |
| | | | | | | | | | | | | | | | | | | | |
Total from investment operations | | | 2.06 | | | | 4.06 | | | | 8.55 | | | | (14.02 | ) | | | (4.00 | ) |
| | | | | | | | | | | | | | | | | | | | |
Less distributions from: | | | | | | | | | | | | | | | | | | | | |
Net investment income | | | — | | | | (.02 | ) | | | (.15 | ) | | | (.09 | ) | | | (.68 | ) |
| | | | | | | | | | | | | | | | | | | | |
Total distributions | | | — | | | | (.02 | ) | | | (.15 | ) | | | (.09 | ) | | | (.68 | ) |
| | | | | | | | | | | | | | | | | | | | |
Net asset value, end of period | | $ | 25.38 | | | $ | 23.32 | | | $ | 19.28 | | | $ | 10.88 | | | $ | 24.99 | |
| | | | | | | | | | | | | | | | | | | | |
Total Returnb | | | 8.79 | % | | | 21.09 | % | | | 78.74 | % | | | (56.13 | %) | | | (13.92 | %) |
| | | | | | | | | | | | | | | | | | | | |
Ratios/Supplemental Data | | | | | | | | | | | | | | | | | | | | |
Net assets, end of period (in thousands) | | $ | 1,472 | | | $ | 5,843 | | | $ | 1,876 | | | $ | 3,612 | | | $ | 11,791 | |
| | | | | | | | | | | | | | | | | | | | |
Ratios to average net assets: | | | | | | | | | | | | | | | | | | | | |
Net investment income (loss) | | | 0.06 | % | | | (0.11 | %) | | | 0.18 | % | | | 0.70 | % | | | 0.97 | % |
Total expenses | | | 1.51 | % | | | 1.54 | % | | | 1.54 | % | | | 1.54 | % | | | 1.52 | % |
| | | | | | | | | | | | | | | | | | | | |
Portfolio turnover rate | | | 116 | % | | | 53 | % | | | 68 | % | | | 143 | % | | | 115 | % |
| | | | | | | | | | | | | | | | | | | | |
C-Class | | Year Ended
March 31,
2012 | | | Year Ended
March 31,
2011 | | | Year Ended
March 31,
2010 | | | Year Ended
March 31,
2009 | | | Year Ended
March 31,
2008 | |
Per Share Data | | | | | | | | | | | | | | | | | | | | |
Net asset value, beginning of period | | $ | 22.01 | | | $ | 18.33 | | | $ | 10.42 | | | $ | 24.14 | | | $ | 28.91 | |
| | | | | | | | | | | | | | | | | | | | |
Income (loss) from investment operations: | | | | | | | | | | | | | | | | | | | | |
Net investment income (loss)a | | | (.13 | ) | | | (.16 | ) | | | (.09 | ) | | | (.01 | ) | | | .07 | |
Net gain (loss) on investments (realized and unrealized) | | | 1.89 | | | | 3.86 | | | | 8.15 | | | | (13.62 | ) | | | (4.16 | ) |
| | | | | | | | | | | | | | | | | | | | |
Total from investment operations | | | 1.76 | | | | 3.70 | | | | 8.06 | | | | (13.63 | ) | | | (4.09 | ) |
| | | | | | | | | | | | | | | | | | | | |
Less distributions from: | | | | | | | | | | | | | | | | | | | | |
Net investment income | | | — | | | | (.02 | ) | | | (.15 | ) | | | (.09 | ) | | | (.68 | ) |
| | | | | | | | | | | | | | | | | | | | |
Total distributions | | | — | | | | (.02 | ) | | | (.15 | ) | | | (.09 | ) | | | (.68 | ) |
| | | | | | | | | | | | | | | | | | | | |
Net asset value, end of period | | $ | 23.77 | | | $ | 22.01 | | | $ | 18.33 | | | $ | 10.42 | | | $ | 24.14 | |
| | | | | | | | | | | | | | | | | | | | |
Total Returnb | | | 8.00 | % | | | 20.22 | % | | | 77.51 | % | | | (56.49 | %) | | | (14.60 | %) |
| | | | | | | | | | | | | | | | | | | | |
Ratios/Supplemental Data | | | | | | | | | | | | | | | | | | | | |
Net assets, end of period (in thousands) | | $ | 8,829 | | | $ | 10,461 | | | $ | 10,661 | | | $ | 9,314 | | | $ | 29,715 | |
| | | | | | | | | | | | | | | | | | | | |
Ratios to average net assets: | | | | | | | | | | | | | | | | | | | | |
Net investment income (loss) | | | (0.62 | %) | | | (0.85 | %) | | | (0.61 | %) | | | (0.05 | %) | | | 0.24 | % |
Total expenses | | | 2.26 | % | | | 2.29 | % | | | 2.28 | % | | | 2.29 | % | | | 2.27 | % |
| | | | | | | | | | | | | | | | | | | | |
Portfolio turnover rate | | | 116 | % | | | 53 | % | | | 68 | % | | | 143 | % | | | 115 | % |
| a | Net investment income (loss) per share was computed using average shares outstanding throughout the period. |
| b | Total return does not reflect the impact of any applicable sales charges and has not been annualized. |
| | |
SEE NOTES TO FINANCIAL STATEMENTS. | | THE RYDEX SERIES FUNDS ANNUAL REPORT | 21 |
| | |
| PERFORMANCE REPORT AND FUND PROFILE (Unaudited) | | March 31, 2012 |
S&P 500 FUND
OBJECTIVE: Seeks to provide investment results that match, before fees and expenses, the performance of a specific benchmark on a daily basis. The Fund’s current benchmark is the S&P 500® Index (the “underlying index”).
The broad-market S&P 500 Index returned 8.54% for the one-year period ended March 31, 2012, while the S&P 500 Fund H-Class returned 6.86% for the same period. The Fund maintained a daily correlation of over 99% to its benchmark of the daily price movement of the S&P 500 Index*.
Sectors contributing most to performance of the index were Information Technology, Health Care, Consumer Discretionary and Consumer Staples. Energy, Financials and Materials detracted from performance of the index for the year.
Apple, Inc., International Business Machines Corp. and Microsoft Corp. were among the stocks which provided the most performance to the index during the year. Schlumberger Ltd., Hewlett-Packard Co. and Bank of America Corp. detracted from performance of the index for the year.
Derivatives in the Fund were used to help provide exposure to the composition of the benchmark in the highest efficient manner and not for hedging purposes. The results of derivatives use during the period were within our expectations and contributed to the Fund’s performance.
*Standard & Poor’s 500 Index (S&P 500®)—a capitalization-weighted index covering 500 industrial, utility, transportation and financial companies of the U.S. markets (mostly NYSE Euronext issues).
Performance displayed represents past performance which is no guarantee of future results.
Holdings Diversification (Market Exposure as % of Net Assets)
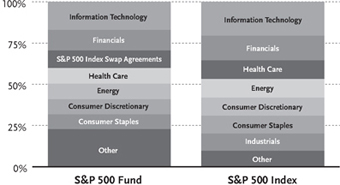
“Holdings Diversification (Market Exposure as % of Net Assets)” excludes any temporary cash investments.
| | | | |
Inception Dates: | |
A-Class | | | May 31, 2006 | |
C-Class | | | May 31, 2006 | |
H-Class | | | May 31, 2006 | |
| | | | |
Ten Largest Holdings (% of Total Net Assets) | |
Apple, Inc. | | | 3.7 | % |
Exxon Mobil Corp. | | | 2.7 | % |
International Business Machines Corp. | | | 1.6 | % |
Microsoft Corp. | | | 1.6 | % |
General Electric Co. | | | 1.4 | % |
Chevron Corp. | | | 1.4 | % |
AT&T, Inc. | | | 1.2 | % |
Procter & Gamble Co. | | | 1.2 | % |
Johnson & Johnson | | | 1.2 | % |
Wells Fargo & Co. | | | 1.2 | % |
| | | | |
Top Ten Total | | | 17.2 | % |
| | | | |
“Ten Largest Holdings” exclude any temporary
cash or derivative investments.
22 | THE RYDEX SERIES FUNDS ANNUAL REPORT
PERFORMANCE REPORT AND FUND PROFILE (Unaudited) (concluded)
Cumulative Fund Performance*
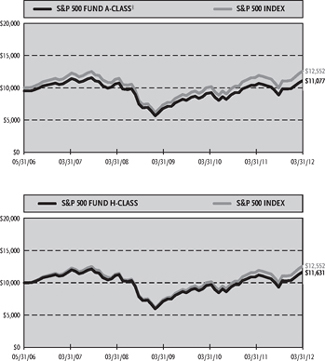
Average Annual Returns*
Periods Ended 03/31/12
| | | | | | | | | | | | |
| | | 1 Year | | | 5 Year | | | Since
Inception
(05/31/06) | |
A-Class Shares | | | 6.78 | % | | | 0.88 | % | | | 2.62 | % |
A-Class Shares with sales charge‡ | | | 1.69 | % | | | -0.10 | % | | | 1.77 | % |
C-Class Shares | | | 5.90 | % | | | 0.07 | % | | | 1.81 | % |
C-Class Shares with CDSC† | | | 4.90 | % | | | 0.07 | % | | | 1.81 | % |
H-Class Shares | | | 6.86 | % | | | 0.89 | % | | | 2.62 | % |
S&P 500 Index | | | 8.54 | % | | | 2.01 | % | | | 3.97 | % |
| * | The performance data above represents past performance that is not predictive of future results. The investment return and principal value of an investment in the Fund will fluctuate so that an investor’s shares, when redeemed, may be worth more or less than their original cost. Returns are historical and include changes in principal and reinvested dividends and capital gains and do not reflect the effect of taxes. The S&P 500 Index is an unmanaged index and, unlike the Fund, has no management fees or operating expenses to reduce its reported return. The graphs are based on A-Class shares and H-Class shares only; performance for C-Class shares will vary due to differences in fee structures. |
| † | Fund returns include a CDSC of 1% if redeemed within 12 months of purchase. |
| ‡ | Fund returns are calculated using the maximum sales charge of 4.75%. |
THE RYDEX SERIES FUNDS ANNUAL REPORT | 23
| | |
| SCHEDULE OF INVESTMENTS | | March 31, 2012 |
| S&P 500 FUND | | |
| | | | | | | | |
| | | SHARES | | | VALUE | |
COMMON STOCKS† - 83.2% | | | | | | | | |
INFORMATION TECHNOLOGY - 17.0% | | | | | | | | |
Apple, Inc.* | | | 16,116 | | | $ | 9,661,058 | |
International Business Machines Corp. | | | 20,032 | | | | 4,179,677 | |
Microsoft Corp. | | | 129,106 | | | | 4,163,669 | |
Google, Inc. — Class A* | | | 4,383 | | | | 2,810,555 | |
Intel Corp. | | | 86,374 | | | | 2,427,974 | |
QUALCOMM, Inc. | | | 29,244 | | | | 1,989,176 | |
Oracle Corp. | | | 67,773 | | | | 1,976,261 | |
Cisco Systems, Inc. | | | 93,121 | | | | 1,969,509 | |
EMC Corp.* | | | 35,495 | | | | 1,060,591 | |
Visa, Inc. — Class A | | | 8,600 | | | | 1,014,801 | |
Hewlett-Packard Co. | | | 34,168 | | | | 814,223 | |
Mastercard, Inc. — Class A | | | 1,835 | | | | 771,691 | |
eBay, Inc.* | | | 19,802 | | | | 730,496 | |
Accenture plc — Class A | | | 11,187 | | | | 721,561 | |
Texas Instruments, Inc. | | | 19,795 | | | | 665,311 | |
Automatic Data Processing, Inc. | | | 8,479 | | | | 467,956 | |
Dell, Inc.* | | | 26,396 | | | | 438,174 | |
Cognizant Technology Solutions Corp. — Class A* | | | 5,243 | | | | 403,449 | |
Corning, Inc. | | | 26,311 | | | | 370,459 | |
Salesforce.com, Inc.* | | | 2,351 | | | | 363,253 | |
Broadcom Corp. — Class A* | | | 8,480 | | | | 333,264 | |
Yahoo!, Inc.* | | | 20,984 | | | | 319,376 | |
Intuit, Inc. | | | 5,099 | | | | 306,603 | |
Adobe Systems, Inc.* | | | 8,534 | | | | 292,802 | |
NetApp, Inc.* | | | 6,277 | | | | 281,021 | |
Applied Materials, Inc. | | | 22,322 | | | | 277,685 | |
TE Connectivity Ltd. | | | 7,368 | | | | 270,774 | |
Motorola Solutions, Inc. | | | 5,092 | | | | 258,826 | |
Citrix Systems, Inc.* | | | 3,208 | | | | 253,143 | |
Symantec Corp.* | | | 12,611 | | | | 235,826 | |
Altera Corp. | | | 5,573 | | | | 221,917 | |
Juniper Networks, Inc.* | | | 9,102 | | | | 208,254 | |
SanDisk Corp.* | | | 4,195 | | | | 208,030 | |
Analog Devices, Inc. | | | 5,146 | | | | 207,898 | |
Red Hat, Inc.* | | | 3,335 | | | | 199,733 | |
Teradata Corp.* | | | 2,896 | | | | 197,362 | |
Western Union Co. | | | 10,721 | | | | 188,690 | |
Xerox Corp. | | | 23,027 | | | | 186,058 | |
F5 Networks, Inc.* | | | 1,369 | | | | 184,760 | |
Motorola Mobility Holdings, Inc.* | | | 4,557 | | | | 178,817 | |
CA, Inc. | | | 6,297 | | | | 173,545 | |
Paychex, Inc. | | | 5,578 | | | | 172,862 | |
Amphenol Corp. — Class A | | | 2,824 | | | | 168,790 | |
Western Digital Corp.* | | | 4,042 | | | | 167,298 | |
Fiserv, Inc.* | | | 2,396 | | | | 166,258 | |
Autodesk, Inc.* | | | 3,906 | | | | 165,302 | |
Xilinx, Inc. | | | 4,527 | | | | 164,919 | |
NVIDIA Corp.* | | | 10,555 | | | | 162,441 | |
KLA-Tencor Corp. | | | 2,887 | | | | 157,111 | |
Micron Technology, Inc.* | | | 17,074 | | | | 138,299 | |
Fidelity National Information Services, Inc. | | | 4,054 | | | | 134,268 | |
Linear Technology Corp. | | | 3,962 | | | | 133,519 | |
Microchip Technology, Inc. | | | 3,322 | | | | 123,578 | |
| | | | | | | | |
| | | SHARES | | | VALUE | |
BMC Software, Inc.* | | | 2,839 | | | $ | 114,014 | |
Akamai Technologies, Inc.* | | | 3,074 | | | | 112,816 | |
VeriSign, Inc. | | | 2,762 | | | | 105,895 | |
Electronic Arts, Inc.* | | | 5,730 | | | | 94,430 | |
Harris Corp. | | | 1,969 | | | | 88,763 | |
LSI Corp.* | | | 9,799 | | | | 85,055 | |
Advanced Micro Devices, Inc.* | | | 10,141 | | | | 81,331 | |
Computer Sciences Corp. | | | 2,681 | | | | 80,269 | |
Jabil Circuit, Inc. | | | 3,187 | | | | 80,057 | |
FLIR Systems, Inc. | | | 2,663 | | | | 67,401 | |
Molex, Inc. | | | 2,371 | | | | 66,673 | |
Total System Services, Inc. | | | 2,776 | | | | 64,042 | |
SAIC, Inc.* | | | 4,779 | | | | 63,083 | |
Novellus Systems, Inc.* | | | 1,220 | | | | 60,890 | |
JDS Uniphase Corp.* | | | 3,971 | | | | 57,540 | |
Teradyne, Inc.* | | | 3,222 | | | | 54,420 | |
Lexmark International, Inc. — Class A | | | 1,225 | | | | 40,719 | |
| | | | | | | | |
Total Information Technology | | | | | | | 45,156,271 | |
| | | | | | | | |
FINANCIALS—12.4% | | | | | | | | |
Wells Fargo & Co. | | | 91,164 | | | | 3,112,339 | |
JPMorgan Chase & Co. | | | 65,999 | | | | 3,034,635 | |
Berkshire Hathaway, Inc. — Class B* | | | 30,398 | | | | 2,466,797 | |
Citigroup, Inc. | | | 50,638 | | | | 1,850,819 | |
Bank of America Corp. | | | 185,547 | | | | 1,775,685 | |
Goldman Sachs Group, Inc. | | | 8,557 | | | | 1,064,234 | |
U.S. Bancorp | | | 33,037 | | | | 1,046,612 | |
American Express Co. | | | 17,549 | | | | 1,015,385 | |
Simon Property Group, Inc. | | | 5,300 | | | | 772,104 | |
MetLife, Inc. | | | 18,336 | | | | 684,850 | |
PNC Financial Services Group, Inc. | | | 9,125 | | | | 588,470 | |
Capital One Financial Corp. | | | 9,571 | | | | 533,488 | |
Morgan Stanley | | | 26,336 | | | | 517,239 | |
Prudential Financial, Inc. | | | 8,125 | | | | 515,044 | |
Bank of New York Mellon Corp. | | | 20,829 | | | | 502,603 | |
American Tower Corp. — Class A | | | 6,804 | | | | 428,788 | |
ACE Ltd. | | | 5,825 | | | | 426,390 | |
Travelers Companies, Inc. | | | 6,796 | | | | 402,323 | |
State Street Corp. | | | 8,434 | | | | 383,746 | |
BB&T Corp. | | | 12,059 | | | | 378,532 | |
Aflac, Inc. | | | 8,075 | | | | 371,369 | |
BlackRock, Inc. — Class A | | | 1,736 | | | | 355,706 | |
Public Storage | | | 2,460 | | | | 339,898 | |
CME Group, Inc. — Class A | | | 1,149 | | | | 332,440 | |
Equity Residential | | | 5,190 | | | | 324,998 | |
Chubb Corp. | | | 4,687 | | | | 323,919 | |
Marsh & McLennan Companies, Inc. | | | 9,398 | | | | 308,160 | |
Franklin Resources, Inc. | | | 2,464 | | | | 305,610 | |
Discover Financial Services | | | 9,163 | | | | 305,494 | |
American International Group, Inc.* | | | 9,298 | | | | 286,656 | |
T. Rowe Price Group, Inc. | | | 4,385 | | | | 286,341 | |
ProLogis, Inc. | | | 7,935 | | | | 285,819 | |
Ventas, Inc. | | | 4,999 | | | | 285,443 | |
Allstate Corp. | | | 8,615 | | | | 283,606 | |
HCP, Inc. | | | 7,080 | | | | 279,377 | |
Aon plc | | | 5,627 | | | | 276,061 | |
Vornado Realty Trust | | | 3,201 | | | | 269,524 | |
Boston Properties, Inc. | | | 2,564 | | | | 269,194 | |
| | |
24 | THE RYDEX SERIES FUNDS ANNUAL REPORT | | SEE NOTES TO FINANCIAL STATEMENTS. |
| | |
| SCHEDULE OF INVESTMENTS (continued) | | March 31, 2012 |
S&P 500 FUND | | |
| | | | | | | | |
| | | SHARES | | | VALUE | |
Charles Schwab Corp. | | | 18,682 | | | $ | 268,460 | |
Progressive Corp. | | | 10,572 | | | | 245,059 | |
AvalonBay Communities, Inc. | | | 1,646 | | | | 232,662 | |
Fifth Third Bancorp | | | 15,908 | | | | 223,507 | |
SunTrust Banks, Inc. | | | 9,204 | | | | 222,461 | |
Ameriprise Financial, Inc. | | | 3,836 | | | | 219,151 | |
Loews Corp. | | | 5,280 | | | | 210,514 | |
Invesco Ltd. | | | 7,713 | | | | 205,706 | |
Weyerhaeuser Co. | | | 9,278 | | | | 203,374 | |
Host Hotels & Resorts, Inc. | | | 12,238 | | | | 200,948 | |
Health Care REIT, Inc. | | | 3,635 | | | | 199,780 | |
Northern Trust Corp. | | | 4,166 | | | | 197,677 | |
M&T Bank Corp. | | | 2,187 | | | | 190,007 | |
IntercontinentalExchange, Inc.* | | | 1,255 | | | | 172,462 | |
Hartford Financial Services Group, Inc. | | | 7,611 | | | | 160,440 | |
Principal Financial Group, Inc. | | | 5,212 | | | | 153,806 | |
Regions Financial Corp. | | | 21,786 | | | | 143,570 | |
Moody’s Corp. | | | 3,395 | | | | 142,930 | |
KeyCorp | | | 16,478 | | | | 140,063 | |
SLM Corp. | | | 8,811 | | | | 138,861 | |
Kimco Realty Corp. | | | 7,040 | | | | 135,590 | |
NYSE Euronext | | | 4,466 | | | | 134,025 | |
Lincoln National Corp. | | | 5,037 | | | | 132,775 | |
Unum Group | | | 5,024 | | | | 122,988 | |
XL Group plc — Class A | | | 5,457 | | | | 118,362 | |
Plum Creek Timber Company, Inc. | | | 2,793 | | | | 116,077 | |
CBRE Group, Inc. — Class A* | | | 5,670 | | | | 113,173 | |
Comerica, Inc. | | | 3,417 | | | | 110,574 | |
Cincinnati Financial Corp. | | | 2,809 | | | | 96,939 | |
Huntington Bancshares, Inc. | | | 14,945 | | | | 96,395 | |
Leucadia National Corp. | | | 3,423 | | | | 89,340 | |
Torchmark Corp. | | | 1,732 | | | | 86,340 | |
People’s United Financial, Inc. | | | 6,210 | | | | 82,221 | |
Genworth Financial, Inc. — Class A* | | | 8,499 | | | | 70,712 | |
Zions Bancorporation | | | 3,189 | | | | 68,436 | |
Hudson City Bancorp, Inc. | | | 9,120 | | | | 66,667 | |
Assurant, Inc. | | | 1,513 | | | | 61,277 | |
Legg Mason, Inc. | | | 2,146 | | | | 59,938 | |
NASDAQ OMX Group, Inc.* | | | 2,158 | | | | 55,892 | |
Apartment Investment & Management Co. — | | | | | | | | |
Class A | | | 2,098 | | | | 55,408 | |
E*Trade Financial Corp.* | | | 4,389 | | | | 48,060 | |
First Horizon National Corp. | | | 4,433 | | | | 46,015 | |
Federated Investors, Inc. — Class B | | | 1,594 | | | | 35,722 | |
| | | | | | | | |
Total Financials | | | | | | | 32,864,062 | |
| | | | | | | | |
HEALTH CARE—9.5% | | | | | | | | |
Johnson & Johnson | | | 47,456 | | | | 3,130,198 | |
Pfizer, Inc. | | | 130,331 | | | | 2,953,300 | |
Merck & Company, Inc. | | | 52,628 | | | | 2,020,915 | |
Abbott Laboratories | | | 27,184 | | | | 1,666,107 | |
UnitedHealth Group, Inc. | | | 18,066 | | | | 1,064,810 | |
Bristol-Myers Squibb Co. | | | 29,185 | | | | 984,994 | |
Amgen, Inc. | | | 13,686 | | | | 930,511 | |
Eli Lilly & Co. | | | 17,655 | | | | 710,967 | |
Medtronic, Inc. | | | 17,990 | | | | 705,028 | |
Gilead Sciences, Inc.* | | | 13,092 | | | | 639,544 | |
Celgene Corp.* | | | 7,586 | | | | 588,067 | |
| | | | | | | | |
| | | SHARES | | | VALUE | |
Baxter International, Inc. | | | 9,688 | | | $ | 579,149 | |
Biogen Idec, Inc.* | | | 4,127 | | | | 519,878 | |
Allergan, Inc. | | | 5,261 | | | | 502,057 | |
Medco Health Solutions, Inc.* | | | 6,715 | | | | 472,064 | |
Covidien plc | | | 8,354 | | | | 456,797 | |
Express Scripts Holding Co. | | | 8,381 | | | | 454,083 | |
WellPoint, Inc. | | | 5,787 | | | | 427,081 | |
McKesson Corp. | | | 4,260 | | | | 373,900 | |
Intuitive Surgical, Inc.* | | | 679 | | | | 367,848 | |
Thermo Fisher Scientific, Inc. | | | 6,325 | | | | 356,604 | |
Stryker Corp. | | | 5,599 | | | | 310,633 | |
Aetna, Inc. | | | 6,058 | | | | 303,869 | |
Becton Dickinson and Co. | | | 3,632 | | | | 282,025 | |
Agilent Technologies, Inc. | | | 6,012 | | | | 267,594 | |
Humana, Inc. | | | 2,835 | | | | 262,181 | |
Cardinal Health, Inc. | | | 5,975 | | | | 257,582 | |
St. Jude Medical, Inc. | | | 5,540 | | | | 245,477 | |
Cigna Corp. | | | 4,950 | | | | 243,788 | |
Zimmer Holdings, Inc. | | | 3,080 | | | | 197,982 | |
Cerner Corp.* | | | 2,523 | | | | 192,152 | |
AmerisourceBergen Corp. | | | 4,454 | | | | 176,735 | |
Mylan, Inc.* | | | 7,378 | | | | 173,014 | |
Quest Diagnostics, Inc. | | | 2,740 | | | | 167,551 | |
Perrigo Co. | | | 1,613 | | | | 166,639 | |
Forest Laboratories, Inc.* | | | 4,591 | | | | 159,262 | |
Laboratory Corporation of America Holdings* | | | 1,680 | | | | 153,787 | |
Life Technologies Corp.* | | | 3,082 | | | | 150,463 | |
Boston Scientific Corp.* | | | 25,092 | | | | 150,050 | |
Watson Pharmaceuticals, Inc.* | | | 2,197 | | | | 147,331 | |
DaVita, Inc.* | | | 1,617 | | | | 145,805 | |
Edwards Lifesciences Corp.* | | | 1,984 | | | | 144,296 | |
CR Bard, Inc. | | | 1,453 | | | | 143,440 | |
Waters Corp.* | | | 1,540 | | | | 142,696 | |
Varian Medical Systems, Inc.* | | | 1,953 | | | | 134,679 | |
Hospira, Inc.* | | | 2,848 | | | | 106,487 | |
CareFusion Corp.* | | | 3,883 | | | | 100,686 | |
DENTSPLY International, Inc. | | | 2,458 | | | | 98,640 | |
Coventry Health Care, Inc. | | | 2,441 | | | | 86,826 | |
PerkinElmer, Inc. | | | 1,962 | | | | 54,269 | |
Patterson Companies, Inc. | | | 1,514 | | | | 50,568 | |
Tenet Healthcare Corp.* | | | 7,088 | | | | 37,637 | |
| | | | | | | | |
Total Health Care | | | | | | | 25,158,046 | |
| | | | | | | | |
ENERGY—9.4% | | | | | | | | |
Exxon Mobil Corp. | | | 81,485 | | | | 7,067,193 | |
Chevron Corp. | | | 34,179 | | | | 3,665,356 | |
ConocoPhillips | | | 22,124 | | | | 1,681,645 | |
Schlumberger Ltd. | | | 23,059 | | | | 1,612,516 | |
Occidental Petroleum Corp. | | | 14,026 | | | | 1,335,696 | |
Anadarko Petroleum Corp. | | | 8,620 | | | | 675,291 | |
Apache Corp. | | | 6,645 | | | | 667,424 | |
National Oilwell Varco, Inc. | | | 7,334 | | | | 582,833 | |
Halliburton Co. | | | 15,956 | | | | 529,580 | |
EOG Resources, Inc. | | | 4,650 | | | | 516,615 | |
Devon Energy Corp. | | | 6,987 | | | | 496,915 | |
El Paso Corp. | | | 13,358 | | | | 394,729 | |
Marathon Oil Corp. | | | 12,175 | | | | 385,948 | |
Spectra Energy Corp. | | | 11,255 | | | | 355,095 | |
| | |
SEE NOTES TO FINANCIAL STATEMENTS. | | THE RYDEX SERIES FUNDS ANNUAL REPORT | 25 |
| | |
| SCHEDULE OF INVESTMENTS (continued) | | March 31, 2012 |
S&P 500 FUND | | |
| | | | | | | | |
| | | SHARES | | | VALUE | |
Baker Hughes, Inc. | | | 7,566 | | | $ | 317,318 | |
Williams Companies, Inc. | | | 10,238 | | | | 315,433 | |
Hess Corp. | | | 5,228 | | | | 308,191 | |
Noble Energy, Inc. | | | 3,060 | | | | 299,207 | |
Chesapeake Energy Corp. | | | 11,458 | | | | 265,482 | |
Marathon Petroleum Corp. | | | 6,010 | | | | 260,594 | |
Valero Energy Corp. | | | 9,596 | | | | 247,288 | |
Pioneer Natural Resources Co. | | | 2,133 | | | | 238,021 | |
Cameron International Corp.* | | | 4,258 | | | | 224,950 | |
FMC Technologies, Inc.* | | | 4,136 | | | | 208,537 | |
Murphy Oil Corp. | | | 3,355 | | | | 188,786 | |
Southwestern Energy Co.* | | | 6,037 | | | | 184,732 | |
Noble Corp.* | | | 4,364 | | | | 163,519 | |
Range Resources Corp. | | | 2,729 | | | | 158,664 | |
Peabody Energy Corp. | | | 4,711 | | | | 136,431 | |
Consol Energy, Inc. | | | 3,929 | | | | 133,979 | |
Equities Corp. | | | 2,588 | | | | 124,767 | |
Denbury Resources, Inc.* | | | 6,747 | | | | 122,998 | |
Cabot Oil & Gas Corp. | | | 3,633 | | | | 113,241 | |
Helmerich & Payne, Inc. | | | 1,856 | | | | 100,131 | |
QEP Resources, Inc. | | | 3,065 | | | | 93,483 | |
Nabors Industries Ltd.* | | | 4,993 | | | | 87,328 | |
Diamond Offshore Drilling, Inc. | | | 1,202 | | | | 80,234 | |
Newfield Exploration Co.* | | | 2,288 | | | | 79,348 | |
Sunoco, Inc. | | | 1,847 | | | | 70,463 | |
Rowan Companies, Inc.* | | | 2,137 | | | | 70,371 | |
Tesoro Corp.* | | | 2,403 | | | | 64,497 | |
WPX Energy, Inc.* | | | 3,432 | | | | 61,810 | |
Alpha Natural Resources, Inc.* | | | 3,807 | | | | 57,904 | |
| | | | | | | | |
Total Energy | | | | | | | 24,744,543 | |
| | | | | | | | |
CONSUMER DISCRETIONARY—9.1% | | | | | | | | |
McDonald’s Corp. | | | 17,610 | | | | 1,727,541 | |
Comcast Corp. — Class A | | | 46,619 | | | | 1,399,037 | |
Walt Disney Co. | | | 30,991 | | | | 1,356,785 | |
Home Depot, Inc. | | | 26,649 | | | | 1,340,711 | |
Amazon.com, Inc.* | | | 6,293 | | | | 1,274,395 | |
Ford Motor Co. | | | 65,713 | | | | 820,755 | |
News Corp. — Class A | | | 37,213 | | | | 732,724 | |
Starbucks Corp. | | | 13,025 | | | | 727,967 | |
NIKE, Inc. — Class B | | | 6,347 | | | | 688,269 | |
Target Corp. | | | 11,611 | | | | 676,573 | |
Lowe’s Companies, Inc. | | | 21,455 | | | | 673,258 | |
Time Warner, Inc. | | | 16,764 | | | | 632,841 | |
Priceline.com, Inc.* | | | 861 | | | | 617,768 | |
DIRECTV — Class A* | | | 11,692 | | | | 576,883 | |
Yum! Brands, Inc. | | | 7,962 | | | | 566,735 | |
TJX Companies, Inc. | | | 13,041 | | | | 517,859 | |
Viacom, Inc. — Class B | | | 9,339 | | | | 443,229 | |
Time Warner Cable, Inc. | | | 5,430 | | | | 442,545 | |
Coach, Inc. | | | 4,975 | | | | 384,467 | |
Johnson Controls, Inc. | | | 11,770 | | | | 382,289 | |
CBS Corp. — Class B | | | 11,222 | | | | 380,538 | |
Macy’s, Inc. | | | 7,161 | | | | 284,507 | |
Bed Bath & Beyond, Inc.* | | | 4,093 | | | | 269,197 | |
Carnival Corp. | | | 7,833 | | | | 251,282 | |
Omnicom Group, Inc. | | | 4,716 | | | | 238,866 | |
| | | | | | | | |
| | | SHARES | | | VALUE | |
McGraw-Hill Companies, Inc. | | | 4,806 | | | $ | 232,947 | |
Ross Stores, Inc. | | | 3,953 | | | | 229,669 | |
Chipotle Mexican Grill, Inc. — Class A* | | | 544 | | | | 227,392 | |
Discovery Communications, Inc. — Class A* | | | 4,469 | | | | 226,131 | |
VF Corp. | | | 1,516 | | | | 221,306 | |
Kohl’s Corp. | | | 4,379 | | | | 219,081 | |
Limited Brands, Inc. | | | 4,256 | | | | 204,288 | |
O’Reilly Automotive, Inc.* | | | 2,201 | | | | 201,061 | |
Mattel, Inc. | | | 5,858 | | | | 197,181 | |
Ralph Lauren Corp. — Class A | | | 1,114 | | | | 194,204 | |
Dollar Tree, Inc.* | | | 2,055 | | | | 194,177 | |
Staples, Inc. | | | 12,000 | | | | 194,160 | |
Harley-Davidson, Inc. | | | 3,951 | | | | 193,915 | |
Starwood Hotels & Resorts Worldwide, Inc. | | | 3,392 | | | | 191,343 | |
AutoZone, Inc.* | | | 471 | | | | 175,118 | |
Marriott International, Inc. — Class A | | | 4,618 | | | | 174,791 | |
Wynn Resorts Ltd. | | | 1,371 | | | | 171,210 | |
Genuine Parts Co. | | | 2,697 | | | | 169,237 | |
BorgWarner, Inc.* | | | 1,887 | | | | 159,150 | |
Nordstrom, Inc. | | | 2,764 | | | | 154,010 | |
Tiffany & Co. | | | 2,193 | | | | 151,602 | |
The Gap, Inc. | | | 5,741 | | | | 150,070 | |
CarMax, Inc.* | | | 3,921 | | | | 135,863 | |
Family Dollar Stores, Inc. | | | 2,036 | | | | 128,838 | |
Wyndham Worldwide Corp. | | | 2,523 | | | | 117,345 | |
Best Buy Company, Inc. | | | 4,906 | | | | 116,174 | |
Darden Restaurants, Inc. | | | 2,221 | | | | 113,626 | |
Netflix, Inc.* | | | 955 | | | | 109,863 | |
Whirlpool Corp. | | | 1,321 | | | | 101,532 | |
Newell Rubbermaid, Inc. | | | 4,986 | | | | 88,801 | |
JC Penney Company, Inc. | | | 2,498 | | | | 88,504 | |
Interpublic Group of Companies, Inc. | | | 7,713 | | | | 88,005 | |
International Game Technology | | | 5,140 | | | | 86,301 | |
H&R Block, Inc. | | | 5,067 | | | | 83,453 | |
Scripps Networks Interactive, Inc. — Class A | | | 1,651 | | | | 80,387 | |
Lennar Corp. — Class A | | | 2,811 | | | | 76,403 | |
Apollo Group, Inc. — Class A* | | | 1,945 | | | | 75,155 | |
Hasbro, Inc. | | | 2,002 | | | | 73,513 | |
Abercrombie & Fitch Co. — Class A | | | 1,481 | | | | 73,472 | |
DR Horton, Inc. | | | 4,821 | | | | 73,135 | |
Gannett Company, Inc. | | | 4,096 | | | | 62,792 | |
TripAdvisor, Inc.* | | | 1,638 | | | | 58,427 | |
Harman International Industries, Inc. | | | 1,210 | | | | 56,640 | |
Urban Outfitters, Inc.* | | | 1,918 | | | | 55,833 | |
Leggett & Platt, Inc. | | | 2,423 | | | | 55,753 | |
Cablevision Systems Corp. — Class A | | | 3,746 | | | | 54,991 | |
Expedia, Inc. | | | 1,640 | | | | 54,842 | |
GameStop Corp. — Class A | | | 2,359 | | | | 51,521 | |
PulteGroup, Inc.* | | | 5,817 | | | | 51,480 | |
Big Lots, Inc.* | | | 1,134 | | | | 48,785 | |
Goodyear Tire & Rubber Co.* | | | 4,230 | | | | 47,461 | |
Sears Holdings Corp.* | | | 662 | | | | 43,858 | |
DeVry, Inc. | | | 1,033 | | | | 34,988 | |
Washington Post Co. — Class B | | | 83 | | | | 31,006 | |
AutoNation, Inc.* | | | 775 | | | | 26,590 | |
| | | | | | | | |
Total Consumer Discretionary | | | | | | | 24,084,401 | |
| | | | | | | | |
| | |
26 | THE RYDEX SERIES FUNDS ANNUAL REPORT | | SEE NOTES TO FINANCIAL STATEMENTS. |
| | |
| SCHEDULE OF INVESTMENTS (continued) | | March 31, 2012 |
S&P 500 FUND | | |
| | | | | | | | |
| | | SHARES | | | VALUE | |
CONSUMER STAPLES — 9.0% | | | | | | | | |
Procter & Gamble Co. | | | 47,621 | | | $ | 3,200,607 | |
Coca-Cola Co. | | | 39,130 | | | | 2,896,010 | |
Philip Morris International, Inc. | | | 29,769 | | | | 2,637,832 | |
Wal-Mart Stores, Inc. | | | 30,199 | | | | 1,848,179 | |
PepsiCo, Inc. | | | 27,151 | | | | 1,801,469 | |
Kraft Foods, Inc. — Class A | | | 30,574 | | | | 1,162,118 | |
Altria Group, Inc. | | | 35,367 | | | | 1,091,779 | |
CVS Caremark Corp. | | | 22,516 | | | | 1,008,717 | |
Colgate-Palmolive Co. | | | 8,291 | | | | 810,694 | |
Costco Wholesale Corp. | | | 7,524 | | | | 683,179 | |
Walgreen Co. | | | 15,102 | | | | 505,766 | |
Kimberly-Clark Corp. | | | 6,804 | | | | 502,748 | |
General Mills, Inc. | | | 11,145 | | | | 439,670 | |
Archer-Daniels-Midland Co. | | | 11,439 | | | | 362,159 | |
Sysco Corp. | | | 10,106 | | | | 301,765 | |
HJ Heinz Co. | | | 5,531 | | | | 296,185 | |
Lorillard, Inc. | | | 2,282 | | | | 295,473 | |
Mead Johnson Nutrition Co. — Class A | | | 3,518 | | | | 290,165 | |
Estee Lauder Companies, Inc. — Class A | | | 3,890 | | | | 240,947 | |
Kroger Co. | | | 9,937 | | | | 240,774 | |
Reynolds American, Inc. | | | 5,777 | | | | 239,399 | |
Whole Foods Market, Inc. | | | 2,805 | | | | 233,376 | |
Kellogg Co. | | | 4,261 | | | | 228,517 | |
Sara Lee Corp. | | | 10,225 | | | | 220,144 | |
ConAgra Foods, Inc. | | | 7,133 | | | | 187,313 | |
Hershey Co. | | | 2,650 | | | | 162,525 | |
JM Smucker Co. | | | 1,960 | | | | 159,466 | |
Beam, Inc. | | | 2,706 | | | | 158,490 | |
Clorox Co. | | | 2,244 | | | | 154,275 | |
Coca-Cola Enterprises, Inc. | | | 5,192 | | | | 148,491 | |
Dr Pepper Snapple Group, Inc. | | | 3,666 | | | | 147,410 | |
Avon Products, Inc. | | | 7,456 | | | | 144,348 | |
Brown-Forman Corp. — Class B | | | 1,717 | | | | 143,180 | |
McCormick & Company, Inc. | | | 2,300 | | | | 125,189 | |
Molson Coors Brewing Co. — Class B | | | 2,715 | | | | 122,854 | |
Campbell Soup Co. | | | 3,086 | | | | 104,461 | |
Tyson Foods, Inc. — Class A | | | 5,043 | | | | 96,573 | |
Safeway, Inc. | | | 4,630 | | | | 93,572 | |
Hormel Foods Corp. | | | 2,374 | | | | 70,080 | |
Constellation Brands, Inc. — Class A* | | | 2,969 | | | | 70,039 | |
Dean Foods Co.* | | | 3,188 | | | | 38,607 | |
SUPERVALU, Inc. | | | 3,670 | | | | 20,956 | |
| | | | | | | | |
Total Consumer Staples | | | | | | | 23,685,501 | |
| | | | | | | | |
INDUSTRIALS—8.8% | | | | | | | | |
General Electric Co. | | | 182,935 | | | | 3,671,505 | |
United Parcel Service, Inc. — Class B | | | 16,575 | | | | 1,337,933 | |
United Technologies Corp. | | | 15,741 | | | | 1,305,559 | |
Caterpillar, Inc. | | | 11,197 | | | | 1,192,705 | |
3M Co. | | | 12,008 | | | | 1,071,234 | |
Boeing Co. | | | 12,895 | | | | 959,001 | |
Union Pacific Corp. | | | 8,300 | | | | 892,084 | |
Honeywell International, Inc. | | | 13,405 | | | | 818,375 | |
Emerson Electric Co. | | | 12,697 | | | | 662,529 | |
Deere & Co. | | | 6,947 | | | | 562,012 | |
Danaher Corp. | | | 9,891 | | | | 553,896 | |
| | | | | | | | |
| | | SHARES | | | VALUE | |
FedEx Corp. | | | 5,437 | | | $ | 499,987 | |
Illinois Tool Works, Inc. | | | 8,366 | | | | 477,866 | |
General Dynamics Corp. | | | 6,173 | | | | 452,975 | |
Tyco International Ltd. | | | 7,974 | | | | 447,979 | |
Precision Castparts Corp. | | | 2,515 | | | | 434,844 | |
Lockheed Martin Corp. | | | 4,612 | | | | 414,434 | |
Cummins, Inc. | | | 3,318 | | | | 398,293 | |
CSX Corp. | | | 18,189 | | | | 391,427 | |
Norfolk Southern Corp. | | | 5,708 | | | | 375,758 | |
Raytheon Co. | | | 5,876 | | | | 310,135 | |
PACCAR, Inc. | | | 6,170 | | | | 288,941 | |
Eaton Corp. | | | 5,792 | | | | 288,615 | |
Waste Management, Inc. | | | 7,975 | | | | 278,806 | |
Fastenal Co. | | | 5,109 | | | | 276,397 | |
Goodrich Corp. | | | 2,180 | | | | 273,459 | |
Northrop Grumman Corp. | | | 4,368 | | | | 266,797 | |
WW Grainger, Inc. | | | 1,054 | | | | 226,410 | |
Stanley Black & Decker, Inc. | | | 2,933 | | | | 225,724 | |
Parker Hannifin Corp. | | | 2,606 | | | | 220,337 | |
Ingersoll-Rand plc | | | 5,141 | | | | 212,580 | |
Dover Corp. | | | 3,175 | | | | 199,835 | |
Rockwell Automation, Inc. | | | 2,466 | | | | 196,540 | |
CH Robinson Worldwide, Inc. | | | 2,824 | | | | 184,944 | |
Fluor Corp. | | | 2,922 | | | | 175,437 | |
Cooper Industries plc | | | 2,738 | | | | 175,095 | |
Expeditors International of Washington, Inc. | | | 3,663 | | | | 170,366 | |
Republic Services, Inc. — Class A | | | 5,434 | | | | 166,063 | |
Roper Industries, Inc. | | | 1,673 | | | | 165,895 | |
Rockwell Collins, Inc. | | | 2,570 | | | | 147,929 | |
Textron, Inc. | | | 4,837 | | | | 134,614 | |
Joy Global, Inc. | | | 1,828 | | | | 134,358 | |
Stericycle, Inc.* | | | 1,465 | | | | 122,533 | |
L-3 Communications Holdings, Inc. | | | 1,711 | | | | 121,087 | |
Pall Corp. | | | 1,995 | | | | 118,962 | |
Southwest Airlines Co. | | | 13,363 | | | | 110,111 | |
Flowserve Corp. | | | 942 | | | | 108,810 | |
Jacobs Engineering Group, Inc.* | | | 2,221 | | | | 98,546 | |
Equifax, Inc. | | | 2,072 | | | | 91,707 | |
Xylem, Inc. | | | 3,192 | | | | 88,578 | |
Iron Mountain, Inc. | | | 2,958 | | | | 85,190 | |
Masco Corp. | | | 6,178 | | | | 82,600 | |
Quanta Services, Inc.* | | | 3,651 | | | | 76,306 | |
Cintas Corp. | | | 1,906 | | | | 74,563 | |
Robert Half International, Inc. | | | 2,457 | | | | 74,447 | |
Dun & Bradstreet Corp. | | | 825 | | | | 69,902 | |
Snap-on, Inc. | | | 1,010 | | | | 61,580 | |
Pitney Bowes, Inc. | | | 3,452 | | | | 60,687 | |
Avery Dennison Corp. | | | 1,842 | | | | 55,499 | |
Ryder System, Inc. | | | 883 | | | | 46,622 | |
RR Donnelley & Sons Co. | | | 3,086 | | | | 38,236 | |
First Solar, Inc.* | | | 1,017 | | | | 25,476 | |
| | | | | | | | |
Total Industrials | | | | | | | 23,251,115 | |
| | | | | | | | |
MATERIALS—2.9% | | | | | | | | |
EI du Pont de Nemours & Co. | | | 16,121 | | | | 852,801 | |
Monsanto Co. | | | 9,260 | | | | 738,577 | |
Dow Chemical Co. | | | 20,492 | | | | 709,843 | |
| | |
SEE NOTES TO FINANCIAL STATEMENTS. | | THE RYDEX SERIES FUNDS ANNUAL REPORT | 27 |
| | |
| SCHEDULE OF INVESTMENTS (continued) | | March 31, 2012 |
| S&P 500 FUND | | |
| | | | | | | | |
| | | SHARES | | | VALUE | |
Freeport-McMoRan Copper & Gold, Inc. | | | 16,388 | | | $ | 623,399 | |
Praxair, Inc. | | | 5,159 | | | | 591,428 | |
Newmont Mining Corp. | | | 8,562 | | | | 438,974 | |
Air Products & Chemicals, Inc. | | | 3,637 | | | | 333,877 | |
Ecolab, Inc. | | | 5,036 | | | | 310,822 | |
Mosaic Co. | | | 5,148 | | | | 284,633 | |
International Paper Co. | | | 7,561 | | | | 265,391 | |
PPG Industries, Inc. | | | 2,628 | | | | 251,762 | |
Nucor Corp. | | | 5,475 | | | | 235,151 | |
CF Industries Holdings, Inc. | | | 1,132 | | | | 206,760 | |
Alcoa, Inc. | | | 18,433 | | | | 184,699 | |
Cliffs Natural Resources, Inc. | | | 2,455 | | | | 170,033 | |
Sherwin-Williams Co. | | | 1,495 | | | | 162,462 | |
Sigma-Aldrich Corp. | | | 2,089 | | | | 152,622 | |
FMC Corp. | | | 1,207 | | | | 127,773 | |
Eastman Chemical Co. | | | 2,368 | | | | 122,402 | |
Ball Corp. | | | 2,699 | | | | 115,733 | |
Airgas, Inc. | | | 1,190 | | | | 105,874 | |
Vulcan Materials Co. | | | 2,235 | | | | 95,502 | |
MeadWestvaco Corp. | | | 2,956 | | | | 93,380 | |
International Flavors & Fragrances, Inc. | | | 1,398 | | | | 81,923 | |
Allegheny Technologies, Inc. | | | 1,845 | | | | 75,959 | |
United States Steel Corp. | | | 2,495 | | | | 73,278 | |
Owens-Illinois, Inc.* | | | 2,841 | | | | 66,309 | |
Sealed Air Corp. | | | 3,321 | | | | 64,129 | |
Bemis Company, Inc. | | | 1,781 | | | | 57,508 | |
Titanium Metals Corp. | | | 1,423 | | | | 19,296 | |
| | | | | | | | |
Total Materials | | | | | | | 7,612,300 | |
| | | | | | | | |
UTILITIES—2.8% | | | | | | | | |
Southern Co. | | | 14,985 | | | | 673,275 | |
Dominion Resources, Inc. | | | 9,858 | | | | 504,829 | |
Duke Energy Corp. | | | 23,100 | | | | 485,330 | |
Exelon Corp. | | | 11,474 | | | | 449,896 | |
NextEra Energy, Inc. | | | 7,196 | | | | 439,532 | |
FirstEnergy Corp. | | | 7,227 | | | | 329,479 | |
American Electric Power Company, Inc. | | | 8,357 | | | | 322,413 | |
PG&E Corp. | | | 7,128 | | | | 309,427 | |
Consolidated Edison, Inc. | | | 5,067 | | | | 296,015 | |
PPL Corp. | | | 10,016 | | | | 283,052 | |
Progress Energy, Inc. | | | 5,105 | | | | 271,127 | |
Public Service Enterprise Group, Inc. | | | 8,746 | | | | 267,715 | |
Sempra Energy | | | 4,163 | | | | 249,613 | |
Edison International | | | 5,635 | | | | 239,544 | |
Xcel Energy, Inc. | | | 8,418 | | | | 222,824 | |
Entergy Corp. | | | 3,052 | | | | 205,094 | |
DTE Energy Co. | | | 2,929 | | | | 161,183 | |
ONEOK, Inc. | | | 1,794 | | | | 146,498 | |
AES Corp.* | | | 11,126 | | | | 145,417 | |
CenterPoint Energy, Inc. | | | 7,368 | | | | 145,297 | |
Wisconsin Energy Corp. | | | 3,989 | | | | 140,333 | |
Ameren Corp. | | | 4,200 | | | | 136,836 | |
NiSource, Inc. | | | 4,883 | | | | 118,901 | |
Northeast Utilities | | | 3,065 | | | | 113,773 | |
CMS Energy Corp. | | | 4,452 | | | | 97,944 | |
| | | | | | | | |
| | | SHARES | | | VALUE | |
SCANA Corp. | | | 2,010 | | | $ | 91,676 | |
Pinnacle West Capital Corp. | | | 1,889 | | | | 90,483 | |
AGL Resources, Inc. | | | 2,022 | | | | 79,303 | |
Pepco Holdings, Inc. | | | 3,940 | | | | 74,427 | |
Integrys Energy Group, Inc. | | | 1,358 | | | | 71,960 | |
TECO Energy, Inc. | | | 3,728 | | | | 65,426 | |
NRG Energy, Inc.* | | | 3,936 | | | | 61,677 | |
| | | | | | | | |
Total Utilities | | | | | | | 7,290,299 | |
| | | | | | | | |
TELECOMMUNICATION SERVICES—2.3% | | | | | | | | |
AT&T, Inc. | | | 102,503 | | | | 3,201,169 | |
Verizon Communications, Inc. | | | 49,024 | | | | 1,874,188 | |
CenturyLink, Inc. | | | 10,713 | | | | 414,057 | |
Crown Castle International Corp.* | | | 4,330 | | | | 230,963 | |
Sprint Nextel Corp.* | | | 51,826 | | | | 147,704 | |
Windstream Corp. | | | 10,140 | | | | 118,739 | |
Frontier Communications Corp. | | | 17,204 | | | | 71,741 | |
MetroPCS Communications, Inc.* | | | 5,073 | | | | 45,758 | |
| | | | | | | | |
Total Telecommunication Services | | | | | | | 6,104,319 | |
| | | | | | | | |
Total Common Stocks
(Cost $172,134,175) | | | | | | | 219,950,857 | |
| | | | | | | | |
| | | | | | | | |
| | | FACE | | | | |
| | | AMOUNT | | | | |
REPURCHASE AGREEMENTS††,1—15.1% | | | | | | | | |
HSBC Group issued 03/30/12 at 0.01%due 04/02/12 | | $ | 25,865,988 | | | | 25,865,988 | |
Mizuho Financial Group, Inc. issued 03/30/12 at 0.01% due 04/02/12 | | | 7,277,379 | | | | 7,277,379 | |
Credit Suisse Group issued 03/30/12 at 0.01% due 04/02/122 | | | 4,859,390 | | | | 4,859,390 | |
Deutsche Bank issued 03/30/12 at 0.01% due 04/02/12 | | | 1,934,247 | | | | 1,934,247 | |
| | | | | | | | |
Total Repurchase Agreements
(Cost $39,937,004) | | | | | | | 39,937,004 | |
| | | | | | | | |
Total Investments – 98.3%
(Cost $212,071,179) | | | | | | $ | 259,887,861 | |
| | | | | | | | |
Other Assets & Liabilities, net – 1.7% | | | | | | | 4,482,512 | |
| | | | | | | | |
Total Net Assets – 100.0% | | | | | | $ | 264,370,373 | |
| |
| | | | | | | | |
| | | | | | UNREALIZED | |
| | | CONTRACTS | | | GAIN | |
FUTURES CONTRACTS PURCHASED† | | | | | | | | |
June 2012 S&P 500 Index Mini Futures Contracts (Aggregate Value of Contracts $16,123,000) | | | 230 | | | $ | 47,561 | |
| | | | | | | | |
| | |
28 | THE RYDEX SERIES FUNDS ANNUAL REPORT | | SEE NOTES TO FINANCIAL STATEMENTS. |
| | |
| SCHEDULE OF INVESTMENTS (concluded) | | March 31, 2012 |
| S&P 500 FUND | | |
| | | | | | | | |
| | | | | | UNREALIZED | |
| | | UNITS | | | GAIN (LOSS) | |
EQUITY INDEX SWAP AGREEMENTS†† | | | | | | | | |
Barclays Bank plc | | | | | | | | |
April 2012 S&P 500 Index Swap, Terminating 04/30/123 (Notional Value $13,253,933) | | | 9,410 | | | $ | 48,547 | |
Credit Suisse Capital, LLC | | | | | | | | |
April 2012 S&P 500 Index Swap, Terminating 04/30/123 (Notional Value $10,551,586) | | | 7,492 | | | | 31,648 | |
Morgan Stanley Capital Services, Inc. | | | | | | | | |
April 2012 S&P 500 Index Swap, Terminating 04/30/123 (Notional Value $1,379,869) | | | 980 | | | | (3,662 | ) |
Goldman Sachs International | | | | | | | | |
April 2012 S&P 500 Index Swap, Terminating 04/27/123 (Notional Value $3,078,913) | | | 2,186 | | | | (12,654 | ) |
| | | | | | | | |
(Total Notional Value $28,264,301) | | | | | | $ | 63,879 | |
| | | | | | | | |
| * | Non-income producing security. |
| † | Value determined based on Level 1 inputs — See Note 4. |
| †† | Value determined based on Level 2 inputs — See Note 4. |
| 1 | Repurchase Agreements — See Note 5. |
| 2 | All or a portion of this security is pledged as equity index swap collateral at March 31, 2012. |
| 3 | Total Return based on S&P 500 Index +/- financing at a variable rate. |
| | plc—Public Limited Company |
| | REIT— Real Estate Investment Trust |
| | |
SEE NOTES TO FINANCIAL STATEMENTS. | | THE RYDEX SERIES FUNDS ANNUAL REPORT | 29 |
S&P 500 FUND
STATEMENT OF ASSETS AND LIABILITIES
| | | | |
| |
March 31, 2012 | | | | |
| |
ASSETS: | | | | |
Investments, at value | | | | |
(cost $172,134,175) | | $ | 219,950,857 | |
Repurchase agreements, at value | | | | |
(cost $39,937,004) | | | 39,937,004 | |
| | | | |
Total investments | | | | |
(cost $212,071,179) | | | 259,887,861 | |
Segregated cash with broker | | | 2,149,967 | |
Unrealized appreciation on swap agreements | | | 80,195 | |
Cash | | | 4,497 | |
Receivables: | | | | |
Fund shares sold | | | 2,909,337 | |
Dividends | | | 310,127 | |
Variation margin | | | 43,700 | |
Interest | | | 22 | |
| | | | |
Total assets | | | 265,385,706 | |
| | | | |
LIABILITIES: | | | | |
Unrealized depreciation on swap agreements | | | 16,316 | |
Payable for: | | | | |
Fund shares redeemed | | | 591,436 | |
Management fees | | | 158,770 | |
Distribution and service fees | | | 59,408 | |
Transfer agent and administrative fees | | | 52,923 | |
Portfolio accounting fees | | | 21,122 | |
Miscellaneous | | | 115,358 | |
| | | | |
Total liabilities | | | 1,015,333 | |
| | | | |
NET ASSETS | | $ | 264,370,373 | |
| | | | |
NET ASSETS CONSIST OF: | | | | |
Paid in capital | | $ | 261,163,788 | |
Undistributed net investment income | | | — | |
Accumulated net realized loss on investments | | | (44,721,537 | ) |
Net unrealized appreciation on investments | | | 47,928,122 | |
| | | | |
Net assets | | $ | 264,370,373 | |
| | | | |
A-CLASS: | | | | |
Net assets | | $ | 13,413,164 | |
Capital shares outstanding | | | 475,611 | |
Net asset value per share | | $ | 28.20 | |
| | | | |
Maximum offering price per share
(Net asset value divided by 95.25%) | | $ | 29.61 | |
| | | | |
C-CLASS: | | | | |
Net assets | | $ | 10,110,080 | |
Capital shares outstanding | | | 375,661 | |
Net asset value per share | | $ | 26.91 | |
| | | | |
H-CLASS: | | | | |
Net assets | | $ | 240,847,129 | |
Capital shares outstanding | | | 8,540,201 | |
Net asset value per share | | $ | 28.20 | |
| | | | |
STATEMENT OF OPERATIONS
| | | | |
| |
Year Ended March 31, 2012 | | | | |
| |
INVESTMENT INCOME: | | | | |
Dividends (net of foreign withholding tax of $12) | | $ | 2,961,941 | |
Interest | | | 18,355 | |
| | | | |
Total investment income | | | 2,980,296 | |
| | | | |
EXPENSES: | | | | |
Management fees | | | 1,556,830 | |
Transfer agent and administrative fees | | | 518,943 | |
Distribution and service fees: | | | | |
A-Class | | | 25,992 | |
C-Class | | | 98,006 | |
H-Class | | | 468,450 | |
Portfolio accounting fees | | | 205,002 | |
Custodian fees | | | 54,570 | |
Trustees’ fees* | | | 15,918 | |
Miscellaneous | | | 242,371 | |
| | | | |
Total expenses | | | 3,186,082 | |
| | | | |
Net investment loss | | | (205,786 | ) |
| | | | |
NET REALIZED AND UNREALIZED GAIN (LOSS): | | | | |
Net realized gain (loss) on: | | | | |
Investments | | | (7,011,562 | ) |
Swap agreements | | | 4,408,817 | |
Futures contracts | | | 1,895,681 | |
| | | | |
Net realized loss | | | (707,064 | ) |
| | | | |
Net change in unrealized appreciation
(depreciation) on: | | | | |
Investments | | | 16,195,157 | |
Swap agreements | | | (467,242 | ) |
Futures contracts | | | (363,115 | ) |
| | | | |
Net change in unrealized appreciation
(depreciation) | | | 15,364,800 | |
| | | | |
Net realized and unrealized gain | | | 14,657,736 | |
| | | | |
Net increase in net assets resulting from operations | | $ | 14,451,950 | |
| | | | |
| * | Relates to Trustees not deemed “interested persons” within the meaning of Section 2(a)(19) of the 1940 Act. |
| | |
30 | THE RYDEX SERIES FUNDS ANNUAL REPORT | | SEE NOTES TO FINANCIAL STATEMENTS. |
S&P 500 FUND
STATEMENTS OF CHANGES IN NET ASSETS
| | | | | | | | |
| | | Year Ended
March 31,
2012 | | | Year Ended
March 31,
2011 | |
INCREASE (DECREASE) IN NET ASSETS FROM OPERATIONS: | | | | | | | | |
Net investment loss | | $ | (205,786 | ) | | $ | (645,887 | ) |
Net realized gain (loss) on investments | | | (707,064 | ) | | | 9,714,709 | |
Net change in unrealized appreciation (depreciation) on investments | | | 15,364,800 | | | | (463,472 | ) |
| | | | | | | | |
Net increase in net assets resulting from operations | | | 14,451,950 | | | | 8,605,350 | |
| | | | | | | | |
DISTRIBUTIONS TO SHAREHOLDERS FROM: | | | | | | | | |
Net investment income | | | | | | | | |
A-Class | | | — | | | | (110 | ) |
C-Class | | | — | | | | (114 | ) |
H-Class | | | — | | | | (1,766 | ) |
| | | | | | | | |
Total distributions to shareholders | | | — | | | | (1,990 | ) |
| | | | | | | | |
CAPITAL SHARE TRANSACTIONS: | | | | | | | | |
PROCEEDS FROM SALE OF SHARES | | | | | | | | |
A-Class | | | 102,743,762 | | | | 69,882,666 | |
C-Class | | | 157,204,528 | | | | 206,181,020 | |
H-Class | | | 1,762,118,692 | | | | 1,555,991,786 | |
DISTRIBUTIONS REINVESTED | | | | | | | | |
A-Class | | | — | | | | 85 | |
C-Class | | | — | | | | 102 | |
H-Class | | | — | | | | 1,759 | |
COST OF SHARES REDEEMED | | | | | | | | |
A-Class | | | (99,361,075 | ) | | | (104,986,027 | ) |
C-Class | | | (157,538,958 | ) | | | (208,236,521 | ) |
H-Class | | | (1,784,659,332 | ) | | | (1,509,988,670 | ) |
| | | | | | | | |
Net increase (decrease) from capital share transactions | | | (19,492,383 | ) | | | 8,846,200 | |
| | | | | | | | |
Net increase (decrease) in net assets | | | (5,040,433 | ) | | | 17,449,560 | |
| | |
NET ASSETS: | | | | | | | | |
Beginning of year | | | 269,410,806 | | | | 251,961,246 | |
| | | | | | | | |
End of year | | $ | 264,370,373 | | | $ | 269,410,806 | |
| | | | | | | | |
Undistributed net investment income at end of year | | $ | — | | | $ | — | |
| | | | | | | | |
CAPITAL SHARE ACTIVITY: | | | | | | | | |
Shares sold | | | | | | | | |
A-Class | | | 4,096,321 | | | | 2,964,621 | |
C-Class | | | 6,482,033 | | | | 8,931,270 | |
H-Class | | | 70,536,838 | | | | 65,387,409 | |
Shares issued from reinvestment of distributions | | | | | | | | |
A-Class | | | — | | | | 3 | |
C-Class | | | — | | | | 4 | |
H-Class | | | — | | | | 72 | |
Shares redeemed | | | | | | | | |
A-Class | | | (4,010,269 | ) | | | (4,572,700 | ) |
C-Class | | | (6,501,183 | ) | | | (9,045,576 | ) |
H-Class | | | (71,435,348 | ) | | | (64,329,954 | ) |
| | | | | | | | |
Net decrease in shares | | | (831,608 | ) | | | (664,851 | ) |
| | | | | | | | |
| | |
SEE NOTES TO FINANCIAL STATEMENTS. | | THE RYDEX SERIES FUNDS ANNUAL REPORT | 31 |
S&P 500 FUND
FINANCIAL HIGHLIGHTS
This table is presented to show selected data for a share outstanding throughout each period and to assist shareholders in evaluating a Fund’s performance for the periods presented.
| | | | | | | | | | | | | | | | | | | | |
| A-Class | | Year Ended
March 31,
2012 | | | Year Ended
March 31,
2011 | | | Year Ended
March 31,
2010 | | | Year Ended
March 31,
2009 | | | Year Ended
March 31,
2008 | |
Per Share Data | | | | | | | | | | | | | | | | | | | | |
Net asset value, beginning of period | | $ | 26.41 | | | $ | 23.18 | | | $ | 15.79 | | | $ | 25.92 | | | $ | 27.32 | |
| | | | | | | | | | | | | | | | | | | | |
Income (loss) from investment operations: | | | | | | | | | | | | | | | | | | | | |
Net investment income (loss)a | | | .01 | | | | (.06 | ) | | | .07 | | | | .12 | | | | .52 | |
Net gain (loss) on investments (realized and unrealized) | | | 1.78 | | | | 3.29 | | | | 7.43 | | | | (10.21 | ) | | | (1.78 | ) |
| | | | | | | | | | | | | | | | | | | | |
Total from investment operations | | | 1.79 | | | | 3.23 | | | | 7.50 | | | | (10.09 | ) | | | (1.26 | ) |
| | | | | | | | | | | | | | | | | | | | |
Less distributions from: | | | | | | | | | | | | | | | | | | | | |
Net investment income | | | — | | | | — | c | | | (.11 | ) | | | (.04 | ) | | | (.14 | ) |
| | | | | | | | | | | | | | | | | | | | |
Total distributions | | | — | | | | — | | | | (.11 | ) | | | (.04 | ) | | | (.14 | ) |
| | | | | | | | | | | | | | | | | | | | |
Net asset value, end of period | | $ | 28.20 | | | $ | 26.41 | | | $ | 23.18 | | | $ | 15.79 | | | $ | 25.92 | |
| | | | | | | | | | | | | | | | | | | | |
| | | | | |
Total Returnb | | | 6.78 | % | | | 13.94 | % | | | 47.55 | % | | | (38.95 | %) | | | (4.68 | %) |
| | | | | | | | | | | | | | | | | | | | |
Ratios/Supplemental Data | | | | | | | | | | | | | | | | | | | | |
Net assets, end of period (in thousands) | | $ | 13,413 | | | $ | 10,288 | | | $ | 46,312 | | | $ | 29,409 | | | $ | 2,358 | |
| | | | | | | | | | | | | | | | | | | | |
Ratios to average net assets: | | | | | | | | | | | | | | | | | | | | |
Net investment income (loss) | | | 0.05 | % | | | (0.25 | %) | | | 0.34 | % | | | 0.68 | % | | | 1.86 | % |
Total expenses | | | 1.51 | % | | | 1.54 | % | | | 1.53 | % | | | 1.52 | % | | | 1.51 | % |
| | | | | | | | | | | | | | | | | | | | |
Portfolio turnover rate | | | 196 | % | | | 202 | % | | | 58 | % | | | 168 | % | | | 396 | % |
| | | | | | | | | | | | | | | | | | | | |
| C-Class | | Year Ended
March 31,
2012 | | | Year Ended
March 31,
2011 | | | Year Ended
March 31,
2010 | | | Year Ended
March 31,
2009 | | | Year Ended
March 31,
2008 | |
Per Share Data | | | | | | | | | | | | | | | | | | | | |
Net asset value, beginning of period | | $ | 25.41 | | | $ | 22.50 | | | $ | 15.44 | | | $ | 25.55 | | | $ | 27.15 | |
| | | | | | | | | | | | | | | | | | | | |
Income (loss) from investment operations: | | | | | | | | | | | | | | | | | | | | |
Net investment income (loss)a | | | (.20 | ) | | | (.27 | ) | | | (.08 | ) | | | (.02 | ) | | | .18 | |
Net gain (loss) on investments (realized and unrealized) | | | 1.70 | | | | 3.18 | | | | 7.25 | | | | (10.05 | ) | | | (1.64 | ) |
| | | | | | | | | | | | | | | | | | | | |
Total from investment operations | | | 1.50 | | | | 2.91 | | | | 7.17 | | | | (10.07 | ) | | | (1.46 | ) |
| | | | | | | | | | | | | | | | | | | | |
Less distributions from: | | | | | | | | | | | | | | | | | | | | |
Net investment income | | | — | | | | — | c | | | (.11 | ) | | | (.04 | ) | | | (.14 | ) |
| | | | | | | | | | | | | | | | | | | | |
Total distributions | | | — | | | | — | | | | (.11 | ) | | | (.04 | ) | | | (.14 | ) |
| | | | | | | | | | | | | | | | | | | | |
Net asset value, end of period | | $ | 26.91 | | | $ | 25.41 | | | $ | 22.50 | | | $ | 15.44 | | | $ | 25.55 | |
| | | | | | | | | | | | | | | | | | | | |
| | | | | |
Total Returnb | | | 5.90 | % | | | 12.93 | % | | | 46.49 | % | | | (39.43 | %) | | | (5.45 | %) |
| | | | | | | | | | | | | | | | | | | | |
Ratios/Supplemental Data | | | | | | | | | | | | | | | | | | | | |
Net assets, end of period (in thousands) | | $ | 10,110 | | | $ | 10,032 | | | $ | 11,456 | | | $ | 7,295 | | | $ | 7,836 | |
| | | | | | | | | | | | | | | | | | | | |
Ratios to average net assets: | | | | | | | | | | | | | | | | | | | | |
Net investment income (loss) | | | (0.80 | %) | | | (1.11 | %) | | | (0.41 | %) | | | (0.08 | %) | | | 0.67 | % |
Total expenses | | | 2.26 | % | | | 2.29 | % | | | 2.28 | % | | | 2.28 | % | | | 2.25 | % |
| | | | | | | | | | | | | | | | | | | | |
Portfolio turnover rate | | | 196 | % | | | 202 | % | | | 58 | % | | | 168 | % | | | 396 | % |
| | |
32 | THE RYDEX SERIES FUNDS ANNUAL REPORT | | SEE NOTES TO FINANCIAL STATEMENTS. |
S&P 500 FUND
FINANCIAL HIGHLIGHTS (concluded)
This table is presented to show selected data for a share outstanding throughout each period and to assist shareholders in evaluating a Fund’s performance for the periods presented.
| | | | | | | | | | | | | | | | | | | | |
| H-Class | | Year Ended
March 31,
2012 | | | Year Ended
March 31,
2011 | | | Year Ended
March 31,
2010 | | | Year Ended
March 31,
2009 | | | Year Ended
March 31,
2008 | |
Per Share Data | | | | | | | | | | | | | | | | | | | | |
Net asset value, beginning of period | | $ | 26.39 | | | $ | 23.17 | | | $ | 15.78 | | | $ | 25.90 | | | $ | 27.31 | |
| | | | | | | | | | | | | | | | | | | | |
Income (loss) from investment operations: | | | | | | | | | | | | | | | | | | | | |
Net investment income (loss)a | | | (.02 | ) | | | (.09 | ) | | | .06 | | | | .13 | | | | .39 | |
Net gain (loss) on investments (realized and unrealized) | | | 1.83 | | | | 3.31 | | | | 7.44 | | | | (10.21 | ) | | | (1.66 | ) |
| | | | | | | | | | | | | | | | | | | | |
Total from investment operations | | | 1.81 | | | | 3.22 | | | | 7.50 | | | | (10.08 | ) | | | (1.27 | ) |
| | | | | | | | | | | | | | | | | | | | |
Less distributions from: | | | | | | | | | | | | | | | | | | | | |
Net investment income | | | — | | | | — | c | | | (.11 | ) | | | (.04 | ) | | | (.14 | ) |
| | | | | | | | | | | | | | | | | | | | |
Total distributions | | | — | | | | — | | | | (.11 | ) | | | (.04 | ) | | | (.14 | ) |
| | | | | | | | | | | | | | | | | | | | |
Net asset value, end of period | | $ | 28.20 | | | $ | 26.39 | | | $ | 23.17 | | | $ | 15.78 | | | $ | 25.90 | |
| | | | | | | | | | | | | | | | | | | | |
Total Returnb | | | 6.86 | % | | | 13.90 | % | | | 47.58 | % | | | (38.94 | %) | | | (4.72 | %) |
| | | | | | | | | | | | | | | | | | | | |
Ratios/Supplemental Data | | | | | | | | | | | | | | | | | | | | |
Net assets, end of period (in thousands) | | $ | 240,847 | | | $ | 249,090 | | | $ | 194,193 | | | $ | 139,759 | | | $ | 78,963 | |
| | | | | | | | | | | | | | | | | | | | |
Ratios to average net assets: | | | | | | | | | | | | | | | | | | | | |
Net investment income (loss) | | | (0.07 | %) | | | (0.37 | %) | | | 0.29 | % | | | 0.64 | % | | | 1.40 | % |
Total expenses | | | 1.50 | % | | | 1.54 | % | | | 1.53 | % | | | 1.53 | % | | | 1.48 | % |
| | | | | | | | | | | | | | | | | | | | |
Portfolio turnover rate | | | 196 | % | | | 202 | % | | | 58 | % | | | 168 | % | | | 396 | % |
| a | Net investment income (loss) per share was computed using average shares outstanding throughout the period. |
| b | Total return does not reflect the impact of any applicable sales charges and has not been annualized. |
| c | Less than $0.01 per share. |
| | |
SEE NOTES TO FINANCIAL STATEMENTS. | | THE RYDEX SERIES FUNDS ANNUAL REPORT | 33 |
| | |
| PERFORMANCE REPORT AND FUND PROFI LE (Unaudited ) | | March 31, 2012 |
INVERSE S&P 500 STRATEGY FUND
OBJECTIVE: Seeks to provide investment results that match, before fees and expenses, the performance of a specific benchmark on a daily basis. The Fund’s current benchmark is the inverse (opposite) of the performance of the S&P 500® Index (the “underlying index”). The Fund does not seek to achieve its investment objective over a period of time greater than one day.
For the one-year period ended March 31, 2012, Inverse S&P 500 Strategy Fund maintained a daily correlation of over 99% to its benchmark of -100% of the daily price movement of the S&P 500 Index*. Inverse S&P 500 Strategy Fund Investor Class returned -13.65%, while the S&P 500 Index returned 8.54% over the same period.
Sectors contributing most to performance of the index were Information Technology, Health Care, Consumer Discretionary and Consumer Staples. Energy, Financials and Materials detracted from performance of the index for the year.
Apple, Inc., International Business Machines Corp. and Microsoft Corp. were among the stocks which provided the most performance to the index during the year. Schlumberger Ltd., Hewlett-Packard Co. and Bank of America Corp. detracted from performance of the index for the year.
Derivatives in the Fund were used to help provide exposure to the composition of the benchmark in the highest efficient manner and not for hedging purposes. The results of derivatives use during the period were within our expectations and contributed to the Fund’s performance.
Due to the compounding of daily returns, leveraged and inverse funds’ returns over periods other than one day will likely differ in amount and possibly direction from the benchmark return for the same period. Investors should monitor their leveraged and inverse funds’ holdings to ensure that they are consistent with their strategies, as frequently as daily.
The effects of compounding may cause the longer-term correlation of the fund to its benchmark to diminish. The apparent discrepancy between the leveraged and unleveraged indices is the result of compounding, which is described briefly on page 4 of this report.
*Standard & Poor’s 500 Index (S&P 500®)—a capitalization-weighted index covering 500 industrial, utility, transportation and financial companies of the U.S. markets (mostly NYSE Euronext issues).
Performance displayed represents past performance which is no guarantee of future results.
Holdings Diversification (Market Exposure as % of Net Assets)
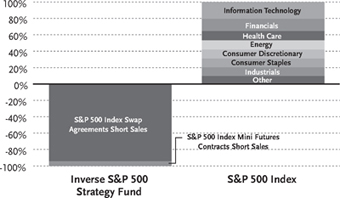
| | |
Inception Dates: | | |
Investor Class | | January 7, 1994 |
Advisor Class | | August 5, 1998 |
A-Class | | March 31, 2004 |
C-Class | | March 15, 2001 |
The Fund invests principally in derivative investments such as swap agreements and futures contracts.
“Holdings Diversification (Market Exposure as % of Net Assets)” excludes any temporary cash investments.
34 | THE RYDEX SERIES FUNDS ANNUAL REPORT
PERFORMANCE REPORT AND FUND PROFILE (Unaudited)(concluded)
Cumulative Fund Performance*
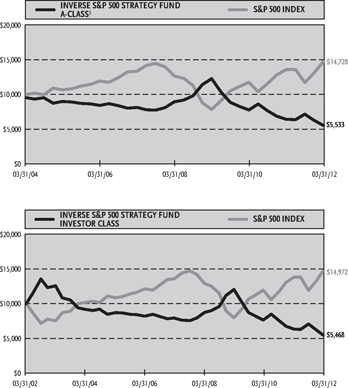
Average Annual Returns*
Periods Ended 03/31/12
| | | | | | | | | | | | |
| | | 1 Year | | | 5 Year | | | 10 Year | |
Investor Class Shares | | | -13.65 | % | | | -7.16 | % | | | -5.86 | % |
Advisor Class Shares | | | -14.11 | % | | | -7.66 | % | | | -6.34 | % |
C-Class Shares | | | -14.49 | % | | | -8.10 | % | | | -6.81 | % |
C-Class Shares with CDSC† | | | -15.35 | % | | | -8.10 | % | | | -6.81 | % |
S&P 500 Index | | | 8.54 | % | | | 2.01 | % | | | 4.12 | % |
| | | | | | | | | | | | |
| | | | | | | | | Since
Inception
(03/31/04) | |
A-Class Shares | | | -13.87 | % | | | -7.40 | % | | | -6.57 | % |
A-Class Shares with sales charge‡ | | | -17.97 | % | | | -8.30 | % | | | -7.13 | % |
S&P 500 Index | | | 8.54 | % | | | 2.01 | % | | | 4.96 | % |
| * | The performance data above represents past performance that is not predictive of future results. The investment return and principal value of an investment in the Fund will fluctuate so that an investor’s shares, when redeemed, may be worth more or less than their original cost. Returns are historical and include changes in principal and reinvested dividends and capital gains and do not reflect the effect of taxes. The S&P 500 Index is an unmanaged index and, unlike the Fund, has no management fees or operating expenses to reduce its reported return. The graphs are based on Investor Class shares and A-Class shares only; performance for Advisor Class shares and C-Class shares will vary due to differences in fee structures. |
| † | Fund returns include a CDSC of 1% if redeemed within 12 months of purchase. |
| ‡ | Fund returns are calculated using the maximum sales charge of 4.75%. |
THE RYDEX SERIES FUNDS ANNUAL REPORT | 35
| | |
| SCHEDULE OF INVESTMENTS | | March 31, 2012 |
| INVERSE S&P 500 STRATEGY FUND | | |
| | | | | | | | |
| | | FACE
AMOUNT | | | VALUE | |
FEDERAL AGENCY DISCOUNT NOTES†† - 55.9% | | | | | | | | |
Fannie Mae1 | | | | | | | | |
0.08% due 04/04/12 | | $ | 15,000,000 | | | $ | 14,999,985 | |
0.19% due 05/01/12 | | | 10,000,000 | | | | 9,999,760 | |
0.15% due 09/12/12 | | | 10,000,000 | | | | 9,995,470 | |
| | | | | | | | |
Total Fannie Mae | | | | | | | 34,995,215 | |
| | | | | | | | |
Freddie Mac1 0.08%
due 04/02/12 | | | 15,000,000 | | | | 15,000,000 | |
| | | | | | | | |
Federal Farm Credit Bank2 0.14%
due 05/15/12 | | | 15,000,000 | | | | 14,999,460 | |
| | | | | | | | |
Federal Home Loan Bank2 0.06%
due 05/01/12 | | | 10,000,000 | | | | 9,999,760 | |
| | | | | | | | |
Total Federal Agency Discount Notes (Cost $74,988,383) | | | | | | | 74,994,435 | |
| | | | | | | | |
FEDERAL AGENCY NOTES††—14.9% | | | | | | | | |
Federal Home Loan Bank2 0.13%
due 05/15/12 | | | 20,000,000 | | | | 19,999,520 | |
| | | | | | | | |
Total Federal Agency Notes
(Cost $19,998,705) | | | | | | | 19,999,520 | |
| | | | | | | | |
REPURCHASE AGREEMENTS††,3—28.2% | | | | | | | | |
Credit Suisse Group
issued 03/30/12 at 0.01%
due 04/02/124 | | | 16,937,310 | | | | 16,937,310 | |
HSBC Group
issued 03/30/12 at 0.01%
due 04/02/12 | | | 15,355,308 | | | | 15,355,308 | |
Mizuho Financial Group, Inc.
issued 03/30/12 at 0.01%
due 04/02/12 | | | 4,320,206 | | | | 4,320,206 | |
Deutsche Bank
issued 03/30/12 at 0.01%
due 04/02/12 | | | 1,148,263 | | | | 1,148,263 | |
| | | | | | | | |
Total Repurchase Agreements
(Cost $37,761,087) | | | | | | | 37,761,087 | |
| | | | | | | | |
Total Investments – 99.0%
(Cost $132,748,175) | | | | | | $ | 132,755,042 | |
| | | | | | | | |
Other Assets & Liabilities, net – 1.0% | | | | | | | 1,341,219 | |
| | | | | | | | |
Total Net Assets – 100.0% | | | | | | $ | 134,096,261 | |
| |
| | | | | | | | |
| | | CONTRACTS | | | UNREALIZED
GAIN (LOSS) | |
FUTURES CONTRACTS SOLD SHORT† | | | | | | | | |
June 2012 S&P 500 Index
Mini Futures Contracts
(Aggregate Value of
Contracts $7,711,000) | | | 110 | | | $ | (59,708 | ) |
| | | | | | | | |
| | | | | | | | |
| | | UNITS | | | | |
EQUITY INDEX SWAP AGREEMENTS SOLD SHORT†† | | | | | | | | |
Goldman Sachs International
April 2012 S&P 500 Index Swap,
Terminating 04/27/125
(Notional Value $27,192,378) | | | 19,306 | | | $ | 145,439 | |
Morgan Stanley Capital Services, Inc.
April 2012 S&P 500 Index Swap,
Terminating 04/30/12 5
(Notional Value $3,523,099) | | | 2,501 | | | | 9,251 | |
Barclays Bank plc
April 2012 S&P 500 Index Swap,
Terminating 04/30/12 5
(Notional Value $36,256,484) | | | 25,742 | | | | (133,350 | ) |
Credit Suisse Capital, LLC
April 2012 S&P 500 Index Swap,
Terminating 04/30/12 5
(Notional Value $59,347,665) | | | 42,136 | | | | (219,510 | ) |
| | | | | | | | |
(Total Notional Value $126,319,626) | | | | | | $ | (198,170 | ) |
| | | | | | | | |
| † | Value determined based on Level 1 inputs — See Note 4. |
| †† | Value determined based on Level 2 inputs — See Note 4. |
| 1 | On September 7, 2008, the issuer was placed in conservatorship by the Federal Housing Finance Agency (FHFA). As conservator, the FHFA has full powers to control the assets and operations of the firm. |
| 2 | The issuer operates under a Congressional charter; its securities are neither issued nor guaranteed by the U.S. Government. |
| 3 | Repurchase Agreements — See Note 5. |
| 4 | All or a portion of this security is pledged as equity index swap collateral at March 31, 2012. |
| 5 | Total Return based on S&P 500 Index +/- financing at a variable rate. |
plc — Public Limited Company
| | |
36 | THE RYDEX SERIES FUNDS ANNUAL REPORT | | SEE NOTES TO FINANCIAL STATEMENTS. |
INVERSE S&P 500 STRATEGY FUND
STATEMENT OF ASSETS AND LIABILITIES
| | | | |
March 31, 2012 | | | | |
| |
ASSETS: | | | | |
| |
Investments, at value
(cost $94,987,088) | | $ | 94,993,955 | |
Repurchase agreements, at value
(cost $37,761,087) | | | 37,761,087 | |
| | | | |
Total investments
(cost $132,748,175) | | | 132,755,042 | |
Segregated cash with broker | | | 874,491 | |
Unrealized appreciation on swap agreements | | | 154,690 | |
Receivables: | | | | |
Fund shares sold | | | 1,114,985 | |
Interest | | | 16,378 | |
| | | | |
Total assets | | | 134,915,586 | |
| | | | |
LIABILITIES: | | | | |
Unrealized depreciation on swap agreements | | | 352,860 | |
Payable for: | | | | |
Fund shares redeemed | | | 160,398 | |
Management fees | | | 109,723 | |
Transfer agent and administrative fees | | | 30,479 | |
Variation margin | | | 20,900 | |
Distribution and service fees | | | 13,524 | |
Portfolio accounting fees | | | 12,191 | |
Swap settlement | | | 369 | |
Miscellaneous | | | 118,881 | |
| | | | |
Total liabilities | | | 819,325 | |
| | | | |
NET ASSETS | | $ | 134,096,261 | |
| | | | |
NET ASSETS CONSIST OF: | | | | |
Paid in capital | | $ | 541,867,119 | |
Accumulated net investment loss | | | (592,068 | ) |
Accumulated net realized loss on investments | | | (406,927,779 | ) |
Net unrealized depreciation on investments | | | (251,011 | ) |
| | | | |
Net assets | | $ | 134,096,261 | |
| | | | |
INVESTOR CLASS: | | | | |
Net assets | | $ | 112,333,886 | |
Capital shares outstanding | | | 4,564,817 | |
Net asset value per share | | $ | 24.61 | |
| | | | |
ADVISOR CLASS: | | | | |
Net assets | | $ | 5,977,613 | |
Capital shares outstanding | | | 263,174 | |
Net asset value per share | | $ | 22.71 | |
| | | | |
A-CLASS: | | | | |
Net assets | | $ | 7,914,858 | |
Capital shares outstanding | | | 342,647 | |
Net asset value per share | | $ | 23.10 | |
| | | | |
Maximum offering price per share | | | | |
(Net asset value divided by 95.25%) | | $ | 24.25 | |
| | | | |
C-CLASS: | | | | |
Net assets | | $ | 7,869,904 | |
Capital shares outstanding | | | 360,546 | |
Net asset value per share | | $ | 21.83 | |
| | | | |
STATEMENT OF OPERATIONS
| | | | |
Year Ended March 31, 2012 | | | | |
| |
INVESTMENT INCOME: | | | | |
Interest | | $ | 219,589 | |
| | | | |
Total investment income | | | 219,589 | |
| | | | |
| |
EXPENSES: | | | | |
Management fees | | | 1,964,517 | |
Transfer agent and administrative fees | | | 545,699 | |
Distribution and service fees: | | | | |
Advisor Class | | | 51,201 | |
A-Class | | | 27,191 | |
C-Class | | | 105,804 | |
Portfolio accounting fees | | | 213,199 | |
Custodian fees | | | 70,618 | |
Trustees’ fees* | | | 17,259 | |
Miscellaneous | | | 268,325 | |
| | | | |
Total expenses | | | 3,263,813 | |
| | | | |
Net investment loss | | | (3,044,224 | ) |
| | | | |
| |
NET REALIZED AND UNREALIZED GAIN (LOSS): | | | | |
Net realized gain (loss) on: | | | | |
Swap agreements | | | (36,690,513 | ) |
Futures contracts | | | (12,216,510 | ) |
| | | | |
Net realized loss | | | (48,907,023 | ) |
| | | | |
Net change in unrealized appreciation (depreciation) on: | | | | |
Investments | | | (11,397 | ) |
Swap agreements | | | 812,255 | |
Futures contracts | | | 309,223 | |
| | | | |
Net change in unrealized appreciation | | | | |
(depreciation) | | | 1,110,081 | |
| | | | |
Net realized and unrealized loss | | | (47,796,942 | ) |
| | | | |
| |
Net decrease in net assets resulting from operations | | $ | (50,841,166 | ) |
| | | | |
| * | Relates to Trustees not deemed “interested persons” within the meaning of Section 2(a)(19) of the 1940 Act. |
| | |
SEE NOTES TO FINANCIAL STATEMENTS. | | THE RYDEX SERIES FUNDS ANNUAL REPORT | 37 |
INVERSE S&P 500 STRATEGY FUND
STATEMENTS OF CHANGES IN NET ASSETS
| | | | | | | | |
| | | Year Ended
March 31,
2012 | | | Year Ended
March 31,
2011 | |
INCREASE (DECREASE) IN NET ASSETS FROM OPERATIONS: | | | | | | | | |
Net investment loss | | $ | (3,044,224 | ) | | $ | (3,367,949 | ) |
Net realized loss on investments | | | (48,907,023 | ) | | | (58,643,611 | ) |
Net change in unrealized appreciation (depreciation) on investments | | | 1,110,081 | | | | 5,102,624 | |
| | | | | | | | |
Net decrease in net assets resulting from operations | | | (50,841,166 | ) | | | (56,908,936 | ) |
| | | | | | | | |
| | |
CAPITALSHARETRANSACTIONS: | | | | | | | | |
PROCEEDSFROMSALEOFSHARES | | | | | | | | |
Investor Class | | | 740,514,113 | | | | 642,700,913 | |
Advisor Class | | | 91,994,118 | | | | 80,481,458 | |
A-Class | | | 78,100,721 | | | | 48,429,821 | |
C-Class | | | 22,769,486 | | | | 27,104,532 | |
COSTOFSHARESREDEEMED | | | | | | | | |
Investor Class | | | (702,486,924 | ) | | | (649,407,835 | ) |
Advisor Class | | | (90,159,118 | ) | | | (78,781,983 | ) |
A-Class | | | (72,186,098 | ) | | | (69,617,663 | ) |
C-Class | | | (25,298,728 | ) | | | (27,946,527 | ) |
| | | | | | | | |
Net increase (decrease) from capital share transactions | | | 43,247,570 | | | | (27,037,284 | ) |
| | | | | | | | |
Net decrease in net assets | | | (7,593,596 | ) | | | (83,946,220 | ) |
NETASSETS: | | | | | | | | |
Beginning of year | | | 141,689,857 | | | | 225,636,077 | |
| | | | | | | | |
End of year | | $ | 134,096,261 | | | $ | 141,689,857 | |
| | | | | | | | |
Accumulated net investment loss at end of year | | $ | (592,068 | ) | | $ | — | |
| | | | | | | | |
CAPITALSHAREACTIVITY: | | | | | | | | |
Shares sold | | | | | | | | |
Investor Class | | | 24,859,345 | | | | 18,633,323 | |
Advisor Class | | | 3,384,090 | | | | 2,527,217 | |
A-Class | | | 2,790,019 | | | | 1,480,123 | |
C-Class | | | 886,566 | | | | 886,722 | |
Shares redeemed | | | | | | | | |
Investor Class | | | (24,449,326 | ) | | | (19,464,630 | ) |
Advisor Class | | | (3,364,284 | ) | | | (2,583,534 | ) |
A-Class | | | (2,634,880 | ) | | | (2,173,401 | ) |
C-Class | | | (988,825 | ) | | | (939,419 | ) |
| | | | | | | | |
Net increase (decrease) in shares | | | 482,705 | | | | (1,633,599 | ) |
| | | | | | | | |
| | |
38 | THE RYDEX SERIES FUNDS ANNUAL REPORT | | SEE NOTES TO FINANCIAL STATEMENTS. |
INVERSE S&P 500 STRATEGY FUND
FINANCIAL HIGHLIGHTS
This table is presented to show selected data for a share outstanding throughout each period and to assist shareholders in evaluating a Fund’s performance for the periods presented.
| | | 000000000 | | | | 000000000 | | | | 000000000 | | | | 000000000 | | | | 000000000 | |
Investor Class | | Year Ended
March 31,
2012 | | | Year Ended
March 31,
2011 | | | Year Ended
March 31,
2010 | | | Year Ended
March 31,
2009 | | | Year Ended
March 31,
2008d | |
Per Share Data | | | | | | | | | | | | | | | | | | | | |
Net asset value, beginning of period | | $ | 28.50 | | | $ | 34.38 | | | $ | 54.23 | | | $ | 40.00 | | | $ | 37.85 | |
| | | | | | | | | | | | | | | | | | | | |
Income (loss) from investment operations: | | | | | | | | | | | | | | | | | | | | |
Net investment income (loss)a | | | (.38 | ) | | | (.41 | ) | | | (.47 | ) | | | .12 | | | | .93 | |
Net gain (loss) on investments (realized and unrealized) | | | (3.51 | ) | | | (5.47 | ) | | | (19.32 | ) | | | 14.94 | | | | 2.74 | |
| | | | | | | | | | | | | | | | | | | | |
Total from investment operations | | | (3.89 | ) | | | (5.88 | ) | | | (19.79 | ) | | | 15.06 | | | | 3.67 | |
| | | | | | | | | | | | | | | | | | | | |
Less distributions from: | | | | | | | | | | | | | | | | | | | | |
Net investment income | | | — | | | | — | | | | (.06 | ) | | | (.83 | ) | | | (1.52 | ) |
| | | | | | | | | | | | | | | | | | | | |
Total distributions | | | — | | | | — | | | | (.06 | ) | | | (.83 | ) | | | (1.52 | ) |
| | | | | | | | | | | | | | | | | | | | |
Net asset value, end of period | | $ | 24.61 | | | $ | 28.50 | | | $ | 34.38 | | | $ | 54.23 | | | $ | 40.00 | |
| | | | | | | | | | | | | | | | | | | | |
Total Returnb | | | (13.65 | %) | | | (17.10 | %) | | | (36.51 | %) | | | 37.66 | % | | | 10.24 | % |
| | | | | | | | | | | | | | | | | | | | |
Ratios/Supplemental Data | | | | | | | | | | | | | | | | | | | | |
Net assets, end of period (in thousands) | | $ | 112,334 | | | $ | 118,410 | | | $ | 171,423 | | | $ | 217,740 | | | $ | 223,044 | |
| | | | | | | | | | | | | | | | | | | | |
Ratios to average net assets: | | | | | | | | | | | | | | | | | | | | |
Net investment income (loss) | | | (1.31 | %) | | | (1.22 | %) | | | (1.16 | %) | | | 0.25 | % | | | 3.08 | % |
Total expenses | | | 1.41 | % | | | 1.44 | % | | | 1.43 | % | | | 1.43 | % | | | 1.41 | % |
| | | | | | | | | | | | | | | | | | | | |
Portfolio turnover rate | | | — | | | | — | | | | — | | | | — | | | | — | |
| | | 00000000 | | | | 00000000 | | | | 00000000 | | | | 00000000 | | | | 00000000 | |
Advisor Class | | Year Ended
March 31,
2012 | | | Year Ended
March 31,
2011 | | | Year Ended
March 31,
2010 | | | Year Ended
March 31,
2009 | | | Year Ended
March 31,
2008d | |
Per Share Data | | | | | | | | | | | | | | | | | | | | |
Net asset value, beginning of period | | $ | 26.44 | | | $ | 32.06 | | | $ | 50.83 | | | $ | 37.72 | | | $ | 36.00 | |
| | | | | | | | | | | | | | | | | | | | |
Income (loss) from investment operations: | | | | | | | | | | | | | | | | | | | | |
Net investment income (loss)a | | | (.48 | ) | | | (.54 | ) | | | (.63 | ) | | | (.13 | ) | | | .73 | |
Net gain (loss) on investments (realized and unrealized) | | | (3.25 | ) | | | (5.08 | ) | | | (18.08 | ) | | | 14.07 | | | | 2.51 | |
| | | | | | | | | | | | | | | | | | | | |
Total from investment operations | | | (3.73 | ) | | | (5.62 | ) | | | (18.71 | ) | | | 13.94 | | | | 3.24 | |
| | | | | | | | | | | | | | | | | | | | |
Less distributions from: | | | | | | | | | | | | | | | | | | | | |
Net investment income | | | — | | | | — | | | | (.06 | ) | | | (.83 | ) | | | (1.52 | ) |
| | | | | | | | | | | | | | | | | | | | |
Total distributions | | | — | | | | — | | | | (.06 | ) | | | (.83 | ) | | | (1.52 | ) |
| | | | | | | | | | | | | | | | | | | | |
Net asset value, end of period | | $ | 22.71 | | | $ | 26.44 | | | $ | 32.06 | | | $ | 50.83 | | | $ | 37.72 | |
| | | | | | | | | | | | | | | | | | | | |
Total Returnb | | | (14.11 | %) | | | (17.53 | %) | | | (36.82 | %) | | | 36.96 | % | | | 9.56 | % |
| | | | | | | | | | | | | | | | | | | | |
Ratios/Supplemental Data | | | | | | | | | | | | | | | | | | | | |
Net assets, end of period (in thousands) | | $ | 5,978 | | | $ | 6,434 | | | $ | 9,607 | | | $ | 15,305 | | | $ | 11,131 | |
| | | | | | | | | | | | | | | | | | | | |
Ratios to average net assets: | | | | | | | | | | | | | | | | | | | | |
Net investment income (loss) | | | (1.81 | %) | | | (1.72 | %) | | | (1.63 | %) | | | (0.30 | %) | | | 2.64 | % |
Total expenses | | | 1.91 | % | | | 1.93 | % | | | 1.93 | % | | | 1.93 | % | | | 1.92 | % |
| | | | | | | | | | | | | | | | | | | | |
Portfolio turnover rate | | | — | | | | — | | | | — | | | | — | | | | — | |
| | |
SEE NOTES TO FINANCIAL STATEMENTS. | | THE RYDEX SERIES FUNDS ANNUAL REPORT | 39 |
INVERSE S&P 500 STRATEGY FUND
FINANCIAL HIGHLIGHTS (concluded)
This table is presented to show selected data for a share outstanding throughout each period and to assist shareholders in evaluating a Fund’s performance for the periods presented.
| | | | | | | | | | | | | | | | | | | | |
| A-Class | | Year Ended
March 31,
2012 | | | Year Ended
March 31,
2011 | | | Year Ended
March 31,
2010 | | | Year Ended
March 31,
2009 | | | Year Ended
March 31,
2008d | |
Per Share Data | | | | | | | | | | | | | | | | | | | | |
Net asset value, beginning of period | | $ | 26.82 | | | $ | 32.43 | | | $ | 51.30 | | | $ | 37.97 | | | $ | 36.10 | |
| | | | | | | | | | | | | | | | | | | | |
Income (loss) from investment operations: | | | | | | | | | | | | | | | | | | | | |
Net investment income (loss)a | | | (.42 | ) | | | (.48 | ) | | | (.53 | ) | | | — | c | | | .81 | |
Net gain (loss) on investments (realized and unrealized) | | | (3.30 | ) | | | (5.13 | ) | | | (18.28 | ) | | | 14.16 | | | | 2.58 | |
| | | | | | | | | | | | | | | | | | | | |
Total from investment operations | | | (3.72 | ) | | | (5.61 | ) | | | (18.81 | ) | | | 14.16 | | | | 3.39 | |
| | | | | | | | | | | | | | | | | | | | |
Less distributions from: | | | | | | | | | | | | | | | | | | | | |
Net investment income | | | — | | | | — | | | | (.06 | ) | | | (.83 | ) | | | (1.52 | ) |
| | | | | | | | | | | | | | | | | | | | |
Total distributions | | | — | | | | — | | | | (.06 | ) | | | (.83 | ) | | | (1.52 | ) |
| | | | | | | | | | | | | | | | | | | | |
Net asset value, end of period | | $ | 23.10 | | | $ | 26.82 | | | $ | 32.43 | | | $ | 51.30 | | | $ | 37.97 | |
| | | | | | | | | | | | | | | | | | | | |
Total Returnb | | | (13.87 | %) | | | (17.30 | %) | | | (36.68 | %) | | | 37.30 | % | | | 9.95 | % |
| | | | | | | | | | | | | | | | | | | | |
Ratios/Supplemental Data | | | | | | | | | | | | | | | | | | | | |
Net assets, end of period (in thousands) | | $ | 7,915 | | | $ | 5,029 | | | $ | 28,565 | | | $ | 18,381 | | | $ | 9,344 | |
| | | | | | | | | | | | | | | | | | | | |
Ratios to average net assets: | | | | | | | | | | | | | | | | | | | | |
Net investment income (loss) | | | (1.56 | %) | | | (1.47 | %) | | | (1.42 | %) | | | 0.00 | % | | | 2.83 | % |
Total expenses | | | 1.66 | % | | | 1.68 | % | | | 1.67 | % | | | 1.68 | % | | | 1.66 | % |
| | | | | | | | | | | | | | | | | | | | |
Portfolio turnover rate | | | — | | | | — | | | | — | | | | — | | | | — | |
| | | | | | | | | | | | | | | | | | | | |
| C-Class | | Year Ended
March 31,
2012 | | | Year Ended
March 31,
2011 | | | Year Ended
March 31,
2010 | | | Year Ended
March 31,
2009 | | | Year Ended
March 31,
2008d | |
Per Share Data | | | | | | | | | | | | | | | | | | | | |
Net asset value, beginning of period | | $ | 25.53 | | | $ | 31.12 | | | $ | 49.59 | | | $ | 37.00 | | | $ | 35.50 | |
| | | | | | | | | | | | | | | | | | | | |
Income (loss) from investment operations: | | | | | | | | | | | | | | | | | | | | |
Net investment income (loss)a | | | (.59 | ) | | | (.67 | ) | | | (.79 | ) | | | (.28 | ) | | | .58 | |
Net gain (loss) on investments (realized and unrealized) | | | (3.11 | ) | | | (4.92 | ) | | | (17.62 | ) | | | 13.70 | | | | 2.44 | |
Total from investment operations | | | (3.70 | ) | | | (5.59 | ) | | | (18.41 | ) | | | 13.42 | | | | 3.02 | |
| | | | | | | | | | | | | | | | | | | | |
Less distributions from: | | | | | | | | | | | | | | | | | | | | |
Net investment income | | | — | | | | — | | | | (.06 | ) | | | (.83 | ) | | | (1.52 | ) |
| | | | | | | | | | | | | | | | | | | | |
Total distributions | | | — | | | | — | | | | (.06 | ) | | | (.83 | ) | | | (1.52 | ) |
| | | | | | | | | | | | | | | | | | | | |
Net asset value, end of period | | $ | 21.83 | | | $ | 25.53 | | | $ | 31.12 | | | $ | 49.59 | | | $ | 37.00 | |
| | | | | | | | | | | | | | | | | | | | |
Total Returnb | | | (14.49 | %) | | | (17.96 | %) | | | (37.14 | %) | | | 36.27 | % | | | 9.07 | % |
| | | | | | | | | | | | | | | | | | | | |
Ratios/Supplemental Data | | | | | | | | | | | | | | | | | | | | |
Net assets, end of period (in thousands) | | $ | 7,870 | | | $ | 11,817 | | | $ | 16,041 | | | $ | 19,674 | | | $ | 32,299 | |
| | | | | | | | | | | | | | | | | | | | |
Ratios to average net assets: | | | | | | | | | | | | | | | | | | | | |
Net investment income (loss) | | | (2.31 | %) | | | (2.23 | %) | | | (2.15 | %) | | | (0.67 | %) | | | 2.14 | % |
Total expenses | | | 2.42 | % | | | 2.44 | % | | | 2.43 | % | | | 2.43 | % | | | 2.41 | % |
| | | | | | | | | | | | | | | | | | | | |
Portfolio turnover rate | | | — | | | | — | | | | — | | | | — | | | | — | |
| a | Net investment income (loss) per share was computed using average shares outstanding throughout the period. |
| b | Total return does not reflect the impact of any applicable sales charges and has not been annualized. |
| c | Net investment income is less than $0.01 per share. |
| d | Per share amounts for the period April 1, 2007 through April 23, 2007 have been restated to reflect a 1:5 reverse share split effective April 23, 2007. |
| | |
40 | THE RYDEX SERIES FUNDS ANNUAL REPORT | | SEE NOTES TO FINANCIAL STATEMENTS. |
This page intentionally left blank.
THE RYDEX SERIES FUNDS ANNUAL REPORT | 41
| | |
PERFORMANCE REPORT AND FUND PROFILE (Unaudited) | | March 31, 2012 |
NASDAQ-100® FUND
OBJECTIVE: Seeks to provide investment results that correspond, before fees and expenses, to a benchmark for over-the-counter securities on a daily basis. The Fund’s current benchmark is the NASDAQ-100 Index® (the “underlying index”).
For the one-year period ended March 31, 2012, NASDAQ-100® Fund maintained a daily correlation of over 99% to its benchmark of 100% of the daily price movement of the NASDAQ-100 Index*. The NASDAQ-100 Fund Investor Class returned 17.66%, while the NASDAQ-100 Index returned 18.99% over the same period.
Sectors contributing most to performance of the index were Information Technology and Consumer Discretionary, while Consumer Staples, Industrials and Materials contributed the least to performance of the index. Telecommunications Services was the only sector detracting from performance.
Apple, Inc., Microsoft Corp. and Intel Corp. were among the stocks which provided the most performance to the index, while First Solar, Inc., Research in Motion Ltd. and Oracle Corp. were among the stocks which provided the least performance to the index during the year.
Derivatives in the Fund were used to help provide exposure to the composition of the benchmark in the highest efficient manner and not for hedging purposes. The results of derivatives use during the period were within our expectations and contributed to the Fund’s performance.
*The NASDAQ-100® Index includes 100 of the largest domestic and international non-financial securities listed on The Nasdaq Stock Market based on market capitalization. The Index reflects companies across major industry groups including computer hardware and software, telecommunications, retail/wholesale trade and biotechnology. It does not contain securities of financial companies, including investment companies.
Performance displayed represents past performance which is no guarantee of future results.
Holdings Diversification (Market Exposure as % of Net Assets)
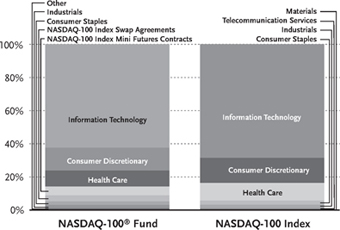
“Holdings Diversification (Market Exposure as % of Net Assets)” excludes any temporary cash investments.
| | | | |
Inception Dates: | | | |
Investor Class | | | February 14, 1994 | |
Advisor Class | | | September 22, 1998 | |
A-Class | | | March 31, 2004 | |
C-Class | | | March 26, 2001 | |
| | | | |
Ten Largest Holdings (% of Total Net Assets) | |
Apple, Inc. | | | 16.9 | % |
Microsoft Corp. | | | 8.2 | % |
Google, Inc. — Class A | | | 5.0 | % |
Oracle Corp. | | | 4.4 | % |
Intel Corp. | | | 4.3 | % |
QUALCOMM, Inc. | | | 3.5 | % |
Cisco Systems, Inc. | | | 3.5 | % |
Amazon.com, Inc. | | | 2.8 | % |
Comcast Corp. — Class A | | | 1.9 | % |
Amgen, Inc. | | | 1.6 | % |
| | | | |
Top Ten Total | | | 52.1 | % |
| | | | |
“Ten Largest Holdings” exclude any temporary
cash or derivative investments.
42 | THE RYDEX SERIES FUNDS ANNUAL REPORT
PERFORMANCE REPORT AND FUND PROFILE (Unaudited) (concluded)
Cumulative Fund Performance*
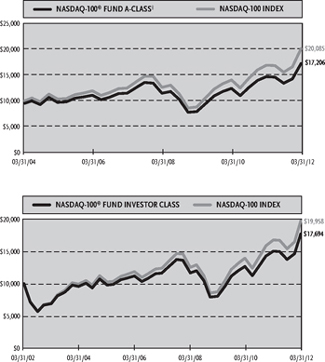
Average Annual Returns*
| | | | | | | | | | | | |
Periods Ended 03/31/12 | | | | | | | | | | | | |
| | | 1 Year | | | 5 Year | | | 10 Year | |
Investor Class Shares | | | 17.66 | % | | | 8.75 | % | | | 5.87 | % |
Advisor Class Shares | | | 17.03 | % | | | 8.20 | % | | | 5.33 | % |
C-Class Shares | | | 16.40 | % | | | 7.70 | % | | | 4.80 | % |
C-Class Shares with CDSC† | | | 15.40 | % | | | 7.70 | % | | | 4.80 | % |
NASDAQ-100 Index | | | 18.99 | % | | | 10.00 | % | | | 7.15 | % |
| | | | | | | | | | | | |
| | | | | | | | | Since
Inception
(03/31/04) | |
A-Class Shares | | | 17.29 | % | | | 8.43 | % | | | 7.67 | % |
A-Class Shares with sales charge‡ | | | 11.75 | % | | | 7.38 | % | | | 7.02 | % |
NASDAQ-100 Index | | | 18.99 | % | | | 10.00 | % | | | 9.11 | % |
| * | The performance data above represents past performance that is not predictive of future results. The investment return and principal value of an investment in the Fund will fluctuate so that an investor’s shares, when redeemed, may be worth more or less than their original cost. Returns are historical and include changes in principal and reinvested dividends and capital gains and do not reflect the effect of taxes. The NASDAQ-100 Index is an unmanaged index and, unlike the Fund, has no management fees or operating expenses to reduce its reported return. The graphs are based on Investor Class shares and A-Class shares only; performance for Advisor Class shares and C-Class shares will vary due to differences in fee structures. |
| † | Fund returns include a CDSC of 1% if redeemed within 12 months of purchase. |
| ‡ | Fund returns are calculated using the maximum sales charge of 4.75%. |
THE RYDEX SERIES FUNDS ANNUAL REPORT | 43
| | |
| SCHEDULE OF INVESTMENTS | | March 31, 2012 |
NASDAQ-100® FUND | | |
| | | | | | | | |
| | | SHARES | | | VALUE | |
| | |
COMMON STOCKS† - 91.1% | | | | | | | | |
| | |
INFORMATION TECHNOLOGY - 62.5% | | | | | | | | |
Apple, Inc.* | | | 244,685 | | | $ | 146,681,316 | |
Microsoft Corp. | | | 2,202,019 | | | | 71,015,112 | |
Google, Inc. — Class A* | | | 67,699 | | | | 43,411,308 | |
Oracle Corp. | | | 1,318,955 | | | | 38,460,728 | |
Intel Corp. | | | 1,311,120 | | | | 36,855,582 | |
QUALCOMM, Inc. | | | 443,886 | | | | 30,193,126 | |
Cisco Systems, Inc. | | | 1,413,449 | | | | 29,894,446 | |
eBay, Inc.* | | | 337,732 | | | | 12,458,933 | |
Baidu, Inc. ADR* | | | 71,174 | | | | 10,375,034 | |
Dell, Inc.* | | | 471,461 | | | | 7,826,253 | |
Automatic Data Processing, Inc. | | | 128,739 | | | | 7,105,106 | |
Cognizant Technology Solutions Corp. — Class A* | | | 79,618 | | | | 6,126,605 | |
Broadcom Corp. — Class A* | | | 129,119 | | | | 5,074,377 | |
Yahoo!, Inc.* | | | 318,529 | | | | 4,848,011 | |
Intuit, Inc. | | | 77,394 | | | | 4,653,701 | |
Adobe Systems, Inc.* | | | 129,593 | | | | 4,446,336 | |
Applied Materials, Inc. | | | 338,834 | | | | 4,215,095 | |
NetApp, Inc.* | | | 94,110 | | | | 4,213,304 | |
Citrix Systems, Inc.* | | | 48,702 | | | | 3,843,075 | |
Activision Blizzard, Inc. | | | 294,678 | | | | 3,777,772 | |
Symantec Corp.* | | | 191,431 | | | | 3,579,760 | |
CA, Inc. | | | 127,449 | | | | 3,512,494 | |
Check Point Software Technologies Ltd.* | | | 54,483 | | | | 3,478,195 | |
Altera Corp. | | | 84,603 | | | | 3,368,891 | |
Seagate Technology plc | | | 117,761 | | | | 3,173,659 | |
SanDisk Corp.* | | | 63,613 | | | | 3,154,569 | |
Paychex, Inc. | | | 95,111 | | | | 2,947,490 | |
F5 Networks, Inc.* | | | 20,782 | | | | 2,804,739 | |
Fiserv, Inc.* | | | 36,370 | | | | 2,523,714 | |
Autodesk, Inc.* | | | 59,280 | | | | 2,508,730 | |
Xilinx, Inc. | | | 68,712 | | | | 2,503,178 | |
Avago Technologies Ltd. | | | 63,979 | | | | 2,493,262 | |
NVIDIA Corp.* | | | 160,258 | | | | 2,466,371 | |
Marvell Technology Group Ltd.* | | | 153,130 | | | | 2,408,735 | |
KLA-Tencor Corp. | | | 43,753 | | | | 2,381,038 | |
Maxim Integrated Products, Inc. | | | 76,575 | | | | 2,189,279 | |
Micron Technology, Inc.* | | | 259,239 | | | | 2,099,836 | |
Nuance Communications, Inc.* | | | 80,880 | | | | 2,068,910 | |
Linear Technology Corp. | | | 60,095 | | | | 2,025,202 | |
Research In Motion Ltd.* | | | 136,644 | | | | 2,010,033 | |
Microchip Technology, Inc. | | | 50,400 | | | | 1,874,880 | |
BMC Software, Inc.* | | | 43,099 | | | | 1,730,856 | |
Akamai Technologies, Inc.* | | | 46,661 | | | | 1,712,459 | |
VeriSign, Inc. | | | 41,860 | | | | 1,604,912 | |
Electronic Arts, Inc.* | | | 86,966 | | | | 1,433,200 | |
Lam Research Corp.* | | | 31,459 | | | | 1,403,701 | |
Flextronics International Ltd.* | | | 180,299 | | | | 1,303,562 | |
Infosys Ltd. ADR | | | 21,251 | | | | 1,211,945 | |
| | | | | | | | |
Total Information Technology | | | | | | | 541,448,820 | |
| | | | | | | | |
| | | | | | | | |
| | | SHARES | | | VALUE | |
| | |
CONSUMER DISCRETIONARY - 13.8% | | | | | | | | |
Amazon.com, Inc.* | | | 119,422 | | | $ | 24,184,150 | |
Comcast Corp. — Class A | | | 549,922 | | | | 16,503,159 | |
Starbucks Corp. | | | 197,716 | | | | 11,050,347 | |
Priceline.com, Inc.* | | | 13,065 | | | | 9,374,138 | |
DIRECTV — Class A* | | | 177,475 | | | | 8,756,617 | |
News Corp. — Class A | | | 439,719 | | | | 8,658,067 | |
Bed Bath & Beyond, Inc.* | | | 63,311 | | | | 4,163,964 | |
Ross Stores, Inc. | | | 60,003 | | | | 3,486,174 | |
Wynn Resorts Ltd. | | | 26,380 | | | | 3,294,334 | |
O’Reilly Automotive, Inc.* | | | 33,412 | | | | 3,052,186 | |
Mattel, Inc. | | | 88,966 | | | | 2,994,596 | |
Dollar Tree, Inc.* | | | 31,241 | | | | 2,951,962 | |
Staples, Inc. | | | 182,156 | | | | 2,947,284 | |
Liberty Interactive Corp. — Class A* | | | 143,261 | | | | 2,734,852 | |
Garmin Ltd. | | | 51,074 | | | | 2,397,924 | |
Sirius XM Radio, Inc.* | | | 985,504 | | | | 2,276,514 | |
Fossil, Inc.* | | | 16,215 | | | | 2,140,056 | |
Sears Holdings Corp.* | | | 27,901 | | | | 1,848,441 | |
Virgin Media, Inc. | | | 73,223 | | | | 1,829,111 | |
Netflix, Inc.* | | | 14,549 | | | | 1,673,717 | |
Apollo Group, Inc. — Class A* | | | 33,043 | | | | 1,276,782 | |
Expedia, Inc. | | | 31,719 | | | | 1,060,683 | |
Ctrip.com International Ltd. ADR* | | | 38,745 | | | | 838,442 | |
| | | | | | | | |
Total Consumer Discretionary | | | | | | | 119,493,500 | |
| | | | | | | | |
HEALTH CARE—9.6% | | | | | | | | |
Amgen, Inc. | | | 207,699 | | | | 14,121,455 | |
Gilead Sciences, Inc.* | | | 198,748 | | | | 9,708,840 | |
Celgene Corp.* | | | 115,159 | | | | 8,927,126 | |
Teva Pharmaceutical Industries Ltd. ADR | | | 183,451 | | | | 8,266,302 | |
Biogen Idec, Inc.* | | | 62,650 | | | | 7,892,021 | |
Express Scripts Holding Co. | | | 127,223 | | | | 6,892,942 | |
Intuitive Surgical, Inc.* | | | 10,324 | | | | 5,593,027 | |
Alexion Pharmaceuticals, Inc.* | | | 48,807 | | | | 4,532,218 | |
Cerner Corp.* | | | 44,527 | | | | 3,391,176 | |
Mylan, Inc.* | | | 112,045 | | | | 2,627,455 | |
Perrigo Co. | | | 24,484 | | | | 2,529,442 | |
Life Technologies Corp.* | | | 46,781 | | | | 2,283,848 | |
Vertex Pharmaceuticals, Inc.* | | | 55,196 | | | | 2,263,588 | |
Henry Schein, Inc.* | | | 23,560 | | | | 1,783,021 | |
DENTSPLY International, Inc. | | | 37,279 | | | | 1,496,006 | |
Warner Chilcott plc — Class A* | | | 65,434 | | | | 1,099,946 | |
| | | | | | | | |
Total Health Care | | | | | | | 83,408,413 | |
| | | | | | | | |
CONSUMER STAPLES—2.2% | | | | | | | | |
Costco Wholesale Corp. | | | 114,143 | | | | 10,364,184 | |
Whole Foods Market, Inc. | | | 47,861 | | | | 3,982,035 | |
Monster Beverage Corp.* | | | 45,750 | | | | 2,840,618 | |
Green Mountain Coffee Roasters, Inc.* | | | 40,636 | | | | 1,903,390 | |
| | | | | | | | |
Total Consumer Staples | | | | | | | 19,090,227 | |
| | | | | | | | |
| | |
44 | THE RYDEX SERIES FUNDS ANNUAL REPORT | | SEE NOTES TO FINANCIAL STATEMENTS. |
| | |
| SCHEDULE OF INVESTMENTS (concluded) | | March 31, 2012 |
NASDAQ-100® FUND | | |
| | | | | | | | |
| | | SHARES | | | VALUE | |
INDUSTRIALS - 1.9% | | | | | | | | |
PACCAR, Inc. | | | 93,661 | | | $ | 4,386,145 | |
Fastenal Co. | | | 77,488 | | | | 4,192,101 | |
CH Robinson Worldwide, Inc. | | | 42,869 | | | | 2,807,490 | |
Expeditors International of Washington, Inc. | | | 55,655 | | | | 2,588,514 | |
Stericycle, Inc.* | | | 22,248 | | | | 1,860,823 | |
First Solar, Inc.* | | | 22,696 | | | | 568,535 | |
| | | | | | | | |
Total Industrials | | | | | | | 16,403,608 | |
| | | | | | | | |
TELECOMMUNICATION SERVICES—0.7% | | | | | | | | |
Vodafone Group plc ADR | | | 229,704 | | | | 6,355,910 | |
| | | | | | | | |
MATERIALS—0.4% | | | | | | | | |
Sigma-Aldrich Corp. | | | 31,684 | | | | 2,314,833 | |
Randgold Resources Ltd. ADR | | | 14,628 | | | | 1,286,971 | |
| | | | | | | | |
Total Materials | | | | | | | 3,601,804 | |
| | | | | | | | |
Total Common Stocks | | | | | | | | |
(Cost $401,998,136) | | | | | | | 789,802,282 | |
| | | | | | | | |
| | |
| | | FACE
AMOUNT | | | | |
REPURCHASE AGREEMENTS††,1 - 8.8% | | | | | | | | |
HSBC Group
issued 03/30/12 at 0.01%
due 04/02/12 | | $ | 50,122,173 | | | | 50,122,173 | |
Mizuho Financial Group, Inc.
issued 03/30/12 at 0.01%
due 04/02/12 | | | 14,101,840 | | | | 14,101,840 | |
Credit Suisse Group
issued 03/30/12 at 0.01%
due 04/02/122 | | | 7,930,251 | | | | 7,930,251 | |
Deutsche Bank
issued 03/30/12 at 0.01%
due 04/02/12 | | | 3,748,113 | | | | 3,748,113 | |
| | | | | | | | |
Total Repurchase Agreements | | | | | | | | |
(Cost $75,902,377) | | | | | | | 75,902,377 | |
| | | | | | | | |
Total Investments – 99.9% | | | | | | | | |
(Cost $477,900,513) | | | | | | $ | 865,704,659 | |
| | | | | | | | |
Other Assets & Liabilities, net – 0.1% | | | | | | | 621,622 | |
| | | | | | | | |
Total Net Assets – 100.0% | | | | | | $ | 866,326,281 | |
| |
| | | | | | | | |
| | | CONTRACTS | | | UNREALIZED
GAIN (LOSS) | |
FUTURES CONTRACTS PURCHASED† | | | | | | | | |
June 2012 NASDAQ-100 Index
Mini Futures Contracts
(Aggregate Value of
Contracts $46,817,765) | | | 851 | | | $ | 727,499 | |
| | | | | | | | |
| | |
| | | UNITS | | | | |
EQUITY INDEX SWAP AGREEMENTS†† | | | | | | | | |
Credit Suisse Capital, LLC
April 2012 NASDAQ-100 Index Swap,
Terminating 04/30/123
(Notional Value $6,916,908) | | | 2,510 | | | $ | (13,759 | ) |
Morgan Stanley Capital Services, Inc.
April 2012 NASDAQ-100 Index Swap,
Terminating 04/30/123
(Notional Value $3,134,304) | | | 1,138 | | | | (30,682 | ) |
Barclays Bank plc
April 2012 NASDAQ-100 Index Swap,
Terminating 04/30/123
(Notional Value $14,981,476) | | | 5,437 | | | | (37,167 | ) |
Goldman Sachs International
April 2012 NASDAQ-100
Index Swap, Terminating 04/27/123
(Notional Value $6,099,101) | | | 2,214 | | | | (50,536 | ) |
| | | | | | | | |
(Total Notional Value $31,131,789) | | | | | | $ | (132,144 | ) |
| | | | | | | | |
| * | Non-income producing security. |
| † | Value determined based on Level 1 inputs — See Note 4. |
| †† | Value determined based on Level 2 inputs — See Note 4. |
| 1 | Repurchase Agreements — See Note 5. |
| 2 | All or a portion of this security is pledged as equity index swap collateral at March 31, 2012. |
| 3 | Total Return based on NASDAQ-100 Index +/- financing at a variable rate. |
ADR — American Depositary Receipt
plc — Public Limited Company
| | |
SEE NOTES TO FINANCIAL STATEMENTS. | | THE RYDEX SERIES FUNDS ANNUAL REPORT | 45 |
NASDAQ-100® FUND
STATEMENT OF ASSETS AND LIABILITIES
| | | | |
| March 31, 2012 | | | |
| |
ASSETS: | | | | |
Investments, at value | | | | |
(cost $401,998,136) | | $ | 789,802,282 | |
Repurchase agreements, at value | | | | |
(cost $75,902,377) | | | 75,902,377 | |
| | | | |
Total investments | | | | |
(cost $477,900,513) | | | 865,704,659 | |
Segregated cash with broker | | | 2,166,803 | |
Receivables: | | | | |
Fund shares sold | | | 1,791,704 | |
Dividends | | | 176,861 | |
Interest | | | 42 | |
| | | | |
Total assets | | | 869,840,069 | |
| | | | |
LIABILITIES: | | | | |
Unrealized depreciation on swap agreements | | | 132,144 | |
Payable for: | | | | |
Fund shares redeemed | | | 2,055,879 | |
Management fees | | | 525,858 | |
Transfer agent and administrative fees | | | 175,286 | |
Variation margin | | | 127,650 | |
Portfolio accounting fees | | | 49,619 | |
Distribution and service fees | | | 37,883 | |
Miscellaneous | | | 409,469 | |
| | | | |
Total liabilities | | | 3,513,788 | |
| | | | |
NET ASSETS | | $ | 866,326,281 | |
| | | | |
NET ASSETS CONSIST OF: | | | | |
Paid in capital | | $ | 553,742,424 | |
Accumulated net investment loss | | | (1,097,969 | ) |
Accumulated net realized loss on investments | | | (74,717,675 | ) |
Net unrealized appreciation on investments | | | 388,399,501 | |
| | | | |
Net assets | | $ | 866,326,281 | |
| | | | |
INVESTOR CLASS: | | | | |
Net assets | | $ | 770,626,273 | |
Capital shares outstanding | | | 42,999,397 | |
Net asset value per share | | $ | 17.92 | |
| | | | |
ADVISOR CLASS: | | | | |
Net assets | | $ | 65,970,094 | |
Capital shares outstanding | | | 3,949,696 | |
Net asset value per share | | $ | 16.70 | |
| | | | |
A-CLASS: | | | | |
Net assets | | $ | 14,552,729 | |
Capital shares outstanding | | | 854,619 | |
Net asset value per share | | $ | 17.03 | |
| | | | |
Maximum offering price per share | | | | |
(Net asset value divided by 95.25%) | | $ | 17.88 | |
| | | | |
C-CLASS: | | | | |
Net assets | | $ | 15,177,185 | |
Capital shares outstanding | | | 950,088 | |
Net asset value per share | | $ | 15.97 | |
STATEMENT OF OPERATIONS
| | | | |
| Year Ended March 31, 2012 | | | |
| |
INVESTMENT INCOME: | | | | |
Dividends (net of foreign withholding tax of $2,349) | | $ | 6,157,304 | |
Interest | | | 37,577 | |
| | | | |
Total investment income | | | 6,194,881 | |
| | | | |
EXPENSES: | | | | |
Management fees | | | 5,092,327 | |
Transfer agent and administrative fees | | | 1,697,442 | |
Distribution and service fees: | | | | |
Advisor Class | | | 261,664 | |
A-Class | | | 29,131 | |
C-Class | | | 119,361 | |
Portfolio accounting fees | | | 525,026 | |
Custodian fees | | | 185,929 | |
Trustees’ fees* | | | 55,953 | |
Miscellaneous | | | 1,041,604 | |
| | | | |
Total expenses | | | 9,008,437 | |
| | | | |
Net investment loss | | | (2,813,556 | ) |
| | | | |
NET REALIZED AND UNREALIZED GAIN (LOSS): | | | | |
Net realized gain (loss) on: | | | | |
Investments | | | 75,534,229 | |
Swap agreements | | | 8,087,908 | |
Futures contracts | | | (7,886,916 | ) |
| | | | |
Net realized gain | | | 75,735,221 | |
| | | | |
Net change in unrealized appreciation
(depreciation) on: | | | | |
Investments | | | 43,286,198 | |
Swap agreements | | | (902,680 | ) |
Futures contracts | | | 718,676 | |
| | | | |
Net change in unrealized appreciation | | | | |
(depreciation) | | | 43,102,194 | |
| | | | |
Net realized and unrealized gain | | | 118,837,415 | |
| | | | |
Net increase in net assets resulting from operations | | $ | 116,023,859 | |
| | | | |
| * | Relates to Trustees not deemed “interested persons” within the meaning of Section 2(a)(19) of the 1940 Act. |
| | |
46 | THE RYDEX SERIES FUNDS ANNUAL REPORT | | SEE NOTES TO FINANCIAL STATEMENTS. |
NASDAQ-100® FUND
STATEMENTS OF CHANGES IN NET ASSETS
| | | | | | | | |
| | | Year Ended
March 31,
2012 | | | Year Ended
March 31,
2011 | |
INCREASE (DECREASE) IN NET ASSETS FROM OPERATIONS: | | | | | | | | |
Net investment loss | | $ | (2,813,556 | ) | | $ | (3,428,489 | ) |
Net realized gain on investments | | | 75,735,221 | | | | 70,297,595 | |
Net change in unrealized appreciation (depreciation) on investments | | | 43,102,194 | | | | 34,762,528 | |
| | | | | | | | |
Net increase in net assets resulting from operations | | | 116,023,859 | | | | 101,631,634 | |
| | | | | | | | |
CAPITALSHARETRANSACTIONS: | | | | | | | | |
PROCEEDSFROMSALEOFSHARES | | | | | | | | |
Investor Class | | | 1,153,783,841 | | | | 860,487,604 | |
Advisor Class | | | 571,956,189 | | | | 441,307,154 | |
A-Class | | | 97,487,517 | | | | 67,791,746 | |
C-Class | | | 21,424,113 | | | | 21,551,470 | |
COSTOFSHARESREDEEMED | | | | | | | | |
Investor Class | | | (1,063,699,726 | ) | | | (940,995,522 | ) |
Advisor Class | | | (639,590,826 | ) | | | (348,748,232 | ) |
A-Class | | | (102,605,558 | ) | | | (64,453,774 | ) |
C-Class | | | (20,325,435 | ) | | | (23,664,570 | ) |
| | | | | | | | |
Net increase from capital share transactions | | | 18,430,115 | | | | 13,275,876 | |
| | | | | | | | |
Net increase in net assets | | | 134,453,974 | | | | 114,907,510 | |
NETASSETS: | | | | | | | | |
Beginning of year | | | 731,872,307 | | | | 616,964,797 | |
| | | | | | | | |
End of year | | $ | 866,326,281 | | | $ | 731,872,307 | |
| | | | | | | | |
Accumulated net investment loss at end of year | | $ | (1,097,969 | ) | | $ | — | |
| | | | | | | | |
CAPITALSHAREACTIVITY: | | | | | | | | |
Shares sold | | | | | | | | |
Investor Class | | | 75,538,259 | | | | 63,709,336 | |
Advisor Class | | | 40,025,316 | | | | 35,761,441 | |
A-Class | | | 6,747,249 | | | | 5,034,771 | |
C-Class | | | 1,580,216 | | | | 1,782,827 | |
Shares redeemed | | | | | | | | |
Investor Class | | | (70,605,176 | ) | | | (70,201,212 | ) |
Advisor Class | | | (44,503,780 | ) | | | (28,810,838 | ) |
A-Class | | | (7,256,942 | ) | | | (4,903,901 | ) |
C-Class | | | (1,494,948 | ) | | | (1,964,626 | ) |
| | | | | | | | |
Net increase in shares | | | 30,194 | | | | 407,798 | |
| | | | | | | | |
| | |
SEE NOTES TO FINANCIAL STATEMENTS. | | THE RYDEX SERIES FUNDS ANNUAL REPORT | 47 |
NASDAQ-100® FUND
FINANCIAL HIGHLIGHTS
This table is presented to show selected data for a share outstanding throughout each period and to assist shareholders in evaluating a Fund’s performance for the periods presented.
| | | | | | | | | | | | | | | | | | | | |
Investor Class | | Year Ended
March 31,
2012 | | | Year Ended
March 31,
2011 | | | Year Ended
March 31,
2010 | | | Year Ended
March 31,
2009 | | | Year Ended
March 31,
2008 | |
Per Share Data | | | | | | | | | | | | | | | | | | | | |
Net asset value, beginning of period | | $ | 15.23 | | | $ | 12.83 | | | $ | 8.15 | | | $ | 11.81 | | | $ | 11.78 | |
| | | | | | | | | | | | | | | | | | | | |
Income (loss) from investment operations: | | | | | | | | | | | | | | | | | | | | |
Net investment lossa | | | (.05 | ) | | | (.07 | ) | | | (.07 | ) | | | (.06 | ) | | | (.06 | ) |
Net gain (loss) on investments (realized and unrealized) | | | 2.74 | | | | 2.47 | | | | 4.75 | | | | (3.60 | ) | | | .09 | |
| | | | | | | | | | | | | | | | | | | | |
Total from investment operations | | | 2.69 | | | | 2.40 | | | | 4.68 | | | | (3.66 | ) | | | .03 | |
| | | | | | | | | | | | | | | | | | | | |
Net asset value, end of period | | $ | 17.92 | | | $ | 15.23 | | | $ | 12.83 | | | $ | 8.15 | | | $ | 11.81 | |
| | | | | | | | | | | | | | | | | | | | |
Total Returnb | | | 17.66 | % | | | 18.71 | % | | | 57.42 | % | | | (30.99 | %) | | | 0.25 | % |
| | | | | | | | | | | | | | | | | | | | |
Ratios/Supplemental Data | | | | | | | | | | | | | | | | | | | | |
Net assets, end of period (in thousands) | | $ | 770,626 | | | $ | 579,925 | | | $ | 571,761 | | | $ | 389,944 | | | $ | 617,923 | |
| | | | | | | | | | | | | | | | | | | | |
Ratios to average net assets: | | | | | | | | | | | | | | | | | | | | |
Net investment loss | | | (0.34 | %) | | | (0.50 | %) | | | (0.63 | %) | | | (0.59 | %) | | | (0.50 | %) |
Total expenses | | | 1.27 | % | | | 1.31 | % | | | 1.30 | % | | | 1.30 | % | | | 1.28 | % |
| | | | | | | | | | | | | | | | | | | | |
Portfolio turnover rate | | | 94 | % | | | 39 | % | | | 34 | % | | | 55 | % | | | 57 | % |
| | | | | |
Advisor Class | | Year Ended
March 31,
2012 | | | Year Ended
March 31,
2011 | | | Year Ended
March 31,
2010 | | | Year Ended
March 31,
2009 | | | Year Ended
March 31,
2008 | |
Per Share Data | | | | | | | | | | | | | | | | | | | | |
Net asset value, beginning of period | | $ | 14.27 | | | $ | 12.09 | | | $ | 7.72 | | | $ | 11.23 | | | $ | 11.26 | |
| | | | | | | | | | | | | | | | | | | | |
Income (loss) from investment operations: | | | | | | | | | | | | | | | | | | | | |
Net investment lossa | | | (.13 | ) | | | (.12 | ) | | | (.12 | ) | | | (.11 | ) | | | (.12 | ) |
Net gain (loss) on investments (realized and unrealized) | | | 2.56 | | | | 2.30 | | | | 4.49 | | | | (3.40 | ) | | | .09 | |
| | | | | | | | | | | | | | | | | | | | |
Total from investment operations | | | 2.43 | | | | 2.18 | | | | 4.37 | | | | (3.51 | ) | | | (.03 | ) |
| | | | | | | | | | | | | | | | | | | | |
Net asset value, end of period | | $ | 16.70 | | | $ | 14.27 | | | $ | 12.09 | | | $ | 7.72 | | | $ | 11.23 | |
| | | | | | | | | | | | | | | | | | | | |
Total Returnb | | | 17.03 | % | | | 18.03 | % | | | 56.61 | % | | | (31.26 | %) | | | (0.27 | %) |
| | | | | | | | | | | | | | | | | | | | |
Ratios/Supplemental Data | | | | | | | | | | | | | | | | | | | | |
Net assets, end of period (in thousands) | | $ | 65,970 | | | $ | 120,277 | | | $ | 17,859 | | | $ | 18,078 | | | $ | 15,184 | |
| | | | | | | | | | | | | | | | | | | | |
Ratios to average net assets: | | | | | | | | | | | | | | | | | | | | |
Net investment loss | | | (0.87 | %) | | | (1.00 | %) | | | (1.13 | %) | | | (1.11 | %) | | | (0.99 | %) |
Total expenses | | | 1.76 | % | | | 1.80 | % | | | 1.80 | % | | | 1.79 | % | | | 1.78 | % |
| | | | | | | | | | | | | | | | | | | | |
Portfolio turnover rate | | | 94 | % | | | 39 | % | | | 34 | % | | | 55 | % | | | 57 | % |
| | |
48 | THE RYDEX SERIES FUNDS ANNUAL REPORT | | SEE NOTES TO FINANCIAL STATEMENTS. |
NASDAQ-100® FUND
FINANCIAL HIGHLIGHTS (concluded)
This table is presented to show selected data for a share outstanding throughout each period and to assist shareholders in evaluating a Fund’s performance for the periods presented.
| | | | | | | | | | | | | | | | | | | | |
A-Class | | Year Ended
March 31,
2012 | | | Year Ended
March 31,
2011 | | | Year Ended
March 31,
2010 | | | Year Ended
March 31,
2009 | | | Year Ended
March 31,
2008 | |
Per Share Data | | | | | | | | | | | | | | | | | | | | |
Net asset value, beginning of period | | $ | 14.52 | | | $ | 12.27 | | | $ | 7.82 | | | $ | 11.35 | | | $ | 11.36 | |
| | | | | | | | | | | | | | | | | | | | |
Income (loss) from investment operations: | | | | | | | | | | | | | | | | | | | | |
Net investment lossa | | | (.09 | ) | | | (.11 | ) | | | (.09 | ) | | | (.08 | ) | | | (.09 | ) |
Net gain (loss) on investments (realized and unrealized) | | | 2.60 | | | | 2.36 | | | | 4.54 | | | | (3.45 | ) | | | .08 | |
| | | | | | | | | | | | | | | | | | | | |
Total from investment operations | | | 2.51 | | | | 2.25 | | | | 4.45 | | | | (3.53 | ) | | | (.01 | ) |
| | | | | | | | | | | | | | | | | | | | |
Net asset value, end of period | | $ | 17.03 | | | $ | 14.52 | | | $ | 12.27 | | | $ | 7.82 | | | $ | 11.35 | |
| | | | | | | | | | | | | | | | | | | | |
Total Returnb | | | 17.29 | % | | | 18.34 | % | | | 56.91 | % | | | (31.10 | %) | | | (0.09 | %) |
| | | | | | | | | | | | | | | | | | | | |
Ratios/Supplemental Data | | | | | | | | | | | | | | | | | | | | |
Net assets, end of period (in thousands) | | $ | 14,553 | | | $ | 19,806 | | | $ | 15,128 | | | $ | 3,140 | | | $ | 6,044 | |
| | | | | | | | | | | | | | | | | | | | |
Ratios to average net assets: | | | | | | | | | | | | | | | | | | | | |
Net investment loss | | | (0.61 | %) | | | (0.81 | %) | | | (0.86 | %) | | | (0.82 | %) | | | (0.76 | %) |
Total expenses | | | 1.53 | % | | | 1.56 | % | | | 1.55 | % | | | 1.55 | % | | | 1.54 | % |
| | | | | | | | | | | | | | | | | | | | |
Portfolio turnover rate | | | 94 | % | | | 39 | % | | | 34 | % | | | 55 | % | | | 57 | % |
| | | | | |
C-Class | | Year Ended
March 31,
2012 | | | Year Ended
March 31,
2011 | | | Year Ended
March 31,
2010 | | | Year Ended
March 31,
2009 | | | Year Ended
March 31,
2008 | |
Per Share Data | | | | | | | | | | | | | | | | | | | | |
Net asset value, beginning of period | | $ | 13.72 | | | $ | 11.67 | | | $ | 7.49 | | | $ | 10.95 | | | $ | 11.02 | |
| | | | | | | | | | | | | | | | | | | | |
Income (loss) from investment operations: | | | | | | | | | | | | | | | | | | | | |
Net investment lossa | | | (.19 | ) | | | (.19 | ) | | | (.16 | ) | | | (.15 | ) | | | (.18 | ) |
Net gain (loss) on investments (realized and unrealized) | | | 2.44 | | | | 2.24 | | | | 4.34 | | | | (3.31 | ) | | | .11 | |
| | | | | | | | | | | | | | | | | | | | |
Total from investment operations | | | 2.25 | | | | 2.05 | | | | 4.18 | | | | (3.46 | ) | | | (.07 | ) |
| | | | | | | | | | | | | | | | | | | | |
Net asset value, end of period | | $ | 15.97 | | | $ | 13.72 | | | $ | 11.67 | | | $ | 7.49 | | | $ | 10.95 | |
| | | | | | | | | | | | | | | | | | | | |
Total Returnb | | | 16.40 | % | | | 17.57 | % | | | (55.81 | %) | | | (31.60 | %) | | | (0.64 | %) |
| | | | | | | | | | | | | | | | | | | | |
Ratios/Supplemental Data | | | | | | | | | | | | | | | | | | | | |
Net assets, end of period (in thousands) | | $ | 15,177 | | | $ | 11,864 | | | $ | 12,216 | | | $ | 6,368 | | | $ | 10,343 | |
| | | | | | | | | | | | | | | | | | | | |
Ratios to average net assets: | | | | | | | | | | | | | | | | | | | | |
Net investment loss | | | (1.35 | %) | | | (1.52 | %) | | | (1.63 | %) | | | (1.59 | %) | | | (1.50 | %) |
Total expenses | | | 2.27 | % | | | 2.31 | % | | | 2.30 | % | | | 2.30 | % | | | 2.28 | % |
| | | | | | | | | | | | | | | | | | | | |
Portfolio turnover rate | | | 94 | % | | | 39 | % | | | 34 | % | | | 55 | % | | | 57 | % |
| a | Net investment loss per share was computed using average shares outstanding throughout the period. |
| b | Total return does not reflect the impact of any applicable sales charges and has not been annualized. |
| | |
SEE NOTES TO FINANCIAL STATEMENTS. | | THE RYDEX SERIES FUNDS ANNUAL REPORT | 49 |
| | |
PERFORMANCE REPORT AND FUND PROFILE (Unaudited) | | March 31, 2012 |
INVERSE NASDAQ-100® STRATEGY FUND
OBJECTIVE: Seeks to provide investment results that match, before fees and expenses, the performance of a specific benchmark on a daily basis. The Fund’s current benchmark is the inverse (opposite) of the performance of the NASDAQ-100 Index® (the “underlying index”). The Fund does not seek to achieve its investment objective over a period of time greater than one day.
For the one-year period ended March 31, 2012, with the NASDAQ-100 Index up 18.99%, the Inverse NASDAQ-100® Fund Investor Class returned -21.22% over the same time period. For the same one-year period, Inverse NASDAQ-100® Fund maintained a daily correlation of over 99% to its benchmark of -100% of the daily price movement of the NASDAQ-100 Index*.
Sectors contributing most to performance of the index were Information Technology and Consumer Discretionary, while Consumer Staples, Industrials and Materials contributed the least to performance of the index. Telecommunications Services was the only sector detracting from performance of the index.
Apple, Inc., Microsoft Corp. and Intel Corp. were among the stocks which provided the most performance to the index, while First Solar, Inc., Research in Motion Ltd. and Oracle Corp. were among the stocks which provided the least performance to the index during the year.
Derivatives in the Fund were used to help provide exposure to the composition of the benchmark in the highest efficient manner and not for hedging purposes. The results of derivatives use during the period were within our expectations and contributed to the Fund’s performance.
Due to the compounding of daily returns, leveraged and inverse funds’ returns over periods other than one day will likely differ in amount and possibly direction from the benchmark return for the same period. Investors should monitor their leveraged and inverse funds’ holdings to ensure that they are consistent with their strategies, as frequently as daily.
The effects of compounding may cause the longer-term correlation of the fund to its benchmark to diminish. The apparent discrepancy between the leveraged and unleveraged indices is the result of compounding, which is described briefly on page 4 of this report.
*The NASDAQ-100® Index includes 100 of the largest domestic and international non-financial securities listed on The Nasdaq Stock Market based on market capitalization. The Index reflects companies across major industry groups including computer hardware and software, telecommunications, retail/wholesale trade and biotechnology. It does not contain securities of financial companies, including investment companies.
Performance displayed represents past performance which is no guarantee of future results.
Holdings Diversification (Market Exposure as % of Net Assets)
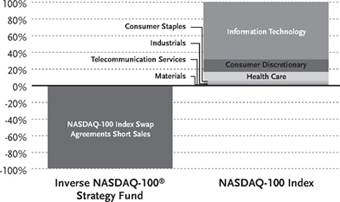
“Holdings Diversification (Market Exposure as % of Net Assets)” excludes any temporary cash investments.
| | | | |
Investor Class | | | September 3, 1998 | |
Advisor Class | | | August 1, 2003 | |
A-Class | | | March 31, 2004 | |
C-Class | | | March 7, 2001 | |
The Fund invests principally in derivative investments such as swap agreements and futures contracts.
50 | THE RYDEX SERIES FUNDS ANNUAL REPORT
PERFORMANCE REPORT AND FUND PROFILE (Unaudited) (concluded)
Cumulative Fund Performance*
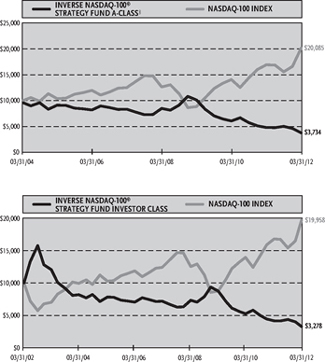
Average Annual Returns*
Periods Ended 03/31/12
| | | | | | | | | | | | |
| | | 1 Year | | | 5 Year | | | 10 Year | |
Investor Class Shares | | | -21.22 | % | | | -14.54 | % | | | -10.56 | % |
C-Class Shares | | | -22.12 | % | | | -15.42 | % | | | -11.48 | % |
C-Class Shares with CDSC† | | | -22.90 | % | | | -15.42 | % | | | -11.48 | % |
NASDAQ-100 Index | | | 18.99 | % | | | 10.00 | % | | | 7.15 | % |
| | | | | | | | | Since
Inception
(08/01/03) | |
Advisor Class Shares | | | -21.26 | % | | | -14.94 | % | | | -12.02 | % |
NASDAQ-100 Index | | | 18.99 | % | | | 10.00 | % | | | 10.03 | % |
| | | | | | | | | | | (03/31/04 | ) |
A-Class Shares | | | -21.53 | % | | | -14.78 | % | | | -11.05 | % |
A-Class Shares with sales charge‡ | | | -25.25 | % | | | -15.61 | % | | | -11.59 | % |
NASDAQ-100 Index | | | 18.99 | % | | | 10.00 | % | | | 9.11 | % |
| * | The performance data above represents past performance that is not predictive of future results. The investment return and principal value of an investment in the Fund will fluctuate so that an investor’s shares, when redeemed, may be worth more or less than their original cost. Returns are historical and include changes in principal and reinvested dividends and capital gains and do not reflect the effect of taxes. The NASDAQ-100 Index is an unmanaged index and, unlike the Fund, has no management fees or operating expenses to reduce its reported return. The graphs are based on Investor Class shares and A-Class shares only; performance for Advisor Class shares and C-Class shares will vary due to differences in fee structures. |
| † | Fund returns include a CDSC of 1% if redeemed within 12 months of purchase. |
| ‡ | Fund returns are calculated using the maximum sales charge of 4.75%. |
THE RYDEX SERIES FUNDS ANNUAL REPORT | 51
| | |
| SCHEDULE OF INVESTMENTS | | March31,2012 |
INVERSE NASDAQ-100® STRATEGY FUND | | |
| | | | | | | | |
| | | FACE
AMOUNT | | | VALUE | |
| | |
REPURCHASE AGREEMENTS†,1 – 89.8% | | | | | | | | |
HSBC Group
issued 03/30/12 at 0.01%
due 04/02/12 | | $ | 5,296,603 | | | $ | 5,296,603 | |
Credit Suisse Group
issued 03/30/12 at 0.01%
due 04/02/122 | | | 1,995,246 | | | | 1,995,246 | |
Mizuho Financial Group, Inc.
issued 03/30/12 at 0.01%
due 04/02/12 | | | 1,490,196 | | | | 1,490,196 | |
Deutsche Bank
issued 03/30/12 at 0.01%
due 04/02/12 | | | 396,078 | | | | 396,078 | |
| | | | | | | | |
Total Repurchase Agreements | | | | | | | | |
(Cost $9,178,123) | | | | | | | 9,178,123 | |
| | | | | | | | |
Total Investments – 89.8% | | | | | | | | |
(Cost $9,178,123) | | | | | | $ | 9,178,123 | |
| | | | | | | | |
Other Assets & Liabilities, net – 10.2% | | | | | | | 1,046,342 | |
| | | | | | | | |
Total Net Assets – 100.0% | | | | | | $ | 10,224,465 | |
| |
| | | | | | | | |
| | | UNITS | | | UNREALIZED
GAIN | |
| | |
EQUITY INDEX SWAP AGREEMENTS SOLD SHORT† | | | | | | | | |
Goldman Sachs International | | | | | | | | |
April 2012 NASDAQ-100 Index | | | | | | | | |
Swap, Terminating 04/27/123 | | | | | | | | |
(Notional Value $2,204,172) | | | 800 | | | $ | 18,229 | |
Credit Suisse Capital, LLC | | | | | | | | |
April 2012 NASDAQ-100 Index | | | | | | | | |
Swap, Terminating 04/30/123 | | | | | | | | |
(Notional Value $4,759,477) | | | 1,727 | | | | 10,438 | |
Barclays Bank plc | | | | | | | | |
April 2012 NASDAQ-100 Index | | | | | | | | |
Swap, Terminating 04/30/123 | | | | | | | | |
(Notional Value $2,525,505) | | | 917 | | | | 6,244 | |
Morgan Stanley Capital Services, Inc. | | | | | | | | |
April 2012 NASDAQ-100 Index | | | | | | | | |
Swap, Terminating 04/30/123 | | | | | | | | |
(Notional Value $637,354) | | | 231 | | | | 6,208 | |
| | | | | | | | |
(Total Notional Value $10,126,508) | | | | | | $ | 41,119 | |
| | | | | | | | |
| † | Value determined based on Level 2 inputs — See Note 4. |
| 1 | Repurchase Agreements — See Note 5. |
| 2 | All or a portion of this security is pledged as equity index swap collateral at March 31, 2012. |
| 3 | Total Return based on NASDAQ-100 Index +/- financing at a variable rate. |
plc — Public Limited Company
| | |
52 | THE RYDEX SERIES FUNDS ANNUAL REPORT | | SEE NOTES TO FINANCIAL STATEMENTS. |
INVERSE NASDAQ-100® STRATEGY FUND
| | | | |
STATEMENT OF ASSETS AND LIABILITIES | |
| |
March 31, 2012 | | | | |
| |
ASSETS: | | | | |
Repurchase agreements, at value
(cost $9,178,123) | | $ | 9,178,123 | |
| | | | |
Total investments
(cost $9,178,123) | | | 9,178,123 | |
Segregated cash with broker | | | 482,868 | |
Unrealized appreciation on swap agreements | | | 41,119 | |
Cash | | | 62 | |
Receivables: | | | | |
Fund shares sold | | | 579,278 | |
| | | | |
Total assets | | | 10,281,450 | |
| | | | |
LIABILITIES: | | | | |
Payable for: | | | | |
Fund shares redeemed | | | 33,235 | |
Management fees | | | 8,167 | |
Transfer agent and administrative fees | | | 2,269 | |
Distribution and service fees | | | 977 | |
Portfolio accounting fees | | | 907 | |
Miscellaneous | | | 11,430 | |
| | | | |
Total liabilities | | | 56,985 | |
| | | | |
NET ASSETS | | $ | 10,224,465 | |
| | | | |
NET ASSETS CONSIST OF: | | | | |
Paid in capital | | $ | 90,814,754 | |
Accumulated net investment loss | | | (46,094 | ) |
Accumulated net realized loss on investments | | | (80,585,314 | ) |
Net unrealized appreciation on investments | | | 41,119 | |
| | | | |
Net assets | | $ | 10,224,465 | |
| | | | |
INVESTOR CLASS: | | | | |
Net assets | | $ | 8,791,973 | |
Capital shares outstanding | | | 936,239 | |
Net asset value per share | | $ | 9.39 | |
| | | | |
ADVISOR CLASS: | | | | |
Net assets | | $ | 207,299 | |
Capital shares outstanding | | | 23,030 | |
Net asset value per share | | $ | 9.00 | |
| | | | |
A-CLASS: | | | | |
Net assets | | $ | 473,584 | |
Capital shares outstanding | | | 51,740 | |
Net asset value per share | | $ | 9.15 | |
| | | | |
Maximum offering price per share
(Net asset value divided by 95.25%) | | $ | 9.61 | |
| | | | |
C-CLASS: | | | | |
Net assets | | $ | 751,609 | |
Capital shares outstanding | | | 90,387 | |
Net asset value per share | | $ | 8.32 | |
| | | | |
| | | | |
STATEMENT OF OPERATIONS | | | | |
| |
Year Ended March 31, 2012 | | | | |
| |
INVESTMENT INCOME: | | | | |
Interest | | $ | 13,268 | |
| | | | |
Total investment income | | | 13,268 | |
| | | | |
EXPENSES: | | | | |
Management fees | | | 176,419 | |
Transfer agent and administrative fees | | | 49,005 | |
Distribution and service fees: | | | | |
Advisor Class | | | 15,324 | |
A-Class | | | 2,068 | |
C-Class | | | 10,762 | |
Portfolio accounting fees | | | 19,602 | |
Custodian fees | | | 4,953 | |
Trustees’ fees* | | | 2,029 | |
Miscellaneous | | | 31,380 | |
| | | | |
Total expenses | | | 311,542 | |
| | | | |
Net investment loss | | | (298,274 | ) |
| | | | |
NET REALIZED AND UNREALIZED GAIN (LOSS): | | | | |
Net realized gain (loss) on: | | | | |
Swap agreements | | | (6,494,251 | ) |
Futures contracts | | | (1,333,742 | ) |
| | | | |
Net realized loss | | | (7,827,993 | ) |
| | | | |
Net change in unrealized appreciation | | | | |
(depreciation) on: | | | | |
Investments | | | (3,616 | ) |
Swap agreements | | | 377,447 | |
Futures contracts | | | 173,780 | |
| | | | |
Net change in unrealized appreciation
(depreciation) | | | 547,611 | |
| | | | |
Net realized and unrealized loss | | | (7,280,382 | ) |
| | | | |
Net decrease in net assets resulting
from operations | | $ | (7,578,656 | ) |
| | | | |
| * | Relates to Trustees not deemed “interested persons” within the meaning of Section 2(a)(19) of the 1940 Act. |
| | |
SEE NOTES TO FINANCIAL STATEMENTS. | | THE RYDEX SERIES FUNDS ANNUAL REPORT | 53 |
INVERSE NASDAQ-100® STRATEGY FUND
STATEMENTS OF CHANGES IN NET ASSETS
| | | | | | | | |
| | | Year Ended
March 31,
2012 | | | Year Ended
March 31,
2011 | |
INCREASE (DECREASE) IN NET ASSETS FROM OPERATIONS: | | | | | | | | |
Net investment loss | | $ | (298,274 | ) | | $ | (371,197 | ) |
Net realized loss on investments | | | (7,827,993 | ) | | | (7,304,342 | ) |
Net change in unrealized appreciation (depreciation) on investments | | | 547,611 | | | | 882,515 | |
| | | | | | | | |
Net decrease in net assets resulting from operations | | | (7,578,656 | ) | | | (6,793,024 | ) |
| | | | | | | | |
CAPITALSHARETRANSACTIONS: | | | | | | | | |
PROCEEDS FROM SALE OF SHARES | | | | | | | | |
Investor Class | | | 142,109,664 | | | | 260,086,564 | |
Advisor Class | | | 114,452,287 | | | | 27,365,708 | |
A-Class | | | 6,351,382 | | | | 4,601,753 | |
C-Class | | | 7,348,638 | | | | 9,852,417 | |
COSTOFSHARESREDEEMED | | | | | | | | |
Investor Class | | | (162,650,698 | ) | | | (242,454,552 | ) |
Advisor Class | | | (111,429,096 | ) | | | (27,271,613 | ) |
A-Class | | | (6,619,902 | ) | | | (4,482,661 | ) |
C-Class | | | (8,759,826 | ) | | | (8,856,521 | ) |
| | | | | | | | |
Net increase (decrease) from capital share transactions | | | (19,197,551 | ) | | | 18,841,095 | |
| | | | | | | | |
Net increase (decrease) in net assets | | | (26,776,207 | ) | | | 12,048,071 | |
| | |
NET ASSETS: | | | | | | | | |
Beginning of year | | | 37,000,672 | | | | 24,952,601 | |
| | | | | | | | |
End of year | | $ | 10,224,465 | | | $ | 37,000,672 | |
| | | | | | | | |
Accumulated net investment loss at end of year | | $ | (46,094 | ) | | $ | — | |
| | | | | | | | |
CAPITALSHAREACTIVITY: | | | | | | | | |
Shares sold | | | | | | | | |
Investor Class | | | 12,219,255 | | | | 18,840,855 | |
Advisor Class | | | 9,713,681 | | | | 2,019,121 | |
A-Class | | | 569,930 | | | | 320,094 | |
C-Class | | | 688,617 | | | | 786,039 | |
Shares redeemed | | | | | | | | |
Investor Class | | | (14,048,576 | ) | | | (17,478,115 | ) |
Advisor Class | | | (9,746,834 | ) | | | (2,025,955 | ) |
A-Class | | | (599,296 | ) | | | (309,462 | ) |
C-Class | | | (826,443 | ) | | | (694,263 | ) |
| | | | | | | | |
Net increase (decrease) in shares | | | (2,029,666 | ) | | | 1,458,314 | |
| | | | | | | | |
| | |
54 | THE RYDEX SERIES FUNDS ANNUAL REPORT | | SEE NOTES TO FINANCIAL STATEMENTS. |
INVERSE NASDAQ-100® STRATEGY FUND
FINANCIAL HIGHLIGHTS
This table is presented to show selected data for a share outstanding throughout each period and to assist shareholders in evaluating a Fund’s performance for the periods presented.
| | | | | | | | | | | | | | | | | | | | |
Investor Class | | Year Ended
March 31,
2012 | | | Year Ended
March 31,
2011 | | | Year Ended
March 31,
2010 | | | Year Ended
March 31,
2009 | | | Year Ended
March 31,
2008 | |
Per Share Data | | | | | | | | | | | | | | | | | | | | |
Net asset value, beginning of period | | $ | 11.92 | | | $ | 15.07 | | | $ | 25.09 | | | $ | 21.27 | | | $ | 21.67 | |
| | | | | | | | | | | | | | | | | | | | |
Income (loss) from investment operations: | | | | | | | | | | | | | | | | | | | | |
Net investment income (loss)a | | | (.16 | ) | | | (.18 | ) | | | (.25 | ) | | | (.06 | ) | | | .59 | |
Net gain (loss) on investments (realized and unrealized) | | | (2.37 | ) | | | (2.97 | ) | | | (9.77 | ) | | | 4.25 | | | | (.30 | ) |
| | | | | | | | | | | | | | | | | | | | |
Total from investment operations | | | (2.53 | ) | | | (3.15 | ) | | | (10.02 | ) | | | 4.19 | | | | .29 | |
| | | | | | | | | | | | | | | | | | | | |
Less distributions from: | | | | | | | | | | | | | | | | | | | | |
Net investment income | | | — | | | | — | | | | — | | | | (.37 | ) | | | (.69 | ) |
| | | | | | | | | | | | | | | | | | | | |
Total distributions | | | — | | | | — | | | | — | | | | (.37 | ) | | | (.69 | ) |
| | | | | | | | | | | | | | | | | | | | |
Net asset value, end of period | | $ | 9.39 | | | $ | 11.92 | | | $ | 15.07 | | | $ | 25.09 | | | $ | 21.27 | |
| | | | | | | | | | | | | | | | | | | | |
Total Returnb | | | (21.22 | %) | | | (20.90 | %) | | | (39.94 | %) | | | 19.48 | % | | | 1.92 | % |
| | | | | | | | | | | | | | | | | | | | |
Ratios/Supplemental Data | | | | | | | | | | | | | | | | | | | | |
Net assets, end of period (in thousands) | | $ | 8,792 | | | $ | 32,978 | | | $ | 21,137 | | | $ | 33,672 | | | $ | 59,819 | |
| | | | | | | | | | | | | | | | | | | | |
Ratios to average net assets: | | | | | | | | | | | | | | | | | | | | |
Net investment income (loss) | | | (1.38 | %) | | | (1.30 | %) | | | (1.35 | %) | | | (0.26 | %) | | | 2.98 | % |
Total expenses | | | 1.45 | % | | | 1.47 | % | | | 1.47 | % | | | 1.46 | % | | | 1.47 | % |
| | | | | | | | | | | | | | | | | | | | |
Portfolio turnover rate | | | — | | | | — | | | | — | | | | — | | | | — | |
| | | | | | | | | | | | | | | | | | | | |
Advisor Class | | Year Ended
March 31,
2012 | | | Year Ended
March 31,
2011 | | | Year Ended
March 31,
2010 | | | Year Ended
March 31,
2009 | | | Year Ended
March 31,
2008 | |
Per Share Data | | | | | | | | | | | | | | | | | | | | |
Net asset value, beginning of period | | $ | 11.43 | | | $ | 14.54 | | | $ | 24.37 | | | $ | 20.77 | | | $ | 21.28 | |
| | | | | | | | | | | | | | | | | | | | |
Income (loss) from investment operations: | | | | | | | | | | | | | | | | | | | | |
Net investment income (loss)a | | | (.21 | ) | | | (.24 | ) | | | (.32 | ) | | | (.06 | ) | | | .51 | |
Net gain (loss) on investments (realized and unrealized) | | | (2.22 | ) | | | (2.87 | ) | | | (9.51 | ) | | | 4.03 | | | | (.33 | ) |
| | | | | | | | | | | | | | | | | | | | |
Total from investment operations | | | (2.43 | ) | | | (3.11 | ) | | | (9.83 | ) | | | 3.97 | | | | .18 | |
| | | | | | | | | | | | | | | | | | | | |
Less distributions from: | | | | | | | | | | | | | | | | | | | | |
Net investment income | | | — | | | | — | | | | — | | | | (.37 | ) | | | (.69 | ) |
| | | | | | | | | | | | | | | | | | | | |
Total distributions | | | — | | | | — | | | | — | | | | (.37 | ) | | | (.69 | ) |
| | | | | | | | | | | | | | | | | | | | |
Net asset value, end of period | | $ | 9.00 | | | $ | 11.43 | | | $ | 14.54 | | | $ | 24.37 | | | $ | 20.77 | |
| | | | | | | | | | | | | | | | | | | | |
Total Returnb | | | (21.26 | %) | | | (21.39 | %) | | | (40.34 | %) | | | 18.88 | % | | | 1.43 | % |
| | | | | | | | | | | | | | | | | | | | |
Ratios/Supplemental Data | | | | | | | | | | | | | | | | | | | | |
Net assets, end of period (in thousands) | | $ | 207 | | | $ | 642 | | | $ | 916 | | | $ | 476 | | | $ | 3,744 | |
| | | | | | | | | | | | | | | | | | | | |
Ratios to average net assets: | | | | | | | | | | | | | | | | | | | | |
Net investment income (loss) | | | (1.91 | %) | | | (1.80 | %) | | | (1.84 | %) | | | (0.29 | %) | | | 2.56 | % |
Total expenses | | | 1.95 | % | | | 1.97 | % | | | 1.97 | % | | | 1.97 | % | | | 1.98 | % |
| | | | | | | | | | | | | | | | | | | | |
Portfolio turnover rate | | | — | | | | — | | | | — | | | | — | | | | — | |
| | |
SEE NOTES TO FINANCIAL STATEMENTS. | | THE RYDEX SERIES FUNDS ANNUAL REPORT | 55 |
INVERSE NASDAQ-100® STRATEGY FUND
FINANCIAL HIGHLIGHTS (concluded)
This table is presented to show selected data for a share outstanding throughout each period and to assist shareholders in evaluating a Fund’s performance for the periods presented.
| | | | | | | | | | | | | | | | | | | | |
A-Class | | Year Ended
March 31,
2012 | | | Year Ended
March 31,
2011 | | | Year Ended
March 31,
2010 | | | Year Ended
March 31,
2009 | | | Year Ended
March 31,
2008 | |
Per Share Data | | | | | | | | | | | | | | | | | | | | |
Net asset value, beginning of period | | $ | 11.66 | | | $ | 14.78 | | | $ | 24.67 | | | $ | 20.97 | | | $ | 21.43 | |
| | | | | | | | | | | | | | | | | | | | |
Income (loss) from investment operations: | | | | | | | | | | | | | | | | | | | | |
Net investment income (loss)a | | | (.18 | ) | | | (.21 | ) | | | (.26 | ) | | | (.22 | ) | | | .52 | |
Net gain (loss) on investments (realized and unrealized) | | | (2.33 | ) | | | (2.91 | ) | | | (9.63 | ) | | | 4.29 | | | | (.29 | ) |
| | | | | | | | | | | | | | | | | | | | |
Total from investment operations | | | (2.51 | ) | | | (3.12 | ) | | | (9.89 | ) | | | 4.07 | | | | .23 | |
| | | | | | | | | | | | | | | | | | | | |
Less distributions from: | | | | | | | | | | | | | | | | | | | | |
Net investment income | | | — | | | | — | | | | — | | | | (.37 | ) | | | (.69 | ) |
| | | | | | | | | | | | | | | | | | | | |
Total distributions | | | — | | | | — | | | | — | | | | (.37 | ) | | | (.69 | ) |
| | | | | | | | | | | | | | | | | | | | |
Net asset value, end of period | | $ | 9.15 | | | $ | 11.66 | | | $ | 14.78 | | | $ | 24.67 | | | $ | 20.97 | |
| | | | | | | | | | | | | | | | | | | | |
Total Returnb | | | (21.53 | %) | | | (21.11 | %) | | | (40.09 | %) | | | 19.18 | % | | | 1.65 | % |
| | | | | | | | | | | | | | | | | | | | |
Ratios/Supplemental Data | | | | | | | | | | | | | | | | | | | | |
Net assets, end of period (in thousands) | | $ | 474 | | | $ | 946 | | | $ | 1,041 | | | $ | 2,301 | | | $ | 1,784 | |
| | | | | | | | | | | | | | | | | | | | |
Ratios to average net assets: | | | | | | | | | | | | | | | | | | | | |
Net investment income (loss) | | | (1.62 | %) | | | (1.54 | %) | | | (1.37 | %) | | | (0.92 | %) | | | 2.61 | % |
Total expenses | | | 1.69 | % | | | 1.72 | % | | | 1.71 | % | | | 1.71 | % | | | 1.72 | % |
| | | | | | | | | | | | | | | | | | | | |
Portfolio turnover rate | | | — | | | | — | | | | — | | | | — | | | | — | |
| | | | | | | | | | | | | | | | | | | | |
C-Class | | Year Ended
March 31,
2012 | | | Year Ended
March 31,
2011 | | | Year Ended
March 31,
2010 | | | Year Ended
March 31,
2009 | | | Year Ended
March 31,
2008 | |
Per Share Data | | | | | | | | | | | | | | | | | | | | |
Net asset value, beginning of period | | $ | 10.67 | | | $ | 13.62 | | | $ | 22.91 | | | $ | 19.63 | | | $ | 20.27 | |
| | | | | | | | | | | | | | | | | | | | |
Income (loss) from investment operations: | | | | | | | | | | | | | | | | | | | | |
Net investment income (loss)a | | | (.24 | ) | | | (.29 | ) | | | (.39 | ) | | | (.25 | ) | | | .38 | |
Net gain (loss) on investments (realized and unrealized) | | | (2.11 | ) | | | (2.66 | ) | | | (8.90 | ) | | | 3.90 | | | | (.33 | ) |
| | | | | | | | | | | | | | | | | | | | |
Total from investment operations | | | (2.35 | ) | | | (2.95 | ) | | | (9.29 | ) | | | 3.65 | | | | .05 | |
| | | | | | | | | | | | | | | | | | | | |
Less distributions from: | | | | | | | | | | | | | | | | | | | | |
Net investment income | | | — | | | | — | | | | — | | | | (.37 | ) | | | (.69 | ) |
| | | | | | | | | | | | | | | | | | | | |
Total distributions | | | — | | | | — | | | | — | | | | (.37 | ) | | | (.69 | ) |
| | | | | | | | | | | | | | | | | | | | |
Net asset value, end of period | | $ | 8.32 | | | $ | 10.67 | | | $ | 13.62 | | | $ | 22.91 | | | $ | 19.63 | |
| | | | | | | | | | | | | | | | | | | | |
Total Returnb | | | (22.12 | %) | | | (21.66 | %) | | | (40.55 | %) | | | 18.35 | % | | | 0.85 | % |
| | | | | | | | | | | | | | | | | | | | |
Ratios/Supplemental Data | | | | | | | | | | | | | | | | | | | | |
Net assets, end of period (in thousands) | | $ | 752 | | | $ | 2,435 | | | $ | 1,858 | | | $ | 3,066 | | | $ | 7,633 | |
| | | | | | | | | | | | | | | | | | | | |
Ratios to average net assets: | | | | | | | | | | | | | | | | | | | | |
Net investment income (loss) | | | (2.37 | %) | | | (2.29 | %) | | | (2.33 | %) | | | (1.19 | %) | | | 2.05 | % |
Total expenses | | | 2.45 | % | | | 2.47 | % | | | 2.47 | % | | | 2.47 | % | | | 2.48 | % |
| | | | | | | | | | | | | | | | | | | | |
Portfolio turnover rate | | | — | | | | — | | | | — | | | | — | | | | — | |
| a | Net investment income (loss) per share was computed using average shares outstanding throughout the period. |
| b | Total return does not reflect the impact of any applicable sales charges and has not been annualized. |
| | |
56 | THE RYDEX SERIES FUNDS ANNUAL REPORT | | SEE NOTES TO FINANCIAL STATEMENTS. |
This page intentionally left blank.
THE RYDEX SERIES FUNDS ANNUAL REPORT | 57
| | |
PERFORMANCE REPORT AND FUND PROFILE (Unaudited) | | March 31, 2012 |
MID-CAP 1.5x STRATEGY FUND
OBJECTIVE: Seeks to provide investment results that correlate, before fees and expenses, to the performance of a specific benchmark for mid-cap securities on a daily basis. The Fund’s current benchmark is 150% of the performance of the S&P MidCap 400® Index (the “underlying index”). The Fund does not seek to achieve its investment objective over a period of time greater than one day.
For the year ended March 31, 2012, the Mid-Cap 1.5x Strategy Fund H-Class returned -2.29%. Over the year, its benchmark, the S&P MidCap 400 Index*, had a 1.98% return. The Fund had a correlation of more than 99% to its benchmark of 150% of the daily price movement of the S&P MidCap 400 Index.
Sectors contributing most to performance of the index were Consumer Discretionary and Industrials. Energy was the largest detractor from return of the index for the year.
Regeneron Pharmaceuticals, Inc., Monster Beverage Corp. and Dollar Tree, Inc. were among the stocks which provided the most performance to the index during the year. Cimarex Energy Co., Green Mountain Coffee Roasters, Inc. and Arch Coal, Inc. were among the stocks which provided the least performance to the index during the year.
Derivatives in the Fund were used to help provide exposure to the composition of the benchmark in the highest efficient manner and to provide leverage, not for hedging purposes. The results of derivatives use during the period were within our expectations and contributed to the Fund’s performance.
Due to the compounding of daily returns, leveraged and inverse funds’ returns over periods other than one day will likely differ in amount and possibly direction from the benchmark return for the same period. Investors should monitor their leveraged and inverse funds’ holdings to ensure that they are consistent with their strategies, as frequently as daily.
The effects of compounding may cause the longer-term correlation of the fund to its benchmark to diminish. The apparent discrepancy between the leveraged and unleveraged indices is the result of compounding, which is described briefly on page 4 of this report.
*The S&P MidCap 400® Index provides investors with a benchmark for mid-sized companies. The index covers approximately 7% of the U.S. equity market, and seeks to remain an accurate measure of mid-sized companies, reflecting the risk and return characteristics of the broader mid-cap universe on an on-going basis.
Performance displayed represents past performance which is no guarantee of future results.
Holdings Diversification (Market Exposure as % of Net Assets)
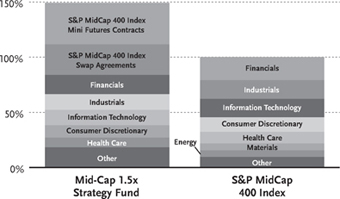
“Holdings Diversification (Market Exposure as % of Net Assets)” excludes any temporary cash investments.
| | | | |
Inception Dates: | | | |
A-Class | | | March 31, 2004 | |
C-Class | | | August 20, 2001 | |
H-Class | | | August 16, 2001 | |
Ten Largest Holdings (% of Total Net Assets) | |
Monster Beverage Corp. | | | 0.7 | % |
Regeneron Pharmaceuticals, Inc. | | | 0.6 | % |
Vertex Pharmaceuticals, Inc. | | | 0.6 | % |
Kansas City Southern | | | 0.6 | % |
AMETEK, Inc. | | | 0.6 | % |
Macerich Co. | | | 0.5 | % |
Equinix, Inc. | | | 0.5 | % |
Church & Dwight Company, Inc. | | | 0.5 | % |
Fossil, Inc. | | | 0.5 | % |
Henry Schein, Inc. | | | 0.5 | % |
Top Ten Total | | | 5.6 | % |
“Ten Largest Holdings” exclude any temporary cash or derivative investments. | | | | |
58 | THE RYDEX SERIES FUNDS ANNUAL REPORT
PERFORMANCE REPORT AND FUND PROFILE (Unaudited) (concluded)
Cumulative Fund Performance*
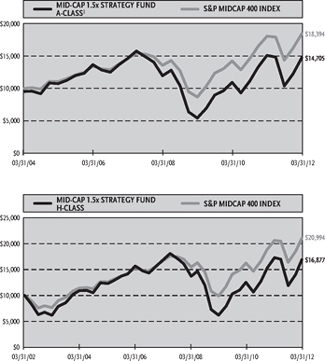
Average Annual Returns*
Periods Ended 03/31/12
| | | | | | | | | | | | |
| | | 1 Year | | | 5 Year | | | 10 Year | |
C-Class Shares | | | -3.15 | % | | | -0.61 | % | | | 4.58 | % |
C-Class Shares with CDSC† | | | -4.12 | % | | | -0.61 | % | | | 4.58 | % |
H-Class Shares | | | -2.29 | % | | | 0.13 | % | | | 5.37 | % |
S&P MidCap 400 Index | | | 1.98 | % | | | 4.78 | % | | | 7.70 | % |
| | | | | | | | | Since
Inception
(03/31/04) | |
A-Class Shares | | | -2.45 | % | | | 0.12 | % | | | 5.58 | % |
A-Class Shares with sales charge‡ | | | -7.08 | % | | | -0.85 | % | | | 4.94 | % |
S&P MidCap 400 Index | | | 1.98 | % | | | 4.78 | % | | | 7.92 | % |
| * | The performance data above represents past performance that is not predictive of future results. The investment return and principal value of an investment in the Fund will fluctuate so that an investor’s shares, when redeemed, may be worth more or less than their original cost. Returns are historical and include changes in principal and reinvested dividends and capital gains and do not reflect the effect of taxes. The S&P MidCap 400 Index is an unmanaged index and, unlike the Fund, has no management fees or operating expenses to reduce its reported return. The graphs are based on A-Class shares and H-Class shares only; performance for C-Class shares will vary due to differences in fee structures. |
| † | Fund returns include a CDSC of 1% if redeemed within 12 months of purchase. |
| ‡ | Fund returns are calculated using the maximum sales charge of 4.75%. |
THE RYDEX SERIES FUNDS ANNUAL REPORT | 59
| | |
| SCHEDULE OF INVESTMENTS | | March 31, 2012 |
| MID-CAP 1.5x STRATEGY FUND | | |
| | | | | | | | |
| | | SHARES | | | VALUE | |
COMMON STOCKS† — 83.8% | | | | | | | | |
FINANCIALS — 17.5% | | | | | | | | |
Macerich Co. | | | 2,215 | | | $ | 127,916 | |
SL Green Realty Corp. | | | 1,450 | | | | 112,448 | |
Federal Realty Investment Trust | | | 1,069 | | | | 103,469 | |
New York Community Bancorp, Inc. | | | 7,363 | | | | 102,420 | |
Affiliated Managers Group, Inc.* | | | 900 | | | | 100,629 | |
UDR, Inc. | | | 3,750 | | | | 100,162 | |
Rayonier, Inc. | | | 2,058 | | | | 90,738 | |
Essex Property Trust, Inc. | | | 579 | | | | 87,724 | |
Camden Property Trust | | | 1,324 | | | | 87,053 | |
Realty Income Corp. | | | 2,239 | | | | 86,716 | |
Everest Re Group Ltd. | | | 900 | | | | 83,268 | |
Alleghany Corp.* | | | 246 | | | | 80,959 | |
Alexandria Real Estate Equities, Inc. | | | 1,037 | | | | 75,836 | |
MSCI, Inc. — Class A* | | | 2,040 | | | | 75,092 | |
Reinsurance Group of America, Inc. — Class A | | | 1,230 | | | | 73,148 | |
Taubman Centers, Inc. | | | 970 | | | | 70,762 | |
Liberty Property Trust | | | 1,959 | | | | 69,975 | |
Arthur J Gallagher & Co. | | | 1,930 | | | | 68,978 | |
Raymond James Financial, Inc. | | | 1,869 | | | | 68,275 | |
WR Berkley Corp. | | | 1,874 | | | | 67,689 | |
Regency Centers Corp. | | | 1,509 | | | | 67,120 | |
Fidelity National Financial, Inc. — Class A | | | 3,714 | | | | 66,963 | |
BRE Properties, Inc. | | | 1,270 | | | | 64,199 | |
Duke Realty Corp. | | | 4,344 | | | | 62,293 | |
Jones Lang LaSalle, Inc. | | | 730 | | | | 60,816 | |
Senior Housing Properties Trust | | | 2,730 | | | | 60,197 | |
Cullen/Frost Bankers, Inc. | | | 1,028 | | | | 59,819 | |
First Niagara Financial Group, Inc. | | | 5,907 | | | | 58,125 | |
East West Bancorp, Inc. | | | 2,495 | | | | 57,610 | |
American Campus Communities, Inc. | | | 1,250 | | | | 55,900 | |
Eaton Vance Corp. | | | 1,942 | | | | 55,502 | |
Hospitality Properties Trust | | | 2,073 | | | | 54,872 | |
HCC Insurance Holdings, Inc. | | | 1,747 | | | | 54,454 | |
Commerce Bancshares, Inc. | | | 1,329 | | | | 53,851 | |
Weingarten Realty Investors | | | 2,028 | | | | 53,600 | |
Hancock Holding Co. | | | 1,422 | | | | 50,495 | |
SEI Investments Co. | | | 2,430 | | | | 50,277 | |
Home Properties, Inc. | | | 812 | | | | 49,540 | |
American Financial Group, Inc. | | | 1,282 | | | | 49,460 | |
Signature Bank* | | | 775 | | | | 48,856 | |
National Retail Properties, Inc. | | | 1,772 | | | | 48,181 | |
Jefferies Group, Inc. | | | 2,520 | | | | 47,477 | |
SVB Financial Group* | | | 728 | | | | 46,840 | |
Waddell & Reed Financial, Inc. — Class A | | | 1,438 | | | | 46,606 | |
Brown & Brown, Inc. | | | 1,949 | | | | 46,347 | |
Old Republic International Corp. | | | 4,348 | | | | 45,871 | |
Mack-Cali Realty Corp. | | | 1,470 | | | | 42,365 | |
CBOE Holdings, Inc. | | | 1,490 | | | | 42,346 | |
City National Corp. | | | 786 | | | | 41,241 | |
Valley National Bancorp | | | 3,149 | | | | 40,780 | |
Associated Banc-Corp. | | | 2,920 | | | | 40,763 | |
Highwoods Properties, Inc. | | | 1,220 | | | | 40,650 | |
Protective Life Corp. | | | 1,371 | | | | 40,609 | |
Bank of Hawaii Corp. | | | 770 | | | | 37,230 | |
| | | | | | | | |
| | | | | | | | |
| | | SHARES | | | VALUE | |
Omega Healthcare Investors, Inc. | | | 1,740 | | | $ | 36,992 | |
Prosperity Bancshares, Inc. | | | 790 | | | | 36,182 | |
Fulton Financial Corp. | | | 3,362 | | | | 35,301 | |
Aspen Insurance Holdings Ltd. | | | 1,188 | | | | 33,193 | |
TCF Financial Corp. | | | 2,653 | | | | 31,544 | |
Hanover Insurance Group, Inc. | | | 755 | | | | 31,046 | |
FirstMerit Corp. | | | 1,833 | | | | 30,904 | |
StanCorp Financial Group, Inc. | | | 743 | | | | 30,418 | |
Washington Federal, Inc. | | | 1,804 | | | | 30,343 | |
First American Financial Corp. | | | 1,770 | | | | 29,435 | |
Janus Capital Group, Inc. | | | 3,166 | | | | 28,209 | |
Corporate Office Properties Trust | | | 1,209 | | | | 28,061 | |
Webster Financial Corp. | | | 1,237 | | | | 28,043 | |
Synovus Financial Corp. | | | 13,300 | | | | 27,265 | |
Trustmark Corp. | | | 1,080 | | | | 26,978 | |
Mercury General Corp. | | | 610 | | | | 26,681 | |
Kemper Corp. | | | 840 | | | | 25,435 | |
Apollo Investment Corp. | | | 3,307 | | | | 23,711 | |
Cathay General Bancorp | | | 1,320 | | | | 23,364 | |
Westamerica Bancorporation | | | 471 | | | | 22,608 | |
Potlatch Corp. | | | 677 | | | | 21,217 | |
Greenhill & Company, Inc. | | | 480 | | | | 20,947 | |
Equity One, Inc. | | | 998 | | | | 20,180 | |
International Bancshares Corp. | | | 890 | | | | 18,824 | |
BancorpSouth, Inc. | | | 1,375 | | | | 18,521 | |
Astoria Financial Corp. | | | 1,406 | | | | 13,863 | |
| | | | | | | | |
Total Financials | | | | | | | 4,173,777 | |
| | | | | | | | |
INDUSTRIALS—14.2% | | | | | | | | |
Kansas City Southern* | | | 1,840 | | | | 131,910 | |
AMETEK, Inc. | | | 2,694 | | | | 130,687 | |
Donaldson Company, Inc. | | | 2,500 | | | | 89,324 | |
KBR, Inc. | | | 2,484 | | | | 88,306 | |
J.B. Hunt Transport Services, Inc. | | | 1,511 | | | | 82,154 | |
BE Aerospace, Inc.* | | | 1,748 | | | | 81,230 | |
Pentair, Inc. | | | 1,655 | | | | 78,794 | |
Hubbell, Inc. — Class B | | | 999 | | | | 78,501 | |
AGCO Corp.* | | | 1,631 | | | | 76,999 | |
Timken Co. | | | 1,410 | | | | 71,542 | |
Waste Connections, Inc. | | | 2,068 | | | | 67,272 | |
SPX Corp. | | | 858 | | | | 66,521 | |
MSC Industrial Direct Co., Inc. — Class A | | | 769 | | | | 64,042 | |
Lincoln Electric Holdings, Inc. | | | 1,406 | | | | 63,720 | |
Manpower, Inc. | | | 1,345 | | | | 63,712 | |
Thomas & Betts Corp.* | | | 876 | | | | 62,993 | |
Kirby Corp.* | | | 936 | | | | 61,580 | |
Wabtec Corp. | | | 806 | | | | 60,748 | |
Kennametal, Inc. | | | 1,339 | | | | 59,626 | |
IDEX Corp. | | | 1,407 | | | | 59,277 | |
Fortune Brands Home & Security, Inc.* | | | 2,654 | | | | 58,574 | |
URS Corp. | | | 1,336 | | | | 56,807 | |
Towers Watson & Co. — Class A | | | 850 | | | | 56,160 | |
Gardner Denver, Inc. | | | 850 | | | | 53,567 | |
Clean Harbors, Inc.* | | | 790 | | | | 53,191 | |
Graco, Inc. | | | 1,000 | | | | 53,060 | |
Nordson Corp. | | | 956 | | | | 52,112 | |
Carlisle Companies, Inc. | | | 1,033 | | | | 51,567 | |
Copart, Inc.* | | | 1,792 | | | | 46,717 | |
| | |
60 | THE RYDEX SERIES FUNDS ANNUAL REPORT | | SEE NOTES TO FINANCIAL STATEMENTS. |
| | |
| SCHEDULE OF INVESTMENTS (continued) | | March 31, 2012 |
| MID-CAP 1.5x STRATEGY FUND | | |
| | | | | | | | |
| | | SHARES | | | VALUE | |
Regal-Beloit Corp. | | | 699 | | | $ | 45,819 | |
Corrections Corporation of America* | | | 1,671 | | | | 45,635 | |
Triumph Group, Inc. | | | 724 | | | | 45,366 | |
United Rentals, Inc.* | | | 1,056 | | | | 45,292 | |
Landstar System, Inc. | | | 784 | | | | 45,252 | |
Valmont Industries, Inc. | | | 380 | | | | 44,616 | |
Trinity Industries, Inc. | | | 1,346 | | | | 44,351 | |
Acuity Brands, Inc. | | | 702 | | | | 44,107 | |
AECOM Technology Corp.* | | | 1,970 | | | | 44,069 | |
Woodward, Inc. | | | 1,010 | | | | 43,258 | |
Alaska Air Group, Inc.* | | | 1,190 | | | | 42,625 | |
Terex Corp.* | | | 1,840 | | | | 41,400 | |
CLARCOR, Inc. | | | 840 | | | | 41,236 | |
Crane Co. | | | 814 | | | | 39,479 | |
Exelis, Inc. | | | 3,101 | | | | 38,825 | |
Esterline Technologies Corp.* | | | 514 | | | | 36,730 | |
ITT Corp. | | | 1,590 | | | | 36,475 | |
Oshkosh Corp.* | | | 1,540 | | | | 35,682 | |
Watsco, Inc. | | | 475 | | | | 35,169 | |
Shaw Group, Inc.* | | | 1,094 | | | | 34,691 | |
Lennox International, Inc. | | | 854 | | | | 34,416 | |
Alexander & Baldwin, Inc. | | | 707 | | | | 34,254 | |
Huntington Ingalls Industries, Inc.* | | | 818 | | | | 32,916 | |
Harsco Corp. | | | 1,352 | | | | 31,718 | |
GATX Corp. | | | 780 | | | | 31,434 | |
Con-way, Inc. | | | 936 | | | | 30,523 | |
UTI Worldwide, Inc. | | | 1,720 | | | | 29,636 | |
Alliant Techsystems, Inc. | | | 554 | | | | 27,766 | |
FTI Consulting, Inc.* | | | 695 | | | | 26,076 | |
General Cable Corp.* | | | 835 | | | | 24,282 | |
Corporate Executive Board Co. | | | 558 | | | | 24,000 | |
Rollins, Inc. | | | 1,080 | | | | 22,982 | |
Herman Miller, Inc. | | | 973 | | | | 22,340 | |
Mine Safety Appliances Co. | | | 516 | | | | 21,197 | |
HNI Corp. | | | 753 | | | | 20,896 | |
Deluxe Corp. | | | 855 | | | | 20,024 | |
Brink’s Co. | | | 787 | | | | 18,786 | |
Werner Enterprises, Inc. | | | 750 | | | | 18,645 | |
JetBlue Airways Corp.* | | | 3,450 | | | | 16,871 | |
Granite Construction, Inc. | | | 577 | | | | 16,583 | |
Korn* | | | 802 | | | | 13,434 | |
| | | | | | | | |
Total Industrials | | | | | | | 3,369,549 | |
| | | | | | | | |
INFORMATION TECHNOLOGY—14.0% | | | | | | | | |
Equinix, Inc.* | | | 783 | | | | 123,283 | |
Trimble Navigation Ltd.* | | | 2,090 | | | | 113,738 | |
Alliance Data Systems Corp.* | | | 842 | | | | 106,058 | |
ANSYS, Inc.* | | | 1,560 | | | | 101,430 | |
Rackspace Hosting, Inc.* | | | 1,750 | | | | 101,133 | |
Informatica Corp.* | | | 1,800 | | | | 95,220 | |
VeriFone Systems, Inc.* | | | 1,782 | | | | 92,432 | |
Lam Research Corp.* | | | 2,012 | | | | 89,775 | |
Avnet, Inc.* | | | 2,435 | | | | 88,609 | |
Skyworks Solutions, Inc.* | | | 3,162 | | | | 87,430 | |
TIBCO Software, Inc.* | | | 2,800 | | | | 85,400 | |
Arrow Electronics, Inc.* | | | 1,875 | | | | 78,694 | |
Factset Research Systems, Inc. | | | 757 | | | | 74,973 | |
| | | | | | | | |
| | | SHARES | | | VALUE | |
Synopsys, Inc.* | | | 2,444 | | | $ | 74,933 | |
Atmel Corp.* | | | 7,569 | | | | 74,631 | |
MICROS Systems, Inc.* | | | 1,342 | | | | 74,199 | |
Riverbed Technology, Inc.* | | | 2,640 | | | | 74,131 | |
Gartner, Inc.* | | | 1,567 | | | | 66,817 | |
Global Payments, Inc. | | | 1,315 | | | | 62,463 | |
Cree, Inc.* | | | 1,940 | | | | 61,362 | |
Rovi Corp.* | | | 1,801 | | | | 58,623 | |
NCR Corp.* | | | 2,655 | | | | 57,641 | |
Polycom, Inc.* | | | 2,979 | | | | 56,810 | |
Parametric Technology Corp.* | | | 1,992 | | | | 55,656 | |
Cadence Design Systems, Inc.* | | | 4,594 | | | | 54,393 | |
Solera Holdings, Inc. | | | 1,176 | | | | 53,967 | |
Broadridge Financial Solutions, Inc. | | | 2,082 | | | | 49,781 | |
Jack Henry & Associates, Inc. | | | 1,456 | | | | 49,679 | |
Ingram Micro, Inc. — Class A* | | | 2,519 | | | | 46,753 | |
Concur Technologies, Inc.* | | | 786 | | | | 45,101 | |
National Instruments Corp. | | | 1,560 | | | | 44,491 | |
NeuStar, Inc. — Class A* | | | 1,133 | | | | 42,204 | |
Wright Express Corp.* | | | 651 | | | | 42,139 | |
Cypress Semiconductor Corp.* | | | 2,599 | | | | 40,622 | |
Diebold, Inc. | | | 1,049 | | | | 40,407 | |
Tech Data Corp.* | | | 690 | | | | 37,439 | |
Lender Processing Services, Inc. | | | 1,416 | | | | 36,816 | |
Zebra Technologies Corp. — Class A* | | | 873 | | | | 35,950 | |
Compuware Corp.* | | | 3,668 | | | | 33,709 | |
ADTRAN, Inc. | | | 1,070 | | | | 33,373 | |
Vishay Intertechnology, Inc.* | | | 2,639 | | | | 32,090 | |
Semtech Corp.* | | | 1,092 | | | | 31,078 | |
Fairchild Semiconductor International,
Inc. — Class A* | | | 2,114 | | | | 31,076 | |
DST Systems, Inc. | | | 564 | | | | 30,586 | |
Silicon Laboratories, Inc.* | | | 710 | | | | 30,530 | |
Itron, Inc.* | | | 668 | | | | 30,334 | |
AOL, Inc.* | | | 1,591 | | | | 30,181 | |
QLogic Corp.* | | | 1,656 | | | | 29,411 | |
CoreLogic, Inc.* | | | 1,788 | | | | 29,180 | |
Plantronics, Inc. | | | 721 | | | | 29,027 | |
Ciena Corp.* | | | 1,660 | | | | 26,875 | |
International Rectifier Corp.* | | | 1,159 | | | | 26,738 | |
ValueClick, Inc.* | | | 1,348 | | | | 26,610 | |
ACI Worldwide, Inc.* | | | 660 | | | | 26,578 | |
Fair Isaac Corp. | | | 601 | | | | 26,384 | |
Convergys Corp.* | | | 1,945 | | | | 25,966 | |
Tellabs, Inc. | | | 6,132 | | | | 24,835 | |
Intersil Corp. — Class A | | | 2,120 | | | | 23,744 | |
Mentor Graphics Corp.* | | | 1,561 | | | | 23,196 | |
RF Micro Devices, Inc.* | | | 4,636 | | | | 23,087 | |
Quest Software, Inc.* | | | 952 | | | | 22,153 | |
Monster Worldwide, Inc.* | | | 2,066 | | | | 20,144 | |
Acxiom Corp.* | | | 1,312 | | | | 19,260 | |
Integrated Device Technology, Inc.* | | | 2,373 | | | | 16,967 | |
MEMC Electronic Materials, Inc.* | | | 3,873 | | | | 13,982 | |
Advent Software, Inc.* | | | 538 | | | | 13,773 | |
Mantech International Corp. — Class A | | | 390 | | | | 13,439 | |
| | | | | | | | |
Total Information Technology | | | | | | | 3,319,489 | |
| | | | | | | | |
| | |
SEE NOTES TO FINANCIAL STATEMENTS. | | THE RYDEX SERIES FUNDS ANNUAL REPORT | 61 |
| | |
| SCHEDULE OF INVESTMENTS (continued) | | March 31, 2012 |
| MID-CAP 1.5x STRATEGY FUND | | |
| | | xxxxxxxxx | | | | xxxxxxxxx | |
| | | SHARES | | | VALUE | |
CONSUMER DISCRETIONARY - 11.2% | | | | | | | | |
Fossil, Inc.* | | | 871 | | | $ | 114,955 | |
Advance Auto Parts, Inc. | | | 1,225 | | | | 108,498 | |
Tractor Supply Co. | | | 1,197 | | | | 108,400 | |
PetSmart, Inc. | | | 1,871 | | | | 107,059 | |
PVH Corp. | | | 1,130 | | | | 100,943 | |
Polaris Industries, Inc. | | | 1,149 | | | | 82,900 | |
Panera Bread Co. — Class A* | | | 502 | | | | 80,781 | |
Foot Locker, Inc. | | | 2,538 | | | | 78,805 | |
Dick’s Sporting Goods, Inc. | | | 1,621 | | | | 77,938 | |
LKQ Corp.* | | | 2,470 | | | | 76,990 | |
Signet Jewelers Ltd. | | | 1,459 | | | | 68,982 | |
Williams-Sonoma, Inc. | | | 1,727 | | | | 64,728 | |
Mohawk Industries, Inc.* | | | 959 | | | | 63,783 | |
NVR, Inc.* | | | 85 | | | | 61,738 | |
Tupperware Brands Corp. | | | 942 | | | | 59,817 | |
Gentex Corp. | | | 2,418 | | | | 59,241 | |
Toll Brothers, Inc.* | | | 2,461 | | | | 59,039 | |
Under Armour, Inc. — Class A* | | | 617 | | | | 57,998 | |
American Eagle Outfitters, Inc. | | | 3,252 | | | | 55,902 | |
Ascena Retail Group, Inc.* | | | 1,131 | | | | 50,126 | |
Hanesbrands, Inc.* | | | 1,637 | | | | 48,357 | |
Sotheby’s | | | 1,130 | | | | 44,454 | |
AMC Networks, Inc. — Class A* | | | 965 | | | | 43,068 | |
Carter’s, Inc.* | | | 859 | | | | 42,752 | |
Chico’s FAS, Inc. | | | 2,814 | | | | 42,491 | |
Service Corporation International | | | 3,718 | | | | 41,865 | |
Deckers Outdoor Corp.* | | | 646 | | | | 40,730 | |
Warnaco Group, Inc.* | | | 674 | | | | 39,362 | |
Rent-A-Center, Inc. — Class A | | | 996 | | | | 37,599 | |
John Wiley & Sons, Inc. — Class A | | | 788 | | | | 37,500 | |
Brinker International, Inc. | | | 1,318 | | | | 36,311 | |
Life Time Fitness, Inc.* | | | 710 | | | | 35,904 | |
Guess?, Inc. | | | 1,120 | | | | 35,000 | |
Bally Technologies, Inc.* | | | 720 | | | | 33,660 | |
Aaron’s, Inc. | | | 1,272 | | | | 32,945 | |
Lamar Advertising Co. — Class A* | | | 980 | | | | 31,762 | |
Saks, Inc.* | | | 2,616 | | | | 30,372 | |
Aeropostale, Inc.* | | | 1,355 | | | | 29,295 | |
Cheesecake Factory, Inc.* | | | 917 | | | | 26,951 | |
ANN, Inc.* | | | 879 | | | | 25,175 | |
HSN, Inc. | | | 661 | | | | 25,138 | |
Wendy’s Co. | | | 4,974 | | | | 24,920 | |
Thor Industries, Inc. | | | 736 | | | | 23,228 | |
DreamWorks Animation SKG, Inc. — Class A* | | | 1,200 | | | | 22,140 | |
WMS Industries, Inc.* | | | 928 | | | | 22,021 | |
ITT Educational Services, Inc.* | | | 329 | | | | 21,760 | |
Meredith Corp. | | | 620 | | | | 20,125 | |
Collective Brands, Inc.* | | | 1,017 | | | | 19,994 | |
Bob Evans Farms, Inc. | | | 489 | | | | 18,445 | |
Strayer Education, Inc. | | | 187 | | | | 17,630 | |
Regis Corp. | | | 951 | | | | 17,527 | |
Valassis Communications, Inc.* | | | 717 | | | | 16,491 | |
MDC Holdings, Inc. | | | 633 | | | | 16,325 | |
Office Depot, Inc.* | | | 4,714 | | | | 16,263 | |
Matthews International Corp. — Class A | | | 474 | | | | 14,997 | |
| | | | | | | | |
| | | SHARES | | | VALUE | |
Scholastic Corp. | | | 420 | | | $ | 14,818 | |
New York Times Co. — Class A* | | | 2,035 | | | | 13,818 | |
International Speedway Corp. — Class A | | | 469 | | | | 13,015 | |
Scientific Games Corp. — Class A* | | | 977 | | | | 11,392 | |
KB Home | | | 1,211 | | | | 10,778 | |
RadioShack Corp. | | | 1,667 | | | | 10,369 | |
American Greetings Corp. — Class A | | | 643 | | | | 9,864 | |
Barnes & Noble, Inc.* | | | 690 | | | | 9,143 | |
| | | | | | | | |
Total Consumer Discretionary | | | | | | | 2,664,377 | |
| | | | | | | | |
HEALTH CARE—8.6% | | | | | | | | |
Regeneron Pharmaceuticals, Inc.* | | | 1,280 | | | | 149,274 | |
Vertex Pharmaceuticals, Inc.* | | | 3,530 | | | | 144,765 | |
Henry Schein, Inc.* | | | 1,507 | | | | 114,050 | |
Mettler-Toledo International, Inc.* | | | 528 | | | | 97,547 | |
Hologic, Inc.* | | | 4,425 | | | | 95,358 | |
IDEXX Laboratories, Inc.* | | | 924 | | | | 80,803 | |
Endo Pharmaceuticals Holdings, Inc.* | | | 1,959 | | | | 75,872 | |
ResMed, Inc.* | | | 2,420 | | | | 74,802 | |
Universal Health Services, Inc. — Class B | | | 1,624 | | | | 68,062 | |
Omnicare, Inc. | | | 1,907 | | | | 67,833 | |
Cooper Companies, Inc. | | | 800 | | | | 65,368 | |
Mednax, Inc.* | | | 820 | | | | 60,983 | |
Health Net, Inc.* | | | 1,386 | | | | 55,051 | |
AMERIGROUP Corp.* | | | 810 | | | | 54,497 | |
Catalyst Health Solutions, Inc.* | | | 840 | | | | 53,533 | |
Allscripts Healthcare Solutions, Inc.* | | | 3,200 | | | | 53,120 | |
WellCare Health Plans, Inc.* | | | 719 | | | | 51,682 | |
Gen-Probe, Inc.* | | | 759 | | | | 50,405 | |
Covance, Inc.* | | | 982 | | | | 46,773 | |
HMS Holdings Corp.* | | | 1,440 | | | | 44,942 | |
Techne Corp. | | | 617 | | | | 43,252 | |
United Therapeutics Corp.* | | | 900 | | | | 42,417 | |
Teleflex, Inc. | | | 680 | | | | 41,582 | |
Lincare Holdings, Inc. | | | 1,460 | | | | 37,785 | |
Medicis Pharmaceutical Corp. — Class A | | | 989 | | | | 37,177 | |
Hill-Rom Holdings, Inc. | | | 1,041 | | | | 34,780 | |
Bio-Rad Laboratories, Inc. — Class A* | | | 330 | | | | 34,218 | |
VCA Antech, Inc.* | | | 1,470 | | | | 34,119 | |
Thoratec Corp.* | | | 981 | | | | 33,070 | |
Community Health Systems, Inc.* | | | 1,483 | | | | 32,982 | |
Owens & Minor, Inc. | | | 1,067 | | | | 32,447 | |
LifePoint Hospitals, Inc.* | | | 809 | | | | 31,907 | |
STERIS Corp. | | | 967 | | | | 30,577 | |
Charles River Laboratories International, Inc.* | | | 821 | | | | 29,630 | |
Health Management Associates, | | | | | | | | |
Inc. — Class A* | | | 4,270 | | | | 28,694 | |
Masimo Corp.* | | | 978 | | | | 22,866 | |
| | | | | | | | |
Total Health Care | | | | | | | 2,052,223 | |
| | | | | | | | |
MATERIALS—5.4% | | | | | | | | |
Albemarle Corp. | | | 1,493 | | | | 95,432 | |
Ashland, Inc. | | | 1,314 | | | | 80,233 | |
Rock-Tenn Co. — Class A | | | 1,180 | | | | 79,721 | |
Valspar Corp. | | | 1,563 | | | | 75,477 | |
Reliance Steel & Aluminum Co. | | | 1,258 | | | | 71,052 | |
Martin Marietta Materials, Inc. | | | 766 | | | | 65,593 | |
| | |
62 | THE RYDEX SERIES FUNDS ANNUAL REPORT | | SEE NOTES TO FINANCIAL STATEMENTS. |
| | |
| SCHEDULE OF INVESTMENTS (continued) | | March 31, 2012 |
| MID-CAP 1.5x STRATEGY FUND | | |
| | | | | | | | |
| | | SHARES | | | VALUE | |
Aptargroup, Inc. | | | 1,110 | | | $ | 60,794 | |
Domtar Corp. | | | 613 | | | | 58,468 | |
RPM International, Inc. | | | 2,200 | | �� | | 57,618 | |
Sonoco Products Co. | | | 1,690 | | | | 56,108 | |
Steel Dynamics, Inc. | | | 3,676 | | | | 53,449 | |
Packaging Corporation of America | | | 1,620 | | | | 47,936 | |
Cytec Industries, Inc. | | | 769 | | | | 46,748 | |
Cabot Corp. | | | 1,058 | | | | 45,155 | |
Compass Minerals International, Inc. | | | 550 | | | | 39,457 | |
Scotts Miracle-Gro Co. — Class A | | | 725 | | | | 39,266 | |
Carpenter Technology Corp. | | | 738 | | | | 38,546 | |
Silgan Holdings, Inc. | | | 830 | | | | 36,686 | |
NewMarket Corp. | | | 180 | | | | 33,732 | |
Sensient Technologies Corp. | | | 844 | | | | 32,072 | |
Olin Corp. | | | 1,344 | | | | 29,232 | |
Greif, Inc. — Class A | | | 516 | | | | 28,855 | |
Commercial Metals Co. | | | 1,940 | | | | 28,751 | |
Louisiana-Pacific Corp.* | | | 2,300 | | | | 21,505 | |
Intrepid Potash, Inc.* | | | 880 | | | | 21,410 | |
Minerals Technologies, Inc. | | | 298 | | | | 19,492 | |
Worthington Industries, Inc. | | | 879 | | | | 16,859 | |
| | | | | | | | |
Total Materials | | | | | | | 1,279,647 | |
| | | | | | | | |
ENERGY—4.7% | | | | | | | | |
HollyFrontier Corp. | | | 3,495 | | | | 112,364 | |
Cimarex Energy Co. | | | 1,438 | | | | 108,526 | |
Oceaneering International, Inc. | | | 1,813 | | | | 97,702 | |
Plains Exploration & Production Co.* | | | 2,152 | | | | 91,783 | |
SM Energy Co. | | | 1,076 | | | | 76,149 | |
Superior Energy Services, Inc.* | | | 2,646 | | | | 69,749 | |
Oil States International, Inc.* | | | 860 | | | | 67,132 | |
Dresser-Rand Group, Inc.* | | | 1,271 | | | | 58,962 | |
World Fuel Services Corp. | | | 1,194 | | | | 48,954 | |
Tidewater, Inc. | | | 861 | | | | 46,511 | |
Patterson-UTI Energy, Inc. | | | 2,595 | | | | 44,867 | |
Atwood Oceanics, Inc.* | | | 947 | | | | 42,511 | |
Arch Coal, Inc. | | | 3,580 | | | | 38,342 | |
Dril-Quip, Inc.* | | | 580 | | | | 37,712 | |
CARBO Ceramics, Inc. | | | 330 | | | | 34,799 | |
Helix Energy Solutions Group, Inc.* | | | 1,773 | | | | 31,559 | |
Unit Corp.* | | | 696 | | | | 29,761 | |
Forest Oil Corp.* | | | 1,881 | | | | 22,798 | |
Northern Oil and Gas, Inc.* | | | 1,060 | | | | 21,984 | |
Bill Barrett Corp.* | | | 788 | | | | 20,496 | |
Quicksilver Resources, Inc.* | | | 1,986 | | | | 10,009 | |
Patriot Coal Corp.* | | | 1,556 | | | | 9,709 | |
| | | | | | | | |
Total Energy | | | | | | | 1,122,379 | |
| | | | | | | | |
UTILITIES—4.5% | | | | | | | | |
OGE Energy Corp. | | | 1,646 | | | | 88,062 | |
NSTAR | | | 1,734 | | | | 84,324 | |
Alliant Energy Corp. | | | 1,859 | | | | 80,532 | |
MDU Resources Group, Inc. | | | 3,169 | | | | 70,954 | |
National Fuel Gas Co. | | | 1,395 | | | | 67,127 | |
N.V. Energy, Inc. | | | 3,961 | | | | 63,850 | |
Energen Corp. | | | 1,210 | | | | 59,472 | |
Westar Energy, Inc. | | | 2,110 | | | | 58,932 | |
Questar Corp. | | | 2,986 | | | | 57,510 | |
Aqua America, Inc. | | | 2,330 | | | | 51,936 | |
| | | | | | | | |
| | | SHARES | | | VALUE | |
UGI Corp. | | | 1,882 | | | $ | 51,285 | |
Atmos Energy Corp. | | | 1,514 | | | | 47,630 | |
Great Plains Energy, Inc. | | | 2,285 | | | | 46,317 | |
Hawaiian Electric Industries, Inc. | | | 1,610 | | | | 40,814 | |
Cleco Corp. | | | 1,021 | | | | 40,483 | |
Vectren Corp. | | | 1,370 | | | | 39,812 | |
WGL Holdings, Inc. | | | 864 | | | | 35,165 | |
IDACORP, Inc. | | | 838 | | | | 34,459 | |
Black Hills Corp. | | | 738 | | | | 24,745 | |
PNM Resources, Inc. | | | 1,337 | | | | 24,467 | |
| | | | | | | | |
Total Utilities | | | | | | | 1,067,876 | |
| | | | | | | | |
CONSUMER STAPLES—3.3% | | | | | | | | |
Monster Beverage Corp.* | | | 2,542 | | | | 157,833 | |
Church & Dwight Company, Inc. | | | 2,390 | | | | 117,564 | |
Green Mountain Coffee Roasters, Inc.* | | | 2,183 | | | | 102,252 | |
Energizer Holdings, Inc.* | | | 1,107 | | | | 82,117 | |
Corn Products International, Inc. | | | 1,280 | | | | 73,792 | |
Ralcorp Holdings, Inc.* | | | 927 | | | | 68,681 | |
Smithfield Foods, Inc.* | | | 2,701 | | | | 59,503 | |
Flowers Foods, Inc. | | | 1,895 | | | | 38,601 | |
Harris Teeter Supermarkets, Inc.* | | | 827 | | | | 33,163 | |
Lancaster Colony Corp. | | | 330 | | | | 21,932 | |
Universal Corp. | | | 389 | | | | 18,127 | |
Post Holdings, Inc.* | | | 460 | | | | 15,148 | |
Tootsie Roll Industries, Inc. | | | 428 | | | | 9,799 | |
| | | | | | | | |
Total Consumer Staples | | | | | | | 798,512 | |
| | | | | | | | |
TELECOMMUNICATION SERVICES—0.4% | | | | | | | | |
tw telecom, Inc. — Class A* | | | 2,518 | | | | 55,799 | |
Telephone & Data Systems, Inc. | | | 1,620 | | | | 37,503 | |
| | | | | | | | |
Total Telecommunication Services | | | | | | | 93,302 | |
| | | | | | | | |
Total Common Stocks
(Cost $15,025,011) | | | | | | | 19,941,131 | |
| | | | | | | | |
| | |
| | | FACE
AMOUNT | | | | |
REPURCHASE AGREEMENTS††,1 – 16.0% | | | | | | | | |
HSBC Group
issued 03/30/12 at 0.01%
due 04/02/12 | | $ | 2,239,083 | | | | 2,239,083 | |
Credit Suisse Group
issued 03/30/12 at 0.01%
due 04/02/122 | | | 768,150 | | | | 768,150 | |
Mizuho Financial Group, Inc.
issued 03/30/12 at 0.01%
due 04/02/12 | | | 629,964 | | | | 629,964 | |
Deutsche Bank
issued 03/30/12 at 0.01%
due 04/02/12 | | | 167,438 | | | | 167,438 | |
| | | | | | | | |
| | |
Total Repurchase Agreements
(Cost $3,804,635) | | | | | | | 3,804,635 | |
| | | | | | | | |
| | |
Total Investments – 99.8%
(Cost $18,829,646) | | | | | | $ | 23,745,766 | |
| | | | | | | | |
Other Assets & Liabilities, net – 0.2% | | | | | | | 40,080 | |
| | | | | | | | |
Total Net Assets – 100.0% | | | | | | $ | 23,785,846 | |
| |
| | |
SEE NOTES TO FINANCIAL STATEMENTS. | | THE RYDEX SERIES FUNDS ANNUAL REPORT | 63 |
| | |
| SCHEDULE OF INVESTMENTS (concluded) | | March 31, 2012 |
| MID-CAP 1.5x STRATEGY FUND | | |
| | | | | | | | |
| | | CONTRACTS | | | UNREALIZED
GAIN (LOSS) | |
FUTURES CONTRACTS PURCHASED† | | | | | | | | |
June 2012 S&P MidCap 400 Index
Mini Futures Contracts
(Aggregate Value of
Contracts $8,914,500) | | | 90 | | | $ | 195,103 | |
| | | | | | | | |
| | |
| | | UNITS | | | | |
EQUITY INDEX SWAP AGREEMENTS†† | | | | | | | | |
Credit Suisse Capital, LLC
April 2012 S&P MidCap 400 Index
Swap, Terminating 04/30/123
(Notional Value $464,365) | | | 467 | | | $ | (161 | ) |
Barclays Bank plc
April 2012 S&P MidCap 400 Index
Swap, Terminating 04/30/123
(Notional Value $3,323,983) | | | 3,343 | | | | (1,240 | ) |
Morgan Stanley Capital Services, Inc.
April 2012 S&P MidCap 400 Index
Swap, Terminating 04/30/123
(Notional Value $1,176,683) | | | 1,183 | | | | (7,325 | ) |
Goldman Sachs International
April 2012 S&P MidCap 400 Index
Swap, Terminating 04/27/123
(Notional Value $1,650,906) | | | 1,660 | | | | (17,407 | ) |
| | | | | | | | |
(Total Notional Value $6,615,937) | | | | | | $ | (26,133 | ) |
| | | | | | | | |
| * | Non-income producing security. |
| † | Value determined based on Level 1 inputs—See Note 4. |
| †† | Value determined based on Level 2 inputs—See Note 4. |
| 1 | Repurchase Agreements — See Note 5. |
| 2 | All or a portion of this security is pledged as equity index swap collateral at March 31, 2012. |
| 3 | Total Return based on S&P MidCap 400 Index +/- financing at a variable rate. |
plc — Public Limited Company
| | |
64 | THE RYDEX SERIES FUNDS ANNUAL REPORT | | SEE NOTES TO FINANCIAL STATEMENTS. |
MID-CAP 1.5x STRATEGY FUND
STATEMENT OF ASSETS AND LIABILITIES
| | | | |
| March 31, 2012 | | | |
| |
ASSETS: | | | | |
Investments, at value
(cost $15,025,011) | | $ | 19,941,131 | |
Repurchase agreements, at value
(cost $3,804,635) | | | 3,804,635 | |
| | | | |
Total investments
(cost $18,829,646) | | | 23,745,766 | |
Segregated cash with broker | | | 829,602 | |
Cash | | | 219 | |
Receivables: | | | | |
Fund shares sold | | | 122,685 | |
Dividends | | | 17,615 | |
| | | | |
Total assets | | | 24,715,887 | |
| | | | |
| |
LIABILITIES: | | | | |
Unrealized depreciation on swap agreements | | | 26,133 | |
Payable for: | | | | |
Fund shares redeemed | | | 808,313 | |
Variation margin | | | 26,100 | |
Management fees | | | 18,404 | |
Swap settlement | | | 17,226 | |
Distribution and service fees | | | 9,072 | |
Transfer agent and administrative fees | | | 5,112 | |
Portfolio accounting fees | | | 2,045 | |
Miscellaneous | | | 17,636 | |
| | | | |
Total liabilities | | | 930,041 | |
| | | | |
NET ASSETS | | $ | 23,785,846 | |
| | | | |
NET ASSETS CONSIST OF: | | | | |
Paid in capital | | $ | 37,473,184 | |
Accumulated net investment loss | | | (67,408 | ) |
Accumulated net realized loss on investments | | | (18,705,020 | ) |
Net unrealized appreciation on investments | | | 5,085,090 | |
| | | | |
Net assets | | $ | 23,785,846 | |
| | | | |
A-CLASS: | | | | |
Net assets | | $ | 1,997,263 | |
Capital shares outstanding | | | 55,123 | |
Net asset value per share | | $ | 36.23 | |
| | | | |
Maximum offering price per share
(Net asset value divided by 95.25%) | | $ | 38.04 | |
| | | | |
C-CLASS: | | | | |
Net assets | | $ | 4,814,953 | |
Capital shares outstanding | | | 145,126 | |
Net asset value per share | | $ | 33.18 | |
| | | | |
H-CLASS: | | | | |
Net assets | | $ | 16,973,630 | |
Capital shares outstanding | | | 467,965 | |
Net asset value per share | | $ | 36.27 | |
| | | | |
STATEMENT OF OPERATIONS
| | | | |
| Year Ended March 31, 2012 | | | |
| |
INVESTMENT INCOME: | | | | |
Dividends | | $ | 272,163 | |
Interest | | | 2,057 | |
| | | | |
Total investment income | | | 274,220 | |
| | | | |
| |
EXPENSES: | | | | |
Management fees | | | 258,148 | |
Transfer agent and administrative fees | | | 71,708 | |
Distribution and service fees: | | | | |
A-Class | | | 3,598 | |
C-Class | | | 62,900 | |
H-Class | | | 52,385 | |
Portfolio accounting fees | | | 28,683 | |
Custodian fees | | | 7,504 | |
Trustees’ fees* | | | 2,919 | |
Miscellaneous | | | 35,307 | |
| | | | |
Total expenses | | | 523,152 | |
| | | | |
Net investment loss | | | (248,932 | ) |
| | | | |
| |
NET REALIZED AND UNREALIZED GAIN (LOSS): | | | | |
Net realized gain (loss) on: | | | | |
Investments | | | (2,509,050 | ) |
Swap agreements | | | 588,413 | |
Futures contracts | | | (1,806,429 | ) |
| | | | |
Net realized loss | | | (3,727,066 | ) |
| | | | |
Net change in unrealized appreciation
(depreciation) on: | | | | |
Investments | | | (48,469 | ) |
Swap agreements | | | (890,840 | ) |
Futures contracts | | | 194,958 | |
| | | | |
Net change in unrealized appreciation
(depreciation) | | | (744,351 | ) |
| | | | |
Net realized and unrealized loss | | | (4,471,417 | ) |
| | | | |
Net decrease in net assets resulting from operations | | $ | (4,720,349 | ) |
| |
| * | Relates to Trustees not deemed “interested persons” within the meaning of Section 2(a)(19) of the 1940 Act. |
| | |
SEE NOTES TO FINANCIAL STATEMENTS. | | THE RYDEX SERIES FUNDS ANNUAL REPORT | 65 |
MID-CAP 1.5x STRATEGY FUND
STATEMENTS OF CHANGES IN NET ASSETS
| | | | | | | | |
| | | Year Ended
March 31,
2012 | | | Year Ended
March 31,
2011 | |
| | |
INCREASE (DECREASE) IN NET ASSETS FROM OPERATIONS: | | | | | | | | |
Net investment loss | | $ | (248,932 | ) | | $ | (353,954 | ) |
Net realized gain (loss) on investments | | | (3,727,066 | ) | | | 3,824,140 | |
Net change in unrealized appreciation (depreciation) on investments | | | (744,351 | ) | | | 1,314,011 | |
| | | | | | | | |
Net increase (decrease) in net assets resulting from operations | | | (4,720,349 | ) | | | 4,784,197 | |
| | | | | | | | |
| | |
CAPITALSHARETRANSACTIONS: | | | | | | | | |
PROCEEDSFROMSALEOFSHARES | | | | | | | | |
A-Class | | | 4,439,075 | | | | 1,553,048 | |
C-Class | | | 8,856,328 | | | | 16,167,502 | |
H-Class | | | 191,352,207 | | | | 368,792,421 | |
COSTOFSHARESREDEEMED | | | | | | | | |
A-Class | | | (4,211,118 | ) | | | (1,666,271 | ) |
C-Class | | | (9,591,810 | ) | | | (15,672,167 | ) |
H-Class | | | (212,908,174 | ) | | | (359,850,110 | ) |
| | | | | | | | |
Net increase (decrease) from capital share transactions | | | (22,063,492 | ) | | | 9,324,423 | |
| | | | | | | | |
Net increase (decrease) in net assets | | | (26,783,841 | ) | | | 14,108,620 | |
| | |
NETASSETS: | | | | | | | | |
Beginning of year | | | 50,569,687 | | | | 36,461,067 | |
| | | | | | | | |
End of year | | $ | 23,785,846 | | | $ | 50,569,687 | |
| | | | | | | | |
Accumulated net investment loss at end of year | | $ | (67,408 | ) | | $ | — | |
| | | | | | | | |
CAPITALSHAREACTIVITY: | | | | | | | | |
Shares sold | | | | | | | | |
A-Class | | | 137,923 | | | | 51,004 | |
C-Class | | | 276,605 | | | | 563,073 | |
H-Class | | | 5,925,626 | | | | 12,089,650 | |
Shares redeemed | | | | | | | | |
A-Class | | | (133,333 | ) | | | (58,734 | ) |
C-Class | | | (307,940 | ) | | | (549,462 | ) |
H-Class | | | (6,606,666 | ) | | | (12,087,163 | ) |
| | | | | | | | |
Net increase (decrease) in shares | | | (707,785 | ) | | | 8,368 | |
| | | | | | | | |
| | |
66 | THE RYDEX SERIES FUNDS ANNUAL REPORT | | SEE NOTES TO FINANCIAL STATEMENTS. |
MID-CAP 1.5x STRATEGY FUND
FINANCIAL HIGHLIGHTS
This table is presented to show selected data for a share outstanding throughout each period and to assist shareholders in evaluating a Fund’s performance for the periods presented.
| | | | | | | | | | | | | | | | | | | | |
A-Class | | Year Ended
March 31,
2012 | | | Year Ended
March 31,
2011 | | | Year Ended
March 31,
2010 | | | Year Ended
March 31,
2009 | | | Year Ended
March 31,
2008 | |
Per Share Data | | | | | | | | | | | | | | | | | | | | |
Net asset value, beginning of period | | $ | 37.14 | | | $ | 26.89 | | | $ | 13.33 | | | $ | 32.39 | | | $ | 41.56 | |
| | | | | | | | | | | | | | | | | | | | |
Income (loss) from investment operations: | | | | | | | | | | | | | | | | | | | | |
Net investment income (loss)a | | | (.23 | ) | | | (.26 | ) | | | (.16 | ) | | | — | b | | | .23 | |
Net gain (loss) on investments (realized and unrealized) | | | (.68 | ) | | | 10.51 | | | | 13.72 | | | | (17.74 | ) | | | (7.46 | ) |
| | | | | | | | | | | | | | | | | | | | |
Total from investment operations | | | (.91 | ) | | | 10.25 | | | | 13.56 | | | | (17.74 | ) | | | (7.23 | ) |
| | | | | | | | | | | | | | | | | | | | |
Less distributions from: | | | | | | | | | | | | | | | | | | | | |
Net investment income | | | — | | | | — | | | | — | | | | — | | | | (.26 | ) |
Net realized gains | | | — | | | | — | | | | — | | | | (1.32 | ) | | | (1.68 | ) |
| | | | | | | | | | | | | | | | | | | | |
Total distributions | | | — | | | | — | | | | — | | | | (1.32 | ) | | | (1.94 | ) |
| | | | | | | | | | | | | | | | | | | | |
Net asset value, end of period | | $ | 36.23 | | | $ | 37.14 | | | $ | 26.89 | | | $ | 13.33 | | | $ | 32.39 | |
| | | | | | | | | | | | | | | | | | | | |
| | | | | |
Total Returnc | | | (2.45 | %) | | | 38.12 | % | | | 101.73 | % | | | (54.70 | %) | | | (18.29 | %) |
| | | | | | | | | | | | | | | | | | | | |
Ratios/Supplemental Data | | | | | | | | | | | | | | | | | | | | |
Net assets, end of period (in thousands) | | $ | 1,997 | | | $ | 1,877 | | | $ | 1,567 | | | $ | 1,080 | | | $ | 1,571 | |
| | | | | | | | | | | | | | | | | | | | |
Ratios to average net assets: | | | | | | | | | | | | | | | | | | | | |
Net investment income (loss) | | | (0.68 | %) | | | (0.88 | %) | | | (0.79 | %) | | | 0.01 | % | | | 0.57 | % |
Total expenses | | | 1.66 | % | | | 1.70 | % | | | 1.69 | % | | | 1.68 | % | | | 1.67 | % |
| | | | | | | | | | | | | | | | | | | | |
Portfolio turnover rate | | | 141 | % | | | 211 | % | | | 219 | % | | | 204 | % | | | 226 | % |
| | | | | | | | | | | | | | | | | | | | |
C-Class | | Year Ended
March 31,
2012 | | | Year Ended
March 31,
2011 | | | Year Ended
March 31,
2010 | | | Year Ended
March 31,
2009 | | | Year Ended
March 31,
2008 | |
Per Share Data | | | | | | | | | | | | | | | | | | | | |
Net asset value, beginning of period | | $ | 34.26 | | | $ | 24.98 | | | $ | 12.47 | | | $ | 30.73 | | | $ | 39.82 | |
| | | | | | | | | | | | | | | | | | | | |
Income (loss) from investment operations: | | | | | | | | | | | | | | | | | | | | |
Net investment lossa | | | (.43 | ) | | | (.43 | ) | | | (.27 | ) | | | (.17 | ) | | | (.08 | ) |
Net gain (loss) on investments (realized and unrealized) | | | (.65 | ) | | | 9.71 | | | | 12.78 | | | | (16.77 | ) | | | (7.07 | ) |
| | | | | | | | | | | | | | | | | | | | |
Total from investment operations | | | (1.08 | ) | | | 9.28 | | | | 12.51 | | | | (16.94 | ) | | | (7.15 | ) |
| | | | | | | | | | | | | | | | | | | | |
Less distributions from: | | | | | | | | | | | | | | | | | | | | |
Net investment income | | | — | | | | — | | | | — | | | | — | | | | (.26 | ) |
Net realized gains | | | — | | | | — | | | | — | | | | (1.32 | ) | | | (1.68 | ) |
| | | | | | | | | | | | | | | | | | | | |
Total distributions | | | — | | | | — | | | | — | | | | (1.32 | ) | | | (1.94 | ) |
| | | | | | | | | | | | | | | | | | | | |
Net asset value, end of period | | $ | 33.18 | | | $ | 34.26 | | | $ | 24.98 | | | $ | 12.47 | | | $ | 30.73 | |
| | | | | | | | | | | | | | | | | | | | |
| | | | | |
Total Returnc | | | (3.15 | %) | | | 37.15 | % | | | 100.32 | % | | | (55.06 | %) | | | (18.90 | %) |
| | | | | | | | | | | | | | | | | | | | |
Ratios/Supplemental Data | | | | | | | | | | | | | | | | | | | | |
Net assets, end of period (in thousands) | | $ | 4,815 | | | $ | 6,045 | | | $ | 4,069 | | | $ | 2,954 | | | $ | 8,388 | |
| | | | | | | | | | | | | | | | | | | | |
Ratios to average net assets: | | | | | | | | | | | | | | | | | | | | |
Net investment loss | | | (1.42 | %) | | | (1.59 | %) | | | (1.43 | %) | | | (0.72 | %) | | | (0.20 | %) |
Total expenses | | | 2.41 | % | | | 2.44 | % | | | 2.44 | % | | | 2.43 | % | | | 2.42 | % |
| | | | | | | | | | | | | | | | | | | | |
Portfolio turnover rate | | | 141 | % | | | 211 | % | | | 219 | % | | | 204 | % | | | 226 | % |
| | |
SEE NOTES TO FINANCIAL STATEMENTS. | | THE RYDEX SERIES FUNDS ANNUAL REPORT | 67 |
MID-CAP 1.5x STRATEGY FUND
FINANCIAL HIGHLIGHTS (concluded)
This table is presented to show selected data for a share outstanding throughout each period and to assist shareholders in evaluating a Fund’s performance for the periods presented.
| | | | | | | | | | | | | | | | | | | | |
H-Class | | Year Ended
March 31,
2012 | | | Year Ended
March 31,
2011 | | | Year Ended
March 31,
2010 | | | Year Ended
March 31,
2009 | | | Year Ended
March 31,
2008 | |
Per Share Data | | | | | | | | | | | | | | | | | | | | |
Net asset value, beginning of period | | $ | 37.12 | | | $ | 26.89 | | | $ | 13.33 | | | $ | 32.40 | | | $ | 41.58 | |
| | | | | | | | | | | | | | | | | | | | |
Income (loss) from investment operations: | | | | | | | | | | | | | | | | | | | | |
Net investment income (loss)a | | | (.24 | ) | | | (.28 | ) | | | (.15 | ) | | | .01 | | | | .25 | |
Net gain (loss) on investments (realized and unrealized) | | | (.61 | ) | | | 10.51 | | | | 13.71 | | | | (17.76 | ) | | | (7.49 | ) |
| | | | | | | | | | | | | | | | | | | | |
Total from investment operations | | | (.85 | ) | | | 10.23 | | | | 13.56 | | | | (17.75 | ) | | | (7.24 | ) |
| | | | | | | | | | | | | | | | | | | | |
Less distributions from: | | | | | | | | | | | | | | | | | | | | |
Net investment income | | | — | | | | — | | | | — | | | | — | | | | (.26 | ) |
Net realized gains | | | — | | | | — | | | | — | | | | (1.32 | ) | | | (1.68 | ) |
| | | | | | | | | | | | | | | | | | | | |
Total distributions | | | — | | | | — | | | | — | | | | (1.32 | ) | | | (1.94 | ) |
| | | | | | | | | | | | | | | | | | | | |
Net asset value, end of period | | $ | 36.27 | | | $ | 37.12 | | | $ | 26.89 | | | $ | 13.33 | | | $ | 32.40 | |
| | | | | | | | | | | | | | | | | | | | |
| | | | | |
Total Returnc | | | (2.29 | %) | | | 38.04 | % | | | 101.73 | % | | | (54.71 | %) | | | (18.31 | %) |
| | | | | | | | | | | | | | | | | | | | |
Ratios/Supplemental Data | | | | | | | | | | | | | | | | | | | | |
Net assets, end of period (in thousands) | | $ | 16,974 | | | $ | 42,647 | | | $ | 30,825 | | | $ | 11,063 | | | $ | 11,763 | |
| | | | | | | | | | | | | | | | | | | | |
Ratios to average net assets: | | | | | | | | | | | | | | | | | | | | |
Net investment income (loss) | | | (0.72 | %) | | | (0.91 | %) | | | (0.73 | %) | | | 0.06 | % | | | 0.61 | % |
Total expenses | | | 1.66 | % | | | 1.70 | % | | | 1.68 | % | | | 1.68 | % | | | 1.67 | % |
| | | | | | | | | | | | | | | | | | | | |
Portfolio turnover rate | | | 141 | % | | | 211 | % | | | 219 | % | | | 204 | % | | | 226 | % |
| a | Net investment income (loss) per share was computed using average shares outstanding throughout the period. |
| b | Net investment income is less than $0.01 per share. |
| c | Total return does not reflect the impact of any applicable sales charges and has not been annualized. |
| | |
68 | THE RYDEX SERIES FUNDS ANNUAL REPORT | | SEE NOTES TO FINANCIAL STATEMENTS. |
This page intentionally left blank.
THE RYDEX SERIES FUNDS ANNUAL REPORT | 69
| | |
PERFORMANCE REPORT AND FUND PROFILE (Unaudited) | | March 31, 2012 |
INVERSE MID-CAP STRATEGY FUND
OBJECTIVE: Seeks to provide investment results that match, before fees and expenses, the performance of a specific benchmark on a daily basis. The Fund’s current benchmark is the inverse (opposite) of the performance of the S&P MidCap 400 Index (the “underlying index”). The Fund does not seek to achieve its investment objective over a period of time greater than one day.
For the year ended March 31, 2012, Inverse Mid-Cap Strategy Fund H-Class returned -10.66%. Over the year, its benchmark, the S&P MidCap 400 Index*, had a 1.98% return. Inverse Mid-Cap Strategy Fund achieved a daily correlation of 99% to its benchmark of -100% of the daily price movement of the S&P MidCap 400 Index.
Sectors contributing most to performance of the index were Consumer Discretionary and Industrials. Energy was the largest detractor from return of the index for the year.
Regeneron Pharmaceuticals, Inc., Monster Beverage Corp. and Dollar Tree, Inc. were among the stocks which provided the most performance to the index during the year. Cimarex Energy Co., Green Mountain Coffee Roasters, Inc. and Arch Coal, Inc. were among the stocks which provided the least performance to the index during the year.
Derivatives in the Fund were used to help provide exposure to the composition of the benchmark in the highest efficient manner and not for hedging purposes. The results of derivatives use during the period were within our expectations and contributed to the Fund’s performance.
Due to the compounding of daily returns, leveraged and inverse funds’ returns over periods other than one day will likely differ in amount and possibly direction from the benchmark return for the same period. Investors should monitor their leveraged and inverse funds’ holdings to ensure that they are consistent with their strategies, as frequently as daily.
The effects of compounding may cause the longer-term correlation of the fund to its benchmark to diminish. The apparent discrepancy between the leveraged and unleveraged indices is the result of compounding, which is described briefly on page 4 of this report.
*The S&P MidCap 400® Index provides investors with a benchmark for mid-sized companies. The index covers approximately 7% of the U.S. equity market, and seeks to remain an accurate measure of mid-sized companies, reflecting the risk and return characteristics of the broader mid-cap universe on an on-going basis.
Performance displayed represents past performance which is no guarantee of future results.
Holdings Diversification (Market Exposure as % of Net Assets)
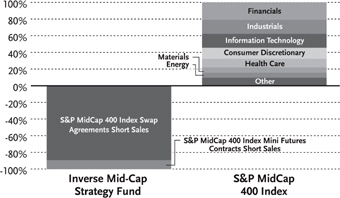
“Holdings Diversification (Market Exposure as % of Net Assets)” excludes any temporary cash investments.
| | | | |
Inception Dates: | | | |
A-Class | | | March 31, 2004 | |
C-Class | | | February 20, 2004 | |
H-Class | | | February 20, 2004 | |
The Fund invests principally in derivative investments such as swap agreements and futures contracts.
70 | THE RYDEX SERIES FUNDS ANNUAL REPORT
PERFORMANCE REPORT AND FUND PROFILE (Unaudited)(concluded)
Cumulative Fund Performance*
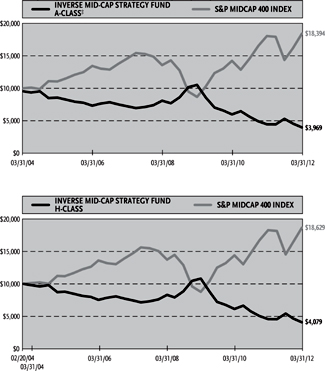
Average Annual Returns*
Periods Ended 03/31/12
| | | | | | | | | | | | |
| | | 1 Year | | | 5 Year | | | Since
Inception
(03/31/04) | |
A-Class Shares | | | -10.65 | % | | | -11.28 | % | | | -10.37 | % |
A-Class Shares with sales charge‡ | | | -14.91 | % | | | -12.14 | % | | | -10.91 | % |
S&P MidCap 400 Index | | | 1.98 | % | | | 4.78 | % | | | 7.92 | % |
| | | |
| | | | | | | | | (02/20/04) | |
C-Class Shares | | | -11.33 | % | | | -11.95 | % | | | -11.14 | % |
C-Class Shares with CDSC† | | | -12.22 | % | | | -11.95 | % | | | -11.14 | % |
H-Class Shares | | | -10.66 | % | | | -11.30 | % | | | -10.47 | % |
S&P MidCap 400 Index | | | 1.98 | % | | | 4.78 | % | | | 7.97 | % |
| * | The performance data above represents past performance that is not predictive of future results. The investment return and principal value of an investment in the Fund will fluctuate so that an investor’s shares, when redeemed, may be worth more or less than their original cost. Returns are historical and include changes in principal and reinvested dividends and capital gains and do not reflect the effect of taxes. The S&P MidCap 400 Index is an unmanaged index and, unlike the Fund, has no management fees or operating expenses to reduce its reported return. The graphs are based on A-Class shares and H-Class shares only; performance for C-Class shares will vary due to differences in fee structures. |
| † | Fund returns include a CDSC of 1% if redeemed within 12 months of purchase. |
| ‡ | Fund returns are calculated using the maximum sales charge of 4.75%. |
THE RYDEX SERIES FUNDS ANNUAL REPORT | 71
| | |
| SCHEDULE OF INVESTMENTS | | March31,2012 |
INVERSE MID-CAP STRATEGY FUND | | |
| | | | | | | | |
| | | FACE
AMOUNT | | | VALUE | |
REPURCHASE AGREEMENTS††,1 - 93.6% | | | | | | | | |
HSBC Group | | | | | | | | |
issued 03/30/12 at 0.01% due 04/02/12 | | $ | 957,551 | | | $ | 957,551 | |
Credit Suisse Group
| | | | | | | | |
issued 03/30/12 at 0.01% due 04/02/122 | | | 399,128 | | | | 399,128 | |
Mizuho Financial Group, Inc.
| | | | | | | | |
issued 03/30/12 at 0.01% due 04/02/12 | | | 269,407 | | | | 269,407 | |
Deutsche Bank
| | | | | | | | |
issued 03/30/12 at 0.01% due 04/02/12 | | | 71,605 | | | | 71,605 | |
| | | | | | | | |
Total Repurchase Agreements
(Cost $1,697,691) | | | | | | | 1,697,691 | |
| | | | | | | | |
Total Investments – 93.6%
(Cost $1,697,691) | | | | | | $ | 1,697,691 | |
| | | | | | | | |
Other Assets & Liabilities, net – 6.4% | | | | | | | 116,912 | |
| | | | | | | | |
Total Net Assets – 100.0% | | | | | | $ | 1,814,603 | |
| |
| | | | | | | | |
| | | CONTRACTS | | | UNREALIZED
GAIN | |
FUTURES CONTRACTS SOLD SHORT† | | | | | | | | |
June 2012 S&P MidCap 400
Index Mini Futures Contracts (Aggregate Value of Contracts $198,100) | | | 2 | | | $ | 1,297 | |
| | | | | | | | |
| | |
| | | UNITS | | | | |
EQUITY INDEX SWAP AGREEMENTS SOLD SHORT†† | | | | | | | | |
Goldman Sachs International
April 2012 S&P MidCap 400 Index Swap, Terminating 04/27/123 (Notional Value $280,503) | | | 282 | | | $ | 2,263 | |
Morgan Stanley Capital Services, Inc.
April 2012 S&P MidCap 400 Index Swap, Terminating 04/30/123 (Notional Value $155,013) | | | 156 | | | | 1,034 | |
Credit Suisse Capital, LLC
April 2012 S&P MidCap 400 Index Swap, Terminating 04/30/123 (Notional Value $905,767) | | | 911 | | | | 315 | |
Barclays Bank plc
April 2012 S&P MidCap 400 Index Swap, Terminating 04/30/123 (Notional Value $279,771) | | | 281 | | | | 103 | |
| | | | | | | | |
(Total Notional Value $1,621,054) | | | | | | $ | 3,715 | |
| | | | | | | | |
| † | Value determined based on Level 1 inputs — See Note 4. |
| †† | Value determined based on Level 2 inputs — See Note 4. |
| 1 | Repurchase Agreements — See Note 5. |
| 2 | All or a portion of this security is pledged as equity index swap collateral at March 31, 2012. |
| 3 | Total Return based on S&P MidCap 400 Index +/- financing at a variable rate. |
| | plc — Public Limited Company |
| | |
72 | THE RYDEX SERIES FUNDS ANNUAL REPORT | | SEE NOTES TO FINANCIAL STATEMENTS. |
INVERSE MID-CAP STRATEGY FUND
STATEMENT OF ASSETS AND LIABILITIES
| | | | |
| March 31, 2012 | | | |
| |
ASSETS: | | | | |
Repurchase agreements, at value
(cost $1,697,691) | | $ | 1,697,691 | |
| | | | |
Total investments
(cost $1,697,691) | | | 1,697,691 | |
Segregated cash with broker | | | 117,416 | |
Unrealized appreciation on swap agreements | | | 3,715 | |
Receivable for swap settlement | | | 273 | |
Receivable: | | | | |
Variation margin | | | 580 | |
| | | | |
Total assets | | | 1,819,675 | |
| | | | |
LIABILITIES: | | | | |
Payable for: | | | | |
Management fees | | | 1,486 | |
Distribution and service fees | | | 504 | |
Transfer agent and administrative fees | | | 413 | |
Portfolio accounting fees | | | 165 | |
Miscellaneous | | | 2,504 | |
| | | | |
Total liabilities | | | 5,072 | |
| | | | |
NET ASSETS | | $ | 1,814,603 | |
| | | | |
NET ASSETS CONSISTOF: | | | | |
Paid in capital | | $ | 16,836,382 | |
Accumulated net investment loss | | | (9,051 | ) |
Accumulated net realized loss on investments | | | (15,017,740 | ) |
Net unrealized appreciation on investments | | | 5,012 | |
| | | | |
Net assets | | $ | 1,814,603 | |
| | | | |
A-CLASS: | | | | |
Net assets | | $ | 115,500 | |
Capital shares outstanding | | | 6,342 | |
Net asset value per share | | $ | 18.21 | |
| | | | |
Maximum offering price per share
(Net asset value divided by 95.25%) | | $ | 19.12 | |
| | | | |
C-CLASS: | | | | |
Net assets | | $ | 120,916 | |
Capital shares outstanding | | | 7,087 | |
Net asset value per share | | $ | 17.06 | |
| | | | |
H-CLASS: | | | | |
Net assets | | $ | 1,578,187 | |
Capital shares outstanding | | | 86,765 | |
Net asset value per share | | $ | 18.19 | |
| | | | |
STATEMENT OF OPERATIONS
| | | | |
| Year Ended March 31, 2012 | | | |
| |
INVESTMENT INCOME: | | | | |
Interest | | $ | 1,187 | |
| | | | |
Total investment income | | | 1,187 | |
| | | | |
EXPENSES: | | | | |
Management fees | | | 41,244 | |
Transfer agent and administrative fees | | | 11,457 | |
Distribution and service fees: | | | | |
A-Class | | | 583 | |
C-Class | | | 3,449 | |
H-Class | | | 10,011 | |
Portfolio accounting fees | | | 4,583 | |
Custodian fees | | | 1,184 | |
Trustees’ fees* | | | 387 | |
Miscellaneous | | | 5,808 | |
| | | | |
Total expenses | | | 78,706 | |
| | | | |
Net investment loss | | | (77,519 | ) |
| | | | |
NET REALIZEDAND UNREALIZED GAIN (LOSS): | | | | |
Net realized gain (loss) on: | | | | |
Swap agreements | | | (1,297,632 | ) |
Futures contracts | | | (491,657 | ) |
| | | | |
Net realized loss | | | (1,789,289 | ) |
| | | | |
Net change in unrealized appreciation (depreciation) on: | | | | |
Swap agreements | | | 49,519 | |
Futures contracts | | | 1,404 | |
| | | | |
Net change in unrealized appreciation (depreciation) | | | 50,923 | |
| | | | |
Net realized and unrealized loss | | | (1,738,366 | ) |
| | | | |
Net decrease in net assets resulting from operations | | $ | (1,815,885 | ) |
| | | | |
| * | Relates to Trustees not deemed “interested persons” within the meaning of Section 2(a)(19) of the 1940 Act. |
| | |
SEE NOTES TO FINANCIAL STATEMENTS. | | THE RYDEX SERIES FUNDS ANNUAL REPORT | 73 |
INVERSE MID-CAP STRATEGY FUND
STATEMENTS OF CHANGES IN NET ASSETS
| | | | | | | | |
| | | Year Ended
March 31,
2012 | | | Year Ended
March 31,
2011 | |
INCREASE (DECREASE) IN NET ASSETS FROM OPERATIONS: | | | | | | | | |
Net investment loss | | $ | (77,519 | ) | | $ | (67,569 | ) |
Net realized loss on investments | | | (1,789,289 | ) | | | (1,408,270 | ) |
Net change in unrealized appreciation (depreciation) on investments | | | 50,923 | | | | 124,179 | |
| | | | | | | | |
Net decrease in net assets resulting from operations | | | (1,815,885 | ) | | | (1,351,660 | ) |
| | | | | | | | |
| | |
CAPITALSHARETRANSACTIONS: | | | | | | | | |
PROCEEDSFROMSALEOFSHARES | | | | | | | | |
A-Class | | | 422,447 | | | | 686,044 | |
C-Class | | | 1,884,393 | | | | 1,570,414 | |
H-Class | | | 35,539,703 | | | | 41,475,130 | |
COSTOFSHARESREDEEMED | | | | | | | | |
A-Class | | | (552,182 | ) | | | (1,036,384 | ) |
C-Class | | | (2,014,057 | ) | | | (1,354,262 | ) |
H-Class | | | (34,099,863 | ) | | | (41,431,048 | ) |
| | | | | | | | |
Net increase (decrease) from capital share transactions | | | 1,180,441 | | | | (90,106 | ) |
| | | | | | | | |
Net decrease in net assets | | | (635,444 | ) | | | (1,441,766 | ) |
| | |
NETASSETS: | | | | | | | | |
Beginning of period | | | 2,450,047 | | | | 3,891,813 | |
| | | | | | | | |
End of year | | $ | 1,814,603 | | | $ | 2,450,047 | |
| | | | | | | | |
Accumulated net investment loss at end of year | | $ | (9,051 | ) | | $ | — | |
| | | | | | | | |
CAPITALSHAREACTIVITY: | | | | | | | | |
Shares sold | | | | | | | | |
A-Class | | | 20,135 | | | | 25,274 | |
C-Class | | | 88,767 | | | | 61,434 | |
H-Class | | | 1,591,658 | | | | 1,626,446 | |
Shares redeemed | | | | | | | | |
A-Class | | | (26,947 | ) | | | (38,915 | ) |
C-Class | | | (99,207 | ) | | | (54,193 | ) |
H-Class | | | (1,595,492 | ) | | | (1,641,534 | ) |
| | | | | | | | |
Net decrease in shares | | | (21,086 | ) | | | (21,488 | ) |
| | | | | | | | |
| | |
74 | THE RYDEX SERIES FUNDS ANNUAL REPORT | | SEE NOTES TO FINANCIAL STATEMENTS. |
INVERSE MID-CAP STRATEGY FUND
FINANCIAL HIGHLIGHTS
This table is presented to show selected data for a share outstanding throughout each period and to assist shareholders in evaluating a Fund’s performance for the periods presented.
| | | | | | | | | | | | | | | | | | | | |
A-Class | | Year Ended
March 31,
2012 | | | Year Ended
March 31,
2011 | | | Year Ended
March 31,
2010 | | | Year Ended
March 31,
2009 | | | Year Ended
March 31,
2008 | |
Per Share Data | | | | | | | | | | | | | | | | | | | | |
Net asset value, beginning of period | | $ | 20.38 | | | $ | 27.37 | | | $ | 48.21 | | | $ | 37.07 | | | $ | 33.78 | |
| | | | | | | | | | | | | | | | | | | | |
Income (loss) from investment operations: | | | | | | | | | | | | | | | | | | | | |
Net investment income (loss)a | | | (.34 | ) | | | (.39 | ) | | | (.52 | ) | | | (.22 | ) | | | .81 | |
Net gain (loss) on investments (realized and unrealized) | | | (1.83 | ) | | | (6.60 | ) | | | (20.32 | ) | | | 11.40 | | | | 3.11 | |
| | | | | | | | | | | | | | | | | | | | |
Total from investment operations | | | (2.17 | ) | | | (6.99 | ) | | | (20.84 | ) | | | 11.18 | | | | 3.92 | |
| | | | | | | | | | | | | | | | | | | | |
Less distributions from: | | | | | | | | | | | | | | | | | | | | |
Net investment income | | | — | | | | — | | | | — | | | | (.04 | ) | | | (.63 | ) |
| | | | | | | | | | | | | | | | | | | | |
Total distributions | | | — | | | | — | | | | — | | | | (.04 | ) | | | (.63 | ) |
| | | | | | | | | | | | | | | | | | | | |
Net asset value, end of period | | $ | 18.21 | | | $ | 20.38 | | | $ | 27.37 | | | $ | 48.21 | | | $ | 37.07 | |
| | | | | | | | | | | | | | | | | | | | |
Total Returnb | | | (10.65 | %) | | | (25.54 | %) | | | (43.23 | %) | | | 30.14 | % | | | 11.83 | % |
| | | | | | | | | | | | | | | | | | | | |
Ratios/Supplemental Data | | | | | | | | | | | | | | | | | | | | |
Net assets, end of period (in thousands) | | $ | 115 | | | $ | 268 | | | $ | 733 | | | $ | 452 | | | $ | 906 | |
| | | | | | | | | | | | | | | | | | | | |
Ratios to average net assets: | | | | | | | | | | | | | | | | | | | | |
Net investment income (loss) | | | (1.63 | %) | | | (1.54 | %) | | | (1.56 | %) | | | (0.55 | %) | | | 2.35 | % |
Total expenses | | | 1.66 | % | | | 1.69 | % | | | 1.69 | % | | | 1.68 | % | | | 1.66 | % |
| | | | | | | | | | | | | | | | | | | | |
Portfolio turnover rate | | | — | | | | — | | | | — | | | | — | | | | — | |
| | | | | | | | | | | | | | | | | | | | |
C-Class | | Year Ended
March 31,
2012 | | | Year Ended
March 31,
2011 | | | Year Ended
March 31,
2010 | | | Year Ended
March 31,
2009 | | | Year Ended
March 31,
2008 | |
Per Share Data | | | | | | | | | | | | | | | | | | | | |
Net asset value, beginning of period | | $ | 19.24 | | | $ | 26.03 | | | $ | 46.24 | | | $ | 35.82 | | | $ | 32.89 | |
| | | | | | | | | | | | | | | | | | | | |
Income (loss) from investment operations: | | | | | | | | | | | | | | | | | | | | |
Net investment income (loss)a | | | (.48 | ) | | | (.55 | ) | | | (.75 | ) | | | (.41 | ) | | | .60 | |
Net gain (loss) on investments (realized and unrealized) | | | (1.70 | ) | | | (6.24 | ) | | | (19.46 | ) | | | 10.87 | | | | 2.96 | |
| | | | | | | | | | | | | | | | | | | | |
Total from investment operations | | | (2.18 | ) | | | (6.79 | ) | | | (20.21 | ) | | | 10.46 | | | | 3.56 | |
| | | | | | | | | | | | | | | | | | | | |
Less distributions from: | | | | | | | | | | | | | | | | | | | | |
Net investment income | | | — | | | | — | | | | — | | | | (.04 | ) | | | (.63 | ) |
| | | | | | | | | | | | | | | | | | | | |
Total distributions | | | — | | | | — | | | | — | | | | (.04 | ) | | | (.63 | ) |
| | | | | | | | | | | | | | | | | | | | |
Net asset value, end of period | | $ | 17.06 | | | $ | 19.24 | | | $ | 26.03 | | | $ | 46.24 | | | $ | 35.82 | |
| | | | | | | | | | | | | | | | | | | | |
Total Returnb | | | (11.33 | %) | | | (26.09 | %) | | | (43.71 | %) | | | 29.18 | % | | | 11.05 | % |
| | | | | | | | | | | | | | | | | | | | |
Ratios/Supplemental Data | | | | | | | | | | | | | | | | | | | | |
Net assets, end of period (in thousands) | | $ | 121 | | | $ | 337 | | | $ | 268 | | | $ | 327 | | | $ | 1,478 | |
| | | | | | | | | | | | | | | | | | | | |
Ratios to average net assets: | | | | | | | | | | | | | | | | | | | | |
Net investment income (loss) | | | (2.39 | %) | | | (2.29 | %) | | | (2.30 | %) | | | (1.07 | %) | | | 1.83 | % |
Total expenses | | | 2.42 | % | | | 2.44 | % | | | 2.43 | % | | | 2.43 | % | | | 2.41 | % |
| | | | | | | | | | | | | | | | | | | | |
Portfolio turnover rate | | | — | | | | — | | | | — | | | | — | | | | — | |
| | |
SEE NOTES TO FINANCIAL STATEMENTS. | | THE RYDEX SERIES FUNDS ANNUAL REPORT | 75 |
INVERSE MID-CAP STRATEGY FUND
FINANCIAL HIGHLIGHTS (concluded)
This table is presented to show selected data for a share outstanding throughout each period and to assist shareholders in evaluating a Fund’s performance for the periods presented.
| | | | | | | | | | | | | | | | | | | | |
H-Class | | Year Ended
March 31,
2012 | | | Year Ended
March 31,
2011 | | | Year Ended
March 31,
2010 | | | Year Ended
March 31,
2009 | | | Year Ended
March 31,
2008 | |
Per Share Data | | | | | | | | | | | | | | | | | | | | |
Net asset value, beginning of period | | $ | 20.36 | | | $ | 27.35 | | | $ | 48.21 | | | $ | 37.07 | | | $ | 33.78 | |
| | | | | | | | | | | | | | | | | | | | |
Income (loss) from investment operations: | | | | | | | | | | | | | | | | | | | | |
Net investment income (loss)a | | | (.35 | ) | | | (.40 | ) | | | (.55 | ) | | | (.27 | ) | | | .78 | |
Net gain (loss) on investments (realized and unrealized) | | | (1.82 | ) | | | (6.59 | ) | | | (20.31 | ) | | | 11.45 | | | | 3.14 | |
| | | | | | | | | | | | | | | | | | | | |
Total from investment operations | | | (2.17 | ) | | | (6.99 | ) | | | (20.86 | ) | | | 11.18 | | | | 3.92 | |
| | | | | | | | | | | | | | | | | | | | |
Less distributions from: | | | | | | | | | | | | | | | | | | | | |
Net investment income | | | — | | | | — | | | | — | | | | (.04 | ) | | | (.63 | ) |
| | | | | | | | | | | | | | | | | | | | |
Total distributions | | | — | | | | — | | | | — | | | | (.04 | ) | | | (.63 | ) |
| | | | | | | | | | | | | | | | | | | | |
Net asset value, end of period | | $ | 18.19 | | | $ | 20.36 | | | $ | 27.35 | | | $ | 48.21 | | | $ | 37.07 | |
| | | | | | | | | | | | | | | | | | | | |
Total Returnb | | | (10.66 | %) | | | (25.56 | %) | | | (43.27 | %) | | | 30.14 | % | | | 11.83 | % |
| | | | | | | | | | | | | | | | | | | | |
Ratios/Supplemental Data | | | | | | | | | | | | | | | | | | | | |
Net assets, end of period (in thousands) | | $ | 1,578 | | | $ | 1,845 | | | $ | 2,891 | | | $ | 7,350 | | | $ | 46,630 | |
| | | | | | | | | | | | | | | | | | | | |
Ratios to average net assets: | | | | | | | | | | | | | | | | | | | | |
Net investment income (loss) | | | (1.64 | %) | | | (1.53 | %) | | | (1.55 | %) | | | (0.62 | %) | | | 2.26 | % |
Total expenses | | | 1.67 | % | | | 1.69 | % | | | 1.68 | % | | | 1.70 | % | | | 1.65 | % |
| | | | | | | | | | | | | | | | | | | | |
Portfolio turnover rate | | | — | | | | — | | | | — | | | | — | | | | — | |
| a | Net investment income (loss) per share was computed using average shares outstanding throughout the period. |
| b | Total return does not reflect the impact of any applicable sales charges and has not been annualized. |
| | |
76 | THE RYDEX SERIES FUNDS ANNUAL REPORT | | SEE NOTES TO FINANCIAL STATEMENTS. |
This page intentionally left blank.
THE RYDEX SERIES FUNDS ANNUAL REPORT | 77
| | |
PERFORMANCE REPORT AND FUND PROFILE (Unaudited) | | March 31, 2012 |
RUSSELL 2000® 1.5x STRATEGY FUND
OBJECTIVE: Seeks to provide investment results that correlate, before fees and expenses, to the performance of a specific benchmark for small-cap securities on a daily basis. The Fund’s current benchmark is 150% of the performance of the Russell 2000® Index (the “underlying index”). The Fund does not seek to achieve its investment objective over a period of time greater than one day.
For the one-year period ended March 31, 2012, Russell 2000® 1.5x Strategy Fund maintained a daily correlation of over 99% to its benchmark of 150% of the daily price movement of the Russell 2000 Index. Russell 2000® 1.5x Strategy Fund H-Class returned -6.30%, while the Russell 2000 Index* returned -0.18% over the same period.
The biggest performance contributors to the index during the period were the Financials and Health Care sectors. Energy and Information Technology provided the least performance to the index during the year.
Medivation, Inc., Nu Skin Enterprises, Inc. Class A and Inhibitex, Inc. were among the stocks which provided the most performance to the index during the year. MF Global Holdings Ltd., InterMune, Inc. and Patriot Coal Corp. were among the stocks which provided the least performance to the index during the year.
Derivatives in the Fund were used to help provide exposure to the composition of the benchmark in the highest efficient manner and to provide leverage, not for hedging purposes. The results of derivatives use during the period were within our expectations and contributed to the Fund’s performance.
Due to the compounding of daily returns, leveraged and inverse funds’ returns over periods other than one day will likely differ in amount and possibly direction from the benchmark return for the same period. Investors should monitor their leveraged and inverse funds’ holdings to ensure that they are consistent with their strategies, as frequently as daily.
The effects of compounding may cause the longer-term correlation of the fund to its benchmark to diminish. The apparent discrepancy between the leveraged and unleveraged indices is the result of compounding, which is described briefly on page 4 of this report.
*Russell 2000® Index measures the performance of the small-cap value segment of the U.S. equity universe.
Performance displayed represents past performance which is no guarantee of future results.
Holdings Diversification (Market Exposure as % of Net Assets)
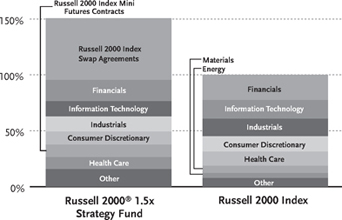
“Holdings Diversification (Market Exposure as % of Net Assets)” excludes any temporary cash investments.
| | | | |
Inception Dates: | | | |
A-Class | | | March 31, 2004 | |
C-Class | | | January 23, 2001 | |
H-Class | | | November 1, 2000 | |
| | | | |
Ten Largest Holdings (% of Total Net Assets) | |
Parametric Technology Corp. | | | 0.2 | % |
Nu Skin Enterprises, Inc.—Class A | | | 0.2 | % |
Clean Harbors, Inc. | | | 0.2 | % |
American Campus Communities, Inc. | | | 0.2 | % |
WellCare Health Plans, Inc. | | | 0.2 | % |
Salix Pharmaceuticals Ltd. | | | 0.2 | % |
Jack Henry & Associates, Inc. | | | 0.2 | % |
Signature Bank | | | 0.2 | % |
Home Properties, Inc. | | | 0.2 | % |
BioMed Realty Trust, Inc. | | | 0.2 | % |
| | | | |
Top Ten Total | | | 2.0 | % |
| | | | |
“Ten Largest Holdings” exclude any temporary cash or derivative investments.
78 | THE RYDEX SERIES FUNDS ANNUAL REPORT
PERFORMANCE REPORT AND FUND PROFILE (Unaudited)(concluded)
Cumulative Fund Performance*
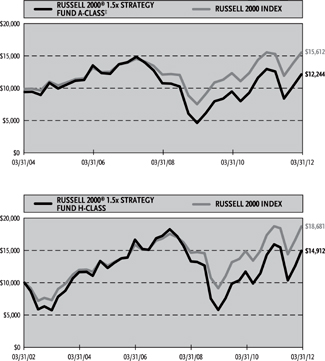
Average Annual Returns*
Periods Ended 03/31/12
| | | | | | | | | | | | |
| | | 1 Year | | | 5 Year | | | 10 Year | |
C-Class Shares | | | -7.02 | % | | | -3.58 | % | | | 3.28 | % |
C-Class Shares with CDSC† | | | -7.95 | % | | | -3.58 | % | | | 3.28 | % |
H-Class Shares | | | -6.30 | % | | | -2.85 | % | | | 4.08 | % |
Russell 2000 Index | | | -0.18 | % | | | 2.13 | % | | | 6.45 | % |
| | | |
| | | | | | | | | Since
Inception
(03/31/04) | |
A-Class Shares | | | -6.31 | % | | | -2.82 | % | | | 3.19 | % |
A-Class Shares with sales charge‡ | | | -10.75 | % | | | -3.77 | % | | | 2.56 | % |
Russell 2000 Index | | | -0.18 | % | | | 2.13 | % | | | 5.73 | % |
| * | The performance data above represents past performance that is not predictive of future results. The investment return and principal value of an investment in the Fund will fluctuate so that an investor’s shares, when redeemed, may be worth more or less than their original cost. Returns are historical and include changes in principal and reinvested dividends and capital gains and do not reflect the effect of taxes. The Russell 2000 Index is an unmanaged index and, unlike the Fund, has no management fees or operating expenses to reduce its reported return. The graphs are based on A-Class shares and H-Class shares only; performance for C-Class shares will vary due to differences in fee structures. |
| † | Fund returns include a CDSC of 1% if redeemed within 12 months of purchase. |
| ‡ | Fund returns are calculated using the maximum sales charge of 4.75%. |
THE RYDEX SERIES FUNDS ANNUAL REPORT | 79
| | |
| SCHEDULE OF INVESTMENTS | | March 31, 2012 |
| RUSSELL 2000® 1.5x STRATEGY FUND | | |
| | | | | | | | |
| | | SHARES | | | VALUE | |
COMMON STOCKS† - 84.0% | | | | | | | | |
| | |
FINANCIALS - 18.9% | | | | | | | | |
American Campus Communities, Inc. | | | 860 | | | $ | 38,458 | |
Signature Bank* | | | 572 | | | | 36,058 | |
Home Properties, Inc. | | | 591 | | | | 36,057 | |
BioMed Realty Trust, Inc. | | | 1,899 | | | | 36,043 | |
National Retail Properties, Inc. | | | 1,288 | | | | 35,021 | |
CBL & Associates Properties, Inc. | | | 1,835 | | | | 34,718 | |
SVB Financial Group* | | | 534 | | | | 34,357 | |
Kilroy Realty Corp. | | | 737 | | | | 34,352 | |
Hancock Holding Co. | | | 957 | | | | 33,983 | |
Extra Space Storage, Inc. | | | 1,157 | | | | 33,309 | |
ProAssurance Corp. | | | 377 | | | | 33,216 | |
MFA Financial, Inc. | | | 4,402 | | | | 32,882 | |
Tanger Factory Outlet Centers | | | 1,062 | | | | 31,573 | |
Mid-America Apartment Communities, Inc. | | | 464 | | | | 31,102 | |
Highwoods Properties, Inc. | | | 922 | | | | 30,721 | |
Post Properties, Inc. | | | 648 | | | | 30,365 | |
LaSalle Hotel Properties | | | 1,051 | | | | 29,575 | |
Equity Lifestyle Properties, Inc. | | | 401 | | | | 27,966 | |
Entertainment Properties Trust | | | 585 | | | | 27,132 | |
Omega Healthcare Investors, Inc. | | | 1,260 | | | | 26,788 | |
Delphi Financial Group, Inc.—Class A | | | 596 | | | | 26,683 | |
Prosperity Bancshares, Inc. | | | 581 | | | | 26,610 | |
Hatteras Financial Corp. | | | 925 | | | | 25,808 | |
Alterra Capital Holdings Ltd. | | | 1,119 | | | | 25,715 | |
Invesco Mortgage Capital, Inc. | | | 1,441 | | | | 25,434 | |
Stifel Financial Corp.* | | | 668 | | | | 25,276 | |
Starwood Property Trust, Inc. | | | 1,156 | | | | 24,299 | |
Washington Real Estate Investment Trust | | | 811 | | | | 24,087 | |
FirstMerit Corp. | | | 1,352 | | | | 22,795 | |
Colonial Properties Trust | | | 1,036 | | | | 22,512 | |
First American Financial Corp. | | | 1,301 | | | | 21,635 | |
DiamondRock Hospitality Co. | | | 2,071 | | | | 21,311 | |
CNO Financial Group, Inc.* | | | 2,737 | | | | 21,294 | |
Healthcare Realty Trust, Inc. | | | 965 | | | | 21,230 | |
FNB Corp. | | | 1,679 | | | | 20,282 | |
Webster Financial Corp. | | | 894 | | | | 20,267 | |
Iberiabank Corp. | | | 377 | | | | 20,158 | |
Trustmark Corp. | | | 786 | | | | 19,634 | |
Susquehanna Bancshares, Inc. | | | 1,971 | | | | 19,473 | |
Umpqua Holdings Corp. | | | 1,419 | | | | 19,242 | |
Ezcorp, Inc. — Class A* | | | 583 | | | | 18,922 | |
Ocwen Financial Corp.* | | | 1,185 | | | | 18,522 | |
CubeSmart | | | 1,508 | | | | 17,945 | |
DCT Industrial Trust, Inc. | | | 3,040 | | | | 17,937 | |
United Bankshares, Inc. | | | 620 | | | | 17,893 | |
DuPont Fabros Technology, Inc. | | | 729 | | | | 17,824 | |
UMB Financial Corp. | | | 398 | | | | 17,805 | |
Westamerica Bancorporation | | | 369 | | | | 17,712 | |
Cash America International, Inc. | | | 365 | | | | 17,494 | |
Apollo Investment Corp. | | | 2,425 | | | | 17,388 | |
| | | | | | | | |
| | | SHARES | | | VALUE | |
Cathay General Bancorp | | | 971 | | | $ | 17,187 | |
Sovran Self Storage, Inc. | | | 344 | | | | 17,142 | |
Platinum Underwriters Holdings Ltd. | | | 463 | | | | 16,900 | |
First Cash Financial Services, Inc.* | | | 388 | | | | 16,641 | |
EastGroup Properties, Inc. | | | 329 | | | | 16,522 | |
RLI Corp. | | | 229 | | | | 16,406 | |
Northwest Bancshares, Inc. | | | 1,275 | | | | 16,193 | |
Knight Capital Group, Inc.—Class A* | | | 1,253 | | | | 16,126 | |
Texas Capital Bancshares, Inc.* | | | 460 | | | | 15,925 | |
Wintrust Financial Corp. | | | 435 | | | | 15,569 | |
Potlatch Corp. | | | 493 | | | | 15,451 | |
Old National Bancorp | | | 1,168 | | | | 15,348 | |
PS Business Parks, Inc. | | | 233 | | | | 15,271 | |
National Health Investors, Inc. | | | 305 | | | | 14,878 | |
Portfolio Recovery Associates, Inc.* | | | 207 | | | | 14,845 | |
Prospect Capital Corp. | | | 1,350 | | | | 14,824 | |
Montpelier Re Holdings Ltd. | | | 767 | | | | 14,818 | |
BancorpSouth, Inc. | | | 1,079 | | | | 14,534 | |
Glimcher Realty Trust | | | 1,422 | | | | 14,533 | |
Two Harbors Investment Corp. | | | 1,427 | | | | 14,470 | |
MB Financial, Inc. | | | 686 | | | | 14,399 | |
Strategic Hotels & Resorts, Inc.* | | | 2,165 | | | | 14,246 | |
International Bancshares Corp. | | | 673 | | | | 14,234 | |
Sunstone Hotel Investors, Inc.* | | | 1,458 | | | | 14,201 | |
Pebblebrook Hotel Trust | | | 627 | | | | 14,158 | |
Cardtronics, Inc.* | | | 533 | | | | 13,991 | |
Capstead Mortgage Corp. | | | 1,056 | | | | 13,844 | |
Community Bank System, Inc. | | | 481 | | | | 13,843 | |
National Penn Bancshares, Inc. | | | 1,553 | | | | 13,744 | |
First Financial Bankshares, Inc. | | | 389 | | | | 13,697 | |
Equity One, Inc. | | | 665 | | | | 13,446 | |
Lexington Realty Trust | | | 1,492 | | | | 13,413 | |
MarketAxess Holdings, Inc. | | | 358 | | | | 13,350 | |
Glacier Bancorp, Inc. | | | 892 | | | | 13,326 | |
First Industrial Realty Trust, Inc.* | | | 1,072 | | | | 13,239 | |
CVB Financial Corp. | | | 1,118 | | | | 13,125 | |
Medical Properties Trust, Inc. | | | 1,384 | | | | 12,844 | |
LTC Properties, Inc. | | | 390 | | | | 12,480 | |
First Financial Bancorp | | | 716 | | | | 12,387 | |
Education Realty Trust, Inc. | | | 1,131 | | | | 12,260 | |
CYS Investments, Inc. | | | 922 | | | | 12,069 | |
Acadia Realty Trust | | | 528 | | | | 11,901 | |
Alexander’s, Inc. | | | 30 | | | | 11,816 | |
Selective Insurance Group, Inc. | | | 670 | | | | 11,799 | |
World Acceptance Corp.* | | | 192 | | | | 11,760 | |
MGIC Investment Corp.* | | | 2,315 | | | | 11,482 | |
PrivateBancorp, Inc. | | | 743 | | | | 11,271 | |
Columbia Banking System, Inc. | | | 493 | | | | 11,231 | |
Sun Communities, Inc. | | | 257 | | | | 11,136 | |
First Midwest Bancorp, Inc. | | | 925 | | | | 11,082 | |
Park National Corp. | | | 160 | | | | 11,067 | |
Redwood Trust, Inc. | | | 975 | | | | 10,920 | |
Bank of the Ozarks, Inc. | | | 348 | | | | 10,878 | |
Anworth Mortgage Asset Corp. | | | 1,652 | | | | 10,870 | |
Provident Financial Services, Inc. | | | 742 | | | | 10,781 | |
| | |
80 | THE RYDEX SERIES FUNDS ANNUAL REPORT | | SEE NOTES TO FINANCIAL STATEMENTS. |
| | |
| SCHEDULE OF INVESTMENTS (continued) | | March 31, 2012 |
| RUSSELL 2000® 1.5x STRATEGY FUND | | |
| | | | | | | | |
| | | SHARES | | | VALUE | |
PHH Corp.* | | | 695 | | | $ | 10,752 | |
Financial Engines, Inc.* | | | 476 | | | | 10,643 | |
Astoria Financial Corp. | | | 1,072 | | | | 10,570 | |
Primerica, Inc. | | | 418 | | | | 10,538 | |
Tower Group, Inc. | | | 468 | | | | 10,497 | |
Government Properties Income Trust | | | 435 | | | | 10,488 | |
Pennsylvania Real Estate Investment Trust | | | 685 | | | | 10,460 | |
BBCN Bancorp, Inc.* | | | 920 | | | | 10,240 | |
DFC Global Corp.* | | | 539 | | | | 10,171 | |
Solar Capital Ltd. | | | 453 | | | | 9,997 | |
Argo Group International Holdings Ltd. | | | 334 | | | | 9,977 | |
Symetra Financial Corp. | | | 833 | | | | 9,604 | |
Hersha Hospitality Trust — Class A | | | 1,735 | | | | 9,473 | |
Boston Private Financial Holdings, Inc. | | | 953 | | | | 9,444 | |
American Equity Investment Life Holding Co. | | | 736 | | | | 9,399 | |
Oritani Financial Corp. | | | 640 | | | | 9,395 | |
NBT Bancorp, Inc. | | | 423 | | | | 9,340 | |
Franklin Street Properties Corp. | | | 871 | | | | 9,233 | |
Fifth Street Finance Corp. | | | 940 | | | | 9,174 | |
PacWest Bancorp | | | 376 | | | | 9,137 | |
American Assets Trust, Inc. | | | 399 | | | | 9,097 | |
Brookline Bancorp, Inc. | | | 953 | | | | 8,930 | |
BlackRock Kelso Capital Corp. | | | 909 | | | | 8,926 | |
Harleysville Group, Inc. | | | 153 | | | | 8,828 | |
Horace Mann Educators Corp. | | | 493 | | | | 8,686 | |
Associated Estates Realty Corp. | | | 531 | | | | 8,677 | |
Inland Real Estate Corp. | | | 977 | | | | 8,666 | |
Investors Bancorp, Inc.* | | | 570 | | | | 8,561 | |
Cousins Properties, Inc. | | | 1,125 | | | | 8,528 | |
Greenlight Capital Re Ltd. — Class A* | | | 344 | | | | 8,473 | |
Credit Acceptance Corp.* | | | 83 | | | | 8,384 | |
iStar Financial, Inc.* | | | 1,155 | | | | 8,374 | |
Nelnet, Inc. — Class A | | | 322 | | | | 8,343 | |
Employers Holdings, Inc. | | | 461 | | | | 8,164 | |
Newcastle Investment Corp. | | | 1,300 | | | | 8,164 | |
Independent Bank Corp. | | | 281 | | | | 8,073 | |
Enstar Group Ltd.* | | | 81 | | | | 8,018 | |
First Commonwealth Financial Corp. | | | 1,304 | | | | 7,980 | |
Infinity Property & Casualty Corp. | | | 152 | | | | 7,954 | |
Pinnacle Financial Partners, Inc.* | | | 433 | | | | 7,946 | |
Amtrust Financial Services, Inc. | | | 295 | | | | 7,930 | |
KBW, Inc. | | | 426 | | | | 7,881 | |
Chemical Financial Corp. | | | 335 | | | | 7,852 | |
National Financial Partners Corp.* | | | 510 | | | | 7,721 | |
Investors Real Estate Trust | | | 995 | | | | 7,652 | |
Evercore Partners, Inc. — Class A | | | 263 | | | | 7,645 | |
First Potomac Realty Trust | | | 630 | | | | 7,617 | |
Sabra Health Care REIT, Inc. | | | 458 | | | | 7,530 | |
S&T Bancorp, Inc. | | | 346 | | | | 7,505 | |
Home Bancshares, Inc. | | | 281 | | | | 7,477 | |
| | | | | | | | |
| | | SHARES | | | VALUE | |
Compass Diversified Holdings | | | 503 | | | $ | 7,439 | |
Cohen & Steers, Inc. | | | 233 | | | | 7,433 | |
Retail Opportunity Investments Corp. | | | 608 | | | | 7,320 | |
Western Alliance Bancorporation* | | | 863 | | | | 7,310 | |
Banco Latinoamericano de Comercio Exterior S.A. — Class E | | | 345 | | | | 7,283 | |
Navigators Group, Inc.* | | | 154 | | | | 7,275 | |
CreXus Investment Corp. | | | 703 | | | | 7,269 | |
Walter Investment Management Corp. | | | 322 | | | | 7,261 | |
Advance America Cash Advance Centers, Inc. | | | 685 | | | | 7,186 | |
Radian Group, Inc. | | | 1,640 | | | | 7,134 | |
Chesapeake Lodging Trust | | | 393 | | | | 7,062 | |
Oriental Financial Group, Inc. | | | 580 | | | | 7,018 | |
Bankrate, Inc.* | | | 283 | | | | 7,004 | |
ViewPoint Financial Group | | | 450 | | | | 6,921 | |
Main Street Capital Corp. | | | 280 | | | | 6,896 | |
Sterling Financial Corp.* | | | 329 | | | | 6,870 | |
BGC Partners, Inc. — Class A | | | 929 | | | | 6,865 | |
State Bank Financial Corp.* | | | 391 | | | | 6,846 | |
Forestar Group, Inc.* | | | 433 | | | | 6,663 | |
Colony Financial, Inc. | | | 405 | | | | 6,634 | |
City Holding Co. | | | 190 | | | | 6,597 | |
Trustco Bank Corp. | | | 1,148 | | | | 6,555 | |
PICO Holdings, Inc.* | | | 278 | | | | 6,519 | |
Safety Insurance Group, Inc. | | | 155 | | | | 6,454 | |
PennyMac Mortgage Investment Trust | | | 345 | | | | 6,441 | |
RLJ Lodging Trust | | | 345 | | | | 6,427 | |
NorthStar Realty Finance Corp. | | | 1,183 | | | | 6,400 | |
Simmons First National Corp. — Class A | | | 247 | | | | 6,380 | |
Hercules Technology Growth Capital, Inc. | | | 570 | | | | 6,316 | |
ARMOUR Residential REIT, Inc. | | | 933 | | | | 6,298 | |
Meadowbrook Insurance Group, Inc. | | | 672 | | | | 6,270 | |
Investment Technology Group, Inc.* | | | 518 | | | | 6,195 | |
Berkshire Hills Bancorp, Inc. | | | 267 | | | | 6,120 | |
Universal Health Realty Income Trust | | | 154 | | | | 6,103 | |
HFF, Inc. — Class A* | | | 369 | | | | 6,078 | |
Community Trust Bancorp, Inc. | | | 188 | | | | 6,029 | |
Duff & Phelps Corp. — Class A | | | 387 | | | | 6,014 | |
AMERISAFE, Inc.* | | | 240 | | | | 5,938 | |
PennantPark Investment Corp. | | | 567 | | | | 5,897 | |
SCBT Financial Corp. | | | 179 | | | | 5,855 | |
Ramco-Gershenson Properties Trust | | | 479 | | | | 5,853 | |
WesBanco, Inc. | | | 289 | | | | 5,820 | |
Coresite Realty Corp. | | | 246 | | | | 5,803 | |
Urstadt Biddle Properties, Inc. — Class A | | | 293 | | | | 5,784 | |
Ashford Hospitality Trust, Inc. | | | 640 | | | | 5,766 | |
Dime Community Bancshares, Inc. | | | 389 | | | | 5,683 | |
Maiden Holdings Ltd. | | | 629 | | | | 5,661 | |
Virtus Investment Partners, Inc.* | | | 65 | | | | 5,576 | |
FelCor Lodging Trust, Inc.* | | | 1,547 | | | | 5,569 | |
| | |
SEE NOTES TO FINANCIAL STATEMENTS. | | THE RYDEX SERIES FUNDS ANNUAL REPORT | 81 |
| | |
| SCHEDULE OF INVESTMENTS (continued) | | March 31, 2012 |
| RUSSELL 2000® 1.5x STRATEGY FUND | | |
| | | | | | | | |
| | | SHARES | | | VALUE | |
Tejon Ranch Co.* | | | 194 | | | $ | 5,556 | |
Triangle Capital Corp. | | | 275 | | | | 5,431 | |
Flushing Financial Corp. | | | 401 | | | | 5,397 | |
Sandy Spring Bancorp, Inc. | | | 297 | | | | 5,396 | |
FBL Financial Group, Inc. — Class A | | | 159 | | | | 5,358 | |
Piper Jaffray Cos.* | | | 198 | | | | 5,271 | |
Flagstone Reinsurance Holdings S.A. | | | 669 | | | | 5,265 | |
Lakeland Financial Corp. | | | 198 | | | | 5,154 | |
Resource Capital Corp. | | | 954 | | | | 5,142 | |
Renasant Corp. | | | 312 | | | | 5,079 | |
United Community Banks, Inc.* | | | 509 | | | | 4,963 | |
Getty Realty Corp. | | | 315 | | | | 4,908 | |
United Fire Group, Inc. | | | 272 | | | | 4,866 | |
First Busey Corp. | | | 981 | | | | 4,846 | |
Southside Bancshares, Inc. | | | 217 | | | | 4,796 | |
West Coast Bancorp* | | | 251 | | | | 4,749 | |
Banner Corp. | | | 215 | | | | 4,736 | |
Monmouth Real Estate Investment Corp. — Class A | | | 483 | | | | 4,704 | |
Citizens, Inc.* | | | 472 | | | | 4,663 | |
1st Source Corp. | | | 190 | | | | 4,649 | |
Washington Trust Bancorp, Inc. | | | 192 | | | | 4,635 | |
Excel Trust, Inc. | | | 379 | | | | 4,578 | |
Epoch Holding Corp. | | | 191 | | | | 4,561 | |
Safeguard Scientifics, Inc.* | | | 264 | | | | 4,541 | |
Kennedy-Wilson Holdings, Inc. | | | 336 | | | | 4,536 | |
First Financial Corp. | | | 142 | | | | 4,509 | |
Rockville Financial, Inc. | | | 384 | | | | 4,474 | |
Encore Capital Group, Inc.* | | | 198 | | | | 4,465 | |
eHealth, Inc.* | | | 273 | | | | 4,453 | |
Campus Crest Communities, Inc. | | | 377 | | | | 4,396 | |
OneBeacon Insurance Group Ltd. — Class A | | | 285 | | | | 4,392 | |
Dynex Capital, Inc. | | | 455 | | | | 4,345 | |
Cardinal Financial Corp. | | | 379 | | | | 4,283 | |
Hilltop Holdings, Inc.* | | | 492 | | | | 4,128 | |
TowneBank | | | 305 | | | | 4,114 | |
Winthrop Realty Trust | | | 354 | | | | 4,103 | |
MCG Capital Corp. | | | 964 | | | | 4,097 | |
Hudson Pacific Properties, Inc. | | | 270 | | | | 4,085 | |
Tompkins Financial Corp. | | | 100 | | | | 4,006 | |
National Western Life Insurance Co. — Class A | | | 29 | | | | 3,969 | |
GAMCO Investors, Inc. — Class A | | | 80 | | | | 3,969 | |
First Merchants Corp. | | | 321 | | | | 3,961 | |
Provident New York Bancorp | | | 468 | | | | 3,959 | |
Hanmi Financial Corp.* | | | 391 | | | | 3,957 | |
Apollo Commercial Real Estate Finance, Inc. | | | 251 | | | | 3,928 | |
MVC Capital, Inc. | | | 297 | | | | 3,900 | |
Ameris Bancorp* | | | 295 | | | | 3,876 | |
TICC Capital Corp. | | | 395 | | | | 3,847 | |
NewStar Financial, Inc.* | | | 345 | | | | 3,836 | |
INTL FCStone, Inc.* | | | 180 | | | | 3,798 | |
Capital Southwest Corp. | | | 40 | | | | 3,782 | |
Bancorp, Inc.* | | | 375 | | | | 3,765 | |
| | | | | | | | |
| | | SHARES | | | VALUE | |
Wilshire Bancorp, Inc.* | | | 772 | | | $ | 3,729 | |
Beneficial Mutual Bancorp, Inc.* | | | 426 | | | | 3,723 | |
Sterling Bancorp | | | 386 | | | | 3,702 | |
WSFS Financial Corp. | | | 89 | | | | 3,649 | |
Kite Realty Group Trust | | | 692 | | | | 3,647 | |
Eagle Bancorp, Inc.* | | | 216 | | | | 3,616 | |
Cedar Realty Trust, Inc. | | | 697 | | | | 3,569 | |
Westwood Holdings Group, Inc. | | | 92 | | | | 3,563 | |
Saul Centers, Inc. | | | 88 | | | | 3,552 | |
Phoenix Companies, Inc.* | | | 1,443 | | | | 3,535 | |
Univest Corporation of Pennsylvania | | | 209 | | | | 3,507 | |
Bancfirst Corp. | | | 80 | | | | 3,485 | |
Hudson Valley Holding Corp. | | | 216 | | | | 3,484 | |
Union First Market Bankshares Corp. | | | 248 | | | | 3,472 | |
Global Indemnity plc—Class A* | | | 177 | | | | 3,450 | |
Camden National Corp. | | | 98 | | | | 3,445 | |
SY Bancorp, Inc. | | | 147 | | | | 3,410 | |
CapLease, Inc. | | | 845 | | | | 3,405 | |
StellarOne Corp. | | | 284 | | | | 3,371 | |
GFI Group, Inc. | | | 876 | | | | 3,294 | |
Republic Bancorp, Inc. — Class A | | | 135 | | | | 3,229 | |
Stewart Information Services Corp. | | | 227 | | | | 3,226 | |
Calamos Asset Management, Inc. — Class A | | | 245 | | | | 3,212 | |
Bryn Mawr Bank Corp. | | | 142 | | | | 3,186 | |
United Financial Bancorp, Inc. | | | 197 | | | | 3,117 | |
Centerstate Banks, Inc. | | | 380 | | | | 3,101 | |
Territorial Bancorp, Inc. | | | 149 | | | | 3,101 | |
OmniAmerican Bancorp, Inc.* | | | 160 | | | | 3,098 | |
Presidential Life Corp. | | | 271 | | | | 3,098 | |
German American Bancorp, Inc. | | | 158 | | | | 3,070 | |
Arrow Financial Corp. | | | 124 | | | | 3,026 | |
Parkway Properties, Inc. | | | 287 | | | | 3,008 | |
Great Southern Bancorp, Inc. | | | 125 | | | | 3,000 | |
Trico Bancshares | | | 172 | | | | 2,996 | |
MainSource Financial Group, Inc. | | | 248 | | | | 2,988 | |
Citizens & Northern Corp. | | | 149 | | | | 2,980 | |
Agree Realty Corp. | | | 131 | | | | 2,958 | |
Northfield Bancorp, Inc. | | | 208 | | | | 2,958 | |
First Connecticut Bancorp, Inc. | | | 224 | | | | 2,955 | |
Heartland Financial USA, Inc. | | | 170 | | | | 2,948 | |
State Auto Financial Corp. | | | 200 | | | | 2,922 | |
OceanFirst Financial Corp. | | | 203 | | | | 2,891 | |
CoBiz Financial, Inc. | | | 407 | | | | 2,877 | |
Netspend Holdings, Inc.* | | | 370 | | | | 2,871 | |
Farmer Mac — Class C | | | 126 | | | | 2,860 | |
First Interstate Bancsystem, Inc. — Class A | | | 195 | | | | 2,851 | |
Washington Banking Co. | | | 204 | | | | 2,817 | |
Lakeland Bancorp, Inc. | | | 280 | | | | 2,761 | |
FXCM, Inc. — Class A | | | 211 | | | | 2,741 | |
Westfield Financial, Inc. | | | 343 | | | | 2,713 | |
Financial Institutions, Inc. | | | 167 | | | | 2,700 | |
STAG Industrial, Inc. | | | 193 | | | | 2,694 | |
Heritage Financial Corp. | | | 198 | | | | 2,693 | |
Franklin Financial Corp.* | | | 200 | | | | 2,686 | |
| | |
82 | THE RYDEX SERIES FUNDS ANNUAL REPORT | | SEE NOTES TO FINANCIAL STATEMENTS. |
| | |
| SCHEDULE OF INVESTMENTS (continued) | | March 31, 2012 |
| RUSSELL 2000® 1.5x STRATEGY FUND | | |
| | | | | | | | |
| | | SHARES | | | VALUE | |
National Bankshares, Inc. | | | 89 | | | $ | 2,679 | |
Bank of Marin Bancorp | | | 69 | | | | 2,623 | |
First Community Bancshares, Inc. | | | 195 | | | | 2,605 | |
CNB Financial Corp. | | | 155 | | | | 2,590 | |
Virginia Commerce Bancorp, Inc.* | | | 294 | | | | 2,581 | |
First of Long Island Corp. | | | 97 | | | | 2,571 | |
Summit Hotel Properties, Inc. | | | 336 | | | | 2,547 | |
One Liberty Properties, Inc. | | | 138 | | | | 2,525 | |
Pacific Capital Bancorp North America* | | | 55 | | | | 2,509 | |
RAIT Financial Trust | | | 495 | | | | 2,460 | |
American Safety Insurance Holdings Ltd.* | | | 130 | | | | 2,451 | |
Doral Financial Corp.* | | | 1,585 | | | | 2,441 | |
Chatham Lodging Trust | | | 192 | | | | 2,436 | |
Central Pacific Financial Corp.* | | | 186 | | | | 2,409 | |
Apollo Residential Mortgage, Inc. | | | 130 | | | | 2,389 | |
Cogdell Spencer, Inc. | | | 563 | | | | 2,387 | |
Ames National Corp. | | | 100 | | | | 2,380 | |
Oppenheimer Holdings, Inc. — Class A | | | 137 | | | | 2,377 | |
Gladstone Commercial Corp. | | | 137 | | | | 2,358 | |
Peoples Bancorp, Inc. | | | 134 | | | | 2,350 | |
Ladenburg Thalmann Financial Services, Inc.* | | | 1,311 | | | | 2,334 | |
National Interstate Corp. | | | 91 | | | | 2,328 | |
Bank Mutual Corp. | | | 572 | | | | 2,311 | |
Encore Bancshares, Inc.* | | | 113 | | | | 2,302 | |
Enterprise Financial Services Corp. | | | 195 | | | | 2,289 | |
First Financial Holdings, Inc. | | | 208 | | | | 2,288 | |
Fox Chase Bancorp, Inc. | | | 176 | | | | 2,288 | |
Diamond Hill Investment Group, Inc. | | | 31 | | | | 2,283 | |
ESB Financial Corp. | | | 158 | | | | 2,278 | |
SeaBright Holdings, Inc. | | | 249 | | | | 2,263 | |
Baldwin & Lyons, Inc. — Class B | | | 101 | | | | 2,260 | |
Mission West Properties, Inc. | | | 228 | | | | 2,248 | |
Cowen Group, Inc. — Class A* | | | 829 | | | | 2,247 | |
Medallion Financial Corp. | | | 200 | | | | 2,232 | |
Home Federal Bancorp, Inc. | | | 220 | | | | 2,229 | |
Southwest Bancorp, Inc.* | | | 241 | | | | 2,222 | |
Manning & Napier, Inc. — Class A* | | | 151 | | | | 2,220 | |
Flagstar Bancorp, Inc.* | | | 2,410 | | | | 2,217 | |
American Capital Mortgage Investment Corp. | | | 101 | | | | 2,199 | |
Metro Bancorp, Inc.* | | | 188 | | | | 2,198 | |
Taylor Capital Group, Inc.* | | | 151 | | | | 2,167 | |
Pacific Continental Corp. | | | 230 | | | | 2,167 | |
SWS Group, Inc. | | | 377 | | | | 2,156 | |
Gladstone Capital Corp. | | | 265 | | | | 2,149 | |
BofI Holding, Inc.* | | | 122 | | | | 2,084 | |
First Bancorp | | | 189 | | | | 2,066 | |
1st United Bancorp, Inc.* | | | 339 | | | | 2,051 | |
Golub Capital BDC, Inc. | | | 134 | | | | 2,046 | |
Gladstone Investment Corp. | | | 270 | | | | 2,044 | |
Arlington Asset Investment Corp. — Class A | | | 89 | | | | 1,976 | |
Alliance Financial Corp. | | | 65 | | | | 1,970 | |
West Bancorporation, Inc. | | | 197 | | | | 1,968 | |
First Defiance Financial Corp. | | | 116 | | | | 1,956 | |
| | | | | | | | |
| | | SHARES | | | VALUE | |
Park Sterling Corp.* | | | 399 | | | $ | 1,915 | |
Artio Global Investors, Inc. — Class A | | | 387 | | | | 1,846 | |
Penns Woods Bancorp, Inc. | | | 44 | | | | 1,799 | |
Kansas City Life Insurance Co. | | | 55 | | | | 1,771 | |
Kearny Financial Corp. | | | 180 | | | | 1,755 | |
BankFinancial Corp. | | | 265 | | | | 1,754 | |
Bank of Kentucky Financial Corp. | | | 68 | | | | 1,750 | |
Merchants Bancshares, Inc. | | | 62 | | | | 1,747 | |
NGP Capital Resources Co. | | | 266 | | | | 1,742 | |
Sun Bancorp, Inc.* | | | 492 | | | | 1,737 | |
Heritage Commerce Corp.* | | | 267 | | | | 1,717 | |
Walker & Dunlop, Inc.* | | | 135 | | | | 1,701 | |
First Bancorp, Inc. | | | 112 | | | | 1,661 | |
Bridge Bancorp, Inc. | | | 79 | | | | 1,657 | |
Marlin Business Services Corp. | | | 110 | | | | 1,657 | |
Kohlberg Capital Corp. | | | 239 | | | | 1,651 | |
Edelman Financial Group, Inc. | | | 249 | | | | 1,646 | |
UMH Properties, Inc. | | | 150 | | | | 1,644 | |
Crawford & Co. — Class B | | | 329 | | | | 1,612 | |
FBR & Company* | | | 624 | | | | 1,604 | |
Harris & Harris Group, Inc.* | | | 386 | | | | 1,602 | |
Medley Capital Corp. | | | 142 | | | | 1,600 | |
Seacoast Banking Corporation of Florida* | | | 909 | | | | 1,600 | |
Solar Senior Capital Ltd. | | | 98 | | | | 1,579 | |
First Pactrust Bancorp, Inc. | | | 129 | | | | 1,538 | |
Nicholas Financial, Inc. | | | 116 | | | | 1,530 | |
Sierra Bancorp | | | 155 | | | | 1,524 | |
Suffolk Bancorp* | | | 116 | | | | 1,507 | |
THL Credit, Inc. | | | 117 | | | | 1,505 | |
Center Bancorp, Inc. | | | 150 | | | | 1,505 | |
Meridian Interstate Bancorp, Inc.* | | | 112 | | | | 1,471 | |
Bridge Capital Holdings* | | | 109 | | | | 1,467 | |
ESSA Bancorp, Inc. | | | 148 | | | | 1,450 | |
Consolidated-Tomoka Land Co. | | | 48 | | | | 1,428 | |
MPG Office Trust, Inc.* | | | 601 | | | | 1,406 | |
Terreno Realty Corp. | | | 98 | | | | 1,402 | |
JMP Group, Inc. | | | 190 | | | | 1,402 | |
AV Homes, Inc.* | | | 114 | | | | 1,389 | |
Donegal Group, Inc. — Class A | | | 98 | | | | 1,340 | |
MidSouth Bancorp, Inc. | | | 97 | | | | 1,319 | |
AG Mortgage Investment Trust, Inc. | | | 66 | | | | 1,303 | |
Gleacher & Company, Inc.* | | | 949 | | | | 1,291 | |
Whitestone REIT — Class B | | | 95 | | | | 1,239 | |
New Mountain Finance Corp. | | | 88 | | | | 1,209 | |
Century Bancorp, Inc. — Class A | | | 44 | | | | 1,201 | |
Cape Bancorp, Inc.* | | | 150 | | | | 1,197 | |
Enterprise Bancorp, Inc. | | | 72 | | | | 1,184 | |
Hallmark Financial Services* | | | 150 | | | | 1,184 | |
Clifton Savings Bancorp, Inc. | | | 110 | | | | 1,147 | |
EMC Insurance Group, Inc. | | | 55 | | | | 1,105 | |
Independence Holding Co. | | | 108 | | | | 1,076 | |
Capital City Bank Group, Inc. | | | 140 | | | | 1,043 | |
Fidus Investment Corp. | | | 73 | | | | 1,023 | |
Universal Insurance Holdings, Inc. | | | 242 | | | | 941 | |
| | |
SEE NOTES TO FINANCIAL STATEMENTS. | | THE RYDEX SERIES FUNDS ANNUAL REPORT | 83 |
| | |
| SCHEDULE OF INVESTMENTS (continued) | | March 31, 2012 |
| RUSSELL 2000® 1.5x STRATEGY FUND | | |
| | | | | | | | |
| | | SHARES | | | VALUE | |
Roma Financial Corp. | | | 95 | | | $ | 930 | |
CIFC Corp.* | | | 145 | | | | 899 | |
Charter Financial Corp. | | | 99 | | | | 887 | |
First Marblehead Corp.* | | | 684 | | | | 834 | |
Orrstown Financial Services, Inc. | | | 94 | | | | 824 | |
Pzena Investment Management, Inc. — Class A | | | 111 | | | | 649 | |
Imperial Holdings, Inc.* | | | 228 | | | | 609 | |
Fortegra Financial Corp.* | | | 71 | | | | 594 | |
Gain Capital Holdings, Inc. | | | 93 | | | | 467 | |
Cascade Bancorp* | | | 71 | | | | 403 | |
Capital Bank Corp.* | | | 174 | | | | 390 | |
Hampton Roads Bankshares, Inc.* | | | 120 | | | | 364 | |
California First National Bancorp | | | 21 | | | | 322 | |
| | | | | | | | |
Total Financials | | | | | | | 3,418,006 | |
| | | | | | | | |
INFORMATION TECHNOLOGY—13.9% | | | | | | | | |
Parametric Technology Corp.* | | | 1,470 | | | | 41,072 | |
Jack Henry & Associates, Inc. | | | 1,070 | | | | 36,508 | |
Concur Technologies, Inc.* | | | 547 | | | | 31,387 | |
Wright Express Corp.* | | | 475 | | | | 30,747 | |
QLIK Technologies, Inc.* | | | 877 | | | | 28,064 | |
SolarWinds, Inc.* | | | 710 | | | | 27,442 | |
CommVault Systems, Inc.* | | | 547 | | | | 27,152 | |
Anixter International, Inc.* | | | 359 | | | | 26,037 | |
ADTRAN, Inc. | | | 822 | | | | 25,639 | |
Aruba Networks, Inc.* | | | 1,103 | | | | 24,576 | |
Taleo Corp. — Class A* | | | 519 | | | | 23,838 | |
Ultimate Software Group, Inc.* | | | 323 | | | | 23,669 | |
Plantronics, Inc. | | | 586 | | | | 23,593 | |
FEI Co.* | | | 479 | | | | 23,523 | |
CACI International, Inc. — Class A* | | | 376 | | | | 23,420 | |
Semtech Corp.* | | | 819 | | | | 23,309 | |
Microsemi Corp.* | | | 1,070 | | | | 22,941 | |
Cognex Corp. | | | 526 | | | | 22,280 | |
Finisar Corp.* | | | 1,103 | | | | 22,226 | |
Aspen Technology, Inc.* | | | 1,053 | | | | 21,618 | |
Viasat, Inc.* | | | 444 | | | | 21,405 | |
Fair Isaac Corp. | | | 484 | | | | 21,248 | |
Hittite Microwave Corp.* | | | 385 | | | | 20,909 | |
Progress Software Corp.* | | | 869 | | | | 20,526 | |
InterDigital, Inc. | | | 570 | | | | 19,870 | |
Cirrus Logic, Inc.* | | | 832 | | | | 19,802 | |
ACI Worldwide, Inc.* | | | 483 | | | | 19,450 | |
Littelfuse, Inc. | | | 307 | | | | 19,248 | |
MKS Instruments, Inc. | | | 651 | | | | 19,223 | |
ValueClick, Inc.* | | | 971 | | | | 19,167 | |
Cymer, Inc.* | | | 377 | | | | 18,849 | |
Cavium, Inc.* | | | 594 | | | | 18,378 | |
Blackbaud, Inc. | | | 551 | | | | 18,310 | |
Netgear, Inc.* | | | 472 | | | | 18,030 | |
Coherent, Inc.* | | | 306 | | | | 17,849 | |
Mentor Graphics Corp.* | | | 1,194 | | | | 17,743 | |
TiVo, Inc.* | | | 1,477 | | | | 17,709 | |
Quest Software, Inc.* | | | 755 | | | | 17,569 | |
MAXIMUS, Inc. | | | 429 | | | | 17,447 | |
| | | | | | | | |
| | | SHARES | | | VALUE | |
Universal Display Corp.* | | | 477 | | | $ | 17,425 | |
Convergys Corp.* | | | 1,301 | | | | 17,368 | |
Arris Group, Inc.* | | | 1,534 | | | | 17,334 | |
RF Micro Devices, Inc.* | | | 3,412 | | | | 16,992 | |
Sourcefire, Inc.* | | | 352 | | | | 16,942 | |
Sapient Corp. | | | 1,346 | | | | 16,758 | |
NetSuite, Inc.* | | | 331 | | | | 16,646 | |
j2 Global, Inc. | | | 569 | | | | 16,318 | |
DealerTrack Holdings, Inc.* | | | 523 | | | | 15,825 | |
Entegris, Inc.* | | | 1,671 | | | | 15,606 | |
Plexus Corp.* | | | 445 | | | | 15,571 | |
JDA Software Group, Inc.* | | | 542 | | | | 14,894 | |
Acxiom Corp.* | | | 1,013 | | | | 14,871 | |
Synaptics, Inc.* | | | 405 | | | | 14,786 | |
OSI Systems, Inc.* | | | 239 | | | | 14,651 | |
Tyler Technologies, Inc.* | | | 378 | | | | 14,519 | |
Veeco Instruments, Inc.* | | | 506 | | | | 14,471 | |
Omnivision Technologies, Inc.* | | | 720 | | | | 14,400 | |
TriQuint Semiconductor, Inc.* | | | 2,034 | | | | 14,024 | |
Take-Two Interactive Software, Inc.* | | | 909 | | | | 13,984 | |
Heartland Payment Systems, Inc. | | | 479 | | | | 13,814 | |
Manhattan Associates, Inc.* | | | 285 | | | | 13,546 | |
MicroStrategy, Inc. — Class A* | | | 96 | | | | 13,440 | |
Euronet Worldwide, Inc.* | | | 637 | | | | 13,307 | |
Power Integrations, Inc. | | | 355 | | | | 13,178 | |
Integrated Device Technology, Inc.* | | | 1,833 | | | | 13,106 | |
Benchmark Electronics, Inc.* | | | 767 | | | | 12,648 | |
Scansource, Inc.* | | | 336 | | | | 12,540 | |
Insight Enterprises, Inc.* | | | 571 | | | | 12,522 | |
Bottomline Technologies, Inc.* | | | 444 | | | | 12,405 | |
VirnetX Holding Corp.* | | | 503 | | | | 12,037 | |
SYNNEX Corp.* | | | 311 | | | | 11,862 | |
FARO Technologies, Inc.* | | | 200 | | | | 11,666 | |
OpenTable, Inc.* | | | 287 | | | | 11,614 | |
Sanmina-SCI Corp.* | | | 1,012 | | | | 11,587 | |
Liquidity Services, Inc.* | | | 256 | | | | 11,468 | |
Emulex Corp.* | | | 1,093 | | | | 11,345 | |
Websense, Inc.* | | | 533 | | | | 11,241 | |
Cabot Microelectronics Corp. | | | 287 | | | | 11,159 | |
BroadSoft, Inc.* | | | 290 | | | | 11,093 | |
Kulicke & Soffa Industries, Inc.* | | | 892 | | | | 11,088 | |
LivePerson, Inc.* | | | 658 | | | | 11,034 | |
Syntel, Inc. | | | 196 | | | | 10,976 | |
Constant Contact, Inc.* | | | 368 | | | | 10,963 | |
Earthlink, Inc. | | | 1,359 | | | | 10,858 | |
Tessera Technologies, Inc.* | | | 628 | | | | 10,833 | |
Loral Space & Communications, Inc. | | | 134 | | | | 10,666 | |
Synchronoss Technologies, Inc.* | | | 330 | | | | 10,534 | |
Unisys Corp.* | | | 534 | | | | 10,530 | |
Volterra Semiconductor Corp.* | | | 304 | | | | 10,462 | |
MTS Systems Corp. | | | 197 | | | | 10,459 | |
Infinera Corp.* | | | 1,287 | | | | 10,450 | |
Kenexa Corp.* | | | 333 | | | | 10,403 | |
Advent Software, Inc.* | | | 402 | | | | 10,291 | |
| | |
84 | THE RYDEX SERIES FUNDS ANNUAL REPORT | | SEE NOTES TO FINANCIAL STATEMENTS. |
| | |
| SCHEDULE OF INVESTMENTS (continued) | | March 31, 2012 |
| RUSSELL 2000® 1.5x STRATEGY FUND | | |
| | | | | | | | |
| | | SHARES | | | VALUE | |
Brooks Automation, Inc. | | | 821 | | | $ | 10,123 | |
Diodes, Inc.* | | | 436 | | | | 10,106 | |
Mantech International Corp. — Class A | | | 287 | | | | 9,890 | |
Stratasys, Inc.* | | | 265 | | | | 9,678 | |
Electronics for Imaging, Inc.* | | | 574 | | | | 9,540 | |
NIC, Inc. | | | 786 | | | | 9,534 | |
Netscout Systems, Inc.* | | | 467 | | | | 9,499 | |
Comtech Telecommunications Corp. | | | 287 | | | | 9,350 | |
Lattice Semiconductor Corp.* | | | 1,453 | | | | 9,343 | |
Rofin-Sinar Technologies, Inc.* | | | 352 | | | | 9,282 | |
LogMeIn, Inc.* | | | 262 | | | | 9,230 | |
ATMI, Inc.* | | | 391 | | | | 9,110 | |
Ultratech, Inc.* | | | 311 | | | | 9,013 | |
Ancestry.com, Inc.* | | | 392 | | | | 8,914 | |
Verint Systems, Inc.* | | | 271 | | | | 8,778 | |
Digital River, Inc.* | | | 462 | | | | 8,644 | |
comScore, Inc.* | | | 397 | | | | 8,492 | |
Newport Corp.* | | | 469 | | | | 8,311 | |
Ebix, Inc. | | | 355 | | | | 8,222 | |
Pegasystems, Inc. | | | 209 | | | | 7,975 | |
Amkor Technology, Inc.* | | | 1,282 | | | | 7,878 | |
Rambus, Inc.* | | | 1,218 | | | | 7,856 | |
Park Electrochemical Corp. | | | 257 | | | | 7,769 | |
Harmonic, Inc.* | | | 1,417 | | | | 7,751 | |
Spansion, Inc. — Class A* | | | 625 | | | | 7,613 | |
Sonus Networks, Inc.* | | | 2,611 | | | | 7,572 | |
Rogers Corp.* | | | 195 | | | | 7,556 | |
RealPage, Inc.* | | | 390 | | | | 7,476 | |
Standard Microsystems Corp.* | | | 286 | | | | 7,399 | |
TTM Technologies, Inc.* | | | 643 | | | | 7,388 | |
Quantum Corp.* | | | 2,790 | | | | 7,310 | |
SS&C Technologies Holdings, Inc.* | | | 310 | | | | 7,232 | |
Monolithic Power Systems, Inc.* | | | 366 | | | | 7,199 | |
DTS, Inc.* | | | 237 | | | | 7,162 | |
Advanced Energy Industries, Inc.* | | | 539 | | | | 7,072 | |
TNS, Inc.* | | | 322 | | | | 6,997 | |
RealD, Inc.* | | | 512 | | | | 6,912 | |
Brightpoint, Inc.* | | | 854 | | | | 6,875 | |
Ceva, Inc.* | | | 296 | | | | 6,722 | |
CSG Systems International, Inc.* | | | 435 | | | | 6,586 | |
iGate Corp.* | | | 389 | | | | 6,520 | |
Monotype Imaging Holdings, Inc.* | | | 437 | | | | 6,511 | |
Forrester Research, Inc. | | | 200 | | | | 6,480 | |
Measurement Specialties, Inc.* | | | 190 | | | | 6,403 | |
Micrel, Inc. | | | 620 | | | | 6,361 | |
Maxwell Technologies, Inc.* | | | 341 | | | | 6,251 | |
Global Cash Access Holdings, Inc.* | | | 800 | | | | 6,240 | |
InfoSpace, Inc.* | | | 485 | | | | 6,213 | |
Entropic Communications, Inc.* | | | 1,063 | | | | 6,197 | |
Super Micro Computer, Inc.* | | | 349 | | | | 6,094 | |
Xyratex Ltd. | | | 377 | | | | 5,998 | |
Ixia* | | | 478 | | | | 5,970 | |
Black Box Corp. | | | 234 | | | | 5,969 | |
Silicon Image, Inc.* | | | 984 | | | | 5,786 | |
| | | | | | | | |
| | | SHARES | | | VALUE | |
Interactive Intelligence Group, Inc.* | | | 189 | | | $ | 5,766 | |
Intermec, Inc.* | | | 731 | | | | 5,651 | |
Dice Holdings, Inc.* | | | 596 | | | | 5,561 | |
Checkpoint Systems, Inc.* | | | 492 | | | | 5,550 | |
Accelrys, Inc.* | | | 689 | | | | 5,498 | |
Applied Micro Circuits Corp.* | | | 786 | | | | 5,455 | |
Opnet Technologies, Inc. | | | 188 | | | | 5,452 | |
ExlService Holdings, Inc.* | | | 198 | | | | 5,433 | |
United Online, Inc. | | | 1,105 | | | | 5,403 | |
Web.com Group, Inc.* | | | 369 | | | | 5,325 | |
Kemet Corp.* | | | 548 | | | | 5,129 | |
PROS Holdings, Inc.* | | | 272 | | | | 5,086 | |
Mercury Computer Systems, Inc.* | | | 378 | | | | 5,009 | |
TeleTech Holdings, Inc.* | | | 311 | | | | 5,007 | |
Cass Information Systems, Inc. | | | 122 | | | | 4,874 | |
Move, Inc.* | | | 501 | | | | 4,865 | |
STEC, Inc.* | | | 514 | | | | 4,852 | |
Photronics, Inc.* | | | 729 | | | | 4,848 | |
Nanometrics, Inc.* | | | 258 | | | | 4,776 | |
EPIQ Systems, Inc. | | | 392 | | | | 4,743 | |
Internap Network Services Corp.* | | | 643 | | | | 4,720 | |
Electro Rent Corp. | | | 256 | | | | 4,713 | |
CTS Corp. | | | 433 | | | | 4,555 | |
Fabrinet* | | | 257 | | | | 4,551 | |
Sycamore Networks, Inc.* | | | 249 | | | | 4,417 | |
LTX-Credence Corp.* | | | 612 | | | | 4,400 | |
Rudolph Technologies, Inc.* | | | 396 | | | | 4,400 | |
Extreme Networks* | | | 1,142 | | | | 4,374 | |
Methode Electronics, Inc. | | | 458 | | | | 4,250 | |
Avid Technology, Inc.* | | | 386 | | | | 4,246 | |
Electro Scientific Industries, Inc. | | | 282 | | | | 4,233 | |
ICG Group, Inc.* | | | 470 | | | | 4,207 | |
Oplink Communications, Inc.* | | | 245 | | | | 4,190 | |
OCZ Technology Group, Inc.* | | | 600 | | | | 4,188 | |
Procera Networks, Inc.* | | | 181 | | | | 4,047 | |
Calix, Inc.* | | | 472 | | | | 4,026 | |
Globecomm Systems, Inc.* | | | 272 | | | | 3,939 | |
LoopNet, Inc.* | | | 209 | | | | 3,925 | |
IXYS Corp.* | | | 297 | | | | 3,920 | |
GSI Group, Inc.* | | | 323 | | | | 3,895 | |
Power-One, Inc.* | | | 854 | | | | 3,886 | |
Exar Corp.* | | | 462 | | | | 3,881 | |
Daktronics, Inc. | | | 431 | | | | 3,832 | |
Zygo Corp.* | | | 195 | | | | 3,816 | |
Keynote Systems, Inc. | | | 192 | | | | 3,794 | |
Inphi Corp.* | | | 265 | | | | 3,758 | |
Silicon Graphics International Corp.* | | | 386 | | | | 3,736 | |
Stamps.com, Inc.* | | | 134 | | | | 3,736 | |
Integrated Silicon Solution, Inc.* | | | 329 | | | | 3,672 | |
VASCO Data Security International, Inc.* | | | 338 | | | | 3,647 | |
Saba Software, Inc.* | | | 370 | | | | 3,630 | |
KIT Digital, Inc.* | | | 502 | | | | 3,614 | |
Perficient, Inc.* | | | 297 | | | | 3,567 | |
QuinStreet, Inc.* | | | 340 | | | | 3,567 | |
| | |
SEE NOTES TO FINANCIAL STATEMENTS. | | THE RYDEX SERIES FUNDS ANNUAL REPORT | 85 |
| | |
| SCHEDULE OF INVESTMENTS (continued) | | March 31, 2012 |
RUSSELL 2000® 1.5x STRATEGY FUND | | |
| | | | | | | | |
| | | SHARES | | | VALUE | |
MIPS Technologies, Inc. — Class A* | | | 653 | | | $ | 3,552 | |
Formfactor, Inc.* | | | 629 | | | | 3,510 | |
Digital Generation, Inc.* | | | 342 | | | | 3,492 | |
Anaren, Inc.* | | | 190 | | | | 3,487 | |
XO Group, Inc.* | | | 371 | | | | 3,484 | |
Digi International, Inc.* | | | 311 | | | | 3,418 | |
Kopin Corp.* | | | 834 | | | | 3,394 | |
NVE Corp.* | | | 64 | | | | 3,392 | |
Cohu, Inc. | | | 297 | | | | 3,377 | |
CIBER, Inc.* | | | 792 | | | | 3,358 | |
ShoreTel, Inc.* | | | 583 | | | | 3,311 | |
Virtusa Corp.* | | | 191 | | | | 3,299 | |
Cray, Inc.* | | | 447 | | | | 3,272 | |
Ubiquiti Networks, Inc.* | | | 101 | | | | 3,195 | |
Deltek, Inc.* | | | 298 | | | | 3,177 | |
Symmetricom, Inc.* | | | 535 | | | | 3,087 | |
Cornerstone OnDemand, Inc.* | | | 140 | | | | 3,058 | |
Callidus Software, Inc.* | | | 386 | | | | 3,015 | |
Envestnet, Inc.* | | | 239 | | | | 2,992 | |
Multi-Fineline Electronix, Inc.* | | | 109 | | | | 2,992 | |
Actuate Corp.* | | | 474 | | | | 2,977 | |
SPS Commerce, Inc.* | | | 109 | | | | 2,930 | |
Limelight Networks, Inc.* | | | 885 | | | | 2,912 | |
ModusLink Global Solutions, Inc.* | | | 539 | | | | 2,911 | |
Computer Task Group, Inc.* | | | 189 | | | | 2,895 | |
Vocus, Inc.* | | | 218 | | | | 2,889 | |
Glu Mobile, Inc.* | | | 588 | | | | 2,852 | |
Mindspeed Technologies, Inc.* | | | 435 | | | | 2,771 | |
Aeroflex Holding Corp.* | | | 247 | | | | 2,752 | |
Imperva, Inc.* | | | 68 | | | | 2,662 | |
Seachange International, Inc.* | | | 337 | | | | 2,622 | |
RealNetworks, Inc. | | | 263 | | | | 2,614 | |
Active Network, Inc.* | | | 155 | | | | 2,609 | |
Pericom Semiconductor Corp.* | | | 312 | | | | 2,524 | |
AXT, Inc.* | | | 394 | | | | 2,502 | |
Supertex, Inc.* | | | 136 | | | | 2,458 | |
American Software, Inc. — Class A | | | 285 | | | | 2,445 | |
Tangoe, Inc.* | | | 130 | | | | 2,445 | |
Oclaro, Inc.* | | | 619 | | | | 2,439 | |
Bel Fuse, Inc. — Class B | | | 138 | | | | 2,438 | |
Intevac, Inc.* | | | 285 | | | | 2,423 | |
PDF Solutions, Inc.* | | | 285 | | | | 2,403 | |
Zix Corp.* | | | 822 | | | | 2,392 | |
Openwave Systems, Inc.* | | | 1,051 | | | | 2,386 | |
Digimarc Corp.* | | | 85 | | | | 2,375 | |
Imation Corp.* | | | 380 | | | | 2,352 | |
FSI International, Inc.* | | | 481 | | | | 2,352 | |
Convio, Inc.* | | | 151 | | | | 2,336 | |
DDi Corp. | | | 190 | | | | 2,318 | |
Angie’s List, Inc.* | | | 122 | | | | 2,305 | |
Rubicon Technology, Inc.* | | | 218 | | | | 2,274 | |
SciQuest, Inc.* | | | 149 | | | | 2,271 | |
Ultra Clean Holdings* | | | 301 | | | | 2,270 | |
Hackett Group, Inc.* | | | 378 | | | | 2,257 | |
MoneyGram International, Inc.* | | | 125 | | | | 2,250 | |
| | | | | | | | |
| | | SHARES | | | VALUE | |
Axcelis Technologies, Inc.* | | | 1,308 | | | $ | 2,250 | |
PLX Technology, Inc.* | | | 551 | | | | 2,215 | |
Vishay Precision Group, Inc.* | | | 149 | | | | 2,210 | |
Echo Global Logistics, Inc.* | | | 137 | | | | 2,206 | |
Lionbridge Technologies, Inc.* | | | 761 | | | | 2,192 | |
Richardson Electronics Ltd. | | | 180 | | | | 2,156 | |
KVH Industries, Inc.* | | | 204 | | | | 2,142 | |
Aviat Networks, Inc.* | | | 756 | | | | 2,132 | |
Agilysys, Inc.* | | | 237 | | | | 2,131 | |
ServiceSource International, Inc.* | | | 137 | | | | 2,121 | |
InvenSense, Inc. — Class A* | | | 116 | | | | 2,100 | |
LeCroy Corp.* | | | 201 | | | | 2,088 | |
Sigma Designs, Inc.* | | | 399 | | | | 2,067 | |
IntraLinks Holdings, Inc.* | | | 390 | | | | 2,063 | |
Guidance Software, Inc.* | | | 186 | | | | 2,055 | |
Anadigics, Inc.* | | | 836 | | | | 1,981 | |
Alpha & Omega Semiconductor Ltd.* | | | 203 | | | | 1,953 | |
Immersion Corp.* | | | 351 | | | | 1,916 | |
Wave Systems Corp. — Class A* | | | 1,025 | | | | 1,907 | |
Echelon Corp.* | | | 430 | | | | 1,905 | |
DSP Group, Inc.* | | | 285 | | | | 1,898 | |
support.com, Inc.* | | | 595 | | | | 1,874 | |
Archipelago Learning, Inc.* | | | 165 | | | | 1,835 | |
Zillow, Inc. — Class A* | | | 51 | | | | 1,815 | |
Radisys Corp.* | | | 240 | | | | 1,776 | |
ePlus, Inc.* | | | 55 | | | | 1,758 | |
Travelzoo, Inc.* | | | 72 | | | | 1,656 | |
MoSys, Inc.* | | | 408 | | | | 1,620 | |
TeleCommunication Systems, Inc. — Class A* | | | 570 | | | | 1,585 | |
Westell Technologies, Inc. — Class A* | | | 673 | | | | 1,568 | |
PRGX Global, Inc.* | | | 246 | | | | 1,547 | |
X-Rite, Inc.* | | | 337 | | | | 1,530 | |
Responsys, Inc.* | | | 121 | | | | 1,448 | |
Rosetta Stone, Inc.* | | | 137 | | | | 1,414 | |
TeleNav, Inc.* | | | 201 | | | | 1,411 | |
FalconStor Software, Inc.* | | | 376 | | | | 1,406 | |
Novatel Wireless, Inc.* | | | 399 | | | | 1,337 | |
Pulse Electronics Corp. | | | 532 | | | | 1,335 | |
Emcore Corp.* | | | 277 | | | | 1,321 | |
TechTarget, Inc.* | | | 190 | | | | 1,317 | |
Communications Systems, Inc. | | | 96 | | | | 1,260 | |
Ellie Mae, Inc.* | | | 111 | | | | 1,239 | |
Rimage Corp. | | | 117 | | | | 1,171 | |
Marchex, Inc. — Class A | | | 262 | | | | 1,169 | |
Numerex Corp. — Class A* | | | 114 | | | | 1,115 | |
MaxLinear, Inc. — Class A* | | | 199 | | | | 1,108 | |
QAD, Inc. — Class A* | | | 83 | | | | 1,087 | |
Dot Hill Systems Corp.* | | | 713 | | | | 1,077 | |
GSI Technology, Inc.* | | | 249 | | | | 1,056 | |
PC Connection, Inc. | | | 127 | | | | 1,044 | |
SRS Labs, Inc.* | | | 150 | | | | 1,043 | |
Dynamics Research Corp.* | | | 108 | | | | 1,041 | |
Smith Micro Software, Inc.* | | | 438 | | | | 1,021 | |
Identive Group, Inc.* | | | 480 | | | | 1,003 | |
| | |
86 | THE RYDEX SERIES FUNDS ANNUAL REPORT | | SEE NOTES TO FINANCIAL STATEMENTS. |
| | |
| SCHEDULE OF INVESTMENTS (continued) | | March 31, 2012 |
RUSSELL 2000® 1.5x STRATEGY FUND | | |
| | | | | | | | |
| | | SHARES | | | VALUE | |
Amtech Systems, Inc.* | | | 114 | | | $ | 950 | |
Carbonite, Inc.* | | | 86 | | | | 947 | |
Opnext, Inc.* | | | 539 | | | | 835 | |
Powerwave Technologies, Inc.* | | | 392 | | | | 804 | |
eMagin Corp.* | | | 234 | | | | 761 | |
Demand Media, Inc.* | | | 103 | | | | 747 | |
Viasystems Group, Inc.* | | | 39 | | | | 740 | |
Intermolecular, Inc.* | | | 114 | | | | 708 | |
NCI, Inc. — Class A* | | | 89 | | | | 569 | |
Meru Networks, Inc.* | | | 139 | | | | 563 | |
Motricity, Inc.* | | | 470 | | | | 517 | |
NeoPhotonics Corp.* | | | 109 | | | | 516 | |
THQ, Inc.* | | | 837 | | | | 469 | |
Stream Global Services, Inc.* | | | 119 | | | | 392 | |
Quepasa Corp.* | | | 83 | | | | 369 | |
Dialogic, Inc.* | | | 191 | | | | 166 | |
FriendFinder Networks, Inc.* | | | 69 | | | | 94 | |
| | | | | | | | |
Total Information Technology | | | | | | | 2,511,545 | |
| | | | | | | | |
INDUSTRIALS—13.3% | | | | | | | | |
Clean Harbors, Inc.* | | | 578 | | | | 38,916 | |
Acuity Brands, Inc. | | | 541 | | | | 33,990 | |
United Rentals, Inc.* | | | 776 | | | | 33,283 | |
Woodward, Inc. | | | 772 | | | | 33,064 | |
Alaska Air Group, Inc.* | | | 892 | | | | 31,952 | |
Dollar Thrifty Automotive Group, Inc.* | | | 384 | | | | 31,070 | |
CLARCOR, Inc. | | | 620 | | | | 30,436 | |
Triumph Group, Inc. | | | 476 | | | | 29,826 | |
Hexcel Corp.* | | | 1,212 | | | | 29,100 | |
Teledyne Technologies, Inc.* | | | 452 | | | | 28,499 | |
Old Dominion Freight Line, Inc.* | | | 583 | | | | 27,792 | |
Esterline Technologies Corp.* | | | 377 | | | | 26,940 | |
Chart Industries, Inc.* | | | 365 | | | | 26,765 | |
HEICO Corp. | | | 516 | | | | 26,620 | |
Genesee & Wyoming, Inc. — Class A* | | | 485 | | | | 26,471 | |
Watsco, Inc. | | | 344 | | | | 25,470 | |
Robbins & Myers, Inc. | | | 488 | | | | 25,400 | |
Actuant Corp. — Class A | | | 853 | | | | 24,728 | |
Moog, Inc. — Class A* | | | 564 | | | | 24,190 | |
EMCOR Group, Inc. | | | 829 | | | | 22,979 | |
Middleby Corp.* | | | 227 | | | | 22,968 | |
Acacia Research Corp.* | | | 534 | | | | 22,289 | |
Belden, Inc. | | | 582 | | | | 22,064 | |
CoStar Group, Inc.* | | | 317 | | | | 21,889 | |
Mueller Industries, Inc. | | | 481 | | | | 21,861 | |
Applied Industrial Technologies, Inc. | | | 526 | | | | 21,634 | |
EnerSys* | | | 618 | | | | 21,414 | |
Curtiss-Wright Corp. | | | 571 | | | | 21,133 | |
AO Smith Corp. | | | 468 | | | | 21,037 | |
Tetra Tech, Inc.* | | | 767 | | | | 20,218 | |
Colfax Corp.* | | | 561 | | | | 19,770 | |
FTI Consulting, Inc.* | | | 521 | | | | 19,548 | |
Corporate Executive Board Co. | | | 445 | | | | 19,139 | |
RSC Holdings, Inc.* | | | 837 | | | | 18,908 | |
| | | | | | | | |
| | | SHARES | | | VALUE | |
Brady Corp. — Class A | | | 582 | | | $ | 18,828 | |
Advisory Board Co.* | | | 208 | | | | 18,433 | |
Avis Budget Group, Inc.* | | | 1,300 | | | | 18,395 | |
Barnes Group, Inc. | | | 683 | | | | 17,970 | |
United Stationers, Inc. | | | 568 | | | | 17,624 | |
Healthcare Services Group, Inc. | | | 824 | | | | 17,525 | |
Simpson Manufacturing Company, Inc. | | | 523 | | | | 16,866 | |
Herman Miller, Inc. | | | 728 | | | | 16,715 | |
Rollins, Inc. | | | 780 | | | | 16,598 | |
HUB Group, Inc. — Class A* | | | 458 | | | | 16,502 | |
ABM Industries, Inc. | | | 673 | | | | 16,354 | |
Atlas Air Worldwide Holdings, Inc.* | | | 324 | | | | 15,944 | |
Watts Water Technologies, Inc. — Class A | | | 384 | | | | 15,648 | |
Geo Group, Inc.* | | | 813 | | | | 15,455 | |
US Airways Group, Inc.* | | | 2,016 | | | | 15,302 | |
HNI Corp. | | | 551 | | | | 15,290 | |
II-VI, Inc.* | | | 642 | | | | 15,183 | |
USG Corp.* | | | 882 | | | | 15,170 | |
Beacon Roofing Supply, Inc.* | | | 582 | | | | 14,992 | |
Deluxe Corp. | | | 640 | | | | 14,989 | |
JetBlue Airways Corp.* | | | 3,041 | | | | 14,871 | |
Brink’s Co. | | | 595 | | | | 14,203 | |
Franklin Electric Company, Inc. | | | 284 | | | | 13,936 | |
Mine Safety Appliances Co. | | | 338 | | | | 13,885 | |
Granite Construction, Inc. | | | 481 | | | | 13,823 | |
Raven Industries, Inc. | | | 226 | | | | 13,788 | |
RBC Bearings, Inc.* | | | 294 | | | | 13,562 | |
Forward Air Corp. | | | 368 | | | | 13,495 | |
Werner Enterprises, Inc. | | | 539 | | | | 13,400 | |
Knight Transportation, Inc. | | | 754 | | | | 13,316 | |
GT Advanced Technologies, Inc.* | | | 1,553 | | | | 12,843 | |
MasTec, Inc.* | | | 698 | | | | 12,626 | |
Titan International, Inc. | | | 522 | | | | 12,345 | |
3D Systems Corp.* | | | 524 | | | | 12,335 | |
ESCO Technologies, Inc. | | | 324 | | | | 11,913 | |
Amerco, Inc. | | | 109 | | | | 11,501 | |
Unifirst Corp. | | | 185 | | | | 11,387 | |
Swift Transportation Co. — Class A* | | | 976 | | | | 11,263 | |
Briggs & Stratton Corp. | | | 619 | | | | 11,099 | |
Huron Consulting Group, Inc.* | | | 293 | | | | 11,005 | |
EnPro Industries, Inc.* | | | 267 | | | | 10,974 | |
Kaman Corp. | | | 321 | | | | 10,898 | |
Tennant Co. | | | 238 | | | | 10,472 | |
Kaydon Corp. | | | 408 | | | | 10,408 | |
Lindsay Corp. | | | 155 | | | | 10,272 | |
Dycom Industries, Inc.* | | | 437 | | | | 10,208 | |
Blount International, Inc.* | | | 612 | | | | 10,208 | |
TAL International Group, Inc. | | | 274 | | | | 10,059 | |
Ceradyne, Inc. | | | 304 | | | | 9,898 | |
Knoll, Inc. | | | 594 | | | | 9,884 | |
Allegiant Travel Co. — Class A* | | | 180 | | | | 9,810 | |
Korn* | | | 582 | | | | 9,748 | |
Orbital Sciences Corp.* | | | 726 | | | | 9,547 | |
Mobile Mini, Inc.* | | | 452 | | | | 9,546 | |
McGrath Rentcorp | | | 296 | | | | 9,505 | |
| | |
SEE NOTES TO FINANCIAL STATEMENTS. | | THE RYDEX SERIES FUNDS ANNUAL REPORT | 87 |
| | |
| SCHEDULE OF INVESTMENTS (continued) | | March 31, 2012 |
RUSSELL 2000® 1.5x STRATEGY FUND | | |
| | | | | | | | |
| | | SHARES | | | VALUE | |
Steelcase, Inc. — Class A | | | 986 | | | $ | 9,466 | |
TrueBlue, Inc.* | | | 524 | | | | 9,368 | |
Cubic Corp. | | | 197 | | | | 9,314 | |
Interface, Inc. — Class A | | | 664 | | | | 9,263 | |
Interline Brands, Inc.* | | | 426 | | | | 9,206 | |
Astec Industries, Inc.* | | | 249 | | | | 9,084 | |
AAR Corp. | | | 494 | | | | 9,016 | |
Heartland Express, Inc. | | | 620 | | | | 8,965 | |
Insperity, Inc. | | | 289 | | | | 8,855 | |
Navigant Consulting, Inc.* | | | 636 | | | | 8,847 | |
Aegion Corp. — Class A* | | | 493 | | | | 8,790 | |
Wabash National Corp.* | | | 846 | | | | 8,756 | |
Exponent, Inc.* | | | 180 | | | | 8,734 | |
G&K Services, Inc. — Class A | | | 255 | | | | 8,721 | |
Aircastle Ltd. | | | 710 | | | | 8,690 | |
Resources Connection, Inc. | | | 610 | | | | 8,571 | |
Rush Enterprises, Inc. — Class A* | | | 402 | | | | 8,530 | |
ACCO Brands Corp.* | | | 684 | | | | 8,488 | |
Quanex Building Products Corp. | | | 479 | | | | 8,445 | |
SYKES Enterprises, Inc.* | | | 524 | | | | 8,279 | |
Universal Forest Products, Inc. | | | 240 | | | | 8,275 | |
NACCO Industries, Inc. — Class A | | | 71 | | | | 8,262 | |
AZZ, Inc. | | | 158 | | | | 8,160 | |
On Assignment, Inc.* | | | 464 | | | | 8,106 | |
American Science & Engineering, Inc. | | | 119 | | | | 7,979 | |
Albany International Corp. — Class A | | | 345 | | | | 7,918 | |
Generac Holdings, Inc.* | | | 311 | | | | 7,635 | |
Encore Wire Corp. | | | 252 | | | | 7,492 | |
Team, Inc.* | | | 241 | | | | 7,459 | |
SkyWest, Inc. | | | 664 | | | | 7,337 | |
Trimas Corp.* | | | 325 | | | | 7,277 | |
Sauer-Danfoss, Inc. | | | 154 | | | | 7,238 | |
CIRCOR International, Inc. | | | 215 | | | | 7,153 | |
H&E Equipment Services, Inc.* | | | 351 | | | | 6,641 | |
GeoEye, Inc.* | | | 274 | | | | 6,595 | |
Sun Hydraulics Corp. | | | 252 | | | | 6,592 | |
Standex International Corp. | | | 158 | | | | 6,508 | |
Badger Meter, Inc. | | | 190 | | | | 6,458 | |
Mueller Water Products, Inc. — Class A | | | 1,927 | | | | 6,417 | |
Altra Holdings, Inc.* | | | 329 | | | | 6,317 | |
Trex Company, Inc.* | | | 196 | | | | 6,288 | |
Griffon Corp. | | | 584 | | | | 6,249 | |
Kforce, Inc.* | | | 415 | | | | 6,184 | |
Tutor Perini Corp.* | | | 391 | | | | 6,092 | |
ICF International, Inc.* | | | 238 | | | | 6,038 | |
Cascade Corp. | | | 117 | | | | 5,864 | |
Arkansas Best Corp. | | | 311 | | | | 5,850 | |
RailAmerica, Inc.* | | | 271 | | | | 5,816 | |
John Bean Technologies Corp. | | | 358 | | | | 5,800 | |
Tredegar Corp. | | | 296 | | | | 5,799 | |
DigitalGlobe, Inc.* | | | 434 | | | | 5,790 | |
Aerovironment, Inc.* | | | 214 | | | | 5,737 | |
Gibraltar Industries, Inc.* | | | 377 | | | | 5,712 | |
| | | | | | | | |
| | | SHARES | | | VALUE | |
Higher One Holdings, Inc.* | | | 377 | | | $ | 5,636 | |
Primoris Services Corp. | | | 349 | | | | 5,605 | |
Gorman-Rupp Co. | | | 190 | | | | 5,544 | |
Titan Machinery, Inc.* | | | 196 | | | | 5,527 | |
Global Power Equipment Group, Inc.* | | | 196 | | | | 5,429 | |
Kelly Services, Inc. — Class A | | | 334 | | | | 5,341 | |
Layne Christensen Co.* | | | 239 | | | | 5,318 | |
Ennis, Inc. | | | 335 | | | | 5,300 | |
Great Lakes Dredge & Dock Corp. | | | 730 | | | | 5,271 | |
Comfort Systems USA, Inc. | | | 483 | | | | 5,270 | |
Heidrick & Struggles International, Inc. | | | 238 | | | | 5,243 | |
GenCorp, Inc.* | | | 730 | | | | 5,183 | |
Consolidated Graphics, Inc.* | | | 112 | | | | 5,068 | |
AAON, Inc. | | | 249 | | | | 5,027 | |
Viad Corp. | | | 258 | | | | 5,013 | |
US Ecology, Inc. | | | 228 | | | | 4,957 | |
EnergySolutions, Inc.* | | | 1,000 | | | | 4,900 | |
Greenbrier Companies, Inc.* | | | 246 | | | | 4,868 | |
Mistras Group, Inc.* | | | 200 | | | | 4,764 | |
Textainer Group Holdings Ltd. | | | 140 | | | | 4,746 | |
DXP Enterprises, Inc.* | | | 109 | | | | 4,740 | |
Astronics Corp.* | | | 129 | | | | 4,510 | |
Apogee Enterprises, Inc. | | | 343 | | | | 4,442 | |
MYR Group, Inc.* | | | 245 | | | | 4,376 | |
Accuride Corp.* | | | 502 | | | | 4,362 | |
Commercial Vehicle Group, Inc.* | | | 357 | | | | 4,359 | |
Quad Graphics Inc. | | | 311 | | | | 4,323 | |
Federal Signal Corp.* | | | 772 | | | | 4,292 | |
Wesco Aircraft Holdings, Inc.* | | | 264 | | | | 4,277 | |
Standard Parking Corp.* | | | 208 | | | | 4,264 | |
Marten Transport Ltd. | | | 189 | | | | 4,171 | |
Celadon Group, Inc. | | | 257 | | | | 3,996 | |
InnerWorkings, Inc.* | | | 337 | | | | 3,926 | |
Columbus McKinnon Corp.* | | | 241 | | | | 3,926 | |
Air Transport Services Group, Inc.* | | | 667 | | | | 3,862 | |
Spirit Airlines, Inc.* | | | 190 | | | | 3,813 | |
CRA International, Inc.* | | | 151 | | | | 3,808 | |
Powell Industries, Inc.* | | | 104 | | | | 3,562 | |
Kadant, Inc.* | | | 149 | | | | 3,549 | |
Dolan Co.* | | | 381 | | | | 3,471 | |
Dynamic Materials Corp. | | | 161 | | | | 3,399 | |
Saia, Inc.* | | | 199 | | | | 3,385 | |
LB Foster Co. — Class A | | | 118 | | | | 3,364 | |
PMFG, Inc.* | | | 222 | | | | 3,332 | |
FreightCar America, Inc. | | | 148 | | | | 3,329 | |
Houston Wire & Cable Co. | | | 237 | | | | 3,292 | |
GP Strategies Corp.* | | | 186 | | | | 3,255 | |
Taser International, Inc.* | | | 750 | | | | 3,255 | |
Aceto Corp. | | | 342 | | | | 3,246 | |
Hawaiian Holdings, Inc.* | | | 619 | | | | 3,237 | |
Douglas Dynamics, Inc. | | | 233 | | | | 3,204 | |
Multi-Color Corp. | | | 140 | | | | 3,151 | |
Capstone Turbine Corp.* | | | 3,056 | | | | 3,117 | |
CBIZ, Inc.* | | | 489 | | | | 3,090 | |
| | |
88 | THE RYDEX SERIES FUNDS ANNUAL REPORT | | SEE NOTES TO FINANCIAL STATEMENTS. |
| | |
| SCHEDULE OF INVESTMENTS (continued) | | March 31, 2012 |
RUSSELL 2000® 1.5x STRATEGY FUND | | |
| | | | | | | | |
| | | SHARES | | | VALUE | |
Ameresco, Inc. — Class A* | | | 224 | | | $ | 3,035 | |
Furmanite Corp.* | | | 467 | | | | 2,998 | |
Republic Airways Holdings, Inc.* | | | 595 | | | | 2,939 | |
American Railcar Industries, Inc.* | | | 123 | | | | 2,892 | |
CDI Corp. | | | 159 | | | | 2,851 | |
Graham Corp. | | | 130 | | | | 2,846 | |
Odyssey Marine Exploration, Inc.* | | | 904 | | | | 2,802 | |
NCI Building Systems, Inc.* | | | 239 | | | | 2,751 | |
Pacer International, Inc.* | | | 435 | | | | 2,749 | |
CAI International, Inc.* | | | 151 | | | | 2,745 | |
Kimball International, Inc. — Class B | | | 392 | | | | 2,709 | |
Thermon Group Holdings, Inc.* | | | 131 | | | | 2,679 | |
Insteel Industries, Inc. | | | 218 | | | | 2,649 | |
Hurco Companies, Inc.* | | | 93 | | | | 2,627 | |
Twin Disc, Inc. | | | 100 | | | | 2,609 | |
American Reprographics Co.* | | | 481 | | | | 2,593 | |
Swisher Hygiene, Inc.* | | | 1,043 | | | | 2,566 | |
Quality Distribution, Inc.* | | | 185 | | | | 2,549 | |
FuelCell Energy, Inc.* | | | 1,621 | | | | 2,545 | |
Miller Industries, Inc. | | | 148 | | | | 2,504 | |
Builders FirstSource, Inc.* | | | 578 | | | | 2,445 | |
SeaCube Container Leasing Ltd. | | | 142 | | | | 2,442 | |
Northwest Pipe Co.* | | | 114 | | | | 2,421 | |
Michael Baker Corp.* | | | 101 | | | | 2,409 | |
Alamo Group, Inc. | | | 80 | | | | 2,405 | |
Orion Marine Group, Inc.* | | | 329 | | | | 2,379 | |
American Superconductor Corp.* | | | 575 | | | | 2,369 | |
Preformed Line Products Co. | | | 36 | | | | 2,358 | |
Flow International Corp.* | | | 584 | | | | 2,348 | |
Genco Shipping & Trading Ltd.* | | | 366 | | | | 2,327 | |
Cenveo, Inc.* | | | 684 | | | | 2,312 | |
Ampco-Pittsburgh Corp. | | | 110 | | | | 2,214 | |
Kratos Defense & Security Solutions, Inc.* | | | 414 | | | | 2,211 | |
Hudson Highland Group, Inc.* | | | 403 | | | | 2,168 | |
RPX Corp.* | | | 127 | | | | 2,154 | |
LMI Aerospace, Inc.* | | | 117 | | | | 2,129 | |
Lydall, Inc.* | | | 208 | | | | 2,120 | |
Park-Ohio Holdings Corp.* | | | 105 | | | | 2,105 | |
Metalico, Inc.* | | | 491 | | | | 2,097 | |
Sterling Construction Company, Inc.* | | | 213 | | | | 2,077 | |
Roadrunner Transportation Systems, Inc.* | | | 119 | | | | 2,065 | |
American Woodmark Corp. | | | 114 | | | | 2,052 | |
EnerNOC, Inc.* | | | 284 | | | | 2,045 | |
Met-Pro Corp. | | | 191 | | | | 2,017 | |
Zipcar, Inc.* | | | 135 | | | | 1,999 | |
Vicor Corp. | | | 247 | | | | 1,976 | |
TMS International Corp. — Class A* | | | 161 | | | | 1,948 | |
Casella Waste Systems, Inc. — Class A* | | | 311 | | | | 1,938 | |
Barrett Business Services, Inc. | | | 97 | | | | 1,924 | |
Patriot Transportation Holding, Inc.* | | | 81 | | | | 1,886 | |
Schawk, Inc. — Class A | | | 150 | | | | 1,877 | |
LSI Industries, Inc. | | | 239 | | | | 1,752 | |
KEYW Holding Corp.* | | | 226 | | | | 1,752 | |
Pike Electric Corp.* | | | 208 | | | | 1,712 | |
| | | | | | | | |
| | | SHARES | | | VALUE | |
Courier Corp. | | | 147 | | | $ | 1,705 | |
NN, Inc.* | | | 208 | | | | 1,697 | |
Ducommun, Inc.* | | | 138 | | | | 1,642 | |
Franklin Covey Co.* | | | 171 | | | | 1,609 | |
Intersections, Inc. | | | 124 | | | | 1,585 | |
International Shipholding Corp. | | | 68 | | | | 1,570 | |
Eagle Bulk Shipping, Inc.* | | | 775 | | | | 1,504 | |
Argan, Inc. | | | 93 | | | | 1,492 | |
PowerSecure International, Inc.* | | | 246 | | | | 1,491 | |
TRC Companies, Inc.* | | | 228 | | | | 1,393 | |
AT Cross Co. — Class A* | | | 114 | | | | 1,373 | |
Energy Recovery, Inc.* | | | 572 | | | | 1,316 | |
Heritage-Crystal Clean, Inc.* | | | 65 | | | | 1,297 | |
Chase Corp. | | | 81 | | | | 1,276 | |
Fuel Tech, Inc.* | | | 229 | | | | 1,250 | |
A123 Systems, Inc.* | | | 1,096 | | | | 1,228 | |
Hill International, Inc.* | | | 311 | | | | 1,222 | |
VSE Corp. | | | 48 | | | | 1,191 | |
Excel Maritime Carriers Ltd. — Class A* | | | 571 | | | | 1,142 | |
Universal Truckload Services, Inc. | | | 67 | | | | 1,009 | |
Coleman Cable, Inc.* | | | 100 | | | | 972 | |
Tecumseh Products Co. — Class A* | | | 238 | | | | 957 | |
Xerium Technologies, Inc.* | | | 136 | | | | 877 | |
Baltic Trading Ltd. | | | 204 | | | | 847 | |
Broadwind Energy, Inc.* | | | 1,723 | | | | 810 | |
Essex Rental Corp.* | | | 207 | | | | 791 | |
Active Power, Inc.* | | | 985 | | | | 768 | |
Valence Technology, Inc.* | | | 897 | | | | 725 | |
School Specialty, Inc.* | | | 196 | | | | 694 | |
Lawson Products, Inc. | | | 43 | | | | 650 | |
Ultrapetrol Bahamas Ltd.* | | | 274 | | | | 548 | |
Microvision, Inc.* | | | 194 | | | | 530 | |
UniTek Global Services, Inc.* | | | 137 | | | | 462 | |
Omega Flex, Inc.* | | | 36 | | | | 457 | |
Satcon Technology Corp.* | | | 1,120 | | | | 403 | |
Covenant Transportation Group, Inc. — Class A* | | | 102 | | | | 326 | |
Compx International, Inc. | | | 15 | | | | 209 | |
| | | | | | | | |
Total Industrials | | | | | | | 2,407,389 | |
| | | | | | | | |
CONSUMER DISCRETIONARY—11.7% | | | | | | | | |
Ascena Retail Group, Inc.* | | | 775 | | | | 34,349 | |
Sotheby’s | | | 833 | | | | 32,769 | |
Warnaco Group, Inc.* | | | 531 | | | | 31,011 | |
Carter’s, Inc.* | | | 612 | | | | 30,459 | |
Rent-A-Center, Inc. — Class A | | | 762 | | | | 28,766 | |
Brunswick Corp. | | | 1,111 | | | | 28,608 | |
Domino’s Pizza, Inc. | | | 785 | | | | 28,496 | |
Dana Holding Corp. | | | 1,827 | | | | 28,318 | |
Tenneco, Inc.* | | | 742 | | | | 27,565 | |
Life Time Fitness, Inc.* | | | 536 | | | | 27,106 | |
Cinemark Holdings, Inc. | | | 1,155 | | | | 25,352 | |
Men’s Wearhouse, Inc. | | | 640 | | | | 24,813 | |
Coinstar, Inc.* | | | 389 | | | | 24,721 | |
Six Flags Entertainment Corp. | | | 517 | | | | 24,180 | |
Crocs, Inc.* | | | 1,118 | | | | 23,388 | |
Wolverine World Wide, Inc. | | | 625 | | | | 23,237 | |
| | |
SEE NOTES TO FINANCIAL STATEMENTS. | | THE RYDEX SERIES FUNDS ANNUAL REPORT | 89 |
| | |
| SCHEDULE OF INVESTMENTS (continued) | | March 31, 2012 |
RUSSELL 2000® 1.5x STRATEGY FUND | | |
| | | | | | | | |
| | | SHARES | | | VALUE | |
Pier 1 Imports, Inc.* | | | 1,251 | | | $ | 22,743 | |
Pool Corp. | | | 595 | | | | 22,265 | |
Select Comfort Corp.* | | | 683 | | | | 22,122 | |
Cheesecake Factory, Inc.* | | | 742 | | | | 21,807 | |
Aeropostale, Inc.* | | | 1,002 | | | | 21,663 | |
Cabela’s, Inc.* | | | 544 | | | | 20,754 | |
Genesco, Inc.* | | | 289 | | | | 20,707 | |
Buffalo Wild Wings, Inc.* | | | 228 | | | | 20,677 | |
Steven Madden Ltd.* | | | 476 | | | | 20,349 | |
Vail Resorts, Inc. | | | 449 | | | | 19,419 | |
HSN, Inc. | | | 493 | | | | 18,748 | |
ANN, Inc.* | | | 643 | | | | 18,416 | |
Hibbett Sports, Inc.* | | | 336 | | | | 18,329 | |
Hillenbrand, Inc. | | | 774 | | | | 17,763 | |
Jos A. Bank Clothiers, Inc.* | | | 347 | | | | 17,492 | |
Children’s Place Retail Stores, Inc.* | | | 335 | | | | 17,309 | |
Express, Inc.* | | | 686 | | | | 17,136 | |
Saks, Inc.* | | | 1,451 | | | | 16,846 | |
Live Nation Entertainment, Inc.* | | | 1,747 | | | | 16,422 | |
Buckle, Inc. | | | 339 | | | | 16,238 | |
Cracker Barrel Old Country Store, Inc. | | | 290 | | | | 16,182 | |
Group 1 Automotive, Inc. | | | 282 | | | | 15,841 | |
Monro Muffler Brake, Inc. | | | 378 | | | | 15,683 | |
Iconix Brand Group, Inc.* | | | 899 | | | | 15,625 | |
Liz Claiborne, Inc.* | | | 1,169 | | | | 15,618 | |
Collective Brands, Inc.* | | | 768 | | | | 15,099 | |
BJ’s Restaurants, Inc.* | | | 297 | | | | 14,954 | |
Meredith Corp. | | | 444 | | | | 14,412 | |
Bob Evans Farms, Inc. | | | 376 | | | | 14,183 | |
Penske Automotive Group, Inc. | | | 575 | | | | 14,162 | |
Strayer Education, Inc. | | | 149 | | | | 14,049 | |
Valassis Communications, Inc.* | | | 609 | | | | 14,007 | |
Finish Line, Inc. — Class A | | | 644 | | | | 13,666 | |
Vitamin Shoppe, Inc.* | | | 309 | | | | 13,661 | |
Gaylord Entertainment Co.* | | | 443 | | | | 13,644 | |
Jack in the Box, Inc.* | | | 563 | | | | 13,495 | |
Regis Corp. | | | 721 | | | | 13,288 | |
Jones Group, Inc. | | | 1,051 | | | | 13,201 | |
Texas Roadhouse, Inc. — Class A | | | 778 | | | | 12,946 | |
Helen of Troy Ltd.* | | | 380 | | | | 12,924 | |
Arbitron, Inc. | | | 338 | | | | 12,500 | |
MDC Holdings, Inc. | | | 473 | | | | 12,198 | |
Sturm Ruger & Company, Inc. | | | 246 | | | | 12,079 | |
Orient-Express Hotels Ltd. — Class A* | | | 1,179 | | | | 12,026 | |
Matthews International Corp. — Class A | | | 379 | | | | 11,992 | |
Peet’s Coffee & Tea, Inc.* | | | 161 | | | | 11,866 | |
Office Depot, Inc.* | | | 3,433 | | | | 11,844 | |
Shuffle Master, Inc.* | | | 672 | | | | 11,827 | |
Scholastic Corp. | | | 335 | | | | 11,819 | |
Cooper Tire & Rubber Co. | | | 768 | | | | 11,689 | |
New York Times Co. — Class A* | | | 1,695 | | | | 11,509 | |
Shutterfly, Inc.* | | | 365 | | | | 11,435 | |
Ryland Group, Inc. | | | 553 | | | | 10,661 | |
National CineMedia, Inc. | | | 684 | | | | 10,465 | |
PF Chang’s China Bistro, Inc. | | | 264 | | | | 10,433 | |
International Speedway Corp. — Class A | | | 375 | | | | 10,406 | |
| | | | | | | | |
| | | SHARES | | | VALUE | |
Asbury Automotive Group, Inc.* | | | 385 | | | $ | 10,395 | |
GNC Holdings, Inc. — Class A | | | 286 | | | | 9,979 | |
PEP Boys-Manny Moe & Jack | | | 662 | | | | 9,877 | |
Zumiez, Inc.* | | | 273 | | | | 9,858 | |
Ascent Capital Group, Inc. — Class A* | | | 206 | | | | 9,742 | |
American Axle & Manufacturing Holdings, Inc.* | | | 825 | | | | 9,661 | |
Cato Corp. — Class A | | | 345 | | | | 9,536 | |
La-Z-Boy, Inc.* | | | 637 | | | | 9,530 | |
Meritor, Inc.* | | | 1,169 | | | | 9,434 | |
DineEquity, Inc.* | | | 190 | | | | 9,424 | |
Steiner Leisure Ltd.* | | | 191 | | | | 9,327 | |
CEC Entertainment, Inc. | | | 246 | | | | 9,326 | |
Meritage Homes Corp.* | | | 344 | | | | 9,309 | |
Papa John’s International, Inc.* | | | 242 | | | | 9,114 | |
Pinnacle Entertainment, Inc.* | | | 786 | | | | 9,047 | |
True Religion Apparel, Inc.* | | | 328 | | | | 8,987 | |
Sonic Automotive, Inc. — Class A | | | 501 | | | | 8,973 | |
Interval Leisure Group, Inc. | | | 501 | | | | 8,717 | |
American Public Education, Inc.* | | | 228 | | | | 8,664 | |
Churchill Downs, Inc. | | | 154 | | | | 8,609 | |
Charming Shoppes, Inc.* | | | 1,442 | | | | 8,508 | |
KB Home | | | 953 | | | | 8,482 | |
Scientific Games Corp. — Class A* | | | 721 | | | | 8,407 | |
American Greetings Corp. — Class A | | | 542 | | | | 8,314 | |
Belo Corp. — Class A | | | 1,141 | | | | 8,182 | |
Oxford Industries, Inc. | | | 160 | | | | 8,131 | |
iRobot Corp.* | | | 294 | | | | 8,014 | |
Lions Gate Entertainment Corp.* | | | 571 | | | | 7,948 | |
K12, Inc.* | | | 334 | | | | 7,892 | |
Lithia Motors, Inc. — Class A | | | 292 | | | | 7,650 | |
Ethan Allen Interiors, Inc. | | | 298 | | | | 7,545 | |
Vera Bradley, Inc.* | | | 249 | | | | 7,517 | |
Ameristar Casinos, Inc. | | | 397 | | | | 7,396 | |
Ruby Tuesday, Inc.* | | | 799 | | | | 7,295 | |
Capella Education Co.* | | | 202 | | | | 7,262 | |
Biglari Holdings, Inc.* | | | 18 | | | | 7,251 | |
Lumber Liquidators Holdings, Inc.* | | | 281 | | | | 7,056 | |
Knology, Inc.* | | | 384 | | | | 6,989 | |
Sinclair Broadcast Group, Inc. — Class A | | | 631 | | | | 6,979 | |
Columbia Sportswear Co. | | | 146 | | | | 6,928 | |
Fred’s, Inc. — Class A | | | 466 | | | | 6,808 | |
Dorman Products, Inc.* | | | 133 | | | | 6,730 | |
Drew Industries, Inc.* | | | 239 | | | | 6,527 | |
Quiksilver, Inc.* | | | 1,602 | | | | 6,472 | |
Maidenform Brands, Inc.* | | | 284 | | | | 6,393 | |
Arctic Cat, Inc.* | | | 146 | | | | 6,253 | |
Grand Canyon Education, Inc.* | | | 349 | | | | 6,198 | |
Stage Stores, Inc. | | | 380 | | | | 6,171 | |
OfficeMax, Inc.* | | | 1,062 | | | | 6,075 | |
Skechers U.S.A., Inc. — Class A* | | | 473 | | | | 6,017 | |
Sonic Corp.* | | | 780 | | | | 5,990 | |
Red Robin Gourmet Burgers, Inc.* | | | 161 | | | | 5,988 | |
G-III Apparel Group Ltd.* | | | 208 | | | | 5,911 | |
Jakks Pacific, Inc. | | | 338 | | | | 5,898 | |
Stewart Enterprises, Inc. — Class A | | | 970 | | | | 5,888 | |
| | |
90 | THE RYDEX SERIES FUNDS ANNUAL REPORT | | SEE NOTES TO FINANCIAL STATEMENTS. |
| | |
| SCHEDULE OF INVESTMENTS (continued) | | March 31, 2012 |
RUSSELL 2000® 1.5x STRATEGY FUND | | |
| | | | | | | | |
| | | SHARES | | | VALUE | |
Superior Industries International, Inc. | | | 299 | | | $ | 5,842 | |
Standard Pacific Corp.* | | | 1,308 | | | | 5,834 | |
Smith & Wesson Holding Corp.* | | | 752 | | | | 5,828 | |
Core-Mark Holding Company, Inc. | | | 140 | | | | 5,731 | |
Bridgepoint Education, Inc.* | | | 227 | | | | 5,618 | |
Rue21, Inc.* | | | 190 | | | | 5,575 | |
Hot Topic, Inc. | | | 539 | | | | 5,471 | |
Fuel Systems Solutions, Inc.* | | | 207 | | | | 5,415 | |
Callaway Golf Co. | | | 798 | | | | 5,394 | |
Krispy Kreme Doughnuts, Inc.* | | | 729 | | | | 5,322 | |
Boyd Gaming Corp.* | | | 674 | | | | 5,284 | |
Blue Nile, Inc.* | | | 157 | | | | 5,178 | |
AFC Enterprises, Inc.* | | | 304 | | | | 5,156 | |
Movado Group, Inc. | | | 209 | | | | 5,131 | |
Modine Manufacturing Co.* | | | 572 | | | | 5,051 | |
America’s Car-Mart, Inc.* | | | 112 | | | | 4,926 | |
Denny’s Corp.* | | | 1,218 | | | | 4,921 | |
Harte-Hanks, Inc. | | | 543 | | | | 4,914 | |
Barnes & Noble, Inc.* | | | 369 | | | | 4,889 | |
National Presto Industries, Inc. | | | 64 | | | | 4,855 | |
Bravo Brio Restaurant Group, Inc.* | | | 240 | | | | 4,790 | |
Brown Shoe Company, Inc. | | | 517 | | | | 4,772 | |
Blyth, Inc. | | | 61 | | | | 4,565 | |
Amerigon, Inc.* | | | 281 | | | | 4,547 | |
Cost Plus, Inc.* | | | 253 | | | | 4,529 | |
Leapfrog Enterprises, Inc. — Class A* | | | 532 | | | | 4,448 | |
Standard Motor Products, Inc. | | | 248 | | | | 4,400 | |
Bebe Stores, Inc. | | | 475 | | | | 4,384 | |
Body Central Corp.* | | | 150 | | | | 4,353 | |
EW Scripps Co. — Class A* | | | 420 | | | | 4,145 | |
Cavco Industries, Inc.* | | | 88 | | | | 4,099 | |
Corinthian Colleges, Inc.* | | | 977 | | | | 4,045 | |
Francesca’s Holdings Corp.* | | | 127 | | | | 4,014 | |
NutriSystem, Inc. | | | 348 | | | | 3,908 | |
Wet Seal, Inc. — Class A* | | | 1,120 | | | | 3,864 | |
Universal Electronics, Inc.* | | | 190 | | | | 3,796 | |
Shoe Carnival, Inc.* | | | 117 | | | | 3,770 | |
Universal Technical Institute, Inc. | | | 275 | | | | 3,627 | |
Winnebago Industries, Inc.* | | | 369 | | | | 3,616 | |
Multimedia Games Holding Company, Inc.* | | | 329 | | | | 3,606 | |
MDC Partners, Inc. — Class A | | | 312 | | | | 3,469 | |
Kirkland’s, Inc.* | | | 209 | | | | 3,382 | |
Stoneridge, Inc.* | | | 338 | | | | 3,343 | |
PetMed Express, Inc. | | | 267 | | | | 3,305 | |
Ruth’s Hospitality Group, Inc.* | | | 435 | | | | 3,302 | |
Fisher Communications, Inc.* | | | 106 | | | | 3,256 | |
Town Sports International Holdings, Inc.* | | | 255 | | | | 3,221 | |
Central European Media Enterprises Ltd. — Class A* | | | 452 | | | | 3,209 | |
Marcus Corp. | | | 255 | | | | 3,200 | |
Libbey, Inc.* | | | 245 | | | | 3,170 | |
Exide Technologies* | | | 980 | | | | 3,067 | |
Beazer Homes USA, Inc.* | | | 943 | | | | 3,065 | |
VOXX International Corp. — Class A* | | | 223 | | | | 3,024 | |
Caribou Coffee Company, Inc.* | | | 161 | | | | 3,001 | |
Journal Communications, Inc. — Class A* | | | 531 | | | | 2,990 | |
| | | | | | | | |
| | | SHARES | | | VALUE | |
World Wrestling Entertainment, Inc. — Class A | | | 336 | | | $ | 2,980 | |
M/I Homes, Inc.* | | | 237 | | | | 2,929 | |
Perry Ellis International, Inc.* | | | 155 | | | | 2,894 | |
Speedway Motorsports, Inc. | | | 150 | | | | 2,802 | |
Conn’s, Inc.* | | | 178 | | | | 2,732 | |
Haverty Furniture Companies, Inc. | | | 239 | | | | 2,653 | |
Talbots, Inc.* | | | 872 | | | | 2,642 | |
REX American Resources Corp.* | | | 86 | | | | 2,640 | |
hhgregg, Inc.* | | | 229 | | | | 2,606 | |
Rentrak Corp.* | | | 114 | | | | 2,588 | |
Mattress Firm Holding Corp.* | | | 66 | | | | 2,501 | |
Weyco Group, Inc. | | | 105 | | | | 2,489 | |
Destination Maternity Corp. | | | 134 | | | | 2,488 | |
Benihana, Inc. — Class A | | | 187 | | | | 2,440 | |
Carrols Restaurant Group, Inc.* | | | 154 | | | | 2,349 | |
MarineMax, Inc.* | | | 284 | | | | 2,337 | |
Big 5 Sporting Goods Corp. | | | 298 | | | | 2,336 | |
Stein Mart, Inc.* | | | 345 | | | | 2,277 | |
West Marine, Inc.* | | | 190 | | | | 2,276 | |
Lincoln Educational Services Corp. | | | 286 | | | | 2,262 | |
O’Charleys, Inc.* | | | 229 | | | | 2,253 | |
Steinway Musical Instruments, Inc.* | | | 90 | | | | 2,250 | |
Spartan Motors, Inc. | | | 420 | | | | 2,222 | |
Mac-Gray Corp. | | | 145 | | | | 2,194 | |
Systemax, Inc.* | | | 130 | | | | 2,192 | |
Citi Trends, Inc.* | | | 190 | | | | 2,177 | |
McClatchy Co. — Class A* | | | 718 | | | | 2,075 | |
Tuesday Morning Corp.* | | | 534 | | | | 2,051 | |
Skullcandy, Inc.* | | | 123 | | | | 1,947 | |
CSS Industries, Inc. | | | 100 | | | | 1,946 | |
Entercom Communications Corp. — Class A* | | | 297 | | | | 1,928 | |
Winmark Corp. | | | 33 | | | | 1,912 | |
Hovnanian Enterprises, Inc. — Class A* | | | 764 | | | | 1,872 | |
Saga Communications, Inc. — Class A* | | | 52 | | | | 1,862 | |
Unifi, Inc.* | | | 186 | | | | 1,797 | |
Isle of Capri Casinos, Inc.* | | | 249 | | | | 1,758 | |
Casual Male Retail Group, Inc.* | | | 522 | | | | 1,754 | |
Teavana Holdings, Inc.* | | | 88 | | | | 1,735 | |
Delta Apparel, Inc.* | | | 103 | | | | 1,692 | |
Jamba, Inc.* | | | 813 | | | | 1,683 | |
Red Lion Hotels Corp.* | | | 200 | | | | 1,642 | |
Cumulus Media, Inc. — Class A* | | | 467 | | | | 1,630 | |
Kenneth Cole Productions, Inc. — Class A* | | | 98 | | | | 1,578 | |
Gordmans Stores, Inc.* | | | 70 | | | | 1,538 | |
Outdoor Channel Holdings, Inc. | | | 206 | | | | 1,506 | |
Bon-Ton Stores, Inc. | | | 162 | | | | 1,497 | |
Luby’s, Inc.* | | | 246 | | | | 1,493 | |
LIN TV Corp. — Class A* | | | 366 | | | | 1,482 | |
Motorcar Parts of America, Inc.* | | | 150 | | | | 1,443 | |
RG Barry Corp. | | | 109 | | | | 1,330 | |
Morgans Hotel Group Co.* | | | 268 | | | | 1,327 | |
Cherokee, Inc. | | | 116 | | | | 1,321 | |
K-Swiss, Inc. — Class A* | | | 321 | | | | 1,316 | |
Lifetime Brands, Inc. | | | 117 | | | | 1,315 | |
Black Diamond, Inc.* | | | 142 | | | | 1,315 | |
New York & Company, Inc.* | | | 347 | | | | 1,294 | |
| | |
SEE NOTES TO FINANCIAL STATEMENTS. | | THE RYDEX SERIES FUNDS ANNUAL REPORT | 91 |
| | |
| SCHEDULE OF INVESTMENTS (continued) | | March 31, 2012 |
RUSSELL 2000® 1.5x STRATEGY FUND | | |
| | | | | | | | |
| | | SHARES | | | VALUE | |
Martha Stewart Living Omnimedia — Class A | | | 334 | | | $ | 1,273 | |
Sealy Corp.* | | | 613 | | | | 1,238 | |
Zale Corp.* | | | 399 | | | | 1,233 | |
Einstein Noah Restaurant Group, Inc. | | | 82 | | | | 1,223 | |
AH Belo Corp. — Class A | | | 242 | | | | 1,183 | |
Ambassadors Group, Inc. | | | 219 | | | | 1,172 | |
Gray Television, Inc.* | | | 615 | | | | 1,162 | |
Nexstar Broadcasting Group, Inc. — Class A* | | | 137 | | | | 1,138 | |
Monarch Casino & Resort, Inc.* | | | 107 | | | | 1,102 | |
Tower International, Inc.* | | | 90 | | | | 1,096 | |
Summer Infant, Inc.* | | | 179 | | | | 1,074 | |
Entravision Communications Corp. — Class A | | | 619 | | | | 1,058 | |
Valuevision Media, Inc. — Class A* | | | 510 | | | | 1,056 | |
Johnson Outdoors, Inc. — Class A* | | | 55 | | | | 1,051 | |
Coldwater Creek, Inc.* | | | 902 | | | | 1,046 | |
Pacific Sunwear of California, Inc.* | | | 584 | | | | 1,028 | |
Build-A-Bear Workshop, Inc. — Class A* | | | 192 | | | | 1,008 | |
1-800-Flowers.com, Inc. — Class A* | | | 329 | | | | 997 | |
ReachLocal, Inc.* | | | 131 | | | | 934 | |
Geeknet, Inc.* | | | 63 | | | | 911 | |
Furniture Brands International, Inc.* | | | 531 | | | | 892 | |
Global Sources Ltd.* | | | 140 | | | | 862 | |
Christopher & Banks Corp. | | | 446 | | | | 830 | |
Orbitz Worldwide, Inc.* | | | 267 | | | | 814 | |
Marine Products Corp. | | | 135 | | | | 803 | |
Overstock.com, Inc.* | | | 140 | | | | 734 | |
National American University Holdings, Inc. | | | 112 | | | | 706 | |
Crown Media Holdings, Inc. — Class A* | | | 430 | | | | 684 | |
Skyline Corp. | | | 89 | | | | 681 | |
US Auto Parts Network, Inc.* | | | 185 | | | | 668 | |
Shiloh Industries, Inc. | | | 63 | | | | 600 | |
Cambium Learning Group, Inc.* | | | 214 | | | | 567 | |
Digital Domain Media Group, Inc.* | | | 40 | | | | 228 | |
Value Line, Inc. | | | 18 | | | | 221 | |
Dial Global, Inc.* | | | 61 | | | | 142 | |
| | | | | | | | |
Total Consumer Discretionary | | | | | | | 2,118,886 | |
| | | | | | | | |
HEALTH CARE—10.6% | | | | | | | | |
WellCare Health Plans, Inc.* | | | 528 | | | | 37,952 | |
Salix Pharmaceuticals Ltd.* | | | 717 | | | | 37,642 | |
Cepheid, Inc.* | | | 802 | | | | 33,549 | |
HMS Holdings Corp.* | | | 1,053 | | | | 32,865 | |
Cubist Pharmaceuticals, Inc.* | | | 743 | | | | 32,136 | |
athenahealth, Inc.* | | | 430 | | | | 31,871 | |
Centene Corp.* | | | 630 | | | | 30,851 | |
Onyx Pharmaceuticals, Inc.* | | | 787 | | | | 29,654 | |
Medivation, Inc.* | | | 385 | | | | 28,767 | |
Medicis Pharmaceutical Corp. — Class A | | | 759 | | | | 28,530 | |
Zoll Medical Corp.* | | | 298 | | | | 27,603 | |
Viropharma, Inc.* | | | 879 | | | | 26,431 | |
Ariad Pharmaceuticals, Inc.* | | | 1,639 | | | | 26,142 | |
Questcor Pharmaceuticals, Inc.* | | | 659 | | | | 24,792 | |
Vivus, Inc.* | | | 1,104 | | | | 24,685 | |
Seattle Genetics, Inc.* | | | 1,193 | | | | 24,313 | |
HealthSouth Corp.* | | | 1,180 | | | | 24,167 | |
Owens & Minor, Inc. | | | 792 | | | | 24,084 | |
| | | | | | | | |
| | | SHARES | | | VALUE | |
STERIS Corp. | | | 736 | | | $ | 23,271 | |
Haemonetics Corp.* | | | 327 | | | | 22,785 | |
Alkermes plc* | | | 1,176 | | | | 21,815 | |
Incyte Corporation Ltd.* | | | 1,110 | | | | 21,423 | |
Align Technology, Inc.* | | | 768 | | | | 21,158 | |
Quality Systems, Inc. | | | 479 | | | | 20,947 | |
PAREXEL International Corp.* | | | 739 | | | | 19,932 | |
Impax Laboratories, Inc.* | | | 808 | | | | 19,861 | |
Magellan Health Services, Inc.* | | | 400 | | | | 19,524 | |
West Pharmaceutical Services, Inc. | | | 445 | | | | 18,926 | |
PSS World Medical, Inc.* | | | 724 | | | | 18,346 | |
Volcano Corp.* | | | 642 | | | | 18,201 | |
Par Pharmaceutical Companies, Inc.* | | | 448 | | | | 17,351 | |
Theravance, Inc.* | | | 866 | | | | 16,887 | |
MAKO Surgical Corp.* | | | 399 | | | | 16,818 | |
Chemed Corp. | | | 256 | | | | 16,047 | |
Pharmacyclics, Inc.* | | | 576 | | | | 15,990 | |
Masimo Corp.* | | | 657 | | | | 15,361 | |
Halozyme Therapeutics, Inc.* | | | 1,090 | | | | 13,908 | |
MWI Veterinary Supply, Inc.* | | | 158 | | | | 13,904 | |
Jazz Pharmaceuticals plc* | | | 284 | | | | 13,765 | |
Cyberonics, Inc.* | | | 352 | | | | 13,422 | |
Medicines Co.* | | | 662 | | | | 13,286 | |
Immunogen, Inc.* | | | 923 | | | | 13,282 | |
Acorda Therapeutics, Inc.* | | | 488 | | | | 12,956 | |
Air Methods Corp.* | | | 142 | | | | 12,391 | |
Molina Healthcare, Inc.* | | | 342 | | | | 11,501 | |
Nektar Therapeutics* | | | 1,413 | | | | 11,191 | |
Luminex Corp.* | | | 476 | | | | 11,115 | |
Neogen Corp.* | | | 284 | | | | 11,096 | |
PDL BioPharma, Inc. | | | 1,737 | | | | 11,030 | |
NxStage Medical, Inc.* | | | 571 | | | | 11,003 | |
Auxilium Pharmaceuticals, Inc.* | | | 592 | | | | 10,993 | |
Insulet Corp.* | | | 571 | | | | 10,929 | |
Amsurg Corp. — Class A* | | | 389 | | | | 10,885 | |
Isis Pharmaceuticals, Inc.* | | | 1,227 | | | | 10,761 | |
Analogic Corp. | | | 158 | | | | 10,671 | |
CONMED Corp. | | | 349 | | | | 10,425 | |
Meridian Bioscience, Inc. | | | 514 | | | | 9,961 | |
Accretive Health, Inc.* | | | 495 | | | | 9,886 | |
InterMune, Inc.* | | | 665 | | | | 9,756 | |
HeartWare International, Inc.* | | | 148 | | | | 9,722 | |
Hanger Orthopedic Group, Inc.* | | | 440 | | | | 9,618 | |
Dynavax Technologies Corp.* | | | 1,885 | | | | 9,538 | |
Wright Medical Group, Inc.* | | | 485 | | | | 9,370 | |
Arthrocare Corp.* | | | 345 | | | | 9,263 | |
Spectrum Pharmaceuticals, Inc.* | | | 710 | | | | 8,967 | |
Endologix, Inc.* | | | 606 | | | | 8,878 | |
Ironwood Pharmaceuticals, Inc. — Class A* | | | 667 | | | | 8,878 | |
NuVasive, Inc.* | | | 521 | | | | 8,774 | |
Momenta Pharmaceuticals, Inc.* | | | 569 | | | | 8,717 | |
Integra LifeSciences Holdings Corp.* | | | 251 | | | | 8,707 | |
Orthofix International N.V.* | | | 231 | | | | 8,681 | |
ABIOMED, Inc.* | | | 391 | | | | 8,676 | |
DexCom, Inc.* | | | 828 | | | | 8,636 | |
Exelixis, Inc.* | | | 1,622 | | | | 8,402 | |
| | |
92 | THE RYDEX SERIES FUNDS ANNUAL REPORT | | SEE NOTES TO FINANCIAL STATEMENTS. |
| | |
| SCHEDULE OF INVESTMENTS (continued) | | March 31, 2012 |
| RUSSELL 2000® 1.5x STRATEGY FUND | | |
| | | | | | | | |
| | | SHARES | | | VALUE | |
Abaxis, Inc.* | | | 284 | | | $ | 8,273 | |
Akorn, Inc.* | | | 697 | | | | 8,155 | |
Optimer Pharmaceuticals, Inc.* | | | 570 | | | | 7,923 | |
MedAssets, Inc.* | | | 593 | | | | 7,804 | |
Exact Sciences Corp.* | | | 694 | | | | 7,745 | |
Computer Programs & Systems, Inc. | | | 136 | | | | 7,687 | |
IPC The Hospitalist Company, Inc.* | | | 207 | | | | 7,640 | |
ICU Medical, Inc.* | | | 149 | | | | 7,325 | |
NPS Pharmaceuticals, Inc.* | | | 1,063 | | | | 7,271 | |
Idenix Pharmaceuticals, Inc.* | | | 742 | | | | 7,264 | |
Bio-Reference Labs, Inc.* | | | 304 | | | | 7,147 | |
Greatbatch, Inc.* | | | 289 | | | | 7,086 | |
Team Health Holdings, Inc.* | | | 343 | | | | 7,052 | |
Medidata Solutions, Inc.* | | | 262 | | | | 6,980 | |
Rigel Pharmaceuticals, Inc.* | | | 852 | | | | 6,859 | |
OraSure Technologies, Inc.* | | | 595 | | | | 6,837 | |
Genomic Health, Inc.* | | | 218 | | | | 6,673 | |
Emeritus Corp.* | | | 377 | | | | 6,658 | |
Quidel Corp.* | | | 356 | | | | 6,540 | |
Merit Medical Systems, Inc.* | | | 524 | | | | 6,508 | |
Omnicell, Inc.* | | | 424 | | | | 6,449 | |
Opko Health, Inc.* | | | 1,343 | | | | 6,352 | |
National Healthcare Corp. | | | 138 | | | | 6,287 | |
Cantel Medical Corp. | | | 248 | | | | 6,222 | |
Landauer, Inc. | | | 116 | | | | 6,150 | |
Accuray, Inc.* | | | 850 | | | | 6,001 | |
Invacare Corp. | | | 349 | | | | 5,783 | |
Triple-S Management Corp. — Class B* | | | 250 | | | | 5,775 | |
Conceptus, Inc.* | | | 395 | | | | 5,680 | |
Achillion Pharmaceuticals, Inc.* | | | 585 | | | | 5,604 | |
AVANIR Pharmaceuticals, Inc. — Class A* | | | 1,631 | | | | 5,578 | |
Ensign Group, Inc. | | | 205 | | | | 5,568 | |
Kindred Healthcare, Inc.* | | | 642 | | | | 5,547 | |
Arena Pharmaceuticals, Inc.* | | | 1,804 | | | | 5,538 | |
Amedisys, Inc.* | | | 379 | | | | 5,480 | |
HealthStream, Inc.* | | | 227 | | | | 5,264 | |
Sequenom, Inc.* | | | 1,261 | | | | 5,132 | |
Affymax, Inc.* | | | 435 | | | | 5,107 | |
Alnylam Pharmaceuticals, Inc.* | | | 455 | | | | 5,037 | |
Hi-Tech Pharmacal Company, Inc.* | | | 139 | | | | 4,994 | |
Neurocrine Biosciences, Inc.* | | | 624 | | | | 4,973 | |
Metropolitan Health Networks, Inc.* | | | 526 | | | | 4,929 | |
AVEO Pharmaceuticals, Inc.* | | | 387 | | | | 4,803 | |
Emergent Biosolutions, Inc.* | | | 299 | | | | 4,784 | |
eResearchTechnology, Inc.* | | | 611 | | | | 4,778 | |
Staar Surgical Co.* | | | 437 | | | | 4,733 | |
Arqule, Inc.* | | | 667 | | | | 4,676 | |
Curis, Inc.* | | | 957 | | | | 4,613 | |
Sunrise Senior Living, Inc.* | | | 720 | | | | 4,550 | |
PharMerica Corp.* | | | 365 | | | | 4,537 | |
MModal, Inc.* | | | 418 | | | | 4,410 | |
Universal American Corp. | | | 402 | | | | 4,334 | |
AMAG Pharmaceuticals, Inc.* | | | 271 | | | | 4,317 | |
Select Medical Holdings Corp.* | | | 561 | | | | 4,314 | |
Spectranetics Corp.* | | | 411 | | | | 4,274 | |
Keryx Biopharmaceuticals, Inc.* | | | 858 | | | | 4,273 | |
| | | | | | | | |
| | | SHARES | | | VALUE | |
Natus Medical, Inc.* | | | 357 | | | $ | 4,259 | |
Depomed, Inc.* | | | 673 | | | | 4,213 | |
Lexicon Pharmaceuticals, Inc.* | | | 2,263 | | | | 4,209 | |
ExamWorks Group, Inc.* | | | 330 | | | | 4,099 | |
MAP Pharmaceuticals, Inc.* | | | 282 | | | | 4,050 | |
Merge Healthcare, Inc.* | | | 690 | | | | 4,037 | |
ZIOPHARM Oncology, Inc.* | | | 746 | | | | 4,028 | |
Assisted Living Concepts, Inc. — Class A | | | 240 | | | | 3,986 | |
Raptor Pharmaceutical Corp.* | | | 586 | | | | 3,961 | |
Ardea Biosciences, Inc.* | | | 182 | | | | 3,960 | |
Santarus, Inc.* | | | 667 | | | | 3,902 | |
Navidea Biopharmaceuticals, Inc.* | | | 1,170 | | | | 3,838 | |
Ligand Pharmaceuticals, Inc. — Class B* | | | 239 | | | | 3,812 | |
AngioDynamics, Inc.* | | | 309 | | | | 3,785 | |
Vanguard Health Systems, Inc.* | | | 378 | | | | 3,727 | |
Affymetrix, Inc.* | | | 870 | | | | 3,715 | |
LHC Group, Inc.* | | | 197 | | | | 3,650 | |
Progenics Pharmaceuticals, Inc.* | | | 366 | | | | 3,623 | |
ISTA Pharmaceuticals, Inc.* | | | 399 | | | | 3,595 | |
Corvel Corp.* | | | 90 | | | | 3,590 | |
Tornier N.V.* | | | 138 | | | | 3,547 | |
Antares Pharma, Inc.* | | | 1,097 | | | | 3,543 | |
BioScrip, Inc.* | | | 498 | | | | 3,381 | |
Obagi Medical Products, Inc.* | | | 252 | | | | 3,377 | |
Atrion Corp. | | | 16 | | | | 3,363 | |
US Physical Therapy, Inc. | | | 143 | | | | 3,296 | |
Transcend Services, Inc.* | | | 112 | | | | 3,287 | |
Gentiva Health Services, Inc.* | | | 376 | | | | 3,286 | |
Clovis Oncology, Inc.* | | | 128 | | | | 3,258 | |
Cell Therapeutics, Inc.* | | | 2,500 | | | | 3,250 | |
Unilife Corp.* | | | 796 | | | | 3,232 | |
Kensey Nash Corp. | | | 110 | | | | 3,219 | |
Capital Senior Living Corp.* | | | 346 | | | | 3,197 | |
Symmetry Medical, Inc.* | | | 452 | | | | 3,196 | |
Enzon Pharmaceuticals, Inc.* | | | 467 | | | | 3,194 | |
Healthways, Inc.* | | | 431 | | | | 3,172 | |
Sangamo Biosciences, Inc.* | | | 642 | | | | 3,146 | |
Vical, Inc.* | | | 891 | | | | 3,029 | |
IRIS International, Inc.* | | | 223 | | | | 3,013 | |
SurModics, Inc.* | | | 194 | | | | 2,982 | |
Furiex Pharmaceuticals, Inc.* | | | 126 | | | | 2,977 | |
AMN Healthcare Services, Inc.* | | | 490 | | | | 2,969 | |
Immunomedics, Inc.* | | | 818 | | | | 2,969 | |
Infinity Pharmaceuticals, Inc.* | | | 241 | | | | 2,882 | |
Celldex Therapeutics, Inc.* | | | 549 | | | | 2,794 | |
Almost Family, Inc.* | | | 105 | | | | 2,731 | |
Sciclone Pharmaceuticals, Inc.* | | | 431 | | | | 2,720 | |
Geron Corp.* | | | 1,592 | | | | 2,690 | |
Cambrex Corp.* | | | 375 | | | | 2,621 | |
AVI BioPharma, Inc.* | | | 1,678 | | | | 2,584 | |
Providence Service Corp.* | | | 163 | | | | 2,528 | |
RTI Biologics, Inc.* | | | 682 | | | | 2,523 | |
Cerus Corp.* | | | 593 | | | | 2,384 | |
Solta Medical, Inc.* | | | 756 | | | | 2,291 | |
Cadence Pharmaceuticals, Inc.* | | | 607 | | | | 2,246 | |
Vascular Solutions, Inc.* | | | 208 | | | | 2,244 | |
| | |
SEE NOTES TO FINANCIAL STATEMENTS. | | THE RYDEX SERIES FUNDS ANNUAL REPORT | 93 |
| | |
| SCHEDULE OF INVESTMENTS (continued) | | March 31, 2012 |
| RUSSELL 2000® 1.5x STRATEGY FUND | | |
| | | | | | | | |
| | | SHARES | | | VALUE | |
Oncothyreon, Inc.* | | | 510 | | | $ | 2,224 | |
MannKind Corp.* | | | 898 | | | | 2,218 | |
Maxygen, Inc.* | | | 384 | | | | 2,204 | |
Palomar Medical Technologies, Inc.* | | | 230 | | | | 2,148 | |
Young Innovations, Inc. | | | 69 | | | | 2,133 | |
Sun Healthcare Group, Inc.* | | | 311 | | | | 2,127 | |
Cynosure, Inc. — Class A* | | | 117 | | | | 2,090 | |
Corcept Therapeutics, Inc.* | | | 521 | | | | 2,048 | |
Pozen, Inc.* | | | 337 | | | | 2,022 | |
Array Biopharma, Inc.* | | | 590 | | | | 2,012 | |
Nymox Pharmaceutical Corp.* | | | 244 | | | | 1,962 | |
XenoPort, Inc.* | | | 433 | | | | 1,949 | |
Savient Pharmaceuticals, Inc.* | | | 877 | | | | 1,912 | |
Synergetics USA, Inc.* | | | 294 | | | | 1,911 | |
Dusa Pharmaceuticals, Inc.* | | | 305 | | | | 1,909 | |
Dyax Corp.* | | | 1,220 | | | | 1,903 | |
Delcath Systems, Inc.* | | | 594 | | | | 1,865 | |
AtriCure, Inc.* | | | 186 | | | | 1,851 | |
Exactech, Inc.* | | | 116 | | | | 1,839 | |
Rockwell Medical Technologies, Inc.* | | | 194 | | | | 1,835 | |
Skilled Healthcare Group, Inc. — Class A* | | | 237 | | | | 1,815 | |
CryoLife, Inc.* | | | 344 | | | | 1,813 | |
Chelsea Therapeutics International Ltd.* | | | 707 | | | | 1,810 | |
Five Star Quality Care, Inc.* | | | 514 | | | | 1,753 | |
Hansen Medical, Inc.* | | | 583 | | | | 1,749 | |
BioCryst Pharmaceuticals, Inc.* | | | 359 | | | | 1,734 | |
Orexigen Therapeutics, Inc.* | | | 422 | | | | 1,730 | |
Cross Country Healthcare, Inc.* | | | 345 | | | | 1,728 | |
Pain Therapeutics, Inc.* | | | 480 | | | | 1,723 | |
Cardiovascular Systems, Inc.* | | | 186 | | | | 1,721 | |
Sagent Pharmaceuticals, Inc.* | | | 96 | | | | 1,716 | |
Targacept, Inc.* | | | 335 | | | | 1,715 | |
Vanda Pharmaceuticals, Inc.* | | | 353 | | | | 1,691 | |
Medtox Scientific, Inc.* | | | 97 | | | | 1,635 | |
Aegerion Pharmaceuticals, Inc.* | | | 117 | | | | 1,618 | |
Alphatec Holdings, Inc.* | | | 669 | | | | 1,586 | |
Cytori Therapeutics, Inc.* | | | 635 | | | | 1,581 | |
OncoGenex Pharmaceutical, Inc.* | | | 117 | | | | 1,555 | |
Novavax, Inc.* | | | 1,210 | | | | 1,525 | |
Allos Therapeutics, Inc.* | | | 971 | | | | 1,437 | |
SIGA Technologies, Inc.* | | | 427 | | | | 1,435 | |
Pacific Biosciences of California, Inc.* | | | 418 | | | | 1,430 | |
Fluidigm Corp.* | | | 89 | | | | 1,400 | |
Chindex International, Inc.* | | | 147 | | | | 1,397 | |
Biotime, Inc.* | | | 303 | | | | 1,336 | |
Synta Pharmaceuticals Corp.* | | | 304 | | | | 1,322 | |
Astex Pharmaceuticals* | | | 692 | | | | 1,287 | |
Enzo Biochem, Inc.* | | | 476 | | | | 1,280 | |
Metabolix, Inc.* | | | 435 | | | | 1,231 | |
RadNet, Inc.* | | | 377 | | | | 1,199 | |
National Research Corp. | | | 27 | | | | 1,159 | |
Sucampo Pharmaceuticals, Inc. — Class A* | | | 155 | | | | 1,155 | |
Insmed, Inc.* | | | 314 | | | | 1,140 | |
Medical Action Industries, Inc.* | | | 199 | | | | 1,138 | |
Harvard Bioscience, Inc.* | | | 286 | | | | 1,121 | |
GTx, Inc.* | | | 288 | | | | 1,109 | |
| | | | | | | | |
| | | SHARES | | | VALUE | |
Zalicus, Inc.* | | | 920 | | | $ | 1,104 | |
Codexis, Inc.* | | | 301 | | | | 1,099 | |
Endocyte, Inc.* | | | 215 | | | | 1,071 | |
Pacira Pharmaceuticals, Inc.* | | | 92 | | | | 1,062 | |
Osiris Therapeutics, Inc.* | | | 203 | | | | 1,039 | |
Biolase Technology, Inc.* | | | 379 | | | | 1,027 | |
Amicus Therapeutics, Inc.* | | | 193 | | | | 1,019 | |
Sunesis Pharmaceuticals, Inc.* | | | 352 | | | | 1,010 | |
Nabi Biopharmaceuticals* | | | 534 | | | | 993 | |
Biospecifics Technologies Corp.* | | | 62 | | | | 981 | |
CardioNet, Inc.* | | | 305 | | | | 939 | |
Biosante Pharmaceuticals, Inc.* | | | 1,357 | | | | 923 | |
Ampio Pharmaceuticals, Inc.* | | | 261 | | | | 890 | |
Cleveland Biolabs, Inc.* | | | 348 | | | | 856 | |
KV Pharmaceutical Co. — Class A* | | | 640 | | | | 845 | |
Anacor Pharmaceuticals, Inc.* | | | 142 | | | | 836 | |
Lannett Company, Inc.* | | | 198 | | | | 826 | |
Durect Corp.* | | | 1,002 | | | | 802 | |
Albany Molecular Research, Inc.* | | | 294 | | | | 794 | |
PharmAthene, Inc.* | | | 444 | | | | 786 | |
NewLink Genetics Corp.* | | | 85 | | | | 778 | |
Uroplasty, Inc.* | | | 257 | | | | 774 | |
Transcept Pharmaceuticals, Inc.* | �� | | 71 | | | | 747 | |
Bacterin International Holdings, Inc.* | | | 293 | | | | 709 | |
BG Medicine, Inc.* | | | 98 | | | | 688 | |
Columbia Laboratories, Inc.* | | | 905 | | | | 643 | |
Epocrates, Inc.* | | | 73 | | | | 626 | |
Anthera Pharmaceuticals, Inc.* | | | 273 | | | | 603 | |
Cornerstone Therapeutics, Inc.* | | | 100 | | | | 596 | |
BioMimetic Therapeutics, Inc.* | | | 239 | | | | 590 | |
Peregrine Pharmaceuticals, Inc.* | | | 1,052 | | | | 568 | |
Zogenix, Inc.* | | | 265 | | | | 530 | |
Zeltiq Aesthetics, Inc.* | | | 84 | | | | 518 | |
Trius Therapeutics, Inc.* | | | 90 | | | | 482 | |
Alimera Sciences, Inc.* | | | 136 | | | | 460 | |
Pernix Therapeutics Holdings* | | | 51 | | | | 459 | |
Acura Pharmaceuticals, Inc.* | | | 130 | | | | 450 | |
Alliance HealthCare Services, Inc.* | | | 298 | | | | 447 | |
Complete Genomics, Inc.* | | | 142 | | | | 400 | |
Stereotaxis, Inc.* | | | 549 | | | | 357 | |
DynaVox, Inc. — Class A* | | | 114 | | | | 351 | |
Horizon Pharma, Inc.* | | | 68 | | | | 282 | |
Neostem, Inc.* | | | 629 | | | | 237 | |
| | | | | | | | |
Total Health Care | | | | | | | 1,916,187 | |
| | | | | | | | |
ENERGY—5.3% | | | | | | | | |
World Fuel Services Corp. | | | 875 | | | | 35,874 | |
Energy XXI Bermuda Ltd.* | | | 935 | | | | 33,763 | |
Rosetta Resources, Inc.* | | | 652 | | | | 31,792 | |
Kodiak Oil & Gas Corp.* | | | 3,182 | | | | 31,693 | |
Lufkin Industries, Inc. | | | 376 | | | | 30,323 | |
Berry Petroleum Co. — Class A | | | 638 | | | | 30,069 | |
CVR Energy, Inc.* | | | 1,088 | | | | 29,104 | |
Dril-Quip, Inc.* | | | 427 | | | | 27,764 | |
Key Energy Services, Inc.* | | | 1,553 | | | | 23,994 | |
Helix Energy Solutions Group, Inc.* | | | 1,314 | | | | 23,389 | |
| | |
94 | THE RYDEX SERIES FUNDS ANNUAL REPORT | | SEE NOTES TO FINANCIAL STATEMENTS. |
| | |
| SCHEDULE OF INVESTMENTS (continued) | | March 31, 2012 |
| RUSSELL 2000® 1.5x STRATEGY FUND | | |
| | | | | | | | |
| | | SHARES | | | VALUE | |
Oasis Petroleum, Inc.* | | | 736 | | | $ | 22,691 | |
Bristow Group, Inc. | | | 457 | | | | 21,813 | |
Golar LNG Ltd. | | | 493 | | | | 18,759 | |
Stone Energy Corp.* | | | 625 | | | | 17,869 | |
Gulfport Energy Corp.* | | | 559 | | | | 16,278 | |
Northern Oil and Gas, Inc.* | | | 778 | | | | 16,136 | |
Hornbeck Offshore Services, Inc.* | | | 378 | | | | 15,887 | |
SemGroup Corp. — Class A* | | | 531 | | | | 15,473 | |
Swift Energy Co.* | | | 529 | | | | 15,357 | |
Bill Barrett Corp.* | | | 582 | | | | 15,138 | |
Gulfmark Offshore, Inc. — Class A* | | | 298 | | | | 13,696 | |
Carrizo Oil & Gas, Inc.* | | | 483 | | | | 13,650 | |
Clean Energy Fuels Corp.* | | | 635 | | | | 13,513 | |
McMoRan Exploration Co.* | | | 1,216 | | | | 13,011 | |
Western Refining, Inc. | | | 667 | | | | 12,553 | |
Cheniere Energy, Inc.* | | | 822 | | | | 12,314 | |
Cloud Peak Energy, Inc.* | | | 758 | | | | 12,076 | |
Approach Resources, Inc.* | | | 318 | | | | 11,750 | |
Petroleum Development Corp.* | | | 294 | | | | 10,904 | |
ION Geophysical Corp.* | | | 1,628 | | | | 10,501 | |
Exterran Holdings, Inc.* | | | 791 | | | | 10,433 | |
Nordic American Tankers Ltd. | | | 616 | | | | 9,782 | |
Targa Resources Corp. | | | 207 | | | | 9,408 | |
Comstock Resources, Inc.* | | | 593 | | | | 9,387 | |
W&T Offshore, Inc. | | | 444 | | | | 9,360 | |
Newpark Resources, Inc.* | | | 1,120 | | | | 9,173 | |
Tetra Technologies, Inc.* | | | 962 | | | | 9,062 | |
Contango Oil & Gas Co.* | | | 153 | | | | 9,013 | |
Magnum Hunter Resources Corp.* | | | 1,397 | | | | 8,955 | |
Parker Drilling Co.* | | | 1,447 | | | | 8,639 | |
Ship Finance International Ltd. | | | 561 | | | | 8,583 | |
GeoResources, Inc.* | | | 251 | | | | 8,218 | |
Apco Oil and Gas International, Inc. | | | 117 | | | | 7,976 | |
Crosstex Energy, Inc. | | | 522 | | | | 7,381 | |
Patriot Coal Corp.* | | | 1,124 | | | | 7,014 | |
Hercules Offshore, Inc.* | | | 1,433 | | | | 6,778 | |
Pioneer Drilling Co.* | | | 765 | | | | 6,732 | |
Resolute Energy Corp.* | | | 572 | | | | 6,509 | |
Goodrich Petroleum Corp.* | | | 334 | | | | 6,353 | |
Vaalco Energy, Inc.* | | | 636 | | | | 6,010 | |
OYO Geospace Corp.* | | | 57 | | | | 6,004 | |
Energy Partners Ltd.* | | | 358 | | | | 5,946 | |
Endeavour International Corp.* | | | 487 | | | | 5,771 | |
Rentech, Inc.* | | | 2,755 | | | | 5,730 | |
Clayton Williams Energy, Inc.* | | | 71 | | | | 5,640 | |
Gulf Island Fabrication, Inc. | | | 191 | | | | 5,591 | |
Tesco Corp.* | | | 378 | | | | 5,364 | |
Heckmann Corp.* | | | 1,244 | | | | 5,362 | |
Basic Energy Services, Inc.* | | | 297 | | | | 5,153 | |
BPZ Resources, Inc.* | | | 1,267 | | | | 5,106 | |
Frontline Ltd. | | | 637 | | | | 4,899 | |
Rex Energy Corp.* | | | 435 | | | | 4,646 | |
Matrix Service Co.* | | | 331 | | | | 4,637 | |
Knightsbridge Tankers Ltd. | | | 296 | | | | 4,256 | |
Petroquest Energy, Inc.* | | | 688 | | | | 4,224 | |
| | | | | | | | |
| | | SHARES | | | VALUE | |
Overseas Shipholding Group, Inc. | | | 325 | | | $ | 4,105 | |
ATP Oil & Gas Corp.* | | | 555 | | | | 4,079 | |
Venoco, Inc.* | | | 376 | | | | 4,076 | |
Cal Dive International, Inc.* | | | 1,176 | | | | 3,881 | |
PHI, Inc.* | | | 161 | | | | 3,727 | |
Triangle Petroleum Corp.* | | | 534 | | | | 3,685 | |
Uranium Energy Corp.* | | | 927 | | | | 3,615 | |
FX Energy, Inc.* | | | 651 | | | | 3,541 | |
Dawson Geophysical Co.* | | | 103 | | | | 3,538 | |
Vantage Drilling Co.* | | | 2,155 | | | | 3,448 | |
Mitcham Industries, Inc.* | | | 150 | | | | 3,369 | |
Abraxas Petroleum Corp.* | | | 1,014 | | | | 3,164 | |
Teekay Tankers Ltd. — Class A | | | 518 | | | | 3,144 | |
Callon Petroleum Co.* | | | 481 | | | | 3,025 | |
Delek US Holdings, Inc. | | | 195 | | | | 3,024 | |
Harvest Natural Resources, Inc.* | | | 427 | | | | 3,023 | |
Warren Resources, Inc.* | | | 882 | | | | 2,875 | |
Panhandle Oil and Gas, Inc. — Class A | | | 90 | | | | 2,653 | |
Green Plains Renewable Energy, Inc.* | | | 245 | | | | 2,644 | |
Penn Virginia Corp. | | | 581 | | | | 2,644 | |
Hyperdynamics Corp.* | | | 2,049 | | | | 2,643 | |
C&J Energy Services, Inc.* | | | 147 | | | | 2,615 | |
Scorpio Tankers, Inc.* | | | 367 | | | | 2,591 | |
Global Geophysical Services, Inc.* | | | 228 | | | | 2,419 | |
James River Coal Co.* | | | 443 | | | | 2,268 | |
Gastar Exploration Ltd.* | | | 717 | | | | 2,144 | |
Uranerz Energy Corp.* | | | 802 | | | | 2,021 | |
Natural Gas Services Group, Inc.* | | | 153 | | | | 2,020 | |
Solazyme, Inc.* | | | 137 | | | | 2,004 | |
Evolution Petroleum Corp.* | | | 194 | | | | 1,804 | |
Miller Energy Resources, Inc.* | | | 398 | | | | 1,680 | |
KiOR, Inc. — Class A* | | | 124 | | | | 1,658 | |
Ur-Energy, Inc.* | | | 1,293 | | | | 1,577 | |
Willbros Group, Inc.* | | | 485 | | | | 1,571 | |
Westmoreland Coal Co.* | | | 136 | | | | 1,519 | |
USEC, Inc.* | | | 1,432 | | | | 1,518 | |
Voyager Oil & Gas, Inc.* | | | 582 | | | | 1,414 | |
RigNet, Inc.* | | | 71 | | | | 1,245 | |
Alon USA Energy, Inc. | | | 137 | | | | 1,240 | |
Crimson Exploration, Inc.* | | | 282 | | | | 1,170 | |
Amyris, Inc.* | | | 224 | | | | 1,160 | |
Houston American Energy Corp.* | | | 208 | | | | 1,086 | |
Syntroleum Corp.* | | | 1,100 | | | | 1,062 | |
Union Drilling, Inc.* | | | 190 | | | | 1,056 | |
Uranium Resources, Inc.* | | | 1,151 | | | | 1,047 | |
GMX Resources, Inc.* | | | 790 | | | | 1,003 | |
Zion Oil & Gas, Inc.* | | | 379 | | | | 1,001 | |
Isramco, Inc.* | | | 10 | | | | 874 | |
DHT Holdings, Inc. | | | 822 | | | | 789 | |
Gevo, Inc.* | | | 82 | | | | 754 | |
CAMAC Energy, Inc.* | | | 721 | | | | 721 | |
L&L Energy, Inc.* | | | 276 | | | | 676 | |
Hallador Energy Co. | | | 56 | | | | 495 | |
Geokinetics, Inc.* | | | 144 | | | | 253 | |
| | | | | | | | |
Total Energy | | | | | | | 956,587 | |
| | | | | | | | |
| | |
SEE NOTES TO FINANCIAL STATEMENTS. | | THE RYDEX SERIES FUNDS ANNUAL REPORT | 95 |
| | |
| SCHEDULE OF INVESTMENTS (continued) | | March 31, 2012 |
| RUSSELL 2000® 1.5x STRATEGY FUND | | |
| | | | | | | | |
| | | SHARES | | | VALUE | |
MATERIALS - 3.9% | | | | | | | | |
Coeur d’Alene Mines Corp.* | | | 1,106 | | | $ | 26,256 | |
Sensient Technologies Corp. | | | 626 | | | | 23,789 | |
Olin Corp. | | | 1,000 | | | | 21,750 | |
NewMarket Corp. | | | 109 | | | | 20,427 | |
Chemtura Corp.* | | | 1,194 | | | | 20,274 | |
HB Fuller Co. | | | 607 | | | | 19,928 | |
Eagle Materials, Inc. | | | 551 | | | | 19,147 | |
Stillwater Mining Co.* | | | 1,423 | | | | 17,987 | |
Buckeye Technologies, Inc. | | | 494 | | | | 16,782 | |
PolyOne Corp. | | | 1,153 | | | | 16,603 | |
Hecla Mining Co. | | | 3,467 | | | | 16,018 | |
Minerals Technologies, Inc. | | | 237 | | | | 15,502 | |
Louisiana-Pacific Corp.* | | | 1,636 | | | | 15,297 | |
Georgia Gulf Corp.* | | | 428 | | | | 14,928 | |
Worthington Industries, Inc. | | | 752 | | | | 14,424 | |
Innophos Holdings, Inc. | | | 282 | | | | 14,134 | |
Schweitzer-Mauduit International, Inc. | | | 199 | | | | 13,743 | |
Thompson Creek Metals Company, Inc.* | | | 1,888 | | | | 12,763 | |
SunCoke Energy, Inc.* | | | 860 | | | | 12,221 | |
Globe Specialty Metals, Inc. | | | 775 | | | | 11,524 | |
Calgon Carbon Corp.* | | | 723 | | | | 11,285 | |
Graphic Packaging Holding Co.* | | | 1,983 | | | | 10,946 | |
Balchem Corp. | | | 357 | | | | 10,799 | |
OM Group, Inc.* | | | 386 | | | | 10,619 | |
Kraton Performance Polymers, Inc.* | | | 399 | | | | 10,601 | |
Boise, Inc. | | | 1,285 | | | | 10,550 | |
A. Schulman, Inc. | | | 377 | | | | 10,187 | |
Texas Industries, Inc. | | | 286 | | | | 10,013 | |
Koppers Holdings, Inc. | | | 254 | | | | 9,794 | |
Haynes International, Inc. | | | 153 | | | | 9,693 | |
KapStone Paper and Packaging Corp.* | | | 489 | | | | 9,633 | |
Kaiser Aluminum Corp. | | | 203 | | | | 9,594 | |
LSB Industries, Inc.* | | | 241 | | | | 9,380 | |
Clearwater Paper Corp.* | | | 281 | | | | 9,332 | |
PH Glatfelter Co. | | | 578 | | | | 9,121 | |
Deltic Timber Corp. | | | 142 | | | | 8,987 | |
Innospec, Inc.* | | | 293 | | | | 8,901 | |
Stepan Co. | | | 100 | | | | 8,780 | |
AMCOL International Corp. | | | 297 | | | | 8,759 | |
RTI International Metals, Inc.* | | | 378 | | | | 8,717 | |
Gold Resource Corp. | | | 349 | | | | 8,484 | |
Flotek Industries, Inc.* | | | 620 | | | | 7,452 | |
Materion Corp.* | | | 251 | | | | 7,211 | |
TPC Group, Inc.* | | | 161 | | | | 7,118 | |
Ferro Corp.* | | | 1,066 | | | | 6,332 | |
Quaker Chemical Corp. | | | 158 | | | | 6,233 | |
American Vanguard Corp. | | | 286 | | | | 6,203 | |
Horsehead Holding Corp.* | | | 539 | | | | 6,139 | |
Golden Star Resources Ltd.* | | | 3,192 | | | | 5,937 | |
Wausau Paper Corp. | | | 622 | | | | 5,834 | |
McEwen Mining, Inc.* | | | 1,299 | | | | 5,768 | |
Myers Industries, Inc. | | | 389 | | | | 5,737 | |
Century Aluminum Co.* | | | 636 | | | | 5,648 | |
Neenah Paper, Inc. | | | 180 | | | | 5,353 | |
| | | | | | | | |
| | | SHARES | | | VALUE | |
Jaguar Mining, Inc.* | | | 1,057 | | | $ | 4,936 | |
Universal Stainless & Alloy* | | | 102 | | | | 4,357 | |
Zep, Inc. | | | 298 | | | | 4,291 | |
Hawkins, Inc. | | | 104 | | | | 3,869 | |
Zoltek Companies, Inc.* | | | 341 | | | | 3,860 | |
Omnova Solutions, Inc.* | | | 564 | | | | 3,807 | |
Paramount Gold and Silver Corp.* | | | 1,442 | | | | 3,259 | |
Zagg, Inc.* | | | 304 | | | | 3,232 | |
Headwaters, Inc.* | | | 765 | | | | 3,198 | |
Noranda Aluminum Holding Corp. | | | 293 | | | | 2,921 | |
Golden Minerals Co.* | | | 345 | | | | 2,908 | |
General Moly, Inc.* | | | 835 | | | | 2,797 | |
Vista Gold Corp.* | | | 877 | | | | 2,754 | |
AM Castle & Co.* | | | 208 | | | | 2,631 | |
Olympic Steel, Inc. | | | 109 | | | | 2,616 | |
FutureFuel Corp. | | | 231 | | | | 2,536 | |
Metals USA Holdings Corp.* | | | 154 | | | | 2,219 | |
Landec Corp.* | | | 331 | | | | 2,161 | |
United States Lime & Minerals, Inc.* | | | 36 | | | | 2,156 | |
Spartech Corp.* | | | 386 | | | | 1,884 | |
STR Holdings, Inc.* | | | 369 | | | | 1,786 | |
AEP Industries, Inc.* | | | 50 | | | | 1,741 | |
KMG Chemicals, Inc. | | | 96 | | | | 1,733 | |
Midway Gold Corp.* | | | 1,056 | | | | 1,510 | |
Senomyx, Inc.* | | | 488 | | | | 1,337 | |
Revett Minerals, Inc.* | | | 312 | | | | 1,304 | |
NL Industries, Inc. | | | 83 | | | | 1,237 | |
Handy & Harman Ltd.* | | | 71 | | | | 1,025 | |
US Energy Corp.* | | | 305 | | | | 964 | |
Verso Paper Corp.* | | | 186 | | | | 350 | |
| | | | | | | | |
Total Materials | | | | | | | 704,016 | |
| | | | | | | | |
CONSUMER STAPLES—3.0% | | | | | | | | |
Nu Skin Enterprises, Inc. — Class A | | | 679 | | | | 39,320 | |
United Natural Foods, Inc.* | | | 596 | | | | 27,809 | |
TreeHouse Foods, Inc.* | | | 438 | | | | 26,060 | |
Casey’s General Stores, Inc. | | | 468 | | | | 25,955 | |
Darling International, Inc.* | | | 1,443 | | | | 25,136 | |
Harris Teeter Supermarkets, Inc.* | | | 626 | | | | 25,103 | |
Hain Celestial Group, Inc.* | | | 447 | | | | 19,583 | |
Fresh Market, Inc.* | | | 353 | | | | 16,926 | |
Pricesmart, Inc. | | | 223 | | | | 16,237 | |
Lancaster Colony Corp. | | | 241 | | | | 16,017 | |
Snyders-Lance, Inc. | | | 583 | | | | 15,071 | |
Sanderson Farms, Inc. | | | 275 | | | | 14,583 | |
Universal Corp. | | | 295 | | | | 13,747 | |
B&G Foods, Inc. — Class A | | | 592 | | | | 13,326 | |
Rite Aid Corp.* | | | 7,281 | | | | 12,669 | |
Andersons, Inc. | | | 239 | | | | 11,637 | |
Prestige Brands Holdings, Inc.* | | | 639 | | | | 11,169 | |
Boston Beer Company, Inc. — Class A* | | | 101 | | | | 10,786 | |
Elizabeth Arden, Inc.* | | | 306 | | | | 10,704 | |
Vector Group Ltd. | | | 600 | | | | 10,632 | |
Fresh Del Monte Produce, Inc. | | | 451 | | | | 10,301 | |
J&J Snack Foods Corp. | | | 185 | | | | 9,705 | |
WD-40 Co. | | | 198 | | | | 8,979 | |
| | |
96 | THE RYDEX SERIES FUNDS ANNUAL REPORT | | SEE NOTES TO FINANCIAL STATEMENTS. |
| | |
| SCHEDULE OF INVESTMENTS (continued) | | March 31, 2012 |
| RUSSELL 2000® 1.5x STRATEGY FUND | | |
| | | | | | | | |
| | | SHARES | | | VALUE | |
Spectrum Brands Holdings, Inc.* | | | 208 | | | $ | 7,272 | |
Cal-Maine Foods, Inc. | | | 186 | | | | 7,116 | |
Tootsie Roll Industries, Inc. | | | 306 | | | | 7,010 | |
Weis Markets, Inc. | | | 151 | | | | 6,584 | |
Diamond Foods, Inc. | | | 272 | | | | 6,207 | |
Central Garden and Pet Co. — Class A* | | | 589 | | | | 5,672 | |
Pilgrim’s Pride Corp.* | | | 756 | | | | 5,640 | |
Chiquita Brands International, Inc.* | | | 566 | | | | 4,975 | |
Spartan Stores, Inc. | | | 274 | | | | 4,965 | |
Smart Balance, Inc.* | | | 736 | | | | 4,865 | |
Central European Distribution Corp.* | | | 911 | | | | 4,655 | |
Dole Food Company, Inc.* | | | 447 | | | | 4,461 | |
Star Scientific, Inc.* | | | 1,320 | | | | 4,330 | |
Nash Finch Co. | | | 149 | | | | 4,235 | |
Coca-Cola Bottling Company Consolidated | | | 66 | | | | 4,141 | |
Alliance One International, Inc.* | | | 1,077 | | | | 4,060 | |
Calavo Growers, Inc. | | | 142 | | | | 3,803 | |
Pantry, Inc.* | | | 289 | | | | 3,760 | |
Chefs’ Warehouse, Inc.* | | | 136 | | | | 3,147 | |
Inter Parfums, Inc. | | | 196 | | | | 3,075 | |
USANA Health Sciences, Inc.* | | | 82 | | | | 3,061 | |
Susser Holdings Corp.* | | | 118 | | | | 3,029 | |
Medifast, Inc.* | | | 173 | | | | 3,021 | |
Seneca Foods Corp. — Class A* | | | 114 | | | | 3,003 | |
Village Super Market, Inc. — Class A | | | 91 | | | | 2,875 | |
Ingles Markets, Inc. — Class A | | | 155 | | | | 2,734 | |
National Beverage Corp.* | | | 153 | | | | 2,454 | |
Nature’s Sunshine Products, Inc.* | | | 152 | | | | 2,435 | |
Revlon, Inc. — Class A* | | | 133 | | | | 2,294 | |
Omega Protein Corp.* | | | 243 | | | | 1,849 | |
Schiff Nutrition International, Inc.* | | | 150 | | | | 1,844 | |
Nutraceutical International Corp.* | | | 117 | | | | 1,704 | |
Limoneira Co. | | | 95 | | | | 1,605 | |
Oil-Dri Corporation of America | | | 70 | | | | 1,490 | |
Arden Group, Inc. — Class A | | | 15 | | | | 1,363 | |
Female Health Co. | | | 237 | | | | 1,285 | |
Synutra International, Inc.* | | | 210 | | | | 1,235 | |
Alico, Inc. | | | 44 | | | | 1,017 | |
Craft Brew Alliance, Inc.* | | | 130 | | | | 996 | |
Farmer Brothers Co.* | | | 89 | | | | 969 | |
Griffin Land & Nurseries, Inc. | | | 31 | | | | 819 | |
MGP Ingredients, Inc. | | | 145 | | | | 780 | |
Imperial Sugar Co. | | | 153 | | | | 718 | |
Harbinger Group, Inc.* | | | 109 | | | | 565 | |
Lifeway Foods, Inc.* | | | 53 | | | | 490 | |
Primo Water Corp.* | | | 203 | | | | 396 | |
Total Consumer Staples | | | | | | | 535,459 | |
UTILITIES—2.7% | | | | | | | | |
Cleco Corp. | | | 762 | | | | 30,213 | |
Piedmont Natural Gas Company, Inc. | | | 892 | | | | 27,714 | |
WGL Holdings, Inc. | | | 637 | | | | 25,926 | |
IDACORP, Inc. | | | 615 | | | | 25,289 | |
Southwest Gas Corp. | | | 563 | | | | 24,063 | |
New Jersey Resources Corp. | | | 527 | | | | 23,488 | |
Portland General Electric Co. | | | 934 | | | | 23,331 | |
UIL Holdings Corp. | | | 620 | | | | 21,551 | |
| | | | | | | | |
| | | SHARES | | | VALUE | |
Atlantic Power Corp. | | | 1,399 | | | $ | 19,362 | |
PNM Resources, Inc. | | | 1,054 | | | | 19,288 | |
South Jersey Industries, Inc. | | | 376 | | | | 18,815 | |
Avista Corp. | | | 722 | | | | 18,468 | |
Unisource Energy Corp. | | | 468 | | | | 17,115 | |
El Paso Electric Co. | | | 522 | | | | 16,960 | |
Black Hills Corp. | | | 488 | | | | 16,363 | |
Allete, Inc. | | | 390 | | | | 16,181 | |
NorthWestern Corp. | | | 448 | | | | 15,886 | |
Northwest Natural Gas Co. | | | 334 | | | | 15,164 | |
MGE Energy, Inc. | | | 295 | | | | 13,095 | |
CH Energy Group, Inc. | | | 194 | | | | 12,946 | |
Empire District Electric Co. | | | 526 | | | | 10,704 | |
Laclede Group, Inc. | | | 273 | | | | 10,652 | |
Otter Tail Corp. | | | 448 | | | | 9,722 | |
California Water Service Group | | | 526 | | | | 9,578 | |
American States Water Co. | | | 231 | | | | 8,348 | |
Central Vermont Public Service Corp. | | | 175 | | | | 6,160 | |
SJW Corp. | | | 198 | | | | 4,776 | |
Ormat Technologies, Inc. | | | 234 | | | | 4,715 | |
Chesapeake Utilities Corp. | | | 114 | | | | 4,688 | |
Unitil Corp. | | | 134 | | | | 3,595 | |
Middlesex Water Co. | | | 190 | | | | 3,589 | |
Connecticut Water Service, Inc. | | | 109 | | | | 3,084 | |
York Water Co. | | | 154 | | | | 2,664 | |
Artesian Resources Corp. — Class A | | | 100 | | | | 1,879 | |
Genie Energy Ltd. — Class B | | | 186 | | | | 1,799 | |
Consolidated Water Company Ltd. | | | 183 | | | | 1,448 | |
Cadiz, Inc.* | | | 150 | | | | 1,380 | |
Dynegy, Inc. — Class A* | | | 1,278 | | | | 716 | |
| | | | | | | | |
Total Utilities | | | | | | | 490,715 | |
| | | | | | | | |
TELECOMMUNICATION SERVICES—0.7% | | | | | | | | |
AboveNet, Inc.* | | | 283 | | | | 23,432 | |
Cogent Communications Group, Inc.* | | | 582 | | | | 11,105 | |
Cincinnati Bell, Inc.* | | | 2,452 | | | | 9,858 | |
Leap Wireless International, Inc.* | | | 753 | | | | 6,574 | |
Consolidated Communications Holdings, Inc. | | | 334 | | | | 6,556 | |
Premiere Global Services, Inc.* | | | 653 | | | | 5,903 | |
Pendrell Corp.* | | | 1,879 | | | | 4,904 | |
Neutral Tandem, Inc.* | | | 395 | | | | 4,815 | |
Iridium Communications, Inc.* | | | 540 | | | | 4,730 | |
General Communication, Inc. — Class A* | | | 517 | | | | 4,508 | |
SureWest Communications | | | 186 | | | | 4,194 | |
NTELOS Holdings Corp. | | | 197 | | | | 4,078 | |
Atlantic Tele-Network, Inc. | | | 111 | | | | 4,036 | |
Vonage Holdings Corp.* | | | 1,710 | | | | 3,779 | |
USA Mobility, Inc. | | | 270 | | | | 3,761 | |
Shenandoah Telecommunications Co. | | | 295 | | | | 3,289 | |
8x8, Inc.* | | | 768 | | | | 3,226 | |
Cbeyond, Inc.* | | | 344 | | | | 2,752 | |
Towerstream Corp.* | | | 523 | | | | 2,484 | |
Lumos Networks Corp. | | | 197 | | | | 2,120 | |
inContact, Inc.* | | | 376 | | | | 2,098 | |
HickoryTech Corp. | | | 182 | | | | 1,882 | |
Alaska Communications Systems Group, Inc. | | | 565 | | | | 1,740 | |
IDT Corp. — Class B | | | 186 | | | | 1,737 | |
| | |
SEE NOTES TO FINANCIAL STATEMENTS. | | THE RYDEX SERIES FUNDS ANNUAL REPORT | 97 |
| | |
| SCHEDULE OF INVESTMENTS (concluded) | | March 31, 2012 |
| RUSSELL 2000® 1.5x STRATEGY FUND | | |
| | | | | | | | |
| | | SHARES | | | VALUE | |
ORBCOMM, Inc.* | | | 435 | | | $ | 1,675 | |
Fairpoint Communications, Inc.* | | | 276 | | | | 1,038 | |
Boingo Wireless, Inc.* | | | 75 | | | | 908 | |
Globalstar, Inc.* | | | 1,263 | | | | 884 | |
| | | | | | | | |
Total Telecommunication Services | | | | | | | 128,066 | |
| | | | | | | | |
Total Common Stocks
(Cost $13,358,555) | | | | | | | 15,186,856 | |
WARRANTS††—0.0% | | | | | | | | |
Magnum Hunter Resources Corp. | | | | | | | | |
$10.50, 10/14/13 | | | 23 | | | | — | |
| | | | | | | | |
Total Warrants
(Costs $—) | | | | | | | — | |
| | | | | | | | |
RIGHTS††—0.0% | | | | | | | | |
DHT Holdings, Inc. | | | | | | | | |
Expires 05/01/12 | | | 822 | | | | 214 | |
Total Rights
(Cost $178) | | | | | | | 214 | |
| | |
| | | FACE | | | | | |
| | | AMOUNT | | | | |
REPURCHASE AGREEMENTS††,1—18.0% | | | | | | | | |
Credit Suisse Group issued 03/30/12 at 0.01 % due 04/02/122 | | $ | 1,648,004 | | | | 1,648,004 | |
HSBC Group issued 03/30/12 at 0.01% due 04/02/12 | | | 1,192,458 | | | | 1,192,458 | |
Mizuho Financial Group, Inc. issued 03/30/12 at 0.01%due 04/02/12 | | | 335,497 | | | | 335,497 | |
Deutsche Bank issued 03/30/12 at 0.01% due 04/02/12 | | | 89,171 | | | | 89,171 | |
| | | | | | | | |
Total Repurchase Agreements
(Cost $3,265,130) | | | | | | | 3,265,130 | |
| | | | | | | | |
Total Investments – 102.0%
(Cost $16,623,863) | | | | | | $ | 18,452,200 | |
| | | | | | | | |
Other Assets & Liabilities, net – (2.0)% | | | | | | | (357,067 | ) |
| | | | | | | | |
Total Net Assets – 100.0% | | | | | | $ | 18,095,133 | |
| | | | | | | | |
| | | | | | | | |
| | | | | | UNREALIZED | |
| | | CONTRACTS | | | GAIN (LOSS) | |
FUTURES CONTRACTS PURCHASED† | | | | | | | | |
June 2012 Russell 2000 Index | | | | | | | | |
Mini Futures Contracts | | | | | | | | |
(Aggregate Value of | | | | | | | | |
Contracts $2,067,500) | | | 25 | | | $ | 54,724 | |
| | | | | | | | |
| | |
| | | UNITS | | | | |
EQUITY INDEX SWAP AGREEMENTS†† | | | | | | | | |
Barclays Bank plc | | | | | | | | |
April 2012 Russell 2000 Index Swap, | | | | | | | | |
Terminating 04/30/123 | | | | | | | | |
(Notional Value $1,751,057) | | | 2,109 | | | $ | (3,993 | ) |
Goldman Sachs International | | | | | | | | |
April 2012 Russell 2000 Index | | | | | | | | |
Swap, Terminating 04/27/123 | | | | | | | | |
(Notional Value $253,917) | | | 306 | | | | (4,721 | ) |
Morgan Stanley Capital Services, Inc. | | | | | | | | |
April 2012 Russell 2000 Index Swap, | | | | | | | | |
Terminating 04/30/123 | | | | | | | | |
(Notional Value $1,315,918) | | | 1,585 | | | | (14,670 | ) |
Credit Suisse Capital, LLC | | | | | | | | |
April 2012 Russell 2000 Index Swap, | | | | | | | | |
Terminating 04/30/123 | | | | | | | | |
(Notional Value $6,682,463) | | | 8,048 | | | | (15,315 | ) |
| | | | | | | | |
(Total Notional Value $10,003,355) | | | | | | $ | (38,699 | ) |
| | | | | | | | |
| * | Non-income producing security. |
| † | Value determined based on Level 1 inputs — See Note 4. |
| †† | Value determined based on Level 2 inputs — See Note 4. |
| 1 | Repurchase Agreements — See Note 5. |
| 2 | All or a portion of this security is pledged as equity index swap collateral at March 31, 2012. |
| 3 | Total Return based on Russell 2000 Index +/- financing at a variable rate. |
| plc | — Public Limited Company |
| REIT | — Real Estate Investment Trust |
| | |
98 | THE RYDEX SERIES FUNDS ANNUAL REPORT | | SEE NOTES TO FINANCIAL STATEMENTS. |
RUSSELL 2000® 1.5x STRATEGY FUND
| | |
| STATEMENT OF ASSETS AND LIABILITIES | | STATEMENT OF OPERATIONS |
| | | | |
March 31, 2012 | | | | |
| |
ASSETS: | | | | |
Investments, at value (cost $13,358,733) | | $ | 15,187,070 | |
Repurchase agreements, at value (cost $3,265,130) | | | 3,265,130 | |
| | | | |
Total investments (cost $16,623,863) | | | 18,452,200 | |
Foreign currency, at value (cost $103) | | | 103 | |
Segregated cash with broker | | | 597,403 | |
Cash | | | 421 | |
Receivables: | | | | |
Fund shares sold | | | 25,403 | |
Dividends | | | 19,744 | |
| | | | |
Total assets | | | 19,095,274 | |
| | | | |
LIABILITIES: | | | | |
Unrealized depreciation on swap agreements | | | 38,699 | |
Payable for: | | | | |
Fund shares redeemed | | | 913,723 | |
Management fees | | | 15,153 | |
Variation margin | | | 9,000 | |
Distribution and service fees | | | 5,343 | |
Transfer agent and administrative fees | | | 4,209 | |
Swap settlement | | | 2,775 | |
Portfolio accounting fees | | | 1,683 | |
Miscellaneous | | | 9,556 | |
| | | | |
Total liabilities | | | 1,000,141 | |
| | | | |
NET ASSETS | | $ | 18,095,133 | |
| | | | |
NET ASSETS CONSIST OF: | | | | |
Paid in capital | | $ | 27,481,787 | |
Accumulated net investment loss | | | (43,290 | ) |
Accumulated net realized loss on investments | | | (11,187,726 | ) |
Net unrealized appreciation on investments | | | 1,844,362 | |
| | | | |
Net assets | | $ | 18,095,133 | |
| | | | |
A-CLASS: | | | | |
Net assets | | $ | 1,354,840 | |
Capital shares outstanding | | | 42,075 | |
Net asset value per share | | $ | 32.20 | |
| | | | |
Maximum offering price per share | | | | |
(Net asset value divided by 95.25%) | | $ | 33.81 | |
| | | | |
C-CLASS: | | | | |
Net assets | | $ | 1,838,682 | |
Capital shares outstanding | | | 62,275 | |
Net asset value per share | | $ | 29.52 | |
| | | | |
H-CLASS: | | | | |
Net assets | | $ | 14,901,611 | |
Capital shares outstanding | | | 463,761 | |
Net asset value per share | | $ | 32.13 | |
| | | | |
| | | | |
Year Ended March 31, 2012 | | | | |
| |
INVESTMENT INCOME: | | | | |
Dividends (net of foreign withholding tax of $41) | | $ | 102,706 | |
Interest | | | 4,414 | |
| | | | |
Total investment income | | | 107,120 | |
| | | | |
EXPENSES: | | | | |
Management fees | | | 198,961 | |
Transfer agent and administrative fees | | | 55,267 | |
Distribution and service fees: | | | | |
A-Class | | | 2,783 | |
C-Class | | | 20,139 | |
H-Class | | | 47,450 | |
Portfolio accounting fees | | | 22,107 | |
Custodian fees | | | 5,572 | |
Trustees’ fees* | | | 2,297 | |
Miscellaneous | | | 41,635 | |
| | | | |
Total expenses | | | 396,211 | |
| | | | |
Net investment loss | | | (289,091 | ) |
| | | | |
NET REALIZED AND UNREALIZED GAIN (LOSS): | | | | |
Net realized gain (loss) on: | | | | |
Investments | | | 1,385,222 | |
Swap agreements | | | (2,610,267 | ) |
Futures contracts | | | (5,424 | ) |
Foreign currency | | | (6 | ) |
Realized gain distributions received from investment company shares | | | 328 | |
| | | | |
Net realized loss | | | (1,230,147 | ) |
| | | | |
Net change in unrealized appreciation (depreciation) on: | | | | |
Investments | | | (333,899 | ) |
Swap agreements | | | (1,452,305 | ) |
Futures contracts | | | (59,916 | ) |
Net change in unrealized appreciation (depreciation) | | | (1,846,120 | ) |
| | | | |
Net realized and unrealized loss | | | (3,076,267 | ) |
| | | | |
Net decrease in net assets resulting from operations | | $ | (3,365,358 | ) |
| | | | |
| * | Relates to Trustees not deemed “interested persons” within the meaning of Section 2(a)(19) of the 1940 Act. |
| | |
SEE NOTES TO FINANCIAL STATEMENTS. | | THE RYDEX SERIES FUNDS ANNUAL REPORT | 99 |
RUSSELL 2000® 1.5x STRATEGY FUND
STATEMENTS OF CHANGES IN NET ASSETS
| | | | | | | | |
| | | Year Ended | | | Year Ended | |
| | | March 31, | | | March 31, | |
| | | 2012 | | | 2011 | |
INCREASE (DECREASE) IN NET ASSETS FROM OPERATIONS: | | | | | | | | |
Net investment loss | | $ | (289,091 | ) | | $ | (342,033 | ) |
Net realized gain (loss) on investments | | | (1,230,147 | ) | | | 7,585,812 | |
Net change in unrealized appreciation (depreciation) on investments | | | (1,846,120 | ) | | | (1,516,617 | ) |
| | | | | | | | |
Net increase (decrease) in net assets resulting from operations | | | (3,365,358 | ) | | | 5,727,162 | |
| | | | | | | | |
| | |
CAPITAL SHARE TRANSACTIONS: | | | | | | | | |
PROCEEDS FROM SALE OF SHARES | | | | | | | | |
A-Class | | | 3,364,331 | | | | 6,815,665 | |
C-Class | | | 645,809 | | | | 1,474,481 | |
H-Class | | | 184,051,398 | | | | 198,061,598 | |
COST OF SHARES REDEEMED | | | | | | | | |
A-Class | | | (4,002,486 | ) | | | (5,760,396 | ) |
C-Class | | | (1,356,339 | ) | | | (2,047,330 | ) |
H-Class | | | (204,119,521 | ) | | | (188,080,975 | ) |
| | | | | | | | |
Net increase (decrease) from capital share transactions | | | (21,416,808 | ) | | | 10,463,043 | |
| | | | | | | | |
Net increase (decrease) in net assets | | | (24,782,166 | ) | | | 16,190,205 | |
| | |
NET ASSETS: | | | | | | | | |
Beginning of year | | | 42,877,299 | | | | 26,687,094 | |
| | | | | | | | |
End of year | | $ | 18,095,133 | | | $ | 42,877,299 | |
| | | | | | | | |
Accumulated net investment loss at end of year | | $ | (43,290 | ) | | $ | (3,229 | ) |
| | | | | | | | |
CAPITAL SHARE ACTIVITY: | | | | | | | | |
Shares sold | | | | | | | | |
A-Class | | | 108,140 | | | | 266,605 | |
C-Class | | | 23,548 | | | | 57,713 | |
H-Class | | | 6,337,910 | | | | 7,264,965 | |
Shares redeemed | | | | | | | | |
A-Class | | | (133,321 | ) | | | (222,529 | ) |
C-Class | | | (49,014 | ) | | | (88,368 | ) |
H-Class | | | (6,975,808 | ) | | | (7,088,420 | |
| | | | | | | | |
Net increase (decrease) in shares | | | (688,545 | ) | | | 189,966 | |
| | | | | | | | |
| | |
100 | THE RYDEX SERIES FUNDS ANNUAL REPORT | | SEE NOTES TO FINANCIAL STATEMENTS. |
RUSSELL 2000® 1.5x STRATEGY FUND
FINANCIAL HIGHLIGHTS
This table is presented to show selected data for a share outstanding throughout each period and to assist shareholders in evaluating a Fund’s performance for the periods presented.
| | | | | | | | | | | | | | | | | | | | |
| | | Year Ended | | | Year Ended | | | Year Ended | | | Year Ended | | | Year Ended | |
| | | March 31, | | | March 31, | | | March 31, | | | March 31, | | | March 31, | |
A-Class | | 2012 | | | 2011 | | | 2010 | | | 2009 | | | 2008 | |
Per Share Data | | | | | | | | | | | | | | | | | | | | |
Net asset value, beginning of period | | $ | 34.37 | | | $ | 25.24 | | | $ | 12.49 | | | $ | 28.62 | | | $ | 37.24 | |
| | | | | | | | | | | | | | | | | | | | |
Income (loss) from investment operations: | | | | | | | | | | | | | | | | | | | | |
Net investment income (loss)a | | | (.39 | ) | | | (.35 | ) | | | (.11 | ) | | | (.02 | ) | | | .29 | |
Net gain (loss) on investments (realized and unrealized) | | | (1.78 | ) | | | 9.48 | | | | 12.86 | | | | (16.11 | ) | | | (8.83 | ) |
| | | | | | | | | | | | | | | | | | | | |
Total from investment operations | | | (2.17 | ) | | | 9.13 | | | | 12.75 | | | | (16.13 | ) | | | (8.54 | ) |
| | | | | | | | | | | | | | | | | | | | |
Less distributions from: | | | | | | | | | | | | | | | | | | | | |
Net investment income | | | — | | | | — | | | | — | | | | — | | | | (.08 | ) |
| | | | | | | | | | | | | | | | | | | | |
Total distributions | | | — | | | | — | | | | — | | | | — | | | | (.08 | ) |
| | | | | | | | | | | | | | | | | | | | |
Net asset value, end of period | | $ | 32.20 | | | $ | 34.37 | | | $ | 25.24 | | | $ | 12.49 | | | $ | 28.62 | |
| | | | | | | | | | | | | | | | | | | | |
Total Returnb | | | (6.31 | %) | | | 36.17 | % | | | 102.08 | % | | | (56.36 | %) | | | (22.98 | %) |
| | | | | | | | | | | | | | | | | | | | |
Ratios/Supplemental Data | | | | | | | | | | | | | | | | | | | | |
Net assets, end of period (in thousands) | | $ | 1,355 | | | $ | 2,312 | | | $ | 585 | | | $ | 591 | | | $ | 4,372 | |
| | | | | | | | | | | | | | | | | | | | |
Ratios to average net assets: | | | | | | | | | | | | | | | | | | | | |
Net investment income (loss) | | | (1.24 | %) | | | (1.25 | %) | | | (0.59 | %) | | | (0.07 | %) | | | 0.81 | % |
Total expenses | | | 1.73 | % | | | 1.72 | % | | | 1.71 | % | | | 1.70 | % | | | 1.67 | % |
| | | | | | | | | | | | | | | | | | | | |
Portfolio turnover rate | | | 177 | % | | | 211 | % | | | 109 | % | | | 288 | % | | | 227 | % |
| | | | | | | | | | | | | | | | | | | | |
| | | Year Ended | | | Year Ended | | | Year Ended | | | Year Ended | | | Year Ended | |
| | | March 31, | | | March 31, | | | March 31, | | | March 31, | | | March 31, | |
C-Class | | 2012 | | | 2011 | | | 2010 | | | 2009 | | | 2008 | |
Per Share Data | | | | | | | | | | | | | | | | | | | | |
Net asset value, beginning of period | | $ | 31.75 | | | $ | 23.50 | | | $ | 11.71 | | | $ | 27.10 | | | $ | 35.51 | |
| | | | | | | | | | | | | | | | | | | | |
Income (loss) from investment operations: | | | | | | | | | | | | | | | | | | | | |
Net investment income (loss)a | | | (.54 | ) | | | (.47 | ) | | | (.24 | ) | | | (.18 | ) | | | .03 | |
Net gain (loss) on investments (realized and unrealized) | | | (1.69 | ) | | | 8.72 | | | | 12.03 | | | | (15.21 | ) | | | (8.36 | ) |
| | | | | | | | | | | | | | | | | | | | |
Total from investment operations | | | (2.23 | ) | | | 8.25 | | | | 11.79 | | | | (15.39 | ) | | | (8.33 | ) |
| | | | | | | | | | | | | | | | | | | | |
Less distributions from: | | | | | | | | | | | | | | | | | | | | |
Net investment income | | | — | | | | — | | | | — | | | | — | | | | (.08 | ) |
| | | | | | | | | | | | | | | | | | | | |
Total distributions | | | — | | | | — | | | | — | | | | — | | | | (.08 | ) |
| | | | | | | | | | | | | | | | | | | | |
Net asset value, end of period | | $ | 29.52 | | | $ | 31.75 | | | $ | 23.50 | | | $ | 11.71 | | | $ | 27.10 | |
| | | | | | | | | | | | | | | | | | | | |
Total Returnb | | | (7.02 | %) | | | 35.11 | % | | | 100.68 | % | | | (56.79 | %) | | | (23.50 | %) |
| | | | | | | | | | | | | | | | | | | | |
Ratios/Supplemental Data | | | | | | | | | | | | | | | | | | | | |
Net assets, end of period (in thousands) | | $ | 1,839 | | | $ | 2,786 | | | $ | 2,782 | | | $ | 3,381 | | | $ | 10,873 | |
| | | | | | | | | | | | | | | | | | | | |
Ratios to average net assets: | | | | | | | | | | | | | | | | | | | | |
Net investment income (loss) | | | (1.99 | %) | | | (1.90 | %) | | | (1.36 | %) | | | (0.83 | %) | | | 0.09 | % |
Total expenses | | | 2.49 | % | | | 2.47 | % | | | 2.46 | % | | | 2.45 | % | | | 2.42 | % |
| | | | | | | | | | | | | | | | | | | | |
Portfolio turnover rate | | | 177 | % | | | 211 | % | | | 109 | % | | | 288 | % | | | 227 | % |
| | |
SEE NOTES TO FINANCIAL STATEMENTS. | | THE RYDEX SERIES FUNDS ANNUAL REPORT | 101 |
RUSSELL 2000® 1.5x STRATEGY FUND
FINANCIAL HIGHLIGHTS (concluded)
This table is presented to show selected data for a share outstanding throughout each period and to assist shareholders in evaluating a Fund’s performance for the periods presented.
| | | | | | | | | | | | | | | | | | | | |
| | | Year Ended | | | Year Ended | | | Year Ended | | | Year Ended | | | Year Ended | |
| | | March 31, | | | March 31, | | | March 31, | | | March 31, | | | March 31, | |
H-Class | | 2012 | | | 2011 | | | 2010 | | | 2009 | | | 2008 | |
Per Share Data | | | | | | | | | | | | | | | | | | | | |
Net asset value, beginning of period | | $ | 34.29 | | | $ | 25.21 | | | $ | 12.47 | | | $ | 28.62 | | | $ | 37.22 | |
| | | | | | | | | | | | | | | | | | | | |
Income (loss) from investment operations: | | | | | | | | | | | | | | | | | | | | |
Net investment income (loss)a | | | (.37 | ) | | | (.35 | ) | | | (.19 | ) | | | (.02 | ) | | | .30 | |
Net gain (loss) on investments (realized and unrealized) | | | (1.79 | ) | | | 9.43 | | | | 12.93 | | | | (16.13 | ) | | | (8.82 | ) |
| | | | | | | | | | | | | | | | | | | | |
Total from investment operations | | | (2.16 | ) | | | 9.08 | | | | 12.74 | | | | (16.15 | ) | | | (8.52 | ) |
| | | | | | | | | | | | | | | | | | | | |
Less distributions from: | | | | | | | | | | | | | | | | | | | | |
Net investment income | | | — | | | | — | | | | — | | | | — | | | | (.08 | ) |
| | | | | | | | | | | | | | | | | | | | |
Total distributions | | | — | | | | — | | | | — | | | | — | | | | (.08 | ) |
| | | | | | | | | | | | | | | | | | | | |
Net asset value, end of period | | $ | 32.13 | | | $ | 34.29 | | | $ | 25.21 | | | $ | 12.47 | | | $ | 28.62 | |
| | | | | | | | | | | | | | | | | | | | |
Total Returnb | | | (6.30 | %) | | | 36.02 | % | | | 102.17 | % | | | (56.43 | %) | | | (22.93 | %) |
| | | | | | | | | | | | | | | | | | | | |
Ratios/Supplemental Data | | | | | | | | | | | | | | | | | | | | |
Net assets, end of period (in thousands) | | $ | 14,902 | | | $ | 37,780 | | | $ | 23,320 | | | $ | 13,807 | | | $ | 13,839 | |
| | | | | | | | | | | | | | | | | | | | |
Ratios to average net assets: | | | | | | | | | | | | | | | | | | | | |
Net investment income (loss) | | | (1.24 | %) | | | (1.25 | %) | | | (0.94 | %) | | | (0.07 | %) | | | 0.83 | % |
Total expenses | | | 1.73 | % | | | 1.72 | % | | | 1.71 | % | | | 1.70 | % | | | 1.67 | % |
| | | | | | | | | | | | | | | | | | | | |
Portfolio turnover rate | | | 177 | % | | | 211 | % | | | 109 | % | | | 288 | % | | | 227 | % |
| a | Net investment income (loss) per share was computed using average shares outstanding throughout the period. |
| b | Total return does not reflect the impact of any applicable sales charges and has not been annualized. |
| | |
102 | THE RYDEX SERIES FUNDS ANNUAL REPORT | | SEE NOTES TO FINANCIAL STATEMENTS. |
This page intentionally left blank.
THE RYDEX SERIES FUNDS ANNUAL REPORT | 103
| | |
| PERFORMANCE REPORT AND FUND PROFILE (Unaudited) | | March 31, 2012 |
RUSSELL 2000® FUND
OBJECTIVE: Seeks to provide investment results that match, before fees and expenses, the performance of a specific benchmark on a daily basis. The Fund’s current benchmark is the Russell 2000® Index (the “underlying index”).
Russell 2000® Fund H-Class turned in a -1.26% performance for the one-year period ended March 31, 2012. Its benchmark, the Russell 2000 Index*, returned -0.18% for the period. Russell 2000® Fund maintained a daily correlation of over 99% to its benchmark of the daily price movement of the Russell 2000 Index.
The biggest performance contributors to the index during the period were the Financials and Health Care sectors. Energy and Information Technology provided the least performance to the index during the year.
Medivation, Inc., Nu Skin Enterprises, Inc. Class A and Inhibitex, Inc. were among the stocks which provided the most performance to the index during the year. MF Global Holdings Ltd., InterMune, Inc. and Patriot Coal Corp. were among the stocks which provided the least performance to the index during the year.
Derivatives in the Fund were used to help provide exposure to the composition of the benchmark in the highest efficient manner and not for hedging purposes. The results of derivatives use during the period were within our expectations and contributed to the Fund’s performance.
*Russell 2000® Index measures the performance of the small-cap value segment of the U.S. equity universe.
Performance displayed represents past performance which is no guarantee of future results.
Holdings Diversification (Market Exposure as % of Net Assets)
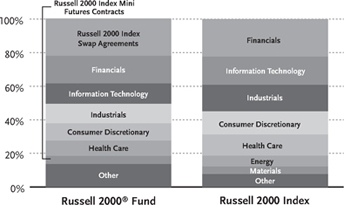
“Holdings Diversification (Market Exposure as % of Net Assets)” excludes any temporary cash investments.
| | | | |
Inception Dates: | | | |
A-Class | | | May 31, 2006 | |
C-Class | | | May 31, 2006 | |
H-Class | | | May 31, 2006 | |
| | | | |
Ten Largest Holdings (% of Total Net Assets) | |
Parametric Technology Corp. | | | 0.2 | % |
Nu Skin Enterprises, Inc. — Class A | | | 0.2 | % |
Clean Harbors, Inc. | | | 0.2 | % |
WellCare Health Plans, Inc. | | | 0.2 | % |
Salix Pharmaceuticals Ltd. | | | 0.2 | % |
American Campus Communities, Inc. | | | 0.2 | % |
Jack Henry & Associates, Inc. | | | 0.2 | % |
Home Properties, Inc. | | | 0.2 | % |
Signature Bank | | | 0.2 | % |
World Fuel Services Corp. | | | 0.2 | % |
| | | | |
Top Ten Total | | | 2.0 | % |
| | | | |
“Ten Largest Holdings” exclude any temporary cash or derivative investments.
104 | THE RYDEX SERIES FUNDS ANNUAL REPORT
PERFORMANCE REPORT AND FUND PROFILE (Unaudited) (concluded)
Cumulative Fund Performance*
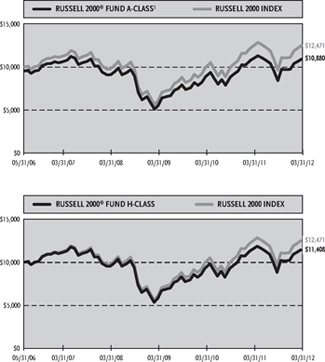
Average Annual Returns*
Periods Ended 03/31/12
| | | | | | | | | | | | |
| | | | | | | | | Since | |
| | | | | | | | | Inception | |
| | | 1 Year | | | 5 Year | | | (05/31/06) | |
A-Class Shares | | | -1.19 | % | | | 0.55 | % | | | 2.31 | % |
A-Class Shares with sales charge‡ | | | -5.87 | % | | | -0.42 | % | | | 1.46 | % |
C-Class Shares | | | -2.04 | % | | | -0.27 | % | | | 1.49 | % |
C-Class Shares with CDSC† | | | -3.02 | % | | | -0.27 | % | | | 1.49 | % |
H-Class Shares | | | -1.26 | % | | | 0.53 | % | | | 2.28 | % |
Russell 2000 Index | | | -0.18 | % | | | 2.13 | % | | | 3.86 | % |
| * | The performance data above represents past performance that is not predictive of future results. The investment return and principal value of an investment in the Fund will fluctuate so that an investor’s shares, when redeemed, may be worth more or less than their original cost. Returns are historical and include changes in principal and reinvested dividends and capital gains and do not reflect the effect of taxes. The Russell 2000 Index is an unmanaged index and, unlike the Fund, has no management fees or operating expenses to reduce its reported return. The graphs are based on A-Class shares and H-Class shares only; performance for C-Class shares will vary due to differences in fee structures. |
| † | Fund returns include a CDSC of 1% if redeemed within 12 months of purchase. |
| ‡ | Fund returns are calculated using the maximum sales charge of 4.75%. |
THE RYDEX SERIES FUNDS ANNUAL REPORT | 105
| | |
| SCHEDULE OF INVESTMENTS | | March 31, 2012 |
| RUSSELL 2000® FUND | | |
| | | | | | | | |
| | | SHARES | | | VALUE | |
COMMON STOCKS† - 73.3% | | | | | | | | |
| | |
FINANCIALS - 16.6% | | | | | | | | |
American Campus Communities, Inc. | | | 2,893 | | | $ | 129,374 | |
Home Properties, Inc. | | | 2,036 | | | | 124,216 | |
Signature Bank* | | | 1,964 | | | | 123,810 | |
BioMed Realty Trust, Inc. | | | 6,419 | | | | 121,833 | |
CBL & Associates Properties, Inc. | | | 6,314 | | | | 119,462 | |
National Retail Properties, Inc. | | | 4,386 | | | | 119,255 | |
SVB Financial Group* | | | 1,825 | | | | 117,420 | |
Kilroy Realty Corp. | | | 2,503 | | | | 116,665 | |
Hancock Holding Co. | | | 3,247 | | | | 115,300 | |
Extra Space Storage, Inc. | | | 3,996 | | | | 115,044 | |
ProAssurance Corp. | | | 1,301 | | | | 114,631 | |
MFA Financial, Inc. | | | 15,157 | | | | 113,224 | |
Tanger Factory Outlet Centers | | | 3,648 | | | | 108,455 | |
Mid-America Apartment Communities, Inc. | | | 1,559 | | | | 104,500 | |
Highwoods Properties, Inc. | | | 3,067 | | | | 102,192 | |
LaSalle Hotel Properties | | | 3,626 | | | | 102,035 | |
Post Properties, Inc. | | | 2,124 | | | | 99,531 | |
Entertainment Properties Trust | | | 1,991 | | | | 92,343 | |
Delphi Financial Group, Inc. — Class A | | | 2,057 | | | | 92,091 | |
Omega Healthcare Investors, Inc. | | | 4,328 | | | | 92,013 | |
Equity Lifestyle Properties, Inc. | | | 1,315 | | | | 91,708 | |
Prosperity Bancshares, Inc. | | | 1,992 | | | | 91,234 | |
Hatteras Financial Corp. | | | 3,186 | | | | 88,890 | |
Alterra Capital Holdings Ltd. | | | 3,865 | | | | 88,817 | |
Invesco Mortgage Capital, Inc. | | | 4,916 | | | | 86,767 | |
Stifel Financial Corp.* | | | 2,289 | | | | 86,615 | |
Starwood Property Trust, Inc. | | | 3,972 | | | | 83,491 | |
Washington Real Estate Investment Trust | | | 2,806 | | | | 83,337 | |
FirstMerit Corp. | | | 4,653 | | | | 78,450 | |
Colonial Properties Trust | | | 3,549 | | | | 77,119 | |
First American Financial Corp. | | | 4,480 | | | | 74,502 | |
CNO Financial Group, Inc.* | | | 9,440 | | | | 73,443 | |
DiamondRock Hospitality Co. | | | 7,126 | | | | 73,327 | |
Healthcare Realty Trust, Inc. | | | 3,315 | | | | 72,930 | |
Webster Financial Corp. | | | 3,068 | | | | 69,552 | |
FNB Corp. | | | 5,744 | | | | 69,388 | |
Trustmark Corp. | | | 2,730 | | | | 68,195 | |
Iberiabank Corp. | | | 1,260 | | | | 67,372 | |
Susquehanna Bancshares, Inc. | | | 6,706 | | | | 66,255 | |
Umpqua Holdings Corp. | | | 4,873 | | | | 66,078 | |
Ezcorp, Inc. — Class A* | | | 2,001 | | | | 64,943 | |
United Bankshares, Inc. | | | 2,141 | | | | 61,789 | |
Ocwen Financial Corp.* | | | 3,948 | | | | 61,708 | |
DCT Industrial Trust, Inc. | | | 10,457 | | | | 61,696 | |
DuPont Fabros Technology, Inc. | | | 2,509 | | | | 61,345 | |
Two Harbors Investment Corp. | | | 6,024 | | | | 61,083 | |
UMB Financial Corp. | | | 1,365 | | | | 61,063 | |
CubeSmart | | | 5,082 | | | | 60,476 | |
Cash America International, Inc. | | | 1,252 | | | | 60,008 | |
Apollo Investment Corp. | | | 8,346 | | | | 59,840 | |
Cathay General Bancorp | | | 3,351 | | | | 59,313 | |
Westamerica Bancorporation | | | 1,232 | | | | 59,136 | |
| | | | | | | | |
| | | SHARES | | | VALUE | |
Sovran Self Storage, Inc. | | | 1,178 | | | $ | 58,700 | |
Platinum Underwriters Holdings Ltd. | | | 1,585 | | | | 57,853 | |
First Cash Financial Services, Inc.* | | | 1,336 | | | | 57,301 | |
EastGroup Properties, Inc. | | | 1,141 | | | | 57,301 | |
RLI Corp. | | | 778 | | | | 55,736 | |
Texas Capital Bancshares, Inc.* | | | 1,588 | | | | 54,977 | |
Knight Capital Group, Inc. — Class A* | | | 4,271 | | | | 54,968 | |
Potlatch Corp. | | | 1,701 | | | | 53,309 | |
Old National Bancorp | | | 4,023 | | | | 52,862 | |
Wintrust Financial Corp. | | | 1,476 | | | | 52,826 | |
Northwest Bancshares, Inc. | | | 4,151 | | | | 52,718 | |
Portfolio Recovery Associates, Inc.* | | | 722 | | | | 51,781 | |
PS Business Parks, Inc. | | | 790 | | | | 51,777 | |
Montpelier Re Holdings Ltd. | | | 2,652 | | | | 51,237 | |
Prospect Capital Corp. | | | 4,640 | | | | 50,946 | |
National Health Investors, Inc. | | | 1,034 | | | | 50,439 | |
Pebblebrook Hotel Trust | | | 2,172 | | | | 49,044 | |
Sunstone Hotel Investors, Inc.* | | | 5,030 | | | | 48,992 | |
Strategic Hotels & Resorts, Inc.* | | | 7,439 | | | | 48,949 | |
MB Financial, Inc. | | | 2,316 | | | | 48,613 | |
Cardtronics, Inc.* | | | 1,833 | | | | 48,116 | |
BancorpSouth, Inc. | | | 3,560 | | | | 47,953 | |
International Bancshares Corp. | | | 2,258 | | | | 47,757 | |
Capstead Mortgage Corp. | | | 3,593 | | | | 47,104 | |
First Financial Bankshares, Inc. | | | 1,336 | | | | 47,041 | |
CYS Investments, Inc. | | | 3,585 | | | | 46,928 | |
Glimcher Realty Trust | | | 4,588 | | | | 46,889 | |
National Penn Bancshares, Inc. | | | 5,266 | | | | 46,604 | |
Equity One, Inc. | | | 2,289 | | �� | | 46,284 | |
Lexington Realty Trust | | | 5,103 | | | | 45,876 | |
Glacier Bancorp, Inc. | | | 3,056 | | | | 45,657 | |
First Industrial Realty Trust, Inc.* | | | 3,686 | | | | 45,522 | |
MarketAxess Holdings, Inc. | | | 1,209 | | | | 45,084 | |
Community Bank System, Inc. | | | 1,565 | | | | 45,041 | |
Medical Properties Trust, Inc. | | | 4,807 | | | | 44,609 | |
CVB Financial Corp. | | | 3,799 | | | | 44,600 | |
First Financial Bancorp | | | 2,485 | | | | 42,991 | |
LTC Properties, Inc. | | | 1,290 | | | | 41,280 | |
Education Realty Trust, Inc. | | | 3,798 | | | | 41,170 | |
Selective Insurance Group, Inc. | | | 2,301 | | | | 40,521 | |
Acadia Realty Trust | | | 1,796 | | | | 40,482 | |
Sun Communities, Inc. | | | 923 | | | | 39,994 | |
MGIC Investment Corp.* | | | 7,995 | | | | 39,655 | |
World Acceptance Corp.* | | | 640 | | | | 39,200 | |
PrivateBancorp, Inc. | | | 2,556 | | | | 38,775 | |
Columbia Banking System, Inc. | | | 1,683 | | | | 38,339 | |
Park National Corp. | | | 552 | | | | 38,182 | |
First Midwest Bancorp, Inc. | | | 3,168 | | | | 37,953 | |
Redwood Trust, Inc. | | | 3,341 | | | | 37,419 | |
Provident Financial Services, Inc. | | | 2,572 | | | | 37,371 | |
Anworth Mortgage Asset Corp. | | | 5,666 | | | | 37,282 | |
Bank of the Ozarks, Inc. | | | 1,188 | | | | 37,137 | |
PHH Corp.* | | | 2,387 | | | | 36,927 | |
Financial Engines, Inc.* | | | 1,632 | | | | 36,492 | |
Astoria Financial Corp. | | | 3,699 | | | | 36,472 | |
| | |
106 | THE RYDEX SERIES FUNDS ANNUAL REPORT | | SEE NOTES TO FINANCIAL STATEMENTS. |
| | |
| SCHEDULE OF INVESTMENTS (continued) | | March 31, 2012 |
| RUSSELL 2000® FUND | | |
| | | | | | | | |
| | | SHARES | | | VALUE | |
| | | | | | | | |
Government Properties Income Trust | | | 1,503 | | | $ | 36,237 | |
Pennsylvania Real Estate Investment Trust | | | 2,370 | | | | 36,190 | |
Tower Group, Inc. | | | 1,568 | | | | 35,170 | |
Alexander’s, Inc. | | | 89 | | | | 35,055 | |
Argo Group International Holdings Ltd. | | | 1,173 | | | | 35,038 | |
DFC Global Corp.* | | | 1,846 | | | | 34,834 | |
BBCN Bancorp, Inc.* | | | 3,110 | | | | 34,614 | |
Solar Capital Ltd. | | | 1,546 | | | | 34,121 | |
Symetra Financial Corp. | | | 2,869 | | | | 33,080 | |
Hersha Hospitality Trust — Class A | | | 5,996 | | | | 32,738 | |
Boston Private Financial Holdings, Inc. | | | 3,282 | | | | 32,525 | |
American Equity Investment Life Holding Co. | | | 2,535 | | | | 32,372 | |
NBT Bancorp, Inc. | | | 1,464 | | | | 32,325 | |
Primerica, Inc. | | | 1,279 | | | | 32,244 | |
Franklin Street Properties Corp. | | | 3,008 | | | | 31,885 | |
American Assets Trust, Inc. | | | 1,377 | | | | 31,396 | |
PacWest Bancorp | | | 1,290 | | | | 31,347 | |
BlackRock Kelso Capital Corp. | | | 3,112 | | | | 30,560 | |
Fifth Street Finance Corp. | | | 3,102 | | | | 30,276 | |
Harleysville Group, Inc. | | | 518 | | | | 29,889 | |
Horace Mann Educators Corp. | | | 1,691 | | | | 29,796 | |
Investors Bancorp, Inc.* | | | 1,968 | | | | 29,559 | |
Greenlight Capital Re Ltd. — Class A* | | | 1,198 | | | | 29,507 | |
Cousins Properties, Inc. | | | 3,882 | | | | 29,426 | |
Inland Real Estate Corp. | | | 3,281 | | | | 29,102 | |
Associated Estates Realty Corp. | | | 1,768 | | | | 28,889 | |
Enstar Group Ltd.* | | | 291 | | | | 28,806 | |
Credit Acceptance Corp.* | | | 285 | | | | 28,788 | |
Oritani Financial Corp. | | | 1,950 | | | | 28,626 | |
Nelnet, Inc. — Class A | | | 1,096 | | | | 28,397 | |
Newcastle Investment Corp. | | | 4,476 | | | | 28,109 | |
Infinity Property & Casualty Corp. | | | 525 | | | | 27,473 | |
Amtrust Financial Services, Inc. | | | 1,022 | | | | 27,471 | |
Chemical Financial Corp. | | | 1,170 | | | | 27,425 | |
First Commonwealth Financial Corp. | | | 4,466 | | | | 27,332 | |
Brookline Bancorp, Inc. | | | 2,891 | | | | 27,089 | |
National Financial Partners Corp.* | | | 1,767 | | | | 26,752 | |
Pinnacle Financial Partners, Inc.* | | | 1,457 | | | | 26,736 | |
Investors Real Estate Trust | | | 3,420 | | | | 26,300 | |
Employers Holdings, Inc. | | | 1,483 | | | | 26,264 | |
Independent Bank Corp. | | | 914 | | | | 26,259 | |
Evercore Partners, Inc. — Class A | | | 895 | | | | 26,018 | |
KBW, Inc. | | | 1,404 | | | | 25,974 | |
S&T Bancorp, Inc. | | | 1,195 | | | | 25,920 | |
Sabra Health Care REIT, Inc. | | | 1,575 | | | | 25,893 | |
First Potomac Realty Trust | | | 2,129 | | | | 25,740 | |
ARMOUR Residential REIT, Inc. | | | 3,811 | | | | 25,724 | |
Home Bancshares, Inc. | | | 957 | | | | 25,466 | |
Compass Diversified Holdings | | | 1,720 | | | | 25,439 | |
iStar Financial, Inc.* | | | 3,487 | | | | 25,281 | |
CreXus Investment Corp. | | | 2,438 | | | | 25,209 | |
Western Alliance Bancorporation* | | | 2,955 | | | | 25,029 | |
Banco Latinoamericano de Comercio Exterior S.A. — Class E | | | 1,181 | | | | 24,930 | |
Retail Opportunity Investments Corp. | | | 2,062 | | | | 24,826 | |
Walter Investment Management Corp. | | | 1,097 | | | | 24,737 | |
| | | | | | | | |
| | | SHARES | | | VALUE | |
| | | | | | | | |
Radian Group, Inc. | | | 5,667 | | | $ | 24,651 | |
Advance America Cash Advance Centers, Inc. | | | 2,347 | | | | 24,620 | |
Chesapeake Lodging Trust | | | 1,368 | | | | 24,583 | |
Cohen & Steers, Inc. | | | 761 | | | | 24,276 | |
Bankrate, Inc.* | | | 972 | | | | 24,057 | |
BGC Partners, Inc. — Class A | | | 3,215 | | | | 23,759 | |
Sterling Financial Corp.* | | | 1,133 | | | | 23,657 | |
State Bank Financial Corp.* | | | 1,344 | | | | 23,533 | |
Main Street Capital Corp. | | | 954 | | | | 23,497 | |
Forestar Group, Inc.* | | | 1,508 | | | | 23,208 | |
ViewPoint Financial Group | | | 1,483 | | | | 22,809 | |
PICO Holdings, Inc.* | | | 972 | | | | 22,793 | |
Colony Financial, Inc. | | | 1,391 | | | | 22,785 | |
Trustco Bank Corp. | | | 3,956 | | | | 22,589 | |
City Holding Co. | | | 649 | | | | 22,533 | |
Safety Insurance Group, Inc. | | | 541 | | | | 22,527 | |
NorthStar Realty Finance Corp. | | | 4,080 | | | | 22,073 | |
PennyMac Mortgage Investment Trust | | | 1,181 | | | | 22,049 | |
Navigators Group, Inc.* | | | 463 | | | | 21,872 | |
RLJ Lodging Trust | | | 1,170 | | | | 21,797 | |
Oriental Financial Group, Inc. | | | 1,760 | | | | 21,296 | |
Meadowbrook Insurance Group, Inc. | | | 2,267 | | | | 21,151 | |
Investment Technology Group, Inc.* | | | 1,760 | | | | 21,050 | |
Hercules Technology Growth Capital, Inc. | | | 1,872 | | | | 20,742 | |
PennantPark Investment Corp. | | | 1,972 | | | | 20,509 | |
Virtus Investment Partners, Inc.* | | | 238 | | | | 20,416 | |
HFF, Inc. — Class A* | | | 1,238 | | | | 20,390 | |
Berkshire Hills Bancorp, Inc. | | | 884 | | | | 20,261 | |
Universal Health Realty Income Trust | | | 508 | | | | 20,132 | |
Duff & Phelps Corp. — Class A | | | 1,290 | | | | 20,047 | |
Ashford Hospitality Trust, Inc. | | | 2,223 | | | | 20,029 | |
Ramco-Gershenson Properties Trust | | | 1,633 | | | | 19,955 | |
WesBanco, Inc. | | | 984 | | | | 19,818 | |
Coresite Realty Corp. | | | 835 | | | | 19,698 | |
SCBT Financial Corp. | | | 597 | | | | 19,528 | |
Urstadt Biddle Properties, Inc. — Class A | | | 984 | | | | 19,424 | |
Maiden Holdings Ltd. | | | 2,153 | | | | 19,377 | |
Dime Community Bancshares, Inc. | | | 1,321 | | | | 19,300 | |
AMERISAFE, Inc.* | | | 779 | | | | 19,272 | |
FelCor Lodging Trust, Inc.* | | | 5,297 | | | | 19,069 | |
Simmons First National Corp. — Class A | | | 735 | | | | 18,985 | |
Community Trust Bancorp, Inc. | | | 590 | | | | 18,921 | |
Triangle Capital Corp. | | | 956 | | | | 18,881 | |
Sandy Spring Bancorp, Inc. | | | 1,022 | | | | 18,570 | |
FBL Financial Group, Inc. — Class A | | | 537 | | | | 18,097 | |
Flushing Financial Corp. | | | 1,333 | | | | 17,942 | |
Piper Jaffray Cos.* | | | 670 | | | | 17,835 | |
Lakeland Financial Corp. | | | 681 | | | | 17,726 | |
Resource Capital Corp. | | | 3,269 | | | | 17,620 | |
Flagstone Reinsurance Holdings S.A. | | | 2,235 | | | | 17,589 | |
Tejon Ranch Co.* | | | 609 | | | | 17,441 | |
Renasant Corp. | | | 1,067 | | | | 17,371 | |
United Community Banks, Inc.* | | | 1,768 | | | | 17,238 | |
Getty Realty Corp. | | | 1,102 | | | | 17,169 | |
Dynex Capital, Inc. | | | 1,750 | | | | 16,713 | |
United Fire Group, Inc. | | | 914 | | | | 16,351 | |
| | |
SEE NOTES TO FINANCIAL STATEMENTS. | | THE RYDEX SERIES FUNDS ANNUAL REPORT | 107 |
| | |
| SCHEDULE OF INVESTMENTS (continued) | | March 31, 2012 |
| RUSSELL 2000® FUND | | |
| | | | | | | | |
| | | SHARES | | | VALUE | |
| | | | | | | | |
First Busey Corp. | | | 3,280 | | | $ | 16,203 | |
Monmouth Real Estate Investment Corp. — Class A | | | 1,642 | | | | 15,993 | |
Citizens, Inc.* | | | 1,617 | | | | 15,976 | |
1st Source Corp. | | | 649 | | | | 15,881 | |
Excel Trust, Inc. | | | 1,310 | | | | 15,825 | |
Banner Corp. | | | 710 | | | | 15,641 | |
Encore Capital Group, Inc.* | | | 690 | | | | 15,560 | |
West Coast Bancorp* | | | 817 | | | | 15,458 | |
Southside Bancshares, Inc. | | | 698 | | | | 15,426 | |
Kennedy-Wilson Holdings, Inc. | | | 1,131 | | | | 15,269 | |
Campus Crest Communities, Inc. | | | 1,301 | | | | 15,170 | |
Safeguard Scientifics, Inc.* | | | 877 | | | | 15,084 | |
Epoch Holding Corp. | | | 631 | | | | 15,068 | |
First Financial Corp. | | | 473 | | | | 15,018 | |
Washington Trust Bancorp, Inc. | | | 608 | | | | 14,677 | |
Rockville Financial, Inc. | | | 1,254 | | | | 14,609 | |
GAMCO Investors, Inc. — Class A | | | 294 | | | | 14,585 | |
OneBeacon Insurance Group Ltd. — Class A | | | 945 | | | | 14,562 | |
Hudson Pacific Properties, Inc. | | | 944 | | | | 14,283 | |
Hilltop Holdings, Inc.* | | | 1,685 | | | | 14,137 | |
Winthrop Realty Trust | | | 1,217 | | | | 14,105 | |
eHealth, Inc.* | | | 857 | | | | 13,978 | |
TowneBank | | | 1,034 | | | | 13,949 | |
MCG Capital Corp. | | | 3,280 | | | | 13,940 | |
Cardinal Financial Corp. | | | 1,229 | | | | 13,888 | |
Tompkins Financial Corp. | | | 344 | | | | 13,781 | |
Provident New York Bancorp | | | 1,618 | | | | 13,688 | |
Apollo Commercial Real Estate Finance, Inc. | | | 874 | | | | 13,678 | |
First Merchants Corp. | | | 1,096 | | | | 13,525 | |
MVC Capital, Inc. | | | 1,022 | | | | 13,419 | |
TICC Capital Corp. | | | 1,375 | | | | 13,393 | |
Ameris Bancorp* | | | 1,013 | | | | 13,311 | |
NewStar Financial, Inc.* | | | 1,160 | | | | 12,899 | |
Hanmi Financial Corp.* | | | 1,257 | | | | 12,721 | |
Wilshire Bancorp, Inc.* | | | 2,621 | | | | 12,659 | |
Sterling Bancorp | | | 1,319 | | | | 12,649 | |
Bancfirst Corp. | | | 288 | | | | 12,545 | |
Bancorp, Inc.* | | | 1,243 | | | | 12,480 | |
Saul Centers, Inc. | | | 309 | | | | 12,471 | |
Kite Realty Group Trust | | | 2,358 | | | | 12,427 | |
Beneficial Mutual Bancorp, Inc.* | | | 1,414 | | | | 12,358 | |
Capital Southwest Corp. | | | 130 | | | | 12,292 | |
Cedar Realty Trust, Inc. | | | 2,384 | | | | 12,206 | |
National Western Life Insurance Co. — Class A | | | 89 | | | | 12,181 | |
Phoenix Companies, Inc.* | | | 4,950 | | | | 12,128 | |
Union First Market Bankshares Corp. | | | 863 | | | | 12,082 | |
Eagle Bancorp, Inc.* | | | 712 | | | | 11,919 | |
Univest Corporation of Pennsylvania | | | 708 | | | | 11,880 | |
SY Bancorp, Inc. | | | 511 | | | | 11,855 | |
INTL FCStone, Inc.* | | | 561 | | | | 11,837 | |
CapLease, Inc. | | | 2,896 | | | | 11,671 | |
StellarOne Corp. | | | 982 | | | | 11,656 | |
Camden National Corp. | | | 330 | | | | 11,600 | |
GFI Group, Inc. | | | 3,013 | | | | 11,329 | |
WSFS Financial Corp. | | | 271 | | | | 11,111 | |
| | | | | | | | |
| | | SHARES | | | VALUE | |
| | | | | | | | |
Stewart Information Services Corp. | | | 775 | | | $ | 11,013 | |
United Financial Bancorp, Inc. | | | 682 | | | | 10,789 | |
Global Indemnity plc — Class A* | | | 548 | | | | 10,681 | |
Hudson Valley Holding Corp. | | | 662 | | | | 10,678 | |
Calamos Asset Management, Inc. — Class A | | | 813 | | | | 10,658 | |
Bryn Mawr Bank Corp. | | | 474 | | | | 10,637 | |
Arrow Financial Corp. | | | 434 | | | | 10,590 | |
Presidential Life Corp. | | | 919 | | | | 10,504 | |
Westwood Holdings Group, Inc. | | | 271 | | | | 10,496 | |
German American Bancorp, Inc. | | | 540 | | | | 10,492 | |
Centerstate Banks, Inc. | | | 1,284 | | | | 10,477 | |
Trico Bancshares | | | 601 | | | | 10,469 | |
Great Southern Bancorp, Inc. | | | 434 | | | | 10,416 | |
Citizens & Northern Corp. | | | 518 | | | | 10,360 | |
MainSource Financial Group, Inc. | | | 859 | | | | 10,351 | |
Northfield Bancorp, Inc. | | | 727 | | | | 10,338 | |
Republic Bancorp, Inc. — Class A | | | 424 | | | | 10,142 | |
First Connecticut Bancorp, Inc. | | | 756 | | | | 9,972 | |
CoBiz Financial, Inc. | | | 1,383 | | | | 9,778 | |
First Interstate Bancsystem, Inc. — Class A | | | 668 | | | | 9,766 | |
Parkway Properties, Inc. | | | 931 | | | | 9,757 | |
Territorial Bancorp, Inc. | | | 467 | | | | 9,718 | |
Heartland Financial USA, Inc. | | | 557 | | | | 9,658 | |
Agree Realty Corp. | | | 427 | | | | 9,642 | |
FXCM, Inc. — Class A | | | 740 | | | | 9,613 | |
Lakeland Bancorp, Inc. | | | 972 | | | | 9,577 | |
Financial Institutions, Inc. | | | 590 | | | | 9,540 | |
Westfield Financial, Inc. | | | 1,197 | | | | 9,468 | |
Farmer Mac — Class C | | | 417 | | | | 9,466 | |
STAG Industrial, Inc. | | | 673 | | | | 9,395 | |
OmniAmerican Bancorp, Inc.* | | | 475 | | | | 9,196 | |
State Auto Financial Corp. | | | 623 | | | | 9,102 | |
Heritage Financial Corp. | | | 666 | | | | 9,058 | |
Washington Banking Co. | | | 654 | | | | 9,032 | |
First Community Bancshares, Inc. | | | 670 | | | | 8,951 | |
National Bankshares, Inc. | | | 295 | | | | 8,880 | |
OceanFirst Financial Corp. | | | 623 | | | | 8,872 | |
CNB Financial Corp. | | | 528 | | | | 8,823 | |
Summit Hotel Properties, Inc. | | | 1,160 | | | | 8,793 | |
Netspend Holdings, Inc.* | | | 1,127 | | | | 8,746 | |
Bank of Marin Bancorp | | | 230 | | | | 8,742 | |
Virginia Commerce Bancorp, Inc.* | | | 995 | | | | 8,736 | |
One Liberty Properties, Inc. | | | 476 | | | | 8,711 | |
First of Long Island Corp. | | | 324 | | | | 8,586 | |
RAIT Financial Trust | | | 1,705 | | | | 8,474 | |
Central Pacific Financial Corp.* | | | 654 | | | | 8,469 | |
Ames National Corp. | | | 354 | | | | 8,425 | |
Doral Financial Corp.* | | | 5,425 | | | | 8,355 | |
American Safety Insurance Holdings Ltd.* | | | 442 | | | | 8,332 | |
Ladenburg Thalmann Financial Services, Inc.* | | | 4,531 | | | | 8,065 | |
Cogdell Spencer, Inc. | | | 1,898 | | | | 8,048 | |
Gladstone Commercial Corp. | | | 467 | | | | 8,037 | |
Baldwin & Lyons, Inc. — Class B | | | 355 | | | | 7,945 | |
Franklin Financial Corp.* | | | 591 | | | | 7,937 | |
Bank Mutual Corp. | | | 1,954 | | | | 7,894 | |
Peoples Bancorp, Inc. | | | 449 | | | | 7,875 | |
| | |
108 | THE RYDEX SERIES FUNDS ANNUAL REPORT | | SEE NOTES TO FINANCIAL STATEMENTS. |
| | |
| SCHEDULE OF INVESTMENTS (continued) | | March 31, 2012 |
| RUSSELL 2000® FUND | | |
| | | | | | | | |
| | | SHARES | | | VALUE | |
| | | | | | | | |
Enterprise Financial Services Corp. | | | 670 | | | $ | 7,866 | |
First Financial Holdings, Inc. | | | 708 | | | | 7,788 | |
Apollo Residential Mortgage, Inc. | | | 423 | | | | 7,775 | |
SeaBright Holdings, Inc. | | | 848 | | | | 7,708 | |
Cowen Group, Inc. — Class A* | | | 2,844 | | | | 7,707 | |
Pacific Capital Bancorp North America* | | | 167 | | | | 7,617 | |
Southwest Bancorp, Inc.* | | | 825 | | | | 7,607 | |
Taylor Capital Group, Inc.* | | | 530 | | | | 7,606 | |
Flagstar Bancorp, Inc.* | | | 8,240 | | | | 7,581 | |
Fox Chase Bancorp, Inc. | | | 583 | | | | 7,579 | |
Oppenheimer Holdings, Inc. — Class A | | | 435 | | | | 7,547 | |
National Interstate Corp. | | | 295 | | | | 7,546 | |
American Capital Mortgage Investment Corp. | | | 346 | | | | 7,532 | |
Chatham Lodging Trust | | | 591 | | | | 7,500 | |
ESB Financial Corp. | | | 520 | | | | 7,498 | |
Mission West Properties, Inc. | | | 755 | | | | 7,444 | |
Pacific Continental Corp. | | | 788 | | | | 7,423 | |
Diamond Hill Investment Group, Inc. | | | 100 | | | | 7,365 | |
Encore Bancshares, Inc.* | | | 361 | | | | 7,354 | |
Gladstone Capital Corp. | | | 893 | | | | 7,242 | |
Gladstone Investment Corp. | | | 944 | | | | 7,146 | |
SWS Group, Inc. | | | 1,239 | | | | 7,087 | |
1st United Bancorp, Inc.* | | | 1,160 | | | | 7,018 | |
First Bancorp | | | 640 | | | | 6,995 | |
Medallion Financial Corp. | | | 623 | | | | 6,953 | |
First Defiance Financial Corp. | | | 412 | | | | 6,946 | |
Metro Bancorp, Inc.* | | | 591 | | | | 6,909 | |
Home Federal Bancorp, Inc. | | | 671 | | | | 6,797 | |
BofI Holding, Inc.* | | | 395 | | | | 6,747 | |
Golub Capital BDC, Inc. | | | 439 | | | | 6,704 | |
West Bancorporation, Inc. | | | 665 | | | | 6,643 | |
Penns Woods Bancorp, Inc. | | | 162 | | | | 6,623 | |
Park Sterling Corp.* | | | 1,360 | | | | 6,528 | |
Manning & Napier, Inc. — Class A* | | | 438 | | | | 6,439 | |
Bank of Kentucky Financial Corp. | | | 248 | | | | 6,381 | |
Artio Global Investors, Inc. — Class A | | | 1,336 | | | | 6,373 | |
NGP Capital Resources Co. | | | 926 | | | | 6,065 | |
Arlington Asset Investment Corp. — Class A | | | 271 | | | | 6,016 | |
Alliance Financial Corp. | | | 198 | | | | 6,001 | |
Bridge Bancorp, Inc. | | | 285 | | | | 5,976 | |
Sun Bancorp, Inc.* | | | 1,693 | | | | 5,976 | |
BankFinancial Corp. | | | 893 | | | | 5,912 | |
Merchants Bancshares, Inc. | | | 207 | | | | 5,833 | |
Terreno Realty Corp. | | | 405 | | | | 5,796 | |
Walker & Dunlop, Inc.* | | | 459 | | | | 5,783 | |
Heritage Commerce Corp.* | | | 884 | | | | 5,684 | |
Kansas City Life Insurance Co. | | | 176 | | | | 5,667 | |
Kohlberg Capital Corp. | | | 819 | | | | 5,659 | |
Edelman Financial Group, Inc. | | | 851 | | | | 5,625 | |
UMH Properties, Inc. | | | 511 | | | | 5,601 | |
Kearny Financial Corp. | | | 572 | | | | 5,577 | |
Harris & Harris Group, Inc.* | | | 1,319 | | | | 5,474 | |
Nicholas Financial, Inc. | | | 412 | | | | 5,434 | |
Seacoast Banking Corporation of Florida* | | | 3,084 | | | | 5,428 | |
Consolidated-Tomoka Land Co. | | | 182 | | | | 5,415 | |
| | | | | | | | |
| | | SHARES | | | VALUE | |
| | | | | | | | |
Marlin Business Services Corp. | | | 359 | | | $ | 5,407 | |
First Bancorp, Inc. | | | 364 | | | | 5,398 | |
Crawford & Co. — Class B | | | 1,096 | | | | 5,370 | |
Suffolk Bancorp* | | | 412 | | | | 5,352 | |
Medley Capital Corp. | | | 473 | | | | 5,331 | |
Solar Senior Capital Ltd. | | | 330 | | | | 5,316 | |
AG Mortgage Investment Trust, Inc. | | | 269 | | | | 5,310 | |
Bridge Capital Holdings* | | | 387 | | | | 5,209 | |
Center Bancorp, Inc. | | | 514 | | | | 5,155 | |
First Pactrust Bancorp, Inc. | | | 432 | | | | 5,149 | |
THL Credit, Inc. | | | 395 | | | | 5,080 | |
Sierra Bancorp | | | 508 | | | | 4,994 | |
FBR & Company* | | | 1,914 | | | | 4,919 | |
MPG Office Trust, Inc.* | | | 2,080 | | | | 4,867 | |
JMP Group, Inc. | | | 648 | | | | 4,782 | |
Meridian Interstate Bancorp, Inc.* | | | 364 | | | | 4,779 | |
Donegal Group, Inc. — Class A | | | 331 | | | | 4,525 | |
ESSA Bancorp, Inc. | | | 461 | | | | 4,518 | |
AV Homes, Inc.* | | | 368 | | | | 4,482 | |
MidSouth Bancorp, Inc. | | | 324 | | | | 4,406 | |
Gleacher & Company, Inc.* | | | 3,133 | | | | 4,261 | |
New Mountain Finance Corp. | | | 310 | | | | 4,259 | |
Whitestone REIT — Class B | | | 319 | | | | 4,160 | |
Hallmark Financial Services* | | | 513 | | | | 4,048 | |
EMC Insurance Group, Inc. | | | 200 | | | | 4,018 | |
Enterprise Bancorp, Inc. | | | 244 | | | | 4,011 | |
Cape Bancorp, Inc.* | | | 490 | | | | 3,910 | |
Century Bancorp, Inc. — Class A | | | 140 | | | | 3,822 | |
Clifton Savings Bancorp, Inc. | | | 361 | | | | 3,765 | |
Capital City Bank Group, Inc. | | | 490 | | | | 3,651 | |
Independence Holding Co. | | | 337 | | | | 3,357 | |
Fidus Investment Corp. | | | 225 | | | | 3,152 | |
CIFC Corp.* | | | 508 | | | | 3,150 | |
Universal Insurance Holdings, Inc. | | | 803 | | | | 3,124 | |
Roma Financial Corp. | | | 319 | | | | 3,123 | |
First Marblehead Corp.* | | | 2,350 | | | | 2,867 | |
Orrstown Financial Services, Inc. | | | 295 | | | | 2,587 | |
Charter Financial Corp. | | | 285 | | | | 2,554 | |
Pzena Investment Management, Inc. — Class A | | | 367 | | | | 2,147 | |
Fortegra Financial Corp.* | | | 248 | | | | 2,073 | |
Imperial Holdings, Inc.* | | | 745 | | | | 1,989 | |
Gain Capital Holdings, Inc. | | | 321 | | | | 1,611 | |
Cascade Bancorp* | | | 255 | | | | 1,448 | |
California First National Bancorp | | | 89 | | | | 1,365 | |
Capital Bank Corp.* | | | 592 | | | | 1,326 | |
Hampton Roads Bankshares, Inc.* | | | 418 | | | | 1,267 | |
| | | | | | | | |
Total Financials | | | | | | | 11,628,520 | |
| | | | | | | | |
INFORMATION TECHNOLOGY—12.1% | | | | | | | | |
Parametric Technology Corp.* | | | 5,073 | | | | 141,739 | |
Jack Henry & Associates, Inc. | | | 3,673 | | | | 125,322 | |
Concur Technologies, Inc.* | | | 1,902 | | | | 109,137 | |
Wright Express Corp.* | | | 1,646 | | | | 106,546 | |
QLIK Technologies, Inc.* | | | 2,996 | | | | 95,872 | |
SolarWinds, Inc.* | | | 2,428 | | | | 93,842 | |
CommVault Systems, Inc.* | | | 1,879 | | | | 93,273 | |
| | |
SEE NOTES TO FINANCIAL STATEMENTS. | | THE RYDEX SERIES FUNDS ANNUAL REPORT | 109 |
| | |
| SCHEDULE OF INVESTMENTS (continued) | | March 31, 2012 |
| RUSSELL 2000® FUND | | |
| | | | | | | | |
| | | SHARES | | | VALUE | |
| | | | | | | | |
Anixter International, Inc.* | | | 1,238 | | | $ | 89,793 | |
ADTRAN, Inc. | | | 2,750 | | | | 85,772 | |
Aruba Networks, Inc.* | | | 3,639 | | | | 81,077 | |
FEI Co.* | | | 1,649 | | | | 80,982 | |
Ultimate Software Group, Inc.* | | | 1,104 | | | | 80,901 | |
Taleo Corp. — Class A* | | | 1,748 | | | | 80,286 | |
Semtech Corp.* | | | 2,774 | | | | 78,948 | |
Microsemi Corp.* | | | 3,676 | | | | 78,813 | |
Finisar Corp.* | | | 3,819 | | | | 76,953 | |
Cognex Corp. | | | 1,765 | | | | 74,766 | |
Plantronics, Inc. | | | 1,851 | | | | 74,521 | |
Viasat, Inc.* | | | 1,541 | | | | 74,292 | |
Aspen Technology, Inc.* | | | 3,601 | | | | 73,929 | |
Hittite Microwave Corp.* | | | 1,336 | | | | 72,558 | |
CACI International, Inc. — Class A* | | | 1,127 | | | | 70,201 | |
InterDigital, Inc. | | | 1,933 | | | | 67,384 | |
Cirrus Logic, Inc.* | | | 2,820 | | | | 67,116 | |
ACI Worldwide, Inc.* | | | 1,666 | | | | 67,090 | |
Fair Isaac Corp. | | | 1,523 | | | | 66,860 | |
ValueClick, Inc.* | | | 3,351 | | | | 66,150 | |
MKS Instruments, Inc. | | | 2,221 | | | | 65,586 | |
Cymer, Inc.* | | | 1,301 | | | | 65,050 | |
Cavium, Inc.* | | | 2,049 | | | | 63,396 | |
Blackbaud, Inc. | | | 1,896 | | | | 63,004 | |
Progress Software Corp.* | | | 2,639 | | | | 62,333 | |
Mentor Graphics Corp.* | | | 4,104 | | | | 60,985 | |
TiVo, Inc.* | | | 5,075 | | | | 60,849 | |
MAXIMUS, Inc. | | | 1,476 | | | | 60,029 | |
Universal Display Corp.* | | | 1,638 | | | | 59,837 | |
Convergys Corp.* | | | 4,480 | | | | 59,808 | |
Arris Group, Inc.* | | | 5,273 | | | | 59,585 | |
Netgear, Inc.* | | | 1,557 | | | | 59,477 | |
Coherent, Inc.* | | | 1,005 | | | | 58,623 | |
RF Micro Devices, Inc.* | | | 11,761 | | | | 58,570 | |
NetSuite, Inc.* | | | 1,160 | | | | 58,336 | |
Sourcefire, Inc.* | | | 1,205 | | | | 57,997 | |
Sapient Corp. | | | 4,649 | | | | 57,880 | |
Littelfuse, Inc. | | | 920 | | | | 57,684 | |
Quest Software, Inc.* | | | 2,418 | | | | 56,267 | |
j2 Global, Inc. | | | 1,954 | | | | 56,041 | |
Entegris, Inc.* | | | 5,719 | | | | 53,415 | |
DealerTrack Holdings, Inc.* | | | 1,748 | | | | 52,894 | |
Plexus Corp.* | | | 1,510 | | | | 52,835 | |
Acxiom Corp.* | | | 3,454 | | | | 50,705 | |
Synaptics, Inc.* | | | 1,370 | | | | 50,019 | |
OSI Systems, Inc.* | | | 807 | | | | 49,469 | |
Omnivision Technologies, Inc.* | | | 2,473 | | | | 49,460 | |
Veeco Instruments, Inc.* | | | 1,729 | | | | 49,449 | |
JDA Software Group, Inc.* | | | 1,798 | | | | 49,409 | |
Tyler Technologies, Inc.* | | | 1,267 | | | | 48,665 | |
TriQuint Semiconductor, Inc.* | | | 6,992 | | | | 48,210 | |
Take-Two Interactive Software, Inc.* | | | 3,129 | | | | 48,139 | |
Heartland Payment Systems, Inc. | | | 1,643 | | | | 47,384 | |
MicroStrategy, Inc. — Class A* | | | 335 | | | | 46,900 | |
Power Integrations, Inc. | | | 1,232 | | | | 45,732 | |
Euronet Worldwide, Inc.* | | | 2,177 | | | | 45,478 | |
| | | | | | | | |
| | | SHARES | | | VALUE | |
| | | | | | | | |
Integrated Device Technology, Inc.* | | | 6,311 | | | $ | 45,124 | |
Scansource, Inc.* | | | 1,145 | | | | 42,731 | |
Bottomline Technologies, Inc.* | | | 1,529 | | | | 42,720 | |
Benchmark Electronics, Inc.* | | | 2,589 | | | | 42,693 | |
Manhattan Associates, Inc.* | | | 874 | | | | 41,541 | |
VirnetX Holding Corp.* | | | 1,723 | | | | 41,231 | |
Insight Enterprises, Inc.* | | | 1,872 | | | | 41,053 | |
SYNNEX Corp.* | | | 1,072 | | | | 40,886 | |
OpenTable, Inc.* | | | 1,008 | | | | 40,794 | |
FARO Technologies, Inc.* | | | 678 | | | | 39,548 | |
Sanmina-SCI Corp.* | | | 3,431 | | | | 39,285 | |
Cabot Microelectronics Corp. | | | 1,001 | | | | 38,919 | |
Emulex Corp.* | | | 3,742 | | | | 38,842 | |
Kulicke & Soffa Industries, Inc.* | | | 3,063 | | | | 38,073 | |
LivePerson, Inc.* | | | 2,243 | | | | 37,615 | |
Tessera Technologies, Inc.* | | | 2,180 | | | | 37,605 | |
Earthlink, Inc. | | | 4,683 | | | | 37,417 | |
Constant Contact, Inc.* | | | 1,250 | | | | 37,238 | |
BroadSoft, Inc.* | | | 958 | | | | 36,644 | |
Syntel, Inc. | | | 654 | | | | 36,624 | |
Loral Space & Communications, Inc. | | | 459 | | | | 36,536 | |
Unisys Corp.* | | | 1,834 | | | | 36,166 | |
Infinera Corp.* | | | 4,452 | | | | 36,150 | |
Volterra Semiconductor Corp.* | | | 1,048 | | | | 36,067 | |
Synchronoss Technologies, Inc.* | | | 1,122 | | | | 35,814 | |
Liquidity Services, Inc.* | | | 796 | | | | 35,661 | |
Advent Software, Inc.* | | | 1,390 | | | | 35,584 | |
MTS Systems Corp. | | | 668 | | | | 35,464 | |
Kenexa Corp.* | | | 1,126 | | | | 35,176 | |
Diodes, Inc.* | | | 1,505 | | | | 34,886 | |
Brooks Automation, Inc. | | | 2,814 | | | | 34,697 | |
Mantech International Corp. — Class A | | | 989 | | | | 34,081 | |
Websense, Inc.* | | | 1,608 | | | | 33,913 | |
Electronics for Imaging, Inc.* | | | 1,992 | | | | 33,107 | |
NIC, Inc. | | | 2,728 | | | | 33,091 | |
Stratasys, Inc.* | | | 903 | | | | 32,977 | |
Netscout Systems, Inc.* | | | 1,593 | | | | 32,402 | |
Lattice Semiconductor Corp.* | | | 5,019 | | | | 32,272 | |
Rofin-Sinar Technologies, Inc.* | | | 1,212 | | | | 31,960 | |
ATMI, Inc.* | | | 1,352 | | | | 31,502 | |
Ultratech, Inc.* | | | 1,073 | | | | 31,096 | |
Ancestry.com, Inc.* | | | 1,350 | | | | 30,699 | |
LogMeIn, Inc.* | | | 867 | | | | 30,544 | |
Digital River, Inc.* | | | 1,593 | | | | 29,805 | |
Verint Systems, Inc.* | | | 902 | | | | 29,216 | |
comScore, Inc.* | | | 1,352 | | | | 28,919 | |
Newport Corp.* | | | 1,595 | | | | 28,263 | |
Ebix, Inc. | | | 1,213 | | | | 28,093 | |
Comtech Telecommunications Corp. | | | 862 | | | | 28,084 | |
Pegasystems, Inc. | | | 709 | | | | 27,055 | |
Rambus, Inc.* | | | 4,179 | | | | 26,955 | |
Park Electrochemical Corp. | | | 884 | | | | 26,723 | |
Harmonic, Inc.* | | | 4,881 | | | | 26,699 | |
Rogers Corp.* | | | 679 | | | | 26,311 | |
Spansion, Inc. — Class A* | | | 2,140 | | | | 26,065 | |
Sonus Networks, Inc.* | | | 8,985 | | | | 26,057 | |
| | |
110 | THE RYDEX SERIES FUNDS ANNUAL REPORT | | SEE NOTES TO FINANCIAL STATEMENTS. |
| | |
| SCHEDULE OF INVESTMENTS (continued) | | March 31, 2012 |
| RUSSELL 2000® FUND | | |
| | | | | | | | |
| | | SHARES | | | VALUE | |
| | | | | | | | |
TTM Technologies, Inc.* | | | 2,203 | | | $ | 25,312 | |
Amkor Technology, Inc.* | | | 4,115 | | | | 25,287 | |
Standard Microsystems Corp.* | | | 977 | | | | 25,275 | |
Quantum Corp.* | | | 9,595 | | | | 25,139 | |
Monolithic Power Systems, Inc.* | | | 1,276 | | | | 25,099 | |
SS&C Technologies Holdings, Inc.* | | | 1,072 | | | | 25,010 | |
RealPage, Inc.* | | | 1,290 | | | | 24,729 | |
Advanced Energy Industries, Inc.* | | | 1,857 | | | | 24,364 | |
TNS, Inc.* | | | 1,088 | | | | 23,642 | |
RealD, Inc.* | | | 1,745 | | | | 23,558 | |
Brightpoint, Inc.* | | | 2,908 | | | | 23,409 | |
Monotype Imaging Holdings, Inc.* | | | 1,520 | | | | 22,648 | |
DTS, Inc.* | | | 745 | | | | 22,514 | |
Ceva, Inc.* | | | 985 | | | | 22,369 | |
CSG Systems International, Inc.* | | | 1,473 | | | | 22,301 | |
Micrel, Inc. | | | 2,147 | | | | 22,028 | |
iGate Corp.* | | | 1,307 | | | | 21,905 | |
Maxwell Technologies, Inc.* | | | 1,184 | | | | 21,703 | |
Measurement Specialties, Inc.* | | | 639 | | | | 21,534 | |
InfoSpace, Inc.* | | | 1,676 | | | | 21,470 | |
Global Cash Access Holdings, Inc.* | | | 2,750 | | | | 21,450 | |
Entropic Communications, Inc.* | | | 3,646 | | | | 21,256 | |
Ixia* | | | 1,645 | | | | 20,546 | |
Forrester Research, Inc. | | | 623 | | | | 20,185 | |
Super Micro Computer, Inc.* | | | 1,149 | | | | 20,062 | |
Silicon Image, Inc.* | | | 3,389 | | | | 19,927 | |
Black Box Corp. | | | 766 | | | | 19,541 | |
Intermec, Inc.* | | | 2,523 | | | | 19,503 | |
Xyratex Ltd. | | | 1,209 | | | | 19,235 | |
Checkpoint Systems, Inc.* | | | 1,705 | | | | 19,232 | |
Dice Holdings, Inc.* | | | 2,058 | | | | 19,201 | |
Accelrys, Inc.* | | | 2,356 | | | | 18,801 | |
Applied Micro Circuits Corp.* | | | 2,694 | | | | 18,696 | |
ExlService Holdings, Inc.* | | | 681 | | | | 18,687 | |
Interactive Intelligence Group, Inc.* | | | 607 | | | | 18,520 | |
United Online, Inc. | | | 3,774 | | | | 18,455 | |
Web.com Group, Inc.* | | | 1,239 | | | | 17,879 | |
Opnet Technologies, Inc. | | | 616 | | | | 17,864 | |
Kemet Corp.* | | | 1,876 | | | | 17,559 | |
TeleTech Holdings, Inc.* | | | 1,083 | | | | 17,436 | |
PROS Holdings, Inc.* | | | 918 | | | | 17,167 | |
Mercury Computer Systems, Inc.* | | | 1,287 | | | | 17,053 | |
Photronics, Inc.* | | | 2,506 | | | | 16,665 | |
Move, Inc.* | | | 1,692 | | | | 16,429 | |
Internap Network Services Corp.* | | | 2,223 | | | | 16,317 | |
EPIQ Systems, Inc. | | | 1,336 | | | | 16,166 | |
Nanometrics, Inc.* | | | 860 | | | | 15,919 | |
Cass Information Systems, Inc. | | | 393 | | | | 15,700 | |
OCZ Technology Group, Inc.* | | | 2,233 | | | | 15,586 | |
CTS Corp. | | | 1,465 | | | | 15,412 | |
Fabrinet* | | | 864 | | | | 15,301 | |
LTX-Credence Corp.* | | | 2,111 | | | | 15,178 | |
Sycamore Networks, Inc.* | | | 851 | | | | 15,097 | |
Extreme Networks* | | | 3,922 | | | | 15,021 | |
Rudolph Technologies, Inc.* | | | 1,340 | | | | 14,887 | |
STEC, Inc.* | | | 1,568 | | | | 14,802 | |
| | | | | | | | |
| | | SHARES | | | VALUE | |
| | | | | | | | |
Electro Rent Corp. | | | 796 | | | $ | 14,654 | |
Methode Electronics, Inc. | | | 1,577 | | | | 14,635 | |
Electro Scientific Industries, Inc. | | | 954 | | | | 14,320 | |
Oplink Communications, Inc.* | | | 831 | | | | 14,210 | |
ICG Group, Inc.* | | | 1,576 | | | | 14,105 | |
Globecomm Systems, Inc.* | | | 957 | | | | 13,857 | |
Avid Technology, Inc.* | | | 1,257 | | | | 13,827 | |
Procera Networks, Inc.* | | | 616 | | | | 13,774 | |
Calix, Inc.* | | | 1,605 | | | | 13,691 | |
IXYS Corp.* | | | 1,032 | | | | 13,622 | |
GSI Group, Inc.* | | | 1,104 | | | | 13,314 | |
LoopNet, Inc.* | | | 708 | | | | 13,296 | |
Power-One, Inc.* | | | 2,895 | | | | 13,172 | |
Zygo Corp.* | | | 670 | | | | 13,112 | |
Daktronics, Inc. | | | 1,473 | | | | 13,095 | |
Exar Corp.* | | | 1,554 | | | | 13,054 | |
Inphi Corp.* | | | 911 | | | | 12,918 | |
Silicon Graphics International Corp.* | | | 1,319 | | | | 12,768 | |
Integrated Silicon Solution, Inc.* | | | 1,143 | | | | 12,756 | |
Stamps.com, Inc.* | | | 449 | | | | 12,518 | |
VASCO Data Security International, Inc.* | | | 1,154 | | | | 12,452 | |
Perficient, Inc.* | | | 1,032 | | | | 12,394 | |
QuinStreet, Inc.* | | | 1,178 | | | | 12,357 | |
Keynote Systems, Inc. | | | 621 | | | | 12,271 | |
MIPS Technologies, Inc. — Class A* | | | 2,241 | | | | 12,191 | |
Formfactor, Inc.* | | | 2,157 | | | | 12,036 | |
Digital Generation, Inc.* | | | 1,170 | | | | 11,946 | |
Anaren, Inc.* | | | 649 | | | | 11,909 | |
Digi International, Inc.* | | | 1,077 | | | | 11,836 | |
Saba Software, Inc.* | | | 1,202 | | | | 11,792 | |
KIT Digital, Inc.* | | | 1,635 | | | | 11,772 | |
Kopin Corp.* | | | 2,883 | | | | 11,734 | |
Cohu, Inc. | | | 1,022 | | | | 11,620 | |
CIBER, Inc.* | | | 2,720 | | | | 11,533 | |
XO Group, Inc.* | | | 1,220 | | | | 11,456 | |
ShoreTel, Inc.* | | | 2,009 | | | | 11,411 | |
Cray, Inc.* | | | 1,541 | | | | 11,280 | |
Virtusa Corp.* | | | 641 | | | | 11,070 | |
NVE Corp.* | | | 206 | | | | 10,918 | |
Cornerstone OnDemand, Inc.* | | | 490 | | | | 10,702 | |
Symmetricom, Inc.* | | | 1,843 | | | | 10,634 | |
Multi-Fineline Electronix, Inc.* | | | 387 | | | | 10,623 | |
Envestnet, Inc.* | | | 819 | | | | 10,254 | |
ModusLink Global Solutions, Inc.* | | | 1,866 | | | | 10,076 | |
Actuate Corp.* | | | 1,603 | | | | 10,067 | |
Deltek, Inc.* | | | 943 | | | | 10,052 | |
Vocus, Inc.* | | | 755 | | | | 10,004 | |
Ubiquiti Networks, Inc.* | | | 316 | | | | 9,995 | |
Callidus Software, Inc.* | | | 1,274 | | | | 9,950 | |
Glu Mobile, Inc.* | | | 2,013 | | | | 9,763 | |
Computer Task Group, Inc.* | | | 636 | | | | 9,744 | |
SPS Commerce, Inc.* | | | 351 | | | | 9,435 | |
Aeroflex Holding Corp.* | | | 839 | | | | 9,346 | |
Mindspeed Technologies, Inc.* | | | 1,431 | | | | 9,115 | |
RealNetworks, Inc. | | | 897 | | | | 8,916 | |
Limelight Networks, Inc.* | | | 2,690 | | | | 8,850 | |
| | |
SEE NOTES TO FINANCIAL STATEMENTS. | | THE RYDEX SERIES FUNDS ANNUAL REPORT | 111 |
| | |
| SCHEDULE OF INVESTMENTS (continued) | | March 31, 2012 |
| RUSSELL 2000® FUND | | |
| | | | | | | | |
| | | SHARES | | | VALUE | |
| | | | | | | | |
Seachange International, Inc.* | | | 1,128 | | | $ | 8,776 | |
Active Network, Inc.* | | | 518 | | | | 8,718 | |
Pericom Semiconductor Corp.* | | | 1,067 | | | | 8,632 | |
AXT, Inc.* | | | 1,359 | | | | 8,630 | |
Oclaro, Inc.* | | | 2,151 | | | | 8,475 | |
PDF Solutions, Inc.* | | | 1,002 | | | | 8,447 | |
Intevac, Inc.* | | | 977 | | | | 8,305 | |
American Software, Inc. — Class A | | | 965 | | | | 8,280 | |
Zix Corp.* | | | 2,830 | | | | 8,235 | |
Openwave Systems, Inc.* | | | 3,626 | | | | 8,231 | |
Tangoe, Inc.* | | | 432 | | | | 8,126 | |
FSI International, Inc.* | | | 1,646 | | | | 8,049 | |
SciQuest, Inc.* | | | 528 | | | | 8,047 | |
MoneyGram International, Inc.* | | | 446 | | | | 8,028 | |
Convio, Inc.* | | | 517 | | | | 7,998 | |
Supertex, Inc.* | | | 442 | | | | 7,987 | |
Imation Corp.* | | | 1,284 | | | | 7,948 | |
Bel Fuse, Inc. — Class B | | | 449 | | | | 7,934 | |
Vishay Precision Group, Inc.* | | | 528 | | | | 7,830 | |
Imperva, Inc.* | | | 199 | | | | 7,791 | |
DDi Corp. | | | 638 | | | | 7,784 | |
Axcelis Technologies, Inc.* | | | 4,521 | | | | 7,776 | |
Rubicon Technology, Inc.* | | | 745 | | | | 7,770 | |
Hackett Group, Inc.* | | | 1,295 | | | | 7,731 | |
PLX Technology, Inc.* | | | 1,892 | | | | 7,606 | |
Echo Global Logistics, Inc.* | | | 471 | | | | 7,583 | |
Lionbridge Technologies, Inc.* | | | 2,624 | | | | 7,557 | |
Digimarc Corp.* | | | 269 | | | | 7,516 | |
Ultra Clean Holdings* | | | 967 | | | | 7,291 | |
Aviat Networks, Inc.* | | | 2,585 | | | | 7,290 | |
IntraLinks Holdings, Inc.* | | | 1,360 | | | | 7,194 | |
Richardson Electronics Ltd. | | | 596 | | | | 7,140 | |
LeCroy Corp.* | | | 685 | | | | 7,117 | |
Sigma Designs, Inc.* | | | 1,350 | | | | 6,993 | |
Angie’s List, Inc.* | | | 365 | | | | 6,895 | |
ServiceSource International, Inc.* | | | 444 | | | | 6,873 | |
Anadigics, Inc.* | | | 2,869 | | | | 6,800 | |
Immersion Corp.* | | | 1,220 | | | | 6,661 | |
DSP Group, Inc.* | | | 995 | | | | 6,627 | |
KVH Industries, Inc.* | | | 629 | | | | 6,605 | |
Echelon Corp.* | | | 1,488 | | | | 6,592 | |
Wave Systems Corp. — Class A* | | | 3,525 | | | | 6,557 | |
support.com, Inc.* | | | 2,063 | | | | 6,498 | |
Agilysys, Inc.* | | | 721 | | | | 6,482 | |
InvenSense, Inc. — Class A* | | | 348 | | | | 6,299 | |
Archipelago Learning, Inc.* | | | 554 | | | | 6,160 | |
Radisys Corp.* | | | 823 | | | | 6,090 | |
Guidance Software, Inc.* | | | 550 | | | | 6,078 | |
Alpha & Omega Semiconductor Ltd.* | | | 623 | | | | 5,993 | |
MoSys, Inc.* | | | 1,393 | | | | 5,530 | |
TeleCommunication Systems, Inc. — Class A* | | | 1,978 | | | | 5,499 | |
Travelzoo, Inc.* | | | 234 | | | | 5,382 | |
Westell Technologies, Inc. — Class A* | | | 2,258 | | | | 5,261 | |
PRGX Global, Inc.* | | | 831 | | | | 5,227 | |
X-Rite, Inc.* | | | 1,119 | | | | 5,080 | |
ePlus, Inc.* | | | 158 | | | | 5,051 | |
| | | | | | | | |
| | | SHARES | | | VALUE | |
| | | | | | | | |
Zillow, Inc. — Class A* | | | 140 | | | $ | 4,983 | |
FalconStor Software, Inc.* | | | 1,299 | | | | 4,858 | |
TeleNav, Inc.* | | | 692 | | | | 4,858 | |
Rosetta Stone, Inc.* | | | 467 | | | | 4,819 | |
Responsys, Inc.* | | | 391 | | | | 4,680 | |
Novatel Wireless, Inc.* | | | 1,367 | | | | 4,579 | |
Emcore Corp.* | | | 938 | | | | 4,474 | |
Pulse Electronics Corp. | | | 1,773 | | | | 4,450 | |
TechTarget, Inc.* | | | 623 | | | | 4,317 | |
Marchex, Inc. — Class A | | | 909 | | | | 4,054 | |
Ellie Mae, Inc.* | | | 361 | | | | 4,029 | |
Rimage Corp. | | | 398 | | | | 3,984 | |
Numerex Corp. — Class A* | | | 397 | | | | 3,883 | |
MaxLinear, Inc. — Class A* | | | 677 | | | | 3,771 | |
Communications Systems, Inc. | | | 280 | | | | 3,676 | |
Dynamics Research Corp.* | | | 380 | | | | 3,663 | |
QAD, Inc. — Class A* | | | 279 | | | | 3,655 | |
GSI Technology, Inc.* | | | 861 | | | | 3,651 | |
Dot Hill Systems Corp.* | | | 2,410 | | | | 3,639 | |
SRS Labs, Inc.* | | | 514 | | | | 3,572 | |
Smith Micro Software, Inc.* | | | 1,530 | | | | 3,565 | |
Identive Group, Inc.* | | | 1,645 | | | | 3,438 | |
Carbonite, Inc.* | | | 303 | | | | 3,336 | |
Amtech Systems, Inc.* | | | 399 | | | | 3,324 | |
PC Connection, Inc. | | | 395 | | | | 3,247 | |
Opnext, Inc.* | | | 1,859 | | | | 2,881 | |
Powerwave Technologies, Inc.* | | | 1,353 | | | | 2,774 | |
eMagin Corp.* | | | 785 | | | | 2,551 | |
Demand Media, Inc.* | | | 335 | | | | 2,429 | |
Viasystems Group, Inc.* | | | 120 | | | | 2,278 | |
Intermolecular, Inc.* | | | 338 | | | | 2,099 | |
Meru Networks, Inc.* | | | 461 | | | | 1,867 | |
NCI, Inc. — Class A* | | | 287 | | | | 1,834 | |
Motricity, Inc.* | | | 1,581 | | | | 1,739 | |
NeoPhotonics Corp.* | | | 367 | | | | 1,736 | |
THQ, Inc.* | | | 2,867 | | | | 1,606 | |
Quepasa Corp.* | | | 293 | | | | 1,301 | |
Stream Global Services, Inc.* | | | 387 | | | | 1,273 | |
Dialogic, Inc.* | | | 650 | | | | 566 | |
FriendFinder Networks, Inc.* | | | 242 | | | | 329 | |
| | | | | | | | |
Total Information Technology | | | | | | | 8,497,352 | |
| | | | | | | | |
INDUSTRIALS—11.6% | | | | | | | | |
Clean Harbors, Inc.* | | | 1,992 | | | | 134,121 | |
Acuity Brands, Inc. | | | 1,842 | | | | 115,732 | |
United Rentals, Inc.* | | | 2,662 | | | | 114,174 | |
Woodward, Inc. | | | 2,620 | | | | 112,215 | |
Alaska Air Group, Inc.* | | | 3,060 | | | | 109,608 | |
CLARCOR, Inc. | | | 2,137 | | | | 104,904 | |
Triumph Group, Inc. | | | 1,602 | | | | 100,381 | |
Hexcel Corp.* | | | 4,166 | | | | 100,026 | |
Dollar Thrifty Automotive Group, Inc.* | | | 1,233 | | | | 99,763 | |
Teledyne Technologies, Inc.* | | | 1,564 | | | | 98,610 | |
Old Dominion Freight Line, Inc.* | | | 2,019 | | | | 96,246 | |
Esterline Technologies Corp.* | | | 1,295 | | | | 92,541 | |
Genesee & Wyoming, Inc. — Class A* | | | 1,684 | | | | 91,912 | |
| | |
112 | THE RYDEX SERIES FUNDS ANNUAL REPORT | | SEE NOTES TO FINANCIAL STATEMENTS. |
| | |
| SCHEDULE OF INVESTMENTS (continued) | | March 31, 2012 |
| RUSSELL 2000® FUND | | |
| | | | | | | | |
| | | SHARES | | | VALUE | |
| | | | | | | | |
HEICO Corp. | | | 1,781 | | | $ | 91,882 | |
Chart Industries, Inc.* | | | 1,248 | | | | 91,516 | |
Watsco, Inc. | | | 1,199 | | | | 88,774 | |
Robbins & Myers, Inc. | | | 1,681 | | | | 87,496 | |
Actuant Corp. — Class A | | | 2,922 | | | | 84,709 | |
Moog, Inc. — Class A* | | | 1,931 | | | | 82,821 | |
Middleby Corp.* | | | 803 | | | | 81,248 | |
EMCOR Group, Inc. | | | 2,849 | | | | 78,974 | |
Belden, Inc. | | | 2,021 | | | | 76,616 | |
Acacia Research Corp.* | | | 1,817 | | | | 75,841 | |
Applied Industrial Technologies, Inc. | | | 1,809 | | | | 74,404 | |
CoStar Group, Inc.* | | | 1,077 | | | | 74,366 | |
Curtiss-Wright Corp. | | | 1,980 | | | | 73,280 | |
Mueller Industries, Inc. | | | 1,610 | | | | 73,175 | |
AO Smith Corp. | | | 1,618 | | | | 72,729 | |
EnerSys* | | | 2,027 | | | | 70,236 | |
Tetra Tech, Inc.* | | | 2,652 | | | | 69,907 | |
Colfax Corp.* | | | 1,928 | | | | 67,943 | |
FTI Consulting, Inc.* | | | 1,794 | | | | 67,310 | |
Brady Corp. — Class A | | | 2,010 | | | | 65,024 | |
RSC Holdings, Inc.* | | | 2,870 | | | | 64,833 | |
Corporate Executive Board Co. | | | 1,471 | | | | 63,268 | |
Avis Budget Group, Inc.* | | | 4,466 | | | | 63,194 | |
Barnes Group, Inc. | | | 2,315 | | | | 60,908 | |
Healthcare Services Group, Inc. | | | 2,830 | | | | 60,194 | |
Advisory Board Co.* | | | 672 | | | | 59,553 | |
Rollins, Inc. | | | 2,711 | | | | 57,690 | |
Simpson Manufacturing Company, Inc. | | | 1,768 | | | | 57,018 | |
HUB Group, Inc. — Class A* | | | 1,569 | | | | 56,530 | |
United Stationers, Inc. | | | 1,814 | | | | 56,288 | |
Herman Miller, Inc. | | | 2,435 | | | | 55,908 | |
Atlas Air Worldwide Holdings, Inc.* | | | 1,123 | | | | 55,263 | |
ABM Industries, Inc. | | | 2,257 | | | | 54,845 | |
HNI Corp. | | | 1,910 | | | | 53,003 | |
Geo Group, Inc.* | | | 2,760 | | | | 52,468 | |
US Airways Group, Inc.* | | | 6,902 | | | | 52,386 | |
USG Corp.* | | | 3,044 | | | | 52,357 | |
II-VI, Inc.* | | | 2,202 | | | | 52,077 | |
Watts Water Technologies, Inc. — Class A | | | 1,277 | | | | 52,038 | |
JetBlue Airways Corp.* | | | 10,498 | | | | 51,335 | |
Deluxe Corp. | | | 2,187 | | | | 51,220 | |
Beacon Roofing Supply, Inc.* | | | 1,953 | | | | 50,309 | |
Franklin Electric Company, Inc. | | | 990 | | | | 48,579 | |
Brink’s Co. | | | 1,992 | | | | 47,549 | |
Mine Safety Appliances Co. | | | 1,153 | | | | 47,365 | |
Granite Construction, Inc. | | | 1,647 | | | | 47,335 | |
Raven Industries, Inc. | | | 773 | | | | 47,161 | |
Werner Enterprises, Inc. | | | 1,868 | | | | 46,438 | |
Knight Transportation, Inc. | | | 2,603 | | | | 45,969 | |
Forward Air Corp. | | | 1,248 | | | | 45,764 | |
GT Advanced Technologies, Inc.* | | | 5,357 | | | | 44,302 | |
MasTec, Inc.* | | | 2,404 | | | | 43,488 | |
RBC Bearings, Inc.* | | | 933 | | | | 43,039 | |
Titan International, Inc. | | | 1,787 | | | | 42,264 | |
3D Systems Corp.* | | | 1,786 | | | | 42,042 | |
ESCO Technologies, Inc. | | | 1,132 | | | | 41,624 | |
| | | | | | | | |
| | | SHARES | | | VALUE | |
| | | | | | | | |
Swift Transportation Co. — Class A* | | | 3,373 | | | $ | 38,924 | |
Amerco, Inc. | | | 367 | | | | 38,722 | |
Briggs & Stratton Corp. | | | 2,147 | | | | 38,496 | |
Kaman Corp. | | | 1,118 | | | | 37,956 | |
Unifirst Corp. | | | 608 | | | | 37,422 | |
EnPro Industries, Inc.* | | | 884 | | | | 36,332 | |
Tennant Co. | | | 815 | | | | 35,860 | |
Huron Consulting Group, Inc.* | | | 950 | | | | 35,682 | |
Kaydon Corp. | | | 1,392 | | | | 35,510 | |
Lindsay Corp. | | | 534 | | | | 35,389 | |
Dycom Industries, Inc.* | | | 1,497 | | | | 34,970 | |
TAL International Group, Inc. | | | 941 | | | | 34,544 | |
Blount International, Inc.* | | | 2,070 | | | | 34,528 | |
Ceradyne, Inc. | | | 1,052 | | | | 34,253 | |
Allegiant Travel Co. — Class A* | | | 628 | | | | 34,226 | |
Knoll, Inc. | | | 2,027 | | | | 33,729 | |
Korn* | | | 2,003 | | | | 33,549 | |
McGrath Rentcorp | | | 1,032 | | | | 33,138 | |
Mobile Mini, Inc.* | | | 1,559 | | | | 32,926 | |
Orbital Sciences Corp.* | | | 2,484 | | | | 32,665 | |
Steelcase, Inc. — Class A | | | 3,383 | | | | 32,477 | |
Cubic Corp. | | | 669 | | | | 31,630 | |
Interface, Inc. — Class A | | | 2,241 | | | | 31,262 | |
Astec Industries, Inc.* | | | 853 | | | | 31,118 | |
Heartland Express, Inc. | | | 2,147 | | | | 31,046 | |
AAR Corp. | | | 1,684 | | | | 30,733 | |
Interline Brands, Inc.* | | | 1,421 | | | | 30,708 | |
TrueBlue, Inc.* | | | 1,712 | | | | 30,610 | |
Navigant Consulting, Inc.* | | | 2,195 | | | | 30,532 | |
Wabash National Corp.* | | | 2,921 | | | | 30,232 | |
Aegion Corp. — Class A* | | | 1,683 | | | | 30,008 | |
Insperity, Inc. | | | 975 | | | | 29,874 | |
Rush Enterprises, Inc. — Class A* | | | 1,378 | | | | 29,241 | |
ACCO Brands Corp.* | | | 2,353 | | | | 29,201 | |
Universal Forest Products, Inc. | | | 833 | | | | 28,722 | |
NACCO Industries, Inc. — Class A | | | 246 | | | | 28,627 | |
Aircastle Ltd. | | | 2,334 | | | | 28,568 | |
Quanex Building Products Corp. | | | 1,611 | | | | 28,402 | |
On Assignment, Inc.* | | | 1,576 | | | | 27,533 | |
Exponent, Inc.* | | | 561 | | | | 27,220 | |
AZZ, Inc. | | | 527 | | | | 27,215 | |
G&K Services, Inc. — Class A | | | 793 | | | | 27,121 | |
Albany International Corp. — Class A | | | 1,181 | | | | 27,104 | |
SYKES Enterprises, Inc.* | | | 1,694 | | | | 26,765 | |
American Science & Engineering, Inc. | | | 387 | | | | 25,948 | |
Generac Holdings, Inc.* | | | 1,056 | | | | 25,925 | |
Resources Connection, Inc. | | | 1,838 | | | | 25,824 | |
Team, Inc.* | | | 825 | | | | 25,534 | |
SkyWest, Inc. | | | 2,252 | | | | 24,885 | |
Trimas Corp.* | | | 1,085 | | | | 24,293 | |
CIRCOR International, Inc. | | | 730 | | | | 24,287 | |
Encore Wire Corp. | | | 786 | | | | 23,368 | |
H&E Equipment Services, Inc.* | | | 1,220 | | | | 23,082 | |
Sauer-Danfoss, Inc. | | | 491 | | | | 23,077 | |
GeoEye, Inc.* | | | 946 | | | | 22,770 | |
Sun Hydraulics Corp. | | | 854 | | | | 22,341 | |
| | |
SEE NOTES TO FINANCIAL STATEMENTS. | | THE RYDEX SERIES FUNDS ANNUAL REPORT | 113 |
| | |
| SCHEDULE OF INVESTMENTS (continued) | | March 31, 2012 |
| RUSSELL 2000® FUND | | |
| | | | | | | | |
| | | SHARES | | | VALUE | |
| | | | | | | | |
Mueller Water Products, Inc. — Class A | | | 6,621 | | | $ | 22,048 | |
Altra Holdings, Inc.* | | | 1,133 | | | | 21,754 | |
Griffon Corp. | | | 2,033 | | | | 21,753 | |
Badger Meter, Inc. | | | 638 | | | | 21,686 | |
Standex International Corp. | | | 524 | | | | 21,584 | |
Trex Company, Inc.* | | | 668 | | | | 21,429 | |
ICF International, Inc.* | | | 837 | | | | 21,235 | |
Tutor Perini Corp.* | | | 1,330 | | | | 20,721 | |
Arkansas Best Corp. | | | 1,082 | | | | 20,352 | |
DigitalGlobe, Inc.* | | | 1,499 | | | | 19,997 | |
Tredegar Corp. | | | 1,019 | | | | 19,962 | |
John Bean Technologies Corp. | | | 1,217 | | | | 19,715 | |
Gibraltar Industries, Inc.* | | | 1,294 | | | | 19,604 | |
Seaboard Corp.* | | | 10 | | | | 19,510 | |
RailAmerica, Inc.* | | | 908 | | | | 19,486 | |
Higher One Holdings, Inc.* | | | 1,301 | | | | 19,450 | |
Cascade Corp. | | | 385 | | | | 19,296 | |
Aerovironment, Inc.* | | | 714 | | | | 19,142 | |
Gorman-Rupp Co. | | | 648 | | | | 18,909 | |
Kforce, Inc.* | | | 1,268 | | | | 18,893 | |
Layne Christensen Co.* | | | 841 | | | | 18,712 | |
Global Power Equipment Group, Inc.* | | | 666 | | | | 18,448 | |
Titan Machinery, Inc.* | | | 654 | | | | 18,443 | |
Primoris Services Corp. | | | 1,138 | | | | 18,276 | |
Great Lakes Dredge & Dock Corp. | | | 2,508 | | | | 18,108 | |
Kelly Services, Inc. — Class A | | | 1,132 | | | | 18,101 | |
GenCorp, Inc.* | | | 2,498 | | | | 17,736 | |
Comfort Systems USA, Inc. | | | 1,611 | | | | 17,576 | |
Ennis, Inc. | | | 1,105 | | | | 17,481 | |
US Ecology, Inc. | | | 777 | | | | 16,892 | |
Viad Corp. | | | 867 | | | | 16,846 | |
EnergySolutions, Inc.* | | | 3,394 | | | | 16,631 | |
Textainer Group Holdings Ltd. | | | 490 | | | | 16,611 | |
Heidrick & Struggles International, Inc. | | | 754 | | | | 16,611 | |
Greenbrier Companies, Inc.* | | | 832 | | | | 16,465 | |
Consolidated Graphics, Inc.* | | | 360 | | | | 16,290 | |
AAON, Inc. | | | 803 | | | | 16,213 | |
DXP Enterprises, Inc.* | | | 367 | | | | 15,961 | |
Apogee Enterprises, Inc. | | | 1,197 | | | | 15,501 | |
Astronics Corp.* | | | 439 | | | | 15,347 | |
MYR Group, Inc.* | | | 855 | | | | 15,270 | |
Accuride Corp.* | | | 1,722 | | | | 14,964 | |
Commercial Vehicle Group, Inc.* | | | 1,225 | | | | 14,957 | |
Quad Graphics Inc. | | | 1,072 | | | | 14,901 | |
Mistras Group, Inc.* | | | 623 | | | | 14,840 | |
Federal Signal Corp.* | | | 2,644 | | | | 14,701 | |
Wesco Aircraft Holdings, Inc.* | | | 899 | | | | 14,564 | |
Marten Transport Ltd. | | | 658 | | | | 14,522 | |
Standard Parking Corp.* | | | 670 | | | | 13,735 | |
Spirit Airlines, Inc.* | | | 666 | | | | 13,367 | |
Columbus McKinnon Corp.* | | | 815 | | | | 13,276 | |
Air Transport Services Group, Inc.* | | | 2,289 | | | | 13,253 | |
Celadon Group, Inc. | | | 850 | | | | 13,218 | |
Powell Industries, Inc.* | | | 374 | | | | 12,810 | |
InnerWorkings, Inc.* | | | 1,094 | | | | 12,745 | |
Kadant, Inc.* | | | 528 | | | | 12,577 | |
| | | | | | | | |
| | | SHARES | | | VALUE | |
| | | | | | | | |
Dynamic Materials Corp. | | | 568 | | | $ | 11,990 | |
Dolan Co.* | | | 1,298 | | | | 11,825 | |
CRA International, Inc.* | | | 459 | | | | 11,576 | |
Saia, Inc.* | | | 676 | | | | 11,499 | |
PMFG, Inc.* | | | 757 | | | | 11,363 | |
FreightCar America, Inc. | | | 505 | | | | 11,357 | |
Hawaiian Holdings, Inc.* | | | 2,137 | | | | 11,177 | |
GP Strategies Corp.* | | | 631 | | | | 11,043 | |
Multi-Color Corp. | | | 490 | | | | 11,030 | |
LB Foster Co. — Class A | | | 383 | | | | 10,919 | |
Douglas Dynamics, Inc. | | | 791 | | | | 10,876 | |
Aceto Corp. | | | 1,132 | | | | 10,743 | |
Capstone Turbine Corp.* | | | 10,472 | | | | 10,681 | |
CBIZ, Inc.* | | | 1,683 | | | | 10,637 | |
Houston Wire & Cable Co. | | | 753 | | | | 10,459 | |
Taser International, Inc.* | | | 2,364 | | | | 10,260 | |
Ameresco, Inc. — Class A* | | | 755 | | | | 10,230 | |
Republic Airways Holdings, Inc.* | | | 2,050 | | | | 10,127 | |
Furmanite Corp.* | | | 1,575 | | | | 10,112 | |
American Railcar Industries, Inc.* | | | 414 | | | | 9,733 | |
CDI Corp. | | | 542 | | | | 9,718 | |
NCI Building Systems, Inc.* | | | 841 | | | | 9,680 | |
Odyssey Marine Exploration, Inc.* | | | 3,101 | | | | 9,613 | |
Twin Disc, Inc. | | | 361 | | | | 9,418 | |
Pacer International, Inc.* | | | 1,483 | | | | 9,373 | |
CAI International, Inc.* | | | 508 | | | | 9,235 | |
Kimball International, Inc. — Class B | | | 1,336 | | | | 9,232 | |
Insteel Industries, Inc. | | | 755 | | | | 9,173 | |
Graham Corp. | | | 417 | | | | 9,128 | |
Swisher Hygiene, Inc.* | | | 3,601 | | | | 8,858 | |
Quality Distribution, Inc.* | | | 641 | | | | 8,833 | |
Thermon Group Holdings, Inc.* | | | 424 | | | | 8,671 | |
Alamo Group, Inc. | | | 288 | | | | 8,657 | |
American Reprographics Co.* | | | 1,575 | | | | 8,489 | |
Michael Baker Corp.* | | | 355 | | | | 8,467 | |
Northwest Pipe Co.* | | | 395 | | | | 8,390 | |
FuelCell Energy, Inc.* | | | 5,305 | | | | 8,329 | |
Orion Marine Group, Inc.* | | | 1,138 | | | | 8,228 | |
Builders FirstSource, Inc.* | | | 1,939 | | | | 8,202 | |
SeaCube Container Leasing Ltd. | | | 473 | | | | 8,136 | |
Flow International Corp.* | | | 2,011 | | | | 8,084 | |
Miller Industries, Inc. | | | 475 | | | | 8,037 | |
Genco Shipping & Trading Ltd.* | | | 1,260 | | �� | | 8,013 | |
Cenveo, Inc.* | | | 2,345 | | | | 7,926 | |
American Superconductor Corp.* | | | 1,898 | | | | 7,820 | |
Hurco Companies, Inc.* | | | 271 | | | | 7,656 | |
Kratos Defense & Security Solutions, Inc.* | | | 1,413 | | | | 7,545 | |
Hudson Highland Group, Inc.* | | | 1,391 | | | | 7,484 | |
Lydall, Inc.* | | | 733 | | | | 7,469 | |
Metalico, Inc.* | | | 1,702 | | | | 7,268 | |
Ampco-Pittsburgh Corp. | | | 361 | | | | 7,267 | |
RPX Corp.* | | | 428 | | | | 7,259 | |
LMI Aerospace, Inc.* | | | 395 | | | | 7,189 | |
American Woodmark Corp. | | | 398 | | | | 7,164 | |
EnerNOC, Inc.* | | | 991 | | | | 7,135 | |
Park-Ohio Holdings Corp.* | | | 351 | | | | 7,038 | |
| | |
114 | THE RYDEX SERIES FUNDS ANNUAL REPORT | | SEE NOTES TO FINANCIAL STATEMENTS. |
| | |
| SCHEDULE OF INVESTMENTS (continued) | | March 31, 2012 |
| RUSSELL 2000® FUND | | |
| | | | | | | | |
| | | SHARES | | | VALUE | |
| | | | | | | | |
Sterling Construction Company, Inc.* | | | 700 | | | $ | 6,825 | |
Casella Waste Systems, Inc. — Class A* | | | 1,083 | | | | 6,747 | |
Roadrunner Transportation Systems, Inc.* | | | 387 | | | | 6,714 | |
TMS International Corp. — Class A* | | | 552 | | | | 6,679 | |
Vicor Corp. | | | 825 | | | | 6,600 | |
Met-Pro Corp. | | | 621 | | | | 6,558 | |
Preformed Line Products Co. | | | 100 | | | | 6,550 | |
Zipcar, Inc.* | | | 432 | | | | 6,398 | |
Schawk, Inc. — Class A | | | 502 | | | | 6,280 | |
Barrett Business Services, Inc. | | | 316 | | | | 6,266 | |
KEYW Holding Corp.* | | | 788 | | | | 6,107 | |
LSI Industries, Inc. | | | 831 | | | | 6,091 | |
Patriot Transportation Holding, Inc.* | | | 259 | | | | 6,032 | |
NN, Inc.* | | | 713 | | | | 5,818 | |
Pike Electric Corp.* | | | 690 | | | | 5,679 | |
Argan, Inc. | | | 337 | | | | 5,405 | |
Franklin Covey Co.* | | | 572 | | | | 5,383 | |
Ducommun, Inc.* | | | 449 | | | | 5,343 | |
International Shipholding Corp. | | | 231 | | | | 5,334 | |
Eagle Bulk Shipping, Inc.* | | | 2,653 | | | | 5,147 | |
Intersections, Inc. | | | 398 | | | | 5,086 | |
Courier Corp. | | | 437 | | | | 5,069 | |
PowerSecure International, Inc.* | | | 806 | | | | 4,884 | |
AT Cross Co. — Class A* | | | 399 | | | | 4,804 | |
TRC Companies, Inc.* | | | 754 | | | | 4,607 | |
Energy Recovery, Inc.* | | | 1,947 | | | | 4,478 | |
VSE Corp. | | | 174 | | | | 4,317 | |
Chase Corp. | | | 271 | | | | 4,268 | |
Fuel Tech, Inc.* | | | 777 | | | | 4,242 | |
A123 Systems, Inc.* | | | 3,757 | | | | 4,208 | |
Hill International, Inc.* | | | 1,059 | | | | 4,162 | |
Heritage-Crystal Clean, Inc.* | | | 198 | | | | 3,950 | |
Excel Maritime Carriers Ltd. — Class A* | | | 1,947 | | | | 3,894 | |
Universal Truckload Services, Inc. | | | 233 | | | | 3,509 | |
Coleman Cable, Inc.* | | | 352 | | | | 3,421 | |
Tecumseh Products Co. — Class A* | | | 786 | | | | 3,160 | |
Xerium Technologies, Inc.* | | | 473 | | | | 3,051 | |
Baltic Trading Ltd. | | | 688 | | | | 2,855 | |
Essex Rental Corp.* | | | 732 | | | | 2,796 | |
Broadwind Energy, Inc.* | | | 5,945 | | | | 2,795 | |
Active Power, Inc.* | | | 3,376 | | | | 2,634 | |
Valence Technology, Inc.* | | | 3,074 | | | | 2,485 | |
School Specialty, Inc.* | | | 675 | | | | 2,390 | |
Lawson Products, Inc. | | | 145 | | | | 2,191 | |
Ultrapetrol Bahamas Ltd.* | | | 907 | | | | 1,814 | |
Microvision, Inc.* | | | 639 | | | | 1,744 | |
UniTek Global Services, Inc.* | | | 467 | | | | 1,574 | |
Omega Flex, Inc.* | | | 120 | | | | 1,524 | |
Satcon Technology Corp.* | | | 3,839 | | | | 1,382 | |
Covenant Transportation Group, Inc. — Class A* | | | 345 | | | | 1,104 | |
Compx International, Inc. | | | 40 | | | | 556 | |
| | | | | | | | |
Total Industrials | | | | | | | 8,199,398 | |
| | | | | | | | |
| | | | | | | | |
| | | SHARES | | | VALUE | |
| | | | | | | | |
CONSUMER DISCRETIONARY—10.2% | | | | | | | | |
Ascena Retail Group, Inc.* | | | 2,672 | | | $ | 118,423 | |
Sotheby’s | | | 2,873 | | | | 113,023 | |
Carter’s, Inc.* | | | 2,098 | | | | 104,418 | |
Warnaco Group, Inc.* | | | 1,727 | | | | 100,857 | |
Brunswick Corp. | | | 3,787 | | | | 97,516 | |
Dana Holding Corp. | | | 6,225 | | | | 96,487 | |
Tenneco, Inc.* | | | 2,572 | | | | 95,550 | |
Rent-A-Center, Inc. — Class A | | | 2,503 | | | | 94,488 | |
Life Time Fitness, Inc.* | | | 1,798 | | | | 90,924 | |
Domino’s Pizza, Inc. | | | 2,478 | | | | 89,950 | |
Cinemark Holdings, Inc. | | | 3,961 | | | | 86,943 | |
Men’s Wearhouse, Inc. | | | 2,197 | | | | 85,178 | |
Coinstar, Inc.* | | | 1,336 | | | | 84,902 | |
Six Flags Entertainment Corp. | | | 1,771 | | | | 82,830 | |
Crocs, Inc.* | | | 3,817 | | | | 79,851 | |
Wolverine World Wide, Inc. | | | 2,114 | | | | 78,598 | |
Select Comfort Corp.* | | | 2,370 | | | | 76,765 | |
Pool Corp. | | | 2,050 | | | | 76,711 | |
Pier 1 Imports, Inc.* | | | 4,174 | | | | 75,883 | |
Aeropostale, Inc.* | | | 3,441 | | | | 74,394 | |
Cheesecake Factory, Inc.* | | | 2,458 | | | | 72,241 | |
Genesco, Inc.* | | | 991 | | | | 71,005 | |
Buffalo Wild Wings, Inc.* | | | 778 | | | | 70,557 | |
Cabela’s, Inc.* | | | 1,841 | | | | 70,233 | |
Steven Madden Ltd.* | | | 1,613 | | | | 68,956 | |
Vail Resorts, Inc. | | | 1,533 | | | | 66,302 | |
HSN, Inc. | | | 1,694 | | | | 64,423 | |
Hibbett Sports, Inc.* | | | 1,172 | | | | 63,933 | |
ANN, Inc.* | | | 2,212 | | | | 63,352 | |
Hillenbrand, Inc. | | | 2,668 | | | | 61,231 | |
Jos A. Bank Clothiers, Inc.* | | | 1,174 | | | | 59,181 | |
Express, Inc.* | | | 2,358 | | | | 58,903 | |
Children’s Place Retail Stores, Inc.* | | | 1,115 | | | | 57,612 | |
Saks, Inc.* | | | 4,914 | | | | 57,052 | |
Live Nation Entertainment, Inc.* | | | 6,010 | | | | 56,494 | |
Buckle, Inc. | | | 1,148 | | | | 54,989 | |
Cracker Barrel Old Country Store, Inc. | | | 977 | | | | 54,517 | |
Group 1 Automotive, Inc. | | | 964 | | | | 54,147 | |
Iconix Brand Group, Inc.* | | | 3,104 | | | | 53,948 | |
Liz Claiborne, Inc.* | | | 4,032 | | | | 53,868 | |
Monro Muffler Brake, Inc. | | | 1,295 | | | | 53,730 | |
Collective Brands, Inc.* | | | 2,626 | | | | 51,627 | |
BJ’s Restaurants, Inc.* | | | 1,022 | | | | 51,458 | |
Meredith Corp. | | | 1,548 | | | | 50,247 | |
Strayer Education, Inc. | | | 519 | | | | 48,932 | |
Bob Evans Farms, Inc. | | | 1,290 | | | | 48,659 | |
Gaylord Entertainment Co.* | | | 1,520 | | | | 46,815 | |
Vitamin Shoppe, Inc.* | | | 1,058 | | | | 46,774 | |
Penske Automotive Group, Inc. | | | 1,898 | | | | 46,748 | |
Finish Line, Inc. — Class A | | | 2,198 | | | | 46,642 | |
Regis Corp. | | | 2,462 | | | | 45,375 | |
| | |
SEE NOTES TO FINANCIAL STATEMENTS. | | THE RYDEX SERIES FUNDS ANNUAL REPORT | 115 |
| | |
| SCHEDULE OF INVESTMENTS (continued) | | March 31, 2012 |
| RUSSELL 2000® FUND | | |
| | | | | | | | |
| | | SHARES | | | VALUE | |
| | | | | | | | |
Jack in the Box, Inc.* | | | 1,877 | | | $ | 44,992 | |
Helen of Troy Ltd.* | | | 1,317 | | | | 44,791 | |
Texas Roadhouse, Inc. — Class A | | | 2,673 | | | | 44,479 | |
Valassis Communications, Inc.* | | | 1,903 | | | | 43,769 | |
Jones Group, Inc. | | | 3,440 | | | | 43,206 | |
Arbitron, Inc. | | | 1,153 | | | | 42,638 | |
Orient-Express Hotels Ltd. — Class A* | | | 4,053 | | | | 41,341 | |
MDC Holdings, Inc. | | | 1,593 | | | | 41,084 | |
Office Depot, Inc.* | | | 11,815 | | | | 40,762 | |
Shuffle Master, Inc.* | | | 2,301 | | | | 40,497 | |
Cooper Tire & Rubber Co. | | | 2,646 | | | | 40,272 | |
Peet’s Coffee & Tea, Inc.* | | | 542 | | | | 39,945 | |
Scholastic Corp. | | | 1,131 | | | | 39,902 | |
Shutterfly, Inc.* | | | 1,269 | | | | 39,757 | |
New York Times Co. — Class A* | | | 5,842 | | | | 39,667 | |
Matthews International Corp. — Class A | | | 1,253 | | | | 39,645 | |
Sturm Ruger & Company, Inc. | | | 806 | | | | 39,575 | |
Ryland Group, Inc. | | | 1,889 | | | | 36,420 | |
National CineMedia, Inc. | | | 2,353 | | | | 36,001 | |
PF Chang’s China Bistro, Inc. | | | 907 | | | | 35,845 | |
International Speedway Corp. — Class A | | | 1,253 | | | | 34,771 | |
GNC Holdings, Inc. — Class A | | | 977 | | | | 34,088 | |
Asbury Automotive Group, Inc.* | | | 1,243 | | | | 33,561 | |
PEP Boys-Manny Moe & Jack | | | 2,243 | | | | 33,466 | |
American Axle & Manufacturing Holdings, Inc.* | | | 2,842 | | | | 33,280 | |
La-Z-Boy, Inc.* | | | 2,212 | | | | 33,092 | |
Zumiez, Inc.* | | | 905 | | | | 32,680 | |
Cato Corp. — Class A | | | 1,180 | | | | 32,615 | |
DineEquity, Inc.* | | | 657 | | | | 32,587 | |
Meritor, Inc.* | | | 4,022 | | | | 32,458 | |
Meritage Homes Corp.* | | | 1,188 | | | | 32,147 | |
CEC Entertainment, Inc. | | | 840 | | | | 31,844 | |
Steiner Leisure Ltd.* | | | 641 | | | | 31,300 | |
Sonic Automotive, Inc. — Class A | | | 1,710 | | | | 30,626 | |
Pinnacle Entertainment, Inc.* | | | 2,638 | | | | 30,363 | |
Papa John’s International, Inc.* | | | 798 | | | | 30,053 | |
True Religion Apparel, Inc.* | | | 1,095 | | | | 30,003 | |
Churchill Downs, Inc. | | | 534 | | | | 29,851 | |
Interval Leisure Group, Inc. | | | 1,710 | | | | 29,754 | |
KB Home | | | 3,280 | | | | 29,192 | |
Charming Shoppes, Inc.* | | | 4,947 | | | | 29,187 | |
American Public Education, Inc.* | | | 762 | | | | 28,956 | |
Scientific Games Corp. — Class A* | | | 2,479 | | | | 28,905 | |
Ascent Capital Group, Inc. — Class A* | | | 611 | | | | 28,894 | |
Belo Corp. — Class A | | | 3,947 | | | | 28,299 | |
Oxford Industries, Inc. | | | 547 | | | | 27,799 | |
iRobot Corp.* | | | 1,012 | | | | 27,587 | |
Lions Gate Entertainment Corp.* | | | 1,918 | | | | 26,699 | |
K12, Inc.* | | | 1,112 | | | | 26,277 | |
Ethan Allen Interiors, Inc. | | | 1,024 | | | | 25,928 | |
Ameristar Casinos, Inc. | | | 1,375 | | | | 25,616 | |
Vera Bradley, Inc.* | | | 841 | | | | 25,390 | |
Ruby Tuesday, Inc.* | | | 2,774 | | | | 25,327 | |
American Greetings Corp. — Class A | | | 1,630 | | | | 25,003 | |
Lumber Liquidators Holdings, Inc.* | | | 982 | | | | 24,658 | |
Lithia Motors, Inc. — Class A | | | 940 | | | | 24,628 | |
| | | | | | | | |
| | | SHARES | | | VALUE | |
| | | | | | | | |
Columbia Sportswear Co. | | | 508 | | | $ | 24,105 | |
Sinclair Broadcast Group, Inc. — Class A | | | 2,150 | | | | 23,779 | |
Knology, Inc.* | | | 1,284 | | | | 23,369 | |
Fred’s, Inc. — Class A | | | 1,578 | | | | 23,055 | |
Dorman Products, Inc.* | | | 448 | | | | 22,669 | |
Drew Industries, Inc.* | | | 819 | | | | 22,367 | |
Maidenform Brands, Inc.* | | | 993 | | | | 22,352 | |
Quiksilver, Inc.* | | | 5,525 | | | | 22,321 | |
Arctic Cat, Inc.* | | | 518 | | | | 22,186 | |
Capella Education Co.* | | | 614 | | | | 22,073 | |
Grand Canyon Education, Inc.* | | | 1,219 | | | | 21,649 | |
Stage Stores, Inc. | | | 1,328 | | | | 21,567 | |
OfficeMax, Inc.* | | | 3,651 | | | | 20,884 | |
Red Robin Gourmet Burgers, Inc.* | | | 554 | | | | 20,603 | |
Stewart Enterprises, Inc. — Class A | | | 3,350 | | | | 20,335 | |
Jakks Pacific, Inc. | | | 1,163 | | | | 20,294 | |
Skechers U.S.A., Inc. — Class A* | | | 1,594 | | | | 20,276 | |
Sonic Corp.* | | | 2,634 | | | | 20,229 | |
Standard Pacific Corp.* | | | 4,527 | | | | 20,190 | |
Coreßßßßß-Mark Holding Company, Inc. | | | 490 | | | | 20,061 | |
G-III Apparel Group Ltd.* | | | 701 | | | | 19,922 | |
Smith & Wesson Holding Corp.* | | | 2,567 | | | | 19,894 | |
Superior Industries International, Inc. | | | 995 | | | | 19,442 | |
Biglari Holdings, Incß.* | | | 47 | | | | 18,934 | |
Bridgepoint Education, Inc.* | | | 760 | | | | 18,810 | |
Rue21, Inc.* | | | 638 | | | | 18,719 | |
Callaway Golf Co. | | | 2,743 | | | | 18,543 | |
Fuel Systems Solutions, Inc.* | | | 701 | | | | 18,338 | |
Boyd Gaming Corp.* | | | 2,333 | | | | 18,291 | |
Hot Topic, Inc. | | | 1,802 | | | | 18,290 | |
Krispy Kreme Doughnuts, Inc.* | | | 2,487 | | | | 18,155 | |
Movado Group, Inc. | | | 739 | | | | 18,142 | |
AFC Enterprises, Inc.* | | | 1,049 | | | | 17,791 | |
Modine Manufacturing Co.* | | | 1,984 | | | | 17,519 | |
Harte-Hanks, Inc. | | | 1,888 | | | | 17,086 | |
Denny’s Corp.* | | | 4,215 | | | | 17,029 | |
Blyth, Inc. | | | 226 | | | | 16,912 | |
Blue Nile, Inc.* | | | 504 | | | | 16,622 | |
Brown Shoe Company, Inc. | | | 1,783 | | | | 16,457 | |
Barnes & Noble, Inc.* | | | 1,238 | | | | 16,404 | |
Bravo Brio Restaurant Group, Inc.* | | | 816 | | | | 16,287 | |
National Presto Industries, Inc. | | | 207 | | | | 15,703 | |
America’s Car-Mart, Inc.* | | | 350 | | | | 15,393 | |
Amerigon, Inc.* | | | 943 | | | | 15,258 | |
Bebe Stores, Inc. | | | 1,638 | | | | 15,119 | |
Standard Motor Products, Inc. | | | 837 | | | | 14,848 | |
Leapfrog Enterprises, Inc. — Class A* | | | 1,770 | | | | 14,797 | |
Body Central Corp.* | | | 502 | | | | 14,568 | |
Cost Plus, Inc.* | | | 809 | | | | 14,481 | |
Cavco Industries, Inc.* | | | 295 | | | | 13,741 | |
Corinthian Colleges, Inc.* | | | 3,317 | | | | 13,732 | |
Francesca’s Holdings Corp.* | | | 427 | | | | 13,497 | |
Wet Seal, Inc. — Class A* | | | 3,857 | | | | 13,307 | |
EW Scripps Co. — Class A* | | | 1,346 | | | | 13,285 | |
NutriSystem, Inc. | | | 1,149 | | | | 12,903 | |
Universal Electronics, Inc.* | | | 643 | | | | 12,847 | |
| | |
116 | THE RYDEX SERIES FUNDS ANNUAL REPORT | | SEE NOTES TO FINANCIAL STATEMENTS. |
| | |
| SCHEDULE OF INVESTMENTS (continued) | | March 31, 2012 |
| RUSSELL 2000® FUND | | |
| | | | | | | | |
| | | SHARES | | | VALUE | |
| | | | | | | | |
Multimedia Games Holding Company, Inc.* | | | 1,148 | | | $ | 12,582 | |
Shoe Carnival, Inc.* | | | 385 | | | | 12,405 | |
Winnebago Industries, Inc.* | | | 1,241 | | | | 12,162 | |
Universal Technical Institute, Inc. | | | 920 | | | | 12,135 | |
MDC Partners, Inc. — Class A | | | 1,067 | | | | 11,865 | |
Kirkland’s, Inc.* | | | 716 | | | | 11,585 | |
Fisher Communications, Inc.* | | | 372 | | | | 11,428 | |
Ruth’s Hospitality Group, Inc.* | | | 1,495 | | | | 11,347 | |
Stoneridge, Inc.* | | | 1,128 | | | | 11,156 | |
Central European Media Enterprises | | | | | | | | |
Ltd. — Class A* | | | 1,553 | | | | 11,026 | |
Town Sports International Holdings, Inc.* | | | 870 | | | | 10,988 | |
Libbey, Inc.* | | | 841 | | | | 10,883 | |
Marcus Corp. | | | 867 | | | | 10,881 | |
PetMed Express, Inc. | | | 864 | | | | 10,696 | |
Beazer Homes USA, Inc.* | | | 3,246 | | | | 10,550 | |
VOXX International Corp. — Class A* | | | 772 | | | | 10,468 | |
Journal Communications, Inc. — Class A* | | | 1,836 | | | | 10,337 | |
Exide Technologies* | | | 3,294 | | | | 10,310 | |
World Wrestling Entertainment, Inc. — Class A | | | 1,162 | | | | 10,307 | |
Caribou Coffee Company, Inc.* | | | 544 | | | | 10,140 | |
M/I Homes, Inc.* | | | 793 | | | | 9,801 | |
Perry Ellis International, Inc.* | | | 521 | | | | 9,727 | |
Speedway Motorsports, Inc. | | | 507 | | | | 9,471 | |
Conn’s, Inc.* | | | 614 | | | | 9,425 | |
Rentrak Corp.* | | | 398 | | | | 9,035 | |
Talbots, Inc.* | | | 2,978 | | | | 9,023 | |
Haverty Furniture Companies, Inc. | | | 803 | | | | 8,913 | |
Destination Maternity Corp. | | | 459 | | | | 8,524 | |
Carrols Restaurant Group, Inc.* | | | 540 | | | | 8,235 | |
hhgregg, Inc.* | | | 721 | | | | 8,205 | |
MarineMax, Inc.* | | | 990 | | | | 8,148 | |
REX American Resources Corp.* | | | 264 | | | | 8,105 | |
Benihana, Inc. — Class A | | | 613 | | | | 8,000 | |
Systemax, Inc.* | | | 460 | | | | 7,756 | |
O’Charleys, Inc.* | | | 788 | | | | 7,754 | |
Stein Mart, Inc.* | | | 1,169 | | | | 7,715 | |
Lincoln Educational Services Corp. | | | 967 | | | | 7,649 | |
Mattress Firm Holding Corp.* | | | 199 | | | | 7,542 | |
Spartan Motors, Inc. | | | 1,422 | | | | 7,522 | |
Mac-Gray Corp. | | | 497 | | | | 7,520 | |
West Marine, Inc.* | | | 623 | | | | 7,464 | |
Big 5 Sporting Goods Corp. | | | 933 | | | | 7,315 | |
Citi Trends, Inc.* | | | 638 | | | | 7,311 | |
Weyco Group, Inc. | | | 302 | | | | 7,157 | |
McClatchy Co. — Class A* | | | 2,458 | | | | 7,104 | |
Tuesday Morning Corp.* | | | 1,832 | | | | 7,035 | |
Steinway Musical Instruments, Inc.* | | | 279 | | | | 6,975 | |
CSS Industries, Inc. | | | 345 | | | | 6,714 | |
Entercom Communications Corp. — Class A* | | | 1,032 | | | | 6,698 | |
Skullcandy, Inc.* | | | 408 | | | | 6,459 | |
Hovnanian Enterprises, Inc. — Class A* | | | 2,608 | | | | 6,390 | |
Isle of Capri Casinos, Inc.* | | | 867 | | | | 6,121 | |
Casual Male Retail Group, Inc.* | | | 1,797 | | | | 6,038 | |
Teavana Holdings, Inc.* | | | 295 | | | | 5,817 | |
Jamba, Inc.* | | | 2,810 | | | | 5,817 | |
| | | | | | | | |
| | | SHARES | | | VALUE | |
| | | | | | | | |
Winmark Corp. | | | 99 | | | $ | 5,736 | |
Unifi, Inc.* | | | 590 | | | | 5,699 | |
Cumulus Media, Inc. — Class A* | | | 1,598 | | | | 5,577 | |
Black Diamond, Inc.* | | | 573 | | | | 5,306 | |
Kenneth Cole Productions, Inc. — Class A* | | | 319 | | | | 5,136 | |
LIN TV Corp. — Class A* | | | 1,264 | | | | 5,119 | |
Red Lion Hotels Corp.* | | | 623 | | | | 5,115 | |
Saga Communications, Inc. — Class A* | | | 142 | | | | 5,084 | |
Gordmans Stores, Inc.* | | | 231 | | | | 5,075 | |
Delta Apparel, Inc.* | | | 301 | | | | 4,945 | |
Motorcar Parts of America, Inc.* | | | 514 | | | | 4,945 | |
Luby’s, Inc.* | | | 806 | | | | 4,892 | |
Bon-Ton Stores, Inc. | | | 525 | | | | 4,851 | |
Morgans Hotel Group Co.* | | | 941 | | | | 4,658 | |
K-Swiss, Inc. — Class A* | | | 1,115 | | | | 4,572 | |
RG Barry Corp. | | | 367 | | | | 4,477 | |
Outdoor Channel Holdings, Inc. | | | 611 | | | | 4,466 | |
Lifetime Brands, Inc. | | | 395 | | | | 4,440 | |
Martha Stewart Living Omnimedia — Class A | | | 1,160 | | | | 4,420 | |
New York & Company, Inc.* | | | 1,155 | | | | 4,308 | |
Sealy Corp.* | | | 2,109 | | | | 4,260 | |
Zale Corp.* | | | 1,360 | | | | 4,202 | |
Cherokee, Inc. | | | 361 | | | | 4,112 | |
Ambassadors Group, Inc. | | | 748 | | | | 4,002 | |
Gray Television, Inc.* | | | 2,114 | | | | 3,995 | |
Johnson Outdoors, Inc. — Class A* | | | 204 | | | | 3,896 | |
AH Belo Corp. — Class A | | | 796 | | | | 3,892 | |
Nexstar Broadcasting Group, Inc. — Class A* | | | 467 | | | | 3,881 | |
Monarch Casino & Resort, Inc.* | | | 375 | | | | 3,863 | |
Einstein Noah Restaurant Group, Inc. | | | 250 | | | | 3,730 | |
Entravision Communications Corp. — Class A | | | 2,134 | | | | 3,649 | |
Valuevision Media, Inc. — Class A* | | | 1,741 | | | | 3,604 | |
Coldwater Creek, Inc.* | | | 3,077 | | | | 3,569 | |
Pacific Sunwear of California, Inc.* | | | 2,021 | | | | 3,557 | |
Summer Infant, Inc.* | | | 573 | | | | 3,438 | |
Tower International, Inc.* | | | 279 | | | | 3,398 | |
1-800-Flowers.com, Inc. — Class A* | | | 1,103 | | | | 3,342 | |
Build-A-Bear Workshop, Inc. — Class A* | | | 629 | | | | 3,302 | |
ReachLocal, Inc.* | | | 424 | | | | 3,023 | |
Global Sources Ltd.* | | | 490 | | | | 3,018 | |
Furniture Brands International, Inc.* | | | 1,784 | | | | 2,997 | |
Christopher & Banks Corp. | | | 1,520 | | | | 2,827 | |
Orbitz Worldwide, Inc.* | | | 894 | | | | 2,727 | |
Geeknet, Inc.* | | | 184 | | | | 2,661 | |
Overstock.com, Inc.* | | | 491 | | | | 2,573 | |
Marine Products Corp. | | | 432 | | | | 2,570 | |
Crown Media Holdings, Inc. — Class A* | | | 1,484 | | | | 2,360 | |
National American University Holdings, Inc. | | | 366 | | | | 2,306 | |
US Auto Parts Network, Inc.* | | | 631 | | | | 2,278 | |
Skyline Corp. | | | 295 | | | | 2,257 | |
Shiloh Industries, Inc. | | | 230 | | | | 2,192 | |
Cambium Learning Group, Inc.* | | | 702 | | | | 1,860 | |
Digital Domain Media Group, Inc.* | | | 130 | | | | 740 | |
Value Line, Inc. | | | 49 | | | | 602 | |
Dial Global, Inc.* | | | 217 | | | | 506 | |
| | | | | | | | |
Total Consumer Discretionary | | | | | | | 7,176,290 | |
| | | | | | | | |
| | |
SEE NOTES TO FINANCIAL STATEMENTS. | | THE RYDEX SERIES FUNDS ANNUAL REPORT | 117 |
| | |
| SCHEDULE OF INVESTMENTS (continued) | | March 31, 2012 |
| RUSSELL 2000® FUND | | |
| | | | | | | | |
| | | SHARES | | | VALUE | |
| | | | | | | | |
HEALTH CARE - 9.2% | | | | | | | | |
WellCare Health Plans, Inc.* | | | 1,811 | | | $ | 130,176 | |
Salix Pharmaceuticals Ltd.* | | | 2,477 | | | | 130,042 | |
HMS Holdings Corp.* | | | 3,610 | | | | 112,668 | |
Cubist Pharmaceuticals, Inc.* | | | 2,556 | | | | 110,548 | |
athenahealth, Inc.* | | | 1,489 | | | | 110,365 | |
Cepheid, Inc.* | | | 2,634 | | | | 110,181 | |
Centene Corp.* | | | 2,128 | | | | 104,208 | |
Onyx Pharmaceuticals, Inc.* | | | 2,696 | | | | 101,585 | |
Medivation, Inc.* | | | 1,334 | | | | 99,676 | |
Medicis Pharmaceutical Corp. — Class A | | | 2,634 | | | | 99,011 | |
Viropharma, Inc.* | | | 3,015 | | | | 90,661 | |
Ariad Pharmaceuticals, Inc.* | | | 5,671 | | | | 90,452 | |
Zoll Medical Corp.* | | | 933 | | | | 86,423 | |
Questcor Pharmaceuticals, Inc.* | | | 2,259 | | | | 84,984 | |
Vivus, Inc.* | | | 3,783 | | | | 84,588 | |
Seattle Genetics, Inc.* | | | 4,107 | | | | 83,701 | |
HealthSouth Corp.* | | | 4,052 | | | | 82,985 | |
Owens & Minor, Inc. | | | 2,710 | | | | 82,411 | |
STERIS Corp. | | | 2,524 | | | | 79,809 | |
Haemonetics Corp.* | | | 1,094 | | | | 76,229 | |
Alkermes plc* | | | 4,046 | | | | 75,053 | |
Incyte Corporation Ltd.* | | | 3,767 | | | | 72,703 | |
Quality Systems, Inc. | | | 1,650 | | | | 72,155 | |
Align Technology, Inc.* | | | 2,613 | | | | 71,987 | |
Impax Laboratories, Inc.* | | | 2,782 | | | | 68,382 | |
PAREXEL International Corp.* | | | 2,504 | | | | 67,534 | |
Volcano Corp.* | | | 2,218 | | | | 62,880 | |
West Pharmaceutical Services, Inc. | | | 1,422 | | | | 60,478 | |
Par Pharmaceutical Companies, Inc.* | | | 1,536 | | | | 59,489 | |
Magellan Health Services, Inc.* | | | 1,214 | | | | 59,255 | |
MAKO Surgical Corp.* | | | 1,367 | | | | 57,619 | |
Theravance, Inc.* | | | 2,941 | | | | 57,350 | |
PSS World Medical, Inc.* | | | 2,182 | | | | 55,292 | |
Pharmacyclics, Inc.* | | | 1,954 | | | | 54,243 | |
Chemed Corp. | | | 845 | | | | 52,965 | |
Masimo Corp.* | | | 2,234 | | | | 52,231 | |
MWI Veterinary Supply, Inc.* | | | 527 | | | | 46,376 | |
Medicines Co.* | | | 2,297 | | | | 46,101 | |
Immunogen, Inc.* | | | 3,194 | | | | 45,962 | |
Jazz Pharmaceuticals plc* | | | 940 | | | | 45,562 | |
Cyberonics, Inc.* | | | 1,193 | | | | 45,489 | |
Halozyme Therapeutics, Inc.* | | | 3,506 | | | | 44,737 | |
Acorda Therapeutics, Inc.* | | | 1,674 | | | | 44,445 | |
Air Methods Corp.* | | | 476 | | | | 41,531 | |
Molina Healthcare, Inc.* | | | 1,199 | | | | 40,322 | |
Neogen Corp.* | | | 990 | | | | 38,679 | |
Nektar Therapeutics* | | | 4,856 | | | | 38,460 | |
Auxilium Pharmaceuticals, Inc.* | | | 2,038 | | | | 37,846 | |
PDL BioPharma, Inc. | | | 5,951 | | | | 37,789 | |
Luminex Corp.* | | | 1,613 | | | | 37,664 | |
Insulet Corp.* | | | 1,954 | | | | 37,400 | |
Amsurg Corp. — Class A* | | | 1,336 | | | | 37,381 | |
Isis Pharmaceuticals, Inc.* | | | 4,238 | | | | 37,167 | |
NxStage Medical, Inc.* | | | 1,896 | | | | 36,536 | |
CONMED Corp. | | | 1,202 | | | | 35,904 | |
| | | | | | | | |
| | | SHARES | | | VALUE | |
| | | | | | | | |
Analogic Corp. | | | 524 | | | $ | 35,391 | |
Accretive Health, Inc.* | | | 1,706 | | | | 34,069 | |
Meridian Bioscience, Inc. | | | 1,750 | | | | 33,915 | |
InterMune, Inc.* | | | 2,305 | | | | 33,814 | |
HeartWare International, Inc.* | | | 505 | | | | 33,173 | |
Dynavax Technologies Corp.* | | | 6,351 | | | | 32,136 | |
Wright Medical Group, Inc.* | | | 1,660 | | | | 32,071 | |
Arthrocare Corp.* | | | 1,161 | | | | 31,173 | |
Hanger Orthopedic Group, Inc.* | | | 1,424 | | | | 31,129 | |
Endologix, Inc.* | | | 2,080 | | | | 30,472 | |
Spectrum Pharmaceuticals, Inc.* | | | 2,406 | | | | 30,388 | |
ABIOMED, Inc.* | | | 1,352 | | | | 30,001 | |
NuVasive, Inc.* | | | 1,781 | | | | 29,992 | |
Momenta Pharmaceuticals, Inc.* | | | 1,949 | | | | 29,859 | |
DexCom, Inc.* | | | 2,849 | | | | 29,715 | |
Orthofix International N.V.* | | | 771 | | | | 28,974 | |
Integra LifeSciences Holdings Corp.* | | | 834 | | | | 28,931 | |
Ironwood Pharmaceuticals, Inc. — Class A* | | | 2,153 | | | | 28,656 | |
Exelixis, Inc.* | | | 5,477 | | | | 28,371 | |
Abaxis, Inc.* | | | 956 | | | | 27,848 | |
Akorn, Inc.* | | | 2,376 | | | | 27,799 | |
Optimer Pharmaceuticals, Inc.* | | | 1,970 | | | | 27,383 | |
MedAssets, Inc.* | | | 2,027 | | | | 26,675 | |
Exact Sciences Corp.* | | | 2,381 | | | | 26,572 | |
Computer Programs & Systems, Inc. | | | 464 | | | | 26,225 | |
IPC The Hospitalist Company, Inc.* | | | 701 | | | | 25,874 | |
NPS Pharmaceuticals, Inc.* | | | 3,660 | | | | 25,034 | |
ICU Medical, Inc.* | | | 508 | | | | 24,973 | |
Idenix Pharmaceuticals, Inc.* | | | 2,537 | | | | 24,837 | |
Bio-Reference Labs, Inc.* | | | 1,048 | | | | 24,638 | |
Greatbatch, Inc.* | | | 992 | | | | 24,324 | |
Medidata Solutions, Inc.* | | | 893 | | | | 23,790 | |
Rigel Pharmaceuticals, Inc.* | | | 2,921 | | | | 23,514 | |
Team Health Holdings, Inc.* | | | 1,137 | | | | 23,377 | |
Emeritus Corp.* | | | 1,301 | | | | 22,976 | |
OraSure Technologies, Inc.* | | | 1,992 | | | | 22,888 | |
Quidel Corp.* | | | 1,210 | | | | 22,228 | |
Genomic Health, Inc.* | | | 723 | | | | 22,131 | |
Merit Medical Systems, Inc.* | | | 1,781 | | | | 22,120 | |
Opko Health, Inc.* | | | 4,640 | | | | 21,947 | |
Omnicell, Inc.* | | | 1,410 | | | | 21,446 | |
Cantel Medical Corp. | | | 844 | | | | 21,176 | |
Landauer, Inc. | | | 395 | | | | 20,943 | |
Accuray, Inc.* | | | 2,916 | | | | 20,587 | |
Invacare Corp. | | | 1,219 | | | | 20,199 | |
National Healthcare Corp. | | | 439 | | | | 20,001 | |
Triple-S Management Corp. — Class B* | | | 842 | | | | 19,450 | |
Achillion Pharmaceuticals, Inc.* | | | 2,021 | | | | 19,361 | |
Conceptus, Inc.* | | | 1,328 | | | | 19,097 | |
Arena Pharmaceuticals, Inc.* | | | 6,210 | | | | 19,065 | |
Kindred Healthcare, Inc.* | | | 2,203 | | | | 19,034 | |
Ensign Group, Inc. | | | 686 | | | | 18,632 | |
AVANIR Pharmaceuticals, Inc. — Class A* | | | 5,303 | | | | 18,136 | |
Amedisys, Inc.* | | | 1,253 | | | | 18,118 | |
Alnylam Pharmaceuticals, Inc.* | | | 1,594 | | | | 17,646 | |
Affymax, Inc.* | | | 1,502 | | | | 17,633 | |
| | |
118 | THE RYDEX SERIES FUNDS ANNUAL REPORT | | SEE NOTES TO FINANCIAL STATEMENTS. |
| | |
| SCHEDULE OF INVESTMENTS (continued) | | March 31, 2012 |
| RUSSELL 2000® FUND | | |
| | | | | | | | |
| | | SHARES | | | VALUE | |
| | | | | | | | |
HealthStream, Inc.* | | | 751 | | | $ | 17,416 | |
Sequenom, Inc.* | | | 4,229 | | | | 17,212 | |
Neurocrine Biosciences, Inc.* | | | 2,124 | | | | 16,928 | |
Metropolitan Health Networks, Inc.* | | | 1,796 | | | | 16,829 | |
Emergent Biosolutions, Inc.* | | | 1,034 | | | | 16,544 | |
AVEO Pharmaceuticals, Inc.* | | | 1,328 | | | | 16,480 | |
Staar Surgical Co.* | | | 1,513 | | | | 16,386 | |
eResearchTechnology, Inc.* | | | 2,089 | | | | 16,336 | |
Arqule, Inc.* | | | 2,276 | | | | 15,955 | |
Hi-Tech Pharmacal Company, Inc.* | | | 439 | | | | 15,773 | |
Ardea Biosciences, Inc.* | | | 724 | | | | 15,754 | |
Curis, Inc.* | | | 3,247 | | | | 15,651 | |
PharMerica Corp.* | | | 1,252 | | | | 15,562 | |
Sunrise Senior Living, Inc.* | | | 2,448 | | | | 15,471 | |
MModal, Inc.* | | | 1,417 | | | | 14,949 | |
Universal American Corp. | | | 1,380 | | | | 14,876 | |
Natus Medical, Inc.* | | | 1,236 | | | | 14,745 | |
Atrion Corp. | | | 70 | | | | 14,715 | |
Spectranetics Corp.* | | | 1,412 | | | | 14,685 | |
Keryx Biopharmaceuticals, Inc.* | | | 2,946 | | | | 14,671 | |
Select Medical Holdings Corp.* | | | 1,903 | | | | 14,634 | |
AMAG Pharmaceuticals, Inc.* | | | 902 | | | | 14,369 | |
Depomed, Inc.* | | | 2,285 | | | | 14,304 | |
ExamWorks Group, Inc.* | | | 1,141 | | | | 14,171 | |
Assisted Living Concepts, Inc. — Class A | | | 835 | | | | 13,869 | |
Merge Healthcare, Inc.* | | | 2,358 | | | | 13,794 | |
Raptor Pharmaceutical Corp.* | | | 2,008 | | | | 13,574 | |
Lexicon Pharmaceuticals, Inc.* | | | 7,284 | | | | 13,548 | |
ZIOPHARM Oncology, Inc.* | | | 2,496 | | | | 13,478 | |
Ligand Pharmaceuticals, Inc. — Class B* | | | 841 | | | | 13,414 | |
MAP Pharmaceuticals, Inc.* | | | 933 | | | | 13,398 | |
Santarus, Inc.* | | | 2,265 | | | | 13,250 | |
Navidea Biopharmaceuticals, Inc.* | | | 4,030 | | | | 13,218 | |
AngioDynamics, Inc.* | | | 1,054 | | | | 12,912 | |
Affymetrix, Inc.* | | | 2,995 | | | | 12,789 | |
Vanguard Health Systems, Inc.* | | | 1,297 | | | | 12,788 | |
LHC Group, Inc.* | | | 674 | | | | 12,489 | |
Progenics Pharmaceuticals, Inc.* | | | 1,247 | | | | 12,345 | |
ISTA Pharmaceuticals, Inc.* | | | 1,357 | | | | 12,227 | |
Antares Pharma, Inc.* | | | 3,736 | | | | 12,067 | |
BioScrip, Inc.* | | | 1,729 | | | | 11,740 | |
US Physical Therapy, Inc. | | | 503 | | | | 11,594 | |
Tornier N.V.* | | | 449 | | | | 11,539 | |
Gentiva Health Services, Inc.* | | | 1,299 | | | | 11,353 | |
Unilife Corp.* | | | 2,709 | | | | 10,999 | |
Enzon Pharmaceuticals, Inc.* | | | 1,605 | | | | 10,978 | |
Sangamo Biosciences, Inc.* | | | 2,231 | | | | 10,932 | |
Symmetry Medical, Inc.* | | | 1,544 | | | | 10,916 | |
Capital Senior Living Corp.* | | | 1,170 | | | | 10,811 | |
Cell Therapeutics, Inc.* | | | 8,258 | | | | 10,735 | |
Transcend Services, Inc.* | | | 364 | | | | 10,683 | |
Healthways, Inc.* | | | 1,449 | | | | 10,665 | |
Kensey Nash Corp. | | | 361 | | | | 10,563 | |
Obagi Medical Products, Inc.* | | | 786 | | | | 10,532 | |
Vical, Inc.* | | | 3,075 | | | | 10,455 | |
Corvel Corp.* | | | 262 | | | | 10,451 | |
| | | | | | | | |
| | | SHARES | | | VALUE | |
| | | | | | | | |
IRIS International, Inc.* | | | 761 | | | $ | 10,281 | |
AMN Healthcare Services, Inc.* | | | 1,685 | | | | 10,211 | |
Immunomedics, Inc.* | | | 2,800 | | | | 10,164 | |
SurModics, Inc.* | | | 654 | | | | 10,052 | |
Furiex Pharmaceuticals, Inc.* | | | 418 | | | | 9,877 | |
Infinity Pharmaceuticals, Inc.* | | | 817 | | | | 9,771 | |
Clovis Oncology, Inc.* | | | 377 | | | | 9,595 | |
Celldex Therapeutics, Inc.* | | | 1,879 | | | | 9,564 | |
Sciclone Pharmaceuticals, Inc.* | | | 1,473 | | | | 9,295 | |
Geron Corp.* | | | 5,493 | | | | 9,283 | |
Almost Family, Inc.* | | | 347 | | | | 9,025 | |
AVI BioPharma, Inc.* | | | 5,769 | | | | 8,884 | |
Cambrex Corp.* | | | 1,253 | | | | 8,758 | |
RTI Biologics, Inc.* | | | 2,336 | | | | 8,643 | |
Providence Service Corp.* | | | 552 | | | | 8,562 | |
Array Biopharma, Inc.* | | | 2,454 | | | | 8,368 | |
Cerus Corp.* | | | 2,029 | | | | 8,157 | |
MannKind Corp.* | | | 3,301 | | | | 8,153 | |
Solta Medical, Inc.* | | | 2,585 | | | | 7,833 | |
Vascular Solutions, Inc.* | | | 724 | | | | 7,812 | |
Oncothyreon, Inc.* | | | 1,770 | | | | 7,717 | |
Cadence Pharmaceuticals, Inc.* | | | 2,047 | | | | 7,574 | |
Palomar Medical Technologies, Inc.* | | | 806 | | | | 7,528 | |
Young Innovations, Inc. | | | 239 | | | | 7,390 | |
Sun Healthcare Group, Inc.* | | | 1,068 | | | | 7,305 | |
Cynosure, Inc. — Class A* | | | 400 | | | | 7,144 | |
Corcept Therapeutics, Inc.* | | | 1,750 | | | | 6,878 | |
Maxygen, Inc.* | | | 1,197 | | | | 6,871 | |
XenoPort, Inc.* | | | 1,507 | | | | 6,782 | |
Pozen, Inc.* | | | 1,128 | | | | 6,768 | |
Nymox Pharmaceutical Corp.* | | | 823 | | | | 6,617 | |
Savient Pharmaceuticals, Inc.* | | | 3,026 | | | | 6,597 | |
Dyax Corp.* | | | 4,202 | | | | 6,555 | |
Rockwell Medical Technologies, Inc.* | | | 687 | | | | 6,499 | |
Dusa Pharmaceuticals, Inc.* | | | 1,028 | | | | 6,435 | |
Delcath Systems, Inc.* | | | 2,047 | | | | 6,428 | |
Skilled Healthcare Group, Inc. — Class A* | | | 825 | | | | 6,320 | |
CryoLife, Inc.* | | | 1,188 | | | | 6,261 | |
Synergetics USA, Inc.* | | | 943 | | | | 6,130 | |
Five Star Quality Care, Inc.* | | | 1,781 | | | | 6,073 | |
Targacept, Inc.* | | | 1,171 | | | | 5,996 | |
AtriCure, Inc.* | | | 601 | | | | 5,980 | |
Hansen Medical, Inc.* | | | 1,993 | | | | 5,979 | |
BioCryst Pharmaceuticals, Inc.* | | | 1,232 | | | | 5,951 | |
Cross Country Healthcare, Inc.* | | | 1,181 | | | | 5,917 | |
Chelsea Therapeutics International Ltd.* | | | 2,292 | | | | 5,868 | |
Vanda Pharmaceuticals, Inc.* | | | 1,197 | | | | 5,734 | |
Exactech, Inc.* | | | 361 | | | | 5,722 | |
Orexigen Therapeutics, Inc.* | | | 1,377 | | | | 5,646 | |
Cardiovascular Systems, Inc.* | | | 610 | | | | 5,643 | |
Pain Therapeutics, Inc.* | | | 1,568 | | | | 5,629 | |
Medtox Scientific, Inc.* | | | 326 | | | | 5,496 | |
Aegerion Pharmaceuticals, Inc.* | | | 393 | | | | 5,435 | |
Alphatec Holdings, Inc.* | | | 2,293 | | | | 5,434 | |
Cytori Therapeutics, Inc.* | | | 2,163 | | | | 5,386 | |
OncoGenex Pharmaceutical, Inc.* | | | 404 | | | | 5,369 | |
| | |
SEE NOTES TO FINANCIAL STATEMENTS. | | THE RYDEX SERIES FUNDS ANNUAL REPORT | 119 |
| | |
| SCHEDULE OF INVESTMENTS (continued) | | March 31, 2012 |
| RUSSELL 2000® FUND | | |
| | | | | | | | |
| | | SHARES | | | VALUE | |
| | | | | | | | |
Novavax, Inc.* | | | 4,092 | | | $ | 5,156 | |
Sagent Pharmaceuticals, Inc.* | | | 280 | | | | 5,004 | |
Allos Therapeutics, Inc.* | | | 3,351 | | | | 4,959 | |
Pacific Biosciences of California, Inc.* | | | 1,448 | | | | 4,952 | |
SIGA Technologies, Inc.* | | | 1,465 | | | | 4,922 | |
Biotime, Inc.* | | | 1,056 | | | | 4,657 | |
Chindex International, Inc.* | | | 480 | | | | 4,560 | |
Astex Pharmaceuticals* | | | 2,405 | | | | 4,473 | |
Enzo Biochem, Inc.* | | | 1,626 | | | | 4,374 | |
Synta Pharmaceuticals Corp.* | | | 1,005 | | | | 4,372 | |
Fluidigm Corp.* | | | 271 | | | | 4,263 | |
RadNet, Inc.* | | | 1,301 | | | | 4,137 | |
Metabolix, Inc.* | | | 1,448 | | | | 4,098 | |
Sucampo Pharmaceuticals, Inc. — Class A* | | | 542 | | | | 4,038 | |
Medical Action Industries, Inc.* | | | 701 | | | | 4,010 | |
Harvard Bioscience, Inc.* | | | 977 | | | | 3,830 | |
Insmed, Inc.* | | | 1,052 | | | | 3,819 | |
Zalicus, Inc.* | | | 3,171 | | | | 3,805 | |
Codexis, Inc.* | | | 1,035 | | | | 3,778 | |
Endocyte, Inc.* | | | 729 | | | | 3,630 | |
Osiris Therapeutics, Inc.* | | | 706 | | | | 3,615 | |
GTx, Inc.* | | | 930 | | | | 3,581 | |
Amicus Therapeutics, Inc.* | | | 674 | | | | 3,559 | |
Biolase Technology, Inc.* | | | 1,302 | | | | 3,529 | |
Sunesis Pharmaceuticals, Inc.* | | | 1,205 | | | | 3,458 | |
Nabi Biopharmaceuticals* | | | 1,827 | | | | 3,398 | |
Pacira Pharmaceuticals, Inc.* | | | 292 | | | | 3,370 | |
Biospecifics Technologies Corp.* | | | 209 | | | | 3,306 | |
CardioNet, Inc.* | | | 1,034 | | | | 3,185 | |
Biosante Pharmaceuticals, Inc.* | | | 4,661 | | | | 3,169 | |
National Research Corp. | | | 70 | | | | 3,006 | |
Cleveland Biolabs, Inc.* | | | 1,203 | | | | 2,959 | |
Lannett Company, Inc.* | | | 690 | | | | 2,877 | |
KV Pharmaceutical Co. — Class A* | | | 2,179 | | | | 2,876 | |
Ampio Pharmaceuticals, Inc.* | | | 842 | | | | 2,871 | |
Durect Corp.* | | | 3,441 | | | | 2,753 | |
Anacor Pharmaceuticals, Inc.* | | | 455 | | | | 2,680 | |
PharmAthene, Inc.* | | | 1,512 | | | | 2,676 | |
Uroplasty, Inc.* | | | 884 | | | | 2,661 | |
Albany Molecular Research, Inc.* | | | 933 | | | | 2,519 | |
Bacterin International Holdings, Inc.* | | | 1,016 | | | | 2,459 | |
Epocrates, Inc.* | | | 273 | | | | 2,342 | |
Transcept Pharmaceuticals, Inc.* | | | 216 | | | | 2,272 | |
Columbia Laboratories, Inc.* | | | 3,105 | | | | 2,205 | |
BG Medicine, Inc.* | | | 314 | | | | 2,204 | |
NewLink Genetics Corp.* | | | 230 | | | | 2,105 | |
Cornerstone Therapeutics, Inc.* | | | 345 | | | | 2,056 | |
BioMimetic Therapeutics, Inc.* | | | 819 | | | | 2,023 | |
Anthera Pharmaceuticals, Inc.* | | | 895 | | | | 1,978 | |
Peregrine Pharmaceuticals, Inc.* | | | 3,381 | | | | 1,826 | |
Trius Therapeutics, Inc.* | | | 321 | | | | 1,717 | |
Zogenix, Inc.* | | | 835 | | | | 1,670 | |
Alimera Sciences, Inc.* | | | 476 | | | | 1,609 | |
Zeltiq Aesthetics, Inc.* | | | 258 | | | | 1,592 | |
Acura Pharmaceuticals, Inc.* | | | 459 | | | | 1,588 | |
Alliance HealthCare Services, Inc.* | | | 1,032 | | | | 1,548 | |
| | | | | | | | |
| | | SHARES | | | VALUE | |
| | | | | | | | |
Pernix Therapeutics Holdings* | | | 154 | | | $ | 1,386 | |
Complete Genomics, Inc.* | | | 443 | | | | 1,249 | |
DynaVox, Inc. — Class A* | | | 398 | | | | 1,226 | |
Stereotaxis, Inc.* | | | 1,879 | | | | 1,221 | |
Horizon Pharma, Inc.* | | | 199 | | | | 824 | |
Neostem, Inc.* | | | 2,092 | | | | 790 | |
| | | | | | | | |
Total Health Care | | | | | | | 6,500,219 | |
| | | | | | | | |
ENERGY— 4.6% | | | | | | | | |
World Fuel Services Corp. | | | 3,017 | | | | 123,697 | |
Energy XXI Bermuda Ltd.* | | | 3,200 | | | | 115,553 | |
Rosetta Resources, Inc.* | | | 2,257 | | | | 110,051 | |
Kodiak Oil & Gas Corp.* | | | 10,686 | | | | 106,433 | |
Lufkin Industries, Inc. | | | 1,295 | | | | 104,441 | |
Berry Petroleum Co. — Class A | | | 2,188 | | | | 103,120 | |
CVR Energy, Inc.* | | | 3,741 | | | | 100,072 | |
Dril-Quip, Inc.* | | | 1,465 | | | | 95,254 | |
Key Energy Services, Inc.* | | | 5,311 | | | | 82,055 | |
Helix Energy Solutions Group, Inc.* | | | 4,519 | | | | 80,438 | |
Oasis Petroleum, Inc.* | | | 2,534 | | | | 78,123 | |
Bristow Group, Inc. | | | 1,546 | | | | 73,791 | |
Golar LNG Ltd. | | | 1,697 | | | | 64,570 | |
Stone Energy Corp.* | | | 2,083 | | | | 59,553 | |
Gulfport Energy Corp.* | | | 1,921 | | | | 55,940 | |
Northern Oil and Gas, Inc.* | | | 2,686 | | | | 55,708 | |
Hornbeck Offshore Services, Inc.* | | | 1,279 | | | | 53,756 | |
Cheniere Energy, Inc.* | | | 3,557 | | | | 53,284 | |
Swift Energy Co.* | | | 1,805 | | | | 52,399 | |
Bill Barrett Corp.* | | | 2,006 | | | | 52,176 | |
SemGroup Corp. — Class A* | | | 1,768 | | | | 51,520 | |
Carrizo Oil & Gas, Inc.* | | | 1,653 | | | | 46,714 | |
Gulfmark Offshore, Inc. — Class A* | | | 1,006 | | | | 46,236 | |
Clean Energy Fuels Corp.* | | | 2,110 | | | | 44,901 | |
McMoRan Exploration Co.* | | | 4,179 | | | | 44,715 | |
Western Refining, Inc. | | | 2,250 | | | | 42,345 | |
Cloud Peak Energy, Inc.* | | | 2,593 | | | | 41,306 | |
Approach Resources, Inc.* | | | 1,096 | | | | 40,497 | |
Petroleum Development Corp.* | | | 993 | | | | 36,830 | |
ION Geophysical Corp.* | | | 5,594 | | | | 36,081 | |
Exterran Holdings, Inc.* | | | 2,718 | | | | 35,850 | |
Comstock Resources, Inc.* | | | 2,029 | | | | 32,119 | |
Nordic American Tankers Ltd. | | | 2,015 | | | | 31,998 | |
Targa Resources Corp. | | | 695 | | | | 31,588 | |
Newpark Resources, Inc.* | | | 3,845 | | | | 31,491 | |
W&T Offshore, Inc. | | | 1,481 | | | | 31,219 | |
Tetra Technologies, Inc.* | | | 3,269 | | | | 30,794 | |
Contango Oil & Gas Co.* | | | 518 | | | | 30,515 | |
Magnum Hunter Resources Corp.* | | | 4,741 | | | | 30,390 | |
Parker Drilling Co.* | | | 4,968 | | | | 29,659 | |
Ship Finance International Ltd. | | | 1,913 | | | | 29,269 | |
GeoResources, Inc.* | | | 847 | | | | 27,731 | |
Apco Oil and Gas International, Inc. | | | 385 | | | | 26,245 | |
Crosstex Energy, Inc. | | | 1,733 | | | | 24,505 | |
Patriot Coal Corp.* | | | 3,890 | | | | 24,274 | |
Hercules Offshore, Inc.* | | | 4,903 | | | | 23,191 | |
Pioneer Drilling Co.* | | | 2,624 | | | | 23,091 | |
Resolute Energy Corp.* | | | 1,964 | | | | 22,350 | |
| | |
120 | THE RYDEX SERIES FUNDS ANNUAL REPORT | | SEE NOTES TO FINANCIAL STATEMENTS. |
| | |
| SCHEDULE OF INVESTMENTS (continued) | | March 31, 2012 |
RUSSELL 2000® FUND | | |
| | | | | | | | |
| | | SHARES | | | VALUE | |
Goodrich Petroleum Corp.* | | | 1,102 | | | $ | 20,960 | |
Vaalco Energy, Inc.* | | | 2,174 | | | | 20,544 | |
Energy Partners Ltd.* | | | 1,231 | | | | 20,447 | |
Clayton Williams Energy, Inc.* | | | 256 | | | | 20,337 | |
Rentech, Inc.* | | | 9,489 | | | | 19,737 | |
OYO Geospace Corp.* | | | 184 | | | | 19,381 | |
Endeavour International Corp.* | | | 1,579 | | | | 18,711 | |
Heckmann Corp.* | | | 4,240 | | | | 18,274 | |
Tesco Corp.* | | | 1,287 | | | | 18,263 | |
Gulf Island Fabrication, Inc. | | | 608 | | | | 17,796 | |
Basic Energy Services, Inc.* | | | 1,022 | | | | 17,732 | |
BPZ Resources, Inc.* | | | 4,350 | | | | 17,531 | |
Frontline Ltd. | | | 2,198 | | | | 16,903 | |
Rex Energy Corp.* | | | 1,498 | | | | 15,999 | |
Matrix Service Co.* | | | 1,122 | | | | 15,719 | |
Petroquest Energy, Inc.* | | | 2,382 | | | | 14,625 | |
Overseas Shipholding Group, Inc. | | | 1,134 | | | | 14,322 | |
ATP Oil & Gas Corp.* | | | 1,893 | | | | 13,914 | |
Venoco, Inc.* | | | 1,260 | | | | 13,658 | |
Knightsbridge Tankers Ltd. | | | 933 | | | | 13,417 | |
Cal Dive International, Inc.* | | | 4,055 | | | | 13,382 | |
PHI, Inc.* | | | 552 | | | | 12,779 | |
Triangle Petroleum Corp.* | | | 1,834 | | | | 12,655 | |
Uranium Energy Corp.* | | | 3,198 | | | | 12,472 | |
FX Energy, Inc.* | | | 2,229 | | | | 12,126 | |
Vantage Drilling Co.* | | | 7,438 | | | | 11,901 | |
Dawson Geophysical Co.* | | | 333 | | | | 11,439 | |
Mitcham Industries, Inc.* | | | 504 | | | | 11,320 | |
Teekay Tankers Ltd. — Class A | | | 1,833 | | | | 11,126 | |
Abraxas Petroleum Corp.* | | | 3,500 | | | | 10,920 | |
Callon Petroleum Co.* | | | 1,665 | | | | 10,473 | |
Harvest Natural Resources, Inc.* | | | 1,446 | | | | 10,238 | |
Warren Resources, Inc.* | | | 3,044 | | | | 9,923 | |
Delek US Holdings, Inc. | | | 608 | | | | 9,430 | |
C&J Energy Services, Inc.* | | | 504 | | | | 8,966 | |
Penn Virginia Corp. | | | 1,946 | | | | 8,854 | |
Scorpio Tankers, Inc.* | | | 1,249 | | | | 8,818 | |
Hyperdynamics Corp.* | | | 6,653 | | | | 8,582 | |
Green Plains Renewable Energy, Inc.* | | | 794 | | | | 8,567 | |
Panhandle Oil and Gas, Inc. — Class A | | | 289 | | | | 8,520 | |
Global Geophysical Services, Inc.* | | | 772 | | | | 8,191 | |
James River Coal Co.* | | | 1,518 | | | | 7,772 | |
Gastar Exploration Ltd.* | | | 2,473 | | | | 7,394 | |
Uranerz Energy Corp.* | | | 2,748 | | | | 6,925 | |
Natural Gas Services Group, Inc.* | | | 518 | | | | 6,838 | |
Solazyme, Inc.* | | | 467 | | | | 6,832 | |
Evolution Petroleum Corp.* | | | 688 | | | | 6,398 | |
Miller Energy Resources, Inc.* | | | 1,319 | | | | 5,566 | |
Willbros Group, Inc.* | | | 1,660 | | | | 5,378 | |
Ur-Energy, Inc.* | | | 4,403 | | | | 5,372 | |
USEC, Inc.* | | | 4,947 | | | | 5,244 | |
KiOR, Inc. — Class A* | | | 378 | | | | 5,054 | |
Voyager Oil & Gas, Inc.* | | | 2,003 | | | | 4,867 | |
Westmoreland Coal Co.* | | | 418 | | | | 4,669 | |
RigNet, Inc.* | | | 248 | | | | 4,347 | |
Alon USA Energy, Inc. | | | 474 | | | | 4,290 | |
Amyris, Inc.* | | | 755 | | | | 3,911 | |
| | | | | | | | |
| | | SHARES | | | VALUE | |
Isramco, Inc.* | | | 44 | | | $ | 3,844 | |
Crimson Exploration, Inc.* | | | 925 | | | | 3,839 | |
Houston American Energy Corp.* | | | 708 | | | | 3,696 | |
Syntroleum Corp.* | | | 3,758 | | | | 3,626 | |
Uranium Resources, Inc.* | | | 3,959 | | | | 3,602 | |
Union Drilling, Inc.* | | | 638 | | | | 3,547 | |
Zion Oil & Gas, Inc.* | | | 1,298 | | | | 3,427 | |
GMX Resources, Inc.* | | | 2,540 | | | | 3,226 | |
DHT Holdings, Inc. | | | 2,743 | | | | 2,633 | |
CAMAC Energy, Inc.* | | | 2,499 | | | | 2,499 | |
L&L Energy, Inc.* | | | 950 | | | | 2,328 | |
Gevo, Inc.* | | | 250 | | | | 2,298 | |
Hallador Energy Co. | | | 194 | | | | 1,715 | |
Geokinetics, Inc.* | | | 478 | | | | 841 | |
| | | | | | | | |
Total Energy | | | | | | | 3,268,768 | |
| | | | | | | | |
MATERIALS—3.4% | | | | | | | | |
Coeur d’Alene Mines Corp.* | | | 3,817 | | | | 90,615 | |
Sensient Technologies Corp. | | | 2,128 | | | | 80,863 | |
Olin Corp. | | | 3,394 | | | | 73,819 | |
NewMarket Corp. | | | 377 | | | | 70,650 | |
Chemtura Corp.* | | | 4,104 | | | | 69,686 | |
HB Fuller Co. | | | 2,106 | | | | 69,140 | |
Eagle Materials, Inc. | | | 1,896 | | | | 65,885 | |
Stillwater Mining Co.* | | | 4,851 | | | | 61,317 | |
Buckeye Technologies, Inc. | | | 1,686 | | | | 57,273 | |
PolyOne Corp. | | | 3,973 | | | | 57,211 | |
Hecla Mining Co. | | | 11,885 | | | | 54,909 | |
Louisiana-Pacific Corp.* | | | 5,630 | | | | 52,640 | |
Minerals Technologies, Inc. | | | 780 | | | | 51,020 | |
Georgia Gulf Corp.* | | | 1,449 | | | | 50,541 | |
Schweitzer-Mauduit International, Inc. | | | 683 | | | | 47,168 | |
Innophos Holdings, Inc. | | | 926 | | | | 46,411 | |
Thompson Creek Metals Company, Inc.* | | | 6,504 | | | | 43,967 | |
Worthington Industries, Inc. | | | 2,288 | | | | 43,885 | |
Globe Specialty Metals, Inc. | | | 2,683 | | | | 39,896 | |
Graphic Packaging Holding Co.* | | | 6,811 | | | | 37,596 | |
Calgon Carbon Corp.* | | | 2,400 | | | | 37,464 | |
Balchem Corp. | | | 1,228 | | | | 37,147 | |
SunCoke Energy, Inc.* | | | 2,603 | | | | 36,989 | |
OM Group, Inc.* | | | 1,319 | | | | 36,286 | |
Kraton Performance Polymers, Inc.* | | | 1,357 | | | | 36,055 | |
A. Schulman, Inc. | | | 1,311 | | | | 35,423 | |
Koppers Holdings, Inc. | | | 882 | | | | 34,010 | |
Texas Industries, Inc. | | | 967 | | | | 33,855 | |
Haynes International, Inc. | | | 518 | | | | 32,815 | |
KapStone Paper and Packaging Corp.* | | | 1,660 | | | | 32,702 | |
Kaiser Aluminum Corp. | | | 685 | | | | 32,373 | |
Clearwater Paper Corp.* | | | 974 | | | | 32,347 | |
Boise, Inc. | | | 3,893 | | | | 31,962 | |
Innospec, Inc.* | | | 998 | | | | 30,319 | |
LSB Industries, Inc.* | | | 779 | | | | 30,319 | |
AMCOL International Corp. | | | 1,028 | | | | 30,316 | |
Stepan Co. | | | 345 | | | | 30,291 | |
RTI International Metals, Inc.* | | | 1,287 | | | | 29,678 | |
Gold Resource Corp. | | | 1,205 | | | | 29,294 | |
PH Glatfelter Co. | | | 1,856 | | | | 29,288 | |
| | |
SEE NOTES TO FINANCIAL STATEMENTS. | | THE RYDEX SERIES FUNDS ANNUAL REPORT | 121 |
| | |
| SCHEDULE OF INVESTMENTS (continued) | | March 31, 2012 |
RUSSELL 2000® FUND | | |
| | | | | | | | |
| | | SHARES | | | VALUE | |
Deltic Timber Corp. | | | 461 | | | $ | 29,177 | |
Flotek Industries, Inc.* | | | 2,128 | | | | 25,579 | |
TPC Group, Inc.* | | | 558 | | | | 24,669 | |
Materion Corp.* | | | 858 | | | | 24,650 | |
Ferro Corp.* | | | 3,686 | | | | 21,895 | |
Quaker Chemical Corp. | | | 537 | | | | 21,185 | |
Horsehead Holding Corp.* | | | 1,859 | | | | 21,174 | |
American Vanguard Corp. | | | 948 | | | | 20,562 | |
Golden Star Resources Ltd.* | | | 11,008 | | | | 20,474 | |
McEwen Mining, Inc.* | | | 4,489 | | | | 19,931 | |
Wausau Paper Corp. | | | 2,093 | | | | 19,632 | |
Century Aluminum Co.* | | | 2,195 | | | | 19,492 | |
Myers Industries, Inc. | | | 1,271 | | | | 18,748 | |
Neenah Paper, Inc. | | | 628 | | | | 18,677 | |
Jaguar Mining, Inc.* | | | 3,592 | | | | 16,775 | |
Hawkins, Inc. | | | 367 | | | | 13,652 | |
Zep, Inc. | | | 931 | | | | 13,406 | |
Zoltek Companies, Inc.* | | | 1,171 | | | | 13,256 | |
Omnova Solutions, Inc.* | | | 1,930 | | | | 13,028 | |
Universal Stainless & Alloy* | | | 303 | | | | 12,944 | |
Paramount Gold and Silver Corp.* | | | 4,989 | | | | 11,275 | |
Headwaters, Inc.* | | | 2,587 | | | | 10,814 | |
Golden Minerals Co.* | | | 1,191 | | | | 10,040 | |
Zagg, Inc.* | | | 942 | | | | 10,013 | |
Noranda Aluminum Holding Corp. | | | 967 | | | | 9,641 | |
General Moly, Inc.* | | | 2,873 | | | | 9,625 | |
Vista Gold Corp.* | | | 3,029 | | | | 9,511 | |
Olympic Steel, Inc. | | | 387 | | | | 9,288 | |
AM Castle & Co.* | | | 714 | | | | 9,032 | |
FutureFuel Corp. | | | 793 | | | | 8,707 | |
Landec Corp.* | | | 1,129 | | | | 7,372 | |
Metals USA Holdings Corp.* | | | 491 | | | | 7,075 | |
United States Lime & Minerals, Inc.* | | | 110 | | | | 6,588 | |
AEP Industries, Inc.* | | | 188 | | | | 6,544 | |
Spartech Corp.* | | | 1,311 | | | | 6,398 | |
STR Holdings, Inc.* | | | 1,287 | | | | 6,229 | |
KMG Chemicals, Inc. | | | 302 | | | | 5,451 | |
Midway Gold Corp.* | | | 3,650 | | | | 5,220 | |
Senomyx, Inc.* | | | 1,671 | | | | 4,579 | |
Revett Minerals, Inc.* | | | 1,067 | | | | 4,460 | |
NL Industries, Inc. | | | 285 | | | | 4,247 | |
Handy & Harman Ltd.* | | | 248 | | | | 3,581 | |
US Energy Corp.* | | | 1,038 | | | | 3,280 | |
Verso Paper Corp.* | | | 641 | | | | 1,205 | |
| | | | | | | | |
Total Materials | | | | | | | 2,382,506 | |
| | | | | | | | |
CONSUMER STAPLES—2.6% | | | | | | | | |
Nu Skin Enterprises, Inc. — Class A | | | 2,332 | | | | 135,047 | |
United Natural Foods, Inc.* | | | 2,058 | | | | 96,027 | |
TreeHouse Foods, Inc.* | | | 1,517 | | | | 90,263 | |
Casey’s General Stores, Inc. | | | 1,617 | | | | 89,680 | |
Darling International, Inc.* | | | 4,983 | | | | 86,803 | |
Harris Teeter Supermarkets, Inc.* | | | 2,093 | | | | 83,929 | |
Hain Celestial Group, Inc.* | | | 1,518 | | | | 66,504 | |
Fresh Market, Inc.* | | | 1,197 | | | | 57,396 | |
Pricesmart, Inc. | | | 761 | | | | 55,408 | |
Lancaster Colony Corp. | | | 793 | | | | 52,703 | |
| | | | | | | | |
| | | SHARES | | | VALUE | |
Snyders-Lance, Inc. | | | 2,009 | | | $ | 51,933 | |
Sanderson Farms, Inc. | | | 946 | | | | 50,166 | |
B&G Foods, Inc. — Class A | | | 2,044 | | | | 46,010 | |
Universal Corp. | | | 984 | | | | 45,855 | |
Rite Aid Corp.* | | | 25,095 | | | | 43,665 | |
Andersons, Inc. | | | 796 | | | | 38,757 | |
Prestige Brands Holdings, Inc.* | | | 2,140 | | | | 37,407 | |
Boston Beer Company, Inc. — Class A* | | | 348 | | | | 37,163 | |
Vector Group Ltd. | | | 2,050 | | | | 36,326 | |
Elizabeth Arden, Inc.* | | | 1,038 | | | | 36,309 | |
Fresh Del Monte Produce, Inc. | | | 1,551 | | | | 35,425 | |
J&J Snack Foods Corp. | | | 609 | | | | 31,948 | |
WD-40 Co. | | | 667 | | | | 30,249 | |
Spectrum Brands Holdings, Inc.* | | | 714 | | | | 24,961 | |
Tootsie Roll Industries, Inc. | | | 1,043 | | | | 23,900 | |
Cal-Maine Foods, Inc. | | | 605 | | | | 23,147 | |
Diamond Foods, Inc. | | | 933 | | | | 21,291 | |
Weis Markets, Inc. | | | 467 | | | | 20,361 | |
Pilgrim’s Pride Corp.* | | | 2,529 | | | | 18,866 | |
Spartan Stores, Inc. | | | 964 | | | | 17,468 | |
Central Garden and Pet Co. — Class A* | | | 1,781 | | | | 17,151 | |
Chiquita Brands International, Inc.* | | | 1,933 | | | | 16,991 | |
Smart Balance, Inc.* | | | 2,535 | | | | 16,756 | |
Central European Distribution Corp.* | | | 3,097 | | | | 15,826 | |
Dole Food Company, Inc.* | | | 1,519 | | | | 15,160 | |
Star Scientific, Inc.* | | | 4,555 | | | | 14,940 | |
Nash Finch Co. | | | 508 | | | | 14,437 | |
Alliance One International, Inc.* | | | 3,705 | | | | 13,968 | |
Calavo Growers, Inc. | | | 497 | | | | 13,310 | |
Pantry, Inc.* | | | 984 | | | | 12,802 | |
Coca-Cola Bottling Company Consolidated | | | 190 | | | | 11,920 | |
Inter Parfums, Inc. | | | 681 | | | | 10,685 | |
Medifast, Inc.* | | | 588 | | | | 10,266 | |
USANA Health Sciences, Inc.* | | | 275 | | | | 10,266 | |
Seneca Foods Corp. — Class A* | | | 389 | | | | 10,246 | |
Chefs’ Warehouse, Inc.* | | | 438 | | | | 10,135 | |
Susser Holdings Corp.* | | | 393 | | | | 10,088 | |
Ingles Markets, Inc. — Class A | | | 541 | | | | 9,543 | |
Village Super Market, Inc. — Class A | | | 268 | | | | 8,466 | |
Revlon, Inc. — Class A* | | | 457 | | | | 7,883 | |
National Beverage Corp.* | | | 473 | | | | 7,587 | |
Nature’s Sunshine Products, Inc.* | | | 473 | | | | 7,577 | |
Omega Protein Corp.* | | | 827 | | | | 6,293 | |
Schiff Nutrition International, Inc.* | | | 510 | | | | 6,268 | |
Nutraceutical International Corp.* | | | 385 | | | | 5,606 | |
Limoneira Co. | | | 329 | | | | 5,557 | |
Oil-Dri Corporation of America | | | 208 | | | | 4,428 | |
Synutra International, Inc.* | | | 741 | | | | 4,357 | |
Female Health Co. | | | 786 | | | | 4,260 | |
Arden Group, Inc. — Class A | | | 40 | | | | 3,636 | |
Alico, Inc. | | | 148 | | | | 3,420 | |
Craft Brew Alliance, Inc.* | | | 439 | | | | 3,363 | |
Farmer Brothers Co.* | | | 285 | | | | 3,104 | |
MGP Ingredients, Inc. | | | 517 | | | | 2,781 | |
Griffin Land & Nurseries, Inc. | | | 99 | | | | 2,615 | |
Imperial Sugar Co. | | | 521 | | | | 2,443 | |
| | |
122 | THE RYDEX SERIES FUNDS ANNUAL REPORT | | SEE NOTES TO FINANCIAL STATEMENTS. |
| | |
| SCHEDULE OF INVESTMENTS (continued) | | March 31, 2012 |
RUSSELL 2000® FUND | | |
| | | | | | | | |
| | | SHARES | | | VALUE | |
Harbinger Group, Inc.* | | | 387 | | | $ | 2,005 | |
Lifeway Foods, Inc.* | | | 200 | | | | 1,850 | |
Primo Water Corp.* | | | 623 | | | | 1,215 | |
| | | | | | | | |
Total Consumer Staples | | | | | | | 1,814,171 | |
| | | | | | | | |
UTILITIES—2.4% | | | | | | | | |
Cleco Corp. | | | 2,600 | | | | 103,089 | |
Piedmont Natural Gas Company, Inc. | | | 3,054 | | | | 94,887 | |
WGL Holdings, Inc. | | | 2,177 | | | | 88,604 | |
IDACORP, Inc. | | | 2,114 | | | | 86,927 | |
Southwest Gas Corp. | | | 1,954 | | | | 83,514 | |
Portland General Electric Co. | | | 3,203 | | | | 80,011 | |
New Jersey Resources Corp. | | | 1,758 | | | | 78,354 | |
UIL Holdings Corp. | | | 2,154 | | | | 74,873 | |
Atlantic Power Corp. | | | 4,627 | | | | 64,038 | |
South Jersey Industries, Inc. | | | 1,274 | | | | 63,751 | |
Avista Corp. | | | 2,458 | | | | 62,876 | |
PNM Resources, Inc. | | | 3,393 | | | | 62,092 | |
El Paso Electric Co. | | | 1,797 | | | | 58,385 | |
Unisource Energy Corp. | | | 1,559 | | | | 57,013 | |
Black Hills Corp. | | | 1,681 | | | | 56,364 | |
Allete, Inc. | | | 1,350 | | | | 56,012 | |
NorthWestern Corp. | | | 1,543 | | | | 54,715 | |
Northwest Natural Gas Co. | | | 1,132 | | | | 51,393 | |
CH Energy Group, Inc. | | | 666 | | | | 44,442 | |
MGE Energy, Inc. | | | 982 | | | | 43,591 | |
Laclede Group, Inc. | | | 957 | | | | 37,342 | |
Empire District Electric Co. | | | 1,778 | | | | 36,182 | |
Otter Tail Corp. | | | 1,533 | | | | 33,266 | |
California Water Service Group | | | 1,778 | | | | 32,377 | |
American States Water Co. | | | 792 | | | | 28,623 | |
Central Vermont Public Service Corp. | | | 570 | | | | 20,064 | |
Chesapeake Utilities Corp. | | | 398 | | | | 16,366 | |
Ormat Technologies, Inc. | | | 766 | | | | 15,435 | |
SJW Corp. | | | 599 | | | | 14,448 | |
Middlesex Water Co. | | | 666 | | | | 12,581 | |
Unitil Corp. | | | 459 | | | | 12,315 | |
Connecticut Water Service, Inc. | | | 367 | | | | 10,382 | |
York Water Co. | | | 540 | | | | 9,342 | |
Artesian Resources Corp. — Class A | | | 311 | | | | 5,844 | |
Genie Energy Ltd. — Class B | | | 591 | | | | 5,715 | |
Consolidated Water Company Ltd. | | | 617 | | | | 4,880 | |
Cadiz, Inc.* | | | 504 | | | | 4,637 | |
Dynegy, Inc. — Class A* | | | 4,384 | | | | 2,455 | |
| | | | | | | | |
Total Utilities | | | | | | | 1,667,185 | |
| | | | | | | | |
TELECOMMUNICATION SERVICES—0.6% | | | | | | | | |
AboveNet, Inc.* | | | 990 | | | | 81,973 | |
Cogent Communications Group, Inc.* | | | 1,954 | | | | 37,282 | |
Cincinnati Bell, Inc.* | | | 8,465 | | | | 34,028 | |
Leap Wireless International, Inc.* | | | 2,596 | | | | 22,663 | |
Consolidated Communications Holdings, Inc. | | | 1,118 | | | | 21,946 | |
Premiere Global Services, Inc.* | | | 2,221 | | | | 20,078 | |
Pendrell Corp.* | | | 6,433 | | | | 16,790 | |
Neutral Tandem, Inc.* | | | 1,340 | | | | 16,335 | |
Iridium Communications, Inc.* | | | 1,853 | | | | 16,232 | |
General Communication, Inc. — Class A* | | | 1,768 | | | | 15,417 | |
Atlantic Tele-Network, Inc. | | | 402 | | | | 14,617 | |
| | | | | | | | |
| | | SHARES | | | VALUE | |
SureWest Communications | | | 601 | | | $ | 13,553 | |
NTELOS Holdings Corp. | | | 642 | | | | 13,289 | |
USA Mobility, Inc. | | | 944 | | | | 13,150 | |
Vonage Holdings Corp.* | | | 5,906 | | | | 13,052 | |
Shenandoah Telecommunications Co. | | | 1,010 | | | | 11,262 | |
8x8, Inc.* | | | 2,646 | | | | 11,113 | |
Cbeyond, Inc.* | | | 1,189 | | | | 9,512 | |
Towerstream Corp.* | | | 1,807 | | | | 8,583 | |
inContact, Inc.* | | | 1,299 | | | | 7,248 | |
Lumos Networks Corp. | | | 642 | | | | 6,908 | |
HickoryTech Corp. | | | 573 | | | | 5,925 | |
Alaska Communications Systems Group, Inc. | | | 1,922 | | | | 5,920 | |
ORBCOMM, Inc.* | | | 1,473 | | | | 5,671 | |
IDT Corp. — Class B | | | 591 | | | | 5,520 | |
Fairpoint Communications, Inc.* | | | 914 | | | | 3,437 | |
Globalstar, Inc.* | | | 4,322 | | | | 3,025 | |
Boingo Wireless, Inc.* | | | 248 | | | | 3,001 | |
| | | | | | | | |
Total Telecommunication Services | | | | | | | 437,530 | |
| | | | | | | | |
Total Common Stocks (Cost $46,938,923) | | | | | | | 51,571,939 | |
| | | | | | | | |
WARRANTS††—0.0% | | | | | | | | |
Magnum Hunter Resources Corp. $10.50, 10/14/13 | | | 17 | | | | — | |
| | | | | | | | |
Total Warrants (Cost $—) | | | | | | | — | |
| | | | | | | | |
RIGHTS††—0.0% | | | | | | | | |
DHT Holdings, Inc. Expires 05/01/12 | | | 2,743 | | | | 713 | |
| | | | | | | | |
Total Rights (Cost $549) | | | | | | | 713 | |
| | | | | | | | |
| | |
| | | FACE
AMOUNT | | | | |
| | | | | |
REPURCHASE AGREEMENTS††,1—30.7% | | | | | | | | |
HSBC Group issued 03/30/12 at 0.01% due 04/02/12 | | $ | 13,124,625 | | | | 13,124,625 | |
Credit Suisse Group issued 03/30/12 at 0.01% due 04/02/122 | | | 3,838,656 | | | | 3,838,656 | |
Mizuho Financial Group, Inc. issued 03/30/12 at 0.01% due 04/02/12 | | | 3,692,605 | | | | 3,692,605 | |
Deutsche Bank issued 03/30/12 at 0.01% due 04/02/12 | | | 981,453 | | | | 981,453 | |
| | | | | | | | |
Total Repurchase Agreements
(Cost $21,637,339) | | | | | | | 21,637,339 | |
| | | | | | | | |
Total Investments — 104.0%
(Cost $68,576,811) | | | | | | $ | 73,209,991 | |
| | | | | | | | |
Other Assets & Liabilities, net — (4.0)% | | | | | | | (2,808,066 | ) |
| | | | | | | | |
Total Net Assets — 100.0% | | | | | | $ | 70,401,925 | |
| |
| | |
SEE NOTES TO FINANCIAL STATEMENTS. | | THE RYDEX SERIES FUNDS ANNUAL REPORT | 123 |
| | |
| SCHEDULE OF INVESTMENTS (concluded) | | March 31, 2012 |
RUSSELL 2000® FUND | | |
| | | | | | | | |
| | | CONTRACTS | | | UNREALIZED
GAIN (LOSS) | |
FUTURES CONTRACTS PURCHASED† | | | | | | | | |
June 2012 Russell 2000 Index Mini Futures Contracts (Aggregate Value of Contracts $3,390,700) | | | 41 | | | $ | 34,348 | |
| | | | | | | | |
| | |
| | | UNITS | | | | |
EQUITY INDEX SWAP AGREEMENTS†† | | | | | | | | |
Goldman Sachs International April 2012 Russell 2000 Index Swap, Terminating 04/27/123 (Notional Value $196,524) | | | 237 | | | $ | (3,654 | ) |
Morgan Stanley Capital Services, Inc. April 2012 Russell 2000 Index Swap, Terminating 04/30/123 (Notional Value $489,111) | | | 589 | | | | (5,453 | ) |
Barclays Bank plc April 2012 Russell 2000 Index Swap, Terminating 04/30/123 (Notional Value $3,152,692) | | | 3,797 | | | | (7,190 | ) |
Credit Suisse Capital, LLC April 2012 Russell 2000 Index Swap, Terminating 04/30/123 (Notional Value $11,824,297) | | | 14,241 | | | | (27,094 | ) |
| | | | | | | | |
(Total Notional Value $15,662,624) | | | | | | $ | (43,391 | ) |
| | | | | | | | |
| * | Non-income producing security. |
| † | Value determined based on Level 1 inputs — See Note 4. |
| †† | Value determined based on Level 2 inputs — See Note 4. |
| 1 | Repurchase Agreements — See Note 5. |
| 2 | All or a portion of this security is pledged as equity index swap collateral at March 31, 2012. |
| 3 | Total Return based on Russell 2000 Index +/- financing at a variable rate. |
| | plc — Public Limited Company |
| | REIT — Real Estate Investment Trust |
| | |
124 | THE RYDEX SERIES FUNDS ANNUAL REPORT | | SEE NOTES TO FINANCIAL STATEMENTS. |
STATEMENT OF ASSETS AND LIABILITIES
| | | | |
March 31, 2012 | | | |
ASSETS: | | | | |
Investments, at value
(cost $46,939,472) | | $ | 51,572,652 | |
Repurchase agreements, at value
(cost $21,637,339) | | | 21,637,339 | |
| | | | |
Total investments
(cost $68,576,811) | | | 73,209,991 | |
Foreign currency, at value
(cost $448) | | | 448 | |
Segregated cash with broker | | | 304,072 | |
Cash | | | 1,185 | |
Receivables: | | | | |
Dividends | | | 64,277 | |
Fund shares sold | | | 49,701 | |
Interest | | | 13 | |
| | | | |
Total assets | | | 73,629,687 | |
| | | | |
LIABILITIES: | | | | |
Unrealized depreciation on swap agreements | | | 43,391 | |
Payable for: | | | | |
Fund shares redeemed | | | 3,030,455 | |
Management fees | | | 46,622 | |
Distribution and service fees | | | 19,595 | |
Transfer agent and administrative fees | | | 15,541 | |
Variation margin | | | 15,029 | |
Swap settlement | | | 6,283 | |
Portfolio accounting fees | | | 6,216 | |
Miscellaneous | | | 44,630 | |
| | | | |
Total liabilities | | | 3,227,762 | |
| | | | |
NETASSETS | | $ | 70,401,925 | |
| | | | |
NETASSETSCONSISTOF: | | | | |
Paid in capital | | $ | 70,011,239 | |
Accumulated net investment loss | | | (153,610 | ) |
Accumulated net realized loss on investments | | | (4,079,843 | ) |
Net unrealized appreciation on investments | | | 4,624,139 | |
| | | | |
Net assets | | $ | 70,401,925 | |
| | | | |
A-CLASS: | | | | |
Net assets | | $ | 669,632 | |
Capital shares outstanding | | | 23,745 | |
Net asset value per share | | $ | 28.20 | |
| | | | |
Maximum offering price per share (Net asset value divided by 95.25%) | | $ | 29.61 | |
| | | | |
C-CLASS: | | | | |
Net assets | | $ | 6,285,177 | |
Capital shares outstanding | | | 233,669 | |
Net asset value per share | | $ | 26.90 | |
| | | | |
H-CLASS: | | | | |
Net assets | | $ | 63,447,116 | |
Capital shares outstanding | | | 2,252,760 | |
Net asset value per share | | $ | 28.16 | |
| | | | |
STATEMENT OF OPERATIONS
| | | | |
Year Ended March 31, 2012 | | | |
INVESTMENT INCOME: | | | | |
Dividends (net of foreign withholding tax of $188) | | $ | 308,659 | |
Interest | | | 9,902 | |
| | | | |
Total investment income | | | 318,561 | |
| | | | |
EXPENSES: | | | | |
Management fees | | | 335,617 | |
Transfer agent and administrative fees | | | 111,873 | |
Distribution and service fees: | | | | |
A-Class | | | 12,215 | |
C-Class | | | 61,116 | |
H-Class | | | 84,379 | |
Portfolio accounting fees | | | 44,749 | |
Licensing fees | | | 41,548 | |
Custodian fees | | | 11,662 | |
Trustees’ fees* | | | 2,038 | |
Miscellaneous | | | 46,883 | |
| | | | |
Total expenses | | | 752,080 | |
| | | | |
Net investment loss | | | (433,519 | ) |
| | | | |
NET REALIZEDAND UNREALIZED GAIN (LOSS): | | | | |
Net realized gain (loss) on: | | | | |
Investments | | | 563,240 | |
Swap agreements | | | 2,128,755 | |
Futures contracts | | | 3,611,956 | |
Foreign currency | | | 5 | |
Realized gain distributions received from investment company shares | | | 977 | |
| | | | |
Net realized gain | | | 6,304,933 | |
| | | | |
Net change in unrealized appreciation (depreciation) on: | | | | |
Investments | | | 3,497,647 | |
Swap agreements | | | (356,409 | ) |
Futures contracts | | | (278,882 | ) |
Foreign currency | | | 2 | |
| | | | |
Net change in unrealized appreciation (depreciation) | | | 2,862,358 | |
| | | | |
Net realized and unrealized gain | | | 9,167,291 | |
| | | | |
Net increase in net assets resulting from operations | | $ | 8,733,772 | |
| | | | |
| * | Relates to Trustees not deemed “interested persons” within the meaning of Section 2(a)(19) of the 1940 Act. |
| | |
SEE NOTES TO FINANCIAL STATEMENTS. | | THE RYDEX SERIES FUNDS ANNUAL REPORT | 125 |
RUSSELL 2000® FUND
STATEMENTS OF CHANGES IN NET ASSETS
| | | | | | | | |
| | | Year Ended
March 31,
2012 | | | Year Ended
March 31,
2011 | |
INCREASE (DECREASE) IN NET ASSETS FROM OPERATIONS: | | | | | | | | |
Net investment loss | | $ | (433,519 | ) | | $ | (292,419 | ) |
Net realized gain on investments | | | 6,304,933 | | | | 3,070,540 | |
Net change in unrealized appreciation (depreciation) on investments | | | 2,862,358 | | | | (810,396 | ) |
| | | | | | | | |
Net increase in net assets resulting from operations | | | 8,733,772 | | | | 1,967,725 | |
| | | | | | | | |
| | |
CAPITALSHARETRANSACTIONS: | | | | | | | | |
PROCEEDSFROMSALEOFSHARES | | | | | | | | |
A-Class | | | 35,603,617 | | | | 3,318,909 | |
C-Class | | | 83,457,886 | | | | 92,851,121 | |
H-Class | | | 364,847,623 | | | | 378,981,182 | |
COSTOFSHARESREDEEMED | | | | | | | | |
A-Class | | | (38,744,977 | ) | | | (4,088,188 | ) |
C-Class | | | (84,349,313 | ) | | | (89,838,530 | ) |
H-Class | | | (339,357,813 | ) | | | (379,943,686 | ) |
| | | | | | | | |
Net increase from capital share transactions | | | 21,457,023 | | | | 1,280,808 | |
| | | | | | | | |
Net increase in net assets | | | 30,190,795 | | | | 3,248,533 | |
| | |
NETASSETS: | | | | | | | | |
Beginning of year | | | 40,211,130 | | | | 36,962,597 | |
| | | | | | | | |
End of year | | $ | 70,401,925 | | | $ | 40,211,130 | |
| | | | | | | | |
Accumulated net investment loss at end of year | | $ | (153,610 | ) | | $ | (1,263 | ) |
| | | | | | | | |
CAPITALSHAREACTIVITY: | | | | | | | | |
Shares sold | | | | | | | | |
A-Class | | | 1,467,841 | | | | 147,548 | |
C-Class | | | 3,373,536 | | | | 4,000,710 | |
H-Class | | | 14,071,385 | | | | 15,599,483 | |
Shares redeemed | | | | | | | | |
A-Class | | | (1,470,535 | ) | | | (178,309 | ) |
C-Class | | | (3,397,242 | ) | | | (3,871,654 | ) |
H-Class | | | (12,954,131 | ) | | | (15,893,726 | ) |
| | | | | | | | |
Net increase (decrease) in shares | | | 1,090,854 | | | | (195,948 | ) |
| | | | | | | | |
| | |
126 | THE RYDEX SERIES FUNDS ANNUAL REPORT | | SEE NOTES TO FINANCIAL STATEMENTS. |
FINANCIAL HIGHLIGHTS
This table is presented to show selected data for a share outstanding throughout each period and to assist shareholders in evaluating a Fund’s performance for the periods presented.
| | | | | | | | | | | | | | | | | | | | |
A-Class | | Year Ended
March 31,
2012 | | | Year Ended
March 31,
2011 | | | Year Ended
March 31,
2010 | | | Year Ended
March 31,
2009 | | | Year Ended
March 31,
2008 | |
Per Share Data | | | | | | | | | | | | | | | | | | | | |
Net asset value, beginning of period | | $ | 28.54 | | | $ | 22.96 | | | $ | 14.31 | | | $ | 23.57 | | | $ | 27.64 | |
| | | | | | | | | | | | | | | | | | | | |
Income (loss) from investment operations: | | | | | | | | | | | | | | | | | | | | |
Net investment income (loss)a | | | (.23 | ) | | | (.24 | ) | | | (.15 | ) | | | (.02 | ) | | | .34 | |
Net gain (loss) on investments (realized and unrealized) | | | (.11 | ) | | | 5.82 | | | | 8.80 | | | | (9.24 | ) | | | (4.21 | ) |
| | | | | | | | | | | | | | | | | | | | |
Total from investment operations | | | (.34 | ) | | | 5.58 | | | | 8.65 | | | | (9.26 | ) | | | (3.87 | ) |
| | | | | | | | | | | | | | | | | | | | |
Less distributions from: | | | | | | | | | | | | | | | | | | | | |
Net investment income | | | — | | | | — | | | | — | | | | — | | | | (.20 | ) |
| | | | | | | | | | | | | | | | | | | | |
Total distributions | | | — | | | | — | | | | — | | | | — | | | | (.20 | ) |
| | | | | | | | | | | | | | | | | | | | |
Net asset value, end of period | | $ | 28.20 | | | $ | 28.54 | | | $ | 22.96 | | | $ | 14.31 | | | $ | 23.57 | |
| | | | | | | | | | | | | | | | | | | | |
Total Returnb | | | (1.19 | )% | | | 24.30 | % | | | 60.45 | % | | | (39.29 | )% | | | (14.08 | )% |
| | | | | | | | | | | | | | | | | | | | |
Ratios/Supplemental Data | | | | | | | | | | | | | | | | | | | | |
Net assets, end of period (in thousands) | | $ | 670 | | | $ | 755 | | | $ | 1,313 | | | $ | 2,309 | | | $ | 909 | |
| | | | | | | | | | | | | | | | | | | | |
Ratios to average net assets: | | | | | | | | | | | | | | | | | | | | |
Net investment income (loss) | | | (0.89 | %) | | | (1.01 | %) | | | (0.81 | %) | | | (0.13 | %) | | | 1.26 | % |
Total expenses | | | 1.58 | % | | | 1.56 | % | | | 1.57 | % | | | 1.56 | % | | | 1.51 | % |
| | | | | | | | | | | | | | | | | | | | |
Portfolio turnover rate | | | 121 | % | | | 284 | % | | | 370 | % | | | 485 | % | | | 535 | % |
| | | | | |
C-Class | | Year Ended
March 31,
2012 | | | Year Ended
March 31,
2011 | | | Year Ended
March 31,
2010 | | | Year Ended
March 31,
2009 | | | Year Ended
March 31,
2008 | |
Per Share Data | | | | | | | | | | | | | | | | | | | | |
Net asset value, beginning of period | | $ | 27.46 | | | $ | 22.29 | | | $ | 14.00 | | | $ | 23.28 | | | $ | 27.48 | |
| | | | | | | | | | | | | | | | | | | | |
Income (loss) from investment operations: | | | | | | | | | | | | | | | | | | | | |
Net investment income (loss)a | | | (.46 | ) | | | (.47 | ) | | | (.34 | ) | | | (.15 | ) | | | .23 | |
Net gain (loss) on investments (realized and unrealized) | | | (.10 | ) | | | 5.64 | | | | 8.63 | | | | (9.13 | ) | | | (4.23 | ) |
| | | | | | | | | | | | | | | | | | | | |
Total from investment operations | | | (.56 | ) | | | 5.17 | | | | 8.29 | | | | (9.28 | ) | | | (4.00 | ) |
| | | | | | | | | | | | | | | | | | | | |
Less distributions from: | | | | | | | | | | | | | | | | | | | | |
Net investment income | | | — | | | | — | | | | — | | | | — | | | | (.20 | ) |
| | | | | | | | | | | | | | | | | | | | |
Total distributions | | | — | | | | — | | | | — | | | | — | | | | (.20 | ) |
| | | | | | | | | | | | | | | | | | | | |
Net asset value, end of period | | $ | 26.90 | | | $ | 27.46 | | | $ | 22.29 | | | $ | 14.00 | | | $ | 23.28 | |
| | | | | | | | | | | | | | | | | | | | |
Total Returnb | | | (2.04 | )% | | | 23.25 | % | | | 59.21 | % | | | (39.86 | )% | | | (14.63 | )% |
| | | | | | | | | | | | | | | | | | | | |
Ratios/Supplemental Data | | | | | | | | | | | | | | | | | | | | |
Net assets, end of period (in thousands) | | $ | 6,285 | | | $ | 7,068 | | | $ | 2,860 | | | $ | 2,123 | | | $ | 678 | |
| | | | | | | | | | | | | | | | | | | | |
Ratios to average net assets: | | | | | | | | | | | | | | | | | | | | |
Net investment income (loss) | | | (1.83 | )% | | | (1.87 | )% | | | (1.56 | )% | | | (0.82 | )% | | | 0.85 | % |
Total expenses | | | 2.34 | % | | | 2.31 | % | | | 2.30 | % | | | 2.29 | % | | | 2.27 | % |
| | | | | | | | | | | | | | | | | | | | |
Portfolio turnover rate | | | 121 | % | | | 284 | % | | | 370 | % | | | 485 | % | | | 535 | % |
| | |
SEE NOTES TO FINANCIAL STATEMENTS. | | THE RYDEX SERIES FUNDS ANNUAL REPORT | 127 |
RUSSELL 2000® FUND
FINANCIAL HIGHLIGHTS (concluded)
This table is presented to show selected data for a share outstanding throughout each period and to assist shareholders in evaluating a Fund’s performance for the periods presented.
| | | | | | | | | | | | | | | | | | | | |
H-Class | | Year Ended
March 31,
2012 | | | Year Ended
March 31,
2011 | | | Year Ended
March 31,
2010 | | | Year Ended
March 31,
2009 | | | Year Ended
March 31,
2008 | |
Per Share Data | | | | | | | | | | | | | | | | | | | | |
Net asset value, beginning of period | | $ | 28.52 | | | $ | 22.93 | | | $ | 14.31 | | | $ | 23.57 | | | $ | 27.64 | |
| | | | | | | | | | | | | | | | | | | | |
Income (loss) from investment operations: | | | | | | | | | | | | | | | | | | | | |
Net investment income (loss)a | | | (.22 | ) | | | (.27 | ) | | | (.16 | ) | | | (.02 | ) | | | .51 | |
Net gain (loss) on investments (realized and unrealized) | | | (.14 | ) | | | 5.86 | | | | 8.78 | | | | (9.24 | ) | | | (4.38 | ) |
| | | | | | | | | | | | | | | | | | | | |
Total from investment operations | | | (.36 | ) | | | 5.59 | | | | 8.62 | | | | (9.26 | ) | | | (3.87 | ) |
| | | | | | | | | | | | | | | | | | | | |
Less distributions from: | | | | | | | | | | | | | | | | | | | | |
Net investment income | | | — | | | | — | | | | — | | | | — | | | | (.20 | ) |
| | | | | | | | | | | | | | | | | | | | |
Total distributions | | | — | | | | — | | | | — | | | | — | | | | (.20 | ) |
| | | | | | | | | | | | | | | | | | | | |
Net asset value, end of period | | $ | 28.16 | | | $ | 28.52 | | | $ | 22.93 | | | $ | 14.31 | | | $ | 23.57 | |
| | | | | | | | | | | | | | | | | | | | |
Total Returnb | | | (1.26 | )% | | | 24.32 | % | | | 60.24 | % | | | (39.29 | )% | | | (14.08 | )% |
| | | | | | | | | | | | | | | | | | | | |
Ratios/Supplemental Data | | | | | | | | | | | | | | | | | | | | |
Net assets, end of period (in thousands) | | $ | 63,447 | | | $ | 32,389 | | | $ | 32,790 | | | $ | 19,847 | | | $ | 4,327 | |
| | | | | | | | | | | | | | | | | | | | |
Ratios to average net assets: | | | | | | | | | | | | | | | | | | | | |
Net investment income (loss) | | | (0.83 | )% | | | (1.09 | )% | | | (0.83 | )% | | | (0.09 | )% | | | 1.86 | % |
Total expenses | | | 1.58 | % | | | 1.57 | % | | | 1.56 | % | | | 1.55 | % | | | 1.52 | % |
| | | | | | | | | | | | | | | | | | | | |
Portfolio turnover rate | | | 121 | % | | | 284 | % | | | 370 | % | | | 485 | % | | | 535 | % |
| a | Net investment income (loss) per share was computed using average shares outstanding throughout the period. |
| b | Total return does not reflect the impact of any applicable sales charges and has not been annualized. |
| | |
128 | THE RYDEX SERIES FUNDS ANNUAL REPORT | | SEE NOTES TO FINANCIAL STATEMENTS. |
This page intentionally left blank.
THE RYDEX SERIES FUNDS ANNUAL REPORT | 129
| | |
PERFORMANCE REPORT AND FUND PROFILE (Unaudited) | | March 31, 2012 |
INVERSE RUSSELL 2000® STRATEGY FUND
OBJECTIVE: Seeks to provide investment results that match, before fees and expenses, the performance of a specific benchmark on a daily basis. The Fund’s current benchmark is the inverse (opposite) of the performance of the Russell 2000® Index (the “underlying index”). The Fund does not seek to achieve its investment objective over a period of time greater than one day.
For the one-year period ended March 31, 2012, Inverse Russell 2000® Strategy Fund maintained a daily correlation of over 99% to its benchmark of -100% of the daily price movement of the Russell 2000 Index. Inverse Russell 2000® Strategy Fund H-Class returned -11.72% while the Russell 2000 Index* returned -0.18% over the same period.
The biggest performance contributors to the index during the period were the Financials and Health Care sectors. Energy and Information Technology provided the least performance to the index during the year.
Medivation, Inc., Nu Skin Enterprises, Inc. — Class A and Inhibitex, Inc. were among the stocks which provided the most performance to the index during the year. MF Global Holdings Ltd., InterMune, Inc. and Patriot Coal Corp. were among the stocks which provided the least performance to the index during the year.
Derivatives in the Fund were used to help provide exposure to the composition of the benchmark in the highest efficient manner and not for hedging purposes. The results of derivatives use during the period were within our expectations and contributed to the Fund’s performance.
Due to the compounding of daily returns, leveraged and inverse funds’ returns over periods other than one day will likely differ in amount and possibly direction from the benchmark return for the same period. Investors should monitor their leveraged and inverse funds’ holdings to ensure that they are consistent with their strategies, as frequently as daily.
The effects of compounding may cause the longer-term correlation of the fund to its benchmark to diminish. The apparent discrepancy between the leveraged and unleveraged indices is the result of compounding, which is described briefly on page 4 of this report.
*Russell 2000® Index measures the performance of the small-cap value segment of the U.S. equity universe.
Performance displayed represents past performance which is no guarantee of future results.
Holdings Diversification (Market Exposure as % of Net Assets)
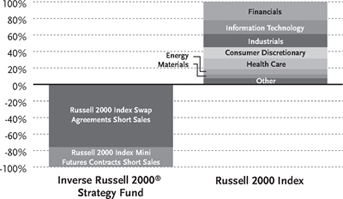
“Holdings Diversification (Market Exposure as % of Net Assets)” excludes any temporary cash investments.
| | | | |
Inception Dates: | | | |
A-Class | | | March 31, 2004 | |
C-Class | | | February 20, 2004 | |
H-Class | | | February 20, 2004 | |
The Fund invests principally in derivative investments such as swap agreements and futures contracts.
130 | THE RYDEX SERIES FUNDS ANNUAL REPORT
PERFORMANCE REPORT AND FUND PROFILE (Unaudited) (concluded)
Cumulative Fund Performance*
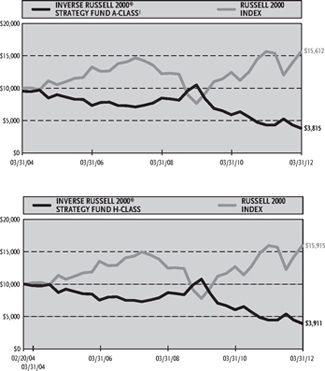
Average Annual Returns*
Periods Ended 03/31/12
| | | | | | | | | | | | |
| | | 1 Year | | | 5 Year | | | Since
Inception
(03/31/04) | |
A-Class Shares | | | -11.68 | % | | | -12.15 | % | | | -10.81 | % |
A-Class Shares with sales charge‡ | | | -15.90 | % | | | -13.01 | % | | | -11.35 | % |
Russell 2000 Index | | | -0.18 | % | | | 2.13 | % | | | 5.73 | % |
| | | | | | | | | | | (02/20/04 | ) |
C-Class Shares | | | -12.29 | % | | | -12.80 | % | | | -11.59 | % |
C-Class Shares with CDSC† | | | -13.17 | % | | | -12.80 | % | | | -11.59 | % |
H-Class Shares | | | -11.72 | % | | | -12.16 | % | | | -10.93 | % |
Russell 2000 Index | | | -0.18 | % | | | 2.13 | % | | | 5.90 | % |
| * | The performance data above represents past performance that is not predictive of future results. The investment return and principal value of an investment in the Fund will fluctuate so that an investor’s shares, when redeemed, may be worth more or less than their original cost. Returns are historical and include changes in principal and reinvested dividends and capital gains and do not reflect the effect of taxes. The Russell 2000 Index is an unmanaged index and, unlike the Fund, has no management fees or operating expenses to reduce its reported return. The graphs are based on A-Class shares and H-Class shares only; performance for C-Class shares will vary due to differences in fee structures. |
| † | Fund returns include a CDSC of 1% if redeemed within 12 months of purchase. |
| ‡ | Fund returns are calculated using the maximum sales charge of 4.75%. |
THE RYDEX SERIES FUNDS ANNUAL REPORT | 131
| | |
| SCHEDULE OF INVESTMENTS | | March 31, 2012 |
INVERSE RUSSELL 2000® STRATEGY FUND | | |
| | | | | | | | |
| | | FACE
AMOUNT | | | VALUE | |
REPURCHASE AGREEMENTS††,1 - 98.7% | | | | | | | | |
HSBC Group issued 03/30/12 at 0.01% due 04/02/12 | | $ | 10,827,958 | | | $ | 10,827,958 | |
Credit Suisse Group issued 03/30/12 at 0.01% due 04/02/122 | | | 3,802,812 | | | | 3,802,812 | |
Mizuho Financial Group, Inc. issued 03/30/12 at 0.01% due 04/02/12 | | | 3,046,439 | | | | 3,046,439 | |
Deutsche Bank issued 03/30/12 at 0.01% due 04/02/12 | | | 809,710 | | | | 809,710 | |
| | | | | | | | |
Total Repurchase Agreements
(Cost $18,486,919) | | | | | | | 18,486,919 | |
| | | | | | | | |
Total Investments – 98.7%
(Cost $18,486,919) | | | | | | $ | 18,486,919 | |
| | | | | | | | |
Other Assets & Liabilities, net – 1.3% | | | | | | | 244,716 | |
| | | | | | | | |
Total Net Assets – 100.0% | | | | | | $ | 18,731,635 | |
| |
| | | | | | | | |
| | | CONTRACTS | | | UNREALIZED
GAIN (LOSS) | |
FUTURES CONTRACTS SOLD SHORT† | | | | | | | | |
June 2012 Russell 2000 Index Mini Futures Contracts (Aggregate Value of Contracts $4,465,800) | | | 54 | | | $ | (111,362 | ) |
| | | | | | | | |
| | |
| | | UNITS | | | | |
EQUITY INDEX SWAP AGREEMENTS SOLD SHORT†† | | | | | | | | |
Credit Suisse Capital, LLC April 2012 Russell 2000 Index Swap, Terminating 04/30/123 (Notional Value $12,457,336) | | | 15,003 | | | $ | 28,571 | |
Goldman Sachs International April 2012 Russell 2000 Index Swap, Terminating 04/27/123 (Notional Value $549,450) | | | 662 | | | | 10,205 | |
Morgan Stanley Capital Services, Inc. April 2012 Russell 2000 Index Swap, Terminating 04/30/123 (Notional Value $410,590) | | | 495 | | | | 4,557 | |
Barclays Bank plc April 2012 Russell 2000 Index Swap, Terminating 04/30/123 (Notional Value $766,867) | | | 924 | | | | 1,775 | |
| | | | | | | | |
(Total Notional Value $14,184,243) | | | | | | $ | 45,108 | |
| | | | | | | | |
| † | Value determined based on Level 1 inputs — See Note 4. |
| †† | Value determined based on Level 2 inputs — See Note 4. |
| 1 | Repurchase Agreements — See Note 5. |
| 2 | All or a portion of this security is pledged as equity index swap collateral at March 31, 2012. |
| 3 | Total Return based on Russell 2000 Index +/- financing at a variable rate. |
| | plc —Public Limited Company |
| | |
132 | THE RYDEX SERIES FUNDS ANNUAL REPORT | | SEE NOTES TO FINANCIAL STATEMENTS. |
INVERSE RUSSELL 2000® STRATEGY FUND
STATEMENT OF ASSETS AND LIABILITIES
| | | | |
| March 31, 2012 | | | |
| |
ASSETS: | | | | |
Repurchase agreements, at value (cost $18,486,919) | | $ | 18,486,919 | |
| | | | |
Total investments (cost $18,486,919) | | | 18,486,919 | |
Segregated cash with broker | | | 339,995 | |
Unrealized appreciation on swap agreements | | | 45,108 | |
Receivable for swap settlement | | | 231 | |
Receivables: | | | | |
Variation margin | | | 19,440 | |
Fund shares sold | | | 11,824 | |
Interest | | | 10 | |
| | | | |
Total assets | | | 18,903,527 | |
| | | | |
LIABILITIES: | | | | |
Payable for: | | | | |
Fund shares redeemed | | | 146,408 | |
Management fees | | | 15,318 | |
Distribution and service fees | | | 4,779 | |
Transfer agent and administrative fees | | | 4,255 | |
Portfolio accounting fees | | | 1,702 | |
Miscellaneous | | | (570 | ) |
| | | | |
Total liabilities | | | 171,892 | |
| | | | |
NET ASSETS | | $ | 18,731,635 | |
| | | | |
NET ASSETS CONSIST OF: | | | | |
Paid in capital | | $ | 72,433,612 | |
Accumulated net investment loss | | | (70,742 | ) |
Accumulated net realized loss on investments | | | (53,564,981 | ) |
Net unrealized depreciation on investments | | | (66,254 | ) |
| | | | |
Net assets | | $ | 18,731,635 | |
| | | | |
A-CLASS: | | | | |
Net assets | | $ | 612,293 | |
Capital shares outstanding | | | 35,069 | |
Net asset value per share | | $ | 17.46 | |
| | | | |
Maximum offering price per share (Net asset value divided by 95.25%) | | $ | 18.33 | |
| | | | |
C-CLASS: | | | | |
Net assets | | $ | 836,529 | |
Capital shares outstanding | | | 50,988 | |
Net asset value per share | | $ | 16.41 | |
| | | | |
H-CLASS: | | | | |
Net assets | | $ | 17,282,813 | |
Capital shares outstanding | | | 989,057 | |
Net asset value per share | | $ | 17.47 | |
| | | | |
STATEMENT OF OPERATIONS
| | | | |
| Year Ended March 31, 2012 | | | |
| |
INVESTMENT INCOME: | | | | |
Interest | | $ | 13,923 | |
| | | | |
Total investment income | | | 13,923 | |
| | | | |
EXPENSES: | | | | |
Management fees | | | 178,949 | |
Transfer agent and administrative fees | | | 49,708 | |
Distribution and service fees: | | | | |
A-Class | | | 3,197 | |
C-Class | | | 10,310 | |
H-Class | | | 43,934 | |
Portfolio accounting fees | | | 19,883 | |
Licensing fees | | | 20,568 | |
Custodian fees | | | 6,752 | |
Trustees’ fees* | | | 1,621 | |
Miscellaneous | | | 23,346 | |
| | | | |
Total expenses | | | 358,268 | |
| | | | |
Net investment loss | | | (344,345 | ) |
| | | | |
NET REALIZEDAND UNREALIZED GAIN (LOSS): | | | | |
Net realized gain (loss) on: | | | | |
Swap agreements | | | (1,284,144 | ) |
Futures contracts | | | (1,201,924 | ) |
| | | | |
Net realized loss | | | (2,486,068 | ) |
| | | | |
Net change in unrealized appreciation (depreciation) on: | | | | |
Investments | | | (3,616 | ) |
Swap agreements | | | 308,282 | |
Futures contracts | | | (105,852 | ) |
| | | | |
Net change in unrealized appreciation (depreciation) | | | 198,814 | |
| | | | |
Net realized and unrealized loss | | | (2,287,254 | ) |
| | | | |
Net decrease in net assets resulting from operations | | $ | (2,631,599 | ) |
| | | | |
| * | Relates to Trustees not deemed “interested persons” within the meaning of Section 2(a)(19) of the 1940 Act. |
| | |
SEE NOTES TO FINANCIAL STATEMENTS. | | THE RYDEX SERIES FUNDS ANNUAL REPORT | 133 |
INVERSE RUSSELL 2000® STRATEGY FUND
STATEMENTS OF CHANGES IN NET ASSETS
| | | | | | | | |
| | | Year Ended
March 31,
2012 | | | Year Ended
March 31,
2011 | |
INCREASE (DECREASE) IN NET ASSETS FROM OPERATIONS: | | | | | | | | |
Net investment loss | | $ | (344,345 | ) | | $ | (428,511 | ) |
Net realized loss on investments | | | (2,486,068 | ) | | | (9,330,901 | ) |
Net change in unrealized appreciation (depreciation) on investments | | | 198,814 | | | | (192 | ) |
| | | | | | | | |
Net decrease in net assets resulting from operations | | | (2,631,599 | ) | | | (9,759,604 | ) |
| | | | | | | | |
| | |
CAPITALSHARETRANSACTIONS: | | | | | | | | |
PROCEEDSFROMSALEOFSHARES | | | | | | | | |
A-Class | | | 7,173,118 | | | | 7,959,272 | |
C-Class | | | 6,283,582 | | | | 15,298,718 | |
H-Class | | | 201,994,386 | | | | 454,278,543 | |
COSTOFSHARESREDEEMED | | | | | | | | |
A-Class | | | (7,494,667 | ) | | | (7,860,444 | ) |
C-Class | | | (6,502,435 | ) | | | (15,531,833 | ) |
H-Class | | | (191,935,153 | ) | | | (462,232,894 | ) |
| | | | | | | | |
Net increase (decrease) from capital share transactions | | | 9,518,831 | | | | (8,088,638 | ) |
| | | | | | | | |
Net increase (decrease) in net assets | | | 6,887,232 | | | | (17,848,242 | ) |
| | |
NETASSETS: | | | | | | | | |
Beginning of year | | | 11,844,403 | | | | 29,692,645 | |
| | | | | | | | |
End of year | | $ | 18,731,635 | | | $ | 11,844,403 | |
| | | | | | | | |
Accumulated net investment loss at end of year | | $ | (70,742 | ) | | $ | — | |
| | | | | | | | |
CAPITALSHAREACTIVITY: | | | | | | | | |
Shares sold | | | | | | | | |
A-Class | | | 336,649 | | | | 308,625 | |
C-Class | | | 310,758 | | | | 580,595 | |
H-Class | | | 9,760,842 | | | | 18,194,735 | |
Shares redeemed | | | | | | | | |
A-Class | | | (357,933 | ) | | | (317,626 | ) |
C-Class | | | (321,668 | ) | | | (596,494 | ) |
H-Class | | | (9,255,491 | ) | | | (18,670,803 | ) |
| | | | | | | | |
Net increase (decrease) in shares | | | 473,157 | | | | (500,968 | ) |
| | | | | | | | |
| | |
134 | THE RYDEX SERIES FUNDS ANNUAL REPORT | | SEE NOTES TO FINANCIAL STATEMENTS. |
INVERSE RUSSELL 2000® STRATEGY FUND
FINANCIAL HIGHLIGHTS
This table is presented to show selected data for a share outstanding throughout each period and to assist shareholders in evaluating a Fund’s performance for the periods presented.
| | | | | | | | | | | | | | | | | | | | |
A-Class | | Year Ended
March 31,
2012 | | | Year Ended
March 31,
2011 | | | Year Ended
March 31,
2010 | | | Year Ended
March 31,
2009 | | | Year Ended
March 31,
2008 | |
Per Share Data | | | | | | | | | | | | | | | | | | | | |
Net asset value, beginning of period | | $ | 19.77 | | | $ | 27.00 | | | $ | 48.02 | | | $ | 39.05 | | | $ | 35.00 | |
| | | | | | | | | | | | | | | | | | | | |
Income (loss) from investment operations: | | | | | | | | | | | | | | | | | | | | |
Net investment income (loss)a | | | (.34 | ) | | | (.38 | ) | | | (.54 | ) | | | (.21 | ) | | | 1.06 | |
Net gain (loss) on investments (realized and unrealized) | | | (1.97 | ) | | | (6.85 | ) | | | (20.48 | ) | | | 9.57 | | | | 4.40 | |
| | | | | | | | | | | | | | | | | | | | |
Total from investment operations | | | (2.31 | ) | | | (7.23 | ) | | | (21.02 | ) | | | 9.36 | | | | 5.46 | |
| | | | | | | | | | | | | | | | | | | | |
Less distributions from: | | | | | | | | | | | | | | | | | | | | |
Net investment income | | | — | | | | — | | | | — | | | | (.39 | ) | | | (1.41 | ) |
| | | | | | | | | | | | | | | | | | | | |
Total distributions | | | — | | | | — | | | | — | | | | (.39 | ) | | | (1.41 | ) |
| | | | | | | | | | | | | | | | | | | | |
Net asset value, end of period | | $ | 17.46 | | | $ | 19.77 | | | $ | 27.00 | | | $ | 48.02 | | | $ | 39.05 | |
| | | | | | | | | | | | | | | | | | | | |
Total Returnb | | | (11.68 | %) | | | (26.78 | %) | | | (43.77 | %) | | | 23.91 | % | | | 16.11 | % |
| | | | | | | | | | | | | | | | | | | | |
Ratios/Supplemental Data | | | | | | | | | | | | | | | | | | | | |
Net assets, end of period (in thousands) | | $ | 612 | | | $ | 1,114 | | | $ | 1,765 | | | $ | 2,299 | | | $ | 6,816 | |
| | | | | | | | | | | | | | | | | | | | |
Ratios to average net assets: | | | | | | | | | | | | | | | | | | | | |
Net investment income (loss) | | | (1.66 | %) | | | (1.53 | %) | | | (1.58 | %) | | | (0.50 | %) | | | 2.96 | % |
Total expenses | | | 1.75 | % | | | 1.71 | % | | | 1.71 | % | | | 1.96 | % | | | 1.89 | % |
Operating expensesc | | | 1.75 | % | | | 1.71 | % | | | 1.71 | % | | | 1.71 | % | | | 1.89 | % |
| | | | | | | | | | | | | | | | | | | | |
Portfolio turnover rate | | | — | | | | — | | | | — | | | | 214 | % | | | — | |
| | | | | | | | | | | | | | | | | | | | |
C-Class | | Year Ended
March 31,
2012 | | | Year Ended
March 31,
2011 | | | Year Ended
March 31,
2010 | | | Year Ended
March 31,
2009 | | | Year Ended
March 31,
2008 | |
Per Share Data | | | | | | | | | | | | | | | | | | | | |
Net asset value, beginning of period | | $ | 18.71 | | | $ | 25.75 | | | $ | 46.15 | | | $ | 37.80 | | | $ | 34.18 | |
| | | | | | | | | | | | | | | | | | | | |
Income (loss) from investment operations: | | | | | | | | | | | | | | | | | | | | |
Net investment income (loss)a | | | (.47 | ) | | | (.55 | ) | | | (.76 | ) | | | (.40 | ) | | | .76 | |
Net gain (loss) on investments (realized and unrealized) | | | (1.83 | ) | | | (6.49 | ) | | | (19.64 | ) | | | 9.14 | | | | 4.27 | |
| | | | | | | | | | | | | | | | | | | | |
Total from investment operations | | | (2.30 | ) | | | (7.04 | ) | | | (20.40 | ) | | | 8.74 | | | | 5.03 | |
| | | | | | | | | | | | | | | | | | | | |
Less distributions from: | | | | | | | | | | | | | | | | | | | | |
Net investment income | | | — | | | | — | | | | — | | | | (.39 | ) | | | (1.41 | ) |
| | | | | | | | | | | | | | | | | | | | |
Total distributions | | | — | | | | — | | | | — | | | | (.39 | ) | | | (1.41 | ) |
| | | | | | | | | | | | | | | | | | | | |
Net asset value, end of period | | $ | 16.41 | | | $ | 18.71 | | | $ | 25.75 | | | $ | 46.15 | | | $ | 37.80 | |
| | | | | | | | | | | | | | | | | | | | |
Total Returnb | | | (12.29 | %) | | | (27.34 | %) | | | (44.20 | %) | | | 23.06 | % | | | 15.22 | % |
| | | | | | | | | | | | | | | | | | | | |
Ratios/Supplemental Data | | | | | | | | | | | | | | | | | | | | |
Net assets, end of period (in thousands) | | $ | 837 | | | $ | 1,158 | | | $ | 2,003 | | | $ | 2,199 | | | $ | 6,136 | |
| | | | | | | | | | | | | | | | | | | | |
Ratios to average net assets: | | | | | | | | | | | | | | | | | | | | |
Net investment income (loss) | | | (2.43 | %) | | | (2.28 | %) | | | (2.34 | %) | | | (1.03 | %) | | | 2.17 | % |
Total expenses | | | 2.51 | % | | | 2.46 | % | | | 2.46 | % | | | 2.76 | % | | | 2.67 | % |
Operating expensesc | | | 2.51 | % | | | 2.46 | % | | | 2.46 | % | | | 2.45 | % | | | 2.67 | % |
| | | | | | | | | | | | | | | | | | | | |
Portfolio turnover rate | | | — | | | | — | | | | — | | | | 214 | % | | | — | |
| | |
SEE NOTES TO FINANCIAL STATEMENTS. | | THE RYDEX SERIES FUNDS ANNUAL REPORT | 135 |
INVERSE RUSSELL 2000® STRATEGY FUND
FINANCIAL HIGHLIGHTS (concluded)
This table is presented to show selected data for a share outstanding throughout each period and to assist shareholders in evaluating a Fund’s performance for the periods presented.
| | | | | | | | | | | | | | | | | | | | |
H-Class | | Year Ended
March 31,
2012 | | | Year Ended
March 31,
2011 | | | Year Ended
March 31,
2010 | | | Year Ended
March 31,
2009 | | | Year Ended
March 31,
2008 | |
Per Share Data | | | | | | | | | | | | | | | | | | | | |
Net asset value, beginning of period | | $ | 19.79 | | | $ | 27.01 | | | $ | 48.05 | | | $ | 39.07 | | | $ | 35.02 | |
| | | | | | | | | | | | | | | | | | | | |
Income (loss) from investment operations: | | | | | | | | | | | | | | | | | | | | |
Net investment income (loss)a | | | (.35 | ) | | | (.38 | ) | | | (.53 | ) | | | (.19 | ) | | | 1.05 | |
Net gain (loss) on investments (realized and unrealized) | | | (1.97 | ) | | | (6.84 | ) | | | (20.51 | ) | | | 9.56 | | | | 4.41 | |
| | | | | | | | | | | | | | | | | | | | |
Total from investment operations | | | (2.32 | ) | | | (7.22 | ) | | | (21.04 | ) | | | 9.37 | | | | 5.46 | |
| | | | | | | | | | | | | | | | | | | | |
Less distributions from: | | | | | | | | | | | | | | | | | | | | |
Net investment income | | | — | | | | — | | | | — | | | | (.39 | ) | | | (1.41 | ) |
| | | | | | | | | | | | | | | | | | | | |
Total distributions | | | — | | | | — | | | | — | | | | (.39 | ) | | | (1.41 | ) |
| | | | | | | | | | | | | | | | | | | | |
Net asset value, end of period | | $ | 17.47 | | | $ | 19.79 | | | $ | 27.01 | | | $ | 48.05 | | | $ | 39.07 | |
| | | | | | | | | | | | | | | | | | | | |
Total Returnb | | | (11.72 | %) | | | (26.73 | %) | | | (43.79 | %) | | | 23.93 | % | | | 16.10 | % |
| | | | | | | | | | | | | | | | | | | | |
Ratios/Supplemental Data | | | | | | | | | | | | | | | | | | | | |
Net assets, end of period (in thousands) | | $ | 17,283 | | | $ | 9,572 | | | $ | 25,924 | | | $ | 30,131 | | | $ | 42,554 | |
| | | | | | | | | | | | | | | | | | | | |
Ratios to average net assets: | | | | | | | | | | | | | | | | | | | | |
Net investment income (loss) | | | (1.70 | %) | | | (1.53 | %) | | | (1.58 | %) | | | (0.45 | %) | | | 2.93 | % |
Total expenses | | | 1.77 | % | | | 1.71 | % | | | 1.71 | % | | | 1.97 | % | | | 1.89 | % |
Operating expensesc | | | 1.77 | % | | | 1.71 | % | | | 1.71 | % | | | 1.70 | % | | | 1.89 | % |
| | | | | | | | | | | | | | | | | | | | |
Portfolio turnover rate | | | — | | | | — | | | | — | | | | 214 | % | | | — | |
| a | Net investment income (loss) per share was computed using average shares outstanding throughout the period. |
| b | Total return does not reflect the impact of any applicable sales charges and has not been annualized. |
| c | Operating expenses exclude dividend expense from securities sold short. |
| | |
136 | THE RYDEX SERIES FUNDS ANNUAL REPORT | | SEE NOTES TO FINANCIAL STATEMENTS. |
This page intentionally left blank.
THE RYDEX SERIES FUNDS ANNUAL REPORT | 137
| | |
PERFORMANCE REPORT AND FUND PROFILE (Unaudited) | | March 31, 2012 |
S&P 500 PURE GROWTH FUND
OBJECTIVE: Seeks to provide investment results that match, before fees and expenses, the performance of a benchmark for large-cap growth securities on a daily basis. The Fund’s current benchmark is the S&P 500 Pure Growth Index (the “underlying index”)
For the one-year period ended March 31, 2012, S&P 500 Pure Growth Fund H-Class returned 4.96%, compared with 6.88% for the S&P 500 Pure Growth Index*. S&P 500 Pure Growth Fund maintained a daily correlation of over 99% to its benchmark. Large-cap growth stocks slightly outperformed large-cap value stocks during the period.
The Consumer Discretionary sector was the biggest contributor to returns, followed by the Health Care sector and Financials sector. Information Technology and Energy were the sectors detracting most from return.
The stocks contributing most to performance in the index were Apple, Inc., Ross Stores, Inc. and Intuitive Surgical, Inc. Those detracting the most from performance in the index were Netflix, Inc., First Solar, Inc. and Micron Technology, Inc.
*The S&P 500® Pure Growth Index is narrow in focus, containing only those S&P 500 Index companies with strong growth characteristics as selected by S&P. The S&P 500 Index is a capitalization-weighted index covering 500 industrial, utility, transportation and financial companies of the U.S. markets (mostly NYSE Euronext issues).
Performance displayed represents past performance which is no guarantee of future results.
Holdings Diversification (Market Exposure as % of Net Assets)
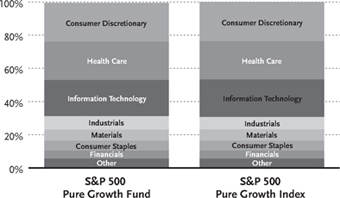
“Holdings Diversification (Market Exposure as % of Net Assets)” excludes any temporary cash investments.
| | | | |
Inception Dates: | | | |
A-Class | | | September 1, 2004 | |
C-Class | | | February 20, 2004 | |
H-Class | | | February 20, 2004 | |
| | |
Ten Largest Holdings (% of Total Net Assets) |
| | | | |
Apple, Inc. | | | 1.8 | % |
Netflix, Inc. | | | 1.7 | % |
Priceline.com, Inc. | | | 1.5 | % |
Visa, Inc. — Class A | | | 1.4 | % |
Medco Health Solutions, Inc. | | | 1.3 | % |
Intuitive Surgical, Inc. | | | 1.3 | % |
Celgene Corp. | | | 1.3 | % |
Salesforce.com, Inc. | | | 1.3 | % |
Chipotle Mexican Grill, Inc. — Class A | | | 1.3 | % |
F5 Networks, Inc. | | | 1.2 | % |
| | | | |
Top Ten Total | | | 14.1 | % |
| | | | |
“Ten Largest Holdings” exclude any temporary cash or derivative investments.
138 | THE RYDEX SERIES FUNDS ANNUAL REPORT
PERFORMANCE REPORT AND FUND PROFILE (Unaudited) (concluded)
Cumulative Fund Performance*
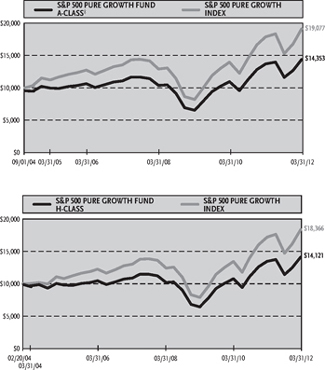
Average Annual Returns*
Periods Ended 03/31/12
| | | | | | | | | | | | |
| | | 1 Year | | | 5 Year | | | Since
Inception
(09/01/04) | |
A-Class Shares | | | 4.96 | % | | | 5.37 | % | | | 5.56 | % |
A-Class Shares with sales charge‡ | | | -0.02 | % | | | 4.35 | % | | | 4.88 | % |
S&P 500 Pure Growth Index | | | 6.88 | % | | | 7.12 | % | | | 8.90 | % |
| | | | | | | | | | | (02/20/04 | ) |
C-Class Shares | | | 4.15 | % | | | 4.55 | % | | | 3.57 | % |
C-Class Shares with CDSC† | | | 3.15 | % | | | 4.55 | % | | | 3.57 | % |
H-Class Shares | | | 4.96 | % | | | 5.36 | % | | | 4.35 | % |
S&P 500 Pure Growth Index | | | 6.88 | % | | | 7.12 | % | | | 7.78 | % |
| * | The performance data above represents past performance that is not predictive of future results. The investment return and principal value of an investment in the Fund will fluctuate so that an investor’s shares, when redeemed, may be worth more or less than their original cost. Returns are historical and include changes in principal and reinvested dividends and capital gains and do not reflect the effect of taxes. The S&P 500 Pure Growth Index is an unmanaged index and, unlike the Fund, has no management fees or operating expenses to reduce its reported return. The graphs are based on A-Class shares and H-Class shares only; performance for C-Class shares will vary due to differences in fee structures. |
| † | Fund returns include a CDSC of 1% if redeemed within 12 months of purchase. |
| ‡ | Fund returns are calculated using the maximum sales charge of 4.75%. |
THE RYDEX SERIES FUNDS ANNUAL REPORT | 139
| | |
| SCHEDULE OF INVESTMENTS | | March 31, 2012 |
S&P 500 PURE GROWTH FUND | | |
| | | | | | | | |
| | | SHARES | | | VALUE | |
COMMON STOCKS† - 99.5% | | | | | | | | |
| | |
CONSUMER DISCRETIONARY - 23.4% | | | | | | | | |
Netflix, Inc.* | | | 7,635 | | | $ | 878,329 | |
Priceline.com, Inc.* | | | 1,041 | | | | 746,918 | |
Chipotle Mexican Grill, Inc. — Class A* | | | 1,539 | | | | 643,302 | |
Coach, Inc. | | | 7,927 | | | | 612,599 | |
O’Reilly Automotive, Inc.* | | | 6,681 | | | | 610,309 | |
Ross Stores, Inc. | | | 10,433 | | | | 606,158 | |
AutoZone, Inc.* | | | 1,628 | | | | 605,290 | |
Dollar Tree, Inc.* | | | 6,106 | | | | 576,956 | |
Discovery Communications, Inc. — Class A* | | | 11,203 | | | | 566,872 | |
Amazon.com, Inc.* | | | 2,666 | | | | 539,892 | |
DIRECTV — Class A* | | | 10,397 | | | | 512,988 | |
TJX Companies, Inc. | | | 11,368 | | | | 451,423 | |
DeVry, Inc. | | | 13,280 | | | | 449,794 | |
Scripps Networks Interactive, Inc. — Class A | | | 9,184 | | | | 447,169 | |
Family Dollar Stores, Inc. | | | 6,965 | | | | 440,745 | |
Apollo Group, Inc. — Class A* | | | 10,502 | | | | 405,797 | |
Wynn Resorts Ltd. | | | 2,871 | | | | 358,530 | |
Ralph Lauren Corp. — Class A | | | 2,045 | | | | 356,505 | |
Bed Bath & Beyond, Inc.* | | | 5,363 | | | | 352,725 | |
Yum! Brands, Inc. | | | 4,747 | | | | 337,891 | |
McDonald’s Corp. | | | 3,019 | | | | 296,164 | |
NIKE, Inc. — Class B | | | 2,570 | | | | 278,691 | |
Viacom, Inc. — Class B | | | 5,698 | | | | 270,427 | |
Tiffany & Co. | | | 3,166 | | | | 218,866 | |
Starbucks Corp. | | | 3,726 | | | | 208,246 | |
VF Corp. | | | 1,390 | | | | 202,912 | |
| | | | | | | | |
Total Consumer Discretionary | | | | | | | 11,975,498 | |
| | | | | | | | |
HEALTH CARE—23.1% | | | | | | | | |
Medco Health Solutions, Inc.* | | | 9,524 | | | | 669,537 | |
Intuitive Surgical, Inc.* | | | 1,231 | | | | 666,895 | |
Celgene Corp.* | | | 8,571 | | | | 664,424 | |
Biogen Idec, Inc.* | | | 4,689 | | | | 590,673 | |
Express Scripts Holding Co. | | | 10,620 | | | | 575,392 | |
Mylan, Inc.* | | | 24,280 | | | | 569,366 | |
Gilead Sciences, Inc.* | | | 11,069 | | | | 540,721 | |
Perrigo Co. | | | 4,900 | | | | 506,219 | |
UnitedHealth Group, Inc. | | | 7,980 | | | | 470,341 | |
CR Bard, Inc. | | | 4,370 | | | | 431,406 | |
Laboratory Corporation of America Holdings* | | | 4,612 | | | | 422,182 | |
Abbott Laboratories | | | 6,680 | | | | 409,417 | |
Edwards Lifesciences Corp.* | | | 5,500 | | | | 400,015 | |
Varian Medical Systems, Inc.* | | | 5,740 | | | | 395,830 | |
DaVita, Inc.* | | | 4,170 | | | | 376,009 | |
Amgen, Inc. | | | 5,240 | | | | 356,268 | |
Zimmer Holdings, Inc. | | | 5,410 | | | | 347,755 | |
Life Technologies Corp.* | | | 7,093 | | | | 346,281 | |
Waters Corp.* | | | 3,737 | | | | 346,270 | |
Baxter International, Inc. | | | 5,710 | | | | 341,344 | |
Cerner Corp.* | | | 4,332 | | | | 329,925 | |
Stryker Corp. | | | 5,840 | | | | 324,003 | |
Quest Diagnostics, Inc. | | | 5,150 | | | | 314,923 | |
St. Jude Medical, Inc. | | | 6,991 | | | | 309,771 | |
| | | | | | | | |
| | | SHARES | | | VALUE | |
Becton Dickinson and Co. | | | 3,860 | | | $ | 299,729 | |
Allergan, Inc. | | | 3,056 | | | | 291,634 | |
Watson Pharmaceuticals, Inc.* | | | 4,200 | | | | 281,652 | |
Johnson & Johnson | | | 3,170 | | | | 209,093 | |
| | | | | | | | |
Total Health Care | | | | | | | 11,787,075 | |
| | | | | | | | |
INFORMATION TECHNOLOGY—21.8% | | | | | | | | |
Apple, Inc.* | | | 1,530 | | | | 917,189 | |
Visa, Inc. — Class A | | | 5,877 | | | | 693,485 | |
Salesforce.com, Inc.* | | | 4,165 | | | | 643,534 | |
F5 Networks, Inc.* | | | 4,608 | | | | 621,896 | |
Red Hat, Inc.* | | | 9,918 | | | | 593,989 | |
Cognizant Technology Solutions Corp. — Class A* | | | 7,565 | | | | 582,127 | |
Google, Inc. — Class A* | | | 849 | | | | 544,413 | |
Broadcom Corp. — Class A* | | | 11,733 | | | | 461,107 | |
Altera Corp. | | | 11,527 | | | | 459,005 | |
KLA-Tencor Corp. | | | 8,129 | | | | 442,380 | |
Mastercard, Inc. — Class A | | | 1,025 | | | | 431,054 | |
QUALCOMM, Inc. | | | 6,069 | | | | 412,813 | |
SanDisk Corp.* | | | 8,153 | | | | 404,308 | |
Intuit, Inc. | | | 6,713 | | | | 403,653 | |
Teradata Corp.* | | | 5,685 | | | | 387,433 | |
NetApp, Inc.* | | | 8,433 | | | | 377,545 | |
Citrix Systems, Inc.* | | | 4,566 | | | | 360,303 | |
Microchip Technology, Inc. | | | 9,586 | | | | 356,599 | |
Amphenol Corp. — Class A | | | 5,948 | | | | 355,512 | |
Fiserv, Inc.* | | | 4,590 | | | | 318,500 | |
International Business Machines Corp. | | | 1,357 | | | | 283,138 | |
Oracle Corp. | | | 9,582 | | | | 279,411 | |
Automatic Data Processing, Inc. | | | 5,050 | | | | 278,710 | |
Xilinx, Inc. | | | 7,439 | | | | 271,003 | |
Akamai Technologies, Inc.* | | | 6,889 | | | | 252,826 | |
| | | | | | | | |
Total Information Technology | | | | | | | 11,131,933 | |
| | | | | | | | |
INDUSTRIALS—8.1% | | | | | | | | |
Stericycle, Inc.* | | | 6,399 | | | | 535,212 | |
WW Grainger, Inc. | | | 1,765 | | | | 379,140 | |
First Solar, Inc.* | | | 13,895 | | | | 348,070 | |
Lockheed Martin Corp. | | | 3,690 | | | | 331,583 | |
Dun & Bradstreet Corp. | | | 3,800 | | | | 321,974 | |
CH Robinson Worldwide, Inc. | | | 4,780 | | | | 313,042 | |
Deere & Co. | | | 3,632 | | | | 293,829 | |
United Parcel Service, Inc. — Class B | | | 3,460 | | | | 279,291 | |
Pall Corp. | | | 4,470 | | | | 266,546 | |
Union Pacific Corp. | | | 2,340 | | | | 251,503 | |
Roper Industries, Inc. | | | 2,280 | | | | 226,085 | |
Rockwell Automation, Inc. | | | 2,757 | | | | 219,733 | |
Goodrich Corp. | | | 1,624 | | | | 203,715 | |
Joy Global, Inc. | | | 2,250 | | | | 165,375 | |
| | | | | | | | |
Total Industrials | | | | | | | 4,135,098 | |
| | | | | | | | |
MATERIALS—6.8% | | | | | | | | |
Newmont Mining Corp. | | | 9,485 | | | | 486,296 | |
Cliffs Natural Resources, Inc. | | | 5,500 | | | | 380,930 | |
FMC Corp. | | | 3,459 | | | | 366,170 | |
International Flavors & Fragrances, Inc. | | | 5,595 | | | | 327,867 | |
CF Industries Holdings, Inc. | | | 1,750 | | | | 319,638 | |
Sigma-Aldrich Corp. | | | 4,264 | | | | 311,528 | |
| | |
140 | THE RYDEX SERIES FUNDS ANNUAL REPORT | | SEE NOTES TO FINANCIAL STATEMENTS. |
| | |
| SCHEDULE OF INVESTMENTS (concluded) | | March 31, 2012 |
S&P 500 PURE GROWTH FUND | | |
| | | | | | | | |
| | | SHARES | | | VALUE | |
Ecolab, Inc. | | | 4,670 | | | $ | 288,232 | |
Sherwin-Williams Co. | | | 2,620 | | | | 284,715 | |
PPG Industries, Inc. | | | 2,970 | | | | 284,526 | |
Praxair, Inc. | | | 2,090 | | | | 239,598 | |
Monsanto Co. | | | 2,290 | | | | 182,650 | |
| | | | | | | | |
Total Materials | | | | | | | 3,472,150 | |
| | | | | | | | |
CONSUMER STAPLES—5.9% | | | | | | | | |
PepsiCo, Inc. | | | 6,740 | | | | 447,199 | |
Philip Morris International, Inc. | | | 4,982 | | | | 441,455 | |
Coca-Cola Co. | | | 4,990 | | | | 369,310 | |
Colgate-Palmolive Co. | | | 2,940 | | | | 287,474 | |
Mead Johnson Nutrition Co. — Class A | | | 3,430 | | | | 282,907 | |
Hershey Co. | | | 4,580 | | | | 280,891 | |
Kimberly-Clark Corp. | | | 3,460 | | | | 255,659 | |
Estee Lauder Companies, Inc. — Class A | | | 3,764 | | | | 233,142 | |
Kellogg Co. | | | 4,010 | | | | 215,056 | |
Brown-Forman Corp. — Class B | | | 2,401 | | | | 200,219 | |
| | | | | | | | |
Total Consumer Staples | | | | | | | 3,013,312 | |
| | | | | | | | |
FINANCIALS—4.9% | | | | | | | | |
IntercontinentalExchange, Inc.* | | | 4,304 | | | | 591,455 | |
American Tower Corp. — Class A | | | 6,681 | | | | 421,037 | |
Franklin Resources, Inc. | | | 3,090 | | | | 383,252 | |
Aflac, Inc. | | | 7,940 | | | | 365,161 | |
BlackRock, Inc. — Class A | | | 1,610 | | | | 329,889 | |
T. Rowe Price Group, Inc. | | | 3,400 | | | | 222,020 | |
Ventas, Inc. | | | 3,156 | | | | 180,208 | |
| | | | | | | | |
Total Financials | | | | | | | 2,493,022 | |
| | | | | | | | |
ENERGY—4.6% | | | | | | | | |
Diamond Offshore Drilling, Inc. | | | 5,359 | | | | 357,713 | |
Southwestern Energy Co.* | | | 10,798 | | | | 330,418 | |
EOG Resources, Inc. | | | 2,900 | | | | 322,190 | |
Pioneer Natural Resources Co. | | | 2,428 | | | | 270,941 | |
Peabody Energy Corp. | | | 9,003 | | | | 260,727 | |
Cameron International Corp.* | | | 4,701 | | | | 248,354 | |
Helmerich & Payne, Inc. | | | 4,370 | | | | 235,762 | |
Schlumberger Ltd. | | | 2,510 | | | | 175,524 | |
Cabot Oil & Gas Corp. | | | 4,290 | | | | 133,719 | |
| | | | | | | | |
Total Energy | | | | | | | 2,335,348 | |
| | | | | | | | |
TELECOMMUNICATION SERVICES—0.9% | | | | | | | | |
Crown Castle International Corp.* | | | 9,010 | | | | 480,593 | |
| | | | | | | | |
Total Common Stocks
(Cost $38,374,065) | | | | | | | 50,824,029 | |
| | | | | | | | |
| | | | | | | | |
| | | FACE
AMOUNT | | | VALUE | |
REPURCHASE AGREEMENTS††,1 - 0.9% | | | | | | | | |
HSBC Group
issued 03/30/12 at 0.01%
due 04/02/12 | | $ | 312,036 | | | $ | 312,036 | |
Mizuho Financial Group, Inc.
issued 03/30/12 at 0.01%
due 04/02/12 | | | 87,791 | | | | 87,791 | |
Credit Suisse Group
issued 03/30/12 at 0.01%
due 04/02/12 | | | 40,284 | | | | 40,284 | |
Deutsche Bank
issued 03/30/12 at 0.01%
due 04/02/12 | | | 23,334 | | | | 23,334 | |
| | | | | | | | |
Total Repurchase Agreements
(Cost $463,445) | | | | | | | 463,445 | |
| | | | | | | | |
Total Investments – 100.4%
(Cost $38,837,510) | | | | | | $ | 51,287,474 | |
| | | | | | | | |
Other Assets & Liabilities, net – (0.4)% | | | | | | | (191,654 | ) |
| | | | | | | | |
Total Net Assets – 100.0% | | | | | | $ | 51,095,820 | |
| * | Non-income producing security. |
| † | Value determined based on Level 1 inputs — See Note 4. |
| †† | Value determined based on Level 2 inputs — See Note 4. |
| 1 | Repurchase Agreements — See Note 5. |
| | |
SEE NOTES TO FINANCIAL STATEMENTS. | | THE RYDEX SERIES FUNDS ANNUAL REPORT | 141 |
S&P 500 PURE GROWTH FUND
| | |
| STATEMENT OF ASSETS AND LIABILITIES | | STATEMENT OF OPERATIONS |
| | | | |
March 31, 2012 | | | | |
| |
ASSETS: | | | | |
Investments, at value
(cost $38,374,065) | | $ | 50,824,029 | |
Repurchase agreements, at value
(cost $463,445) | | | 463,445 | |
| | | | |
Total investments
(cost $38,837,510) | | | 51,287,474 | |
Receivables: | | | | |
Fund shares sold | | | 6,751,848 | |
| | | | |
Dividends | | | 32,706 | |
Total assets | | | 58,072,028 | |
| | | | |
LIABILITIES: | | | | |
Payable for: | | | | |
Securities purchased | | | 6,801,912 | |
Fund shares redeemed | | | 86,461 | |
Management fees | | | 28,363 | |
Distribution and service fees | | | 16,789 | |
Transfer agent and administrative fees | | | 9,454 | |
Portfolio accounting fees | | | 3,782 | |
Miscellaneous | | | 29,447 | |
Total liabilities | | | 6,976,208 | |
| | | | |
NETASSETS | | $ | 51,095,820 | |
| | | | |
NETASSETSCONSISTOF: | | | | |
Paid in capital | | $ | 48,847,454 | |
Accumulated net investment loss | | | (82,706 | ) |
Accumulated net realized loss on investments | | | (10,118,892 | ) |
Net unrealized appreciation on investments | | | 12,449,964 | |
| | | | |
Net assets | | $ | 51,095,820 | |
| | | | |
A-CLASS: | | | | |
Net assets | | $ | 2,845,508 | |
Capital shares outstanding | | | 82,383 | |
Net asset value per share | | $ | 34.54 | |
| | | | |
Maximum offering price per share
(Net asset value divided by 95.25%) | | $ | 36.26 | |
| | | | |
C-CLASS: | | | | |
Net assets | | $ | 11,622,983 | |
Capital shares outstanding | | | 357,894 | |
Net asset value per share | | $ | 32.48 | |
| | | | |
H-CLASS: | | | | |
Net assets | | $ | 36,627,329 | |
Capital shares outstanding | | | 1,060,969 | |
Net asset value per share | | $ | 34.52 | |
| | | | |
| | | | |
Year Ended March 31, 2012 | | | | |
| |
INVESTMENT INCOME: | | | | |
Dividends | | $ | 482,510 | |
Interest | | | 140 | |
| | | | |
Total investment income | | | 482,650 | |
| | | | |
EXPENSES: | | | | |
Management fees | | | 394,976 | |
Transfer agent and administrative fees | | | 131,659 | |
Distribution and service fees: | | | | |
A-Class | | | 13,278 | |
C-Class | | | 90,338 | |
H-Class | | | 95,796 | |
Portfolio accounting fees | | | 52,663 | |
Custodian fees | | | 14,280 | |
Trustees’ fees* | | | 5,393 | |
Miscellaneous | | | 63,596 | |
| | | | |
Total expenses | | | 861,979 | |
| | | | |
Net investment loss | | | (379,329 | ) |
| | | | |
NET REALIZEDAND UNREALIZED GAIN (LOSS): | | | | |
Net realized gain (loss) on: | | | | |
Investments | | | (3,533,260 | ) |
| | | | |
Net realized loss | | | (3,533,260 | ) |
| | | | |
Net change in unrealized appreciation
(depreciation) on: | | | | |
Investments | | | 151,421 | |
| | | | |
Net change in unrealized appreciation
(depreciation) | | | 151,421 | |
| | | | |
Net realized and unrealized loss | | | (3,381,839 | ) |
| | | | |
Net decrease in net assets resulting from operations | | $ | (3,761,168 | ) |
| | | | |
| * | Relates to Trustees not deemed “interested persons” within the meaning of Section 2(a)(19) of the 1940 Act. |
| | |
142 | THE RYDEX SERIES FUNDS ANNUAL REPORT | | SEE NOTES TO FINANCIAL STATEMENTS. |
S&P 500 PURE GROWTH FUND
STATEMENTS OF CHANGES IN NET ASSETS
| | | | | | | | |
| | | Year Ended
March 31,
2012 | | | Year Ended
March 31,
2011 | |
INCREASE (DECREASE) IN NET ASSETS FROM OPERATIONS: | | | | | | | | |
Net investment loss | | $ | (379,329 | ) | | $ | (476,960 | ) |
Net realized gain (loss) on investments | | | (3,533,260 | ) | | | 6,110,300 | |
Net change in unrealized appreciation (depreciation) on investments | | | 151,421 | | | | 7,095,188 | |
| | | | | | | | |
Net increase (decrease) in net assets resulting from operations | | | (3,761,168 | ) | | | 12,728,528 | |
| | | | | | | | |
DISTRIBUTIONSTOSHAREHOLDERSFROM: | | | | | | | | |
Net realized gains | | | | | | | | |
A-Class | | | (25,990 | ) | | | — | |
C-Class | | | (71,516 | ) | | | — | |
H-Class | | | (538,834 | ) | | | — | |
| | | | | | | | |
Total distributions to shareholders | | | (636,340 | ) | | | — | |
| | | | | | | | |
| | |
CAPITALSHARETRANSACTIONS: | | | | | | | | |
PROCEEDSFROMSALEOFSHARES | | | | | | | | |
A-Class | | | 29,481,857 | | | | 23,075,207 | |
C-Class | | | 8,753,921 | | | | 8,392,407 | |
H-Class | | | 317,543,098 | | | | 452,894,846 | |
DISTRIBUTIONSREINVESTED | | | | | | | | |
A-Class | | | 24,625 | | | | — | |
C-Class | | | 69,727 | | | | — | |
H-Class | | | 519,152 | | | | — | |
COSTOFSHARESREDEEMED | | | | | | | | |
A-Class | | | (28,735,214 | ) | | | (23,684,382 | ) |
C-Class | | | (6,108,124 | ) | | | (8,275,738 | ) |
H-Class | | | (315,975,426 | ) | | | (439,353,112 | ) |
| | | | | | | | |
Net increase from capital share transactions | | | 5,573,616 | | | | 13,049,228 | |
| | | | | | | | |
Net increase in net assets | | | 1,176,108 | | | | 25,777,756 | |
| | |
NETASSETS: | | | | | | | | |
Beginning of year | | | 49,919,712 | | | | 24,141,956 | |
| | | | | | | | |
End of year | | $ | 51,095,820 | | | $ | 49,919,712 | |
| | | | | | | | |
Accumulated net investment loss at end of year | | $ | (82,706 | ) | | $ | — | |
| | | | | | | | |
CAPITALSHAREACTIVITY: | | | | | | | | |
Shares sold | | | | | | | | |
A-Class | | | 902,644 | | | | 830,903 | |
C-Class | | | 293,533 | | | | 313,215 | |
H-Class | | | 9,949,737 | | | | 16,228,786 | |
Shares issued from reinvestment of distributions | | | | | | | | |
A-Class | | | 794 | | | | — | |
C-Class | | | 2,385 | | | | — | |
H-Class | | | 16,752 | | | | — | |
Shares redeemed | | | | | | | | |
A-Class | | | (902,622 | ) | | | (816,244 | ) |
C-Class | | | (204,848 | ) | | | (302,875 | ) |
H-Class | | | (10,077,462 | ) | | | (15,655,887 | ) |
| | | | | | | | |
Net increase (decrease) in shares | | | (19,087 | ) | | | 597,898 | |
| | | | | | | | |
| | |
SEE NOTES TO FINANCIAL STATEMENTS. | | THE RYDEX SERIES FUNDS ANNUAL REPORT | 143 |
S&P 500 PURE GROWTH FUND
FINANCIAL HIGHLIGHTS
This table is presented to show selected data for a share outstanding throughout each period and to assist shareholders in evaluating a Fund’s performance for the periods presented.
| | | | | | | | | | | | | | | | | | | | |
A-Class | | Year Ended
March 31,
2012 | | | Year Ended
March 31,
2011 | | | Year Ended
March 31,
2010 | | | Year Ended
March 31,
2009 | | | Year Ended
March 31,
2008 | |
Per Share Data | | | | | | | | | | | | | | | | | | | | |
Net asset value, beginning of period | | $ | 33.15 | | | $ | 26.51 | | | $ | 15.82 | | | $ | 25.11 | | | $ | 27.17 | |
| | | | | | | | | | | | | | | | | | | | |
Income (loss) from investment operations: | | | | | | | | | | | | | | | | | | | | |
Net investment lossa | | | (.20 | ) | | | (.18 | ) | | | (.18 | ) | | | (.11 | ) | | | (.15 | ) |
Net gain (loss) on investments (realized and unrealized) | | | 1.82 | | | | 6.82 | | | | 10.87 | | | | (9.18 | ) | | | (1.52 | ) |
| | | | | | | | | | | | | | | | | | | | |
Total from investment operations | | | 1.62 | | | | 6.64 | | | | 10.69 | | | | (9.29 | ) | | | (1.67 | ) |
| | | | | | | | | | | | | | | | | | | | |
Less distributions from: | | | | | | | | | | | | | | | | | | | | |
Net realized gains | | | (.23 | ) | | | — | | | | — | | | | — | | | | (.39 | ) |
| | | | | | | | | | | | | | | | | | | | |
Total distributions | | | (.23 | ) | | | — | | | | — | | | | — | | | | (.39 | ) |
| | | | | | | | | | | | | | | | | | | | |
Net asset value, end of period | | $ | 34.54 | | | $ | 33.15 | | | $ | 26.51 | | | $ | 15.82 | | | $ | 25.11 | |
| | | | | | | | | | | | | | | | | | | | |
Total Returnb | | | 4.96 | % | | | 25.05 | % | | | 67.57 | % | | | (37.00 | %) | | | (6.28 | %) |
| | | | | | | | | | | | | | | | | | | | |
Ratios/Supplemental Data | | | | | | | | | | | | | | | | | | | | |
Net assets, end of period (in thousands) | | $ | 2,846 | | | $ | 2,704 | | | $ | 1,774 | | | $ | 2,346 | | | $ | 5,443 | |
| | | | | | | | | | | | | | | | | | | | |
Ratios to average net assets: | | | | | | | | | | | | | | | | | | | | |
Net investment loss | | | (0.62 | %) | | | (0.65 | %) | | | (0.81 | %) | | | (0.46 | %) | | | (0.53 | %) |
Total expenses | | | 1.52 | % | | | 1.53 | % | | | 1.52 | % | | | 1.53 | % | | | 1.51 | % |
| | | | | | | | | | | | | | | | | | | | |
Portfolio turnover rate | | | 586 | % | | | 808 | % | | | 699 | % | | | 573 | % | | | 450 | % |
| | | | | | | | | | | | | | | | | | | | |
C-Class | | Year Ended
March 31,
2012 | | | Year Ended
March 31,
2011 | | | Year Ended
March 31,
2010 | | | Year Ended
March 31,
2009 | | | Year Ended
March 31,
2008 | |
Per Share Data | | | | | | | | | | | | | | | | | | | | |
Net asset value, beginning of period | | $ | 31.42 | | | $ | 25.32 | | | $ | 15.23 | | | $ | 24.35 | | | $ | 26.57 | |
| | | | | | | | | | | | | | | | | | | | |
Income (loss) from investment operations: | | | | | | | | | | | | | | | | | | | | |
Net investment lossa | | | (.41 | ) | | | (.41 | ) | | | (.30 | ) | | | (.23 | ) | | | (.32 | ) |
Net gain (loss) on investments (realized and unrealized) | | | 1.70 | | | | 6.51 | | | | 10.39 | | | | (8.89 | ) | | | (1.51 | ) |
| | | | | | | | | | | | | | | | | | | | |
Total from investment operations | | | 1.29 | | | | 6.10 | | | | 10.09 | | | | (9.12 | ) | | | (1.83 | ) |
| | | | | | | | | | | | | | | | | | | | |
Less distributions from: | | | | | | | | | | | | | | | | | | | | |
Net realized gains | | | (.23 | ) | | | — | | | | — | | | | — | | | | (.39 | ) |
| | | | | | | | | | | | | | | | | | | | |
Total distributions | | | (.23 | ) | | | — | | | | — | | | | — | | | | (.39 | ) |
| | | | | | | | | | | | | | | | | | | | |
Net asset value, end of period | | $ | 32.48 | | | $ | 31.42 | | | $ | 25.32 | | | $ | 15.23 | | | $ | 24.35 | |
| | | | | | | | | | | | | | | | | | | | |
Total Returnb | | | 4.15 | % | | | 24.09 | % | | | 66.25 | % | | | (37.45 | %) | | | (7.02 | %) |
| | | | | | | | | | | | | | | | | | | | |
Ratios/Supplemental Data | | | | | | | | | | | | | | | | | | | | |
Net assets, end of period (in thousands) | | $ | 11,623 | | | $ | 8,384 | | | $ | 6,494 | | | $ | 2,111 | | | $ | 4,453 | |
| | | | | | | | | | | | | | | | | | | | |
Ratios to average net assets: | | | | | | | | | | | | | | | | | | | | |
Net investment loss | | | (1.35 | %) | | | (1.53 | %) | | | (1.40 | %) | | | (1.13 | %) | | | (1.21 | %) |
Total expenses | | | 2.26 | % | | | 2.29 | % | | | 2.28 | % | | | 2.29 | % | | | 2.27 | % |
| | | | | | | | | | | | | | | | | | | | |
Portfolio turnover rate | | | 586 | % | | | 808 | % | | | 699 | % | | | 573 | % | | | 450 | % |
| | |
144 | THE RYDEX SERIES FUNDS ANNUAL REPORT | | SEE NOTES TO FINANCIAL STATEMENTS. |
S&P 500 PURE GROWTH FUND
FINANCIAL HIGHLIGHTS (concluded)
This table is presented to show selected data for a share outstanding throughout each period and to assist shareholders in evaluating a Fund’s performance for the periods presented.
| | | | | | | | | | | | | | | | | | | | |
H-Class | | Year Ended
March 31,
2012 | | | Year Ended
March 31,
2011 | | | Year Ended
March 31,
2010 | | | Year Ended
March 31,
2009 | | | Year Ended
March 31,
2008 | |
Per Share Data | | | | | | | | | | | | | | | | | | | | |
Net asset value, beginning of period | | $ | 33.13 | | | $ | 26.50 | | | $ | 15.81 | | | $ | 25.10 | | | $ | 27.16 | |
| | | | | | | | | | | | | | | | | | | | |
Income (loss) from investment operations: | | | | | | | | | | | | | | | | | | | | |
Net investment lossa | | | (.19 | ) | | | (.26 | ) | | | (.14 | ) | | | (.09 | ) | | | (.17 | ) |
Net gain (loss) on investments (realized and unrealized) | | | 1.81 | | | | 6.89 | | | | 10.83 | | | | (9.20 | ) | | | (1.50 | ) |
| | | | | | | | | | | | | | | | | | | | |
Total from investment operations | | | 1.62 | | | | 6.63 | | | | 10.69 | | | | (9.29 | ) | | | (1.67 | ) |
| | | | | | | | | | | | | | | | | | | | |
Less distributions from: | | | | | | | | | | | | | | | | | | | | |
Net realized gains | | | (.23 | ) | | | — | | | | — | | | | — | | | | (.39 | ) |
| | | | | | | | | | | | | | | | | | | | |
Total distributions | | | (.23 | ) | | | — | | | | — | | | | — | | | | (.39 | ) |
| | | | | | | | | | | | | | | | | | | | |
Net asset value, end of period | | $ | 34.52 | | | $ | 33.13 | | | $ | 26.50 | | | $ | 15.81 | | | $ | 25.10 | |
| | | | | | | | | | | | | | | | | | | | |
Total Returnb | | | 4.96 | % | | | 25.02 | % | | | 67.62 | % | | | (37.01 | %) | | | (6.28 | %) |
| | | | | | | | | | | | | | | | | | | | |
Ratios/Supplemental Data | | | | | | | | | | | | | | | | | | | | |
Net assets, end of period (in thousands) | | $ | 36,627 | | | $ | 38,831 | | | $ | 15,874 | | | $ | 12,512 | | | $ | 11,937 | |
| | | | | | | | | | | | | | | | | | | | |
Ratios to average net assets: | | | | | | | | | | | | | | | | | | | | |
Net investment loss | | | (0.59 | %) | | | (0.89 | %) | | | (0.60 | %) | | | (0.41 | %) | | | (0.62 | %) |
Total expenses | | | 1.51 | % | | | 1.55 | % | | | 1.53 | % | | | 1.53 | % | | | 1.53 | % |
| | | | | | | | | | | | | | | | | | | | |
Portfolio turnover rate | | | 586 | % | | | 808 | % | | | 699 | % | | | 573 | % | | | 450 | % |
| a | Net investment loss per share was computed using average shares outstanding throughout the period. |
| b | Total return does not reflect the impact of any applicable sales charges and has not been annualized. |
| | |
SEE NOTES TO FINANCIAL STATEMENTS. | | THE RYDEX SERIES FUNDS ANNUAL REPORT | 145 |
| | |
| PERFORMANCE REPORT AND FUND PROFILE (Unaudited) | | March 31, 2012 |
S&P 500 PURE VALUE FUND
OBJECTIVE: Seeks to provide investment results that match, before fees and expenses, the performance of a benchmark for large-cap value securities on a daily basis. The Fund’s current benchmark is the S&P 500 Pure Value Index (the “underlying index”).
For the one-year period ended March 31, 2012, S&P 500 Pure Value Fund H-Class returned 3.65%, compared with 6.45% for the S&P 500 Pure Value Index*. S&P 500 Pure Value Fund maintained a daily correlation of over 99% to its benchmark. Large-cap growth stocks slightly outperformed large-cap value stocks during the period.
The Financials, Utilities and Health Care sectors provided the greatest contribution to return. Telecommunication Services, Energy and Industrials were the largest detractors from return.
The strongest contributors to index performance for the period were American International Group, Inc., Constellation Energy Group and Whirlpool Corp. The stocks detracting most from return were Sears Holdings Corp., NRG Energy, Inc. and Sprint Nextel Corp.
Performance displayed represents past performance which is no guarantee of future results.
| * | The S&P 500® Pure Value Index is narrow in focus, containing only those S&P 500 Index companies with strong value characteristics as selected by S&P. The S&P 500 Index is a capitalization-weighted index covering 500 industrial, utility, transportation and financial companies of the U.S. markets (mostly NYSE Euronext issues). |
Performance displayed represents past performance which is no guarantee of future results.
Holdings Diversification (Market Exposure as % of Net Assets)
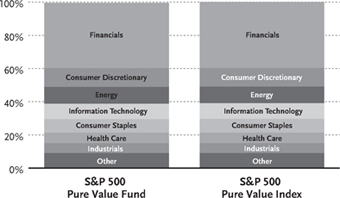
“Holdings Diversification (Market Exposure as % of Net Assets)” excludes any temporary cash investments.
| | | | |
Inception Dates: | | | |
A-Class | | | September 1, 2004 | |
C-Class | | | February 20, 2004 | |
H-Class | | | February 20, 2004 | |
| | | | |
Ten Largest Holdings (% of Total Net Assets) | |
American International Group, Inc. | | | 2.6 | % |
Whirlpool Corp. | | | 2.5 | % |
Computer Sciences Corp. | | | 2.4 | % |
Hartford Financial Services Group, Inc. | | | 2.0 | % |
Genworth Financial, Inc. — Class A | | | 2.0 | % |
Valero Energy Corp. | | | 1.8 | % |
Lincoln National Corp. | | | 1.7 | % |
Bank of America Corp. | | | 1.7 | % |
Marathon Oil Corp. | | | 1.7 | % |
Morgan Stanley | | | 1.6 | % |
| | | | |
Top Ten Total | | | 20.0 | % |
| | | | |
“Ten Largest Holdings” exclude any temporary cash or derivative investments.
146 | THE RYDEX SERIES FUNDS ANNUAL REPORT
PERFORMANCE REPORT AND FUND PROFILE (Unaudited) (concluded)
Cumulative Fund Performance*
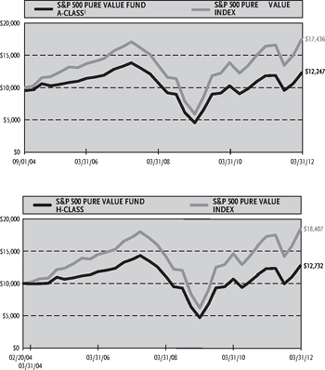
Average Annual Returns*
Periods Ended 03/31/12
| | | | | | | | | | | | |
| | | 1 Year | | | 5 Year | | | Since
Inception
(09/01/04) | |
A-Class Shares | | | 3.64 | % | | | -1.59 | % | | | 3.37 | % |
A-Class Shares with sales charge‡ | | | -1.29 | % | | | -2.55 | % | | | 2.71 | % |
S&P 500 Pure Value Index | | | 6.45 | % | | | 1.36 | % | | | 7.61 | % |
| | | | | | | | | | | (02/20/04 | ) |
C-Class Shares | | | 2.88 | % | | | -2.26 | % | | | 2.26 | % |
C-Class Shares with CDSC† | | | 1.88 | % | | | -2.26 | % | | | 2.26 | % |
H-Class Shares | | | 3.65 | % | | | -1.53 | % | | | 3.02 | % |
S&P 500 Pure Value Index | | | 6.45 | % | | | 1.36 | % | | | 7.82 | % |
| * | The performance data above represents past performance that is not predictive of future results. The investment return and principal value of an investment in the Fund will fluctuate so that an investor’s shares, when redeemed, may be worth more or less than their original cost. Returns are historical and include changes in principal and reinvested dividends and capital gains and do not reflect the effect of taxes. The S&P 500 Pure Value Index is an unmanaged index and, unlike the Fund, has no management fees or operating expenses to reduce its reported return. The graphs are based on A-Class shares and H-Class shares only; performance for C-Class shares will vary due to differences in fee structures. |
| † | Fund returns include a CDSC of 1% if redeemed within 12 months of purchase. |
| ‡ | Fund returns are calculated using the maximum sales charge of 4.75%. |
THE RYDEX SERIES FUNDS ANNUAL REPORT | 147
| | |
| SCHEDULE OF INVESTMENTS | | March 31, 2012 |
| S&P 500 PURE VALUE FUND | | |
| | | | | | | | |
| | | SHARES | | | VALUE | |
COMMON STOCKS† - 99.5% | | | | | | | | |
| | |
FINANCIALS - 39.4% | | | | | | | | |
American International Group, Inc.* | | | 61,670 | | | $ | 1,901,286 | |
Hartford Financial Services Group, Inc. | | | 68,820 | | | | 1,450,726 | |
Genworth Financial, Inc. — Class A* | | | 171,149 | | | | 1,423,960 | |
Lincoln National Corp. | | | 48,118 | | | | 1,268,391 | |
Bank of America Corp. | | | 131,950 | | | | 1,262,762 | |
Morgan Stanley | | | 60,286 | | | | 1,184,017 | |
Citigroup, Inc. | | | 31,468 | | | | 1,150,155 | |
MetLife, Inc. | | | 28,466 | | | | 1,063,206 | |
Hudson City Bancorp, Inc. | | | 142,500 | | | | 1,041,675 | |
Allstate Corp. | | | 29,193 | | | | 961,034 | |
Prudential Financial, Inc. | | | 15,092 | | | | 956,682 | |
JPMorgan Chase & Co. | | | 19,159 | | | | 880,931 | |
Goldman Sachs Group, Inc. | | | 6,414 | | | | 797,710 | |
SunTrust Banks, Inc. | | | 32,130 | | | | 776,582 | |
Unum Group | | | 30,611 | | | | 749,357 | |
XL Group plc — Class A | | | 33,548 | | | | 727,656 | |
Capital One Financial Corp. | | | 13,027 | | | | 726,125 | |
E*Trade Financial Corp.* | | | 65,552 | | | | 717,794 | |
Assurant, Inc. | | | 16,655 | | | | 674,528 | |
Principal Financial Group, Inc. | | | 22,440 | | | | 662,204 | |
Bank of New York Mellon Corp. | | | 26,950 | | | | 650,304 | |
Regions Financial Corp. | | | 88,977 | | | | 586,358 | |
KeyCorp | | | 63,450 | | | | 539,325 | |
Legg Mason, Inc. | | | 19,098 | | | | 533,407 | |
Loews Corp. | | | 11,320 | | | | 451,328 | |
Leucadia National Corp. | | | 16,520 | | | | 431,172 | |
Comerica, Inc. | | | 12,670 | | | | 410,001 | |
Ameriprise Financial, Inc. | | | 7,100 | | | | 405,623 | |
Cincinnati Financial Corp. | | | 11,636 | | | | 401,558 | |
PNC Financial Services Group, Inc. | | | 6,043 | | | | 389,713 | |
ACE Ltd. | | | 5,220 | | | | 382,104 | |
Fifth Third Bancorp | | | 23,625 | | | | 331,931 | |
BB&T Corp. | | | 10,276 | | | | 322,564 | |
Wells Fargo & Co. | | | 9,050 | | | | 308,967 | |
Huntington Bancshares, Inc. | | | 46,050 | | | | 297,023 | |
Weyerhaeuser Co. | | | 13,532 | | | | 296,621 | |
First Horizon National Corp. | | | 28,330 | | | | 294,065 | |
CME Group, Inc. — Class A | | | 1,010 | | | | 292,223 | |
NASDAQ OMX Group, Inc.* | | | 10,932 | | | | 283,139 | |
Torchmark Corp. | | | 5,202 | | | | 259,320 | |
SLM Corp. | | | 16,186 | | | | 255,091 | |
NYSE Euronext | | | 8,199 | | | | 246,052 | |
| | | | | | | | |
Total Financials | | | | | | | 28,744,670 | |
| | | | | | | | |
CONSUMER DISCRETIONARY—11.2% | | | | | | | | |
Whirlpool Corp. | | | 23,979 | | | | 1,843,026 | |
Sears Holdings Corp.* | | | 17,698 | | | | 1,172,492 | |
Best Buy Company, Inc. | | | 32,190 | | | | 762,259 | |
GameStop Corp. — Class A | | | 32,675 | | | | 713,622 | |
Gannett Company, Inc. | | | 45,554 | | | | 698,343 | |
Ford Motor Co. | | | 51,090 | | | | 638,114 | |
Staples, Inc. | | | 35,630 | | | | 576,493 | |
| | | | | | | | |
| | | SHARES | | | VALUE | |
Washington Post Co. — Class B | | | 1,516 | | | $ | 566,332 | |
JC Penney Company, Inc. | | | 13,920 | | | | 493,186 | |
Johnson Controls, Inc. | | | 9,710 | | | | 315,381 | |
AutoNation, Inc.* | | | 6,285 | | | | 215,638 | |
Goodyear Tire & Rubber Co.* | | | 17,862 | | | | 200,412 | |
| | | | | | | | |
Total Consumer Discretionary | | | | | | | 8,195,298 | |
| | | | | | | | |
ENERGY—10.0% | | | | | | | | |
Valero Energy Corp. | | | 51,113 | | | | 1,317,182 | |
Marathon Oil Corp. | | | 39,466 | | | | 1,251,072 | |
Marathon Petroleum Corp. | | | 23,323 | | | | 1,011,285 | |
Tesoro Corp.* | | | 35,256 | | | | 946,271 | |
Sunoco, Inc. | | | 24,325 | | | | 927,999 | |
Murphy Oil Corp. | | | 9,190 | | | | 517,121 | |
Hess Corp. | | | 8,545 | | | | 503,728 | |
ConocoPhillips | | | 5,736 | | | | 435,993 | |
Nabors Industries Ltd.* | | | 11,848 | | | | 207,222 | |
Alpha Natural Resources, Inc.* | | | 12,490 | | | | 189,973 | |
| | | | | | | | |
Total Energy | | | | | | | 7,307,846 | |
| | | | | | | | |
INFORMATION TECHNOLOGY—9.4% | | | | | | | | |
Computer Sciences Corp. | | | 59,070 | | | | 1,768,556 | |
Jabil Circuit, Inc. | | | 36,342 | | | | 912,911 | |
Micron Technology, Inc.* | | | 100,640 | | | | 815,184 | |
SAIC, Inc.* | | | 44,180 | | | | 583,176 | |
Western Digital Corp.* | | | 13,710 | | | | 567,457 | |
Xerox Corp. | | | 69,526 | | | | 561,770 | |
Hewlett-Packard Co. | | | 18,940 | | | | 451,341 | |
Harris Corp. | | | 8,140 | | | | 366,951 | |
Lexmark International, Inc. — Class A | | | 10,050 | | | | 334,062 | |
Corning, Inc. | | | 18,240 | | | | 256,819 | |
Dell, Inc.* | | | 13,684 | | | | 227,154 | |
| | | | | | | | |
Total Information Technology | | | | | | | 6,845,381 | |
| | | | | | | | |
CONSUMER STAPLES—8.2% | | | | | | | | |
Archer-Daniels-Midland Co. | | | 35,800 | | | | 1,133,428 | |
Dean Foods Co.* | | | 79,973 | | | | 968,474 | |
Tyson Foods, Inc. — Class A | | | 46,923 | | | | 898,575 | |
Safeway, Inc. | | | 41,538 | | | | 839,483 | |
Kroger Co. | | | 28,700 | | | | 695,401 | |
CVS Caremark Corp. | | | 9,733 | | | | 436,038 | |
Walgreen Co. | | | 12,504 | | | | 418,759 | |
Molson Coors Brewing Co. — Class B | | | 6,648 | | | | 300,822 | |
Sysco Corp. | | | 9,172 | | | | 273,876 | |
| | | | | | | | |
Total Consumer Staples | | | | | | | 5,964,856 | |
| | | | | | | | |
HEALTH CARE—6.3% | | | | | | | | |
Tenet Healthcare Corp.* | | | 200,860 | | | | 1,066,567 | |
Coventry Health Care, Inc. | | | 21,404 | | | | 761,340 | |
Cardinal Health, Inc. | | | 16,000 | | | | 689,759 | |
AmerisourceBergen Corp. | | | 17,170 | | | | 681,305 | |
McKesson Corp. | | | 7,663 | | | | 672,582 | |
Cigna Corp. | | | 8,850 | | | | 435,863 | |
PerkinElmer, Inc. | | | 10,930 | | | | 302,324 | |
| | | | | | | | |
Total Health Care | | | | | | | 4,609,740 | |
| | | | | | | | |
| | |
148 | THE RYDEX SERIES FUNDS ANNUAL REPORT | | SEE NOTES TO FINANCIAL STATEMENTS. |
| | |
| SCHEDULE OF INVESTMENTS (concluded) | | March 31, 2012 |
S&P 500 PURE VALUE FUND | | |
| | | | | | | | |
| | | SHARES | | | VALUE | |
INDUSTRIALS - 6.0% | | | | | | | | |
L-3 Communications Holdings, Inc. | | | 10,038 | | | $ | 710,389 | |
Northrop Grumman Corp. | | | 10,587 | | | | 646,654 | |
RR Donnelley & Sons Co. | | | 49,199 | | | | 609,576 | |
Avery Dennison Corp. | | | 19,630 | | | | 591,452 | |
Southwest Airlines Co. | | | 67,590 | | | | 556,942 | |
Jacobs Engineering Group, Inc.* | | | 8,485 | | | | 376,479 | |
Ingersoll-Rand plc | | | 8,320 | | | | 344,032 | |
Textron, Inc. | | | 11,270 | | | | 313,644 | |
Ryder System, Inc. | | | 4,553 | | | | 240,398 | |
| | | | | | | | |
Total Industrials | | | | | | | 4,389,566 | |
| | | | | | | | |
MATERIALS—4.3% | | | | | | | | |
Alcoa, Inc. | | | 68,131 | | | | 682,673 | |
United States Steel Corp. | | | 19,527 | | | | 573,508 | |
Sealed Air Corp. | | | 24,947 | | | | 481,726 | |
Owens-Illinois, Inc.* | | | 18,840 | | | | 439,726 | |
International Paper Co. | | | 10,970 | | | | 385,047 | |
Dow Chemical Co. | | | 9,259 | | | | 320,732 | |
Bemis Company, Inc. | | | 7,679 | | | | 247,954 | |
| | | | | | | | |
Total Materials | | | | | | | 3,131,366 | |
| | | | | | | | |
UTILITIES—2.7% | | | | | | | | |
NRG Energy, Inc.* | | | 49,000 | | | | 767,830 | |
Pepco Holdings, Inc. | | | 18,872 | | | | 356,492 | |
Edison International | | | 8,000 | | | | 340,080 | |
Integrys Energy Group, Inc. | | | 4,687 | | | | 248,364 | |
DTE Energy Co. | | | 4,026 | | | | 221,551 | |
| | | | | | | | |
Total Utilities | | | | | | | 1,934,317 | |
| | | | | | | | |
TELECOMMUNICATION SERVICES—2.0% | | | | | | | | |
Sprint Nextel Corp.* | | | 228,715 | | | | 651,837 | |
MetroPCS Communications, Inc.* | | | 40,330 | | | | 363,777 | |
CenturyLink, Inc. | | | 5,740 | | | | 221,851 | |
Frontier Communications Corp. | | | 44,500 | | | | 185,565 | |
| | | | | | | | |
Total Telecommunication Services | | | | | | | 1,423,030 | |
| | | | | | | | |
Total Common Stocks
(Cost $69,446,872) | | | | | | | 72,546,070 | |
| | | | | | �� | | |
| | | | | | | | |
| | | FACE
AMOUNT | | | VALUE | |
REPURCHASE AGREEMENTS††,1 - 0.7% | | | | | | | | |
HSBC Group
issued 03/30/12 at 0.01%
due 04/02/12 | | $ | 323,699 | | | $ | 323,699 | |
Mizuho Financial Group, Inc.
issued 03/30/12 at 0.01%
due 04/02/12 | | | 91,073 | | | | 91,073 | |
Credit Suisse Group
issued 03/30/12 at 0.01%
due 04/02/12 | | | 41,790 | | | | 41,790 | |
Deutsche Bank
issued 03/30/12 at 0.01%
due 04/02/12 | | | 24,206 | | | | 24,206 | |
| | | | | | | | |
Total Repurchase Agreements
(Cost $480,768) | | | | | | | 480,768 | |
| | | | | | | | |
Total Investments – 100.2%
(Cost $69,927,640) | | | | | | $ | 73,026,838 | |
| | | | | | | | |
Other Assets & Liabilities, net – (0.2)% | | | | | | | (166,472 | ) |
| | | | | | | | |
Total Net Assets – 100.0% | | | | | | $ | 72,860,366 | |
| | | | | | | | |
| * | Non-income producing security. |
| † | Value determined based on Level 1 inputs — See Note 4. |
| †† | Value determined based on Level 2 inputs — See Note 4. |
| 1 | Repurchase Agreements — See Note 5. |
| | plc — Public Limited Company |
| | |
SEE NOTES TO FINANCIAL STATEMENTS. | | THE RYDEX SERIES FUNDS ANNUAL REPORT | 149 |
S&P 500 PURE VALUE FUND
STATEMENT OF ASSETS AND LIABILITIES
| | | | |
March 31, 2012 | | | | |
| |
ASSETS: | | | | |
Investments, at value
(cost $69,446,872) | | $ | 72,546,070 | |
Repurchase agreements, at value
(cost $480,768) | | | 480,768 | |
| | | | |
Total investments
(cost $69,927,640) | | | 73,026,838 | |
Cash | | | 417 | |
Receivables: | | | | |
Securities sold | | | 6,721,637 | |
Fund shares sold | | | 174,150 | |
Dividends | | | 53,188 | |
| | | | |
Total assets | | | 79,976,230 | |
| | | | |
| |
LIABILITIES: | | | | |
Payable for: | | | | |
Fund shares redeemed | | | 7,048,511 | |
Management fees | | | 26,531 | |
Distribution and service fees | | | 10,155 | |
Transfer agent and administrative fees | | | 8,844 | |
Portfolio accounting fees | | | 3,537 | |
Miscellaneous | | | 18,286 | |
| | | | |
Total liabilities | | | 7,115,864 | |
| | | | |
NET ASSETS | | $ | 72,860,366 | |
| | | | |
| |
NET ASSETS CONSISTOF: | | | | |
Paid in capital | | $ | 75,600,944 | |
Undistributed net investment income | | | 81,734 | |
Accumulated net realized loss on investments | | | (5,921,510 | ) |
Net unrealized appreciation on investments | | | 3,099,198 | |
| | | | |
Net assets | | $ | 72,860,366 | |
| | | | |
| |
A-CLASS: | | | | |
Net assets | | $ | 1,846,252 | |
Capital shares outstanding | | | 19,748 | |
Net asset value per share | | $ | 93.49 | |
| | | | |
Maximum offering price per share | | | | |
(Net asset value divided by 95.25%) | | $ | 98.15 | |
| | | | |
| |
C-CLASS: | | | | |
Net assets | | $ | 2,128,362 | |
Capital shares outstanding | | | 24,628 | |
Net asset value per share | | $ | 86.42 | |
| | | | |
| |
H-CLASS: | | | | |
Net assets | | $ | 68,885,752 | |
Capital shares outstanding | | | 734,360 | |
Net asset value per share | | $ | 93.80 | |
| | | | |
STATEMENT OF OPERATIONS
| | | | |
Year Ended March 31, 2012 | | | | |
| |
INVESTMENT INCOME: | | | | |
Dividends | | $ | 554,131 | |
Interest | | | 86 | |
| | | | |
Total investment income | | | 554,217 | |
| | | | |
| |
EXPENSES: | | | | |
Management fees | | | 221,111 | |
Transfer agent and administrative fees | | | 73,704 | |
Distribution and service fees: | | | | |
A-Class | | | 3,590 | |
C-Class | | | 36,772 | |
H-Class | | | 60,921 | |
Portfolio accounting fees | | | 29,481 | |
Custodian fees | | | 8,233 | |
Trustees’ fees* | | | 2,944 | |
Miscellaneous | | | 35,727 | |
| | | | |
Total expenses | | | 472,483 | |
| | | | |
Net investment income | | | 81,734 | |
| | | | |
| |
NET REALIZED AND UNREALIZED GAIN (LOSS): | | | | |
Net realized gain (loss) on: | | | | |
Investments | | | 238,143 | |
| | | | |
Net realized gain | | | 238,143 | |
| | | | |
Net change in unrealized appreciation
(depreciation) on: | | | | |
Investments | | | (2,958,416 | ) |
| | | | |
Net change in unrealized appreciation
(depreciation) | | | (2,958,416 | ) |
| | | | |
Net realized and unrealized loss | | | (2,720,273 | ) |
| | | | |
Net decrease in net assets resulting from operations | | $ | (2,638,539 | ) |
| | | | |
| * | Relates to Trustees not deemed “interested persons” within the meaning of Section 2(a)(19) of the 1940 Act. |
| | |
150 | THE RYDEX SERIES FUNDS ANNUAL REPORT | | SEE NOTES TO FINANCIAL STATEMENTS. |
S&P 500 PURE VALUE FUND
STATEMENTS OF CHANGES IN NET ASSETS
| | | | | | | | |
| | | Year Ended
March 31,
2012 | | | Year Ended
March 31,
2011 | |
INCREASE (DECREASE) IN NET ASSETS FROM OPERATIONS: | | | | | | | | |
Net investment income (loss) | | $ | 81,734 | | | $ | (32,522 | ) |
Net realized gain on investments | | | 238,143 | | | | 8,480,016 | |
Net change in unrealized appreciation (depreciation) on investments | | | (2,958,416 | ) | | | (8,294,860 | ) |
| | | | | | | | |
Net increase (decrease) in net assets resulting from operations | | | (2,638,539 | ) | | | 152,634 | |
| | | | | | | | |
DISTRIBUTIONS TO SHAREHOLDERS FROM: | | | | | | | | |
Net investment income | | | | | | | | |
A-Class | | | — | | | | (16,831 | ) |
C-Class | | | — | | | | (38,161 | ) |
H-Class | | | — | | | | (168,310 | ) |
| | | | | | | | |
Total distributions to shareholders | | | — | | | | (223,302 | ) |
| | | | | | | | |
| | |
CAPITALSHARETRANSACTIONS:
PROCEEDSFROMSALEOFSHARES | | | | | | | | |
A-Class | | | 9,200,693 | | | | 20,577,766 | |
C-Class | | | 4,609,920 | | | | 12,317,081 | |
H-Class | | | 315,392,630 | | | | 446,114,591 | |
DISTRIBUTIONSREINVESTED | | | | | | | | |
A-Class | | | — | | | | 11,816 | |
C- Class | | | — | | | | 32,218 | |
H-Class | | | — | | | | 165,705 | |
COSTOFSHARESREDEEMED | | | | | | | | |
A-Class | | | (9,753,404 | ) | | | (26,189,401 | ) |
C-Class | | | (7,654,634 | ) | | | (11,762,447 | ) |
H-Class | | | (271,168,176 | ) | | | (567,934,046 | ) |
| | | | | | | | |
Net increase (decrease) from capital share transactions | | | 40,627,029 | | | | (126,666,717 | ) |
| | | | | | | | |
Net increase (decrease) in net assets | | | 37,988,490 | | | | (126,737,385 | ) |
| | |
NETASSETS: | | | | | | | | |
Beginning of year | | | 34,871,876 | | | | 161,609,261 | |
| | | | | | | | |
End of year | | $ | 72,860,366 | | | $ | 34,871,876 | |
| | | | | | | | |
Undistributed net investment income at end of year | | $ | 81,734 | | | $ | — | |
| | | | | | | | |
CAPITALSHAREACTIVITY: | | | | | | | | |
Shares sold | | | | | | | | |
A-Class | | | 99,586 | | | | 251,530 | |
C-Class | | | 56,030 | | | | 160,280 | |
H-Class | | | 3,557,929 | | | | 5,470,210 | |
Shares issued from reinvestment of distributions | | | | | | | | |
A-Class | | | — | | | | 149 | |
C-Class | | | — | | | | 436 | |
H-Class | | | — | | | | 2,086 | |
Shares redeemed | | | | | | | | |
A-Class | | | (105,660 | ) | | | (328,246 | ) |
C-Class | | | (99,149 | ) | | | (158,144 | ) |
H-Class | | | (3,120,293 | ) | | | (7,034,879 | ) |
| | | | | | | | |
Net increase (decrease) in shares | | | 388,443 | | | | (1,636,578 | ) |
| | | | | | | | |
| | |
SEE NOTES TO FINANCIAL STATEMENTS. | | THE RYDEX SERIES FUNDS ANNUAL REPORT | 151 |
S&P 500 PURE VALUE FUND
FINANCIAL HIGHLIGHTS
This table is presented to show selected data for a share outstanding throughout each period and to assist shareholders in evaluating a Fund’s performance for the periods presented.
| | | | | | | | | | | | | | | | | | | | |
| A-Class | | Year Ended
March 31,
2012 | | | Year Ended
March 31,
2011 | | | Year Ended
March 31,
2010c | | | Year Ended
March 31,
2009c | | | Year Ended
March 31,
2008c | |
Per Share Data | | | | | | | | | | | | | | | | | | | | |
Net asset value, beginning of period | | $ | 90.21 | | | $ | 79.66 | | | $ | 35.58 | | | $ | 100.00 | | | $ | 167.30 | |
| | | | | | | | | | | | | | | | | | | | |
Income (loss) from investment operations: | | | | | | | | | | | | | | | | | | | | |
Net investment incomea | | | .30 | | | | .01 | | | | .26 | | | | 1.95 | | | | 2.45 | |
Net gain (loss) on investments (realized and unrealized) | | | 2.98 | | | | 11.87 | | | | 44.60 | | | | (57.52 | ) | | | (30.50 | ) |
| | | | | | | | | | | | | | | | | | | | |
Total from investment operations | | | 3.28 | | | | 11.88 | | | | 44.86 | | | | (55.57 | ) | | | (28.05 | ) |
| | | | | | | | | | | | | | | | | | | | |
Less distributions from: | | | | | | | | | | | | | | | | | | | | |
Net investment income | | | — | | | | (1.33 | ) | | | (.78 | ) | | | (1.05 | ) | | | (9.95 | ) |
Net realized gains | | | — | | | | — | | | | — | | | | (7.80 | ) | | | (29.30 | ) |
| | | | | | | | | | | | | | | | | | | | |
Total distributions | | | — | | | | (1.33 | ) | | | (.78 | ) | | | (8.85 | ) | | | (39.25 | ) |
| | | | | | | | | | | | | | | | | | | | |
Net asset value, end of period | | $ | 93.49 | | | $ | 90.21 | | | $ | 79.66 | | | $ | 35.58 | | | $ | 100.00 | |
| | | | | | | | | | | | | | | | | | | | |
Total Returnb | | | 3.64 | % | | | 15.14 | % | | | 126.37 | % | | | (57.28 | %) | | | (19.98 | %) |
| | | | | | | | | | | | | | | | | | | | |
Ratios/Supplemental Data | | | | | | | | | | | | | | | | | | | | |
Net assets, end of period (in thousands) | | $ | 1,846 | | | $ | 2,329 | | | $ | 8,156 | | | $ | 203 | | | $ | 4,269 | |
| | | | | | | | | | | | | | | | | | | | |
Ratios to average net assets: | | | | | | | | | | | | | | | | | | | | |
Net investment income | | | 0.34 | % | | | 0.01 | % | | | 0.39 | % | | | 2.16 | % | | | 1.67 | % |
Total expenses | | | 1.51 | % | | | 1.54 | % | | | 1.52 | % | | | 1.53 | % | | | 1.52 | % |
| | | | | | | | | | | | | | | | | | | | |
Portfolio turnover rate | | | 762 | % | | | 820 | % | | | 673 | % | | | 1,448 | % | | | 289 | % |
| | | | | |
| C-Class | | Year Ended
March 31,
2012 | | | Year Ended
March 31,
2011 | | | Year Ended
March 31,
2010c | | | Year Ended
March 31,
2009c | | | Year Ended
March 31,
2008c | |
Per Share Data | | | | | | | | | | | | | | | | | | | | |
Net asset value, beginning of period | | $ | 83.99 | | | $ | 74.81 | | | $ | 33.66 | | | $ | 96.00 | | | $ | 163.40 | |
| | | | | | | | | | | | | | | | | | | | |
Income (loss) from investment operations: | | | | | | | | | | | | | | | | | | | | |
Net investment income (loss)a | | | (.36 | ) | | | (.51 | ) | | | (.02 | ) | | | 1.40 | | | | .70 | |
Net gain (loss) on investments (realized and unrealized) | | | 2.79 | | | | 11.02 | | | | 41.95 | | | | (54.89 | ) | | | (28.85 | ) |
| | | | | | | | | | | | | | | | | | | | |
Total from investment operations | | | 2.43 | | | | 10.51 | | | | 41.93 | | | | (53.49 | ) | | | (28.15 | ) |
| | | | | | | | | | | | | | | | | | | | |
Less distributions from: | | | | | | | | | | | | | | | | | | | | |
Net investment income | | | — | | | | (1.33 | ) | | | (.78 | ) | | | (1.05 | ) | | | (9.95 | ) |
Net realized gains | | | — | | | | — | | | | — | | | | (7.80 | ) | | | (29.30 | ) |
| | | | | | | | | | | | | | | | | | | | |
Total distributions | | | — | | | | (1.33 | ) | | | (.78 | ) | | | (8.85 | ) | | | (39.25 | ) |
| | | | | | | | | | | | | | | | | | | | |
Net asset value, end of period | | $ | 86.42 | | | $ | 83.99 | | | $ | 74.81 | | | $ | 33.66 | | | $ | 96.00 | |
| | | | | | | | | | | | | | | | | | | | |
Total Returnb | | | 2.88 | % | | | 14.28 | % | | | 124.86 | % | | | (57.55 | %) | | | (20.57 | %) |
| | | | | | | | | | | | | | | | | | | | |
Ratios/Supplemental Data | | | | | | | | | | | | | | | | | | | | |
Net assets, end of period (in thousands) | | $ | 2,128 | | | $ | 5,690 | | | $ | 4,876 | | | $ | 1,129 | | | $ | 1,838 | |
| | | | | | | | | | | | | | | | | | | | |
Ratios to average net assets: | | | | | | | | | | | | | | | | | | | | |
Net investment income (loss) | | | (0.45 | %) | | | (0.68 | %) | | | (0.03 | %) | | | 2.44 | % | | | 0.48 | % |
Total expenses | | | 2.27 | % | | | 2.29 | % | | | 2.27 | % | | | 2.29 | % | | | 2.29 | % |
| | | | | | | | | | | | | | | | | | | | |
Portfolio turnover rate | | | 762 | % | | | 820 | % | | | 673 | % | | | 1,448 | % | | | 289 | % |
| | |
152 | THE RYDEX SERIES FUNDS ANNUAL REPORT | | SEE NOTES TO FINANCIAL STATEMENTS. |
S&P 500 PURE VALUE FUND
FINANCIAL HIGHLIGHTS (concluded)
This table is presented to show selected data for a share outstanding throughout each period and to assist shareholders in evaluating a Fund’s performance for the periods presented.
| | | | | | | | | | | | | | | | | | | | |
| H-Class | | Year Ended
March 31,
2012 | | | Year Ended
March 31,
2011 | | | Year Ended
March 31,
2010c | | | Year Ended
March 31,
2009c | | | Year Ended
March 31,
2008c | |
Per Share Data | | | | | | | | | | | | | | | | | | | | |
Net asset value, beginning of period | | $ | 90.50 | | | $ | 79.91 | | | $ | 35.67 | | | $ | 100.00 | | | $ | 167.30 | |
| | | | | | | | | | | | | | | | | | | | |
Income (loss) from investment operations: | | | | | | | | | | | | | | | | | | | | |
Net investment income (loss)a | | | .33 | | | | (.02 | ) | | | .32 | | | | 1.40 | | | | 1.80 | |
Net gain (loss) on investments (realized and unrealized) | | | 2.97 | | | | 11.94 | | | | 44.70 | | | | (56.88 | ) | | | (29.85 | ) |
| | | | | | | | | | | | | | | | | | | | |
Total from investment operations | | | 3.30 | | | | 11.92 | | | | 45.02 | | | | (55.48 | ) | | | (28.05 | ) |
| | | | | | | | | | | | | | | | | | | | |
Less distributions from: | | | | | | | | | | | | | | | | | | | | |
Net investment income | | | — | | | | (1.33 | ) | | | (.78 | ) | | | (1.05 | ) | | | (9.95 | ) |
Net realized gains | | | — | | | | — | | | | — | | | | (7.80 | ) | | | (29.30 | ) |
| | | | | | | | | | | | | | | | | | | | |
Total distributions | | | — | | | | (1.33 | ) | | | (.78 | ) | | | (8.85 | ) | | | (39.25 | ) |
| | | | | | | | | | | | | | | | | | | | |
Net asset value, end of period | | $ | 93.80 | | | $ | 90.50 | | | $ | 79.91 | | | $ | 35.67 | | | $ | 100.00 | |
| | | | | | | | | | | | | | | | | | | | |
Total Returnb | | | 3.65 | % | | | 15.14 | % | | | 126.50 | % | | | (57.23 | %) | | | (19.98 | %) |
| | | | | | | | | | | | | | | | | | | | |
Ratios/Supplemental Data | | | | | | | | | | | | | | | | | | | | |
Net assets, end of period (in thousands) | | $ | 68,886 | | | $ | 26,852 | | | $ | 148,578 | | | $ | 4,558 | | | $ | 18,459 | |
| | | | | | | | | | | | | | | | | | | | |
Ratios to average net assets: | | | | | | | | | | | | | | | | | | | | |
Net investment income (loss) | | | 0.38 | % | | | (0.03 | %) | | | 0.47 | % | | | 2.36 | % | | | 1.11 | % |
Total expenses | | | 1.51 | % | | | 1.54 | % | | | 1.54 | % | | | 1.53 | % | | | 1.53 | % |
| | | | | | | | | | | | | | | | | | | | |
Portfolio turnover rate | | | 762 | % | | | 820 | % | | | 673 | % | | | 1,448 | % | | | 289 | % |
| a | Net investment income (loss) per share was computed using average shares outstanding throughout the period. |
| b | Total return does not reflect the impact of any applicable sales charges and has not been annualized. |
| c | Reverse share split — Per share amounts for the period March 31, 2007 through April 19, 2009 have been restated to reflect a 1:5 reverse share split effective April 20, 2009. |
| | |
SEE NOTES TO FINANCIAL STATEMENTS. | | THE RYDEX SERIES FUNDS ANNUAL REPORT | 153 |
| | |
| PERFORMANCE REPORT AND FUND PROFILE (Unaudited) | | March 31, 2012 |
S&P MIDCAP 400 PURE GROWTH FUND
OBJECTIVE: Seeks to provide investment results that match, before fees and expenses, the performance of a benchmark for mid-cap growth securities on a daily basis. The Fund’s current benchmark is the S&P MidCap 400 Pure Growth Index (the “underlying index”).
For the one-year period ended March 31, 2012, S&P MidCap 400 Pure Growth Fund H-Class returned 3.11%, compared with 4.25% for the S&P MidCap 400 Pure Growth Index*. S&P MidCap 400 Pure Growth Fund maintained a daily correlation of over 99% to its benchmark. Mid-cap growth stocks significantly outperformed mid-cap value stocks during the period.
Health Care, Consumer Discretionary and Industrials holdings contributed the most to Fund return. Information Technology, Energy and Financials detracted from return.
Regeneron Pharmaceuticals, Inc. Monster Beverage Corp. and Equinix, Inc. were among the stocks which added the most to the index during the year. Cree, Inc., Skyworks Solutions, Inc. and Green Mountain Coffee Roasters were among the stocks which provided the least performance to the index during the year.
* The S&P MidCap 400® Pure Growth Index is narrow in focus, containing only those S&P MidCap 400 Index companies with strong growth characteristics as selected by S&P. The S&P MidCap 400 Index measures the performance of the mid-capitalization sector of the U.S. equity market.
Performance displayed represents past performance which is no guarantee of future results.
Holdings Diversification (Market Exposure as % of Net Assets)
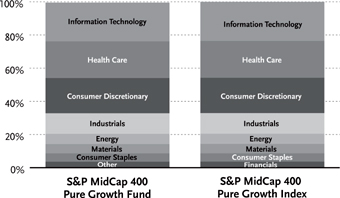
“Holdings Diversification (Market Exposure as % of Net Assets)” excludes any temporary cash investments.
| | | | |
Inception Dates: | | | |
A-Class | | | September 1, 2004 | |
C-Class | | | February 20, 2004 | |
H-Class | | | February 20, 2004 | |
| | | | |
Ten Largest Holdings (% of Total Net Assets) | | | |
Regeneron Pharmaceuticals, Inc. | | | 3.0 | % |
ITT Educational Services, Inc. | | | 2.2 | % |
Equinix, Inc. | | | 2.1 | % |
Fossil, Inc. | | | 1.8 | % |
Catalyst Health Solutions, Inc. | | | 1.7 | % |
AMERIGROUP Corp. | | | 1.7 | % |
Alliance Data Systems Corp. | | | 1.7 | % |
Advance Auto Parts, Inc. | | | 1.6 | % |
Under Armour, Inc. — Class A | | | 1.5 | % |
Monster Beverage Corp. | | | 1.5 | % |
| | | | |
Top Ten Total | | | 18.8 | % |
| | | | |
“Ten Largest Holdings” exclude any temporary cash or derivative investments.
154 | THE RYDEX SERIES FUNDS ANNUAL REPORT
PERFORMANCE REPORT AND FUND PROFILE (Unaudited) (concluded)
Cumulative Fund Performance*
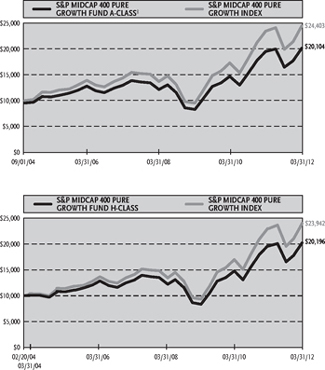
Average Annual Returns*
Periods Ended 03/31/12
| | | | | | | | | | | | |
| | | 1 Year | | | 5 Year | | | Since
Inception
(09/01/04) | |
A-Class Shares | | | 3.16 | % | | | 9.18 | % | | | 10.36 | % |
A-Class Shares with sales charge‡ | | | -1.74 | % | | | 8.13 | % | | | 9.65 | % |
S&P MidCap 400 Pure Growth Index | | | 4.25 | % | | | 11.18 | % | | | 12.49 | % |
| | | | | | | | | | | (02/20/04) | |
C- Class Shares | | | 2.35 | % | | | 8.37 | % | | | 8.25 | % |
C- Class Shares with CDSC† | | | 1.35 | % | | | 8.37 | % | | | 8.25 | % |
H- Class Shares | | | 3.11 | % | | | 9.18 | % | | | 9.05 | % |
S&P MidCap 400 Pure Growth Index | | | 4.25 | % | | | 11.18 | % | | | 11.37 | % |
| * | The performance data above represents past performance that is not predictive of future results. The investment return and principal value of an investment in the Fund will fluctuate so that an investor’s shares, when redeemed, may be worth more or less than their original cost. Returns are historical and include changes in principal and reinvested dividends and capital gains and do not reflect the effect of taxes. The S&P MidCap 400 Pure Growth Index is an unmanaged index and, unlike the Fund, has no management fees or operating expenses to reduce its reported return. The graphs are based on A-Class shares and H-Class shares only; performance for C-Class shares will vary due to differences in fee structures. |
| † | Fund returns include a CDSC of 1% if redeemed within 12 months of purchase. |
| ‡ | Fund returns are calculated using the maximum sales charge of 4.75%. |
THE RYDEX SERIES FUNDS ANNUAL REPORT | 155
| | |
| SCHEDULE OF INVESTMENTS | | March 31, 2012 |
| S&P MIDCAP 400 PURE GROWTH FUND | | |
| | | | | | | | |
| | | SHARES | | | VALUE | |
COMMON STOCKS†—99.5% | | | | | | | | |
| | |
INFORMATION TECHNOLOGY—23.5% | | | | | | | | |
Equinix, Inc.* | | | 49,380 | | | $ | 7,774,881 | |
Alliance Data Systems Corp.* | | | 49,539 | | | | 6,239,932 | |
Rackspace Hosting, Inc.* | | | 96,835 | | | | 5,596,095 | |
Informatica Corp.* | | | 96,730 | | | | 5,117,016 | |
Wright Express Corp.* | | | 68,500 | | | | 4,434,005 | |
Silicon Laboratories, Inc.* | | | 101,844 | | | | 4,379,292 | |
VeriFone Systems, Inc.* | | | 80,700 | | | | 4,185,909 | |
Rovi Corp.* | | | 124,969 | | | | 4,067,741 | |
Global Payments, Inc. | | | 81,594 | | | | 3,875,715 | |
Factset Research Systems, Inc. | | | 38,224 | | | | 3,785,705 | |
ANSYS, Inc.* | | | 55,638 | | | | 3,617,583 | |
Lam Research Corp.* | | | 78,700 | | | | 3,511,594 | |
Concur Technologies, Inc.* | | | 56,915 | | | | 3,265,783 | |
Semtech Corp.* | | | 107,045 | | | | 3,046,501 | |
Solera Holdings, Inc. | | | 60,855 | | | | 2,792,636 | |
Riverbed Technology, Inc.* | | | 97,475 | | | | 2,737,098 | |
Zebra Technologies Corp. — Class A* | | | 56,642 | | | | 2,332,518 | |
MICROS Systems, Inc.* | | | 41,346 | | | | 2,286,020 | |
ADTRAN, Inc. | | | 68,603 | | | | 2,139,728 | |
ACI Worldwide, Inc.* | | | 52,579 | | | | 2,117,356 | |
Jack Henry & Associates, Inc. | | | 56,758 | | | | 1,936,583 | |
NeuStar, Inc. — Class A* | | | 44,900 | | | | 1,672,525 | |
Gartner, Inc.* | | | 39,208 | | | | 1,671,829 | |
Trimble Navigation Ltd.* | | | 29,000 | | | | 1,578,180 | |
Advent Software, Inc.* | | | 48,348 | | | | 1,237,709 | |
| | | | | | | | |
Total Information Technology | | | | | | | 85,399,934 | |
| | | | | | | | |
HEALTH CARE—22.2% | | | | | | | | |
Regeneron Pharmaceuticals, Inc.* | | | 93,400 | | | | 10,892,308 | |
Catalyst Health Solutions, Inc.* | | | 99,382 | | | | 6,333,615 | |
AMERIGROUP Corp.* | | | 93,900 | | | | 6,317,592 | |
Mednax, Inc.* | | | 74,604 | | | | 5,548,299 | |
United Therapeutics Corp.* | | | 107,600 | | | | 5,071,188 | |
Gen-Probe, Inc.* | | | 73,734 | | | | 4,896,675 | |
Bio-Rad Laboratories, Inc. — Class A* | | | 39,800 | | | | 4,126,862 | |
IDEXX Laboratories, Inc.* | | | 45,239 | | | | 3,956,151 | |
Endo Pharmaceuticals Holdings, Inc.* | | | 101,316 | | | | 3,923,969 | |
Henry Schein, Inc.* | | | 51,200 | | | | 3,874,816 | |
Mettler-Toledo International, Inc.* | | | 19,728 | | | | 3,644,748 | |
Cooper Companies, Inc. | | | 41,894 | | | | 3,423,159 | |
Medicis Pharmaceutical Corp. — Class A | | | 80,092 | | | | 3,010,658 | |
Techne Corp. | | | 42,900 | | | | 3,007,290 | |
Thoratec Corp.* | | | 89,033 | | | | 3,001,302 | |
HMS Holdings Corp.* | | | 95,200 | | | | 2,971,192 | |
ResMed, Inc.* | | | 92,108 | | | | 2,847,058 | |
Covance, Inc.* | | | 45,300 | | | | 2,157,639 | |
Allscripts Healthcare Solutions, Inc.* | | | 104,260 | | | | 1,730,716 | |
| | | | | | | | |
Total Health Care | | | | | | | 80,735,237 | |
| | | | | | | | |
| | | | | | | | |
| | | SHARES | | | VALUE | |
CONSUMER DISCRETIONARY—21.1% | | | | | | | | |
ITT Educational Services, Inc.* | | | 120,757 | | | $ | 7,986,868 | |
Fossil, Inc.* | | | 50,675 | | | | 6,688,086 | |
Advance Auto Parts, Inc. | | | 64,458 | | | | 5,709,045 | |
Under Armour, Inc. — Class A* | | | 60,003 | | | | 5,640,282 | |
Strayer Education, Inc. | | | 57,970 | | | | 5,465,412 | |
PVH Corp. | | | 60,252 | | | | 5,382,311 | |
Tractor Supply Co. | | | 57,481 | | | | 5,205,480 | |
Panera Bread Co. — Class A* | | | 31,538 | | | | 5,075,095 | |
Carter’s, Inc.* | | | 101,500 | | | | 5,051,655 | |
PetSmart, Inc. | | | 67,933 | | | | 3,887,126 | |
Warnaco Group, Inc.* | | | 64,317 | | | | 3,756,113 | |
Polaris Industries, Inc. | | | 47,988 | | | | 3,462,334 | |
Deckers Outdoor Corp.* | | | 51,424 | | | | 3,242,283 | |
Tupperware Brands Corp. | | | 50,932 | | | | 3,234,182 | |
LKQ Corp.* | | | 102,675 | | | | 3,200,380 | |
Life Time Fitness, Inc.* | | | 61,333 | | | | 3,101,610 | |
Gentex Corp. | | | 42,866 | | | | 1,050,217 | |
| | | | | | | | |
Total Consumer Discretionary | | | | | | | 77,138,479 | |
| | | | | | | | |
INDUSTRIALS—12.3% | | | | | | | | |
Triumph Group, Inc. | | | 89,446 | | | | 5,604,686 | |
Valmont Industries, Inc. | | | 37,800 | | | | 4,438,099 | |
Clean Harbors, Inc.* | | | 65,600 | | | | 4,416,848 | |
Watsco, Inc. | | | 57,800 | | | | 4,279,512 | |
Alaska Air Group, Inc.* | | | 106,400 | | | | 3,811,248 | |
MSC Industrial Direct Co., Inc. — Class A | | | 39,200 | | | | 3,264,576 | |
Copart, Inc.* | | | 121,300 | | | | 3,162,291 | |
Wabtec Corp. | | | 37,000 | | | | 2,788,690 | |
Woodward, Inc. | | | 60,516 | | | | 2,591,900 | |
J.B. Hunt Transport Services, Inc. | | | 47,400 | | | | 2,577,138 | |
Donaldson Company, Inc. | | | 65,800 | | | | 2,351,034 | |
AMETEK, Inc. | | | 44,500 | | | | 2,158,695 | |
FTI Consulting, Inc.* | | | 57,300 | | | | 2,149,896 | |
Gardner Denver, Inc. | | | 23,000 | | | | 1,449,460 | |
| | | | | | | | |
Total Industrials | | | | | | | 45,044,073 | |
| | | | | | | | |
ENERGY—6.2% | | | | | | | | |
CARBO Ceramics, Inc. | | | 31,725 | | | | 3,345,401 | |
Cimarex Energy Co. | | | 40,100 | | | | 3,026,348 | |
Bill Barrett Corp.* | | | 109,529 | | | | 2,848,849 | |
Dresser-Rand Group, Inc.* | | | 58,319 | | | | 2,705,418 | |
Oil States International, Inc.* | | | 30,900 | | | | 2,412,054 | |
Dril-Quip, Inc.* | | | 36,448 | | | | 2,369,849 | |
Oceaneering International, Inc. | | | 42,864 | | | | 2,309,941 | |
Northern Oil and Gas, Inc.* | | | 97,449 | | | | 2,021,092 | |
SM Energy Co. | | | 19,900 | | | | 1,408,323 | |
| | | | | | | | |
Total Energy | | | | | | | 22,447,275 | |
| | | | | | | | |
MATERIALS—5.6% | | | | | | | | |
Rock-Tenn Co. — Class A | | | 69,900 | | | | 4,722,444 | |
NewMarket Corp. | | | 24,187 | | | | 4,532,644 | |
Compass Minerals International, Inc. | | | 46,017 | | | | 3,301,260 | |
Albemarle Corp. | | | 43,958 | | | | 2,809,795 | |
Aptargroup, Inc. | | | 50,600 | | | | 2,771,362 | |
Intrepid Potash, Inc.* | | | 100,500 | | | | 2,445,165 | |
| | | | | | | | |
Total Materials | | | | | | | 20,582,670 | |
| | | | | | | | |
| | |
156 | THE RYDEX SERIES FUNDS ANNUAL REPORT | | SEE NOTES TO FINANCIAL STATEMENTS. |
| | |
| SCHEDULE OF INVESTMENTS (concluded) | | March 31, 2012 |
| S&P MIDCAP 400 PURE GROWTH FUND | | |
| | | | | | | | |
| | | SHARES | | | VALUE | |
CONSUMER STAPLES - 5.0% | | | | | | | | |
Monster Beverage Corp.* | | | 90,416 | | | $ | 5,613,929 | |
Green Mountain Coffee Roasters, Inc.* | | | 90,932 | | | | 4,259,255 | |
Corn Products International, Inc. | | | 58,300 | | | | 3,360,995 | |
Lancaster Colony Corp. | | | 45,600 | | | | 3,030,576 | |
Church & Dwight Company, Inc. | | | 38,300 | | | | 1,883,977 | |
| | | | | | | | |
Total Consumer Staples | | | | | | | 18,148,732 | |
| | | | | | | | |
FINANCIALS—3.6% | | | | | | | | |
Signature Bank* | | | 53,900 | | | | 3,397,856 | |
MSCI, Inc. — Class A* | | | 62,209 | | | | 2,289,913 | |
Taubman Centers, Inc. | | | 30,800 | | | | 2,246,860 | |
Federal Realty Investment Trust | | | 22,300 | | | | 2,158,417 | |
Home Properties, Inc. | | | 25,800 | | | | 1,574,058 | |
Essex Property Trust, Inc. | | | 10,300 | | | | 1,560,553 | |
| | | | | | | | |
Total Financials | | | | | | | 13,227,657 | |
| | | | | | | | |
Total Common Stocks
(Cost $292,004,771) | | | | | | | 362,724,057 | |
| | | | | | | | |
| | | | | | | | |
| | | FACE
AMOUNT | | | VALUE | |
REPURCHASE AGREEMENTS††,1 - 0.7% | | | | | | | | |
HSBC Group
issued 03/30/12 at 0.01%
due 04/02/12 | | $ | 1,789,548 | | | $ | 1,789,548 | |
Mizuho Financial Group, Inc.
issued 03/30/12 at 0.01%
due 04/02/12 | | | 503,489 | | | | 503,489 | |
Credit Suisse Group
issued 03/30/12 at 0.01%
due 04/02/12 | | | 231,032 | | | | 231,032 | |
Deutsche Bank
issued 03/30/12 at 0.01%
due 04/02/12 | | | 133,822 | | | | 133,822 | |
| | | | | | | | |
Total Repurchase Agreements
(Cost $2,657,891) | | | | | | | 2,657,891 | |
| | | | | | | | |
Total Investments – 100.2%
(Cost $294,662,662) | | | | | | $ | 365,381,948 | |
| | | | | | | | |
Other Assets & Liabilities, net – (0.2)% | | | | | | | (592,259 | ) |
| | | | | | | | |
Total Net Assets – 100.0% | | | | | | $ | 364,789,689 | |
| * | Non-income producing security. |
| † | Value determined based on Level 1 inputs — See Note 4. |
| †† | Value determined based on Level 2 inputs — See Note 4. |
| 1 | Repurchase Agreements — See Note 5. |
| | |
SEE NOTES TO FINANCIAL STATEMENTS. | | THE RYDEX SERIES FUNDS ANNUAL REPORT | 157 |
S&P MIDCAP 400 PURE GROWTH FUND
STATEMENT OF ASSETS AND LIABILITIES
| | | | |
March 31, 2012 | | | | |
| |
ASSETS: | | | | |
Investments, at value
(cost $292,004,771) | | $ | 362,724,057 | |
Repurchase agreements, at value
(cost $2,657,891) | | | 2,657,891 | |
| | | | |
Total investments
(cost $294,662,662) | | | 365,381,948 | |
Receivables: | | | | |
Fund shares sold | | | 514,142 | |
Dividends | | | 102,151 | |
| | | | |
Total assets | | | 365,998,241 | |
| | | | |
| |
LIABILITIES: | | | | |
Payable for: | | | | |
Fund shares redeemed | | | 636,618 | |
Management fees | | | 230,601 | |
Distribution and service fees | | | 86,954 | |
Transfer agent and administrative fees | | | 76,867 | |
Portfolio accounting fees | | | 28,354 | |
Miscellaneous | | | 149,158 | |
| | | | |
Total liabilities | | | 1,208,552 | |
| | | | |
NETASSETS | | $ | 364,789,689 | |
| | | | |
NET ASSETS CONSIST OF: | | | | |
Paid in capital | | $ | 335,648,011 | |
Accumulated net investment loss | | | (889,323 | ) |
Accumulated net realized loss on investments | | | (40,688,285 | ) |
Net unrealized appreciation on investments | | | 70,719,286 | |
| | | | |
Net assets | | $ | 364,789,689 | |
| | | | |
A-CLASS: | | | | |
Net assets | | $ | 36,052,045 | |
Capital shares outstanding | | | 817,362 | |
Net asset value per share | | $ | 44.11 | |
| | | | |
Maximum offering price per share
(Net asset value divided by 95.25%) | | $ | 46.31 | |
| | | | |
C-CLASS: | | | | |
Net assets | | $ | 16,227,581 | |
Capital shares outstanding | | | 391,717 | |
Net asset value per share | | $ | 41.43 | |
| | | | |
H-CLASS: | | | | |
Net assets | | $ | 312,510,063 | |
Capital shares outstanding | | | 7,079,265 | |
Net asset value per share | | $ | 44.14 | |
| | | | |
STATEMENT OF OPERATIONS
| | | | |
Year Ended March 31, 2012 | | | | |
| |
INVESTMENT INCOME: | | | | |
Dividends | | $ | 1,167,201 | |
Interest | | | 739 | |
| | | | |
Total investment income | | | 1,167,940 | |
| | | | |
| |
EXPENSES: | | | | |
Management fees | | | 2,068,762 | |
Transfer agent and administrative fees | | | 689,587 | |
Distribution and service fees: | | | | |
A-Class | | | 73,913 | |
C-Class | | | 123,488 | |
H-Class | | | 584,802 | |
Portfolio accounting fees | | | 266,801 | |
Custodian fees | | | 71,730 | |
Trustees’ fees* | | | 21,805 | |
Miscellaneous | | | 326,053 | |
| | | | |
Total expenses | | | 4,226,941 | |
| | | | |
Net investment loss | | | (3,059,001 | ) |
| | | | |
| |
NET REALIZEDAND UNREALIZED GAIN (LOSS): | | | | |
Net realized gain (loss) on: | | | | |
Investments | | | (31,284,272 | ) |
| | | | |
Net realized loss | | | (31,284,272 | ) |
| | | | |
Net change in unrealized appreciation
(depreciation) on: | | | | |
Investments | | | 33,096,261 | |
| | | | |
Net change in unrealized appreciation
(depreciation) | | | 33,096,261 | |
| | | | |
Net realized and unrealized gain | | | 1,811,989 | |
| | | | |
Net decrease in net assets resulting from operations | | $ | (1,247,012 | ) |
| | | | |
| * | Relates to Trustees not deemed “interested persons” within the meaning of Section 2(a)(19) of the 1940 Act. |
| | |
158 | THE RYDEX SERIES FUNDS ANNUAL REPORT | | SEE NOTES TO FINANCIAL STATEMENTS. |
S&P MIDCAP 400 PURE GROWTH FUND
STATEMENTS OF CHANGES IN NET ASSETS
| | | | | | | | |
| | | Year Ended
March 31,
2012 | | | Year Ended
March 31,
2011 | |
INCREASE (DECREASE) IN NET ASSETS FROM OPERATIONS: | | | | | | | | |
Net investment loss | | $ | (3,059,001 | ) | | $ | (1,206,546 | ) |
Net realized gain (loss) on investments | | | (31,284,272 | ) | | | 11,940,557 | |
Net change in unrealized appreciation (depreciation) on investments | | | 33,096,261 | | | | 25,095,377 | |
| | | | | | | | |
Net increase (decrease) in net assets resulting from operations | | | (1,247,012 | ) | | | 35,829,388 | |
| | | | | | | | |
| | |
CAPITALSHARETRANSACTIONS: | | | | | | | | |
PROCEEDSFROMSALEOFSHARES | | | | | | | | |
A-Class | | | 97,480,590 | | | | 48,413,965 | |
C-Class | | | 17,194,237 | | | | 16,223,181 | |
H-Class | | | 771,690,633 | | | | 621,590,504 | |
COSTOFSHARESREDEEMED | | | | | | | | |
A-Class | | | (84,908,346 | ) | | | (27,798,637 | ) |
C-Class | | | (11,282,635 | ) | | | (11,666,481 | ) |
H-Class | | | (672,131,177 | ) | | | (505,069,223 | ) |
| | | | | | | | |
Net increase from capital share transactions | | | 118,043,302 | | | | 141,693,309 | |
| | | | | | | | |
Net increase in net assets | | | 116,796,290 | | | | 177,522,697 | |
| | |
NETASSETS: | | | | | | | | |
Beginning of year | | | 247,993,399 | | | | 70,470,702 | |
End of year | | $ | 364,789,689 | | | $ | 247,993,399 | |
| | | | | | | | |
Accumulated net investment loss at end of year | | $ | (889,323 | ) | | $ | — | |
| | | | | | | | |
CAPITALSHAREACTIVITY: | | | | | | | | |
Shares sold | | | | | | | | |
A-Class | | | 2,352,695 | | | | 1,303,426 | |
C-Class | | | 436,239 | | | | 465,724 | |
H-Class | | | 18,455,166 | | | | 17,350,447 | |
Shares redeemed | | | | | | | | |
A-Class | | | (2,125,511 | ) | | | (782,853 | ) |
C-Class | | | (294,141 | ) | | | (339,178 | ) |
H-Class | | | (16,343,786 | ) | | | (14,381,054 | ) |
| | | | | | | | |
Net increase in shares | | | 2,480,662 | | | | 3,616,512 | |
| | | | | | | | |
| | |
SEE NOTES TO FINANCIAL STATEMENTS. | | THE RYDEX SERIES FUNDS ANNUAL REPORT | 159 |
S&P MIDCAP 400 PURE GROWTH FUND
FINANCIAL HIGHLIGHTS
This table is presented to show selected data for a share outstanding throughout each period and to assist shareholders in evaluating a Fund’s performance for the periods presented.
| | | | | | | | | | | | | | | | | | | | |
A-Class | | Year Ended
March 31,
2012 | | | Year Ended
March 31,
2011 | | | Year Ended
March 31,
2010 | | | Year Ended
March 31,
2009 | | | Year Ended
March 31,
2008 | |
Per Share Data | | | | | | | | | | | | | | | | | | | | |
Net asset value, beginning of period | | $ | 42.76 | | | $ | 32.21 | | | $ | 18.19 | | | $ | 26.65 | | | $ | 30.72 | |
| | | | | | | | | | | | | | | | | | | | |
Income (loss) from investment operations: | | | | | | | | | | | | | | | | | | | | |
Net investment lossa | | | (.45 | ) | | | (.38 | ) | | | (.28 | ) | | | (.24 | ) | | | (.27 | ) |
Net gain (loss) on investments
(realized and unrealized) | | | 1.80 | | | | 10.93 | | | | 14.30 | | | | (8.22 | ) | | | (1.42 | ) |
| | | | | | | | | | | | | | | | | | | | |
Total from investment operations | | | 1.35 | | | | 10.55 | | | | 14.02 | | | | (8.46 | ) | | | (1.69 | ) |
| | | | | | | | | | | | | | | | | | | | |
Less distributions from: | | | | | | | | | | | | | | | | | | | | |
Net realized gains | | | — | | | | — | | | | — | | | | — | | | | (2.38 | ) |
| | | | | | | | | | | | | | | | | | | | |
Total distributions | | | — | | | | — | | | | — | | | | — | | | | (2.38 | ) |
| | | | | | | | | | | | | | | | | | | | |
Net asset value, end of period | | $ | 44.11 | | | $ | 42.76 | | | $ | 32.21 | | | $ | 18.19 | | | $ | 26.65 | |
| | | | | | | | | | | | | | | | | | | | |
Total Returnb | | | 3.16 | % | | | 32.75 | % | | | 77.08 | % | | | (31.74 | %) | | | (6.26 | %) |
| | | | | | | | | | | | | | | | | | | | |
Ratios/Supplemental Data | | | | | | | | | | | | | | | | | | | | |
Net assets, end of period
(in thousands) | | $ | 36,052 | | | $ | 25,237 | | | $ | 2,242 | | | $ | 723 | | | $ | 3,863 | |
| | | | | | | | | | | | | | | | | | | | |
Ratios to average net assets: | | | | | | | | | | | | | | | | | | | | |
Net investment loss | | | (1.09 | %) | | | (1.04 | %) | | | (1.03 | %) | | | (0.93 | %) | | | (0.88 | %) |
Total expenses | | | 1.50 | % | | | 1.54 | % | | | 1.53 | % | | | 1.58 | % | | | 1.52 | % |
| | | | | | | | | | | | | | | | | | | | |
Portfolio turnover rate | | | 226 | % | | | 448 | % | | | 626 | % | | | 1,281 | % | | | 736 | % |
| | | | | | | | | | | | | | | | | | | | |
C-Class | | Year Ended
March 31,
2012 | | | Year Ended
March 31,
2011 | | | Year Ended
March 31,
2010 | | | Year Ended
March 31,
2009 | | | Year Ended
March 31,
2008 | |
Per Share Data | | | | | | | | | | | | | | | | | | | | |
Net asset value, beginning of period | | $ | 40.47 | | | $ | 30.71 | | | $ | 17.48 | | | $ | 25.79 | | | $ | 30.01 | |
| | | | | | | | | | | | | | | | | | | | |
Income (loss) from investment operations: | | | | | | | | | | | | | | | | | | | | |
Net investment lossa | | | (.71 | ) | | | (.63 | ) | | | (.44 | ) | | | (.42 | ) | | | (.50 | ) |
Net gain (loss) on investments
(realized and unrealized) | | | 1.67 | | | | 10.39 | | | | 13.67 | | | | (7.89 | ) | | | (1.34 | ) |
| | | | | | | | | | | | | | | | | | | | |
Total from investment operations | | | .96 | | | | 9.76 | | | | 13.23 | | | | (8.31 | ) | | | (1.84 | ) |
| | | | | | | | | | | | | | | | | | | | |
Less distributions from: | | | | | | | | | | | | | | | | | | | | |
Net realized gains | | | — | | | | — | | | | — | | | | — | | | | (2.38 | ) |
| | | | | | | | | | | | | | | | | | | | |
Total distributions | | | — | | | | — | | | | — | | | | — | | | | (2.38 | ) |
| | | | | | | | | | | | | | | | | | | | |
Net asset value, end of period | | $ | 41.43 | | | $ | 40.47 | | | $ | 30.71 | | | $ | 17.48 | | | $ | 25.79 | |
| | | | | | | | | | | | | | | | | | | | |
Total Returnb | | | 2.35 | % | | | 31.78 | % | | | 75.69 | % | | | (32.22 | %) | | | (6.92 | %) |
| | | | | | | | | | | | | | | | | | | | |
Ratios/Supplemental Data | | | | | | | | | | | | | | | | | | | | |
Net assets, end of period
(in thousands) | | $ | 16,228 | | | $ | 10,102 | | | $ | 3,780 | | | $ | 3,477 | | | $ | 1,426 | |
| | | | | | | | | | | | | | | | | | | | |
Ratios to average net assets: | | | | | | | | | | | | | | | | | | | | |
Net investment loss | | | (1.83 | %) | | | (1.83 | %) | | | (1.77 | %) | | | (1.72 | %) | | | (1.69 | %) |
Total expenses | | | 2.25 | % | | | 2.29 | % | | | 2.28 | % | | | 2.32 | % | | | 2.28 | % |
| | | | | | | | | | | | | | | | | | | | |
Portfolio turnover rate | | | 226 | % | | | 448 | % | | | 626 | % | | | 1,281 | % | | | 736 | % |
| | |
160 | THE RYDEX SERIES FUNDS ANNUAL REPORT | | SEE NOTES TO FINANCIAL STATEMENTS. |
S&P MIDCAP 400 PURE GROWTH FUND
FINANCIAL HIGHLIGHTS (concluded)
This table is presented to show selected data for a share outstanding throughout each period and to assist shareholders in evaluating a Fund’s performance for the periods presented.
| | | | | | | | | | | | | | | | | | | | |
H-Class | | Year Ended
March 31,
2012 | | | Year Ended
March 31,
2011 | | | Year Ended
March 31,
2010 | | | Year Ended
March 31,
2009 | | | Year Ended
March 31,
2008 | |
Per Share Data | | | | | | | | | | | | | | | | | | | | |
Net asset value, beginning of period | | $ | 42.81 | | | $ | 32.25 | | | $ | 18.21 | | | $ | 26.68 | | | $ | 30.75 | |
| | | | | | | | | | | | | | | | | | | | |
Income (loss) from investment operations: | | | | | | | | | | | | | | | | | | | | |
Net investment lossa | | | (.44 | ) | | | (.38 | ) | | | (.26 | ) | | | (.22 | ) | | | (.28 | ) |
Net gain (loss) on investments
(realized and unrealized) | | | 1.77 | | | | 10.94 | | | | 14.30 | | | | (8.25 | ) | | | (1.41 | ) |
| | | | | | | | | | | | | | | | | | | | |
Total from investment operations | | | 1.33 | | | | 10.56 | | | | 14.04 | | | | (8.47 | ) | | | (1.69 | ) |
| | | | | | | | | | | | | | | | | | | | |
Less distributions from: | | | | | | | | | | | | | | | | | | | | |
Net realized gains | | | — | | | | — | | | | — | | | | — | | | | (2.38 | ) |
| | | | | | | | | | | | | | | | | | | | |
Total distributions | | | — | | | | — | | | | — | | | | — | | | | (2.38 | ) |
| | | | | | | | | | | | | | | | | | | | |
Net asset value, end of period | | $ | 44.14 | | | $ | 42.81 | | | $ | 32.25 | | | $ | 18.21 | | | $ | 26.68 | |
| | | | | | | | | | | | | | | | | | | | |
Total Returnb | | | 3.11 | % | | | 32.74 | % | | | 77.10 | % | | | (31.75 | %) | | | (6.25 | %) |
| | | | | | | | | | | | | | | | | | | | |
Ratios/Supplemental Data | | | | | | | | | | | | | | | | | | | | |
Net assets, end of period
(in thousands) | | $ | 312,510 | | | $ | 212,654 | | | $ | 64,449 | | | $ | 15,591 | | | $ | 14,158 | |
| | | | | | | | | | | | | | | | | | | | |
Ratios to average net assets: | | | | | | | | | | | | | | | | | | | | |
Net investment loss | | | (1.08 | %) | | | (1.02 | %) | | | (0.99 | %) | | | (0.95 | %) | | | (0.92 | %) |
Total expenses | | | 1.50 | % | | | 1.55 | % | | | 1.54 | % | | | 1.55 | % | | | 1.51 | % |
| | | | | | | | | | | | | | | | | | | | |
Portfolio turnover rate | | | 226 | % | | | 448 | % | | | 626 | % | | | 1,281 | % | | | 736 | % |
| a | Net investment loss per share was computed using average shares outstanding throughout the period. |
| b | Total return does not reflect the impact of any applicable sales charges and has not been annualized. |
| | |
SEE NOTES TO FINANCIAL STATEMENTS. | | THE RYDEX SERIES FUNDS ANNUAL REPORT | 161 |
| | |
| PERFORMANCE REPORT AND FUND PROFILE (Unaudited) | | March 31, 2012 |
S&P MIDCAP 400 PURE VALUE FUND
OBJECTIVE: Seeks to provide investment results that match, before fees and expenses, the performance of a benchmark for mid-cap value securities on a daily basis. The Fund’s current benchmark is the S&P MidCap 400 Pure Value Index (the “underlying index”).
For the one-year period ended March 31, 2012, S&P MidCap 400 Pure Value Fund H-Class returned -1.78%, compared with 1.41% for the S&P MidCap 400 Pure Value Index*. S&P MidCap 400 Pure Value Fund maintained a daily correlation of over 99% to its benchmark. Mid-cap growth stocks significantly outperformed mid-cap value stocks during the period.
Financials, Utilities and Consumer Discretionary were the sectors contributing most to return. Health Care and Energy were the largest detractors from return.
The best-performing holdings included Excelis, Inc., PNM Resources, Inc. and Jeffries Group, Inc., while CoreLogic, Inc., Overseas Shipholding Group, Inc. and Kindred Healthcare, Inc. were among the stocks providing the least performance to the index during the year.
*The S&P MidCap 400® Pure Value Index is narrow in focus, containing only those S&P MidCap 400 Index companies with strong value characteristics as selected by S&P. The S&P MidCap 400 Index measures the performance of the mid-capitalization sector of the U.S. equity market.
Performance displayed represents past performance which is no guarantee of future results.
Holdings Diversification (Market Exposure as % of Net Assets)
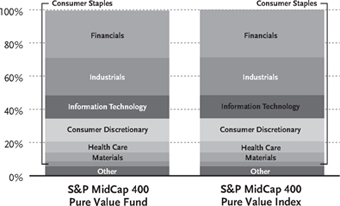
“Holdings Diversification (Market Exposure as % of Net Assets)” excludes any temporary cash investments.
| | | | |
Inception Dates: | | | |
A-Class | | | September 1, 2004 | |
C-Class | | | February 20, 2004 | |
H-Class | | | February 20, 2004 | |
| | | | |
Ten Largest Holdings (% of Total Net Assets) | |
Exelis, Inc. | | | 3.1 | % |
ITT Corp. | | | 2.8 | % |
First American Financial Corp. | | | 2.8 | % |
Collective Brands, Inc. | | | 2.3 | % |
Community Health Systems, Inc. | | | 2.3 | % |
URS Corp. | | | 2.1 | % |
Protective Life Corp. | | | 2.0 | % |
Avnet, Inc. | | | 2.0 | % |
Ingram Micro, Inc. — Class A | | | 2.0 | % |
Huntington Ingalls Industries, Inc. | | | 1.9 | % |
| | | | |
Top Ten.Total | | | 23.3 | % |
| | | | |
| “Ten Largest Holdings” exclude any temporary cash or derivative investments. | |
162 | THE RYDEX SERIES FUNDS ANNUAL REPORT
PERFORMANCE REPORT AND FUND PROFILE (Unaudited) (concluded)
Cumulative Fund Performance*
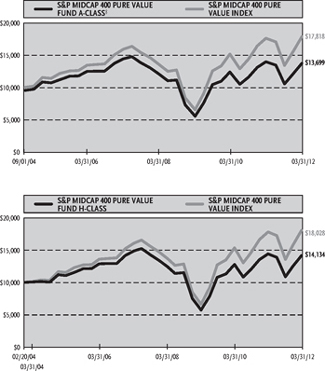
Average Annual Returns*
Periods Ended 03/31/12
| | | | | | | | | | | | |
| | | 1 Year | | | 5 Year | | | Since
Inception
(09/01/04) | |
A-Class Shares | | | -1.75 | % | | | -0.97 | % | | | 4.91 | % |
A-Class Shares with sales charge‡ | | | -6.42 | % | | | -1.93 | % | | | 4.24 | % |
S&P MidCap 400 Pure Value Index | | | 1.41 | % | | | 2.34 | % | | | 7.92 | % |
| | | | | | | | | (02/20/04) | |
C-Class Shares | | | -2.54 | % | | | -1.79 | % | | | 3.55 | % |
C-Class Shares with CDSC† | | | -3.51 | % | | | -1.79 | % | | | 3.55 | % |
H-Class Shares | | | -1.78 | % | | | -0.98 | % | | | 4.36 | % |
S&P MidCap 400 Pure Value Index | | | 1.41 | % | | | 2.34 | % | | | 7.54 | % |
| * | The performance data above represents past performance that is not predictive of future results. The investment return and principal value of an investment in the Fund will fluctuate so that an investor’s shares, when redeemed, may be worth more or less than their original cost. Returns are historical and include changes in principal and reinvested dividends and capital gains and do not reflect the effect of taxes. The S&P MidCap 400 Pure Value Index is an unmanaged index and, unlike the Fund, has no management fees or operating expenses to reduce its reported return. The graphs are based on A-Class shares and H-Class shares only; performance for C-Class shares will vary due to differences in fee structures. |
| † | Fund returns include a CDSC of 1% if redeemed within 12 months of purchase. |
| ‡ | Fund returns are calculated using the maximum sales charge of 4.75%. |
THE RYDEX SERIES FUNDS ANNUAL REPORT | 163
| | |
| SCHEDULE OF INVESTMENTS | | March 31, 2012 |
| S&P MIDCAP 400 PURE VALUE FUND | | |
| | | | | | | | |
| | | SHARES | | | VALUE | |
COMMON STOCKS† - 99.3% | | | | | | | | |
| | |
FINANCIALS - 28.7% | | | | | | | | |
First American Financial Corp. | | | 47,368 | | | $ | 787,730 | |
Protective Life Corp. | | | 19,264 | | | | 570,600 | |
Astoria Financial Corp. | | | 49,129 | | | | 484,411 | |
Reinsurance Group of America,
Inc. — Class A | | | 7,908 | | | | 470,289 | |
Hanover Insurance Group, Inc. | | | 11,432 | | | | 470,084 | |
Old Republic International Corp. | | | 42,402 | | | | 447,341 | |
Jefferies Group, Inc. | | | 21,340 | | | | 402,046 | |
Aspen Insurance Holdings Ltd. | | | 14,350 | | | | 400,939 | |
StanCorp Financial Group, Inc. | | | 8,451 | | | | 345,984 | |
Kemper Corp. | | | 11,337 | | | | 343,285 | |
BancorpSouth, Inc. | | | 22,898 | | | | 308,436 | |
Everest Re Group Ltd. | | | 3,168 | | | | 293,103 | |
Fidelity National Financial, Inc. — Class A | | | 15,074 | | | | 271,784 | |
American Financial Group, Inc. | | | 7,016 | | | | 270,677 | |
First Niagara Financial Group, Inc. | | | 27,034 | | | | 266,015 | |
TCF Financial Corp. | | | 19,590 | | | | 232,925 | |
Washington Federal, Inc. | | | 13,834 | | | | 232,688 | |
Janus Capital Group, Inc. | | | 25,500 | | | | 227,205 | |
HCC Insurance Holdings, Inc. | | | 6,826 | | | | 212,766 | |
Apollo Investment Corp. | | | 29,188 | | | | 209,278 | |
Associated Banc-Corp. | | | 12,680 | | | | 177,013 | |
New York Community Bancorp, Inc. | | | 11,790 | | | | 163,999 | |
International Bancshares Corp. | | | 7,621 | | | | 161,184 | |
WR Berkley Corp. | | | 3,173 | | | | 114,609 | |
Fulton Financial Corp. | | | 9,930 | | | | 104,265 | |
| | | | | | | | |
Total Financials | | | | | | | 7,968,656 | |
| | | | | | | | |
INDUSTRIALS—22.6% | | | | | | | | |
Exelis, Inc. | | | 69,450 | | | | 869,514 | |
ITT Corp. | | | 34,450 | | | | 790,283 | |
URS Corp. | | | 13,995 | | | | 595,067 | |
Huntington Ingalls Industries, Inc.* | | | 12,940 | | | | 520,706 | |
Oshkosh Corp.* | | | 21,850 | | | | 506,265 | |
JetBlue Airways Corp.* | | | 103,346 | | | | 505,362 | |
General Cable Corp.* | | | 16,000 | | | | 465,280 | |
AECOM Technology Corp.* | | | 15,096 | | | | 337,698 | |
Manpower, Inc. | | | 6,248 | | | | 295,968 | |
UTI Worldwide, Inc. | | | 15,580 | | | | 268,443 | |
Con-way, Inc. | | | 7,376 | | | | 240,531 | |
Terex Corp.* | | | 10,670 | | | | 240,075 | |
KBR, Inc. | | | 5,759 | | | | 204,732 | |
Brink’s Co. | | | 6,476 | | | | 154,582 | |
Harsco Corp. | | | 6,444 | | | | 151,176 | |
AGCO Corp.* | | | 2,300 | | | | 108,583 | |
| | | | | | | | |
Total Industrials | | | | | | | 6,254,265 | |
| | | | | | | | |
INFORMATION TECHNOLOGY—13.9% | | | | | | | | |
Avnet, Inc.* | | | 15,043 | | | | 547,414 | |
Ingram Micro, Inc. — Class A* | | | 29,414 | | | | 545,924 | |
Arrow Electronics, Inc.* | | | 11,911 | | | | 499,905 | |
Tech Data Corp.* | | | 8,955 | | | | 485,898 | |
| | | | | | | | |
| | | SHARES | | | VALUE | |
MEMC Electronic Materials, Inc.* | | | 104,540 | | | $ | 377,388 | |
Vishay Intertechnology, Inc.* | | | 23,800 | | | | 289,408 | |
Tellabs, Inc. | | | 69,593 | | | | 281,852 | |
Itron, Inc.* | | | 5,880 | | | | 267,011 | |
International Rectifier Corp.* | | | 7,540 | | | | 173,948 | |
CoreLogic, Inc.* | | | 9,327 | | | | 152,217 | |
Monster Worldwide, Inc.* | | | 14,450 | | | | 140,888 | |
Fairchild Semiconductor International,
Inc. — Class A* | | | 8,290 | | | | 121,863 | |
| | | | | | | | |
Total Information Technology | | | | | | | 3,883,716 | |
| | | | | | | | |
CONSUMER DISCRETIONARY—13.7% | | | | | | | | |
Collective Brands, Inc.* | | | 32,791 | | | | 644,671 | |
Office Depot, Inc.* | | | 108,880 | | | | 375,636 | |
American Greetings Corp. — Class A | | | 20,731 | | | | 318,014 | |
Regis Corp. | | | 15,827 | | | | 291,692 | |
Scholastic Corp. | | | 8,198 | | | | 289,225 | |
Valassis Communications, Inc.* | | | 11,240 | | | | 258,520 | |
Thor Industries, Inc. | | | 7,490 | | | | 236,384 | |
Barnes & Noble, Inc.* | | | 16,233 | | | | 215,087 | |
RadioShack Corp. | | | 31,686 | | | | 197,087 | |
New York Times Co. — Class A* | | | 28,200 | | | | 191,478 | |
KB Home | | | 20,759 | | | | 184,755 | |
Saks, Inc.* | | | 15,170 | | | | 176,124 | |
Mohawk Industries, Inc.* | | | 2,475 | | | | 164,612 | |
Wendy’s Co. | | | 28,055 | | | | 140,555 | |
Bob Evans Farms, Inc. | | | 3,566 | | | | 134,510 | |
| | | | | | | | |
Total Consumer Discretionary | | | | | | | 3,818,350 | |
| | | | | | | | |
HEALTH CARE—6.7% | | | | | | | | |
Community Health Systems, Inc.* | | | 28,967 | | | | 644,226 | |
Health Net, Inc.* | | | 11,275 | | | | 447,843 | |
Owens & Minor, Inc. | | | 10,195 | | | | 310,030 | |
LifePoint Hospitals, Inc.* | | | 5,257 | | | | 207,336 | |
Omnicare, Inc. | | | 3,620 | | | | 128,763 | |
Health Management Associates, Inc. — Class A* | | | 17,530 | | | | 117,802 | |
| | | | | | | | |
Total Health Care | | | | | | | 1,856,000 | |
| | | | | | | | |
MATERIALS—5.4% | | | | | | | | |
Commercial Metals Co. | | | 15,386 | | | | 228,020 | |
Steel Dynamics, Inc. | | | 14,140 | | | | 205,596 | |
Ashland, Inc. | | | 2,895 | | | | 176,769 | |
Reliance Steel & Aluminum Co. | | | 3,083 | | | | 174,128 | |
Greif, Inc. — Class A | | | 2,920 | | | | 163,286 | |
Worthington Industries, Inc. | | | 8,346 | | | | 160,076 | |
Louisiana-Pacific Corp.* | | | 15,360 | | | | 143,616 | |
Cabot Corp. | | | 2,985 | | | | 127,400 | |
Cytec Industries, Inc. | | | 2,070 | | | | 125,835 | |
| | | | | | | | |
Total Materials | | | | | | | 1,504,726 | |
| | | | | | | | |
CONSUMER STAPLES—2.8% | | | | | | | | |
Smithfield Foods, Inc.* | | | 15,210 | | | | 335,077 | |
Universal Corp. | | | 6,954 | | | | 324,056 | |
Harris Teeter Supermarkets, Inc.* | | | 3,338 | | | | 133,854 | |
| | | | | | | | |
Total Consumer Staples | | | | | | | 792,987 | |
| | | | | | | | |
| | |
164 | THE RYDEX SERIES FUNDS ANNUAL REPORT | | SEE NOTES TO FINANCIAL STATEMENTS. |
| | |
| SCHEDULE OF INVESTMENTS (concluded) | | March 31, 2012 |
| S&P MIDCAP 400 PURE VALUE FUND | | |
| | | | | | | | |
| | | SHARES | | | VALUE | |
ENERGY - 2.7% | | | | | | | | |
World Fuel Services Corp. | | | 6,710 | | | $ | 275,111 | |
HollyFrontier Corp. | | | 8,335 | | | | 267,970 | |
Arch Coal, Inc. | | | 7,700 | | | | 82,467 | |
Patriot Coal Corp.* | | | 11,610 | | | | 72,446 | |
Quicksilver Resources, Inc.* | | | 12,760 | | | | 64,310 | |
| | | | | | | | |
Total Energy | | | | | | | 762,304 | |
| | | | | | | | |
UTILITIES—1.8% | | | | | | | | |
Great Plains Energy, Inc. | | | 6,446 | | | | 130,661 | |
UGI Corp. | | | 4,777 | | | | 130,173 | |
N.V. Energy, Inc. | | | 7,608 | | | | 122,641 | |
Atmos Energy Corp. | | | 3,676 | | | | 115,647 | |
| | | | | | | | |
Total Utilities | | | | | | | 499,122 | |
| | | | | | | | |
TELECOMMUNICATION SERVICES—1.0% | | | | | | | | |
Telephone & Data Systems, Inc. | | | 12,565 | | | | 290,880 | |
| | | | | | | | |
Total Common Stocks
(Cost $24,782,937) | | | | | | | 27,631,006 | |
| | | | | | | | |
| | | | | | | | |
| | | FACE
AMOUNT | | | VALUE | |
REPURCHASE AGREEMENTS††,1 - 0.6% | | | | | | | | |
HSBC Group issued 03/30/12 at 0.01% due 04/02/12 | | $ | 120,750 | | | $ | 120,750 | |
Mizuho Financial Group, Inc. issued 03/30/12 at 0.01%due 04/02/12 | | | 33,973 | | | | 33,973 | |
Credit Suisse Group issued 03/30/12 at 0.01% due 04/02/12 | | | 15,589 | | | | 15,589 | |
Deutsche Bank issued 03/30/12 at 0.01% due 04/02/12 | | | 9,030 | | | | 9,030 | |
| | | | | | | | |
Total Repurchase Agreements
(Cost $179,342) | | | | | | | 179,342 | |
| | | | | | | | |
Total Investments – 99.9%
(Cost $24,962,279) | | | | | | $ | 27,810,348 | |
| | | | | | | | |
Other Assets & Liabilities, net – 0.1% | | | | | | | 38,422 | |
| | | | | | | | |
Total Net Assets – 100.0% | | | | | | $ | 27,848,770 | |
| * | Non-income producing security. |
| † | Value determined based on Level 1 inputs — See Note 4. |
| †† | Value determined based on Level 2 inputs — See Note 4. |
| 1 | Repurchase Agreements — See Note 5. |
| | |
SEE NOTES TO FINANCIAL STATEMENTS. | | THE RYDEX SERIES FUNDS ANNUAL REPORT | 165 |
S&P MIDCAP 400 PURE VALUE FUND
STATEMENT OF ASSETS AND LIABILITIES
| | | | |
| March 31, 2012 | | | |
| |
ASSETS: | | | | |
Investments, at value | | | | |
(cost $24,782,937) | | $ | 27,631,006 | |
Repurchase agreements, at value | | | | |
(cost $179,342) | | | 179,342 | |
| | | | |
Total investments | | | | |
(cost $24,962,279) | | | 27,810,348 | |
Receivables: | | | | |
Fund shares sold | | | 57,927 | |
Dividends | | | 33,039 | |
| | | | |
Total assets | | | 27,901,314 | |
| | | | |
LIABILITIES: | | | | |
Payable for: | | | | |
Management fees | | | 14,885 | |
Distribution and service fees | | | 6,298 | |
Fund shares redeemed | | | 5,723 | |
Transfer agent and administrative fees | | | 4,962 | |
Portfolio accounting fees | | | 1,984 | |
Miscellaneous | | | 18,692 | |
| | | | |
Total liabilities | | | 52,544 | |
| | | | |
NET ASSETS | | $ | 27,848,770 | |
| | | | |
NET ASSETS CONSIST OF: | | | | |
Paid in capital | | $ | 35,129,551 | |
Undistributed net investment income | | | — | |
Accumulated net realized loss on investments | | | (10,128,850 | ) |
Net unrealized appreciation on investments | | | 2,848,069 | |
| | | | |
Net assets | | $ | 27,848,770 | |
| | | | |
A-CLASS: | | | | |
Net assets | | $ | 6,817,203 | |
Capital shares outstanding | | | 220,737 | |
Net asset value per share | | $ | 30.88 | |
| | | | |
Maximum offering price per share | | | | |
(Net asset value divided by 95.25%) | | $ | 32.42 | |
| | | | |
C-CLASS: | | | | |
Net assets | | $ | 2,193,966 | |
Capital shares outstanding | | | 76,221 | |
Net asset value per share | | $ | 28.78 | |
| | | | |
H-CLASS: | | | | |
Net assets | | $ | 18,837,601 | |
Capital shares outstanding | | | 610,350 | |
Net asset value per share | | $ | 30.86 | |
| | | | |
STATEMENT OF OPERATIONS
| | | | |
| Year Ended March 31, 2012 | | | |
| |
INVESTMENT INCOME: | | | | |
Dividends | | $ | 470,381 | |
Interest | | | 87 | |
| | | | |
Total investment income | | | 470,468 | |
| | | | |
EXPENSES: | | | | |
Management fees | | | 228,734 | |
Transfer agent and administrative fees | | | 76,244 | |
Distribution and service fees: | | | | |
A-Class | | | 2,740 | |
C-Class | | | 17,055 | |
H-Class | | | 69,241 | |
Portfolio accounting fees | | | 30,498 | |
Custodian fees | | | 7,828 | |
Trustees’ fees* | | | 3,467 | |
Miscellaneous | | | 37,589 | |
| | | | |
Total expenses | | | 473,396 | |
| | | | |
Net investment loss | | | (2,928 | ) |
| | | | |
NET REALIZED AND UNREALIZED GAIN (LOSS): | | | | |
Net realized gain (loss) on: | | | | |
Investments | | | (4,788,943 | ) |
| | | | |
Net realized loss | | | (4,788,943 | ) |
| | | | |
Net change in unrealized appreciation
(depreciation) on: | | | | |
Investments | | | (3,979,874 | ) |
| | | | |
Net change in unrealized appreciation
(depreciation) | | | (3,979,874 | ) |
| | | | |
Net realized and unrealized loss | | | (8,768,817 | ) |
| | | | |
Net decrease in net assets resulting from operations | | $ | (8,771,745 | ) |
| | | | |
| * | Relates to Trustees not deemed “interested persons” within the meaning of Section 2(a)(19) of the 1940 Act. |
| | |
166 | THE RYDEX SERIES FUNDS ANNUAL REPORT | | SEE NOTES TO FINANCIAL STATEMENTS. |
S&P MIDCAP 400 PURE VALUE FUND
STATEMENTS OF CHANGES IN NET ASSETS
| | | | | | | | |
| | | Year Ended
March 31,
2012 | | | Year Ended
March 31,
2011 | |
INCREASE (DECREASE) IN NET ASSETS FROM OPERATIONS: | | | | | | | | |
Net investment loss | | $ | (2,928 | ) | | $ | (129,387 | ) |
Net realized loss on investments | | | (4,788,943 | ) | | | (606,918 | ) |
Net change in unrealized appreciation (depreciation) on investments | | | (3,979,874 | ) | | | (15,191,426 | ) |
| | | | | | | | |
Net decrease in net assets resulting from operations | | | (8,771,745 | ) | | | (15,927,731 | ) |
| | | | | | | | |
DISTRIBUTIONSTOSHAREHOLDERSFROM: | | | | | | | | |
Net investment income | | | | | | | | |
A-Class | | | — | | | | (4,094 | ) |
C-Class | | | — | | | | (10,678 | ) |
H-Class | | | — | | | | (217,178 | ) |
Net realized gains | | | | | | | | |
A-Class | | | — | | | | (62,048 | ) |
C-Class | | | — | | | | (161,851 | ) |
H-Class | | | — | | | | (3,291,876 | ) |
| | | | | | | | |
Total distributions to shareholders | | | — | | | | (3,747,725 | ) |
| | | | | | | | |
| | |
CAPITALSHARETRANSACTIONS: | | | | | | | | |
PROCEEDSFROMSALEOFSHARES | | | | | | | | |
A-Class | | | 16,598,230 | | | | 47,393,406 | |
C-Class | | | 4,792,154 | | | | 3,405,437 | |
H-Class | | | 201,968,886 | | | | 300,937,705 | |
DISTRIBUTIONSREINVESTED | | | | | | | | |
A-Class | | | — | | | | 59,087 | |
C-Class | | | — | | | | 169,667 | |
H-Class | | | — | | | | 3,493,240 | |
COSTOFSHARESREDEEMED | | | | | | | | |
A-Class | | | (10,504,241 | ) | | | (54,039,897 | ) |
C-Class | | | (4,830,228 | ) | | | (3,799,622 | ) |
H-Class | | | (228,706,063 | ) | | | (433,465,765 | ) |
| | | | | | | | |
Net decrease from capital share transactions | | | (20,681,262 | ) | | | (135,846,742 | ) |
| | | | | | | | |
Net decrease in net assets | | | (29,453,007 | ) | | | (155,522,198 | ) |
| | |
NETASSETS: | | | | | | | | |
Beginning of year | | | 57,301,777 | | | | 212,823,975 | |
| | | | | | | | |
End of year | | $ | 27,848,770 | | | $ | 57,301,777 | |
| | | | | | | | |
Undistributed net investment income at end of year | | $ | — | | | $ | — | |
| | | | | | | | |
CAPITALSHAREACTIVITY: | | | | | | | | |
Shares sold | | | | | | | | |
A-Class | | | 542,524 | | | | 1,703,485 | |
C-Class | | | 184,166 | | | | 120,225 | |
H-Class | | | 7,008,305 | | | | 10,052,190 | |
Shares issued from reinvestment of distributions | | | | | | | | |
A-Class | | | — | | | | 2,048 | |
C-Class | | | — | | | | 6,245 | |
H-Class | | | — | | | | 121,125 | |
Shares redeemed | | | | | | | | |
A-Class | | | (346,750 | ) | | | (2,038,144 | ) |
C-Class | | | (186,183 | ) | | | (133,794 | ) |
H-Class | | | (8,123,063 | ) | | | (15,002,876 | ) |
| | | | | | | | |
Net decrease in shares | | | (921,001 | ) | | | (5,169,496 | ) |
| | | | | | | | |
| | |
SEE NOTES TO FINANCIAL STATEMENTS. | | THE RYDEX SERIES FUNDS ANNUAL REPORT | 167 |
S&P MIDCAP 400 PURE VALUE FUND
FINANCIAL HIGHLIGHTS
This table is presented to show selected data for a share outstanding throughout each period and to assist shareholders in evaluating a Fund’s performance for the periods presented.
| | | | | | | | | | | | | | | | | | | | |
| | | Year
Ended | | | Year
Ended | | | Year
Ended | | | Year
Ended | | | Year
Ended | |
| | | March 31, | | | March 31, | | | March 31, | | | March 31, | | | March 31, | |
A-Class | | 2012 | | | 2011 | | | 2010 | | | 2009 | | | 2008 | |
Per Share Data | | | | | | | | | | | | | | | | | | | | |
Net asset value, beginning of period | | $ | 31.43 | | | $ | 30.45 | | | $ | 13.68 | | | $ | 29.72 | | | $ | 36.58 | |
| | | | | | | | | | | | | | | | | | | | |
Income (loss) from investment operations: | | | | | | | | | | | | | | | | | | | | |
Net investment incomea | | | .06 | | | | .02 | | | | .12 | | | | .47 | | | | .44 | |
Net gain (loss) on investments (realized and unrealized) | | | (.61 | ) | | | 3.64 | | | | 16.75 | | | | (16.51 | ) | | | (6.37 | ) |
| | | | | | | | | | | | | | | | | | | | |
Total from investment operations | | | (.55 | ) | | | 3.66 | | | | 16.87 | | | | (16.04 | ) | | | (5.93 | ) |
| | | | | | | | | | | | | | | | | | | | |
Less distributions from: | | | | | | | | | | | | | | | | | | | | |
Net investment income | | | — | | | | (.17 | ) | | | (.10 | ) | | | — | | | | (.93 | ) |
Net realized gains | | | — | | | | (2.51 | ) | | | — | | | | — | | | | — | |
| | | | | | | | | | | | | | | | | | | | |
Total distributions | | | — | | | | (2.68 | ) | | | (.10 | ) | | | — | | | | (.93 | ) |
| | | | | | | | | | | | | | | | | | | | |
Net asset value, end of period | | $ | 30.88 | | | $ | 31.43 | | | $ | 30.45 | | | $ | 13.68 | | | $ | 29.72 | |
| | | | | | | | | | | | | | | | | | | | |
Total Returnb | | | (1.75 | %) | | | 12.81 | % | | | 123.41 | % | | | (53.97 | %) | | | (16.45 | %) |
| | | | | | | | | | | | | | | | | | | | |
Ratios/Supplemental Data | | | | | | | | | | | | | | | | | | | | |
Net assets, end of period (in thousands) | | $ | 6,817 | | | $ | 785 | | | $ | 10,888 | | | $ | 100 | | | $ | 2,797 | |
| | | | | | | | | | | | | | | | | | | | |
Ratios to average net assets: | | | | | | | | | | | | | | | | | | | | |
Net investment income | | | 0.22 | % | | | 0.08 | % | | | 0.43 | % | | | 1.66 | % | | | 1.25 | % |
Total expenses | | | 1.49 | % | | | 1.53 | % | | | 1.52 | % | | | 1.54 | % | | | 1.53 | % |
| | | | | | | | | | | | | | | | | | | | |
Portfolio turnover rate | | | 619 | % | | | 407 | % | | | 443 | % | | | 977 | % | | | 297 | % |
| | | | | | | | | | | | | | | | | | | | |
| | | Year
Ended | | | Year
Ended | | | Year
Ended | | | Year
Ended | | | Year
Ended | |
| | | March 31, | | | March 31, | | | March 31, | | | March 31, | | | March 31, | |
C-Class | | 2012 | | | 2011 | | | 2010 | | | 2009 | | | 2008 | |
Per Share Data | | | | | | | | | | | | | | | | | | | | |
Net asset value, beginning of period | | $ | 29.53 | | | $ | 28.96 | | | $ | 13.12 | | | $ | 28.78 | | | $ | 35.75 | |
| | | | | | | | | | | | | | | | | | | | |
Income (loss) from investment operations: | | | | | | | | | | | | | | | | | | | | |
Net investment income (loss)a | | | (.16 | ) | | | (.23 | ) | | | (.06 | ) | | | .39 | | | | .30 | |
Net gain (loss) on investments (realized and unrealized) | | | (.59 | ) | | | 3.48 | | | | 16.00 | | | | (16.05 | ) | | | (6.34 | ) |
| | | | | | | | | | | | | | | | | | | | |
Total from investment operations | | | (.75 | ) | | | 3.25 | | | | 15.94 | | | | (15.66 | ) | | | (6.04 | ) |
| | | | | | | | | | | | | | | | | | | | |
Less distributions from: | | | | | | | | | | | | | | | | | | | | |
Net investment income | | | — | | | | (.17 | ) | | | (.10 | ) | | | — | | | | (.93 | ) |
Net realized gains | | | — | | | | (2.51 | ) | | | — | | | | — | | | | — | |
| | | | | | | | | | | | | | | | | | | | |
Total distributions | | | — | | | | (2.68 | ) | | | (.10 | ) | | | — | | | | (.93 | ) |
| | | | | | | | | | | | | | | | | | | | |
Net asset value, end of period | | $ | 28.78 | | | $ | 29.53 | | | $ | 28.96 | | | $ | 13.12 | | | $ | 28.78 | |
| | | | | | | | | | | | | | | | | | | | |
Total Returnb | | | (2.54 | %) | | | 12.03 | % | | | 121.59 | % | | | (54.41 | %) | | | (17.15 | %) |
| | | | | | | | | | | | | | | | | | | | |
Ratios/Supplemental Data | | | | | | | | | | | | | | | | | | | | |
Net assets, end of period (in thousands) | | $ | 2,194 | | | $ | 2,311 | | | $ | 2,478 | | | $ | 627 | | | $ | 1,082 | |
| | | | | | | | | | | | | | | | | | | | |
Ratios to average net assets: | | | | | | | | | | | | | | | | | | | | |
Net investment income (loss) | | | (0.60 | %) | | | (0.83 | %) | | | (0.24 | %) | | | 1.58 | % | | | 0.88 | % |
Total expenses | | | 2.26 | % | | | 2.30 | % | | | 2.29 | % | | | 2.29 | % | | | 2.28 | % |
| | | | | | | | | | | | | | | | | | | | |
Portfolio turnover rate | | | 619 | % | | | 407 | % | | | 443 | % | | | 977 | % | | | 297 | % |
| | |
168 | THE RYDEX SERIES FUNDS ANNUAL REPORT | | SEE NOTES TO FINANCIAL STATEMENTS. |
S&P MIDCAP 400 PURE VALUE FUND
FINANCIAL HIGHLIGHTS (concluded)
This table is presented to show selected data for a share outstanding throughout each period and to assist shareholders in evaluating a Fund’s performance for the periods presented.
| | | | | | | | | | | | | | | | | | | | |
| | | Year
Ended | | | Year
Ended | | | Year
Ended | | | Year
Ended | | | Year
Ended | |
| | | March 31, | | | March 31, | | | March 31, | | | March 31, | | | March 31, | |
H-Class | | 2012 | | | 2011 | | | 2010 | | | 2009 | | | 2008 | |
Per Share Data | | | | | | | | | | | | | | | | | | | | |
Net asset value, beginning of period | | $ | 31.42 | | | $ | 30.43 | | | $ | 13.67 | | | $ | 29.71 | | | $ | 36.58 | |
| | | | | | | | | | | | | | | | | | | | |
Income (loss) from investment operations: | | | | | | | | | | | | | | | | | | | | |
Net investment income (loss)a | | | .01 | | | | (.06 | ) | | | .10 | | | | .47 | | | | .35 | |
Net gain (loss) on investments (realized and unrealized) | | | (.57 | ) | | | 3.73 | | | | 16.76 | | | | (16.51 | ) | | | (6.29 | ) |
| | | | | | | | | | | | | | | | | | | | |
Total from investment operations | | | (.56 | ) | | | 3.67 | | | | 16.86 | | | | (16.04 | ) | | | (5.94 | ) |
| | | | | | | | | | | | | | | | | | | | |
Less distributions from: | | | | | | | | | | | | | | | | | | | | |
Net investment income | | | — | | | | (.17 | ) | | | (.10 | ) | | | — | | | | (.93 | ) |
Net realized gains | | | — | | | | (2.51 | ) | | | — | | | | — | | | | — | |
| | | | | | | | | | | | | | | | | | | | |
Total distributions | | | — | | | | (2.68 | ) | | | (.10 | ) | | | — | | | | (.93 | ) |
| | | | | | | | | | | | | | | | | | | | |
Net asset value, end of period | | $ | 30.86 | | | $ | 31.42 | | | $ | 30.43 | | | $ | 13.67 | | | $ | 29.71 | |
| | | | | | | | | | | | | | | | | | | | |
Total Returnb | | | (1.78 | %) | | | 12.85 | % | | | 123.43 | % | | | (53.99 | %) | | | (16.48 | %) |
| | | | | | | | | | | | | | | | | | | | |
Ratios/Supplemental Data | | | | | | | | | | | | | | | | | | | | |
Net assets, end of period (in thousands) | | $ | 18,838 | | | $ | 54,206 | | | $ | 199,458 | | | $ | 3,985 | | | $ | 6,512 | |
Ratios to average net assets: | | | | | | | | | | | | | | | | | | | | |
Net investment income (loss) | | | 0.02 | % | | | (0.19 | %) | | | 0.37 | % | | | 2.01 | % | | | 0.96 | % |
Total expenses | | | 1.51 | % | | | 1.54 | % | | | 1.53 | % | | | 1.54 | % | | | 1.54 | % |
| | | | | | | | | | | | | | | | | | | | |
Portfolio turnover rate | | | 619 | % | | | 407 | % | | | 443 | % | | | 977 | % | | | 297 | % |
| a | Net investment income (loss) per share was computed using average shares outstanding throughout the period. |
| b | Total return does not reflect the impact of any applicable sales charges and has not been annualized. |
| | |
SEE NOTES TO FINANCIAL STATEMENTS. | | THE RYDEX SERIES FUNDS ANNUAL REPORT | 169 |
| | |
PERFORMANCE REPORT AND FUND PROFILE (Unaudited) | | March 31, 2012 |
S&P SMALLCAP 600 PURE GROWTH FUND
OBJECTIVE: Seeks to provide investment results that match, before fees and expenses, the performance of a benchmark for small-cap growth securities on a daily basis. The Fund’s current benchmark is the S&P SmallCap 600 Pure Growth Index (the “underlying index”).
For the one-year period ended March 31, 2012, S&P SmallCap 600 Pure Growth Fund H-Class returned 5.27%, compared with 7.24% for the S&P SmallCap 600 Pure Growth Index*. S&P SmallCap 600 Pure Growth Fund maintained a daily correlation of over 99% to its benchmark. Small-cap growth stocks significantly outperformed small-cap value stocks during the period.
Health Care stocks, which make up about 21% of the index, contributed most to return, followed by Consumer Discretionary. Detracting from return were the Telecommunication Services and Industrials sectors.
The best-performing stocks in the S&P SmallCap 600 Pure Growth Index were Questcor Pharmaceuticals, Inc., Sturm Ruger & Co. and Hi-Tech Pharmacal Co., Inc. The leading detractors from return were Smith Micro Software, Inc., Interactive Intelligence Group, Inc. and TriQuint Semiconductor, Inc.
*The S&P SmallCap 600® Pure Growth Index is narrow in focus, containing only those S&P SmallCap 600 Index companies with strong growth characteristics as selected by S&P. The S&P SmallCap 600 Index measures the performance of the small-capitalization sector of the U.S. equity market.
Performance displayed represents past performance which is no guarantee of future results.
Holdings Diversification (Market Exposure as % of Net Assets)

“Holdings Diversification (Market Exposure as % of Net Assets)” excludes any temporary cash investments.
| | |
Inception Dates: | | |
A-Class | | September 1, 2004 |
C-Class | | February 20, 2004 |
H-Class | | February 20, 2004 |
| | | | |
Ten Largest Holdings (% of Total Net Assets) | |
Buffalo Wild Wings, Inc. | | | 1.4 | % |
Coinstar, Inc. | | | 1.4 | % |
MWI Veterinary Supply, Inc. | | | 1.3 | % |
Cirrus Logic, Inc. | | | 1.2 | % |
Veeco Instruments, Inc. | | | 1.2 | % |
Zoll Medical Corp. | | | 1.1 | % |
Sourcefire, Inc. | | | 1.1 | % |
SEACOR Holdings, Inc. | | | 1.1 | % |
Allegiant Travel Co. — Class A | | | 1.1 | % |
Sturm Ruger & Company, Inc. | | | 1.0 | % |
| | | | |
Top Ten Total | | | 11.9 | % |
| | | | |
| | |
“Ten Largest Holdings” exclude any temporary cash or derivative investments. |
| | |
170 | THE RYDEX SERIES FUNDS ANNUAL REPORT | | |
PERFORMANCE REPORT AND FUND PROFILE (Unaudited) (concluded)
Cumulative Fund Performance*
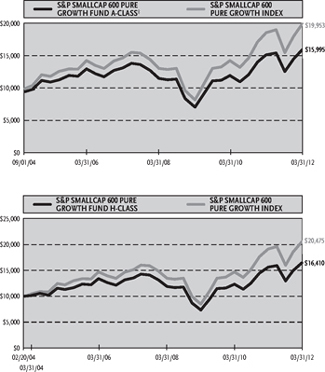
| | | | | | |
| Average Annual Returns* | | | | | | |
Periods Ended 03/31/12 | | | | | | |
| | | | | | | | | | | | |
| | | | | | | | | Since | |
| | | | | | | | | Inception | |
| | | 1 Year | | | 5 Year | | | (09/01/04) | |
A-Class Shares | | | 5.30 | % | | | 3.96 | % | | | 7.08 | % |
A-Class Shares with sales charge‡ | | | 0.29 | % | | | 2.95 | % | | | 6.39 | % |
S&P SmallCap 600 Pure | | | | | | | | | | | | |
Growth Index | | | 7.24 | % | | | 6.28 | % | | | 9.54 | % |
| | | | | | | | | | | (02/20/04 | ) |
C-Class Shares | | | 4.50 | % | | | 3.19 | % | | | 5.55 | % |
C-Class Shares with CDSC† | | | 3.50 | % | | | 3.19 | % | | | 5.55 | % |
H-Class Shares | | | 5.27 | % | | | 3.95 | % | | | 6.30 | % |
S&P SmallCap 600 Pure | | | | | | | | | | | | |
Growth Index | | | 7.24 | % | | | 6.28 | % | | | 9.24 | % |
| * | The performance data above represents past performance that is not predictive of future results. The investment return and principal value of an investment in the Fund will fluctuate so that an investor’s shares, when redeemed, may be worth more or less than their original cost. Returns are historical and include changes in principal and reinvested dividends and capital gains and do not reflect the effect of taxes. The S&P SmallCap 600 Pure Growth Index is an unmanaged index and, unlike the Fund, has no management fees or operating expenses to reduce its reported return. The graphs are based on A-Class shares and H-Class shares only; performance for C-Class shares will vary due to differences in fee structures. |
| † | Fund returns include a CDSC of 1% if redeemed within 12 months of purchase. |
| ‡ | Fund returns are calculated using the maximum sales charge of 4.75%. |
THE RYDEX SERIES FUNDS ANNUAL REPORT | 171
| | |
| SCHEDULE OF INVESTMENTS | | March 31, 2012 |
| S&P SMALLCAP 600 PURE GROWTH FUND | | |
| | | | | | | | |
| | | SHARES | | | VALUE | |
| COMMON STOCKS†—99.2% | | | | | | |
| | |
| INFORMATION TECHNOLOGY—27.8% | | | | | | |
Cirrus Logic, Inc.* | | | 16,621 | | | $ | 395,580 | |
Veeco Instruments, Inc.* | | | 13,292 | | | | 380,151 | |
Sourcefire, Inc.* | | | 7,439 | | | | 358,039 | |
Kulicke & Soffa Industries, Inc.* | | | 26,654 | | | | 331,309 | |
Hittite Microwave Corp.* | | | 6,032 | | | | 327,598 | |
CACI International, Inc. — Class A* | | | 5,240 | | | | 326,399 | |
CommVault Systems, Inc.* | | | 6,066 | | | | 301,116 | |
Exar Corp.* | | | 34,925 | | | | 293,370 | |
Volterra Semiconductor Corp.* | | | 8,453 | | | | 290,910 | |
MicroStrategy, Inc. — Class A* | | | 2,045 | | | | 286,301 | |
Synaptics, Inc.* | | | 7,140 | | | | 260,681 | |
Power Integrations, Inc. | | | 6,914 | | | | 256,648 | |
Littelfuse, Inc. | | | 4,085 | | | | 256,129 | |
InfoSpace, Inc.* | | | 19,465 | | | | 249,346 | |
LogMeIn, Inc.* | | | 6,550 | | | | 230,757 | |
Cognex Corp. | | | 5,345 | | | | 226,415 | |
MAXIMUS, Inc. | | | 5,477 | | | | 222,750 | |
Entropic Communications, Inc.* | | | 37,961 | | | | 221,313 | |
Rubicon Technology, Inc.* | | | 21,181 | | | | 220,918 | |
Tyler Technologies, Inc.* | | | 5,713 | | | | 219,436 | |
DTS, Inc.* | | | 7,240 | | | | 218,793 | |
Ebix, Inc. | | | 9,231 | | | | 213,790 | |
MTS Systems Corp. | | | 3,405 | | | | 180,771 | |
Cymer, Inc.* | | | 3,530 | | | | 176,500 | |
OSI Systems, Inc.* | | | 2,780 | | | | 170,414 | |
Interactive Intelligence Group, Inc.* | | | 5,458 | | | | 166,524 | |
Websense, Inc.* | | | 7,668 | | | | 161,718 | |
Cabot Microelectronics Corp. | | | 3,766 | | | | 146,422 | |
Netscout Systems, Inc.* | | | 7,116 | | | | 144,739 | |
LivePerson, Inc.* | | | 8,596 | | | | 144,155 | |
Stamps.com, Inc.* | | | 4,927 | | | | 137,365 | |
Manhattan Associates, Inc.* | | | 2,890 | | | | 137,362 | |
Netgear, Inc.* | | | 3,554 | | | | 135,763 | |
Opnet Technologies, Inc. | | | 4,668 | | | | 135,372 | |
Viasat, Inc.* | | | 2,799 | | | | 134,940 | |
comScore, Inc.* | | | 6,033 | | | | 129,046 | |
FARO Technologies, Inc.* | | | 2,162 | | | | 126,109 | |
Blackbaud, Inc. | | | 3,657 | | | | 121,522 | |
j2 Global, Inc. | | | 4,090 | | | | 117,301 | |
Synchronoss Technologies, Inc.* | | | 3,585 | | | | 114,433 | |
JDA Software Group, Inc.* | | | 4,025 | | | | 110,607 | |
Liquidity Services, Inc.* | | | 2,266 | | | | 101,517 | |
Forrester Research, Inc. | | | 3,127 | | | | 101,315 | |
Taleo Corp. — Class A* | | | 2,072 | | | | 95,167 | |
Ceva, Inc.* | | | 3,740 | | | | 84,935 | |
| | | | | | | | |
Total Information Technology | | | | | | | 9,161,746 | |
| | | | | | | | |
HEALTH CARE—22.2% | | | | | | | | |
MWI Veterinary Supply, Inc.* | | | 4,814 | | | | 423,632 | |
Zoll Medical Corp.* | | | 3,883 | | | | 359,683 | |
Medidata Solutions, Inc.* | | | 12,070 | | | | 321,545 | |
Magellan Health Services, Inc.* | | | 6,460 | | | | 315,313 | |
| | | | | | | | |
| | | SHARES | | | VALUE | |
Hi-Tech Pharmacal Company, Inc.* | | | 8,622 | | | $ | 309,787 | |
ICU Medical, Inc.* | | | 6,230 | | | | 306,267 | |
Haemonetics Corp.* | | | 4,360 | | | | 303,805 | |
NuVasive, Inc.* | | | 17,854 | | | | 300,661 | |
Momenta Pharmaceuticals, Inc.* | | | 19,569 | | | | 299,797 | |
Cubist Pharmaceuticals, Inc.* | | | 6,900 | | | | 298,425 | |
Quality Systems, Inc. | | | 6,533 | | | | 285,688 | |
Chemed Corp. | | | 4,555 | | | | 285,506 | |
Computer Programs & Systems, Inc. | | | 4,875 | | | | 275,535 | |
Air Methods Corp.* | | | 3,078 | | | | 268,556 | |
Cyberonics, Inc.* | | | 6,845 | | | | 261,000 | |
Neogen Corp.* | | | 6,562 | | | | 256,377 | |
IPC The Hospitalist Company, Inc.* | | | 6,658 | | | | 245,747 | |
Medicines Co.* | | | 12,185 | | | | 244,553 | |
Analogic Corp. | | | 3,510 | | | | 237,065 | |
Questcor Pharmaceuticals, Inc.* | | | 6,180 | | | | 232,492 | |
Corvel Corp.* | | | 5,676 | | | | 226,416 | |
Viropharma, Inc.* | | | 7,353 | | | | 221,105 | |
Landauer, Inc. | | | 4,145 | | | | 219,768 | |
Ensign Group, Inc. | | | 7,476 | | | | 203,048 | |
Arqule, Inc.* | | | 27,982 | | | | 196,154 | |
Abaxis, Inc.* | | | 4,430 | | | | 129,046 | |
Salix Pharmaceuticals Ltd.* | | | 2,443 | | | | 128,258 | |
Akorn, Inc.* | | | 10,520 | | | | 123,084 | |
| | | | | | | | |
Total Health Care | | | | | | | 7,278,313 | |
| | | | | | | | |
CONSUMER DISCRETIONARY—19.9% | | | | | | | | |
Buffalo Wild Wings, Inc.* | | | 5,173 | | | | 469,138 | |
Coinstar, Inc.* | | | 7,215 | | | | 458,513 | |
Sturm Ruger & Company, Inc. | | | 6,826 | | | | 335,157 | |
Peet’s Coffee & Tea, Inc.* | | | 4,445 | | | | 327,597 | |
Steven Madden Ltd.* | | | 7,094 | | | | 303,269 | |
BJ’s Restaurants, Inc.* | | | 5,969 | | | | 300,539 | |
Buckle, Inc. | | | 6,140 | | | | 294,105 | |
Capella Education Co.* | | | 8,123 | | | | 292,022 | |
Biglari Holdings, Inc.* | | | 718 | | | | 289,246 | |
DineEquity, Inc.* | | | 5,735 | | | | 284,456 | |
Jos A. Bank Clothiers, Inc.* | | | 5,449 | | | | 274,684 | |
Hibbett Sports, Inc.* | | | 4,979 | | | | 271,604 | |
American Public Education, Inc.* | | | 7,035 | | | | 267,330 | |
Genesco, Inc.* | | | 3,638 | | | | 260,663 | |
Rue21, Inc.* | | | 8,356 | | | | 245,165 | |
CEC Entertainment, Inc. | | | 6,198 | | | | 234,966 | |
Monro Muffler Brake, Inc. | | | 5,550 | | | | 230,270 | |
Vitamin Shoppe, Inc.* | | | 4,593 | | | | 203,057 | |
True Religion Apparel, Inc.* | | | 6,687 | | | | 183,224 | |
iRobot Corp.* | | | 6,342 | | | | 172,883 | |
National Presto Industries, Inc. | | | 2,249 | | | | 170,609 | |
Children’s Place Retail Stores, Inc.* | | | 3,182 | | | | 164,414 | |
Arbitron, Inc. | | | 4,068 | | | | 150,435 | |
Papa John’s International, Inc.* | | | 3,775 | | | | 142,167 | |
Wolverine World Wide, Inc. | | | 2,990 | | | | 111,168 | |
Blue Nile, Inc.* | | | 3,043 | | | | 100,358 | |
| | | | | | | | |
Total Consumer Discretionary | | | | | | | 6,537,039 | |
| | | | | | | | |
| | |
172 | THE RYDEX SERIES FUNDS ANNUAL REPORT | | SEE NOTES TO FINANCIAL STATEMENTS. |
| | |
| SCHEDULE OF INVESTMENTS (concluded) | | March 31, 2012 |
| S&P SMALLCAP 600 PURE GROWTH FUND | | |
| | | | | | | | |
| | | SHARES | | | VALUE | |
INDUSTRIALS—9.0% | | | | | | | | |
Allegiant Travel Co. — Class A* | | | 6,431 | | | $ | 350,490 | |
American Science & Engineering, Inc. | | | 4,790 | | | | 321,169 | |
Cubic Corp. | | | 5,895 | | | | 278,715 | |
Dolan Co.* | | | 26,718 | | | | 243,401 | |
Exponent, Inc.* | | | 4,305 | | | | 208,879 | |
Toro Co. | | | 2,655 | | | | 188,797 | |
Franklin Electric Company, Inc. | | | 3,825 | | | | 187,693 | |
GT Advanced Technologies, Inc.* | | | 21,812 | | | | 180,385 | |
AZZ, Inc. | | | 3,345 | | | | 172,736 | |
Teledyne Technologies, Inc.* | | | 2,696 | | | | 169,983 | |
Lindsay Corp. | | | 2,393 | | | | 158,584 | |
II-VI, Inc.* | | | 6,680 | | | | 157,982 | |
Higher One Holdings, Inc.* | | | 8,483 | | | | 126,821 | |
Forward Air Corp. | | | 3,030 | | | | 111,110 | |
Aerovironment, Inc.* | | | 3,456 | | | | 92,655 | |
| | | | | | | | |
Total Industrials | | | | | | | 2,949,400 | |
| | | | | | | | |
FINANCIALS—7.3% | | | | | | | | |
Portfolio Recovery Associates, Inc.* | | | 4,517 | | | | 323,959 | |
World Acceptance Corp.* | | | 4,584 | | | | 280,770 | |
Cash America International, Inc. | | | 5,166 | | | | 247,606 | |
Infinity Property & Casualty Corp. | | | 4,501 | | | | 235,537 | |
Ezcorp, Inc. — Class A* | | | 7,210 | | | | 234,001 | |
Financial Engines, Inc.* | | | 8,805 | | | | 196,880 | |
ProAssurance Corp. | | | 2,180 | | | | 192,080 | |
First Cash Financial Services, Inc.* | | | 3,514 | | | | 150,715 | |
PS Business Parks, Inc. | | | 2,205 | | | | 144,516 | |
Mid-America Apartment Communities, Inc. | | | 2,079 | | | | 139,355 | |
RLI Corp. | | | 1,915 | | | | 137,191 | |
EastGroup Properties, Inc. | | | 2,239 | | | | 112,443 | |
| | | | | | | | |
Total Financials | | | | | | | 2,395,053 | |
| | | | | | | | |
CONSUMER STAPLES—5.1% | | | | | | | | |
Casey’s General Stores, Inc. | | | 5,225 | | | | 289,779 | |
Sanderson Farms, Inc. | | | 5,368 | | | | 284,664 | |
Boston Beer Company, Inc. — Class A* | | | 2,659 | | | | 283,955 | |
TreeHouse Foods, Inc.* | | | 4,152 | | | | 247,044 | |
Medifast, Inc.* | | | 12,592 | | | | 219,856 | |
J&J Snack Foods Corp. | | | 4,080 | | | | 214,037 | |
WD-40 Co. | | | 2,766 | | | | 125,438 | |
| | | | | | | | |
Total Consumer Staples | | | | | | | 1,664,773 | |
| | | | | | | | |
ENERGY—4.2% | | | | | | | | |
SEACOR Holdings, Inc.* | | | 3,719 | | | | 356,205 | |
Contango Oil & Gas Co.* | | | 4,778 | | | | 281,472 | |
GeoResources, Inc.* | | | 7,820 | | | | 256,027 | |
Lufkin Industries, Inc. | | | 2,191 | | | | 176,704 | |
Approach Resources, Inc.* | | | 4,185 | | | | 154,636 | |
OYO Geospace Corp.* | | | 1,450 | | | | 152,729 | |
| | | | | | | | |
Total Energy | | | | | | | 1,377,773 | |
| | | | | | | | |
| | | | | | | | |
| | | SHARES | | | VALUE | |
MATERIALS—2.2% | | | | | | | | |
Hawkins, Inc. | | | 6,026 | | | $ | 224,167 | |
Deltic Timber Corp. | | | 2,895 | | | | 183,225 | |
Schweitzer-Mauduit International, Inc. | | | 2,464 | | | | 170,164 | |
Balchem Corp. | | | 4,896 | | | | 148,104 | |
| | | | | | | | |
Total Materials | | | | | | | 725,660 | |
| | | | | | | | |
UTILITIES—0.8% | | | | | | | | |
American States Water Co. | | | 3,485 | | | | 125,948 | |
South Jersey Industries, Inc. | | | 2,500 | | | | 125,100 | |
| | | | | | | | |
Total Utilities | | | | | | | 251,048 | |
| | | | | | | | |
TELECOMMUNICATION SERVICES—0.7% | | | | | | | | |
Atlantic Tele-Network, Inc. | | | 6,140 | | | | 223,250 | |
| | | | | | | | |
Total Common Stocks (Cost $27,288,679) | | | | | | | 32,564,055 | |
| | | | | | | | |
| | | FACE | | | | |
| | | AMOUNT | | | | |
REPURCHASE AGREEMENTS††,1—1.5% | | | | | | | | |
HSBC Group issued 03/30/12 at 0.01% due 04/02/12 | | $ | 321,827 | | | | 321,827 | |
Mizuho Financial Group, Inc. issued 03/30/12 at 0.01% due 04/02/12 | | | 90,546 | | | | 90,546 | |
Credit Suisse Group issued 03/30/12 at 0.01% due 04/02/12 | | | 41,548 | | | | 41,548 | |
Deutsche Bank issued 03/30/12 at 0.01% due 04/02/12 | | | 24,066 | | | | 24,066 | |
| | | | | | | | |
Total Repurchase Agreements (Cost $477,987) | | | | | | | 477,987 | |
Total Investments – 100.7% (Cost $27,766,666) | | | | | | $ | 33,042,042 | |
| | | | | | | | |
Other Assets & Liabilities, net – (0.7)% | | | | | | | (242,196 | ) |
| | | | | | | | |
Total Net Assets – 100.0% | | | | | | $ | 32,799,846 | |
| * | Non-income producing security. |
| † | Value determined based on Level 1 inputs — See Note 4. |
| †† | Value determined based on Level 2 inputs — See Note 4. |
| 1 | Repurchase Agreements — See Note 5. |
| | |
SEE NOTES TO FINANCIAL STATEMENTS. | | THE RYDEX SERIES FUNDS ANNUAL REPORT | 173 |
S&P SMALLCAP 600 PURE GROWTH FUND
STATEMENT OF ASSETS AND LIABILITIES
| | | | |
March 31, 2012 | | | | |
| |
ASSETS: | | | | |
Investments, at value (cost $27,288,679) | | $ | 32,564,055 | |
Repurchase agreements, at value (cost $477,987) | | | 477,987 | |
| | | | |
Total investments (cost $27,766,666) | | | 33,042,042 | |
Receivables: | | | | |
Fund shares sold | | | 66,296 | |
Dividends | | | 12,832 | |
| | | | |
Total assets | | | 33,121,170 | |
| | | | |
LIABILITIES: | | | | |
Payable for: | | | | |
Fund shares redeemed | | | 249,649 | |
Management fees | | | 20,593 | |
Distribution and service fees | | | 8,386 | |
Transfer agent and administrative fees | | | 6,864 | |
Portfolio accounting fees | | | 2,746 | |
Miscellaneous | | | 33,086 | |
| | | | |
Total liabilities | | | 321,324 | |
| | | | |
NET ASSETS | | $ | 32,799,846 | |
| | | | |
NET ASSETS CONSIST OF: | | | | |
Paid in capital | | $ | 41,326,264 | |
Accumulated net investment loss | | | (9,714 | ) |
Accumulated net realized loss on investments | | | (13,792,080 | ) |
Net unrealized appreciation on investments | | | 5,275,376 | |
| | | | |
Net assets | | $ | 32,799,846 | |
| | | | |
A-CLASS: | | | | |
Net assets | | $ | 1,017,900 | |
Capital shares outstanding | | | 26,807 | |
Net asset value per share | | $ | 37.97 | |
| | | | |
Maximum offering price per share
(Net asset value divided by 95.25%) | | $ | 39.86 | |
| | | | |
C-CLASS: | | | | |
Net assets | | $ | 2,567,900 | |
Capital shares outstanding | | | 71,744 | |
Net asset value per share | | $ | 35.79 | |
| | | | |
H-CLASS: | | | | |
Net assets | | $ | 29,214,046 | |
Capital shares outstanding | | | 769,352 | |
Net asset value per share | | $ | 37.97 | |
| | | | |
STATEMENT OF OPERATIONS
| | | | |
Year Ended March 31, 2012 | | | | |
| |
INVESTMENT INCOME: | | | | |
Dividends | | $ | 236,479 | |
Interest | | | 125 | |
| | | | |
Total investment income | | | 236,604 | |
| | | | |
EXPENSES: | | | | |
Management fees | | | 417,528 | |
Transfer agent and administrative fees | | | 139,176 | |
Distribution and service fees: | | | | |
A-Class | | | 5,308 | |
C-Class | | | 27,095 | |
H-Class | | | 127,094 | |
Portfolio accounting fees | | | 55,670 | |
Custodian fees | | | 14,221 | |
Trustees’ fees* | | | 7,131 | |
Miscellaneous | | | 70,371 | |
| | | | |
Total expenses | | | 863,594 | |
| | | | |
Net investment loss | | | (626,990 | ) |
| | | | |
NET REALIZEDAND UNREALIZED GAIN (LOSS): | | | | |
Net realized gain (loss) on: | | | | |
Investments | | | (3,318,234 | ) |
| | | | |
Net realized loss | | | (3,318,234 | ) |
| | | | |
Net change in unrealized appreciation
(depreciation) on: | | | | |
Investments | | | (9,577,483 | ) |
| | | | |
Net change in unrealized appreciation
(depreciation) | | | (9,577,483 | ) |
| | | | |
Net realized and unrealized loss | | | (12,895,717 | ) |
| | | | |
Net decrease in net assets resulting from operations | | $ | (13,522,707 | ) |
| | | | |
| * | Relates to Trustees not deemed “interested persons” within the meaning of Section 2(a)(19) of the 1940 Act. |
| | |
174 | THE RYDEX SERIES FUNDS ANNUAL REPORT | | SEE NOTES TO FINANCIAL STATEMENTS. |
S&P SMALLCAP 600 PURE GROWTH FUND
STATEMENTS OF CHANGES IN NET ASSETS
| | | | | | | | |
| | | Year Ended
March 31,
2012 | | | Year Ended
March 31,
2011 | |
INCREASE (DECREASE) IN NET ASSETS FROM OPERATIONS: | | | | | | | | |
Net investment loss | | $ | (626,990 | ) | | $ | (524,500 | ) |
Net realized loss on investments | | | (3,318,234 | ) | | | (2,358,973 | ) |
Net change in unrealized appreciation (depreciation) on investments | | | (9,577,483 | ) | | | 11,640,140 | |
| | | | | | | | |
Net increase (decrease) in net assets resulting from operations | | | (13,522,707 | ) | | | 8,756,667 | |
| | | | | | | | |
CAPITALSHARETRANSACTIONS: | | | | | | | | |
PROCEEDSFROMSALEOFSHARES | | | | | | | | |
A-Class | | | 29,768,714 | | | | 22,007,416 | |
C-Class | | | 6,213,193 | | | | 5,904,587 | |
H-Class | | | 307,332,512 | | | | 414,097,385 | |
COSTOFSHARESREDEEMED | | | | | | | | |
A-Class | | | (31,305,259 | ) | | | (20,788,528 | ) |
C-Class | | | (6,576,491 | ) | | | (4,935,070 | ) |
H-Class | | | (356,380,909 | ) | | | (340,251,324 | ) |
| | | | | | | | |
Net increase (decrease) from capital share transactions | | | (50,948,240 | ) | | | 76,034,466 | |
| | | | | | | | |
Net increase (decrease) in net assets | | | (64,470,947 | ) | | | 84,791,133 | |
NETASSETS: | | | | | | | | |
Beginning of year | | | 97,270,793 | | | | 12,479,660 | |
| | | | | | | | |
End of year | | $ | 32,799,846 | | | $ | 97,270,793 | |
| | | | | | | | |
Accumulated net investment loss at end of year | | $ | (9,714 | ) | | $ | — | |
| | | | | | | | |
CAPITALSHAREACTIVITY: | | | | | | | | |
Shares sold | | | | | | | | |
A-Class | | | 911,948 | | | | 759,208 | |
C-Class | | | 183,065 | | | | 197,736 | |
H-Class | | | 8,576,270 | | | | 13,305,001 | |
Shares redeemed | | | | | | | | |
A-Class | | | (943,812 | ) | | | (726,863 | ) |
C-Class | | | (201,004 | ) | | | (168,877 | ) |
H-Class | | | (10,359,949 | ) | | | (11,105,623 | ) |
| | | | | | | | |
Net increase (decrease) in shares | | | (1,833,482 | ) | | | 2,260,582 | |
| | | | | | | | |
| | |
SEE NOTES TO FINANCIAL STATEMENTS. | | THE RYDEX SERIES FUNDS ANNUAL REPORT | 175 |
S&P SMALLCAP 600 PURE GROWTH FUND
FINANCIAL HIGHLIGHTS
This table is presented to show selected data for a share outstanding throughout each period and to assist shareholders in evaluating a Fund’s performance for the periods presented.
| | | | | | | | | | | | | | | | | | | | |
| A-Class | | Year Ended
March 31,
2012 | | | Year Ended
March 31,
2011 | | | Year Ended
March 31,
2010 | | | Year Ended
March 31,
2009 | | | Year Ended
March 31,
2008 | |
Per Share Data | | | | | | | | | | | | | | | | | | | | |
Net asset value, beginning of period | | $ | 36.06 | | | $ | 28.49 | | | $ | 16.93 | | | $ | 27.43 | | | $ | 32.61 | |
| | | | | | | | | | | | | | | | | | | | |
Income (loss) from investment operations: | | | | | | | | | | | | | | | | | | | | |
Net investment lossa | | | (.35 | ) | | | (.34 | ) | | | (.28 | ) | | | (.19 | ) | | | (.13 | ) |
Net gain (loss) on investments (realized and unrealized) | | | 2.26 | | | | 7.91 | | | | 11.84 | | | | (10.31 | ) | | | (3.72 | ) |
| | | | | | | | | | | | | | | | | | | | |
Total from investment operations | | | 1.91 | | | | 7.57 | | | | 11.56 | | | | (10.50 | ) | | | (3.85 | ) |
| | | | | | | | | | | | | | | | | | | | |
Less distributions from: | | | | | | | | | | | | | | | | | | | | |
Net realized gains | | | — | | | | — | | | | — | | | | — | | | | (1.33 | ) |
| | | | | | | | | | | | | | | | | | | | |
Total distributions | | | — | | | | — | | | | — | | | | — | | | | (1.33 | ) |
| | | | | | | | | | | | | | | | | | | | |
Net asset value, end of period | | $ | 37.97 | | | $ | 36.06 | | | $ | 28.49 | | | $ | 16.93 | | | $ | 27.43 | |
| | | | | | | | | | | | | | | | | | | | |
| | | | | |
Total Returnb | | | 5.30 | % | | | 26.57 | % | | | 68.28 | % | | | (33.28 | %) | | | (12.27 | %) |
| | | | | | | | | | | | | | | | | | | | |
Ratios/Supplemental Data | | | | | | | | | | | | | | | | | | | | |
Net assets, end of period (in thousands) | | $ | 1,018 | | | $ | 2,115 | | | $ | 750 | | | $ | 117 | | | $ | 1,938 | |
| | | | | | | | | | | | | | | | | | | | |
Ratios to average net assets: | | | | | | | | | | | | | | | | | | | | |
Net investment loss | | | (1.00 | %) | | | (1.15 | %) | | | (1.15 | %) | | | (0.73 | %) | | | (0.40 | %) |
Total expenses | | | 1.52 | % | | | 1.54 | % | | | 1.54 | % | | | 1.54 | % | | | 1.52 | % |
| | | | | | | | | | | | | | | | | | | | |
Portfolio turnover rate | | | 500 | % | | | 732 | % | | | 1,476 | % | | | 1,066 | % | | | 834 | % |
| | | | | | | | | | | | | | | | | | | | |
| C-Class | | Year Ended
March 31,
2012 | | | Year Ended
March 31,
2011 | | | Year Ended
March 31,
2010 | | | Year Ended
March 31,
2009 | | | Year Ended
March 31,
2008 | |
Per Share Data | | | | | | | | | | | | | | | | | | | | |
Net asset value, beginning of period | | $ | 34.25 | | | $ | 27.25 | | | $ | 16.32 | | | $ | 26.65 | | | $ | 31.94 | |
| | | | | | | | | | | | | | | | | | | | |
Income (loss) from investment operations: | | | | | | | | | | | | | | | | | | | | |
Net investment lossa | | | (.57 | ) | | | (.54 | ) | | | (.42 | ) | | | (.32 | ) | | | (.51 | ) |
Net gain (loss) on investments (realized and unrealized) | | | 2.11 | | | | 7.54 | | | | 11.35 | | | | (10.01 | ) | | | (3.45 | ) |
| | | | | | | | | | | | | | | | | | | | |
Total from investment operations | | | 1.54 | | | | 7.00 | | | | 10.93 | | | | (10.33 | ) | | | (3.96 | ) |
| | | | | | | | | | | | | | | | | | | | |
Less distributions from: | | | | | | | | | | | | | | | | | | | | |
Net realized gains | | | — | | | | — | | | | — | | | | — | | | | (1.33 | ) |
| | | | | | | | | | | | | | | | | | | | |
Total distributions | | | — | | | | — | | | | — | | | | — | | | | (1.33 | ) |
| | | | | | | | | | | | | | | | | | | | |
Net asset value, end of period | | $ | 35.79 | | | $ | 34.25 | | | $ | 27.25 | | | $ | 16.32 | | | $ | 26.65 | |
| | | | | | | | | | | | | | | | | | | | |
| | | | | |
Total Returnb | | | 4.50 | % | | | 25.69 | % | | | 66.97 | % | | | (38.76 | %) | | | (12.88 | %) |
| | | | | | | | | | | | | | | | | | | | |
Ratios/Supplemental Data | | | | | | | | | | | | | | | | | | | | |
Net assets, end of period (in thousands) | | $ | 2,568 | | | $ | 3,072 | | | $ | 1,658 | | | $ | 369 | | | $ | 1,980 | |
| | | | | | | | | | | | | | | | | | | | |
Ratios to average net assets: | | | | | | | | | | | | | | | | | | | | |
Net investment loss | | | (1.71 | %) | | | (1.80 | %) | | | (1.82 | %) | | | (1.28 | %) | | | (1.57 | %) |
Total expenses | | | 2.26 | % | | | 2.29 | % | | | 2.28 | % | | | 2.29 | % | | | 2.29 | % |
| | | | | | | | | | | | | | | | | | | | |
Portfolio turnover rate | | | 500 | % | | | 732 | % | | | 1,476 | % | | | 1,066 | % | | | 834 | % |
| | |
176 | THE RYDEX SERIES FUNDS ANNUAL REPORT | | SEE NOTES TO FINANCIAL STATEMENTS. |
S&P SMALLCAP 600 PURE GROWTH FUND
FINANCIAL HIGHLIGHTS (concluded)
This table is presented to show selected data for a share outstanding throughout each period and to assist shareholders in evaluating a Fund’s performance for the periods presented.
| | | | | | | | | | | | | | | | | | | | |
H-Class | | Year Ended
March 31,
2012 | | | Year Ended
March 31,
2011 | | | Year Ended
March 31,
2010 | | | Year Ended
March 31,
2009 | | | Year Ended
March 31,
2008 | |
Per Share Data | | | | | | | | | | | | | | | | | | | | |
Net asset value, beginning of period | | $ | 36.07 | | | $ | 28.48 | | | $ | 16.94 | | | $ | 27.45 | | | $ | 32.62 | |
| | | | | | | | | | | | | | | | | | | | |
Income (loss) from investment operations: | | | | | | | | | | | | | | | | | | | | |
Net investment lossa | | | (.39 | ) | | | (.34 | ) | | | (.25 | ) | | | (.13 | ) | | | (.26 | ) |
Net gain (loss) on investments (realized and unrealized) | | | 2.29 | | | | 7.93 | | | | 11.79 | | | | (10.38 | ) | | | (3.58 | ) |
| | | | | | | | | | | | | | | | | | | | |
Total from investment operations | | | 1.90 | | | | 7.59 | | | | 11.54 | | | | (10.51 | ) | | | (3.84 | ) |
| | | | | | | | | | | | | | | | | | | | |
Less distributions from: | | | | | | | | | | | | | | | | | | | | |
Net realized gains | | | — | | | | — | | | | — | | | | — | | | | (1.33 | ) |
| | | | | | | | | | | | | | | | | | | | |
Total distributions | | | — | | | | — | | | | — | | | | — | | | | (1.33 | ) |
| | | | | | | | | | | | | | | | | | | | |
Net asset value, end of period | | $ | 37.97 | | | $ | 36.07 | | | $ | 28.48 | | | $ | 16.94 | | | $ | 27.45 | |
| | | | | | | | | | | | | | | | | | | | |
Total Returnb | | | 5.27 | % | | | 26.65 | % | | | 68.12 | % | | | (38.29 | %) | | | (12.23 | %) |
| | | | | | | | | | | | | | | | | | | | |
Ratios/Supplemental Data | | | | | | | | | | | | | | | | | | | | |
Net assets, end of period (in thousands) | | $ | 29,214 | | | $ | 92,084 | | | $ | 10,072 | | | $ | 9,795 | | | $ | 6,259 | |
| | | | | | | | | | | | | | | | | | | | |
Ratios to average net assets: | | | | | | | | | | | | | | | | | | | | |
Net investment loss | | | (1.10 | %) | | | (1.07 | %) | | | (1.05 | %) | | | (0.55 | %) | | | (0.79 | %) |
Total expenses | | | 1.52 | % | | | 1.55 | % | | | 1.53 | % | | | 1.56 | % | | | 1.53 | % |
| | | | | | | | | | | | | | | | | | | | |
Portfolio turnover rate | | | 500 | % | | | 732 | % | | | 1,476 | % | | | 1,066 | % | | | 834 | % |
| a | Net investment loss per share was computed using average shares outstanding throughout the period. |
| b | Total return does not reflect the impact of any applicable sales charges and has not been annualized. |
| | |
SEE NOTES TO FINANCIAL STATEMENTS. | | THE RYDEX SERIES FUNDS ANNUAL REPORT | 177 |
| | |
PERFORMANCE REPORT AND FUND PROFILE (Unaudited) | | March 31, 2012 |
S&P SMALLCAP 600 PURE VALUE FUND
OBJECTIVE: Seeks to provide investment results that match, before fees and expenses, the performance of a benchmark for small-cap value securities on a daily basis. The Fund’s current benchmark is the S&P SmallCap 600 Pure Value Index (the “underlying index”).
For the one-year period ended March 31, 2012, S&P SmallCap 600 Pure Value Fund H-Class returned -2.19%, compared with 1.35% for the S&P SmallCap 600 Pure Value Index*. S&P SmallCap 600 Pure Value Fund maintained a daily correlation of over 99% to its benchmark. Small-cap growth stocks significantly outperformed small-cap value stocks during the period.
Consumer Discretionary sector contributed the most to return, followed by the Health Care and Materials sectors. Sectors detracting the most from return were Information Technology, Industrials and Consumer Staples.
The stocks contributing the most to return in the S&P SmallCap 600 Pure Value Index were VOXX International Corp., Lithia Motors, Inc., Class A and Kendle International, Inc. The largest detractors from return were Christopher & Banks Corp., CIBER, Inc. and School Specialty, Inc.
*The S&P SmallCap 600® Pure Value Index is narrow in focus, containing only those S&P SmallCap 600 Index companies with strong value characteristics as selected by S&P. The S&P SmallCap 600 Index measures the performance of the small-capitalization sector of the U.S. equity market.
Performance displayed represents past performance which is no guarantee of future results.
Holdings Diversification (Market Exposure as % of Net Assets)
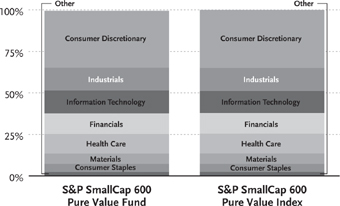
| | |
Inception Dates: | | |
A-Class | | September 1, 2004 |
C-Class | | February 20, 2004 |
H-Class | | February 20, 2004 |
| | | | |
Ten Largest Holdings (% of Total Net Assets) | |
VOXX International Corp. — Class A | | | 2.3 | % |
Gentiva Health Services, Inc. | | | 1.9 | % |
Marriott Vacations Worldwide Corp. | | | 1.8 | % |
Amedisys, Inc. | | | 1.7 | % |
Perry Ellis International, Inc. | | | 1.6 | % |
Tuesday Morning Corp. | | | 1.6 | % |
Almost Family, Inc. | | | 1.5 | % |
Career Education Corp. | | | 1.4 | % |
Healthways, Inc. | | | 1.4 | % |
OfficeMax, Inc. | | | 1.3 | % |
| | | | |
Top Ten Total | | | 16.5 | % |
| | | | |
“Ten Largest Holdings” exclude any temporary cash or derivative investments.
“Holdings Diversification (Market Exposure as % of Net Assets)” excludes any temporary cash investments.
178 | THE RYDEX SERIES FUNDS ANNUAL REPORT
PERFORMANCE REPORT AND FUND PROFILE (Unaudited)(concluded)
Cumulative Fund Performance*
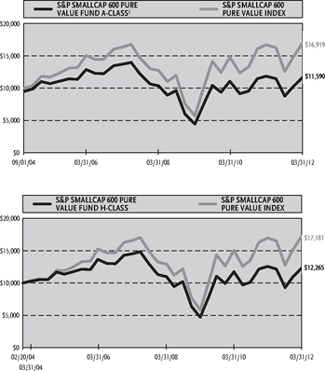
Average Annual Returns*
Periods Ended 03/31/12
| | | | | | | | | | | | |
| | | 1 Year | | | 5 Year | | | Since
Inception
(09/01/04) | |
A-Class Shares | | | -2.01 | % | | | -3.28 | % | | | 2.62 | % |
A-Class Shares with sales charge‡ | | | -6.67 | % | | | -4.21 | % | | | 1.97 | % |
S&P SmallCap 600 Pure Value Index | | | 1.35 | % | | | 0.70 | % | | | 7.19 | % |
| | | | | | | | | | | (02/20/04 | ) |
C-Class Shares | | | -2.84 | % | | | -4.06 | % | | | 1.77 | % |
C-Class Shares with CDSC† | | | -3.81 | % | | | -4.06 | % | | | 1.77 | % |
H-Class Shares | | | -2.19 | % | | | -3.32 | % | | | 2.55 | % |
S&P SmallCap 600 Pure Value Index | | | 1.35 | % | | | 0.70 | % | | | 6.90 | % |
| * | The performance data above represents past performance that is not predictive of future results. The investment return and principal value of an investment in the Fund will fluctuate so that an investor’s shares, when redeemed, may be worth more or less than their original cost. Returns are historical and include changes in principal and reinvested dividends and capital gains and do not reflect the effect of taxes. The S&P SmallCap 600 Pure Value Index is an unmanaged index and, unlike the Fund, has no management fees or operating expenses to reduce its reported return. The graphs are based on A-Class shares and H-Class shares only; performance for C-Class shares will vary due to differences in fee structures. |
| † | Fund returns include a CDSC of 1% if redeemed within 12 months of purchase. |
| ‡ | Fund returns are calculated using the maximum sales charge of 4.75%. |
THE RYDEX SERIES FUNDS ANNUAL REPORT | 179
| | |
| SCHEDULE OF INVESTMENTS | | March 31, 2012 |
| S&P SMALLCAP 600 PURE VALUE FUND | | |
| | | | | | | | |
| | | SHARES | | | VALUE | |
COMMON STOCKS† — 99.5% | | | | | | | | |
| | |
CONSUMER DISCRETIONARY — 34.3% | | | | | | | | |
VOXX International Corp. — Class A* | | | 45,348 | | | $ | 614,919 | |
Marriott Vacations Worldwide Corp.* | | | 17,546 | | | | 500,236 | |
Perry Ellis International, Inc.* | | | 23,208 | | | | 433,293 | |
Tuesday Morning Corp.* | | | 110,385 | | | | 423,878 | |
Career Education Corp.* | | | 48,136 | | | | 387,976 | |
OfficeMax, Inc.* | | | 64,451 | | | | 368,659 | |
Boyd Gaming Corp.* | | | 45,259 | | | | 354,831 | |
Lincoln Educational Services Corp. | | | 41,924 | | | | 331,619 | |
MarineMax, Inc.* | | | 39,991 | | | | 329,126 | |
Ruby Tuesday, Inc.* | | | 31,383 | | | | 286,527 | |
Brown Shoe Company, Inc. | | | 30,685 | | | | 283,222 | |
Skechers U.S.A., Inc. — Class A* | | | 21,919 | | | | 278,810 | |
Quiksilver, Inc.* | | | 65,542 | | | | 264,790 | |
Stage Stores, Inc. | | | 15,719 | | | | 255,277 | |
PEP Boys-Manny Moe & Jack | | | 16,303 | | | | 243,241 | |
Sonic Automotive, Inc. — Class A | | | 13,460 | | | | 241,069 | |
Stein Mart, Inc.* | | | 36,438 | | | | 240,491 | |
Corinthian Colleges, Inc.* | | | 53,914 | | | | 223,204 | |
Callaway Golf Co. | | | 32,081 | | | | 216,867 | |
Fred’s, Inc. — Class A | | | 13,598 | | | | 198,667 | |
Group 1 Automotive, Inc. | | | 3,487 | | | | 195,865 | |
Spartan Motors, Inc. | | | 36,533 | | | | 193,259 | |
O’Charleys, Inc.* | | | 18,551 | | | | 182,542 | |
Big 5 Sporting Goods Corp. | | | 22,938 | | | | 179,834 | |
Standard Pacific Corp.* | | | 35,925 | | | | 160,225 | |
M/I Homes, Inc.* | | | 12,683 | | | | 156,762 | |
Lithia Motors, Inc. — Class A | | | 5,872 | | | | 153,846 | |
Winnebago Industries, Inc.* | | | 15,267 | | | | 149,617 | |
Coldwater Creek, Inc.* | | | 127,244 | | | | 147,603 | |
Superior Industries International, Inc. | | | 7,390 | | | | 144,401 | |
EW Scripps Co. — Class A* | | | 12,397 | | | | 122,358 | |
La-Z-Boy, Inc.* | | | 7,382 | | | | 110,435 | |
Haverty Furniture Companies, Inc. | | | 9,841 | | | | 109,235 | |
Zale Corp.* | | | 32,623 | | | | 100,805 | |
Ruth’s Hospitality Group, Inc.* | | | 13,263 | | | | 100,666 | |
Christopher & Banks Corp. | | | 53,408 | | | | 99,339 | |
Universal Electronics, Inc.* | | | 4,574 | | | | 91,389 | |
Cabela’s, Inc.* | | | 2,222 | | | | 84,769 | |
Red Robin Gourmet Burgers, Inc.* | | | 2,162 | | | | 80,405 | |
Live Nation Entertainment, Inc.* | | | 8,132 | | | | 76,441 | |
Harte-Hanks, Inc. | | | 7,745 | | | | 70,092 | |
Jakks Pacific, Inc. | | | 3,917 | | | | 68,352 | |
Jack in the Box, Inc.* | | | 2,758 | | | | 66,109 | |
| | | | | | | | |
Total Consumer Discretionary | | | | | | | 9,321,051 | |
| | | | | | | | |
INDUSTRIALS—13.8% | | | | | | | | |
SkyWest, Inc. | | | 29,378 | | | | 324,627 | |
Kelly Services, Inc. — Class A | | | 18,208 | | | | 291,146 | |
Orion Marine Group, Inc.* | | | 40,093 | | | | 289,873 | |
Universal Forest Products, Inc. | | | 6,972 | | | | 240,395 | |
CDI Corp. | | | 13,130 | | | | 235,421 | |
AAR Corp. | | | 11,488 | | | | 209,656 | |
Griffon Corp. | | | 18,739 | | | | 200,507 | |
Briggs & Stratton Corp. | | | 9,603 | | | | 172,181 | |
| | | | | | | | |
| | | SHARES | | | VALUE | |
ABM Industries, Inc. | | | 6,363 | | | $ | 154,621 | |
Lawson Products, Inc. | | | 10,103 | | | | 152,656 | |
Aegion Corp. — Class A* | | | 7,633 | | | | 136,096 | |
Lydall, Inc.* | | | 12,903 | | | | 131,482 | |
EnerSys* | | | 3,712 | | | | 128,621 | |
Arkansas Best Corp. | | | 6,788 | | | | 127,682 | |
Comfort Systems USA, Inc. | | | 11,487 | | | | 125,323 | |
United Stationers, Inc. | | | 3,774 | | | | 117,107 | |
Viad Corp. | | | 5,634 | | | | 109,469 | |
G&K Services, Inc. — Class A | | | 2,711 | | | | 92,716 | |
Standard Register Co. | | | 71,413 | | | | 89,266 | |
Apogee Enterprises, Inc. | | | 6,093 | | | | 78,904 | |
EMCOR Group, Inc. | | | 2,693 | | | | 74,650 | |
Standex International Corp. | | | 1,788 | | | | 73,648 | |
Insperity, Inc. | | | 2,371 | | | | 72,647 | |
Geo Group, Inc.* | | | 3,652 | | | | 69,425 | |
Powell Industries, Inc.* | | | 1,963 | | | | 67,233 | |
| | | | | | | | |
Total Industrials | | | | | | | 3,765,352 | |
| | | | | | | | |
INFORMATION TECHNOLOGY—13.7% | | | | | | | | |
SYNNEX Corp.* | | | 8,663 | | | | 330,406 | |
Insight Enterprises, Inc.* | | | 14,851 | | | | 325,681 | |
Benchmark Electronics, Inc.* | | | 17,501 | | | | 288,592 | |
Radisys Corp.* | | | 36,851 | | | | 272,697 | |
Black Box Corp. | | | 8,035 | | | | 204,972 | |
Intevac, Inc.* | | | 19,717 | | | | 167,595 | |
United Online, Inc. | | | 28,922 | | | | 141,429 | |
Sigma Designs, Inc.* | | | 26,788 | | | | 138,761 | |
Scansource, Inc.* | | | 3,683 | | | | 137,450 | |
CTS Corp. | | | 12,967 | | | | 136,413 | |
Cohu, Inc. | | | 11,430 | | | | 129,959 | |
Digital Generation, Inc.* | | | 12,508 | | | | 127,707 | |
NCI, Inc. — Class A* | | | 19,801 | | | | 126,529 | |
Checkpoint Systems, Inc.* | | | 11,086 | | | | 125,050 | |
Avid Technology, Inc.* | | | 10,748 | | | | 118,228 | |
Novatel Wireless, Inc.* | | | 32,646 | | | | 109,364 | |
Plexus Corp.* | | | 3,109 | | | | 108,784 | |
Brightpoint, Inc.* | | | 13,351 | | | | 107,476 | |
Pericom Semiconductor Corp.* | | | 12,363 | | | | 100,017 | |
Advanced Energy Industries, Inc.* | | | 7,448 | | | | 97,718 | |
CIBER, Inc.* | | | 21,918 | | | | 92,932 | |
Anixter International, Inc.* | | | 1,269 | | | | 92,041 | |
TTM Technologies, Inc.* | | | 7,621 | | | | 87,565 | |
Bel Fuse, Inc. — Class B | | | 4,655 | | | | 82,254 | |
DSP Group, Inc.* | | | 10,169 | | | | 67,726 | |
| | | | | | | | |
Total Information Technology | | | | | | | 3,717,346 | |
| | | | | | | | |
FINANCIALS—12.4% | | | | | | | | |
Stewart Information Services Corp. | | | 24,062 | | | | 341,922 | |
Horace Mann Educators Corp. | | | 19,398 | | | | 341,793 | |
Piper Jaffray Cos.* | | | 9,589 | | | | 255,259 | |
Investment Technology Group, Inc.* | | | 15,265 | | | | 182,569 | |
Presidential Life Corp. | | | 15,905 | | | | 181,794 | |
Delphi Financial Group, Inc. — Class A | | | 3,886 | | | | 173,976 | |
Tower Group, Inc. | | | 7,747 | | | | 173,766 | |
Selective Insurance Group, Inc. | | | 8,830 | | | | 155,496 | |
Susquehanna Bancshares, Inc. | | | 15,393 | | | | 152,083 | |
First Commonwealth Financial Corp. | | | 23,970 | | | | 146,696 | |
| | |
180 | THE RYDEX SERIES FUNDS ANNUAL REPORT | | SEE NOTES TO FINANCIAL STATEMENTS. |
| | |
| SCHEDULE OF INVESTMENTS (concluded) | | March 31, 2012 |
S&P SMALLCAP 600 PURE VALUE FUND | | |
| | | | | | | | |
| | | SHARES | | | VALUE | |
First BanCorp* | | | 32,050 | | | $ | 141,020 | |
Wintrust Financial Corp. | | | 3,539 | | | | 126,661 | |
United Fire Group, Inc. | | | 6,998 | | | | 125,194 | |
Cedar Realty Trust, Inc. | | | 20,812 | | | | 106,557 | |
PrivateBancorp, Inc. | | | 6,946 | | | | 105,371 | |
United Community Banks, Inc.* | | | 10,569 | | | | 103,048 | |
Meadowbrook Insurance Group, Inc. | | | 10,666 | | | | 99,514 | |
Parkway Properties, Inc. | | | 8,662 | | | | 90,778 | |
SWS Group, Inc. | | | 15,347 | | | | 87,785 | |
Safety Insurance Group, Inc. | | | 1,983 | | | | 82,572 | |
Calamos Asset Management, Inc. — Class A | | | 5,687 | | | | 74,556 | |
Prospect Capital Corp. | | | 6,314 | | | | 69,328 | |
National Financial Partners Corp.* | | | 4,452 | | | | 67,403 | |
| | | | | | | | |
Total Financials | | | | | | | 3,385,141 | |
| | | | | | | | |
HEALTH CARE—11.8% | | | | | | | | |
Gentiva Health Services, Inc.* | | | 59,693 | | | | 521,718 | |
Amedisys, Inc.* | | | 32,274 | | | | 466,682 | |
Almost Family, Inc.* | | | 15,378 | | | | 399,982 | |
Healthways, Inc.* | | | 50,373 | | | | 370,745 | |
Molina Healthcare, Inc.* | | | 8,960 | | | | 301,325 | |
LHC Group, Inc.* | | | 14,055 | | | | 260,439 | |
Kindred Healthcare, Inc.* | | | 28,916 | | | | 249,834 | |
Cross Country Healthcare, Inc.* | | | 41,544 | | | | 208,135 | |
PharMerica Corp.* | | | 12,752 | | | | 158,507 | |
Invacare Corp. | | | 6,901 | | | | 114,349 | |
Natus Medical, Inc.* | | | 7,515 | | | | 89,654 | |
Symmetry Medical, Inc.* | | | 10,481 | | | | 74,101 | |
| | | | | | | | |
Total Health Care | | | | | | | 3,215,471 | |
| | | | | | | | |
MATERIALS—6.2% | | | | | | | | |
OM Group, Inc.* | | | 10,523 | | | | 289,489 | |
A. Schulman, Inc. | | | 8,909 | | | | 240,721 | |
Wausau Paper Corp. | | | 18,240 | | | | 171,091 | |
Materion Corp.* | | | 5,901 | | | | 169,536 | |
PolyOne Corp. | | | 10,923 | | | | 157,291 | |
Neenah Paper, Inc. | | | 5,149 | | | | 153,131 | |
Olympic Steel, Inc. | | | 6,270 | | | | 150,480 | |
AM Castle & Co.* | | | 11,016 | | | | 139,352 | |
Century Aluminum Co.* | | | 11,821 | | | | 104,970 | |
SunCoke Energy, Inc.* | | | 4,405 | | | | 62,595 | |
AK Steel Holding Corp. | | | 7,726 | | | | 58,409 | |
| | | | | | | | |
Total Materials | | | | | | | 1,697,065 | |
| | | | | | | | |
CONSUMER STAPLES—4.9% | | | | | | | | |
Seneca Foods Corp. — Class A* | | | 12,264 | | | | 323,034 | |
Nash Finch Co. | | | 9,765 | | | | 277,521 | |
Central Garden and Pet Co. — Class A* | | | 23,059 | | | | 222,058 | |
Spartan Stores, Inc. | | | 11,488 | | | | 208,163 | |
Andersons, Inc. | | | 4,232 | | | | 206,056 | |
Alliance One International, Inc.* | | | 22,883 | | | | 86,269 | |
| | | | | | | | |
Total Consumer Staples | | | | | | | 1,323,101 | |
| | | | | | | | |
| | | | | | | | |
| | | SHARES | | | VALUE | |
ENERGY - 2.2% | | | | | | | | |
Exterran Holdings, Inc.* | | | 18,927 | | | $ | 249,646 | |
Matrix Service Co.* | | | 15,359 | | | | 215,180 | |
Overseas Shipholding Group, Inc. | | | 9,825 | | | | 124,090 | |
| | | | | | | | |
Total Energy | | | | | | | 588,916 | |
| | | | | | | | |
UTILITIES—0.2% | | | | | | | | |
Laclede Group, Inc. | | | 1,600 | | | | 62,432 | |
| | | | | | | | |
Total Common Stocks
(Cost $20,754,485) | | | | | | | 27,075,875 | |
| | | | | | | | |
| | |
| | | FACE
AMOUNT | | | | |
REPURCHASE AGREEMENTS††,1—0.3% | | | | | | | | |
HSBC Group
issued 03/30/12 at 0.01%
due 04/02/12 | | $ | 62,639 | | | | 62,639 | |
Mizuho Financial Group, Inc.
issued 03/30/12 at 0.01%
due 04/02/12 | | | 17,624 | | | | 17,624 | |
Credit Suisse Group
issued 03/30/12 at 0.01%
due 04/02/12 | | | 8,087 | | | | 8,087 | |
Deutsche Bank
issued 03/30/12 at 0.01%
due 04/02/12 | | | 4,684 | | | | 4,684 | |
| | | | | | | | |
Total Repurchase Agreements
(Cost $93,034) | | | | | | | 93,034 | |
| | | | | | | | |
Total Investments – 99.8% (Cost $20,847,519) | | | | | | $ | 27,168,909 | |
| | | | | | | | |
Other Assets & Liabilities, net – 0.2% | | | | | | | 44,594 | |
| | | | | | | | |
Total Net Assets – 100.0% | | | | | | $ | 27,213,503 | |
| * | Non-income producing security. |
| † | Value determined based on Level 1 inputs — See Note 4. |
| †† | Value determined based on Level 2 inputs — See Note 4. |
| 1 | Repurchase Agreements — See Note 5. |
| | |
SEE NOTES TO FINANCIAL STATEMENTS. | | THE RYDEX SERIES FUNDS ANNUAL REPORT | 181 |
S&P SMALLCAP 600 PURE VALUE FUND
STATEMENT OF ASSETS AND LIABILITIES
| | | | |
March 31, 2012 | | | | |
| |
ASSETS: | | | | |
Investments, at value (cost $20,754,485) | | $ | 27,075,875 | |
Repurchase agreements, at value (cost $93,034) | | | 93,034 | |
| | | | |
Total investments (cost $20,847,519) | | | 27,168,909 | |
Receivables: | | | | |
Securities sold | | | 144,883 | |
Dividends | | | 18,091 | |
Fund shares sold | | | 2,838 | |
| | | | |
Total assets | | | 27,334,721 | |
| | | | |
LIABILITIES: | | | | |
Payable for: | | | | |
Fund shares redeemed | | | 60,364 | |
Management fees | | | 24,286 | |
Distribution and service fees | | | 9,323 | |
Transfer agent and administrative fees | | | 8,095 | |
Portfolio accounting fees | | | 3,238 | |
Miscellaneous | | | 15,912 | |
| | | | |
Total liabilities | | | 121,218 | |
| | | | |
NET ASSETS | | $ | 27,213,503 | |
| | | | |
NET ASSETS CONSIST OF: | | | | |
Paid in capital | | $ | 57,287,166 | |
Accumulated net investment loss | | | (124,123 | ) |
Accumulated net realized loss on investments | | | (36,270,930 | ) |
Net unrealized appreciation on investments | | | 6,321,390 | |
| | | | |
Net assets | | $ | 27,213,503 | |
| | | | |
A-CLASS: | | | | |
Net assets | | $ | 961,295 | |
Capital shares outstanding | | | 56,326 | |
Net asset value per share | | $ | 17.07 | |
| | | | |
Maximum offering price per share | | | | |
(Net asset value divided by 95.25%) | | $ | 17.92 | |
| | | | |
C-CLASS: | | | | |
Net assets | | $ | 1,954,543 | |
Capital shares outstanding | | | 126,910 | |
Net asset value per share | | $ | 15.40 | |
| | | | |
H-CLASS: | | | | |
Net assets | | $ | 24,297,665 | |
Capital shares outstanding | | | 1,429,186 | |
Net asset value per share | | $ | 17.00 | |
| | | | |
STATEMENT OF OPERATIONS
| | | | |
Year Ended March 31, 2012 | | | | |
| |
INVESTMENT INCOME: | | | | |
Dividends | | $ | 235,878 | |
Interest | | | 128 | |
| | | | |
Total investment income | | | 236,006 | |
| | | | |
| |
EXPENSES: | | | | |
Management fees | | | 218,124 | |
Transfer agent and administrative fees | | | 72,708 | |
Distribution and service fees: | | | | |
A-Class | | | 4,505 | |
C-Class | | | 17,677 | |
H-Class | | | 63,783 | |
Portfolio accounting fees | | | 29,083 | |
Custodian fees | | | 8,469 | |
Trustees’ fees* | | | 2,291 | |
Miscellaneous | | | 31,316 | |
| | | | |
Total expenses | | | 447,956 | |
| | | | |
Net investment loss | | | (211,950 | ) |
| | | | |
| |
NET REALIZEDAND UNREALIZED GAIN (LOSS): | | | | |
Net realized gain (loss) on: | | | | |
Investments | | | 738,781 | |
Futures contracts | | | 63,018 | |
| | | | |
Net realized gain | | | 801,799 | |
| | | | |
Net change in unrealized appreciation (depreciation) on: Investments | | | 1,398,357 | |
| | | | |
Net change in unrealized appreciation (depreciation) | | | 1,398,357 | |
| | | | |
Net realized and unrealized gain | | | 2,200,156 | |
| | | | |
Net increase in net assets resulting from operations | | $ | 1,988,206 | |
| | | | |
| * | Relates to Trustees not deemed “interested persons” within the meaning of Section 2(a)(19) of the 1940 Act. |
| | |
182 | THE RYDEX SERIES FUNDS ANNUAL REPORT | | SEE NOTES TO FINANCIAL STATEMENTS. |
S&P SMALLCAP 600 PURE VALUE FUND
STATEMENTS OF CHANGES IN NET ASSETS
| | | | | | | | |
| | | Year Ended
March 31,
2012 | | | Year Ended
March 31,
2011 | |
| INCREASE (DECREASE) IN NET ASSETS FROM OPERATIONS: | | | | | | | | |
Net investment loss | | $ | (211,950 | ) | | $ | (496,202 | ) |
Net realized gain (loss) on investments | | | 801,799 | | | | (32,740,838 | ) |
Net change in unrealized appreciation (depreciation) on investments | | | 1,398,357 | | | | (23,416,369 | ) |
| | | | | | | | |
Net increase (decrease) in net assets resulting from operations | | | 1,988,206 | | | | (56,653,409 | ) |
| | | | | | | | |
DISTRIBUTIONS To SHAREHOLDERS FROM: | | | | | | | | |
Net realized gains | | | | | | | | |
A-Class | | | — | | | | (259,417 | ) |
C-Class | | | — | | | | (594,105 | ) |
H-Class | | | — | | | | (3,228,330 | ) |
| | | | | | | | |
Total distributions to shareholders | | | — | | | | (4,081,852 | ) |
| | | | | | | | |
| | |
CAPITAL SHARE TRANSACTIONS: | | | | | | | | |
PROCEEDS FROM SALE OF SHARES | | | | | | | | |
A-Class | | | 1,607,485 | | | | 87,881,068 | |
C-Class | | | 3,511,546 | | | | 10,097,253 | |
H-Class | | | 235,758,088 | | | | 544,333,378 | |
DISTRIBUTIONS REINVESTED | | | | | | | | |
A-Class | | | — | | | | 249,100 | |
C-Class | | | — | | | | 532,082 | |
H-Class | | | — | | | | 3,141,985 | |
COST OF SHARES REDEEMED | | | | | | | | |
A-Class | | | (8,919,019 | ) | | | (75,909,416 | ) |
C-Class | | | (3,810,568 | ) | | | (15,728,991 | ) |
H-Class | | | (229,990,161 | ) | | | (697,821,686 | ) |
| | | | | | | | |
Net decrease from capital share transactions | | | (1,842,629 | ) | | | (143,225,227 | ) |
| | | | | | | | |
Net increase (decrease) in net assets | | | 145,577 | | | | (203,960,488 | ) |
| | |
NET ASSETS: | | | | | | | | |
Beginning of year | | | 27,067,926 | | | | 231,028,414 | |
| | | | | | | | |
End of year | | $ | 27,213,503 | | | $ | 27,067,926 | |
| | | | | | | | |
Accumulated net investment loss at end of year | | $ | (124,123 | ) | | $ | — | |
| | | | | | | | |
CAPITAL SHARE ACTIVITY: | | | | | | | | |
Shares sold | | | | | | | | |
A-Class | | | 93,288 | | | | 4,918,837 | |
C-Class | | | 248,404 | | | | 565,219 | |
H-Class | | | 15,003,556 | | | | 29,253,756 | |
Shares issued from reinvestment of distributions | | | | | | | | |
A-Class | | | — | | | | 15,637 | |
C-Class | | | — | | | | 36,594 | |
H-Class | | | — | | | | 197,609 | |
Shares redeemed | | | | | | | | |
A-Class | | | (544,754 | ) | | | (4,708,722 | ) |
C-Class | | | (262,957 | ) | | | (952,937 | ) |
H- Class | | | (14,494,039 | ) | | | (39,594,125 | ) |
| | | | | | | | |
Net increase (decrease) in shares | | | 43,498 | | | | (10,268,132 | ) |
| | | | | | | | |
| | |
SEE NOTES TO FINANCIAL STATEMENTS. | | THE RYDEX SERIES FUNDS ANNUAL REPORT | 183 |
S&P SMALLCAP 600 PURE VALUE FUND
FINANCIAL HIGHLIGHTS
This table is presented to show selected data for a share outstanding throughout each period and to assist shareholders in evaluating a Fund’s performance for the periods presented.
| | | | | | | | | | | | | | | | | | | | |
A-Class | | Year Ended
March 31,
2012 | | | Year Ended
March 31,
2011 | | | Year Ended
March 31,
2010 | | | Year Ended
March 31,
2009 | | | Year Ended
March 31,
2008 | |
Per Share Data | | | | | | | | | | | | | | | | | | | | |
Net asset value, beginning of period | | $ | 17.42 | | | $ | 19.60 | | | $ | 11.08 | | | $ | 26.56 | | | $ | 35.54 | |
| | | | | | | | | | | | | | | | | | | | |
Income (loss) from investment operations: | | | | | | | | | | | | | | | | | | | | |
Net investment income (loss)a | | | (.12 | ) | | | (.13 | ) | | | (.13 | ) | | | .50 | | | | .26 | |
Net gain (loss) on investments (realized and unrealized) | | | (.23 | ) | | | 1.20 | | | | 15.44 | | | | (15.61 | ) | | | (8.97 | ) |
| | | | | | | | | | | | | | | | | | | | |
Total from investment operations | | | (.35 | ) | | | 1.07 | | | | 15.31 | | | | (15.11 | ) | | | (8.71 | ) |
| | | | | | | | | | | | | | | | | | | | |
Less distributions from: | | | | | | | | | | | | | | | | | | | | |
Net investment income | | | — | | | | — | | | | (.03 | ) | | | (.37 | ) | | | (.27 | ) |
Net realized gains | | | — | | | | (3.25 | ) | | | (6.76 | ) | | | — | | | | — | |
| | | | | | | | | | | | | | | | | | | | |
Total distributions | | | — | | | | (3.25 | ) | | | (6.79 | ) | | | (.37 | ) | | | (.27 | ) |
| | | | | | | | | | | | | | | | | | | | |
Net asset value, end of period | | $ | 17.07 | | | $ | 17.42 | | | $ | 19.60 | | | $ | 11.08 | | | $ | 26.56 | |
| | | | | | | | | | | | | | | | | | | | |
| | | | | |
Total Returnb | | | (2.01 | %) | | | 6.98 | % | | | 150.09 | % | | | (57.21 | %) | | | (24.54 | %) |
| | | | | | | | | | | | | | | | | | | | |
Ratios/Supplemental Data | | | | | | | | | | | | | | | | | | | | |
Net assets, end of period (in thousands) | | $ | 961 | | | $ | 8,845 | | | $ | 5,529 | | | $ | 78 | | | $ | 2,945 | |
| | | | | | | | | | | | | | | | | | | | |
Ratios to average net assets: | | | | | | | | | | | | | | | | | | | | |
Net investment income (loss) | | | (0.71 | %) | | | (0.73 | %) | | | (0.62 | %) | | | 2.04 | % | | | 0.82 | % |
Total expenses | | | 1.53 | % | | | 1.53 | % | | | 1.53 | % | | | 1.54 | % | | | 1.53 | % |
| | | | | | | | | | | | | | | | | | | | |
Portfolio turnover rate | | | 744 | % | | | 692 | % | | | 443 | % | | | 878 | % | | | 566 | % |
| | | | | | | | | | | | | | | | | | | | |
| | | Year Ended | | | Year Ended | | | Year Ended | | | Year Ended | | | Year Ended | |
| | | March 31, | | | March 31, | | | March 31, | | | March 31, | | | March 31, | |
C-Class | | 2012 | | | 2011 | | | 2010 | | | 2009 | | | 2008 | |
Per Share Data | | | | | | | | | | | | | | | | | | | | |
Net asset value, beginning of period | | $ | 15.85 | | | $ | 18.27 | | | $ | 10.62 | | | $ | 25.71 | | | $ | 34.68 | |
| | | | | | | | | | | | | | | | | | | | |
Income (loss) from investment operations: | | | | | | | | | | | | | | | | | | | | |
Net investment income (loss)a | | | (.20 | ) | | | (.23 | ) | | | (.27 | ) | | | .04 | | | | .28 | |
Net gain (loss) on investments (realized and unrealized) | | | (.25 | ) | | | 1.06 | | | | 14.71 | | | | (14.76 | ) | | | (8.98 | ) |
| | | | | | | | | | | | | | | | | | | | |
Total from investment operations | | | (.45 | ) | | | .83 | | | | 14.44 | | | | (14.72 | ) | | | (8.70 | ) |
| | | | | | | | | | | | | | | | | | | | |
Less distributions from: | | | | | | | | | | | | | | | | | | | | |
Net investment income | | | — | | | | — | | | | (.03 | ) | | | (.37 | ) | | | (.27 | ) |
Net realized gains | | | — | | | | (3.25 | ) | | | (6.76 | ) | | | — | | | | — | |
Total distributions | | | — | | | | (3.25 | ) | | | (6.79 | ) | | | (.37 | ) | | | (.27 | ) |
| | | | | | | | | | | | | | | | | | | | |
Net asset value, end of period | | $ | 15.40 | | | $ | 15.85 | | | $ | 18.27 | | | $ | 10.62 | | | $ | 25.71 | |
| | | | | | | | | | | | | | | | | | | | |
| | | | | |
Total Returnb | | | (2.84 | %) | | | 6.12 | % | | | 148.23 | % | | | (57.59 | %) | | | (25.12 | %) |
| | | | | | | | | | | | | | | | | | | | |
Ratios/Supplemental Data | | | | | | | | | | | | | | | | | | | | |
Net assets, end of period (in thousands) | | $ | 1,955 | | | $ | 2,243 | | | $ | 8,999 | | | $ | 691 | | | $ | 14,040 | |
| | | | | | | | | | | | | | | | | | | | |
Ratios to average net assets: | | | | | | | | | | | | | | | | | | | | |
Net investment income (loss) | | | (1.39 | %) | | | (1.37 | %) | | | (1.39 | %) | | | 0.21 | % | | | 0.99 | % |
Total expenses | | | 2.26 | % | | | 2.28 | % | | | 2.28 | % | | | 2.32 | % | | | 2.26 | % |
| | | | | | | | | | | | | | | | | | | | |
Portfolio turnover rate | | | 744 | % | | | 692 | % | | | 443 | % | | | 878 | % | | | 566 | % |
| | |
184 | THE RYDEX SERIES FUNDS ANNUAL REPORT | | SEE NOTES TO FINANCIAL STATEMENTS. |
S&P SMALLCAP 600 PURE VALUE FUND
FINANCIAL HIGHLIGHTS (concluded)
This table is presented to show selected data for a share outstanding throughout each period and to assist shareholders in evaluating a Fund’s performance for the periods presented.
| | | | | | | | | | | | | | | | | | | | |
H-Class | | Year Ended
March 31,
2012 | | | Year Ended
March 31,
2011 | | | Year Ended
March 31,
2010 | | | Year Ended
March 31,
2009 | | | Year Ended
March 31,
2008 | |
Per Share Data | | | | | | | | | | | | | | | | | | | | |
Net asset value, beginning of period | | $ | 17.38 | | | $ | 19.57 | | | $ | 11.07 | | | $ | 26.53 | | | $ | 35.51 | |
| | | | | | | | | | | | | | | | | | | | |
Income (loss) from investment operations: | | | | | | | | | | | | | | | | | | | | |
Net investment income (loss)a | | | (.11 | ) | | | (.11 | ) | | | (.12 | ) | | | .27 | | | | .33 | |
Net gain (loss) on investments (realized and unrealized) | | | (.27 | ) | | | 1.17 | | | | 15.41 | | | | (15.36 | ) | | | (9.04 | ) |
| | | | | | | | | | | | | | | | | | | | |
Total from investment operations | | | (.38 | ) | | | 1.06 | | | | 15.29 | | | | (15.09 | ) | | | (8.71 | ) |
| | | | | | | | | | | | | | | | | | | | |
Less distributions from: | | | | | | | | | | | | | | | | | | | | |
Net investment income | | | — | | | | — | | | | (.03 | ) | | | (.37 | ) | | | (.27 | ) |
Net realized gains | | | — | | | | (3.25 | ) | | | (6.76 | ) | | | — | | | | — | |
| | | | | | | | | | | | | | | | | | | | |
Total distributions | | | — | | | | (3.25 | ) | | | (6.79 | ) | | | (.37 | ) | | | (.27 | ) |
| | | | | | | | | | | | | | | | | | | | |
Net asset value, end of period | | $ | 17.00 | | | $ | 17.38 | | | $ | 19.57 | | | $ | 11.07 | | | $ | 26.53 | |
| | | | | | | | | | | | | | | | | | | | |
| | | | | |
Total Returnb | | | (2.19 | %) | | | 6.94 | % | | | 150.07 | % | | | (57.20 | %) | | | (24.56 | %) |
| | | | | | | | | | | | | | | | | | | | |
Ratios/Supplemental Data | | | | | | | | | | | | | | | | | | | | |
Net assets, end of period (in thousands) | | $ | 24,298 | | | $ | 15,980 | | | $ | 216,500 | | | $ | 21,489 | | | $ | 51,563 | |
| | | | | | | | | | | | | | | | | | | | |
Ratios to average net assets: | | | | | | | | | | | | | | | | | | | | |
Net investment income (loss) | | | (0.69 | %) | | | (0.56 | %) | | | 0.62 | % | | | 1.40 | % | | | 1.04 | % |
Total expenses | | | 1.49 | % | | | 1.54 | % | | | 1.54 | % | | | 1.55 | % | | | 1.48 | % |
| | | | | | | | | | | | | | | | | | | | |
Portfolio turnover rate | | | 744 | % | | | 692 | % | | | 443 | % | | | 878 | % | | | 566 | % |
| a | Net investment income (loss) per share was computed using average shares outstanding throughout the period. |
| b | Total return does not reflect the impact of any applicable sales charges and has not been annualized. |
| | |
SEE NOTES TO FINANCIAL STATEMENTS. | | THE RYDEX SERIES FUNDS ANNUAL REPORT | 185 |
| | |
PERFORMANCE REPORT AND FUND PROFILE (Unaudited) | | March 31, 2012 |
EUROPE 1.25x STRATEGY FUND
OBJECTIVE: Seeks to provide investment results that correlate, before fees and expenses, to the performance of a specific benchmark. The Fund’s current benchmark is 125% of the fair value of the STOXX 50® Index (the “underlying index”).
For the one-year period ended March 31, 2012, Europe 1.25x Strategy Fund maintained a daily correlation of over 97% to its benchmark of 125% of the daily price movement of the STOXX 50 Index. Europe 1.25x Strategy Fund H-Class returned -10.46% while the STOXX 50 Index* returned -7.29% over the same period.
Consumer Staples was the sector contributing most to return of the index, followed by Health Care. Smaller contributions were recorded from the Energy and Consumer Discretionary sectors. Financials was the leading detractor from return of the index, followed by Materials and Telecommunications Services.
Among the stocks contributing the most to return of the index were British American Tobacco plc ADR, GlaxoSmithKline plc ADR and Roche Holding AG ADR. The stocks detracting most from performance of the index for the period were Telefonica S.A. ADR, Societe Generale S.A. ADR and Siemens AG ADR.
The European sovereign debt crisis continued to weigh on the continent’s stocks over the past 12 months. Equities have done better in early 2012, helped by the monetary easing from the European Central Bank in December, the restructuring of Greece’s debt and the establishment of a global financial emergency fund to fight the debt crisis that now tops $1 trillion.
Germany’s stock market has been the strongest on the continent, although the potential for slowing growth in emerging markets, which could hurt the country’s large exporters, has pared gains recently. Indeed, 53% of European company earnings come from outside the continent, according to some analysts. Although equity valuations are compelling in many instances compared with other major markets, stocks will continue to face headwinds, especially sluggish growth, as countries struggle with debt reduction efforts and austerity measures.
Derivatives in the Fund were used to help provide exposure to the composition of the benchmark in the highest efficient manner and to provide leverage, not for hedging purposes. The results of derivatives use during the period were within our expectations and contributed to the Fund’s performance.
Due to the compounding of daily returns, leveraged and inverse funds’ returns over periods other than one day will likely differ in amount and possibly direction from the benchmark return for the same period. Investors should monitor their leveraged and inverse funds’ holdings to ensure that they are consistent with their strategies, as frequently as daily.
The effects of compounding may cause the longer-term correlation of the fund to its benchmark to diminish. The apparent discrepancy between the leveraged and unleveraged indices is the result of compounding, which is described briefly on page 4 of this report.
*The STOXX 50® Index provides a blue-chip representation of supersector leaders in the eurozone. The index covers 50 stocks from 12 eurozone countries:
Austria, Belgium, Finland, France, Germany, Greece, Ireland, Italy, Luxembourg, the Netherlands, Portugal and Spain.
Performance displayed represents past performance which is no guarantee of future results.
| | |
| Holdings Diversification (Market Exposure as % of Net Assets) | | |
| |
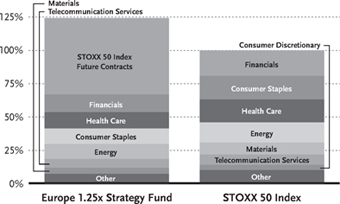 | | |
|
| “Holdings Diversification (Market Exposure as % of Net Assets)” excludes any temporary cash investments. |
| | | | |
Inception Dates: | | | |
A-Class | | | March 31, 2004 | |
C-Class | | | May 10, 2001 | |
H-Class | | | May 8, 2000 | |
| | | | |
|
Ten Largest Holdings (% of Total Net Assets) | |
Nestle S.A. ADR | | | 4.6 | % |
HSBC Holdings plc ADR | | | 3.7 | % |
BP plc ADR | | | 3.6 | % |
Novartis AG ADR | | | 3.6 | % |
Vodafone Group plc ADR | | | 3.5 | % |
Royal Dutch Shell plc ADR | | | 2.9 | % |
Total S.A. ADR | | | 2.8 | % |
GlaxoSmithKline plc ADR | | | 2.8 | % |
British American Tobacco plc ADR | | | 2.7 | % |
Sanofi ADR | | | 2.3 | % |
| | | | |
Top Ten Total | | | 32.5 | % |
| | | | |
|
| “Ten Largest Holdings” exclude any temporary cash or derivative investments. | |
186 | THE RYDEX SERIES FUNDS ANNUAL REPORT
PERFORMANCE REPORT AND FUND PROFILE (Unaudited) (concluded)
| | | | | | |
| Cumulative Fund Performance*,†† | | | | | | |
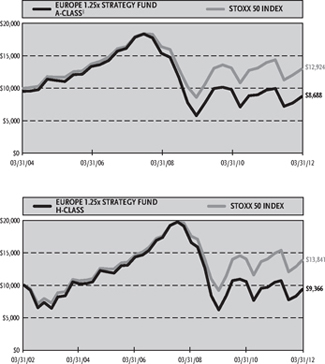
| | | | | | | | | | | | |
Average Annual Returns*,†† | | | | | | | | | | | | |
Periods Ended 03/31/12 | | | | | | | | | | | | |
| | | 1 Year | | | 5 Year | | | 10 Year | |
C-Class Shares | | | -11.10 | % | | | -12.26 | % | | | -1.43 | % |
C-Class Shares with CDSC† | | | -11.99 | % | | | -12.26 | % | | | -1.43 | % |
H-Class Shares | | | -10.46 | % | | | -11.61 | % | | | -0.65 | % |
STOXX 50 Index (Total Return/Dollars) | | | -7.29 | % | | | -4.66 | % | | | 3.30 | % |
| | | |
| | | | | | | | | Since
Inception
(03/31/04) | |
A-Class Shares | | | -10.60 | % | | | -11.63 | % | | | -1.14 | % |
A-Class Shares with sales charge‡ | | | -14.84 | % | | | -12.48 | % | | | -1.74 | % |
STOXX 50 Index (Total Return/Dollars) | | | -7.29 | % | | | -4.66 | % | | | 3.26 | % |
| * | The performance data above represents past performance that is not predictive of future results. The investment return and principal value of an investment in the Fund will fluctuate so that an investor’s shares, when redeemed, may be worth more or less than their original cost. Returns are historical and include changes in principal and reinvested dividends and capital gains and do not reflect the effect of taxes. The STOXX 50 Index (Total Return/Dollars) is an unmanaged index and, unlike the Fund, has no management fees or operating expenses to reduce its reported return. The graphs are based on A-Class shares and H-Class shares only; performance for C-Class shares will vary due to differences in fee structures. |
| † | Fund returns include a CDSC of 1% if redeemed within 12 months of purchase. |
| †† | The effects of compounding and currency exchange rates may cause the longer-term correlation of the Fund to its benchmark to diminish. |
| ‡ | Fund returns are calculated using the maximum sales charge of 4.75%. |
THE RYDEX SERIES FUNDS ANNUAL REPORT | 187
| | | | |
SCHEDULE OF INVESTMENTS | | | March 31, 2012 | |
| EUROPE 1.25x STRATEGY FUND | | | | |
| | | | | | | | |
| | | SHARES | | | VALUE | |
COMMON STOCKS† — 66.8% | | | | | | | | |
| | |
FINANCIALS - 13.2% | | | | | | | | |
HSBC Holdings plc ADR | | | 7,322 | | | $ | 325,023 | |
Banco Santander S.A. ADR | | | 19,479 | | | | 149,403 | |
UBS AG* | | | 9,440 | | | | 132,349 | |
Deutsche Bank AG | | | 2,375 | | | | 118,251 | |
Barclays plc ADR | | | 6,419 | | | | 97,248 | |
Banco Bilbao Vizcaya Argentaria S.A. ADR | | | 11,399 | | | | 91,078 | |
Credit Suisse Group AG ADR | | | 2,855 | | | | 81,396 | |
ING Groep N.V. ADR* | | | 9,416 | | | | 78,341 | |
Allianz SE ADR | | | 5,961 | | | | 70,757 | |
Societe Generale S.A. ADR | | | 4,716 | | | | 27,353 | |
| | | | | | | | |
Total Financials | | | | | | | 1,171,199 | |
| | | | | | | | |
HEALTH CARE—12.2% | | | | | | | | |
Novartis AG ADR | | | 5,787 | | | | 320,658 | |
GlaxoSmithKline plc ADR | | | 5,608 | | | | 251,855 | |
Sanofi ADR | | | 5,298 | | | | 205,298 | |
AstraZeneca plc ADR | | | 3,894 | | | | 173,244 | |
Roche Holding AG ADR | | | 2,971 | | | | 129,654 | |
| | | | | | | | |
Total Health Care | | | | | | | 1,080,709 | |
| | | | | | | | |
CONSUMER STAPLES—11.6% | | | | | | | | |
Nestle S.A. ADR | | | 6,454 | | | | 406,602 | |
British American Tobacco plc ADR | | | 2,357 | | | | 238,576 | |
Diageo plc ADR | | | 1,542 | | | | 148,803 | |
Unilever N.V. | | | 3,802 | | | | 129,382 | |
Anheuser-Busch InBev N.V. ADR | | | 1,511 | | | | 109,880 | |
| | | | | | | | |
Total Consumer Staples | | | | | | | 1,033,243 | |
| | | | | | | | |
ENERGY—11.2% | | | | | | | | |
BP plc ADR | | | 7,181 | | | | 323,146 | |
Royal Dutch Shell plc ADR | | | 3,726 | | | | 261,304 | |
Total S.A. ADR | | | 4,936 | | | | 252,328 | |
ENI SpA ADR | | | 3,314 | | | | 155,161 | |
| | | | | | | | |
Total Energy | | | | | | | 991,939 | |
| | | | | | | | |
TELECOMMUNICATION SERVICES—6.8% | | | | | | | | |
Vodafone Group plc ADR | | | 11,096 | | | | 307,026 | |
Telefonica S.A. ADR | | | 8,686 | | | | 142,537 | |
Deutsche Telekom AG ADR | | | 7,618 | | | | 91,797 | |
France Telecom S.A. ADR | | | 4,123 | | | | 61,227 | |
| | | | | | | | |
Total Telecommunication Services | | | | | | | 602,587 | |
| | | | | | | | |
MATERIALS—4.5% | | | | | | | | |
Rio Tinto plc ADR | | | 3,189 | | | | 177,277 | |
BHP Billiton Ltd. ADR | | | 2,132 | | | | 154,357 | |
Anglo American plc ADR | | | 3,641 | | | | 68,487 | |
| | | | | | | | |
Total Materials | | | | | | | 400,121 | |
| | | | | | | | |
INDUSTRIALS—3.4% | | | | | | | | |
Siemens AG ADR | | | 1,816 | | | | 183,126 | |
ABB Ltd. ADR* | | | 5,710 | | | | 116,541 | |
| | | | | | | | |
Total Industrials | | | | | | | 299,667 | |
| | | | | | | | |
| | | | | | | | |
| | | SHARES | | | VALUE | |
INFORMATION TECHNOLOGY — 2.2% | | | | | | | | |
SAP AG ADR | | | 2,289 | | | $ | 159,818 | |
Nokia Oyj ADR | | | 7,245 | | | | 39,775 | |
| | | | | | | | |
Total Information Technology | | | | | | | 199,593 | |
| | | | | | | | |
CONSUMER DISCRETIONARY—1.7% | | | | | | | | |
Daimler AG | | | 2,528 | | | | 152,969 | |
| | | | | | | | |
Total Common Stocks
(Cost $5,858,137) | | | | | | | 5,932,027 | |
| | | | | | | | |
| | | FACE
AMOUNT | | | | |
REPURCHASE AGREEMENTS††,1—51.9% | | | | | | | | |
HSBC Group
issued 03/30/12 at 0.01%
due 04/02/12 | | $ | 3,110,363 | | | | 3,110,363 | |
Mizuho Financial Group, Inc.
issued 03/30/12 at 0.01%
due 04/02/12 | | | 875,098 | | | | 875,098 | |
Credit Suisse Group
issued 03/30/12 at 0.01%
due 04/02/12 | | | 401,549 | | | | 401,549 | |
Deutsche Bank
issued 03/30/12 at 0.01%
due 04/02/12 | | | 232,591 | | | | 232,591 | |
| | | | | | | | |
Total Repurchase Agreements
(Cost $4,619,601) | | | | | | | 4,619,601 | |
| | | | | | | | |
Total Investments – 118.7%
(Cost $10,477,738) | | | | | | $ | 10,551,628 | |
| | | | | | | | |
Other Assets & Liabilities, net – (18.7)% | | | | | | | (1,659,173 | ) |
| | | | | | | | |
Total Net Assets – 100.0% | | | | | | $ | 8,892,455 | |
| | |
188 | THE RYDEX SERIES FUNDS ANNUAL REPORT | | SEE NOTES TO FINANCIAL STATEMENTS. |
| | |
| SCHEDULE OF INVESTMENTS (concluded) | | March 31, 2012 |
EUROPE 1.25x STRATEGY FUND | | |
| | | | | | | | |
| | | CONTRACTS | | | UNREALIZED
GAIN (LOSS) | |
CURRENCY FUTURE CONTRACTS PURCHASED† | | | | | | | | |
June 2012 Euro Currency Futures Contracts
(Aggregate Value of Contracts $5,170,025) | | | 31 | | | $ | 26,181 | |
| | | | | | | | |
FUTURE CONTRACTS PURCHASED† | | | | | | | | |
June 2012 Euro STOXX 50 Index
Futures Contracts
(Aggregate Value of
Contracts $1,318,453) | | | 41 | | | $ | (22,114 | ) |
June 2012 STOXX 50 Index
Futures Contracts
(Aggregate Value of
Contracts $3,794,571) | | | 118 | | | | (129,009 | ) |
| | | | | | | | |
(Total Aggregate Value of
Contracts $5,113,024) | | | | | | $ | (151,123 | ) |
| | | | | | | | |
Country Diversification
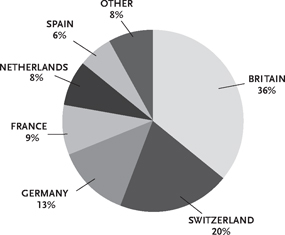
The pie chart above reflects percentages of the market value of Common Stocks.
| * | Non-income producing security. |
| † | Value determined based on Level 1 inputs — See Note 4. |
| †† | Value determined based on Level 2 inputs — See Note 4. |
| 1 | Repurchase Agreements — See Note 5. |
ADR — American Depositary Receipt
plc — Public Limited Company
| | |
SEE NOTES TO FINANCIAL STATEMENTS. | | THE RYDEX SERIES FUNDS ANNUAL REPORT | 189 |
EUROPE 1.25x STRATEGY FUND
| | | | |
| STATEMENT OF ASSETS AND LIABILITIES | |
| |
| March 31, 2012 | | | |
| |
ASSETS: | | | | |
Investments, at value
(cost $5,858,137) | | $ | 5,932,027 | |
Repurchase agreements, at value
(cost $4,619,601) | | | 4,619,601 | |
| | | | |
Total investments
(cost $10,477,738) | | | 10,551,628 | |
Segregated cash with broker | | | 763,722 | |
Due from broker | | | 230,185 | |
Receivables: | | | | |
Fund shares sold | | | 204,839 | |
Variation margin | | | 105,740 | |
Dividends | | | 15,461 | |
Foreign taxes reclaim | | | 5,832 | |
| | | | |
Total assets | | | 11,877,407 | |
| | | | |
LIABILITIES: | | | | |
Foreign currency due to broker, at value
(cost $230,595) | | | 230,976 | |
Payable for: | | | | |
Fund shares redeemed | | | 2,482,741 | |
Securities purchased | | | 249,670 | |
Management fees | | | 7,589 | |
Distribution and service fees | | | 2,352 | |
Transfer agent and administrative fees | | | 2,108 | |
Portfolio accounting fees | | | 843 | |
Miscellaneous | | | 8,673 | |
| | | | |
Total liabilities | | | 2,984,952 | |
| | | | |
NET ASSETS | | $ | 8,892,455 | |
| | | | |
NET ASSETS CONSIST OF: | | | | |
Paid in capital | | $ | 25,739,015 | |
Undistributed net investment income | | | 121,348 | |
Accumulated net realized loss on investments | | | (16,916,477 | ) |
Net unrealized depreciation on investments | | | (51,431 | ) |
| | | | |
Net assets | | $ | 8,892,455 | |
| | | | |
A-CLASS: | | | | |
Net assets | | $ | 694,126 | |
Capital shares outstanding | | | 55,239 | |
Net asset value per share | | $ | 12.57 | |
| | | | |
Maximum offering price per share
(Net asset value divided by 95.25%) | | $ | 13.20 | |
| | | | |
C-CLASS: | | | | |
Net assets | | $ | 439,052 | |
Capital shares outstanding | | | 38,090 | |
Net asset value per share | | $ | 11.53 | |
| | | | |
H-CLASS: | | | | |
Net assets | | $ | 7,759,277 | |
Capital shares outstanding | | | 616,439 | |
Net asset value per share | | $ | 12.59 | |
| | | | |
| | | | |
| STATEMENT OF OPERATIONS | |
| |
| Year Ended March 31, 2012 | | | |
| |
INVESTMENT INCOME: | | | | |
Dividends (net of foreign withholding tax of $3,283) | | $ | 386,096 | |
Interest | | | 1,521 | |
Total investment income | | | 387,617 | |
EXPENSES: | | | | |
Management fees | | | 122,158 | |
Transfer agent and administrative fees | | | 33,933 | |
Distribution and service fees: | | | | |
A-Class | | | 1,329 | |
C-Class | | | 4,790 | |
H-Class | | | 31,406 | |
Portfolio accounting fees | | | 13,573 | |
Custodian fees | | | 3,377 | |
Trustees’ fees* | | | 1,622 | |
Miscellaneous | | | 18,454 | |
| | | | |
Total expenses | | | 230,642 | |
| | | | |
Net investment income | | | 156,975 | |
| | | | |
NET REALIZED AND UNREALIZED GAIN (LOSS): | | | | |
Net realized gain (loss) on: | | | | |
Investments | | | 692,847 | |
Futures contracts | | | (75,897 | ) |
Foreign currency | | | (16,852 | ) |
| | | | |
Net realized gain | | | 600,098 | |
| | | | |
Net change in unrealized appreciation
(depreciation) on: | | | | |
Investments | | | (2,256,173 | ) |
Futures contracts | | | (258,934 | ) |
Foreign currency | | | (769 | ) |
| | | | |
Net change in unrealized appreciation
(depreciation) | | | (2,515,876 | ) |
Net realized and unrealized loss | | | (1,915,778 | ) |
| | | | |
Net decrease in net assets resulting from operations | | $ | (1,758,803 | ) |
| | | | |
| * | Relates to Trustees not deemed “interested persons” within the meaning of Section 2(a)(19) of the 1940 Act. |
| | |
190 | THE RYDEX SERIES FUNDS ANNUAL REPORT | | SEE NOTES TO FINANCIAL STATEMENTS. |
EUROPE 1.25x STRATEGY FUND
STATEMENTS OF CHANGES IN NET ASSETS
| | | | | | | | |
| | | Year Ended
March 31,
2012 | | | Year Ended
March 31,
2011 | |
INCREASE (DECREASE) IN NET ASSETS FROM OPERATIONS: | | | | | | | | |
Net investment income | | $ | 156,975 | | | $ | 139,166 | |
Net realized gain (loss) on investments | | | 600,098 | | | | (2,967,256 | ) |
Net change in unrealized appreciation (depreciation) on investments | | | (2,515,876 | ) | | | 1,903,749 | |
| | | | | | | | |
Net decrease in net assets resulting from operations | | | (1,758,803 | ) | | | (924,341 | ) |
| | | | | | | | |
CAPITALSHARETRANSACTIONS: | | | | | | | | |
PROCEEDSFROMSALEOFSHARES | | | | | | | | |
A-Class | | | 9,432,391 | | | | 24,294,825 | |
C-Class | | | 14,386,018 | | | | 51,477,462 | |
H-Class | | | 171,570,269 | | | | 282,350,914 | |
COSTOFSHARESREDEEMED | | | | | | | | |
A-Class | | | (8,804,569 | ) | | | (23,420,946 | ) |
C-Class | | | (14,574,700 | ) | | | (52,874,691 | ) |
H-Class | | | (185,689,568 | ) | | | (266,134,416 | ) |
| | | | | | | | |
Net increase (decrease) from capital share transactions | | | (13,680,159 | ) | | | 15,693,148 | |
| | | | | | | | |
Net increase (decrease) in net assets | | | (15,438,962 | ) | | | 14,768,807 | |
NETASSETS: | | | | | | | | |
Beginning of year | | | 24,331,417 | | | | 9,562,610 | |
| | | | | | | | |
End of year | | $ | 8,892,455 | | | $ | 24,331,417 | |
| | | | | | | | |
Undistributed/(Accumulated) net investment income/(loss) at end of year | | $ | 121,348 | | | $ | (18,775 | ) |
| | | | | | | | |
CAPITALSHAREACTIVITY: | | | | | | | | |
Shares sold | | | | | | | | |
A-Class | | | 714,987 | | | | 1,938,982 | |
C-Class | | | 1,264,090 | | | | 4,392,090 | |
H-Class | | | 13,533,222 | | | | 21,984,676 | |
Shares redeemed | | | | | | | | |
A-Class | | | (692,132 | ) | | | (1,939,280 | ) |
C-Class | | | (1,275,181 | ) | | | (4,503,196 | ) |
H-Class | | | (14,569,374 | ) | | | (20,824,312 | ) |
| | | | | | | | |
Net increase (decrease) in shares | | | (1,024,388 | ) | | | 1,048,960 | |
| | | | | | | | |
| | |
SEE NOTES TO FINANCIAL STATEMENTS. | | THE RYDEX SERIES FUNDS ANNUAL REPORT | 191 |
EUROPE 1.25x STRATEGY FUND
FINANCIAL HIGHLIGHTS
This table is presented to show selected data for a share outstanding throughout each period and to assist shareholders in evaluating a Fund’s performance for the periods presented.
| | | | | | | | | | | | | | | | | | | | |
A-Class | | Year Ended
March 31,
2012 | | | Year Ended
March 31,
2011 | | | Year Ended
March 31,
2010 | | | Year Ended
March 31,
2009 | | | Year Ended
March 31,
2008 | |
Per Share Data | | | | | | | | | | | | | | | | | | | | |
Net asset value, beginning of period | | $ | 14.06 | | | $ | 14.18 | | | $ | 8.36 | | | $ | 22.25 | | | $ | 24.13 | |
| | | | | | | | | | | | | | | | | | | | |
Income (loss) from investment operations: | | | | | | | | | | | | | | | | | | | | |
Net investment incomea | | | .10 | | | | .08 | | | | .04 | | | | .18 | | | | .62 | |
Net gain (loss) on investments (realized and unrealized) | | | (1.59 | ) | | | (.20 | ) | | | 5.78 | | | | (14.07 | ) | | | (1.57 | ) |
| | | | | | | | | | | | | | | | | | | | |
Total from investment operations | | | (1.49 | ) | | | (.12 | ) | | | 5.82 | | | | (13.89 | ) | | | (.95 | ) |
| | | | | | | | | | | | | | | | | | | | |
Less distributions from: | | | | | | | | | | | | | | | | | | | | |
Net investment income | | | — | | | | — | | | | — | | | | �� | | | | (.23 | ) |
Net realized gains | | | — | | | | — | | | | — | | | | — | | | | (.70 | ) |
| | | | | | | | | | | | | | | | | | | | |
Total distributions | | | — | | | | — | | | | — | | | | — | | | | (.93 | ) |
| | | | | | | | | | | | | | | | | | | | |
Net asset value, end of period | | $ | 12.57 | | | $ | 14.06 | | | $ | 14.18 | | | $ | 8.36 | | | $ | 22.25 | |
| | | | | | | | | | | | | | | | | | | | |
Total Returnb | | | (10.60 | %) | | | (0.85 | %) | | | 69.62 | % | | | (62.43 | %) | | | (4.60 | %) |
| | | | | | | | | | | | | | | | | | | | |
Ratios/Supplemental Data | | | | | | | | | | | | | | | | | | | | |
Net assets, end of period (in thousands) | | $ | 694 | | | $ | 455 | | | $ | 463 | | | $ | 316 | | | $ | 1,750 | |
| | | | | | | | | | | | | | | | | | | | |
Ratios to average net assets: | | | | | | | | | | | | | | | | | | | | |
Net investment income | | | 0.77 | % | | | 0.66 | % | | | 0.33 | % | | | 1.05 | % | | | 2.42 | % |
Total expenses | | | 1.67 | % | | | 1.69 | % | | | 1.66 | % | | | 1.68 | % | | | 1.69 | % |
| | | | | | | | | | | | | | | | | | | | |
Portfolio turnover rate | | | 318 | % | | | 515 | % | | | 1,353 | % | | | 384 | % | | | 320 | % |
| | | | | | | | | | | | | | | | | | | | |
C-Class | | Year Ended
March 31,
2012 | | | Year Ended
March 31,
2011 | | | Year Ended
March 31,
2010 | | | Year Ended
March 31,
2009 | | | Year Ended
March 31,
2008 | |
Per Share Data | | | | | | | | | | | | | | | | | | | | |
Net asset value, beginning of period | | $ | 12.97 | | | $ | 13.17 | | | $ | 7.83 | | | $ | 21.00 | | | $ | 22.98 | |
| | | | | | | | | | | | | | | | | | | | |
Income (loss) from investment operations: | | | | | | | | | | | | | | | | | | | | |
Net investment income (loss)a | | | — | c | | | .03 | | | | (.04 | ) | | | .07 | | | | .31 | |
Net gain (loss) on investments (realized and unrealized) | | | (1.44 | ) | | | (.23 | ) | | | 5.38 | | | | (13.24 | ) | | | (1.36 | ) |
| | | | | | | | | | | | | | | | | | | | |
Total from investment operations | | | (1.44 | ) | | | (.20 | ) | | | 5.34 | | | | (13.17 | ) | | | (1.05 | ) |
| | | | | | | | | | | | | | | | | | | | |
Less distributions from: | | | | | | | | | | | | | | | | | | | | |
Net investment income | | | — | | | | — | | | | — | | | | — | | | | (.23 | ) |
Net realized gains | | | — | | | | — | | | | — | | | | — | | | | (.70 | ) |
Total distributions | | | — | | | | — | | | | — | | | | — | | | | (.93 | ) |
| | | | | | | | | | | | | | | | | | | | |
Net asset value, end of period | | $ | 11.53 | | | $ | 12.97 | | | $ | 13.17 | | | $ | 7.83 | | | $ | 21.00 | |
| | | | | | | | | | | | | | | | | | | | |
Total Returnb | | | (11.10 | %) | | | (1.52 | %) | | | 68.20 | % | | | (62.71 | %) | | | (5.28 | %) |
| | | | | | | | | | | | | | | | | | | | |
Ratios/Supplemental Data | | | | | | | | | | | | | | | | | | | | |
Net assets, end of period (in thousands) | | $ | 439 | | | $ | 638 | | | $ | 2,111 | | | $ | 754 | | | $ | 6,149 | |
| | | | | | | | | | | | | | | | | | | | |
Ratios to average net assets: | | | | | | | | | | | | | | | | | | | | |
Net investment income (loss) | | | 0.03 | % | | | 0.22 | % | | | (0.36 | %) | | | 0.42 | % | | | 1.27 | % |
Total expenses | | | 2.43 | % | | | 2.43 | % | | | 2.42 | % | | | 2.43 | % | | | 2.40 | % |
| | | | | | | | | | | | | | | | | | | | |
Portfolio turnover rate | | | 318 | % | | | 515 | % | | | 1,353 | % | | | 384 | % | | | 320 | % |
| | |
192 | THE RYDEX SERIES FUNDS ANNUAL REPORT | | SEE NOTES TO FINANCIAL STATEMENTS. |
EUROPE 1.25x STRATEGY FUND
FINANCIAL HIGHLIGHTS (concluded)
This table is presented to show selected data for a share outstanding throughout each period and to assist shareholders in evaluating a Fund’s performance for the periods presented.
| | | | | | | | | | | | | | | | | | | | |
H-Class | | Year Ended
March 31,
2012 | | | Year Ended
March 31,
2011 | | | Year Ended
March 31,
2010 | | | Year Ended
March 31,
2009 | | | Year Ended
March 31,
2008 | |
Per Share Data | | | | | | | | | | | | | | | | | | | | |
Net asset value, beginning of period | | $ | 14.06 | | | $ | 14.20 | | | $ | 8.36 | | | $ | 22.26 | | | $ | 24.14 | |
| | | | | | | | | | | | | | | | | | | | |
Income (loss) from investment operations: | | | | | | | | | | | | | | | | | | | | |
Net investment incomea | | | .16 | | | | .09 | | | | .03 | | | | .21 | | | | .57 | |
Net gain (loss) on investments (realized and unrealized) | | | (1.63 | ) | | | (.23 | ) | | | 5.81 | | | | (14.11 | ) | | | (1.52 | ) |
| | | | | | | | | | | | | | | | | | | | |
Total from investment operations | | | (1.47 | ) | | | (.14 | ) | | | 5.84 | | | | (13.90 | ) | | | (.95 | ) |
| | | | | | | | | | | | | | | | | | | | |
Less distributions from: | | | | | | | | | | | | | | | | | | | | |
Net investment income | | | — | | | | — | | | | — | | | | — | | | | (.23 | ) |
Net realized gains | | | — | | | | — | | | | — | | | | — | | | | (.70 | ) |
Total distributions | | | — | | | | — | | | | — | | | | — | | | | (.93 | ) |
| | | | | | | | | | | | | | | | | | | | |
Net asset value, end of period | | $ | 12.59 | | | $ | 14.06 | | | $ | 14.20 | | | $ | 8.36 | | | $ | 22.26 | |
| | | | | | | | | | | | | | | | | | | | |
Total Returnb | | | (10.46 | %) | | | (0.99 | %) | | | 69.86 | % | | | (62.44 | %) | | | (4.60 | %) |
| | | | | | | | | | | | | | | | | | | | |
Ratios/Supplemental Data | | | | | | | | | | | | | | | | | | | | |
Net assets, end of period (in thousands) | | $ | 7,759 | | | $ | 23,238 | | | $ | 6,989 | | | $ | 4,739 | | | $ | 21,670 | |
| | | | | | | | | | | | | | | | | | | | |
Ratios to average net assets: | | | | | | | | | | | | | | | | | | | | |
Net investment income | | | 1.22 | % | | | 0.70 | % | | | 0.21 | % | | | 1.22 | % | | | 2.20 | % |
| | | | | | | | | | | | | | | | | | | | |
Total expenses | | | 1.68 | % | | | 1.69 | % | | | 1.70 | % | | | 1.71 | % | | | 1.67 | % |
| | | | | | | | | | | | | | | | | | | | |
Portfolio turnover rate | | | 318 | % | | | 515 | % | | | 1,353 | % | | | 384 | % | | | 320 | % |
| a | Net investment income (loss) per share was computed using average shares outstanding throughout the period. |
| b | Total return does not reflect the impact of any applicable sales charges and has not been annualized. |
| c | Net investment income is less than $0.01 per share. |
| | |
SEE NOTES TO FINANCIAL STATEMENTS. | | THE RYDEX SERIES FUNDS ANNUAL REPORT | 193 |
| | | | |
PERFORMANCE REPORT AND FUND PROFILE (Unaudited) | | | March 31, 2012 | |
JAPAN 2x STRATEGY FUND
OBJECTIVE: Seeks to provide investment results that correlate, before fees and expenses, to the performance of a specific benchmark. The Fund’s current benchmark is 200% of the fair value of the Nikkei-225 Stock Average Index (the “underlying index”).
For the one-year period ended March 31, 2012, Japan 2x Strategy Fund maintained a daily correlation of over 99% to its benchmark of 200% of the daily price movement of the fair value of the Nikkei-225 Stock Average Index. Japan 2x Strategy Fund H-Class returned 3.40% while the Nikkei-225 Stock Average Index* returned 3.62% over the same time period.
The Consumer Discretionary sector contributed most to return of the index, followed by Consumer Staples and Industrials. Telecommunication Services was the sector detracting most from performance of the index.
Among stocks contributing the most to return of the index were Fast Retailing Co. Ltd. and Fanuc Corp. SoftBank Corp., Olympus Corp. and Sony Corp. were the leading detractors from return of the index.
The Japanese equity market has been dealing with the aftermath of the earthquake and tsunami, the country’s worst natural disaster in 90 years. However, manufacturers have repaired much of the damage to supply chains, and the central bank has steered down the value of the yen from last year’s highs, a boon for the country’s exporters but which reduces returns for dollar-based investors. The economy, which fell in 2011, is expected to deliver 2% growth in 2012, higher than Europe’s and on par with the forecast U.S. increase.
Derivatives in the Fund were used to help provide exposure to the composition of the benchmark in the highest efficient manner and to provide leverage, not for hedging purposes. The results of derivatives use during the period were within our expectations and contributed to the Fund’s performance.
Due to the compounding of daily returns, leveraged and inverse funds’ returns over periods other than one day will likely differ in amount and possibly direction from the benchmark return for the same period. Investors should monitor their leveraged and inverse funds’ holdings to ensure that they are consistent with their strategies, as frequently as daily.
The effects of compounding may cause the longer-term correlation of the fund to its benchmark to diminish. The apparent discrepancy between the leveraged and unleveraged indices is the result of compounding, which is described briefly on page 4 of this report.
*The Nikkei-225 Stock Average Index is a price-weighted index comprised of Japan’s top 225 blue-chip companies on the Tokyo Stock Exchange.
Performance displayed represents past performance which is no guarantee of future results.
Holdings Diversification (Market Exposure as % of Net Assets)
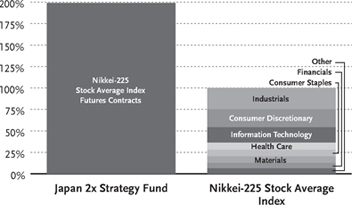
“Holdings Diversification (Market Exposure as % of Net Assets)” excludes any temporary cash investments.
| | | | |
| Inception Dates: | | | |
A-Class | | | February 22, 2008 | |
C-Class | | | February 22, 2008 | |
H-Class | | | February 22, 2008 | |
The Fund invests principally in derivative
investments such as futures contracts.
194 | THE RYDEX SERIES FUNDS ANNUAL REPORT
PERFORMANCE REPORT AND FUND PROFILE (Unaudited) (concluded)
Cumulative Fund Performance*,††
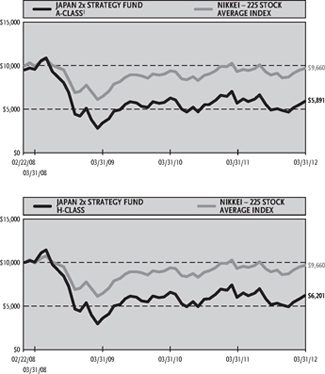
| | | | | | | | |
| Average Annual Returns*,†† | | | | | | |
Periods Ended 03/31/12 | | | | | | | | |
| | | 1 Year | | | Since
Inception
(02/22/08) | |
A-Class Shares | | | 3.34 | % | | | -11.05 | % |
A-Class Shares with sales charge‡ | | | -1.59 | % | | | -12.10 | % |
C-Class Shares | | | 2.67 | % | | | -11.70 | % |
C-Class Shares with CDSC† | | | 1.67 | % | | | -11.70 | % |
H-Class Shares | | | 3.40 | % | | | -10.99 | % |
Nikkei-225 Stock Average Index | | | 3.62 | % | | | -0.84 | % |
| * | The performance data above represents past performance that is not predictive of future results. The investment return and principal value of an investment in the Fund will fluctuate so that an investor’s shares, when redeemed, may be worth more or less than their original cost. Returns are historical and include changes in principal and reinvested dividends and capital gains and do not reflect the effect of taxes. The Nikkei-225 Stock Average Index is an unmanaged index and, unlike the Fund, has no management fees or operating expenses to reduce its reported return. The graphs are based on A-Class shares and H-Class shares only; performance for C-Class shares will vary due to differences in fee structures. |
| † | Fund returns include a CDSC of 1% if redeemed within 12 months of purchase. |
| †† | The effects of compounding and currency exchange rates may cause the longer-term correlation of the Fund to its benchmark to diminish. |
| ‡ | Fund returns are calculated using the maximum sales charge of 4.75%. |
THE RYDEX SERIES FUNDS ANNUAL REPORT | 195
| | |
| SCHEDULE OF INVESTMENTS | | March 31, 2012 |
JAPAN 2x STRATEGY FUND | | |
| | | | | | | | |
| | | FACE
AMOUNT | | | | |
| | | | VALUE | |
REPURCHASE AGREEMENTS††,1 - 74.1% | | | | | | | | |
HSBC Group issued 03/30/12 at 0.01% due 04/02/12 | | $ | 3,065,154 | | | $ | 3,065,154 | |
Mizuho Financial Group, Inc.issued 03/30/12 at 0.01% due 04/02/12 | | | 862,379 | | | | 862,379 | |
Credit Suisse Group issued 03/30/12 at 0. 01% due 04/02/12 | | | 395,713 | | | | 395,713 | |
Deutsche Bank issued 03/30/12 at 0. 01% due 04/02/12 | | | 229,211 | | | | 229,211 | |
| | | | | | | | |
Total Repurchase Agreements
(Cost $4,552,457) | | | | | | | 4,552,457 | |
| | | | | | | | |
Total Investments – 74.1% (Cost $4,552,457) | | | | | | $ | 4,552,457 | |
| | | | | | | | |
Other Assets & Liabilities, net – 25.9% | | | | | | | 1,590,209 | |
| | | | | | | | |
Total Net Assets – 100.0% | | | | | | $ | 6,142,666 | |
| | | | | | | | |
| | | | | | | | |
| | | | | | UNREALIZED
GAIN | |
| | | CONTRACTS | | |
FUTURES CONTRACTS PURCHASED† | | | | | | | | |
June 2012 Nikkei-225 Stock Average Index Futures Contracts (Aggregate Value of Contracts $12,234,000) | | | 240 | | | $ | 679,097 | |
| | | | | | | | |
| | |
CURRENCY FUTURES CONTRACTS PURCHASED† | | | | | | | | |
June 2012 Japanese Yen Currency Futures Contracts (Aggregate Value of Contracts $12,239,100) | | | 81 | | | $ | 13,605 | |
| | | | | | | | |
| † | Value determined based on Level 1 inputs — See Note 4. |
| †† | Value determined based on Level 2 inputs — See Note 4. |
| 1 | Repurchase Agreements — See Note 5. |
| | |
196 | THE RYDEX SERIES FUNDS ANNUAL REPORT | | SEE NOTES TO FINANCIAL STATEMENTS. |
JAPAN 2x STRATEGY FUND
STATEMENT OF ASSETS AND LIABILITIES
| | | | |
| March 31, 2012 | | | |
| |
ASSETS: | | | | |
Repurchase agreements, at value
(cost $4,552,457) | | $ | 4,552,457 | |
| | | | |
Total investments
(cost $4,552,457) | | | 4,552,457 | |
Segregated cash with broker | | | 907,200 | |
Receivables: | | | | |
Fund shares sold | | | 702,857 | |
Variation margin | | | 35,286 | |
| | | | |
Total assets | | | 6,197,800 | |
| | | | |
LIABILITIES: | | | | |
Payable for: | | | | |
Fund shares redeemed | | | 45,492 | |
Management fees | | | 3,376 | |
Distribution and service fees | | | 1,250 | |
Transfer agent and administrative fees | | | 1,125 | |
Portfolio accounting fees | | | 450 | |
Miscellaneous | | | 3,441 | |
| | | | |
Total liabilities | | | 55,134 | |
| | | | |
NET ASSETS | | $ | 6,142,666 | |
| | | | |
NET ASSETS CONSIST OF: | | | | |
Paid in capital | | $ | 8,292,270 | |
Accumulated net investment loss | | | (13,890 | ) |
Accumulated net realized loss on investments | | | (2,828,416 | ) |
Net unrealized appreciation on investments | | | 692,702 | |
| | | | |
Net assets | | $ | 6,142,666 | |
| | | | |
A-CLASS: | | | | |
Net assets | | $ | 1,428,036 | |
Capital shares outstanding | | | 92,442 | |
Net asset value per share | | $ | 15.45 | |
| | | | |
Maximum offering price per share | | | | |
(Net asset value divided by 95.25%) | | $ | 16.22 | |
| | | | |
C-CLASS: | | | | |
Net assets | | $ | 140,134 | |
Capital shares outstanding | | | 9,350 | |
Net asset value per share | | $ | 14.99 | |
| | | | |
H-CLASS: | | | | |
Net assets | | $ | 4,574,496 | |
Capital shares outstanding | | | 295,334 | |
Net asset value per share | | $ | 15.49 | |
| | | | |
STATEMENT OF OPERATIONS
| | | | |
| Year Ended March 31, 2012 | | | |
| |
INVESTMENT INCOME: | | | | |
Interest | | $ | 1,820 | |
| | | | |
Total investment income | | | 1,820 | |
| | | | |
EXPENSES: | | | | |
Management fees | | | 52,865 | |
Transfer agent and administrative fees | | | 17,622 | |
Distribution and service fees: | | | | |
A-Class | | | 6,151 | |
C-Class | | | 1,934 | |
H-Class | | | 10,987 | |
Portfolio accounting fees | | | 7,049 | |
Custodian fees | | | 1,780 | |
Trustees’ fees* | | | 902 | |
Miscellaneous | | | 8,478 | |
| | | | |
Total expenses | | | 107,768 | |
| | | | |
Net investment loss | | | (105,948 | ) |
| | | | |
NET REALIZED AND UNREALIZED GAIN (LOSS): | | | | |
Net realized gain (loss) on: | | | | |
Futures contracts | | | (1,311,288 | ) |
| | | | |
Net realized loss | | | (1,311,288 | ) |
| | | | |
Net change in unrealized appreciation
(depreciation) on: | | | | |
Futures contracts | | | 149,144 | |
| | | | |
Net change in unrealized appreciation
(depreciation) | | | 149,144 | |
| | | | |
Net realized and unrealized loss | | | (1,162,144 | ) |
| | | | |
Net decrease in net assets resulting from operations | | $ | (1,268,092 | ) |
| | | | |
| * | Relates to Trustees not deemed “interested persons” within the meaning of Section 2(a)(19) of the 1940 Act. |
| | |
SEE NOTES TO FINANCIAL STATEMENTS. | | THE RYDEX SERIES FUNDS ANNUAL REPORT | 197 |
JAPAN 2x STRATEGY FUND
STATEMENTS OF CHANGES IN NET ASSETS
| | | | | | | | |
| | | Year Ended
March 31,
2012 | | | Year Ended
March 31,
2011 | |
INCREASE (DECREASE) IN NET ASSETS FROM OPERATIONS: | | | | | | | | |
Net investment loss | | $ | (105,948 | ) | | $ | (96,087 | ) |
Net realized loss on investments | | | (1,311,288 | ) | | | (372,576 | ) |
Net change in unrealized appreciation (depreciation) on investments | | | 149,144 | | | | 380,066 | |
| | | | | | | | |
Net decrease in net assets resulting from operations | | | (1,268,092 | ) | | | (88,597 | ) |
| | | | | | | | |
| | |
CAPITALSHARETRANSACTIONS: | | | | | | | | |
Proceeds from sale of shares | | | | | | | | |
A-Class | | | 6,900,436 | | | | 17,011,157 | |
C-Class | | | 1,962,446 | | | | 26,730,136 | |
H-Class | | | 59,130,720 | | | | 76,584,589 | |
| | |
COSTOFSHARESREDEEMED | | | | | | | | |
A-Class | | | (11,634,483 | ) | | | (13,470,349 | ) |
C-Class | | | (1,938,876 | ) | | | (26,785,624 | ) |
H-Class | | | (58,485,850 | ) | | | (76,584,721 | ) |
| | | | | | | | |
Net increase (decrease) from capital share transactions | | | (4,065,607 | ) | | | 3,485,188 | |
| | | | | | | | |
Net increase (decrease) in net assets | | | (5,333,699 | ) | | | 3,396,591 | |
| | |
NETASSETS: | | | | | | | | |
Beginning of year | | | 11,476,365 | | | | 8,079,774 | |
| | | | | | | | |
End of year | | $ | 6,142,666 | | | $ | 11,476,365 | |
| | | | | | | | |
Accumulated net investment loss at end of year | | $ | (13,890 | ) | | $ | — | |
| | | | | | | | |
CAPITALSHAREACTIVITY: | | | | | | | | |
Shares sold | | | | | | | | |
A-Class | | | 480,177 | | | | 1,106,525 | |
C-Class | | | 143,517 | | | | 1,765,492 | |
H-Class | | | 3,972,584 | | | | 4,903,823 | |
Shares redeemed | | | | | | | | |
A-Class | | | (784,460 | ) | | | (845,237 | ) |
C-Class | | | (147,120 | ) | | | (1,779,134 | ) |
H-Class | | | (4,034,878 | ) | | | (4,874,700 | ) |
| | | | | | | | |
Net increase (decrease) in shares | | | (370,180 | ) | | | 276,769 | |
| | | | | | | | |
| | |
198 | THE RYDEX SERIES FUNDS ANNUAL REPORT | | SEE NOTES TO FINANCIAL STATEMENTS. |
JAPAN 2x STRATEGY FUND
FINANCIAL HIGHLIGHTS
This table is presented to show selected data for a share outstanding throughout each period and to assist shareholders in evaluating a Fund’s performance for the periods presented.
| | | | | | | | | | | | | | | | | | | | |
| | | Year Ended | | | Year Ended | | | Year Ended | | | Year Ended | | | Year Ended | |
| | | March 31, | | | March 31, | | | March 31, | | | March 31, | | | March 31, | |
A-Class | | 2012 | | | 2011 | | | 2010 | | | 2009 | | | 2008a | |
Per Share Data | | | | | | | | | | | | | | | | | | | | |
Net asset value, beginning of period | | $ | 14.95 | | | $ | 16.49 | | | $ | 9.01 | | | $ | 25.12 | | | $ | 25.00 | |
| | | | | | | | | | | | | | | | | | | | |
Income (loss) from investment operations: | | | | | | | | | | | | | | | | | | | | |
Net investment lossb | | | (.22 | ) | | | (.24 | ) | | | (.19 | ) | | | (.06 | ) | | | — | c |
Net gain (loss) on investments (realized and unrealized) | | | .72 | | | | (1.30 | ) | | | 7.67 | | | | (16.24 | ) | | | .12 | |
| | | | | | | | | | | | | | | | | | | | |
Total from investment operations | | | .50 | | | | (1.54 | ) | | | 7.48 | | | | (16.30 | ) | | | .12 | |
Less distributions from: | | | | | | | | | | | | | | | | | | | | |
Net investment income | | | — | | | | — | | | | — | | | | (.01 | ) | | | — | |
| | | | | | | | | | | | | | | | | | | | |
Total distributions | | | — | | | | — | | | | — | | | | (.01 | ) | | | — | |
| | | | | | | | | | | | | | | | | | | | |
Payments by affiliates | | | — | | | | — | | | | — | | | | .20 | d | | | — | |
| | | | | | | | | | | | | | | | | | | | |
Net asset value, end of period | | $ | 15.45 | | | $ | 14.95 | | | $ | 16.49 | | | $ | 9.01 | | | $ | 25.12 | |
| | | | | | | | | | | | | | | | | | | | |
Total Returne | | | 3.34 | % | | | (9.34 | %) | | | 83.02 | % | | | (64.10 | %)d | | | 0.48 | % |
| | | | | | | | | | | | | | | | | | | | |
Ratios/Supplemental Data | | | | | | | | | | | | | | | | | | | | |
Net assets, end of period (in thousands) | | $ | 1,428 | | | $ | 5,931 | | | $ | 2,234 | | | $ | 299 | | | $ | 636 | |
| | | | | | | | | | | | | | | | | | | | |
Ratios to average net assets: | | | | | | | | | | | | | | | | | | | | |
Net investment loss | | | (1.49 | %) | | | (1.45 | %) | | | (1.42 | %) | | | (0.42 | %) | | | (0.12 | %) |
Total expenses | | | 1.51 | % | | | 1.55 | % | | | 1.53 | % | | | 1.53 | % | | | 1.25 | % |
| | | | | | | | | | | | | | | | | | | | |
Portfolio turnover rate | | | — | | | | — | | | | — | | | | — | | | | — | |
| | | | | | | | | | | | | | | | | | | | |
| | | Year Ended | | | Year Ended | | | Year Ended | | | Year Ended | | | Year Ended | |
| | | March 31, | | | March 31, | | | March 31, | | | March 31, | | | March 31, | |
C-Class | | 2012 | | | 2011 | | | 2010 | | | 2009 | | | 2008a | |
Per Share Data | | | | | | | | | | | | | | | | | | | | |
Net asset value, beginning of period | | $ | 14.60 | | | $ | 16.23 | | | $ | 8.94 | | | $ | 25.10 | | | $ | 25.00 | |
| | | | | | | | | | | | | | | | | | | | |
Income (loss) from investment operations: | | | | | | | | | | | | | | | | | | | | |
Net investment lossb | | | (.31 | ) | | | (.31 | ) | | | (.31 | ) | | | (.17 | ) | | | (.02 | ) |
Net gain (loss) on investments (realized and unrealized) | | | .70 | | | | (1.32 | ) | | | 7.60 | | | | (16.18 | ) | | | .12 | |
| | | | | | | | | | | | | | | | | | | | |
Total from investment operations | | | .39 | | | | (1.63 | ) | | | 7.29 | | | | (16.35 | ) | | | .10 | |
| | | | | | | | | | | | | | | | | | | | |
Less distributions from: | | | | | | | | | | | | | | | | | | | | |
Net investment income | | | — | | | | — | | | | — | | | | (.01 | ) | | | — | |
| | | | | | | | | | | | | | | | | | | | |
Total distributions | | | — | | | | — | | | | — | | | | (.01 | ) | | | — | |
| | | | | | | | | | | | | | | | | | | | |
Payments by affiliates | | | — | | | | — | | | | — | | | | .20 | d | | | — | |
| | | | | | | | | | | | | | | | | | | | |
Net asset value, end of period | | $ | 14.99 | | | $ | 14.60 | | | $ | 16.23 | | | $ | 8.94 | | | $ | 25.10 | |
| | | | | | | | | | | | | | | | | | | | |
Total Returne | | | 2.67 | % | | | (10.04 | %) | | | 81.54 | % | | | (64.35 | %)d | | | 0.40 | % |
| | | | | | | | | | | | | | | | | | | | |
Ratios/Supplemental Data | | | | | | | | | | | | | | | | | | | | |
Net assets, end of period (in thousands) | | $ | 140 | | | $ | 189 | | | $ | 432 | | | $ | 879 | | | $ | 240 | |
| | | | | | | | | | | | | | | | | | | | |
Ratios to average net assets: | | | | | | | | | | | | | | | | | | | | |
Net investment loss | | | (2.23 | %) | | | (2.18 | %) | | | (2.20 | %) | | | (0.98 | %) | | | (0.74 | %) |
Total expenses | | | 2.26 | % | | | 2.29 | % | | | 2.28 | % | | | 2.26 | % | | | 2.21 | % |
| | | | | | | | | | | | | | | | | | | | |
Portfolio turnover rate | | | — | | | | — | | | | — | | | | — | | | | — | |
| | |
SEE NOTES TO FINANCIAL STATEMENTS. | | THE RYDEX SERIES FUNDS ANNUAL REPORT | 199 |
JAPAN 2x STRATEGY FUND
FINANCIAL HIGHLIGHTS (concluded)
This table is presented to show selected data for a share outstanding throughout each period and to assist shareholders in evaluating a Fund’s performance for the periods presented.
| | | | | | | | | | | | | | | | | | | | |
| | | Year Ended | | | Year Ended | | | Year Ended | | | Year Ended | | | Year Ended | |
| | | March 31, | | | March 31, | | | March 31, | | | March 31, | | | March 31, | |
H-Class | | 2012 | | | 2011 | | | 2010 | | | 2009 | | | 2008a | |
Per Share Data | | | | | | | | | | | | | | | | | | | | |
Net asset value, beginning of period | | $ | 14.98 | | | $ | 16.48 | | | $ | 9.01 | | | $ | 25.12 | | | $ | 25.00 | |
| | | | | | | | | | | | | | | | | | | | |
Income (loss) from investment operations: | | | | | | | | | | | | | | | | | | | | |
Net investment lossb | | | (.22 | ) | | | (.23 | ) | | | (.21 | ) | | | (.08 | ) | | | — | c |
Net gain (loss) on investments (realized and unrealized) | | | .73 | | | | (1.27 | ) | | | 7.68 | | | | (16.22 | ) | | | .12 | |
| | | | | | | | | | | | | | | | | | | | |
Total from investment operations | | | .51 | | | | (1.50 | ) | | | 7.47 | | | | (16.30 | ) | | | .12 | |
| | | | | | | | | | | | | | | | | | | | |
Less distributions from: | | | | | | | | | | | | | | | | | | | | |
Net investment income | | | — | | | | — | | | | — | | | | (.01 | ) | | | — | |
| | | | | | | | | | | | | | | | | | | | |
Total distributions | | | — | | | | — | | | | — | | | | (.01 | ) | | | — | |
| | | | | | | | | | | | | | | | | | | | |
Payments by affiliates | | | — | | | | — | | | | — | | | | .20 | d | | | — | |
| | | | | | | | | | | | | | | | | | | | |
Net asset value, end of period | | $ | 15.49 | | | $ | 14.98 | | | $ | 16.48 | | | $ | 9.01 | | | $ | 25.12 | |
| | | | | | | | | | | | | | | | | | | | |
Total Returne | | | 3.40 | % | | | (9.10 | %) | | | 82.91 | % | | | (64.10 | %)d | | | 0.48 | % |
| | | | | | | | | | | | | | | | | | | | |
Ratios/Supplemental Data | | | | | | | | | | | | | | | | | | | | |
Net assets, end of period (in thousands) | | $ | 4,574 | | | $ | 5,356 | | | $ | 5,414 | | | $ | 6,531 | | | $ | 5,243 | |
| | | | | | | | | | | | | | | | | | | | |
Ratios to average net assets: | | | | | | | | | | | | | | | | | | | | |
Net investment income (loss) | | | (1.48 | %) | | | (1.44 | %) | | | (1.44 | %) | | | (0.55 | %) | | | 0.17 | % |
Total expenses | | | 1.51 | % | | | 1.54 | % | | | 1.53 | % | | | 1.52 | % | | | 1.44 | % |
| | | | | | | | | | | | | | | | | | | | |
Portfolio turnover rate | | | — | | | | — | | | | — | | | | — | | | | — | |
| a | Since commencement of operations: February 22, 2008. Percentage amounts for the period, except total return and portfolio turnover rate, have been annualized. |
| b | Net investment income (loss) per share was computed using average shares outstanding throughout the period. |
| c | Net investment income is less than $0.01 per share. |
| d | Excluding the reimbursement, the Fund’s total return would have been -64.90%, -65.15% and -64.90% for the A-Class, C-Class and H-Class, respectively. |
| e | Total return does not reflect the impact of any applicable sales charges and has not been annualized. |
| | |
200 | THE RYDEX SERIES FUNDS ANNUAL REPORT | | SEE NOTES TO FINANCIAL STATEMENTS. |
This page intentionally left blank.
THE RYDEX SERIES FUNDS ANNUAL REPORT | 201
| | |
PERFORMANCE REPORT AND FUND PROFILE (Unaudited) | | March 31, 2012 |
STRENGTHENING DOLLAR 2x STRATEGY FUND
OBJECTIVE: Seeks to provide investment results that match the performance of a specific benchmark, before fees and expenses, on a daily basis. The Fund’s current benchmark is 200% of the performance of the U.S. Dollar Index® (the “underlying index”). The Fund does not seek to achieve its investment objective over a period of time greater than one day.
For the one-year period ended March 31, 2012, Strengthening Dollar 2x Strategy Fund maintained a daily correlation of over 99% to its benchmark of 200% of the daily price movement of the U.S. Dollar Index. Strengthening Dollar 2x Strategy Fund H-Class returned -0.07%, compared with 4.14% gain for its benchmark, the U.S. Dollar Index*.
The U.S. Dollar Index was its low point for the past 12 months in late April 2011, when it appeared the global economy was strengthening. It traded in a narrow range until August, when S&P lowered the U.S. triple-A debt rating and Europe was overcome by sovereign debt woes. As the year progressed, the negative effects of the European debt crisis and possible collapse of the euro currency bloc drove investors to the dollar in waves of safe-haven buying—a situation that reversed itself in the first quarter of 2012, as Europe’s crisis eased and the outlook for global economic growth improved.
Strategists say the dollar is being buoyed by improving U.S. economic conditions and a diminishing chance for more Fed easing. But they point out that the government debt situation may eventually weigh on the currency. The dollar/euro rate has moved in a surprisingly tight range in the last year ($1.48 to $1.26, ending at around $1.30), given that, at different times, investors feared that the U.S. might default on government debt and the euro currency union might break apart. The yen, which was at a historic high against the dollar for most of the period, began losing value against the dollar in February, as the Bank of Japan increased its quantitative easing.
Derivatives in the Fund were used to help provide exposure to the composition of the benchmark in the highest efficient manner and to provide leverage, not for hedging purposes. The results of derivatives use during the period were within our expectations and contributed to the Fund’s performance.
Due to the compounding of daily returns, leveraged and inverse funds’ returns over periods other than one day will likely differ in amount and possibly direction from the benchmark return for the same period. Investors should monitor their leveraged and inverse funds’ holdings to ensure that they are consistent with their strategies, as frequently as daily.
The effects of compounding may cause the longer-term correlation of the fund to its benchmark to diminish. The apparent discrepancy between the leveraged and unleveraged indices is the result of compounding, which is described briefly on page 4 of this report.
*The USD or U.S. Dollar Index® (USDX) is an index that determines the relative value of the United States dollar to a basket of foreign currencies. This formulated “basket” of currencies comprises the weighting of six other currencies as follows: Euro (EUR), 57.6% + Japanese Yen (JPY), 13.6% + Pound Sterling (GBP), 11.9% + Canadian Dollar (CAD), 9.1% + Swedish Krona (SEK), 4.2% + Swiss Franc (CHF) 3.6%.
Performance displayed represents past performance which is no guarantee of future results.
Holdings Diversification (Market Exposure as % of Net Assets)
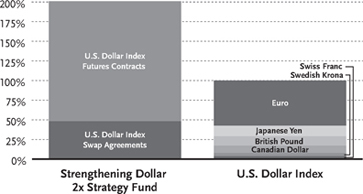
“Holdings Diversification (Market Exposure as % of Net Assets)” excludes any temporary cash investments.
| | | | |
| Inception Dates: | | | |
A-Class | | | May 25, 2005 | |
C-Class | | | May 25, 2005 | |
H-Class | | | May 25, 2005 | |
The Fund invests principally in derivative investments such as swap agreements and futures contracts.
202 | THE RYDEX SERIES FUNDS ANNUAL REPORT
PERFORMANCE REPORT AND FUND PROFILE (Unaudited)(concluded)
Cumulative Fund Performance*
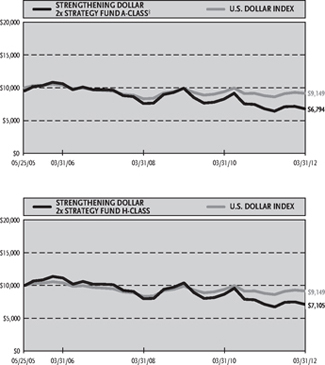
Average Annual Returns*
Periods Ended 03/31/12
| | | | | | |
| | | 1 Year | | 5 Year | | Since
Inception
(05/25/05) |
A-Class Shares | | -0.07% | | -6.88% | | -4.81% |
A-Class Shares with sales charge‡ | | -4.81% | | -7.78% | | -5.49% |
C-Class Shares | | -0.94% | | -7.50% | | -5.47% |
C-Class Shares with CDSC† | | -1.93% | | -7.50% | | -5.47% |
H-Class Shares | | -0.07% | | -6.94% | | -4.87% |
U.S. Dollar Index | | 4.14% | | -0.97% | | -1.29% |
| * | The performance data above represents past performance that is not predictive of future results. The investment return and principal value of an investment in the Fund will fluctuate so that an investor’s shares, when redeemed, may be worth more or less than their original cost. Returns are historical and include changes in principal and reinvested dividends and capital gains and do not reflect the effect of taxes. The U.S. Dollar Index is an unmanaged index and, unlike the Fund, has no management fees or operating expenses to reduce its reported return. The graphs are based on A-Class shares and H-Class shares only; performance for C-Class shares will vary due to differences in fee structures. |
| † | Fund returns include a CDSC of 1% if redeemed within 12 months of purchase. |
| ‡ | Fund returns are calculated using the maximum sales charge of 4.75%. |
THE RYDEX SERIES FUNDS ANNUAL REPORT | 203
| | |
| SCHEDULE OF INVESTMENTS | | March 31, 2012 |
STRENGTHENING DOLLAR 2x STRATEGY FUND | | |
| | | | | | | | |
| | | FACE
AMOUNT | | | VALUE | |
REPURCHASE AGREEMENTS††,1 - 95.9% | | | | | | | | |
HSBC Group issued 03/30/12 at 0.01% due 04/02/12 | | $ | 20,256,776 | | | $ | 20,256,776 | |
Mizuho Financial Group, Inc. issued 03/30/12 at 0.01% due 04/02/12 | | | 5,699,231 | | | | 5,699,231 | |
Credit Suisse Group issued 03/30/12 at 0.01% due 04/02/122 | | | 4,120,219 | | | | 4,120,219 | |
Deutsche Bank issued 03/30/12 at 0.01% due 04/02/12 | | | 1,514,792 | | | | 1,514,792 | |
| | | | | | | | |
Total Repurchase Agreements | | | | | | | | |
(Cost $31,591,018) | | | | | | | 31,591,018 | |
| | | | | | | | |
Total Investments – 95.9% | | | | | | | | |
(Cost $31,591,018) | | | | | | $ | 31,591,018 | |
| | | | | | | | |
Other Assets & Liabilities, net – 4.1% | | | | | | | 1,355,814 | |
| | | | | | | | |
Total Net Assets – 100.0% | | | | | | $ | 32,946,832 | |
| | | | | | | | |
| | | CONTRACTS | | | UNREALIZED
LOSS | |
CURRENCY FUTURES CONTRACTS PURCHASED† | | | | | | | | |
June 2012 U.S. Dollar Index Futures Contracts (Aggregate Value of Contracts $50,412,180) | | | 637 | | | $ | (694,853 | ) |
| | | | | | | | |
| | |
| | | UNITS | | | | |
CURRENCY INDEX SWAP AGREEMENTS†† | | | | | | | | |
Goldman Sachs International May 2012 U.S. Dollar Index Swap, Terminating 05/29/123 (Notional Value $15,827,084) | | | 200,207 | | | $ | (50,971 | ) |
| | | | | | | | |
| † | Value determined based on Level 1 inputs — See Note 4. |
| †† | Value determined based on Level 2 inputs — See Note 4. |
| 1 | Repurchase Agreements — See Note 5. |
| 2 | All or a portion of this security is pledged as currency index swap collateral at March 31, 2012. |
| 3 | Total Return based on U.S. Dollar Index +/- financing at a variable rate. |
| | |
204 | THE RYDEX SERIES FUNDS ANNUAL REPORT | | SEE NOTES TO FINANCIAL STATEMENTS. |
STRENGTHENING DOLLAR 2x STRATEGY FUND
| | |
| STATEMENT OF ASSETS AND LIABILITIES | | STATEMENT OF OPERATIONS |
| | | | |
| March 31, 2012 | | | |
| |
ASSETS: | | | | |
Repurchase agreements, at value (cost $31,591,018) | | $ | 31,591,018 | |
| | | | |
Total investments (cost $31,591,018) | | | 31,591,018 | |
Segregated cash with broker | | | 730,800 | |
Receivables: | | | | |
Fund shares sold | | | 1,273,573 | |
Interest | | | 18 | |
| | | | |
Total assets | | | 33,595,409 | |
| | | | |
| |
LIABILITIES: | | | | |
Unrealized depreciation on swap agreements | | | 50,971 | |
Payable for: | | | | |
Swap settlement | | | 235,735 | |
Variation margin | | | 132,183 | |
Fund shares redeemed | | | 121,178 | |
Management fees | | | 32,787 | |
Distribution and service fees | | | 11,607 | |
Transfer agent and administrative fees | | | 9,108 | |
Portfolio accounting fees | | | 3,643 | |
Miscellaneous | | | 51,365 | |
| | | | |
Total liabilities | | | 648,577 | |
| | | | |
NETASSETS | | $ | 32,946,832 | |
| | | | |
| |
NETASSETS CONSIST OF: | | | | |
Paid in capital | | $ | 57,028,360 | |
Accumulated net investment loss | | | (260,588 | ) |
Accumulated net realized loss on investments | | | (23,075,116 | ) |
Net unrealized depreciation on investments | | | (745,824 | ) |
| | | | |
Net assets | | $ | 32,946,832 | |
| | | | |
| |
A-CLASS: | | | | |
Net assets | | $ | 6,874,632 | |
Capital shares outstanding | | | 511,118 | |
Net asset value per share | | $ | 13.45 | |
| | | | |
Maximum offering price per share | | | | |
(Net asset value divided by 95.25%) | | $ | 14.12 | |
| | | | |
| |
C-CLASS: | | | | |
Net assets | | $ | 4,090,686 | |
Capital shares outstanding | | | 321,787 | |
Net asset value per share | | $ | 12.71 | |
| | | | |
| |
H-CLASS: | | | | |
Net assets | | $ | 21,981,514 | |
Capital shares outstanding | | | 1,641,542 | |
Net asset value per share | | $ | 13.39 | |
| | | | |
| | | | |
| Year Ended March 31, 2012 | | | |
| |
INVESTMENT INCOME: | | | | |
Interest | | $ | 38,674 | |
| | | | |
Total investment income | | | 38,674 | |
| | | | |
| |
EXPENSES: | | | | |
Management fees | | | 527,518 | |
Transfer agent and administrative fees | | | 146,532 | |
Distribution and service fees: | | | | |
A-Class | | | 36,458 | |
C-Class | | | 33,194 | |
H-Class | | | 101,776 | |
Portfolio accounting fees | | | 58,612 | |
Custodian fees | | | 15,282 | |
Trustees’ fees* | | | 4,093 | |
Miscellaneous | | | 88,726 | |
| | | | |
Total expenses | | | 1,012,191 | |
| | | | |
Net investment loss | | | (973,517 | ) |
| | | | |
| |
NET REALIZED AND UNREALIZED GAIN (LOSS): | | | | |
Net realized gain (loss) on: | | | | |
Swap agreements | | | (338,923 | ) |
Futures contracts | | | (773,286 | ) |
| | | | |
Net realized loss | | | (1,112,209 | ) |
| | | | |
Net change in unrealized appreciation (depreciation) on: | | | | |
Investments | | | (7,753 | ) |
Swap agreements | | | 124,713 | |
Futures contracts | | | (378,078 | ) |
| | | | |
Net change in unrealized appreciation (depreciation) | | | (261,118 | ) |
| | | | |
Net realized and unrealized loss | | | (1,373,327 | ) |
| | | | |
Net decrease in net assets resulting from operations | | $ | (2,346,844 | ) |
| | | | |
| * | Relates to Trustees not deemed “interested persons” with in the meaning of Section 2(a)(19) of the 1940 Act. |
| | |
SEE NOTES TO FINANCIAL STATEMENTS. | | THE RYDEX SERIES FUNDS ANNUAL REPORT | 205 |
STRENGTHENING DOLLAR 2x STRATEGY FUND
STATEMENTS OF CHANGES IN NET ASSETS
| | | | | | | | |
| | | Year Ended
March 31,
2012 | | | Year Ended
March 31,
2011 | |
INCREASE (DECREASE) IN NET ASSETS FROM OPERATIONS: | | | | | | | | |
Net investment loss | | $ | (973,517 | ) | | $ | (753,122 | ) |
Net realized loss on investments | | | (1,112,209 | ) | | | (5,041,903 | ) |
Net change in unrealized appreciation (depreciation) on investments | | | (261,118 | ) | | | (1,296,163 | ) |
| | | | | | | | |
Net decrease in net assets resulting from operations | | | (2,346,844 | ) | | | (7,091,188 | ) |
| | | | | | | | |
| | |
CAPITALSHARETRANSACTIONS: | | | | | | | | |
PROCEEDSFROMSALEOFSHARES | | | | | | | | |
A-Class | | | 111,171,758 | | | | 17,727,633 | |
C-Class | | | 55,468,750 | | | | 108,147,406 | |
H-Class | | | 392,571,353 | | | | 305,686,505 | |
COSTOFSHARESREDEEMED | | | | | | | | |
A-Class | | | (109,893,869 | ) | | | (27,399,277 | ) |
C-Class | | | (55,198,150 | ) | | | (113,295,488 | ) |
H-Class | | | (389,702,612 | ) | | | (341,270,791 | ) |
| | | | | | | | |
Net increase (decrease) from capital share transactions | | | 4,417,230 | | | | (50,404,012 | ) |
| | | | | | | | |
Net increase (decrease) in net assets | | | 2,070,386 | | | | (57,495,200 | ) |
| | |
NETASSETS: | | | | | | | | |
Beginning of year | | | 30,876,446 | | | | 88,371,646 | |
| | | | | | | | |
End of year | | $ | 32,946,832 | | | $ | 30,876,446 | |
| | | | | | | | |
Accumulated net investment loss at end of year | | $ | (260,588 | ) | | $ | — | |
| | | | | | | | |
| | |
CAPITALSHAREACTIVITY: | | | | | | | | |
Shares sold | | | | | | | | |
A-Class | | | 8,200,309 | | | | 1,056,533 | |
C-Class | | | 4,391,001 | | | | 7,130,889 | |
H-Class | | | 29,359,395 | | | | 19,388,467 | |
Shares redeemed | | | | | | | | |
A-Class | | | (8,143,418 | ) | | | (1,629,766 | ) |
C-Class | | | (4,383,207 | ) | | | (7,490,156 | ) |
H-Class | | | (29,265,128 | ) | | | (21,578,685 | ) |
| | | | | | | | |
Net increase (decrease) in shares | | | 158,952 | | | | (3,122,718 | ) |
| | | | | | | | |
| | |
206 | THE RYDEX SERIES FUNDS ANNUAL REPORT | | SEE NOTES TO FINANCIAL STATEMENTS. |
STRENGTHENING DOLLAR 2x STRATEGY FUND
FINANCIAL HIGHLIGHTS
This table is presented to show selected data for a share outstanding throughout each period and to assist shareholders in evaluating a Fund’s performance for the periods presented.
| | | | | | | | | | | | | | | | | | | | |
A-Class | | Year Ended
March 31,
2012 | | | Year Ended
March 31,
2011 | | | Year Ended
March 31,
2010 | | | Year Ended
March 31,
2009 | | | Year Ended
March 31,
2008 | |
Per Share Data | | | | | | | | | | | | | | | | | | | | |
Net asset value, beginning of period | | $ | 13.46 | | | $ | 16.38 | | | $ | 19.64 | | | $ | 19.85 | | | $ | 25.35 | |
| | | | | | | | | | | | | | | | | | | | |
Income (loss) from investment operations: | | | | | | | | | | | | | | | | | | | | |
Net investment income (loss)a | | | (.22 | ) | | | (.25 | ) | | | (.25 | ) | | | .02 | | | | .39 | |
Net gain (loss) on investments (realized and unrealized) | | | .21 | | | | (2.67 | ) | | | (3.01 | ) | | | 6.50 | | | | (5.89 | ) |
| | | | | | | | | | | | | | | | | | | | |
Total from investment operations | | | (.01 | ) | | | (2.92 | ) | | | (3.26 | ) | | | 6.52 | | | | (5.50 | ) |
| | | | | | | | | | | | | | | | | | | | |
Less distributions from: | | | | | | | | | | | | | | | | | | | | |
Net realized gains | | | — | | | | — | | | | — | | | | (6.73 | ) | | | — | |
| | | | | | | | | | | | | | | | | | | | |
Total distributions | | | — | | | | — | | | | — | | | | (6.73 | ) | | | — | |
| | | | | | | | | | | | | | | | | | | | |
Net asset value, end of period | | $ | 13.45 | | | $ | 13.46 | | | $ | 16.38 | | | $ | 19.64 | | | $ | 19.85 | |
| | | | | | | | | | | | | | | | | | | | |
Total Returnb | | | (0.07 | %) | | | (17.83 | %) | | | (16.60 | %) | | | 30.59 | % | | | (21.70 | %) |
| | | | | | | | | | | | | | | | | | | | |
Ratios/Supplemental Data | | | | | | | | | | | | | | | | | | | | |
Net assets, end of period (in thousands) | | $ | 6,875 | | | $ | 6,115 | | | $ | 16,833 | | | $ | 7,314 | | | $ | 2,795 | |
| | | | | | | | | | | | | | | | | | | | |
Ratios to average net assets: | | | | | | | | | | | | | | | | | | | | |
Net investment income (loss) | | | (1.62 | %) | | | (1.55 | %) | | | (1.57 | %) | | | 0.07 | % | | | 1.73 | % |
Total expenses | | | 1.68 | % | | | 1.71 | % | | | 1.67 | % | | | 1.69 | % | | | 1.66 | % |
| | | | | | | | | | | | | | | | | | | | |
Portfolio turnover rate | | | — | | | | — | | | | — | | | | — | | | | — | |
| | | | | | | | | | | | | | | | | | | | |
C-Class | | Year Ended
March 31,
2012 | | | Year Ended
March 31,
2011 | | | Year Ended
March 31,
2010 | | | Year Ended
March 31,
2009 | | | Year Ended
March 31,
2008 | |
Per Share Data | | | | | | | | | | | | | | | | | | | | |
Net asset value, beginning of period | | $ | 12.83 | | | $ | 15.74 | | | $ | 19.01 | | | $ | 19.42 | | | $ | 24.99 | |
| | | | | | | | | | | | | | | | | | | | |
Income (loss) from investment operations: | | | | | | | | | | | | | | | | | | | | |
Net investment income (loss)a | | | (.30 | ) | | | (.35 | ) | | | (.36 | ) | | | (.14 | ) | | | .42 | |
Net gain (loss) on investments (realized and unrealized) | | | .18 | | | | (2.56 | ) | | | (2.91 | ) | | | 6.46 | | | | (5.99 | ) |
| | | | | | | | | | | | | | | | | | | | |
Total from investment operations | | | (.12 | ) | | | (2.91 | ) | | | (3.27 | ) | | | 6.32 | | | | (5.57 | ) |
| | | | | | | | | | | | | | | | | | | | |
Less distributions from: | | | | | | | | | | | | | | | | | | | | |
Net realized gains | | | — | | | | — | | | | — | | | | (6.73 | ) | | | — | |
| | | | | | | | | | | | | | | | | | | | |
Total distributions | | | — | | | | — | | | | — | | | | (6.73 | ) | | | — | |
| | | | | | | | | | | | | | | | | | | | |
Net asset value, end of period | | $ | 12.71 | | | $ | 12.83 | | | $ | 15.74 | | | $ | 19.01 | | | $ | 19.42 | |
| | | | | | | | | | | | | | | | | | | | |
Total Returnb | | | (0.94 | %) | | | (18.49 | %) | | | (17.20 | %) | | | 30.36 | % | | | (22.29 | %) |
| | | | | | | | | | | | | | | | | | | | |
Ratios/Supplemental Data | | | | | | | | | | | | | | | | | | | | |
Net assets, end of period (in thousands) | | $ | 4,091 | | | $ | 4,028 | | | $ | 10,594 | | | $ | 5,728 | | | $ | 6,131 | |
| | | | | | | | | | | | | | | | | | | | |
Ratios to average net assets: | | | | | | | | | | | | | | | | | | | | |
Net investment income (loss) | | | (2.36 | %) | | | (2.29 | %) | | | (2.31 | %) | | | (0.66 | %) | | | 1.84 | % |
Total expenses | | | 2.44 | % | | | 2.46 | % | | | 2.42 | % | | | 2.44 | % | | | 2.40 | % |
| | | | | | | | | | | | | | | | | | | | |
Portfolio turnover rate | | | — | | | | — | | | | — | | | | — | | | | — | |
| | |
SEE NOTES TO FINANCIAL STATEMENTS. | | THE RYDEX SERIES FUNDS ANNUAL REPORT | 207 |
STRENGTHENING DOLLAR 2x STRATEGY FUND
FINANCIAL HIGHLIGHTS (concluded)
This table is presented to show selected data for a share outstanding throughout each period and to assist shareholders in evaluating a Fund’s performance for the periods presented.
| | | | | | | | | | | | | | | | | | | | |
H-Class | | Year Ended
March 31,
2012 | | | Year Ended
March 31,
2011 | | | Year Ended
March 31,
2010 | | | Year Ended
March 31,
2009 | | | Year Ended
March 31,
2008 | |
Per Share Data | | | | | | | | | | | | | | | | | | | | |
Net asset value, beginning of period | | $ | 13.40 | | | $ | 16.31 | | | $ | 19.56 | | | $ | 19.83 | | | $ | 25.33 | |
Income (loss) from investment operations: | | | | | | | | | | | | | | | | | | | | |
Net investment income (loss)a | | | (.22 | ) | | | (.25 | ) | | | (.25 | ) | | | .02 | | | | .57 | |
Net gain (loss) on investments (realized and unrealized) | | | .21 | | | | (2.66 | ) | | | (3.00 | ) | | | 6.44 | | | | (6.07 | ) |
| | | | | | | | | | | | | | | | | | | | |
Total from investment operations | | | (.01 | ) | | | (2.91 | ) | | | (3.25 | ) | | | 6.46 | | | | (5.50 | ) |
| | | | | | | | | | | | | | | | | | | | |
Less distributions from: | | | | | | | | | | | | | | | | | | | | |
Net realized gains | | | — | | | | — | | | | — | | | | (6.73 | ) | | | — | |
| | | | | | | | | | | | | | | | | | | | |
Total distributions | | | — | | | | — | | | | — | | | | (6.73 | ) | | | — | |
| | | | | | | | | | | | | | | | | | | | |
Net asset value, end of period | | $ | 13.39 | | | $ | 13.40 | | | $ | 16.31 | | | $ | 19.56 | | | $ | 19.83 | |
| | | | | | | | | | | | | | | | | | | | |
Total Returnb | | | (0.07 | %) | | | (17.84 | %) | | | (16.62 | %) | | | 30.25 | % | | | (21.71 | %) |
| | | | | | | | | | | | | | | | | | | | |
Ratios/Supplemental Data | | | | | | | | | | | | | | | | | | | | |
Net assets, end of period (in thousands) | | $ | 21,982 | | | $ | 20,733 | | | $ | 60,944 | | | $ | 22,147 | | | $ | 29,011 | |
| | | | | | | | | | | | | | | | | | | | |
Ratios to average net assets: | | | | | | | | | | | | | | | | | | | | |
Net investment income (loss) | | | (1.62 | %) | | | (1.55 | %) | | | (1.57 | %) | | | 0.08 | % | | | 2.44 | % |
Total expenses | | | 1.69 | % | | | 1.72 | % | | | 1.67 | % | | | 1.69 | % | | | 1.66 | % |
| | | | | | | | | | | | | | | | | | | | |
Portfolio turnover rate | | | — | | | | — | | | | — | | | | — | | | | — | |
| a | Net investment income (loss) per share was computed using average shares outstanding throughout the period. |
| b | Total return does not reflect the impact of any applicable sales charges and has not been annualized. |
| | |
208 | THE RYDEX SERIES FUNDS ANNUAL REPORT | | SEE NOTES TO FINANCIAL STATEMENTS. |
This page intentionally left blank.
THE RYDEX SERIES FUNDS ANNUAL REPORT | 209
| | |
PERFORMANCE REPORT AND FUND PROFILE (Unaudited) | | March 31, 2012 |
WEAKENING DOLLAR 2x STRATEGY FUND
OBJECTIVE: Seeks to provide investment results that match, before fees and expenses, the performance of a specific benchmark on a daily basis. The Fund’s current benchmark is 200% of the inverse (opposite) of the performance of the U.S. Dollar Index® (the “underlying index”). The Fund does not seek to achieve its investment objective over a period of time greater than one day.
For the one-year period ended March 31, 2012, Weakening Dollar 2x Strategy Fund maintained a daily correlation of over 99% to its benchmark of -200% of the daily price movement of the U.S. Dollar Index. Weakening Dollar 2x Strategy Fund H-Class returned -6.84%, compared with a 4.14% gain for its benchmark, the U.S. Dollar Index*.
The U.S. Dollar Index was its low point for the past 12 months in late April 2011, when it appeared the global economy was strengthening. It traded in a narrow range until August, when S&P lowered the U.S. triple-A debt rating and Europe was overcome by sovereign debt woes. As the year progressed, the negative effects of the European debt crisis and possible collapse of the euro currency bloc drove investors to the dollar in waves of safe-haven buying—a situation that reversed itself in the first quarter of 2012, as Europe’s crisis eased and the outlook for global economic growth improved.
Strategists say the dollar is being buoyed by improving U.S. economic conditions and a diminishing chance for more Fed easing. But they point out that the government debt situation may eventually weigh on the currency. The dollar/euro rate has moved in a surprisingly tight range in the last year ($1.48 to $1.26, ending at around $1.30), given that, at different times, investors feared that the U.S. might default on government debt and the euro currency union might break apart. The yen, which was at a historic high against the dollar for most of the period, began losing value against the dollar in February, as the Bank of Japan increased its quantitative easing.
Derivatives in the Fund were used to help provide exposure to the composition of the benchmark in the highest efficient manner and to provide leverage, not for hedging purposes. The results of derivatives use during the period were within our expectations and contributed to the Fund’s performance.
Due to the compounding of daily returns, leveraged and inverse funds’ returns over periods other than one day will likely differ in amount and possibly direction from the benchmark return for the same period. Investors should monitor their leveraged and inverse funds’ holdings to ensure that they are consistent with their strategies, as frequently as daily.
The effects of compounding may cause the longer-term correlation of the fund to its benchmark to diminish. The apparent discrepancy between the leveraged and unleveraged indices is the result of compounding, which is described briefly on page 4 of this report.
*The USD or U.S. Dollar Index® (USDX) is an index that determines the relative value of the United States dollar to a basket of foreign currencies. This formulated “basket” of currencies comprises the weighting of six other currencies as follows: Euro (EUR), 57.6% + Japanese Yen (JPY), 13.6% + Pound Sterling (GBP), 11.9% + Canadian Dollar (CAD), 9.1% + Swedish Krona (SEK), 4.2% + Swiss Franc (CHF) 3.6%.
Performance displayed represents past performance which is no guarantee of future results.
Holdings Diversification (Market Exposure as % of Net Assets)
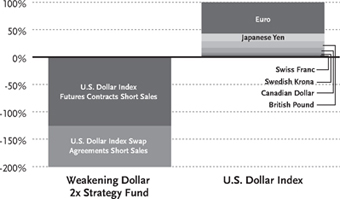
“Holdings Diversification (Market Exposure as % of Net Assets)” excludes any temporary cash investments.
| | | | |
Inception Dates: | | | |
A-Class | | | May 25, 2005 | |
C-Class | | | May 25, 2005 | |
H-Class | | | May 25, 2005 | |
The Fund invests principally in derivative
investments such as swap agreements and
futures contracts.
210 | THE RYDEX SERIES FUNDS ANNUAL REPORT
PERFORMANCE REPORT AND FUND PROFILE (Unaudited) (concluded)
Cumulative Fund Performance*
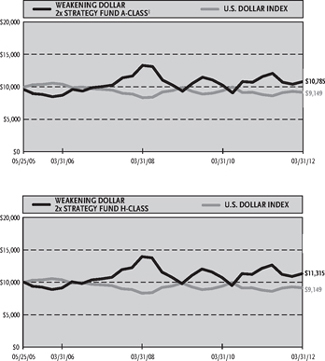
Average Annual Returns*
Periods Ended 03/31/12
| | | | | | | | | | | | |
| | | 1 Year | | | 5 Year | | | Since
Inception
(05/25/05) | |
A-Class Shares | | | -6.83 | % | | | 1.45 | % | | | 1.83 | % |
A-Class Shares with sales charge‡ | | | -11.24 | % | | | 0.47 | % | | | 1.11 | % |
C-Class Shares | | | -7.49 | % | | | 0.70 | % | | | 1.07 | % |
C-Class Shares with CDSC† | | | -8.41 | % | | | 0.70 | % | | | 1.07 | % |
H-Class Shares | | | -6.84 | % | | | 1.44 | % | | | 1.82 | % |
U.S. Dollar Index | | | 4.14 | % | | | -0.97 | % | | | -1.29 | % |
| * | The performance data above represents past performance that is not predictive of future results. The investment return and principal value of an investment in the Fund will fluctuate so that an investor’s shares, when redeemed, may be worth more or less than their original cost. Returns are historical and include changes in principal and reinvested dividends and capital gains and do not reflect the effect of taxes. The U.S. Dollar Index is an unmanaged index and, unlike the Fund, has no management fees or operating expenses to reduce its reported return. The graphs are based on A-Class shares and H-Class shares only; performance for C-Class shares will vary due to differences in fee structures. |
| † | Fund returns include a CDSC of 1% if redeemed within 12 months of purchase. |
| ‡ | Fund returns are calculated using the maximum sales charge of 4.75%. |
THE RYDEX SERIES FUNDS ANNUAL REPORT | 211
| | |
SCHEDULE OF INVESTMENTS | | March 31, 2012 |
WEAKENING DOLLAR 2x STRATEGY FUND | | |
| | | | | | | | |
| | | FACE
AMOUNT | | | VALUE | |
REPURCHASE AGREEMENTS††,1 - 99.6% | | | | | | | | |
HSBC Group
issued 03/30/12 at 0.01%
due 04/02/12 | | $ | 12,220,187 | | | $ | 12,220,187 | |
Mizuho Financial Group, Inc.
issued 03/30/12 at 0.01%
due 04/02/12 | | | 3,438,142 | | | | 3,438,142 | |
Credit Suisse Group
issued 03/30/12 at 0.01%
due 04/02/122 | | | 2,600,590 | | | | 2,600,590 | |
Deutsche Bank
issued 03/30/12 at 0.01% due 04/02/12 | | | 913,820 | | | | 913,820 | |
| | | | | | | | |
Total Repurchase Agreements | | | | | | | | |
(Cost $19,172,739) | | | | | | | 19,172,739 | |
| | | | | | | | |
Total Investments – 99.6% | | | | | | | | |
(Cost $19,172,739) | | | | | | $ | 19,172,739 | |
| | | | | | | | |
Other Assets & Liabilities, net – 0.4% | | | | | | | 85,352 | |
| | | | | | | | |
Total Net Assets – 100.0% | | | | | | $ | 19,258,091 | |
| |
| | | | | | | | |
| | | CONTRACTS | | | UNREALIZED
GAIN | |
CURRENCY FUTURES CONTRACTS SOLD SHORT† | | | | | | | | |
June 2012 U.S. Dollar Index
Futures Contracts (Aggregate
Value of Contracts
$24,137,700) | | | 305 | | | $ | 350,304
| |
| | | | | | | | |
| | |
| | | UNITS | | | | |
CURRENCY INDEX SWAP AGREEMENTS SOLD SHORT†† | | | | | | | | |
Goldman Sachs International
May 2012 U.S. Dollar
Index Swap, Terminating
05/29/123 (Notional Value $14,532,028) | | | 183,825 | | | $ | 126,199 | |
| | | | | | | | |
| † | Value determined based on Level 1 inputs — See Note 4. |
| †† | Value determined based on Level 2 inputs — See Note 4. |
| 1 | Repurchase Agreements — See Note 5. |
| 2 | All or a portion of this security is pledged as currency index swap collateral at March 31, 2012. |
| 3 | Total Return based on U.S. Dollar Index +/- financing at a variable rate. |
| | |
212 | THE RYDEX SERIES FUNDS ANNUAL REPORT | | SEE NOTES TO FINANCIAL STATEMENTS. |
WEAKENING DOLLAR 2x STRATEGY FUND
| | |
| STATEMENT OF ASSETS AND LIABILITIES | | STATEMENT OF OPERATIONS |
| | | | |
| March 31, 2012 | | | |
| |
ASSETS: | | | | |
Repurchase agreements, at value (cost $19,172,739) | | $ | 19,172,739 | |
| | | | |
Total investments (cost $19,172,739) | | | 19,172,739 | |
Segregated cash with broker | | | 372,000 | |
Unrealized appreciation on swap agreements | | | 126,199 | |
Receivables: | | | | |
Fund shares sold | | | 432,339 | |
Variation margin | | | 67,265 | |
Interest | | | 11 | |
| | | | |
Total assets | | | 20,170,553 | |
| | | | |
| |
LIABILITIES: | | | | |
Payable for: | | | | |
Fund shares redeemed | | | 796,072 | |
Swap settlement | | | 61,780 | |
Management fees | | | 15,579 | |
Distribution and service fees | | | 5,982 | |
Transfer agent and administrative fees | | | 4,328 | |
Portfolio accounting fees | | | 1,731 | |
Miscellaneous | | | 26,990 | |
| | | | |
Total liabilities | | | 912,462 | |
| | | | |
NET ASSETS | | $ | 19,258,091 | |
| | | | |
| |
NETASSETSCONSISTOF: | | | | |
Paid in capital | | $ | 33,088,538 | |
Accumulated net investment loss | | | (90,469 | ) |
Accumulated net realized loss on investments | | | (14,216,481 | ) |
Net unrealized appreciation on investments | | | 476,503 | |
| | | | |
Net assets | | $ | 19,258,091 | |
| | | | |
A-CLASS: | | | | |
Net assets | | $ | 2,880,597 | |
Capital shares outstanding | | | 151,973 | |
Net asset value per share | | $ | 18.95 | |
| | | | |
Maximum offering price per share (Net asset value divided by 95.25%) | | $ | 19.90 | |
| | | | |
C-CLASS: | | | | |
Net assets | | $ | 2,826,211 | |
Capital shares outstanding | | | 158,868 | |
Net asset value per share | | $ | 17.79 | |
| | | | |
H-CLASS: | | | | |
Net assets | | $ | 13,551,283 | |
Capital shares outstanding | | | 715,788 | |
Net asset value per share | | $ | 18.93 | |
| | | | |
| | | | |
| Year Ended March 31, 2012 | | | |
| |
INVESTMENTINCOME: | | | | |
Interest | | $ | 24,481 | |
| | | | |
Total investment income | | | 24,481 | |
| | | | |
| |
EXPENSES: | | | | |
Management fees | | | 274,804 | |
Transfer agent and administrative fees | | | 76,334 | |
Distribution and service fees: | | | | |
A-Class | | | 13,088 | |
C-Class | | | 29,611 | |
H-Class | | | 55,844 | |
Portfolio accounting fees | | | 30,534 | |
Custodian fees | | | 7,773 | |
Trustees’ fees* | | | 3,112 | |
Miscellaneous | | | 47,282 | |
| | | | |
Total expenses | | | 538,382 | |
| | | | |
Net investment loss | | | (513,901 | ) |
| | | | |
| |
NET REALIZED AND UNREALIZED GAIN (LOSS): | | | | |
Net realized gain (loss) on: | | | | |
Swap agreements | | | (96,916 | ) |
Futures contracts | | | (2,948,203 | ) |
| | | | |
Net realized loss | | | (3,045,119 | ) |
| | | | |
Net change in unrealized appreciation (depreciation) on: | | | | |
Investments | | | (5,846 | ) |
Swap agreements | | | (13,148 | ) |
Futures contracts | | | (57,401 | ) |
| | | | |
Net change in unrealized appreciation (depreciation) | | | (76,395 | ) |
| | | | |
Net realized and unrealized loss | | | (3,121,514 | ) |
| | | | |
Net decrease in net assets resulting from operations | | $ | (3,635,415 | ) |
| | | | |
| * | Relates to Trustees not deemed “interested persons” within the meaning of Section 2(a)(19) of the 1940 Act. |
| | |
SEE NOTES TO FINANCIAL STATEMENTS. | | THE RYDEX SERIES FUNDS ANNUAL REPORT | 213 |
WEAKENING DOLLAR 2x STRATEGY FUND
STATEMENTS OF CHANGES IN NET ASSETS
| | | | | | | | |
| | | Year Ended
March 31,
2012 | | | Year Ended
March 31,
2011 | |
INCREASE (DECREASE) IN NET ASSETS FROM OPERATIONS: | | | | | | | | |
Net investment loss | | $ | (513,901 | ) | | $ | (583,526 | ) |
Net realized gain (loss) on investments | | | (3,045,119 | ) | | | 2,498,240 | |
Net change in unrealized appreciation (depreciation) on investments | | | (76,395 | ) | | | 1,064,893 | |
| | | | | | | | |
Net increase (decrease) in net assets resulting from operations | | | (3,635,415 | ) | | | 2,979,607 | |
| | | | | | | | |
| | |
CAPITALSHARETRANSACTIONS: | | | | | | | | |
PROCEEDSFROMSALEOFSHARES | | | | | | | | |
A-Class | | | 16,758,536 | | | | 4,356,031 | |
C-Class | | | 10,391,984 | | | | 12,924,698 | |
H-Class | | | 130,852,185 | | | | 111,744,031 | |
COSTOFSHARESREDEEMED | | | | | | | | |
A-Class | | | (18,584,771 | ) | | | (6,022,901 | ) |
C-Class | | | (11,302,405 | ) | | | (14,644,735 | ) |
H-Class | | | (138,192,645 | ) | | | (120,468,235 | ) |
| | | | | | | | |
Net decrease from capital share transactions | | | (10,077,116 | ) | | | (12,111,111 | ) |
| | | | | | | | |
Net decrease in net assets | | | (13,712,531 | ) | | | (9,131,504 | ) |
| | |
NETASSETS: | | | | | | | | |
Beginning of year | | | 32,970,622 | | | | 42,102,126 | |
End of year | | $ | 19,258,091 | | | $ | 32,970,622 | |
| | | | | | | | |
Accumulated net investment loss at end of year | | $ | (90,469 | ) | | $ | — | |
| | | | | | | | |
CAPITALSHAREACTIVITY: | | | | | | | | |
Shares sold | | | | | | | | |
A-Class | | | 825,070 | | | | 238,396 | |
C-Class | | | 540,579 | | | | 721,312 | |
H-Class | | | 6,509,852 | | | | 6,176,809 | |
Shares redeemed | | | | | | | | |
A-Class | | | (947,230 | ) | | | (339,920 | ) |
C-Class | | | (587,844 | ) | | | (825,578 | ) |
H-Class | | | (6,947,445 | ) | | | (6,696,001 | ) |
| | | | | | | | |
Net decrease in shares | | | (607,018 | ) | | | (724,982 | ) |
| | | | | | | | |
| | |
214 | THE RYDEX SERIES FUNDS ANNUAL REPORT | | SEE NOTES TO FINANCIAL STATEMENTS. |
WEAKENING DOLLAR 2x STRATEGY FUND
FINANCIAL HIGHLIGHTS
This table is presented to show selected data for a share outstanding throughout each period and to assist shareholders in evaluating a Fund’s performance for the periods presented.
| | | | | | | | | | | | | | | | | | | | |
A-Class | | Year Ended
March 31,
2012 | | | Year Ended
March 31,
2011 | | | Year Ended
March 31,
2010 | | | Year Ended
March 31,
2009 | | | Year Ended
March 31,
2008 | |
Per Share Data | | | | | | | | | | | | | | | | | | | | |
Net asset value, beginning of period | | $ | 20.34 | | | $ | 17.98 | | | $ | 16.38 | | | $ | 29.27 | | | $ | 26.18 | |
| | | | | | | | | | | | | | | | | | | | |
Income (loss) from investment operations: | | | | | | | | | | | | | | | | | | | | |
Net investment income (loss)a | | | (.33 | ) | | | (.28 | ) | | | (.30 | ) | | | (.07 | ) | | | .70 | |
Net gain (loss) on investments (realized and unrealized) | | | (1.06 | ) | | | 2.64 | | | | 1.90 | | | | (8.77 | ) | | | 7.17 | |
| | | | | | | | | | | | | | | | | | | | |
Total from investment operations | | | (1.39 | ) | | | 2.36 | | | | 1.60 | | | | (8.84 | ) | | | 7.87 | |
| | | | | | | | | | | | | | | | | | | | |
Less distributions from: | | | | | | | | | | | | | | | | | | | | |
Net investment income | | | — | | | | — | | | | — | | | | (1.28 | ) | | | (4.78 | ) |
Net realized gains | | | — | | | | — | | | | — | | | | (2.77 | ) | | | (— | )b |
| | | | | | | | | | | | | | | | | | | | |
Total distributions | | | — | | | | — | | | | — | | | | (4.05 | ) | | | (4.78 | ) |
| | | | | | | | | | | | | | | | | | | | |
Net asset value, end of period | | $ | 18.95 | | | $ | 20.34 | | | $ | 17.98 | | | $ | 16.38 | | | $ | 29.27 | |
| | | | | | | | | | | | | | | | | | | | |
Total Returnc | | | (6.83 | %) | | | 13.13 | % | | | 9.77 | % | | | (29.87 | %) | | | 32.49 | % |
| | | | | | | | | | | | | | | | | | | | |
Ratios/Supplemental Data | | | | | | | | | | | | | | | | | | | | |
Net assets, end of period (in thousands) | | $ | 2,881 | | | $ | 5,576 | | | $ | 6,753 | | | $ | 17,642 | | | $ | 22,148 | |
| | | | | | | | | | | | | | | | | | | | |
Ratios to average net assets: | | | | | | | | | | | | | | | | | | | | |
Net investment income (loss) | | | (1.62 | %) | | | (1.54 | %) | | | (1.57 | %) | | | (0.30 | %) | | | 2.51 | % |
Total expenses | | | 1.70 | % | | | 1.71 | % | | | 1.68 | % | | | 1.69 | % | | | 1.67 | % |
| | | | | | | | | | | | | | | | | | | | |
Portfolio turnover rate | | | — | | | | — | | | | — | | | | — | | | | — | |
| | | | | | | | | | | | | | | | | | | | |
C-Class | | Year Ended
March 31,
2012 | | | Year Ended
March 31,
2011 | | | Year Ended
March 31,
2010 | | | Year Ended
March 31,
2009 | | | Year Ended
March 31,
2008 | |
Per Share Data | | | | | | | | | | | | | | | | | | | | |
Net asset value, beginning of period | | $ | 19.23 | | | $ | 17.12 | | | $ | 15.73 | | | $ | 28.53 | | | $ | 25.81 | |
| | | | | | | | | | | | | | | | | | | | |
Income (loss) from investment operations: | | | | | | | | | | | | | | | | | | | | |
Net investment income (loss)a | | | (.44 | ) | | | (.39 | ) | | | (.43 | ) | | | (.21 | ) | | | .43 | |
Net gain (loss) on investments (realized and unrealized) | | | (1.00 | ) | | | 2.50 | | | | 1.82 | | | | (8.54 | ) | | | 7.07 | |
| | | | | | | | | | | | | | | | | | | | |
Total from investment operations | | | (1.44 | ) | | | 2.11 | | | | 1.39 | | | | (8.75 | ) | | | 7.50 | |
| | | | | | | | | | | | | | | | | | | | |
Less distributions from: | | | | | | | | | | | | | | | | | | | | |
Net investment income | | | — | | | | — | | | | — | | | | (1.28 | ) | | | (4.78 | ) |
Net realized gains | | | — | | | | — | | | | — | | | | (2.77 | ) | | | (— | )b |
| | | | | | | | | | | | | | | | | | | | |
Total distributions | | | — | | | | — | | | | — | | | | (4.05 | ) | | | (4.78 | ) |
| | | | | | | | | | | | | | | | | | | | |
Net asset value, end of period | | $ | 17.79 | | | $ | 19.23 | | | $ | 17.12 | | | $ | 15.73 | | | $ | 28.53 | |
| | | | | | | | | | | | | | | | | | | | |
Total Returnc | | | (7.49 | %) | | | 12.32 | % | | | 8.84 | % | | | (30.37 | %) | | | 31.47 | % |
| | | | | | | | | | | | | | | | | | | | |
Ratios/Supplemental Data | | | | | | | | | | | | | | | | | | | | |
Net assets, end of period (in thousands) | | $ | 2,826 | | | $ | 3,963 | | | $ | 5,314 | | | $ | 8,687 | | | $ | 21,604 | |
| | | | | | | | | | | | | | | | | | | | |
Ratios to average net assets: | | | | | | | | | | | | | | | | | | | | |
Net investment income (loss) | | | (2.36 | %) | | | (2.29 | %) | | | (2.32 | %) | | | (0.93 | %) | | | 1.57 | % |
Total expenses | | | 2.44 | % | | | 2.46 | % | | | 2.43 | % | | | 2.45 | % | | | 2.41 | % |
| | | | | | | | | | | | | | | | | | | | |
Portfolio turnover rate | | | — | | | | — | | | | — | | | | — | | | | — | |
| | |
SEE NOTES TO FINANCIAL STATEMENTS. | | THE RYDEX SERIES FUNDS ANNUAL REPORT | 215 |
WEAKENING DOLLAR 2x STRATEGY FUND
FINANCIAL HIGHLIGHTS (concluded)
This table is presented to show selected data for a share outstanding throughout each period and to assist shareholders in evaluating a Fund’s performance for the periods presented.
| | | | | | | | | | | | | | | | | | | | |
H-Class | | Year Ended
March 31,
2012 | | | Year Ended
March 31,
2011 | | | Year Ended
March 31,
2010 | | | Year Ended
March 31,
2009 | | | Year Ended
March 31,
2008 | |
Per Share Data | | | | | | | | | | | | | | | | | | | | |
Net asset value, beginning of period | | $ | 20.32 | | | $ | 17.96 | | | $ | 16.37 | | | $ | 29.25 | | | $ | 26.18 | |
| | | | | | | | | | | | | | | | | | | | |
Income (loss) from investment operations: | | | | | | | | | | | | | | | | | | | | |
Net investment income (loss)a | | | (.32 | ) | | | (.28 | ) | | | (.30 | ) | | | (.03 | ) | | | .68 | |
Net gain (loss) on investments (realized and unrealized) | | | (1.07 | ) | | | 2.64 | | | | 1.89 | | | | (8.80 | ) | | | 7.17 | |
| | | | | | | | | | | | | | | | | | | | |
Total from investment operations | | | (1.39 | ) | | | 2.36 | | | | 1.59 | | | | (8.83 | ) | | | 7.85 | |
| | | | | | | | | | | | | | | | | | | | |
Less distributions from: | | | | | | | | | | | | | | | | | | | | |
Net investment income | | | — | | | | — | | | | — | | | | (1.28 | ) | | | (4.78 | ) |
Net realized gains | | | — | | | | — | | | | — | | | | (2.77 | ) | | | (— | )b |
Total distributions | | | — | | | | — | | | | — | | | | (4.05 | ) | | | (4.78 | ) |
| | | | | | | | | | | | | | | | | | | | |
Net asset value, end of period | | $ | 18.93 | | | $ | 20.32 | | | $ | 17.96 | | | $ | 16.37 | | | $ | 29.25 | |
| | | | | | | | | | | | | | | | | | | | |
Total Returnc | | | (6.84 | %) | | | 13.14 | % | | | 9.71 | % | | | (29.86 | %) | | | 32.41 | % |
| | | | | | | | | | | | | | | | | | | | |
Ratios/Supplemental Data | | | | | | | | | | | | | | | | | | | | |
Net assets, end of period (in thousands) | | $ | 13,551 | | | $ | 23,432 | | | $ | 30,036 | | | $ | 60,249 | | | $ | 103,867 | |
| | | | | | | | | | | | | | | | | | | | |
Ratios to average net assets: | | | | | | | | | | | | | | | | | | | | |
Net investment income (loss) | | | (1.61 | %) | | | (1.54 | %) | | | (1.57 | %) | | | (0.13 | %) | | | 2.45 | % |
Total expenses | | | 1.69 | % | | | 1.71 | % | | | 1.68 | % | | | 1.70 | % | | | 1.67 | % |
| | | | | | | | | | | | | | | | | | | | |
Portfolio turnover rate | | | — | | | | — | | | | — | | | | — | | | | — | |
| a | Net investment income (loss) per share was computed using average shares outstanding throughout the period. |
| b | Distributions from realized gains are less than $0.01 per share. |
| c | Total return does not reflect the impact of any applicable sales charges and has not been annualized. |
| | |
216 | THE RYDEX SERIES FUNDS ANNUAL REPORT | | SEE NOTES TO FINANCIAL STATEMENTS. |
This page intentionally left blank.
THE RYDEX SERIES FUNDS ANNUAL REPORT | 217
| | |
PERFORMANCE REPORT AND FUND PROFILE (Unaudited) | | March 31, 2012 |
REAL ESTATE FUND
OBJECTIVE: Seeks to provide capital appreciation by investing in companies that are involved in the real estate industry, including real estate investment trusts (“REITs”) (collectively, “Real Estate Companies”).
Real Estate Fund H-Class returned 5.42%, compared to a return of 13.02% for the MSCI U.S. REIT Index*.
Within the sector, Real Estate Investment Trusts (REITs), which compose 92% of the portfolio, was the main contributor to return. Real Estate Management & Development segment detracted from performance.
REIT performance was driven by an improving economy and low interest rates that made their dividends attractive by comparison. Better fundamentals included lower commercial mortgage delinquency rates and higher rates of occupancy growth, which helped income growth. Self storage, apartments, health care and retail were among the better-performing segments. Lodging, industrial, office and mortgage REITs were the weaker segments.
The strongest-performing stocks included Simon Property Group, Inc., Public Storage and Digital Realty Trust, Inc. Pennsylvania Real Estate Investment Trust, Corporate Office Properties Trust and CBRE Group, Inc. detracted from performance for the year.
*MSCI U.S. REIT Index is a free float-adjusted market capitalization weighted index that is comprised of equity REITs that are included in the MSCI U.S. Investable Market 2500 Index, with the exception of specialty equity REITs that do not generate a majority of their revenue and income from real estate rental and leasing operations. The index represents approximately 85% of the US REIT universe.
Performance displayed represents past performance which is no guarantee of future results.
Holdings Diversification (Market Exposure as % of Net Assets)
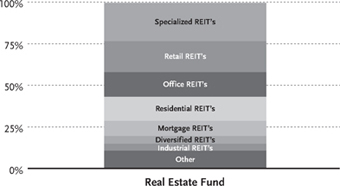
“Holdings Diversification (Market Exposure as % of Net Assets)” excludes any temporary cash investments.
| | | | |
Inception Dates: | | | |
A-Class | | | September 1, 2004 | |
C-Class | | | February 20, 2004 | |
H-Class | | | February 20, 2004 | |
| | | | |
Ten Largest Holdings (% of Total Net Assets) | |
Simon Property Group, Inc. | | | 3.5 | % |
American Tower Corp. — Class A | | | 2.6 | % |
Public Storage | | | 2.6 | % |
Equity Residential | | | 2.3 | % |
ProLogis, Inc. | | | 2.1 | % |
Ventas, Inc. | | | 2.1 | % |
HCP, Inc. | | | 2.1 | % |
General Growth Properties, Inc. | | | 2.1 | % |
Boston Properties, Inc. | | | 2.1 | % |
Vornado Realty Trust | | | 2.1 | % |
| | | | |
Top Ten Total | | | 23.6 | % |
| | | | |
“Ten Largest Holdings” exclude any temporary cash or derivative investments.
218 | THE RYDEX SERIES FUNDS ANNUAL REPORT
PERFORMANCE REPORT AND FUND PROFILE (Unaudited) (concluded)
Cumulative Fund Performance*
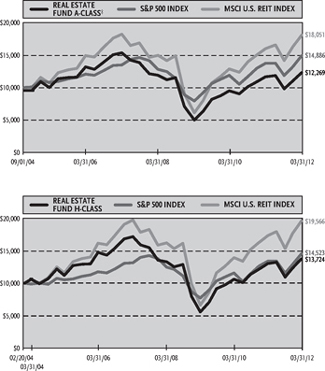
Average Annual Returns*
Periods Ended 03/31/12
| | | | | | | | | | | | |
| | | 1 Year | | | 5 Year | | | Since
Inception
(09/01/04) | |
A-Class Shares | | | 5.42 | % | | | -4.37 | % | | | 3.40 | % |
A-Class Shares with sales charge‡ | | | 0.41 | % | | | -5.29 | % | | | 2.74 | % |
S&P 500 Index | | | 8.54 | % | | | 2.01 | % | | | 5.39 | % |
MSCI U.S. REIT Index | | | 13.02 | % | | | -0.16 | % | | | 8.11 | % |
| | | | | | | | | | | (02/20/04 | ) |
C-Class Shares | | | 4.57 | % | | | -5.13 | % | | | 3.20 | % |
C-Class Shares with CDSC† | | | 3.57 | % | | | -5.13 | % | | | 3.20 | % |
H-Class Shares | | | 5.42 | % | | | -4.38 | % | | | 3.98 | % |
S&P 500 Index | | | 8.54 | % | | | 2.01 | % | | | 4.71 | % |
MSCI U.S. REIT Index | | | 13.02 | % | | | -0.16 | % | | | 8.63 | % |
| * | The performance data above represents past performance that is not predictive of future results. The investment return and principal value of an investment in the Fund will fluctuate so that an investor’s shares, when redeemed, may be worth more or less than their original cost. Returns are historical and include changes in principal and reinvested dividends and capital gains and do not reflect the effect of taxes. The S&P 500 Index and MSCI U.S. REIT Index are unmanaged indices and, unlike the Fund, have no management fees or operating expenses to reduce their reported returns. The graphs are based on A-Class shares and H-Class shares only; performance for C-Class shares will vary due to differences in fee structures. |
| † | Fund returns include a CDSC of 1% if redeemed within 12 months of purchase. |
| ‡ | Fund returns are calculated using the maximum sales charge of 4.75%. |
THE RYDEX SERIES FUNDS ANNUAL REPORT | 219
| | |
| SCHEDULE OF INVESTMENTS | | March 31, 2012 |
REAL ESTATE FUND | | |
| | | | | | | | |
| | | SHARES | | | VALUE | |
COMMON STOCKS† — 99.6% | | | | | | | | |
| | |
REAL ESTATE INVESTMENT TRUSTS (REITS) - 93.3% | | | | | | | | |
SPECIALIZED REIT’S — 23.1% | | | | | | | | |
Public Storage | | | 3,343 | | | $ | 461,902 | |
Ventas, Inc. | | | 6,568 | | | | 375,033 | |
HCP, Inc. | | | 9,298 | | | | 366,899 | |
Health Care REIT, Inc. | | | 5,780 | | | | 317,669 | |
Host Hotels & Resorts, Inc. | | | 19,173 | | | | 314,821 | |
Plum Creek Timber Company, Inc. | | | 5,765 | | | | 239,593 | |
Rayonier, Inc. | | | 4,863 | | | | 214,410 | |
Senior Housing Properties Trust | | | 7,941 | | | | 175,099 | |
Hospitality Properties Trust | | | 6,382 | | | | 168,932 | |
Extra Space Storage, Inc. | | | 5,416 | | | | 155,927 | |
LaSalle Hotel Properties | | | 5,046 | | | | 141,994 | |
Omega Healthcare Investors, Inc. | | | 6,492 | | | | 138,020 | |
Entertainment Properties Trust | | | 2,926 | | | | 135,708 | |
DiamondRock Hospitality Co. | | | 11,923 | | | | 122,688 | |
Healthcare Realty Trust, Inc. | | | 5,493 | | | | 120,846 | |
CubeSmart | | | 9,422 | | | | 112,122 | |
Sovran Self Storage, Inc. | | | 2,250 | | | | 112,118 | |
Potlatch Corp. | | | 3,319 | | | | 104,017 | |
Medical Properties Trust, Inc. | | | 11,017 | | | | 102,238 | |
Sunstone Hotel Investors, Inc.* | | | 10,261 | | | | 99,942 | |
Pebblebrook Hotel Trust | | | 4,350 | | | | 98,223 | |
| | | | | | | | |
Total Specialized Reit’s | | | | | | | 4,078,201 | |
| | | | | | | | |
RETAIL REIT’S—18.6% | | | | | | | | |
Simon Property Group, Inc. | | | 4,277 | | | | 623,072 | |
General Growth Properties, Inc. | | | 21,594 | | | | 366,882 | |
Kimco Realty Corp. | | | 13,414 | | | | 258,354 | |
Macerich Co. | | | 4,470 | | | | 258,143 | |
Federal Realty Investment Trust | | | 2,364 | | | | 228,812 | |
Realty Income Corp. | | | 5,471 | | | | 211,892 | |
Taubman Centers, Inc. | | | 2,629 | | | | 191,786 | |
Regency Centers Corp. | | | 4,147 | | | | 184,459 | |
DDR Corp. | | | 12,607 | | | | 184,062 | |
Weingarten Realty Investors | | | 6,300 | | | | 166,509 | |
National Retail Properties, Inc. | | | 5,808 | | | | 157,920 | |
CBL & Associates Properties, Inc. | | | 8,221 | | | | 155,541 | |
Tanger Factory Outlet Centers | | | 5,107 | | | | 151,831 | |
Equity One, Inc. | | | 7,103 | | | | 143,623 | |
| | | | | | | | |
Total Retail Reit’s | | | | | | | 3,282,886 | |
| | | | | | | | |
OFFICE REIT’S—14.9% | | | | | | | | |
Boston Properties, Inc. | | | 3,476 | | | | 364,944 | |
Digital Realty Trust, Inc. | | | 3,537 | | | | 261,632 | |
SL Green Realty Corp. | | | 3,089 | | | | 239,552 | |
Alexandria Real Estate Equities, Inc. | | | 2,681 | | | | 196,062 | |
Duke Realty Corp. | | | 12,333 | | | | 176,855 | |
Kilroy Realty Corp. | | | 3,576 | | | | 166,677 | |
Douglas Emmett, Inc. | | | 7,280 | | | | 166,057 | |
Piedmont Office Realty Trust, Inc. — Class A | | | 9,066 | | | | 160,922 | |
BioMed Realty Trust, Inc. | | | 8,280 | | | | 157,154 | |
| | | | | | | | |
| | | SHARES | | | VALUE | |
Mack-Cali Realty Corp. | | | 5,074 | | | $ | 146,233 | |
Highwoods Properties, Inc. | | | 4,355 | | | | 145,109 | |
Brandywine Realty Trust | | | 10,384 | | | | 119,208 | |
Corporate Office Properties Trust | | | 5,046 | | | | 117,118 | |
CommonWealth REIT | | | 6,182 | | | | 115,109 | |
Lexington Realty Trust | | | 12,003 | | | | 107,907 | |
| | | | | | | | |
Total Office Reit’s | | | | | | | 2,640,539 | |
| | | | | | | | |
RESIDENTIAL REIT’S—14.4% | | | | | | | | |
Equity Residential | | | 6,497 | | | | 406,841 | |
AvalonBay Communities, Inc. | | | 2,423 | | | | 342,491 | |
UDR, Inc. | | | 8,545 | | | | 228,237 | |
Essex Property Trust, Inc. | | | 1,411 | | | | 213,781 | |
Camden Property Trust | | | 3,238 | | | | 212,899 | |
BRE Properties, Inc. | | | 3,595 | | | | 181,727 | |
American Campus Communities, Inc. | | | 3,793 | | | | 169,623 | |
Apartment Investment & Management Co. — Class A | | | 6,314 | | | | 166,753 | |
Home Properties, Inc. | | | 2,629 | | | | 160,395 | |
Equity Lifestyle Properties, Inc. | | | 2,263 | | | | 157,822 | |
Mid-America Apartment Communities, Inc. | | | 2,312 | | | | 154,973 | |
Post Properties, Inc. | | | 3,172 | | | | 148,640 | |
| | | | | | | | |
Total Residential Reit’s | | | | | | | 2,544,182 | |
| | | | | | | | |
MORTGAGE REIT’S—9.2% | | | | | | | | |
Annaly Capital Management, Inc. | | | 22,704 | | | | 359,178 | |
American Capital Agency Corp. | | | 9,336 | | | | 275,785 | |
MFA Financial, Inc. | | | 20,287 | | | | 151,544 | |
Hatteras Financial Corp. | | | 4,867 | | | | 135,789 | |
Two Harbors Investment Corp. | | | 13,165 | | | | 133,493 | |
Invesco Mortgage Capital, Inc. | | | 7,349 | | | | 129,710 | |
Starwood Property Trust, Inc. | | | 6,092 | | | | 128,054 | |
CYS Investments, Inc. | | | 8,336 | | | | 109,118 | |
ARMOUR Residential REIT, Inc. | | | 15,120 | | | | 102,060 | |
Capstead Mortgage Corp. | | | 7,575 | | | | 99,308 | |
| | | | | | | | |
Total Mortgage Reit’s | | | | | | | 1,624,039 | |
| | | | | | | | |
DIVERSIFIED REIT’S—4.6% | | | | | | | | |
Vornado Realty Trust | | | 4,317 | | | | 363,491 | |
Liberty Property Trust | | | 5,378 | | | | 192,102 | |
Colonial Properties Trust | | | 5,981 | | | | 129,967 | |
Washington Real Estate Investment Trust | | | 4,364 | | | | 129,611 | |
| | | | | | | | |
Total Diversified Reit’s | | | | | | | 815,171 | |
| | | | | | | | |
INDUSTRIAL REIT’S—4.1% | | | | | | | | |
ProLogis, Inc. | | | 10,531 | | | | 379,326 | |
DuPont Fabros Technology, Inc. | | | 4,739 | | | | 115,869 | |
DCT Industrial Trust, Inc. | | | 19,170 | | | | 113,103 | |
EastGroup Properties, Inc. | | | 2,190 | | | | 109,982 | |
| | | | | | | | |
Total Industrial Reit’s | | | | | | | 718,280 | |
| | | | | | | | |
WIRELESS TELECOMMUNICATION SERVICES—2.6% | | | | | | | | |
American Tower Corp. — Class A | | | 7,330 | | | | 461,937 | |
| | | | | | | | |
FOREST PRODUCTS—1.8% | | | | | | | | |
Weyerhaeuser Co. | | | 14,319 | | | | 313,872 | |
| | | | | | | | |
Total Real Estate Investment Trusts (REITs) | | | | | | | 16,479,107 | |
| | | | | | | | |
| | |
220 | THE RYDEX SERIES FUNDS ANNUAL REPORT | | SEE NOTES TO FINANCIAL STATEMENTS. |
| | |
SCHEDULE OF INVESTMENTS (concluded) | | March 31, 2012 |
REAL ESTATE FUND | | |
| | | | | | | | |
| | | SHARES | | | VALUE | |
REAL ESTATE MANAGEMENT & DEVELOPMENT — 6.3% | | | | | | | | |
REAL ESTATE OPERATING COMPANIES — 2.4% | | | | | | | | |
Brookfield Office Properties, Inc. | | | 15,726 | | | $ | 274,418 | |
Forest City Enterprises, Inc. — Class A* | | | 9,795 | | | | 153,390 | |
| | | | | | | | |
Total Real Estate Operating Companies | | | | | | | 427,808 | |
| | | | | | | | |
REAL ESTATE SERVICES — 2.3% | | | | | | | | |
CBRE Group, Inc. — Class A* | | | 11,580 | | | | 231,137 | |
Jones Lang LaSalle, Inc. | | | 2,088 | | | | 173,951 | |
| | | | | | | | |
Total Real Estate Services | | | | | | | 405,088 | |
| | | | | | | | |
DIVERSIFIED REAL ESTATE ACTIVITIES—1.6% | | | | | | | | |
Brookfield Asset Management, Inc. — Class A | | | 4,990 | | | | 157,534 | |
St. Joe Co.* | | | 6,308 | | | | 119,915 | |
| | | | | | | | |
Total Diversified Real Estate Activities | | | | | | | 277,449 | |
| | | | | | | | |
Total Real Estate Management & Development | | | | | | | 1,110,345 | |
| | | | | | | | |
Total Common Stocks
(Cost $11,442,045) | | | | | | | 17,589,452 | |
| | | | | | | | |
| | | | | | | | |
| | | FACE
AMOUNT | | | VALUE | |
REPURCHASE AGREEMENT††,1 — 0.2% | | | | | | | | |
Credit Suisse Group issued 03/30/12 at 0.01% due 04/02/12 | | $ | 38,743 | | | $ | 38,743 | |
| | | | | | | | |
Total Repurchase Agreement
(Cost $38,743) | | | | | | | 38,743 | |
| | | | | | | | |
Total Investments – 99.8%
(Cost $11,480,788) | | | | | | $ | 17,628,195 | |
| | | | | | | | |
Other Assets & Liabilities, net – 0.2% | | | | | | | 43,716 | |
| | | | | | | | |
Total Net Assets – 100.0% | | | | | | $ | 17,671,911 | |
| * | Non-income producing security. |
| † | Value determined based on Level 1 inputs — See Note 4. |
| †† | Value determined based on Level 2 inputs — See Note 4. |
| 1 | Repurchase Agreements — See Note 5. |
| REIT | — Real Estate Investment Trust |
| | |
SEE NOTES TO FINANCIAL STATEMENTS. | | THE RYDEX SERIES FUNDS ANNUAL REPORT | 221 |
REAL ESTATE FUND
STATEMENT OF ASSETS AND LIABILITIES
| | | | |
March 31, 2012 | | | | |
| |
ASSETS: | | | | |
Investments, at value
(cost $11,442,045) | | $ | 17,589,452 | |
Repurchase agreements, at value
(cost $38,743) | | | 38,743 | |
| | | | |
Total investments
(cost $11,480,788) | | | 17,628,195 | |
Cash | | | 1,923 | |
Receivables: | | | | |
Fund shares sold | | | 1,041,331 | |
Securities sold | | | 648,433 | |
Dividends | | | 83,338 | |
| | | | |
Total assets | | | 19,403,220 | |
| | | | |
LIABILITIES: | | | | |
Payable for: | | | | |
Fund shares redeemed | | | 1,699,917 | |
Management fees | | | 12,181 | |
Distribution and service fees | | | 4,876 | |
Transfer agent and administrative fees | | | 3,583 | |
Portfolio accounting fees | | | 1,433 | |
Miscellaneous | | | 9,319 | |
| | | | |
Total liabilities | | | 1,731,309 | |
| | | | |
NET ASSETS | | $ | 17,671,911 | |
| | | | |
NET ASSETS CONSIST OF: | | | | |
Paid in capital | | $ | 30,644,339 | |
Undistributed net investment income | | | 156,672 | |
Accumulated net realized loss on investments | | | (19,276,507 | ) |
Net unrealized appreciation on investments | | | 6,147,407 | |
| | | | |
Net assets | | $ | 17,671,911 | |
| | | | |
A-CLASS: | | | | |
NET ASSETS | | $ | 2,363,720 | |
Capital shares outstanding | | | 78,099 | |
Net asset value per share | | $ | 30.27 | |
| | | | |
Maximum offering price per share
(Net asset value divided by 95.25%) | | $ | 31.78 | |
| | | | |
C-CLASS: | | | | |
Net assets | | $ | 1,797,500 | |
Capital shares outstanding | | | 63,541 | |
Net asset value per share | | $ | 28.29 | |
| | | | |
H-CLASS: | | | | |
Net assets | | $ | 13,510,691 | |
Capital shares outstanding | | | 446,959 | |
Net asset value per share | | $ | 30.23 | |
| | | | |
STATEMENT OF OPERATIONS
| | | | |
Year Ended March 31, 2012 | | | | |
| |
INVESTMENT INCOME: | | | | |
Dividends (net of foreign withholding tax of $1,417) | | $ | 579,943 | |
Interest | | | 45 | |
| | | | |
Total investment income | | | 579,988 | |
| | | | |
| |
EXPENSES: | | | | |
Management fees | | | 158,343 | |
Transfer agent and administrative fees | | | 46,571 | |
Distribution and service fees: | | | | |
A-Class | | | 8,157 | |
C-Class | | | 21,304 | |
H-Class | | | 33,088 | |
Portfolio accounting fees | | | 18,628 | |
Custodian fees | | | 4,970 | |
Trustees’ fees* | | | 1,957 | |
Tax expense | | | 2,143 | |
Miscellaneous | | | 19,683 | |
| | | | |
Total expenses | | | 314,844 | |
| | | | |
Net investment income | | | 265,144 | |
| | | | |
| |
NET REALIZED AND UNREALIZED GAIN (LOSS): | | | | |
Net realized gain (loss) on: | | | | |
Investments | | | (6,951,187 | ) |
| | | | |
Net realized loss | | | (6,951,187 | ) |
| | | | |
Net change in unrealized appreciation
(depreciation) on: | | | | |
Investments | | | (2,024,497 | ) |
| | | | |
Net change in unrealized appreciation
(depreciation) | | | (2,024,497 | ) |
| | | | |
Net realized and unrealized loss | | | (8,975,684 | ) |
| | | | |
Net decrease in net assets resulting from operations | | $ | (8,710,540 | ) |
| | | | |
| * | Relates to Trustees not deemed “interested persons” within the meaning of Section 2(a)(19) of the 1940 Act. |
| | |
222 | THE RYDEX SERIES FUNDS ANNUAL REPORT | | SEE NOTES TO FINANCIAL STATEMENTS. |
REAL ESTATE FUND
STATEMENTS OF CHANGES IN NET ASSETS
| | | | | | | | |
| | | Year Ended
March 31,
2012 | | | Year Ended
March 31,
2011 | |
INCREASE (DECREASE) IN NET ASSETS FROM OPERATIONS: | | | | | | | | |
Net investment income | | $ | 265,144 | | | $ | 450,481 | |
Net realized gain (loss) on investments | | | (6,951,187 | ) | | | 5,516,376 | |
Net change in unrealized appreciation (depreciation) on investments | | | (2,024,497 | ) | | | (1,134,604 | ) |
| | | | | | | | |
Net increase (decrease) in net assets resulting from operations | | | (8,710,540 | ) | | | 4,832,253 | |
| | | | | | | | |
DISTRIBUTIONSTOSHAREHOLDERSFROM: | | | | | | | | |
Net investment income | | | | | | | | |
A-Class | | | (13,842 | ) | | | (110,657 | ) |
C-Class | | | (19,533 | ) | | | (51,561 | ) |
H-Class | | | (77,240 | ) | | | (717,890 | ) |
| | | | | | | | |
Total distributions to shareholders | | | (110,615 | ) | | | (880,108 | ) |
| | | | | | | | |
| | |
CAPITALSHARETRANSACTIONS: | | | | | | | | |
PROCEEDSFROMSALEOFSHARES | | | | | | | | |
A-Class | | | 13,167,117 | | | | 17,712,810 | |
C-Class | | | 67,554,814 | | | | 85,507,957 | |
H-Class | | | 222,385,631 | | | | 224,118,250 | |
DISTRIBUTIONSREINVESTED | | | | | | | | |
A-Class | | | 13,078 | | | | 99,290 | |
C-Class | | | 18,741 | | | | 47,000 | |
H-Class | | | 76,349 | | | | 713,980 | |
COSTOFSHARESREDEEMED | | | | | | | | |
A-Class | | | (14,286,238 | ) | | | (18,942,704 | ) |
C-Class | | | (68,113,410 | ) | | | (85,940,210 | ) |
H-Class | | | (222,715,004 | ) | | | (240,249,139 | ) |
| | | | | | | | |
Net decrease from capital share transactions | | | (1,898,922 | ) | | | (16,932,766 | ) |
| | | | | | | | |
Net decrease in net assets | | | (10,720,077 | ) | | | (12,980,621 | ) |
| | |
NETASSETS: | | | | | | | | |
Beginning of year | | | 28,391,988 | | | | 41,372,609 | |
| | | | | | | | |
End of year | | $ | 17,671,911 | | | $ | 28,391,988 | |
| | | | | | | | |
Undistributed net investment income at end of year | | $ | 156,672 | | | $ | — | |
| | | | | | | | |
CAPITALSHAREACTIVITY: | | | | | | | | |
Shares sold | | | | | | | | |
A-Class | | | 458,395 | | | | 695,632 | |
C-Class | | | 2,537,675 | | | | 3,424,767 | |
H-Class | | | 7,867,436 | | | | 8,635,622 | |
Shares issued from reinvestment of distributions | | | | | | | | |
A-Class | | | 521 | | | | 3,804 | |
C-Class | | | 797 | | | | 1,904 | |
H-Class | | | 3,047 | | | | 27,377 | |
Shares redeemed | | | | | | | | |
A-Class | | | (518,172 | ) | | | (739,617 | ) |
C-Class | | | (2,560,890 | ) | | | (3,433,471 | ) |
H-Class | | | (8,183,044 | ) | | | (9,345,781 | ) |
| | | | | | | | |
Net decrease in shares | | | (394,235 | ) | | | (729,763 | ) |
| | | | | | | | |
| | |
SEE NOTES TO FINANCIAL STATEMENTS. | | THE RYDEX SERIES FUNDS ANNUAL REPORT | 223 |
REAL ESTATE FUND
FINANCIAL HIGHLIGHTS
This table is presented to show selected data for a share outstanding throughout each period and to assist shareholders in evaluating a Fund’s performance for the periods presented.
| | | | | | | | | | | | | | | | | | | | |
A-Class | | Year Ended
March 31,
2012 | | | Year Ended
March 31,
2011 | | | Year Ended
March 31,
2010 | | | Year Ended
March 31,
2009 | | | Year Ended
March 31,
2008 | |
Per Share Data | | | | | | | | | | | | | | | | | | | | |
Net asset value, beginning of period | | $ | 29.06 | | | $ | 24.24 | | | $ | 12.83 | | | $ | 32.42 | | | $ | 42.16 | |
| | | | | | | | | | | | | | | | | | | | |
Income (loss) from investment operations: | | | | | | | | | | | | | | | | | | | | |
Net investment incomea | | | .45 | | | | .27 | | | | .44 | | | | .74 | | | | .54 | |
Net gain (loss) on investments (realized and unrealized) | | | 1.07 | | | | 5.17 | | | | 11.11 | | | | (19.43 | ) | | | (10.05 | ) |
| | | | | | | | | | | | | | | | | | | | |
Total from investment operations | | | 1.52 | | | | 5.44 | | | | 11.55 | | | | (18.69 | ) | | | (9.51 | ) |
| | | | | | | | | | | | | | | | | | | | |
Less distributions from: | | | | | | | | | | | | | | | | | | | | |
Net investment income | | | (.31 | ) | | | (.62 | ) | | | (.14 | ) | | | (.90 | ) | | | (.23 | ) |
| | | | | | | | | | | | | | | | | | | | |
Total distributions | | | (.31 | ) | | | (.62 | ) | | | (.14 | ) | | | (.90 | ) | | | (.23 | ) |
| | | | | | | | | | | | | | | | | | | | |
Net asset value, end of period | | $ | 30.27 | | | $ | 29.06 | | | $ | 24.24 | | | $ | 12.83 | | | $ | 32.42 | |
| | | | | | | | | | | | | | | | | | | | |
Total Returnb | | | 5.42 | % | | | 22.72 | % | | | 90.16 | % | | | (58.00 | %) | | | (22.59 | %) |
| | | | | | | | | | | | | | | | | | | | |
Ratios/Supplemental Data | | | | | | | | | | | | | | | | | | | | |
Net assets, end of period (in thousands) | | $ | 2,364 | | | $ | 3,991 | | | $ | 4,303 | | | $ | 1,554 | | | $ | 2,866 | |
| | | | | | | | | | | | | | | | | | | | |
Ratios to average net assets: | | | | | | | | | | | | | | | | | | | | |
Net investment income | | | 1.59 | % | | | 1.07 | % | | | 2.15 | % | | | 2.81 | % | | | 1.45 | % |
Total expenses | | | 1.61 | % | | | 1.63 | % | | | 1.65 | % | | | 1.68 | % | | | 1.64 | % |
| | | | | | | | | | | | | | | | | | | | |
Portfolio turnover rate | | | 974 | % | | | 485 | % | | | 1,520 | % | | | 780 | % | | | 832 | % |
| | | | | | | | | | | | | | | | | | | | |
C-Class | | Year Ended
March 31,
2012 | | | Year Ended
March 31,
2011 | | | Year Ended
March 31,
2010 | | | Year Ended
March 31,
2009 | | | Year Ended
March 31,
2008 | |
Per Share Data | | | | | | | | | | | | | | | | | | | | |
Net asset value, beginning of period | | $ | 27.41 | | | $ | 23.11 | | | $ | 12.33 | | | $ | 31.44 | | | $ | 41.22 | |
| | | | | | | | | | | | | | | | | | | | |
Income (loss) from investment operations: | | | | | | | | | | | | | | | | | | | | |
Net investment incomea | | | .22 | | | | .10 | | | | .40 | | | | .66 | | | | .29 | |
Net gain (loss) on investments (realized and unrealized) | | | .97 | | | | 4.82 | | | | 10.52 | | | | (18.87 | ) | | | (9.84 | ) |
| | | | | | | | | | | | | | | | | | | | |
Total from investment operations | | | 1.19 | | | | 4.92 | | | | 10.92 | | | | (18.21 | ) | | | (9.55 | ) |
| | | | | | | | | | | | | | | | | | | | |
Less distributions from: | | | | | | | | | | | | | | | | | | | | |
Net investment income | | | (.31 | ) | | | (.62 | ) | | | (.14 | ) | | | (.90 | ) | | | (.23 | ) |
| | | | | | | | | | | | | | | | | | | | |
Total distributions | | | (.31 | ) | | | (.62 | ) | | | (.14 | ) | | | (.90 | ) | | | (.23 | ) |
| | | | | | | | | | | | | | | | | | | | |
Net asset value, end of period | | $ | 28.29 | | | $ | 27.41 | | | $ | 23.11 | | | $ | 12.33 | | | $ | 31.44 | |
| | | | | | | | | | | | | | | | | | | | |
Total Returnb | | | 4.57 | % | | | 21.58 | % | | | 88.70 | % | | | (58.28 | %) | | | (23.21 | %) |
| | | | | | | | | | | | | | | | | | | | |
Ratios/Supplemental Data | | | | | | | | | | | | | | | | | | | | |
Net assets, end of period (in thousands) | | $ | 1,798 | | | $ | 2,356 | | | $ | 2,143 | | | $ | 1,075 | | | $ | 2,290 | |
| | | | | | | | | | | | | | | | | | | | |
Ratios to average net assets: | | | | | | | | | | | | | | | | | | | | |
Net investment income | | | 0.83 | % | | | 0.42 | % | | | 2.06 | % | | | 2.62 | % | | | 0.78 | % |
Total expenses | | | 2.36 | % | | | 2.39 | % | | | 2.41 | % | | | 2.42 | % | | | 2.39 | % |
| | | | | | | | | | | | | | | | | | | | |
Portfolio turnover rate | | | 974 | % | | | 485 | % | | | 1,520 | % | | | 780 | % | | | 832 | % |
| | |
224 | THE RYDEX SERIES FUNDS ANNUAL REPORT | | SEE NOTES TO FINANCIAL STATEMENTS. |
REAL ESTATE FUND
FINANCIAL HIGHLIGHTS (concluded)
This table is presented to show selected data for a share outstanding throughout each period and to assist shareholders in evaluating a Fund’s performance for the periods presented.
| | | | | | | | | | | | | | | | | | | | |
H-Class | | Year Ended
March 31,
2012 | | | Year Ended
March 31,
2011 | | | Year Ended
March 31,
2010 | | | Year Ended
March 31,
2009 | | | Year Ended
March 31,
2008 | |
Per Share Data | | | | | | | | | | | | | | | | | | | | |
Net asset value, beginning of period | | $ | 29.02 | | | $ | 24.22 | | | $ | 12.82 | | | $ | 32.40 | | | $ | 42.14 | |
| | | | | | | | | | | | | | | | | | | | |
Income (loss) from investment operations: | | | | | | | | | | | | | | | | | | | | |
Net investment incomea | | | .42 | | | | .29 | | | | .50 | | | | .61 | | | | .53 | |
Net gain (loss) on investments (realized and unrealized) | | | 1.10 | | | | 5.13 | | | | 11.04 | | | | (19.29 | ) | | | (10.04 | ) |
| | | | | | | | | | | | | | | | | | | | |
Total from investment operations | | | 1.52 | | | | 5.42 | | | | 11.54 | | | | (18.68 | ) | | | (9.51 | ) |
| | | | | | | | | | | | | | | | | | | | |
Less distributions from: | | | | | | | | | | | | | | | | | | | | |
Net investment income | | | (.31 | ) | | | (.62 | ) | | | (.14 | ) | | | (.90 | ) | | | (.23 | ) |
| | | | | | | | | | | | | | | | | | | | |
Total distributions | | | (.31 | ) | | | (.62 | ) | | | (.14 | ) | | | (.90 | ) | | | (.23 | ) |
| | | | | | | | | | | | | | | | | | | | |
Net asset value, end of period | | $ | 30.23 | | | $ | 29.02 | | | $ | 24.22 | | | $ | 12.82 | | | $ | 32.40 | |
| | | | | | | | | | | | | | | | | | | | |
Total Returnb | | | 5.42 | % | | | 22.70 | % | | | 90.15 | % | | | (58.01 | %) | | | (22.60 | %) |
| | | | | | | | | | | | | | | | | | | | |
Ratios/Supplemental Data | | | | | | | | | | | | | | | | | | | | |
Net assets, end of period (in thousands) | | $ | 13,511 | | | $ | 22,045 | | | $ | 34,926 | | | $ | 1,757 | | | $ | 14,140 | |
| | | | | | | | | | | | | | | | | | | | |
Ratios to average net assets: | | | | | | | | | | | | | | | | | | | | |
Net investment income | | | 1.48 | % | | | 1.13 | % | | | 2.41 | % | | | 2.14 | % | | | 1.43 | % |
Total expenses | | | 1.61 | % | | | 1.63 | % | | | 1.68 | % | | | 1.64 | % | | | 1.64 | % |
| | | | | | | | | | | | | | | | | | | | |
Portfolio turnover rate | | | 974 | % | | | 485 | % | | | 1,520 | % | | | 780 | % | | | 832 | % |
| a | Net investment income per share was computed using average shares outstanding throughout the period. |
| b | Total return does not reflect the impact of any applicable sales charges and has not been annualized. |
| | |
SEE NOTES TO FINANCIAL STATEMENTS. | | THE RYDEX SERIES FUNDS ANNUAL REPORT | 225 |
| | |
PERFORMANCE REPORT AND FUND PROFILE (Unaudited) | | March 31, 2012 |
GOVERNMENT LONG BOND 1.2x STRATEGY FUND
OBJECTIVE: Seeks to provide investment results that correspond, before fees and expenses, to a benchmark for U.S. Government securities on a daily basis. The Fund’s current benchmark is 120% of the daily price movement of the Long Treasury Bond. The Long Treasury Bond is the U.S. Treasury bond with the longest maturity, which is currently 30 years. The price movement of the Long Treasury Bond is based on the daily price change of the most recently issued Long Treasury Bond. The Fund does not seek to achieve its investment objective over a period of time greater than one day.
The 30-year bond ended the 12-month period ended March 31, 2012, with a yield of 3.27%, compared with a yield of about 4.51% at the start of the period. Treasury yields have been under pressure due to safe-haven buying amid recurring concerns about the European debt crisis, although the situation was seen as less urgent as the first quarter of 2012 progressed and U.S. economic data grew stronger. Yields actually rose in the final month of the period out of the range that had persisted for months, due to interpretation of a Fed policy statement that it might step back from its bond purchases through quantitative easing. But even that situation reversed itself, with yields falling to close the period, as Fed comments turned more dovish. The stable performance of Treasuries throughout the year helped the Government Long Bond 1.2x Strategy Fund Investor Class return 33.38% for the 12 months ended March 31, 2012, compared with a return of -7.92% for the daily price movement of the Long Treasury Bond. The Fund maintained a daily correlation of over 99% to its benchmark of 120% of the daily price movement of the Long Treasury Bond.
Derivatives in the Fund are used to provide additional exposure to composition of the benchmark in the highest efficient manner and to provide leverage, not for hedging purposes. The results of derivatives use during the period were within our expectations and contributed to the Fund’s performance.
Due to the compounding of daily returns, leveraged and inverse funds’ returns over periods other than one day will likely differ in amount and possibly direction from the benchmark return for the same period. Investors should monitor their leveraged and inverse funds’ holdings to ensure that they are consistent with their strategies, as frequently as daily.
The effects of compounding may cause the longer-term correlation of the fund to its benchmark to diminish. The apparent discrepancy between the leveraged and unleveraged indices is the result of compounding, which is described briefly on page 4 of this report.
Performance displayed represents past performance which is no guarantee of future results.
Holdings Diversification [Market Exposure as % of Net Assets]
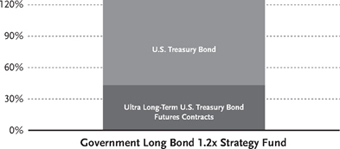
“Holdings Diversification (Market Exposure as % of Net Assets)” excludes any temporary cash investments.
| | |
Investor Class | | January 3, 1994 |
Advisor Class | | August 1, 2003 |
A-Class | | March 31, 2004 |
C-Class | | May 2, 2001 |
The Fund invests principally in U.S. Government securities and in derivative investments such as futures contracts.
226 | THE RYDEX SERIES FUNDS ANNUAL REPORT
PERFORMANCE REPORT AND FUND PROFILE (Unaudited) (concluded)
Cumulative Fund Performance*
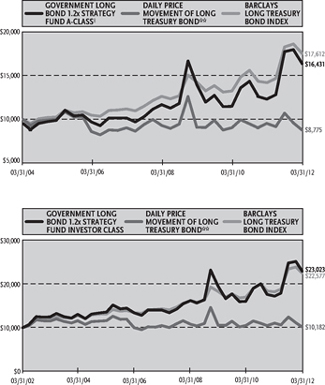
Average Annual Returns*
Periods Ended 3/31/2012
| | | | | | | | | | | | |
| | | 1 Year | | | 5 Year | | | 10 Year | |
Investor Class Shares | | | 33.38 | % | | | 10.34 | % | | | 8.70 | % |
C-Class Shares | | | 32.01 | % | | | 9.22 | % | | | 7.61 | % |
C-Class Shares with CDSC† | | | 31.01 | % | | | 9.22 | % | | | 7.61 | % |
Daily Price Movement of Long Treasury Bond** | | | -7.92 | % | | | -0.60 | % | | | 0.18 | % |
Barclays Long Treasury Bond Index | | | 23.65 | % | | | 9.46 | % | | | 8.48 | % |
| | | | | | | | | | | | |
| | | | | | | | | Since | |
| | | | | | | | | Inception | |
| | | | | | | | | (08/01/03) | |
Advisor Class Shares | | | 32.56 | % | | | 9.74 | % | | | 7.66 | % |
Daily Price Movement of Long Treasury Bond** | | | -7.92 | % | | | -0.60 | % | | | -0.59 | % |
Barclays Long Treasury Bond | | | | | | | | | | | | |
Index | | | 23.65 | % | | | 9.46 | % | | | 8.04 | % |
| | | | | | | | | | | (03/31/04 | ) |
A-Class Shares | | | 33.00 | % | | | 10.07 | % | | | 7.05 | % |
A-Class Shares withsales charge‡ | | | 26.69 | % | | | 9.01 | % | | | 6.40 | % |
Daily Price Movement of Long Treasury Bond** | | | -7.92 | % | | | -0.60 | % | | | -1.62 | % |
Barclays Long Treasury Bond Index | | | 23.65 | % | | | 9.46 | % | | | 7.33 | % |
| * | The performance data above represents past performance that is not predictive of future results. The investment return and principal value of an investment in the Fund will fluctuate so that an investor’s shares, when redeemed, may be worth more or less than their original cost. Returns are historical and include changes in principal and reinvested dividends and capital gains and do not reflect the effect of taxes. The Barclays Long Treasury Bond Index and Daily Price Movement of Long Treasury Bond are unmanaged indices and, unlike the Fund, have no management fees or operating expenses to reduce their reported returns. The graphs are based on Investor Class shares and A-Class shares only; performance for Advisor Class shares and C-Class shares will vary due to differences in fee structures. |
| † | Fund returns include a CDSC of 1% if redeemed within 12 months of purchase. |
| ‡ | Fund returns are calculated using the maximum sales charge of 4.75%. |
| ** | Does not reflect any interest. |
THE RYDEX SERIES FUNDS ANNUAL REPORT | 227
| | |
SCHEDULE OF INVESTMENTS | | March 31, 2012 |
GOVERNMENT LONG BOND 1.2x STRATEGY FUND
| | | | | | | | |
| | | FACE | | | | |
| | | AMOUNT | | | VALUE | |
U.S. GOVERNMENT SECURITIES† - 81.5% | | | | | | | | |
U.S. Treasury Bond 3.13% due 02/15/42 | | $ | 60,192,000 | | | $ | 57,539,790 | |
| | | | | | | | |
Total U.S. Government Securities
(Cost $57,396,165) | | | | | | | 57,539,790 | |
| | | | | | | | |
REPURCHASE AGREEMENTS††,1—59.5% | | | | | | | | |
HSBC Group issued 03/30/12 at 0.01% due 04/02/12 | | | 28,304,480 | | | | 28,304,480 | |
Mizuho Financial Group, Inc. issued 03/30/12 at 0.01% due 04/02/12 | | | 7,963,447 | | | | 7,963,447 | |
Credit Suisse Group issued 03/30/12 at 0.01% due 04/02/12 | | | 3,654,123 | | | | 3,654,123 | |
Deutsche Bank issued 03/30/12 at 0.01%due 04/02/12 | | | 2,116,596 | | | | 2,116,596 | |
| | | | | | | | |
Total Repurchase Agreements
(Cost $42,038,646) | | | | | | | 42,038,646 | |
| | | | | | | | |
Total Investments – 141.0% | | | | | | | | |
(Cost $99,434,811) | | | | | | $ | 99,578,436 | |
| | | | | | | | |
Other Assets & Liabilities, net – (41.0)% | | | | | | | (28,933,838 | ) |
| | | | | | | | |
Total Net Assets – 100.0% | | | | | | $ | 70,644,598 | |
| |
| | | | | | | | |
| | | | | | UNREALIZED | |
| | | CONTRACTS | | | GAIN | |
INTEREST RATE FUTURES CONTRACTS PURCHASED† | | | | | |
June 2012 Ultra Long-Term U.S. Treasury Bond Futures Contracts (Aggregate Value of Contracts $30,388,375) | | | 202 | | | $ | 212,724 | |
| | | | | | | | |
| † | Value determined based on Level 1 inputs — See Note 4. |
| †† | Value determined based on Level 2 inputs — See Note 4. |
| 1 | Repurchase Agreements — See Note 5. |
| | |
228 | THE RYDEX SERIES FUNDS ANNUAL REPORT | | SEE NOTES TO FINANCIAL STATEMENTS. |
GOVERNMENT LONG BOND 1.2x STRATEGY FUND
STATEMENT OF ASSETS AND LIABILITIES
| | | | |
| March 31, 2012 | | | |
| |
ASSETS: | | | | |
Investments, at value
(cost $57,396,165) | | $ | 57,539,790 | |
Repurchase agreements, at value
(cost $42,038,646) | | | 42,038,646 | |
| | | | |
Total investments
(cost $99,434,811) | | | 99,578,436 | |
Segregated cash with broker | | | 2,346,000 | |
Cash | | | 18 | |
Receivables: | | | | |
Securities sold | | | 38,237,500 | |
Fund shares sold | | | 2,172,035 | |
Interest | | | 395,700 | |
| | | | |
Total assets | | | 142,729,689 | |
| | | | |
| |
LIABILITIES: | | | | |
Payable for: | | | | |
Fund shares redeemed | | | 70,764,939 | |
Variation margin | | | 1,149,808 | |
Management fees | | | 47,202 | |
Transfer agent and administrative fees | | | 18,881 | |
Distribution and service fees | | | 15,750 | |
Portfolio accounting fees | | | 9,440 | |
Miscellaneous | | | 79,071 | |
| | | | |
Total liabilities | | | 72,085,091 | |
| | | | |
NET ASSETS | | $ | 70,644,598 | |
| | | | |
| |
NET ASSETS CONSIST OF: | | | | |
Paid in capital | | $ | 101,094,540 | |
Undistributed net investment income | | | 164,097 | |
Accumulated net realized loss on investments | | | (30,970,388 | ) |
Net unrealized appreciation on investments | | | 356,349 | |
| | | | |
Net assets | | $ | 70,644,598 | |
| | | | |
| |
INVESTOR CLASS: | | | | |
Net assets | | $ | 43,709,431 | |
Capital shares outstanding | | | 2,931,379 | |
Net asset value per share | | $ | 14.91 | |
| | | | |
| |
ADVISOR CLASS: | | | | |
Net assets | | $ | 11,599,527 | |
Capital shares outstanding | | | 784,917 | |
Net asset value per share | | $ | 14.78 | |
| | | | |
| |
A-CLASS: | | | | |
Net assets | | $ | 10,885,023 | |
Capital shares outstanding | | | 729,436 | |
Net asset value per share | | $ | 14.92 | |
| | | | |
Maximum offering price per share
(Net asset value divided by 95.25%) | | $ | 15.66 | |
| | | | |
| |
C-CLASS: | | | | |
Net assets | | $ | 4,450,617 | |
Capital shares outstanding | | | 299,162 | |
Net asset value per share | | $ | 14.88 | |
| | | | |
STATEMENT OF OPERATIONS
| | | | |
| Year Ended March 31, 2012 | | | |
| |
INVESTMENT INCOME: | | | | |
Interest | | $ | 5,716,314 | |
| | | | |
Total investment income | | | 5,716,314 | |
| | | | |
| |
EXPENSES: | | | | |
Management fees | | | 893,656 | |
Transfer agent and administrative fees | | | 357,466 | |
Distribution and service fees: | | | | |
Advisor Class | | | 428,411 | |
A-Class | | | 14,127 | |
C-Class | | | 59,634 | |
Portfolio accounting fees | | | 177,706 | |
Custodian fees | | | 46,554 | |
Trustees’ fees* | | | 19,019 | |
Miscellaneous | | | 201,446 | |
| | | | |
Total expenses | | | 2,198,019 | |
| | | | |
Net investment income | | | 3,518,295 | |
| | | | |
| |
NET REALIZED AND UNREALIZED GAIN (LOSS): | | | | |
Net realized gain (loss) on: | | | | |
Investments | | | 27,758,576 | |
Futures contracts | | | 9,863,660 | |
| | | | |
Net realized gain | | | 37,622,236 | |
| | | | |
Net change in unrealized appreciation (depreciation) on: | | | | |
Investments | | | (1,140,890 | ) |
Futures contracts | | | (33,261 | ) |
| | | | |
Net change in unrealized appreciation (depreciation) | | | (1,174,151 | ) |
| | | | |
Net realized and unrealized gain | | | 36,448,085 | |
| | | | |
Net increase in net assets resulting from operations | | $ | 39,966,380 | |
| | | | |
| * | Relates to Trustees not deemed “interested persons” within the meaning of Section 2(a)(19) of the 1940 Act. |
| | |
SEE NOTES TO FINANCIAL STATEMENTS. | | THE RYDEX SERIES FUNDS ANNUAL REPORT | 229 |
GOVERNMENT LONG BOND 1.2x STRATEGY FUND
STATEMENTS OF CHANGES IN NET ASSETS
| | | | | | | | |
| | | Year Ended
March 31,
2012 | | | Year Ended
March 31,
2011 | |
Increase (Decrease) In Net Assets From Operations: | | | | | | | | |
Net investment income | | $ | 3,518,295 | | | $ | 4,528,442 | |
Net realized gain (loss) on investments | | | 37,622,236 | | | | (30,533,013 | ) |
Net change in unrealized appreciation (depreciation) on investments | | | (1,174,151 | ) | | | 4,044,342 | |
| | | | | | | | |
Net increase (decrease) in net assets resulting from operations | | | 39,966,380 | | | | (21,960,229 | ) |
| | | | | | | | |
DISTRIBUTIONSTO SHAREHOLDERSFROM: | | | | | | | | |
Net investment income | | | | | | | | |
Investor Class | | | (1,811,096 | ) | | | (3,465,913 | ) |
Advisor Class | | | (1,508,473 | ) | | | (768,221 | ) |
A-Class | | | (113,166 | ) | | | (106,843 | ) |
C-Class | | | (78,463 | ) | | | (211,765 | ) |
| | | | | | | | |
Total distributions to shareholders | | | (3,511,198 | ) | | | (4,552,742 | ) |
| | | | | | | | |
CAPITALSHARETRANSACTIONS: | | | | | | | | |
PROCEEDSFROMSALEOFSHARES | | | | | | | | |
Investor Class | | | 1,675,880,698 | | | | 1,801,417,431 | |
Advisor Class | | | 2,528,532,134 | | | | 1,632,214,111 | |
A-Class | | | 51,950,833 | | | | 18,572,361 | |
C-Class | | | 81,980,435 | | | | 70,381,488 | |
DISTRIBUTIONSREINVESTED | | | | | | | | |
Investor Class | | | 1,774,830 | | | | 3,373,033 | |
Advisor Class | | | 1,506,029 | | | | 753,317 | |
A-Class | | | 75,151 | | | | 89,641 | |
C-Class | | | 71,194 | | | | 199,586 | |
COSTOFSHARESREDEEMED | | | | | | | | |
Investor Class | | | (1,691,477,174 | ) | | | (2,011,038,348 | ) |
Advisor Class | | | (2,570,913,999 | ) | | | (1,633,935,780 | ) |
A-Class | | | (45,216,771 | ) | | | (21,725,044 | ) |
C-Class | | | (84,944,406 | ) | | | (78,468,284 | ) |
| | | | | | | | |
Net decrease from capital share transactions | | | (50,781,046 | ) | | | (218,166,488 | ) |
| | | | | | | | |
Net decrease in net assets | | | (14,325,864 | ) | | | (244,679,459 | ) |
| | |
NETASSETS: | | | | | | | | |
Beginning of year | | | 84,970,462 | | | | 329,649,921 | |
| | | | | | | | |
End of year | | $ | 70,644,598 | | | $ | 84,970,462 | |
| | | | | | | | |
Undistributed net investment income at end of year | | $ | 164,097 | | | $ | 157,000 | |
| | | | | | | | |
CAPITALSHAREACTIVITY: | | | | | | | | |
Shares sold | | | | | | | | |
Investor Class | | | 113,773,929 | | | | 150,851,651 | |
Advisor Class | | | 180,330,851 | | | | 137,028,703 | |
A-Class | | | 3,367,899 | | | | 1,510,564 | |
C-Class | | | 5,659,684 | | | | 5,832,353 | |
Shares issued from reinvestment of distributions | | | | | | | | |
Investor Class | | | 124,695 | | | | 286,286 | |
Advisor Class | | | 107,513 | | | | 62,194 | |
A-Class | | | 5,334 | | | | 7,372 | |
C-Class | | | 5,263 | | | | 16,077 | |
Shares redeemed | | | | | | | | |
Investor Class | | | (114,879,517 | ) | | | (172,993,989 | ) |
Advisor Class | | | (182,419,554 | ) | | | (136,988,367 | ) |
A-Class | | | (2,884,296 | ) | | | (1,786,069 | ) |
C-Class | | | (5,899,279 | ) | | | (6,475,524 | ) |
| | | | | | | | |
Net decrease in shares | | | (2,707,478 | ) | | | (22,648,749 | ) |
| | | | | | | | |
| | |
230 | THE RYDEX SERIES FUNDS ANNUAL REPORT | | SEE NOTES TO FINANCIAL STATEMENTS. |
GOVERNMENT LONG BOND 1.2x STRATEGY FUND
FINANCIAL HIGHLIGHTS
This table is presented to show selected data for a share outstanding throughout each period and to assist shareholders in evaluating a Fund’s performance for the periods presented.
| | | | | | | | | | | | | | | | | | | | |
Investor Class | | Year Ended
March 31,
2012 | | | Year Ended
March 31,
2011 | | | Year Ended
March 31,
2010 | | | Year Ended
March 31,
2009 | | | Year Ended
March 31,
2008 | |
Per Share Data | | | | | | | | | | | | | | | | | | | | |
Net asset value, beginning of period | | $ | 11.43 | | | $ | 10.96 | | | $ | 13.74 | | | $ | 11.78 | | | $ | 10.59 | |
| | | | | | | | | | | | | | | | | | | | |
Income (loss) from investment operations: | | | | | | | | | | | | | | | | | | | | |
Net investment incomea | | | .32 | | | | .36 | | | | .36 | | | | .36 | | | | .40 | |
Net gain (loss) on investments (realized and unrealized) | | | 3.48 | | | | .47 | | | | (2.78 | ) | | | 1.97 | | | | 1.19 | |
| | | | | | | | | | | | | | | | | | | | |
Total from investment operations | | | 3.80 | | | | .83 | | | | (2.42 | ) | | | 2.33 | | | | 1.59 | |
| | | | | | | | | | | | | | | | | | | | |
Less distributions from: | | | | | | | | | | | | | | | | | | | | |
Net investment income | | | (.32 | ) | | | (.36 | ) | | | (.36 | ) | | | (.37 | ) | | | (.40 | ) |
| | | | | | | | | | | | | | | | | | | | |
Total distributions | | | (.32 | ) | | | (.36 | ) | | | (.36 | ) | | | (.37 | ) | | | (.40 | ) |
| | | | | | | | | | | | | | | | | | | | |
Net asset value, end of period | | $ | 14.91 | | | $ | 11.43 | | | $ | 10.96 | | | $ | 13.74 | | | $ | 11.78 | |
| | | | | | | | | | | | | | | | | | | | |
Total Returnb | | | 33.38 | % | | | 7.42 | % | | | (17.71 | %) | | | 20.17 | % | | | 15.43 | % |
| | | | | | | | | | | | | | | | | | | | |
Ratios/Supplemental Data | | | | | | | | | | | | | | | | | | | | |
Net assets, end of period (in thousands) | | $ | 43,709 | | | $ | 44,707 | | | $ | 282,388 | | | $ | 43,237 | | | $ | 30,695 | |
| | | | | | | | | | | | | | | | | | | | |
Ratios to average net assets: | | | | | | | | | | | | | | | | | | | | |
Net investment income | | | 2.24 | % | | | 3.03 | % | | | 3.16 | % | | | 2.79 | % | | | 3.75 | % |
Total expenses | | | 0.95 | % | | | 0.98 | % | | | 0.98 | % | | | 0.98 | % | | | 0.97 | % |
| | | | | | | | | | | | | | | | | | | | |
Portfolio turnover rate | | | 2,322 | % | | | 1,930 | % | | | 1,503 | % | | | 1,794 | % | | | 1,142 | % |
| | | | | | | | | | | | | | | | | | | | |
Advisor Class | | Year Ended
March 31,
2012 | | | Year Ended
March 31,
2011 | | | Year Ended
March 31,
2010 | | | Year Ended
March 31,
2009 | | | Year Ended
March 31,
2008 | |
Per Share Data | | | | | | | | | | | | | | | | | | | | |
Net asset value, beginning of period | | $ | 11.36 | | | $ | 10.88 | | | $ | 13.66 | | | $ | 11.72 | | | $ | 10.54 | |
| | | | | | | | | | | | | | | | | | | | |
Income (loss) from investment operations: | | | | | | | | | | | | | | | | | | | | |
Net investment incomea | | | .25 | | | | .31 | | | | .32 | | | | .31 | | | | .34 | |
Net gain (loss) on investments (realized and unrealized) | | | 3.42 | | | | .47 | | | | (2.80 | ) | | | 1.93 | | | | 1.19 | |
| | | | | | | | | | | | | | | | | | | | |
Total from investment operations | | | 3.67 | | | | .78 | | | | (2.48 | ) | | | 2.24 | | | | 1.53 | |
| | | | | | | | | | | | | | | | | | | | |
Less distributions from: | | | | | | | | | | | | | | | | | | | | |
Net investment income | | | (.25 | ) | | | (.30 | ) | | | (.30 | ) | | | (.30 | ) | | | (.35 | ) |
| | | | | | | | | | | | | | | | | | | | |
Total distributions | | | (.25 | ) | | | (.30 | ) | | | (.30 | ) | | | (.30 | ) | | | (.35 | ) |
| | | | | | | | | | | | | | | | | | | | |
Net asset value, end of period | | $ | 14.78 | | | $ | 11.36 | | | $ | 10.88 | | | $ | 13.66 | | | $ | 11.72 | |
| | | | | | | | | | | | | | | | | | | | |
Total Returnb | | | 32.56 | % | | | 7.03 | % | | | (18.18 | %) | | | 19.49 | % | | | 14.82 | % |
| | | | | | | | | | | | | | | | | | | | |
Ratios/Supplemental Data | | | | | | | | | | | | | | | | | | | | |
Net assets, end of period (in thousands) | | $ | 11,600 | | | $ | 31,420 | | | $ | 28,990 | | | $ | 7,867 | | | $ | 25,181 | |
| | | | | | | | | | | | | | | | | | | | |
Ratios to average net assets: | | | | | | | | | | | | | | | | | | | | |
Net investment income | | | 1.77 | % | | | 2.46 | % | | | 2.76 | % | | | 2.49 | % | | | 3.13 | % |
Total expenses | | | 1.45 | % | | | 1.48 | % | | | 1.48 | % | | | 1.48 | % | | | 1.47 | % |
| | | | | | | | | | | | | | | | | | | | |
Portfolio turnover rate | | | 2,322 | % | | | 1,930 | % | | | 1,503 | % | | | 1,794 | % | | | 1,142 | % |
| | |
SEE NOTES TO FINANCIAL STATEMENTS. | | THE RYDEX SERIES FUNDS ANNUAL REPORT | 231 |
GOVERNMENT LONG BOND 1.2x STRATEGY FUND
FINANCIAL HIGHLIGHTS (concluded)
This table is presented to show selected data for a share outstanding throughout each period and to assist shareholders in evaluating a Fund’s performance for the periods presented.
| | | | | | | | | | | | | | | | | | | | |
A-Class | | Year Ended
March 31,
2012 | | | Year Ended
March 31,
2011 | | | Year Ended
March 31,
2010 | | | Year Ended
March 31,
2009 | | | Year Ended
March 31,
2008 | |
Per Share Data | | | | | | | | | | | | | | | | | | | | |
Net asset value, beginning of period | | $ | 11.45 | | | $ | 10.96 | | | $ | 13.75 | | | $ | 11.79 | | | $ | 10.60 | |
| | | | | | | | | | | | | | | | | | | | |
Income (loss) from investment operations: | | | | | | | | | | | | | | | | | | | | |
Net investment incomea | | | .29 | | | | .33 | | | | .33 | | | | .34 | | | | .38 | |
Net gain (loss) on investments (realized and unrealized) | | | 3.47 | | | | .49 | | | | (2.79 | ) | | | 1.95 | | | | 1.19 | |
| | | | | | | | | | | | | | | | | | | | |
Total from investment operations | | | 3.76 | | | | .82 | | | | (2.46 | ) | | | 2.29 | | | | 1.57 | |
| | | | | | | | | | | | | | | | | | | | |
Less distributions from: | | | | | | | | | | | | | | | | | | | | |
Net investment income | | | (.29 | ) | | | (.33 | ) | | | (.33 | ) | | | (.33 | ) | | | (.38 | ) |
| | | | | | | | | | | | | | | | | | | | |
Total distributions | | | (.29 | ) | | | (.33 | ) | | | (.33 | ) | | | (.33 | ) | | | (.38 | ) |
| | | | | | | | | | | | | | | | | | | | |
Net asset value, end of period | | $ | 14.92 | | | $ | 11.45 | | | $ | 10.96 | | | $ | 13.75 | | | $ | 11.79 | |
| | | | | | | | | | | | | | | | | | | | |
Total Returnb | | | 33.00 | % | | | 7.35 | % | | | (17.98 | %) | | | 19.84 | % | | | 15.13 | % |
| | | | | | | | | | | | | | | | | | | | |
Ratios/Supplemental Data | | | | | | | | | | | | | | | | | | | | |
Net assets, end of period (in thousands) | | $ | 10,885 | | | $ | 2,753 | | | $ | 5,576 | | | $ | 11,119 | | | $ | 20,374 | |
| | | | | | | | | | | | | | | | | | | | |
Ratios to average net assets: | | | | | | | | | | | | | | | | | | | | |
Net investment income | | | 2.02 | % | | | 2.75 | % | | | 2.84 | % | | | 2.74 | % | | | 3.44 | % |
Total expenses | | | 1.20 | % | | | 1.23 | % | | | 1.24 | % | | | 1.23 | % | | | 1.22 | % |
| | | | | | | | | | | | | | | | | | | | |
Portfolio turnover rate | | | 2,322 | % | | | 1,930 | % | | | 1,503 | % | | | 1,794 | % | | | 1,142 | % |
| | | | | | | | | | | | | | | | | | | | |
C-Class | | Year Ended
March 31,
2012 | | | Year Ended
March 31,
2011 | | | Year Ended
March 31,
2010 | | | Year Ended
March 31,
2009 | | | Year Ended
March 31,
2008 | |
Per Share Data | | | | | | | | | | | | | | | | | | | | |
Net asset value, beginning of period | | $ | 11.42 | | | $ | 10.94 | | | $ | 13.72 | | | $ | 11.77 | | | $ | 10.59 | |
| | | | | | | | | | | | | | | | | | | | |
Income (loss) from investment operations: | | | | | | | | | | | | | | | | | | | | |
Net investment incomea | | | .19 | | | | .24 | | | | .25 | | | | .25 | | | | .30 | |
Net gain (loss) on investments (realized and unrealized) | | | 3.45 | | | | .48 | | | | (2.78 | ) | | | 1.94 | | | | 1.18 | |
| | | | | | | | | | | | | | | | | | | | |
Total from investment operations | | | 3.64 | | | | .72 | | | | (2.53 | ) | | | 2.19 | | | | 1.48 | |
| | | | | | | | | | | | | | | | | | | | |
Less distributions from: | | | | | | | | | | | | | | | | | | | | |
Net investment income | | | (.18 | ) | | | (.24 | ) | | | (.25 | ) | | | (.24 | ) | | | (.30 | ) |
Total distributions | | | (.18 | ) | | | (.24 | ) | | | (.25 | ) | | | (.24 | ) | | | (.30 | ) |
| | | | | | | | | | | | | | | | | | | | |
Net asset value, end of period | | $ | 14.88 | | | $ | 11.42 | | | $ | 10.94 | | | $ | 13.72 | | | $ | 11.77 | |
| | | | | | | | | | | | | | | | | | | | |
Total Returnb | | | 32.01 | % | | | 6.47 | % | | | (18.56 | %) | | | 18.90 | % | | | 14.20 | % |
| | | | | | | | | | | | | | | | | | | | |
Ratios/Supplemental Data | | | | | | | | | | | | | | | | | | | | |
Net assets, end of period (in thousands) | | $ | 4,451 | | | $ | 6,091 | | | $ | 12,695 | | | $ | 5,502 | | | $ | 6,239 | |
| | | | | | | | | | | | | | | | | | | | |
Ratios to average net assets: | | | | | | | | | | | | | | | | | | | | |
Net investment income | | | 1.32 | % | | | 1.93 | % | | | 2.17 | % | | | 2.00 | % | | | 2.80 | % |
Total expenses | | | 1.95 | % | | | 1.97 | % | | | 2.00 | % | | | 1.97 | % | | | 1.98 | % |
| | | | | | | | | | | | | | | | | | | | |
Portfolio turnover rate | | | 2,322 | % | | | 1,930 | % | | | 1,503 | % | | | 1,794 | % | | | 1,142 | % |
| a | Net investment income per share was computed using average shares outstanding throughout the period. |
| b | Total return does not reflect the impact of any applicable sales charges and has not been annualized. |
| | |
232 | THE RYDEX SERIES FUNDS ANNUAL REPORT | | SEE NOTES TO FINANCIAL STATEMENTS. |
This page intentionally left blank.
THE RYDEX SERIES FUNDS ANNUAL REPORT | 233
| | |
| PERFORMANCE REPORT AND FUND PROFILE (Unaudited) | | March 31, 2012 |
INVERSE GOVERNMENT LONG BOND STRATEGY FUND
OBJECTIVE: Seeks to provide total returns that inversely correlate, before fees and expenses, to the price movements of a benchmark for U.S. Treasury debt instruments or futures contracts on a specified debt instrument on a daily basis. The Fund’s current benchmark is the daily price movement of the Long Treasury Bond. The Long Treasury Bond is the U.S. Treasury bond with the longest maturity, which is currently 30 years. The price movement of the Long Treasury Bond is based on the daily price change of the most recently issued Long Treasury Bond. The Fund does not seek to achieve its investment objective over a period of time greater than one day.
The 30-year bond ended the 12-month period ended March 31, 2012, with a yield of 3.27%, compared with a yield of about 4.51% at the start of the period. Treasury yields have been under pressure due to safe-haven buying amid recurring concerns about the European debt crisis, although the situation was seen as less urgent as the first quarter of 2012 progressed and U.S. economic data grew stronger. Yields actually rose in the final month of the period out of the range that had persisted for months, due to interpretation of a Fed policy statement that it might step back from its bond purchases through quantitative easing. But even that situation reversed itself, with yields falling to close the period, as Fed comments turned more dovish. The Inverse Government Long Bond Strategy Fund Investor Class returned -26.07% for the 12 months ended March 31, 2012, compared with a return of -7.92% for the daily price movement of the Long Treasury Bond. The fund maintained a daily correlation of over 99% to its benchmark of -100% of the daily price movement of the Long Treasury Bond.
Derivatives in the Fund are used to provide additional exposure to composition of the benchmark in the highest efficient manner and not for hedging purposes. The results of derivatives use during the period were within our expectations and contributed to the Fund’s performance.
Due to the compounding of daily returns, leveraged and inverse funds’ returns over periods other than one day will likely differ in amount and possibly direction from the benchmark return for the same period. Investors should monitor their leveraged and inverse funds’ holdings to ensure that they are consistent with their strategies, as frequently as daily.
The effects of compounding may cause the longer-term correlation of the fund to its benchmark to diminish. The apparent discrepancy between the leveraged and unleveraged indices is the result of compounding, which is described briefly on page 4 of this report.
Performance displayed represents past performance which is no guarantee of future results.
Holdings Diversification (Market Exposure as % of Net Assets)
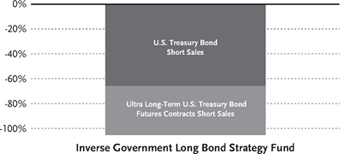
“Holdings Diversification (Market Exposure as % of Net Assets)” excludes any temporary cash investments.
| | | | |
Inception Dates: | | | |
Investor Class | | | March 3, 1995 | |
Advisor Class | | | August 1, 2003 | |
A-Class | | | March 31, 2004 | |
C-Class | | | March 28, 2001 | |
The Fund invests principally in short sales and derivative investments such as futures contracts.
234 | THE RYDEX SERIES FUNDS ANNUAL REPORT
PERFORMANCE REPORT AND FUND PROFILE (Unaudited) (concluded)
Cumulative Fund Performance*
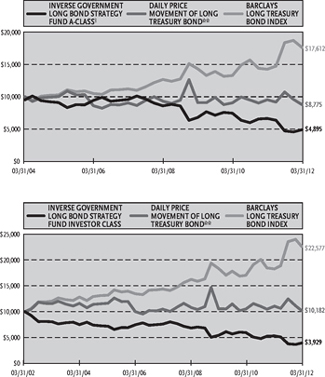
Average Annual Returns*
Periods Ended 03/31/12
| | | | | | | | | | | | |
| | | 1 Year | | | 5 Year | | | 10 Year | |
Investor Class Shares | | | -26.07 | % | | | -12.33 | % | | | -8.92 | % |
| | | | | | | | | | | | |
C-Class Shares | | | -26.82 | % | | | -13.20 | % | | | -9.81 | % |
| | | | | | | | | | | | |
C-Class Shares with CDSC† | | | -27.55 | % | | | -13.20 | % | | | -9.81 | % |
| | | | | | | | | | | | |
Daily Price Movement of Long Treasury Bond** | | | -7.92 | % | | | -0.60 | % | | | 0.18 | % |
| | | | | | | | | | | | |
Barclays Long Treasury Bond Index | | | 23.65 | % | | | 9.46 | % | | | 8.48 | % |
| | | | | | | | | | | | |
| | | |
| | | | | | | | | Since
Inception
(08/01/03) | |
Advisor Class Shares | | | -26.75 | % | | | -12.80 | % | | | -8.99 | % |
| | | | | | | | | | | | |
Daily Price Movement of Long Treasury Bond** | | | -7.92 | % | | | -0.60 | % | | | -0.59 | % |
| | | | | | | | | | | | |
Barclays Long Treasury Bond Index | | | 23.65 | % | | | 9.46 | % | | | 8.04 | % |
| | | | | | | | | | | | |
| | | |
| | | | | | | | | (03/31/01) | |
A-Class Shares | | | -26.25 | % | | | -12.55 | % | | | -7.99 | % |
| | | | | | | | | | | | |
A-Class Shares with sales charge‡ | | | -29.76 | % | | | -13.41 | % | | | -8.54 | % |
| | | | | | | | | | | | |
Daily Price Movement of Long Treasury Bond** | | | -7.92 | % | | | -0.60 | % | | | -1.62 | % |
| | | | | | | | | | | | |
Barclays Long Treasury Bond Index | | | 23.65 | % | | | 9.46 | % | | | 7.33 | % |
| | | | | | | | | | | | |
| * | The performance data above represents past performance that is not predictive of future results. The investment return and principal value of an investment in the Fund will fluctuate so that an investor’s shares, when redeemed, may be worth more or less than their original cost. Returns are historical and include changes in principal and reinvested dividends and capital gains and do not reflect the effect of taxes. The Barclays Long Treasury Bond Index and Daily Price Movement of Long Treasury Bond are unmanaged indices and, unlike the Fund, have no management fees or operating expenses to reduce their reported returns. The graphs are based on Investor Class shares and A-Class shares only; performance for Advisor Class shares and C-Class shares will vary due to differences in fee structures. |
| † | Fund returns include a CDSC of 1% if redeemed within 12 months of purchase. |
| ‡ | Fund returns are calculated using the maximum sales charge of 4.75%. |
| ** | Does not reflect any interest. |
THE RYDEX SERIES FUNDS ANNUAL REPORT | 235
| | |
| SCHEDULE OF INVESTMENTS | | March 31, 2012 |
INVERSE GOVERNMENT LONG BOND STRATEGY FUND | | |
| | | | | | | | |
| | | FACE
AMOUNT | | | VALUE | |
FEDERAL AGENCY DISCOUNT NOTES††—53.3% | | | | | |
Federal Farm Credit Bank1 | | | | | | | | |
0.05% due 04/25/12 | | $ | 100,000,000 | | | $ | 99,996,667 | |
0.19% due 05/31/12 | | | 25,000,000 | | | | 24,998,775 | |
| | | | | | | | |
Total Federal Farm Credit Bank | | | | | | | 124,995,442 | |
| | | | | | | | |
Federal Home Loan Bank1 | | | | | | | | |
0.03% due 04/02/12 | | | 100,000,000 | | | | 99,999,916 | |
0.10% due 05/11/12 | | | 20,000,000 | | | | 19,997,778 | |
| | | | | | | | |
Total Federal Home Loan Bank | | | | | | | 119,997,694 | |
| | | | | | | | |
Freddie Mac2 | | | | | | | | |
0.19% due 05/15/12 | | | 25,000,000 | | | | 24,999,100 | |
0.06% due 05/29/12 | | | 15,000,000 | | | | 14,999,280 | |
| | | | | | | | |
Total Freddie Mac | | | | | | | 39,998,380 | |
| | | | | | | | |
Farmer Mac1 | | | | | | | | |
0.14% due 08/10/12 | | | 10,000,000 | | | | 9,997,830 | |
| | | | | | | | |
Total Federal Agency Discount Notes
(Cost $294,973,974) | | | | | | | 294,989,346 | |
| | | | | | | | |
| |
FEDERAL AGENCY NOTES††—18.1% | | | | | |
Federal Home Loan Bank1 | | | | | | | | |
0.25% due 07/02/12 | | | 25,000,000 | | | | 25,005,625 | |
0.25% due 06/21/12 | | | 25,000,000 | | | | 25,005,475 | |
0.23% due 06/28/12 | | | 25,000,000 | | | | 25,003,575 | |
0.20% due 06/15/12 | | | 25,000,000 | | | | 25,002,525 | |
| | | | | | | | |
Total Federal Home Loan Bank | | | | | | | 100,017,200 | |
| | | | | | | | |
Total Federal Agency Notes
(Cost $99,998,556) | | | | | | | 100,017,200 | |
| | | | | | | | |
| |
REPURCHASE AGREEMENTS††—74.3% | | | | | |
Individual Repurchase Agreement4 | | | | | | | | |
Barclays Capital issued | | | | | | | | |
03/30/12 at (0.05)%due 04/02/12 (secured by a U.S. Treasury Bond, at a rate of 3.13% and maturing 02/15/42 as collateral, with a value of $331,303,050) to be repurchased at $324,805,558 | | | 324,806,912 | | | | 324,806,912 | |
| | | | | | | | |
| | | FACE
AMOUNT | | | VALUE | |
Joint Repurchase Agreements3 | | | | | | | | |
HSBC Group | | | | | | | | |
issued 03/30/12 at 0.01% due 04/02/12 | | $ | 58,462,716 | | | $ | 58,462,716 | |
Mizuho Financial Group, Inc. | | | | | | | | |
issued 03/30/12 at 0.01% due 04/02/12 | | | 16,448,446 | | | | 16,448,446 | |
Credit Suisse Group | | | | | | | | |
issued 03/30/12 at 0.01% due 04/02/12 | | | 7,547,568 | | | | 7,547,568 | |
Deutsche Bank | | | | | | | | |
issued 03/30/12 at 0.01% due 04/02/12 | | | 4,371,815 | | | | 4,371,815 | |
| | | | | | | | |
Total Repurchase Agreements
(Cost $411,637,457) | | | | | | | 411,637,457 | |
| | | | | | | | |
Total Long Investments—145.7%
(Cost $806,609,987) | | | | | | $ | 806,644,003 | |
| | | | | | | | |
U.S. GOVERNMENT SECURITIES SOLD SHORT†—(65.6)% | | | | | | | | |
U.S. Treasury Bond | | | | | | | | |
3.13% due 02/15/42 | | | 379,798,000 | | | $ | (363,063,151 | ) |
| | | | | | | | |
Total U.S. Government Securities Sold Short
(Proceeds $379,556,210) | | | | | | | (363,063,151 | ) |
| | | | | | | | |
Other Assets & Liabilities, net—19.9% | | | | | | | 110,089,630 | |
| | | | | | | | |
Total Net Assets—100.0% | | | | | | $ | 553,670,482 | |
| | | | | | | | |
| | |
| | | CONTRACTS | | | UNREALIZED
GAIN | |
INTEREST RATE FUTURES CONTRACTS SOLD SHORT† | | | | | |
June 2012 Ultra Long-Term U.S. Treasury | | | | | | | | |
Bond Futures Contracts (Aggregate Value of Contracts $219,638,750) | | | 1,460 | | | $ | 6,471,548 | |
| | | | | | | | |
| † | Value determined based on Level 1 inputs — See Note 4. |
| †† | Value determined based on Level 2 inputs — See Note 4. |
| 1 | The issuer operates under a Congressional charter; its securities are neither issued nor guaranteed by the U.S. Government. |
| 2 | On September 7, 2008, the issuer was placed in conservatorship by the Federal Housing Finance Agency (FHFA). As conservator, the FHFA has full powers to control the assets and operations of the firm. |
| 3 | Repurchase Agreements — See Note 5. |
| 4 | All or portion of this security is pledged as short collateral at March 31, 2012. |
| | |
236 | THE RYDEX SERIES FUNDS ANNUAL REPORT | | SEE NOTES TO FINANCIAL STATEMENTS. |
INVERSE GOVERNMENT LONG BOND STRATEGY FUND
STATEMENT OF ASSETS AND LIABILITIES
| | | | |
| March 31, 2012 | | | |
| |
ASSETS: | | | | |
Investments, at value
(cost $394,972,530) | | $ | 395,006,546 | |
Repurchase agreements, at value
(cost $411,637,457) | | | 411,637,457 | |
| | | | |
Total investments
(cost $806,609,987) | | | 806,644,003 | |
Segregated cash with broker | | | 4,717,500 | |
Receivables: | | | | |
Fund shares sold | | | 67,841,629 | |
Securities sold | | | 38,237,500 | |
Variation margin | | | 2,589,692 | |
Interest | | | 61,696 | |
| | | | |
Total assets | | | 920,092,020 | |
| | | | |
LIABILITIES: | | | | |
Securities sold short, at value
(proceeds $379,556,210) | | | 363,063,151 | |
Payable for: | | | | |
Fund shares redeemed | | | 1,110,524 | |
Management fees | | | 381,395 | |
Distribution and service fees | | | 140,586 | |
Transfer agent and administrative fees | | | 105,943 | |
Portfolio accounting fees | | | 36,824 | |
Accrued interest | | | 1,341,922 | |
Miscellaneous | | | 241,193 | |
| | | | |
Total liabilities | | | 366,421,538 | |
| | | | |
NET ASSETS | | $ | 553,670,482 | |
| | | | |
NET ASSETS CONSIST OF: | | | | |
Paid in capital | | $ | 1,035,236,162 | |
Accumulated net investment loss | | | (4,115,790 | ) |
Accumulated net realized loss on investments | | | (500,448,513 | ) |
Net unrealized appreciation on investments | | | 22,998,623 | |
| | | | |
Net assets | | $ | 553,670,482 | |
| | | | |
INVESTOR CLASS: | | | | |
Net assets | | $ | 247,454,245 | |
Capital shares outstanding | | | 25,598,696 | |
Net asset value per share | | $ | 9.67 | |
| | | | |
ADVISOR CLASS: | | | | |
Net assets | | $ | 199,136,738 | |
Capital shares outstanding | | | 21,567,664 | |
Net asset value per share | | $ | 9.23 | |
| | | | |
A-CLASS: | | | | |
Net assets | | $ | 37,607,364 | |
Capital shares outstanding | | | 3,985,127 | |
Net asset value per share | | $ | 9.44 | |
| | | | |
Maximum offering price per share
(Net asset value divided by 95.25%) | | $ | 9.91 | |
| | | | |
C-CLASS: | | | | |
Net assets | | $ | 69,472,135 | |
Capital shares outstanding | | | 8,032,324 | |
Net asset value per share | | $ | 8.65 | |
| | | | |
STATEMENT OF OPERATIONS
| | | | |
| Year Ended March 31, 2012 | | | |
| |
INVESTMENT INCOME: | | | | |
Interest | | $ | 692,133 | |
| | | | |
Total investment income | | | 692,133 | |
| | | | |
EXPENSES: | | | | |
Management fees | | | 4,294,234 | |
Transfer agent and administrative fees | | | 1,192,841 | |
Distribution and service fees: | | | | |
Advisor Class | | | 312,580 | |
A-Class | | | 132,599 | |
C-Class | | | 875,778 | |
Portfolio accounting fees | | | 411,375 | |
Interest expense | | | 12,883,387 | |
Trustees’ fees* | | | 154,391 | |
Custodian fees | | | 124,966 | |
Miscellaneous | | | 448,249 | |
| | | | |
Total expenses | | | 20,830,400 | |
| | | | |
Net investment loss | | | (20,138,267 | ) |
| | | | |
NET REALIZED AND UNREALIZED GAIN (LOSS): | | | | |
Net realized gain (loss) on: | | | | |
Investments | | | 3,875 | |
Futures contracts | | | (52,969,697 | ) |
Securities sold short | | | (119,272,136 | ) |
| | | | |
Net realized loss | | | (172,237,958 | ) |
| | | | |
Net change in unrealized appreciation (depreciation) on: | | | | |
Investments | | | (88,670 | ) |
Securities sold short | | | 26,481,648 | |
Futures contracts | | | 6,801,936 | |
| | | | |
Net change in unrealized appreciation (depreciation) | | | 33,194,914 | |
| | | | |
Net realized and unrealized loss | | | (139,043,044 | ) |
| | | | |
Net decrease in net assets resulting from operations | | $ | (159,181,311 | ) |
| | | | |
| * | Relates to Trustees not deemed “interested persons” within the meaning of Section 2(a)(19) of the 1940 Act. |
| | |
SEE NOTES TO FINANCIAL STATEMENTS. | | THE RYDEX SERIES FUNDS ANNUAL REPORT | 237 |
INVERSE GOVERNMENT LONG BOND STRATEGY FUND
STATEMENTS OF CHANGES IN NET ASSETS
| | | | | | | | |
| | | Year Ended
March 31,
2012 | | | Year Ended
March 31,
2011 | |
INCREASE (DECREASE) IN NET ASSETS FROM OPERATIONS: | | | | | | | | |
Net investment loss | | $ | (20,138,267 | ) | | $ | (30,208,843 | ) |
Net realized loss on investments | | | (172,237,958 | ) | | | (28,164,676 | ) |
Net change in unrealized appreciation (depreciation) on investments | | | 33,194,914 | | | | (13,957,821 | ) |
| | | | | | | | |
Net decrease in net assets resulting from operations | | | (159,181,311 | ) | | | (72,331,340 | ) |
| | | | | | | | |
CAPITALSHARETRANSACTIONS: | | | | | | | | |
PROCEEDSFROMSALEOFSHARES | | | | | | | | |
Investor Class | | | 1,308,403,784 | | | | 1,015,107,588 | |
Advisor Class | | | 2,192,757,950 | | | | 1,581,298,508 | |
A-Class | | | 22,252,450 | | | | 55,076,811 | |
C-Class | | | 43,128,478 | | | | 53,771,581 | |
COSTOFSHARESREDEEMED | | | | | | | | |
Investor Class | | | (1,366,228,209 | ) | | | (942,202,484 | ) |
Advisor Class | | | (2,029,756,332 | ) | | | (1,599,920,603 | ) |
A-Class | | | (39,208,507 | ) | | | (52,462,669 | ) |
C-Class | | | (57,271,653 | ) | | | (63,407,171 | ) |
| | | | | | | | |
Net increase from capital share transactions | | | 74,077,961 | | | | 47,261,561 | |
| | | | | | | | |
Net decrease in net assets | | | (85,103,350 | ) | | | (25,069,779 | ) |
NETASSETS: | | | | | | | | |
Beginning of year | | | 638,773,832 | | | | 663,843,611 | |
| | | | | | | | |
End of year | | $ | 553,670,482 | | | $ | 638,773,832 | |
| | | | | | | | |
Accumulated net investment loss at end of year | | $ | (4,115,790 | ) | | | — | |
| | | | | | | | |
CAPITALSHAREACTIVITY: | | | | | | | | |
Shares sold | | | | | | | | |
Investor Class | | | 131,857,730 | | | | 77,699,043 | |
Advisor Class | | | 224,370,362 | | | | 126,977,398 | |
A-Class | | | 2,217,179 | | | | 4,274,325 | |
C-Class | | | 4,392,197 | | | | 4,548,281 | |
Shares redeemed | | | | | | | | |
Investor Class | | | (137,294,023 | ) | | | (72,375,726 | ) |
Advisor Class | | | (206,359,255 | ) | | | (128,126,460 | ) |
A-Class | | | (3,972,717 | ) | | | (4,113,451 | ) |
C-Class | | | (6,045,734 | ) | | | (5,373,749 | ) |
| | | | | | | | |
Net increase in shares | | | 9,165,739 | | | | 3,509,661 | |
| | | | | | | | |
| | |
238 | THE RYDEX SERIES FUNDS ANNUAL REPORT | | SEE NOTES TO FINANCIAL STATEMENTS. |
INVERSE GOVERNMENT LONG BOND STRATEGY FUND
FINANCIAL HIGHLIGHTS
This table is presented to show selected data for a share outstanding throughout each period and to assist shareholders in evaluating a Fund’s performance for the periods presented.
| | | | | | | | | | | | | | | | | | | | |
Investor Class | | Year Ended
March 31,
2012 | | | Year Ended
March 31,
2011 | | | Year Ended
March 31,
2010 | | | Year Ended
March 31,
2009 | | | Year Ended
March 31,
2008 | |
Per Share Data | | | | | | | | | | | | | | | | | | | | |
Net asset value, beginning of period | | $ | 13.08 | | | $ | 14.65 | | | $ | 13.32 | | | $ | 16.81 | | | $ | 19.37 | |
| | | | | | | | | | | | | | | | | | | | |
Income (loss) from investment operations: | | | | | | | | | | | | | | | | | | | | |
Net investment income (loss)a | | | (.43 | ) | | | (.62 | ) | | | (.33 | ) | | | (.11 | ) | | | .49 | |
Net gain (loss) on investments (realized and unrealized) | | | (2.98 | ) | | | (.95 | ) | | | 1.66 | | | | (3.38 | ) | | | (2.39 | ) |
| | | | | | | | | | | | | | | | | | | | |
Total from investment operations | | | (3.41 | ) | | | (1.57 | ) | | | 1.33 | | | | (3.49 | ) | | | (1.90 | ) |
| | | | | | | | | | | | | | | | | | | | |
Less distributions from: | | | | | | | | | | | | | | | | | | | | |
Net investment income | | | — | | | | — | | | | — | | | | — | | | | (.66 | ) |
| | | | | | | | | | | | | | | | | | | | |
Total distributions | | | — | | | | — | | | | — | | | | — | | | | (.66 | ) |
| | | | | | | | | | | | | | | | | | | | |
Net asset value, end of period | | $ | 9.67 | | | $ | 13.08 | | | $ | 14.65 | | | $ | 13.32 | | | $ | 16.81 | |
| | | | | | | | | | | | | | | | | | | | |
Total Returnb | | | (26.07 | %) | | | (10.72 | %) | | | 9.98 | % | | | (20.76 | %) | | | (9.98 | %) |
| | | | | | | | | | | | | | | | | | | | |
Ratios/Supplemental Data | | | | | | | | | | | | | | | | | | | | |
Net assets, end of period (in thousands) | | $ | 247,454 | | | $ | 406,031 | | | $ | 376,574 | | | $ | 269,155 | | | $ | 237,900 | |
| | | | | | | | | | | | | | | | | | | | |
Ratios to average net assets: | | | | | | | | | | | | | | | | | | | | |
Net investment income (loss) | | | (3.99 | %) | | | (4.78 | %) | | | (2.23 | %) | | | (0.72 | %) | | | 2.56 | % |
Total expenses | | | 4.13 | % | | | 5.06 | % | | | 2.53 | % | | | 2.80 | % | | | 3.45 | % |
Operating expensesc | | | 1.39 | % | | | 1.42 | % | | | 1.41 | % | | | 1.41 | % | | | 1.40 | % |
| | | | | | | | | | | | | | | | | | | | |
Portfolio turnover rate | | | 1,107 | % | | | 771 | % | | | 985 | % | | | 584 | % | | | 550 | % |
| | | | | | | | | | | | | | | | | | | | |
Advisor Class | | Year Ended
March 31,
2012 | | | Year Ended
March 31,
2011 | | | Year Ended
March 31,
2010 | | | Year Ended
March 31,
2009 | | | Year Ended
March 31,
2008 | |
Per Share Data | | | | | | | | | | | | | | | | | | | | |
Net asset value, beginning of period | | $ | 12.60 | | | $ | 14.17 | | | $ | 12.95 | | | $ | 16.41 | | | $ | 19.01 | |
| | | | | | | | | | | | | | | | | | | | |
Income (loss) from investment operations: | | | | | | | | | | | | | | | | | | | | |
Net investment income (loss)a | | | (.41 | ) | | | (.66 | ) | | | (.39 | ) | | | (.18 | ) | | | .34 | |
Net gain (loss) on investments (realized and unrealized) | | | (2.96 | ) | | | (.91 | ) | | | 1.61 | | | | (3.28 | ) | | | (2.28 | ) |
| | | | | | | | | | | | | | | | | | | | |
Total from investment operations | | | (3.37 | ) | | | (1.57 | ) | | | 1.22 | | | | (3.46 | ) | | | (1.94 | ) |
| | | | | | | | | | | | | | | | | | | | |
Less distributions from: | | | | | | | | | | | | | | | | | | | | |
Net investment income | | | — | | | | — | | | | — | | | | — | | | | (.66 | ) |
| | | | | | | | | | | | | | | | | | | | |
Total distributions | | | — | | | | — | | | | — | | | | — | | | | (.66 | ) |
| | | | | | | | | | | | | | | | | | | | |
Net asset value, end of period | | $ | 9.23 | | | $ | 12.60 | | | $ | 14.17 | | | $ | 12.95 | | | $ | 16.41 | |
| | | | | | | | | | | | | | | | | | | | |
Total Returnb | | | (26.75 | %) | | | (11.08 | %) | | | 9.42 | % | | | (21.08 | %) | | | (10.39 | %) |
| | | | | | | | | | | | | | | | | | | | |
Ratios/Supplemental Data | | | | | | | | | | | | | | | | | | | | |
Net assets, end of period (in thousands) | | $ | 199,137 | | | $ | 44,798 | | | $ | 66,668 | | | $ | 35,153 | | | $ | 24,891 | |
| | | | | | | | | | | | | | | | | | | | |
Ratios to average net assets: | | | | | | | | | | | | | | | | | | | | |
Net investment income (loss) | | | (4.22 | %) | | | (5.28 | %) | | | (2.79 | %) | | | (1.19 | %) | | | 1.84 | % |
Total expenses | | | 4.38 | % | | | 5.56 | % | | | 3.09 | % | | | 3.36 | % | | | 4.10 | % |
Operating expensesc | | | 1.87 | % | | | 1.91 | % | | | 1.91 | % | | | 1.91 | % | | | 1.90 | % |
| | | | | | | | | | | | | | | | | | | | |
Portfolio turnover rate | | | 1,107 | % | | | 771 | % | | | 985 | % | | | 584 | % | | | 550 | % |
| | |
SEE NOTES TO FINANCIAL STATEMENTS. | | THE RYDEX SERIES FUNDS ANNUAL REPORT | 239 |
INVERSE GOVERNMENT LONG BOND STRATEGY FUND
FINANCIAL HIGHLIGHTS (concluded)
This table is presented to show selected data for a share outstanding throughout each period and to assist shareholders in evaluating a Fund’s performance for the periods presented.
| | | | | | | | | | | | | | | | | | | | |
A-Class | | Year Ended
March 31,
2012 | | | Year Ended
March 31,
2011 | | | Year Ended
March 31,
2010 | | | Year Ended
March 31,
2009 | | | Year Ended
March 31,
2008 | |
Per Share Data | | | | | | | | | | | | | | | | | | | | |
Net asset value, beginning of period | | $ | 12.80 | | | $ | 14.36 | | | $ | 13.10 | | | $ | 16.57 | | | $ | 19.16 | |
| | | | | | | | | | | | | | | | | | | | |
Income (loss) from investment operations: | | | | | | | | | | | | | | | | | | | | |
Net investment income (loss)a | | | (.45 | ) | | | (.64 | ) | | | (.35 | ) | | | (.15 | ) | | | .44 | |
Net gain (loss) on investments (realized and unrealized) | | | (2.91 | ) | | | (.92 | ) | | | 1.61 | | | | (3.32 | ) | | | (2.37 | ) |
| | | | | | | | | | | | | | | | | | | | |
Total from investment operations | | | (3.36 | ) | | | (1.56 | ) | | | 1.26 | | | | (3.47 | ) | | | (1.93 | ) |
| | | | | | | | | | | | | | | | | | | | |
Less distributions from: | | | | | | | | | | | | | | | | | | | | |
Net investment income | | | — | | | | — | | | | — | | | | — | | | | (.66 | ) |
| | | | | | | | | | | | | | | | | | | | |
Total distributions | | | — | | | | — | | | | — | | | | — | | | | (.66 | ) |
| | | | | | | | | | | | | | | | | | | | |
Net asset value, end of period | | $ | 9.44 | | | $ | 12.80 | | | $ | 14.36 | | | $ | 13.10 | | | $ | 16.57 | |
| | | | | | | | | | | | | | | | | | | | |
Total Returnb | | | (26.25 | %) | | | (10.86 | %) | | | 9.62 | % | | | (20.94 | %) | | | (10.25 | %) |
| | | | | | | | | | | | | | | | | | | | |
Ratios/Supplemental Data | | | | | | | | | | | | | | | | | | | | |
Net assets, end of period (in thousands) | | $ | 37,607 | | | $ | 73,475 | | | $ | 80,151 | | | $ | 54,574 | | | $ | 37,256 | |
| | | | | | | | | | | | | | | | | | | | |
Ratios to average net assets: | | | | | | | | | | | | | | | | | | | | |
Net investment income (loss) | | | (4.24 | %) | | | (5.03 | %) | | | (2.47 | %) | | | (0.94 | %) | | | 2.37 | % |
Total expenses | | | 4.38 | % | | | 5.31 | % | | | 2.77 | % | | | 3.00 | % | | | 3.86 | % |
Operating expensesc | | | 1.65 | % | | | 1.67 | % | | | 1.66 | % | | | 1.65 | % | | | 1.65 | % |
| | | | | | | | | | | | | | | | | | | | |
Portfolio turnover rate | | | 1,107 | % | | | 771 | % | | | 985 | % | | | 584 | % | | | 550 | % |
| | | | | |
C-Class | | Year Ended
March 31,
2012 | | | Year Ended
March 31,
2011 | | | Year Ended
March 31,
2010 | | | Year Ended
March 31,
2009 | | | Year Ended
March 31,
2008 | |
Per Share Data | | | | | | | | | | | | | | | | | | | | |
Net asset value, beginning of period | | $ | 11.82 | | | $ | 13.36 | | | $ | 12.28 | | | $ | 15.65 | | | $ | 18.26 | |
| | | | | | | | | | | | | | | | | | | | |
Income (loss) from investment operations: | | | | | | | | | | | | | | | | | | | | |
Net investment income (loss)a | | | (.48 | ) | | | (.68 | ) | | | (.43 | ) | | | (.25 | ) | | | .29 | |
Net gain (loss) on investments (realized and unrealized) | | | (2.69 | ) | | | (.86 | ) | | | 1.51 | | | | (3.12 | ) | | | (2.24 | ) |
| | | | | | | | | | | | | | | | | | | | |
Total from investment operations | | | (3.17 | ) | | | (1.54 | ) | | | 1.08 | | | | (3.37 | ) | | | (1.95 | ) |
| | | | | | | | | | | | | | | | | | | | |
Less distributions from: | | | | | | | | | | | | | | | | | | | | |
Net investment income | | | — | | | | — | | | | — | | | | — | | | | (.66 | ) |
| | | | | | | | | | | | | | | | | | | | |
Total distributions | | | — | | | | — | | | | — | | | | — | | | | (.66 | ) |
| | | | | | | | | | | | | | | | | | | | |
Net asset value, end of period | | $ | 8.65 | | | $ | 11.82 | | | $ | 13.36 | | | $ | 12.28 | | | $ | 15.65 | |
| | | | | | | | | | | | | | | | | | | | |
Total Returnb | | | (26.82 | %) | | | (11.53 | %) | | | 8.79 | % | | | (21.53 | %) | | | (10.87 | %) |
| | | | | | | | | | | | | | | | | | | | |
Ratios/Supplemental Data | | | | | | | | | | | | | | | | | | | | |
Net assets, end of period (in thousands) | | $ | 69,472 | | | $ | 114,470 | | | $ | 140,451 | | | $ | 123,413 | | | $ | 124,572 | |
| | | | | | | | | | | | | | | | | | | | |
Ratios to average net assets: | | | | | | | | | | | | | | | | | | | | |
Net investment income (loss) | | | (4.98 | %) | | | (5.78 | %) | | | (3.17 | %) | | | (1.70 | %) | | | 1.62 | % |
Total expenses | | | 5.12 | % | | | 6.06 | % | | | 3.47 | % | | | 3.81 | % | | | 4.44 | % |
Operating expensesc | | | 2.40 | % | | | 2.42 | % | | | 2.41 | % | | | 2.41 | % | | | 2.40 | % |
| | | | | | | | | | | | | | | | | | | | |
Portfolio turnover rate | | | 1,107 | % | | | 771 | % | | | 985 | % | | | 584 | % | | | 550 | % |
| a | Net investment income (loss) per share was computed using average shares outstanding throughout the period. |
| b | Total return does not reflect the impact of any applicable sales charges and has not been annualized. |
| c | Operating expenses exclude interest expense from securities sold short. |
| | |
240 | THE RYDEX SERIES FUNDS ANNUAL REPORT | | SEE NOTES TO FINANCIAL STATEMENTS. |
This page intentionally left blank.
THE RYDEX SERIES FUNDS ANNUAL REPORT | 241
| | |
PERFORMANCE REPORT AND FUND PROFILE (Unaudited) | | March 31, 2012 |
HIGH YIELD STRATEGY FUND
OBJECTIVE: Seeks to provide investment results that correlate, before fees and expenses, to the performance of the high yield bond market.
High-yield bonds continued to rally through the year ended March 31, 2012, as investor appetite for income and yield remains strong in a low interest rate environment, and the U.S. Federal Reserve has signaled its intention to keep interest rates low for well beyond 2012. Moreover, companies with so-called “junk” credit ratings are stampeding the debt markets at a record pace, taking advantage of ultra-low borrowing costs and solid demand from investors seeking higher yields. Thomson Reuters said the $75 billion in junk bond issuance in the first quarter of 2012 was the highest in any quarter since 1980, when it began keeping records, and that the average rate on bonds sold in the first quarter was 7.98%.
The economy appears to be continuing its slow but gradual recovery, avoiding the outright recession that is infecting Europe. Despite volatility in the high-yield sector that will be around as long as the European situation persists, investors will be attracted to the sector’s low default rate and relatively better yields compared with other fixed-income investments.
High Yield Strategy Fund H-Class returned 6.95% for the year ended March 31, 2012, as opposed to its index, the Barclays U.S. High Yield Index*, which returned 6.45%.
Derivatives in the Fund are used to help provide exposure to the composition of the benchmark in the highest efficient manner and not for hedging purposes. The results of derivatives use during the period were within our expectations and contributed to the Fund’s performance.
*Barclays U.S. High Yield Index – an index that measures the market of USD-denominated, non-investment grade, fixed-rate, taxable corporate bonds. Securities are classified as high yield if the middle rating of Moody’s, Fitch, and S&P is Ba1/BB+/BB+ or below.
Performance displayed represents past performance which is no guarantee of future results.
Holdings Diversification (Market Exposure as % of Net Assets)
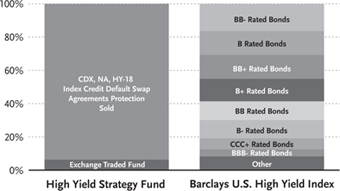
“Holdings Diversification (Market Exposure as % of Net Assets)” excludes any temporary cash investments.
| | | | |
Inception Dates: | | | |
A-Class | | | April 16, 2007 | |
C-Class | | | April 16, 2007 | |
H-Class | | | April 16, 2007 | |
The Fund invests principally in derivative investments such as high yield credit default swap agreements and futures contracts.
242 | THE RYDEX SERIES FUNDS ANNUAL REPORT
| | |
PERFORMANCE REPORT AND FUND PROFILE (Unaudited) (concluded) | | |
Cumulative Fund Performance*
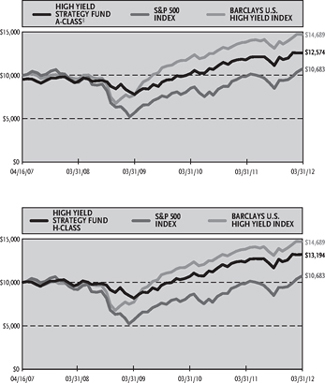
Average Annual Returns*
Periods Ended 03/31/12
| | | | | | | | |
| | | 1 Year | | | Since
Inception
(04/16/07) | |
A-Class Shares | | | 6.94 | % | | | 5.76 | % |
A-Class Shares with sales charge‡ | | | 1.85 | % | | | 4.73 | % |
C-Class Shares | | | 6.16 | % | | | 4.97 | % |
C-Class Shares with CDSC† | | | 5.16 | % | | | 4.97 | % |
H-Class Shares | | | 6.95 | % | | | 5.75 | % |
S&P 500 Index | | | 8.54 | % | | | 1.34 | % |
Barclays U.S. High Yield Index | | | 6.45 | % | | | 8.06 | % |
| * | The performance data above represents past performance that is not predictive of future results. The investment return and principal value of an investment in the Fund will fluctuate so that an investor’s shares, when redeemed, may be worth more or less than their original cost. Returns are historical and include changes in principal and reinvested dividends and capital gains and do not reflect the effect of taxes. The S&P 500 Index and the Barclays U.S. High Yield Index are unmanaged indices and, unlike the Fund, have no management fees or other operating expenses to reduce their reported returns. The graphs are based on A-Class shares and H-Class shares only; performance for C-Class shares will vary due to differences in fee structures. |
| † | Fund returns include a CDSC of 1% if redeemed within 12 months of purchase. |
| ‡ | Fund returns are calculated using the maximum sales charge of 4.75%. |
THE RYDEX SERIES FUNDS ANNUAL REPORT | 243
| | |
| SCHEDULE OF INVESTMENTS | | March 31, 2012 |
| |
HIGH YIELD STRATEGY FUND | | |
| | | | | | | | |
| | | SHARES | | | VALUE | |
EXCHANGE TRADED FUNDS† — 6.3% | | | | | | | | |
iShares iBoxx $ High Yield Corporate Bond Fund | | | 199,758 | | | $ | 18,146,016 | |
| | | | | | | | |
Total Exchange Traded Funds
(Cost $17,848,526) | | | | | | | 18,146,016 | |
| | | | | | | | |
| | | FACE
AMOUNT | | | | |
REPURCHASE AGREEMENTS††,1—72.5% | | | | | | | | |
HSBC Group issued 03/30/12 at 0.01%due 04/02/12 | | $ | 128,174,986 | | | | 128,174,986 | |
Mizuho Financial Group, Inc. issued 03/30/12 at 0.01% due 04/02/12 | | | 36,061,947 | | | | 36,061,947 | |
Credit Suisse Group issued 03/30/12 at 0.01% due 04/02/122 | | | 33,678,576 | | | | 33,678,576 | |
Deutsche Bank issued 03/30/12 at 0.01% due 04/02/12 | | | 9,584,867 | | | | 9,584,867 | |
| | | | | | | | |
Total Repurchase Agreements
(Cost $207,500,376) | | | | | | | 207,500,376 | |
| | | | | | | | |
Total Investments – 78.8%
(Cost $225,348,902) | | | | | | $ | 225,646,392 | |
| | | | | | | | |
Other Assets & Liabilities, net – 21.2% | | | | | | | 60,535,445 | |
| | | | | | | | |
Total Net Assets – 100.0% | | | | | | $ | 286,181,837 | |
| |
| | | | | | | | |
| | | CONTRACTS | | | UNREALIZED
LOSS | |
INTEREST RATE FUTURES CONTRACTS PURCHASED† | | | | | | | | |
June 2012 U.S. Treasury 5 Year Note Futures Contracts (Aggregate Value of Contracts $198,817,500) | | | 1,623 | | | $ | (805,607 | ) |
| | | | | | | | |
CREDIT DEFAULT SWAP AGREEMENT PROTECTION SOLD††,3
| | | | | | | | | | | | | | | | | | | | | | | | | | |
INDEX | | COUNTERPARTY | | PROTECTION
PREMIUM RATE | | | MATURITY
DATE | | | NOTIONAL
PRINCIPAL | | | NOTIONAL
VALUE | | | UPFRONT
PAYMENTS
RECEIVED | | | UNREALIZED
DEPRECIATION | |
CDX.NA.HY-18 Index | | Goldman Sachs International | | | 5.00 | % | | | 06/20/17 | | | $ | 3,800,000 | | | $ | (3,686,000 | ) | | $ | (90,061 | ) | | $ | (23,939 | ) |
CDX.NA.HY-18 Index | | Credit Suisse International | | | 5.00 | % | | | 06/20/17 | | | | 121,000,000 | | | | (117,370,000 | ) | | | (2,867,732 | ) | | | (762,268 | ) |
CDX.NA.HY-18 Index | | Barclays Bank plc | | | 5.00 | % | | | 06/20/17 | | | | 151,600,000 | | | | (147,052,000 | ) | | | (3,788,666 | ) | | | (759,334 | ) |
| † | Value determined based on Level 1 inputs — See Note 4. |
| †† | Value determined based on Level 2 inputs — See Note 4. |
| 1 | Repurchase Agreements — See Note 5. |
| 2 | All or a portion of this security is pledged as credit default swap collateral at March 31, 2012. |
| 3 | Credit Default Swaps — See Note 6. |
| | |
244 | THE RYDEX SERIES FUNDS ANNUAL REPORT | | SEE NOTES TO FINANCIAL STATEMENTS. |
HIGH YIELD STRATEGY FUND
STATEMENT OF ASSETS AND LIABILITIES
March 31, 2012
| | | | |
ASSETS: | | | | |
Investments, at value
(cost $17,848,526) | | $ | 18,146,016 | |
Repurchase agreements, at value
(cost $207,500,376) | | | 207,500,376 | |
| | | | |
Total investments
(cost $225,348,902) | | | 225,646,392 | |
Cash | | | 50,574,692 | |
Segregated cash with broker | | | 19,044,950 | |
Receivables: | | | | |
Fund shares sold | | | 3,129,011 | |
Protection fees on credit default swaps | | | 460,782 | |
Credit default swaps settlement | | | 41,910 | |
| | | | |
Total assets | | | 298,897,737 | |
| | | | |
LIABILITIES: | | | | |
Unamortized upfront payments received on credit default swaps | | | 6,746,459 | |
Unrealized depreciation on swap agreements | | | 1,545,541 | |
Payable for: | | | | |
Fund shares redeemed | | | 3,735,410 | |
Variation margin | | | 266,266 | |
Management fees | | | 171,817 | |
Distribution and service fees | | | 62,340 | |
Transfer agent and administrative fees | | | 57,272 | |
Portfolio accounting fees | | | 22,443 | |
Miscellaneous | | | 108,352 | |
| | | | |
Total liabilities | | | 12,715,900 | |
| | | | |
NET ASSETS | | $ | 286,181,837 | |
| | | | |
NETASSETSCONSISTOF: | | | | |
Paid in capital | | $ | 283,349,094 | |
Accumulated net investment loss | | | (296,427 | ) |
Accumulated net realized gain on investments | | | 5,182,828 | |
Net unrealized depreciation on investments | | | (2,053,658 | ) |
| | | | |
Net assets | | $ | 286,181,837 | |
| | | | |
A-CLASS: | | | | |
Net assets | | $ | 11,889,805 | |
Capital shares outstanding | | | 518,562 | |
Net asset value per share | | $ | 22.93 | |
| | | | |
Maximum offering price per share (Net asset value divided by 95.25%) | | $ | 24.07 | |
| | | | |
C-CLASS: | | | | |
Net assets | | $ | 7,342,511 | |
Capital shares outstanding | | | 334,945 | |
Net asset value per share | | $ | 21.92 | |
| | | | |
H-CLASS: | | | | |
Net assets | | $ | 266,949,521 | |
Capital shares outstanding | | | 11,657,238 | |
Net asset value per share | | $ | 22.90 | |
| | | | |
STATEMENT OF OPERATIONS
Year Ended March 31, 2012
| | | | |
INVESTMENT INCOME: | | | | |
Dividends | | $ | 416,241 | |
Interest | | | 83,645 | |
| | | | |
Total investment income | | | 499,886 | |
| | | | |
| |
EXPENSES: | | | | |
Management fees | | | 1,653,121 | |
Transfer agent and administrative fees | | | 551,040 | |
Distribution and service fees: | | | | |
A-Class | | | 34,219 | |
C-Class | | | 70,841 | |
H-Class | | | 499,111 | |
Portfolio accounting fees | | | 210,301 | |
Custodian fees | | | 56,328 | |
Trustees’ fees* | | | 15,624 | |
Tax expense | | | 47,623 | |
Miscellaneous | | | 196,030 | |
| | | | |
Total expenses | | | 3,334,238 | |
| | | | |
Net investment loss | | | (2,834,352 | ) |
| | | | |
| |
NET REALIZED AND UNREALIZED GAIN (LOSS): | | | | |
Net realized gain (loss) on: | | | | |
Investments | | | (2,043,734 | ) |
Swap agreements | | | 5,086,478 | |
Futures contracts | | | 14,878,983 | |
| | | | |
Net realized gain | | | 17,921,727 | |
| | | | |
Net change in unrealized appreciation (depreciation) on: | | | | |
Investments | | | 297,490 | |
Swap agreements | | | (1,547,014 | ) |
Futures contracts | | | (782,652 | ) |
| | | | |
Net change in unrealized appreciation (depreciation) | | | (2,032,176 | ) |
| | | | |
Net realized and unrealized gain | | | 15,889,551 | |
| | | | |
Net increase in net assets resulting from operations | | $ | 13,055,199 | |
| | | | |
| * | Relates to Trustees not deemed “interested persons” within the meaning of Section 2(a) (19) of the 1940 Act. |
| | |
SEE NOTES TO FINANCIAL STATEMENTS. | | THE RYDEX SERIES FUNDS ANNUAL REPORT | 245 |
HIGH YIELD STRATEGY FUND
STATEMENTS OF CHANGES IN NET ASSETS
| | | | | | | | |
| | | Year Ended
March 31,
2012 | | | Year Ended
March 31,
2011 | |
INCREASE (DECREASE) IN NET ASSETS FROM OPERATIONS: | | | | | | | | |
Net investment loss | | $ | (2,834,352 | ) | | $ | (2,645,405 | ) |
Net realized gain on investments | | | 17,921,727 | | | | 17,982,503 | |
Net change in unrealized appreciation (depreciation) on investments | | | (2,032,176 | ) | | | (10,835 | ) |
| | | | | | | | |
Net increase in net assets resulting from operations | | | 13,055,199 | | | | 15,326,263 | |
| | | | | | | | |
DISTRIBUTIONSTOSHAREHOLDERSFROM: | | | | | | | | |
Net investment income | | | | | | | | |
A-Class | | | (547,032 | ) | | | (1,422,631 | ) |
C-Class | | | (168,804 | ) | | | (626,512 | ) |
H-Class | | | (6,784,948 | ) | | | (2,761,602 | ) |
| | | | | | | | |
Total distributions to shareholders | | | (7,500,784 | ) | | | (4,810,745 | ) |
| | | | | | | | |
| | |
CAPITALSHARETRANSACTIONS: | | | | | | | | |
PROCEEDSFROMSALEOFSHARES | | | | | | | | |
A-Class | | | 125,538,758 | | | | 102,263,958 | |
C-Class | | | 77,987,615 | | | | 68,379,959 | |
H-Class | | | 1,220,509,361 | | | | 1,145,448,113 | |
DISTRIBUTIONSREINVESTED | | | | | | | | |
A-Class | | | 131,423 | | | | 942,150 | |
C-Class | | | 153,755 | | | | 577,687 | |
H-Class | | | 6,728,875 | | | | 2,516,782 | |
COSTOFSHARESREDEEMED | | | | | | | | |
A-Class | | | (127,439,479 | ) | | | (92,522,654 | ) |
C-Class | | | (77,109,524 | ) | | | (66,540,825 | ) |
H-Class | | | (1,082,668,489 | ) | | | (1,059,304,080 | ) |
| | | | | | | | |
Net increase from capital share transactions | | | 143,832,295 | | | | 101,761,090 | |
| | | | | | | | |
Net increase in net assets | | | 149,386,710 | | | | 112,276,608 | |
| | |
NETASSETS: | | | | | | | | |
Beginning of year | | | 136,795,127 | | | | 24,518,519 | |
| | | | | | | | |
End of year | | $ | 286,181,837 | | | $ | 136,795,127 | |
| | | | | | | | |
(Accumulated)/Undistributed net investment income/(loss) at end of year | | $ | (296,427 | ) | | $ | 2,754,226 | |
| | | | | | | | |
CAPITALSHAREACTIVITY: | | | | | | | | |
Shares sold | | | | | | | | |
A-Class | | | 5,627,710 | | | | 4,689,630 | |
C-Class | | | 3,669,955 | | | | 3,271,747 | |
H-Class | | | 54,935,323 | | | | 53,236,425 | |
Shares issued from reinvestment of distributions | | | | | | | | |
A-Class | | | 6,020 | | | | 43,801 | |
C-Class | | | 7,350 | | | | 27,800 | |
H-Class | | | 308,664 | | | | 117,169 | |
Shares redeemed | | | | | | | | |
A-Class | | | (5,777,601 | ) | | | (4,306,080 | ) |
C-Class | | | (3,631,647 | ) | | | (3,178,877 | ) |
H-Class | | | (48,876,797 | ) | | | (48,866,599 | ) |
| | | | | | | | |
Net increase in shares | | | 6,268,977 | | | | 5,035,016 | |
| | | | | | | | |
| | |
246 | THE RYDEX SERIES FUNDS ANNUAL REPORT | | SEE NOTES TO FINANCIAL STATEMENTS. |
HIGH YIELD STRATEGY FUND
FINANCIAL HIGHLIGHTS
This table is presented to show selected data for a share outstanding throughout each period and to assist shareholders in evaluating a Fund’s performance for the periods presented.
| | | | | | | | | | | | | | | | | | | | |
A-Class | | Year Ended
March 31,
2012 | | | Year Ended
March 31,
2011 | | | Year Ended
March 31,
2010 | | | Year Ended
March 31,
2009 | | | Year Ended
March 31,
2008a | |
Per Share Data | | | | | | | | | | | | | | | | | | | | |
Net asset value, beginning of period | | $ | 21.98 | | | $ | 20.42 | | | $ | 16.64 | | | $ | 24.31 | | | $ | 25.00 | |
| | | | | | | | | | | | | | | | | | | | |
Income (loss) from investment operations: | | | | | | | | | | | | | | | | | | | | |
Net investment income (loss)b | | | (.27 | ) | | | (.30 | ) | | | (.26 | ) | | | (.16 | ) | | | .69 | |
Net gain (loss) on investments (realized and unrealized) | | | 1.77 | | | | 3.37 | | | | 5.39 | | | | (3.51 | ) | | | (1.31 | ) |
| | | | | | | | | | | | | | | | | | | | |
Total from investment operations | | | 1.50 | | | | 3.07 | | | | 5.13 | | | | (3.67 | ) | | | (.62 | ) |
| | | | | | | | | | | | | | | | | | | | |
Less distributions from: | | | | | | | | | | | | | | | | | | | | |
Net investment income | | | (.55 | ) | | | (1.51 | ) | | | (1.35 | ) | | | (4.00 | ) | | | (.07 | ) |
| | | | | | | | | | | | | | | | | | | | |
Total distributions | | | (.55 | ) | | | (1.51 | ) | | | (1.35 | ) | | | (4.00 | ) | | | (.07 | ) |
| | | | | | | | | | | | | | | | | | | | |
Net asset value, end of period | | $ | 22.93 | | | $ | 21.98 | | | $ | 20.42 | | | $ | 16.64 | | | $ | 24.31 | |
| | | | | | | | | | | | | | | | | | | | |
Total Returnc | | | 6.94 | % | | | 15.21 | % | | | 31.07 | % | | | (16.15 | %) | | | (2.49 | %) |
| | | | | | | | | | | | | | | | | | | | |
Ratios/Supplemental Data | | | | | | | | | | | | | | | | | | | | |
Net assets, end of period (in thousands) | | $ | 11,890 | | | $ | 14,561 | | | $ | 4,800 | | | $ | 5,748 | | | $ | 10,530 | |
| | | | | | | | | | | | | | | | | | | | |
Ratios to average net assets: | | | | | | | | | | | | | | | | | | | | |
Net investment income (loss) | | | (1.21 | %) | | | (1.40 | %) | | | (1.37 | %) | | | (0.71 | %) | | | 2.79 | % |
Total expenses | | | 1.49 | % | | | 1.54 | % | | | 1.54 | % | | | 1.57 | % | | | 1.50 | % |
| | | | | | | | | | | | | | | | | | | | |
Portfolio turnover rate | | | 583 | % | | | — | | | | — | | | | — | | | | — | |
| | | | | | | | | | | | | | | | | | | | |
C-Class | | Year Ended
March 31,
2012 | | | Year Ended
March 31,
2011 | | | Year Ended
March 31,
2010 | | | Year Ended
March 31,
2009 | | | Year Ended
March 31,
2008a | |
Per Share Data | | | | | | | | | | | | | | | | | | | | |
Net asset value, beginning of period | | $ | 21.19 | | | $ | 19.87 | | | $ | 16.33 | | | $ | 24.12 | | | $ | 25.00 | |
| | | | | | | | | | | | | | | | | | | | |
Income (loss) from investment operations: | | | | | | | | | | | | | | | | | | | | |
Net investment income (loss)b | | | (.45 | ) | | | (.45 | ) | | | (.40 | ) | | | (.25 | ) | | | .46 | |
Net gain (loss) on investments (realized and unrealized) | | | 1.73 | | | | 3.28 | | | | 5.29 | | | | (3.54 | ) | | | (1.27 | ) |
| | | | | | | | | | | | | | | | | | | | |
Total from investment operations | | | 1.28 | | | | 2.83 | | | | 4.89 | | | | (3.79 | ) | | | (.81 | ) |
| | | | | | | | | | | | | | | | | | | | |
Less distributions from: | | | | | | | | | | | | | | | | | | | | |
Net investment income | | | (.55 | ) | | | (1.51 | ) | | | (1.35 | ) | | | (4.00 | ) | | | (.07 | ) |
| | | | | | | | | | | | | | | | | | | | |
Total distributions | | | (.55 | ) | | | (1.51 | ) | | | (1.35 | ) | | | (4.00 | ) | | | (.07 | ) |
| | | | | | | | | | | | | | | | | | | | |
Net asset value, end of period | | $ | 21.92 | | | $ | 21.19 | | | $ | 19.87 | | | $ | 16.33 | | | $ | 24.12 | |
| | | | | | | | | | | | | | | | | | | | |
Total Returnc | | | 6.16 | % | | | 14.40 | % | | | 30.17 | % | | | (16.83 | %) | | | (3.25 | %) |
| | | | | | | | | | | | | | | | | | | | |
Ratios/Supplemental Data | | | | | | | | | | | | | | | | | | | | |
Net assets, end of period (in thousands) | | $ | 7,343 | | | $ | 6,129 | | | $ | 3,351 | | | $ | 1,773 | | | $ | 1,001 | |
| | | | | | | | | | | | | | | | | | | | |
Ratios to average net assets: | | | | | | | | | | | | | | | | | | | | |
Net investment income (loss) | | | (2.10 | %) | | | (2.13 | %) | | | (2.13 | %) | | | (1.21 | %) | | | 1.90 | % |
Total expenses | | | 2.25 | % | | | 2.28 | % | | | 2.29 | % | | | 2.32 | % | | | 2.22 | % |
| | | | | | | | | | | | | | | | | | | | |
Portfolio turnover rate | | | 583 | % | | | — | | | | — | | | | — | | | | — | |
| | |
SEE NOTES TO FINANCIAL STATEMENTS. | | THE RYDEX SERIES FUNDS ANNUAL REPORT | 247 |
HIGH YIELD STRATEGY FUND
FINANCIAL HIGHLIGHTS (concluded)
This table is presented to show selected data for a share outstanding throughout each period and to assist shareholders in evaluating a Fund’s performance for the periods presented.
| | | | | | | | | | | | | | | | | | | | |
H-Class | | Year Ended
March 31,
2012 | | | Year Ended
March 31,
2011 | | | Year Ended
March 31,
2010 | | | Year Ended
March 31,
2009 | | | Year Ended
March 31,
2008a | |
Per Share Data | | | | | | | | | | | | | | | | | | | | |
Net asset value, beginning of period | | $ | 21.95 | | | $ | 20.38 | | | $ | 16.61 | | | $ | 24.28 | | | $ | 25.00 | |
| | | | | | | | | | | | | | | | | | | | |
Income (loss) from investment operations: | | | | | | | | | | | | | | | | | | | | |
Net investment income (loss)b | | | (.28 | ) | | | (.30 | ) | | | (.26 | ) | | | (.04 | ) | | | .62 | |
Net gain (loss) on investments (realized and unrealized) | | | 1.78 | | | | 3.38 | | | | 5.38 | | | | (3.63 | ) | | | (1.27 | ) |
| | | | | | | | | | | | | | | | | | | | |
Total from investment operations | | | 1.50 | | | | 3.08 | | | | 5.12 | | | | (3.67 | ) | | | (.65 | ) |
| | | | | | | | | | | | | | | | | | | | |
Less distributions from: | | | | | | | | | | | | | | | | | | | | |
Net investment income | | | (.55 | ) | | | (1.51 | ) | | | (1.35 | ) | | | (4.00 | ) | | | (.07 | ) |
| | | | | | | | | | | | | | | | | | | | |
Total distributions | | | (.55 | ) | | | (1.51 | ) | | | (1.35 | ) | | | (4.00 | ) | | | (.07 | ) |
| | | | | | | | | | | | | | | | | | | | |
Net asset value, end of period | | $ | 22.90 | | | $ | 21.95 | | | $ | 20.38 | | | $ | 16.61 | | | $ | 24.28 | |
| | | | | | | | | | | | | | | | | | | | |
Total Returnc | | | 6.95 | % | | | 15.29 | % | | | 31.07 | % | | | (16.16 | %) | | | (2.61 | %) |
| | | | | | | | | | | | | | | | | | | | |
Ratios/Supplemental Data | | | | | | | | | | | | | | | | | | | | |
Net assets, end of period (in thousands) | | $ | 266,950 | | | $ | 116,106 | | | $ | 16,368 | | | $ | 239,528 | | | $ | 64,290 | |
| | | | | | | | | | | | | | | | | | | | |
Ratios to average net assets: | | | | | | | | | | | | | | | | | | | | |
Net investment income (loss) | | | (1.26 | %) | | | (1.38 | %) | | | (1.37 | %) | | | (0.20 | %) | | | 2.55 | % |
Total expenses | | | 1.49 | % | | | 1.53 | % | | | 1.53 | % | | | 1.56 | % | | | 1.49 | % |
| | | | | | | | | | | | | | | | | | | | |
Portfolio turnover rate | | | 583 | % | | | — | | | | — | | | | — | | | | — | |
| a | Since commencement of operations: April 16, 2007. Percentage amounts for the period, except total return and portfolio turnover rate, have been annualized. |
| b | Net investment income (loss) per share was computed using average shares outstanding throughout the period. |
| c | Total return does not reflect the impact of any applicable sales charges and has not been annualized. |
| | |
248 | THE RYDEX SERIES FUNDS ANNUAL REPORT | | SEE NOTES TO FINANCIAL STATEMENTS. |
This page intentionally left blank.
THE RYDEX SERIES FUNDS ANNUAL REPORT | 249
| | |
| PERFORMANCE REPORT AND FUND PROFILE (Unaudited) | | March 31, 2012 |
INVERSE HIGH YIELD STRATEGY FUND
OBJECTIVE: Seeks to provide investment results that inversely correlate, before fees and expenses, to the performance of the high yield bond market.
High-yield bonds continued to rally through the year ended March 31, 2012, as investor appetite for income and yield remains strong in a low interest rate environment, and the U.S. Federal Reserve has signaled its intention to keep interest rates low for well beyond 2012. Moreover, companies with so-called “junk” credit ratings are stampeding the debt markets at a record pace, taking advantage of ultra-low borrowing costs and solid demand from investors seeking higher yields. Thomson Reuters said the $75 billion in junk bond issuance in the first quarter of 2012 was the highest in any quarter since 1980, when it began keeping records, and that the average rate on bonds sold in the first quarter was 7.98%.
The economy appears to be continuing its slow but gradual recovery, avoiding the outright recession that is infecting Europe. Despite volatility in the high-yield sector that will be around as long as the European situation persists, investors will be attracted to the sector’s low default rate and relatively better yields compared with other fixed-income investments.
Inverse High Yield Strategy Fund H-Class returned -11.92% for the year ended March 31, 2012, as opposed to its index, the Barclays U.S. High Yield Index*, which returned 6.45%.
Derivatives in the Fund are used to help provide exposure to the composition of the benchmark in the highest efficient manner and not for hedging purposes. The results of derivatives use during the period were within our expectations and contributed to the Fund’s performance.
Due to the compounding of daily returns, leveraged and inverse funds’ returns over periods other than one day will likely differ in amount and possibly direction from the benchmark return for the same period. Investors should monitor their leveraged and inverse funds’ holdings to ensure that they are consistent with their strategies, as frequently as daily.
The effects of compounding may cause the longer-term correlation of the fund to its benchmark to diminish. The apparent discrepancy between the leveraged and unleveraged indices is the result of compounding, which is described briefly on page 4 of this report.
*Barclays U.S. High Yield Index – an index that measures the market of USD-denominated, non-investment grade, fixed-rate, taxable corporate bonds. Securities are classified as high yield if the middle rating of Moody’s, Fitch, and S&P is Ba1/BB+/BB+ or below.
Performance displayed represents past performance which is no guarantee of future results.
Holdings Diversification (Market Exposure as % of Net Assets)

“Holdings Diversification (Market Exposure as % of Net Assets)” excludes any temporary cash investments.
| | |
Inception Dates: | | |
A-Class | | April 16, 2007 |
C-Class | | April 16, 2007 |
H-Class | | April 16, 2007 |
The Fund invests principally in derivative investments such as high yield credit default swap agreements and futures contracts.
250 | THE RYDEX SERIES FUNDS ANNUAL REPORT
PERFORMANCE REPORT AND FUND PROFILE (Unaudited) (concluded)
Cumulative Fund Performance*
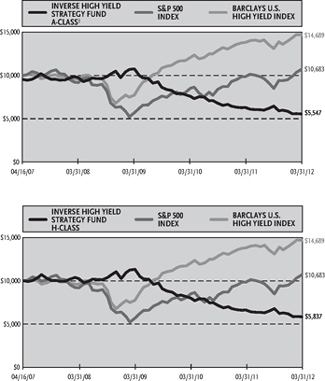
Average Annual Returns*
Periods Ended 03/31/12
| | | | | | |
| | | 1 Year | | | Since
Inception
(04/16/07) |
A-Class Shares | | | -11.98 | % | | -10.33% |
A-Class Shares with sales charge‡ | | | -16.15 | % | | -11.20% |
C-Class Shares | | | -12.60 | % | | -10.94% |
C-Class Shares with CDSC† | | | -13.47 | % | | -10.94% |
H-Class Shares | | | -11.92 | % | | -10.29% |
S&P 500 Index | | | 8.54 | % | | 1.34% |
Barclays U.S. High Yield Index | | | 6.45 | % | | 8.06% |
| * | The performance data above represents past performance that is not predictive of future results. The investment return and principal value of an investment in the Fund will fluctuate so that an investor’s shares, when redeemed, may be worth more or less than their original cost. Returns are historical and include changes in principal and reinvested dividends and capital gains and do not reflect the effect of taxes. The S&P 500 Index and the Barclays U.S. High Yield Index are unmanaged indices and, unlike the Fund, have no management fees or other operating expenses to reduce their reported returns. The graphs are based on A-Class shares and H-Class shares only; performance for C-Class shares will vary due to differences in fee structures. |
| † | Fund returns include a CDSC of 1% if redeemed within 12 months of purchase. |
| ‡ | Fund returns are calculated using the maximum sales charge of 4.75%. |
THE RYDEX SERIES FUNDS ANNUAL REPORT | 251
| | |
| SCHEDULE OF INVESTMENTS | | March 31, 2012 |
| |
| INVERSE HIGH YIELD STRATEGY FUND | | |
| | | | | | | | |
| | | FACE
AMOUNT | | | VALUE | |
REPURCHASE AGREEMENTS††,1 - 107.6% | | | | | | | | |
HSBC Group issued 03/30/12 at 0.01% due 04/02/12 | | $ | 10,260,874 | | | $ | 10,260,874 | |
Mizuho Financial Group, Inc. issued 03/30/12 at 0.01% due 04/02/12 | | | 2,886,890 | | | | 2,886,890 | |
Credit Suisse Group issued 03/30/12 at 0.01% due 04/02/122 | | | 1,801,550 | | | | 1,801,550 | |
Deutsche Bank issued 03/30/12 at 0.01% due 04/02/12 | | | 767,303 | | | | 767,303 | |
| | | | | | | | |
Total Repurchase Agreements
(Cost $15,716,617) | | | | | | | 15,716,617 | |
| | | | | | | | |
Total Investments – 107.6%
(Cost $15,716,617) | | | | | | $ | 15,716,617 | |
| | | | | | | | |
Other Assets & Liabilities, net – (7.6)%
| | | | | | | (1,110,720 | ) |
| | | | | | | | |
Total Net Assets – 100.0% | | | | | | $ | 14,605,897 | |
| |
| | | | | | | | |
| | | CONTRACTS | | | UNREALIZED
GAIN (LOSS) | |
| INTEREST RATE FUTURES CONTRACTS SOLD SHORT† | | | | | | | | |
June 2012 U.S. Treasury 5 Year
Note Futures Contracts
(Aggregate Value of
Contracts $12,495,000) | | | 102 | | | $ | (625 | ) |
| | | | | | | | |
CREDIT DEFAULT SWAP AGREEMENTS PROTECTION PURCHASED††
| | | | | | | | | | | | | | | | | | | | | | | | | | |
INDEX | | COUNTERPARTY | | PROTECTION
PREMIUM RATE | | | MATURITY
DATE | | | NOTIONAL
PRINCIPAL | | | NOTIONAL
VALUE | | | UPFRONT
PAYMENTS
PAID | | | UNREALIZED
APPRECIATION | |
CDX.NA.HY-18 Index | | Barclays Bank plc | | | 5.00 | % | | | 06/20/17 | | | $ | 13,100,000 | | | $ | 12,707,000 | | | $ | 328,381 | | | $ | 64,619 | |
CDX.NA.HY-18 Index | | Credit Suisse International | | | 5.00 | % | | | 06/20/17 | | | | 1,000,000 | | | | 970,000 | | | | 23,700 | | | | 6,300 | |
CDX.NA.HY-18 Index | | Goldman Sachs International | | | 5.00 | % | | | 06/20/17 | | | | 800,000 | | | | 776,000 | | | | 18,960 | | | | 5,040 | |
| † | Value determined based on Level 1 inputs — See Note 4. |
| †† | Value determined based on Level 2 inputs — See Note 4. |
| 1 | Repurchase Agreements — See Note 5. |
| 2 | All or a portion of this security is pledged as credit default swap collateral at March 31, 2012. |
| | |
252 | THE RYDEX SERIES FUNDS ANNUAL REPORT | | SEE NOTES TO FINANCIAL STATEMENTS. |
INVERSE HIGH YIELD STRATEGY FUND
STATEMENT OF ASSETS AND LIABILITIES
| | | | |
| March 31, 2012 | | | |
| |
ASSETS: | | | | |
Repurchase agreements, at value
(cost $15,716,617) | | $ | 15,716,617 | |
| | | | |
Total investments
(cost $15,716,617) | | | 15,716,617 | |
Segregated cash with broker | | | 1,496,050 | |
Unamortized upfront payments paid
on credit default swaps | | | 371,041 | |
Unrealized appreciation on swap agreements | | | 75,959 | |
Receivables: | | | | |
Credit default swaps settlement | | | 85,417 | |
Variation margin | | | 19,056 | |
Fund shares sold | | | 8,714 | |
Interest | | | 9 | |
| | | | |
Total assets | | | 17,772,863 | |
| | | | |
LIABILITIES: | | | | |
Payable for: | | | | |
Fund shares redeemed | | | 3,025,473 | |
Credit default swaps settlement | | | 94,063 | |
Management fees | | | 6,505 | |
Distribution and service fees | | | 2,563 | |
Transfer agent and administrative fees | | | 2,168 | |
Portfolio accounting fees | | | 867 | |
Protection fees on credit default swaps | | | 24,833 | |
Miscellaneous | | | 10,494 | |
| | | | |
Total liabilities | | | 3,166,966 | |
| | | | |
NET ASSETS | | $ | 14,605,897 | |
| | | | |
NETASSETSCONSISTOF: | | | | |
Paid in capital | | $ | 25,938,116 | |
Undistributed net investment income | | | — | |
Accumulated net realized loss on investments | | | (11,407,553 | ) |
Net unrealized appreciation on investments | | | 75,334 | |
| | | | |
Net assets | | $ | 14,605,897 | |
| | | | |
A-CLASS: | | | | |
Net assets | | $ | 555,999 | |
Capital shares outstanding | | | 19,750 | |
Net asset value per share | | $ | 28.15 | |
| | | | |
Maximum offering price per share
(Net asset value divided by 95.25%) | | $ | 29.55 | |
| | | | |
C-CLASS: | | | | |
Net assets | | $ | 692,868 | |
Capital shares outstanding | | | 25,465 | |
Net asset value per share | | $ | 27.21 | |
| | | | |
H-CLASS: | | | | |
Net assets | | $ | 13,357,030 | |
Capital shares outstanding | | | 473,304 | |
Net asset value per share | | $ | 28.22 | |
| | | | |
STATEMENT OF OPERATIONS
| | | | |
| Year Ended March 31, 2012 | | | |
| |
INVESTMENT INCOME: | | | | |
Interest | | $ | 6,309 | |
| | | | |
Total investment income | | | 6,309 | |
| | | | |
EXPENSES: | | | | |
Management fees | | | 157,593 | |
Transfer agent and administrative fees | | | 52,531 | |
Distribution and service fees: | | | | |
A-Class | | | 7,459 | |
C-Class | | | 8,472 | |
H-Class | | | 42,954 | |
Portfolio accounting fees | | | 21,012 | |
Custodian fees | | | 5,375 | |
Trustees’ fees* | | | 1,705 | |
Miscellaneous | | | 25,448 | |
| | | | |
Total expenses | | | 322,549 | |
| | | | |
Net investment loss | | | (316,240 | ) |
| | | | |
NET REALIZED AND UNREALIZED GAIN (LOSS): | | | | |
Net realized gain (loss) on: | | | | |
Swap agreements | | | (2,735,299 | ) |
Futures contracts | | | (859,497 | ) |
| | | | |
Net realized loss | | | (3,594,796 | ) |
| | | | |
Net change in unrealized appreciation
(depreciation) on: | | | | |
Swap agreements | | | 76,123 | |
Futures contracts | | | (180,153 | ) |
| | | | |
Net change in unrealized appreciation
(depreciation) | | | (104,030 | ) |
| | | | |
Net realized and unrealized loss | | | (3,698,826 | ) |
| | | | |
Net decrease in net assets resulting from operations | | $ | (4,015,066 | ) |
| | | | |
| * | Relates to Trustees not deemed “interested persons” within the meaning of Section 2(a)(19) of the 1940 Act. |
| | |
SEE NOTES TO FINANCIAL STATEMENTS. | | THE RYDEX SERIES FUNDS ANNUAL REPORT | 253 |
INVERSE HIGH YIELD STRATEGY FUND
STATEMENTS OF CHANGES IN NET ASSETS
| | | | | | | | |
| | | Year Ended
March 31,
2012 | | | Year Ended
March 31,
2011 | |
INCREASE (DECREASE) IN NET ASSETS FROM OPERATIONS: | | | | | | | | |
Net investment loss | | $ | (316,240 | ) | | $ | (276,545 | ) |
Net realized loss on investments | | | (3,594,796 | ) | | | (4,368,493 | ) |
Net change in unrealized appreciation (depreciation) on investments | | | (104,030 | ) | | | 152,532 | |
| | | | | | | | |
Net decrease in net assets resulting from operations | | | (4,015,066 | ) | | | (4,492,506 | ) |
| | | | | | | | |
| | |
CAPITALSHARETRANSACTIONS: | | | | | | | | |
PROCEEDSFROMSALEOFSHARES | | | | | | | | |
A-Class | | | 71,981,360 | | | | 40,028,327 | |
C-Class | | | 8,812,685 | | | | 5,760,752 | |
H-Class | | | 333,685,614 | | | | 230,820,350 | |
COSTOFSHARESREDEEMED | | | | | | | | |
A-Class | | | (72,478,567 | ) | | | (39,859,655 | ) |
C-Class | | | (10,566,693 | ) | | | (4,931,877 | ) |
H-Class | | | (326,559,879 | ) | | | (245,856,867 | ) |
| | | | | | | | |
Net increase (decrease) from capital share transactions | | | 4,874,520 | | | | (14,038,970 | ) |
| | | | | | | | |
Net increase (decrease) in net assets | | | 859,454 | | | | (18,531,476 | ) |
| | |
NETASSETS: | | | | | | | | |
Beginning of year | | | 13,746,443 | | | | 32,277,919 | |
| | | | | | | | |
End of year | | $ | 14,605,897 | | | $ | 13,746,443 | |
| | | | | | | | |
Undistributed net investment income at end of year | | $ | — | | | $ | — | |
| | | | | | | | |
CAPITALSHAREACTIVITY: | | | | | | | | |
Shares sold | | | | | | | | |
A-Class | | | 2,353,360 | | | | 1,182,246 | |
C-Class | | | 299,399 | | | | 179,518 | |
H-Class | | | 10,932,156 | | | | 6,507,282 | |
Shares redeemed | | | | | | | | |
A-Class | | | (2,380,877 | ) | | | (1,193,892 | ) |
C-Class | | | (355,403 | ) | | | (152,460 | ) |
H-Class | | | (10,761,580 | ) | | | (6,928,732 | ) |
| | | | | | | | |
Net increase (decrease) in shares | | | 87,055 | | | | (406,038 | ) |
| | | | | | | | |
| | |
254 | THE RYDEX SERIES FUNDS ANNUAL REPORT | | SEE NOTES TO FINANCIAL STATEMENTS. |
INVERSE HIGH YIELD STRATEGY FUND
FINANCIAL HIGHLIGHTS
This table is presented to show selected data for a share outstanding throughout each period and to assist shareholders in evaluating a Fund’s performance for the periods presented.
| | | | | | | | | | | | | | | | | | | | |
A-Class | | Year Ended
March 31,
2012 | | | Year Ended
March 31,
2011 | | | Year Ended
March 31,
2010 | | | Year Ended
March 31,
2009 | | | Period Ended
March 31,
2008a | |
Per Share Data | | | | | | | | | | | | | | | | | | | | |
Net asset value, beginning of period | | $ | 31.99 | | | $ | 38.51 | | | $ | 55.13 | | | $ | 51.26 | | | $ | 50.00 | |
| | | | | | | | | | | | | | | | | | | | |
Income (loss) from investment operations: | | | | | | | | | | | | | | | | | | | | |
Net investment income (loss)b | | | (.43 | ) | | | (.47 | ) | | | (.63 | ) | | | (.10 | ) | | | .54 | |
Net gain (loss) on investments (realized and unrealized) | | | (3.41 | ) | | | (6.05 | ) | | | (15.60 | ) | | | 5.29 | | | | .72 | |
| | | | | | | | | | | | | | | | | | | | |
Total from investment operations | | | (3.84 | ) | | | (6.52 | ) | | | (16.23 | ) | | | 5.19 | | | | 1.26 | |
| | | | | | | | | | | | | | | | | | | | |
Less distributions from: | | | | | | | | | | | | | | | | | | | | |
Net realized gains | | | — | | | | — | | | | (.39 | ) | | | (1.32 | ) | | | — | |
| | | | | | | | | | | | | | | | | | | | |
Total distributions | | | — | | | | — | | | | (.39 | ) | | | (1.32 | ) | | | — | |
| | | | | | | | | | | | | | | | | | | | |
Net asset value, end of period | | $ | 28.15 | | | $ | 31.99 | | | $ | 38.51 | | | $ | 55.13 | | | $ | 51.26 | |
| | | | | | | | | | | | | | | | | | | | |
Total Returnc | | | (11.98 | %) | | | (16.96 | %) | | | 29.47 | % | | | 10.17 | % | | | 2.52 | % |
| | | | | | | | | | | | | | | | | | | | |
Ratios/Supplemental Data | | | | | | | | | | | | | | | | | | | | |
Net assets, end of period (in thousands) | | $ | 556 | | | $ | 1,512 | | | $ | 2,269 | | | $ | 2,278 | | | $ | 1,673 | |
| | | | | | | | | | | | | | | | | | | | |
Ratios to average net assets: | | | | | | | | | | | | | | | | | | | | |
Net investment income (loss) | | | (1.39 | %) | | | (1.39 | %) | | | (1.43 | %) | | | (0.19 | %) | | | 1.09 | % |
Total expenses | | | 1.51 | % | | | 1.53 | % | | | 1.54 | % | | | 1.52 | % | | | 1.52 | % |
| | | | | | | | | | | | | | | | | | | | |
Portfolio turnover rate | | | — | | | | — | | | | — | | | | — | | | | — | |
| | | | | |
C-Class | | Year Ended
March 31,
2012 | | | Year Ended
March 31,
2011 | | | Year Ended
March 31,
2010 | | | Year Ended
March 31,
2009 | | | Period Ended
March 31,
2008a | |
Per Share Data | | | | | | | | | | | | | | | | | | | | |
Net asset value, beginning of period | | $ | 31.12 | | | $ | 37.77 | | | $ | 54.49 | | | $ | 51.06 | | | $ | 50.00 | |
| | | | | | | | | | | | | | | | | | | | |
Income (loss) from investment operations: | | | | | | | | | | | | | | | | | | | | |
Net investment lossb | | | (.55 | ) | | | (.72 | ) | | | (.95 | ) | | | (.52 | ) | | | (.62 | ) |
Net gain (loss) on investments (realized and unrealized) | | | (3.36 | ) | | | (5.93 | ) | | | (15.38 | ) | | | 5.27 | | | | 1.68 | |
| | | | | | | | | | | | | | | | | | | | |
Total from investment operations | | | (3.91 | ) | | | (6.65 | ) | | | (16.33 | ) | | | 4.75 | | | | 1.06 | |
| | | | | | | | | | | | | | | | | | | | |
Less distributions from: | | | | | | | | | | | | | | | | | | | | |
Net realized gains | | | — | | | | — | | | | (.39 | ) | | | (1.32 | ) | | | — | |
| | | | | | | | | | | | | | | | | | | | |
Total distributions | | | — | | | | — | | | | (.39 | ) | | | (1.32 | ) | | | — | |
| | | | | | | | | | | | | | | | | | | | |
Net asset value, end of period | | $ | 27.21 | | | $ | 31.12 | | | $ | 37.77 | | | $ | 54.49 | | | $ | 51.06 | |
| | | | | | | | | | | | | | | | | | | | |
Total Returnc | | | (12.60 | %) | | | (17.61 | %) | | | (30.00 | %) | | | 9.34 | % | | | 2.12 | % |
| | | | | | | | | | | | | | | | | | | | |
Ratios/Supplemental Data | | | | | | | | | | | | | | | | | | | | |
Net assets, end of period (in thousands) | | $ | 693 | | | $ | 2,535 | | | $ | 2,055 | | | $ | 869 | | | $ | 2,958 | |
| | | | | | | | | | | | | | | | | | | | |
Ratios to average net assets: | | | | | | | | | | | | | | | | | | | | |
Net investment loss | | | (1.87 | %) | | | (2.13 | %) | | | (2.18 | %) | | | (1.00 | %) | | | (1.25 | %) |
Total expenses | | | 2.26 | % | | | 2.28 | % | | | 2.29 | % | | | 2.28 | % | | | 2.26 | % |
| | | | | | | | | | | | | | | | | | | | |
Portfolio turnover rate | | | — | | | | — | | | | — | | | | — | | | | — | |
| | |
SEE NOTES TO FINANCIAL STATEMENTS. | | THE RYDEX SERIES FUNDS ANNUAL REPORT | 255 |
INVERSE HIGH YIELD STRATEGY FUND
FINANCIAL HIGHLIGHTS (concluded)
This table is presented to show selected data for a share outstanding throughout each period and to assist shareholders in evaluating a Fund’s performance for the periods presented.
| | | | | | | | | | | | | | | | | | | | |
H-Class | | Year
Ended
March 31,
2012 | | | Year
Ended
March 31,
2011 | | | Year
Ended
March 31,
2010 | | | Year
Ended
March 31,
2009 | | | Period
Ended
March 31,
2008a | |
Per Share Data | | | | | | | | | | | | | | | | | | | | |
Net asset value, beginning of period | | $ | 32.04 | | | $ | 38.60 | | | $ | 55.26 | | | $ | 51.38 | | | $ | 50.00 | |
| | | | | | | | | | | | | | | | | | | | |
Income (loss) from investment operations: | | | | | | | | | | | | | | | | | | | | |
Net investment income (loss)b | | | (.47 | ) | | | (.50 | ) | | | (.61 | ) | | | (.29 | ) | | | 1.44 | |
Net gain (loss) on investments (realized and unrealized) | | | (3.35 | ) | | | (6.06 | ) | | | (15.66 | ) | | | 5.49 | | | | (.06 | ) |
| | | | | | | | | | | | | | | | | | | | |
Total from investment operations | | | (3.82 | ) | | | (6.56 | ) | | | (16.27 | ) | | | 5.20 | | | | 1.38 | |
| | | | | | | | | | | | | | | | | | | | |
Less distributions from: | | | | | | | | | | | | | | | | | | | | |
Net realized gains | | | — | | | | — | | | | (.39 | ) | | | (1.32 | ) | | | — | |
| | | | | | | | | | | | | | | | | | | | |
Total distributions | | | — | | | | — | | | | (.39 | ) | | | (1.32 | ) | | | — | |
| | | | | | | | | | | | | | | | | | | | |
Net asset value, end of period | | $ | 28.22 | | | $ | 32.04 | | | $ | 38.60 | | | $ | 55.26 | | | $ | 51.38 | |
| | | | | | | | | | | | | | | | | | | | |
Total Returnc | | | (11.92 | %) | | | (16.99 | %) | | | (29.47 | %) | | | 10.17 | % | | | 2.76 | % |
| | | | | | | | | | | | | | | | | | | | |
Ratios/Supplemental Data | | | | | | | | | | | | | | | | | | | | |
Net assets, end of period (in thousands) | | $ | 13,357 | | | $ | 9,699 | | | $ | 27,954 | | | $ | 13,799 | | | $ | 6,536 | |
| | | | | | | | | | | | | | | | | | | | |
Ratios to average net assets: | | | | | | | | | | | | | | | | | | | | |
Net investment income (loss) | | | (1.51 | %) | | | (1.38 | %) | | | (1.43 | %) | | | (0.55 | %) | | | 2.84 | % |
Total expenses | | | 1.51 | % | | | 1.53 | % | | | 1.53 | % | | | 1.53 | % | | | 1.52 | % |
| | | | | | | | | | | | | | | | | | | | |
Portfolio turnover rate | | | — | | | | — | | | | — | | | | — | | | | — | |
| a | Since commencement of operations: April 16, 2007. Percentage amounts for the period, except total return and portfolio turnover rate, have been annualized. |
| b | Net investment income (loss) per share was computed using average shares outstanding throughout the period. |
| c | Total return does not reflect the impact of any applicable sales charges and has not been annualized. |
| | |
256 | THE RYDEX SERIES FUNDS ANNUAL REPORT | | SEE NOTES TO FINANCIAL STATEMENTS. |
This page intentionally left blank.
THE RYDEX SERIES FUNDS ANNUAL REPORT | 257
| | |
| PERFORMANCE REPORT AND FUND PROFILE (Unaudited) | | March 31, 2012 |
U.S. GOVERNMENT MONEY MARKET FUND
OBJECTIVE: Seeks to provide security of principal, high current income, and liquidity.
For the year ended March 31, 2012, U.S. Government Money Market Fund returned 0.00%. Money market yields continued to languish in the near-zero short-term interest-rate environment maintained by the Fed. Regulatory issues have been at the forefront of the industry: all money market funds have already been subjected to rules to help reduce risk and improve liquidity and transparency, which are considered to be working well. More regulations have been discussed, including capital requirements and a net asset value that could float, in contrast to the current practice of rounding off the share price to a dollar.
Short-term debt, affirmed at A-1, remains a top-tier approved credit for this Fund.
Uncertainty surrounding sovereign credit risk led us to halt investment in counterparties with major exposure to Greece, Italy, Portugal and Spain.
As the Federal Reserve continues its programs to keep interest rates low, the Fund continues to waive Fund expenses.
Performance displayed represents past performance which is no guarantee of future results.
This fund may not be suitable for all investors. An investment in the U.S. Government Money Market Fund is not insured or guaranteed by the Federal Deposit Insurance Corporation or any other government agency. Although the fund seeks to preserve the value of your investment at $1.00 per share, it is possible to lose money by investing in the fund.
Holdings Diversification (Market Exposure as % of Net Assets)
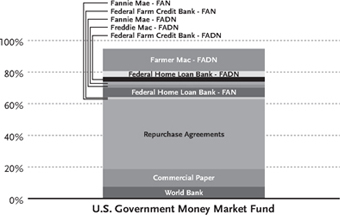
FAN – Federal Agency Notes.
FADN – Federal Agency Discount Notes.
| | |
Inception Dates: | | |
Investor Class | | December 1, 1993 |
Investor2 Class | | July 10, 2009 |
Advisor Class | | April 1, 1998 |
A-Class | | March 31, 2004 |
C-Class | | October 19, 2000 |
The Fund invests principally in money market instruments issued or guaranteed as to principal and interest by the U.S. Government, its agencies or instrumentalities and enters into repurchase agreements fully collateralized by U.S. government securities.
258 | THE RYDEX SERIES FUNDS ANNUAL REPORT
PERFORMANCE REPORT AND FUND PROFILE (Unaudited) (concluded)
Average Annual Returns
Periods Ended 03/31/12
| | | | | | | | | | | | |
| | | 1 Year | | | 5 Year | | | 10 Year | |
Investor Class Shares | | | 0.00 | % | | | 0.96 | % | | | 1.35 | % |
| | | | | | | | | | | | |
Advisor Class Shares | | | 0.00 | % | | | 0.77 | % | | | 1.06 | % |
| | | | | | | | | | | | |
C-Class Shares | | | 0.00 | % | | | 0.60 | % | | | 0.82 | % |
| | | | | | | | | | | | |
C-Class Shares with CDSC† | | | -1.00 | % | | | 0.60 | % | | | 0.82 | % |
| | | | | | | | | | | | |
| | | |
| | | 1 Year | | | 5 Year | | | Since
Inception
(03/31/04) | |
A-Class Shares | | | 0.00 | % | | | 0.87 | % | | | 1.43 | % |
| | | | | | | | | | | | |
| | | | | | | 1 Year | | | | (07/10/09) | |
| | | | | | | | | | | | |
Investor2 Class Shares | | | | | | | 0.00 | % | | | 0.01 | % |
| | | | | | | | | | | | |
| † | Fund returns include a CDSC of 1% if redeemed within 12 months of purchase. |
THE RYDEX SERIES FUNDS ANNUAL REPORT | 259
| | |
| SCHEDULE OF INVESTMENTS | | March 31, 2012 |
| U.S. GOVERNMENT MONEY MARKET FUND | | |
| | | | | | | | |
| | | FACE
AMOUNT | | | VALUE | |
FEDERAL AGENCY DISCOUNT NOTES† - 24.6% | | | | | |
Farmer Mac1 | | | | | | | | |
0.01% due 04/03/12 | | $ | 100,000,000 | | | $ | 99,999,944 | |
0.15% due 11/29/12 | | | 25,000,000 | | | | 24,974,791 | |
0.18% due 11/27/12 | | | 25,000,000 | | | | 24,970,000 | |
0.20% due 05/15/12 | | | 15,000,000 | | | | 14,996,333 | |
0.17% due 07/24/12 | | | 15,000,000 | | | | 14,991,925 | |
0.12% due 06/22/12 | | | 10,000,000 | | | | 9,997,267 | |
| | | | | | | | |
Total Farmer Mac | | | | 189,930,260 | |
| | | | | | | | |
Federal Home Loan Bank1 | | | | | | | | |
0.18% due 10/01/12 | | | 25,000,000 | | | | 24,977,125 | |
0.18% due 02/11/13 | | | 15,000,000 | | | | 14,976,300 | |
0.12% due 08/03/12 | | | 10,000,000 | | | | 9,995,867 | |
| | | | | | | | |
Total Federal Home Loan Bank | | | | 49,949,292 | |
| | | | | | | | |
Federal Farm Credit Bank1 | | | | | | | | |
0.18% due 04/18/12 | | | 20,000,000 | | | | 19,998,300 | |
0.13% due 05/09/12 | | | 10,000,000 | | | | 9,998,628 | |
0.14% due 05/15/12 | | | 10,000,000 | | | | 9,998,289 | |
| | | | | | | | |
Total Federal Farm Credit Bank | | | | 39,995,217 | |
| | | | | | | | |
Freddie Mac2 | | | | | | | | |
0.12% due 04/10/12 | | | 25,000,000 | | | | 24,999,219 | |
| | | | | | | | |
Fannie Mae2 | | | | | | | | |
0.20% due 06/01/12 | | | 25,000,000 | | | | 24,991,528 | |
| | | | | | | | |
Total Federal Agency Discount Notes
(Cost $329,865,516) | | | | 329,865,516 | |
| | | | | | | | |
FEDERAL AGENCY NOTES†—7.6% | | | | | |
Federal Home Loan Bank1 | | | | | | | | |
0.18% due 12/28/12 | | | 30,000,000 | | | | 29,998,707 | |
0.16% due 04/02/12 | | | 15,000,000 | | | | 14,999,997 | |
0.15% due 06/07/12 | | | 15,000,000 | | | | 14,999,229 | |
0.20% due 01/11/13 | | | 10,000,000 | | | | 10,000,000 | |
0.20% due 12/28/12 | | | 10,000,000 | | | | 9,999,718 | |
| | | | | | | | |
Total Federal Home Loan Bank | | | | 79,997,651 | |
| | | | | | | | |
Federal Farm Credit Bank1 | | | | | | | | |
0.40% due 11/02/12 | | | 11,400,000 | | | | 11,415,114 | |
| | | | | | | | |
Fannie Mae2 | | | | | | | | |
0.75% due 02/26/13 | | | 10,000,000 | | | | 10,048,190 | |
| | | | | | | | |
Total Federal Agency Notes
(Cost $101,460,955) | | | | 101,460,955 | |
| | | | | | | | |
WORLD BANK DISCOUNT NOTE†—7.4% | | | | | |
World Bank | | | | | | | | |
0.04% due 04/02/12 | | | 100,000,000 | | | | 99,999,861 | |
| | | | | | | | |
Total World Bank Discount Note
(Cost $99,999,861) | | | | 99,999,861 | |
| | | | | | | | |
| | | | | | | | |
| | | FACE
AMOUNT | | | VALUE | |
COMMERCIAL PAPER† - 11.2% | | | | | |
Jupiter Securitization Company LLC | | | | | | | | |
0.15% due 04/19/12 | | $ | 10,000,000 | | | $ | 9,999,250 | |
Caterpillar Inc. | | | | | | | | |
0.12% due 04/26/12 | | | 10,000,000 | | | | 9,999,167 | |
General Reinsurance Corp. | | | | | | | | |
0.12% due 05/07/12 | | | 10,000,000 | | | | 9,998,800 | |
Societe Generale | | | | | | | | |
0.32% due 04/19/12 | | | 10,000,000 | | | | 9,998,150 | |
American Honda Finance | | | | | | | | |
0.13% due 06/05/12 | | | 10,000,000 | | | | 9,997,653 | |
ING U.S. Funding, LLC | | | | | | | | |
0.47% due 04/30/12 | | | 10,000,000 | | | | 9,996,214 | |
Coca-Cola Co. | | | | | | | | |
0.13% due 06/05/12 | | | 5,000,000 | | | | 4,998,826 | |
0.21% due 08/01/12 | | | 5,000,000 | | | | 4,996,442 | |
| | | | | | | | |
Total Coca-Cola Co. | | | | 9,995,268 | |
| | | | | | | | |
General Electric Capital Corp. | | | | | | | | |
0.30% due 06/01/12 | | | 10,000,000 | | | | 9,994,917 | |
Nestle Capital Corp. | | | | | | | | |
0.21% due 04/03/12 | | | 5,000,000 | | | | 4,999,941 | |
0.21% due 10/12/12 | | | 5,000,000 | | | | 4,994,342 | |
| | | | | | | | |
Total Nestle Capital Corp. | | | | 9,994,283 | |
| | | | | | | | |
Danske Corp. | | | | | | | | |
0.52% due 05/21/12 | | | 10,000,000 | | | | 9,992,778 | |
| | | | | | | | |
Westpack Banking Corp. | | | | | | | | |
0.27% due 09/21/12 | | | 10,000,000 | | | | 9,987,025 | |
| | | | | | | | |
Toyota Motor Credit Co. | | | | | | | | |
0.36% due 08/27/12 | | | 10,000,000 | | | | 9,985,200 | |
| | | | | | | | |
Prudential plc | | | | | | | | |
0.75% due 07/30/12 | | | 10,000,000 | | | | 9,975,000 | |
| | | | | | | | |
Barclays US Funding, LLC | | | | | | | | |
0.79% due 08/15/12 | | | 10,000,000 | | | | 9,970,155 | |
| | | | | | | | |
UBS Finance Delaware LLC | | | | | | | | |
0.71% due 09/20/12 | | | 10,000,000 | | | | 9,966,078 | |
| | | | | | | | |
Total Commercial Paper
(Cost $149,849,938) | | | | 149,849,938 | |
| | | | | | | | |
| | |
260 | THE RYDEX SERIES FUNDS ANNUAL REPORT | | SEE NOTES TO FINANCIAL STATEMENTS. |
| | |
| SCHEDULE OF INVESTMENTS (concluded) | | March 31, 2012 |
| U.S. GOVERNMENT MONEY MARKET FUND | | |
| | | | | | | | |
| | | FACE
AMOUNT | | | VALUE | |
REPURCHASE AGREEMENTS† - 43.9% | | | | | | | | |
Individual Repurchase Agreement | | | | | | | | |
Mizuho Financial Group, Inc.
issued 03/30/12 at 0.01%
due 04/02/12 secured by:
U.S. Treasury Notes,
0.625%—2.500%
07/31/12—03/31/13
with a value of $99,572,539
and U.S. Treasury Bills,
0.000% 09/06/12 – 09/13/12
with a value of $23,724,032, to be
repurchased at $123,941,152 | | $ | 121,514,943 | | | $ | 121,514,943 | |
Joint Repurchase Agreements3 | | | | | | | | |
HSBC Group
issued 03/30/12 at 0.01%
due 04/02/12 | | | 315,892,908 | | | | 315,892,908 | |
Mizuho Financial Group, Inc.
issued 03/30/12 at 0.01%
due 04/02/12 | | | 88,876,260 | | | | 88,876,260 | |
Credit Suisse Group
issued 03/30/12 at 0.01%
due 04/02/12 | | | 40,781,942 | | | | 40,781,942 | |
Deutsche Bank
issued 03/30/12 at 0.01%
due 04/02/12 | | | 23,622,327 | | | | 23,622,327 | |
| | | | | | | | |
Total Repurchase Agreements
(Cost $590,688,380) | | | | | | | 590,688,380 | |
| | | | | | | | |
Total Investments – 94.7%
(Cost $1,271,864,650) | | | | | | $ | 1,271,864,650 | |
| | | | | | | | |
Other Assets & Liabilities, net – 5.3% | | | | | | | 71,495,241 | |
| | | | | | | | |
Total Net Assets – 100.0% | | | | | | $ | 1,343,359,891 | |
| † | Value determined based on Level 2 inputs — See Note 4. |
| 1 | The issuer operates under a Congressional charter; its securities are neither issued nor guaranteed by the U.S. Government. |
| 2 | On September 7, 2008, the issuer was placed in conservatorship by the Federal Housing Finance Agency (FHFA). As conservator, the FHFA has full powers to control the assets and operations of the firm. |
| 3 | Repurchase Agreements — See Note 5. |
plc — Public Limited Company
| | |
SEE NOTES TO FINANCIAL STATEMENTS. | | THE RYDEX SERIES FUNDS ANNUAL REPORT | 261 |
U.S. GOVERNMENT MONEY MARKET FUND
| | | | |
| STATEMENT OF ASSETS AND LIABILITIES | |
| |
| March 31, 2012 | | | |
| |
ASSETS: | | | | |
Investments, at value
(cost $681,176,270) | | $ | 681,176,270 | |
Repurchase agreements, at value
(cost $590,688,380) | | | 590,688,380 | |
| | | | |
Total investments
(cost $1,271,864,650) | | | 1,271,864,650 | |
Receivables: | | | | |
Fund shares sold | | | 103,425,178 | |
Interest | | | 69,119 | |
| | | | |
Total assets | | | 1,375,358,947 | |
| | | | |
LIABILITIES: | | | | |
Payable for: | | | | |
Fund shares redeemed | | | 31,374,084 | |
Portfolio accounting fees | | | 48,065 | |
Transfer agent and administrative fees | | | 4,023 | |
Miscellaneous | | | 572,884 | |
| | | | |
Total liabilities | | | 31,999,056 | |
| | | | |
NET ASSETS | | $ | 1,343,359,891 | |
| | | | |
| |
NET ASSETS CONSIST OF: | | | | |
Paid in capital | | $ | 1,343,325,100 | |
Undistributed net investment income | | | 977 | |
Accumulated net realized gain on investments | | | 33,814 | |
Net unrealized appreciation on investments | | | — | |
| | | | |
Net assets | | $ | 1,343,359,891 | |
| | | | |
INVESTOR CLASS: | | | | |
Net assets | | $ | 607,565,400 | |
Capital shares outstanding | | | 607,966,245 | |
Net asset value per share | | $ | 1.00 | |
INVESTOR2 CLASS: | | | | |
Net assets | | $ | 37,885,964 | |
Capital shares outstanding | | | 37,882,580 | |
Net asset value per share | | $ | 1.00 | |
| | | | |
ADVISOR CLASS: | | | | |
Net assets | | $ | 623,763,503 | |
Capital shares outstanding | | | 623,875,453 | |
Net asset value per share | | $ | 1.00 | |
| | | | |
A-CLASS: | | | | |
Net assets | | $ | 38,383,814 | |
Capital shares outstanding | | | 38,400,415 | |
Net asset value per share | | $ | 1.00 | |
| | | | |
C-CLASS: | | | | |
Net assets | | $ | 35,761,210 | |
Capital shares outstanding | | | 35,811,377 | |
Net asset value per share | | $ | 1.00 | |
| | | | |
| | | | |
| STATEMENT OF OPERATIONS | |
| |
| Year Ended March 31, 2012 | | | |
| |
INVESTMENT INCOME: | | | | |
Interest | | $ | 1,218,030 | |
| | | | |
Total investment income | | | 1,218,030 | |
| | | | |
EXPENSES: | | | | |
Management fees | | | 5,824,442 | |
Transfer agent and administrative fees | | | 2,329,799 | |
Distribution and service fees: | | | | |
Advisor Class | | | 1,249,668 | |
C-Class | | | 508,555 | |
Portfolio accounting fees | | | 687,669 | |
Custodian fees | | | 299,265 | |
Trustees’ fees* | | | 99,188 | |
Miscellaneous | | | 1,358,163 | |
| | | | |
Total expenses | | | 12,356,749 | |
| | | | |
LESS: | | | | |
Expenses waived by service company | | | (2,927,723 | ) |
Expenses waived by distributor | | | (1,758,223 | ) |
Expenses waived by advisor | | | (6,456,927 | ) |
| | | | |
Total waived expenses | | | (11,142,873 | ) |
| | | | |
Net expenses | | | 1,213,876 | |
| | | | |
Net investment income | | | 4,154 | |
| | | | |
NET REALIZED GAIN (LOSS): | | | | |
Net realized gain (loss) on: | | | | |
Investments | | | 33,814 | |
| | | | |
Net realized gain | | | 33,814 | |
| | | | |
Net Increase In Net Assets Resulting From Operations | | $ | 37,968 | |
| | | | |
| * | Relates to Trustees not deemed “interested persons” within the meaning of Section 2(a)(19) of the 1940 Act. |
| | |
262 | THE RYDEX SERIES FUNDS ANNUAL REPORT | | SEE NOTES TO FINANCIAL STATEMENTS. |
U.S. GOVERNMENT MONEY MARKET FUND
STATEMENTS OF CHANGES IN NET ASSETS
| | | | | | | | |
| | | Year Ended
March 31,
2012 | | | Year Ended
March
31, 2011 | |
INCREASE (DECREASE) IN NET ASSETS FROM OPERATIONS: | | | | | | | | |
Net investment income | | $ | 4,154 | | | $ | 66,580 | |
Net realized gain on investments | | | 33,814 | | | | 22,225 | |
| | | | | | | | |
Net increase in net assets resulting from operations | | | 37,968 | | | | 88,805 | |
| | | | | | | | |
DISTRIBUTIONSTO sHAREHOLDERSFROM: | | | | | | | | |
Net investment income | | | | | | | | |
Investor Class | | | (2,991 | ) | | | (44,307 | ) |
Investor2 Class | | | (169 | ) | | | (2,773 | ) |
Advisor Class | | | (613 | ) | | | (13,727 | ) |
A-Class | | | (155 | ) | | | (2,159 | ) |
C-Class | | | (195 | ) | | | (3,616 | ) |
Net realized gains | | | | | | | | |
Investor Class | | | (14,115 | ) | | | (22,699 | ) |
Investor2 Class | | | (524 | ) | | | (1,157 | ) |
Advisor Class | | | (3,382 | ) | | | (4,482 | ) |
A-Class | | | (517 | ) | | | (1,101 | ) |
C-Class | | | (803 | ) | | | (1,385 | ) |
| | | | | | | | |
Total distributions to shareholders | | | (23,464 | ) | | | (97,406 | ) |
| | | | | | | | |
CAPITAL sHARETRANSACTIONS: | | | | | | | | |
PROCEEDSFROMSALEOFSHARES | | | | | | | | |
Investor Class | | | 8,520,351,901 | | | | 9,630,003,112 | |
Investor2 Class | | | 38,434,174 | | | | 48,377,228 | |
Advisor Class | | | 5,981,133,747 | | | | 5,264,379,210 | |
A-Class | | | 140,249,344 | | | | 151,697,120 | |
C-Class | | | 332,253,713 | | | | 322,812,213 | |
DISTRIBUTIONSREINVESTED | | | | | | | | |
Investor Class | | | 17,010 | | | | 66,874 | |
Investor2 Class | | | 677 | | | | 3,178 | |
Advisor Class | | | 3,962 | | | | 18,140 | |
A-Class | | | 627 | | | | 3,160 | |
C-Class | | | 968 | | | | 4,826 | |
COSTOFSHARESREDEEMED | | | | | | | | |
Investor Class | | | (8,746,713,127 | ) | | | (9,668,927,624 | ) |
Investor2 Class | | | (45,998,905 | ) | | | (54,121,061 | ) |
Advisor Class | | | (5,497,279,690 | ) | | | (5,248,363,560 | ) |
A-Class | | | (142,707,495 | ) | | | (141,499,697 | ) |
C-Class | | | (345,516,973 | ) | | | (350,392,231 | ) |
| | | | | | | | |
Net increase (decrease) from capital share transactions | | | 234,229,933 | | | | (45,939,112 | ) |
| | | | | | | | |
Net increase (decrease) in net assets | | | 234,244,437 | | | | (45,947,713 | ) |
NETASSETS: | | | | | | | | |
Beginning of year | | | 1,109,115,454 | | | | 1,155,063,167 | |
| | | | | | | | |
End of year | | $ | 1,343,359,891 | | | $ | 1,109,115,454 | |
| | | | | | | | |
Undistributed net investment income at end of year | | $ | 977 | | | $ | 679 | |
| | | | | | | | |
| | |
SEE NOTES TO FINANCIAL STATEMENTS. | | THE RYDEX SERIES FUNDS ANNUAL REPORT | 263 |
U.S. GOVERNMENT MONEY MARKET FUND
STATEMENTS OF CHANGES IN NET ASSETS (concluded)
| | | | | | | | |
| | | Year Ended
March
31, 2012 | | | Year Ended
March
31, 2011 | |
CAPITALSHAREACTIVITY: | | | | | | | | |
Shares sold | | | | | | | | |
Investor Class | | | 8,520,351,901 | | | | 9,630,003,112 | |
Investor2 Class | | | 38,434,174 | | | | 48,377,228 | |
Advisor Class | | | 5,981,133,747 | | | | 5,264,379,210 | |
A-Class | | | 140,249,345 | | | | 151,697,119 | |
C-Class | | | 332,253,713 | | | | 322,812,212 | |
Shares issued from reinvestment of distributions | | | | | | | | |
Investor Class | | | 17,013 | | | | 66,868 | |
Investor2 Class | | | 677 | | | | 3,179 | |
Advisor Class | | | 3,962 | | | | 18,140 | |
A-Class | | | 627 | | | | 3,161 | |
C-Class | | | 969 | | | | 4,825 | |
Shares redeemed | | | | | | | | |
Investor Class | | | (8,746,713,127 | ) | | | (9,668,927,624 | ) |
Investor2 Class | | | (45,998,904 | ) | | | (54,121,059 | ) |
Advisor Class | | | (5,497,279,690 | ) | | | (5,248,363,560 | ) |
A-Class | | | (142,707,495 | ) | | | (141,499,697 | ) |
C-Class | | | (345,516,973 | ) | | | (350,392,230 | ) |
| | | | | | | | |
Net increase (decrease) in shares | | | 234,229,939 | | | | (45,939,116 | ) |
| | | | | | | | |
264 | THE RYDEX SERIES FUNDS ANNUAL REPORT
U.S. GOVERNMENT MONEY MARKET FUND
FINANCIAL HIGHLIGHTS
This table is presented to show selected data for a share outstanding throughout each period and to assist shareholders in evaluating a Fund’s performance for the periods presented.
| | | | | | | | | | | | | | | | | | | | |
Investor Class | | Year Ended
March 31,
2012 | | | Year Ended
March 31,
2011 | | | Year Ended
March 31,
2010 | | | Year Ended
March 31,
2009 | | | Year Ended
March 31,
2008 | |
Per Share Data | | | | | | | | | | | | | | | | | | | | |
Net asset value, beginning of period | | $ | 1.00 | | | $ | 1.00 | | | $ | 1.00 | | | $ | 1.00 | | | $ | 1.00 | |
| | | | | | | | | | | | | | | | | | | | |
Income (loss) from investment operations: | | | | | | | | | | | | | | | | | | | | |
Net investment income | | | — | a | | | — | a | | | — | a | | | .01 | | | | .04 | |
Net gain on investments (realized and unrealized) | | | — | a | | | — | a | | | — | | | | — | | | | — | |
| | | | | | | | | | | | | | | | | | | | |
Total from investment operations | | | — | a | | | — | a | | | — | a | | | .01 | | | | .04 | |
| | | | | | | | | | | | | | | | | | | | |
Less distributions from: | | | | | | | | | | | | | | | | | | | | |
Net investment income | | | (— | )a | | | (— | )a | | | (— | )a | | | (.01 | ) | | | (.04 | ) |
Net realized gains | | | (— | )a | | | (— | )a | | | — | | | | — | | | | — | |
| | | | | | | | | | | | | | | | | | | | |
Total distributions | | | (— | )a | | | (— | )a | | | (— | )a | | | (.01 | ) | | | (.04 | ) |
| | | | | | | | | | | | | | | | | | | | |
Net asset value, end of period | | $ | 1.00 | | | $ | 1.00 | | | $ | 1.00 | | | $ | 1.00 | | | $ | 1.00 | |
| | | | | | | | | | | | | | | | | | | | |
| | | | | |
Total Returnb | | | 0.00 | % | | | 0.01 | % | | | 0.01 | % | | | 1.06 | % | | | 3.76 | % |
| | | | | | | | | | | | | | | | | | | | |
Ratios/Supplemental Data | | | | | | | | | | | | | | | | | | | | |
Net assets, end of period (in thousands) | | $ | 607,565 | | | $ | 833,899 | | | $ | 872,765 | | | $ | 1,114,286 | | | $ | 978,584 | |
| | | | | | | | | | | | | | | | | | | | |
Ratios to average net assets: | | | | | | | | | | | | | | | | | | | | |
Net investment income | | | 0.00 | %e | | | 0.01 | % | | | 0.01 | % | | | 1.02 | % | | | 3.71 | % |
Total expenses | | | 0.91 | % | | | 0.94 | % | | | 0.93 | % | | | 0.95 | % | | | 0.93 | % |
Net expensesc | | | 0.11 | % | | | 0.22 | % | | | 0.37 | % | | | 0.90 | % | | | 0.93 | % |
| | | | | | | | | | | | | | | | | | | | |
Portfolio turnover rate | | | — | | | | — | | | | — | | | | — | | | | — | |
| | | | | | | | | | | | |
Investor2 Class | | Year Ended
March 31,
2012 | | | Year Ended
March 31,
2011 | | | Year Ended
March 31,
2010d | |
Per Share Data | | | | | | | | | | | | |
Net asset value, beginning of period | | $ | 1.00 | | | $ | 1.00 | | | $ | 1.00 | |
| | | | | | | | | | | | |
Income (loss) from investment operations: | | | | | | | | | | | | |
Net investment income | | | — | a | | | — | a | | | — | a |
Net gain on investments (realized and unrealized) | | | — | a | | | — | a | | | — | |
| | | | | | | | | | | | |
Total from investment operations | | | — | a | | | — | a | | | — | a |
| | | | | | | | | | | | |
Less distributions from: | | | | | | | | | | | | |
Net investment income | | | (— | )a | | | (— | )a | | | (— | )a |
Net realized gains | | | (— | )a | | | (— | )a | | | — | |
| | | | | | | | | | | | |
Total distributions | | | (— | )a | | | (— | )a | | | (— | )a |
| | | | | | | | | | | | |
Net asset value, end of period | | $ | 1.00 | | | $ | 1.00 | | | $ | 1.00 | |
| | | | | | | | | | | | |
| | | |
Total Returnb | | | 0.00 | % | | | 0.01 | % | | | 0.00 | % |
| | | | | | | | | | | | |
Ratios/Supplemental Data | | | | | | | | | | | | |
Net assets, end of period (in thousands) | | $ | 37,886 | | | $ | 45,449 | | | $ | 51,190 | |
| | | | | | | | | | | | |
Ratios to average net assets: | | | | | | | | | | | | |
Net investment income | | | 0.00 | %e | | | 0.01 | % | | | 0.01 | % |
Total expenses | | | 0.91 | % | | | 0.94 | % | | | 0.94 | % |
Net expensesc | | | 0.11 | % | | | 0.22 | % | | | 0.29 | % |
| | | | | | | | | | | | |
Portfolio turnover rate | | | — | | | | — | | | | — | |
| | |
SEE NOTES TO FINANCIAL STATEMENTS. | | THE RYDEX SERIES FUNDS ANNUAL REPORT | 265 |
U.S. GOVERNMENT MONEY MARKET FUND
FINANCIAL HIGHLIGHTS (continued)
This table is presented to show selected data for a share outstanding throughout each period and to assist shareholders in evaluating a Fund’s performance for the periods presented.
| | | | | | | | | | | | | | | | | | | | |
Advisor Class | | Year Ended
March 31,
2012 | | | Year Ended
March 31,
2011 | | | Year Ended
March 31,
2010 | | | Year Ended
March 31,
2009 | | | Year Ended
March 31,
2008 | |
Per Share Data | | | | | | | | | | | | | | | | | | | | |
Net asset value, beginning of period | | $ | 1.00 | | | $ | 1.00 | | | $ | 1.00 | | | $ | 1.00 | | | $ | 1.00 | |
| | | | | | | | | | | | | | | | | | | | |
Income (loss) from investment operations: | | | | | | | | | | | | | | | | | | | | |
Net investment income | | | — | a | | | — | a | | | — | a | | | .01 | | | | .03 | |
Net gain on investments (realized and unrealized) | | | — | a | | | — | a | | | — | | | | — | | | | — | |
| | | | | | | | | | | | | | | | | | | | |
Total from investment operations | | | — | a | | | — | a | | | — | a | | | .01 | | | | .03 | |
| | | | | | | | | | | | | | | | | | | | |
Less distributions from: | | | | | | | | | | | | | | | | | | | | |
Net investment income | | | (— | )a | | | (— | )a | | | (— | )a | | | (.01 | ) | | | (.03 | ) |
Net realized gains | | | (— | )a | | | (— | )a | | | — | | | | — | | | | — | |
| | | | | | | | | | | | | | | | | | | | |
Total distributions | | | (— | )a | | | (— | )a | | | (— | )a | | | (.01 | ) | | | (.03 | ) |
| | | | | | | | | | | | | | | | | | | | |
Net asset value, end of period | | $ | 1.00 | | | $ | 1.00 | | | $ | 1.00 | | | $ | 1.00 | | | $ | 1.00 | |
| | | | | | | | | | | | | | | | | | | | |
| | | | | |
Total Returnb | | | 0.00 | % | | | 0.01 | % | | | 0.01 | % | | | 0.65 | % | | | 3.24 | % |
| | | | | | | | | | | | | | | | | | | | |
Ratios/Supplemental Data | | | | | | | | | | | | | | | | | | | | |
Net assets, end of period (in thousands) | | $ | 623,764 | | | $ | 139,904 | | | $ | 123,870 | | | $ | 341,425 | | | $ | 159,111 | |
| | | | | | | | | | | | | | | | | | | | |
Ratios to average net assets: | | | | | | | | | | | | | | | | | | | | |
Net investment income | | | 0.00 | %e | | | 0.01 | % | | | 0.03 | % | | | 0.55 | % | | | 3.25 | % |
Total expenses | | | 1.41 | % | | | 1.44 | % | | | 1.43 | % | | | 1.45 | % | | | 1.43 | % |
Net expensesc | | | 0.10 | % | | | 0.22 | % | | | 0.37 | % | | | 1.26 | % | | | 1.43 | % |
| | | | | | | | | | | | | | | | | | | | |
Portfolio turnover rate | | | — | | | | — | | | | — | | | | — | | | | — | |
| | | | | |
A-Class | | Year Ended
March 31,
2012 | | | Year Ended
March 31,
2011 | | | Year Ended
March 31,
2010 | | | Year Ended
March 31,
2009 | | | Year Ended
March 31,
2008 | |
Per Share Data | | | | | | | | | | | | | | | | | | | | |
Net asset value, beginning of period | | $ | 1.00 | | | $ | 1.00 | | | $ | 1.00 | | | $ | 1.00 | | | $ | 1.00 | |
| | | | | | | | | | | | | | | | | | | | |
Income (loss) from investment operations: | | | | | | | | | | | | | | | | | | | | |
Net investment income | | | — | a | | | — | a | | | (— | )a | | | .01 | | | | .03 | |
Net gain on investments (realized and unrealized) | | | — | a | | | — | a | | | — | | | | — | | | | — | |
| | | | | | | | | | | | | | | | | | | | |
Total from investment operations | | | — | a | | | — | a | | | (— | )a | | | .01 | | | | .03 | |
| | | | | | | | | | | | | | | | | | | | |
Less distributions from: | | | | | | | | | | | | | | | | | | | | |
Net investment income | | | (— | )a | | | (— | )a | | | (— | )a | | | (.01 | ) | | | (.03 | ) |
Net realized gains | | | (— | )a | | | (— | )a | | | — | | | | — | | | | — | |
| | | | | | | | | | | | | | | | | | | | |
Total distributions | | | (— | )a | | | (— | )a | | | (— | )a | | | (.01 | ) | | | (.03 | ) |
| | | | | | | | | | | | | | | | | | | | |
Net asset value, end of period | | $ | 1.00 | | | $ | 1.00 | | | $ | 1.00 | | | $ | 1.00 | | | $ | 1.00 | |
| | | | | | | | | | | | | | | | | | | | |
| | | | | |
Total Returnb | | | 0.00 | % | | | 0.01 | % | | | 0.01 | % | | | 0.85 | % | | | 3.51 | % |
| | | | | | | | | | | | | | | | | | | | |
Ratios/Supplemental Data | | | | | | | | | | | | | | | | | | | | |
Net assets, end of period (in thousands) | | $ | 38,384 | | | $ | 40,841 | | | $ | 30,640 | | | $ | 49,072 | | | $ | 21,174 | |
| | | | | | | | | | | | | | | | | | | | |
Ratios to average net assets: | | | | | | | | | | | | | | | | | | | | |
Net investment income (loss) | | | 0.00 | %e | | | 0.01 | % | | | (0.04 | %) | | | 0.74 | % | | | 3.45 | % |
Total expenses | | | 0.91 | % | | | 1.13 | % | | | 1.18 | % | | | 1.20 | % | | | 1.18 | % |
Net expensesc | | | 0.11 | % | | | 0.21 | % | | | 0.38 | % | | | 1.09 | % | | | 1.18 | % |
| | | | | | | | | | | | | | | | | | | | |
Portfolio turnover rate | | | — | | | | — | | | | — | | | | — | | | | — | |
| | |
266 | THE RYDEX SERIES FUNDS ANNUAL REPORT | | SEE NOTES TO FINANCIAL STATEMENTS. |
U.S. GOVERNMENT MONEY MARKET FUND
FINANCIAL HIGHLIGHTS (concluded)
This table is presented to show selected data for a share outstanding throughout each period and to assist shareholders in evaluating a Fund’s performance for the periods presented.
| | | | | | | | | | | | | | | | | | | | |
C-Class | | Year Ended
March 31,
2012 | | | Year Ended
March 31,
2011 | | | Year Ended
March 31,
2010 | | | Year Ended
March 31,
2009 | | | Year Ended
March 31,
2008 | |
Per Share Data | | | | | | | | | | | | | | | | | | | | |
Net asset value, beginning of period | | $ | 1.00 | | | $ | 1.00 | | | $ | 1.00 | | | $ | 1.00 | | | $ | 1.00 | |
| | | | | | | | | | | | | | | | | | | | |
Income (loss) from investment operations: | | | | | | | | | | | | | | | | | | | | |
Net investment income | | | — | a | | | — | a | | | (— | )a | | | — | a | | | .03 | |
Net gain on investments (realized and unrealized) | | | — | a | | | — | a | | | — | | | | — | | | | — | |
| | | | | | | | | | | | | | | | | | | | |
Total from investment operations | | | — | a | | | — | a | | | (— | )a | | | — | | | | .03 | |
| | | | | | | | | | | | | | | | | | | | |
Less distributions from: | | | | | | | | | | | | | | | | | | | | |
Net investment income | | | (— | )a | | | (— | )a | | | (— | )a | | | (— | )a | | | (.03 | ) |
Net realized gains | | | (— | )a | | | (— | )a | | | — | | | | — | | | | — | |
| | | | | | | | | | | | | | | | | | | | |
Total distributions | | | (— | )a | | | (— | )a | | | (— | )a | | | (— | )a | | | (.03 | ) |
| | | | | | | | | | | | | | | | | | | | |
Net asset value, end of period | | $ | 1.00 | | | $ | 1.00 | | | $ | 1.00 | | | $ | 1.00 | | | $ | 1.00 | |
| | | | | | | | | | | | | | | | | | | | |
| | | | | |
Total Returnb | | | 0.00 | % | | | 0.01 | % | | | 0.01 | % | | | 0.26 | % | | | 2.74 | % |
| | | | | | | | | | | | | | | | | | | | |
Ratios/Supplemental Data | | | | | | | | | | | | | | | | | | | | |
Net assets, end of period (in thousands) | | $ | 35,761 | | | $ | 49,023 | | | $ | 76,598 | | | $ | 135,384 | | | $ | 121,436 | |
| | | | | | | | | | | | | | | | | | | | |
Ratios to average net assets: | | | | | | | | | | | | | | | | | | | | |
Net investment income (loss) | | | 0.00 | %e | | | 0.01 | % | | | (0.05 | %) | | | 0.24 | % | | | 2.69 | % |
Total expenses | | | 1.92 | % | | | 1.94 | % | | | 1.93 | % | | | 1.95 | % | | | 1.93 | % |
Net expensesc | | | 0.10 | % | | | 0.22 | % | | | 0.39 | % | | | 1.70 | % | | | 1.93 | % |
| | | | | | | | | | | | | | | | | | | | |
Portfolio turnover rate | | | — | | | | — | | | | — | | | | — | | | | — | |
| a | Less than $0.01 per share. |
| b | Total return does not reflect the impact of any applicable sales charges and has not been annualized. |
| c | Net expense information reflects the expense ratios after voluntary expense waivers. |
| d | Since commencement of operations: July 10, 2009. Percentage amounts for the period, except total return and portfolio turnover rate, have been annualized. |
| | |
SEE NOTES TO FINANCIAL STATEMENTS. | | THE RYDEX SERIES FUNDS ANNUAL REPORT | 267 |
NOTES TO FINANCIAL STATEMENTS
1. Organization and Significant Accounting Policies Organization
The Rydex Series Funds (the “Trust”) is registered with the SEC under the Investment Company Act of 1940 (the”1940 Act”) as a non-diversified, open-ended investment company. The Trust offers eight separate classes of shares, Investor Class shares, Investor2 Class shares, Advisor Class shares, A-Class shares, C-Class shares, H-Class shares, Y-Class shares, and Institutional Class shares. Sales of shares of each Class are made without a front-end sales charge at the net asset value per share (“NAV”), with the exception of A-Class shares. A-Class shares are sold at the NAV, plus the applicable front-end sales charge. The sales charge varies depending on the amount purchased, but will not exceed 4.75%. A-Class share purchases of $1 million or more are exempt from the front-end sales charge but have a 1% contingent deferred sales charge (“CDSC”) if shares are redeemed within 12 months of purchase. C-Class shares have a 1% CDSC if shares are redeemed within 12 months of purchase.
At March 31, 2012, the Trust consisted of fifty-seven separate funds. This report covers the Target Beta Funds and the Money Market Fund (the “Funds”), while the other funds are contained in separate reports. Only Investor Class, Investor2 Class, Advisor Class, A-Class, C-Class, and H-Class had been issued in the Funds.
Guggenheim Investments (“GI”) provides advisory services and Rydex Fund Services, LLC (“RFS”) provides transfer agent, administrative and accounting services to the Trust. Rydex Distributors, LLC (“RDL”) acts as principal underwriter for the Trust. GI, RFS and RDL are affiliated entities.
The Funds are designed and operated to accommodate frequent trading by shareholders and, unlike most mutual funds, offer unlimited exchange privileges with no minimum holding periods or transactions fees, which may cause the Funds to experience high portfolio turnover.
Significant Accounting Policies
The following significant accounting policies are in conformity with U.S. generally accepted accounting principles and are consistently followed by the Trust. This requires management to make estimates and assumptions that affect the reported amount of assets and liabilities and disclosure of contingent assets and liabilities at the date of the financial statements and the reported amounts of revenues and expenses during the reporting period. Actual results could differ from these estimates. All time references are based on Eastern Time.
A. The Trust calculates a NAV twice each business day, first in the morning and again in the afternoon for the Russell 2000® Fund and the S&P 500 Fund. All other Funds in this report will price at the afternoon NAV.
The morning NAV is calculated at 10:45 a.m. and the afternoon NAV is calculated at the close of the New York Stock Exchange (“NYSE”), usually 4:00 p.m. The NAV is calculated using the current market value of each Fund’s total assets as of the respective time of calculation. These financial statements are based on the March 31, 2012, afternoon NAV.
Equity securities listed on an exchange (NYSE or American Stock Exchange) are valued at the last quoted sales price as of the close of business on the NYSE, usually 4:00 p.m. on the valuation date. Equity securities listed on the NASDAQ market system are valued at the NASDAQ Official Closing Price on the valuation date.
The value of futures contracts purchased and sold by the Funds are accounted for using the unrealized gain or loss on the contracts that is determined by marking the contracts to their current realized settlement prices. Financial futures contracts are valued at the 4:00 p.m. price on the valuation date. In the event that the exchange for a specific futures contract closes earlier than 4:00 p.m., the futures contract is valued at the Official Settlement Price of the exchange. However, the underlying securities from which the futures contract value is derived are monitored until 4:00 p.m. to determine if fair valuation would provide a more accurate valuation.
The U.S. Government Money Market Fund values debt securities at amortized cost pursuant to Rule 2a-7 of the 1940 Act, which approximates market value.
With the exception of the U.S. Government Money Market Fund, non-U.S. government securities are valued by either independent pricing services, the last traded fill price, or at the reported bid price at the close of business. Other debt securities with a maturity of greater than 60 days at acquisition are valued at prices that reflect broker/dealer-supplied valuations or are obtained from independent pricing services, which may consider the trade activity, treasury yields, yield or price of bonds of comparable quality, coupon, maturity, and type, as well as prices quoted by dealers who make markets in such securities. Short-term debt securities with a maturity of 60 days or less at acquisition and repurchase agreements are valued at amortized cost, which approximates market value.
Open-end investment companies (“Mutual Funds”) are valued at their NAV as of the close of business on the valuation date. Exchange Traded Funds (“ETFs”) and closed-end investment companies are valued at the last quoted sales price.
The value of equity index and credit default swap agreements entered into by a Fund is accounted for using the unrealized gain or loss on the agreements that is determined by marking the agreements to the last quoted value of the index that the swap
268 | THE RYDEX SERIES FUNDS ANNUAL REPORT
NOTES TO FINANCIAL STATEMENTS (continued)
pertains to at the close of the NYSE. The swap’s market value is then adjusted to include dividends accrued, financing charges and/or interest associated with the swap agreements.
The value of currency index swap agreements entered into by a Fund is accounted for using the unrealized gain or loss on the agreements that is determined by marking the agreements to the broker quote.
Investments for which market quotations are not readily available are fair valued as determined in good faith by GI under the direction of the Board of Trustees using methods established or ratified by the Board of Trustees. These methods include, but are not limited to: (i) using general information as to how these securities and assets trade; (ii) in connection with futures contracts and options thereupon, and other derivative investments, information as to how (a) these contracts and other derivative investments trade in the futures or other derivative markets, respectively, and (b) the securities underlying these contracts and other derivative investments trade in the cash market; and (iii) other information and considerations, including current values in related markets.
B. Security transactions are recorded on the trade date for financial reporting purposes. Realized gains and losses from securities transactions are recorded using the identified cost basis. Proceeds from lawsuits related to investment holdings are recorded as realized gains in the respective Fund. Dividend income is recorded on the ex-dividend date, net of applicable taxes withheld by foreign countries. Taxable non-cash dividends are recorded as dividend income. Interest income, including amortization of premiums and accretion of discounts, is accrued on a daily basis. Distributions received from investments in REITs are recorded as dividend income on the ex-dividend date, subject to reclassification upon notice of the character of such distribution by the issuer.
C. Dividends from net investment income are declared daily in the Government Long Bond 1.2x Strategy Fund and the U.S. Government Money Market Fund. Dividends are reinvested in additional shares unless shareholders request payment in cash. Distributions of net investment income in the remaining Funds and distributions of net realized gains, if any, in all Funds are declared at least annually and recorded on the ex-dividend date and are determined in accordance with income tax regulations which may differ from U.S. generally accepted accounting principles.
D. When a Fund engages in a short sale of a security, an amount equal to the proceeds is reflected as an asset and an equivalent liability. The amount of the liability is subsequently marked-to-market to reflect the market value of the short sale. The Fund maintains a segregated account of cash and/or securities as collateral for short sales.
The Fund is exposed to market risk based on the amount, if any, that the market value of the security exceeds the market value of the securities in the segregated account.
Fees, if any, paid to brokers to borrow securities in connection with short sales are recorded as interest expense. In addition, the Fund must pay out the dividend rate of the equity or coupon rate of the treasury obligation to the lender and record this as an expense. Short dividend or interest expense is a cost associated with the investment objective of short sales transactions, rather than an operational cost associated with the day-to-day management of any mutual fund. The Funds may also receive rebate income from the broker resulting from the investment of the proceeds from securities sold short.
E. Upon entering into a futures contract, the Fund deposits and maintains as collateral such initial margin as required by the exchange on which the transaction is affected. Pursuant to the contract, the Fund agrees to receive from or pay to the broker an amount of cash equal to the daily fluctuation in value of the contract. Such receipts or payments are known as variation margin and are recorded by the Fund as unrealized gains or losses. When the contract is closed, the Fund records a realized gain or loss equal to the difference between the value of the contract at the time it was opened and the value at the time it was closed.
F. Swap agreements are marked-to-market daily and the change, if any, is recorded as unrealized gain or loss. Payments received or made as a result of an agreement or termination of the agreement are recognized as realized gains or losses.
Upfront payments received or made by a Fund on credit default swap agreements are amortized over the expected life of the agreement. Periodic payments received or paid by a Fund are recorded as realized gains or losses. Payments received or made as a result of a credit event or termination of the contract are recognized, net of a proportional amount of the upfront payment, as realized gains or losses.
G. Investment securities and other assets and liabilities denominated in foreign currencies are translated into U.S. dollar amounts at the date of valuation. Purchases and sales of investment securities and income and expense items denominated in foreign currencies are translated into U.S. dollar amounts on the respective dates of such transactions. The Trust does not isolate that portion of the results of operations resulting from changes in foreign exchange rates on investments from the fluctuations arising from changes in market prices of securities held. Such fluctuations are included with the net realized and unrealized gain and loss from investments.
THE RYDEX SERIES FUNDS ANNUAL REPORT | 269
NOTES TO FINANCIAL STATEMENTS (continued)
Reported net realized foreign exchange gains or losses arise from sales of foreign currencies and currency gains or losses realized between the trade and settlement dates on investment transactions. Net unrealized exchange gains and losses arise from changes in the fair values of assets and liabilities other than investments in securities at the fiscal period end, resulting from changes in exchange rates.
H. Certain U.S. Government and Agency Obligations are traded on a discount basis; the interest rates shown on the Schedules of Investments reflect the effective rates paid at the time of purchase by the Funds. Other securities bear interest at the rates shown, payable at fixed dates through maturity.
I. The Funds may leave cash overnight in their cash account with the custodian, U.S. Bank. Periodically, a Fund may have cash due to the custodian bank as an overdraft balance. A fee is incurred on this overdraft, calculated by multiplying the overdraft by a rate based on the federal funds rate. Segregated cash with the broker is held as collateral for investments in derivative instruments such as futures contracts or swap agreements.
J. Interest and dividend income, most expenses, all realized gains and losses, and all unrealized gains and losses are allocated to the Classes based upon the value of the outstanding shares in each Class. Certain costs, such as distribution fees relating to A-Class shares and H-Class shares and service and distribution fees related to Advisor Class shares and C-Class shares, are charged directly to specific Classes. In addition, certain expenses have been allocated to the individual Funds in the Trust on a pro rata basis upon the respective aggregate net assets of each Fund included in the Trust.
K. Throughout the normal course of business, the Funds enter into contracts that contain a variety of representations and warranties which provide general indemnifications. The Funds’ maximum exposure under these arrangements is unknown, as this would involve future claims that may be made against the Funds and/or their affiliates that have not yet occurred. However, based on experience, the Funds expect the risk of loss to be remote.
2. Financial Instruments
As part of their investment strategy, the Funds utilize short sales and a variety of derivative instruments including futures and swap agreements. These investments involve, to varying degrees, elements of market risk and risks in excess of the amounts recognized in the Statements of Assets and Liabilities.
A short sale is a transaction in which a Fund sells a security it does not own. If the security sold short decreases in price between the time the Fund sells the security and closes its short position,
that Fund will realize a gain on the transaction. Conversely, if the security increases in price during the period, that Fund will realize a loss on the transaction. The risk of such price increases is the principal risk of engaging in short sales.
A futures contract is an agreement to purchase (long) or sell (short) an agreed amount of securities or other instruments at a set price for delivery at a future date. There are significant risks associated with a Fund’s or an underlying fund’s use of futures contracts and related options, including (i) there may be an imperfect or no correlation between the changes in market value of the underlying asset and the prices of futures contracts; (ii) there may not be a liquid secondary market for a futures contract; (iii) trading restrictions or limitations may be imposed by an exchange; and (iv) government regulations may restrict trading in futures contracts. When investing in futures, there is minimal counterparty credit risk to the Fund because futures are exchange-traded and the exchange’s clearinghouse, as counterparty to all exchange-traded futures, guarantees against default.
A swap is an agreement that obligates two parties to exchange a series of cash flows at specified intervals based upon or calculated by reference to changes in specified prices or rates for a specified amount of an underlying asset. A credit default swap enables a Fund to buy or sell protection against a defined credit event of an issuer or a basket of securities. Generally, the seller of credit protection against an issuer or basket of securities receives a periodic payment from the buyer to compensate against potential default events. If a default event occurs, the seller must pay the buyer the full notional value of the reference obligation in exchange for the reference obligation. If no default occurs, the counterparty will pay the stream of payments and have no further obligations to the Fund selling the credit protection. A Fund bears the risk of loss of the amount expected to be received under a swap agreement in the event of the default or bankruptcy of a swap agreement counterparty, or in the case of a credit default swap in which the Fund is selling credit protection, the default of a third party issuer. Additionally, there is no guarantee that a Fund or an underlying fund could eliminate its exposure under an outstanding swap agreement by entering into an offsetting swap agreement with the same or another party.
In conjunction with the use of short sales, futures, and swap agreements, the Funds are required to maintain collateral in various forms. The Funds use, where appropriate, depending on the financial instrument utilized and the broker involved, margin deposits at the broker, cash and/or securities segregated at the custodian bank, discount notes, or the repurchase agreements allocated to each Fund.
270 | THE RYDEX SERIES FUNDS ANNUAL REPORT
NOTES TO FINANCIAL STATEMENTS (continued)
The Trust has established counterparty credit guidelines and enters into transactions only with financial institutions of investment grade or better. The Trust monitors the counterparty credit risk.
3. Fees and Other Transactions with Affiliates
Under the terms of an investment advisory contract, the Funds pay GI investment advisory fees calculated at the annualized rates below, based on the average daily net assets of the Funds:
| | | | |
Fund | | Management Fees
(as a % of Net Assets) | |
Nova Fund | | | 0.75 | % |
S&P 500 Fund | | | 0.75 | % |
Inverse S&P 500 Strategy Fund | | | 0.90 | % |
Nasdaq-100® Fund | | | 0.75 | % |
Inverse Nasdaq-100® Strategy Fund | | | 0.90 | % |
Mid-Cap 1.5x Strategy Fund | | | 0.90 | % |
Inverse Mid-Cap Strategy Fund | | | 0.90 | % |
Russell 2000® 1.5x Strategy Fund | | | 0.90 | % |
Russell 2000® Fund | | | 0.75 | % |
Inverse Russell 2000® Strategy Fund | | | 0.90 | % |
S&P 500 Pure Growth Fund | | | 0.75 | % |
S&P 500 Pure Value Fund | | | 0.75 | % |
S&P MidCap 400 Pure Growth Fund | | | 0.75 | % |
S&P MidCap 400 Pure Value Fund | | | 0.75 | % |
S&P SmallCap 600 Pure Growth Fund | | | 0.75 | % |
S&P SmallCap 600 Pure Value Fund | | | 0.75 | % |
Europe 1.25x Strategy Fund | | | 0.90 | % |
Japan 2x Strategy Fund | | | 0.75 | % |
Strengthening Dollar 2x Strategy Fund | | | 0.90 | % |
Weakening Dollar 2x Strategy Fund | | | 0.90 | % |
Real Estate Fund | | | 0.85 | % |
Government Long Bond 1.2x Strategy Fund | | | 0.50 | % |
Inverse Government Long Bond Strategy Fund | | | 0.90 | % |
High Yield Strategy Fund | | | 0.75 | % |
Inverse High Yield Strategy Fund | | | 0.75 | % |
U.S. Government Money Market Fund | | | 0.50 | % |
RFS provides transfer agent and administrative services to the Trust for fees calculated at the annualized rates based on the average daily net assets of the Funds. For these services, RFS receives the following:
| | | | |
Fund | | Transfer Agent and
Administrative Fees
(as a % of Net Assets) | |
Government Long Bond 1.2x Strategy Fund | | | 0.20 | % |
U.S. Government Money Market Fund | | | 0.20 | % |
Remaining Funds | | | 0.25 | % |
RFS also provides accounting services to the Funds for fees calculated at annualized rates below, based on the average daily net assets of each Fund.
| | | | |
Fund Accounting | | (as a % of net assets) | |
On the first $250 million | | | 0.10 | % |
On the next $250 million | | | 0.075 | % |
On the next $250 million | | | 0.05 | % |
Over $750 million | | | 0.03 | % |
RFS engages external service providers to perform other necessary services for the Trust, such as audit and accounting related services, legal services, custody, printing and mailing, etc., on a pass-through basis. Such expenses are allocated to various Funds within the complex based on relative net assets.
The Trust has adopted a Distribution and Shareholder Services Plan applicable to its Advisor Class shares and a Distribution Plan applicable to A-Class shares for which RDL and other firms that provide distribution and/or shareholder services (“Service Providers”) may receive compensation. If a Service Provider provides distribution services, the Trust will pay distribution fees to RDL at an annual rate not to exceed 0.25% of average daily net assets, pursuant to Rule 12b-1 of the 1940 Act. RDL, in turn, will pay the Service Provider out of its fees. RDL may, at its discretion, retain a portion of such payments to compensate itself for distribution services. With regard to Advisor Class shares only, if a Service Provider provides shareholders services, RDL will receive shareholder servicing fees from the Trust at an annual rate not to exceed 0.25% of average daily net assets. RDL, in turn, will compensate Service Providers for providing such services, while retaining a portion of such payments to compensate itself for shareholder services it performs.
The Trust has adopted a separate Distribution and Shareholder Services Plan applicable to its C-Class shares that allows the Funds to pay annual distribution and service fees of 1.00% of the Funds’ C-Class shares average daily net assets. The annual 0.25% service fee compensates the shareholder’s financial advisor for providing ongoing services to the shareholder. The annual distribution fee of 0.75% reimburses RDL for paying the shareholder’s financial advisor an ongoing sales commission. RDL advances the first year’s service and distribution fees to the financial advisor. RDL retains the service and distribution fees on accounts with no authorized dealer of record.
GI and its affiliates have voluntarily agreed to waive their fees, including but not limited to accounting, shareholder services and investment advisory fees, in an attempt to maintain a positive net yield for the U.S. Government Money Market Fund. GI or its affiliates may terminate this voluntary waiver at any time upon notice to the Fund. When shareholder services fees are waived, dealer compensation will be reduced to the extent of such waiver.
For the year ended March 31, 2012, RDL retained sales charges of $404,264 relating to sales of A-Class shares of the Trust.
Certain officers and trustees of the Trust are also officers of GI, RFS and RDL.
THE RYDEX SERIES FUNDS ANNUAL REPORT | 271
NOTES TO FINANCIAL STATEMENTS (continued)
4. Fair Value Measurement
In accordance with U.S. generally accepted accounting principles, fair value is defined as the price that the Fund would receive to sell an investment or pay to transfer a liability in an orderly transaction with an independent buyer in the principal market, or in the absence of a principal market the most advantageous market for the investment or liability. A three-tier hierarchy is utilized to distinguish between (1) inputs that reflect the assumptions market participants would use in pricing an asset or liability developed based on market data obtained from sources independent of the reporting entity (observable inputs) and (2) inputs that reflect the reporting entity’s own assumptions about the assumptions market participants would use in pricing an asset or liability developed based on the best information available in the circumstances (unobservable inputs) and to establish classification of fair value measurements for disclosure purposes. Various inputs are used in determining the value of the Funds’ investments. The inputs are summarized in the three broad levels listed below:
Level 1 — quoted prices in active markets for identical securities.
Level 2 — other significant observable inputs (including quoted prices for similar securities, interest rates, prepayment speeds, credit risk, etc.).
Level 3 — significant unobservable inputs (including the fund’s own assumptions used to determine the fair value of investments).
The inputs or methodologies used for valuing securities are not necessarily an indication of the risk associated with investing in those securities.
The following table summarizes the inputs used to value the Funds’ net assets at March 31, 2012:
| | | | | | | | | | | | | | | | | | | | | | | | |
| | | Level 1
Investments
In Securities | | | Level 1
Other Financial
Instruments* | | | Level 2
Investments
In Securities | | | Level 2
Other Financial
Instruments* | | | Level 3
Investments
In Securities | | | Total | |
Assets | | | | | | | | | | | | | | | | | | | | | | | | |
Nova Fund | | $ | 42,278,202 | | | $ | 53,298 | | | $ | 26,336,313 | | | $ | 99,503 | | | $ | — | | | $ | 68,767,316 | |
S&P 500 Fund | | | 219,950,857 | | | | 47,561 | | | | 39,937,004 | | | | 80,195 | | | | — | | | | 260,015,617 | |
Inverse S&P 500 Strategy Fund | | | — | | | | — | | | | 132,755,042 | | | | 154,690 | | | | — | | | | 132,909,732 | |
NASDAQ-100® Fund | | | 789,802,282 | | | | 727,499 | | | | 75,902,377 | | | | — | | | | — | | | | 866,432,158 | |
Inverse NASDAQ-100® Strategy Fund | | | — | | | | — | | | | 9,178,123 | | | | 41,119 | | | | — | | | | 9,219,242 | |
Mid-Cap 1.5x Strategy Fund | | | 19,941,131 | | | | 195,103 | | | | 3,804,635 | | | | — | | | | — | | | | 23,940,869 | |
Inverse Mid-Cap Strategy Fund | | | — | | | | 1,297 | | | | 1,697,691 | | | | 3,715 | | | | — | | | | 1,702,703 | |
Russell 2000® 1.5x Strategy Fund | | | 15,186,856 | | | | 54,724 | | | | 3,265,344 | | | | — | | | | — | | | | 18,506,924 | |
Russell 2000® Fund | | | 51,571,939 | | | | 34,348 | | | | 21,638,052 | | | | — | | | | — | | | | 73,244,339 | |
Inverse Russell 2000® Strategy Fund | | | — | | | | — | | | | 18,486,919 | | | | 45,108 | | | | — | | | | 18,532,027 | |
S&P 500 Pure Growth Fund | | | 50,824,029 | | | | — | | | | 463,445 | | | | — | | | | — | | | | 51,287,474 | |
S&P 500 Pure Value Fund | | | 72,546,070 | | | | — | | | | 480,768 | | | | — | | | | — | | | | 73,026,838 | |
S&P MidCap 400 Pure Growth Fund | | | 362,724,057 | | | | — | | | | 2,657,891 | | | | — | | | | — | | | | 365,381,948 | |
S&P MidCap 400 Pure Value Fund | | | 27,631,006 | | | | — | | | | 179,342 | | | | — | | | | — | | | | 27,810,348 | |
S&P SmallCap 600 Pure Growth Fund | | | 32,564,055 | | | | — | | | | 477,987 | | | | — | | | | — | | | | 33,042,042 | |
S&P SmallCap 600 Pure Value Fund | | | 27,075,875 | | | | — | | | | 93,034 | | | | — | | | | — | | | | 27,168,909 | |
Europe 1.25x Strategy Fund | | | 5,932,027 | | | | 26,181 | | | | 4,619,601 | | | | — | | | | — | | | | 10,577,809 | |
Japan 2x Strategy Fund | | | — | | | | 692,702 | | | | 4,552,457 | | | | — | | | | — | | | | 5,245,159 | |
Strengthening Dollar 2x Strategy Fund | | | — | | | | — | | | | 31,591,018 | | | | — | | | | — | | | | 31,591,018 | |
Weakening Dollar 2x Strategy Fund | | | — | | | | 350,304 | | | | 19,172,739 | | | | 126,199 | | | | — | | | | 19,649,242 | |
Real Estate Fund | | | 17,589,452 | | | | — | | | | 38,743 | | | | — | | | | — | | | | 17,628,195 | |
Government Long Bond 1.2x Strategy Fund | | | 57,539,790 | | | | 212,724 | | | | 42,038,646 | | | | — | | | | — | | | | 99,791,160 | |
Inverse Government Long Bond Strategy Fund | | | — | | | | 6,471,548 | | | | 806,644,003 | | | | — | | | | — | | | | 813,115,551 | |
High Yield Strategy Fund | | | 18,146,016 | | | | — | | | | 207,500,376 | | | | — | | | | — | | | | 225,646,392 | |
Inverse High Yield Strategy Fund | | | — | | | | — | | | | 15,716,617 | | | | 75,959 | | | | — | | | | 15,792,576 | |
U.S. Government Money Market Fund | | | — | | | | — | | | | 1,271,864,650 | | | | — | | | | — | | | | 1,271,864,650 | |
| | | | | | | | | | | | | | | | | | | | | | | | |
Liabilities | | | | | | | | | | | | | | | | | | | | | | | | |
Nova Fund | | $ | — | | | $ | — | | | $ | — | | | $ | 103,632 | | | $ | — | | | $ | 103,632 | |
S&P 500 Fund | | | — | | | | — | | | | — | | | | 16,316 | | | | — | | | | 16,316 | |
Inverse S&P 500 Strategy Fund | | | — | | | | 59,708 | | | | — | | | | 352,860 | | | | — | | | | 412,568 | |
NASDAQ-100® Fund | | | — | | | | — | | | | — | | | | 132,144 | | | | — | | | | 132,144 | |
Mid-Cap 1.5x Strategy Fund | | | — | | | | — | | | | — | | | | 26,133 | | | | — | | | | 26,133 | |
Russell 2000® 1.5x Strategy Fund | | | — | | | | — | | | | — | | | | 38,699 | | | | — | | | | 38,699 | |
Russell 2000® Fund | | | — | | | | — | | | | — | | | | 43,391 | | | | — | | | | 43,391 | |
Inverse Russell 2000® Strategy Fund | | | — | | | | 111,362 | | | | — | | | | — | | | | — | | | | 111,362 | |
Europe 1.25x Strategy Fund | | | — | | | | 151,123 | | | | — | | | | — | | | | — | | | | 151,123 | |
Strengthening Dollar 2x Strategy Fund | | | — | | | | 694,853 | | | | — | | | | 50,971 | | | | — | | | | 745,824 | |
Inverse Government Long Bond Strategy Fund | | | 363,063,151 | | | | — | | | | — | | | | — | | | | — | | | | 363,063,151 | |
High Yield Strategy Fund | | | — | | | | 805,607 | | | | — | | | | 1,545,541 | | | | — | | | | 2,351,148 | |
Inverse High Yield Strategy Fund | | | — | | | | 625 | | | | — | | | | — | | | | — | | | | 625 | |
| * | Other financial instruments may include futures contracts and/or swaps, which are reported as unrealized gain/loss at period end. |
272 | THE RYDEX SERIES FUNDS ANNUAL REPORT
NOTES TO FINANCIAL STATEMENTS (continued)
During the year ended March 31, 2012, there were no investments that transferred between levels.
Summary of Fair Value Level 3 Activity
Following is a reconciliation of Level 3 assets for which significant unobservable inputs were used to determine fair value for the year ended March 31, 2012:
| | | | |
| | | Securities | |
Russell 2000® Strategy Fund | | | | |
Assets: | | | | |
Beginning Balance | | $ | 25 | |
Total realized gains or losses included in earnings | | | (101 | ) |
Total change in unrealized gains or losses included in earnings | | | 306 | |
Sales | | | (230 | ) |
| | | | |
Ending Balance | | $ | — | |
| | | | |
| |
| | | Securities | |
Russell 2000® 1.5x Strategy Fund | | | | |
Assets: | | | | |
Beginning Balance | | $ | 20 | |
Total realized gains or losses included in earnings | | | (43 | ) |
Total change in unrealized gains or losses included in earnings | | | 207 | |
Sales | | | (184 | ) |
| | | | |
Ending Balance | | $ | — | |
| | | | |
5. Repurchase Agreements
The Funds transfer uninvested cash balances into a single joint account, the daily aggregate balance of which is invested in one or more repurchase agreements collateralized by obligations of the U.S. Treasury and U.S. Government Agencies. The collateral is in the possession of the Funds’ custodian and is evaluated to ensure that its market value exceeds, at a minimum, 102% of the original face amount of the repurchase agreements. Each Fund holds a pro rata share of the collateral based on the dollar amount of the repurchase agreement entered into by each Fund.
At March 31, 2012, the collateral for the repurchase agreements in the joint account was as follows:
| | | | | | | | | | | | | | | | | | | | |
Counterparty and Terms of Agreement | | Face Value | | | Repurchase Price | | | Collateral | | | Par Value | | | Fair Value | |
HSBC Group | | | | | | | | | | | U.S. Treasury STRIPS | | | | | | | | | |
0.01% | | | | | | | | | | | 0.00% | | | | | | | | | |
Due 04/02/12 | | $ | 945,000,000 | | | $ | 945,000,788 | | | | 02/15/13 – 02/15/22 | | | $ | 1,040,731,200 | | | $ | 963,900,029 | |
Mizuho Financial Group, Inc. | | | | | | | | | | | U.S. Treasury Bills | | | | | | | | | |
0.01% | | | | | | | | | | | 0.00% | | | | | | | | | |
Due 04/02/12 | | | 265,875,123 | | | | 265,875,345 | | | | 08/23/12 – 02/07/13 | | | | 231,055,000 | | | | 230,868,945 | |
| | | | | | | | | | | U.S. Treasury Notes | | | | | | | | | |
| | | | | | | | | | | 2.50% – 2.63% | | | | | | | | | |
| | | | | | | | | | | 03/31/13 – 11/15/20 | | | | 37,530,300 | | | | 40,323,785 | |
Credit Suisse Group | | | | | | | | | | | U.S. Treasury Notes | | | | | | | | | |
0.01% | | | | | | | | | | | 1.38% – 2.13% | | | | | | | | | |
Due 04/02/12 | | | 235,771,833 | | | | 235,772,030 | | | | 11/30/15 – 08/15/21 | | | | 235,636,900 | | | | 240,487,393 | |
Deutsche Bank | | | | | | | | | | | U.S. Treasury Note | | | | | | | | | |
0.01% | | | | | | | | | | | 1.25% | | | | | | | | | |
Due 04/02/12 | | | 70,666,667 | | | | 70,666,726 | | | | 03/15/14 | | | | 70,800,000 | | | | 72,080,016 | |
In the event of counterparty default, the Funds have the right to collect the collateral to offset losses incurred. There is potential loss to the Funds in the event the Funds are delayed or prevented from exercising their rights to dispose of the collateral securities, including the risk of a possible decline in the value of the underlying securities during the period while the Funds seek to assert their rights. The Funds’ investment advisor, acting under the supervision of the Board of Trustees, reviews the value of the collateral and the creditworthiness of those banks and dealers with which the Funds enter into repurchase agreements to evaluate potential risks.
THE RYDEX SERIES FUNDS ANNUAL REPORT | 273
NOTES TO FINANCIAL STATEMENTS (continued)
6. Disclosures about Credit Derivatives
In accordance with its principal investment strategy, the High Yield Strategy Fund enters into credit default swaps as a seller of protection primarily to gain exposure similar to the high yield bond market. Credit default swaps are instruments which allow for the full or partial transfer of third party credit risk, with respect to a particular entity or entities, from one counterparty to the other. A seller of credit default swaps is selling credit protection or assuming credit risk with respect to the underlying entity or entities. If a credit event occurs, as defined under the terms of the swap agreement, the Fund will either (i) pay to the buyer of protection an amount equal to the notional amount of the swap and take delivery of the referenced obligation or underlying securities comprising the referenced index or (ii) pay a net settlement amount in the form of cash or securities equal to the notional amount of the swap less the recovery value of the referenced obligation or underlying securities comprising the referenced index. The Notional Principal reflects the maximum potential amount the Fund could be required to make as a seller of credit protection if a credit event occurs. As the seller of protection, the Fund receives periodic premium payments from the counterparty and may also receive or pay an upfront premium adjustment to the stated periodic premium. In the event a credit event occurs, an adjustment will be made to any upfront premiums that were received by a reduction of 1.00% per credit event.
The quoted market prices and resulting market values for credit default swap agreements on securities and credit indices serve as an indicator of the current status of the payment/performance risk and represent the likelihood of an expected liability (or profit) for the credit derivative had the notional amount of the swap agreement been closed/sold as of the period end. Increasing market values, in absolute terms when compared to the notional amount of the swap, represent a deterioration of the referenced entity’s credit soundness and a greater likelihood or risk of default or other credit event occurring as defined under the terms of the agreement.
The table on page 244 included in the Schedule of Investments summarizes the information with regard to sold protection on credit default swap contracts as of March 31, 2012.
7. Derivative Investment Holdings Categorized by Risk Exposure
U.S. generally accepted accounting principles requires disclosures to enable investors to better understand how and why the Funds use derivative instruments, how these derivative instruments are accounted for and their effects on the Funds’ financial position and results of operations. None of the derivatives currently held by the Funds are being used as hedging instruments.
The following Funds utilized derivatives for the following purposes:
| | | | |
Fund Name | | Index Exposure | | Liquidity |
Nova Fund | | X | | X |
S&P 500 Fund | | X | | X |
Inverse S&P 500 Strategy Fund | | X | | X |
NASDAQ-100® Fund | | X | | X |
Inverse NASDAQ-100® Strategy Fund | | X | | X |
Mid-Cap 1.5x Strategy Fund | | X | | X |
Inverse Mid-Cap Strategy Fund | | X | | X |
Russell 2000® 1.5x Strategy Fund | | X | | X |
Russell 2000® Fund | | X | | X |
Inverse Russell 2000® Strategy Fund | | X | | X |
Europe 1.25x Strategy Fund | | X | | X |
Japan 2x Strategy Fund | | X | | X |
Strengthening Dollar 2x Strategy Fund | | X | | X |
Weakening Dollar 2x Strategy Fund | | X | | X |
Government Long Bond 1.2x Strategy Fund | | X | | X |
Inverse Government Long Bond Strategy Fund | | X | | X |
High Yield Strategy Fund | | X | | X |
Inverse High Yield Strategy Fund | | X | | X |
274 | THE RYDEX SERIES FUNDS ANNUAL REPORT
NOTES TO FINANCIAL STATEMENTS (continued)
The following table represents the notional amount of derivative instruments outstanding, as an approximate percentage of the Funds’ net assets on a daily basis, while the risk to the Fund is limited to the profit earned on such derivatives.
| | | | | | | | |
| | | Approximate percentage of Fund’s | |
| | | net assets on a daily basis | |
Fund | | Long | | | Short | |
Nova Fund | | | 95 | % | | | — | |
S&P 500 Fund | | | 15 | % | | | — | |
Inverse S&P 500 Strategy Fund | | | — | | | | 100 | % |
NASDAQ-100® Fund | | | 10 | % | | | — | |
Inverse NASDAQ-100® Strategy Fund | | | — | | | | 100 | % |
Mid-Cap 1.5x Strategy Fund | | | 65 | % | | | — | |
Inverse Mid-Cap Strategy Fund | | | — | | | | 100 | % |
Russell 2000® 1.5x Strategy Fund | | | 65 | % | | | — | |
Russell 2000® Fund | | | 25 | % | | | — | |
Inverse Russell 2000® Strategy Fund | | | — | | | | 100 | % |
Europe 1.25x Strategy Fund* | | | 55 | % | | | — | |
Japan 2x Strategy Fund* | | | 200 | % | | | — | |
Strengthening Dollar 2x Strategy Fund | | | 200 | % | | | — | |
Weakening Dollar 2x Strategy Fund | | | — | | | | 200 | % |
Government Long Bond 1.2x Strategy Fund | | | 45 | % | | | — | |
Inverse Government Long Bond Strategy Fund | | | — | | | | 40 | % |
High Yield Strategy Fund | | | 165 | % | | | — | |
Inverse High Yield Strategy Fund | | | — | | | | 165 | % |
| * | These Funds utilize a combination of currency and/or financial-linked derivatives to obtain exposure to their benchmarks. The net derivative instrument exposure to the benchmark is 115% and 400% for the Europe 1.25x Strategy Fund and Japan 2x Strategy Fund, respectively. |
The following is a summary of the location of derivative investments on the Funds’ Statements of Assets and Liabilities as of March 31, 2012:
| | | | |
| Derivative | | Location on the Statements of Assets and Liabilities |
Investments Type | | Asset Derivatives | | Liability Derivatives |
Equity, currency, interest rate and credit contracts | | Variation margin Unrealized appreciation on swap agreements | | Variation margin
Unrealized depreciation on swap agreements |
The following table sets forth the fair value of the Funds’ derivative investments categorized by primary risk exposure at March 31, 2012:
| | | | | | | | | | | | | | | | | | | | | | | | | | | | |
| | | Asset Derivative Investments Value | |
Fund | | Futures
Equity
Contracts* | | | Swaps
Equity
Contracts | | | Futures
Currency
Contracts* | | | Swaps
Currency
Contracts | | | Futures
Interest Rate
Contracts* | | | Credit
Default
Contracts | | | Total Value at
March 31,
2012 | |
Nova Fund | | $ | 53,298 | | | $ | 99,503 | | | $ | — | | | $ | — | | | $ | — | | | $ | — | | | $ | 152,801 | |
S&P 500 Fund | | | 47,561 | | | | 80,195 | | | | — | | | | — | | | | — | | | | — | | | | 127,756 | |
Inverse S&P 500 Strategy Fund | | | — | | | | 154,690 | | | | — | | | | — | | | | — | | | | — | | | | 154,690 | |
NASDAQ-100® Fund | | | 727,499 | | | | — | | | | — | | | | — | | | | — | | | | — | | | | 727,499 | |
Inverse NASDAQ-100® Strategy Fund | | | — | | | | 41,119 | | | | — | | | | — | | | | — | | | | — | | | | 41,119 | |
Mid-Cap 1.5x Strategy Fund | | | 195,103 | | | | — | | | | — | | | | — | | | | — | | | | — | | | | 195,103 | |
Inverse Mid-Cap Strategy Fund | | | 1,297 | | | | 3,715 | | | | — | | | | — | | | | — | | | | — | | | | 5,012 | |
Russell 2000® 1.5x Strategy Fund | | | 54,724 | | | | — | | | | — | | | | — | | | | — | | | | — | | | | 54,724 | |
Russell 2000® Fund | | | 34,348 | | | | — | | | | — | | | | — | | | | — | | | | — | | | | 34,348 | |
Inverse Russell 2000® Strategy Fund | | | — | | | | 45,108 | | | | — | | | | — | | | | — | | | | — | | | | 45,108 | |
Europe 1.25x Strategy Fund | | | — | | | | — | | | | 26,181 | | | | — | | | | — | | | | — | | | | 26,181 | |
Japan 2x Strategy Fund | | | 679,097 | | | | — | | | | 13,605 | | | | — | | | | — | | | | — | | | | 692,702 | |
Strengthening Dollar 2x Strategy Fund | | | — | | | | — | | | | — | | | | — | | | | — | | | | — | | | | — | |
Weakening Dollar 2x Strategy Fund | | | — | | | | — | | | | 350,304 | | | | 126,199 | | | | — | | | | — | | | | 476,503 | |
Government Long Bond 1.2x Strategy Fund | | | — | | | | — | | | | — | | | | — | | | | 212,724 | | | | — | | | | 212,724 | |
Inverse Government Long Bond Strategy Fund | | | — | | | | — | | | | — | | | | — | | | | 6,471,548 | | | | — | | | | 6,471,548 | |
High Yield Strategy Fund | | | — | | | | — | | | | — | | | | — | | | | — | | | | — | | | | — | |
Inverse High Yield Strategy Fund | | | — | | | | — | | | | — | | | | — | | | | — | | | | 75,959 | | | | 75,959 | |
THE RYDEX SERIES FUNDS ANNUAL REPORT | 275
NOTES TO FINANCIAL STATEMENTS (continued)
| | | | | | | | | | | | | | | | | | | | | | | | | | | | |
| | | Liability Derivative Investments Value | |
Fund | | Futures
Equity
Contracts* | | | Swaps
Equity
Contracts | | | Futures
Currency
Contracts* | | | Swaps
Currency
Contracts | | | Futures
Interest Rate
Contracts* | | | Credit
Default
Contracts | | | Total
Value at
March 31,
2012 | |
Nova Fund | | $ | — | | | $ | 103,632 | | | $ | — | | | $ | — | | | $ | — | | | $ | — | | | $ | 103,632 | |
S&P 500 Fund | | | — | | | | 16,316 | | | | — | | | | — | | | | — | | | | — | | | | 16,316 | |
Inverse S&P 500 Strategy Fund | | | 59,708 | | | | 352,860 | | | | — | | | | — | | | | — | | | | — | | | | 412,568 | |
NASDAQ-100® Fund | | | — | | | | 132,144 | | | | — | | | | — | | | | — | | | | — | | | | 132,144 | |
Inverse NASDAQ-100® Strategy Fund | | | — | | | | — | | | | — | | | | — | | | | — | | | | — | | | | — | |
Mid-Cap 1.5x Strategy Fund | | | — | | | | 26,133 | | | | — | | | | — | | | | — | | | | — | | | | 26,133 | |
Inverse Mid-Cap Strategy Fund | | | — | | | | — | | | | — | | | | — | | | | — | | | | — | | | | — | |
Russell 2000® 1.5x Strategy Fund | | | — | | | | 38,699 | | | | — | | | | — | | | | — | | | | — | | | | 38,699 | |
Russell 2000® Fund | | | — | | | | 43,391 | | | | — | | | | — | | | | — | | | | — | | | | 43,391 | |
Inverse Russell 2000® Strategy Fund | | | 111,362 | | | | — | | | | — | | | | — | | | | — | | | | — | | | | 111,362 | |
Europe 1.25x Strategy Fund | | | 151,123 | | | | — | | | | — | | | | — | | | | — | | | | — | | | | 151,123 | |
Japan 2x Strategy Fund | | | — | | | | — | | | | — | | | | — | | | | — | | | | — | | | | — | |
Strengthening Dollar 2x Strategy Fund | | | — | | | | — | | | | 694,853 | | | | 50,971 | | | | — | | | | — | | | | 745,824 | |
Weakening Dollar 2x Strategy Fund | | | — | | | | — | | | | — | | | | — | | | | — | | | | — | | | | — | |
Government Long Bond 1.2x Strategy Fund | | | — | | | | — | | | | — | | | | — | | | | — | | | | — | | | | — | |
Inverse Government Long Bond Strategy Fund | | | — | | | | — | | | | — | | | | — | | | | — | | | | — | | | | — | |
High Yield Strategy Fund | | | — | | | | — | | | | — | | | | — | | | | 805,607 | | | | 1,545,541 | | | | 2,351,148 | |
Inverse High Yield Strategy Fund | | | — | | | | — | | | | — | | | | — | | | | 625 | | | | — | | | | 625 | |
| * | Includes cumulative appreciation (depreciation) of futures contracts as reported on the Schedule of Investments. Only current day’s variation margin is reported within the Statements of Assets and Liabilities. |
The following is a summary of the location of derivative investments on the Funds’ Statements of Operations for the year ended March 31, 2012:
| | |
Derivative Investment Type | | Location of Gain (Loss) on Derivatives |
Equity/currency contracts | | Net realized gain (loss) on futures contracts and swap agreements |
| | Net change in unrealized appreciation (depreciation) on futures contracts and swap agreements |
Interest Rate contracts | | Net realized gain (loss) on futures contracts |
| | Net change in unrealized appreciation (depreciation) on futures contracts |
Credit contracts | | Net realized gain (loss) on swap agreements |
| | Net change in unrealized appreciation (depreciation) on swap agreements |
The following is a summary of the Funds’ realized gain (loss) and change in unrealized appreciation (depreciation) on derivative investments recognized on the Statements of Operations categorized by primary risk exposure for the year ended March 31, 2012:
| | | | | | | | | | | | | | | | | | | | | | | | | | | | |
| | | Realized Gain (Loss) on Derivative Investments Recognized in the Statement of Operations | |
Fund | | Futures
Equity
Contracts | | | Swaps
Equity
Contracts | | | Futures
Currency
Contracts | | | Swaps
Currency
Contracts | | | Futures
Interest Rate
Contracts | | | Credit
Default
Contracts | | | Total | |
Nova Fund | | $ | 1,233,041 | | | $ | 1,972,026 | | | $ | — | | | $ | — | | | $ | — | | | $ | — | | | $ | 3,205,067 | |
S&P 500 Fund | | | 1,895,681 | | | | 4,408,817 | | | | — | | | | — | | | | — | | | | — | | | | 6,304,498 | |
Inverse S&P 500 Strategy Fund | | | (12,216,510 | ) | | | (36,690,513 | ) | | | — | | | | — | | | | — | | | | — | | | | (48,907,023 | ) |
NASDAQ-100® Fund | | | (7,886,916 | ) | | | 8,087,908 | | | | — | | | | — | | | | — | | | | — | | | | 200,992 | |
Inverse NASDAQ-100® Strategy Fund | | | (1,333,742 | ) | | | (6,494,251 | ) | | | — | | | | — | | | | — | | | | — | | | | (7,827,993 | ) |
Mid-Cap 1.5x Strategy Fund | | | (1,806,429 | ) | | | 588,413 | | | | — | | | | — | | | | — | | | | — | | | | (1,218,016 | ) |
Inverse Mid-Cap Strategy Fund | | | (491,657 | ) | | | (1,297,632 | ) | | | — | | | | — | | | | — | | | | — | | | | (1,789,289 | ) |
Russell 2000® 1.5x Strategy Fund | | | (5,424 | ) | | | (2,610,267 | ) | | | — | | | | — | | | | — | | | | — | | | | (2,615,691 | ) |
Russell 2000® Fund | | | 3,611,956 | | | | 2,128,755 | | | | — | | | | — | | | | — | | | | — | | | | 5,740,711 | |
Inverse Russell 2000® Strategy Fund | | | (1,201,924 | ) | | | (1,284,144 | ) | | | — | | | | — | | | | — | | | | — | | | | (2,486,068 | ) |
S&P SmallCap 600 Pure Value Fund | | | 63,018 | | | | — | | | | — | | | | — | | | | — | | | | — | | | | 63,018 | |
Europe 1.25x Strategy Fund | | | (207,846 | ) | | | — | | | | 131,949 | | | | — | | | | — | | | | — | | | | (75,897 | ) |
Japan 2x Strategy Fund | | | (1,801,231 | ) | | | — | | | | 489,943 | | | | — | | | | — | | | | — | | | | (1,311,288 | ) |
Strengthening Dollar 2x Strategy Fund | | | — | | | | — | | | | (773,286 | ) | | | (338,923 | ) | | | — | | | | — | | | | (1,112,209 | ) |
Weakening Dollar 2x Strategy Fund | | | — | | | | — | | | | (2,948,203 | ) | | | (96,916 | ) | | | — | | | | — | | | | (3,045,119 | ) |
Government Long Bond 1.2x Strategy Fund | | | — | | | | — | | | | — | | | | — | | | | 9,863,660 | | | | — | | | | 9,863,660 | |
Inverse Government Long Bond Strategy Fund | | | — | | | | — | | | | — | | | | — | | | | (52,969,697 | ) | | | — | | | | (52,969,697 | ) |
High Yield Strategy Fund | | | — | | | | — | | | | — | | | | — | | | | 14,878,983 | | | | 5,086,478 | | | | 19,965,461 | |
Inverse High Yield Strategy Fund | | | — | | | | — | | | | — | | | | — | | | | (859,497 | ) | | | (2,735,299 | ) | | | (3,594,796 | ) |
276 | THE RYDEX SERIES FUNDS ANNUAL REPORT
NOTES TO FINANCIAL STATEMENTS (continued)
| | | | | | | | | | | | | | |
Change in Unrealized Appreciation (Depreciation) on Derivative Investments Recognized in the Statement of Operations |
| | | | | | | | | | | | | | | | | | | | | | | | | | | | |
Fund | | Futures
Equity
Contracts | | | Swaps
Equity
Contracts | | | Futures
Currency
Contracts | | | Swaps
Currency
Contracts | | | Futures
Interest
Rate
Contracts | | | Credit
Default
Contracts | | | Total | |
Nova Fund | | $ | (60,934 | ) | | $ | (601,139 | ) | | $ | — | | | $ | — | | | $ | — | | | $ | — | | | $ | (662,073 | ) |
S&P 500 Fund | | | (363,115 | ) | | | (467,242 | ) | | | — | | | | — | | | | — | | | | — | | | | (830,357 | ) |
Inverse S&P 500 Strategy Fund | | | 309,223 | | | | 812,255 | | | | — | | | | — | | | | — | | | | — | | | | 1,121,478 | |
NASDAQ-100® Fund | | | 718,676 | | | | (902,680 | ) | | | — | | | | — | | | | — | | | | — | | | | (184,004 | ) |
Inverse NASDAQ-100® Strategy Fund | | | 173,780 | | | | 377,447 | | | | — | | | | — | | | | — | | | | — | | | | 551,227 | |
Mid-Cap 1.5x Strategy Fund | | | 194,958 | | | | (890,840 | ) | | | — | | | | — | | | | — | | | | — | | | | (695,882 | ) |
Inverse Mid-Cap Strategy Fund | | | 1,404 | | | | 49,519 | | | | — | | | | — | | | | — | | | | — | | | | 50,923 | |
Russell 2000® 1.5x Strategy Fund | | | (59,916 | ) | | | (1,452,305 | ) | | | — | | | | — | | | | — | | | | — | | | | (1,512,221 | ) |
Russell 2000® Fund | | | (278,882 | ) | | | (356,409 | ) | | | — | | | | — | | | | — | | | | — | | | | (635,291 | ) |
Inverse Russell 2000® Strategy Fund | | | (105,852 | ) | | | 308,282 | | | | — | | | | — | | | | — | | | | — | | | | 202,430 | |
Europe 1.25x Strategy Fund | | | (148,516 | ) | | | — | | | | (110,418 | ) | | | — | | | | — | | | | — | | | | (258,934 | ) |
Japan 2x Strategy Fund | | | (87,584 | ) | | | — | | | | 236,728 | | | | — | | | | — | | | | — | | | | 149,144 | |
Strengthening Dollar 2x Strategy Fund | | | — | | | | — | | | | (378,078 | ) | | | 124,713 | | | | — | | | | — | | | | (253,365 | ) |
Weakening Dollar 2x Strategy Fund | | | — | | | | — | | | | (57,401 | ) | | | (13,148 | ) | | | — | | | | — | | | | (70,549 | ) |
Government Long Bond 1.2x Strategy Fund | | | — | | | | — | | | | — | | | | — | | | | (33,261 | ) | | | — | | | | (33,261 | ) |
Inverse Government Long Bond Strategy Fund | | | — | | | | — | | | | — | | | | — | | | | 6,801,936 | | | | — | | | | 6,801,936 | |
High Yield Strategy Fund | | | — | �� | | | — | | | | — | | | | — | | | | (782,652 | ) | | | (1,547,014 | ) | | | (2,329,666 | ) |
Inverse High Yield Strategy Fund | | | — | | | | — | | | | — | | | | — | | | | (180,153 | ) | | | 76,123 | | | | (104,030 | ) |
8. Federal Income Tax Information
The Funds intend to comply with the provisions of Subchapter M of the Internal Revenue Code applicable to regulated investment companies and will distribute substantially all taxable net investment income and capital gains sufficient to relieve the Funds from all, or substantially all, federal income, excise and state income taxes. Therefore, no provision for federal or state income tax is required.
Tax positions taken or expected to be taken in the course of preparing the Funds’ tax returns are evaluated to determine whether the tax positions are “more-likely-than-not” of being sustained by the applicable tax authority. Tax positions not deemed to meet the more-likely-than-not threshold would be recorded as a tax benefit or expense in the current year. Management has analyzed the Funds’ tax positions taken, or to be taken, on Federal income tax returns for all open tax years (fiscal years 2009-2012), and has concluded that no provision for income tax is required in the Funds’ financial statements.
The RIC Modernization Act of 2010 was signed into law on December 22, 2010 and seeks to simplify some of the tax provisions applicable to regulated investment companies and the tax reporting to their shareholders, and to improve the tax efficiency of certain fund structures. The changes are generally effective for taxable years beginning after the date of enactment.
One of the more prominent changes addresses capital loss carryforwards. Funds will be permitted to carry forward capital losses incurred in taxable years beginning after December 22, 2010 for an unlimited period. However, any losses incurred during those future taxable years will be required to be utilized prior to the losses incurred in pre-enactment taxable years. Under pre-enactment law, capital losses could be carried forward for eight years, and carried forward as short-term capital, irrespective of the character of the original loss. As a result of this ordering rule, pre-enactment capital loss carryforwards may potentially expire unused. Additionally, post-enactment capital losses that are carried forward will retain their character as either short-term or long-term capital losses rather than being considered all short-term as under previous law.
Tax basis capital losses in excess of capital gains are carried forward to offset future net capital gains. For the year ended March 31, 2012, the following capital loss carryforward amounts were expired or used:
| | | | |
Fund | | Amount | |
Nova Fund | | $ | 5,983,755 | |
S&P 500 Fund | | | 3,233,374 | |
Inverse S&P 500 Strategy Fund | | | 5,725,764 | |
NASDAQ-100® Fund | | | 87,722,029 | |
Inverse NASDAQ-100® Strategy Fund | | | 19,380,747 | |
Russell 2000® Fund | | | 6,873,582 | |
S&P 500 Pure Growth Fund | | | 1,012,190 | |
S&P 500 Pure Value Fund | | | 1,037,708 | |
THE RYDEX SERIES FUNDS ANNUAL REPORT | 277
NOTES TO FINANCIAL STATEMENTS (continued)
| | | | |
Fund | | Amount | |
S&P SmallCap 600 Pure Value Fund | | $ | 2,196,704 | |
Inverse Government Long Bond Strategy Fund | | | 16,998,940 | |
High Yield Strategy Fund | | | 5,151,003 | |
The tax character of distributions paid during the year ended March 31, 2012 was as follows:
| | | | | | | | | | | | |
Fund | | Ordinary
Income | | | Long-Term
Capital Gain | | | Total
Distributions | |
Nova Fund | | $ | — | | | $ | — | | | $ | — | |
S&P 500 Fund | | | — | | | | — | | | | — | |
Inverse S&P 500 Strategy Fund | | | — | | | | — | | | | — | |
NASDAQ-100® Fund | | | — | | | | — | | | | — | |
Inverse NASDAQ-100® Strategy Fund | | | — | | | | — | | | | — | |
Mid-Cap 1.5x Strategy Fund | | | — | | | | — | | | | — | |
Inverse Mid-Cap Strategy Fund | | | — | | | | — | | | | — | |
Russell 2000® 1.5x Strategy Fund | | | — | | | | — | | | | — | |
Russell 2000® Fund | | | — | | | | — | | | | — | |
Inverse Russell 2000® Strategy Fund | | | — | | | | — | | | | — | |
S&P 500 Pure Growth Fund | | | 394,919 | | | | 241,421 | | | | 636,340 | |
S&P 500 Pure Value Fund | | | — | | | | — | | | | — | |
S&P MidCap 400 Pure Growth Fund | | | — | | | | — | | | | — | |
S&P MidCap 400 Pure Value Fund | | | — | | | | — | | | | — | |
S&P SmallCap 600 Pure Growth Fund | | | — | | | | — | | | | — | |
S&P SmallCap 600 Pure Value Fund | | | — | | | | — | | | | — | |
Europe 1.25x Strategy Fund | | | — | | | | — | | | | — | |
Japan 2x Strategy Fund | | | — | | | | — | | | | — | |
Strengthening Dollar 2x Strategy Fund | | | — | | | | — | | | | — | |
Weakening Dollar 2x Strategy Fund | | | — | | | | — | | | | — | |
Real Estate Fund | | | 110,615 | | | | — | | | | 110,615 | |
Government Long Bond 1.2x Strategy Fund | | | 3,511,198 | | | | — | | | | 3,511,198 | |
Inverse Government Long Bond Strategy Fund | | | — | | | | — | | | | — | |
High Yield Strategy Fund | | | 7,500,784 | | | | — | | | | 7,500,784 | |
Inverse High Yield Strategy Fund | | | — | | | | — | | | | — | |
U.S. Government Money Market Fund | | | 23,464 | | | | — | | | | 23,464 | |
The tax character of distributions paid during the year ended March 31, 2011 was as follows:
| | | | | | | | | | | | |
Fund
| | Ordinary
Income | | | Long-Term
Capital Gain | | | Total
Distributions | |
Nova Fund | | $ | 78,732 | | | $ | — | | | $ | 78,732 | |
S&P 500 Fund | | | 1,990 | | | | — | | | | 1,990 | |
Inverse S&P 500 Strategy Fund | | | — | | | | — | | | | — | |
NASDAQ-100® Fund | | | — | | | | — | | | | — | |
Inverse NASDAQ-100® Strategy Fund | | | — | | | | — | | | | — | |
Mid-Cap 1.5x Strategy Fund | | | — | | | | — | | | | — | |
Inverse Mid-Cap Strategy Fund | | | — | | | | — | | | | — | |
Russell 2000® 1.5x Strategy Fund | | | — | | | | — | | | | — | |
Russell 2000® Fund | | | — | | | | — | | | | — | |
Inverse Russell 2000® Strategy Fund | | | — | | | | — | | | | — | |
S&P 500 Pure Growth Fund | | | — | | | | — | | | | — | |
S&P 500 Pure Value Fund | | | 223,302 | | | | — | | | | 223,302 | |
S&P MidCap 400 Pure Growth Fund | | | — | | | | — | | | | — | |
S&P MidCap 400 Pure Value Fund | | | 3,747,725 | | | | — | | | | 3,747,725 | |
S&P SmallCap 600 Pure Growth Fund | | | — | | | | — | | | | — | |
S&P SmallCap 600 Pure Value Fund | | | 4,081,852 | | | | — | | | | 4,081,852 | |
Europe 1.25x Strategy Fund | | | — | | | | — | | | | — | |
Japan 2x Strategy Fund | | | — | | | | — | | | | — | |
Strengthening Dollar 2x Strategy Fund | | | — | | | | — | | | | — | |
Weakening Dollar 2x Strategy Fund | | | — | | | | — | | | | — | |
Real Estate Fund | | | 880,108 | | | | — | | | | 880,108 | |
Government Long Bond 1.2x Strategy Fund | | | 4,552,742 | | | | — | | | | 4,552,742 | |
Inverse Government Long Bond Strategy Fund | | | — | | | | — | | | | — | |
High Yield Strategy Fund | | | 4,810,745 | | | | — | | | | 4,810,745 | |
Inverse High Yield Strategy Fund | | | — | | | | — | | | | — | |
U.S. Government Money Market Fund | | | 97,406 | | | | — | | | | 97,406 | |
Note: For federal income tax purposes, short-term capital gain distributions are treated as ordinary income distributions. | |
278 | THE RYDEX SERIES FUNDS ANNUAL REPORT
NOTES TO FINANCIAL STATEMENTS (continued)
The tax character of distributable earnings/(accumulated losses) at March 31, 2012 was as follows:
| | | | | | | | | | | | | | | | |
Fund | | Undistributed
Ordinary
Income | | | Undistributed
Long-Term
Capital Gain | | | Net Unrealized
Appreciation/
(Depreciation) | | | Capital Loss
Carryforward1 | |
Nova Fund | | $ | 72,406 | | | $ | — | | | $ | 14,717,970 | | | $ | (44,668,893 | ) |
S&P 500 Fund | | | — | | | | — | | | | 24,549,825 | | | | (21,343,240 | ) |
Inverse S&P 500 Strategy Fund | | | — | | | | — | | | | (191,303 | ) | | | (380,632,954 | ) |
NASDAQ-100® Fund | | | — | | | | — | | | | 355,626,867 | | | | (39,977,153 | ) |
Inverse NASDAQ-100® Strategy Fund | | | — | | | | — | | | | 41,119 | | | | (78,427,449 | ) |
Mid-Cap 1.5x Strategy Fund | | | — | | | | — | | | | 2,211,521 | | | | (15,831,452 | ) |
Inverse Mid-Cap Strategy Fund | | | — | | | | — | | | | 3,715 | | | | (14,606,381 | ) |
Russell 2000® 1.5x Strategy Fund | | | — | | | | — | | | | 1,087,430 | | | | (10,432,158 | ) |
Russell 2000® Fund | | | — | | | | — | | | | 3,036,272 | | | | (2,495,832 | ) |
Inverse Russell 2000® Strategy Fund | | | — | | | | — | | | | 45,108 | | | | (50,555,846 | ) |
S&P 500 Pure Growth Fund | | | — | | | | — | | | | 7,216,346 | | | | — | |
S&P 500 Pure Value Fund | | | 81,734 | | | | — | | | | (12,611 | ) | | | (1,438,842 | ) |
S&P MidCap 400 Pure Growth Fund | | | — | | | | — | | | | 53,925,222 | | | | (10,721,429 | ) |
S&P MidCap 400 Pure Value Fund | | | — | | | | — | | | | (490,192 | ) | | | (6,790,589 | ) |
S&P SmallCap 600 Pure Growth Fund | | | — | | | | — | | | | 2,167,609 | | | | (10,684,313 | ) |
S&P SmallCap 600 Pure Value Fund | | | — | | | | — | | | | 2,478,726 | | | | (32,428,267 | ) |
Europe 1.25x Strategy Fund | | | 121,349 | | | | — | | | | (596,414 | ) | | | (16,371,495 | ) |
Japan 2x Strategy Fund | | | — | | | | — | | | | — | | | | (2,135,714 | ) |
Strengthening Dollar 2x Strategy Fund | | | — | | | | — | | | | — | | | | (23,820,939 | ) |
Weakening Dollar 2x Strategy Fund | | | — | | | | — | | | | — | | | | (12,505,248 | ) |
Real Estate Fund | | | 156,672 | | | | — | | | | 517,375 | | | | (13,616,153 | ) |
Government Long Bond 1.2x Strategy Fund | | | 164,097 | | | | — | | | | (5,471,118 | ) | | | (25,142,921 | ) |
Inverse Government Long Bond Strategy Fund | | | — | | | | — | | | | 15,446,044 | | | | (457,620,479 | ) |
High Yield Strategy Fund | | | — | | | | 4,377,221 | | | | (1,248,051 | ) | | | — | |
Inverse High Yield Strategy Fund | | | — | | | | — | | | | 75,959 | | | | (9,100,726 | ) |
U.S. Government Money Market Fund | | | 34,797 | | | | — | | | | — | | | | — | |
Capital Loss Carryforward amounts may be limited due to Federal income tax regulations.
1 A summary of the expiration of the aforementioned Capital Loss Carryforward is as follows:
| | | | | | | | | | | | | | | | | | | | | | | | | | | | | | | | | | | | | | | | |
| | | Expires in | | | Expires in | | | Expires in | | | Expires in | | | Expires in | | | Expires in | | | Expires in | | | Unlimited | | | Total Capital Loss | |
Fund | | 2013 | | | 2014 | | | 2015 | | | 2016 | | | 2017 | | | 2018 | | | 2019 | | | Short-Term | | | Long-Term | | | Carryforward | |
| Nova Fund | | $ | — | | | $ | — | | | $ | — | | | $ | — | | | $ | (42,453,023 | ) | | $ | (2,215,870 | ) | | $ | — | | | $ | — | | | $ | — | | | $ | (44,668,893 | ) |
| S&P 500 Fund | | | — | | | | — | | | | — | | | | — | | | | (16,393,041 | ) | | | (4,950,199 | ) | | | — | | | | — | | | | — | | | | (21,343,240 | ) |
| Inverse S&P 500 | | | | | | | | | | | | | | | | | | | | | | | | | | | | | | | | | | | | | | | | |
| Strategy Fund | | | (65,527,919 | ) | | | (37,877,636 | ) | | | (59,724,340 | ) | | | — | | | | — | | | | (107,667,355 | ) | | | (64,265,070 | ) | | | (39,020,260 | ) | | | (6,550,374 | ) | | | (380,632,954 | ) |
| NASDAQ-100® Fund | | | (17,809,338 | ) | | | — | | | | — | | | | — | | | | (22,167,815 | ) | | | — | | | | — | | | | — | | | | — | | | | (39,977,153 | ) |
| Inverse NASDAQ-100® | | | | | | | | | | | | | | | | | | | | | | | | | | | | | | | | | | | | | | | | |
| Strategy Fund | | | (3,723,075 | ) | | | (17,351,209 | ) | | | (15,380,081 | ) | | | (8,534,020 | ) | | | — | | | | (16,105,314 | ) | | | (9,266,829 | ) | | | (7,245,987 | ) | | | (820,934 | ) | | | (78,427,449 | ) |
| Mid-Cap 1.5x Strategy Fund | | | — | | | | — | | | | — | | | | — | | | | (9,080,922 | ) | | | (4,124,009 | ) | | | — | | | | (1,664,112 | ) | | | (962,409 | ) | | | (15,831,452 | ) |
| Inverse Mid-Cap | | | | | | | | | | | | | | | | | | | | | | | | | | | | | | | | | | | | | | | | |
| Strategy Fund | | | — | | | | — | | | | (3,855,787 | ) | | | (850,800 | ) | | | — | | | | (6,411,872 | ) | | | (1,499,847 | ) | | | (1,655,894 | ) | | | (332,181 | ) | | | (14,606,381 | ) |
| Russell 2000® 1.5x | | | | | | | | | | | | | | | | | | | | | | | | | | | | | | | | | | | | | | | | |
| Strategy Fund | | | — | | | | — | | | | — | | | | — | | | | (8,885,709 | ) | | | — | | | | — | | | | (1,546,449 | ) | | | — | | | | (10,432,158 | ) |
| Russell 2000® Fund | | | — | | | | — | | | | — | | | | — | | | | — | | | | (2,495,832 | ) | | | — | | | | — | | | | — | | | | (2,495,832 | ) |
| Inverse Russell 2000® | | | | | | | | | | | | | | | | | | | | | | | | | | | | | | | | | | | | | | | | |
| Strategy Fund | | | — | | | | — | | | | (13,474,576 | ) | | | (7,459,340 | ) | | | — | | | | (15,938,452 | ) | | | (10,451,551 | ) | | | (1,493,569 | ) | | | (1,738,358 | ) | | | (50,555,846 | ) |
| S&P 500 Pure Growth Fund | | | — | | | | — | | | | — | | | | — | | | | — | | | | — | | | | — | | | | — | | | | — | | | | — | |
| S&P 500 Pure Value Fund | | | — | | | | — | | | | — | | | | — | | | | — | | | | (1,438,842 | ) | | | — | | | | — | | | | — | | | | (1,438,842 | ) |
| S&P MidCap 400 | | | | | | | | | | | | | | | | | | | | | | | | | | | | | | | | | | | | | | | | |
| Pure Growth Fund | | | — | | | | — | | | | — | | | | — | | | | — | | | | (3,166,543 | ) | | | — | | | | (4,689,466 | ) | | | (2,865,420 | ) | | | (10,721,429 | ) |
| S&P MidCap 400 Pure | | | | | | | | | | | | | | | | | | | | | | | | | | | | | | | | | | | | | | | | |
| Value Fund | | | — | | | | — | | | | — | | | | — | | | | — | | | | — | | | | (1,769,395 | ) | | | (5,021,194 | ) | | | — | | | | (6,790,589 | ) |
| S&P SmallCap 600 | | | | | | | | | | | | | | | | | | | | | | | | | | | | | | | | | | | | | | | | |
| Pure Growth Fund | | | — | | | | — | | | | — | | | | — | | | | (5,316,867 | ) | | | (56,524 | ) | | | — | | | | (5,310,922 | ) | | | — | | | | (10,684,313 | ) |
| S&P SmallCap 600 | | | | | | | | | | | | | | | | | | | | | | | | | | | | | | | | | | | | | | | | |
| Pure Value Fund | | | — | | | | — | | | | — | | | | — | | | | — | | | | — | | | | (32,428,267 | ) | | | — | | | | — | | | | (32,428,267 | ) |
| Europe 1.25x Strategy Fund | | | — | | | | — | | | | — | | | | — | | | | (13,511,526 | ) | | | — | | | | (2,098,062 | ) | | | (512,522 | ) | | | (249,385 | ) | | | (16,371,495 | ) |
| Japan 2x Strategy Fund | | | — | | | | — | | | | — | | | | — | | | | (973,570 | ) | | | — | | | | — | | | | (464,857 | ) | | | (697,287 | ) | | | (2,135,714 | ) |
THE RYDEX SERIES FUNDS ANNUAL REPORT | 279
NOTES TO FINANCIAL STATEMENTS (continued)
| | | | | | | | | | | | | | | | | | | | | | | | | | | | | | | | | | | | | | | | |
Fund | | Expires in
2013 | | | Expires in
2014 | | | Expires in
2015 | | | Expires in
2016 | | | Expires in
2017 | | | Expires in
2018 | | | Expires in
2019 | | | Short-Term | | | Unlimited
Long-Term | | | Total Capital
Loss
Carryforward | |
Strengthening Dollar 2x | | | | | | | | | | | | | | | | | | | | | | | | | | | | | | | | | | | | | | | | |
Strategy Fund | | $ | — | | | $ | — | | | $ | — | | | $ | — | | | $ | — | | | $ | (16,109,547 | ) | | $ | (4,395,594 | ) | | | $(1,326,319) $(1,989,479) | | | $ | (23,820,939 | ) |
Weakening Dollar | | | | | | | | | | | | | | | | | | | | | | | | | | | | | | | | | | | | | | | | |
2x Strategy Fund | | | — | | | | — | | | | — | | | | — | | | | (6,635,880 | ) | | | — | | | | (3,988,430 | ) | | | (752,375 | ) | | | (1,128,563 | ) | | | (12,505,248 | ) |
Real Estate Fund | | | — | | | | — | | | | — | | | | — | | | | (2,247,435 | ) | | | (4,305,317 | ) | | | — | | | | (7,063,401 | ) | | | — | | | | (13,616,153 | ) |
Government Long Bond | | | | | | | | | | | | | | | | | | | | | | | | | | | | | | | | | | | | | | | | |
1.2x Strategy Fund | | | — | | | | — | | | | — | | | | — | | | | — | | | | (19,633,290 | ) | | | — | | | | (5,509,631 | ) | | | — | | | | (25,142,921 | ) |
Inverse Government | | | | | | | | | | | | | | | | | | | | | | | | | | | | | | | | | | | | | | | | |
Long Bond Strategy Fund | | | (63,759,468 | ) | | | (82,212,943 | ) | | | (60,731,802 | ) | | | (2,188,094 | ) | | | (24,167,315 | ) | | | (68,305,233 | ) | | | (23,242,075 | ) | | | (105,312,893 | ) | | | (27,700,656 | ) | | | (457,620,479 | ) |
High Yield Strategy Fund | | | — | | | | — | | | | — | | | | — | | | | — | | | | — | | | | — | | | | — | | | | — | | | | — | |
Inverse High Yield | | | | | | | | | | | | | | | | | | | | | | | | | | | | | | | | | | | | | | | | |
Strategy Fund | | | — | | | | — | | | | — | | | | — | | | | — | | | | (3,356,295 | ) | | | (4,361,182 | ) | | | (1,090,660 | ) | | | (292,589 | ) | | | (9,100,726 | ) |
U.S. Government | | | | | | | | | | | | | | | | | | | | | | | | | | | | | | | | | | | | | | | | |
Money Market Fund | | | — | | | | — | | | | — | | | | — | | | | — | | | | — | | | | — | | | | — | | | | — | | | | — | |
Net investment income and net realized gains (losses) may differ for financial statement and tax purposes because of temporary or permanent book/tax differences. These differences are typically due to post-October losses, losses deferred due to wash sales, tax treatment of payments from credit default swaps, utilization of earnings and profits on shareholder redemptions, foreign currency gains and losses, and the “mark-to-market” of certain passive foreign investment companies (PFICs) for tax purposes. Additional differences may result from tax treatment of net investment losses and expired capital loss carryforwards. To the extent these differences are permanent, reclassifications are made to the appropriate equity accounts in the period that the differences arise. These reclassifications have no effect on net assets or NAV per share.
On the Statements of Assets and Liabilities, the following reclassifications were made for permanent book/tax differences:
| | | | | | | | | | | | |
Fund | | Paid In Capital | | | Undistributed
Net Investment
Income | | | Accumulated
Net Realized
Gain (Loss) | |
Nova Fund | | $ | (1,410 | ) | | $ | — | | | $ | 1,410 | |
S&P 500 Fund | | | (208,837 | ) | | | 205,786 | | | | 3,051 | |
Inverse S&P 500 Strategy Fund | | | (8,177,920 | ) | | | 2,452,156 | | | | 5,725,764 | |
NASDAQ-100® Fund | | | (1,715,587 | ) | | | 1,715,587 | | | | — | |
Inverse NASDAQ-100® Strategy Fund | | | (19,632,927 | ) | | | 252,180 | | | | 19,380,747 | |
Mid-Cap 1.5x Strategy Fund | | | (193,078 | ) | | | 181,524 | | | | 11,554 | |
Inverse Mid-Cap Strategy Fund | | | (68,468 | ) | | | 68,468 | | | | — | |
Russell 2000® 1.5x Strategy Fund | | | 325,740 | | | | 249,030 | | | | (574,770 | ) |
Russell 2000® Fund | | | (286,713 | ) | | | 281,172 | | | | 5,541 | |
Inverse Russell 2000® Strategy Fund | | | (273,603 | ) | | | 273,603 | | | | — | |
S&P 500 Pure Growth Fund | | | 943,690 | | | | 296,623 | | | | (1,240,313 | ) |
S&P 500 Pure Value Fund | | | — | | | | — | | | | — | |
S&P MidCap 400 Pure Growth Fund | | | (2,233,795 | ) | | | 2,169,678 | | | | 64,117 | |
S&P MidCap 400 Pure Value Fund | | | (2,927 | ) | | | 2,928 | | | | (1 | ) |
S&P SmallCap 600 Pure Growth Fund | | | (617,397 | ) | | | 617,276 | | | | 121 | |
S&P SmallCap 600 Pure Value Fund | | | (97,532 | ) | | | 87,827 | | | | 9,705 | |
Europe 1.25x Strategy Fund | | | 1 | | | | (16,852 | ) | | | 16,851 | |
Japan 2x Strategy Fund | | | (92,058 | ) | | | 92,058 | | | | — | |
Strengthening Dollar 2x Strategy Fund | | | (712,929 | ) | | | 712,929 | | | | — | |
Weakening Dollar 2x Strategy Fund | | | (423,432 | ) | | | 423,432 | | | | — | |
Real Estate Fund | | | (167,305 | ) | | | 2,143 | | | | 165,162 | |
Government Long Bond 1.2x Strategy Fund | | | — | | | | — | | | | — | |
Inverse Government Long Bond Strategy Fund | | | (33,021,416 | ) | | | 16,022,477 | | | | 16,998,939 | |
High Yield Strategy Fund | | | (47,623 | ) | | | 7,284,483 | | | | (7,236,860 | ) |
Inverse High Yield Strategy Fund | | | (1,245,985 | ) | | | 316,240 | | | | 929,745 | |
U.S. Government Money Market Fund | | | — | | | | 267 | | | | (267 | ) |
280 | THE RYDEX SERIES FUNDS ANNUAL REPORT
NOTES TO FINANCIAL STATEMENTS (continued)
At March 31, 2012, the cost of securities for Federal income tax purposes, the aggregate gross unrealized gain for all securities for which there was an excess of value over tax cost and the aggregate gross unrealized loss for all securities for which there was an excess of tax cost over value, were as follows:
| | | | | | | | | | | | | | | | |
Fund | | Tax Cost | | | Tax Unrealized
Gain | | | Tax
Unrealized
Loss | | | Net Unrealized
Gain (Loss) | |
Nova Fund | | $ | 53,892,416 | | | $ | 14,770,514 | | | $ | (48,415 | ) | | $ | 14,722,099 | |
S&P 500 Fund | | | 235,401,915 | | | | 25,620,777 | | | | (1,134,831 | ) | | | 24,485,946 | |
Inverse S&P 500 Strategy Fund | | | 132,748,175 | | | | 6,867 | | | | — | | | | 6,867 | |
NASDAQ-100® Fund | | | 509,945,648 | | | | 361,746,475 | | | | (5,987,464 | ) | | | 355,759,011 | |
Inverse NASDAQ-100® Strategy Fund | | | 9,178,123 | | | | — | | | | — | | | | — | |
Mid-Cap 1.5x Strategy Fund | | | 21,508,112 | | | | 2,507,107 | | | | (269,453 | ) | | | 2,237,654 | |
Inverse Mid-Cap Strategy Fund | | | 1,697,691 | | | | — | | | | — | | | | — | |
Russell 2000® 1.5x Strategy Fund | | | 17,326,071 | | | | 1,359,069 | | | | (232,940 | ) | | | 1,126,129 | |
Russell 2000® Fund | | | 70,130,328 | | | | 4,103,758 | | | | (1,024,095 | ) | | | 3,079,663 | |
Inverse Russell 2000® Strategy Fund | | | 18,486,919 | | | | — | | | | — | | | | — | |
S&P 500 Pure Growth Fund | | | 44,071,128 | | | | 7,593,933 | | | | (377,587 | ) | | | 7,216,346 | |
S&P 500 Pure Value Fund | | | 73,039,449 | | | | 2,076,387 | | | | (2,088,998 | ) | | | (12,611 | ) |
S&P MidCap 400 Pure Growth Fund | | | 311,456,726 | | | | 57,771,613 | | | | (3,846,391 | ) | | | 53,925,222 | |
S&P MidCap 400 Pure Value Fund | | | 28,300,540 | | | | 94,599 | | | | (584,791 | ) | | | (490,192 | ) |
S&P SmallCap 600 Pure Growth Fund | | | 30,874,433 | | | | 2,667,165 | | | | (499,556 | ) | | | 2,167,609 | |
S&P SmallCap 600 Pure Value Fund | | | 24,690,183 | | | | 2,757,274 | | | | (278,548 | ) | | | 2,478,726 | |
Europe 1.25x Strategy Fund | | | 10,996,538 | | | | — | | | | (444,910 | ) | | | (444,910 | ) |
Japan 2x Strategy Fund | | | 4,552,457 | | | | — | | | | — | | | | — | |
Strengthening Dollar 2x Strategy Fund | | | 31,591,018 | | | | — | | | | — | | | | — | |
Weakening Dollar 2x Strategy Fund | | | 19,172,739 | | | | — | | | | — | | | | — | |
Real Estate Fund | | | 17,110,820 | | | | 536,147 | | | | (18,772 | ) | | | 517,375 | |
Government Long Bond 1.2x Strategy Fund | | | 105,049,554 | | | | — | | | | (5,471,118 | ) | | | (5,471,118 | ) |
Inverse Government Long Bond Strategy Fund | | | 806,609,987 | | | | 34,016 | | | | — | | | | 34,016 | |
High Yield Strategy Fund | | | 225,348,902 | | | | 341,759 | | | | (44,269 | ) | | | 297,490 | |
Inverse High Yield Strategy Fund | | | 15,716,617 | | | | — | | | | — | | | | — | |
U.S. Government Money Market Fund | | | 1,271,864,650 | | | | — | | | | — | | | | — | |
Pursuant to Federal income tax regulations applicable to investment companies, the Funds have elected to treat net capital losses and certain ordinary losses realized between November 1 and March 31 of each year as occurring on the first day of the following tax year. The Funds have also elected to treat certain ordinary losses realized between January 1 and March 31 of each year as occurring on the first day of the following tax year. For the year ended March 31, 2012, the following losses reflected in the accompanying financial statements were deferred for Federal income tax purposes until April 1, 2012:
| | | | | | | | |
Fund | | Ordinary | | | Capital | |
Nova Fund | | $ | — | | | $ | (80,026 | ) |
Inverse S&P 500 Strategy Fund | | | (592,068 | ) | | | (26,354,533 | ) |
NASDAQ-100® Fund | | | (1,097,969 | ) | | | (1,967,888 | ) |
Inverse NASDAQ-100® Strategy Fund | | | (46,095 | ) | | | (2,157,864 | ) |
Mid-Cap 1.5x Strategy Fund | | | (67,408 | ) | | | — | |
Inverse Mid-Cap Strategy Fund | | | (9,051 | ) | | | (410,062 | ) |
Russell 2000® 1.5x Strategy Fund | | | (41,926 | ) | | | — | |
Russell 2000® Fund | | | (149,756 | ) | | | — | |
Inverse Russell 2000® Strategy Fund | | | (70,741 | ) | | | (3,120,497 | ) |
S&P 500 Pure Growth Fund | | | (82,706 | ) | | | (4,885,274 | ) |
S&P 500 Pure Value Fund | | | — | | | | (1,370,859 | ) |
S&P MidCap 400 Pure Growth Fund | | | (889,323 | ) | | | (13,172,792 | ) |
S&P SmallCap 600 Pure Growth Fund | | | (9,714 | ) | | | — | |
S&P SmallCap 600 Pure Value Fund | | | (124,122 | ) | | | — | |
Japan 2x Strategy Fund | | | (13,890 | ) | | | — | |
Strengthening Dollar 2x Strategy Fund | | | (260,587 | ) | | | — | |
Weakening Dollar 2x Strategy Fund | | | (90,469 | ) | | | (1,234,730 | ) |
THE RYDEX SERIES FUNDS ANNUAL REPORT | 281
NOTES TO FINANCIAL STATEMENTS (continued)
| | | | | | | | |
Fund | | Ordinary | | | Capital | |
Real Estate Fund | | $ | — | | | $ | (30,322 | ) |
Inverse Government Long Bond Strategy Fund | | | (4,115,790 | ) | | | (35,275,455 | ) |
High Yield Strategy Fund | | | (296,427 | ) | | | — | |
Inverse High Yield Strategy Fund | | | — | | | | (2,307,452 | ) |
9. Securities Transactions
For the year ended March 31, 2012, the cost of purchases and proceeds from sales of investment securities, excluding government securities and short-term investments, were:
| | | | | | | | |
| | | Purchases | | | Sales | |
Nova Fund | | $ | 55,268,493 | | | $ | 71,185,151 | |
S&P 500 Fund | | | 305,438,548 | | | | 286,389,476 | |
Inverse S&P 500 Strategy Fund | | | — | | | | — | |
NASDAQ-100® Fund | | | 619,354,271 | | | | 588,284,827 | |
Inverse NASDAQ-100® Strategy Fund | | | — | | | | — | |
Mid-Cap 1.5x Strategy Fund | | | 32,313,394 | | | | 47,017,907 | |
Inverse Mid-Cap Strategy Fund | | | — | | | | — | |
Russell 2000® 1.5x Strategy Fund | | | 22,607,357 | | | | 12,316,503 | |
Russell 2000® Fund | | | 67,214,051 | | | | 23,834,344 | |
Inverse Russell 2000® Strategy Fund | | | — | | | | — | |
S&P 500 Pure Growth Fund | | | 319,362,846 | | | | 314,509,698 | |
S&P 500 Pure Value Fund | | | 301,223,748 | | | | 260,643,412 | |
S&P MidCap 400 Pure Growth Fund | | | 756,554,204 | | | | 641,724,265 | |
S&P MidCap 400 Pure Value Fund | | | 200,326,656 | | | | 220,808,085 | |
S&P SmallCap 600 Pure Growth Fund | | | 294,078,986 | | | | 344,433,896 | |
S&P SmallCap 600 Pure Value Fund | | | 217,397,120 | | | | 219,202,402 | |
Europe 1.25x Strategy Fund | | | 27,446,492 | | | | 38,619,332 | |
Japan 2x Strategy Fund | | | — | | | | — | |
Strengthening Dollar 2x Strategy Fund | | | — | | | | — | |
Weakening Dollar 2x Strategy Fund | | | — | | | | — | |
Real Estate Fund | | | 182,884,841 | | | | 184,302,911 | |
Government Long Bond 1.2x Strategy Fund | | | — | | | | — | |
Inverse Government Long Bond Strategy Fund | | | 25,000,000 | | | | 25,000,000 | |
High Yield Strategy Fund | | | 59,593,377 | | | | 39,701,116 | |
Inverse High Yield Strategy Fund | | | — | | | | — | |
U.S. Government Money Market Fund | | | — | | | | — | |
For the year ended March 31, 2012, the cost of purchases and proceeds from sales of government securities were:
| | | | | | | | |
Purchases | | Purchases | | | Sales | |
Government Long Bond 1.2x Strategy Fund | | $ | 3,327,896,088 | | | $ | 3,372,499,579 | |
Inverse Government Long Bond Strategy Fund | | | 3,523,413,273 | | | | 3,713,387,100 | |
10. Line of Credit
The Trust, along with other affiliated trusts, secured an uncommitted, $75,000,000 line of credit from U.S. Bank, N.A., which expires June 15, 2012. This line of credit is reserved for emergency or temporary purposes. Borrowings, if any, under this arrangement bear interest equal to the Prime Rate, minus 2%, which shall be paid monthly, averaging 1.25% for the year ended March 31, 2012. The Funds did not have any borrowings under this agreement at March 31, 2012.
The following table illustrates the average daily balance borrowed for the year ended March 31, 2012:
| | | | |
Fund | | Average Daily Balance | |
Nova Fund | | $ | 14,445 | |
S&P 500 Fund | | | 97,180 | |
NASDAQ-100® Fund | | | 915,268 | |
Mid-Cap 1.5x Strategy Fund | | | 25,391 | |
Russell 2000 1.5x Strategy Fund | | | 566 | |
Inverse Russell 2000 Strategy Fund | | | 126,044 | |
S&P 500 Pure Growth Fund | | | 61,724 | |
S&P 500 Pure Value Fund | | | 63,221 | |
S&P MidCap 400 Pure Growth Fund | | | 54,467 | |
282 | THE RYDEX SERIES FUNDS ANNUAL REPORT
NOTES TO FINANCIAL STATEMENTS (continued)
| | | | |
Fund | | Average Daily Balance | |
S&P MidCap 400 Pure Value Fund | | $ | 17,180 | |
S&P SmallCap 600 Pure Growth Fund | | | 29,016 | |
S&P SmallCap 600 Pure Value Fund | | | 69,325 | |
Strengthening Dollar 2x Strategy Fund | | | 7,918 | |
Real Estate Fund | | | 18,866 | |
Government Long Bond 1.2x Strategy Fund | | | 26,601 | |
Inverse Government Long Bond Strategy Fund | | | 234,101 | |
11. Legal Proceedings
Tribune Company
Rydex Series Funds has been named as a defendant and a putative member of the proposed defendant class of shareholders in the case entitled Official Committee of Unsecured Creditors of Tribune Co. v. FitzSimons (In re Tribune Co.), Adv. Pro. No. 10-54010 (Bankr. D. Del.), as a result of ownership of shares in the Tribune Company (“Tribune”) in 2007 by certain series of the Rydex Series Funds when Tribune effected a leveraged buyout transaction (“LBO”) by which Tribune converted to a privately-held company. In its complaint, the Unsecured Creditors Committee (the “UCC”) has alleged that, in connection with the LBO, insiders and major shareholders were overpaid for their Tribune stock using financing that the insiders knew would, and ultimately did, leave the Tribune insolvent. The UCC has asserted claims against certain insiders, major shareholders, professional advisers, and others involved in the LBO, and is attempting to obtain from these individuals and entities the proceeds paid out in connection with the LBO. This adversary proceeding in the Bankruptcy Court has been stayed pending further order of the Bankruptcy Court.
In June 2011, a group of Tribune creditors, not including the UCC, filed multiple actions involving state law constructive fraudulent conveyance claims against former Tribune shareholders. Rydex Series Funds also has been named as a defendant in one or more of these suits. These cases have been consolidated in a multidistrict litigation proceeding in the United States District Court for the Southern District of New York and have been stayed pending further order of that court or of the Bankruptcy Court.
None of these lawsuits allege any wrongdoing on the part of Rydex Series Funds. The following series of Rydex Series Funds held shares of Tribune and tendered these shares as part of Tribune’s LBO: Nova Fund, S&P 500 Pure Value Fund, Multi-Cap Core Equity Fund, S&P 500 Fund, Multi-Hedge Strategies Fund and Hedged Equity Fund (the “Funds”). The value of the proceeds received by the foregoing Funds was $28,220, $109,242, $9,860, $3,400, $1,181,160, and $10,880, respectively. At this stage of the proceedings, Rydex Series Funds is not able to make a reliable predication as to the outcome of these lawsuits or the effect, if any, on a Fund’s net asset value.
Litigation
In March, 2010, an action was filed against PADCO Advisors, Inc. (hereinafter, the “Manager”), Rydex Distributors, Inc. (hereinafter, the “Distributor”), Rydex Series Funds (hereinafter, the “Trust”) and certain trustees and officers of the Trust in federal district court in San Francisco, California. The action sought class action status on behalf of purchasers of shares in a series of the Trust, the Rydex Inverse Government Long Bond Strategy Fund (the “Fund”) during a particular time period. The action asserted claims under provisions of the federal securities laws, alleging that certain registration statements of the Trust contained negligent misrepresentations and omissions with respect to certain risks associated with investment in the Fund, the suitability of the Fund and differences between performance of the Fund’s shares over time and that of its reference benchmark. The action also asserted a claim seeking to hold the Manager and the individual trustee defendants liable as control persons of the Trust. The action sought unspecified damages and interest thereon as well as an award to the plaintiffs and putative class of attorney’s fees and litigation expenses. Following the commencement of discovery, the parties reached an agreement to settle the case in its entirety. The terms of the settlement were negotiated and, on February 9, 2012, the Court entered a final order approving the settlement and the plan of allocation, certifying the class for purposes of the settlement, approving an award of fees and expenses to plaintiffs’ counsel and to lead plaintiffs, and dismissing the action with prejudice. Neither the Manager, the Distributor nor the Trust were required to fund any of the settlement amount, which totaled $5.5 million and was covered by insurance. To our knowledge, no member of the plaintiff class has filed a notice of appeal with respect to the February 9 final order.
Lyondell Chemical Company
In December 2011, Rydex Series Funds was named as a defendant in Weisfelner, as Trustee of the LB Creditor Trust, v. Fund 1 (In re Lyondell Chemical Co.), Adv. Pro. No. 10-4609 (Bankr. S.D.N.Y.).
THE RYDEX SERIES FUNDS ANNUAL REPORT | 283
NOTES TO FINANCIAL STATEMENTS (concluded)
Similar to the claims made in the Tribune matter, the Weisfelner complaint seeks to have set aside and recovered as fraudulent transfers from former Lyondell Chemical Company (“Lyondell”) shareholders the consideration paid to them pursuant to the cash out merger of Lyondell shareholders in connection with the combination of Lyondell and Basell AF in 2007. Lyondell filed for bankruptcy in 2008.
This lawsuit does not allege any wrongdoing on the part of Rydex Series Funds. The following series of Rydex Series Funds received cash proceeds from the cash out merger in the following amounts: Basic Materials Fund—$ 1,725,168; U.S. Long Short Momentum Fund—$2,193,600; Global 130/30 Strategy Fund—$37,920; Hedged Equity Fund—$1,440; and Multi-Hedge Strategies Fund—$1,116,480. At this stage of the proceedings, Rydex Series Funds is not able to make a reliable predication as to the outcome of these lawsuits or the effect, if any, on a Fund’s net asset value.
12. Subsequent Event
Effective following the close of business on June 15, 2012, the Rydex Series Funds U.S. Government Money Market Fund (the “Fund”) will no longer offer Investor Class shares, Advisor Class shares, A-Class shares, C-Class shares, and Investor2 Class shares, and all outstanding shares of the Fund will be converted to the Fund’s new share class, the Money Market Class shares, based on the existing class NAVs. Money Market Class shares of the Fund will be eligible for exchange with shares of any other fund in the same fund family regardless of class subject to the purchaser eligibility requirements of such class. The Fund will no longer be subject to Rule 12b-1 distribution, shareholder service fees, or contingent deferred sales charges. There will be no account privilege restrictions if held directly through Rydex Fund Services, LLC, or tax consequences associated with the conversion.
284 | THE RYDEX SERIES FUNDS ANNUAL REPORT
REPORT OF INDEPENDENT REGISTERED PUBLIC ACCOUNTING FIRM
To the Board of Trustees and Shareholders
of Rydex Series Funds:
We have audited the accompanying statements of assets and liabilities, including the schedules of investments, of Nova Fund, S&P 500 Fund, Inverse S&P 500 Strategy Fund, NASDAQ-100® Fund, Inverse NASDAQ-100® Strategy Fund, Mid-Cap 1.5x Strategy Fund, Inverse Mid-Cap Strategy Fund, Russell 2000® 1.5x Strategy Fund, Russell 2000® Fund, Inverse Russell 2000® Strategy Fund, S&P 500 Pure Growth Fund, S&P 500 Pure Value Fund, S&P MidCap 400 Pure Growth Fund, S&P MidCap 400 Pure Value Fund, S&P SmallCap 600 Pure Growth Fund, S&P SmallCap 600 Pure Value Fund, Europe 1.25x Strategy Fund, Japan 2x Strategy Fund, Strengthening Dollar 2x Strategy Fund, Weakening Dollar 2x Strategy Fund, Real Estate Fund, Government Long Bond 1.2x Strategy Fund, Inverse Government Long Bond Strategy Fund, High Yield Strategy Fund, Inverse High Yield Strategy Fund, and U.S. Government Money Market Fund (twenty-six of the series constituting the Rydex Series Funds) (the “Funds”) as of March 31, 2012, and the related statements of operations for the year then ended, statements of changes in net assets for each of the two years in the period then ended, and the financial highlights for each of the years or periods indicated therein. These financial statements and financial highlights are the responsibility of the Funds’ management. Our responsibility is to express an opinion on these financial statements and financial highlights based on our audits.
We conducted our audits in accordance with the standards of the Public Company Accounting Oversight Board (United States). Those standards require that we plan and perform the audit to obtain reasonable assurance about whether the financial statements and financial highlights are free of material misstatement. We were not engaged to perform an audit of the Funds’ internal control over financial reporting. Our audits included consideration of internal control over financial reporting as a basis for designing audit procedures that are appropriate in the circumstances, but not for the purpose of expressing an opinion on the effectiveness of the Funds’ internal control over financial reporting. Accordingly, we express no such opinion. An audit also includes examining, on a test basis, evidence supporting the amounts and disclosures in the financial statements and financial highlights, assessing the accounting principles used and significant estimates made by management, as well as evaluating the overall financial statement presentation. Our procedures included confirmation of securities owned as of March 31, 2012, by correspondence with the custodian and brokers or by other appropriate auditing procedures where replies from brokers were not received. We believe that our audits provide a reasonable basis for our opinion.
In our opinion, the financial statements and financial highlights referred to above present fairly, in all material respects, the financial position of the above listed Funds at March 31, 2012, the results of their operations for the year then ended, the changes in their net assets for each of the two years in the period then ended, and their financial highlights for each of the years or periods indicated therein, in conformity with U.S. generally accepted accounting principles.

McLean, Virginia
May 24, 2012
THE RYDEX SERIES FUNDS ANNUAL REPORT | 285
OTHER INFORMATION (Unaudited)
Tax Information
This information is being provided as required by the Internal Revenue Code. Amounts shown may differ from those elsewhere in the report because of differences in tax and financial reporting practice.
Of the taxable ordinary income distributions paid during the fiscal year ending March 31, 2012, the following funds had the corresponding percentages qualify for the dividends received deduction for corporations:
| | | | |
Fund | | % Qualifying | |
S&P 500 Pure Growth Fund | | | 93.65 | % |
High Yield Strategy Fund | | | 2.45 | % |
Additionally, the following amounts of taxable ordinary income dividends paid during the fiscal year qualified for the lower income tax rate available to individuals under the Jobs and Growth Tax Relief Reconciliation Act of 2003.
| | | | |
Fund | | % Qualifying | |
S&P 500 Pure Growth Fund | | | 79.66 | % |
High Yield Strategy Fund | | | 1.12 | % |
With respect to the taxable year ended March 31, 2012, the Funds hereby designate as capital gain dividends the amounts listed below, or, if subsequently determined to be different, the net capital gain of such year:
| | | | |
| | | S&P 500 | |
| | | Pure Growth | |
| | | Fund | |
From long-term capital gains, subject to the 15% rate gains category: | | $ | 241,421 | |
From long-term capital gains, using proceeds from shareholder redemptions: | | | 943,691 | |
Proxy Voting Information
A description of the policies and procedures that the Trust uses to determine how to vote proxies relating to securities held in the Funds’ portfolios is available, without charge and upon request, by calling 1.800.820.0888. This information is also available from the EDGAR database on the SEC’s website at http://www.sec.gov.
Information regarding how the Funds voted proxies relating to portfolio securities during the most recent 12-month period ended June 30 is available without charge, upon request, by calling 1.800.820.0888. This information is also available from the EDGAR database on the SEC’s website at http://www.sec.gov.
At a special meeting of shareholders held on January 26, 2012, the shareholders of the Funds voted on whether to approve a new investment advisory agreement between Rydex Series Funds and Security Investors, LLC. A description of the number of shares voted is as follows:
| | | | | | | | | | | | |
Fund | | Shares For | | | Shares Against | | | Shares Abstained | |
Nova Fund | | | 834,436 | | | | 28,139 | | | | 49,303 | |
S&P 500 Fund | | | 3,004,072 | | | | 63,660 | | | | 45,228 | |
Inverse S&P 500 Strategy Fund | | | 4,737,821 | | | | 118,613 | | | | 133,037 | |
NASDAQ-100® Fund | | | 15,160,761 | | | | 517,125 | | | | 532,056 | |
Inverse NASDAQ-100® Strategy Fund | | | 767,107 | | | | 37,131 | | | | 28,970 | |
Mid-Cap 1.5x Strategy Fund | | | 283,002 | | | | 8,301 | | | | 7,056 | |
Inverse Mid-Cap Strategy Fund | | | 248,180 | | | | 7,502 | | | | 2,551 | |
Russell 2000® Fund | | | 145,797 | | | | 1,914 | | | | 1,608 | |
Russell 2000® 1.5x Strategy Fund | | | 175,680 | | | | 10,548 | | | | 2,187 | |
Inverse Russell 2000® Strategy Fund | | | 1,028,865 | | | | 13,780 | | | | 9,623 | |
S&P 500 Pure Growth Fund | | | 1,088,197 | | | | 38,832 | | | | 38,383 | |
S&P 500 Pure Value Fund | | | 115,208 | | | | 4,705 | | | | 4,854 | |
S&P MidCap 400 Pure Growth Fund | | | 2,862,290 | | | | 77,012 | | | | 64,980 | |
S&P MidCap 400 Pure Value Fund | | | 93,373 | | | | 3,301 | | | | 2,615 | |
286 | THE RYDEX SERIES FUNDS ANNUAL REPORT
OTHER INFORMATION (Unaudited) (continued)
| | | | | | | | | | | | |
Fund | | Shares For | | | Shares Against | | | Shares Abstained | |
S&P SmallCap 600 Pure Growth Fund | | | 231,817 | | | | 3,322 | | | | 8,757 | |
S&P SmallCap 600 Pure Value Fund | | | 236,061 | | | | 3,959 | | | | 9,752 | |
Europe 1.25x Strategy Fund | | | 263,205 | | | | 5,707 | | | | 2,533 | |
Japan 2x Strategy Fund | | | 108,125 | | | | 7,608 | | | | 213 | |
Strengthening Dollar 2x Strategy Fund | | | 2,809,315 | | | | 31,957 | | | | 46,498 | |
Weakening Dollar 2x Strategy Fund | | | 667,249 | | | | 68,054 | | | | 32,371 | |
Real Estate Fund | | | 201,371 | | | | 8,984 | | | | 12,852 | |
Government Long Bond 1.2x Strategy Fund | | | 5,865,399 | | | | 164,170 | | | | 198,733 | |
Inverse Government Long Bond Strategy Fund | | | 16,333,001 | | | | 705,210 | | | | 549,708 | |
High Yield Strategy Fund | | | 580,938 | | | | 17,533 | | | | 10,900 | |
Inverse High Yield Strategy Fund | | | 551,047 | | | | 7,996 | | | | 19,689 | |
U.S. Government Money Market Fund | | | 916,413,122 | | | | 7,792,221 | | | | 11,435,070 | |
At a special meeting of shareholders held on November 22, 2011, the shareholders of the Funds also voted on whether to approve the election of nominees to the Board of Trustees. A description of the number of shares voted is as follows:
| | | | | | | | | | | | | | | | | | | | |
Donald C. Cacciapaglia | | | | | Corey A. Colehour | | | | | | J. Kenneth Dalton | | | | |
For | | | 1,443,600,903 | | | | For | | | | 1,444,213,017 | | | | For | | | | 1,444,422,997 | |
Withhold | | | 23,402,732 | | | | Withhold | | | | 22,790,618 | | | | Withhold | | | | 22,580,638 | |
Total | | | 1,467,003,635 | | | | Total | | | | 1,467,003,635 | | | | Total | | | | 1,467,003,635 | |
| | | | | | | | | | | | | | | | | | | | |
John O. Demaret | | | | | Richard M. Goldman | | | | | | Werner E. Keller | | | | |
For | | | 1,445,255,754 | | | | For | | | | 1,443,668,595 | | | | For | | | | 1,445,494,273 | |
Withhold | | | 21,747,881 | | | | Withhold | | | | 23,335,040 | | | | Withhold | | | | 21,509,362 | |
Total | | | 1,467,003,635 | | | | Total | | | | 1,467,003,635 | | | | Total | | | | 1,467,003,635 | |
| | | | | | | | | | | | | | | | | | | | |
Thomas F. Lydon | | | | | Patrick T. McCarville | | | | | | Roger Somers | | | | |
For | | | 1,444,219,448 | | | | For | | | | 1,445,357,773 | | | | For | | | | 1,443,486,735 | |
Withhold | | | 22,784,187 | | | | Withhold | | | | 21,645,862 | | | | Withhold | | | | 23,516,900 | |
Total | | | 1,467,003,635 | | | | Total | | | | 1,467,003,635 | | | | Total | | | | 1,467,003,635 | |
At a special meeting of shareholders held on January 26, 2012, the shareholders of the Funds also voted on whether to approve a “manager of managers” arrangement for each of the Funds. Although shareholder votes were placed, not enough votes were received to meet the minimum requirements to constitute a majority vote. As such, the matter was closed.
At a special meeting of shareholders held on December 13, 2011, the shareholders of the Funds also voted on whether to approve the
Elimination of the Fundamental Investment Policy on Investing in Other Investment Companies. A description of the number of shares voted is as follows:
| | | | | | | | | | | | |
Fund | | Shares For | | | Shares Against | | | Shares Abstained | |
U.S. Government Money Market Fund | | | 905,094,161 | | | | 18,684,699 | | | | 11,861,553 | |
Quarterly Portfolio Schedules Information
The Trust files its complete schedule of portfolio holdings with the SEC for the first and third quarters of each fiscal year on Form N-Q; which are available on the SEC’s website at http://www.sec.gov. The Funds’ Forms N-Q may be reviewed and copied at the SEC’s Public Reference Room in Washington, DC, and that information on the operation of the Public Reference Room may be obtained by calling 1-800-SEC-0330. Copies of the portfolio holdings are also available to shareholders, without charge and upon request, by calling 1.800.820.0888.
THE RYDEX SERIES FUNDS ANNUAL REPORT | 287
OTHER INFORMATION (Unaudited) (concluded)
Office Locations
The offices of Guggenheim Investments can be found in the following locations:
40 East 52nd Street
16th Floor
New York, NY 10022
(Headquarters)
Four Irvington Centre
805 King Farm Boulevard
Suite 600
Rockville, MD 20850
9401 Indian Creek Parkway
40 Corporate Woods
Suite 850
Overland Park, KS 66210
Guggenheim Transaction
On September 20, 2011, Guggenheim Capital, LLC agreed to purchase the indirect holding company of Security Investors, LLC, the Fund’s investment manager (the “Investment Manager”) (the “Transaction”). Guggenheim Capital, LLC’s subsidiary, Guggenheim Partners, LLC (“Guggenheim”), is a global, independent, privately-held, diversified financial services firm with more than 1,500 dedicated professionals. The Transaction closed on February 29, 2012.
The Transaction should not result in material changes to the day-to-day management and operation of the Fund or any increase in fees.
In anticipation of the Transaction, the Board of Trustees of the Fund (the “Board”) called a special meeting of shareholders (the “Meeting”), at which shareholders of the Fund of record as of October 3, 2011 were asked to consider the approval of a new investment management agreement between the Fund and the Investment Manager (the “New Agreement”). This approval was necessary because, under the Investment Company Act of 1940 (the “1940 Act”), the Transaction could result in the termination of the Fund’s current investment management agreement with the Investment Manager (the “Current Agreement”). The Fund’s shareholders approved the New Agreement, the terms of which are substantially identical to the corresponding Current Agreement, except with respect to the date of execution.
Election of Board Members
The Board also approved a proposal to elect nine individuals to the Board. The Board proposed the election of the following nominees: Donald C. Cacciapaglia, Corey A. Colehour, J. Kenneth Dalton, John O. Demaret, Richard M. Goldman, Werner E. Keller, Thomas F. Lydon, Patrick T. McCarville and Roger Somers. Each of the nominees, other than Mr. Cacciapaglia, currently serves as a Trustee. In connection with the Transaction, the Board believes that expanding the Board to include Mr. Cacciapaglia, who is a member of senior management of Guggenheim’s investment management business, and who would serve on other boards in the Guggenheim Investments family of funds, would be appropriate. The Trusts’ shareholders ultimately approved the aforementioned proposal.
288 | THE RYDEX SERIES FUNDS ANNUAL REPORT
INFORMATION ON BOARD OF TRUSTEES AND OFFICERS (Unaudited)
A Board of Trustees oversees the Trust, as well as other trusts of GI, in which its members have no stated term of service, and continue to serve after election until resignation. The Statement of Additional Information includes further information about Fund Trustees and Officers, and can be obtained without charge by calling 800.820.0888.
All Trustees and Officers may be reached c/o Guggenheim Investments, 805 King Farm Boulevard, Suite 600, Rockville, MD 20850.
| | | | |
| TRUSTEE AND OFFICER | | | | |
| | | Length of Service | | |
| Name, Position and | | as Trustee | | Number of |
| Year of Birth | | (Year Began) | | Funds Overseen |
| –––––––––––––––––––––––––––––– | | ––––––––––––––––––––––––––––––––––– | | –––––––––––––––––––––––– |
Donald C. Cacciapaglia* | | Rydex Series Funds – 2012 | | 148 |
Trustee, President (1951) | | Rydex Variable Trust – 2012 | | |
| | Rydex Dynamic Funds –2012 | | |
| | Rydex ETF Trust – 2012 | | |
Principal Occupations During Past Five Years: Security Investors, LLC: President and CEO from April 2012 to present; Guggenheim Investments: President and Chief Administrative Officer from February 2010 to present; Channel Capital Group, Inc.: Chairman and CEO from April 2002 to February 2010.
| | | | |
| INDEPENDENT TRUSTEES | | | | |
| | | Length of Service | | |
| Name, Position and | | as Trustee | | Number of |
| Year of Birth | | (Year Began) | | Funds Overseen |
| –––––––––––––––––––––––––––––– | | ––––––––––––––––––––––––––––––––––– | | –––––––––––––––––––––––– |
Corey A. Colehour | | Rydex Series Funds – 1993 | | 148 |
Trustee (1945) | | Rydex Variable Trust – 1998 | | |
| | Rydex Dynamic Funds –1999 | | |
| | Rydex ETF Trust – 2003 | | |
Principal Occupations During Past Five Years: Retired; Member of the audit,Governance and Nominating Committees(1995 to present)
| | | | |
J. Kenneth Dalton | | Rydex Series Funds – 1995 | | 148 |
Trustee (1941) | | Rydex Variable Trust – 1998 | | |
| | Rydex Dynamic Funds – 1999 | | |
| | Rydex ETF Trust – 2003 | | |
Principal Occupations During Past Five Years: Retired; Member of the Governance and Nominating Committees (1995 to present); Chairman of the Audit Committee (1997 to present); Member of the Risk Oversight Committee (2010 to present)
| | | | |
John O. Demaret | | Rydex Series Funds – 1997 | | 148 |
Trustee, Chairman of the | | Rydex Variable Trust – 1998 | | |
Board (1941) | | Rydex Dynamic Funds – 1999 | | |
| | Rydex ETF Trust – 2003 | | |
Principal Occupations During Past Five Years: Retired; Member of the Audit Committee (1997 to present); Member of the Risk Oversight Committee (2010 to present)
| | | | |
Werner E. Keller | | Rydex Series Funds – 2005 | | 148 |
Trustee (1940) | | Rydex Variable Trust – 2005 | | |
| | Rydex Dynamic Funds – 2005 | | |
| | Rydex ETF Trust – 2005 | | |
Principal Occupations During Past Five Years: Founder and President of Keller Partners, LLC (registered investment adviser) (2005 to present); Member of the Audit, Governance and Nominating Committees (2005 to present); Chairman and Member of the Risk Oversight Committee (2010 to present)
| | | | |
Thomas F. Lydon, Jr. | | Rydex Series Funds – 2005 | | 148 |
Trustee (1960) | | Rydex Variable Trust – 2005 | | |
| | Rydex Dynamic Funds – 2005 | | |
| | Rydex ETF Trust – 2005 | | |
Principal Occupations During Past Five Years: President, Global Trends Investments (1996 to present); Member of the Audit, Governance and Nominating Committees (2005 to present)
THE RYDEX SERIES FUNDS ANNUAL REPORT | 289
INFORMATION ON BOARD OF TRUSTEES AND OFFICERS (Unaudited) (continued)
INDEPENDENT TRUSTEES — concluded
| | | | |
| | | Length of Service | | |
| Name, Position and | | as Trustee | | Number of |
| Year of Birth | | (Year Began) | | Funds Overseen |
| –––––––––––––––––––––––––––––– | | ––––––––––––––––––––––––––––––––––– | | –––––––––––––––––––––––– |
| Patrick T. McCarville | | Rydex Series Funds – 1997 | | 148 |
| Trustee (1942) | | Rydex Variable Trust – 1998 | | |
| | Rydex Dynamic Funds –1999 | | |
| | Rydex ETF Trust – 2003 | | |
Principal Occupations During Past Five Years: CEO, Par Industries, Inc., d/b/a Par Leasing (1977 to 2010); Chairman of the Governance and Nominating Committees (1997 to present); Member of the Audit Committee (1997 to present)
| | | | |
| Roger Somers | | Rydex Series Funds –1993 | | 148 |
| Trustee (1944) | | Rydex Variable Trust –1998 | | |
| | Rydex Dynamic Funds –1999 | | |
| | Rydex ETF Trust – 2003 | | |
Principal Occupations During Past Five Years: Founder and CEO of Arrow Limousine (1965 to present); Member of the Audit, Governance and Nominating Committees (1995 to present)
| | |
EXECUTIVE OFFICERS | | |
| Name, Position and | | Principal Occupations |
| Year of Birth | | During Past Five Years |
| ––––––––––––––––––––––– | | ––––––––––––––––––––––––––––––––––– |
| |
| Michael P. Byrum* Vice President (1970) | | Current: President, Security Benefit Asset Management Holdings, LLC; Senior Vice President, Security Investors, LLC; President and Chief Investment Officer, Rydex Holdings, LLC; Director and Chairman of the Board, Advisor Research Center, Inc.; Manager, Rydex Specialized Products, LLC |
| |
| | Previous: Rydex Distributors, LLC (f/k/a Rydex Distributors, Inc.), Vice President (2009); Rydex Fund Services, LLC, Director (2009-2010), Secretary (2002- 2010), Executive Vice President (2002- 2006); Rydex Advisors, LLC (f/k/a PADCO Advisors, Inc.), Director (2008-2010), Chief Investment Officer (2006-2010), President (2004-2010), Secretary (2002-2010); Rydex Advisors II, LLC (f/k/a PADCO Advisors II, Inc.), Director (2008-2010), Chief Investment Officer (2006-2010), President (2004-2010), Secretary (2002-2010); Rydex Capital Partners, LLC, President and Secretary (2003- 2007); Rydex Capital Partners II, LLC, (2003-2007); Rydex Holdings, LLC (f/k/a Rydex Holdings, Inc.), Secretary (2005-2008), Executive Vice President (2005-2006); Advisor Research Center, Inc., Secretary (2006-2009), Executive Vice President (2006); Rydex Specialized Products, LLC, Secretary (2005-2008) |
| |
Nikolaos Bonos* Vice President and Treasurer (1963) | | Current: Senior Vice President, Security Investors, LLC; Chief Executive Officer and Manager, Rydex Specialized Products, LLC; Chief Executive Officer and President, Rydex Fund Services, LLC; Vice President, Rydex Holdings, LLC; Treasurer, SBL Fund; Security Equity Fund; Security Income Fund; Security Large Cap Value Fund and Security Mid Cap Growth Fund; Vice President, Security Benefit Asset Management Holdings, LLC |
| |
| | Previous: Security Global Investors, LLC, Senior Vice President (2010-2011); Rydex Advisors, LLC (f/k/a PADCO Advisors, Inc.) Senior Vice President (2006-2011); Rydex Fund Services, LLC (f/k/a Rydex Fund Services, Inc.), Director (2009), Senior Vice President (2003-2006); Rydex Specialized Products, LLC, Chief Financial Officer (2005-2009) |
| |
| Elisabeth Miller* Chief Compliance Officer (1968) | | Current: Chief Compliance Officer, Rydex Series Funds, Rydex Dynamic Funds, Rydex Variable Trust, Rydex ETF Trust, Security Equity Fund, Security Income Fund, Security Large Cap Value Fund, Security Mid Cap Growth Fund, SBL Fund, Security Investors, LLC, and Rydex Distributors, LLC |
| |
| | Previous: Senior Manager, Security Investors, LLC and Rydex Distributors, LLC (2004-2009). |
290 | THE RYDEX SERIES FUNDS ANNUAL REPORT
INFORMATION ON BOARD OF TRUSTEES AND OFFICERS (Unaudited) (concluded)
| | |
| EXECUTIVE OFFICERS —concluded | | |
| Name, Position and | | Principal Occupations |
| Year of Birth | | During Past Five Years |
| ––––––––––––––––––––––– | | ––––––––––––––––––––––––––––––––––– |
| |
Amy J. Lee* Vice President and Assistant Secretary (1960) | | Current: Senior Vice President and Secretary, Security Investors, LLC; Secretary and Chief Compliance Officer, Security Distributors, Inc.; Vice President, Associate General Counsel and Assistant Secretary, Security Benefit Life Insurance Company and Security Benefit Corporation; Associate General Counsel, First Security Benefit Life Insurance and Annuity of New York; Vice President and Secretary, SBL Fund; Security Equity Fund; Security Income Fund; Security Large Cap Value Fund and Security Mid Cap Growth Fund; Vice President and Secretary, Rydex Holdings, LLC; Secretary, Advisor Research Center, Inc., Rydex Specialized Products, LLC, Rydex Distributors, LLC and Rydex Fund Services, LLC; Assistant Secretary, Security Benefit Clinic and Hospital |
| |
| | Previous: Security Global Investors, LLC, Senior Vice President and Secretary (2007-2011); Rydex Advisors, LLC (f/k/a PADCO Advisors, Inc.) and Rydex Advisors II, LLC (f/k/a PADCO Advisors II, Inc.), Senior Vice President and Secretary (2010-2011); Brecek and Young Advisors, Inc., Director (2004-2008) |
| |
| Joseph M. Arruda* Assistant Treasurer (1966) | | Current: Assistant Treasurer, SBL Fund; Security Equity Fund; Security Income Fund; Security Large Cap Value Fund and Security Mid Cap Growth Fund; Vice President, Security Investors, LLC; Chief Financial Officer and Manager, Rydex Specialized Products, LLC |
| |
| | Previous: Security Global Investors, LLC, Vice President (2010-2011); Rydex Advisors, LLC (f/k/a PADCO Advisors, Inc.) and Rydex Advisors II, LLC (f/k/a PADCO Advisors II, Inc.), Vice President (2004-2011) |
| * | Officers of the Funds are deemed to be “interested persons” of the Trust, within the meaning of Section 2(a) (19) of the 1940 Act, inasmuch as this person is affiliated with Security Global Investors. |
THE RYDEX SERIES FUNDS ANNUAL REPORT | 291
GUGGENHEIM INVESTMENTS PRIVACY POLICIES
Rydex Funds, Guggenheim Funds, Rydex Investments, Rydex Distributors, Inc., Security Investors, LLC, Security Distributors, Inc. and Rydex Advisory Services (Collectively “Guggenheim Investments”)
Our Commitment to You
When you become a Guggenheim Investments investor, you entrust us with not only your hard-earned money but also with personal and financial information about you. We recognize that your relationship with us is based on trust and that you expect us to act responsibly and in your best interests. Because we have access to this private information about you, we hold ourselves to the highest standards in its safekeeping and use. This means, most importantly, that we do not sell client information to anyone—whether it is your personal information or if you are a current or former Guggenheim Investments client.
The Information We Collect About You
In the course of doing business with shareholders and investors, we collect nonpublic personal information about you. You typically provide personal information when you complete a Guggenheim Investments account application or when you request a transaction that involves Rydex and Guggenheim Investments funds or one of the Guggenheim Investments affiliated companies. “Nonpublic personal information” is personally identifiable private information about you. For example, it includes information regarding your name and address, Social Security or taxpayer identification number, assets, income, account balance, bank account information and investment activity (e.g., purchase and redemption history).
How We Handle Your Personal Information
As emphasized above, we do not sell information about current or former clients or their accounts to third parties. Nor do we share such information, except when necessary to complete transactions at your request or to make you aware of related investment products and services that we offer. Additional details about how we handle your personal information are provided below. To complete certain transactions or account changes that you direct, it may be necessary to provide identifying information to companies, individuals or groups that are not affiliated with Guggenheim Investments. For example, if you ask to transfer assets from another financial institution to Guggenheim Investments, we will need to provide certain information about you to that company to complete the transaction. To alert you to other Guggenheim Investments investment products and services, we may share your information within the Guggenheim Investments family of affiliated companies. This would include, for example, sharing your information within Guggenheim Investments so we can make you aware of new Rydex and Guggenheim Investments funds or the services offered through another Guggenheim Investments affiliated company. In certain instances, we may contract with nonaffiliated companies to perform services for us. Where necessary, we will disclose information we have about you to these third parties. In all such cases, we provide the third party with only the information necessary to carry out its assigned responsibilities and only for that purpose. And we require these third parties to treat your private information with the same high degree of confidentiality that we do. In certain instances, we may share information with other financial institutions regarding individuals and entities in response to the U.S.A. Patriot Act. Finally, we will release information about you if you direct us to do so, if we are compelled by law to do so or in other circumstances permitted by law.
Opt Out Provisions
We do not sell your personal information to anyone. The law allows you to “opt out” of only certain kinds of information sharing with third parties. The firm does not share personal information about you with any third parties that triggers this opt-out right. This means YOU ARE ALREADY OPTED OUT.
How We Protect Privacy Online
Our concern for the privacy of our shareholders also extends to those who use our web site, www.rydex-sgi.com. Our web site uses some of the most secure forms of online communication available, including encryption technology, Secure Socket Layer (SSL) protocol, firewalls and user names and passwords. These technologies provide a high level of security and privacy when you access your account information or initiate online transactions. The Guggenheim Investments web site offers customized features that require our use of “http cookies”—tiny pieces of information that we ask your browser to store. However, we make very limited use of these cookies. We only use cookies for session management and security features on the Guggenheim Investments web site. We do not use them to pull data from your hard drive, to learn your email address, or to view data in cookies created by other web sites. We will not share the information in our cookies or give others access to it. See the legal information area on our web site for more details about web site security and privacy features.
292 | THE RYDEX SERIES FUNDS ANNUAL REPORT
GUGGENHEIM INVESTMENTS PRIVACY POLICIES (concluded)
How We Safeguard Your Personal Information
We restrict access to nonpublic personal information about shareholders to our employees and in some cases to third parties (for example, the service providers described above) as permitted by law. We maintain strict physical, electronic and procedural safeguards that comply with federal standards to guard your nonpublic personal information.
We’ll Keep You Informed
As required by federal law, we will notify shareholders of our privacy policy annually. We reserve the right to modify this policy at any time, but rest assured that if we do change it, we will tell you promptly. You will also be able to access our privacy policy from our web site at www.rydex-sgi.com. Should you have any questions regarding our privacy policy, contact us at 800.820.0888 or 301.296.5100.
THE RYDEX SERIES FUNDS ANNUAL REPORT | 293

805 King Farm Boulevard, Suite 600
Rockville, MD 20850
www.rydex-sgi.com
800.820.0888
RBENF-ANN-2-0312x0313

SECTOR FUNDS
BANKING FUND
BASIC MATERIALS FUND
BIOTECHNOLOGY FUND
CONSUMER PRODUCTS FUND
ELECTRONICS FUND
ENERGY FUND
ENERGY SERVICES FUND
FINANCIAL SERVICES FUND
HEALTH CARE FUND
INTERNET FUND
LEISURE FUND
PRECIOUS METALS FUND
RETAILING FUND
TECHNOLOGY FUND
TELECOMMUNICATIONS FUND
TRANSPORTATION FUND
UTILITIES FUND

ELIMINATE MAILBOX CLUTTER
Go paperless with Guggenheim Investments eDelivery—a service giving you full online access to account information and documents. Save time, cut down on mailbox clutter and be a friend to the environment with eDelivery.
With Guggenheim Investments eDelivery you can:
| | • | | View online confirmations and statements at your convenience. |
| | • | | Receive email notification when your most recent confirmations, statements and other account documents are available for review. |
| | • | | Access prospectuses, annual reports and semiannual reports online. |

If you have questions about Guggenheim Investments eDelivery services, contact one of our Shareholder Service
Representatives at 800.820.0888.

This report and the financial statements contained herein are submitted for the general information of our shareholders. The report is not authorized for distribution to prospective investors unless preceded or accompanied by an effective prospectus.
Distributed by Rydex Distributors, LLC.
TABLE OF CONTENTS
| | | | |
| | | | | |
| | THE RYDEX FUNDSANNUALREPORT | | 1 |
|
| LETTER TO OUR SHAREHOLDERS |
| |
TO OUR SHAREHOLDERS:
A restructuring of Greece’s massive debt, continued accommodation by the world’s major central banks and better news on the U.S. economy helped support financial markets over the fiscal year ended March 31, 2012, with the S&P 500® Index* rising about 9%. Market optimism peaked in early 2012, when several major equity indices pushed to the highest levels in four years or more. But the mood grew more cautious late in the period after the Federal Reserve (“the Fed”) expressed views that continued weakness in housing and employment may pose a risk to the strength of the recovery.
U.S. equities experienced big intra-year swings. Markets swooned by nearly 20% last summer amid the loss of the U.S. AAA credit rating, the end of the Federal Reserve’s second round of quantitative easing and rising oil prices. But after touching the year’s low in early October, improving U.S. economic data and European Central Bank’s injections of three-year loans into the continent’s banking system helped markets make up lost ground, which carried over into a strong first quarter of 2012.
Among the upbeat U.S. economic reports in recent months: more than 600,000 jobs have been added since the beginning of 2012; house prices have fallen enough to start to spur demand, lifting sales and new construction; and the U.S. GDP expanded at an annual rate of 3% in the fourth quarter of 2011, its strongest rate in a year and a half. Consumer confidence climbed in March to its highest level in a year.
While acknowledging the good news, the Fed warned that policymakers cannot be sure the recent pace of improvement will be sustained unless growth picks up. To foster growth, the Fed has said it will leave its key interest rate close to zero at least through 2014, despite arguments by some Fed officials and investors that the Fed may have to consider raising rates much earlier than that to prevent inflation. For now, the Fed’s leadership appears to be committed to keeping rates low, thus reducing borrowing costs for businesses and consumers. Consumer spending remains sluggish, and lackluster forecasts for first-quarter corporate profits were a reminder that the economic recovery remains fragile.
The world’s leading central bankers have continued to take steps to recharge the global economy. Greece’s debt restructuring enabled a new international bailout, while an injection of liquidity from the European Central Bank lessened financial stresses across the continent and contributed to improvement in global financial markets. However, March manufacturing gauges indicated that the eurozone has entered a period of economic contraction, meaning that policy makers may need to do more to revive economic growth across the region. The Bank of England and the Bank of Japan have also increased asset-buying programs. In China, recent strong factory data eased fears that a hard landing could wreak havoc on the global economy. The country cut its annual growth target to 7.5%, as its policymakers are trying to shift the country away from investment and exports and to greater domestic consumption.
Improvement in the U.S. economy is luring investors from ultra-safe, but often low-yielding assets. Falling U.S. Treasury bond prices, for example, boosted yields from a 70-year low last fall to a recent range of around 2% for the 10-year note. After outperforming equities for much of the past decade, and drawing heavy asset flows, many analysts are cautious about certain fixed-income sectors, particularly government debt, as the economy improves and the potential grows for a rise in interest rates. Investment-grade and higher-yielding corporates, however, are expected to continue to outperform.
Likewise, commodities, which had been slumping since mid-2011 due to slowing economic activity and the European debt crisis, rebounded in early 2012 on stronger macroeconomic data, with the price of a barrel of oil surging from last October’s $77 to a peak of $113 in late February. Investors also have been shifting out of gold to assets with greater return potential; after peaking at nearly $2,000 last summer, the price per ounce has fallen back to around $1,600.
| | | | |
| | | | | |
| 2 | | THE RYDEX FUNDSANNUALREPORT | | |
|
| LETTER TO OUR SHAREHOLDERS (concluded) |
| |
The U.S. economy seems to be decoupling from slowing growth in the rest of the world and from ongoing uncertainty in the European debt crisis, as well as the domestic debate over tax and spending policy. In this resiliency, we see potential in U.S. investments, including equities, high yield bonds, bank loans and other risk assets. It appears that the U.S. may have entered a period of self-sustaining, if modest, economic expansion, driven primarily by the aggressive monetary policy of the Fed and reinforced by the ECB, and is increasingly becoming the economic locomotive of the global economy.
We look forward to continuing our service to you. Thank you for investing in our funds.
Sincerely,

Donald C. Cacciapaglia
President
*S&P 500® Index is a capitalization-weighted index covering 500 industrial, utility, transportation and financial companies of the U.S. markets (mostly NYSE Euronext issues).
Performance displayed represents past performance which is no guarantee of future results. Of course, fund performance is subject to daily market volatility and may be better or worse since the end of the last quarter. For up-to-date fund performance, call us at 800.820.0888 or visit www.rydex-sgi.com.
Read each fund’s prospectus and summary prospectus (if available) carefully before investing. It contains the fund’s investment objectives, risks, charges, expenses and other information, which should be considered carefully before investing. Obtain a prospectus and summary prospectus (if available) at www.rydex-sgi.com or call 800.820.0888
The referenced funds are distributed by Rydex Distributors, LLC. Guggenheim Investments represents the investment management business of Guggenheim Partners, LLC, which includes Security Investors, LLC, the investment advisor to the referenced funds. Rydex Distributors, LLC is affiliated with Guggenheim Partners, LLC and Security Investors, LLC.
| | | | |
| | | | | |
| | THE RYDEX FUNDSANNUALREPORT | | 3 |
|
| ABOUT SHAREHOLDERS’ FUND EXPENSES (Unaudited) |
| |
All mutual funds have operating expenses and it is important for our shareholders to understand the impact of costs on their investments. Shareholders of a Fund incur two types of costs: (i) transaction costs, including sales charges (loads) on purchase payments, reinvested dividends, or other distributions; and exchange fees; and (ii) ongoing costs, including management fees, administrative services, and shareholder reports, among others. These ongoing costs, or operating expenses, are deducted from a fund’s gross income and reduce the investment return of the fund.
A fund’s expenses are expressed as a percentage of its average net assets, which is known as the expense ratio. The following examples are intended to help investors understand the ongoing costs (in dollars) of investing in a Fund and to compare these costs with the ongoing costs of investing in other mutual funds.
The examples are based on an investment of $1,000 made at the beginning of the period and held for the entire six-month period beginning September 30, 2011 and ending March 31, 2012.
The following tables illustrate a Fund’s costs in two ways:
Table 1. Based on actual Fund return. This section helps investors estimate the actual expenses paid over the period. The “Ending Account Value” shown is derived from the Fund’s actual return, and the fourth column shows the dollar amount that would have been paid by an investor who started with $1,000 in the Fund. Investors may use the information here, together with the amount invested, to estimate the expenses paid over the period. Simply divide the Fund’s account value by $1,000 (for example, an $8,600 account value divided by $1,000 = 8.6), then multiply the result by the number provided under the heading “Expenses Paid During Period.”
Table 2. Based on hypothetical 5% return. This section is intended to help investors compare a Fund’s cost with those of other mutual funds. The table provides information about hypothetical account values and hypothetical expenses based on the Fund’s actual expense ratio and an assumed rate of return of 5% per year before expenses, which is not the Fund’s actual return. The hypothetical account values and expenses may not be used to estimate the actual ending account balance or expenses paid during the period. The example is useful in making comparisons because the U.S.
Securities and Exchange Commission (the “SEC”) requires all mutual funds to calculate expenses based on the 5% return. Investors can assess a Fund’s costs by comparing this hypothetical example with the hypothetical examples that appear in shareholder reports of other funds.
The calculations illustrated above assume no shares were bought or sold during the period. Actual costs may have been higher or lower, depending on the amount of investment and the timing of any purchases or redemptions.
Please note that the expenses shown in the table are meant to highlight your ongoing costs only and do not reflect any transactional costs, such as sales charges (loads) on purchase payments, and contingent deferred sales charges (“CDSC”) on redemptions, if any. Therefore, the second table is useful in comparing ongoing costs only, and will not help you determine the relative total costs of owning different funds. In addition, if these transactional costs were included, your costs would have been higher.
More information about a Fund’s expenses, including annual expense ratios for the past five years, can be found in the Financial Highlights section of this report. For additional information on operating expenses and other shareholder costs, please refer to the appropriate Fund prospectus.
| | | | |
| | | | | |
| 4 | | THE RYDEX FUNDSANNUALREPORT | | |
|
| ABOUT SHAREHOLDERS’ FUND EXPENSES (Unaudited) (continued) |
| |
| | | | | | | | | | | | | | | | | | | | |
| | | Expense
Ratio1 | | | Fund
Return | | | Beginning
Account Value
September 30, 2011 | | | Ending
Account Value
March 31, 2012 | | | Expenses
Paid During
Period2 | |
Table 1. Based on actual Fund return3 | | | | | | | | | | | | | | | | | | | | |
| | | | | |
Banking Fund | | | | | | | | | | | | | | | | | | | | |
Investor Class | | | 1.32 | % | | | 35.23 | % | | $ | 1,000.00 | | | $ | 1,352.30 | | | $ | 7.76 | |
Advisor Class | | | 1.82 | % | | | 34.86 | % | | | 1,000.00 | | | | 1,348.60 | | | | 10.69 | |
A-Class | | | 1.58 | % | | | 35.03 | % | | | 1,000.00 | | | | 1,350.30 | | | | 9.28 | |
C-Class | | | 2.33 | % | | | 34.55 | % | | | 1,000.00 | | | | 1,345.50 | | | | 13.66 | |
| | | | | |
Basic Materials Fund | | | | | | | | | | | | | | | | | | | | |
Investor Class | | | 1.33 | % | | | 18.86 | % | | | 1,000.00 | | | | 1,188.60 | | | | 7.28 | |
Advisor Class | | | 1.84 | % | | | 18.58 | % | | | 1,000.00 | | | | 1,185.80 | | | | 10.05 | |
A-Class | | | 1.58 | % | | | 18.71 | % | | | 1,000.00 | | | | 1,187.10 | | | | 8.64 | |
C-Class | | | 2.33 | % | | | 18.31 | % | | | 1,000.00 | | | | 1,183.10 | | | | 12.72 | |
| | | | | |
Biotechnology Fund | | | | | | | | | | | | | | | | | | | | |
Investor Class | | | 1.33 | % | | | 34.48 | % | | | 1,000.00 | | | | 1,344.80 | | | | 7.80 | |
Advisor Class | | | 1.83 | % | | | 34.13 | % | | | 1,000.00 | | | | 1,341.30 | | | | 10.71 | |
A-Class | | | 1.59 | % | | | 34.31 | % | | | 1,000.00 | | | | 1,343.10 | | | | 9.31 | |
C-Class | | | 2.33 | % | | | 33.77 | % | | | 1,000.00 | | | | 1,337.70 | | | | 13.62 | |
| | | | | |
Consumer Products Fund | | | | | | | | | | | | | | | | | | | | |
Investor Class | | | 1.33 | % | | | 14.52 | % | | | 1,000.00 | | | | 1,145.20 | | | | 7.13 | |
Advisor Class | | | 1.83 | % | | | 14.25 | % | | | 1,000.00 | | | | 1,142.50 | | | | 9.80 | |
A-Class | | | 1.58 | % | | | 14.37 | % | | | 1,000.00 | | | | 1,143.70 | | | | 8.47 | |
C-Class | | | 2.33 | % | | | 13.98 | % | | | 1,000.00 | | | | 1,139.80 | | | | 12.46 | |
| | | | | |
Electronics Fund | | | | | | | | | | | | | | | | | | | | |
Investor Class | | | 1.33 | % | | | 23.49 | % | | | 1,000.00 | | | | 1,234.90 | | | | 7.43 | |
Advisor Class | | | 1.84 | % | | | 23.20 | % | | | 1,000.00 | | | | 1,232.00 | | | | 10.27 | |
A-Class | | | 1.58 | % | | | 23.30 | % | | | 1,000.00 | | | | 1,233.00 | | | | 8.82 | |
C-Class | | | 2.34 | % | | | 22.82 | % | | | 1,000.00 | | | | 1,228.20 | | | | 13.03 | |
| | | | | |
Energy Fund | | | | | | | | | | | | | | | | | | | | |
Investor Class | | | 1.33 | % | | | 24.59 | % | | | 1,000.00 | | | | 1,245.90 | | | | 7.47 | |
Advisor Class | | | 1.83 | % | | | 24.39 | % | | | 1,000.00 | | | | 1,243.90 | | | | 10.27 | |
A-Class | | | 1.59 | % | | | 24.36 | % | | | 1,000.00 | | | | 1,243.60 | | | | 8.92 | |
C-Class | | | 2.33 | % | | | 24.01 | % | | | 1,000.00 | | | | 1,240.10 | | | | 13.05 | |
| | | | | |
Energy Services Fund | | | | | | | | | | | | | | | | | | | | |
Investor Class | | | 1.33 | % | | | 25.73 | % | | | 1,000.00 | | | | 1,257.30 | | | | 7.51 | |
Advisor Class | | | 1.83 | % | | | 25.43 | % | | | 1,000.00 | | | | 1,254.30 | | | | 10.31 | |
A-Class | | | 1.58 | % | | | 25.56 | % | | | 1,000.00 | | | | 1,255.60 | | | | 8.91 | |
C-Class | | | 2.33 | % | | | 25.13 | % | | | 1,000.00 | | | | 1,251.30 | | | | 13.11 | |
| | | | | |
Financial Services Fund | | | | | | | | | | | | | | | | | | | | |
Investor Class | | | 1.33 | % | | | 29.91 | % | | | 1,000.00 | | | | 1,299.10 | | | | 7.64 | |
Advisor Class | | | 1.83 | % | | | 29.58 | % | | | 1,000.00 | | | | 1,295.80 | | | | 10.50 | |
A-Class | | | 1.58 | % | | | 29.76 | % | | | 1,000.00 | | | | 1,297.60 | | | | 9.08 | |
C-Class | | | 2.33 | % | | | 29.31 | % | | | 1,000.00 | | | | 1,293.10 | | | | 13.36 | |
| | | | |
| | | | | |
| | THE RYDEX FUNDSANNUALREPORT | | 5 |
|
| ABOUT SHAREHOLDERS’ FUND EXPENSES (Unaudited) (continued) |
| |
| | | | | | | | | | | | | | | | | | | | |
| | | Expense
Ratio1 | | | Fund
Return | | | Beginning
Account Value
September 30, 2011 | | | Ending
Account Value
March 31, 2012 | | | Expenses
Paid During
Period2 | |
Health Care Fund | | | | | | | | | | | | | | | | | | | | |
Investor Class | | | 1.33 | % | | | 21.56 | % | | $ | 1,000.00 | | | $ | 1,215.60 | | | $ | 7.37 | |
Advisor Class | | | 1.83 | % | | | 21.37 | % | | | 1,000.00 | | | | 1,213.70 | | | | 10.13 | |
A-Class | | | 1.58 | % | | | 21.48 | % | | | 1,000.00 | | | | 1,214.80 | | | | 8.75 | |
C-Class | | | 2.33 | % | | | 21.03 | % | | | 1,000.00 | | | | 1,210.30 | | | | 12.87 | |
| | | | | |
Internet Fund | | | | | | | | | | | | | | | | | | | | |
Investor Class | | | 1.33 | % | | | 27.74 | % | | | 1,000.00 | | | | 1,277.40 | | | | 7.57 | |
Advisor Class | | | 1.84 | % | | | 27.42 | % | | | 1,000.00 | | | | 1,274.20 | | | | 10.46 | |
A-Class | | | 1.59 | % | | | 27.55 | % | | | 1,000.00 | | | | 1,275.50 | | | | 9.05 | |
C-Class | | | 2.34 | % | | | 27.12 | % | | | 1,000.00 | | | | 1,271.20 | | | | 13.29 | |
| | | | | |
Leisure Fund | | | | | | | | | | | | | | | | | | | | |
Investor Class | | | 1.32 | % | | | 30.76 | % | | | 1,000.00 | | | | 1,307.60 | | | | 7.62 | |
Advisor Class | | | 1.83 | % | | | 30.43 | % | | | 1,000.00 | | | | 1,304.30 | | | | 10.54 | |
A-Class | | | 1.58 | % | | | 30.60 | % | | | 1,000.00 | | | | 1,306.00 | | | | 9.11 | |
C-Class | | | 2.32 | % | | | 30.10 | % | | | 1,000.00 | | | | 1,301.00 | | | | 13.35 | |
| | | | | |
Precious Metals Fund | | | | | | | | | | | | | | | | | | | | |
Investor Class | | | 1.23 | % | | | (3.93 | %) | | | 1,000.00 | | | | 960.70 | | | | 6.03 | |
Advisor Class | | | 1.74 | % | | | (4.15 | %) | | | 1,000.00 | | | | 958.50 | | | | 8.52 | |
A-Class | | | 1.48 | % | | | (4.06 | %) | | | 1,000.00 | | | | 959.40 | | | | 7.25 | |
C-Class | | | 2.24 | % | | | (4.40 | %) | | | 1,000.00 | | | | 956.00 | | | | 10.95 | |
| | | | | |
Retailing Fund | | | | | | | | | | | | | | | | | | | | |
Investor Class | | | 1.33 | % | | | 27.03 | % | | | 1,000.00 | | | | 1,270.30 | | | | 7.55 | |
Advisor Class | | | 1.83 | % | | | 26.56 | % | | | 1,000.00 | | | | 1,265.60 | | | | 10.37 | |
A-Class | | | 1.57 | % | | | 26.88 | % | | | 1,000.00 | | | | 1,268.80 | | | | 8.91 | |
C-Class | | | 2.34 | % | | | 26.30 | % | | | 1,000.00 | | | | 1,263.00 | | | | 13.24 | |
| | | | | |
Technology Fund | | | | | | | | | | | | | | | | | | | | |
Investor Class | | | 1.33 | % | | | 27.31 | % | | | 1,000.00 | | | | 1,273.10 | | | | 7.56 | |
Advisor Class | | | 1.83 | % | | | 26.87 | % | | | 1,000.00 | | | | 1,268.70 | | | | 10.38 | |
A-Class | | | 1.57 | % | | | 27.13 | % | | | 1,000.00 | | | | 1,271.30 | | | | 8.91 | |
C-Class | | | 2.34 | % | | | 26.52 | % | | | 1,000.00 | | | | 1,265.20 | | | | 13.25 | |
| | | | | |
Telecommunications Fund | | | | | | | | | | | | | | | | | | | | |
Investor Class | | | 1.33 | % | | | 16.33 | % | | | 1,000.00 | | | | 1,163.30 | | | | 7.19 | |
Advisor Class | | | 1.83 | % | | | 16.14 | % | | | 1,000.00 | | | | 1,161.40 | | | | 9.89 | |
A-Class | | | 1.58 | % | | | 16.28 | % | | | 1,000.00 | | | | 1,162.80 | | | | 8.54 | |
C-Class | | | 2.33 | % | | | 15.99 | % | | | 1,000.00 | | | | 1,159.90 | | | | 12.58 | |
| | | | | |
Transportation Fund | | | | | | | | | | | | | | | | | | | | |
Investor Class | | | 1.33 | % | | | 27.35 | % | | | 1,000.00 | | | | 1,273.50 | | | | 7.56 | |
Advisor Class | | | 1.83 | % | | | 26.97 | % | | | 1,000.00 | | | | 1,269.70 | | | | 10.38 | |
A-Class | | | 1.59 | % | | | 27.15 | % | | | 1,000.00 | | | | 1,271.50 | | | | 9.03 | |
C-Class | | | 2.33 | % | | | 26.64 | % | | | 1,000.00 | | | | 1,266.40 | | | | 13.20 | |
| | | | | |
Utilities Fund | | | | | | | | | | | | | | | | | | | | |
Investor Class | | | 1.34 | % | | | 7.65 | % | | | 1,000.00 | | | | 1,076.50 | | | | 6.96 | |
Advisor Class | | | 1.83 | % | | | 7.37 | % | | | 1,000.00 | | | | 1,073.70 | | | | 9.49 | |
A-Class | | | 1.58 | % | | | 7.49 | % | | | 1,000.00 | | | | 1,074.90 | | | | 8.20 | |
C-Class | | | 2.34 | % | | | 7.11 | % | | | 1,000.00 | | | | 1,071.10 | | | | 12.12 | |
| | | | |
| | | | | |
| 6 | | THE RYDEX FUNDSANNUALREPORT | | |
|
| ABOUT SHAREHOLDERS’ FUND EXPENSES (Unaudited) (continued) |
| |
| | | | | | | | | | | | | | | | | | | | |
| | | Expense
Ratio1 | | | Fund
Return | | | Beginning
Account Value
September 30, 2011 | | | Ending
Account Value
March 31, 2012 | | | Expenses
Paid During
Period2 | |
Table 2. Based on hypothetical 5% return (before expenses) | |
| | | | | |
Banking Fund | | | | | | | | | | | | | | | | | | | | |
Investor Class | | | 1.32 | % | | | 5.00 | % | | $ | 1,000.00 | | | $ | 1,018.40 | | | $ | 6.66 | |
Advisor Class | | | 1.82 | % | | | 5.00 | % | | | 1,000.00 | | | | 1,015.90 | | | | 9.17 | |
A-Class | | | 1.58 | % | | | 5.00 | % | | | 1,000.00 | | | | 1,017.10 | | | | 7.97 | |
C-Class | | | 2.33 | % | | | 5.00 | % | | | 1,000.00 | | | | 1,013.35 | | | | 11.73 | |
| | | | | |
Basic Materials Fund | | | | | | | | | | | | | | | | | | | | |
Investor Class | | | 1.33 | % | | | 5.00 | % | | | 1,000.00 | | | | 1,018.35 | | | | 6.71 | |
Advisor Class | | | 1.84 | % | | | 5.00 | % | | | 1,000.00 | | | | 1,015.80 | | | | 9.27 | |
A-Class | | | 1.58 | % | | | 5.00 | % | | | 1,000.00 | | | | 1,017.10 | | | | 7.97 | |
C-Class | | | 2.33 | % | | | 5.00 | % | | | 1,000.00 | | | | 1,013.35 | | | | 11.73 | |
| | | | | |
Biotechnology Fund | | | | | | | | | | | | | | | | | | | | |
Investor Class | | | 1.33 | % | | | 5.00 | % | | | 1,000.00 | | | | 1,018.35 | | | | 6.71 | |
Advisor Class | | | 1.83 | % | | | 5.00 | % | | | 1,000.00 | | | | 1,015.85 | | | | 9.22 | |
A-Class | | | 1.59 | % | | | 5.00 | % | | | 1,000.00 | | | | 1,017.05 | | | | 8.02 | |
C-Class | | | 2.33 | % | | | 5.00 | % | | | 1,000.00 | | | | 1,013.35 | | | | 11.73 | |
| | | | | |
Consumer Products Fund | | | | | | | | | | | | | | | | | | | | |
Investor Class | | | 1.33 | % | | | 5.00 | % | | | 1,000.00 | | | | 1,018.35 | | | | 6.71 | |
Advisor Class | | | 1.83 | % | | | 5.00 | % | | | 1,000.00 | | | | 1,015.85 | | | | 9.22 | |
A-Class | | | 1.58 | % | | | 5.00 | % | | | 1,000.00 | | | | 1,017.10 | | | | 7.97 | |
C-Class | | | 2.33 | % | | | 5.00 | % | | | 1,000.00 | | | | 1,013.35 | | | | 11.73 | |
| | | | | |
Electronics Fund | | | | | | | | | | | | | | | | | | | | |
Investor Class | | | 1.33 | % | | | 5.00 | % | | | 1,000.00 | | | | 1,018.35 | | | | 6.71 | |
Advisor Class | | | 1.84 | % | | | 5.00 | % | | | 1,000.00 | | | | 1,015.80 | | | | 9.27 | |
A-Class | | | 1.58 | % | | | 5.00 | % | | | 1,000.00 | | | | 1,017.10 | | | | 7.97 | |
C-Class | | | 2.34 | % | | | 5.00 | % | | | 1,000.00 | | | | 1,013.30 | | | | 11.78 | |
| | | | | |
Energy Fund | | | | | | | | | | | | | | | | | | | | |
Investor Class | | | 1.33 | % | | | 5.00 | % | | | 1,000.00 | | | | 1,018.35 | | | | 6.71 | |
Advisor Class | | | 1.83 | % | | | 5.00 | % | | | 1,000.00 | | | | 1,015.85 | | | | 9.22 | |
A-Class | | | 1.59 | % | | | 5.00 | % | | | 1,000.00 | | | | 1,017.05 | | | | 8.02 | |
C-Class | | | 2.33 | % | | | 5.00 | % | | | 1,000.00 | | | | 1,013.35 | | | | 11.73 | |
| | | | | |
Energy Services Fund | | | | | | | | | | | | | | | | | | | | |
Investor Class | | | 1.33 | % | | | 5.00 | % | | | 1,000.00 | | | | 1,018.35 | | | | 6.71 | |
Advisor Class | | | 1.83 | % | | | 5.00 | % | | | 1,000.00 | | | | 1,015.85 | | | | 9.22 | |
A-Class | | | 1.58 | % | | | 5.00 | % | | | 1,000.00 | | | | 1,017.10 | | | | 7.97 | |
C-Class | | | 2.33 | % | | | 5.00 | % | | | 1,000.00 | | | | 1,013.35 | | | | 11.73 | |
| | | | | |
Financial Services Fund | | | | | | | | | | | | | | | | | | | | |
Investor Class | | | 1.33 | % | | | 5.00 | % | | | 1,000.00 | | | | 1,018.35 | | | | 6.71 | |
Advisor Class | | | 1.83 | % | | | 5.00 | % | | | 1,000.00 | | | | 1,015.85 | | | | 9.22 | |
A-Class | | | 1.58 | % | | | 5.00 | % | | | 1,000.00 | | | | 1,017.10 | | | | 7.97 | |
C-Class | | | 2.33 | % | | | 5.00 | % | | | 1,000.00 | | | | 1,013.35 | | | | 11.73 | |
| | | | | |
Health Care Fund | | | | | | | | | | | | | | | | | | | | |
Investor Class | | | 1.33 | % | | | 5.00 | % | | | 1,000.00 | | | | 1,018.35 | | | | 6.71 | |
Advisor Class | | | 1.83 | % | | | 5.00 | % | | | 1,000.00 | | | | 1,015.85 | | | | 9.22 | |
A-Class | | | 1.58 | % | | | 5.00 | % | | | 1,000.00 | | | | 1,017.10 | | | | 7.97 | |
C-Class | | | 2.33 | % | | | 5.00 | % | | | 1,000.00 | | | | 1,013.35 | | | | 11.73 | |
| | | | |
| | | | | |
| | THE RYDEX FUNDSANNUALREPORT | | 7 |
|
| ABOUT SHAREHOLDERS’ FUND EXPENSES (Unaudited) (concluded) |
| |
| | | | | | | | | | | | | | | | | | | | |
| | | Expense
Ratio1 | | | Fund
Return | | | Beginning
Account Value
September 30, 2011 | | | Ending
Account Value
March 31, 2012 | | | Expenses
Paid During
Period2 | |
Internet Fund | | | | | | | | | | | | | | | | | | | | |
Investor Class | | | 1.33 | % | | | 5.00 | % | | $ | 1,000.00 | | | $ | 1,018.35 | | | $ | 6.71 | |
Advisor Class | | | 1.84 | % | | | 5.00 | % | | | 1,000.00 | | | | 1,015.80 | | | | 9.27 | |
A-Class | | | 1.59 | % | | | 5.00 | % | | | 1,000.00 | | | | 1,017.05 | | | | 8.02 | |
C-Class | | | 2.34 | % | | | 5.00 | % | | | 1,000.00 | | | | 1,013.30 | | | | 11.78 | |
| | | | | |
Leisure Fund | | | | | | | | | | | | | | | | | | | | |
Investor Class | | | 1.32 | % | | | 5.00 | % | | | 1,000.00 | | | | 1,018.40 | | | | 6.66 | |
Advisor Class | | | 1.83 | % | | | 5.00 | % | | | 1,000.00 | | | | 1,015.85 | | | | 9.22 | |
A-Class | | | 1.58 | % | | | 5.00 | % | | | 1,000.00 | | | | 1,017.10 | | | | 7.97 | |
C-Class | | | 2.32 | % | | | 5.00 | % | | | 1,000.00 | | | | 1,013.40 | | | | 11.68 | |
| | | | | |
Precious Metals Fund | | | | | | | | | | | | | | | | | | | | |
Investor Class | | | 1.23 | % | | | 5.00 | % | | | 1,000.00 | | | | 1,018.85 | | | | 6.21 | |
Advisor Class | | | 1.74 | % | | | 5.00 | % | | | 1,000.00 | | | | 1,016.30 | | | | 8.77 | |
A-Class | | | 1.48 | % | | | 5.00 | % | | | 1,000.00 | | | | 1,017.60 | | | | 7.47 | |
C-Class | | | 2.24 | % | | | 5.00 | % | | | 1,000.00 | | | | 1,013.80 | | | | 11.28 | |
| | | | | |
Retailing Fund | | | | | | | | | | | | | | | | | | | | |
Investor Class | | | 1.33 | % | | | 5.00 | % | | | 1,000.00 | | | | 1,018.35 | | | | 6.71 | |
Advisor Class | | | 1.83 | % | | | 5.00 | % | | | 1,000.00 | | | | 1,015.85 | | | | 9.22 | |
A-Class | | | 1.57 | % | | | 5.00 | % | | | 1,000.00 | | | | 1,017.15 | | | | 7.92 | |
C-Class | | | 2.34 | % | | | 5.00 | % | | | 1,000.00 | �� | | | 1,013.30 | | | | 11.78 | |
| | | | | |
Technology Fund | | | | | | | | | | | | | | | | | | | | |
Investor Class | | | 1.33 | % | | | 5.00 | % | | | 1,000.00 | | | | 1,018.35 | | | | 6.71 | |
Advisor Class | | | 1.83 | % | | | 5.00 | % | | | 1,000.00 | | | | 1,015.85 | | | | 9.22 | |
A-Class | | | 1.57 | % | | | 5.00 | % | | | 1,000.00 | | | | 1,017.15 | | | | 7.92 | |
C-Class | | | 2.34 | % | | | 5.00 | % | | | 1,000.00 | | | | 1,013.30 | | | | 11.78 | |
| | | | | |
Telecommunications Fund | | | | | | | | | | | | | | | | | | | | |
Investor Class | | | 1.33 | % | | | 5.00 | % | | | 1,000.00 | | | | 1,018.35 | | | | 6.71 | |
Advisor Class | | | 1.83 | % | | | 5.00 | % | | | 1,000.00 | | | | 1,015.85 | | | | 9.22 | |
A-Class | | | 1.58 | % | | | 5.00 | % | | | 1,000.00 | | | | 1,017.10 | | | | 7.97 | |
C-Class | | | 2.33 | % | | | 5.00 | % | | | 1,000.00 | | | | 1,013.35 | | | | 11.73 | |
| | | | | |
Transportation Fund | | | | | | | | | | | | | | | | | | | | |
Investor Class | | | 1.33 | % | | | 5.00 | % | | | 1,000.00 | | | | 1,018.35 | | | | 6.71 | |
Advisor Class | | | 1.83 | % | | | 5.00 | % | | | 1,000.00 | | | | 1,015.85 | | | | 9.22 | |
A-Class | | | 1.59 | % | | | 5.00 | % | | | 1,000.00 | | | | 1,017.05 | | | | 8.02 | |
C-Class | | | 2.33 | % | | | 5.00 | % | | | 1,000.00 | | | | 1,013.35 | | | | 11.73 | |
| | | | | |
Utilities Fund | | | | | | | | | | | | | | | | | | | | |
Investor Class | | | 1.34 | % | | | 5.00 | % | | | 1,000.00 | | | | 1,018.30 | | | | 6.76 | |
Advisor Class | | | 1.83 | % | | | 5.00 | % | | | 1,000.00 | | | | 1,015.85 | | | | 9.22 | |
A-Class | | | 1.58 | % | | | 5.00 | % | | | 1,000.00 | | | | 1,017.10 | | | | 7.97 | |
C-Class | | | 2.34 | % | | | 5.00 | % | | | 1,000.00 | | | | 1,013.30 | | | | 11.78 | |
| 2 | Expenses are equal to the Fund’s annualized expense ratio, net of any applicable fee waivers, multiplied by the average account value over the period, multiplied by 183/366 (to reflect the one-half year period). |
| 3 | Actual cumulative return at net asset value for the period September 30, 2011 to March 31, 2012. |
| | | | |
| | | | | |
| 8 | | THE RYDEX FUNDSANNUALREPORT | | |
This page intentionally left blank.
| | | | |
| | | | | |
| | THE RYDEX FUNDSANNUALREPORT | | 9 |
| | |
| PERFORMANCE REPORT AND FUND PROFILE (Unaudited) | | March 31, 2012 |
| | | |
BANKING FUND
OBJECTIVE: Seeks to provide capital appreciation by investing in companies that are involved in the banking sector, including commercial banks (and their holding companies) and savings and loan institutions (“Banking Companies”).
Improving credit conditions and greater stability in banks and diversified financial services has helped performance in this sector in the past few months, and exposure to European banks does not appear to be an immediate threat. Banks are being hampered by weak loan demand due to the underperforming economy, and are confronting new regulations that restrict the fees they can charge consumers. But they offer high capital ratios, good asset quality and adequate deposits, and the recent mortgage settlement with 49 state attorneys general is helping banks address the backlog of foreclosures. Within the sector, all industries that compose the fund detracted from return; commercial banks and diversified financial services are the fund’s two largest components, at 74% and 11%, respectively, but were the smallest detractors from return.
For the one-year period ended March 31, 2012, Banking Fund Investor Class returned -5.89% compared with the S&P 500® Financials Index*, which returned -1.76%.
U.S. Bancorp, Wells Fargo & Co. and Credicorp Ltd. were among the best-performing stocks in the Fund for the year. The worst-performing holdings for the period were Regions Financial Corp., Bank of America Corp. and Bank of New York Mellon Corp.
*S&P 500® Financials Index is a sub-index of the S&P 500® Index, a capitalization-weighted index covering 500 industrial, utility, transportation and financial companies of the U.S. markets (mostly NYSE Euronext issues). The Financials index contains companies involved in activities such as banking, mortgage finance, consumer finance, specialized finance, investment banking and brokerage, asset management and custody, corporate lending, insurance, and financial investment, and real estate, including REITs.
Performance displayed represents past performance which is no guarantee of future results.
Holdings Diversification (Market Exposure
as % of Net Assets)
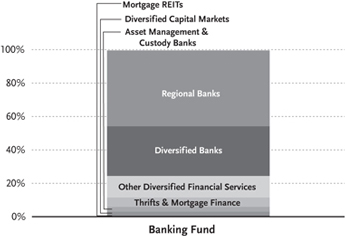
“Holdings Diversification (Market Exposure as % of Net Assets)” excludes any temporary cash investments.
| | | | |
Inception Dates: | |
Investor Class | | | April 1, 1998 | |
Advisor Class | | | April 1, 1998 | |
A-Class | | | September 1, 2004 | |
C-Class | | | March 30, 2001 | |
| | | | |
Ten Largest Holdings (% of Total Net Assets) | |
JPMorgan Chase & Co. | | | 4.1 | % |
U.S. Bancorp | | | 4.0 | % |
Wells Fargo & Co. | | | 4.0 | % |
Bank of America Corp. | | | 3.9 | % |
Citigroup, Inc. | | | 3.9 | % |
PNC Financial Services Group, Inc. | | | 3.2 | % |
Bank of New York Mellon Corp. | | | 2.9 | % |
BB&T Corp. | | | 2.5 | % |
SunTrust Banks, Inc. | | | 1.9 | % |
Fifth Third Bancorp | | | 1.9 | % |
| | | | |
Top Ten Total | | | 32.3 | % |
| | | | |
“Ten Largest Holdings” exclude any temporary cash or derivative investments.
| | | | |
| | | | | |
| 10 | | THE RYDEX FUNDSANNUALREPORT | | |
| | |
| PERFORMANCE REPORT AND FUND PROFILE (Unaudited) (concluded) | | March 31, 2012 |
Cumulative Fund Performance*
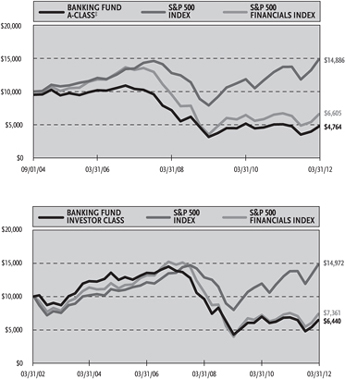
Average Annual Returns*
Periods Ended 03/31/12
| | | | | | | | | | | | |
| | | 1 Year | | | 5 Year | | | 10 Year | |
Investor Class Shares | | | -5.89 | % | | | -14.19 | % | | | -4.31 | % |
Advisor Class Shares | | | -6.43 | % | | | -14.63 | % | | | -4.84 | % |
C-Class Shares | | | -6.88 | % | | | -15.01 | % | | | -5.31 | % |
C-Class Shares with CDSC† | | | -7.81 | % | | | -15.01 | % | | | -5.31 | % |
S&P 500 Index | | | 8.54 | % | | | 2.01 | % | | | 4.12 | % |
S&P 500 Financials Index | | | -1.76 | % | | | -13.02 | % | | | -3.02 | % |
| | | |
| | | 1 Year | | | 5 Year | | | Since
Inception
(09/01/04) | |
A-Class Shares | | | -6.19 | % | | | -14.45 | % | | | -8.74 | % |
A-Class Shares with sales charge‡ | | | -10.64 | % | | | -15.28 | % | | | -9.32 | % |
S&P 500 Index | | | 8.54 | % | | | 2.01 | % | | | 5.41 | % |
S&P 500 Financials Index | | | -1.76 | % | | | -13.02 | % | | | -5.39 | % |
| * | The performance data above represents past performance that is not predictive of future results. The investment return and principal value of an investment in the Fund will fluctuate so that an investor’s shares, when redeemed, may be worth more or less than their original cost. Returns are historical and include changes in principal and reinvested dividends and capital gains and do not reflect the effect of taxes. The S&P 500 Index and the S&P 500 Financial Index are unmanaged indices and, unlike the Fund, have no management fees or operating expenses to reduce their reported returns. The graphs are based on Investor Class shares and A-Class shares only; performance for Advisor Class shares and C-Class shares will vary due to differences in fee structures. |
| † | Fund returns include a CDSC of 1% if redeemed within 12 months of purchase. |
| ‡ | Fund returns are calculated using the maximum sales charge of 4.75%. |
| | | | |
| | | | | |
| | THE RYDEX FUNDSANNUALREPORT | | 11 |
| | |
| SCHEDULE OF INVESTMENTS | | March 31, 2012 |
| | | |
| BANKING FUND | | |
| | | | | | | | |
| | | SHARES | | | VALUE | |
COMMON STOCKS† - 99.5% | | | | | | | | |
Regional Banks - 45.4% | | | | | | | | |
PNC Financial Services Group, Inc. | | | 18,217 | | | $ | 1,174,814 | |
BB&T Corp. | | | 29,889 | | | | 938,216 | |
SunTrust Banks, Inc. | | | 29,622 | | | | 715,964 | |
Fifth Third Bancorp | | | 50,326 | | | | 707,080 | |
M&T Bank Corp. | | | 7,688 | | | | 667,933 | |
Regions Financial Corp. | | | 93,080 | | | | 613,397 | |
KeyCorp | | | 66,177 | | | | 562,505 | |
CIT Group, Inc.* | | | 13,597 | | | | 560,740 | |
Huntington Bancshares, Inc. | | | 72,906 | | | | 470,244 | |
First Republic Bank* | | | 13,145 | | | | 432,996 | |
Zions Bancorporation | | | 18,166 | | | | 389,842 | |
Commerce Bancshares, Inc. | | | 9,311 | | | | 377,282 | |
Cullen/Frost Bankers, Inc. | | | 6,403 | | | | 372,591 | |
First Niagara Financial Group, Inc. | | | 37,221 | | | | 366,255 | |
East West Bancorp, Inc. | | | 15,772 | | | | 364,175 | |
Hancock Holding Co. | | | 9,623 | | | | 341,713 | |
Signature Bank* | | | 5,305 | | | | 334,427 | |
SVB Financial Group* | | | 5,088 | | | | 327,362 | |
City National Corp. | | | 6,215 | | | | 326,101 | |
First Horizon National Corp. | | | 30,857 | | | | 320,296 | |
Valley National Bancorp | | | 23,991 | | | | 310,683 | |
Associated Banc-Corp. | | | 21,786 | | | | 304,133 | |
Bank of Hawaii Corp. | | | 6,101 | | | | 294,983 | |
Fulton Financial Corp. | | | 27,675 | | | | 290,588 | |
Prosperity Bancshares, Inc. | | | 6,293 | | | | 288,219 | |
Webster Financial Corp. | | | 12,154 | | | | 275,531 | |
TCF Financial Corp. | | | 22,873 | | | | 271,960 | |
FirstMerit Corp. | | | 16,005 | | | | 269,844 | |
UMB Financial Corp. | | | 5,925 | | | | 265,055 | |
FNB Corp. | | | 21,352 | | | | 257,932 | |
Trustmark Corp. | | | 10,019 | | | | 250,275 | |
Umpqua Holdings Corp. | | | 18,362 | | | | 248,989 | |
Susquehanna Bancshares, Inc. | | | 24,986 | | | | 246,862 | |
Iberiabank Corp. | | | 4,600 | | | | 245,962 | |
United Bankshares, Inc. | | | 8,090 | | | | 233,477 | |
Cathay General Bancorp | | | 13,071 | | | | 231,357 | |
Westamerica Bancorporation | | | 4,771 | | | | 229,008 | |
National Penn Bancshares, Inc. | | | 25,850 | | | | 228,773 | |
CVB Financial Corp. | | | 19,250 | | | | 225,995 | |
Old National Bancorp | | | 17,171 | | | | 225,627 | |
Wintrust Financial Corp. | | | 6,296 | | | | 225,334 | |
Texas Capital Bancshares, Inc.* | | | 6,470 | | | | 223,991 | |
BancorpSouth, Inc. | | | 16,507 | | | | 222,349 | |
Community Bank System, Inc. | | | 7,400 | | | | 212,972 | |
PrivateBancorp, Inc. | | | 13,620 | | | | 206,615 | |
Bank of the Ozarks, Inc. | | | 6,540 | | | | 204,440 | |
| | | | | | | | |
Total Regional Banks | | | | | | | 16,854,887 | |
| | | | | | | | |
Diversified Banks - 29.7% | | | | | | | | |
U.S. Bancorp | | | 46,963 | | | | 1,487,788 | |
Wells Fargo & Co. | | | 43,375 | | | | 1,480,823 | |
Itau Unibanco Holding S.A. ADR | | | 26,648 | | | | 511,375 | |
Banco Bradesco S.A. ADR | | | 28,801 | | | | 504,018 | |
Comerica, Inc. | | | 15,414 | | | | 498,797 | |
New York Community Bancorp, Inc. | | | 35,837 | | | | 498,493 | |
| | | | | | | | |
| | | SHARES | | | VALUE | |
ICICI Bank Ltd. ADR | | | 13,635 | | | $ | 475,452 | |
HSBC Holdings plc ADR | | | 10,332 | | | | 458,637 | |
HDFC Bank Ltd. ADR | | | 13,000 | | | | 443,300 | |
Toronto-Dominion Bank | | | 5,205 | | | | 442,165 | |
Credicorp Ltd. | | | 3,325 | | | | 438,302 | |
Barclays plc ADR | | | 28,849 | | | | 437,062 | |
Royal Bank of Canada | | | 7,418 | | | | 430,615 | |
Bank of Montreal | | | 7,236 | | | | 429,963 | |
Banco Santander Chile ADR | | | 4,910 | | | | 422,702 | |
Bank of Nova Scotia | | | 7,530 | | | | 421,981 | |
BanColombia S.A. ADR | | | 6,510 | | | | 420,937 | |
Canadian Imperial Bank of Commerce | | | 5,280 | | | | 403,867 | |
Banco Santander Brasil S.A. ADR | | | 44,025 | | | | 403,709 | |
Banco Santander S.A. ADR | | | 51,302 | | | | 393,486 | |
| | | | | | | | |
Total Diversified Banks | | | | | | | 11,003,472 | |
| | | | | | | | |
Other Diversified Financial Services - 12.9% | | | | | | | | |
JPMorgan Chase & Co. | | | 32,805 | | | | 1,508,374 | |
Bank of America Corp. | | | 151,733 | | | | 1,452,085 | |
Citigroup, Inc. | | | 39,088 | | | | 1,428,666 | |
ING Groep N.V. ADR* | | | 45,600 | | | | 379,392 | |
| | | | | | | | |
Total Other Diversified Financial Services | | | | | | | 4,768,517 | |
| | | | | | | | |
Thrifts & Mortgage
Finance - 5.6% | | | | | | | | |
People’s United Financial, Inc. | | | 32,865 | | | | 435,132 | |
Hudson City Bancorp, Inc. | | | 52,984 | | | | 387,313 | |
Ocwen Financial Corp.* | | | 18,020 | | | | 281,653 | |
Capitol Federal Financial, Inc. | | | 23,671 | | | | 280,738 | |
Washington Federal, Inc. | | | 15,807 | | | | 265,874 | |
Northwest Bancshares, Inc. | | | 17,361 | | | | 220,485 | |
Astoria Financial Corp. | | | 19,816 | | | | 195,386 | |
| | | | | | | | |
Total Thrifts & Mortgage Finance | | | | | | | 2,066,581 | |
| | | | | | | | |
Asset Management & Custody Banks - 2.9% | | | | | | | | |
Bank of New York Mellon Corp. | | | 44,546 | | | | 1,074,895 | |
| | | | | | | | |
Diversified Capital
Markets - 2.3% | | | | | | | | |
Deutsche Bank AG | | | 8,938 | | | | 445,023 | |
UBS AG* | | | 30,356 | | | | 425,591 | |
| | | | | | | | |
Total Diversified Capital Markets | | | | | | | 870,614 | |
| | | | | | | | |
Mortgage REITs - 0.7% | | | | | | | | |
CapitalSource, Inc. | | | 36,770 | | | | 242,682 | |
| | | | | | | | |
Total Common Stocks
(Cost $32,443,110) | | | | | | | 36,881,648 | |
| | | | | | | | |
| | |
| | | FACE
AMOUNT | | | | |
REPURCHASE AGREEMENT††,1 - 0.8% | | | | | | | | |
Credit Suisse Group issued 03/30/12 at 0.01% due 04/02/12 | | $ | 314,021 | | | | 314,021 | |
| | | | | | | | |
Total Repurchase Agreement
(Cost $314,021) | | | | | | | 314,021 | |
| | | | | | | | |
Total Investments - 100.3%
(Cost $32,757,131) | | | | | | $ | 37,195,669 | |
| | | | | | | | |
Other Assets & Liabilities, net - (0.3)% | | | | | | | (100,865 | ) |
| | | | | | | | |
Total Net Assets - 100.0% | | | | | | $ | 37,094,804 | |
| * | Non-income producing security. |
| † | Value determined based on Level 1 inputs — See Note 4. |
| †† | Value determined based on Level 2 inputs — See Note 4. |
| 1 | Repurchase Agreement — See Note 5. |
ADR — American Depositary Receipt
plc — Public Limited Company
| | | | |
| | | | | |
| 12 | | THE RYDEX FUNDSANNUALREPORT | | SEE NOTES TO FINANCIAL STATEMENTS. |
STATEMENT OF ASSETS AND LIABILITIES
| | | | |
| March 31, 2012 | | | | |
| |
ASSETS: | | | | |
Investments, at value
(cost $32,443,110) | | $ | 36,881,648 | |
Repurchase agreements, at value
(cost $314,021) | | | 314,021 | |
| | | | |
Total investments
(cost $32,757,131) | | | 37,195,669 | |
Receivables: | | | | |
Fund shares sold | | | 343,249 | |
Dividends | | | 47,206 | |
Foreign taxes reclaim | | | 237 | |
| | | | |
Total assets | | | 37,586,361 | |
| | | | |
LIABILITIES: | | | | |
Payable for: | | | | |
Securities purchased | | | 227,614 | |
Fund shares redeemed | | | 222,319 | |
Management fees | | | 23,210 | |
Transfer agent and administrative fees | | | 6,827 | |
Distribution and service fees | | | 3,398 | |
Portfolio accounting fees | | | 2,730 | |
Miscellaneous | | | 5,459 | |
| | | | |
Total liabilities | | | 491,557 | |
| | | | |
NET ASSETS | | $ | 37,094,804 | |
| | | | |
NET ASSETS CONSISTOF: | | | | |
Paid in capital | | $ | 58,182,481 | |
Undistributed net investment income | | | 82,877 | |
Accumulated net realized loss on investments | | | (25,609,092 | ) |
Net unrealized appreciation on investments | | | 4,438,538 | |
| | | | |
Net assets | | $ | 37,094,804 | |
| | | | |
INVESTOR CLASS: | | | | |
Net assets | | $ | 29,061,185 | |
Capital shares outstanding | | | 621,669 | |
Net asset value per share | | $ | 46.75 | |
| | | | |
ADVISOR CLASS: | | | | |
Net assets | | $ | 1,104,824 | |
Capital shares outstanding | | | 25,918 | |
Net asset value per share | | $ | 42.63 | |
| | | | |
A-CLASS: | | | | |
Net assets | | $ | 3,087,554 | |
Capital shares outstanding | | | 71,068 | |
Net asset value per share | | $ | 43.45 | |
| | | | |
Maximum offering price per share
(Net asset value divided by 95.25%) | | $ | 45.62 | |
| | | | |
C-CLASS: | | | | |
Net assets | | $ | 3,841,241 | |
Capital shares outstanding | | | 93,481 | |
Net asset value per share | | $ | 41.09 | |
| | | | |
| | | | |
STATEMENT OF OPERATIONS | |
| Year Ended March 31, 2012 | | | | |
| |
INVESTMENT INCOME: | | | | |
Dividends (net of foreign withholding tax of $1,358) | | $ | 264,517 | |
Interest | | | 41 | |
| | | | |
Total investment income | | | 264,558 | |
| | | | |
EXPENSES: | | | | |
Management fees | | | 96,564 | |
Transfer agent and administrative fees | | | 28,401 | |
Distribution and service fees: | | | | |
Advisor Class | | | 4,001 | |
A-Class | | | 2,865 | |
C-Class | | | 22,631 | |
Portfolio accounting fees | | | 11,360 | |
Custodian fees | | | 3,018 | |
Trustees’ fees* | | | 1,027 | |
Miscellaneous | | | 11,815 | |
| | | | |
Total expenses | | | 181,682 | |
| | | | |
Net investment income | | | 82,876 | |
| | | | |
NET REALIZEDAND UNREALIZED GAIN (LOSS): | |
Net realized gain (loss) on: | | | | |
Investments | | | (308,256 | ) |
| | | | |
Net realized loss | | | (308,256 | ) |
| | | | |
Net change in unrealized appreciation (depreciation) on: | | | | |
Investments | | | 985,526 | |
| | | | |
Net change in unrealized appreciation (depreciation) | | | 985,526 | |
| | | | |
Net realized and unrealized gain | | | 677,270 | |
| | | | |
Net increase in net assets resulting from operations | | $ | 760,146 | |
| | | | |
| * | Relates to Trustees not deemed “interested persons” within the meaning of Section 2(a)(19) of the 1940 Act. |
| | | | |
| | | | | |
| SEE NOTES TO FINANCIAL STATEMENTS. | | THE RYDEX FUNDSANNUALREPORT | | 13 |
STATEMENTS OF CHANGES IN NET ASSETS
| | | | | | | | |
| | | Year Ended
March 31,
2012 | | | Year Ended
March 31,
2011 | |
INCREASE (DECREASE) IN NET ASSETS FROM OPERATIONS: | | | | | | | | |
Net investment income | | $ | 82,876 | | | $ | 8,682 | |
Net realized loss on investments | | | (308,256 | ) | | | (187,828 | ) |
Net change in unrealized appreciation (depreciation) on investments | | | 985,526 | | | | (1,197,289 | ) |
| | | | | | | | |
Net increase (decrease) in net assets resulting from operations | | | 760,146 | | | | (1,376,435 | ) |
| | | | | | | | |
DISTRIBUTIONSTO SHAREHOLDERS FROM: | | | | | | | | |
Net investment income | | | | | | | | |
Investor Class | | | (4,887 | ) | | | (35,313 | ) |
Advisor Class | | | (312 | ) | | | (5,190 | ) |
A-Class | | | (1,058 | ) | | | (2,945 | ) |
C-Class | | | (2,425 | ) | | | (10,322 | ) |
| | | | | | | | |
Total distributions to shareholders | | | (8,682 | ) | | | (53,770 | ) |
| | | | | | | | |
CAPITAL SHARE TRANSACTIONS: | | | | | | | | |
Proceeds from sale of shares | | | | | | | | |
Investor Class | | | 74,194,636 | | | | 164,957,214 | |
Advisor Class | | | 8,893,776 | | | | 24,430,833 | |
A-Class | | | 7,556,286 | | | | 5,916,707 | |
C-Class | | | 21,091,736 | | | | 62,239,417 | |
Distributions reinvested | | | | | | | | |
Investor Class | | | 4,793 | | | | 21,325 | |
Advisor Class | | | 310 | | | | 4,972 | |
A-Class | | | 941 | | | | 2,723 | |
C-Class | | | 2,128 | | | | 8,842 | |
Cost of shares redeemed | | | | | | | | |
Investor Class | | | (54,909,089 | ) | | | (182,816,064 | ) |
Advisor Class | | | (8,436,847 | ) | | | (24,348,034 | ) |
A-Class | | | (5,211,904 | ) | | | (10,663,178 | ) |
C-Class | | | (19,941,025 | ) | | | (64,846,218 | ) |
| | | | | | | | |
Net increase (decrease) from capital share transactions | | | 23,245,741 | | | | (25,091,461 | ) |
| | | | | | | | |
Net increase (decrease) in net assets | | | 23,997,205 | | | | (26,521,666 | ) |
| | |
NET ASSETS: | | | | | | | | |
Beginning of year | | | 13,097,599 | | | | 39,619,265 | |
| | | | | | | | |
End of year | | $ | 37,094,804 | | | $ | 13,097,599 | |
| | | | | | | | |
Undistributed net investment income at end of year | | $ | 82,877 | | | $ | 8,683 | |
| | | | | | | | |
CAPITAL SHARE ACTIVITY: | | | | | | | | |
Shares sold | | | | | | | | |
Investor Class | | | 1,701,638 | | | | 3,520,121 | |
Advisor Class | | | 227,380 | | | | 551,252 | |
A-Class | | | 176,291 | | | | 125,988 | |
C-Class | | | 543,253 | | | | 1,462,060 | |
Shares issued from reinvestment of distributions | | | | | | | | |
Investor Class | | | 135 | | | | 484 | |
Advisor Class | | | 10 | | | | 123 | |
A-Class | | | 28 | | | | 66 | |
C-Class | | | 68 | | | | 225 | |
Shares redeemed | | | | | | | | |
Investor Class | | | (1,255,178 | ) | | | (3,864,747 | ) |
Advisor Class | | | (215,262 | ) | | | (565,185 | ) |
A-Class | | | (124,945 | ) | | | (240,955 | ) |
C-Class | | | (514,199 | ) | | | (1,521,121 | ) |
| | | | | | | | |
Net increase (decrease) in shares | | | 539,219 | | | | (531,689 | ) |
| | | | | | | | |
| | | | |
| | | | | |
| 14 | | THE RYDEX FUNDSANNUALREPORT | | SEE NOTES TO FINANCIAL STATEMENTS. |
FINANCIAL HIGHLIGHTS
This table is presented to show selected data for a share outstanding throughout each period and to assist shareholders in evaluating a Fund’s performance for the periods presented.
| | | | | | | | | | | | | | | | | | | | |
Investor Class | | Year Ended
March 31,
2012 | | | Year Ended
March 31,
2011 | | | Year Ended
March 31,
2010c | | | Year Ended
March 31,
2009c | | | Year Ended
March 31,
2008c | |
Per Share Data | | | | | | | | | | | | | | | | | | | | |
Net asset value, beginning of period | | $ | 49.75 | | | $ | 50.73 | | | $ | 32.62 | | | $ | 75.60 | | | $ | 110.30 | |
| | | | | | | | | | | | | | | | | | | | |
Income (loss) from investment operations: | | | | | | | | | | | | | | | | | | | | |
Net investment incomea | | | .44 | | | | .13 | | | | .28 | | | | 1.30 | | | | 2.50 | |
Net gain (loss) on investments (realized and unrealized) | | | (3.39 | ) | | | (.99 | ) | | | 20.05 | | | | (42.98 | ) | | | (36.20 | ) |
| | | | | | | | | | | | | | | | | | | | |
Total from investment operations | | | (2.95 | ) | | | (.86 | ) | | | 20.33 | | | | (41.68 | ) | | | (33.70 | ) |
| | | | | | | | | | | | | | | | | | | | |
Less distributions from: | | | | | | | | | | | | | | | | | | | | |
Net investment income | | | (.05 | ) | | | (.12 | ) | | | (2.22 | ) | | | (1.30 | ) | | | (1.00 | ) |
| | | | | | | | | | | | | | | | | | | | |
Total distributions | | | (.05 | ) | | | (.12 | ) | | | (2.22 | ) | | | (1.30 | ) | | | (1.00 | ) |
| | | | | | | | | | | | | | | | | | | | |
Net asset value, end of period | | $ | 46.75 | | | $ | 49.75 | | | $ | 50.73 | | | $ | 32.62 | | | $ | 75.60 | |
| | | | | | | | | | | | | | | | | | | | |
Total Returnb | | | (5.89 | %) | | | (1.66 | %) | | | 63.48 | % | | | (55.66 | %) | | | (30.69 | %) |
| | | | | | | | | | | | | | | | | | | | |
Ratios/Supplemental Data | | | | | | | | | | | | | | | | | | | | |
Net assets, end of period (in thousands) | | $ | 29,061 | | | $ | 8,711 | | | $ | 26,340 | | | $ | 23,804 | | | $ | 7,035 | |
| | | | | | | | | | | | | | | | | | | | |
Ratios to average net assets: | | | | | | | | | | | | | | | | | | | | |
Net investment income | | | 1.02 | % | | | 0.27 | % | | | 0.67 | % | | | 2.42 | % | | | 2.59 | % |
Total expenses | | | 1.34 | % | | | 1.39 | % | | | 1.38 | % | | | 1.37 | % | | | 1.37 | % |
| | | | | | | | | | | | | | | | | | | | |
Portfolio turnover rate | | | 544 | % | | | 1,130 | % | | | 986 | % | | | 1,055 | % | | | 1,417 | % |
| | | | | |
Advisor Class | | Year Ended
March 31,
2012 | | | Year Ended
March 31,
2011 | | | Year Ended
March 31,
2010c | | | Year Ended
March 31,
2009c | | | Year Ended
March 31,
2008c | |
Per Share Data | | | | | | | | | | | | | | | | | | | | |
Net asset value, beginning of period | | $ | 45.63 | | | $ | 46.79 | | | $ | 30.36 | | | $ | 70.70 | | | $ | 103.90 | |
| | | | | | | | | | | | | | | | | | | | |
Income (loss) from investment operations: | | | | | | | | | | | | | | | | | | | | |
Net investment income (loss)a | | | .12 | | | | (.08 | ) | | | .06 | | | | 1.20 | | | | 2.00 | |
Net gain (loss) on investments (realized and unrealized) | | | (3.07 | ) | | | (.96 | ) | | | 18.59 | | | | (40.24 | ) | | | (34.20 | ) |
| | | | | | | | | | | | | | | | | | | | |
Total from investment operations | | | (2.95 | ) | | | (1.04 | ) | | | 18.65 | | | | (39.04 | ) | | | (32.20 | ) |
| | | | | | | | | | | | | | | | | | | | |
Less distributions from: | | | | | | | | | | | | | | | | | | | | |
Net investment income | | | (.05 | ) | | | (.12 | ) | | | (2.22 | ) | | | (1.30 | ) | | | (1.00 | ) |
| | | | | | | | | | | | | | | | | | | | |
Total distributions | | | (.05 | ) | | | (.12 | ) | | | (2.22 | ) | | | (1.30 | ) | | | (1.00 | ) |
| | | | | | | | | | | | | | | | | | | | |
Net asset value, end of period | | $ | 42.63 | | | $ | 45.63 | | | $ | 46.79 | | | $ | 30.36 | | | $ | 70.70 | |
| | | | | | | | | | | | | | | | | | | | |
Total Returnb | | | (6.43 | %) | | | (2.19 | %) | | | 62.66 | % | | | (55.70 | %) | | | (31.14 | %) |
| | | | | | | | | | | | | | | | | | | | |
Ratios/Supplemental Data | | | | | | | | | | | | | | | | | | | | |
Net assets, end of period (in thousands) | | $ | 1,105 | | | $ | 629 | | | $ | 1,291 | | | $ | 2,509 | | | $ | 1,449 | |
| | | | | | | | | | | | | | | | | | | | |
Ratios to average net assets: | | | | | | | | | | | | | | | | | | | | |
Net investment income (loss) | | | 0.30 | % | | | (0.18 | %) | | | 0.17 | % | | | 2.42 | % | | | 2.32 | % |
Total expenses | | | 1.83 | % | | | 1.89 | % | | | 1.88 | % | | | 1.88 | % | | | 1.85 | % |
| | | | | | | | | | | | | | | | | | | | |
Portfolio turnover rate | | | 544 | % | | | 1,130 | % | | | 986 | % | | | 1,055 | % | | | 1,417 | % |
| | | | |
| | | | | |
| SEE NOTES TO FINANCIAL STATEMENTS. | | THE RYDEX FUNDSANNUALREPORT | | 15 |
FINANCIAL HIGHLIGHTS (concluded)
This table is presented to show selected data for a share outstanding throughout each period and to assist shareholders in evaluating a Fund’s performance for the periods presented.
| | | | | | | | | | | | | | | | | | | | |
A-Class | | Year
Ended
March 31,
2012 | | | Year
Ended
March 31,
2011 | | | Year
Ended
March 31,
2010c | | | Year
Ended
March 31,
2009c | | | Year
Ended
March 31,
2008c | |
Per Share Data | | | | | | | | | | | | | | | | | | | | |
| | | | | |
Net asset value, beginning of period | | $ | 46.38 | | | $ | 47.41 | | | $ | 30.67 | | | $ | 71.50 | | | $ | 104.70 | |
| | | | | | | | | | | | | | | | | | | | |
Income (loss) from investment operations: | | | | | | | | | | | | | | | | | | | | |
Net investment incomea | | | .30 | | | | .04 | | | | .02 | | | | 1.30 | | | | 2.00 | |
Net gain (loss) on investments (realized and unrealized) | | | (3.18 | ) | | | (.95 | ) | | | 18.94 | | | | (40.83 | ) | | | (34.20 | ) |
| | | | | | | | | | | | | | | | | | | | |
Total from investment operations | | | (2.88 | ) | | | (.91 | ) | | | 18.96 | | | | (39.53 | ) | | | (32.20 | ) |
| | | | | | | | | | | | | | | | | | | | |
Less distributions from: | | | | | | | | | | | | | | | | | | | | |
Net investment income | | | (.05 | ) | | | (.12 | ) | | | (2.22 | ) | | | (1.30 | ) | | | (1.00 | ) |
| | | | | | | | | | | | | | | | | | | | |
Total distributions | | | (.05 | ) | | | (.12 | ) | | | (2.22 | ) | | | (1.30 | ) | | | (1.00 | ) |
| | | | | | | | | | | | | | | | | | | | |
Net asset value, end of period | | $ | 43.45 | | | $ | 46.38 | | | $ | 47.41 | | | $ | 30.67 | | | $ | 71.50 | |
| | | | | | | | | | | | | | | | | | | | |
Total Returnb | | | (6.19 | %) | | | (1.89 | %) | | | 63.04 | % | | | (55.77 | %) | | | (30.90 | %) |
| | | | | | | | | | | | | | | | | | | | |
Ratios/Supplemental Data | | | | | | | | | | | | | | | | | | | | |
| | | | | |
Net assets, end of period (in thousands) | | $ | 3,088 | | | $ | 913 | | | $ | 6,381 | | | $ | 851 | | | $ | 547 | |
| | | | | | | | | | | | | | | | | | | | |
Ratios to average net assets: | | | | | | | | | | | | | | | | | | | | |
Net investment income | | | 0.73 | % | | | 0.09 | % | | | 0.06 | % | | | 2.71 | % | | | 2.33 | % |
Total expenses | | | 1.61 | % | | | 1.64 | % | | | 1.63 | % | | | 1.62 | % | | | 1.55 | % |
| | | | | | | | | | | | | | | | | | | | |
Portfolio turnover rate | | | 544 | % | | | 1,130 | % | | | 986 | % | | | 1,055 | % | | | 1,417 | % |
| | | | | |
C-Class | | Year
Ended
March 31,
2012 | | | Year
Ended
March 31,
2011 | | | Year
Ended
March 31,
2010c | | | Year
Ended
March 31,
2009c | | | Year
Ended
March 31,
2008c | |
Per Share Data | | | | | | | | | | | | | | | | | | | | |
| | | | | |
Net asset value, beginning of period | | $ | 44.20 | | | $ | 45.51 | | | $ | 29.90 | | | $ | 69.50 | | | $ | 102.70 | |
| | | | | | | | | | | | | | | | | | | | |
Income (loss) from investment operations: | | | | | | | | | | | | | | | | | | | | |
Net investment income (loss)a | | | (.01 | ) | | | (.29 | ) | | | (.16 | ) | | | .90 | | | | 1.60 | |
Net gain (loss) on investments (realized and unrealized) | | | (3.05 | ) | | | (.90 | ) | | | 17.99 | | | | (39.20 | ) | | | (33.80 | ) |
| | | | | | | | | | | | | | | | | | | | |
Total from investment operations | | | (3.06 | ) | | | (1.19 | ) | | | 17.83 | | | | (38.30 | ) | | | (32.20 | ) |
| | | | | | | | | | | | | | | | | | | | |
Less distributions from: | | | | | | | | | | | | | | | | | | | | |
Net investment income | | | (.05 | ) | | | (.12 | ) | | | (2.22 | ) | | | (1.30 | ) | | | (1.00 | ) |
| | | | | | | | | | | | | | | | | | | | |
Total distributions | | | (.05 | ) | | | (.12 | ) | | | (2.22 | ) | | | (1.30 | ) | | | (1.00 | ) |
| | | | | | | | | | | | | | | | | | | | |
Net asset value, end of period | | $ | 41.09 | | | $ | 44.20 | | | $ | 45.51 | | | $ | 29.90 | | | $ | 69.50 | |
| | | | | | | | | | | | | | | | | | | | |
Total Returnb | | | (6.88 | %) | | | (2.58 | %) | | | 60.86 | % | | | (55.64 | %) | | | (31.51 | %) |
| | | | | | | | | | | | | | | | | | | | |
Ratios/Supplemental Data | | | | | | | | | | | | | | | | | | | | |
| | | | | |
Net assets, end of period (in thousands) | | $ | 3,841 | | | $ | 2,844 | | | $ | 5,607 | | | $ | 2,114 | | | $ | 3,408 | |
| | | | | | | | | | | | | | | | | | | | |
Ratios to average net assets: | | | | | | | | | | | | | | | | | | | | |
Net investment income (loss) | | | (0.03 | %) | | | (0.67 | %) | | | (0.42 | %) | | | 1.82 | % | | | 1.89 | % |
Total expenses | | | 2.35 | % | | | 2.38 | % | | | 2.38 | % | | | 2.40 | % | | | 2.35 | % |
| | | | | | | | | | | | | | | | | | | | |
Portfolio turnover rate | | | 544 | % | | | 1,130 | % | | | 986 | % | | | 1,055 | % | | | 1,417 | % |
| a | Net investment income (loss) per share was computed using average shares outstanding throughout the period. |
| b | Total return does not reflect the impact of any applicable sales charges and has not been annualized. |
| c | Per share amounts for the period March 31, 2007-April 19, 2009 have been restated to reflect a 1:10 reverse stock split effective April 20, 2009. |
| | | | |
| | | | | |
| 16 | | THE RYDEX FUNDSANNUALREPORT | | SEE NOTES TO FINANCIAL STATEMENTS. |
This page intentionally left blank.
| | | | |
| | | | | |
| | THE RYDEX FUNDSANNUALREPORT | | 17 |
| | |
| PERFORMANCE REPORT AND FUND PROFILE (Unaudited) | | March 31, 2012 |
BASIC MATERIALS FUND
OBJECTIVE: Seeks to provide capital appreciation by investing in companies engaged in the mining, manufacture or sale of basic materials, such as lumber, steel, iron, aluminum, concrete, chemicals and other basic building and manufacturing materials (“Basic Materials Companies”).
For the one-year period ended March 31, 2012, Basic Materials Fund Investor Class returned -11.66% compared with -4.01% for the S&P 500® Materials Index*.
Materials sector performance shadowed sentiment about the economy over the past 12 months, with weak results last summer aligning with worries about renewed recession. Falling commodity prices and a strengthening dollar also presented headwinds in the last part of 2011, as did weak economic growth in Europe and slowing growth in China.
The Fund is composed largely of two industries—chemicals (37% of the weight) and metals & mining (49% of the weight). Chemicals was the largest contributor to performance, followed by paper and forest products. But their positive showing could not offset poor results for holdings in the metals & mining industry, which as a group had a return of -24% for the year.
The top-performing holdings were Monsanto Co., LyondellBasell Industries N.V. Class A and Sherwin-Williams Co. The worst-performing holdings included Alcoa, Inc., Agnico-Eagle Mines Ltd. and Mechel OAO ADS.
*S&P 500® Materials Index is a sub-index of the S&P 500® Index, a capitalization-weighted index covering 500 industrial, utility, transportation and financial companies of the U.S. markets (mostly NYSE Euronext issues). The Materials index encompasses a wide range of commodity-related manufacturing industries. Included in this sector are companies that manufacture chemicals, construction materials, glass, paper, forest products and related packaging products, and metals, minerals and mining companies, including producers of steel.
Performance displayed represents past performance which is no guarantee of future results.
Holdings Diversification (Market Exposure as % of Net Assets)
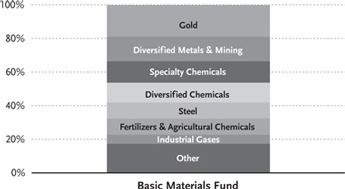
“Holdings Diversification (Market Exposure as % of Net Assets)” excludes any temporary cash investments.
| | |
Inception Dates: |
Investor Class | | April 1, 1998 |
Advisor Class | | April 14, 1998 |
A-Class | | September 1, 2004 |
C-Class | | May 3, 2001 |
| | | | |
Ten Largest Holdings (% of Total Net Assets) | |
EI du Pont de Nemours & Co. | | | 2.9 | % |
Monsanto Co. | | | 2.7 | % |
Barrick Gold Corp. | | | 2.7 | % |
Dow Chemical Co. | | | 2.6 | % |
Goldcorp, Inc. | | | 2.5 | % |
Praxair, Inc. | | | 2.5 | % |
Freeport-McMoRan Copper & Gold, Inc. | | | 2.4 | % |
Vale S.A. ADR | | | 2.4 | % |
Southern Copper Corp. | | | 2.1 | % |
LyondellBasell Industries N.V. — Class A | | | 2.1 | % |
| | | | |
Top Ten Total | | | 24.9 | % |
| | | | |
“Ten Largest Holdings” exclude any temporary cash orderivative investments.
| | | | |
| | | | | |
| 18 | | THE RYDEX FUNDSANNUALREPORT | | |
| | |
| PERFORMANCE REPORT AND FUND PROFILE (Unaudited) (concluded) | | March 31, 2012 |
Cumulative Fund Performance*
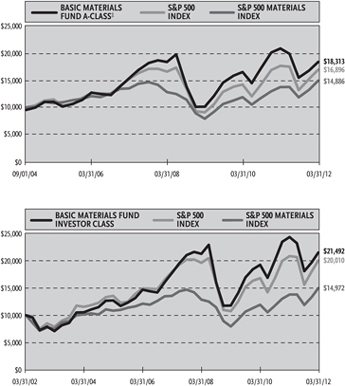
Average Annual Returns*
Periods Ended 03/31/12
| | | | | | | | | | | | |
| | | 1 Year | | | 5 Year | | | 10 Year | |
Investor Class Shares | | | -11.66 | % | | | 3.89 | % | | | 7.95 | % |
Advisor Class Shares | | | -12.08 | % | | | 3.37 | % | | | 7.43 | % |
C-Class Shares | | | -12.50 | % | | | 2.85 | % | | | 6.89 | % |
C-Class Shares with CDSC† | | | -13.38 | % | | | 2.85 | % | | | 6.89 | % |
S&P 500 Index | | | 8.54 | % | | | 2.01 | % | | | 4.12 | % |
S&P 500 Materials Index | | | -4.01 | % | | | 2.17 | % | | | 7.18 | % |
| | | |
| | | 1 Year | | | 5 Year | | | Since
Inception
(09/01/04) | |
A-Class Shares | | | -11.87 | % | | | 3.63 | % | | | 9.01 | % |
A-Class Shares with salescharge‡ | | | -16.06 | % | | | 2.63 | % | | | 8.31 | % |
S&P 500 Index | | | 8.54 | % | | | 2.01 | % | | | 5.41 | % |
S&P 500 Materials Index | | | -4.01 | % | | | 2.17 | % | | | 7.20 | % |
| * | The performance data above represents past performance that is not predictive of future results. The investment return and principal value of an investment in the Fund will fluctuate so that an investor’s shares, when redeemed, may be worth more or less than their original cost. Returns are historical and include changes in principal and reinvested dividends and capital gains and do not reflect the effect of taxes. The S&P 500 Index and the S&P 500 Materials Index are unmanaged indices and, unlike the Fund, have no management fees or operating expenses to reduce their reported returns. The graphs are based on Investor Class shares and A-Class shares only; performance for Advisor Class shares and C-Class shares will vary due to differences in fee structures. |
| † | Fund returns include a CDSC of 1% if redeemed within 12 months of purchase. |
| ‡ | Fund returns are calculated using the maximum sales charge of 4.75%. |
| | | | |
| | | | | |
| | THE RYDEX FUNDSANNUALREPORT | | 19 |
| | |
| SCHEDULE OF INVESTMENTS | | March 31, 2012 |
| BASIC MATERIALS FUND | | |
| | | | | | | | |
| | | SHARES | | | VALUE | |
COMMON STOCKS† - 99.9% | | | | | | | | |
Gold - 18.8% | | | | | | | | |
Barrick Gold Corp. | | | 37,048 | | | $ | 1,610,847 | |
Goldcorp, Inc. | | | 33,209 | | | | 1,496,398 | |
Newmont Mining Corp. | | | 23,524 | | | | 1,206,075 | |
AngloGold Ashanti Ltd. ADR | | | 24,647 | | | | 909,967 | |
Yamana Gold, Inc. | | | 53,473 | | | | 835,248 | |
Cia de Minas Buenaventura S.A. ADR | | | 20,485 | | | | 825,750 | |
Kinross Gold Corp. | | | 82,175 | | | | 804,493 | |
Gold Fields Ltd. ADR | | | 55,565 | | | | 772,354 | |
Randgold Resources Ltd. ADR | | | 7,399 | | | | 650,964 | |
Agnico-Eagle Mines Ltd. | | | 17,394 | | | | 580,612 | |
Eldorado Gold Corp. | | | 40,580 | | | | 557,569 | |
IAMGOLD Corp. | | | 39,115 | | | | 519,838 | |
Royal Gold, Inc. | | | 7,544 | | | | 492,020 | |
| | | | | | | | |
Total Gold | | | | | | | 11,262,135 | |
| | | | | | | | |
Diversified Metals &
Mining -14.7% | | | | | | | | |
Freeport-McMoRan Copper & Gold, Inc. | | | 37,982 | | | | 1,444,834 | |
Vale S.A. ADR | | | 61,444 | | | | 1,433,488 | |
Southern Copper Corp. | | | 40,497 | | | | 1,284,160 | |
BHP Billiton Ltd. ADR | | | 11,014 | | | | 797,414 | |
Ivanhoe Mines Ltd.* | | | 50,300 | | | | 791,722 | |
Rio Tinto plc ADR | | | 13,576 | | | | 754,690 | |
Teck Resources Ltd.
— Class B | | | 18,319 | | | | 653,256 | |
Walter Energy, Inc. | | | 7,855 | | | | 465,095 | |
Molycorp, Inc.* | | | 12,900 | | | | 436,407 | |
Compass Minerals International, Inc. | | | 5,400 | | | | 387,396 | |
Titanium Metals Corp. | | | 27,376 | | | | 371,219 | |
| | | | | | | | |
Total Diversified Metals &
Mining | | | | | | | 8,819,681 | |
| | | | | | | | |
Specialty Chemicals - 12.7% | | | | | | | | |
LyondellBasell Industries N.V. — Class A | | | 28,320 | | | | 1,236,169 | |
Ecolab, Inc. | | | 17,081 | | | | 1,054,240 | |
Sherwin-Williams Co. | | | 7,690 | | | | 835,672 | |
Sigma-Aldrich Corp. | | | 9,991 | | | | 729,942 | |
Celanese Corp. — Class A | | | 14,467 | | | | 668,086 | |
Albemarle Corp. | | | 9,236 | | | | 590,365 | |
International Flavors & Fragrances, Inc. | | | 9,325 | | | | 546,445 | |
Valspar Corp. | | | 10,825 | | | | 522,739 | |
WR Grace & Co.* | | | 8,804 | | | | 508,871 | |
Rockwood Holdings, Inc.* | | | 9,496 | | | | 495,216 | |
Cytec Industries, Inc. | | | 6,788 | | | | 412,643 | |
| | | | | | | | |
Total Specialty Chemicals | | | | | | | 7,600,388 | |
| | | | | | | | |
Diversified Chemicals - 11.8% | | | | | | | | |
EI du Pont de Nemours & Co. | | | 32,662 | | | | 1,727,820 | |
Dow Chemical Co. | | | 45,027 | | | | 1,559,735 | |
PPG Industries, Inc. | | | 9,894 | | | | 947,845 | |
FMC Corp. | | | 6,586 | | | | 697,194 | |
Eastman Chemical Co. | | | 12,734 | | | | 658,220 | |
Ashland, Inc. | | | 8,812 | | | | 538,061 | |
Solutia, Inc. | | | 16,400 | | | | 458,216 | |
Huntsman Corp. | | | 32,058 | | | | 449,133 | |
| | | | | | | | |
Total Diversified Chemicals | | | | | | | 7,036,224 | |
| | | | | | | | |
Steel - 9.6% | | | | | | | | |
Nucor Corp. | | | 20,967 | | | | 900,534 | |
Cliffs Natural Resources, Inc. | | | 10,936 | | | | 757,427 | |
ArcelorMittal | | | 33,140 | | | | 633,968 | |
| | | | | | | | |
| | | SHARES | | | VALUE | |
Gerdau S.A. ADR | | | 60,170 | | | $ | 579,437 | |
Cia Siderurgica Nacional S.A. ADR | | | 57,103 | | | | 540,194 | |
Reliance Steel & Aluminum Co. | | | 9,014 | | | | 509,111 | |
Allegheny Technologies, Inc. | | | 12,202 | | | | 502,356 | |
United States Steel Corp. | | | 16,906 | | | | 496,529 | |
Steel Dynamics, Inc. | | | 29,366 | | | | 426,982 | |
Carpenter Technology Corp. | | | 7,852 | | | | 410,110 | |
| | | | | | | | |
Total Steel | | | | | | | 5,756,648 | |
| | | | | | | | |
Fertilizers & Agricultural
Chemicals - 9.6% | | | | | | | | |
Monsanto Co. | | | 20,302 | | | | 1,619,289 | |
Mosaic Co. | | | 21,005 | | | | 1,161,366 | |
Potash Corporation of Saskatchewan, Inc. | | | 22,504 | | | | 1,028,208 | |
CF Industries Holdings, Inc. | | | 4,694 | | | | 857,359 | |
Agrium, Inc. | | | 7,293 | | | | 629,896 | |
Scotts Miracle-Gro
Co. — Class A | | | 8,434 | | | | 456,785 | |
| | | | | | | | |
Total Fertilizers & Agricultural Chemicals | | | | | | | 5,752,903 | |
| | | | | | | | |
Industrial Gases - 5.4% | | | | | | | | |
Praxair, Inc. | | | 12,818 | | | | 1,469,456 | |
Air Products & Chemicals, Inc. | | | 11,833 | | | | 1,086,269 | |
Airgas, Inc. | | | 7,361 | | | | 654,908 | |
| | | | | | | | |
Total Industrial Gases | | | | | | | 3,210,633 | |
| | | | | | | | |
Paper Products - 3.3% | | | | | | | | |
International Paper Co. | | | 27,191 | | | | 954,404 | |
MeadWestvaco Corp. | | | 18,242 | | | | 576,265 | |
Domtar Corp. | | | 4,780 | | | | 455,916 | |
| | | | | | | | |
Total Paper Products | | | | | | | 1,986,585 | |
| | | | | | | | |
Precious Metals &
Minerals - 3.1% | | | | | | | | |
Silver Wheaton Corp. | | | 25,526 | | | | 847,463 | |
Pan American Silver Corp. | | | 17,100 | | | | 377,226 | |
Coeur d’Alene Mines Corp.* | | | 14,866 | | | | 352,919 | |
Stillwater Mining Co.* | | | 22,900 | | | | 289,456 | |
| | | | | | | | |
Total Precious Metals & Minerals | | | | | | | 1,867,064 | |
| | | | | | | | |
Construction
Materials - 2.9% | | | | | | | | |
Cemex SAB de CV ADR* | | | 87,498 | | | | 678,986 | |
Vulcan Materials Co. | | | 13,132 | | | | 561,130 | |
Martin Marietta Materials, Inc. | | | 5,609 | | | | 480,299 | |
| | | | | | | | |
Total Construction Materials | | | | | | | 1,720,415 | |
| | | | | | | | |
Metal & Glass
Containers - 2.9% | | | | | | | | |
Ball Corp. | | | 15,212 | | | | 652,291 | |
Crown Holdings, Inc.* | | | 15,507 | | | | 571,123 | |
Owens-Illinois, Inc.* | | | 20,448 | | | | 477,256 | |
| | | | | | | | |
Total Metal & Glass Containers | | | | | | | 1,700,670 | |
| | | | | | | | |
Paper Packaging - 2.4% | | | | | | | | |
Rock-Tenn Co.
— Class A | | | 7,956 | | | | 537,507 | |
Sealed Air Corp. | | | 24,129 | | | | 465,931 | |
Bemis Company, Inc. | | | 14,072 | | | | 454,385 | |
| | | | | | | | |
Total Paper Packaging | | | | | | | 1,457,823 | |
| | | | | | | | |
Forest Products - 1.4% | | | | | | | | |
Weyerhaeuser Co. | | | 38,086 | | | | 834,845 | |
| | | | | | | | |
Aluminum - 1.3% | | | | | | | | |
Alcoa, Inc. | | | 78,415 | | | | 785,718 | |
| | | | | | | | |
Total Common Stocks
(Cost $33,772,583) | | | | | | | 59,791,732 | |
| | | | | | | | |
| | | | |
| | | | | |
| 20 | | THE RYDEX FUNDSANNUALREPORT | | SEE NOTES TO FINANCIAL STATEMENTS. |
| | |
| SCHEDULE OF INVESTMENTS (concluded) | | March 31, 2012 |
| BASIC MATERIALS FUND | | |
| | | | | | | | |
| | | FACE
AMOUNT | | | VALUE | |
REPURCHASE AGREEMENT††,1 - 0.5% | | | | | | | | |
Credit Suisse Group issued 03/30/12 at 0.01% due 04/02/12 | | $ | 284,087 | | | $ | 284,087 | |
| | | | | | | | |
Total Repurchase Agreement
(Cost $284,087) | | | | | | | 284,087 | |
| | | | | | | | |
Total Investments - 100.4% (Cost $34,056,670) | | | | | | $ | 60,075,819 | |
| | | | | | | | |
Other Assets & Liabilities, net - (0.4)% | | | | | | | (213,975 | ) |
| | | | | | | | |
Total Net Assets - 100.0% | | | | | | $ | 59,861,844 | |
| * | Non-income producing security. |
| † | Value determined based on Level 1 inputs — See Note 4. |
| †† | Value determined based on Level 2 inputs — See Note 4. |
| 1 | Repurchase Agreement — See Note 5. |
ADR — American Depositary Receipt
plc — Public Limited Company
| | | | |
| | | | | |
| SEE NOTES TO FINANCIAL STATEMENTS. | | THE RYDEX FUNDSANNUALREPORT | | 21 |
STATEMENT OF ASSETS AND LIABILITIES
| | | | |
March 31, 2012 | | | | |
| |
ASSETS: | | | | |
Investments, at value
(cost $33,772,583) | | $ | 59,791,732 | |
Repurchase agreements, at value
(cost $284,087) | | | 284,087 | |
| | | | |
Total investments
(cost $34,056,670) | | | 60,075,819 | |
Cash | | | 7,955 | |
Receivables: | | | | |
Fund shares sold | | | 509,599 | |
Securities sold | | | 85,935 | |
Dividends | | | 69,945 | |
| | | | |
Total assets | | | 60,749,253 | |
| | | | |
LIABILITIES: | | | | |
Payable for: | | | | |
Fund shares redeemed | | | 770,839 | |
Management fees | | | 45,411 | |
Transfer agent and administrative fees | | | 13,356 | |
Distribution and service fees | | | 11,597 | |
Portfolio accounting fees | | | 5,342 | |
Miscellaneous | | | 40,864 | |
| | | | |
Total liabilities | | | 887,409 | |
| | | | |
NET ASSETS | | $ | 59,861,844 | |
| | | | |
NET ASSETS CONSISTOF: | | | | |
Paid in capital | | $ | 68,382,131 | |
Undistributed net investment income | | | 27,822 | |
Accumulated net realized loss on investments | | | (34,567,258 | ) |
Net unrealized appreciation on investments | | | 26,019,149 | |
| | | | |
Net assets | | $ | 59,861,844 | |
| | | | |
INVESTOR CLASS: | | | | |
Net assets | | $ | 36,846,919 | |
Capital shares outstanding | | | 739,946 | |
Net asset value per share | | $ | 49.80 | |
| | | | |
ADVISOR CLASS: | | | | |
Net assets | | $ | 5,287,360 | |
Capital shares outstanding | | | 113,447 | |
Net asset value per share | | $ | 46.61 | |
| | | | |
A-CLASS: | | | | |
Net assets | | $ | 9,410,264 | |
Capital shares outstanding | | | 197,760 | |
Net asset value per share | | $ | 47.58 | |
| | | | |
Maximum offering price per share
(Net asset value divided by 95.25%) | | $ | 49.95 | |
| | | | |
C-CLASS: | | | | |
Net assets | | $ | 8,317,301 | |
Capital shares outstanding | | | 187,123 | |
Net asset value per share | | $ | 44.45 | |
| | | | |
STATEMENT OF OPERATIONS
| | | | |
Year Ended March 31, 2012 | | | | |
| |
INVESTMENT INCOME: | | | | |
Dividends (net of foreign withholding tax of $50,989) | | $ | 1,281,049 | |
Interest | | | 91 | |
| | | | |
Total investment income | | | 1,281,140 | |
| | | | |
EXPENSES: | | | | |
Management fees | | | 682,501 | |
Transfer agent and administrative fees | | | 200,735 | |
Distribution and service fees: | | | | |
Advisor Class | | | 39,330 | |
A-Class | | | 33,098 | |
C-Class | | | 99,611 | |
Portfolio accounting fees | | | 80,293 | |
Custodian fees | | | 20,547 | |
Trustees’ fees* | | | 9,528 | |
Tax expense | | | 5,093 | |
Miscellaneous | | | 88,748 | |
| | | | |
Total expenses | | | 1,259,484 | |
| | | | |
Net investment income | | | 21,656 | |
| | | | |
NET REALIZEDAND UNREALIZED GAIN (LOSS): | | | | |
Net realized gain (loss) on: | | | | |
Investments | | | (8,319,042 | ) |
Foreign currency | | | 1,073 | |
| | | | |
Net realized loss | | | (8,317,969 | ) |
| | | | |
Net change in unrealized appreciation (depreciation) on: | | | | |
Investments | | | (16,403,333 | ) |
| | | | |
Net change in unrealized appreciation (depreciation) | | | (16,403,333 | ) |
| | | | |
Net realized and unrealized loss | | | (24,721,302 | ) |
| | | | |
Net decrease in net assets resulting from operations | | $ | (24,699,646 | ) |
| | | | |
| * | Relates to Trustees not deemed “interested persons” within the meaning of Section 2(a)(19) of the 1940 Act. |
| | | | |
| | | | | |
| 22 | | THE RYDEX FUNDSANNUALREPORT | | SEE NOTES TO FINANCIAL STATEMENTS. |
STATEMENTS OF CHANGES IN NET ASSETS
| | | | | | | | |
| | | Year Ended
March 31,
2012 | | | Year Ended
March 31,
2011 | |
INCREASE (DECREASE) IN NET ASSETS FROM OPERATIONS: | | | | | | | | |
Net investment income (loss) | | $ | 21,656 | | | $ | (148,914 | ) |
Net realized gain (loss) on investments | | | (8,317,969 | ) | | | 11,009,906 | |
Net change in unrealized appreciation (depreciation) on investments | | | (16,403,333 | ) | | | 16,475,314 | |
| | | | | | | | |
Net increase (decrease) in net assets resulting from operations | | | (24,699,646 | ) | | | 27,336,306 | |
| | | | | | | | |
DISTRIBUTIONSTO SHAREHOLDERS FROM: | | | | | | | | |
Net investment income | | | | | | | | |
Investor Class | | | — | | | | (222,370 | ) |
Advisor Class | | | — | | | | (21,324 | ) |
A-Class | | | — | | | | (31,662 | ) |
C-Class | | | — | | | | (29,598 | ) |
| | | | | | | | |
Total distributions to shareholders | | | — | | | | (304,954 | ) |
| | | | | | | | |
CAPITAL SHARE TRANSACTIONS: | | | | | | | | |
Proceeds from sale of shares | | | | | | | | |
Investor Class | | | 158,637,965 | | | | 290,808,232 | |
Advisor Class | | | 35,677,067 | | | | 30,920,509 | |
A-Class | | | 13,460,261 | | | | 17,579,705 | |
C-Class | | | 61,071,902 | | | | 122,015,297 | |
Distributions reinvested | | | | | | | | |
Investor Class | | | — | | | | 206,954 | |
Advisor Class | | | — | | | | 20,596 | |
A-Class | | | — | | | | 25,164 | |
C-Class | | | — | | | | 28,100 | |
Cost of shares redeemed | | | | | | | | |
Investor Class | | | (178,091,332 | ) | | | (282,325,246 | ) |
Advisor Class | | | (43,057,527 | ) | | | (25,392,783 | ) |
A-Class | | | (19,707,926 | ) | | | (10,581,967 | ) |
C-Class | | | (64,560,166 | ) | | | (119,870,587 | ) |
| | | | | | | | |
Net increase (decrease) from capital share transactions | | | (36,569,756 | ) | | | 23,433,974 | |
| | | | | | | | |
Net increase (decrease) in net assets | | | (61,269,402 | ) | | | 50,465,326 | |
NET ASSETS: | | | | | | | | |
Beginning of year | | | 121,131,246 | | | | 70,665,920 | |
| | | | | | | | |
End of year | | $ | 59,861,844 | | | $ | 121,131,246 | |
| | | | | | | | |
Undistributed/(Accumulated) net investment income (loss) at end of year | | $ | 27,822 | | | $ | (28,515 | ) |
| | | | | | | | |
CAPITAL SHARE ACTIVITY: | | | | | | | | |
Shares sold | | | | | | | | |
Investor Class | | | 3,036,471 | | | | 6,100,024 | |
Advisor Class | | | 762,822 | | | | 676,750 | |
A-Class | | | 266,896 | | | | 361,833 | |
C-Class | | | 1,333,277 | | | | 2,837,089 | |
Shares issued from reinvestment of distributions | | | | | | | | |
Investor Class | | | — | | | | 4,118 | |
Advisor Class | | | — | | | | 435 | |
A-Class | | | — | | | | 522 | |
C-Class | | | — | | | | 618 | |
Shares redeemed | | | | | | | | |
Investor Class | | | (3,602,522 | ) | | | (5,796,546 | ) |
Advisor Class | | | (950,966 | ) | | | (584,091 | ) |
A-Class | | | (405,994 | ) | | | (215,761 | ) |
C-Class | | | (1,408,986 | ) | | | (2,799,223 | ) |
| | | | | | | | |
Net increase (decrease) in shares | | | (969,002 | ) | | | 585,768 | |
| | | | | | | | |
| | | | |
| | | | | |
| SEE NOTES TO FINANCIAL STATEMENTS. | | THE RYDEX FUNDSANNUALREPORT | | 23 |
FINANCIAL HIGHLIGHTS
This table is presented to show selected data for a share outstanding throughout each period and to assist shareholders in evaluating a Fund’s performance for the periods presented.
| | | | | | | | | | | | | | | | | | | | |
Investor Class | | Year Ended
March 31,
2012 | | | Year Ended
March 31,
2011 | | | Year Ended
March 31,
2010 | | | Year Ended
March 31,
2009 | | | Year Ended
March 31,
2008 | |
Per Share Data | | | | | | | | | | | | | | | | | | | | |
Net asset value, beginning of period | | $ | 56.36 | | | $ | 44.65 | | | $ | 27.43 | | | $ | 50.49 | | | $ | 42.25 | |
| | | | | | | | | | | | | | | | | | | | |
Income (loss) from investment operations: | | | | | | | | | | | | | | | | | | | | |
Net investment incomea | | | .09 | | | | — | b | | | .24 | | | | .20 | | | | .15 | |
Net gain (loss) on investments (realized and unrealized) | | | (6.65 | ) | | | 11.82 | | | | 17.07 | | | | (22.77 | ) | | | 8.18 | |
| | | | | | | | | | | | | | | | | | | | |
Total from investment operations | | | (6.56 | ) | | | 11.82 | | | | 17.31 | | | | (22.57 | ) | | | 8.33 | |
| | | | | | | | | | | | | | | | | | | | |
Less distributions from: | | | | | | | | | | | | | | | | | | | | |
Net investment income | | | — | | | | (.11 | ) | | | (.09 | ) | | | (.49 | ) | | | (.09 | ) |
| | | | | | | | | | | | | | | | | | | | |
Total distributions | | | — | | | | (.11 | ) | | | (.09 | ) | | | (.49 | ) | | | (.09 | ) |
| | | | | | | | | | | | | | | | | | | | |
Net asset value, end of period | | $ | 49.80 | | | $ | 56.36 | | | $ | 44.65 | | | $ | 27.43 | | | $ | 50.49 | |
| | | | | | | | | | | | | | | | | | | | |
Total Returnc | | | (11.66 | %) | | | 26.50 | % | | | 63.12 | % | | | (44.54 | %) | | | 19.71 | % |
| | | | | | | | | | | | | | | | | | | | |
Ratios/Supplemental Data | | | | | | | | | | | | | | | | | | | | |
Net assets, end of period (in thousands) | | $ | 36,847 | | | $ | 73,606 | | | $ | 44,582 | | | $ | 98,767 | | | $ | 120,870 | |
| | | | | | | | | | | | | | | | | | | | |
Ratios to average net assets: | | | | | | | | | | | | | | | | | | | | |
Net investment income | | | 0.17 | % | | | 0.00 | % | | | 0.65 | % | | | 0.46 | % | | | 0.31 | % |
Total expenses | | | 1.36 | % | | | 1.39 | % | | | 1.39 | % | | | 1.37 | % | | | 1.37 | % |
| | | | | | | | | | | | | | | | | | | | |
Portfolio turnover rate | | | 217 | % | | | 292 | % | | | 455 | % | | | 288 | % | | | 225 | % |
| | | | | |
Advisor Class | | Year Ended
March 31,
2012 | | | Year Ended
March 31,
2011 | | | Year Ended
March 31,
2010 | | | Year Ended
March 31,
2009 | | | Year Ended
March 31,
2008 | |
Per Share Data | | | | | | | | | | | | | | | | | | | | |
Net asset value, beginning of period | | $ | 53.00 | | | $ | 42.20 | | | $ | 26.06 | | | $ | 48.27 | | | $ | 40.61 | |
| | | | | | | | | | | | | | | | | | | | |
Income (loss) from investment operations: | | | | | | | | | | | | | | | | | | | | |
Net investment income (loss)a | | | .08 | | | | (.20 | ) | | | .03 | | | | .05 | | | | (.11 | ) |
Net gain (loss) on investments (realized and unrealized) | | | (6.47 | ) | | | 11.11 | | | | 16.20 | | | | (21.77 | ) | | | 7.86 | |
| | | | | | | | | | | | | | | | | | | | |
Total from investment operations | | | (6.39 | ) | | | 10.91 | | | | 16.23 | | | | (21.72 | ) | | | 7.75 | |
| | | | | | | | | | | | | | | | | | | | |
Less distributions from: | | | | | | | | | | | | | | | | | | | | |
Net investment income | | | — | | | | (.11 | ) | | | (.09 | ) | | | (.49 | ) | | | (.09 | ) |
| | | | | | | | | | | | | | | | | | | | |
Total distributions | | | — | | | | (.11 | ) | | | (.09 | ) | | | (.49 | ) | | | (.09 | ) |
| | | | | | | | | | | | | | | | | | | | |
Net asset value, end of period | | $ | 46.61 | | | $ | 53.00 | | | $ | 42.20 | | | $ | 26.06 | | | $ | 48.27 | |
| | | | | | | | | | | | | | | | | | | | |
Total Returnc | | | (12.08 | %) | | | 25.88 | % | | | 62.30 | % | | | (44.83 | %) | | | 19.08 | % |
| | | | | | | | | | | | | | | | | | | | |
Ratios/Supplemental Data | | | | | | | | | | | | | | | | | | | | |
Net assets, end of period (in thousands) | | $ | 5,287 | | | $ | 15,986 | | | $ | 8,799 | | | $ | 4,705 | | | $ | 11,899 | |
| | | | | | | | | | | | | | | | | | | | |
Ratios to average net assets: | | | | | | | | | | | | | | | | | | | | |
Net investment income (loss) | | | 0.17 | % | | | (0.44 | %) | | | 0.07 | % | | | 0.13 | % | | | (0.25 | %) |
Total expenses | | | 1.86 | % | | | 1.89 | % | | | 1.89 | % | | | 1.88 | % | | | 1.87 | % |
| | | | | | | | | | | | | | | | | | | | |
Portfolio turnover rate | | | 217 | % | | | 292 | % | | | 455 | % | | | 288 | % | | | 225 | % |
| | | | |
| | | | | |
| 24 | | THE RYDEX FUNDSANNUALREPORT | | SEE NOTES TO FINANCIAL STATEMENTS. |
|
| FINANCIAL HIGHLIGHTS (concluded) |
This table is presented to show selected data for a share outstanding throughout each period and to assist shareholders in evaluating a Fund’s performance for the periods presented.
| | | | | | | | | | | | | | | | | | | | |
A-Class | | Year Ended
March 31,
2012 | | | Year Ended
March 31,
2011 | | | Year Ended
March 31,
2010 | | | Year Ended
March 31,
2009 | | | Year Ended
March 31,
2008 | |
Per Share Data | | | | | | | | | | | | | | | | | | | | |
Net asset value, beginning of period | | $ | 53.99 | | | $ | 42.88 | | | $ | 26.41 | | | $ | 48.80 | | | $ | 40.92 | |
| | | | | | | | | | | | | | | | | | | | |
Income (loss) from investment operations: | | | | | | | | | | | | | | | | | | | | |
Net investment income (loss)a | | | (.01 | ) | | | (.09 | ) | | | .15 | | | | .12 | | | | .03 | |
Net gain (loss) on investments (realized and unrealized) | | | (6.40 | ) | | | 11.31 | | | | 16.41 | | | | (22.02 | ) | | | 7.94 | |
| | | | | | | | | | | | | | | | | | | | |
Total from investment operations | | | (6.41 | ) | | | 11.22 | | | | 16.56 | | | | (21.90 | ) | | | 7.97 | |
| | | | | | | | | | | | | | | | | | | | |
Less distributions from: | | | | | | | | | | | | | | | | | | | | |
Net investment income | | | — | | | | (.11 | ) | | | (.09 | ) | | | (.49 | ) | | | (.09 | ) |
| | | | | | | | | | | | | | | | | | | | |
Total distributions | | | — | | | | (.11 | ) | | | (.09 | ) | | | (.49 | ) | | | (.09 | ) |
| | | | | | | | | | | | | | | | | | | | |
Net asset value, end of period | | $ | 47.58 | | | $ | 53.99 | | | $ | 42.88 | | | $ | 26.41 | | | $ | 48.80 | |
| | | | | | | | | | | | | | | | | | | | |
Total Returnc | | | (11.87 | %) | | | 26.20 | % | | | 62.72 | % | | | (44.71 | %) | | | 19.47 | % |
| | | | | | | | | | | | | | | | | | | | |
Ratios/Supplemental Data | | | | | | | | | | | | | | | | | | | | |
Net assets, end of period (in thousands) | | $ | 9,410 | | | $ | 18,187 | | | $ | 8,159 | | | $ | 3,986 | | | $ | 6,985 | |
| | | | | | | | | | | | | | | | | | | | |
Ratios to average net assets: | | | | | | | | | | | | | | | | | | | | |
Net investment income (loss) | | | (0.03 | %) | | | (0.19 | %) | | | 0.40 | % | | | 0.30 | % | | | 0.07 | % |
Total expenses | | | 1.61 | % | | | 1.64 | % | | | 1.65 | % | | | 1.63 | % | | | 1.62 | % |
| | | | | | | | | | | | | | | | | | | | |
Portfolio turnover rate | | | 217 | % | | | 292 | % | | | 455 | % | | | 288 | % | | | 225 | % |
| | | | | |
C-Class | | Year Ended
March 31,
2012 | | | Year Ended
March 31,
2011 | | | Year Ended
March 31,
2010 | | | Year Ended
March 31,
2009 | | | Year Ended
March 31,
2008 | |
Per Share Data | | | | | | | | | | | | | | | | | | | | |
Net asset value, beginning of period | | $ | 50.80 | | | $ | 40.67 | | | $ | 25.24 | | | $ | 47.02 | | | $ | 39.76 | |
| | | | | | | | | | | | | | | | | | | | |
Income (loss) from investment operations: | | | | | | | | | | | | | | | | | | | | |
Net investment lossa | | | (.33 | ) | | | (.40 | ) | | | (.13 | ) | | | (.18 | ) | | | (.28 | ) |
Net gain (loss) on investments (realized and unrealized) | | | (6.02 | ) | | | 10.64 | | | | 15.65 | | | | (21.11 | ) | | | 7.63 | |
| | | | | | | | | | | | | | | | | | | | |
Total from investment operations | | | (6.35 | ) | | | 10.24 | | | | 15.52 | | | | (21.29 | ) | | | 7.35 | |
| | | | | | | | | | | | | | | | | | | | |
Less distributions from: | | | | | | | | | | | | | | | | | | | | |
Net investment income | | | — | | | | (.11 | ) | | | (.09 | ) | | | (.49 | ) | | | (.09 | ) |
| | | | | | | | | | | | | | | | | | | | |
Total distributions | | | — | | | | (.11 | ) | | | (.09 | ) | | | (.49 | ) | | | (.09 | ) |
| | | | | | | | | | | | | | | | | | | | |
Net asset value, end of period | | $ | 44.45 | | | $ | 50.80 | | | $ | 40.67 | | | $ | 25.24 | | | $ | 47.02 | |
| | | | | | | | | | | | | | | | | | | | |
Total Returnc | | | (12.50 | %) | | | 25.21 | % | | | 61.51 | % | | | (45.11 | %) | | | 18.48 | % |
| | | | | | | | | | | | | | | | | | | | |
Ratios/Supplemental Data | | | | | | | | | | | | | | | | | | | | |
Net assets, end of period (in thousands) | | $ | 8,317 | | | $ | 13,353 | | | $ | 9,125 | | | $ | 4,024 | | | $ | 12,725 | |
| | | | | | | | | | | | | | | | | | | | |
Ratios to average net assets: | | | | | | | | | | | | | | | | | | | | |
Net investment loss | | | (0.73 | %) | | | (0.93 | %) | | | (0.37 | %) | | | (0.46 | %) | | | (0.63 | %) |
Total expenses | | | 2.36 | % | | | 2.39 | % | | | 2.40 | % | | | 2.38 | % | | | 2.37 | % |
| | | | | | | | | | | | | | | | | | | | |
Portfolio turnover rate | | | 217 | % | | | 292 | % | | | 455 | % | | | 288 | % | | | 225 | % |
| a | Net investment income (loss) per share was computed using average shares outstanding throughout the period. |
| b | Net investment income is less than $0.01 per share. |
| c | Total return does not reflect the impact of any applicable sales charges and has not been annualized. |
| | | | |
| | | | | |
| SEE NOTES TO FINANCIAL STATEMENTS. | | THE RYDEX FUNDSANNUALREPORT | | 25 |
| | |
| PERFORMANCE REPORT AND FUND PROFILE (Unaudited) | | March 31, 2012 |
| | | |
BIOTECHNOLOGY FUND
OBJECTIVE: Seeks to provide capital appreciation by investing in companies that are involved in the biotechnology industry, including companies involved in research and development, genetic or biological engineering and in the design, manufacture, or sale of related biotechnology products or services (“Biotechnology Companies”).
For the one-year period ended March 31, 2012, Biotechnology Fund Investor Class returned 26.54% compared with the S&P 500® Health Care Index*, which returned 16.41%.
The Biotechnology industry had good performance in 2011, as the U.S. Food and Drug Administration approved new drugs at the highest level in seven years. Better safety data from pharmaceutical companies may have contributed to the pickup in the pace of approvals. The approvals help companies replace products whose patents are expiring in the coming months. The leading acquisition for the year was Gilead’s purchase of Pharmasset for almost $11 billion.
Almost all the Fund’s performance was driven by holdings in the biotechnology segment.
The best-performing stocks in the Fund were Pharmasset, Biogen Idec, Inc. and Regeneron Pharmaceuticals, Inc. The worst-performing stocks in the Fund included InterMune, Inc., Dendreon Corp. and Human Genome Sciences, Inc.
*S&P 500® Health Care Index is a sub-index of the S&P 500® Index, a capitalization-weighted index covering 500 industrial, utility, transportation and financial companies of the U.S. markets (mostly NYSE Euronext issues). The Health Care index encompasses two main industry groups. The first includes companies who manufacture health care equipment and supplies or provide health care related services, including distributors of health care products, providers of basic health-care services, and owners and operators of health care facilities and organizations. The first group also includes companies operating in the health care technology industry. The second group includes companies primarily involved in the research, development, production and marketing of pharmaceuticals, biotechnology and life sciences products.
Performance displayed represents past performance which is no guarantee of future results.
Holdings Diversification (Market Exposure as % of Net Assets)
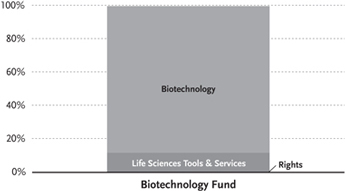
“Holdings Diversification (Market Exposure as % of Net Assets)” excludes any temporary cash investments.
| | | | |
Inception Dates: | |
Investor Class | | | April 1, 1998 | |
Advisor Class | | | April 1, 1998 | |
A-Class | | | September 1, 2004 | |
C-Class | | | March 30, 2001 | |
| | | | |
Ten Largest Holdings (% of Total Net Assets) | |
Amgen, Inc. | | | 9.1 | % |
Gilead Sciences, Inc. | | | 7.7 | % |
Celgene Corp. | | | 7.3 | % |
Biogen Idec, Inc. | | | 7.0 | % |
Alexion Pharmaceuticals, Inc. | | | 5.2 | % |
Regeneron Pharmaceuticals, Inc. | | | 4.0 | % |
Life Technologies Corp. | | | 3.8 | % |
Vertex Pharmaceuticals, Inc. | | | 3.7 | % |
Illumina, Inc. | | | 3.2 | % |
Amylin Pharmaceuticals, Inc. | | | 3.2 | % |
| | | | |
Top Ten Total | | | 54.2 | % |
| | | | |
“Ten Largest Holdings” exclude any temporary cash or derivative investments.
| | | | |
| | | | | |
| 26 | | THE RYDEX FUNDSANNUALREPORT | | |
| | |
| PERFORMANCE REPORT AND FUND PROFILE (Unaudited) (concluded) | | March 31, 2012 |
Cumulative Fund Performance*
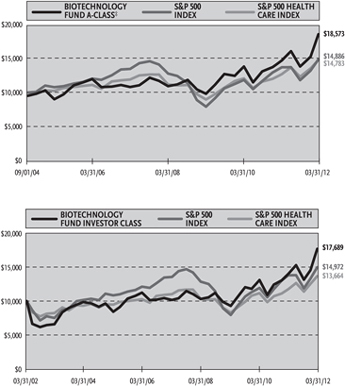
| | | | | | | | | | | | |
Average Annual Returns* Periods Ended 03/31/12 | |
| | | |
| | | 1 Year | | | 5 Year | | | 10 Year | |
Investor Class Shares | | | 26.54 | % | | | 11.71 | % | | | 5.87 | % |
Advisor Class Shares | | | 25.90 | % | | | 11.15 | % | | | 5.34 | % |
C-Class Shares | | | 25.25 | % | | | 10.62 | % | | | 4.81 | % |
C-Class Shares with CDSC† | | | 24.25 | % | | | 10.62 | % | | | 4.81 | % |
S&P 500 Index | | | 8.54 | % | | | 2.01 | % | | | 4.12 | % |
S&P 500 Health Care Index | | | 16.41 | % | | | 4.39 | % | | | 3.17 | % |
| | | |
| | | 1 Year | | | 5 Year | | | Since
Inception
(09/01/04) | |
A-Class Shares | | | 26.19 | % | | | 11.43 | % | | | 9.21 | % |
A-Class Shares with sales charge‡ | | | 20.19 | % | | | 10.36 | % | | | 8.51 | % |
S&P 500 Index | | | 8.54 | % | | | 2.01 | % | | | 5.41 | % |
S&P 500 Health Care Index | | | 16.41 | % | | | 4.39 | % | | | 5.33 | % |
| * | The performance data above represents past performance that is not predictive of future results. The investment return and principal value of an investment in the Fund will fluctuate so that an investor’s shares, when redeemed, may be worth more or less than their original cost. Returns are historical and include changes in principal and reinvested dividends and capital gains and do not reflect the effect of taxes. The S&P 500 Index and the S&P 500 Health Care Index are unmanaged indices and, unlike the Fund, have no management fees or operating expenses to reduce their reported returns. The graphs are based on Investor Class shares and A-Class shares only; performance for Advisor Class shares and C-Class shares will vary due to differences in fee structures. |
| † | Fund returns include a CDSC of 1% if redeemed within 12 months of purchase. |
| ‡ | Fund returns are calculated using the maximum sales charge of 4.75%. |
| | | | |
| | | | | |
| | THE RYDEX FUNDSANNUALREPORT | | 27 |
| | |
| SCHEDULE OF INVESTMENTS | | March 31, 2012 |
| BIOTECHNOLOGY FUND | | |
| | | | | | | | |
| | | SHARES | | | VALUE | |
COMMON STOCKS† - 99.5% | | | | | | | | |
Biotechnology - 88.1% | |
Amgen, Inc. | | | 146,694 | | | $ | 9,973,725 | |
Gilead Sciences, Inc.* | | | 171,542 | | | | 8,379,827 | |
Celgene Corp.* | | | 103,017 | | | | 7,985,878 | |
Biogen Idec, Inc.* | | | 60,558 | | | | 7,628,491 | |
Alexion Pharmaceuticals, Inc.* | | | 61,276 | | | | 5,690,089 | |
Regeneron Pharmaceuticals, Inc.* | | | 37,796 | | | | 4,407,770 | |
Vertex Pharmaceuticals, Inc.* | | | 97,122 | | | | 3,982,973 | |
Amylin Pharmaceuticals, Inc.* | | | 138,939 | | | | 3,467,917 | |
BioMarin Pharmaceutical, Inc.* | | | 78,411 | | | | 2,685,577 | |
Alkermes plc* | | | 122,329 | | | | 2,269,203 | |
Medivation, Inc.* | | | 30,224 | | | | 2,258,337 | |
Cubist Pharmaceuticals, Inc.* | | | 51,668 | | | | 2,234,641 | |
Cepheid, Inc.* | | | 53,376 | | | | 2,232,718 | |
Ariad Pharmaceuticals, Inc.* | | | 138,575 | | | | 2,210,271 | |
Incyte Corporation Ltd.* | | | 112,869 | | | | 2,178,372 | |
United Therapeutics Corp.* | | | 45,183 | | | | 2,129,475 | |
Onyx Pharmaceuticals, Inc.* | | | 56,366 | | | | 2,123,871 | |
Seattle Genetics, Inc.* | | | 104,114 | | | | 2,121,843 | |
Pharmacyclics, Inc.* | | | 68,980 | | | | 1,914,885 | |
Myriad Genetics, Inc.* | | | 79,572 | | | | 1,882,674 | |
Dendreon Corp.* | | | 167,496 | | | | 1,784,670 | |
Theravance, Inc.* | | | 90,450 | | | | 1,763,775 | |
Human Genome Sciences, Inc.* | | | 210,404 | | | | 1,733,729 | |
Halozyme Therapeutics, Inc.* | | | 130,300 | | | | 1,662,628 | |
Amarin Corporation plc ADR* | | | 135,760 | | | | 1,536,803 | |
Idenix Pharmaceuticals, Inc.* | | | 138,400 | | | | 1,354,936 | |
Acorda Therapeutics, Inc.* | | | 50,695 | | | | 1,345,952 | |
InterMune, Inc.* | | | 89,155 | | | | 1,307,904 | |
PDL BioPharma, Inc. | | | 201,893 | | | | 1,282,021 | |
Momenta Pharmaceuticals, Inc.* | | | 78,935 | | | | 1,209,284 | |
Exelixis, Inc.* | | | 224,800 | | | | 1,164,464 | |
Spectrum Pharmaceuticals, Inc.* | | | 90,600 | | | | 1,144,278 | |
Achillion Pharmaceuticals, Inc.* | | | 114,700 | | | | 1,098,826 | |
| | | | | | | | |
Total Biotechnology | | | | | | | 96,147,807 | |
| | | | | | | | |
Life Sciences Tools & Services - 11.4% | | | | | |
Life Technologies Corp.* | | | 83,800 | | | | 4,091,116 | |
Illumina, Inc.* | | | 67,229 | | | | 3,536,918 | |
Charles River Laboratories International, Inc.* | | | 50,100 | | | | 1,808,109 | |
Bio-Rad Laboratories, Inc. — Class A* | | | 14,900 | | | | 1,544,981 | |
Techne Corp. | | | 20,800 | | | | 1,458,080 | |
| | | | | | | | |
Total Life Sciences Tools & Services | | | | 12,439,204 | |
| | | | | | | | |
Total Common Stocks
(Cost $62,767,174) | | | | | | | 108,587,011 | |
| | | | | | | | |
| | | | | | | | |
| | |
| | | SHARES | | | VALUE | |
RIGHTS - 0.0% | | | | | | | | |
Clinical Data, Inc. | | | | | | | | |
Expires 12/31/20*,†††,1 | | | 24,000 | | | $ | — | |
| | | | | | | | |
Total Rights
(Cost $—) | | | | | | | — | |
| | | | | | | | |
| | |
| | | FACE
AMOUNT | | | | |
REPURCHASE AGREEMENT††,2 - 0.7% | |
Credit Suisse Group issued 03/30/12 at 0.01% due 04/02/12 | | $ | 711,822 | | | | 711,822 | |
| | | | | | | | |
Total Repurchase Agreement
(Cost $711,822) | | | | 711,822 | |
| | | | | | | | |
Total Investments - 100.2%
(Cost $63,478,996) | | | $ | 109,298,833 | |
| | | | | | | | |
Other Assets & Liabilities, net - (0.2)% | | | | (247,767 | ) |
| | | | | | | | |
Total Net Assets - 100.0% | | | | | | $ | 109,051,066 | |
| * | Non-income producing security. |
| † | Value determined based on Level 1 inputs — See Note 4. |
| †† | Value determined based on Level 2 inputs — See Note 4. |
| ††† | Value determined based on Level 3 inputs — See Note 4. |
| 2 | Repurchase Agreement — See Note 5. |
ADR — American Depositary Receipt
plc — Public Limited Company
| | | | |
| | | | | |
| 28 | | THE RYDEX FUNDSANNUALREPORT | | SEE NOTES TO FINANCIAL STATEMENTS. |
| | | | |
| STATEMENT OF ASSETS AND LIABILITIES | |
March 31, 2012 | | | | |
| |
ASSETS: | | | | |
Investments, at value
(cost $62,767,174) | | $ | 108,587,011 | |
Repurchase agreements, at value
(cost $711,822) | | | 711,822 | |
| | | | |
Total investments
(cost $63,478,996) | | | 109,298,833 | |
Receivables: | | | | |
Securities sold | | | 1,295,029 | |
Fund shares sold | | | 318,275 | |
| | | | |
Total assets | | | 110,912,137 | |
| | | | |
LIABILITIES: | | | | |
Payable for: | | | | |
Fund shares redeemed | | | 1,699,989 | |
Management fees | | | 75,690 | |
Transfer agent and administrative fees | | | 22,262 | |
Distribution and service fees | | | 10,182 | |
Portfolio accounting fees | | | 8,904 | |
Miscellaneous | | | 44,044 | |
| | | | |
Total liabilities | | | 1,861,071 | |
| | | | |
NET ASSETS | | $ | 109,051,066 | |
| | | | |
NET ASSETS CONSISTOF: | | | | |
Paid in capital | | $ | 126,977,077 | |
Accumulated net investment loss | | | (589,343 | ) |
Accumulated net realized loss on investments | | | (63,156,505 | ) |
Net unrealized appreciation on investments | | | 45,819,837 | |
| | | | |
Net assets | | $ | 109,051,066 | |
| | | | |
INVESTOR CLASS: | | | | |
Net assets | | $ | 89,027,482 | |
Capital shares outstanding | | | 2,412,697 | |
Net asset value per share | | $ | 36.90 | |
| | | | |
ADVISOR CLASS: | | | | |
Net assets | | $ | 8,313,203 | |
Capital shares outstanding | | | 242,569 | |
Net asset value per share | | $ | 34.27 | |
| | | | |
A-CLASS: | | | | |
Net assets | | $ | 4,741,050 | |
Capital shares outstanding | | | 135,922 | |
Net asset value per share | | $ | 34.88 | |
| | | | |
Maximum offering price per share
(Net asset value divided by 95.25%) | | $ | 36.62 | |
| | | | |
C-CLASS: | | | | |
Net assets | | $ | 6,969,331 | |
Capital shares outstanding | | | 210,926 | |
Net asset value per share | | $ | 33.04 | |
| | | | |
| | | | |
STATEMENT OF OPERATIONS | | | | |
Year Ended March 31, 2012 | | | | |
| |
INVESTMENT INCOME: | | | | |
Dividends | | $ | 252,492 | |
Interest | | | 99 | |
| | | | |
Total investment income | | | 252,591 | |
| | | | |
EXPENSES: | | | | |
Management fees | | | 792,409 | |
Transfer agent and administrative fees | | | 233,061 | |
Distribution and service fees: | | | | |
Advisor Class | | | 36,542 | |
A-Class | | | 11,269 | |
C-Class | | | 43,218 | |
Portfolio accounting fees | | | 93,224 | |
Custodian fees | | | 32,606 | |
Trustees’ fees* | | | 8,017 | |
Miscellaneous | | | 107,679 | |
| | | | |
Total expenses | | | 1,358,025 | |
| | | | |
Net investment loss | | | (1,105,434 | ) |
| | | | |
NET REALIZEDAND UNREALIZED GAIN (LOSS): | |
Net realized gain (loss) on: | | | | |
Investments | | | (1,767,250 | ) |
| | | | |
Net realized loss | | | (1,767,250 | ) |
| | | | |
Net change in unrealized appreciation
(depreciation) on: | | | | |
Investments | | | 12,875,710 | |
| | | | |
Net change in unrealized appreciation (depreciation) | | | 12,875,710 | |
| | | | |
Net realized and unrealized gain | | | 11,108,460 | |
| | | | |
Net increase in net assets resulting from operations | | $ | 10,003,026 | |
| | | | |
| * | Relates to Trustees not deemed “interested persons” within the meaning of Section 2(a)(19) of the 1940 Act. |
| | | | |
| | | | | |
| SEE NOTES TO FINANCIAL STATEMENTS. | | THE RYDEX FUNDSANNUALREPORT | | 29 |
STATEMENTS OF CHANGES IN NET ASSETS
| | | | | | | | |
| | | Year Ended
March 31, 2012 | | | Year Ended
March 31, 2011 | |
INCREASE (DECREASE) IN NET ASSETS FROM OPERATIONS: | | | | | | | | |
Net investment loss | | $ | (1,105,434 | ) | | $ | (864,668 | ) |
Net realized gain (loss) on investments | | | (1,767,250 | ) | | | 5,894,249 | |
Net change in unrealized appreciation (depreciation) on investments | | | 12,875,710 | | | | (5,568,909 | ) |
| | | | | | | | |
Net increase (decrease) in net assets resulting from operations | | | 10,003,026 | | | | (539,328 | ) |
| | | | | | | | |
CAPITAL SHARE TRANSACTIONS: | | | | | | | | |
Proceeds from sale of shares | | | | | | | | |
Investor Class | | | 409,078,194 | | | | 200,353,498 | |
Advisor Class | | | 57,985,279 | | | | 32,859,417 | |
A-Class | | | 13,301,426 | | | | 4,397,821 | |
C-Class | | | 41,235,486 | | | | 83,602,839 | |
Cost of shares redeemed | | | | | | | | |
Investor Class | | | (373,528,443 | ) | | | (302,455,838 | ) |
Advisor Class | | | (57,829,153 | ) | | | (34,822,391 | ) |
A-Class | | | (10,403,210 | ) | | | (5,002,905 | ) |
C-Class | | | (38,491,682 | ) | | | (85,042,173 | ) |
| | | | | | | | |
Net increase (decrease) from capital share transactions | | | 41,347,897 | | | | (106,109,732 | ) |
| | | | | | | | |
Net increase (decrease) in net assets | | | 51,350,923 | | | | (106,649,060 | ) |
NET ASSETS: | | | | | | | | |
Beginning of year | | | 57,700,143 | | | | 164,349,203 | |
| | | | | | | | |
End of year | | $ | 109,051,066 | | | $ | 57,700,143 | |
| | | | | | | | |
Accumulated net investment loss at end of year | | $ | (589,343 | ) | | $ | (7,214 | ) |
| | | | | | | | |
CAPITAL SHARE ACTIVITY: | | | | | | | | |
Shares sold | | | | | | | | |
Investor Class | | | 12,989,084 | | | | 7,766,203 | |
Advisor Class | | | 2,002,963 | | | | 1,325,998 | |
A-Class | | | 438,491 | | | | 181,773 | |
C-Class | | | 1,445,494 | | | | 3,546,616 | |
Shares redeemed | | | | | | | | |
Investor Class | | | (12,108,672 | ) | | | (11,632,862 | ) |
Advisor Class | | | (2,032,560 | ) | | | (1,410,259 | ) |
A-Class | | | (382,591 | ) | | | (212,222 | ) |
C-Class | | | (1,363,188 | ) | | | (3,606,457 | ) |
| | | | | | | | |
Net increase (decrease) in shares | | | 989,021 | | | | (4,041,210 | ) |
| | | | | | | | |
| | | | |
| | | | | |
| 30 | | THE RYDEX FUNDSANNUALREPORT | | SEE NOTES TO FINANCIAL STATEMENTS. |
FINANCIAL HIGHLIGHTS
This table is presented to show selected data for a share outstanding throughout each period and to assist shareholders in evaluating a Fund’s performance for the periods presented.
| | | | | | | | | | | | | | | | | | | | |
Investor Class | | Year Ended
March 31,
2012 | | | Year Ended
March 31,
2011 | | | Year Ended
March 31,
2010 | | | Year Ended
March 31,
2009 | | | Year Ended
March 31,
2008 | |
Per Share Data | | | | | | | | | | | | | | | | | | | | |
Net asset value, beginning of period | | $ | 29.16 | | | $ | 27.34 | | | $ | 19.37 | | | $ | 21.51 | | | $ | 21.21 | |
| | | | | | | | | | | | | | | | | | | | |
Income (loss) from investment operations: | | | | | | | | | | | | | | | | | | | | |
Net investment lossa | | | (.34 | ) | | | (.33 | ) | | | (.21 | ) | | | (.19 | ) | | | (.22 | ) |
Net gain (loss) on investments (realized and unrealized) | | | 8.08 | | | | 2.15 | | | | 8.18 | | | | (1.95 | ) | | | .52 | |
| | | | | | | | | | | | | | | | | | | | |
Total from investment operations | | | 7.74 | | | | 1.82 | | | | 7.97 | | | | (2.14 | ) | | | .30 | |
| | | | | | | | | | | | | | | | | | | | |
Net asset value, end of period | | $ | 36.90 | | | $ | 29.16 | | | $ | 27.34 | | | $ | 19.37 | | | $ | 21.51 | |
| | | | | | | | | | | | | | | | | | | | |
Total Returnb | | | 26.54 | % | | | 6.66 | % | | | 41.15 | % | | | (9.95 | %) | | | 1.41 | % |
| | | | | | | | | | | | | | | | | | | | |
Ratios/Supplemental Data | | | | | | | | | | | | | | | | | | | | |
Net assets, end of period (in thousands) | | $ | 89,027 | | | $ | 44,686 | | | $ | 147,631 | | | $ | 65,829 | | | $ | 47,696 | |
| | | | | | | | | | | | | | | | | | | | |
Ratios to average net assets: | | | | | | | | | | | | | | | | | | | | |
Net investment loss | | | (1.09 | %) | | | (1.26 | %) | | | (0.90 | %) | | | (0.86 | %) | | | (0.94 | %) |
Total expenses | | | 1.36 | % | | | 1.39 | % | | | 1.39 | % | | | 1.38 | % | | | 1.39 | % |
| | | | | | | | | | | | | | | | | | | | |
Portfolio turnover rate | | | 333 | % | | | 337 | % | | | 316 | % | | | 370 | % | | | 193 | % |
| | | | | |
Advisor Class | | Year Ended
March 31,
2012 | | | Year Ended
March 31,
2011 | | | Year Ended
March 31,
2010 | | | Year Ended
March 31,
2009 | | | Year Ended
March 31,
2008 | |
Per Share Data | | | | | | | | | | | | | | | | | | | | |
Net asset value, beginning of period | | $ | 27.22 | | | $ | 25.66 | | | $ | 18.27 | | | $ | 20.39 | | | $ | 20.20 | |
| | | | | | | | | | | | | | | | | | | | |
Income (loss) from investment operations: | | | | | | | | | | | | | | | | | | | | |
Net investment lossa | | | (.48 | ) | | | (.43 | ) | | | (.30 | ) | | | (.29 | ) | | | (.31 | ) |
Net gain (loss) on investments (realized and unrealized) | | | 7.53 | | | | 1.99 | | | | 7.69 | | | | (1.83 | ) | | | .50 | |
| | | | | | | | | | | | | | | | | | | | |
Total from investment operations | | | 7.05 | | | | 1.56 | | | | 7.39 | | | | (2.12 | ) | | | .19 | |
| | | | | | | | | | | | | | | | | | | | |
Net asset value, end of period | | $ | 34.27 | | | $ | 27.22 | | | $ | 25.66 | | | $ | 18.27 | | | $ | 20.39 | |
| | | | | | | | | | | | | | | | | | | | |
Total Returnb | | | 25.90 | % | | | 6.08 | % | | | 40.45 | % | | | (10.40 | %) | | | 0.94 | % |
| | | | | | | | | | | | | | | | | | | | |
Ratios/Supplemental Data | | | | | | | | | | | | | | | | | | | | |
Net assets, end of period (in thousands) | | $ | 8,313 | | | $ | 7,410 | | | $ | 9,144 | | | $ | 6,675 | | | $ | 4,220 | |
| | | | | | | | | | | | | | | | | | | | |
Ratios to average net assets: | | | | | | | | | | | | | | | | | | | | |
Net investment loss | | | (1.65 | %) | | | (1.77 | %) | | | (1.38 | %) | | | (1.40 | %) | | | (1.42 | %) |
Total expenses | | | 1.87 | % | | | 1.89 | % | | | 1.89 | % | | | 1.88 | % | | | 1.89 | % |
| | | | | | | | | | | | | | | | | | | | |
Portfolio turnover rate | | | 333 | % | | | 337 | % | | | 316 | % | | | 370 | % | | | 193 | % |
| | | | |
| | | | | |
| SEE NOTES TO FINANCIAL STATEMENTS. | | THE RYDEX FUNDSANNUALREPORT | | 31 |
FINANCIAL HIGHLIGHTS (concluded)
This table is presented to show selected data for a share outstanding throughout each period and to assist shareholders in evaluating a Fund’s performance for the periods presented.
| | | | | | | | | | | | | | | | | | | | |
A-Class | | Year Ended
March 31,
2012 | | | Year Ended
March 31,
2011 | | | Year Ended
March 31,
2010 | | | Year Ended
March 31,
2009 | | | Year Ended
March 31,
2008 | |
Per Share Data | | | | | | | | | | | | | | | | | | | | |
Net asset value, beginning of period | | $ | 27.64 | | | $ | 25.98 | | | $ | 18.45 | | | $ | 20.54 | | | $ | 20.30 | |
| | | | | | | | | | | | | | | | | | | | |
Income (loss) from investment operations: | | | | | | | | | | | | | | | | | | | | |
Net investment lossa | | | (.37 | ) | | | (.37 | ) | | | (.25 | ) | | | (.24 | ) | | | (.27 | ) |
Net gain (loss) on investments (realized and unrealized) | | | 7.61 | | | | 2.03 | | | | 7.78 | | | | (1.85 | ) | | | .51 | |
| | | | | | | | | | | | | | | | | | | | |
Total from investment operations | | | 7.24 | | | | 1.66 | | | | 7.53 | | | | (2.09 | ) | | | .24 | |
| | | | | | | | | | | | | | | | | | | | |
Net asset value, end of period | | $ | 34.88 | | | $ | 27.64 | | | $ | 25.98 | | | $ | 18.45 | | | $ | 20.54 | |
| | | | | | | | | | | | | | | | | | | | |
Total Returnb | | | 26.19 | % | | | 6.39 | % | | | 40.81 | % | | | (10.18 | %) | | | 1.18 | % |
| | | | | | | | | | | | | | | | | | | | |
Ratios/Supplemental Data | | | | | | | | | | | | | | | | | | | | |
Net assets, end of period (in thousands) | | $ | 4,741 | | | $ | 2,211 | | | $ | 2,869 | | | $ | 4,346 | | | $ | 2,321 | |
| | | | | | | | | | | | | | | | | | | | |
Ratios to average net assets: | | | | | | | | | | | | | | | | | | | | |
Net investment loss | | | (1.30 | %) | | | (1.51 | %) | | | (1.12 | %) | | | (1.17 | %) | | | (1.26 | %) |
Total expenses | | | 1.61 | % | | | 1.64 | % | | | 1.64 | % | | | 1.64 | % | | | 1.62 | % |
| | | | | | | | | | | | | | | | | | | | |
Portfolio turnover rate | | | 333 | % | | | 337 | % | | | 316 | % | | | 370 | % | | | 193 | % |
| | | | | |
C-Class | | Year Ended
March 31,
2012 | | | Year Ended
March 31,
2011 | | | Year Ended
March 31,
2010 | | | Year Ended
March 31,
2009 | | | Year Ended
March 31,
2008 | |
Per Share Data | | | | | | | | | | | | | | | | | | | | |
Net asset value, beginning of period | | $ | 26.38 | | | $ | 24.96 | | | $ | 17.87 | | | $ | 20.03 | | | $ | 19.95 | |
| | | | | | | | | | | | | | | | | | | | |
Income (loss) from investment operations: | | | | | | | | | | | | | | | | | | | | |
Net investment lossa | | | (.58 | ) | | | (.54 | ) | | | (.38 | ) | | | (.38 | ) | | | (.42 | ) |
Net gain (loss) on investments (realized and unrealized) | | | 7.24 | | | | 1.96 | | | | 7.47 | | | | (1.78 | ) | | | .50 | |
| | | | | | | | | | | | | | | | | | | | |
Total from investment operations | | | 6.66 | | | | 1.42 | | | | 7.09 | | | | (2.16 | ) | | | .08 | |
| | | | | | | | | | | | | | | | | | | | |
Net asset value, end of period | | $ | 33.04 | | | $ | 26.38 | | | $ | 24.96 | | | $ | 17.87 | | | $ | 20.03 | |
| | | | | | | | | | | | | | | | | | | | |
Total Returnb | | | 25.25 | % | | | 5.65 | % | | | 39.68 | % | | | (10.78 | %) | | | 0.40 | % |
| | | | | | | | | | | | | | | | | | | | |
Ratios/Supplemental Data | | | | | | | | | | | | | | | | | | | | |
Net assets, end of period (in thousands) | | $ | 6,969 | | | $ | 3,393 | | | $ | 4,705 | | | $ | 4,028 | | | $ | 3,671 | |
| | | | | | | | | | | | | | | | | | | | |
Ratios to average net assets: | | | | | | | | | | | | | | | | | | | | |
Net investment loss | | | (2.06 | %) | | | (2.27 | %) | | | (1.78 | %) | | | (1.89 | %) | | | (1.99 | %) |
Total expenses | | | 2.36 | % | | | 2.39 | % | | | 2.39 | % | | | 2.39 | % | | | 2.38 | % |
| | | | | | | | | | | | | | | | | | | | |
Portfolio turnover rate | | | 333 | % | | | 337 | % | | | 316 | % | | | 370 | % | | | 193 | % |
| a | Net investment loss per share was computed using average shares outstanding throughout the period. |
| b | Total return does not reflect the impact of any applicable sales charges and has not been annualized. |
| | | | |
| | | | | |
| 32 | | THE RYDEX FUNDSANNUALREPORT | | SEE NOTES TO FINANCIAL STATEMENTS. |
This page intentionally left blank.
| | | | |
| | | | | |
| | THE RYDEX FUNDSANNUALREPORT | | 33 |
| | |
| PERFORMANCE REPORT AND FUND PROFILE (Unaudited) | | March 31, 2012 |
CONSUMER PRODUCTS FUND
OBJECTIVE: Seeks to provide capital appreciation by investing in companies engaged in manufacturing finished goods and services both domestically and internationally (“Consumer Products Companies”).
Continuing uneven economic recovery was a positive for the group in the past year, as earnings from Consumer Staples stocks tend to hold up in tough economic times. Investors may lose interest in the defensive characteristics of the sector’s stocks as the economy continues to improve. Company fundamentals remain solid and the sector’s higher exposure to emerging markets compared with other sectors has benefited performance. The sector has also enjoyed healthy dividend growth—according to UBS Wealth Management Research, the sector has increased dividends at an annualized rate of 10% over the past 10 years.
For the one-year period ended March 31, 2012, Consumer Products Fund Investor Class returned 15.06%, compared with 17.34% for the S&P 500® Consumer Staples Index*.
Within the sector, all industries were contributors to performance. The beverages and tobacco industries were the biggest contributors to Fund performance. Food and staples retailing was the weakest contributor to Fund performance.
Fund performance for the year got the biggest boost from Philip Morris International, Inc., Monster Beverage Corp. and Kraft Foods, Inc. The weakest performers were Green Mountain Coffee Roasters, Inc., Avon Products, Inc. and Diamond Foods, Inc.
*S&P 500® Consumer Staples Index is a sub-index of the S&P 500® Index, a capitalization-weighted index covering 500 industrial, utility, transportation and financial companies of the U.S. markets (mostly NYSE Euronext issues). The Consumer Staples index comprises companies whose businesses are less sensitive to economic cycles. It includes manufacturers and distributors of food, beverages and tobacco and producers of non-durable household goods and personal products. It also includes food & drug retailing companies as well as hypermarkets and consumer super centers.
Performance displayed represents past performance which is no guarantee of future results.
Holdings Diversification (Market Exposure
as % of Net Assets)
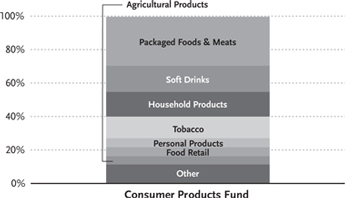
“Holdings Diversification (Market Exposure as % of Net Assets)” excludes any temporary cash investments.
| | | | |
Inception Dates: | |
Investor Class | | | July 6, 1998 | |
Advisor Class | | | August 17, 1998 | |
A-Class | | | September 1, 2004 | |
C-Class | | | July 24, 2001 | |
| | | | |
Ten Largest Holdings (% of Total Net Assets) | |
Procter & Gamble Co. | | | 6.0 | % |
Coca-Cola Co. | | | 5.8 | % |
Philip Morris International, Inc. | | | 5.5 | % |
PepsiCo, Inc. | | | 4.5 | % |
Kraft Foods, Inc. — Class A | | | 3.6 | % |
Altria Group, Inc. | | | 3.5 | % |
Colgate-Palmolive Co. | | | 3.0 | % |
Kimberly-Clark Corp. | | | 2.4 | % |
General Mills, Inc. | | | 2.2 | % |
Reynolds American, Inc. | | | 2.1 | % |
| | | | |
Top Ten Total | | | 38.6 | % |
| | | | |
“Ten Largest Holdings” exclude any temporary cash or derivative investments.
| | | | |
| | | | | |
| 34 | | THE RYDEX FUNDSANNUALREPORT | | |
| | |
| PERFORMANCE REPORT AND FUND PROFILE (Unaudited) (concluded) | | March 31, 2012 |
| | | |
Cumulative Fund Performance*
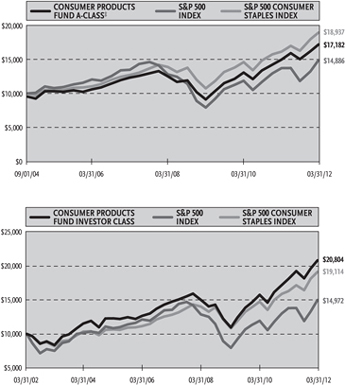
Average Annual Returns*
Periods Ended 03/31/12
| | | | | | | | | | | | |
| | | 1 Year | | | 5 Year | | | 10 Year | |
Investor Class Shares | | | 15.06 | % | | | 7.13 | % | | | 7.60 | % |
Advisor Class Shares | | | 14.49 | % | | | 6.62 | % | | | 7.09 | % |
C-Class Shares | | | 13.91 | % | | | 6.08 | % | | | 6.52 | % |
C-Class Shares with CDSC† | | | 12.91 | % | | | 6.08 | % | | | 6.52 | % |
S&P 500 Index | | | 8.54 | % | | | 2.01 | % | | | 4.12 | % |
S&P 500 Consumer Staples Index | | | 17.34 | % | | | 8.31 | % | | | 6.69 | % |
| | | |
| | | 1 Year | | | 5 Year | | | Since
Inception
(09/01/04) | |
A-Class Shares | | | 14.80 | % | | | 6.88 | % | | | 8.10 | % |
A-Class Shares with sales charge‡ | | | 9.35 | % | | | 5.84 | % | | | 7.40 | % |
S&P 500 Index | | | 8.54 | % | | | 2.01 | % | | | 5.41 | % |
S&P 500 Consumer Staples Index | | | 17.34 | % | | | 8.31 | % | | | 8.79 | % |
| * | The performance data above represents past performance that is not predictive of future results. The investment return and principal value of an investment in the Fund will fluctuate so that an investor’s shares, when redeemed, may be worth more or less than their original cost. Returns are historical and include changes in principal and reinvested dividends and capital gains and do not reflect the effect of taxes. The S&P 500 Index and the S&P 500 Consumer Staples Index are unmanaged indices and, unlike the Fund, have no management fees or operating expenses to reduce their reported returns. The graphs are based on Investor Class shares and A-Class shares only; performance for Advisor Class shares and C-Class shares will vary due to differences in fee structures. |
| † | Fund returns include a CDSC of 1% if redeemed within 12 months of purchase. |
| ‡ | Fund returns are calculated using the maximum sales charge of 4.75%. |
| | | | |
| | | | | |
| | THE RYDEX FUNDSANNUALREPORT | | 35 |
| | |
| SCHEDULE OF INVESTMENTS | | March 31, 2012 |
| CONSUMER PRODUCTS FUND | | |
| | | | | | | | |
| | | SHARES | | | VALUE | |
COMMON STOCKS† - 99.6% | | | | | | | | |
Packaged Foods & Meats - 29.3% | | | | | |
Kraft Foods, Inc. — Class A | | | 190,892 | | | $ | 7,255,804 | |
General Mills, Inc. | | | 114,587 | | | | 4,520,457 | |
Kellogg Co. | | | 73,340 | | | | 3,933,224 | |
HJ Heinz Co. | | | 69,027 | | | | 3,696,396 | |
Mead Johnson Nutrition Co. — Class A | | | 44,706 | | | | 3,687,351 | |
Hershey Co. | | | 54,242 | | | | 3,326,662 | |
Sara Lee Corp. | | | 146,615 | | | | 3,156,621 | |
Campbell Soup Co. | | | 86,977 | | | | 2,944,171 | |
ConAgra Foods, Inc. | | | 111,242 | | | | 2,921,215 | |
JM Smucker Co. | | | 33,352 | | | | 2,713,519 | |
Hormel Foods Corp. | | | 84,556 | | | | 2,496,093 | |
McCormick & Company, Inc. | | | 45,023 | | | | 2,450,602 | |
Tyson Foods, Inc. — Class A | | | 121,465 | | | | 2,326,055 | |
Green Mountain Coffee Roasters, Inc.* | | | 49,267 | | | | 2,307,666 | |
Unilever N.V. | | | 65,821 | | | | 2,239,889 | |
BRF - Brasil Foods S.A. ADR | | | 99,600 | | | | 1,992,996 | |
Ralcorp Holdings, Inc.* | | | 24,700 | | | | 1,830,023 | |
Smithfield Foods, Inc.* | | | 75,136 | | | | 1,655,246 | |
Flowers Foods, Inc. | | | 72,685 | | | | 1,480,593 | |
Dean Foods Co.* | | | 110,321 | | | | 1,335,987 | |
TreeHouse Foods, Inc.* | | | 22,232 | | | | 1,322,804 | |
| | | | | | | | |
Total Packaged Foods & Meats | | | | 59,593,374 | |
| | | | | | | | |
Soft Drinks - 15.6% | | | | | | | | |
Coca-Cola Co. | | | 158,978 | | | | 11,765,963 | |
PepsiCo, Inc. | | | 137,704 | | | | 9,136,660 | |
Monster Beverage Corp.* | | | 47,588 | | | | 2,954,739 | |
Dr Pepper Snapple Group, Inc. | | | 66,105 | | | | 2,658,082 | |
Coca-Cola Enterprises, Inc. | | | 91,334 | | | | 2,612,152 | |
Fomento Economico Mexicano SAB de CV ADR | | | 30,563 | | | | 2,514,418 | |
| | | | | | | | |
Total Soft Drinks | | | | | | | 31,642,014 | |
| | | | | | | | |
Household Products - 14.8% | | | | | | | | |
Procter & Gamble Co. | | | 179,980 | | | | 12,096,455 | |
Colgate-Palmolive Co. | | | 62,981 | | | | 6,158,282 | |
Kimberly-Clark Corp. | | | 65,002 | | | | 4,802,998 | |
Clorox Co. | | | 38,677 | | | | 2,659,044 | |
Church & Dwight Company, Inc. | | | 47,898 | | | | 2,356,103 | |
Energizer Holdings, Inc.* | | | 26,035 | | | | 1,931,276 | |
| | | | | | | | |
Total Household Products | | | | | | | 30,004,158 | |
| | | | | | | | |
Tobacco - 12.9% | | | | | | | | |
Philip Morris International, Inc. | | | 125,101 | | | | 11,085,200 | |
Altria Group, Inc. | | | 231,255 | | | | 7,138,842 | |
Reynolds American, Inc. | | | 104,978 | | | | 4,350,288 | |
Lorillard, Inc. | | | 28,175 | | | | 3,648,099 | |
| | | | | | | | |
Total Tobacco | | | | | | | 26,222,429 | |
| | | | | | | | |
Personal Products - 5.4% | | | | | | | | |
Estee Lauder Companies, Inc. — Class A | | | 69,880 | | | | 4,328,367 | |
Avon Products, Inc. | | | 134,002 | | | | 2,594,279 | |
| | | | | | | | |
| | | SHARES | | | VALUE | |
Herbalife Ltd. | | | 36,071 | | | $ | 2,482,406 | |
Nu Skin Enterprises, Inc. — Class A | | | 28,630 | | | | 1,657,963 | |
| | | | | | | | |
Total Personal Products | | | | | | | 11,063,015 | |
| | | | | | | | |
Food Retail - 5.4% | | | | | | | | |
Whole Foods Market, Inc. | | | 41,357 | | | | 3,440,902 | |
Kroger Co. | | | 137,143 | | | | 3,322,975 | |
Safeway, Inc. | | | 99,875 | | | | 2,018,474 | |
Harris Teeter Supermarkets, Inc.* | | | 31,000 | | | | 1,243,100 | |
SUPERVALU, Inc. | | | 163,646 | | | | 934,419 | |
| | | | | | | | |
Total Food Retail | | | | | | | 10,959,870 | |
| | | | | | | | |
Agricultural Products - 4.9% | | | | | |
Archer-Daniels-Midland Co. | | | 127,643 | | | | 4,041,178 | |
Bunge Ltd. | | | 41,046 | | | | 2,809,188 | |
Corn Products International, Inc. | | | 33,114 | | | | 1,909,022 | |
Darling International, Inc.* | | | 72,360 | | | | 1,260,511 | |
| | | | | | | | |
Total Agricultural Products | | | | 10,019,899 | |
| | | | | | | | |
Distillers & Vintners - 4.9% | | | | | |
Brown-Forman Corp. — Class B | | | 37,071 | | | | 3,091,351 | |
Beam, Inc. | | | 46,600 | | | | 2,729,362 | |
Diageo plc ADR | | | 22,500 | | | | 2,171,250 | |
Constellation Brands, Inc. — Class A* | | | 83,454 | | | | 1,968,680 | |
| | | | | | | | |
Total Distillers & Vintners | | | | 9,960,643 | |
| | | | | | | | |
Brewers - 3.9% | | | | | | | | |
Cia de Bebidas das Americas ADR | | | 69,740 | | | | 2,881,656 | |
Molson Coors Brewing Co. — Class B | | | 57,787 | | | | 2,614,862 | |
Anheuser-Busch InBev N.V. ADR | | | 32,022 | | | | 2,328,640 | |
| | | | | | | | |
Total Brewers | | | | | | | 7,825,158 | |
| | | | | | | | |
Food Distributors - 2.5% | | | | | | | | |
Sysco Corp. | | | 124,695 | | | | 3,723,393 | |
United Natural Foods, Inc.* | | | 28,700 | | | | 1,339,142 | |
| | | | | | | | |
Total Food Distributors | | | | | | | 5,062,535 | |
| | | | | | | | |
Total Common Stocks
(Cost $168,703,998) | | | | | | | 202,353,095 | |
| | | | | | | | |
| | |
| | | FACE
AMOUNT | | | | |
REPURCHASE AGREEMENT††,1 - 0.6% | |
Credit Suisse Group issued 03/30/12 at 0.01% due 04/02/12 | | $ | 1,246,051 | | | | 1,246,051 | |
| | | | | | | | |
Total Repurchase Agreement
(Cost $1,246,051) | | | | | | | 1,246,051 | |
| | | | | | | | |
Total Investments - 100.2%
(Cost $169,950,049) | | | | | | $ | 203,599,146 | |
| | | | | | | | |
Other Assets & Liabilities, net - (0.2)% | | | | (458,919 | ) |
| | | | | | | | |
Total Net Assets - 100.0% | | | | | | $ | 203,140,227 | |
| * | Non-income producing security. |
| † | Value determined based on Level 1 inputs — See Note 4. |
| †† | Value determined based on Level 2 inputs — See Note 4. |
| 1 | Repurchase Agreement — See Note 5. |
ADR — American Depositary Receipt
plc — Public Limited Company
| | | | |
| | | | | |
| 36 | | THE RYDEX FUNDSANNUALREPORT | | SEE NOTES TO FINANCIAL STATEMENTS. |
| | | | |
STATEMENT OF ASSETS AND LIABILITIES | |
| March 31, 2012 | | | | |
| |
ASSETS: | | | | |
Investments, at value
(cost $168,703,998) | | $ | 202,353,095 | |
Repurchase agreements, at value
(cost $1,246,051) | | | 1,246,051 | |
| | | | |
Total investments
(cost $169,950,049) | | | 203,599,146 | |
Cash | | | 6,460 | |
Receivables: | | | | |
Fund shares sold | | | 3,135,990 | |
Dividends | | | 537,593 | |
| | | | |
Total assets | | | 207,279,189 | |
| | | | |
LIABILITIES: | | | | |
Payable for: | | | | |
Securities purchased | | | 3,048,521 | |
Fund shares redeemed | | | 819,389 | |
Management fees | | | 137,043 | |
Transfer agent and administrative fees | | | 40,307 | |
Distribution and service fees | | | 18,214 | |
Portfolio accounting fees | | | 16,123 | |
Miscellaneous | | | 59,365 | |
| | | | |
Total liabilities | | | 4,138,962 | |
| | | | |
NET ASSETS | | $ | 203,140,227 | |
| | | | |
NET ASSETS CONSISTOF: | | | | |
Paid in capital | | $ | 183,034,791 | |
Undistributed net investment income | | | — | |
Accumulated net realized loss on investments | | | (13,543,661 | ) |
Net unrealized appreciation on investments | | | 33,649,097 | |
| | | | |
Net assets | | $ | 203,140,227 | |
| | | | |
INVESTOR CLASS: | | | | |
Net assets | | $ | 155,431,907 | |
Capital shares outstanding | | | 3,867,854 | |
Net asset value per share | | $ | 40.19 | |
| | | | |
ADVISOR CLASS: | | | | |
Net assets | | $ | 16,975,262 | |
Capital shares outstanding | | | 457,807 | |
Net asset value per share | | $ | 37.08 | |
| | | | |
A-CLASS: | | | | |
Net assets | | $ | 21,021,388 | |
Capital shares outstanding | | | 554,173 | |
Net asset value per share | | $ | 37.93 | |
| | | | |
Maximum offering price per share
(Net asset value divided by 95.25%) | | $ | 39.82 | |
| | | | |
C-CLASS: | | | | |
Net assets | | $ | 9,711,670 | |
Capital shares outstanding | | | 276,624 | |
Net asset value per share | | $ | 35.11 | |
| | | | |
| | | | |
STATEMENT OF OPERATIONS | |
| Year Ended March 31, 2012 | | | | |
| |
INVESTMENT INCOME: | | | | |
Dividends (net of foreign withholding tax of $3,721) | | $ | 3,377,993 | |
Interest income | | | 175 | |
| | | | |
Total investment income | | | 3,378,168 | |
| | | | |
EXPENSES: | | | | |
Management fees | | | 1,090,481 | |
Transfer agent and administrative fees | | | 320,729 | |
Distribution and service fees: | | | | |
Advisor Class | | | 56,619 | |
A-Class | | | 32,891 | |
C-Class | | | 57,863 | |
Portfolio accounting fees | | | 128,291 | |
Custodian fees | | | 34,703 | |
Trustees’ fees* | | | 8,775 | |
Miscellaneous | | | 142,888 | |
| | | | |
Total expenses | | | 1,873,240 | |
| | | | |
Net investment income | | | 1,504,928 | |
| | | | |
NET REALIZEDAND UNREALIZED GAIN (Loss): | | | | |
Net realized gain (loss) on: | | | | |
Investments | | | (6,633,752 | ) |
| | | | |
Net realized loss | | | (6,633,752 | ) |
| | | | |
Net change in unrealized appreciation (depreciation) on: | | | | |
Investments | | | 20,261,583 | |
| | | | |
Net change in unrealized appreciation (depreciation) | | | 20,261,583 | |
| | | | |
Net realized and unrealized gain | | | 13,627,831 | |
| | | | |
Net increase in net assets resulting from operations | | $ | 15,132,759 | |
| | | | |
| * | Relates to Trustees not deemed “interested persons” within the meaning of Section 2(a)(19) of the 1940 Act. |
| | | | |
| | | | | |
| SEE NOTES TO FINANCIAL STATEMENTS. | | THE RYDEX FUNDSANNUALREPORT | | 37 |
STATEMENTS OF CHANGES IN NET ASSETS
| | | | | | | | |
| | | Year Ended
March 31,
2012 | | | Year Ended
March 31,
2011 | |
INCREASE (DECREASE) IN NET ASSETS FROM OPERATIONS: | | | | | | | | |
Net investment income | | $ | 1,504,928 | | | $ | 1,510,144 | |
Net realized gain (loss) on investments | | | (6,633,752 | ) | | | 23,091,560 | |
Net change in unrealized appreciation (depreciation) on investments | | | 20,261,583 | | | | (13,671,959 | ) |
| | | | | | | | |
Net increase in net assets resulting from operations | | | 15,132,759 | | | | 10,929,745 | |
| | | | | | | | |
DISTRIBUTIONS TO SHAREHOLDERS FROM: | | | | | | | | |
Net investment income | | | | | | | | |
Investor Class | | | (990,072 | ) | | | (1,233,220 | ) |
Advisor Class | | | (144,687 | ) | | | (155,870 | ) |
A-Class | | | (240,403 | ) | | | (80,810 | ) |
C-Class | | | (134,982 | ) | | | (110,514 | ) |
Net realized gains | | | | | | | | |
Investor Class | | | (1,589,392 | ) | | | (8,588,996 | ) |
Advisor Class | | | (232,270 | ) | | | (1,085,584 | ) |
A-Class | | | (385,926 | ) | | | (562,819 | ) |
C-Class | | | (216,691 | ) | | | (769,755 | ) |
| | | | | | | | |
Total distributions to shareholders | | | (3,934,423 | ) | | | (12,587,568 | ) |
| | | | | | | | |
CAPITAL SHARE TRANSACTIONS: | | | | | | | | |
Proceeds from sale of shares | | | | | | | | |
Investor Class | | | 659,811,510 | | | | 390,995,240 | |
Advisor Class | | | 75,806,217 | | | | 35,315,185 | |
A-Class | | | 31,615,141 | | | | 6,689,410 | |
C-Class | | | 57,692,984 | | | | 68,579,568 | |
Distributions reinvested | | | | | | | | |
Investor Class | | | 2,488,504 | | | | 9,569,300 | |
Advisor Class | | | 373,093 | | | | 1,219,720 | |
A-Class | | | 494,046 | | | | 593,646 | |
C-Class | | | 339,654 | | | | 861,273 | |
Cost of shares redeemed | | | | | | | | |
Investor Class | | | (573,144,067 | ) | | | (525,670,868 | ) |
Advisor Class | | | (63,966,727 | ) | | | (38,462,251 | ) |
A-Class | | | (17,284,638 | ) | | | (22,692,937 | ) |
C-Class | | | (52,151,706 | ) | | | (69,681,980 | ) |
| | | | | | | | |
Net increase (decrease) from capital share transactions | | | 122,074,011 | | | | (142,684,694 | ) |
| | | | | | | | |
Net increase (decrease) in net assets | | | 133,272,347 | | | | (144,342,517 | ) |
NET ASSETS: | | | | | | | | |
Beginning of year | | | 69,867,880 | | | | 214,210,397 | |
| | | | | | | | |
End of year | | $ | 203,140,227 | | | $ | 69,867,880 | |
| | | | | | | | |
Undistributed net investment income at end of year | | $ | — | | | $ | 1,510,146 | |
| | | | | | | | |
CAPITAL SHARE ACTIVITY: | | | | | | | | |
Shares sold | | | | | | | | |
Investor Class | | | 17,440,289 | | | | 10,684,021 | |
Advisor Class | | | 2,159,455 | | | | 1,029,449 | |
A-Class | | | 881,716 | | | | 191,526 | |
C-Class | | | 1,721,281 | | | | 2,055,708 | |
Shares issued from reinvestment of distributions | | | | | | | | |
Investor Class | | | 69,356 | | | | 283,619 | |
Advisor Class | | | 11,251 | | | | 38,795 | |
A-Class | | | 14,574 | | | | 18,540 | |
C-Class | | | 10,800 | | | | 28,671 | |
Shares redeemed | | | | | | | | |
Investor Class | | | (15,233,138 | ) | | | (14,211,944 | ) |
Advisor Class | | | (1,815,584 | ) | | | (1,128,358 | ) |
A-Class | | | (488,025 | ) | | | (650,900 | ) |
C-Class | | | (1,563,405 | ) | | | (2,097,770 | ) |
| | | | | | | | |
Net increase (decrease) in shares | | | 3,208,570 | | | | (3,758,643 | ) |
| | | | | | | | |
| | | | |
| | | | | |
| 38 | | THE RYDEX FUNDSANNUALREPORT | | SEE NOTES TO FINANCIAL STATEMENTS. |
FINANCIAL HIGHLIGHTS
This table is presented to show selected data for a share outstanding throughout each period and to assist shareholders in evaluating a Fund’s performance for the periods presented.
| | | | | | | | | | | | | | | | | | | | |
Investor Class | | Year Ended
March 31,
2012 | | | Year Ended
March 31,
2011 | | | Year Ended
March 31,
2010 | | | Year Ended
March 31,
2009 | | | Year Ended
March 31,
2008 | |
Per Share Data | | | | | | | | | | | | | | | | | | | | |
Net asset value, beginning of period | | $ | 36.37 | | | $ | 37.83 | | | $ | 26.39 | | | $ | 36.40 | | | $ | 36.11 | |
| | | | | | | | | | | | | | | | | | | | |
Income (loss) from investment operations: | | | | | | | | | | | | | | | | | | | | |
Net investment incomea | | | .49 | | | | .69 | | | | .50 | | | | .55 | | | | .52 | |
Net gain (loss) on investments (realized and unrealized) | | | 4.82 | | | | 4.40 | | | | 11.04 | | | | (10.35 | ) | | | .13 | |
| | | | | | | | | | | | | | | | | | | | |
Total from investment operations | | | 5.31 | | | | 5.09 | | | | 11.54 | | | | (9.80 | ) | | | .65 | |
| | | | | | | | | | | | | | | | | | | | |
Less distributions from: | | | | | | | | | | | | | | | | | | | | |
Net investment income | | | (.57 | ) | | | (.82 | ) | | | (.10 | ) | | | (.21 | ) | | | (.36 | ) |
Net realized gains | | | (.92 | ) | | | (5.73 | ) | | | — | | | | — | | | | — | |
| | | | | | | | | | | | | | | | | | | | |
Total distributions | | | (1.49 | ) | | | (6.55 | ) | | | (.10 | ) | | | (.21 | ) | | | (.36 | ) |
| | | | | | | | | | | | | | | | | | | | |
Net asset value, end of period | | $ | 40.19 | | | $ | 36.37 | | | $ | 37.83 | | | $ | 26.39 | | | $ | 36.40 | |
| | | | | | | | | | | | | | | | | | | | |
Total Returnb | | | 15.06 | % | | | 14.81 | % | | | 43.75 | % | | | (26.96 | %) | | | 1.72 | % |
| | | | | | | | | | | | | | | | | | | | |
Ratios/Supplemental Data | | | | | | | | | | | | | | | | | | | | |
Net assets, end of period (in thousands) | | $ | 155,432 | | | $ | 57,876 | | | $ | 182,915 | | | $ | 14,703 | | | $ | 8,722 | |
| | | | | | | | | | | | | | | | | | | | |
Ratios to average net assets: | | | | | | | | | | | | | | | | | | | | |
Net investment income | | | 1.29 | % | | | 1.84 | % | | | 1.46 | % | | | 1.81 | % | | | 1.37 | % |
Total expenses | | | 1.35 | % | | | 1.38 | % | | | 1.37 | % | | | 1.38 | % | | | 1.37 | % |
| | | | | | | | | | | | | | | | | | | | |
Portfolio turnover rate | | | 402 | % | | | 400 | % | | | 200 | % | | | 445 | % | | | 449 | % |
| | | | | |
Advisor Class | | Year Ended
March 31,
2012 | | | Year Ended
March 31,
2011 | | | Year Ended
March 31,
2010 | | | Year Ended
March 31,
2009 | | | Year Ended
March 31,
2008 | |
Per Share Data | | | | | | | | | | | | | | | | | | | | |
Net asset value, beginning of period | | $ | 33.84 | | | $ | 35.77 | | | $ | 25.09 | | | $ | 34.78 | | | $ | 34.68 | |
| | | | | | | | | | | | | | | | | | | | |
Income (loss) from investment operations: | | | | | | | | | | | | | | | | | | | | |
Net investment incomea | | | .24 | | | | .62 | | | | .35 | | | | .34 | | | | .15 | |
Net gain (loss) on investments (realized and unrealized) | | | 4.49 | | | | 4.00 | | | | 10.43 | | | | (9.82 | ) | | | .31 | |
| | | | | | | | | | | | | | | | | | | | |
Total from investment operations | | | 4.73 | | | | 4.62 | | | | 10.78 | | | | (9.48 | ) | | | .46 | |
| | | | | | | | | | | | | | | | | | | | |
Less distributions from: | | | | | | | | | | | | | | | | | | | | |
Net investment income | | | (.57 | ) | | | (.82 | ) | | | (.10 | ) | | | (.21 | ) | | | (.36 | ) |
Net realized gains | | | (.92 | ) | | | (5.73 | ) | | | — | | | | — | | | | — | |
| | | | | | | | | | | | | | | | | | | | |
Total distributions | | | (1.49 | ) | | | (6.55 | ) | | | (.10 | ) | | | (.21 | ) | | | (.36 | ) |
| | | | | | | | | | | | | | | | | | | | |
Net asset value, end of period | | $ | 37.08 | | | $ | 33.84 | | | $ | 35.77 | | | $ | 25.09 | | | $ | 34.78 | |
| | | | | | | | | | | | | | | | | | | | |
Total Returnb | | | 14.49 | % | | | 14.32 | % | | | 42.99 | % | | | (27.29 | %) | | | 1.25 | % |
| | | | | | | | | | | | | | | | | | | | |
Ratios/Supplemental Data | | | | | | | | | | | | | | | | | | | | |
Net assets, end of period (in thousands) | | $ | 16,975 | | | $ | 3,475 | | | $ | 5,824 | | | $ | 11,113 | | | $ | 5,384 | |
| | | | | | | | | | | | | | | | | | | | |
Ratios to average net assets: | | | | | | | | | | | | | | | | | | | | |
Net investment income | | | 0.68 | % | | | 1.78 | % | | | 1.17 | % | | | 1.18 | % | | | 0.42 | % |
Total expenses | | | 1.84 | % | | | 1.88 | % | | | 1.88 | % | | | 1.87 | % | | | 1.87 | % |
| | | | | | | | | | | | | | | | | | | | |
Portfolio turnover rate | | | 402 | % | | | 400 | % | | | 200 | % | | | 445 | % | | | 449 | % |
| | | | |
| | | | | |
| SEE NOTES TO FINANCIAL STATEMENTS. | | THE RYDEX FUNDSANNUALREPORT | | 39 |
FINANCIAL HIGHLIGHTS (concluded)
This table is presented to show selected data for a share outstanding throughout each period and to assist shareholders in evaluating a Fund’s performance for the periods presented.
| | | | | | | | | | | | | | | | | | | | |
A-Class | | Year Ended
March 31,
2012 | | | Year Ended
March 31,
2011 | | | Year Ended
March 31,
2010 | | | Year Ended
March 31,
2009 | | | Year Ended
March 31,
2008 | |
Per Share Data | | | | | | | | | | | | | | | | | | | | |
Net asset value, beginning of period | | $ | 34.49 | | | $ | 36.26 | | | $ | 25.37 | | | $ | 35.09 | | | $ | 34.90 | |
| | | | | | | | | | | | | | | | | | | | |
Income (loss) from investment operations: | | | | | | | | | | | | | | | | | | | | |
Net investment incomea | | | .40 | | | | .41 | | | | .55 | | | | .42 | | | | .50 | |
Net gain (loss) on investments (realized and unrealized) | | | 4.53 | | | | 4.37 | | | | 10.44 | | | | (9.93 | ) | | | .05 | |
| | | | | | | | | | | | | | | | | | | | |
Total from investment operations | | | 4.93 | | | | 4.78 | | | | 10.99 | | | | (9.51 | ) | | | .55 | |
| | | | | | | | | | | | | | | | | | | | |
Less distributions from: | | | | | | | | | | | | | | | | | | | | |
Net investment income | | | (.57 | ) | | | (.82 | ) | | | (.10 | ) | | | (.21 | ) | | | (.36 | ) |
Net realized gains | | | (.92 | ) | | | (5.73 | ) | | | — | | | | — | | | | — | |
| | | | | | | | | | | | | | | | | | | | |
Total distributions | | | (1.49 | ) | | | (6.55 | ) | | | (.10 | ) | | | (.21 | ) | | | (.36 | ) |
| | | | | | | | | | | | | | | | | | | | |
Net asset value, end of period | | $ | 37.93 | | | $ | 34.49 | | | $ | 36.26 | | | $ | 25.37 | | | $ | 35.09 | |
| | | | | | | | | | | | | | | | | | | | |
Total Returnb | | | 14.80 | % | | | 14.58 | % | | | 43.34 | % | | | (27.14 | %) | | | 1.50 | % |
| | | | | | | | | | | | | | | | | | | | |
Ratios/Supplemental Data | | | | | | | | | | | | | | | | | | | | |
Net assets, end of period (in thousands) | | $ | 21,021 | | | $ | 5,033 | | | $ | 21,277 | | | $ | 2,898 | | | $ | 1,682 | |
| | | | | | | | | | | | | | | | | | | | |
Ratios to average net assets: | | | | | | | | | | | | | | | | | | | | |
Net investment income | | | 1.11 | % | | | 1.14 | % | | | 1.72 | % | | | 1.41 | % | | | 1.38 | % |
Total expenses | | | 1.60 | % | | | 1.63 | % | | | 1.63 | % | | | 1.63 | % | | | 1.63 | % |
| | | | | | | | | | | | | | | | | | | | |
Portfolio turnover rate | | | 402 | % | | | 400 | % | | | 200 | % | | | 445 | % | | | 449 | % |
| | | | | |
C-Class | | Year Ended
March 31,
2012 | | | Year Ended
March 31,
2011 | | | Year Ended
March 31,
2010 | | | Year Ended
March 31,
2009 | | | Year Ended
March 31,
2008 | |
Per Share Data | | | | | | | | | | | | | | | | | | | | |
Net asset value, beginning of period | | $ | 32.28 | | | $ | 34.57 | | | $ | 24.36 | | | $ | 33.95 | | | $ | 34.04 | |
| | | | | | | | | | | | | | | | | | | | |
Income (loss) from investment operations: | | | | | | | | | | | | | | | | | | | | |
Net investment incomea | | | .12 | | | | .30 | | | | .24 | | | | .19 | | | | .17 | |
Net gain (loss) on investments (realized and unrealized) | | | 4.20 | | | | 3.96 | | | | 10.07 | | | | (9.57 | ) | | | .10 | |
| | | | | | | | | | | | | | | | | | | | |
Total from investment operations | | | 4.32 | | | | 4.26 | | | | 10.31 | | | | (9.38 | ) | | | .27 | |
| | | | | | | | | | | | | | | | | | | | |
Less distributions from: | | | | | | | | | | | | | | | | | | | | |
Net investment income | | | (.57 | ) | | | (.82 | ) | | | (.10 | ) | | | (.21 | ) | | | (.36 | ) |
Net realized gains | | | (.92 | ) | | | (5.73 | ) | | | — | | | | — | | | | — | |
| | | | | | | | | | | | | | | | | | | | |
Total distributions | | | (1.49 | ) | | | (6.55 | ) | | | (.10 | ) | | | (.21 | ) | | | (.36 | ) |
| | | | | | | | | | | | | | | | | | | | |
Net asset value, end of period | | $ | 35.11 | | | $ | 32.28 | | | $ | 34.57 | | | $ | 24.36 | | | $ | 33.95 | |
| | | | | | | | | | | | | | | | | | | | |
Total Returnb | | | 13.91 | % | | | 13.78 | % | | | 42.35 | % | | | (27.67 | %) | | | 0.71 | % |
| | | | | | | | | | | | | | | | | | | | |
Ratios/Supplemental Data | | | | | | | | | | | | | | | | | | | | |
Net assets, end of period (in thousands) | | $ | 9,712 | | | $ | 3,484 | | | $ | 4,194 | | | $ | 3,067 | | | $ | 3,903 | |
| | | | | | | | | | | | | | | | | | | | |
Ratios to average net assets: | | | | | | | | | | | | | | | | | | | | |
Net investment income | | | 0.36 | % | | | 0.90 | % | | | 0.77 | % | | | 0.65 | % | | | 0.49 | % |
Total expenses | | | 2.35 | % | | | 2.38 | % | | | 2.38 | % | | | 2.38 | % | | | 2.37 | % |
| | | | | | | | | | | | | | | | | | | | |
Portfolio turnover rate | | | 402 | % | | | 400 | % | | | 200 | % | | | 445 | % | | | 449 | % |
| a | Net investment income per share was computed using average shares outstanding throughout the period. |
| b | Total return does not reflect the impact of any applicable sales charges and has not been annualized. |
| | | | |
| | | | | |
| 40 | | THE RYDEX FUNDSANNUALREPORT | | SEE NOTES TO FINANCIAL STATEMENTS. |
This page intentionally left blank.
| | | | |
| | | | | |
| | THE RYDEX FUNDSANNUALREPORT | | 41 |
| | |
PERFORMANCE REPORT AND FUND PROFILE (Unaudited) | | March 31, 2012 |
ELECTRONICS FUND
OBJECTIVE: Seeks to provide capital appreciation by investing in companies that are involved in the electronics sector, including semiconductor manufacturers and distributors, and makers and vendors of other electronic components and devices (“Electronics Companies”).
The semiconductor industry had a difficult year, impacted by a weak global economy, lower demand and supply chain disruptions caused by natural disasters in Japan and Thailand.
For the one-year period ended March 31, 2012, Electronics Fund Investor Class returned -9.05%, compared with 20.21% for the S&P 500® Information Technology Index*.
The semiconductors & semiconductor equipment industry accounted for most of the negative Fund return.
For the year, Fund performance got the biggest boost from Intel Corp., National Semiconductor Corp. and KLA-Tencor Corp. MEMC Electronic Materials, Inc., Trina Solar Ltd ADR and First Solar, Inc. were among the stocks which provided the least to Fund performance for the period.
*S&P 500® Information Technology Index is a sub-index of the S&P 500® Index, a capitalization-weighted index covering 500 industrial, utility, transportation and financial companies of the U.S. markets (mostly NYSE Euronext issues). The Information Technology index covers the following general areas: Technology software & services, including companies that primarily develop software in various fields such as the Internet, applications, systems, databases management and/or home entertainment, and companies that provide information technology consulting and services, as well as data processing and outsourced services; secondly, Technology Hardware & Equipment, including manufacturers and distributors of communications equipment, computers & peripherals, electronic equipment and related instruments; and thirdly, Semiconductors & Semiconductor Equipment Manufacturers.
Performance displayed represents past performance which is no guarantee of future results.
Holdings Diversification (Market Exposure
as % of Net Assets)
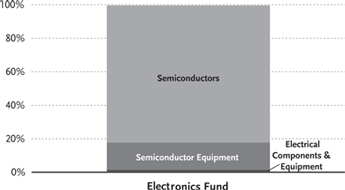
“Holdings Diversification (Market Exposure as % of Net Assets)” excludes any temporary cash investments.
| | | | |
Inception Dates: | | | |
Investor Class | | | April 1, 1998 | |
Advisor Class | | | April 2, 1998 | |
A-Class | | | September 1, 2004 | |
C-Class | | | March 26, 2001 | |
| | | | |
|
Ten Largest Holdings (% of Total Net Assets) | |
Intel Corp. | | | 11.6 | % |
Texas Instruments, Inc. | | | 6.0 | % |
Broadcom Corp. — Class A | | | 4.5 | % |
Applied Materials, Inc. | | | 3.9 | % |
Altera Corp. | | | 3.5 | % |
Analog Devices, Inc. | | | 3.4 | % |
NVIDIA Corp. | | | 3.1 | % |
Xilinx, Inc. | | | 3.0 | % |
Avago Technologies Ltd. | | | 3.0 | % |
KLA-Tencor Corp. | | | 3.0 | % |
| | | | |
Top Ten Total | | | 45.0 | % |
| | | | |
“Ten Largest Holdings” exclude any temporary cash or derivative investments.
| | | | |
| | | | | |
| 42 | | THE RYDEX FUNDSANNUALREPORT | | |
| | |
| PERFORMANCE REPORT AND FUND PROFILE (Unaudited) (concluded) | | March 31, 2012 |
Cumulative Fund Performance*
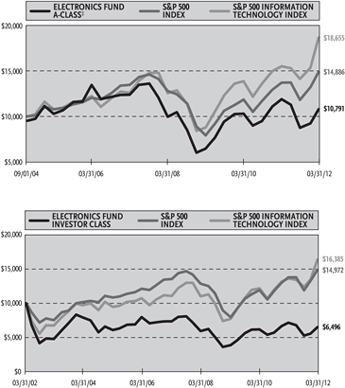
Average Annual Returns*
Periods Ended 03/31/12
| | | | | | | | | | | | |
| | | 1 Year | | | 5 Year | | | 10 Year | |
Investor Class Shares | | | -9.05 | % | | | -2.43 | % | | | -4.22 | % |
Advisor Class Shares | | | -9.46 | % | | | -2.85 | % | | | -4.69 | % |
C-Class Shares | | | -10.01 | % | | | -3.33 | % | | | -5.16 | % |
C-Class Shares with CDSC† | | | -10.91 | % | | | -3.33 | % | | | -5.16 | % |
S&P 500 Index | | | 8.54 | % | | | 2.01 | % | | | 4.12 | % |
S&P 500 Information Technology Index | | | 20.21 | % | | | 8.15 | % | | | 5.06 | % |
| | | |
| | | 1 Year | | | 5 Year | | | Since
Inception
(09/01/04) | |
A-Class Shares | | | -9.31 | % | | | -2.72 | % | | | 1.66 | % |
A-Class Shares with sales charge‡ | | | -13.61 | % | | | -3.66 | % | | | 1.01 | % |
S&P 500 Index | | | 8.54 | % | | | 2.01 | % | | | 5.41 | % |
S&P 500 Information Technology Index | | | 20.21 | % | | | 8.15 | % | | | 8.65 | % |
| * | The performance data above represents past performance that is not predictive of future results. The investment return and principal value of an investment in the Fund will fluctuate so that an investor’s shares, when redeemed, may be worth more or less than their original cost. Returns are historical and include changes in principal and reinvested dividends and capital gains and do not reflect the effect of taxes. The S&P 500 Index and the S&P 500 Information Technology Index are unmanaged indices and, unlike the Fund, have no management fees or operating expenses to reduce their reported returns. The graphs are based on Investor Class shares and A-Class shares only; performance for Advisor Class shares and C-Class shares will vary due to differences in fee structures. |
| † | Fund returns include a CDSC of 1% if redeemed within 12 months of purchase. |
| ‡ | Fund returns are calculated using the maximum sales charge of 4.75%. |
| | | | |
| | | | | |
| | THE RYDEX FUNDSANNUALREPORT | | 43 |
| | |
| SCHEDULE OF INVESTMENTS | | March 31, 2012 |
| | | |
| ELECTRONICS FUND | | |
| | | | | | | | |
| | | SHARES | | | VALUE | |
COMMON STOCKS† - 99.6% | | | | | | | | |
Semiconductors - 81.9% | | | | | | | | |
Intel Corp. | | | 31,566 | | | $ | 887,321 | |
Texas Instruments, Inc. | | | 13,720 | | | | 461,130 | |
Broadcom Corp. —
Class A* | | | 8,820 | | | | 346,626 | |
Altera Corp. | | | 6,727 | | | | 267,869 | |
Analog Devices, Inc. | | | 6,386 | | | | 257,994 | |
NVIDIA Corp.* | | | 15,350 | | | | 236,237 | |
Xilinx, Inc. | | | 6,375 | | | | 232,241 | |
Avago Technologies Ltd. | | | 5,921 | | | | 230,741 | |
Marvell Technology Group Ltd.* | | | 14,233 | | | | 223,885 | |
Maxim Integrated Products, Inc. | | | 7,501 | | | | 214,454 | |
Linear Technology Corp. | | | 6,120 | | | | 206,244 | |
Micron Technology, Inc.* | | | 25,195 | | | | 204,080 | |
Microchip Technology, Inc. | | | 5,374 | | | | 199,913 | |
Taiwan Semiconductor Manufacturing Company Ltd. ADR | | | 11,887 | | | | 181,633 | |
Advanced Micro Devices, Inc.* | | | 21,782 | | | | 174,692 | |
Skyworks Solutions, Inc.* | | | 6,034 | | | | 166,840 | |
LSI Corp.* | | | 18,799 | | | | 163,175 | |
Atmel Corp.* | | | 15,504 | | | | 152,869 | |
ON Semiconductor Corp.* | | | 16,435 | | | | 148,079 | |
Cree, Inc.* | | | 4,494 | | | | 142,145 | |
ARM Holdings plc ADR | | | 4,806 | | | | 135,962 | |
Cypress Semiconductor Corp.* | | | 7,357 | | | | 114,990 | |
Fairchild Semiconductor International, Inc. — Class A* | | | 6,894 | | | | 101,342 | |
Silicon Laboratories, Inc.* | | | 2,347 | | | | 100,921 | |
Semtech Corp.* | | | 3,540 | | | | 100,748 | |
PMC - Sierra, Inc.* | | | 13,413 | | | | 96,976 | |
Cirrus Logic, Inc.* | | | 3,828 | | | | 91,106 | |
Trina Solar Ltd. ADR* | | | 12,720 | | | | 90,694 | |
Cavium, Inc.* | | | 2,841 | | | | 87,901 | |
Intersil Corp. — Class A | | | 7,847 | | | | 87,886 | |
TriQuint Semiconductor, Inc.* | | | 11,740 | | | | 80,947 | |
Omnivision Technologies, Inc.* | | | 3,782 | | | | 75,640 | |
| | | | | | | | |
Total Semiconductors | | | | | | | 6,263,281 | |
| | | | | | | | |
Semiconductor Equipment - 16.3% | | | | | |
Applied Materials, Inc. | | | 23,760 | | | | 295,574 | |
KLA-Tencor Corp. | | | 4,171 | | | | 226,986 | |
Lam Research Corp.* | �� | | 3,857 | | | | 172,099 | |
Novellus Systems, Inc.* | | | 2,805 | | | | 139,998 | |
Teradyne, Inc.* | | | 7,821 | | | | 132,097 | |
ASML Holding N.V. ADR | | | 2,632 | | | | 131,968 | |
Veeco Instruments, Inc.* | | | 2,597 | | | | 74,274 | |
GT Advanced Technologies, Inc.* | | | 8,899 | | | | 73,595 | |
Total Semiconductor Equipment | | | | | | | 1,246,591 | |
| | | | | | | | |
Electrical Components & Equipment - 1.4% | | | | | | | | |
First Solar, Inc.* | | | 4,165 | | | | 104,333 | |
| | | | | | | | |
Total Common Stocks
(Cost $4,910,957) | | | | | | | 7,614,205 | |
| | | | | | | | |
| | | | | | | | |
| | | FACE
AMOUNT | | | VALUE | |
REPURCHASE AGREEMENT††,1 - 0.6% | | | | | | | | |
Credit Suisse Group issued 03/30/12 at 0.01% due 04/02/12 | | $ | 47,096 | | | $ | 47,096 | |
| | | | | | | | |
Total Repurchase Agreement
(Cost $47,096) | | | | | | | 47,096 | |
| | | | | | | | |
Total Investments - 100.2%
(Cost $4,958,053) | | | | | | $ | 7,661,301 | |
| | | | | | | | |
Other Assets & Liabilities,
net - (0.2)% | | | | | | | (15,317 | ) |
| | | | | | | | |
Total Net Assets - 100.0% | | | | | | $ | 7,645,984 | |
| * | Non-income producing security. |
| † | Value determined based on Level 1 inputs — See Note 4. |
| †† | Value determined based on Level 2 inputs — See Note 4. |
| 1 | Repurchase Agreement — See Note 5. |
ADR — American Depositary Receipt
plc — Public Limited Company
| | | | |
| | | | | |
| 44 | | THE RYDEX FUNDSANNUALREPORT | | SEE NOTES TO FINANCIAL STATEMENTS. |
STATEMENT OF ASSETS AND LIABILITIES
March 31, 2012
| | | | |
ASSETS: | | | | |
Investments, at value
(cost $4,910,957) | | $ | 7,614,205 | |
Repurchase agreements, at value
(cost $47,096) | | | 47,096 | |
| | | | |
Total investments
(cost $4,958,053) | | | 7,661,301 | |
Receivables: | | | | |
Securities sold | | | 631,698 | |
Fund shares sold | | | 547,533 | |
Dividends | | | 753 | |
| | | | |
Total assets | | | 8,841,285 | |
| | | | |
LIABILITIES: | | | | |
Payable for: | | | | |
Fund shares redeemed | | | 1,180,412 | |
Management fees | | | 5,594 | |
Transfer agent and administrative fees | | | 1,645 | |
Distribution and service fees | | | 921 | |
Portfolio accounting fees | | | 658 | |
Miscellaneous | | | 6,071 | |
| | | | |
Total liabilities | | | 1,195,301 | |
| | | | |
NET ASSETS | | $ | 7,645,984 | |
| | | | |
NET ASSETS CONSIST OF: | | | | |
Paid in capital | | $ | 33,477,179 | |
Accumulated net investment loss | | | (14,534 | ) |
Accumulated net realized loss on investments | | | (28,519,909 | ) |
Net unrealized appreciation on investments | | | 2,703,248 | |
| | | | |
Net assets | | $ | 7,645,984 | |
| | | | |
INVESTOR CLASS: | | | | |
Net assets | | $ | 5,453,383 | |
Capital shares outstanding | | | 98,994 | |
Net asset value per share | | $ | 55.09 | |
| | | | |
ADVISOR CLASS: | | | | |
Net assets | | $ | 1,270,899 | |
Capital shares outstanding | | | 24,726 | |
Net asset value per share | | $ | 51.40 | |
| | | | |
A-CLASS: | | | | |
Net assets | | $ | 659,099 | |
Capital shares outstanding | | | 12,618 | |
Net asset value per share | | $ | 52.23 | |
| | | | |
Maximum offering price per share
(Net asset value divided by 95.25%) | | $ | 54.83 | |
| | | | |
C-CLASS: | | | | |
Net assets | | $ | 262,603 | |
Capital shares outstanding | | | 5,305 | |
Net asset value per share | | $ | 49.50 | |
| | | | |
STATEMENT OF OPERATIONS
Year Ended March 31, 2012
| | | | |
INVESTMENT INCOME: | | | | |
Dividends (net of foreign withholding tax of $241) | | $ | 100,934 | |
Interest | | | 13 | |
| | | | |
Total investment income | | | 100,947 | |
| | | | |
EXPENSES: | | | | |
Management fees | | | 75,916 | |
Transfer agent and administrative fees | | | 22,328 | |
Distribution and service fees: | | | | |
Advisor Class | | | 9,482 | |
A-Class | | | 1,607 | |
C-Class | | | 9,590 | |
Portfolio accounting fees | | | 8,932 | |
Registration fees | | | 14,589 | |
Custodian fees | | | 2,206 | |
Trustees’ fees* | | | 1,607 | |
Miscellaneous | | | (4,672 | ) |
| | | | |
Total expenses | | | 141,585 | |
| | | | |
Net investment loss | | | (40,638 | ) |
| | | | |
NET REALIZED AND UNREALIZED GAIN (LOSS): | | | | |
Net realized gain (loss) on: | | | | |
Investments | | | 645,228 | |
| | | | |
Net realized gain | | | 645,228 | |
| | | | |
Net change in unrealized appreciation (depreciation) on: | | | | |
Investments | | | (2,200,960 | ) |
| | | | |
Net change in unrealized appreciation (depreciation) | | | (2,200,960 | ) |
| | | | |
Net realized and unrealized loss | | | (1,555,732 | ) |
| | | | |
Net decrease in net assets resulting from operations | | $ | (1,596,370 | ) |
| | | | |
| * | Relates to Trustees not deemed “interested persons” within the meaning of Section 2(a)(19) of the 1940 Act. |
| | | | |
| | | | | |
| SEE NOTES TO FINANCIAL STATEMENTS. | | THE RYDEX FUNDSANNUALREPORT | | 45 |
STATEMENTS OF CHANGES IN NET ASSETS
| | | | | | | | |
| | | Year Ended
March 31,
2012 | | | Year Ended
March 31,
2011 | |
INCREASE (DECREASE) IN NET ASSETS FROM OPERATIONS: | | | | | | | | |
Net investment loss | | $ | (40,638 | ) | | $ | (97,316 | ) |
Net realized gain (loss) on investments | | | 645,228 | | | | (1,831,352 | ) |
Net change in unrealized appreciation (depreciation) on investments | | | (2,200,960 | ) | | | (1,072,361 | ) |
| | | | | | | | |
Net decrease in net assets resulting from operations | | | (1,596,370 | ) | | | (3,001,029 | ) |
| | | | | | | | |
CAPITAL SHARE TRANSACTIONS: | | | | | | | | |
Proceeds from sale of shares | | | | | | | | |
Investor Class | | | 98,746,392 | | | | 353,378,731 | |
Advisor Class | | | 26,293,819 | | | | 29,701,725 | |
A-Class | | | 4,470,157 | | | | 7,556,407 | |
C-Class | | | 56,542,448 | | | | 128,873,486 | |
Cost of shares redeemed | | | | | | | | |
Investor Class | | | (99,518,199 | ) | | | (359,599,458 | ) |
Advisor Class | | | (27,450,204 | ) | | | (28,156,131 | ) |
A-Class | | | (5,415,408 | ) | | | (6,829,314 | ) |
C-Class | | | (57,348,385 | ) | | | (131,295,692 | ) |
| | | | | | | | |
Net decrease from capital share transactions | | | (3,679,380 | ) | | | (6,370,246 | ) |
| | | | | | | | |
Net decrease in net assets | | | (5,275,750 | ) | | | (9,371,275 | ) |
NET ASSETS: | | | | | | | | |
Beginning of year | | | 12,921,734 | | | | 22,293,009 | |
| | | | | | | | |
End of year | | $ | 7,645,984 | | | $ | 12,921,734 | |
| | | | | | | | |
Accumulated net investment loss at end of year | | $ | (14,534 | ) | | $ | — | |
| | | | | | | | |
CAPITAL SHARE ACTIVITY: | | | | | | | | |
Shares sold | | | | | | | | |
Investor Class | | | 1,826,514 | | | | 6,465,968 | |
Advisor Class | | | 530,537 | | | | 577,894 | |
A-Class | | | 90,548 | | | | 144,798 | |
C-Class | | | 1,191,961 | | | | 2,693,693 | |
Shares redeemed | | | | | | | | |
Investor Class | | | (1,842,695 | ) | | | (6,656,304 | ) |
Advisor Class | | | (560,085 | ) | | | (556,791 | ) |
A-Class | | | (106,039 | ) | | | (143,325 | ) |
C-Class | | | (1,209,292 | ) | | | (2,740,831 | ) |
| | | | | | | | |
Net decrease in shares | | | (78,551 | ) | | | (214,898 | ) |
| | | | | | | | |
| | | | |
| | | | | |
| 46 | | THE RYDEX FUNDSANNUALREPORT | | SEE NOTES TO FINANCIAL STATEMENTS. |
FINANCIAL HIGHLIGHTS
This table is presented to show selected data for a share outstanding throughout each period and to assist shareholders in evaluating a Fund’s performance for the periods presented.
| | | | | | | | | | | | | | | | | | | | |
Investor Class | | Year Ended
March 31,
2012 | | | Year Ended
March 31,
2011 | | | Year Ended
March 31,
2010d | | | Year Ended
March 31,
2009d | | | Year Ended
March 31,
2008d | |
Per Share Data | | | | | | | | | | | | | | | | | | | | |
Net asset value, beginning of period | | $ | 60.57 | | | $ | 52.33 | | | $ | 32.76 | | | $ | 50.30 | | | $ | 62.30 | |
| | | | | | | | | | | | | | | | | | | | |
Income (loss) from investment operations: | | | | | | | | | | | | | | | | | | | | |
Net investment lossa | | | (.12 | ) | | | (.13 | ) | | | (.02 | ) | | | (— | )b | | | (.25 | ) |
Net gain (loss) on investments (realized and unrealized) | | | (5.36 | ) | | | 8.37 | | | | 19.59 | | | | (17.54 | ) | | | (11.75 | ) |
| | | | | | | | | | | | | | | | | | | | |
Total from investment operations | | | (5.48 | ) | | | 8.24 | | | | 19.57 | | | | (17.54 | ) | | | (12.00 | ) |
| | | | | | | | | | | | | | | | | | | | |
Net asset value, end of period | | $ | 55.09 | | | $ | 60.57 | | | $ | 52.33 | | | $ | 32.76 | | | $ | 50.30 | |
| | | | | | | | | | | | | | | | | | | | |
Total Returnc | | | (9.05 | %) | | | 15.75 | % | | | 59.74 | % | | | (34.89 | %) | | | (19.26 | %) |
| | | | | | | | | | | | | | | | | | | | |
Ratios/Supplemental Data | | | | | | | | | | | | | | | | | | | | |
Net assets, end of period (in thousands) | | $ | 5,453 | | | $ | 6,976 | | | $ | 15,988 | | | $ | 106,703 | | | $ | 9,835 | |
| | | | | | | | | | | | | | | | | | | | |
Ratios to average net assets: | | | | | | | | | | | | | | | | | | | | |
Net investment loss | | | (0.22 | %) | | | (0.23 | %) | | | (0.06 | %) | | | (0.03 | %) | | | (0.37 | %) |
Total expenses | | | 1.35 | % | | | 1.39 | % | | | 1.38 | % | | | 1.34 | % | | | 1.36 | % |
| | | | | | | | | | | | | | | | | | | | |
Portfolio turnover rate | | | 1,329 | % | | | 1,171 | % | | | 592 | % | | | 408 | % | | | 784 | % |
| | | | | |
Advisor Class | | Year Ended
March 31,
2012 | | | Year Ended
March 31,
2011 | | | Year Ended
March 31,
2010d | | | Year Ended
March 31,
2009d | | | Year Ended
March 31,
2008d | |
Per Share Data | | | | | | | | | | | | | | | | | | | | |
Net asset value, beginning of period | | $ | 56.77 | | | $ | 49.26 | | | $ | 31.01 | | | $ | 47.80 | | | $ | 59.40 | |
| | | | | | | | | | | | | | | | | | | | |
Income (loss) from investment operations: | | | | | | | | | | | | | | | | | | | | |
Net investment lossa | | | (.34 | ) | | | (.41 | ) | | | (.16 | ) | | | (.10 | ) | | | (.60 | ) |
Net gain (loss) on investments (realized and unrealized) | | | (5.03 | ) | | | 7.92 | | | | 18.41 | | | | (16.69 | ) | | | (11.00 | ) |
| | | | | | | | | | | | | | | | | | | | |
Total from investment operations | | | (5.37 | ) | | | 7.51 | | | | 18.25 | | | | (16.79 | ) | | | (11.60 | ) |
| | | | | | | | | | | | | | | | | | | | |
Net asset value, end of period | | $ | 51.40 | | | $ | 56.77 | | | $ | 49.26 | | | $ | 31.01 | | | $ | 47.80 | |
| | | | | | | | | | | | | | | | | | | | |
Total Returnc | | | (9.46 | %) | | | 15.25 | % | | | 58.85 | % | | | (35.15 | %) | | | (19.53 | %) |
| | | | | | | | | | | | | | | | | | | | |
Ratios/Supplemental Data | | | | | | | | | | | | | | | | | | | | |
Net assets, end of period (in thousands) | | $ | 1,271 | | | $ | 3,081 | | | $ | 1,634 | | | $ | 3,152 | | | $ | 566 | |
| | | | | | | | | | | | | | | | | | | | |
Ratios to average net assets: | | | | | | | | | | | | | | | | | | | | |
Net investment loss | | | (0.67 | %) | | | (0.79 | %) | | | (0.39 | %) | | | (0.29 | %) | | | (0.98 | %) |
Total expenses | | | 1.86 | % | | | 1.89 | % | | | 1.87 | % | | | 1.86 | % | | | 1.88 | % |
| | | | | | | | | | | | | | | | | | | | |
Portfolio turnover rate | | | 1,329 | % | | | 1,171 | % | | | 592 | % | | | 408 | % | | | 784 | % |
| | | | |
| | | | | |
| SEE NOTES TO FINANCIAL STATEMENTS. | | THE RYDEX FUNDSANNUALREPORT | | 47 |
FINANCIAL HIGHLIGHTS (concluded)
This table is presented to show selected data for a share outstanding throughout each period and to assist shareholders in evaluating a Fund’s performance for the periods presented.
| | | | | | | | | | | | | | | | | | | | |
A-Class | | Year Ended
March 31,
2012 | | | Year Ended
March 31,
2011 | | | Year Ended
March 31,
2010d | | | Year Ended
March 31,
2009d | | | Year Ended
March 31,
2008d | |
Per Share Data | | | | | | | | | | | | | | | | | | | | |
Net asset value, beginning of period | | $ | 57.59 | | | $ | 49.88 | | | $ | 31.31 | | | $ | 48.25 | | | $ | 59.95 | |
| | | | | | | | | | | | | | | | | | | | |
Income (loss) from investment operations: | | | | | | | | | | | | | | | | | | | | |
Net investment lossa | | | (.19 | ) | | | (.21 | ) | | | (.14 | ) | | | (.10 | ) | | | (.55 | ) |
Net gain (loss) on investments (realized and unrealized) | | | (5.17 | ) | | | 7.92 | | | | 18.71 | | | | (16.84 | ) | | | (11.15 | ) |
| | | | | | | | | | | | | | | | | | | | |
Total from investment operations | | | (5.36 | ) | | | 7.71 | | | | 18.57 | | | | (16.94 | ) | | | (11.70 | ) |
| | | | | | | | | | | | | | | | | | | | |
Net asset value, end of period | | $ | 52.23 | | | $ | 57.59 | | | $ | 49.88 | | | $ | 31.31 | | | $ | 48.25 | |
| | | | | | | | | | | | | | | | | | | | |
Total Returnc | | | (9.31 | %) | | | 15.46 | % | | | 59.31 | % | | | (35.13 | %) | | | (19.52 | %) |
| | | | | | | | | | | | | | | | | | | | |
Ratios/Supplemental Data | | | | | | | | | | | | | | | | | | | | |
Net assets, end of period (in thousands) | | $ | 659 | | | $ | 1,619 | | | $ | 1,329 | | | $ | 42 | | | $ | 85 | |
| | | | | | | | | | | | | | | | | | | | |
Ratios to average net assets: | | | | | | | | | | | | | | | | | | | | |
Net investment loss | | | (0.36 | %) | | | (0.43 | %) | | | (0.31 | %) | | | (0.26 | %) | | | (0.90 | %) |
Total expenses | | | 1.62 | % | | | 1.64 | % | | | 1.62 | % | | | 1.60 | % | | | 1.62 | % |
| | | | | | | | | | | | | | | | | | | | |
Portfolio turnover rate | | | 1,329 | % | | | 1,171 | % | | | 592 | % | | | 408 | % | | | 784 | % |
| | | | | |
C-Class | | Year Ended
March 31,
2012 | | | Year Ended
March 31,
2011 | | | Year Ended
March 31,
2010d | | | Year Ended
March 31,
2009d | | | Year Ended
March 31,
2008d | |
Per Share Data | | | | | | | | | | | | | | | | | | | | |
Net asset value, beginning of period | | $ | 55.03 | | | $ | 47.90 | | | $ | 30.28 | | | $ | 46.90 | | | $ | 58.65 | |
| | | | | | | | | | | | | | | | | | | | |
Income (loss) from investment operations: | | | | | | | | | | | | | | | | | | | | |
Net investment lossa | | | (.70 | ) | | | (.65 | ) | | | (.51 | ) | | | (.30 | ) | | | (.75 | ) |
Net gain (loss) on investments (realized and unrealized) | | | (4.83 | ) | | | 7.78 | | | | 18.13 | | | | (16.32 | ) | | | (11.00 | ) |
| | | | | | | | | | | | | | | | | | | | |
Total from investment operations | | | (5.53 | ) | | | 7.13 | | | | 17.62 | | | | (16.62 | ) | | | (11.75 | ) |
| | | | | | | | | | | | | | | | | | | | |
Net asset value, end of period | | $ | 49.50 | | | $ | 55.03 | | | $ | 47.90 | | | $ | 30.28 | | | $ | 46.90 | |
| | | | | | | | | | | | | | | | | | | | |
Total Returnc | | | (10.01 | %) | | | 14.86 | % | | | 58.19 | % | | | (35.39 | %) | | | (20.03 | %) |
| | | | | | | | | | | | | | | | | | | | |
Ratios/Supplemental Data | | | | | | | | | | | | | | | | | | | | |
Net assets, end of period (in thousands) | | $ | 263 | | | $ | 1,246 | | | $ | 3,342 | | | $ | 460 | | | $ | 962 | |
| | | | | | | | | | | | | | | | | | | | |
Ratios to average net assets: | | | | | | | | | | | | | | | | | | | | |
Net investment loss | | | (1.42 | %) | | | (1.31 | %) | | | (1.21 | %) | | | (0.74 | %) | | | (1.26 | %) |
Total expenses | | | 2.36 | % | | | 2.39 | % | | | 2.38 | % | | | 2.42 | % | | | 2.38 | % |
| | | | | | | | | | | | | | | | | | | | |
Portfolio turnover rate | | | 1,329 | % | | | 1,171 | % | | | 592 | % | | | 408 | % | | | 784 | % |
| a | Net investment loss per share was computed using average shares outstanding throughout the period. |
| b | Net investment loss is less than $0.01 per share. |
| c | Total return does not reflect the impact of any applicable sales charges and has not been annualized. |
| d | Per share amounts for the period March 31, 2007–April 19, 2009 have been restated to reflect a 1:5 reverse stock split effective April 20, 2009. |
| | | | |
| | | | | |
| 48 | | THE RYDEX FUNDSANNUALREPORT | | SEE NOTES TO FINANCIAL STATEMENTS. |
This page intentionally left blank.
| | | | |
| | | | | |
| | THE RYDEX FUNDSANNUALREPORT | | 49 |
| | |
| PERFORMANCE REPORT AND FUND PROFILE (Unaudited) | | March 31, 2012 |
| | | |
ENERGY FUND
OBJECTIVE: Seeks to provide capital appreciation by investing in companies involved in the energy field, including the exploration, production and development of oil, gas, coal and alternative sources of energy (“Energy Companies”).
The price of a barrel of oil ended the fiscal year about where it started—slightly higher than $100, despite a drop in mid-2011 to below $80 as eurozone debt woes hampered expectations for economic growth. Still, global oil supply may struggle to keep up with demand, as the U.S. economic recovery gains strength and China growth continues, although at a somewhat slower pace. The price of natural gas was also pushed down by plentiful supply and has become a drag on earnings. The sector is expected to remain volatile as regional political uncertainties affect supply and the global economic recovery remains slow.
For the one-year period ended March 31, 2012, Energy Fund Investor Class returned -14.39%, compared with -6.86% for the S&P 500® Energy Index*.
Within the sector, the oil, gas & consumable fuels segment that composes about three-fourths of the Fund was the largest detractor from return. The segment most sensitive to changes in the price of oil, energy equipment & services, accounted for about 25% of the holdings, and it also detracted from return.
El Paso Corp., Kinder Morgan, Inc. and Exxon Mobil Corp. were among the most significant positive contributors to Fund performance for the year, while Peabody Energy Corp., Schlumberger Ltd. and Alpha Natural Resources, Inc. were among the weakest contributors.
*S&P 500® Energy Index is a sub-index of the S&P 500® Index, a capitalization-weighted index covering 500 industrial, utility, transportation and financial companies of the U.S. markets (mostly NYSE Euronext issues). The Energy index comprises companies whose businesses are dominated by either of the following activities: The construction or provision of oil rigs, drilling equipment and other energy-related equipment and services, including seismic data collection; companies engaged in the exploration, production, marketing, refining and/or transportation of oil and gas products, coal and other consumable fuels.
Performance displayed represents past performance which is no guarantee of future results.
Holdings Diversification (Market Exposure as % of Net Assets)
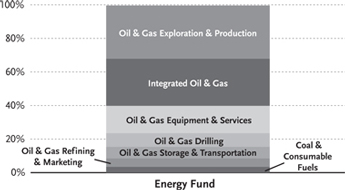
“Holdings Diversification (Market Exposure as % of Net Assets)” excludes any temporary cash investments.
| | | | |
Inception Dates: | |
Investor Class | | | April 21, 1998 | |
Advisor Class | | | May 5, 1998 | |
A-Class | | | September 1, 2004 | |
C-Class | | | April 19, 2001 | |
| | | | |
Ten Largest Holdings (% of Total Net Assets) | |
Exxon Mobil Corp. | | | 6.5 | % |
Chevron Corp. | | | 4.7 | % |
ConocoPhillips | | | 3.2 | % |
Schlumberger Ltd. | | | 3.0 | % |
Occidental Petroleum Corp. | | | 2.8 | % |
Anadarko Petroleum Corp. | | | 2.0 | % |
Apache Corp. | | | 2.0 | % |
Kinder Morgan, Inc. | | | 1.8 | % |
National Oilwell Varco, Inc. | | | 1.8 | % |
Petroleo Brasileiro S.A. ADR | | | 1.8 | % |
| | | | |
Top Ten Total | | | 29.6 | % |
| | | | |
“Ten Largest Holdings” exclude any temporary cash or derivative investments.
| | | | |
| | | | | |
| 50 | | THE RYDEX FUNDSANNUALREPORT | | |
| | |
| PERFORMANCE REPORT AND FUND PROFILE (Unaudited) (concluded) | | March 31, 2012 |
Cumulative Fund Performance*
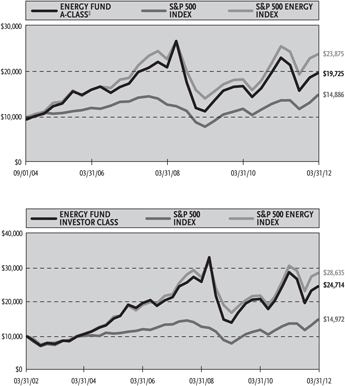
Average Annual Returns*
Periods Ended 03/31/12
| | | | | | | | | | | | |
| | | 1 Year | | | 5 Year | | | 10 Year | |
Investor Class Shares | | | -14.39 | % | | | 2.78 | % | | | 9.47 | % |
Advisor Class Shares | | | -14.78 | % | | | 2.28 | % | | | 8.95 | % |
C-Class Shares | | | -15.24 | % | | | 1.77 | % | | | 8.40 | % |
C-Class Shares with CDSC† | | | -16.09 | % | | | 1.77 | % | | | 8.40 | % |
S&P 500 Index | | | 8.54 | % | | | 2.01 | % | | | 4.12 | % |
S&P 500 Energy Index | | | -6.86 | % | | | 5.03 | % | | | 11.09 | % |
| | | |
| | | 1 Year | | | 5 Year | | | Since
Inception
(09/01/04) | |
A-Class Shares | | | -14.67 | % | | | 2.50 | % | | | 10.09 | % |
A-Class Shares with sales charge‡ | | | -18.73 | % | | | 1.51 | % | | | 9.38 | % |
S&P 500 Index | | | 8.54 | % | | | 2.01 | % | | | 5.41 | % |
S&P 500 Energy Index | | | -6.86 | % | | | 5.03 | % | | | 12.36 | % |
| * | The performance data above represents past performance that is not predictive of future results. The investment return and principal value of an investment in the Fund will fluctuate so that an investor’s shares, when redeemed, may be worth more or less than their original cost. Returns are historical and include changes in principal and reinvested dividends and capital gains and do not reflect the effect of taxes. The S&P 500 Index and the S&P 500 Energy Index are unmanaged indices and, unlike the Fund, have no management fees or operating expenses to reduce their reported returns. The graphs are based on Investor Class shares and A-Class shares only; performance for Advisor Class shares and C-Class shares will vary due to differences in fee structures. |
| † | Fund returns include a CDSC of 1% if redeemed within 12 months of purchase. |
| ‡ | Fund returns are calculated using the maximum sales charge of 4.75%. |
| | | | |
| | | | | |
| | THE RYDEX FUNDSANNUALREPORT | | 51 |
| | |
| SCHEDULE OF INVESTMENTS | | March 31, 2012 |
| ENERGY FUND | | |
| | | | | | | | |
| | | SHARES | | | VALUE | |
COMMON STOCKS† - 99.5% | |
Oil & Gas Exploration & Production - 31.7% | |
Anadarko Petroleum Corp. | | | 17,852 | | | $ | 1,398,525 | |
Apache Corp. | | | 13,840 | | | | 1,390,090 | |
EOG Resources, Inc. | | | 11,105 | | | | 1,233,766 | |
Devon Energy Corp. | | | 16,922 | | | | 1,203,493 | |
Marathon Oil Corp. | | | 32,941 | | | | 1,044,230 | |
Noble Energy, Inc. | | | 9,731 | | | | 951,497 | |
Continental Resources, Inc.* | | | 10,536 | | | | 904,200 | |
Pioneer Natural Resources Co. | | | 7,854 | | | | 876,428 | |
Chesapeake Energy Corp. | | | 36,939 | | | | 855,877 | |
Cobalt International Energy, Inc.* | | | 25,400 | | | | 762,762 | |
Concho Resources, Inc.* | | | 7,361 | | | | 751,411 | |
Southwestern Energy Co.* | | | 23,392 | | | | 715,795 | |
Range Resources Corp. | | | 11,581 | | | | 673,319 | |
Canadian Natural Resources Ltd. | | | 18,528 | | | | 614,759 | |
Denbury Resources, Inc.* | | | 32,878 | | | | 599,366 | |
Equities Corp. | | | 12,410 | | | | 598,286 | |
Whiting Petroleum Corp.* | | | 10,466 | | | | 568,304 | |
Cabot Oil & Gas Corp. | | | 18,202 | | | | 567,356 | |
Cimarex Energy Co. | | | 7,453 | | | | 562,478 | |
Encana Corp. | | | 28,198 | | | | 554,091 | |
Plains Exploration & Production Co.* | | | 12,274 | | | | 523,486 | |
QEP Resources, Inc. | | | 16,984 | | | | 518,012 | |
Newfield Exploration Co.* | | | 14,112 | | | | 489,404 | |
SM Energy Co. | | | 6,568 | | | | 464,817 | |
Talisman Energy, Inc. | | | 36,722 | | | | 462,697 | |
CNOOC Ltd. ADR | | | 2,230 | | | | 455,567 | |
WPX Energy, Inc.* | | | 23,635 | | | | 425,666 | |
Nexen, Inc. | | | 22,838 | | | | 419,077 | |
Ultra Petroleum Corp.* | | | 18,017 | | | | 407,725 | |
Oasis Petroleum, Inc.* | | | 12,718 | | | | 392,096 | |
Energy XXI Bermuda Ltd.* | | | 10,584 | | | | 382,188 | |
Kodiak Oil & Gas Corp.* | | | 36,102 | | | | 359,576 | |
Berry Petroleum Co. — Class A | | | 7,550 | | | | 355,832 | |
| | | | | | | | |
Total Oil & Gas Exploration & Production | | | | 22,482,176 | |
| | | | | | | | |
Integrated Oil & Gas - 28.0% | |
Exxon Mobil Corp. | | | 53,383 | | | | 4,629,908 | |
Chevron Corp. | | | 30,900 | | | | 3,313,716 | |
ConocoPhillips | | | 29,351 | | | | 2,230,970 | |
Occidental Petroleum Corp. | | | 20,844 | | | | 1,984,974 | |
Petroleo Brasileiro S.A. ADR | | | 46,809 | | | | 1,243,247 | |
BP plc ADR | | | 23,615 | | | | 1,062,675 | |
Hess Corp. | | | 17,002 | | | | 1,002,268 | |
Murphy Oil Corp. | | | 13,281 | | | | 747,322 | |
Suncor Energy, Inc. | | | 21,648 | | | | 707,890 | |
Royal Dutch Shell plc ADR | | | 9,207 | | | | 645,687 | |
Total S.A. ADR | | | 10,954 | | | | 559,968 | |
PetroChina Company Ltd. ADR | | | 3,190 | | | | 448,291 | |
Statoil ASA ADR | | | 15,768 | | | | 427,470 | |
Cenovus Energy, Inc. | | | 11,759 | | | | 422,618 | |
SandRidge Energy, Inc.* | | | 52,412 | | | | 410,386 | |
| | | | | | | | |
Total Integrated Oil & Gas | | | | | | | 19,837,390 | |
| | | | | | | | |
| | | | | | | | |
| | | SHARES | | | VALUE | |
Oil & Gas Equipment & Services - 16.3% | |
Schlumberger Ltd. | | | 30,277 | | | $ | 2,117,271 | |
National Oilwell Varco, Inc. | | | 16,382 | | | | 1,301,878 | |
Halliburton Co. | | | 37,135 | | | | 1,232,511 | |
Baker Hughes, Inc. | | | 21,882 | | | | 917,731 | |
Cameron International Corp.* | | | 15,599 | | | | 824,095 | |
FMC Technologies, Inc.* | | | 15,653 | | | | 789,224 | |
Weatherford International Ltd.* | | | 48,579 | | | | 733,057 | |
Core Laboratories N.V. | | | 4,427 | | | | 582,460 | |
Oceaneering International, Inc. | | | 10,363 | | | | 558,462 | |
Tenaris S.A. ADR | | | 12,070 | | | | 461,436 | |
Superior Energy Services, Inc.* | | | 17,069 | | | | 449,939 | |
Oil States International, Inc.* | | | 5,740 | | | | 448,064 | |
McDermott International, Inc.* | | | 30,359 | | | | 388,899 | |
Tidewater, Inc. | | | 7,005 | | | | 378,410 | |
Key Energy Services, Inc.* | | | 21,976 | | | | 339,529 | |
| | | | | | | | |
Total Oil & Gas Equipment & Services | | | | 11,522,966 | |
| | | | | | | | |
Oil & Gas Drilling - 8.2% | | | | | |
Transocean Ltd. | | | 17,905 | | | | 979,404 | |
Seadrill Ltd. | | | 25,500 | | | | 956,505 | |
Noble Corp.* | | | 18,177 | | | | 681,092 | |
Diamond Offshore Drilling, Inc. | | | 10,125 | | | | 675,844 | |
Ensco plc ADR | | | 12,522 | | | | 662,789 | |
Helmerich & Payne, Inc. | | | 9,802 | | | | 528,818 | |
Nabors Industries Ltd.* | | | 27,349 | | | | 478,334 | |
Rowan Companies, Inc.* | | | 13,482 | | | | 443,962 | |
Patterson-UTI Energy, Inc. | | | 21,261 | | | | 367,603 | |
| | | | | | | | |
Total Oil & Gas Drilling | | | | 5,774,351 | �� |
| | | | | | | | |
Oil & Gas Storage & Transportation - 6.9% | |
Kinder Morgan, Inc. | | | 33,812 | | | | 1,306,834 | |
El Paso Corp. | | | 37,134 | | | | 1,097,310 | |
Spectra Energy Corp. | | | 32,579 | | | | 1,027,867 | |
Williams Companies, Inc. | | | 31,605 | | | | 973,750 | |
Energy Transfer Equity, LP | | | 12,263 | | | | 494,199 | |
| | | | | | | | |
Total Oil & Gas Storage & Transportation | | | | 4,899,960 | |
| | | | | | | | |
Oil & Gas Refining & Marketing - 5.0% | | | | | |
Marathon Petroleum Corp. | | | 20,431 | | | | 885,888 | |
Valero Energy Corp. | | | 32,414 | | | | 835,309 | |
HollyFrontier Corp. | | | 17,449 | | | | 560,985 | |
Sunoco, Inc. | | | 11,805 | | | | 450,361 | |
Tesoro Corp.* | | | 15,911 | | | | 427,051 | |
| | |
World Fuel Services Corp. | | | 9,459 | | | | 387,819 | |
| | | | | | | | |
Total Oil & Gas Refining & Marketing | | | | 3,547,413 | |
| | | | | | | | |
Coal & Consumable Fuels - 3.4% | | | | | |
Consol Energy, Inc. | | | 18,524 | | | | 631,668 | |
Peabody Energy Corp. | | | 21,228 | | | | 614,763 | |
Cameco Corp. | | | 21,156 | | | | 454,642 | |
Alpha Natural Resources, Inc.* | | | 26,251 | | | | 399,278 | |
Arch Coal, Inc. | | | 30,238 | | | | 323,849 | |
| | | | | | | | |
Total Coal & Consumable Fuels | | | | 2,424,200 | |
| | | | | | | | |
Total Common Stocks
(Cost $41,645,269) | | | | 70,488,456 | |
| | | | | | | | |
| | | | |
| | | | | |
| 52 | | THE RYDEX FUNDSANNUALREPORT | | SEE NOTES TO FINANCIAL STATEMENTS. |
| | |
| SCHEDULE OF INVESTMENTS (concluded) | | March 31, 2012 |
| ENERGY FUND | | |
| | | | | | | | |
| | | FACE
AMOUNT | | | VALUE | |
REPURCHASE AGREEMENT††,1 - 0.6% | |
Credit Suisse Group issued 03/30/12 at 0.01% due 04/02/12 | | $ | 396,827 | | | $ | 396,827 | |
| | | | | | | | |
Total Repurchase Agreement
(Cost $396,827) | | | | 396,827 | |
| | | | | | | | |
Total Investments - 100.1%
(Cost $42,042,096) | | | $ | 70,885,283 | |
| | | | | | | | |
Other Assets & Liabilities, net - (0.1)% | | | | (83,620 | ) |
| | | | | | | | |
Total Net Assets - 100.0% | | | | | | $ | 70,801,663 | |
| * | Non-income producing security. |
| † | Value determined based on Level 1 inputs — See Note 4. |
| †† | Value determined based on Level 2 inputs — See Note 4. |
| 1 | Repurchase Agreement — See Note 5. |
ADR — American Depositary Receipt
plc — Public Limited Company
| | | | |
| | | | | |
| SEE NOTES TO FINANCIAL STATEMENTS. | | THE RYDEX FUNDSANNUALREPORT | | 53 |
| | | | |
| STATEMENT OF ASSETS AND LIABILITIES | |
| March 31, 2012 | | | | |
| |
ASSETS: | | | | |
Investments, at value
(cost $41,645,269) | | $ | 70,488,456 | |
Repurchase agreements, at value
(cost $396,827) | | | 396,827 | |
| | | | |
Total investments
(cost $42,042,096) | | | 70,885,283 | |
Cash | | | 15,898 | |
Receivables: | | | | |
Fund shares sold | | | 1,342,203 | |
Securities sold | | | 731,294 | |
Dividends | | | 36,304 | |
Foreign taxes reclaim | | | 2,698 | |
| | | | |
Total assets | | | 73,013,680 | |
| | | | |
LIABILITIES: | | | | |
Payable for: | | | | |
Fund shares redeemed | | | 2,072,948 | |
Management fees | | | 53,658 | |
Distribution and service fees | | | 18,016 | |
Transfer agent and administrative fees | | | 15,782 | |
Portfolio accounting fees | | | 6,313 | |
Miscellaneous | | | 45,300 | |
| | | | |
Total liabilities | | | 2,212,017 | |
| | | | |
NET ASSETS | | $ | 70,801,663 | |
| | | | |
NET ASSETS CONSIST OF: | | | | |
Paid in capital | | $ | 65,278,837 | |
Accumulated net investment loss | | | (2,890 | ) |
Accumulated net realized loss on investments | | | (23,317,471 | ) |
Net unrealized appreciation on investments | | | 28,843,187 | |
| | | | |
Net assets | | $ | 70,801,663 | |
| | | | |
INVESTOR CLASS: | | | | |
Net assets | | $ | 40,946,677 | |
Capital shares outstanding | | | 1,666,179 | |
Net asset value per share | | $ | 24.58 | |
| | | | |
ADVISOR CLASS: | | | | |
Net assets | | $ | 11,079,772 | |
Capital shares outstanding | | | 482,858 | |
Net asset value per share | | $ | 22.95 | |
| | | | |
A-CLASS: | | | | |
Net assets | | $ | 5,622,386 | |
Capital shares outstanding | | | 240,428 | |
Net asset value per share | | $ | 23.38 | |
| | | | |
Maximum offering price per share
(Net asset value divided by 95.25%) | | $ | 24.55 | |
| | | | |
C-CLASS: | | | | |
Net assets | | $ | 13,152,828 | |
Capital shares outstanding | | | 601,933 | |
Net asset value per share | | $ | 21.85 | |
| | | | |
| | | | |
| STATEMENT OF OPERATIONS | |
| Year Ended March 31, 2012 | | | | |
| |
INVESTMENT INCOME: | | | | |
Dividends (net of foreign withholding tax of $35,233) | | $ | 1,405,812 | |
Interest | | | 91 | |
| | | | |
Total investment income | | | 1,405,903 | |
| | | | |
EXPENSES: | | | | |
Management fees | | | 751,019 | |
Transfer agent and administrative fees | | | 220,887 | |
Distribution and service fees: | | | | |
Advisor Class | | | 45,495 | |
A-Class | | | 20,533 | |
C-Class | | | 146,808 | |
Portfolio accounting fees | | | 88,354 | |
Custodian fees | | | 23,631 | |
Trustees’ fees* | | | 8,504 | |
Miscellaneous | | | 104,409 | |
| | | | |
Total expenses | | | 1,409,640 | |
| | | | |
Net investment loss | | | (3,737 | ) |
| | | | |
NET REALIZED AND UNREALIZED GAIN (LOSS): | | | | |
Net realized gain (loss) on: | | | | |
Investments | | | (5,643,611 | ) |
| | | | |
Net realized loss | | | (5,643,611 | ) |
| | | | |
Net change in unrealized appreciation (depreciation) on: | | | | |
Investments | | | (21,665,145 | ) |
| | | | |
Net change in unrealized appreciation (depreciation) | | | (21,665,145 | ) |
| | | | |
Net realized and unrealized loss | | | (27,308,756 | ) |
| | | | |
Net decrease in net assets resulting from operations | | $ | (27,312,493 | ) |
| | | | |
| * | Relates to Trustees not deemed “interested persons” within the meaning of Section 2(a)(19) of the 1940 Act. |
| | | | |
| | | | | |
| 54 | | THE RYDEX FUNDSANNUALREPORT | | SEE NOTES TO FINANCIAL STATEMENTS. |
STATEMENTS OF CHANGES IN NET ASSETS
| | | | | | | | |
| | | Year Ended
March 31,
2012 | | | Year Ended
March 31,
2011 | |
INCREASE (DECREASE) IN NET ASSETS FROM OPERATIONS: | | | | | | | | |
Net investment loss | | $ | (3,737 | ) | | $ | (201,866 | ) |
Net realized gain (loss) on investments | | | (5,643,611 | ) | | | 4,967,964 | |
Net change in unrealized appreciation (depreciation) on investments | | | (21,665,145 | ) | | | 24,910,039 | |
| | | | | | | | |
Net increase (decrease) in net assets resulting from operations | | | (27,312,493 | ) | | | 29,676,137 | |
| | | | | | | | |
DISTRIBUTIONS TO SHAREHOLDERS FROM: | | | | | | | | |
Net investment income | | | | | | | | |
Investor Class | | | — | | | | (57,578 | ) |
Advisor Class | | | — | | | | (8,833 | ) |
A-Class | | | — | | | | (6,392 | ) |
C-Class | | | — | | | | (19,609 | ) |
| | | | | | | | |
Total distributions to shareholders | | | — | | | | (92,412 | ) |
| | | | | | | | |
CAPITAL SHARE TRANSACTIONS: | | | | | | | | |
Proceeds from sale of shares | | | | | | | | |
Investor Class | | | 259,673,506 | | | | 288,061,481 | |
Advisor Class | | | 45,234,147 | | | | 18,472,831 | |
A-Class | | | 36,601,233 | | | | 18,443,868 | |
C-Class | | | 70,279,961 | | | | 76,637,847 | |
Distributions reinvested | | | | | | | | |
Investor Class | | | — | | | | 56,100 | |
Advisor Class | | | — | | | | 8,744 | |
A-Class | | | — | | | | 4,737 | |
C-Class | | | — | | | | 18,406 | |
Cost of shares redeemed | | | | | | | | |
Investor Class | | | (294,390,687 | ) | | | (248,929,384 | ) |
Advisor Class | | | (47,103,298 | ) | | | (11,587,850 | ) |
A-Class | | | (42,750,254 | ) | | | (10,355,093 | ) |
C-Class | | | (73,838,306 | ) | | | (75,599,238 | ) |
| | | | | | | | |
Net increase (decrease) from capital share transactions | | | (46,293,698 | ) | | | 55,232,449 | |
| | | | | | | | |
Net increase (decrease) in net assets | | | (73,606,191 | ) | | | 84,816,174 | |
NET ASSETS: | | | | | | | | |
Beginning of year | | | 144,407,854 | | | | 59,591,680 | |
| | | | | | | | |
End of year | | $ | 70,801,663 | | | $ | 144,407,854 | |
| | | | | | | | |
Accumulated net investment loss at end of year | | $ | (2,890 | ) | | $ | — | |
| | | | | | | | |
CAPITAL SHARE ACTIVITY: | | | | | | | | |
Shares sold | | | | | | | | |
Investor Class | | | 10,314,220 | | | | 11,988,260 | |
Advisor Class | | | 2,028,589 | | | | 820,658 | |
A-Class | | | 1,545,449 | | | | 766,871 | |
C-Class | | | 3,174,677 | | | | 3,852,683 | |
Shares issued from reinvestment of distributions | | | | | | | | |
Investor Class | | | — | | | | 2,456 | |
Advisor Class | | | — | | | | 407 | |
A-Class | | | — | | | | 217 | |
C-Class | | | — | | | | 894 | |
Shares redeemed | | | | | | | | |
Investor Class | | | (11,910,644 | ) | | | (10,412,527 | ) |
Advisor Class | | | (2,140,312 | ) | | | (555,486 | ) |
A-Class | | | (1,843,425 | ) | | | (423,733 | ) |
C-Class | | | (3,348,275 | ) | | | (3,814,448 | ) |
| | | | | | | | |
Net increase (decrease) in shares | | | (2,179,721 | ) | | | 2,226,252 | |
| | | | | | | | |
| | | | |
| | | | | |
| SEE NOTES TO FINANCIAL STATEMENTS. | | THE RYDEX FUNDSANNUALREPORT | | 55 |
FINANCIAL HIGHLIGHTS
This table is presented to show selected data for a share outstanding throughout each period and to assist shareholders in evaluating a Fund’s performance for the periods presented.
| | | | | | | | | | | | | | | | | | | | |
Investor Class | | Year Ended
March 31,
2012 | | | Year Ended
March 31,
2011 | | | Year Ended
March 31,
2010 | | | Year Ended
March 31,
2009 | | | Year Ended
March 31,
2008 | |
Per Share Data | | | | | | | | | | | | | | | | | | | | |
Net asset value, beginning of period | | $ | 28.70 | | | $ | 20.91 | | | $ | 14.01 | | | $ | 27.29 | | | $ | 23.19 | |
| | | | | | | | | | | | | | | | | | | | |
Income (loss) from investment operations: | | | | | | | | | | | | | | | | | | | | |
Net investment income (loss)a | | | .07 | | | | — | b | | | .10 | | | | .06 | | | | (.03 | ) |
Net gain (loss) on investments (realized and unrealized) | | | (4.19 | ) | | | 7.82 | | | | 6.82 | | | | (12.61 | ) | | | 4.86 | |
| | | | | | | | | | | | | | | | | | | | |
Total from investment operations | | | (4.12 | ) | | | 7.82 | | | | 6.92 | | | | (12.55 | ) | | | 4.83 | |
| | | | | | | | | | | | | | | | | | | | |
Less distributions from: | | | | | | | | | | | | | | | | | | | | |
Net investment income | | | — | | | | (.03 | ) | | | (.02 | ) | | | — | | | | — | |
Net realized gains | | | — | | | | — | | | | — | | | | (.73 | ) | | | (.73 | ) |
| | | | | | | | | | | | | | | | | | | | |
Total distributions | | | — | | | | (.03 | ) | | | (.02 | ) | | | (.73 | ) | | | (.73 | ) |
| | | | | | | | | | | | | | | | | �� | | | |
Net asset value, end of period | | $ | 24.58 | | | $ | 28.70 | | | $ | 20.91 | | | $ | 14.01 | | | $ | 27.29 | |
| | | | | | | | | | | | | | | | | | | | |
Total Returnc | | | (14.39 | %) | | | 37.43 | % | | | 49.37 | % | | | (46.01 | %) | | | 20.91 | % |
| | | | | | | | | | | | | | | | | | | | |
Ratios/Supplemental Data | | | | | | | | | | | | | | | | | | | | |
Net assets, end of period (in thousands) | | $ | 40,947 | | | $ | 93,648 | | | $ | 35,228 | | | $ | 53,627 | | | $ | 63,325 | |
| | | | | | | | | | | | | | | | | | | | |
Ratios to average net assets: | | | | | | | | | | | | | | | | | | | | |
Net investment income (loss) | | | 0.27 | % | | | 0.00 | % | | | 0.51 | % | | | 0.28 | % | | | (0.10 | %) |
Total expenses | | | 1.36 | % | | | 1.39 | % | | | 1.38 | % | | | 1.37 | % | | | 1.37 | % |
| | | | | | | | | | | | | | | | | | | | |
Portfolio turnover rate | | | 288 | % | | | 273 | % | | | 228 | % | | | 310 | % | | | 188 | % |
| | | | | |
Advisor Class | | Year Ended
March 31,
2012 | | | Year Ended
March 31,
2011 | | | Year Ended
March 31,
2010 | | | Year Ended
March 31,
2009 | | | Year Ended
March 31,
2008 | |
Per Share Data | | | | | | | | | | | | | | | | | | | | |
Net asset value, beginning of period | | $ | 26.93 | | | $ | 19.72 | | | $ | 13.28 | | | $ | 26.07 | | | $ | 22.29 | |
| | | | | | | | | | | | | | | | | | | | |
Income (loss) from investment operations: | | | | | | | | | | | | | | | | | | | | |
Net investment lossa | | | (.08 | ) | | | (.11 | ) | | | (— | )b | | | (.04 | ) | | | (.15 | ) |
Net gain (loss) on investments (realized and unrealized) | | | (3.90 | ) | | | 7.35 | | | | 6.46 | | | | (12.02 | ) | | | 4.66 | |
| | | | | | | | | | | | | | | | | | | | |
Total from investment operations | | | (3.98 | ) | | | 7.24 | | | | 6.46 | | | | (12.06 | ) | | | 4.51 | |
| | | | | | | | | | | | | | | | | | | | |
Less distributions from: | | | | | | | | | | | | | | | | | | | | |
Net investment income | | | — | | | | (.03 | ) | | | (.02 | ) | | | — | | | | — | |
Net realized gains | | | — | | | | — | | | | — | | | | (.73 | ) | | | (.73 | ) |
| | | | | | | | | | | | | | | | | | | | |
Total distributions | | | — | | | | (.03 | ) | | | (.02 | ) | | | (.73 | ) | | | (.73 | ) |
| | | | | | | | | | | | | | | | | | | | |
Net asset value, end of period | | $ | 22.95 | | | $ | 26.93 | | | $ | 19.72 | | | $ | 13.28 | | | $ | 26.07 | |
| | | | | | | | | | | | | | | | | | | | |
Total Returnc | | | (14.78 | %) | | | 36.75 | % | | | 48.62 | % | | | (46.29 | %) | | | 20.31 | % |
| | | | | | | | | | | | | | | | | | | | |
Ratios/Supplemental Data | | | | | | | | | | | | | | | | | | | | |
Net assets, end of period (in thousands) | | $ | 11,080 | | | $ | 16,015 | | | $ | 6,489 | | | $ | 4,679 | | | $ | 17,713 | |
| | | | | | | | | | | | | | | | | | | | |
Ratios to average net assets: | | | | | | | | | | | | | | | | | | | | |
Net investment loss | | | (0.33 | %) | | | (0.53 | %) | | | (0.02 | %) | | | (0.16 | %) | | | (0.58 | %) |
Total expenses | | | 1.86 | % | | | 1.89 | % | | | 1.88 | % | | | 1.88 | % | | | 1.86 | % |
| | | | | | | | | | | | | | | | | | | | |
Portfolio turnover rate | | | 288 | % | | | 273 | % | | | 228 | % | | | 310 | % | | | 188 | % |
| | | | |
| | | | | |
| 56 | | THE RYDEX FUNDSANNUALREPORT | | SEE NOTES TO FINANCIAL STATEMENTS. |
FINANCIAL HIGHLIGHTS (concluded)
This table is presented to show selected data for a share outstanding throughout each period and to assist shareholders in evaluating a Fund’s performance for the periods presented.
| | | | | | | | | | | | | | | | | | | | |
A-Class | | Year Ended
March 31,
2012 | | | Year Ended
March 31,
2011 | | | Year Ended
March 31,
2010 | | | Year Ended
March 31,
2009 | | | Year Ended
March 31,
2008 | |
Per Share Data | | | | | | | | | | | | | | | | | | | | |
Net asset value, beginning of period | | $ | 27.40 | | | $ | 20.01 | | | $ | 13.44 | | | $ | 26.30 | | | $ | 22.44 | |
| | | | | | | | | | | | | | | | | | | | |
Income (loss) from investment operations: | | | | | | | | | | | | | | | | | | | | |
Net investment income (loss)a | | | (.01 | ) | | | (.08 | ) | | | .06 | | | | .02 | | | | (.08 | ) |
Net gain (loss) on investments (realized and unrealized) | | | (4.01 | ) | | | 7.50 | | | | 6.53 | | | | (12.15 | ) | | | 4.67 | |
| | | | | | | | | | | | | | | | | | | | |
Total from investment operations | | | (4.02 | ) | | | 7.42 | | | | 6.59 | | | | (12.13 | ) | | | 4.59 | |
| | | | | | | | | | | | | | | | | | | | |
Less distributions from: | | | | | | | | | | | | | | | | | | | | |
Net investment income | | | — | | | | (.03 | ) | | | (.02 | ) | | | — | | | | — | |
Net realized gains | | | — | | | | — | | | | — | | | | (.73 | ) | | | (.73 | ) |
| | | | | | | | | | | | | | | | | | | | |
Total distributions | | | — | | | | (.03 | ) | | | (.02 | ) | | | (.73 | ) | | | (.73 | ) |
| | | | | | | | | | | | | | | | | | | | |
Net asset value, end of period | | $ | 23.38 | | | $ | 27.40 | | | $ | 20.01 | | | $ | 13.44 | | | $ | 26.30 | |
| | | | | | | | | | | | | | | | | | | | |
Total Returnc | | | (14.67 | %) | | | 37.11 | % | | | 49.01 | % | | | (46.15 | %) | | | 20.54 | % |
| | | | | | | | | | | | | | | | | | | | |
Ratios/Supplemental Data | | | | | | | | | | | | | | | | | | | | |
Net assets, end of period (in thousands) | | $ | 5,622 | | | $ | 14,752 | | | $ | 3,903 | | | $ | 4,845 | | | $ | 6,378 | |
| | | | | | | | | | | | | | | | | | | | |
Ratios to average net assets: | | | | | | | | | | | | | | | | | | | | |
Net investment income (loss) | | | (0.05 | %) | | | (0.38 | %) | | | 0.35 | % | | | 0.10 | % | | | (0.31 | %) |
Total expenses | | | 1.61 | % | | | 1.64 | % | | | 1.63 | % | | | 1.63 | % | | | 1.61 | % |
| | | | | | | | | | | | | | | | | | | | |
Portfolio turnover rate | | | 288 | % | | | 273 | % | | | 228 | % | | | 310 | % | | | 188 | % |
| | | | | |
C-Class | | Year Ended
March 31,
2012 | | | Year Ended
March 31,
2011 | | | Year Ended
March 31,
2010 | | | Year Ended
March 31,
2009 | | | Year Ended
March 31,
2008 | |
Per Share Data | | | | | | | | | | | | | | | | | | | | |
Net asset value, beginning of period | | $ | 25.78 | | | $ | 18.97 | | | $ | 12.84 | | | $ | 25.37 | | | $ | 21.81 | |
| | | | | | | | | | | | | | | | | | | | |
Income (loss) from investment operations: | | | | | | | | | | | | | | | | | | | | |
Net investment lossa | | | (.19 | ) | | | (.20 | ) | | | (.08 | ) | | | (.14 | ) | | | (.27 | ) |
Net gain (loss) on investments (realized and unrealized) | | | (3.74 | ) | | | 7.04 | | | | 6.23 | | | | (11.66 | ) | | | 4.56 | |
| | | | | | | | | | | | | | | | | | | | |
Total from investment operations | | | (3.93 | ) | | | 6.84 | | | | 6.15 | | | | (11.80 | ) | | | 4.29 | |
| | | | | | | | | | | | | | | | | | | | |
Less distributions from: | | | | | | | | | | | | | | | | | | | | |
Net investment income | | | — | | | | (.03 | ) | | | (.02 | ) | | | — | | | | — | |
Net realized gains | | | — | | | | — | | | | — | | | | (.73 | ) | | | (.73 | ) |
| | | | | | | | | | | | | | | | | | | | |
Total distributions | | | — | | | | (.03 | ) | | | (.02 | ) | | | (.73 | ) | | | (.73 | ) |
| | | | | | | | | | | | | | | | | | | | |
Net asset value, end of period | | $ | 21.85 | | | $ | 25.78 | | | $ | 18.97 | | | $ | 12.84 | | | $ | 25.37 | |
| | | | | | | | | | | | | | | | | | | | |
Total Returnc | | | (15.24 | %) | | | 36.09 | % | | | 47.87 | % | | | (46.55 | %) | | | 19.74 | % |
| | | | | | | | | | | | | | | | | | | | |
Ratios/Supplemental Data | | | | | | | | | | | | | | | | | | | | |
Net assets, end of period (in thousands) | | $ | 13,153 | | | $ | 19,993 | | | $ | 13,972 | | | $ | 9,865 | | | $ | 20,989 | |
| | | | | | | | | | | | | | | | | | | | |
Ratios to average net assets: | | | | | | | | | | | | | | | | | | | | |
Net investment loss | | | (0.84 | %) | | | (0.99 | %) | | | (0.48 | %) | | | (0.65 | %) | | | (1.07 | %) |
Total expenses | | | 2.36 | % | | | 2.39 | % | | | 2.38 | % | | | 2.38 | % | | | 2.36 | % |
| | | | | | | | | | | | | | | | | | | | |
Portfolio turnover rate | | | 288 | % | | | 273 | % | | | 228 | % | | | 310 | % | | | 188 | % |
| a | Net investment income (loss) per share was computed using average shares outstanding throughout the period. |
| b | Net investment loss is less than $0.01 per share. |
| c | Total return does not reflect the impact of any applicable sales charges and has not been annualized. |
| | | | |
| | | | | |
| SEE NOTES TO FINANCIAL STATEMENTS. | | THE RYDEX FUNDSANNUALREPORT | | 57 |
| | |
| PERFORMANCE REPORT AND FUND PROFILE (Unaudited) | | March 31, 2012 |
| | | |
ENERGY SERVICES FUND
OBJECTIVE: Seeks to provide capital appreciation by investing in companies that are involved in the energy services field, including those that provide services and equipment in the areas of oil, coal and gas exploration and production (“Energy Services Companies”).
The energy equipment and services providers that make up this Fund, and typically are sensitive to changes in the price of oil, responded to the jump in oil prices in early 2011 and then again in early 2012, despite a drop in mid-2011 to below $80 as eurozone debt woes hampered expectations for economic growth. The sector is expected to remain volatile as regional political uncertainties affect supply and the global economic recovery remains slow.
For the one-year period ended March 31, 2012, Energy Services Fund Investor Class returned -18.82%, compared with the S&P 500® Energy Index*, which returned -6.86%.
The energy equipment & services holdings in this Fund, which makes up 98% of the portfolio, accounted for most of the Fund’s negative return for the period.
Seadrill Ltd., Oceaneering International, Inc. and Core Laboratories N.V. were among the Fund’s best-performing stocks for the year. The Fund’s worst-performing holdings included Halliburton Co., Baker Hughes, Inc. and Schlumberger Ltd.
*S&P 500® Energy Index is a sub-index of the S&P 500® Index, a capitalization-weighted index covering 500 industrial, utility, transportation and financial companies of the U.S. markets (mostly NYSE Euronext issues). The Energy index comprises companies whose businesses are dominated by either of the following activities: The construction or provision of oil rigs, drilling equipment and other energy-related equipment and services, including seismic data collection; companies engaged in the exploration, production, marketing, refining and/or transportation of oil and gas products, coal and other consumable fuels.
Performance displayed represents past performance which is no guarantee of future results.
Holdings Diversification (Market Exposure
as % of Net Assets)
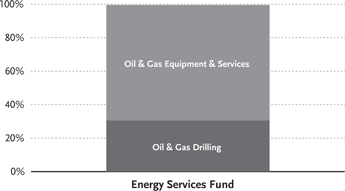
“Holdings Diversification (Market Exposure as % of Net Assets)” excludes any temporary cash investments.
| | | | |
Inception Dates: | |
Investor Class | | | April 1, 1998 | |
Advisor Class | | | April 2, 1998 | |
A-Class | | | September 1, 2004 | |
C-Class | | | March 30, 2001 | |
| | | | |
Ten Largest Holdings (% of Total Net Assets) | |
Schlumberger Ltd. | | | 10.1 | % |
National Oilwell Varco, Inc. | | | 6.2 | % |
Halliburton Co. | | | 5.9 | % |
Transocean Ltd. | | | 4.7 | % |
Seadrill Ltd. | | | 4.6 | % |
Baker Hughes, Inc. | | | 4.4 | % |
Cameron International Corp. | | | 3.9 | % |
FMC Technologies, Inc. | | | 3.8 | % |
Weatherford International Ltd. | | | 3.5 | % |
Noble Corp. | | | 3.3 | % |
| | | | |
Top Ten Total | | | 50.4 | % |
| | | | |
“Ten Largest Holdings” exclude any temporary cash or derivative investments.
| | | | |
| | | | | |
| 58 | | THE RYDEX FUNDSANNUALREPORT | | |
| | |
| PERFORMANCE REPORT AND FUND PROFILE (Unaudited) (concluded) | | March 31, 2012 |
| | | |
Cumulative Fund Performance*
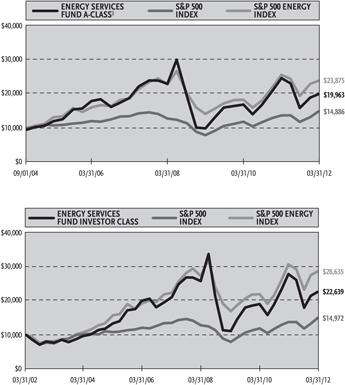
Average Annual Returns*
Periods Ended 03/31/12
| | | | | | | | | | | | |
| | | 1 Year | | | 5 Year | | | 10 Year | |
Investor Class Shares | | | -18.82 | % | | | 1.39 | % | | | 8.51 | % |
Advisor Class Shares | | | -19.21 | % | | | 0.89 | % | | | 7.99 | % |
C-Class Shares | | | -19.63 | % | | | 0.39 | % | | | 7.46 | % |
C-Class Shares with CDSC† | | | -20.43 | % | | | 0.39 | % | | | 7.46 | % |
S&P 500 Index | | | 8.54 | % | | | 2.01 | % | | | 4.12 | % |
S&P 500 Energy Index | | | -6.86 | % | | | 5.03 | % | | | 11.09 | % |
| | | |
| | | 1 Year | | | 5 Year | | | Since
Inception
(09/01/04) | |
A-Class Shares | | | -19.03 | % | | | 1.15 | % | | | 10.26 | % |
A-Class Shares with sales charge‡ | | | -22.87 | % | | | 0.17 | % | | | 9.55 | % |
S&P 500 Index | | | 8.54 | % | | | 2.01 | % | | | 5.41 | % |
S&P 500 Energy Index | | | -6.86 | % | | | 5.03 | % | | | 12.36 | % |
| * | The performance data above represents past performance that is not predictive of future results. The investment return and principal value of an investment in the Fund will fluctuate so that an investor’s shares, when redeemed, may be worth more or less than their original cost. Returns are historical and include changes in principal and reinvested dividends and capital gains and do not reflect the effect of taxes. The S&P 500 Index and the S&P 500 Energy Index are unmanaged indices and, unlike the Fund, have no management fees or operating expenses to reduce their reported returns. The graphs are based on Investor Class shares and A-Class shares only; performance for Advisor Class shares and C-Class shares will vary due to differences in fee structures. |
| † | Fund returns include a CDSC of 1% if redeemed within 12 months of purchase. |
| ‡ | Fund returns are calculated using the maximum sales charge of 4.75%. |
| | | | |
| | | | | |
| | THE RYDEX FUNDSANNUALREPORT | | 59 |
| | |
| SCHEDULE OF INVESTMENTS | | March 31, 2012 |
| ENERGY SERVICES FUND | | |
| | | | | | | | |
| | | SHARES | | | VALUE | |
COMMON STOCKS† - 99.6% | | | | | | | | |
Oil & Gas Equipment & Services - 69.1% | | | | | |
Schlumberger Ltd. | | | 86,216 | | | $ | 6,029,086 | |
National Oilwell Varco, Inc. | | | 46,660 | | | | 3,708,071 | |
Halliburton Co. | | | 105,796 | | | | 3,511,369 | |
Baker Hughes, Inc. | | | 62,145 | | | | 2,606,361 | |
Cameron International Corp.* | | | 44,410 | | | | 2,346,180 | |
FMC Technologies, Inc.* | | | 44,427 | | | | 2,240,009 | |
Weatherford International Ltd.* | | | 138,137 | | | | 2,084,487 | |
Core Laboratories N.V. | | | 12,504 | | | | 1,645,151 | |
Oceaneering International, Inc. | | | 29,190 | | | | 1,573,049 | |
Superior Energy Services, Inc.* | | | 48,754 | | | | 1,285,155 | |
Oil States International, Inc.* | | | 16,255 | | | | 1,268,865 | |
Dresser-Rand Group, Inc.* | | | 25,184 | | | | 1,168,286 | |
McDermott International, Inc.* | | | 86,547 | | | | 1,108,667 | |
Lufkin Industries, Inc. | | | 13,393 | | | | 1,080,145 | |
Tidewater, Inc. | | | 19,877 | | | | 1,073,756 | |
Dril-Quip, Inc.* | | | 16,099 | | | | 1,046,757 | |
Tenaris S.A. ADR | | | 26,917 | | | | 1,029,037 | |
CARBO Ceramics, Inc. | | | 9,669 | | | | 1,019,596 | |
RPC, Inc. | | | 93,347 | | | | 990,412 | |
Key Energy Services, Inc.* | | | 62,450 | | | | 964,853 | |
Helix Energy Solutions Group, Inc.* | | | 49,215 | | | | 876,027 | |
Hornbeck Offshore Services, Inc.* | | | 18,606 | | | | 782,010 | |
C&J Energy Services, Inc.* | | | 34,100 | | | | 606,639 | |
Exterran Holdings, Inc.* | | | 43,615 | | | | 575,282 | |
Basic Energy Services, Inc.* | | | 31,294 | | | | 542,951 | |
| | | | | | | | |
Total Oil & Gas Equipment & Services | | | | 41,162,201 | |
| | | | | | | | |
Oil & Gas Drilling - 30.5% | | | | | | | | |
Transocean Ltd. | | | 50,863 | | | | 2,782,205 | |
Seadrill Ltd. | | | 72,688 | | | | 2,726,526 | |
Noble Corp.* | | | 51,747 | | | | 1,938,960 | |
Diamond Offshore Drilling, Inc. | | | 28,805 | | | | 1,922,734 | |
Ensco plc ADR | | | 31,192 | | | | 1,650,993 | |
Helmerich & Payne, Inc. | | | 27,950 | | | | 1,507,903 | |
Nabors Industries Ltd.* | | | 77,843 | | | | 1,361,474 | |
Rowan Companies, Inc.* | | | 38,417 | | | | 1,265,072 | |
Atwood Oceanics, Inc.* | | | 24,149 | | | | 1,084,049 | |
Patterson-UTI Energy, Inc. | | | 60,367 | | | | 1,043,745 | |
Unit Corp.* | | | 21,260 | | | | 909,078 | |
| | | | | | | | |
Total Oil & Gas Drilling | | | | | | | 18,192,739 | |
| | | | | | | | |
Total Common Stocks
(Cost $27,948,417) | | | | | | | 59,354,940 | |
| | | | | | | | |
| | | | | | | | |
| | | FACE
AMOUNT | | | VALUE | |
REPURCHASE AGREEMENT††,1 - 0.6% | |
Credit Suisse Group issued 03/30/12 at 0.01% due 04/02/12 | | $ | 372,091 | | | $ | 372,091 | |
| | | | | | | | |
Total Repurchase Agreement
(Cost $372,091) | | | | 372,091 | |
| | | | | | | | |
Total Investments - 100.2%
(Cost $28,320,508) | | | $ | 59,727,031 | |
| | | | | | | | |
Other Assets & Liabilities, net - (0.2)% | | | | (90,662 | ) |
| | | | | | | | |
Total Net Assets - 100.0% | | | | | | $ | 59,636,369 | |
| * | Non-income producing security. |
| † | Value determined based on Level 1 inputs — See Note 4. |
| †† | Value determined based on Level 2 inputs — See Note 4. |
| 1 | Repurchase Agreement — See Note 5. |
ADR — American Depositary Receipt
plc — Public Limited Company
| | | | |
| | | | | |
| 60 | | THE RYDEX FUNDSANNUALREPORT | | SEE NOTES TO FINANCIAL STATEMENTS. |
STATEMENT OF ASSETS AND LIABILITIES
March 31, 2012
| | | | |
ASSETS: | | | | |
Investments at value
(cost $27,948,417) | | $ | 59,354,940 | |
Repurchase agreements, at value
(cost $372,091) | | | 372,091 | |
| | | | |
Total investments
(cost $28,320,508) | | | 59,727,031 | |
Receivables: | | | | |
Securities sold | | | 2,932,718 | |
Fund shares sold | | | 134,520 | |
Dividends | | | 21,723 | |
| | | | |
Total assets | | | 62,815,992 | |
| | | | |
LIABILITIES: | | | | |
Payable for: | | | | |
Fund shares redeemed | | | 3,043,827 | |
Management fees | | | 48,291 | |
Distribution and service fees | | | 15,443 | |
Transfer agent and administrative fees | | | 14,203 | |
Portfolio accounting fees | | | 5,681 | |
Miscellaneous | | | 52,178 | |
| | | | |
Total liabilities | | | 3,179,623 | |
| | | | |
NET ASSETS | | $ | 59,636,369 | |
| | | | |
NET ASSETS CONSIST OF: | | | | |
Paid in capital | | $ | 70,786,601 | |
Accumulated net investment loss | | | (35,120 | ) |
Accumulated net realized loss on investments | | | (42,521,635 | ) |
Net unrealized appreciation on investments | | | 31,406,523 | |
| | | | |
Net assets | | $ | 59,636,369 | |
| | | | |
INVESTOR CLASS: | | | | |
Net assets | | $ | 34,352,588 | |
Capital shares outstanding | | | 675,279 | |
Net asset value per share | | $ | 50.87 | |
| | | | |
ADVISOR CLASS: | | | | |
Net assets | | $ | 8,025,187 | |
Capital shares outstanding | | | 168,455 | |
Net asset value per share | | $ | 47.64 | |
| | | | |
A-CLASS: | | | | |
Net assets | | $ | 7,114,795 | |
Capital shares outstanding | | | 146,410 | |
Net asset value per share | | $ | 48.59 | |
| | | | |
Maximum offering price per share
(Net asset value divided by 95.25%) | | $ | 51.01 | |
| | | | |
C-CLASS: | | | | |
Net assets | | $ | 10,143,799 | |
Capital shares outstanding | | | 222,152 | |
Net asset value per share | | $ | 45.66 | |
| | | | |
STATEMENT OF OPERATIONS
Year Ended March 31, 2012
| | | | |
INVESTMENT INCOME: | | | | |
Dividends (net of foreign withholding tax of $4,253) | | $ | 1,103,571 | |
Interest | | | 103 | |
| | | | |
Total investment income | | | 1,103,674 | |
| | | | |
EXPENSES: | | | | |
Management fees | | | 825,567 | |
Transfer agent and administrative fees | | | 242,813 | |
Distribution and service fees: | | | | |
Advisor Class | | | 47,072 | |
A-Class | | | 34,431 | |
C-Class | | | 121,933 | |
Portfolio accounting fees | | | 97,125 | |
Custodian fees | | | 26,245 | |
Trustees’ fees* | | | 12,384 | |
Miscellaneous | | | 116,329 | |
| | | | |
Total expenses | | | 1,523,899 | |
| | | | |
Net investment loss | | | (420,225 | ) |
| | | | |
NET REALIZED AND UNREALIZED GAIN (LOSS): | |
Net realized gain (loss) on: | | | | |
Investments | | | 10,379,464 | |
| | | | |
Net realized gain | | | 10,379,464 | |
| | | | |
Net change in unrealized appreciation (depreciation) on: | | | | |
Investments | | | (46,057,326 | ) |
| | | | |
Net change in unrealized appreciation (depreciation) | | | (46,057,326 | ) |
| | | | |
Net realized and unrealized loss | | | (35,677,862 | ) |
| | | | |
Net decrease in net assets resulting from operations | | $ | (36,098,087 | ) |
| | | | |
| * | Relates to Trustees not deemed “interested persons” within the meaning of Section 2(a)(19) of the 1940 Act. |
| | | | |
| | | | | |
| SEE NOTES TO FINANCIAL STATEMENTS. | | THE RYDEX FUNDSANNUALREPORT | | 61 |
STATEMENTS OF CHANGES IN NET ASSETS
| | | | | | | | |
| | | Year Ended
March 31,
2012 | | | Year Ended
March 31,
2011 | |
INCREASE (DECREASE) IN NET ASSETS FROM OPERATIONS: | | | | | | | | |
Net investment loss | | $ | (420,225 | ) | | $ | (644,521 | ) |
Net realized gain on investments | | | 10,379,464 | | | | 11,780,705 | |
Net change in unrealized appreciation (depreciation) on investments | | | (46,057,326 | ) | | | 38,608,948 | |
| | | | | | | | |
Net increase (decrease) in net assets resulting from operations | | | (36,098,087 | ) | | | 49,745,132 | |
| | | | | | | | |
CAPITAL SHARE TRANSACTIONS: | | | | | | | | |
Proceeds from sale of shares | | | | | | | | |
Investor Class | | | 234,908,118 | | | | 325,185,196 | |
Advisor Class | | | 34,706,940 | | | | 49,966,638 | |
A-Class | | | 20,278,466 | | | | 20,554,024 | |
C-Class | | | 44,471,112 | | | | 75,084,065 | |
Cost of shares redeemed | | | | | | | | |
Investor Class | | | (327,454,174 | ) | | | (258,712,201 | ) |
Advisor Class | | | (40,482,465 | ) | | | (42,622,239 | ) |
A-Class | | | (32,499,776 | ) | | | (11,461,422 | ) |
C-Class | | | (46,859,111 | ) | | | (75,092,139 | ) |
| | | | | | | | |
Net increase (decrease) from capital share transactions | | | (112,930,890 | ) | | | 82,901,922 | |
| | | | | | | | |
Net increase (decrease) in net assets | | | (149,028,977 | ) | | | 132,647,054 | |
| | |
NET ASSETS: | | | | | | | | |
Beginning of year | | | 208,665,346 | | | | 76,018,292 | |
| | | | | | | | |
End of year | | $ | 59,636,369 | | | $ | 208,665,346 | |
| | | | | | | | |
Accumulated net investment loss at end of year | | $ | (35,120 | ) | | $ | — | |
| | | | | | | | |
CAPITAL SHARE ACTIVITY: | | | | | | | | |
Shares sold | | | | | | | | |
Investor Class | | | 4,303,024 | | | | 6,666,644 | |
Advisor Class | | | 674,396 | | | | 1,113,500 | |
A-Class | | | 373,580 | | | | 435,077 | |
C-Class | | | 915,082 | | | | 1,773,704 | |
Shares redeemed | | | | | | | | |
Investor Class | | | (6,042,507 | ) | | | (5,404,466 | ) |
Advisor Class | | | (797,982 | ) | | | (985,175 | ) |
A-Class | | | (641,283 | ) | | | (238,789 | ) |
C-Class | | | (961,820 | ) | | | (1,786,808 | ) |
| | | | | | | | |
Net increase (decrease) in shares | | | (2,177,510 | ) | | | 1,573,687 | |
| | | | | | | | |
| | | | |
| | | | | |
| 62 | | THE RYDEX FUNDSANNUALREPORT | | SEE NOTES TO FINANCIAL STATEMENTS. |
FINANCIAL HIGHLIGHTS
This table is presented to show selected data for a share outstanding throughout each period and to assist shareholders in evaluating a Fund’s performance for the periods presented.
| | | | | | | | | | | | | | | | | | | | |
Investor Class | | Year Ended
March 31,
2012 | | | Year Ended
March 31,
2011 | | | Year Ended
March 31,
2010 | | | Year Ended
March 31,
2009 | | | Year Ended
March 31,
2008 | |
Per Share Data | | | | | | | | | | | | | | | | | | | | |
Net asset value, beginning of period | | $ | 62.66 | | | $ | 42.83 | | | $ | 25.07 | | | $ | 58.04 | | | $ | 47.47 | |
| | | | | | | | | | | | | | | | | | | | |
Income (loss) from investment operations: | | | | | | | | | | | | | | | | | | | | |
Net investment lossa | | | (.14 | ) | | | (.21 | ) | | | (.01 | ) | | | (.24 | ) | | | (.43 | ) |
Net gain (loss) on investments (realized and unrealized) | | | (11.65 | ) | | | 20.04 | | | | 17.77 | | | | (32.73 | ) | | | 11.00 | |
| | | | | | | | | | | | | | | | | | | | |
Total from investment operations | | | (11.79 | ) | | | 19.83 | | | | 17.76 | | | | (32.97 | ) | | | 10.57 | |
| | | | | | | | | | | | | | | | | | | | |
Net asset value, end of period | | $ | 50.87 | | | $ | 62.66 | | | $ | 42.83 | | | $ | 25.07 | | | $ | 58.04 | |
| | | | | | | | | | | | | | | | | | | | |
Total Returnb | | | (18.82 | %) | | | 46.27 | % | | | 70.84 | % | | | (56.81 | %) | | | 22.27 | % |
| | | | | | | | | | | | | | | | | | | | |
Ratios/Supplemental Data | | | | | | | | | | | | | | | | | | | | |
Net assets, end of period (in thousands) | | $ | 34,353 | | | $ | 151,318 | | | $ | 49,371 | | | $ | 59,706 | | | $ | 82,691 | |
| | | | | | | | | | | | | | | | | | | | |
Ratios to average net assets: | | | | | | | | | | | | | | | | | | | | |
Net investment loss | | | (0.25 | %) | | | (0.42 | %) | | | (0.01 | %) | | | (0.48 | %) | | | (0.77 | %) |
Total expenses | | | 1.36 | % | | | 1.39 | % | | | 1.38 | % | | | 1.37 | % | | | 1.37 | % |
| | | | | | | | | | | | | | | | | | | | |
Portfolio turnover rate | | | 162 | % | | | 205 | % | | | 472 | % | | | 207 | % | | | 193 | % |
| | | | | |
Advisor Class | | Year Ended
March 31,
2012 | | | Year Ended
March 31,
2011 | | | Year Ended
March 31,
2010 | | | Year Ended
March 31,
2009 | | | Year Ended
March 31,
2008 | |
Per Share Data | | | | | | | | | | | | | | | | | | | | |
Net asset value, beginning of period | | $ | 58.97 | | | $ | 40.50 | | | $ | 23.83 | | | $ | 55.45 | | | $ | 45.58 | |
| | | | | | | | | | | | | | | | | | | | |
Income (loss) from investment operations: | | | | | | | | | | | | | | | | | | | | |
Net investment lossa | | | (.34 | ) | | | (.42 | ) | | | (.26 | ) | | | (.43 | ) | | | (.69 | ) |
Net gain (loss) on investments (realized and unrealized) | | | (10.99 | ) | | | 18.89 | | | | 16.93 | | | | (31.19 | ) | | | 10.56 | |
| | | | | | | | | | | | | | | | | | | | |
Total from investment operations | | | (11.33 | ) | | | 18.47 | | | | 16.67 | | | | (31.62 | ) | | | 9.87 | |
| | | | | | | | | | | | | | | | | | | | |
Net asset value, end of period | | $ | 47.64 | | | $ | 58.97 | | | $ | 40.50 | | | $ | 23.83 | | | $ | 55.45 | |
| | | | | | | | | | | | | | | | | | | | |
Total Returnb | | | (19.21 | %) | | | 45.61 | % | | | 69.95 | % | | | (57.02 | %) | | | 21.65 | % |
| | | | | | | | | | | | | | | | | | | | |
Ratios/Supplemental Data | | | | | | | | | | | | | | | | | | | | |
Net assets, end of period (in thousands) | | $ | 8,025 | | | $ | 17,222 | | | $ | 6,631 | | | $ | 7,058 | | | $ | 15,929 | |
| | | | | | | | | | | | | | | | | | | | |
Ratios to average net assets: | | | | | | | | | | | | | | | | | | | | |
Net investment loss | | | (0.66 | %) | | | (0.93 | %) | | | (0.70 | %) | | | (0.92 | %) | | | (1.28 | %) |
Total expenses | | | 1.86 | % | | | 1.89 | % | | | 1.88 | % | | | 1.88 | % | | | 1.87 | % |
| | | | | | | | | | | | | | | | | | | | |
Portfolio turnover rate | | | 162 | % | | | 205 | % | | | 472 | % | | | 207 | % | | | 193 | % |
| | | | |
| | | | | |
| SEE NOTES TO FINANCIAL STATEMENTS. | | THE RYDEX FUNDSANNUALREPORT | | 63 |
FINANCIAL HIGHLIGHTS (concluded)
This table is presented to show selected data for a share outstanding throughout each period and to assist shareholders in evaluating a Fund’s performance for the periods presented.
| | | | | | | | | | | | | | | | | | | | |
A-Class | | Year Ended
March 31,
2012 | | | Year Ended
March 31,
2011 | | | Year Ended
March 31,
2010 | | | Year Ended
March 31,
2009 | | | Year Ended
March 31,
2008 | |
Per Share Data | | | | | | | | | | | | | | | | | | | | |
Net asset value, beginning of period | | $ | 60.01 | | | $ | 41.12 | | | $ | 24.13 | | | $ | 55.99 | | | $ | 45.90 | |
| | | | | | | | | | | | | | | | | | | | |
Income (loss) from investment operations: | | | | | | | | | | | | | | | | | | | | |
Net investment lossa | | | (.25 | ) | | | (.31 | ) | | | (.16 | ) | | | (.31 | ) | | | (.55 | ) |
Net gain (loss) on investments (realized and unrealized) | | | (11.17 | ) | | | 19.20 | | | | 17.15 | | | | (31.55 | ) | | | 10.64 | |
| | | | | | | | | | | | | | | | | | | | |
Total from investment operations | | | (11.42 | ) | | | 18.89 | | | | 16.99 | | | | (31.86 | ) | | | 10.09 | |
| | | | | | | | | | | | | | | | | | | | |
Net asset value, end of period | | $ | 48.59 | | | $ | 60.01 | | | $ | 41.12 | | | $ | 24.13 | | | $ | 55.99 | |
| | | | | | | | | | | | | | | | | | | | |
Total Returnb | | | (19.03 | %) | | | 45.94 | % | | | 70.41 | % | | | (56.90 | %) | | | 21.98 | % |
| | | | | | | | | | | | | | | | | | | | |
Ratios/Supplemental Data | | | | | | | | | | | | | | | | | | | | |
Net assets, end of period (in thousands) | | $ | 7,115 | | | $ | 24,849 | | | $ | 8,957 | | | $ | 4,920 | | | $ | 11,450 | |
| | | | | | | | | | | | | | | | | | | | |
Ratios to average net assets: | | | | | | | | | | | | | | | | | | | | |
Net investment loss | | | (0.47 | %) | | | (0.67 | %) | | | (0.43 | %) | | | (0.68 | %) | | | (1.01 | %) |
Total expenses | | | 1.61 | % | | | 1.64 | % | | | 1.63 | % | | | 1.63 | % | | | 1.62 | % |
| | | | | | | | | | | | | | | | | | | | |
Portfolio turnover rate | | | 162 | % | | | 205 | % | | | 472 | % | | | 207 | % | | | 193 | % |
| | | | | |
C-Class | | Year Ended
March 31,
2012 | | | Year Ended
March 31,
2011 | | | Year Ended
March 31,
2010 | | | Year Ended
March 31,
2009 | | | Year Ended
March 31,
2008 | |
Per Share Data | | | | | | | | | | | | | | | | | | | | |
Net asset value, beginning of period | | $ | 56.81 | | | $ | 39.22 | | | $ | 23.19 | | | $ | 54.22 | | | $ | 44.79 | |
| | | | | | | | | | | | | | | | | | | | |
Income (loss) from investment operations: | | | | | | | | | | | | | | | | | | | | |
Net investment lossa | | | (.54 | ) | | | (.60 | ) | | | (.44 | ) | | | (.64 | ) | | | (.93 | ) |
Net gain (loss) on investments (realized and unrealized) | | | (10.61 | ) | | | 18.19 | | | | 16.47 | | | | (30.39 | ) | | | 10.36 | |
| | | | | | | | | | | | | | | | | | | | |
Total from investment operations | | | (11.15 | ) | | | 17.59 | | | | 16.03 | | | | (31.03 | ) | | | 9.43 | |
| | | | | | | | | | | | | | | | | | | | |
Net asset value, end of period | | $ | 45.66 | | | $ | 56.81 | | | $ | 39.22 | | | $ | 23.19 | | | $ | 54.22 | |
| | | | | | | | | | | | | | | | | | | | |
Total Returnb | | | (19.63 | %) | | | 44.85 | % | | | 69.12 | % | | | (57.23 | %) | | | 21.05 | % |
| | | | | | | | | | | | | | | | | | | | |
Ratios/Supplemental Data | | | | | | | | | | | | | | | | | | | | |
Net assets, end of period (in thousands) | | $ | 10,144 | | | $ | 15,276 | | | $ | 11,059 | | | $ | 9,196 | | | $ | 29,316 | |
| | | | | | | | | | | | | | | | | | | | |
Ratios to average net assets: | | | | | | | | | | | | | | | | | | | | |
Net investment loss | | | (1.13 | %) | | | (1.43 | %) | | | (1.25 | %) | | | (1.41 | %) | | | (1.76 | %) |
Total expenses | | | 2.36 | % | | | 2.39 | % | | | 2.38 | % | | | 2.38 | % | | | 2.37 | % |
| | | | | | | | | | | | | | | | | | | | |
Portfolio turnover rate | | | 162 | % | | | 205 | % | | | 472 | % | | | 207 | % | | | 193 | % |
| a | Net investment loss per share was computed using average shares outstanding throughout the period. |
| b | Total return does not reflect the impact of any applicable sales charges and has not been annualized. |
| | | | |
| | | | | |
| 64 | | THE RYDEX FUNDSANNUALREPORT | | SEE NOTES TO FINANCIAL STATEMENTS. |
This page intentionally left blank.
| | | | |
| | | | | |
| | THE RYDEX FUNDSANNUALREPORT | | 65 |
| | |
| PERFORMANCE REPORT AND FUND PROFILE (Unaudited) | | March 31, 2012 |
| | | |
FINANCIAL SERVICES FUND
OBJECTIVE: Seeks to provide capital appreciation by investing in companies involved in the financial services sector (“Financial Services Companies”).
Improving credit conditions and greater stability in banks and diversified financial services has helped performance in this sector in the past few months, but banks continue to be hampered by weak loan demand due to the underperforming economy. The REIT, consumer finance and commercial bank industries contributed slightly to return, while the Fund’s largest component, insurance, detracted slightly from return. Lower interest rates have restrained performance in the property and casualty market, which makes it harder to meet long-term asset return assumptions.
For the one-year period ended March 31, 2012, Financial Services Fund Investor Class returned -3.31%, while the S&P 500® Financials Index* returned -1.76% over the same period.
Simon Property Group, Inc., Wells Fargo & Co. and U.S. Bancorp were among the stocks which contributed the most to Fund performance during the year. Regions Financial Corp., Goldman Sachs Group, Inc. and Bank of America Corp. were among the stocks that contributed the least to Fund performance for the period.
*S&P 500® Financials Index is a sub-index of the S&P 500® Index, a capitalization-weighted index covering 500 industrial, utility, transportation and financial companies of the U.S. markets (mostly NYSE Euronext issues). The Financials index contains companies involved in activities such as banking, mortgage finance, consumer finance, specialized finance, investment banking and brokerage, asset management and custody, corporate lending, insurance, and financial investment, and real estate, including REITs.
Performance displayed represents past performance which is no guarantee of future results.
Holdings Diversification (Market Exposure as % of Net Assets)
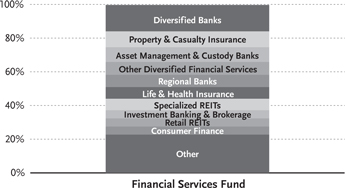
“Holdings Diversification (Market Exposure as % of Net Assets)” excludes any temporary cash investments.
| | | | |
Inception Dates: | | | |
Investor Class | | | April 2, 1998 | |
Advisor Class | | | April 6, 1998 | |
A-Class | | | September 1, 2004 | |
C-Class | | | April 19, 2001 | |
| | | | |
Ten Largest Holdings (% of Total Net Assets) | |
Berkshire Hathaway, Inc. — Class B | | | 3.2 | % |
Wells Fargo & Co. | | | 3.0 | % |
JPMorgan Chase & Co. | | | 3.0 | % |
Citigroup, Inc. | | | 2.3 | % |
Bank of America Corp. | | | 2.3 | % |
American Express Co. | | | 1.9 | % |
Goldman Sachs Group, Inc. | | | 1.8 | % |
U.S. Bancorp | | | 1.8 | % |
American International Group, Inc. | | | 1.8 | % |
Simon Property Group, Inc. | | | 1.5 | % |
| | | | |
Top Ten Total | | | 22.6 | % |
| | | | |
“Ten Largest Holdings” exclude any temporary cash or derivative investments.
| | | | |
| | | | | |
| 66 | | THE RYDEX FUNDSANNUALREPORT | | |
| | |
| PERFORMANCE REPORT AND FUND PROFILE (Unaudited) (concluded) | | March 31, 2012 |
Cumulative Fund Performance*

Average Annual Returns*
Periods Ended 03/31/12
| | | | | | | | | | | | |
| | | 1 Year | | | 5 Year | | | 10 Year | |
Investor Class Shares | | | -3.31 | % | | | -9.87 | % | | | -1.60 | % |
Advisor Class Shares | | | -3.80 | % | | | -10.34 | % | | | -2.05 | % |
C-Class Shares | | | -4.27 | % | | | -10.72 | % | | | -2.53 | % |
C-Class Shares with CDSC† | | | -5.23 | % | | | -10.72 | % | | | -2.53 | % |
S&P 500 Index | | | 8.54 | % | | | 2.01 | % | | | 4.12 | % |
S&P 500 Financials Index | | | -1.76 | % | | | -13.02 | % | | | -3.02 | % |
| | | |
| | | 1 Year | | | 5 Year | | | Since
Inception
(09/01/04) | |
A-Class Shares | | | -3.57 | % | | | -10.07 | % | | | -3.35 | % |
A-Class Shares with sales charge‡ | | | -8.14 | % | | | -10.94 | % | | | -3.98 | % |
S&P 500 Index | | | 8.54 | % | | | 2.01 | % | | | 5.41 | % |
S&P 500 Financials Index | | | -1.76 | % | | | -13.02 | % | | | -5.39 | % |
| * | The performance data above represents past performance that is not predictive of future results. The investment return and principal value of an investment in the Fund will fluctuate so that an investor’s shares, when redeemed, may be worth more or less than their original cost. Returns are historical and include changes in principal and reinvested dividends and capital gains and do not reflect the effect of taxes. The S&P 500 Index and the S&P 500 Financials Index are unmanaged indices and, unlike the Fund, have no management fees or operating expenses to reduce their reported returns. The graphs are based on Investor Class shares and A-Class shares only; performance for Advisor Class shares and C-Class shares will vary due to differences in fee structures. |
| † | Fund returns include a CDSC of 1% if redeemed within 12 months of purchase. |
| ‡ | Fund returns are calculated using the maximum sales charge of 4.75%. |
| | | | |
| | | | | |
| | THE RYDEX FUNDSANNUALREPORT | | 67 |
| | |
| SCHEDULE OF INVESTMENTS | | March 31, 2012 |
| FINANCIAL SERVICES FUND | | |
| | | | | | | | |
| | | SHARES | | | VALUE | |
COMMON STOCKS† - 99.5% | | | | | | | | |
Diversified Banks - 15.6% | | | | | | | | |
Wells Fargo & Co. | | | 22,815 | | | $ | 778,903 | |
U.S. Bancorp | | | 14,345 | | | | 454,449 | |
Itau Unibanco Holding S.A. ADR | | | 12,337 | | | | 236,747 | |
Banco Bradesco S.A. ADR | | | 13,314 | | | | 232,995 | |
ICICI Bank Ltd. ADR | | | 6,359 | | | | 221,738 | |
Credicorp Ltd. | | | 1,640 | | | | 216,185 | |
HSBC Holdings plc ADR | | | 4,801 | | | | 213,116 | |
HDFC Bank Ltd. ADR | | | 6,036 | | | | 205,828 | |
Toronto-Dominion Bank | | | 2,417 | | | | 205,324 | |
Barclays plc ADR | | | 13,291 | | | | 201,359 | |
Bank of Montreal | | | 3,364 | | | | 199,889 | |
Royal Bank of Canada | | | 3,410 | | | | 197,951 | |
Banco Santander Brasil S.A. ADR | | | 20,268 | | | | 185,858 | |
Banco Santander S.A. ADR | | | 23,604 | | | | 181,043 | |
Comerica, Inc. | | | 4,498 | | | | 145,555 | |
New York Community Bancorp, Inc. | | | 10,459 | | | | 145,485 | |
| | | | | | | | |
Total Diversified Banks | | | | | | | 4,022,425 | |
| | | | | | | | |
Property & Casualty Insurance - 9.3% | |
Berkshire Hathaway, Inc. — Class B* | | | 10,193 | | | | 827,163 | |
ACE Ltd. | | | 3,932 | | | | 287,822 | |
Travelers Companies, Inc. | | | 4,773 | | | | 282,562 | |
Chubb Corp. | | | 3,657 | | | | 252,735 | |
Allstate Corp. | | | 7,216 | | | | 237,551 | |
Progressive Corp. | | | 9,558 | | | | 221,554 | |
XL Group plc — Class A | | | 7,089 | | | | 153,760 | |
Cincinnati Financial Corp. | | | 3,980 | | | | 137,350 | |
| | | | | | | | |
Total Property & Casualty Insurance | | | | 2,400,497 | |
| | | | | | | | |
Asset Management & Custody Banks - 8.8% | |
BlackRock, Inc. — Class A | | | 1,831 | | | | 375,172 | |
Bank of New York Mellon Corp. | | | 12,999 | | | | 313,666 | |
Franklin Resources, Inc. | | | 2,444 | | | | 303,129 | |
State Street Corp. | | | 6,032 | | | | 274,456 | |
T. Rowe Price Group, Inc. | | | 3,662 | | | | 239,129 | |
Ameriprise Financial, Inc. | | | 3,662 | | | | 209,210 | |
Invesco Ltd. | | | 7,657 | | | | 204,212 | |
Northern Trust Corp. | | | 4,153 | | | | 197,060 | |
Affiliated Managers Group, Inc.* | | | 1,332 | | | | 148,931 | |
| | | | | | | | |
Total Asset Management & Custody Banks | | | | 2,264,965 | |
| | | | | | | | |
Other Diversified Financial Services - 7.6% | |
JPMorgan Chase & Co. | | | 16,933 | | | | 778,580 | |
Citigroup, Inc. | | | 16,193 | | | | 591,854 | |
Bank of America Corp. | | | 61,025 | | | | 584,009 | |
| | | | | | | | |
Total Other Diversified Financial Services | | | | 1,954,443 | |
| | | | | | | | |
Regional Banks - 7.3% | | | | | | | | |
PNC Financial Services Group, Inc. | | | 5,314 | | | | 342,701 | |
BB&T Corp. | | | 8,729 | | | | 274,003 | |
SunTrust Banks, Inc. | | | 8,644 | | | | 208,925 | |
Fifth Third Bancorp | | | 14,694 | | | | 206,451 | |
M&T Bank Corp. | | | 2,241 | | | | 194,698 | |
Regions Financial Corp. | | | 27,170 | | | | 179,050 | |
| | | | | | | | |
| | | SHARES | | | VALUE | |
CIT Group, Inc.* | | | 4,009 | | | $ | 165,331 | |
KeyCorp | | | 19,325 | | | | 164,263 | |
Huntington Bancshares, Inc. | | | 21,283 | | | | 137,275 | |
| | | | | | | | |
Total Regional Banks | | | | | | | 1,872,697 | |
| | | | | | | | |
Life & Health Insurance - 6.9% | | | | | | | | |
MetLife, Inc. | | | 9,671 | | | | 361,211 | |
Prudential Financial, Inc. | | | 4,989 | | | | 316,253 | |
Aflac, Inc. | | | 5,798 | | | | 266,650 | |
Manulife Financial Corp. | | | 14,498 | | | | 196,448 | |
Principal Financial Group, Inc. | | | 5,994 | | | | 176,883 | |
Lincoln National Corp. | | | 6,100 | | | | 160,796 | |
Unum Group | | | 6,393 | | | | 156,501 | |
Torchmark Corp. | | | 2,611 | | | | 130,158 | |
| | | | | | | | |
Total Life & Health Insurance | | | | | | | 1,764,900 | |
| | | | | | | | |
Specialized REITs - 6.8% | | | | | | | | |
Public Storage | | | 2,118 | | | | 292,644 | |
American Tower Corp. — Class A | | | 4,630 | | | | 291,783 | |
Ventas, Inc. | | | 4,154 | | | | 237,193 | |
HCP, Inc. | | | 5,875 | | | | 231,828 | |
Health Care REIT, Inc. | | | 3,649 | | | | 200,549 | |
Host Hotels & Resorts, Inc. | | | 12,124 | | | | 199,076 | |
Plum Creek Timber Company, Inc. | | | 3,645 | | | | 151,486 | |
Rayonier, Inc. | | | 3,074 | | | | 135,533 | |
| | | | | | | | |
Total Specialized REITs | | | | | | | 1,740,092 | |
| | | | | | | | |
Investment Banking & Brokerage - 4.9% | |
Goldman Sachs Group, Inc. | | | 3,761 | | | | 467,755 | |
Morgan Stanley | | | 18,210 | | | | 357,644 | |
Charles Schwab Corp. | | | 16,770 | | | | 240,985 | |
TD Ameritrade Holding Corp. | | | 9,648 | | | | 190,452 | |
| | | | | | | | |
Total Investment Banking & Brokerage | | | | 1,256,836 | |
| | | | | | | | |
Retail REITs - 4.8% | | | | | | | | |
Simon Property Group, Inc. | | | 2,703 | | | | 393,773 | |
General Growth Properties, Inc. | | | 13,658 | | | | 232,049 | |
Macerich Co. | | | 2,832 | | | | 163,548 | |
Kimco Realty Corp. | | | 8,479 | | | | 163,306 | |
Federal Realty Investment Trust | | | 1,582 | | | | 153,122 | |
Realty Income Corp. | | | 3,460 | | | | 134,006 | |
| | | | | | | | |
Total Retail REITs | | | | | | | 1,239,804 | |
| | | | | | | | |
Consumer Finance - 4.8% | | | | | | | | |
American Express Co. | | | 8,354 | | | | 483,363 | |
Capital One Financial Corp. | | | 5,974 | | | | 332,991 | |
Discover Financial Services | | | 7,559 | | | | 252,017 | |
SLM Corp. | | | 10,282 | | | | 162,044 | |
| | | | | | | | |
Total Consumer Finance | | | | | | | 1,230,415 | |
| | | | | | | | |
Residential REITs - 3.5% | | | | | | | | |
Equity Residential | | | 4,109 | | | | 257,305 | |
AvalonBay Communities, Inc. | | | 1,624 | | | | 229,552 | |
UDR, Inc. | | | 5,408 | | | | 144,448 | |
Camden Property Trust | | | 2,045 | | | | 134,459 | |
Essex Property Trust, Inc. | | | 870 | | | | 131,814 | |
| | | | | | | | |
Total Residential REITs | | | | | | | 897,578 | |
| | | | | | | | |
| | | | |
| | | | | |
| 68 | | THE RYDEX FUNDSANNUALREPORT | | SEE NOTES TO FINANCIAL STATEMENTS. |
| | |
| SCHEDULE OF INVESTMENTS (concluded) | | March 31, 2012 |
| FINANCIAL SERVICES FUND | | |
| | | | | | | | |
| | | SHARES | | | VALUE | |
Multi-Line Insurance - 3.4% | | | | | | | | |
American International Group, Inc.* | | | 14,680 | | | $ | 452,585 | |
Loews Corp. | | | 5,860 | | | | 233,638 | |
Hartford Financial Services Group, Inc. | | | 8,291 | | | | 174,774 | |
| | | | | | | | |
Total Multi-Line Insurance | | | | | | | 860,997 | |
| | | | | | | | |
Specialized Finance - 3.1% | | | | | | | | |
CME Group, Inc. — Class A | | | 859 | | | | 248,534 | |
IntercontinentalExchange, Inc.* | | | 1,403 | | | | 192,800 | |
Moody’s Corp. | | | 4,289 | | | | 180,567 | |
NYSE Euronext | | | 5,371 | | | | 161,184 | |
| | | | | | | | |
Total Specialized Finance | | | | | | | 783,085 | |
| | | | | | | | |
Diversified Capital Markets - 2.3% | | | | | |
Deutsche Bank AG | | | 4,156 | | | | 206,927 | |
Credit Suisse Group AG ADR | | | 6,915 | | | | 197,147 | |
UBS AG* | | | 13,971 | | | | 195,873 | |
| | | | | | | | |
Total Diversified Capital Markets | | | | 599,947 | |
| | | | | | | | |
Office REITs - 2.1% | | | | | | | | |
Boston Properties, Inc. | | | 2,203 | | | | 231,292 | |
Digital Realty Trust, Inc. | | | 2,243 | | | | 165,915 | |
SL Green Realty Corp. | | | 1,954 | | | | 151,533 | |
| | | | | | | | |
Total Office REITs | | | | | | | 548,740 | |
| | | | | | | | |
Insurance Brokers - 1.9% | | | | | | | | |
Marsh & McLennan Companies, Inc. | | | 7,566 | | | | 248,089 | |
Aon plc | | | 4,784 | | | | 234,703 | |
| | | | | | | | |
Total Insurance Brokers | | | | | | | 482,792 | |
| | | | | | | | |
Mortgage REITs - 1.6% | | | | | | | | |
Annaly Capital Management, Inc. | | | 14,360 | | | | 227,175 | |
American Capital Agency Corp. | | | 5,904 | | | | 174,404 | |
| | | | | | | | |
Total Mortgage REITs | | | | | | | 401,579 | |
| | | | | | | | |
Industrial REITs - 0.9% | | | | | | | | |
ProLogis, Inc. | | | 6,656 | | | | 239,749 | |
| | | | | | | | |
Diversified REITs - 0.9% | | | | | | | | |
Vornado Realty Trust | | | 2,732 | | | | 230,034 | |
| | | | | | | | |
Forest Products - 0.8% | | | | | | | | |
Weyerhaeuser Co. | | | 9,058 | | | | 198,551 | |
| | | | | | | | |
Real Estate Services - 0.6% | | | | | | | | |
CBRE Group, Inc. — Class A* | | | 7,325 | | | | 146,207 | |
| | | | | | | | |
Multi-Sector Holdings - 0.6% | | | | | | | | |
Leucadia National Corp. | | | 5,435 | | | | 141,854 | |
| | | | | | | | |
Reinsurance - 0.5% | | | | | | | | |
Everest Re Group Ltd. | | | 1,473 | | | | 136,282 | |
| | | | | | | | |
Thrifts & Mortgage Finance - 0.5% | | | | | |
People’s United Financial, Inc. | | | 9,595 | | | | 127,038 | |
| | | | | | | | |
| | |
Total Common Stocks
(Cost $19,692,096) | | | | | | | 25,541,507 | |
| | | | | | | | |
| | | | | | | | |
| | | FACE
AMOUNT | | | VALUE | |
REPURCHASE AGREEMENT††,1 - 0.4% | |
Credit Suisse Group issued 03/30/12 at 0.01% due 04/02/12 | | $ | 109,309 | | | $ | 109,309 | |
| | | | | | | | |
Total Repurchase Agreement
(Cost $109,309) | | | | 109,309 | |
| | | | | | | | |
Total Investments - 99.9%
(Cost $19,801,405) | | | $ | 25,650,816 | |
| | | | | | | | |
Other Assets & Liabilities, net - 0.1% | | | | 13,825 | |
| | | | | | | | |
Total Net Assets - 100.0% | | | | | | $ | 25,664,641 | |
| * | Non-income producing security. |
| † | Value determined based on Level 1 inputs — See Note 4. |
| †† | Value determined based on Level 2 inputs — See Note 4. |
| 1 | Repurchase Agreement — See Note 5. |
ADR — American Depositary Receipt
plc — Public Limited Company
REIT — Real Estate Investment Trust
| | | | |
| | | | | |
| SEE NOTES TO FINANCIAL STATEMENTS. | | THE RYDEX FUNDSANNUALREPORT | | 69 |
STATEMENT OF ASSETS AND LIABILITIES
March 31, 2012
| | | | |
ASSETS: | | | | |
Investments, at value
(cost $19,692,096) | | $ | 25,541,507 | |
Repurchase agreements, at value
(cost $109,309) | | | 109,309 | |
| | | | |
Total investments
(cost $19,801,405) | | | 25,650,816 | |
Cash | | | 1,009 | |
Receivables: | | | | |
Securities sold | | | 1,321,506 | |
Dividends | | | 39,434 | |
Fund shares sold | | | 32,373 | |
| | | | |
Total assets | | | 27,045,138 | |
| | | | |
LIABILITIES: | | | | |
Payable for: | | | | |
Fund shares redeemed | | | 1,348,109 | |
Management fees | | | 16,188 | |
Transfer agent and administrative fees | | | 4,761 | |
Distribution and service fees | | | 2,310 | |
Portfolio accounting fees | | | 1,904 | |
Miscellaneous | | | 7,225 | |
| | | | |
Total liabilities | | | 1,380,497 | |
| | | | |
NETASSETS | | $ | 25,664,641 | |
| | | | |
NETASSETSCONSISTOF: | | | | |
Paid in capital | | $ | 28,156,485 | |
Undistributed net investment income | | | 103,876 | |
Accumulated net realized loss on investments | | | (8,445,131 | ) |
Net unrealized appreciation on investments | | | 5,849,411 | |
| | | | |
Net assets | | $ | 25,664,641 | |
| | | | |
INVESTOR CLASS: | | | | |
Net assets | | $ | 19,973,043 | |
Capital shares outstanding | | | 254,543 | |
Net asset value per share | | $ | 78.47 | |
| | | | |
ADVISOR CLASS: | | | | |
Net assets | | $ | 4,243,150 | |
Capital shares outstanding | | | 57,704 | |
Net asset value per share | | $ | 73.53 | |
| | | | |
A-CLASS: | | | | |
Net assets | | $ | 631,803 | |
Capital shares outstanding | | | 8,416 | |
Net asset value per share | | $ | 75.07 | |
| | | | |
Maximum offering price per share
(Net asset value divided by 95.25%) | | $ | 78.81 | |
| | | | |
C-CLASS: | | | | |
Net assets | | $ | 816,645 | |
Capital shares outstanding | | | 11,624 | |
Net asset value per share | | $ | 70.26 | |
| | | | |
STATEMENT OF OPERATIONS
Year Ended March 31, 2012
| | | | |
INVESTMENT INCOME: | | | | |
Dividends (net of foreign withholding tax of $102) | | $ | 325,674 | |
Interest | | | 20 | |
| | | | |
Total investment income | | | 325,694 | |
| | | | |
EXPENSES: | | | | |
Management fees | | | 125,559 | |
Transfer agent and administrative fees | | | 36,929 | |
Distribution and service fees: | | | | |
Advisor Class | | | 11,734 | |
A-Class | | | 2,826 | |
C-Class | | | 9,180 | |
Portfolio accounting fees | | | 14,772 | |
Custodian fees | | | 4,081 | |
Trustees’ fees* | | | 1,374 | |
Miscellaneous | | | 15,809 | |
| | | | |
Total expenses | | | 222,264 | |
| | | | |
Net investment income | | | 103,430 | |
| | | | |
NET REALIZEDAND UNREALIZED GAIN (LOSS): | |
Net realized gain (loss) on: | | | | |
Investments | | | (1,220,034 | ) |
| | | | |
Net realized loss | | | (1,220,034 | ) |
| | | | |
Net change in unrealized appreciation (depreciation) on: | | | | |
Investments | | | 1,814,186 | |
| | | | |
Net change in unrealized appreciation (depreciation) | | | 1,814,186 | |
| | | | |
Net realized and unrealized gain | | | 594,152 | |
| | | | |
Net increase in net assets resulting from operations | | $ | 697,582 | |
| | | | |
| * | Relates to Trustees not deemed “interested persons” within the meaning of Section 2(a)(19) of the 1940 Act. |
| | | | |
| | | | | |
| 70 | | THE RYDEX FUNDSANNUALREPORT | | SEE NOTES TO FINANCIAL STATEMENTS. |
STATEMENTS OF CHANGES IN NET ASSETS
| | | | | | | | |
| | | Year Ended
March 31,
2012 | | | Year Ended
March 31,
2011 | |
INCREASE (DECREASE) IN NET ASSETS FROM OPERATIONS: | | | | | | | | |
Net investment income | | $ | 103,430 | | | $ | 5,611 | |
Net realized gain (loss) on investments | | | (1,220,034 | ) | | | 4,285,469 | |
Net change in unrealized appreciation (depreciation) on investments | | | 1,814,186 | | | | (4,675,933 | ) |
| | | | | | | | |
Net increase (decrease) in net assets resulting from operations | | | 697,582 | | | | (384,853 | ) |
| | | | | | | | |
DISTRIBUTIONSTO SHAREHOLDERSFROM: | | | | | | | | |
Net investment income | | | | | | | | |
Investor Class | | | (4,792 | ) | | | (64,919 | ) |
Advisor Class | | | (283 | ) | | | (33,103 | ) |
A-Class | | | (282 | ) | | | (15,355 | ) |
C-Class | | | (276 | ) | | | (15,591 | ) |
| | | | | | | | |
Total distributions to shareholders | | | (5,633 | ) | | | (128,968 | ) |
| | | | | | | | |
CAPITAL SHARE TRANSACTIONS: | | | | | | | | |
Proceeds from sale of shares | | | | | | | | |
Investor Class | | | 147,870,058 | | | | 82,605,048 | |
Advisor Class | | | 20,606,160 | | | | 13,931,559 | |
A-Class | | | 5,182,199 | | | | 8,082,499 | |
C-Class | | | 13,036,171 | | | | 35,513,916 | |
Distributions reinvested | | | | | | | | |
Investor Class | | | 4,758 | | | | 63,278 | |
Advisor Class | | | 279 | | | | 32,905 | |
A-Class | | | 199 | | | | 8,992 | |
C-Class | | | 258 | | | | 14,303 | |
Cost of shares redeemed | | | | | | | | |
Investor Class | | | (133,582,777 | ) | | | (103,700,539 | ) |
Advisor Class | | | (20,032,579 | ) | | | (13,783,069 | ) |
A-Class | | | (6,307,011 | ) | | | (7,670,882 | ) |
C-Class | | | (13,219,440 | ) | | | (36,169,022 | ) |
| | | | | | | | |
Net increase (decrease) from capital share transactions | | | 13,558,275 | | | | (21,071,012 | ) |
| | | | | | | | |
Net increase (decrease) in net assets | | | 14,250,224 | | | | (21,584,833 | ) |
NET ASSETS: | | | | | | | | |
Beginning of year | | | 11,414,417 | | | | 32,999,250 | |
| | | | | | | | |
End of year | | $ | 25,664,641 | | | $ | 11,414,417 | |
| | | | | | | | |
Undistributed net investment income at end of year | | $ | 103,876 | | | $ | 5,638 | |
| | | | | | | | |
CAPITAL SHARE ACTIVITY: | | | | | | | | |
Shares sold | | | | | | | | |
Investor Class | | | 2,115,046 | | | | 1,092,006 | |
Advisor Class | | | 329,675 | | | | 199,648 | |
A-Class | | | 72,286 | | | | 111,610 | |
C-Class | | | 197,182 | | | | 522,367 | |
Shares issued from reinvestment of distributions | | | | | | | | |
Investor Class | | | 76 | | | | 876 | |
Advisor Class | | | 5 | | | | 483 | |
A-Class | | | 3 | | | | 130 | |
C-Class | | | 5 | | | | 218 | |
Shares redeemed | | | | | | | | |
Investor Class | | | (1,920,753 | ) | | | (1,383,149 | ) |
Advisor Class | | | (319,490 | ) | | | (198,704 | ) |
A-Class | | | (86,753 | ) | | | (108,312 | ) |
C-Class | | | (200,740 | ) | | | (535,638 | ) |
| | | | | | | | |
Net increase (decrease) in shares | | | 186,542 | | | | (298,465 | ) |
| | | | | | | | |
| | | | |
| | | | | |
| SEE NOTES TO FINANCIAL STATEMENTS. | | THE RYDEX FUNDSANNUALREPORT | | 71 |
FINANCIAL HIGHLIGHTS
This table is presented to show selected data for a share outstanding throughout each period and to assist shareholders in evaluating a Fund’s performance for the periods presented.
| | | | | | | | | | | | | | | | | | | | |
Investor Class | | Year Ended
March 31,
2012 | | | Year Ended
March 31,
2011 | | | Year Ended
March 31,
2010c | | | Year Ended
March 31,
2009c | | | Year Ended
March 31,
2008c | |
Per Share Data | | | | | | | | | | | | | | | | | | | | |
Net asset value, beginning of period | | $ | 81.18 | | | $ | 75.23 | | | $ | 44.37 | | | $ | 101.80 | | | $ | 142.50 | |
| | | | | | | | | | | | | | | | | | | | |
Income (loss) from investment operations: | | | | | | | | | | | | | | | | | | | | |
Net investment incomea | | | .61 | | | | .15 | | | | .41 | | | | 1.60 | | | | 1.70 | |
Net gain (loss) on investments (realized and unrealized) | | | (3.29 | ) | | | 6.75 | | | | 31.07 | | | | (57.13 | ) | | | (40.20 | ) |
| | | | | | | | | | | | | | | | | | | | |
Total from investment operations | | | (2.68 | ) | | | 6.90 | | | | 31.48 | | | | (55.53 | ) | | | (38.50 | ) |
| | | | | | | | | | | | | | | | | | | | |
Less distributions from: | | | | | | | | | | | | | | | | | | | | |
Net investment income | | | (.03 | ) | | | (.95 | ) | | | (.62 | ) | | | (1.90 | ) | | | (2.20 | ) |
| | | | | | | | | | | | | | | | | | | | |
Total distributions | | | (.03 | ) | | | (.95 | ) | | | (.62 | ) | | | (1.90 | ) | | | (2.20 | ) |
| | | | | | | | | | | | | | | | | | | | |
Net asset value, end of period | | $ | 78.47 | | | $ | 81.18 | | | $ | 75.23 | | | $ | 44.37 | | | $ | 101.80 | |
| | | | | | | | | | | | | | | | | | | | |
Total Returnb | | | (3.31 | %) | | | 9.33 | % | | | 71.12 | % | | | (54.76 | %) | | | (27.26 | %) |
| | | | | | | | | | | | | | | | | | | | |
Ratios/Supplemental Data | | | | | | | | | | | | | | | | | | | | |
Net assets, end of period (in thousands) | | $ | 19,973 | | | $ | 4,885 | | | $ | 26,364 | | | $ | 13,257 | | | $ | 4,640 | |
| | | | | | | | | | | | | | | | | | | | |
Ratios to average net assets: | | | | | | | | | | | | | | | | | | | | |
Net investment income | | | 0.86 | % | | | 0.19 | % | | | 0.64 | % | | | 2.16 | % | | | 1.25 | % |
Total expenses | | | 1.34 | % | | | 1.39 | % | | | 1.38 | % | | | 1.37 | % | | | 1.38 | % |
| | | | | | | | | | | | | | | | | | | | |
Portfolio turnover rate | | | 970 | % | | | 601 | % | | | 447 | % | | | 755 | % | | | 913 | % |
| | | | | |
Advisor Class | | Year Ended
March 31,
2012 | | | Year Ended
March 31,
2011 | | | Year Ended
March 31,
2010c | | | Year Ended
March 31,
2009c | | | Year Ended
March 31,
2008c | |
Per Share Data | | | | | | | | | | | | | | | | | | | | |
Net asset value, beginning of period | | $ | 76.47 | | | $ | 71.29 | | | $ | 42.28 | | | $ | 97.80 | | | $ | 137.60 | |
| | | | | | | | | | | | | | | | | | | | |
Income (loss) from investment operations: | | | | | | | | | | | | | | | | | | | | |
Net investment income (loss)a | | | .26 | | | | (.14 | ) | | | .12 | | | | 1.30 | | | | .90 | |
Net gain (loss) on investments (realized and unrealized) | | | (3.17 | ) | | | 6.27 | | | | 29.51 | | | | (54.92 | ) | | | (38.50 | ) |
| | | | | | | | | | | | | | | | | | | | |
Total from investment operations | | | (2.91 | ) | | | 6.13 | | | | 29.63 | | | | (53.62 | ) | | | (37.60 | ) |
| | | | | | | | | | | | | | | | | | | | |
Less distributions from: | | | | | | | | | | | | | | | | | | | | |
Net investment income | | | (.03 | ) | | | (.95 | ) | | | (.62 | ) | | | (1.90 | ) | | | (2.20 | ) |
| | | | | | | | | | | | | | | | | | | | |
Total distributions | | | (.03 | ) | | | (.95 | ) | | | (.62 | ) | | | (1.90 | ) | | | (2.20 | ) |
| | | | | | | | | | | | | | | | | | | | |
Net asset value, end of period | | $ | 73.53 | | | $ | 76.47 | | | $ | 71.29 | | | $ | 42.28 | | | $ | 97.80 | |
| | | | | | | | | | | | | | | | | | | | |
Total Returnb | | | (3.80 | %) | | | 8.76 | % | | | 70.26 | % | | | (55.06 | %) | | | (27.58 | %) |
| | | | | | | | | | | | | | | | | | | | |
Ratios/Supplemental Data | | | | | | | | | | | | | | | | | | | | |
Net assets, end of period (in thousands) | | $ | 4,243 | | | $ | 3,634 | | | $ | 3,285 | | | $ | 2,710 | | | $ | 1,957 | |
| | | | | | | | | | | | | | | | | | | | |
Ratios to average net assets: | | | | | | | | | | | | | | | | | | | | |
Net investment income (loss) | | | 0.37 | % | | | (0.20 | %) | | | 0.21 | % | | | 1.83 | % | | | 0.70 | % |
Total expenses | | | 1.85 | % | | | 1.89 | % | | | 1.88 | % | | | 1.88 | % | | | 1.89 | % |
| | | | | | | | | | | | | | | | | | | | |
Portfolio turnover rate | | | 970 | % | | | 601 | % | | | 447 | % | | | 755 | % | | | 913 | % |
| | | | |
| | | | | |
| 72 | | THE RYDEX FUNDSANNUALREPORT | | SEE NOTES TO FINANCIAL STATEMENTS. |
FINANCIAL HIGHLIGHTS (concluded)
This table is presented to show selected data for a share outstanding throughout each period and to assist shareholders in evaluating a Fund’s performance for the periods presented.
| | | | | | | | | | | | | | | | | | | | |
A-Class | | Year Ended
March 31,
2012 | | | Year Ended
March 31,
2011 | | | Year Ended
March 31,
2010c | | | Year Ended
March 31,
2009c | | | Year Ended
March 31,
2008c | |
Per Share Data | | | | | | | | | | | | | | | | | | | | |
Net asset value, beginning of period | | $ | 77.87 | | | $ | 72.38 | | | $ | 42.80 | | | $ | 98.60 | | | $ | 138.20 | |
| | | | | | | | | | | | | | | | | | | | |
Income (loss) from investment operations: | | | | | | | | | | | | | | | | | | | | |
Net investment income (loss)a | | | .45 | | | | (.01 | ) | | | .30 | | | | 1.30 | | | | 1.60 | |
Net gain (loss) on investments (realized and unrealized) | | | (3.22 | ) | | | 6.45 | | | | 29.90 | | | | (55.20 | ) | | | (39.00 | ) |
| | | | | | | | | | | | | | | | | | | | |
Total from investment operations | | | (2.77 | ) | | | 6.44 | | | | 30.20 | | | | (53.90 | ) | | | (37.40 | ) |
| | | | | | | | | | | | | | | | | | | | |
Less distributions from: | | | | | | | | | | | | | | | | | | | | |
Net investment income | | | (.03 | ) | | | (.95 | ) | | | (.62 | ) | | | (1.90 | ) | | | (2.20 | ) |
| | | | | | | | | | | | | | | | | | | | |
Total distributions | | | (.03 | ) | | | (.95 | ) | | | (.62 | ) | | | (1.90 | ) | | | (2.20 | ) |
| | | | | | | | | | | | | | | | | | | | |
Net asset value, end of period | | $ | 75.07 | | | $ | 77.87 | | | $ | 72.38 | | | $ | 42.80 | | | $ | 98.60 | |
| | | | | | | | | | | | | | | | | | | | |
Total Returnb | | | (3.57 | %) | | | 9.06 | % | | | 70.74 | % | | | (54.92 | %) | | | (27.32 | %) |
| | | | | | | | | | | | | | | | | | | | |
Ratios/Supplemental Data | | | | | | | | | | | | | | | | | | | | |
Net assets, end of period (in thousands) | | $ | 632 | | | $ | 1,782 | | | $ | 1,408 | | | $ | 2,683 | | | $ | 1,367 | |
| | | | | | | | | | | | | | | | | | | | |
Ratios to average net assets: | | | | | | | | | | | | | | | | | | | | |
Net investment income (loss) | | | 0.64 | % | | | (0.01 | %) | | | 0.50 | % | | | 1.97 | % | | | 1.42 | % |
Total expenses | | | 1.61 | % | | | 1.64 | % | | | 1.63 | % | | | 1.62 | % | | | 1.59 | % |
| | | | | | | | | | | | | | | | | | | | |
Portfolio turnover rate | | | 970 | % | | | 601 | % | | | 447 | % | | | 755 | % | | | 913 | % |
| | | | | |
C-Class | | Year Ended
March 31,
2012 | | | Year Ended
March 31,
2011 | | | Year Ended
March 31,
2010c | | | Year Ended
March 31,
2009c | | | Year Ended
March 31,
2008c | |
Per Share Data | | | | | | | | | | | | | | | | | | | | |
Net asset value, beginning of period | | $ | 73.42 | | | $ | 68.79 | | | $ | 41.01 | | | $ | 95.10 | | | $ | 134.60 | |
| | | | | | | | | | | | | | | | | | | | |
Income (loss) from investment operations: | | | | | | | | | | | | | | | | | | | | |
Net investment income (loss)a | | | (.12 | ) | | | (.49 | ) | | | (.24 | ) | | | .80 | | | | .50 | |
Net gain (loss) on investments
(realized and unrealized) | | | (3.01 | ) | | | 6.07 | | | | 28.64 | | | | (52.99 | ) | | | (37.80 | ) |
| | | | | | | | | | | | | | | | | | | | |
Total from investment operations | | | (3.13 | ) | | | 5.58 | | | | 28.40 | | | | (52.19 | ) | | | (37.30 | ) |
| | | | | | | | | | | | | | | | | | | | |
Less distributions from: | | | | | | | | | | | | | | | | | | | | |
Net investment income | | | (.03 | ) | | | (.95 | ) | | | (.62 | ) | | | (1.90 | ) | | | (2.20 | ) |
| | | | | | | | | | | | | | | | | | | | |
Total distributions | | | (.03 | ) | | | (.95 | ) | | | (.62 | ) | | | (1.90 | ) | | | (2.20 | ) |
| | | | | | | | | | | | | | | | | | | | |
Net asset value, end of period | | $ | 70.26 | | | $ | 73.42 | | | $ | 68.79 | | | $ | 41.01 | | | $ | 95.10 | |
| | | | | | | | | | | | | | | | | | | | |
Total Returnb | | | (4.27 | %) | | | 8.28 | % | | | 69.44 | % | | | (55.16 | %) | | | (27.98 | %) |
| | | | | | | | | | | | | | | | | | | | |
Ratios/Supplemental Data | | | | | | | | | | | | | | | | | | | | |
Net assets, end of period (in thousands) | | $ | 817 | | | $ | 1,114 | | | $ | 1,942 | | | $ | 1,407 | | | $ | 2,847 | |
| | | | | | | | | | | | | | | | | | | | |
Ratios to average net assets: | | | | | | | | | | | | | | | | | | | | |
Net investment income (loss) | | | (0.18 | %) | | | (0.72 | %) | | | (0.40 | %) | | | 1.13 | % | | | 0.45 | % |
Total expenses | | | 2.36 | % | | | 2.39 | % | | | 2.38 | % | | | 2.38 | % | | | 2.37 | % |
| | | | | | | | | | | | | | | | | | | | |
Portfolio turnover rate | | | 970 | % | | | 601 | % | | | 447 | % | | | 755 | % | | | 913 | % |
| a | Net investment income (loss) per share was computed using average shares outstanding throughout the period. |
| b | Total return does not reflect the impact of any applicable sales charges and has not been annualized. |
| c | Per share amounts for the period March 31, 2007–April 19, 2009 have been restated to reflect a 1:10 reverse stock split effective April 20, 2009. |
| | | | |
| | | | | |
| SEE NOTES TO FINANCIAL STATEMENTS. | | THE RYDEX FUNDSANNUALREPORT | | 73 |
| | |
| PERFORMANCE REPORT AND FUND PROFILE (Unaudited) | | March 31, 2012 |
|
HEALTH CARE FUND
OBJECTIVE: Seeks to provide capital appreciation by investing in companies that are involved in the health care industry (“Health Care Companies”).
Judicial action continued to be a factor in performance of the health care sector, as The Supreme Court began its review of the 2010 health care law during the period, adding uncertainty to sector performance. As a traditionally defensive sector, health care has benefited from concern over the strength of the U.S. and global recovery. It is also being supported by stabilizing profitability and accelerated spending, as well as solid balance sheets that are helping drive the level of mergers and acquisitions. The big pharmaceutical companies are dealing with a number of patent expirations for blockbuster drugs, which could affect valuations.
For the one-year period ended March 31, 2012, Health Care Fund Investor Class returned 9.86%, compared with a 16.41% for the S&P 500® Health Care Index*.
The biggest positive contributors to Fund performance were pharmaceuticals and biotechnology companies. Health care providers & services was the other large contributor. Only the lightly weighted life sciences tools segment detracted from return.
The year’s top-performing holdings included Regeneron Pharmaceuticals, Inc., Biogen Idec, Inc. and Pharmasset. Hospira, Inc., Dendreon Corp. and Human Genome Sciences, Inc. were among the Fund’s weakest performers for the period.
*S&P 500® Health Care Index is a sub-index of the S&P 500® Index, a capitalization-weighted index covering 500 industrial, utility, transportation and financial companies of the U.S. markets (mostly NYSE Euronext issues). The Health Care index encompasses two main industry groups. The first includes companies who manufacture health care equipment and supplies or provide health care related services, including distributors of health care products, providers of basic health-care services, and owners and operators of health care facilities and organizations. The first group also includes companies operating in the health care technology industry. The second group includes companies primarily involved in the research, development, production and marketing of pharmaceuticals, biotechnology and life sciences products.
Performance displayed represents past performance which is no guarantee of future results.
Holdings Diversification (Market Exposure
as % of Net Assets)
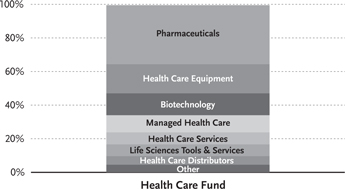
“Holdings Diversification (Market Exposure as % of Net Assets)” excludes any temporary cash investments.
| | | | |
Inception Dates: | |
Investor Class | | | April 17, 1998 | |
Advisor Class | | | May 11, 1998 | |
A-Class | | | September 1, 2004 | |
C-Class | | | March 30, 2001 | |
| | | | |
|
Ten Largest Holdings (% of Total Net Assets) | |
Johnson & Johnson | | | 4.1 | % |
Pfizer, Inc. | | | 4.1 | % |
Merck & Company, Inc. | | | 3.3 | % |
Abbott Laboratories | | | 3.0 | % |
UnitedHealth Group, Inc. | | | 2.5 | % |
Bristol-Myers Squibb Co. | | | 2.3 | % |
Amgen, Inc. | | | 2.3 | % |
Eli Lilly & Co. | | | 2.1 | % |
Teva Pharmaceutical Industries Ltd. ADR | | | 2.0 | % |
Medtronic, Inc. | | | 1.9 | % |
| | | | |
Top Ten Total | | | 27.6 | % |
| | | | |
“Ten Largest Holdings” exclude any temporary cash or derivative investments.
| | | | |
| | | | | |
| 74 | | THE RYDEX FUNDSANNUALREPORT | | |
| | |
| PERFORMANCE REPORT AND FUND PROFILE (Unaudited) (concluded) | | March 31, 2012 |
Cumulative Fund Performance*
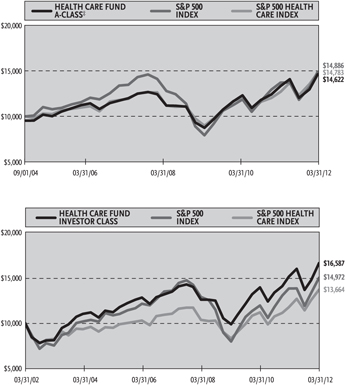
Average Annual Returns*
Periods Ended 03/31/12
| | | | | | | | | | | | |
| | | 1 Year | | | 5 Year | | | 10 Year | |
Investor Class Shares | | | 9.86 | % | | | 4.28 | % | | | 5.19 | % |
Advisor Class Shares | | | 9.41 | % | | | 3.78 | % | | | 4.69 | % |
C-Class Shares | | | 8.77 | % | | | 3.29 | % | | | 4.14 | % |
C-Class Shares with CDSC† | | | 7.77 | % | | | 3.29 | % | | | 4.14 | % |
S&P 500 Index | | | 8.54 | % | | | 2.01 | % | | | 4.12 | % |
S&P 500 Health Care Index | | | 16.41 | % | | | 4.39 | % | | | 3.17 | % |
| | | |
| | | 1 Year | | | 5 Year | | | Since
Inception
(09/01/04) | |
A-Class Shares | | | 9.63 | % | | | 4.04 | % | | | 5.82 | % |
A-Class Shares with sales charge‡ | | | 4.44 | % | | | 3.03 | % | | | 5.14 | % |
S&P 500 Index | | | 8.54 | % | | | 2.01 | % | | | 5.41 | % |
S&P 500 Health Care Index | | | 16.41 | % | | | 4.39 | % | | | 5.33 | % |
| * | The performance data above represents past performance that is not predictive of future results. The investment return and principal value of an investment in the Fund will fluctuate so that an investor’s shares, when redeemed, may be worth more or less than their original cost. Returns are historical and include changes in principal and reinvested dividends and capital gains and do not reflect the effect of taxes. The S&P 500 Index and the S&P 500 Health Care Index are unmanaged indices and, unlike the Fund, have no management fees or operating expenses to reduce their reported returns. The graphs are based on Investor Class shares and A-Class shares only; performance for Advisor Class shares and C-Class shares will vary due to differences in fee structures. |
| † | Fund returns include a CDSC of 1% if redeemed within 12 months of purchase. |
| ‡ | Fund returns are calculated using the maximum sales charge of 4.75%. |
| | | | |
| | | | | |
| | THE RYDEX FUNDSANNUALREPORT | | 75 |
| | |
| SCHEDULE OF INVESTMENTS | | March 31, 2012 |
|
HEALTH CARE FUND
| | | | | | | | |
| | | SHARES | | | VALUE | |
COMMON STOCKS† - 99.5% | | | | | | | | |
Pharmaceuticals - 35.2% | | | | | | | | |
Johnson & Johnson | | | 31,086 | | | $ | 2,050,432 | |
Pfizer, Inc. | | | 89,154 | | | | 2,020,229 | |
Merck & Company, Inc. | | | 42,950 | | | | 1,649,279 | |
Abbott Laboratories | | | 24,395 | | | | 1,495,169 | |
Bristol-Myers Squibb Co. | | | 34,166 | | | | 1,153,102 | |
Eli Lilly & Co. | | | 25,732 | | | | 1,036,228 | |
Teva Pharmaceutical Industries Ltd. ADR | | | 22,427 | | | | 1,010,561 | |
Allergan, Inc. | | | 8,758 | | | | 835,776 | |
Mylan, Inc.* | | | 20,746 | | | | 486,494 | |
Perrigo Co. | | | 4,690 | | | | 484,524 | |
Watson Pharmaceuticals, Inc.* | | | 7,175 | | | | 481,156 | |
Forest Laboratories, Inc.* | | | 13,667 | | | | 474,108 | |
Novartis AG ADR | | | 8,119 | | | | 449,874 | |
Valeant Pharmaceuticals International, Inc.* | | | 8,286 | | | | 444,875 | |
GlaxoSmithKline plc ADR | | | 9,484 | | | | 425,926 | |
Sanofi ADR | | | 10,390 | | | | 402,613 | |
Hospira, Inc.* | | | 10,173 | | | | 380,368 | |
AstraZeneca plc ADR | | | 8,118 | | | | 361,170 | |
Elan Corp. plc ADR* | | | 23,860 | | | | 358,139 | |
Endo Pharmaceuticals Holdings, Inc.* | | | 8,720 | | | | 337,726 | |
Warner Chilcott plc — Class A* | | | 18,600 | | | | 312,666 | |
Shire plc ADR | | | 3,280 | | | | 310,780 | |
Salix Pharmaceuticals Ltd.* | | | 5,157 | | | | 270,743 | |
Jazz Pharmaceuticals plc* | | | 5,400 | | | | 261,738 | |
| | | | | | | | |
Total Pharmaceuticals | | | | | | | 17,493,676 | |
| | | | | | | | |
Health Care Equipment - 17.3% | | | | | |
Medtronic, Inc. | | | 24,512 | | | | 960,626 | |
Baxter International, Inc. | | | 14,857 | | | | 888,151 | |
Covidien plc | | | 14,490 | | | | 792,313 | |
Intuitive Surgical, Inc.* | | | 1,311 | | | | 710,234 | |
Stryker Corp. | | | 12,783 | | | | 709,201 | |
Becton Dickinson and Co. | | | 7,996 | | | | 620,889 | |
St. Jude Medical, Inc. | | | 13,223 | | | | 585,911 | |
Zimmer Holdings, Inc. | | | 8,088 | | | | 519,897 | |
CR Bard, Inc. | | | 4,612 | | | | 455,297 | |
Boston Scientific Corp.* | | | 74,175 | | | | 443,567 | |
Edwards Lifesciences Corp.* | | | 5,910 | | | | 429,834 | |
Varian Medical Systems, Inc.* | | | 5,925 | | | | 408,588 | |
CareFusion Corp.* | | | 14,394 | | | | 373,236 | |
Hologic, Inc.* | | | 16,870 | | | | 363,549 | |
ResMed, Inc.* | | | 10,308 | | | | 318,620 | |
| | | | | | | | |
Total Health Care Equipment | | | | | | | 8,579,913 | |
| | | | | | | | |
Biotechnology - 13.0% | | | | | | | | |
Amgen, Inc. | | | 16,638 | | | | 1,131,217 | |
Gilead Sciences, Inc.* | | | 19,185 | | | | 937,187 | |
Celgene Corp.* | | | 11,695 | | | | 906,596 | |
Biogen Idec, Inc.* | | | 6,866 | | | | 864,910 | |
Alexion Pharmaceuticals, Inc.* | | | 6,952 | | | | 645,563 | |
Regeneron Pharmaceuticals, Inc.* | | | 4,111 | | | | 479,425 | |
Vertex Pharmaceuticals, Inc.* | | | 11,011 | | | | 451,561 | |
BioMarin Pharmaceutical, Inc.* | | | 8,890 | | | | 304,483 | |
Medivation, Inc.* | | | 3,450 | | | | 257,784 | |
Cubist Pharmaceuticals, Inc.* | | | 5,640 | | | | 243,930 | |
United Therapeutics Corp.* | | | 5,130 | | | | 241,777 | |
| | | | | | | | |
Total Biotechnology | | | | | | | 6,464,433 | |
| | | | | | | | |
| | | | | | | | |
| | | SHARES | | | VALUE | |
Managed Health Care - 10.2% | | | | | | | | |
UnitedHealth Group, Inc. | | | 20,932 | | | $ | 1,233,732 | |
WellPoint, Inc. | | | 10,836 | | | | 799,697 | |
Aetna, Inc. | | | 13,302 | | | | 667,228 | |
Humana, Inc. | | | 6,722 | | | | 621,651 | |
Cigna Corp. | | | 12,031 | | | | 592,527 | |
Coventry Health Care, Inc. | | | 9,926 | | | | 353,068 | |
Health Net, Inc.* | | | 7,100 | | | | 282,012 | |
WellCare Health Plans, Inc.* | | | 3,860 | | | | 277,457 | |
AMERIGROUP Corp.* | | | 4,030 | | | | 271,138 | |
| | | | | | | | |
Total Managed Health Care | | | | | | | 5,098,510 | |
| | | | | | | | |
Health Care Services - 7.2% | | | | | | | | |
Medco Health Solutions, Inc.* | | | 11,501 | | | | 808,520 | |
Express Scripts Holding Co. | | | 14,663 | | | | 794,441 | |
Quest Diagnostics, Inc. | | | 7,894 | | | | 482,718 | |
Laboratory Corporation of America Holdings* | | | 5,046 | | | | 461,911 | |
DaVita, Inc.* | | | 5,009 | | | | 451,662 | |
Omnicare, Inc. | | | 8,879 | | | | 315,826 | |
HMS Holdings Corp.* | | | 8,100 | | | | 252,801 | |
| | | | | | | | |
Total Health Care Services | | | | | | | 3,567,879 | |
| | | | | | | | |
Life Sciences
Tools & Services - 7.0% | | | | | | | | |
Thermo Fisher Scientific, Inc. | | | 12,249 | | | | 690,598 | |
Agilent Technologies, Inc. | | | 13,454 | | | | 598,838 | |
Life Technologies Corp.* | | | 9,512 | | | | 464,376 | |
Waters Corp.* | | | 4,778 | | | | 442,729 | |
Illumina, Inc.* | | | 7,494 | | | | 394,259 | |
Mettler-Toledo International, Inc.* | | | 1,990 | | | | 367,653 | |
PerkinElmer, Inc. | | | 9,901 | | | | 273,862 | |
Covance, Inc.* | | | 5,422 | | | | 258,250 | |
| | | | | | | | |
Total Life Sciences Tools & Services | | | | | | | 3,490,565 | |
| | | | | | | | |
Health Care Distributors - 5.1% | | | | | |
McKesson Corp. | | | 8,146 | | | | 714,974 | |
Cardinal Health, Inc. | | | 14,119 | | | | 608,670 | |
AmerisourceBergen Corp. | | | 12,466 | | | | 494,651 | |
Henry Schein, Inc.* | | | 5,264 | | | | 398,380 | |
Patterson Companies, Inc. | | | 9,010 | | | | 300,934 | |
| | | | | | | | |
Total Health Care Distributors | | | | | | | 2,517,609 | |
| | | | | | | | |
Health Care Technology - 1.6% | | | | | |
Cerner Corp.* | | | 7,238 | | | | 551,246 | |
Allscripts Healthcare Solutions, Inc.* | | | 15,775 | | | | 261,865 | |
| | | | | | | | |
Total Health Care Technology | | | | | | | 813,111 | |
| | | | | | | | |
Health Care Facilities - 1.6% | | | | | | | | |
HCA Holdings, Inc. | | | 20,080 | | | | 496,780 | |
Universal Health Services, Inc. — Class B | | | 7,252 | | | | 303,931 | |
| | | | | | | | |
Total Health Care Facilities | | | | | | | 800,711 | |
| | | | | | | | |
Health Care Supplies - 1.3% | | | | | | | | |
DENTSPLY International, Inc. | | | 9,233 | | | | 370,520 | |
Cooper Companies, Inc. | | | 3,569 | | | | 291,623 | |
| | | | | | | | |
Total Health Care Supplies | | | | | | | 662,143 | |
| | | | | | | | |
Total Common Stocks
(Cost $37,133,228) | | | | | | | 49,488,550 | |
| | | | | | | | |
| | | | |
| | | | | |
| 76 | | THE RYDEX FUNDSANNUALREPORT | | SEE NOTES TO FINANCIAL STATEMENTS. |
| | |
| SCHEDULE OF INVESTMENTS (concluded) | | March 31, 2012 |
HEALTH CARE FUND
| | | | | | | | |
| | | FACE
AMOUNT | | | VALUE | |
REPURCHASE
AGREEMENT††,1 - 0.5% | | | | | | | | |
Credit Suisse Group issued 03/30/12 at 0.01% due 04/02/12 | | $ | 253,686 | | | $ | 253,686 | |
| | | | | | | | |
Total Repurchase Agreement
(Cost $253,686) | | | | | | | 253,686 | |
| | | | | | | | |
Total Investments -100.0%
(Cost $37,386,914) | | | | | | $ | 49,742,236 | |
| | | | | | | | |
Other Assets & Liabilities,
net - 0.0% | | | | | | | (203 | ) |
| | | | | | | | |
Total Net Assets - 100.0% | | | | | | $ | 49,742,033 | |
| * | Non-income producing security. |
| † | Value determined based on Level 1 inputs — See Note 4. |
| †† | Value determined based on Level 2 inputs — See Note 4. |
| 1 | Repurchase Agreement — See Note 5. |
ADR — American Depositary Receipt
plc — Public Limited Company
| | | | |
| | | | | |
| SEE NOTES TO FINANCIAL STATEMENTS. | | THE RYDEX FUNDSANNUALREPORT | | 77 |
STATEMENT OF ASSETS AND LIABILITIES
| | | | |
March 31, 2012 | | | | |
| |
ASSETS: | | | | |
Investments, at value
(cost $37,133,228) | | $ | 49,488,550 | |
Repurchase agreements, at value
(cost $253,686) | | | 253,686 | |
| | | | |
Total investments
(cost $37,386,914) | | | 49,742,236 | |
Receivables: | | | | |
Fund shares sold | | | 2,336,541 | |
Securities sold | | | 345,117 | |
Dividends | | | 64,644 | |
Foreign taxes reclaim | | | 1,311 | |
| | | | |
Total assets | | | 52,489,849 | |
| | | | |
LIABILITIES: | | | | |
Payable for: | | | | |
Fund shares redeemed | | | 2,672,544 | |
Management fees | | | 34,742 | |
Transfer agent and administrative fees | | | 10,218 | |
Distribution and service fees | | | 5,359 | |
Portfolio accounting fees | | | 4,087 | |
Miscellaneous | | | 20,866 | |
| | | | |
Total liabilities | | | 2,747,816 | |
| | | | |
NET ASSETS | | $ | 49,742,033 | |
| | | | |
NET ASSETS CONSISTOF: | | | | |
Paid in capital | | $ | 47,958,602 | |
Undistributed net investment income | | | — | |
Accumulated net realized loss on investments | | | (10,571,891 | ) |
Net unrealized appreciation on investments | | | 12,355,322 | |
| | | | |
Net assets | | $ | 49,742,033 | |
| | | | |
INVESTOR CLASS: | | | | |
Net assets | | $ | 39,035,502 | |
Capital shares outstanding | | | 2,072,784 | |
Net asset value per share | | $ | 18.83 | |
| | | | |
ADVISOR CLASS: | | | | |
Net assets | | $ | 4,274,665 | |
Capital shares outstanding | | | 243,624 | |
Net asset value per share | | $ | 17.55 | |
| | | | |
A-CLASS: | | | | |
Net assets | | $ | 2,963,775 | |
Capital shares outstanding | | | 165,881 | |
Net asset value per share | | $ | 17.87 | |
| | | | |
Maximum offering price per share
(Net asset value divided by 95.25%) | | $ | 18.76 | |
| | | | |
C-CLASS: | | | | |
Net assets | | $ | 3,468,091 | |
Capital shares outstanding | | | 205,690 | |
Net asset value per share | | $ | 16.86 | |
| | | | |
STATEMENT OF OPERATIONS
| | | | |
Year Ended March 31, 2012 | | | | |
| |
INVESTMENT INCOME: | | | | |
Dividends | | $ | 635,042 | |
Interest | | | 34 | |
| | | | |
Total investment income | | | 635,076 | |
| | | | |
EXPENSES: | | | | |
Management fees | | | 376,343 | |
Transfer agent and administrative fees | | | 110,689 | |
Distribution and service fees: | | | | |
Advisor Class | | | 27,568 | |
A-Class | | | 5,900 | |
C-Class | | | 36,235 | |
Portfolio accounting fees | | | 44,275 | |
Custodian fees | | | 12,575 | |
Trustees’ fees* | | | 3,428 | |
Miscellaneous | | | 51,544 | |
| | | | |
Total expenses | | | 668,557 | |
| | | | |
Net investment loss | | | (33,481 | ) |
| | | | |
NET REALIZEDAND UNREALIZED GAIN (LOSS): | | | | |
Net realized gain (loss) on: | | | | |
Investments | | | (2,733,212 | ) |
| | | | |
Net realized loss | | | (2,733,212 | ) |
| | | | |
Net change in unrealized appreciation (depreciation) on: | | | | |
Investments | | | 4,434,547 | |
| | | | |
Net change in unrealized appreciation (depreciation) | | | 4,434,547 | |
| | | | |
Net realized and unrealized gain | | | 1,701,335 | |
| | | | |
Net increase in net assets resulting from operations | | $ | 1,667,854 | |
| | | | |
| * | Relates to Trustees not deemed “interested persons” within the meaning of Section 2(a)(19) of the 1940 Act. |
| | | | |
| | | | | |
| 78 | | THE RYDEX FUNDSANNUALREPORT | | SEE NOTES TO FINANCIAL STATEMENTS. |
STATEMENTS OF CHANGES IN NET ASSETS
| | | | | | | | |
| | | Year Ended
March 31, 2012 | | | Year Ended
March 31, 2011 | |
INCREASE (DECREASE) IN NET ASSETS FROM OPERATIONS: | | | | | | | | |
Net investment loss | | $ | (33,481 | ) | | $ | (58,998 | ) |
Net realized gain (loss) on investments | | | (2,733,212 | ) | | | 14,717,139 | |
Net change in unrealized appreciation (depreciation) on investments | | | 4,434,547 | | | | (15,485,060 | ) |
| | | | | | | | |
Net increase (decrease) in net assets resulting from operations | | | 1,667,854 | | | | (826,919 | ) |
| | | | | | | | |
CAPITAL SHARE TRANSACTIONS: | | | | | | | | |
Proceeds from sale of shares | | | | | | | | |
Investor Class | | | 326,325,036 | | | | 199,840,233 | |
Advisor Class | | | 30,857,462 | | | | 29,192,400 | |
A-Class | | | 7,626,282 | | | | 2,774,503 | |
C-Class | | | 55,798,360 | | | | 104,802,117 | |
Cost of shares redeemed | | | | | | | | |
Investor Class | | | (308,122,674 | ) | | | (375,189,188 | ) |
Advisor Class | | | (29,208,278 | ) | | | (30,446,417 | ) |
A-Class | | | (5,704,682 | ) | | | (7,868,260 | ) |
C-Class | | | (56,286,961 | ) | | | (109,133,717 | ) |
| | | | | | | | |
Net increase (decrease) from capital share transactions | | | 21,284,545 | | | | (186,028,329 | ) |
| | | | | | | | |
Net increase (decrease) in net assets | | | 22,952,399 | | | | (186,855,248 | ) |
| | |
NET ASSETS: | | | | | | | | |
Beginning of year | | | 26,789,634 | | | | 213,644,882 | |
| | | | | | | | |
End of year | | $ | 49,742,033 | | | $ | 26,789,634 | |
| | | | | | | | |
Undistributed net investment income | | $ | — | | | $ | — | |
| | | | | | | | |
CAPITAL SHARE ACTIVITY: | | | | | | | | |
Shares sold | | | | | | | | |
Investor Class | | | 18,620,010 | | | | 12,963,598 | |
Advisor Class | | | 1,915,231 | | | | 2,051,470 | |
A-Class | | | 466,763 | | | | 186,925 | |
C-Class | | | 3,613,148 | | | | 7,534,727 | |
Shares redeemed | | | | | | | | |
Investor Class | | | (17,686,638 | ) | | | (24,208,012 | ) |
Advisor Class | | | (1,810,557 | ) | | | (2,143,572 | ) |
A-Class | | | (371,821 | ) | | | (528,117 | ) |
C-Class | | | (3,657,187 | ) | | | (7,868,157 | ) |
| | | | | | | | |
Net increase (decrease) in shares | | | 1,088,949 | | | | (12,011,138 | ) |
| | | | | | | | |
| | | | |
| | | | | |
| SEE NOTES TO FINANCIAL STATEMENTS. | | THE RYDEX FUNDSANNUALREPORT | | 79 |
FINANCIAL HIGHLIGHTS
This table is presented to show selected data for a share outstanding throughout each period and to assist shareholders in evaluating a Fund’s performance for the periods presented.
| | | | | | | | | | | | | | | | | | | | |
Investor Class | | Year Ended
March 31,
2012 | | | Year Ended
March 31,
2011 | | | Year Ended
March 31,
2010 | | | Year Ended
March 31,
2009 | | | Year Ended
March 31,
2008 | |
Per Share Data | | | | | | | | | | | | | | | | | | | | |
Net asset value, beginning of period | | $ | 17.14 | | | $ | 15.80 | | | $ | 11.20 | | | $ | 14.28 | | | $ | 15.28 | |
| | | | | | | | | | | | | | | | | | | | |
Income (loss) from investment operations: | | | | | | | | | | | | | | | | | | | | |
Net investment income (loss)a | | | .01 | | | | (.02 | ) | | | (.01 | ) | | | .07 | | | | (.02 | ) |
Net gain (loss) on investments (realized and unrealized) | | | 1.68 | | | | 1.36 | | | | 4.62 | | | | (3.15 | ) | | | (.98 | ) |
| | | | | | | | | | | | | | | | | | | | |
Total from investment operations | | | 1.69 | | | | 1.34 | | | | 4.61 | | | | (3.08 | ) | | | (1.00 | ) |
| | | | | | | | | | | | | | | | | | | | |
Less distributions from: | | | | | | | | | | | | | | | | | | | | |
Net investment income | | | — | | | | — | | | | (.01 | ) | | | — | | | | — | |
| | | | | | | | | | | | | | | | | | | | |
Total distributions | | | — | | | | — | | | | (.01 | ) | | | — | | | | — | |
| | | | | | | | | | | | | | | | | | | | |
Net asset value, end of period | | $ | 18.83 | | | $ | 17.14 | | | $ | 15.80 | | | $ | 11.20 | | | $ | 14.28 | |
| | | | | | | | | | | | | | | | | | | | |
Total Returnb | | | 9.86 | % | | | 8.48 | % | | | 41.17 | % | | | (21.57 | %) | | | (6.54 | %) |
| | | | | | | | | | | | | | | | | | | | |
Ratios/Supplemental Data | | | | | | | | | | | | | | | | | | | | |
Net assets, end of period (in thousands) | | $ | 39,036 | | | $ | 19,534 | | | $ | 195,616 | | | $ | 13,920 | | | $ | 22,062 | |
| | | | | | | | | | | | | | | | | | | | |
Ratios to average net assets: | | | | | | | | | | | | | | | | | | | | |
Net investment income (loss) | | | 0.08 | % | | | (0.10 | %) | | | (0.04 | %) | | | 0.48 | % | | | (0.13 | %) |
Total expenses | | | 1.36 | % | | | 1.38 | % | | | 1.37 | % | | | 1.36 | % | | | 1.37 | % |
| | | | | | | | | | | | | | | | | | | | |
Portfolio turnover rate | | | 582 | % | | | 619 | % | | | 241 | % | | | 745 | % | | | 444 | % |
| | | | | |
Advisor Class | | Year Ended
March 31,
2012 | | | Year Ended
March 31,
2011 | | | Year Ended
March 31,
2010 | | | Year Ended
March 31,
2009 | | | Year Ended
March 31,
2008 | |
Per Share Data | | | | | | | | | | | | | | | | | | | | |
Net asset value, beginning of period | | $ | 16.04 | | | $ | 14.85 | | | $ | 10.58 | | | $ | 13.57 | | | $ | 14.59 | |
| | | | | | | | | | | | | | | | | | | | |
Income (loss) from investment operations: | | | | | | | | | | | | | | | | | | | | |
Net investment income (loss)a | | | (.07 | ) | | | (.05 | ) | | | (.04 | ) | | | .01 | | | | (.09 | ) |
Net gain (loss) on investments (realized and unrealized) | | | 1.58 | | | | 1.24 | | | | 4.32 | | | | (3.00 | ) | | | (.93 | ) |
| | | | | | | | | | | | | | | | | | | | |
Total from investment operations | | | 1.51 | | | | 1.19 | | | | 4.28 | | | | (2.99 | ) | | | (1.02 | ) |
| | | | | | | | | | | | | | | | | | | | |
Less distributions from: | | | | | | | | | | | | | | | | | | | | |
Net investment income | | | — | | | | — | | | | (.01 | ) | | | — | | | | — | |
| | | | | | | | | | | | | | | | | | | | |
Total distributions | | | — | | | | — | | | | (.01 | ) | | | — | | | | — | |
| | | | | | | | | | | | | | | | | | | | |
Net asset value, end of period | | $ | 17.55 | | | $ | 16.04 | | | $ | 14.85 | | | $ | 10.58 | | | $ | 13.57 | |
| | | | | | | | | | | | | | | | | | | | |
Total Returnb | | | 9.41 | % | | | 8.01 | % | | | 40.46 | % | | | (22.03 | %) | | | (6.99 | %) |
| | | | | | | | | | | | | | | | | | | | |
Ratios/Supplemental Data | | | | | | | | | | | | | | | | | | | | |
Net assets, end of period (in thousands) | | $ | 4,275 | | | $ | 2,229 | | | $ | 3,432 | | | $ | 6,353 | | | $ | 13,099 | |
| | | | | | | | | | | | | | | | | | | | |
Ratios to average net assets: | | | | | | | | | | | | | | | | | | | | |
Net investment income (loss) | | | (0.44 | %) | | | (0.36 | %) | | | (0.33 | %) | | | 0.04 | % | | | (0.60 | %) |
Total expenses | | | 1.85 | % | | | 1.88 | % | | | 1.88 | % | | | 1.93 | % | | | 1.86 | % |
| | | | | | | | | | | | | | | | | | | | |
Portfolio turnover rate | | | 582 | % | | | 619 | % | | | 241 | % | | | 745 | % | | | 444 | % |
| | | | |
| | | | | |
| 80 | | THE RYDEX FUNDSANNUALREPORT | | SEE NOTES TO FINANCIAL STATEMENTS. |
FINANCIAL HIGHLIGHTS (concluded)
This table is presented to show selected data for a share outstanding throughout each period and to assist shareholders in evaluating a Fund’s performance for the periods presented.
| | | | | | | | | | | | | | | | | | | | |
A-Class | | Year Ended
March 31,
2012 | | | Year Ended
March 31,
2011 | | | Year Ended
March 31,
2010 | | | Year Ended
March 31,
2009 | | | Year Ended
March 31,
2008 | |
Per Share Data | | | | | | | | | | | | | | | | | | | | |
Net asset value, beginning of period | | $ | 16.30 | | | $ | 15.05 | | | $ | 10.69 | | | $ | 13.68 | | | $ | 14.67 | |
| | | | | | | | | | | | | | | | | | | | |
Income (loss) from investment operations: | | | | | | | | | | | | | | | | | | | | |
Net investment income (loss)a | | | (.02 | ) | | | (.02 | ) | | | (.03 | ) | | | .02 | | | | (.06 | ) |
Net gain (loss) on investments (realized and unrealized) | | | 1.59 | | | | 1.27 | | | | 4.40 | | | | (3.01 | ) | | | (.93 | ) |
| | | | | | | | | | | | | | | | | | | | |
Total from investment operations | | | 1.57 | | | | 1.25 | | | | 4.37 | | | | (2.99 | ) | | | (.99 | ) |
| | | | | | | | | | | | | | | | | | | | |
Less distributions from: | | | | | | | | | | | | | | | | | | | | |
Net investment income | | | — | | | | — | | | | (.01 | ) | | | — | | | | — | |
| | | | | | | | | | | | | | | | | | | | |
Total distributions | | | — | | | | — | | | | (.01 | ) | | | — | | | | — | |
| | | | | | | | | | | | | | | | | | | | |
Net asset value, end of period | | $ | 17.87 | | | $ | 16.30 | | | $ | 15.05 | | | $ | 10.69 | | | $ | 13.68 | |
| | | | | | | | | | | | | | | | | | | | |
Total Returnb | | | 9.63 | % | | | 8.31 | % | | | 40.88 | % | | | (21.86 | %) | | | (6.75 | %) |
| | | | | | | | | | | | | | | | | | | | |
Ratios/Supplemental Data | | | | | | | | | | | | | | | | | | | | |
Net assets, end of period (in thousands) | | $ | 2,964 | | | $ | 1,156 | | | $ | 6,204 | | | $ | 997 | | | $ | 730 | |
| | | | | | | | | | | | | | | | | | | | |
Ratios to average net assets: | | | | | | | | | | | | | | | | | | | | |
Net investment income (loss) | | | (0.13 | %) | | | (0.14 | %) | | | (0.25 | %) | | | 0.15 | % | | | (0.36 | %) |
Total expenses | | | 1.60 | % | | | 1.63 | % | | | 1.62 | % | | | 1.63 | % | | | 1.61 | % |
| | | | | | | | | | | | | | | | | | | | |
Portfolio turnover rate | | | 582 | % | | | 619 | % | | | 241 | % | | | 745 | % | | | 444 | % |
| | | | | |
C-Class | | Year Ended
March 31,
2012 | | | Year Ended
March 31,
2011 | | | Year Ended
March 31,
2010 | | | Year Ended
March 31,
2009 | | | Year Ended
March 31,
2008 | |
Per Share Data | | | | | | | | | | | | | | | | | | | | |
Net asset value, beginning of period | | $ | 15.50 | | | $ | 14.39 | | | $ | 10.30 | | | $ | 13.28 | | | $ | 14.35 | |
| | | | | | | | | | | | | | | | | | | | |
Income (loss) from investment operations: | | | | | | | | | | | | | | | | | | | | |
Net investment lossa | | | (.14 | ) | | | (.11 | ) | | | (.11 | ) | | | (.08 | ) | | | (.16 | ) |
Net gain (loss) on investments (realized and unrealized) | | | 1.50 | | | | 1.22 | | | | 4.21 | | | | (2.90 | ) | | | (.91 | ) |
| | | | | | | | | | | | | | | | | | | | |
Total from investment operations | | | 1.36 | | | | 1.11 | | | | 4.10 | | | | (2.98 | ) | | | (1.07 | ) |
| | | | | | | | | | | | | | | | | | | | |
Less distributions from: | | | | | | | | | | | | | | | | | | | | |
Net investment income | | | — | | | | — | | | | (.01 | ) | | | — | | | | — | |
| | | | | | | | | | | | | | | | | | | | |
Total distributions | | | — | | | | — | | | | (.01 | ) | | | — | | | | — | |
| | | | | | | | | | | | | | | | | | | | |
Net asset value, end of period | | $ | 16.86 | | | $ | 15.50 | | | $ | 14.39 | | | $ | 10.30 | | | $ | 13.28 | |
| | | | | | | | | | | | | | | | | | | | |
Total Returnb | | | 8.77 | % | | | 7.71 | % | | | 39.81 | % | | | (22.44 | %) | | | (7.46 | %) |
| | | | | | | | | | | | | | | | | | | | |
Ratios/Supplemental Data | | | | | | | | | | | | | | | | | | | | |
Net assets, end of period (in thousands) | | $ | 3,468 | | | $ | 3,870 | | | $ | 8,393 | | | $ | 5,101 | | | $ | 5,677 | |
| | | | | | | | | | | | | | | | | | | | |
Ratios to average net assets: | | | | | | | | | | | | | | | | | | | | |
Net investment loss | | | (0.91 | %) | | | (0.76 | %) | | | (0.91 | %) | | | (0.65 | %) | | | (1.12 | %) |
Total expenses | | | 2.36 | % | | | 2.38 | % | | | 2.38 | % | | | 2.38 | % | | | 2.37 | % |
| | | | | | | | | | | | | | | | | | | | |
Portfolio turnover rate | | | 582 | % | | | 619 | % | | | 241 | % | | | 745 | % | | | 444 | % |
| a | Net investment income (loss) per share was computed using average shares outstanding throughout the period. |
| b | Total return does not reflect the impact of any applicable sales charges and has not been annualized. |
| | | | |
| | | | | |
| SEE NOTES TO FINANCIAL STATEMENTS. | | THE RYDEX FUNDSANNUALREPORT | | 81 |
| | |
| PERFORMANCE REPORT AND FUND PROFILE (Unaudited) | | March 31, 2012 |
INTERNET FUND
OBJECTIVE: Seeks to provide capital appreciation by investing in companies that provide products or services designed for or related to the Internet (“Internet Companies”).
The Commerce Department says $62 billion of retail sales were conducted online in the fourth quarter of 2011, a 16% rise over the prior year, and representing about 5.5% of all retail spending over the holiday period. The software segment and the internet & catalog retail segment were the largest contributors to return. Internet software and Internet software & services and communications equipment were the largest detractors from return.
For the one-year period ended March 31, 2012, Internet Fund Investor Class returned -0.73%, compared with 20.21% for the S&P 500® Information Technology Index*.
Cisco Systems, Inc., QUALCOMM, Inc. and priceline.com, Inc. were among the stocks which added the most to Fund performance for the year, while Sina Corp., Juniper Networks, Inc. and Research in Motion Ltd. were among the stocks which added the least to Fund performance for the year.
*S&P 500® Information Technology Index is a sub-index of the S&P 500® Index, a capitalization-weighted index covering 500 industrial, utility, transportation and financial companies of the U.S. markets (mostly NYSE Euronext issues). The Information Technology index covers the following general areas: Technology software & services, including companies that primarily develop software in various fields such as the Internet, applications, systems, databases management and/or home entertainment, and companies that provide information technology consulting and services, as well as data processing and outsourced services; secondly, Technology Hardware & Equipment, including manufacturers and distributors of communications equipment, computers & peripherals, electronic equipment and related instruments; and thirdly, Semiconductors & Semiconductor Equipment Manufacturers.
Performance displayed represents past performance which is no guarantee of future results.
Holdings Diversification (Market Exposure as % of Net Assets)
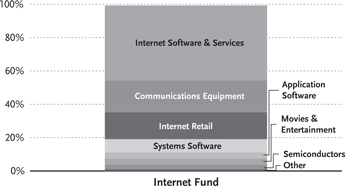
“Holdings Diversification (Market Exposure as % of Net Assets)” excludes any temporary cash investments.
| | | | |
Inception Dates: | | | |
Investor Class | | | April 6, 2000 | |
Advisor Class | | | April 6, 2000 | |
A-Class | | | September 1, 2004 | |
C-Class | | | April 19, 2001 | |
| | | | |
| |
Ten Largest Holdings (% of Total Net Assets) | | | |
Google, Inc. — Class A | | | 8.5 | % |
QUALCOMM, Inc. | | | 6.3 | % |
Cisco Systems, Inc. | | | 6.3 | % |
Amazon.com, Inc. | | | 5.7 | % |
Baidu, Inc. ADR | | | 4.3 | % |
eBay, Inc. | | | 4.0 | % |
Time Warner, Inc. | | | 3.6 | % |
Priceline.com, Inc. | | | 3.5 | % |
Broadcom Corp. — Class A | | | 2.7 | % |
Intuit, Inc. | | | 2.5 | % |
| | | | |
Top Ten Total | | | 47.4 | % |
| | | | |
“Ten Largest Holdings” exclude any temporary cash or derivative investments.
| | | | |
| | | | | |
| 82 | | THE RYDEX FUNDSANNUALREPORT | | |
| | |
| PERFORMANCE REPORT AND FUND PROFILE (Unaudited) (concluded) | | March 31, 2012 |
Cumulative Fund Performance*
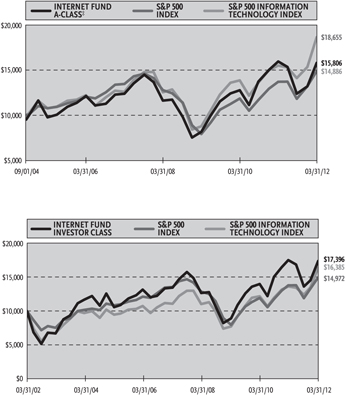
Average Annual Returns*
Periods Ended 03/31/12
| | | | | | | | | | | | |
| | | 1 Year | | | 5 Year | | | 10 Year | |
Investor Class Shares | | | -0.73 | % | | | 5.27 | % | | | 5.69 | % |
Advisor Class Shares | | | -1.24 | % | | | 4.73 | % | | | 5.16 | % |
C-Class Shares | | | -1.69 | % | | | 4.22 | % | | | 4.65 | % |
C-Class Shares with CDSC† | | | -2.67 | % | | | 4.22 | % | | | 4.65 | % |
S&P 500 Index | | | 8.54 | % | | | 2.01 | % | | | 4.12 | % |
S&P 500 Information Technology Index | | | 20.21 | % | | | 8.15 | % | | | 5.06 | % |
| | | |
| | | 1 Year | | | 5 Year | | | Since
Inception
(09/01/04) | |
A-Class Shares | | | -1.00 | % | | | 4.99 | % | | | 6.91 | % |
A-Class Shares with sales charge‡ | | | -5.70 | % | | | 3.97 | % | | | 6.23 | % |
S&P 500 Index | | | 8.54 | % | | | 2.01 | % | | | 5.41 | % |
S&P 500 Information Technology Index | | | 20.21 | % | | | 8.15 | % | | | 8.65 | % |
| * | The performance data above represents past performance that is not predictive of future results. The investment return and principal value of an investment in the Fund will fluctuate so that an investor’s shares, when redeemed, may be worth more or less than their original cost. Returns are historical and include changes in principal and reinvested dividends and capital gains and do not reflect the effect of taxes. The S&P 500 Index and the S&P 500 Information Technology Index are unmanaged indices and, unlike the Fund, have no management fees or operating expenses to reduce their reported returns. The graphs are based on Investor Class shares and A-Class shares only; performance for Advisor Class shares and C-Class shares will vary due to differences in fee structures. |
| † | Fund returns include a CDSC of 1% if redeemed within 12 months of purchase. |
| ‡ | Fund returns are calculated using the maximum sales charge of 4.75%. |
| | | | |
| | | | | |
| | THE RYDEX FUNDSANNUALREPORT | | 83 |
| | |
| SCHEDULE OF INVESTMENTS | | March 31, 2012 |
INTERNET FUND | | |
| | | | | | | | |
| | | SHARES | | | VALUE | |
COMMON STOCKS† - 99.3% | | | | | |
Internet Software & Services - 45.1% | | | | | |
Google, Inc. — Class A* | | | 1,109 | | | $ | 711,135 | |
Baidu, Inc. ADR* | | | 2,456 | | | | 358,011 | |
eBay, Inc.* | | | 9,088 | | | | 335,256 | |
Yahoo!, Inc.* | | | 13,581 | | | | 206,703 | |
LinkedIn Corp. — Class A* | | | 1,585 | | | | 161,654 | |
Yandex N.V. — Class A* | | | 5,650 | | | | 151,816 | |
Equinix, Inc.* | | | 884 | | | | 139,186 | |
Netease.com ADR* | | | 2,350 | | | | 136,535 | |
Rackspace Hosting, Inc.* | | | 2,345 | | | | 135,518 | |
Akamai Technologies, Inc.* | | | 3,393 | | | | 124,523 | |
VeriSign, Inc. | | | 3,169 | | | | 121,499 | |
MercadoLibre, Inc. | | | 1,037 | | | | 101,408 | |
IAC/InterActiveCorp. | | | 1,985 | | | | 97,444 | |
Sina Corp.* | | | 1,474 | | | | 95,810 | |
Open Text Corp.* | | | 1,535 | | | | 93,865 | |
Qihoo 360 Technology Co. Ltd. ADR* | | | 3,520 | | | | 86,064 | |
Renren, Inc. ADR* | | | 13,510 | | | | 74,575 | |
Youku, Inc. ADR* | | | 3,200 | | | | 70,368 | |
Sohu.com, Inc.* | | | 1,232 | | | | 67,969 | |
AOL, Inc.* | | | 3,539 | | | | 67,135 | |
ValueClick, Inc.* | | | 3,103 | | | | 61,253 | |
WebMD Health Corp. — Class A* | | | 2,312 | | | | 59,141 | |
VistaPrint N.V.* | | | 1,493 | | | | 57,704 | |
Liquidity Services, Inc.* | | | 1,260 | | | | 56,448 | |
j2 Global, Inc. | | | 1,953 | | | | 56,012 | |
Monster Worldwide, Inc.* | | | 5,606 | | | | 54,659 | |
Ancestry.com, Inc.* | | | 2,169 | | | | 49,323 | |
OpenTable, Inc.* | | | 1,178 | | | | 47,674 | |
| | | | | | | | |
Total Internet Software & Services | | | | 3,778,688 | |
| | | | | | | | |
Communications Equipment - 19.1% | | | | | |
QUALCOMM, Inc. | | | 7,811 | | | | 531,304 | |
Cisco Systems, Inc. | | | 25,091 | | | | 530,675 | |
Juniper Networks, Inc.* | | | 7,733 | | | | 176,931 | |
F5 Networks, Inc.* | | | 1,215 | | | | 163,976 | |
Research In Motion Ltd.* | | | 9,449 | | | | 138,995 | |
Ciena Corp.* | | | 3,862 | | | | 62,526 | |
| | | | | | | | |
Total Communications Equipment | | | | 1,604,407 | |
| | | | | | | | |
Internet Retail - 16.0% | | | | | | | | |
Amazon.com, Inc.* | | | 2,346 | | | | 475,087 | |
Priceline.com, Inc.* | | | 409 | | | | 293,457 | |
Groupon, Inc. — Class A* | | | 9,970 | | | | 183,249 | |
Netflix, Inc.* | | | 1,073 | | | | 123,438 | |
TripAdvisor, Inc.* | | | 3,059 | | | | 109,115 | |
Expedia, Inc. | | | 3,079 | | | | 102,962 | |
Shutterfly, Inc.* | | | 1,603 | | | | 50,222 | |
| | | | | | | | |
Total Internet Retail | | | | | | | 1,337,530 | |
| | | | | | | | |
| | | | | | | | |
| | | SHARES | | | VALUE | |
Systems Software - 8.0% | | | | | | | | |
Symantec Corp.* | | | 9,791 | | | $ | 183,091 | |
Red Hat, Inc.* | | | 3,028 | | | | 181,347 | |
Check Point Software Technologies Ltd.* | | | 2,830 | | | | 180,667 | |
BMC Software, Inc.* | | | 3,204 | | | | 128,673 | |
| | | | | | | | |
Total Systems Software | | | | | | | 673,778 | |
| | | | | | | | |
Application Software - 3.8% | | | | | | | | |
Intuit, Inc. | | | 3,438 | | | | 206,726 | |
TIBCO Software, Inc.* | | | 3,629 | | | | 110,685 | |
| | | | | | | | |
Total Application Software | | | | | | | 317,411 | |
| | | | | | | | |
Movies & Entertainment - 3.6% | | | | | |
Time Warner, Inc. | | | 8,086 | | | | 305,247 | |
| | | | | | | | |
Semiconductors - 2.7% | | | | | | | | |
Broadcom Corp. —
Class A* | | | 5,845 | | | | 229,709 | |
| | | | | | | | |
Investment Banking & Brokerage - 1.0% | | | | | |
E*Trade Financial Corp.* | | | 7,825 | | | | 85,684 | |
| | | | | | | | |
Total Common Stocks
(Cost $4,537,292) | | | | | | | 8,332,454 | |
| | | | | | | | |
| | |
| | | FACE
AMOUNT | | | | |
REPURCHASE AGREEMENT††,1 - 0.6% | | | | | |
Credit Suisse Group issued 03/30/12 at 0.01% due 04/02/12 | | $ | 51,710 | | | | 51,710 | |
| | | | | | | | |
Total Repurchase Agreement
(Cost $51,710) | | | | | | | 51,710 | |
| | | | | | | | |
Total Investments - 99.9%
(Cost $4,589,002) | | | | | | $ | 8,384,164 | |
| | | | | | | | |
Other Assets & Liabilities, net - 0.1% | | | | 11,304 | |
| | | | | | | | |
Total Net Assets - 100.0% | | | | | | $ | 8,395,468 | |
| * | Non-income producing security. |
| † | Value determined based on Level 1 inputs — See Note 4. |
| †† | Value determined based on Level 2 inputs — See Note 4. |
| 1 | Repurchase Agreement — See Note 5. |
ADR — American Depositary Receipt
| | | | |
| | | | | |
| 84 | | THE RYDEX FUNDSANNUALREPORT | | SEE NOTES TO FINANCIAL STATEMENTS. |
| | | | |
| STATEMENT OF ASSETS AND LIABILITIES | |
March 31, 2012 | | | | |
| |
ASSETS: | | | | |
Investments, at value
(cost $4,537,292) | | $ | 8,332,454 | |
Repurchase agreements, at value
(cost $51,710) | | | 51,710 | |
| | | | |
Total investments
(cost $4,589,002) | | | 8,384,164 | |
Receivables: | | | | |
Fund shares sold | | | 129,003 | |
Dividends | | | 112 | |
| | | | |
Total assets | | | 8,513,279 | |
| | | | |
LIABILITIES: | | | | |
Payable for: | | | | |
Fund shares redeemed | | | 99,927 | |
Management fees | | | 5,465 | |
Transfer agent and administrative fees | | | 1,607 | |
Distribution and service fees | | | 1,091 | |
Portfolio accounting fees | | | 643 | |
Miscellaneous | | | 9,078 | |
| | | | |
Total liabilities | | | 117,811 | |
| | | | |
NET ASSETS | | $ | 8,395,468 | |
| | | | |
NET ASSETS CONSISTOF: | | | | |
Paid in capital | | $ | 6,072,579 | |
Accumulated net investment loss | | | (52,998 | ) |
Accumulated net realized gain on investments | | | (1,419,275 | ) |
Net unrealized appreciation on investments | | | 3,795,162 | |
| | | | |
Net assets | | $ | 8,395,468 | |
| | | | |
INVESTOR CLASS: | | | | |
Net assets | | $ | 6,205,596 | |
Capital shares outstanding | | | 119,568 | |
Net asset value per share | | $ | 51.90 | |
| | | | |
ADVISOR CLASS: | | | | |
Net assets | | $ | 718,718 | |
Capital shares outstanding | | | 14,756 | |
Net asset value per share | | $ | 48.71 | |
| | | | |
A-CLASS: | | | | |
Net assets | | $ | 828,095 | |
Capital shares outstanding | | | 16,685 | |
Net asset value per share | | $ | 49.63 | |
| | | | |
Maximum offering price per share
(Net asset value divided by 95.25%) | | $ | 52.10 | |
| | | | |
C-CLASS: | | | | |
Net assets | | $ | 643,059 | |
Capital shares outstanding | | | 13,830 | |
Net asset value per share | | $ | 46.50 | |
| | | | |
| | | | |
| STATEMENT OF OPERATIONS | |
Year Ended March 31, 2012 | | | | |
| |
INVESTMENT INCOME: | | | | |
Dividends (net of foreign withholding tax of $115) | | $ | 42,260 | |
Interest | | | 21 | |
| | | | |
Total investment income | | | 42,281 | |
| | | | |
EXPENSES: | | | | |
Management fees | | | 120,432 | |
Transfer agent and administrative fees | | | 35,421 | |
Distribution and service fees: | | | | |
Advisor Class | | | 6,343 | |
A-Class | | | 2,253 | |
C-Class | | | 9,514 | |
Portfolio accounting fees | | | 14,169 | |
Registration fees | | | 24,093 | |
Pricing service expense | | | 12,667 | |
Trustees’ fees* | | | 4,576 | |
Custodian fees | | | 3,596 | |
Miscellaneous | | | (22,222 | ) |
| | | | |
Total expenses | | | 210,842 | |
| | | | |
Net investment loss | | | (168,561 | ) |
| | | | |
NET REALIZEDAND UNREALIZED GAIN (LOSS): | |
Net realized gain (loss) on: | | | | |
Investments | | | 3,682,105 | |
| | | | |
Net realized gain | | | 3,682,105 | |
| | | | |
Net change in unrealized appreciation (depreciation) on: | | | | |
Investments | | | (7,435,883 | ) |
| | | | |
Net change in unrealized appreciation (depreciation) | | | (7,435,883 | ) |
| | | | |
Net realized and unrealized loss | | | (3,753,778 | ) |
| | | | |
Net decrease in net assets resulting from operations | | $ | (3,922,339 | ) |
| | | | |
| * | Relates to Trustees not deemed “interested persons” within the meaning of Section 2(a)(19) of the 1940 Act. |
| | | | |
| | | | | |
| SEE NOTES TO FINANCIAL STATEMENTS. | | THE RYDEX FUNDSANNUALREPORT | | 85 |
STATEMENTS OF CHANGES IN NET ASSETS
| | | | | | | | |
| | | Year Ended
March 31, 2012 | | | Year Ended
March 31, 2011 | |
INCREASE (DECREASE) IN NET ASSETS FROM OPERATIONS: | | | | | | | | |
Net investment loss | | $ | (168,561 | ) | | $ | (697,413 | ) |
Net realized gain on investments | | | 3,682,105 | | | | 26,981,612 | ) |
Net change in unrealized appreciation (depreciation) on investments | | | (7,435,883 | ) | | | 1,549,620 | |
| | | | | | | | |
Net increase (decrease) in net assets resulting from operations | | | (3,922,339 | ) | | | 27,833,819 | |
| | | | | | | | |
CAPITAL SHARE TRANSACTIONS: | | | | | | | | |
Proceeds from sale of shares | | | | | | | | |
Investor Class | | | 46,931,498 | | | | 236,370,905 | |
Advisor Class | | | 3,247,918 | | | | 21,569,818 | |
A-Class | | | 3,283,366 | | | | 3,274,554 | |
C-Class | | | 25,638,180 | | | | 51,664,283 | |
Cost of shares redeemed | | | | | | | | |
Investor Class | | | (58,111,981 | ) | | | (264,624,471 | ) |
Advisor Class | | | (4,394,039 | ) | | | (23,765,932 | ) |
A-Class | | | (3,259,688 | ) | | | (5,523,556 | ) |
C-Class | | | (26,601,531 | ) | | | (51,093,192 | ) |
| | | | | | | | |
Net decrease from capital share transactions | | | (13,266,277 | ) | | | (32,127,591 | ) |
| | | | | | | | |
Net decrease in net assets | | | (17,188,616 | ) | | | (4,293,772 | ) |
| NET ASSETS: | | | | | | | | |
Beginning of year | | | 25,584,084 | | | | 29,877,856 | |
| | | | | | | | |
End of year | | $ | 8,395,468 | | | $ | 25,584,084 | |
| | | | | | | | |
Accumulated net investment loss at end of year | | $ | (52,998 | ) | | $ | — | |
| | | | | | | | |
| CAPITAL SHARE ACTIVITY: | | | | | | | | |
Shares sold | | | | | | | | |
Investor Class | | | 952,258 | | | | 5,219,504 | |
Advisor Class | | | 71,309 | | | | 490,716 | |
A-Class | | | 69,108 | | | | 74,437 | |
C-Class | | | 593,808 | | | | 1,264,666 | |
Shares redeemed | | | | | | | | |
Investor Class | | | (1,226,540 | ) | | | (5,350,861 | ) |
Advisor Class | | | (99,635 | ) | | | (546,388 | ) |
A-Class | | | (74,379 | ) | | | (126,995 | ) |
C-Class | | | (617,390 | ) | | | (1,254,939 | ) |
| | | | | | | | |
Net decrease in shares | | | (331,461 | ) | | | (229,860 | ) |
| | | | | | | | |
| | | | |
| | | | | |
| 86 | | THE RYDEX FUNDSANNUALREPORT | | SEE NOTES TO FINANCIAL STATEMENTS. |
| | |
INTERNET FUND | | |
FINANCIAL HIGHLIGHTS |
| This table is presented to show selected data for a share outstanding throughout each period and to assist shareholders in evaluating a Fund’s performance for the periods presented. |
| | | | | | | | | | | | | | | | | | | | |
Investor Class | | Year Ended
March 31,
2012 | | | Year Ended
March 31,
2011 | | | Year Ended
March 31,
2010 | | | Year Ended
March 31,
2009 | | | Year Ended
March 31,
2008 | |
Per Share Data | | | | | | | | | | | | | | | | | | | | |
Net asset value, beginning of period | | $ | 52.28 | | | $ | 41.74 | | | $ | 26.58 | | | $ | 38.55 | | | $ | 41.11 | |
| | | | | | | | | | | | | | | | | | | | |
Income (loss) from investment operations: | | | | | | | | | | | | | | | | | | | | |
Net investment income (loss)a | | | (.51 | ) | | | (.34 | ) | | | (.38 | ) | | | (.29 | ) | | | .46 | |
Net gain (loss) on investments (realized and unrealized) | | | .13 | | | | 10.88 | | | | 15.54 | | | | (11.23 | ) | | | (2.87 | ) |
| | | | | | | | | | | | | | | | | | | | |
Total from investment operations | | | (.38 | ) | | | 10.54 | | | | 15.16 | | | | (11.52 | ) | | | (2.41 | ) |
| | | | | | | | | | | | | | | | | | | | |
Less distributions from: | | | | | | | | | | | | | | | | | | | | |
Net investment income | | | — | | | | — | | | | — | | | | (.45 | ) | | | (.15 | ) |
| | | | | | | | | | | | | | | | | | | | |
Total distributions | | | — | | | | — | | | | — | | | | (.45 | ) | | | (.15 | ) |
| | | | | | | | | | | | | | | | | | | | |
Net asset value, end of period | | $ | 51.90 | | | $ | 52.28 | | | $ | 41.74 | | | $ | 26.58 | | | $ | 38.55 | |
| | | | | | | | | | | | | | | | | | | | |
Total Returnb | | | (0.73 | %) | | | 25.25 | % | | | 57.04 | % | | | (29.63 | %) | | | (5.92 | %) |
| | | | | | | | | | | | | | | | | | | | |
Ratios/Supplemental Data | | | | | | | | | | | | | | | | | | | | |
Net assets, end of period (in thousands) | | $ | 6,206 | | | $ | 20,589 | | | $ | 21,924 | | | $ | 61,745 | | | $ | 4,365 | |
| | | | | | | | | | | | | | | | | | | | |
Ratios to average net assets: | | | | | | | | | | | | | | | | | | | | |
Net investment income (loss) | | | (1.05 | %) | | | (0.69 | %) | | | (1.12 | %) | | | (1.01 | %) | | | 1.00 | % |
Total expenses | | | 1.36 | % | | | 1.39 | % | | | 1.37 | % | | | 1.35 | % | | | 1.38 | % |
| | | | | | | | | | | | | | | | | | | | |
Portfolio turnover rate | | | 380 | % | | | 291 | % | | | 443 | % | | | 550 | % | | | 870 | % |
| | | | | |
Advisor Class | | Year Ended
March 31,
2012 | | | Year Ended
March 31,
2011 | | | Year Ended
March 31,
2010 | | | Year Ended
March 31,
2009 | | | Year Ended
March 31,
2008 | |
Per Share Data | | | | | | | | | | | | | | | | | | | | |
Net asset value, beginning of period | | $ | 49.31 | | | $ | 39.57 | | | $ | 25.32 | | | $ | 36.95 | | | $ | 39.61 | |
| | | | | | | | | | | | | | | | | | | | |
Income (loss) from investment operations: | | | | | | | | | | | | | | | | | | | | |
Net investment lossa | | | (.71 | ) | | | (.59 | ) | | | (.58 | ) | | | (.41 | ) | | | (.09 | ) |
Net gain (loss) on investments (realized and unrealized) | | | .11 | | | | 10.33 | | | | 14.83 | | | | (10.77 | ) | | | (2.42 | ) |
| | | | | | | | | | | | | | | | | | | | |
Total from investment operations | | | (.60 | ) | | | 9.74 | | | | 14.25 | | | | (11.18 | ) | | | (2.51 | ) |
| | | | | | | | | | | | | | | | | | | | |
Less distributions from: | | | | | | | | | | | | | | | | | | | | |
Net investment income | | | — | | | | — | | | | — | | | | (.45 | ) | | | (.15 | ) |
| | | | | | | | | | | | | | | | | | | | |
Total distributions | | | — | | | | — | | | | — | | | | (.45 | ) | | | (.15 | ) |
| | | | | | | | | | | | | | | | | | | | |
Net asset value, end of period | | $ | 48.71 | | | $ | 49.31 | | | $ | 39.57 | | | $ | 25.32 | | | $ | 36.95 | |
| | | | | | | | | | | | | | | | | | | | |
Total Returnb | | | (1.24 | %) | | | 24.61 | % | | | 56.28 | % | | | (29.99 | %) | | | (6.40 | %) |
| | | | | | | | | | | | | | | | | | | | |
Ratios/Supplemental Data | | | | | | | | | | | | | | | | | | | | |
Net assets, end of period (in thousands) | | $ | 719 | | | $ | 2,124 | | | $ | 3,908 | | | $ | 3,604 | | | $ | 1,364 | |
| | | | | | | | | | | | | | | | | | | | |
Ratios to average net assets: | | | | | | | | | | | | | | | | | | | | |
Net investment loss | | | (1.58 | %) | | | (1.32 | %) | | | (1.74 | %) | | | (1.43 | %) | | | (0.21 | %) |
Total expenses | | | 1.86 | % | | | 1.89 | % | | | 1.88 | % | | | 1.87 | % | | | 1.88 | % |
| | | | | | | | | | | | | | | | | | | | |
Portfolio turnover rate | | | 380 | % | | | 291 | % | | | 443 | % | | | 550 | % | | | 870 | % |
| | | | |
| | | | | |
| SEE NOTES TO FINANCIAL STATEMENTS. | | THE RYDEX FUNDSANNUALREPORT | | 87 |
| | |
| INTERNET FUND | | |
| |
| FINANCIAL HIGHLIGHTS (concluded) | | |
This table is presented to show selected data for a share outstanding throughout each period and to assist shareholders in evaluating a Fund’s performance for the periods presented.
| | | | | | | | | | | | | | | | | | | | |
A-Class | | Year Ended
March 31,
2012 | | | Year Ended
March 31,
2011 | | | Year Ended
March 31,
2010 | | | Year Ended
March 31,
2009 | | | Year Ended
March 31,
2008 | |
Per Share Data | | | | | | | | | | | | | | | | | | | | |
Net asset value, beginning of period | | $ | 50.13 | | | $ | 40.12 | | | $ | 25.62 | | | $ | 37.29 | | | $ | 39.87 | |
| | | | | | | | | | | | | | | | | | | | |
Income (loss) from investment operations: | | | | | | | | | | | | | | | | | | | | |
Net investment lossa | | | (.64 | ) | | | (.46 | ) | | | (.50 | ) | | | (.33 | ) | | | (.19 | ) |
Net gain (loss) on investments (realized and unrealized) | | | .14 | | | | 10.47 | | | | 15.00 | | | | (10.89 | ) | | | (2.24 | ) |
| | | | | | | | | | | | | | | | | | | | |
Total from investment operations | | | (.50 | ) | | | 10.01 | | | | 14.50 | | | | (11.22 | ) | | | (2.43 | ) |
| | | | | | | | | | | | | | | | | | | | |
Less distributions from: | | | | | | | | | | | | | | | | | | | | |
Net investment income | | | — | | | | — | | | | — | | | | (.45 | ) | | | (.15 | ) |
| | | | | | | | | | | | | | | | | | | | |
Total distributions | | | — | | | | — | | | | — | | | | (.45 | ) | | | (.15 | ) |
| | | | | | | | | | | | | | | | | | | | |
Net asset value, end of period | | $ | 49.63 | | | $ | 50.13 | | | $ | 40.12 | | | $ | 25.62 | | | $ | 37.29 | |
| | | | | | | | | | | | | | | | | | | | |
Total Returnb | | | (1.00 | %) | | | 24.95 | % | | | 56.60 | % | | | (29.82 | %) | | | (6.16 | %) |
| | | | | | | | | | | | | | | | | | | | |
Ratios/Supplemental Data | | | | | | | | | | | | | | | | | | | | |
Net assets, end of period (in thousands) | | $ | 828 | | | $ | 1,101 | | | $ | 2,989 | | | $ | 91 | | | $ | 116 | |
| | | | | | | | | | | | | | | | | | | | |
Ratios to average net assets: | | | | | | | | | | | | | | | | | | | | |
Net investment loss | | | (1.39 | %) | | | (1.01 | %) | | | (1.44 | %) | | | (1.07 | %) | | | (0.44 | %) |
Total expenses | | | 1.61 | % | | | 1.64 | % | | | 1.63 | % | | | 1.62 | % | | | 1.63 | % |
| | | | | | | | | | | | | | | | | | | | |
Portfolio turnover rate | | | 380 | % | | | 291 | % | | | 443 | % | | | 550 | % | | | 870 | % |
| | | | | |
C-Class | | Year Ended
March 31,
2012 | | | Year Ended
March 31,
2011 | | | Year Ended
March 31,
2010 | | | Year Ended
March 31,
2009d | | | Year Ended
March 31,
2008d | |
Per Share Data | | | | | | | | | | | | | | | | | | | | |
Net asset value, beginning of period | | $ | 47.30 | | | $ | 38.17 | | | $ | 24.56 | | | $ | 36.01 | | | $ | 38.79 | |
| | | | | | | | | | | | | | | | | | | | |
Income (loss) from investment operations: | | | | | | | | | | | | | | | | | | | | |
Net investment lossa | | | (.94 | ) | | | (.83 | ) | | | (.66 | ) | | | (.59 | ) | | | (.38 | ) |
Net gain (loss) on investments
(realized and unrealized) | | | .14 | | | | 9.96 | | | | 14.27 | | | | (10.41 | ) | | | (2.25 | ) |
| | | | | | | | | | | | | | | | | | | | |
Total from investment operations | | | (.80 | ) | | | 9.13 | | | | 13.61 | | | | (11.00 | ) | | | (2.63 | ) |
| | | | | | | | | | | | | | | | | | | | |
Less distributions from: | | | | | | | | | | | | | | | | | | | | |
Net investment income | | | — | | | | — | | | | — | | | | (.45 | ) | | | (.15 | ) |
| | | | | | | | | | | | | | | | | | | | |
Total distributions | | | — | | | | — | | | | — | | | | (.45 | ) | | | (.15 | ) |
| | | | | | | | | | | | | | | | | | | | |
Net asset value, end of period | | $ | 46.50 | | | $ | 47.30 | | | $ | 38.17 | | | $ | 24.56 | | | $ | 36.01 | |
| | | | | | | | | | | | | | | | | | | | |
Total Returnb | | | (1.69 | %) | | | 23.92 | % | | | 55.42 | % | | | (30.28 | %) | | | (6.84 | %) |
| | | | | | | | | | | | | | | | | | | | |
Ratios/Supplemental Data | | | | | | | | | | | | | | | | | | | | |
Net assets, end of period (in thousands) | | $ | 643 | | | $ | 1,770 | | | $ | 1,057 | | | $ | 602 | | | $ | 1,608 | |
| | | | | | | | | | | | | | | | | | | | |
Ratios to average net assets: | | | | | | | | | | | | | | | | | | | | |
Net investment loss | | | (2.17 | %) | | | (1.92 | %) | | | (2.00 | %) | | | (1.95 | %) | | | (0.89 | %) |
Total expenses | | | 2.36 | % | | | 2.39 | % | | | 2.38 | % | | | 2.38 | % | | | 2.37 | % |
| | | | | | | | | | | | | | | | | | | | |
Portfolio turnover rate | | | 380 | % | | | 291 | % | | | 443 | % | | | 550 | % | | | 870 | % |
| a | Net investment income (loss) per share was computed using average shares outstanding throughout the period. |
| b | Total return does not reflect the impact of any applicable sales charges and has not been annualized. |
| | | | |
| | | | | |
| 88 | | THE RYDEX FUNDSANNUALREPORT | | SEE NOTES TO FINANCIAL STATEMENTS. |
This page intentionally left blank.
| | | | |
| | | | | |
| | THE RYDEX FUNDSANNUALREPORT | | 89 |
| | |
| PERFORMANCE REPORT AND FUND PROFILE (Unaudited) | | March 31, 2012 |
LEISURE FUND
OBJECTIVE: Seeks to provide capital appreciation by investing in companies engaged in leisure and entertainment businesses (“Leisure Companies”).
The sector performed well based on U.S. retail spending that is increasing, reflecting positive, yet slow, economic growth, and consumer confidence survey results that are at their highest level in a year. An accommodative Federal Reserve and views that gasoline prices are reaching a cyclical peak have also been driving consumer spending, but sustained job growth may be needed for it to climb higher.
For the one-year period ended March 31, 2012, Leisure Fund Investor Class returned 10.27%, compared with 17.53% for the S&P 500® Consumer Discretionary Index*.
Within the sector, the hotels, restaurants & leisure segment, which made up 38% of the portfolio, contributed about half of the Fund’s return for the year, while media holdings were the next-largest contributor. The lightly weighted automobiles and software segments were the weakest contributors to performance, while the electronic equipment instruments segment detracted from performance.
Among the stocks that contributed the most to the Fund’s annual performance were McDonald’s Corp., Philip Morris International, Inc. and Starbucks Corp. Royal Caribbean Cruises Ltd., Cablevision Systems Corp. and Ctrip.com International Ltd. ADR were among the Fund’s weakest holdings for the period.
*S&P 500® Consumer Discretionary Index is a sub-index of the S&P 500® Index, a capitalization-weighted index covering 500 industrial, utility, transportation and financial companies of the U.S. markets (mostly NYSE Euronext issues). The Consumer Discretionary index includes companies whose businesses are dominated by one of the following activities: The manufacture and distribution of capital goods, including aerospace & defense, construction, engineering & building products, electrical equipment and industrial machinery; the provision of commercial services and supplies, including printing, environmental, office and security services; the provision of professional services, including employment and research & consulting services; or the provision of transportation services, including airlines, couriers, marine, road & rail and transportation infrastructure.
Performance displayed represents past performance which is no guarantee of future results.
Holdings Diversification (Market Exposure as % of Net Assets)
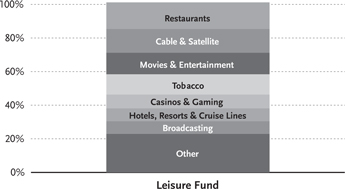
“Holdings Diversification (Market Exposure as % of Net Assets)” excludes any temporary cash investments.
| | |
Inception Dates: | | |
Investor Class | | April 1, 1998 |
Advisor Class | | June 3, 1998 |
A-Class | | September 1, 2004 |
C-Class | | May 3, 2001 |
| | | | |
Ten Largest Holdings (% of Total Net Assets) | | | |
Philip Morris International, Inc. | | | 5.1 | % |
McDonald’s Corp. | | | 4.1 | % |
Comcast Corp. — Class A | | | 3.7 | % |
Walt Disney Co. | | | 3.6 | % |
Altria Group, Inc. | | | 3.3 | % |
News Corp. — Class A | | | 2.9 | % |
Starbucks Corp. | | | 2.7 | % |
Las Vegas Sands Corp. | | | 2.7 | % |
Time Warner, Inc. | | | 2.5 | % |
DIRECTV — Class A | | | 2.4 | % |
| | | | |
Top Ten Total | | | 33.0 | % |
| | | | |
“Ten Largest Holdings” exclude any temporary cash or derivative investments.
| | | | |
| | | | | |
| 90 | | THE RYDEX FUNDSANNUALREPORT | | |
| | |
| PERFORMANCE REPORT AND FUND PROFILE (Unaudited) (concluded) | | March 31, 2012 |
Cumulative Fund Performance*
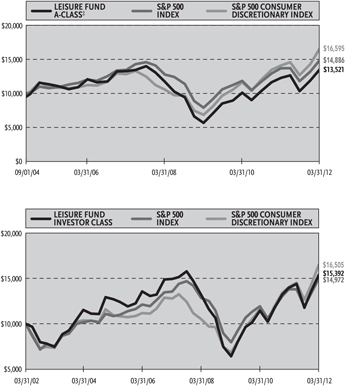
Average Annual Returns*
Periods Ended 03/31/12
| | | | | | | | | | | | |
| | | 1 Year | | | 5 Year | | | 10 Year | |
Investor Class Shares | | | 10.27 | % | | | 0.59 | % | | | 4.41 | % |
Advisor Class Shares | | | 9.72 | % | | | 0.11 | % | | | 3.93 | % |
C-Class Shares | | | 9.19 | % | | | -0.42 | % | | | 3.37 | % |
C-Class Shares with CDSC† | | | 8.19 | % | | | -0.42 | % | | | 3.37 | % |
S&P 500 Index | | | 8.54 | % | | | 2.01 | % | | | 4.12 | % |
S&P 500 Consumer Discretionary Index | | | 17.53 | % | | | 5.24 | % | | | 5.14 | % |
| | | |
| | | 1 Year | | | 5 Year | | | Since
Inception
(09/01/04) | |
A-Class Shares | | | 9.95 | % | | | 0.34 | % | | | 4.73 | % |
A-Class Shares with sales charge‡ | | | 4.74 | % | | | -0.63 | % | | | 4.06 | % |
S&P 500 Index | | | 8.54 | % | | | 2.01 | % | | | 5.41 | % |
S&P 500 Consumer Discretionary Index | | | 17.53 | % | | | 5.24 | % | | | 6.94 | % |
| * | The performance data above represents past performance that is not predictive of future results. The investment return and principal value of an investment in the Fund will fluctuate so that an investor’s shares, when redeemed, may be worth more or less than their original cost. Returns are historical and include changes in principal and reinvested dividends and capital gains and do not reflect the effect of taxes. The S&P 500 Index and the S&P 500 Consumer Discretionary Index are unmanaged indices and, unlike the Fund, have no management fees or operating expenses to reduce their reported returns. The graphs are based on Investor Class shares and A-Class shares only; performance for Advisor Class shares and C-Class shares will vary due to differences in fee structures. |
| † | Fund returns include a CDSC of 1% if redeemed within 12 months of purchase. |
| ‡ | Fund returns are calculated using the maximum sales charge of 4.75%. |
| | | | |
| | | | | |
| | THE RYDEX FUNDSANNUALREPORT | | 91 |
| | |
| SCHEDULE OF INVESTMENTS | | March 31, 2012 |
| LEISURE FUND | | |
| | | | | | | | |
| | | SHARES | | | VALUE | |
COMMON STOCKS† - 101.2% | | | | | |
Restaurants - 15.9% | | | | | | | | |
McDonald’s Corp. | | | 6,599 | | | $ | 647,361 | |
Starbucks Corp. | | | 7,638 | | | | 426,888 | |
Yum! Brands, Inc. | | | 5,221 | | | | 371,631 | |
Chipotle Mexican Grill, Inc. — Class A* | | | 559 | | | | 233,662 | |
Darden Restaurants, Inc. | | | 3,183 | | | | 162,842 | |
Panera Bread Co. —
Class A* | | | 878 | | | | 141,288 | |
Dunkin’ Brands Group, Inc. | | | 4,010 | | | | 120,741 | |
Brinker International, Inc. | | | 3,360 | | | | 92,568 | |
Wendy’s Co. | | | 17,968 | | | | 90,020 | |
Domino’s Pizza, Inc. | | | 2,451 | | | | 88,971 | |
Buffalo Wild Wings, Inc.* | | | 937 | | | | 84,977 | |
Cheesecake Factory, Inc.* | | | 2,704 | | | | 79,471 | |
| | | | | | | | |
Total Restaurants | | | | | | | 2,540,420 | |
| | | | | | | | |
Cable & Satellite - 14.1% | | | | | | | | |
Comcast Corp. — Class A | | | 19,463 | | | | 584,084 | |
DIRECTV — Class A* | | | 7,702 | | | | 380,016 | |
Time Warner Cable, Inc. | | | 4,052 | | | | 330,238 | |
DISH Network Corp. — Class A | | | 7,746 | | | | 255,076 | |
Liberty Global, Inc. — Class A* | | | 4,697 | | | | 235,226 | |
Virgin Media, Inc. | | | 6,918 | | | | 172,812 | |
Charter Communications, Inc. — Class A* | | | 2,580 | | | | 163,701 | |
Cablevision Systems Corp. — Class A | | | 8,938 | | | | 131,210 | |
| | | | | | | | |
Total Cable & Satellite | | | | | | | 2,252,363 | |
| | | | | | | | |
Movies & Entertainment - 12.8% | |
Walt Disney Co. | | | 13,174 | | | | 576,759 | |
News Corp. — Class A | | | 23,134 | | | | 455,508 | |
Time Warner, Inc. | | | 10,692 | | | | 403,623 | |
Viacom, Inc. — Class B | | | 6,938 | | | | 329,277 | |
Cinemark Holdings, Inc. | | | 4,656 | | | | 102,199 | |
Regal Entertainment Group — Class A | | | 6,828 | | | | 92,861 | |
DreamWorks Animation SKG, Inc. — Class A* | | | 4,321 | | | | 79,722 | |
| | | | | | | | |
Total Movies & Entertainment | | | | | | | 2,039,949 | |
| | | | | | | | |
Tobacco - 12.1% | | | | | | | | |
Philip Morris International, Inc. | | | 9,126 | | | | 808,655 | |
Altria Group, Inc. | | | 16,859 | | | | 520,437 | |
Reynolds American, Inc. | | | 7,655 | | | | 317,223 | |
Lorillard, Inc. | | | 2,054 | | | | 265,952 | |
| | | | | | | | |
Total Tobacco | | | | | | | 1,912,267 | |
| | | | | | | | |
Casinos & Gaming - 8.2% | | | | | |
Las Vegas Sands Corp. | | | 7,317 | | | | 421,239 | |
Wynn Resorts Ltd. | | | 1,811 | | | | 226,158 | |
MGM Resorts International* | | | 11,940 | | | | 162,623 | |
International Game Technology | | | 8,688 | | | | 145,872 | |
Melco Crown Entertainment Ltd. ADR* | | | 9,756 | | | | 132,779 | |
Penn National Gaming, Inc.* | | | 2,693 | | | | 115,745 | |
Bally Technologies, Inc.* | | | 1,977 | | | | 92,425 | |
| | | | | | | | |
Total Casinos & Gaming | | | | | | | 1,296,841 | |
| | | | | | | | |
Hotels, Resorts & Cruise Lines - 7.7% | | | | | |
Carnival Corp. | | | 10,224 | | | | 327,986 | |
Marriott International, Inc. — Class A | | | 6,103 | | | | 230,999 | |
| | | | | | | | |
| | | SHARES | | | VALUE | |
Starwood Hotels & Resorts Worldwide, Inc. | | | 3,806 | | | $ | 214,696 | |
Wyndham Worldwide Corp. | | | 3,685 | | | | 171,389 | |
Royal Caribbean Cruises Ltd. | | | 5,472 | | | | 161,041 | |
Ctrip.com International Ltd. ADR* | | | 5,065 | | | | 109,607 | |
| | | | | | | | |
Total Hotels, Resorts & Cruise Lines | | | | 1,215,718 | |
| | | | | | | | |
Broadcasting - 7.5% | | | | | | | | |
CBS Corp. — Class B | | | 9,235 | | | | 313,158 | |
Discovery Communications, Inc. — Class A* | | | 5,340 | | | | 270,204 | |
Liberty Media Corp.—Liberty Capital — Class A* | | | 2,437 | | | | 214,822 | |
Scripps Networks Interactive, Inc. — Class A | | | 3,750 | | | | 182,588 | |
Grupo Televisa SAB ADR | | | 5,730 | | | | 120,788 | |
Pandora Media, Inc.* | | | 8,090 | | | | 82,599 | |
| | | | | | | | |
Total Broadcasting | | | | | | | 1,184,159 | |
| | | | | | | | |
Publishing - 4.8% | | | | | | | | |
Thomson Reuters Corp. | | | 10,844 | | | | 313,391 | |
McGraw-Hill Companies, Inc. | | | 4,948 | | | | 239,830 | |
Gannett Company, Inc. | | | 8,016 | | | | 122,885 | |
Meredith Corp. | | | 2,391 | | | | 77,612 | |
| | | | | | | | |
Total Publishing | | | | | | | 753,718 | |
| | | | | | | | |
Distillers & Vintners - 4.3% | | | | | |
Brown-Forman Corp. — Class B | | | 2,699 | | | | 225,069 | |
Beam, Inc. | | | 3,394 | | | | 198,787 | |
Constellation Brands, Inc. — Class A* | | | 6,079 | | | | 143,404 | |
Diageo plc ADR | | | 1,260 | | | | 121,590 | |
| | | | | | | | |
Total Distillers & Vintners | | | | | | | 688,850 | |
| | | | | | | | |
Leisure Products - 3.8% | | | | | |
Mattel, Inc. | | | 6,499 | | | | 218,756 | |
Polaris Industries, Inc. | | | 2,045 | | | | 147,547 | |
Hasbro, Inc. | | | 3,852 | | | | 141,445 | |
Brunswick Corp. | | | 3,814 | | | | 98,211 | |
| | | | | | | | |
Total Leisure Products | | | | | | | 605,959 | |
| | | | | | | | |
Home Entertainment Software - 3.6% | |
Electronic Arts, Inc.* | | | 14,590 | | | | 240,443 | |
Activision Blizzard, Inc. | | | 17,001 | | | | 217,953 | |
Take-Two Interactive Software, Inc.* | | | 6,979 | | | | 107,372 | |
| | | | | | | | |
Total Home Entertainment Software | | | | 565,768 | |
| | | | | | | | |
Brewers - 3.2% | | | | | | | | |
Molson Coors Brewing Co. — Class B | | | 4,214 | | | | 190,684 | |
Cia de Bebidas das Americas ADR | | | 4,360 | | | | 180,155 | |
Anheuser-Busch InBev N.V. ADR | | | 1,853 | | | | 134,750 | |
| | | | | | | | |
Total Brewers | | | | | | | 505,589 | |
| | | | | | | | |
Leisure Facilities - 1.8% | | | | | | | | |
Six Flags Entertainment Corp. | | | 2,235 | | | | 104,531 | |
Life Time Fitness, Inc.* | | | 1,869 | | | | 94,515 | |
Vail Resorts, Inc. | | | 1,831 | | | | 79,191 | |
| | | | | | | | |
Total Leisure Facilities | | | | | | | 278,237 | |
| | | | | | | | |
Motorcycle Manufacturers - 1.4% | | | | | |
Harley-Davidson, Inc. | | | 4,427 | | | | 217,277 | |
| | | | | | | | |
Total Common Stocks
(Cost $13,758,756) | | | | | | | 16,057,115 | |
| | | | | | | | |
| | | | |
| | | | | |
| 92 | | THE RYDEX FUNDSANNUALREPORT | | |
| | |
| SCHEDULE OF INVESTMENTS (concluded) | | March 31, 2012 |
| LEISURE FUND | | |
| | | | | | | | |
| | | FACE
AMOUNT | | | VALUE | |
REPURCHASE AGREEMENT††,1 - 0.7% | |
Credit Suisse Group issued 03/30/12 at 0.01% due 04/02/12 | | $ | 103,149 | | | $ | 103,149 | |
| | | | | | | | |
Total Repurchase Agreement
(Cost $103,149) | | | | 103,149 | |
| | | | | | | | |
Total Investments - 101.9%
(Cost $13,861,905) | | | $ | 16,160,264 | |
| | | | | | | | |
Other Assets & Liabilities, net - (1.9)% | | | | (300,826 | ) |
| | | | | | | | |
Total Net Assets - 100.0% | | | | | | $ | 15,859,438 | |
| * | Non-income producing security. |
| † | Value determined based on Level 1 inputs — See Note 4. |
| †† | Value determined based on Level 2 inputs — See Note 4. |
| 1 | Repurchase Agreement — See Note 5. |
ADR — American Depositary Receipt
plc — Public Limited Company
| | | | |
| | | | | |
| SEE NOTES TO FINANCIAL STATEMENTS. | | THE RYDEX FUNDSANNUALREPORT | | 93 |
| | | | |
STATEMENT OF ASSETS AND LIABILITIES | |
March 31, 2012 | | | | |
| |
ASSETS: | | | | |
Investments, at value
(cost $13,758,756) | | $ | 16,057,115 | |
Repurchase agreements, at value
(cost $103,149) | | | 103,149 | |
| | | | |
Total investments
(cost $13,861,905) | | | 16,160,264 | |
Cash | | | 318 | |
Receivables: | | | | |
Fund shares sold | | | 573,994 | |
Securities sold | | | 468,836 | |
Dividends | | | 29,231 | |
| | | | |
Total assets | | | 17,232,643 | |
| | | | |
LIABILITIES: | | | | |
Payable for: | | | | |
Fund shares redeemed | | | 861,273 | |
Securities purchased | | | 493,622 | |
Management fees | | | 9,216 | |
Transfer agent and administrative fees | | | 2,710 | |
Distribution and service fees | | | 1,633 | |
Portfolio accounting fees | | | 1,084 | |
Miscellaneous | | | 3,667 | |
| | | | |
Total liabilities | | | 1,373,205 | |
| | | | |
NET ASSETS | | $ | 15,859,438 | |
| | | | |
NET ASSETS CONSISTOF: | | | | |
Paid in capital | | $ | 18,856,780 | |
Undistributed net investment income | | | 24,145 | |
Accumulated net realized loss on investments | | | (5,319,846 | ) |
Net unrealized appreciation on investments | | | 2,298,359 | |
| | | | |
Net assets | | $ | 15,859,438 | |
| | | | |
INVESTOR CLASS: | | | | |
Net assets | | $ | 12,687,135 | |
Capital shares outstanding | | | 343,456 | |
Net asset value per share | | $ | 36.94 | |
| | | | |
ADVISOR CLASS: | | | | |
Net assets | | $ | 1,378,716 | |
Capital shares outstanding | | | 40,162 | |
Net asset value per share | | $ | 34.33 | |
| | | | |
A-CLASS: | | | | |
Net assets | | $ | 448,309 | |
Capital shares outstanding | | | 12,842 | |
Net asset value per share | | $ | 34.91 | |
| | | | |
Maximum offering price per share
(Net asset value divided by 95.25%) | | $ | 36.65 | |
| | | | |
C-CLASS: | | | | |
Net assets | | $ | 1,345,278 | |
Capital shares outstanding | | | 40,573 | |
Net asset value per share | | $ | 33.16 | |
| | | | |
| | | | |
STATEMENT OF OPERATIONS | |
Year Ended March 31, 2012 | | | | |
| |
INVESTMENT INCOME: | | | | |
Dividends (net of foreign withholding tax of $1,450) | | $ | 139,485 | |
Interest | | | 15 | |
| | | | |
Total investment income | | | 139,500 | |
| | | | |
EXPENSES: | | | | |
Management fees | | | 64,776 | |
Transfer agent and administrative fees | | | 19,052 | |
Distribution and service fees: | | | | |
Advisor Class | | | 4,421 | |
A-Class | | | 1,767 | |
C-Class | | | 6,597 | |
Portfolio accounting fees | | | 7,621 | |
Custodian fees | | | 1,966 | |
Trustees’ fees* | | | 729 | |
Miscellaneous | | | 8,426 | |
| | | | |
Total expenses | | | 115,355 | |
| | | | |
Net investment income | | | 24,145 | |
| | | | |
NET REALIZEDAND UNREALIZED GAIN (LOSS): | | | | |
Net realized gain (loss) on: | | | | |
Investments | | | (1,120,704 | ) |
| | | | |
Net realized loss | | | (1,120,704 | ) |
| | | | |
Net change in unrealized appreciation
(depreciation) on: | | | | |
Investments | | | 490,827 | |
| | | | |
Net change in unrealized appreciation (depreciation) | | | 490,827 | |
| | | | |
Net realized and unrealized loss | | | (629,877 | ) |
| | | | |
Net decrease in net assets resulting from operations | | $ | (605,732 | ) |
| | | | |
| * | Relates to Trustees not deemed “interested persons” within the meaning of Section 2(a)(19) of the 1940 Act. |
| | | | |
| | | | | |
| 94 | | THE RYDEX FUNDSANNUALREPORT | | SEE NOTES TO FINANCIAL STATEMENTS. |
STATEMENTS OF CHANGES IN NET ASSETS
| | | | | | | | |
| | | Year Ended
March 31,
2012 | | | Year Ended
March 31,
2011 | |
INCREASE (DECREASE) IN NET ASSETS FROM OPERATIONS: | | | | | | | | |
Net investment income (loss) | | $ | 24,145 | | | $ | (28,602 | ) |
Net realized gain (loss) on investments | | | (1,120,704 | ) | | | 1,115,448 | |
Net change in unrealized appreciation (depreciation) on investments | | | 490,827 | | | | (464,544 | ) |
| | | | | | | | |
Net increase (decrease) in net assets resulting from operations | | | (605,732 | ) | | | 622,302 | |
| | | | | | | | |
CAPITAL SHARE TRANSACTIONS: | | | | | | | | |
Proceeds from sale of shares | | | | | | | | |
Investor Class | | | 67,307,816 | | | | 125,035,458 | |
Advisor Class | | | 7,640,459 | | | | 16,335,922 | |
A-Class | | | 1,101,175 | | | | 2,661,993 | |
C-Class | | | 5,204,525 | | | | 13,154,026 | |
Cost of shares redeemed | | | | | | | | |
Investor Class | | | (56,013,411 | ) | | | (136,617,181 | ) |
Advisor Class | | | (6,768,833 | ) | | | (16,737,008 | ) |
A-Class | | | (1,923,474 | ) | | | (2,179,683 | ) |
C-Class | | | (4,790,936 | ) | | | (13,283,662 | ) |
| | | | | | | | |
Net increase (decrease) from capital share transactions | | | 11,757,321 | | | | (11,630,135 | ) |
| | | | | | | | |
Net increase (decrease) in net assets | | | 11,151,589 | | | | (11,007,833 | ) |
NET ASSETS: | | | | | | | | |
Beginning of year | | | 4,707,849 | | | | 15,715,682 | |
| | | | | | | | |
End of year | | $ | 15,859,438 | | | $ | 4,707,849 | |
| | | | | | | | |
Undistributed net investment income at end of year | | $ | 24,145 | | | $ | — | |
| | | | | | | | |
CAPITAL SHARE ACTIVITY: | | | | | | | | |
Shares sold | | | | | | | | |
Investor Class | | | 1,961,935 | | | | 4,337,324 | |
Advisor Class | | | 240,055 | | | | 613,234 | |
A-Class | | | 37,255 | | | | 96,339 | |
C-Class | | | 171,187 | | | | 514,174 | |
Shares redeemed | | | | | | | | |
Investor Class | | | (1,682,378 | ) | | | (4,753,299 | ) |
Advisor Class | | | (218,494 | ) | | | (637,678 | ) |
A-Class | | | (60,854 | ) | | | (78,619 | ) |
C-Class | | | (157,894 | ) | | | (523,771 | ) |
| | | | | | | | |
Net increase (decrease) in shares | | | 290,812 | | | | (432,296 | ) |
| | | | | | | | |
| | | | |
| | | | | |
| SEE NOTES TO FINANCIAL STATEMENTS. | | THE RYDEX FUNDSANNUALREPORT | | 95 |
FINANCIAL HIGHLIGHTS
This table is presented to show selected data for a share outstanding throughout each period and to assist shareholders in evaluating a Fund’s performance for the periods presented.
| | | | | | | | | | | | | | | | | | | | |
Investor Class | | Year Ended
March 31,
2012 | | | Year Ended
March 31,
2011 | | | Year Ended
March 31,
2010 | | | Year Ended
March 31,
2009 | | | Year Ended
March 31,
2008 | |
Per Share Data | | | | | | | | | | | | | | | | | | | | |
Net asset value, beginning of period | | $ | 33.50 | | | $ | 27.48 | | | $ | 15.40 | | | $ | 31.72 | | | $ | 35.87 | |
| | | | | | | | | | | | | | | | | | | | |
Income (loss) from investment operations: | | | | | | | | | | | | | | | | | | | | |
Net investment income (loss)a | | | .17 | | | | (.02 | ) | | | .03 | | | | .01 | | | | .09 | |
Net gain (loss) on investments (realized and unrealized) | | | 3.27 | | | | 6.04 | | | | 12.05 | | | | (16.33 | ) | | | (4.24 | ) |
| | | | | | | | | | | | | | | | | | | | |
Total from investment operations | | | 3.44 | | | | 6.02 | | | | 12.08 | | | | (16.32 | ) | | | (4.15 | ) |
| | | | | | | | | | | | | | | | | | | | |
Net asset value, end of period | | $ | 36.94 | | | $ | 33.50 | | | $ | 27.48 | | | $ | 15.40 | | | $ | 31.72 | |
| | | | | | | | | | | | | | | | | | | | |
Total Returnb | | | 10.27 | % | | | 21.91 | % | | | 78.44 | % | | | (51.45 | %) | | | (11.57 | %) |
| | | | | | | | | | | | | | | | | | | | |
Ratios/Supplemental Data | | | | | | | | | | | | | | | | | | | | |
Net assets, end of period (in thousands) | | $ | 12,687 | | | $ | 2,141 | | | $ | 13,186 | | | $ | 4,132 | | | $ | 3,283 | |
| | | | | | | | | | | | | | | | | | | | |
Ratios to average net assets: | | | | | | | | | | | | | | | | | | | | |
Net investment income (loss) | | | 0.49 | % | | | (0.07 | %) | | | 0.13 | % | | | 0.05 | % | | | 0.24 | % |
Total expenses | | | 1.35 | % | | | 1.39 | % | | | 1.37 | % | | | 1.37 | % | | | 1.39 | % |
| | | | | | | | | | | | | | | | | | | | |
Portfolio turnover rate | | | 797 | % | | | 963 | % | | | 943 | % | | | 1,529 | % | | | 646 | % |
| | | | | |
Advisor Class | | Year Ended
March 31,
2012 | | | Year Ended
March 31,
2011 | | | Year Ended
March 31,
2010 | | | Year Ended
March 31,
2009 | | | Year Ended
March 31,
2008 | |
Per Share Data | | | | | | | | | | | | | | | | | | | | |
Net asset value, beginning of period | | $ | 31.29 | | | $ | 25.81 | | | $ | 14.53 | | | $ | 30.06 | | | $ | 34.14 | |
| | | | | | | | | | | | | | | | | | | | |
Income (loss) from investment operations: | | | | | | | | | | | | | | | | | | | | |
Net investment lossa | | | (.01 | ) | | | (.16 | ) | | | (.11 | ) | | | (.03 | ) | | | (.07 | ) |
Net gain (loss) on investments (realized and unrealized) | | | 3.05 | | | | 5.64 | | | | 11.39 | | | | (15.50 | ) | | | (4.01 | ) |
| | | | | | | | | | | | | | | | | | | | |
Total from investment operations | | | 3.04 | | | | 5.48 | | | | 11.28 | | | | (15.53 | ) | | | (4.08 | ) |
| | | | | | | | | | | | | | | | | | | | |
Net asset value, end of period | | $ | 34.33 | | | $ | 31.29 | | | $ | 25.81 | | | $ | 14.53 | | | $ | 30.06 | |
| | | | | | | | | | | | | | | | | | | | |
Total Returnb | | | 9.72 | % | | | 21.23 | % | | | 77.63 | % | | | (51.66 | %) | | | (11.95 | %) |
| | | | | | | | | | | | | | | | | | | | |
Ratios/Supplemental Data | | | | | | | | | | | | | | | | | | | | |
Net assets, end of period (in thousands) | | $ | 1,379 | | | $ | 582 | | | $ | 1,111 | | | $ | 373 | | | $ | 1,611 | |
| | | | | | | | | | | | | | | | | | | | |
Ratios to average net assets: | | | | | | | | | | | | | | | | | | | | |
Net investment loss | | | (0.03 | %) | | | (0.61 | %) | | | (0.56 | %) | | | (0.11 | %) | | | (0.22 | %) |
Total expenses | | | 1.86 | % | | | 1.89 | % | | | 1.88 | % | | | 1.88 | % | | | 1.89 | % |
| | | | | | | | | | | | | | | | | | | | |
Portfolio turnover rate | | | 797 | % | | | 963 | % | | | 943 | % | | | 1,529 | % | | | 646 | % |
| | | | |
| | | | | |
| 96 | | THE RYDEX FUNDSANNUALREPORT | | SEE NOTES TO FINANCIAL STATEMENTS. |
FINANCIAL HIGHLIGHTS (concluded)
This table is presented to show selected data for a share outstanding throughout each period and to assist shareholders in evaluating a Fund’s performance for the periods presented.
| | | | | | | | | | | | | | | | | | | | |
A-Class | | Year Ended
March 31,
2012 | | | Year Ended
March 31,
2011 | | | Year Ended
March 31,
2010 | | | Year Ended
March 31,
2009 | | | Year Ended
March 31,
2008 | |
Per Share Data | | | | | | | | | | | | | | | | | | | | |
Net asset value, beginning of period | | $ | 31.75 | | | $ | 26.13 | | | $ | 14.67 | | | $ | 30.30 | | | $ | 34.32 | |
| | | | | | | | | | | | | | | | | | | | |
Income (loss) from investment operations: | | | | | | | | | | | | | | | | | | | | |
Net investment income (loss)a | | | .07 | | | | (.05 | ) | | | .17 | | | | (.04 | ) | | | (.07 | ) |
Net gain (loss) on investments (realized and unrealized) | | | 3.09 | | | | 5.67 | | | | 11.29 | | | | (15.59 | ) | | | (3.95 | ) |
| | | | | | | | | | | | | | | | | | | | |
Total from investment operations | | | 3.16 | | | | 5.62 | | | | 11.46 | | | | (15.63 | ) | | | (4.02 | ) |
| | | | | | | | | | | | | | | | | | | | |
Net asset value, end of period | | $ | 34.91 | | | $ | 31.75 | | | $ | 26.13 | | | $ | 14.67 | | | $ | 30.30 | |
| | | | | | | | | | | | | | | | | | | | |
Total Returnb | | | 9.95 | % | | | 21.51 | % | | | 78.12 | % | | | (51.58 | %) | | | (11.71 | %) |
| | | | | | | | | | | | | | | | | | | | |
Ratios/Supplemental Data | | | | | | | | | | | | | | | | | | | | |
Net assets, end of period (in thousands) | | $ | 448 | | | $ | 1,157 | | | $ | 489 | | | $ | 25 | | | $ | 206 | |
| | | | | | | | | | | | | | | | | | | | |
Ratios to average net assets: | | | | | | | | | | | | | | | | | | | | |
Net investment income (loss) | | | 0.23 | % | | | (0.18 | %) | | | 0.74 | % | | | (0.16 | %) | | | (0.20 | %) |
Total expenses | | | 1.60 | % | | | 1.63 | % | | | 1.63 | % | | | 1.63 | % | | | 1.67 | % |
| | | | | | | | | | | | | | | | | | | | |
Portfolio turnover rate | | | 797 | % | | | 963 | % | | | 943 | % | | | 1,529 | % | | | 646 | % |
| | | | | |
C-Class | | Year Ended
March 31,
2012 | | | Year Ended
March 31,
2011 | | | Year Ended
March 31,
2010 | | | Year Ended
March 31,
2009 | | | Year Ended
March 31,
2008 | |
Per Share Data | | | | | | | | | | | | | | | | | | | | |
Net asset value, beginning of period | | $ | 30.36 | | | $ | 25.19 | | | $ | 14.26 | | | $ | 29.66 | | | $ | 33.86 | |
| | | | | | | | | | | | | | | | | | | | |
Income (loss) from investment operations: | | | | | | | | | | | | | | | | | | | | |
Net investment lossa | | | (.15 | ) | | | (.30 | ) | | | (.22 | ) | | | (.18 | ) | | | (.28 | ) |
Net gain (loss) on investments (realized and unrealized) | | | 2.95 | | | | 5.47 | | | | 11.15 | | | | (15.22 | ) | | | (3.92 | ) |
| | | | | | | | | | | | | | | | | | | | |
Total from investment operations | | | 2.80 | | | | 5.17 | | | | 10.93 | | | | (15.40 | ) | | | (4.20 | ) |
| | | | | | | | | | | | | | | | | | | | |
Net asset value, end of period | | $ | 33.16 | | | $ | 30.36 | | | $ | 25.19 | | | $ | 14.26 | | | $ | 29.66 | |
| | | | | | | | | | | | | | | | | | | | |
Total Returnb | | | 9.19 | % | | | 20.52 | % | | | 76.65 | % | | | (51.92 | %) | | | (12.40 | %) |
| | | | | | | | | | | | | | | | | | | | |
Ratios/Supplemental Data | | | | | | | | | | | | | | | | | | | | |
Net assets, end of period (in thousands) | | $ | 1,345 | | | $ | 828 | | | $ | 929 | | | $ | 123 | | | $ | 430 | |
| | | | | | | | | | | | | | | | | | | | |
Ratios to average net assets: | | | | | | | | | | | | | | | | | | | | |
Net investment loss | | | (0.50 | %) | | | (1.13 | %) | | | (1.01 | %) | | | (0.78 | %) | | | (0.81 | %) |
Total expenses | | | 2.35 | % | | | 2.39 | % | | | 2.38 | % | | | 2.38 | % | | | 2.40 | % |
| | | | | | | | | | | | | | | | | | | | |
Portfolio turnover rate | | | 797 | % | | | 963 | % | | | 943 | % | | | 1,529 | % | | | 646 | % |
| a | Net investment income (loss) per share was computed using average shares outstanding throughout the period. |
| b | Total return does not reflect the impact of any applicable sales charges and has not been annualized. |
| | | | |
| | | | | |
| SEE NOTES TO FINANCIAL STATEMENTS. | | THE RYDEX FUNDSANNUALREPORT | | 97 |
| | |
| PERFORMANCE REPORT AND FUND PROFILE (Unaudited) | | March 31, 2012 |
| | | |
PRECIOUS METALS FUND
OBJECTIVE: Seeks to provide capital appreciation by investing in U.S. and foreign companies that are involved in the precious metals sector, including exploration, mining, production and development, and other precious metals-related services (“Precious Metals Companies”).
Volatility in the precious metals markets defined much the past 12 months. Gold moved from about $1,400 an ounce at the beginning of the period, when the global economy appeared to be strengthening, to $1,900 in August after the U.S. lost its triple-A credit rating. But it then sold off through the end of March 2012 to about $1,600, as the eurozone debt picture improved and investors sought investments with greater return potential. Silver was also volatile, ending the period roughly in the middle of its 12-month trading range.
For the one-year period ended March 31, 2012, Precious Metals Fund Investor Class returned -23.91%, compared with -4.01% in the S&P 500® Materials Index*.
The metals & mining holdings accounted for all of the negative return for the year.
Yamana Gold, Inc., Royal Gold, Inc. and Northgate Minerals Corp. added the most to Fund performance during the year. Freeport-McMoRan Copper & Gold, Inc., Silver Wheaton Corp. and Agnico-Eagle Mines Ltd. were among the stocks which contributed the least to Fund performance.
*S&P 500® Materials Index is a sub-index of the S&P 500® Index, a capitalization-weighted index covering 500 industrial, utility, transportation and financial companies of the U.S. markets (mostly NYSE Euronext issues). The Materials index encompasses a wide range of commodity-related manufacturing industries. Included in this sector are companies that manufacture chemicals, construction materials, glass, paper, forest products and related packaging products, and metals, minerals and mining companies, including producers of steel.
Performance displayed represents past performance which is no guarantee of future results.
Holdings Diversification (Market Exposure
as % of Net Assets)
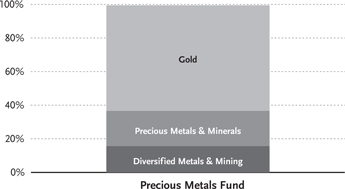
“Holdings Diversification (Market Exposure as % of Net Assets)” excludes any temporary cash investments.
| | | | |
Inception Dates: | |
Investor Class | | | December 1, 1993 | |
Advisor Class | | | August 1, 2003 | |
A-Class | | | September 1, 2004 | |
C-Class | | | April 27, 2001 | |
| | | | |
|
Ten Largest Holdings (% of Total Net Assets) | |
Freeport-McMoRan Copper & Gold, Inc. | | | 10.3 | % |
Newmont Mining Corp. | | | 7.3 | % |
Barrick Gold Corp. | | | 7.2 | % |
Goldcorp, Inc. | | | 6.1 | % |
Silver Wheaton Corp. | | | 5.2 | % |
Yamana Gold, Inc. | | | 4.2 | % |
Kinross Gold Corp. | | | 3.8 | % |
Southern Copper Corp. | | | 3.6 | % |
Agnico-Eagle Mines Ltd. | | | 3.5 | % |
AngloGold Ashanti Ltd. ADR | | | 3.2 | % |
| | | | |
Top Ten Total | | | 54.4 | % |
| | | | |
“Ten Largest Holdings” exclude any temporary cash or derivative investments
| | | | |
| | | | | |
| 98 | | THE RYDEX FUNDSANNUALREPORT | | |
| | |
| PERFORMANCE REPORT AND FUND PROFILE (Unaudited) (concluded) | | March 31, 2012 |
| | | |
Cumulative Fund Performance*
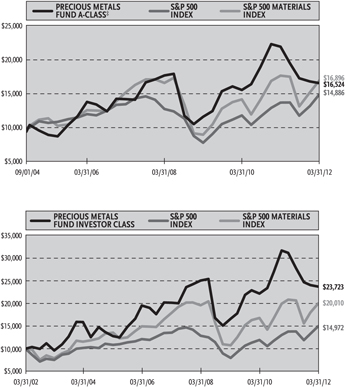
Average Annual Returns*
Periods Ended 03/31/12
| | | | | | | | | | | | |
| | | 1 Year | | | 5 Year | | | 10 Year | |
Investor Class Shares | | | -23.91 | % | | | 3.32 | % | | | 9.02 | % |
C-Class Shares | | | -24.68 | % | | | 2.28 | % | | | 7.93 | % |
C-Class Shares with CDSC† | | | -25.43 | % | | | 2.28 | % | | | 7.93 | % |
S&P 500 Index | | | 8.54 | % | | | 2.01 | % | | | 4.12 | % |
S&P 500 Materials Index | | | -4.01 | % | | | 2.17 | % | | | 7.18 | % |
| | | |
| | | 1 Year | | | 5 Year | | | Since
Inception
(08/01/03) | |
Advisor Class Shares | | | -24.29 | % | | | 2.81 | % | | | 8.35 | % |
S&P 500 Index | | | 8.54 | % | | | 2.01 | % | | | 6.27 | % |
S&P 500 Materials Index | | | -4.01 | % | | | 2.17 | % | | | 8.71 | % |
| | | |
| | | | | | | | | (09/01/04) | |
A-Class Shares | | | -24.13 | % | | | 3.06 | % | | | 7.54 | % |
A-Class Shares with sales charge‡ | | | -27.73 | % | | | 2.07 | % | | | 6.85 | % |
S&P 500 Index | | | 8.54 | % | | | 2.01 | % | | | 5.41 | % |
S&P 500 Materials Index | | | -4.01 | % | | | 2.17 | % | | | 7.20 | % |
| * | The performance data above represents past performance that is not predictive of future results. The investment return and principal value of an investment in the Fund will fluctuate so that an investor’s shares, when redeemed, may be worth more or less than their original cost. Returns are historical and include changes in principal and reinvested dividends and capital gains and do not reflect the effect of taxes. The S&P 500 Index and the S&P 500 Materials Index are unmanaged indices and, unlike the Fund, have no management fees or operating expenses to reduce their reported returns. The graphs are based on Investor Class shares and A-Class shares only; performance for Advisor Class shares and C-Class shares will vary due to differences in fee structures. |
| † | Fund returns include a CDSC of 1% if redeemed within 12 months of purchase. |
| ‡ | Fund returns are calculated using the maximum sales charge of 4.75%. |
| | | | |
| | | | | |
| | THE RYDEX FUNDSANNUALREPORT | | 99 |
| | |
| SCHEDULE OF INVESTMENTS | | March 31, 2012 |
| | | |
| PRECIOUS METALS FUND | | |
| | | | | | | | |
| | | SHARES | | | VALUE | |
COMMON STOCKS† - 99.5% | | | | | |
Gold - 62.9% | | | | | | | | |
Newmont Mining Corp. | | | 173,084 | | | $ | 8,874,016 | |
Barrick Gold Corp. | | | 202,781 | | | | 8,816,918 | |
Goldcorp, Inc. | | | 165,327 | | | | 7,449,635 | |
Yamana Gold, Inc. | | | 330,992 | | | | 5,170,095 | |
Kinross Gold Corp. | | | 470,099 | | | | 4,602,269 | |
Agnico-Eagle Mines Ltd. | | | 126,737 | | | | 4,230,481 | |
AngloGold Ashanti Ltd. ADR | | | 105,804 | | | | 3,906,284 | |
Eldorado Gold Corp. | | | 265,290 | | | | 3,645,085 | |
Royal Gold, Inc. | | | 51,991 | | | | 3,390,853 | |
Gold Fields Ltd. ADR | | | 239,250 | | | | 3,325,575 | |
Randgold Resources Ltd. ADR | | | 35,385 | | | | 3,113,172 | |
IAMGOLD Corp. | | | 225,809 | | | | 3,001,002 | |
Cia de Minas Buenaventura S.A. ADR | | | 72,084 | | | | 2,905,706 | |
Novagold Resources, Inc.* | | | 393,573 | | | | 2,825,854 | |
New Gold, Inc.* | | | 281,147 | | | | 2,777,732 | |
Allied Nevada Gold Corp.* | | | 75,556 | | | | 2,457,837 | |
Harmony Gold Mining Company Ltd. ADR | | | 216,015 | | | | 2,361,044 | |
AuRico Gold, Inc.* | | | 236,006 | | | | 2,093,373 | |
Jaguar Mining, Inc.* | | | 247,327 | | | | 1,155,017 | |
Seabridge Gold, Inc.* | | | 32,300 | | | | 648,907 | |
| | | | | | | | |
Total Gold | | | | | | | 76,750,855 | |
| | | | | | | | |
Precious Metals & Minerals - 21.0% | | | | | |
Silver Wheaton Corp. | | | 190,619 | | | | 6,328,550 | |
Pan American Silver Corp. | | | 142,778 | | | | 3,149,683 | |
Coeur d’Alene Mines Corp.* | | | 124,436 | | | | 2,954,111 | |
Hecla Mining Co. | | | 623,181 | | | | 2,879,096 | |
Stillwater Mining Co.* | | | 198,405 | | | | 2,507,839 | |
Silver Standard Resources, Inc.* | | | 134,122 | | | | 2,017,195 | |
McEwen Mining, Inc.* | | | 427,683 | | | | 1,898,913 | |
Endeavour Silver Corp.* | | | 187,083 | | | | 1,773,547 | |
Silvercorp Metals, Inc. | | | 246,355 | | | | 1,697,386 | |
Gold Resource Corp. | | | 18,843 | | | | 458,073 | |
| | | | | | | | |
Total Precious Metals & Minerals | | | | | | | 25,664,393 | |
| | | | | | | | |
Diversified Metals & Mining - 15.6% | | | | | |
Freeport-McMoRan Copper & Gold, Inc. | | | 330,716 | | | | 12,580,437 | |
Southern Copper Corp. | | | 139,293 | | | | 4,416,981 | |
Titanium Metals Corp. | | | 155,627 | | | | 2,110,302 | |
| | | | | | | | |
Total Diversified Metals & Mining | | | | | | | 19,107,720 | |
| | | | | | | | |
Total Common Stocks
(Cost $61,758,081) | | | | | | | 121,522,968 | |
| | | | | | | | |
| | | | | | | | |
| | | FACE
AMOUNT | | | VALUE | |
REPURCHASE
AGREEMENT††,1 - 0.5% | | | | | |
Credit Suisse Group issued 03/30/12 at 0.01% due 04/02/12 | | $ | 664,860 | | | $ | 664,860 | |
| | | | | | | | |
Total Repurchase Agreement
(Cost $664,860) | | | | | | | 664,860 | |
| | | | | | | | |
Total Investments - 100.0%
(Cost $62,422,941) | | | | | | $ | 122,187,828 | |
| | | | | | | | |
Other Assets & Liabilities,
net - 0.0% | | | | | | | 3,638 | |
| | | | | | | | |
Total Net Assets - 100.0% | | | | | | $ | 122,191,466 | |
| * | Non-income producing security. |
| † | Value determined based on Level 1 inputs — See Note 4. |
| †† | Value determined based on Level 2 inputs — See Note 4. |
| 1 | Repurchase Agreement — See Note 5. |
ADR — American Depositary Receipt
| | | | |
| | | | | |
| 100 | | THE RYDEX FUNDSANNUALREPORT | | SEE NOTES TO FINANCIAL STATEMENTS. |
| | | | |
STATEMENT OF ASSETS AND LIABILITIES | |
| March 31, 2012 | | | | |
| |
ASSETS: | | | | |
Investments, at value
(cost $61,758,081) | | $ | 121,522,968 | |
Repurchase agreements, at value
(cost $664,860) | | | 664,860 | |
| | | | |
Total investments
(cost $62,422,941) | | | 122,187,828 | |
Receivables: | | | | |
Fund shares sold | | | 1,591,817 | |
Dividends | | | 46,784 | |
| | | | |
Total assets | | | 123,826,429 | |
| | | | |
LIABILITIES: | | | | |
Payable for: | | | | |
Securities purchased | | | 867,309 | |
Fund shares redeemed | | | 552,936 | |
Management fees | | | 76,012 | |
Distribution and service fees | | | 25,807 | |
Transfer agent and administrative fees | | | 25,337 | |
Portfolio accounting fees | | | 10,135 | |
Miscellaneous | | | 77,427 | |
| | | | |
Total liabilities | | | 1,634,963 | |
| | | | |
NET ASSETS | | $ | 122,191,466 | |
| | | | |
NET ASSETS CONSISTOF: | | | | |
Paid in capital | | $ | 80,990,902 | |
Accumulated net investment loss | | | (928,587 | ) |
Accumulated net realized loss on investments | | | (17,635,736 | ) |
Net unrealized appreciation on investments | | | 59,764,887 | |
| | | | |
Net assets | | $ | 122,191,466 | |
| | | | |
INVESTOR CLASS: | | | | |
Net assets | | $ | 79,636,841 | |
Capital shares outstanding | | | 1,211,536 | |
Net asset value per share | | $ | 65.73 | |
| | | | |
ADVISOR CLASS: | | | | |
Net assets | | $ | 9,610,369 | |
Capital shares outstanding | | | 152,496 | |
Net asset value per share | | $ | 63.02 | |
| | | | |
A-CLASS: | | | | |
Net assets | | $ | 6,411,743 | |
Capital shares outstanding | | | 99,863 | |
Net asset value per share | | $ | 64.21 | |
| | | | |
Maximum offering price per share
(Net asset value divided by 95.25%) | | $ | 67.41 | |
| | | | |
C-CLASS: | | | | |
Net assets | | $ | 26,532,513 | |
Capital shares outstanding | | | 449,581 | |
Net asset value per share | | $ | 59.02 | |
| | | | |
| | | | |
STATEMENT OF OPERATIONS | |
| Year Ended March 31, 2012 | | | | |
| |
INVESTMENT INCOME: | | | | |
Dividends (net of foreign withholding tax of $82,223) | | $ | 1,856,422 | |
Interest | | | 184 | |
| | | | |
Total investment income | | | 1,856,606 | |
| | | | |
EXPENSES: | | | | |
Management fees | | | 1,147,361 | |
Transfer agent and administrative fees | | | 382,454 | |
Distribution and service fees: | | | | |
Advisor Class | | | 82,876 | |
A-Class | | | 22,716 | |
C-Class | | | 309,802 | |
Portfolio accounting fees | | | 152,979 | |
Custodian fees | | | 38,959 | |
Trustees’ fees* | | | 16,406 | |
Miscellaneous | | | 179,605 | |
| | | | |
Total expenses | | | 2,333,158 | |
| | | | |
Net investment loss | | | (476,552 | ) |
| | | | |
NET REALIZEDAND UNREALIZED GAIN (LOSS): | | | | |
Net realized gain (loss) on: | | | | |
Investments | | | 19,678,206 | |
Foreign currency | | | 455 | |
| | | | |
Net realized gain | | | 19,678,661 | |
| | | | |
Net change in unrealized appreciation (depreciation) on: | | | | |
Investments | | | (67,488,597 | ) |
| | | | |
Net change in unrealized appreciation (depreciation) | | | (67,488,597 | ) |
| | | | |
Net realized and unrealized loss | | | (47,809,936 | ) |
| | | | |
Net decrease in net assets resulting from operations | | $ | (48,286,488 | ) |
| | | | |
| * | Relates to Trustees not deemed “interested persons” within the meaning of Section 2(a)(19) of the 1940 Act. |
| | | | |
| | | | | |
| SEE NOTES TO FINANCIAL STATEMENTS. | | THE RYDEX FUNDSANNUALREPORT | | 101 |
| | | | | | | | |
| STATEMENTS OF CHANGES IN NET ASSETS | | | | | | |
| | |
| | | Year Ended
March 31,
2012 | | | Year Ended
March 31,
2011 | |
INCREASE (DECREASE) IN NET ASSETS FROM OPERATIONS: | | | | | | | | |
Net investment loss | | $ | (476,552 | ) | | $ | (1,370,442 | ) |
Net realized gain on investments | | | 19,678,661 | | | | 31,189,959 | |
Net change in unrealized appreciation (depreciation) on investments | | | (67,488,597 | ) | | | 31,925,087 | |
| | | | | | | | |
Net increase (decrease) in net assets resulting from operations | | | (48,286,488 | ) | | | 61,744,604 | |
| | | | | | | | |
DISTRIBUTIONSTO SHAREHOLDERSFROM: | | | | | | | | |
Net investment income | | | | | | | | |
Investor Class | | | (342,783 | ) | | | (94,591 | ) |
Advisor Class | | | (98,439 | ) | | | (11,506 | ) |
A-Class | | | (29,266 | ) | | | (7,004 | ) |
C-Class | | | (131,027 | ) | | | (19,112 | ) |
| | | | | | | | |
Total distributions to shareholders | | | (601,515 | ) | | | (132,213 | ) |
| | | | | | | | |
CAPITAL SHARE TRANSACTIONS: | | | | | | | | |
Proceeds from sale of shares | | | | | | | | |
Investor Class | | | 423,424,295 | | | | 824,385,947 | |
Advisor Class | | | 175,221,277 | | | | 364,066,887 | |
A-Class | | | 16,352,801 | | | | 29,625,719 | |
C-Class | | | 100,545,119 | | | | 145,601,909 | |
Distributions reinvested | | | | | | | | |
Investor Class | | | 327,275 | | | | 92,212 | |
Advisor Class | | | 98,109 | | | | 11,341 | |
A-Class | | | 26,774 | | | | 6,500 | |
C-Class | | | 127,230 | | | | 17,945 | |
Cost of shares redeemed | | | | | | | | |
Investor Class | | | (456,983,256 | ) | | | (834,585,403 | ) |
Advisor Class | | | (188,141,866 | ) | | | (361,238,854 | ) |
A-Class | | | (21,646,696 | ) | | | (27,278,650 | ) |
C-Class | | | (105,056,886 | ) | | | (139,661,292 | ) |
| | | | | | | | |
Net increase (decrease) from capital share transactions | | | (55,705,824 | ) | | | 1,044,261 | |
| | | | | | | | |
Net increase (decrease) in net assets | | | (104,593,827 | ) | | | 62,656,652 | |
NET ASSETS: | | | | | | | | |
Beginning of year | | | 226,785,293 | | | | 164,128,641 | |
| | | | | | | | |
End of year | | $ | 122,191,466 | | | $ | 226,785,293 | |
| | | | | | | | |
Accumulated net investment loss at end of year | | $ | (928,587 | ) | | $ | (1,020,463 | ) |
| | | | | | | | |
CAPITAL SHARE ACTIVITY: | | | | | | | | |
Shares sold | | | | | | | | |
Investor Class | | | 5,482,005 | | | | 11,212,113 | |
Advisor Class | | | 2,329,104 | | | | 5,207,693 | |
A-Class | | | 219,463 | | | | 411,950 | |
C-Class | | | 1,456,077 | | | | 2,195,554 | |
Shares issued from reinvestment of distributions | | | | | | | | |
Investor Class | | | 4,566 | | | | 1,121 | |
Advisor Class | | | 1,425 | | | | 143 | |
A-Class | | | 382 | | | | 81 | |
C-Class | | | 1,971 | | | | 240 | |
Shares redeemed | | | | | | | | |
Investor Class | | | (5,909,703 | ) | | | (11,417,831 | ) |
Advisor Class | | | (2,541,906 | ) | | | (5,156,332 | ) |
A-Class | | | (295,558 | ) | | | (375,373 | ) |
C-Class | | | (1,512,258 | ) | | | (2,107,087 | ) |
| | | | | | | | |
Net decrease in shares | | | (764,432 | ) | | | (27,728 | ) |
| | | | | | | | |
| | | | |
| | | | | |
| 102 | | THE RYDEX FUNDSANNUALREPORT | | SEE NOTES TO FINANCIAL STATEMENTS. |
FINANCIAL HIGHLIGHTS
This table is presented to show selected data for a share outstanding throughout each period and to assist shareholders in evaluating a Fund’s performance for the periods presented.
| | | | | | | | | | | | | | | | | | | | |
Investor Class | | Year Ended
March 31,
2012 | | | Year Ended
March 31,
2011 | | | Year Ended
March 31,
2010 | | | Year Ended
March 31,
2009 | | | Year Ended
March 31,
2008 | |
Per Share Data | | | | | | | | | | | | | | | | | | | | |
Net asset value, beginning of period | | $ | 86.74 | | | $ | 61.73 | | | $ | 46.36 | | | $ | 69.89 | | | $ | 56.21 | |
| | | | | | | | | | | | | | | | | | | | |
Income (loss) from investment operations: | | | | | | | | | | | | | | | | | | | | |
Net investment lossa | | | (.02 | ) | | | (.28 | ) | | | (.44 | ) | | | (.23 | ) | | | (.37 | ) |
Net gain (loss) on investments (realized and unrealized) | | | (20.70 | ) | | | 25.32 | | | | 15.96 | | | | (23.30 | ) | | | 14.05 | |
| | | | | | | | | | | | | | | | | | | | |
Total from investment operations | | | (20.72 | ) | | | 25.04 | | | | 15.52 | | | | (23.53 | ) | | | 13.68 | |
| | | | | | | | | | | | | | | | | | | | |
Less distributions from: | | | | | | | | | | | | | | | | | | | | |
Net investment income | | | (.29 | ) | | | (.03 | ) | | | — | | | | — | | | | — | |
Net realized gains | | | — | | | | — | | | | (.08 | ) | | | — | | | | — | |
Return of capital | | | — | | | | — | | | | (.07 | ) | | | — | | | | — | |
| | | | | | | | | | | | | | | | | | | | |
Total distributions | | | (.29 | ) | | | (.03 | ) | | | (.15 | ) | | | — | | | | — | |
| | | | | | | | | | | | | | | | | | | | |
Net asset value, end of period | | $ | 65.73 | | | $ | 86.74 | | | $ | 61.73 | | | $ | 46.36 | | | $ | 69.89 | |
| | | | | | | | | | | | | | | | | | | | |
Total Returnb | | | (23.91 | %) | | | 40.57 | % | | | 33.44 | % | | | (33.67 | %) | | | 24.34 | % |
| | | | | | | | | | | | | | | | | | | | |
Ratios/Supplemental Data | | | | | | | | | | | | | | | | | | | | |
Net assets, end of period (in thousands) | | $ | 79,637 | | | $ | 141,798 | | | $ | 113,546 | | | $ | 160,759 | | | $ | 149,805 | |
| | | | | | | | | | | | | | | | | | | | |
Ratios to average net assets: | | | | | | | | | | | | | | | | | | | | |
Net investment loss | | | (0.03 | %) | | | (0.37 | %) | | | (0.76 | %) | | | (0.48 | %) | | | (0.58 | %) |
Total expenses | | | 1.26 | % | | | 1.28 | % | | | 1.28 | % | | | 1.28 | % | | | 1.27 | % |
| | | | | | | | | | | | | | | | | | | | |
Portfolio turnover rate | | | 235 | % | | | 322 | % | | | 383 | % | | | 245 | % | | | 203 | % |
| | | | | |
Advisor Class | | Year Ended
March 31,
2012 | | | Year Ended
March 31,
2011 | | | Year Ended
March 31,
2010 | | | Year Ended
March 31,
2009 | | | Year Ended
March 31,
2008 | |
Per Share Data | | | | | | | | | | | | | | | | | | | | |
Net asset value, beginning of period | | $ | 83.59 | | | $ | 59.79 | | | $ | 45.12 | | | $ | 68.36 | | | $ | 55.24 | |
| | | | | | | | | | | | | | | | | | | | |
Income (loss) from investment operations: | | | | | | | | | | | | | | | | | | | | |
Net investment lossa | | | (.44 | ) | | | (.61 | ) | | | (.79 | ) | | | (.50 | ) | | | (.69 | ) |
Net gain (loss) on investments (realized and unrealized) | | | (19.84 | ) | | | 24.44 | | | | 15.61 | | | | (22.74 | ) | | | 13.81 | |
| | | | | | | | | | | | | | | | | | | | |
Total from investment operations | | | (20.28 | ) | | | 23.83 | | | | 14.82 | | | | (23.24 | ) | | | 13.12 | |
| | | | | | | | | | | | | | | | | | | | |
Less distributions from: | | | | | | | | | | | | | | | | | | | | |
Net investment income | | | (.29 | ) | | | (.03 | ) | | | — | | | | — | | | | — | |
Net realized gains | | | — | | | | — | | | | (.08 | ) | | | — | | | | — | |
Return of capital | | | — | | | | — | | | | (.07 | ) | | | — | | | | — | |
| | | | | | | | | | | | | | | | | | | | |
Total distributions | | | (.29 | ) | | | (.03 | ) | | | (.15 | ) | | | — | | | | — | |
| | | | | | | | | | | | | | | | | | | | |
Net asset value, end of period | | $ | 63.02 | | | $ | 83.59 | | | $ | 59.79 | | | $ | 45.12 | | | $ | 68.36 | |
| | | | | | | | | | | | | | | | | | | | |
Total Returnb | | | (24.29 | %) | | | 39.87 | % | | | 32.81 | % | | | (34.00 | %) | | | 23.75 | % |
| | | | | | | | | | | | | | | | | | | | |
Ratios/Supplemental Data | | | | | | | | | | | | | | | | | | | | |
Net assets, end of period (in thousands) | | $ | 9,610 | | | $ | 30,418 | | | $ | 18,677 | | | $ | 12,056 | | | $ | 11,817 | |
| | | | | | | | | | | | | | | | | | | | |
Ratios to average net assets: | | | | | | | | | | | | | | | | | | | | |
Net investment loss | | | (0.59 | %) | | | (0.86 | %) | | | (1.35 | %) | | | (1.02 | %) | | | (1.09 | %) |
Total expenses | | | 1.76 | % | | | 1.78 | % | | | 1.77 | % | | | 1.77 | % | | | 1.77 | % |
| | | | | | | | | | | | | | | | | | | | |
Portfolio turnover rate | | | 235 | % | | | 322 | % | | | 383 | % | | | 245 | % | | | 203 | % |
| | | | |
| | | | | |
| SEE NOTES TO FINANCIAL STATEMENTS. | | THE RYDEX FUNDSANNUALREPORT | | 103 |
FINANCIAL HIGHLIGHTS (concluded)
This table is presented to show selected data for a share outstanding throughout each period and to assist shareholders in evaluating a Fund’s performance for the periods presented.
| | | | | | | | | | | | | | | | | | | | |
A-Class | | Year Ended
March 31,
2012 | | | Year Ended
March 31,
2011 | | | Year Ended
March 31,
2010 | | | Year Ended
March 31,
2009 | | | Year Ended
March 31,
2008 | |
Per Share Data | | | | | | | | | | | | | | | | | | | | |
Net asset value, beginning of period | | $ | 84.97 | | | $ | 60.63 | | | $ | 45.64 | | | $ | 68.96 | | | $ | 55.59 | |
| | | | | | | | | | | | | | | | | | | | |
Income (loss) from investment operations: | | | | | | | | | | | | | | | | | | | | |
Net investment lossa | | | (.22 | ) | | | (.45 | ) | | | (.59 | ) | | | (.36 | ) | | | (.55 | ) |
Net gain (loss) on investments (realized and unrealized) | | | (20.25 | ) | | | 24.82 | | | | 15.73 | | | | (22.96 | ) | | | 13.92 | |
| | | | | | | | | | | | | | | | | | | | |
Total from investment operations | | | (20.47 | ) | | | 24.37 | | | | 15.14 | | | | (23.32 | ) | | | 13.37 | |
| | | | | | | | | | | | | | | | | | | | |
Less distributions from: | | | | | | | | | | | | | | | | | | | | |
Net investment income | | | (.29 | ) | | | (.03 | ) | | | — | | | | — | | | | — | |
Net realized gains | | | — | | | | — | | | | (.08 | ) | | | — | | | | — | |
Return of capital | | | — | | | | — | | | | (.07 | ) | | | — | | | | — | |
| | | | | | | | | | | | | | | | | | | | |
Total distributions | | | (.29 | ) | | | (.03 | ) | | | (.15 | ) | | | — | | | | — | |
| | | | | | | | | | | | | | | | | | | | |
Net asset value, end of period | | $ | 64.21 | | | $ | 84.97 | | | $ | 60.63 | | | $ | 45.64 | | | $ | 68.96 | |
| | | | | | | | | | | | | | | | | | | | |
Total Returnb | | | (24.13 | %) | | | 40.21 | % | | | 33.14 | % | | | (33.82 | %) | | | 24.05 | % |
| | | | | | | | | | | | | | | | | | | | |
Ratios/Supplemental Data | | | | | | | | | | | | | | | | | | | | |
Net assets, end of period (in thousands) | | $ | 6,412 | | | $ | 14,919 | | | $ | 8,422 | | | $ | 8,484 | | | $ | 10,911 | |
| | | | | | | | | | | | | | | | | | | | |
Ratios to average net assets: | | | | | | | | | | | | | | | | | | | | |
Net investment loss | | | (0.30 | %) | | | (0.63 | %) | | | (1.04 | %) | | | (0.71 | %) | | | (0.84 | %) |
Total expenses | | | 1.51 | % | | | 1.53 | % | | | 1.52 | % | | | 1.53 | % | | | 1.52 | % |
| | | | | | | | | | | | | | | | | | | | |
Portfolio turnover rate | | | 235 | % | | | 322 | % | | | 383 | % | | | 245 | % | | | 203 | % |
| | | | | |
C-Class | | Year Ended
March 31,
2012 | | | Year Ended
March 31,
2011 | | | Year Ended
March 31,
2010 | | | Year Ended
March 31,
2009 | | | Year Ended
March 31,
2008 | |
Per Share Data | | | | | | | | | | | | | | | | | | | | |
Net asset value, beginning of period | | $ | 78.70 | | | $ | 56.58 | | | $ | 42.92 | | | $ | 65.38 | | | $ | 53.12 | |
| | | | | | | | | | | | | | | | | | | | |
Income (loss) from investment operations: | | | | | | | | | | | | | | | | | | | | |
Net investment lossa | | | (.72 | ) | | | (.94 | ) | | | (.97 | ) | | | (.68 | ) | | | (.97 | ) |
Net gain (loss) on investments (realized and unrealized) | | | (18.67 | ) | | | 23.09 | | | | 14.78 | | | | (21.78 | ) | | | 13.23 | |
| | | | | | | | | | | | | | | | | | | | |
Total from investment operations | | | (19.39 | ) | | | 22.15 | | | | 13.81 | | | | (22.46 | ) | | | 12.26 | |
| | | | | | | | | | | | | | | | | | | | |
Less distributions from: | | | | | | | | | | | | | | | | | | | | |
Net investment income | | | (.29 | ) | | | (.03 | ) | | | — | | | | — | | | | — | |
Net realized gains | | | — | | | | — | | | | (.08 | ) | | | — | | | | — | |
Return of capital | | | — | | | | — | | | | (.07 | ) | | | — | | | | — | |
| | | | | | | | | | | | | | | | | | | | |
Total distributions | | | (.29 | ) | | | (.03 | ) | | | (.15 | ) | | | — | | | | — | |
| | | | | | | | | | | | | | | | | | | | |
Net asset value, end of period | | $ | 59.02 | | | $ | 78.70 | | | $ | 56.58 | | | $ | 42.92 | | | $ | 65.38 | |
| | | | | | | | | | | | | | | | | | | | |
Total Returnb | | | (24.68 | %) | | | 39.18 | % | | | 32.14 | % | | | (34.35 | %) | | | 23.08 | % |
| | | | | | | | | | | | | | | | | | | | |
Ratios/Supplemental Data | | | | | | | | | | | | | | | | | | | | |
Net assets, end of period (in thousands) | | $ | 26,533 | | | $ | 39,650 | | | $ | 23,483 | | | $ | 20,452 | | | $ | 26,319 | |
| | | | | | | | | | | | | | | | | | | | |
Ratios to average net assets: | | | | | | | | | | | | | | | | | | | | |
Net investment loss | | | (1.04 | %) | | | (1.37 | %) | | | (1.81 | %) | | | (1.43 | %) | | | (1.60 | %) |
Total expenses | | | 2.26 | % | | | 2.28 | % | | | 2.28 | % | | | 2.27 | % | | | 2.27 | % |
| | | | | | | | | | | | | | | | | | | | |
Portfolio turnover rate | | | 235 | % | | | 322 | % | | | 383 | % | | | 245 | % | | | 203 | % |
| a | Net investment loss per share was computed using average shares outstanding throughout the period. |
| b | Total return does not reflect the impact of any applicable sales charges and has not been annualized. |
| | | | |
| | | | | |
| 104 | | THE RYDEX FUNDSANNUALREPORT | | SEE NOTES TO FINANCIAL STATEMENTS. |
This page intentionally left blank.
| | | | |
| | | | | |
| | THE RYDEX FUNDSANNUALREPORT | | 105 |
| | |
| PERFORMANCE REPORT AND FUND PROFILE (Unaudited) | | March 31, 2012 |
RETAILING FUND
OBJECTIVE: Seeks to provide capital appreciation by investing in companies engaged in merchandising finished goods and services, including department stores, mail-order operations and other companies involved in selling products to consumers (“Retailing Companies”).
Positive, yet slow, economic growth helped this sector, along with an accommodative Federal Reserve and commodity prices that eased in the last part of 2011, all of which gave a boost to spending and stemmed fears of another recession. Retail sales continued picking up in the beginning of 2012, which could be attributed to warmer winter weather. In addition, consumers may be cutting savings in order to spend, which may not continue without more growth of jobs and wages.
For the one-year period ended March 31, 2012, Retailing Fund Investor Class returned 19.14%, compared with 17.53% for the S&P 500® Consumer Discretionary Index*.
Within the sector, heavily weighted specialty retail contributed about half of the Fund performance. Multiline retail and food & staples retailing accounted for most of the remainder of the Fund’s return.
Fund performance for the year benefited most from Wal-Mart Stores, Inc., Home Depot, Inc. and TJX Companies, Inc,. Walgreen Co., Shutterfly, Inc. and Netflix, Inc. were among the Fund’s weakest-performing stocks for the period.
*S&P 500® Consumer Discretionary Index is a sub-index of the S&P 500® Index, a capitalization-weighted index covering 500 industrial, utility, transportation and financial companies of the U.S. markets (mostly NYSE Euronext issues). The Consumer Discretionary index includes companies whose businesses are dominated by one of the following activities: The manufacture and distribution of capital goods, including aerospace & defense, construction, engineering & building products, electrical equipment and industrial machinery; the provision of commercial services and supplies, including printing, environmental, office and security services; the provision of professional services, including employment and research & consulting services; or the provision of transportation services, including airlines, couriers, marine, road & rail and transportation infrastructure.
Performance displayed represents past performance which is no guarantee of future results.
Holdings Diversification (Market Exposure as % of Net Assets)
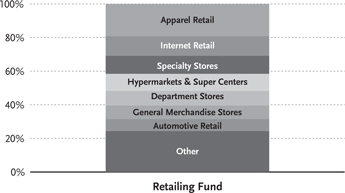
“Holdings Diversification (Market Exposure as % of Net Assets)” excludes any temporary cash investments.
| | | | |
Inception Dates: | | | |
Investor Class | | | April 1, 1998 | |
Advisor Class | | | April 21, 1998 | |
A-Class | | | September 1, 2004 | |
C-Class | | | May 9, 2001 | |
| | | | |
Ten Largest Holdings (% of Total Net Assets) | | | |
Wal-Mart Stores, Inc. | | | 6.5 | % |
Amazon.com, Inc. | | | 4.3 | % |
Home Depot, Inc. | | | 4.0 | % |
CVS Caremark Corp. | | | 3.4 | % |
Lowe’s Companies, Inc. | | | 2.9 | % |
Costco Wholesale Corp. | | | 2.8 | % |
Target Corp. | | | 2.8 | % |
Priceline.com, Inc. | | | 2.7 | % |
TJX Companies, Inc. | | | 2.5 | % |
Walgreen Co. | | | 2.4 | % |
| | | | |
Top Ten Total | | | 34.3 | % |
| | | | |
“Ten Largest Holdings” exclude any temporary cash or derivative investments.
| | | | |
| | | | | |
| 106 | | THE RYDEX FUNDSANNUALREPORT | | |
| | |
| PERFORMANCE REPORT AND FUND PROFILE (Unaudited) (concluded) | | March 31, 2012 |
Cumulative Fund Performance*
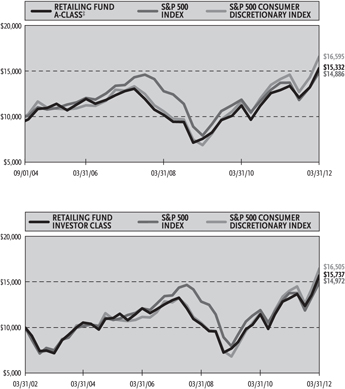
Average Annual Returns*
Periods Ended 03/31/12
| | | | | | | | | | | | |
| | | 1 Year | | | 5 Year | | | 10 Year | |
Investor Class Shares | | | 19.14 | % | | | 3.87 | % | | | 4.64 | % |
Advisor Class Shares | | | 18.38 | % | | | 3.38 | % | | | 4.19 | % |
C-Class Shares | | | 17.83 | % | | | 2.84 | % | | | 3.58 | % |
C-Class Shares with CDSC† | | | 16.83 | % | | | 2.84 | % | | | 3.58 | % |
S&P 500 Index | | | 8.54 | % | | | 2.01 | % | | | 4.12 | % |
S&P 500 Consumer Discretionary Index | | | 17.53 | % | | | 5.24 | % | | | 5.14 | % |
| | | |
| | | 1 Year | | | 5 Year | | | Since
Inception
(09/01/04) | |
A-Class Shares | | | 18.71 | % | | | 3.68 | % | | | 6.48 | % |
A-Class Shares with sales charge‡ | | | 13.04 | % | | | 2.67 | % | | | 5.80 | % |
S&P 500 Index | | | 8.54 | % | | | 2.01 | % | | | 5.41 | % |
S&P 500 Consumer Discretionary Index | | | 17.53 | % | | | 5.24 | % | | | 6.94 | % |
| * | The performance data above represents past performance that is not predictive of future results. The investment return and principal value of an investment in the Fund will fluctuate so that an investor’s shares, when redeemed, may be worth more or less than their original cost. Returns are historical and include changes in principal and reinvested dividends and capital gains and do not reflect the effect of taxes. The S&P 500 Index and the S&P 500 Consumer Discretionary Index are unmanaged indices and, unlike the Fund, have no management fees or operating expenses to reduce their reported returns. The graphs are based on Investor Class shares and A-Class shares only; performance for Advisor Class shares and C-Class shares will vary due to differences in fee structures. |
| † | Fund returns include a CDSC of 1% if redeemed within 12 months of purchase. |
| ‡ | Fund returns are calculated using the maximum sales charge of 4.75%. |
| | | | |
| | | | | |
| | THE RYDEX FUNDSANNUALREPORT | | 107 |
| | |
| SCHEDULE OF INVESTMENTS | | M arch 31, 2012 |
| RETAILING FUND | | |
| | | | | | | | |
| | | SHARES | | | VALUE | |
COMMON STOCKS† - 100.0% | |
Apparel Retail - 19.2% | | | | | | | | |
TJX Companies, Inc. | | | 29,442 | | | $ | 1,169,141 | |
Limited Brands, Inc. | | | 16,677 | | | | 800,495 | |
Ross Stores, Inc. | | | 13,370 | | | | 776,797 | |
The Gap, Inc. | | | 28,909 | | | | 755,681 | |
Foot Locker, Inc. | | | 14,853 | | | | 461,186 | |
Urban Outfitters, Inc.* | | | 14,979 | | | | 436,039 | |
Abercrombie & Fitch Co. — Class A | | | 8,486 | | | | 420,990 | |
American Eagle Outfitters, Inc. | | | 22,690 | | | | 390,041 | |
Ascena Retail Group, Inc.* | | | 8,783 | | | | 389,263 | |
Guess?, Inc. | | | 11,310 | | | | 353,438 | |
Chico’s FAS, Inc. | | | 21,816 | | | | 329,422 | |
Express, Inc.* | | | 12,800 | | | | 319,744 | |
Buckle, Inc. | | | 6,613 | | | | 316,763 | |
DSW, Inc. — Class A | | | 5,755 | | | | 315,201 | |
Men’s Wearhouse, Inc. | | | 7,653 | | | | 296,707 | |
Aeropostale, Inc.* | | | 13,145 | | | | 284,195 | |
Genesco, Inc.* | | | 3,828 | | | | 274,276 | |
ANN, Inc.* | | | 8,687 | | | | 248,796 | |
Jos A. Bank Clothiers, Inc.* | | | 4,793 | | | | 241,615 | |
Children’s Place Retail Stores, Inc.* | | | 4,648 | | | | 240,162 | |
Finish Line, Inc. — Class A | | | 9,773 | | | | 207,383 | |
| | | | | | | | |
Total Apparel Retail | | | | | | | 9,027,335 | |
| | | | | | | | |
Internet Retail - 11.7% | | | | | | | | |
Amazon.com, Inc.* | | | 10,113 | | | | 2,047,985 | |
Priceline.com, Inc.* | | | 1,778 | | | | 1,275,715 | |
Groupon, Inc. — Class A* | | | 40,409 | | | | 742,717 | |
Netflix, Inc.* | | | 4,625 | | | | 532,060 | |
TripAdvisor, Inc.* | | | 13,175 | | | | 469,952 | |
Expedia, Inc. | | | 13,255 | | | | 443,247 | |
| | | | | | | | |
Total Internet Retail | | | | | | | 5,511,676 | |
| | | | | | | | |
Specialty Stores - 10.7% | | | | | | | | |
Staples, Inc. | | | 42,905 | | | | 694,202 | |
Tiffany & Co. | | | 8,793 | | | | 607,860 | |
Tractor Supply Co. | | | 6,021 | | | | 545,262 | |
PetSmart, Inc. | | | 9,272 | | | | 530,544 | |
Ulta Salon Cosmetics & Fragrance, Inc. | | | 5,515 | | | | 512,288 | |
Dick’s Sporting Goods, Inc. | | | 10,607 | | | | 509,985 | |
Sally Beauty Holdings, Inc.* | | | 18,546 | | | | 459,941 | |
GNC Holdings, Inc. — Class A | | | 11,900 | | | | 415,191 | |
Signet Jewelers Ltd. | | | 8,728 | | | | 412,660 | |
Cabela’s, Inc.* | | | 9,079 | | | | 346,364 | |
| | | | | | | | |
Total Specialty Stores | | | | | | | 5,034,297 | |
| | | | | | | | |
Hypermarkets & Super
Centers - 10.2% | | | | | | | | |
Wal-Mart Stores, Inc. | | | 50,330 | | | | 3,080,196 | |
Costco Wholesale Corp. | | | 14,667 | | | | 1,331,764 | |
Cia Brasileira de Distribuicao Grupo
Pao de Acucar ADR | | | 7,790 | | | | 370,960 | |
| | | | | | | | |
Total Hypermarkets &
Super Centers | | | | | | | 4,782,920 | |
| | | | | | | | |
Department Stores - 8.7% | | | | | | | | |
Macy’s, Inc. | | | 21,658 | | | | 860,473 | |
Kohl’s Corp. | | | 14,979 | | | | 749,399 | |
Nordstrom, Inc. | | | 12,981 | | | | 723,301 | |
| | | | | | | | |
| | | SHARES | | | VALUE | |
JC Penney Company, Inc. | | | 16,049 | | | $ | 568,616 | |
Sears Holdings Corp.* | | | 7,680 | | | | 508,800 | |
Dillard’s, Inc. — Class A | | | 6,159 | | | | 388,140 | |
Saks, Inc.* | | | 24,785 | | | | 287,754 | |
| | | | | | | | |
Total Department Stores | | | | | | | 4,086,483 | |
| | | | | | | | |
General Merchandise
Stores - 8.1% | | | | | | | | |
Target Corp. | | | 22,654 | | | | 1,320,049 | |
Dollar General Corp.* | | | 18,187 | | | | 840,239 | |
Dollar Tree, Inc.* | | | 7,495 | | | | 708,203 | |
Family Dollar Stores, Inc. | | | 9,587 | | | | 606,665 | |
Big Lots, Inc.* | | | 7,988 | | | | 343,644 | |
| | | | | | | | |
Total General Merchandise Stores | | | | | | | 3,818,800 | |
| | | | | | | | |
Automotive Retail - 7.1% | | | | | | | | |
AutoZone, Inc.* | | | 2,146 | | | | 797,883 | |
O’Reilly Automotive, Inc.* | | | 7,963 | | | | 727,420 | |
CarMax, Inc.* | | | 17,057 | | | | 591,025 | |
Advance Auto Parts, Inc. | | | 6,071 | | | | 537,708 | |
AutoNation, Inc.* | | | 12,934 | | | | 443,766 | |
Group 1 Automotive, Inc. | | | 4,297 | | | | 241,362 | |
| | | | | | | | |
Total Automotive Retail | | | | | | | 3,339,164 | |
| | | | | | | | |
Home Improvement
Retail - 6.8% | | | | | | | | |
Home Depot, Inc. | | | 37,273 | | | | 1,875,204 | |
Lowe’s Companies, Inc. | | | 42,815 | | | | 1,343,535 | |
| | | | | | | | |
Total Home Improvement Retail | | | | | | | 3,218,739 | |
| | | | | | | | |
Drug Retail - 5.9% | | | | | | | | |
CVS Caremark Corp. | | | 36,154 | | | | 1,619,699 | |
Walgreen Co. | | | 34,006 | | | | 1,138,861 | |
| | | | | | | | |
Total Drug Retail | | | | | | | 2,758,560 | |
| | | | | | | | |
Homefurnishing Retail - 4.5% | | | | | | | | |
Bed Bath & Beyond, Inc.* | | | 12,768 | | | | 839,752 | |
Williams-Sonoma, Inc. | | | 10,882 | | | | 407,857 | |
Pier 1 Imports, Inc.* | | | 16,518 | | | | 300,297 | |
Aaron’s, Inc. | | | 11,459 | | | | 296,788 | |
Select Comfort Corp.* | | | 8,820 | | | | 285,680 | |
| | | | | | | | |
Total Homefurnishing Retail | | | | | | | 2,130,374 | |
| | | | | | | | |
Computer & Electronics
Retail - 2.7% | | | | | | | | |
Best Buy Company, Inc. | | | 24,375 | | | | 577,199 | |
GameStop Corp. — Class A | | | 15,915 | | | | 347,584 | |
Rent-A-Center, Inc. — Class A | | | 8,682 | | | | 327,746 | |
| | | | | | | | |
Total Computer & Electronics Retail | | | | | | | 1,252,529 | |
| | | | | | | | |
Distributors - 2.3% | | | | | | | | |
Genuine Parts Co. | | | 10,493 | | | | 658,436 | |
LKQ Corp.* | | | 14,331 | | | | 446,697 | |
| | | | | | | | |
Total Distributors | | | | | | | 1,105,133 | |
| | | | | | | | |
Catalog Retail - 2.1% | | | | | | | | |
Liberty Interactive
Corp. — Class A* | | | 36,383 | | | | 694,551 | |
HSN, Inc. | | | 8,250 | | | | 313,748 | |
| | | | | | | | |
Total Catalog Retail | | | | | | | 1,008,299 | |
| | | | | | | | |
Total Common Stocks
(Cost $40,405,214) | | | | | | | 47,074,309 | |
| | | | | | | | |
| | | | |
| | | | | |
| 108 | | THE RYDEX FUNDSANNUALREPORT | | SEE NOTES TO FINANCIAL STATEMENTS. |
| | |
| SCHEDULE OF INVESTMENTS (concluded) | | M arch 31, 2012 |
RETAILING FUND | | |
| | | | | | | | |
| | | FACE
AMOUNT | | | VALUE | |
REPURCHASE AGREEMENT††,1 - 2.1% | | | | | | | | |
Credit Suisse Group issued 03/30/12 at 0.01%
due 04/02/12 | | $ | 990,228 | | | $ | 990,228 | |
| | | | | | | | |
Total Repurchase Agreement
(Cost $990,228) | | | | | | | 990,228 | |
| | | | | | | | |
Total Investments - 102.1%
(Cost $41,395,442) | | | | | | $ | 48,064,537 | |
| | | | | | | | |
Other Assets & Liabilities, net - (2.1)% | | | | | | | (983,216 | ) |
| | | | | | | | |
Total Net Assets - 100.0% | | | | | | $ | 47,081,321 | |
| * | Non-income producing security. |
| † | Value determined based on Level 1 inputs — See Note 4. |
| †† | Value determined based on Level 2 inputs — See Note 4. |
| 1 | Repurchase Agreement — See Note 5. |
ADR — American Depositary Receipt
| | | | |
| | | | | |
| SEE NOTES TO FINANCIAL STATEMENTS. | | THE RYDEX FUNDSANNUALREPORT | | 109 |
STATEMENT OF ASSETS AND LIABILITIES
| | | | |
| March 31, 2012 | | | | |
| |
ASSETS: | | | | |
Investments, at value
(cost $40,405,214) | | $ | 47,074,309 | |
Repurchase agreements, at value
(cost $990,228) | | | 990,228 | |
| | | | |
Total investments
(cost $41,395,442) | | | 48,064,537 | |
Receivables: | | | | |
Fund shares sold | | | 4,462,534 | |
Dividends | | | 31,820 | |
| | | | |
Total assets | | | 52,558,891 | |
| | | | |
LIABILITIES: | | | | |
Payable for: | | | | |
Securities purchased | | | 4,943,672 | |
Fund shares redeemed | | | 488,240 | |
Management fees | | | 24,403 | |
Transfer agent and administrative fees | | | 7,177 | |
Distribution and service fees | | | 3,729 | |
Portfolio accounting fees | | | 2,871 | |
Miscellaneous | | | 7,478 | |
| | | | |
Total liabilities | | | 5,477,570 | |
| | | | |
NET ASSETS | | $ | 47,081,321 | |
| | | | |
NET ASSETS CONSISTOF: | | | | |
Paid in capital | | $ | 47,885,376 | |
Accumulated net investment loss | | | (18,867 | ) |
Accumulated net realized loss on investments | | | (7,454,283 | ) |
Net unrealized appreciation on investments | | | 6,669,095 | |
| | | | |
Net assets | | $ | 47,081,321 | |
| | | | |
INVESTOR CLASS: | | | | |
Net assets | | $ | 34,801,946 | |
Capital shares outstanding | | | 1,994,222 | |
Net asset value per share | | $ | 17.45 | |
| | | | |
ADVISOR CLASS: | | | | |
Net assets | | $ | 3,979,140 | |
Capital shares outstanding | | | 241,874 | |
Net asset value per share | | $ | 16.45 | |
| | | | |
A-CLASS: | | | | |
Net assets | | $ | 5,697,236 | |
Capital shares outstanding | | | 339,775 | |
Net asset value per share | | $ | 16.77 | |
| | | | |
Maximum offering price per share
(Net asset value divided by 95.25%) | | $ | 17.61 | |
| | | | |
C-CLASS: | | | | |
Net assets | | $ | 2,602,999 | |
Capital shares outstanding | | | 166,594 | |
Net asset value per share | | $ | 15.62 | |
| | | | |
STATEMENT OF OPERATIONS
| | | | |
| Year Ended March 31, 2012 | | | | |
| |
INVESTMENT INCOME: | | | | |
Dividends | | $ | 215,571 | |
Interest | | | 32 | |
| | | | |
Total investment income | | | 215,603 | |
| | | | |
EXPENSES: | | | | |
Management fees | | | 135,865 | |
Transfer agent and administrative fees | | | 39,960 | |
Distribution and service fees: | | | | |
Advisor Class | | | 13,560 | |
A-Class | | | 2,079 | |
C-Class | | | 17,876 | |
Portfolio accounting fees | | | 15,984 | |
Custodian fees | | | 4,277 | |
Trustees’ fees* | | | 976 | |
Miscellaneous | | | 17,162 | |
| | | | |
Total expenses | | | 247,739 | |
| | | | |
Net investment loss | | | (32,136 | ) |
| | | | |
NET REALIZEDAND UNREALIZED GAIN (LOSS): | | | | |
Net realized gain (loss) on: | | | | |
Investments | | | (1,736,442 | ) |
| | | | |
Net realized loss | | | (1,736,442 | ) |
| | | | |
Net change in unrealized appreciation (depreciation) on: | | | | |
Investments | | | 4,064,079 | |
| | | | |
Net change in unrealized appreciation (depreciation) | | | 4,064,079 | |
| | | | |
Net realized and unrealized gain | | | 2,327,637 | |
| | | | |
Net increase in net assets resulting from operations | | $ | 2,295,501 | |
| | | | |
| * | Relates to Trustees not deemed “interested persons” within the meaning of Section 2(a)(19) of the 1940 Act. |
| | | | |
| | | | | |
| 110 | | THE RYDEX FUNDSANNUALREPORT | | SEE NOTES TO FINANCIAL STATEMENTS. |
STATEMENTS OF CHANGES IN NET ASSETS
| | | | | | | | |
| | | Year Ended
March 31, 2012 | | | Year Ended
March 31, 2011 | |
INCREASE (DECREASE) IN NET ASSETS FROM OPERATIONS: | | | | | | | | |
Net investment income (loss) | | $ | (32,136 | ) | | $ | 16,042 | |
Net realized gain (loss) on investments | | | (1,736,442 | ) | | | 836,451 | |
Net change in unrealized appreciation (depreciation) on investments | | | 4,064,079 | | | | (384,162 | ) |
| | | | | | | | |
Net increase in net assets resulting from operations | | | 2,295,501 | | | | 468,331 | |
| | | | | | | | |
DISTRIBUTIONSTO SHAREHOLDERSFROM: | | | | | | | | |
Net investment income | | | | | | | | |
Investor Class | | | (10,261 | ) | | | (35,479 | ) |
Advisor Class | | | (2,123 | ) | | | (1,353 | ) |
A-Class | | | (918 | ) | | | (9,855 | ) |
C-Class | | | (2,740 | ) | | | (3,390 | ) |
| | | | | | | | |
Total distributions to shareholders | | | (16,042 | ) | | | (50,077 | ) |
| | | | | | | | |
CAPITAL SHARE TRANSACTIONS: | | | | | | | | |
Proceeds from sale of shares | | | | | | | | |
Investor Class | | | 154,522,734 | | | | 112,945,561 | |
Advisor Class | | | 41,989,998 | | | | 26,751,400 | |
A-Class | | | 6,468,017 | | | | 8,381,272 | |
C-Class | | | 42,900,385 | | | | 65,235,224 | |
Distributions reinvested | | | | | | | | |
Investor Class | | | 9,550 | | | | 34,766 | |
Advisor Class | | | 2,100 | | | | 1,339 | |
A-Class | | | 708 | | | | 821 | |
C-Class | | | 1,782 | | | | 1,554 | |
Cost of shares redeemed | | | | | | | | |
Investor Class | | | (124,920,412 | ) | | | (121,601,948 | ) |
Advisor Class | | | (39,872,121 | ) | | | (27,523,161 | ) |
A-Class | | | (1,518,199 | ) | | | (8,427,176 | ) |
C-Class | | | (43,364,257 | ) | | | (64,150,957 | ) |
| | | | | | | | |
Net increase (decrease) from capital share transactions | | | 36,220,285 | | | | (8,351,305 | ) |
| | | | | | | | |
Net increase (decrease) in net assets | | | 38,499,744 | | | | (7,933,051 | ) |
NET ASSETS: | | | | | | | | |
Beginning of year | | | 8,581,577 | | | | 16,514,628 | |
| | | | | | | | |
End of year | | $ | 47,081,321 | | | $ | 8,581,577 | |
| | | | | | | | |
Accumulated/(Undistributed) net investment income/(loss) at end of year | | $ | (18,867 | ) | | $ | 16,042 | |
| | | | | | | | |
CAPITAL SHARE ACTIVITY: | | | | | | | | |
Shares sold | | | | | | | | |
Investor Class | | | 10,008,491 | | | | 8,649,369 | |
Advisor Class | | | 2,942,412 | | | | 2,198,130 | |
A-Class | | | 406,397 | | | | 661,053 | |
C-Class | | | 3,163,632 | | | | 5,633,007 | |
Shares issued from reinvestment of distributions | | | | | | | | |
Investor Class | | | 653 | | | | 2,489 | |
Advisor Class | | | 152 | | | | 101 | |
A-Class | | | 50 | | | | 61 | |
C-Class | | | 136 | | | | 122 | |
Shares redeemed | | | | | | | | |
Investor Class | | | (8,272,567 | ) | | | (9,340,211 | ) |
Advisor Class | | | (2,814,468 | ) | | | (2,278,060 | ) |
A-Class | | | (103,243 | ) | | | (656,603 | ) |
C-Class | | | (3,201,016 | ) | | | (5,575,994 | ) |
| | | | | | | | |
Net increase (decrease) in shares | | | 2,130,629 | | | | (706,536 | ) |
| | | | | | | | |
| | | | |
| | | | | |
| SEE NOTES TO FINANCIAL STATEMENTS. | | THE RYDEX FUNDSANNUALREPORT | | 111 |
FINANCIAL HIGHLIGHTS
This table is presented to show selected data for a share outstanding throughout each period and to assist shareholders in evaluating a Fund’s performance for the periods presented.
| | | | | | | | | | | | | | | | | | | | |
Investor Class | | Year Ended
March 31,
2012 | | | Year Ended
March 31,
2011 | | | Year Ended
March 31,
2010 | | | Year Ended
March 31,
2009 | | | Year Ended
March 31,
2008 | |
Per Share Data | | | | | | | | | | | | | | | | | | | | |
Net asset value, beginning of period | | $ | 14.66 | | | $ | 12.75 | | | $ | 8.58 | | | $ | 11.54 | | | $ | 14.47 | |
| | | | | | | | | | | | | | | | | | | | |
Income (loss) from investment operations: | | | | | | | | | | | | | | | | | | | | |
Net investment income (loss)a | | | .01 | | | | .05 | | | | .03 | | | | (.01 | ) | | | (.04 | ) |
Net gain (loss) on investments (realized and unrealized) | | | 2.79 | | | | 1.89 | | | | 4.14 | | | | (2.95 | ) | | | (2.89 | ) |
| | | | | | | | | | | | | | | | | | | | |
Total from investment operations | | | 2.80 | | | | 1.94 | | | | 4.17 | | | | (2.96 | ) | | | (2.93 | ) |
| | | | | | | | | | | | | | | | | | | | |
Less distributions from: | | | | | | | | | | | | | | | | | | | | |
Net investment income | | | (.01 | ) | | | (.03 | ) | | | — | | | | — | | | | — | |
| | | | | | | | | | | | | | | | | | | | |
Total distributions | | | (.01 | ) | | | (.03 | ) | | | — | | | | — | | | | — | |
| | | | | | | | | | | | | | | | | | | | |
Net asset value, end of period | | $ | 17.45 | | | $ | 14.66 | | | $ | 12.75 | | | $ | 8.58 | | | $ | 11.54 | |
| | | | | | | | | | | | | | | | | | | | |
Total Returnb | | | 19.14 | % | | | 15.20 | % | | | 48.60 | % | | | (25.65 | %) | | | (20.25 | %) |
| | | | | | | | | | | | | | | | | | | | |
Ratios/Supplemental Data | | | | | | | | | | | | | | | | | | | | |
Net assets, end of period (in thousands) | | $ | 34,802 | | | $ | 3,776 | | | $ | 12,060 | | | $ | 84,894 | | | $ | 3,152 | |
| | | | | | | | | | | | | | | | | | | | |
Ratios to average net assets: | | | | | | | | | | | | | | | | | | | | |
Net investment income (loss) | | | 0.04 | % | | | 0.34 | % | | | 0.28 | % | | | (0.14 | %) | | | (0.27 | %) |
Total expenses | | | 1.34 | % | | | 1.39 | % | | | 1.38 | % | | | 1.32 | % | | | 1.37 | % |
| | | | | | | | | | | | | | | | | | | | |
Portfolio turnover rate | | | 822 | % | | | 1,062 | % | | | 1,049 | % | | | 461 | % | | | 1,205 | % |
| | | | | |
Advisor Class | | Year Ended
March 31,
2012 | | | Year Ended
March 31,
2011 | | | Year Ended
March 31,
2010 | | | Year Ended
March 31,
2009 | | | Year Ended
March 31,
2008 | |
Per Share Data | | | | | | | | | | | | | | | | | | | | |
Net asset value, beginning of period | | $ | 13.91 | | | $ | 12.14 | | | $ | 8.20 | | | $ | 11.10 | | | $ | 13.97 | |
| | | | | | | | | | | | | | | | | | | | |
Income (loss) from investment operations: | | | | | | | | | | | | | | | | | | | | |
Net investment lossa | | | (.09 | ) | | | (.07 | ) | | | (.06 | ) | | | (.02 | ) | | | (.12 | ) |
Net gain (loss) on investments (realized and unrealized) | | | 2.64 | | | | 1.87 | | | | 4.00 | | | | (2.88 | ) | | | (2.75 | ) |
| | | | | | | | | | | | | | | | | | | | |
Total from investment operations | | | 2.55 | | | | 1.80 | | | | 3.94 | | | | (2.90 | ) | | | (2.87 | ) |
| | | | | | | | | | | | | | | | | | | | |
Less distributions from: | | | | | | | | | | | | | | | | | | | | |
Net investment income | | | (.01 | ) | | | (.03 | ) | | | — | | | | — | | | | — | |
| | | | | | | | | | | | | | | | | | | | |
Total distributions | | | (.01 | ) | | | (.03 | ) | | | — | | | | — | | | | — | |
| | | | | | | | | | | | | | | | | | | | |
Net asset value, end of period | | $ | 16.45 | | | $ | 13.91 | | | $ | 12.14 | | | $ | 8.20 | | | $ | 11.10 | |
| | | | | | | | | | | | | | | | | | | | |
Total Returnb | | | 18.38 | % | | | 14.81 | % | | | 48.05 | % | | | (26.13 | %) | | | (20.54 | %) |
| | | | | | | | | | | | | | | | | | | | |
Ratios/Supplemental Data | | | | | | | | | | | | | | | | | | | | |
Net assets, end of period (in thousands) | | $ | 3,979 | | | $ | 1,583 | | | $ | 2,350 | | | $ | 901 | | | $ | 800 | |
| | | | | | | | | | | | | | | | | | | | |
Ratios to average net assets: | | | | | | | | | | | | | | | | | | | | |
Net investment loss | | | (0.66 | %) | | | (0.58 | %) | | | (0.57 | %) | | | (0.26 | %) | | | (0.89 | %) |
Total expenses | | | 1.84 | % | | | 1.89 | % | | | 1.87 | % | | | 1.88 | % | | | 1.87 | % |
| | | | | | | | | | | | | | | | | | | | |
Portfolio turnover rate | | | 822 | % | | | 1,062 | % | | | 1,049 | % | | | 461 | % | | | 1,205 | % |
| | | | |
| | | | | |
| 112 | | THE RYDEX FUNDSANNUALREPORT | | SEE NOTES TO FINANCIAL STATEMENTS. |
FINANCIAL HIGHLIGHTS (concluded)
This table is presented to show selected data for a share outstanding throughout each period and to assist shareholders in evaluating a Fund’s performance for the periods presented.
| | | | | | | | | | | | | | | | | | | | |
A-Class | | Year Ended
March 31,
2012 | | | Year Ended
March 31,
2011 | | | Year Ended
March 31,
2010 | | | Year Ended
March 31,
2009 | | | Year Ended
March 31,
2008 | |
Per Share Data | | | | | | | | | | | | | | | | | | | | |
Net asset value, beginning of period | | $ | 14.14 | | | $ | 12.31 | | | $ | 8.30 | | | $ | 11.18 | | | $ | 14.04 | |
| | | | | | | | | | | | | | | | | | | | |
Income (loss) from investment operations: | | | | | | | | | | | | | | | | | | | | |
Net investment income (loss)a | | | (.03 | ) | | | .18 | | | | (.01 | ) | | | (.02 | ) | | | (.10 | ) |
Net gain (loss) on investments (realized and unrealized) | | | 2.67 | | | | 1.68 | | | | 4.02 | | | | (2.86 | ) | | | (2.76 | ) |
| | | | | | | | | | | | | | | | | | | | |
Total from investment operations | | | 2.64 | | | | 1.86 | | | | 4.01 | | | | (2.88 | ) | | | (2.86 | ) |
| | | | | | | | | | | | | | | | | | | | |
Less distributions from: | | | | | | | | | | | | | | | | | | | | |
Net investment income | | | (.01 | ) | | | (.03 | ) | | | — | | | | — | | | | — | |
| | | | | | | | | | | | | | | | | | | | |
Total distributions | | | (.01 | ) | | | (.03 | ) | | | — | | | | — | | | | — | |
| | | | | | | | | | | | | | | | | | | | |
Net asset value, end of period | | $ | 16.77 | | | $ | 14.14 | | | $ | 12.31 | | | $ | 8.30 | | | $ | 11.18 | |
| | | | | | | | | | | | | | | | | | | | |
Total Returnb | | | 18.71 | % | | | 15.09 | % | | | 48.31 | % | | | (25.76 | %) | | | (20.37 | %) |
| | | | | | | | | | | | | | | | | | | | |
Ratios/Supplemental Data | | | | | | | | | | | | | | | | | | | | |
Net assets, end of period (in thousands) | | $ | 5,697 | | | $ | 517 | | | $ | 395 | | | $ | 49 | | | $ | 101 | |
| | | | | | | | | | | | | | | | | | | | |
Ratios to average net assets: | | | | | | | | | | | | | | | | | | | | |
Net investment income (loss) | | | (0.18 | %) | | | 1.42 | % | | | (0.12 | %) | | | (0.17 | %) | | | (0.73 | %) |
Total expenses | | | 1.58 | % | | | 1.64 | % | | | 1.62 | % | | | 1.63 | % | | | 1.63 | % |
| | | | | | | | | | | | | | | | | | | | |
Portfolio turnover rate | | | 822 | % | | | 1,062 | % | | | 1,049 | % | | | 461 | % | | | 1,205 | % |
| | | | | |
C-Class | | Year Ended
March 31,
2012 | | | Year Ended
March 31,
2011 | | | Year Ended
March 31,
2010 | | | Year Ended
March 31,
2009 | | | Year Ended
March 31,
2008 | |
Per Share Data | | | | | | | | | | | | | | | | | | | | |
Net asset value, beginning of period | | $ | 13.27 | | | $ | 11.65 | | | $ | 7.92 | | | $ | 10.76 | | | $ | 13.62 | |
| | | | | | | | | | | | | | | | | | | | |
Income (loss) from investment operations: | | | | | | | | | | | | | | | | | | | | |
Net investment lossa | | | (.13 | ) | | | (.11 | ) | | | (.10 | ) | | | (.07 | ) | | | (.17 | ) |
Net gain (loss) on investments (realized and unrealized) | | | 2.49 | | | | 1.76 | | | | 3.83 | | | | (2.77 | ) | | | (2.69 | ) |
| | | | | | | | | | | | | | | | | | | | |
Total from investment operations | | | 2.36 | | | | 1.65 | | | | 3.73 | | | | (2.84 | ) | | | (2.86 | ) |
| | | | | | | | | | | | | | | | | | | | |
Less distributions from: | | | | | | | | | | | | | | | | | | | | |
Net investment income | | | (.01 | ) | | | (.03 | ) | | | — | | | | — | | | | — | |
| | | | | | | | | | | | | | | | | | | | |
Total distributions | | | (.01 | ) | | | (.03 | ) | | | — | | | | — | | | | — | |
| | | | | | | | | | | | | | | | | | | | |
Net asset value, end of period | | $ | 15.62 | | | $ | 13.27 | | | $ | 11.65 | | | $ | 7.92 | | | $ | 10.76 | |
| | | | | | | | | | | | | | | | | | | | |
Total Returnb | | | 17.83 | % | | | 14.14 | % | | | 47.10 | % | | | (26.39 | %) | | | (21.00 | %) |
| | | | | | �� | | | | | | | | | | | | | | |
Ratios/Supplemental Data | | | | | | | | | | | | | | | | | | | | |
Net assets, end of period (in thousands) | | $ | 2,603 | | | $ | 2,705 | | | $ | 1,709 | | | $ | 1,008 | | | $ | 1,291 | |
| | | | | | | | | | | | | | | | | | | | |
Ratios to average net assets: | | | | | | | | | | | | | | | | | | | | |
Net investment loss | | | (0.96 | %) | | | (0.96 | %) | | | (1.08 | %) | | | (0.76 | %) | | | (1.36 | %) |
Total expenses | | | 2.35 | % | | | 2.39 | % | | | 2.38 | % | | | 2.38 | % | | | 2.37 | % |
| | | | | | | | | | | | | | | | | | | | |
Portfolio turnover rate | | | 822 | % | | | 1,062 | % | | | 1,049 | % | | | 461 | % | | | 1,205 | % |
| a | Net investment income (loss) per share was computed using average shares outstanding throughout the period. |
| b | Total return does not reflect the impact of any applicable sales charges and has not been annualized. |
| | | | |
| | | | | |
| SEE NOTES TO FINANCIAL STATEMENTS. | | THE RYDEX FUNDSANNUALREPORT | | 113 |
| | |
| PERFORMANCE REPORT AND FUND PROFILE (Unaudited) | | March 31, 2012 |
| | | |
TECHNOLOGY FUND
OBJECTIVE: Seeks to provide capital appreciation by investing in companies that are involved in the technology sector, including computer software and service companies, semiconductor manufacturers, networking and telecommunications equipment manufacturers, PC hardware and peripherals companies (“Technology Companies”).
Technology stocks had subdued growth during the period, due to inventory worries, management turnover and supply chain concerns in Japan and Thailand. In addition, demand in consumer-related electronics and public-sector spending has been weak, and some forecasts for worldwide information technology spending in 2012 have been cut by a third.
For the one-year period ended March 31, 2012, Technology Fund Investor Class returned 2.65%, compared with 20.21% for the S&P 500® Information Technology Index*.
Within the sector, computers & peripherals was the biggest contributor to return, followed by IT services and software. Communications equipment was the weakest contributor to return.
Fund performance for the year got the biggest boost from Apple, Inc., Microsoft Corp. and Intel Corp. First Solar, Inc., Research in Motion Ltd. and Hewlett-Packard Co. were among the weakest-performing stocks for the period.
*S&P 500® Information Technology Index is a sub-index of the S&P 500® Index, a capitalization-weighted index covering 500 industrial, utility, transportation and financial companies of the U.S. markets (mostly NYSE Euronext issues). The Information Technology index covers the following general areas: Technology software & services, including companies that primarily develop software in various fields such as the Internet, applications, systems, databases management and/or home entertainment, and companies that provide information technology consulting and services, as well as data processing and outsourced services; secondly, Technology Hardware & Equipment, including manufacturers and distributors of communications equipment, computers & peripherals, electronic equipment and related instruments; and thirdly, Semiconductors & Semiconductor Equipment Manufacturers.
Performance displayed represents past performance which is no guarantee of future results.
Holdings Diversification (Market Exposure as % of Net Assets)
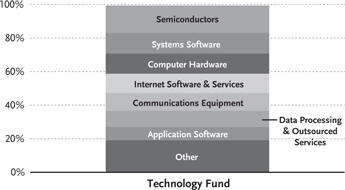
“Holdings Diversification (Market Exposure as % of Net Assets)” excludes any temporary cash investments.
| | | | |
Inception Dates: | |
Investor Class | | | April 14, 1998 | |
Advisor Class | | | April 29, 1998 | |
A-Class | | | September 1, 2004 | |
C-Class | | | April 18, 2001 | |
| | | | |
Ten Largest Holdings (% of Total Net Assets) | |
Apple, Inc. | | | 5.5 | % |
Microsoft Corp. | | | 3.8 | % |
International Business Machines Corp. | | | 3.7 | % |
Google, Inc. — Class A | | | 3.4 | % |
Intel Corp. | | | 2.8 | % |
Oracle Corp. | | | 2.8 | % |
Cisco Systems, Inc. | | | 2.5 | % |
QUALCOMM, Inc. | | | 2.5 | % |
Visa, Inc. — Class A | | | 2.1 | % |
EMC Corp. | | | 1.9 | % |
| | | | |
Top Ten Total | | | 31.0 | % |
| | | | |
“Ten Largest Holdings” exclude any temporary cash or derivative investments.
| | | | |
| | | | | |
| 114 | | THE RYDEX FUNDSANNUALREPORT | | |
| | |
| PERFORMANCE REPORT AND FUND PROFILE (Unaudited) (concluded) | | March 31, 2012 |
Cumulative Fund Performance*
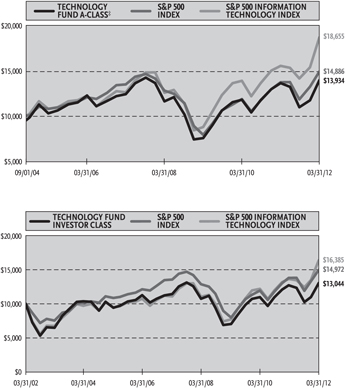
Average Annual Returns*
Periods Ended 03/31/12
| | | | | | | | | | | | |
| | | 1 Year | | | 5 Year | | | 10 Year | |
Investor Class Shares | | | 2.65 | % | | | 2.69 | % | | | 2.69 | % |
Advisor Class Shares | | | 2.13 | % | | | 2.16 | % | | | 2.24 | % |
C-Class Shares | | | 1.50 | % | | | 1.65 | % | | | 1.71 | % |
C-Class Shares with CDSC† | | | 0.50 | % | | | 1.65 | % | | | 1.71 | % |
S&P 500 Index | | | 8.54 | % | | | 2.01 | % | | | 4.12 | % |
S&P 500 Information Technology Index | | | 20.21 | % | | | 8.15 | % | | | 5.06 | % |
| | | |
| | | 1 Year | | | 5 Year | | | Since
Inception
(09/01/04) | |
A-Class Shares | | | 2.33 | % | | | 2.37 | % | | | 5.14 | % |
A-Class Shares with sales charge‡ | | | -2.51 | % | | | 1.38 | % | | | 4.48 | % |
S&P 500 Index | | | 8.54 | % | | | 2.01 | % | | | 5.41 | % |
S&P 500 Information Technology Index | | | 20.21 | % | | | 8.15 | % | | | 8.65 | % |
| * | The performance data above represents past performance that is not predictive of future results. The investment return and principal value of an investment in the Fund will fluctuate so that an investor’s shares, when redeemed, may be worth more or less than their original cost. Returns are historical and include changes in principal and reinvested dividends and capital gains and do not reflect the effect of taxes. The S&P 500 Index and the S&P 500 Information Technology Index are unmanaged indices and, unlike the Fund, have no management fees or operating expenses to reduce their reported returns. The graphs are based on Investor Class shares and A-Class shares only; performance for Advisor Class shares and C-Class shares will vary due to differences in fee structures. |
| † | Fund returns include a CDSC of 1% if redeemed within 12 months of purchase. |
| ‡ | Fund returns are calculated using the maximum sales charge of 4.75%. |
| | | | |
| | | | | |
| | THE RYDEX FUNDSANNUALREPORT | | 115 |
| | |
| SCHEDULE OF INVESTMENTS | | March 31, 2012 |
| | | |
TECHNOLOGY FUND
| | | | | | | | |
| | | SHARES | | | VALUE | |
COMMON STOCKS† - 99.4% | | | | | | | | |
Semiconductors - 16.4% | | | | | | | | |
Intel Corp. | | | 32,164 | | | $ | 904,129 | |
Texas Instruments, Inc. | | | 13,996 | | | | 470,405 | |
Broadcom
Corp. — Class A* | | | 8,942 | | | | 351,420 | |
Taiwan Semiconductor Manufacturing Company Ltd. ADR | | | 21,288 | | | | 325,281 | |
ARM Holdings plc ADR | | | 10,642 | | | | 301,062 | |
Altera Corp. | | | 6,846 | | | | 272,608 | |
Analog Devices, Inc. | | | 6,500 | | | | 262,600 | |
NVIDIA Corp.* | | | 15,654 | | | | 240,915 | |
Xilinx, Inc. | | | 6,488 | | | | 236,358 | |
Avago Technologies Ltd. | | | 6,022 | | | | 234,677 | |
Marvell Technology Group Ltd.* | | | 14,522 | | | | 228,431 | |
Maxim Integrated Products, Inc. | | | 7,632 | | | | 218,199 | |
Linear Technology Corp. | | | 6,220 | | | | 209,614 | |
Micron Technology, Inc.* | | | 25,675 | | | | 207,968 | |
Microchip Technology, Inc. | | | 5,459 | | | | 203,075 | |
Advanced Micro Devices, Inc.* | | | 22,210 | | | | 178,124 | |
Skyworks Solutions, Inc.* | | | 6,140 | | | | 169,771 | |
LSI Corp.* | | | 19,170 | | | | 166,396 | |
Atmel Corp.* | | | 15,810 | | | | 155,887 | |
| | | | | | | | |
Total Semiconductors | | | | | | | 5,336,920 | |
| | | | | | | | |
Systems Software - 12.3% | | | | | | | | |
Microsoft Corp. | | | 38,700 | | | | 1,248,074 | |
Oracle Corp. | | | 30,712 | | | | 895,562 | |
VMware, Inc. — Class A* | | | 4,716 | | | | 529,937 | |
Symantec Corp.* | | | 15,120 | | | | 282,744 | |
Red Hat, Inc.* | | | 4,637 | | | | 277,710 | |
Check Point Software Technologies Ltd.* | | | 4,350 | | | | 277,704 | |
CA, Inc. | | | 10,052 | | | | 277,033 | |
BMC Software, Inc.* | | | 4,937 | | | | 198,270 | |
Total Systems Software | | | | | | | 3,987,034 | |
Computer Hardware - 12.0% | | | | | | | | |
Apple, Inc.* | | | 2,996 | | | | 1,796,011 | |
International Business Machines Corp. | | | 5,698 | | | | 1,188,888 | |
Hewlett-Packard Co. | | | 21,819 | | | | 519,947 | |
Dell, Inc.* | | | 24,317 | | | | 403,662 | |
| | | | | | | | |
Total Computer Hardware | | | | | | | 3,908,508 | |
| | | | | | | | |
Internet Software &
Services - 11.5% | | | | | | | | |
Google, Inc. — Class A* | | | 1,732 | | | | 1,110,628 | |
Baidu, Inc. ADR* | | | 3,852 | | | | 561,506 | |
eBay, Inc.* | | | 14,055 | | | | 518,489 | |
Yahoo!, Inc.* | | | 21,002 | | | | 319,650 | |
LinkedIn Corp. — Class A* | | | 2,481 | | | | 253,037 | |
Equinix, Inc.* | | | 1,390 | | | | 218,856 | |
Rackspace Hosting, Inc.* | | | 3,680 | | | | 212,667 | |
Akamai Technologies, Inc.* | | | 5,235 | | | | 192,125 | |
VeriSign, Inc. | | | 4,892 | | | | 187,559 | |
Sina Corp.* | | | 2,310 | | | | 150,150 | |
| | | | | | | | |
Total Internet Software & Services | | | | | | | 3,724,667 | |
| | | | | | | | |
| | | | | | | | |
| | | SHARES | | | VALUE | |
Communications
Equipment - 10.6% | | | | | | | | |
Cisco Systems, Inc. | | | 38,553 | | | $ | 815,397 | |
QUALCOMM, Inc. | | | 11,962 | | | | 813,656 | |
Nokia Oyj ADR | | | 58,066 | | | | 318,782 | |
Motorola Solutions, Inc. | | | 6,003 | | | | 305,132 | |
Juniper Networks, Inc.* | | | 11,975 | | | | 273,988 | |
Motorola Mobility Holdings, Inc.* | | | 6,618 | | | | 259,690 | |
F5 Networks, Inc.* | | | 1,892 | | | | 255,344 | |
Research In Motion Ltd.* | | | 14,573 | | | | 214,369 | |
Harris Corp. | | | 3,902 | | | | 175,902 | |
| | | | | | | | |
Total Communications Equipment | | | | | | | 3,432,260 | |
| | | | | | | | |
Data Processing & Outsourced Services - 9.7% | | | | | | | | |
Visa, Inc. — Class A | | | 5,705 | | | | 673,189 | |
Mastercard, Inc. — Class A | | | 1,339 | | | | 563,103 | |
Automatic Data Processing, Inc. | | | 7,145 | | | | 394,333 | |
Western Union Co. | | | 14,174 | | | | 249,462 | |
Paychex, Inc. | | | 8,033 | | | | 248,943 | |
Fiserv, Inc.* | | | 3,448 | | | | 239,257 | |
Fidelity National Information Services, Inc. | | | 7,074 | | | | 234,291 | |
Alliance Data Systems Corp.* | | | 1,537 | | | | 193,601 | |
VeriFone Systems, Inc.* | | | 3,550 | | | | 184,139 | |
Computer Sciences Corp. | | | 5,396 | | | | 161,556 | |
| | | | | | | | |
Total Data Processing & Outsourced Services | | | | | | | 3,141,874 | |
| | | | | | | | |
Application Software - 7.8% | | | | | | | | |
Salesforce.com, Inc.* | | | 2,301 | | | | 355,527 | |
Intuit, Inc. | | | 5,290 | | | | 318,088 | |
Adobe Systems, Inc.* | | | 9,208 | | | | 315,926 | |
Citrix Systems, Inc.* | | | 3,781 | | | | 298,359 | |
SAP AG ADR | | | 4,198 | | | | 293,104 | |
Autodesk, Inc.* | | | 5,608 | | | | 237,331 | |
Nuance Communications, Inc.* | | | 8,170 | | | | 208,989 | |
Informatica Corp.* | | | 3,500 | | | | 185,150 | |
TIBCO Software, Inc.* | | | 5,570 | | | | 169,885 | |
Factset Research Systems, Inc. | | | 1,630 | | | | 161,435 | |
| | | | | | | | |
Total Application Software | | | | | | | 2,543,794 | |
| | | | | | | | |
Computer Storage & Peripherals - 5.2% | | | | | | | | |
EMC Corp.* | | | 20,195 | | | | 603,427 | |
NetApp, Inc.* | | | 6,779 | | | | 303,496 | |
Seagate Technology plc | | | 9,743 | | | | 262,574 | |
SanDisk Corp.* | | | 5,263 | | | | 260,992 | |
Western Digital Corp.* | | | 5,852 | | | | 242,214 | |
| | | | | | | | |
Total Computer Storage & Peripherals | | | | | | | 1,672,703 | |
| | | | | | | | |
IT Consulting & Other
Services - 4.9% | | | | | | | | |
Accenture plc — Class A | | | 8,007 | | | | 516,451 | |
Infosys Ltd. ADR | | | 7,532 | | | | 429,550 | |
Cognizant Technology Solutions
Corp. — Class A* | | | 4,770 | | | | 367,052 | |
Teradata Corp.* | | | 3,865 | | | | 263,400 | |
| | | | | | | | |
Total IT Consulting & Other Services | | | | | | | 1,576,453 | |
| | | | | | | | |
| | | | |
| | | | | |
| 116 | | THE RYDEX FUNDSANNUALREPORT | | SEE NOTES TO FINANCIAL STATEMENTS. |
| | |
| SCHEDULE OF INVESTMENTS (concluded) | | March 31, 2012 |
TECHNOLOGY FUND
| | | | | | | | |
| | | SHARES | | | VALUE | |
Semiconductor
Equipment - 3.1% | | | | | | | | |
ASML Holding N.V. ADR | | | 6,069 | | | $ | 304,300 | |
Applied Materials, Inc. | | | 24,205 | | | | 301,110 | |
KLA-Tencor Corp. | | | 4,238 | | | | 230,632 | |
Lam Research Corp.* | | | 3,924 | | | | 175,089 | |
| | | | | | | | |
Total Semiconductor Equipment | | | | | | | 1,011,131 | |
| | | | | | | | |
Electronic
Components - 1.8% | | | | | | | | |
Corning, Inc. | | | 24,860 | | | | 350,029 | |
Amphenol
Corp. — Class A | | | 4,121 | | | | 246,312 | |
| | | | | | | | |
Total Electronic Components | | | | | | | 596,341 | |
| | | | | | | | |
Electronic Manufacturing Services - 1.4% | | | | | | | | |
TE Connectivity Ltd. | | | 8,147 | | | | 299,402 | |
Jabil Circuit, Inc. | | | 6,710 | | | | 168,555 | |
| | | | | | | | |
Total Electronic Manufacturing Services | | | | | | | 467,957 | |
| | | | | | | | |
Home Entertainment Software - 1.4% | | | | | | | | |
Activision Blizzard, Inc. | | | 22,636 | | | | 290,194 | |
Electronic Arts, Inc.* | | | 10,425 | | | | 171,804 | |
| | | | | | | | |
Total Home Entertainment Software | | | | | | | 461,998 | |
| | | | | | | | |
Office Electronics - 0.8% | | | | | | | | |
Xerox Corp. | | | 30,370 | | | | 245,390 | |
| | | | | | | | |
Technology
Distributors - 0.5% | | | | | | | | |
Avnet, Inc.* | | | 4,730 | | | | 172,125 | |
| | | | | | | | |
Total Common Stocks
(Cost $22,439,270) | | | | | | | 32,279,155 | |
| | | | | | | | |
| | |
| | | FACE
AMOUNT | | | | |
REPURCHASE
AGREEMENT††,1 - 0.7% | | | | | | | | |
Credit Suisse Group
issued 03/30/12 at 0.01%
due 04/02/12 | | $ | 214,900 | | | | 214,900 | |
| | | | | | | | |
Total Repurchase Agreement
(Cost $214,900) | | | | | | | 214,900 | |
| | | | | | | | |
Total Investments - 100.1%
(Cost $22,654,170) | | | | | | $ | 32,494,055 | |
| | | | | | | | |
Other Assets & Liabilities, net - (0.1)% | | | | | | | (37,841 | ) |
| | | | | | | | |
Total Net Assets - 100.0% | | | | | | $ | 32,456,214 | |
| * | Non-income producing security. |
| † | Value determined based on Level 1 inputs — See Note 4. |
| †† | Value determined based on Level 2 inputs — See Note 4. |
| 1 | Repurchase Agreement — See Note 5. |
ADR — American Depositary Receipt
plc — Public Limited Company
| | | | |
| | | | | |
| SEE NOTES TO FINANCIAL STATEMENTS. | | THE RYDEX FUNDSANNUALREPORT | | 117 |
STATEMENT OF ASSETS AND LIABILITIES
March 31, 2012
| | | | |
ASSETS: | | | | |
Investments, at value | | | | |
(cost $22,439,270) | | $ | 32,279,155 | |
Repurchase agreements, at value | | | | |
(cost $214,900) | | | 214,900 | |
| | | | |
Total investments | | | | |
(cost $22,654,170) | | | 32,494,055 | |
Receivables: | | | | |
Fund shares sold | | | 597,281 | |
Dividends | | | 13,913 | |
| | | | |
Total assets | | | 33,105,249 | |
| | | | |
LIABILITIES: | | | | |
Payable for: | | | | |
Securities purchased | | | 395,343 | |
Fund shares redeemed | | | 199,509 | |
Management fees | | | 24,262 | |
Transfer agent and administrative fees | | | 7,136 | |
Distribution and service fees | | | 5,430 | |
Portfolio accounting fees | | | 2,854 | |
Miscellaneous | | | 14,501 | |
| | | | |
Total liabilities | | | 649,035 | |
| | | | |
NET ASSETS | | $ | 32,456,214 | |
| | | | |
NET ASSETS CONSISTOF: | | | | |
Paid in capital | | $ | 41,537,152 | |
Accumulated net investment loss | | | (82,903 | ) |
Accumulated net realized loss on investments | | | (18,837,920 | ) |
Net unrealized appreciation on investments | | | 9,839,885 | |
| | | | |
Net assets | | $ | 32,456,214 | |
| | | | |
INVESTOR CLASS: | | | | |
Net assets | | $ | 19,985,473 | |
Capital shares outstanding | | | 1,396,926 | |
Net asset value per share | | $ | 14.31 | |
| | | | |
ADVISOR CLASS: | | | | |
Net assets | | $ | 2,360,914 | |
Capital shares outstanding | | | 176,110 | |
Net asset value per share | | $ | 13.41 | |
| | | | |
A-CLASS: | | | | |
Net assets | | $ | 7,366,630 | |
Capital shares outstanding | | | 542,133 | |
Net asset value per share | | $ | 13.59 | |
| | | | |
Maximum offering price per share | | | | |
(Net asset value divided by 95.25%) | | $ | 14.27 | |
| | | | |
C-CLASS: | | | | |
Net assets | | $ | 2,743,197 | |
Capital shares outstanding | | | 212,940 | |
Net asset value per share | | $ | 12.88 | |
| | | | |
STATEMENT OF OPERATIONS
Year Ended March 31, 2012
| | | | |
INVESTMENT INCOME: | | | | |
Dividends (net of foreign withholding tax of $5,842) | | $ | 329,637 | |
Interest | | | 45 | |
| | | | |
Total investment income | | | 329,682 | |
| | | | |
EXPENSES: | | | | |
Management fees | | | 241,749 | |
Transfer agent and administrative fees | | | 71,102 | |
Distribution and service fees: | | | | |
Advisor Class | | | 19,607 | |
A-Class | | | 4,759 | |
C-Class | | | 23,980 | |
Portfolio accounting fees | | | 28,441 | |
Custodian fees | | | 7,306 | |
Trustees’ fees* | | | 3,058 | |
Miscellaneous | | | 33,938 | |
| | | | |
Total expenses | | | 433,940 | |
| | | | |
Net investment loss | | | (104,258 | ) |
| | | | |
NET REALIZEDAND UNREALIZED GAIN (Loss): | | | | |
Net realized gain (loss) on: | | | | |
Investments | | | 1,250,892 | |
| | | | |
Net realized gain | | | 1,250,892 | |
| | | | |
Net change in unrealized appreciation (depreciation) on: | | | | |
Investments | | | (2,397,822 | ) |
| | | | |
Net change in unrealized appreciation (depreciation) | | | (2,397,822 | ) |
| | | | |
Net realized and unrealized loss | | | (1,146,930 | ) |
| | | | |
Net decrease in net assets resulting from operations | | $ | (1,251,188 | ) |
| | | | |
| * | Relates to Trustees not deemed “interested persons” within the meaning of Section 2(a)(19) of the 1940 Act. |
| | | | |
| | | | | |
| 118 | | THE RYDEX FUNDSANNUALREPORT | | SEE NOTES TO FINANCIAL STATEMENTS. |
STATEMENTS OF CHANGES IN NET ASSETS
| | | | | | | | |
| | | Year Ended
March 31, 2012 | | | Year Ended
March 31, 2011 | |
INCREASE (DECREASE) IN NET ASSETS FROM OPERATIONS: | | | | | | | | |
Net investment loss | | $ | (104,258 | ) | | $ | (294,384 | ) |
Net realized gain on investments | | | 1,250,892 | | | | 6,855,354 | |
Net change in unrealized appreciation (depreciation) on investments | | | (2,397,822 | ) | | | (3,631,811 | ) |
| | | | | | | | |
Net increase (decrease) in net assets resulting from operations | | | (1,251,188 | ) | | | 2,929,159 | |
| | | | | | | | |
CAPITAL SHARE TRANSACTIONS: | | | | | | | | |
Proceeds from sale of shares | | | | | | | | |
Investor Class | | | 108,582,687 | | | | 135,813,468 | |
Advisor Class | | | 8,173,636 | | | | 28,472,116 | |
A-Class | | | 7,857,718 | | | | 4,442,948 | |
C-Class | | | 60,684,739 | | | | 88,193,972 | |
Cost of shares redeemed | | | | | | | | |
Investor Class | | | (122,517,037 | ) | | | (139,967,215 | ) |
Advisor Class | | | (12,349,402 | ) | | | (40,011,196 | ) |
A-Class | | | (2,487,350 | ) | | | (6,872,533 | ) |
C-Class | | | (60,553,860 | ) | | | (89,700,251 | ) |
| | | | | | | | |
Net decrease from capital share transactions | | | (12,608,869 | ) | | | (19,628,691 | ) |
| | | | | | | | |
Net decrease in net assets | | | (13,860,057 | ) | | | (16,699,532 | ) |
| | |
NET ASSETS: | | | | | | | | |
Beginning of year | | | 46,316,271 | | | | 63,015,803 | |
| | | | | | | | |
End of year | | $ | 32,456,214 | | | $ | 46,316,271 | |
| | | | | | | | |
Accumulated net investment loss at end of year | | $ | (82,903 | ) | | $ | — | |
| | | | | | | | |
CAPITAL SHARE ACTIVITY: | | | | | | | | |
Shares sold | | | | | | | | |
Investor Class | | | 8,083,995 | | | | 10,630,438 | |
Advisor Class | | | 672,443 | | | | 2,464,584 | |
A-Class | | | 613,241 | | | | 365,677 | |
C-Class | | | 5,174,420 | | | | 7,895,392 | |
Shares redeemed | | | | | | | | |
Investor Class | | | (9,227,976 | ) | | | (11,196,482 | ) |
Advisor Class | | | (996,290 | ) | | | (3,541,746 | ) |
A-Class | | | (201,069 | ) | | | (578,302 | ) |
C-Class | | | (5,167,807 | ) | | | (8,025,633 | ) |
| | | | | | | | |
Net decrease in shares | | | (1,049,045 | ) | | | (1,986,072 | ) |
| | | | | | | | |
| | | | |
| | | | | |
| SEE NOTES TO FINANCIAL STATEMENTS. | | THE RYDEX FUNDSANNUALREPORT | | 119 |
FINANCIAL HIGHLIGHTS
This table is presented to show selected data for a share outstanding throughout each period and to assist shareholders in evaluating a Fund’s performance for the periods presented.
| | | | | | | | | | | | | | | | | | | | |
Investor Class | | Year Ended
March 31,
2012 | | | Year Ended
March 31,
2011 | | | Year Ended
March 31,
2010 | | | Year Ended
March 31,
2009 | | | Year Ended
March 31,
2008 | |
Per Share Data | | | | | | | | | | | | | | | | | | | | |
Net asset value, beginning of period | | $ | 13.94 | | | $ | 12.03 | | | $ | 7.70 | | | $ | 11.77 | | | $ | 12.53 | |
| | | | | | | | | | | | | | | | | | | | |
Income (loss) from investment operations: | | | | | | | | | | | | | | | | | | | | |
Net investment lossa | | | (.01 | ) | | | (.06 | ) | | | (.05 | ) | | | (.03 | ) | | | (.10 | ) |
Net gain (loss) on investments (realized and unrealized) | | | .38 | | | | 1.97 | | | | 4.38 | | | | (4.04 | ) | | | (.66 | ) |
| | | | | | | | | | | | | | | | | | | | |
Total from investment operations | | | .37 | | | | 1.91 | | | | 4.33 | | | | (4.07 | ) | | | (.76 | ) |
| | | | | | | | | | | | | | | | | | | | |
Net asset value, end of period | | $ | 14.31 | | | $ | 13.94 | | | $ | 12.03 | | | $ | 7.70 | | | $ | 11.77 | |
| | | | | | | | | | | | | | | | | | | | |
Total Returnb | | | 2.65 | % | | | 15.88 | % | | | 56.23 | % | | | (34.58 | %) | | | (6.07 | %) |
| | | | | | | | | | | | | | | | | | | | |
Ratios/Supplemental Data | | | | | | | | | | | | | | | | | | | | |
Net assets, end of period (in thousands) | | $ | 19,985 | | | $ | 35,408 | | | $ | 37,391 | | | $ | 11,601 | | | $ | 9,916 | |
| | | | | | | | | | | | | | | | | | | | |
Ratios to average net assets: | | | | | | | | | | | | | | | | | | | | |
Net investment loss | | | (0.10 | %) | | | (0.48 | %) | | | (0.52 | %) | | | (0.29 | %) | | | (0.72 | %) |
Total expenses | | | 1.36 | % | | | 1.39 | % | | | 1.38 | % | | | 1.37 | % | | | 1.37 | % |
| | | | | | | | | | | | | | | | | | | | |
Portfolio turnover rate | | | 487 | % | | | 393 | % | | | 335 | % | | | 564 | % | | | 694 | % |
| | | | | |
Advisor Class | | Year Ended
March 31,
2012 | | | Year Ended
March 31,
2011 | | | Year Ended
March 31,
2010 | | | Year Ended
March 31,
2009 | | | Year Ended
March 31,
2008 | |
Per Share Data | | | | | | | | | | | | | | | | | | | | |
Net asset value, beginning of period | | $ | 13.13 | | | $ | 11.39 | | | $ | 7.32 | | | $ | 11.27 | | | $ | 12.05 | |
| | | | | | | | | | | | | | | | | | | | |
Income (loss) from investment operations: | | | | | | | | | | | | | | | | | | | | |
Net investment lossa | | | (.11 | ) | | | (.11 | ) | | | (.11 | ) | | | (.05 | ) | | | (.15 | ) |
Net gain (loss) on investments (realized and unrealized) | | | .39 | | | | 1.85 | | | | 4.18 | | | | (3.90 | ) | | | (.63 | ) |
| | | | | | | | | | | | | | | | | | | | |
Total from investment operations | | | .28 | | | | 1.74 | | | | 4.07 | | | | (3.95 | ) | | | (.78 | ) |
| | | | | | | | | | | | | | | | | | | | |
Net asset value, end of period | | $ | 13.41 | | | $ | 13.13 | | | $ | 11.39 | | | $ | 7.32 | | | $ | 11.27 | |
| | | | | | | | | | | | | | | | | | | | |
Total Returnb | | | 2.13 | % | | | 15.28 | % | | | 55.60 | % | | | (35.05 | %) | | | (6.47 | %) |
| | | | | | | | | | | | | | | | | | | | |
Ratios/Supplemental Data | | | | | | | | | | | | | | | | | | | | |
Net assets, end of period (in thousands) | | $ | 2,361 | | | $ | 6,565 | | | $ | 17,969 | | | $ | 1,914 | | | $ | 2,077 | |
| | | | | | | | | | | | | | | | | | | | |
Ratios to average net assets: | | | | | | | | | | | | | | | | | | | | |
Net investment loss | | | (0.87 | %) | | | (0.94 | %) | | | (1.04 | %) | | | (0.53 | %) | | | (1.16 | %) |
Total expenses | | | 1.85 | % | | | 1.88 | % | | | 1.87 | % | | | 1.87 | % | | | 1.88 | % |
| | | | | | | | | | | | | | | | | | | | |
Portfolio turnover rate | | | 487 | % | | | 393 | % | | | 335 | % | | | 564 | % | | | 694 | % |
| | | | |
| | | | | |
| 120 | | THE RYDEX FUNDSANNUALREPORT | | SEE NOTES TO FINANCIAL STATEMENTS. |
FINANCIAL HIGHLIGHTS (concluded)
This table is presented to show selected data for a share outstanding throughout each period and to assist shareholders in evaluating a Fund’s performance for the periods presented.
| | | | | | | | | | | | | | | | | | | | |
A-Class | | Year Ended
March 31,
2012 | | | Year Ended
March 31,
2011 | | | Year Ended
March 31,
2010 | | | Year Ended
March 31,
2009 | | | Year Ended
March 31,
2008 | |
Per Share Data | | | | | | | | | | | | | | | | | | | | |
Net asset value, beginning of period | | $ | 13.28 | | | $ | 11.49 | | | $ | 7.37 | | | $ | 11.32 | | | $ | 12.09 | |
| | | | | | | | | | | | | | | | | | | | |
Income (loss) from investment operations: | | | | | | | | | | | | | | | | | | | | |
Net investment lossa | | | (.10 | ) | | | (.09 | ) | | | (.08 | ) | | | (.04 | ) | | | (.11 | ) |
Net gain (loss) on investments (realized and unrealized) | | | .41 | | | | 1.88 | | | | 4.20 | | | | (3.91 | ) | | | (.66 | ) |
| | | | | | | | | | | | | | | | | | | | |
Total from investment operations | | | .31 | | | | 1.79 | | | | 4.12 | | | | (3.95 | ) | | | (.77 | ) |
| | | | | | | | | | | | | | | | | | | | |
Net asset value, end of period | | $ | 13.59 | | | $ | 13.28 | | | $ | 11.49 | | | $ | 7.37 | | | $ | 11.32 | |
| | | | | | | | | | | | | | | | | | | | |
Total Returnb | | | 2.33 | % | | | 15.58 | % | | | 55.90 | % | | | (34.89 | %) | | | (6.37 | %) |
| | | | | | | | | | | | | | | | | | | | |
Ratios/Supplemental Data | | | | | | | | | | | | | | | | | | | | |
Net assets, end of period (in thousands) | | $ | 7,367 | | | $ | 1,725 | | | $ | 3,936 | | | $ | 1,669 | | | $ | 546 | |
| | | | | | | | | | | | | | | | | | | | |
Ratios to average net assets: | | | | | | | | | | | | | | | | | | | | |
Net investment loss | | | (0.76 | %) | | | (0.73 | %) | | | (0.78 | %) | | | (0.41 | %) | | | (0.86 | %) |
Total expenses | | | 1.59 | % | | | 1.64 | % | | | 1.63 | % | | | 1.63 | % | | | 1.60 | % |
| | | | | | | | | | | | | | | | | | | | |
Portfolio turnover rate | | | 487 | % | | | 393 | % | | | 335 | % | | | 564 | % | | | 694 | % |
| | | | | |
C-Class | | Year Ended
March 31,
2012 | | | Year Ended
March 31,
2011 | | | Year Ended
March 31,
2010 | | | Year Ended
March 31,
2009 | | | Year Ended
March 31,
2008 | |
Per Share Data | | | | | | | | | | | | | | | | | | | | |
Net asset value, beginning of period | | $ | 12.69 | | | $ | 11.05 | | | $ | 7.14 | | | $ | 11.04 | | | $ | 11.87 | |
| | | | | | | | | | | | | | | | | | | | |
Income (loss) from investment operations: | | | | | | | | | | | | | | | | | | | | |
Net investment lossa | | | (.17 | ) | | | (.17 | ) | | | (.14 | ) | | | (.12 | ) | | | (.21 | ) |
Net gain (loss) on investments (realized and unrealized) | | | .36 | | | | 1.81 | | | | 4.05 | | | | (3.78 | ) | | | (.62 | ) |
| | | | | | | | | | | | | | | | | | | | |
Total from investment operations | | | .19 | | | | 1.64 | | | | 3.91 | | | | (3.90 | ) | | | (.83 | ) |
| | | | | | | | | | | | | | | | | | | | |
Net asset value, end of period | | $ | 12.88 | | | $ | 12.69 | | | $ | 11.05 | | | $ | 7.14 | | | $ | 11.04 | |
| | | | | | | | | | | | | | | | | | | | |
Total Returnb | | | 1.50 | % | | | 14.84 | % | | | 54.76 | % | | | (35.33 | %) | | | (6.99 | %) |
| | | | | | | | | | | | | | | | | | | | |
Ratios/Supplemental Data | | | | | | | | | | | | | | | | | | | | |
Net assets, end of period (in thousands) | | $ | 2,743 | | | $ | 2,618 | | | $ | 3,719 | | | $ | 1,335 | | | $ | 2,448 | |
| | | | | | | | | | | | | | | | | | | | |
Ratios to average net assets: | | | | | | | | | | | | | | | | | | | | |
Net investment loss | | | (1.45 | %) | | | (1.53 | %) | | | (1.49 | %) | | | (1.24 | %) | | | (1.67 | %) |
Total expenses | | | 2.36 | % | | | 2.39 | % | | | 2.38 | % | | | 2.38 | % | | | 2.35 | % |
| | | | | | | | | | | | | | | | | | | | |
Portfolio turnover rate | | | 487 | % | | | 393 | % | | | 335 | % | | | 564 | % | | | 694 | % |
| a | Net investment loss per share was computed using average shares outstanding throughout the period. |
| b | Total return does not reflect the impact of any applicable sales charges and has not been annualized. |
| | | | |
| | | | | |
| SEE NOTES TO FINANCIAL STATEMENTS. | | THE RYDEX FUNDSANNUALREPORT | | 121 |
| | |
| PERFORMANCE REPORT AND FUND PROFILE (Unaudited) | | March 31, 2012 |
| | | |
TELECOMMUNICATIONS FUND
OBJECTIVE: Seeks to provide capital appreciation by investing in companies engaged in the development, manufacture or sale of communications services or communications equipment (“Telecommunications Companies”).
The sector has benefited from overall growth involving the shift to the wireless world, and relatively high dividends. But these have not overcome the squeeze in net profits resulting from the cost of servicing high amounts of debt and from a glut of operators in a competitive wireless marketplace.
For the one-year period ended March 31, 2012, Telecommunications Fund Investor Class returned -8.77%, compared with 3.46% for the S&P 500® Telecommunications Services Index*.
The industries in the sector that contributed most to the Fund’s return were lightly weighted REITs and diversified telecommunication services. Communications equipment and wireless telecommunications services were the largest detractors from return.
Cisco Systems, Inc., QUALCOMM, Inc. and Motorola Mobility Holdings, Inc. were among the strongest performers for the year. NII Holdings, Inc., Sprint Nextel Corp. and Research in Motion Ltd. were among the stocks which added least to Fund performance during the year.
*S&P 500® Telecommunications Services Index is a sub-index of the S&P 500® Index, a capitalization-weighted index covering 500 industrial, utility, transportation and financial companies of the U.S. markets (mostly NYSE Euronext issues). The Telecommunications Services index contains companies that provide communications services primarily through a fixed-line, cellular, wireless, high bandwidth and/or fiber optic cable network.
Performance displayed represents past performance which is no guarantee of future results.
Holdings Diversification (Market Exposure
as % of Net Assets)
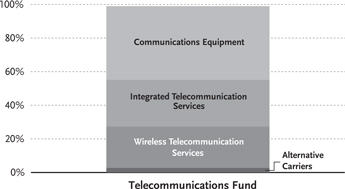
“Holdings Diversification (Market Exposure as % of Net Assets)” excludes any temporary cash investments.
| | | | |
Inception Dates: | |
Investor Class | | | April 1, 1998 | |
Advisor Class | | | April 1, 1998 | |
A-Class | | | September 1, 2004 | |
C-Class | | | April 18, 2001 | |
| | | | |
|
Ten Largest Holdings (% of Total Net Assets) | |
AT&T, Inc. | | | 8.9 | % |
Vodafone Group plc ADR | | | 7.8 | % |
QUALCOMM, Inc. | | | 7.2 | % |
Cisco Systems, Inc. | | | 7.2 | % |
Verizon Communications, Inc. | | | 6.8 | % |
CenturyLink, Inc. | | | 3.2 | % |
Motorola Solutions, Inc. | | | 2.7 | % |
Crown Castle International Corp. | | | 2.6 | % |
Juniper Networks, Inc. | | | 2.4 | % |
Motorola Mobility Holdings, Inc. | | | 2.3 | % |
| | | | |
Top Ten Total | | | 51.1 | % |
| | | | |
“Ten Largest Holdings” exclude any temporary cash or derivative investments.
| | | | |
| | | | | |
| 122 | | THE RYDEX FUNDSANNUALREPORT | | |
| | |
| PERFORMANCE REPORT AND FUND PROFILE (Unaudited) (concluded) | | March 31, 2012 |
| | | |
Cumulative Fund Performance*
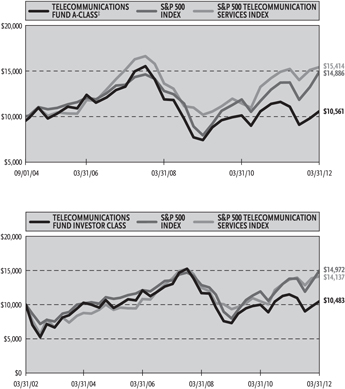
Average Annual Returns*
Periods Ended 03/31/12
| | | | | | | | | | | | |
| | | 1 Year | | | 5 Year | | | 10 Year | |
Investor Class Shares | | | -8.77 | % | | | -4.25 | % | | | 0.47 | % |
Advisor Class Shares | | | -9.15 | % | | | -4.68 | % | | | 0.08 | % |
C-Class Shares | | | -9.52 | % | | | -5.11 | % | | | -0.45 | % |
C-Class Shares with CDSC† | | | -10.39 | % | | | -5.11 | % | | | -0.45 | % |
S&P 500 Index | | | 8.54 | % | | | 2.01 | % | | | 4.12 | % |
S&P 500 Telecommunication Services Index | | | 3.46 | % | | | 0.39 | % | | | 3.52 | % |
| | | |
| | | 1 Year | | | 5 Year | | | Since
Inception
(09/01/04) | |
A-Class Shares | | | -8.91 | % | | | -4.46 | % | | | 1.38 | % |
A-Class Shares with sales charge‡ | | | -13.22 | % | | | -5.39 | % | | | 0.72 | % |
S&P 500 Index | | | 8.54 | % | | | 2.01 | % | | | 5.41 | % |
S&P 500 Telecommunication Services Index | | | 3.46 | % | | | 0.39 | % | | | 5.94 | % |
| * | The performance data above represents past performance that is not predictive of future results. The investment return and principal value of an investment in the Fund will fluctuate so that an investor’s shares, when redeemed, may be worth more or less than their original cost. Returns are historical and include changes in principal and reinvested dividends and capital gains and do not reflect the effect of taxes. The S&P 500 Index and the S&P 500 Telecommunication Services Index are unmanaged indices and, unlike the Fund, have no management fees or operating expenses to reduce their reported returns. The graphs are based on Investor Class shares and A-Class shares only; performance for Advisor Class shares and C-Class shares will vary due to differences in fee structures. |
| † | Fund returns include a CDSC of 1% if redeemed within 12 months of purchase. |
| ‡ | Fund returns are calculated using the maximum sales charge of 4.75%. |
| | | | |
| | | | | |
| | THE RYDEX FUNDSANNUALREPORT | | 123 |
| | |
| SCHEDULE OF INVESTMENTS | | March 31, 2012 |
| TELECOMMUNICATIONS FUND | | |
| | | | | | | | |
| | | SHARES | | | VALUE | |
COMMON STOCKS† - 99.0% | |
Communications Equipment - 43.9% | |
QUALCOMM, Inc. | | | 9,989 | | | $ | 679,452 | |
Cisco Systems, Inc. | | | 32,005 | | | | 676,906 | |
Motorola Solutions, Inc. | | | 4,996 | | | | 253,947 | |
Juniper Networks, Inc.* | | | 9,927 | | | | 227,130 | |
Motorola Mobility Holdings, Inc.* | | | 5,509 | | | | 216,173 | |
F5 Networks, Inc.* | | | 1,554 | | | | 209,728 | |
Research In Motion Ltd.* | | | 12,084 | | | | 177,756 | |
Nokia Oyj ADR | | | 29,621 | | | | 162,619 | |
Harris Corp. | | | 3,198 | | | | 144,166 | |
Riverbed Technology, Inc.* | | | 4,801 | | | | 134,812 | |
JDS Uniphase Corp.* | | | 8,063 | | | | 116,833 | |
Polycom, Inc.* | | | 6,112 | | | | 116,556 | |
Telefonaktiebolaget LM Ericsson ADR —
Class B | | | 10,733 | | | | 110,657 | |
Brocade Communications Systems, Inc.* | | | 18,023 | | | | 103,632 | |
Aruba Networks, Inc.* | | | 4,244 | | | | 94,556 | |
Viasat, Inc.* | | | 1,906 | | | | 91,888 | |
ADTRAN, Inc. | | | 2,860 | | | | 89,203 | |
Finisar Corp.* | | | 4,378 | | | | 88,217 | |
Plantronics, Inc. | | | 2,101 | | | | 84,586 | |
Acme Packet, Inc.* | | | 3,067 | | | | 84,404 | |
Ciena Corp.* | | | 4,927 | | | | 79,768 | |
InterDigital, Inc. | | | 2,248 | | | | 78,365 | |
Netgear, Inc.* | | | 1,973 | | | | 75,369 | |
Emulex Corp.* | | | 5,703 | | | | 59,197 | |
| | | | | | | | |
Total Communications Equipment | | | | 4,155,920 | |
| | | | | | | | |
Integrated Telecommunication Services - 27.8% | |
AT&T, Inc. | | | 27,126 | | | | 847,144 | |
Verizon Communications, Inc. | | | 16,817 | | | | 642,913 | |
CenturyLink, Inc. | | | 7,911 | | | | 305,760 | |
Windstream Corp. | | | 13,894 | | | | 162,699 | |
Telefonica S.A. ADR | | | 6,385 | | | | 104,778 | |
Telefonica Brasil S.A. ADR | | | 3,404 | | | | 104,265 | |
Chunghwa Telecom Company Ltd. ADR | | | 3,130 | | | | 96,279 | |
BCE, Inc. | | | 2,375 | | | | 95,143 | |
China Unicom Hong Kong Ltd. ADR | | | 5,647 | | | | 94,870 | |
KT Corp. ADR* | | | 6,340 | | | | 86,795 | |
France Telecom S.A. ADR | | | 5,590 | | | | 83,012 | |
| | | | | | | | |
Total Integrated Telecommunication Services | | | | 2,623,658 | |
| | | | | | | | |
Wireless Telecommunication Services - 24.6% | |
Vodafone Group plc ADR | | | 26,758 | | | | 740,394 | |
Crown Castle International Corp.* | | | 4,619 | | | | 246,377 | |
America Movil SAB de CV ADR | | | 7,701 | | | | 191,216 | |
SBA Communications Corp. — Class A* | | | 3,024 | | | | 153,649 | |
China Mobile Ltd. ADR | | | 2,343 | | | | 129,052 | |
Mobile TeleSystems ADR | | | 6,673 | | | | 122,383 | |
NII Holdings, Inc.* | | | 6,273 | | | | 114,859 | |
MetroPCS Communications, Inc.* | | | 12,037 | | | | 108,574 | |
Tim Participacoes S.A. ADR | | | 3,124 | | | | 100,780 | |
| | | | | | | | |
| | | SHARES | | | VALUE | |
Telephone & Data Systems, Inc. | | | 4,263 | | | $ | 98,688 | |
VimpelCom Ltd. ADR | | | 8,720 | | | | 97,315 | |
SK Telecom Company Ltd. ADR | | | 6,672 | | | | 92,808 | |
Rogers Communications, Inc. — Class B | | | 2,200 | | | | 87,340 | |
Leap Wireless International, Inc.* | | | 5,645 | | | | 49,281 | |
| | | | | | | | |
Total Wireless Telecommunication Services | | | | 2,332,716 | |
| | | | | | | | |
Alternative Carriers - 2.7% | |
Level 3 Communications, Inc.* | | | 5,406 | | | | 139,097 | |
tw telecom, Inc. —
Class A* | | | 5,140 | | | | 113,902 | |
| | | | | | | | |
Total Alternative Carriers | | | | 252,999 | |
| | | | | | | | |
Total Common Stocks
(Cost $7,673,269) | | | | 9,365,293 | |
| | | | | | | | |
| | |
| | | FACE
AMOUNT | | | | |
REPURCHASE AGREEMENT††,1 - 0.4% | |
Credit Suisse Group issued 03/30/12 at 0.01% due 04/02/12 | | $ | 41,516 | | | | 41,516 | |
| | | | | | | | |
Total Repurchase Agreement
(Cost $41,516) | | | | 41,516 | |
| | | | | | | | |
Total Investments - 99.4%
(Cost $7,714,785) | | | $ | 9,406,809 | |
| | | | | | | | |
Other Assets & Liabilities, net - 0.6% | | | | 59,962 | |
| | | | | | | | |
Total Net Assets - 100.0% | | | $ | 9,466,771 | |
| * | Non-income producing security. |
| † | Value determined based on Level 1 inputs — See Note 4. |
| †† | Value determined based on Level 2 inputs — See Note 4. |
| 1 | Repurchase Agreement — See Note 5. |
ADR — American Depositary Receipt
plc — Public Limited Company
| | | | |
| | | | | |
| 124 | | THE RYDEX FUNDSANNUALREPORT | | SEE NOTES TO FINANCIAL STATEMENTS. |
| | | | |
STATEMENT OF ASSETS AND LIABILITIES | |
| March 31, 2012 | |
| |
ASSETS: | | | | |
Investments, at value
(cost $7,673,269) | | $ | 9,365,293 | |
Repurchase agreements, at value
(cost $41,516) | | | 41,516 | |
| | | | |
Total investments
(cost $7,714,785) | | | 9,406,809 | |
Receivables: | | | | |
Fund shares sold | | | 471,826 | |
Dividends | | | 6,102 | |
Foreign taxes reclaim | | | 77 | |
| | | | |
Total assets | | | 9,884,814 | |
| | | | |
LIABILITIES: | | | | |
Payable for: | | | | |
Fund shares redeemed | | | 404,090 | |
Management fees | | | 6,074 | |
Transfer agent and administrative fees | | | 1,786 | |
Distribution and service fees | | | 1,210 | |
Portfolio accounting fees | | | 715 | |
Miscellaneous | | | 4,168 | |
| | | | |
Total liabilities | | | 418,043 | |
| | | | |
NET ASSETS | | $ | 9,466,771 | |
| | | | |
NET ASSETS CONSISTOF: | | | | |
Paid in capital | | $ | 12,489,813 | |
Undistributed net investment income | | | 87,671 | |
Accumulated net realized loss on investments | | | (4,802,737 | ) |
Net unrealized appreciation on investments | | | 1,692,024 | |
| | | | |
Net assets | | $ | 9,466,771 | |
| | | | |
INVESTOR CLASS: | | | | |
Net assets | | $ | 7,028,250 | |
Capital shares outstanding | | | 507,878 | |
Net asset value per share | | $ | 13.84 | |
| | | | |
ADVISOR CLASS: | | | | |
Net assets | | $ | 200,387 | |
Capital shares outstanding | | | 15,537 | |
Net asset value per share | | $ | 12.90 | |
| | | | |
A-CLASS: | | | | |
Net assets | | $ | 1,566,267 | |
Capital shares outstanding | | | 119,646 | |
Net asset value per share | | $ | 13.09 | |
| | | | |
Maximum offering price per share
(Net asset value divided by 95.25%) | | $ | 13.74 | |
| | | | |
C-CLASS: | | | | |
Net assets | | $ | 671,867 | |
Capital shares outstanding | | | 54,412 | |
Net asset value per share | | $ | 12.35 | |
| | | | |
| | | | |
STATEMENT OF OPERATIONS | |
| Year Ended March 31, 2012 | | | | |
| |
INVESTMENT INCOME: | | | | |
Dividends (net of foreign withholding tax of $5,890) | | $ | 299,082 | |
Interest | | | 12 | |
| | | | |
Total investment income | | | 299,094 | |
| | | | |
EXPENSES: | | | | |
Management fees | | | 66,800 | |
Transfer agent and administrative fees | | | 19,647 | |
Distribution and service fees: | | | | |
Advisor Class | | | 2,302 | |
A-Class | | | 2,264 | |
C-Class | | | 11,975 | |
Portfolio accounting fees | | | 7,859 | |
Custodian fees | | | 2,071 | |
Trustees’ fees* | | | 1,046 | |
Tax expense | | | 211 | |
Miscellaneous | | | 9,084 | |
| | | | |
Total expenses | | | 123,259 | |
| | | | |
Net investment income | | | 175,835 | |
| | | | |
NET REALIZEDAND UNREALIZED GAIN (LOSS): | | | | |
Net realized gain (loss) on: | | | | |
Investments | | | 446,580 | |
| | | | |
Net realized gain | | | 446,580 | |
| | | | |
Net change in unrealized appreciation (depreciation) on: | | | | |
Investments | | | (1,853,210 | ) |
| | | | |
Net change in unrealized appreciation (depreciation) | | | (1,853,210 | ) |
| | | | |
Net realized and unrealized loss | | | (1,406,630 | ) |
| | | | |
Net decrease in net assets resulting from operations | | $ | (1,230,795 | ) |
| | | | |
| * | Relates to Trustees not deemed “interested persons” within the meaning of Section 2(a)(19) of the 1940 Act. |
| | | | |
| | | | | |
| SEE NOTES TO FINANCIAL STATEMENTS. | | THE RYDEX FUNDSANNUALREPORT | | 125 |
STATEMENTS OF CHANGES IN NET ASSETS
| | | | | | | | |
| | | Year Ended
March 31, 2012 | | | Year Ended
March 31, 2011 | |
INCREASE (DECREASE) IN NET ASSETS FROM OPERATIONS: | | | | | | | | |
Net investment income | | $ | 175,835 | | | $ | 80,971 | |
Net realized gain on investments | | | 446,580 | | | | 588,234 | |
Net change in unrealized appreciation (depreciation) on investments | | | (1,853,210 | ) | | | 1,503,267 | |
| | | | | | | | |
Net increase (decrease) in net assets resulting from operations | | | (1,230,795 | ) | | | 2,172,472 | |
| | | | | | | | |
DISTRIBUTIONSTO SHAREHOLDERS FROM: | | | | | | | | |
Net investment income | | | | | | | | |
Investor Class | | | (75,956 | ) | | | (67,481 | ) |
Advisor Class | | | (26,034 | ) | | | (5,275 | ) |
A-Class | | | (45,257 | ) | | | (4,577 | ) |
C-Class | | | (22,099 | ) | | | (18,522 | ) |
| | | | | | | | |
Total distributions to shareholders | | | (169,346 | ) | | | (95,855 | ) |
| | | | | | | | |
CAPITAL SHARE TRANSACTIONS: | | | | | | | | |
Proceeds from sale of shares | | | | | | | | |
Investor Class | | | 47,973,211 | | | | 134,026,357 | |
Advisor Class | | | 2,527,832 | | | | 14,787,230 | |
A-Class | | | 2,925,127 | | | | 3,138,157 | |
C-Class | | | 64,107,314 | | | | 101,895,836 | |
Distributions reinvested | | | | | | | | |
Investor Class | | | 74,213 | | | | 66,267 | |
Advisor Class | | | 23,065 | | | | 4,612 | |
A-Class | | | 45,175 | | | | 4,413 | |
C-Class | | | 21,048 | | | | 16,598 | |
Cost of shares redeemed | | | | | | | | |
Investor Class | | | (88,037,595 | ) | | | (92,550,806 | ) |
Advisor Class | | | (2,967,150 | ) | | | (14,584,997 | ) |
A-Class | | | (2,011,577 | ) | | | (3,561,229 | ) |
C-Class | | | (66,192,569 | ) | | | (100,130,077 | ) |
| | | | | | | | |
Net increase (decrease) from capital share transactions | | | (41,511,906 | ) | | | 43,112,361 | |
| | | | | | | | |
Net increase (decrease) in net assets | | | (42,912,047 | ) | | | 45,188,978 | |
| | |
NET ASSETS: | | | | | | | | |
Beginning of year | | | 52,378,818 | | | | 7,189,840 | |
| | | | | | | | |
End of year | | $ | 9,466,771 | | | $ | 52,378,818 | |
| | | | | | | | |
Undistributed net investment income at end of year | | $ | 87,671 | | | $ | 80,971 | |
| | | | | | | | |
CAPITAL SHARE ACTIVITY: | | | | | | | | |
Shares sold | | | | | | | | |
Investor Class | | | 3,399,757 | | | | 9,014,851 | |
Advisor Class | | | 180,932 | | | | 1,144,045 | |
A-Class | | | 231,535 | | | | 239,651 | |
C-Class | | | 5,027,824 | | | | 7,870,456 | |
Shares issued from reinvestment of distributions | | | | | | | | |
Investor Class | | | 5,970 | | | | 4,511 | |
Advisor Class | | | 1,988 | | | | 334 | |
A-Class | | | 3,841 | | | | 316 | |
C-Class | | | 1,891 | | | | 1,246 | |
Shares redeemed | | | | | | | | |
Investor Class | | | (5,959,087 | ) | | | (6,298,891 | ) |
Advisor Class | | | (214,545 | ) | | | (1,118,811 | ) |
A-Class | | | (162,618 | ) | | | (276,676 | ) |
C-Class | | | (5,179,379 | ) | | | (7,758,916 | ) |
| | | | | | | | |
Net increase (decrease) in shares | | | (2,661,891 | ) | | | 2,822,116 | |
| | | | | | | | |
| | | | |
| | | | | |
| 126 | | THE RYDEX FUNDSANNUALREPORT | | SEE NOTES TO FINANCIAL STATEMENTS. |
FINANCIAL HIGHLIGHTS
This table is presented to show selected data for a share outstanding throughout each period and to assist shareholders in evaluating a Fund’s performance for the periods presented.
| | | | | | | | | | | | | | | | | | | | |
Investor Class | | Year Ended
March 31,
2012 | | | Year Ended
March 31,
2011 | | | Year Ended
March 31,
2010 | | | Year Ended
March 31,
2009 | | | Year Ended
March 31,
2008 | |
Per Share Data | | | | | | | | | | | | | | | | | | | | |
Net asset value, beginning of period | | $ | 15.71 | | | $ | 13.73 | | | $ | 10.29 | | | $ | 17.04 | | | $ | 19.02 | |
| | | | | | | | | | | | | | | | | | | | |
Income (loss) from investment operations: | | | | | | | | | | | | | | | | | | | | |
Net investment incomea | | | .41 | | | | .10 | | | | .26 | | | | .27 | | | | .12 | |
Net gain (loss) on investments (realized and unrealized) | | | (1.84 | ) | | | 1.96 | | | | 3.52 | | | | (6.68 | ) | | | (2.08 | ) |
| | | | | | | | | | | | | | | | | | | | |
Total from investment operations | | | (1.43 | ) | | | 2.06 | | | | 3.78 | | | | (6.41 | ) | | | (1.96 | ) |
| | | | | | | | | | | | | | | | | | | | |
Less distributions from: | | | | | | | | | | | | | | | | | | | | |
Net investment income | | | (.44 | ) | | | (.08 | ) | | | (.34 | ) | | | (.34 | ) | | | (.02 | ) |
| | | | | | | | | | | | | | | | | | | | |
Total distributions | | | (.44 | ) | | | (.08 | ) | | | (.34 | ) | | | (.34 | ) | | | (.02 | ) |
| | | | | | | | | | | | | | | | | | | | |
Net asset value, end of period | | $ | 13.84 | | | $ | 15.71 | | | $ | 13.73 | | | $ | 10.29 | | | $ | 17.04 | |
| | | | | | | | | | | | | | | | | | | | |
Total Returnb | | | (8.77 | %) | | | 15.06 | % | | | 36.88 | % | | | (37.55 | %) | | | (10.32 | %) |
| | | | | | | | | | | | | | | | | | | | |
Ratios/Supplemental Data | | | | | | | | | | | | | | | | | | | | |
Net assets, end of period (in thousands) | | $ | 7,028 | | | $ | 48,089 | | | $ | 4,677 | | | $ | 4,440 | | | $ | 11,134 | |
| | | | | | | | | | | | | | | | | | | | |
Ratios to average net assets: | | | | | | | | | | | | | | | | | | | | |
Net investment income | | | 2.86 | % | | | 0.73 | % | | | 2.03 | % | | | 1.92 | % | | | 0.58 | % |
Total expenses | | | 1.36 | % | | | 1.39 | % | | | 1.39 | % | | | 1.39 | % | | | 1.37 | % |
| | | | | | | | | | | | | | | | | | | | |
Portfolio turnover rate | | | 793 | % | | | 1,008 | % | | | 867 | % | | | 672 | % | | | 528 | % |
| | | | | |
Advisor Class | | Year Ended
March 31,
2012 | | | Year Ended
March 31,
2011 | | | Year Ended
March 31,
2010 | | | Year Ended
March 31,
2009 | | | Year Ended
March 31,
2008 | |
Per Share Data | | | | | | | | | | | | | | | | | | | | |
Net asset value, beginning of period | | $ | 14.74 | | | $ | 12.94 | | | $ | 9.75 | | | $ | 16.26 | | | $ | 18.24 | |
| | | | | | | | | | | | | | | | | | | | |
Income (loss) from investment operations: | | | | | | | | | | | | | | | | | | | | |
Net investment income (loss)a | | | .22 | | | | .03 | | | | .23 | | | | .17 | | | | (.02 | ) |
Net gain (loss) on investments (realized and unrealized) | | | (1.62 | ) | | | 1.85 | | | | 3.30 | | | | (6.34 | ) | | | (1.94 | ) |
| | | | | | | | | | | | | | | | | | | | |
Total from investment operations | | | (1.40 | ) | | | 1.88 | | | | 3.53 | | | | (6.17 | ) | | | (1.96 | ) |
| | | | | | | | | | | | | | | | | | | | |
Less distributions from: | | | | | | | | | | | | | | | | | | | | |
Net investment income | | | (.44 | ) | | | (.08 | ) | | | (.34 | ) | | | (.34 | ) | | | (.02 | ) |
| | | | | | | | | | | | | | | | | | | | |
Total distributions | | | (.44 | ) | | | (.08 | ) | | | (.34 | ) | | | (.34 | ) | | | (.02 | ) |
| | | | | | | | | | | | | | | | | | | | |
Net asset value, end of period | | $ | 12.90 | | | $ | 14.74 | | | $ | 12.94 | | | $ | 9.75 | | | $ | 16.26 | |
| | | | | | | | | | | | | | | | | | | | |
Total Returnb | | | (9.15 | %) | | | 14.59 | % | | | 36.35 | % | | | (37.88 | %) | | | (10.76 | %) |
| | | | | | | | | | | | | | | | | | | | |
Ratios/Supplemental Data | | | | | | | | | | | | | | | | | | | | |
Net assets, end of period (in thousands) | | $ | 200 | | | $ | 695 | | | $ | 279 | | | $ | 9,991 | | | $ | 835 | |
| | | | | | | | | | | | | | | | | | | | |
Ratios to average net assets: | | | | | | | | | | | | | | | | | | | | |
Net investment income (loss) | | | 1.65 | % | | | 0.25 | % | | | 1.94 | % | | | 1.53 | % | | | (0.09 | %) |
Total expenses | | | 1.85 | % | | | 1.88 | % | | | 1.89 | % | | | 1.81 | % | | | 1.88 | % |
| | | | | | | | | | | | | | | | | | | | |
Portfolio turnover rate | | | 793 | % | | | 1,008 | % | | | 867 | % | | | 672 | % | | | 528 | % |
| | | | |
| | | | | |
| SEE NOTES TO FINANCIAL STATEMENTS. | | THE RYDEX FUNDSANNUALREPORT | | 127 |
FINANCIAL HIGHLIGHTS (concluded)
This table is presented to show selected data for a share outstanding throughout each period and to assist shareholders in evaluating a Fund’s performance for the periods presented.
| | | | | | | | | | | | | | | | | | | | |
A-Class | | Year
Ended
March 31,
2012 | | | Year
Ended
March 31,
2011 | | | Year
Ended
March 31,
2010 | | | Year
Ended
March 31,
2009 | | | Year
Ended
March 31,
2008 | |
Per Share Data | | | | | | | | | | | | | | | | | | | | |
Net asset value, beginning of period | | $ | 14.91 | | | $ | 13.07 | | | $ | 9.83 | | | $ | 16.33 | | | $ | 18.28 | |
| | | | | | | | | | | | | | | | | | | | |
Income (loss) from investment operations: | | | | | | | | | | | | | | | | | | | | |
Net investment incomea | | | .18 | | | | .14 | | | | .17 | | | | .27 | | | | .03 | |
Net gain (loss) on investments (realized and unrealized) | | | (1.56 | ) | | | 1.78 | | | | 3.41 | | | | (6.43 | ) | | | (1.96 | ) |
| | | | | | | | | | | | | | | | | | | | |
Total from investment operations | | | (1.38 | ) | | | 1.92 | | | | 3.58 | | | | (6.16 | ) | | | (1.93 | ) |
| | | | | | | | | | | | | | | | | | | | |
Less distributions from: | | | | | | | | | | | | | | | | | | | | |
Net investment income | | | (.44 | ) | | | (.08 | ) | | | (.34 | ) | | | (.34 | ) | | | (.02 | ) |
| | | | | | | | | | | | | | | | | | | | |
Total distributions | | | (.44 | ) | | | (.08 | ) | | | (.34 | ) | | | (.34 | ) | | | (.02 | ) |
| | | | | | | | | | | | | | | | | | | | |
Net asset value, end of period | | $ | 13.09 | | | $ | 14.91 | | | $ | 13.07 | | | $ | 9.83 | | | $ | 16.33 | |
| | | | | | | | | | | | | | | | | | | | |
Total Returnb | | | (8.91 | %) | | | 14.75 | % | | | 36.57 | % | | | (37.66 | %) | | | (10.57 | %) |
| | | | | | | | | | | | | | | | | | | | |
Ratios/Supplemental Data | | | | | | | | | | | | | | | | | | | | |
Net assets, end of period (in thousands) | | $ | 1,566 | | | $ | 699 | | | $ | 1,093 | | | $ | 1,317 | | | $ | 451 | |
| | | | | | | | | | | | | | | | | | | | |
Ratios to average net assets: | | | | | | | | | | | | | | | | | | | | |
Net investment income | | | 1.41 | % | | | 1.01 | % | | | 1.45 | % | | | 2.15 | % | | | 0.13 | % |
Total expenses | | | 1.60 | % | | | 1.64 | % | | | 1.63 | % | | | 1.63 | % | | | 1.61 | % |
| | | | | | | | | | | | | | | | | | | | |
Portfolio turnover rate | | | 793 | % | | | 1,008 | % | | | 867 | % | | | 672 | % | | | 528 | % |
| | | | | |
C-Class | | Year
Ended
March 31,
2012 | | | Year
Ended
March 31,
2011 | | | Year
Ended
March 31,
2010 | | | Year
Ended
March 31,
2009 | | | Year
Ended
March 31,
2008 | |
Per Share Data | | | | | | | | | | | | | | | | | | | | |
Net asset value, beginning of period | | $ | 14.19 | | | $ | 12.50 | | | $ | 9.48 | | | $ | 15.91 | | | $ | 17.93 | |
| | | | | | | | | | | | | | | | | | | | |
Income (loss) from investment operations: | | | | | | | | | | | | | | | | | | | | |
Net investment income (loss)a | | | .05 | | | | (.01 | ) | | | .10 | | | | .13 | | | | (.10 | ) |
Net gain (loss) on investments (realized and unrealized) | | | (1.45 | ) | | | 1.78 | | | | 3.26 | | | | (6.22 | ) | | | (1.90 | ) |
| | | | | | | | | | | | | | | | | | | | |
Total from investment operations | | | (1.40 | ) | | | 1.77 | | | | 3.36 | | | | (6.09 | ) | | | (2.00 | ) |
| | | | | | | | | | | | | | | | | | | | |
Less distributions from: | | | | | | | | | | | | | | | | | | | | |
Net investment income | | | (.44 | ) | | | (.08 | ) | | | (.34 | ) | | | (.34 | ) | | | (.02 | ) |
| | | | | | | | | | | | | | | | | | | | |
Total distributions | | | (.44 | ) | | | (.08 | ) | | | (.34 | ) | | | (.34 | ) | | | (.02 | ) |
| | | | | | | | | | | | | | | | | | | | |
Net asset value, end of period | | $ | 12.35 | | | $ | 14.19 | | | $ | 12.50 | | | $ | 9.48 | | | $ | 15.91 | |
| | | | | | | | | | | | | | | | | | | | |
Total Returnb | | | (9.52 | %) | | | 14.22 | % | | | 35.59 | % | | | (38.21 | %) | | | (11.17 | %) |
| | | | | | | | | | | | | | | | | | | | |
Ratios/Supplemental Data | | | | | | | | | | | | | | | | | | | | |
Net assets, end of period (in thousands) | | $ | 672 | | | $ | 2,896 | | | $ | 1,141 | | | $ | 1,281 | | | $ | 2,846 | |
| | | | | | | | | | | | | | | | | | | | |
Ratios to average net assets: | | | | | | | | | | | | | | | | | | | | |
Net investment income (loss) | | | 0.39 | % | | | (0.07 | %) | | | 0.86 | % | | | 0.99 | % | | | (0.50 | %) |
Total expenses | | | 2.36 | % | | | 2.39 | % | | | 2.39 | % | | | 2.42 | % | | | 2.37 | % |
| | | | | | | | | | | | | | | | | | | | |
Portfolio turnover rate | | | 793 | % | | | 1,008 | % | | | 867 | % | | | 672 | % | | | 528 | % |
| a | Net investment income (loss) per share was computed using average shares outstanding throughout the period. |
| b | Total return does not reflect the impact of any applicable sales charges and has not been annualized. |
| | | | |
| | | | | |
| 128 | | THE RYDEX FUNDSANNUALREPORT | | SEE NOTES TO FINANCIAL STATEMENTS. |
This page intentionally left blank.
| | | | |
| | | | | |
| | THE RYDEX FUNDSANNUALREPORT | | 129 |
| | |
| PERFORMANCE REPORT AND FUND PROFILE (Unaudited) | | March 31, 2012 |
TRANSPORTATION FUND
OBJECTIVE: Seeks to provide capital appreciation by investing in companies engaged in providing transportation services or companies engaged in the design, manufacture, distribution or sale of transportation equipment (“Transportation Companies”).
The Industrials sector was affected by uneven economic growth domestically and abroad for much of the past 12 months, although performance in the auto sector was a bright spot, as sales were the highest since the Great Recession. The sector also has a sizeable exposure to the eurozone, which is dealing with a weak banking sector and government austerity. The three largest segments by weight—road & rail, air freight & logistics, and airlines—all detracted from return. Autos and automobile components both contributed to return.
For the one-year period ended March 31, 2012, Transportation Fund Investor Class returned -3.20%, compared with 1.75% for the S&P 500® Industrials Index*.
Tata Motors Ltd. ADR, Harley-Davidson, Inc. and Union Pacific Corp. were among the biggest contributors to Fund performance for the year. CSX Corp., AMR Corp. and Southwest Airlines Co. were among the stocks which provided the least performance to the Fund during the year.
*S&P 500® Industrials Index is a sub-index of the S&P 500® Index, a capitalization-weighted index covering 500 industrial, utility, transportation and financial companies of the U.S. markets (mostly NYSE Euronext issues). The Industrials index includes companies whose businesses are dominated by one of the following activities: The manufacture and distribution of capital goods, including aerospace & defense, construction, engineering & building products, electrical equipment and industrial machinery; the provision of commercial services and supplies, including printing, environmental, office and security services; the provision of professional services, including employment and research & consulting services; or the provision of transportation services, including airlines, couriers, marine, road & rail and transportation infrastructure.
Performance displayed represents past performance which is no guarantee of future results.
Holdings Diversification (Market Exposure as % of Net Assets)
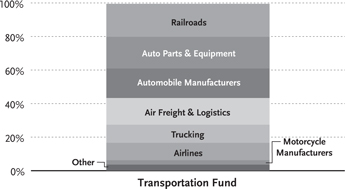
“Holdings Diversification (Market Exposure as % of Net Assets)” excludes any temporary cash investments.
| | | | |
Inception Dates: | |
Investor Class | | | April 2, 1998 | |
Advisor Class | | | June 9, 1998 | |
A-Class | | | September 1, 2004 | |
C-Class | | | May 14, 2001 | |
| | | | |
|
Ten Largest Holdings (% of Total Net Assets) | |
United Parcel Service, Inc. —
Class B | | | 6.8 | % |
Union Pacific Corp. | | | 5.4 | % |
Ford Motor Co. | | | 5.3 | % |
General Motors Co. | | | 4.9 | % |
FedEx Corp. | | | 4.1 | % |
CSX Corp. | | | 3.6 | % |
Johnson Controls, Inc. | | | 3.6 | % |
Norfolk Southern Corp. | | | 3.6 | % |
Harley-Davidson, Inc. | | | 2.6 | % |
CH Robinson Worldwide, Inc. | | | 2.6 | % |
| | | | |
Top Ten Total | | | 42.5 | % |
| | | | |
“Ten Largest Holdings” exclude any temporary cash or derivative investments.
| | | | |
| | | | | |
| 130 | | THE RYDEX FUNDSANNUALREPORT | | |
| | |
| PERFORMANCE REPORT AND FUND PROFILE (Unaudited) (concluded) | | March 31, 2012 |
Cumulative Fund Performance*
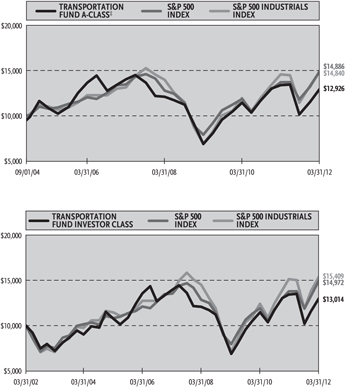
Average Annual Returns*
Periods Ended 03/31/12
| | | | | | | | | | | | |
| | | 1 Year | | | 5 Year | | | 10 Year | |
Investor Class Shares | | | -3.20 | % | | | -1.43 | % | | | 2.67 | % |
Advisor Class Shares | | | -3.66 | % | | | -1.88 | % | | | 2.24 | % |
C-Class Shares | | | -4.10 | % | | | -2.40 | % | | | 1.69 | % |
C-Class Shares with CDSC† | | | -5.06 | % | | | -2.40 | % | | | 1.69 | % |
S&P 500 Index | | | 8.54 | % | | | 2.01 | % | | | 4.12 | % |
S&P 500 Industrials Index | | | 1.75 | % | | | 2.46 | % | | | 4.42 | % |
| | | |
| | | 1 Year | | | 5 Year | | | Since
Inception
(09/01/04) | |
A-Class Shares | | | -3.48 | % | | | -1.64 | % | | | 4.11 | % |
A-Class Shares with sales charge‡ | | | -8.05 | % | | | -2.59 | % | | | 3.45 | % |
S&P 500 Index | | | 8.54 | % | | | 2.01 | % | | | 5.41 | % |
S&P 500 Industrials Index | | | 1.75 | % | | | 2.46 | % | | | 5.38 | % |
| * | The performance data above represents past performance that is not predictive of future results. The investment return and principal value of an investment in the Fund will fluctuate so that an investor’s shares, when redeemed, may be worth more or less than their original cost. Returns are historical and include changes in principal and reinvested dividends and capital gains and do not reflect the effect of taxes. The S&P 500 Index and the S&P 500 Industrials Index are unmanaged indices and, unlike the Fund, have no management fees or operating expenses to reduce their reported returns. The graphs are based on Investor Class shares and A-Class shares only; performance for Advisor Class shares and C-Class shares will vary due to differences in fee structures. |
| † | Fund returns include a CDSC of 1% if redeemed within 12 months of purchase. |
| ‡ | Fund returns are calculated using the maximum sales charge of 4.75%. |
| | | | |
| | | | | |
| | THE RYDEX FUNDSANNUALREPORT | | 131 |
| | |
| SCHEDULE OF INVESTMENTS | | March 31, 2012 |
| TRANSPORTATION FUND | | |
| | | | | | | | |
| | | SHARES | | | VALUE | |
COMMON STOCKS† - 99.5% | | | | | | | | |
Railroads - 19.7% | | | | | | | | |
Union Pacific Corp. | | | 7,445 | | | $ | 800,189 | |
CSX Corp. | | | 24,944 | | | | 536,795 | |
Norfolk Southern Corp. | | | 8,022 | | | | 528,088 | |
Kansas City Southern* | | | 4,457 | | | | 319,522 | |
Canadian National Railway Co. | | | 3,770 | | | | 299,451 | |
Canadian Pacific Railway Ltd. | | | 3,248 | | | | 246,686 | |
Genesee & Wyoming, Inc. — Class A* | | | 3,064 | | | | 167,233 | |
| | | | | | | | |
Total Railroads | | | | | | | 2,897,964 | |
| | | | | | | | |
Auto Parts & Equipment - 18.9% | | | | | | | | |
Johnson Controls, Inc. | | | 16,420 | | | | 533,321 | |
BorgWarner, Inc.* | | | 4,110 | | | | 346,637 | |
Autoliv, Inc. | | | 4,160 | | | | 278,928 | |
TRW Automotive Holdings Corp.* | | | 5,910 | | | | 274,520 | |
Magna International, Inc. | | | 5,290 | | | | 252,545 | |
Lear Corp. | | | 5,270 | | | | 245,002 | |
Gentex Corp. | | | 8,580 | | | | 210,210 | |
Visteon Corp.* | | | 3,495 | | | | 185,235 | |
Dana Holding Corp. | | | 10,910 | | | | 169,105 | |
Tenneco, Inc.* | | | 4,530 | | | | 168,290 | |
American Axle & Manufacturing Holdings, Inc.* | | | 9,160 | | | | 107,264 | |
| | | | | | | | |
Total Auto Parts & Equipment | | | | | | | 2,771,057 | |
| | | | | | | | |
Automobile
Manufacturers - 17.6% | | | | | | | | |
Ford Motor Co. | | | 62,710 | | | | 783,247 | |
General Motors Co.* | | | 28,330 | | | | 726,665 | |
Tata Motors Ltd. ADR | | | 9,640 | | | | 259,991 | |
Toyota Motor Corp. ADR | | | 2,840 | | | | 246,569 | |
Tesla Motors, Inc.* | | | 6,225 | | | | 231,819 | |
Honda Motor Company, Ltd. ADR | | | 5,290 | | | | 203,295 | |
Thor Industries, Inc. | | | 4,570 | | | | 144,229 | |
| | | | | | | | |
Total Automobile Manufacturers | | | | | | | 2,595,815 | |
| | | | | | | | |
Air Freight & Logistics - 15.9% | | | | | | | | |
United Parcel Service, Inc. — Class B | | | 12,411 | | | | 1,001,815 | |
FedEx Corp. | | | 6,560 | | | | 603,258 | |
CH Robinson Worldwide, Inc. | | | 5,739 | | | | 375,847 | |
Expeditors International of Washington, Inc. | | | 7,811 | | | | 363,290 | |
| | | | | | | | |
Total Air Freight & Logistics | | | | | | | 2,344,210 | |
| | | | | | | | |
Trucking - 10.8% | | | | | | | | |
J.B. Hunt Transport Services, Inc. | | | 5,322 | | | | 289,358 | |
Hertz Global Holdings, Inc.* | | | 18,879 | | | | 283,940 | |
Old Dominion Freight Line, Inc.* | | | 3,955 | | | | 188,535 | |
Landstar System, Inc. | | | 3,238 | | | | 186,897 | |
Ryder System, Inc. | | | 3,481 | | | | 183,797 | |
Dollar Thrifty Automotive Group, Inc.* | | | 2,120 | | | | 171,529 | |
Con-way, Inc. | | | 4,622 | | | | 150,723 | |
Swift Transportation Co. — Class A* | | | 12,020 | | | | 138,711 | |
| | | | | | | | |
Total Trucking | | | | | | | 1,593,490 | |
| | | | | | | | |
| * | Non-income producing security. |
| † | Value determined based on Level 1 inputs — See Note 4. |
| †† | Value determined based on Level 2 inputs — See Note 4. |
| 1 | Repurchase Agreement — See Note 5. |
ADR — American Depositary Receipt
| | | | | | | | |
| | | SHARES | | | VALUE | |
Airlines - 10.4% | | | | | | | | |
Delta Air Lines, Inc.* | | | 33,827 | | | $ | 335,225 | |
United Continental Holdings, Inc.* | | | 14,260 | | | | 306,590 | |
Southwest Airlines Co. | | | 34,428 | | | | 283,687 | |
Copa Holdings S.A. — Class A | | | 2,732 | | | | 216,374 | |
JetBlue Airways Corp.* | | | 26,510 | | | | 129,634 | |
Alaska Air Group, Inc.* | | | 3,594 | | | | 128,737 | |
US Airways Group, Inc.* | | | 16,274 | | | | 123,520 | |
| | | | | | | | |
Total Airlines | | | | | | | 1,523,767 | |
| | | | | | | | |
Motorcycle
Manufacturers - 2.6% | | | | | | | | |
Harley-Davidson, Inc. | | | 7,780 | | | | 381,842 | |
| | | | | | | | |
Marine - 1.5% | | | | | | | | |
Kirby Corp.* | | | 3,258 | | | | 214,344 | |
| | | | | | | | |
Tires & Rubber - 1.2% | | | | | | | | |
Goodyear Tire & Rubber Co.* | | | 16,210 | | | | 181,876 | |
| | | | | | | | |
Diversified Commercial & Professional Services - 0.9% | | | | | | | | |
Avis Budget Group, Inc.* | | | 9,774 | | | | 138,302 | |
| | | | | | | | |
Total Common Stocks
(Cost $11,415,335) | | | | | | | 14,642,667 | |
| | | | | | | | |
| | |
| | | FACE
AMOUNT | | | | |
REPURCHASE AGREEMENT††,1 - 0.6% | | | | | | | | |
Credit Suisse Group issued 03/30/12 at 0.01% due 04/02/12 | | $ | 83,006 | | | | 83,006 | |
| | | | | | | | |
Total Repurchase Agreement
(Cost $83,006) | | | | | | | 83,006 | |
| | | | | | | | |
Total Investments - 100.1%
(Cost $11,498,341) | | | | | | $ | 14,725,673 | |
| | | | | | | | |
Other Assets & Liabilities,
net - (0.1)% | | | | | | | (10,805 | ) |
| | | | | | | | |
Total Net Assets - 100.0% | | | | | | $ | 14,714,868 | |
| | | | |
| | | | | |
| 132 | | THE RYDEX FUNDSANNUALREPORT | | SEE NOTES TO FINANCIAL STATEMENTS. |
| | | | |
| STATEMENT OF ASSETS AND LIABILITIES | |
| March 31, 2012 | | | | |
| |
ASSETS: | | | | |
Investments, at value
(cost $11,415,335) | | $ | 14,642,667 | |
Repurchase agreements, at value
(cost $83,006) | | | 83,006 | |
| | | | |
Total investments
(cost $11,498,341) | | | 14,725,673 | |
Cash | | | 1,476 | |
Receivables: | | | | |
Fund shares sold | | | 393,497 | |
Securities sold | | | 197,879 | |
Dividends | | | 13,388 | |
| | | | |
Total assets | | | 15,331,913 | |
| | | | |
LIABILITIES: | | | | |
Payable for: | | | | |
Fund shares redeemed | | | 592,633 | |
Management fees | | | 10,602 | |
Distribution and service fees | | | 3,580 | |
Transfer agent and administrative fees | | | 3,118 | |
Portfolio accounting fees | | | 1,247 | |
Miscellaneous | | | 5,865 | |
| | | | |
Total liabilities | | | 617,045 | |
| | | | |
NET ASSETS | | $ | 14,714,868 | |
| | | | |
NET ASSETS CONSISTOF: | | | | |
Paid in capital | | $ | 36,663,030 | |
Accumulated net investment loss | | | (9,953 | ) |
Accumulated net realized loss on investments | | | (25,165,541 | ) |
Net unrealized appreciation on investments | | | 3,227,332 | |
| | | | |
Net assets | | $ | 14,714,868 | |
| | | | |
INVESTOR CLASS: | | | | |
Net assets | | $ | 8,030,811 | |
Capital shares outstanding | | | 297,885 | |
Net asset value per share | | $ | 26.96 | |
| | | | |
ADVISOR CLASS: | | | | |
Net assets | | $ | 2,354,881 | |
Capital shares outstanding | | | 95,096 | |
Net asset value per share | | $ | 24.76 | |
| | | | |
A-CLASS: | | | | |
Net assets | | $ | 1,600,059 | |
Capital shares outstanding | | | 63,378 | |
Net asset value per share | | $ | 25.25 | |
| | | | |
Maximum offering price per share
(Net asset value divided by 95.25%) | | $ | 26.51 | |
| | | | |
C-CLASS: | | | | |
Net assets | | $ | 2,729,117 | |
Capital shares outstanding | | | 112,115 | |
Net asset value per share | | $ | 24.34 | |
| | | | |
| | | | |
| STATEMENT OF OPERATIONS | |
| Year Ended March 31, 2012 | | | | |
| |
INVESTMENT INCOME: | | | | |
Dividends (net of foreign withholding
tax of $1,268) | | $ | 136,519 | |
Interest | | | 16 | |
| | | | |
Total investment income | | | 136,535 | |
| | | | |
EXPENSES: | | | | |
Management fees | | | 101,600 | |
Transfer agent and administrative fees | | | 29,882 | |
Distribution and service fees: | | | | |
Advisor Class | | | 7,088 | |
A-Class | | | 2,969 | |
C-Class | | | 17,146 | |
Portfolio accounting fees | | | 11,953 | |
Custodian fees | | | 3,396 | |
Trustees’ fees* | | | 1,248 | |
Miscellaneous | | | 13,497 | |
| | | | |
Total expenses | | | 188,779 | |
| | | | |
Net investment loss | | | (52,244 | ) |
| | | | |
NET REALIZEDAND UNREALIZED GAIN (LOSS): | | | | |
Net realized gain (loss) on: | | | | |
Investments | | | 701,658 | |
| | | | |
Net realized gain | | | 701,658 | |
| | | | |
Net change in unrealized appreciation (depreciation) on: | | | | |
Investments | | | (1,537,677 | ) |
| | | | |
Net change in unrealized appreciation (depreciation) | | | (1,537,677 | ) |
| | | | |
Net realized and unrealized loss | | | (836,019 | ) |
| | | | |
Net decrease in net assets resulting from operations | | $ | (888,263 | ) |
| | | | |
|
* Relates to Trustees not deemed “interested persons” within the meaning of Section 2(a)(19) of the 1940 Act. |
| | | | |
| | | | | |
| SEE NOTES TO FINANCIAL STATEMENTS. | | THE RYDEX FUNDSANNUALREPORT | | 133 |
STATEMENTS OF CHANGES IN NET ASSETS
| | | | | | | | |
| | | Year Ended
March 31,
2012 | | | Year Ended
March 31,
2011 | |
INCREASE (DECREASE) IN NET ASSETS FROM OPERATIONS: | | | | | | | | |
Net investment loss | | $ | (52,244 | ) | | $ | (42,640 | ) |
Net realized gain (loss) on investments | | | 701,658 | | | | (7,140,358 | ) |
Net change in unrealized appreciation (depreciation) on investments | | | (1,537,677 | ) | | | (334,950 | ) |
| | | | | | | | |
Net decrease in net assets resulting from operations | | | (888,263 | ) | | | (7,517,948 | ) |
| | | | | | | | |
CAPITAL SHARE TRANSACTIONS: | | | | | | | | |
Proceeds from sale of shares | | | | | | | | |
Investor Class | | | 146,001,078 | | | | 228,555,205 | |
Advisor Class | | | 11,497,718 | | | | 27,043,322 | |
A-Class | | | 2,345,386 | | | | 7,772,436 | |
C-Class | | | 53,815,378 | | | | 76,303,386 | |
Cost of shares redeemed | | | | | | | | |
Investor Class | | | (143,034,415 | ) | | | (238,376,331 | ) |
Advisor Class | | | (11,458,698 | ) | | | (26,790,951 | ) |
A-Class | | | (1,836,804 | ) | | | (8,264,038 | ) |
C-Class | | | (53,256,215 | ) | | | (77,498,784 | ) |
| | | | | | | | |
Net increase (decrease) from capital share transactions | | | 4,073,428 | | | | (11,255,755 | ) |
| | | | | | | | |
Net increase (decrease) in net assets | | | 3,185,165 | | | | (18,773,703 | ) |
| | |
NET ASSETS: | | | | | | | | |
Beginning of year | | | 11,529,703 | | | | 30,303,406 | |
| | | | | | | | |
End of year | | $ | 14,714,868 | | | $ | 11,529,703 | |
| | | | | | | | |
Accumulated net investment loss at end of year | | $ | (9,953 | ) | | $ | — | |
| | | | | | | | |
CAPITAL SHARE ACTIVITY: | | | | | | | | |
Shares sold | | | | | | | | |
Investor Class | | | 5,515,828 | | | | 9,276,996 | |
Advisor Class | | | 478,798 | | | | 1,198,656 | |
A-Class | | | 91,969 | | | | 337,827 | |
C-Class | | | 2,280,986 | | | | 3,303,513 | |
Shares redeemed | | | | | | | | |
Investor Class | | | (5,408,959 | ) | | | (10,023,188 | ) |
Advisor Class | | | (496,602 | ) | | | (1,212,479 | ) |
A-Class | | | (75,967 | ) | | | (372,787 | ) |
C-Class | | | (2,250,403 | ) | | | (3,376,280 | ) |
| | | | | | | | |
Net increase (decrease) in shares | | | 135,650 | | | | (867,742 | ) |
| | | | | | | | |
| | | | |
| | | | | |
| 134 | | THE RYDEX FUNDSANNUALREPORT | | SEE NOTES TO FINANCIAL STATEMENTS. |
FINANCIAL HIGHLIGHTS
This table is presented to show selected data for a share outstanding throughout each period and to assist shareholders in evaluating a Fund’s performance for the periods presented.
| | | | | | | | | | | | | | | | | | | | |
Investor Class | | Year Ended
March 31,
2012 | | | Year Ended
March 31,
2011 | | | Year Ended
March 31,
2010 | | | Year Ended
March 31,
2009 | | | Year Ended
March 31,
2008 | |
Per Share Data | | | | | | | | | | | | | | | | | | | | |
Net asset value, beginning of period | | $ | 27.85 | | | $ | 23.79 | | | $ | 14.38 | | | $ | 25.21 | | | $ | 29.16 | |
| | | | | | | | | | | | | | | | | | | | |
Income (loss) from investment operations: | | | | | | | | | | | | | | | | | | | | |
Net investment income (loss)a | | | (.06 | ) | | | — | b | | | (.15 | ) | | | .07 | | | | .06 | |
Net gain (loss) on investments (realized and unrealized) | | | (.83 | ) | | | 4.06 | | | | 9.70 | | | | (10.90 | ) | | | (4.01 | ) |
| | | | | | | | | | | | | | | | | | | | |
Total from investment operations | | | (.89 | ) | | | 4.06 | | | | 9.55 | | | | (10.83 | ) | | | (3.95 | ) |
| | | | | | | | | | | | | | | | | | | | |
Less distributions from: | | | | | | | | | | | | | | | | | | | | |
Net investment income | | | — | | | | — | | | | (.14 | ) | | | — | | | | — | |
| | | | | | | | | | | | | | | | | | | | |
Total distributions | | | — | | | | — | | | | (.14 | ) | | | — | | | | — | |
| | | | | | | | | | | | | | | | | | | | |
Net asset value, end of period | | $ | 26.96 | | | $ | 27.85 | | | $ | 23.79 | | | $ | 14.38 | | | $ | 25.21 | |
| | | | | | | | | | | | | | | | | | | | |
Total Returnc | | | (3.20 | %) | | | 17.07 | % | | | 66.51 | % | | | (42.96 | %) | | | (13.55 | %) |
| | | | | | | | | | | | | | | | | | | | |
Ratios/Supplemental Data | | | | | | | | | | | | | | | | | | | | |
Net assets, end of period (in thousands) | | $ | 8,031 | | | $ | 5,320 | | | $ | 22,292 | | | $ | 20,990 | | | $ | 17,420 | |
| | | | | | | | | | | | | | | | | | | | |
Ratios to average net assets: | | | | | | | | | | | | | | | | | | | | |
Net investment income (loss) | | | (0.22 | %) | | | 0.02 | % | | | (0.68 | %) | | | 0.33 | % | | | 0.22 | % |
Total expenses | | | 1.35 | % | | | 1.38 | % | | | 1.37 | % | | | 1.38 | % | | | 1.36 | % |
| | | | | | | | | | | | | | | | | | | | |
Portfolio turnover rate | | | 1,082 | % | | | 1,217 | % | | | 1,073 | % | | | 875 | % | | | 952 | % |
| | | | | |
Advisor Class | | Year Ended
March 31,
2012 | | | Year Ended
March 31,
2011 | | | Year Ended
March 31,
2010 | | | Year Ended
March 31,
2009 | | | Year Ended
March 31,
2008 | |
Per Share Data | | | | | | | | | | | | | | | | | | | | |
Net asset value, beginning of period | | $ | 25.70 | | | $ | 22.05 | | | $ | 13.40 | | | $ | 23.59 | | | $ | 27.42 | |
| | | | | | | | | | | | | | | | | | | | |
Income (loss) from investment operations: | | | | | | | | | | | | | | | | | | | | |
Net investment income (loss)a | | | (.14 | ) | | | (.17 | ) | | | (.18 | ) | | | .10 | | | | (.01 | ) |
Net gain (loss) on investments (realized and unrealized) | | | (.80 | ) | | | 3.82 | | | | 8.97 | | | | (10.29 | ) | | | (3.82 | ) |
| | | | | | | | | | | | | | | | | | | | |
Total from investment operations | | | (.94 | ) | | | 3.65 | | | | 8.79 | | | | (10.19 | ) | | | (3.83 | ) |
| | | | | | | | | | | | | | | | | | | | |
Less distributions from: | | | | | | | | | | | | | | | | | | | | |
Net investment income | | | — | | | | — | | | | (.14 | ) | | | — | | | | — | |
| | | | | | | | | | | | | | | | | | | | |
Total distributions | | | — | | | | — | | | | (.14 | ) | | | — | | | | — | |
| | | | | | | | | | | | | | | | | | | | |
Net asset value, end of period | | $ | 24.76 | | | $ | 25.70 | | | $ | 22.05 | | | $ | 13.40 | | | $ | 23.59 | |
| | | | | | | | | | | | | | | | | | | | |
Total Returnc | | | (3.66 | %) | | | 16.55 | % | | | 65.70 | % | | | (43.20 | %) | | | (13.97 | %) |
| | | | | | | | | | | | | | | | | | | | |
Ratios/Supplemental Data | | | | | | | | | | | | | | | | | | | | |
Net assets, end of period (in thousands) | | $ | 2,355 | | | $ | 2,902 | | | $ | 2,795 | | | $ | 1,139 | | | $ | 5,152 | |
| | | | | | | | | | | | | | | | | | | | |
Ratios to average net assets: | | | | | | | | | | | | | | | | | | | | |
Net investment income (loss) | | | (0.55 | %) | | | (0.74 | %) | | | (0.95 | %) | | | 0.51 | % | | | (0.05 | %) |
Total expenses | | | 1.86 | % | | | 1.89 | % | | | 1.88 | % | | | 1.90 | % | | | 1.87 | % |
| | | | | | | | | | | | | | | | | | | | |
Portfolio turnover rate | | | 1,082 | % | | | 1,217 | % | | | 1,073 | % | | | 875 | % | | | 952 | % |
| | | | |
| | | | | |
| SEE NOTES TO FINANCIAL STATEMENTS. | | THE RYDEX FUNDSANNUALREPORT | | 135 |
FINANCIAL HIGHLIGHTS (concluded)
This table is presented to show selected data for a share outstanding throughout each period and to assist shareholders in evaluating a Fund’s performance for the periods presented.
| | | | | | | | | | | | | | | | | | | | |
A-Class | | Year Ended
March 31,
2012 | | | Year Ended
March 31,
2011 | | | Year Ended
March 31,
2010 | | | Year Ended
March 31,
2009 | | | Year Ended
March 31,
2008 | |
Per Share Data | | | | | | | | | | | | | | | | | | | | |
Net asset value, beginning of period | | $ | 26.15 | | | $ | 22.37 | | | $ | 13.55 | | | $ | 23.81 | | | $ | 27.60 | |
| | | | | | | | | | | | | | | | | | | | |
Income (loss) from investment operations: | | | | | | | | | | | | | | | | | | | | |
Net investment income (loss)a | | | (.12 | ) | | | (.10 | ) | | | (.04 | ) | | | .08 | | | | — | b |
Net gain (loss) on investments (realized and unrealized) | | | (.78 | ) | | | 3.88 | | | | 9.00 | | | | (10.34 | ) | | | (3.79 | ) |
| | | | | | | | | | | | | | | | | | | | |
Total from investment operations | | | (.90 | ) | | | 3.78 | | | | 8.96 | | | | (10.26 | ) | | | (3.79 | ) |
| | | | | | | | | | | | | | | | | | | | |
Less distributions from: | | | | | | | | | | | | | | | | | | | | |
Net investment income | | | — | | | | — | | | | (.14 | ) | | | — | | | | — | |
| | | | | | | | | | | | | | | | | | | | |
Total distributions | | | — | | | | — | | | | (.14 | ) | | | — | | | | — | |
| | | | | | | | | | | | | | | | | | | | |
Net asset value, end of period | | $ | 25.25 | | | $ | 26.15 | | | $ | 22.37 | | | $ | 13.55 | | | $ | 23.81 | |
| | | | | | | | | | | | | | | | | | | | |
Total Returnc | | | (3.48 | %) | | | 16.90 | % | | | 66.22 | % | | | (43.09 | %) | | | (13.73 | %) |
| | | | | | | | | | | | | | | | | | | | |
Ratios/Supplemental Data | | | | | | | | | | | | | | | | | | | | |
Net assets, end of period (in thousands) | | $ | 1,600 | | | $ | 1,239 | | | $ | 1,842 | | | $ | 561 | | | $ | 228 | |
| | | | | | | | | | | | | | | | | | | | |
Ratios to average net assets: | | | | | | | | | | | | | | | | | | | | |
Net investment income (loss) | | | (0.51 | %) | | | (0.42 | %) | | | (0.22 | %) | | | 0.43 | % | | | — | % |
Total expenses | | | 1.61 | % | | | 1.64 | % | | | 1.62 | % | | | 1.67 | % | | | 1.62 | % |
| | | | | | | | | | | | | | | | | | | | |
Portfolio turnover rate | | | 1,082 | % | | | 1,217 | % | | | 1,073 | % | | | 875 | % | | | 952 | % |
| | | | | |
C-Class | | Year Ended
March 31,
2012 | | | Year Ended
March 31,
2011 | | | Year Ended
March 31,
2010 | | | Year Ended
March 31,
2009 | | | Year Ended
March 31,
2008 | |
Per Share Data | | | | | | | | | | | | | | | | | | | | |
Net asset value, beginning of period | | $ | 25.38 | | | $ | 21.87 | | | $ | 13.40 | | | $ | 23.70 | | | $ | 27.68 | |
| | | | | | | | | | | | | | | | | | | | |
Income (loss) from investment operations: | | | | | | | | | | | | | | | | | | | | |
Net investment lossa | | | (.29 | ) | | | (.24 | ) | | | (.24 | ) | | | (.16 | ) | | | (.20 | ) |
Net gain (loss) on investments (realized and unrealized) | | | (.75 | ) | | | 3.75 | | | | 8.85 | | | | (10.14 | ) | | | (3.78 | ) |
| | | | | | | | | | | | | | | | | | | | |
Total from investment operations | | | (1.04 | ) | | | 3.51 | | | | 8.61 | | | | (10.30 | ) | | | (3.98 | ) |
| | | | | | | | | | | | | | | | | | | | |
Less distributions from: | | | | | | | | | | | | | | | | | | | | |
Net investment income | | | — | | | | — | | | | (.14 | ) | | | — | | | | — | |
| | | | | | | | | | | | | | | | | | | | |
Total distributions | | | — | | | | — | | | | (.14 | ) | | | — | | | | — | |
| | | | | | | | | | | | | | | | | | | | |
Net asset value, end of period | | $ | 24.34 | | | $ | 25.38 | | | $ | 21.87 | | | $ | 13.40 | | | $ | 23.70 | |
| | | | | | | | | | | | | | | | | | | | |
Total Returnc | | | (4.10 | %) | | | 16.05 | % | | | 64.35 | % | | | (43.46 | %) | | | (14.38 | %) |
| | | | | | | | | | | | | | | | | | | | |
Ratios/Supplemental Data | | | | | | | | | | | | | | | | | | | | |
Net assets, end of period (in thousands) | | $ | 2,729 | | | $ | 2,069 | | | $ | 3,375 | | | $ | 2,186 | | | $ | 845 | |
| | | | | | | | | | | | | | | | | | | | |
Ratios to average net assets: | | | | | | | | | | | | | | | | | | | | |
Net investment loss | | | (1.24 | %) | | | (1.04 | %) | | | (1.31 | %) | | | (0.79 | %) | | | (0.73 | %) |
Total expenses | | | 2.35 | % | | | 2.39 | % | | | 2.38 | % | | | 2.40 | % | | | 2.38 | % |
| | | | | | | | | | | | | | | | | | | | |
Portfolio turnover rate | | | 1,082 | % | | | 1,217 | % | | | 1,073 | % | | | 875 | % | | | 952 | % |
| a | Net investment income (loss) per share was computed using average shares outstanding throughout the period. |
| b | Net investment income is less than $0.01 per share. |
| c | Total return does not reflect the impact of any applicable sales charges and has not been annualized. |
| | | | |
| | | | | |
| 136 | | THE RYDEX FUNDSANNUALREPORT | | SEE NOTES TO FINANCIAL STATEMENTS. |
This page intentionally left blank.
| | | | |
| | | | | |
| | THE RYDEX FUNDSANNUALREPORT | | 137 |
| | |
| PERFORMANCE REPORT AND FUND PROFILE (Unaudited) | | March 31, 2012 |
| | | |
UTILITIES FUND
OBJECTIVE: Seeks to provide capital appreciation by investing in companies that operate public utilities (“Utilities Companies”).
Utilities outperformed the broad market during the 12 months, as investors flocked to this more defensive, low-beta sector during the economic uncertainty of 2011. But as markets rebounded in the first quarter of 2012, this sector languished, given its record valuations. The sector continues to benefit from low natural gas and coal prices and low long-term bond yields.
For the one-year period ended March 31, 2012, Utilities Fund Investor Class returned 9.44%, compared with 14.82% for the S&P 500® Utilities Index*.
Within the sector, electric utilities, 45% of the portfolio weight, provided the largest contribution to performance. The multi-utilities segment, a third of the portfolio weight, was next. Lightly weighted industries, including independent power producers and oil gas & consumable fuels, detracted from performance for the period.
Southern Co., FirstEnergy Corp. and Duke Energy Corp. were among the Fund’s best-performing stocks over the one-year period, while National Fuel Gas Co., NRG Energy, Inc. and Energen Corp. were among the weakest performers.
*S&P 500® Utilities Index is a sub-index of the S&P 500® Index, a capitalization-weighted index covering 500 industrial, utility, transportation and financial companies of the U.S. markets (mostly NYSE Euronext issues). The Utilities index encompasses those companies considered electric, gas or water utilities, or companies that operate as independent producers and/or distributors of power.
Performance displayed represents past performance which is no guarantee of future results.
Holdings Diversification (Market Exposure
as % of Net Assets)
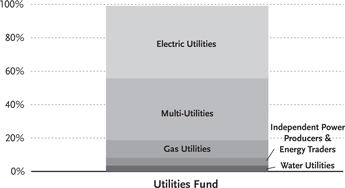
“Holdings Diversification (Market Exposure as % of Net Assets)” excludes any temporary cash investments.
| | | | |
Inception Dates: | |
Investor Class | | | April 3, 2000 | |
Advisor Class | | | April 3, 2000 | |
A-Class | | | September 1, 2004 | |
C-Class | | | April 27, 2001 | |
| | | | |
Ten Largest Holdings (% of Total Net Assets) | |
Southern Co. | | | 3.7 | % |
Exelon Corp. | | | 3.4 | % |
Dominion Resources, Inc. | | | 3.2 | % |
Duke Energy Corp. | | | 3.1 | % |
NextEra Energy, Inc. | | | 3.0 | % |
FirstEnergy Corp. | | | 2.6 | % |
American Electric Power Company, Inc. | | | 2.5 | % |
PG&E Corp. | | | 2.5 | % |
Consolidated Edison, Inc. | | | 2.4 | % |
PPL Corp. | | | 2.4 | % |
| | | | |
Top Ten Total | | | 28.8 | % |
| | | | |
“Ten Largest Holdings” exclude any temporary cash or derivative investments.
| | | | |
| | | | | |
| 138 | | THE RYDEX FUNDSANNUALREPORT | | |
| | |
| PERFORMANCE REPORT AND FUND PROFILE (Unaudited) (concluded) | | March 31, 2012 |
| | | |
Cumulative Fund Performance*
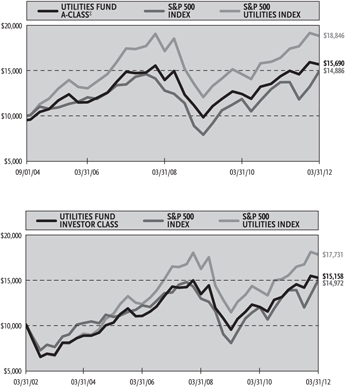
Average Annual Returns*
Periods Ended 03/31/12
| | | | | | | | | | | | |
| | | 1 Year | | | 5 Year | | | 10 Year | |
Investor Class Shares | | | 9.44 | % | | | 1.32 | % | | | 4.25 | % |
Advisor Class Shares | | | 8.90 | % | | | 0.83 | % | | | 3.70 | % |
C-Class Shares | | | 8.28 | % | | | 0.30 | % | | | 3.18 | % |
C-Class Shares with CDSC† | | | 7.28 | % | | | 0.30 | % | | | 3.18 | % |
S&P 500 Index | | | 8.54 | % | | | 2.01 | % | | | 4.12 | % |
S&P 500 Utilities Index | | | 14.82 | % | | | 1.55 | % | | | 5.89 | % |
| | | |
| | | 1 Year | | | 5 Year | | | Since
Inception
(09/01/04) | |
A-Class Shares | | | 9.16 | % | | | 1.08 | % | | | 6.81 | % |
A-Class Shares with sales charge‡ | | | 3.99 | % | | | 0.10 | % | | | 6.12 | % |
S&P 500 Index | | | 8.54 | % | | | 2.01 | % | | | 5.41 | % |
S&P 500 Utilities Index | | | 14.82 | % | | | 1.55 | % | | | 8.74 | % |
| * | The performance data above represents past performance that is not predictive of future results. The investment return and principal value of an investment in the Fund will fluctuate so that an investor’s shares, when redeemed, may be worth more or less than their original cost. Returns are historical and include changes in principal and reinvested dividends and capital gains and do not reflect the effect of taxes. The S&P 500 Index and the S&P 500 Utilities Index are unmanaged indices and, unlike the Fund, have no management fees or operating expenses to reduce their reported returns. The graphs are based on Investor Class shares and A-Class shares only; performance for Advisor Class shares and C-Class shares will vary due to differences in fee structures. |
| † | Fund returns include a CDSC of 1% if redeemed within 12 months of purchase. |
| ‡ | Fund returns are calculated using the maximum sales charge of 4.75%. |
| | | | |
| | | | | |
| | THE RYDEX FUNDSANNUALREPORT | | 139 |
| | |
| SCHEDULE OF INVESTMENTS | | March 31, 2012 |
| | | |
UTILITIES FUND
| | | | | | | | |
| | | SHARES | | | VALUE | |
COMMON STOCKS† - 99.1% | | | | | | | | |
Electric Utilities - 43.4% | | | | | | | | |
Southern Co. | | | 49,623 | | | $ | 2,229,560 | |
Exelon Corp. | | | 52,398 | | | | 2,054,525 | |
Duke Energy Corp. | | | 89,455 | | | | 1,879,450 | |
NextEra Energy, Inc. | | | 29,497 | | | | 1,801,677 | |
FirstEnergy Corp. | | | 34,343 | | | | 1,565,697 | |
American Electric Power Company, Inc. | | | 39,622 | | | | 1,528,617 | |
PPL Corp. | | | 51,184 | | | | 1,446,460 | |
Progress Energy, Inc. | | | 26,507 | | | | 1,407,787 | |
Edison International | | | 31,070 | | | | 1,320,786 | |
Entergy Corp. | | | 18,139 | | | | 1,218,941 | |
Northeast Utilities | | | 24,603 | | | | 913,263 | |
Pinnacle West Capital Corp. | | | 17,059 | | | | 817,126 | |
Cia Energetica de Minas Gerais ADR | | | 33,619 | | | | 799,460 | |
Pepco Holdings, Inc. | | | 38,818 | | | | 733,272 | |
ITC Holdings Corp. | | | 9,093 | | | | 699,615 | |
N.V. Energy, Inc. | | | 43,286 | | | | 697,770 | |
Westar Energy, Inc. | | | 24,001 | | | | 670,348 | |
Great Plains Energy, Inc. | | | 29,114 | | | | 590,141 | |
Cleco Corp. | | | 13,974 | | | | 554,069 | |
Hawaiian Electric Industries, Inc. | | | 21,782 | | | | 552,174 | |
IDACORP, Inc. | | | 12,423 | | | | 510,834 | |
Portland General Electric Co. | | | 19,472 | | | | 486,411 | |
UIL Holdings Corp. | | | 13,470 | | | | 468,217 | |
PNM Resources, Inc. | | | 23,516 | | | | 430,343 | |
Unisource Energy Corp. | | | 11,489 | | | | 420,153 | |
El Paso Electric Co. | | | 12,537 | | | | 407,327 | |
| | | | | | | | |
Total Electric Utilities | | | | | | | 26,204,023 | |
| | | | | | | | |
Multi-Utilities -37.0% | | | | | | | | |
Dominion Resources, Inc. | | | 37,564 | | | | 1,923,652 | |
PG&E Corp. | | | 34,601 | | | | 1,502,029 | |
Consolidated Edison, Inc. | | | 25,220 | | | | 1,473,352 | |
Public Service Enterprise Group, Inc. | | | 46,075 | | | | 1,410,356 | |
Sempra Energy | | | 22,636 | | | | 1,357,255 | |
Xcel Energy, Inc. | | | 48,072 | | | | 1,272,466 | |
DTE Energy Co. | | | 19,699 | | | | 1,084,036 | |
CenterPoint Energy, Inc. | | | 52,757 | | | | 1,040,368 | |
Wisconsin Energy Corp. | | | 28,955 | | | | 1,018,637 | |
Ameren Corp. | | | 31,004 | | | | 1,010,110 | |
NiSource, Inc. | | | 38,850 | | | | 945,998 | |
SCANA Corp. | | | 19,161 | | | | 873,933 | |
CMS Energy Corp. | | | 38,564 | | | | 848,408 | |
OGE Energy Corp. | | | 15,241 | | | | 815,394 | |
NSTAR | | | 16,458 | | | | 800,353 | |
Alliant Energy Corp. | | | 18,041 | | | | 781,536 | |
MDU Resources Group, Inc. | | | 32,718 | | | | 732,556 | |
Integrys Energy Group, Inc. | | | 13,557 | | | | 718,385 | |
TECO Energy, Inc. | | | 39,209 | | | | 688,118 | |
National Grid plc ADR | | | 12,500 | | | | 631,000 | |
| | | | | | | | |
| | | SHARES | | | VALUE | |
Vectren Corp. | | | 18,922 | | | $ | 549,873 | |
Avista Corp. | | | 17,138 | | | | 438,390 | |
Black Hills Corp. | | | 12,879 | | | | 431,833 | |
| | | | | | | | |
Total Multi-Utilities | | | | | | | 22,348,038 | |
| | | | | | | | |
Gas Utilities - 10.6% | | | | | | | | |
ONEOK, Inc. | | | 12,543 | | | | 1,024,262 | |
AGL Resources, Inc. | | | 19,405 | | | | 761,064 | |
National Fuel Gas Co. | | | 14,520 | | | | 698,702 | |
Questar Corp. | | | 33,762 | | | | 650,256 | |
UGI Corp. | | | 22,652 | | | | 617,267 | |
Atmos Energy Corp. | | | 19,168 | | | | 603,025 | |
Piedmont Natural Gas Company, Inc. | | | 16,945 | | | | 526,481 | |
WGL Holdings, Inc. | | | 12,623 | | | | 513,756 | |
Southwest Gas Corp. | | | 11,625 | | | | 496,853 | |
New Jersey Resources Corp. | | | 10,850 | | | | 483,585 | |
| | | | | | | | |
Total Gas Utilities | | | | | | | 6,375,251 | |
| | | | | | | | |
Independent Power Producers & Energy Traders - 4.6% | | | | | | | | |
AES Corp.* | | | 85,138 | | | | 1,112,754 | |
Calpine Corp.* | | | 58,991 | | | | 1,015,235 | |
NRG Energy, Inc.* | | | 41,355 | | | | 648,033 | |
| | | | | | | | |
Total Independent Power Producers & Energy Traders | | | | 2,776,022 | |
| | | | | | | | |
Water Utilities - 3.5% | | | | | | | | |
American Water Works Company, Inc. | | | 25,665 | | | | 873,380 | |
Cia de Saneamento Basico do Estado de Sao Paulo ADR | | | 8,210 | | | | 629,050 | |
Aqua America, Inc. | | | 28,172 | | | | 627,954 | |
| | | | | | | | |
Total Water Utilities | | | | | | | 2,130,384 | |
| | | | | | | | |
Total Common Stocks (Cost $50,169,239) | | | | | | | 59,833,718 | |
| | | | | | | | |
| | |
| | | FACE
AMOUNT | | | | |
REPURCHASE AGREEMENT††,1 - 0.2% | |
Credit Suisse Group issued 03/30/12 at 0.01% due 04/02/12 | | $ | 147,326 | | | | 147,326 | |
| | | | | | | | |
Total Repurchase Agreement (Cost $147,326) | | | | | | | 147,326 | |
| | | | | | | | |
Total Investments - 99.3% (Cost $50,316,565) | | | | | | $ | 59,981,044 | |
| | | | | | | | |
Other Assets & Liabilities, net - 0.7% | | | | | | | 395,845 | |
| | | | | | | | |
Total Net Assets - 100.0% | | | | | | $ | 60,376,889 | |
| * | Non-income producing security. |
| † | Value determined based on Level 1 inputs — See Note 4. |
| †† | Value determined based on Level 2 inputs — See Note 4. |
| 1 | Repurchase Agreement — See Note 5. |
| | ADR — American Depositary Receipt |
| | plc — Public Limited Company |
| | | | |
| | | | | |
| 140 | | THE RYDEX FUNDSANNUALREPORT | | SEE NOTES TO FINANCIAL STATEMENTS. |
STATEMENT OF ASSETS AND LIABILITIES
March 31, 2012
| | | | |
ASSETS: | | | | |
Investments, at value
(cost $50,169,239) | | $ | 59,833,718 | |
Repurchase agreements, at value
(cost $147,326) | | | 147,326 | |
| | | | |
Total investments
(cost $50,316,565) | | | 59,981,044 | |
Receivables: | | | | |
Fund shares sold | | | 1,089,793 | |
Dividends | | | 147,845 | |
| | | | |
Total assets | | | 61,218,682 | |
| | | | |
LIABILITIES: | | | | |
Payable for: | | | | |
Fund shares redeemed | | | 752,059 | |
Management fees | | | 37,996 | |
Distribution and service fees | | | 11,342 | |
Transfer agent and administrative fees | | | 11,175 | |
Portfolio accounting fees | | | 4,470 | |
Miscellaneous | | | 24,751 | |
| | | | |
Total liabilities | | | 841,793 | |
| | | | |
NET ASSETS | | $ | 60,376,889 | |
| | | | |
NET ASSETS CONSISTOF: | | | | |
Paid in capital | | $ | 63,345,227 | |
Undistributed net investment income | | | 542,275 | |
Accumulated net realized loss on investments | | | (13,175,092 | ) |
Net unrealized appreciation on investments | | | 9,664,479 | |
| | | | |
Net assets | | $ | 60,376,889 | |
| | | | |
INVESTOR CLASS: | | | | |
Net assets | | $ | 37,468,843 | |
Capital shares outstanding | | | 1,286,118 | |
Net asset value per share | | $ | 29.13 | |
| | | | |
ADVISOR CLASS: | | | | |
Net assets | | $ | 8,035,603 | |
Capital shares outstanding | | | 296,571 | |
Net asset value per share | | $ | 27.10 | |
| | | | |
A-CLASS: | | | | |
Net assets | | $ | 7,911,678 | |
Capital shares outstanding | | | 285,691 | |
Net asset value per share | | $ | 27.69 | |
| | | | |
Maximum offering price per share
(Net asset value divided by 95.25%) | | $ | 29.07 | |
| | | | |
C-CLASS: | | | | |
Net assets | | $ | 6,960,765 | |
Capital shares outstanding | | | 275,008 | |
Net asset value per share | | $ | 25.31 | |
| | | | |
STATEMENT OF OPERATIONS
Year Ended March 31, 2012
| | | | |
INVESTMENT INCOME: | | | | |
Dividends (net of foreign withholding tax of $2,110) | | $ | 2,094,251 | |
Interest | | | 40 | |
| | | | |
Total investment income | | | 2,094,291 | |
| | | | |
EXPENSES: | | | | |
Management fees | | | 448,770 | |
Transfer agent and administrative fees | | | 131,991 | |
Distribution and service fees: | | | | |
Advisor Class | | | 35,099 | |
A-Class | | | 22,356 | |
C-Class | | | 60,159 | |
Portfolio accounting fees | | | 52,796 | |
Custodian fees | | | 14,565 | |
Trustees’ fees* | | | 3,021 | |
Tax expense | | | 5,686 | |
Miscellaneous | | | 53,206 | |
| | | | |
Total expenses | | | 827,649 | |
| | | | |
Net investment income | | | 1,266,642 | |
| | | | |
NET REALIZEDAND UNREALIZED GAIN (LOSS): | | | | |
Net realized gain (loss) on: | | | | |
Investments | | | (3,259,840 | ) |
| | | | |
Net realized loss | | | (3,259,840 | ) |
| | | | |
Net change in unrealized appreciation (depreciation) on: | | | | |
Investments | | | 3,867,455 | |
| | | | |
Net change in unrealized appreciation (depreciation) | | | 3,867,455 | |
| | | | |
Net realized and unrealized gain | | | 607,615 | |
| | | | |
Net increase in net assets resulting from operations | | $ | 1,874,257 | |
| | | | |
| * | Relates to Trustees not deemed “interested persons” within the meaning of Section 2(a)(19) of the 1940 Act. |
| | | | |
| | | | | |
| SEE NOTES TO FINANCIAL STATEMENTS. | | THE RYDEX FUNDSANNUALREPORT | | 141 |
STATEMENTS OF CHANGES IN NET ASSETS
| | | | | | | | |
| | | Year Ended
March 31,
2012 | | | Year Ended
March 31,
2011 | |
INCREASE (DECREASE) IN NET ASSETS FROM OPERATIONS: | | | | | | | | |
Net investment income | | $ | 1,266,642 | | | $ | 1,391,199 | |
Net realized gain (loss) on investments | | | (3,259,840 | ) | | | 373,049 | |
Net change in unrealized appreciation (depreciation) on investments | | | 3,867,455 | | | | 1,578,780 | |
| | | | | | | | |
Net increase in net assets resulting from operations | | | 1,874,257 | | | | 3,343,028 | |
| | | | | | | | |
DISTRIBUTIONSTO SHAREHOLDERS FROM: | | | | | | | | |
Net investment income | | | | | | | | |
Investor Class | | | (570,365 | ) | | | (705,132 | ) |
Advisor Class | | | (54,402 | ) | | | (226,210 | ) |
A-Class | | | (183,282 | ) | | | (134,548 | ) |
C-Class | | | (110,178 | ) | | | (413,324 | ) |
| | | | | | | | |
Total distributions to shareholders | | | (918,227 | ) | | | (1,479,214 | ) |
| | | | | | | | |
CAPITAL SHARE TRANSACTIONS: | | | | | | | | |
Proceeds from sale of shares | | | | | | | | |
Investor Class | | | 338,234,668 | | | | 323,523,204 | |
Advisor Class | | | 87,974,041 | | | | 51,448,065 | |
A-Class | | | 24,133,839 | | | | 11,412,994 | |
C-Class | | | 76,501,438 | | | | 119,886,227 | |
Distributions reinvested | | | | | | | | |
Investor Class | | | 471,912 | | | | 681,476 | |
Advisor Class | | | 45,467 | | | | 219,223 | |
A-Class | | | 174,040 | | | | 94,343 | |
C-Class | | | 103,815 | | | | 371,617 | |
Cost of shares redeemed | | | | | | | | |
Investor Class | | | (310,540,659 | ) | | | (325,638,244 | ) |
Advisor Class | | | (81,379,607 | ) | | | (51,854,302 | ) |
A-Class | | | (20,137,942 | ) | | | (10,071,727 | ) |
C-Class | | | (74,769,209 | ) | | | (123,450,180 | ) |
| | | | | | | | |
Net increase (decrease) from capital share transactions | | | 40,811,803 | | | | (3,377,304 | ) |
| | | | | | | | |
Net increase (decrease) in net assets | | | 41,767,833 | | | | (1,513,490 | ) |
NET ASSETS: | | | | | | | | |
Beginning of year | | | 18,609,056 | | | | 20,122,546 | |
| | | | | | | | |
End of year | | $ | 60,376,889 | | | $ | 18,609,056 | |
| | | | | | | | |
Undistributed net investment income at end of year | | $ | 542,275 | | | $ | 188,174 | |
| | | | | | | | |
CAPITAL SHARE ACTIVITY: | | | | | | | | |
Shares sold | | | | | | | | |
Investor Class | | | 12,034,044 | | | | 12,458,666 | |
Advisor Class | | | 3,319,631 | | | | 2,121,840 | |
A-Class | | | 900,431 | | | | 468,693 | |
C-Class | | | 3,120,067 | | | | 5,265,040 | |
Shares issued from reinvestment of distributions | | | | | | | | |
Investor Class | | | 17,123 | | | | 27,270 | |
Advisor Class | | | 1,771 | | | | 9,364 | |
A-Class | | | 6,638 | | | | 3,956 | |
C-Class | | | 4,322 | | | | 16,853 | |
Shares redeemed | | | | | | | | |
Investor Class | | | (11,110,513 | ) | | | (12,540,196 | ) |
Advisor Class | | | (3,073,927 | ) | | | (2,132,698 | ) |
A-Class | | | (749,118 | ) | | | (417,328 | ) |
C-Class | | | (3,049,349 | ) | | | (5,410,845 | ) |
| | | | | | | | |
Net increase (decrease) in shares | | | 1,421,120 | | | | (129,385 | ) |
| | | | | | | | |
| | | | |
| | | | | |
| 142 | | THE RYDEX FUNDSANNUALREPORT | | SEE NOTES TO FINANCIAL STATEMENTS. |
FINANCIAL HIGHLIGHTS
This table is presented to show selected data for a share outstanding throughout each period and to assist shareholders in evaluating a Fund’s performance for the periods presented.
| | | | | | | | | | | | | | | | | | | | |
Investor Class | | Year Ended
March 31,
2012 | | | Year Ended
March 31,
2011 | | | Year Ended
March 31,
2010 | | | Year Ended
March 31,
2009 | | | Year Ended
March 31,
2008 | |
Per Share Data | | | | | | | | | | | | | | | | | | | | |
Net asset value, beginning of period | | $ | 27.00 | | | $ | 24.80 | | | $ | 20.56 | | | $ | 29.29 | | | $ | 31.89 | |
| | | | | | | | | | | | | | | | | | | | |
Income (loss) from investment operations: | | | | | | | | | | | | | | | | | | | | |
Net investment incomea | | | .73 | | | | .86 | | | | .61 | | | | .72 | | | | .51 | |
Net gain (loss) on investments (realized and unrealized) | | | 1.80 | | | | 2.96 | | | | 4.85 | | | | (9.32 | ) | | | (2.31 | ) |
| | | | | | | | | | | | | | | | | | | | |
Total from investment operations | | | 2.53 | | | | 3.82 | | | | 5.46 | | | | (8.60 | ) | | | (1.80 | ) |
| | | | | | | | | | | | | | | | | | | | |
Less distributions from: | | | | | | | | | | | | | | | | | | | | |
Net investment income | | | (.40 | ) | | | (1.62 | ) | | | (1.22 | ) | | | (.13 | ) | | | (.80 | ) |
| | | | | | | | | | | | | | | | | | | | |
Total distributions | | | (.40 | ) | | | (1.62 | ) | | | (1.22 | ) | | | (.13 | ) | | | (.80 | ) |
| | | | | �� | | | | | | | | | | | | | | | |
Net asset value, end of period | | $ | 29.13 | | | $ | 27.00 | | | $ | 24.80 | | | $ | 20.56 | | | $ | 29.29 | |
| | | | | | | | | | | | | | | | | | | | |
Total Returnb | | | 9.44 | % | | | 15.94 | % | | | 26.58 | % | | | (29.40 | %) | | | (5.88 | %) |
| | | | | | | | | | | | | | | | | | | | |
Ratios/Supplemental Data | | | | | | | | | | | | | | | | | | | | |
Net assets, end of period (in thousands) | | $ | 37,469 | | | $ | 9,328 | | | $ | 9,912 | | | $ | 10,348 | | | $ | 11,242 | |
| | | | | | | | | | | | | | | | | | | | |
Ratios to average net assets: | | | | | | | | | | | | | | | | | | | | |
Net investment income | | | 2.59 | % | | | 3.35 | % | | | 2.49 | % | | | 2.90 | % | | | 1.57 | % |
Total expenses | | | 1.35 | % | | | 1.37 | % | | | 1.39 | % | | | 1.39 | % | | | 1.39 | % |
| | | | | | | | | | | | | | | | | | | | |
Portfolio turnover rate | | | 549 | % | | | 800 | % | | | 758 | % | | | 684 | % | | | 375 | % |
| | | | | |
Advisor Class | | Year Ended
March 31,
2012 | | | Year Ended
March 31,
2011 | | | Year Ended
March 31,
2010 | | | Year Ended
March 31,
2009 | | | Year Ended
March 31,
2008 | |
Per Share Data | | | | | | | | | | | | | | | | | | | | |
Net asset value, beginning of period | | $ | 25.26 | | | $ | 23.40 | | | $ | 19.56 | | | $ | 28.00 | | | $ | 30.65 | |
| | | | | | | | | | | | | | | | | | | | |
Income (loss) from investment operations: | | | | | | | | | | | | | | | | | | | | |
Net investment incomea | | | .56 | | | | .62 | | | | .47 | | | | .63 | | | | .32 | |
Net gain (loss) on investments (realized and unrealized) | | | 1.68 | | | | 2.86 | | | | 4.59 | | | | (8.94 | ) | | | (2.17 | ) |
| | | | | | | | | | | | | | | | | | | | |
Total from investment operations | | | 2.24 | | | | 3.48 | | | | 5.06 | | | | (8.31 | ) | | | (1.85 | ) |
| | | | | | | | | | | | | | | | | | | | |
Less distributions from: | | | | | | | | | | | | | | | | | | | | |
Net investment income | | | (.40 | ) | | | (1.62 | ) | | | (1.22 | ) | | | (.13 | ) | | | (.80 | ) |
| | | | | | | | | | | | | | | | | | | | |
Total distributions | | | (.40 | ) | | | (1.62 | ) | | | (1.22 | ) | | | (.13 | ) | | | (.80 | ) |
| | | | | | | | | | | | | | | | | | | | |
Net asset value, end of period | | $ | 27.10 | | | $ | 25.26 | | | $ | 23.40 | | | $ | 19.56 | | | $ | 28.00 | |
| | | | | | | | | | | | | | | | | | | | |
Total Returnb | | | 8.90 | % | | | 15.43 | % | | | 25.89 | % | | | (29.72 | %) | | | (6.28 | %) |
| | | | | | | | | | | | | | | | | | | | |
Ratios/Supplemental Data | | | | | | | | | | | | | | | | | | | | |
Net assets, end of period (in thousands) | | $ | 8,036 | | | $ | 1,240 | | | $ | 1,184 | | | $ | 5,939 | | | $ | 2,960 | |
| | | | | | | | | | | | | | | | | | | | |
Ratios to average net assets: | | | | | | | | | | | | | | | | | | | | |
Net investment income | | | 2.11 | % | | | 2.53 | % | | | 2.07 | % | | | 2.72 | % | | | 1.02 | % |
Total expenses | | | 1.84 | % | | | 1.87 | % | | | 1.88 | % | | | 1.90 | % | | | 1.88 | % |
| | | | | | | | | | | | | | | | | | | | |
Portfolio turnover rate | | | 549 | % | | | 800 | % | | | 758 | % | | | 684 | % | | | 375 | % |
| | | | |
| | | | | |
| SEE NOTES TO FINANCIAL STATEMENTS. | | THE RYDEX FUNDSANNUALREPORT | | 143 |
FINANCIAL HIGHLIGHTS (concluded)
This table is presented to show selected data for a share outstanding throughout each period and to assist shareholders in evaluating a Fund’s performance for the periods presented.
| | | | | | | | | | | | | | | | | | | | |
A-Class | | Year Ended
March 31,
2012 | | | Year Ended
March 31,
2011 | | | Year Ended
March 31,
2010 | | | Year Ended
March 31,
2009 | | | Year Ended
March 31,
2008 | |
Per Share Data | | | | | | | | | | | | | | | | | | | | |
Net asset value, beginning of period | | $ | 25.75 | | | $ | 23.77 | | | $ | 19.80 | | | $ | 28.27 | | | $ | 30.87 | |
| | | | | | | | | | | | | | | | | | | | |
Income (loss) from investment operations: | | | | | | | | | | | | | | | | | | | | |
Net investment incomea | | | .67 | | | | .54 | | | | .65 | | | | .54 | | | | .42 | |
Net gain (loss) on investments (realized and unrealized) | | | 1.67 | | | | 3.06 | | | | 4.54 | | | | (8.88 | ) | | | (2.22 | ) |
| | | | | | | | | | | | | | | | | | | | |
Total from investment operations | | | 2.34 | | | | 3.60 | | | | 5.19 | | | | (8.34 | ) | | | (1.80 | ) |
| | | | | | | | | | | | | | | | | | | | |
Less distributions from: | | | | | | | | | | | | | | | | | | | | |
Net investment income | | | (.40 | ) | | | (1.62 | ) | | | (1.22 | ) | | | (.13 | ) | | | (.80 | ) |
| | | | | | | | | | | | | | | | | | | | |
Total distributions | | | (.40 | ) | | | (1.62 | ) | | | (1.22 | ) | | | (.13 | ) | | | (.80 | ) |
| | | | | | | | | | | | | | | | | | | | |
Net asset value, end of period | | $ | 27.69 | | | $ | 25.75 | | | $ | 23.77 | | | $ | 19.80 | | | $ | 28.27 | |
| | | | | | | | | | | | | | | | | | | | |
Total Returnb | | | 9.16 | % | | | 15.70 | % | | | 26.24 | % | | | (29.54 | %) | | | (6.07 | %) |
| | | | | | | | | | | | | | | | | | | | |
Ratios/Supplemental Data | | | | | | | | | | | | | | | | | | | | |
Net assets, end of period (in thousands) | | $ | 7,912 | | | $ | 3,289 | | | $ | 1,721 | | | $ | 1,489 | | | $ | 3,032 | |
| | | | | | | | | | | | | | | | | | | | |
Ratios to average net assets: | | | | | | | | | | | | | | | | | | | | |
Net investment income | | | 2.47 | % | | | 2.23 | % | | | 2.81 | % | | | 2.15 | % | | | 1.38 | % |
Total expenses | | | 1.60 | % | | | 1.63 | % | | | 1.64 | % | | | 1.64 | % | | | 1.63 | % |
| | | | | | | | | | | | | | | | | | | | |
Portfolio turnover rate | | | 549 | % | | | 800 | % | | | 758 | % | | | 684 | % | | | 375 | % |
| | | | | |
C-Class | | Year Ended
March 31,
2012 | | | Year Ended
March 31,
2011 | | | Year Ended
March 31,
2010 | | | Year Ended
March 31,
2009 | | | Year Ended
March 31,
2008 | |
Per Share Data | | | | | | | | | | | | | | | | | | | | |
Net asset value, beginning of period | | $ | 23.76 | | | $ | 22.21 | | | $ | 18.71 | | | $ | 26.93 | | | $ | 29.66 | |
| | | | | | | | | | | | | | | | | | | | |
Income (loss) from investment operations: | | | | | | | | | | | | | | | | | | | | |
Net investment incomea | | | .42 | | | | .39 | | | | .39 | | | | .32 | | | | .18 | |
Net gain (loss) on investments (realized and unrealized) | | | 1.53 | | | | 2.78 | | | | 4.33 | | | | (8.41 | ) | | | (2.11 | ) |
| | | | | | | | | | | | | | | | | | | | |
Total from investment operations | | | 1.95 | | | | 3.17 | | | | 4.72 | | | | (8.09 | ) | | | (1.93 | ) |
| | | | | | | | | | | | | | | | | | | | |
Less distributions from: | | | | | | | | | | | | | | | | | | | | |
Net investment income | | | (.40 | ) | | | (1.62 | ) | | | (1.22 | ) | | | (.13 | ) | | | (.80 | ) |
| | | | | | | | | | | | | | | | | | | | |
Total distributions | | | (.40 | ) | | | (1.62 | ) | | | (1.22 | ) | | | (.13 | ) | | | (.80 | ) |
| | | | | | | | | | | | | | | | | | | | |
Net asset value, end of period | | $ | 25.31 | | | $ | 23.76 | | | $ | 22.21 | | | $ | 18.71 | | | $ | 26.93 | |
| | | | | | | | | | | | | | | | | | | | |
Total Returnb | | | 8.28 | % | | | 14.85 | % | | | 25.24 | % | | | (30.08 | %) | | | (6.77 | %) |
| | | | | | | | | | | | | | | | | | | | |
Ratios/Supplemental Data | | | | | | | | | | | | | | | | | | | | |
Net assets, end of period (in thousands) | | $ | 6,961 | | | $ | 4,751 | | | $ | 7,306 | | | $ | 4,127 | | | $ | 8,934 | |
| | | | | | | | | | | | | | | | | | | | |
Ratios to average net assets: | | | | | | | | | | | | | | | | | | | | |
Net investment income | | | 1.70 | % | | | 1.72 | % | | | 1.77 | % | | | 1.31 | % | | | 0.60 | % |
Total expenses | | | 2.35 | % | | | 2.38 | % | | | 2.39 | % | | | 2.39 | % | | | 2.38 | % |
| | | | | | | | | | | | | | | | | | | | |
Portfolio turnover rate | | | 549 | % | | | 800 | % | | | 758 | % | | | 684 | % | | | 375 | % |
| a | Net investment income per share was computed using average shares outstanding throughout the period. |
| b | Total return does not reflect the impact of any applicable sales charges and has not been annualized. |
| | | | |
| | | | | |
| 144 | | THE RYDEX FUNDSANNUALREPORT | | SEE NOTES TO FINANCIAL STATEMENTS. |
|
| NOTES TO FINANCIAL STATEMENTS |
| |
1. Organization and Significant Accounting Policies
Organization
The Rydex Series Funds (the “Trust”) is registered with the SEC under the Investment Company Act of 1940 (the“1940 Act”) as a non-diversified, open-ended investment company. The Trust offers eight separate classes of shares, Investor Class shares, Investor2 Class shares, Advisor Class shares, A-Class shares, C-Class shares, H-Class shares, Y-Class shares, and Institutional Class shares. Sales of shares of each Class are made without a front-end sales charge at the net asset value per share (“NAV”), with the exception of A-Class shares. A-Class shares are sold at the NAV, plus the applicable front-end sales charge. The sales charge varies depending on the amount purchased, but will not exceed 4.75%. A-Class share purchases of $1 million or more are exempt from the front-end sales charge but have a 1% contingent deferred sales charge (“CDSC”) if shares are redeemed within 12 months of purchase. C-Class shares have a 1% CDSC if shares are redeemed within 12 months of purchase.
At March 31, 2012, the Trust consisted of fifty-seven separate funds. This report covers the Sector Funds (the “Funds”), while the other funds are contained in separate reports. Only A-Class, C-Class, Advisor Class and Investor Class had been issued in the Funds.
Guggenheim Investments (“GI”) provides advisory services and Rydex Fund Services, LLC (“RFS”) provides transfer agent, administrative and accounting services to the Trust. Rydex Distributors, LLC (“RDL”) acts as principal underwriter for the Trust. GI, RFS and RDL are affiliated entities.
The Funds invest in a specific industry sector. To the extent that investments are concentrated in a single sector, the Funds are subject to legislative or regulatory changes, adverse market conditions and/or increased competition affecting such sector.
The Funds seek capital appreciation and invest substantially all of their assets in equity securities of companies involved in their sector.
The Funds are designed and operated to accommodate frequent trading by shareholders and, unlike most mutual funds, offer unlimited exchange privileges with no minimum holding periods or transactions fees, which may cause the Funds to experience high portfolio turnover.
Significant Accounting Policies
The following significant accounting policies are in conformity with U.S. generally accepted accounting principles and are consistently followed by the Trust. This requires management to make estimates and assumptions that affect the reported amount of assets and liabilities and disclosure of contingent assets and liabilities at the date of the financial statements and the reported amounts of revenues and expenses during the reporting period. Actual results could differ from these estimates. All time references are based on Eastern Time.
A. Equity securities listed on an exchange (New York Stock Exchange (“NYSE”) or American Stock Exchange) are valued at the last quoted sales price as of the close of business on the NYSE on the valuation date. Equity securities listed on the NASDAQ market system are valued at the NASDAQ Official Closing Price on the valuation date.
Repurchase agreements are valued at amortized cost, which approximates market value.
Investments for which market quotations are not readily available are fair valued as determined in good faith by GI under the direction of the Board of Trustees using methods established or ratified by the Board of Trustees. These methods include, but are not limited to: (i) using general information as to how these securities and assets trade; and (ii) other information and considerations, including current values in related markets.
B. Security transactions are recorded on the trade date for financial reporting purposes. Realized gains and losses from securities transactions are recorded using the identified cost basis. Proceeds from lawsuits related to investment holdings are recorded as realized gains in the respective Fund. Dividend income is recorded on the ex-dividend date, net of applicable taxes withheld by foreign countries. Taxable non-cash dividends are recorded as dividend income. Interest income, including amortization of premiums and accretion of discount, is accrued on a daily basis. Distributions received from investments in REITs are recorded as dividend income on the ex-dividend date, subject to reclassification upon notice of the character of such distribution by the issuer.
C. Investment securities and other assets and liabilities denominated in foreign currencies are translated into U.S. dollar amounts at the date of valuation. Purchases and sales of investment securities and income and expense items denominated in foreign currencies are translated into U.S. dollar amounts on the respective dates of such transactions. The Trust does not isolate that portion
| | | | |
| | | | | |
| | THE RYDEX FUNDSANNUALREPORT | | 145 |
|
| NOTES TO FINANCIAL STATEMENTS (continued) |
| |
of the results of operations resulting from changes in foreign exchange rates on investments from the fluctuations arising from changes in market prices of securities held. Such fluctuations are included with the net realized and unrealized gain and loss from investments. Reported net realized foreign exchange gains or losses arise from sales of foreign currencies and currency gains or losses realized between the trade and settlement dates on investment transactions. Net unrealized exchange gains and losses arise from changes in the fair values of assets and liabilities other than investments in securities at the fiscal period end, resulting from changes in exchange rates.
D. Distributions of net investment income and net realized gains, if any, are declared and paid at least annually. Distributions are recorded on the ex-dividend date and are determined in accordance with income tax regulations which may differ from U.S. generally accepted accounting principles.
E. The Funds may leave cash overnight in their cash account with the custodian, U.S. Bank. Periodically, a Fund may have cash due to the custodian bank as an overdraft balance. A fee is incurred on this overdraft, calculated by multiplying the overdraft by a rate based on the federal funds rate.
F. Interest and dividend income, most expenses, all realized gains and losses, and all unrealized gains and losses are allocated to the Classes based upon the value of the outstanding shares in each Class. Certain costs, such as distribution fees relating to A-Class shares and service and distribution fees related to Advisor Class shares and C-Class shares, are charged directly to specific Classes. In addition, certain expenses have been allocated to the individual Funds in the Trust on a pro rata basis upon the respective aggregate net assets of each Fund included in the Trust.
G. Throughout the normal course of business, the Funds enter into contracts that contain a variety of representations and warranties which provide general indemnifications. The Funds’ maximum exposure under these arrangements is unknown, as this would involve future claims that may be made against the Funds and/or their affiliates that have not yet occurred. However, based on experience, the Funds expect the risk of loss to be remote.
2. Fees and Other Transactions with Affiliates
Under the terms of an investment advisory contract, the Funds pay GI investment advisory fees calculated at the annualized rates below, based on the average daily net assets of the Funds.
| | | | |
Fund | | Management Fees
(as a % of Net Assets) | |
Banking Fund | | | 0.85 | % |
Basic Materials Fund | | | 0.85 | % |
Biotechnology Fund | | | 0.85 | % |
Consumer Products Fund | | | 0.85 | % |
Electronics Fund | | | 0.85 | % |
Energy Fund | | | 0.85 | % |
Energy Services Fund | | | 0.85 | % |
Financial Services Fund | | | 0.85 | % |
Health Care Fund | | | 0.85 | % |
Internet Fund | | | 0.85 | % |
Leisure Fund | | | 0.85 | % |
Precious Metals Fund | | | 0.75 | % |
Retailing Fund | | | 0.85 | % |
Technology Fund | | | 0.85 | % |
Telecommunications Fund | | | 0.85 | % |
Transportation Fund | | | 0.85 | % |
Utilities Fund | | | 0.85 | % |
RFS provides transfer agent and administrative services to the Funds calculated at an annual percentage rate of 0.25% of the average daily net assets of each Fund.
RFS also provides accounting services to the Funds for fees calculated at annualized rates below, based on the average daily net assets of each Fund.
| | | | |
Fund Accounting | | (as a % of net assets) | |
On the first $250 million | | | 0.10 | % |
On the next $250 million | | | 0.075 | % |
On the next $250 million | | | 0.05 | % |
Over $750 million | | | 0.03 | % |
RFS engages external service providers to perform other necessary services for the Trust, such as audit and accounting related services, legal services, custody, printing and mailing, etc., on a pass-through basis. Such expenses are allocated to various Funds within the complex based on relative net assets.
The Trust has adopted a Distribution and Shareholder Services Plan applicable to its Advisor Class shares and a Distribution Plan applicable to A-Class shares for which RDL and other firms that provide distribution and/or shareholder services (“Service Providers”) may receive compensation. If a Service Provider provides distribution services, the Trust will pay distribution fees to RDL at an annual rate not to exceed 0.25% of average daily net assets, pursuant to Rule 12b-1 of the 1940 Act. RDL, in turn, will pay the Service Provider out of its fees. RDL may, at its discretion, retain a portion of such payments to compensate itself for distribution services. With regard to Advisor Class shares only, if a Service Provider provides shareholder services, RDL will receive shareholder servicing fees from the Trust at an annual rate not to exceed 0.25% of average daily net assets. RDL, in turn, will pay the Service Provider out of its fees.
| | | | |
| | | | | |
| 146 | | THE RYDEX FUNDSANNUALREPORT | | |
|
| NOTES TO FINANCIAL STATEMENTS (continued) |
| |
The Trust has adopted a separate Distribution and Shareholder Services Plan applicable to its C-Class shares that allows the Funds to pay annual distribution and service fees of 1.00% of the Funds’ C-Class shares average daily net assets. The annual 0.25% service fee compensates the shareholder’s financial advisor for providing ongoing services to the shareholder. The annual distribution fee of 0.75% reimburses RDL for paying the shareholder’s financial advisor an ongoing sales commission. RDL advances the first year’s service and distribution fees to the financial advisor. RDL retains the service and distribution fees on accounts with no authorized dealer of record.
For the year ended March 31, 2012, RDL retained sales charges of $404,264 relating to sales of A-Class shares of the Trust.
Certain officers and trustees of the Trust are also officers of GI, RFS and RDL.
3. Federal Income Tax Information
The Funds intend to comply with the provisions of Subchapter M of the Internal Revenue Code applicable to regulated investment companies and will distribute substantially all taxable net investment income and capital gains sufficient to relieve the Funds from all, or substantially all, federal income, excise and state income taxes. Therefore, no provision for federal or state income tax is required.
Tax positions taken or expected to be taken in the course of preparing the Funds’ tax returns are evaluated to determine whether the tax positions are “more-likely-than-not” of being sustained by the applicable tax authority. Tax positions not deemed to meet the more-likely-than-not threshold would be recorded as a tax benefit or expense in the current year. Management has analyzed the Funds’ tax positions taken, or to be taken, on Federal income tax returns for all open tax years (fiscal years 2009-2012), and has concluded that no provision for income tax is required in the Funds’ financial statements.
The RIC Modernization Act of 2010 was signed into law on December 22, 2010 and seeks to simplify some of the tax provisions applicable to regulated investment companies and the tax reporting to their shareholders, and to improve the tax efficiency of certain fund structures. The changes are generally effective for taxable years beginning after the date of enactment.
One of the more prominent changes addresses capital loss carryforwards. Funds will be permitted to carry forward capital losses incurred in taxable years beginning after December 22, 2010 for an unlimited period. However, any losses incurred during those future taxable years will be required to be utilized prior to the losses incurred in pre-enactment taxable years. Under pre-enactment law, capital losses could be carried forward for eight years, and carried forward as short-term capital, irrespective of the character of the original loss. As a result of this ordering rule, pre-enactment capital loss carryforwards may potentially expire unused. Additionally, post-enactment capital losses that are carried forward will retain their character as either short-term or long-term capital losses rather than being considered all short-term as under previous law.
Tax basis capital losses in excess of capital gains are carried forward to offset future net capital gains. For the year ended March 31, 2012, the following capital loss carryforward amounts were expired or used:
| | | | |
Fund | | Amount | |
Biotechnology Fund | | $ | 543,006 | |
Electronics Fund | | | 21,975,263 | |
Energy Services Fund | | | 10,710,084 | |
Leisure Fund | | | 76,092 | |
Precious Metals Fund | | | 11,129,255 | |
Retailing Fund | | | 537,464 | |
Transportation Fund | | | 1,263,341 | |
The tax character of distributions paid during the year ended March 31, 2012 was as follows:
| | | | | | | | | | | | |
Fund | | Ordinary
Income | | | Long-Term
Capital Gain | | | Total
Distributions | |
Banking Fund | | $ | 8,682 | | | $ | — | | | $ | 8,682 | |
Basic Materials Fund | | | — | | | | — | | | | — | |
Biotechnology Fund | | | — | | | | — | | | | — | |
Consumer Products Fund | | | 3,934,423 | | | | — | | | | 3,934,423 | |
Electronics Fund | | | — | | | | — | | | | — | |
Energy Fund | | | — | | | | — | | | | — | |
| | | | |
| | | | | |
| | THE RYDEX FUNDSANNUALREPORT | | 147 |
|
| NOTES TO FINANCIAL STATEMENTS (continued) |
| |
| | | | | | | | | | | | |
Fund | | Ordinary
Income | | | Long-Term
Capital Gain | | | Total
Distributions | |
Energy Services Fund | | $ | — | | | $ | — | | | $ | — | |
Financial Services Fund | | | 5,633 | | | | — | | | | 5,633 | |
Health Care Fund | | | — | | | | — | | | | — | |
Internet Fund | | | — | | | | — | | | | — | |
Leisure Fund | | | — | | | | — | | | | — | |
Precious Metals Fund | | | 601,515 | | | | — | | | | 601,515 | |
Retailing Fund | | | 16,042 | | | | — | | | | 16,042 | |
Technology Fund | | | — | | | | — | | | | — | |
Telecommunications Fund | | | 169,346 | | | | — | | | | 169,346 | |
Transportation Fund | | | — | | | | — | | | | — | |
Utilities Fund | | | 918,227 | | | | — | | | | 918,227 | |
The tax character of distributions paid during the year ended March 31, 2011 was as follows:
| | | | | | | | | | | | |
Fund | | Ordinary
Income | | | Long-Term
Capital Gain | | | Total
Distributions | |
Banking Fund | | $ | 53,770 | | | $ | — | | | $ | 53,770 | |
Basic Materials Fund | | | 304,954 | | | | — | | | | 304,954 | |
Biotechnology Fund | | | — | | | | — | | | | — | |
Consumer Products Fund | | | 12,587,568 | | | | — | | | | 12,587,568 | |
Electronics Fund | | | — | | | | — | | | | — | |
Energy Fund | | | 92,412 | | | | — | | | | 92,412 | |
Energy Services Fund | | | — | | | | — | | | | — | |
Financial Services Fund | | | 128,968 | | | | — | | | | 128,968 | |
Health Care Fund | | | — | | | | — | | | | — | |
Internet Fund | | | — | | | | — | | | | — | |
Leisure Fund | | | — | | | | — | | | | — | |
Precious Metals Fund | | | 132,213 | | | | — | | | | 132,213 | |
Retailing Fund | | | 50,077 | | | | — | | | | 50,077 | |
Technology Fund | | | — | | | | — | | | | — | |
Telecommunications Fund | | | 95,855 | | | | — | | | | 95,855 | |
Transportation Fund | | | — | | | | — | | | | — | |
Utilities Fund | | | 1,479,214 | | | | — | | | | 1,479,214 | |
(Note: For federal income tax purposes, short-term capital gain distributions are treated as ordinary income distributions.)
The tax character of distributable earnings/(accumulated losses) at March 31, 2012 was as follows:
| | | | | | | | | | | | | | | | |
Fund | | Undistributed
Ordinary
Income | | | Undistributed
Long-Term
Capital Gain | | | Net Unrealized
Appreciation/
(Depreciation) | | | Capital Loss
Carryforward1 | |
Banking Fund | | $ | 82,877 | | | $ | — | | | $ | (249,317 | ) | | $ | (20,850,464 | ) |
Basic Materials Fund | | | 27,822 | | | | — | | | | 13,835,582 | | | | (20,919,929 | ) |
Biotechnology Fund | | | — | | | | — | | | | 34,882,579 | | | | (52,808,590 | ) |
Consumer Products Fund | | | — | | | | — | | | | 20,105,436 | | | | — | |
Electronics Fund | | | — | | | | — | | | | 650,744 | | | | (26,029,022 | ) |
Energy Fund | | | — | | | | — | | | | 16,762,847 | | | | (8,027,835 | ) |
Energy Services Fund | | | — | | | | — | | | | 21,438,313 | | | | (32,553,425 | ) |
Financial Services Fund | | | 103,876 | | | | — | | | | 1,370,543 | | | | (3,941,335 | ) |
Health Care Fund | | | — | | | | — | | | | 6,877,479 | | | | (5,045,284 | ) |
Internet Fund | | | — | | | | 113,384 | | | | 2,260,073 | | | | — | |
Leisure Fund | | | 24,145 | | | | — | | | | 1,765,487 | | | | (4,786,974 | ) |
Precious Metals Fund | | | — | | | | 5,526,266 | | | | 35,676,357 | | | | — | |
Retailing Fund | | | — | | | | — | | | | 2,953,762 | | | | (3,653,724 | ) |
Technology Fund | | | — | | | | — | | | | 6,075,848 | | | | (15,013,853 | ) |
Telecommunications Fund | | | 87,671 | | | | — | | | | 3,637 | | | | (3,039,034 | ) |
Transportation Fund | | | — | | | | — | | | | 863,104 | | | | (22,801,313 | ) |
Utilities Fund | | | 542,275 | | | | — | | | | 3,491,323 | | | | (6,385,917 | ) |
Capital Loss Carryforward amounts may be limited due to Federal income tax regulations.
| | | | |
| 148 | | THE RYDEX FUNDSANNUALREPORT | | |
|
| NOTES TO FINANCIAL STATEMENTS (continued) |
| |
1A summary of the expiration of the aforementioned Capital Loss Carryforward is as follows:
| | | | | | | | | | | | | | | | | | | | | | | | | | | | | | | | | | | | | | | | |
Fund | | Expires in
2013 | | | Expires in
2014 | | | Expires in
2015 | | | Expires in
2016 | | | Expires in
2017 | | | Expires in
2018 | | | Expires in
2019 | | | Unlimited | | | Total
Capital Loss
Carryforward | |
| | | | | | | | | Short-Term | | | Long-Term | | |
Banking Fund | | $ | — | | | $ | (214,478 | ) | | $ | — | | | $ | (311,892 | ) | | $ | (1,809,926 | ) | | $ | (16,385,824 | ) | | $ | (912,723 | ) | | $ | (531,127 | ) | | $ | (684,494 | ) | | $ | (20,850,464 | ) |
Basic Materials Fund | | | — | | | | — | | | | — | | | | — | | | | (6,151,760 | ) | | | (8,009,421 | ) | | | — | | | | (6,758,748 | ) | | | — | | | | (20,919,929 | ) |
Biotechnology Fund | | | (52,808,590 | ) | | | — | | | | — | | | | — | | | | — | | | | — | | | | — | | | | — | | | | — | | | | (52,808,590 | ) |
Consumer Products Fund | | | — | | | | — | | | | — | | | | — | | | | — | | | | — | | | | — | | | | — | | | | — | | | | — | |
Electronics Fund | | | (6,480,667 | ) | | | (2,395,860 | ) | | | (5,495,145 | ) | | | (1,900,883 | ) | | | (6,118,835 | ) | | | — | | | | (3,055,204 | ) | | | (582,428 | ) | | | — | | | | (26,029,022 | ) |
Energy Fund | | | — | | | | — | | | | — | | | | — | | | | — | | | | (7,008,326 | ) | | | — | | | | (1,019,509 | ) | | | — | | | | (8,027,835 | ) |
Energy Services Fund | | | — | | | | — | | | | — | | | | — | | | | (26,850,596 | ) | | | (5,702,829 | ) | | | — | | | | — | | | | — | | | | (32,553,425 | ) |
Financial Services Fund | | | — | | | | — | | | | — | | | | — | | | | (3,098,998 | ) | | | (417,729 | ) | | | — | | | | (412,582 | ) | | | (12,026 | ) | | | (3,941,335 | ) |
Health Care Fund | | | — | | | | — | | | | — | | | | — | | | | (676,233 | ) | | | (3,281,101 | ) | | | — | | | | (842,240 | ) | | | (245,710 | ) | | | (5,045,284 | ) |
Internet Fund | | | — | | | | — | | | | — | | | | — | | | | — | | | | — | | | | — | | | | — | | | | — | | | | — | |
Leisure Fund | | | (353,498 | ) | | | (1,914,441 | ) | | | — | | | | — | | | | (652,027 | ) | | | (586,133 | ) | | | — | | | | (1,280,875 | ) | | | — | | | | (4,786,974 | ) |
Precious Metals Fund | | | — | | | | — | | | | — | | | | — | | | | — | | | | — | | | | — | | | | — | | | | — | | | | — | |
Retailing Fund | | | (464,755 | ) | | | — | | | | — | | | | — | | | | (3,188,969 | ) | | | — | | | | — | | | | — | | | | — | | | | (3,653,724 | ) |
Technology Fund | | | (5,462,751 | ) | | | (3,582,117 | ) | | | — | | | | — | | | | (5,077,190 | ) | | | — | | | | — | | | | (891,795 | ) | | | — | | | | (15,013,853 | ) |
Telecommunications Fund | | | (618,538 | ) | | | — | | | | — | | | | — | | | | (1,745,552 | ) | | �� | — | | | | — | | | | (470,561 | ) | | | (204,383 | ) | | | (3,039,034 | ) |
Transportation Fund | | | (894,874 | ) | | | — | | | | — | | | | — | | | | (795,900 | ) | | | (13,907,033 | ) | | | (6,866,455 | ) | | | (337,051 | ) | | | — | | | | (22,801,313 | ) |
Utilities Fund | | | — | | | | — | | | | — | | | | — | | | | (1,315,205 | ) | | | (3,228,655 | ) | | | (1,841,534 | ) | | | — | | | | (523 | ) | | | (6,385,917 | ) |
Net investment income and net realized gains (losses) may differ for financial statement and tax purposes because of temporary or permanent book/tax differences. These differences are typically due to post-October losses, losses deferred due to wash sales, tax treatment of payments from credit default swaps, utilization of earnings and profits on shareholder redemptions, foreign currency gains and losses, and the “mark-to-market” of certain passive foreign investment companies (PFICs) for tax purposes. Additional differences may result from tax treatment of net investment losses and expired capital loss carryforwards. To the extent these differences are permanent, reclassifications are made to the appropriate equity accounts in the period that the differences arise. These reclassifications have no effect on net assets or NAV per share.
On the Statements of Assets and Liabilities, the following reclassifications were made for permanent book/tax differences:
| | | | | | | | | | | | |
Fund | | Paid In
Capital | | | Undistributed
Net Investment
Income | | | Accumulated
Net Realized
Gain (Loss) | |
Banking Fund | | $ | (208 | ) | | $ | — | | | $ | 208 | |
Basic Materials Fund | | | (5,500 | ) | | | 34,681 | | | | (29,181 | ) |
Biotechnology Fund | | | (347,368 | ) | | | 523,305 | | | | (175,937 | ) |
Consumer Products Fund | | | 3,671,871 | | | | (1,504,930 | ) | | | (2,166,941 | ) |
Electronics Fund | | | (23,723,564 | ) | | | 26,104 | | | | 23,697,460 | |
Energy Fund | | | — | | | | 847 | | | | (847 | ) |
Energy Services Fund | | | (1,943,550 | ) | | | 385,105 | | | | 1,558,445 | |
Financial Services Fund | | | (6,236 | ) | | | 441 | | | | 5,795 | |
Health Care Fund | | | (33,482 | ) | | | 33,481 | | | | 1 | |
Internet Fund | | | 19,309,525 | | | | 115,563 | | | | (19,425,088 | ) |
Leisure Fund | | | (76,092 | ) | | | — | | | | 76,092 | |
Precious Metals Fund | | | (886,497 | ) | | | 1,169,943 | | | | (283,446 | ) |
Retailing Fund | | | 151,939 | | | | 13,269 | | | | (165,208 | ) |
Technology Fund | | | (21,355 | ) | | | 21,355 | | | | — | |
Telecommunications Fund | | | (211 | ) | | | 211 | | | | — | |
Transportation Fund | | | (1,305,633 | ) | | | 42,291 | | | | 1,263,342 | |
Utilities Fund | | | (5,686 | ) | | | 5,686 | | | | — | |
| | | | |
| | | | | |
| | THE RYDEX FUNDSANNUALREPORT | | 149 |
|
| NOTES TO FINANCIAL STATEMENTS (continued) |
| |
At March 31, 2012, the cost of securities for Federal income tax purposes, the aggregate gross unrealized gain for all securities for which there was an excess of value over tax cost and the aggregate gross unrealized loss for all securities for which there was an excess of tax cost over value, were as follows:
| | | | | | | | | | | | | | | | |
Fund | | Tax
Cost | | | Tax
Unrealized
Gain | | | Tax
Unrealized
Loss | | | Net
Unrealized
Gain/(Loss) | |
Banking Fund | | $ | 37,444,986 | | | $ | 235,422 | | | $ | (484,739 | ) | | $ | (249,317 | ) |
Basic Materials Fund | | | 46,240,237 | | | | 14,476,127 | | | | (640,545 | ) | | | 13,835,582 | |
Biotechnology Fund | | | 74,416,254 | | | | 35,447,566 | | | | (564,987 | ) | | | 34,882,579 | |
Consumer Products Fund | | | 183,493,710 | | | | 21,020,097 | | | | (914,661 | ) | | | 20,105,436 | |
Electronics Fund | | | 7,010,557 | | | | 687,931 | | | | (37,187 | ) | | | 650,744 | |
Energy Fund | | | 54,122,437 | | | | 17,648,046 | | | | (885,200 | ) | | | 16,762,846 | |
Energy Services Fund | | | 38,288,718 | | | | 21,836,536 | | | | (398,223 | ) | | | 21,438,313 | |
Financial Services Fund | | | 24,280,273 | | | | 1,393,981 | | | | (23,438 | ) | | | 1,370,543 | |
Health Care Fund | | | 42,864,757 | | | | 6,949,769 | | | | (72,290 | ) | | | 6,877,479 | |
Internet Fund | | | 6,124,091 | | | | 2,270,599 | | | | (10,526 | ) | | | 2,260,073 | |
Leisure Fund | | | 14,394,777 | | | | 1,854,719 | | | | (89,232 | ) | | | 1,765,487 | |
Precious Metals Fund | | | 86,511,471 | | | | 36,692,101 | | | | (1,015,744 | ) | | | 35,676,357 | |
Retailing Fund | | | 45,110,775 | | | | 3,245,240 | | | | (291,478 | ) | | | 2,953,762 | |
Technology Fund | | | 26,418,207 | | | | 6,159,042 | | | | (83,194 | ) | | | 6,075,848 | |
Telecommunications Fund | | | 9,403,172 | | | | 93,190 | | | | (89,553 | ) | | | 3,637 | |
Transportation Fund | | | 13,862,569 | | | | 961,016 | | | | (97,912 | ) | | | 863,104 | |
Utilities Fund | | | 56,489,721 | | | | 3,653,898 | | | | (162,575 | ) | | | 3,491,323 | |
Pursuant to Federal income tax regulations applicable to investment companies, the Funds have elected to treat net capital losses and certain ordinary losses realized between November 1 and March 31 of each year as occurring on the first day of the following tax year. The Funds have also elected to treat certain ordinary losses realized between January 1 and March 31 of each year as occurring on the first day of the following tax year. For the year ended March 31, 2012, the following losses reflected in the accompanying financial statements were deferred for Federal income tax purposes until April 1, 2012:
| | | | | | | | |
Fund | | Ordinary | | | Capital | |
Banking Fund | | $ | — | | | $ | (70,773 | ) |
Basic Materials Fund | | | — | | | | (1,463,762 | ) |
Electronics Fund | | | (14,534 | ) | | | (438,383 | ) |
Energy Fund | | | (2,890 | ) | | | (3,209,296 | ) |
Energy Services Fund | | | (35,120 | ) | | | — | |
Financial Services | | | — | | | | (24,928 | ) |
Health Care Fund | | | — | | | | (48,764 | ) |
Internet Fund | | | (50,568 | ) | | | — | |
Precious Metals Fund | | | (2,059 | ) | | | — | |
Retailing Fund | | | (18,867 | ) | | | (85,226 | ) |
Technology Fund | | | (82,903 | ) | | | (60,030 | ) |
Telecommunications Fund | | | — | | | | (75,316 | ) |
Transportation Fund | | | (9,953 | ) | | | — | |
Utilities Fund | | | — | | | | (616,019 | ) |
4. Fair Value Measurement
In accordance with U.S. generally accepted accounting principles, fair value is defined as the price that the Fund would receive to sell an investment or pay to transfer a liability in an orderly transaction with an independent buyer in the principal market, or in the absence of a principal market the most advantageous market for the investment or liability. A three-tier hierarchy is utilized to distinguish between (1) inputs that reflect the assumptions market participants would use in pricing an asset or liability developed based on market data obtained from sources independent of the reporting entity (observable inputs) and (2) inputs that reflect the reporting entity’s own assumptions about the assumptions market participants would use in pricing an asset or liability developed based on the best information available in the circumstances (unobservable inputs) and to establish classification of fair value measurements for disclosure purposes. Various inputs are used in determining the value of the Funds’ investments. The inputs are summarized in the three broad levels listed below:
| | | | |
| | | | | |
| 150 | | THE RYDEX FUNDSANNUALREPORT | | |
|
| NOTES TO FINANCIAL STATEMENTS (continued) |
| |
Level 1 — quoted prices in active markets for identical securities.
Level 2 — other significant observable inputs (including quoted prices for similar securities, interest rates, prepayment speeds, credit risk, etc.).
Level 3 — significant unobservable inputs (including the fund’s own assumptions used to determine the fair value of investments).
The inputs or methodologies used for valuing securities are not necessarily an indication of the risk associated with investing in those securities.
The following table summarizes the inputs used to value the Funds’ net assets at March 31, 2012:
| | | | | | | | | | | | | | | | |
Fund | | Level 1
Investments In
Securities | | | Level 2
Investments
In Securities | | | Level 3
Investments
In Securities | | | Total | |
Assets | | | | | | | | | | | | | | | | |
Banking Fund | | $ | 36,881,648 | | | $ | 314,021 | | | $ | — | | | $ | 37,195,669 | |
Basic Materials Fund | | | 59,791,732 | | | | 284,087 | | | | — | | | | 60,075,819 | |
Biotechnology Fund | | | 108,587,011 | | | | 711,822 | | | | — | | | | 109,298,833 | |
Consumer Products Fund | | | 202,353,095 | | | | 1,246,051 | | | | — | | | | 203,599,146 | |
Electronics Fund | | | 7,614,205 | | | | 47,096 | | | | — | | | | 7,661,301 | |
Energy Fund | | | 70,488,456 | | | | 396,827 | | | | — | | | | 70,885,283 | |
Energy Services Fund | | | 59,354,940 | | | | 372,091 | | | | — | | | | 59,727,031 | |
Financial Services Fund | | | 25,541,507 | | | | 109,309 | | | | — | | | | 25,650,816 | |
Health Care Fund | | | 49,488,550 | | | | 253,686 | | | | — | | | | 49,742,236 | |
Internet Fund | | | 8,332,454 | | | | 51,710 | | | | — | | | | 8,384,164 | |
Leisure Fund | | | 16,057,115 | | | | 103,149 | | | | — | | | | 16,160,264 | |
Precious Metals Fund | | | 121,522,968 | | | | 664,860 | | | | — | | | | 122,187,828 | |
Retailing Fund | | | 47,074,309 | | | | 990,228 | | | | — | | | | 48,064,537 | |
Technology Fund | | | 32,279,155 | | | | 214,900 | | | | — | | | | 32,494,055 | |
Telecommunications Fund | | | 9,365,293 | | | | 41,516 | | | | — | | | | 9,406,809 | |
Transportation Fund | | | 14,642,667 | | | | 83,006 | | | | — | | | | 14,725,673 | |
Utilities Fund | | | 59,833,718 | | | | 147,326 | | | | — | | | | 59,981,044 | |
For the year ended March 31, 2012, there were no transfers between levels.
Following is a reconciliation of Level 3 assets for which significant unobservable inputs were used to determine fair value for the year ended March 31, 2012:
LEVEL 3 - Fair value measurement using significant unobservable inputs
| | | | |
| | | Securities | |
Biotechnology | | | | |
Assets: | | | | |
Beginning Balance | | $ | — | |
Total realized gains or losses included in earnings | | | — | |
Total unrealized gains or losses included in earnings | | | — | |
Issuances | | | — | |
| | | | |
Ending Balance | | $ | — | |
| | | | |
5. Repurchase Agreements
The Funds transfer uninvested cash balances into a single joint account, the daily aggregate balance of which is invested in one or more repurchase agreements collateralized by obligations of the U.S. Treasury and U.S. Government Agencies. The collateral is in the possession of the Funds’ custodian and is evaluated to ensure that its market value exceeds, at a minimum, 102% of the original face amount of the repurchase agreements. Each Fund holds a pro rata share of the collateral based on the dollar amount of the repurchase agreement entered into by each Fund.
At March 31, 2012, the collateral for the repurchase agreements in the joint account was as follows:
| | | | | | | | | | | | | | | | | | |
Counterparty and Terms of Agreement | | Face Value | | | Repurchase Price | | | Collateral | | Par Value | | | Fair Value | |
Credit Suisse Group
0.01%
Due 04/02/12 | | $ | 57,898,514 | | | $ | 57,898,562 | | | U.S. Treasury Note
1.375%
11/30/2015 | | $ | 57,159,300 | | | $ | 59,056,509 | |
| | | | |
| | | | | |
| | THE RYDEX FUNDSANNUALREPORT | | 151 |
|
| NOTES TO FINANCIAL STATEMENTS (continued) |
| |
In the event of counterparty default, the Funds have the right to collect the collateral to offset losses incurred. There is potential loss to the Funds in the event the Funds are delayed or prevented from exercising their rights to dispose of the collateral securities, including the risk of a possible decline in the value of the underlying securities during the period while the Funds seek to assert their rights. The Funds’ investment advisor, acting under the supervision of the Board of Trustees, reviews the value of the collateral and the creditworthiness of those banks and dealers with which the Funds enter into repurchase agreements to evaluate potential risks.
6. Securities Transactions
For the year ended March 31, 2012, the cost of purchases and proceeds from sales of investment securities, excluding government securities and short-term investments, were:
| | | | | | | | |
| | | Purchases | | | Sales | |
Banking Fund | | $ | 91,151,779 | | | $ | 68,162,068 | |
Basic Materials Fund | | | 180,779,104 | | | | 216,492,352 | |
Biotechnology Fund | | | 361,805,946 | | | | 321,642,452 | |
Consumer Products Fund | | | 617,016,820 | | | | 497,798,949 | |
Electronics Fund | | | 115,757,580 | | | | 119,398,993 | |
Energy Fund | | | 253,334,152 | | | | 298,945,228 | |
Energy Services Fund | | | 166,323,434 | | | | 279,480,863 | |
Financial Services Fund | | | 155,600,271 | | | | 141,945,748 | |
Health Care Fund | | | 274,703,892 | | | | 253,543,458 | |
Internet Fund | | | 56,153,782 | | | | 69,255,331 | |
Leisure Fund | | | 72,930,467 | | | | 60,916,388 | |
Precious Metals Fund | | | 373,795,719 | | | | 430,168,484 | |
Retailing Fund | | | 179,653,498 | | | | 143,431,191 | |
Technology Fund | | | 139,685,694 | | | | 152,228,892 | |
Telecommunications Fund | | | 82,575,918 | | | | 123,729,217 | |
Transportation Fund | | | 159,060,277 | | | | 155,049,217 | |
Utilities Fund | | | 339,267,375 | | | | 298,508,221 | |
7. Line of Credit
The Trust, along with other affiliated trusts, secured an uncommitted, $75,000,000 line of credit from U.S. Bank, N.A., which expires June 15, 2012. This line of credit is reserved for emergency or temporary purposes. Borrowings, if any, under this arrangement bear interest equal to the Prime Rate, minus 2%, which shall be paid monthly, averaging 1.25% for the year ended March 31, 2012. The Funds did not have any borrowings under this agreement at March 31, 2012.
The following table illustrates the average daily balance borrowed for the year ended March 31, 2012:
| | | | |
Fund | | Average Daily Balance | |
Banking Fund | | $ | 5,470 | |
Basic Materials Fund | | | 20,077 | |
Biotechnology Fund | | | 684,661 | |
Consumer Products Fund | | | 107,008 | |
Electronics Fund | | | 4,678 | |
Energy Fund | | | 104,437 | |
Energy Services Fund | | | 163,107 | |
Financial Services Fund | | | 21,429 | |
Health Care Fund | | | 98,396 | |
Internet Fund | | | 13,645 | |
Leisure Fund | | | 1,273 | |
Precious Metals Fund | | | 18,885 | |
Retailing Fund | | | 8,650 | |
Technology Fund | | | 13,240 | |
Telecommunications Fund | | | 8,814 | |
Transportation Fund | | | 27,708 | |
Utilities Fund | | | 66,921 | |
| | | | |
| | | | | |
| 152 | | THE RYDEX FUNDSANNUALREPORT | | |
| | |
| NOTES TO FINANCIAL STATEMENTS (concluded) | | |
| | | |
8. Legal Proceedings
Tribune Company
Rydex Series Funds has been named as a defendant and a putative member of the proposed defendant class of shareholders in the case entitled Official Committee of Unsecured Creditors of Tribune Co. v. FitzSimons (In re Tribune Co.), Adv. Pro. No. 10-54010 (Bankr. D. Del.), as a result of ownership of shares in the Tribune Company (“Tribune”) in 2007 by certain series of the Rydex Series Funds when Tribune effected a leveraged buyout transaction (“LBO”) by which Tribune converted to a privately-held company. In its complaint, the Unsecured Creditors Committee (the “UCC”) has alleged that, in connection with the LBO, insiders and major shareholders were overpaid for their Tribune stock using financing that the insiders knew would, and ultimately did, leave the Tribune insolvent. The UCC has asserted claims against certain insiders, major shareholders, professional advisers, and others involved in the LBO, and is attempting to obtain from these individuals and entities the proceeds paid out in connection with the LBO. This adversary proceeding in the Bankruptcy Court has been stayed pending further order of the Bankruptcy Court.
In June 2011, a group of Tribune creditors, not including the UCC, filed multiple actions involving state law constructive fraudulent conveyance claims against former Tribune shareholders. Rydex Series Funds also has been named as a defendant in one or more of these suits. These cases have been consolidated in a multidistrict litigation proceeding in the United States District Court for the Southern District of New York and have been stayed pending further order of that court or of the Bankruptcy Court.
None of these lawsuits allege any wrongdoing on the part of Rydex Series Funds. The following series of Rydex Series Funds held shares of Tribune and tendered these shares as part of Tribune’s LBO: Nova Fund, S&P 500 Pure Value Fund, Multi-Cap Core Equity Fund, S&P 500 Fund, Multi-Hedge Strategies Fund and Hedged Equity Fund (the “Funds”). The value of the proceeds received by the foregoing Funds was $28,220, $109,242, $9,860, $3,400, $1,181,160, and $10,880, respectively. At this stage of the proceedings, Rydex Series Funds is not able to make a reliable predication as to the outcome of these lawsuits or the effect, if any, on a Fund’s net asset value.
Lyondell Chemical Company
In December 2011, Rydex Series Funds was named as a defendant in Weisfelner, as Trustee of the LB Creditor Trust, v. Fund 1 (In re Lyondell Chemical Co.), Adv. Pro. No. 10-4609 (Bankr. S.D.N.Y.).
Similar to the claims made in the Tribune matter, the Weisfelner complaint seeks to have set aside and recovered as fraudulent transfers from former Lyondell Chemical Company (“Lyondell”) shareholders the consideration paid to them pursuant to the cash out merger of Lyondell shareholders in connection with the combination of Lyondell and Basell AF in 2007. Lyondell filed for bankruptcy in 2008.
This lawsuit does not allege any wrongdoing on the part of Rydex Series Funds. The following series of Rydex Series Funds received cash proceeds from the cash out merger in the following amounts: Basic Materials Fund - $ 1,725,168; U.S. Long Short Momentum Fund - $2,193,600; Global 130/30 Strategy Fund - $37,920; Hedged Equity Fund - $1,440; and Multi-Hedge Strategies Fund - $1,116,480. At this stage of the proceedings, Rydex Series Funds is not able to make a reliable predication as to the outcome of these lawsuits or the effect, if any, on a Fund’s net asset value.
| | | | |
| | | | | |
| | THE RYDEX FUNDSANNUALREPORT | | 153 |
| | |
| REPORT OF INDEPENDENT REGISTERED PUBLIC ACCOUNTING FIRM | | |
| | | |
To the Board of Trustees and Shareholders
of Rydex Series Funds:
We have audited the accompanying statements of assets and liabilities, including the schedules of investments, of Banking Fund, Basic Materials Fund, Biotechnology Fund, Consumer Products Fund, Electronics Fund, Energy Fund, Energy Services Fund, Financial Services Fund, Health Care Fund, Internet Fund, Leisure Fund, Precious Metals Fund, Retailing Fund, Technology Fund, Telecommunications Fund, Transportation Fund and Utilities Fund (seventeen of the series constituting the Rydex Series Funds) (the “Funds”) as of March 31, 2012, and the related statements of operations for the year then ended, the statements of changes in net assets for each of the two years in the period then ended, and the financial highlights for each of the five years in the period then ended. These financial statements and financial highlights are the responsibility of the Funds’ management. Our responsibility is to express an opinion on these financial statements and financial highlights based on our audits.
We conducted our audits in accordance with the standards of the Public Company Accounting Oversight Board (United States). Those standards require that we plan and perform the audit to obtain reasonable assurance about whether the financial statements and financial highlights are free of material misstatement. We were not engaged to perform an audit of the Funds’ internal control over financial reporting. Our audits included consideration of internal control over financial reporting as a basis for designing audit procedures that are appropriate in the circumstances, but not for the purpose of expressing an opinion on the effectiveness of the Funds’ internal control over financial reporting. Accordingly, we express no such opinion. An audit also includes examining, on a test basis, evidence supporting the amounts and disclosures in the financial statements and financial highlights, assessing the accounting principles used and significant estimates made by management, as well as evaluating the overall financial statement presentation. Our procedures included confirmation of securities owned as of March 31, 2012, by correspondence with the custodian and brokers or by other appropriate auditing procedures where replies from brokers were not received. We believe that our audits provide a reasonable basis for our opinion.
In our opinion, the financial statements and financial highlights referred to above present fairly, in all material respects, the financial position of the above listed Funds at March 31, 2012, the results of their operations for the year then ended, the changes in their net assets for each of the two years in the period then ended, and their financial highlights for each of the five years in the period then ended, in conformity with U.S. generally accepted accounting principles.

McLean, Virginia
May 24, 2012
| | | | |
| | | | | |
| 154 | | THE RYDEX FUNDSANNUALREPORT | | |
|
| OTHER INFORMATION (Unaudited) |
| |
Tax Information
This information is being provided as required by the Internal Revenue Code. Amounts shown may differ from those elsewhere in the report because of differences in tax and financial reporting practice.
Of the taxable ordinary income distributions paid during the fiscal year ending March 31, 2012, the following funds had the corresponding percentages qualify for the dividends received deduction for corporations:
| | | | |
Fund | | % Qualifying | |
Banking Fund | | | 100.00 | % |
Consumer Products Fund | | | 14.81 | % |
Financial Services Fund | | | 100.00 | % |
Precious Metals Fund | | | 100.00 | % |
Retailing Fund | | | 100.00 | % |
Telecommunications Fund | | | 89.98 | % |
Utilities Fund | | | 100.00 | % |
Additionally, the following amounts of taxable ordinary income dividends paid during the fiscal year qualified for the lower income tax rate available to individuals under the Jobs and Growth Tax Relief Reconciliation Act of 2003.
| | | | |
Fund | | % Qualifying | |
Banking Fund | | | 100.00 | % |
Consumer Products Fund | | | 14.55 | % |
Financial Services Fund | | | 100.00 | % |
Precious Metals Fund | | | 100.00 | % |
Retailing Fund | | | 100.00 | % |
Telecommunications Fund | | | 89.35 | % |
Utilities Fund | | | 92.17 | % |
With respect to the taxable year ended March 31, 2012, the Funds hereby designate as capital gain dividends the amounts listed below, or, if subsequently determined to be different, the net capital gain of such year:
| | | | | | | | |
| | | Consumer
Products
Fund | | | Internet
Fund | |
From long-term capital gains, using proceeds from shareholder redemptions: | | $ | 327,245 | | | $ | 5,236,352 | |
For the fiscal year ending March 31, 2012, Precious Metals Fund earned gross income derived from foreign sources totaling $777,152. The Precious Metals Fund paid foreign taxes totaling $82,223 for the fiscal year and may pass these taxes through to shareholders, who may be able to claim them as a foreign tax credit. A final determination will be made at the end of the calendar year. The Funds will notify shareholders of amounts for use in preparing 2012 income tax forms in January 2013.
Proxy Voting Information
A description of the policies and procedures that the Trust uses to determine how to vote proxies relating to securities held in the Funds’ portfolios is available, without charge and upon request, by calling 1.800.820.0888. This information is also available from the EDGAR database on the SEC’s website at http://www.sec.gov.
Information regarding how the Funds voted proxies relating to portfolio securities during the most recent 12-month period ended June 30 is available without charge, upon request, by calling 1.800.820.0888. This information is also available from the EDGAR database on the SEC’s website at http://www.sec.gov.
| | | | |
| | | | | |
| | THE RYDEX FUNDSANNUALREPORT | | 155 |
|
| OTHER INFORMATION (Unaudited) (continued) |
| |
At a special meeting of shareholders held on January 26, 2012, the shareholders of the Funds voted on whether to approve a new investment advisory agreement between Rydex Series Funds and Security Investors, LLC. A description of the number of shares voted is as follows:
| | | | | | | | | | | | |
Fund | | Shares For | | | Shares
Against | | | Shares Abstained | |
Banking Fund | | | 93,811 | | | | 1,088 | | | | 2,098 | |
Basic Materials Fund | | | 603,291 | | | | 18,611 | | | | 29,856 | |
Biotechnology Fund | | | 1,377,342 | | | | 40,566 | | | | 39,915 | |
Consumer Products Fund | | | 1,659,544 | | | | 47,951 | | | | 54,711 | |
Electronics Fund | | | 64,181 | | | | 868 | | | | 5,328 | |
Energy Fund | | | 1,242,632 | | | | 23,894 | | | | 46,257 | |
Energy Services Fund | | | 517,806 | | | | 19,142 | | | | 10,373 | |
Financial Services Fund | | | 40,806 | | | | 842 | | | | 660 | |
Health Care Fund | | | 696,833 | | | | 36,241 | | | | 11,894 | |
Internet Fund | | | 104,773 | | | | 5,715 | | | | 1,976 | |
Leisure Fund | | | 54,501 | | | | 519 | | | | 810 | |
Precious Metals Fund | | | 880,530 | | | | 46,134 | | | | 21,944 | |
Retailing Fund | | | 368,764 | | | | 6,934 | | | | 6,278 | |
Technology Fund | | | 549,155 | | | | 13,372 | | | | 6,267 | |
Telecommunications Fund | | | 184,033 | | | | 8,634 | | | | 563 | |
Transportation Fund | | | 100,569 | | | | 3,469 | | | | 5,521 | |
Utilities Fund | | | 1,558,681 | | | | 61,483 | | | | 49,694 | |
At a special meeting of shareholders held on November 22, 2011, the shareholders of the Funds also voted on whether to approve the election of nominees to the Board of Trustees. A description of the number of shares voted is as follows:
| | | | | | | | | | | | | | | | | | | | | | |
Donald C. Cacciapaglia | | | | | | | Corey A. Colehour | | | | | | | J. Kenneth Dalton | | | | | |
For | | | 1,443,600,903 | | | | | For | | | 1,444,213,017 | | | | | For | | | | | 1,444,422,997 | |
Withhold | | | 23,402,732 | | | | | Withhold | | | 22,790,618 | | | | | Withhold | | | | | 22,580,638 | |
Total | | | 1,467,003,635 | | | | | Total | | | 1,467,003,635 | | | | | Total | | | | | 1,467,003,635 | |
| | | | | | | | |
John O. Demaret | | | | | | | Richard M. Goldman | | | | | | | Werner E. Keller | | | | | |
For | | | 1,445,255,754 | | | | | For | | | 1,443,668,595 | | | | | For | | | | | 1,445,494,273 | |
Withhold | | | 21,747,881 | | | | | Withhold | | | 23,335,040 | | | | | Withhold | | | | | 21,509,362 | |
Total | | | 1,467,003,635 | | | | | Total | | | 1,467,003,635 | | | | | Total | | | | | 1,467,003,635 | |
| | | | | | | | |
Thomas F. Lydon | | | | | | | Patrick T. McCarville | | | | | | | Roger Somers | | | | | |
For | | | 1,444,219,448 | | | | | For | | | 1,445,357,773 | | | | | For | | | | | 1,443,486,735 | |
Withhold | | | 22,784,187 | | | | | Withhold | | | 21,645,862 | | | | | Withhold | | | | | 23,516,900 | |
Total | | | 1,467,003,635 | | | | | Total | | | 1,467,003,635 | | | | | Total | | | | | 1,467,003,635 | |
At a special meeting of shareholders held on January 26, 2012, the shareholders of the Funds also voted on whether to approve a “manager of managers” arrangement for each of the Funds. Although shareholder votes were placed, not enough votes were received to meet the minimum requirements to constitute a majority vote. As such, the matter was closed.
Quarterly Portfolio Schedules Information
The Trust files its complete schedule of portfolio holdings with the SEC for the first and third quarters of each fiscal year on Form N-Q; which are available on the SEC’s website at http://www.sec.gov. The Funds’ Forms N-Q may be reviewed and copied at the SEC’s Public Reference Room in Washington, DC, and that information on the operation of the Public Reference Room may be obtained by calling 1-800-SEC-0330. Copies of the portfolio holdings are also available to shareholders, without charge and upon request, by calling 1.800.820.0888.
| | | | |
| | | | | |
| 156 | | THE RYDEX FUNDSANNUALREPORT | | |
|
| OTHER INFORMATION (Unaudited) (concluded) |
| |
Office Locations
The offices of Guggenheim Investments can be found in the following locations:
40 East 52nd Street
16th Floor
New York, NY 10022
(Headquarters)
Four Irvington Centre
805 King Farm Boulevard
Suite 600
Rockville, MD 20850
9401 Indian Creek Parkway
40 Corporate Woods
Suite 850
Overland Park, KS 66210
Guggenheim Transaction
On September 20, 2011, Guggenheim Capital, LLC agreed to purchase the indirect holding company of Security Investors, LLC, the Fund’s investment manager (the “Investment Manager”) (the “Transaction”). Guggenheim Capital, LLC’s subsidiary, Guggenheim Partners, LLC (“Guggenheim”), is a global, independent, privately-held, diversified financial services firm with more than 1,500 dedicated professionals. The Transaction closed on February 29, 2012.
The Transaction should not result in material changes to the day-to-day management and operation of the Fund or any increase in fees.
In anticipation of the Transaction, the Board of Trustees of the Funds (the “Board”) called a special meeting of shareholders (the “Meeting”), at which shareholders of the Funds of record as of October 3, 2011 were asked to consider the approval of a new investment management agreement between the Funds and the Investment Manager (the “New Agreement”). This approval was necessary because, under the Investment Company Act of 1940 (the “1940 Act”), the Transaction could result in the termination of the Funds’ current investment management agreement with the Investment Manager (the “Current Agreement”). The Funds’ shareholders approved the New Agreement, the terms of which are substantially identical to the corresponding Current Agreement, except with respect to the date of execution.
Election of Board Members
The Board also approved a proposal to elect nine individuals to the Board. The Board proposed the election of the following nominees: Donald C. Cacciapaglia, Corey A. Colehour, J. Kenneth Dalton, John O. Demaret, Richard M. Goldman, Werner E. Keller, Thomas F. Lydon, Patrick T. McCarville and Roger Somers. Each of the nominees, other than Mr. Cacciapaglia, currently serves as a Trustee. In connection with the Transaction, the Board believes that expanding the Board to include Mr. Cacciapaglia, who is a member of senior management of Guggenheim’s investment management business, and who would serve on other boards in the Guggenheim Investments family of funds, would be appropriate. The Trusts’ shareholders ultimately approved the aforementioned proposal.
| | | | |
| | | | | |
| | THE RYDEX FUNDSANNUALREPORT | | 157 |
|
| INFORMATION ON BOARD OF TRUSTEES AND OFFICERS (Unaudited) |
| |
A Board of Trustees oversees the Trust, as well as other trusts of GI, in which its members have no stated term of service, and continue to serve after election until resignation. The Statement of Additional Information includes further information about Fund Trustees and Officers, and can be obtained without charge by calling 800.820.0888.
All Trustees and Officers may be reached c/o Guggenheim Investments, 805 King Farm Boulevard, Suite 600, Rockville, MD 20850.
TRUSTEE AND OFFICER
| | | | |
Name, Position and Year of Birth | | Length of Service As Trustee (Year Began) | | Number of Funds Overseen |
Donald C. Cacciapaglia* | | Rydex Series Funds – 2012 | | 148 |
| Trustee, President (1951) | | Rydex Variable Trust – 2012 | | |
| | Rydex Dynamic Funds – 2012 | | |
| | Rydex ETF Trust – 2012 | | |
Principal Occupations During Past Five Years: Security Investors, LLC: President and CEO from April 2012 to present; Guggenheim Investments: President and Chief Administrative Officer from February 2010 to present; Channel Capital Group, Inc.: Chairman and CEO from April 2002 to February 2010.
INDEPENDENT TRUSTEES
| | | | |
Name, Position and Year of Birth | | Length of Service As Trustee (Year Began) | | Number of Funds Overseen |
| Corey A. Colehour | | Rydex Series Funds – 1993 | | 148 |
| Trustee (1945) | | Rydex Variable Trust – 1998 | | |
| | Rydex Dynamic Funds – 1999 | | |
| | Rydex ETF Trust – 2003 | | |
Principal Occupations During Past Five Years: Retired; Member of the Audit, Governance and Nominating Committees (1995 to present)
| | | | |
| J. Kenneth Dalton | | Rydex Series Funds – 1995 | | 148 |
| Trustee (1941) | | Rydex Variable Trust – 1998 | | |
| | Rydex Dynamic Funds – 1999 | | |
| | Rydex ETF Trust – 2003 | | |
Principal Occupations During Past Five Years: Retired; Member of the Governance and Nominating Committees (1995 to present); Chairman of the Audit Committee (1997 to present); Member of the Risk Oversight Committee (2010 to present)
| | | | |
| John O. Demaret | | Rydex Series Funds – 1997 | | 148 |
| Trustee, Chairman of the | | Rydex Variable Trust – 1998 | | |
| Board (1941) | | Rydex Dynamic Funds – 1999 | | |
| | Rydex ETF Trust – 2003 | | |
Principal Occupations During Past Five Years: Retired; Member of the Audit Committee (1997 to present); Member of the Risk Oversight Committee (2010 to present)
| | | | |
| Werner E. Keller | | Rydex Series Funds – 2005 | | 148 |
| Trustee (1940) | | Rydex Variable Trust – 2005 | | |
| | Rydex Dynamic Funds – 2005 | | |
| | Rydex ETF Trust – 2005 | | |
Principal Occupations During Past Five Years: Founder and President of Keller Partners, LLC (registered investment adviser) (2005 to present); Member of the Audit, Governance and Nominating Committees (2005 to present); Chairman and Member of the Risk Oversight Committee (2010 to present)
| | | | |
| Thomas F. Lydon, Jr. | | Rydex Series Funds – 2005 | | 148 |
| Trustee (1960) | | Rydex Variable Trust – 2005 | | |
| | Rydex Dynamic Funds – 2005 | | |
| | Rydex ETF Trust – 2005 | | |
Principal Occupations During Past Five Years: President, Global Trends Investments (1996 to present); Member of the Audit, Governance and Nominating Committees (2005 to present)
| | | | |
| | | | | |
| 158 | | THE RYDEX FUNDSANNUALREPORT | | |
|
INFORMATION ON BOARD OF TRUSTEES AND OFFICERS (Unaudited) (continued) |
|
INDEPENDENT TRUSTEES – concluded
| | | | |
Name, Position and Year of Birth | | Length of Service As Trustee (Year Began) | | Number of Funds Overseen |
Patrick T. McCarville | | Rydex Series Funds – 1997 | | 148 |
Trustee (1942) | | Rydex Variable Trust – 1998 | | |
| | Rydex Dynamic Funds – 1999 | | |
| | Rydex ETF Trust – 2003 | | |
Principal Occupations During Past Five Years: CEO, Par Industries, Inc., d/b/a Par Leasing (1977 to 2010); Chairman of the Governance and Nominating Committees (1997 to present); Member of the Audit Committee (1997 to present)
| | | | |
Roger Somers | | Rydex Series Funds – 1993 | | 148 |
Trustee (1944) | | Rydex Variable Trust – 1998 | | |
| | Rydex Dynamic Funds – 1999 | | |
| | Rydex ETF Trust – 2003 | | |
Principal Occupations During Past Five Years: Founder and CEO of Arrow Limousine (1965 to present); Member of the Audit, Governance and Nominating Committees (1995 to present)
EXECUTIVE OFFICERS
| | |
Name, Position and Year of Birth | | Principal Occupations During Past Five Years |
Michael P. Byrum* Vice President (1970) | | Current: President, Security Benefit Asset Management Holdings, LLC; Senior Vice President, Security Investors, LLC; President and Chief Investment Officer, Rydex Holdings, LLC; Director and Chairman of the Board, Advisor Research Center, Inc.; Manager, Rydex Specialized Products, LLC Previous: Rydex Distributors, LLC (f/k/a Rydex Distributors, Inc.), Vice President (2009); Rydex Fund Services, LLC, Director (2009-2010), Secretary (2002- 2010), Executive Vice President (2002- 2006); Rydex Advisors, LLC (f/k/a PADCO Advisors, Inc.), Director (2008- 2010), Chief Investment Officer (2006-2010), President (2004-2010), Secretary (2002-2010); Rydex Advisors II, LLC (f/k/a PADCO Advisors II, Inc.), Director (2008-2010), Chief Investment Officer (2006-2010), President (2004-2010), Secretary (2002-2010); Rydex Capital Partners, LLC, President and Secretary (2003-2007); Rydex Capital Partners II, LLC, (2003-2007); Rydex Holdings, LLC (f/k/a Rydex Holdings, Inc.), Secretary (2005-2008), Executive Vice President (2005-2006); Advisor Research Center, Inc., Secretary (2006-2009), Executive Vice President (2006); Rydex Specialized Products, LLC, Secretary (2005-2008) |
| |
Nikolaos Bonos* Vice President and Treasurer (1963) | | Current: Senior Vice President, Security Investors, LLC; Chief Executive Officer and Manager, Rydex Specialized Products, LLC; Chief Executive Officer and President, Rydex Fund Services, LLC; Vice President, Rydex Holdings, LLC; Treasurer, SBL Fund; Security Equity Fund; Security Income Fund; Security Large Cap Value Fund and Security Mid Cap Growth Fund; Vice President, Security Benefit Asset Management Holdings, LLC Previous: Security Global Investors, LLC, Senior Vice President (2010-2011); Rydex Advisors, LLC (f/k/a PADCO Advisors, Inc.) Senior Vice President (2006-2011); Rydex Fund Services, LLC (f/k/a Rydex Fund Services, Inc.), Director (2009), Senior Vice President (2003-2006); Rydex Specialized Products, LLC, Chief Financial Officer (2005-2009) |
| |
Elisabeth Miller* Chief Compliance Officer (1968) | | Current: Chief Compliance Officer, Rydex Series Funds, Rydex Dynamic Funds, Rydex Variable Trust, Rydex ETF Trust, Security Equity Fund, Security Income Fund, Security Large Cap Value Fund, Security Mid Cap Growth Fund, SBL Fund, Security Investors, LLC, and Rydex Distributors, LLC Previous: Senior Manager, Security Investors, LLC and Rydex Distributors, LLC (2004-2009). |
| | | | |
| | | | | |
| | THE RYDEX FUNDSANNUALREPORT | | 159 |
|
INFORMATION ON BOARD OF TRUSTEES AND OFFICERS (Unaudited) (concluded) |
|
EXECUTIVE OFFICERS – concluded
| | |
Name, Position and Year of Birth | | Principal Occupations During Past Five Years |
Amy J. Lee* Vice President and Assistant Secretary (1960) | | Current: Senior Vice President and Secretary, Security Investors, LLC; Secretary and Chief Compliance Officer, Security Distributors, Inc.; Vice President, Associate General Counsel and Assistant Secretary, Security Benefit Life Insurance Company and Security Benefit Corporation; Associate General Counsel, First Security Benefit Life Insurance and Annuity of New York; Vice President and Secretary, SBL Fund; Security Equity Fund; Security Income Fund; Security Large Cap Value Fund and Security Mid Cap Growth Fund; Vice President and Secretary, Rydex Holdings, LLC; Secretary, Advisor Research Center, Inc., Rydex Specialized Products, LLC, Rydex Distributors, LLC and Rydex Fund Services, LLC; Assistant Secretary, Security Benefit Clinic and Hospital Previous: Security Global Investors, LLC, Senior Vice President and Secretary (2007- 2011); Rydex Advisors, LLC (f/k/a PADCO Advisors, Inc.) and Rydex Advisors II, LLC (f/k/a PADCO Advisors II, Inc.), Senior Vice President and Secretary (2010- 2011); Brecek and Young Advisors, Inc., Director (2004- 2008) |
| |
Joseph M. Arruda* Assistant Treasurer (1966) | | Current: Assistant Treasurer, SBL Fund; Security Equity Fund; Security Income Fund; Security Large Cap Value Fund and Security Mid Cap Growth Fund; Vice President, Security Investors, LLC; Chief Financial Officer and Manager, Rydex Specialized Products, LLC Previous: Security Global Investors, LLC, Vice President (2010-2011); Rydex Advisors, LLC (f/k/a PADCO Advisors, Inc.) and Rydex Advisors II, LLC (f/k/a PADCO Advisors II, Inc.), Vice President (2004-2011) |
| * | Officers of the Funds are deemed to be “interested persons” of the Trust, within the meaning of Section 2(a) (19) of the 1940 Act, inasmuch as this person is affiliated with Security Global Investors. |
| | | | |
| | | | | |
| 160 | | THE RYDEX FUNDSANNUALREPORT | | |
|
| GUGGENHEIM INVESTMENTS PRIVACY POLICIES |
Rydex Funds, Guggenheim Funds, Rydex Investments, Rydex Distributors, Inc., Security Investors, LLC, Security Distributors, Inc. and Rydex Advisory Services (Collectively “Guggenheim Investments”)
Our Commitment to You
When you become a Guggenheim Investments investor, you entrust us with not only your hard-earned money but also with personal and financial information about you. We recognize that your relationship with us is based on trust and that you expect us to act responsibly and in your best interests. Because we have access to this private information about you, we hold ourselves to the highest standards in its safekeeping and use. This means, most importantly, that we do not sell client information to anyone—whether it is your personal information or if you are a current or former Guggenheim Investments client.
The Information We Collect About You
In the course of doing business with shareholders and investors, we collect nonpublic personal information about you. You typically provide personal information when you complete a Guggenheim Investments account application or when you request a transaction that involves Rydex and Guggenheim Investments funds or one of the Guggenheim Investments affiliated companies. “Nonpublic personal information” is personally identifiable private information about you. For example, it includes information regarding your name and address, Social Security or taxpayer identification number, assets, income, account balance, bank account information and investment activity (e.g., purchase and redemption history).
How We Handle Your Personal Information
As emphasized above, we do not sell information about current or former clients or their accounts to third parties. Nor do we share such information, except when necessary to complete transactions at your request or to make you aware of related investment products and services that we offer. Additional details about how we handle your personal information are provided below. To complete certain transactions or account changes that you direct, it may be necessary to provide identifying information to companies, individuals or groups that are not affiliated with Guggenheim Investments. For example, if you ask to transfer assets from another financial institution to Guggenheim Investments, we will need to provide certain information about you to that company to complete the transaction. To alert you to other Guggenheim Investments investment products and services, we may share your information within the Guggenheim Investments family of affiliated companies. This would include, for example, sharing your information within Guggenheim Investments so we can make you aware of new Rydex and Guggenheim Investments funds or the services offered through another Guggenheim Investments affiliated company. In certain instances, we may contract with nonaffiliated companies to perform services for us. Where necessary, we will disclose information we have about you to these third parties. In all such cases, we provide the third party with only the information necessary to carry out its assigned responsibilities and only for that purpose. And we require these third parties to treat your private information with the same high degree of confidentiality that we do. In certain instances, we may share information with other financial institutions regarding individuals and entities in response to the U.S.A. Patriot Act. Finally, we will release information about you if you direct us to do so, if we are compelled by law to do so or in other circumstances permitted by law.
Opt Out Provisions
We do not sell your personal information to anyone. The law allows you to “opt out” of only certain kinds of information sharing with third parties. The firm does not share personal information about you with any third parties that triggers this opt-out right. This means YOU ARE ALREADY OPTED OUT.
How We Protect Privacy Online
Our concern for the privacy of our shareholders also extends to those who use our web site, www.rydex-sgi.com. Our web site uses some of the most secure forms of online communication available, including encryption technology, Secure Socket Layer (SSL) protocol, firewalls and user names and passwords. These technologies provide a high level of security and privacy when you access your account information or initiate online transactions. The Guggenheim Investments web site offers customized features that require our use of “http cookies”—tiny pieces of
| | | | |
| | | | | |
| | THE RYDEX FUNDSANNUALREPORT | | 161 |
|
| GUGGENHEIM INVESTMENTS PRIVACY POLICIES (concluded) |
information that we ask your browser to store. However, we make very limited use of these cookies. We only use cookies for session management and security features on the Guggenheim Investments web site. We do not use them to pull data from your hard drive, to learn your email address, or to view data in cookies created by other web sites. We will not share the information in our cookies or give others access to it. See the legal information area on our web site for more details about web site security and privacy features.
How We Safeguard Your Personal Information
We restrict access to nonpublic personal information about shareholders to our employees and in some cases to third parties (for example, the service providers described above) as permitted by law. We maintain strict physical, electronic and procedural safeguards that comply with federal standards to guard your nonpublic personal information.
We’ll Keep You Informed
As required by federal law, we will notify shareholders of our privacy policy annually. We reserve the right to modify this policy at any time, but rest assured that if we do change it, we will tell you promptly. You will also be able to access our privacy policy from our web site at www.rydex-sgi.com. Should you have any questions regarding our privacy policy, contact us at 800.820.0888 or 301.296.5100.
| | | | |
| | | | | |
| 162 | | THE RYDEX FUNDSANNUALREPORT | | |
This page intentionally left blank.
This page intentionally left blank.
This page intentionally left blank.

805 King Farm Boulevard, Suite 600
Rockville, MD 20850
www.rydex-sgi.com
800.820.0888
RSECF-ANN-2-0312x0313

GUGGENHEIM ALTERNATIVES FUNDS
GUGGENHEIM U.S. LONG SHORT MOMENTUM FUND
GUGGENHEIM ALTERNATIVE STRATEGIES ALLOCATION FUND
GUGGENHEIM EVENT DRIVEN AND DISTRESSED STRATEGIES FUND
GUGGENHEIM LONG SHORT EQUITY STRATEGY FUND
GUGGENHEIM LONG SHORT INTEREST RATE STRATEGY FUND
RYDEX INTERNATIONAL EQUITY FUNDS
RYDEX EMERGING MARKETS 2x STRATEGY FUND
RYDEX INVERSE EMERGING MARKETS 2x STRATEGY FUND

ELIMINATE MAILBOX CLUTTER
Go paperless with Guggenheim Investments eDelivery—a service giving you full online access to account information and documents. Save time, cut down on mailbox clutter and be a friend to the environment with eDelivery.
With Guggenheim Investments eDelivery you can:
| • | | View online confirmations and statements at your convenience. |
| • | | Receive email notifications when your most recent confirmations, statements and other account documents are available for review. |
| • | | Access prospectuses, annual reports and semiannual reports online. |

If you have questions about Guggenheim Investments eDelivery services, contact one of our Shareholder Service Representatives at 800.820.0888.

This report and the financial statements contained herein are submitted for the general information of our shareholders. The report is not authorized for distribution to prospective investors unless preceded or accompanied by an effective prospectus.
Distributed by Rydex Distributors, LLC.
| | | | |
| | | | | |
| | THE GUGGENHEIM FUNDS ANNUAL REPORT | | 1 |
|
| LETTER TO OUR SHAREHOLDERS |
| |
To Our Shareholders:
A restructuring of Greece’s massive debt, continued accommodation by the world’s major central banks and better news on the U.S. economy helped support financial markets over the fiscal year ended March 31, 2012, with the S&P 500® Index* rising about 9%. Market optimism peaked in early 2012, when several major equity indices pushed to the highest levels in four years or more. But the mood grew more cautious late in the period after the Federal Reserve (“the Fed”) expressed views that continued weakness in housing and employment may pose a risk to the strength of the recovery.
U.S. equities experienced big intra-year swings. Markets swooned by nearly 20% last summer amid the loss of the U.S. AAA credit rating, the end of the Fed’s second round of quantitative easing and rising oil prices. But after touching the year’s low in early October, improving U.S. economic data and European Central Bank’s injections of three-year loans into the continent’s banking system helped markets make up lost ground, which carried over into a strong first quarter of 2012.
Among the upbeat U.S. economic reports in recent months: more than 600,000 jobs have been added since the beginning of 2012; house prices have fallen enough to start to spur demand, lifting sales and new construction; and the U.S. GDP expanded at an annual rate of 3% in the fourth quarter of 2011, its strongest rate in a year and a half. Consumer confidence climbed in March to its highest level in a year.
While acknowledging the good news, the Fed warned that policymakers cannot be sure the recent pace of improvement will be sustained unless growth picks up. To foster growth, the Fed has said it will leave its key interest rate close to zero at least through 2014, despite arguments by some Fed officials and investors that the Fed may have to consider raising rates much earlier than that to prevent inflation. For now, the Fed’s leadership appears to be committed to keeping rates low, thus reducing borrowing costs for businesses and consumers. Consumer spending remains sluggish, and lackluster forecasts for first-quarter corporate profits were a reminder that the economic recovery remains fragile.
The world’s leading central bankers have continued to take steps to recharge the global economy. Greece’s debt restructuring enabled a new international bailout, while an injection of liquidity from the European Central Bank lessened financial stresses across the continent and contributed to improvement in global financial markets. However, March manufacturing gauges indicated that the eurozone has entered a period of economic contraction, meaning that policy makers may need to do more to revive economic growth across the region. The Bank of England and the Bank of Japan have also increased asset-buying programs. In China, recent strong factory data eased fears that a hard landing could wreak havoc on the global economy. The country cut its annual growth target to 7.5%, as its policymakers are trying to shift the country away from investment and exports and to greater domestic consumption.
Improvement in the U.S. economy is luring investors from ultra-safe, but often low-yielding assets. Falling U.S. Treasury bond prices, for example, boosted yields from a 70-year low last fall to a recent range of around 2% for the 10-year note. After outperforming equities for much of the past decade, and drawing heavy asset flows, many analysts are cautious about certain
fixed-income sectors, particularly government debt, as the economy improves and the potential grows for a rise in interest rates. Investment-grade and higher-yielding corporates, however, are expected to continue to outperform.
Likewise, commodities, which had been slumping since mid-2011 due to slowing economic activity and the European debt crisis, rebounded in early 2012 on stronger macroeconomic data, with the price of a barrel of oil surging from last October’s $77 to a peak of $113 in late February. Investors also have been shifting out of gold to assets with greater return potential; after peaking at nearly $2,000 last summer, the price per ounce has fallen back to around $1,600.
| | | | |
| | | | | |
| 2 | | THE GUGGENHEIM FUNDS ANNUAL REPORT | | |
|
| LETTER TO OUR SHAREHOLDERS (concluded) |
| |
The U.S. economy seems to be decoupling from slowing growth in the rest of the world and from ongoing uncertainty in the European debt crisis, as well as the domestic debate over tax and spending policy. In this resiliency, we see potential in U.S. investments, including equities, high yield bonds, bank loans and other risk assets. It appears that the U.S. may have entered a period of self-sustaining, if modest, economic expansion, driven primarily by the aggressive monetary policy of the Fed and reinforced by the ECB, and is increasingly becoming the economic locomotive of the global economy.
We look forward to continuing our service to you. Thank you for investing in our funds.
Sincerely,

Donald C. Cacciapaglia
President
*S&P 500® Index is a capitalization-weighted index covering 500 industrial, utility, transportation and financial companies of the U.S. markets (mostly NYSE Euronext issues).
Performance displayed represents past performance which is no guarantee of future results. Of course, fund performance is subject to daily market volatility and may be better or worse since the end of the last quarter. For up-to-date fund performance, call us at 800.820.0888 or visit www.rydex-sgi.com.
Read each fund’s prospectus and summary prospectus (if available) carefully before investing. It contains the fund’s investment objectives, risks, charges, expenses and other information, which should be considered carefully before investing. Obtain a prospectus and summary prospectus (if available) at www.rydex-sgi.com or call 800.820.0888
The referenced funds are distributed by Rydex Distributors, LLC. Guggenheim Investments represents the investment management business of Guggenheim Partners, LLC, which includes Security Investors, LLC, the investment advisor to the referenced funds. Rydex Distributors, LLC is affiliated with Guggenheim Partners, LLC and Security Investors, LLC.
| | | | |
| | | | | |
| | THE GUGGENHEIM FUNDS ANNUAL REPORT | | 3 |
|
| A BRIEF NOTE ON THE COMPOUNDING OF RETURNS (Unaudited) |
| |
Emerging Markets 2x Strategy Fund and Inverse Emerging Markets 2x Strategy Fund described in this report are benchmarked daily to leveraged and/or inverse leveraged versions of published indices. To properly evaluate the performance of these funds, it is essential to understand the effect of mathematical compounding on their respective returns.
Because of the nonlinear effects of leverage applied over time, it is possible for a fund to perform in line with its benchmark for several individual periods in a row, yet seem to trail the benchmark over the entire period. It is also possible that a fund that performs in line with its benchmark on a daily basis may seem to outperform its benchmark over longer periods.
An Example Of Compounding
For example, consider a hypothetical fund that is designed to produce returns that correspond to 150% of an index. On the first day of a period, the index rises from a level of 100 to a level of 106, producing a 6.0% gain and an expectation that the fund will rise by 9.0%. On the same day, the fund’s net asset value (“NAV”) per share increases from $10.00 to $10.90 for a gain of 9.0%–in line with its benchmark. On day two, assume the index falls from 106 to 99 for a loss of about 6.6%. The fund, as expected, falls 9.9% to a price of $9.82. On each day, the fund performed exactly in line with its benchmark, but for the two-day period, the fund was down 1.8%, while the index was down only 1.0%. Without taking into account the daily compounding of returns, one would expect the fund to lose 1.5% and would see the fund as trailing by 0.3% when in fact it had performed perfectly. This example is summarized in the table below.
| | | | | | | | | | | | | | | | | | | | | | | | |
| | | Index
Level | | | Index
Performance | | | Fund
Expectation | | | Fund
NAV | | | Fund
Performance | | | Assessment | |
Start | | | 100 | | | | | | | | | | | $ | 10.00 | | | | | | | | | |
Day 1 | | | 106 | | | | 6.0 | % | | | 9.0 | % | | $ | 10.90 | | | | 9.0 | % | | | In line | |
Day 2 | | | 99 | | | | -6.6 | % | | | -9.9 | % | | $ | 9.82 | | | | -9.9 | % | | | In line | |
Cumulative | | | | | | | -1.0 | % | | | -1.5 | % | | | | | | | -1.8 | % | | | -0.3 | % |
As illustrated by this simple example, the effect of leverage can make it difficult to form expectations or judgments about fund performance given only the returns of the unleveraged index.
Because funds seek to track the performance of their benchmark on a daily basis, mathematical compounding, especially with respect to those funds that use leverage as part of their investment strategy, may prevent a fund from correlating with the monthly, quarterly, annual or other period performance of its benchmark. Due to the compounding of daily returns, leveraged and inverse funds’ returns over periods other than one day will likely differ in amount and possibly direction from the benchmark return for the same period. Investors should monitor their leveraged and inverse funds’ holdings consistent with their strategies, as frequently as daily. For those funds that consistently apply leverage, the value of the fund’s shares will tend to increase or decrease more than the value of any increase or decrease in its benchmark index. For more on correlation, leverage and other risks, please read the prospectus.
In general, any change in direction in an index will produce compounding that seems to work against an investor. Were the index to move in the same direction (either up or down) for two or more periods in a row, the compounding of those returns would work in an investor’s favor, causing the fund to seemingly beat its benchmark.
As a general rule of thumb, more leverage in a fund will magnify the compounding effect, while less leverage will generally produce results that are more in line with expectations. In addition, periods of high volatility in an underlying index will also cause the effects of compounding to be more pronounced, while lower volatility will produce a more muted effect.
| | | | |
| | | | | |
| 4 | | THE GUGGENHEIM FUNDS ANNUAL REPORT | | |
|
| ABOUT SHAREHOLDERS’ FUND EXPENSES (Unaudited) |
| |
All mutual funds have operating expenses and it is important for our shareholders to understand the impact of costs on their investments. Shareholders of a Fund incur two types of costs: (i) transaction costs, including sales charges (loads) on purchase payments, reinvested dividends, or other distributions; and exchange fees; and (ii) ongoing costs, including management fees, administrative services, and shareholder reports, among others. These ongoing costs, or operating expenses, are deducted from a fund’s gross income and reduce the investment return of the fund.
A fund’s expenses are expressed as a percentage of its average net assets, which is known as the expense ratio. The following examples are intended to help investors understand the ongoing costs (in dollars) of investing in a Fund and to compare these costs with the ongoing costs of investing in other mutual funds.
The examples are based on an investment of $1,000 made at the beginning of the period and held for the entire six-month period beginning September 30, 2011 and ending March 31, 2012.
The following tables illustrate a Fund’s costs in two ways:
Table 1. Based on actual Fund return. This section helps investors estimate the actual expenses paid over the period. The “Ending Account Value” shown is derived from the Fund’s actual return, and the fourth column shows the dollar amount that would have been paid by an investor who started with $1,000 in the Fund. Investors may use the information here, together with the amount invested, to estimate the expenses paid over the period. Simply divide the Fund’s account value by $1,000 (for example, an $8,600 account value divided by $1,000 = 8.6), then multiply the result by the number provided under the heading “Expenses Paid During Period.”
Table 2. Based on hypothetical 5% return. This section is intended to help investors compare a Fund’s cost with those of other mutual funds. The table provides information about hypothetical account values and hypothetical expenses based on the Fund’s actual expense ratio and an assumed rate of return of 5% per year before expenses, which is not the Fund’s actual return. The hypothetical account values and expenses may not be used to estimate the actual ending account balance or expenses paid during the period. The example is useful in making comparisons because the U.S. Securities and Exchange Commission (the “SEC”) requires all mutual funds to calculate expenses based on the 5% return. Investors can assess a Fund’s costs by comparing this hypothetical example with the hypothetical examples that appear in shareholder reports of other funds.
The calculations illustrated above assume no shares were bought or sold during the period. Actual costs may have been higher or lower, depending on the amount of investment and the timing of any purchases or redemptions.
Please note that the expenses shown in the table are meant to highlight your ongoing costs only and do not reflect any transactional costs, such as sales charges (loads) on purchase payments, and contingent deferred sales charges (“CDSC”) on redemptions, if any. Therefore, the second table is useful in comparing ongoing costs only, and will not help you determine the relative total costs of owning different funds. In addition, if these transactional costs were included, your costs would have been higher.
More information about a Fund’s expenses, including annual expense ratios for the past five years, can be found in the Financial Highlights section of this report. For additional information on operating expenses and other shareholder costs, please refer to the appropriate Fund prospectus.
| | | | |
| | | | | |
| | THE GUGGENHEIM FUNDS ANNUAL REPORT | | 5 |
|
| ABOUT SHAREHOLDERS’ FUND EXPENSES (Unaudited) (continued) |
| |
| | | | | | | | | | | | | | | | | | | | |
| | | Expense
Ratio1 | | | Fund
Return | | | Beginning
Account Value
September 30, 2011 | | | Ending
Account Value
March 31, 2012 | | | Expenses
Paid During
Period2 | |
Table 1. Based on actual Fund return3 | | | | | | | | | | | | | | | | | | | | |
| | | | | |
U.S. Long Short Momentum Fund | | | | | | | | | | | | | | | | | | | | |
A-Class | | | 1.64 | % | | | 12.07 | % | | $ | 1,000.00 | | | $ | 1,120.70 | | | $ | 8.69 | |
C-Class | | | 2.39 | % | | | 11.71 | % | | | 1,000.00 | | | | 1,117.10 | | | | 12.65 | |
H-Class | | | 1.64 | % | | | 12.11 | % | | | 1,000.00 | | | | 1,121.10 | | | | 8.70 | |
Institutional Class5 | | | 1.36 | % | | | 7.59 | % | | | 1,000.00 | | | | 1,075.90 | | | | 4.71 | |
| | | | | |
Alternative Strategies Allocation Fund4 | | | | | | | | | | | | | | | | | | | | |
A-Class | | | 0.00 | % | | | 4.85 | % | | | 1,000.00 | | | | 1,048.50 | | | | — | |
C-Class | | | 0.75 | % | | | 4.49 | % | | | 1,000.00 | | | | 1,044.90 | | | | 3.83 | |
H-Class | | | 0.00 | % | | | 4.85 | % | | | 1,000.00 | | | | 1,048.50 | | | | — | |
| | | | | |
Event Driven and Distressed Strategies Fund | | | | | | | | | | | | | | | | | | | | |
A-Class | | | 1.80 | % | | | 10.48 | % | | | 1,000.00 | | | | 1,104.80 | | | | 9.47 | |
C-Class | | | 2.56 | % | | | 10.03 | % | | | 1,000.00 | | | | 1,100.30 | | | | 13.44 | |
H-Class | | | 1.81 | % | | | 10.48 | % | | | 1,000.00 | | | | 1,104.80 | | | | 9.52 | |
Institutional Class | | | 1.57 | % | | | 10.61 | % | | | 1,000.00 | | | | 1,106.10 | | | | 8.27 | |
| | | | | |
Long Short Equity Strategy Fund | | | | | | | | | | | | | | | | | | | | |
A-Class | | | 2.41 | % | | | 11.15 | % | | | 1,000.00 | | | | 1,111.50 | | | | 12.72 | |
C-Class | | | 3.30 | % | | | 10.72 | % | | | 1,000.00 | | | | 1,107.20 | | | | 17.38 | |
H-Class | | | 2.54 | % | | | 11.15 | % | | | 1,000.00 | | | | 1,111.50 | | | | 13.41 | |
Institutional Class | | | 2.23 | % | | | 11.28 | % | | | 1,000.00 | | | | 1,112.80 | | | | 11.78 | |
| | | | | |
Long Short Interest Rate Strategy Fund | | | | | | | | | | | | | | | | | | | | |
A-Class | | | 1.49 | % | | | 0.63 | % | | | 1,000.00 | | | | 1,006.30 | | | | 7.47 | |
C-Class | | | 2.24 | % | | | 0.26 | % | | | 1,000.00 | | | | 1,002.60 | | | | 11.21 | |
H-Class | | | 1.49 | % | | | 0.63 | % | | | 1,000.00 | | | | 1,006.30 | | | | 7.47 | |
Institutional Class | | | 1.24 | % | | | 0.76 | % | | | 1,000.00 | | | | 1,007.60 | | | | 6.22 | |
| | | | | |
Emerging Markets 2x Strategy Fund | | | | | | | | | | | | | | | | | | | | |
A-Class | | | 1.67 | % | | | 35.14 | % | | | 1,000.00 | | | | 1,351.40 | | | | 9.82 | |
C-Class | | | 2.44 | % | | | 34.92 | % | | | 1,000.00 | | | | 1,349.20 | | | | 14.33 | |
H-Class | | | 1.67 | % | | | 35.37 | % | | | 1,000.00 | | | | 1,353.70 | | | | 9.83 | |
| | | | | |
Inverse Emerging Markets 2x Strategy Fund | | | | | | | | | | | | | | | | | | | | |
A-Class | | | 1.68 | % | | | (37.97 | %) | | | 1,000.00 | | | | 620.30 | | | | 6.81 | |
C-Class | | | 2.42 | % | | | (36.52 | %) | | | 1,000.00 | | | | 634.80 | | | | 9.89 | |
H-Class | | | 1.68 | % | | | (37.93 | %) | | | 1,000.00 | | | | 620.70 | | | | 6.81 | |
| | | | |
| | | | | |
| 6 | | THE GUGGENHEIM FUNDS ANNUAL REPORT | | |
|
| ABOUT SHAREHOLDERS’ FUND EXPENSES (Unaudited) (concluded) |
| |
| | | | | | | | | | | | | | | | | | | | |
| | | Expense
Ratio1 | | | Fund
Return | | | Beginning
Account Value
September 30, 2011 | | | Ending
Account Value
March 31, 2012 | | | Expenses
Paid During
Period2 | |
Table 2. Based on hypothetical 5% return (before expenses) | |
| | | | | |
U.S. Long Short Momentum Fund | | | | | | | | | | | | | | | | | | | | |
A-Class | | | 1.64 | % | | | 5.00 | % | | $ | 1,000.00 | | | $ | 1,016.80 | | | $ | 8.27 | |
C-Class | | | 2.39 | % | | | 5.00 | % | | | 1,000.00 | | | | 1,013.05 | | | | 12.03 | |
H-Class | | | 1.64 | % | | | 5.00 | % | | | 1,000.00 | | | | 1,016.80 | | | | 8.27 | |
Institutional Class | | | 1.36 | % | | | 5.00 | % | | | 1,000.00 | | | | 1,018.20 | | | | 6.86 | |
| | | | | |
Alternative Strategies Allocation Fund4 | | | | | | | | | | | | | | | | | | | | |
A-Class | | | 0.00 | % | | | 5.00 | % | | | 1,000.00 | | | | 1,025.00 | | | | — | |
C-Class | | | 0.75 | % | | | 5.00 | % | | | 1,000.00 | | | | 1,021.25 | | | | 3.79 | |
H-Class | | | 0.00 | % | | | 5.00 | % | | | 1,000.00 | | | | 1,025.00 | | | | — | |
| | | | | |
Event Driven and Distressed Strategies Fund | | | | | | | | | | | | | | | | | | | | |
A-Class | | | 1.80 | % | | | 5.00 | % | | | 1,000.00 | | | | 1,016.00 | | | | 9.07 | |
C-Class | | | 2.56 | % | | | 5.00 | % | | | 1,000.00 | | | | 1,012.20 | | | | 12.88 | |
H-Class | | | 1.81 | % | | | 5.00 | % | | | 1,000.00 | | | | 1,015.95 | | | | 9.12 | |
Institutional Class | | | 1.57 | % | | | 5.00 | % | | | 1,000.00 | | | | 1,017.15 | | | | 7.92 | |
| | | | | |
Long Short Equity Strategy Fund | | | | | | | | | | | | | | | | | | | | |
A-Class | | | 2.41 | % | | | 5.00 | % | | | 1,000.00 | | | | 1,012.95 | | | | 12.13 | |
C-Class | | | 3.30 | % | | | 5.00 | % | | | 1,000.00 | | | | 1,008.50 | | | | 16.57 | |
H-Class | | | 2.54 | % | | | 5.00 | % | | | 1,000.00 | | | | 1,012.30 | | | | 12.78 | |
Institutional Class | | | 2.23 | % | | | 5.00 | % | | | 1,000.00 | | | | 1,013.85 | | | | 11.23 | |
| | | | | |
Long Short Interest Rate Strategy Fund | | | | | | | | | | | | | | | | | | | | |
A-Class | | | 1.49 | % | | | 5.00 | % | | | 1,000.00 | | | | 1,017.55 | | | | 7.52 | |
C-Class | | | 2.24 | % | | | 5.00 | % | | | 1,000.00 | | | | 1,013.80 | | | | 11.28 | |
H-Class | | | 1.49 | % | | | 5.00 | % | | | 1,000.00 | | | | 1,017.55 | | | | 7.52 | |
Institutional Class | | | 1.24 | % | | | 5.00 | % | | | 1,000.00 | | | | 1,018.80 | | | | 6.26 | |
| | | | | |
Emerging Markets 2x Strategy Fund | | | | | | | | | | | | | | | | | | | | |
A-Class | | | 1.67 | % | | | 5.00 | % | | | 1,000.00 | | | | 1,016.65 | | | | 8.42 | |
C-Class | | | 2.44 | % | | | 5.00 | % | | | 1,000.00 | | | | 1,012.80 | | | | 12.28 | |
H-Class | | | 1.67 | % | | | 5.00 | % | | | 1,000.00 | | | | 1,016.65 | | | | 8.42 | |
| | | | | |
Inverse Emerging Markets 2x Strategy Fund | | | | | | | | | | | | | | | | | | | | |
A-Class | | | 1.68 | % | | | 5.00 | % | | | 1,000.00 | | | | 1,016.60 | | | | 8.47 | |
C-Class | | | 2.42 | % | | | 5.00 | % | | | 1,000.00 | | | | 1,012.90 | | | | 12.18 | |
H-Class | | | 1.68 | % | | | 5.00 | % | | | 1,000.00 | | | | 1,016.60 | | | | 8.47 | |
| 1 | This ratio represents annualized Net Expenses, which include interest and dividend expense related to securities sold short. Excluding short dividend expense and prime broker interest expense, the operating expense ratio would be 0.51%, 0.65%, 0.64%, and 0.58% lower in the Long Short Equity Strategy Fund for the A-Class, C-Class, H-Class and Institutional Class, respectively. |
| 2 | Expenses are equal to the Fund’s annualized expense ratio, net of any applicable fee waivers, multiplied by the average account value over the period, multiplied by 183/366 (to reflect the one-half year period). |
| 3 | Actual cumulative return at net asset value for the period September 30, 2011 to March 31, 2012. |
| 4 | Excludes expenses of the underlying funds in which the Fund invests. |
| 5 | Since commencement of operations: November 30, 2011. |
| | | | |
| | | | | |
| | THE GUGGENHEIM FUNDS ANNUAL REPORT | | 7 |
| | |
| PERFORMANCE REPORT AND FUND PROFILE (Unaudited) | | March 31, 2012 |
U.S. LONG SHORT MOMENTUM FUND
OBJECTIVE: Seeks long-term capital appreciation.
For the fiscal year ended March 31, 2012, the U.S. Long Short Momentum Fund H-Class returned -6.91% as opposed to its benchmark, the Russell 3000® Index*, which ended the year up 7.18%. The performance differential for the Fund can be attributed to three major sources of relative returns: core momentum strategy, defensive hedge and transaction costs/fees.
Momentum strategies performed in line with equity markets for the first half of the fiscal year. In October, the market experienced a strong counter-trend rally, resulting in benchmark relative performance of -4.3%. In January, after generating the strongest returns of calendar year 2011, Utilities reverted significantly. This reversal largely explains the core momentum model’s -3.4% underperformance relative to the Russell 3000 Index for this month. For the full fiscal year, the Fund’s core momentum model trailed the Russell 3000 Index by -8.8%. We saw negative performance for momentum strategies from both intermediate (3-months) and long-term (12-months) models in fiscal year 2011. This behavior was distinct from our 2010 experience, when positive performance from the long-term model roughly offset negative performance from the intermediate model.
The defensive hedging model served the role of dampening Fund volatility, but also suffered from October’s strong counter-trend rally. After being up the first half of the fiscal year, the defensive hedge surrendered -3.3% of Fund performance in October. For the fiscal year, the defensive hedge cost the Fund -3.4%. The hedge resulted in a reduction of annualized fund volatility to 12.0% versus 15.9% for the core model and 16.9% for the Russell 3000 Index.
For the year, transaction costs, which are estimated at 31 basis points, were relatively low given the turnover level of the momentum strategy, which approximated 112% per side in fiscal year 2011. Combined with management fees, these operational costs reduced Fund performance by -2.0% versus the Russell 3000 Index.
Within the core momentum model, large overweight positions of Trading Companies & Distributors and Tobacco industries contributed positively to benchmark relative return, with the two industry allocations generating alpha of 1.4% and 1.2%, respectively. A large underweight of the Diversified Financial Service industry also contributed positively to benchmark relative return, producing 0.5% of alpha for the Fund. The three biggest detractors from Fund performance were overweight positions in the Energy Equipment & Services, Healthcare Technology, and Multi-Utilities industries. These allocations cost the Fund -2.0%, -1.9%, and -1.2% of relative return, respectively.
Derivatives in the Fund are used for various purposes, including speculation.
*The Russell 3000 Index measures the performance of the largest 3000 U.S. companies, representing approximately 98% of the investable U.S. equity market. Performance displayed represents past performance which is no guarantee of future results.
Holdings Diversification (Market Exposure as % of Net Assets)
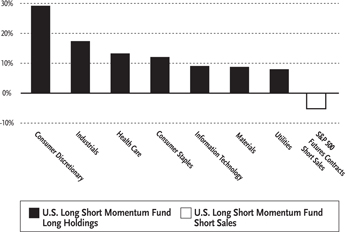
“Holdings Diversification (Market Exposure as % of Net Assets)” excludes any temporary cash investments.
| | | | |
Inception Dates: | |
A-Class | | | March 31, 2004 | |
C-Class | | | March 22, 2002 | |
H-Class | | | March 22, 2002 | |
Institutional Class | | | November 30, 2011 | |
| | | | |
Ten Largest Long Holdings (% of Total Net Assets) | |
Philip Morris International, Inc. | | | 4.7 | % |
Altria Group, Inc. | | | 2.9 | % |
International Paper Co. | | | 2.3 | % |
NIKE, Inc. — Class B | | | 2.2 | % |
Reynolds American, Inc. | | | 1.8 | % |
Fastenal Co. | | | 1.8 | % |
WW Grainger, Inc. | | | 1.7 | % |
Coach, Inc. | | | 1.6 | % |
Lorillard, Inc. | | | 1.6 | % |
Apple, Inc. | | | 1.5 | % |
| | | | |
Top Ten Total | | | 22.1 | % |
| | | | |
“Ten Largest Holdings” exclude any temporary cash or derivative investments.
| | | | |
| 8 | | THE GUGGENHEIM FUNDS ANNUAL REPORT | | |
| | |
| PERFORMANCE REPORT AND FUND PROFILE (Unaudited) (concluded) | | March 31, 2012 |
Cumulative Fund Performance*
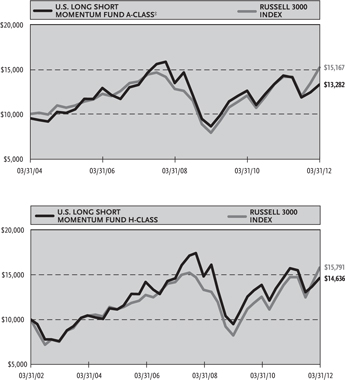
| | | | | | | | | | | | |
| Average Annual Returns* | |
| Periods Ended 03/31/12 | | | | | | | | | | | | |
| | | |
| | | 1 Year | | | 5 Year | | | 10 Year | |
C-Class Shares | | | -7.65 | % | | | -0.70 | % | | | 3.10 | % |
C-Class Shares with CDSC† | | | -8.58 | % | | | -0.70 | % | | | 3.10 | % |
H-Class Shares | | | -6.91 | % | | | 0.06 | % | | | 3.88 | % |
Russell 3000 Index | | | 7.18 | % | | | 2.18 | % | | | 4.67 | % |
| | | |
| | | 1 Year | | | 5 Year | | | Since
Inception
(03/31/04) | |
A-Class Shares | | | -7.00 | % | | | 0.04 | % | | | 4.24 | % |
A-Class Shares with sales charge‡ | | | -11.41 | % | | | -0.92 | % | | | 3.61 | % |
Russell 3000 Index | | | 7.18 | % | | | 2.18 | % | | | 5.34 | % |
| | | |
| | | Since
Inception
(11/30/11) | | | | | | | |
Institutional Class Shares | | | 7.59 | % | | | | | | | | |
Russell 3000 Index | | | 13.80 | % | | | | | | | | |
| * | The performance data above represents past performance that is not predictive of future results. The investment return and principal value of an investment in the Fund will fluctuate so that an investor’s shares, when redeemed, may be worth more or less than their original cost. Returns are historical and include changes in principal and reinvested dividends and capital gains and do not reflect the effect of taxes. The Russell 3000 Index is an unmanaged index and, unlike the Fund, has no management fees or operating expenses to reduce its reported return. The graphs are based on A-Class shares and H-Class shares only; performance for C-Class shares and Institutional Class shares will vary due to differences in fee structures. |
| † | Fund returns include a CDSC of 1% if redeemed within 12 months of purchase. |
| ‡ | Fund returns are calculated using the maximum sales charge of 4.75%. |
| | | | |
| | | | | |
| | THE GUGGENHEIM FUNDS ANNUAL REPORT | | 9 |
| | |
| SCHEDULE OF INVESTMENTS | | March 31, 2012 |
U.S. LONG SHORT MOMENTUM FUND
| | | | | | | | |
| | | SHARES | | | VALUE | |
COMMON STOCKS† - 97.9% | | | | | | | | |
Consumer Discretionary - 29.2% | |
NIKE, Inc. — Class B | | | 20,927 | | | $ | 2,269,324 | |
Coach, Inc. | | | 21,973 | | | | 1,698,074 | |
Mattel, Inc. | | | 45,402 | | | | 1,528,230 | |
VF Corp. | | | 9,889 | | | | 1,443,596 | |
Ralph Lauren
Corp. — Class A | | | 6,939 | | | | 1,209,676 | |
Home Depot, Inc. | | | 23,350 | | | | 1,174,739 | |
Polaris Industries, Inc. | | | 13,992 | | | | 1,009,523 | |
Hasbro, Inc. | | | 26,744 | | | | 982,040 | |
Fossil, Inc.* | | | 7,403 | | | | 977,048 | |
PVH Corp. | | | 9,993 | | | | 892,675 | |
Lowe’s Companies, Inc. | | | 27,493 | | | | 862,730 | |
TJX Companies, Inc. | | | 18,648 | | | | 740,513 | |
Under Armour,
Inc. — Class A* | | | 7,498 | | | | 704,812 | |
Carter’s, Inc.* | | | 13,534 | | | | 673,587 | |
Brunswick Corp. | | | 26,154 | | | | 673,466 | |
Warnaco Group, Inc.* | | | 9,328 | | | | 544,755 | |
Hanesbrands, Inc.* | | | 18,357 | | | | 542,266 | |
The Gap, Inc. | | | 20,239 | | | | 529,047 | |
McDonald’s Corp. | | | 5,232 | | | | 513,260 | |
Bed Bath & Beyond, Inc.* | | | 7,798 | | | | 512,874 | |
Limited Brands, Inc. | | | 10,677 | | | | 512,496 | |
AutoZone, Inc.* | | | 1,333 | | | | 495,609 | |
Ross Stores, Inc. | | | 8,321 | | | | 483,450 | |
Sturm Ruger & Company, Inc. | | | 9,139 | | | | 448,725 | |
O’Reilly Automotive, Inc.* | | | 4,912 | | | | 448,711 | |
Wolverine World Wide, Inc. | | | 11,717 | | | | 435,638 | |
Staples, Inc. | | | 26,124 | | | | 422,687 | |
Deckers Outdoor Corp.* | | | 6,335 | | | | 399,422 | |
Tiffany & Co. | | | 5,609 | | | | 387,750 | |
Columbia Sportswear Co. | | | 8,158 | | | | 387,097 | |
CarMax, Inc.* | | | 10,606 | | | | 367,498 | |
Crocs, Inc.* | | | 16,859 | | | | 352,690 | |
Best Buy Company, Inc. | | | 14,714 | | | | 348,428 | |
Tractor Supply Co. | | | 3,734 | | | | 338,151 | |
Arctic Cat, Inc.* | | | 7,771 | | | | 332,832 | |
Starbucks Corp. | | | 5,926 | | | | 331,204 | |
PetSmart, Inc. | | | 5,715 | | | | 327,012 | |
Las Vegas Sands Corp. | | | 5,641 | | | | 324,752 | |
Smith & Wesson Holding Corp.* | | | 41,574 | | | | 322,199 | |
Iconix Brand Group, Inc.* | | | 18,093 | | | | 314,456 | |
Jakks Pacific, Inc. | | | 17,976 | | | | 313,681 | |
Leapfrog Enterprises,
Inc. — Class A* | | | 37,143 | | | | 310,515 | |
Callaway Golf Co. | | | 43,855 | | | | 296,460 | |
Yum! Brands, Inc. | | | 4,071 | | | | 289,774 | |
Carnival Corp. | | | 6,923 | | | | 222,090 | |
Chipotle Mexican Grill,
Inc. — Class A* | | | 441 | | | | 184,338 | |
Marriott International,
Inc. — Class A | | | 4,760 | | | | 180,166 | |
Wynn Resorts Ltd. | | | 1,410 | | | | 176,081 | |
Starwood Hotels & Resorts Worldwide, Inc. | | | 2,969 | | | | 167,481 | |
Wyndham Worldwide Corp. | | | 2,889 | | | | 134,367 | |
AutoNation, Inc.* | | | 3,886 | | | | 133,329 | |
Darden Restaurants, Inc. | | | 2,532 | | | | 129,537 | |
| | | | | | | | |
| | | SHARES | | | VALUE | |
Royal Caribbean Cruises Ltd. | | | 4,348 | | | $ | 127,962 | |
MGM Resorts International* | | | 9,390 | | | | 127,892 | |
International Game Technology | | | 6,819 | | | | 114,491 | |
Panera Bread
Co. — Class A* | | | 671 | | | | 107,977 | |
| | | | | | | | |
Total Consumer Discretionary | | | | 30,279,183 | |
| | | | | | | | |
Industrials - 17.4% | |
Fastenal Co. | | | 34,598 | | | | 1,871,751 | |
WW Grainger, Inc. | | | 8,074 | | | | 1,734,375 | |
RSC Holdings, Inc.* | | | 39,705 | | | | 896,936 | |
MSC Industrial Direct Co., Inc. — Class A | | | 10,545 | | | | 878,188 | |
United Rentals, Inc.* | | | 20,281 | | | | 869,852 | |
WESCO International, Inc.* | | | 11,590 | | | | 756,943 | |
Masco Corp. | | | 56,376 | | | | 753,747 | |
Owens Corning* | | | 20,302 | | | | 731,481 | |
Fortune Brands Home & Security, Inc.* | | | 30,371 | | | | 670,288 | |
Air Lease
Corp. — Class A* | | | 25,969 | | | | 625,074 | |
Watsco, Inc. | | | 8,431 | | | | 624,231 | |
Textainer Group Holdings Ltd. | | | 17,629 | | | | 597,623 | |
Applied Industrial Technologies, Inc. | | | 13,990 | | | | 575,409 | |
Armstrong World Industries, Inc. | | | 11,339 | | | | 553,003 | |
GATX Corp. | | | 13,718 | | | | 552,835 | |
TAL International Group, Inc. | | | 14,195 | | | | 521,098 | |
Lennox International, Inc. | | | 12,762 | | | | 514,309 | |
Beacon Roofing Supply, Inc.* | | | 19,635 | | | | 505,798 | |
AO Smith Corp. | | | 10,577 | | | | 475,436 | |
USG Corp.* | | | 26,519 | | | | 456,127 | |
Simpson Manufacturing Company, Inc. | | | 13,853 | | | | 446,759 | |
Aircastle Ltd. | | | 31,215 | | | | 382,072 | |
Kaman Corp. | | | 10,824 | | | | 367,475 | |
Quanex Building Products Corp. | | | 16,793 | | | | 296,061 | |
Universal Forest Products, Inc. | | | 8,504 | | | | 293,218 | |
Griffon Corp. | | | 26,972 | | | | 288,600 | |
Trex Company, Inc.* | | | 8,040 | | | | 257,923 | |
Gibraltar Industries, Inc.* | | | 16,192 | | | | 245,309 | |
Ameresco,
Inc. — Class A* | | | 15,118 | | | | 204,849 | |
3D Systems Corp.* | | | 2,966 | | | | 69,820 | |
| | | | | | | | |
Total Industrials | | | | | | | 18,016,590 | |
| | | | | | | | |
Health Care - 13.3% | | | | | | | | |
Amgen, Inc. | | | 20,700 | | | | 1,407,394 | |
Gilead Sciences, Inc.* | | | 23,986 | | | | 1,171,716 | |
Celgene Corp.* | | | 14,761 | | | | 1,144,273 | |
Biogen Idec, Inc.* | | | 8,653 | | | | 1,090,018 | |
Cerner Corp.* | | | 13,689 | | | | 1,042,554 | |
Alexion Pharmaceuticals, Inc.* | | | 9,346 | | | | 867,870 | |
Regeneron Pharmaceuticals, Inc.* | | | 6,380 | | | | 744,036 | |
SXC Health Solutions Corp.* | | | 8,561 | | | | 641,733 | |
Vertex Pharmaceuticals, Inc.* | | | 14,539 | | | | 596,244 | |
athenahealth, Inc.* | | | 6,408 | | | | 474,961 | |
Allscripts Healthcare Solutions, Inc.* | | | 28,584 | | | | 474,494 | |
Quality Systems, Inc. | | | 10,661 | | | | 466,206 | |
BioMarin Pharmaceutical, Inc.* | | | 10,804 | | | | 370,037 | |
Cepheid, Inc.* | | | 8,448 | | | | 353,380 | |
Cubist Pharmaceuticals, Inc.* | | | 7,561 | | | | 327,013 | |
| | | | |
| | | | | |
| 10 | | THE GUGGENHEIM FUNDS ANNUAL REPORT | | SEE NOTES TO FINANCIAL STATEMENTS. |
| | |
| SCHEDULE OF INVESTMENTS (continued) | | March 31, 2012 |
| U.S. LONG SHORT MOMENTUM FUND | | |
| | | | | | | | |
| | | SHARES | | | VALUE | |
Ariad Pharmaceuticals, Inc.* | | | 19,772 | | | $ | 315,363 | |
Seattle Genetics, Inc.* | | | 15,160 | | | | 308,961 | |
United Therapeutics Corp.* | | | 6,542 | | | | 308,324 | |
Incyte Corporation Ltd.* | | | 15,598 | | | | 301,041 | |
Onyx Pharmaceuticals, Inc.* | | | 7,463 | | | | 281,206 | |
Medidata Solutions, Inc.* | | | 9,905 | | | | 263,869 | |
MedAssets, Inc.* | | | 18,515 | | | | 243,657 | |
Computer Programs & Systems, Inc. | | | 3,881 | | | | 219,354 | |
Omnicell, Inc.* | | | 13,723 | | | | 208,727 | |
Merge Healthcare, Inc.* | | | 33,865 | | | | 198,110 | |
| | | | | | | | |
Total Health Care | | | | | | | 13,820,541 | |
| | | | | | | | |
Consumer Staples - 12.1% | | | | | | | | |
Philip Morris International, Inc. | | | 55,305 | | | | 4,900,576 | |
Altria Group, Inc. | | | 98,824 | | | | 3,050,697 | |
Reynolds American, Inc. | | | 45,280 | | | | 1,876,403 | |
Lorillard, Inc. | | | 12,827 | | | | 1,660,840 | |
Vector Group Ltd. | | | 23,598 | | | | 418,157 | |
Universal Corp. | | | 8,572 | | | | 399,455 | |
Star Scientific, Inc.* | | | 69,962 | | | | 229,475 | |
| | | | | | | | |
Total Consumer Staples | | | | | | | 12,535,603 | |
| | | | | | | | |
Information Technology - 9.1% | |
Apple, Inc.* | | | 2,593 | | | | 1,554,425 | |
International Business Machines Corp. | | | 4,964 | | | | 1,035,739 | |
Visa, Inc. — Class A | | | 4,434 | | | | 523,213 | |
EMC Corp.* | | | 16,944 | | | | 506,286 | |
Mastercard,
Inc. — Class A | | | 1,156 | | | | 486,144 | |
Accenture plc — Class A | | | 6,798 | | | | 438,471 | |
Hewlett-Packard Co. | | | 17,774 | | | | 423,554 | |
Infosys Ltd. ADR | | | 6,472 | | | | 369,098 | |
Dell, Inc.* | | | 20,157 | | | | 334,606 | |
Automatic Data Processing, Inc. | | | 5,765 | | | | 318,170 | |
Cognizant Technology Solutions
Corp. — Class A* | | | 4,070 | | | | 313,187 | |
Computer Sciences Corp. | | | 10,009 | | | | 299,669 | |
NetApp, Inc.* | | | 5,744 | | | | 257,158 | |
Teradata Corp.* | | | 3,560 | | | | 242,614 | |
Seagate Technology plc | | | 7,981 | | | | 215,088 | |
Fidelity National Information Services, Inc. | | | 6,459 | | | | 213,922 | |
SanDisk Corp.* | | | 4,307 | | | | 213,584 | |
Paychex, Inc. | | | 6,622 | | | | 205,216 | |
Fiserv, Inc.* | | | 2,933 | | | | 203,521 | |
Western Digital Corp.* | | | 4,909 | | | | 203,184 | |
Western Union Co. | | | 11,208 | | | | 197,261 | |
Amdocs Ltd.* | | | 4,714 | | | | 148,868 | |
SAIC, Inc.* | | | 9,884 | | | | 130,469 | |
NCR Corp.* | | | 5,408 | | | | 117,408 | |
Diebold, Inc. | | | 2,584 | | | | 99,536 | |
Fusion-io, Inc.* | | | 3,321 | | | | 94,350 | |
Lexmark International,
Inc. — Class A | | | 2,799 | | | | 93,039 | |
QLogic Corp.* | | | 4,801 | | | | 85,266 | |
Synaptics, Inc.* | | | 1,874 | | | | 68,420 | |
| | | | | | | | |
Total Information Technology | | | | 9,391,466 | |
| | | | | | | | |
| | | | | | | | |
| | | SHARES | | | VALUE | |
Materials - 8.8% | | | | | | | | |
International Paper Co. | | | 67,696 | | | $ | 2,376,131 | |
MeadWestvaco Corp. | | | 42,341 | | | | 1,337,553 | |
Domtar Corp. | | | 11,608 | | | | 1,107,171 | |
Louisiana-Pacific Corp.* | | | 69,085 | | | | 645,945 | |
Buckeye Technologies, Inc. | | | 18,585 | | | | 631,332 | |
Schweitzer-Mauduit International, Inc. | | | 8,774 | | | | 605,932 | |
KapStone Paper and Packaging Corp.* | | | 28,842 | | | | 568,187 | |
Deltic Timber Corp. | | | 7,780 | | | | 492,396 | |
PH Glatfelter Co. | | | 31,094 | | | | 490,663 | |
Clearwater Paper Corp.* | | | 14,059 | | | | 466,899 | |
Neenah Paper, Inc. | | | 14,406 | | | | 428,434 | |
| | | | | | | | |
Total Materials | | | | | | | 9,150,643 | |
| | | | | | | | |
Utilities - 8.0% | | | | | | | | |
Dominion Resources, Inc. | | | 9,181 | | | | 470,159 | |
Southern Co. | | | 10,226 | | | | 459,454 | |
Exelon Corp. | | | 10,900 | | | | 427,389 | |
Duke Energy Corp. | | | 18,669 | | | | 392,236 | |
NextEra Energy, Inc. | | | 6,102 | | | | 372,710 | |
PG&E Corp. | | | 8,479 | | | | 368,073 | |
Consolidated Edison, Inc. | | | 6,194 | | | | 361,853 | |
Public Service Enterprise Group, Inc. | | | 11,194 | | | | 342,648 | |
Sempra Energy | | | 5,527 | | | | 331,399 | |
FirstEnergy Corp. | | | 7,117 | | | | 324,464 | |
American Electric Power Company, Inc. | | | 8,267 | | | | 318,941 | |
Xcel Energy, Inc. | | | 11,783 | | | | 311,896 | |
PPL Corp. | | | 10,595 | | | | 299,415 | |
Progress Energy, Inc. | | | 5,518 | | | | 293,061 | |
Edison International | | | 6,397 | | | | 271,936 | |
DTE Energy Co. | | | 4,819 | | | | 265,190 | |
Entergy Corp. | | | 3,793 | | | | 254,890 | |
CenterPoint Energy, Inc. | | | 12,812 | | | | 252,653 | |
Wisconsin Energy Corp. | | | 7,037 | | | | 247,562 | |
Ameren Corp. | | | 7,526 | | | | 245,197 | |
NiSource, Inc. | | | 9,421 | | | | 229,401 | |
SCANA Corp. | | | 4,650 | | | | 212,087 | |
CMS Energy Corp. | | | 9,440 | | | | 207,680 | |
OGE Energy Corp. | | | 3,725 | | | | 199,288 | |
NSTAR | | | 3,996 | | | | 194,325 | |
Northeast Utilities | | | 5,099 | | | | 189,275 | |
Pinnacle West Capital Corp. | | | 3,542 | | | | 169,662 | |
Pepco Holdings, Inc. | | | 8,052 | | | | 152,102 | |
ITC Holdings Corp. | | | 1,896 | | | | 145,878 | |
| | | | | | | | |
Total Utilities | | | | | | | 8,310,824 | |
| | | | | | | | |
Total Common Stocks
(Cost $90,074,519) | | | | | | | 101,504,850 | |
| | | | | | | | |
| | | | |
| | | | | |
| SEE NOTES TO FINANCIAL STATEMENTS. | | THE GUGGENHEIM FUNDS ANNUAL REPORT | | 11 |
| | |
| SCHEDULE OF INVESTMENTS (concluded) | | March 31, 2012 |
| U.S. LONG SHORT MOMENTUM FUND | | |
| | | | | | | | |
| | | FACE
AMOUNT | | | VALUE | |
REPURCHASE AGREEMENTS††,1 - 1.9% | |
HSBC Group
issued 03/30/12 at 0.01% due 04/02/12 | | $ | 1,304,103 | | | $ | 1,304,103 | |
Mizuho Financial Group, Inc. issued 03/30/12 at 0.01% due 04/02/12 | | | 366,908 | | | | 366,908 | |
Credit Suisse Group
issued 03/30/12 at 0.01% due 04/02/12 | | | 168,360 | | | | 168,360 | |
Deutsche Bank
issued 03/30/12 at 0.01% due 04/02/12 | | | 97,520 | | | | 97,520 | |
| | | | | | | | |
Total Repurchase Agreements
(Cost $1,936,891) | | | | 1,936,891 | |
| | | | | | | | |
Total Investments - 99.8%
(Cost $92,011,410) | | | $ | 103,441,741 | |
| | | | | | | | |
Other Assets & Liabilities, net - 0.2% | | | | 169,989 | |
| | | | | | | | |
Total Net Assets - 100.0% | | | $ | 103,611,730 | |
| | | |
| | | CONTRACTS | | | UNREALIZED
LOSS | |
FUTURES CONTRACTS SOLD SHORT† | |
June 2012 S&P 500 Index Mini Futures Contracts (Aggregate Value of Contracts $5,397,700) | | | 77 | | | $ | (212,043 | ) |
| | | | | | | | |
| * | Non-income producing security. |
| † | Value determined based on Level 1 inputs — See Note 4. |
| †† | Value determined based on Level 2 inputs — See Note 4. |
| 1 | Repurchase Agreements — See Note 5. |
ADR — American Depositary Receipt
plc — Public Limited Company
| | | | |
| | | | | |
| 12 | | THE GUGGENHEIM FUNDS ANNUAL REPORT | | SEE NOTES TO FINANCIAL STATEMENTS. |
| | |
| U.S. LONG SHORT MOMENTUM FUND | | |
| | | | |
STATEMENT OF ASSETS AND LIABILITIES | |
| March 31, 2012 | | | | |
| |
ASSETS: | | | | |
Investments, at value | | | | |
(cost $90,074,519) | | $ | 101,504,850 | |
Repurchase agreements, at value | | | | |
(cost $1,936,891) | | | 1,936,891 | |
| | | | |
Total investments | | | | |
(cost $92,011,410) | | | 103,441,741 | |
Segregated cash with broker | | | 269,500 | |
Cash | | | 10,092 | |
Receivables: | | | | |
Dividends | | | 281,887 | |
Fund shares sold | | | 33,987 | |
| | | | |
Total assets | | | 104,037,207 | |
| | | | |
LIABILITIES: | | | | |
Payable for: | | | | |
Fund shares redeemed | | | 184,109 | |
Management fees | | | 79,826 | |
Distribution and service fees | | | 43,025 | |
Transfer agent and administrative fees | | | 22,174 | |
Variation margin | | | 14,630 | |
Portfolio accounting fees | | | 8,869 | |
Miscellaneous | | | 72,844 | |
| | | | |
Total liabilities | | | 425,477 | |
| | | | |
NET ASSETS | | $ | 103,611,730 | |
| | | | |
NET ASSETS CONSISTOF: | | | | |
Paid in capital | | $ | 177,669,936 | |
Accumulated net investment loss | | | (32,832 | ) |
Accumulated net realized loss on investments | | | (85,243,662 | ) |
Net unrealized appreciation on investments | | | 11,218,288 | |
| | | | |
Net assets | | $ | 103,611,730 | |
| | | | |
A-CLASS: | | | | |
Net assets | | $ | 16,509,644 | |
Capital shares outstanding | | | 1,243,115 | |
Net asset value per share | | $ | 13.28 | |
| | | | |
Maximum offering price per share
(Net asset value divided by 95.25%) | | $ | 13.94 | |
| | | | |
C-CLASS: | | | | |
Net assets | | $ | 32,502,563 | |
Capital shares outstanding | | | 2,640,010 | |
Net asset value per share | | $ | 12.31 | |
| | | | |
H-CLASS: | | | | |
Net assets | | $ | 54,588,761 | |
Capital shares outstanding | | | 4,096,479 | |
Net asset value per share | | $ | 13.33 | |
| | | | |
INSTITUTIONAL CLASS: | | | | |
Net assets | | $ | 10,762 | |
Capital shares outstanding | | | 807 | |
Net asset value per share | | $ | 13.33 | |
| | | | |
| | | | |
| | | | |
STATEMENT OF OPERATIONS | |
| Year Ended March 31, 2012 | | | | |
| |
INVESTMENT INCOME: | | | | |
Dividends (net of foreign withholding tax of $6,363) | | $ | 2,370,883 | |
Interest | | | 2,548 | |
| | | | |
Total investment income | | | 2,373,431 | |
| | | | |
EXPENSES: | | | | |
Management fees | | | 1,146,327 | |
Transfer agent and administrative fees | | | 318,424 | |
Distribution and service fees: | | | | |
A-Class | | | 50,290 | |
C-Class | | | 390,932 | |
H-Class | | | 170,393 | |
Portfolio accounting fees | | | 127,368 | |
Custodian fees | | | 32,448 | |
Trustees’ fees* | | | 12,656 | |
Miscellaneous | | | 156,293 | |
| | | | |
Total expenses | | | 2,405,131 | |
| | | | |
Net investment loss | | | (31,700 | ) |
| | | | |
NET REALIZED AND UNREALIZED GAIN (LOSS): | | | | |
Net realized gain (loss) on: | | | | |
Investments | | | 684,291 | |
Futures contracts | | | (1,906,510 | ) |
| | | | |
Net realized loss | | | (1,222,219 | ) |
| | | | |
Net change in unrealized appreciation (depreciation) on: | | | | |
Investments | | | (11,132,570 | ) |
Futures contracts | | | (206,020 | ) |
| | | | |
Net change in unrealized appreciation (depreciation) | | | (11,338,590 | ) |
| | | | |
Net realized and unrealized loss | | | (12,560,809 | ) |
| | | | |
Net decrease in net assets resulting from operations | | $ | (12,592,509 | ) |
| | | | |
| * | Relates to Trustees not deemed “interested persons” within the meaning of Section 2(a)(19) of the 1940 Act. |
| | | | |
| | | | | |
| SEE NOTES TO FINANCIAL STATEMENTS. | | THE GUGGENHEIM FUNDS ANNUAL REPORT | | 13 |
|
| U.S. LONG SHORT MOMENTUM FUND |
| | | | | | | | |
| STATEMENTS OF CHANGES IN NET ASSETS | |
| | | Year Ended
March 31,
2012 | | | Year Ended
March 31,
2011 | |
INCREASE (DECREASE) IN NET ASSETS FROM OPERATIONS: | | | | | | | | |
Net investment loss | | $ | (31,700 | ) | | $ | (962,766 | ) |
Net realized gain (loss) on investments | | | (1,222,219 | ) | | | 21,275,436 | |
Net change in unrealized appreciation (depreciation) on investments | | | (11,338,590 | ) | | | (1,832,424 | ) |
| | | | | | | | |
Net increase (decrease) in net assets resulting from operations | | | (12,592,509 | ) | | | 18,480,246 | |
| | | | | | | | |
CAPITAL SHARE TRANSACTIONS: | | | | | | | | |
Proceeds from sale of shares | | | | | | | | |
A-Class | | | 7,600,825 | | | | 7,048,585 | |
C-Class | | | 1,083,648 | | | | 3,608,855 | |
H-Class | | | 27,684,775 | | | | 38,536,319 | |
Institutional Class | | | 10,000 | * | | | — | |
Redemption fees collected | | | | | | | | |
A-Class | | | — | | | | 1,640 | |
C-Class | | | — | | | | 3,071 | |
H-Class | | | — | | | | 4,901 | |
Institutional Class | | | — | * | | | — | |
Cost of shares redeemed | | | | | | | | |
A-Class | | | (14,808,494 | ) | | | (21,035,067 | ) |
C-Class | | | (14,982,720 | ) | | | (23,551,234 | ) |
H-Class | | | (53,424,983 | ) | | | (60,622,746 | ) |
Institutional Class | | | — | * | | | — | |
| | | | | | | | |
Net decrease from capital share transactions | | | (46,836,949 | ) | | | (56,005,676 | ) |
| | | | | | | | |
Net decrease in net assets | | | (59,429,458 | ) | | | (37,525,430 | ) |
NET ASSETS: | | | | | | | | |
Beginning of year | | | 163,041,188 | | | | 200,566,618 | |
| | | | | | | | |
End of year | | $ | 103,611,730 | | | $ | 163,041,188 | |
| | | | | | | | |
Accumulated net investment loss at end of year | | $ | (32,832 | ) | | $ | (150,484 | ) |
| | | | | | | | |
CAPITAL SHARE ACTIVITY: | | | | | | | | |
Shares sold | | | | | | | | |
A-Class | | | 581,398 | | | | 571,914 | |
C-Class | | | 85,372 | | | | 306,995 | |
H-Class | | | 2,126,165 | | | | 3,071,070 | |
Institutional Class | | | 807 | * | | | — | |
Shares redeemed | | | | | | | | |
A-Class | | | (1,120,843 | ) | | | (1,666,394 | ) |
C-Class | | | (1,224,264 | ) | | | (2,006,910 | ) |
H-Class | | | (4,118,953 | ) | | | (4,850,644 | ) |
Institutional Class | | | — | * | | | — | |
| | | | | | | | |
Net decrease in shares | | | (3,670,318 | ) | | | (4,573,969 | ) |
| | | | | | | | |
| * | Since commencement of operations: November 30, 2011-Institutional Class. |
| | | | |
| | | | | |
| 14 | | THE GUGGENHEIM FUNDS ANNUAL REPORT | | SEE NOTES TO FINANCIAL STATEMENTS. |
|
| U.S. LONG SHORT MOMENTUM FUND |
FINANCIAL HIGHLIGHTS
This table is presented to show selected data for a share outstanding throughout each period and to assist shareholders in evaluating a Fund’s performance for the periods presented.
| | | | | | | | | | | | | | | | | | | | |
| A-Class | | Year Ended
March 31,
2012 | | | Year Ended
March 31,
2011 | | | Year Ended
March 31,
2010 | | | Year Ended
March 31,
2009 | | | Year Ended
March 31,
2008 | |
Per Share Data | | | | | | | | | | | | | | | | | | | | |
Net asset value, beginning of period | | $ | 14.28 | | | $ | 12.59 | | | $ | 8.62 | | | $ | 13.45 | | | $ | 14.08 | |
| | | | | | | | | | | | | | | | | | | | |
Income (loss) from investment operations: | | | | | | | | | | | | | | | | | | | | |
Net investment income (loss)a | | | .03 | | | | (.04 | ) | | | (.07 | ) | | | .01 | | | | (.01 | ) |
Net gain (loss) on investments (realized and unrealized) | | | (1.03 | ) | | | 1.73 | | | | 4.04 | | | | (4.84 | ) | | | .30 | |
| | | | | | | | | | | | | | | | | | | | |
Total from investment operations | | | (1.00 | ) | | | 1.69 | | | | 3.97 | | | | (4.83 | ) | | | .29 | |
| | | | | | | | | | | | | | | | | | | | |
Less distributions from: | | | | | | | | | | | | | | | | | | | | |
Net realized gains | | | — | | | | — | | | | — | | | | — | | | | (.93 | ) |
| | | | | | | | | | | | | | | | | | | | |
Total distributions | | | — | | | | — | | | | — | | | | — | | | | (.93 | ) |
| | | | | | | | | | | | | | | | | | | | |
Redemption fees collected | | | — | | | | — | f | | | — | f | | | — | f | | | .01 | |
| | | | | | | | | | | | | | | | | | | | |
Net asset value, end of period | | $ | 13.28 | | | $ | 14.28 | | | $ | 12.59 | | | $ | 8.62 | | | $ | 13.45 | |
| | | | | | | | | | | | | | | | | | | | |
Total Returnb | | | (7.00 | %) | | | 13.42 | % | | | 46.06 | % | | | (35.91 | %) | | | 1.50 | % |
| | | | | | | | | | | | | | | | | | | | |
Ratios/Supplemental Data | | | | | | | | | | | | | | | | | | | | |
Net assets, end of period (in thousands) | | $ | 16,510 | | | $ | 25,447 | | | $ | 36,231 | | | $ | 31,925 | | | $ | 49,148 | |
| | | | | | | | | | | | | | | | | | | | |
Ratios to average net assets: | | | | | | | | | | | | | | | | | | | | |
Net investment income (loss) | | | 0.21 | % | | | (0.33 | %) | | | (0.62 | %) | | | 0.13 | % | | | (0.08 | %) |
Total expenses | | | 1.66 | % | | | 1.71 | % | | | 1.68 | % | | | 1.69 | % | | | 1.65 | % |
Operating expensesc | | | 1.66 | % | | | 1.69 | % | | | 1.68 | % | | | 1.69 | % | | | 1.65 | % |
| | | | | | | | | | | | | | | | | | | | |
Portfolio turnover rate | | | 190 | % | | | 231 | % | | | 375 | % | | | 528 | % | | | 278 | % |
| | | | | |
| C-Class | | Year Ended
March 31,
2012 | | | Year Ended
March 31,
2011 | | | Year Ended
March 31,
2010 | | | Year Ended
March 31,
2009 | | | Year Ended
March 31,
2008 | |
Per Share Data | | | | | | | | | | | | | | | | | | | | |
Net asset value, beginning of period | | $ | 13.33 | | | $ | 11.85 | | | $ | 8.17 | | | $ | 12.85 | | | $ | 13.58 | |
| | | | | | | | | | | | | | | | | | | | |
Income (loss) from investment operations: | | | | | | | | | | | | | | | | | | | | |
Net investment lossa | | | (.07 | ) | | | (.13 | ) | | | (.14 | ) | | | (.07 | ) | | | (.12 | ) |
Net gain (loss) on investments (realized and unrealized) | | | (.95 | ) | | | 1.61 | | | | 3.82 | | | | (4.61 | ) | | | .31 | |
| | | | | | | | | | | | | | | | | | | | |
Total from investment operations | | | (1.02 | ) | | | 1.48 | | | | 3.68 | | | | (4.68 | ) | | | .19 | |
| | | | | | | | | | | | | | | | | | | | |
Less distributions from: | | | | | | | | | | | | | | | | | | | | |
Net realized gains | | | — | | | | — | | | | — | | | | — | | | | (.93 | ) |
| | | | | | | | | | | | | | | | | | | | |
Total distributions | | | — | | | | — | | | | — | | | | — | | | | (.93 | ) |
| | | | | | | | | | | | | | | | | | | | |
Redemption fees collected | | | — | | | | — | f | | | — | f | | | — | f | | | .01 | |
| | | | | | | | | | | | | | | | | | | | |
Net asset value, end of period | | $ | 12.31 | | | $ | 13.33 | | | $ | 11.85 | | | $ | 8.17 | | | $ | 12.85 | |
| | | | | | | | | | | | | | | | | | | | |
Total Returnb | | | (7.65 | %) | | | 12.49 | % | | | 45.04 | % | | | (36.42 | %) | | | 0.81 | % |
| | | | | | | | | | | | | | | | | | | | |
Ratios/Supplemental Data | | | | | | | | | | | | | | | | | | | | |
Net assets, end of period (in thousands) | | $ | 32,503 | | | $ | 50,381 | | | $ | 64,918 | | | $ | 57,792 | | | $ | 115,136 | |
| | | | | | | | | | | | | | | | | | | | |
Ratios to average net assets: | | | | | | | | | | | | | | | | | | | | |
Net investment loss | | | (0.54 | %) | | | (1.08 | %) | | | (1.37 | %) | | | (0.66 | %) | | | (0.80 | %) |
Total expenses | | | 2.41 | % | | | 2.46 | % | | | 2.43 | % | | | 2.44 | % | | | 2.41 | % |
Operating expensesc | | | 2.41 | % | | | 2.44 | % | | | 2.43 | % | | | 2.44 | % | | | 2.41 | % |
| | | | | | | | | | | | | | | | | | | | |
Portfolio turnover rate | | | 190 | % | | | 231 | % | | | 375 | % | | | 528 | % | | | 278 | % |
| | | | |
| | | | | |
| SEE NOTES TO FINANCIAL STATEMENTS. | | THE GUGGENHEIM FUNDS ANNUAL REPORT | | 15 |
|
| U.S. LONG SHORT MOMENTUM FUND |
FINANCIAL HIGHLIGHTS (concluded)
This table is presented to show selected data for a share outstanding throughout each period and to assist shareholders in evaluating a Fund’s performance for the periods presented.
| | | | | | | | | | | | | | | | | | | | |
H-Class | | Year Ended
March 31,
2012 | | | Year Ended
March 31,
2011 | | | Year Ended
March 31,
2010 | | | Year Ended
March 31,
2009 | | | Year Ended
March 31,
2008 | |
Per Share Data | | | | | | | | | | | | | | | | | | | | |
Net asset value, beginning of period | | $ | 14.32 | | | $ | 12.63 | | | $ | 8.65 | | | $ | 13.49 | | | $ | 14.12 | |
| | | | | | | | | | | | | | | | | | | | |
Income (loss) from investment operations: | | | | | | | | | | | | | | | | | | | | |
Net investment income (loss)a | | | .03 | | | | (.04 | ) | | | (.07 | ) | | | — | d | | | (.02 | ) |
Net gain (loss) on investments (realized and unrealized) | | | (1.02 | ) | | | 1.73 | | | | 4.05 | | | | (4.84 | ) | | | .31 | |
| | | | | | | | | | | | | | | | | | | | |
Total from investment operations | | | (.99 | ) | | | 1.69 | | | | 3.98 | | | | (4.84 | ) | | | .29 | |
| | | | | | | | | | | | | | | | | | | | |
Less distributions from: | | | | | | | | | | | | | | | | | | | | |
Net realized gains | | | — | | | | — | | | | — | | | | — | | | | (.93 | ) |
| | | | | | | | | | | | | | | | | | | | |
Total distributions | | | — | | | | — | | | | — | | | | — | | | | (.93 | ) |
| | | | | | | | | | | | | | | | | | | | |
Redemption fees collected | | | — | | | | — | f | | | — | f | | | — | f | | | .01 | |
| | | | | | | | | | | | | | | | | | | | |
Net asset value, end of period | | $ | 13.33 | | | $ | 14.32 | | | $ | 12.63 | | | $ | 8.65 | | | $ | 13.49 | |
| | | | | | | | | | | | | | | | | | | | |
Total Returnb | | | (6.91 | %) | | | 13.38 | % | | | 46.01 | % | | | (35.88 | %) | | | 1.50 | % |
| | | | | | | | | | | | | | | | | | | | |
Ratios/Supplemental Data | | | | | | | | | | | | | | | | | | | | |
Net assets, end of period (in thousands) | | $ | 54,589 | | | $ | 87,212 | | | $ | 99,418 | | | $ | 76,080 | | | $ | 178,949 | |
| | | | | | | | | | | | | | | | | | | | |
Ratios to average net assets: | | | | | | | | | | | | | | | | | | | | |
Net investment income (loss) | | | 0.20 | % | | | (0.31 | %) | | | (0.63 | %) | | | (0.01 | %) | | | (0.13 | %) |
Total expenses | | | 1.66 | % | | | 1.70 | % | | | 1.68 | % | | | 1.68 | % | | | 1.65 | % |
Operating expensesc | | | 1.66 | % | | | 1.69 | % | | | 1.68 | % | | | 1.68 | % | | | 1.65 | % |
| | | | | | | | | | | | | | | | | | | | |
Portfolio turnover rate | | | 190 | % | | | 231 | % | | | 375 | % | | | 528 | % | | | 278 | % |
| | | | |
Institutional Class | | Period Ended
March 31,
2012e | |
Per Share Data | | | | |
Net asset value, beginning of period | | $ | 12.39 | |
| | | | |
Income (loss) from investment operations: | | | | |
Net investment incomea | | | .06 | |
Net gain on investments (realized and unrealized) | | | .88 | |
| | | | |
Total from investment operations | | | .94 | |
| | | | |
Net asset value, end of period | | $ | 13.33 | |
| | | | |
Total Returnb | | | 7.59 | % |
| | | | |
Ratios/Supplemental Data | | | | |
Net assets, end of period (in thousands) | | $ | 11 | |
| | | | |
Ratios to average net assets: | | | | |
Net investment income | | | 1.29 | % |
Total expenses | | | 1.36 | % |
| | | | |
Portfolio turnover rate | | | 190 | % |
| a | Net investment income (loss) per share was computed using average shares outstanding throughout the period. |
| b | Total return does not reflect the impact of any applicable sales charges and has not been annualized. |
| c | Operating expenses exclude interest and dividend expense from securities sold short. |
| d | Net investment income (loss) is less than $0.01 per share. |
| e | Since commencement of operations: November 30, 2011. Percentage amounts for the period, except total return and portfolio turnover rate, have been annualized. |
| f | Redemption fees collected are less than $0.01 per share. |
| | | | |
| | | | | |
| 16 | | THE GUGGENHEIM FUNDS ANNUAL REPORT | | SEE NOTES TO FINANCIAL STATEMENTS. |
This page intentionally left blank.
| | | | |
| | | | | |
| | THE GUGGENHEIM FUNDS ANNUAL REPORT | | 17 |
| | |
| PERFORMANCE REPORT AND FUND PROFILE (Unaudited) | | March 31, 2012 |
ALTERNATIVE STRATEGIES ALLOCATION FUND
OBJECTIVE: Seeks to deliver a return that has a low correlation to the returns of traditional stock and bond asset classes as well as to provide capital appreciation.
In the past 12 months, the financial markets continued to be driven by macroeconomic forces. Among them, the European debt crisis was the most important one. It first surprised the market with more problems, yet there were few tangible solutions looming. Together with U.S. debt downgrade, it caused a massive sell-off in the summer. As speculation grew that China and international organizations might step in to help, the market was relieved. And finally, the change of leadership at the European Central Bank brought loosened monetary policy and a mechanism to reduce the liquidity problem in the European debt market, which led the equity market to rally further in the first quarter of 2012.
Market volatility, with the VIX Index* as a proxy, also had a turbulent year, with its intra-period high reaching the level seen in early 2009. In this macro-driven market, correlations between risky assets were high, making diversification more challenging to achieve. Volatility made it hard to identify a trend.
Our dynamically managed tactical overlay made a positive contribution to the portfolio’s performance, but not enough to permit the portfolio to overcome the tumult in the market.
The Real Estate Fund, Long Short Equity Strategy Fund and Multi-Hedge Strategies Fund contributed to the portfolio’s performance. The Managed Futures Strategy Fund, Commodities Strategy Fund and Long Short Interest Rate Strategy Fund detracted from performance.
Derivatives in the Fund are used to provide broad index exposure and liquidity. The results of derivatives use during the period were within our expectations and contributed to the Fund’s performance.
The Alternative Strategies Allocation Fund H-Class returned -2.04% for the year ended March 31, 2012. Equities, as represented by the S&P 500® Index**, returned 8.54% and the Barclays U.S. Aggregate Bond Index*** rose 7.71% over the same period.
*The VIX is the ticker for the Chicago Board Options Exchange (CBOE) Volatility Index, which is designed to measure market expectations of future volatility that is implied by S&P 500 index option contracts. The VIX is a widely used measure of market risk and is often referred to as the fear gauge.
**Standard & Poor’s 500 Index (S&P 500®)—a capitalization-weighted index covering 500 industrial, utility, transportation and financial companies of the U.S. markets (mostly NYSE Euronext issues).
***The Barclays U.S. Aggregate Bond Index measures performance of the U.S. investment-grade bond market, including investment-grade U.S. government bonds, investment-grade corporate bonds, mortgage pass-through securities and asset-backed securities.
Performance displayed represents past performance which is no guarantee of future results.
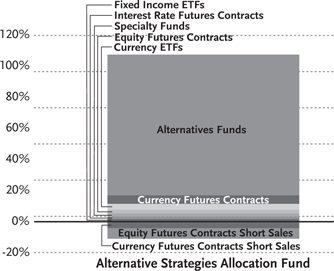
“Holdings Diversification (Market Exposure as % of net assets)” excludes any temporary cash investments.
| | | | |
Inception Dates: | |
A-Class | | | March 7, 2008 | |
C-Class | | | March 7, 2008 | |
H-Class | | | March 7, 2008 | |
|
Ten Largest Holdings (% of Total Net Assets) | |
RSF — Long Short Equity Strategy
Fund — A Class | | | 19.3 | % |
RSF — Multi-Hedge Strategies
Fund — A Class | | | 18.2 | % |
RSF — Event Driven and Distressed
Strategies Fund — A Class | | | 17.4 | % |
RSF — Managed Futures Strategy
Fund — A Class | | | 14.7 | % |
RSF — Long Short Interest Rate
Strategy Fund — A Class | | | 11.3 | % |
RSF — Long/Short Commodities
Strategy Fund — A Class | | | 7.6 | % |
PowerShares DB G10 Currency
Harvest Fund | | | 3.8 | % |
RSF — Commodities Strategy
Fund — A Class | | | 2.3 | % |
RSF — Real Estate Fund — A Class | | | 2.2 | % |
iShares Barclays Aggregate Bond Fund | | | 1.4 | % |
| | | | |
Top Ten Total | | | 98.2 | % |
| | | | |
“Ten Largest Holdings” exclude any temporary cash or derivative investments.
| | | | |
| | | | | |
| 18 | | THE GUGGENHEIM FUNDS ANNUAL REPORT | | |
| | |
| PERFORMANCE REPORT AND FUND PROFILE (Unaudited) (concluded) | | March 31, 2012 |
Average Annual Returns*
Periods Ended 3/31/12
| | | | | | | | |
| | | 1 Year | | | Since
Inception
(03/07/08) | |
A-Class Shares | | | -2.04 | % | | | -4.59 | % |
A-Class Shares with sales charge‡ | | | -6.70 | % | | | -5.73 | % |
C-Class Shares | | | -2.80 | % | | | -5.30 | % |
C-Class Shares with CDSC† | | | -3.76 | % | | | -5.30 | % |
H-Class Shares | | | -2.04 | % | | | -4.59 | % |
Barclays U.S. Aggregate Bond Index | | | 7.71 | % | | | 6.17 | % |
S&P 500 Index | | | 8.54 | % | | | 4.40 | % |
| * | The performance data above represents past performance that is not predictive of future results. The investment return and principal value of an investment in the Fund will fluctuate so that an investor’s shares, when redeemed, may be worth more or less than their original cost. Returns are historical and include changes in principal and reinvested dividends and capital gains and do not reflect the effect of taxes. The Barclays U.S. Aggregate Bond Index and the S&P 500 Index are unmanaged indices and, unlike the Fund, have no management fees or operating expenses to reduce their reported returns. The graphs are based on A-Class shares and H-Class shares only; performance for C-Class shares will vary due to differences in fee structure. |
| † | Fund returns include a CDSC of 1% if redeemed within 12 months of purchase. |
| ‡ | Fund returns are calculated using the maximum sales charge of 4.75%. |
| | | | |
| | | | | |
| | THE GUGGENHEIM FUNDS ANNUAL REPORT | | 19 |
| | |
| SCHEDULE OF INVESTMENTS | | March 31, 2012 |
| ALTERNATIVE STRATEGIES ALLOCATION FUND | | |
| | | | | | | | |
| | | SHARES | | | VALUE | |
CURRENCY EXCHANGE TRADED FUNDS† - 3.8% | |
PowerShares DB G10 Currency Harvest Fund* | | | 12,001 | | | $ | 300,145 | |
| | | | | | | | |
Total Currency Exchange Traded Funds
(Cost $231,746) | | | | | | | 300,145 | |
| | | | | | | | |
EXCHANGE TRADED FUNDS† - 1.4% | | | | | | | | |
iShares Barclays Aggregate Bond Fund | | | 1,003 | | | | 110,180 | |
| | | | | | | | |
Total Exchange Traded Funds
(Cost $110,326) | | | | | | | 110,180 | |
| | | | | | | | |
MUTUAL FUNDS†,1 - 93.0% | |
Alternatives Funds - 90.9% | | | | | |
RSF — Long Short Equity Strategy Fund — A Class | | | 57,708 | | | | 1,541,969 | |
RSF — Multi-Hedge Strategies Fund — A Class | | | 64,855 | | | | 1,454,051 | |
RSF — Event Driven and Distressed Strategies Fund — A Class | | | 54,888 | | | | 1,392,503 | |
RSF — Managed Futures Strategy Fund — A Class* | | | 51,072 | | | | 1,171,089 | |
RSF — Long Short Interest Rate Strategy Fund — A Class* | | | 38,010 | | | | 906,167 | |
RSF — Long/Short Commodities Strategy Fund — A Class | | | 22,919 | | | | 603,230 | |
RSF — Commodities Strategy Fund — A Class | | | 10,849 | | | | 185,523 | |
| | | | | | | | |
Total Alternatives Funds | | | | | | | 7,254,532 | |
| | | | | | | | |
Specialty Funds - 2.1% | | | | | | | | |
RSF — Real Estate Fund — A Class | | | 5,663 | | | | 171,370 | |
| | | | | | | | |
Total Mutual Funds
(Cost $6,959,887) | | | | | | | 7,425,902 | |
| | | | | | | | |
| | |
| | | FACE
AMOUNT | | | | |
REPURCHASE AGREEMENT††,2 - 1.1% | |
Credit Suisse Group issued 03/30/12 at 0.01% due 04/02/12 | | $ | 90,201 | | | | 90,201 | |
| | | | | | | | |
Total Repurchase Agreement
(Cost $90,201) | | | | | | | 90,201 | |
| | | | | | | | |
Total Investments - 99.3%
(Cost $7,392,160) | | | | | | $ | 7,926,428 | |
| | | | | | | | |
Other Assets & Liabilities, net - 0.7% | | | | | | | 59,701 | |
| | | | | | | | |
Total Net Assets - 100.0% | | | | | | $ | 7,986,129 | |
| | | |
| | | CONTRACTS | | | UNREALIZED
GAIN | |
FUTURES CONTRACTS PURCHASED† | |
June 2012 S&P 500 Index Mini Futures Contracts
(Aggregate Value of Contracts $140,200) | | | 2 | | | $ | 5,498 | |
June 2012 Nikkei-225 Stock Average Index Futures Contracts (Aggregate Value of Contracts $50,975) | | | 1 | | | | 3,472 | |
| | | | | | | | |
(Total Aggregate Value of Contracts $191,175) | | | | | | $ | 8,970 | |
| | | | | | | | |
| | | | | | | | |
| | | CONTRACTS | | | UNREALIZED
GAIN (LOSS) | |
INTEREST RATE FUTURES CONTRACTS PURCHASED† | |
June 2012 U.S. Treasury 5 Year Note Futures Contracts
(Aggregate Value of Contracts $122,500) | | | 1 | | | $ | 530 | |
| | | | | | | | |
CURRENCY FUTURES CONTRACTS PURCHASED† | |
June 2012 Japanese Yen Futures Contracts (Aggregate Value of Contracts $151,100) | | | 1 | | | | 160 | |
June 2012 Mexican Peso Futures Contracts (Aggregate Value of Contracts $77,600) | | | 2 | | | | (855 | ) |
June 2012 Canadian Dollar Futures Contracts (Aggregate Value of Contracts $200,181) | | | 2 | | | | (1,165 | ) |
| | | | | | | | |
(Total Aggregate Value of Contracts $428,881) | | | | | | $ | (1,860 | ) |
| | | | | | | | |
FUTURES CONTRACTS SOLD SHORT† | |
April 2012 CAC 40 Euro Futures Contracts (Aggregate Value of Contracts $182,568) | | | 4 | | | | 3,778 | |
June 2012 FTSE 100 Index Futures Contracts (Aggregate Value of Contracts $91,554) | | | 1 | | | | 1,176 | |
June 2012 MSCI Emerging Markets Index Mini Futures Contracts (Aggregate Value of Contracts $77,025) | | | 1 | | | | (20 | ) |
June 2012 SPI 200 Index Futures Contracts (Aggregate Value of Contracts $112,331) | | | 1 | | | | (676 | ) |
June 2012 Russell 2000 Index Mini Futures Contracts
(Aggregate Value of Contracts $82,700) | | | 1 | | | | (3,582 | ) |
| | | | | | | | |
(Total Aggregate Value of Contracts $546,178) | | | | | | $ | 676 | |
| | | | | | | | |
CURRENCY FUTURES CONTRACTS SOLD SHORT† | |
June 2012 Euro Futures Contracts (Aggregate Value of Contracts $166,775) | | | 1 | | | | (738 | ) |
June 2012 Swiss Franc Futures Contracts
(Aggregate Value of Contracts $138,613) | | | 1 | | | | (4,128 | ) |
| | | | | | | | |
(Total Aggregate Value of Contracts $305,388) | | | | | | $ | (4,866 | ) |
| | | | | | | | |
| * | Non-income producing security. |
| † | Value determined based on Level 1 inputs — See Note 4. |
| †† | Value determined based on Level 2 inputs — See Note 4. |
| 1 | A-Class shares of affiliated funds. |
| 2 | Repurchase Agreement — See Note 5. |
| | | | |
| | | | | |
| 20 | | THE GUGGENHEIM FUNDS ANNUAL REPORT | | SEE NOTES TO FINANCIAL STATEMENTS. |
|
| ALTERNATIVE STRATEGIES ALLOCATION FUND |
STATEMENT OF ASSETS AND LIABILITIES
| | | | |
| March 31, 2012 | | | | |
| |
ASSETS: | | | | |
Investments in unaffiliated issuers, at value (cost $342,072) | | $ | 410,325 | |
Investments in affiliated issuers, at value
(cost $6,959,887) | | | 7,425,902 | |
Repurchase agreements, at value
(cost $90,201) | | | 90,201 | |
| | | | |
Total investments
(cost $7,392,160) | | | 7,926,428 | |
Foreign currency, at value
(cost $46,197) | | | 46,504 | |
Segregated cash with broker | | | 59,101 | |
| |
Receivables: | | | | |
Fund shares sold | | | 10,007 | |
| | | | |
Total assets | | | 8,042,040 | |
| | | | |
LIABILITIES: | | | | |
Overdraft due to custodian bank | | | 46,407 | |
Payable for: | | | | |
Fund shares redeemed | | | 4,255 | |
Variation margin | | | 3,449 | |
Distribution and service fees | | | 1,800 | |
| | | | |
Total liabilities | | | 55,911 | |
| | | | |
NET ASSETS | | $ | 7,986,129 | |
| | | | |
NET ASSETS CONSISTOF: | | | | |
Paid in capital | | $ | 16,209,594 | |
Undistributed net investment income | | | 243,692 | |
Accumulated net realized loss on investments | | | (9,005,182 | ) |
Net unrealized appreciation on investments | | | 538,025 | |
| | | | |
Net assets | | $ | 7,986,129 | |
| | | | |
A-CLASS: | | | | |
Net assets | | $ | 1,594,318 | |
Capital shares outstanding | | | 81,538 | |
Net asset value per share | | $ | 19.55 | |
| | | | |
Maximum offering price per share
(Net asset value divided by 95.25%) | | $ | 20.52 | |
| | | | |
C-CLASS: | | | | |
Net assets | | $ | 2,720,599 | |
Capital shares outstanding | | | 143,549 | |
Net asset value per share | | $ | 18.95 | |
| | | | |
H-CLASS: | | | | |
Net assets | | $ | 3,671,212 | |
Capital shares outstanding | | | 187,764 | |
Net asset value per share | | $ | 19.55 | |
| | | | |
STATEMENT OF OPERATIONS
| | | | |
| Year Ended March 31, 2012 | | | | |
| |
INVESTMENT INCOME: | | | | |
Dividends from securities of affiliated issuers | | $ | 102,394 | |
Dividends from securities of unaffiliated issuers | | | 1,877 | |
| | | | |
Total investment income | | | 104,271 | |
| | | | |
EXPENSES: | | | | |
Distribution and service fees: | | | | |
C-Class | | | 23,464 | |
Custodian fees | | | 384 | |
| | | | |
Total expenses | | | 23,848 | |
| | | | |
Net investment income | | | 80,423 | |
| | | | |
NET REALIZEDAND UNREALIZED GAIN (LOSS): | | | | |
Net realized gain (loss) on: | | | | |
Investments in unaffiliated issuers | | | 74,011 | |
Investments in affiliated issuers | | | (218,483 | ) |
Futures contracts | | | 56,627 | |
Foreign currency | | | (359 | ) |
Realized gain distributions received from unaffiliated issuers | | | 200 | |
Realized gain distributions received from affiliated issuers | | | 157,539 | |
| | | | |
Net realized gain | | | 69,535 | |
| | | | |
Net change in unrealized appreciation (depreciation) on: | | | | |
Investments in unaffiliated issuers | | | (66,506 | ) |
Investments in affiliated issuers | | | (718,596 | ) |
Futures contracts | | | 6,887 | |
Foreign currency | | | 307 | |
| | | | |
Net change in unrealized appreciation (depreciation) | | | (777,908 | ) |
| | | | |
Net realized and unrealized loss | | | (708,373 | ) |
| | | | |
Net decrease in net assets resulting from operations | | $ | (627,950 | ) |
| | | | |
| | | | |
| | | | | |
| SEE NOTES TO FINANCIAL STATEMENTS. | | THE GUGGENHEIM FUNDS ANNUAL REPORT | | 21 |
| | |
| ALTERNATIVE STRATEGIES ALLOCATION FUND | | |
STATEMENTS OF CHANGES IN NET ASSETS
| | | | | | | | |
| | | Year Ended
March 31, 2012 | | | Year Ended
March 31, 2011 | |
INCREASE (DECREASE) IN NET ASSETS FROM OPERATIONS: | | | | | | | | |
Net investment income | | $ | 80,423 | | | $ | 168,401 | |
Net realized gain (loss) on investments | | | 69,535 | | | | (1,253,912 | ) |
Net change in unrealized appreciation (depreciation) on investments | | | (777,908 | ) | | | 1,318,460 | |
| | | | | | | | |
Net increase (decrease) in net assets resulting from operations | | | (627,950 | ) | | | 232,949 | |
| | | | | | | | |
DISTRIBUTIONSTO SHAREHOLDERS FROM: | | | | | | | | |
Net investment income | | | | | | | | |
A-Class | | | (27,917 | ) | | | (28,424 | )a |
C-Class | | | (41,138 | ) | | | (26,948 | )a |
H-Class | | | (139,906 | ) | | | (106,353 | )a |
Net realized gains | | | | | | | | |
A-Class | | | — | | | | (44,683 | )a |
C-Class | | | — | | | | (42,363 | )a |
H-Class | | | — | | | | (167,188 | )a |
| | | | | | | | |
Total distributions to shareholders | | | (208,961 | ) | | | (415,959 | ) |
| | | | | | | | |
CAPITAL SHARE TRANSACTIONS: | | | | | | | | |
Proceeds from sale of shares | | | | | | | | |
A-Class | | | 412,398 | | | | 1,435,110 | |
C-Class | | | 1,261,728 | | | | 812,636 | |
H-Class | | | 2,581,588 | | | | 6,506,749 | |
Redemption fees collected | | | | | | | | |
A-Class | | | — | | | | 54 | |
C-Class | | | — | | | | 68 | |
H-Class | | | — | | | | 209 | |
Distributions reinvested | | | | | | | | |
A-Class | | | 25,839 | | | | 65,586 | |
C-Class | | | 38,567 | | | | 66,099 | |
H-Class | | | 58,029 | | | | 140,841 | |
Cost of shares redeemed | | | | | | | | |
A-Class | | | (1,999,898 | ) | | | (2,710,954 | ) |
C-Class | | | (1,842,227 | ) | | | (4,349,793 | ) |
H-Class | | | (12,503,070 | ) | | | (11,518,009 | ) |
| | | | | | | | |
Net decrease from capital share transactions | | | (11,967,046 | ) | | | (9,551,404 | ) |
| | | | | | | | |
Net decrease in net assets | | | (12,803,957 | ) | | | (9,734,414 | ) |
NET ASSETS: | | | | | | | | |
Beginning of year | | | 20,790,086 | | | | 30,524,500 | |
| | | | | | | | |
End of year | | $ | 7,986,129 | | | $ | 20,790,086 | |
| | | | | | | | |
Undistributed net investment income at end of year | | $ | 243,692 | | | $ | 225,866 | |
| | | | | | | | |
CAPITAL SHARE ACTIVITY: | | | | | | | | |
Shares sold | | | | | | | | |
A-Class | | | 20,817 | | | | 72,012 | |
C-Class | | | 65,721 | | | | 41,750 | |
H-Class | | | 130,584 | | | | 330,334 | |
Shares issued from reinvestment of distributions | | | | | | | | |
A-Class | | | 1,358 | | | | 3,316 | |
C-Class | | | 2,086 | | | | 3,412 | |
H-Class | | | 3,049 | | | | 7,120 | |
Shares redeemed | | | | | | | | |
A-Class | | | (101,522 | ) | | | (137,310 | ) |
C-Class | | | (96,514 | ) | | | (224,330 | ) |
H-Class | | | (643,674 | ) | | | (585,220 | ) |
| | | | | | | | |
Net decrease in shares | | | (618,095 | ) | | | (488,916 | ) |
| | | | | | | | |
| a | For financial reporting purposes, certain distributions from net investment income for federal tax purposes have been reclassified to distributions from realized gains. |
| | | | |
| | | | | |
| 22 | | THE GUGGENHEIM FUNDS ANNUAL REPORT | | SEE NOTES TO FINANCIAL STATEMENTS. |
|
| ALTERNATIVE STRATEGIES ALLOCATION FUND |
|
FINANCIAL HIGHLIGHTS
This table is presented to show selected data for a share outstanding throughout each period and to assist shareholders in evaluating a Fund’s performance for the periods presented.
| | | | | | | | | | | | | | | | | | | | |
| A-Class | | Year Ended
March 31,
2012 | | | Year Ended
March 31,
2011 | | | Year Ended
March 31,
2010 | | | Year Ended
March 31,
2009 | | | Year Ended
March 31,
2008a | |
Per Share Data | | | | | | | | | | | | | | | | | | | | |
Net asset value, beginning of period | | $ | 20.24 | | | $ | 20.16 | | | $ | 19.33 | | | $ | 24.84 | | | $ | 25.00 | |
| | | | | | | | | | | | | | | | | | | | |
Income (loss) from investment operations: | | | | | | | | | | | | | | | | | | | | |
Net investment incomeb | | | .11 | | | | .17 | | | | — | c | | | .62 | | | | — | c |
Net gain (loss) on investments (realized and unrealized) | | | (.53 | ) | | | .27 | | | | .82 | | | | (5.69 | ) | | | (.16 | ) |
| | | | | | | | | | | | | | | | | | | | |
Total from investment operations | | | (.42 | ) | | | .44 | | | �� | .82 | | | | (5.07 | ) | | | (.16 | ) |
| | | | | | | | | | | | | | | | | | | | |
Less distributions from: | | | | | | | | | | | | | | | | | | | | |
Net investment income | | | (.27 | ) | | | (.14 | )f | | | — | | | | (.44 | )f | | | — | |
Net realized gains | | | — | | | | (.22 | )f | | | — | | | | (.03 | )f | | | — | |
| | | | | | | | | | | | | | | | | | | | |
Total distributions | | | (.27 | ) | | | (.36 | ) | | | — | | | | (.47 | ) | | | — | |
| | | | | | | | | | | | | | | | | | | | |
Redemption fees collected | | | — | | | | — | h | | | .01 | | | | .03 | | | | — | h |
| | | | | | | | | | | | | | | | | | | | |
Net asset value, end of period | | $ | 19.55 | | | $ | 20.24 | | | $ | 20.16 | | | $ | 19.33 | | | $ | 24.84 | |
| | | | | | | | | | | | | | | | | | | | |
Total Returnd | | | (2.04 | %) | | | 2.21 | % | | | 4.29 | % | | | (20.39 | %) | | | (0.64 | %) |
| | | | | | | | | | | | | | | | | | | | |
Ratios/Supplemental Data | | | | | | | | | | | | | | | | | | | | |
Net assets, end of period (in thousands) | | $ | 1,594 | | | $ | 3,257 | | | $ | 4,492 | | | $ | 5,816 | | | $ | 1,121 | |
| | | | | | | | | | | | | | | | | | | | |
Ratios to average net assets: | | | | | | | | | | | | | | | | | | | | |
Net investment income | | | 0.56 | % | | | 0.85 | % | | | 0.16 | % | | | 2.82 | % | | | 0.16 | % |
Total expensese | | | — | g | | | — | g | | | — | g | | | — | g | | | — | |
| | | | | | | | | | | | | | | | | | | | |
Portfolio turnover rate | | | 96 | % | | | 123 | % | | | 79 | % | | | 88 | % | | | — | |
| | | | | |
| C-Class | | Year Ended
March 31,
2012 | | | Year Ended
March 31,
2011 | | | Year Ended
March 31,
2010 | | | Year Ended
March 31,
2009 | | | Year Ended
March 31,
2008a | |
Per Share Data | | | | | | | | | | | | | | | | | | | | |
Net asset value, beginning of period | | $ | 19.78 | | | $ | 19.85 | | | $ | 19.17 | | | $ | 24.83 | | | $ | 25.00 | |
| | | | | | | | | | | | | | | | | | | | |
Income (loss) from investment operations: | | | | | | | | | | | | | | | | | | | | |
Net investment income (loss)b | | | (.03 | ) | | | .01 | | | | (.14 | ) | | | .39 | | | | (.01 | ) |
Net gain (loss) on investments (realized and unrealized) | | | (.53 | ) | | | .28 | | | | .81 | | | | (5.60 | ) | | | (.16 | ) |
| | | | | | | | | | | | | | | | | | | | |
Total from investment operations | | | (.56 | ) | | | .29 | | | | .67 | | | | (5.21 | ) | | | (.17 | ) |
| | | | | | | | | | | | | | | | | | | | |
Less distributions from: | | | | | | | | | | | | | | | | | | | | |
Net investment income | | | (.27 | ) | | | (.14 | )f | | | — | | | | (.44 | )f | | | — | |
Net realized gains | | | — | | | | (.22 | )f | | | — | | | | (.03 | )f | | | — | |
Total distributions | | | (.27 | ) | | | (.36 | ) | | | — | | | | (.47 | ) | | | — | |
| | | | | | | | | | | | | | | | | | | | |
Redemption fees collected | | | — | | | | — | h | | | .01 | | | | .02 | | | | — | h |
| | | | | | | | | | | | | | | | | | | | |
Net asset value, end of period | | $ | 18.95 | | | $ | 19.78 | | | $ | 19.85 | | | $ | 19.17 | | | $ | 24.83 | |
| | | | | | | | | | | | | | | | | | | | |
Total Returnd | | | (2.80 | %) | | | 1.49 | % | | | 3.55 | % | | | (21.00 | %) | | | (0.68 | %) |
| | | | | | | | | | | | | | | | | | | | |
Ratios/Supplemental Data | | | | | | | | | | | | | | | | | | | | |
Net assets, end of period (in thousands) | | $ | 2,721 | | | $ | 3,407 | | | $ | 6,975 | | | $ | 7,750 | | | $ | 152 | |
| | | | | | | | | | | | | | | | | | | | |
Ratios to average net assets: | | | | | | | | | | | | | | | | | | | | |
Net investment income (loss) | | | (0.13 | %) | | | 0.04 | % | | | (0.58 | %) | | | 1.77 | % | | | (0.56 | %) |
Total expensese | | | 0.75 | % | | | 0.75 | % | | | 0.75 | % | | | 0.75 | % | | | 0.68 | % |
| | | | | | | | | | | | | | | | | | | | |
Portfolio turnover rate | | | 96 | % | | | 123 | % | | | 79 | % | | | 88 | % | | | — | |
| | | | |
| | | | | |
| SEE NOTES TO FINANCIAL STATEMENTS. | | THE GUGGENHEIM FUNDS ANNUAL REPORT | | 23 |
|
ALTERNATIVE STRATEGIES ALLOCATION FUND |
|
FINANCIAL HIGHLIGHTS (concluded)
This table is presented to show selected data for a share outstanding throughout each period and to assist shareholders in evaluating a Fund’s performance for the periods presented.
| | | | | | | | | | | | | | | | | | | | |
H-Class | | Year Ended
March 31,
2012 | | | Year Ended
March 31,
2011 | | | Year Ended
March 31,
2010 | | | Year Ended
March 31,
2009 | | | Year Ended
March 31,
2008a | |
Per Share Data | | | | | | | | | | | | | | | | | | | | |
Net asset value, beginning of period | | $ | 20.24 | | | $ | 20.15 | | | $ | 19.32 | | | $ | 24.84 | | | $ | 25.00 | |
| | | | | | | | | | | | | | | | | | | | |
Income (loss) from investment operations: | | | | | | | | | | | | | | | | | | | | |
Net investment incomeb | | | .14 | | | | .16 | | | | .01 | | | | .56 | | | | — | c |
Net gain (loss) on investments (realized and unrealized) | | | (.56 | ) | | | .29 | | | | .81 | | | | (5.63 | ) | | | (.16 | ) |
| | | | | | | | | | | | | | | | | | | | |
Total from investment operations | | | (.42 | ) | | | .45 | | | | .82 | | | | (5.07 | ) | | | (.16 | ) |
| | | | | | | | | | | | | | | | | | | | |
Less distributions from: | | | | | | | | | | | | | | | | | | | | |
Net investment income | | | (.27 | ) | | | (.14 | )f | | | — | | | | (.44 | )f | | | — | |
Net realized gains | | | — | | | | (.22 | )f | | | — | | | | (.03 | )f | | | — | |
| | | | | | | | | | | | | | | | | | | | |
Total distributions | | | (.27 | ) | | | (.36 | ) | | | — | | | | (.47 | ) | | | — | |
| | | | | | | | | | | | | | | | | | | | |
Redemption fees collected | | | — | | | | — | h | | | .01 | | | | .02 | | | | — | h |
| | | | | | | | | | | | | | | | | | | | |
Net asset value, end of period | | $ | 19.55 | | | $ | 20.24 | | | $ | 20.15 | | | $ | 19.32 | | | $ | 24.84 | |
| | | | | | | | | | | | | | | | | | | | |
Total Returnd | | | (2.04 | %) | | | 2.26 | % | | | 4.30 | % | | | (20.43 | %) | | | (0.64 | %) |
| | | | | | | | | | | | | | | | | | | | |
Ratios/Supplemental Data | | | | | | | | | | | | | | | | | | | | |
Net assets, end of period (in thousands) | | $ | 3,671 | | | $ | 14,126 | | | $ | 19,057 | | | $ | 18,528 | | | $ | 3,893 | |
| | | | | | | | | | | | | | | | | | | | |
Ratios to average net assets: | | | | | | | | | | | | | | | | | | | | |
Net investment income | | | 0.69 | % | | | 0.79 | % | | | 0.19 | % | | | 2.55 | % | | | 0.12 | % |
Total expensese | | | — | g | | | — | g | | | — | g | | | — | g | | | — | |
| | | | | | | | | | | | | | | | | | | | |
Portfolio turnover rate | | | 96 | % | | | 123 | % | | | 79 | % | | | 88 | % | | | — | |
| a | Since commencement of operations: March 7, 2008. Percentage amounts for the period, except total return and portfolio turnover rate, have been annualized. |
| b | Net investment income (loss) per share was computed using average shares outstanding throughout the period. |
| c | Net investment income is less than $0.01 per share. |
| d | Total return does not reflect the impact of any applicable sales charges and has not been annualized. |
| e | Does not include expenses of the underlying funds in which the Fund invests. |
| f | For financial reporting purposes, certain distributions from net investment income for federal income tax purposes have been reclassified to distributions from realized gains. |
| h | Redemption fees collected are less than $0.01 per share. |
| | | | |
| | | | | |
| 24 | | THE GUGGENHEIM FUNDS ANNUAL REPORT | | SEE NOTES TO FINANCIAL STATEMENTS. |
This page intentionally left blank.
| | | | |
| | | | | |
| | THE GUGGENHEIM FUNDS ANNUAL REPORT | | 25 |
| | |
| PERFORMANCE REPORT AND FUND PROFILE (Unaudited) | | March 31, 2012 |
| | | |
EVENT DRIVEN AND DISTRESSED STRATEGIES FUND
OBJECTIVE: Seeks to achieve capital growth.
Effective July 11, 2011, the investment objective for the Event Driven and Distressed Strategies Fund changed from seeking to track the performance of a benchmark to seeking to achieve capital growth. The Fund’s principal investment strategy was also revised to reflect the new objective.
The Event Driven and Distressed Strategies Fund H-Class returned -2.60% for the year ended March 31, 2012. By comparison, the S&P 500® Index* returned 8.54% and the Credit Suisse Event Driven Liquid Index**, returned -0.80% over the same period.
The Fund gains exposure to event driven and distressed situations through various exposures, such as merger arbitrage, high yield, equities and volatility. During the period, the Fund used derivatives, such as swaps, as the primary instrument to gain exposure to these factors. The results of derivatives use during the period were within our expectations and contributed to the Fund’s performance.
The main positive driver of performance was from high yield exposures and the main negative driver of performance was from equity exposures. High yield exposures, mainly through exposure to high yield bonds, contributed just less than 4% of the return during the period. Equity exposures, through small cap equity exposure and equities of high yield companies, contributed just over -4% to the return for the period. Merger arbitrage contributed negatively to returns, but was down less than 1%. There was no exposure to market volatility during the period.
*Standard & Poor’s 500 Index (S&P 500®) — a capitalization-weighted index covering 500 industrial, utility, transportation and financial companies of the U.S. markets (mostly NYSE Euronext issues).
**Credit Suisse Event Driven Liquid Index reflects the returns of a dynamic basket of liquid, investable market factors selected and weighted in accordance with an algorithm that aims to approximate the aggregate returns of the universe of event driven hedge fund managers, as represented by the Event Driven sector of the Dow Jones Credit Suisse Hedge Fund Index.
Performance displayed represents past performance which is no guarantee of future results.
Holdings Diversification (Market Exposure as % of Net Assets)
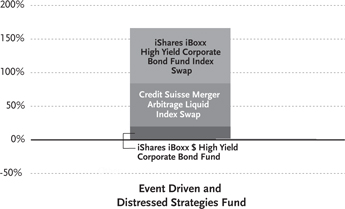
“Holdings Diversification (Market Exposure as % of Net Assets)” excludes any temporary cash investments.
| | | | |
Inception Dates: | |
A-Class | | | June 30, 2010 | |
C-Class | | | June 30, 2010 | |
H-Class | | | June 30, 2010 | |
Institutional Class | | | June 30, 2010 | |
The Fund invests principally in exchange traded funds and derivative investments such as swap agreements.
| | | | |
| | | | | |
| 26 | | THE GUGGENHEIM FUNDS ANNUAL REPORT | | |
| | |
| PERFORMANCE REPORT AND FUND PROFILE (Unaudited) (concluded) | | March 31, 2012 |
Cumulative Fund Performance*
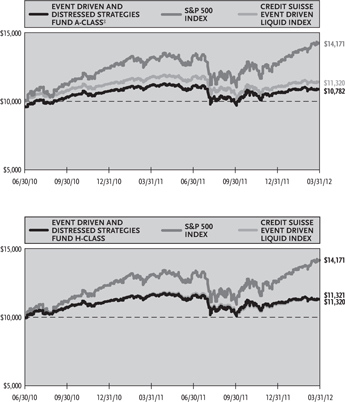
| | | | | | | | |
| Average Annual Returns* | |
Periods Ended 3/31/12 | |
| | | 1 Year | | | Since
Inception
(06/30/10) | |
A-Class Shares | | | -2.60 | % | | | 7.35 | % |
A-Class Shares with sales charge‡ | | | -7.23 | % | | | 4.40 | % |
C-Class Shares | | | -3.38 | % | | | 6.45 | % |
C-Class Shares with CDSC† | | | -4.32 | % | | | 6.45 | % |
H-Class Shares | | | -2.60 | % | | | 7.35 | % |
Institutional Class Shares | | | -2.34 | % | | | 7.62 | % |
Credit Suisse Event Driven
Liquid Index | | | -0.80 | % | | | 8.74 | % |
S&P 500 Index | | | 8.54 | % | | | 22.03 | % |
| * | The performance data above represents past performance that is not predictive of future results. The investment return and principal value of an investment in the Fund will fluctuate so that an investor’s shares, when redeemed, may be worth more or less than their original cost. Returns are historical and include changes in principal and reinvested dividends and capital gains and do not reflect the effect of taxes. The Credit Suisse Event Driven Liquid Index and the S&P 500 Index are unmanaged indices and, unlike the Fund, have no management fees or operating expenses to reduce their reported returns. The graphs are based on A-Class shares and H-Class shares only; performance for C-Class shares and Institutional Class shares will vary due to differences in fee structures. Effective July 11, 2011, the Fund’s investment objective changed from seeking to track the performance of a benchmark to seeking to achieve capital growth. The Fund’s principal investment strategy was also revised to reflect the new objective. |
| † | Fund returns include a CDSC of 1% if redeemed within 12 months of purchase. |
| ‡ | Fund returns are calculated using the maximum sales charge of 4.75%. |
| | | | |
| | | | | |
| | THE GUGGENHEIM FUNDS ANNUAL REPORT | | 27 |
| | |
| SCHEDULE OF INVESTMENTS | | March 31, 2012 |
| EVENT DRIVEN AND DISTRESSED STRATEGIES FUND | | |
| | | | | | |
| | | SHARES | | VALUE | |
EXCHANGE TRADED FUNDS† - 18.9% | | | | |
iShares iBoxx $ High Yield Corporate Bond Fund | | 21,100 | | $ | 1,916,724 | |
| | | | | | |
Total Exchange Traded Funds
(Cost $1,845,582) | | | 1,916,724 | |
| | | | | | |
| | | FACE
AMOUNT | | | |
FEDERAL AGENCY DISCOUNT NOTES†† - 29.6% | |
Fannie Mae1 | | | | | | |
0.23% due 04/02/12 | | $3,000,000 | | | 3,000,000 | |
| | | | | | |
Total Federal Agency Discount Notes
(Cost $2,999,981) | | | 3,000,000 | |
| | | | | | |
REPURCHASE AGREEMENTS††,2 - 52.0% | | | | |
Credit Suisse Group Issued 03/30/12 at 0.01% due 04/02/123 | | 3,516,207 | | | 3,516,207 | |
HSBC Group
issued 03/30/12 at 0.01%
due 04/02/12 | | 1,290,212 | | | 1,290,212 | |
Mizuho Financial Group, Inc.
issued 03/30/12 at 0.01%
due 04/02/12 | | 363,000 | | | 363,000 | |
Deutsche Bankissued
03/30/12 at 0.01%
due 04/02/12 | | 96,481 | | | 96,481 | |
| | | | | | |
Total Repurchase Agreements
(Cost $5,265,900) | | | | | 5,265,900 | |
| | | | | | |
Total Investments - 100.5%
(Cost $10,111,463) | | | | $ | 10,182,624 | |
| | | | | | |
Other Assets & Liabilities, net - (0.5)% | | | (52,684 | ) |
| | | | | | |
Total Net Assets - 100.0% | | | | $ | 10,129,940 | |
| | | | | | |
| | | | | | | | |
| | | UNITS | | | UNREALIZED
GAIN (LOSS) | |
CORPORATE BOND INDEX SWAP AGREEMENTS†† | | | | | | | | |
Credit Suisse Capital LLC April 2012 iShares iBoxx High Yield Corporate Bond Fund Index Swap, Terminating 04/30/124 (Notional Value $8,350,323) | | | 92,045 | | | $ | (16,738 | ) |
| | | | | | | | |
EQUITY INDEX SWAP AGREEMENTS†† | | | | | | | | |
Credit Suisse Capital LLC April 2012 Credit Suisse Merger Arbitrage Liquid Index Swap Terminating 04/30/125 (Notional Value $6,597,246) | | | 5,917 | | | $ | 4,370 | |
| | | | | | | | |
| † | Value determined based on Level 1 inputs — See Note 4. |
| †† | Value determined based on Level 2 inputs — See Note 4. |
| 1 | On September 7, 2008, the issuer was placed in conservatorship by the Federal Housing Finance Agency (FHFA). As conservator, the FHFA has full powers to control the assets and operations of the firm. |
| 2 | Repurchase Agreements — See Note 5. |
| 3 | All or a portion of this security is pledged as equity index swap collateral at March 31, 2012. |
| 4 | Total Return based on iShares iBoxx High Yield Corporate Bond Fund Index +/- financing at a variable rate. |
| 5 | Total Return based on Credit Suisse Merger Arbitrage Liquid Index +/- financing at a variable rate. |
| | | | |
| | | | | |
| 28 | | THE GUGGENHEIM FUNDS ANNUAL REPORT | | SEE NOTES TO FINANCIAL STATEMENTS. |
|
| EVENT DRIVEN AND DISTRESSED STRATEGIES FUND |
|
| | | | |
STATEMENT OF ASSETS AND LIABILITIES | |
| March 31, 2012 | | | | |
| |
ASSETS: | | | | |
Investments, at value
(cost $4,845,563) | | $ | 4,916,724 | |
Repurchase agreements, at value
(cost $5,265,900) | | | 5,265,900 | |
| | | | |
Total investments
(cost $10,111,463) | | | 10,182,624 | |
Segregated cash with broker | | | 7,041 | |
Unrealized appreciation on swap agreements | | | 4,370 | |
Prepaid expenses | | | 115 | |
Receivables: | | | | |
Fund shares sold | | | 48 | |
Interest | | | 3 | |
| | | | |
Total assets | | | 10,194,201 | |
| | | | |
LIABILITIES: | | | | |
Unrealized depreciation on swap agreements | | | 16,738 | |
Payable for: | | | | |
Licensing fees | | | 17,701 | |
Management fees | | | 7,966 | |
Fund shares redeemed | | | 3,894 | |
Distribution and service fees | | | 2,816 | |
Transfer agent and administrative fees | | | 2,213 | |
Portfolio accounting fees | | | 885 | |
Miscellaneous | | | 12,048 | |
| | | | |
Total liabilities | | | 64,261 | |
| | | | |
NET ASSETS | | $ | 10,129,940 | |
| | | | |
NET ASSETS CONSISTOF: | | | | |
Paid in capital | | $ | 10,765,994 | |
Accumulated net investment loss | | | (46,114 | ) |
Accumulated net realized loss on investments | | | (648,733 | ) |
Net unrealized appreciation on investments | | | 58,793 | |
| | | | |
Net assets | | $ | 10,129,940 | |
| | | | |
A-CLASS: | | | | |
Net assets | | $ | 2,595,141 | |
Capital shares outstanding | | | 102,303 | |
Net asset value per share | | $ | 25.37 | |
| | | | |
Maximum offering price per share
(Net asset value divided by 95.25%) | | $ | 26.64 | |
| | | | |
C-CLASS: | | | | |
Net assets | | $ | 1,022,272 | |
Capital shares outstanding | | | 40,913 | |
Net asset value per share | | $ | 24.99 | |
| | | | |
H-CLASS: | | | | |
Net assets | | $ | 6,183,173 | |
Capital shares outstanding | | | 243,737 | |
Net asset value per share | | $ | 25.37 | |
| | | | |
INSTITUTIONAL CLASS: | | | | |
Net assets | | $ | 329,354 | |
Capital shares outstanding | | | 12,923 | |
Net asset value per share | | $ | 25.49 | |
| | | | |
| | | | |
STATEMENT OF OPERATIONS | |
| Year Ended March 31, 2012 | | | | |
| |
INVESTMENT INCOME: | | | | |
Dividends (net of foreign withholding tax of $37) | | $ | 58,867 | |
Interest | | | 19,269 | |
| | | | |
Total investment income | | | 78,136 | |
| | | | |
EXPENSES: | | | | |
Management fees | | | 144,579 | |
Transfer agent and administrative fees | | | 40,161 | |
Distribution and service fees: | | | | |
A-Class | | | 16,847 | |
C-Class | | | 13,050 | |
H-Class | | | 19,573 | |
Portfolio accounting fees | | | 16,064 | |
Licensing fees | | | 40,494 | |
Custodian fees | | | 4,359 | |
Trustees’ fees* | | | 1,511 | |
Miscellaneous | | | 19,665 | |
| | | | |
Total expenses | | | 316,303 | |
Less: | | | | |
Expenses waived by Advisor | | | (10,380 | ) |
| | | | |
Net expenses | | | 305,923 | |
| | | | |
Net investment loss | | | (227,787 | ) |
| | | | |
NET REALIZED AND UNREALIZED GAIN (LOSS): | | | | |
Net realized gain (loss) on: | | | | |
Investments | | | (263,615 | ) |
Swap agreements | | | (466,844 | ) |
Futures contracts | | | 74,281 | |
Securities sold short | | | 7,316 | |
| | | | |
Net realized loss | | | (648,862 | ) |
| | | | |
Net change in unrealized appreciation (depreciation) on: | | | | |
Investments | | | 67,988 | |
Swap agreements | | | (182,036 | ) |
| | | | |
Net change in unrealized appreciation (depreciation) | | | (114,048 | ) |
| | | | |
Net realized and unrealized loss | | | (762,910 | ) |
| | | | |
Net decrease in net assets resulting from operations | | $ | (990,697 | ) |
| | | | |
| * | Relates to Trustees not deemed “interested persons” within the meaning of Section 2(a)(19) of the 1940 Act. |
| | | | |
| | | | | |
| SEE NOTES TO FINANCIAL STATEMENTS. | | THE GUGGENHEIM FUNDS ANNUAL REPORT | | 29 |
|
| EVENT DRIVEN AND DISTRESSED STRATEGIES FUND |
|
STATEMENTS OF CHANGES IN NET ASSETS
| | | | | | | | |
| | | Year Ended
March 31, 2012 | | | Period Ended
March 31, 2011a | |
INCREASE (DECREASE) IN NET ASSETS FROM OPERATIONS: | | | | | | | | |
Net investment loss | | $ | (227,787 | ) | | $ | (157,395 | ) |
Net realized gain (loss) on investments | | | (648,862 | ) | | | 1,757,786 | |
Net change in unrealized appreciation (depreciation) on investments | | | (114,048 | ) | | | 172,841 | |
| | | | | | | | |
Net increase (decrease) in net assets resulting from operations | | | (990,697 | ) | | | 1,773,232 | |
| | | | | | | | |
DISTRIBUTIONSTO SHAREHOLDERS FROM: | | | | | | | | |
Net realized gains | | | | | | | | |
A-Class | | | (123,350 | ) | | | (585,261 | ) |
C-Class | | | (34,259 | ) | | | (53,531 | ) |
H-Class | | | (195,843 | ) | | | (238,566 | ) |
Institutional Class | | | (7,071 | ) | | | (984 | ) |
| | | | | | | | |
Total distributions to shareholders | | | (360,523 | ) | | | (878,342 | ) |
| | | | | | | | |
CAPITAL SHARE TRANSACTIONS: | | | | | | | | |
Proceeds from sale of shares | | | | | | | | |
A-Class | | | 9,458,376 | | | | 23,804,628 | |
C-Class | | | 503,350 | | | | 1,566,171 | |
H-Class | | | 12,381,886 | | | | 10,028,018 | |
Institutional Class | | | 303,221 | | | | 66,975 | |
Redemption fees collected | | | | | | | | |
A-Class | | | — | | | | 144 | |
C-Class | | | — | | | | — | * |
H-Class | | | — | | | | 26 | |
Institutional Class | | | — | | | | — | * |
Distributions reinvested | | | | | | | | |
A-Class | | | 120,912 | | | | 547,724 | |
C-Class | | | 32,777 | | | | 38,503 | |
H-Class | | | 195,843 | | | | 222,004 | |
Institutional Class | | | 7,071 | | | | 984 | |
Cost of shares redeemed | | | | | | | | |
A-Class | | | (17,938,484 | ) | | | (13,391,287 | ) |
C-Class | | | (770,952 | ) | | | (253,411 | ) |
H-Class | | | (14,678,435 | ) | | | (1,616,324 | ) |
Institutional Class | | | (33,231 | ) | | | (10,219 | ) |
| | | | | | | | |
Net increase (decrease) from capital share transactions | | | (10,417,666 | ) | | | 21,003,936 | |
| | | | | | | | |
Net increase (decrease) in net assets | | | (11,768,886 | ) | | | 21,898,826 | |
| | |
NET ASSETS: | | | | | | | | |
Beginning of period | | | 21,898,826 | | | | — | |
| | | | | | | | |
End of period | | $ | 10,129,940 | | | $ | 21,898,826 | |
| | | | | | | | |
Accumulated net investment loss at end of period | | $ | (46,114 | ) | | $ | — | |
| | | | | | | | |
CAPITAL SHARE ACTIVITY: | | | | | | | | |
Shares sold | | | | | | | | |
A-Class | | | 358,306 | | | | 917,830 | |
C-Class | | | 19,545 | | | | 59,379 | |
H-Class | | | 468,085 | | | | 383,699 | |
Institutional Class | | | 11,688 | | | | 2,546 | |
Shares issued from reinvestment of distributions | | | | | | | | |
A-Class | | | 4,947 | | | | 21,530 | |
C-Class | | | 1,358 | | | | 1,521 | |
H-Class | | | 8,013 | | | | 8,727 | |
Institutional Class | | | 288 | | | | 39 | |
Shares redeemed | | | | | | | | |
A-Class | | | (692,503 | ) | | | (507,807 | ) |
C-Class | | | (31,104 | ) | | | (9,786 | ) |
H-Class | | | (563,225 | ) | | | (61,562 | ) |
Institutional Class | | | (1,250 | ) | | | (388 | ) |
| | | | | | | | |
Net increase (decrease) in shares | | | (415,852 | ) | | | 815,728 | |
| | | | | | | | |
| a | Since commencement of operations: June 30, 2010. |
| * | Redemption fees collected are less than $1.00. |
| | | | |
| | | | | |
| 30 | | THE GUGGENHEIM FUNDS ANNUAL REPORT | | SEE NOTES TO FINANCIAL STATEMENTS. |
|
| EVENT DRIVEN AND DISTRESSED STRATEGIES FUND |
|
FINANCIAL HIGHLIGHTS
This table is presented to show selected data for a share outstanding throughout each period and to assist shareholders in evaluating a Fund’s performance for the periods presented.
| | | | | | | | |
| A-Class | | Year Ended
March 31, 2012 | | | Period Ended
March 31, 2011a | |
Per Share Data | | | | | | | | |
Net asset value, beginning of period | | $ | 26.86 | | | $ | 25.00 | |
| | | | | | | | |
Income (loss) from investment operations: | | | | | | | | |
Net investment lossb | | | (.37 | ) | | | (.33 | ) |
Net gain (loss) on investments (realized and unrealized) | | | (.36 | ) | | | 4.27 | |
| | | | | | | | |
Total from investment operations | | | (.73 | ) | | | 3.94 | |
| | | | | | | | |
Less distributions from: | | | | | | | | |
Net realized gains | | | (.76 | ) | | | (2.08 | ) |
| | | | | | | | |
Total distributions | | | (.76 | ) | | | (2.08 | ) |
| | | | | | | | |
Net asset value, end of period | | $ | 25.37 | | | $ | 26.86 | |
| | | | | | | | |
Total Returnc | | | (2.60 | %) | | | 16.24 | % |
| | | | | | | | |
Ratios/Supplemental Data | | | | | | | | |
Net assets, end of period (in thousands) | | $ | 2,595 | | | $ | 11,591 | |
| | | | | | | | |
Ratios to average net assets: | | | | | | | | |
Net investment loss | | | (1.43 | %) | | | (1.65 | %) |
Total expensesd | | | 1.93 | % | | | 2.03 | % |
Net expensese | | | 1.85 | % | | | 1.89 | % |
| | | | | | | | |
Portfolio turnover rate | | | 513 | % | | | — | |
| | |
| C-Class | | Year Ended
March 31, 2012 | | | Period Ended
March 31, 2011a | |
Per Share Data | | | | | | | | |
Net asset value, beginning of period | | $ | 26.67 | | | $ | 25.00 | |
| | | | | | | | |
Income (loss) from investment operations: | | | | | | | | |
Net investment lossb | | | (.52 | ) | | | (.48 | ) |
Net gain (loss) on investments (realized and unrealized) | | | (.40 | ) | | | 4.23 | |
| | | | | | | | |
Total from investment operations | | | (.92 | ) | | | 3.75 | |
| | | | | | | | |
Less distributions from: | | | | | | | | |
Net realized gains | | | (.76 | ) | | | (2.08 | ) |
| | | | | | | | |
Total distributions | | | (.76 | ) | | | (2.08 | ) |
| | | | | | | | |
Net asset value, end of period | | $ | 24.99 | | | $ | 26.67 | |
| | | | | | | | |
Total Returnc | | | (3.38 | %) | | | 15.46 | % |
| | | | | | | | |
Ratios/Supplemental Data | | | | | | | | |
Net assets, end of period (in thousands) | | $ | 1,022 | | | $ | 1,363 | |
| | | | | | | | |
Ratios to average net assets: | | | | | | | | |
Net investment loss | | | (2.04 | %) | | | (2.42 | %) |
Total expensesd | | | 2.66 | % | | | 2.79 | % |
Net expensese | | | 2.60 | % | | | 2.65 | % |
| | | | | | | | |
Portfolio turnover rate | | | 513 | % | | | — | |
| | | | |
| | | | | |
| SEE NOTES TO FINANCIAL STATEMENTS. | | THE GUGGENHEIM FUNDS ANNUAL REPORT | | 31 |
|
| EVENT DRIVEN AND DISTRESSED STRATEGIES FUND |
|
FINANCIAL HIGHLIGHTS (concluded)
This table is presented to show selected data for a share outstanding throughout each period and to assist shareholders in evaluating a Fund’s performance for the periods presented.
| | | | | | | | |
| H-Class | | Year Ended
March 31, 2012 | | | Period Ended
March 31, 2011a | |
Per Share Data | | | | | | | | |
Net asset value, beginning of period | | $ | 26.86 | | | $ | 25.00 | |
| | | | | | | | |
Income (loss) from investment operations: | | | | | | | | |
Net investment lossb | | | (.34 | ) | | | (.33 | ) |
Net gain (loss) on investments (realized and unrealized) | | | (.39 | ) | | | 4.27 | |
| | | | | | | | |
Total from investment operations | | | (.73 | ) | | | 3.94 | |
| | | | | | | | |
Less distributions from: | | | | | | | | |
Net realized gains | | | (.76 | ) | | | (2.08 | ) |
| | | | | | | | |
Total distributions | | | (.76 | ) | | | (2.08 | ) |
| | | | | | | | |
Net asset value, end of period | | $ | 25.37 | | | $ | 26.86 | |
| | | | | | | | |
Total Returnc | | | (2.60 | %) | | | 16.24 | % |
| | | | | | | | |
Ratios/Supplemental Data | | | | | | | | |
Net assets, end of period (in thousands) | | $ | 6,183 | | | $ | 8,886 | |
| | | | | | | | |
Ratios to average net assets: | | | | | | | | |
Net investment loss | | | (1.33 | %) | | | (1.67 | %) |
| | | | | | | | |
Total expensesd | | | 1.91 | % | | | 2.04 | % |
Net expensese | | | 1.85 | % | | | 1.90 | % |
| | | | | | | | |
Portfolio turnover rate | | | 513 | % | | | — | |
| | |
| Institutional Class | | Year Ended
March 31, 2012 | | | Period Ended
March 31, 2011a | |
Per Share Data | | | | | | | | |
Net asset value, beginning of period | | $ | 26.91 | | | $ | 25.00 | |
| | | | | | | | |
Income (loss) from investment operations: | | | | | | | | |
Net investment lossb | | | (.23 | ) | | | (.27 | ) |
Net gain (loss) on investments (realized and unrealized) | | | (.43 | ) | | | 4.26 | |
| | | | | | | | |
Total from investment operations | | | (.66 | ) | | | 3.99 | |
| | | | | | | | |
Less distributions from: | | | | | | | | |
Net realized gains | | | (.76 | ) | | | (2.08 | ) |
| | | | | | | | |
Total distributions | | | (.76 | ) | | | (2.08 | ) |
| | | | | | | | |
Net asset value, end of period | | $ | 25.49 | | | $ | 26.91 | |
| | | | | | | | |
Total Returnc | | | (2.34 | %) | | | 16.45 | % |
| | | | | | | | |
Ratios/Supplemental Data | | | | | | | | |
Net assets, end of period (in thousands) | | $ | 329 | | | $ | 59 | |
| | | | | | | | |
Ratios to average net assets: | | | | | | | | |
Net investment loss | | | (0.90 | %) | | | (1.42 | %) |
Total expensesd | | | 1.61 | % | | | 1.79 | % |
Net expensese | | | 1.58 | % | | | 1.65 | % |
| | | | | | | | |
Portfolio turnover rate | | | 513 | % | | | — | |
| a | Since commencement of operations: June 30, 2010. Percentage amounts for the period, except total return and portfolio turnover rate, have been annualized. |
| b | Net investment loss per share was computed using average shares outstanding throughout the period. |
| c | Total return does not reflect the impact of any applicable sales charges and has not been annualized. |
| d | Does not include expenses of the underlying funds in which the Fund invests. |
| e | Net expense information reflects the expense ratios after expense waivers. |
| | | | |
| | | | | |
| 32 | | THE GUGGENHEIM FUNDS ANNUAL REPORT | | SEE NOTES TO FINANCIAL STATEMENTS. |
This page intentionally left blank.
| | | | |
| | | | | |
| | THE GUGGENHEIM FUNDS ANNUAL REPORT | | 33 |
| | |
| PERFORMANCE REPORT AND FUND PROFILE (Unaudited) | | March 31, 2012 |
LONG SHORT EQUITY STRATEGY FUND
OBJECTIVE: Seeks to achieve long-term capital appreciation with less volatility than the S&P 500 Index.
Effective July 11, 2011, the Fund’s investment objective changed from seeking to track the performance of a benchmark to seeking to achieve long-term capital appreciation with less volatility than the S&P 500* Index. The Fund’s principal investment strategy was also revised to reflect the new objective.
The Long Short Equity Strategy Fund H-Class performed well for the year ended March 31, 2012, returning 3.20%. By comparison, the S&P 500 Index returned 8.54% and the Credit Suisse Long/Short Liquid Index** returned 1.49% over the same period.
The Fund gains exposure to long-short equity exposure through various investable market factors covering five base index factors, four style factors and nine sector factors. During the period, the Fund used derivatives, such as futures, and exchange traded funds, as the primary instruments to gain exposure to these factors. The results of derivatives use during the period were within our expectations and contributed to the Fund’s performance.
The main driver of performance was exposure to the base factors, which contributed almost 4% of the return for the period. The other two factors were both down for the year, with the sector factors contributing -1% to return and the style factors marginally down. At the individual factor level, the top-performing factors were exposures to the value stocks, international large cap stocks, U.S. small cap stocks and U.S. concentrated large cap stocks. The individual factors that contributed negatively to performance were from positions in growth stocks and U.S. broad large cap stocks.
*Standard & Poor’s 500 Index (S&P 500®) — a capitalization-weighted index covering 500 industrial, utility, transportation and financial companies of the U.S. markets (mostly NYSE Euronext issues).
**Credit Suisse Long/Short Liquid Index reflects the returns of a dynamic basket of liquid, investable market factors selected and weighted in accordance with an algorithm that aims to approximate the aggregate returns of the universe of Long/Short Equity hedge fund managers, as represented by the Long/Short Equity sector of the Dow Jones Credit Suisse Hedge Fund Index.
Performance displayed represents past performance which is no guarantee of future results.
Holdings Diversification (Market Exposure
as % of Net Assets)
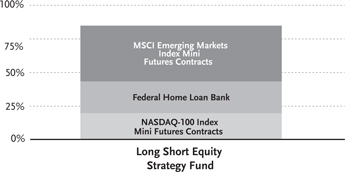
“Holdings Diversification (Market Exposure as % of Net Assets)” excludes any temporary cash investments.
| | | | |
Inception Dates: | |
A-Class | | | June 30, 2010 | |
C-Class | | | June 30, 2010 | |
H-Class | | | June 30, 2010 | |
Institutional Class | | | June 30, 2010 | |
The Fund invests principally in futures contracts.
| | | | |
| | | | | |
| 34 | | THE GUGGENHEIM FUNDS ANNUAL REPORT | | |
| | |
| PERFORMANCE REPORT AND FUND PROFILE (Unaudited) (concluded) | | March 31, 2012 |
Cumulative Fund Performance*
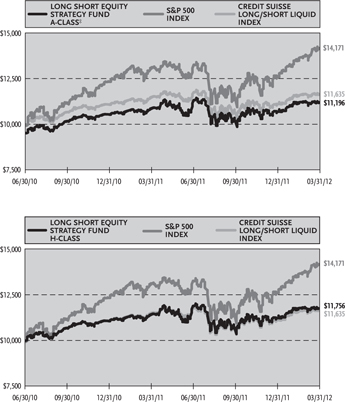
Average Annual Returns*
Periods Ended 03/31/12
| | | | | | | | |
| | | 1 Year | | | Since
Inception
(06/30/10) | |
A-Class Shares | | | 3.20 | % | | | 9.68 | % |
A-Class Shares with sales charge‡ | | | -1.69 | % | | | 6.67 | % |
C-Class Shares | | | 2.41 | % | | | 8.87 | % |
C-Class Shares with CDSC† | | | 1.42 | % | | | 8.87 | % |
H-Class Shares | | | 3.20 | % | | | 9.68 | % |
Institutional Class Shares | | | 3.46 | % | | | 9.95 | % |
Credit Suisse Long/Short Liquid Index | | | 1.49 | % | | | 9.03 | % |
S&P 500 Index | | | 8.54 | % | | | 22.03 | % |
| * | The performance data above represents past performance that is not predictive of future results. The investment return and principal value of an investment in the Fund will fluctuate so that an investor’s shares, when redeemed, may be worth more or less than their original cost. Returns are historical and include changes in principal and reinvested dividends and capital gains and do not reflect the effect of taxes. The Credit Suisse Long/Short Liquid Index and the S&P 500 Index are unmanaged indices and, unlike the Fund, have no management fees or operating expenses to reduce their reported returns. The graphs are based on A-Class shares and H-Class shares only; performance for C-Class and Institutional Class shares will vary due to differences in fee structures. Effective July 11, 2011, the Fund’s investment objective changed from seeking to track the performance of a benchmark to seeking to achieve long-term capital appreciation with less volatility than the S&P 500 Index. The Fund’s principal investment strategy was also revised to reflect the new objective. |
| † | Fund returns include a CDSC of 1% if redeemed within 12 months of purchase. |
| ‡ | Fund returns are calculated using the maximum sales charge of 4.75%. |
| | | | |
| | | | | |
| | THE GUGGENHEIM FUNDS ANNUAL REPORT | | 35 |
| | |
| SCHEDULE OF INVESTMENTS | | March 31, 2012 |
| LONG SHORT EQUITY STRATEGY FUND | | |
| | | | | | | | |
| | | FACE
AMOUNT | | | VALUE | |
FEDERAL AGENCY NOTES†† - 18.9% | |
Federal Home Loan Bank1 | | | | | | | | |
0.13% due 05/15/12 | | $ | 1,000,000 | | | $ | 999,976 | |
| | | | | | | | |
Total Federal Agency Notes
(Cost $999,936) | | | | | | | 999,976 | |
| | | | | | | | |
REPURCHASE AGREEMENTS††,2 - 51.9% | |
HSBC Group
issued 03/30/12 at 0.01%
due 04/02/12 | | | 1,845,963 | | | | 1,845,963 | |
Mizuho Financial Group, Inc.
issued 03/30/12 at 0.01%
due 04/02/12 | | | 519,360 | | | | 519,360 | |
Credit Suisse Group
issued 03/30/12 at 0.01%
due 04/02/12 | | | 238,315 | | | | 238,315 | |
Deutsche Bank
issued 03/30/12 at 0.01%
due 04/02/12 | | | 138,040 | | | | 138,040 | |
| | | | | | | | |
Total Repurchase Agreements
(Cost $2,741,678) | | | | | | | 2,741,678 | |
| | | | | | | | |
Total Investments - 70.8%
(Cost $3,741,614) | | | | | | $ | 3,741,654 | |
| | | | | | | | |
Other Assets & Liabilities,
net - 29.2% | | | | | | | 1,543,291 | |
| | | | | | | | |
Total Net Assets - 100.0% | | | | | | $ | 5,284,945 | |
| | |
| | | | | | | | | |
| | | | | | | | |
| | | CONTRACTS | | | UNREALIZED
GAIN (LOSS) | |
| | |
FUTURES CONTRACTS PURCHASED† | |
June 2012 NASDAQ-100 Index
Mini Futures Contracts
(Aggregate Value of
Contracts $825,225) | | | 15 | | | $ | 12,949 | |
June 2012 MSCI Emerging Markets Index
Mini Futures Contracts
(Aggregate Value of
Contracts $924,300) | | | 12 | | | | 6,696 | |
June 2012 MSCI Emerging Markets Index
Mini Futures Contracts
(Aggregate Value of
Contracts $831,200) | | | 16 | | | | (10,411 | ) |
| | | | | | | | |
(Total Aggregate Value of Contracts $2,580,725) | | | | | | $ | 9,234 | |
| | | | | | | | |
| † | Value determined based on Level 1 inputs — See Note 4. |
| †† | Value determined based on Level 2 inputs — See Note 4. |
| 1 | The issuer operates under a Congressional charter; its securities are neither issued nor guaranteed by the U.S. Government. |
| 2 | Repurchase Agreements — See Note 5. |
| | | | |
| | | | | |
| 36 | | THE GUGGENHEIM FUNDS ANNUAL REPORT | | SEE NOTES TO FINANCIAL STATEMENTS. |
|
| LONG SHORT EQUITY STRATEGY FUND |
|
STATEMENT OF ASSETS AND LIABILITIES
March 31, 2012
| | | | |
| |
ASSETS: | | | | |
Investments, at value
(cost $999,936) | | $ | 999,976 | |
Repurchase agreements, at value
(cost $2,741,678) | | | 2,741,678 | |
| | | | |
Total investments
(cost $3,741,614) | | | 3,741,654 | |
Segregated cash with broker | | | 1,548,126 | |
Prepaid expenses | | | 233 | |
Cash | | | 30 | |
Receivables: | | | | |
Variation margin | | | 12,595 | |
Fund shares sold | | | 1,200 | |
Interest | | | 818 | |
| | | | |
Total assets | | | 5,304,656 | |
| | | | |
LIABILITIES: | | | | |
Payable for: | | | | |
Licensing fees | | | 9,717 | |
Management fees | | | 3,954 | |
Distribution and service fees | | | 1,241 | |
Transfer agent and administrative fees | | | 1,098 | |
Portfolio accounting fees | | | 440 | |
Miscellaneous | | | 3,261 | |
| | | | |
Total liabilities | | | 19,711 | |
| | | | |
NET ASSETS | | $ | 5,284,945 | |
| | | | |
NET ASSETS CONSISTOF: | | | | |
Paid in capital | | $ | 5,172,741 | |
Accumulated net investment loss | | | (32,408 | ) |
Accumulated net realized gain on investments | | | 135,338 | |
Net unrealized appreciation on investments | | | 9,274 | |
| | | | |
Net assets | | $ | 5,284,945 | |
| | | | |
A-CLASS: | | | | |
Net assets | | $ | 2,346,720 | |
Capital shares outstanding | | | 87,829 | |
Net asset value per share | | $ | 26.72 | |
| | | | |
Maximum offering price per share
(Net asset value divided by 95.25%) | | $ | 28.05 | |
| | | | |
C-CLASS: | | | | |
Net assets | | $ | 278,266 | |
Capital shares outstanding | | | 10,556 | |
Net asset value per share | | $ | 26.36 | |
| | | | |
H-CLASS: | | | | |
Net assets | | $ | 2,528,733 | |
Capital shares outstanding | | | 94,648 | |
Net asset value per share | | $ | 26.72 | |
| | | | |
INSTITUTIONAL CLASS: | | | | |
Net assets | | $ | 131,226 | |
Capital shares outstanding | | | 4,890 | |
Net asset value per share | | $ | 26.84 | |
| | | | |
STATEMENT OF OPERATIONS
Year Ended March 31, 2012
| | | | |
| |
INVESTMENT INCOME: | | | | |
Dividends | | $ | 5,045 | |
Interest | | | 3,623 | |
| | | | |
Total investment income | | | 8,668 | |
| | | | |
EXPENSES: | | | | |
Management fees | | | 56,799 | |
Transfer agent and administrative fees | | | 15,778 | |
Distribution and service fees: | | | | |
A-Class | | | 9,486 | |
C-Class | | | 2,095 | |
H-Class | | | 5,534 | |
Portfolio accounting fees | | | 6,311 | |
Short sales dividend expense | | | 28,291 | |
Licensing fees | | | 22,088 | |
Prime broker interest expense | | | 3,769 | |
Custodian fees | | | 1,614 | |
Trustees’ fees* | | | 552 | |
Miscellaneous | | | 7,465 | |
| | | | |
Total expenses | | | 159,782 | |
Less: | | | | |
Expenses waived by Advisor | | | (6,634 | ) |
| | | | |
Net expenses | | | 153,148 | |
| | | | |
Net investment loss | | | (144,480 | ) |
| | | | |
NET REALIZEDAND UNREALIZED GAIN (LOSS): | | | | |
Net realized gain (loss) on: | | | | |
Investments | | | (204,907 | ) |
Futures contracts | | | 428,857 | |
Securities sold short | | | 118,217 | |
| | | | |
Net realized gain | | | 342,167 | |
| | | | |
Net change in unrealized appreciation (depreciation) on: | | | | |
Investments | | | (88,053 | ) |
Securities sold short | | | 54,808 | |
Futures contracts | | | (49,172 | ) |
| | | | |
Net change in unrealized appreciation (depreciation) | | | (82,417 | ) |
| | | | |
Net realized and unrealized gain | | | 259,750 | |
| | | | |
Net increase in net assets resulting from operations | | $ | 115,270 | |
| | | | |
| * | Relates to Trustees not deemed “interested persons” within the meaning of Section 2(a)(19) of the 1940 Act. |
| | | | |
| | | | | |
| SEE NOTES TO FINANCIAL STATEMENTS. | | THE GUGGENHEIM FUNDS ANNUAL REPORT | | 37 |
|
| LONG SHORT EQUITY STRATEGY FUND |
|
STATEMENTS OF CHANGES IN NET ASSETS
| | | | | | | | |
| | | Year Ended
March 31,
2012 | | | Period Ended
March 31,
2011a | |
INCREASE (DECREASE) IN NET ASSETS FROM OPERATIONS: | | | | | | | | |
Net investment loss | | $ | (144,480 | ) | | $ | (48,229 | ) |
Net realized gain on investments | | | 342,167 | | | | 381,521 | |
Net change in unrealized appreciation (depreciation) on investments | | | (82,417 | ) | | | 91,691 | |
| | | | | | | | |
Net increase in net assets resulting from operations | | | 115,270 | | | | 424,983 | |
| | | | | | | | |
DISTRIBUTIONSTO SHAREHOLDERS FROM: | | | | | | | | |
Net realized gains | | | | | | | | |
A-Class | | | (86,500 | ) | | | (138,650 | ) |
C-Class | | | (5,022 | ) | | | (11,501 | ) |
H-Class | | | (51,501 | ) | | | (73,618 | ) |
Institutional Class | | | (2,968 | ) | | | (746 | ) |
| | | | | | | | |
Total distributions to shareholders | | | (145,991 | ) | | | (224,515 | ) |
| | | | | | | | |
CAPITAL SHARE TRANSACTIONS: | | | | | | | | |
Proceeds from sale of shares | | | | | | | | |
A-Class | | | 5,623,039 | | | | 4,544,525 | |
C-Class | | | 162,804 | | | | 221,155 | |
H-Class | | | 3,857,235 | | | | 3,147,114 | |
Institutional Class | | | 95,137 | | | | 52,500 | |
Distributions reinvested | | | | | | | | |
A-Class | | | 86,281 | | | | 138,650 | |
C-Class | | | 5,022 | | | | 11,501 | |
H-Class | | | 51,501 | | | | 73,616 | |
Institutional Class | | | 2,968 | | | | 746 | |
Cost of shares redeemed | | | | | | | | |
A-Class | | | (6,977,556 | ) | | | (1,168,664 | ) |
C-Class | | | (82,220 | ) | | | (41,123 | ) |
H-Class | | | (3,375,476 | ) | | | (1,285,677 | ) |
Institutional Class | | | (27,880 | ) | | | — | |
| | | | | | | | |
Net increase (decrease) from capital share transactions | | | (579,145 | ) | | | 5,694,343 | |
| | | | | | | | |
Net increase (decrease) in net assets | | | (609,866 | ) | | | 5,894,811 | |
NET ASSETS: | | | | | | | | |
Beginning of period | | | 5,894,811 | | | | — | |
| | | | | | | | |
End of period | | $ | 5,284,945 | | | $ | 5,894,811 | |
| | | | | | | | |
Accumulated net investment loss at end of period | | $ | (32,408 | ) | | $ | — | |
| | | | | | | | |
CAPITAL SHARE ACTIVITY: | | | | | | | | |
Shares sold | | | | | | | | |
A-Class | | | 212,702 | | | | 176,581 | |
C-Class | | | 6,316 | | | | 8,371 | |
H-Class | | | 144,305 | | | | 121,888 | |
Institutional Class | | | 3,778 | | | | 2,012 | |
Shares issued from reinvestment of distributions | | | | | | | | |
A-Class | | | 3,397 | | | | 5,401 | |
C-Class | | | 200 | | | | 450 | |
H-Class | | | 2,028 | | | | 2,869 | |
Institutional Class | | | 116 | | | | 29 | |
Shares redeemed | | | | | | | | |
A-Class | | | (265,676 | ) | | | (44,576 | ) |
C-Class | | | (3,180 | ) | | | (1,601 | ) |
H-Class | | | (127,059 | ) | | | (49,383 | ) |
Institutional Class | | | (1,045 | ) | | | — | |
| | | | | | | | |
Net increase (decrease) in shares | | | (24,118 | ) | | | 222,041 | |
| | | | | | | | |
| a | Since commencement of operations: June 30, 2010. |
| | | | |
| | | | | |
| 38 | | THE GUGGENHEIM FUNDS ANNUAL REPORT | | SEE NOTES TO FINANCIAL STATEMENTS. |
|
| LONG SHORT EQUITY STRATEGY FUND |
|
FINANCIAL HIGHLIGHTS
This table is presented to show selected data for a share outstanding throughout each period and to assist shareholders in evaluating a Fund’s performance for the periods presented.
| | | | | | | | |
| A-Class | | Year Ended
March 31,
2012 | | | Period Ended
March 31,
2011a | |
Per Share Data | | | | | | | | |
Net asset value, beginning of period | | $ | 26.55 | | | $ | 25.00 | |
| | | | | | | | |
Income (loss) from investment operations: | | | | | | | | |
Net investment lossb | | | (.59 | ) | | | (.36 | ) |
Net gain on investments (realized and unrealized) | | | 1.41 | | | | 3.78 | |
| | | | | | | | |
Total from investment operations | | | .82 | | | | 3.42 | |
| | | | | | | | |
Less distributions from: | | | | | | | | |
Net realized gains | | | (.65 | ) | | | (1.87 | ) |
| | | | | | | | |
Total distributions | | | (.65 | ) | | | (1.87 | ) |
| | | | | | | | |
Net asset value, end of period | | $ | 26.72 | | | $ | 26.55 | |
| | | | | | | | |
Total Returnc | | | 3.20 | % | | | 13.92 | % |
| | | | | | | | |
Ratios/Supplemental Data | | | | | | | | |
Net assets, end of period (in thousands) | | $ | 2,347 | | | $ | 3,648 | |
| | | | | | | | |
Ratios to average net assets: | | | | | | | | |
Net investment loss | | | (2.25 | %) | | | (1.86 | %) |
Total expenses | | | 2.50 | % | | | 2.52 | % |
Net expensesd | | | 2.39 | % | | | 2.38 | % |
Operating expensese | | | 1.90 | % | | | 1.90 | % |
| | | | | | | | |
Portfolio turnover rate | | | 983 | % | | | 142 | % |
| | |
| C-Class | | Year Ended
March 31,
2012 | | | Period Ended
March 31,
2011a | |
Per Share Data | | | | | | | | |
Net asset value, beginning of period | | $ | 26.40 | | | $ | 25.00 | |
| | | | | | | | |
Income (loss) from investment operations: | | | | | | | | |
Net investment lossb | | | (.80 | ) | | | (.49 | ) |
Net gain on investments (realized and unrealized) | | | 1.41 | | | | 3.76 | |
| | | | | | | | |
Total from investment operations | | | .61 | | | | 3.27 | |
| | | | | | | | |
Less distributions from: | | | | | | | | |
Net realized gains | | | (.65 | ) | | | (1.87 | ) |
| | | | | | | | |
Total distributions | | | (.65 | ) | | | (1.87 | ) |
| | | | | | | | |
Net asset value, end of period | | $ | 26.36 | | | $ | 26.40 | |
| | | | | | | | |
Total Returnc | | | 2.41 | % | | | 13.30 | % |
| | | | | | | | |
Ratios/Supplemental Data | | | | | | | | |
Net assets, end of period (in thousands) | | $ | 278 | | | $ | 191 | |
| | | | | | | | |
Ratios to average net assets: | | | | | | | | |
Net investment loss | | | (3.10 | %) | | | (2.48 | %) |
Total expenses | | | 3.32 | % | | | 3.23 | % |
Net expensesd | | | 3.22 | % | | | 3.08 | % |
Operating expensese | | | 2.65 | % | | | 2.65 | % |
| | | | | | | | |
Portfolio turnover rate | | | 983 | % | | | 142 | % |
| | | | |
| | | | | |
| SEE NOTES TO FINANCIAL STATEMENTS. | | THE GUGGENHEIM FUNDS ANNUAL REPORT | | 39 |
|
| LONG SHORT EQUITY STRATEGY FUND |
|
FINANCIAL HIGHLIGHTS (concluded)
This table is presented to show selected data for a share outstanding throughout each period and to assist shareholders in evaluating a Fund’s performance for the periods presented.
| | | | | | | | |
H-Class | | Year Ended
March 31,
2012 | | | Period Ended
March 31,
2011a | |
Per Share Data | | | | | | | | |
Net asset value, beginning of period | | $ | 26.55 | | | $ | 25.00 | |
| | | | | | | | |
Income (loss) from investment operations: | | | | | | | | |
Net investment lossb | | | (.61 | ) | | | (.36 | ) |
Net gain on investments (realized and unrealized) | | | 1.43 | | | | 3.78 | |
| | | | | | | | |
Total from investment operations | | | .82 | | | | 3.42 | |
| | | | | | | | |
Less distributions from: | | | | | | | | |
Net realized gains | | | (.65 | ) | | | (1.87 | ) |
| | | | | | | | |
Total distributions | | | (.65 | ) | | | (1.87 | ) |
| | | | | | | | |
Net asset value, end of period | | $ | 26.72 | | | $ | 26.55 | |
| | | | | | | | |
Total Returnc | | | 3.20 | % | | | 13.92 | % |
| | | | | | | | |
Ratios/Supplemental Data | | | | | | | | |
Net assets, end of period (in thousands) | | $ | 2,529 | | | $ | 2,001 | |
| | | | | | | | |
Ratios to average net assets: | | | | | | | | |
Net investment loss | | | (2.31 | %) | | | (1.85 | %) |
Total expenses | | | 2.55 | % | | | 2.50 | % |
Net expensesd | | | 2.44 | % | | | 2.36 | % |
Operating expensese | | | 1.90 | % | | | 1.89 | % |
| | | | | | | | |
Portfolio turnover rate | | | 983 | % | | | 142 | % |
| | |
Institutional Class | | Year Ended
March 31,
2012 | | | Period Ended
March 31,
2011a | |
Per Share Data | | | | | | | | |
Net asset value, beginning of period | | $ | 26.60 | | | $ | 25.00 | |
| | | | | | | | |
Income (loss) from investment operations: | | | | | | | | |
Net investment lossb | | | (.55 | ) | | | (.28 | ) |
Net gain on investments (realized and unrealized) | | | 1.44 | | | | 3.75 | |
| | | | | | | | |
Total from investment operations | | | .89 | | | | 3.47 | |
| | | | | | | | |
Less distributions from: | | | | | | | | |
Net realized gains | | | (.65 | ) | | | (1.87 | ) |
| | | | | | | | |
Total distributions | | | (.65 | ) | | | (1.87 | ) |
| | | | | | | | |
Net asset value, end of period | | $ | 26.84 | | | $ | 26.60 | |
| | | | | | | | |
Total Returnc | | | 3.46 | % | | | 14.12 | % |
| | | | | | | | |
Ratios/Supplemental Data | | | | | | | | |
Net assets, end of period (in thousands) | | $ | 131 | | | $ | 54 | |
| | | | | | | | |
Ratios to average net assets: | | | | | | | | |
Net investment loss | | | (2.11 | %) | | | (1.45 | %) |
Total expenses | | | 2.30 | % | | | 2.33 | % |
Net expensesd | | | 2.20 | % | | | 2.19 | % |
Operating expensese | | | 1.65 | % | | | 1.65 | % |
| | | | | | | | |
Portfolio turnover rate | | | 983 | % | | | 142 | % |
| a | Since commencement of operations: June 30, 2010. Percentage amounts for the period, except total return and portfolio turnover rate, have been annualized. |
| b | Net investment loss per share was computed using average shares outstanding throughout the period. |
| c | Total return does not reflect the impact of any applicable sales charges and has not been annualized. |
| d | Net expense information reflects the expense ratios after expense waivers. |
| e | Operating expenses exclude interest and dividend expense from securities sold short. |
| | | | |
| | | | | |
| 40 | | THE GUGGENHEIM FUNDS ANNUAL REPORT | | SEE NOTES TO FINANCIAL STATEMENTS. |
This page intentionally left blank.
| | | | |
| | | | | |
| | THE GUGGENHEIM FUNDS ANNUAL REPORT | | 41 |
| | |
| PERFORMANCE REPORT AND FUND PROFILE (Unaudited) | | March 31, 2012 |
LONG SHORT INTEREST RATE STRATEGY FUND
OBJECTIVE: Seeks to maximize total return by taking advantage of price movements in the U.S. Treasury bond market.
The Long Short Interest Rate Strategy Fund H-Class returned -4.53% for the one-year period ended March 31, 2012. In comparison, a long-only exposure to the Barclay’s U.S. Aggregate Government Treasury Index* for the same period would have resulted in a return of 8.57%.
The Fund attempts to capitalize on interest rate trends by using different duration targets. The Fund is able to have five signals: fully bullish, moderately bullish, neutral, moderately bearish and fully bearish. During the period, the Fund used derivatives, such as bond futures, as the primary instrument to gain its exposures. The results of derivatives use during the period were within our expectations and contributed to the Fund’s performance.
Performance for the period ended March 31, 2012 was dominated by events exogenous to those factors on which we base our investment decisions. Typically, events such as Three Mile Island, Chernobyl and Fukushima have an impact on U.S. Treasury prices that is reversed well within our forecast horizon—roughly 30 days. In fact, the impact of such events typically runs its course in 7-12 trading days. But when external events do have a longer impact on U.S. Treasury prices, they affect our discipline negatively at times—concern about the eurozone last year—and, at other times, positively. Over time, such outcomes occur rarely and the behavior of interest rates is driven by the fundamentals of our interest rate risk management approach, measures of real growth and inflation with an allowance for investor sentiment. An allowance is made for sentiment because over periods as short as our “monthly” forecast interval—designed to capture deviations from, as well as the basic trends in, interest rates—investor psychology can be an important factor in market price action.
Our own view, consistent with the research of Ken Rogoff and Carmen Reinhart, John Taylor and Charles Kindleberger, is that there is not a “New Normal;” the basic economic principles governing the behavior of interest rates still apply. The experience of the last few years—recession accompanied by financial crisis—is consistent with the results of prior episodes of aggressive easing in monetary policy, dramatic increases in the amount of government debt outstanding relative to gross domestic product, and accompanied by “irrational exuberance,” as evidenced in the excessive use of leverage. Additionally, longer-term yields have moved by significant amounts both higher and lower since the Federal Reserve lowered the target for the Federal Funds Rate to roughly zero in December 2008. So, even if the “Fed” maintains this target value, there is ample opportunity for our discipline to add value. As the performance in both September and the first quarter of 2012 suggests, when the discipline rights itself, it can make up lost ground fairly quickly. The basic principle of reversion to the mean or reverting to the norm in terms of performance would imply that attractive near-term results may lie ahead if the discipline performs in both absolute and relative terms in line with its potential.
*Barclay’s U.S. Aggregate Government Treasury Index is a component of the Barclays U.S. Aggregate Bond Index. The Barclays U.S. Aggregate Bond Index measures performance of the U.S. investment-grade bond market, including investment-grade U.S. government bonds, investment-grade corporate bonds, mortgage pass-through securities and asset-backed securities.
Performance displayed represents past performance which is no guarantee of future results.
Holdings Diversification (Market Exposure
as % of Net Assets)
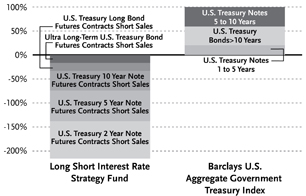
“Holdings Diversification (Market Exposure as % of Net Assets)” excludes any temporary cash investments.
| | |
Inception Dates: |
A-Class | | June 30, 2010 |
C-Class | | June 30, 2010 |
H-Class | | June 30, 2010 |
Institutional Class | | June 30, 2010 |
|
| The Fund invests principally in derivative investments such as futures contracts. |
| | | | |
| | | | | |
| 42 | | THE GUGGENHEIM FUNDS ANNUAL REPORT | | |
| | |
| PERFORMANCE REPORT AND FUND PROFILE (Unaudited) (concluded) | | March 31, 2012 |
Cumulative Fund Performance*
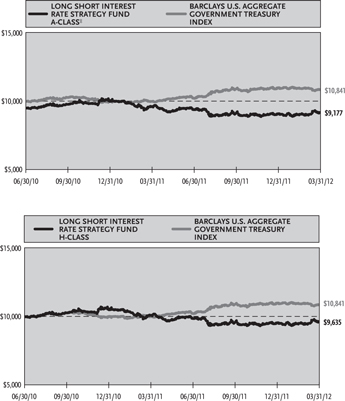
Average Annual Returns*
Periods Ended 03/31/12
| | | | | | | | |
| | | 1 Year | | | Since
Inception
(06/30/10) | |
A-Class Shares | | | -4.53 | % | | | -2.10 | % |
A-Class Shares with sales charge‡ | | | -9.08 | % | | | -4.79 | % |
C-Class Shares | | | -5.24 | % | | | -2.83 | % |
C-Class Shares with CDSC† | | | -6.18 | % | | | -2.83 | % |
H-Class Shares | | | -4.53 | % | | | -2.10 | % |
Institutional Class Shares | | | -4.28 | % | | | -1.86 | % |
Barclays U.S. Aggregate Government Treasury Index | | | 8.57 | % | | | 4.72 | % |
| * | The performance data above represents past performance that is not predictive of future results. The investment return and principal value of an investment in the Fund will fluctuate so that an investor’s shares, when redeemed, may be worth more or less than their original cost. Returns are historical and include changes in principal and reinvested dividends and capital gains and do not reflect the effect of taxes. The Barclays U.S. Aggregate Government Treasury Index is an unmanaged index and, unlike the Fund, has no management fees or operating expenses to reduce its reported return. The graphs are based on A-Class shares and H-Class shares only; performance for C-Class shares and Institutional Class shares will vary due to differences in fee structures. | |
| † | Fund returns include a CDSC of 1% if redeemed within 12 months of purchase. |
| ‡ | Fund returns are calculated using the maximum sales charge of 4.75%. |
| | | | |
| | | | | |
| | THE GUGGENHEIM FUNDS ANNUAL REPORT | | 43 |
| | |
| SCHEDULE OF INVESTMENTS | | March 31, 2012 |
LONG SHORT INTEREST RATE STRATEGY FUND | | |
| | | | | | | | |
| | | FACE
AMOUNT | | | VALUE | |
FEDERAL AGENCY DISCOUNT NOTES†† - 42.9% | |
Farmer Mac1 | | | | | | | | |
0.20% due 05/11/12 | | $ | 15,000,000 | | | $ | 14,999,520 | |
| | | | | | | | |
Fannie Mae2 | | | | | | | | |
0.15% due 09/12/12 | | | 10,000,000 | | | | 9,995,470 | |
0.23% due 04/02/12 | | | 5,000,000 | | | | 5,000,000 | |
| | | | | | | | |
Total Fannie Mae | | | | | | | 14,995,470 | |
| | | | | | | | |
Federal Home Loan Bank1 | | | | | | | | |
0.12% due 10/22/12 | | | 10,000,000 | | | | 9,993,800 | |
| | | | | | | | |
Total Federal Agency Discount Notes
(Cost $39,983,284) | | | | | | | 39,988,790 | |
| | | | | | | | |
FEDERAL AGENCY NOTES†† - 32.5% | |
Federal Home Loan Bank1 | | | | | | | | |
0.20% due 12/28/12 | | | 15,290,000 | | | | 15,288,899 | |
Federal Farm Credit Bank1 | | | | | | | | |
0.24% due 06/20/12 | | | 15,000,000 | | | | 15,002,925 | |
| | | | | | | | |
Total Federal Agency Notes
(Cost $30,289,922) | | | | | | | 30,291,824 | |
| | | | | | | | |
| | | | | | | | |
REPURCHASE AGREEMENTS††,3 - 23.2% | |
HSBC Group
issued 03/30/12 at 0.01% due 04/02/12 | | | 14,532,468 | | | | 14,532,468 | |
Mizuho Financial Group, Inc.
issued 03/30/12 at 0.01% due 04/02/12 | | | 4,088,700 | | | | 4,088,700 | |
Credit Suisse Group
issued 03/30/12 at 0.01% due 04/02/12 | | | 1,876,149 | | | | 1,876,149 | |
Deutsche Bank
issued 03/30/12 at 0.01% due 04/02/12 | | | 1,086,731 | | | | 1,086,731 | |
| | | | | | | | |
Total Repurchase Agreements
(Cost $21,584,048) | | | | 21,584,048 | |
| | | | | | | | |
Total Investments - 98.6%
(Cost $91,857,254) | | | $ | 91,864,662 | |
| | | | | | | | |
Other Assets & Liabilities, net - 1.4% | | | | 1,289,775 | |
| | | | | | | | |
Total Net Assets - 100.0% | | | $ | 93,154,437 | |
| | |
| | | | | | | | | |
| | | | | | | | |
| | | CONTRACTS | | | UNREALIZED
GAIN | |
INTEREST RATE FUTURES CONTRACTS SOLD SHORT† | |
June 2012 Ultra Long-Term U.S.Treasury Bond Futures Contracts
(Aggregate Value of Contracts $15,495,063) | | | 103 | | | $ | 772,351 | |
June 2012 U.S. Treasury 10 Year Note Futures Contracts
(Aggregate Value of Contracts $38,050,031) | | | 294 | | | | 541,667 | |
June 2012 U.S. Treasury Long Bond Futures Contracts
(Aggregate Value of Contracts $15,551,625) | | | 113 | | | | 506,805 | |
June 2012 U.S. Treasury 5 Year Note Futures Contracts
(Aggregate Value of Contracts $59,290,000) | | | 484 | | | | 345,173 | |
June 2012 U.S. Treasury 2 Year Note Futures Contracts
(Aggregate Value of Contracts $72,646,406) | | | 330 | | | | 31,131 | |
| | | | | | | | |
(Total Aggregate Value of Contracts $201,033,125) | | | $ | 2,197,127 | |
| | | | | | | | |
| † | Value determined based on Level 1 inputs — See Note 4. |
| †† | Value determined based on Level 2 inputs — See Note 4. |
| 1 | The issuer operates under a Congressional charter; its securities are neither issued nor guaranteed by the U.S. Government. |
| 2 | On September 7, 2008, the issuer was placed in conservatorship by the Federal Housing Finance Agency (FHFA). As conservator, the FHFA has full powers to control the assets and operations of the firm. |
| 3 | Repurchase Agreements — See Note 5. |
| | |
| | | |
| 44 | THE GUGGENHEIM FUNDS ANNUAL REPORT | | SEE NOTES TO FINANCIAL STATEMENTS. |
|
| LONG SHORT INTEREST RATE STRATEGY FUND |
STATEMENT OF ASSETS AND LIABILITIES
March 31, 2012
| | | | |
ASSETS: | | | | |
Investments, at value
(cost $70,273,206) | | $ | 70,280,614 | |
Repurchase agreements, at value
(cost $21,584,048) | | | 21,584,048 | |
| | | | |
Total investments
(cost $91,857,254) | | | 91,864,662 | |
Segregated cash with broker | | | 1,482,900 | |
Receivables: | | | | |
Variation margin | | | 605,158 | |
Interest | | | 18,012 | |
Fund shares sold | | | 7,719 | |
| | | | |
Total assets | | | 93,978,451 | |
| | | | |
LIABILITIES: | | | | |
Payable for: | | | | |
Fund shares redeemed | | | 617,606 | |
Management fees | | | 60,429 | |
Distribution and service fees | | | 20,601 | |
Transfer agent and administrative fees | | | 20,143 | |
Portfolio accounting fees | | | 8,057 | |
Miscellaneous | | | 97,178 | |
| | | | |
Total liabilities | | | 824,014 | |
| | | | |
NET ASSETS | | $ | 93,154,437 | |
| | | | |
NET ASSETS CONSISTOF: | | | | |
Paid in capital | | $ | 104,060,205 | |
Accumulated net investment loss | | | (318,354 | ) |
Accumulated net realized loss on investments | | | (12,791,949 | ) |
Net unrealized appreciation on investments | | | 2,204,535 | |
| | | | |
Net assets | | $ | 93,154,437 | |
| | | | |
A-CLASS: | | | | |
Net assets | | $ | 25,536,050 | |
Capital shares outstanding | | | 1,070,878 | |
Net asset value per share | | $ | 23.85 | |
| | | | |
Maximum offering price per share
(Net asset value divided by 95.25%) | | $ | 25.04 | |
| | | | |
C-CLASS: | | | | |
Net assets | | $ | 12,449,122 | |
Capital shares outstanding | | | 528,980 | |
Net asset value per share | | $ | 23.53 | |
| | | | |
H-CLASS: | | | | |
Net assets | | $ | 18,240,461 | |
Capital shares outstanding | | | 764,965 | |
Net asset value per share | | $ | 23.84 | |
| | | | |
INSTITUTIONAL CLASS: | | | | |
Net assets | | $ | 36,928,804 | |
Capital shares outstanding | | | 1,542,306 | |
Net asset value per share | | $ | 23.94 | |
| | | | |
STATEMENT OF OPERATIONS
Year Ended March 31, 2012
| | | | |
INVESTMENT INCOME: | | | | |
Interest | | $ | 256,600 | |
| | | | |
Total investment income | | | 256,600 | |
| | | | |
EXPENSES: | | | | |
Management fees | | | 1,004,023 | |
Transfer agent and administrative fees | | | 334,674 | |
Distribution and service fees: | | | | |
A-Class | | | 104,596 | |
C-Class | | | 163,850 | |
H-Class | | | 86,484 | |
Portfolio accounting fees | | | 133,869 | |
Custodian fees | | | 35,363 | |
Trustees’ fees* | | | 12,097 | |
Miscellaneous | | | 159,590 | |
| | | | |
Total expenses | | | 2,034,546 | |
| | | | |
Net investment loss | | | (1,777,946 | ) |
| | | | |
NET REALIZEDAND UNREALIZED GAIN (LOSS): | | | | |
Net realized gain (loss) on: | | | | |
Investments | | | 2,125 | |
Futures contracts | | | (9,593,206 | ) |
| | | | |
Net realized loss | | | (9,591,081 | ) |
| | | | |
Net change in unrealized appreciation (depreciation) on: | | | | |
Investments | | | (12,907 | ) |
Futures contracts | | | 2,541,385 | |
| | | | |
Net change in unrealized appreciation (depreciation) | | | 2,528,478 | |
| | | | |
Net realized and unrealized loss | | | (7,062,603 | ) |
| | | | |
Net decrease in net assets resulting from operations | | $ | (8,840,549 | ) |
| | | | |
| * | Relates to Trustees not deemed “interested persons” within the meaning of Section 2(a)(19) of the 1940 Act. |
| | | | |
| | | | | |
| SEE NOTES TO FINANCIAL STATEMENTS. | | THE GUGGENHEIM FUNDS ANNUAL REPORT | | 45 |
|
| LONG SHORT INTEREST RATE STRATEGY FUND |
STATEMENTS OF CHANGES IN NET ASSETS
| | | | | | | | |
| | | Year Ended
March 31,
2012 | | | Period Ended
March 31,
2011a | |
INCREASE (DECREASE) IN NET ASSETS FROM OPERATIONS: | | | | | | | | |
Net investment loss | | $ | (1,777,946 | ) | | $ | (558,298 | ) |
Net realized loss on investments | | | (9,591,081 | ) | | | (2,608,946 | ) |
Net change in unrealized appreciation (depreciation) on investments | | | 2,528,478 | | | | (323,943 | ) |
| | | | | | | | |
Net decrease in net assets resulting from operations | | | (8,840,549 | ) | | | (3,491,187 | ) |
| | | | | | | | |
DISTRIBUTIONSTO SHAREHOLDERS FROM: | | | | | | | | |
Net realized gains | | | | | | | | |
A-Class | | | — | | | | (170,618 | ) |
C-Class | | | — | | | | (60,418 | ) |
H-Class | | | — | | | | (213,112 | ) |
Institutional Class | | | — | | | | (58,988 | ) |
| | | | | | | | |
Total distributions to shareholders | | | — | | | | (503,136 | ) |
| | | | | | | | |
CAPITAL SHARE TRANSACTIONS: | | | | | | | | |
Proceeds from sale of shares | | | | | | | | |
A-Class | | | 23,645,537 | | | | 60,601,738 | |
C-Class | | | 7,494,316 | | | | 17,451,313 | |
H-Class | | | 25,597,870 | | | | 60,389,752 | |
Institutional Class | | | 28,451,019 | | | | 38,029,920 | |
Redemption fees collected | | | | | | | | |
A-Class | | | — | | | | 213 | |
C-Class | | | — | | | | 12 | |
H-Class | | | — | | | | 179 | |
Institutional Class | | | — | | | | — | |
Distributions reinvested | | | | | | | | |
A-Class | | | — | | | | 149,959 | |
C-Class | | | — | | | | 59,528 | |
H-Class | | | — | | | | 204,615 | |
Institutional Class | | | — | | | | 55,179 | |
Cost of shares redeemed | | | | | | | | |
A-Class | | | (46,966,821 | ) | | | (7,435,129 | ) |
C-Class | | | (9,100,331 | ) | | | (1,951,006 | ) |
H-Class | | | (51,941,799 | ) | | | (11,546,620 | ) |
Institutional Class | | | (26,789,213 | ) | | | (410,922 | ) |
| | | | | | | | |
Net increase (decrease) from capital share transactions | | | (49,609,422 | ) | | | 155,598,731 | |
| | | | | | | | |
Net increase (decrease) in net assets | | | (58,449,971 | ) | | | 151,604,408 | |
| | |
NET ASSETS: | | | | | | | | |
Beginning of period | | | 151,604,408 | | | | — | |
| | | | | | | | |
End of period | | $ | 93,154,437 | | | $ | 151,604,408 | |
| | | | | | | | |
Accumulated net investment loss at end of period | | $ | (318,354 | ) | | $ | — | |
| | | | | | | | |
CAPITAL SHARE ACTIVITY: | | | | | | | | |
Shares sold | | | | | | | | |
A-Class | | | 978,397 | | | | 2,365,260 | |
C-Class | | | 310,507 | | | | 681,438 | |
H-Class | | | 1,063,468 | | | | 2,343,550 | |
Institutional Class | | | 1,177,662 | | | | 1,507,953 | |
Shares issued from reinvestment of distributions | | | | | | | | |
A-Class | | | — | | | | 5,761 | |
C-Class | | | — | | | | 2,295 | |
H-Class | | | — | | | | 7,861 | |
Institutional Class | | | — | | | | 2,118 | |
Shares redeemed | | | | | | | | |
A-Class | | | (1,986,372 | ) | | | (292,168 | ) |
C-Class | | | (389,005 | ) | | | (76,255 | ) |
H-Class | | | (2,190,686 | ) | | | (459,228 | ) |
Institutional Class | | | (1,128,561 | ) | | | (16,866 | ) |
| | | | | | | | |
Net increase (decrease) in shares | | | (2,164,590 | ) | | | 6,071,719 | |
| | | | | | | | |
| a | Since commencement of operations: June 30, 2010. |
| | | | |
| | | | | |
| 46 | | THE GUGGENHEIM FUNDS ANNUAL REPORT | | SEE NOTES TO FINANCIAL STATEMENTS. |
|
| LONG SHORT INTEREST RATE STRATEGY FUND |
FINANCIAL HIGHLIGHTS
This table is presented to show selected data for a share outstanding throughout each period and to assist shareholders in evaluating a Fund’s performance for the periods presented.
| | | | | | | | |
| A-Class | | Year Ended
March 31,
2012 | | | Period Ended
March 31,
2011a | |
Per Share Data | | | | | | | | |
Net asset value, beginning of period | | $ | 24.97 | | | $ | 25.00 | |
| | | | | | | | |
Income (loss) from investment operations: | | | | | | | | |
Net investment lossb | | | (.31 | ) | | | (.26 | ) |
Net gain (loss) on investments (realized and unrealized) | | | (.81 | ) | | | .50 | |
| | | | | | | | |
Total from investment operations | | | (1.12 | ) | | | .24 | |
| | | | | | | | |
Less distributions from: | | | | | | | | |
Net realized gains | | | — | | | | (.27 | ) |
| | | | | | | | |
Total distributions | | | — | | | | (.27 | ) |
| | | | | | | | |
Net asset value, end of period | | $ | 23.85 | | | $ | 24.97 | |
| | | | | | | | |
Total Returnc | | | (4.53 | %) | | | 0.92 | % |
| | | | | | | | |
Ratios/Supplemental Data | | | | | | | | |
Net assets, end of period (in thousands) | | $ | 25,536 | | | $ | 51,915 | |
| | | | | | | | |
Ratios to average net assets: | | | | | | | | |
Net investment loss | | | (1.32 | %) | | | (1.35 | %) |
Total expenses | | | 1.51 | % | | | 1.54 | % |
| | | | | | | | |
Portfolio turnover rate | | | — | | | | — | |
| | |
| C-Class | | Year Ended
March 31,
2012 | | | Period Ended
March 31,
2011a | |
Per Share Data | | | | | | | | |
Net asset value, beginning of period | | $ | 24.83 | | | $ | 25.00 | |
| | | | | | | | |
Income (loss) from investment operations: | | | | | | | | |
Net investment lossb | | | (.49 | ) | | | (.40 | ) |
Net gain (loss) on investments (realized and unrealized) | | | (.81 | ) | | | .50 | |
| | | | | | | | |
Total from investment operations | | | (1.30 | ) | | | .10 | |
| | | | | | | | |
Less distributions from: | | | | | | | | |
Net realized gains | | | — | | | | (.27 | ) |
| | | | | | | | |
Total distributions | | | — | | | | (.27 | ) |
| | | | | | | | |
Net asset value, end of period | | $ | 23.53 | | | $ | 24.83 | |
| | | | | | | | |
Total Returnc | | | (5.24 | %) | | | 0.36 | % |
| | | | | | | | |
Ratios/Supplemental Data | | | | | | | | |
Net assets, end of period (in thousands) | | $ | 12,449 | | | $ | 15,086 | |
| | | | | | | | |
Ratios to average net assets: | | | | | | | | |
Net investment loss | | | (2.06 | %) | | | (2.12 | %) |
Total expenses | | | 2.26 | % | | | 2.30 | % |
| | | | | | | | |
Portfolio turnover rate | | | — | | | | — | |
| | | | |
| | | | | |
| SEE NOTES TO FINANCIAL STATEMENTS. | | THE GUGGENHEIM FUNDS ANNUAL REPORT | | 47 |
| | |
| LONG SHORT INTEREST RATE STRATEGY FUND | | |
FINANCIAL HIGHLIGHTS (concluded)
This table is presented to show selected data for a share outstanding throughout each period and to assist shareholders in evaluating a Fund’s performance for the periods presented.
| | | | | | | | |
H-Class | | Year Ended
March 31,
2012 | | | Period Ended
March 31,
2011a | |
Per Share Data | | | | | | | | |
Net asset value, beginning of period | | $ | 24.97 | | | $ | 25.00 | |
| | | | | | | | |
Income (loss) from investment operations: | | | | | | | | |
Net investment lossb | | | (.32 | ) | | | (.26 | ) |
Net gain (loss) on investments (realized and unrealized) | | | (.81 | ) | | | .50 | |
| | | | | | | | |
Total from investment operations | | | (1.13 | ) | | | .24 | |
| | | | | | | | |
Less distributions from: | | | | | | | | |
Net realized gains | | | — | | | | (.27 | ) |
| | | | | | | | |
Total distributions | | | — | | | | (.27 | ) |
| | | | | | | | |
Net asset value, end of period | | $ | 23.84 | | | $ | 24.97 | |
| | | | | | | | |
Total Returnc | | | (4.53 | %) | | | 0.92 | % |
| | | | | | | | |
Ratios/Supplemental Data | | | | | | | | |
Net assets, end of period (in thousands) | | $ | 18,240 | | | $ | 47,252 | |
| | | | | | | | |
Ratios to average net assets: | | | | | | | | |
Net investment loss | | | (1.32 | %) | | | (1.36 | %) |
Total expenses | | | 1.51 | % | | | 1.54 | % |
| | | | | | | | |
Portfolio turnover rate | | | — | | | | — | |
| | |
Institutional Class | | Year Ended
March 31,
2012 | | | Period Ended
March 31,
2011a | |
Per Share Data | | | | | | | | |
Net asset value, beginning of period | | $ | 25.01 | | | $ | 25.00 | |
| | | | | | | | |
Income (loss) from investment operations: | | | | | | | | |
Net investment lossb | | | (.25 | ) | | | (.21 | ) |
Net gain (loss) on investments (realized and unrealized) | | | (.82 | ) | | | .49 | |
| | | | | | | | |
Total from investment operations | | | (1.07 | ) | | | .28 | |
| | | | | | | | |
Less distributions from: | | | | | | | | |
Net realized gains | | | — | | | | (.27 | ) |
Total distributions | | | — | | | | (.27 | ) |
| | | | | | | | |
Net asset value, end of period | | $ | 23.94 | | | $ | 25.01 | |
| | | | | | | | |
Total Returnc | | | (4.28 | %) | | | 1.08 | % |
| | | | | | | | |
Ratios/Supplemental Data | | | | | | | | |
Net assets, end of period (in thousands) | | $ | 36,929 | | | $ | 37,351 | |
| | | | | | | | |
Ratios to average net assets: | | | | | | | | |
Net investment loss | | | (1.06 | %) | | | (1.13 | %) |
Total expenses | | | 1.25 | % | | | 1.30 | % |
| | | | | | | | |
Portfolio turnover rate | | | — | | | | — | |
| a | Since commencement of operations: June 30, 2010. Percentage amounts for the period, except total return and portfolio turnover rate, have been annualized. |
| b | Net investment loss per share was computed using average shares outstanding throughout the period. |
| c | Total return does not reflect the impact of any applicable sales charges and has not been annualized. |
| | | | |
| | | | | |
| 48 | | THE GUGGENHEIM FUNDS ANNUAL REPORT | | SEE NOTES TO FINANCIAL STATEMENTS. |
This page intentionally left blank.
| | | | |
| | | | | |
| | THE GUGGENHEIM FUNDS ANNUAL REPORT | | 49 |
| | |
| PERFORMANCE REPORT AND FUND PROFILE (Unaudited) | | March 31, 2012 |
EMERGING MARKETS 2x STRATEGY FUND
OBJECTIVE: To seek to provide investment results that correlate, before fees and expenses, to the performance of a specific benchmark on a daily basis. The Fund’s current benchmark is 200% of the performance of the BNY Mellon Emerging Markets 50 ADR Index (the “underlying index”). The Fund does not seek to achieve its investment objective over a period of time greater than one day.
For the one-year period ended March 31, 2012, Emerging Markets 2x Strategy Fund H-Class returned -29.70%, while the BNY Mellon Emerging Markets 50 ADR Index* returned -10.01% over the same period.
For the period, Emerging Markets 2x Strategy Fund maintained a daily correlation of over 99% to its benchmark of 200% of the daily price movement of the BNY Mellon Emerging Markets 50 ADR Index.
Emerging markets as a group underperformed for much of the past 12 months. After a weak 2011, the sector had a good start to 2012, but fell off on news of a slowdown in China’s economy, higher oil prices and worldwide economic weakness. Other ongoing risks to emerging market growth are the eurozone’s debt problems and political changes that are occurring in many developing countries in 2012.
Derivatives in the Fund were used to help provide exposure to the composition of the benchmark in the highest efficient manner and to provide leverage, not for hedging purposes. The results of derivatives use during the period were within our expectations and contributed to the Fund’s performance.
Due to the compounding of daily returns, leveraged and inverse funds’ returns over periods other than one day will likely differ in amount and possibly direction from the benchmark return for the same period. Investors should monitor their leveraged and inverse funds’ holdings to ensure that they are consistent with their strategies, as frequently as daily.
The effects of compounding may cause the longer-term correlation of the Fund to its benchmark to diminish. The apparent discrepancy between the leveraged and unleveraged indices is the result of compounding, which is described briefly on page 4 of this report.
*BNY Mellon Emerging Markets 50 ADR Index is capitalization-weighted and designed to track the performance of approximately 50 emerging market-based depositary receipts.
Performance displayed represents past performance which is no guarantee of future results.
Holdings Diversification (Market Exposure
as % of Net Assets)
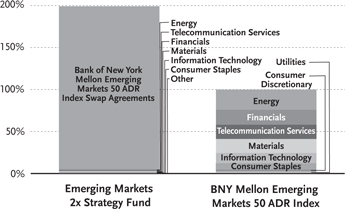
“Holdings Diversification (Market Exposure as % of Net Assets)” excludes any temporary cash investments.
| | |
Inception Dates: |
A-Class | | October 29, 2010 |
C-Class | | October 29, 2010 |
H-Class | | October 29, 2010 |
The Fund invests principally in derivative investments such as swap agreements.
| | | | |
| | | | | |
| 50 | | THE GUGGENHEIM FUNDS ANNUAL REPORT | | |
| | |
| PERFORMANCE REPORT AND FUND PROFILE (Unaudited) (concluded) | | March 31, 2012 |
Cumulative Fund Performance*
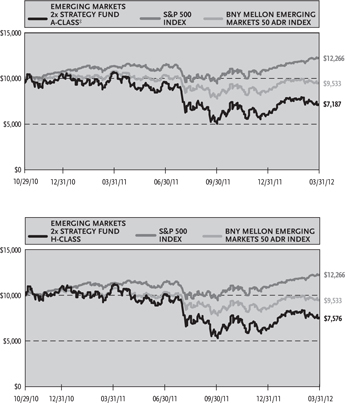
| | | | | | | | |
| Average Annual Returns* | | | | | | | | |
| Periods Ended 03/31/12 | | | | | | | | |
| | | 1 Year | | | Since
Inception
(10/29/10) | |
A-Class Shares | | | -30.00 | % | | | -17.99 | % |
A-Class Shares with sales charge‡ | | | -33.31 | % | | | -20.76 | % |
C-Class Shares | | | -29.75 | % | | | -18.05 | % |
C-Class Shares with CDSC† | | | -30.40 | % | | | -18.05 | % |
H-Class Shares | | | -29.70 | % | | | -17.77 | % |
BNY Mellon Emerging Markets 50 ADR Index | | | -10.01 | % | | | -3.32 | % |
S&P 500 Index | | | 8.54 | % | | | 15.48 | % |
| * | The performance data above represents past performance that is not predictive of future results. The investment return and principal value of an investment in the Fund will fluctuate so that an investor’s shares, when redeemed, may be worth more or less than their original cost. Returns are historical and include changes in principal and reinvested dividends and capital gains and do not reflect the effect of taxes. The BNY Mellon Emerging Markets 50 ADR Index and the S&P 500 Index are unmanaged indices and, unlike the Fund, have no management fees or operating expenses to reduce their reported returns. The graphs are based on A-Class shares and H-Class shares only; performance for C-Class shares will vary due to differences in fee structure. |
| † | Fund returns include a CDSC of 1% if redeemed within 12 months of purchase. |
| ‡ | Fund returns are calculated using the maximum sales charge of 4.75%. |
| | | | |
| | | | | |
| | THE GUGGENHEIM FUNDS ANNUAL REPORT | | 51 |
| | | | |
| SCHEDULE OF INVESTMENTS | | | March 31, 2012 | |
| EMERGING MARKETS 2x STRATEGY FUND | | | | |
| | | | | | | | |
| | | SHARES | | | VALUE | |
COMMON STOCKS† - 5.0% | | | | | | | | |
Energy - 1.1% | | | | | | | | |
Petroleo Brasileiro S.A. — Class A ADR | | | 568 | | | $ | 14,519 | |
Petroleo Brasileiro S.A. ADR | | | 440 | | | | 11,686 | |
CNOOC Ltd. ADR | | | 40 | | | | 8,172 | |
PetroChina Company Ltd. ADR | | | 56 | | | | 7,870 | |
Sasol Ltd. ADR | | | 132 | | | | 6,420 | |
China Petroleum & Chemical Corp. ADR | | | 45 | | | | 4,892 | |
Ecopetrol S.A. ADR | | | 55 | | | | 3,360 | |
Ultrapar Participacoes S.A. ADR | | | 110 | | | | 2,386 | |
| | | | | | | | |
Total Energy | | | | | | | 59,305 | |
| | | | | | | | |
Telecommunication Services - 0.9% | | | | | | | | |
China Mobile Ltd. ADR | | | 278 | | | | 15,312 | |
America Movil SAB de CV ADR | | | 514 | | | | 12,763 | |
Chunghwa Telecom Company Ltd. ADR | | | 102 | | | | 3,137 | |
Mobile TeleSystems ADR | | | 138 | | | | 2,531 | |
Telefonica Brasil S.A. ADR | | | 77 | | | | 2,359 | |
China Unicom Hong Kong Ltd. ADR | | | 126 | | | | 2,117 | |
China Telecom Corporation Ltd. ADR | | | 37 | | | | 2,031 | |
Telekomunikasi Indonesia Persero Tbk PT ADR | | | 66 | | | | 2,004 | |
Tim Participacoes S.A. ADR | | | 49 | | | | 1,581 | |
Philippine Long Distance Telephone Co. ADR | | | 23 | | | | 1,430 | |
| | | | | | | | |
Total Telecommunication Services | | | | | | | 45,265 | |
| | | | | | | | |
Financials - 0.9% | | | | | | | | |
Itau Unibanco Holding S.A. ADR | | | 596 | | | | 11,437 | |
Banco Bradesco S.A. ADR | | | 510 | | | | 8,925 | |
China Life Insurance Company Ltd. ADR | | | 132 | | | | 5,131 | |
HDFC Bank Ltd. ADR | | | 150 | | | | 5,115 | |
Shinhan Financial Group Company Ltd. ADR | | | 59 | | | | 4,549 | |
ICICI Bank Ltd. ADR | | | 113 | | | | 3,940 | |
KB Financial Group, Inc. ADR | | | 96 | | | | 3,523 | |
Banco Santander Brasil S.A. ADR | | | 150 | | | | 1,376 | |
| | | | | | | | |
Total Financials | | | | | | | 43,996 | |
| | | | | | | | |
Materials - 0.8% | | | | | | | | |
Vale S.A. — Class B ADR | | | 542 | | | | 12,298 | |
Vale S.A. ADR | | | 348 | | | | 8,119 | |
POSCO ADR | | | 72 | | | | 6,026 | |
AngloGold Ashanti Ltd. ADR | | | 102 | | | | 3,766 | |
Gold Fields Ltd. ADR | | | 192 | | | | 2,669 | |
Gerdau S.A. ADR | | | 238 | | | | 2,292 | |
Cemex SAB de CV ADR* | | | 283 | | | | 2,192 | |
Cia Siderurgica Nacional S.A. ADR | | | 210 | | | | 1,987 | |
Cia de Minas Buenaventura S.A. ADR | | | 42 | | | | 1,693 | |
Sociedad Quimica y Minera de Chile S.A. ADR | | | 24 | | | | 1,408 | |
| | | | | | | | |
Total Materials | | | | | | | 42,450 | |
| | | | | | | | |
Information Technology - 0.7% | | | | | | | | |
Taiwan Semiconductor Manufacturing | | | | | | | | |
Company Ltd. ADR | | | 1,299 | | | | 19,848 | |
Infosys Ltd. ADR | | | 128 | | | | 7,300 | |
Baidu, Inc. ADR* | | | 36 | | | | 5,248 | |
United Microelectronics Corp. ADR | | | 693 | | | | 1,698 | |
| | | | | | | | |
Total Information Technology | | | | | | | 34,094 | |
| | | | | | | | |
| | | | | | | | |
| | | SHARES | | | VALUE | |
Consumer Staples - 0.4% | | | | | | | | |
Cia de Bebidas das Americas ADR | | | 212 | | | $ | 8,760 | |
Fomento Economico Mexicano SAB de CV ADR | | | 50 | | | | 4,114 | |
BRF - Brasil Foods S.A. ADR | | | 178 | | | | 3,562 | |
Cia de Bebidas das Americas ADR | | | 63 | | | | 2,180 | |
Cia Brasileira de Distribuicao Grupo Paode Acucar ADR | | | 33 | | | | 1,571 | |
| | | | | | | | |
Total Consumer Staples | | | | | | | 20,187 | |
| | | | | | | | |
Consumer Discretionary - 0.1% | | | | | | | | |
Grupo Televisa SAB ADR | | | 150 | | | | 3,162 | |
Tata Motors Ltd. ADR | | | 92 | | | | 2,481 | |
| | | | | | | | |
Total Consumer Discretionary | | | | | | | 5,643 | |
| | | | | | | | |
Utilities - 0.1% | | | | | | | | |
Cia Energetica de Minas Gerais ADR | | | 102 | | | | 2,426 | |
Empresa Nacional de Electricidad S.A. ADR | | | 29 | | | | 1,565 | |
Korea Electric Power Corp. ADR* | | | 140 | | | | 1,362 | |
| | | | | | | | |
Total Utilities | | | | | | | 5,353 | |
| | | | | | | | |
Total Common Stocks
(Cost $212,416) | | | | | | | 256,293 | |
| | | | | | | | |
| | | FACE
AMOUNT | | | | |
REPURCHASE AGREEMENTS††,1 - 111.9% | |
HSBC Group issued 03/30/12 at 0.01% due 04/02/12 | | $ | 2,610,722 | | | | 2,610,722 | |
Credit Suisse Group issued 03/30/12 at 0.01% due 04/02/122 | | | 2,207,755 | | | | 2,207,755 | |
Mizuho Financial Group, Inc. issued 03/30/12 at 0.01% due 04/02/12 | | | 734,525 | | | | 734,525 | |
Deutsche Bank issued 03/30/12 at 0.01% due 04/02/12 | | | 195,228 | | | | 195,228 | |
| | | | | | | | |
Total Repurchase Agreements
(Cost $5,748,230) | | | | | | | 5,748,230 | |
| | | | | | | | |
Total Investments - 116.9%
(Cost $5,960,646) | | | | | | $ | 6,004,523 | |
| | | | | | | | |
Other Assets & Liabilities, net - (16.9)% | | | | (866,069 | ) |
| | | | | | | | |
Total Net Assets - 100.0% | | | | | | $ | 5,138,454 | |
| | | | |
| | | | | |
| 52 | | THE GUGGENHEIM FUNDS ANNUAL REPORT | | SEE NOTES TO FINANCIAL STATEMENTS. |
| | |
| SCHEDULE OF INVESTMENTS (concluded) | | March 31, 2012 |
EMERGING MARKETS 2x STRATEGY FUND
| | | | | | | | |
| | | UNITS | | | UNREALIZED
LOSS | |
EQUITY INDEX SWAP AGREEMENTS†† | | | | | | | | |
Goldman Sachs International April 2012 Bank of New York Mellon Emerging Markets 50 ADR Index Swap, Terminating 04/27/123 (Notional Value $9,973,278) | | | 3,758 | | | $ | (195,234 | ) |
| | | | | | | | |
| * | Non-income producing security. |
| † | Value determined based on Level 1 inputs — See Note 4. |
| †† | Value determined based on Level 2 inputs — See Note 4. |
| 1 | Repurchase Agreements — See Note 5. |
| 2 | All or a portion of this security is pledged as equity index swap collateral at March 31, 2012. |
| 3 | Total Return based on Bank of New York Mellon Emerging Markets 50 ADR Index +/- financing at a variable rate. |
| ADR | — American Depositary Receipt |
| | | | |
| | | | | |
| SEE NOTES TO FINANCIAL STATEMENTS. | | THE GUGGENHEIM FUNDS ANNUAL REPORT | | 53 |
|
| EMERGING MARKETS 2x STRATEGY FUND |
| | | | |
STATEMENT OF ASSETS AND LIABILITIES | |
March 31, 2012 | | | | |
| |
ASSETS: | | | | |
Investments, at value | | | | |
(cost $212,416) | | $ | 256,293 | |
Repurchase agreements, at value | | | | |
(cost $5,748,230) | | | 5,748,230 | |
| | | | |
Total investments | | | | |
(cost $5,960,646) | | | 6,004,523 | |
Segregated cash with broker | | | 44,800 | |
Cash | | | 1,182 | |
Receivables: | | | | |
Fund shares sold | | | 112,405 | |
Dividends | | | 5,324 | |
Variation margin | | | 598 | |
| | | | |
Total assets | | | 6,168,832 | |
| | | | |
LIABILITIES: | | | | |
Unrealized depreciation on swap agreements | | | 195,234 | |
Payable for: | | | | |
Fund shares redeemed | | | 741,144 | |
Swap settlement | | | 78,573 | |
Management fees | | | 7,205 | |
Distribution and service fees | | | 2,135 | |
Transfer agent and administrative fees | | | 2,001 | |
Portfolio accounting fees | | | 801 | |
Miscellaneous | | | 3,285 | |
| | | | |
Total liabilities | | | 1,030,378 | |
| | | | |
NET ASSETS | | $ | 5,138,454 | |
| | | | |
NET ASSETS CONSISTOF: | | | | |
Paid in capital | | $ | 5,683,254 | |
Accumulated net investment loss | | | (18,506 | ) |
Accumulated net realized loss on investments | | | (374,937 | ) |
Net unrealized depreciation on investments | | | (151,357 | ) |
| | | | |
Net assets | | $ | 5,138,454 | |
| | | | |
A-CLASS: | | | | |
Net assets | | $ | 363,487 | |
Capital shares outstanding | | | 20,795 | |
Net asset value per share | | $ | 17.48 | |
| | | | |
Maximum offering price per share | | | | |
(Net asset value divided by 95.25%) | | $ | 18.35 | |
| | | | |
C-CLASS: | | | | |
Net assets | | $ | 61,938 | |
Capital shares outstanding | | | 3,547 | |
Net asset value per share | | $ | 17.46 | |
| | | | |
H-CLASS: | | | | |
Net assets | | $ | 4,713,029 | |
Capital shares outstanding | | | 268,585 | |
Net asset value per share | | $ | 17.55 | |
| | | | |
| | | | |
STATEMENT OF OPERATIONS | |
Year Ended March 31, 2012 | | | | |
| |
INVESTMENT INCOME: | | | | |
Dividends (net of foreign withholding tax of $1,754) | | $ | 62,343 | |
Interest | | | 814 | |
| | | | |
Total investment income | | | 63,157 | |
| | | | |
EXPENSES: | | | | |
Management fees | | | 42,211 | |
Transfer agent and administrative fees | | | 11,725 | |
Distribution and service fees: | | | | |
A-Class | | | 277 | |
C-Class | | | 3,307 | |
H-Class | | | 10,621 | |
Portfolio accounting fees | | | 4,690 | |
Licensing fees | | | 5,661 | |
Custodian fees | | | 1,581 | |
Trustees’ fees* | | | 333 | |
Miscellaneous | | | 5,041 | |
| | | | |
Total expenses | | | 85,447 | |
Less: | | | | |
Expenses waived by Advisor | | | (3,784 | ) |
| | | | |
Net expenses | | | 81,663 | |
| | | | |
Net investment loss | | | (18,506 | ) |
| | | | |
NET REALIZEDAND UNREALIZED GAIN (Loss): | | | | |
Net realized gain (loss) on: | | | | |
Investments | | | (333,162 | ) |
Swap agreements | | | 6,746 | |
Futures contracts | | | 52,158 | |
| | | | |
Net realized loss | | | (274,258 | ) |
| | | | |
Net change in unrealized appreciation (depreciation) on: | | | | |
Investments | | | (87,951 | ) |
Swap agreements | | | (425,723 | ) |
Futures contracts | | | 36 | |
| | | | |
Net change in unrealized appreciation (depreciation) | | | (513,638 | ) |
| | | | |
Net realized and unrealized loss | | | (787,896 | ) |
| | | | |
Net decrease in net assets resulting from operations | | $ | (806,402 | ) |
| | | | |
| * | Relates to Trustees not deemed “interested persons” within the meaning of Section 2(a)(19) of the 1940 Act. |
| | | | |
| | | | | |
| 54 | | THE GUGGENHEIM FUNDS ANNUAL REPORT | | SEE NOTES TO FINANCIAL STATEMENTS. |
|
| EMERGING MARKETS 2x STRATEGY FUND |
|
STATEMENTS OF CHANGES IN NET ASSETS
| | | | | | | | |
| | | Year Ended
March 31,
2012 | | | Period Ended
March 31,
2011a | |
INCREASE (DECREASE) IN NET ASSETS FROM OPERATIONS: | | | | | | | | |
Net investment loss | | $ | (18,506 | ) | | $ | (17,717 | ) |
Net realized gain (loss) on investments | | | (274,258 | ) | | | 108,807 | |
Net change in unrealized appreciation (depreciation) on investments | | | (513,638 | ) | | | 362,281 | |
| | | | | | | | |
Net increase (decrease) in net assets resulting from operations | | | (806,402 | ) | | | 453,371 | |
| | | | | | | | |
DISTRIBUTIONSTO SHAREHOLDERS FROM: | | | | | | | | |
Net realized gains | | | | | | | | |
A-Class | | | (1,547 | ) | | | — | |
C-Class | | | (1,676 | ) | | | — | |
H-Class | | | (191,123 | ) | | | — | |
| | | | | | | | |
Total distributions to shareholders | | | (194,346 | ) | | | — | |
| | | | | | | | |
CAPITAL SHARE TRANSACTIONS: | | | | | | | | |
Proceeds from sale of shares | | | | | | | | |
A-Class | | | 2,133,102 | | | | 941,826 | |
C-Class | | | 67,533,983 | | | | 11,122,536 | |
H-Class | | | 112,547,354 | | | | 43,838,990 | |
Distributions reinvested | | | | | | | | |
A-Class | | | 1,547 | | | | — | |
C-Class | | | 1,676 | | | | — | |
H-Class | | | 189,012 | | | | — | |
Cost of shares redeemed | | | | | | | | |
A-Class | | | (2,733,563 | ) | | | (14,982 | ) |
C-Class | | | (68,198,547 | ) | | | (10,417,206 | ) |
H-Class | | | (110,758,822 | ) | | | (40,501,075 | ) |
| | | | | | | | |
Net increase from capital share transactions | | | 715,742 | | | | 4,970,089 | |
| | | | | | | | |
Net increase (decrease) in net assets | | | (285,006 | ) | | | 5,423,460 | |
NET ASSETS: | | | | | | | | |
Beginning of period | | | 5,423,460 | | | | — | |
| | | | | | | | |
End of period | | $ | 5,138,454 | | | $ | 5,423,460 | |
| | | | | | | | |
Accumulated net investment loss at end of period | | $ | (18,506 | ) | | $ | — | |
| | | | | | | | |
CAPITAL SHARE ACTIVITY: | | | | | | | | |
Shares sold | | | | | | | | |
A-Class | | | 93,188 | | | | 37,422 | |
C-Class | | | 3,321,992 | | | | 437,312 | |
H-Class | | | 5,747,087 | | | | 1,719,799 | |
Shares issued from reinvestment of distributions | | | | | | | | |
A-Class | | | 110 | | | | — | |
C-Class | | | 119 | | | | — | |
H-Class | | | 13,358 | | | | — | |
Shares redeemed | | | | | | | | |
A-Class | | | (109,307 | ) | | | (618 | ) |
C-Class | | | (3,345,630 | ) | | | (410,246 | ) |
H-Class | | | (5,629,413 | ) | | | (1,582,246 | ) |
| | | | | | | | |
Net increase in shares | | | 91,504 | | | | 201,423 | |
| | | | | | | | |
| a | Since commencement of operations: October 29, 2010. |
| | | | |
| | | | | |
| SEE NOTES TO FINANCIAL STATEMENTS. | | THE GUGGENHEIM FUNDS ANNUAL REPORT | | 55 |
|
| EMERGING MARKETS 2x STRATEGY FUND |
|
FINANCIAL HIGHLIGHTS
This table is presented to show selected data for a share outstanding throughout each period and to assist shareholders in evaluating a Fund’s performance for the periods presented.
| | | | | | | | |
| A-Class | | Year Ended
March 31,
2012 | | | Period Ended
March 31,
2011a | |
Per Share Data | | | | | | | | |
Net asset value, beginning of period | | $ | 26.95 | | | $ | 25.00 | |
| | | | | | | | |
Income (loss) from investment operations: | | | | | | | | |
Net investment lossb | | | (— | )c | | | (.13 | ) |
Net gain (loss) on investments (realized and unrealized) | | | (8.35 | ) | | | 2.08 | |
| | | | | | | | |
Total from investment operations | | | (8.35 | ) | | | 1.95 | |
| | | | | | | | |
Less distributions from: | | | | | | | | |
Net realized gains | | | (1.12 | ) | | | — | |
| | | | | | | | |
Total distributions | | | (1.12 | ) | | | — | |
| | | | | | | | |
Net asset value, end of period | | $ | 17.48 | | | $ | 26.95 | |
| | | | | | | | |
Total Returnd | | | (30.00 | %) | | | 7.80 | % |
| | | | | | | | |
Ratios/Supplemental Data | | | | | | | | |
Net assets, end of period (in thousands) | | $ | 363 | | | $ | 992 | |
| | | | | | | | |
Ratios to average net assets: | | | | | | | | |
Net investment loss | | | (0.01 | %) | | | (1.42 | %) |
Total expenses | | | 1.77 | % | | | 1.85 | % |
Net expensese | | | 1.69 | % | | | 1.73 | % |
| | | | | | | | |
Portfolio turnover rate | | | 883 | % | | | 58 | % |
| C-Class | | Year Ended
March 31,
2012 | | | Period Ended
March 31,
2011a | |
Per Share Data | | | | | | | | |
Net asset value, beginning of period | | $ | 26.83 | | | $ | 25.00 | |
| | | | | | | | |
Income (loss) from investment operations: | | | | | | | | |
Net investment lossb | | | (.18 | ) | | | (.31 | ) |
Net gain (loss) on investments (realized and unrealized) | | | (8.07 | ) | | | 2.14 | |
| | | | | | | | |
Total from investment operations | | | (8.25 | ) | | | 1.83 | |
| | | | | | | | |
Less distributions from: | | | | | | | | |
Net realized gains | | | (1.12 | ) | | | — | |
| | | | | | | | |
Total distributions | | | (1.12 | ) | | | — | |
| | | | | | | | |
Net asset value, end of period | | $ | 17.46 | | | $ | 26.83 | |
| | | | | | | | |
Total Returnd | | | (29.75 | %) | | | 7.32 | % |
| | | | | | | | |
Ratios/Supplemental Data | | | | | | | | |
Net assets, end of period (in thousands) | | $ | 62 | | | $ | 726 | |
| | | | | | | | |
Ratios to average net assets: | | | | | | | | |
Net investment loss | | | (0.87 | %) | | | (1.98 | %) |
Total expenses | | | 2.54 | % | | | 2.60 | % |
Net expensese | | | 2.46 | % | | | 2.49 | % |
| | | | | | | | |
Portfolio turnover rate | | | 883 | % | | | 58 | % |
| | | | |
| | | | | |
| 56 | | THE GUGGENHEIM FUNDS ANNUAL REPORT | | SEE NOTES TO FINANCIAL STATEMENTS. |
|
| EMERGING MARKETS 2x STRATEGY FUND |
|
FINANCIAL HIGHLIGHTS (concluded)
This table is presented to show selected data for a share outstanding throughout each period and to assist shareholders in evaluating a Fund’s performance for the periods presented.
| | | | | | | | |
H-Class | | Year Ended
March 31,
2012 | | | Period Ended
March 31,
2011a | |
Per Share Data | | | | | | | | |
Net asset value, beginning of period | | $ | 26.94 | | | $ | 25.00 | |
| | | | | | | | |
Income (loss) from investment operations: | | | | | | | | |
Net investment lossb | | | (.07 | ) | | | (.11 | ) |
Net gain (loss) on investments (realized and unrealized) | | | (8.20 | ) | | | 2.05 | |
| | | | | | | | |
Total from investment operations | | | (8.27 | ) | | | 1.94 | |
| | | | | | | | |
Less distributions from: | | | | | | | | |
Net realized gains | | | (1.12 | ) | | | — | |
| | | | | | | | |
Total distributions | | | (1.12 | ) | | | — | |
| | | | | | | | |
Net asset value, end of period | | $ | 17.55 | | | $ | 26.94 | |
| | | | | | | | |
Total Returnd | | | (29.70 | %) | | | 7.76 | % |
| | | | | | | | |
Ratios/Supplemental Data | | | | | | | | |
Net assets, end of period (in thousands) | | $ | 4,713 | | | $ | 3,705 | |
| | | | | | | | |
Ratios to average net assets: | | | | | | | | |
Net investment loss | | | (0.37 | %) | | | (1.05 | %) |
Total expenses | | | 1.77 | % | | | 1.85 | % |
Net expensese | | | 1.69 | % | | | 1.74 | % |
| | | | | | | | |
Portfolio turnover rate | | | 883 | % | | | 58 | % |
| a | Since commencement of operations: October 29, 2010. Percentage amounts for the period, except total return and portfolio turnover rate, have been annualized. |
| b | Net investment loss per share was computed using average shares outstanding throughout the period. |
| c | Net investment loss is less than $0.01 per share. |
| d | Total return does not reflect the impact of any applicable sales charges and has not been annualized. |
| e | Net expense information reflects the expense ratios after expense waivers. |
| | | | |
| | | | | |
| SEE NOTES TO FINANCIAL STATEMENTS. | | THE GUGGENHEIM FUNDS ANNUAL REPORT | | 57 |
| | |
| PERFORMANCE REPORT AND FUND PROFILE (Unaudited) | | March 31, 2012 |
INVERSE EMERGING MARKETS 2x STRATEGY FUND
OBJECTIVE: To seek to provide investment results that correlate, before fees and expenses, to the performance of a specific benchmark on a daily basis. The Fund’s current benchmark is 200% of the inverse (opposite) of the performance of the BNY Mellon Emerging Markets 50 ADR Index (the “underlying index”). The Fund does not seek to achieve its investment objective over a period of time greater than one day.
For the one-year period ended March 31, 2012, Inverse Emerging Markets 2x Strategy Fund H-Class returned -8.79%, while the BNY Mellon Emerging Markets 50 ADR Index* returned -10.01% over the same period.
For the period, Inverse Emerging Markets 2x Strategy Fund maintained a daily correlation of over 99% to its benchmark of -200% of the daily price movement of the BNY Mellon Emerging Markets 50 ADR Index.
Emerging markets as a group underperformed for much of the past 12 months. After a weak 2011, the sector had a good start to 2012, but fell off on news of a slowdown in China’s economy, higher oil prices and worldwide economic weakness. Other ongoing risks to emerging market growth are the eurozone’s debt problems and political changes that are occurring in many developing countries in 2012.
Derivatives in the Fund were used to help provide exposure to the composition of the benchmark in the highest efficient manner and to provide leverage, not for hedging purposes. The results of derivatives use during the period were within our expectations and contributed to the Fund’s performance.
Due to the compounding of daily returns, leveraged and inverse funds’ returns over periods other than one day will likely differ in amount and possibly direction from the benchmark return for the same period. Investors should monitor their leveraged and inverse funds’ holdings to ensure that they are consistent with their strategies, as frequently as daily.
The effects of compounding may cause the longer-term correlation of the Fund to its benchmark to diminish. The apparent discrepancy between the leveraged and unleveraged indices is the result of compounding, which is described briefly on page 4 of this report. *BNY Mellon Emerging Markets 50 ADR Index is capitalization-weighted and designed to track the performance of approximately 50 emerging market-based depositary receipts.
Performance displayed represents past performance which is no guarantee of future results.
Holdings Diversification (Market Exposure as % of Net Assets)
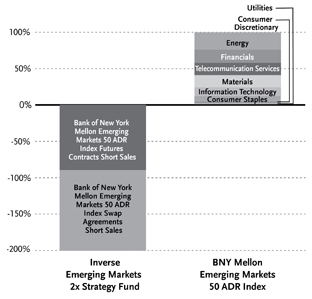
“Holdings Diversification (Market Exposure as % of Net Assets)” excludes any temporary cash investments.
| | |
Inception Dates: | | |
A-Class | | October 29, 2010 |
C-Class | | October 29, 2010 |
H-Class | | October 29, 2010 |
The Fund invests principally in derivative investments such as swap agreements and futures contracts. |
| | | | |
| | | | | |
| 58 | | THE GUGGENHEIM FUNDS ANNUAL REPORT | | |
| | |
| PERFORMANCE REPORT AND FUND PROFILE (Unaudited) (concluded) | | March 31, 2012 |
Cumulative Fund Performance*
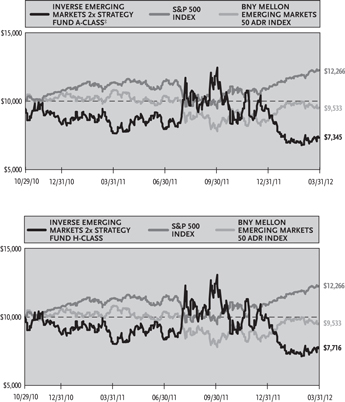
Average Annual Returns*
Periods Ended 03/31/12
| | | | | | | | |
| | | 1 Year | | | Since
Inception
(10/29/10) | |
A-Class Shares | | | -8.84 | % | | | -16.73 | % |
A-Class Shares with sales charge‡ | | | -13.15 | % | | | -19.54 | % |
C-Class Shares** | | | -5.06 | % | | | -13.80 | % |
C-Class Shares with CDSC†,** | | | -6.01 | % | | | -13.80 | % |
H-Class Shares | | | -8.79 | % | | | -16.70 | % |
BNY Mellon Emerging Markets 50 ADR Index | | | -10.01 | % | | | -3.32 | % |
S&P 500 Index | | | 8.54 | % | | | 15.48 | % |
| * | The performance data above represents past performance that is not predictive of future results. The investment return and principal value of an investment in the Fund will fluctuate so that an investor’s shares, when redeemed, may be worth more or less than their original cost. Returns are historical and include changes in principal and reinvested dividends and capital gains and do not reflect the effect of taxes. The BNY Mellon Emerging Markets 50 ADR Index and the S&P 500 Index are unmanaged indices and, unlike the Fund, have no management fees or operating expenses to reduce their reported returns. The graphs are based on A-Class shares and H-Class shares only; performance for C-Class shares will vary due to differences in fee structure. |
| ** | Generally, the performance of the Fund’s C-Class Shares will underperform the Fund’s H-Class Shares and A-Class Shares due to the C-Class Shares’ higher expense ratio. However, the performance of the Fund’s C-Class Shares is greater than that of the H-Class Shares and A-Class Shares due to the impact large redemptions of C-Class Shares had on the expense accruals for C-Class Shares. The effect of the expense accruals on the performance of the C-Class Shares of the Fund was magnified by the small asset base of the C-Class Shares. |
| † | Fund returns include a CDSC of 1% if redeemed within 12 months of purchase. |
| ‡ | Fund returns are calculated using the maximum sales charge of 4.75%. |
| | | | |
| | | | | |
| | THE GUGGENHEIM FUNDS ANNUAL REPORT | | 59 |
| | |
| SCHEDULE OF INVESTMENTS | | March 31, 2012 |
| | | |
INVERSE EMERGING MARKETS 2x STRATEGY FUND
| | | | | | | | |
| | | FACE
AMOUNT | | | VALUE | |
REPURCHASE AGREEMENTS††,1 - 44.6% | |
HSBC Group issued 03/30/12 at 0.01% due 04/02/12 | | $ | 735,575 | | | $ | 735,575 | |
Credit Suisse Group issued 03/30/12 at 0.01% due 04/02/122 | | | 555,514 | | | | 555,514 | |
Mizuho Financial Group, Inc. issued 03/30/12 at 0.01% due 04/02/12 | | | 206,953 | | | | 206,953 | |
Deutsche Bank issued 03/30/12 at 0.01% due 04/02/12 | | | 55,006 | | | | 55,006 | |
| | | | | | | | |
Total Repurchase Agreements
(Cost $1,553,048) | | | | | | | 1,553,048 | |
| | | | | | | | |
Total Investments - 44.6%
(Cost $1,553,048) | | | | | | $ | 1,553,048 | |
| | | | | | | | |
Other Assets & Liabilities, net - 55.4% | | | | | | | 1,931,455 | |
| | | | | | | | |
Total Net Assets - 100.0% | | | | | | $ | 3,484,503 | |
| | | | | | | | |
| | | | | | | | | |
| | | | | | | | |
| | | CONTRACTS | | | UNREALIZED
GAIN (LOSS) | |
FUTURES CONTRACTS SOLD SHORT† | |
June 2012 MSCI Emerging Markets Index Mini Futures Contracts (Aggregate Value of Contracts $3,117,000) | | | 60 | | | $ | (2,219 | ) |
| | | | | | | | |
| | |
| | | UNITS | | | | |
EQUITY INDEX SWAP AGREEMENTS SOLD SHORT†† | |
Goldman Sachs International April 2012 Bank of New York Mellon Emerging Markets 50 ADR Index Swap, Terminating 04/27/123 (Notional Value $3,860,123) | | | 1,454 | | | $ | 53,604 | |
| | | | | | | | |
| † | Value determined based on Level 1 inputs — See Note 4. |
| †† | Value determined based on Level 2 inputs — See Note 4. |
| 1 | Repurchase Agreements — See Note 5. |
| 2 | All or a portion of this security is pledged as equity index swap collateral at March 31, 2012. |
| 3 | Total Return based on Bank of New York Mellon Emerging Markets 50 ADR Index +/- financing at a variable rate. |
| | | | |
| | | | | |
| 60 | | THE GUGGENHEIM FUNDS ANNUAL REPORT | | SEE NOTES TO FINANCIAL STATEMENTS. |
|
| INVERSE EMERGING MARKETS 2x STRATEGY FUND |
| | | | |
STATEMENT OF ASSETS AND LIABILITIES | |
March 31, 2012 | | | | |
| |
ASSETS: | | | | |
Repurchase agreements, at value
(cost $1,553,048) | | $ | 1,553,048 | |
| | | | |
Total investments
(cost $1,553,048) | | | 1,553,048 | |
Unrealized appreciation on swap agreements | | | 53,604 | |
Receivable for swap settlement | | | 43,674 | |
Segregated cash with broker | | | 39,200 | |
Receivables: | | | | |
Fund shares sold | | | 1,895,068 | |
| | | | |
Total assets | | | 3,584,594 | |
| | | | |
LIABILITIES: | | | | |
Payable for: | | | | |
Fund shares redeemed | | | 90,454 | |
Variation margin | | | 4,025 | |
Management fees | | | 1,647 | |
Distribution and service fees | | | 849 | |
Transfer agent and administrative fees | | | 458 | |
Portfolio accounting fees | | | 183 | |
Miscellaneous | | | 2,475 | |
| | | | |
Total liabilities | | | 100,091 | |
| | | | |
NET ASSETS | | $ | 3,484,503 | |
| | | | |
NET ASSETS CONSISTOF: | | | | |
Paid in capital | | $ | 4,713,828 | |
Accumulated net investment loss | | | (12,214 | ) |
Accumulated net realized loss on investments | | | (1,268,496 | ) |
Net unrealized appreciation on investments | | | 51,385 | |
| | | | |
Net assets | | $ | 3,484,503 | |
| | | | |
A-CLASS: | | | | |
Net assets | | $ | 8,331 | |
Capital shares outstanding | | | 432 | |
Net asset value per share | | $ | 19.29 | |
| | | | |
Maximum offering price per share
(Net asset value divided by 95.25%) | | $ | 20.25 | |
| | | | |
C-CLASS: | | | | |
Net assets | | $ | 1,261,115 | |
Capital shares outstanding | | | 62,277 | |
Net asset value per share | | $ | 20.25 | |
| | | | |
H-CLASS: | | | | |
Net assets | | $ | 2,215,057 | |
Capital shares outstanding | | | 114,835 | |
Net asset value per share | | $ | 19.29 | |
| | | | |
| | | | |
STATEMENT OF OPERATIONS | |
Year Ended March 31, 2012 | | | | |
| |
INVESTMENT INCOME: | | | | |
Interest | | $ | 926 | |
| | | | |
Total investment income | | | 926 | |
| | | | |
EXPENSES: | | | | |
Management fees | | | 29,262 | |
Transfer agent and administrative fees | | | 8,128 | |
Distribution and service fees: | | | | |
A-Class | | | 449 | |
C-Class | | | 4,085 | |
H-Class | | | 6,658 | |
Portfolio accounting fees | | | 3,251 | |
Licensing fees | | | 4,332 | |
Custodian fees | | | 829 | |
Trustees’ fees* | | | 273 | |
Miscellaneous | | | 3,812 | |
| | | | |
Total expenses | | | 61,079 | |
Less: | | | | |
Expenses waived by Advisor | | | (3,031 | ) |
| | | | |
Net expenses | | | 58,048 | |
| | | | |
Net investment loss | | | (57,122 | ) |
| | | | |
NET REALIZEDAND UNREALIZED GAIN (LOSS): | | | | |
Net realized gain (loss) on: | | | | |
Swap agreements | | | (621,439 | ) |
Futures contracts | | | (331,893 | ) |
| | | | |
Net realized loss | | | (953,332 | ) |
| | | | |
Net change in unrealized appreciation (depreciation) on: | | | | |
Swap agreements | | | 164,676 | |
Futures contracts | | | 82,720 | |
| | | | |
Net change in unrealized appreciation (depreciation) | | | 247,396 | |
| | | | |
Net realized and unrealized loss | | | (705,936 | ) |
| | | | |
Net decrease in net assets resulting from operations | | $ | (763,058 | ) |
| | | | |
| * | Relates to Trustees not deemed “interested persons” within the meaning of Section 2(a)(19) of the 1940 Act. |
| | | | |
| | | | | |
| SEE NOTES TO FINANCIAL STATEMENTS. | | THE GUGGENHEIM FUNDS ANNUAL REPORT | | 61 |
|
| INVERSE EMERGING MARKETS 2x STRATEGY FUND |
|
STATEMENTS OF CHANGES IN NET ASSETS
| | | | | | | | |
| | | Year Ended
March 31,
2012 | | | Period Ended
March 31,
2011a | |
INCREASE (DECREASE) IN NET ASSETS FROM OPERATIONS: | | | | | | | | |
Net investment loss | | $ | (57,122 | ) | | $ | (19,633 | ) |
Net realized loss on investments | | | (953,332 | ) | | | (315,164 | ) |
Net change in unrealized appreciation (depreciation) on investments | | | 247,396 | | | | (196,011 | ) |
| | | | | | | | |
Net decrease in net assets resulting from operations | | | (763,058 | ) | | | (530,808 | ) |
| | | | | | | | |
CAPITAL SHARE TRANSACTIONS: | | | | | | | | |
Proceeds from sale of shares | | | | | | | | |
A-Class | | | 648,870 | | | | 173,520 | |
C-Class | | | 87,793,549 | | | | 9,915,158 | |
H-Class | | | 73,854,823 | | | | 34,731,130 | |
Cost of shares redeemed | | | | | | | | |
A-Class | | | (567,237 | ) | | | (125,927 | ) |
C-Class | | | (86,340,121 | ) | | | (9,852,057 | ) |
H-Class | | | (74,083,821 | ) | | | (31,369,518 | ) |
| | | | | | | | |
Net increase from capital share transactions | | | 1,306,063 | | | | 3,472,306 | |
| | | | | | | | |
Net increase in net assets | | | 543,005 | | | | 2,941,498 | |
NET ASSETS: | | | | | | | | |
Beginning of period | | | 2,941,498 | | | | — | |
| | | | | | | | |
End of period | | $ | 3,484,503 | | | $ | 2,941,498 | |
| | | | | | | | |
Accumulated net investment loss at end of period | | $ | (12,214 | ) | | $ | — | |
| | | | | | | | |
CAPITAL SHARE ACTIVITY: | | | | | | | | |
Shares sold | | | | | | | | |
A-Class | | | 24,792 | | | | 6,828 | |
C-Class | | | 3,786,907 | | | | 427,743 | |
H-Class | | | 3,190,564 | | | | 1,486,122 | |
Shares redeemed | | | | | | | | |
A-Class | | | (25,988 | ) | | | (5,200 | ) |
C-Class | | | (3,725,324 | ) | | | (427,049 | ) |
H-Class | | | (3,212,511 | ) | | | (1,349,340 | ) |
| | | | | | | | |
Net increase in shares | | | 38,440 | | | | 139,104 | |
| | | | | | | | |
| a | Since commencement of operations: October 29, 2010. |
| | | | |
| | | | | |
| 62 | | THE GUGGENHEIM FUNDS ANNUAL REPORT | | SEE NOTES TO FINANCIAL STATEMENTS. |
|
| INVERSE EMERGING MARKETS 2x STRATEGY FUND |
|
FINANCIAL HIGHLIGHTS
This table is presented to show selected data for a share outstanding throughout each period and to assist shareholders in evaluating a Fund’s performance for the periods presented.
| | | | | | | | |
| A-Class | | Year Ended
March 31,
2012 | | | Period Ended
March 31,
2011a | |
Per Share Data | | | | | | | | |
Net asset value, beginning of period | | $ | 21.15 | | | $ | 25.00 | |
Income (loss) from investment operations: | | | | | | | | |
Net investment lossb | | | (.39 | ) | | | (.16 | ) |
Net loss on investments (realized and unrealized) | | | (1.47 | ) | | | (3.69 | ) |
| | | | | | | | |
Total from investment operations | | | (1.86 | ) | | | (3.85 | ) |
| | | | | | | | |
Net asset value, end of period | | $ | 19.29 | | | $ | 21.15 | |
| | | | | | | | |
Total Returnc | | | (8.84 | %) | | | (15.40 | %) |
| | | | | | | | |
Ratios/Supplemental Data | | | | | | | | |
Net assets, end of period (in thousands) | | $ | 8 | | | $ | 34 | |
Ratios to average net assets: | | | | | | | | |
Net investment loss | | | (1.66 | %) | | | (1.61 | %) |
Total expenses | | | 1.78 | % | | | 1.85 | % |
Net expensesd | | | 1.69 | % | | | 1.73 | % |
| | | | | | | | |
Portfolio turnover rate | | | — | | | | — | |
| | |
| C-Class | | Year Ended
March 31,
2012 | | | Period Ended
March 31,
2011a | |
Per Share Data | | | | | | | | |
Net asset value, beginning of period | | $ | 21.33 | | | $ | 25.00 | |
Income (loss) from investment operations: | | | | | | | | |
Net investment lossb | | | (.55 | ) | | | (.25 | ) |
Net loss on investments (realized and unrealized) | | | (.53 | ) | | | (3.42 | ) |
| | | | | | | | |
Total from investment operations | | | (1.08 | ) | | | (3.67 | ) |
| | | | | | | | |
Net asset value, end of period | | $ | 20.25 | | | $ | 21.33 | |
| | | | | | | | |
Total Returnc,e | | | (5.06 | %) | | | (14.68 | %) |
| | | | | | | | |
Ratios/Supplemental Data | | | | | | | | |
Net assets, end of period (in thousands) | | $ | 1,261 | | | $ | 15 | |
| | | | | | | | |
Ratios to average net assets: | | | | | | | | |
Net investment loss | | | (2.41 | %) | | | (2.37 | %) |
Total expenses | | | 2.53 | % | | | 2.57 | % |
Net expensesd | | | 2.44 | % | | | 2.46 | % |
| | | | | | | | |
Portfolio turnover rate | | | — | | | | — | |
| | | | |
| | | | | |
| SEE NOTES TO FINANCIAL STATEMENTS. | | THE GUGGENHEIM FUNDS ANNUAL REPORT | | 63 |
|
| INVERSE EMERGING MARKETS 2x STRATEGY FUND |
|
FINANCIAL HIGHLIGHTS (concluded)
This table is presented to show selected data for a share outstanding throughout each period and to assist shareholders in evaluating a Fund’s performance for the periods presented.
| | | | | | | | |
H-Class | | Year Ended
March 31,
2012 | | | Period Ended
March 31,
2011a | |
Per Share Data | | | | | | | | |
Net asset value, beginning of period | | $ | 21.15 | | | $ | 25.00 | |
| | | | | | | | |
Income (loss) from investment operations: | | | | | | | | |
Net investment lossb | | | (.38 | ) | | | (.16 | ) |
Net loss on investments (realized and unrealized) | | | (1.48 | ) | | | (3.69 | ) |
| | | | | | | | |
Total from investment operations | | | (1.86 | ) | | | (3.85 | ) |
| | | | | | | | |
Net asset value, end of period | | $ | 19.29 | | | $ | 21.15 | |
| | | | | | | | |
Total Returnc | | | (8.79 | %) | | | (15.40 | %) |
| | | | | | | | |
Ratios/Supplemental Data | | | | | | | | |
Net assets, end of period (in thousands) | | $ | 2,215 | | | $ | 2,892 | |
| | | | | | | | |
Ratios to average net assets: | | | | | | | | |
Net investment loss | | | (1.67 | %) | | | (1.63 | %) |
Total expenses | | | 1.79 | % | | | 1.85 | % |
Net expensesd | | | 1.70 | % | | | 1.74 | % |
| | | | | | | | |
Portfolio turnover rate | | | — | | | | — | |
| a | Since commencement of operations: October 29, 2010. Percentage amounts for the period, except total return and portfolio turnover rate, have been annualized. |
| b | Net investment loss per share was computed using average shares outstanding throughout the period. |
| c | Total return does not reflect the impact of any applicable sales charges and has not been annualized. |
| d | Net expense information reflects the expense ratios after expense waivers. |
| e | Generally, the performance of the Fund’s C-Class Shares will underperform the Fund’s H-Class Shares and A-Class Shares due to the C-Class Shares’ higher expense ratio. However, the performance of the Fund’s C-Class Shares is greater than that of the H-Class Shares and A-Class Shares due to the impact large redemptions of C-Class Shares had on the expense accruals for C-Class Shares. The effect of the expense accruals on the performance of the C-Class Shares of the Fund was magnified by the small asset base of the C-Class Shares. | |
| | | | |
| | | | | |
| 64 | | THE GUGGENHEIM FUNDS ANNUAL REPORT | | SEE NOTES TO FINANCIAL STATEMENTS. |
|
| NOTES TO FINANCIAL STATEMENTS |
| |
| 1. | Organization and Significant Accounting Policies |
Organization
The Rydex Series Funds (the “Trust”) is registered with the SEC under the Investment Company Act of 1940 (the “1940 Act”) as a non-diversified, open-ended investment company. The Trust offers eight separate classes of shares, Investor Class shares, Investor2 Class shares, Advisor Class shares, A-Class shares, C-Class shares, H-Class shares, Y-Class shares, and Institutional Class shares. Sales of shares of each Class are made without a front-end sales charge at the net asset value per share (“NAV”), with the exception of A-Class shares. A-Class shares are sold at the NAV, plus the applicable front-end sales charge. The sales charge varies depending on the amount purchased, but will not exceed 4.75%. A-Class share purchases of $1 million or more are exempt from the front-end sales charge but have a 1% contingent deferred sales charge (“CDSC”) if shares are redeemed within 12 months of purchase. C-Class shares have a 1% CDSC if shares are redeemed within 12 months of purchase.
At March 31, 2012, the Trust consisted of fifty-seven separate funds. This report covers the Alternatives Funds and the International Equity Funds (the “Funds”), while the other funds are contained in separate reports. Only A-Class, C-Class, H-Class and Institutional Class shares had been issued in the Funds.
Guggenheim Investments (“GI”) provides advisory services and Rydex Fund Services, LLC (“RFS”) provides transfer agent, administrative and accounting services to the Trust. Rydex Distributors, LLC (“RDL”) acts as principal underwriter for the Trust. GI, RFS and RDL are affiliated entities.
The Alternative Strategies Allocation Fund is a “fund of funds,” which means that the Fund seeks to achieve its investment objective by investing principally in a diversified portfolio of affiliated and unaffiliated funds (the “underlying funds”) instead of individual securities.
American Independence Financial Services, LLC serves as investment sub-adviser to the Long Short Interest Rate Strategy Fund. The Sub-Advisor constructs and provides the Advisor with the Long Short Interest Rate Strategy Fund’s investment model.
The International Equity Funds are designed and operated to accommodate frequent trading by shareholders and, unlike most mutual funds, offer unlimited exchange privileges with no minimum holding periods or transactions fees, which may cause the Funds to experience high portfolio turnover.
Significant Accounting Policies
The following significant accounting policies are in conformity with U.S. generally accepted accounting principles and are consistently followed by the Trust. This requires management to make estimates and assumptions that affect the reported amount of assets and liabilities and disclosure of contingent assets and liabilities at the date of the financial statements and the reported amounts of revenues and expenses during the reporting period. Actual results could differ from these estimates. All time references are based on Eastern Time.
A. The Trust calculates a NAV twice each business day, first in the morning and again in the afternoon for the Emerging Markets 2x Strategy Fund and Inverse Emerging Markets 2x Strategy Fund. All other Funds in this report will price at the afternoon NAV. The morning NAV is calculated at 10:45 a.m. and the afternoon NAV is calculated at the close of the New York Stock Exchange (“NYSE”), usually 4:00 p.m. The NAV is calculated using the current market value of each Fund’s total assets as of the respective time of calculation. These financial statements are based on the March 31, 2012, afternoon NAV.
Equity securities listed on an exchange (NYSE or American Stock Exchange) are valued at the last quoted sales price as of the close of business on the NYSE, usually 4:00 p.m. on the valuation date. Equity securities listed on the NASDAQ market system are valued at the NASDAQ Official Closing Price on the valuation date.
The value of futures contracts purchased and sold by the Funds is accounted for using the unrealized gain or loss on the contracts that is determined by marking the contracts to their current realized settlement prices. Financial futures contracts are valued at the 4:00 p.m. price on the valuation date. In the event that the exchange for a specific futures contract closes earlier than 4:00 p.m., the futures contract is valued at the Official Settlement Price of the exchange. However, the underlying securities from which the futures contract value is derived are monitored until 4:00 p.m. to determine if fair valuation would provide a more accurate valuation.
The value of swap agreements entered into by a Fund is accounted for using the unrealized gain or loss on the agreements that is determined by marking the agreements to the last quoted value of the index that the swap pertains to at the close of the NYSE. The swap’s market value is then adjusted to include dividends accrued, financing charges and/or interest associated with the swap agreements.
| | | | |
| | | | | |
| | THE GUGGENHEIM FUNDS ANNUAL REPORT | | 65 |
|
| NOTES TO FINANCIAL STATEMENTS (continued) |
| |
Non-U.S. government securities are valued by independent pricing services, the last traded fill price, or at the reported bid price at the close of business. Other debt securities with a maturity of greater than 60 days at acquisition are valued at prices that reflect broker/dealer-supplied valuations or are obtained from independent pricing services, which may consider the trade activity, treasury spreads, yield or price of bonds of comparable quality, coupon, maturity, and type, as well as prices quoted by dealers who make markets in such securities. Short-term debt securities with a maturity of 60 days or less at acquisition and repurchase agreements are valued at amortized cost, which approximates market value.
Open-end investment companies (“Mutual Funds”) are valued at their NAV as of the close of business on the valuation date. Exchange Traded Funds (“ETFs”) and closed-end investment companies are valued at the last quoted sales price.
Investments for which market quotations are not readily available are fair valued as determined in good faith by GI under the direction of the Board of Trustees using methods established or ratified by the Board of Trustees. These methods include, but are not limited to: (i) using general information as to how these securities and assets trade; (ii) in connection with futures contracts and options thereupon, and other derivative investments, information as to how (a) these contracts and other derivative investments trade in the futures or other derivative markets, respectively, and (b) the securities underlying these contracts and other derivative investments trade in the cash market; and (iii) other information and considerations, including current values in related markets.
B. Security transactions are recorded on the trade date for financial reporting purposes. Realized gains and losses from securities transactions are recorded using the identified cost basis. Proceeds from lawsuits related to investment holdings are recorded as realized gains in the respective Fund. Dividend income is recorded on the ex-dividend date, net of applicable taxes withheld by foreign countries. Taxable non-cash dividends are recorded as dividend income. Interest income, including amortization of premiums and accretion of discount, is accrued on a daily basis. Distributions received from investments in REITs are recorded as dividend income on the ex-dividend date, subject to reclassification upon notice of the character of such distribution by the issuer.
C. Distributions of net investment income and net realized gains, if any, are declared and paid at least annually. Distributions are recorded on the ex-dividend date and are determined in accordance with income tax regulations which may differ from U.S. generally accepted accounting principles.
D. When a Fund engages in a short sale of a security, an amount equal to the proceeds is reflected as an asset and an equivalent liability. The amount of the liability is subsequently marked-to-market to reflect the market value of the short sale. The Fund maintains a segregated account of cash and/or securities as collateral for short sales. The Fund is exposed to market risk based on the amount, if any, that the market value of the security exceeds the market value of the securities in the segregated account.
Fees, if any, paid to brokers to borrow securities in connection with short sales are recorded as interest expense. In addition, the Fund must pay out the dividend rate of the equity or coupon rate of the treasury obligation to the lender and record this as an expense. Short dividend or interest expense is a cost associated with the investment objective of short sales transactions, rather than an operational cost associated with the day-to-day management of any mutual fund. The Funds may also receive rebate income from the broker resulting from the investment of the proceeds from securities sold short.
E. Upon entering into a futures contract, the Fund deposits and maintains as collateral such initial margin as required by the exchange on which the transaction is affected. Pursuant to the contract, the Fund agrees to receive from or pay to the broker an amount of cash equal to the daily fluctuation in value of the contract. Such receipts or payments are known as variation margin and are recorded by the Fund as unrealized gains or losses. When the contract is closed, the Fund records a realized gain or loss equal to the difference between the value of the contract at the time it was opened and the value at the time it was closed.
F. Swap agreements are marked-to-market daily and the change, if any, is recorded as unrealized gain or loss. Payments received or made as a result of an agreement or termination of the agreement are recognized as realized gains or losses.
Credit default swap agreements are marked-to-market daily and the change, if any, is recorded as unrealized gain or loss. Upfront payments received or made by a Fund are amortized over the expected life of the agreement. Periodic payments received or paid by a Fund are recorded as realized gains or losses. Payments received or made as a result of a credit event or termination of the contract are recognized, net of a proportional amount of the upfront payment, as realized gains or losses.
G. Investment securities and other assets and liabilities denominated in foreign currencies are translated into U.S. dollar amounts at the date of valuation. Purchases and sales of investment securities and income and expense items denominated in foreign currencies
| | | | |
| | | | | |
| 66 | | THE GUGGENHEIM FUNDS ANNUAL REPORT | | |
|
| NOTES TO FINANCIAL STATEMENTS (continued) |
| |
are translated into U.S. dollar amounts on the respective dates of such transactions. The Trust does not isolate that portion of the results of operations resulting from changes in foreign exchange rates on investments from the fluctuations arising from changes in market prices of securities held. Such fluctuations are included with the net realized and unrealized gain and loss from investments. Reported net realized foreign exchange gains or losses arise from sales of foreign currencies and currency gains or losses realized between the trade and settlement dates on investment transactions. Net unrealized exchange gains and losses arise from changes in the fair values of assets and liabilities other than investments in securities at the fiscal period end, resulting from changes in exchange rates.
H. The Funds may leave cash overnight in their cash account with the custodian, U.S. Bank. Periodically, a Fund may have cash due to the custodian bank as an overdraft balance. A fee is incurred on this overdraft, calculated by multiplying the overdraft by a rate based on the federal funds rate.
Segregated cash with the broker is held as collateral for investments in derivative instruments such as futures contracts or swap agreements.
I. Interest and dividend income, most expenses, all realized gains and losses, and all unrealized gains and losses are allocated to the Classes based upon the value of the outstanding shares in each Class. Certain costs, such as distribution fees relating to A-Class shares and H-Class shares and service and distribution fees related to C-Class shares, are charged directly to specific Classes. In addition, certain expenses have been allocated to the individual Funds in the Trust on a pro rata basis upon the respective aggregate net assets of each Fund included in the Trust.
J. Throughout the normal course of business, the Funds enter into contracts that contain a variety of representations and warranties which provide general indemnifications. The Funds’ maximum exposure under these arrangements is unknown, as this would involve future claims that may be made against the Funds and/or their affiliates that have not yet occurred. However, based on experience, the Funds expect the risk of loss to be remote.
As part of their investment strategy, the Funds and certain underlying funds utilize short sales and a variety of derivative instruments including futures and swap agreements. These investments involve, to varying degrees, elements of market risk and risks in excess of the amounts recognized in the Statements of Assets and Liabilities.
A short sale is a transaction in which a Fund sells a security it does not own. If the security sold short decreases in price between the time the Fund sells the security and closes its short position, that Fund will realize a gain on the transaction. Conversely, if the security increases in price during the period, that Fund will realize a loss on the transaction. The risk of such price increases is the principal risk of engaging in short sales.
A futures contract is an agreement to purchase (long) or sell (short) an agreed amount of securities or other instruments at a set price for delivery at a future date. There are significant risks associated with a Fund’s or an underlying fund’s use of futures contracts and related options, including (i) there may be an imperfect or no correlation between the changes in market value of the underlying asset and the prices of futures contracts; (ii) there may not be a liquid secondary market for a futures contract; (iii) trading restrictions or limitations may be imposed by an exchange; and (iv) government regulations may restrict trading in futures contracts. When investing in futures, there is minimal counterparty credit risk to the Fund because futures are exchange-traded and the exchange’s clearinghouse, as counterparty to all exchange-traded futures, guarantees against default.
A swap is an agreement that obligates two parties to exchange a series of cash flows at specified intervals based upon or calculated by reference to changes in specified prices or rates for a specified amount of an underlying asset. A credit default swap enables a Fund to buy or sell protection against a defined credit event of an issuer or a basket of securities. Generally, the seller of credit protection against an issuer or basket of securities receives a periodic payment from the buyer to compensate against potential default events. If a default event occurs, the seller must pay the buyer the full notional value of the reference obligation in exchange for the reference obligation. If no default occurs, the counterparty will pay the stream of payments and have no further obligations to the Fund selling the credit protection. A Fund or an underlying fund bears the risk of loss of the amount expected to be received under a swap agreement in the event of the default or bankruptcy of a swap agreement counterparty, or in the case of a credit default swap in which the Fund is selling credit protection, the default of a third party issuer. Additionally, there is no guarantee that a Fund or an underlying fund could eliminate its exposure under an outstanding swap agreement by entering into an offsetting swap agreement with the same or another party.
In conjunction with the use of short sales, futures, and swap agreements, the Funds are required to maintain collateral in various forms. The Funds use, where appropriate, depending on the
| | | | |
| | | | | |
| | THE GUGGENHEIM FUNDS ANNUAL REPORT | | 67 |
|
| NOTES TO FINANCIAL STATEMENTS (continued) |
| |
financial instrument utilized and the broker involved, margin deposits at the broker, cash and/or securities segregated at the custodian bank, discount notes, or the repurchase agreements allocated to each Fund.
There are several risks associated with exposure to foreign currencies, foreign issuers and emerging markets. A Fund’s indirect and direct exposure to foreign currencies subjects the Fund to the risk that those currencies will decline in value relative to the U.S. dollar, or, in the case of short positions, that the U.S. dollar will decline in value relative to the currency being hedged. Currency rates in foreign countries may fluctuate significantly over short periods of time for a number of reasons, including changes in interest rates and the imposition of currency controls or other political developments in the U.S. or abroad. In addition, the Fund may incur transaction costs in connection with conversions between various currencies. The Fund may, but is not obligated to, engage in currency hedging transactions, which generally involve buying currency forward, options or futures contracts. However, not all currency risk may be effectively hedged, and in some cases the costs of hedging techniques may outweigh expected benefits. In such instances, the value of securities denominated in foreign currencies can change significantly when foreign currencies strengthen or weaken relative to the U.S. dollar.
Certain Funds may invest in securities of foreign companies directly, or in financial instruments, such as ADRs and exchange-traded funds, which are indirectly linked to the performance of foreign issuers. Foreign markets can be more volatile than the U.S. market due to increased risks of adverse issuer, political, regulatory, market, or economic developments and can perform differently from the U.S. market. Investing in securities of foreign companies directly, or in financial instruments that are indirectly linked to the performance of foreign issuers, may involve risks not typically associated with investing in U.S. issuers. The value of securities denominated in foreign currencies, and of dividends from such securities, can change significantly when foreign currencies strengthen or weaken relative to the U.S. dollar. Foreign securities markets generally have less trading volume and less liquidity than U.S. markets, and prices in some foreign markets may fluctuate more than those of securities traded on U.S. markets. Many foreign countries lack accounting and disclosure standards comparable to those that apply to U.S. companies, and it may be more difficult to obtain reliable information regarding a foreign issuer’s financial condition and operations. Transaction costs and costs associated with custody services are generally higher for foreign securities than they are for U.S. securities. Some foreign governments levy withholding taxes against dividend and interest income. Although in some countries portions of
these taxes are recoverable, the non-recovered portion will reduce the income received by the Fund.
Emerging markets, which consist of countries that have an emerging stock market as defined by Standard & Poor’s®, countries or markets with low- to middle-income economies as classified by the World Bank, and other countries or markets with similar characteristics as determined by SGI, can be more volatile than the U.S. market due to increased risks of adverse issuer, political, regulatory, market, or economic developments and can perform differently from the U.S. market. Emerging markets can be subject to greater social, economic, regulatory, and political uncertainties and can be extremely volatile. As a result, the securities of emerging market issuers may present market, credit, currency, liquidity, legal, political and other risks different from, or greater than, the risks of investing in securities of developed foreign countries. In addition, the risks associated with investing in a narrowly defined geographic area are generally more pronounced with respect to investments in emerging market countries. The Fund may also be subject to this risk with respect to its investments in derivatives or other securities or financial instruments whose returns are related to the returns of emerging market securities.
The Trust has established counterparty credit guidelines and enters into transactions only with financial institutions of investment grade or better. The Trust monitors the counterparty credit risk.
3. Fees and Other Transactions with Affiliates
Under the terms of an investment advisory contract, the Funds pay GI investment advisory fees calculated at the annualized rates below, based on the average daily net assets of the Funds:
| | | | |
Fund | | Management Fees
(as a % of Net Assets) | |
U.S. Long Short Momentum Fund | | | 0.90 | % |
Alternative Strategies Allocation Fund | | | — | |
Event Driven and Distressed Strategies Fund | | | 0.90 | % |
Long Short Equity Strategy Fund | | | 0.90 | % |
Long Short Interest Rate Strategy Fund | | | 0.75 | % |
Emerging Markets 2x Strategy Fund | | | 0.90 | % |
Inverse Emerging Markets 2x Strategy Fund | | | 0.90 | % |
GI manages the investment and reinvestment of the assets of the Alternative Strategies Allocation Fund in accordance with the investment objectives, policies, and limitations of the Fund. As part of its agreement with the Trust, GI will pay all expenses of the Fund, including the cost of transfer agency, fund administration, audit and other services, excluding interest expense, taxes (expected to be de minimis), brokerage commissions and other expenses connected with the execution of portfolio transactions, short dividend expenses, and extraordinary expenses. The Fund indirectly
| | | | |
| | | | | |
| 68 | | THE GUGGENHEIM FUNDS ANNUAL REPORT | | |
|
| NOTES TO FINANCIAL STATEMENTS (continued) |
| |
bears a proportionate share of the total operating expenses (including investment management, shareholder servicing, custody, transfer agency, audit and other underlying fund expenses) of the underlying funds in which the Fund invests.
GI has contractually agreed to reduce fees and/or reimburse expenses for the Event Driven and Distressed Strategies Fund and Long Short Equity Strategy Fund to the extent necessary to keep net operating expenses for A-Class, C-Class, H-Class, and Institutional Class Shares (excluding interest, taxes, brokerage commissions, acquired fund fees and expenses, dividends on securities sold short, and extraordinary expenses (“Excluded Expenses”)) from exceeding 1.90%, 2.65%, 1.90%, and 1.65%, respectively, of the Fund’s A-Class, C-Class, H-Class, and Institutional Class Shares average daily net assets until July 31, 2012. The total annual fund operating expenses after fee waiver and/or expense reimbursement includes excluded expenses and, thus, from time to time may be higher than 1.90%, 2.65%, 1.90%, and 1.65%, respectively. This Agreement may be terminated: (i) by the Board, for any reason at any time, or (ii) by the Advisor, upon ninety (90) days’ prior written notice to the Trust, effective as of the close of business on the last day of the then-current one-year period.
For the year ended March 31, 2012, GI voluntarily agreed to reimburse a portion of the licensing fee charged to the Emerging Markets 2x Strategy Fund and Inverse Emerging Markets 2x Strategy Fund.
RFS provides transfer agent and administrative services to the Funds for fees calculated at an annualized rate of 0.25% of the average daily net assets of each Fund. Fees related to the Alternative Strategies Allocation Fund are paid by GI, as previously noted.
RFS also provides accounting services to the Funds for fees calculated at annualized rates below, based on the average daily net assets of each Fund. Fees related to the Alternative Strategies Allocation Fund are paid by GI, as previously noted.
| | | | |
Fund Accounting Fees | | (as a % of net assets) | |
On the first $250 million | | | 0.10 | % |
On the next $250 million | | | 0.075 | % |
On the next $250 million | | | 0.05 | % |
Over $750 million | | | 0.03 | % |
RFS engages external service providers to perform other necessary services for the Trust, such as audit and accounting related services, legal services, custody, printing and mailing, etc., on a passthrough basis. Such expenses are allocated to various Funds within the complex based on relative net assets. Certain expenses allocated to the Alternative Strategies Allocation Fund are paid by GI, as previously noted.
The Trust has adopted a Distribution Plan applicable to A-Class shares and H-Class shares for which RDL and other firms that provide distribution and/or shareholder services (“Service Providers”) may receive compensation. If a Service Provider provides distribution services, the Funds will pay distribution fees to RDL at an annual rate not to exceed 0.25% of average daily net assets, pursuant to Rule 12b-1 of the 1940 Act. RDL, in turn, will pay the Service Provider out of its fees. RDL may, at its discretion, retain a portion of such payments to compensate itself for distribution services.
The Trust has adopted a separate Distribution and Shareholder Services Plan applicable to its C-Class shares that allows the Funds to pay annual distribution and service fees of 1.00% of the Funds’ C-Class shares average daily net assets. The annual 0.25% service fee compensates the shareholder’s financial advisor for providing ongoing services to the shareholder. The annual distribution fee of 0.75% reimburses RDL for paying the shareholder’s financial advisor an ongoing sales commission. RDL advances the first year’s service and distribution fees to the financial advisor. RDL retains the service and distribution fees on accounts with no authorized dealer of record.
For the year ended March 31, 2012, RDL retained sales charges of $404,264 relating to sales of A-Class shares of the Trust.
Certain officers and trustees of the Trust are also officers of GI, RFS and RDL.
4. Fair Value Measurement
In accordance with U.S. generally accepted accounting principles, fair value is defined as the price that the Fund would receive to sell an investment or pay to transfer a liability in an orderly transaction with an independent buyer in the principal market, or in the absence of a principal market the most advantageous market for the investment or liability. A three-tier hierarchy is utilized to distinguish between (1) inputs that reflect the assumptions market participants would use in pricing an asset or liability developed based on market data obtained from sources independent of the reporting entity (observable inputs) and (2) inputs that reflect the reporting entity’s own assumptions about the assumptions market participants would use in pricing an asset or liability developed based on the best information available in the circumstances (unobservable inputs) and to establish classification of fair value measurements for disclosure purposes. Various inputs are used in determining the value of the Funds’ investments. The inputs are summarized in the three broad levels listed below:
| | |
| Level 1 – | | quoted prices in active markets for identical securities. |
| Level 2 – | | other significant observable inputs (including quoted prices for similar securities, interest rates, prepayment speeds, credit risk, etc.). |
| | | | |
| | | | | |
| | THE GUGGENHEIM FUNDS ANNUAL REPORT | | 69 |
|
| NOTES TO FINANCIAL STATEMENTS (continued) |
| |
Level 3 – significant unobservable inputs (including the fund’s own assumptions used to determine the fair value of investments).
The inputs or methodologies used for valuing securities are not necessarily an indication of the risk associated with investing in those securities.
The following table summarizes the inputs used to value the Funds’ net assets at March 31, 2012:
| | | | | | | | | | | | | | | | | | | | | | | | |
| | | Level 1
Investments In
Securities | | | Level 1
Other Financial
Instruments* | | | Level 2
Investments
In Securities | | | Level 2
Other Financial
Instruments* | | | Level 3
Investments
In Securities | | | Total | |
Assets | | | | | | | | | | | | | | | | | | | | | | | | |
U.S. Long Short Momentum Fund | | $ | 101,504,850 | | | $ | — | | | $ | 1,936,891 | | | $ | — | | | $ | — | | | $ | 103,441,741 | |
Alternative Strategies Allocation Fund | | | 7,836,227 | | | | 14,614 | | | | 90,201 | | | | — | | | | — | | | | 7,941,042 | |
Event Driven and Distressed Strategies Fund | | | 1,916,724 | | | | — | | | | 8,265,900 | | | | 4,370 | | | | — | | | | 10,186,994 | |
Long Short Equity Strategy Fund | | | — | | | | 19,645 | | | | 3,741,654 | | | | — | | | | — | | | | 3,761,299 | |
Long Short Interest Rate Strategy Fund | | | — | | | | 2,197,127 | | | | 91,864,662 | | | | — | | | | — | | | | 94,061,789 | |
Emerging Markets 2x Strategy Fund | | | 256,293 | | | | — | | | | 5,748,230 | | | | — | | | | — | | | | 6,004,523 | |
Inverse Emerging Markets 2x Strategy Fund | | | — | | | | — | | | | 1,553,048 | | | | 53,604 | | | | — | | | | 1,606,652 | |
| | | | | | |
Liabilities | | | | | | | | | | | | | | | | | | | | | | | | |
U.S. Long Short Momentum Fund | | $ | — | | | $ | 212,043 | | | $ | — | | | $ | — | | | $ | — | | | $ | 212,043 | |
Alternative Strategies Allocation Fund | | | — | | | | 11,164 | | | | — | | | | — | | | | — | | | | 11,164 | |
Event Driven and Distressed Strategies Fund | | | — | | | | — | | | | — | | | | 16,738 | | | | — | | | | 16,738 | |
Long Short Equity Strategy Fund | | | — | | | | 10,411 | | | | — | | | | — | | | | — | | | | 10,411 | |
Emerging Markets 2x Strategy Fund | | | — | | | | — | | | | — | | | | 195,234 | | | | — | | | | 195,234 | |
Inverse Emerging Markets 2x Strategy Fund | | | — | | | | 2,219 | | | | — | | | | — | | | | — | | | | 2,219 | |
| * | Other financial instruments may include futures contracts and/or swaps, which are reported as unrealized gain/loss at period end. |
For the year ended March 31, 2012, there were no transfers between levels.
Summary of Fair Value Level 3 Activity
Following is a reconciliation of Level 3 assets for which significant unobservable inputs were used to determine fair value for the year ended March 31, 2012:
| | | | |
| | | Common
Stock | |
U.S. Long Short Momentum Fund | | | | |
Assets: | | | | |
Beginning Balance | | $ | 17,250 | |
Total realized gains or losses included in earnings | | | (158,183 | ) |
Total change in unrealized gains or losses included in earnings | | | 339,612 | |
Sales | | | (198,679 | ) |
| | | | | |
Ending Balance | | $ | — | |
| | | | | |
The Funds transfer uninvested cash balances into a single joint account, the daily aggregate balance of which is invested in one or more repurchase agreements collateralized by obligations of the U.S. Treasury and U.S. Government Agencies. The collateral is in the possession of the Funds’ custodian and is evaluated to ensure that its market value exceeds, at a minimum, 102% of the original face amount of the repurchase agreements. Each Fund holds a pro rata share of the collateral based on the dollar amount of the repurchase agreement entered into by each Fund.
| | | | |
| | | | | |
| 70 | | THE GUGGENHEIM FUNDS ANNUAL REPORT | | |
|
| NOTES TO FINANCIAL STATEMENTS (continued) |
| |
At March 31, 2012, the collateral for the repurchase agreements in the joint account was as follows:
| | | | | | | | | | | | | | | | | | |
Counterparty and Terms of Agreement | | Face Value | | | Repurchase Price | | | Collateral | | Par Value | | | Fair Value | |
HSBC Group
0.01% Due 04/02/12 | | $ | 945,000,000 | | | $ | 945,000,788 | | | U.S. Treasury STRIPS 0.00% 02/15/13 - 02/15/22 | | $ | 1,040,731,200 | | | $ | 963,900,029 | |
Mizuho Financial Group, Inc. 0.01% Due 04/02/12 | | | 265,875,123 | | | | 265,875,345 | | | U.S. Treasury Bills 0.00% 08/23/12 - 02/07/13 | | | 231,055,000 | | | | 230,868,945 | |
| | | | | | | | | | U.S. Treasury Notes 2.50% - 2.63% 03/31/13 - 11/15/20 | | | 37,530,300 | | | | 40,323,785 | |
Credit Suisse Group
0.01% Due 04/02/12 | | | 235,771,833 | | | | 235,772,030 | | | U.S. Treasury Notes 1.38% - 2.13% 11/30/15 - 08/15/21 | | | 235,636,900 | | | | 240,487,393 | |
Deutsche Bank
0.01% Due 04/02/12 | | | 70,666,667 | | | | 70,666,726 | | | U.S. Treasury Note 1.25% 03/15/14 | | | 70,800,000 | | | | 72,080,016 | |
In the event of counterparty default, the Funds have the right to collect the collateral to offset losses incurred. There is potential loss to the Funds in the event the Funds are delayed or prevented from exercising their rights to dispose of the collateral securities, including the risk of a possible decline in the value of the underlying securities during the period while the Funds seek to assert their rights. The Funds’ investment advisor, acting under the supervision of the Board of Trustees, reviews the value of the collateral and the creditworthiness of those banks and dealers with which the Funds enter into repurchase agreements to evaluate potential risks.
6. Derivative Investment Holdings Categorized by Risk Exposure
U.S. generally accepted accounting principles requires disclosures to enable investors to better understand how and why the Funds use derivative instruments, how these derivative instruments are accounted for and their effects on the Funds’ financial position and results of operations. None of the derivatives currently held by the Funds are being used as hedging instruments.
The following Funds utilized derivatives for the following purposes:
| | | | | | | | |
| Fund | | Index Exposure | | | Liquidity | |
U.S. Long Short Momentum Fund | | | | | | | x | |
Alternative Strategies Allocation Fund | | | x | | | | x | |
Event Driven and Distressed Strategies Fund | | | x | | | | x | |
Long Short Equity Strategy Fund | | | x | | | | x | |
Long Short Interest Rate Strategy Fund | | | x | | | | x | |
Emerging Markets 2x Strategy Fund | | | x | | | | x | |
Inverse Emerging Markets 2x Strategy Fund | | | x | | | | x | |
The following table represents the notional amount of derivative instruments outstanding, as an approximate percentage of the Funds’ net assets on a daily basis, while the risk to the Fund is limited to the profit earned on such derivatives.
| | | | | | | | |
| | | Approximate percentage of Fund’s
net assets on a daily basis | |
| Fund | | Long | | | Short | |
U.S. Long Short Momentum Fund | | | — | | | | 5 | % |
Alternative Strategies Allocation Fund | | | 10 | % | | | 10 | % |
Event Driven and Distressed Strategies Fund | | | 150 | % | | | — | |
Long Short Equity Strategy Fund | | | 50 | % | | | — | |
Long Short Interest Rate Strategy Fund | | | — | | | | 215 | % |
Emerging Markets 2x Strategy Fund | | | 195 | % | | | — | |
Inverse Emerging Markets 2x Strategy Fund | | | — | | | | 200 | % |
| | | | |
| | | | | |
| | THE GUGGENHEIM FUNDS ANNUAL REPORT | | 71 |
|
| NOTES TO FINANCIAL STATEMENTS (continued) |
| |
The following is a summary of the location of derivative investments on the Funds’ Statements of Assets and Liabilities as of March 31, 2012:
| | | | |
| Location on the Statements of Assets and Liabilities |
Derivative Investment Type | | Asset Derivatives | | Liability Derivatives |
Equity/Interest Rate/Currency contracts | | Variation margin | | Variation margin |
| | Unrealized appreciation on swap agreements | | Unrealized depreciation on swap agreements |
Corporate Bond contracts | | Unrealized appreciation on swap agreements | | Unrealized depreciation on swap agreements |
The following table sets forth the fair value of the Funds’ derivative investments categorized by primary risk exposure at March 31, 2012:
| | | | | | | | | | | | | | | | | | | | | | | | |
| | | Asset Derivative Investments Value | |
Fund | | Futures
Equity
Contracts* | | | Futures
Interest Rate
Contracts* | | | Futures
Currency
Contracts* | | | Swaps
Equity Index
Contracts | | | Swaps
Corporate Bond
Contracts | | | Total Value at
March 31, 2012 | |
U.S. Long Short Momentum Fund | | $ | — | | | $ | — | | | $ | — | | | $ | — | | | $ | — | | | $ | — | |
Alternative Strategies Allocation Fund | | | 13,924 | | | | 530 | | | | 160 | | | | — | | | | — | | | | 14,614 | |
Event Driven and Distressed Strategies Fund | | | — | | | | — | | | | — | | | | 4,370 | | | | — | | | | 4,370 | |
Long Short Equity Strategy Fund | | | 19,645 | | | | — | | | | — | | | | — | | | | — | | | | 19,645 | |
Long Short Interest Rate Strategy Fund | | | — | | | | 2,197,127 | | | | — | | | | — | | | | — | | | | 2,197,127 | |
Emerging Markets 2x Strategy Fund | | | — | | | | — | | | | — | | | | — | | | | — | | | | — | |
Inverse Emerging Markets 2x Strategy Fund | | | — | | | | — | | | | — | | | | 53,604 | | | | — | | | | 53,604 | |
| |
| | | Liability Derivative Investments Value | |
Fund | | Futures
Equity
Contracts* | | | Futures
Interest Rate
Contracts* | | | Futures
Currency
Contracts* | | | Swaps
Equity Index
Contracts | | | Swaps
Corporate Bond
Contracts | | | Total Value at
March 31, 2012 | |
U.S. Long Short Momentum Fund | | $ | 212,043 | | | $ | — | | | $ | — | | | $ | — | | | $ | — | | | $ | 212,043 | |
Alternative Strategies Allocation Fund | | | 4,278 | | | | — | | | | 6,886 | | | | — | | | | — | | | | 11,164 | |
Event Driven and Distressed Strategies Fund | | | — | | | | — | | | | — | | | | — | | | | 16,738 | | | | 16,738 | |
Long Short Equity Strategy Fund | | | 10,411 | | | | — | | | | — | | | | — | | | | — | | | | 10,411 | |
Long Short Interest Rate Strategy Fund | | | — | | | | — | | | | — | | | | — | | | | — | | | | — | |
Emerging Markets 2x Strategy Fund | | | — | | | | — | | | | — | | | | 195,234 | | | | — | | | | 195,234 | |
Inverse Emerging Markets 2x Strategy Fund | | | 2,219 | | | | — | | | | — | | | | — | | | | — | | | | 2,219 | |
| * | Includes cumulative appreciation (depreciation) of futures contracts as reported on the Schedule of Investments. Only current day’s variation margin is reported within the Statements of Assets and Liabilities. |
The following is a summary of the location of derivative investments on the Funds’ Statements of Operations for the year ended March 31, 2012:
| | |
Derivative Investment Type | | Location of Gain (Loss) on Derivatives |
Equity/Interest Rate/Currency/Corporate Bond/ | | Net realized gain (loss) on swap agreements |
Credit Default contracts | | Net realized gain (loss) on futures contracts |
| | Net change in net unrealized appreciation (depreciation) on swap agreements |
| | Net change in net unrealized appreciation (depreciation) on futures contracts |
The following is a summary of the Funds’ realized gain (loss) and change in unrealized appreciation (depreciation) on derivative investments recognized on the Statements of Operations categorized by primary risk exposure for the year ended March 31, 2012:
| | | | | | | | | | | | | | | | | | | | | | | | | | | | |
| | | Realized Gain (Loss) on Derivative Investments Recognized on the Statement of Operations | |
Fund | | Futures
Equity
Contracts | | | Futures
Interest Rate
Contracts | | | Futures
Currency
Contracts | | | Swaps
Equity Index
Contracts | | | Swaps
Corporate Bond
Contracts | | | Swaps
Credit Default
Contracts | | | Total | |
U.S. Long Short Momentum Fund | | $ | (1,906,510 | ) | | $ | — | | | $ | — | | | $ | — | | | $ | — | | | $ | — | | | $ | (1,906,510 | ) |
Alternative Strategies Allocation Fund | | | 19,282 | | | | 31,899 | | | | 5,446 | | | | — | | | | — | | | | — | | | | 56,627 | |
Event Driven and Distressed Strategies Fund | | | 74,281 | | | | — | | | | — | | | | (683,813 | ) | | | 233,448 | | | | (16,479 | ) | | | (392,563 | ) |
Long Short Equity Strategy Fund | | | 428,857 | | | | — | | | | — | | | | — | | | | — | | | | — | | | | 428,857 | |
Long Short Interest Rate Strategy Fund | | | — | | | | (9,593,206 | ) | | | — | | | | — | | | | — | | | | — | | | | (9,593,206 | ) |
Emerging Markets 2x Strategy Fund | | | 52,158 | | | | — | | | | — | | | | 6,746 | | | | — | | | | — | | | | 58,904 | |
Inverse Emerging Markets 2x Strategy Fund | | | (331,893 | ) | | | — | | | | — | | | | (621,439 | ) | | | — | | | | — | | | | (953,332 | ) |
| | | | |
| | | | | |
| 72 | | THE GUGGENHEIM FUNDS ANNUAL REPORT | | |
|
| NOTES TO FINANCIAL STATEMENTS (continued) |
| |
| | | | | | | | | | | | | | | | | | | | | | | | | | | | |
| | | Change in Unrealized Appreciation (Depreciation) on Derivative Investments
Recognized on the Statement of Operations | |
Fund | | Futures
Equity
Contracts | | | Futures
Interest
Rate
Contracts | | | Futures
Currency
Contracts | | | Swaps
Equity
Index
Contracts | | | Swaps
Corporate
Bond
Contracts | | | Swaps
Credit
Default
Contracts | | | Total | |
U.S. Long Short Momentum Fund | | $ | (206,020 | ) | | $ | — | | | $ | — | | | $ | — | | | $ | — | | | $ | — | | | $ | (206,020 | ) |
Alternative Strategies Allocation Fund | | | 7,294 | | | | 6,319 | | | | (6,726 | ) | | | — | | | | — | | | | — | | | | 6,887 | |
Event Driven and Distressed Strategies Fund | | | — | | | | — | | | | — | | | | (153,270 | ) | | | (28,766 | ) | | | — | | | | (182,036 | ) |
Long Short Equity Strategy Fund | | | (49,172 | ) | | | — | | | | — | | | | — | | | | — | | | | — | | | | (49,172 | ) |
Long Short Interest Rate Strategy Fund | | | — | | | | 2,541,385 | | | | — | | | | — | | | | — | | | | — | | | | 2,541,385 | |
Emerging Markets 2x Strategy Fund | | | 36 | | | | — | | | | — | | | | (425,723 | ) | | | — | | | | — | | | | (425,687 | ) |
Inverse Emerging Markets 2x Strategy Fund | | | 82,720 | | | | — | | | | — | | | | 164,676 | | | | — | | | | — | | | | 247,396 | |
7. Federal Income Tax Information
The Funds intend to comply with the provisions of Subchapter M of the Internal Revenue Code applicable to regulated investment companies and will distribute substantially all taxable net investment income and capital gains sufficient to relieve the Funds from all, or substantially all, federal income, excise and state income taxes. Therefore, no provision for federal or state income tax is required.
Tax positions taken or expected to be taken in the course of preparing the Funds’ tax returns are evaluated to determine whether the tax positions are “more-likely-than-not” of being sustained by the applicable tax authority. Tax positions not deemed to meet the more-likely-than-not threshold would be recorded as a tax benefit or expense in the current year. Management has analyzed the Funds’ tax positions taken, or to be taken, on Federal income tax returns for all open tax years (fiscal years 2009-2012), and has concluded that no provision for income tax is required in the Funds’ financial statements.
The RIC Modernization Act of 2010 was signed into law on December 22, 2010 and seeks to simplify some of the tax provisions applicable to regulated investment companies and the tax reporting to their shareholders, and to improve the tax efficiency of certain fund structures. The changes are generally effective for taxable years beginning after the date of enactment.
One of the more prominent changes addresses capital loss carryforwards. Funds will be permitted to carry forward capital losses incurred in taxable years beginning after December 22, 2010 for an unlimited period. However, any losses incurred during those future taxable years will be required to be utilized prior to the losses incurred in pre-enactment taxable years. Under pre-enactment law, capital losses could be carried forward for eight years, and carried forward as short-term capital, irrespective of the character of the original loss. As a result of this ordering rule, pre-enactment capital loss carryforwards may potentially expire unused. Additionally, post-enactment capital losses that are carried forward will retain their character as either short-term or long-term capital losses rather than being considered all short-term as under previous law.
The tax character of distributions paid during the year ended March 31, 2012, was as follows:
| | | | | | | | | | | | |
Fund | | Ordinary
Income | | | Long-Term
Capital
Gain | | | Total
Distributions | |
U.S. Long Short Momentum Fund | | $ | — | | | $ | — | | | $ | — | |
Alternative Strategies Allocation Fund | | | 208,961 | | | | — | | | | 208,961 | |
Event Driven and Distressed Strategies Fund | | | 360,523 | | | | — | | | | 360,523 | |
Long Short Equity Strategy Fund | | | 68,171 | | | | 77,820 | | | | 145,991 | |
Long Short Interest Rate Strategy Fund | | | — | | | | — | | | | — | |
Emerging Markets 2x Strategy Fund | | | 194,346 | | | | — | | | | 194,346 | |
Inverse Emerging Markets 2x Strategy Fund | | | — | | | | — | | | | — | |
The tax character of distributions paid during the year ended March 31, 2011, was as follows:
| | | | | | | | | | | | |
Fund | | Ordinary
Income | | | Long-Term
Capital Gain | | | Total
Distributions | |
U.S. Long Short Momentum Fund | | $ | — | | | $ | — | | | $ | — | |
Alternative Strategies Allocation Fund | | | 415,959 | | | | — | | | | 415,959 | |
Event Driven and Distressed Strategies Fund | | | 878,342 | | | | — | | | | 878,342 | |
Long Short Equity Strategy Fund | | | 94,717 | | | | 129,798 | | | | 224,515 | |
Long Short Interest Rate Strategy Fund | | | 147,983 | | | | 355,153 | | | | 503,136 | |
Emerging Markets 2x Strategy Fund | | | — | | | | — | | | | — | |
Inverse Emerging Markets 2x Strategy Fund | | | — | | | | — | | | | — | |
Note: For federal income tax purposes, short-term capital gain distributions are treated as ordinary income distributions.
| | | | |
| | | | | |
| | THE GUGGENHEIM FUNDS ANNUAL REPORT | | 73 |
|
| NOTES TO FINANCIAL STATEMENTS (continued) |
| |
The tax character of distributable earnings/(accumulated losses) at March 31, 2012, was as follows:
| | | | | | | | | | | | | | | | |
Fund | | Undistributed
Ordinary
Income | | | Undistributed
Long-Term
Capital Gain | | | Net Unrealized
Appreciation/
(Depreciation) | | | Capital Loss
Carryforward1 | |
U.S. Long Short Momentum Fund | | $ | — | | | $ | — | | | $ | 11,260,797 | | | $ | (85,319,003 | ) |
Alternative Strategies Allocation Fund | | | — | | | | — | | | | 203,991 | | | | (8,379,754 | ) |
Event Driven and Distressed Strategies Fund | | | — | | | | — | | | | 58,793 | | | | (606,090 | ) |
Long Short Equity Strategy Fund | | | — | | | | 144,572 | | | | 40 | | | | — | |
Long Short Interest Rate Strategy Fund | | | — | | | | — | | | | 7,408 | | | | (10,594,822 | ) |
Emerging Markets 2x Strategy Fund | | | — | | | | — | | | | (418,918 | ) | | | — | |
Inverse Emerging Markets 2x Strategy Fund | | | — | | | | — | | | | 53,605 | | | | (450,973 | ) |
Capital Loss Carryforward amounts may be limited due to Federal income tax regulations.
| 1 | A summary of the expiration of the aforementioned Capital Loss Carryforward is as follows: |
| | | | | | | | | | | | | | | | | | | | | | | | |
| | | Expires in | | | Expires in | | | Expires in | | | Unlimited | | | Total Capital Loss | |
Fund | | 2017 | | | 2018 | | | 2019 | | | Short-Term | | | Long-Term | | | Carryforward | |
U.S. Long Short Momentum Fund | | $ | (64,490,485 | ) | | $ | (19,377,927 | ) | | $ | — | | | $ | (1,450,591 | ) | | $ | — | | | $ | (85,319,003 | ) |
Alternative Strategies Allocation Fund | | | — | | | | (6,408,935 | ) | | | (1,363,136 | ) | | | (177,502 | ) | | | (430,181 | ) | | | (8,379,754 | ) |
Event Driven and Distressed Strategies Fund | | | — | | | | — | | | | — | | | | (606,090 | ) | | | — | | | | (606,090 | ) |
Long Short Equity Strategy Fund | | | — | | | | — | | | | — | | | | — | | | | — | | | | — | |
Long Short Interest Rate Strategy Fund | | | — | | | | — | | | | — | | | | (4,236,654 | ) | | | (6,358,168 | ) | | | (10,594,822 | ) |
Emerging Markets 2x Strategy Fund | | | — | | | | — | | | | — | | | | — | | | | — | | | | — | |
Inverse Emerging Markets 2x Strategy Fund | | | — | | | | — | | | | — | | | | (422,373 | ) | | | (28,600 | ) | | | (450,973 | ) |
Net investment income and net realized gains (losses) may differ for financial statement and tax purposes because of temporary or permanent book/tax differences. These differences are typically due to post-October losses, losses deferred due to wash sales, tax treatment of payments from credit default swaps, utilization of earnings and profits on shareholder redemptions, foreign currency gains and losses, and the “mark-to-market” of certain passive foreign investment companies (PFICs) for tax purposes. Additional differences may result from tax treatment of net investment losses and expired capital loss carryforwards. To the extent these differences are permanent, reclassifications are made to the appropriate equity accounts in the period that the differences arise. These reclassifications have no effect on net assets or NAV per share.
On the Statements of Assets and Liabilities the following reclassifications were made for permanent book/tax differences:
| | | | | | | | | | | | |
Fund | | Paid In
Capital | | | Undistributed
Net Investment
Income | | | Accumulated
Net Realized
Gain (Loss) | |
U.S. Long Short Momentum Fund | | $ | (7,773 | ) | | $ | 149,352 | | | $ | (141,579 | ) |
Alternative Strategies Allocation Fund | | | (26,419 | ) | | | 146,364 | | | | (119,945 | ) |
Event Driven and Distressed Strategies Fund | | | (181,802 | ) | | | 181,673 | | | | 129 | |
Long Short Equity Strategy Fund | | | 31,583 | | | | 112,072 | | | | (143,655 | ) |
Long Short Interest Rate Strategy Fund | | | (1,459,592 | ) | | | 1,459,592 | | | | — | |
Emerging Markets 2x Strategy Fund | | | — | | | | — | | | | — | |
Inverse Emerging Markets 2x Strategy Fund | | | (44,908 | ) | | | 44,908 | | | | — | |
At March 31, 2012, the cost of securities for Federal income tax purposes, the aggregate gross unrealized gain for all securities for which there was an excess of value over tax cost and the aggregate gross unrealized loss for all securities for which there was an excess of tax cost over value, were as follows:
| | | | | | | | | | | | | | | | |
Fund | | Tax
Cost | | | Tax
Unrealized
Gain | | | Tax
Unrealized
Loss | | | Net
Unrealized
Gain (Loss) | |
U.S. Long Short Momentum Fund | | $ | 92,180,944 | | | $ | 12,711,544 | | | $ | (1,450,747 | ) | | $ | 11,260,797 | |
Alternative Strategies Allocation Fund | | | 7,722,067 | | | | 279,090 | | | | (74,729 | ) | | | 204,361 | |
Event Driven and Distressed Strategies Fund | | | 10,111,463 | | | | 71,161 | | | | — | | | | 71,161 | |
Long Short Equity Strategy Fund | | | 3,741,614 | | | | 40 | | | | — | | | | 40 | |
Long Short Interest Rate Strategy Fund | | | 91,857,254 | | | | 8,070 | | | | (662 | ) | | | 7,408 | |
Emerging Markets 2x Strategy Fund | | | 6,228,207 | | | | — | | | | (223,684 | ) | | | (223,684 | ) |
Inverse Emerging Markets 2x Strategy Fund | | | 1,553,048 | | | | — | | | | — | | | | — | |
| | | | |
| | | | | |
| 74 | | THE GUGGENHEIM FUNDS ANNUAL REPORT | | |
|
| NOTES TO FINANCIAL STATEMENTS (continued) |
| |
Pursuant to Federal income tax regulations applicable to investment companies, the Funds have elected to treat net capital losses and certain ordinary losses realized between November 1 and March 31 of each year as occurring on the first day of the following tax year. The Funds have also elected to treat certain ordinary losses realized between January 1 and March 31 of each year as occurring on the first day of the following tax year. For the year ended March 31, 2012, the following losses reflected in the accompanying financial statements were deferred for Federal income tax purposes until April 1, 2012:
| | | | | | | | |
Fund | | Ordinary | | | Capital | |
U.S. Long Short Momentum Fund | | $ | — | | | $ | — | |
Alternative Strategies Allocation Fund | | | (5,076 | ) | | | (42,626 | ) |
Event Driven and Distressed Strategies Fund | | | (46,114 | ) | | | (42,643 | ) |
Long Short Equity Strategy Fund | | | (32,408 | ) | | | — | |
Long Short Interest Rate Strategy Fund | | | (318,354 | ) | | | — | |
Emerging Markets 2x Strategy Fund | | | (18,506 | ) | | | (107,376 | ) |
Inverse Emerging Markets 2x Strategy Fund | | | (12,214 | ) | | | (819,742 | ) |
8. Securities Transactions
For the year ended March 31, 2012, the cost of purchases and proceeds from sales of investment securities, excluding government securities and short-term investments, were:
| | | | | | | | |
| | | Purchases | | | Sales | |
U.S. Long Short Momentum Fund | | $ | 229,974,083 | | | $ | 277,029,132 | |
Alternative Strategies Allocation Fund | | | 14,848,338 | | | | 26,580,791 | |
Event Driven and Distressed Strategies Fund | | | 8,435,178 | | | | 6,332,888 | |
Long Short Equity Strategy Fund | | | (2,587,107 | ) | | | (1,775,539 | ) |
Long Short Interest Rate Strategy Fund | | | — | | | | — | |
Emerging Markets 2x Strategy Fund | | | 17,462,381 | | | | 19,803,913 | |
Inverse Emerging Markets 2x Strategy Fund | | | — | | | | — | |
9. Line of Credit
The Trust, along with other affiliated trusts, secured an uncommitted, $75,000,000 line of credit from U.S. Bank, N.A., which expires June 15, 2012. This line of credit is reserved for emergency or temporary purposes. Borrowings, if any, under this arrangement bear interest equal to the Prime Rate, minus 2%, which shall be paid monthly, averaging 1.25% for the year ended March 31, 2012. The Funds did not have any borrowings under this agreement at March 31, 2012.
The following table illustrates the average daily balance borrowed for the year ended March 31, 2012:
| | | | |
Fund | | Average Daily Balance | |
U.S. Long Short Momentum Fund | | $ | 3,361 | |
Alternative Strategies Allocation Fund | | | 23,678 | |
Event Driven and Distressed Strategies Fund | | | 22,448 | |
Long Short Interest Rate Strategy Fund | | | 99,104 | |
Emerging Markets 2x Strategy Fund | | | 16,019 | |
10. Legal Proceedings
Tribune Company
Rydex Series Funds has been named as a defendant and a putative member of the proposed defendant class of shareholders in the case entitled Official Committee of Unsecured Creditors of Tribune Co. v. FitzSimons (In re Tribune Co.), Adv. Pro. No. 10-54010 (Bankr. D. Del.), as a result of ownership of shares in the Tribune Company (“Tribune”) in 2007 by certain series of the Rydex Series Funds when Tribune effected a leveraged buyout transaction (“LBO”) by which Tribune converted to a privately-held company. In its complaint, the Unsecured Creditors Committee (the “UCC”) has alleged that, in connection with the LBO, insiders and major shareholders were overpaid for their Tribune stock using financing that the insiders knew would, and ultimately did, leave the Tribune insolvent. The UCC has asserted claims against certain insiders, major shareholders, professional advisers, and others involved in the LBO, and is attempting to obtain from these individuals and entities the proceeds paid out in connection with the LBO. This adversary proceeding in the Bankruptcy Court has been stayed pending further order of the Bankruptcy Court.
| | | | |
| | | | | |
| | THE GUGGENHEIM FUNDS ANNUAL REPORT | | 75 |
|
| NOTES TO FINANCIAL STATEMENTS (concluded) |
| |
In June 2011, a group of Tribune creditors, not including the UCC, filed multiple actions involving state law constructive fraudulent conveyance claims against former Tribune shareholders. Rydex Series Funds also has been named as a defendant in one or more of these suits. These cases have been consolidated in a multidistrict litigation proceeding in the United States District Court for the Southern District of New York and have been stayed pending further order of that court or of the Bankruptcy Court.
None of these lawsuits allege any wrongdoing on the part of Rydex Series Funds. The following series of Rydex Series Funds held shares of Tribune and tendered these shares as part of Tribune’s LBO: Nova Fund, S&P 500 Pure Value Fund, Multi-Cap Core Equity Fund, S&P 500 Fund, Multi-Hedge Strategies Fund and Hedged Equity Fund (the “Funds”). The value of the proceeds received by the foregoing Funds was $28,220, $109,242, $9,860, $3,400, $1,181,160, and $10,880, respectively. At this stage of the proceedings, Rydex Series Funds is not able to make a reliable predication as to the outcome of these lawsuits or the effect, if any, on a Fund’s net asset value.
Lyondell Chemical Company
In December 2011, Rydex Series Funds was named as a defendant in Weisfelner, as Trustee of the LB Creditor Trust, v. Fund 1 (In re Lyondell Chemical Co.), Adv. Pro. No. 10-4609 (Bankr. S.D.N.Y.).
Similar to the claims made in the Tribune matter, the Weisfelner complaint seeks to have set aside and recovered as fraudulent transfers from former Lyondell Chemical Company (“Lyondell”) shareholders the consideration paid to them pursuant to the cash out merger of Lyondell shareholders in connection with the combination of Lyondell and Basell AF in 2007. Lyondell filed for bankruptcy in 2008.
This lawsuit does not allege any wrongdoing on the part of Rydex Series Funds. The following series of Rydex Series Funds received cash proceeds from the cash out merger in the following amounts: Basic Materials Fund—$ 1,725,168; U.S. Long Short Momentum Fund – $2,193,600; Global 130/30 Strategy Fund – $37,920; Hedged Equity Fund – $1,440; and Multi-Hedge Strategies Fund – $1,116,480. At this stage of the proceedings, Rydex Series Funds is not able to make a reliable predication as to the outcome of these lawsuits or the effect, if any, on a Fund’s net asset value.
11. Proposed Fund Merger
At a meeting held on November 21, 2011, the Board of Trustees (the “Board”) of Rydex Series Funds (the “Trust”) unanimously approved an Agreement and Plan of Reorganization (the “Agreement”) providing for the reorganization of the Trust’s Alternative Strategies Allocation Fund with and into the Multi-Hedge Strategies Fund, each a separate series of the Trust. The Agreement provides for: (a) the transfer of the assets and stated liabilities of each share class of the Alternative Strategies Allocation Fund in exchange for the corresponding share class of the Multi-Hedge Strategies Fund, and (b) the distribution of the appropriate share class of the Multi-Hedge Strategies Fund pro rata by the Alternative Strategies Allocation Fund to its shareholders, in complete liquidation of the Alternative Strategies Allocation Fund (the “Reorganization”). The Reorganization is expected to be a tax-free transaction and is subject to shareholder approval at a Special Meeting of Shareholders, scheduled to occur June 29, 2012. If the Reorganization is approved, shareholders will receive the applicable class of shares of the Multi-Hedge Strategies Fund with a value equal to the value of their investment in the Alternative Strategies Allocation Fund as of 4:00 p.m., Eastern Time on the Closing Date (the “Effective Time”). Following the distribution of Multi-Hedge Strategies Fund shares, the Alternative Strategies Allocation Fund will cease operations and be liquidated.
| | | | |
| | | | | |
| 76 | | THE GUGGENHEIM FUNDS ANNUAL REPORT | | |
|
| REPORT OF INDEPENDENT REGISTERED PUBLIC ACCOUNTING FIRM |
| |
To the Board of Trustees and Shareholders of Rydex Series Funds:
We have audited the accompanying statements of assets and liabilities, including the schedules of investments, of U.S. Long Short Momentum Fund, Alternative Strategies Allocation Fund, Event Driven and Distressed Strategies Fund, Long Short Equity Strategy Fund, Long Short Interest Rate Strategy Fund, Emerging Markets 2X Strategy Fund, and Inverse Emerging Markets 2X Strategy Fund (seven of the series constituting the Rydex Series Funds) (the “Funds”) as of March 31, 2012, and the related statements of operations for the year then ended, and statements of changes in net assets and financial highlights for each of the years or periods indicated therein. These financial statements and financial highlights are the responsibility of the Funds’ management. Our responsibility is to express an opinion on these financial statements and financial highlights based on our audits.
We conducted our audits in accordance with the standards of the Public Company Accounting Oversight Board (United States). Those standards require that we plan and perform the audit to obtain reasonable assurance about whether the financial statements and financial highlights are free of material misstatement. We were not engaged to perform an audit of the Funds’ internal control over financial reporting. Our audits included consideration of internal control over financial reporting as a basis for designing audit procedures that are appropriate in the circumstances, but not for the purpose of expressing an opinion on the effectiveness of the Funds’ internal control over financial reporting. Accordingly, we express no such opinion. An audit also includes examining, on a test basis, evidence supporting the amounts and disclosures in the financial statements and financial highlights, assessing the accounting principles used and significant estimates made by management, as well as evaluating the overall financial statement presentation. Our procedures included confirmation of securities owned as of March 31, 2012, by correspondence with the custodian, the transfer agent of underlying funds, and brokers or by other appropriate auditing procedures where replies from brokers were not received. We believe that our audits provide a reasonable basis for our opinion.
In our opinion, the financial statements and financial highlights referred to above present fairly, in all material respects, the financial position of the above listed Funds at March 31, 2012, the results of their operations for the year then ended, and the changes in their net assets and their financial highlights for each of the years or periods indicated therein, in conformity with U.S. generally accepted accounting principles.

McLean, Virginia
May 24, 2012
| | | | |
| | | | | |
| | THE GUGGENHEIM FUNDS ANNUAL REPORT | | 77 |
|
| OTHER INFORMATION (Unaudited) |
| |
Tax Information
This information is being provided as required by the Internal Revenue Code. Amounts shown may differ from those elsewhere in the report because of differences in tax and financial reporting practice.
Of the taxable ordinary income distributions paid during the fiscal year ended March 31, 2012, the following funds had the corresponding percentages qualify for the dividends received deduction for corporations:
| | | | |
Fund | | % Qualifying | |
Alternative Strategies Allocation Fund | | | 9.58 | % |
Long Short Equity Strategy Fund | | | 1.49 | % |
Additionally, the following amounts of taxable ordinary income dividends paid during the fiscal year qualified for the lower income tax rate available to individuals under the Jobs and Growth Tax Relief Reconciliation Act of 2003.
| | | | |
Fund | | % Qualifying | |
Alternative Strategies Allocation Fund | | | 9.60 | % |
Long Short Equity Strategy Fund | | | 1.67 | % |
With respect to the taxable year ended March 31, 2012, the Funds hereby designate as capital gain dividends the amounts listed below, or, if subsequently determined to be different, the net capital gain of such year:
| | | | |
| | | Long Short
Equity Strategy Fund | |
From long-term capital gains,subject to the 15% rate gains category: | | $ | 77,820 | |
From long-term capital gains, using proceeds from shareholder redemptions: | | | 83,238 | |
Proxy Voting Information
A description of the policies and procedures that the Trust uses to determine how to vote proxies relating to securities held in the Funds’ portfolios is available, without charge and upon request, by calling 1.800.820.0888. This information is also available from the EDGAR database on the SEC’s website at http://www.sec.gov.
Information regarding how the Funds voted proxies relating to portfolio securities during the most recent 12-month period ended June 30 is available without charge, upon request, by calling 1.800.820.0888. This information is also available from the EDGAR database on the SEC’s website at http://www.sec.gov.
At a special meeting of shareholders held on December 13, 2011, the shareholders of the Funds voted on whether to approve a new investment advisory agreement between Rydex Series Funds and Security Investors, LLC. A description of the number of shares voted is as follows:
| | | | | | | | | | | | |
Fund | | Shares For | | | Shares Against | | | Shares Abstained | |
U.S. Long Short Momentum Fund | | | 4,748,887 | | | | 73,347 | | | | 165,284 | |
Alternative Strategies Allocation Fund | | | 453,569 | | | | 8,584 | | | | 10,831 | |
Event Driven and Distressed Strategies Fund | | | 480,492 | | | | 1,987 | | | | 2,903 | |
Long Short Equity Strategy Fund | | | 169,384 | | | | 54 | | | | — | |
Long Short Interest Rate Strategy Fund | | | 2,674,622 | | | | 44,033 | | | | 100,412 | |
Emerging Markets 2x Strategy Fund | | | 152,355 | | | | 854 | | | | 2,008 | |
Inverse Emerging Markets 2x Strategy Fund | | | 60,044 | | | | 4,813 | | | | 1,814 | |
At a special meeting of shareholders held on January 26, 2012, the shareholders of the Funds voted on whether to approve a new sub-advisory agreement between Security Investors, LLC and American Independence Financial Services, LLC. A description of the number of shares voted is as follows:
| | | | | | | | | | | | |
Fund | | Shares For | | | Shares Against | | | Shares Abstained | |
Long Short Interest Rate Strategy Fund | | | 2,668,124 | | | | 46,152 | | | | 104,792 | |
| | | | |
| | | | | |
| 78 | | THE GUGGENHEIM FUNDS ANNUAL REPORT | | |
|
| OTHER INFORMATION (Unaudited) (continued) |
| |
At a special meeting of shareholders held on November 22, 2011, the shareholders of the Funds also voted on whether to approve the election of nominees to the Board of Trustees. A description of the number of shares voted is as follows:
| | | | | | | | | | | | | | | | | | | | | | |
Donald C. Cacciapaglia | | Corey A. Colehour | | J. Kenneth Dalton |
For | | | 1,443,600,903 | | | | | For | | | 1,444,213,017 | | | | | For | | | 1,444,422,997 | | | |
Withhold | | | 23,402,732 | | | | | Withhold | | | 22,790,618 | | | | | Withhold | | | 22,580,638 | | | |
Total | | | 1,467,003,635 | | | | | Total | | | 1,467,003,635 | | | | | Total | | | 1,467,003,635 | | | |
| | |
John O. Demaret | | Richard M. Goldman | | Werner E. Keller |
For | | | 1,445,255,754 | | | | | For | | | 1,443,668,595 | | | | | For | | | 1,445,494,273 | | | |
Withhold | | | 21,747,881 | | | | | Withhold | | | 23,335,040 | | | | | Withhold | | | 21,509,362 | | | |
Total | | | 1,467,003,635 | | | | | Total | | | 1,467,003,635 | | | | | Total | | | 1,467,003,635 | | | |
| | |
Thomas F. Lydon | | Patrick T. McCarville | | Roger Somers |
For | | | 1,444,219,448 | | | | | For | | | 1,445,357,773 | | | | | For | | | 1,443,486,735 | | | |
Withhold | | | 22,784,187 | | | | | Withhold | | | 21,645,862 | | | | | Withhold | | | 23,516,900 | | | |
Total | | | 1,467,003,635 | | | | | Total | | | 1,467,003,635 | | | | | Total | | | 1,467,003,635 | | | |
At a special meeting of shareholders held on January 26, 2012, the shareholders of the Funds also voted on whether to approve a “manager of managers” arrangement for each of the Funds. Although shareholder votes were placed, not enough votes were received to meet the minimum requirements to constitute a majority vote. As such, the matter was closed.
Quarterly Portfolio Schedules Information
The Trust files its complete schedule of portfolio holdings with the SEC for the first and third quarters of each fiscal year on Form NQ; which are available on the SEC’s website at http://www.sec.gov. The Funds’ Forms N-Q may be reviewed and copied at the SEC’s Public Reference Room in Washington, DC, and that information on the operation of the Public Reference Room may be obtained by calling 1-800-SEC-0330. Copies of the portfolio holdings are also available to shareholders, without charge and upon request, by calling 1.800.820.0888.
Office Locations
The offices of Guggenheim Investments can be found in the following locations:
40 East 52nd Street
16th Floor
New York, NY 10022
(Headquarters)
Four Irvington Centre
805 King Farm Boulevard
Suite 600
Rockville, MD 20850
9401 Indian Creek Parkway
40 Corporate Woods
Suite 850
Overland Park, KS 66210
Guggenheim Transaction
On September 20, 2011, Guggenheim Capital, LLC agreed to purchase the indirect holding company of Security Investors, LLC, the Fund’s investment manager (the “Investment Manager”) (the “Transaction”). Guggenheim Capital, LLC’s subsidiary, Guggenheim Partners, LLC (“Guggenheim”), is a global, independent, privately-held, diversified financial services firm with more than 1,500 dedicated professionals. The transaction closed on February 29, 2012.
The Transaction should not result in material changes to the day-to-day management and operation of the Funds or any increase in fees.
| | | | |
| | | | | |
| | THE GUGGENHEIM FUNDS ANNUAL REPORT | | 79 |
|
| OTHER INFORMATION (Unaudited) (concluded) |
| |
In anticipation of the Transaction, the Board of Trustees of the Funds (the “Board”) called a special meeting of shareholders (the “Meeting”), at which shareholders of the Funds of record as of October 3, 2011 were asked to consider the approval of a new investment management agreement between the Funds and the Investment Manager (the “New Agreement”). This approval was necessary because, under the Investment Company Act of 1940 (the “1940 Act”), the Transaction could result in the termination of the Funds’ current investment management agreement with the Investment Manager (the “Current Agreement”). The Funds’ shareholders approved the New Agreement, the terms of which are substantially identical to the corresponding Current Agreement, except with respect to the date of execution.
Election of Board Members
The Board also approved a proposal to elect nine individuals to the Board. The Board proposed the election of the following nominees: Donald C. Cacciapaglia, Corey A. Colehour, J. Kenneth Dalton, John O. Demaret, Richard M. Goldman, Werner E. Keller, Thomas F. Lydon, Patrick T. McCarville and Roger Somers. Each of the nominees, other than Mr. Cacciapaglia, currently serves as a Trustee. In connection with the Transaction, the Board believes that expanding the Board to include Mr. Cacciapaglia, who is a member of senior management of Guggenheim’s investment management business, and who would serve on other boards in the Guggenheim Investments family of funds, would be appropriate. The Trusts’ shareholders ultimately approved the aforementioned proposal.
| | | | |
| | | | | |
| 80 | | THE GUGGENHEIM FUNDS ANNUAL REPORT | | |
|
| INFORMATION ON BOARD OF TRUSTEES AND OFFICERS (Unaudited) |
| |
A Board of Trustees oversees the Trust, as well as other trusts of GI, in which its members have no stated term of service, and continue to serve after election until resignation. The Statement of Additional Information includes further information about Fund Trustees and Officers, and can be obtained without charge by calling 800.820.0888.
All Trustees and Officers may be reached c/o Guggenheim Investments, 805 King Farm Boulevard, Suite 600, Rockville, MD 20850.
TRUSTEE AND OFFICER
| | | | |
Name, Position and Year of Birth | | Length of Service as Trustee (Year Began) | | Number of Funds Overseen |
Donald C. Cacciapaglia* | | Rydex Series Funds – 2012 | | 148 |
Trustee, President (1951) | | Rydex Variable Trust – 2012 | | |
| | Rydex Dynamic Funds – 2012 | | |
| | Rydex ETF Trust – 2012 | | |
|
Principal Occupations During Past Five Years: Security Investors, LLC: President and CEO from April 2012 to present; Guggenheim Investments: President and Chief Administrative Officer from February 2010 to present; Channel Capital Group, Inc.: Chairman and CEO from April 2002 to February 2010. INDEPENDENT TRUSTEES |
Name, Position and Year of Birth | | Length of Service As Trustee (Year Began) | | Number of Funds Overseen |
Corey A. Colehour | | Rydex Series Funds – 1993 | | 148 |
Trustee (1945) | | Rydex Variable Trust – 1998 | | |
| | Rydex Dynamic Funds – 1999 | | |
| | Rydex ETF Trust – 2003 | | |
|
| Principal Occupations During Past Five Years: Retired; Member of the Audit, Governance and Nominating Committees (1995 to present) |
| | |
| | | | | |
| | |
J. Kenneth Dalton | | Rydex Series Funds – 1995 | | 148 |
Trustee (1941) | | Rydex Variable Trust – 1998 | | |
| | Rydex Dynamic Funds – 1999 | | |
| | Rydex ETF Trust – 2003 | | |
|
| Principal Occupations During Past Five Years: Retired; Member of the Governance and Nominating Committees (1995 to present); Chairman of the Audit Committee (1997 to present); Member of the Risk Oversight Committee (2010 to present) |
| | |
| | | | | |
| | |
John O. Demaret | | Rydex Series Funds – 1997 | | 148 |
Trustee, Chairman of the | | Rydex Variable Trust – 1998 | | |
Board (1941) | | Rydex Dynamic Funds – 1999 | | |
| | Rydex ETF Trust – 2003 | | |
|
| Principal Occupations During Past Five Years: Retired; Member of the Audit Committee (1997 to present); Member of the Risk Oversight Committee (2010 to present) |
| | |
| | | | | |
| | |
Werner E. Keller | | Rydex Series Funds – 2005 | | 148 |
Trustee (1940) | | Rydex Variable Trust – 2005 | | |
| | Rydex Dynamic Funds – 2005 | | |
| | Rydex ETF Trust – 2005 | | |
|
| Principal Occupations During Past Five Years: Founder and President of Keller Partners, LLC (registered investment adviser) (2005 to present); Member of the Audit, Governance and Nominating Committees (2005 to present); Chairman and Member of the Risk Oversight Committee (2010 to present) |
| | |
| | | | | |
| | |
Thomas F. Lydon, Jr. | | Rydex Series Funds – 2005 | | 148 |
Trustee (1960) | | Rydex Variable Trust – 2005 | | |
| | Rydex Dynamic Funds – 2005 | | |
| | Rydex ETF Trust – 2005 | | |
| | | | |
|
| Principal Occupations During Past Five Years: President, Global Trends Investments (1996 to present); Member of the Audit, Governance and Nominating Committees (2005 to present) |
| | |
| | | | | |
|
|
| | | | |
| | | | | |
| | THE GUGGENHEIM FUNDS ANNUAL REPORT | | 81 |
|
| INFORMATION ON BOARD OF TRUSTEES AND OFFICERS (Unaudited) (continued) |
| |
INDEPENDENT TRUSTEES - concluded
| | | | |
Name, Position and Year of Birth | | Length of Service As Trustee (Year Began) | | Number of Funds Overseen |
Patrick T. McCarville | | Rydex Series Funds – 1997 | | 148 |
Trustee (1942) | | Rydex Variable Trust – 1998 | | |
| | Rydex Dynamic Funds – 1999 | | |
| | Rydex ETF Trust – 2003 | | |
|
| Principal Occupations During Past Five Years: CEO, Par Industries, Inc., d/b/a Par Leasing (1977 to 2010); Chairman of the Governance and Nominating Committees (1997 to present); Member of the Audit Committee (1997 to present) |
| | | | | |
| | |
Roger Somers | | Rydex Series Funds – 1993 | | 148 |
Trustee (1944) | | Rydex Variable Trust – 1998 | | |
| | Rydex Dynamic Funds – 1999 | | |
| | Rydex ETF Trust – 2003 | | |
|
| Principal Occupations During Past Five Years: Founder and CEO of Arrow Limousine (1965 to present); Member of the Audit, Governance and Nominating Committees (1995 to present) |
EXECUTIVE OFFICERS
| | |
Name, Position and Year of Birth | | Principal Occupations During Past Five Years |
Michael P. Byrum* Vice President (1970) | | Current: President, Security Benefit Asset Management Holdings, LLC; Senior Vice President, Security Investors, LLC; President and Chief Investment Officer, Rydex Holdings, LLC; Director and Chairman of the Board, Advisor Research Center, Inc.; Manager, Rydex Specialized Products, LLC |
| |
| | Previous: Rydex Distributors, LLC (f/k/a Rydex Distributors, Inc.), Vice President (2009); Rydex Fund Services, LLC, Director (2009-2010), Secretary (2002- 2010), Executive Vice President (2002-2006); Rydex Advisors, LLC (f/k/a PADCO Advisors, Inc.), Director (2008- 2010), Chief Investment Officer (2006-2010), President (2004-2010), Secretary (2002-2010); Rydex Advisors II, LLC (f/k/a PADCO Advisors II, Inc.), Director (2008-2010), Chief Investment Officer (2006-2010), President (2004-2010), Secretary (2002-2010); Rydex Capital Partners, LLC, President and Secretary (2003-2007); Rydex Capital Partners II, LLC, (2003- 2007); Rydex Holdings, LLC (f/k/a Rydex Holdings, Inc.), Secretary (2005-2008), Executive Vice President (2005-2006); Advisor Research Center, Inc., Secretary (2006-2009), Executive Vice President (2006); Rydex Specialized Products, LLC, Secretary (2005-2008) |
| |
Nikolaos Bonos* Vice President and Treasurer (1963) | | Current: Senior Vice President, Security Investors, LLC; Chief Executive Officer and Manager, Rydex Specialized Products, LLC; Chief Executive Officer and President, Rydex Fund Services, LLC; Vice President, Rydex Holdings, LLC; Treasurer, SBL Fund; Security Equity Fund; Security Income Fund; Security Large Cap Value Fund and Security Mid Cap Growth Fund; Vice President, Security Benefit Asset Management Holdings, LLC |
| |
| | Previous: Security Global Investors, LLC, Senior Vice President (2010-2011); Rydex Advisors, LLC (f/k/a PADCO Advisors, Inc.) Senior Vice President (2006-2011); Rydex Fund Services, LLC (f/k/a Rydex Fund Services, Inc.), Director (2009), Senior Vice President (2003-2006); Rydex Specialized Products, LLC, Chief Financial Officer (2005-2009) |
| |
Elisabeth Miller* Chief Compliance Officer (1968) | | Current: Chief Compliance Officer, Rydex Series Funds, Rydex Dynamic Funds, Rydex Variable Trust, Rydex ETF Trust, Security Equity Fund, Security Income Fund, Security Large Cap Value Fund, Security Mid Cap Growth Fund, SBL Fund, Security Investors, LLC, and Rydex Distributors, LLC |
| |
| | Previous: Senior Manager, Security Investors, LLC and Rydex Distributors, LLC (2004-2009) |
| | | | |
| | | | | |
| 82 | | THE GUGGENHEIM FUNDS ANNUAL REPORT | | |
|
| INFORMATION ON BOARD OF TRUSTEES AND OFFICERS (Unaudited) (concluded) |
| |
EXECUTIVE OFFICERS - concluded
| | |
Name, Position and Year of Birth | | Principal Occupations During Past Five Years |
Amy J. Lee* Vice President and Assistant Secretary (1960) | | Current: Senior Vice President and Secretary, Security Investors, LLC; Secretary and Chief Compliance Officer, Security Distributors, Inc.; Vice President, Associate General Counsel and Assistant Secretary, Security Benefit Life Insurance Company and Security Benefit Corporation; Associate General Counsel, First Security Benefit Life Insurance and Annuity of New York; Vice President and Secretary, SBL Fund; Security Equity Fund; Security Income Fund; Security Large Cap Value Fund and Security Mid Cap Growth Fund; Vice President and Secretary, Rydex Holdings, LLC; Secretary, Advisor Research Center, Inc., Rydex Specialized Products, LLC, Rydex Distributors, LLC and Rydex Fund Services, LLC; Assistant Secretary, Security Benefit Clinic and Hospital |
| |
| | Previous: Security Global Investors, LLC, Senior Vice President and Secretary (2007-2011); Rydex Advisors, LLC (f/k/a PADCO Advisors, Inc.) and Rydex Advisors II, LLC (f/k/a PADCO Advisors II, Inc.), Senior Vice President and Secretary (2010-2011); Brecek and Young Advisors, Inc., Director (2004-2008) |
| |
Joseph M. Arruda* Assistant Treasurer (1966) | | Current: Assistant Treasurer, SBL Fund; Security Equity Fund; Security Income Fund; Security Large Cap Value Fund and Security Mid Cap Growth Fund; Vice President, Security Investors, LLC; Chief Financial Officer and Manager, Rydex Specialized Products, LLC |
| |
| | Previous: Security Global Investors, LLC, Vice President (2010-2011); Rydex Advisors, LLC (f/k/a PADCO Advisors, Inc.) and Rydex Advisors II, LLC (f/k/a PADCO Advisors II, Inc.), Vice President (2004-2011) |
| * | Officers of the Funds are deemed to be “interested persons” of the Trust, within the meaning of Section 2(a)(19) of the 1940 Act, inasmuch as this person is affiliated with Security Global Investors. |
| | | | |
| | | | | |
| | THE GUGGENHEIM FUNDS ANNUAL REPORT | | 83 |
|
| GUGGENHEIM INVESTMENTS PRIVACY POLICIES |
| |
Rydex Funds, Guggenheim Funds, Rydex Investments, Rydex Distributors, Inc., Security Investors, LLC, Security Distributors, Inc. and Rydex Advisory Services (Collectively “Guggenheim Investments”)
Our Commitment to You
When you become a Guggenheim Investments investor, you entrust us with not only your hard-earned money but also with personal and financial information about you. We recognize that your relationship with us is based on trust and that you expect us to act responsibly and in your best interests. Because we have access to this private information about you, we hold ourselves to the highest standards in its safekeeping and use. This means, most importantly, that we do not sell client information to anyone—whether it is your personal information or if you are a current or former Guggenheim Investments client.
The Information We Collect About You
In the course of doing business with shareholders and investors, we collect nonpublic personal information about you. You typically provide personal information when you complete a Guggenheim Investments account application or when you request a transaction that involves Rydex and Guggenheim Investments funds or one of the Guggenheim Investments affiliated companies. “Nonpublic personal information” is personally identifiable private information about you. For example, it includes information regarding your name and address, Social Security or taxpayer identification number, assets, income, account balance, bank account information and investment activity (e.g., purchase and redemption history).
How We Handle Your Personal Information
As emphasized above, we do not sell information about current or former clients or their accounts to third parties. Nor do we share such information, except when necessary to complete transactions at your request or to make you aware of related investment products and services that we offer. Additional details about how we handle your personal information are provided below.To complete certain transactions or account changes that you direct, it may be necessary to provide identifying information to companies, individuals or groups that are not affiliated with Guggenheim Investments. For example, if you ask to transfer assets from another financial institution to Guggenheim Investments, we will need to provide certain information about you to that company to complete the transaction. To alert you to other Guggenheim Investments investment products and services, we may share your information within the Guggenheim Investments family of affiliated companies. This would include, for example, sharing your information within Guggenheim Investments so we can make you aware of new Rydex and Guggenheim Investments funds or the services offered through another Guggenheim Investments affiliated company. In certain instances, we may contract with nonaffiliated companies to perform services for us. Where necessary, we will disclose information we have about you to these third parties. In all such cases, we provide the third party with only the information necessary to carry out its assigned responsibilities and only for that purpose. And we require these third parties to treat your private information with the same high degree of confidentiality that we do. In certain instances, we may share information with other financial institutions regarding individuals and entities in response to the U.S.A. Patriot Act. Finally, we will release information about you if you direct us to do so, if we are compelled by law to do so or in other circumstances permitted by law.
Opt Out Provisions
We do not sell your personal information to anyone. The law allows you to “opt out” of only certain kinds of information sharing with third parties. The firm does not share personal information about you with any third parties that triggers this opt-out right. This means YOU ARE ALREADY OPTED OUT.
How We Protect Privacy Online
Our concern for the privacy of our shareholders also extends to those who use our web site, www.rydex-sgi.com. Our web site uses some of the most secure forms of online communication available, including encryption technology, Secure Socket Layer (SSL) protocol, firewalls and user names and passwords. These technologies provide a high level of security and privacy when you access your account information or initiate online transactions. The Guggenheim Investments web site offers customized features that require our use of “http cookies”—tiny pieces of information that we ask your browser to store. However, we make very limited use of these cookies. We only use cookies for session management and security features on the Guggenheim Investments web site. We do not use them to pull data from your hard drive, to learn your email address, or to view data in cookies created by other web sites. We will not share the information in our cookies or give others access to it. See the legal information area on our web site for more details about web site security and privacy features.
| | | | |
| | | | | |
| 84 | | THE GUGGENHEIM FUNDS ANNUAL REPORT | | |
|
| GUGGENHEIM INVESTMENTS PRIVACY POLICIES (concluded) |
| |
How We Safeguard Your Personal Information
We restrict access to nonpublic personal information about shareholders to our employees and in some cases to third parties (for example, the service providers described above) as permitted by law. We maintain strict physical, electronic and procedural safeguards that comply with federal standards to guard your nonpublic personal information.
We’ll Keep You Informed
As required by federal law, we will notify shareholders of our privacy policy annually. We reserve the right to modify this policy at any time, but rest assured that if we do change it, we will tell you promptly. You will also be able to access our privacy policy from our web site at www.rydex-sgi.com. Should you have any questions regarding our privacy policy, contact us at 800.820.0888 or 301.296.5100.
| | | | |
| | | | | |
| | THE GUGGENHEIM FUNDS ANNUAL REPORT | | 85 |

805 King Farm Boulevard, Suite 600
Rockville, MD 20850
www.rydex-sgi.com
800.820.0888
RSTF-ANN-0312x0313

MARCH 31, 2012
GUGGENHEIM FUNDS
ANNUAL REPORT
ASSET ALLOCATION FUNDS
ALL-ASSET CONSERVATIVE STRATEGY FUND
ALL-ASSET MODERATE STRATEGY FUND
ALL-ASSET AGGRESSIVE STRATEGY FUND

Go paperless with Guggenheim Investments eDelivery—a service giving you full online access to account information and documents. Save time, cut down on mailbox clutter and be a friend to the environment with eDelivery.
With Guggenheim Investments eDelivery you can:
| | • | | View online confirmations and statements at your convenience. |
| | • | | Receive email notifications when your most recent confirmations, statements and other account documents are available for review. |
| | • | | Access prospectuses, annual reports and semiannual reports online. |
It’s easy to enroll:
1/ Visit www.rydex-sgi.com
2/ Click on “eDelivery Sign-Up” 
3/ Follow the simple enrollment instructions
If you have questions about Guggenheim Investments eDelivery services, contact one of our Shareholder Service Representatives at 800.820.0888.

This report and the financial statements contained herein are submitted for the general information of our shareholders. The report is not authorized for distribution to prospective investors unless preceded or accompanied by an effective prospectus.
Distributed by Rydex Distributors, LLC.
TABLE OF CONTENTS
THE GUGGENHEIM FUNDS ANNUAL REPORT | 1
LETTER TO OUR SHAREHOLDERS
To Our Shareholders:
A restructuring of Greece’s massive debt, continued accommodation by the world’s major central banks and better news on the U.S. economy helped support financial markets over the fiscal year ended March 31, 2012, with the S&P 500® Index* rising about 9%. Market optimism peaked in early 2012, when several major equity indices pushed to the highest levels in four years or more. But the mood grew more cautious late in the period after the Federal Reserve (“the Fed”) expressed views that continued weakness in housing and employment may pose a risk to the strength of the recovery.
U.S. equities experienced big intra-year swings. Markets swooned by nearly 20% last summer amid the loss of the U.S. AAA credit rating, the end of the Fed’s second round of quantitative easing and rising oil prices. But after touching the year’s low in early October, improving U.S. economic data and European Central Bank’s injections of three-year loans into the continent's banking system helped markets make up lost ground, which carried over into a strong first quarter of 2012.
Among the upbeat U.S. economic reports in recent months: more than 600,000 jobs have been added since the beginning of 2012; house prices have fallen enough to start to spur demand, lifting sales and new construction; and the U.S. GDP expanded at an annual rate of 3% in the fourth quarter of 2011, its strongest rate in a year and a half. Consumer confidence climbed in March to its highest level in a year.
While acknowledging the good news, the Fed warned that policymakers cannot be sure the recent pace of improvement will be sustained unless growth picks up. To foster growth, the Fed has said it will leave its key interest rate close to zero at least through 2014, despite arguments by some Fed officials and investors that the Fed may have to consider raising rates much earlier than that to prevent inflation. For now, the Fed’s leadership appears to be committed to keeping rates low, thus reducing borrowing costs for businesses and consumers. Consumer spending remains sluggish, and lackluster forecasts for first-quarter corporate profits were a reminder that the economic recovery remains fragile.
The world’s leading central bankers have continued to take steps to recharge the global economy. Greece’s debt restructuring enabled a new international bailout, while an injection of liquidity from the European Central Bank lessened financial stresses across the continent and contributed to improvement in global financial markets. However, March manufacturing gauges indicated that the eurozone has entered a period of economic contraction, meaning that policy makers may need to do more to revive economic growth across the region. The Bank of England and the Bank of Japan have also increased asset-buying programs. In China, recent strong factory data eased fears that a hard landing could wreak havoc on the global economy. The country cut its annual growth target to 7.5%, as its policymakers are trying to shift the country away from investment and exports and to greater domestic consumption.
Improvement in the U.S. economy is luring investors from ultra-safe, but often low-yielding assets. Falling U.S. Treasury bond prices, for example, boosted yields from a 70-year low last fall to a recent range of around 2% for the 10-year note. After outperforming equities for much of the past decade, and drawing heavy asset flows, many analysts are cautious about certain fixed-income sectors, particularly government debt, as the economy improves and the potential grows for a rise in interest rates. Investment-grade and higher-yielding corporates, however, are expected to continue to outperform.
Likewise, commodities, which had been slumping since mid-2011 due to slowing economic activity and the European debt crisis, rebounded in early 2012 on stronger macroeconomic data, with the price of a barrel of oil surging from last October’s $77 to a peak of $113 in late February. Investors also have been shifting out of gold to assets with greater return potential; after peaking at nearly $2,000 last summer, the price per ounce has fallen back to around $1,600.
2 | THE GUGGENHEIM FUNDS ANNUAL REPORT
LETTER TO OUR SHAREHOLDERS (concluded)
The U.S. economy seems to be decoupling from slowing growth in the rest of the world and from ongoing uncertainty in the European debt crisis, as well as the domestic debate over tax and spending policy. In this resiliency, we see potential in U.S. investments, including equities, high yield bonds, bank loans and other risk assets. It appears that the U.S. may have entered a period of self-sustaining, if modest, economic expansion, driven primarily by the aggressive monetary policy of the Fed and reinforced by the ECB, and is increasingly becoming the economic locomotive of the global economy.
We look forward to continuing our service to you. Thank you for investing in our funds.
|
| Sincerely, |
|

|
| Donald C. Cacciapaglia |
| President |
| * | S&P 500® Index is a capitalization-weighted index covering 500 industrial, utility, transportation and financial companies of the U.S. markets (mostly NYSE Euronext issues). |
Performance displayed represents past performance which is no guarantee of future results. Of course, fund performance is subject to daily market volatility and may be better or worse since the end of the last quarter. For up-to-date fund performance, call us at 800.820.0888 or visit www.rydex-sgi.com.
Read each fund’s prospectus and summary prospectus (if available) carefully before investing. It contains the fund’s investment objectives, risks, charges, expenses and other information, which should be considered carefully before investing. Obtain a prospectus and summary prospectus (if available) at www.rydex-sgi.com or call 800.820.0888.
The referenced funds are distributed by Rydex Distributors, LLC (RDL). Guggenheim Investments represents the investment management business of Guggenheim Partners, LLC which includes Security Investors, LLC, the investment advisor to the referenced funds. Rydex Distributors, LLC, is affiliated with Guggenheim Partners, LLC and Security Investors, LLC.
THE GUGGENHEIM FUNDS ANNUAL REPORT | 3
ABOUT SHAREHOLDERS’ FUND EXPENSES (Unaudited)
All mutual funds have operating expenses and it is important for our shareholders to understand the impact of costs on their investments. Shareholders of a Fund incur two types of costs: (i) transaction costs, including sales charges (loads) on purchase payments, reinvested dividends, or other distributions; and exchange fees; and (ii) ongoing costs, including management fees, administrative services, and shareholder reports, among others. These ongoing costs, or operating expenses, are deducted from a fund’s gross income and reduce the investment return of the fund.
A fund’s expenses are expressed as a percentage of its average net assets, which is known as the expense ratio. The following examples are intended to help investors understand the ongoing costs (in dollars) of investing in a Fund and to compare these costs with the ongoing costs of investing in other mutual funds.
The examples are based on an investment of $1,000 made at the beginning of the period and held for the entire six-month period beginning September 30, 2011 and ending March 31, 2012.
The following tables illustrate a Fund’s costs in two ways:
Table 1. Based on actual Fund return. This section helps investors estimate the actual expenses paid over the period. The “Ending Account Value” shown is derived from the Fund’s actual return, and the fourth column shows the dollar amount that would have been paid by an investor who started with $1,000 in the Fund. Investors may use the information here, together with the amount invested, to estimate the expenses paid over the period. Simply divide the Fund’s account value by $1,000 (for example, an $8,600 account value divided by $1,000 = 8.6), then multiply the result by the number provided under the heading “Expenses Paid During Period.”
Table 2. Based on hypothetical 5% return. This section is intended to help investors compare a Fund’s cost with those of other mutual funds. The table provides information about hypothetical account values and hypothetical expenses based on the Fund’s actual expense ratio and an assumed rate of return of 5% per year before expenses, which is not the Fund’s actual return. The hypothetical account values and expenses may not be used to estimate the actual ending account balance or expenses paid during the period. The example is useful in making comparisons because the U.S. Securities and Exchange Commission (the “SEC”) requires all mutual funds to calculate expenses based on the 5% return. Investors can assess a Fund’s costs by comparing this hypothetical example with the hypothetical examples that appear in shareholder reports of other funds.
Certain retirement plans such as IRA, SEP, Roth IRA and 403(b), Rydex prototype money purchase plan and profit sharing plan accounts are charged an annual $15 maintenance fee. Upon liquidating a retirement account, a $15 account closing fee will be taken from the proceeds of the redemption.
The calculations illustrated above assume no shares were bought or sold during the period. Actual costs may have been higher or lower, depending on the amount of investment and the timing of any purchases or redemptions.
Please note that the expenses shown in the table are meant to highlight your ongoing costs only and do not reflect any transactional costs, such as sales charges (loads) on purchase payments, and contingent deferred sales charges (“CDSC”) on redemptions, if any. Therefore, the second table is useful in comparing ongoing costs only, and will not help you determine the relative total costs of owning different funds. In addition, if these transactional costs were included, your costs would have been higher.
More information about a Fund’s expenses, including annual expense ratios for the past five years, can be found in the Financial Highlights section of this report. For additional information on operating expenses and other shareholder costs, please refer to the appropriate Fund prospectus.
4 | THE GUGGENHEIM FUNDS ANNUAL REPORT
ABOUT SHAREHOLDERS’ FUND EXPENSES (Unaudited) (concluded)
| | | | | | | | | | | | | | | | | | | | |
| | | Expense
Ratio1 | | | Fund
Return | | | Beginning
Account Value
September 30, 2011 | | | Ending
Account Value
March 31, 2012 | | | Expenses
Paid During
Period2 | |
Table 1. Based on actual Fund return3 | | | | | | | | | | | | | | | | | | | | |
| | | | | |
All-Asset Conservative Strategy Fund | | | | | | | | | | | | | | | | | | | | |
A-Class | | | 0.00 | % | | | 8.44 | % | | $ | 1,000.00 | | | $ | 1,084.40 | | | $ | — | |
C-Class | | | 0.75 | % | | | 7.96 | % | | | 1,000.00 | | | | 1,079.60 | | | | 3.90 | |
H-Class | | | 0.00 | % | | | 8.43 | % | | | 1,000.00 | | | | 1,084.30 | | | | — | |
| | | | | |
All-Asset Moderate Strategy Fund | | | | | | | | | | | | | | | | | | | | |
A-Class | | | 0.00 | % | | | 12.16 | % | | | 1,000.00 | | | | 1,121.60 | | | | — | |
C-Class | | | 0.75 | % | | | 11.79 | % | | | 1,000.00 | | | | 1,117.90 | | | | 3.97 | |
H-Class | | | 0.00 | % | | | 12.26 | % | | | 1,000.00 | | | | 1,122.60 | | | | — | |
| | | | | |
All-Asset Aggressive Strategy Fund | | | | | | | | | | | | | | | | | | | | |
A-Class | | | 0.00 | % | | | 16.13 | % | | | 1,000.00 | | | | 1,161.30 | | | | — | |
C-Class | | | 0.75 | % | | | 15.80 | % | | | 1,000.00 | | | | 1,158.00 | | | | 4.05 | |
H-Class | | | 0.00 | % | | | 16.26 | % | | | 1,000.00 | | | | 1,162.60 | | | | — | |
| | | | | |
Table 2. Based on hypothetical 5% return (before expenses) | | | | | | | | | | | | | | | | | | | | |
| | | | | |
All-Asset Conservative Strategy Fund | | | | | | | | | | | | | | | | | | | | |
A-Class | | | 0.00 | % | | | 5.00 | % | | $ | 1,000.00 | | | $ | 1,025.00 | | | $ | — | |
C-Class | | | 0.75 | % | | | 5.00 | % | | | 1,000.00 | | | | 1,021.25 | | | | 3.79 | |
H-Class | | | 0.00 | % | | | 5.00 | % | | | 1,000.00 | | | | 1,025.00 | | | | — | |
| | | | | |
All-Asset Moderate Strategy Fund | | | | | | | | | | | | | | | | | | | | |
A-Class | | | 0.00 | % | | | 5.00 | % | | | 1,000.00 | | | | 1,025.00 | | | | — | |
C-Class | | | 0.75 | % | | | 5.00 | % | | | 1,000.00 | | | | 1,021.25 | | | | 3.79 | |
H-Class | | | 0.00 | % | | | 5.00 | % | | | 1,000.00 | | | | 1,025.00 | | | | — | |
| | | | | |
All-Asset Aggressive Strategy Fund | | | | | | | | | | | | | | | | | | | | |
A-Class | | | 0.00 | % | | | 5.00 | % | | | 1,000.00 | | | | 1,025.00 | | | | — | |
C-Class | | | 0.75 | % | | | 5.00 | % | | | 1,000.00 | | | | 1,021.25 | | | | 3.79 | |
H-Class | | | 0.00 | % | | | 5.00 | % | | | 1,000.00 | | | | 1,025.00 | | | | — | |
| 1 | Annualized and excludes expenses of the underlying funds in which the Funds invest. |
| 2 | Expenses are equal to the Fund’s annualized expense ratio, net of any applicable fee waivers, multiplied by the average account value over the period, multiplied by 183/366 (to reflect the one-half year period). |
| 3 | Actual cumulative return at net asset value for the period September 30, 2011 to March 31, 2012. |
THE GUGGENHEIM FUNDS ANNUAL REPORT | 5
| | |
| PERFORMANCE REPORT AND FUND PROFILE (Unaudited) | | March 31, 2012 |
ALL-ASSET CONSERVATIVE STRATEGY FUND
OBJECTIVE: To seek preservation of capital and, secondarily, long-term growth of capital.
In the past 12 months, the financial markets continued to be driven by macroeconomic forces. Among them, the European debt crisis was the most important one. It first surprised the market with more problems, yet there were few tangible solutions looming. Together with U.S. debt downgrade, it caused a massive sell-off in the summer. As speculation grew that China and international organizations might step in to help, the market was relieved. And finally, the change of leadership at the European Central Bank brought loosened monetary policy and a mechanism to reduce the liquidity problem in the European debt market, which led the equity market to rally further in the first quarter of 2012.
Market volatility, with the VIX Index* as a proxy, also had a turbulent year, with its intra-period high reaching the level seen in early 2009. In this environment, Treasuries had another great year, easily leading equity by a large margin. In this macro-driven market, correlations between risky assets were high, making diversification more challenging to achieve. Volatility made it hard to identify a trend.
Our dynamically managed tactical overlay made a positive contribution to the portfolio’s performance, but not enough to permit the portfolio to overcome the tumult in the market.
In the period, the U.S. Intermediate Bond Series, Mid Cap Growth and Large Cap Growth Funds contributed to performance, while the Managed Futures Strategy Fund, MSCI EAFE Equal Weight Fund and the Commodities Strategy Fund detracted from the portfolio’s performance.
For the one-year period ended March 31, 2012, the All-Asset Conservative Strategy Fund H-Class returned 0.71%, compared with its benchmark** (32% Russell 3000® Index, 8% MSCI EAFE Index and 60% Barclays U.S. Aggregate Bond Index), which returned 6.98%.
Derivatives in the Fund are used to provide the most efficient exposure to the components of the blended benchmark, as well as to provide liquidity.
Diversification neither assures a profit nor eliminates the risk of experiencing investment losses.
| * | The VIX Index is the ticker for the Chicago Board Options Exchange (CBOE) Volatility Index, which is designed to measure market expectations of future price volatility that is implied by S&P 500 Index option contracts. The VIX Index is a widely used measure of market risk and is often referred to as the fear gauge. |
| ** | The components of the blended benchmark are defined as follows: |
The MSCI EAFE Index (Europe, Australasia, Far East) is a free float-adjusted market capitalization index that is designed to measure the equity market performance of developed markets, excluding the US & Canada. The MSCI EAFE Index consists of the following 22 developed market country indices: Australia, Austria, Belgium, Denmark, Finland, France, Germany, Greece, Hong Kong, Ireland, Israel, Italy, Japan, the Netherlands, New Zealand, Norway, Portugal, Singapore, Spain, Sweden, Switzerland, and the United Kingdom.
The Russell 3000® Index measures the performance of the largest 3,000 U.S. companies, representing approximately 98% of the investable U.S. equity market.
The Barclays U.S. Aggregate Bond Index measures performance of the U.S. investment-grade bond market, including investment-grade U.S. government bonds, investment-grade corporate bonds, mortgage pass-through securities and asset-backed securities.
Performance displayed represents past performance which is no guarantee of future results.
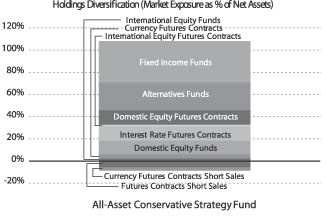
“Holdings Diversification (Market Exposure as % of Net Assets)” excludes any temporary cash investments.
| | | | |
Inception Dates: | | | |
A-Class | | | June 30, 2006 | |
C-Class | | | June 30, 2006 | |
H-Class | | | June 30, 2006 | |
| | | | |
Ten Largest Holdings (% of Total Net Assets) | | | |
Security Income Fund® – U.S. Intermediate Bond Fund1 | | | 19.0 | % |
iShares Barclays Aggregate Bond Fund | | | 13.0 | % |
RSF – U.S. Long Short Momentum Fund1 | | | 11.8 | % |
RSF – Multi-Hedge Strategies Fund1 | | | 6.5 | % |
Security Income Fund® – High Yield Fund1 | | | 6.0 | % |
Security Large Cap Value Fund1 | | | 4.7 | % |
Security Equity Fund® – Large Cap Concentrated Growth Fund1 | | | 4.7 | % |
RSF – Long Short Interest Rate Strategy Fund1 | | | 2.5 | % |
Security Equity Fund® – MSCI EAFE Equal Weight Fund1 | | | 2.2 | % |
RSF – Managed Futures Strategy Fund1 | | | 1.4 | % |
| | | | |
Top Ten Total | | | 71.8 | % |
| | | | |
“Ten Largest Holdings” exclude any temporary cash or derivative investments.
RSF – Rydex Series Funds
6 | THE GUGGENHEIM FUNDS ANNUAL REPORT
| | |
| PERFORMANCE REPORT AND FUND PROFILE (Unaudited) (concluded) | | March 31, 2012 |
ALL-ASSET CONSERVATIVE STRATEGY FUND
Average Annual Returns*
Periods Ended 03/31/12
| | | | | | | | | | | | |
| | | 1 Year | | | 5 Year | | | Since
Inception
(06/30/06) | |
A-Class Shares | | | 0.72 | % | | | 2.15 | % | | | 3.23 | % |
A-Class Shares with sales charge† | | | -4.08 | %�� | | | 1.17 | % | | | 2.36 | % |
C-Class Shares | | | -0.12 | % | | | 1.36 | % | | | 2.45 | % |
C-Class Shares with CDSC‡ | | | -1.11 | % | | | 1.36 | % | | | 2.45 | % |
H-Class Shares | | | 0.71 | % | | | 2.15 | % | | | 3.24 | % |
S&P 500 Index | | | 8.54 | % | | | 2.01 | % | | | 4.01 | % |
Synthetic All-Asset Conservative Strategy Benchmark¿ | | | 6.98 | % | | | 4.64 | % | | | 5.76 | % |
| * | The performance data above represents past performance that is not predictive of future results. The investment return and principal value of an investment in the Fund will fluctuate so that an investor’s shares, when redeemed, may be worth more or less than their original cost. Returns are historical and include changes in principal and reinvested dividends and capital gains and do not reflect the effect of taxes. The S&P 500 Index, Barclays U.S. Aggregate Bond Index, Russell 3000 Index, and the MSCI EAFE Index are unmanaged indices and, unlike the Fund, have no management fees or operating expenses to reduce their reported returns. The graphs are based on A-Class shares and H-Class shares only; performance for C-Class shares will vary due to differences in fee structures. |
| † | Fund returns are calculated using the maximum sales charge of 4.75%. |
| ‡ | Fund returns include a contingent deferred sales charge (“CDSC”) of 1% if redeemed within 12 months of purchase. |
| ¿ | Benchmark reflects 32% Russell 3000® Index, 8% MSCI EAFE Index®, and 60% Barclays U.S. Aggregate Bond Index. |
THE GUGGENHEIM FUNDS ANNUAL REPORT | 7
| | |
| SCHEDULE OF INVESTMENTS | | March 31, 2012 |
ALL-ASSET CONSERVATIVE STRATEGY FUND
| | | | | | | | |
| | | SHARES | | | VALUE | |
EXCHANGE TRADED FUND† - 13.0% | | | | | | | | |
iShares Barclays Aggregate Bond Fund | | | 17,458 | | | $ | 1,917,761 | |
| | | | | | | | |
Total Exchange Traded Fund
(Cost $1,911,030) | | | | | | | 1,917,761 | |
| | | | | | | | |
MUTUAL FUNDS†,1 - 64.8% | | | | | | | | |
Alternatives Funds - 25.3% | | | | | | | | |
RSF - U.S. Long Short Momentum Fund* | | | 131,458 | | | | 1,745,770 | |
RSF - Multi-Hedge Strategies Fund | | | 42,871 | | | | 961,157 | |
RSF - Long Short Interest Rate Strategy Fund | | | 15,550 | | | | 370,718 | |
RSF - Managed Futures Strategy Fund* | | | 9,294 | | | | 213,102 | |
RSF - Long/Short Commodities Strategy Fund | | | 6,111 | | | | 160,838 | |
RSF - Long Short Equity Strategy Fund | | | 5,527 | | | | 147,684 | |
RSF - Event Driven and Distressed Strategies Fund | | | 5,817 | | | | 147,574 | |
| | | | | | | | |
Total Alternatives Funds | | | | | | | 3,746,843 | |
| | | | | | | | |
Fixed Income Funds - 25.1% | | | | | | | | |
Security Income Fund® - U.S. Intermediate Bond Fund | | | 160,219 | | | | 2,810,243 | |
Security Income Fund® - High Yield Fund | | | 77,046 | | | | 894,499 | |
| | | | | | | | |
Total Fixed Income Funds | | | | | | | 3,704,742 | |
| | | | | | | | |
Domestic Equity Funds - 12.2% | | | | | | | | |
Security Large Cap Value Fund | | | 22,593 | | | | 698,817 | |
Security Equity Fund® - Large Cap Concentrated Growth Fund* | | | 73,856 | | | | 698,677 | |
Security Mid Cap Growth Fund* | | | 4,840 | | | | 177,733 | |
Security Equity Fund® - Mid Cap Value Fund | | | 5,312 | | | | 176,794 | |
Security Equity Fund® - Small Cap Value Fund | | | 1,965 | | | | 29,980 | |
Security Equity Fund® - Small Cap Growth Fund* | | | 1,883 | | | | 29,674 | |
| | | | | | | | |
Total Domestic Equity Funds | | | | | | | 1,811,675 | |
| | | | | | | | |
International Equity Funds - 2.2% | | | | | | | | |
Security Equity Fund® - MSCI EAFE | | | | | | | | |
Equal Weight Fund | | | 29,780 | | | | 326,388 | |
| | | | | | | | |
Total Mutual Funds
(Cost $8,339,763) | | | | | | | 9,589,648 | |
| | | | | | | | |
| | |
| | | FACE
AMOUNT | | | | |
REPURCHASE AGREEMENT††,2 - 20.9% | | | | | | | | |
Credit Suisse Group
issued 03/30/12 at 0.01%
due 04/02/12 | | $ | 3,083,720 | | | | 3,083,720 | |
| | | | | | | | |
| | | | | | | | |
Total Repurchase Agreement
(Cost $3,083,720) | | | | | | | 3,083,720 | |
| | | | | | | | |
Total Investments - 98.7%
(Cost $13,334,513) | | | | | | $ | 14,591,129 | |
| | | | | | | | |
Other Assets & Liabilities, net - 1.3% | | | | | | | 198,290 | |
| | | | | | | | |
Total Net Assets - 100.0% | | | | | | $ | 14,789,419 | |
| | | | | | | | |
| | | CONTRACTS | | | UNREALIZED
GAIN (LOSS) | |
FUTURES CONTRACTS PURCHASED† | | | | | | | | |
June 2012 S&P 500 Index Mini Futures Contracts
(Aggregate Value of Contracts $1,261,800) | | | 18 | | | $ | 43,468 | |
June 2012 MSCI Emerging Markets Index Mini Futures Contracts
(Aggregate Value of Contracts $693,225) | | | 9 | | | | 5,022 | |
June 2012 Nikkei-225 Stock Average Index Futures Contracts
(Aggregate Value of Contracts $50,975) | | | 1 | | | | 3,472 | |
June 2012 S&P/Toronto Stock Exchange 60 Index Futures Contracts
(Aggregate Value of Contracts $141,381) | | | 1 | | | | 2,233 | |
| | | | | | | | |
(Total Aggregate Value of Contracts $2,147,381) | | | | | | $ | 54,195 | |
| | | | | | | | |
CURRENCY FUTURES CONTRACTS PURCHASED† | | | | | | | | |
June 2012 British Pound Futures Contracts
(Aggregate Value of Contracts $99,913) | | | 1 | | | $ | 2,010 | |
June 2012 Japanese Yen Futures Contracts
(Aggregate Value of Contracts $151,100) | | | 1 | | | | 160 | |
June 2012 Canadian Dollar Futures Contracts
(Aggregate Value of Contracts $200,180) | | | 2 | | | | (1,165 | ) |
June 2012 Mexican Peso Futures Contracts
(Aggregate Value of Contracts $116,400) | | | 3 | | | | (1,283 | ) |
| | | | | | | | |
(Total Aggregate Value of Contracts $567,593) | | | | | | $ | (278 | ) |
| | | | | | | | |
INTEREST RATE FUTURES CONTRACTS PURCHASED† | | | | | | | | |
June 2012 U.S. Treasury 5 Year Note Futures Contracts
(Aggregate Value of Contracts $1,960,000) | | | 16 | | | $ | (8,771 | ) |
| | | | | | | | |
FUTURES CONTRACTS SOLD SHORT† | | | | | | | | |
April 2012 CAC 40 Euro Futures Contracts
(Aggregate Value of Contracts $136,926) | | | 3 | | | $ | 2,833 | |
June 2012 FTSE 100 Index Futures Contracts
(Aggregate Value of Contracts $91,554) | | | 1 | | | | 1,176 | |
June 2012 SPI 200 Index Futures Contracts
(Aggregate Value of Contracts $112,331) | | | 1 | | | | (676 | ) |
June 2012 DAX Index Futures Contracts
(Aggregate Value of Contracts $232,244) | | | 1 | | | | (2,601 | ) |
June 2012 Russell 2000 Index Mini Futures Contracts
(Aggregate Value of Contracts $165,400) | | | 2 | | | | (7,164 | ) |
| | | | | | | | |
(Total Aggregate Value of Contracts $738,455) | | | | | | $ | (6,432 | ) |
| | | | | | | | |
CURRENCY FUTURES CONTRACTS SOLD SHORT† | | | | | | | | |
June 2012 Swiss Franc Futures Contracts
(Aggregate Value of Contracts $138,613) | | | 1 | | | $ | (4,128 | ) |
June 2012 Euro Futures Contracts
(Aggregate Value of Contracts $333,550) | | | 2 | | | | (4,658 | ) |
| | | | | | | | |
(Total Aggregate Value of Contracts $472,163) | | | | | | $ | (8,786 | ) |
| | | | | | | | |
| * | Non-income producing security. |
| † | Value determined based on Level 1 inputs — See Note 4. |
| †† | Value determined based on Level 2 inputs — See Note 4. |
| 1 | A-Class shares of affiliated funds. |
| 2 | Repurchase Agreement — See Note 5. |
RSF — Rydex Series Funds
| | |
| 8 | THE GUGGENHEIM FUNDS ANNUAL REPORT | | SEE NOTES TO FINANCIAL STATEMENTS. |
| | |
| ALL-ASSET CONSERVATIVE STRATEGY FUND | | |
STATEMENT OF ASSETS AND LIABILITIES
March 31, 2012
| | | | |
ASSETS: | | | | |
Investments in unaffiliated issuers, at value
(cost $1,911,030) | | $ | 1,917,761 | |
Investments in affiliated issuers, at value
(cost $8,339,763) | | | 9,589,648 | |
Repurchase agreements, at value
(cost $3,083,720) | | | 3,083,720 | |
| | | | |
Total investments
(cost $13,334,513) | | | 14,591,129 | |
Foreign currency, at value
(cost $779) | | | 495 | |
Segregated cash with broker | | | 217,890 | |
Cash | | | 149,443 | |
Receivables: | | | | |
Dividends | | | 10,022 | |
Variation margin | | | 2,975 | |
Fund shares sold | | | 1,708 | |
| | | | |
Total assets | | | 14,973,662 | |
| | | | |
LIABILITIES: | | | | |
Payable for: | | | | |
Fund shares redeemed | | | 19,772 | |
Securities purchased | | | 160,021 | |
Distribution and service fees | | | 4,450 | |
| | | | |
Total liabilities | | | 184,243 | |
| | | | |
NET ASSETS | | $ | 14,789,419 | |
| | | | |
NET ASSETS CONSISTOF: | | | | |
Paid in capital | | $ | 14,941,789 | |
Undistributed net investment income | | | 146,978 | |
Accumulated net realized loss on investments | | | (1,585,608 | ) |
Net unrealized appreciation on investments | | | 1,286,260 | |
| | | | |
Net assets | | $ | 14,789,419 | |
| | | | |
A-CLASS: | | | | |
Net assets | | $ | 3,212,451 | |
Capital shares outstanding | | | 299,163 | |
Net asset value per share | | $ | 10.74 | |
| | | | |
Maximum offering price per share
(Net asset value divided by 95.25%) | | $ | 11.28 | |
| | | | |
C-CLASS: | | | | |
Net assets | | $ | 6,941,138 | |
Capital shares outstanding | | | 676,469 | |
Net asset value per share | | $ | 10.26 | |
| | | | |
H-CLASS: | | | | |
Net assets | | $ | 4,635,830 | |
Capital shares outstanding | | | 431,421 | |
Net asset value per share | | $ | 10.75 | |
| | | | |
STATEMENT OF OPERATIONS
Year Ended March 31, 2012
| | | | |
INVESTMENT INCOME: | | | | |
Dividends from securities of affiliated issuers | | $ | 174,904 | |
Dividends from securities of unaffiliated issuers | | | 19,194 | |
Interest | | | 694 | |
| | | | |
Total investment income | | | 194,792 | |
| | | | |
EXPENSES: | | | | |
Distribution and service fees: | | | | |
C-Class | | | 57,650 | |
Custodian fees | | | 35 | |
| | | | |
Total expenses | | | 57,685 | |
| | | | |
Net investment income | | | 137,107 | |
| | | | |
NET REALIZEDAND UNREALIZED GAIN (LOSS): | | | | |
Net realized gain (loss) on: | | | | |
Investments in unaffiliated issuers | | | 210 | |
Investments in affiliated issuers | | | 90,752 | |
Futures contracts | | | 59,973 | |
Foreign currency | | | (419 | ) |
Realized gain distributions received from affiliated issuers | | | 35,391 | |
Realized gain distributions received from unaffiliated issuers | | | 2,042 | |
| | | | |
Net realized gain | | | 187,949 | |
| | | | |
Net change in unrealized appreciation (depreciation) on: | | | | |
Investments in unaffiliated issuers | | | 6,731 | |
Investments in affiliated issuers | | | (328,470 | ) |
Futures contracts | | | 20,487 | |
Foreign currency | | | (284 | ) |
| | | | |
Net change in unrealized appreciation (depreciation) | | | (301,536 | ) |
| | | | |
Net realized and unrealized loss | | | (113,587 | ) |
| | | | |
Net increase in net assets resulting from operations | | $ | 23,520 | |
| | | | |
| | |
| SEE NOTES TO FINANCIAL STATEMENTS. | | THE GUGGENHEIM FUNDS ANNUAL REPORT | 9 |
| | |
| ALL-ASSET CONSERVATIVE STRATEGY FUND | | |
STATEMENTS OF CHANGES IN NET ASSETS
| | | | | | | | |
| | | Year Ended
March 31,
2012 | | | Year Ended
March 31,
2011 | |
INCREASE (DECREASE)IN NET ASSETSFROM OPERATIONS: | | | | | | | | |
Net investment income | | $ | 137,107 | | | $ | 144,331 | |
Net realized gain on investments | | | 187,949 | | | | 743,525 | |
Net change in unrealized appreciation (depreciation) on investments | | | (301,536 | ) | | | 179,072 | |
| | | | | | | | |
Net increase in net assets resulting from operations | | | 23,520 | | | | 1,066,928 | |
| | | | | | | | |
DISTRIBUTIONSTO SHAREHOLDERSFROM: | | | | | | | | |
Net investment income | | | | | | | | |
A-Class | | | (43,707 | ) | | | (17,209 | )a |
C-Class | | | (97,577 | )�� | | | (62,122 | )a |
H-Class | | | (40,701 | ) | | | (18,378 | )a |
Net realized gains | | | | | | | | |
A-Class | | | — | | | | (6,632 | )a |
C-Class | | | — | | | | (23,940 | )a |
H-Class | | | — | | | | (7,082 | )a |
| | | | | | | | |
Total distributions to shareholders | | | (181,985 | ) | | | (135,363 | ) |
| | | | | | | | |
CAPITAL SHARE TRANSACTIONS: | | | | | | | | |
Proceeds from sale of shares | | | | | | | | |
A-Class | | | 9,397,815 | | | | 1,312,584 | |
C-Class | | | 1,754,348 | | | | 3,358,472 | |
H-Class | | | 3,738,975 | | | | 1,148,814 | |
Redemption fees collected | | | | | | | | |
A-Class | | | — | | | | 297 | |
C-Class | | | — | | | | 1,002 | |
H-Class | | | — | | | | 420 | |
Distributions reinvested | | | | | | | | |
A-Class | | | 36,459 | | | | 21,774 | |
C-Class | | | 88,690 | | | | 80,877 | |
H-Class | | | 35,178 | | | | 23,579 | |
Cost of shares redeemed | | | | | | | | |
A-Class | | | (9,129,139 | ) | | | (1,409,993 | ) |
C-Class | | | (3,446,312 | ) | | | (4,789,006 | ) |
H-Class | | | (1,694,933 | ) | | | (3,460,152 | ) |
| | | | | | | | |
Net increase (decrease) from capital share transactions | | | 781,081 | | | | (3,711,332 | ) |
| | | | | | | | |
Net increase (decrease) in net assets | | | 622,616 | | | | (2,779,767 | ) |
NET ASSETS: | | | | | | | | |
Beginning of year | | | 14,166,803 | | | | 16,946,570 | |
| | | | | | | | |
End of year | | $ | 14,789,419 | | | $ | 14,166,803 | |
| | | | | | | | |
Undistributed net investment income at end of year | | $ | 146,978 | | | $ | 181,984 | |
| | | | | | | | |
CAPITAL SHARE ACTIVITY: | | | | | | | | |
Shares sold | | | | | | | | |
A-Class | | | 886,084 | | | | 126,661 | |
C-Class | | | 175,048 | | | | 340,674 | |
H-Class | | | 352,100 | | | | 110,639 | |
Shares issued from reinvestment of distributions | | | | | | | | |
A-Class | | | 3,599 | | | | 2,066 | |
C-Class | | | 9,143 | | | | 7,952 | |
H-Class | | | 3,469 | | | | 2,235 | |
Shares redeemed | | | | | | | | |
A-Class | | | (860,201 | ) | | | (136,437 | ) |
C-Class | | | (341,306 | ) | | | (479,619 | ) |
H-Class | | | (161,461 | ) | | | (336,679 | ) |
| | | | | | | | |
Net increase (decrease) in shares | | | 66,475 | | | | (362,508 | ) |
| | | | | | | | |
| a | For financial reporting purposes, certain distributions from net investment income for federal tax purposes have been reclassified to distributions from realized gains. |
| | |
| 10 | THE GUGGENHEIM FUNDS ANNUAL REPORT | | SEE NOTES TO FINANCIAL STATEMENTS. |
ALL-ASSET CONSERVATIVE STRATEGY FUND
FINANCIAL HIGHLIGHTS
This table is presented to show selected data for a share outstanding throughout each period and to assist shareholders in evaluating a Fund’s performance for the periods presented.
| | | | | | | | | | | | | | | | | | | | |
A-Class | | Year Ended
March 31,
2012 | | | Year Ended
March 31,
2011 | | | Year Ended
March 31,
2010 | | | Year Ended
March 31,
2009 | | | Year Ended
March 31,
2008 | |
Per Share Data | | | | | | | | | | | | | | | | | | | | |
Net asset value, beginning of period | | $ | 10.81 | | | $ | 10.11 | | | $ | 8.64 | | | $ | 10.74 | | | $ | 10.70 | |
| | | | | | | | | | | | | | | | | | | | |
Income (loss) from investment operations: | | | | | | | | | | | | | | | | | | | | |
Net investment incomea | | | .15 | | | | .14 | | | | .12 | | | | .28 | | | | .26 | |
Net gain (loss) on investments (realized and unrealized) | | | (.08 | ) | | | .65 | | | | 1.52 | | | | (2.08 | ) | | | .12 | |
| | | | | | | | | | | | | | | | | | | | |
Total from investment operations | | | .07 | | | | .79 | | | | 1.64 | | | | (1.80 | ) | | | .38 | |
| | | | | | | | | | | | | | | | | | | | |
Less distributions from: | | | | | | | | | | | | | | | | | | | | |
Net investment income | | | (.14 | ) | | | (.07 | )e | | | (.16 | )e | | | (.14 | )e | | | (.22 | )e |
Net realized gains | | | — | | | | (.02 | )e | | | (.01 | )e | | | (.16 | )e | | | (.14 | )e |
| | | | | | | | | | | | | | | | | | | | |
Total distributions | | | (.14 | ) | | | (.09 | ) | | | (.17 | ) | | | (.30 | ) | | | (.36 | ) |
| | | | | | | | | | | | | | | | | | | | |
Redemption fees collected | | | — | | | | — | b | | | — | b | | | — | b | | | .02 | |
| | | | | | | | | | | | | | | | | | | | |
Net asset value, end of period | | $ | 10.74 | | | $ | 10.81 | | | $ | 10.11 | | | $ | 8.64 | | | $ | 10.74 | |
| | | | | | | | | | | | | | | | | | | | |
Total Returnc | | | 0.72 | % | | | 7.86 | % | | | 19.02 | % | | | (17.05 | %) | | | 3.70 | % |
| | | | | | | | | | | | | | | | | | | | |
Ratios/Supplemental Data | | | | | | | | | | | | | | | | | | | | |
Net assets, end of period (in thousands) | | $ | 3,212 | | | $ | 2,915 | | | $ | 2,805 | | | $ | 2,274 | | | $ | 4,431 | |
| | | | | | | | | | | | | | | | | | | | |
Ratios to average net assets: | | | | | | | | | | | | | | | | | | | | |
Net investment income | | | 1.41 | % | | | 1.39 | % | | | 1.27 | % | | | 2.84 | % | | | 2.39 | % |
Total expensesd | | | — | | | | — | | | | — | | | | — | | | | 0.01 | % |
| | | | | | | | | | | | | | | | | | | | |
Portfolio turnover rate | | | 134 | % | | | 112 | % | | | 174 | % | | | 230 | % | | | 119 | % |
| | | | | |
C-Class | | Year Ended
March 31,
2012 | | | Year Ended
March 31,
2011 | | | Year Ended
March 31,
2010 | | | Year Ended
March 31,
2009 | | | Year Ended
March 31,
2008 | |
Per Share Data | | | | | | | | | | | | | | | | | | | | |
Net asset value, beginning of period | | $ | 10.42 | | | $ | 9.82 | | | $ | 8.46 | | | $ | 10.60 | | | $ | 10.65 | |
| | | | | | | | | | | | | | | | | | | | |
Income (loss) from investment operations: | | | | | | | | | | | | | | | | | | | | |
Net investment incomea | | | .07 | | | | .07 | | | | .05 | | | | .28 | | | | .17 | |
Net gain (loss) on investments (realized and unrealized) | | | (.09 | ) | | | .62 | | | | 1.48 | | | | (2.12 | ) | | | .12 | |
| | | | | | | | | | | | | | | | | | | | |
Total from investment operations | | | (.02 | ) | | | .69 | | | | 1.53 | | | | (1.84 | ) | | | .29 | |
| | | | | | | | | | | | | | | | | | | | |
Less distributions from: | | | | | | | | | | | | | | | | | | | | |
Net investment income | | | (.14 | ) | | | (.07 | )e | | | (.16 | )e | | | (.14 | )e | | | (.22 | )e |
Net realized gains | | | — | | | | (.02 | )e | | | (.01 | )e | | | (.16 | )e | | | (.14 | )e |
| | | | | | | | | | | | | | | | | | | | |
Total distributions | | | (.14 | ) | | | (.09 | ) | | | (.17 | ) | | | (.30 | ) | | | (.36 | ) |
| | | | | | | | | | | | | | | | | | | | |
Redemption fees collected | | | — | | | | — | b | | | — | b | | | — | b | | | .02 | |
| | | | | | | | | | | | | | | | | | | | |
Net asset value, end of period | | $ | 10.26 | | | $ | 10.42 | | | $ | 9.82 | | | $ | 8.46 | | | $ | 10.60 | |
| | | | | | | | | | | | | | | | | | | | |
Total Returnc | | | (0.12 | %) | | | 7.07 | % | | | 18.12 | % | | | (17.65 | %) | | | 2.86 | % |
| | | | | | | | | | | | | | | | | | | | |
Ratios/Supplemental Data | | | | | | | | | | | | | | | | | | | | |
Net assets, end of period (in thousands) | | $ | 6,941 | | | $ | 8,683 | | | $ | 9,474 | | | $ | 5,107 | | | $ | 5,074 | |
| | | | | | | | | | | | | | | | | | | | |
Ratios to average net assets: | | | | | | | | | | | | | | | | | | | | |
Net investment income | | | 0.65 | % | | | 0.66 | % | | | 0.58 | % | | | 2.87 | % | | | 1.53 | % |
Total expensesd | | | 0.75 | % | | | 0.75 | % | | | 0.75 | % | | | 0.75 | % | | | 0.75 | % |
| | | | | | | | | | | | | | | | | | | | |
Portfolio turnover rate | | | 134 | % | | | 112 | % | | | 174 | % | | | 230 | % | | | 119 | % |
| | |
| SEE NOTES TO FINANCIAL STATEMENTS. | | THE GUGGENHEIM FUNDS ANNUAL REPORT | 11 |
ALL-ASSET CONSERVATIVE STRATEGY FUND
FINANCIAL HIGHLIGHTS (concluded)
This table is presented to show selected data for a share outstanding throughout each period and to assist shareholders in evaluating a Fund’s performance for the periods presented.
| | | | | | | | | | | | | | | | | | | | |
H-Class | | Year Ended
March 31,
2012 | | | Year Ended
March 31,
2011 | | | Year Ended
March 31,
2010 | | | Year Ended
March 31,
2009 | | | Year Ended
March 31,
2008 | |
Per Share Data | | | | | | | | | | | | | | | | | | | | |
Net asset value, beginning of period | | $ | 10.82 | | | $ | 10.12 | | | $ | 8.65 | | | $ | 10.75 | | | $ | 10.71 | |
| | | | | | | | | | | | | | | | | | | | |
Income (loss) from investment operations: | | | | | | | | | | | | | | | | | | | | |
Net investment incomea | | | .15 | | | | .14 | | | | .12 | | | | .31 | | | | .25 | |
Net gain (loss) on investments (realized and unrealized) | | | (.08 | ) | | | .65 | | | | 1.52 | | | | (2.11 | ) | | | .13 | |
| | | | | | | | | | | | | | | | | | | | |
Total from investment operations | | | .07 | | | | .79 | | | | 1.64 | | | | (1.80 | ) | | | .38 | |
| | | | | | | | | | | | | | | | | | | | |
Less distributions from: | | | | | | | | | | | | | | | | | | | | |
Net investment income | | | (.14 | ) | | | (.07 | )e | | | (.16 | )e | | | (.14 | )e | | | (.22 | )e |
Net realized gains | | | — | | | | (.02 | )e | | | (.01 | )e | | | (.16 | )e | | | (.14 | )e |
| | | | | | | | | | | | | | | | | | | | |
Total distributions | | | (.14 | ) | | | (.09 | ) | | | (.17 | ) | | | (.30 | ) | | | (.36 | ) |
| | | | | | | | | | | | | | | | | | | | |
Redemption fees collected | | | — | | | | — | b | | | — | b | | | — | b | | | .02 | |
| | | | | | | | | | | | | | | | | | | | |
Net asset value, end of period | | $ | 10.75 | | | $ | 10.82 | | | $ | 10.12 | | | $ | 8.65 | | | $ | 10.75 | |
| | | | | | | | | | | | | | | | | | | | |
Total Returnc | | | 0.71 | % | | | 7.85 | % | | | 19.00 | % | | | (17.03 | %) | | | 3.69 | % |
| | | | | | | | | | | | | | | | | | | | |
Ratios/Supplemental Data | | | | | | | | | | | | | | | | | | | | |
Net assets, end of period (in thousands) | | $ | 4,636 | | | $ | 2,568 | | | $ | 4,667 | | | $ | 3,022 | | | $ | 7,014 | |
| | | | | | | | | | | | | | | | | | | | |
Ratios to average net assets: | | | | | | | | | | | | | | | | | | | | |
Net investment income | | | 1.46 | % | | | 1.33 | % | | | 1.28 | % | | | 3.14 | % | | | 2.28 | % |
Total expensesd | | | — | | | | — | | | | — | | | | — | | | | 0.01 | % |
| | | | | | | | | | | | | | | | | | | | |
Portfolio turnover rate | | | 134 | % | | | 112 | % | | | 174 | % | | | 230 | % | | | 119 | % |
| a | Net investment income per share was computed using average shares outstanding throughout the period. |
| b | Redemption fees collected are less than $0.01 per share. |
| c | Total return does not reflect the impact of any applicable sales charges and has not been annualized. |
| d | Does not include expenses of the underlying funds in which the Fund invests. |
| e | For financial reporting purposes, certain distributions from net investment income for federal tax purposes have been reclassified to distributions from realized gains. |
| | |
| 12 | THE GUGGENHEIM FUNDS ANNUAL REPORT | | SEE NOTES TO FINANCIAL STATEMENTS. |
This page intentionally left blank.
THE GUGGENHEIM FUNDS ANNUAL REPORT | 13
| | | | |
| PERFORMANCE REPORT AND FUND PROFILE ( Unaudited) | | | March 31, 2012 | |
ALL-ASSET MODERATE STRATEGY FUND
OBJECTIVE: To seek growth of capital and, secondarily, preservation of capital.
In the past 12 months, the financial markets continued to be driven by macroeconomic forces. Among them, the European debt crisis was the most important one. It first surprised the market with more problems, yet there were few tangible solutions looming. Together with U.S. debt downgrade, it caused a massive sell-off in the summer. As speculation grew that China and international organizations might step in to help, the market was relieved. And finally, the change of leadership at the European Central Bank brought loosened monetary policy and a mechanism to reduce the liquidity problem in the European debt market, which led the equity market to rally further in the first quarter of 2012.
Market volatility, with the VIX Index* as a proxy, also had a turbulent year, with its intra-period high reaching the level seen in early 2009. In this environment, Treasuries had another great year, easily leading equity by a large margin. In this macro-driven market, correlations between risky assets were high, making diversification more challenging to achieve. Volatility made it hard to identify a trend.
Our dynamically managed tactical overlay made a positive contribution to the portfolio’s performance, but not enough to permit the portfolio to overcome the tumult in the market.
In the period, the U.S. Intermediate Bond Series, Mid Cap Growth and Large Cap Growth Funds contributed to performance, while the Managed Futures Strategy Fund, MSCI EAFE Equal Weight Fund and the Commodities Strategy Fund detracted from the portfolio’s performance.
For the one-year period ended March 31, 2012, the All-Asset Moderate Strategy Fund H-Class returned 1.13%, compared with its benchmark** (48% Russell 3000® Index, 12% MSCI EAFE Index and 40% Barclays U.S. Aggregate Bond Index), which returned 6.40%.
Derivatives in the Fund are used to provide the most efficient exposure to the components of the blended benchmark, as well as to provide liquidity.
Diversification neither assures a profit nor eliminates the risk of experiencing investment losses.
| * | The VIX Index is the ticker for the Chicago Board Options Exchange (CBOE) Volatility Index, which is designed to measure market expectations of future price volatility that is implied by S&P 500 Index option contracts. The VIX Index is a widely used measure of market risk and is often referred to as the fear gauge. |
| ** | The components of the blended benchmark are defined as follows: |
The MSCI EAFE Index (Europe, Australasia, Far East) is a free float-adjusted market capitalization index that is designed to measure the equity market performance of developed markets, excluding the US & Canada. The MSCI EAFE Index consists of the following 22 developed market country indices: Australia, Austria, Belgium, Denmark, Finland, France, Germany, Greece, Hong Kong, Ireland, Israel, Italy, Japan, the Netherlands, New Zealand, Norway, Portugal, Singapore, Spain, Sweden, Switzerland, and the United Kingdom.
The Russell 3000® Index measures the performance of the largest 3,000 U.S. companies, representing approximately 98% of the investable U.S. equity market.
The Barclays U.S. Aggregate Bond Index measures performance of the U.S. investment-grade bond market, including investment-grade U.S. government bonds, investment-grade corporate bonds, mortgage pass-through securities and asset-backed securities.
Performance displayed represents past performance which is no guarantee of future results.
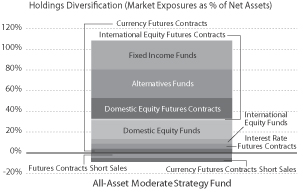
“Holdings Diversification (Market Exposure as % of Net Assets)” excludes any temporary cash investments.
| | | | |
Inception Dates: | | | |
A-Class | | | June 30, 2006 | |
C-Class | | | June 30, 2006 | |
H-Class | | | June 30, 2006 | |
| | | | |
Ten Largest Holdings (% of Total Net Assets) | | | |
Security Income Fund® - U.S. Intermediate Bond Fund1 | | | 18.8 | % |
RSF – U.S. Long Short Momentum Fund1 | | | 16.1 | % |
iShares Barclays Aggregate Bond Fund | | | 10.2 | % |
Security Equity Fund® – Large Cap Concentrated Growth Fund1 | | | 7.1 | % |
Security Large Cap Value Fund1 | | | 7.0 | % |
RSF – Multi-Hedge Strategies Fund1 | | | 5.4 | % |
Security Equity Fund® – MSCI EAFE Equal Weight Fund1 | | | 5.1 | % |
RSF – Long Short Interest Rate Strategy Fund1 | | | 3.0 | % |
Security Mid Cap Growth Fund1 | | | 2.0 | % |
Security Equity Fund® – Mid Cap Value Fund1 | | | 2.0 | % |
| | | | |
Top Ten Total | | | 76.7 | % |
| | | | |
“Ten Largest Holdings” exclude any temporary cash or derivative investments.
RFS – Rydex Series Funds
14 | THE GUGGENHEIM FUNDS ANNUAL REPORT
| | | | |
PERFORMANCE REPORT AND FUND PROFILE (Unaudited) (concluded) | | | March 31, 2012 | |
ALL-ASSET MODERATE STRATEGY FUND
Average Annual Returns*
Periods Ended 03/31/12
| | | | | | | | | | | | |
| | | 1 Year | | | 5 Year | | | Since
Inception
(06/30/06) | |
A-Class Shares | | | 1.04 | % | | | 1.87 | % | | | 3.30 | % |
A-Class Shares with sales charge† | | | -3.74 | % | | | 0.87 | % | | | 2.43 | % |
C-Class Shares | | | 0.30 | % | | | 1.13 | % | | | 2.55 | % |
C-Class Shares with CDSC‡ | | | -0.69 | % | | | 1.13 | % | | | 2.55 | % |
H-Class Shares | | | 1.13 | % | | | 1.89 | % | | | 3.32 | % |
S&P 500 Index | | | 8.54 | % | | | 2.01 | % | | | 4.01 | % |
Synthetic All-Asset Moderate Strategy Benchmark¿ | | | 6.40 | % | | | 3.68 | % | | | 5.08 | % |
| * | The performance data above represents past performance that is not predictive of future results. The investment return and principal value of an investment in the Fund will fluctuate so that an investor’s shares, when redeemed, may be worth more or less than their original cost. Returns are historical and include changes in principal and reinvested dividends and capital gains and do not reflect the effect of taxes. The S&P 500 Index, Barclays U.S. Aggregate Bond Index, Russell 3000® Index, and the MSCI EAFE Index® are unmanaged indices and, unlike the Fund, have no management fees or operating expenses to reduce their reported returns. The graphs are based on A-Class shares and H-Class shares only; performance for C-Class shares will vary due to differences in fee structures. |
| † | Fund returns are calculated using the maximum sales charge of 4.75% . |
| ‡ | Fund returns include a CDSC of 1% if redeemed within 12 months of purchase. |
| ¿ | Benchmark reflects 48% Russell 3000® Index, 12% MSCI EAFE Index®, and 40% Barclays U.S. Aggregate Bond Index. |
THE GUGGENHEIM FUNDS ANNUAL REPORT | 15
| | |
| SCHEDULE OF INVESTMENTS | | March 31, 2012 |
ALL-ASSET MODERATE STRATEGY FUND
| | | | | | | | |
| | | SHARES | | | VALUE | |
EXCHANGE TRADED FUND† - 10.2% | | | | | | | | |
iShares Barclays Aggregate Bond Fund | | | 22,480 | | | $ | 2,469,428 | |
| | | | | | | | |
Total Exchange Traded Fund
(Cost $2,461,061) | | | | | | | 2,469,428 | |
| | | | | | | | |
MUTUAL FUNDS†,1 - 72.9% | | | | | | | | |
Alternatives Funds - 29.1% | | | | | | | | |
RSF - U.S. Long Short Momentum Fund* | | | 294,570 | | | | 3,911,883 | |
RSF - Multi-Hedge Strategies Fund | | | 58,002 | | | | 1,300,411 | |
RSF - Long Short Interest Rate Strategy Fund | | | 30,796 | | | | 734,172 | |
RSF - Long/Short Commodities Strategy Fund | | | 13,972 | | | | 367,734 | |
RSF - Managed Futures Strategy Fund* | | | 13,081 | | | | 299,946 | |
RSF - Long Short Equity Strategy Fund | | | 9,061 | | | | 242,122 | |
RSF - Event Driven and Distressed Strategies Fund | | | 9,460 | | | | 239,989 | |
| | | | | | | | |
Total Alternatives Funds | | | | | | | 7,096,257 | |
| | | | | | | | |
Fixed Income Funds - 19.6% | | | | | | | | |
Security Income Fund® - U.S. Intermediate Bond Fund | | | 260,906 | | | | 4,576,284 | |
Security Income Fund® - High Yield Fund | | | 17,017 | | | | 197,563 | |
| | | | | | | | |
Total Fixed Income Funds | | | | | | | 4,773,847 | |
| | | | | | | | |
Domestic Equity Funds - 19.1% | | | | | | | | |
Security Equity Fund® - Large Cap Concentrated Growth Fund* | | | 182,589 | | | | 1,727,292 | |
Security Large Cap Value Fund | | | 55,229 | | | | 1,708,231 | |
Security Mid Cap Growth Fund* | | | 13,029 | | | | 478,421 | |
Security Equity Fund® - Mid Cap Value Fund | | | 14,285 | | | | 475,402 | |
Security Equity Fund® - Small Cap Value Fund | | | 8,138 | | | | 124,187 | |
Security Equity Fund® - Small Cap Growth Fund* | | | 7,740 | | | | 121,985 | |
| | | | | | | | |
Total Domestic Equity Funds | | | | | | | 4,635,518 | |
| | | | | | | | |
International Equity Funds - 5.1% | | | | | | | | |
Security Equity Fund® - MSCI EAFE Equal Weight Fund | | | 113,514 | | | | 1,244,111 | |
| | | | | | | | |
Total Mutual Funds
(Cost $14,694,187) | | | | | | | 17,749,733 | |
| | | | | | | | |
| | |
| | | FACE
AMOUNT | | | | |
REPURCHASE AGREEMENT†† ,2 - 14.9% | | | | | | | | |
Credit Suisse Group issued 03/30/12 at 0.01% due 04/02/12 | | $ | 3,624,507 | | | | 3,624,507 | |
| | | | | | | | |
Total Repurchase Agreement
(Cost $3,624,507) | | | | | | | 3,624,507 | |
| | | | | | | | |
Total Investments - 98.0%
(Cost $20,779,755) | | | | | | $ | 23,843,668 | |
| | | | | | | | |
Other Assets & Liabilities, net - 2.0% | | | | | | | 481,541 | |
| | | | | | | | |
Total Net Assets - 100.0% | | | | | | $ | 24,325,209 | |
| | | | | | | | |
| | | CONTRACTS | | | UNREALIZED
GAIN (LOSS) | |
FUTURES CONTRACTS PURCHASED† | | | | | | | | |
June 2012 S&P 500 Index Mini Futures Contracts
(Aggregate Value of Contracts $3,925,600) | | | 56 | | | $ | 145,356 | |
June 2012 MSCI Emerging Markets Index Mini Futures Contracts
(Aggregate Value of Contracts $1,232,400) | | | 16 | | | | 8,928 | |
June 2012 Nikkei-225 Stock Average Index Futures Contracts
(Aggregate Value of Contracts $101,950) | | | 2 | | | | 6,943 | |
June 2012 S&P/Toronto Stock Exchange 60 Index Futures Contracts
(Aggregate Value of Contracts $141,381) | | | 1 | | | | 2,233 | |
April 2012 Hang Seng Index Futures Contracts
(Aggregate Value of Contracts $131,615) | | | 1 | | | | (6,757 | ) |
| | | | | | | | |
(Total Aggregate Value of Contracts $5,532,946) | | | | | | $ | 156,703 | |
| | | | | | | | |
INTEREST RATE FUTURES CONTRACTS PURCHASED† | | | | | | | | |
June 2012 U.S. Treasury 5 Year Note Futures Contracts
(Aggregate Value of Contracts $1,225,000) | | | 10 | | | $ | (1,293 | ) |
| | | | | | | | |
CURRENCY FUTURES CONTRACTS PURCHASED† | | | | | | | | |
June 2012 British Pound Futures Contracts
(Aggregate Value of Contracts $99,913) | | | 1 | | | $ | 2,010 | |
June 2012 Japanese Yen Futures Contracts
(Aggregate Value of Contracts $151,100) | | | 1 | | | | 160 | |
June 2012 Canadian Dollar Futures Contracts
(Aggregate Value of Contracts $400,360) | | | 4 | | | | (2,330 | ) |
June 2012 Mexican Peso Futures Contracts
(Aggregate Value of Contracts $232,800) | | | 6 | | | | (2,565 | ) |
| | | | | | | | |
(Total Aggregate Value of Contracts $884,173) | | | | | | $ | (2,725 | ) |
| | | | | | | | |
FUTURES CONTRACTS SOLD SHORT† | | | | | | | | |
April 2012 CAC 40 Euro Futures Contracts
(Aggregate Value of Contracts $273,851) | | | 6 | | | $ | 5,666 | |
June 2012 FTSE 100 Index Futures Contracts
(Aggregate Value of Contracts $183,108) | | | 2 | | | | 2,353 | |
June 2012 SPI 200 Index Futures Contracts
(Aggregate Value of Contracts $224,662) | | | 2 | | | | (1,352 | ) |
June 2012 DAX Index Futures Contracts
(Aggregate Value of Contracts $232,244) | | | 1 | | | | (2,601 | ) |
June 2012 Russell 2000 Index Mini Futures Contracts
(Aggregate Value of Contracts $248,100) | | | 3 | | | | (10,745 | ) |
| | | | | | | | |
(Total Aggregate Value of Contracts $1,161,965) | | | | | | $ | (6,679 | ) |
| | | | | | | | |
CURRENCY FUTURES CONTRACTS SOLD SHORT† | | | | | | | | |
June 2012 Euro Futures Contracts
(Aggregate Value of Contracts $667,101) | | | 4 | | | $ | (6,135 | ) |
June 2012 Swiss Franc Futures Contracts
(Aggregate Value of Contracts $277,225) | | | 2 | | | | (8,255 | ) |
| | | | | | | | |
(Total Aggregate Value of Contracts $944,326) | | | | | | $ | (14,390 | ) |
| | | | | | | | |
| * | Non-income producing security. |
| † | Value determined based on Level 1 inputs — See Note 4. |
| †† | Value determined based on Level 2 inputs — See Note 4. |
| 1 | A-Class shares of affiliated funds. |
| 2 | Repurchase Agreement — See Note 5. RSF - Rydex Series Funds |
| | |
| 16 | THE GUGGENHEIM FUNDS ANNUAL REPORT | | SEE NOTES TO FINANCIAL STATEMENTS. |
ALL-ASSET MODERATE STRATEGY FUND
STATEMENT OF ASSETS AND LIABILITIES
March 31, 2012
| | | | |
ASSETS: | | | | |
Investments, in unaffiliated issuers, at value
(cost $2,461,061) | | $ | 2,469,428 | |
Investments, in affiliated issuers, at value
(cost $14,694,187) | | | 17,749,733 | |
Repurchase agreements, at value
(cost $3,624,507) | | | 3,624,507 | |
| | | | |
Total investments
(cost $20,779,755) | | | 23,843,668 | |
Foreign currency, at value
(cost $15,459) | | | 15,241 | |
Segregated cash with broker | | | 467,107 | |
Receivables: | | | | |
Fund shares sold | | | 20,405 | |
Variation margin | | | 14,114 | |
Dividends | | | 9,297 | |
| | | | |
Total assets | | | 24,369,832 | |
| | | | |
LIABILITIES: | | | | |
Overdraft due to custodian bank | | | 15,220 | |
Payable for: | | | | |
Fund shares redeemed | | | 11,687 | |
Securities purchased | | | 9,295 | |
Distribution and service fees | | | 8,421 | |
| | | | |
Total liabilities | | | 44,623 | |
| | | | |
NET ASSETS | | $ | 24,325,209 | |
| | | | |
NET ASSETS CONSISTOF: | | | | |
Paid in capital | | $ | 27,937,423 | |
Undistributed net investment income | | | 141,148 | |
Accumulated net realized loss on investments | | | (6,948,673 | ) |
Net unrealized appreciation on investments | | | 3,195,311 | |
| | | | |
Net assets | | $ | 24,325,209 | |
| | | | |
A-CLASS: | | | | |
Net assets | | $ | 7,036,066 | |
Capital shares outstanding | | | 658,015 | |
Net asset value per share | | $ | 10.69 | |
| | | | |
Maximum offering price per share
(Net asset value divided by 95.25%) | | $ | 11.22 | |
| | | | |
C-CLASS: | | | | |
Net assets | | $ | 13,240,822 | |
Capital shares outstanding | | | 1,294,653 | |
Net asset value per share | | $ | 10.23 | |
| | | | |
H-CLASS: | | | | |
Net assets | | $ | 4,048,321 | |
Capital shares outstanding | | | 378,506 | |
Net asset value per share | | $ | 10.70 | |
| | | | |
STATEMENT OF OPERATIONS
Year Ended March 31, 2012
| | | | |
INVESTMENT INCOME: | | | | |
Dividends from securities of affiliated issuers | | $ | 202,288 | |
Dividends from securities of unaffiliated issuers | | | 26,858 | |
Interest | | | 989 | |
| | | | |
Total investment income | | | 230,135 | |
| | | | |
EXPENSES: | | | | |
Distribution and service fees: | | | | |
C-Class | | | 110,449 | |
| | | | |
Total expenses | | | 110,449 | |
| | | | |
Net investment income | | | 119,686 | |
| | | | |
NET REALIZEDAND UNREALIZED GAIN (LOSS): | | | | |
Net realized gain (loss) on: | | | | |
Investments in unaffiliated issuers | | | 168 | |
Investments in affiliated issuers | | | 707,811 | |
Futures contracts | | | 137,899 | |
Foreign currency | | | 135 | |
Realized gain distributions received from affiliated issuers | | | 41,255 | |
Realized gain distributions received from unaffiliated issuers | | | 2,857 | |
| | | | |
Net realized gain | | | 890,125 | |
| | | | |
Net change in unrealized appreciation (depreciation) on: | | | | |
Investments in unaffiliated issuers | | | 8,367 | |
Investments in affiliated issuers | | | (1,229,937 | ) |
Futures contracts | | | 80,197 | |
Foreign currency | | | (218 | ) |
| | | | |
Net change in unrealized appreciation (depreciation) | | | (1,141,591 | ) |
| | | | |
Net realized and unrealized loss | | | (251,466 | ) |
| | | | |
Net decrease in net assets resulting from operations | | $ | (131,780 | ) |
| | | | |
| | |
| SEE NOTES TO FINANCIAL STATEMENTS. | | THE GUGGENHEIM FUNDS ANNUAL REPORT | 17 |
ALL-ASSET MODERATE STRATEGY FUND
STATEMENTS OF CHANGES IN NET ASSETS
| | | | | | | | |
| | | Year Ended
March 31,
2012 | | | Year Ended
March 31,
2011 | |
INCREASE (DECREASE)IN NET ASSETSFROM OPERATIONS: | | | | | | | | |
Net investment income | | $ | 119,686 | | | $ | 168,883 | |
Net realized gain on investments | | | 890,125 | | | | 2,056,733 | |
Net change in unrealized appreciation (depreciation) on investments | | | (1,141,591 | ) | | | 229,321 | |
| | | | | | | | |
Net increase (decrease) in net assets resulting from operations | | | (131,780 | ) | | | 2,454,937 | |
| | | | | | | | |
DISTRIBUTIONSTO SHAREHOLDERSFROM: | | | | | | | | |
Net investment income | | | | | | | | |
A-Class | | | (69,182 | ) | | | (36,863 | )a |
C-Class | | | (138,307 | ) | | | (80,363 | )a |
H-Class | | | (38,073 | ) | | | (21,060 | )a |
Net realized gains | | | | | | | | |
A-Class | | | — | | | | (20,468 | )a |
C-Class | | | — | | | | (44,621 | )a |
H-Class | | | — | | | | (11,693 | )a |
| | | | | | | | |
Total distributions to shareholders | | | (245,562 | ) | | | (215,068 | ) |
| | | | | | | | |
CAPITAL SHARE TRANSACTIONS: | | | | | | | | |
Proceeds from sale of shares | | | | | | | | |
A-Class | | | 953,533 | | | | 2,264,995 | |
C-Class | | | 1,660,360 | | | | 4,762,262 | |
H-Class | | | 2,213,182 | | | | 1,666,855 | |
Redemption fees collected | | | | | | | | |
A-Class | | | — | | | | 551 | |
C-Class | | | — | | | | 1,160 | |
H-Class | | | — | | | | 371 | |
Distributions reinvested | | | | | | | | |
A-Class | | | 63,638 | | | | 53,429 | |
C-Class | | | 127,252 | | | | 117,251 | |
H-Class | | | 37,295 | | | | 32,009 | |
Cost of shares redeemed | | | | | | | | |
A-Class | | | (2,396,111 | ) | | | (4,409,898 | ) |
C-Class | | | (6,071,901 | ) | | | (7,882,677 | ) |
H-Class | | | (2,662,165 | ) | | | (5,242,983 | ) |
| | | | | | | | |
Net decrease from capital share transactions | | | (6,074,917 | ) | | | (8,636,675 | ) |
| | | | | | | | |
Net decrease in net assets | | | (6,452,259 | ) | | | (6,396,806 | ) |
| | |
NET ASSETS: | | | | | | | | |
Beginning of year | | | 30,777,468 | | | | 37,174,274 | |
| | | | | | | | |
End of year | | $ | 24,325,209 | | | $ | 30,777,468 | |
| | | | | | | | |
Undistributed net investment income at end of year | | $ | 141,148 | | | $ | 245,665 | |
| | | | | | | | |
CAPITAL SHARE ACTIVITY: | | | | | | | | |
Shares sold | | | | | | | | |
A-Class | | | 92,258 | | | | 222,647 | |
C-Class | | | 166,888 | | | | 487,674 | |
H-Class | | | 214,253 | | | | 163,150 | |
Shares issued from reinvestment of distributions | | | | | | | | |
A-Class | | | 6,500 | | | | 5,167 | |
C-Class | | | 13,566 | | | | 11,737 | |
H-Class | | | 3,810 | | | | 3,096 | |
Shares redeemed | | | | | | | | |
A-Class | | | (234,397 | ) | | | (441,339 | ) |
C-Class | | | (614,294 | ) | | | (822,570 | ) |
H-Class | | | (258,330 | ) | | | (525,938 | ) |
| | | | | | | | |
Net decrease in shares | | | (609,746 | ) | | | (896,376 | ) |
| | | | | | | | |
| a | For financial reporting purposes, certain distributions from net investment income for federal tax purposes have been reclassified to distributions from realized gains. |
| | |
| 18 | THE GUGGENHEIM FUNDS ANNUAL REPORT | | SEE NOTES TO FINANCIAL STATEMENTS. |
ALL-ASSET MODERATE STRATEGY FUND
FINANCIAL HIGHLIGHTS
This table is presented to show selected data for a share outstanding throughout each period and to assist shareholders in evaluating a Fund’s performance for the periods presented.
| | | | | | | | | | | | | | | | | | | | |
A-Class | | Year Ended
March 31,
2012 | | | Year Ended
March 31,
2011 | | | Year Ended
March 31,
2010 | | | Year Ended
March 31,
2009 | | | Year Ended
March 31,
2008 | |
Per Share Data | | | | | | | | | | | | | | | | | | | | |
Net asset value, beginning of period | | $ | 10.69 | | | $ | 9.84 | | | $ | 7.93 | | | $ | 10.18 | | | $ | 10.56 | |
| | | | | | | | | | | | | | | | | | | | |
Income (loss) from investment operations: | | | | | | | | | | | | | | | | | | | | |
Net investment incomea | | | .09 | | | | .10 | | | | .09 | | | | .20 | | | | .17 | |
Net gain (loss) on investments (realized and unrealized) | | | .01 | | | | .82 | | | | 1.99 | | | | (2.31 | ) | | | (.24 | ) |
| | | | | | | | | | | | | | | | | | | | |
Total from investment operations | | | .10 | | | | .92 | | | | 2.08 | | | | (2.11 | ) | | | (.07 | ) |
| | | | | | | | | | | | | | | | | | | | |
Less distributions from: | | | | | | | | | | | | | | | | | | | | |
Net investment income | | | (.10 | ) | | | (.05 | )e | | | (.17 | )e | | | (.02 | )e | | | (.12 | )e |
Net realized gains | | | — | | | | (.02 | )e | | | (.01 | )e | | | (.12 | )e | | | (.19 | )e |
| | | | | | | | | | | | | | | | | | | | |
Total distributions | | | (.10 | ) | | | (.07 | ) | | | (.18 | ) | | | (.14 | ) | | | (.31 | ) |
| | | | | | | | | | | | | | | | | | | | |
Redemption fees collected | | | — | | | | — | b | | | .01 | | | | — | b | | | — | b |
| | | | | | | | | | | | | | | | | | | | |
Net asset value, end of period | | $ | 10.69 | | | $ | 10.69 | | | $ | 9.84 | | | $ | 7.93 | | | $ | 10.18 | |
| | | | | | | | | | | | | | | | | | | | |
Total Returnc | | | 1.04 | % | | | 9.39 | % | | | 26.34 | % | | | (20.85 | %) | | | (0.75 | %) |
| | | | | | | | | | | | | | | | | | | | |
Ratios/Supplemental Data | | | | | | | | | | | | | | | | | | | | |
Net assets, end of period (in thousands) | | $ | 7,036 | | | $ | 8,485 | | | $ | 9,907 | | | $ | 7,907 | | | $ | 10,214 | |
| | | | | | | | | | | | | | | | | | | | |
Ratios to average net assets: | | | | | | | | | | | | | | | | | | | | |
Net investment income | | | 0.89 | % | | | 0.95 | % | | | 0.94 | % | | | 2.14 | % | | | 1.58 | % |
Total expensesd | | | — | | | | — | | | | — | | | | — | | | | 0.01 | % |
| | | | | | | | | | | | | | | | | | | | |
Portfolio turnover rate | | | 77 | % | | | 93 | % | | | 170 | % | | | 220 | % | | | 125 | % |
| | | | | |
C-Class | | Year Ended
March 31,
2012 | | | Year Ended
March 31,
2011 | | | Year Ended
March 31,
2010 | | | Year Ended
March 31,
2009 | | | Year Ended
March 31,
2008 | |
Per Share Data | | | | | | | | | | | | | | | | | | | | |
Net asset value, beginning of period | | $ | 10.31 | | | $ | 9.56 | | | $ | 7.77 | | | $ | 10.05 | | | $ | 10.50 | |
| | | | | | | | | | | | | | | | | | | | |
Income (loss) from investment operations: | | | | | | | | | | | | | | | | | | | | |
Net investment incomea | | | .01 | | | | .02 | | | | .02 | | | | .11 | | | | .10 | |
Net gain (loss) on investments (realized and unrealized) | | | .01 | | | | .80 | | | | 1.94 | | | | (2.25 | ) | | | (.24 | ) |
| | | | | | | | | | | | | | | | | | | | |
Total from investment operations | | | .02 | | | | .82 | | | | 1.96 | | | | (2.14 | ) | | | (.14 | ) |
| | | | | | | | | | | | | | | | | | | | |
Less distributions from: | | | | | | | | | | | | | | | | | | | | |
Net investment income | | | (.10 | ) | | | (.05 | )e | | | (.17 | )e | | | (.02 | )e | | | (.12 | )e |
Net realized gains | | | — | | | | (.02 | )e | | | (.01 | )e | | | (.12 | )e | | | (.19 | )e |
| | | | | | | | | | | | | | | | | | | | |
Total distributions | | | (.10 | ) | | | (.07 | ) | | | (.18 | ) | | | (.14 | ) | | | (.31 | ) |
| | | | | | | | | | | | | | | | | | | | |
Redemption fees collected | | | — | | | | — | b | | | .01 | | | | — | b | | | — | b |
| | | | | | | | | | | | | | | | | | | | |
Net asset value, end of period | | $ | 10.23 | | | $ | 10.31 | | | $ | 9.56 | | | $ | 7.77 | | | $ | 10.05 | |
| | | | | | | | | | | | | | | | | | | | |
Total Returnc | | | 0.30 | % | | | 8.62 | % | | | 25.33 | % | | | (21.42 | %) | | | (1.43 | %) |
| | | | | | | | | | | | | | | | | | | | |
Ratios/Supplemental Data | | | | | | | | | | | | | | | | | | | | |
Net assets, end of period (in thousands) | | $ | 13,241 | | | $ | 17,815 | | | $ | 19,607 | | | $ | 17,885 | | | $ | 30,282 | |
| | | | | | | | | | | | | | | | | | | | |
Ratios to average net assets: | | | | | | | | | | | | | | | | | | | | |
Net investment income | | | 0.12 | % | | | 0.21 | % | | | 0.17 | % | | | 1.22 | % | | | 0.90 | % |
Total expensesd | | | 0.75 | % | | | 0.75 | % | | | 0.75 | % | | | 0.75 | % | | | 0.76 | % |
| | | | | | | | | | | | | | | | | | | | |
Portfolio turnover rate | | | 77 | % | | | 93 | % | | | 170 | % | | | 220 | % | | | 125 | % |
| | |
| SEE NOTES TO FINANCIAL STATEMENTS. | | THE GUGGENHEIM FUNDS ANNUAL REPORT | 19 |
ALL-ASSET MODERATE STRATEGY FUND
FINANCIAL HIGHLIGHTS (concluded)
This table is presented to show selected data for a share outstanding throughout each period and to assist shareholders in evaluating a Fund’s performance for the periods presented.
| | | | | | | | | | | | | | | | | | | | |
H-Class | | Year Ended
March 31,
2012 | | | Year Ended
March 31,
2011 | | | Year Ended
March 31,
2010 | | | Year Ended
March 31,
2009 | | | Year Ended
March 31,
2008 | |
Per Share Data | | | | | | | | | | | | | | | | | | | | |
Net asset value, beginning of period | | $ | 10.69 | | | $ | 9.84 | | | $ | 7.94 | | | $ | 10.18 | | | $ | 10.56 | |
| | | | | | | | | | | | | | | | | | | | |
Income (loss) from investment operations: | | | | | | | | | | | | | | | | | | | | |
Net investment incomea | | | .09 | | | | .09 | | | | .08 | | | | .16 | | | | .13 | |
Net gain (loss) on investments (realized and unrealized) | | | .02 | | | | .83 | | | | 1.99 | | | | (2.26 | ) | | | (.20 | ) |
| | | | | | | | | | | | | | | | | | | | |
Total from investment operations | | | .11 | | | | .92 | | | | 2.07 | | | | (2.10 | ) | | | (.07 | ) |
| | | | | | | | | | | | | | | | | | | | |
Less distributions from: | | | | | | | | | | | | | | | | | | | | |
Net investment income | | | (.10 | ) | | | (.05 | )e | | | (.17 | )e | | | (.02 | )e | | | (.12 | )e |
Net realized gains | | | — | | | | (.02 | )e | | | (.01 | )e | | | (.12 | )e | | | (.19 | )e |
| | | | | | | | | | | | | | | | | | | | |
Total distributions | | | (.10 | ) | | | (.07 | ) | | | (.18 | ) | | | (.14 | ) | | | (.31 | ) |
| | | | | | | | | | | | | | | | | | | | |
Redemption fees collected | | | — | | | | — | b | | | .01 | | | | — | b | | | — | b |
| | | | | | | | | | | | | | | | | | | | |
Net asset value, end of period | | $ | 10.70 | | | $ | 10.69 | | | $ | 9.84 | | | $ | 7.94 | | | $ | 10.18 | |
| | | | | | | | | | | | | | | | | | | | |
Total Returnc | | | 1.13 | % | | | 9.39 | % | | | 26.18 | % | | | (20.75 | %) | | | (0.75 | %) |
| | | | | | | | | | | | | | | | | | | | |
Ratios/Supplemental Data | | | | | | | | | | | | | | | | | | | | |
Net assets, end of period (in thousands) | | $ | 4,048 | | | $ | 4,478 | | | $ | 7,660 | | | $ | 6,279 | | | $ | 11,359 | |
| | | | | | | | | | | | | | | | | | | | |
Ratios to average net assets: | | | | | | | | | | | | | | | | | | | | |
Net investment income | | | 0.90 | % | | | 0.92 | % | | | 0.92 | % | | | 1.73 | % | | | 1.22 | % |
Total expensesd | | | — | | | | — | | | | — | | | | — | | | | 0.01 | % |
| | | | | | | | | | | | | | | | | | | | |
Portfolio turnover rate | | | 77 | % | | | 93 | % | | | 170 | % | | | 220 | % | | | 125 | % |
| a | Net investment income per share was computed using average shares outstanding throughout the period. |
| b | Redemption fees collected are less than $0.01 per share. |
| c | Total return does not reflect the impact of any applicable sales charges and has not been annualized. |
| d | Does not include expenses of the underlying funds in which the Fund invests. |
| e | For financial reporting purposes, certain distributions from net investment income for federal tax purposes have been reclassified to distributions from realized gains. |
| | |
| 20 | THE GUGGENHEIM FUNDS ANNUAL REPORT | | SEE NOTES TO FINANCIAL STATEMENTS. |
This page intentionally left blank.
THE GUGGENHEIM FUNDS ANNUAL REPORT | 21
| | |
| PERFORMANCE REPORT AND FUND PROFILE (Unaudited) | | March 31, 2012 |
ALL-ASSET AGGRESSIVE STRATEGY FUND
OBJECTIVE: To seek growth of capital by investing principally in a diversified portfolio of underlying funds.
In the past 12 months, the financial markets continued to be driven by macroeconomic forces. Among them, the European debt crisis was the most important one. It first surprised the market with more problems, yet there were few tangible solutions looming. Together with U.S. debt downgrade, it caused a massive sell-off in the summer. As speculation grew that China and international organizations might step in to help, the market was relieved. And finally, the change of leadership at the European Central Bank brought loosened monetary policy and a mechanism to reduce the liquidity problem in the European debt market, which led the equity market to rally further in the first quarter of 2012.
Market volatility, with the VIX Index* as a proxy, also had a turbulent year, with its intra-period high reaching the level seen in early 2009. In this environment, Treasuries had another great year, easily leading equity by a large margin. In this macro-driven market, correlations between risky assets were high, making diversification more challenging to achieve. Volatility made it hard to identify a trend.
Our dynamically managed tactical overlay made a positive contribution to the portfolio’s performance, but not enough to permit the portfolio to overcome the tumult in the market.
In the period, the U.S. Intermediate Bond Series, Mid Cap Growth and Large Cap Growth Funds contributed to performance, while the Managed Futures Strategy Fund, MSCI EAFE Equal Weight Fund and the Commodities Strategy Fund detracted from the portfolio’s performance.
For the one-year period ended March 31,2012, the All-Asset Aggressive Strategy Fund H-Class returned 0.61%, compared with its benchmark** (64% Russell 3000® Index, 16% MSCI EAFE Index and 20% Barclays U.S. Aggregate Bond Index), which returned 5.79%.
Derivatives in the Fund are used to provide the most efficient exposure to the components of the blended benchmark, as well as to provide liquidity.
Diversification neither assures a profit nor eliminates the risk of experiencing investment losses.
| * | The VIX Index is the ticker for the Chicago Board Options Exchange (CBOE) Volatility Index, which is designed to measure market expectations of future price volatility that is implied by S&P 500 Index option contracts. The VIX Index is a widely used measure of market risk and is often referred to as the fear gauge. |
| ** | The components of the blended benchmark are defined as follows: |
The MSCI EAFE Index (Europe, Australasia, Far East) is a free float-adjusted market capitalization index that is designed to measure the equity market performance of developed markets, excluding the US & Canada. The MSCI EAFE Index consists of the following 22 developed market country indices: Australia, Austria, Belgium, Denmark, Finland, France, Germany, Greece, Hong Kong, Ireland, Israel, Italy, Japan, the Netherlands, New Zealand, Norway, Portugal, Singapore, Spain, Sweden, Switzerland, and the United Kingdom.
The Russell 3000® Index measures the performance of the largest 3,000 U.S. companies, representing approximately 98% of the investable U.S. equity market.
The Barclays U.S. Aggregate Bond Index measures performance of the U.S. investment-grade bond market, including investment-grade U.S. government bonds, investment-grade corporate bonds, mortgage pass-through securities and asset-backed securities.
Performance displayed represents past performance which is no guarantee of future results.
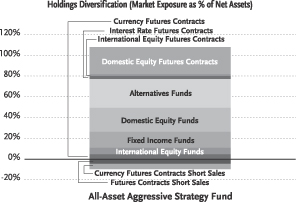
“Holdings Diversification (Market Exposure as % of Net Assets)” excludes any temporary cash investments.
| | | | |
Inception Dates: | | | |
A-Class | | | June 30, 2006 | |
C-Class | | | June 30, 2006 | |
H-Class | | | June 30, 2006 | |
| | | | |
Ten Largest Holdings (% of Total Net Assets) | | | |
RSF – U.S. Long Short Momentum Fund1 | | | 18.6 | % |
Security Large Cap Value Fund1 | | | 9.6 | % |
Security Equity Fund® – Large Cap Concentrated Growth Fund1 | | | 9.6 | % |
Security Income Fund® – U.S. Intermediate Bond Fund1 | | | 8.9 | % |
iShares Barclays Aggregate Bond Fund | | | 8.7 | % |
Security Equity Fund® – MSCI EAFE Equal Weight Fund1 | | | 7.1 | % |
RSF – Multi-Hedge Strategies Fund1 | | | 4.6 | % |
RSF – Long Short Interest Rate Strategy Fund1 | | | 3.5 | % |
Security Mid Cap Growth Fund1 | | | 2.5 | % |
Security Equity Fund® – Mid Cap Value Fund1 | | | 2.5 | % |
| | | | |
Top Ten Total | | | 75.6 | % |
| | | | |
“Ten Largest Holdings” exclude any temporary cash or derivative investments.
RSF – Rydex Series Funds
22 | THE GUGGENHEIM FUNDS ANNUAL REPORT
| | | | |
| PERFORMANCE REPORT AND FUND PROFILE (Unaudited) (concluded) | | | March 31, 2012 | |
ALL-ASSET AGGRESSIVE STRATEGY FUND
Average Annual Returns*
Periods Ended 03/31/12
| | | | | | | | | | | | |
| | | 1 Year | | | 5 Year | | | Since
Inception
(06/30/06) | |
A-Class Shares | | | 0.61 | % | | | 1.67 | % | | | 3.21 | % |
A-Class Shares with sales charge† | | | -4.18 | % | | | 0.69 | % | | | 2.34 | % |
C-Class Shares | | | -0.17 | % | | | 0.88 | % | | | 2.41 | % |
C-Class Shares with CDSC‡ | | | -1.15 | % | | | 0.88 | % | | | 2.41 | % |
H-Class Shares | | | 0.61 | % | | | 1.65 | % | | | 3.21 | % |
S&P 500 Index | | | 8.54 | % | | | 2.01 | % | | | 4.01 | % |
Synthetic All-Asset Aggressive Strategy Benchmark¿ | | | 5.79 | % | | | 2.52 | % | | | 4.39 | % |
| * | The performance data above represents past performance that is not predictive of future results. The investment return and principal value of an investment in the Fund will fluctuate so that an investor’s shares, when redeemed, may be worth more or less than their original cost. Returns are historical and include changes in principal and reinvested dividends and capital gains and do not reflect the effect of taxes. The S&P 500 Index, Barclays U.S. Aggregate Bond Index, Russell 3000 Index, and the MSCI EAFE Index are unmanaged indices and, unlike the Fund, have no management fees or operating expenses to reduce their reported returns. The graphs are based on A-Class shares and H-Class shares only; performance for C-Class shares will vary due to differences in fee structures. |
| † | Fund returns are calculated using the maximum sales charge of 4.75%. |
| ‡ | Fund returns include a CDSC of 1% if redeemed within 12 months of purchase. |
| ¿ | Benchmark reflects 64% Russell 3000® Index, 16% MSCI EAFE Index® and 20% Barclays U.S. Aggregate Bond Index. |
THE GUGGENHEIM FUNDS ANNUAL REPORT | 23
| | |
| SCHEDULE OF INVESTMENTS | | March 31, 2012 |
ALL-ASSET AGGRESSIVE STRATEGY FUND
| | | | | | | | |
| | | SHARES | | | VALUE | |
EXCHANGE TRADED FUND† - 8.7% | |
iShares Barclays Aggregate Bond Fund | | | 8,914 | | | $ | 979,203 | |
| | | | | | | | |
Total Exchange Traded Fund
(Cost $980,203) | | | | | | | 979,203 | |
| | | | | | | | |
MUTUAL FUNDS†,1 - 74.3% | |
Alternatives Funds - 31.7% | |
RSF - U.S. Long Short Momentum Fund* | | | 157,030 | | | | 2,085,361 | |
RSF - Multi-Hedge Strategies Fund | | | 23,307 | | | | 522,547 | |
RSF - Long Short Interest Rate Strategy Fund | | | 16,419 | | | | 391,436 | |
RSF - Long/Short Commodities Strategy Fund | | | 7,133 | | | | 187,750 | |
RSF - Managed Futures Strategy Fund* | | | 6,807 | | | | 156,093 | |
RSF - Long Short Equity Strategy Fund | | | 4,174 | | | | 111,534 | |
RSF - Event Driven and Distressed Strategies Fund | | | 4,357 | | | | 110,526 | |
| | | | | | | | |
Total Alternatives Funds | | | | | | | 3,565,247 | |
| | | | | | | | |
Domestic Equity Funds - 26.4% | |
Security Large Cap Value Fund | | | 34,674 | | | | 1,072,454 | |
Security Equity Fund® - Large Cap Concentrated Growth Fund* | | | 113,317 | | | | 1,071,983 | |
Security Mid Cap Growth Fund* | | | 7,555 | | | | 277,417 | |
Security Equity Fund® - Mid Cap Value Fund | | | 8,318 | | | | 276,835 | |
Security Equity Fund® - Small Cap Value Fund | | | 8,617 | | | | 131,497 | |
Security Equity Fund® - Small Cap Growth Fund* | | | 8,224 | | | | 129,616 | |
| | | | | | | | |
Total Domestic Equity Funds | | | | | | | 2,959,802 | |
| | | | | | | | |
Fixed Income Funds - 9.1% | |
Security Income Fund® - U.S. | | | | | | | | |
Intermediate Bond Fund | | | 56,932 | | | | 998,582 | |
Security Income Fund® - High Yield Fund | | | 2,205 | | | | 25,602 | |
| | | | | | | | |
Total Fixed Income Funds | | | | | | | 1,024,184 | |
| | | | | | | | |
International Equity Funds - 7.1% | |
Security Equity Fund® - MSCI EAFE Equal Weight Fund | | | 72,303 | | | | 792,444 | |
| | | | | | | | |
Total Mutual Funds
(Cost $6,720,368) | | | | | | | 8,341,677 | |
| | | | | | | | |
| | |
| | | FACE
AMOUNT | | | | |
REPURCHASE AGREEMENT ††,2 - 14.7% | |
Credit Suisse Group
issued 03/30/12 at 0.01% due 04/02/12 | | $ | 1,648,857 | | | | 1,648,857 | |
| | | | | | | | |
Total Repurchase Agreement
(Cost $1,648,857) | | | | | | | 1,648,857 | |
| | | | | | | | |
Total Investments - 97.7%
(Cost $9,349,428) | | | | | | $ | 10,969,737 | |
| | | | | | | | |
Other Assets & Liabilities, net - 2.3% | | | | | | | 260,756 | |
| | | | | | | | |
Total Net Assets - 100.0% | | | | | | $ | 11,230,493 | |
| | | | | | | | |
| | | CONTRACTS | | | UNREALIZED
GAIN (LOSS) | |
FUTURES CONTRACTS PURCHASED† | |
June 2012 S&P 500 Index
Mini Futures Contracts
(Aggregate Value of Contracts $2,523,600) | | | 36 | | | $ | 92,944 | |
June 2012 MSCI Emerging Markets Index
Mini Futures Contracts
(Aggregate Value of Contracts $847,275) | | | 11 | | | | 6,138 | |
June 2012 Nikkei-225 Stock Average Index
Futures Contracts
(Aggregate Value of Contracts $50,975) | | | 1 | | | | 3,472 | |
June 2012 S&P/Toronto Stock Exchange 60
Index Futures Contracts
(Aggregate Value of Contracts $141,381) | | | 1 | | | | 2,229 | |
| | | | | | | | |
(Total Aggregate Value of Contracts $3,563,231) | | | | | | $ | 104,783 | |
| | | | | | | | |
INTEREST RATE FUTURES CONTRACTS PURCHASED† | |
June 2012 U.S. Treasury 5 Year Note Futures Contracts (Aggregate Value of Contracts $367,500) | | | 3 | | | $ | 211 | |
| | | | | | | | |
CURRENCY FUTURES CONTRACTS PURCHASED† | |
June 2012 British Pound
Futures Contracts
(Aggregate Value of Contracts $99,913) | | | 1 | | | $ | 2,010 | |
June 2012 Japanese Yen
Futures Contracts
(Aggregate Value of Contracts $151,100) | | | 1 | | | | 160 | |
June 2012 Canadian Dollar
Futures Contracts
(Aggregate Value of Contracts $200,180) | | | 2 | | | | (1,165 | ) |
June 2012 Mexican Peso
Futures Contracts
(Aggregate Value of Contracts $116,400) | | | 3 | | | | (1,283 | ) |
| | | | | | | | |
(Total Aggregate Value of Contracts $567,593) | | | | | | $ | (278 | ) |
| | | | | | | | |
FUTURES CONTRACTS SOLD SHORT† | |
April 2012 CAC 40 Euro
Futures Contracts
(Aggregate Value of Contracts $136,926) | | | 3 | | | $ | 2,833 | |
June 2012 FTSE 100 Index
Futures Contracts
(Aggregate Value of Contracts $91,554) | | | 1 | | | | 1,176 | |
June 2012 SPI 200 Index
Futures Contracts
(Aggregate Value of Contracts $112,331) | | | 1 | | | | (676 | ) |
June 2012 Russell 2000 Index
Mini Futures Contracts
(Aggregate Value of Contracts $165,400) | | | 2 | | | | (7,164 | ) |
| | | | | | | | |
(Total Aggregate Value of Contracts $506,211) | | | | | | $ | (3,831 | ) |
| | | | | | | | |
| | |
| 24 | THE GUGGENHEIM FUNDS ANNUAL REPORT | | SEE NOTES TO FINANCIAL STATEMENTS. |
| | |
| SCHEDULE OF INVESTMENTS (concluded) | | March 31, 2012 |
ALL-ASSET AGGRESSIVE STRATEGY FUND
| | | | | | | | |
| | | CONTRACTS | | | UNREALIZED
LOSS | |
CURRENCY FUTURES CONTRACTS SOLD SHORT† | |
June 2012 Swiss Franc
Futures Contracts
(Aggregate Value of Contracts $138,613) | | | 1 | | | $ | (4,128 | ) |
June 2012 Euro Futures Contracts
(Aggregate Value of Contracts $333,550) | | | 2 | | | | (4,658 | ) |
| | | | | | | | |
(Total Aggregate Value of Contracts $472,163) | | | | | | $ | (8,786 | ) |
| | | | | | | | |
| * | Non-income producing security. |
| † | Value determined based on Level 1 inputs — See Note 4. |
| †† | Value determined based on Level 2 inputs — See Note 4. |
| 1 | A-Class shares of affiliated funds. |
| 2 | Repurchase Agreement — See Note 5. |
| | |
| SEE NOTES TO FINANCIAL STATEMENTS. | | THE GUGGENHEIM FUNDS ANNUAL REPORT | 25 |
ALL-ASSET AGGRESSIVE STRATEGY FUND
STATEMENT OF ASSETS AND LIABILITIES
March 31, 2012
| | | | |
ASSETS: | | | | |
Investments in unaffiliated issuers, at value
(cost $980,203) | | $ | 979,203 | |
Investments in affiliated issuers, at value
(cost $6,720,368) | | | 8,341,677 | |
Repurchase agreements, at value
(cost $1,648,857) | | | 1,648,857 | |
| | | | |
Total investments
(cost $9,349,428) | | | 10,969,737 | |
Foreign currency, at value
(cost $42,523) | | | 42,820 | |
Segregated cash with broker | | | 268,579 | |
Receivables: | | | | |
Variation margin | | | 11,930 | |
Dividends | | | 1,931 | |
Fund shares sold | | | 84 | |
| | | | |
Total assets | | | 11,295,081 | |
| | | | |
LIABILITIES: | | | | |
Overdraft due to custodian bank | | | 42,680 | |
Payable for: | | | | |
Fund shares redeemed | | | 16,364 | |
Distribution and service fees | | | 3,613 | |
Securities purchased | | | 1,931 | |
| | | | |
Total liabilities | | | 64,588 | |
| | | | |
NET ASSETS | | $ | 11,230,493 | |
| | | | |
NET ASSETS CONSISTOF: | | | | |
Paid in capital | | $ | 12,572,427 | |
Undistributed net investment income | | | 34,692 | |
Accumulated net realized loss on investments | | | (3,089,333 | ) |
Net unrealized appreciation on investments | | | 1,712,707 | |
| | | | |
Net assets | | $ | 11,230,493 | |
| | | | |
A-Class: | | | | |
Net assets | | $ | 3,448,959 | |
Capital shares outstanding | | | 332,846 | |
Net asset value per share | | $ | 10.36 | |
| | | | |
Maximum offering price per share (Net asset value divided by 95.25%) | | $ | 10.88 | |
| | | | |
C-Class: | | | | |
Net assets | | $ | 5,707,112 | |
Capital shares outstanding | | | 577,028 | |
Net asset value per share | | $ | 9.89 | |
| | | | |
H-Class: | | | | |
Net assets | | $ | 2,074,422 | |
Capital shares outstanding | | | 200,264 | |
Net asset value per share | | $ | 10.36 | |
| | | | |
STATEMENT OF OPERATIONS
Year Ended March 31, 2012
| | | | |
INVESTMENT INCOME: | | | | |
Dividends from securities of affiliated issuers | | $ | 60,562 | |
Dividends from securities of unaffiliated issuers | | | 8,764 | |
Interest | | | 509 | |
| | | | |
Total investment income | | | 69,835 | |
| | | | |
EXPENSES: | | | | |
Distribution and service fees: | | | | |
C-Class | | | 44,947 | |
| | | | |
Total expenses | | | 44,947 | |
| | | | |
Net investment income | | | 24,888 | |
| | | | |
NET REALIZED AND UNREALIZED GAIN (LOSS): | | | | |
Net realized gain (loss) on: | | | | |
Investments in affiliated issuers | | | 617,048 | |
Futures contracts | | | 26,458 | |
Foreign currency | | | 132 | |
Realized gain distributions received from affiliated issuers | | | 19,301 | |
Realized gain distributions received from unaffiliated issuers | | | 933 | |
| | | | |
Net realized gain | | | 663,872 | |
| | | | |
Net change in unrealized appreciation (depreciation) on: | | | | |
Investments in unaffiliated issuers | | | (1,000 | ) |
Investments in affiliated issuers | | | (1,129,042 | ) |
Futures contracts | | | 52,700 | |
Foreign currency | | | 297 | |
| | | | |
Net change in unrealized appreciation (depreciation) | | | (1,077,045 | ) |
| | | | |
Net realized and unrealized loss | | | (413,173 | ) |
| | | | |
Net decrease in net assets resulting from operations | | $ | (388,285 | ) |
| | | | |
| | |
| 26 | THE GUGGENHEIM FUNDS ANNUAL REPORT | | SEE NOTES TO FINANCIAL STATEMENTS. |
ALL-ASSET AGGRESSIVE STRATEGY FUND
STATEMENTS OF CHANGES IN NET ASSETS
| | | | | | | | |
| | | Year Ended
March 31,
2012 | | | Year Ended
March 31,
2011 | |
INCREASE (DECREASE) IN NET ASSETS FROM OPERATIONS: | | | | | | | | |
Net investment income | | $ | 24,888 | | | $ | 60,403 | |
Net realized gain on investments | | | 663,872 | | | | 824,966 | |
Net change in unrealized appreciation (depreciation) on investments | | | (1,077,045 | ) | | | 915,300 | |
| | | | | | | | |
Net increase (decrease) in net assets resulting from operations | | | (388,285 | ) | | | 1,800,669 | |
| | | | | | | | |
DISTRIBUTIONSTO SHAREHOLDERS FROM: | | | | | | | | |
Net investment income | | | | | | | | |
A-Class | | | (32,421 | ) | | | (4,100 | )a |
C-Class | | | (56,510 | ) | | | (4,071 | )a |
H-Class | | | (17,469 | ) | | | (1,726 | )a |
Net realized gains | | | | | | | | |
A-Class | | | — | | | | (19,053 | )a |
C-Class | | | — | | | | (18,922 | )a |
H-Class | | | — | | | | (8,023 | )a |
| | | | | | | | |
Total distributions to shareholders | | | (106,400 | ) | | | (55,895 | ) |
| | | | | | | | |
CAPITAL SHARE TRANSACTIONS: | | | | | | | | |
Proceeds from sale of shares | | | | | | | | |
A-Class | | | 564,208 | | | | 2,068,087 | |
C-Class | | | 893,522 | | | | 1,443,010 | |
H-Class | | | 1,474,836 | | | | 1,350,482 | |
Redemption fees collected | | | | | | | | |
A-Class | | | — | | | | 121 | |
C-Class | | | — | | | | 128 | |
H-Class | | | — | | | | 62 | |
Distributions reinvested | | | | | | | | |
A-Class | | | 30,714 | | | | 14,520 | |
C-Class | | | 50,150 | | | | 21,423 | |
H-Class | | | 17,168 | | | | 9,658 | |
Cost of shares redeemed | | | | | | | | |
A-Class | | | (4,012,179 | ) | | | (2,185,888 | ) |
C-Class | | | (2,246,851 | ) | | | (2,074,277 | ) |
H-Class | | | (2,257,775 | ) | | | (2,331,122 | ) |
| | | | | | | | |
Net decrease from capital share transactions | | | (5,486,207 | ) | | | (1,683,796 | ) |
| | | | | | | | |
Net increase (decrease) in net assets | | | (5,980,892 | ) | | | 60,978 | |
NET ASSETS: | | | | | | | | |
Beginning of year | | | 17,211,385 | | | | 17,150,407 | |
| | | | | | | | |
End of year | | $ | 11,230,493 | | | $ | 17,211,385 | |
| | | | | | | | |
Undistributed net investment income at end of year | | $ | 34,692 | | | $ | 106,401 | |
| | | | | | | | |
CAPITAL SHARE ACTIVITY: | | | | | | | | |
Shares sold | | | | | | | | |
A-Class | | | 54,903 | | | | 215,657 | |
C-Class | | | 93,743 | | | | 155,387 | |
H-Class | | | 147,220 | | | | 140,593 | |
Shares issued from reinvestment of distributions | | | | | | | | |
A-Class | | | 3,331 | | | | 1,455 | |
C-Class | | | 5,686 | | | | 2,227 | |
H-Class | | | 1,864 | | | | 968 | |
Shares redeemed | | | | | | | | |
A-Class | | | (411,253 | ) | | | (226,325 | ) |
C-Class | | | (235,389 | ) | | | (228,788 | ) |
H-Class | | | (231,875 | ) | | | (249,441 | ) |
| | | | | | | | |
Net decrease in shares | | | (571,770 | ) | | | (188,267 | ) |
| | | | | | | | |
| a | For financial reporting purposes, certain distributions from net investment income for federal tax purposes have been reclassified to distributions from realized gains. |
| | |
| SEE NOTES TO FINANCIAL STATEMENTS. | | THE GUGGENHEIM FUNDS ANNUAL REPORT | 27 |
ALL-ASSET AGGRESSIVE STRATEGY FUND
FINANCIAL HIGHLIGHTS
This table is presented to show selected data for a share outstanding throughout each period and to assist shareholders in evaluating a Fund’s performance for the periods presented.
| | | | | | | | | | | | | | | | | | | | |
A-Class | | Year Ended
March 31,
2012 | | | Year Ended
March 31,
2011 | | | Year Ended
March 31,
2010 | | | Year Ended
March 31,
2009 | | | Year Ended
March 31,
2008 | |
Per Share Data | | | | | | | | | | | | | | | | | | | | |
Net asset value, beginning of period | | $ | 10.40 | | | $ | 9.29 | | | $ | 6.98 | | | $ | 9.69 | | | $ | 10.28 | |
| | | | | | | | | | | | | | | | | | | | |
Income (loss) from investment operations: | | | | | | | | | | | | | | | | | | | | |
Net investment incomea | | | .05 | | | | .07 | | | | .05 | | | | .12 | | | | .11 | |
Net gain (loss) on investments (realized and unrealized) | | | — | | | | 1.07 | | | | 2.37 | | | | (2.60 | ) | | | (.48 | ) |
| | | | | | | | | | | | | | | | | | | | |
Total from investment operations | | | .05 | | | | 1.14 | | | | 2.42 | | | | (2.48 | ) | | | (.37 | ) |
| | | | | | | | | | | | | | | | | | | | |
Less distributions from: | | | | | | | | | | | | | | | | | | | | |
Net investment income | | | (.09 | ) | | | (.01 | )e | | | (.10 | )e | | | (.22 | )e | | | (.06 | )e |
Net realized gains | | | — | | | | (.02 | )e | | | (.01 | )e | | | (.01 | )e | | | (.16 | )e |
| | | | | | | | | | | | | | | | | | | | |
Total distributions | | | (.09 | ) | | | (.03 | ) | | | (.11 | ) | | | (.23 | ) | | | (.22 | ) |
| | | | | | | | | | | | | | | | | | | | |
Redemption fees collected | | | — | | | | — | b | | | — | b | | | — | b | | | — | b |
| | | | | | | | | | | | | | | | | | | | |
Net asset value, end of period | | $ | 10.36 | | | $ | 10.40 | | | $ | 9.29 | | | $ | 6.98 | | | $ | 9.69 | |
| | | | | | | | | | | | | | | | | | | | |
Total Returnc | | | 0.61 | % | | | 12.31 | % | | | 34.67 | % | | | (25.81 | %) | | | (3.77 | %) |
| | | | | | | | | | | | | | | | | | | | |
Ratios/Supplemental Data | | | | | | | | | | | | | | | | | | | | |
Net assets, end of period (in thousands) | | $ | 3,449 | | | $ | 7,134 | | | $ | 6,457 | | | $ | 5,389 | | | $ | 8,596 | |
| | | | | | | | | | | | | | | | | | | | |
Ratios to average net assets: | | | | | | | | | | | | | | | | | | | | |
Net investment income | | | 0.48 | % | | | 0.70 | % | | | 0.55 | % | | | 1.40 | % | | | 1.01 | % |
Total expensesd | | | — | | | | — | | | | — | | | | 0.02 | % | | | 0.01 | % |
| | | | | | | | | | | | | | | | | | | | |
Portfolio turnover rate | | | 77 | % | | | 97 | % | | | 185 | % | | | 278 | % | | | 120 | % |
| | | | | |
C-Class | | Year Ended
March 31,
2012 | | | Year Ended
March 31,
2011 | | | Year Ended
March 31,
2010 | | | Year Ended
March 31,
2009 | | | Year Ended
March 31,
2008 | |
Per Share Data | | | | | | | | | | | | | | | | | | | | |
Net asset value, beginning of period | | $ | 10.01 | | | $ | 9.01 | | | $ | 6.82 | | | $ | 9.56 | | | $ | 10.22 | |
| | | | | | | | | | | | | | | | | | | | |
Income (loss) from investment operations: | | | | | | | | | | | | | | | | | | | | |
Net investment income (loss)a | | | (.02 | ) | | | (.01 | ) | | | (.02 | ) | | | .05 | | | | .06 | |
Net gain (loss) on investments (realized and unrealized) | | | (.01 | ) | | | 1.04 | | | | 2.32 | | | | (2.56 | ) | | | (.50 | ) |
| | | | | | | | | | | | | | | | | | | | |
Total from investment operations | | | (.03 | ) | | | 1.03 | | | | 2.30 | | | | (2.51 | ) | | | (.44 | ) |
| | | | | | | | | | | | | | | | | | | | |
Less distributions from: | | | | | | | | | | | | | | | | | | | | |
Net investment income | | | (.09 | ) | | | (.01 | )e | | | (.10 | )e | | | (.22 | )e | | | (.06 | )e |
Net realized gains | | | — | | | | (.02 | )e | | | (.01 | )e | | | (.01 | )e | | | (.16 | )e |
| | | | | | | | | | | | | | | | | | | | |
Total distributions | | | (.09 | ) | | | (.03 | ) | | | (.11 | ) | | | (.23 | ) | | | (.22 | ) |
| | | | | | | | | | | | | | | | | | | | |
Redemption fees collected | | | — | | | | — | b | | | — | b | | | — | b | | | — | b |
| | | | | | | | | | | | | | | | | | | | |
Net asset value, end of period | | $ | 9.89 | | | $ | 10.01 | | | $ | 9.01 | | | $ | 6.82 | | | $ | 9.56 | |
| | | | | | | | | | | | | | | | | | | | |
Total Returnc | | | (0.17 | %) | | | 11.47 | % | | | 33.72 | % | | | (26.48 | %) | | | (4.48 | %) |
| | | | | | | | | | | | | | | | | | | | |
Ratios/Supplemental Data | | | | | | | | | | | | | | | | | | | | |
Net assets, end of period (in thousands) | | $ | 5,707 | | | $ | 7,135 | | | $ | 7,063 | | | $ | 4,667 | | | $ | 6,178 | |
| | | | | | | | | | | | | | | | | | | | |
Ratios to average net assets: | | | | | | | | | | | | | | | | | | | | |
Net investment income (loss) | | | (0.18 | %) | | | (0.09 | %) | | | (0.21 | %) | | | 0.59 | % | | | 0.60 | % |
Total expensesd | | | 0.75 | % | | | 0.75 | % | | | 0.75 | % | | | 0.77 | % | | | 0.76 | % |
| | | | | | | | | | | | | | | | | | | | |
Portfolio turnover rate | | | 77 | % | | | 97 | % | | | 185 | % | | | 278 | % | | | 120 | % |
| | |
| 28 | THE GUGGENHEIM FUNDS ANNUAL REPORT | | SEE NOTES TO FINANCIAL STATEMENTS. |
| | |
ALL-ASSET AGGRESSIVE STRATEGY FUND FINANCIAL HIGHLIGHTS (concluded) | | |
This table is presented to show selected data for a share outstanding throughout each period and to assist shareholders in evaluating a Fund’s performance for the periods presented.
| | | | | | | | | | | | | | | | | | | | |
H-Class | | Year Ended
March 31,
2012 | | | Year Ended
March 31,
2011 | | | Year Ended
March 31,
2010 | | | Year Ended
March 31,
2009 | | | Year Ended
March 31,
2008 | |
Per Share Data | | | | | | | | | | | | | | | | | | | | |
Net asset value, beginning of period | | $ | 10.40 | | | $ | 9.29 | | | $ | 6.97 | | | $ | 9.69 | | | $ | 10.29 | |
| | | | | | | | | | | | | | | | | | | | |
Income (loss) from investment operations: | | | | | | | | | | | | | | | | | | | | |
Net investment incomea | | | .05 | | | | .06 | | | | .04 | | | | .11 | | | | .08 | |
Net gain (loss) on investments (realized and unrealized) | | | — | | | | 1.08 | | | | 2.39 | | | | (2.60 | ) | | | (.46 | ) |
| | | | | | | | | | | | | | | | | | | | |
Total from investment operations | | | .05 | | | | 1.14 | | | | 2.43 | | | | (2.49 | ) | | | (.38 | ) |
| | | | | | | | | | | | | | | | | | | | |
Less distributions from: | | | | | | | | | | | | | | | | | | | | |
Net investment income | | | (.09 | ) | | | (.01 | )e | | | (.10 | )e | | | (.22 | )e | | | (.06 | )e |
Net realized gains | | | — | | | | (.02 | )e | | | (.01 | )e | | | (.01 | )e | | | (.16 | )e |
| | | | | | | | | | | | | | | | | | | | |
Total distributions | | | (.09 | ) | | | (.03 | ) | | | (.11 | ) | | | (.23 | ) | | | (.22 | ) |
| | | | | | | | | | | | | | | | | | | | |
Redemption fees collected | | | — | | | | — | b | | | — | b | | | — | b | | | — | b |
| | | | | | | | | | | | | | | | | | | | |
Net asset value, end of period | | $ | 10.36 | | | $ | 10.40 | | | $ | 9.29 | | | $ | 6.97 | | | $ | 9.69 | |
| | | | | | | | | | | | | | | | | | | | |
Total Returnc | | | 0.61 | % | | | 12.31 | % | | | 34.86 | % | | | (25.92 | %) | | | (3.87 | %) |
| | | | | | | | | | | | | | | | | | | | |
Ratios/Supplemental Data | | | | | | | | | | | | | | | | | | | | |
Net assets, end of period (in thousands) | | $ | 2,074 | | | $ | 2,943 | | | $ | 3,630 | | | $ | 3,240 | | | $ | 4,447 | |
| | | | | | | | | | | | | | | | | | | | |
Ratios to average net assets: | | | | | | | | | | | | | | | | | | | | |
Net investment income | | | 0.53 | % | | | 0.66 | % | | | 0.53 | % | | | 1.22 | % | | | 0.80 | % |
Total expensesd | | | — | | | | — | | | | — | | | | 0.02 | % | | | 0.01 | % |
| | | | | | | | | | | | | | | | | | | | |
Portfolio turnover rate | | | 77 | % | | | 97 | % | | | 185 | % | | | 278 | % | | | 120 | % |
| a | Net investment income (loss) per share was computed using average shares outstanding throughout the period. |
| b | Redemption fees collected are less than $0.01 per share. |
| c | Total return does not reflect the impact of any applicable sales charges and has not been annualized. |
| d | Does not include expenses of the underlying funds in which the Fund invests. |
| e | For financial reporting purposes, certain distributions from net investment income for federal tax purposes have been reclassified to distributions from realized gains. |
| | |
| SEE NOTES TO FINANCIAL STATEMENTS. | | THE GUGGENHEIM FUNDS ANNUAL REPORT | 29 |
NOTES TO FINANCIAL STATEMENTS
| 1. | Organization and Significant Accounting Policies |
Organization
The Rydex Series Funds (the “Trust”) is registered with the SEC under the Investment Company Act of 1940 (the “1940 Act”) as a non-diversified, open-ended investment company. The Trust offers eight separate classes of shares, Investor Class shares, Investor2 Class shares, Advisor Class shares, A-Class shares, C-Class shares, H-Class shares, Y-Class shares, and Institutional Class shares. Sales of shares of each Class are made without a front-end sales charge at the net asset value per share (“NAV”), with the exception of A-Class shares. A-Class shares are sold at the NAV, plus the applicable front-end sales charge. The sales charge varies depending on the amount purchased, but will not exceed 4.75%. A-Class share purchases of $1 million or more are exempt from the front-end sales charge but have a 1% CDSC if shares are redeemed within 12 months of purchase. C-Class shares have a 1% CDSC if shares are redeemed within 12 months of purchase.
At March 31, 2012, the Trust consisted of fifty-seven separate funds. This report covers the Asset Allocation Funds (the “Funds”), while the other funds are contained in separate reports. Only A-Class, C-Class, and H-Class shares had been issued in the Funds.
Guggenheim Investments (“Gl”) provides advisory services and Rydex Fund Services, LLC (“RFS”) provides transfer agent, administrative and accounting services to the Trust. Rydex Distributors, LLC (“RDL”) acts as principal underwriter for the Trust. Gl, RFS and RDL are affiliated entities.
Each Fund is a “fund of funds,” which means that each Fund seeks to achieve its investment objective by investing primarily in a combination of mutual funds (“the underlying funds”) within the same group of affiliated investment companies and exchange traded funds (“ETFs”) instead of in individual securities. The underlying funds are advised by GI.
Prior to September 13, 2010, all classes were subject to a 1% redemption fee when shares were redeemed within 30 days of purchase. Effective September 13, 2010, the redemption fee was removed.
Significant Accounting Policies
The following significant accounting policies are in conformity with U.S. generally accepted accounting principles and are consistently followed by the Trust. This requires management to make estimates and assumptions that affect the reported amount of assets and liabilities and disclosure of contingent assets and liabilities at the date of the financial statements and the reported amounts of revenues and expenses during the reporting period. Actual results could differ from these estimates. All time references are based on Eastern Time.
A. The underlying funds are valued at their NAV as of the close of business, usually 4:00 p.m. on the valuation date and ETFs are valued at the last quoted sales price. Short-term securities with a maturity of 60 days or less and repurchase agreements, are valued at amortized cost, which approximates market value.
B. The value of futures contracts purchased and sold by the Funds is accounted for using the unrealized gain or loss on the contracts that is determined by marking the contracts to their current realized settlement prices. Financial futures contracts are valued at the 4:00 p.m. price on the valuation date. In the event that the exchange for a specific futures contract closes earlier than 4:00 p.m., the futures contract is valued at the Official Settlement Price of the exchange. However, the underlying securities from which the futures contract value is derived are monitored until 4:00 p.m. to determine if fair valuation would provide a more accurate valuation.
C. Security transactions are recorded on the trade date for financial reporting purposes. Realized gains and losses from securities transactions are recorded using the identified cost basis. Proceeds from lawsuits related to investment holdings are recorded as realized gains in the respective Fund. Dividend income is recorded on the ex-dividend date, net of applicable taxes withheld by foreign countries. Taxable non-cash dividends are recorded as dividend income. Interest income, including amortization of premiums and accretion of discount, is accrued on a daily basis.
D. Interest and dividend income, most expenses, all realized gains and losses, and all unrealized gains and losses are allocated to the Classes based upon the value of the outstanding shares in each Class. Certain costs, such as service and distribution fees related to C-Class shares, are charged directly to such class. In addition, certain expenses have been allocated on a pro rata basis to the individual Funds in the Trust based upon the respective aggregate net assets of each Fund included in the Trust.
E. Upon entering into a futures contract, the Fund deposits and maintains as collateral such initial margin as required by the exchange on which the transaction is affected. Pursuant to the contract, the Fund agrees to receive from or pay to the broker an amount of cash equal to the daily fluctuation in value of the contract. Such receipts or payments are known as variation margin and are recorded by the Fund as unrealized gains or losses. When the contract is closed, the Fund records a realized gain or loss equal to the difference between the value of the contract at the time it was opened and the value at the time it was closed.
F. Distributions of net investment income and net realized gains, if any, are declared and paid at least annually. Distributions are recorded on the ex-dividend date and are determined in accordance with income tax regulations which may differ from U.S. generally accepted accounting principles.
30 | THE GUGGENHEIM FUNDS ANNUAL REPORT
| | |
| NOTES TO FINANCIAL STATEMENTS (continued) | | |
��
G. Throughout the normal course of business, the Funds enter into contracts that contain a variety of representations and warranties which provide general indemnifications. The Funds’ maximum exposure under these arrangements is unknown, as this would involve future claims that may be made against the Funds and/or their affiliates that have not yet occurred. However, based on experience, the Funds expect the risk of loss to be remote.
Investment securities and other assets and liabilities denominated in foreign currencies are translated into U.S. dollar amounts at the date of valuation. Purchases and sales of investment securities and income and expense items denominated in foreign currencies are translated into U.S. dollar amounts on the respective dates of such transactions. The Trust does not isolate that portion of the results of operations resulting from changes in foreign exchange rates on investments from the fluctuations arising from changes in market prices of securities held. Such fluctuations are included with the net realized and unrealized gain and loss from investments. Reported net realized foreign exchange gains or losses arise from sales of foreign currencies and currency gains or losses realized between the trade and settlement dates on investment transactions. Net unrealized exchange gains and losses arise from changes in the fair values of assets and liabilities other than investments in securities at the fiscal period end, resulting from changes in exchange rates.
As part of their investment strategies, the underlying funds may utilize short sales and a variety of derivative instruments including options, futures, options on futures and swap agreements. These investments involve, to varying degrees, elements of market risk and risks in excess of the amounts reflected in the underlying funds’ NAVs.
The Funds’ also directly utilize futures contracts as part of their investment strategies. These investments involve, to varying degrees, elements of market risk and risks in excess of the amounts recognized in the Statements of Assets and Liabilities.
A futures contract is an agreement to purchase (long) or sell (short) an agreed amount of securities or other instruments at a set price for delivery at a future date. There are significant risks associated with a Fund’s or an underlying fund’s use of futures contracts and related options, including (i) there may be an imperfect or no correlation between the changes in market value of the underlying asset and the prices of futures contracts; (ii) there may not be a liquid secondary market for a futures contract; (iii) trading
restrictions or limitations may be imposed by an exchange; and (iv) government regulations may restrict trading in futures contracts. When investing in futures, there is minimal counterparty credit risk to the Fund because futures are exchange-traded and the exchange’s clearinghouse, as counterparty to all exchange-traded futures, guarantees against default.
In conjunction with the use of futures, the Funds are required to maintain collateral in various forms. The Funds use, where appropriate, depending on the financial instrument utilized and the broker involved, margin deposits at the broker, cash and/or securities segregated at the custodian bank, discount notes, or the repurchase agreements allocated to each Fund.
The Trust has established counterparty credit guidelines and enters into transactions only with financial institutions of investment grade or better. The Trust monitors the counterparty credit risk.
| 3. | Fees and Other Transactions with Affiliates |
Gl manages the investment and reinvestment of the assets of each of the Funds in accordance with the investment objectives, policies, and limitations of each Fund, however, the Funds do not pay Gl a management fee. As part of its agreement with the Trust, Gl will pay all expenses of the Funds, including the cost of transfer agency, fund administration, audit and other services, excluding interest expense, taxes (expected to be de minimis), brokerage commissions and other expenses connected with the execution of portfolio transactions, short dividend expenses, and extraordinary expenses.
Each Fund indirectly bears a proportionate share of the total operating expenses (including investment management, shareholder servicing, custody, transfer agency, audit and other expenses) of the underlying funds in which the Fund invests.
RFS provides transfer agent, accounting and administrative services to the Funds. However, the related fees are paid by Gl, as noted above.
The Funds have not adopted a Distribution Plan or a Shareholder Services Plan with respect to A-Class shares and H-Class shares. Instead, the Funds invest in underlying funds that have a distribution plan that allows the underlying funds to pay distribution fees to RDL and other firms that provide distribution services (“Service Providers”). The underlying funds will pay distribution fees to RDL at an annual rate not to exceed 0.25% of average daily net assets, pursuant to Rule l2b-l under the 1940 Act, as amended. If a Service Provider provides distribution or shareholder services, RDL will, in turn, pay the Service Provider for the services it provides at an annual rate not to exceed 0.25% of the average daily net assets.
| | |
| | | THE GUGGENHEIM FUNDS ANNUAL REPORT | 31 |
| | |
| NOTES TO FINANCIAL STATEMENTS (continued) | | |
The Funds have adopted a Distribution and Shareholder Services Plan applicable to their C-Class shares that allows the Funds to pay annual distribution and service fees of 0.75% of the Funds’ C-Class shares average daily net assets. The annual 0.25% service fee compensates the shareholder’s financial advisor for providing ongoing services to the shareholder. The annual 0.50% distribution fee reimburses RDL for paying the shareholder’s financial advisor an ongoing sales commission. RDL advances the first year’s service and distribution fees to the financial advisor. RDL retains the service and distribution fees on accounts with no authorized dealer of record.
In accordance with U.S. generally accepted accounting principles, fair value is defined as the price that the Fund would receive to sell an investment or pay to transfer a liability in an orderly transaction with an independent buyer in the principal market, or in the absence of a principal market the most advantageous market for the investment or liability. A three-tier hierarchy is utilized to distinguish between (1) inputs that reflect the assumptions market participants would use in pricing an asset or liability developed based on market data obtained from sources independent of the reporting entity (observable inputs) and (2) inputs that reflect the reporting entity’s own assumptions about the assumptions market participants would use in pricing an asset or liability developed based on the best information available in the circumstances (unobservable inputs) and to establish classification of fair value measurements for disclosure purposes. Various inputs are used in determining the value of the Funds’ investments. The inputs are summarized in the three broad levels listed below:
Level 1 — quoted prices in active markets for identical securities.
Level 2 — other significant observable inputs (including quoted prices for similar securities, interest rates, prepayment speeds, credit risk, etc.).
Level 3 — significant unobservable inputs (including the fund’s own assumptions used to determine the fair value of investments).
The inputs or methodologies used for valuing securities are not necessarily an indication of the risk associated with investing in those securities.
The following table summarizes the inputs used to value the Funds’ net assets at March 31, 2012:
| | | | | | | | | | | | | | | | | | | | |
| | | Level 1
Investments
In Securities | | | Level 1
Other Financial
Instruments* | | | Level 2
Investments
In Securities | | | Level 3
Investments
In Securities | | | Total | |
Assets | | | | | | | | | | | | | | | | | | | | |
All-Asset Conservative Strategy Fund | | $ | 11,507,409 | | | $ | 60,374 | | | $ | 3,083,720 | | | $ | — | | | $ | 14,651,503 | |
All-Asset Moderate Strategy Fund | | | 20,219,161 | | | | 173,649 | | | | 3,624,507 | | | | — | | | | 24,017,317 | |
All-Asset Aggressive Strategy Fund | | | 9,320,880 | | | | 111,173 | | | | 1,648,857 | | | | — | | | | 11,080,910 | |
| | | | | |
Liabilities | | | | | | | | | | | | | | | | | | | | |
All-Asset Conservative Strategy Fund | | $ | — | | | $ | 30,446 | | | $ | — | | | $ | — | | | $ | 30,446 | |
All-Asset Moderate Strategy Fund | | | — | | | | 42,033 | | | | — | | | | — | | | | 42,033 | |
All-Asset Aggressive Strategy Fund | | | — | | | | 19,074 | | | | — | | | | — | | | | 19,074 | |
| * | Other financial instruments include futures contracts, which are reported as unrealized gain/loss at period end. |
For the year ended March 31, 2012, there were no transfers between levels.
The Funds transfer uninvested cash balances into a single joint account, the daily aggregate balance of which is invested in one or more repurchase agreements collateralized by obligations of the U.S. Treasury and U.S. Government Agencies. The collateral is in the possession of the Funds’ custodian and is evaluated to ensure that its market value exceeds, at a minimum, 102% of the original face amount of the repurchase agreements. Each Fund holds a pro rata share of the collateral based on the dollar amount of the repurchase agreement entered into by each Fund.
At March 31, 2012, the collateral for the repurchase agreements in the joint account was as follows:
| | | | | | | | | | | | | | | | | | |
Counterparty and Terms of Agreement | | Face Value | | | Repurchase Price | | | Collateral | | Par Value | | | Fair Value | |
Credit Suisse Group
0.01%
Due 04/02/12 | | $ | 57,898,514 | | | $ | 57,898,562 | | | U.S. Treasury Note
1.375%
11/30/2015 | | $ | 57,159,300 | | | $ | 59,056,509 | |
| | |
32 | THE GUGGENHEIM FUNDS ANNUAL REPORT | | |
NOTES TO FINANCIAL STATEMENTS (continued)
In the event of counterparty default, the Funds have the right to collect the collateral to offset losses incurred. There is potential loss to the Funds in the event the Funds are delayed or prevented from exercising their rights to dispose of the collateral securities, including the risk of a possible decline in the value of the underlying securities during the period while the Funds seek to assert their rights. The Funds’ investment advisor, acting under the supervision of the Board of Trustees, reviews the value of the collateral and the creditworthiness of those banks and dealers with which the Funds enter into repurchase agreements to evaluate potential risks.
| 6. | Derivative Investment Holdings Categorized by Risk Exposure |
U.S. generally accepted accounting principles requires disclosures to enable investors to better understand how and why the Funds use derivative instruments, how these derivative instruments are accounted for and their effects on the Funds’ financial position and results of operations. None of the derivatives currently held by the Funds are being used as hedging instruments.
During the year ended March 31, 2012, the Funds sought to gain exposure to their respective investment strategies by investing in currency and financial-linked derivative instruments. The following table represents the notional amount of derivative instruments outstanding, as an approximate percentage of the Funds’ net assets on a daily basis, while the risk to the Fund is limited to the profit earned on such derivatives.
| | | | | | | | |
| | | Approximate percentage of Fund’s
net assets on a daily basis | |
Fund | | Long | | | Short | |
All-Asset Conservative Strategy Fund | | | 30 | % | | | 10 | % |
All-Asset Moderate Strategy Fund | | | 30 | % | | | 10 | % |
All-Asset Aggressive Strategy Fund | | | 40 | % | | | 10 | % |
The following is a summary of the location of derivative investments on the Funds’ Statements of Assets and Liabilities as of March 31, 2012:
| | | | |
| Location on the Statements of Assets and Liabilities |
Derivative Investments Type | | Asset Derivatives | | Liability Derivatives |
Equity/Interest rate/Currency contracts | | Variation margin | | Variation margin |
The following table sets forth the fair value of the Funds’ derivative investments categorized by primary risk exposure at March 31, 2012:
| | | | | | | | | | | | | | | | |
| | | Asset Derivative Investments Value | |
Fund | | Futures
Equity
Contracts* | | | Futures
Interest Rate
Contracts* | | | Futures
Currency
Contracts* | | | Total Value at
March 31, 2012 | |
All-Asset Conservative Strategy Fund | | $ | 58,204 | | | $ | — | | | $ | 2,170 | | | $ | 60,374 | |
All-Asset Moderate Strategy Fund | | | 171,479 | | | | — | | | | 2,170 | | | | 173,649 | |
All-Asset Aggressive Strategy Fund | | | 108,792 | | | | 211 | | | | 2,170 | | | | 111,173 | |
| |
| | | Liability Derivative Investments Value | |
Fund | | Futures
Equity
Contracts* | | | Futures
Interest Rate
Contracts* | | | Futures
Currency
Contracts* | | | Total Value at
March 31, 2012 | |
All-Asset Conservative Strategy Fund | | $ | 10,441 | | | $ | 8,771 | | | $ | 11,234 | | | $ | 30,446 | |
All-Asset Moderate Strategy Fund | | | 21,455 | | | | 1,293 | | | | 19,285 | | | | 42,033 | |
All-Asset Aggressive Strategy Fund | | | 7,840 | | | | — | | | | 11,234 | | | | 19,074 | |
| * | Includes cumulative appreciation (depreciation) of futures contracts as reported on the Schedules of Investments. Only current day’s variation margin is reported within the Statements of Assets and Liabilities. |
The following is a summary of the location of derivative investments on the Funds’ Statements of Operations for the year ended March 31, 2012:
| | |
Derivative Investment Type | | Location of Gain (Loss) on Derivatives |
Equity/Interest rate/Currency contracts | | Net realized gain (loss) on futures contracts |
| | Net change in unrealized appreciation (depreciation) on futures contracts |
THE GUGGENHEIM FUNDS ANNUAL REPORT | 33
NOTES TO FINANCIAL STATEMENTS (continued)
The following is a summary of the Funds’ realized gain (loss) and change in unrealized appreciation (depreciation) on derivative investments recognized on the Statements of Operations categorized by primary risk exposure for the year ended March 31, 2012:
Realized Gain (Loss) on Derivative Investments Recognized on the Statements of Operations
| | | | | | | | | | | | | | | | |
Fund | | Futures
Equity
Contracts | | | Futures
Interest Rate
Contracts | | | Futures
Currency
Contracts | | | Total | |
All-Asset Conservative Strategy Fund | | $ | (57,828 | ) | | $ | 104,352 | | | $ | 13,449 | | | $ | 59,973 | |
All-Asset Moderate Strategy Fund | | | (10,758 | ) | | | 109,588 | | | | 39,069 | | | | 137,899 | |
All-Asset Aggressive Strategy Fund | | | (2,809 | ) | | | 25,188 | | | | 4,079 | | | | 26,458 | |
|
| Change in Unrealized Appreciation (Depreciation) on Derivative Investments Recognized on the Statements of Operations | |
| | | | |
Fund | | Futures
Equity
Contracts | | | Futures
Interest Rate
Contracts | | | Futures
Currency
Contracts | | | Total | |
All-Asset Conservative Strategy Fund | | $ | 34,955 | | | $ | (5,404 | ) | | $ | (9,064 | ) | | $ | 20,487 | |
All-Asset Moderate Strategy Fund | | | 95,373 | | | | 1,939 | | | | (17,115 | ) | | | 80,197 | |
All-Asset Aggressive Strategy Fund | | | 60,110 | | | | 1,654 | | | | (9,064 | ) | | | 52,700 | |
| 7. | Federal Income Tax Information |
The Funds intend to comply with the provisions of Subchapter M of the Internal Revenue Code applicable to regulated investment companies and will distribute substantially all taxable net investment income and capital gains sufficient to relieve the Funds from all, or substantially all, federal income, excise and state income taxes. Therefore, no provision for federal or state income tax is required.
Tax positions taken or expected to be taken in the course of preparing the Funds’ tax returns are evaluated to determine whether the tax positions are “more-likely-than-not” of being sustained by the applicable tax authority. Tax positions not deemed to meet the more-likely-than-not threshold would be recorded as a tax benefit or expense in the current year. Management has analyzed the Funds’ tax positions taken or to be taken on Federal income tax returns for all open tax years (fiscal years 2009-2012), and has concluded that no provision for income tax is required in the Funds’ financial statements.
The RIC Modernization Act of 2010 was signed into law on December 22, 2010 and seeks to simplify some of the tax provisions applicable to regulated investment companies and the tax reporting to their shareholders, and to improve the tax efficiency of certain fund structures. The changes are generally effective for taxable years beginning after the date of enactment.
One of the more prominent changes addresses capital loss carryforwards. Funds will be permitted to carry forward capital losses incurred in taxable years beginning after December 22, 2010 for an unlimited period. However, any losses incurred during those future taxable years will be required to be utilized prior to the losses incurred in pre-enactment taxable years. Under pre-enactment law, capital losses could be carried forward for eight years, and carried forward as short-term capital, irrespective of the character of the original loss. As a result of this ordering rule, pre-enactment capital loss carryforwards may potentially expire unused. Additionally, post-enactment capital losses that are carried forward will retain their character as either short-term or long-term capital losses rather than being considered all short-term as under previous law.
Tax basis capital losses in excess of capital gains are carried forward to offset future net capital gains. For the year ended March 31, 2012, the following capital loss carryforward amounts were used:
| | | | |
Fund | | Amount | |
All-Asset Conservative Strategy Fund | | $ | 293,956 | |
All-Asset Moderate Strategy Fund | | | 929,612 | |
All-Asset Aggressive Strategy Fund | | | 529,215 | |
The tax character of distributions paid during the year ended March 31, 2012 was as follows:
| | | | | | | | | | | | |
| | | Ordinary | | | Long-Term | | | Total | |
Fund | | Income | | | Capital Gain | | | Distributions | |
All-Asset Conservative Strategy Fund | | $ | 181,985 | | | $ | — | | | $ | 181,985 | |
All-Asset Moderate Strategy Fund | | | 245,562 | | | | — | | | | 245,562 | |
All-Asset Aggressive Strategy Fund | | | 106,400 | | | | — | | | | 106,400 | |
34 | THE GUGGENHEIM FUNDS ANNUAL REPORT
NOTES TO FINANCIAL STATEMENTS (concluded)
The tax character of distributions paid during the year ended March 31, 2011 was as follows:
| | | | | | | | | | | | |
Fund | | Ordinary
Income | | | Long-Term
Capital Gain | | | Total
Distributions | |
All-Asset Conservative Strategy Fund | | $ | 135,363 | | | $ | — | | | $ | 135,363 | |
All-Asset Moderate Strategy Fund | | | 215,068 | | | | — | | | | 215,068 | |
All-Asset Aggressive Strategy Fund | | | 55,895 | | | | — | | | | 55,895 | |
Note: For federal income tax purposes, short-term capital gain distributions are treated as ordinary income distributions.
The tax character of distributable earnings/(accumulated losses) at March 31, 2012 was as follows:
| | | | | | | | | | | | | | | | |
Fund | | Undistributed
Ordinary
Income | | | Undistributed
Long-Term
Capital Gain | | | Net Unrealized
Appreciation
(Depreciation) | | | Capital Loss
Carryforward1 | |
All-Asset Conservative Strategy Fund | | $ | 146,979 | | | $ | — | | | $ | 1,137,539 | | | $ | (1,436,888 | ) |
All-Asset Moderate Strategy Fund | | | 141,148 | | | | — | | | | 2,689,303 | | | | (6,442,665 | ) |
All-Asset Aggressive Strategy Fund | | | 34,691 | | | | — | | | | 1,389,870 | | | | (2,766,495 | ) |
Capital Loss Carryforward amounts may be limited due to Federal income tax regulations.
| 1 | A summary of the expiration of the aforementioned Capital Loss Carryforward is as follows: |
| | | | | | | | | | | | |
Fund | | Expires in
2017 | | | Expires in
2018 | | | Total
Capital Loss
Carryforward | |
All-Asset Conservative Strategy Fund | | $ | (272,291 | ) | | $ | (1,164,597 | ) | | $ | (1,436,888 | ) |
All-Asset Moderate Strategy Fund | | | (3,058,305 | ) | | | (3,384,360 | ) | | | (6,442,665 | ) |
All-Asset Aggressive Strategy Fund | | | (1,337,352 | ) | | | (1,429,143 | ) | | | (2,766,495 | ) |
Net investment income and net realized gains (losses) may differ for financial statement and tax purposes because of temporary or permanent book/tax differences. These differences are typically due to post-October losses, losses deferred due to wash sales, tax treatment of payments from credit default swaps, utilization of earnings and profits on shareholder redemptions, foreign currency gains and losses, and the “mark-to-market” of certain passive foreign investment companies (PFICs) for tax purposes. Additional differences may result from tax treatment of net investment losses and expired capital loss carryforwards. To the extent these differences are permanent, reclassifications are made to the appropriate equity accounts in the period that the differences arise. These reclassifications have no effect on net assets or NAV per share.
On the Statements of Assets and Liabilities the following reclassifications were made for permanent book/tax differences:
| | | | | | | | | | | | |
Fund | | Paid In
Capital | | | Undistributed
Net Investment
Income | | | Accumulated
Net Realized
Gain (Loss) | |
All-Asset Conservative Strategy Fund | | $ | — | | | $ | 9,872 | | | $ | (9,872 | ) |
All-Asset Moderate Strategy Fund | | | (1 | ) | | | 21,359 | | | | (21,358 | ) |
All-Asset Aggressive Strategy Fund | | | — | | | | 9,803 | | | | (9,803 | ) |
At March 31, 2012, the cost of securities for Federal income tax purposes, the aggregate gross unrealized gain for all securities for which there was an excess of value over tax cost and the aggregate gross unrealized loss for all securities for which there was an excess of tax cost over value, were as follows:
| | | | | | | | | | | | | | | | |
Fund | | Tax
Cost | | | Tax
Unrealized
Gain | | | Tax
Unrealized
Loss | | | Net
Unrealized
Gain | |
All-Asset Conservative Strategy Fund | | $ | 13,450,027 | | | $ | 1,166,035 | | | $ | (24,933 | ) | | $ | 1,141,102 | |
All-Asset Moderate Strategy Fund | | | 21,143,435 | | | | 2,738,786 | | | | (38,553 | ) | | | 2,700,233 | |
All-Asset Aggressive Strategy Fund | | | 9,579,492 | | | | 1,421,090 | | | | (30,845 | ) | | | 1,390,245 | |
| 8. | Securities Transactions |
For the year ended March 31, 2012, the cost of purchases and proceeds from sales of investment securities, excluding government securities and short-term investments, were:
| | | | | | | | |
| | | Purchases | | | Sales | |
All-Asset Conservative Strategy Fund | | $ | 15,135,879 | | | $ | 14,319,765 | |
All-Asset Moderate Strategy Fund | | | 16,348,901 | | | | 20,134,465 | |
All-Asset Aggressive Strategy Fund | | | 8,207,075 | | | | 12,307,008 | |
THE GUGGENHEIM FUNDS ANNUAL REPORT | 35
REPORT OF INDEPENDENT REGISTERED PUBLIC ACCOUNTING FIRM
To the Board of Trustees and Shareholders
of Rydex Series Funds:
We have audited the accompanying statements of assets and liabilities, including the schedules of investments, of All-Asset Conservative Strategy Fund, All-Asset Moderate Strategy Fund, and All-Asset Aggressive Strategy Fund (three of the series constituting the Rydex Series Funds) (the “Funds”) as of March 31, 2012, and the related statements of operations for the year then ended, the statements of changes in net assets for each of the two years in the period then ended, and the financial highlights for each of the five years in the period then ended. These financial statements and financial highlights are the responsibility of the Funds’ management. Our responsibility is to express an opinion on these financial statements and financial highlights based on our audits.
We conducted our audits in accordance with the standards of the Public Company Accounting Oversight Board (United States). Those standards require that we plan and perform the audit to obtain reasonable assurance about whether the financial statements and financial highlights are free of material misstatement. We were not engaged to perform an audit of the Funds’ internal control over financial reporting. Our audits included consideration of internal control over financial reporting as a basis for designing audit procedures that are appropriate in the circumstances, but not for the purpose of expressing an opinion on the effectiveness of the Funds’ internal control over financial reporting. Accordingly, we express no such opinion. An audit also includes examining, on a test basis, evidence supporting the amounts and disclosures in the financial statements and financial highlights, assessing the accounting principles used and significant estimates made by management, as well as evaluating the overall financial statement presentation. Our procedures included confirmation of securities owned as of March 31, 2012, by correspondence with the custodian, the transfer agent of the underlying funds and brokers or by other appropriate auditing procedures where replies from brokers were not received. We believe that our audits provide a reasonable basis for our opinion.
In our opinion, the financial statements and financial highlights referred to above present fairly, in all material respects, the financial position of the above listed Funds at March 31, 2012, the results of their operations for the year then ended, the changes in their net assets for each of the two years in the period then ended, and their financial highlights for each of the five years in the period then ended, in conformity with U.S. generally accepted accounting principles.

McLean, Virginia
May 24, 2012
36 | THE GUGGENHEIM FUNDS ANNUAL REPORT
OTHER INFORMATION (Unaudited)
Tax Information
This information is being provided as required by the Internal Revenue Code. Amounts shown may differ from those elsewhere in the report because of differences in tax and financial reporting practice.
Of the taxable ordinary income distributions paid during the fiscal year ending March 31, 2012, the following funds had the corresponding percentages qualify for the dividends received deduction for corporations:
| | | | |
Fund | | % Qualifying | |
All-Asset Conservative Strategy Fund | | | 2.24 | % |
All-Asset Moderate Strategy Fund | | | 5.23 | % |
All-Asset Aggressive Strategy Fund | | | 8.95 | % |
Additionally, the following amounts of taxable ordinary income dividends paid during the fiscal year qualified for the lower income tax rate available to individuals under the Jobs and Growth Tax Relief Reconciliation Act of 2003.
| | | | |
Fund | | % Qualifying | |
All-Asset Conservative Strategy Fund | | | 2.22 | % |
All-Asset Moderate Strategy Fund | | | 5.17 | % |
All-Asset Aggressive Strategy Fund | | | 8.84 | % |
Proxy Voting Information
A description of the policies and procedures that the Trust uses to determine how to vote proxies relating to securities held in the Funds’ portfolios is available, without charge and upon request, by calling 1.800.820.0888. This information is also available from the EDGAR database on the SEC’s website at http://www.sec.gov.
Information regarding how the Funds voted proxies relating to portfolio securities during the most recent 12-month period ended June 30 is available without charge, upon request, by calling 1.800.820.0888. This information is also available from the EDGAR database on the SEC’s website at http://www.sec.gov.
At a special meeting of shareholders held on January 5, 2012, the shareholders of the Funds voted on whether to approve a new investment advisory agreement between Rydex Series Funds and Security Investors, LLC. A description of the number of shares voted is as follows:
| | | | | | | | | | | | |
Fund | | Shares For | | | Shares Against | | | Shares Abstained | |
All-Asset Conservative Strategy Fund | | | 614,913 | | | | 16,698 | | | | 9,143 | |
All-Asset Moderate Strategy Fund | | | 1,172,915 | | | | 14,006 | | | | 29,955 | |
All-Asset Aggressive Strategy Fund | | | 464,984 | | | | 8,561 | | | | 13,092 | |
At a special meeting of shareholders held on November 22, 2011, the shareholders of the Funds also voted on whether to approve the election of nominees to the Board of Trustees. A description of the number of shares voted is as follows:
| | | | | | | | | | | | | | | | |
| Donald C. Cacciapaglia | | | | | | Corey A. Colehour | | | | | | J. Kenneth Dalton | | | | |
For | | | 1,443,600,903 | | | For | | | 1,444,213,017 | | | For | | | 1,444,422,997 | |
Withhold | | | 23,402,732 | | | Withhold | | | 22,790,618 | | | Withhold | | | 22,580,638 | |
Total | | | 1,467,003,635 | | | Total | | | 1,467,003,635 | | | Total | | | 1,467,003,635 | |
| | | | | |
| John O. Demaret | | | | | | Richard M. Goldman | | | | | | Werner E. Keller | | | | |
For | | | 1,445,255,754 | | | For | | | 1,443,668,595 | | | For | | | 1,445,494,273 | |
Withhold | | | 21,747,881 | | | Withhold | | | 23,335,040 | | | Withhold | | | 21,509,362 | |
Total | | | 1,467,003,635 | | | Total | | | 1,467,003,635 | | | Total | | | 1,467,003,635 | |
| | | | | |
| Thomas F. Lydon | | | | | | Patrick T. McCarville | | | | | | Roger Somers | | | | |
For | | | 1,444,219,448 | | | For | | | 1,445,357,773 | | | For | | | 1,443,486,735 | |
Withhold | | | 22,784,187 | | | Withhold | | | 21,645,862 | | | Withhold | | | 23,516,900 | |
Total | | | 1,467,003,635 | | | Total | | | 1,467,003,635 | | | Total | | | 1,467,003,635 | |
At a special meeting of shareholders held on January 26, 2012, the shareholders of the Funds also voted on whether to approve a “manager of managers” arrangement for each of the Funds. Although shareholder votes were placed, not enough votes were received to meet the minimum requirements to constitute a majority vote. As such, the matter was closed.
THE GUGGENHEIM FUNDS ANNUAL REPORT | 37
OTHER INFORMATION (Unaudited) (concluded)
Quarterly Portfolio Schedules Information
The Trust files its complete schedule of portfolio holdings with the SEC for the first and third quarters of each fiscal year on
Form N-Q; which are available on the SEC’s website at http://www.sec.gov. The Funds’ Forms N-Q may be reviewed and copied at the SEC’s Public Reference Room in Washington, DC, and that information on the operation of the Public Reference Room may be obtained by calling 1-800-SEC-0330. Copies of the portfolio holdings are also available to shareholders, without charge and upon request, by calling 1.800.820.0888.
Office Locations
The offices of Guggenheim Investments can be found in the following locations:
40 East 52nd Street
16th Floor
New York, NY 10022
(Headquarters)
Four Irvington Centre
805 King Farm Boulevard
Suite 600
Rockville, MD 20850
9401 Indian Creek Parkway
40 Corporate Woods
Suite 850
Overland Park, KS 66210
Guggenheim Transaction
On September 20, 2011, Guggenheim Capital, LLC agreed to purchase the indirect holding company of Security Investors, LLC, the Fund’s investment manager (the “Investment Manager”) (the “Transaction”). Guggenheim Capital, LLC’s subsidiary, Guggenheim Partners, LLC (“Guggenheim”), is a global, independent, privately-held, diversified financial services firm with more than 1,500 dedicated professionals. The Transaction closed on February 29, 2012.
The Transaction should not result in material changes to the day-to-day management and operation of the Funds or any increase in fees.
In anticipation of the Transaction, the Board of Trustees of the Funds (the “Board”) called a special meeting of shareholders (the “Meeting”), at which shareholders of the Funds of record as of October 3, 2011 were asked to consider the approval of a new investment management agreement between the Funds and the Investment Manager (the “New Agreement”). This approval was necessary because, under the Investment Company Act of 1940 (the “1940 Act”), the Transaction could have resulted in the termination of the Funds’ current investment management agreement with the Investment Manager (the “Current Agreement”). The Funds’ shareholders approved the New Agreement, the terms of which are substantially identical to the corresponding Current Agreement, except with respect to the date of execution, and the New Agreement will take effect if the Transaction is completed.
Election of Board Members
The Board also approved a proposal to elect nine individuals to the Board. The Board proposed the election of the following nominees: Donald C. Cacciapaglia, Corey A. Colehour, J. Kenneth Dalton, John O. Demaret, Richard M. Goldman, Werner E. Keller, Thomas F. Lydon, Patrick T. McCarville and Roger Somers. Each of the nominees, other than Mr. Cacciapaglia, currently serves as a Trustee. In connection with the Transaction, the Board believes that expanding the Board to include Mr. Cacciapaglia, who is a member of senior management of Guggenheim’s investment management business, and who would serve on other boards in the Guggenheim Investments family of funds, would be appropriate. The Trusts’ shareholders ultimately approved the aforementioned proposal.
| | |
| 38 | THE GUGGENHEIM FUNDS ANNUAL REPORT | | |
INFORMATION ON BOARD OF TRUSTEES AND OFFICERS (Unaudited)
A Board of Trustees oversees the Trust, as well as other trusts of GI, in which its members have no stated term of service, and continue to serve after election until resignation. The Statement of Additional Information includes further information about Fund Trustees and Officers, and can be obtained without charge by calling 800.820.0888.
All Trustees and Officers may be reached c/o Guggenheim Investments, 805 King Farm Boulevard, Suite 600, Rockville, MD 20850.
TRUSTEE AND OFFICER
| | | | |
Name, Position and Year of Birth | | Length of Service As Trustee (Year Began) | | Number of Funds Overseen |
Donald C. Cacciapaglia* | | Rydex Series Funds – 2012 | | 148 |
Trustee, President (1951) | | Rydex Variable Trust – 2012 | | |
| | Rydex Dynamic Funds – 2012 | | |
| | Rydex ETF Trust – 2012 | | |
Principal Occupations During Past Five Years: Security Investors, LLC: President and CEO from April 2012 to present; Guggenheim Investments: President and Chief Administrative Officer from February 2010 to present; Channel Capital Group, Inc.: Chairman and CEO from April 2002 to February 2010.
INDEPENDENT TRUSTEES
| | | | |
Name, Position and Year of Birth | | Length of Service As Trustee (Year Began) | | Number of Funds Overseen |
Corey A. Colehour | | Rydex Series Funds – 1993 | | 148 |
Trustee (1945) | | Rydex Variable Trust – 1998 | | |
| | Rydex Dynamic Funds – 1999 | | |
| | Rydex ETF Trust – 2003 | | |
Principal Occupations During Past Five Years: Retired; Member of the Audit, Governance and Nominating Committees (1995 to present)
| | | | |
J. Kenneth Dalton | | Rydex Series Funds – 1995 | | 148 |
Trustee (1941) | | Rydex Variable Trust – 1998 | | |
| | Rydex Dynamic Funds – 1999 | | |
| | Rydex ETF Trust – 2003 | | |
Principal Occupations During Past Five Years: Retired; Member of the Governance and Nominating Committees (1995 to present); Chairman of the Audit Committee (1997 to present); Member of the Risk Oversight Committee (2010 to present)
| | | | |
John O. Demaret | | Rydex Series Funds – 1997 | | 148 |
Trustee, Chairman of the | | Rydex Variable Trust – 1998 | | |
Board (1941) | | Rydex Dynamic Funds – 1999 | | |
| | Rydex ETF Trust – 2003 | | |
Principal Occupations During Past Five Years: Retired; Member of the Audit Committee (1997 to present); Member of the Risk Oversight Committee (2010 to present)
| | | | |
Werner E. Keller | | Rydex Series Funds – 2005 | | 148 |
Trustee (1940) | | Rydex Variable Trust – 2005 | | |
| | Rydex Dynamic Funds – 2005 | | |
| | Rydex ETF Trust – 2005 | | |
Principal Occupations During Past Five Years: Founder and President of Keller Partners, LLC (registered investment adviser) (2005 to present); Member of the Audit, Governance and Nominating Committees (2005 to present); Chairman and Member of the Risk Oversight Committee (2010 to present)
| | | | |
Thomas F. Lydon, Jr. | | Rydex Series Funds – 2005 | | 148 |
Trustee (1960) | | Rydex Variable Trust – 2005 | | |
| | Rydex Dynamic Funds – 2005 | | |
| | Rydex ETF Trust – 2005 | | |
Principal Occupations During Past Five Years: President, Global Trends Investments (1996 to present); Member of the Audit, Governance and Nominating Committees (2005 to present)
THE GUGGENHEIM FUNDS ANNUAL REPORT | 39
INFORMATION ON BOARD OF TRUSTEES AND OFFICERS (Unaudited) (continued)
INDEPENDENT TRUSTEES – concluded
| | | | |
Name, Position and Year of Birth | | Length of Service As Trustee (Year Began) | | Number of Funds Overseen |
Patrick T. McCarville | | Rydex Series Funds – 1997 | | 148 |
Trustee (1942) | | Rydex Variable Trust – 1998 | | |
| | Rydex Dynamic Funds – 1999 | | |
| | Rydex ETF Trust – 2003 | | |
Principal Occupations During Past Five Years: CEO, Par Industries, Inc., d/b/a Par Leasing (1977 to 2010); Chairman of the Governance and Nominating Committees (1997 to present); Member of the Audit Committee (1997 to present)
| | | | |
Roger Somers | | Rydex Series Funds – 1993 | | 148 |
Trustee (1944) | | Rydex Variable Trust – 1998 | | |
| | Rydex Dynamic Funds – 1999 | | |
| | Rydex ETF Trust – 2003 | | |
Principal Occupations During Past Five Years: Founder and CEO of Arrow Limousine (1965 to present); Member of the Audit, Governance and Nominating Committees (1995 to present)
EXECUTIVE OFFICERS
| | |
Name, Position and Year of Birth | | Principal Occupations During Past Five Years |
Michael P. Byrum* Vice President (1970) | | Current: President, Security Benefit Asset Management Holdings, LLC; Senior Vice President, Security Investors, LLC; President and Chief Investment Officer, Rydex Holdings, LLC; Director and Chairman of the Board, Advisor Research Center, Inc.; Manager, Rydex Specialized Products, LLC |
| |
| | Previous: Rydex Distributors, LLC (f/k/a Rydex Distributors, Inc.), Vice President (2009); Rydex Fund Services, LLC, Director (2009-2010), Secretary (2002-2010), Executive Vice President (2002-2006); Rydex Advisors, LLC (f/k/a PADCO Advisors, Inc.), Director (2008-2010), Chief Investment Officer (2006-2010), President (2004-2010), Secretary (2002-2010); Rydex Advisors II, LLC (f/k/a PADCO Advisors II, Inc.), Director (2008-2010), Chief Investment Officer (2006-2010), President (2004-2010), Secretary (2002-2010); Rydex Capital Partners, LLC, President and Secretary (2003-2007); Rydex Capital Partners II, LLC, (2003- 2007); Rydex Holdings, LLC (f/k/a Rydex Holdings, Inc.), Secretary (2005-2008), Executive Vice President (2005-2006); Advisor Research Center, Inc., Secretary (2006-2009), Executive Vice President (2006); Rydex Specialized Products, LLC, Secretary (2005-2008) |
| |
Nikolaos Bonos* Vice President and Treasurer (1963) | | Current: Senior Vice President, Security Investors, LLC; Chief Executive Officer and Manager, Rydex Specialized Products, LLC; Chief Executive Officer and President, Rydex Fund Services, LLC; Vice President, Rydex Holdings, LLC; Treasurer, SBL Fund; Security Equity Fund; Security Income Fund; Security Large Cap Value Fund and Security Mid Cap Growth Fund; Vice President, Security Benefit Asset Management Holdings, LLC |
| |
| | Previous: Security Global Investors, LLC, Senior Vice President (2010-2011); Rydex Advisors, LLC (f/k/a PADCO Advisors, Inc.) Senior Vice President (2006-2011); Rydex Fund Services, LLC (f/k/a Rydex Fund Services, Inc.), Director (2009), Senior Vice President (2003-2006); Rydex Specialized Products, LLC, Chief Financial Officer (2005-2009) |
| |
Elisabeth Miller* Chief Compliance Officer (1968) | | Current: Chief Compliance Officer, Rydex Series Funds, Rydex Dynamic Funds, Rydex Variable Trust, Rydex ETF Trust, Security Equity Fund, Security Income Fund, Security Large Cap Value Fund, Security Mid Cap Growth Fund, SBL Fund, Security Investors, LLC, and Rydex Distributors, LLC Previous: Senior Manager, Security Investors, LLC and Rydex Distributors, LLC (2004-2009). |
| | |
| 40 | THE GUGGENHEIM FUNDS ANNUAL REPORT | | |
INFORMATION ON BOARD OF TRUSTEES AND OFFICERS (Unaudited) (concluded)
EXECUTIVE OFFICERS – concluded
| | |
Name, Position and Year of Birth | | Principal Occupations During Past Five Years |
Amy J. Lee* Vice President and Assistant Secretary (1960) | | Current: Senior Vice President and Secretary, Security Investors, LLC; Secretary and Chief Compliance Officer, Security Distributors, Inc.; Vice President, Associate General Counsel and Assistant Secretary, Security Benefit Life Insurance Company and Security Benefit Corporation; Associate General Counsel, First Security Benefit Life Insurance and Annuity of New York; Vice President and Secretary, SBL Fund; Security Equity Fund; Security Income Fund; Security Large Cap Value Fund and Security Mid Cap Growth Fund; Vice President and Secretary, Rydex Holdings, LLC; Secretary, Advisor Research Center, Inc., Rydex Specialized Products, LLC, Rydex Distributors, LLC and Rydex Fund Services, LLC; Assistant Secretary, Security Benefit Clinic and Hospital |
| |
| | Previous: Security Global Investors, LLC, Senior Vice President and Secretary (2007-2011); Rydex Advisors, LLC (f/k/a PADCO Advisors, Inc.) and Rydex Advisors II, LLC (f/k/a PADCO Advisors II, Inc.), Senior Vice President and Secretary (2010-2011); Brecek and Young Advisors, Inc., Director (2004-2008) |
| |
Joseph M. Arruda* Assistant Treasurer (1966) | | Current: Assistant Treasurer, SBL Fund; Security Equity Fund; Security Income Fund; Security Large Cap Value Fund and Security Mid Cap Growth Fund; Vice President, Security Investors, LLC; Chief Financial Officer and Manager, Rydex Specialized Products, LLC |
| |
| | Previous: Security Global Investors, LLC, Vice President (2010-2011); Rydex Advisors, LLC (f/k/a PADCO Advisors, Inc.) and Rydex Advisors II, LLC (f/k/a PADCO Advisors II, Inc.), Vice President (2004-2011) |
| * | Officers of the Funds are deemed to be “interested persons” of the Trust, within the meaning of Section 2(a)(19) of the 1940 Act, inasmuch as this person is affiliated with Security Global Investors. |
THE GUGGENHEIM FUNDS ANNUAL REPORT | 41
GUGGENHEIM INVESTMENTS PRIVACY POLICIES
Rydex Funds, Guggenheim Funds, Rydex Investments, Rydex Distributors, Inc., Security Investors, LLC, Security Distributors, Inc. and Rydex Advisory Services (Collectively “Guggenheim Investments”)
Our Commitment to You
When you become a Guggenheim Investments investor, you entrust us with not only your hard-earned money but also with personal and financial information about you. We recognize that your relationship with us is based on trust and that you expect us to act responsibly and in your best interests. Because we have access to this private information about you, we hold ourselves to the highest standards in its safe-keeping and use. This means, most importantly, that we do not sell client information to anyone—whether it is your personal information or if you are a current or former Guggenheim Investments client.
The Information We Collect About You
In the course of doing business with shareholders and investors, we collect nonpublic personal information about you. You typically provide personal information when you complete a Guggenheim Investments account application or when you request a transaction that involves Rydex and Guggenheim Investments funds or one of the Guggenheim Investments affiliated companies. “Nonpublic personal information” is personally identifiable private information about you. For example, it includes information regarding your name and address, Social Security or taxpayer identification number, assets, income, account balance, bank account information and investment activity (e.g., purchase and redemption history).
How We Handle Your Personal Information
As emphasized above, we do not sell information about current or former clients or their accounts to third parties. Nor do we share such information, except when necessary to complete transactions at your request or to make you aware of related investment products and services that we offer. Additional details about how we handle your personal information are provided below. To complete certain transactions or account changes that you direct, it may be necessary to provide identifying information to companies, individuals or groups that are not affiliated with Guggenheim Investments. For example, if you ask to transfer assets from another financial institution to Guggenheim Investments, we will need to provide certain information about you to that company to complete the transaction. To alert you to other Guggenheim Investments investment products and services, we may share your information within the Guggenheim Investments family of affiliated companies. This would include, for example, sharing your information within Guggenheim Investments so we can make you aware of new Rydex and Guggenheim Investments funds or the services offered through another Guggenheim Investments affiliated company. In certain instances, we may contract with nonaffiliated companies to perform services for us. Where necessary, we will disclose information we have about you to these third parties. In all such cases, we provide the third party with only the information necessary to carry out its assigned responsibilities and only for that purpose. And we require these third parties to treat your private information with the same high degree of confidentiality that we do. In certain instances, we may share information with other financial institutions regarding individuals and entities in response to the U.S.A. Patriot Act. Finally, we will release information about you if you direct us to do so, if we are compelled by law to do so or in other circumstances permitted by law.
Opt Out Provisions
We do not sell your personal information to anyone. The law allows you to “opt out” of only certain kinds of information sharing with third parties. The firm does not share personal information about you with any third parties that triggers this opt-out right. This means YOU ARE ALREADY OPTED OUT.
How We Protect Privacy Online
Our concern for the privacy of our shareholders also extends to those who use our web site, www.rydex-sgi.com. Our web site uses some of the most secure forms of online communication available, including encryption technology, Secure Socket Layer (SSL) protocol, firewalls and user names and passwords. These technologies provide a high level of security and privacy when you access your account information or initiate online transactions. The Guggenheim Investments web site offers customized features that require our use of “http cookies”—tiny pieces of
42 | THE GUGGENHEIM FUNDS ANNUAL REPORT
GUGGENHEIM INVESTMENTS PRIVACY POLICIES (concluded)
information that we ask your browser to store. However, we make very limited use of these cookies. We only use cookies for session management and security features on the Guggenheim Investments web site. We do not use them to pull data from your hard drive, to learn your email address, or to view data in cookies created by other web sites. We will not share the information in our cookies or give others access to it. See the legal information area on our web site for more details about web site security and privacy features.
How We Safeguard Your Personal Information
We restrict access to nonpublic personal information about shareholders to our employees and in some cases to third parties (for example, the service providers described above) as permitted by law. We maintain strict physical, electronic and procedural safeguards that comply with federal standards to guard your nonpublic personal information.
We’ll Keep You Informed
As required by federal law, we will notify shareholders of our privacy policy annually. We reserve the right to modify this policy at any time, but rest assured that if we do change it, we will tell you promptly. You will also be able to access our privacy policy from our web site at www.rydex-sgi.com. Should you have any questions regarding our privacy policy, contact us at 800.820.0888 or 301.296.5100.
THE GUGGENHEIM FUNDS ANNUAL REPORT | 43
This page intentionally left blank.
This page intentionally left blank.
805 King Farm Boulevard, Suite 600
Rockville, MD 20850
www.rydex-sgi.com
800.820.0888
RSEP-ANN-0312x0313
Item 2. Code of Ethics.
The registrant’s Board of Trustees has adopted a code of ethics that applies to the registrant’s principal executive officer and principal financial officer. No substantive amendments were approved or waivers were granted to the Code during the period covered by this report. The Code is filed as an exhibit to this Form N-CSR.
Item 3. Audit Committee Financial Expert.
The registrant’s Board of Trustees has determined that Werner Keller, an “independent” Trustee serving on the registrant’s audit committee, is an “audit committee financial expert,” as defined in Item 3 of Form N-CSR. Under applicable securities laws, a person who is determined to be an audit committee financial expert will not be deemed an “expert” for any purpose, including without limitation for the purposes of Section 11 of the Securities Act of 1933, as a result of being designated or identified as an audit committee financial expert. The designation or identification of a person as an audit committee financial expert does not impose on such person any duties, obligations, or liabilities that are greater than the duties, obligations, and liabilities imposed on such person as a member of the audit committee and Board of Trustees in the absence of such designation or identification.
Item 4. Principal Accountant Fees and Services.
(a)-(d) The aggregate Audit Fees billed by the Trust’s principal accountant, for the audit of the annual financial statements in connection with statutory and regulatory filings for the fiscal years ended March 31, 2012 and March 31, 2011 were $991,403 and $960,156, respectively. The aggregate Audit Related Fees by the Trust’s principal accountant billed for the fiscal years ended March 31, 2012 and March 31, 2011 were $0 and $20,889, respectively. The aggregate Tax Fees billed by the Trust’s principal accountant for professional services rendered for tax compliance, tax advice, and tax planning, including preparation of tax returns and distribution assistance, for the fiscal years ended March 31, 2012 and March 31, 2011 was $9,216 and $0, respectively.
(e) The audit committee has adopted a policy whereby audit and non-audit services performed by the registrant’s principal accountant for the registrant, its investment advisor, and any entity controlling, controlled by, or under common control with the investment advisor that provides ongoing services to the registrant require pre-approval in advance at regularly scheduled audit committee meetings. If such service is required between regularly scheduled audit committee meetings, the chairman of the audit committee, J. Kenneth Dalton, is authorized to pre-approve the service with full committee approval at the next scheduled meeting. There shall be no waivers of the pre-approval process. No services described in (b)-(d) above were approved pursuant to paragraph (c)(7)(i)(C) of Rule 2-01 of Regulation S-X.
(f) Not applicable.
(g) The aggregate non-audit fees billed by the registrant’s accountant for the most recent fiscal year and the preceding fiscal year for services rendered to the registrant, the investment advisor, and any entity controlling, controlled by, or under common control with the advisor that provides ongoing services to the registrant were $39,216 and $47,000, respectively. These aggregate fees were less than the aggregate fees billed for the same periods by the registrant’s principal accountant for audit services rendered to the registrant, the investment advisor, and any entity controlling, controlled by, or under common control with the advisor that provides ongoing services to the registrant.
(h) All non-audit services rendered in (g) above were pre-approved by the registrant’s audit committee. As such, the audit committee has considered these services compatible with maintaining the principal accountant’s independence.
Item 5. Audit Committee of Listed Registrants.
Not applicable.
Item 6. Investments.
Schedule of Investments is included as part of the report to shareholders filed under Item 1 of this form.
Item 7. Disclosure of Proxy Voting Policies and Procedures for Closed-End Management Investment Companies.
Not applicable.
Item 8. Portfolio Managers of Closed-End Management Investment Companies.
Not applicable.
Item 9. Purchases of Equity Securities by Closed-End Management Investment Company and Affiliated Purchasers.
Not applicable.
Item 10. Submission of Matters to a Vote of Security Holders.
Not applicable.
Item 11. Controls and Procedures.
(a) The registrant’s President (principal executive officer) and Treasurer (principal financial officer) have evaluated the registrant’s disclosure controls and procedures within 90 days of this filing and have concluded that the registrant’s disclosure controls and procedures were effective as of that date in ensuring that information required to be disclosed by the registrant in this Form N-CSR was recorded, processed, summarized, and reported timely.
(b) The registrant’s principal executive officer and principal financial officer are aware of no change in the registrant’s internal control over financial reporting that occurred during the registrant’s second fiscal quarter covered by this report that has materially affected, or is reasonably likely to materially affect, the registrant’s internal control over financial reporting.
Item 12. Exhibits.
(a)(1) The registrant’s code of ethics pursuant to Item 2 of Form N-CSR is attached.
(a)(2) Separate certifications by the President (principal executive officer) and Treasurer (principal financial officer) of the registrant as required by Rule 30a-2(a) under the Act (17 CFR 270.30a-2(a)) are attached.
(b) A certification by the registrant’s President (principal executive officer) and Treasurer (principal financial officer) as required by Rule 30a-2(b) under the Act (17 CFR 270.30a-2(b)) is attached.
SIGNATURES
Pursuant to the requirements of the Securities Exchange Act of 1934 and the Investment Company Act of 1940, the registrant has duly caused this report to be signed on its behalf by the undersigned, thereunto duly authorized.
(Registrant) Rydex Series Funds
By (Signature and Title)* /s/ Donald C. Cacciapaglia
Donald C. Cacciapaglia, President
Date June 07, 2012
Pursuant to the requirements of the Securities Exchange Act of 1934 and the Investment Company Act of 1940, this report has been signed below by the following persons on behalf of the registrant and in the capacities and on the dates indicated.
By (Signature and Title)* /s/ Donald C. Cacciapaglia
Donald C. Cacciapaglia, President
Date June 07, 2012
By (Signature and Title)* /s/ Nikolaos Bonos
Nikolaos Bonos, Vice President and Treasurer
Date June 07, 2012
| * | Print the name and title of each signing officer under his or her signature. |