UNITED STATES
SECURITIES AND EXCHANGE COMMISSION
Washington, D.C. 20549
FORM N-CSR
CERTIFIED SHAREHOLDER REPORT OF REGISTERED
MANAGEMENT INVESTMENT COMPANIES
Investment Company Act file number 811- 07584
Rydex Series Funds
(Exact name of registrant as specified in charter)
805 King Farm Boulevard, Suite 600
Rockville, Maryland 20850
(Address of principal executive offices) (Zip code)
Richard M. Goldman, President
Rydex Series Funds
805 King Farm Boulevard, Suite 600
Rockville, Maryland 20850
(Name and address of agent for service)
Registrant’s telephone number, including area code: 1-301-296-5100
Date of fiscal year end: December 31
Date of reporting period: December 31, 2011
Form N-CSR is to be used by management investment companies to file reports with the Commission not later than 10 days after the transmission to stockholders of any report that is required to be transmitted to stockholders under Rule 30e-1 under the Investment Company Act of 1940 (17 CFR 270.30e-1). The Commission may use the information provided on Form N-CSR in its regulatory, disclosure review, inspection, and policymaking roles.
A registrant is required to disclose the information specified by Form N-CSR, and the Commission will make this information public. A registrant is not required to respond to the collection of information contained in Form N-CSR unless the Form displays a currently valid Office of Management and Budget (“OMB”) control number. Please direct comments concerning the accuracy of the information collection burden estimate and any suggestions for reducing the burden to Secretary, Securities and Exchange Commission, 450 Fifth Street, NW, Washington, DC 20549-0609. The OMB has reviewed this collection of information under the clearance requirements of 44 U.S.C. § 3507.
ITEM 1. Reports to Stockholders.
ALTERNATIVES FUND
MANAGED FUTURES STRATEGY FUND
GO GREEN!
ELIMINATE MAILBOX CLUTTER
Go paperless with Guggenheim Investments eDelivery—a service giving you full online access to account information and documents. Save time, cut down on mailbox clutter and be a friend to the environment with eDelivery.
With Guggenheim Investments eDelivery you can:
| • | | View online confirmations and statements at your convenience. |
| • | | Receive email notifications when your most recent confirmations, statements and other account documents are available for review. |
| • | | Access prospectuses, annual reports and semiannual reports online. |

If you have questions about Guggenheim Investments eDelivery services, contact one of our Shareholder Service Representatives at 800.820.0888.

This report and the financial statements contained herein are submitted for the general information of our shareholders. The report is not authorized for distribution to prospective investors unless preceded or accompanied by an effective prospectus.
Distributed by Rydex Distributors , LLC.
TABLE OF CONTENTS
THE GUGGENHEIM FUNDSANNUALREPORT | 1
LETTER TO OUR SHAREHOLDERS
To Our Shareholders:
Financial markets endured a lot of turbulence in 2011, due to a variety of events: concerns about debt in the eurozone and in the U.S., which lost its triple-A credit rating, a tsunami-induced Japanese nuclear-plant disaster that disrupted automobile production around the globe, Mideast social unrest that led to a jump in oil prices and weak growth in many of the world’s developed economies. Reflecting the volatility in the stock market was the S&P 500 Index*, which finished the year up about 2%, but only after an 8% rise in the first few months of 2011, then a bearish 19% drop by early October, followed by a 12% fourth-quarter rebound spurred by improved economic data.
The U.S. Federal Reserve was a major factor in the markets for most of 2011, from its winding down of a second asset-purchase program (quantitative easing) in June to August’s “operation twist,” which shifted $400 billion in holdings from short-term to long-term Treasuries. The Fed said it would keep short-term interest rates near zero at least until mid-2013, and late in the year, some analysts were speculating that a third round of quantitative easing might be needed in 2012 to boost subpar growth.
While late-year improvements in economic measures may have dampened concern that the U.S. could slip back into recession, Europe’s recession fears were rising, as high unemployment and austerity measures weighed on weaker members of the euro zone, and threatened the economic engines of Germany and France. The Stoxx Europe 600 Index* was down about 11% for the year, with most individual country indices posting declines in double digits. Many investors continued to brace for a solution to Greece’s debt situation that would prevent financial problems from spreading to other weak countries or to banks, and stabilize the sliding euro, the year’s worst-performing major currency.
Even though they were not at the eye of the sovereign debt storm, many emerging market economies performed poorly in 2011, with those having the strongest links to the eurozone suffering the most. The MSCI Emerging Markets Index* was off by almost 20%, despite pockets of growth. China is facing slowing industrial production, sliding property values and the potential for a hard landing of the economy if housing and banks collapse.
While the market forces play out, many investors have been driven to the sidelines or to safe havens. Gold reached a record high of near $1,900 an ounce in August amid the U.S. debt downgrade, but then lost ground to the rising dollar amid continuing debate over Europe’s debt woes. Still, gold added 10% for the year, while the dollar ended the year within about 3% from where it began against the currencies of most major markets, including the euro, the pound, Canadian dollar and Swiss franc.
Sluggish economic data, concern over European financial weakness and the Fed’s policy efforts also drove investors into U.S. government debt over the course of 2011, despite the country’s lowered credit rating. The 30% total return of the Barclays Capital Long U.S. Treasury Index* made it one of the best-performing of the year, and it gave a lift to indices for corporate bonds, high yield bonds and municipals, which all grew by mid-to-high single digits.
The U.S. economy had momentum heading into 2012, as data showed the world’s largest economy to be maintaining a sustainable, if modest, expansion. Consumer confidence was improving, employment rising and monetary policy remained accommodative. We finished 2011 on a positive note, especially when compared to other countries, and so far continue to be insulated from the worst aspects of the economic troubles in Europe and China.
2 | THE GUGGENHEIM FUNDSANNUALREPORT
LETTER TO OUR SHAREHOLDERS (concluded)
We look forward to continuing our service to you. Thank you for investing in our funds.
|
| Sincerely, |
|
 |
| Michael Byrum |
| President & Chief Investment Officer |
| * | S&P 500® Index is a capitalization-weighted index covering 500 industrial, utility, transportation and financial companies of the U.S. markets (mostly NYSE Euronext issues). |
| * | The STOXX Europe 600 Index is derived from the STOXX Europe Total Market Index (TMI) and is a subset of the STOXX Global 1800 Index. With a fixed number of 600 components, the STOXX Europe 600 Index represents large-, mid- and small-capitalization companies across 18 countries of the European region: Austria, Belgium, Denmark, Finland, France, Germany, Greece, Iceland, Ireland, Italy, Luxembourg, the Netherlands, Norway, Portugal, Spain, Sweden, Switzerland and the United Kingdom. |
| * | The Barclays Capital Long U.S. Treasury Index includes all publicly issued U.S. Treasury securities that have a remaining maturity of 10 or more years, are rated investment grade, and have $250 million or more of outstanding face value. In addition, the securities must be denominated in U.S. dollars and must be fixed rate and non convertible. Excluded from the Long U.S. Treasury Index are certain special issues, such as flower bonds, TINs, state and local government series bonds, TIPS, and coupon issues that have been stripped from bonds included in the index. The Long U.S. Treasury Index is market capitalization weighted and the securities in the index are updated on the last business day of each month. |
| * | MSCI Emerging Markets Index is a free float-adjusted market capitalization index that is designed to measure equity market performance in the global emerging markets. |
Performance displayed represents past performance which is no guarantee of future results. Of course, fund performance is subject to daily market volatility and may be better or worse since the end of the last quarter. For up-to-date fund performance, call us at 800.820.0888 or visit www.rydex-sgi.com.
Read each fund’s prospectus and summary prospectus (if available) carefully before investing. It contains the fund’s investment objectives, risks, charges, expenses and other information, which should be considered carefully before investing. Obtain a prospectus and summary prospectus (if available) at www.rydex-sgi.com or call 800.820.0888
The referenced fund is distributed by Rydex Distributors, LLC (RDL). Guggenheim Investments represents the investment management businesses of Guggenheim Partners, LLC, which includes Security Investors, LLC and Guggenheim Partners Asset Management, the investment advisor to the referenced fund. Rydex Distributors, LLC, is affiliated with Guggenheim Partners, LLC and Security Investors, LLC.
THE GUGGENHEIM FUNDSANNUALREPORT | 3
ABOUT SHAREHOLDERS’ FUND EXPENSES (Unaudited)
All mutual funds have operating expenses and it is important for our shareholders to understand the impact of costs on their investments. Shareholders of a Fund incur two types of costs: (i) transaction costs, including sales charges (loads) on purchase payments, reinvested dividends, or other distributions and exchange fees; and (ii) ongoing costs, including management fees, administrative services, and shareholder reports, among others. These ongoing costs, or operating expenses, are deducted from a fund’s gross income and reduce the investment return of the fund.
A fund’s expenses are expressed as a percentage of its average net assets, which is known as the expense ratio. The following examples are intended to help investors understand the ongoing costs (in dollars) of investing in a Fund and to compare these costs with the ongoing costs of investing in other mutual funds.
The examples are based on an investment of $1,000 made at the beginning of the period and held for the entire six-month period beginning June 30, 2011 and ending December 31, 2011.
The following tables illustrate a Fund’s costs in two ways:
Table 1. Based on actual Fund return. This section helps investors estimate the actual expenses paid over the period. The “Ending Account Value” shown is derived from the Fund’s actual return, and the fourth column shows the dollar amount that would have been paid by an investor who started with $1,000 in the Fund. Investors may use the information here, together with the amount invested, to estimate the expenses paid over the period. Simply divide the Fund’s account value by $1,000 (for example, an $8,600 account value divided by $1,000 = 8.6), then multiply the result by the number provided under the heading “Expenses Paid During Period.”
Table 2. Based on hypothetical 5% return. This section is intended to help investors compare a Fund’s cost with those of other mutual funds. The table provides information about hypothetical account values and hypothetical expenses based on the Fund’s actual expense ratio and an assumed rate of return of 5% per year before expenses, which is not the Fund’s actual return. The hypothetical account values and expenses may not be used to estimate the actual ending account balance or expenses paid during the period. The example is useful in making comparisons because the U.S. Securities and Exchange Commission (the “SEC”) requires all mutual funds to calculate expenses based on the 5% return. Investors can assess a Fund’s costs by comparing this hypothetical example with the hypothetical examples that appear in shareholder reports of other funds.
The calculations illustrated above assume no shares were bought or sold during the period. Actual costs may have been higher or lower, depending on the amount of investment and the timing of any purchases or redemptions.
Please note that the expenses shown in the table are meant to highlight your ongoing costs only and do not reflect any transactional costs, such as sales charges (loads) on purchase payments, and contingent deferred sales charges (“CDSC”) on redemptions, if any. Therefore, the second table is useful in comparing ongoing costs only, and will not help you determine the relative total costs of owning different funds. In addition, if these transactional costs were included, your costs would have been higher.
More information about a Fund’s expenses, including annual expense ratios for the past five years, can be found in the Financial Highlights section of this report. For additional information on operating expenses and other shareholder costs, please refer to the appropriate Fund prospectus.
4 | THE GUGGENHEIM FUNDSANNUALREPORT
ABOUT SHAREHOLDERS’ FUND EXPENSES (Unaudited) (concluded)
| | | | | | | | | | | | | | | | | | | | |
| | | Expense
Ratio1 | | | Fund
Return | | | Beginning
Account Value
June 30, 2011 | | | Ending
Account Value
December 31, 2011 | | | Expenses
Paid During
Period2 | |
Table 1. Based on actual Fund return3 | | | | | | | | | | | | | | | | | | | | |
Managed Futures Strategy Fund | | | | | | | | | | | | | | | | | | | | |
A-Class | | | 1.99 | % | | | (6.12 | %) | | $ | 1,000.00 | | | $ | 938.80 | | | $ | 9.72 | |
C-Class | | | 2.73 | % | | | (6.44 | %) | | | 1,000.00 | | | | 935.60 | | | | 13.32 | |
H-Class | | | 1.98 | % | | | (6.12 | %) | | | 1,000.00 | | | | 938.80 | | | | 9.68 | |
Institutional Class | | | 1.73 | % | | | (5.98 | %) | | | 1,000.00 | | | | 940.20 | | | | 8.46 | |
Y-Class | | | 1.69 | % | | | (5.98 | %) | | | 1,000.00 | | | | 940.20 | | | | 8.26 | |
| | | | | |
Table 2. Based on hypothetical 5% return (before expenses) | | | | | | | | | | | | | | | | | | | | |
Managed Futures Strategy Fund | | | | | | | | | | | | | | | | | | | | |
A-Class | | | 1.99 | % | | | 5.00 | % | | $ | 1,000.00 | | | $ | 1,015.17 | | | $ | 10.11 | |
C-Class | | | 2.73 | % | | | 5.00 | % | | | 1,000.00 | | | | 1,011.44 | | | | 13.84 | |
H-Class | | | 1.98 | % | | | 5.00 | % | | | 1,000.00 | | | | 1,015.22 | | | | 10.06 | |
Institutional Class | | | 1.73 | % | | | 5.00 | % | | | 1,000.00 | | | | 1,016.48 | | | | 8.79 | |
Y-Class | | | 1.69 | % | | | 5.00 | % | | | 1,000.00 | | | | 1,016.69 | | | | 8.59 | |
| 2 | Expenses are equal to the Fund’s annualized expense ratio, net of any applicable fee waivers, multiplied by the average account value over the period, multiplied by 184/365 (to reflect the one-half year period). |
| 3 | Actual cumulative return at net asset value for the period June 30, 2011 to December 31, 2011. |
THE GUGGENHEIM FUNDSANNUALREPORT | 5
| | |
| PERFORMANCE REPORT AND FUND PROFILE (Unaudited) | | December 31, 2011 |
MANAGED FUTURES STRATEGY FUND
OBJECTIVE: Seeks to achieve positive absolute returns.
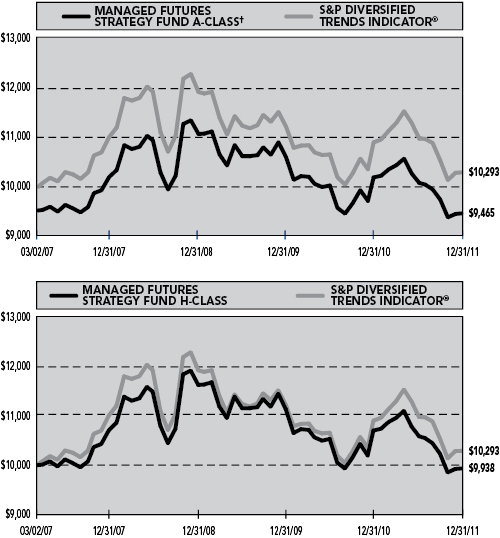
For the year ended December 31, 2011, the Fund’s H-Class returned -7.14%, compared with a return of -5.58% for its benchmark comparison, the Standard & Poor’s Diversified Trends Indicator®* (S&P DTI). The Fund also underperformed the 0.10% return of the Bank of America Merrill Lynch 3-Month U.S. Treasury Bill Index*. Effective July 11, the Fund’s investment objective changed from seeking to track the performance of a benchmark to seeking to achieve positive absolute returns.
U.S. Treasury long bonds, reformulated gasoline blendstock for oxygen blending (gasoline RBOB) and the 10-year U.S. Treasury note were the leading positive contributors to Fund performance during the year, while corn, wheat and soybeans contributed negatively to Fund performance. The negative contribution for the year came almost exclusively from commodities, as financials provided a slight positive return.
Derivatives in the Fund are used to help provide desired exposure in the most efficient manner, as well as to provide liquidity.
| * | The Standard & Poor’s Diversified Trends Indicator® is an investable long/short strategy that can benefit from trends (in either direction) in the global futures markets. It consists of 24 futures contracts, with a 50% weighting in financial futures and 50% weighting in commodities futures. S&P Indices also offers financials-only and commodities-only subsets of the S&P DTI, providing a flexible way to tailor exposure to these respective asset classes. |
| * | Bank of America Merrill Lynch 3-Month U.S. Treasury Bill Index is an unmanaged market index of U.S. Treasury securities maturing in 90 days that assumes reinvestment of all income. |
Performance displayed represents past performance which is no guarantee of future results.
Holdings Diversification (Market Exposure as % of Net Assets)
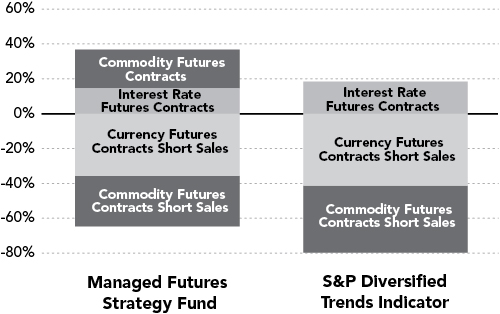
“Holdings Diversification (Market Exposure as % of Net Assets)” excludes any temporary cash investments.
| | | | |
Inception Dates: | | | |
A-Class | | | March 2, 2007 | |
C-Class | | | March 2, 2007 | |
H-Class | | | March 2, 2007 | |
Institutional Class | | | May 3, 2010 | |
Y-Class | | | March 29, 2010 | |
The Fund invests principally in derivative investments such as futures contracts.
6 | THE GUGGENHEIM FUNDSANNUALREPORT
PERFORMANCE REPORT AND FUND PROFILE (Unaudited) (concluded)
MANAGED FUTURES STRATEGY FUND
Cumulative Fund Performance*
Average Annual Returns*
Periods Ended 12/31/11
| | | | | | | | |
| | | 1 Year | | | Since
Inception
(03/02/07) | |
A-Class Shares | | | -7.14 | % | | | -0.13 | % |
A-Class Shares with sales charge† | | | -11.56 | % | | | -1.13 | % |
C-Class Shares | | | -7.79 | % | | | -0.86 | % |
C-Class Shares with CDSC‡ | | | -8.71 | % | | | -0.86 | % |
H-Class Shares | | | -7.14 | % | | | -0.13 | % |
S&P Diversified Trends Indicator | | | -5.58 | % | | | 0.60 | % |
| | |
| | | | | | (05/03/10) | |
Institutional Class Shares | | | -6.85 | % | | | -3.62 | % |
S&P Diversified Trends Indicator | | | -5.58 | % | | | -2.58 | % |
| | |
| | | | | | (03/29/10) | |
Y-Class Shares | | | -6.85 | % | | | -3.74 | % |
S&P Diversified Trends Indicator | | | -5.58 | % | | | -2.72 | % |
| * | The performance data represents past performance that is not predictive of future results. The investment return and principal value of an investment in the Fund will fluctuate so that an investor’s shares, when redeemed, may be worth more or less than their original cost. Returns are historical and include changes in principal and reinvested dividends and capital gains and do not reflect the effect of taxes. The S&P Diversified Trends Indicator is an unmanaged index and, unlike the Fund, has no management fees or operating expenses to reduce its reported return. The graphs are based on A-Class shares and H-Class shares only; performance for Institutional Class shares and Y-Class shares will vary due to differences in fee structure. |
| † | Fund returns are calculated using the maximum sales charge of 4.75%. |
| ‡ | Fund returns include a CDSC of 1% if redeemed within 12 months of purchase. |
THE GUGGENHEIM FUNDSANNUALREPORT | 7
| | |
| CONSOLIDATED SCHEDULE OF INVESTMENTS | | December 31, 2011 |
MANAGED FUTURES STRATEGY FUND
| | | | | | | | |
| | | FACE
AMOUNT | | | VALUE | |
|
FEDERAL AGENCY DISCOUNT NOTES†† - 58.3% | |
Farmer Mac1 | | | | | | | | |
0.25% due 05/03/12 | | $ | 50,000,000 | | | $ | 49,996,650 | |
0.20% due 05/31/12 | | | 50,000,000 | | | | 49,995,850 | |
0.22% due 06/22/12 | | | 50,000,000 | | | | 49,992,850 | |
0.20% due 10/25/12 | | | 50,000,000 | | | | 49,963,050 | |
0.29% due 03/29/12 | | | 40,000,000 | | | | 39,998,080 | |
0.23% due 07/17/12 | | | 30,000,000 | | | | 29,991,840 | |
0.16% due 11/15/12 | | | 26,000,000 | | | | 25,977,120 | |
0.13% due 04/05/12 | | | 25,000,000 | | | | 24,998,700 | |
0.27% due 04/13/12 | | | 25,000,000 | | | | 24,998,600 | |
0.21% due 06/01/12 | | | 25,000,000 | | | | 24,996,875 | |
0.25% due 06/20/12 | | | 25,000,000 | | | | 24,996,475 | |
0.20% due 07/31/12 | | | 25,000,000 | | | | 24,992,700 | |
0.12% due 08/01/12 | | | 25,000,000 | | | | 24,991,200 | |
0.17% due 12/28/12 | | | 25,000,000 | | | | 24,972,525 | |
0.17% due 07/24/12 | | | 20,000,000 | | | | 19,994,360 | |
0.15% due 10/31/12 | | | 20,000,000 | | | | 19,984,920 | |
0.30% due 01/17/12 | | | 16,500,000 | | | | 16,499,868 | |
0.24% due 04/26/12 | | | 15,000,000 | | | | 14,999,055 | |
0.11% due 07/02/12 | | | 15,000,000 | | | | 14,996,235 | |
0.20% due 04/26/12 | | | 10,000,000 | | | | 9,999,370 | |
0.20% due 05/01/12 | | | 10,000,000 | | | | 9,999,340 | |
| | | | | | | | |
Total Farmer Mac | | | | | | | 577,335,663 | |
| | | | | | | | |
Fannie Mae2 | | | | | | | | |
0.23% due 03/01/12 | | | 50,000,000 | | | | 49,998,400 | |
0.18% due 05/01/12 | | | 50,000,000 | | | | 49,996,700 | |
0.20% due 05/29/12 | | | 50,000,000 | | | | 49,995,900 | |
0.20% due 06/01/12 | | | 50,000,000 | | | | 49,993,750 | |
0.18% due 06/01/12 | | | 50,000,000 | | | | 49,993,750 | |
0.21% due 02/01/12 | | | 25,000,000 | | | | 24,999,600 | |
0.21% due 03/01/12 | | | 25,000,000 | | | | 24,999,200 | |
0.22% due 03/19/12 | | | 25,000,000 | | | | 24,998,950 | |
0.23% due 04/02/12 | | | 25,000,000 | | | | 24,998,750 | |
0.19% due 05/01/12 | | | 25,000,000 | | | | 24,998,350 | |
0.06% due 05/21/12 | | | 25,000,000 | | | | 24,998,075 | |
0.10% due 06/01/12 | | | 25,000,000 | | | | 24,996,875 | |
0.14% due 11/15/12 | | | 25,000,000 | | | | 24,978,000 | |
0.14% due 11/19/12 | | | 25,000,000 | | | | 24,977,725 | |
| | | | | | | | |
Total Fannie Mae | | | | | | | 474,924,025 | |
| | | | | | | | |
Federal Farm Credit Bank1 | | | | | | | | |
0.27% due 03/23/12 | | | 50,000,000 | | | | 49,997,800 | |
0.19% due 07/02/12 | | | 30,000,000 | | | | 29,992,470 | |
0.20% due 01/06/12 | | | 25,000,000 | | | | 24,999,950 | |
0.31% due 02/03/12 | | | 25,000,000 | | | | 24,999,575 | |
0.15% due 03/02/12 | | | 25,000,000 | | | | 24,999,175 | |
0.08% due 03/30/12 | | | 25,000,000 | | | | 24,998,800 | |
0.20% due 07/25/12 | | | 25,000,000 | | | | 24,992,925 | |
0.09% due 08/03/12 | | | 25,000,000 | | | | 24,991,125 | |
0.13% due 09/05/12 | | | 25,000,000 | | | | 24,986,350 | |
| | | | | | | | |
Total Federal Farm Credit Bank | | | | 254,958,170 | |
| | | | | | | | |
Freddie Mac2 | | | | | | | | |
0.23% due 03/13/12 | | | 50,000,000 | | | | 49,998,050 | |
0.20% due 08/06/12 | | | 25,000,000 | | | | 24,991,000 | |
0.10% due 05/17/12 | | | 15,000,000 | | | | 14,998,875 | |
| | | | | | | | |
Total Freddie Mac | | | | | | | 89,987,925 | |
| | | | | | | | |
Total Federal Agency Discount Notes
(Cost $1,396,419,411) | | | | | | | 1,397,205,783 | |
| | | | | | | | |
|
FEDERAL AGENCY NOTES†† - 24.3% | |
Federal Home Loan Bank1 | | | | | | | | |
0.23% due 06/28/12 | | | 50,000,000 | | | | 50,008,050 | |
0.16% due 03/30/12 | | | 50,000,000 | | | | 50,004,850 | |
0.19% due 10/26/12 | | | 40,750,000 | | | | 40,730,114 | |
0.25% due 07/25/12 | | | 40,620,000 | | | | 40,626,459 | |
0.28% due 03/15/12 | | | 25,000,000 | | | | 25,008,000 | |
0.30% due 12/10/12 | | | 25,000,000 | | | | 25,007,950 | |
0.25% due 02/24/12 | | | 25,000,000 | | | | 25,006,725 | |
0.16% due 04/02/12 | | | 25,000,000 | | | | 25,002,475 | |
0.33% due 08/08/12 | | | 25,000,000 | | | | 25,001,650 | |
0.14% due 03/29/12 | | | 25,000,000 | | | | 25,001,200 | |
0.25% due 11/28/12 | | | 25,000,000 | | | | 24,997,700 | |
0.22% due 09/07/12 | | | 25,000,000 | | | | 24,996,150 | |
0.18% due 11/21/12 | | | 25,000,000 | | | | 24,982,925 | |
0.24% due 09/26/12 | | | 12,600,000 | | | | 12,599,168 | |
| | | | | | | | |
Total Federal Home Loan Bank | | | | | | | 418,973,416 | |
| | | | | | | | |
Federal Farm Credit Bank1 | | | | | | | | |
0.21% due 05/16/12 | | | 50,000,000 | | | | 50,016,600 | |
0.26% due 05/02/12 | | | 25,000,000 | | | | 25,011,550 | |
0.24% due 06/20/12 | | | 25,000,000 | | | | 25,009,150 | |
| | | | | | | | |
Total Federal Farm Credit Bank | | | | 100,037,300 | |
| | | | | | | | |
Freddie Mac2 | | | | | | | | |
0.52% due 11/26/12 | | | 36,922,000 | | | | 37,019,881 | |
1.13% due 04/25/12 | | | 25,000,000 | | | | 25,080,475 | |
| | | | | | | | |
Total Freddie Mac | | | | | | | 62,100,356 | |
| | | | | | | | |
Total Federal Agency Notes
(Cost $581,111,030) | | | | | | | 581,111,072 | |
| | | | | | | | |
|
REPURCHASE AGREEMENTS††,3 - 13.3% | |
HSBC Group | | | | | | | | |
issued 12/30/11 at 0.00% due 01/03/12 | | | 215,869,223 | | | | 215,869,223 | |
Mizuho Financial Group, Inc. | | | | | | | | |
issued 12/30/11 at 0.00% due 01/03/12 | | | 58,978,375 | | | | 58,978,375 | |
Deutsche Bank | | | | | | | | |
issued 12/30/11 at 0.00% due 01/03/12 | | | 31,365,614 | | | | 31,365,614 | |
Credit Suisse Group | | | | | | | | |
issued 12/30/11 at 0.00% due 01/03/12 | | | 13,042,496 | | | | 13,042,496 | |
| | | | | | | | |
Total Repurchase Agreements
(Cost $319,255,708) | | | | | | | 319,255,708 | |
| | | | | | | | |
| | |
| 8 | THE GUGGENHEIM FUNDSANNUALREPORT | | See Notes to Financial Statements. |
| | |
| CONSOLIDATED SCHEDULE OF INVESTMENTS (continued) | | December 31, 2011 |
MANAGED FUTURES STRATEGY FUND
| | | | | | | | |
| | | | | | VALUE | |
| | |
Total Investments - 95.9%
(Cost $2,296,786,149) | | | | | | $ | 2,297,572,563 | |
| | | | | | | | |
Cash & Other Assets, Less Liabilities - 4.1% | | | | | | | 98,764,277 | |
| | | | | | | | |
Total Net Assets - 100.0% | | | | | | $ | 2,396,336,840 | |
| | |
| | | CONTRACTS | | | UNREALIZED
GAIN (LOSS) | |
|
INTEREST RATE FUTURES CONTRACTS PURCHASED† | |
March 2012 U.S. Treasury | | | | | | | | |
Long Bond Futures Contracts (Aggregate Value of Contracts $176,442,500) | | | 1,220 | | | $ | 4,478,093 | |
March 2012 U.S. Treasury | | | | | | | | |
10 Year Note Futures Contracts (Aggregate Value of Contracts $174,747,969) | | | 1,333 | | | | 1,981,028 | |
| | | | | | | | |
(Total Aggregate Value of Contracts $351,190,469) | | | | | | $ | 6,459,121 | |
| | | | | | | | |
|
COMMODITY FUTURES CONTRACTS PURCHASED† | |
March 2012 RBOB Gasoline | | | | | | | | |
Futures Contracts (Aggregate Value of Contracts $89,285,280) | | | 800 | | | | 2,188,840 | |
February 2012 Live Cattle | | | | | | | | |
Futures Contracts (Aggregate Value of Contracts $42,983,990) | | | 881 | | | | (1,242,039 | ) |
March 2012 Heating Oil | | | | | | | | |
Futures Contracts (Aggregate Value of Contracts $85,705,662) | | | 701 | | | | (2,372,253 | ) |
February 2012 Lean Hogs | | | | | | | | |
Futures Contracts (Aggregate Value of Contracts $7,969,720) | | | 236 | | | | (2,274,848 | ) |
March 2012 WTI Crude | | | | | | | | |
Futures Contracts (Aggregate Value of Contracts $214,034,400) | | | 2,160 | | | | (2,919,389 | ) |
March 2012 Natural Gas | | | | | | | | |
Futures Contracts (Aggregate Value of Contracts $46,909,200) | | | 1,560 | | | | (9,935,887 | ) |
| | | | | | | | |
(Total Aggregate Value of Contracts $486,888,252) | | | | | | $ | (16,555,576 | ) |
| | | | | | | | |
|
COMMODITY FUTURES CONTRACTS SOLD SHORT† | |
March 2012 Cocoa | | | | | | | | |
Futures Contracts (Aggregate Value of Contracts $22,924,160) | | | 1,088 | | | | 6,285,155 | |
March 2012 Silver | | | | | | | | |
Futures Contracts (Aggregate Value of Contracts $32,621,100) | | | 236 | | | | 6,027,587 | |
February 2012 Gold 100 Oz | | | | | | | | |
Futures Contracts (Aggregate Value of Contracts $41,602,400) | | | 266 | | | | 4,686,041 | |
March 2012 Copper | | | | | | | | |
Futures Contracts (Aggregate Value of Contracts $119,689,550) | | | 1,396 | | | | 2,598,889 | |
March 2012 Sugar #11 | | | | | | | | |
Futures Contracts (Aggregate Value of Contracts $24,227,482) | | | 928 | | | | 1,827,096 | |
March 2012 Cotton #2 | | | | | | | | |
Futures Contracts (Aggregate Value of Contracts $24,352,770) | | | 533 | | | | 1,573,048 | |
March 2012 Corn | | | | | | | | |
Futures Contracts (Aggregate Value of Contracts $123,398,212) | | | 3,813 | | | | 1,360,307 | |
March 2012 Coffee ‘C’ | | | | | | | | |
Futures Contracts (Aggregate Value of Contracts $35,334,000) | | | 416 | | | | 1,091,192 | |
March 2012 Wheat | | | | | | | | |
Futures Contracts (Aggregate Value of Contracts $49,026,413) | | | 1,501 | | | | 400,309 | |
June 2012 Gold 100 Oz | | | | | | | | |
Futures Contracts (Aggregate Value of Contracts $39,247,500) | | | 250 | | | | 160,238 | |
June 2012 Lean Hogs | | | | | | | | |
Futures Contracts (Aggregate Value of Contracts $5,945,160) | | | 156 | | | | 36,302 | |
June 2012 Live Cattle | | | | | | | | |
Futures Contracts (Aggregate Value of Contracts $5,595,520) | | | 112 | | | | 26,684 | |
March 2012 Soybean | | | | | | | | |
Futures Contracts (Aggregate Value of Contracts $127,649,925) | | | 2,106 | | | | (2,303,647 | ) |
| | | | | | | | |
(Total Aggregate Value of Contracts $651,614,192) | | | | | | $ | 23,769,201 | |
| | | | | | | | |
| | |
| See Notes to Financial Statements. | | THE GUGGENHEIM FUNDSANNUALREPORT | 9 |
| | |
| CONSOLIDATED SCHEDULE OF INVESTMENTS (concluded) | | December 31, 2011 |
MANAGED FUTURES STRATEGY FUND
| | | | | | | | |
| | | CONTRACTS | | | UNREALIZED
GAIN (LOSS) | |
|
CURRENCY FUTURES CONTRACTS SOLD SHORT† | |
March 2012 Euro | | | | | | | | |
Futures Contracts (Aggregate Value of Contracts $307,862,475) | | | 1,902 | | | $ | 9,878,056 | |
March 2012 British Pound | | | | | | | | |
Futures Contracts (Aggregate Value of Contracts $122,130,869) | | | 1,259 | | | | 713,304 | |
March 2012 Swiss Franc | | | | | | | | |
Futures Contracts (Aggregate Value of Contracts $47,992,500) | | | 360 | | | | 662,441 | |
March 2012 Canadian Dollar | | | | | | | | |
Futures Contracts (Aggregate Value of Contracts $24,696,000) | | | 252 | | | | (59,104 | ) |
March 2012 Australian Dollar | | | | | | | | |
Futures Contracts (Aggregate Value of Contracts $49,681,100) | | | 490 | | | | (175,150 | ) |
March 2012 Japanese Yen | | | | | | | | |
Futures Contracts (Aggregate Value of Contracts $298,579,500) | | | 1,836 | | | | (2,452,904 | ) |
| | | | | | | | |
(Total Aggregate Value of Contracts $850,942,444) | | | | | | $ | 8,566,643 | |
| | | | | | | | |
| † | Value determined based on Level 1 inputs — See Note 4. |
| †† | Value determined based on Level 2 inputs — See Note 4. |
| 1 | The issuer operates under a Congressional charter; its securities are neither issued nor guaranteed by the U.S. Government. |
| 2 | On September 7, 2008, the issuer was placed in conservatorship by the Federal Housing Finance Agency (FHFA). As conservator, the FHFA has full powers to control the assets and operations of the firm. |
| 3 | Repurchase Agreements — See Note 5. |
| | |
| 10 | THE GUGGENHEIM FUNDSANNUALREPORT | | See Notes to Financial Statements. |
MANAGED FUTURES STRATEGY FUND
CONSOLIDATED STATEMENT OF ASSETS AND LIABILITIES
December 31, 2011
| | | | |
ASSETS: | | | | |
Investments, at value
(cost $1,977,530,441) | | $ | 1,978,316,855 | |
Repurchase agreements, at value
(cost $319,255,708) | | | 319,255,708 | |
| | | | |
Total investments
(cost $2,296,786,149) | | | 2,297,572,563 | |
Segregated cash with broker | | | 117,960,950 | |
Receivables: | | | | |
Fund shares sold | | | 10,862,272 | |
Interest | | | 301,517 | |
| | | | |
Total assets | | | 2,426,697,302 | |
| | | | |
LIABILITIES: | | | | |
Payable for: | | | | |
Variation margin | | | 14,761,780 | |
Fund shares redeemed | | | 8,115,341 | |
Management fees | | | 1,868,844 | |
Transfer agent and administrative fees | | | 501,624 | |
Distribution and service fees | | | 471,817 | |
Portfolio accounting fees | | | 90,967 | |
Miscellaneous | | | 4,550,089 | |
| | | | |
Total liabilities | | | 30,360,462 | |
| | | | |
NET ASSETS | | $ | 2,396,336,840 | |
| | | | |
NETASSETSCONSISTOF: | | | | |
Paid in capital | | $ | 2,449,315,222 | |
Accumulated net investment loss | | | (1,952,195 | ) |
Accumulated net realized loss on investments | | | (74,051,990 | ) |
Net unrealized appreciation on investments | | | 23,025,803 | |
| | | | |
NETASSETS | | $ | 2,396,336,840 | |
| | | | |
A-CLASS: | | | | |
Net assets | | $ | 733,469,222 | |
Capital shares outstanding | | | 30,628,847 | |
Net asset value per share | | $ | 23.95 | |
| | | | |
Maximum offering price per share
(Net asset value divided by 95.25%) | | $ | 25.14 | |
| | | | |
C-CLASS: | | | | |
Net assets | | $ | 96,647,156 | |
Capital shares outstanding | | | 4,185,910 | |
Net asset value per share | | $ | 23.09 | |
| | | | |
H-CLASS: | | | | |
Net assets | | $ | 1,059,988,114 | |
Capital shares outstanding | | | 44,265,189 | |
Net asset value per share | | $ | 23.95 | |
| | | | |
INSTITUTIONAL CLASS: | | | | |
Net assets | | $ | 101,548,671 | |
Capital shares outstanding | | | 4,220,875 | |
Net asset value per share | | $ | 24.06 | |
| | | | |
Y-CLASS: | | | | |
Net assets | | $ | 404,683,677 | |
Capital shares outstanding | | | 16,809,448 | |
Net asset value per share | | $ | 24.07 | |
| | | | |
CONSOLIDATED STATEMENT OF OPERATIONS
Year Ended December 31, 2011
| | | | |
INVESTMENT INCOME: | | | | |
Interest | | $ | 5,359,474 | |
| | | | |
Total investment income | | | 5,359,474 | |
| | | | |
| |
EXPENSES: | | | | |
Management fees | | | 24,172,767 | |
Transfer agent and administrative fees: | | | | |
A-Class | | | 1,748,734 | |
C-Class | | | 320,706 | |
H-Class | | | 2,986,584 | |
Institutional Class | | | 303,324 | |
Y-Class | | | 669,600 | |
Distribution and service fees: | | | | |
A-Class | | | 1,748,734 | |
C-Class | | | 1,282,827 | |
H-Class | | | 2,986,584 | |
Portfolio accounting fees | | | 1,081,056 | |
Licensing fees | | | 8,752,503 | |
Custodian fees | | | 629,403 | |
Trustees’ fees* | | | 322,048 | |
Miscellaneous | | | 3,406,050 | |
| | | | |
Total expenses | | | 50,410,920 | |
Less: | | | | |
Expenses waived by Advisor | | | (1,866,177 | ) |
| | | | |
Net expenses | | | 48,544,743 | |
| | | | |
Net investment loss | | | (43,185,269 | ) |
| | | | |
| |
NET REALIZEDAND UNREALIZED GAIN (LOSS): | | | | |
Net realized gain (loss) on: | | | | |
Investments | | | 6,400,010 | |
Futures contracts | | | (85,845,066 | ) |
Options written | | | 2,712,490 | |
| | | | |
Net realized loss | | | (76,732,566 | ) |
| | | | |
Net change in unrealized appreciation (depreciation) on: | | | | |
Investments | | | (5,004,203 | ) |
Futures contracts | | | (60,598,779 | ) |
| | | | |
Net change in unrealized appreciation (depreciation) | | | (65,602,982 | ) |
| | | | |
Net realized and unrealized loss | | | (142,335,548 | ) |
| | | | |
Net decrease in net assets resulting from operations | | $ | (185,520,817 | ) |
| | | | |
| * | Relates to Trustees not deemed “interested persons” within the meaning of Section 2(a)(19) of the 1940 Act. |
| | |
| See Notes to Financial Statements. | | THE GUGGENHEIM FUNDSANNUALREPORT | 11 |
MANAGED FUTURES STRATEGY FUND
CONSOLIDATED STATEMENTS OF CHANGES IN NET ASSETS
| | | | | | | | |
| | | Year Ended
December 31,
2011 | | | Year Ended
December 31,
2010 | |
INCREASE (DECREASE) IN NET ASSETS FROM OPERATIONS: | | | | | | | | |
Net investment loss | | $ | (43,185,269 | ) | | $ | (38,324,724 | ) |
Net realized loss on investments | | | (76,732,566 | ) | | | (171,500,258 | ) |
Net change in unrealized appreciation (depreciation) on investments | | | (65,602,982 | ) | | | 109,768,790 | |
| | | | | | | | |
Net decrease in net assets resulting from operations | | | (185,520,817 | ) | | | (100,056,192 | ) |
| | | | | | | | |
| | |
CAPITALSHARETRANSACTIONS: | | | | | | | | |
Proceeds from sale of shares | | | | | | | | |
A-Class | | | 511,923,650 | | | | 485,582,420 | |
C-Class | | | 16,934,292 | | | | 40,999,773 | |
H-Class | | | 795,455,515 | | | | 960,389,258 | |
Institutional Class | | | 74,985,665 | | | | 182,226,513 | a |
Y-Class | | | 299,957,366 | | | | 190,029,572 | b |
Redemption fees collected | | | | | | | | |
A-Class | | | — | | | | 28,588 | |
C-Class | | | — | | | | 8,912 | |
H-Class | | | — | | | | 61,071 | |
Institutional Class | | | — | | | | 630 | a |
Y-Class | | | — | | | | 1,414 | b |
Cost of shares redeemed | | | | | | | | |
A-Class | | | (383,723,127 | ) | | | (437,708,691 | ) |
C-Class | | | (69,518,004 | ) | | | (95,737,261 | ) |
H-Class | | | (847,649,799 | ) | | | (1,154,326,809 | ) |
Institutional Class | | | (100,701,093 | ) | | | (54,999,816 | )a |
Y-Class | | | (55,454,346 | ) | | | (7,119,708 | )b |
| | | | | | | | |
Net increase from capital share transactions | | | 242,210,119 | | | | 109,435,866 | |
| | | | | | | | |
Net increase in net assets | | | 56,689,302 | | | | 9,379,674 | |
NETASSETS: | | | | | | | | |
Beginning of year | | | 2,339,647,538 | | | | 2,330,267,864 | |
| | | | | | | | |
End of year | | $ | 2,396,336,840 | | | $ | 2,339,647,538 | |
| | | | | | | | |
Accumulated net investment loss at end of year | | $ | (1,952,195 | ) | | $ | (1,952,194 | ) |
| | | | | | | | |
| | |
CAPITALSHAREACTIVITY: | | | | | | | | |
Shares sold | | | | | | | | |
A-Class | | | 20,376,917 | | | | 19,219,855 | |
C-Class | | | 686,909 | | | | 1,645,586 | |
H-Class | | | 31,500,881 | | | | 37,857,879 | |
Institutional Class | | | 2,971,063 | | | | 7,456,715 | a |
Y-Class | | | 11,718,228 | | | | 7,609,399 | b |
Shares redeemed | | | | | | | | |
A-Class | | | (15,245,234 | ) | | | (17,446,752 | ) |
C-Class | | | (2,835,242 | ) | | | (3,901,911 | ) |
H-Class | | | (33,774,119 | ) | | | (46,102,418 | ) |
Institutional Class | | | (3,965,154 | ) | | | (2,241,749 | )a |
Y-Class | | | (2,232,779 | ) | | | (285,400 | )b |
| | | | | | | | |
Net increase in shares | | | 9,201,470 | | | | 3,811,204 | |
| | | | | | | | |
| a | Since the commencement of operations — May 3, 2010. |
| b | Since the commencement of operations — March 29, 2010. |
| | |
| 12 | THE GUGGENHEIM FUNDSANNUALREPORT | | See Notes to Financial Statements. |
MANAGED FUTURES STRATEGY FUND
FINANCIAL HIGHLIGHTS
This table is presented to show selected data for a share outstanding throughout each period and to assist shareholders in evaluating a Fund’s performance for the periods presented.
| | | | | | | | | | | | | | | | | | | | | | | | |
| | | Year Ended | | | Year Ended | | | Year Ended | | | Period Ended | | | Year Ended | | | Period Ended | |
| | | December 31, | | | December 31, | | | December 31, | | | December 31, | | | March 31, | | | March 31, | |
A-Class | | 2011a | | | 2010a | | | 2009a | | | 2008a,b | | | 2008 | | | 2007c | |
Per Share Data | | | | | | | | | | | | | | | | | | | | | | | | |
Net asset value, beginning of period | | $ | 25.78 | | | $ | 26.81 | | | $ | 28.04 | | | $ | 28.26 | | | $ | 25.03 | | | $ | 25.00 | |
| | | | | | | | | | | | | | | | | | | | | | | | |
Income (loss) from investment operations: | | | | | | | | | | | | | | | | | | | | | | | | |
Net investment income (loss)d | | | (.44 | ) | | | (.41 | ) | | | (.39 | ) | | | (— | )e | | | .57 | | | | .09 | |
Net gain (loss) on investments (realized and unrealized) | | | (1.39 | ) | | | (.62 | ) | | | (.84 | ) | | | .83 | | | | 2.64 | | | | (.06 | ) |
| | | | | | | | | | | | | | | | | | | | | | | | |
Total from investment operations | | | (1.83 | ) | | | (1.03 | ) | | | (1.23 | ) | | | .83 | | | | 3.21 | | | | .03 | |
| | | | | | | | | | | | | | | | | | | | | | | | |
Less distributions from: | | | | | | | | | | | | | | | | | | | | | | | | |
Net investment income | | | — | | | | — | | | | — | | | | (.57 | ) | | | — | | | | — | |
Net realized gains | | | — | | | | — | | | | — | | | | (.50 | ) | | | (— | )j | | | — | |
| | | | | | | | | | | | | | | | | | | | | | | | |
Total distributions | | | — | | | | — | | | | — | | | | (1.07 | ) | | | (— | )j | | | — | |
| | | | | | | | | | | | | | | | | | | | | | | | |
Redemption fees collected | | | — | | | | — | f | | | — | f | | | .02 | | | | .02 | | | | — | f |
| | | | | | | | | | | | | | | | | | | | | | | | |
Net asset value, end of period | | $ | 23.95 | | | $ | 25.78 | | | $ | 26.81 | | | $ | 28.04 | | | $ | 28.26 | | | $ | 25.03 | |
| | | | | | | | | | | | | | | | | | | | | | | | |
| | | | | | |
Total Returng | | | (7.14 | %) | | | (3.84 | %) | | | (4.39 | %) | | | 2.96 | % | | | 12.92 | % | | | 0.12 | % |
| | | | | | | | | | | | | | | | | | | | | | | | |
Ratios/Supplemental Data | | | | | | | | | | | | | | | | | | | | | | | | |
Net assets, end of period (in thousands) | | $ | 733,469 | | | $ | 657,317 | | | $ | 636,083 | | | $ | 298,987 | | | $ | 128,744 | | | $ | 23,655 | |
| | | | | | | | | | | | | | | | | | | | | | | | |
Ratios to average net assets: | | | | | | | | | | | | | | | | | | | | | | | | |
Net investment income (loss) | | | (1.76 | %) | | | (1.66 | %) | | | (1.42 | %) | | | (0.02 | %) | | | 2.15 | % | | | 2.06 | % |
Total expenses | | | 2.05 | % | | | 2.04 | % | | | 2.16 | % | | | 1.77 | % | | | 1.72 | % | | | 1.81 | % |
Net expensesh | | | 1.97 | % | | | 1.97 | % | | | 2.05 | % | | | 1.77 | % | | | 1.72 | % | | | 1.81 | % |
Operating expensesi | | | 1.97 | % | | | 1.97 | % | | | 2.05 | % | | | 1.75 | % | | | 1.69 | % | | | 1.81 | % |
| | | | | | | | | | | | | | | | | | | | | | | | |
Portfolio turnover rate | | | 72 | % | | | 148 | % | | | 125 | % | | | 74 | % | | | 154 | % | | | 20 | % |
| | | | | | |
| | | Year Ended | | | Year Ended | | | Year Ended | | | Period Ended | | | Year Ended | | | Period Ended | |
| | | December 31, | | | December 31, | | | December 31, | | | December 31, | | | March 31, | | | March 31, | |
C-Class | | 2011a | | | 2010a | | | 2009a | | | 2008a,b | | | 2008 | | | 2007c | |
Per Share Data | | | | | | | | | | | | | | | | | | | | | | | | |
Net asset value, beginning of period | | $ | 25.04 | | | $ | 26.24 | | | $ | 27.65 | | | $ | 28.04 | | | $ | 25.02 | | | $ | 25.00 | |
| | | | | | | | | | | | | | | | | | | | | | | | |
Income (loss) from investment operations: | | | | | | | | | | | | | | | | | | | | | | | | |
Net investment income (loss)d | | | (.61 | ) | | | (.59 | ) | | | (.58 | ) | | | (.16 | ) | | | .35 | | | | .05 | |
Net gain (loss) on investments (realized and unrealized) | | | (1.34 | ) | | | (.61 | ) | | | (.83 | ) | | | .82 | | | | 2.65 | | | | (.03 | ) |
| | | | | | | | | | | | | | | | | | | | | | | | |
Total from investment operations | | | (1.95 | ) | | | (1.20 | ) | | | (1.41 | ) | | | .66 | | | | 3.00 | | | | .02 | |
| | | | | | | | | | | | | | | | | | | | | | | | |
Less distributions from: | | | | | | | | | | | | | | | | | | | | | | | | |
Net investment income | | | — | | | | — | | | | — | | | | (.57 | ) | | | — | | | | — | |
Net realized gains | | | — | | | | — | | | | — | | | | (.50 | ) | | | (— | )j | | | — | |
| | | | | | | | | | | | | | | | | | | | | | | | |
Total distributions | | | — | | | | — | | | | — | | | | (1.07 | ) | | | (— | )j | | | — | |
| | | | | | | | | | | | | | | | | | | | | | | | |
Redemption fees collected | | | — | | | | — | f | | | — | f | | | .02 | | | | .02 | | | | — | f |
| | | | | | | | | | | | | | | | | | | | | | | | |
Net asset value, end of period | | $ | 23.09 | | | $ | 25.04 | | | $ | 26.24 | | | $ | 27.65 | | | $ | 28.04 | | | $ | 25.02 | |
| | | | | | | | | | | | | | | | | | | | | | | | |
| | | | | | |
Total Returng | | | (7.79 | %) | | | (4.57 | %) | | | (5.10 | %) | | | 2.37 | % | | | 12.08 | % | | | 0.08 | % |
| | | | | | | | | | | | | | | | | | | | | | | | |
Ratios/Supplemental Data | | | | | | | | | | | | | | | | | | | | | | | | |
Net assets, end of period (in thousands) | | $ | 96,647 | | | $ | 158,628 | | | $ | 225,416 | | | $ | 125,601 | | | $ | 46,005 | | | $ | 2,703 | |
| | | | | | | | | | | | | | | | | | | | | | | | |
Ratios to average net assets: | | | | | | | | | | | | | | | | | | | | | | | | |
Net investment income (loss) | | | (2.50 | %) | | | (2.41 | %) | | | (2.17 | %) | | | (0.78 | %) | | | 1.30 | % | | | 1.15 | % |
Total expenses | | | 2.80 | % | | | 2.79 | % | | | 2.92 | % | | | 2.51 | % | | | 2.48 | % | | | 2.60 | % |
Net expensesh | | | 2.72 | % | | | 2.72 | % | | | 2.81 | % | | | 2.51 | % | | | 2.48 | % | | | 2.60 | % |
Operating expensesi | | | 2.72 | % | | | 2.72 | % | | | 2.81 | % | | | 2.49 | % | | | 2.45 | % | | | 2.60 | % |
| | | | | | | | | | | | | | | | | | | | | | | | |
Portfolio turnover rate | | | 72 | % | | | 148 | % | | | 125 | % | | | 74 | % | | | 154 | % | | | 20 | % |
| | |
| See Notes to Financial Statements. | | THE GUGGENHEIM FUNDSANNUALREPORT | 13 |
MANAGED FUTURES STRATEGY FUND
FINANCIAL HIGHLIGHTS (continued)
This table is presented to show selected data for a share outstanding throughout each period and to assist shareholders in evaluating a Fund’s performance for the periods presented.
| | | | | | | | | | | | | | | | | | | | | | | | |
| | | Year Ended | | | Year Ended | | | Year Ended | | | Period Ended | | | Year Ended | | | Period Ended | |
| | | December 31, | | | December 31, | | | December 31, | | | December 31, | | | March 31, | | | March 31, | |
H-Class | | 2011a | | | 2010a | | | 2009a | | | 2008a,b | | | 2008 | | | 2007c | |
Per Share Data | | | | | | | | | | | | | | | | | | | | | | | | |
Net asset value, beginning of period | | $ | 25.78 | | | $ | 26.81 | | | $ | 28.04 | | | $ | 28.26 | | | $ | 25.03 | | | $ | 25.00 | |
| | | | | | | | | | | | | | | | | | | | | | | | |
Income (loss) from investment operations: | | | | | | | | | | | | | | | | | | | | | | | | |
Net investment income (loss)d | | | (.44 | ) | | | (.42 | ) | | | (.38 | ) | | | (.01 | ) | | | .58 | | | | .09 | |
Net gain (loss) on investments (realized and unrealized) | | | (1.39 | ) | | | (.61 | ) | | | (.85 | ) | | | .84 | | | | 2.63 | | | | (.06 | ) |
| | | | | | | | | | | | | | | | | | | | | | | | |
Total from investment operations | | | (1.83 | ) | | | (1.03 | ) | | | (1.23 | ) | | | .83 | | | | 3.21 | | | | .03 | |
| | | | | | | | | | | | | | | | | | | | | | | | |
Less distributions from: | | | | | | | | | | | | | | | | | | | | | | | | |
Net investment income | | | — | | | | — | | | | — | | | | (.57 | ) | | | — | | | | — | |
Net realized gains | | | — | | | | — | | | | — | | | | (.50 | ) | | | (— | )j | | | — | |
| | | | | | | | | | | | | | | | | | | | | | | | |
Total distributions | | | — | | | | — | | | | — | | | | (1.07 | ) | | | (— | )j | | | — | |
| | | | | | | | | | | | | | | | | | | | | | | | |
Redemption fees collected | | | — | | | | — | f | | | — | f | | | .02 | | | | .02 | | | | — | f |
| | | | | | | | | | | | | | | | | | | | | | | | |
Net asset value, end of period | | $ | 23.95 | | | $ | 25.78 | | | $ | 26.81 | | | $ | 28.04 | | | $ | 28.26 | | | $ | 25.03 | |
| | | | | | | | | | | | | | | | | | | | | | | | |
| | | | | | |
Total Returng | | | (7.14 | %) | | | (3.84 | %) | | | (4.39 | %) | | | 2.96 | % | | | 12.92 | % | | | 0.12 | % |
| | | | | | | | | | | | | | | | | | | | | | | | |
Ratios/Supplemental Data | | | | | | | | | | | | | | | | | | | | | | | | |
Net assets, end of period (in thousands) | | $ | 1,059,988 | | | $ | 1,199,718 | | | $ | 1,468,770 | | | $ | 838,511 | | | $ | 322,673 | | | $ | 45,781 | |
| | | | | | | | | | | | | | | | | | | | | | | | |
Ratios to average net assets: | | | | | | | | | | | | | | | | | | | | | | | | |
Net investment income (loss) | | | (1.75 | %) | | | (1.66 | %) | | | (1.41 | %) | | | (0.03 | %) | | | 2.17 | % | | | 2.19 | % |
Total expenses | | | 2.05 | % | | | 2.04 | % | | | 2.16 | % | | | 1.77 | % | | | 1.73 | % | | | 1.77 | % |
Net expensesh | | | 1.97 | % | | | 1.97 | % | | | 2.05 | % | | | 1.77 | % | | | 1.73 | % | | | 1.77 | % |
Operating expensesi | | | 1.97 | % | | | 1.97 | % | | | 2.05 | % | | | 1.75 | % | | | 1.70 | % | | | 1.77 | % |
| | | | | | | | | | | | | | | | | | | | | | | | |
Portfolio turnover rate | | | 72 | % | | | 148 | % | | | 125 | % | | | 74 | % | | | 154 | % | | | 20 | % |
| | | | | | | | |
| | | Year Ended | | | Period Ended | |
| | | December 31, | | | December 31, | |
Institutional Class | | 2011a | | | 2010a,k | |
Per Share Data | | | | | | | | |
Net asset value, beginning of period | | $ | 25.84 | | | $ | 25.58 | |
| | | | | | | | |
Income (loss) from investment operations: | | | | | | | | |
Net investment lossd | | | (.38 | ) | | | (.23 | ) |
Net gain (loss) on investments (realized and unrealized) | | | (1.40 | ) | | | .49 | |
| | | | | | | | |
Total from investment operations | | | (1.78 | ) | | | .26 | |
| | | | | | | | |
Redemption fees collected | | | — | | | | — | f |
| | | | | | | | |
Net asset value, end of period | | $ | 24.06 | | | $ | 25.84 | |
| | | | | | | | |
| | |
Total Returng | | | (6. 85 | %) | | | 0.98 | % |
| | | | | | | | |
Ratios/Supplemental Data | | | | | | | | |
Net assets, end of period (in thousands) | | $ | 101,549 | | | $ | 134,733 | |
| | | | | | | | |
Ratios to average net assets: | | | | | | | | |
Net investment loss | | | (1.50 | %) | | | (1.41 | %) |
Total expenses | | | 1.80 | % | | | 1.78 | % |
Net expensesh | | | 1.72 | % | | | 1.72 | % |
| | | | | | | | |
Portfolio turnover rate | | | 72 | % | | | 148 | % |
| | |
| 14 | THE GUGGENHEIM FUNDSANNUALREPORT | | See Notes to Financial Statements. |
MANAGED FUTURES STRATEGY FUND
FINANCIAL HIGHLIGHTS (concluded)
This table is presented to show selected data for a share outstanding throughout each period and to assist shareholders in evaluating a Fund’s performance for the periods presented.
| | | | | | | | |
| | | Year Ended | | | Period Ended | |
| | | December 31, | | | December 31, | |
Y-Class | | 2011a | | | 2010a,l | |
Per Share Data | | | | | | | | |
Net asset value, beginning of period | | $ | 25.84 | | | $ | 25.74 | |
| | | | | | | | |
Income (loss) from investment operations: | | | | | | | | |
Net investment lossd | | | (.37 | ) | | | (.26 | ) |
Net gain (loss) on investments (realized and unrealized) | | | (1.40 | ) | | | .36 | |
| | | | | | | | |
Total from investment operations | | | (1.77 | ) | | | .10 | |
| | | | | | | | |
Redemption fees collected | | | — | | | | — | f |
| | | | | | | | |
Net asset value, end of period | | $ | 24.07 | | | $ | 25.84 | |
| | | | | | | | |
| | |
Total Returng | | | (6.85 | %) | | | 0.39 | % |
| | | | | | | | |
Ratios/Supplemental Data | | | | | | | | |
Net assets, end of period (in thousands) | | $ | 404,684 | | | $ | 189,251 | |
| | | | | | | | |
Ratios to average net assets: | | | | | | | | |
Net investment loss | | | (1.47 | %) | | | (1.36 | %) |
Total expenses | | | 1.75 | % | | | 1.73 | % |
Net expensesh | | | 1.68 | % | | | 1.67 | % |
| | | | | | | | |
Portfolio turnover rate | | | 72 | % | | | 148 | % |
| b | The Fund changed it’s fiscal year end from March 31 to December 31 in 2008. Percentage amounts for the period, except total return and portfolio turnover rate, have been annualized. |
| c | Since commencement of operations: March 2, 2007. Percentage amounts for the period, except total return and portfolio turnover rate, have been annualized. |
| d | Net investment income (loss) per share was computed using average shares outstanding throughout the period. |
| e | Net investment income is less than $0.01 per share. |
| f | Redemption fees collected are less than $0.01 per share. |
| g | Total return does not reflect the impact of any applicable sales charges and has not been annualized. |
| h | Net expense information reflects the expense ratios after expense waivers. |
| i | Operating expenses exclude interest and dividend expense from securities sold short. |
| j | Distributions from realized gains are less than $0.01 per share. |
| k | Since commencement of operations: May 3, 2010. Percentage amounts for the period, except total return and portfolio turnover rate, have been annualized. |
| l | Since commencement of operations: March 29, 2010. Percentage amounts for the period, except total return and portfolio turnover rate, have been annualized. |
| | |
| See Notes to Financial Statements. | | THE GUGGENHEIM FUNDSANNUALREPORT | 15 |
NOTES TO CONSOLIDATED FINANCIAL STATEMENTS
1. Organization, Consolidation of Subsidiary and Significant Accounting Policies
Organization
The Rydex Series Funds (the “Trust”) is registered with the SEC under the Investment Company Act of 1940 (the “1940 Act”) as a non-diversified, open-ended investment company. The Trust offers eight separate classes of shares, Investor Class shares, Investor2 Class shares, Advisor Class shares, A-Class shares, C-Class shares, H-Class shares, Y-Class shares, and Institutional Class shares. Sales of shares of each Class are made without a sales charge at the NAV, with the exception of A-Class shares. A-Class shares are sold at the NAV, plus the applicable front-end sales charge. The sales charge varies depending on the amount purchased, but will not exceed 4.75%. A-Class share purchases of $1 million or more are exempt from the front-end sales charge but have a 1% CDSC if shares are redeemed within 18 months of purchase. C-Class shares have a 1% CDSC if shares are redeemed within 12 months of purchase.
At December 31, 2011, the Trust consisted of fifty-eight separate funds (the “Funds”). This report covers the Managed Futures Strategy Fund (the “Fund”). Only A-Class, C-Class, H-Class, Y-Class and Institutional Class shares had been issued by the Fund. Effective September 13, 2010, the redemption fee was removed.
Guggenheim Investments (“GI”) provides advisory services, and Rydex Fund Services, LLC (“RFS”) provides transfer agent and administrative services, and accounting services to the Trust. Rydex Distributors, LLC (“RDL”) acts as principal underwriter for the Trust. GI, RFS and RDL are affiliated entities.
Consolidation of Subsidiary
The consolidated financial statements of the Fund include the accounts of a wholly-owned and controlled Cayman Islands subsidiary (the “Subsidiary”). Significant inter-company accounts and transactions have been eliminated in consolidation for the Fund.
The Fund may invest up to 25% of its total assets in its Subsidiary which acts as an investment vehicle in order to effect certain investments consistent with the Fund’s investment objectives and policies.
A summary of the Fund’s investment in its Subsidiary is as follows:
| | | | | | | | | | | | |
| | | Inception
Date of
Subsidiary | | | Subsidiary
Net Assets at
December 31,
2011 | | | % of Total
Net Assets of
the Fund at
December 31,
2011 | |
Managed Futures Strategy Fund | | | 05/01/08 | | | $ | 212,284,867 | | | | 8.86 | % |
Significant Accounting Policies
The following significant accounting policies are in conformity with U.S. generally accepted accounting principles and are consistently followed by the Fund. This requires management to make estimates and assumptions that affect the reported amount of assets and liabilities and disclosure of contingent assets and liabilities at the date of the financial statements and the reported amounts of revenues and expenses during the reporting period. Actual results could differ from these estimates. All time references are based on Eastern Time.
A. The value of futures contracts purchased and sold by the Fund is accounted for using the unrealized gain or loss on the contracts that is determined by marking the contracts to their current realized settlement prices. Financial futures contracts are valued at the 4:00 p.m. price on the valuation date. In the event that the exchange for a specific futures contract closes earlier than 4:00 p.m., the futures contract is valued at the Official Settlement Price of the exchange. However, the underlying securities from which the futures contract value is derived are monitored until 4:00 p.m. to determine if fair valuation would provide a more accurate valuation.
Debt securities with a maturity of greater than 60 days at acquisition are valued at prices that reflect broker/dealer-supplied valuations or are obtained from independent pricing services, which may consider the trade activity, treasury spreads, yield or price of bonds of comparable quality, coupon, maturity, and type, as well as prices quoted by dealers who make markets in such securities. Short-term debt securities with a maturity of 60 days or less at acquisition and repurchase agreements are valued at amortized cost, which approximates market value.
Investments for which market quotations are not readily available are fair valued as determined in good faith by GI under the direction of the Board of Trustees using methods established or ratified by the Board of Trustees. These methods include, but are not limited to: (i) general information as to how these securities and assets trade; (ii) in connection with futures contracts and options thereupon, and other derivative investments, information as to how (a) these contracts and other derivative investments trade in the futures or other derivative markets, respectively, and (b) the securities underlying these contracts and other derivative investments trade in the cash market; and (iii) other information and considerations, including current values in related markets.
B. Security transactions are recorded on the trade date for financial reporting purposes. Realized gains and losses from securities transactions are recorded using the identified cost basis. Proceeds from lawsuits related to
16 | THE GUGGENHEIM FUNDSANNUALREPORT
NOTES TO CONSOLIDATED FINANCIAL STATEMENTS (continued)
investment holdings are recorded as realized gains. Interest income, including amortization of premiums and accretion of discount, is accrued on a daily basis.
C. Distributions of net investment income and net realized gains, if any, are declared and paid at least annually. Distributions are recorded on the ex-dividend date and are determined in accordance with income tax regulations which may differ from U.S. generally accepted accounting principles.
D. Certain U.S. Government and Agency Obligations are traded on a discount basis; the interest rates shown on the Schedules of Investments reflect the effective rates paid at the time of purchase by the Fund. Other securities bear interest at the rates shown, payable at fixed dates through maturity.
E. The Fund may leave cash overnight in its cash account with the custodian, U.S. Bank. Periodically, the Fund may have cash due to the custodian bank as an overdraft balance. A fee is incurred on this overdraft, calculated by multiplying the overdraft by a rate based on the federal funds rate.
Segregated cash with the broker is held as collateral for investments in derivative instruments such as futures contracts or swap agreements.
F. Interest income, most expenses, all realized gains and losses, and all unrealized gains and losses are allocated to the Classes based upon the value of the outstanding shares in each Class. Certain costs, such as distribution fees relating to A-Class shares and H-Class shares and service and distribution fees related to C-Class shares, are charged directly to specific Classes. In addition, certain expenses have been allocated to the individual Funds in the Trust on a pro rata basis upon the respective aggregate net assets of each Fund included in the Trust.
G. Throughout the normal course of business, the Fund enters into contracts that contain a variety of representations and warranties which provide general indemnifications. The Fund’s maximum exposure under these arrangements is unknown, as this would involve future claims that may be made against the Fund and/or its affiliates that have not yet occurred. However, based on experience, the Fund expects the risk of loss to be remote.
H. When the Fund writes (sells) an option, an amount equal to the premium received is entered in the Fund’s accounting records as an asset and equivalent liability. The amount of the liability is subsequently marked-to-market to reflect the current value of the option written.
When a written option expires, or if the Fund enters into a closing purchase transaction, it realizes a gain (or loss if the cost of a closing purchase transaction exceeds the premium received when the option was sold).
I. Upon entering into a futures contract, the Fund deposits and maintains as collateral such initial margin as required by the exchange on which the transaction is affected. Pursuant to the contract, the Fund agrees to receive from or pay to the broker an amount of cash equal to the daily fluctuation in value of the contract. Such receipts or payments are known as variation margin and are recorded by the Fund as unrealized gains or losses. When the contract is closed, the Fund records a realized gain or loss equal to the difference between the value of the contract at the time it was opened and the value at the time it was closed.
2. Financial Instruments
As part of its investment strategy, the Fund utilizes a variety of derivative instruments, including options and futures. These investments involve, to varying degrees, elements of market risk and risks in excess of the amounts recognized on the Statement of Assets and Liabilities.
An option on a security gives the purchaser of the option the right to sell, and the writer of the option the obligation to buy, the underlying security (put option) or the purchaser of the option the right to buy, and the writer of the option the obligation to sell, the underlying security (call option) at any time during the option period. The risk associated with purchasing options is limited to the premium originally paid. The risk in writing a call option is that the Fund may incur a loss if the market price of the underlying security increases and the option is exercised. The risk in writing a put option is that the Fund may incur a loss if the market price of the underlying security decreases and the option is exercised. In addition, there may be an imperfect correlation between the movement in prices of options and the underlying securities and the Fund may not be able to enter into a closing transaction because of an illiquid secondary market or, for over-the-counter options, because of the counterparty’s inability to perform.
A futures contract is an agreement to purchase (long) or sell (short) an agreed amount of securities or other instruments at a set price for delivery at a future date. There are significant risks associated with the Fund’s or an underlying fund’s use of futures contracts and related options, including (i) there may be an imperfect or no correlation between the changes in market value of the underlying asset and the prices of futures contracts; (ii) there may not be a liquid secondary market for a futures
THE GUGGENHEIM FUNDSANNUALREPORT | 17
NOTES TO CONSOLIDATED FINANCIAL STATEMENTS (continued)
contract; (iii) trading restrictions or limitations may be imposed by an exchange; and (iv) government regulations may restrict trading in futures contracts. When investing in futures, there is minimal counterparty credit risk to the Fund because futures are exchange-traded and the exchange’s clearinghouse, as counterparty to all exchange-traded futures, guarantees against default.
In conjunction with the use of written options and futures, the Fund is required to maintain collateral in various forms. The Fund uses, where appropriate, depending on the financial instrument utilized and the broker involved, margin deposits at the broker, cash and/or securities segregated at the custodian bank, discount notes, or the repurchase agreements allocated to the Fund.
The Trust has established counterparty credit guidelines and enters into transactions only with financial institutions of investment grade or better. The Trust monitors the counterparty credit risk.
3. Fees and Other Transactions with Affiliates
Under the terms of an investment advisory contract, the Fund pays GI investment advisory fees calculated at an annualized rate of 0.90% of the average daily net assets.
RFS provides transfer agent and administrative services to the Fund for fees calculated at an annualized rate of 0.25% of the average daily net assets of A-Class, C-Class, H-Class and Institutional Class, and 0.20% of the average daily net assets of Y-Class.
GI has contractually agreed to waive the management fee it receives from the Subsidiary in an amount equal to the management fee paid to GI by the Subsidiary. This undertaking will continue in effect for so long as the Fund invests in the Subsidiary, and may not be terminated by GI unless GI obtains the prior approval of the Fund’s Board of Trustees for such termination. In any event, this undertaking will continue through April 30, 2012.
RFS also provides accounting services to the Fund for fees calculated at annualized rates below, based on the average daily net assets of the Fund.
| | | | |
Fund Accounting/Administration Fees | | (as a % of net assets) | |
On the first $250 million | | | 0.10 | % |
On the next $250 million | | | 0.075 | % |
On the next $250 million | | | 0.05 | % |
Over $750 million | | | 0.03 | % |
RFS engages external service providers to perform other necessary services for the Trust, such as audit related services, legal services, printing and mailing, etc., on a pass-through basis. Such expenses are allocated to various funds within the complex based on relative net assets.
The Trust has adopted a Distribution Plan applicable to A-Class shares and H-Class shares for which RDL and other firms that provide distribution and/or shareholder services (“Service Providers”) may receive compensation. If a Service Provider provides distribution services, the Fund will pay distribution fees to RDL at an annual rate not to exceed 0.25% of average daily net assets, pursuant to Rule 12b-1 of the 1940 Act. RDL, in turn, will pay the Service Provider out of its fees. RDL may, at its discretion, retain a portion of such payments to compensate itself for distribution services.
The Trust has adopted a separate Distribution and Shareholder Services Plan applicable to its C-Class shares that allows the Fund to pay annual distribution and service fees of 1.00% of the Fund’s C-Class shares average daily net assets. The annual 0.25% service fee compensates the shareholder’s financial advisor for providing ongoing services to the shareholder. The annual 0.75% distribution fee reimburses RDL for paying the shareholder’s financial advisor an ongoing sales commission. RDL advances the first year’s service and distribution fees to the financial advisor. RDL retains the service and distribution fees on accounts with no authorized dealer of record.
During the year ended December 31, 2011, RDL retained sales charges of $444,856 relating to sales of A-Class shares of the Trust.
Certain officers and trustees of the Trust are also officers of GI, RFS and RDL.
4. Fair Value Measurement
In accordance with U.S. generally accepted accounting principles, fair value is defined as the price that the Fund would receive to sell an investment or pay to transfer a liability in an orderly transaction with an independent buyer in the principal market, or in the absence of a principal market the most advantageous market for the investment or liability. A three-tier hierarchy is utilized to distinguish between (1) inputs that reflect the assumptions market participants would use in pricing an asset or liability developed based on market data obtained from sources independent of the reporting entity (observable inputs) and (2) inputs that reflect the reporting entity’s own assumptions about the assumptions market participants would use in pricing an asset or liability developed based on the best information available in the circumstances (unobservable inputs) and to establish classification of fair value measurements for disclosure purposes.
18 | THE GUGGENHEIM FUNDSANNUALREPORT
NOTES TO CONSOLIDATED FINANCIAL STATEMENTS (continued)
Various inputs are used in determining the value of the Fund’s investments. The inputs are summarized in the three broad levels listed below:
Level 1 — quoted prices in active markets for identical securities.
Level 2 — other significant observable inputs (including quoted prices for similar securities, interest rates, prepayment speeds, credit risk, etc.).
Level 3 — significant unobservable inputs (including the fund’s own assumptions used to determine the fair value of investments).
The inputs or methodologies used for valuing securities are not necessarily an indication of the risk associated with investing in those securities.
The following table summarizes the inputs used to value the Fund’s net assets at December 31, 2011:
| | | | | | | | | | | | | | | | | | | | |
Fund | | Level 1
Investments
In Securities | | | Level 1
Other Financial
Instruments* | | | Level 2
Investments
In Securities | | | Level 3
Investments
In Securities | | | Total | |
Assets | | | | | | | | | | | | | | | | | | | | |
Managed Futures Strategy Fund | | $ | — | | | $ | 45,974,610 | | | $ | 2,297,572,563 | | | $ | — | | | $ | 2,343,547,173 | |
| | | | | |
Liabilities | | | | | | | | | | | | | | | | | | | | |
Managed Futures Strategy Fund | | $ | — | | | $ | 23,735,221 | | | $ | — | | | $ | — | | | $ | 23,735,221 | |
| * | Other financial instruments include futures contracts, which are reported as unrealized gain/loss at period end. |
For the year ended December 31, 2011, there were no transfers between levels.
5. Repurchase Agreements
The Funds transfer uninvested cash balances into a single joint account, the daily aggregate balance of which is invested in one or more repurchase agreements collateralized by obligations of the U.S. Treasury and U.S. Government Agencies. The collateral is in the possession of the Funds’ custodian and is evaluated to ensure that its market value exceeds, at a minimum, 102% of the original face amount of the repurchase agreements. Each Fund holds a pro rata share of the collateral based on the dollar amount of the repurchase agreement entered into by each Fund.
At December 31, 2011, the collateral for the repurchase agreements in the joint account related to the Fund was as follows:
| | | | | | | | | | | | | | | | | | | | |
Counterparty and Terms of Agreement | | Face Value | | | Repurchase
Price | | | Collateral | | | Par Value | | | Fair Value | |
Mizuho Financial Group, Inc. | | | | | | | | | | | U.S. Treasury Note | | | | | | | | | |
0.00% | | | | | | | | | | | 3.125 | % | | | | | | | | |
Due 01/03/12 | | $ | 231,753,308 | | | $ | 231,753,308 | | | | 05/15/21 | | | $ | 210,634,300 | | | $ | 236,388,382 | |
| | | | | |
Credit Suisse Group | | | | | | | | | | | U.S. Treasury Note | | | | | | | | | |
0.00% | | | | | | | | | | | 1.75 | % | | | | | | | | |
Due 01/03/12 | | | 51,250,000 | | | | 51,250,000 | | | | 05/31/16 | | | | 49,884,700 | | | | 52,275,009 | |
| | | | | |
HSBC Group | | | | | | | | | | | U.S. Treasury STRIPS | | | | | | | | | |
0.00% | | | | | | | | | | | 0.00 | % | | | | | | | | |
Due 01/03/12 | | | 848,250,000 | | | | 848,250,000 | | | | 08/15/12 - 11/15/22 | | | | 930,569,800 | | | | 865,215,018 | |
| | | | | |
Deutsche Bank | | | | | | | | | | | U.S. Treasury Note | | | | | | | | | |
0.00% | | | | | | | | | | | 2.63 | % | | | | | | | | |
Due 01/03/12 | | | 123,250,000 | | | | 123,250,000 | | | | 11/15/20 | | | | 116,533,900 | | | | 125,715,013 | |
In the event of counterparty default, the Funds have the right to collect the collateral to offset losses incurred. There is potential loss to the Funds in the event the Funds are delayed or prevented from exercising their rights to dispose of the collateral securities, including the risk of a possible decline in the value of the underlying securities during the period while the Funds seek to assert their rights. The Funds’ investment advisor, acting under the supervision of the Board of Trustees, reviews the value of the collateral and the creditworthiness of those banks and dealers with which the Funds enter into repurchase agreements to evaluate potential risks.
THE GUGGENHEIM FUNDSANNUALREPORT | 19
NOTES TO CONSOLIDATED FINANCIAL STATEMENTS (continued)
6. Derivative Investment Holdings Categorized by Risk Exposure
U.S. generally accepted accounting principles requires disclosures to enable investors to better understand how and why the Fund uses derivative instruments, how these derivatives instruments are accounted for and their effects on the Fund’s financial position and results of operations. None of the derivatives currently held by the Fund is being used as hedging instruments.
During the year ended December 31, 2011, the Fund sought to gain exposure to its benchmark, as well as for liquidity purposes, by investing in currency and financial-linked derivative instruments, including options and futures. The following table represents the notional amount of derivative instruments outstanding, as an approximate percentage of the Fund’s net assets on a daily basis, while the risk to the Fund is limited to the profit earned on such derivatives.
Approximate percentage of Fund’s net assets on a daily basis
| | | | | | | | |
Fund | | Long | | | Short | |
Managed Futures Strategy Fund | | | 35 | % | | | 65 | % |
The following is a summary of the location of derivative investments on the Fund’s Statement of Assets and Liabilities as of December 31, 2011:
Location on the Statement of Assets and Liabilities
| | | | | | | | |
Derivative Investments Type | | Asset Derivatives | | | Liability Derivatives | |
Commodity/Interest Rate/Currency contracts | | | — | | | | Variation Margin | |
The following table sets forth the fair value of the Fund’s derivative investments categorized by primary risk exposure at December 31, 2011:
Asset Derivative Investments Value
| | | | | | | | | | | | | | | | |
Fund | | Futures
Interest Rate
Contracts* | | | Futures
Commodity
Contracts* | | | Futures
Currency
Contracts* | | | Total Value at
December 31, 2011 | |
Managed Futures Strategy Fund | | $ | 6,459,121 | | | $ | 28,261,688 | | | $ | 11,253,801 | | | $ | 45,974,610 | |
Liability Derivative Investments Value
| | | | | | | | | | | | |
Fund | | Futures
Commodity
Contracts* | | | Futures
Currency
Contracts* | | | Total Value at
December 31, 2011 | |
Managed Futures Strategy Fund | | $ | 21,048,063 | | | $ | 2,687,158 | | | $ | 23,735,221 | |
| * | Includes cumulative appreciation (depreciation) of futures contracts as reported on the Schedule of Investments. Only current day’s variation margin is reported within the Statement of Assets and Liabilities. |
The following is a summary of the location of derivative investments on the Fund’s Statement of Operations for the year ended December 31, 2011:
| | |
Derivative Investment Type | | Location of Gain (Loss) on Derivatives |
Commodity/Currency contracts | | Net realized gain (loss) on investments |
| | Net realized gain (loss) on futures contracts |
| | Net realized gain (loss) on options written |
| | Net change in unrealized appreciation (depreciation) on futures contracts |
Interest Rate contracts | | Net realized gain (loss) on futures contracts |
| | Net change in unrealized appreciation (depreciation) on futures contracts |
The following is a summary of the Fund’s realized gain (loss) and change in unrealized appreciation (depreciation) on derivative investments recognized on the Statement of Operations categorized by primary risk exposure for the year ended December 31, 2011:
Realized Gain (Loss) on Derivative Investments Recognized in the Statement of Operations
| | | | | | | | | | | | | | | | | | | | | | | | | | | | | | | | |
Fund | | Written
Options
Commodity
Contracts | | | Written
Options
Currency
Contracts | | | Purchased
Options
Commodity
Contracts | | | Purchased
Options
Currency
Contracts | | | Futures
Commodity
Contracts | | | Futures
Interest Rate
Contracts | | | Futures
Currency
Contracts | | | Total | |
Managed Futures Strategy Fund | | $ | 2,576,608 | | | $ | 135,882 | | | $ | (1,678,023 | ) | | $ | (53,967 | ) | | $ | (95,595,621 | ) | | $ | 57,498,799 | | | $ | (47,748,244 | ) | | $ | (84,864,566 | ) |
20 | THE GUGGENHEIM FUNDSANNUALREPORT
NOTES TO CONSOLIDATED FINANCIAL STATEMENTS (continued)
Change in Unrealized Appreciation (Depreciation) on Derivative Investments Recognized on the Statement of Operations
| | | | | | | | | | | | | | | | |
Fund | | Futures
Commodity
Contracts | | | Futures
Interest Rate
Contracts | | | Futures
Currency
Contracts | | | Total | |
Managed Futures Strategy Fund | | $ | (66,208,060 | ) | | $ | 1,127,312 | | | $ | 4,481,969 | | | $ | (60,598,779 | ) |
7. Call Options Written
Transactions in options written during the year ended December 31, 2011 were as follows:.
| | | | | | | | |
Managed Futures Strategy Fund Written Call Options | | Number of
Contracts | | | Premium
Amount | |
Balance at December 31, 2010 | | | — | | | $ | — | |
Options written | | | 4,365 | | | | 6,454,616 | |
Options terminated in closing purchase transactions | | | (2,785 | ) | | | (4,389,066 | ) |
Options expired | | | (1,580 | ) | | | (2,065,550 | ) |
Options exercised | | | — | | | | — | |
| | | | | | | | |
Balance at December 31, 2011 | | | — | | | $ | — | |
8. Federal Income Tax Information
The Fund intends to comply with the provisions of Subchapter M of the Internal Revenue Code applicable to regulated investment companies and distribute substantially all taxable net investment income and capital gains sufficient to relieve it from all, or substantially all, federal income, excise and state income taxes. Therefore, no provision for federal or state income tax is required.
Tax positions taken or expected to be taken in the course of preparing the Fund’s tax returns are evaluated to determine whether the tax positions are “more-likely-than-not” of being sustained by the applicable tax authority. Tax positions not deemed to meet the more-likely-than-not threshold would be recorded as a tax benefit or expense in the current year. Management has analyzed the Fund’s tax positions taken on Federal income tax returns for all open tax years (fiscal years 2008-2011), and has concluded that no provision for income tax is required in the Fund’s financial statements.
The Fund intends to invest up to 25% of its assets in the Subsidiary which is expected to provide the Fund with exposure to the commodities markets within the limitations of the federal tax requirements under Subchapter M of the Internal Revenue Code. The Fund has received a private letter ruling from the IRS that concludes that the income the Fund receives from the Subsidiary will constitute qualifying income for purposes of Subchapter M of the Internal Revenue Code. The Subsidiary will be classified as a corporation for U.S. federal income tax purposes. A foreign corporation, such as the Subsidiary, will generally not be subject to U.S. federal income taxation unless it is deemed to be engaged in a U.S. trade or business. The RIC Modernization Act of 2010 was signed into law on December 22, 2010 and seeks to simplify some of the tax provisions applicable to regulated investment companies and the tax reporting to their shareholders, and to improve the tax efficiency of certain fund structures. The changes are generally effective for taxable years beginning after the date of enactment.
One of the more prominent changes addresses capital loss carryforwards. The Fund will be permitted to carry forward capital losses incurred in taxable years beginning after December 22, 2010 for an unlimited period. However, any losses incurred during those future taxable years will be required to be utilized prior to the losses incurred in pre-enactment taxable years. Under pre-enactment law, capital losses could be carried forward for eight years, and carried forward as short-term capital, irrespective of the character of the original loss. As a result of this ordering rule, pre-enactment capital loss carryforwards may potentially expire unused. Additionally, post-enactment capital losses that are carried forward will retain their character as either short-term or long-term capital losses rather than being considered all short-term as under previous law.
Tax basis capital losses in excess of capital gains are carried forward to offset future net capital gains For the year ended December 31, 2011, the following capital loss carryforward amounts expired, were used, or were permanently lost due to loss limitation rules in Section 382 of the Internal Revenue Code:
| | | | |
Fund | | Amount | |
Managed Futures Strategy Fund | | $ | 7,306,846 | |
THE GUGGENHEIM FUNDSANNUALREPORT | 21
NOTES TO CONSOLIDATED FINANCIAL STATEMENTS (continued)
The tax character of distributions paid during the year ended December 31, 2011, was as follows:
| | | | | | | | | | | | |
Fund | | Ordinary
Income | | | Long-Term
Capital Gain | | | Total
Distributions | |
Managed Futures Strategy Fund | | $ | — | | | $ | — | | | $ | — | |
The tax character of distributions paid during the year ended December 31, 2010, was as follows:
| | | | | | | | | | | | |
Fund | | Ordinary
Income | | | Long-Term
Capital Gain | | | Total
Distributions | |
Managed Futures Strategy Fund | | $ | — | | | $ | — | | | $ | — | |
Note: For federal income tax purposes, short term capital gain distributions are treated as ordinary income distributions. The tax character of distributable earnings/(accumulated losses) at December 31, 2011, was as follows:
| | | | | | | | | | | | | | | | |
Fund | | Undistributed
Ordinary
Income | | | Undistributed
Long-Term
Capital Gain | | | Net Unrealized
Appreciation | | | Capital Loss
Carryforward | |
Managed Futures Strategy Fund | | $ | — | | | $ | — | | | $ | 6,047,845 | | | $ | (52,732,787 | )1 |
Capital Loss Carryforward amounts may be limited due to Federal income tax regulations.
| 1 | A summary of the expiration of the aforementioned Capital Loss Carryforward is as follows: |
| | | | | | | | | | | | | | | | | | | | |
| | | | | | | | | | | | | | | Total | |
| | | Expires in | | | Expires in | | | Unlimited | | | Capital Loss | |
Fund | | 2017 | | | 2018 | | | Short Term | | | Long Term | | | Carryforward | |
Managed Futures Strategy Fund | | $ | (9,859,364 | ) | | $ | (42,873,423 | ) | | $ | — | | | $ | — | | | $ | (52,732,787 | ) |
Net investment income and net realized gains (losses) may differ for financial statement and tax purposes because of temporary or permanent book/tax differences. These differences are primarily due to post-October losses, losses deferred due to wash sales, foreign currency gains and losses, and the “mark-to-market” of certain passive foreign investment companies (PFICs) for tax purposes. Additional differences may result from the tax treatment of net investment losses and expired capital loss carryforwards. To the extent these differences are permanent, reclassifications are made to the appropriate equity accounts in the period that the differences arise. These reclassifications have no effect on net assets or NAV per share. On the Statement of Assets and Liabilities, the following reclassifications were made for permanent book/tax differences:
| | | | | | | | | | | | |
| | | | | | Undistributed | | | Accumulated | |
Fund | | Paid In
Capital | | | Net Investment
Income | | | Net Realized
Gain (Loss) | |
Managed Futures Strategy Fund | | $ | (137,882,304 | ) | | $ | 43,185,268 | | | $ | 94,697,036 | |
At December 31, 2011, the cost of securities for Federal income tax purposes, the aggregate gross unrealized gain for all securities for which there was an excess of value over tax cost and the aggregate gross unrealized loss for all securities for which there was an excess of tax cost over value, were as follows:
| | | | | | | | | | | | | | | | |
| | | | | | Tax | | | Tax | | | Net | |
| | | Tax | | | Unrealized | | | Unrealized | | | Unrealized | |
Fund | | Cost | | | Gain | | | Loss | | | Loss | |
Managed Futures Strategy Fund | | $ | 2,298,738,344 | | | $ | — | | | $ | (1,165,781 | ) | | $ | (1,165,781 | ) |
Pursuant to Federal income tax regulations applicable to investment companies, the Fund has elected to treat net capital losses realized between November 1 and December 31 of each year as occurring on the first day of the following tax year. For the period ended December 31, 2011, the following amount of realized capital losses reflected in the accompanying financial statements will not be recognized for Federal income tax purposes until January 1, 2012:
| | | | |
Fund | | Capital | |
Managed Futures Strategy Fund | | $ | 6,293,440 | |
22 | THE GUGGENHEIM FUNDSANNUALREPORT
NOTES TO CONSOLIDATED FINANCIAL STATEMENTS (continued)
9. Securities Transactions
For the year ended December 31, 2011, the cost of purchases and proceeds from sales of investment securities, excluding short-term and temporary cash investments, were:
| | | | | | | | |
| | | Purchases | | | Sales | |
Managed Futures Strategy Fund | | $ | 114,999,200 | | | $ | 309,121,738 | |
10. Line of Credit
The Trust, along with other affiliated trusts, has secured an uncommitted, $75,000,000 line of credit with U.S. Bank, N.A. for emergency or temporary purposes. Borrowings, if any, under this arrangement bear interest equal to the Prime Rate, minus 2%, which shall be paid monthly, averaging 1.25% for the year ended December 31, 2011. At December 31, 2011, the Fund did not have any borrowings under this agreement, which expires on June 15, 2012, but the following table illustrates average daily balances borrowed:
| | | | |
Fund | | Average Daily Balance | |
Managed Futures Strategy Fund | | $ | 400,510 | |
THE GUGGENHEIM FUNDSANNUALREPORT | 23
REPORT OF INDEPENDENT REGISTERED PUBLIC
ACCOUNTING FIRM
To the Board of Trustees and Shareholders
of Rydex Series Funds:
We have audited the accompanying consolidated statement of assets and liabilities, including the consolidated schedule of investments, of Managed Futures Strategy Fund (one of the series constituting the Rydex Series Funds) (the “Fund”) as of December 31, 2011, and the related consolidated statement of operations for the year then ended, the consolidated statements of changes in net assets for each of the two years in the period then ended, and the financial highlights for each of the years or periods indicated therein (consolidated for the years or periods ended December 31, 2011, 2010, 2009 and 2008). These financial statements and financial highlights are the responsibility of the Fund’s management. Our responsibility is to express an opinion on these financial statements and financial highlights based on our audits.
We conducted our audits in accordance with the standards of the Public Company Accounting Oversight Board (United States). Those standards require that we plan and perform the audit to obtain reasonable assurance about whether the financial statements and financial highlights are free of material misstatement. We were not engaged to perform an audit of the Fund’s internal control over financial reporting. Our audits included consideration of internal control over financial reporting as a basis for designing audit procedures that are appropriate in the circumstances, but not for the purpose of expressing an opinion on the effectiveness of the Fund’s internal control over financial reporting. Accordingly, we express no such opinion. An audit also includes examining, on a test basis, evidence supporting the amounts and disclosures in the financial statements and financial highlights, assessing the accounting principles used and significant estimates made by management, as well as evaluating the overall financial statement presentation. Our procedures included confirmation of securities owned as of December 31, 2011, by correspondence with the custodian and brokers or by other appropriate auditing procedures where replies from brokers were not received. We believe that our audits provide a reasonable basis for our opinion.
In our opinion, the financial statements and financial highlights referred to above present fairly, in all material respects, the consolidated financial position of Managed Futures Strategy Fund series of the Rydex Series Funds, at December 31, 2011, the consolidated results of its operations for the year then ended, the consolidated changes in its net assets for each of the two years in the period then ended, and its financial highlights for each of the years or periods indicated therein (consolidated for the years or periods ended December 31, 2011, 2010, 2009 and 2008), in conformity with U.S. generally accepted accounting principles.
McLean, Virginia
February 28, 2012
24 | THE GUGGENHEIM FUNDSANNUALREPORT
OTHER INFORMATION (Unaudited)
Proxy Voting Information
A description of the policies and procedures that the Trust uses to determine how to vote proxies relating to securities held in the Funds’ portfolios is available, without charge and upon request, by calling 1.800.820.0888. This information is also available from the EDGAR database on the SEC’s website at http://www.sec.gov.
Information regarding how the Fund voted proxies relating to portfolio securities during the most recent 12-month period ended June 30 is available without charge, upon request, by calling 1.800.820.0888. This information is also available from the EDGAR database on the SEC’s website at http://www.sec.gov.
At a special meeting of shareholders held on November 22, 2011, the shareholders of the Fund approved a new investment advisory agreement between Rydex Series Trust and Security Investors, LLC. A description of the number of shares voted is as follows:
| | | | | | | | | | | | |
Fund | | Shares For | | | Shares Against | | | Shares Abstained | |
Managed Futures Strategy Fund | | | 48,672,283 | | | | 356,550 | | | | 325,512 | |
At a special meeting of shareholders held on November 22, 2011, the shareholders of the Trust approved the election of nominees to the Board of Trustees. A description of the number of shares voted is as follows:
| | | | | | | | | | | | | | | | |
Donald C. Cacciapaglia | | | Corey A. Colehour | | | J. Kenneth Dalton | |
For | | | 1,443,600,902 | | | For | | | 1,444,213,017 | | | For | | | 1,444,422,997 | |
Withhold | | | 23,402,733 | | | Withhold | | | 22,790,618 | | | Withhold | | | 22,580,638 | |
Total | | | 1,467,003,635 | | | Total | | | 1,467,003,635 | | | Total | | | 1,467,003,635 | |
| | |
John O. Demaret | | | Richard M. Goldman | | | Werner E. Keller | |
For | | | 1,445,255,754 | | | For | | | 1,443,668,596 | | | For | | | 1,445,494,272 | |
Withhold | | | 21,747,881 | | | Withhold | | | 23,335,039 | | | Withhold | | | 21,509,363 | |
Total | | | 1,467,003,635 | | | Total | | | 1,467,003,635 | | | Total | | | 1,467,003,635 | |
| | |
Thomas F. Lydon | | | Patrick T. McCarville | | | Roger Somers | |
For | | | 1,444,219,448 | | | For | | | 1,445,357,772 | | | For | | | 1,443,486,735 | |
Withhold | | | 22,784,187 | | | Withhold | | | 21,645,863 | | | Withhold | | | 23,516,900 | |
Total | | | 1,467,003,635 | | | Total | | | 1,467,003,635 | | | Total | | | 1,467,003,635 | |
At a special meeting of shareholders held on November 22, 2011, the shareholders of the Fund also voted on whether to approve a “manager of managers” arrangement for the Fund. Although shareholder votes were placed, not enough votes were received to meet the minimum requirements to constitute a majority vote. As such the matter was closed.
Quarterly Portfolio Schedules Information
The Trust files its complete schedule of portfolio holdings with the SEC for the first and third quarters of each fiscal year on Form N-Q; which are available on the SEC’s website at http://www.sec.gov. The Fund’s Forms N-Q may be reviewed and copied at the SEC’s Public Reference Room in Washington, DC, and that information on the operation of the Public Reference Room may be obtained by calling 1-800-SEC-0330. Copies of the portfolio holdings are also available to shareholders, without charge and upon request, by calling 1.800.820.0888.
Office Locations
The offices of Guggenheim Investments can be found in the following locations:
40 East 52nd Street
16th Floor
New York, NY 10022
(Headquarters)
Four Irvington Centre
805 King Farm Boulevard
Suite 600
Rockville, MD 20850
9401 Indian Creek Parkway
40 Corporate Woods
Suite 850
Overland Park, KS 66210
THE GUGGENHEIM FUNDSANNUALREPORT | 25
OTHER INFORMATION (Unaudited) (continued)
Guggenheim Transaction
On September 20, 2011, Guggenheim Capital, LLC agreed to purchase the indirect holding company of Security Investors, LLC, the Fund’s investment manager (the “Investment Manager”) (the “Transaction”). Guggenheim Capital, LLC’s subsidiary, Guggenheim Partners, LLC (“Guggenheim”), is a global, independent, privately-held, diversified financial services firm with more than 1,500 dedicated professionals.
The Transaction should not result in material changes to the day-to-day management and operation of the Fund or any increase in fees. The parties expect the Transaction to be completed in early 2012. However, it is subject to various conditions, and could be delayed or even terminated due to unforeseen circumstances.
In anticipation of the Transaction, the Board of Trustees of the Fund (the “Board”) called a special meeting of shareholders (the “Meeting”), at which shareholders of the Fund of record as of October 3, 2011 were asked to consider the approval of a new investment management agreement between the Fund and the Investment Manager (the “New Agreement”). This approval was necessary because, under the Investment Company Act of 1940 (the “1940 Act”), the Transaction could result in the termination of the Fund’s current investment management agreement with the Investment Manager (the “Current Agreement”). The Fund’s shareholders approved the New Agreement, the terms of which are substantially identical to the corresponding Current Agreement, except with respect to the date of execution, and the New Agreement will take effect if the Transaction is completed.
Election of Board Members
The Board also approved a proposal to elect nine individuals to the Board. The Board proposed the election of the following nominees: Donald C. Cacciapaglia, Corey A. Colehour, J. Kenneth Dalton, John O. Demaret, Richard M. Goldman, Werner E. Keller, Thomas F. Lydon, Patrick T. McCarville and Roger Somers. Each of the nominees, other than Mr. Cacciapaglia, currently serves as a Trustee. In connection with the Transaction, the Board believes that expanding the Board to include Mr. Cacciapaglia, who is a member of senior management of Guggenheim’s investment management business, and who would serve on other board in the Guggenheim Investments family of funds, would be appropriate. The Trusts’ shareholders ultimately approved the aforementioned proposal.
Board Considerations in Approving the Investment Advisory Agreements
At an in-person meeting of the Trust’s Board of Trustees held August 16-17, 2011, called for the purpose of, among other things, voting on the approval of investment advisory agreements applicable to the series of the Trust (collectively, the “Funds”), the Trust’s Board of Trustees, including the independent Trustees, unanimously approved the investment advisory agreement between the Trust and Security Investors, LLC (referred to herein as the “Adviser”).
At the meeting of August 16-17, 2011, the Trust’s Board of Trustees also considered new investment advisory agreements that were required as a result of a proposed change in the corporate ownership structure of the Adviser (the “Transaction”). The Investment Company Act of 1940 (the “1940 Act”), the law that regulates mutual funds, including the Funds, requires that a fund’s investment advisory agreement terminate whenever there is deemed to be a “change in control” of the investment adviser. The change in the corporate ownership structure of the Adviser could potentially be deemed to constitute a “change in control” (as this term is used for regulatory purposes) of the Adviser. Before an investment advisory agreement terminates, a new investment advisory agreement must be in effect in order for the investment adviser to continue to manage the fund’s investments. For that reason, the Board of Trustees was asked to approve new investment advisory agreements for the Funds.
At the meeting of August 16-17, 2011, the Board considered the new investment advisory agreement, pursuant to which, subject to its approval by each Fund’s shareholders, the Adviser would continue to serve each Fund as investment adviser after the completion of the Transaction. At a special meeting of the Board held on September 14, 2011, the Board considered further information about the Transaction and voted in favor of the new investment advisory agreement.
In reaching the conclusion to approve the investment advisory agreement, the Trustees requested and obtained from the Adviser such information as the Trustees deemed reasonably necessary to evaluate the proposed agreement. The Trustees carefully evaluated this information and were advised by legal counsel with respect to their deliberations.
26 | THE GUGGENHEIM FUNDSANNUALREPORT
OTHER INFORMATION (Unaudited) (continued)
Prior to the Board meetings in August and September 2011, representatives of Guggenheim Capital informed the Board of the Transaction. With respect to the Transaction, the Board reviewed materials received from Guggenheim Capital, including information relating to the terms of the Transaction. The Board also reviewed information regarding Guggenheim Capital, including, but not limited to: (a) certain representations concerning Guggenheim Capital’s financial condition, (b) information regarding the new proposed ownership structure and its possible effect on shareholders, (c) information regarding the consideration to be paid by Guggenheim Capital, and (d) potential conflicts of interest.
In considering the new investment advisory agreement, the Board determined that the agreement would enable shareholders of the Funds to continue to obtain high quality services at a cost that is appropriate, reasonable, and in the best interests of their shareholders. The Board, including the independent Trustees, unanimously approved the new agreement. In reaching their decision, the Trustees carefully considered information that they had received throughout the year as part of their regular oversight of the Funds, including, in particular, information from the Adviser that the Board had received relating to the current investment advisory agreement at the Board meeting of August 16-17, 2011. The Trustees noted that, at the meeting, they had obtained and reviewed a wide variety of information, including certain comparative information regarding performance of the Funds relative to performance of other comparable mutual funds. They also considered the evolution of the Rydex|SGI family of funds and the Adviser since the change in control of the Investment Adviser in 2010 and Guggenheim Capital’s commitment to the success of the Adviser and the Funds.
In addition, as a part of their required consideration of the renewal of the current investment advisory agreement at the meeting of August 16-17, 2011, the Trustees, including the independent Trustees, had evaluated a number of considerations, including among others: (a) the quality of the Adviser’s investment advisory and other services; (b) the Adviser’s investment management personnel; (c) the Adviser’s operations and financial condition; (d) the Adviser’s brokerage practices (including any soft dollar arrangements) and investment strategies; (e) the level of the fees that the Adviser charges compared with the fees charged to comparable mutual funds or accounts; (f) each Fund’s overall fees and operating expenses compared with similar mutual funds; (g) the level of the Adviser’s profitability from its Fund-related operations; (h) the Adviser’s compliance systems; (i) the Adviser’s policies on and compliance procedures for personal securities transactions; (j) the Adviser’s reputation, expertise and resources in the financial markets; and (k) Fund performance compared with similar mutual funds. Based on the Board’s deliberations at the meetings of August 16-17, 2011 and September 14, 2011, and its evaluation of the information regarding the Transaction and the fact that the Transaction is not expected to change the level and quality of services rendered by the Adviser to any of the Funds, the Board, including all of the independent Trustees, unanimously: (a) concluded that terms of the current and new investment advisory agreements are fair and reasonable; (b) concluded that the Adviser’s fees were reasonable in light of the services that it provides to the Funds; and (c) agreed to approve the current investment advisory agreement and, subject to shareholder approval, the new investment advisory agreement, based upon the following considerations, among others:
| | • | | Nature, Extent and Quality of Services Provided by the Adviser. At the meeting of August 16-17, 2011, the Board reviewed the scope of services to be provided by the Adviser under the current investment advisory agreement, and, at the meetings of August 16-17, 2011 and September 14, 2011, noted that there would be no significant differences between the scope of services required to be provided by the Adviser under the current investment advisory agreement and the scope of services required to be provided by the Advisers under the new investment advisory agreement. The Board noted that the key investment and management personnel of the Adviser servicing the Funds are expected to remain the same following the Transaction. The Trustees also considered Guggenheim Capital’s representations to the Board that the Adviser would continue to provide investment and related services that were of materially the same quality and quantity as services provided to the Funds in the past, and that these services are appropriate in scope and extent in light of the Funds’ operations, the competitive landscape of the investment company business and investor needs. |
| | • | | Fund Expenses and Performance of the Funds and the Adviser. At the meeting of August 16-17, 2011, the Board had reviewed statistical information prepared by the Adviser regarding the expense ratio components and performance of each Fund. Based on the representations made by Guggenheim Capital at the meeting that the Adviser would continue to operate following the closing of the Transaction in much the same manner as it currently operates, the Board concluded that the investment performance of the Adviser was not expected to be affected by the Transaction. |
THE GUGGENHEIM FUNDSANNUALREPORT | 27
OTHER INFORMATION (Unaudited) (concluded)
| | • | | Costs of Services Provided to the Funds and Profits Realized by the Adviser and its Affiliates. At the meeting of August 16-17, 2011, the Board had reviewed information about the profitability of the Funds to the Adviser based on the advisory fees payable under the current investment advisory agreement. At that meeting, the Board had also analyzed the Funds’ expenses, including the investment advisory fees paid to the Adviser. The Board also had reviewed reports comparing the expense ratios to those of other comparable mutual funds. At the Board meeting, the Board considered the fact that the fee rates payable to the Adviser would be the same under each Fund’s new investment advisory agreement as they are under such Fund’s current agreement. With respect to anticipated profitability, the Board noted that it was too early to predict how the Transaction would affect the Adviser’s profitability with respect to the Funds, but noted that this matter would be given further consideration on an ongoing basis. |
| | • | | Economies of Scale. In connection with its review of the Funds’ profitability analysis at the meeting of August 16-17, 2011, the Board reviewed information regarding economies of scale or other efficiencies that may result from increases in the Funds’ asset levels. The Trustees noted that the fees would not change under the new investment advisory agreements, and that no additional economies of scale would be directly realized as a result of the Transaction. They also noted that they will have the opportunity to again review the appropriateness of the fees payable to the Adviser under the new agreement when the renewal of the new agreement comes before the Board. |
| | • | | Other Benefits to the Adviser and/or its Affiliates. In addition to evaluating the services provided by the Adviser, the Board had considered the nature, extent, quality and cost of the distribution services performed by the Funds’ Distributor under a separate agreement at the meeting of August 16-17, 2011. The Board reviewed information regarding potential economies of scale arising from the integration of the asset management businesses of Guggenheim Capital. The Board also considered the terms of the Transaction and the changes to the corporate ownership structure of the Adviser, noting that the Adviser would no longer be a subsidiary of Security Benefit Corporation. In this regard, the Board noted that, under the corporate structure after the Transaction, the Adviser would be more closely controlled by Guggenheim Capital, which could benefit Guggenheim Capital. The Board also noted that the costs associated with the Transaction would be borne by Guggenheim Capital (or its affiliates) and not the Funds. |
On the basis of the information provided to it and its evaluation of that information, the Board, including the independent Trustees, concluded that the terms of the investment advisory agreement for the Funds were reasonable, and that approval of the current and new investment advisory agreements were in the best interests of the Funds.
28 | THE GUGGENHEIM FUNDSANNUALREPORT
INFORMATION ON BOARD OF TRUSTEES AND OFFICERS (Unaudited)
A Board of Trustees oversees the Trust, as well as other trusts of Guggenheim Investments, in which its members have no stated
term of service, and continue to serve after election until resignation. The Statement of Additional Information includes further
information about Fund Trustees and Officers, and can be obtained without charge by calling 800.820.0888.
All Trustees and Officers may be reached c/o Guggenheim Investments, 805 King Farm Boulevard, Suite 600, Rockville, MD 20850.
INDEPENDENT TRUSTEES
| | | | |
Name, Position and Year of Birth | | Length of Service As Trustee (Year Began) | | Number of Funds Overseen |
| | |
| Corey A. Colehour | | Rydex Series Funds – 1993 | | 150 |
| Trustee (1945) | | Rydex Variable Trust – 1998 | | |
| | Rydex Dynamic Funds – 1999 | | |
| | Rydex ETF Trust – 2003 | | |
Principal Occupations During Past Five Years: Retired; Member of the Audit, Governance and Nominating Committees (1995 to present)
| | | | |
| J. Kenneth Dalton | | Rydex Series Funds – 1995 | | 150 |
| Trustee (1941) | | Rydex Variable Trust – 1998 | | |
| | Rydex Dynamic Funds – 1999 | | |
| | Rydex ETF Trust – 2003 | | |
Principal Occupations During Past Five Years: Retired; Member of the Governance and Nominating Committees (1995 to present); Chairman of the Audit Committee (1997 to present); Member of the Risk Oversight Committee (2010 to present)
| | | | |
| John O. Demaret | | Rydex Series Funds – 1997 | | 150 |
| Trustee, Chairman of the | | Rydex Variable Trust – 1998 | | |
| Board (1940) | | Rydex Dynamic Funds – 1999 | | |
| | Rydex ETF Trust – 2003 | | |
Principal Occupations During Past Five Years: Retired; Member of the Audit Committee (1997 to present); Member of the Risk Oversight Committee (2010 to present)
| | | | |
| Werner E. Keller | | Rydex Series Funds – 2005 | | 150 |
| Trustee (1940) | | Rydex Variable Trust – 2005 | | |
| | Rydex Dynamic Funds – 2005 | | |
| | Rydex ETF Trust – 2005 | | |
Principal Occupations During Past Five Years: Founder and President of Keller Partners, LLC (registered investment adviser) (2005 to present); Member of the Audit, Governance and Nominating Committees (2005 to present); Chairman and Member of the Risk Oversight Committee (2010 to present)
| | | | |
| Thomas F. Lydon, Jr. | | Rydex Series Funds – 2005 | | 150 |
| Trustee (1960) | | Rydex Variable Trust – 2005 | | |
| | Rydex Dynamic Funds – 2005 | | |
| | Rydex ETF Trust – 2005 | | |
Principal Occupations During Past Five Years: President, Global Trends Investments (1996 to present); Member of the Audit, Governance and Nominating Committees (2005 to present)
| | | | |
| Patrick T. McCarville | | Rydex Series Funds – 1997 | | 150 |
| Trustee (1942) | | Rydex Variable Trust – 1998 | | |
| | Rydex Dynamic Funds – 1999 | | |
| | Rydex ETF Trust – 2003 | | |
Principal Occupations During Past Five Years: CEO, Par Industries, Inc., d/b/a Par Leasing (1977 to 2010); Chairman of the Governance and Nominating Committees (1997 to present); Member of the Audit Committee (1997 to present)
THE GUGGENHEIM FUNDSANNUALREPORT | 29
INFORMATION ON BOARD OF TRUSTEES AND OFFICERS (Unaudited) (continued)
INDEPENDENT TRUSTEES – continued
| | | | |
Name, Position and Year of Birth | | Length of Service As Trustee (Year Began) | | Number of Funds Overseen |
| | |
| Roger Somers | | Rydex Series Funds – 1993 | | 150 |
| Trustee (1944) | | Rydex Variable Trust – 1998 | | |
| | Rydex Dynamic Funds – 1999 | | |
| | Rydex ETF Trust – 2003 | | |
Principal Occupations During Past Five Years: Founder and CEO of Arrow Limousine (1965 to present); Member of the Audit, Governance and Nominating Committees (1995 to present)
EXECUTIVE OFFICERS
| | |
Name, Position and Year of Birth | | Principal Occupations During Past Five Years |
| |
Richard M. Goldman* President (1961) | | Current: Senior Vice President, Security Benefit Corporation; CEO, Security Benefit Asset Management Holdings, LLC; CEO, President and Manager Representative, Security Investors, LLC; CEO and Manager, Rydex Holdings, LLC; CEO, President and Manager, Rydex Distributors, LLC; Manager, Rydex Fund Services, LLC; President and Trustee, Rydex Series Funds, Rydex ETF Trust, Rydex Dynamic Funds and Rydex Variable Trust |
| |
| | Previous: Director, First Security Benefit Life Insurance Company (2007-2010); President and Director, Security Global Investors (2010–2011); CEO and Director, Rydex Advisors, LLC and Rydex Advisors II, LLC (2010); Director, Security Distributors, Inc. (2007-2009); Managing Member, R.M. Goldman Partners, LLC (2006-2007) |
| |
Michael P. Byrum* Vice President (1970) | | Current: President, Security Benefit Asset Management Holdings, LLC; Senior Vice President, Security Investors, LLC; President and Chief Investment Officer, Rydex Holdings, LLC; Director and Chairman of the Board, Advisor Research Center, Inc.; Manager, Rydex Specialized Products, LLC |
| |
| | Previous: Rydex Distributors, LLC (f/k/a Rydex Distributors, Inc.), Vice President (2009); Rydex Fund Services, LLC, Director (2009-2010), Secretary (2002-2010), Executive Vice President (2002-2006); Rydex Advisors, LLC (f/k/a PADCO Advisors, Inc.), Director (2008-2010), Chief Investment Officer (2006-2010), President (2004-2010), Secretary (2002-2010); Rydex Advisors II, LLC (f/k/a PADCO Advisors II, Inc.), Director (2008-2010), Chief Investment Officer (2006- 2010), President (2004-2010), Secretary (2002-2010); Rydex Capital Partners, LLC, President and Secretary (2003-2007); Rydex Capital Partners II, LLC, (2003- 2007); Rydex Holdings, LLC (f/k/a Rydex Holdings, Inc.), Secretary (2005-2008), Executive Vice President (2005-2006); Advisor Research Center, Inc., Secretary (2006-2009), Executive Vice President (2006); Rydex Specialized Products, LLC, Secretary (2005-2008) |
30 | THE GUGGENHEIM FUNDSANNUALREPORT
INFORMATION ON BOARD OF TRUSTEES AND OFFICERS (Unaudited) (continued)
EXECUTIVE OFFICERS – continued
| | |
Name, Position and Year of Birth | | Principal Occupations During Past Five Years |
| |
Nikolaos Bonos* Vice President and Treasurer (1963) | | Current: Senior Vice President, Security Investors, LLC; Chief Executive Officer and Manager, Rydex Specialized Products, LLC; Chief Executive Officer and President, Rydex Fund Services, LLC; Vice President, Rydex Holdings, LLC; Treasurer, SBL Fund; Security Equity Fund; Security Income Fund; Security Large Cap Value Fund and Security Mid Cap Growth Fund; Vice President, Security Benefit Asset Management Holdings, LLC |
| |
| | Previous: Security Global Investors, LLC, Senior Vice President (2010-2011); Rydex Advisors, LLC (f/k/a PADCO Advisors, Inc.) Senior Vice President (2006- 2011); Rydex Fund Services, LLC (f/k/a Rydex Fund Services, Inc.), Director (2009) and Senior Vice President (2003-2006); Rydex Specialized Products, LLC, Chief Financial Officer (2005-2009) |
| |
Joanna M. Haigney* Chief Compliance Officer and Secretary (1966) | | Current: Chief Compliance Officer and Secretary, SBL Fund; Security Equity Fund; Security Income Fund; Security Large Cap Value Fund and Security Mid Cap Growth Fund; Vice President, Rydex Holdings, LLC; Vice President, Security Benefit Asset Management Holdings, LLC; Senior Vice President and Chief Compliance Officer, Security Investors, LLC |
| |
| | Previous: Security Global Investors, LLC, Senior Vice President (2010-2011); Rydex Advisors, LLC (f/k/a PADCO Advisors, Inc.) and Rydex Advisors II, LLC (f/k/a PADCO Advisors II, Inc.), Chief Compliance Officer and Senior Vice President (2010-2011); Rydex Capital Partners I, LLC and Rydex Capital Partners II, LLC, Chief Compliance Officer (2006-2007); Rydex Fund Services, LLC (f/k/a Rydex Fund Services, Inc.), Vice President (2001-2006) |
| |
Keith A. Fletcher* Vice President (1958) | | Current: Senior Vice President, Security Investors, LLC; Vice President, Rydex Holdings, LLC; Vice President, Rydex Specialized Products, LLC; Vice President, Rydex Distributors, LLC; Vice President, Rydex Fund Services, LLC; Vice President and Director, Advisor Research Center, Inc.; Vice President, SBL Fund; Security Equity Fund; Security Income Fund; Security Large Cap Value Fund and Security Mid Cap Growth Fund |
| |
| | Previous: Security Global Investors, LLC, Vice President (2010-2011); Rydex Advisors, LLC (f/k/a PADCO Advisors, Inc.) and Rydex Advisors II, LLC (f/k/a PADCO Advisors II, Inc.), Vice President (2009-2011); Lyster Watson and Company, Managing Director (2007-2008); Fletcher Financial Group, Inc., Chief Executive Officer (2004-2007) |
THE GUGGENHEIM FUNDSANNUALREPORT | 31
INFORMATION ON BOARD OF TRUSTEES AND OFFICERS (Unaudited) (concluded)
EXECUTIVE OFFICERS – concluded
| | |
Name, Position and Year of Birth | | Principal Occupations During Past Five Years |
| |
Amy J. Lee* Vice President and Assistant Secretary (1960) | | Current: Senior Vice President and Secretary, Security Investors, LLC; Secretary and Chief Compliance Officer, Security Distributors, Inc.; Vice President, Associate General Counsel and Assistant Secretary, Security Benefit Life Insurance Company and Security Benefit Corporation; Associate General Counsel, First Security Benefit Life Insurance and Annuity of New York; Vice President and Secretary, SBL Fund; Security Equity Fund; Security Income Fund; Security Large Cap Value Fund and Security Mid Cap Growth Fund; Vice President and Secretary, Rydex Holdings, LLC; Secretary, Advisor Research Center, Inc., Rydex Specialized Products, LLC, Rydex Distributors, LLC and Rydex Fund Services, LLC; Assistant Secretary, Security Benefit Clinic and Hospital |
| |
| | Previous: Security Global Investors, LLC, Senior Vice President and Secretary (2007-2011); Rydex Advisors, LLC (f/k/a PADCO Advisors, Inc.) and Rydex Advisors II, LLC (f/k/a PADCO Advisors II, Inc.), Senior Vice President and Secretary (2010-2011); Brecek and Young Advisors, Inc., Director (2004-2008) |
| |
Joseph M. Arruda* Assistant Treasurer (1966) | | Current: Assistant Treasurer, SBL Fund, Security Equity Fund, Security Income Fund, Security Large Cap Value Fund, and Security Mid Cap Growth Fund; Vice President, Security Investors, LLC; Chief Financial Officer and Manager, Rydex Specialized Products, LLC |
| |
| | Previous: Security Global Investors, LLC, Vice President (2010-2011); Rydex Advisors, LLC (f/k/a PADCO Advisors, Inc.) and Rydex Advisors II, LLC (f/k/a PADCO Advisors II, Inc.), Vice President (2004-2011) |
| * | Officers of the Funds are deemed to be “interested persons” of the Trust, within the meaning of Section 2(a) (19) of the 1940 Act, inasmuch as this person is affiliated with Guggenheim Investments. |
32 | THE GUGGENHEIM FUNDSANNUALREPORT
GUGGENHEIM INVESTMENTS PRIVACY POLICIES
Rydex Funds, Guggenheim Funds, Rydex Investments, Rydex Distributors, Inc., Security Investors, LLC, Security Distributors, Inc. and Rydex Advisory Services (Collectively “Guggenheim Investments”)
Our Commitment to You
When you become a Guggenheim Investments investor, you entrust us with not only your hard-earned money but also with personal and financial information about you. We recognize that your relationship with us is based on trust and that you expect us to act responsibly and in your best interests. Because we have access to this private information about you, we hold ourselves to the highest standards in its safekeeping and use. This means, most importantly, that we do not sell client information to anyone—whether it is your personal information or if you are a current or former Guggenheim Investments client.
The Information We Collect About You
In the course of doing business with shareholders and investors, we collect nonpublic personal information about you. You typically provide personal information when you complete a Guggenheim Investments account application or when you request a transaction that involves Rydex and Guggenheim Investments funds or one of the Guggenheim Investments affiliated companies. “Nonpublic personal information” is personally identifiable private information about you. For example, it includes information regarding your name and address, Social Security or taxpayer identification number, assets, income, account balance, bank account information and investment activity (e.g., purchase and redemption history).
How We Handle Your Personal Information
As emphasized above, we do not sell information about current or former clients or their accounts to third parties. Nor do we share such information, except when necessary to complete transactions at your request or to make you aware of related investment products and services that we offer. Additional details about how we handle your personal information are provided below. To complete certain transactions or account changes that you direct, it may be necessary to provide identifying information to companies, individuals or groups that are not affiliated with Guggenheim Investments. For example, if you ask to transfer assets from another financial institution to Guggenheim Investments, we will need to provide certain information about you to that company to complete the transaction. To alert you to other Guggenheim Investments investment products and services, we may share your information within the Guggenheim Investments family of affiliated companies. This would include, for example, sharing your information within Guggenheim Investments so we can make you aware of new Rydex and Guggenheim Investments funds or the services offered through another Guggenheim Investments affiliated company. In certain instances, we may contract with nonaffiliated companies to perform services for us. Where necessary, we will disclose information we have about you to these third parties. In all such cases, we provide the third party with only the information necessary to carry out its assigned responsibilities and only for that purpose. And we require these third parties to treat your private information with the same high degree of confidentiality that we do. In certain instances, we may share information with other financial institutions regarding individuals and entities in response to the U.S.A. Patriot Act. Finally, we will release information about you if you direct us to do so, if we are compelled by law to do so or in other circumstances permitted by law.
Opt Out Provisions
We do not sell your personal information to anyone. The law allows you to “opt out” of only certain kinds of information sharing with third parties. The firm does not share personal information about you with any third parties that triggers this opt-out right. This means YOU ARE ALREADY OPTED OUT.
How We Protect Privacy Online
Our concern for the privacy of our shareholders also extends to those who use our web site, www.rydex-sgi.com. Our web site uses some of the most secure forms of online communication available, including encryption technology, Secure Socket Layer (SSL) protocol, firewalls and user names and passwords. These technologies provide a high level of security and privacy when you access your account information or initiate online transactions. The Guggenheim Investments web site offers customized features that require our use of “http cookies”—tiny pieces of information that we ask your browser to store. However, we make very limited use of these cookies. We only use cookies for session management and security features on the Guggenheim Investments web site. We do not use them to pull data from your hard drive, to learn your email address, or to view data in cookies created by other web sites. We will not share the information in our cookies or give others access to it. See the legal information area on our web site for more details about web site security and privacy features.
How We Safeguard Your Personal Information
We restrict access to nonpublic personal information about shareholders to our employees and in some cases to third parties (for example, the service providers described above) as permitted by law. We maintain strict physical, electronic and procedural safeguards that comply with federal standards to guard your nonpublic personal information.
We’ll Keep You Informed
As required by federal law, we will notify shareholders of our privacy policy annually. We reserve the right to modify this policy at any time, but rest assured that if we do change it, we will tell you promptly. You will also be able to access our privacy policy from our web site at www.rydex-sgi.com. Should you have any questions regarding our privacy policy, contact us at 800.820.0888 or 301.296.5100.
THE GUGGENHEIM FUNDSANNUALREPORT | 33
This page intentionally left blank.
This page intentionally left blank.
This page intentionally left blank.

Four Irvington Centre
805 King Farm Boulevard, Suite 600
Rockville, MD 20850
www.rydex-sgi.com
800.820.0888
RMFSF-ANN-1211x1212
GUGGENHEIM ALTERNATIVE INVESTMENT FUNDS
GUGGENHEIM LONG/SHORT COMMODITIES STRATEGY FUND
GUGGENHEIM MULTI-HEDGE STRATEGIES FUND
RYDEX SPECIALTY FUND
RYDEX COMMODITIES STRATEGY FUND
GO GREEN!
ELIMINATE MAILBOX CLUTTER
Go paperless with Guggenheim Investments eDelivery — a service giving you full online access to account information and documents. Save time, cut down on mailbox clutter and be a friend to the environment with eDelivery.
With Guggenheim Investments eDelivery you can:
| • | | View online confirmations and statements at your convenience. |
| • | | Receive emails notifications when your most recent confirmations, statements and other account documents are available for review. |
| • | | Access prospectuses, annual reports and semiannual reports online. |

If you have questions about Guggenheim Investments eDelivery services, contact one of our Shareholder Service Representatives at 800.820.0888.

This report and the financial statements contained herein are submitted for the general information of our shareholders. The report is not authorized for distribution to prospective investors unless preceded or accompanied by an effective prospectus.
Distributed by Rydex Distributors, LLC.
TABLE OF CONTENTS
THE GUGGENHEIM FUNDSANNUALREPORT | 1
LETTER TO OUR SHAREHOLDERS
To Our Shareholders:
Financial markets endured a lot of turbulence in 2011, due to a variety of events: concerns about debt in the eurozone and in the U.S., which lost its triple-A credit rating, a tsunami-induced Japanese nuclear-plant disaster that disrupted automobile production around the globe, Mideast social unrest that led to a jump in oil prices and weak growth in many of the world’s developed economies. Reflecting the volatility in the stock market was the S&P 500 Index*, which finished the year up about 2%, but only after an 8% rise in the first few months of 2011, then a bearish 19% drop by early October, followed by a 12% fourth-quarter rebound spurred by improved economic data.
The U.S. Federal Reserve was a major factor in the markets for most of 2011, from its winding down of a second asset-purchase program (quantitative easing) in June to August’s “operation twist,” which shifted $400 billion in holdings from short-term to long-term Treasuries. The Fed said it would keep short-term interest rates near zero at least until mid-2013, and late in the year, some analysts were speculating that a third round of quantitative easing might be needed in 2012 to boost subpar growth.
While late-year improvements in economic measures may have dampened concern that the U.S. could slip back into recession, Europe’s recession fears were rising, as high unemployment and austerity measures weighed on weaker members of the euro zone, and threatened the economic engines of Germany and France. The Stoxx Europe 600 Index* was down about 11% for the year, with most individual country indices posting declines in double digits. Many investors continued to brace for a solution to Greece’s debt situation that would prevent financial problems from spreading to other weak countries or to banks, and stabilize the sliding euro, the year’s worst-performing major currency.
Even though they were not at the eye of the sovereign debt storm, many emerging market economies performed poorly in 2011, with those having the strongest links to the eurozone suffering the most. The MSCI Emerging Markets Index* was off by almost 20%, despite pockets of growth. China is facing slowing industrial production, sliding property values and the potential for a hard landing of the economy if housing and banks collapse.
While the market forces play out, many investors have been driven to the sidelines or to safe havens. Gold reached a record high of near $1,900 an ounce in August amid the U.S. debt downgrade, but then lost ground to the rising dollar amid continuing debate over Europe’s debt woes. Still, gold added 10% for the year, while the dollar ended the year within about 3% from where it began against the currencies of most major markets, including the euro, the pound, Canadian dollar and Swiss franc.
Sluggish economic data, concern over European financial weakness and the Fed’s policy efforts also drove investors into U.S. government debt over the course of 2011, despite the country’s lowered credit rating. The 30% total return of the Barclays Capital Long U.S. Treasury Index* made it one of the best-performing of the year, and it gave a lift to indices for corporate bonds, high yield bonds and municipals, which all grew by mid-to-high single digits.
The U.S. economy had momentum heading into 2012, as data showed the world’s largest economy to be maintaining a sustainable, if modest, expansion. Consumer confidence was improving, employment rising and monetary policy remained accommodative. We finished 2011 on a positive note, especially when compared to other countries, and so far continue to be insulated from the worst aspects of the economic troubles in Europe and China.
2 | THE GUGGENHEIM FUNDSANNUALREPORT
LETTER TO OUR SHAREHOLDERS (concluded)
We look forward to continuing our service to you. Thank you for investing in our funds.
Sincerely,

Michael Byrum,
President and Chief Investment Officer
| * | S&P 500® Index is a capitalization-weighted index covering 500 industrial, utility, transportation and financial companies of the U.S. markets (mostly NYSE Euronext issues). |
| * | The STOXX Europe 600 Index derived from the STOXX Europe Total Market Index (TMI) and is a subset of the STOXX Global 1800 Index. With a fixed number of 600 components, the STOXX Europe 600 Index represents large-, mid- and small-capitalization companies across 18 countries of the European region: Austria, Belgium, Denmark, Finland, France, Germany, Greece, Iceland, Ireland, Italy, Luxembourg, the Netherlands, Norway, Portugal, Spain, Sweden, Switzerland and the United Kingdom. |
| * | The Barclays Capital Long U.S. Treasury Index includes all publicly issued U.S. Treasury securities that have a remaining maturity of 10 or more years, are rated investment grade, and have $250 million or more of outstanding face value. In addition, the securities must be denominated in U.S. dollars and must be fixed rate and non convertible. Excluded from the Long U.S. Treasury Index are certain special issues, such as flower bonds, TINs, state and local government series bonds, TIPS, and coupon issues that have been stripped from bonds included in the index. The Long U.S. Treasury Index is market capitalization weighted and the securities in the index are updated on the last business day of each month. |
| * | MSCI Emerging Markets Index is a free float-adjusted market capitalization index that is designed to measure equity market performance in the global emerging markets. |
Performance displayed represents past performance which is no guarantee of future results. Of course, fund performance is subject to daily market volatility and may be better or worse since the end of the last quarter. For up-to-date fund performance, call us at 800.820.0888 or visit www.rydex-sgi.com.
Read each fund’s prospectus and summary prospectus (if available) carefully before investing. It contains the fund’s investment objectives, risks, charges, expenses and other information, which should be considered carefully before investing. Obtain a prospectus and summary prospectus (if available) at www.rydex-sgi.com or call 800.820.0888
The referenced funds are distributed by Rydex Distributors, LLC (RDL). Guggenheim Investments represents the investment management businesses of Guggenheim Partners, LLC, which includes Security Investors, LLC and Guggenheim Partners Asset Management, the investment advisor to the referenced funds. Rydex Distributors, LLC, is affiliated with Guggenheim Partners, LLC and Security Investors, LLC.
THE GUGGENHEIM FUNDSANNUALREPORT | 3
ABOUT SHAREHOLDERS’ FUND EXPENSES (Unaudited)
All mutual funds have operating expenses and it is important for our shareholders to understand the impact of costs on their investments. Shareholders of a Fund incur two types of costs: (i) transaction costs, including sales charges (loads) on purchase payments, reinvested dividends, or other distributions; and exchange fees; and (ii) ongoing costs, including management fees, administrative services, and shareholder reports, among others. These ongoing costs, or operating expenses, are deducted from a fund’s gross income and reduce the investment return of the fund.
A fund’s expenses are expressed as a percentage of its average net assets, which is known as the expense ratio. The following examples are intended to help investors understand the ongoing costs (in dollars) of investing in a Fund and to compare these costs with the ongoing costs of investing in other mutual funds.
The examples are based on an investment of $1,000 made at the beginning of the period and held for the entire six-month period beginning June 30, 2011 and ending December 31, 2011.
The following tables illustrate a Fund’s costs in two ways:
Table 1. Based on actual Fund return. This section helps investors estimate the actual expenses paid over the period. The “Ending Account Value” shown is derived from the Fund’s actual return, and the fourth column shows the dollar amount that would have been paid by an investor who started with $1,000 in the Fund. Investors may use the information here, together with the amount invested, to estimate the expenses paid over the period. Simply divide the Fund’s account value by $1,000 (for example, an $8,600 account value divided by $1,000 = 8.6), then multiply the result by the number provided under the heading “Expenses Paid During Period.”
Table 2. Based on hypothetical 5% return. This section is intended to help investors compare a Fund’s cost with those of other mutual funds. The table provides information about hypothetical account values and hypothetical expenses based on the Fund’s actual expense ratio and an assumed rate of return of 5% per year before expenses, which is not the Fund’s actual return. The hypothetical account values and expenses may not be used to estimate the actual ending account balance or expenses paid during the period. The example is useful in making comparisons because the U.S. Securities and Exchange Commission (the “SEC”) requires all mutual funds to calculate expenses based on the 5% return. Investors can assess a Fund’s costs by comparing this hypothetical example with the hypothetical examples that appear in shareholder reports of other funds.
The calculations illustrated above assume no shares were bought or sold during the period. Actual costs may have been higher or lower, depending on the amount of investment and the timing of any purchases or redemptions.
Please note that the expenses shown in the table are meant to highlight your ongoing costs only and do not reflect any transactional costs, such as sales charges (loads) on purchase payments, and contingent deferred sales charges (“CDSC”) on redemptions, if any. Therefore, the second table is useful in comparing ongoing costs only, and will not help you determine the relative total costs of owning different funds. In addition, if these transactional costs were included, your costs would have been higher.
More information about a Fund’s expenses, including annual expense ratios for the past five years, can be found in the Financial Highlights section of this report. For additional information on operating expenses and other shareholder costs, please refer to the appropriate Fund prospectus.
4 | THE GUGGENHEIM FUNDSANNUALREPORT
ABOUT SHAREHOLDERS’ FUND EXPENSES (Unaudited) (concluded)
| | | | | | | | | | | | | | | | | | | | |
| | | Expense
Ratio1 | | | Fund
Return | | | Beginning
Account
Value
June 30,
2011 | | | Ending
Account
Value
December 31,
2011 | | | Expenses
Paid
During
Period2 | |
Table 1. Based on actual Fund return3 | | | | | | | | | | | | | | | | | | | | |
Long/Short Commodities Strategy Fund | | | | | | | | | | | | | | | | | | | | |
A-Class | | | 1.91 | % | | | (5.04 | %) | | $ | 1,000.00 | | | $ | 949.60 | | | $ | 9.39 | |
C-Class | | | 2.66 | % | | | (5.39 | %) | | | 1,000.00 | | | | 946.10 | | | | 13.05 | |
H-Class | | | 1.91 | % | | | (5.04 | %) | | | 1,000.00 | | | | 949.60 | | | | 9.39 | |
Institutional Class | | | 1.65 | % | | | (4.95 | %) | | | 1,000.00 | | | | 950.50 | | | | 8.11 | |
Y-Class | | | 1.59 | % | | | (4.87 | %) | | | 1,000.00 | | | | 951.30 | | | | 7.82 | |
Multi-Hedge Strategies Fund | | | | | | | | | | | | | | | | | | | | |
A-Class | | | 2.59 | % | | | 0.92 | % | | | 1,000.00 | | | | 1,009.20 | | | | 13.12 | |
C-Class | | | 3.31 | % | | | 0.54 | % | | | 1,000.00 | | | | 1,005.40 | | | | 16.73 | |
H-Class | | | 2.57 | % | | | 0.92 | % | | | 1,000.00 | | | | 1,009.20 | | | | 13.02 | |
Institutional Class | | | 2.35 | % | | | 1.01 | % | | | 1,000.00 | | | | 1,010.10 | | | | 11.91 | |
Commodities Strategy Fund | | | | | | | | | | | | | | | | | | | | |
A-Class | | | 1.54 | % | | | (4.77 | %) | | | 1,000.00 | | | | 952.30 | | | | 7.58 | |
C-Class | | | 2.29 | % | | | (5.06 | %) | | | 1,000.00 | | | | 949.40 | | | | 11.25 | |
H-Class | | | 1.50 | % | | | (4.82 | %) | | | 1,000.00 | | | | 951.80 | | | | 7.38 | |
| | | | | |
Table 2. Based on hypothetical 5% return (before expenses) | | | | | | | | | | | | | | | | | | | | |
Long/Short Commodities Strategy Fund | | | | | | | | | | | | | | | | | | | | |
A-Class | | | 1.91 | % | | | 5.00 | % | | $ | 1,000.00 | | | $ | 1,015.58 | | | $ | 9.70 | |
C-Class | | | 2.66 | % | | | 5.00 | % | | | 1,000.00 | | | | 1,011.80 | | | | 13.49 | |
H-Class | | | 1.91 | % | | | 5.00 | % | | | 1,000.00 | | | | 1,015.58 | | | | 9.70 | |
Institutional Class | | | 1.65 | % | | | 5.00 | % | | | 1,000.00 | | | | 1,016.89 | | | | 8.39 | |
Y-Class | | | 1.59 | % | | | 5.00 | % | | | 1,000.00 | | | | 1,017.19 | | | | 8.08 | |
Multi-Hedge Strategies Fund | | | | | | | | | | | | | | | | | | | | |
A-Class | | | 2.59 | % | | | 5.00 | % | | | 1,000.00 | | | | 1,012.15 | | | | 13.14 | |
C-Class | | | 3.31 | % | | | 5.00 | % | | | 1,000.00 | | | | 1,008.52 | | | | 16.76 | |
H-Class | | | 2.57 | % | | | 5.00 | % | | | 1,000.00 | | | | 1,012.25 | | | | 13.03 | |
Institutional Class | | | 2.35 | % | | | 5.00 | % | | | 1,000.00 | | | | 1,013.36 | | | | 11.93 | |
Commodities Strategy Fund | | | | | | | | | | | | | | | | | | | | |
A-Class | | | 1.54 | % | | | 5.00 | % | | | 1,000.00 | | | | 1,017.44 | | | | 7.83 | |
C-Class | | | 2.29 | % | | | 5.00 | % | | | 1,000.00 | | | | 1,013.66 | | | | 11.62 | |
H-Class | | | 1.50 | % | | | 5.00 | % | | | 1,000.00 | | | | 1,017.64 | | | | 7.63 | |
| 1 | Annualized and excludes expenses of the underlying funds in which the Funds invest. This ratio represents Net Expenses, which include dividend and interest expense from securities sold short. Excluding short dividend expense and prime broker interest expense, the operating expense ratio would be 1.18%, 1.17%, 1.17% and 1.15% lower in the Multi-Hedge Strategies Fund for the A-Class, C-Class, H-Class and Institutional Class, respectively. |
| 2 | Expenses are equal to the Fund’s annualized expense ratio, net of any applicable fee waivers, multiplied by the average account value over the period, multiplied by 184/365 (to reflect the one-half year period). |
| 3 | Actual cumulative return at net asset value for the period June 30, 2011 to December 31, 2011. |
THE GUGGENHEIM FUNDSANNUALREPORT | 5
| | |
| PERFORMANCE REPORT AND FUND PROFILE (Unaudited) | | December 31, 2011 |
LONG/SHORT COMMODITIES STRATEGY FUND
OBJECTIVE: Seeks to achieve positive total returns with less volatility than the broad commodity markets.
For the year ended December 31, 2011, the Fund’s H-Class returned -1.83%. Its benchmark comparison, the JPMorgan Core Commodity-Investable Global Asset Rotator Sigma Long-Short Total Return Index (C-IGAR Sigma Index)*, returned -0.16%. As for other benchmark comparisons, the Fund outperformed the Dow Jones-UBS Commodity Index* (-13.32%) and was relatively even with the S&P GSCI®* (-1.18%). Effective July 11, the Fund’s investment objective changed from seeking to track the performance of a benchmark to seeking to achieve positive total returns with less volatility than the broad commodity markets.
The annualized standard deviation for the Fund was 17.76%, compared with 17.77% for the C-IGAR Sigma Index and 19.36% for the S&P GSCI®.
Natural gas, nickel and reformulated gasoline blendstock for oxygen blending (gasoline RBOB) were among the commodities which provided the most performance to the index during the year. Wheat, copper and heating oil were among the commodities which detracted from performance during the year. At year end, seven components were short and two components were long. The long components were gasoline RBOB and Brent crude. The short components at year end were natural gas, aluminum, copper, nickel, corn, soybeans and wheat.
Derivatives in the Fund are used to help provide desired exposure in the most efficient manner, as well as to provide liquidity.
| * | The JPMorgan Core Commodity-Investable Global Asset Rotator Sigma Long-Short Total Return Index references the value of a synthetic portfolio of up to 7 long constituents and 7 short constituents. As a total return index, it reflects the returns that are potentially available through an unleveraged investment in the contracts comprising such index plus interest that could be earned on funds committed to the trading of the underlying futures contracts. |
| * | The S&P GSCI®, a benchmark for investment performance in the commodity markets, measures investable commodity price movements and inflation in the world economy. The index is calculated primarily on a world production weighted basis and is comprised of the principal physical commodities that are the subject of active, liquid futures markets. |
| * | The DJ-UBSCISM is composed of commodities traded on U.S. exchanges, with the exception of aluminum, nickel and zinc, which trade on the London Metal Exchange (LME). The DJ-UBSCI is calculated on an excess return basis, which means it reflects the return of underlying commodity futures price movements only. |
Performance displayed represents past performance which is no guarantee of future results.
Holdings Diversification (Market Exposure as % of Net Assets)
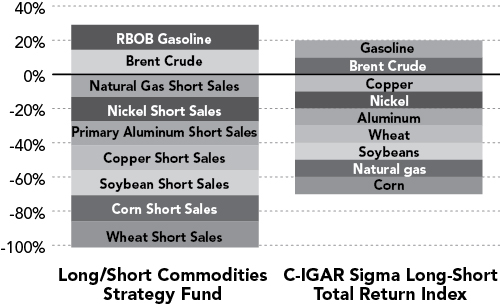
“Holdings Diversification (Market Exposure as % of Net Assets)” excludes any temporary cash investments.
| | |
Inception Dates: | | |
A-Class | | June 25, 2009 |
C-Class | | June 25, 2009 |
H-Class | | June 25, 2009 |
Institutional Class | | May 3, 2010 |
Y-Class | | March 29, 2010 |
The Fund invests principally in derivative investments such as commodity-linked futures contracts.
6 | THE GUGGENHEIM FUNDSANNUALREPORT
PERFORMANCE REPORT AND FUND PROFILE (Unaudited) (concluded)
LONG/SHORT COMMODITIES STRATEGY FUND
Cumulative Fund Performance*
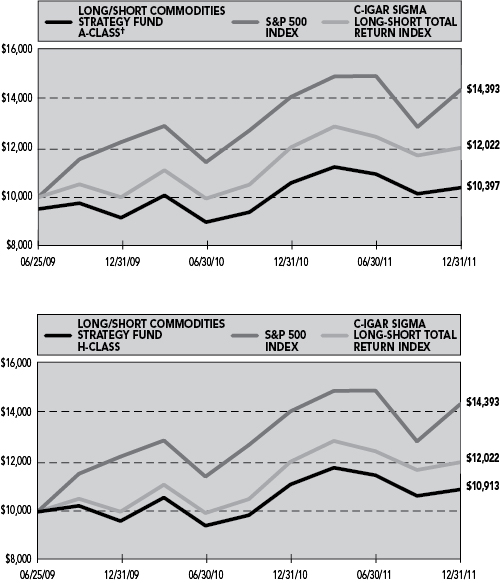
Average Annual Returns*
Periods Ended 12/31/11
| | | | | | | | |
| | | 1 Year | | | Since
Inception
(06/25/09) | |
A-Class Shares | | | -1.83 | % | | | 3.55 | % |
A-Class Shares with sales charge† | | | -6.51 | % | | | 1.56 | % |
C-Class Shares | | | -2.56 | % | | | 2.76 | % |
C-Class Shares with CDSC‡ | | | -3.49 | % | | | 2.76 | % |
H-Class Shares | | | -1.83 | % | | | 3.53 | % |
JPMorgan Core Commodity-IGAR Sigma Long-Short Total Return Index | | | -0.16 | % | | | 7.59 | % |
S&P 500 Index | | | 2.11 | % | | | 15.56 | % |
| | |
| | | | | | (05/03/10) | |
Institutional Class Shares | | | -1.60 | % | | | 2.26 | % |
JPMorgan Core Commodity-IGAR Sigma Long-Short Total Return Index | | | -0.16 | % | | | 4.62 | % |
S&P 500 Index | | | 2.11 | % | | | 4.93 | % |
| | |
| | | | | | (03/29/10) | |
Y-Class Shares | | | -1.52 | % | | | 3.34 | % |
JPMorgan Core Commodity-IGAR Sigma Long-Short Total Return Index | | | -0.16 | % | | | 6.04 | % |
S&P 500 Index | | | 2.11 | % | | | 6.19 | % |
| * | The performance data above represents past performance that is not predictive of future results. The investment return and principal value of an investment in the Fund will fluctuate so that an investor’s shares, when redeemed, may be worth more or less than their original cost. Returns are historical and include changes in principal and reinvested dividends and capital gains and do not reflect the effect of taxes. The JPMorgan Core Commodity-IGAR Sigma Long-Short Total Return Index and S&P 500 Index are unmanaged indices and, unlike the Fund, have no management fees or operating expenses to reduce their reported returns. The graphs are based on A-Class and H-Class shares only; performance for C-Class, Y-Class and Institutional Class shares will vary due to differences in fee structures. |
| † | Fund returns are calculated using the maximum sales charge of 4.75%. |
| ‡ | Fund returns include a CDSC of 1% if redeemed within 12 months of purchase. |
THE GUGGENHEIM FUNDSANNUALREPORT | 7
| | |
| CONSOLIDATED SCHEDULE OF INVESTMENTS | | December 31, 2011 |
LONG/SHORT COMMODITIES STRATEGY FUND
| | | | | | | | |
| | | FACE
AMOUNT | | | VALUE | |
FEDERAL AGENCY DISCOUNT NOTES†† - 46.2% | |
Fannie Mae1 | | | | | | | | |
0.23% due 02/21/12 | | $ | 25,000,000 | | | $ | 24,999,325 | |
0.20% due 05/01/12 | | | 25,000,000 | | | | 24,998,350 | |
0.23% due 04/02/12 | | | 15,000,000 | | | | 14,999,250 | |
| | | | | | | | |
Total Fannie Mae | | | | | | | 64,996,925 | |
| | | | | | | | |
Federal Farm Credit Bank2 | | | | | | | | |
0.19% due 05/09/12 | | | 20,000,000 | | | | 19,998,580 | |
0.26% due 03/08/12 | | | 15,000,000 | | | | 14,999,460 | |
0.14% due 02/02/12 | | | 10,000,000 | | | | 9,999,830 | |
| | | | | | | | |
Total Federal Farm Credit Bank | | | | | | | 44,997,870 | |
| | | | | | | | |
Farmer Mac2 | | | | | | | | |
0.14% due 06/25/12 | | | 25,000,000 | | | | 24,996,375 | |
0.17% due 07/24/12 | | | 15,000,000 | | | | 14,995,770 | |
| | | | | | | | |
Total Farmer Mac | | | | | | | 39,992,145 | |
| | | | | | | | |
Federal Home Loan Bank2 | | | | | | | | |
0.20% due 02/13/12 | | | 15,000,000 | | | | 14,999,655 | |
| | | | | | | | |
Freddie Mac1 | | | | | | | | |
0.23% due 03/14/12 | | | 10,000,000 | | | | 9,999,610 | |
| | | | | | | | |
Total Federal Agency Discount Notes
(Cost $174,903,622) | | | | 174,986,205 | |
| | | | | | | | |
FEDERAL AGENCY NOTES†† - 18.5% | |
Federal Home Loan Bank2 | | | | | | | | |
0.15% due 04/16/12 | | | 25,000,000 | | | | 25,010,725 | |
0.13% due 05/15/12 | | | 20,000,000 | | | | 20,000,720 | |
0.15% due 06/07/12 | | | 15,000,000 | | | | 15,000,930 | |
| | | | | | | | |
Total Federal Home Loan Bank | | | | | | | 60,012,375 | |
| | | | | | | | |
Federal Farm Credit Bank2 | | | | | | | | |
0.24% due 06/20/12 | | | 10,000,000 | | | | 10,003,660 | |
| | | | | | | | |
Total Federal Agency Notes
(Cost $69,993,061) | | | | 70,016,035 | |
| | | | | | | | |
|
REPURCHASE AGREEMENTS††,3 - 23.6% | |
HSBC Group | | | | | | | | |
issued 12/30/11 at 0.00% due 01/03/12 | | | 60,495,424 | | | | 60,495,424 | |
Mizuho Financial Group, Inc. | | | | | | | | |
issued 12/30/11 at 0.00% due 01/03/12 | | | 16,528,164 | | | | 16,528,164 | |
Deutsche Bank | | | | | | | | |
issued 12/30/11 at 0.00% due 01/03/12 | | | 8,789,933 | | | | 8,789,933 | |
Credit Suisse Group | | | | | | | | |
issued 12/30/11 at 0.00% due 01/03/12 | | | 3,655,043 | | | | 3,655,043 | |
| | | | | | | | |
Total Repurchase Agreements
(Cost $89,468,564) | | | | 89,468,564 | |
| | | | | | | | |
Total Investments - 88.3%
(Cost $334,365,247) | | | $ | 334,470,804 | |
| | | | | | | | |
Cash & Other Assets, Less Liabilities - 11.7% | | | | | | $ | 44,288,015 | |
| | | | | | | | |
Total Net Assets - 100.0% | | | $ | 378,758,819 | |
| |
| | |
| | | CONTRACTS | | | UNREALIZED
GAIN (LOSS) | |
COMMODITY FUTURES CONTRACTS PURCHASED† | |
February 2012 RBOB Gasoline | | | | | | | | |
Futures Contracts | | | | | | | | |
(Aggregate Value of Contracts $55,394,371) | | | 496 | | | $ | 1,215,945 | |
March 2012 Brent Crude | | | | | | | | |
Futures Contracts | | | | | | | | |
(Aggregate Value of Contracts $54,478,270) | | | 509 | | | | (1,029,620 | ) |
| | | | | | | | |
(Total Aggregate Value of Contracts $109,872,641) | | | | | | $ | 186,325 | |
| | | | | | | | |
|
COMMODITY FUTURES CONTRACTS SOLD SHORT† | |
February 2012 Natural Gas | | | | | | | | |
Futures Contracts | | | | | | | | |
(Aggregate Value of Contracts $50,131,200) | | | 1,680 | | | | 5,065,739 | |
February 2012 LME | | | | | | | | |
Primary Aluminum | | | | | | | | |
Futures Contracts | | | | | | | | |
(Aggregate Value of Contracts $53,931,406) | | | 1,075 | | | | 351,413 | |
March 2012 Wheat | | | | | | | | |
Futures Contracts | | | | | | | | |
(Aggregate Value of Contracts $57,583,988) | | | 1,763 | | | | (613,146 | ) |
February 2012 LME Nickel | | | | | | | | |
Futures Contracts | | | | | | | | |
(Aggregate Value of Contracts $53,404,344) | | | 476 | | | | (1,142,638 | ) |
February 2012 LME Copper | | | | | | | | |
Futures Contracts | | | | | | | | |
(Aggregate Value of Contracts $54,906,387) | | | 289 | | | | (1,485,762 | ) |
March 2012 Corn | | | | | | | | |
Futures Contracts | | | | | | | | |
(Aggregate Value of Contracts $57,152,175) | | | 1,766 | | | | (3,774,337 | ) |
March 2012 Soybean | | | | | | | | |
Futures Contracts | | | | | | | | |
(Aggregate Value of Contracts $56,066,563) | | | 925 | | | | (4,155,050 | ) |
| | | | | | | | |
(Total Aggregate Value of Contracts $383,176,063) | | | | | | $ | (5,753,781 | ) |
| | | | | | | | |
| † | Value determined based on Level 1 inputs — See Note 4. |
| †† | Value determined based on Level 2 inputs — See Note 4. |
| 1 | On September 7, 2008, the issuer was placed in conservatorship by the Federal Housing Finance Agency (FHFA). As conservator, the FHFA has full powers to control the assets and operations of the firm. |
| 2 | The issuer operates under a Congressional charter; its securities are neither issued nor guaranteed by the U.S. Government. |
| 3 | Repurchase Agreements — See Note 5. |
| | |
| 8 | THE GUGGENHEIM FUNDSANNUALREPORT | | See Notes to Financial Statements. |
LONG/SHORT COMMODITIES STRATEGY FUND
CONSOLIDATED STATEMENT OF ASSETS AND LIABILITIES
December 31, 2011
| | | | |
ASSETS: | | | | |
Investments, at value
(cost $244,896,683) | | $ | 245,002,240 | |
Repurchase agreements, at value
(cost $89,468,564) | | | 89,468,564 | |
| | | | |
Total investments
(cost $334,365,247) | | | 334,470,804 | |
Segregated cash with broker | | | 50,814,854 | |
Receivables: | | | | |
Fund shares sold | | | 1,577,832 | |
Interest | | | 34,653 | |
| | | | |
Total assets | | | 386,898,143 | |
| | | | |
LIABILITIES: | | | | |
Payable for: | | | | |
Variation margin | | | 5,454,825 | |
Fund shares redeemed | | | 1,729,130 | |
Management fees | | | 298,113 | |
Distribution and service fees | | | 97,812 | |
Transfer agent and administrative fees | | | 82,845 | |
Portfolio accounting fees | | | 30,162 | |
Miscellaneous | | | 446,437 | |
| | | | |
Total liabilities | | | 8,139,324 | |
| | | | |
NET ASSETS | | $ | 378,758,819 | |
| | | | |
NETASSETSCONSISTOF: | | | | |
Paid in capital | | $ | 432,592,622 | |
Accumulated net investment loss | | | (47,862,327 | ) |
Accumulated net realized gain on investments | | | (509,577 | ) |
Net unrealized depreciation on investments | | | (5,461,899 | ) |
| | | | |
NETASSETS | | $ | 378,758,819 | |
| | | | |
A-CLASS: | | | | |
Net assets | | $ | 103,636,674 | |
Capital shares outstanding | | | 4,310,334 | |
Net asset value per share | | $ | 24.04 | |
| | | | |
Maximum offering price per share
(Net asset value divided by 95.25%) | | $ | 25.24 | |
| | | | |
C-CLASS: | | | | |
Net assets | | $ | 32,476,278 | |
Capital shares outstanding | | | 1,379,283 | |
Net asset value per share | | $ | 23.55 | |
| | | | |
H-CLASS: | | | | |
Net assets | | $ | 213,062,031 | |
Capital shares outstanding | | | 8,863,799 | |
Net asset value per share | | $ | 24.04 | |
| | | | |
INSTITUTIONAL CLASS: | | | | |
Net assets | | $ | 29,573,241 | |
Capital shares outstanding | | | 1,225,228 | |
Net asset value per share | | $ | 24.14 | |
| | | | |
Y-CLASS: | | | | |
Net assets | | $ | 10,595 | |
Capital shares outstanding | | | 438 | |
Net asset value per share | | $ | 24.17 | |
| | | | |
CONSOLIDATED STATEMENT OF OPERATIONS
For the Year Ended December 31, 2011
| | | | |
INVESTMENT INCOME: | | | | |
Interest | | $ | 614,101 | |
| | | | |
Total investment income | | | 614,101 | |
| | | | |
| |
EXPENSES: | | | | |
Management fees | | | 3,895,617 | |
Transfer agent and administrative fees: | | | | |
A-Class | | | 251,591 | |
C-Class | | | 73,989 | |
H-Class | | | 501,194 | |
Institutional Class | | | 93,454 | |
Y-Class | | | 22 | |
Distribution and service fees: | | | | |
A-Class | | | 251,591 | |
C-Class | | | 295,956 | |
H-Class | | | 501,194 | |
Portfolio accounting fees | | | 338,577 | |
Licensing fees | | | 920,808 | |
Custodian fees | | | 95,461 | |
Trustees’ fees* | | | 64,042 | |
Miscellaneous | | | 503,815 | |
| | | | |
Total expenses | | | 7,787,311 | |
Less: | | | | |
Expenses waived by Advisor | | | (582,824 | ) |
| | | | |
Net expenses | | | 7,204,487 | |
| | | | |
Net investment loss | | | (6,590,386 | ) |
| | | | |
| |
NET REALIZEDAND UNREALIZED GAIN (LOSS): | | | | |
Net realized gain (loss) on: | | | | |
Futures contracts | | | 16,729,604 | |
Options written | | | 432,480 | |
| | | | |
Net realized gain | | | 17,162,084 | |
| | | | |
Net change in unrealized appreciation (depreciation) on: | | | | |
Investments | | | 1,613 | |
Futures contracts | | | (23,674,675 | ) |
| | | | |
Net change in unrealized appreciation (depreciation) | | | (23,673,062 | ) |
| | | | |
Net realized and unrealized loss | | | (6,510,978 | ) |
| | | | |
Net decrease in net assets resulting from operations | | $ | (13,101,364 | ) |
| | | | |
| * | Relates to Trustees not deemed “interested persons” within the meaning of Section 2(a)(19) of the 1940 Act. |
| | |
| See Notes to Financial Statements. | | THE GUGGENHEIM FUNDSANNUALREPORT | 9 |
LONG/SHORT COMMODITIES STRATEGY FUND
CONSOLIDATED STATEMENTS OF CHANGES IN NET ASSETS
| | | | | | | | |
| | | Year Ended
December 31,
2011 | | | Year Ended
December 31,
2010 | |
| | |
INCREASE (DECREASE) IN NET ASSETS FROM OPERATIONS: | | | | | | | | |
Net investment loss | | $ | (6,590,386 | ) | | $ | (2,948,896 | ) |
Net realized gain on investments | | | 17,162,084 | | | | 20,971,508 | |
Net change in unrealized appreciation (depreciation) on investments | | | (23,673,062 | ) | | | 18,369,145 | |
| | | | | | | | |
Net increase (decrease) in net assets resulting from operations | | | (13,101,364 | ) | | | 36,391,757 | |
| | | | | | | | |
| | |
DISTRIBUTIONS TO SHAREHOLDERS FROM: | | | | | | | | |
Net investment income | | | | | | | | |
A-Class | | | (5,635,155 | ) | | | (5,018,207 | ) |
C-Class | | | (1,799,816 | ) | | | (1,214,053 | ) |
H-Class | | | (10,993,341 | ) | | | (9,996,580 | ) |
Institutional Class | | | (1,639,264 | ) | | | (3,484,459 | )a |
Y-Class | | | (552 | ) | | | (744 | )b |
Return of capital | | | | | | | | |
A-Class | | | — | | | | (72,231 | ) |
C-Class | | | — | | | | (17,475 | ) |
H-Class | | | — | | | | (143,889 | ) |
Institutional Class | | | — | | | | (50,154 | )a |
Y-Class | | | — | | | | (11 | )b |
| | | | | | | | |
Total distributions to shareholders | | | (20,068,128 | ) | | | (19,997,803 | ) |
| | | | | | | | |
| | |
CAPITAL SHARE TRANSACTIONS: | | | | | | | | |
Proceeds from sale of shares | | | | | | | | |
A-Class | | | 98,593,867 | | | | 78,416,596 | |
C-Class | | | 25,951,255 | | | | 14,909,523 | |
H-Class | | | 169,426,608 | | | | 98,822,229 | |
Institutional Class | | | 38,198,427 | | | | 53,230,429 | a |
Y-Class | | | — | | | | 10,000 | b |
Redemption fees collected | | | | | | | | |
A-Class | | | — | | | | 5,788 | |
C-Class | | | — | | | | 1,810 | |
H-Class | | | — | | | | 19,654 | |
Institutional Class | | | — | | | | (1,439 | )a |
Y-Class | | | — | | | | 1 | b |
Distributions reinvested | | | | | | | | |
A-Class | | | 5,159,745 | | | | 4,654,207 | |
C-Class | | | 1,730,260 | | | | 1,151,331 | |
H-Class | | | 9,177,213 | | | | 8,968,610 | |
Institutional Class | | | 715,921 | | | | 3,315,547 | a |
Y-Class | | | 552 | | | | 754 | b |
Cost of shares redeemed | | | | | | | | |
A-Class | | | (63,510,864 | ) | | | (23,369,509 | ) |
C-Class | | | (9,104,887 | ) | | | (2,847,332 | ) |
H-Class | | | (90,822,313 | ) | | | (41,345,922 | ) |
Institutional Class | | | (61,251,730 | ) | | | (9,982,378 | )a |
Y-Class | | | — | | | | — | b |
| | | | | | | | |
Net increase from capital share transactions | | | 124,264,054 | | | | 185,959,899 | |
| | | | | | | | |
Net increase in net assets | | | 91,094,562 | | | | 202,353,853 | |
| | | | | | | | |
NET ASSETS: | | | | | | | | |
Beginning of year | | | 287,664,257 | | | | 85,310,404 | |
| | | | | | | | |
End of year | | $ | 378,758,819 | | | $ | 287,664,257 | |
| | | | | | | | |
Accumulated net investment loss at end of year | | $ | (47,862,327 | ) | | $ | (22,354,778 | ) |
| | | | | | | | |
| | |
| 10 | THE GUGGENHEIM FUNDSANNUALREPORT | | See Notes to Financial Statements. |
LONG/SHORT COMMODITIES STRATEGY FUND
CONSOLIDATED STATEMENTS OF CHANGES IN NET ASSETS (concluded)
| | | | | | | | |
| | | Year Ended
December 31,
2011 | | | Year Ended
December 31,
2010 | |
| | |
CAPITALSHAREACTIVITY: | | | | | | | | |
Shares sold | | | | | | | | |
A-Class | | | 3,675,709 | | | | 3,176,483 | |
C-Class | | | 974,518 | | | | 609,331 | |
H-Class | | | 6,336,016 | | | | 4,016,257 | |
Institutional Class | | | 1,435,975 | | | | 2,259,552 | a |
Y-Class | | | — | | | | 387 | b |
Shares issued from reinvestment of distributions | | | | | | | | |
A-Class | | | 205,404 | | | | 186,916 | |
C-Class | | | 70,307 | | | | 46,802 | |
H-Class | | | 365,480 | | | | 360,330 | |
Institutional Class | | | 28,398 | | | | 133,048 | a |
Y-Class | | | 21 | | | | 30 | b |
Shares redeemed | | | | | | | | |
A-Class | | | (2,413,030 | ) | | | (963,784 | ) |
C-Class | | | (356,209 | ) | | | (117,424 | ) |
H-Class | | | (3,476,976 | ) | | | (1,688,642 | ) |
Institutional Class | | | (2,232,323 | ) | | | (399,422 | )a |
Y-Class | | | — | | | | — | b |
| | | | | | | | |
Net increase in shares | | | 4,613,290 | | | | 7,619,864 | |
| | | | | | | | |
| a | Since the commencement of operations: May 3, 2010 — Institutional Class |
| b | Since the commencement of operations: March 29, 2010 — Y-Class |
| | |
| See Notes to Financial Statements. | | THE GUGGENHEIM FUNDSANNUALREPORT | 11 |
LONG/SHORT COMMODITIES STRATEGY FUND
FINANCIAL HIGHLIGHTS
This table is presented to show selected data for a share outstanding throughout each period and to assist shareholders in evaluating a Fund’s performance for the periods presented.
| | | | | | | | | | | | |
A-Class | | Year Ended
December 31,
2011a | | | Year Ended
December 31,
2010a | | | Period Ended
December 31,
2009a,b | |
Per Share Data | | | | | | | | | | | | |
Net asset value, beginning of period | | $ | 25.78 | | | $ | 24.07 | | | $ | 25.00 | |
| | | | | | | | | | | | |
Income (loss) from investment operations: | | | | | | | | | | | | |
Net investment lossc | | | (.47 | ) | | | (.41 | ) | | | (.23 | ) |
Net gain (loss) on investments (realized and unrealized) | | | .05 | | | | 4.07 | | | | (.70 | ) |
| | | | | | | | | | | | |
Total from investment operations | | | (.42 | ) | | | 3.66 | | | | (.93 | ) |
| | | | | | | | | | | | |
Less distributions from: | | | | | | | | | | | | |
Net investment income | | | (1.32 | ) | | | (1.92 | ) | | | — | |
Return of capital | | | — | | | | (.03 | ) | | | — | |
| | | | | | | | | | | | |
Total distributions | | | (1.32 | ) | | | (1.95 | ) | | | — | |
| | | | | | | | | | | | |
Redemption fees collected | | | — | | | | — | d | | | — | d |
| | | | | | | | | | | | |
Net asset value, end of period | | $ | 24.04 | | | $ | 25.78 | | | $ | 24.07 | |
| | | | | | | | | | | | |
| | | |
Total Returne | | | (1.83 | %) | | | 15.51 | % | | | (3.72 | %) |
| | | | | | | | | | | | |
Ratios/Supplemental Data | | | | | | | | | | | | |
Net assets, end of period (in thousands) | | $ | 103,637 | | | $ | 73,274 | | | $ | 10,654 | |
| | | | | | | | | | | | |
Ratios to average net assets: | | | | | | | | | | | | |
Net investment loss | | | (1.76 | %) | | | (1.71 | %) | | | (1.74 | %) |
Total expenses | | | 2.08 | % | | | 2.09 | % | | | 1.95 | % |
Net expensesf | | | 1.92 | % | | | 1.93 | % | | | 1.84 | % |
| | | | | | | | | | | | |
Portfolio turnover rate | | | — | | | | — | | | | — | |
| | | |
C-Class | | Year Ended
December 31,
2011a | | | Year Ended
December 31,
2010a | | | Period Ended
December 31,
2009a,b | |
Per Share Data | | | | | | | | | | | | |
Net asset value, beginning of period | | $ | 25.46 | | | $ | 23.97 | | | $ | 25.00 | |
| | | | | | | | | | | | |
Income (loss) from investment operations: | | | | | | | | | | | | |
Net investment lossc | | | (.66 | ) | | | (.59 | ) | | | (.33 | ) |
Net gain (loss) on investments (realized and unrealized) | | | .07 | | | | 4.03 | | | | (.70 | ) |
| | | | | | | | | | | | |
Total from investment operations | | | (.59 | ) | | | 3.44 | | | | (1.03 | ) |
| | | | | | | | | | | | |
Less distributions from: | | | | | | | | | | | | |
Net investment income | | | (1.32 | ) | | | (1.92 | ) | | | — | |
Return of capital | | | — | | | | (.03 | ) | | | — | |
| | | | | | | | | | | | |
Total distributions | | | (1.32 | ) | | | (1.95 | ) | | | — | |
| | | | | | | | | | | | |
Redemption fees collected | | | — | | | | — | d | | | — | d |
| | | | | | | | | | | | |
Net asset value, end of period | | $ | 23.55 | | | $ | 25.46 | | | $ | 23.97 | |
| | | | | | | | | | | | |
| | | |
Total Returne | | | (2.56 | %) | | | 14.70 | % | | | (4.16 | %) |
| | | | | | | | | | | | |
Ratios/Supplemental Data | | | | | | | | | | | | |
Net assets, end of period (in thousands) | | $ | 32,476 | | | $ | 17,587 | | | $ | 3,642 | |
| | | | | | | | | | | | |
Ratios to average net assets: | | | | | | | | | | | | |
Net investment income (loss) | | | (2.51 | %) | | | (2.46 | %) | | | 2.50 | % |
Total expenses | | | 2.83 | % | | | 2.83 | % | | | 2.70 | % |
Net expensesf | | | 2.67 | % | | | 2.67 | % | | | 2.59 | % |
| | | | | | | | | | | | |
Portfolio turnover rate | | | — | | | | — | | | | — | |
12 | THE GUGGENHEIM FUNDSANNUALREPORT
LONG/SHORT COMMODITIES STRATEGY FUND
FINANCIAL HIGHLIGHTS (continued)
This table is presented to show selected data for a share outstanding throughout each period and to assist shareholders in evaluating a Fund’s performance for the periods presented.
| | | | | | | | | | | | |
H-Class | | Year Ended
December 31,
2011a | | | Year Ended
December 31,
2010a | | | Period Ended
December 31,
2009a,b | |
Per Share Data | | | | | | | | | | | | |
Net asset value, beginning of period | | $ | 25.77 | | | $ | 24.06 | | | $ | 25.00 | |
| | | | | | | | | | | | |
Income (loss) from investment operations: | | | | | | | | | | | | |
Net investment lossc | | | (.47 | ) | | | (.41 | ) | | | (.23 | ) |
Net gain (loss) on investments (realized and unrealized) | | | .06 | | | | 4.07 | | | | (.71 | ) |
| | | | | | | | | | | | |
Total from investment operations | | | (.41 | ) | | | 3.66 | | | | (.94 | ) |
| | | | | | | | | | | | |
Less distributions from: | | | | | | | | | | | | |
Net investment income | | | (1.32 | ) | | | (1.92 | ) | | | — | |
Return of capital | | | — | | | | (.03 | ) | | | — | |
| | | | | | | | | | | | |
Total distributions | | | (1.32 | ) | | | (1.95 | ) | | | — | |
| | | | | | | | | | | | |
Redemption fees collected | | | — | | | | — | d | | | — | d |
| | | | | | | | | | | | |
Net asset value, end of period | | $ | 24.04 | | | $ | 25.77 | | | $ | 24.06 | |
| | | | | | | | | | | | |
| | | |
Total Returne | | | (1.83 | %) | | | 15.51 | % | | | (3.76 | %) |
| | | | | | | | | | | | |
Ratios/Supplemental Data | | | | | | | | | | | | |
Net assets, end of period (in thousands) | | $ | 213,062 | | | $ | 145,349 | | | $ | 71,014 | |
| | | | | | | | | | | | |
Ratios to average net assets: | | | | | | | | | | | | |
Net investment loss | | | (1.76 | %) | | | (1.71 | %) | | | (1.75 | %) |
Total expenses | | | 2.08 | % | | | 2.07 | % | | | 1.95 | % |
Net expensesf | | | 1.92 | % | | | 1.91 | % | | | 1.84 | % |
| | | | | | | | | | | | |
Portfolio turnover rate | | | — | | | | — | | | | — | |
| | | |
Institutional Class | | | | | Year Ended
December 31,
2011a | | | Period Ended
December 31,
2010a,g | |
Per Share Data | | | | | | | | | | | | |
Net asset value, beginning of period | | | | | | $ | 25.81 | | | $ | 26.39 | |
| | | | | | | | | | | | |
Income (loss) from investment operations: | | | | | | | | | | | | |
Net investment lossc | | | | | | | (.40 | ) | | | (.24 | ) |
Net gain on investments (realized and unrealized) | | | | | | | .05 | | | | 1.61 | |
| | | | | | | | | | | | |
Total from investment operations | | | | | | | (.35 | ) | | | 1.37 | |
| | | | | | | | | | | | |
Less distributions from: | | | | | | | | | | | | |
Net investment income | | | | | | | (1.32 | ) | | | (1.92 | ) |
Return of capital | | | | | | | — | | | | (.03 | ) |
| | | | | | | | | | | | |
Total distributions | | | | | | | (1.32 | ) | | | (1.95 | ) |
| | | | | | | | | | | | |
Redemption fees collected | | | | | | | — | | | | — | d |
| | | | | | | | | | | | |
Net asset value, end of period | | | | | | $ | 24.14 | | | $ | 25.81 | |
| | | | | | | | | | | | |
| | | |
Total Returne | | | | | | | (1.60 | %) | | | 5.47 | % |
| | | | | | | | | | | | |
Ratios/Supplemental Data | | | | | | | | | | | | |
Net assets, end of period (in thousands) | | | | | | $ | 29,573 | | | $ | 51,444 | |
| | | | | | | | | | | | |
Ratios to average net assets: | | | | | | | | | | | | |
Net investment loss | | | | | | | (1.50 | %) | | | (1.45 | %) |
Total expenses | | | | | | | 1.84 | % | | | 1.88 | % |
Net expensesf | | | | | | | 1.68 | % | | | 1.70 | % |
| | | | | | | | | | | | |
Portfolio turnover rate | | | | | | | — | | | | — | |
| | |
| | THE GUGGENHEIM FUNDSANNUALREPORT | 13 |
LONG/SHORT COMMODITIES STRATEGY FUND
FINANCIAL HIGHLIGHTS (concluded)
This table is presented to show selected data for a share outstanding throughout each period and to assist shareholders in evaluating a Fund’s performance for the periods presented.
| | | | | | | | |
Y-Class | | Year Ended
December 31,
2011a | | | Period Ended
December 31,
2010a,h | |
Per Share Data | | | | | | | | |
Net asset value, beginning of period | | $ | 25.83 | | | $ | 25.89 | |
| | | | | | | | |
Income (loss) from investment operations: | | | | | | | | |
Net investment lossc | | | (.39 | ) | | | (.26 | ) |
Net gain on investments (realized and unrealized) | | | .05 | | | | 2.15 | |
| | | | | | | | |
Total from investment operations | | | (.34 | ) | | | 1.89 | |
| | | | | | | | |
Less distributions from: | | | | | | | | |
Net investment income | | | (1.32 | ) | | | (1.92 | ) |
Return of capital | | | — | | | | (.03 | ) |
| | | | | | | | |
Total distributions | | | (1.32 | ) | | | (1.95 | ) |
| | | | | | | | |
Redemption fees collected | | | — | | | | — | d |
| | | | | | | | |
Net asset value, end of period | | $ | 24.17 | | | $ | 25.83 | |
| | | | | | | | |
| | |
Total Returne | | | (1.52 | %) | | | 7.58 | % |
| | | | | | | | |
Ratios/Supplemental Data | | | | | | | | |
Net assets, end of period (in thousands) | | $ | 11 | | | $ | 11 | |
| | | | | | | | |
Ratios to average net assets: | | | | | | | | |
Net investment loss | | | (1.46 | %) | | | (1.41 | %) |
Total expenses | | | 1.78 | % | | | 1.79 | % |
Net expensesf | | | 1.62 | % | | | 1.63 | % |
| | | | | | | | |
Portfolio turnover rate | | | — | | | | — | |
| b | Since commencement of operations: June 25, 2009. Percentage amounts for the period, except total return and portfolio turnover rate, have been annualized. |
| c | Net investment income (loss) per share was computed using average shares outstanding throughout the period. |
| d | Redemption fees collected are less than $0.01 per share. |
| e | Total return does not reflect the impact of any applicable sales charges and has not been annualized. |
| f | Net expense information reflects the expense ratios after expense waivers. |
| g | Since commencement of operations: May 3, 2010. Percentage amounts for the period, except total return and portfolio turnover rate, have been annualized. |
| h | Since commencement of operations: March 29, 2010. Percentage amounts for the period, except total return and portfolio turnover rate, have been annualized. |
14 | THE GUGGENHEIM FUNDSANNUALREPORT
This page intentionally left blank.
THE GUGGENHEIM FUNDSANNUALREPORT | 15
| | |
| PERFORMANCE REPORT AND FUND PROFILE (Unaudited) | | December 31, 2011 |
MULTI-HEDGE STRATEGIES FUND
OBJECTIVE: Seeks to provide long-term capital appreciation with less risk than traditional equity funds.
2011 was the second full calendar year of performance since the Fund’s objective was changed from hedge fund replication to capital appreciation. The results for 2011 were strong for a second year as the Fund’s H Class generated a 3.39% return with only 4.3% annualized risk, for a Sharpe ratio* approximating 0.8. In addition to generating a strong Sharpe ratio*, the Fund generated a correlation of -4% to the S&P 500® Index** over the course of the year and demonstrated an ability to preserve and grow capital during the tumultuous months of August and September.
While no longer a replication product, the Fund still maintains the HFRX Global Hedge Fund Index** as its benchmark comparison, which was down -8.92% for the year. All five of the hedge fund styles (global macro, long/short equity, equity market neutral, merger arbitrage and fixed income strategies) employed by the Fund contributed positive returns to the Fund.
Merger Arbitrage contributed the most to return, 2.1%, as we increased our allocation to the strategy early in the year and the model continued to generate very attractive risk-adjusted returns. Our strategy realized a return of 6.2% with 3.1% annualized volatility, significantly better than the -2.1% loss with 5.8% annualized volatility reported for the HFRX Merger Arbitrage Index**.
Global Macro strategies contributed the second most, adding 1.4% to Fund return. Our trend-based and relative-value commodity models contributed approximately equally to this result. The trend model did very well in the first quarter of the calendar year while the relative-value strategy picked up steam in the second and third quarters.
Equity Market Neutral contributed 1.2% to Fund return. Our quantitative model generated a 5.9% return with 2.8% annualized volatility. In contrast, the HFRX Equity Market Neutral Index** lost -2.9% during the calendar year.
Fixed Income strategies contributed 1.1% to Fund return. Tactically allocating to a Treasury flattener trade performed well during the last three quarters of the year as market stress rose during European and U.S. budget discussions. Approximately half of the flattener strategy’s return was generated in the months of August and September alone, a period when we opportunistically increased our exposure to the strategy.
Long/Short Equity contributed 0.9% to Fund return. The industry rotation and size models contributed approximately equal positive amounts to this result while the country rotation model detracted from fund performance. For the full year, small caps underperformed large caps. Prior to 2011, this would have led to negative performance from our size model; however, enhancements allowed us to profit from shifting trends in the relative performance of stocks in different market capitalization categories.
Derivatives in the Fund are used for various purposes, including hedging, producing income and for speculation.
| * | Sharpe Ratio: a risk-adjusted measure calculated using standard deviation and excess return to determine reward per unit of risk. The higher the Sharpe ratio, the better the fund’s historical risk-adjusted performance. |
| ** | Standard & Poor’s 500 Index (S&P 500®) — a capitalization-weighted index covering 500 industrial, utility, transportation and financial companies of the U.S. markets (mostly NYSE Euronext issues). |
| ** | HFRX Global Hedge Fund Index is designed to be representative of the overall composition of the hedge fund universe. It is comprised of all eligible hedge fund strategies, including, but not limited to, convertible arbitrage, distressed securities, equity hedge, equity market neutral, event driven, macro, merger arbitrage and relative-value arbitrage. The strategies are asset weighted based on the distribution of assets in the hedge fund industry. |
| ** | HFRX Merger Arbitrage Index is designed to measure merger arbitrage strategies which employ an investment process primarily focused on opportunities in equity and equity related instruments of companies currently engaged in a corporate transaction. Merger arbitrage strategies typically have over 75% of positions in announced transactions over a given market cycle. |
| ** | HFRX Equity Market Neutral Index is designed to measure equity market neutral strategies which employ sophisticated quantitative techniques of analyzing price data to ascertain information about future price movement and relationships between securities, select securities for purchase and sale. Equity market neutral strategies typically maintain characteristic net equity market exposure no greater than 10% long or short. |
Performance displayed represents past performance which is no guarantee of future results.
16 | THE GUGGENHEIM FUNDSANNUALREPORT
PERFORMANCE REPORT AND FUND PROFILE (Unaudited) (concluded)
MULTI-HEDGE STRATEGIES FUND
Holdings Diversification (Market Exposure as % of Net Assets)
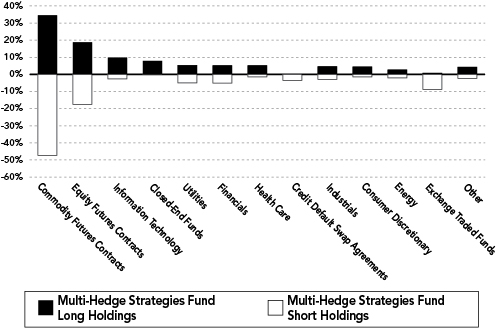
“Holdings Diversification (Market Exposure as % of Net Assets)” excludes any temporary cash investments.
Cumulative Fund Performance*
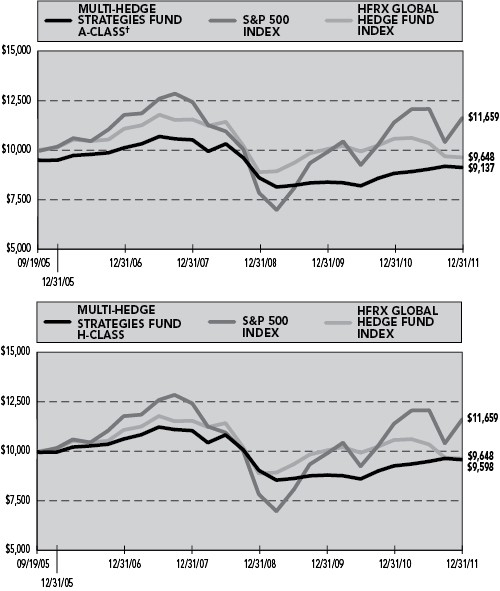
| | |
Inception Dates: | | |
A-Class | | September 19, 2005 |
C-Class | | September 19, 2005 |
H-Class | | September 19, 2005 |
Institutional Class | | May 3, 2010 |
| | | | |
Ten Largest Long Holdings (% of Total Net Assets) | |
Progress Energy, Inc. | | | 1.9 | % |
99 Cents Only Stores | | | 1.7 | % |
Transatlantic Holdings, Inc. | | | 1.6 | % |
Constellation Energy Group, Inc. | | | 1.5 | % |
RightNow Technologies, Inc. | | | 1.4 | % |
Healthspring, Inc. | | | 1.4 | % |
Goodrich Corp. | | | 1.4 | % |
Netlogic Microsystems, Inc. | | | 1.3 | % |
Temple-Inland, Inc. | | | 1.3 | % |
Motorola Mobility Holdings, Inc. | | | 1.0 | % |
| | | | |
Top Ten Total | | | 14.5 | % |
| | | | |
“Ten Largest Holdings” exclude any temporary cash or derivative investments.
Average Annual Returns*
Periods Ended 12/31/11
| | | | | | | | | | | | |
| | | 1 Year | | | 5 Year | | | Since
Inception
(09/19/05) | |
A-Class Shares | | | 3.39 | % | | | -2.05 | % | | | -0.66 | % |
A-Class Shares with sales charge† | | | -1.52 | % | | | -3.00 | % | | | -1.43 | % |
C-Class Shares | | | 2.62 | % | | | -2.79 | % | | | -1.40 | % |
C-Class Shares with CDSC‡ | | | 1.62 | % | | | -2.79 | % | | | -1.40 | % |
H-Class Shares | | | 3.39 | % | | | -2.05 | % | | | -0.65 | % |
HFRX Global Hedge Fund Index | | | -8.92 | % | | | -2.77 | % | | | -0.57 | % |
S&P 500 Index | | | 2.11 | % | | | -0.25 | % | | | 2.47 | % |
| | | | | | | | |
| | | 1 Year | | | Since
Inception
(05/03/10) | |
Institutional Class Shares | | | 3.61 | % | | | 5.40 | % |
HFRX Global Hedge Fund Index | | | -8.92 | % | | | -3.90 | % |
S&P 500 Index | | | 2.11 | % | | | 4.93 | % |
| * | The performance data above represents past performance that is not predictive of future results. The investment return and principal value of an investment in the Fund will fluctuate so that an investor’s shares, when redeemed, may be worth more or less than their original cost. Returns are historical and include changes in principal and reinvested dividends and capital gains and do not reflect the effect of taxes. The HFRX Global Hedge Fund Index and S&P 500 Index are unmanaged indices and, unlike the Fund, have no management fees or operating expenses to reduce their reported returns. The graphs are based on A-Class shares and H-Class shares only; performance for C-Class shares and Institutional Class shares will vary due to differences in fee structures. |
| † | Fund returns are calculated using the maximum sales charge of 4.75%. |
| ‡ | Fund returns include a CDSC of 1% if redeemed within 12 months of purchase. |
THE GUGGENHEIM FUNDSANNUALREPORT | 17
| | |
| CONSOLIDATED SCHEDULE OF INVESTMENTS | | December 31, 2011 |
MULTI-HEDGE STRATEGIES FUND
| | | | | | | | |
| | | SHARES | | | VALUE | |
|
| COMMON STOCKS† - 41.1% | |
INFORMATION TECHNOLOGY - 9.7% | |
RightNow Technologies, Inc.*,1 | | | 35,463 | | | $ | 1,515,334 | |
Netlogic Microsystems, Inc.*,1 | | | 28,599 | | | | 1,417,652 | |
Motorola Mobility Holdings, Inc.*,1 | | | 26,123 | | | | 1,013,572 | |
Blue Coat Systems, Inc.* | | | 33,069 | | | | 841,606 | |
SuccessFactors, Inc.* | | | 16,764 | | | | 668,381 | |
Magma Design Automation, Inc.*,1 | | | 92,768 | | | | 666,074 | |
LoopNet, Inc.*,1 | | | 30,729 | | | | 561,726 | |
Tekelec* | | | 31,351 | | | | 342,666 | |
Novellus Systems, Inc.*,1 | | | 8,281 | | | | 341,922 | |
DemandTec, Inc.* | | | 25,348 | | | | 333,833 | |
Fidelity National Information Services, Inc.1 | | | 6,406 | | | | 170,336 | |
IAC/InterActiveCorp.1 | | | 3,949 | | | | 168,227 | |
Activision Blizzard, Inc.1 | | | 12,029 | | | | 148,197 | |
Alliance Data Systems Corp.*,1 | | | 1,383 | | | | 143,611 | |
Analog Devices, Inc.1 | | | 3,840 | | | | 137,395 | |
Avnet, Inc.*,1 | | | 4,277 | | | | 132,972 | |
CA, Inc.1 | | | 6,242 | | | | 126,182 | |
AVX Corp.1 | | | 9,664 | | | | 123,313 | |
Fairchild Semiconductor International, Inc. — Class A*,1 | | | 9,882 | | | | 118,979 | |
Jabil Circuit, Inc.1 | | | 5,696 | | | | 111,983 | |
Equinix, Inc.*,1 | | | 1,056 | | | | 107,078 | |
DST Systems, Inc.1 | | | 2,220 | | | | 101,054 | |
S1 Corp.*,1 | | | 7,997 | | | | 76,531 | |
Dell, Inc.*,1 | | | 5,223 | | | | 76,412 | |
SanDisk Corp.*,1 | | | 1,492 | | | | 73,421 | |
EchoStar Corp. — Class A*,1 | | | 2,984 | | | | 62,485 | |
Tech Data Corp.*,1 | | | 1,257 | | | | 62,108 | |
eBay, Inc.*,1 | | | 1,966 | | | | 59,629 | |
Apple, Inc.*,1 | | | 139 | | | | 56,295 | |
Microchip Technology, Inc.1 | | | 1,383 | | | | 50,659 | |
Motorola Solutions, Inc.1 | | | 1,074 | | | | 49,715 | |
Teradyne, Inc.*,1 | | | 3,585 | | | | 48,864 | |
Harris Corp.1 | | | 1,330 | | | | 47,933 | |
Avago Technologies Ltd.1 | | | 1,584 | | | | 45,714 | |
Xilinx, Inc.1 | | | 1,293 | | | | 41,454 | |
Compuware Corp.*,1 | | | 3,791 | | | | 31,541 | |
Molex, Inc.1 | | | 1,147 | | | | 27,367 | |
Maxim Integrated Products, Inc.1 | | | 1,038 | | | | 27,030 | |
Xerox Corp.1 | | | 2,305 | | | | 18,348 | |
Vishay Intertechnology, Inc.*,1 | | | 1,885 | | | | 16,946 | |
Synopsys, Inc.*,1 | | | 509 | | | | 13,845 | |
Polycom, Inc.*,1 | | | 527 | | | | 8,590 | |
Solera Holdings, Inc.1 | | | 91 | | | | 4,053 | |
Atmel Corp.*,1 | | | 303 | | | | 2,454 | |
Altera Corp.1 | | | 18 | | | | 668 | |
NVIDIA Corp.*,1 | | | 23 | | | | 319 | |
Electronic Arts, Inc.* | | | 11 | | | | 227 | |
| | | | | | | | |
Total Information Technology | | | | | | | 10,194,701 | |
| | | | | | | | |
| | |
UTILITIES - 5.4% | | | | | | | | |
Progress Energy, Inc.1 | | | 35,154 | | | | 1,969,327 | |
Constellation Energy Group, Inc.1 | | | 38,627 | | | | 1,532,333 | |
Central Vermont Public Service Corp.1 | | | 8,947 | | | | 314,040 | |
Atmos Energy Corp.1 | | | 5,776 | | | | 192,630 | |
NiSource, Inc.1 | | | 7,498 | | | | 178,527 | |
American Electric Power Company, Inc.1 | | | 4,277 | | | | 176,683 | |
Alliant Energy Corp.1 | | | 3,973 | | | | 175,249 | |
Consolidated Edison, Inc.1 | | | 2,821 | | | | 174,987 | |
DTE Energy Co.1 | | | 3,167 | | | | 172,443 | |
N.V. Energy, Inc.1 | | | 10,355 | | | | 169,304 | |
Pennichuck Corp.1 | | | 5,460 | | | | 157,412 | |
NRG Energy, Inc.*,1 | | | 5,532 | | | | 100,240 | |
ONEOK, Inc.1 | | | 1,152 | | | | 99,867 | |
Ameren Corp.1 | | | 1,602 | | | | 53,074 | |
Entergy Corp.1 | | | 631 | | | | 46,095 | |
CenterPoint Energy, Inc.1 | | | 1,347 | | | | 27,061 | |
CMS Energy Corp.1 | | | 982 | | | | 21,683 | |
Westar Energy, Inc.1 | | | 637 | | | | 18,333 | |
Great Plains Energy, Inc.1 | | | 358 | | | | 7,797 | |
| | | | | | | | |
Total Utilities | | | | | | | 5,587,085 | |
| | | | | | | | |
FINANCIALS - 5.2% | | | | | | | | |
Transatlantic Holdings, Inc.1 | | | 30,086 | | | | 1,646,607 | |
Harleysville Group, Inc.1 | | | 6,638 | | | | 375,512 | |
Annaly Capital Management, Inc.1 | | | 12,817 | | | | 204,559 | |
Torchmark Corp.1 | | | 4,022 | | | | 174,515 | |
Fidelity National Financial, Inc. — Class A1 | | | 10,901 | | | | 173,653 | |
Delphi Financial Group, Inc. — Class A | | | 3,902 | | | | 172,859 | |
SL Green Realty Corp.1 | | | 2,475 | | | | 164,934 | |
American Financial Group, Inc.1 | | | 4,422 | | | | 163,128 | |
Commerce Bancshares, Inc.1 | | | 4,254 | | | | 162,162 | |
NASDAQ OMX Group, Inc.*,1 | | | 6,534 | | | | 160,148 | |
Capital One Financial Corp.1 | | | 3,707 | | | | 156,769 | |
Leucadia National Corp.1 | | | 6,078 | | | | 138,214 | |
Reinsurance Group of America, Inc. — Class A1 | | | 2,457 | | | | 128,378 | |
Weyerhaeuser Co.1 | | | 6,803 | | | | 127,012 | |
Huntington Bancshares, Inc.1 | | | 22,996 | | | | 126,248 | |
Endurance Specialty Holdings Ltd.1 | | | 3,221 | | | | 123,203 | |
CapitalSource, Inc.1 | | | 18,205 | | | | 121,974 | |
Discover Financial Services1 | | | 4,841 | | | | 116,184 | |
Marsh & McLennan Companies, Inc.1 | | | 3,506 | | | | 110,860 | |
BlackRock, Inc. — Class A1 | | | 588 | | | | 104,805 | |
Bank of New York Mellon Corp.1 | | | 4,877 | | | | 97,101 | |
American Capital Ltd.*,1 | | | 13,969 | | | | 94,011 | |
East West Bancorp, Inc.1 | | | 4,004 | | | | 79,079 | |
| | |
| 18 | THE GUGGENHEIM FUNDSANNUALREPORT | | See Notes to Financial Statements. |
| | |
| CONSOLIDATED SCHEDULE OF INVESTMENTS (continued) | | December 31, 2011 |
MULTI-HEDGE STRATEGIES FUND
| | | | | | | | |
| | | SHARES | | | VALUE | |
| | |
Hospitality Properties Trust1 | | | 3,136 | | | $ | 72,065 | |
MetLife, Inc.1 | | | 2,234 | | | | 69,656 | |
New York Community Bancorp, Inc.1 | | | 4,702 | | | | 58,164 | |
Taubman Centers, Inc.1 | | | 892 | | | | 55,393 | |
Piedmont Office Realty Trust, Inc. — Class A1 | | | 3,234 | | | | 55,107 | |
CommonWealth REIT1 | | | 3,285 | | | | 54,662 | |
Washington Federal, Inc.1 | | | 3,186 | | | | 44,572 | |
Unum Group1 | | | 1,856 | | | | 39,106 | |
Interactive Brokers Group, Inc. — Class A1 | | | 2,402 | | | | 35,886 | |
E*Trade Financial Corp.*,1 | | | 3,002 | | | | 23,896 | |
Prudential Financial, Inc.1 | | | 453 | | | | 22,704 | |
ACE Ltd.1 | | | 164 | | | | 11,500 | |
Simon Property Group, Inc.1 | | | 73 | | | | 9,413 | |
Liberty Property Trust1 | | | 248 | | | | 7,658 | |
First Niagara Financial Group, Inc.1 | | | 855 | | | | 7,379 | |
Rayonier, Inc.1 | | | 163 | | | | 7,275 | |
Citigroup, Inc.1 | | | 239 | | | | 6,288 | |
UDR, Inc.1 | | | 163 | | | | 4,091 | |
Principal Financial Group, Inc.1 | | | 121 | | | | 2,977 | |
| | | | | | | | |
Total Financials | | | | | | | 5,509,707 | |
| | | | | | | | |
HEALTH CARE - 5.1% | | | | | | | | |
Healthspring, Inc.*,1 | | | 27,773 | | | | 1,514,739 | |
Pharmasset, Inc.*,1 | | | 6,547 | | | | 839,325 | |
SonoSite, Inc.* | | | 7,774 | | | | 418,708 | |
Medco Health Solutions, Inc.*,1 | | | 5,501 | | | | 307,506 | |
Synovis Life Technologies, Inc.* | | | 9,082 | | | | 252,752 | |
Amgen, Inc.1 | | | 3,656 | | | | 234,752 | |
SXC Health Solutions Corp.*,1 | | | 2,692 | | | | 152,044 | |
Coventry Health Care, Inc.*,1 | | | 4,950 | | | | 150,331 | |
LifePoint Hospitals, Inc.*,1 | | | 3,931 | | | | 146,037 | |
Cooper Companies, Inc.1 | | | 2,020 | | | | 142,450 | |
Forest Laboratories, Inc.*,1 | | | 3,585 | | | | 108,482 | |
Agilent Technologies, Inc.*,1 | | | 2,857 | | | | 99,795 | |
Endo Pharmaceuticals Holdings, Inc.*,1 | | | 2,475 | | | | 85,462 | |
American Dental Partners, Inc.*,1 | | | 4,204 | | | | 79,161 | |
Celgene Corp.*,1 | | | 1,088 | | | | 73,549 | |
AmerisourceBergen Corp. — Class A1 | | | 1,893 | | | | 70,401 | |
Gilead Sciences, Inc.*,1 | | | 1,711 | | | | 70,031 | |
Pfizer, Inc.1 | | | 3,203 | | | | 69,313 | |
Bio-Rad Laboratories, Inc. — Class A*,1 | | | 709 | | | | 68,092 | |
Cerner Corp.*,1 | | | 1,038 | | | | 63,577 | |
Biogen Idec, Inc.*,1 | | | 564 | | | | 62,068 | |
Perrigo Co.1 | | | 606 | | | | 58,964 | |
Alexion Pharmaceuticals, Inc.*,1 | | | 619 | | | | 44,258 | |
McKesson Corp.1 | | | 546 | | | | 42,539 | |
Aetna, Inc.1 | | | 819 | | | | 34,554 | |
United Therapeutics Corp.*,1 | | | 634 | | | | 29,956 | |
Henry Schein, Inc.*,1 | | | 364 | | | | 23,453 | |
ResMed, Inc.*,1 | | | 819 | | | | 20,803 | |
Humana, Inc.1 | | | 128 | | | | 11,214 | |
Myriad Genetics, Inc.*,1 | | | 532 | | | | 11,140 | |
UnitedHealth Group, Inc.1 | | | 219 | | | | 11,099 | |
AMERIGROUP Corp.*,1 | | | 182 | | | | 10,753 | |
WellPoint, Inc.1 | | | 146 | | | | 9,672 | |
Hill-Rom Holdings, Inc.1 | | | 267 | | | | 8,995 | |
Edwards Lifesciences Corp.*,1 | | | 97 | | | | 6,858 | |
Boston Scientific Corp.*,1 | | | 710 | | | | 3,791 | |
Cigna Corp.1 | | | 73 | | | | 3,066 | |
| | | | | | | | |
Total Health Care | | | | | | | 5,339,690 | |
| | | | | | | | |
INDUSTRIALS - 4.6% | | | | | | | | |
Goodrich Corp.1 | | | 11,497 | | | | 1,422,179 | |
RSC Holdings, Inc.* | | | 33,999 | | | | 628,981 | |
Stanley Black & Decker, Inc.1 | | | 2,548 | | | | 172,245 | |
Kennametal, Inc.1 | | | 4,331 | | | | 158,168 | |
Towers Watson & Co. — Class A1 | | | 2,584 | | | | 154,859 | |
Northrop Grumman Corp.1 | | | 2,457 | | | | 143,685 | |
Republic Services, Inc. — Class A1 | | | 4,204 | | | | 115,820 | |
KBR, Inc.1 | | | 4,149 | | | | 115,633 | |
Tyco International Ltd.1 | | | 2,329 | | | | 108,788 | |
Union Pacific Corp.1 | | | 1,013 | | | | 107,317 | |
Dover Corp.1 | | | 1,765 | | | | 102,458 | |
FedEx Corp.1 | | | 1,220 | | | | 101,882 | |
Corrections Corporation of America*,1 | | | 4,440 | | | | 90,443 | |
Ryder System, Inc.1 | | | 1,656 | | | | 88,000 | |
WESCO International, Inc.*,1 | | | 1,653 | | | | 87,626 | |
WCA Waste Corp.* | | | 13,276 | | | | 86,427 | |
Caterpillar, Inc.1 | | | 902 | | | | 81,721 | |
GATX Corp.1 | | | 1,766 | | | | 77,104 | |
WW Grainger, Inc.1 | | | 398 | | | | 74,502 | |
AGCO Corp.*,1 | | | 1,729 | | | | 74,295 | |
Nordson Corp.1 | | | 1,801 | | | | 74,165 | |
Air Lease Corp. — Class A*,1 | | | 3,106 | | | | 73,643 | |
MSC Industrial Direct Co., Inc. — Class A1 | | | 884 | | | | 63,250 | |
L-3 Communications Holdings, Inc.1 | | | 910 | | | | 60,679 | |
General Electric Co.1 | | | 3,112 | | | | 55,736 | |
Emerson Electric Co.1 | | | 1,166 | | | | 54,324 | |
CSX Corp.1 | | | 2,402 | | | | 50,586 | |
Donaldson Company, Inc.1 | | | 715 | | | | 48,677 | |
Parker Hannifin Corp.1 | | | 619 | | | | 47,199 | |
Kansas City Southern*,1 | | | 619 | | | | 42,098 | |
Cummins, Inc.1 | | | 473 | | | | 41,633 | |
URS Corp.*,1 | | | 1,165 | | | | 40,915 | |
Armstrong World Industries, Inc.*,1 | | | 685 | | | | 30,051 | |
Gardner Denver, Inc.1 | | | 382 | | | | 29,437 | |
Chicago Bridge & Iron Company N.V.1 | | | 775 | | | | 29,295 | |
Hubbell, Inc. — Class B1 | | | 400 | | | | 26,744 | |
Norfolk Southern Corp.1 | | | 346 | | | | 25,210 | |
CNH Global N.V.*,1 | | | 665 | | | | 23,933 | |
| | |
| See Notes to Financial Statements. | | THE GUGGENHEIM FUNDSANNUALREPORT | 19 |
| | |
| CONSOLIDATED SCHEDULE OF INVESTMENTS (continued) | | December 31, 2011 |
MULTI-HEDGE STRATEGIES FUND
| | | | | | | | |
| | | SHARES | | | VALUE | |
| | |
Fluor Corp.1 | | | 364 | | | $ | 18,291 | |
Thomas & Betts Corp.*,1 | | | 291 | | | | 15,889 | |
Alexander & Baldwin, Inc.1 | | | 291 | | | | 11,879 | |
RR Donnelley & Sons Co.1 | | | 637 | | | | 9,192 | |
Eaton Corp.1 | | | 109 | | | | 4,745 | |
Kirby Corp.*,1 | | | 42 | | | | 2,765 | |
| | | | | | | | |
Total Industrials | | | | | | | 4,872,469 | |
| | | | | | | | |
CONSUMER DISCRETIONARY - 4.3% | |
99 Cents Only Stores*,1 | | | 80,538 | | | | 1,767,809 | |
Wyndham Worldwide Corp.1 | | | 4,222 | | | | 159,718 | |
Foot Locker, Inc.1 | | | 6,642 | | | | 158,345 | |
McCormick & Schmick’s Seafood Restaurants, Inc.* | | | 18,106 | | | | 158,246 | |
Comcast Corp. — Class A1 | | | 6,407 | | | | 151,910 | |
Limited Brands, Inc.1 | | | 3,476 | | | | 140,257 | |
O’Reilly Automotive, Inc.*,1 | | | 1,602 | | | | 128,080 | |
Brinker International, Inc.1 | | | 4,259 | | | | 113,971 | |
Jarden Corp.1 | | | 3,385 | | | | 101,144 | |
MGM Resorts International*,1 | | | 9,646 | | | | 100,608 | |
Dillard’s, Inc. — Class A1 | | | 1,838 | | | | 82,489 | |
Time Warner Cable, Inc.1 | | | 1,280 | | | | 81,370 | |
Darden Restaurants, Inc.1 | | | 1,771 | | | | 80,722 | |
Autoliv, Inc.1 | | | 1,474 | | | | 78,844 | |
Mattel, Inc.1 | | | 2,718 | | | | 75,452 | |
NIKE, Inc. — Class B1 | | | 759 | | | | 73,145 | |
Target Corp.1 | | | 1,356 | | | | 69,454 | |
Coach, Inc.1 | | | 1,119 | | | | 68,304 | |
VF Corp.1 | | | 534 | | | | 67,813 | |
Kohl’s Corp.1 | | | 1,290 | | | | 63,662 | |
Interpublic Group of Companies, Inc.1 | | | 6,424 | | | | 62,506 | |
Fossil, Inc.*,1 | | | 769 | | | | 61,028 | |
Genuine Parts Co.1 | | | 886 | | | | 54,223 | |
JC Penney Company, Inc.1 | | | 1,495 | | | | 52,549 | |
Family Dollar Stores, Inc.1 | | | 883 | | | | 50,914 | |
Deckers Outdoor Corp.*,1 | | | 656 | | | | 49,574 | |
Service Corporation International1 | | | 4,641 | | | | 49,427 | |
Polaris Industries, Inc.1 | | | 874 | | | | 48,927 | |
DISH Network Corp. — Class A1 | | | 1,547 | | | | 44,059 | |
Hanesbrands, Inc.*,1 | | | 1,985 | | | | 43,392 | |
TRW Automotive Holdings Corp.*,1 | | | 1,237 | | | | 40,326 | |
Career Education Corp.*,1 | | | 4,725 | | | | 37,658 | |
CBS Corp. — Class B1 | | | 1,264 | | | | 34,305 | |
Virgin Media, Inc.1 | | | 1,577 | | | | 33,716 | |
Big Lots, Inc.*,1 | | | 725 | | | | 27,376 | |
Liberty Interactive Corp. — Class A*,1 | | | 1,584 | | | | 25,685 | |
Under Armour, Inc. — Class A*,1 | | | 300 | | | | 21,537 | |
Royal Caribbean Cruises Ltd.1 | | | 765 | | | | 18,949 | |
Hasbro, Inc.1 | | | 593 | | | | 18,911 | |
Priceline.com, Inc.*,1 | | | 36 | | | | 16,838 | |
GameStop Corp. — Class A*,1 | | | 582 | | | | 14,044 | |
Aaron’s, Inc.1 | | | 455 | | | | 12,139 | |
DeVry, Inc.1 | | | 292 | | | | 11,230 | |
LKQ Corp.*,1 | | | 239 | | | | 7,189 | |
Tupperware Brands Corp.1 | | | 127 | | | | 7,108 | |
The Gap, Inc.1 | | | 97 | | | | 1,799 | |
| | | | | | | | |
Total Consumer Discretionary | | | | | | | 4,566,752 | |
| | | | | | | | |
ENERGY - 2.6% | | | | | | | | |
Complete Production Services, Inc.*,1 | | | 29,661 | | | | 995,423 | |
El Paso Corp.1 | | | 14,690 | | | | 390,313 | |
Marathon Oil Corp.1 | | | 6,127 | | | | 179,337 | |
Tesoro Corp.*,1 | | | 5,842 | | | | 136,469 | |
Valero Energy Corp.1 | | | 6,460 | | | | 135,983 | |
Spectra Energy Corp.1 | | | 3,448 | | | | 106,026 | |
Chevron Corp.1 | | | 874 | | | | 92,994 | |
Patterson-UTI Energy, Inc.1 | | | 4,058 | | | | 81,079 | |
Unit Corp.*,1 | | | 1,729 | | | | 80,226 | |
Hess Corp.1 | | | 1,329 | | | | 75,487 | |
ConocoPhillips1 | | | 1,019 | | | | 74,255 | |
Chesapeake Energy Corp.1 | | | 3,076 | | | | 68,564 | |
SEACOR Holdings, Inc.*,1 | | | 643 | | | | 57,201 | |
National Oilwell Varco, Inc.1 | | | 733 | | | | 49,837 | |
QEP Resources, Inc.1 | | | 1,548 | | | | 45,356 | |
RPC, Inc.1 | | | 2,420 | | | | 44,165 | |
Murphy Oil Corp.1 | | | 696 | | | | 38,795 | |
Oil States International, Inc.*,1 | | | 455 | | | | 34,748 | |
Occidental Petroleum Corp.1 | | | 345 | | | | 32,326 | |
SM Energy Co.1 | | | 182 | | | | 13,304 | |
Cimarex Energy Co.1 | | | 91 | | | | 5,633 | |
Atwood Oceanics, Inc.*,1 | | | 54 | | | | 2,149 | |
| | | | | | | | |
Total Energy | | | | | | | 2,739,670 | |
| | | | | | | | |
MATERIALS - 2.2% | | | | | | | | |
Temple-Inland, Inc.1 | | | 41,913 | | | | 1,329,061 | |
Westlake Chemical Corp.1 | | | 2,870 | | | | 115,489 | |
Cabot Corp.1 | | | 3,548 | | | | 114,033 | |
LyondellBasell Industries N.V. — Class A1 | | | 3,221 | | | | 104,650 | |
Cliffs Natural Resources, Inc.1 | | | 1,519 | | | | 94,710 | |
Domtar Corp.1 | | | 1,019 | | | | 81,479 | |
CF Industries Holdings, Inc.1 | | | 528 | | | | 76,549 | |
Freeport-McMoRan Copper & Gold, Inc.1 | | | 1,947 | | | | 71,630 | |
MeadWestvaco Corp.1 | | | 2,061 | | | | 61,727 | |
Alcoa, Inc.1 | | | 6,442 | | | | 55,723 | |
Bemis Company, Inc.1 | | | 1,729 | | | | 52,008 | |
Newmont Mining Corp.1 | | | 795 | | | | 47,708 | |
Packaging Corporation of America1 | | | 1,638 | | | | 41,343 | |
Rockwood Holdings, Inc.*,1 | | | 887 | | | | 34,921 | |
International Paper Co.1 | | | 308 | | | | 9,117 | |
Dow Chemical Co.1 | | | 255 | | | | 7,334 | |
EI du Pont de Nemours & Co.1 | | | 146 | | | | 6,684 | |
Ball Corp.1 | | | 182 | | | | 6,499 | |
Walter Energy, Inc.1 | | | 18 | | | | 1,090 | |
| | | | | | | | |
Total Materials | | | | | | | 2,311,755 | |
| | | | | | | | |
| | |
| 20 | THE GUGGENHEIM FUNDSANNUALREPORT | | See Notes to Financial Statements. |
| | |
| CONSOLIDATED SCHEDULE OF INVESTMENTS (continued) | | December 31, 2011 |
MULTI-HEDGE STRATEGIES FUND
| | | | | | | | |
| | | SHARES | | | VALUE | |
| | |
CONSUMER STAPLES - 1.8% | | | | | | | | |
Winn-Dixie Stores, Inc.* | | | 27,500 | | | $ | 257,950 | |
Smithfield Foods, Inc.*,1 | | | 7,334 | | | | 178,070 | |
Tyson Foods, Inc. — Class A1 | | | 8,572 | | | | 176,926 | |
Kroger Co.1 | | | 6,970 | | | | 168,813 | |
Hormel Foods Corp.1 | | | 5,678 | | | | 166,309 | |
Coca-Cola Enterprises, Inc.1 | | | 6,206 | | | | 159,991 | |
ConAgra Foods, Inc.1 | | | 5,714 | | | | 150,850 | |
Lorillard, Inc.1 | | | 940 | | | | 107,160 | |
Philip Morris International, Inc.1 | | | 1,095 | | | | 85,936 | |
Herbalife Ltd.1 | | | 1,565 | | | | 80,864 | |
Reynolds American, Inc.1 | | | 1,841 | | | | 76,254 | |
Kimberly-Clark Corp.1 | | | 965 | | | | 70,985 | |
Energizer Holdings, Inc.*,1 | | | 874 | | | | 67,718 | |
Estee Lauder Companies, Inc. — Class A1 | | | 456 | | | | 51,218 | |
Corn Products International, Inc.1 | | | 928 | | | | 48,804 | |
Whole Foods Market, Inc.1 | | | 304 | | | | 21,152 | |
Costco Wholesale Corp.1 | | | 200 | | | | 16,664 | |
Avon Products, Inc.1 | | | 930 | | | | 16,247 | |
| | | | | | | | |
Total Consumer Staples | | | | | | | 1,901,911 | |
| | | | | | | | |
TELECOMMUNICATION SERVICES - 0.2% | |
Verizon Communications, Inc.1 | | | 3,221 | | | | 129,227 | |
MetroPCS Communications, Inc.*,1 | | | 4,523 | | | | 39,260 | |
Frontier Communications Corp.1 | | | 4,546 | | | | 23,412 | |
Telephone & Data Systems, Inc.1 | | | 346 | | | | 8,958 | |
AT&T, Inc.1 | | | 182 | | | | 5,504 | |
| | | | | | | | |
Total Telecommunication Services | | | | | | | 206,361 | |
| | | | | | | | |
Total Common Stocks
(Cost $41,876,019) | | | | | | | 43,230,101 | |
| | | | | | | | |
EXCHANGE TRADED FUNDS† - 0.7% | |
iShares MSCI United Kingdom Index Fund1 | | | 23,310 | | | | 376,690 | |
iShares MSCI South Korea Index Fund1 | | | 2,326 | | | | 121,557 | |
iShares MSCI Singapore Index Fund1 | | | 5,328 | | | | 57,702 | |
Vanguard MSCI Emerging Markets ETF1 | | | 1,260 | | | | 48,145 | |
iShares MSCI France Index Fund1 | | | 2,084 | | | | 40,805 | |
iShares MSCI Sweden Index Fund1 | | | 1,495 | | | | 37,584 | |
iShares MSCI Spain Index Fund1 | | | 605 | | | | 18,313 | |
iShares MSCI Malaysia Index Fund1 | | | 1,246 | | | | 16,696 | |
iShares MSCI Australia Index Fund1 | | | 672 | | | | 14,408 | |
| | | | | | | | |
Total Exchange Traded Funds
(Cost $721,606) | | | | | | | 731,900 | |
| | | | | | | | |
CLOSED-END FUNDS† - 7.8% | |
Gabelli Dividend & Income Trust1 | | | 27,773 | | | | 428,260 | |
Eaton Vance Risk-Managed Diversified Equity Income Fund1 | | | 38,856 | | | | 406,045 | |
Calamos Strategic Total Return Fund1 | | | 47,440 | | | | 396,124 | |
Royce Value Trust, Inc.1 | | | 32,057 | | | | 393,341 | |
CBRE Clarion Global Real Estate Income Fund1 | | | 55,779 | | | | 381,528 | |
Eaton Vance Enhanced Equity Income Fund II1 | | | 33,527 | | | | 342,311 | |
Western Asset/Claymore Inflation-Linked Opportunities & Income Fund1,4 | | | 25,849 | | | | 325,956 | |
BlackRock Enhanced Capital and Income Fund, Inc.1 | | | 25,077 | | | | 308,447 | |
Clough Global Opportunities Fund1 | | | 28,477 | | | | 301,002 | |
Liberty All Star Equity Fund1 | | | 63,506 | | | | 267,995 | |
Eaton Vance Enhanced Equity Income Fund1 | | | 25,688 | | | | 261,504 | |
Advent Claymore Convertible Securities and Income Fund1,4 | | | 16,693 | | | | 245,888 | |
Zweig Total Return Fund, Inc.1 | | | 78,428 | | | | 237,637 | |
Blackrock Credit Allocation Income Trust IV1 | | | 17,942 | | | | 217,995 | |
Adams Express Co.1 | | | 20,882 | | | | 201,305 | |
BlackRock Credit Allocation Income Trust II, Inc.1 | | | 19,893 | | | | 195,548 | |
AGIC Equity & Convertible Income Fund1 | | | 11,964 | | | | 186,638 | |
John Hancock Bank and Thrift Opportunity Fund1 | | | 13,366 | | | | 183,114 | |
Eaton Vance Tax-Managed Diversified Equity Income Fund1 | | | 20,512 | | | | 181,942 | |
Tri-Continental Corp.1 | | | 12,332 | | | | 175,484 | |
H&Q Healthcare Investors1 | | | 11,974 | | | | 168,953 | |
General American Investors Company, Inc.1 | | | 5,906 | | | | 147,111 | |
BlackRock Strategic Equity Dividend Trust1 | | | 14,252 | | | | 139,670 | |
Source Capital, Inc.1 | | | 2,635 | | | | 123,792 | |
GDL Fund1 | | | 10,400 | | | | 122,720 | |
Clough Global Equity Fund1 | | | 9,775 | | | | 117,593 | |
First Trust Enhanced Equity Income Fund1 | | | 10,656 | | | | 115,405 | |
Zweig Fund, Inc.1 | | | 39,718 | | | | 115,182 | |
Madison/Claymore Covered Call & Equity Strategy Fund1,4 | | | 15,171 | | | | 113,327 | |
Royce Micro-Capital Trust, Inc.1 | | | 11,597 | | | | 101,702 | |
Blackrock Credit Allocation Income Trust III, Inc.1 | | | 9,269 | | | | 97,695 | |
Japan Smaller Capitalization Fund, Inc.1 | | | 13,480 | | | | 96,786 | |
Nuveen Diversified Dividend and Income Fund1 | | | 8,714 | | | | 89,406 | |
Thai Fund, Inc.1 | | | 6,816 | | | | 83,564 | |
| | |
| See Notes to Financial Statements. | | THE GUGGENHEIM FUNDSANNUALREPORT | 21 |
| | |
| CONSOLIDATED SCHEDULE OF INVESTMENTS (continued) | | December 31, 2011 |
MULTI-HEDGE STRATEGIES FUND
| | | | | | | | |
| | | SHARES | | | VALUE | |
| | |
Clough Global Allocation Fund1 | | | 5,805 | | | $ | 74,014 | |
Nuveen Tax-Advantaged Total Return Strategy Fund1 | | | 7,456 | | | | 71,279 | |
Nuveen Multi-Strategy Income and Growth Fund1 | | | 8,824 | | | | 70,680 | |
Cohen & Steers Dividend Majors Fund, Inc.1 | | | 5,743 | | | | 69,548 | |
Lazard Global Total Return and Income Fund, Inc.1 | | | 4,825 | | | | 64,607 | |
LMP Capital and Income Fund, Inc.1 | | | 5,179 | | | | 64,012 | |
Gabelli Global Multimedia Trust, Inc.1 | | | 9,578 | | | | 59,767 | |
Swiss Helvetia Fund, Inc.1 | | | 5,839 | | | | 58,098 | |
LMP Real Estate Income Fund, Inc.1 | | | 5,854 | | | | 54,150 | |
DWS High Income Opportunities Fund, Inc.1 | | | 3,134 | | | | 43,437 | |
Royce Focus Trust, Inc.1 | | | 6,501 | | | | 40,954 | |
Madison Strategic Sector Premium Fund1 | | | 3,459 | | | | 36,804 | |
Liberty All Star Growth Fund, Inc.1 | | | 8,513 | | | | 32,435 | |
Ellsworth Fund Ltd.1 | | | 4,748 | | | | 31,147 | |
Neuberger Berman Real Estate Securities Income Fund, Inc.1 | | | 7,911 | | | | 29,666 | |
Bancroft Fund Ltd.1 | | | 1,596 | | | | 24,132 | |
Gabelli Healthcare & WellnessRx Trust*,1 | | | 2,838 | | | | 20,263 | |
Diamond Hill Financial Trends Fund, Inc.1 | | | 2,179 | | | | 18,020 | |
Petroleum & Resources Corp.1 | | | 377 | | | | 9,218 | |
| | | | | | | | |
Total Closed-End Funds
(Cost $7,878,888) | | | | | | | 8,143,201 | |
| | | | | | | | |
| | |
| | | FACE
AMOUNT | | | | |
REPURCHASE AGREEMENTS††,2 - 43.6% | |
HSBC Group | | | | | | | | |
issued 12/30/11 at 0.00% due 01/03/12 | | $ | 30,999,009 | �� | | | 30,999,009 | |
Mizuho Financial Group, Inc. | | | | | | | | |
issued 12/30/11 at 0.00% due 01/03/12 | | | 8,469,346 | | | | 8,469,346 | |
Deutsche Bank | | | | | | | | |
issued 12/30/11 at 0.00% due 01/03/12 | | | 4,504,129 | | | | 4,504,129 | |
Credit Suisse Group | | | | | | | | |
issued 12/30/11 at 0.00% due 01/03/12 | | | 1,872,914 | | | | 1,872,914 | |
| | | | | | | | |
Total Repurchase Agreements
(Cost $45,845,398) | | | | 45,845,398 | |
| | | | | | | | |
Total Long Investments - 93.2%
(Cost $96,321,911) | | | $ | 97,950,600 | |
| | | | | | | | |
| | | SHARES | | | | |
COMMON STOCKS SOLD SHORT† - (23.2)% | |
TELECOMMUNICATION SERVICES - (0.3)% | |
Crown Castle International Corp.* | | | 36 | | | | (1,613 | ) |
NII Holdings, Inc.* | | | 556 | | | | (11,843 | ) |
Sprint Nextel Corp.* | | | 9,931 | | | | (23,239 | ) |
tw telecom, Inc. — Class A* | | | 2,344 | | | | (45,427 | ) |
American Tower Corp. — Class A | | | 1,413 | | | | (84,794 | ) |
SBA Communications Corp. — Class A* | | | 3,937 | | | | (169,134 | ) |
| | | | | | | | |
Total Telecommunication Services | | | | | | | (336,050 | ) |
| | | | | | | | |
CONSUMER STAPLES - (1.0)% | |
Altria Group, Inc. | | | 279 | | | | (8,272 | ) |
Clorox Co. | | | 163 | | | | (10,849 | ) |
Procter & Gamble Co. | | | 189 | | | | (12,608 | ) |
Brown-Forman Corp. — Class B | | | 200 | | | | (16,102 | ) |
Campbell Soup Co. | | | 818 | | | | (27,190 | ) |
Hansen Natural Corp.* | | | 327 | | | | (30,130 | ) |
PepsiCo, Inc. | | | 563 | | | | (37,355 | ) |
Bunge Ltd. | | | 1,091 | | | | (62,405 | ) |
Colgate-Palmolive Co. | | | 679 | | | | (62,733 | ) |
McCormick & Company, Inc. | | | 1,400 | | | | (70,588 | ) |
HJ Heinz Co. | | | 1,327 | | | | (71,711 | ) |
SUPERVALU, Inc. | | | 9,034 | | | | (73,356 | ) |
Mead Johnson Nutrition Co. — Class A | | | 1,091 | | | | (74,984 | ) |
Archer-Daniels-Midland Co. | | | 2,872 | | | | (82,139 | ) |
Hershey Co. | | | 1,363 | | | | (84,206 | ) |
Kellogg Co. | | | 1,672 | | | | (84,553 | ) |
Sara Lee Corp. | | | 4,471 | | | | (84,591 | ) |
Sysco Corp. | | | 2,980 | | | | (87,403 | ) |
Dean Foods Co.* | | | 8,451 | | | | (94,651 | ) |
| | | | | | | | |
Total Consumer Staples | | | | | | | (1,075,826 | ) |
| | | | | | | | |
MATERIALS - (1.1)% | |
Kronos Worldwide, Inc. | | | 140 | | | | (2,526 | ) |
Molycorp, Inc.* | | | 404 | | | | (9,688 | ) |
Huntsman Corp. | | | 1,158 | | | | (11,580 | ) |
Solutia, Inc.* | | | 783 | | | | (13,530 | ) |
Compass Minerals International, Inc. | | | 218 | | | | (15,009 | ) |
Celanese Corp. — Class A | | | 372 | | | | (16,468 | ) |
Owens-Illinois, Inc.* | | | 1,145 | | | | (22,190 | ) |
Sonoco Products Co. | | | 963 | | | | (31,741 | ) |
Vulcan Materials Co. | | | 872 | | | | (34,313 | ) |
Intrepid Potash, Inc.* | | | 1,732 | | | | (39,195 | ) |
FMC Corp. | | | 473 | | | | (40,697 | ) |
Southern Copper Corp. | | | 1,999 | | | | (60,330 | ) |
Steel Dynamics, Inc. | | | 4,907 | | | | (64,527 | ) |
Valspar Corp. | | | 1,799 | | | | (70,107 | ) |
WR Grace & Co.* | | | 1,724 | | | | (79,166 | ) |
AK Steel Holding Corp. | | | 9,651 | | | | (79,717 | ) |
Titanium Metals Corp. | | | 5,471 | | | | (81,956 | ) |
Praxair, Inc. | | | 836 | | | | (89,368 | ) |
| | |
| 22 | THE GUGGENHEIM FUNDSANNUALREPORT | | See Notes to Financial Statements. |
| | |
| CONSOLIDATED SCHEDULE OF INVESTMENTS (continued) | | December 31, 2011 |
MULTI-HEDGE STRATEGIES FUND
| | | | | | | | |
| | | SHARES | | | VALUE | |
| | |
Commercial Metals Co. | | | 6,519 | | | $ | (90,158 | ) |
Airgas, Inc. | | | 1,163 | | | | (90,807 | ) |
Scotts Miracle-Gro Co. — Class A | | | 1,945 | | | | (90,812 | ) |
Martin Marietta Materials, Inc. | | | 1,670 | | | | (125,935 | ) |
| | | | | | | | |
Total Materials | | | | | | | (1,159,820 | ) |
| | | | | | | | |
HEALTH CARE - (1.5)% | |
Patterson Companies, Inc. | | | 85 | | | | (2,509 | ) |
Allscripts Healthcare Solutions, Inc.* | | | 512 | | | | (9,697 | ) |
DENTSPLY International, Inc. | | | 418 | | | | (14,626 | ) |
DaVita, Inc.* | | | 200 | | | | (15,162 | ) |
Regeneron Pharmaceuticals, Inc.* | | | 327 | | | | (18,126 | ) |
Techne Corp. | | | 327 | | | | (22,321 | ) |
Brookdale Senior Living, Inc. — Class A* | | | 1,945 | | | | (33,824 | ) |
Human Genome Sciences, Inc.* | | | 6,111 | | | | (45,160 | ) |
Hologic, Inc.* | | | 2,653 | | | | (46,454 | ) |
Community Health Systems, Inc.* | | | 2,678 | | | | (46,731 | ) |
Covance, Inc.* | | | 1,073 | | | | (49,058 | ) |
Vertex Pharmaceuticals, Inc.* | | | 1,624 | | | | (53,933 | ) |
Charles River Laboratories International, Inc.* | | | 2,017 | | | | (55,125 | ) |
CareFusion Corp.* | | | 2,308 | | | | (58,646 | ) |
Amylin Pharmaceuticals, Inc.* | | | 5,476 | | | | (62,317 | ) |
Lincare Holdings, Inc. | | | 2,581 | | | | (66,358 | ) |
Quest Diagnostics, Inc. | | | 1,181 | | | | (68,569 | ) |
Laboratory Corporation of America Holdings* | | | 800 | | | | (68,776 | ) |
Warner Chilcott plc — Class A* | | | 4,780 | | | | (72,321 | ) |
Alere, Inc.* | | | 3,235 | | | | (74,696 | ) |
Health Net, Inc.* | | | 2,461 | | | | (74,864 | ) |
VCA Antech, Inc.* | | | 3,908 | | | | (77,183 | ) |
Bruker Corp.* | | | 6,216 | | | | (77,203 | ) |
Hospira, Inc.* | | | 2,617 | | | | (79,478 | ) |
Dendreon Corp.* | | | 10,539 | | | | (80,096 | ) |
Allergan, Inc. | | | 981 | | | | (86,073 | ) |
Express Scripts, Inc.* | | | 4,883 | | | | (218,221 | ) |
| | | | | | | | |
Total Health Care | | | | | | | (1,577,527 | ) |
| | | | | | | | |
CONSUMER DISCRETIONARY - (1.5)% | |
Sirius XM Radio, Inc.* | | | 322 | | | | (586 | ) |
Best Buy Company, Inc. | | | 27 | | | | (631 | ) |
RadioShack Corp. | | | 105 | | | | (1,020 | ) |
Clear Channel Outdoor Holdings, Inc. — Class A* | | | 91 | | | | (1,142 | ) |
Weight Watchers International, Inc. | | | 25 | | | | (1,375 | ) |
Gannett Company, Inc. | | | 152 | | | | (2,032 | ) |
Marriott Vacations Worldwide Corp.* | | | 272 | | | | (4,664 | ) |
Wynn Resorts Ltd. | | | 49 | | | | (5,414 | ) |
Leggett & Platt, Inc. | | | 236 | | | | (5,437 | ) |
Scripps Networks Interactive, Inc. — Class A | | | 145 | | | | (6,151 | ) |
Hyatt Hotels Corp. — Class A* | | | 181 | | | | (6,813 | ) |
Dollar Tree, Inc.* | | | 109 | | | | (9,059 | ) |
McDonald’s Corp. | | | 91 | | | | (9,130 | ) |
Yum! Brands, Inc. | | | 164 | | | | (9,678 | ) |
Starwood Hotels & Resorts Worldwide, Inc. | | | 218 | | | | (10,457 | ) |
Tempur-Pedic International, Inc.* | | | 335 | | | | (17,598 | ) |
H&R Block, Inc. | | | 1,163 | | | | (18,992 | ) |
Johnson Controls, Inc. | | | 636 | | | | (19,881 | ) |
Guess?, Inc. | | | 727 | | | | (21,679 | ) |
WMS Industries, Inc.* | | | 1,263 | | | | (25,917 | ) |
Las Vegas Sands Corp.* | | | 636 | | | | (27,176 | ) |
Choice Hotels International, Inc. | | | 741 | | | | (28,195 | ) |
Tiffany & Co. | | | 437 | | | | (28,956 | ) |
Ross Stores, Inc. | | | 690 | | | | (32,796 | ) |
American Eagle Outfitters, Inc. | | | 2,326 | | | | (35,565 | ) |
Toll Brothers, Inc.* | | | 2,399 | | | | (48,988 | ) |
Ford Motor Co.* | | | 4,562 | | | | (49,087 | ) |
Home Depot, Inc. | | | 1,290 | | | | (54,232 | ) |
NVR, Inc.* | | | 85 | | | | (58,310 | ) |
Urban Outfitters, Inc.* | | | 2,181 | | | | (60,108 | ) |
DreamWorks Animation SKG, Inc. — Class A* | | | 3,635 | | | | (60,323 | ) |
Lamar Advertising Co. — Class A* | | | 2,290 | | | | (62,975 | ) |
Apollo Group, Inc. — Class A* | | | 1,218 | | | | (65,614 | ) |
Regal Entertainment Group — Class A | | | 5,816 | | | | (69,443 | ) |
International Game Technology | | | 4,356 | | | | (74,923 | ) |
Morningstar, Inc. | | | 1,290 | | | | (76,691 | ) |
Newell Rubbermaid, Inc. | | | 4,780 | | | | (77,197 | ) |
Marriott International, Inc. — Class A | | | 2,718 | | | | (79,284 | ) |
Goodyear Tire & Rubber Co.* | | | 5,944 | | | | (84,226 | ) |
Madison Square Garden Co. — Class A* | | | 2,980 | | | | (85,347 | ) |
CarMax, Inc.* | | | 2,890 | | | | (88,087 | ) |
TJX Companies, Inc. | | | 1,400 | | | | (90,370 | ) |
Bally Technologies, Inc.* | | | 2,326 | | | | (92,017 | ) |
| | | | | | | | |
Total Consumer Discretionary | | | | | | | (1,607,566 | ) |
| | | | | | | | |
ENERGY - (2.1)% | |
Denbury Resources, Inc.* | | | 109 | | | | (1,646 | ) |
EXCO Resources, Inc. | | | 1,381 | | | | (14,431 | ) |
Noble Energy, Inc. | | | 182 | | | | (17,179 | ) |
Cabot Oil & Gas Corp. | | | 236 | | | | (17,912 | ) |
Schlumberger Ltd. | | | 345 | | | | (23,567 | ) |
Consol Energy, Inc. | | | 1,036 | | | | (38,021 | ) |
Energen Corp. | | | 854 | | | | (42,700 | ) |
Diamond Offshore Drilling, Inc. | | | 800 | | | | (44,208 | ) |
Ultra Petroleum Corp.* | | | 1,600 | | | | (47,408 | ) |
Sunoco, Inc. | | | 1,209 | | | | (49,593 | ) |
Southwestern Energy Co.* | | | 1,636 | | | | (52,254 | ) |
Alpha Natural Resources, Inc.* | | | 2,872 | | | | (58,675 | ) |
Newfield Exploration Co.* | | | 1,690 | | | | (63,764 | ) |
| | |
| See Notes to Financial Statements. | | THE GUGGENHEIM FUNDSANNUALREPORT | 23 |
| | |
| CONSOLIDATED SCHEDULE OF INVESTMENTS (continued) | | December 31, 2011 |
MULTI-HEDGE STRATEGIES FUND
| | | | | | | | |
| | | SHARES | | | VALUE | |
| | |
EOG Resources, Inc. | | | 654 | | | $ | (64,426 | ) |
Dresser-Rand Group, Inc.* | | | 1,345 | | | | (67,129 | ) |
Range Resources Corp. | | | 1,199 | | | | (74,266 | ) |
Cameron International Corp.* | | | 1,618 | | | | (79,589 | ) |
Teekay Corp. | | | 3,132 | | | | (83,718 | ) |
Cobalt International Energy, Inc.* | | | 5,453 | | | | (84,631 | ) |
Continental Resources, Inc.* | | | 1,290 | | | | (86,056 | ) |
FMC Technologies, Inc.* | | | 1,799 | | | | (93,962 | ) |
Kinder Morgan, Inc. | | | 6,517 | | | | (209,652 | ) |
Superior Energy Services, Inc.* | | | 30,720 | | | | (873,677 | ) |
| | | | | | | | |
Total Energy | | | | | | | (2,188,464 | ) |
| | | | | | | | |
INFORMATION TECHNOLOGY - (2.7)% | |
Teradata Corp.* | | | 24 | | | | (1,164 | ) |
Acme Packet, Inc.* | | | 40 | | | | (1,236 | ) |
Amphenol Corp. — Class A | | | 72 | | | | (3,268 | ) |
Accenture plc — Class A | | | 72 | | | | (3,833 | ) |
Corning, Inc. | | | 381 | | | | (4,945 | ) |
Western Digital Corp.* | | | 182 | | | | (5,633 | ) |
IPG Photonics Corp.* | | | 251 | | | | (8,501 | ) |
Juniper Networks, Inc.* | | | 418 | | | | (8,531 | ) |
Yahoo!, Inc.* | | | 588 | | | | (9,484 | ) |
AOL, Inc.* | | | 1,163 | | | | (17,561 | ) |
ACI Worldwide, Inc.* | | | 932 | | | | (26,692 | ) |
Lender Processing Services, Inc. | | | 2,763 | | | | (41,638 | ) |
Citrix Systems, Inc.* | | | 690 | | | | (41,897 | ) |
CoreLogic, Inc.* | | | 3,326 | | | | (43,005 | ) |
Genpact Ltd.* | | | 2,980 | | | | (44,551 | ) |
NetApp, Inc.* | | | 1,514 | | | | (54,913 | ) |
QLogic Corp.* | | | 3,666 | | | | (54,990 | ) |
Micron Technology, Inc.* | | | 9,052 | | | | (56,937 | ) |
Rovi Corp.* | | | 2,326 | | | | (57,173 | ) |
Brocade Communications Systems, Inc.* | | | 11,075 | | | | (57,479 | ) |
Cognizant Technology Solutions Corp. — Class A* | | | 945 | | | | (60,773 | ) |
Salesforce.com, Inc.* | | | 600 | | | | (60,876 | ) |
Factset Research Systems, Inc. | | | 708 | | | | (61,794 | ) |
Cree, Inc.* | | | 2,872 | | | | (63,299 | ) |
Tellabs, Inc. | | | 15,680 | | | | (63,347 | ) |
National Instruments Corp. | | | 2,472 | | | | (64,148 | ) |
Western Union Co. | | | 3,635 | | | | (66,375 | ) |
LSI Corp.* | | | 11,190 | | | | (66,581 | ) |
Paychex, Inc. | | | 2,326 | | | | (70,036 | ) |
PMC - Sierra, Inc.* | | | 12,722 | | | | (70,098 | ) |
Ciena Corp.* | | | 6,397 | | | | (77,404 | ) |
Akamai Technologies, Inc.* | | | 2,411 | | | | (77,827 | ) |
Diebold, Inc. | | | 2,617 | | | | (78,693 | ) |
Dolby Laboratories, Inc. — Class A* | | | 2,599 | | | | (79,296 | ) |
MICROS Systems, Inc.* | | | 1,709 | | | | (79,605 | ) |
Itron, Inc.* | | | 2,260 | | | | (80,840 | ) |
FLIR Systems, Inc. | | | 3,235 | | | | (81,101 | ) |
ANSYS, Inc.* | | | 1,418 | | | | (81,223 | ) |
Advanced Micro Devices, Inc.* | | | 15,285 | | | | (82,539 | ) |
Trimble Navigation Ltd.* | | | 1,981 | | | | (85,975 | ) |
Silicon Laboratories, Inc.* | | | 1,981 | | | | (86,015 | ) |
Broadridge Financial Solutions, Inc. | | | 3,823 | | | | (86,209 | ) |
VeriSign, Inc. | | | 2,563 | | | | (91,550 | ) |
WebMD Health Corp. — Class A* | | | 2,563 | | | | (96,241 | ) |
Zebra Technologies Corp. — Class A* | | | 3,749 | | | | (134,139 | ) |
Lam Research Corp.* | | | 8,339 | | | | (308,710 | ) |
| | | | | | | | |
Total Information Technology | | | | | | | (2,798,125 | ) |
| | | | | | | | |
INDUSTRIALS - (2.9)% | |
Owens Corning* | | | 93 | | | | (2,671 | ) |
Avery Dennison Corp. | | | 163 | | | | (4,675 | ) |
Equifax, Inc. | | | 146 | | | | (5,656 | ) |
GrafTech International Ltd.* | | | 509 | | | | (6,948 | ) |
WABCO Holdings, Inc.* | | | 172 | | | | (7,465 | ) |
Copa Holdings S.A. — Class A | | | 144 | | | | (8,448 | ) |
Stericycle, Inc.* | | | 109 | | | | (8,493 | ) |
3M Co. | | | 109 | | | | (8,909 | ) |
Polypore International, Inc.* | | | 239 | | | | (10,514 | ) |
Cooper Industries plc | | | 238 | | | | (12,888 | ) |
UTI Worldwide, Inc. | | | 1,066 | | | | (14,167 | ) |
United Technologies Corp. | | | 200 | | | | (14,618 | ) |
Fastenal Co. | | | 572 | | | | (24,945 | ) |
Terex Corp.* | | | 2,411 | | | | (32,573 | ) |
Ingersoll-Rand plc | | | 1,254 | | | | (38,209 | ) |
Spirit Aerosystems Holdings, Inc. — Class A* | | | 1,853 | | | | (38,505 | ) |
CH Robinson Worldwide, Inc. | | | 618 | | | | (43,124 | ) |
Deere & Co. | | | 582 | | | | (45,018 | ) |
Regal-Beloit Corp. | | | 899 | | | | (45,822 | ) |
PACCAR, Inc. | | | 1,224 | | | | (45,863 | ) |
Southwest Airlines Co. | | | 5,394 | | | | (46,173 | ) |
First Solar, Inc.* | | | 1,526 | | | | (51,518 | ) |
United Parcel Service, Inc. — Class B | | | 746 | | | | (54,600 | ) |
Covanta Holding Corp. | | | 4,017 | | | | (54,993 | ) |
Oshkosh Corp.* | | | 2,617 | | | | (55,951 | ) |
Expeditors International of Washington, Inc. | | | 1,400 | | | | (57,344 | ) |
Illinois Tool Works, Inc. | | | 1,272 | | | | (59,415 | ) |
Con-way, Inc. | | | 2,054 | | | | (59,895 | ) |
Graco, Inc. | | | 1,562 | | | | (63,870 | ) |
Carlisle Companies, Inc. | | | 1,472 | | | | (65,210 | ) |
Lennox International, Inc. | | | 1,945 | | | | (65,644 | ) |
Robert Half International, Inc. | | | 2,314 | | | | (65,856 | ) |
Valmont Industries, Inc. | | | 746 | | | | (67,729 | ) |
United Continental Holdings, Inc.* | | | 3,713 | | | | (70,064 | ) |
Iron Mountain, Inc. | | | 2,308 | | | | (71,086 | ) |
Masco Corp. | | | 7,042 | | | | (73,800 | ) |
AECOM Technology Corp.* | | | 3,617 | | | | (74,402 | ) |
Manitowoc Company, Inc. | | | 8,110 | | | | (74,531 | ) |
Manpower, Inc. | | | 2,126 | | | | (76,005 | ) |
| | |
| 24 | THE GUGGENHEIM FUNDSANNUALREPORT | | See Notes to Financial Statements. |
| | |
| CONSOLIDATED SCHEDULE OF INVESTMENTS (continued) | | December 31, 2011 |
MULTI-HEDGE STRATEGIES FUND
| | | | | | | | |
| | | SHARES | | | VALUE | |
| | |
J.B. Hunt Transport Services, Inc. | | | 1,690 | | | $ | (76,168 | ) |
Shaw Group, Inc.* | | | 2,895 | | | | (77,876 | ) |
Flowserve Corp. | | | 836 | | | | (83,032 | ) |
CoStar Group, Inc.* | | | 1,247 | | | | (83,212 | ) |
Crane Co. | | | 1,853 | | | | (86,554 | ) |
Toro Co. | | | 1,436 | | | | (87,108 | ) |
Quanta Services, Inc.* | | | 4,181 | | | | (90,059 | ) |
Boeing Co. | | | 1,254 | | | | (91,981 | ) |
Dun & Bradstreet Corp. | | | 1,236 | | | | (92,490 | ) |
Landstar System, Inc. | | | 1,994 | | | | (95,553 | ) |
Delta Air Lines, Inc.* | | | 13,419 | | | | (108,560 | ) |
Jacobs Engineering Group, Inc.* | | | 3,269 | | | | (132,656 | ) |
United Rentals, Inc.* | | | 9,462 | | | | (279,602 | ) |
| | | | | | | | |
Total Industrials | | | | | | | (3,012,448 | ) |
| | | | | | | | |
UTILITIES - (5.0)% | |
UGI Corp. | | | 251 | | | | (7,379 | ) |
PG&E Corp. | | | 287 | | | | (11,830 | ) |
PPL Corp. | | | 454 | | | | (13,357 | ) |
AGL Resources, Inc. | | | 364 | | | | (15,383 | ) |
Hawaiian Electric Industries, Inc. | | | 1,309 | | | | (34,662 | ) |
TECO Energy, Inc. | | | 2,545 | | | | (48,711 | ) |
AES Corp.* | | | 4,684 | | | | (55,459 | ) |
National Fuel Gas Co. | | | 1,054 | | | | (58,581 | ) |
FirstEnergy Corp. | | | 1,490 | | | | (66,007 | ) |
Aqua America, Inc. | | | 3,126 | | | | (68,928 | ) |
GenOn Energy, Inc.* | | | 26,827 | | | | (70,018 | ) |
Public Service Enterprise Group, Inc. | | | 2,417 | | | | (79,785 | ) |
Calpine Corp.* | | | 4,925 | | | | (80,425 | ) |
NextEra Energy, Inc. | | | 1,363 | | | | (82,979 | ) |
Wisconsin Energy Corp. | | | 2,417 | | | | (84,498 | ) |
Dominion Resources, Inc. | | | 1,593 | | | | (84,556 | ) |
Questar Corp. | | | 4,308 | | | | (85,557 | ) |
Vectren Corp. | | | 2,854 | | | | (86,276 | ) |
Integrys Energy Group, Inc. | | | 1,600 | | | | (86,688 | ) |
MDU Resources Group, Inc. | | | 4,047 | | | | (86,849 | ) |
Southern Co. | | | 1,891 | | | | (87,534 | ) |
Exelon Corp. | | | 39,370 | | | | (1,707,477 | ) |
Duke Energy Corp. | | | 100,654 | | | | (2,214,388 | ) |
| | | | | | | | |
Total Utilities | | | | | | | (5,217,327 | ) |
| | | | | | | | |
FINANCIALS - (5.1)% | |
BBCN Bancorp, Inc.* | | | 69 | | | | (652 | ) |
Regions Financial Corp. | | | 180 | | | | (774 | ) |
Hartford Financial Services Group, Inc. | | | 171 | | | | (2,779 | ) |
Invesco Ltd. | | | 145 | | | | (2,913 | ) |
U.S. Bancorp | | | 115 | | | | (3,111 | ) |
Boston Properties, Inc. | | | 36 | | | | (3,586 | ) |
IntercontinentalExchange, Inc.* | | | 36 | | | | (4,340 | ) |
CNA Financial Corp. | | | 182 | | | | (4,869 | ) |
Moody’s Corp. | | | 152 | | | | (5,119 | ) |
First Horizon National Corp. | | | 665 | | | | (5,320 | ) |
Wells Fargo & Co. | | | 227 | | | | (6,256 | ) |
Arthur J. Gallagher & Co. | | | 200 | | | | (6,688 | ) |
Associated Banc-Corp. | | | 615 | | | | (6,870 | ) |
SunTrust Banks, Inc. | | | 413 | | | | (7,310 | ) |
Raymond James Financial, Inc. | | | 251 | | | | (7,771 | ) |
Lincoln National Corp. | | | 475 | | | | (9,225 | ) |
KeyCorp | | | 1,423 | | | | (10,943 | ) |
TD Ameritrade Holding Corp. | | | 727 | | | | (11,378 | ) |
Aflac, Inc. | | | 277 | | | | (11,983 | ) |
Janus Capital Group, Inc. | | | 1,967 | | | | (12,412 | ) |
Affiliated Managers Group, Inc.* | | | 136 | | | | (13,049 | ) |
City National Corp. | | | 302 | | | | (13,342 | ) |
Allstate Corp. | | | 782 | | | | (21,435 | ) |
Zions Bancorporation | | | 1,451 | | | | (23,622 | ) |
Fulton Financial Corp. | | | 2,410 | | | | (23,642 | ) |
Plum Creek Timber Company, Inc. | | | 672 | | | | (24,568 | ) |
Digital Realty Trust, Inc. | | | 400 | | | | (26,668 | ) |
RenaissanceRe Holdings Ltd. | | | 400 | | | | (29,748 | ) |
Jefferies Group, Inc. | | | 2,169 | | | | (29,824 | ) |
Host Hotels & Resorts, Inc. | | | 2,199 | | | | (32,479 | ) |
CBOE Holdings, Inc. | | | 1,345 | | | | (34,782 | ) |
HCP, Inc. | | | 872 | | | | (36,127 | ) |
BOK Financial Corp. | | | 708 | | | | (38,890 | ) |
BRE Properties, Inc. | | | 782 | | | | (39,475 | ) |
Popular, Inc.* | | | 28,941 | | | | (40,228 | ) |
Waddell & Reed Financial, Inc. — Class A | | | 1,758 | | | | (43,546 | ) |
Forest City Enterprises, Inc. — Class A* | | | 3,719 | | | | (43,959 | ) |
American Express Co. | | | 1,036 | | | | (48,868 | ) |
Assured Guaranty Ltd. | | | 3,926 | | | | (51,588 | ) |
Everest Re Group Ltd. | | | 654 | | | | (54,995 | ) |
Hudson City Bancorp, Inc. | | | 8,810 | | | | (55,063 | ) |
BB&T Corp. | | | 2,196 | | | | (55,273 | ) |
Synovus Financial Corp. | | | 39,586 | | | | (55,816 | ) |
TCF Financial Corp. | | | 5,418 | | | | (55,914 | ) |
Brandywine Realty Trust | | | 5,962 | | | | (56,639 | ) |
Cullen | | | 1,077 | | | | (56,984 | ) |
Franklin Resources, Inc. | | | 602 | | | | (57,828 | ) |
Mack-Cali Realty Corp. | | | 2,308 | | | | (61,601 | ) |
Vornado Realty Trust | | | 818 | | | | (62,872 | ) |
Regency Centers Corp. | | | 1,709 | | | | (64,293 | ) |
Brown & Brown, Inc. | | | 2,859 | | | | (64,699 | ) |
Howard Hughes Corp.* | | | 1,478 | | | | (65,283 | ) |
Jones Lang LaSalle, Inc. | | | 1,077 | | | | (65,977 | ) |
Corporate Office Properties Trust | | | 3,217 | | | | (68,393 | ) |
Protective Life Corp. | | | 3,054 | | | | (68,898 | ) |
Goldman Sachs Group, Inc. | | | 782 | | | | (70,716 | ) |
Genworth Financial, Inc. — Class A* | | | 11,044 | | | | (72,338 | ) |
T. Rowe Price Group, Inc. | | | 1,276 | | | | (72,668 | ) |
Bank of America Corp. | | | 13,341 | | | | (74,176 | ) |
Northern Trust Corp. | | | 1,891 | | | | (74,997 | ) |
Eaton Vance Corp. | | | 3,271 | | | | (77,326 | ) |
Green Dot Corp. — Class A* | | | 2,527 | | | | (78,893 | ) |
| | |
| See Notes to Financial Statements. | | THE GUGGENHEIM FUNDSANNUALREPORT | 25 |
| | |
| CONSOLIDATED SCHEDULE OF INVESTMENTS (continued) | | December 31, 2011 |
MULTI-HEDGE STRATEGIES FUND
| | | | | | | | |
| | | SHARES | | | VALUE | |
| | |
PartnerRe Ltd. | | | 1,236 | | | $ | (79,364 | ) |
MSCI, Inc. — Class A* | | | 2,435 | | | | (80,185 | ) |
SLM Corp. | | | 6,089 | | | | (81,593 | ) |
Greenhill & Company, Inc. | | | 2,254 | | | | (81,978 | ) |
Markel Corp.* | | | 200 | | | | (82,934 | ) |
JPMorgan Chase & Co. | | | 2,513 | | | | (83,557 | ) |
Progressive Corp. | | | 4,308 | | | | (84,049 | ) |
Aspen Insurance Holdings Ltd. | | | 3,181 | | | | (84,297 | ) |
Capitol Federal Financial, Inc. | | | 7,343 | | | | (84,738 | ) |
State Street Corp. | | | 2,103 | | | | (84,772 | ) |
CIT Group, Inc.* | | | 2,435 | | | | (84,908 | ) |
General Growth Properties, Inc. | | | 5,725 | | | | (85,990 | ) |
Ventas, Inc. | | | 1,563 | | | | (86,168 | ) |
Cincinnati Financial Corp. | | | 2,908 | | | | (88,578 | ) |
Mercury General Corp. | | | 1,945 | | | | (88,731 | ) |
Health Care REIT, Inc. — Class A | | | 1,636 | | | | (89,211 | ) |
First Citizens BancShares, Inc. — Class A | | | 510 | | | | (89,245 | ) |
SEI Investments Co. | | | 5,162 | | | | (89,561 | ) |
Old Republic International Corp. | | | 10,015 | | | | (92,839 | ) |
PNC Financial Services Group, Inc. | | | 1,610 | | | | (92,849 | ) |
Bank of Hawaii Corp. | | | 2,115 | | | | (94,096 | ) |
TFS Financial Corp.* | | | 13,615 | | | | (121,990 | ) |
Alleghany Corp.* | | | 4,362 | | | | (1,244,435 | ) |
| | | | | | | | |
Total Financials | | | | | | | (5,407,849 | ) |
| | | | | | | | |
Total Common Stock Sold Short
(Proceeds $24,457,939) | | | | | | | (24,381,002 | ) |
| | | | | | | | |
|
EXCHANGE TRADED FUNDS SOLD SHORT† - (8.8)% | |
iShares MSCI Taiwan Index Fund | | | 654 | | | | (7,658 | ) |
iShares MSCI South Africa Index Fund | | | 184 | | | | (11,237 | ) |
iShares MSCI Austria Investable Market Index Fund | | | 909 | | | | (12,926 | ) |
iShares FTSE China 25 Index Fund | | | 390 | | | | (13,599 | ) |
iShares MSCI Belgium Investable Market Index Fund | | | 1,569 | | | | (16,616 | ) |
iShares MSCI Turkey Index Fund | | | 407 | | | | (16,744 | ) |
iShares MSCI Emerging Markets Index Fund | | | 477 | | | | (18,097 | ) |
iShares iBoxx Investment Grade Corporate Bond Fund | | | 166 | | | | (18,884 | ) |
iShares Barclays 7-10 Year Treasury Bond Fund | | | 317 | | | | (33,466 | ) |
Market Vectors Russia ETF | | | 1,398 | | | | (37,257 | ) |
iShares MSCI Germany Index Fund | | | 2,351 | | | | (45,186 | ) |
iShares MSCI Italy Index Fund | | | 3,821 | | | | (45,814 | ) |
iShares MSCI EMU Index Fund | | | 2,081 | | | | (58,060 | ) |
iPath MSCI India Index ETN* | | | 1,411 | | | | (65,781 | ) |
iShares MSCI Hong Kong Index Fund | | | 5,222 | | | | (80,784 | ) |
Market Vectors Gold Miners ETF | | | 1,663 | | | | (85,528 | ) |
iShares MSCI Chile Investable Market Index Fund | | | 1,504 | | | | (86,796 | ) |
iShares Barclays 20+ Year Treasury Bond Fund | | | 758 | | | | (91,908 | ) |
iShares Barclays 3-7 Year Treasury Bond Fund — Class 7 | | | 838 | | | | (102,270 | ) |
iShares MSCI BRIC Index Fund | | | 3,212 | | | | (116,499 | ) |
iShares MSCI Brazil Index Fund | | | 2,215 | | | | (127,119 | ) |
iShares MSCI Netherlands Investable Market Index Fund | | | 8,006 | | | | (137,943 | ) |
iShares MSCI Canada Index Fund | | | 5,572 | | | | (148,215 | ) |
iShares Barclays TIPS Bond Fund | | | 1,557 | | | | (181,686 | ) |
iShares MSCI Mexico Investable Market Index Fund | | | 3,545 | | | | (190,579 | ) |
Powershares QQQ Trust Series 1 | | | 3,499 | | | | (195,349 | ) |
iShares MSCI Switzerland Index Fund | | | 8,913 | | | | (201,612 | ) |
iShares MSCI EAFE Index Fund | | | 4,180 | | | | (207,035 | ) |
iShares MSCI Japan Index Fund | | | 25,846 | | | | (235,457 | ) |
iShares Barclays Aggregate Bond Fund | | | 2,346 | | | | (258,647 | ) |
iShares Dow Jones US Real Estate Index Fund | | | 6,539 | | | | (371,350 | ) |
SPDR Barclays Capital High Yield Bond ETF | | | 15,565 | | | | (598,474 | ) |
iShares Russell 2000 Index Fund | | | 13,207 | | | | (973,224 | ) |
SPDR S&P 500 ETF Trust | | | 8,394 | | | | (1,053,447 | ) |
iShares Russell 1000 Growth Index Fund | | | 23,304 | | | | (1,346,738 | ) |
iShares Russell 1000 Value Index Fund | | | 31,893 | | | | (2,024,568 | ) |
| | | | | | | | |
Total Exchange Traded Funds Sold Short
(Proceeds $9,284,630) | | | | (9,216,553 | ) |
| | | | | | | | |
Total Securities Sold Short - (32.0)%
(Proceeds $33,742,569) | | | $ | (33,597,555 | ) |
| | | | | | | | |
Cash & Other Assets, Less Liabilities - 38.8% | | | | | | | 40,769,344 | |
| | | | | | | | |
Total Net Assets - 100.0% | | | $ | 105,122,389 | |
| |
| | |
| | | CONTRACTS | | | UNREALIZED
GAIN (LOSS) | |
COMMODITY FUTURES CONTRACTS PURCHASED† | |
December 2012 Wheat | | | | | | | | |
Futures Contracts | | | | | | | | |
(Aggregate Value of Contracts $3,496,850) | | | 97 | | | $ | 226,422 | |
May 2012 Feeder Cattle | | | | | | | | |
Futures Contracts | | | | | | | | |
(Aggregate Value of Contracts $2,717,550) | | | 36 | | | | 103,409 | |
| | |
| 26 | THE GUGGENHEIM FUNDSANNUALREPORT | | See Notes to Financial Statements. |
| | |
| CONSOLIDATED SCHEDULE OF INVESTMENTS (continued) | | December 31, 2011 |
MULTI-HEDGE STRATEGIES FUND
| | | | | | | | |
| | | CONTRACTS | | | UNREALIZED
GAIN (LOSS) | |
| | |
June 2012 Live Cattle | | | | | | | | |
Futures Contracts | | | | | | | | |
(Aggregate Value of Contracts $1,498,800) | | | 30 | | | $ | 42,400 | |
May 2012 RBOB Gasoline | | | | | | | | |
Futures Contracts | | | | | | | | |
(Aggregate Value of Contracts $3,141,747) | | | 27 | | | | 34,294 | |
May 2012 ICE Gas Oil | | | | | | | | |
Futures Contracts | | | | | | | | |
(Aggregate Value of Contracts $3,353,125) | | | 37 | | | | 23,596 | |
April 2012 Heating Oil | | | | | | | | |
Futures Contracts | | | | | | | | |
(Aggregate Value of Contracts $2,792,513) | | | 23 | | | | (39,940 | ) |
July 2012 WTI Crude | | | | | | | | |
Futures Contracts | | | | | | | | |
(Aggregate Value of Contracts $3,380,620) | | | 34 | | | | (46,930 | ) |
September 2012 Soybean Oil | | | | | | | | |
Futures Contracts | | | | | | | | |
(Aggregate Value of Contracts $3,055,104) | | | 96 | | | | (47,475 | ) |
August 2012 Lean Hogs | | | | | | | | |
Futures Contracts | | | | | | | | |
(Aggregate Value of Contracts $2,983,040) | | | 79 | | | | (68,447 | ) |
September 2012 Corn | | | | | | | | |
Futures Contracts | | | | | | | | |
(Aggregate Value of Contracts $3,035,588) | | | 99 | | | | (85,648 | ) |
November 2012 Soybean | | | | | | | | |
Futures Contracts | | | | | | | | |
(Aggregate Value of Contracts $2,657,600) | | | 44 | | | | (126,622 | ) |
July 2012 Sugar #11 | | | | | | | | |
Futures Contracts | | | | | | | | |
(Aggregate Value of Contracts $1,622,118) | | | 64 | | | | (144,743 | ) |
September 2012 Natural Gas | | | | | | | | |
Futures Contracts | | | | | | | | |
(Aggregate Value of Contracts $2,416,840) | | | 74 | | | | (414,394 | ) |
| | | | | | | | |
| | |
(Total Aggregate Value of Contracts $36,151,495) | | | | | | $ | (544,078 | ) |
| | | | | | | | |
|
EQUITY FUTURES CONTRACTS PURCHASED† | |
March 2012 S&P 500 Index Mini | | | | | |
Futures Contracts | | | | | | | | |
(Aggregate Value of Contracts $12,452,425) | | | 199 | | | | 211,179 | |
February 2012 Volatility Index | | | | | | | | |
Futures Contracts | | | | | | | | |
(Aggregate Value of Contracts $7,114,150) | | | 263 | | | | (1,302,123 | ) |
| | | | | | | | |
(Total Aggregate Value of Contracts $19,566,575) | | | | | | $ | (1,090,944 | ) |
| | | | | | | | |
|
COMMODITY FUTURES CONTRACTS SOLD SHORT† | |
December 2012 Natural Gas | | | | | | | | |
Futures Contracts | | | | | | | | |
(Aggregate Value of Contracts $3,438,960) | | | 92 | | | | 370,316 | |
March 2012 Cocoa | | | | | | | | |
Futures Contracts | | | | | | | | |
(Aggregate Value of Contracts $1,390,620) | | | 66 | | | | 299,577 | |
April 2012 Lean Hogs | | | | | | | | |
Futures Contracts | | | | | | | | |
(Aggregate Value of Contracts $2,915,790) | | | 83 | | | | 128,017 | |
February 2012 Heating Oil | | | | | | | | |
Futures Contracts | | | | | | | | |
(Aggregate Value of Contracts $2,697,156) | | | 22 | | | | 116,820 | |
March 2012 Silver | | | | | | | | |
Futures Contracts | | | | | | | | |
(Aggregate Value of Contracts $967,575) | | | 7 | | | | 112,199 | |
March 2012 WTI Crude | | | | | | | | |
Futures Contracts | | | | | | | | |
(Aggregate Value of Contracts $3,071,790) | | | 31 | | | | 70,020 | |
August 2012 ICE Gas Oil | | | | | | | | |
Futures Contracts | | | | | | | | |
(Aggregate Value of Contracts $3,327,225) | | | 37 | | | | 69,029 | |
March 2013 Sugar #11 | | | | | | | | |
Futures Contracts | | | | | | | | |
(Aggregate Value of Contracts $2,223,872) | | | 85 | | | | 57,706 | |
January 2012 LME Lead | | | | | | | | |
Futures Contracts | | | | | | | | |
(Aggregate Value of Contracts $857,629) | | | 17 | | | | 38,937 | |
May 2012 Coffee ‘C’ | | | | | | | | |
Futures Contracts | | | | | | | | |
(Aggregate Value of Contracts $1,725,000) | | | 20 | | | | 16,434 | |
March 2012 Copper | | | | | | | | |
Futures Contracts | | | | | | | | |
(Aggregate Value of Contracts $685,900) | | | 8 | | | | 12,801 | |
| | |
| See Notes to Financial Statements. | | THE GUGGENHEIM FUNDSANNUALREPORT | 27 |
| | |
| CONSOLIDATED SCHEDULE OF INVESTMENTS (concluded) | | December 31, 2011 |
MULTI-HEDGE STRATEGIES FUND
| | | | | | | | |
| | | CONTRACTS | | | UNREALIZED
GAIN (LOSS) | |
| | |
July 2012 Cotton #2 | | | | | | | | |
Futures Contracts | | | | | | | | |
(Aggregate Value of Contracts $1,362,750) | | | 30 | | | $ | 4,512 | |
March 2012 LME Zinc | | | | | | | | |
Futures Contracts | | | | | | | | |
(Aggregate Value of Contracts $968,074) | | | 21 | | | | (353 | ) |
July 2012 Soybean | | | | | | | | |
Futures Contracts | | | | | | | | |
(Aggregate Value of Contracts $3,569,175) | | | 58 | | | | (7,272 | ) |
April 2012 RBOB Gasoline | | | | | | | | |
Futures Contracts | | | | | | | | |
(Aggregate Value of Contracts $2,919,420) | | | 25 | | | | (19,622 | ) |
April 2012 Live Cattle | | | | | | | | |
Futures Contracts | | | | | | | | |
(Aggregate Value of Contracts $1,508,700) | | | 30 | | | | (20,888 | ) |
March 2012 LME Nickel | | | | | | | | |
Futures Contracts | | | | | | | | |
(Aggregate Value of Contracts $673,704) | | | 6 | | | | (29,433 | ) |
March 2012 LME Primary Aluminum | | | | | |
Futures Contracts | | | | | | | | |
(Aggregate Value of Contracts $1,715,512) | | | 34 | | | | (30,257 | ) |
March 2012 Feeder Cattle | | | | | | | | |
Futures Contracts | | | | | | | | |
(Aggregate Value of Contracts $2,678,400) | | | 36 | | | | (33,643 | ) |
March 2012 Soybean Oil | | | | | | | | |
Futures Contracts | | | | | | | | |
(Aggregate Value of Contracts $3,867,858) | | | 123 | | | | (195,147 | ) |
May 2012 Corn | | | | | | | | |
Futures Contracts | | | | | | | | |
(Aggregate Value of Contracts $3,048,075) | | | 93 | | | | (196,015 | ) |
May 2012 Wheat | | | | | | | | |
Futures Contracts | | | | | | | | |
(Aggregate Value of Contracts $4,200,000) | | | 125 | | | | (296,819 | ) |
| | | | | | | | |
(Total Aggregate Value of Contracts $49,813,185) | | | | | | $ | 466,919 | |
| | | | | | | | |
|
EQUITY FUTURE CONTRACTS SOLD SHORT† | |
March 2012 S&P MidCap 400 Index | | | | | |
Mini Futures Contracts | | | | | | | | |
(Aggregate Value of Contracts $6,120,800) | | | 70 | | | | 96,355 | |
March 2012 Russell 2000 Index | | | | | | | | |
Mini Futures Contracts | | | | | | | | |
(Aggregate Value of Contracts $6,185,760) | | | 84 | | | | (146,901 | ) |
January 2012 Volatility Index | | | | | |
Futures Contracts | | | | | | | | |
(Aggregate Value of Contracts $6,057,050) | | | 229 | | | | (664,488 | ) |
| | | | | | | | |
(Total Aggregate Value of Contracts $18,363,610) | | | | | | $ | (715,034 | ) |
| | | | | | | | |
CREDIT DEFAULT SWAP AGREEMENT PROTECTION SOLD††,3
| | | | | | | | | | | | | | | | | | | | | | | | | | |
Index | | Counterparty | | Protection
Premium
Rate | | | Maturity
Date | | | Notional
Principal | | | Notional
Value | | | Upfront
Payments
Received | | | Unrealized
Appreciation | |
CDX.NA.HY-17 Index | | Barclays Bank plc | | | 5.00 | % | | | 12/20/16 | | | $ | 3,920,000 | | | $ | (3,645,600 | ) | | $ | (309,629 | ) | | $ | 35,229 | |
| * | Non-income producing security. |
| † | Value determined based on Level 1 inputs — See Note 4. |
| †† | Value determined based on Level 2 inputs — See Note 4. |
| 1 | All or a portion of this security is pledged as short security collateral at December 31, 2011. |
| 2 | Repurchase Agreements — See Note 5. |
| 3 | Credit Default Swaps — See Note 8. |
| 4 | Investment in a product that pays a management fee to a party related to the advisor. |
plc — Public Limited Company
REIT — Real Estate Investment Trust
| | |
| 28 | THE GUGGENHEIM FUNDSANNUALREPORT | | See Notes to Financial Statements. |
MULTI-HEDGE STRATEGIES FUND
CONSOLIDATED STATEMENT OF ASSETS AND LIABILITIES
December 31, 2011
| | | | |
ASSETS: | | | | |
Investments, at value
(cost $50,476,513) | | $ | 52,105,202 | |
Repurchase agreements, at value
(cost $45,845,398) | | | 45,845,398 | |
| | | | |
Total investments
(cost $96,321,911) | | | 97,950,600 | |
Segregated cash with broker | | | 41,411,312 | |
Unrealized appreciation on swap agreements | | | 35,229 | |
Cash | | | 1,462 | |
Receivables: | | | | |
Fund shares sold | | | 803,233 | |
Dividends | | | 75,738 | |
Interest | | | 6,533 | |
Securities sold | | | 3,645 | |
| | | | |
Total assets | | | 140,287,752 | |
| | | | |
LIABILITIES: | | | | |
Securities sold short, at value
(proceeds $33,742,569) | | | 33,597,555 | |
Unamortized upfront premiums received on credit default swaps | | | 309,629 | |
Payable for: | | | | |
Fund shares redeemed | | | 546,702 | |
Securities purchased | | | 419,593 | |
Variation margin | | | 105,196 | |
Management fees | | | 98,334 | |
Distribution and service fees | | | 29,371 | |
Miscellaneous | | | 58,983 | |
| | | | |
Total liabilities | | | 35,165,363 | |
| | | | |
NETASSETS | | $ | 105,122,389 | |
| | | | |
NETASSETSCONSISTOF: | | | | |
Paid in capital | | $ | 159,779,007 | |
Accumulated net investment loss | | | (1,420,002 | ) |
Accumulated net realized loss on investments | | | (53,162,411 | ) |
Net unrealized depreciation on investments | | | (74,205 | ) |
| | | | |
NETASSETS | | $ | 105,122,389 | |
| | | | |
A-CLASS: | | | | |
Net assets | | $ | 24,832,014 | |
Capital shares outstanding | | | 1,117,933 | |
Net asset value per share | | $ | 22.21 | |
| | | | |
Maximum offering price per share
(Net asset value divided by 95.25%) | | $ | 23.32 | |
| | | | |
C-CLASS: | | | | |
Net assets | | $ | 13,322,139 | |
Capital shares outstanding | | | 629,427 | |
Net asset value per share | | $ | 21.17 | |
| | | | |
H-CLASS: | | | | |
Net assets | | $ | 66,161,100 | |
Capital shares outstanding | | | 2,976,494 | |
Net asset value per share | | $ | 22.23 | |
| | | | |
INSTITUTIONAL CLASS: | | | | |
Net assets | | $ | 807,136 | |
Capital shares outstanding | | | 36,165 | |
Net asset value per share | | $ | 22.32 | |
| | | | |
CONSOLIDATED STATEMENT OF OPERATIONS
Year Ended December 31, 2011
| | | | |
INVESTMENT INCOME: | | | | |
Dividends (net of foreign withholding tax of $2,416) | | $ | 1,009,099 | |
Interest | | | 6,518 | |
| | | | |
Total investment income | | | 1,015,617 | |
| | | | |
| |
EXPENSES: | | | | |
Management fees | | | 919,080 | |
Distribution and service fees: | | | | |
A-Class | | | 40,332 | |
C-Class | | | 119,425 | |
H-Class | | | 109,085 | |
Short sales dividend expense | | | 689,845 | |
Prime broker interest expense | | | 205,131 | |
Trustees’ fees* | | | 11,134 | |
Custodian fees | | | 584 | |
Miscellaneous | | | (5,643 | ) |
| | | | |
Total expenses | | | 2,088,973 | |
Less: | | | | |
Expenses waived by Advisor | | | (90,392 | ) |
| | | | |
Net expenses | | | 1,998,581 | |
| | | | |
Net investment loss | | | (982,964 | ) |
| | | | |
|
NET REALIZED AND UNREALIZED GAIN (Loss): | |
Net realized gain (loss) on: | | | | |
Investments | | | (620,633 | ) |
Swap agreements | | | (1,146 | ) |
Futures contracts | | | 4,616,788 | |
Securities sold short | | | 4,138,054 | |
Realized gain distributions received from investment company shares | | | 57,409 | |
| | | | |
Net realized gain | | | 8,190,472 | |
| | | | |
Net change in unrealized appreciation (depreciation) on: | | | | |
Investments | | | (5,814,849 | ) |
Securities sold short | | | 4,252,073 | |
Swap agreements | | | 35,229 | |
Futures contracts | | | (3,694,332 | ) |
| | | | |
Net change in unrealized appreciation (depreciation) | | | (5,221,879 | ) |
| | | | |
Net realized and unrealized gain | | | 2,968,593 | |
| | | | |
Net increase in net assets resulting from operations | | $ | 1,985,629 | |
| | | | |
| * | Relates to Trustees not deemed “interested persons” within the meaning of Section 2(a)(19) of the 1940 Act. |
| | |
| See Notes to Financial Statements. | | THE GUGGENHEIM FUNDSANNUALREPORT | 29 |
MULTI-HEDGE STRATEGIES FUND
CONSOLIDATED STATEMENTS OF CHANGES IN NET ASSETS
| | | | | | | | |
| | | Year Ended
December 31,
2011 | | | Year Ended
December 31,
2010 | |
| | |
INCREASE (DECREASE)INNETASSETSFROMOPERATIONS: | | | | | | | | |
Net investment loss | | $ | (982,964 | ) | | $ | (1,946,133 | ) |
Net realized gain on investments | | | 8,190,472 | | | | 2,217,669 | |
Net change in unrealized appreciation (depreciation) on investments | | | (5,221,879 | ) | | | 3,101,502 | |
| | | | | | | | |
Net increase in net assets resulting from operations | | | 1,985,629 | | | | 3,373,038 | |
| | | | | | | | |
| | |
DISTRIBUTIONSTOSHAREHOLDERSFROM: | | | | | | | | |
Net investment income | | | | | | | | |
A-Class | | | (175,041 | ) | | | — | |
C-Class | | | (96,950 | ) | | | — | |
H-Class | | | (465,010 | ) | | | — | |
Institutional Class | | | (3,870 | ) | | | — | |
| | | | | | | | |
Total distributions to shareholders | | | (740,871 | ) | | | — | |
| | | | | | | | |
| | |
CAPITALSHARETRANSACTIONS: | | | | | | | | |
Proceeds from sale of shares | | | | | | | | |
A-Class | | | 22,677,918 | | | | 13,527,322 | |
C-Class | | | 5,688,462 | | | | 1,933,931 | |
H-Class | | | 64,118,440 | | | | 15,675,873 | |
Institutional Class | | | 519,704 | | | | 301,491 | * |
Redemption fees collected | | | | | | | | |
A-Class | | | — | | | | 1,142 | |
C-Class | | | — | | | | 1,151 | |
H-Class | | | — | | | | 3,358 | |
Institutional Class | | | — | | | | — | * |
Distributions reinvested | | | | | | | | |
A-Class | | | 170,694 | | | | — | |
C-Class | | | 91,859 | | | | — | |
H-Class | | | 417,772 | | | | — | |
Institutional Class | | | 3,870 | | | | — | * |
Cost of shares redeemed | | | | | | | | |
A-Class | | | (12,381,150 | ) | | | (25,034,739 | ) |
C-Class | | | (7,848,693 | ) | | | (10,842,755 | ) |
H-Class | | | (43,547,530 | ) | | | (42,786,296 | ) |
Institutional Class | | | (18,270 | ) | | | (23,907 | )* |
| | | | | | | | |
Net increase (decrease) from capital share transactions | | | 29,893,076 | | | | (47,243,429 | ) |
| | | | | | | | |
Net increase (decrease) in net assets | | | 31,137,834 | | | | (43,870,391 | ) |
| | |
NET ASSETS: | | | | | | | | |
Beginning of year | | | 73,984,555 | | | | 117,854,946 | |
| | | | | | | | |
End of year | | $ | 105,122,389 | | | $ | 73,984,555 | |
| | | | | | | | |
Accumulated net investment income (loss) at end of year | | $ | (1,420,002 | ) | | $ | 1,064 | |
| | | | | | | | |
| | |
| 30 | THE GUGGENHEIM FUNDSANNUALREPORT | | See Notes to Financial Statements. |
MULTI-HEDGE STRATEGIES FUND
CONSOLIDATED STATEMENTS OF CHANGES IN NET ASSETS (concluded)
| | | | | | | | |
| | | Year Ended
December 31,
2011 | | | Year Ended
December 31,
2010 | |
| | |
CAPITALSHAREACTIVITY: | | | | | | | | |
Shares sold | | | | | | | | |
A-Class | | | 1,019,952 | | | | 660,810 | |
C-Class | | | 267,782 | | | | 96,273 | |
H-Class | | | 2,874,440 | | | | 757,318 | |
Institutional Class | | | 23,171 | | | | 14,765 | * |
Shares issued from reinvestment of distributions | | | | | | | | |
A-Class | | | 7,651 | | | | — | |
C-Class | | | 4,321 | | | | — | |
H-Class | | | 18,716 | | | | — | |
Institutional Class | | | 173 | | | | — | |
Shares redeemed | | | | | | | | |
A-Class | | | (559,378 | ) | | | (1,227,157 | ) |
C-Class | | | (373,099 | ) | | | (546,573 | ) |
H-Class | | | (1,966,390 | ) | | | (2,077,330 | ) |
Institutional Class | | | (821 | ) | | | (1,123 | )* |
| | | | | | | | |
Net increase (decrease) in shares | | | 1,316,518 | | | | (2,323,017 | ) |
| | | | | | | | |
| * | Since the commencement of operations: May 3, 2010 — Institutional Class |
| | |
| See Notes to Financial Statements. | | THE GUGGENHEIM FUNDSANNUALREPORT | 31 |
MULTI-HEDGE STRATEGIES FUND
FINANCIAL HIGHLIGHTS
This table is presented to show selected data for a share outstanding throughout each period and to assist shareholders in evaluating a Fund’s performance for the periods presented.
| | | | | | | | | | | | | | | | | | | | | | | | |
A-Class | | Year Ended
December 31,
2011a | | | Year Ended
December 31,
2010a | | | Period Ended
December 31,
2009a,b | | | Year Ended
March 31,
2009 | | | Year Ended
March 31,
2008 | | | Year Ended
March 31,
2007 | |
Per Share Data | | | | | | | | | | | | | | | | | | | | | | | | |
Net asset value, beginning of period | | $ | 21.66 | | | $ | 20.57 | | | $ | 19.96 | | | $ | 24.61 | | | $ | 26.44 | | | $ | 25.52 | |
| | | | | | | | | | | | | | | | | | | | | | | | |
Income (loss) from investment operations: | | | | | | | | | | | | | | | | | | | | | | | | |
Net investment income (loss)c | | | (.27 | ) | | | (.40 | ) | | | (.15 | ) | | | (.10 | ) | | | .58 | | | | .71 | |
Net gain (loss) on investments (realized and unrealized) | | | .98 | | | | 1.49 | | | | .76 | | | | (4.37 | ) | | | (1.53 | ) | | | .80 | |
| | | | | | | | | | | | | | | | | | | | | | | | |
Total from investment operations | | | .71 | | | | 1.09 | | | | .61 | | | | (4.47 | ) | | | (.95 | ) | | | 1.51 | |
| | | | | | | | | | | | | | | | | | | | | | | | |
Less distributions from: | | | | | | | | | | | | | | | | | | | | | | | | |
Net investment income | | | (.16 | ) | | | — | | | | — | | | | (.12 | ) | | | (.79 | ) | | | (.38 | ) |
Net realized gains | | | — | | | | — | | | | — | | | | (.06 | ) | | | (.09 | ) | | | (.22 | ) |
| | | | | | | | | | | | | | | | | | | | | | | | |
Total distributions | | | (.16 | ) | | | — | | | | — | | | | (.18 | ) | | | (.88 | ) | | | (.06 | ) |
| | | | | | | | | | | | | | | | | | | | | | | | |
Redemption fees collected | | | — | | | | — | d | | | — | d | | | — | d | | | — | d | | | .01 | |
| | | | | | | | | | | | | | | | | | | | | | | | |
Net asset value, end of period | | $ | 22.21 | | | $ | 21.66 | | | $ | 20.57 | | | $ | 19.96 | | | $ | 24.61 | | | $ | 26.44 | |
| | | | | | | | | | | | | | | | | | | | | | | | |
| | | | | | |
Total Returne | | | 3.39 | % | | | 5.30 | % | | | 3.06 | % | | | (18.19 | %) | | | (3.72 | %) | | | 6.05 | % |
| | | | | | | | | | | | | | | | | | | | | | | | |
Ratios/Supplemental Data | | | | | | | | | | | | | | | | | | | | | | | | |
Net assets, end of period (in thousands) | | $ | 24,832 | | | $ | 14,073 | | | $ | 25,010 | | | $ | 45,078 | | | $ | 42,193 | | | $ | 41,771 | |
| | | | | | | | | | | | | | | | | | | | | | | | |
Ratios to average net assets: | | | | | | | | | | | | | | | | | | | | | | | | |
Net investment income (loss) | | | (1.23 | %) | | | (1.97 | %) | | | (1.47 | %) | | | (0.46 | %) | | | 2.18 | % | | | 2.74 | % |
Total expensesf | | | 2.77 | % | | | 3.56 | % | | | 2.36 | % | | | 2.09 | % | | | 1.96 | % | | | 1.93 | % |
Net expensesg | | | 2.65 | % | | | 3.40 | % | | | 2.32 | % | | | 2.09 | % | | | 1.96 | % | | | 1.93 | % |
Operating expensesh | | | 1.41 | % | | | 1.41 | % | | | 1.40 | % | | | 1.40 | % | | | 1.40 | % | | | 1.43 | % |
| | | | | | | | | | | | | | | | | | | | | | | | |
Portfolio turnover rate | | | 433 | % | | | 993 | % | | | 858 | % | | | 1,578 | % | | | 509 | % | | | 298 | % |
| | | | | | |
C-Class | | Year Ended
December 31,
2011a | | | Year Ended
December 31,
2010a | | | Period Ended
December 31,
2009a,b | | | Year Ended
March 31,
2009 | | | Year Ended
March 31,
2008 | | | Year Ended
March 31,
2007 | |
Per Share Data | | | | | | | | | | | | | | | | | | | | | | | | |
Net asset value, beginning of period | | $ | 20.80 | | | $ | 19.90 | | | $ | 19.43 | | | $ | 24.13 | | | $ | 26.14 | | | $ | 25.42 | |
| | | | | | | | | | | | | | | | | | | | | | | | |
Income (loss) from investment operations: | | | | | | | | | | | | | | | | | | | | | | | | |
Net investment income (loss)c | | | (.42 | ) | | | (.55 | ) | | | (.31 | ) | | | (.25 | ) | | | .37 | | | | .51 | |
Net gain (loss) on investments (realized and unrealized) | | | .95 | | | | 1.45 | | | | .78 | | | | (4.27 | ) | | | (1.50 | ) | | | .80 | |
| | | | | | | | | | | | | | | | | | | | | | | | |
Total from investment operations | | | .53 | | | | .90 | | | | .47 | | | | (4.52 | ) | | | (1.13 | ) | | | 1.31 | |
| | | | | | | | | | | | | | | | | | | | | | | | |
Less distributions from: | | | | | | | | | | | | | | | | | | | | | | | | |
Net investment income | | | (.16 | ) | | | — | | | | — | | | | (.12 | ) | | | (.79 | ) | | | (.38 | ) |
Net realized gains | | | — | | | | — | | | | — | | | | (.06 | ) | | | (.09 | ) | | | (.22 | ) |
| | | | | | | | | | | | | | | | | | | | | | | | |
Total distributions | | | (.16 | ) | | | — | | | | — | | | | (.18 | ) | | | (.88 | ) | | | (.60 | ) |
| | | | | | | | | | | | | | | | | | | | | | | | |
Redemption fees collected | | | — | | | | — | d | | | — | d | | | — | d | | | — | d | | | .01 | |
| | | | | | | | | | | | | | | | | | | | | | | | |
Net asset value, end of period | | $ | 21.17 | | | $ | 20.80 | | | $ | 19.90 | | | $ | 19.43 | | | $ | 24.13 | | | $ | 26.14 | |
| | | | | | | | | | | | | | | | | | | | | | | | |
| | | | | | |
Total Returne | | | 2.62 | % | | | 4.52 | % | | | 2.42 | % | | | (18.76 | %) | | | (4.46 | %) | | | 5.28 | % |
| | | | | | | | | | | | | | | | | | | | | | | | |
Ratios/Supplemental Data | | | | | | | | | | | | | | | | | | | | | | | | |
Net assets, end of period (in thousands) | | $ | 13,322 | | | $ | 15,194 | | | $ | 23,494 | | | $ | 28,706 | | | $ | 54,857 | | | $ | 48,052 | |
| | | | | | | | | | | | | | | | | | | | | | | | |
Ratios to average net assets: | | | | | | | | | | | | | | | | | | | | | | | | |
Net investment income (loss) | | | (1.99 | %) | | | (2.79 | %) | | | (2.07 | %) | | | (1.09 | %) | | | 1.41 | % | | | 1.99 | % |
Total expensesf | | | 3.52 | % | | | 4.41 | % | | | 3.14 | % | | | 2.82 | % | | | 2.71 | % | | | 2.66 | % |
Net expensesg | | | 3.39 | % | | | 4.26 | % | | | 3.09 | % | | | 2.82 | % | | | 2.71 | % | | | 2.66 | % |
Operating expensesh | | | 2.15 | % | | | 2.15 | % | | | 2.17 | % | | | 2.17 | % | | | 2.15 | % | | | 2.16 | % |
| | | | | | | | | | | | | | | | | | | | | | | | |
Portfolio turnover rate | | | 433 | % | | | 993 | % | | | 858 | % | | | 1,578 | % | | | 509 | % | | | 298 | % |
32 | THE GUGGENHEIM FUNDSANNUALREPORT
MULTI-HEDGE STRATEGIES FUND
FINANCIAL HIGHLIGHTS (continued)
This table is presented to show selected data for a share outstanding throughout each period and to assist shareholders in evaluating a Fund’s performance for the periods presented.
| | | | | | | | | | | | | | | | | | | | | | | | |
H-Class | | Year Ended
December 31,
2011a | | | Year Ended
December 31,
2010a | | | Period Ended
December 31,
2009a,b | | | Year Ended
March 31,
2009 | | | Year Ended
March 31,
2008 | | | Year Ended
March 31,
2007 | |
Per Share Data | | | | | | | | | | | | | | | | | | | | | | | | |
Net asset value, beginning of period | | $ | 21.67 | | | $ | 20.58 | | | $ | 19.98 | | | $ | 24.63 | | | $ | 26.46 | | | $ | 25.53 | |
| | | | | | | | | | | | | | | | | | | | | | | | |
Income (loss) from investment operations: | | | | | | | | | | | | | | | | | | | | | | | | |
Net investment income (loss)c | | | (.27 | ) | | | (.43 | ) | | | (.21 | ) | | | (.07 | ) | | | .58 | | | | .72 | |
Net gain (loss) on investments (realized and unrealized) | | | .99 | | | | 1.52 | | | | .81 | | | | (4.40 | ) | | | (1.53 | ) | | | .80 | |
| | | | | | | | | | | | | | | | | | | | | | | | |
Total from investment operations | | | .72 | | | | 1.09 | | | | .60 | | | | (4.47 | ) | | | (.95 | ) | | | 1.52 | |
| | | | | | | | | | | | | | | | | | | | | | | | |
Less distributions from: | | | | | | | | | | | | | | | | | | | | | | | | |
Net investment income | | | (.16 | ) | | | — | | | | — | | | | (.12 | ) | | | (.79 | ) | | | (.38 | ) |
Net realized gains | | | — | | | | — | | | | — | | | | (.06 | ) | | | (.09 | ) | | | (.22 | ) |
| | | | | | | | | | | | | | | | | | | | | | | | |
Total distributions | | | (.16 | ) | | | — | | | | — | | | | (.18 | ) | | | (.88 | ) | | | (.60 | ) |
| | | | | | | | | | | | | | | | | | | | | | | | |
Redemption fees collected | | | — | | | | — | d | | | — | d | | | — | d | | | — | d | | | .01 | |
| | | | | | | | | | | | | | | | | | | | | | | | |
Net asset value, end of period | | $ | 22.23 | | | $ | 21.67 | | | $ | 20.58 | | | $ | 19.98 | | | $ | 24.63 | | | $ | 26.46 | |
| | | | | | | | | | | | | | | | | | | | | | | | |
| | | | | | |
Total Returne | | | 3.39 | % | | | 5.30 | % | | | 3.00 | % | | | (18.17 | %) | | | (3.71 | %) | | | 6.09 | % |
| | | | | | | | | | | | | | | | | | | | | | | | |
Ratios/Supplemental Data | | | | | | | | | | | | | | | | | | | | | | | | |
Net assets, end of period (in thousands) | | $ | 66,161 | | | $ | 44,421 | | | $ | 69,351 | | | $ | 63,229 | | | $ | 141,483 | | | $ | 176,187 | |
| | | | | | | | | | | | | | | | | | | | | | | | |
Ratios to average net assets: | | | | | | | | | | | | | | | | | | | | | | | | |
Net investment income (loss) | | | (1.25 | %) | | | (2.08 | %) | | | (1.18 | %) | | | (0.31 | %) | | | 2.21 | % | | | 2.78 | % |
Total expensesf | | | 2.78 | % | | | 3.69 | % | | | 2.37 | % | | | 2.07 | % | | | 1.95 | % | | | 1.90 | % |
Net expensesg | | | 2.65 | % | | | 3.54 | % | | | 2.33 | % | | | 2.07 | % | | | 1.95 | % | | | 1.90 | % |
Operating expensesh | | | 1.41 | % | | | 1.41 | % | | | 1.41 | % | | | 1.40 | % | | | 1.40 | % | | | 1.43 | % |
| | | | | | | | | | | | | | | | | | | | | | | | |
Portfolio turnover rate | | | 433 | % | | | 993 | % | | | 858 | % | | | 1,578 | % | | | 509 | % | | | 298 | % |
| | |
| | THE GUGGENHEIM FUNDSANNUALREPORT | 33 |
MULTI-HEDGE STRATEGIES FUND
FINANCIAL HIGHLIGHTS (concluded)
This table is presented to show selected data for a share outstanding throughout each period and to assist shareholders in evaluating a Fund’s performance for the periods presented.
| | | | | | | | |
Institutional Class | | Year Ended
December 31,
2011a | | | Period Ended
December 31,
2010a,i | |
Per Share Data | | | | | | | | |
Net asset value, beginning of period | | $ | 21.71 | | | $ | 20.61 | |
| | | | | | | | |
Income (loss) from investment operations: | | | | | | | | |
Net investment lossc | | | (.22 | ) | | | (.43 | ) |
Net gain on investments (realized and unrealized) | | | .99 | | | | 1.53 | |
| | | | | | | | |
Total from investment operations | | | .77 | | | | 1.10 | |
| | | | | | | | |
Less distributions from: | | | | | | | | |
Net investment income | | | (.16 | ) | | | — | |
| | | | | | | | |
Total distributions | | | (.16 | ) | | | — | |
| | | | | | | | |
Redemption fees collected | | | — | | | | — | d |
| | | | | | | | |
Net asset value, end of period | | $ | 22.32 | | | $ | 21.71 | |
| | | | | | | | |
| | |
Total Returne | | | 3.61 | % | | | 5.34 | % |
| | | | | | | | |
Ratios/Supplemental Data | | | | | | | | |
Net assets, end of period (in thousands) | | $ | 807 | | | $ | 296 | |
| | | | | | | | |
Ratios to average net assets: | | | | | | | | |
Net investment loss | | | (0.99 | %) | | | (3.10 | %) |
Total expensesf | | | 2.52 | % | | | 5.13 | % |
Net expensesg | | | 2.40 | % | | | 4.98 | % |
Operating expensesh | | | 1.16 | % | | | 1.17 | % |
| | | | | | | | |
Portfolio turnover rate | | | 433 | % | | | 993 | % |
| b | The Fund changed its fiscal year end from March 31 to December 31 in 2009. Percentage amounts for the period, except total return and portfolio turnover rate, have been annualized. |
| c | Net investment income (loss) per share was computed using average shares outstanding throughout the period. |
| d | Redemption fees collected are less than $0.01 per share. |
| e | Total return does not reflect the impact of any applicable sales charges and has not been annualized. |
| f | Does not include expenses of the underlying funds in which the Fund invests. |
| g | Net expense information reflects the expense ratios after expense waivers. |
| h | Operating expenses exclude interest and dividend expense from securities sold short. |
| i | Since commencement of operations: May 3, 2010. Percentage amounts for the period, except total return and portfolio turnover rate, have been annualized. |
34 | THE GUGGENHEIM FUNDSANNUALREPORT
This page intentionally left blank.
THE GUGGENHEIM FUNDSANNUALREPORT | 35
| | | | |
| PERFORMANCE REPORT AND FUND PROFILE (Unaudited) | | | December 31, 2011 | |
COMMODITIES STRATEGY FUND
OBJECTIVE: Seeks to provide investment results that correlate, before fees and expenses, to the performance of a benchmark for commodities. The Fund’s current benchmark is the S&P GSCITM Commodity Index (the “underlying index”).
For the year ended December 31, 2011, the Fund’s H-Class shares returned -3.67%, compared with a return of -1.17% for its benchmark, the S&P Goldman Sachs Commodity Index (S&P GSCI®)*. The S&P GSCI represents an unleveraged, long-only investment in commodity futures that is broadly diversified across the spectrum of commodities. It provides exposure to tangible assets, such as oil, metals and agricultural products.
The index had its first decline since a 46% drop in 2008, with the commodities market experiencing a volatile year. The index rose 16% through April before falling 15% when investors worried whether the European debt crisis and a slowing Chinese economy could impact commodities’ growth. The strengthening dollar late in the year also corresponded with falling commodity prices.
Oil and gold were the only major commodities to post a significant increase for the year. Gold benefited from safe-haven buying, and rose about 10%, after hitting highs in September. Brent crude, unleaded gasoline, heating oil and gas oil all rose by more than 10%. Prices of many industrial metals, particularly those closely tied to Chinese production, fell. Copper, which is often regarded as a key indicator of the health of the global economy, dropped 22%. Aluminum, lead and nickel also dropped.
All the soft commodities (cotton, cocoa, coffee and sugar) posted negative double-digit returns.
Derivatives in the Fund are used to help provide exposure to the composition of the benchmark in the most efficient manner, as well as to provide liquidity.
| * | The S&P GSCI®, a benchmark for investment performance in the commodity markets, measures investable commodity price movements and inflation in the world economy. The index is calculated primarily on a world production weighted basis and is comprised of the principal physical commodities that are the subject of active, liquid futures markets. |
Performance displayed represents past performance which is no guarantee of future results.
Holdings Diversification (Market Exposure as % of Net Assets)
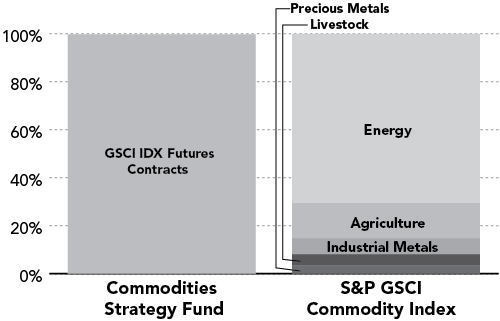
“Holdings Diversification (Market Exposure as % of Net Assets)” excludes any temporary cash investments.
| | | | |
Inception Dates: | |
A-Class | | | May 25, 2005 | |
C-Class | | | May 25, 2005 | |
H-Class | | | May 25, 2005 | |
The Fund invests principally in derivative investments such as commodity-linked futures contracts.
36 | THE RYDEX FUNDANNUALREPORT
PERFORMANCE REPORT AND FUND PROFILE (Unaudited) (concluded)
COMMODITIES STRATEGY FUND
Cumulative Fund Performance*
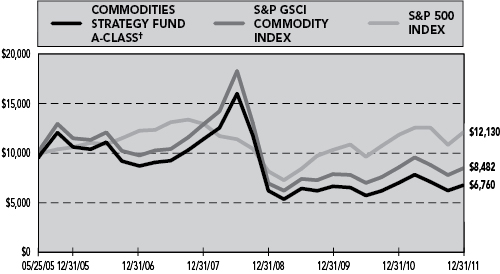
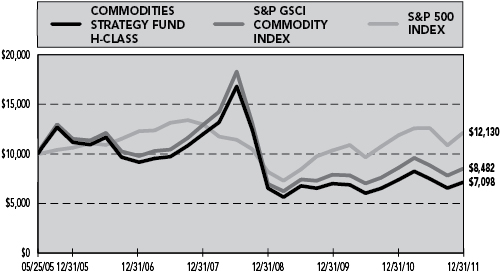
Average Annual Returns*
Periods Ended 12/31/11
| | | | | | | | | | | | |
| | | 1 Year | | | 5 Year | | | Since
Inception
(05/25/05) | |
A-Class Shares | | | -3.61 | % | | | -4.92 | % | | | -5.06 | % |
A-Class Shares with Sales Charge† | | | -8.17 | % | | | -5.85 | % | | | -5.76 | % |
C-Class Shares | | | -4.32 | % | | | -5.62 | % | | | -5.77 | % |
C-Class Shares with CDSC‡ | | | -5.24 | % | | | -5.62 | % | | | -5.77 | % |
H-Class Shares | | | -3.67 | % | | | -4.92 | % | | | -5.06 | % |
S&P Goldman Sachs Commodity Index | | | -1.17 | % | | | -2.79 | % | | | -2.46 | % |
S&P 500 Index | | | 2.11 | % | | | -0.25 | % | | | 2.97 | % |
| * | The performance data above represents past performance that is not predictive of future results. The investment return and principal value of an investment in the Fund will fluctuate so that an investor’s shares, when redeemed, may be worth more or less than their original cost. Returns are historical and include changes in principal and reinvested dividends and capital gains and do not reflect the effect of taxes. The S&P Goldman Sachs Commodity Index and S&P 500 Index are unmanaged indices and, unlike the Fund, have no management fees or operating expenses to reduce their reported returns. The graphs are based on A-Class shares and H-Class shares only; performance for C-Class shares will vary due to differences in fee structures. |
| † | Fund returns are calculated using the maximum sales charge of 4.75%. |
| ‡ | Fund returns include a CDSC of 1% if redeemed within 12 months of purchase. |
THE RYDEX FUNDANNUALREPORT | 37
| | | | |
| CONSOLIDATED SCHEDULE OF INVESTMENTS | | | December 31, 2011 | |
COMMODITIES STRATEGY FUND
| | | | | | | | |
| | | FACE
AMOUNT | | | VALUE | |
|
FEDERAL AGENCY DISCOUNT NOTES†† - 42.1% | |
Farmer Mac1 | | | | | | | | |
0.11% due 02/21/12 | | $ | 10,000,000 | | | $ | 9,999,730 | |
| | | | | | | | |
Total Federal Agency Discount Notes
(Cost $9,998,442) | | | | 9,999,730 | |
| | | | | | | | |
|
REPURCHASE AGREEMENTS††,2 - 8.6% | |
HSBC Group | | | | | | | | |
issued 12/30/11 at 0.00% due 01/03/12 | | | 1,381,733 | | | | 1,381,733 | |
Mizuho Financial Group, Inc. | | | | | | | | |
issued 12/30/11 at 0.00% due 01/03/12 | | | 377,508 | | | | 377,508 | |
Deutsche Bank | | | | | | | | |
issued 12/30/11 at 0.00% due 01/03/12 | | | 200,764 | | | | 200,764 | |
Credit Suisse Group | | | | | | | | |
issued 12/30/11 at 0.00% due 01/03/12 | | | 83,482 | | | | 83,482 | |
| | | | | | | | |
Total Repurchase Agreements
(Cost $2,043,487) | | | | 2,043,487 | |
| | | | | | | | |
Total Investments - 50.7%
(Cost $12,041,929) | | | $ | 12,043,217 | |
| | | | | | | | |
Cash & Other Assets, Less Liabilities - 49.3% | | | | | | | 11,719,115 | |
| | | | | | | | |
Total Net Assets - 100.0% | | | | | | $ | 23,762,332 | |
| |
| | |
| | | CONTRACTS | | | UNREALIZED
LOSS | |
|
COMMODITY FUTURES CONTRACTS PURCHASED† | |
January 2012 Goldman Sachs IDX | | | | | |
Futures Contracts | | | | | | | | |
(Aggregate Value of Contracts $23,703,750) | | | 147 | | | $ | (219,223 | ) |
| | | | | | | | |
| † | Value determined based on Level 1 inputs — See Note 4. |
| †† | Value determined based on Level 2 inputs — See Note 4. |
| 1 | The issuer operates under a Congressional charter; its securities are neither issued nor guaranteed by the U.S. Government. |
| 2 | Repurchase Agreements — See Note 5. |
| | |
| 38 | THE RYDEX FUNDANNUALREPORT | | See Notes to Financial Statements. |
COMMODITIES STRATEGY FUND
CONSOLIDATED STATEMENT OF ASSETS AND LIABILITIES
December 31, 2011
| | | | |
| |
ASSETS: | | | | |
Investments, at value
(cost $9,998,442) | | $ | 9,999,730 | |
Repurchase agreements, at value
(cost $2,043,487) | | | 2,043,487 | |
| | | | |
Total investments
(cost $12,041,929) | | | 12,043,217 | |
Cash | | | 10,300,785 | |
Segregated cash with broker | | | 1,554,000 | |
Receivables: | | | | |
Fund shares sold | | | 2,679 | |
| | | | |
Total assets | | | 23,900,681 | |
| | | | |
LIABILITIES: | | | | |
Payable for: | | | | |
Fund shares redeemed | | | 49,432 | |
Variation margin | | | 37,003 | |
Management fees | | | 16,292 | |
Distribution and service fees | | | 7,784 | |
Transfer agent and administrative fees | | | 5,431 | |
Portfolio accounting fees | | | 2,172 | |
Miscellaneous | | | 20,235 | |
| | | | |
Total liabilities | | | 138,349 | |
| | | | |
NETASSETS | | $ | 23,762,332 | |
| | | | |
NETASSETSCONSISTOF: | | | | |
Paid in capital | | $ | 45,804,379 | |
Accumulated net investment loss | | | (1,972,970 | ) |
Accumulated net realized loss on investments | | | (19,851,142 | ) |
Net unrealized depreciation on investments | | | (217,935 | ) |
| | | | |
NETASSETS | | $ | 23,762,332 | |
| | | | |
A-CLASS: | | | | |
Net assets | | $ | 5,222,667 | |
Capital shares outstanding | | | 322,873 | |
Net asset value per share | | $ | 16.18 | |
| | | | |
Maximum offering price per share
(Net asset value divided by 95.25%) | | $ | 16.99 | |
| | | | |
C-CLASS: | | | | |
Net assets | | $ | 3,557,511 | |
Capital shares outstanding | | | 231,937 | |
Net asset value per share | | $ | 15.34 | |
| | | | |
H-CLASS: | | | | |
Net assets | | $ | 14,982,154 | |
Capital shares outstanding | | | 926,238 | |
Net asset value per share | | $ | 16.18 | |
| | | | |
CONSOLIDATED STATEMENT OF OPERATIONS
Year Ended December 31, 2011
| | | | |
| |
INVESTMENT INCOME: | | | | |
Interest | | $ | 42,167 | |
| | | | |
Total investment income | | | 42,167 | |
| | | | |
| |
EXPENSES: | | | | |
Management fees | | | 443,412 | |
Transfer agent and administrative fees | | | 129,732 | |
Distribution and service fees: | | | | |
A-Class | | | 19,508 | |
C-Class | | | 46,319 | |
H-Class | | | 98,644 | |
Portfolio accounting fees | | | 51,892 | |
Custodian fees | | | 13,005 | |
Trustees’ fees* | | | 8,793 | |
Miscellaneous | | | 85,206 | |
| | | | |
Total expenses | | | 896,511 | |
Less: | | | | |
Expenses waived by Advisor | | | (54,915 | ) |
| | | | |
Net expenses | | | 841,596 | |
| | | | |
Net investment loss | | | (799,429 | ) |
| | | | |
| |
NET REALIZEDAND UNREALIZED GAIN (LOSS): | | | | |
Net realized gain (loss) on: | | | | |
Futures contracts | | | (185,759 | ) |
| | | | |
Net realized loss | | | (185,759 | ) |
| | | | |
Net change in unrealized appreciation (depreciation) on: | | | | |
Investments | | | (3,043 | ) |
Futures contracts | | | (1,983,715 | ) |
| | | | |
Net change in unrealized appreciation (depreciation) | | | (1,986,758 | ) |
| | | | |
Net realized and unrealized loss | | | (2,172,517 | ) |
| | | | |
Net decrease in net assets resulting from operations | | $ | (2,971,946 | ) |
| | | | |
| * | Relates to Trustees not deemed “interested persons” within the meaning of Section 2(a)(19) of the 1940 Act. |
| | |
| See Notes to Financial Statements. | | THE RYDEX FUNDANNUALREPORT | 39 |
COMMODITIES STRATEGY FUND
CONSOLIDATED STATEMENTS OF CHANGES IN NET ASSETS
| | | | | | | | |
| | | Year Ended
December 31,
2011 | | | Year Ended
December 31,
2010 | |
| | |
INCREASE (DECREASE) IN NET ASSETS FROM OPERATIONS: | | | | | | | | |
Net investment loss | | $ | (799,429 | ) | | $ | (535,264 | ) |
Net realized gain (loss) on investments | | | (185,759 | ) | | | 7,267,244 | |
Net change in unrealized appreciation (depreciation) on investments | | | (1,986,758 | ) | | | (7,069,540 | ) |
| | | | | | | | |
Net decrease in net assets resulting from operations | | | (2,971,946 | ) | | | (337,560 | ) |
| | | | | | | | |
| | |
DISTRIBUTIONS TO SHAREHOLDERS FROM: | | | | | | | | |
Net investment income | | | | | | | | |
A-Class | | | (181,426 | ) | | | — | |
C-Class | | | (123,565 | ) | | | — | |
H-Class | | | (552,159 | ) | | | — | |
| | | | | | | | |
Total distributions to shareholders | | | (857,150 | ) | | | — | |
| | | | | | | | |
| | |
CAPITALSHARETRANSACTIONS: | | | | | | | | |
Proceeds from sale of shares | | | | | | | | |
A-Class | | | 11,929,885 | | | | 7,393,876 | |
C-Class | | | 1,959,508 | | | | 2,777,598 | |
H-Class | | | 198,728,902 | | | | 66,067,956 | |
Redemption fees collected | | | | | | | | |
A-Class | | | — | | | | 3 | |
C-Class | | | — | | | | 2 | |
H-Class | | | — | | | | 10 | |
Distributions reinvested | | | | | | | | |
A-Class | | | 165,949 | | | | — | |
C-Class | | | 112,557 | | | | — | |
H-Class | | | 516,857 | | | | — | |
Cost of shares redeemed | | | | | | | | |
A-Class | | | (13,331,979 | ) | | | (8,914,378 | ) |
C-Class | | | (3,022,060 | ) | | | (4,181,943 | ) |
H-Class | | | (213,806,275 | ) | | | (65,225,874 | ) |
| | | | | | | | |
Net decrease from capital share transactions | | | (16,746,656 | ) | | | (2,082,750 | ) |
| | | | | | | | |
Net decrease in net assets | | | (20,575,752 | ) | | | (2,420,310 | ) |
| | | | | | | | |
NETASSETS: | | | | | | | | |
Beginning of year | | | 44,338,084 | | | | 46,758,394 | |
| | | | | | | | |
End of year | | $ | 23,762,332 | | | $ | 44,338,084 | |
| | | | | | | | |
Accumulated net investment loss at end of year | | $ | (1,972,970 | ) | | $ | (383,185 | ) |
| | | | | | | | |
| | |
CAPITALSHAREACTIVITY: | | | | | | | | |
Shares sold | | | | | | | | |
A-Class | | | 644,840 | | | | 472,488 | |
C-Class | | | 111,896 | | | | 185,981 | |
H-Class | | | 11,063,570 | | | | 4,206,889 | |
Shares issued from reinvestment of distributions | | | | | | | | |
A-Class | | | 10,200 | | | | — | |
C-Class | | | 7,295 | | | | — | |
H-Class | | | 31,768 | | | | — | |
Shares redeemed | | | | | | | | |
A-Class | | | (747,260 | ) | | | (579,317 | ) |
C-Class | | | (180,193 | ) | | | (284,662 | ) |
H-Class | | | (12,032,423 | ) | | | (4,296,966 | ) |
| | | | | | | | |
Net decrease in shares | | | (1,090,307 | ) | | | (295,587 | ) |
| | | | | | | | |
| | |
| 40 | THE RYDEX FUNDANNUALREPORT | | See Notes to Financial Statements. |
COMMODITIES STRATEGY FUND
FINANCIAL HIGHLIGHTS
This table is presented to show selected data for a share outstanding throughout each period, and to assist shareholders in evaluating a Fund’s performance for the periods presented.
| | | | | | | | | | | | | | | | | | | | | | | | |
A-Class | | Year Ended
December 31,
2011a | | | Year Ended
December 31,
2010a | | | Period Ended
December 31,
2009a,b | | | Year Ended
March 31,
2009 | | | Year Ended
March 31,
2008 | | | Year Ended
March 31,
2007 | |
Per Share Data | | | | | | | | | | | | | | | | | | | | | | | | |
Net asset value, beginning of period | | $ | 17.33 | | | $ | 16.39 | | | $ | 13.26 | | | $ | 32.68 | | | $ | 23.81 | | | $ | 27.29 | |
| | | | | | | | | | | | | | | | | | | | | | | | |
Income (loss) from investment operations: | | | | | | | | | | | | | | | | | | | | | | | | |
Net investment income (loss)c | | | (.26 | ) | | | (.22 | ) | | | (.14 | ) | | | — | d | | | .68 | | | | .63 | |
Net gain (loss) on investments (realized and unrealized) | | | (.36 | ) | | | 1.16 | | | | 3.37 | | | | (18.80 | ) | | | 8.27 | | | | (4.15 | ) |
| | | | | | | | | | | | | | | | | | | | | | | | |
Total from investment operations | | | (.62 | ) | | | .94 | | | | 3.23 | | | | (18.80 | ) | | | 8.95 | | | | (3.52 | ) |
| | | | | | | | | | | | | | | | | | | | | | | | |
Less distributions from: | | | | | | | | | | | | | | | | | | | | | | | | |
Net investment income | | | (.53 | ) | | | — | | | | (.11 | ) | | | (.70 | ) | | | (.22 | ) | | | — | |
| | | | | | | | | | | | | | | | | | | | | | | | |
Total distributions | | | (.53 | ) | | | — | | | | (.11 | ) | | | (.70 | ) | | | (.22 | ) | | | — | |
| | | | | | | | | | | | | | | | | | | | | | | | |
Redemption fees collected | | | — | | | | — | e | | | .01 | | | | .08 | | | | .14 | | | | .04 | |
| | | | | | | | | | | | | | | | | | | | | | | | |
Net asset value, end of period | | $ | 16.18 | | | $ | 17.33 | | | $ | 16.39 | | | $ | 13.26 | | | $ | 32.68 | | | $ | 23.81 | |
| | | | | | | | | | | | | | | | | | | | | | | | |
| | | | | | |
Total Returnf | | | (3.61 | %) | | | 5.74 | % | | | 24.46 | % | | | (57.55 | %) | | | 38.48 | % | | | (12.75 | %) |
| | | | | | | | | | | | | | | | | | | | | | | | |
Ratios/Supplemental Data | | | | | | | | | | | | | | | | | | | | | | | | |
Net assets, end of period (in thousands) | | $ | 5,223 | | | $ | 7,192 | | | $ | 8,553 | | | $ | 7,189 | | | $ | 18,579 | | | $ | 9,720 | |
| | | | | | | | | | | | | | | | | | | | | | | | |
Ratios to average net assets: | | | | | | | | | | | | | | | | | | | | | | | | |
Net investment income (loss) | | | (1.47 | %) | | | (1.42 | %) | | | (1.24 | %) | | | 0.02 | % | | | 2.49 | % | | | 2.57 | % |
Total expenses | | | 1.66 | % | | | 1.65 | % | | | 1.56 | % | | | 1.52 | % | | | 1.51 | % | | | 1.46 | % |
Net expensesg | | | 1.55 | % | | | 1.56 | % | | | 1.38 | % | | | 1.20 | % | | | 1.19 | % | | | 1.17 | % |
| | | | | | | | | | | | | | | | | | | | | | | | |
Portfolio turnover rate | | | — | | | | 200 | % | | | 220 | % | | | 390 | % | | | 405 | % | | | 672 | % |
| | | | | | | | | | | | | | | | | | | | | | | | |
C-Class | | Year Ended
December 31,
2011a | | | Year Ended
December 31,
2010a | | | Period Ended
December 31,
2009a,b | | | Year Ended
March 31,
2009 | | | Year Ended
March 31,
2008 | | | Year Ended
March 31,
2007 | |
Per Share Data | | | | | | | | | | | | | | | | | | | | | | | | |
Net asset value, beginning of period | | $ | 16.58 | | | $ | 15.80 | | | $ | 12.86 | | | $ | 31.96 | | | $ | 23.47 | | | $ | 27.10 | |
| | | | | | | | | | | | | | | | | | | | | | | | |
Income (loss) from investment operations: | | | | | | | | | | | | | | | | | | | | | | | | |
Net investment income (loss)c | | | (.37 | ) | | | (.32 | ) | | | (.22 | ) | | | (.06 | ) | | | .48 | | | | .56 | |
Net gain (loss) on investments (realized and unrealized) | | | (.34 | ) | | | 1.10 | | | | 3.26 | | | | (18.43 | ) | | | 8.09 | | | | (4.23 | ) |
| | | | | | | | | | | | | | | | | | | | | | | | |
Total from investment operations | | | (.71 | ) | | | .78 | | | | 3.04 | | | | (18.49 | ) | | | 8.57 | | | | 3.67 | |
| | | | | | | | | | | | | | | | | | | | | | | | |
Less distributions from: | | | | | | | | | | | | | | | | | | | | | | | | |
Net investment income | | | (.53 | ) | | | — | | | | (.11 | ) | | | (.70 | ) | | | (.22 | ) | | | — | |
| | | | | | | | | | | | | | | | | | | | | | | | |
Total distributions | | | (.53 | ) | | | — | | | | (.11 | ) | | | (.70 | ) | | | (.22 | ) | | | — | |
| | | | | | | | | | | | | | | | | | | | | | | | |
Redemption fees collected | | | — | | | | — | e | | | .01 | | | | .09 | | | | .14 | | | | .04 | |
| | | | | | | | | | | | | | | | | | | | | | | | |
Net asset value, end of period | | $ | 15.34 | | | $ | 16.58 | | | $ | 15.80 | | | $ | 12.86 | | | $ | 31.96 | | | $ | 23.47 | |
| | | | | | | | | | | | | | | | | | | | | | | | |
| | | | | | |
Total Returnf | | | (4.32 | %) | | | 4.94 | % | | | 23.74 | % | | | (58.03 | %) | | | 37.41 | % | | | (13.39 | %) |
| | | | | | | | | | | | | | | | | | | | | | | | |
Ratios/Supplemental Data | | | | | | | | | | | | | | | | | | | | | | | | |
Net assets, end of period (in thousands) | | $ | 3,558 | | | $ | 4,857 | | | $ | 6,186 | | | $ | 4,072 | | | $ | 10,793 | | | $ | 4,169 | |
| | | | | | | | | | | | | | | | | | | | | | | | |
Ratios to average net assets: | | | | | | | | | | | | | | | | | | | | | | | | |
Net investment income (loss) | | | (2.22 | %) | | | (2.17 | %) | | | (2.03 | %) | | | (0.22 | %) | | | 1.79 | % | | | 2.23 | % |
Total expenses | | | 2.41 | % | | | 2.39 | % | | | 2.31 | % | | | 2.28 | % | | | 2.26 | % | | | 2.23 | % |
Net expensesg | | | 2.30 | % | | | 2.30 | % | | | 2.15 | % | | | 1.95 | % | | | 1.94 | % | | | 1.94 | % |
| | | | | | | | | | | | | | | | | | | | | | | | |
Portfolio turnover rate | | | — | | | | 200 | % | | | 220 | % | | | 390 | % | | | 405 | % | | | 672 | % |
THE RYDEX FUNDANNUALREPORT | 41
COMMODITIES STRATEGY FUND
FINANCIAL HIGHLIGHTS (concluded)
This table is presented to show selected data for a share outstanding throughout each period, and to assist shareholders in evaluating a Fund’s performance for the periods presented.
| | | | | | | | | | | | | | | | | | | | | | | | |
H-Class | | Year Ended
December 31,
2011a | | | Year Ended
December 31,
2010a | | | Period Ended
December 31,
2009a,b | | | Year Ended
March 31,
2009 | | | Year Ended
March 31,
2008 | | | Year Ended
March 31,
2007 | |
Per Share Data | | | | | | | | | | | | | | | | | | | | | | | | |
Net asset value, beginning of period | | $ | 17.33 | | | $ | 16.39 | | | $ | 13.26 | | | $ | 32.66 | | | $ | 23.81 | | | $ | 27.29 | |
| | | | | | | | | | | | | | | | | | | | | | | | |
Income (loss) from investment operations: | | | | | | | | | | | | | | | | | | | | | | | | |
Net investment income (loss)c | | | (.27 | ) | | | (.22 | ) | | | (.14 | ) | | | .13 | | | | .60 | �� | | | .77 | |
Net gain (loss) on investments (realized and unrealized) | | | (.35 | ) | | | 1.16 | | | | 3.37 | | | | (18.93 | ) | | | 8.30 | | | | (4.28 | ) |
| | | | | | | | | | | | | | | | | | | | | | | | |
Total from investment operations | | | (.62 | ) | | | .94 | | | | 3.23 | | | | (18.80 | ) | | | 8.90 | | | | (3.51 | ) |
| | | | | | | | | | | | | | | | | | | | | | | | |
Less distributions from: | | | | | | | | | | | | | | | | | | | | | | | | |
Net investment income | | | (.53 | ) | | | — | | | | (.11 | ) | | | (.70 | ) | | | (.22 | ) | | | — | |
| | | | | | | | | | | | | | | | | | | | | | | | |
Total distributions | | | (.53 | ) | | | — | | | | (.11 | ) | | | (.70 | ) | | | (.22 | ) | | | — | |
| | | | | | | | | | | | | | | | | | | | | | | | |
Redemption fees collected | | | — | | | | — | e | | | .01 | | | | .10 | | | | .17 | | | | .03 | |
| | | | | | | | | | | | | | | | | | | | | | | | |
Net asset value, end of period | | $ | 16.18 | | | $ | 17.33 | | | $ | 16.39 | | | $ | 13.26 | | | $ | 32.66 | | | $ | 23.81 | |
| | | | | | | | | | | | | | | | | | | | | | | | |
| | | | | | |
Total Returnf | | | (3.67 | %) | | | 5.74 | % | | | 24.45 | % | | | (57.52 | %) | | | 38.39 | % | | | (12.75 | %) |
| | | | | | | | | | | | | | | | | | | | | | | | |
Ratios/Supplemental Data | | | | | | | | | | | | | | | | | | | | | | | | |
Net assets, end of period (in thousands) | | $ | 14,982 | | | $ | 32,290 | | | $ | 32,019 | | | $ | 50,622 | | | $ | 124,886 | | | $ | 35,062 | |
| | | | | | | | | | | | | | | | | | | | | | | | |
Ratios to average net assets: | | | | | | | | | | | | | | | | | | | | | | | | |
Net investment income (loss) | | | (1.47 | %) | | | (1.42 | %) | | | (1.22 | %) | | | 0.43 | % | | | 2.10 | % | | | 2.99 | % |
Total expenses | | | 1.66 | % | | | 1.65 | % | | | 1.56 | % | | | 1.52 | % | | | 1.51 | % | | | 1.49 | % |
Net expensesg | | | 1.56 | % | | | 1.56 | % | | | 1.37 | % | | | 1.20 | % | | | 1.19 | % | | | 1.20 | % |
| | | | | | | | | | | | | | | | | | | | | | | | |
Portfolio turnover rate | | | — | | | | 200 | % | | | 220 | % | | | 390 | % | | | 405 | % | | | 672 | % |
| b | The Fund changed its fiscal year end from March 31 to December 31 in 2009. Percentage amounts for the period, except total return and portfolio turnover rate, have been annualized. |
| c | Net investment income (loss) per share was computed using average shares outstanding throughout the period. |
| d | Net investment income is less than $0.01 per share. |
| e | Redemption fees collected are less than $0.01 per share. |
| f | Total return does not reflect the impact of any applicable sales charges and has not been annualized. |
| g | Net expense information reflects the expense ratios after expense waivers. |
42 | THE RYDEX FUNDANNUALREPORT
NOTES TO CONSOLIDATED FINANCIAL STATEMENTS
1. Organization, Consolidation of Subsidiary and Significant Accounting Policies
Organization
The Rydex Series Funds (the “Trust”) is registered with the SEC under the Investment Company Act of 1940 (the “1940 Act”) as a non-diversified, open-ended investment company. The Trust offers eight separate classes of shares, Investor Class shares, Investor2 Class shares, Advisor Class shares, A-Class shares, C-Class shares, H-Class shares, Y-Class shares, and Institutional Class shares. Sales of shares of each Class are made without a sales charge at the NAV, with the exception of A-Class shares. A-Class shares are sold at the NAV, plus the applicable front-end sales charge. The sales charge varies depending on the amount purchased, but will not exceed 4.75%. A-Class share purchases of $1 million or more are exempt from the front-end sales charge but have a 1% CDSC if shares are redeemed within 18 months of purchase. C-Class shares have a 1% CDSC if shares are redeemed within 12 months of purchase.
At December 31, 2011, the Trust consisted of fifty-eight separate funds. This report covers the Long/Short Commodities Strategy Fund, the Multi-Hedge Strategies Fund and the Commodities Strategy Fund (collectively, the “Funds”). Only A-Class, C-Class, H-Class, Y-Class and Institutional Class shares had been issued by the Funds. Effective September 13, 2010, the redemption fee was removed.
Guggenheim Investments (“GI”) provides advisory services, and Rydex Fund Services, LLC (“RFS”) provides transfer agent, administrative, and accounting services to the Trust. Rydex Distributors, LLC (“RDL”) acts as principal underwriter for the Trust. GI, RFS and RDL are affiliated entities.
Consolidation of Subsidiary
Each of the consolidated financial statements of the Funds include the accounts of a wholly-owned and controlled Cayman Islands subsidiary (the “Subsidiary”). Significant inter-company accounts and transactions have been eliminated in consolidation for the Funds.
Each Fund may invest up to 25% of its total assets in its Subsidiary which acts as an investment vehicle in order to effect certain investments consistent with the Fund’s investment objectives and policies.
A summary of each Fund’s investment in its respective Subsidiary is as follows:
| | | | | | | | | | | | |
| | | Inception
Date of
Subsidiary | | | Subsidiary
Net Assets at
December 31,
2011 | | | % of Total
Net Assets of
the Fund at
December 31,
2011 | |
Long/Short Commodities Strategy Fund | | | 6/25/09 | | | $ | 65,704,376 | | | | 17.35 | % |
Multi-Hedge Strategies Fund | | | 9/18/09 | | | | 5,073,383 | | | | 4.83 | % |
Commodities Strategy Fund | | | 9/8/09 | | | | 3,555,502 | | | | 14.96 | % |
Significant Accounting Policies
The following significant accounting policies are in conformity with U.S. generally accepted accounting principles and are consistently followed by the Trust. This requires management to make estimates and assumptions that affect the reported amount of assets and liabilities and disclosure of contingent assets and liabilities at the date of the financial statements and the reported amounts of revenues and expenses during the reporting period. Actual results could differ from these estimates. All time references are based on Eastern Time.
A. Equity securities listed on an exchange (New York Stock Exchange (“NYSE”) or American Stock Exchange) are valued at the last quoted sales price as of the close of business on the NYSE on the valuation date. Equity securities listed on the NASDAQ market system are valued at the NASDAQ Official Closing Price on the valuation date.
The value of futures contracts purchased and sold by the Funds is accounted for using the unrealized gain or loss on the contracts that is determined by marking the contracts to their current realized settlement prices. Financial futures contracts are valued at the 4:00 p.m. price on the valuation date. In the event that the exchange for a specific futures contract closes earlier than 4:00 p.m., the futures contract is valued at the Official Settlement Price of the exchange. However, the underlying securities from which the futures contract value is derived are monitored until 4:00 p.m. to determine if fair valuation would provide a more accurate valuation.
The value of credit default swap agreements entered into by a Fund is accounted for using the unrealized gain or loss on the agreements that is determined by marking the agreements to the last quoted value of the index that the swap pertains to at the close of the NYSE. The swap’s market value is then adjusted to include dividends accrued, financing charges and/or interest associated with the swap agreements.
THE GUGGENHEIM FUNDSANNUALREPORT | 43
NOTES TO CONSOLIDATED FINANCIAL STATEMENTS (continued)
Debt securities with a maturity of greater than 60 days at acquisition are valued at prices that reflect broker/dealer-supplied valuations or are obtained from independent pricing services, which may consider the trade activity, treasury spreads, yield or price of bonds of comparable quality, coupon, maturity, and type, as well as prices quoted by dealers who make markets in such securities. Short-term debt securities with a maturity of 60 days or less at acquisition and repurchase agreements are valued at amortized cost, which approximates market value. Open-end investment companies (“Mutual Funds”) are valued at their NAV as of the close of business on the valuation date. Exchange Traded Funds (“ETFs”) and closed-end investment companies are valued at the last quoted sales price.
Investments for which market quotations are not readily available are fair valued as determined in good faith by GI under the direction of the Board of Trustees using methods established or ratified by the Board of Trustees. These methods include, but are not limited to: (i) general information as to how these securities and assets trade; (ii) in connection with futures contracts and options thereupon, and other derivative investments, information as to how (a) these contracts and other derivative investments trade in the futures or other derivative markets, respectively, and (b) the securities underlying these contracts and other derivative investments trade in the cash market; and (iii) other information and considerations, including current values in related markets.
B. Security transactions are recorded on the trade date for financial reporting purposes. Realized gains and losses from securities transactions are recorded using the identified cost basis. Proceeds from lawsuits related to investment holdings are recorded as realized gains. Dividend income is recorded on the ex-dividend date, net of applicable taxes withheld by foreign countries. Taxable non-cash dividends are recorded as dividend income. Interest income, including amortization of premiums and accretion of discount, is accrued on a daily basis. Distributions received from investments in REITs are recorded as dividend income on the ex-dividend date, subject to reclassification upon notice of the character of such distribution by the issuer.
C. Distributions of net investment income and net realized gains, if any, are declared and paid at least annually. Distributions are recorded on the ex-dividend date and are determined in accordance with income tax regulations which may differ from U.S. generally accepted accounting principles.
D. When a Fund engages in a short sale of a security, an amount equal to the proceeds is reflected as an asset and an equivalent liability. The amount of the liability is subsequently marked-to-market to reflect the market value of the short sale. The Fund maintains a segregated account of cash and/or securities as collateral for short sales. The Fund is exposed to market risk based on the amount, if any, that the market value of the security exceeds the market value of the securities in the segregated account.
Fees, if any, paid to brokers to borrow securities in connection with short sales are recorded as interest expense. In addition, the Fund must pay out the dividend rate of the equity or coupon rate of the treasury obligation to the lender and record this as an expense. Short dividend or interest expense is a cost associated with the investment objective of short sales transactions, rather than an operational cost associated with the day-to-day management of any mutual fund. The Funds may also receive rebate income from the broker resulting from the investment of the proceeds from securities sold short.
E. When the Fund writes (sells) an option, an amount equal to the premium received is entered in that Fund’s accounting records as an asset and equivalent liability. The amount of the liability is subsequently marked-to-market to reflect the current value of the option written. When a written option expires, or if the Fund enters into a closing purchase transaction, it realizes a gain (or loss if the cost of a closing purchase transaction exceeds the premium received when the option was sold).
F. Upon entering into a futures contract, a Fund deposits and maintains as collateral such initial margin as required by the exchange on which the transaction is affected. Pursuant to the contract, the Fund agrees to receive from or pay to the broker an amount of cash equal to the daily fluctuation in value of the contract. Such receipts or payments are known as variation margin and are recorded by the Fund as unrealized gains or losses. When the contract is closed, the Fund records a realized gain or loss equal to the difference between the value of the contract at the time it was opened and the value at the time it was closed.
G. Credit default swap agreements are marked-to-market daily and the change, if any, is recorded as unrealized gain or loss. Upfront payments received or made by a Fund are amortized over the expected life of the agreement. Periodic payments received or paid by a Fund are recorded as realized gains or losses. Payments received or made as a result of a credit event or termination of the contract are recognized, net of a proportional amount of the upfront payment, as realized gains or losses.
44 | THE GUGGENHEIM FUNDSANNUALREPORT
NOTES TO CONSOLIDATED FINANCIAL STATEMENTS (continued)
H. Investment securities and other assets and liabilities denominated in foreign currencies are translated into U.S. dollar amounts at the date of valuation. Purchases and sales of investment securities and income and expense items denominated in foreign currencies are translated into U.S. dollar amounts on the respective dates of such transactions. The Funds do not isolate that portion of the results of operations resulting from changes in foreign exchange rates on investments from the fluctuations arising from changes in market prices of securities held. Such fluctuations are included with the net realized and unrealized gain and loss from investments.
Reported net realized foreign exchange gains or losses arise from sales of foreign currencies and currency gains or losses realized between the trade and settlement dates on investment transactions. Net unrealized exchange gains and losses arise from changes in the fair values of assets and liabilities other than investments in securities at the fiscal period end, resulting from changes in exchange rates.
I. Certain U.S. Government and Agency Obligations are traded on a discount basis; the interest rates shown on the Schedules of Investments reflect the effective rates paid at the time of purchase by the Funds. Other securities bear interest at the rates shown, payable at fixed dates through maturity.
J. The Funds may leave cash overnight in their cash account with the custodian, U.S. Bank. Periodically, a Fund may have cash due to the custodian bank as an overdraft balance. A fee is incurred on this overdraft, calculated by multiplying the overdraft by a rate based on the federal funds rate. Segregated cash with the broker is held as collateral for investments in derivative instruments such as futures contracts or swap agreements.
K. Interest and dividend income, most expenses, all realized gains and losses, and all unrealized gains and losses are allocated to the Classes based upon the value of the outstanding shares in each Class. Certain costs, such as distribution fees relating to A-Class shares and H-Class shares and service and distribution fees related to C-Class shares, are charged directly to specific Classes. In addition, certain expenses have been allocated to the individual Funds in the Trust on a pro rata basis upon the respective aggregate net assets of each Fund included in the Trust.
L. Throughout the normal course of business, the Funds enter into contracts that contain a variety of representations and warranties which provide general indemnifications. The Funds’ maximum exposure under these arrangements is unknown, as this would involve future claims that may be made against the Funds and/or their affiliates that have not yet occurred. However, based on experience, the Funds expect the risk of loss to be remote.
2. Financial Instruments
As part of their investment strategies, the Funds utilize short sales and a variety of derivative instruments, including options, futures and swap agreements. These investments involve, to varying degrees, elements of market risk and risks in excess of the amounts recognized in the Statements of Assets and Liabilities.
A short sale is a transaction in which a Fund sells a security it does not own. If the security sold short decreases in price between the time the Fund sells the security and closes its short position, that Fund will realize a gain on the transaction. Conversely, if the security increases in price during the period, that Fund will realize a loss on the transaction. The risk of such price increases is the principal risk of engaging in short sales.
An option on a security gives the purchaser of the option the right to sell, and the writer of the option the obligation to buy, the underlying security (put option) or the purchaser of the option the right to buy, and the writer of the option the obligation to sell, the underlying security (call option) at any time during the option period. The risk associated with purchasing options is limited to the premium originally paid. The risk in writing a call option is that a Fund may incur a loss if the market price of the underlying security increases and the option is exercised. The risk in writing a put option is that a Fund may incur a loss if the market price of the underlying security decreases and the option is exercised. In addition, there may be an imperfect correlation between the movement in prices of options and the underlying securities and a Fund may not be able to enter into a closing transaction because of an illiquid secondary market or, for over-the-counter options, because of the counterparty’s inability to perform.
A futures contract is an agreement to purchase (long) or sell (short) an agreed amount of securities or other instruments at a set price for delivery at a future date. There are significant risks associated with a Fund’s or an underlying fund’s use of futures contracts and related options, including (i) there may be an imperfect or no correlation between the changes in market value of the underlying asset and the prices of futures contracts; (ii) there may not be a liquid secondary market for a futures contract; (iii) trading restrictions or limitations may be imposed by an exchange; and (iv) government regulations may restrict trading in futures contracts. When investing in futures, there is minimal counterparty credit risk to the Fund because futures are exchange-traded and the exchange’s clearinghouse, as counterparty to all exchange-traded futures, guarantees against default.
THE GUGGENHEIM FUNDSANNUALREPORT | 45
NOTES TO CONSOLIDATED FINANCIAL STATEMENTS (continued)
A swap is an agreement that obligates two parties to exchange a series of cash flows at specified intervals based upon or calculated by reference to changes in specified prices or rates for a specified amount of an underlying asset. A credit default swap enables a Fund to buy or sell protection against a defined credit event of an issuer or a basket of securities. Generally, the seller of credit protection against an issuer or basket of securities receives a periodic payment from the buyer to compensate against potential default events. If a default event occurs, the seller must pay the buyer the full notional value of the reference obligation in exchange for the reference obligation. If no default occurs, the counterparty will pay the stream of payments and have no further obligations to the Fund selling the credit protection. A Fund or an underlying fund bears the risk of loss of the amount expected to be received under a swap agreement in the event of the default or bankruptcy of a swap agreement counterparty, or in the case of a credit default swap in which the Fund is selling credit protection, the default of a third party issuer. Additionally, there is no guarantee that a Fund or an underlying fund could eliminate its exposure under an outstanding swap agreement by entering into an offsetting swap agreement with the same or another party.
In conjunction with the use of short sales, written options, futures and swap agreements, the Funds are required to maintain collateral in various forms. The Funds use, where appropriate, depending on the financial instrument utilized and the broker involved, margin deposits at the broker, cash and/or securities segregated at the custodian bank, discount notes, or the repurchase agreements allocated to each Fund.
The Trust has established counterparty credit guidelines and enters into transactions only with financial institutions of investment grade or better. The Trust monitors the counterparty credit risk.
3. Fees and Other Transactions with Affiliates
Under the terms of an investment advisory contract, the Funds pay GI investment advisory fees calculated at the annualized rates below, based on the average daily net assets of the Funds for the year:
| | | | |
Fund | | Management
Fees
(as a % of
Net Assets) | |
Long/Short Commodities Strategy Fund | | | 0.90 | % |
Multi-Hedge Strategies Fund | | | 1.15 | % |
Commodities Strategy Fund | | | 0.75 | % |
GI has contractually agreed to waive the management fee it receives from each Subsidiary in an amount equal to the management fee paid to GI by the Subsidiary. This undertaking will continue in effect for so long as the Fund invests in the Subsidiary, and may not be terminated by GI unless GI obtains the prior approval of the Fund’s Board of Trustees for such termination. In any event, this undertaking will continue through April 30, 2012.
As part of its agreement with the Trust, GI will pay all expenses of the Multi-Hedge Strategies Fund, including the cost of transfer agency, custody, fund administration, legal, audit and other services, except interest expense, taxes (expected to be de minimis), brokerage commissions and other expenses connected with execution of portfolio transactions, short dividend expenses, subsidiary expenses and extraordinary expenses.
RFS provides transfer agent and administrative services to the Funds for fees calculated at an annualized rate of 0.25% of the average daily net assets of A-Class, C-Class, H-Class and Institutional Class, and 0.20% of the average daily net assets of Y-Class. Fees related to the Multi-Hedge Strategies Fund are paid by GI, as previously noted.
RFS also provides accounting services to the Funds for fees calculated at annualized rates below, based on the average daily net assets of each Fund.
Fees related to the Multi-Hedge Strategies Fund are paid by GI, as previously noted.
| | | | |
Fund Accounting Fees | | (as a % of
Net Assets) | |
On the first $250 million | | | 0.10 | % |
On the next $250 million | | | 0.075 | % |
On the next $250 million | | | 0.05 | % |
Over $750 million | | | 0.03 | % |
RFS engages external service providers to perform other necessary services for the Trust, such as audit and accounting related services, legal services, custody, printing and mailing, etc., on a pass through basis. Such expenses are allocated to various funds within the complex based on relative net assets. Certain expenses allocated to the Multi-Hedge Strategies Fund are paid by GI, as previously noted.
The Trust has adopted a Distribution Plan applicable to A-Class shares and H-Class shares for which RDL and other firms that provide distribution and/or shareholder services (“Service Providers”) may receive compensation. If a Service Provider provides distribution services, the Funds will pay distribution fees to RDL at an annual rate not to exceed 0.25% of average daily net assets, pursuant to Rule 12b-1 of the 1940 Act. RDL, in turn, will pay the Service Provider out of its fees. RDL may, at its discretion, retain a portion of such payments to compensate itself for distribution services.
46 | THE GUGGENHEIM FUNDSANNUALREPORT
NOTES TO CONSOLIDATED FINANCIAL STATEMENTS (continued)
The Trust has adopted a separate Distribution and Shareholder Services Plan applicable to its C-Class shares that allows the Funds to pay annual distribution and service fees of 1.00% of the Funds’ C-Class shares average daily net assets. The annual 0.25% service fee compensates the shareholder’s financial advisor for providing ongoing services to the shareholder. The annual 0.75% distribution fee reimburses RDL for paying the shareholder’s financial advisor an ongoing sales commission. RDL advances the first year’s service and distribution fees to the financial advisor. RDL retains the service and distribution fees on accounts with no authorized dealer of record.
During the year ended December 31, 2011, RDL retained sales charges of $444,856 relating to sales of A-Class shares of the Trust.
Certain officers and trustees of the Trust are also officers of GI, RFS and RDL.
4. Fair Value Measurement
In accordance with U.S. generally accepted accounting principles, fair value is defined as the price that the Fund would receive to sell an investment or pay to transfer a liability in an orderly transaction with an independent buyer in the principal market, or in the absence of a principal market the most advantageous market for the investment or liability. A three-tier hierarchy is utilized to distinguish between (1) inputs that reflect the assumptions market participants would use in pricing an asset or liability developed based on market data obtained from sources independent of the reporting entity (observable inputs) and (2) inputs that reflect the reporting entity’s own assumptions about the assumptions market participants would use in pricing an asset or liability developed based on the best information available in the circumstances (unobservable inputs) and to establish classification of fair value measurements for disclosure purposes. Various inputs are used in determining the value of the Funds’ investments. The inputs are summarized in the three broad levels listed below:
| | |
Level 1 — | | quoted prices in active markets for identical securities. |
| |
Level 2 — | | other significant observable inputs (including quoted prices for similar securities, interest rates, prepayment speeds, credit risk, etc.). |
| |
Level 3 — | | significant unobservable inputs (including the fund’s own assumptions used to determine the fair value of investments). |
The inputs or methodologies used for valuing securities are not necessarily an indication of the risk associated with investing in those securities.
The following table summarizes the inputs used to value the Funds’ net assets at December 31, 2011:
| | | | | | | | | | | | | | | | | | | | | | | | |
| | | Level 1
Investments
In Securities | | | Level 1
Other
Financial
Instruments* | | | Level 2
Investments
In Securities | | | Level 2
Other
Financial
Instruments* | | | Level 3
Investments
In Securities | | | Total | |
Assets | | | | | | | | | | | | | | | | | | | | | | | | |
Long/Short Commodities Strategy Fund | | $ | — | | | $ | 6,633,097 | | | $ | 334,470,804 | | | $ | — | | | $ | — | | | $ | 341,103,901 | |
Multi-Hedge Strategies Fund | | | 52,105,202 | | | | 2,034,023 | | | | 45,845,398 | | | | 35,299 | | | | — | | | | 100,019,922 | |
Commodities Strategy Fund | | | — | | | | — | | | | 12,043,217 | | | | — | | | | — | | | | 12,043,217 | |
| | | | | | |
Liabilities | | | | | | | | | | | | | | | | | | | | | | | | |
Long/Short Commodities Strategy Fund | | $ | — | | | $ | 12,200,553 | | | $ | — | | | $ | — | | | $ | — | | | $ | 12,200,553 | |
Multi-Hedge Strategies Fund | | | 33,597,555 | | | | 3,917,160 | | | | — | | | | — | | | | — | | | | 37,514,715 | |
Commodities Strategy Fund | | | — | | | | 219,223 | | | | — | | | | — | | | | — | | | | 219,223 | |
| * | Other financial instruments include futures contracts and/or swaps, which are reported as unrealized gain/loss at period end. |
For the year ended December 31, 2011, there were no transfers between levels.
5. Repurchase Agreements
The Funds transfer uninvested cash balances into a single joint account, the daily aggregate balance of which is invested in one or more repurchase agreements collateralized by obligations of the U.S. Treasury and U.S. Government Agencies. The collateral is in the possession of the Funds’ custodian and is evaluated to ensure that its market value exceeds, at a minimum, 102% of the original face amount of the repurchase agreements. Each Fund holds a pro rata share of the collateral based on the dollar amount of the repurchase agreement entered into by each Fund.
THE GUGGENHEIM FUNDSANNUALREPORT | 47
NOTES TO CONSOLIDATED FINANCIAL STATEMENTS (continued)
At December 31, 2011, the collateral for the repurchase agreements in the joint account was as follows:
| | | | | | | | | | | | | | | | | | |
Counterparty and Terms of Agreement | | Face Value | | | Repurchase
Price | | | Collateral | | Par Value | | | Fair Value | |
Mizuho Financial Group, Inc. | | | | | | | | | | U.S. Treasury Note | | | | | | | | |
0.00% | | | | | | | | | | 3.125% | | | | | | | | |
Due 01/03/12 | | $ | 231,753,308 | | | $ | 231,753,308 | | | 05/15/21 | | $ | 210,634,300 | | | $ | 236,388,382 | |
Credit Suisse Group | | | | | | | | | | U.S. Treasury Note | | | | | | | | |
0.00% | | | | | | | | | | 1.75% | | | | | | | | |
Due 01/03/12 | | | 51,250,000 | | | | 51,250,000 | | | 05/31/16 | | | 49,884,700 | | | | 52,275,009 | |
HSBC Group | | | | | | | | | | U.S. Treasury STRIPS | | | | | | | | |
0.00% | | | | | | | | | | 0.00% | | | | | | | | |
Due 01/03/12 | | | 848,250,000 | | | | 848,250,000 | | | 08/15/12 - 11/15/22 | | | 930,569,800 | | | | 865,215,018 | |
Deutsche Bank | | | | | | | | | | U.S. Treasury Note | | | | | | | | |
0.00% | | | | | | | | | | 2.63% | | | | | | | | |
Due 01/03/12 | | | 123,250,000 | | | | 123,250,000 | | | 11/15/20 | | | 116,533,900 | | | | 125,715,013 | |
In the event of counterparty default, the Funds have the right to collect the collateral to offset losses incurred. There is potential loss to the Funds in the event the Funds are delayed or prevented from exercising their rights to dispose of the collateral securities, including the risk of a possible decline in the value of the underlying securities during the period while the Funds seek to assert their rights. The Funds’ investment advisor, acting under the supervision of the Board of Trustees, reviews the value of the collateral and the creditworthiness of those banks and dealers with which the Funds enter into repurchase agreements to evaluate potential risks.
6. Derivative Investment Holdings Categorized by Risk Exposure
U.S. generally accepted accounting principles requires disclosures to enable investors to better understand how and why the Funds use derivative instruments, how these derivatives instruments are accounted for and their effects on the Funds’ financial position and results of operations.
During the year ended December 31, 2011, the Funds invested in derivative instruments, including options, credit default swap agreements and futures for the following purposes:
| | | | | | | | | | |
Fund Name | | Index
Exposure | | Liquidity | | Hedging | | Income | | Speculation |
Long/Short Commodities Strategy Fund | | x | | x | | | | | | |
Multi-Hedge Strategies Fund | | | | | | x | | x | | x |
Commodities Strategy Fund | | x | | x | | | | | | |
The following table represents the notional amount of derivative instruments outstanding, as an approximate percentage of the Funds’ net assets on a daily basis, while the risk to the Fund is limited to the profit earned on such derivatives.
| | | | | | | | |
| | | Approximate
percentage of
Fund’s net
assets on a
daily basis | |
Fund | | Long | | | Short | |
Long/Short Commodities Strategy Fund | | | 30 | % | | | 100 | % |
Multi-Hedge Strategies Fund | | | 55 | % | | | 70 | % |
Commodities Strategy Fund | | | 100 | % | | | — | % |
The following is a summary of the location of derivative investments on the Funds’ Statements of Assets and Liabilities as of December 31, 2011:
Location on the Statements of Assets and Liabilities
| | | | |
Derivative Investments Type | | Asset Derivatives | | Liability Derivatives |
Equity/Commodity contracts | | Variation margin | | Variation margin |
Credit contracts | | Unrealized appreciation on swap agreements | | Unrealized depreciation on swap agreements |
48 | THE GUGGENHEIM FUNDSANNUALREPORT
NOTES TO CONSOLIDATED FINANCIAL STATEMENTS (continued)
The following table sets forth the fair value of the Funds’ derivative investments categorized by primary risk exposure at December 31, 2011:
| | | | | | | | | | | | | | | | |
Asset Derivative Investments Value | |
Fund | | Futures
Equity
Contracts* | | | Futures
Commodity
Contracts* | | | Credit
Default
Contracts | | | Total Value at
December 31,
2011 | |
Long/Short Commodities Strategy Fund | | $ | — | | | $ | 6,633,097 | | | $ | — | | | $ | 6,633,097 | |
Multi-Hedge Strategies Fund | | | 307,534 | | | | 1,726,489 | | | | 35,229 | | | | 2,069,252 | |
Commodities Strategy Fund | | | — | | | | — | | | | — | | | | — | |
| | | | | | | | | | | | | | | | |
Liability Derivative Investments Value | |
Fund | | Futures
Equity
Contracts* | | | Futures
Commodity
Contracts* | | | Credit
Default
Contracts | | | Total Value at
December 31,
2011 | |
Long/Short Commodities Strategy Fund | | $ | — | | | $ | 12,200,553 | | | $ | — | | | $ | 12,200,553 | |
Multi-Hedge Strategies Fund | | | 2,113,512 | | | | 1,803,648 | | | | — | | | | 3,917,160 | |
Commodities Strategy Fund | | | — | | | | 219,223 | | | | — | | | | 219,223 | |
| * | Includes cumulative appreciation (depreciation) of futures contracts as reported on the Schedules of Investments. Only current day’s variation margin is reported within the Statements of Assets and Liabilities. |
The following is a summary of the location of derivative investments on the Funds’ Statements of Operations for the year ended December 31, 2011:
| | |
Derivative Investment Type | | Location of Gain (Loss) on Derivatives |
| Equity/Interest Rate/Currency contracts | | Net realized gain (loss) on futures contracts |
| | Net change in unrealized appreciation (depreciation) on futures contracts |
| Commodity contracts | | Net realized gain (loss) on futures contracts |
| | Net realized gain (loss) on written option transactions |
| | Net change in unrealized appreciation (depreciation) on futures contracts |
| Credit contracts | | Net realized gain (loss) on swap agreements |
| | Net change in unrealized appreciation (depreciation) on swap agreements |
The following is a summary of the Funds’ realized gain (loss) and change in unrealized appreciation (depreciation) on derivative investments recognized on the Statements of Operations categorized by primary risk exposure for the year ended December 31, 2011:
| | | | | | | | | | | | | | | | | | | | | | | | | | | | |
Realized Gain (Loss) on Derivative Investments Recognized on the Statements of Operations | |
Fund | | Futures
Equity
Contracts | | | Written
Options
Commodity
Contracts | | | Futures
Commodity
Contracts | | | Futures
Interest
Rate
Contracts | | | Futures
Currency
Contracts | | | Credit
Default
Contracts | | | Total | |
Long/Short Commodities Strategy Fund | | $ | — | | | $ | 432,480 | | | $ | 16,729,604 | | | $ | — | | | $ | — | | | $ | — | | | $ | 17,162,084 | |
Multi-Hedge Strategies Fund | | | 1,197,506 | | | | — | | | | 2,728,690 | | | | 748,645 | | | | (58,053 | ) | | | (1,146 | ) | | | 4,615,642 | |
Commodities Strategy Fund | | | — | | | | — | | | | (185,759 | ) | | | — | | | | — | | | | — | | | | (185,759 | ) |
| | | | | | | | | | | | | | | | | | | | | | | | |
Change in Unrealized Appreciation (Depreciation) on Derivative Investments Recognized on the Statements of Operations | |
Fund | | Futures
Equity
Contracts | | | Futures
Commodity
Contracts | | | Futures
Interest
Rate
Contracts | | | Futures
Currency
Contracts | | | Credit
Default
Contracts | | | Total | |
Long/Short Commodities Strategy Fund | | $ | — | | | $ | (23,674,675 | ) | | $ | — | | | $ | — | | | $ | — | | | $ | (23,674,675 | ) |
Multi-Hedge Strategies Fund | | | (2,088,286 | ) | | | (2,029,455 | ) | | | 420,921 | | | | 2,488 | | | | 35,229 | | | | (3,659,103 | ) |
Commodities Strategy Fund | | | — | | | | (1,983,715 | ) | | | — | | | | — | | | | — | | | | (1,983,715 | ) |
THE GUGGENHEIM FUNDSANNUALREPORT | 49
NOTES TO CONSOLIDATED FINANCIAL STATEMENTS (continued)
7. Put Options Written
Transactions in options written during the year ended December 31, 2011, were as follows:
| | | | | | | | |
Long/Short Commodity Strategy Fund Written Put Options | | Number
of
Contracts | | | Premium
Amount | |
Balance at December 31, 2010 | | | — | | | $ | — | |
Options written | | | 1,200 | | | | 432,480 | |
Options terminated in closing purchase transactions | | | — | | | | — | |
Options expired | | | (1,200 | ) | | | (432,480 | ) |
Options exercised | | | — | | | | — | |
| | | | | | | | |
Balance at December 31, 2011 | | | — | | | | — | |
| | | | | | | | |
8. Disclosures about Credit Derivatives
Multi-Hedge Strategies Fund entered into credit default swaps as a seller of protection primarily to gain exposure similar to the high yield bond market. Credit default swaps are instruments which allow for the full or partial transfer of third party credit risk, with respect to a particular entity or entities, from one counterparty to the other. A seller of credit default swaps is selling credit protection or assuming credit risk with respect to the underlying entity or entities. If a credit event occurs, as defined under the terms of the swap agreement, the Fund will either (i) pay to the buyer of protection an amount equal to the notional amount of the swap and take delivery of the referenced obligation or underlying securities comprising the referenced index or (ii) pay a net settlement amount in the form of cash or securities equal to the notional amount of the swap less the recovery value of the referenced obligation or underlying securities comprising the referenced index. The Notional Principal reflects the maximum potential amount the Fund could be required to make as a seller of credit protection if a credit event occurs. As the seller of protection, the Fund receives periodic premium payments from the counterparty and may also receive or pay an upfront premium adjustment to the stated periodic premium. In the event a credit event occurs, an adjustment will be made to any upfront premiums that were received by a reduction of 1.00% per credit event.
The quoted market prices and resulting market values for credit default swap agreements on securities and credit indices serve as an indicator of the current status of the payment/performance risk and represent the likelihood of an expected liability (or profit) for the credit derivative had the notional amount of the swap agreement been closed/sold as of the period end. Increasing market values, in absolute terms when compared to the notional amount of the swap, represent a deterioration of the referenced entity’s credit soundness and a greater likelihood or risk of default or other credit event occurring as defined under the terms of the agreement.
The table on page 28 included in the Schedule of Investments summarizes the information with regard to sold protection on credit default swap contracts as of December 31, 2011.
9. Federal Income Tax Information
The Funds intend to comply with the provisions of Subchapter M of the Internal Revenue Code applicable to regulated investment companies and distribute substantially all taxable net investment income and capital gains sufficient to relieve them from all, or substantially all, federal income, excise and state income taxes. Therefore, no provision for federal or state income tax is required.
Tax positions taken or expected to be taken in the course of preparing the Funds’ tax returns are evaluated to determine whether the tax positions are “more-likely-than-not” of being sustained by the applicable tax authority. Tax positions not deemed to meet the more-likely-than-not threshold would be recorded as a tax benefit or expense in the current year. Management has analyzed the Funds’ tax positions taken on Federal income tax returns for all open tax years (fiscal years 2008-2011), and has concluded that no provision for income tax is required in the Funds’ financial statements.
The Long/Short Commodities Strategy Fund, the Multi-Hedge Strategies Fund, and the Commodities Strategy Fund intend to invest up to 25% of their assets in the Subsidiary which is expected to provide the Funds with exposure to the commodities markets within the limitations of the federal tax requirements under Subchapter M of the Internal Revenue Code. The Long/Short Commodities Strategy Fund, the Multi-Hedge Strategies Fund, and the Commodities Strategy Fund have received a private letter ruling from the IRS that concludes that the income the Funds receive from the Subsidiary will constitute qualifying income for purposes of Subchapter M of the Internal Revenue Code. The Subsidiary will be classified as a corporation for U.S. federal income tax purposes. A foreign corporation, such as the Subsidiary, will generally not be subject to U.S. federal income taxation unless it is deemed to be engaged in a U.S. trade or business.
50 | THE GUGGENHEIM FUNDSANNUALREPORT
NOTES TO CONSOLIDATED FINANCIAL STATEMENTS (continued)
The RIC Modernization Act of 2010 was signed into law on December 22, 2010 and seeks to simplify some of the tax provisions applicable to regulated investment companies and the tax reporting to their shareholders, and to improve the tax efficiency of certain fund structures. The changes are generally effective for taxable years beginning after the date of enactment.
One of the more prominent changes addresses capital loss carryforwards. Funds will be permitted to carry forward capital losses incurred in taxable years beginning after December 22, 2010 for an unlimited period. However, any losses incurred during those future taxable years will be required to be utilized prior to the losses incurred in pre-enactment taxable years. Under pre-enactment law, capital losses could be carried forward for eight years, and carried forward as short-term capital, irrespective of the character of the original loss. As a result of this ordering rule, pre-enactment capital loss carryforwards may potentially expire unused. Additionally, post-enactment capital losses that are carried forward will retain their character as either short-term or long-term capital losses rather than being considered all short-term as under previous law.
Tax basis capital losses in excess of capital gains are carried forward to offset future net capital gains. For the year ended December 31, 2011, the following capital loss carryforward amounts expired, were used, or were permanently lost due to loss limitation rules in Section 382 of the Internal Revenue Code:
| | | | |
Fund | | Amount | |
Multi-Hedge Strategies Fund | | $ | 3,845,543 | |
The tax character of distributions paid during the year ended December 31, 2011 was as follows:
| | | | | | | | | | | | | | | | |
Fund | | Ordinary
Income | | | Long-Term
Capital Gain | | | Return of
Capital | | | Total
Distributions | |
Long/Short Commodities Strategy Fund | | $ | 20,068,128 | | | $ | — | | | $ | — | | | $ | 20,068,128 | |
Multi-Hedge Strategies Fund | | | 740,871 | | | | — | | | | — | | | | 740,871 | |
Commodities Strategy Fund | | | 857,150 | | | | — | | | | — | | | | 857,150 | |
The tax character of distributions paid during the year ended December 31, 2010 was as follows:
| | | | | | | | | | | | | | | | |
Fund | | Ordinary
Income | | | Long-Term
Capital Gain | | | Return of
Capital | | | Total
Distributions | |
Long/Short Commodities Strategy Fund | | $ | 19,714,043 | | | $ | — | | | $ | 283,760 | | | $ | 19,997,803 | |
Multi-Hedge Strategies Fund | | | — | | | | — | | | | — | | | | — | |
Commodities Strategy Fund | | | — | | | | — | | | | — | | | | — | |
Note: For federal income tax purposes, short term capital gain distributions are treated as ordinary income distributions.
The tax character of distributable earnings/(accumulated losses) at December 31, 2011 was as follows:
| | | | | | | | | | | | | | | | |
Fund | | Undistributed
Ordinary
Income | | | Undistributed
Long-Term
Capital Gain | | | Net Unrealized
Depreciation | | | Capital Loss
Carryforward1 | |
Long/Short Commodities Strategy Fund | | $ | — | | | $ | — | | | $ | (53,324,226 | ) | | $ | (509,577 | ) |
Multi-Hedge Strategies Fund | | | — | | | | — | | | | (37,816 | ) | | | (54,423,049 | ) |
Commodities Strategy Fund | | | 797,248 | | | | — | | | | (2,988,153 | ) | | | (19,851,142 | ) |
Capital Loss Carryforward amounts may be limited due to Federal income tax regulations.
| 1 | A summary of the expiration of the aforementioned Capital Loss Carryforward is as follows: |
| | | | | | | | | | | | | | | | | | | | | | | | | | | | |
Fund | | Expires in
2015 | | | Expires in
2016 | | | Expires in
2017 | | | Expires in
2018 | | | Unlimited | | | Total
Capital Loss
Carryforward | |
| | | | | | Short
Term | | | Long
Term | | |
Long/Short Commodities Strategy Fund | | $ | — | | | $ | — | | | $ | — | | | $ | (509,577 | ) | | $ | — | | | $ | — | | | $ | (509,577 | ) |
Multi-Hedge Strategies Fund | | | (2,472,232 | ) | | | (43,334,928 | ) | | | (8,615,889 | ) | | | — | | | | | | | | — | | | | (54,423,049 | ) |
Commodities Strategy Fund | | | — | | | | — | | | | (19,850,783 | ) | | | — | | | | | | | | (359 | ) | | | (19,851,142 | ) |
THE GUGGENHEIM FUNDSANNUALREPORT | 51
NOTES TO CONSOLIDATED FINANCIAL STATEMENTS (continued)
Net investment income and net realized gains (losses) may differ for financial statement and tax purposes because of temporary or permanent book/tax differences. These differences are primarily due to post-October losses, losses deferred due to wash sales, foreign currency gains and losses, and the “mark-to-market” of certain passive foreign investment companies (PFICs) for tax purposes. Additional differences may result from the tax treatment of net investment losses and expired capital loss carryforwards. To the extent these differences are permanent, reclassifications are made to the appropriate equity accounts in the period that the differences arise. These reclassifications have no effect on net assets or NAV per share.
On the Statements of Assets and Liabilities, the following reclassifications were made for permanent book/tax differences:
| | | | | | | | | | | | |
Fund | | Paid In
Capital | | | Accumulated
Net Investment
Loss | | | Accumulated
Net Realized
Gain (Loss) | |
Long/Short Commodities Strategy Fund | | $ | 16,011,119 | | | $ | 1,150,965 | | | $ | (17,162,084 | ) |
Multi-Hedge Strategies Fund | | | 2,312,963 | | | | 302,769 | | | | (2,615,732 | ) |
Commodities Strategy Fund | | | (258,172 | ) | | | 66,794 | | | | 191,378 | |
At December 31, 2011, the cost of securities for Federal income tax purposes, the aggregate gross unrealized gain for all securities for which there was an excess of value over tax cost and the aggregate gross unrealized loss for all securities for which there was an excess of tax cost over value, were as follows:
| | | | | | | | | | | | | | | | |
Fund | | Tax Cost | | | Tax
Unrealized
Gain | | | Tax
Unrealized
Loss | | | Net
Unrealized
Loss | |
Long/Short Commodities Strategy Fund | | $ | 382,227,574 | | | $ | — | | | $ | (47,756,770 | ) | | $ | (47,756,770 | ) |
Multi-Hedge Strategies Fund | | | 98,091,501 | | | | 1,569,707 | | | | (1,710,608 | ) | | | (140,901 | ) |
Commodities Strategy Fund | | | 14,812,147 | | | | — | | | | (2,768,930 | ) | | | (2,768,930 | ) |
Pursuant to Federal income tax regulations applicable to investment companies, the Funds have elected to treat net capital losses realized between November 1 and December 31 of each year as occurring on the first day of the following tax year. For the year ended December 31, 2011, the following amounts of realized capital losses reflected in the accompanying financial statements will not be recognized for Federal income tax purposes until January 1, 2012:
| | | | |
Fund | | Capital | |
Multi-Hedge Strategies Fund | | $ | 176,275 | |
10. Securities Transactions
For the year ended December 31, 2011, the cost of purchases and proceeds from sales of investment securities, excluding short-term investments, were:
| | | | | | | | |
| | | Purchases | | | Sales | |
Multi-Hedge Strategies Fund | | $ | 78,796,555 | | | $ | 82,926,461 | |
Commodities Strategy Fund | | | — | | | | — | |
Long/Short Commodities Strategy Fund | | | — | | | | — | |
11. Line of Credit
The Trust, along with other affiliated trusts, has secured an uncommitted, $75,000,000 line of credit with U.S. Bank, N.A. for emergency or temporary purposes. Borrowings, if any, under this arrangement bear interest equal to the Prime Rate, minus 2%, which shall be paid monthly, averaging 1.25% for the year ended December 31, 2011. At December 31, 2011, the Funds did not have any borrowings under this agreement, which expires on June 15, 2012, but the following table illustrates average daily balances borrowed:
| | | | |
Fund | | Average
Daily
Balance | |
Long/Short Commodities Strategy Fund | | $ | 30,137 | |
Multi-Hedge Strategies Fund | | | 84,014 | |
52 | THE GUGGENHEIM FUNDSANNUALREPORT
NOTES TO CONSOLIDATED FINANCIAL STATEMENTS (concluded)
12. Legal Proceedings
Tribune Company
Rydex Series Funds has been named as a defendant and a putative member of the proposed defendant class of shareholders in the case entitled Official Committee of Unsecured Creditors of Tribune Co. v. FitzSimons (In re Tribune Co.), Adv. Pro. No. 10-54010 (Bankr. D. Del.), as a result of ownership of shares in the Tribune Company (“Tribune”) in 2007 by certain series of the Rydex Series Funds when Tribune effected a leveraged buyout transaction (“LBO”) by which Tribune converted to a privately-held company. In its complaint, the Unsecured Creditors Committee (the “UCC”) has alleged that, in connection with the LBO, insiders and major shareholders were overpaid for their Tribune stock using financing that the insiders knew would, and ultimately did, leave the Tribune insolvent. The UCC has asserted claims against certain insiders, major shareholders, professional advisers, and others involved in the LBO, and is attempting to obtain from these individuals and entities the proceeds paid out in connection with the LBO. This adversary proceeding in the Bankruptcy Court has been stayed pending further order of the Bankruptcy Court.
In June 2011, a group of Tribune creditors, not including the UCC, filed multiple actions involving state law constructive fraudulent conveyance claims against former Tribune shareholders. Rydex Series Funds also has been named as a defendant in one or more of these suits. These cases have been consolidated in a multidistrict litigation proceeding in the United States District Court for the Southern District of New York and have been stayed pending further order of that court or of the Bankruptcy Court.
None of these lawsuits allege any wrongdoing on the part of Rydex Series Funds. The following series of Rydex Series Funds held shares of Tribune and tendered these shares as part of Tribune’s LBO: Nova Fund, S&P 500 Pure Value Fund, Multi-Cap Core Equity Fund, S&P 500 Fund, Multi-Hedge Strategies Fund and Hedged Equity Fund (the “Funds”). The value of the proceeds received by the foregoing Funds was $28,220, $109,242, $9,860, $3,400, $1,181,160, and $10,880, respectively. At this stage of the proceedings, Rydex Series Funds is not able to make a reliable predication as to the outcome of these lawsuits or the effect, if any, on a Fund’s net asset value.
Lyondell Chemical Company
In December 2011, Rydex Series Funds was named as a defendant in Weisfelner, as Trustee of the LB Creditor Trust, v. Fund 1 (In re Lyondell Chemical Co.), Adv. Pro. No. 10-4609 (Bankr. S.D.N.Y.).
Similar to the claims made in the Tribune matter, the Weisfelner complaint seeks to have set aside and recovered as fraudulent transfers from former Lyondell Chemical Company (“Lyondell”) shareholders the consideration paid to them pursuant to the cash out merger of Lyondell shareholders in connection with the combination of Lyondell and Basell AF in 2007. Lyondell filed for bankruptcy in 2008.
This lawsuit does not allege any wrongdoing on the part of Rydex Series Funds. The following series of Rydex Series Funds received cash proceeds from the cash out merger in the following amounts: Basic Materials Fund — $ 1,725,168; U.S. Long Short Momentum Fund — $2,193,600; Global 130/30 Strategy Fund — $37,920; Hedged Equity Fund — $1,440; and Multi-Hedge Strategies Fund — $1,116,480. At this stage of the proceedings, Rydex Series Funds is not able to make a reliable predication as to the outcome of these lawsuits or the effect, if any, on a Fund’s net asset value.
THE GUGGENHEIM FUNDSANNUALREPORT | 53
REPORT OF INDEPENDENT REGISTERED PUBLIC ACCOUNTING FIRM
To the Board of Trustees and Shareholders
of the Rydex Series Funds:
We have audited the accompanying consolidated statements of assets and liabilities, including the consolidated schedules of investments, of Long/Short Commodities Strategy Fund, Multi-Hedge Strategies Fund, and Commodities Strategy Fund (three of the series constituting the Rydex Series Funds) (the “Funds”) as of December 31, 2011, and the related consolidated statements of operations for the year then ended, the consolidated statements of changes in net assets for each of the two years in the period then ended, and the financial highlights for each of the years or periods indicated therein (consolidated for the years or periods ended December 31, 2011, 2010, and 2009). These financial statements and financial highlights are the responsibility of the Funds’ management. Our responsibility is to express an opinion on these financial statements and financial highlights based on our audits.
We conducted our audits in accordance with the standards of the Public Company Accounting Oversight Board (United States). Those standards require that we plan and perform the audit to obtain reasonable assurance about whether the financial statements and financial highlights are free of material misstatement. We were not engaged to perform an audit of the Funds’ internal control over financial reporting. Our audits included consideration of internal control over financial reporting as a basis for designing audit procedures that are appropriate in the circumstances, but not for the purpose of expressing an opinion on the effectiveness of the Funds’ internal control over financial reporting. Accordingly, we express no such opinion. An audit also includes examining, on a test basis, evidence supporting the amounts and disclosures in the financial statements and financial highlights, assessing the accounting principles used and significant estimates made by management, as well as evaluating the overall financial statement presentation. Our procedures included confirmation of securities owned as of December 31, 2011, by correspondence with the custodian and brokers or by other appropriate auditing procedures where replies from brokers were not received. We believe that our audits provide a reasonable basis for our opinion.
In our opinion, the financial statements and financial highlights referred to above present fairly, in all material respects, the consolidated financial position of the above listed Funds, at December 31, 2011, the consolidated results of their operations for the year then ended, the consolidated changes in their net assets for each of the two years in the period then ended, and their financial highlights for each of the years or periods indicated therein (consolidated for the years or periods ended December 31, 2011, 2010, and 2009), in conformity with U.S. generally accepted accounting principles.

McLean, Virginia
February 28, 2012
54 | THE GUGGENHEIM FUNDSANNUALREPORT
OTHER INFORMATION (Unaudited)
Tax Information
This information is being provided as required by the Internal Revenue Code. Amounts shown may differ from those elsewhere in the report because of differences in tax and financial reporting practice.
Of the ordinary income distributions paid during the year, the following funds had the corresponding percentages qualify for the dividends received deduction for corporations:
| | | | |
Fund | | %
Qualifying | |
Multi-Hedge Strategies Fund | | | 100 | % |
Additionally, the following amounts of taxable ordinary income dividends paid during the fiscal year qualified for the lower income tax rate available to individuals under the Jobs and Growth Tax Relief Reconciliation Act of 2003.
| | | | |
Fund | | %
Qualifying | |
Multi-Hedge Strategies Fund | | | 100 | % |
Proxy Voting Information
A description of the policies and procedures that the Trust uses to determine how to vote proxies relating to securities held in the Funds’ portfolios is available, without charge and upon request, by calling 1.800.820.0888. This information is also available from the EDGAR database on the SEC’s website at http://www.sec.gov.
Information regarding how the Funds voted proxies relating to portfolio securities during the most recent 12-month period ended June 30 is available without charge, upon request, by calling 1.800.820.0888. The proxy statement is also available from the EDGAR database on the SEC’s website at http://www.sec.gov.
At a special meeting of shareholders held on January 5, 2012, the shareholders of the Funds approved a new investment advisory agreement between Rydex Series Trust and Security Investors, LLC. A description of the number of shares voted is as follows:
| | | | | | | | | | | | |
Fund | | Shares For | | | Shares
Against | | | Shares
Abstained | |
Long/Short Commodities Strategy Fund | | | 7,324,034 | | | | 110,271 | | | | 148,686 | |
Multi-Hedge Strategies Fund | | | 1,041,057 | | | | 40,036 | | | | 25,936 | |
Commodities Strategy Fund | | | 768,672 | | | | 33,100 | | | | 12,484 | |
At a special meeting of shareholders held on January 5, 2012, the shareholders of the Trust approved the election of nominees to the Board of Trustees. A description of the number of shares voted is as follows:
| | | | | | | | | | | | | | | | |
Donald C. Cacciapaglia | | | Corey A. Colehour | | | J. Kenneth Dalton | |
For | | | 1,443,600,902 | | | For | | | 1,444,213,017 | | | For | | | 1,444,422,997 | |
Withhold | | | 23,402,733 | | | Withhold | | | 22,790,618 | | | Withhold | | | 22,580,638 | |
Total | | | 1,467,003,635 | | | Total | | | 1,467,003,635 | | | Total | | | 1,467,003,635 | |
| | |
John O. Demaret | | | Richard M. Goldman | | | Werner E. Keller | |
For | | | 1,445,255,754 | | | For | | | 1,443,668,596 | | | For | | | 1,445,494,272 | |
Withhold | | | 21,747,881 | | | Withhold | | | 23,335,039 | | | Withhold | | | 21,509,363 | |
Total | | | 1,467,003,635 | | | Total | | | 1,467,003,635 | | | Total | | | 1,467,003,635 | |
| | |
Thomas F. Lydon | | | Patrick T. McCarville | | | Roger Somers | |
For | | | 1,444,219,448 | | | For | | | 1,445,357,772 | | | For | | | 1,443,486,735 | |
Withhold | | | 22,784,187 | | | Withhold | | | 21,645,863 | | | Withhold | | | 23,516,900 | |
Total | | | 1,467,003,635 | | | Total | | | 1,467,003,635 | | | Total | | | 1,467,003,635 | |
At a special meeting of shareholders held on January 5, 2012, the shareholders of the Funds also voted on whether to approve a “manager of managers” arrangement for each of the Funds. Although shareholder votes were placed, not enough votes were received to meet the minimum requirements to constitute a majority vote. As such the matter was closed.
Quarterly Portfolio Schedules Information
The Trust files its complete schedule of portfolio holdings with the SEC for the first and third quarters of each fiscal year on Form N-Q; which are available on the SEC’s website at http://www.sec.gov. The Funds’ Forms N-Q may be reviewed and copied at the SEC’s Public Reference Room in Washington, DC, and that information on the operation of the Public Reference Room may be obtained by calling 1-800-SEC-0330. Copies of the portfolio holdings are also available to shareholders, without charge and upon request, by calling 1.800.820.0888.
THE GUGGENHEIM FUNDSANNUALREPORT | 55
OTHER INFORMATION (Unaudited) (continued)
Office Locations
The offices of Guggenheim Investments can be found in the following locations:
40 East 52nd Street
16th Floor
New York, NY 10022
(Headquarters)
Four Irvington Centre
805 King Farm Boulevard
Suite 600
Rockville, MD 20850
9401 Indian Creek Parkway
40 Corporate Woods
Suite 850
Overland Park, KS 66210
Guggenheim Transaction
On September 20, 2011, Guggenheim Capital, LLC agreed to purchase the indirect holding company of Security Investors, LLC, the Funds’ investment manager (the “Investment Manager”) (the “Transaction”). Guggenheim Capital, LLC’s subsidiary, Guggenheim Partners, LLC (“Guggenheim”), is a global, independent, privately-held, diversified financial services firm with more than 1,500 dedicated professionals.
The Transaction should not result in material changes to the day-to-day management and operation of the Fund or any increase in fees. The parties expect the Transaction to be completed in early 2012. However, it is subject to various conditions, and could be delayed or even terminated due to unforeseen circumstances.
In anticipation of the Transaction, the Board of Trustees of the Funds (the “Board”) called a special meeting of shareholders (the “Meeting”), at which shareholders of the Funds of record as of October 3, 2011 were asked to consider the approval of a new investment management agreement between the Funds and the Investment Manager (the “New Agreement”). This approval was necessary because, under the Investment Company Act of 1940 (the “1940 Act”), the Transaction could result in the termination of the Funds’ current investment management agreement with the Investment Manager (the “Current Agreement”). The Funds’ shareholders approved the New Agreement, the terms of which are substantially identical to the corresponding Current Agreement, except with respect to the date of execution, and the New Agreements will take effect if the Transaction is completed.
Election of Board Members
The Board also approved a proposal to elect nine individuals to the Board. The Board proposed the election of the following nominees: Donald C. Cacciapaglia, Corey A. Colehour, J. Kenneth Dalton, John O. Demaret, Richard M. Goldman, Werner E. Keller, Thomas F. Lydon, Patrick T. McCarville and Roger Somers. Each of the nominees, other than Mr. Cacciapaglia, currently serves as a Trustee. In connection with the Transaction, the Board believes that expanding the Board to include Mr. Cacciapaglia, who is a member of senior management of Guggenheim’s investment management business, and who would serve on other board in the Guggenheim Investments family of funds, would be appropriate. The Trusts’ shareholders ultimately approved the aforementioned proposal.
Board Considerations in Approving the Investment Advisory Agreements
At an in-person meeting of the Trust’s Board of Trustees held August 16-17, 2011, called for the purpose of, among other things, voting on the approval of investment advisory agreements applicable to the series of the Trust (collectively, the “Funds”), the Trust’s Board of Trustees, including the independent Trustees, unanimously approved the investment advisory agreement between the Trust and Security Investors, LLC (referred to herein as the “Adviser”).
56 | THE GUGGENHEIM FUNDSANNUALREPORT
OTHER INFORMATION (Unaudited) (continued)
At the meeting of August 16-17, 2011, the Trust’s Board of Trustees also considered new investment advisory agreements that were required as a result of a proposed change in the corporate ownership structure of the Adviser (the “Transaction”). The Investment Company Act of 1940 (the “1940 Act”), the law that regulates mutual funds, including the Funds, requires that a fund’s investment advisory agreement terminate whenever there is deemed to be a “change in control” of the investment adviser. The change in the corporate ownership structure of the Adviser could potentially be deemed to constitute a “change in control” (as this term is used for regulatory purposes) of the Adviser. Before an investment advisory agreement terminates, a new investment advisory agreement must be in effect in order for the investment adviser to continue to manage the fund’s investments. For that reason, the Board of Trustees was asked to approve new investment advisory agreements for the Funds.
At the meeting of August 16-17, 2011, the Board considered the new investment advisory agreement, pursuant to which, subject to its approval by each Fund’s shareholders, the Adviser would continue to serve each Fund as investment adviser after the completion of the Transaction. At a special meeting of the Board held on September 14, 2011, the Board considered further information about the Transaction and voted in favor of the new investment advisory agreement.
In reaching the conclusion to approve the investment advisory agreement, the Trustees requested and obtained from the Adviser such information as the Trustees deemed reasonably necessary to evaluate the proposed agreement. The Trustees carefully evaluated this information and were advised by legal counsel with respect to their deliberations.
Prior to the Board meetings in August and September 2011, representatives of Guggenheim Capital informed the Board of the Transaction. With respect to the Transaction, the Board reviewed materials received from Guggenheim Capital, including information relating to the terms of the Transaction. The Board also reviewed information regarding Guggenheim Capital, including, but not limited to: (a) certain representations concerning Guggenheim Capital’s financial condition, (b) information regarding the new proposed ownership structure and its possible effect on shareholders, (c) information regarding the consideration to be paid by Guggenheim Capital, and (d) potential conflicts of interest.
In considering the new investment advisory agreement, the Board determined that the agreement would enable shareholders of the Funds to continue to obtain high quality services at a cost that is appropriate, reasonable, and in the best interests of their shareholders. The Board, including the independent Trustees, unanimously approved the new agreement. In reaching their decision, the Trustees carefully considered information that they had received throughout the year as part of their regular oversight of the Funds, including, in particular, information from the Adviser that the Board had received relating to the current investment advisory agreement at the Board meeting of August 16-17, 2011. The Trustees noted that, at the meeting, they had obtained and reviewed a wide variety of information, including certain comparative information regarding performance of the Funds relative to performance of other comparable mutual funds. They also considered the evolution of the Rydex|SGI family of funds and the Adviser since the change in control of the Investment Adviser in 2010 and Guggenheim Capital’s commitment to the success of the Adviser and the Funds.
In addition, as a part of their required consideration of the renewal of the current investment advisory agreement at the meeting of August 16-17, 2011, the Trustees, including the independent Trustees, had evaluated a number of considerations, including among others: (a) the quality of the Adviser’s investment advisory and other services; (b) the Adviser’s investment management personnel; (c) the Adviser’s operations and financial condition; (d) the Adviser’s brokerage practices (including any soft dollar arrangements) and investment strategies; (e) the level of the fees that the Adviser charges compared with the fees charged to comparable mutual funds or accounts; (f) each Fund’s overall fees and operating expenses compared with similar mutual funds; (g) the level of the Adviser’s profitability from its Fund-related operations; (h) the Adviser’s compliance systems; (i) the Adviser’s policies on and compliance procedures for personal securities transactions; (j) the Adviser’s reputation, expertise and resources in the financial markets; and (k) Fund performance compared with similar mutual funds. Based on the Board’s deliberations at the meetings of August 16-17, 2011 and September 14, 2011, and its evaluation of the information regarding the Transaction and the fact that the Transaction is not expected to change the level and quality of services rendered by the Adviser to any of the Funds, the Board, including all of the independent Trustees, unanimously: (a) concluded that terms of the current and new investment advisory agreements are fair and reasonable; (b) concluded that the Adviser’s fees were reasonable in light of the services that it provides to the Funds; and (c) agreed to approve the current investment advisory agreement and, subject to shareholder approval, the new investment advisory agreement, based upon the following considerations, among others:
| | • | | Nature, Extent and Quality of Services Provided by the Adviser. At the meeting of August 16-17, 2011, the Board reviewed the scope of services to be provided by the Adviser under the current investment advisory agreement, and, at the meetings of August 16-17, 2011 and September 14, 2011, noted that there would be no significant differences between the scope of services required to be provided by the Adviser under the current investment advisory agreement and the scope of services required to be provided by the Advisers under the new investment advisory agreement. The Board noted that the key investment and management personnel of the Adviser servicing the Funds are expected to remain the same following the Transaction. The Trustees also considered Guggenheim Capital’s representations to the Board that the Adviser would continue to provide investment and related services that were of materially the same quality and quantity as services provided to the Funds in the past, and that these services are appropriate in scope and extent in light of the Funds’ operations, the competitive landscape of the investment company business and investor needs. |
THE GUGGENHEIM FUNDSANNUALREPORT | 57
OTHER INFORMATION (Unaudited) (concluded)
| | • | | Fund Expenses and Performance of the Funds and the Adviser. At the meeting of August 16-17, 2011, the Board had reviewed statistical information prepared by the Adviser regarding the expense ratio components and performance of each Fund. Based on the representations made by Guggenheim Capital at the meeting that the Adviser would continue to operate following the closing of the Transaction in much the same manner as it currently operates, the Board concluded that the investment performance of the Adviser was not expected to be affected by the Transaction. |
| | • | | Costs of Services Provided to the Funds and Profits Realized by the Adviser and its Affiliates. At the meeting of August 16-17, 2011, the Board had reviewed information about the profitability of the Funds to the Adviser based on the advisory fees payable under the current investment advisory agreement. At that meeting, the Board had also analyzed the Funds’ expenses, including the investment advisory fees paid to the Adviser. The Board also had reviewed reports comparing the expense ratios to those of other comparable mutual funds. At the Board meeting, the Board considered the fact that the fee rates payable to the Adviser would be the same under each Fund’s new investment advisory agreement as they are under such Fund’s current agreement. With respect to anticipated profitability, the Board noted that it was too early to predict how the Transaction would affect the Adviser’s profitability with respect to the Funds, but noted that this matter would be given further consideration on an ongoing basis. |
| | • | | Economies of Scale. In connection with its review of the Funds’ profitability analysis at the meeting of August 16-17, 2011, the Board reviewed information regarding economies of scale or other efficiencies that may result from increases in the Funds’ asset levels. The Trustees noted that the fees would not change under the new investment advisory agreements, and that no additional economies of scale would be directly realized as a result of the Transaction. They also noted that they will have the opportunity to again review the appropriateness of the fees payable to the Adviser under the new agreement when the renewal of the new agreement comes before the Board. |
| | • | | Other Benefits to the Adviser and/or its Affiliates. In addition to evaluating the services provided by the Adviser, the Board had considered the nature, extent, quality and cost of the distribution services performed by the Funds’ Distributor under a separate agreement at the meeting of August 16-17, 2011. The Board reviewed information regarding potential economies of scale arising from the integration of the asset management businesses of Guggenheim Capital. The Board also considered the terms of the Transaction and the changes to the corporate ownership structure of the Adviser, noting that the Adviser would no longer be a subsidiary of Security Benefit Corporation. In this regard, the Board noted that, under the corporate structure after the Transaction, the Adviser would be more closely controlled by Guggenheim Capital, which could benefit Guggenheim Capital. The Board also noted that the costs associated with the Transaction would be borne by Guggenheim Capital (or its affiliates) and not the Funds. |
On the basis of the information provided to it and its evaluation of that information, the Board, including the independent Trustees, concluded that the terms of the investment advisory agreement for the Funds were reasonable, and that approval of the current and new investment advisory agreements were in the best interests of the Funds.
58 | THE GUGGENHEIM FUNDSANNUALREPORT
INFORMATION ON BOARD OF TRUSTEES AND OFFICERS (Unaudited)
A Board of Trustees oversees the Trust, as well as other trusts of Guggenheim Investments, in which its members have no stated term of service, and continue to serve after election until resignation. The Statement of Additional Information includes further information about Fund Trustees and Officers, and can be obtained without charge by calling 800.820.0888.
All Trustees and Officers may be reached c/o Guggenheim Investments, 805 King Farm Boulevard, Suite 600, Rockville, MD 20850.
INDEPENDENT TRUSTEES
| | | | |
Name, Position and Year of Birth | | Length of Service As Trustee (Year Began) | | Number of Funds Overseen |
| | |
| Corey A. Colehour | | | | |
| Trustee (1945) | | Rydex Series Funds – 1993 | | 150 |
| | Rydex Variable Trust – 1998 | | |
| | Rydex Dynamic Funds – 1999 | | |
| | Rydex ETF Trust – 2003 | | |
Principal Occupations During Past Five Years: Retired; Member of the Audit, Governance and Nominating Committees (1995 to present)
| | | | |
| J. Kenneth Dalton | | Rydex Series Funds – 1995 | | 150 |
| Trustee (1941) | | Rydex Variable Trust – 1998 | | |
| | Rydex Dynamic Funds – 1999 | | |
| | Rydex ETF Trust – 2003 | | |
Principal Occupations During Past Five Years: Retired; Member of the Governance and Nominating Committees (1995 to present); Chairman of the Audit Committee (1997 to present); Member of the Risk Oversight Committee (2010 to present)
| | | | |
| John O. Demaret | | Rydex Series Funds – 1997 | | 150 |
| Trustee, Chairman of the Board (1940) | | Rydex Variable Trust – 1998 | | |
| | Rydex Dynamic Funds – 1999 | | |
| | Rydex ETF Trust – 2003 | | |
Principal Occupations During Past Five Years: Retired; Member of the Audit Committee (1997 to present); Member of the Risk Oversight Committee (2010 to present)
| | | | |
| Werner E. Keller | | Rydex Series Funds – 2005 | | 150 |
| Trustee (1940) | | Rydex Variable Trust – 2005 | | |
| | Rydex Dynamic Funds – 2005 | | |
| | Rydex ETF Trust – 2005 | | |
Principal Occupations During Past Five Years: Founder and President of Keller Partners, LLC (registered investment adviser) (2005 to present); Member of the Audit, Governance and Nominating Committees (2005 to present); Chairman and Member of the Risk Oversight Committee (2010 to present)
| | | | |
| Thomas F. Lydon, Jr. | | Rydex Series Funds – 2005 | | 150 |
| Trustee (1960) | | Rydex Variable Trust – 2005 | | |
| | Rydex Dynamic Funds – 2005 | | |
| | Rydex ETF Trust – 2005 | | |
Principal Occupations During Past Five Years: President, Global Trends Investments (1996 to present); Member of the Audit, Governance and Nominating Committees (2005 to present)
| | | | |
| Patrick T. McCarville | | Rydex Series Funds – 1997 | | 150 |
| Trustee (1942) | | Rydex Variable Trust – 1998 | | |
| | Rydex Dynamic Funds – 1999 | | |
| | Rydex ETF Trust – 2003 | | |
Principal Occupations During Past Five Years: CEO, Par Industries, Inc., d/b/a Par Leasing (1977 to 2010); Chairman of the Governance and Nominating Committees (1997 to present); Member of the Audit Committee (1997 to present)
THE GUGGENHEIM FUNDSANNUALREPORT | 59
INFORMATION ON BOARD OF TRUSTEES AND OFFICERS (Unaudited) (continued)
INDEPENDENT TRUSTEES — continued
| | | | |
Name, Position and Year of Birth | | Length of Service As Trustee (Year Began) | | Number of Funds Overseen |
| | |
| Roger Somers | | Rydex Series Funds – 1993 | | 150 |
| Trustee (1944) | | Rydex Variable Trust – 1998 | | |
| | Rydex Dynamic Funds – 1999 | | |
| | Rydex ETF Trust – 2003 | | |
Principal Occupations During Past Five Years: Founder and CEO of Arrow Limousine (1965 to present); Member of the Audit, Governance and Nominating Committees (1995 to present)
EXECUTIVE OFFICERS
| | |
Name, Position and Year of Birth | | Principal Occupations During Past Five Years |
| |
Richard M. Goldman* President (1961) | | Current: Senior Vice President, Security Benefit Corporation; CEO, Security Benefit Asset Management Holdings, LLC; CEO, President and Manager Representative, Security Investors, LLC; CEO and Manager, Rydex Holdings, LLC; CEO, President and Manager, Rydex Distributors, LLC; Manager, Rydex Fund Services, LLC; President and Trustee, Rydex Series Funds, Rydex ETF Trust, Rydex Dynamic Funds and Rydex Variable Trust |
| |
| | Previous: Director, First Security Benefit Life Insurance Company (2007-2010); President and Director, Security Global Investors (2010-2011); CEO and Director, Rydex Advisors, LLC and Rydex Advisors II, LLC (2010); Director, Security Distributors, Inc. (2007-2009); Managing Member, R.M. Goldman Partners, LLC (2006-2007) |
| |
Michael P. Byrum* Vice President (1970) | | Current: President, Security Benefit Asset Management Holdings, LLC; Senior Vice President, Security Investors, LLC; President and Chief Investment Officer, Rydex Holdings, LLC; Director and Chairman of the Board, Advisor Research Center, Inc.; Manager, Rydex Specialized Products, LLC |
| |
| | Previous: Rydex Distributors, LLC (f/k/a Rydex Distributors, Inc.), Vice President (2009); Rydex Fund Services, LLC, Director (2009-2010), Secretary (2002-2010), Executive Vice President (2002-2006); Rydex Advisors, LLC (f/k/a PADCO Advisors, Inc.), Director (2008-2010), Chief Investment Officer (2006-2010), President (2004-2010), Secretary (2002-2010); Rydex Advisors II, LLC (f/k/a PADCO Advisors II, Inc.), Director (2008-2010), Chief Investment Officer (2006-2010), President (2004-2010), Secretary (2002-2010); Rydex Capital Partners, LLC, President and Secretary (2003-2007); Rydex Capital Partners II, LLC, (2003-2007); Rydex Holdings, LLC (f/k/a Rydex Holdings, Inc.), Secretary (2005-2008), Executive Vice President (2005-2006); Advisor Research Center, Inc., Secretary (2006-2009), Executive Vice President (2006); Rydex Specialized Products, LLC, Secretary (2005-2008) |
60 | THE GUGGENHEIM FUNDSANNUALREPORT
INFORMATION ON BOARD OF TRUSTEES AND OFFICERS (Unaudited) (continued)
EXECUTIVE OFFICERS — continued
| | |
Name, Position and Year of Birth | | Principal Occupations During Past Five Years |
| |
Nikolaos Bonos* Vice President and Treasurer (1963) | | Current: Senior Vice President, Security Investors, LLC; Chief Executive Officer and Manager, Rydex Specialized Products, LLC; Chief Executive Officer and President, Rydex Fund Services, LLC; Vice President, Rydex Holdings, LLC; Treasurer, SBL Fund; Security Equity Fund; Security Income Fund; Security Large Cap Value Fund and Security Mid Cap Growth Fund; Vice President, Security Benefit Asset Management Holdings, LLC |
| |
| | Previous: Security Global Investors, LLC, Senior Vice President (2010-2011); Rydex Advisors, LLC (f/k/a PADCO Advisors, Inc.) Senior Vice President (2006-2011); Rydex Fund Services, LLC (f/k/a Rydex Fund Services, Inc.), Director (2009) and Senior Vice President (2003-2006); Rydex Specialized Products, LLC, Chief Financial Officer (2005-2009) |
| |
Joanna M. Haigney* Chief Compliance Officer and Secretary (1966) | | Current: Chief Compliance Officer and Secretary, SBL Fund; Security Equity Fund; Security Income Fund; Security Large Cap Value Fund and Security Mid Cap Growth Fund; Vice President, Rydex Holdings, LLC; Vice President, Security Benefit Asset Management Holdings, LLC; Senior Vice President and Chief Compliance Officer, Security Investors, LLC |
| |
| | Previous: Security Global Investors, LLC, Senior Vice President (2010-2011); Rydex Advisors, LLC (f/k/a PADCO Advisors, Inc.) and Rydex Advisors II, LLC (f/k/a PADCO Advisors II, Inc.), Chief Compliance Officer and Senior Vice President (2010-2011); Rydex Capital Partners I, LLC and Rydex Capital Partners II, LLC, Chief Compliance Officer (2006-2007); Rydex Fund Services, LLC (f/k/a Rydex Fund Services, Inc.), Vice President (2001-2006) |
| |
Keith A. Fletcher* Vice President (1958) | | Current: Senior Vice President, Security Investors, LLC; Vice President, Rydex Holdings, LLC; Vice President, Rydex Specialized Products, LLC; Vice President, Rydex Distributors, LLC; Vice President, Rydex Fund Services, LLC; Vice President and Director, Advisor Research Center, Inc.; Vice President, SBL Fund; Security Equity Fund; Security Income Fund; Security Large Cap Value Fund and Security Mid Cap Growth Fund |
| |
| | Previous: Security Global Investors, LLC, Vice President (2010-2011); Rydex Advisors, LLC (f/k/a PADCO Advisors, Inc.) and Rydex Advisors II, LLC (f/k/a PADCO Advisors II, Inc.), Vice President (2009-2011); Lyster Watson and Company, Managing Director (2007-2008); Fletcher Financial Group, Inc., Chief Executive Officer (2004-2007) |
THE GUGGENHEIM FUNDSANNUALREPORT | 61
INFORMATION ON BOARD OF TRUSTEES AND OFFICERS (Unaudited) (concluded)
EXECUTIVE OFFICERS — concluded
| | |
Name, Position and Year of Birth | | Principal Occupations During Past Five Years |
| |
Amy J. Lee* Vice President and Assistant Secretary (1960) | | Current: Senior Vice President and Secretary, Security Investors, LLC; Secretary and Chief Compliance Officer, Security Distributors, Inc.; Vice President, Associate General Counsel and Assistant Secretary, Security Benefit Life Insurance Company and Security Benefit Corporation; Associate General Counsel, First Security Benefit Life Insurance and Annuity of New York; Vice President and Secretary, SBL Fund; Security Equity Fund; Security Income Fund; Security Large Cap Value Fund and Security Mid Cap Growth Fund; Vice President and Secretary, Rydex Holdings, LLC Secretary, Advisor Research Center, Inc., Rydex Specialized Products, LLC, Rydex Distributors, LLC and Rydex Fund Services, LLC; Assistant Secretary, Security Benefit Clinic and Hospital |
| |
| | Previous: Security Global Investors, LLC, Senior Vice President and Secretary (2007-2011); Rydex Advisors, LLC (f/k/a PADCO Advisors, Inc.) and Rydex Advisors II, LLC (f/k/a PADCO Advisors II, Inc.), Senior Vice President and Secretary (2010-2011); Brecek and Young Advisors, Inc., Director (2004-2008) |
| |
Joseph M. Arruda* Assistant Treasurer (1966) | | Current: Assistant Treasurer, SBL Fund, Security Equity Fund, Security Income Fund, Security Large Cap Value Fund, and Security Mid Cap Growth Fund; Vice President, Security Investors, LLC; Chief Financial Officer and Manager, Rydex Specialized Products, LLC |
| |
| | Previous: Security Global Investors, LLC, Vice President (2010-2011); Rydex Advisors, LLC (f/k/a PADCO Advisors, Inc.) and Rydex Advisors II, LLC (f/k/a PADCO Advisors II, Inc.), Vice President (2004-2011) |
| * | Officers of the Funds are deemed to be “interested persons” of the Trust, within the meaning of Section 2(a) (19) of the 1940 Act, inasmuch as this person is affiliated with Guggenheim Investments. |
62 | THE GUGGENHEIM FUNDSANNUALREPORT
GUGGENHEIM INVESTMENTS PRIVACY POLICIES
Rydex Funds, Guggenheim Funds, Rydex Investments, Rydex Distributors, Inc., Security Investors, LLC, Security Distributors, Inc. and Rydex Advisory Services (Collectively “Guggenheim Investments”)
Our Commitment to You
When you become a Guggenheim Investments investor, you entrust us with not only your hard-earned money but also with personal and financial information about you. We recognize that your relationship with us is based on trust and that you expect us to act responsibly and in your best interests. Because we have access to this private information about you, we hold ourselves to the highest standards in its safekeeping and use. This means, most importantly, that we do not sell client information to anyone — whether it is your personal information or if you are a current or former Guggenheim Investments client.
The Information We Collect About You
In the course of doing business with shareholders and investors, we collect nonpublic personal information about you. You typically provide personal information when you complete a Guggenheim Investments account application or when you request a transaction that involves Rydex and Guggenheim Investments funds or one of the Guggenheim Investments affiliated companies. “Nonpublic personal information” is personally identifiable private information about you. For example, it includes information regarding your name and address, Social Security or taxpayer identification number, assets, income, account balance, bank account information and investment activity (e.g., purchase and redemption history).
How We Handle Your Personal Information
As emphasized above, we do not sell information about current or former clients or their accounts to third parties. Nor do we share such information, except when necessary to complete transactions at your request or to make you aware of related investment products and services that we offer. Additional details about how we handle your personal information are provided below. To complete certain transactions or account changes that you direct, it may be necessary to provide identifying information to companies, individuals or groups that are not affiliated with Guggenheim Investments. For example, if you ask to transfer assets from another financial institution to Guggenheim Investments, we will need to provide certain information about you to that company to complete the transaction. To alert you to other Guggenheim Investments investment products and services, we may share your information within the Guggenheim Investments family of affiliated companies. This would include, for example, sharing your information within Guggenheim Investments so we can make you aware of new Rydex and Guggenheim Investments funds or the services offered through another Guggenheim Investments affiliated company. In certain instances, we may contract with nonaffiliated companies to perform services for us. Where necessary, we will disclose information we have about you to these third parties. In all such cases, we provide the third party with only the information necessary to carry out its assigned responsibilities and only for that purpose. And we require these third parties to treat your private information with the same high degree of confidentiality that we do. In certain instances, we may share information with other financial institutions regarding individuals and entities in response to the U.S.A. Patriot Act. Finally, we will release information about you if you direct us to do so, if we are compelled by law to do so or in other circumstances permitted by law.
Opt Out Provisions
We do not sell your personal information to anyone. The law allows you to “opt out” of only certain kinds of information sharing with third parties. The firm does not share personal information about you with any third parties that triggers this opt-out right. This means YOU ARE ALREADY OPTED OUT.
How We Protect Privacy Online
Our concern for the privacy of our shareholders also extends to those who use our web site, www.rydex-sgi.com. Our web site uses some of the most secure forms of online communication available, including encryption technology, Secure Socket Layer (SSL) protocol, firewalls and user names and passwords. These technologies provide a high level of security and privacy when you access your account information or initiate online transactions. The Guggenheim Investments web site offers customized features that require our use of “http cookies” — tiny pieces of information that we ask your browser to store. However, we make very limited use of these cookies. We only use cookies for session management and security features on the Guggenheim Investments web site. We do not use them to pull data from your hard drive, to learn your email address, or to view data in cookies created by other web sites. We will not share the information in our cookies or give others access to it. See the legal information area on our web site for more details about web site security and privacy features.
How We Safeguard Your Personal Information
We restrict access to nonpublic personal information about shareholders to our employees and in some cases to third parties (for example, the service providers described above) as permitted by law. We maintain strict physical, electronic and procedural safeguards that comply with federal standards to guard your nonpublic personal information.
We’ll Keep You Informed
As required by federal law, we will notify shareholders of our privacy policy annually. We reserve the right to modify this policy at any time, but rest assured that if we do change it, we will tell you promptly. You will also be able to access our privacy policy from our web site at www.rydex-sgi.com. Should you have any questions regarding our privacy policy, contact us at 800.820.0888 or 301.296.5100.
THE GUGGENHEIM FUNDSANNUALREPORT | 63
This page intentionally left blank.
This page intentionally left blank.
This page intentionally left blank.
This page intentionally left blank.
This page intentionally left blank.
This page intentionally left blank.

805 King Farm Boulevard, Suite 600
Rockville, MD 20850
www.rydex-sgi.com
800-820-0888
RDXSGIALT–ANN–1211x1212
Item 2. Code of Ethics.
The registrant’s Board of Trustees has adopted a code of ethics that applies to the registrant’s principal executive officer and principal financial officer. No substantive amendments were approved or waivers were granted to the Code during the period covered by this report. The Code is filed as an exhibit to this Form N-CSR.
Item 3. Audit Committee Financial Expert.
The registrant’s Board of Trustees has determined that Werner Keller, an “independent” Trustee serving on the registrant’s audit committee, is an “audit committee financial expert,” as defined in Item 3 of Form N-CSR. Under applicable securities laws, a person who is determined to be an audit committee financial expert will not be deemed an “expert” for any purpose, including without limitation for the purposes of Section 11 of the Securities Act of 1933, as a result of being designated or identified as an audit committee financial expert. The designation or identification of a person as an audit committee financial expert does not impose on such person any duties, obligations, or liabilities that are greater than the duties, obligations, and liabilities imposed on such person as a member of the audit committee and Board of Trustees in the absence of such designation or identification.
Item 4. Principal Accountant Fees and Services.
(a)-(d) The aggregate Audit Fees billed by the Trust’s principal accountant, for the audit of the annual financial statements in connection with statutory and regulatory filings for the fiscal years ended December 31, 2011 and December 31, 2010 were $73,437 and $71,123, respectively. The aggregate Audit Related Fees by the Trust’s principal accountant billed for the fiscal years ended December 31, 2011 and December 31, 2010 were $0 and $1,480, respectively. The aggregate Tax Fees billed by the Trust’s principal accountant for professional services rendered for tax compliance, tax advice, and tax planning, including preparation of tax returns and distribution assistance, for the fiscal years ended December 31, 2011 and December 31, 2010 was $9,216 and $0, respectively.
(e) The audit committee has adopted a policy whereby audit and non-audit services performed by the registrant’s principal accountant for the registrant, its investment advisor, and any entity controlling, controlled by, or under common control with the investment advisor that provides ongoing services to the registrant require pre-approval in advance at regularly scheduled audit committee meetings. If such service is required between regularly scheduled audit committee meetings, the chairman of the audit committee, J. Kenneth Dalton, is authorized to pre-approve the service with full committee approval at the next scheduled meeting. There shall be no waivers of the pre-approval process. No services described in (b)-(d) above were approved pursuant to paragraph (c)(7)(i)(C) of Rule 2-01 of Regulation S-X.
(f) Not applicable.
(g) The aggregate non-audit fees billed by the registrant’s accountant for the most recent fiscal year and the preceding fiscal year for services rendered to the registrant, the investment advisor, and any entity controlling, controlled by, or under common control with the advisor that provides ongoing services to the registrant were $39,216 and $0, respectively. These aggregate fees were less than the aggregate fees billed for the same periods by the registrant’s principal accountant for audit services rendered to the registrant, the investment advisor, and any entity controlling, controlled by, or under common control with the advisor that provides ongoing services to the registrant.
(h) All non-audit services rendered in (g) above were pre-approved by the registrant’s audit committee. As such, the audit committee has considered these services in maintaining the principal accountant’s independence.
Item 5. Audit Committee of Listed Registrants.
Not applicable.
Item 6. Investments.
Schedule of Investments is included as part of the report to shareholders filed under Item 1 of this form.
Item 7. Disclosure of Proxy Voting Policies and Procedures for Closed-End Management Investment Companies.
Not applicable.
Item 8. Portfolio Managers of Closed-End Management Investment Companies.
Not applicable.
Item 9. Purchases of Equity Securities by Closed-End Management Investment Company and Affiliated Purchasers.
Not applicable.
Item 10. Submission of Matters to a Vote of Security Holders.
Not applicable.
Item 11. Controls and Procedures.
(a) The registrant’s President (principal executive officer) and Treasurer (principal financial officer) have evaluated the registrant’s disclosure controls and procedures within 90 days of this filing and have concluded that the registrant’s disclosure controls and procedures were effective as of that date in ensuring that information required to be disclosed by the registrant in this Form N-CSR was recorded, processed, summarized, and reported timely.
(b) The registrant’s principal executive officer and principal financial officer are aware of no change in the registrant’s internal control over financial reporting that occurred during the registrant’s second fiscal quarter covered by this report that has materially affected, or is reasonably likely to materially affect, the registrant’s internal control over financial reporting.
Item 12. Exhibits.
(a)(1) The registrant’s code of ethics pursuant to Item 2 of Form N-CSR is attached.
(a)(2) Separate certifications by the President (principal executive officer) and Treasurer (principal financial officer) of the registrant as required by Rule 30a-2(a) under the Act (17 CFR 270.30a-2(a)) are attached.
(b) A certification by the registrant’s President (principal executive officer) and Treasurer (principal financial officer) as required by Rule 30a-2(b) under the Act (17 CFR 270.30a-2(b)) is attached.
SIGNATURES
Pursuant to the requirements of the Securities Exchange Act of 1934 and the Investment Company Act of 1940, the registrant has duly caused this report to be signed on its behalf by the undersigned, thereunto duly authorized.
(Registrant) Rydex Series Funds
| | | | |
| By (Signature and Title)* | | /s/ Richard M. Goldman | | |
| | Richard M. Goldman, President | | |
Date March 09, 2012
Pursuant to the requirements of the Securities Exchange Act of 1934 and the Investment Company Act of 1940, this report has been signed below by the following persons on behalf of the registrant and in the capacities and on the dates indicated.
| | | | |
| By (Signature and Title)* | | /s/ Richard M. Goldman | | |
| | Richard M. Goldman, President | | |
Date March 09, 2012
| | | | |
| By (Signature and Title)* | | /s/ Nikolaos Bonos | | |
| | Nikolaos Bonos, Vice President and Treasurer | | |
Date March 09, 2012
| * | Print the name and title of each signing officer under his or her signature. |