UNITED STATES
SECURITIES AND EXCHANGE COMMISSION
Washington, D.C. 20549
FORM N-CSR
CERTIFIED SHAREHOLDER REPORT OF REGISTERED
MANAGEMENT INVESTMENT COMPANIES
Investment Company Act file number 811- 07584
Rydex Series Funds
(Exact name of registrant as specified in charter)
805 King Farm Boulevard, Suite 600
Rockville, Maryland 20850
(Address of principal executive offices) (Zip code)
Amy J. Lee
Rydex Series Funds
805 King Farm Boulevard, Suite 600
Rockville, Maryland 20850
(Name and address of agent for service)
Registrant's telephone number, including area code: 1-301-296-5100
Date of fiscal year end: December 31
Date of reporting period: December 31, 2015
Form N-CSR is to be used by management investment companies to file reports with the Commission not later than 10 days after the transmission to stockholders of any report that is required to be transmitted to stockholders under Rule 30e-1 under the Investment Company Act of 1940 (17 CFR 270.30e-1). The Commission may use the information provided on Form N-CSR in its regulatory, disclosure review, inspection, and policymaking roles.
A registrant is required to disclose the information specified by Form N-CSR, and the Commission will make this information public. A registrant is not required to respond to the collection of information contained in Form N-CSR unless the Form displays a currently valid Office of Management and Budget ("OMB") control number. Please direct comments concerning the accuracy of the information collection burden estimate and any suggestions for reducing the burden to Secretary, Securities and Exchange Commission, 450 Fifth Street, NW, Washington, DC 20549-0609. The OMB has reviewed this collection of information under the clearance requirements of 44 U.S.C. § 3507.
Item 1. Reports to Stockholders.
The registrant’s annual report transmitted to shareholders pursuant to Rule 30e-1 under the Investment Company Act of 1940, as amended (the “Investment Company Act”), is as follows:
12.31.15
Guggenheim Funds Annual Report
Guggenheim Alternative Fund |
Guggenheim Multi-Hedge Strategies Fund |
Rydex Commodities Fund |
Rydex Commodities Strategy Fund |
RDXSGIALT-ANN-1215x1216 | guggenheiminvestments.com |

DEAR SHAREHOLDER | 2 |
ECONOMIC AND MARKET OVERVIEW | 4 |
ABOUT SHAREHOLDERS’ FUND EXPENSES | 7 |
ALTERNATIVE FUND | |
MULTI-HEDGE STRATEGIES FUND | 10 |
COMMODITIES FUND | |
COMMODITIES STRATEGY FUND | 49 |
NOTES TO CONSOLIDATED FINANCIAL STATEMENTS | 61 |
REPORT OF INDEPENDENT REGISTERED PUBLIC ACCOUNTING FIRM | 88 |
OTHER INFORMATION | 89 |
INFORMATION ON BOARD OF TRUSTEES AND OFFICERS | 90 |
GUGGENHEIM INVESTMENTS PRIVACY POLICIES | 95 |
| | THE GUGGENHEIM FUNDS ANNUAL REPORT | 1 |
Dear Shareholder:
Security Investors, LLC (the “Investment Adviser”) is pleased to present the annual shareholder report for one alternative strategy fund and one commodities fund (the “Funds”) that are part of the Rydex Series Funds. This report covers performance of the Funds for the annual period ended December 31, 2015.
The Investment Adviser is a part of Guggenheim Investments, which represents the investment management businesses of Guggenheim Partners, LLC (“Guggenheim”), a global, diversified financial services firm.
Guggenheim Funds Distributors, LLC is the distributor of the Funds. Guggenheim Funds Distributors, LLC is affiliated with Guggenheim and the Investment Adviser.
We encourage you to read the Economic and Market Overview section of the report, which follows this letter, and then the Performance Report and Fund profile for each Fund.
We are committed to providing innovative investment solutions and appreciate the trust you place in us.
Sincerely,

Donald C. Cacciapaglia
President
January 31, 2016
Read a prospectus and summary prospectus (if available) carefully before investing. It contains the investment objectives, risks, charges, expenses and other information, which should be considered carefully before investing. Obtain a prospectus and summary prospectus (if available) at guggenheiminvestments.com or call 800.820.0888.
The Multi-Hedge Strategies Fund is subject to a number of risks and may not be suitable for all investors. ● The Fund’s use of derivatives such as futures, options and swap agreements may expose the Fund to additional risks that it would not be subject to if it invested directly in the securities underlying those derivatives. ● The more the Fund invests in leveraged instruments, the more the leverage will magnify any gains or losses on those investments. ● The Fund’s use of short selling involves increased risks and costs. The Fund risks paying more for a security than it received from its sale. ● The Fund’s investments in high yield securities and unrated securities of similar credit quality
2 | THE GUGGENHEIM FUNDS ANNUAL REPORT | |
(“junk bonds”) may be subject to greater levels of interest rate, credit and liquidity risk than funds that do not invest in such securities. ● The Fund’s fixed income investments will change in value in response to interest rate changes and other factors. ● The fund’s exposure to the commodity and currency markets may subject the fund to greater volatility as commodity- and currency-linked derivative investments may be affected by changes in overall market movements, commodity index volatility, changes in interest rates or factors affecting a particular industry, commodity or currency—such as droughts, floods, weather, livestock disease, embargoes, tariffs and international economic, political and regulatory developments. The fund may also incur transaction costs with the conversion between various currencies. ● The Fund’s exposure to foreign currencies subjects the fund to the risk that those currencies will decline in value relative to the U.S. dollar, or, in the case of short positions, that the U.S. dollar will decline in value relative to the currency being hedged. ● These risks may cause the Fund to experience higher losses and/or volatility than a fund that does not invest in derivatives, use leverage or short sales or have exposure to high yield/fixed income securities, foreign currencies and/or securities. ● This Fund is considered non-diversified and can invest a greater portion of its assets in securities of individual issuers than a diversified fund. As a result, changes in the market value of a single security could cause greater fluctuations in the value of Fund shares than would occur in a more diversified Fund. ● Please read the prospectus for more detailed information regarding these and other risks.
The Commodities Strategy Fund is subject may not be suitable for all investors. ● The Fund’s exposure to the commodity markets may subject the fund to greater volatility as commodity-linked investments may be affected by changes in overall market movements, commodity index volatility, changes in interest rates or factors affecting a particular industry or commodity—such as droughts, floods, weather, embargos, tariffs and international economic, political and regulatory developments. ● To the extent that the fund’s investments are concentrated in energy-related commodities, the fund is subject to the risk that this sector will underperform the market as a whole. ● The fund’s use of derivatives, such as futures, options, structured notes and swap agreements, may expose the fund to additional risks that it would not be subject to if it invested directly in the securities or investments underlying those derivatives. ● The more the Fund invests in leveraged instruments, the more the leverage will magnify any gains or losses on those investments. ● The fund is subject to tracking error risks, which may cause the fund’s performance not to match that of or be lower than the fund’s underlying benchmark. ● The fund’s investments in other investment companies subjects the fund to those risks affecting the investment company, including the possibility that the value of the underlying securities held by the investment company could decrease. Moreover, the fund will incur its pro rata share of the expenses of the underlying investment companies’ expenses. ●This fund is considered non-diversified and can invest a greater portion of its assets in securities of individual issuers than a diversified fund. As a result, changes in the market value of a single security could cause greater fluctuations in the value of fund shares than would occur in a more diversified fund. ● See the prospectus for more information on these and additional risks.
| | THE GUGGENHEIM FUNDS ANNUAL REPORT | 3 |
ECONOMIC AND MARKET OVERVIEW (Unaudited) | December 31, 2015 |
As of December 16, 2015, the meeting of the Federal Open Market Committee of the U.S. Federal Reserve (the “Fed”) resulted in the Fed raising its target Federal Funds Rate by 25 basis points, its first hike in seven years. This decision to tighten monetary policy was in recognition that growth in the U.S. economy is sufficient to meet expectations in the current recovery. Historically, the period when the Fed begins to tighten leads to an initial sell-off in the bond market, as investors brace themselves for the ill-effects of restrictive monetary policy on the economy. Then, as investors realize the Fed is raising rates because the economy is strong, the fear of defaults diminishes and credit spreads tighten again.
The good news is that, while the U.S. economy may not be fast moving, it certainly has a lot of torque. This is creating strong tailwinds as we move into 2016. MasterCard Advisors’ data on holiday spending indicates that sales were up nearly 8% year over year. All told, the risk to fourth-quarter gross domestic product (“GDP”) is probably to the upside, even as most tracking estimates have been trimmed to around 1%. In addition, the El Niño weather pattern is moving into its most impactful period. Our research indicates that a strong El Niño can add 1% or more to GDP in the first quarter of the year.
A factor after the end of the period was market volatility, spurred by concerns over the price of oil and increasing anxiety over global growth. It was marked by turmoil across asset classes, with heavy drawdowns in a variety of indexes and geographies in the first half of January. The sell-off was brutal and unexpected, but initially there was not a corresponding spike in the key measure of equity market volatility, the VIX. However, the sell-off occurred in what is historically a seasonally strong time for equities, and the VIX did start to rise in January.
In China, the likely catalyst for the volatile start to the equity market in 2016 was the pending expiration of an insider selling ban. The ban was extended in response to the sell-off, but as expiring restrictions enable market participants to finally escape unwanted positions, a sell-off is inevitable. China’s problems extend beyond political interference in the markets and, despite attempts by policy-makers to quiet the turmoil, we expect to see more volatility. Chinese policymakers have also been struggling to protect the renminbi. Allowing it to depreciate in the short run could be negative for markets—particularly Chinese risk assets, and by extension, U.S. risk assets, as well as falling dollar prices for commodities, given China is a main consumer of commodities. In the long run, a depreciation would be positive for the Chinese manufacturing sector and European producers, who have significant exports to China.
4 | THE GUGGENHEIM FUNDS ANNUAL REPORT | |
ECONOMIC AND MARKET OVERVIEW (Unaudited)(continued) | December 31, 2015 |
Meanwhile, the persistent weakness in oil continues to exert its negative influence on all markets, especially corporate credit. Oil prices likely have further to fall: not until it reaches approximately $25 per barrel will we begin to see oil production shuttered, which should then set the stage to stabilize the energy sector.
The next few months are likely to be extremely volatile as markets continue to digest the sell-off that began 2016. However, monetary conditions remain highly supportive for global economic growth, despite the Federal Reserve’s recent actions. The index of leading economic indicators, comprised of 10 components whose changes typically precede changes in the U.S. economy, remains in positive territory and shows no warning signs of recession.
Additionally, if market turmoil continues, and lower oil prices dampen headline inflation, the Fed may delay further rate increases. Given strong employment growth and continued wage growth, along with a stimulative fiscal policy now in place, the U.S. economy is likely to thrive in 2016.
For the year ended December 31, 2015, the Standard & Poor’s 500® (“S&P 500”) Index* returned 1.38%. The Morgan Stanley Capital International (“MSCI”) Europe-Australasia-Far East (“EAFE”) Index* returned -0.81%. The return of the MSCI Emerging Markets Index* was -14.92%.
In the bond market, the Barclays U.S. Aggregate Bond Index* posted a 0.55% return for the period, while the Barclays U.S. Corporate High Yield Index* returned -4.47%. The return of the Bank of America (“BofA”) Merrill Lynch 3-Month U.S. Treasury Bill Index* was 0.05% for the 12-month period.
The opinions and forecasts expressed may not actually come to pass. This information is subject to change at any time, based on market and other conditions, and should not be construed as a recommendation of any specific security or strategy.
*Index Definitions:
The following indices are referenced throughout this report. Indices are unmanaged and not available for direct investment. Index performance does not reflect transaction costs, fees, or expenses.
Barclays U.S. Aggregate Bond Index is a broad-based benchmark that measures the investment grade, U.S. dollar denominated, fixed-rate taxable bond market, including U.S. Treasuries, government-related and corporate securities, MBS (agency fixed-rate and hybrid ARM pass-throughs), ABS, and CMBS.
Barclays U.S. Corporate High Yield Index measures the market of U.S. dollar-denominated, non-investment grade, fixed-rate, taxable corporate bonds. Securities are classified as high yield if the middle rating of Moody’s, Fitch, and S&P is Ba1/BB +/BB + or below.
BofA Merrill Lynch 3-Month U.S. Treasury Bill Index is an unmanaged market index of U.S. Treasury securities maturing in 90 days that assumes reinvestment of all income.
| | THE GUGGENHEIM FUNDS ANNUAL REPORT | 5 |
ECONOMIC AND MARKET OVERVIEW (Unaudited)(concluded) | December 31, 2015 |
MSCI EAFE Index is a free float-adjusted market capitalization index that is designed to measure the equity market performance of developed markets, excluding the U.S. & Canada.
MSCI Emerging Markets Index is a free float-adjusted market capitalization weighted index that is designed to measure equity market performance in the global emerging markets.
S&P 500®Index is a capitalization-weighted index of 500 stocks designed to measure the performance of the broad economy, representing all major industries and is considered a representation of the U.S. stock market.
S&P Goldman Sachs Commodity Index (“GSCI”)™, a benchmark for investment performance in the commodity markets, measures investable commodity price movements and inflation in the world economy. The index is calculated primarily on a world production weighted basis and is comprised of the principal physical commodities that are the subject of active, liquid futures markets.
HFRX Global Hedge Fund Index is designed to be representative of the overall composition of the hedge fund universe. It is comprised of all eligible hedge fund strategies, including, but not limited to, convertible arbitrage, distressed securities, equity hedge, equity market neutral, event driven, macro, merger arbitrage and relative-value arbitrage. The strategies are asset weighted based on the distribution of assets in the hedge fund industry.
6 | THE GUGGENHEIM FUNDS ANNUAL REPORT | |
ABOUT SHAREHOLDERS’ FUND EXPENSES (Unaudited) |
All mutual funds have operating expenses and it is important for our shareholders to understand the impact of costs on their investments. Shareholders of a Fund incur two types of costs: (i) transaction costs, including sales charges (loads) on purchase payments, reinvested dividends, or other distributions; and exchange fees; and (ii) ongoing costs, including management fees, administrative services, and shareholder reports, among others. These ongoing costs, or operating expenses, are deducted from a fund’s gross income and reduce the investment return of the fund.
A fund’s expenses are expressed as a percentage of its average net assets, which is known as the expense ratio. The following examples are intended to help investors understand the ongoing costs (in dollars) of investing in a Fund and to compare these costs with the ongoing costs of investing in other mutual funds.
The examples are based on an investment of $1,000 made at the beginning of the period and held for the entire six-month period beginning June 30, 2015 and ending December 31, 2015.
The following tables illustrate a Fund’s costs in two ways:
Table 1. Based on actual Fund return. This section helps investors estimate the actual expenses paid over the period. The “Ending Account Value” shown is derived from the Fund’s actual return, and the fourth column shows the dollar amount that would have been paid by an investor who started with $1,000 in the Fund. Investors may use the information here, together with the amount invested, to estimate the expenses paid over the period. Simply divide the Fund’s account value by $1,000 (for example, an $8,600 account value divided by $1,000 = 8.6), then multiply the result by the number provided under the heading “Expenses Paid During Period.”
Table 2. Based on hypothetical 5% return. This section is intended to help investors compare a Fund’s cost with those of other mutual funds. The table provides information about hypothetical account values and hypothetical expenses based on the Fund’s actual expense ratio and an assumed rate of return of 5% per year before expenses, which is not the Fund’s actual return. The hypothetical account values and expenses may not be used to estimate the actual ending account balance or expenses paid during the period. The example is useful in making comparisons because the U.S. Securities and Exchange Commission (the “SEC”) requires all mutual funds to calculate expenses based on the 5% return. Investors can assess a Fund’s costs by comparing this hypothetical example with the hypothetical examples that appear in shareholder reports of other funds.
| | THE GUGGENHEIM FUNDS ANNUAL REPORT | 7 |
ABOUT SHAREHOLDERS’ FUND EXPENSES (Unaudited)(continued) |
The calculations illustrated above assume no shares were bought or sold during the period. Actual costs may have been higher or lower, depending on the amount of investment and the timing of any purchases or redemptions.
Please note that the expenses shown in the table are meant to highlight your ongoing costs only and do not reflect any transactional costs, such as sales charges (loads) on purchase payments, and contingent deferred sales charges (“CDSC”) on redemptions, if any. Therefore, the second table is useful in comparing ongoing costs only, and will not help you determine the relative total costs of owning different funds. In addition, if these transactional costs were included, your costs would have been higher.
More information about a Fund’s expenses, including annual expense ratios for the past five years, can be found in the Financial Highlights section of this report. For additional information on operating expenses and other shareholder costs, please refer to the appropriate Fund prospectus.
8 | THE GUGGENHEIM FUNDS ANNUAL REPORT | |
ABOUT SHAREHOLDERS’ FUND EXPENSES (Unaudited)(concluded) |
| | Expense
Ratio1 | Fund
Return | Beginning
Account Value
June 30,
2015 | Ending
Account Value
December 31,
2015 | Expenses
Paid During
Period2 |
Table 1. Based on actual Fund return3 |
Multi-Hedge Strategies Fund | | | | | |
A-Class | 2.58% | 1.04% | $1,000.00 | $1,010.40 | $13.07 |
C-Class | 3.31% | 0.67% | 1,000.00 | 1,006.70 | 16.74 |
P-Class | 2.57% | 1.08% | 1,000.00 | 1,010.80 | 13.03 |
Institutional Class | 2.32% | 1.15% | 1,000.00 | 1,011.50 | 11.76 |
Commodities Strategy Fund | | | | | |
A-Class | 1.66% | (33.88%) | 1,000.00 | 661.20 | 6.95 |
C-Class | 2.30% | (34.04%) | 1,000.00 | 659.60 | 9.62 |
H-Class | 1.64% | (33.84%) | 1,000.00 | 661.60 | 6.87 |
| |
Table 2. Based on hypothetical 5% return (before expenses) |
Multi-Hedge Strategies Fund | | | | | |
A-Class | 2.58% | 5.00% | $1,000.00 | $1,012.20 | $13.09 |
C-Class | 3.31% | 5.00% | 1,000.00 | 1,008.52 | 16.76 |
P-Class | 2.57% | 5.00% | 1,000.00 | 1,012.25 | 13.03 |
Institutional Class | 2.32% | 5.00% | 1,000.00 | 1,013.51 | 11.77 |
Commodities Strategy Fund | | | | | |
A-Class | 1.66% | 5.00% | 1,000.00 | 1,016.84 | 8.44 |
C-Class | 2.30% | 5.00% | 1,000.00 | 1,013.61 | 11.67 |
H-Class | 1.64% | 5.00% | 1,000.00 | 1,016.94 | 8.34 |
1 | Annualized and excludes expenses of the underlying funds in which the Funds invest. This ratio represents net expenses, which include interest and dividend expenses related to securities sold short. Excluding short interest and dividend expenses, the operating expense ratio of the Multi-Hedge Strategies Fund would be 1.45%, 2.20%, 1.45% and 1.20% for the A-Class, C-Class, P-Class and Institutional Class, respectively. |
2 | Expenses are equal to the Fund's annualized expense ratio, net of any applicable fee waivers, multiplied by the average account value over the period, multiplied by 184/365 (to reflect the one-half year period). |
3 | Actual cumulative return at net asset value for the period June 30, 2015 to December 31, 2015. |
| | THE GUGGENHEIM FUNDS ANNUAL REPORT | 9 |
PERFORMANCE REPORT AND FUND PROFILE (Unaudited) | December 31, 2015 |
MULTI-HEDGE STRATEGIES FUND
OBJECTIVE: Seeks to provide long-term capital appreciation with less risk than traditional equity funds.
2015 was the sixth full fiscal year of performance since the Fund’s objective was changed from hedge fund replication to capital appreciation. The Fund seeks capital appreciation with low correlation to equity and fixed income markets, while doing so with low risk–typically in the 5.0% to 8.0% range. For the year, the Institutional Class of the Fund produced a return of 1.44% with annualized risk of 3.3%, which resulted in a Sharpe Ratio* greater than 0.50. Importantly, the Fund achieved this return with correlation** of 55% to the S&P 500 Index and 12% to the Barclays U.S. Aggregate Bond Index over the course of the year.
The S&P 500 had six negative-return calendar months in 2015, and in four of these months the Multi-Hedge Strategies Fund produced positive returns; the Barclays U.S. Aggregate Bond Index had seven negative-return calendar months, and in four of these months the Fund produced a positive return. The S&P 500 beta-adjusted performance (i.e., alpha) of Multi-Hedge Strategies for the year was 1.58%, as the Fund had a realized beta of 12%. These results further demonstrate the Fund’s diversification benefits. Diversification neither assures a profit nor eliminates the risk of experiencing investment losses.
While no longer a hedge fund replication product, the Fund still maintains the HFRX Global Hedge Fund Index as one of its benchmarks. This benchmark returned -3.64% for the year. In contrast to the diversification benefits provided by the Multi-Hedge Strategies Fund, the HFRX Global Hedge Fund Index had a correlation of 78% to the S&P 500 in 2015. Since the Fund changed its investment objective (starting 8/1/2009), it has outperformed the HFRX Global Hedge Fund Index by more than 13% (almost 2.0% annualized), net of fees, while doing so with much lower correlation to equity markets.
All five of the hedge fund styles used within the Fund contributed positively to gross Fund returns in 2015.
The Fund’s Merger Arbitrage strategy contributed the most to gross Fund returns in 2015 with 1.52%; this strategy typically invests in definitive merger deals and makes allocations based upon the expected return and risk parameters of each merger deal.
The Global Macro strategies contributed 0.81%. Within Global Macro, the Managed Futures models contributed 0.91%. The Managed Futures models seek to profit from global trends and reversions by trading commodity, currency, equity, and fixed income futures. The Volatility Arbitrage model contributed -0.10%; this strategy seeks to profit from relative value trades across the VIX futures curve.
10 | THE GUGGENHEIM FUNDS ANNUAL REPORT | |
PERFORMANCE REPORT AND FUND PROFILE (Unaudited)(continued) | December 31, 2015 |
The Equity Market Neutral strategies contributed 0.64% to gross Fund returns. The Quantitative Market Neutral model contributed 0.42%; this model allocates to stocks resulting in a portfolio with tilts toward value and momentum characteristics while seeking equity beta neutrality. The Closed-end Arbitrage model contributed 0.23%; this strategy purchases closed-end funds trading at discounts while hedging the market related risks associated with each fund.
The Long/Short Equity strategies contributed 0.28% to gross Fund returns. The Industry and Factor Rotation model was the sole contributor, as the Size model remained un-invested throughout 2015. The Industry and Factor Rotation model allocates to industries and risk factors based upon recent trends while maintaining a positive equity market beta, generally in the 30%-60% range. The Size model tactically trades the relative performance of large-capitalization equities versus small-capitalization equities.
The Treasury Flattener model was the only Fixed Income strategy used during the year, and it contributed 0.04% to gross Fund returns. The Treasury Flattener model purchases ten-year Treasury futures and hedges with two-year Treasury futures on a duration-neutral basis when the yield spread between the two representative cash bonds is attractive.
In June we introduced a 3% equity market hedge as the combination of the Fund’s strategies was resulting in a forecast equity market correlation reasonably higher than our long-term, upper-bound target of 60%. The hedge was used explicitly to bring the Fund’s risk characteristics in-line with its objectives, which resulted in a 0.05% contribution to gross Fund returns.
Performance displayed represents past performance which is no guarantee of future results.
* | Sharpe Ratio: a risk-adjusted measure calculated using standard deviation and excess return to determine reward per unit of risk. The higher the Sharpe ratio, the better the fund’s historical risk-adjusted performance. |
** | Correlation is a measurement between -1 and 1, which indicates the linear relationship between two variables. If there is no relationship between two variables, the correlation coefficient is 0. If there is a perfect relationship, the correlation is 1. And if there is a perfect inverse relationship, the correlation is -1. |
| | THE GUGGENHEIM FUNDS ANNUAL REPORT | 11 |
PERFORMANCE REPORT AND FUND PROFILE (Unaudited)(continued) | December 31, 2015 |
Consolidated Holdings Diversification (Market Exposure as % of Net Assets)
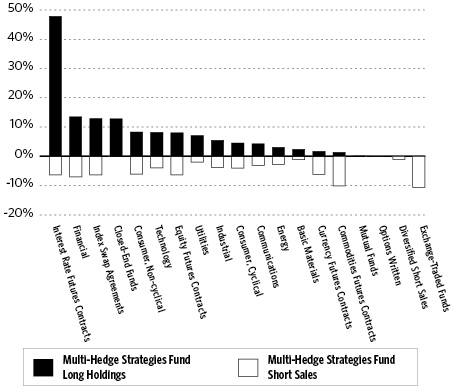
“Consolidated Holdings Diversification (Market Exposure as % of Net Assets)” excludes any temporary cash investments or investments in Guggenheim Strategy Funds Trust mutual funds. Investments in those Funds do not provide “market exposure” to meet the Fund’s investment objective, but will significantly increase the portfolio’s exposure to certain other asset categories (and their associated risks), which may cause the Fund to deviate from its principal investment strategy, including: (i) high yield, high risk debt securities rated below the top four long-term rating categories by a nationally recognized statistical rating organization (also known as “junk bonds”); (ii) securities issued by the U.S. Government or its agencies and instrumentalities; (iii) CLOs and similar investments; and (iv) other short-term fixed income securities.
Inception Dates: |
A-Class | September 19, 2005 |
C-Class | September 19, 2005 |
P-Class* | September 19, 2005 |
Institutional Class | May 3, 2010 |
* | H-Class shares redesignated as P-Class shares effective following the close of business on April 30, 2015 — See Note 14. |
Ten Largest Long Holdings (% of Total Net Assets) |
Cleco Corp. | 2.4% |
Precision Castparts Corp. | 2.0% |
PartnerRe Ltd. | 1.5% |
Broadcom Corp. — Class A | 1.5% |
Symetra Financial Corp. | 1.3% |
Time Warner Cable, Inc. | 1.2% |
Airgas, Inc. | 1.2% |
BioMed Realty Trust, Inc. | 1.1% |
King Digital Entertainment plc | 1.1% |
StanCorp Financial Group, Inc. | 1.1% |
Top Ten Total | 14.4% |
| | |
“Ten Largest Long Holdings” excludes any temporary cash or derivative investments. |
12 | THE GUGGENHEIM FUNDS ANNUAL REPORT | |
PERFORMANCE REPORT AND FUND PROFILE (Unaudited)(continued) | December 31, 2015 |
Cumulative Fund Performance*


| | THE GUGGENHEIM FUNDS ANNUAL REPORT | 13 |
PERFORMANCE REPORT AND FUND PROFILE (Unaudited)(concluded) | December 31, 2015 |
Average Annual Returns*
Periods Ended December 31, 2015
| | 1 Year | 5 Year | 10 Year |
A-Class Shares | 1.21% | 2.57% | 0.54% |
A-Class Shares with sales charge† | -3.58% | 1.58% | 0.05% |
C-Class Shares | 0.45% | 1.80% | -0.22% |
C-Class Shares with CDSC‡ | -0.55% | 1.80% | -0.22% |
P-Class Shares | 1.21% | 2.58% | 0.54% |
S&P 500 Index | 1.38% | 12.57% | 7.31% |
HFRX Global Hedge Fund Index | -3.64% | -0.72% | 0.05% |
| | | | |
| | 1 Year | 5 Year | Since Inception
(05/03/10) |
Institutional Class Shares | 1.44% | 2.82% | 3.43% |
HFRX Global Hedge Fund Index | -3.64% | -0.72% | -0.16% |
S&P 500 Index | 1.38% | 12.57% | 12.18% |
* | The performance data above represents past performance that is not predictive of future results. The investment return and principal value of an investment in the Fund will fluctuate so that an investor’s shares, when redeemed, may be worth more or less than their original cost. Returns are historical and include changes in principal and reinvested dividends and capital gains and do not reflect the effect of taxes. The HFRX Global Hedge Fund Index and the S&P 500 Index are unmanaged indices and, unlike the Fund, have no management fees or operating expenses to reduce their reported returns. The graphs are based on A-Class shares and P-Class shares only; performance for C-Class and Institutional Class shares will vary due to differences in fee structures. |
† | Fund returns are calculated using the maximum sales charge of 4.75%. |
‡ | Fund returns include a CDSC of 1% if redeemed within 12 months of purchase. |
14 | THE GUGGENHEIM FUNDS ANNUAL REPORT | |
CONSOLIDATED SCHEDULE OF INVESTMENTS | December 31, 2015 |
MULTI-HEDGE STRATEGIES FUND | |
| |
Shares
| | | Value | |
| | | | | | | |
COMMON STOCKS† - 56.8% | |
| | | | | | | |
Financial - 13.5% | |
PartnerRe Ltd.1 | | | 13,590 | | | $ | 1,899,066 | |
Symetra Financial Corp.1 | | | 52,073 | | | | 1,654,358 | |
BioMed Realty Trust, Inc.1 | | | 59,583 | | | | 1,411,521 | |
StanCorp Financial Group, Inc.1 | | | 11,920 | | | | 1,357,450 | |
Chubb Corp.1 | | | 7,434 | | | | 986,045 | |
Royal Bank of Canada | | | 16,338 | | | | 875,390 | |
First Niagara Financial Group, Inc.1 | | | 50,653 | | | | 549,585 | |
Plum Creek Timber Company, Inc.1 | | | 8,108 | | | | 386,914 | |
PacWest Bancorp | | | 7,522 | | | | 324,198 | |
Avolon Holdings Ltd.*,1 | | | 9,467 | | | | 293,099 | |
Nasdaq, Inc.1 | | | 3,165 | | | | 184,108 | |
Air Lease Corp. — Class A1 | | | 5,455 | | | | 182,633 | |
Interactive Brokers Group, Inc. — Class A1 | | | 4,175 | | | | 182,030 | |
Lamar Advertising Co. — Class A1 | | | 2,997 | | | | 179,760 | |
Synovus Financial Corp.1 | | | 5,522 | | | | 178,803 | |
JPMorgan Chase & Co.1 | | | 2,694 | | | | 177,885 | |
E*TRADE Financial Corp.*,1 | | | 5,993 | | | | 177,632 | |
Mid-America Apartment Communities, Inc.1 | | | 1,953 | | | | 177,352 | |
PNC Financial Services Group, Inc.1 | | | 1,852 | | | | 176,514 | |
Old Republic International Corp.1 | | | 9,461 | | | | 176,258 | |
Chimera Investment Corp.1 | | | 12,922 | | | | 176,256 | |
Bank of New York Mellon Corp.1 | | | 4,275 | | | | 176,215 | |
Goldman Sachs Group, Inc.1 | | | 976 | | | | 175,904 | |
Huntington Bancshares, Inc.1 | | | 15,892 | | | | 175,766 | |
Berkshire Hathaway, Inc. — Class B*,1 | | | 1,313 | | | | 173,368 | |
Everest Re Group Ltd.1 | | | 943 | | | | 172,654 | |
Citigroup, Inc.1 | | | 3,334 | | | | 172,535 | |
Hanover Insurance Group, Inc.1 | | | 2,121 | | | | 172,522 | |
American Financial Group, Inc.1 | | | 2,390 | | | | 172,271 | |
Voya Financial, Inc.1 | | | 4,646 | | | | 171,484 | |
Arch Capital Group Ltd.*,1 | | | 2,458 | | | | 171,446 | |
Macerich Co.1 | | | 2,121 | | | | 171,144 | |
MFA Financial, Inc.1 | | | 25,858 | | | | 170,663 | |
Capital One Financial Corp.1 | | | 2,323 | | | | 167,674 | |
Assured Guaranty Ltd.1 | | | 6,330 | | | | 167,302 | |
Starwood Property Trust, Inc.1 | | | 8,114 | | | | 166,824 | |
CoreLogic, Inc.*,1 | | | 4,815 | | | | 163,036 | |
Hartford Financial Services Group, Inc.1 | | | 3,669 | | | | 159,455 | |
Reinsurance Group of America, Inc. — Class A1 | | | 1,852 | | | | 158,439 | |
American Capital Agency Corp. REIT1 | | | 8,821 | | | | 152,956 | |
Popular, Inc.1 | | | 5,319 | | | | 150,740 | |
CBL & Associates Properties, Inc.1 | | | 10,673 | | | | 132,025 | |
Santander Consumer USA Holdings, Inc.*,1 | | | 8,181 | | | | 129,669 | |
Cincinnati Financial Corp.1 | | | 2,188 | | | | 129,464 | |
Ameriprise Financial, Inc.1 | | | 1,178 | | | | 125,363 | |
Lincoln National Corp.1 | | | 2,424 | | | | 121,830 | |
Travelers Companies, Inc.1 | | | 1,078 | | | | 121,663 | |
Synchrony Financial*,1 | | | 3,940 | | | | 119,815 | |
East West Bancorp, Inc.1 | | | 2,794 | | | | 116,119 | |
AmTrust Financial Services, Inc.1 | | | 1,650 | | | | 101,607 | |
National Penn Bancshares, Inc.1 | | | 8,088 | | | | 99,725 | |
Fidelity & Guaranty Life1 | | | 3,754 | | | | 95,239 | |
Endurance Specialty Holdings Ltd.1 | | | 1,112 | | | | 71,157 | |
CME Group, Inc. — Class A1 | | | 775 | | | | 70,215 | |
Jones Lang LaSalle, Inc.1 | | | 337 | | | | 53,873 | |
Associated Banc-Corp.1 | | | 2,390 | | | | 44,813 | |
FNF Group1 | | | 1,246 | | | | 43,199 | |
SEE NOTES TO FINANCIAL STATEMENTS. | THE GUGGENHEIM FUNDS ANNUAL REPORT | 15 |
CONSOLIDATED SCHEDULE OF INVESTMENTS (continued) | December 31, 2015 |
MULTI-HEDGE STRATEGIES FUND | |
| |
Shares
| | | Value | |
| | | | | | | |
Raymond James Financial, Inc.1 | | | 572 | | | $ | 33,159 | |
Aspen Insurance Holdings Ltd.1 | | | 572 | | | | 27,628 | |
CIT Group, Inc.1 | | | 640 | | | | 25,408 | |
Two Harbors Investment Corp.1 | | | 3,132 | | | | 25,369 | |
Taubman Centers, Inc.1 | | | 269 | | | | 20,638 | |
Allstate Corp.1 | | | 303 | | | | 18,813 | |
Hospitality Properties Trust1 | | | 404 | | | | 10,565 | |
RMR Group, Inc. — Class A*,1 | | | 7 | | | | 97 | |
Total Financial | | | | | | | 16,806,708 | |
| | | | | | | | | |
Consumer, Non-Cyclical – 8.3% | |
Jarden Corp.*,1 | | | 12,534 | | | | 715,942 | |
Health Net, Inc.*,1 | | | 7,702 | | | | 527,279 | |
Humana, Inc.1 | | | 2,810 | | | | 501,613 | |
Allergan plc*,1 | | | 1,601 | | | | 500,312 | |
Keurig Green Mountain, Inc.1 | | | 5,452 | | | | 490,571 | |
Heartland Payment Systems, Inc. | | | 4,080 | | | | 386,866 | |
Diamond Foods, Inc.*,1 | | | 8,793 | | | | 338,969 | |
Mindray Medical International Ltd. ADR1 | | | 10,912 | | | | 295,933 | |
Boulder Brands, Inc.*,1 | | | 26,521 | | | | 291,201 | |
Cigna Corp.1 | | | 1,719 | | | | 251,541 | |
Sirona Dental Systems, Inc.*,1 | | | 1,792 | | | | 196,349 | |
Dyax Corp.*,1 | | | 5,080 | | | | 191,110 | |
Mondelez International, Inc. — Class A1 | | | 4,040 | | | | 181,154 | |
Amgen, Inc.1 | | | 1,099 | | | | 178,400 | |
Ingredion, Inc.1 | | | 1,852 | | | | 177,496 | |
Constellation Brands, Inc. — Class A1 | | | 1,246 | | | | 177,480 | |
Bio-Rad Laboratories, Inc. — Class A*,1 | | | 1,279 | | | | 177,346 | |
Kroger Co.1 | | | 4,209 | | | | 176,063 | |
Tyson Foods, Inc. — Class A1 | | | 3,300 | | | | 175,989 | |
ManpowerGroup, Inc.1 | | | 2,087 | | | | 175,913 | |
Dr Pepper Snapple Group, Inc.1 | | | 1,885 | | | | 175,682 | |
ADT Corp.1 | | | 5,252 | | | | 173,211 | |
Eli Lilly & Co.1 | | | 2,053 | | | | 172,986 | |
United Therapeutics Corp.*,1 | | | 1,078 | | | | 168,826 | |
Reynolds American, Inc.1 | | | 3,637 | | | | 167,847 | |
Pinnacle Foods, Inc.1 | | | 3,940 | | | | 167,292 | |
Charles River Laboratories International, Inc.*,1 | | | 2,021 | | | | 162,468 | |
UnitedHealth Group, Inc.1 | | | 1,347 | | | | 158,461 | |
Flowers Foods, Inc.1 | | | 7,222 | | | | 155,201 | |
Coty, Inc. — Class A | | | 6,027 | | | | 154,473 | |
Western Union Co.1 | | | 8,586 | | | | 153,775 | |
Herbalife Ltd.* | | | 2,761 | | | | 148,045 | |
Hill-Rom Holdings, Inc.1 | | | 3,064 | | | | 147,256 | |
Graham Holdings Co. — Class B1 | | | 303 | | | | 146,946 | |
Macquarie Infrastructure Corp.1 | | | 1,953 | | | | 141,787 | |
Teleflex, Inc.1 | | | 1,078 | | | | 141,703 | |
Archer-Daniels-Midland Co.1 | | | 3,669 | | | | 134,579 | |
KAR Auction Services, Inc.1 | | | 3,603 | | | | 133,419 | |
DaVita HealthCare Partners, Inc.*,1 | | | 1,818 | | | | 126,733 | |
Church & Dwight Company, Inc.1 | | | 1,481 | | | | 125,707 | |
Cooper Companies, Inc.1 | | | 909 | | | | 121,988 | |
Wausau Paper Corp.1 | | | 9,433 | | | | 96,500 | |
Ocata Therapeutics, Inc.* | | | 11,302 | | | | 95,163 | |
Universal Health Services, Inc. — Class B1 | | | 775 | | | | 92,605 | |
Aaron’s, Inc.1 | | | 3,940 | | | | 88,217 | |
Gilead Sciences, Inc.1 | | | 707 | | | | 71,541 | |
Edwards Lifesciences Corp.*,1 | | | 875 | | | | 69,108 | |
VCA, Inc.*,1 | | | 1,112 | | | | 61,160 | |
OPKO Health, Inc.*,1 | | | 5,522 | | | | 55,496 | |
Hologic, Inc.*,1 | | | 1,347 | | | | 52,115 | |
16 | THE GUGGENHEIM FUNDS ANNUAL REPORT | SEE NOTES TO FINANCIAL STATEMENTS. |
CONSOLIDATED SCHEDULE OF INVESTMENTS (continued) | December 31, 2015 |
MULTI-HEDGE STRATEGIES FUND | |
| |
Shares
| | | Value | |
| | | | | | | |
Laboratory Corporation of America Holdings*,1 | | | 404 | | | $ | 49,951 | |
Cintas Corp.1 | | | 505 | | | | 45,980 | |
Molson Coors Brewing Co. — Class B1 | | | 404 | | | | 37,944 | |
RR Donnelley & Sons Co.1 | | | 2,155 | | | | 31,722 | |
MEDNAX, Inc.*,1 | | | 404 | | | | 28,951 | |
Vantiv, Inc. — Class A*,1 | | | 572 | | | | 27,124 | |
Bluebird Bio, Inc.*,1 | | | 337 | | | | 21,642 | |
Quest Diagnostics, Inc.1 | | | 303 | | | | 21,555 | |
Intrexon Corp.*,1 | | | 707 | | | | 21,316 | |
Total System Services, Inc.1 | | | 337 | | | | 16,783 | |
Quanta Services, Inc.*,1 | | | 303 | | | | 6,136 | |
Acadia Healthcare Company, Inc.*,1 | | | 54 | | | | 3,373 | |
Total Consumer, Non-Cyclical | | | | 10,280,294 | |
| | | | | | | | | |
Technology - 8.2% | |
Broadcom Corp. — Class A1 | | | 31,360 | | | | 1,813,236 | |
King Digital Entertainment plc1 | | | 78,843 | | | | 1,409,713 | |
EMC Corp.1 | | | 46,802 | | | | 1,201,876 | |
NXP Semiconductor N.V.* | | | 9,680 | | | | 815,510 | |
SanDisk Corp.1 | | | 7,142 | | | | 542,721 | |
Constant Contact, Inc.*,1 | | | 15,354 | | | | 448,951 | |
KLA-Tencor Corp.1 | | | 5,004 | | | | 347,028 | |
RealD, Inc.*,1 | | | 28,069 | | | | 296,128 | |
Fairchild Semiconductor International, Inc. — Class A*,1 | | | 9,247 | | | | 191,505 | |
CA, Inc.1 | | | 6,363 | | | | 181,727 | |
Activision Blizzard, Inc.1 | | | 4,646 | | | | 179,846 | |
NVIDIA Corp.1 | | | 5,319 | | | | 175,314 | |
Synopsys, Inc.*,1 | | | 3,838 | | | | 175,051 | |
Intel Corp.1 | | | 5,050 | | | | 173,973 | |
DST Systems, Inc.1 | | | 1,515 | | | | 172,800 | |
Cadence Design Systems, Inc.*,1 | | | 8,215 | | | | 170,954 | |
Allscripts Healthcare Solutions, Inc.*,1 | | | 10,740 | | | | 165,181 | |
Oracle Corp.1 | | | 4,512 | | | | 164,823 | |
ON Semiconductor Corp.*,1 | | | 16,599 | | | | 162,670 | |
Amdocs Ltd.1 | | | 2,896 | | | | 158,035 | |
Apple, Inc.1 | | | 1,481 | | | | 155,890 | |
Brocade Communications Systems, Inc.1 | | | 16,262 | | | | 149,285 | |
Fidelity National Information Services, Inc.1 | | | 2,390 | | | | 144,834 | |
SS&C Technologies Holdings, Inc.1 | | | 2,021 | | | | 137,974 | |
Electronic Arts, Inc.*,1 | | | 1,987 | | | | 136,547 | |
OmniVision Technologies, Inc.*,1 | | | 3,403 | | | | 98,755 | |
Mattson Technology, Inc.*,1 | | | 27,786 | | | | 98,085 | |
Xerox Corp.1 | | | 7,542 | | | | 80,171 | |
Broadridge Financial Solutions, Inc.1 | | | 1,481 | | | | 79,574 | |
Akamai Technologies, Inc.*,1 | | | 943 | | | | 49,630 | |
Nuance Communications, Inc.*,1 | | | 2,021 | | | | 40,198 | |
Genpact Ltd.*,1 | | | 1,212 | | | | 30,276 | |
Skyworks Solutions, Inc.1 | | | 371 | | | | 28,504 | |
Citrix Systems, Inc.*,1 | | | 303 | | | | 22,922 | |
HP, Inc.1 | | | 674 | | | | 7,980 | |
Teradyne, Inc.1 | | | 235 | | | | 4,857 | |
Total Technology | | | | | | | 10,212,524 | |
| | | | | | | | | |
Utilities – 7.1% | |
Cleco Corp.1 | | | 56,098 | | | | 2,928,876 | |
Piedmont Natural Gas Company, Inc.1 | | | 22,851 | | | | 1,302,964 | |
AGL Resources, Inc.1 | | | 12,331 | | | | 786,841 | |
TECO Energy, Inc.1 | | | 29,089 | | | | 775,221 | |
Pepco Holdings, Inc.1 | | | 18,472 | | | | 480,457 | |
American Electric Power Company, Inc.1 | | | 3,165 | | | | 184,425 | |
Great Plains Energy, Inc.1 | | | 6,666 | | | | 182,048 | |
Consolidated Edison, Inc.1 | | | 2,828 | | | | 181,756 | |
SCANA Corp.1 | | | 2,997 | | | | 181,289 | |
Public Service Enterprise Group, Inc.1 | | | 4,680 | | | | 181,069 | |
SEE NOTES TO FINANCIAL STATEMENTS. | THE GUGGENHEIM FUNDS ANNUAL REPORT | 17 |
CONSOLIDATED SCHEDULE OF INVESTMENTS (continued) | December 31, 2015 |
MULTI-HEDGE STRATEGIES FUND | |
| |
Shares
| | | Value | |
| | | | | | | |
NiSource, Inc.1 | | | 9,259 | | | $ | 180,643 | |
Pinnacle West Capital Corp.1 | | | 2,794 | | | | 180,157 | |
Westar Energy, Inc.1 | | | 4,243 | | | | 179,946 | |
Ameren Corp.1 | | | 4,141 | | | | 179,015 | |
Xcel Energy, Inc.1 | | | 4,949 | | | | 177,719 | |
Atmos Energy Corp.1 | | | 2,727 | | | | 171,910 | |
Edison International1 | | | 2,896 | | | | 171,472 | |
PG&E Corp.1 | | | 3,199 | | | | 170,155 | |
UGI Corp.1 | | | 4,243 | | | | 143,244 | |
DTE Energy Co.1 | | | 370 | | | | 29,670 | |
FirstEnergy Corp.1 | | | 135 | | | | 4,284 | |
Total Utilities | | | | | | | 8,773,161 | |
| | | | | | | | | |
Industrial - 5.5% | |
Precision Castparts Corp.1 | | | 10,449 | | | | 2,424,271 | |
Spirit AeroSystems Holdings, Inc. — Class A*,1 | | | 3,569 | | | | 178,700 | |
Republic Services, Inc. — Class A1 | | | 4,006 | | | | 176,224 | |
Owens Corning1 | | | 3,703 | | | | 174,151 | |
Eaton Corporation plc1 | | | 3,334 | | | | 173,501 | |
L-3 Communications Holdings, Inc.1 | | | 1,447 | | | | 172,931 | |
Stanley Black & Decker, Inc.1 | | | 1,616 | | | | 172,475 | |
Huntington Ingalls Industries, Inc.1 | | | 1,347 | | | | 170,867 | |
AMERCO1 | | | 438 | | | | 170,601 | |
Sonoco Products Co.1 | | | 4,141 | | | | 169,242 | |
Masco Corp.1 | | | 5,959 | | | | 168,640 | |
Deere & Co.1 | | | 2,188 | | | | 166,878 | |
AGCO Corp.1 | | | 3,535 | | | | 160,454 | |
Corning, Inc.1 | | | 8,518 | | | | 155,709 | |
CSX Corp.1 | | | 5,893 | | | | 152,923 | |
Northrop Grumman Corp.1 | | | 809 | | | | 152,747 | |
GATX Corp.1 | | | 3,502 | | | | 149,010 | |
Jabil Circuit, Inc.1 | | | 6,296 | | | | 146,634 | |
Blount International, Inc.* | | | 14,540 | | | | 142,638 | |
WestRock Co.1 | | | 3,064 | | | | 139,780 | |
Ryder System, Inc.1 | | | 2,458 | | | | 139,687 | |
Cummins, Inc.1 | | | 1,549 | | | | 136,327 | |
FedEx Corp.1 | | | 708 | | | | 105,485 | |
Carlisle Companies, Inc.1 | | | 1,178 | | | | 104,477 | |
Arrow Electronics, Inc.*,1 | | | 1,919 | | | | 103,972 | |
Orbital ATK, Inc.1 | | | 1,144 | | | | 102,205 | |
UTI Worldwide, Inc.*,1 | | | 13,973 | | | | 98,230 | |
Trinity Industries, Inc.1 | | | 3,906 | | | | 93,822 | |
Avnet, Inc.1 | | | 2,087 | | | | 89,407 | |
Waste Management, Inc.1 | | | 1,178 | | | | 62,870 | |
Snap-on, Inc.1 | | | 269 | | | | 46,115 | |
Teekay Corp.1 | | | 4,411 | | | | 43,537 | |
Crown Holdings, Inc.*,1 | | | 841 | | | | 42,639 | |
Jacobs Engineering Group, Inc.*,1 | | | 1,010 | | | | 42,370 | |
Bemis Company, Inc.1 | | | 943 | | | | 42,143 | |
Caterpillar, Inc.1 | | | 538 | | | | 36,562 | |
Boeing Co.1 | | | 101 | | | | 14,604 | |
PerkinElmer, Inc.1 | | | 235 | | | | 12,589 | |
Textron, Inc.1 | | | 68 | | | | 2,857 | |
Total Industrial | | | | | | | 6,838,274 | |
| | | | | | | | | |
Consumer, Cyclical - 4.5% | |
Office Depot, Inc.* | | | 111,994 | | | | 631,646 | |
Rite Aid Corp.*,1 | | | 61,927 | | | | 485,508 | |
Royal Caribbean Cruises Ltd.1 | | | 1,885 | | | | 190,782 | |
Carnival Corp.1 | | | 3,400 | | | | 185,232 | |
Liberty Interactive Corporation QVC Group — Class A*,1 | | | 6,465 | | | | 176,624 | |
Best Buy Company, Inc.1 | | | 5,791 | | | | 176,336 | |
Lear Corp.1 | | | 1,415 | | | | 173,805 | |
DR Horton, Inc.1 | | | 5,421 | | | | 173,635 | |
Target Corp.1 | | | 2,390 | | | | 173,537 | |
Alaska Air Group, Inc.1 | | | 2,087 | | | | 168,025 | |
Penske Automotive Group, Inc.1 | | | 3,906 | | | | 165,380 | |
GameStop Corp. — Class A | | | 5,758 | | | | 161,454 | |
CVS Health Corp.1 | | | 1,650 | | | | 161,321 | |
Whirlpool Corp.1 | | | 1,078 | | | | 158,326 | |
Foot Locker, Inc.1 | | | 2,424 | | | | 157,778 | |
Darden Restaurants, Inc.1 | | | 2,390 | | | | 152,101 | |
PACCAR, Inc.1 | | | 3,165 | | | | 150,021 | |
18 | THE GUGGENHEIM FUNDS ANNUAL REPORT | SEE NOTES TO FINANCIAL STATEMENTS. |
CONSOLIDATED SCHEDULE OF INVESTMENTS (continued) | December 31, 2015 |
MULTI-HEDGE STRATEGIES FUND | |
| |
Shares
| | | Value | |
| | | | | | | |
Goodyear Tire & Rubber Co.1 | | | 4,175 | | | $ | 136,397 | |
Kohl’s Corp.1 | | | 2,862 | | | | 136,317 | |
Norwegian Cruise Line Holdings Ltd.*,1 | | | 2,323 | | | | 136,128 | |
Walgreens Boots Alliance, Inc.1 | | | 1,549 | | | | 131,905 | |
Lennar Corp. — Class B1 | | | 2,963 | | | | 119,053 | |
Wyndham Worldwide Corp.1 | | | 1,616 | | | | 117,403 | |
Extended Stay America, Inc.1 | | | 7,340 | | | | 116,706 | |
Lennar Corp. — Class A1 | | | 1,987 | | | | 97,184 | |
Homeinns Hotel Group ADR* | | | 2,784 | | | | 95,101 | |
WESCO International, Inc.*,1 | | | 2,087 | | | | 91,160 | |
Southwest Airlines Co.1 | | | 2,087 | | | | 89,866 | |
Ingram Micro, Inc. — Class A1 | | | 2,828 | | | | 85,915 | |
Nu Skin Enterprises, Inc. — Class A | | | 2,087 | | | | 79,076 | |
Six Flags Entertainment Corp.1 | | | 1,415 | | | | 77,740 | |
World Fuel Services Corp.1 | | | 1,953 | | | | 75,112 | |
Dick’s Sporting Goods, Inc.1 | | | 1,750 | | | | 61,862 | |
Pep Boys-Manny Moe & Jack*,1 | | | 2,646 | | | | 48,713 | |
AutoNation, Inc.*,1 | | | 741 | | | | 44,208 | |
United Continental Holdings, Inc.*,1 | | | 674 | | | | 38,620 | |
Ford Motor Co.1 | | | 2,323 | | | | 32,731 | |
General Motors Co.1 | | | 875 | | | | 29,759 | |
Dillard’s, Inc. — Class A1 | | | 404 | | | | 26,547 | |
Hasbro, Inc.1 | | | 235 | | | | 15,830 | |
Urban Outfitters, Inc.*,1 | | | 674 | | | | 15,334 | |
CST Brands, Inc.1 | | | 303 | | | | 11,859 | |
Skechers U.S.A., Inc. — Class A*,1 | | | 337 | | | | 10,181 | |
PVH Corp.1 | | | 68 | | | | 5,008 | |
Total Consumer, Cyclical | | | | | | | 5,567,226 | |
| | | | | | | | | |
Communications - 4.3% | |
Time Warner Cable, Inc.1 | | | 8,284 | | | | 1,537,428 | |
Cablevision Systems Corp. — Class A1 | | | 16,130 | | | | 514,547 | |
Youku Tudou, Inc. ADR*,1 | | | 16,178 | | | | 438,909 | |
Expedia, Inc. 1 | | | 2,243 | | | | 278,831 | |
Comcast Corp. — Class A1 | | | 4,439 | | | | 250,493 | |
EZchip Semiconductor Ltd.*,1 | | | 8,008 | | | | 197,957 | |
Qihoo 360 Technology Company Ltd. ADR* | | | 2,606 | | | | 189,743 | |
Cisco Systems, Inc.1 | | | 6,599 | | | | 179,196 | |
TEGNA, Inc.1 | | | 6,802 | | | | 173,587 | |
Thomson Reuters Corp.1 | | | 4,512 | | | | 170,780 | |
eBay, Inc.*,1 | | | 6,196 | | | | 170,266 | |
Telephone & Data Systems, Inc.1 | | | 6,465 | | | | 167,378 | |
VeriSign, Inc.*,1 | | | 1,750 | | | | 152,880 | |
Walt Disney Co.1 | | | 1,381 | | | | 145,115 | |
Liberty Media Corp. — Class A*,1 | | | 3,400 | | | | 133,450 | |
United States Cellular Corp.*,1 | | | 2,694 | | | | 109,942 | |
Symantec Corp.1 | | | 4,175 | | | | 87,675 | |
Alphabet, Inc. — Class A*,1 | | | 101 | | | | 78,579 | |
Alphabet, Inc. — Class C*,1 | | | 101 | | | | 76,647 | |
IAC/InterActiveCorp1 | | | 1,178 | | | | 70,739 | |
CenturyLink, Inc.1 | | | 2,087 | | | | 52,509 | |
Liberty Media Corp. — Class C*,1 | | | 775 | | | | 29,512 | |
AT&T, Inc.1 | | | 807 | | | | 27,769 | |
Amazon.com, Inc.*,1 | | | 34 | | | | 22,980 | |
T-Mobile US, Inc.*,1 | | | 538 | | | | 21,047 | |
John Wiley & Sons, Inc. — Class A1 | | | 438 | | | | 19,723 | |
Netflix, Inc.*,1 | | | 135 | | | | 15,441 | |
Total Communications | | | | | | | 5,313,123 | |
| | | | | | | | | |
Energy - 3.1% | |
Baker Hughes, Inc. | | | 21,661 | | | | 999,655 | |
Cameron International Corp.*,1 | | | 7,657 | | | | 483,922 | |
Northern Tier Energy, LP | | | 9,285 | | | | 240,110 | |
SEE NOTES TO FINANCIAL STATEMENTS. | THE GUGGENHEIM FUNDS ANNUAL REPORT | 19 |
CONSOLIDATED SCHEDULE OF INVESTMENTS (continued) | December 31, 2015 |
MULTI-HEDGE STRATEGIES FUND | |
| |
Shares
| | | Value | |
| | | | | | | |
Marathon Petroleum Corp.1 | | | 3,502 | | | $ | 181,544 | |
Tesoro Corp.1 | | | 1,718 | | | | 181,026 | |
Valero Energy Corp.1 | | | 2,559 | | | | 180,947 | |
Chevron Corp.1 | | | 1,919 | | | | 172,633 | |
Williams Partners, LP1 | | | 6,189 | | | | 172,364 | |
Phillips 661 | | | 2,087 | | | | 170,717 | |
Rowan Companies plc — Class A1 | | | 9,899 | | | | 167,788 | |
Frank’s International N.V.1 | | | 9,024 | | | | 150,611 | |
CVR Energy, Inc. | | | 3,737 | | | | 147,051 | |
Noble Corporation plc1 | | | 11,784 | | | | 124,321 | |
HollyFrontier Corp.1 | | | 2,828 | | | | 112,809 | |
Helmerich & Payne, Inc.1 | | | 1,750 | | | | 93,713 | |
Diamond Offshore Drilling, Inc. | | | 3,972 | | | | 83,809 | |
SM Energy Co.1 | | | 3,232 | | | | 63,541 | |
Rice Energy, Inc.*,1 | | | 3,603 | | | | 39,273 | |
WPX Energy, Inc.*,1 | | | 5,656 | | | | 32,465 | |
First Solar, Inc.*,1 | | | 404 | | | | 26,660 | |
ConocoPhillips1 | | | 303 | | | | 14,147 | |
EP Energy Corp. — Class A*,1 | | | 3,027 | | | | 13,258 | |
Hess Corp.1 | | | 235 | | | | 11,393 | |
Murphy Oil Corp.1 | | | 505 | | | | 11,337 | |
PBF Energy, Inc. — Class A1 | | | 303 | | | | 11,153 | |
Total Energy | | | | | | | 3,886,247 | |
| | | | | | | | | |
Basic Materials - 2.3% | |
Airgas, Inc. | | | 10,656 | | | | 1,473,938 | |
Celanese Corp. — Class A1 | | | 2,660 | | | | 179,098 | |
LyondellBasell Industries N.V. — Class A1 | | | 2,021 | | | | 175,625 | |
CF Industries Holdings, Inc.1 | | | 4,209 | | | | 171,769 | |
Reliance Steel & Aluminum Co.1 | | | 2,896 | | | | 167,707 | |
Newmont Mining Corp.1 | | | 9,058 | | | | 162,954 | |
Domtar Corp.1 | | | 4,141 | | | | 153,010 | |
Mosaic Co.1 | | | 5,084 | | | | 140,268 | |
Eastman Chemical Co.1 | | | 1,987 | | | | 134,142 | |
Steel Dynamics, Inc.1 | | | 6,296 | | | | 112,510 | |
Westlake Chemical Corp.1 | | | 1,010 | | | | 54,863 | |
Total Basic Materials | | | | | | | 2,925,884 | |
| | | | | | | | | |
Total Common Stocks | | | | | | | | |
(Cost $69,212,295) | | | | | | | 70,603,441 | |
| | | | | | | | | |
MUTUAL FUNDS†,2 - 0.0% | |
Guggenheim Strategy Fund I | | | 796 | | | | 19,796 | |
Guggenheim Strategy Fund II | | | 238 | | | | 5,903 | |
Total Mutual Funds | | | | | | | | |
(Cost $25,761) | | | | | | | 25,699 | |
| | | | | | | | | |
CLOSED-END FUNDS† - 12.8% | |
Nuveen Dividend Advantage Municipal Income Fund1 | | | 30,475 | | | | 441,277 | |
Nuveen Maryland Premium Income Municipal Fund1 | | | 33,440 | | | | 424,353 | |
Western Asset/Claymore Inflation-Linked Opportunities & Income Fund1,2 | | | 39,617 | | | | 407,659 | |
Cohen & Steers REIT and Preferred Income Fund, Inc.1 | | | 21,892 | | | | 403,688 | |
Neuberger Berman Real Estate Securities Income Fund, Inc.1 | | | 80,515 | | | | 403,380 | |
BlackRock Enhanced Equity Dividend Trust1 | | | 51,794 | | | | 394,152 | |
Adams Diversified Equity Fund, Inc.1 | | | 30,540 | | | | 391,828 | |
Alpine Total Dynamic Dividend Fund1 | | | 50,698 | | | | 389,361 | |
Tri-Continental Corp.1 | | | 19,426 | | | | 388,909 | |
BlackRock Core Bond Trust1 | | | 30,578 | | | | 386,506 | |
AllianzGI Equity & Convertible Income Fund1 | | | 21,455 | | | | 385,332 | |
20 | THE GUGGENHEIM FUNDS ANNUAL REPORT | SEE NOTES TO FINANCIAL STATEMENTS. |
CONSOLIDATED SCHEDULE OF INVESTMENTS (continued) | December 31, 2015 |
MULTI-HEDGE STRATEGIES FUND | |
| |
Shares
| | | Value | |
| | | | | | | |
Zweig Total Return Fund, Inc.1 | | | 31,375 | | | $ | 382,148 | |
Morgan Stanley Emerging Markets Debt Fund, Inc.1 | | | 44,174 | | | | 378,571 | |
Western Asset/Claymore Inflation-Linked Securities & Income Fund1,2 | | | 34,885 | | | | 368,734 | |
GDL Fund1 | | | 32,668 | | | | 327,007 | |
BlackRock Resources & Commodities Strategy Trust1 | | | 43,855 | | | | 311,809 | |
Nuveen Credit Strategies Income Fund1 | | | 39,606 | | | | 310,511 | |
General American Investors Company, Inc.1 | | | 9,649 | | | | 308,189 | |
First Trust High Income Long/Short Fund1 | | | 21,657 | | | | 304,931 | |
BlackRock Credit Allocation Income Trust1 | | | 24,525 | | | | 302,639 | |
Boulder Growth & Income Fund, Inc.1 | | | 36,573 | | | | 283,075 | |
Zweig Fund, Inc.1 | | | 18,841 | | | | 247,571 | |
Clough Global Allocation Fund1 | | | 16,933 | | | | 228,088 | |
BlackRock MuniYield Michigan Quality Fund, Inc.1 | | | 15,526 | | | | 216,743 | |
Gabelli Healthcare & WellnessRx Trust1 | | | 20,744 | | | | 212,626 | |
Swiss Helvetia Fund, Inc.1 | | | 19,057 | | | | 201,242 | |
Advent Claymore Convertible Securities and Income Fund II1,2 | | | 34,495 | | | | 191,447 | |
Western Asset Emerging Markets Income Fund, Inc.1 | | | 16,899 | | | | 164,427 | |
Western Asset Worldwide Income Fund, Inc.1 | | | 16,294 | | | | 164,244 | |
Madison Covered Call & Equity Strategy Fund1 | | | 21,874 | | | | 161,430 | |
Cohen & Steers Quality Income Realty Fund, Inc.1 | | | 11,105 | | | | 135,703 | |
Nuveen New Jersey Dividend Advantage Municipal Fund1 | | | 9,626 | | | | 129,951 | |
China Fund, Inc.1 | | | 7,683 | | | | 119,240 | |
Ellsworth Growth and Income Fund Ltd.1 | | | 14,937 | | | | 115,911 | |
New Ireland Fund, Inc.1 | | | 8,068 | | | | 112,387 | |
Morgan Stanley Income Securities, Inc.1 | | | 6,318 | | | | 106,585 | |
Bancroft Fund Ltd.1 | | | 5,859 | | | | 106,458 | |
Putnam High Income Securities Fund1 | | | 14,298 | | | | 104,518 | |
Nuveen Build America Bond Fund1 | | | 4,563 | | | | 91,671 | |
RMR Real Estate Income Fund1 | | | 4,625 | | | | 89,124 | |
Duff & Phelps Global Utility Income Fund, Inc.1 | | | 6,043 | | | | 89,013 | |
Royce Value Trust, Inc.1 | | | 7,546 | | | | 88,816 | |
John Hancock Premium Dividend Fund1 | | | 6,467 | | | | 88,663 | |
BlackRock Multi-Sector Income Trust1 | | | 5,608 | | | | 88,662 | |
BlackRock Limited Duration Income Trust1 | | | 6,070 | | | | 88,501 | |
BlackRock Debt Strategies Fund, Inc.1 | | | 26,245 | | | | 88,446 | |
CBRE Clarion Global Real Estate Income Fund1 | | | 11,551 | | | | 88,250 | |
Liberty All Star Equity Fund1 | | | 16,492 | | | | 88,232 | |
Western Asset High Yield Defined Opportunity Fund, Inc.1 | | | 6,228 | | | | 87,815 | |
BlackRock Corporate High Yield Fund, Inc.1 | | | 8,968 | | | | 87,707 | |
Nuveen Diversified Dividend & Income Fund1 | | | 8,088 | | | | 87,593 | |
SEE NOTES TO FINANCIAL STATEMENTS. | THE GUGGENHEIM FUNDS ANNUAL REPORT | 21 |
CONSOLIDATED SCHEDULE OF INVESTMENTS (continued) | December 31, 2015 |
MULTI-HEDGE STRATEGIES FUND | |
| |
Shares
| | | Value | |
| | | | | | | |
Wells Fargo Multi-Sector Income Fund1 | | | 7,722 | | | $ | 87,413 | |
Eaton Vance Limited Duration Income Fund1 | | | 6,833 | | | | 87,189 | |
Cohen & Steers Closed-End Opportunity Fund, Inc.1 | | | 7,941 | | | | 87,033 | |
Ivy High Income Opportunities Fund1 | | | 7,026 | | | | 86,982 | |
Delaware Enhanced Global Dividend & Income Fund1 | | | 9,289 | | | | 86,852 | |
Franklin Limited Duration Income Trust1 | | | 8,062 | | | | 86,425 | |
Eaton Vance Tax-Advantaged Dividend Income Fund1 | | | 4,462 | | | | 86,295 | |
Ares Dynamic Credit Allocation Fund, Inc.1 | | | 6,443 | | | | 86,078 | |
First Trust Enhanced Equity Income Fund1 | | | 6,513 | | | | 85,972 | |
Central Securities Corp.1 | | | 4,503 | | | | 85,647 | |
MFS Multimarket Income Trust1 | | | 15,540 | | | | 85,625 | |
Templeton Emerging Markets Income Fund1 | | | 8,557 | | | | 85,313 | |
First Trust Aberdeen Global Opportunity Income Fund1 | | | 8,339 | | | | 84,474 | |
Duff & Phelps Utility and Corporate Bond Trust, Inc.1 | | | 9,138 | | | | 83,978 | |
MFS Charter Income Trust1 | | | 11,000 | | | | 83,820 | |
Western Asset Emerging Markets Debt Fund, Inc.1 | | | 6,068 | | | | 83,314 | |
Lazard Global Total Return and Income Fund, Inc.1 | | | 6,255 | | | | 81,815 | |
Korea Equity Fund, Inc.1 | | | 11,328 | | | | 78,956 | |
Advent/Claymore Enhanced Growth & Income Fund1,2 | | | 7,312 | | | | 60,470 | |
Delaware Investments National Municipal Income Fund1 | | | 4,284 | | | | 55,649 | |
First Trust Dividend and Income Fund1 | | | 6,125 | | | | 51,818 | |
Madison Strategic Sector Premium Fund1 | | | 4,473 | | | | 48,174 | |
Deutsche Global High Income Fund, Inc.1 | | | 6,257 | | | | 47,240 | |
Asia Tigers Fund, Inc.1 | | | 5,039 | | | | 45,653 | |
Nuveen Quality Preferred Income Fund 31 | | | 3,197 | | | | 27,143 | |
Aberdeen Singapore Fund, Inc.1 | | | 2,955 | | | | 25,295 | |
Western Asset Managed High Income Fund, Inc.1 | | | 5,448 | | | | 24,625 | |
Nuveen S&P 500 Dynamic Overwrite Fund1 | | | 1,696 | | | | 22,845 | |
First Trust Strategic High Income Fund II1 | | | 1,981 | | | | 22,049 | |
Western Asset High Income Fund II, Inc.1 | | | 3,481 | | | | 21,965 | |
Nuveen Multi-Market Income Fund, Inc.1 | | | 3,055 | | | | 21,691 | |
John Hancock Income Securities Trust1 | | | 1,613 | | | | 21,663 | |
European Equity Fund, Inc.1 | | | 1,889 | | | | 15,225 | |
MFS Intermediate High Income Fund1 | | | 6,051 | | | | 14,038 | |
Deutsche Multi-Market Income Trust1 | | | 1,836 | | | | 14,027 | |
Gabelli Global Utility & Income Trust1 | | | 838 | | | | 13,995 | |
Prudential Global Short Duration High Yield Fund, Inc.1 | | | 987 | | | | 13,966 | |
Macquarie Global Infrastructure Total Return Fund, Inc.1 | | | 732 | | | | 13,945 | |
Prudential Short Duration High Yield Fund, Inc.1 | | | 953 | | | | 13,914 | |
22 | THE GUGGENHEIM FUNDS ANNUAL REPORT | SEE NOTES TO FINANCIAL STATEMENTS. |
CONSOLIDATED SCHEDULE OF INVESTMENTS (continued) | December 31, 2015 |
MULTI-HEDGE STRATEGIES FUND | |
| |
Shares
| | | Value | |
| | | | | | | |
Cohen & Steers Infrastructure Fund, Inc.1 | | | 729 | | | $ | 13,909 | |
LMP Capital and Income Fund, Inc.1 | | | 1,119 | | | | 13,842 | |
Nuveen AMT-Free Municipal Income Fund1 | | | 994 | | | | 13,767 | |
BlackRock New York Municipal Income Quality Trust1 | | | 1,002 | | | | 13,737 | |
Royce Micro-Capital Trust, Inc.1 | | | 1,886 | | | | 13,692 | |
Invesco Pennsylvania Value Municipal Income Trust1 | | | 1,068 | | | | 13,692 | |
Delaware Investments Dividend & Income Fund, Inc.1 | | | 1,552 | | | | 13,689 | |
Tortoise Pipeline & Energy Fund, Inc.1 | | | 943 | | | | 13,683 | |
Nuveen Quality Municipal Fund, Inc.1 | | | 1,002 | | | | 13,667 | |
Eaton Vance Municipal Income 2028 Term Trust1 | | | 739 | | | | 13,664 | |
BlackRock Municipal Income Investment Quality Trust1 | | | 924 | | | | 13,657 | |
Nuveen Texas Quality Income Municipal Fund1 | | | 946 | | | | 13,651 | |
Virtus Global Multi-Sector Income Fund1 | | | 966 | | | | 13,650 | |
Nuveen New York Dividend Advantage Municipal Fund1 | | | 959 | | | | 13,647 | |
Nuveen Michigan Quality Income Municipal Fund1 | | | 996 | | | | 13,635 | |
BlackRock Global Opportunities Equity Trust1 | | | 1,068 | | | | 13,628 | |
Nuveen Municipal Advantage Fund, Inc.1 | | | 983 | | | | 13,615 | |
Nuveen Dividend Advantage Municipal Fund 31 | | | 948 | | | | 13,613 | |
Nuveen Quality Income Municipal Fund, Inc.1 | | | 960 | | | | 13,613 | |
Nuveen Premium Income Municipal Fund 2, Inc.1 | | | 941 | | | | 13,607 | |
Sprott Focus Trust, Inc.1 | | | 2,346 | | | | 13,607 | |
Morgan Stanley Emerging Markets Fund, Inc.1 | | | 1,061 | | | | 13,602 | |
Nuveen Ohio Quality Income Municipal Fund1 | | | 891 | | | | 13,597 | |
BlackRock MuniHoldings New Jersey Quality Fund, Inc.1 | | | 942 | | | | 13,593 | |
Nuveen Premium Income Municipal Fund, Inc.1 | | | 964 | | | | 13,592 | |
Deutsche Strategic Income Trust1 | | | 1,293 | | | | 13,589 | |
Morgan Stanley Asia-Pacific Fund, Inc.1 | | | 982 | | | | 13,581 | |
Nuveen New York AMT-Free Municipal Income Fund1 | | | 1,034 | | | | 13,576 | |
Nuveen Select Quality Municipal Fund, Inc.1 | | | 966 | | | | 13,572 | |
Nuveen Municipal Market Opportunity Fund, Inc.1 | | | 984 | | | | 13,569 | |
Nuveen Dividend Advantage Municipal Fund 21 | | | 958 | | | | 13,565 | |
Eaton Vance New York Municipal Bond Fund1 | | | 1,033 | | | | 13,563 | |
PIMCO Dynamic Credit Income Fund1 | | | 752 | | | | 13,559 | |
Alpine Global Dynamic Dividend Fund1 | | | 1,532 | | | | 13,558 | |
Nuveen Preferred Income Opportunities Fund1 | | | 1,480 | | | | 13,557 | |
BlackRock Muni Intermediate Duration Fund, Inc.1 | | | 956 | | | | 13,547 | |
SEE NOTES TO FINANCIAL STATEMENTS. | THE GUGGENHEIM FUNDS ANNUAL REPORT | 23 |
CONSOLIDATED SCHEDULE OF INVESTMENTS (continued) | December 31, 2015 |
MULTI-HEDGE STRATEGIES FUND | |
| |
Shares
| | | Value | |
| | | | | | | |
BlackRock MuniYield Pennsylvania Quality Fund1 | | | 931 | | | $ | 13,537 | |
BlackRock Long-Term Municipal Advantage Trust1 | | | 1,177 | | | | 13,536 | |
Nuveen Dividend Advantage Municipal Fund1 | | | 930 | | | | 13,532 | |
Aberdeen Japan Equity Fund, Inc.1 | | | 1,755 | | | | 13,531 | |
Nuveen Pennsylvania Investment Quality Municipal Fund1 | | | 987 | | | | 13,522 | |
New America High Income Fund, Inc.1 | | | 1,765 | | | | 13,520 | |
Deutsche High Income Trust1 | | | 1,700 | | | | 13,515 | |
Pioneer Diversified High Income Trust1 | | | 926 | | | | 13,510 | |
Blackstone / GSO Strategic Credit Fund1 | | | 1,010 | | | | 13,504 | |
Nuveen Connecticut Premium Income Municipal Fund1 | | | 1,058 | | | | 13,500 | |
Putnam Managed Municipal Income Trust1 | | | 1,834 | | | | 13,498 | |
Invesco Quality Municipal Income Trust1 | | | 1,063 | | | | 13,489 | |
BlackRock MuniYield Investment Quality Fund1 | | | 956 | | | | 13,480 | |
Nuveen Performance Plus Municipal Fund, Inc.1 | | | 901 | | | | 13,479 | |
JPMorgan China Region Fund, Inc.1 | | | 879 | | | | 13,466 | |
Putnam Municipal Opportunities Trust1 | | | 1,096 | | | | 13,459 | |
Eaton Vance Risk-Managed Diversified Equity Income Fund1 | | | 1,324 | | | | 13,452 | |
Nuveen Premier Municipal Income Fund, Inc.1 | | | 984 | | | | 13,441 | |
Nuveen North Carolina Premium Income Municipal Fund1 | | | 1,026 | | | | 13,441 | |
Eaton Vance Municipal Bond Fund1 | | | 1,034 | | | | 13,421 | |
AllianceBernstein Global High Income Fund, Inc.1 | | | 1,244 | | | | 13,410 | |
Invesco Trust for Investment Grade Municipals1 | | | 1,005 | | | | 13,397 | |
Nuveen Senior Income Fund1 | | | 2,319 | | | | 13,381 | |
Morgan Stanley India Investment Fund, Inc.*,1 | | | 525 | | | | 13,372 | |
Invesco Municipal Trust1 | | | 1,047 | | | | 13,370 | |
Reaves Utility Income Fund1 | | | 514 | | | | 13,348 | |
Western Asset High Income Opportunity Fund, Inc.1 | | | 2,846 | | | | 13,348 | |
Clough Global Opportunities Fund1 | | | 1,278 | | | | 13,342 | |
Delaware Investments Minnesota Municipal Income Fund II, Inc.1 | | | 996 | | | | 13,326 | |
MFS Intermediate Income Trust1 | | | 2,912 | | | | 13,308 | |
Nuveen Real Estate Income Fund1 | | | 1,253 | | | | 13,307 | |
BlackRock Income Trust, Inc.1 | | | 2,085 | | | | 13,302 | |
Dreyfus Municipal Bond Infrastructure Fund, Inc.1 | | | 1,074 | | | | 13,296 | |
Cohen & Steers Total Return Realty Fund, Inc.1 | | | 1,055 | | | | 13,293 | |
Western Asset Global Corporate Defined Opportunity Fund, Inc.1 | | | 841 | | | | 13,288 | |
Guggenheim Enhanced Equity Income Fund1,2 | | | 1,730 | | | | 13,286 | |
24 | THE GUGGENHEIM FUNDS ANNUAL REPORT | SEE NOTES TO FINANCIAL STATEMENTS. |
CONSOLIDATED SCHEDULE OF INVESTMENTS (continued) | December 31, 2015 |
MULTI-HEDGE STRATEGIES FUND | |
| |
Shares
| | | Value | |
| | | | | | | |
Neuberger Berman High Yield Strategies Fund, Inc.1 | | | 1,314 | | | $ | 13,258 | |
Nuveen Floating Rate Income Opportunity Fund1 | | | 1,352 | | | | 13,250 | |
John Hancock Investors Trust1 | | | 918 | | | | 13,201 | |
Brookfield Global Listed Infrastructure Income Fund, Inc.1 | | | 1,123 | | | | 13,195 | |
First Trust Aberdeen Emerging Opportunity Fund1 | | | 1,010 | | | | 13,191 | |
BlackRock Utility and Infrastructure Trust1 | | | 786 | | | | 13,189 | |
Nuveen Flexible Investment Income Fund1 | | | 899 | | | | 13,188 | |
Wells Fargo Global Dividend Opportunity Fund1 | | | 2,227 | | | | 13,184 | |
Tekla Healthcare Opportunities Fund1 | | | 758 | | | | 13,182 | |
Wells Fargo Income Opportunities Fund1 | | | 1,769 | | | | 13,179 | |
Nuveen Global High Income Fund1 | | | 959 | | | | 13,177 | |
Principal Real Estate Income Fund1 | | | 787 | | | | 13,159 | |
Nuveen Global Equity Income Fund1 | | | 1,205 | | | | 13,159 | |
Credit Suisse High Yield Bond Fund1 | | | 5,769 | | | | 13,153 | |
Nuveen Short Duration Credit Opportunities Fund1 | | | 886 | | | | 13,139 | |
New Germany Fund, Inc.1 | | | 893 | | | | 13,127 | |
Invesco High Income Trust II1 | | | 1,021 | | | | 13,120 | |
Source Capital, Inc.1 | | | 198 | | | | 13,119 | |
Calamos Strategic Total Return Fund1 | | | 1,325 | | | | 13,118 | |
Nuveen Tax-Advantaged Total Return Strategy Fund1 | | | 1,123 | | | | 13,105 | |
AllianzGI NFJ Dividend Interest & Premium Strategy Fund1 | | | 1,057 | | | | 13,096 | |
AllianzGI Convertible & Income Fund II1 | | | 2,592 | | | | 13,090 | |
Guggenheim Enhanced Equity Strategy Fund1,2 | | | 827 | | | | 13,042 | |
Lazard World Dividend & Income Fund, Inc.1 | | | 1,430 | | | | 13,027 | |
Credit Suisse Asset Management Income Fund, Inc.1 | | | 4,686 | | | | 13,027 | |
Nuveen Municipal Opportunity Fund, Inc.1 | | | 909 | | | | 13,026 | |
Aberdeen Australia Equity Fund, Inc.1 | | | 2,390 | | | | 13,026 | |
Brookfield High Income Fund, Inc.1 | | | 1,893 | | | | 13,024 | |
Aberdeen Greater China Fund, Inc.1 | | | 1,521 | | | | 13,020 | |
Calamos Convertible and High Income Fund1 | | | 1,238 | | | | 13,011 | |
Avenue Income Credit Strategies Fund1 | | | 1,146 | | | | 13,007 | |
Nuveen Tax-Advantaged Dividend Growth Fund1 | | | 935 | | | | 13,006 | |
Managed Duration Investment Grade Municipal Fund1,2 | | | 944 | | | | 12,989 | |
BlackRock Municipal Target Term Trust1 | | | 602 | | | | 12,985 | |
Gabelli Dividend & Income Trust1 | | | 702 | | | | 12,959 | |
Western Asset Global High Income Fund, Inc.1 | | | 1,486 | | | | 12,958 | |
BlackRock International Growth and Income Trust1 | | | 2,073 | | | | 12,936 | |
Adams Natural Resources Fund, Inc. | | | 729 | | | | 12,932 | |
SEE NOTES TO FINANCIAL STATEMENTS. | THE GUGGENHEIM FUNDS ANNUAL REPORT | 25 |
CONSOLIDATED SCHEDULE OF INVESTMENTS (continued) | December 31, 2015 |
MULTI-HEDGE STRATEGIES FUND | |
| |
Shares
| | | Value | |
| | | | | | | |
Eaton Vance New Jersey Municipal Income Trust | | | 1,019 | | | $ | 12,931 | |
Calamos Global Total Return Fund1 | | | 1,132 | | | | 12,927 | |
GAMCO Natural Resources Gold & Income Trust1 | | | 2,256 | | | | 12,927 | |
KKR Income Opportunities Fund1 | | | 931 | | | | 12,913 | |
Legg Mason BW Global Income Opportunities Fund, Inc.1 | | | 1,115 | | | | 12,912 | |
Franklin Universal Trust1 | | | 2,252 | | | | 12,904 | |
Cushing Renaissance Fund1 | | | 904 | | | | 12,900 | |
Dividend and Income Fund1 | | | 1,170 | | | | 12,882 | |
Calamos Global Dynamic Income Fund1 | | | 1,799 | | | | 12,881 | |
DoubleLine Income Solutions Fund1 | | | 794 | | | | 12,878 | |
Macquarie/First Trust Global Infrastructure/Utilities Dividend & Income Fund1 | | | 1,108 | | | | 12,875 | |
Cohen & Steers Limited Duration Preferred and Income Fund, Inc.1 | | | 571 | | | | 12,859 | |
Clough Global Equity Fund1 | | | 1,026 | | | | 12,856 | |
John Hancock Hedged Equity & Income Fund1 | | | 889 | | | | 12,855 | |
Voya Asia Pacific High Dividend Equity Income Fund1 | | | 1,423 | | | | 12,850 | |
AllianceBernstein National Municipal Income Fund, Inc.1 | | | 930 | | | | 12,843 | |
MFS Investment Grade Municipal Trust1 | | | 1,301 | | | | 12,841 | |
Voya International High Dividend Equity Income Fund1 | | | 2,018 | | | | 12,834 | |
Voya Global Equity Dividend and Premium Opportunity Fund1 | | | 1,833 | | | | 12,831 | |
India Fund, Inc.1 | | | 564 | | | | 12,825 | |
Gabelli Multimedia Trust, Inc.1 | | | 1,710 | | | | 12,825 | |
Eaton Vance Tax-Managed Global Diversified Equity Income Fund1 | | | 1,449 | | | | 12,824 | |
Voya Infrastructure Industrials and Materials Fund1 | | | 1,045 | | | | 12,812 | |
Alliance California Municipal Income Fund, Inc.1 | | | 909 | | | | 12,808 | |
Mexico Fund, Inc.1 | | | 770 | | | | 12,797 | |
Central Europe Russia and Turkey Fund, Inc.1 | | | 767 | | | | 12,755 | |
Voya Emerging Markets High Income Dividend Equity Fund1 | | | 1,723 | | | | 12,750 | |
Calamos Convertible Opportunities and Income Fund1 | | | 1,285 | | | | 12,734 | |
MFS Municipal Income Trust1 | | | 1,872 | | | | 12,730 | |
Aberdeen Emerging Markets Smaller Company Opportunities Fund, Inc.1 | | | 1,171 | | | | 12,705 | |
Taiwan Fund, Inc.*,1 | | | 866 | | | | 12,670 | |
Cutwater Select Income Fund1 | | | 693 | | | | 12,654 | |
Japan Smaller Capitalization Fund, Inc.1 | | | 1,236 | | | | 12,644 | |
Pacholder High Yield Fund, Inc.1 | | | 2,074 | | | | 12,589 | |
Diversified Real Asset Income Fund1 | | | 811 | | | | 12,579 | |
AllianzGI Convertible & Income Fund1 | | | 2,270 | | | | 12,576 | |
Asia Pacific Fund, Inc.1 | | | 1,245 | | | | 12,537 | |
26 | THE GUGGENHEIM FUNDS ANNUAL REPORT | SEE NOTES TO FINANCIAL STATEMENTS. |
CONSOLIDATED SCHEDULE OF INVESTMENTS (continued) | December 31, 2015 |
MULTI-HEDGE STRATEGIES FUND | |
| |
Shares
| | | Value | |
| | | | | | | |
Western Asset Global Partners Income Fund, Inc.1 | | | 1,621 | | | $ | 12,530 | |
ASA Gold and Precious Metals Ltd.1 | | | 1,746 | | | | 12,519 | |
Stone Harbor Emerging Markets Total Income Fund1 | | | 1,087 | | | | 12,359 | |
GAMCO Global Gold Natural Resources & Income Trust1 | | | 2,600 | | | | 12,350 | |
Templeton Dragon Fund, Inc.1 | | | 692 | | | | 12,325 | |
Mexico Equity & Income Fund, Inc.1 | | | 1,144 | | | | 12,309 | |
Special Opportunities Fund, Inc.1 | | | 931 | | | | 12,289 | |
Voya Natural Resources Equity Income Fund1 | | | 2,250 | | | | 12,285 | |
Aberdeen Latin America Equity Fund, Inc.1 | | | 787 | | | | 12,002 | |
Templeton Emerging Markets Fund/United States1 | | | 1,165 | | | | 11,615 | |
Korea Fund, Inc.*,1 | | | 361 | | | | 11,498 | |
DTF Tax-Free Income, Inc.1 | | | 698 | | | | 10,547 | |
Advent Claymore Convertible Securities and Income Fund1,2 | | | 715 | | | | 9,667 | |
BlackRock MuniHoldings Quality Fund, Inc.1 | | | 625 | | | | 8,581 | |
Invesco Municipal Opportunity Trust1 | | | 647 | | | | 8,521 | |
Invesco Advantage Municipal Income Trust II1 | | | 722 | | | | 8,505 | |
Nuveen Build America Bond Opportunity Fund1 | | | 418 | | | | 8,481 | |
BlackRock MuniHoldings Quality Fund II, Inc.1 | | | 623 | | | | 8,479 | |
Aberdeen Chile Fund, Inc.1 | | | 1,519 | | | | 8,476 | |
BlackRock MuniHoldings California Quality Fund, Inc.1 | | | 567 | | | | 8,420 | |
Guggenheim Equal Weight Enhanced Equity Income Fund1,2 | | | 500 | | | | 8,170 | |
Nuveen Massachusetts Premium Income Municipal Fund1 | | | 567 | | | | 7,785 | |
Liberty All Star Growth Fund, Inc.1 | | | 1,566 | | | | 7,172 | |
Gabelli Convertible and Income Securities Fund, Inc.1 | | | 826 | | | | 3,948 | |
Latin American Discovery Fund, Inc.1 | | | 507 | | | | 3,767 | |
First Trust Intermediate Duration Preferred & Income Fund1 | | | 86 | | | | 1,829 | |
Wells Fargo Utilities and High Income Fund1 | | | 96 | | | | 1,075 | |
Total Closed-End Funds | | | | | | | | |
(Cost $16,238,895) | | | | | | | 15,886,357 | |
| | | | | | | | | |
| | | Face
Amount | | | | | |
| | | | | | | | | |
REPURCHASE AGREEMENTS††,3 - 15.7% | |
Royal Bank of Canada
issued 12/31/15 at 0.24%
due 01/04/16 | | $ | 9,120,895 | | | | 9,120,895 | |
Mizuho Financial Group, Inc.
issued 12/31/15 at 0.18%
due 01/04/16 | | | 5,467,262 | | | | 5,467,262 | |
HSBC Group
issued 12/31/15 at 0.18%
due 01/04/16 | | | 4,922,041 | | | | 4,922,041 | |
Total Repurchase Agreements | | | | | |
(Cost $19,510,198) | | | | | | | 19,510,198 | |
Total Investments – 85.3% | | | | | |
(Cost $104,987,149) | | | | | | $ | 106,025,695 | |
SEE NOTES TO FINANCIAL STATEMENTS. | THE GUGGENHEIM FUNDS ANNUAL REPORT | 27 |
CONSOLIDATED SCHEDULE OF INVESTMENTS (continued) | December 31, 2015 |
MULTI-HEDGE STRATEGIES FUND | |
| |
Shares
| | | Value | |
| | | | | | | |
COMMON STOCKS SOLD SHORT† - (33.7)% | |
| | |
Diversified - (0.1)% | |
Leucadia National Corp. | | | 8,500 | | | $ | (147,815 | ) |
| | | | | | | | | |
Basic Materials - (1.1)% | |
NewMarket Corp. | | | 34 | | | | (12,945 | ) |
Freeport-McMoRan, Inc. | | | 3,204 | | | | (21,691 | ) |
PPG Industries, Inc. | | | 539 | | | | (53,264 | ) |
Allegheny Technologies, Inc. | | | 5,970 | | | | (67,163 | ) |
Platform Specialty Products Corp.* | | | 6,511 | | | | (83,536 | ) |
Praxair, Inc. | | | 1,080 | | | | (110,592 | ) |
Monsanto Co. | | | 1,146 | | | | (112,904 | ) |
RPM International, Inc. | | | 2,630 | | | | (115,878 | ) |
Ecolab, Inc. | | | 1,114 | | | | (127,419 | ) |
WR Grace & Co.* | | | 1,349 | | | | (134,347 | ) |
Royal Gold, Inc. | | | 3,710 | | | | (135,304 | ) |
Tahoe Resources, Inc. | | | 15,786 | | | | (136,865 | ) |
FMC Corp. | | | 3,609 | | | | (141,220 | ) |
Albemarle Corp. | | | 2,698 | | | | (151,115 | ) |
Total Basic Materials | | | | | | | (1,404,243 | ) |
| | | | | | | | | |
Utilities - (2.0)% | |
American Water Works Company, Inc. | | | 270 | | | | (16,133 | ) |
Duke Energy Corp. | | | 438 | | | | (31,269 | ) |
NRG Energy, Inc. | | | 3,440 | | | | (40,489 | ) |
MDU Resources Group, Inc. | | | 3,227 | | | | (59,119 | ) |
Calpine Corp.* | | | 4,790 | | | | (69,311 | ) |
Entergy Corp. | | | 1,383 | | | | (94,542 | ) |
OGE Energy Corp. | | | 4,621 | | | | (121,486 | ) |
PPL Corp. | | | 3,643 | | | | (124,336 | ) |
Hawaiian Electric Industries, Inc. | | | 4,554 | | | | (131,838 | ) |
NextEra Energy, Inc. | | | 1,281 | | | | (133,083 | ) |
Sempra Energy | | | 1,518 | | | | (142,707 | ) |
Southern Co. | | | 3,070 | | | | (143,645 | ) |
Dominion Resources, Inc. | | | 2,147 | | | | (145,223 | ) |
Aqua America, Inc. | | | 4,882 | | | | (145,483 | ) |
ITC Holdings Corp. | | | 3,744 | | | | (146,952 | ) |
WEC Energy Group, Inc. | | | 2,867 | | | | (147,106 | ) |
Vectren Corp. | | | 3,474 | | | | (147,367 | ) |
Alliant Energy Corp. | | | 2,361 | | | | (147,444 | ) |
Questar Corp. | | | 7,623 | | | | (148,496 | ) |
CenterPoint Energy, Inc. | | | 8,467 | | | | (155,454 | ) |
National Fuel Gas Co. | | | 3,710 | | | | (158,603 | ) |
Total Utilities | | | | | | | (2,450,086 | ) |
| | | | | | | | | |
Energy - (2.7)% | |
QEP Resources, Inc. | | | 472 | | | | (6,325 | ) |
Southwestern Energy Co.* | | | 3,029 | | | | (21,536 | ) |
Superior Energy Services, Inc. | | | 1,823 | | | | (24,556 | ) |
CONSOL Energy, Inc. | | | 3,406 | | | | (26,907 | ) |
Concho Resources, Inc.* | | | 372 | | | | (34,544 | ) |
Whiting Petroleum Corp.* | | | 4,250 | | | | (40,120 | ) |
Kosmos Energy Ltd.* | | | 7,792 | | | | (40,518 | ) |
RPC, Inc. | | | 4,116 | | | | (49,186 | ) |
Apache Corp. | | | 1,180 | | | | (52,475 | ) |
Oceaneering International, Inc. | | | 1,450 | | | | (54,404 | ) |
Continental Resources, Inc.* | | | 2,463 | | | | (56,600 | ) |
TerraForm Power, Inc. — Class A | | | 4,655 | | | | (58,560 | ) |
ONEOK, Inc. | | | 2,901 | | | | (71,539 | ) |
Gulfport Energy Corp.* | | | 2,934 | | | | (72,088 | ) |
Range Resources Corp. | | | 3,508 | | | | (86,332 | ) |
Weatherford International plc* | | | 10,895 | | | | (91,409 | ) |
Dril-Quip, Inc.* | | | 1,619 | | | | (95,893 | ) |
Western Refining, Inc. | | | 2,772 | | | | (98,739 | ) |
Cobalt International Energy, Inc.* | | | 22,094 | | | | (119,308 | ) |
Cimarex Energy Co. | | | 1,383 | | | | (123,613 | ) |
Pioneer Natural Resources Co. | | | 1,012 | | | | (126,885 | ) |
Cheniere Energy, Inc.* | | | 3,440 | | | | (128,140 | ) |
EOG Resources, Inc. | | | 1,888 | | | | (133,652 | ) |
Anadarko Petroleum Corp. | | | 2,833 | | | | (137,627 | ) |
FMC Technologies, Inc.* | | | 4,890 | | | | (141,859 | ) |
Cabot Oil & Gas Corp. — Class A | | | 8,803 | | | | (155,724 | ) |
28 | THE GUGGENHEIM FUNDS ANNUAL REPORT | SEE NOTES TO FINANCIAL STATEMENTS. |
CONSOLIDATED SCHEDULE OF INVESTMENTS (continued) | December 31, 2015 |
MULTI-HEDGE STRATEGIES FUND | |
| |
Shares
| | | Value | |
| | | | | | | |
Memorial Resource Development Corp.* | | | 9,917 | | | $ | (160,159 | ) |
Schlumberger Ltd. | | | 5,482 | | | | (382,370 | ) |
Halliburton Co. | | | 24,260 | | | | (825,810 | ) |
Total Energy | | | | | | | (3,416,878 | ) |
| | | | | | | | | |
Communications - (3.1)% | |
Twenty-First Century Fox, Inc. — Class A | | | 271 | | | | (7,360 | ) |
Level 3 Communications, Inc.* | | | 236 | | | | (12,829 | ) |
Palo Alto Networks, Inc.* | | | 101 | | | | (17,790 | ) |
Liberty Ventures* | | | 1,012 | | | | (45,651 | ) |
Verizon Communications, Inc. | | | 1,146 | | | | (52,968 | ) |
Nielsen Holdings plc | | | 1,653 | | | | (77,030 | ) |
Groupon, Inc. — Class A* | | | 26,310 | | | | (80,772 | ) |
Clear Channel Outdoor Holdings, Inc. — Class A* | | | 19,536 | | | | (109,206 | ) |
CBS Corp. — Class B | | | 2,630 | | | | (123,952 | ) |
Discovery Communications, Inc. — Class C* | | | 4,924 | | | | (124,183 | ) |
Priceline Group, Inc.* | | | 101 | | | | (128,770 | ) |
Twitter, Inc.* | | | 5,700 | | | | (131,898 | ) |
LinkedIn Corp. — Class A* | | | 607 | | | | (136,624 | ) |
DISH Network Corp. — Class A* | | | 2,395 | | | | (136,946 | ) |
Discovery Communications, Inc. — Class A* | | | 5,161 | | | | (137,696 | ) |
Yelp, Inc. — Class A* | | | 4,790 | | | | (137,952 | ) |
FireEye, Inc.* | | | 6,746 | | | | (139,912 | ) |
Motorola Solutions, Inc. | | | 2,057 | | | | (140,802 | ) |
Yahoo!, Inc.* | | | 4,283 | | | | (142,453 | ) |
Zayo Group Holdings, Inc.* | | | 5,397 | | | | (143,506 | ) |
TripAdvisor, Inc.* | | | 1,721 | | | | (146,715 | ) |
Viavi Solutions, Inc.* | | | 24,320 | | | | (148,109 | ) |
Pandora Media, Inc.* | | | 11,266 | | | | (151,077 | ) |
Splunk, Inc.* | | | 2,664 | | | | (156,670 | ) |
Arista Networks, Inc.* | | | 2,091 | | | | (162,763 | ) |
Expedia, Inc. | | | 2,247 | | | | (279,301 | ) |
Charter Communications, Inc. — Class A* | | | 4,481 | | | | (820,471 | ) |
Total Communications | | | | | | | (3,893,406 | ) |
| | | | | | | | | |
Industrial - (3.7)% | |
Flowserve Corp. | | | 68 | | | | (2,861 | ) |
Expeditors International of Washington, Inc. | | | 304 | | | | (13,710 | ) |
Fortune Brands Home & Security, Inc. | | | 270 | | | | (14,985 | ) |
BWX Technologies, Inc. | | | 472 | | | | (14,995 | ) |
Honeywell International, Inc. | | | 169 | | | | (17,503 | ) |
FLIR Systems, Inc. | | | 674 | | | | (18,919 | ) |
Acuity Brands, Inc. | | | 101 | | | | (23,614 | ) |
Wabtec Corp. | | | 338 | | | | (24,039 | ) |
Chicago Bridge & Iron Company N.V. | | | 708 | | | | (27,605 | ) |
Lincoln Electric Holdings, Inc. | | | 708 | | | | (36,738 | ) |
SPX Corp. | | | 4,048 | | | | (37,768 | ) |
Hexcel Corp. | | | 877 | | | | (40,737 | ) |
Rockwell Collins, Inc. | | | 472 | | | | (43,566 | ) |
Middleby Corp.* | | | 404 | | | | (43,579 | ) |
Emerson Electric Co. | | | 1,046 | | | | (50,030 | ) |
AptarGroup, Inc. | | | 911 | | | | (66,184 | ) |
Kennametal, Inc. | | | 4,148 | | | | (79,642 | ) |
Cognex Corp. | | | 2,429 | | | | (82,027 | ) |
Kansas City Southern | | | 1,114 | | | | (83,182 | ) |
Ball Corp. | | | 1,146 | | | | (83,349 | ) |
Nordson Corp. | | | 1,585 | | | | (101,678 | ) |
Triumph Group, Inc. | | | 2,664 | | | | (105,894 | ) |
J.B. Hunt Transport Services, Inc. | | | 1,450 | | | | (106,372 | ) |
Armstrong World Industries, Inc.* | | | 2,395 | | | | (109,523 | ) |
Stericycle, Inc.* | | | 911 | | | | (109,867 | ) |
Graco, Inc. | | | 1,552 | | | | (111,853 | ) |
Trimble Navigation Ltd.* | | | 5,228 | | | | (112,141 | ) |
CH Robinson Worldwide, Inc. | | | 1,856 | | | | (115,109 | ) |
Timken Co. | | | 4,116 | | | | (117,676 | ) |
SEE NOTES TO FINANCIAL STATEMENTS. | THE GUGGENHEIM FUNDS ANNUAL REPORT | 29 |
CONSOLIDATED SCHEDULE OF INVESTMENTS (continued) | December 31, 2015 |
MULTI-HEDGE STRATEGIES FUND | |
| |
Shares
| | | Value | |
| | | | | | | |
United Parcel Service, Inc. — Class B | | | 1,315 | | | $ | (126,542 | ) |
Allegion plc | | | 1,922 | | | | (126,698 | ) |
Zebra Technologies Corp. — Class A* | | | 1,956 | | | | (136,235 | ) |
IDEX Corp. | | | 1,788 | | | | (136,979 | ) |
Tyco International plc | | | 4,317 | | | | (137,669 | ) |
TransDigm Group, Inc.* | | | 607 | | | | (138,669 | ) |
Lockheed Martin Corp. | | | 641 | | | | (139,193 | ) |
National Instruments Corp. | | | 4,858 | | | | (139,376 | ) |
KBR, Inc. | | | 8,264 | | | | (139,827 | ) |
Owens-Illinois, Inc.* | | | 8,061 | | | | (140,423 | ) |
Garmin Ltd. | | | 3,778 | | | | (140,428 | ) |
Eagle Materials, Inc. | | | 2,361 | | | | (142,675 | ) |
B/E Aerospace, Inc. | | | 3,374 | | | | (142,956 | ) |
SBA Communications Corp. — Class A* | | | 1,383 | | | | (145,312 | ) |
Landstar System, Inc. | | | 2,485 | | | | (145,745 | ) |
Manitowoc Company, Inc. | | | 9,613 | | | | (147,560 | ) |
Donaldson Company, Inc. | | | 5,161 | | | | (147,914 | ) |
USG Corp.* | | | 6,105 | | | | (148,290 | ) |
Covanta Holding Corp. | | | 9,951 | | | | (154,141 | ) |
SunPower Corp. — Class A* | | | 6,577 | | | | (197,376 | ) |
Total Industrial | | | | | | | (4,669,154 | ) |
| | | | | | | | | |
Technology - (3.9)% | |
MSCI, Inc. — Class A | | | 101 | | | | (7,285 | ) |
Western Digital Corp. | | | 125 | | | | (7,506 | ) |
QUALCOMM, Inc. | | | 203 | | | | (10,147 | ) |
Tableau Software, Inc. — Class A* | | | 236 | | | | (22,236 | ) |
Linear Technology Corp. | | | 810 | | | | (34,401 | ) |
International Business Machines Corp. | | | 304 | | | | (41,836 | ) |
Lexmark International, Inc. — Class A | | | 1,653 | | | | (53,640 | ) |
Salesforce.com, Inc.* | | | 1,080 | | | | (84,672 | ) |
IHS, Inc. — Class A* | | | 911 | | | | (107,890 | ) |
Marvell Technology Group Ltd. | | | 12,547 | | | | (110,665 | ) |
Cree, Inc.* | | | 4,655 | | | | (124,149 | ) |
Solera Holdings, Inc. | | | 2,395 | | | | (131,318 | ) |
Autodesk, Inc.* | | | 2,260 | | | | (137,702 | ) |
Teradata Corp.* | | | 5,228 | | | | (138,124 | ) |
Cypress Semiconductor Corp.* | | | 14,133 | | | | (138,644 | ) |
Cerner Corp.* | | | 2,361 | | | | (142,061 | ) |
Workday, Inc. — Class A* | | | 1,788 | | | | (142,468 | ) |
Paychex, Inc. | | | 2,698 | | | | (142,697 | ) |
PTC, Inc.* | | | 4,148 | | | | (143,645 | ) |
ServiceNow, Inc.* | | | 1,687 | | | | (146,027 | ) |
VeriFone Systems, Inc.* | | | 5,363 | | | | (150,271 | ) |
NetSuite, Inc.* | | | 1,788 | | | | (151,301 | ) |
Zynga, Inc. — Class A* | | | 57,747 | | | | (154,762 | ) |
Veeva Systems, Inc. — Class A* | | | 5,397 | | | | (155,703 | ) |
Lam Research Corp. | | | 2,502 | | | | (198,709 | ) |
VMware, Inc. — Class A* | | | 5,195 | | | | (293,881 | ) |
NXP Semiconductor N.V.* | | | 9,679 | | | | (815,456 | ) |
Avago Technologies Ltd. | | | 6,865 | | | | (996,455 | ) |
Total Technology | | | | | | | (4,783,651 | ) |
| | | | | | | | | |
Consumer, Cyclical - (4.0)% | |
American Airlines Group, Inc. | | | 68 | | | | (2,880 | ) |
Ross Stores, Inc. | | | 101 | | | | (5,435 | ) |
VF Corp. | | | 101 | | | | (6,287 | ) |
Michael Kors Holdings Ltd.* | | | 336 | | | | (13,460 | ) |
Genuine Parts Co. | | | 304 | | | | (26,111 | ) |
Williams-Sonoma, Inc. | | | 472 | | | | (27,570 | ) |
Scotts Miracle-Gro Co. — Class A | | | 438 | | | | (28,255 | ) |
Dollar General Corp. | | | 506 | | | | (36,366 | ) |
Cabela’s, Inc.* | | | 877 | | | | (40,982 | ) |
Johnson Controls, Inc. | | | 1,046 | | | | (41,307 | ) |
Mattel, Inc. | | | 1,856 | | | | (50,428 | ) |
Polaris Industries, Inc. | | | 607 | | | | (52,172 | ) |
Costco Wholesale Corp. | | | 438 | | | | (70,737 | ) |
LKQ Corp.* | | | 2,766 | | | | (81,957 | ) |
WW Grainger, Inc. | | | 483 | | | | (97,851 | ) |
Gaming and Leisure Properties, Inc. | | | 3,541 | | | | (98,440 | ) |
HD Supply Holdings, Inc.* | | | 3,374 | | | | (101,321 | ) |
30 | THE GUGGENHEIM FUNDS ANNUAL REPORT | SEE NOTES TO FINANCIAL STATEMENTS. |
CONSOLIDATED SCHEDULE OF INVESTMENTS (continued) | December 31, 2015 |
MULTI-HEDGE STRATEGIES FUND | |
| |
Shares
| | | Value | |
| | | | | | | |
Tempur Sealy International, Inc.* | | | 1,552 | | | $ | (109,354 | ) |
MSC Industrial Direct Company, Inc. — Class A | | | 1,956 | | | | (110,064 | ) |
Ulta Salon Cosmetics & Fragrance, Inc.* | | | 607 | | | | (112,295 | ) |
Lions Gate Entertainment Corp. | | | 3,474 | | | | (112,523 | ) |
Copart, Inc.* | | | 2,966 | | | | (112,738 | ) |
Chipotle Mexican Grill, Inc. — Class A* | | | 236 | | | | (113,245 | ) |
BorgWarner, Inc. | | | 2,698 | | | | (116,635 | ) |
Signet Jewelers Ltd. | | | 978 | | | | (120,969 | ) |
Panera Bread Co. — Class A* | | | 641 | | | | (124,854 | ) |
Tractor Supply Co. | | | 1,484 | | | | (126,882 | ) |
McDonald’s Corp. | | | 1,114 | | | | (131,608 | ) |
CarMax, Inc.* | | | 2,463 | | | | (132,928 | ) |
Toro Co. | | | 1,822 | | | | (133,134 | ) |
Spirit Airlines, Inc.* | | | 3,406 | | | | (135,729 | ) |
Kate Spade & Co.* | | | 7,826 | | | | (139,068 | ) |
MGM Resorts International* | | | 6,240 | | | | (141,773 | ) |
Dunkin’ Brands Group, Inc. | | | 3,340 | | | | (142,251 | ) |
Tupperware Brands Corp. | | | 2,564 | | | | (142,687 | ) |
Dollar Tree, Inc.* | | | 1,856 | | | | (143,320 | ) |
Tiffany & Co. | | | 1,888 | | | | (144,035 | ) |
Choice Hotels International, Inc. | | | 2,867 | | | | (144,525 | ) |
Yum! Brands, Inc. | | | 1,990 | | | | (145,369 | ) |
Fastenal Co. | | | 3,575 | | | | (145,931 | ) |
Sally Beauty Holdings, Inc.* | | | 5,262 | | | | (146,757 | ) |
Tesla Motors, Inc.* | | | 641 | | | | (153,847 | ) |
Wynn Resorts Ltd. | | | 2,226 | | | | (154,017 | ) |
Staples, Inc. | | | 24,504 | | | | (232,053 | ) |
Newell Rubbermaid, Inc. | | | 10,804 | | | | (476,240 | ) |
Total Consumer, Cyclical | | | | | | | (4,926,390 | ) |
| | | | | | | | | |
Consumer, Non-Cyclical - (6.0)% | |
HCA Holdings, Inc.* | | | 135 | | | | (9,130 | ) |
FleetCor Technologies, Inc.* | | | 68 | | | | (9,719 | ) |
Clorox Co. | | | 101 | | | | (12,810 | ) |
Community Health Systems, Inc.* | | | 573 | | | | (15,202 | ) |
Moody’s Corp. | | | 169 | | | | (16,957 | ) |
Akorn, Inc.* | | | 472 | | | | (17,610 | ) |
Intercept Pharmaceuticals, Inc.* | | | 135 | | | | (20,162 | ) |
Whole Foods Market, Inc. | | | 607 | | | | (20,335 | ) |
Alexion Pharmaceuticals, Inc.* | | | 135 | | | | (25,751 | ) |
Estee Lauder Companies, Inc. — Class A | | | 304 | | | | (26,770 | ) |
ConAgra Foods, Inc. | | | 708 | | | | (29,849 | ) |
Rollins, Inc. | | | 1,484 | | | | (38,436 | ) |
Avis Budget Group, Inc.* | | | 1,180 | | | | (42,822 | ) |
Bruker Corp.* | | | 1,888 | | | | (45,822 | ) |
Jazz Pharmaceuticals plc* | | | 338 | | | | (47,509 | ) |
Tenet Healthcare Corp.* | | | 1,619 | | | | (49,056 | ) |
Bristol-Myers Squibb Co. | | | 742 | | | | (51,042 | ) |
Envision Healthcare Holdings, Inc.* | | | 2,091 | | | | (54,304 | ) |
Monster Beverage Corp.* | | | 372 | | | | (55,413 | ) |
Automatic Data Processing, Inc. | | | 675 | | | | (57,186 | ) |
PepsiCo, Inc. | | | 675 | | | | (67,446 | ) |
Stryker Corp. | | | 843 | | | | (78,348 | ) |
Intuitive Surgical, Inc.* | | | 169 | | | | (92,301 | ) |
CR Bard, Inc. | | | 506 | | | | (95,857 | ) |
Medivation, Inc.* | | | 2,159 | | | | (104,366 | ) |
IDEXX Laboratories, Inc.* | | | 1,470 | | | | (107,192 | ) |
Hain Celestial Group, Inc.* | | | 2,698 | | | | (108,972 | ) |
McCormick & Company, Inc. | | | 1,315 | | | | (112,511 | ) |
Endo International plc* | | | 1,922 | | | | (117,665 | ) |
Anthem, Inc. | | | 887 | | | | (123,683 | ) |
Premier, Inc. — Class A* | | | 3,508 | | | | (123,727 | ) |
Brown-Forman Corp. — Class A | | | 1,146 | | | | (126,186 | ) |
Morningstar, Inc. | | | 1,585 | | | | (127,450 | ) |
SEE NOTES TO FINANCIAL STATEMENTS. | THE GUGGENHEIM FUNDS ANNUAL REPORT | 31 |
CONSOLIDATED SCHEDULE OF INVESTMENTS (continued) | December 31, 2015 |
MULTI-HEDGE STRATEGIES FUND | |
| |
Shares
| | | Value | |
| | | | | | | |
Colgate-Palmolive Co. | | | 1,946 | | | $ | (129,643 | ) |
Verisk Analytics, Inc. — Class A* | | | 1,721 | | | | (132,310 | ) |
Seattle Genetics, Inc.* | | | 3,070 | | | | (137,782 | ) |
Brookdale Senior Living, Inc. — Class A* | | | 7,488 | | | | (138,228 | ) |
Brown-Forman Corp. — Class B | | | 1,400 | | | | (138,992 | ) |
Align Technology, Inc.* | | | 2,125 | | | | (139,931 | ) |
Hertz Global Holdings, Inc.* | | | 9,883 | | | | (140,636 | ) |
Live Nation Entertainment, Inc.* | | | 5,734 | | | | (140,884 | ) |
Sysco Corp. | | | 3,440 | | | | (141,040 | ) |
Hershey Co. | | | 1,585 | | | | (141,493 | ) |
Coca-Cola Co. | | | 3,306 | | | | (142,026 | ) |
Philip Morris International, Inc. | | | 1,619 | | | | (142,326 | ) |
Edgewell Personal Care Co. | | | 1,822 | | | | (142,790 | ) |
Avon Products, Inc. | | | 35,451 | | | | (143,577 | ) |
Gartner, Inc.* | | | 1,585 | | | | (143,760 | ) |
Kellogg Co. | | | 1,990 | | | | (143,817 | ) |
Mead Johnson Nutrition Co. — Class A | | | 1,822 | | | | (143,847 | ) |
Kimberly-Clark Corp. | | | 1,146 | | | | (145,886 | ) |
McGraw Hill Financial, Inc. | | | 1,484 | | | | (146,293 | ) |
WhiteWave Foods Co. — Class A* | | | 3,778 | | | | (147,002 | ) |
Sprouts Farmers Market, Inc.* | | | 5,566 | | | | (148,000 | ) |
Vertex Pharmaceuticals, Inc.* | | | 1,180 | | | | (148,479 | ) |
Illumina, Inc.* | | | 810 | | | | (155,475 | ) |
Puma Biotechnology, Inc.* | | | 2,091 | | | | (163,934 | ) |
Agios Pharmaceuticals, Inc.* | | | 2,630 | | | | (170,740 | ) |
Global Payments, Inc. | | | 2,728 | | | | (175,983 | ) |
DENTSPLY International, Inc. | | | 3,251 | | | | (197,824 | ) |
Snyder’s-Lance, Inc. | | | 6,815 | | | | (233,755 | ) |
Aetna, Inc. | | | 2,353 | | | | (254,406 | ) |
Centene Corp.* | | | 4,791 | | | | (315,296 | ) |
Pfizer, Inc. | | | 18,091 | | | | (583,978 | ) |
Total Consumer, Non-Cyclical | | | | (7,401,722 | ) |
| | | | | | | | | |
Financial - (7.1)% | |
RMR Group, Inc. — Class A* | | | 70 | | | | (1,009 | ) |
Progressive Corp. | | | 68 | | | | (2,162 | ) |
Prologis, Inc. | | | 135 | | | | (5,794 | ) |
Liberty Property Trust | | | 202 | | | | (6,272 | ) |
Realty Income Corp. | | | 135 | | | | (6,970 | ) |
Forest City Enterprises, Inc. — Class A* | | | 336 | | | | (7,368 | ) |
Invesco Ltd. | | | 236 | | | | (7,901 | ) |
Torchmark Corp. | | | 169 | | | | (9,660 | ) |
Apartment Investment & Management Co. — Class A | | | 304 | | | | (12,169 | ) |
DDR Corp. | | | 1,112 | | | | (18,726 | ) |
WP Carey, Inc. | | | 372 | | | | (21,948 | ) |
MetLife, Inc. | | | 539 | | | | (25,985 | ) |
Vornado Realty Trust | | | 404 | | | | (40,384 | ) |
Unum Group | | | 1,214 | | | | (40,414 | ) |
Douglas Emmett, Inc. | | | 1,315 | | | | (41,002 | ) |
Outfront Media, Inc. | | | 2,192 | | | | (47,851 | ) |
Kilroy Realty Corp. | | | 776 | | | | (49,105 | ) |
Zions Bancorporation | | | 1,956 | | | | (53,399 | ) |
Bank of America Corp. | | | 3,272 | | | | (55,068 | ) |
HCP, Inc. | | | 1,721 | | | | (65,811 | ) |
BB&T Corp. | | | 1,815 | | | | (68,625 | ) |
American National Insurance Co. | | | 675 | | | | (69,032 | ) |
Waddell & Reed Financial, Inc. — Class A | | | 2,698 | | | | (77,325 | ) |
Franklin Resources, Inc. | | | 2,260 | | | | (83,213 | ) |
Principal Financial Group, Inc. | | | 1,856 | | | | (83,483 | ) |
Healthcare Trust of America, Inc. — Class A | | | 3,205 | | | | (86,439 | ) |
Senior Housing Properties Trust | | | 6,308 | | | | (93,611 | ) |
Simon Property Group, Inc. | | | 506 | | | | (98,387 | ) |
SVB Financial Group* | | | 877 | | | | (104,275 | ) |
32 | THE GUGGENHEIM FUNDS ANNUAL REPORT | SEE NOTES TO FINANCIAL STATEMENTS. |
CONSOLIDATED SCHEDULE OF INVESTMENTS (continued) | December 31, 2015 |
MULTI-HEDGE STRATEGIES FUND | |
| |
Shares
| | | Value | |
| | | | | | | |
State Street Corp. | | | 1,653 | | | $ | (109,693 | ) |
Aflac, Inc. | | | 1,922 | | | | (115,128 | ) |
Markel Corp.* | | | 135 | | | | (119,252 | ) |
TD Ameritrade Holding Corp. | | | 3,474 | | | | (120,583 | ) |
T. Rowe Price Group, Inc. | | | 1,687 | | | | (120,604 | ) |
Alliance Data Systems Corp.* | | | 438 | | | | (121,138 | ) |
White Mountains Insurance Group Ltd. | | | 169 | | | | (122,831 | ) |
Commerce Bancshares, Inc. | | | 2,957 | | | | (125,793 | ) |
American Express Co. | | | 1,822 | | | | (126,720 | ) |
Tanger Factory Outlet Centers, Inc. | | | 4,014 | | | | (131,258 | ) |
Cullen/Frost Bankers, Inc. | | | 2,192 | | | | (131,520 | ) |
ProAssurance Corp. | | | 2,732 | | | | (132,584 | ) |
Arthur J Gallagher & Co. | | | 3,272 | | | | (133,956 | ) |
Crown Castle International Corp. | | | 1,552 | | | | (134,170 | ) |
BankUnited, Inc. | | | 3,744 | | | | (135,009 | ) |
BOK Financial Corp. | | | 2,260 | | | | (135,126 | ) |
Mercury General Corp. | | | 2,934 | | | | (136,636 | ) |
Rayonier, Inc. | | | 6,207 | | | | (137,795 | ) |
CBOE Holdings, Inc. | | | 2,125 | | | | (137,913 | ) |
MasterCard, Inc. — Class A | | | 1,417 | | | | (137,959 | ) |
Intercontinental Exchange, Inc. | | | 539 | | | | (138,124 | ) |
Assurant, Inc. | | | 1,721 | | | | (138,609 | ) |
Genworth Financial, Inc. — Class A* | | | 37,239 | | | | (138,901 | ) |
Signature Bank* | | | 911 | | | | (139,720 | ) |
Aon plc | | | 1,518 | | | | (139,975 | ) |
Eaton Vance Corp. | | | 4,317 | | | | (140,000 | ) |
Howard Hughes Corp.* | | | 1,248 | | | | (141,224 | ) |
Marsh & McLennan Companies, Inc. | | | 2,564 | | | | (142,174 | ) |
Brown & Brown, Inc. | | | 4,430 | | | | (142,202 | ) |
U.S. Bancorp | | | 3,340 | | | | (142,518 | ) |
SLM Corp.* | | | 21,925 | | | | (142,951 | ) |
Iron Mountain, Inc. | | | 5,296 | | | | (143,045 | ) |
American Tower Corp. — Class A | | | 1,484 | | | | (143,874 | ) |
TFS Financial Corp. | | | 7,657 | | | | (144,181 | ) |
Charles Schwab Corp. | | | 4,452 | | | | (146,604 | ) |
Loews Corp. | | | 3,845 | | | | (147,648 | ) |
NorthStar Asset Management Group, Inc. | | | 12,278 | | | | (149,055 | ) |
PacWest Bancorp | | | 7,522 | | | | (324,198 | ) |
Weyerhaeuser Co. | | | 12,973 | | | | (388,932 | ) |
KeyCorp | | | 34,444 | | | | (454,316 | ) |
ACE Ltd. | | | 4,475 | | | | (522,904 | ) |
Royal Bank of Canada | | | 16,338 | | | | (875,390 | ) |
Total Financial | | | | | | | (8,835,601 | ) |
| | | | | | | | | |
Total Common Stocks Sold Short | | | | | |
(Proceeds $44,849,389) | | | | | | | (41,928,946 | ) |
| | | | | | | | | |
EXCHANGE-TRADED FUNDS SOLD SHORT† - (10.6)% | |
iShares MSCI Australia ETF | | | 1,445 | | | | (27,397 | ) |
Market Vectors Russia ETF | | | 1,930 | | | | (28,275 | ) |
iShares MSCI Emerging Markets ETF | | | 2,803 | | | | (90,229 | ) |
iShares MSCI Taiwan ETF | | | 8,209 | | | | (104,829 | ) |
Market Vectors Gold Miners ETF | | | 8,115 | | | | (111,338 | ) |
iShares MSCI Japan ETF | | | 9,555 | | | | (115,807 | ) |
PowerShares QQQ Trust Series 1 | | | 1,135 | | | | (126,961 | ) |
iShares MSCI Mexico Capped ETF | | | 3,134 | | | | (156,167 | ) |
iShares Core U.S. Aggregate Bond ETF | | | 1,700 | | | | (183,617 | ) |
iShares MSCI South Korea Capped ETF | | | 3,733 | | | | (185,418 | ) |
iShares China Large-Capital ETF | | | 6,859 | | | | (242,054 | ) |
iShares MSCI United Kingdom ETF | | | 18,877 | | | | (304,675 | ) |
iShares iBoxx $ Investment Grade Corporate Bond ETF | | | 3,261 | | | | (371,787 | ) |
SEE NOTES TO FINANCIAL STATEMENTS. | THE GUGGENHEIM FUNDS ANNUAL REPORT | 33 |
CONSOLIDATED SCHEDULE OF INVESTMENTS (continued) | December 31, 2015 |
MULTI-HEDGE STRATEGIES FUND | |
| |
Shares
| | | Value | |
| | | | | | | |
iShares 7-10 Year Treasury Bond ETF | | | 3,903 | | | $ | (412,118 | ) |
iShares 20+ Year Treasury Bond ETF | | | 3,578 | | | | (431,578 | ) |
iShares MSCI EAFE ETF | | | 9,186 | | | | (539,678 | ) |
iShares Russell 2000 Index ETF | | | 5,254 | | | | (591,128 | ) |
iShares Russell 1000 Value ETF | | | 9,636 | | | | (942,979 | ) |
iShares TIPS Bond ETF | | | 9,085 | | | | (996,443 | ) |
iShares U.S. Real Estate ETF | | | 14,214 | | | | (1,067,613 | ) |
SPDR S&P 500 ETF Trust | | | 14,590 | | | | (2,974,754 | ) |
SPDR Barclays High Yield Bond ETF | | | 92,921 | | | | (3,150,950 | ) |
Total Exchange-Traded Funds Sold Short | |
(Proceeds $13,220,791) | | | | | | | (13,155,795 | ) |
| | | | | | | | | |
Total Securities Sold Short- (44.3)% | | | | | |
(Proceeds $58,070,180) | | | | | | $ | (55,084,741 | ) |
| | | | | | | | | |
| | | Contracts | | | | | |
| | | | | | | | | |
OPTIONS WRITTEN† - 0.0% | |
Call options on: | | | | | | | | |
Airgas, Inc.
Expiring January 2016 with strike price of $145.00 | | | 30 | | | | (450 | ) |
Total Options Written | | | | | | | | |
(Premiums received $1,349) | | | | (450 | ) |
Other Assets & Liabilities, net - 59.0% | | | | 73,302,741 | |
Total Net Assets - 100.0% | | | $ | 124,243,245 | |
| | Contracts | | | Unrealized
Gain (Loss) | |
| | | | | | | |
INTEREST RATE FUTURES CONTRACTS PURCHASED† | |
March 2016 Japanese Government 10 Year Bond
Futures Contracts††
(Aggregate Value of
Contracts $43,397,672) | | | 35 | | | $ | 60,523 | |
March 2016 Canadian Government 10 Year Bond
Futures Contracts††
(Aggregate Value of
Contracts $7,025,678) | | | 69 | | | | 31,144 | |
March 2016 Euro - Schatz
Futures Contracts††
(Aggregate Value of
Contracts $6,303,852) | | | 52 | | | | 7,439 | |
March 2016 Euro - Bobl
Futures Contracts††
(Aggregate Value of
Contracts $1,280,782) | | | 9 | | | | 5,487 | |
March 2016 U.S. Treasury 10 Year Note
Futures Contracts
(Aggregate Value of
Contracts $629,453) | | | 5 | | | | 1,039 | |
March 2016 U.S. Treasury Long Bond
Futures Contracts
(Aggregate Value of
Contracts $767,188) | | | 5 | | | | (6,625 | ) |
(Total Aggregate Value of Contracts $59,404,625) | | | $ | 99,007 | |
| | | | | | | | | |
COMMODITY FUTURES CONTRACTS PURCHASED† | |
February 2016 LME Lead
Futures Contracts
(Aggregate Value of
Contracts $359,500) | | | 8 | | | $ | 19,886 | |
March 2016 Sugar #11
Futures Contracts
(Aggregate Value of
Contracts $442,915) | | | 26 | | | | 11,876 | |
34 | THE GUGGENHEIM FUNDS ANNUAL REPORT | SEE NOTES TO FINANCIAL STATEMENTS. |
CONSOLIDATED SCHEDULE OF INVESTMENTS (continued) | December 31, 2015 |
MULTI-HEDGE STRATEGIES FUND | |
| | Contracts | | | Unrealized
Gain (Loss) | |
| | | | | | | |
February 2016
Gasoline RBOB
Futures Contracts
(Aggregate Value of
Contracts $266,889) | | | 5 | | | $ | 6,536 | |
March 2016 Silver
Futures Contracts
(Aggregate Value of
Contracts $483,525) | | | 7 | | | | (5,008 | ) |
(Total Aggregate Value of Contracts $1,552,829) | | | | | | $ | 33,290 | |
| | | | | | | | | |
EQUITY FUTURES CONTRACTS PURCHASED† | |
March 2016 CBOE
Volatility Index
Futures Contracts
(Aggregate Value of
Contracts $3,495,299) | | | 183 | | | $ | 53,001 | |
March 2016 Topix Index
Futures Contracts††
(Aggregate Value of
Contracts $635,903) | | | 5 | | | | 864 | |
January 2016 CAC 40 10 Euro Index
Futures Contracts††
(Aggregate Value of
Contracts $200,732) | | | 4 | | | | 831 | |
March 2016 SPI 200 Index
Futures Contracts††
(Aggregate Value of
Contracts $96,120) | | | 1 | | | | (322 | ) |
March 2016 Dow Jones Industrial Average Index
Mini Futures Contracts
(Aggregate Value of
Contracts $866,500) | | | 10 | | | | (398 | ) |
March 2016 Nikkei 225
(OSE) Index
Futures Contracts††
(Aggregate Value of
Contracts $156,284) | | | 1 | | | | (548 | ) |
January 2016
Amsterdam Index
Futures Contracts††
(Aggregate Value of
Contracts $570,993) | | | 6 | | | | (1,480 | ) |
March 2016
NASDAQ-100 Index
Mini Futures Contracts
(Aggregate Value of
Contracts $1,834,500) | | | 20 | | | | (5,604 | ) |
March 2016 FTSE 100 Index
Futures Contracts††
(Aggregate Value of
Contracts $727,107) | | | 8 | | | | (5,775 | ) |
January 2016 IBEX 35 Index
Futures Contracts††
(Aggregate Value of
Contracts $205,123) | | | 2 | | | | (6,177 | ) |
March 2016
Russell 2000 Index
Mini Futures Contracts
(Aggregate Value of
Contracts $1,129,700) | | | 10 | | | | (10,525 | ) |
(Total Aggregate Value of Contracts $9,918,261) | | | | | | $ | 23,867 | |
| | | | | | | | | |
CURRENCY FUTURES CONTRACTS PURCHASED† | |
March 2016 Australian Dollar
Futures Contracts
(Aggregate Value of
Contracts $1,016,540) | | | 14 | | | $ | 3,972 | |
March 2016 Euro FX
Futures Contracts
(Aggregate Value of
Contracts $1,088,500) | | | 8 | | | | (3,022 | ) |
(Total Aggregate Value of Contracts $2,105,040) | | | | | | $ | 950 | |
SEE NOTES TO FINANCIAL STATEMENTS. | THE GUGGENHEIM FUNDS ANNUAL REPORT | 35 |
CONSOLIDATED SCHEDULE OF INVESTMENTS (continued) | December 31, 2015 |
MULTI-HEDGE STRATEGIES FUND | |
| | Contracts | | | Unrealized
Gain | |
| | | | | | | |
EQUITY FUTURES CONTRACTS SOLD SHORT† | |
April 2016 CBOE
Volatility Index
Futures Contracts
(Aggregate Value of
Contracts $1,649,850) | | | 85 | | | $ | 57,196 | |
January 2016 CBOE
Volatility Index
Futures Contracts
(Aggregate Value of
Contracts $224,400) | | | 12 | | | | 47,427 | |
January 2016 H-Shares Index
Futures Contracts††
(Aggregate Value of
Contracts $562,660) | | | 9 | | | | 17,023 | |
January 2016 MSCI
Taiwan Stock Index
Futures Contracts††
(Aggregate Value of
Contracts $817,317) | | | 27 | | | | 11,805 | |
March 2016 S&P 500 Index
Mini Futures Contracts
(Aggregate Value of
Contracts $2,543,126) | | | 25 | | | | 2,665 | |
January 2016
Hang Seng Index
Futures Contracts††
(Aggregate Value of
Contracts $141,140) | | | 1 | | | | 2,106 | |
March 2016 S&P MidCap 400 Index
Mini Futures Contracts
(Aggregate Value of
Contracts $139,230) | | | 1 | | | | 1,588 | |
March 2016 DAX Index
Futures Contracts††
(Aggregate Value of
Contracts $287,818) | | | 1 | | | | 351 | |
February 2016 CBOE Volatility Index
Futures Contracts
(Aggregate Value of
Contracts $1,516,000) | | | 80 | | | | (16,273 | ) |
(Total Aggregate Value of Contracts $7,881,541) | | | | | | $ | 123,888 | |
| | | | | | | | | |
COMMODITY FUTURES CONTRACTS SOLD SHORT† | |
February 2016 Low
Sulphur Gas Oil
Futures Contracts
(Aggregate Value of
Contracts $1,231,200) | | | 36 | | | $ | 77,874 | |
February 2016 New York Harbor Ultra-Low
Sulfur Diesel
Futures Contracts
(Aggregate Value of
Contracts $1,042,549) | | | 22 | | | | 37,839 | |
March 2016 Hard Red
Winter Wheat
Futures Contracts
(Aggregate Value of
Contracts $1,489,599) | | | 64 | | | | 28,665 | |
February 2016 Gold 100 oz.
Futures Contracts
(Aggregate Value of
Contracts $1,271,760) | | | 12 | | | | 26,857 | |
March 2016 Copper
Futures Contracts
(Aggregate Value of
Contracts $533,625) | | | 10 | | | | 13,610 | |
March 2016 Brent Crude
Futures Contracts
(Aggregate Value of
Contracts $1,025,730) | | | 27 | | | | 10,246 | |
February 2016 WTI Crude
Futures Contracts
(Aggregate Value of
Contracts $406,670) | | | 11 | | | | 9,650 | |
36 | THE GUGGENHEIM FUNDS ANNUAL REPORT | SEE NOTES TO FINANCIAL STATEMENTS. |
CONSOLIDATED SCHEDULE OF INVESTMENTS (continued) | December 31, 2015 |
MULTI-HEDGE STRATEGIES FUND | |
| | | Contracts | | | Unrealized
Gain (Loss) | |
| | | | | | | |
March 2016 Corn
Futures Contracts
(Aggregate Value of
Contracts $805,500) | | | 45 | | | $ | 6,875 | |
March 2016 Soybean
Futures Contracts
(Aggregate Value of
Contracts $475,063) | | | 11 | | | | 4,341 | |
March 2016 Wheat
Futures Contracts
(Aggregate Value of
Contracts $258,225) | | | 11 | | | | 401 | |
March 2016 Cotton #2
Futures Contracts
(Aggregate Value of
Contracts $126,640) | | | 4 | | | | (86 | ) |
February 2016 Live Cattle
Futures Contracts
(Aggregate Value of
Contracts $54,500) | | | 1 | | | | (576 | ) |
February 2016 LME
Primary Aluminum
Futures Contracts
(Aggregate Value of
Contracts $980,688) | | | 26 | | | | (889 | ) |
February 2016 LME Nickel
Futures Contracts
(Aggregate Value of
Contracts $369,663) | | | 7 | | | | (4,030 | ) |
February 2016 Lean Hogs
Futures Contracts
(Aggregate Value of
Contracts $646,650) | | | 27 | | | | (6,362 | ) |
March 2016 Coffee ‘C’
Futures Contracts
(Aggregate Value of
Contracts $330,750) | | | 7 | | | | (18,207 | ) |
February 2016 LME Zinc
Futures Contracts
(Aggregate Value of
Contracts $922,444) | | | 23 | | | | (30,017 | ) |
February 2016 Natural Gas
Futures Contracts
(Aggregate Value of
Contracts $559,440) | | | 24 | | | | (42,079 | ) |
(Total Aggregate Value of Contracts $12,530,696) | | | $ | 114,112 | |
| | | | | | | | | |
CURRENCY FUTURES CONTRACTS SOLD SHORT† | |
March 2016 British Pound
Futures Contracts
(Aggregate Value of
Contracts $2,119,163) | | | 23 | | | $ | 23,272 | |
March 2016 Canadian Dollar
Futures Contracts
(Aggregate Value of
Contracts $3,035,340) | | | 42 | | | | 13,586 | |
March 2016 Swiss Franc
Futures Contracts
(Aggregate Value of
Contracts $751,050) | | | 6 | | | | 11,607 | |
March 2016 Japanese Yen
Futures Contracts
(Aggregate Value of
Contracts $1,666,400) | | | 16 | | | | (1,010 | ) |
(Total Aggregate Value of Contracts $7,571,953) | | | | | | $ | 47,455 | |
| | | | | | | | | |
INTEREST RATE FUTURES CONTRACTS SOLD SHORT† | |
March 2016 Long Gilt
Futures Contracts††
(Aggregate Value of
Contracts $2,581,190) | | | 15 | | | $ | 21,196 | |
March 2016 U.S. Treasury Ultra Long Bond
Futures Contracts
(Aggregate Value of
Contracts $474,563) | | | 3 | | | | 5,850 | |
March 2016 U.S. Treasury 5 Year Note
Futures Contracts
(Aggregate Value of
Contracts $3,313,844) | | | 28 | | | | 4,630 | |
SEE NOTES TO FINANCIAL STATEMENTS. | THE GUGGENHEIM FUNDS ANNUAL REPORT | 37 |
CONSOLIDATED SCHEDULE OF INVESTMENTS (continued) | December 31, 2015 |
MULTI-HEDGE STRATEGIES FUND | |
| | Contracts | | | Unrealized
Gain (Loss) | |
| | | | | | | |
March 2016 Australian Government 3 Year Bond
Futures Contracts††
(Aggregate Value of
Contracts $162,638) | | | 2 | | | $ | (704 | ) |
March 2016 Australian Government 10 Year Bond
Futures Contracts††
(Aggregate Value of
Contracts $1,302,110) | | | 14 | | | | (3,405 | ) |
(Total Aggregate Value of Contracts $7,834,345) | | | | | | $ | 27,567 | |
| | | Units | | | Unrealized
Gain (Loss) | |
| | | | | | | |
OTC EQUITY INDEX SWAP AGREEMENTS †† | |
Goldman Sachs International
March 2016
Goldman Sachs
Multi-Hedge Strategies
Short Index Swap,
Terminating 03/09/164
(Notional Value $7,798,256) | | | 75,312 | | | $ | 341,822 | |
Goldman Sachs International
March 2016
Goldman Sachs
Multi-Hedge Strategies
Long Index Swap,
Terminating 03/09/165
(Notional Value $16,000,308) | | | 126,703 | | | $ | (444,693 | ) |
38 | THE GUGGENHEIM FUNDS ANNUAL REPORT | SEE NOTES TO FINANCIAL STATEMENTS. |
CONSOLIDATED SCHEDULE OF INVESTMENTS (continued) | December 31, 2015 |
MULTI-HEDGE STRATEGIES FUND | |
SECTOR DIVERSIFICATION
Goldman Sachs Multi-Hedge Strategies Short Index Swap4
Sector | % of Index |
Industrials | 24.0% |
Consumer Discretionary | 14.1% |
Materials | 12.4% |
Energy | 12.0% |
Financials | 10.3% |
Health Care | 7.5% |
Communications | 6.0% |
Technology | 5.8% |
Utilities | 4.5% |
Consumer Staples | 3.4% |
Total | 100.0% |
Goldman Sachs Multi-Hedge Strategies Long Index Swap5
Sector | % of Index |
Financials | 20.5% |
Technology | 20.2% |
Consumer Discretionary | 15.7% |
Industrials | 10.8% |
Consumer Staples | 9.6% |
Communications | 7.6% |
Energy | 4.5% |
Health Care | 4.1% |
Utilities | 3.5% |
Materials | 3.5% |
Total | 100.0% |
* | Non-income producing security. |
† | Value determined based on Level 1 inputs, unless otherwise noted — See Note 4. |
†† | Value determined based on Level 2 inputs — See Note 4. |
1 | All or a portion of this security is pledged as short security collateral and/or options written at December 31, 2015. |
2 | Affiliated issuers — See Note 10. |
3 | Repurchase Agreements — See Note 5. |
4 | Customized basket of 199 exchange-traded equity securities. Total Return based on Goldman Sachs Multi-Hedge Strategies Short Index +/- financing at a variable rate. |
5 | Customized basket of 208 exchange-traded equity securities. Total Return based on Goldman Sachs Multi-Hedge Strategies Long Index +/- financing at a variable rate. |
| | ADR — American Depositary Receipt |
| | plc — Public Limited Company |
| | REIT — Real Estate Investment Trust |
| | |
| | See Sector Classification in Other Information section. |
SEE NOTES TO FINANCIAL STATEMENTS. | THE GUGGENHEIM FUNDS ANNUAL REPORT | 39 |
CONSOLIDATED SCHEDULE OF INVESTMENTS (concluded) | December 31, 2015 |
MULTI-HEDGE STRATEGIES FUND | |
The following table summarizes the inputs used to value the Fund’s investments at December 31, 2015 (See Note 4 in the Notes to Financial Statements):
Investments in Securities (Assets) | | Level 1 | | | Level 1 - Other* | | | Level 2 | | | Level 2 - Other* | | | Level 3 | | | Total | |
Common Stocks | | $ | 70,603,441 | | | $ | — | | | $ | — | | | $ | — | | | $ | — | | | $ | 70,603,441 | |
Closed-End Funds | | | 15,886,357 | | | | — | | | | — | | | | — | | | | — | | | | 15,886,357 | |
Equity Index Swap Agreements | | | — | | | | — | | | | — | | | | 341,822 | | | | — | | | | 341,822 | |
Futures Contracts | | | — | | | | 480,489 | | | | — | | | | 158,769 | | | | — | | | | 639,258 | |
Mutual Funds | | | 25,699 | | | | — | | | | — | | | | — | | | | — | | | | 25,699 | |
Repurchase Agreements | | | — | | | | — | | | | 19,510,198 | | | | — | | | | — | | | | 19,510,198 | |
Total | | $ | 86,515,497 | | | $ | 480,489 | | | $ | 19,510,198 | | | $ | 500,591 | | | $ | — | | | $ | 107,006,775 | |
Investments in Securities (Liabilities) | | Level 1 | | | Level 1 - Other* | | | Level 2 | | | Level 2 - Other* | | | Level 3 | | | Total | |
Common Stocks | | $ | 41,928,946 | | | $ | — | | | $ | — | | | $ | — | | | $ | — | | | $ | 41,928,946 | |
Equity Index Swap Agreements | | | — | | | | — | | | | — | | | | 444,693 | | | | — | | | | 444,693 | |
Exchange-Traded Funds | | | 13,155,795 | | | | — | | | | — | | | | — | | | | — | | | | 13,155,795 | |
Futures Contracts | | | — | | | | 150,711 | | | | — | | | | 18,411 | | | | — | | | | 169,122 | |
Options Written | | | 450 | | | | — | | | | — | | | | — | | | | — | | | | 450 | |
Total | | $ | 55,085,191 | | | $ | 150,711 | | | $ | — | | | $ | 463,104 | | | $ | — | | | $ | 55,699,006 | |
* | Other financial instruments may include futures contracts and/or swaps, which are reported as unrealized gain/loss at period end. |
For the year ended December 31, 2015, there were no transfers between levels.
40 | THE GUGGENHEIM FUNDS ANNUAL REPORT | SEE NOTES TO FINANCIAL STATEMENTS. |
CONSOLIDATED STATEMENT OF ASSETS AND LIABILITIES |
MULTI-HEDGE STRATEGIES FUND |
December 31, 2015
Assets: | |
Investments in unaffiliated issuers, at value (cost $84,189,180) | | $ | 85,404,334 | |
Investments in affiliated issuers, at value (cost $1,287,771) | | | 1,111,163 | |
Repurchase agreements, at value (cost $19,510,198) | | | 19,510,198 | |
Total investments (cost $104,987,149) | | | 106,025,695 | |
Foreign currency, at value (cost $52,883) | | | 52,915 | |
Segregated cash with broker | | | 72,715,584 | |
Unrealized appreciation on swap agreements | | | 341,822 | |
Receivables: | |
Securities sold | | | 869,339 | |
Dividends | | | 164,424 | |
Fund shares sold | | | 153,689 | |
Interest | | | 650 | |
Total assets | | | 180,324,118 | |
| | | | | |
Liabilities: | |
Securities sold short, at value (proceeds $58,070,180) | | | 55,084,741 | |
Unrealized depreciation on swap agreements | | | 444,693 | |
Overdraft due to custodian bank | | | 49,582 | |
Due to broker | | | 33,684 | |
Options written, at value (premiums received $1,349) | | | 450 | |
Payable for: | |
Management fees | | | 119,421 | |
Variation margin | | | 116,840 | |
Fund shares redeemed | | | 91,293 | |
Distribution and service fees | | | 21,294 | |
Miscellaneous | | | 118,875 | |
Total liabilities | | | 56,080,873 | |
Commitments and contingent liabilities (Note 13) | | | — | |
Net assets | | $ | 124,243,245 | |
| | | | | |
Net assets consist of: | |
Paid in capital | | $ | 166,075,994 | |
Accumulated net investment loss | | | (3,677,930 | ) |
Accumulated net realized loss on investments and foreign currency | | | (42,547,021 | ) |
Net unrealized appreciation on investments and foreign currency | | | 4,392,202 | |
Net assets | | $ | 124,243,245 | |
| | | | | |
A-Class: | |
Net assets | | $ | 15,620,273 | |
Capital shares outstanding | | | 644,899 | |
Net asset value per share | | $ | 24.22 | |
Maximum offering price per share (Net asset value divided by 95.25%) | | $ | 25.43 | |
| | | | | |
C-Class: | |
Net assets | | $ | 9,342,364 | |
Capital shares outstanding | | | 417,374 | |
Net asset value per share | | $ | 22.38 | |
| | | | | |
P-Class:* | |
Net assets | | $ | 49,539,103 | |
Capital shares outstanding | | | 2,043,808 | |
Net asset value per share | | $ | 24.24 | |
| | | | | |
Institutional Class: | |
Net assets | | $ | 49,741,505 | |
Capital shares outstanding | | | 2,023,276 | |
Net asset value per share | | $ | 24.58 | |
* | H-Class shares redesignated as P-Class shares effective following the close of business on April 30, 2015 — See Note 14. |
SEE NOTES TO FINANCIAL STATEMENTS. | THE GUGGENHEIM FUNDS ANNUAL REPORT | 41 |
CONSOLIDATED STATEMENT OF OPERATIONS |
MULTI-HEDGE STRATEGIES FUND |
Year Ended December 31, 2015
Investment Income: | |
Dividends from securities of unaffiliated issuers (net of foreign withholding tax of $3,966) | | $ | 1,825,426 | |
Dividends from securities of affiliated issuers | | | 22,867 | |
Interest | | | 7,826 | |
Income from securities lending, net | | | 4,058 | |
Other income | | | 537 | |
Total investment income | | | 1,860,714 | |
| | | | | |
Expenses: | |
Management fees | | | 1,339,597 | |
Distribution and service fees: | |
A-Class | | | 34,584 | |
C-Class | | | 91,286 | |
P-Class** | | | 109,228 | |
Short sales dividend expense | | | 1,032,982 | |
Prime broker interest expense | | | 293,342 | |
Trustees’ fees* | | | 7,117 | |
Custodian fees | | | 323 | |
Tax expense | | | 170 | |
Miscellaneous | | | 43,669 | |
Total expenses | | | 2,952,298 | |
Less: | |
Expenses waived by Adviser | | | (75,364 | ) |
Net expenses | | | 2,876,934 | |
Net investment loss | | | (1,016,220 | ) |
| | | | | |
Net Realized and Unrealized Gain (Loss): | |
Net realized gain (loss) on: | |
Investments in unaffiliated issuers | | $ | 4,092,143 | |
Investments in affiliated issuers | | | (3,499 | ) |
Swap agreements | | | 790,302 | |
Futures contracts | | | 1,404,361 | |
Foreign currency | | | 6,234 | |
Securities sold short | | | (2,928,774 | ) |
Options purchased | | | (1,121 | ) |
Options written | | | 9,223 | |
Net realized gain on investments and foreign currency | | | 3,368,869 | |
Net change in unrealized appreciation (depreciation) on: | |
Investments in unaffiliated issuers | | | (4,845,582 | ) |
Investments in affiliated issuers | | | (176,608 | ) |
Securities sold short | | | 5,481,056 | |
Swap agreements | | | (400,875 | ) |
Futures contracts | | | (1,151,076 | ) |
Options written | | | 899 | |
Foreign currency | | | 229 | |
Net change in unrealized appreciation (depreciation) on investments and foreign currency | | | (1,091,957 | ) |
Net realized and unrealized gain | | | 2,276,912 | |
Net increase in net assets resulting from operations | | $ | 1,260,692 | |
* | Relates to Trustees not deemed “interested persons” within the meaning of Section 2(a)(19) of the 1940 Act. |
** | H-Class shares redesignated as P-Class shares effective following the close of business on April 30, 2015 — See Note 14. |
42 | THE GUGGENHEIM FUNDS ANNUAL REPORT | SEE NOTES TO FINANCIAL STATEMENTS. |
CONSOLIDATED STATEMENTS OF CHANGES IN NET ASSETS |
MULTI-HEDGE STRATEGIES FUND | |
| | Year Ended
December 31,
2015 | | | Year Ended
December 31,
2014 | |
Increase (Decrease) in Net Assets from Operations: | | | | | | |
Net investment loss | | $ | (1,016,220 | ) | | $ | (1,167,230 | ) |
Net realized gain on investments and foreign currency | | | 3,368,869 | | | | 4,004,144 | |
Net change in unrealized appreciation (depreciation) on investments and foreign currency | | | (1,091,957 | ) | | | 2,150,638 | |
Net increase in net assets resulting from operations | | | 1,260,692 | | | | 4,987,552 | |
| | | | | | | | | |
Distributions to shareholders from: | | | | | | | | |
Net investment income | | | | | | | | |
A-Class | | | — | | | | (88,690 | ) |
C-Class | | | — | | | | (79,610 | ) |
P-Class* | | | — | | | | (298,563 | ) |
Institutional Class | | | — | | | | (333,912 | ) |
Total distributions to shareholders | | | — | | | | (800,775 | ) |
| | | | | | | | | |
Capital share transactions: | | | | | | | | |
Proceeds from sale of shares | | | | | | | | |
A-Class | | | 12,859,054 | | | | 3,310,696 | |
C-Class | | | 2,154,033 | | | | 593,454 | |
P-Class* | | | 43,746,255 | | | | 10,267,963 | |
Institutional Class | | | 18,843,539 | | | | 30,581,943 | |
Distributions reinvested | | | | | | | | |
A-Class | | | — | | | | 83,254 | |
C-Class | | | — | | | | 66,457 | |
P-Class* | | | — | | | | 276,480 | |
Institutional Class | | | — | | | | 333,762 | |
Cost of shares redeemed | | | | | | | | |
A-Class | | | (8,996,021 | ) | | | (10,563,094 | ) |
C-Class | | | (2,484,058 | ) | | | (4,016,782 | ) |
P-Class* | | | (31,075,932 | ) | | | (26,531,348 | ) |
Institutional Class | | | (11,927,077 | ) | | | (16,163,978 | ) |
Net increase (decrease) from capital share transactions | | | 23,119,793 | | | | (11,761,193 | ) |
Net increase (decrease) in net assets | | | 24,380,485 | | | | (7,574,416 | ) |
| | | | | | | | | |
Net assets: | | | | | | | | |
Beginning of year | | | 99,862,760 | | | | 107,437,176 | |
End of year | | $ | 124,243,245 | | | $ | 99,862,760 | |
Accumulated net investment loss at end of year | | $ | (3,677,930 | ) | | $ | (2,997,600 | ) |
SEE NOTES TO FINANCIAL STATEMENTS. | THE GUGGENHEIM FUNDS ANNUAL REPORT | 43 |
CONSOLIDATED STATEMENTS OF CHANGES IN NET ASSETS(concluded) |
MULTI-HEDGE STRATEGIES FUND | |
| | Year Ended
December 31,
2015 | | | Year Ended
December 31,
2014 | |
Capital share activity: | | | | | | |
Shares sold | | | | | | |
A-Class | | | 530,162 | | | | 142,495 | |
C-Class | | | 96,154 | | | | 27,363 | |
P-Class* | | | 1,805,460 | | | | 445,101 | |
Institutional Class | | | 767,679 | | | | 1,321,595 | |
Shares issued from reinvestment of distributions | | | | | | | | |
A-Class | | | — | | | | 3,522 | |
C-Class | | | — | | | | 3,018 | |
P-Class* | | | — | | | | 11,691 | |
Institutional Class | | | — | | | | 13,947 | |
Shares redeemed | | | | | | | | |
A-Class | | | (370,661 | ) | | | (455,620 | ) |
C-Class | | | (110,700 | ) | | | (186,245 | ) |
P-Class* | | | (1,281,530 | ) | | | (1,149,657 | ) |
Institutional Class | | | (485,631 | ) | | | (688,008 | ) |
Net increase (decrease) in shares | | | 950,933 | | | | (510,798 | ) |
* | H-Class shares redesignated as P-Class shares effective following the close of business on April 30, 2015 — See Note 14. |
44 | THE GUGGENHEIM FUNDS ANNUAL REPORT | SEE NOTES TO FINANCIAL STATEMENTS. |
CONSOLIDATED FINANCIAL HIGHLIGHTS |
MULTI-HEDGE STRATEGIES FUND | |
This table is presented to show selected data for a share outstanding throughout each period and to assist shareholders in evaluating a Fund’s performance for the periods presented.
A-Class | | Year Ended
Dec. 31,
2015 | | | Year Ended
Dec. 31,
2014 | | | Year Ended
Dec. 31,
2013 | | | Year Ended
Dec. 31,
2012 | | | Year Ended
Dec. 31,
2011 | |
Per Share Data | | | | | | | | | | | | | | | |
Net asset value, beginning of period | | $ | 23.94 | | | $ | 23.03 | | | $ | 22.68 | | | $ | 22.21 | | | $ | 21.66 | |
Income (loss) from investment operations: | |
Net investment income (loss)a | | | (.23 | ) | | | (.26 | ) | | | (.18 | ) | | | (.35 | ) | | | (.27 | ) |
Net gain (loss) on investments (realized and unrealized) | | | .51 | | | | 1.36 | | | | .53 | | | | .82 | | | | .98 | |
Total from investment operations | | | .28 | | | | 1.10 | | | | .35 | | | | .47 | | | | .71 | |
Less distributions from: | |
Net investment income | | | — | | | | (.19 | ) | | | — | | | | — | | | | (.16 | ) |
Total distributions | | | — | | | | (.19 | ) | | | — | | | | — | | | | (.16 | ) |
Net asset value, end of period | | $ | 24.22 | | | $ | 23.94 | | | $ | 23.03 | | | $ | 22.68 | | | $ | 22.21 | |
| |
Total Returnb | | | 1.21 | % | | | 4.73 | % | | | 1.54 | % | | | 2.02 | % | | | 3.39 | % |
Ratios/Supplemental Data | |
Net assets, end of period (in thousands) | | $ | 15,620 | | | $ | 11,620 | | | $ | 18,307 | | | $ | 27,700 | | | $ | 24,832 | |
Ratios to average net assets: | |
Net investment income (loss) | | | (0.96 | %) | | | (1.13 | %) | | | (0.79 | %) | | | (1.54 | %) | | | (1.23 | %) |
Total expensesc | | | 2.72 | % | | | 2.86 | % | | | 2.74 | % | | | 3.09 | % | | | 2.77 | % |
Net expensesd,e | | | 2.65 | % | | | 2.81 | % | | | 2.69 | % | | | 3.05 | % | | | 2.65 | % |
Portfolio turnover rate | | | 163 | % | | | 304 | % | | | 302 | % | | | 465 | % | | | 433 | % |
SEE NOTES TO FINANCIAL STATEMENTS. | THE GUGGENHEIM FUNDS ANNUAL REPORT | 45 |
CONSOLIDATED FINANCIAL HIGHLIGHTS (continued) |
MULTI-HEDGE STRATEGIES FUND | |
This table is presented to show selected data for a share outstanding throughout each period and to assist shareholders in evaluating a Fund’s performance for the periods presented.
C-Class | | Year Ended
Dec. 31,
2015 | | | Year Ended
Dec. 31,
2014 | | | Year Ended
Dec. 31,
2013 | | | Year Ended
Dec. 31,
2012 | | | Year Ended
Dec. 31,
2011 | |
Per Share Data | | | | | | | | | | | | | | | |
Net asset value, beginning of period | | $ | 22.29 | | | $ | 21.62 | | | $ | 21.45 | | | $ | 21.17 | | | $ | 20.80 | |
Income (loss) from investment operations: | |
Net investment income (loss)a | | | (.39 | ) | | | (.40 | ) | | | (.35 | ) | | | (.50 | ) | | | (.42 | ) |
Net gain (loss) on investments (realized and unrealized) | | | .48 | | | | 1.26 | | | | .52 | | | | .78 | | | | .95 | |
Total from investment operations | | | .09 | | | | .86 | | | | .17 | | | | .28 | | | | .53 | |
Less distributions from: | |
Net investment income | | | — | | | | (.19 | ) | | | — | | | | — | | | | (.16 | ) |
Total distributions | | | — | | | | (.19 | ) | | | — | | | | — | | | | (.16 | ) |
Net asset value, end of period | | $ | 22.38 | | | $ | 22.29 | | | $ | 21.62 | | | $ | 21.45 | | | $ | 21.17 | |
| | |
Total Returnb | | | 0.45 | % | | | 3.97 | % | | | 0.79 | % | | | 1.23 | % | | | 2.62 | % |
Ratios/Supplemental Data | |
Net assets, end of period (in thousands) | | $ | 9,342 | | | $ | 9,627 | | | $ | 12,705 | | | $ | 16,780 | | | $ | 13,322 | |
Ratios to average net assets: | |
Net investment income (loss) | | | (1.73 | %) | | | (1.84 | %) | | | (1.60 | %) | | | (2.33 | %) | | | (1.99 | %) |
Total expensesc | | | 3.47 | % | | | 3.62 | % | | | 3.50 | % | | | 3.85 | % | | | 3.52 | % |
Net expensesd,e | | | 3.40 | % | | | 3.57 | % | | | 3.45 | % | | | 3.81 | % | | | 3.39 | % |
Portfolio turnover rate | | | 163 | % | | | 304 | % | | | 302 | % | | | 465 | % | | | 432 | % |
46 | THE GUGGENHEIM FUNDS ANNUAL REPORT | SEE NOTES TO FINANCIAL STATEMENTS. |
CONSOLIDATED FINANCIAL HIGHLIGHTS (continued) |
MULTI-HEDGE STRATEGIES FUND |
This table is presented to show selected data for a share outstanding throughout each period and to assist shareholders in evaluating a Fund’s performance for the periods presented.
P-Class* | | Year Ended
Dec. 31,
2015 | | | Year Ended
Dec. 31,
2014 | | | Year Ended
Dec. 31,
2013 | | | Year Ended
Dec. 31,
2012 | | | Year Ended
Dec. 31,
2011 | |
Per Share Data | | | | | | | | | | | | | | | |
Net asset value, beginning of period | | $ | 23.96 | | | $ | 23.04 | | | $ | 22.69 | | | $ | 22.23 | | | $ | 21.67 | |
Income (loss) from investment operations: | |
Net investment income (loss)a | | | (.23 | ) | | | (.25 | ) | | | (.19 | ) | | | (.36 | ) | | | (.27 | ) |
Net gain (loss) on investments (realized and unrealized) | | | .51 | | | | 1.36 | | | | .54 | | | | .82 | | | | .99 | |
Total from investment operations | | | .28 | | | | 1.11 | | | | .35 | | | | .46 | | | | .72 | |
Less distributions from: | |
Net investment income | | | — | | | | (.19 | ) | | | — | | | | — | | | | (.16 | ) |
Total distributions | | | — | | | | (.19 | ) | | | — | | | | — | | | | (.16 | ) |
Net asset value, end of period | | $ | 24.24 | | | $ | 23.96 | | | $ | 23.04 | | | $ | 22.69 | | | $ | 22.23 | |
| | |
Total Returnb | | | 1.21 | % | | | 4.77 | % | | | 1.54 | % | | | 2.02 | % | | | 3.39 | % |
Ratios/Supplemental Data | |
Net assets, end of period (in thousands) | | $ | 49,539 | | | $ | 36,411 | | | $ | 50,990 | | | $ | 66,818 | | | $ | 66,161 | |
Ratios to average net assets: | |
Net investment income (loss) | | | (0.95 | %) | | | (1.09 | %) | | | (0.82 | %) | | | (1.59 | %) | | | (1.25 | %) |
Total expensesc | | | 2.72 | % | | | 2.87 | % | | | 2.75 | % | | | 3.07 | % | | | 2.78 | % |
Net expensesd,e | | | 2.65 | % | | | 2.82 | % | | | 2.71 | % | | | 3.03 | % | | | 2.65 | % |
Portfolio turnover rate | | | 163 | % | | | 304 | % | | | 302 | % | | | 465 | % | | | 433 | % |
SEE NOTES TO FINANCIAL STATEMENTS. | THE GUGGENHEIM FUNDS ANNUAL REPORT | 47 |
CONSOLIDATED FINANCIAL HIGHLIGHTS (concluded) |
MULTI-HEDGE STRATEGIES FUND |
This table is presented to show selected data for a share outstanding throughout each period and to assist shareholders in evaluating a Fund’s performance for the periods presented.
Institutional Class | | Year Ended
Dec. 31,
2015 | | | Year Ended
Dec. 31,
2014 | | | Year Ended
Dec. 31,
2013 | | | Year Ended
Dec. 31,
2012 | | | Year Ended
Dec. 31,
2011 | |
Per Share Data | | | | | | | | | | | | | | | |
Net asset value, beginning of period | | $ | 24.24 | | | $ | 23.26 | | | $ | 22.84 | | | $ | 22.32 | | | $ | 21.71 | |
Income (loss) from investment operations: | |
Net investment income (loss)a | | | (.18 | ) | | | (.18 | ) | | | (.13 | ) | | | (.33 | ) | | | (.22 | ) |
Net gain (loss) on investments (realized and unrealized) | | | .52 | | | | 1.35 | | | | .55 | | | | .85 | | | | .99 | |
Total from investment operations | | | .34 | | | | 1.17 | | | | .42 | | | | .52 | | | | .77 | |
Less distributions from: | |
Net investment income | | | — | | | | (.19 | ) | | | — | | | | — | | | | (.16 | ) |
Total distributions | | | — | | | | (.19 | ) | | | — | | | | — | | | | (.16 | ) |
Net asset value, end of period | | $ | 24.58 | | | $ | 24.24 | | | $ | 23.26 | | | $ | 22.84 | | | $ | 22.32 | |
| | |
Total Returnb | | | 1.44 | % | | | 4.98 | % | | | 1.84 | % | | | 2.28 | % | | | 3.61 | % |
Ratios/Supplemental Data | |
Net assets, end of period (in thousands) | | $ | 49,742 | | | $ | 42,204 | | | $ | 25,435 | | | $ | 14,130 | | | $ | 807 | |
Ratios to average net assets: | |
Net investment income (loss) | | | (0.71 | %) | | | (0.79 | %) | | | (0.54 | %) | | | (1.46 | %) | | | (0.99 | %) |
Total expensesc | | | 2.47 | % | | | 2.67 | % | | | 2.56 | % | | | 3.05 | % | | | 2.52 | % |
Net expensesd,e | | | 2.40 | % | | | 2.62 | % | | | 2.51 | % | | | 3.01 | % | | | 2.40 | % |
Portfolio turnover rate | | | 163 | % | | | 304 | % | | | 302 | % | | | 465 | % | | | 433 | % |
a | Net investment income (loss) per share was computed using average shares outstanding throughout the period. |
b | Total return does not reflect the impact of any applicable sales charges. |
c | Does not include expenses of the underlying funds in which the Fund invests. |
d | Net expense information reflects the expense ratios after expense waivers. |
e | Excluding interest and dividend expense related to short sales, the operating expense ratios for the years or periods presented would be: |
| 12/31/15 | 12/31/14 | 12/31/13 | 12/31/12 | 12/31/11 |
A-Class | 1.44% | 1.42% | 1.40% | 1.40% | 1.41% |
C-Class | 2.19% | 2.17% | 2.15% | 2.15% | 2.15% |
P-Class* | 1.45% | 1.42% | 1.40% | 1.40% | 1.41% |
Institutional Class | 1.19% | 1.17% | 1.15% | 1.15% | 1.16% |
* | H-Class shares redesignated as P-Class shares effective following the close of business on April 30, 2015 — See Note 14. |
48 | THE GUGGENHEIM FUNDS ANNUAL REPORT | SEE NOTES TO FINANCIAL STATEMENTS. |
PERFORMANCE REPORT AND FUND PROFILE (Unaudited) | December 31, 2015 |
COMMODITIES STRATEGY FUND
OBJECTIVE: Seeks to provide investment results that correlate, before fees and expenses, to the performance of a benchmark for commodities. The Fund’s current benchmark is the S&P Goldman Sachs Commodity Index (“GSCI”) (the “underlying index”).
For the one-year period ended December 31, 2015, the Fund’s H-Class returned -34.58%, compared with a return of -32.86% for its benchmark, the S&P Goldman Sachs Commodity Index (S&P GSCI).
Cocoa and Cotton were the only components that had positive returns during the year.
Brent Crude, WTI Crude, Nickel, Heating Oil and Gas Oil were all down more than 40% during the year.
Commodities were down again in 2015 due to lower global growth in Europe and China. The dramatic growth in domestic U.S. oil and natural gas production led to excess supply concerns, which hurt oil and natural gas prices. OPEC surprised markets by not cutting production in light of lower prices and actually increased production throughout the year. The potential for sanctions being lifted for Iran weighed on oil prices as well. Industrial metals were primarily hurt by reduced demand from China.
All of the GSCI sectors were down more than 10% for the year. The energy sector was the worst-performing sector, down more than 40% during the year. Industrial metals, livestock and agriculture were also down more than 15% each during the year.
Derivatives in the Fund are used to help provide exposure to the composition of the benchmark in the most efficient manner, as well as to provide liquidity.
Performance displayed represents past performance which is no guarantee of future results.
| | THE GUGGENHEIM FUNDS ANNUAL REPORT | 49 |
PERFORMANCE REPORT AND FUND PROFILE (Unaudited)(continued) | December 31, 2015 |
Holdings Diversification (Market Exposure as % of Net Assets)

“Consolidated Holdings Diversification (Market Exposure as % of Net Assets)” excludes any temporary cash investments or investments in Guggenheim Strategy Funds Trust mutual funds. Investments in those Funds do not provide “market exposure” to meet the Fund’s investment objective, but will significantly increase the portfolio’s exposure to certain other asset categories (and their associated risks), which may cause the Fund to deviate from its principal investment strategy, including: (i) high yield, high risk debt securities rated below the top four long-term rating categories by a nationally recognized statistical rating organization (also known as “junk bonds”); (ii) securities issued by the U.S. Government or its agencies and instrumentalities; (iii) CLOs and similar investments; and (iv) other short-term fixed income securities.
Inception Dates: |
A-Class | May 25, 2005 |
C-Class | May 25, 2005 |
H-Class | May 25, 2005 |
The Fund invests principally in derivative investments such as commodity-linked futures contracts.
Largest Holdings (% of Total Net Assets) |
Guggenheim Strategy Fund I | 32.4% |
Guggenheim Strategy Fund II | 10.2% |
Total | 42.6% |
| | |
“Largest Holdings” excludes any temporary cash or derivative investments. |
50 | THE GUGGENHEIM FUNDS ANNUAL REPORT | |
PERFORMANCE REPORT AND FUND PROFILE (Unaudited)(continued) | December 31, 2015 |
Cumulative Fund Performance*


| | THE GUGGENHEIM FUNDS ANNUAL REPORT | 51 |
PERFORMANCE REPORT AND FUND PROFILE (Unaudited)(concluded) | December 31, 2015 |
Average Annual Returns*
Periods Ended December 31, 2015
| 1 Year | 5 Year | 10 Year |
A-Class Shares | -34.55% | -16.94% | -12.57% |
A-Class Shares with sales charge† | -37.64% | -17.74% | -12.99% |
C-Class Shares | -34.97% | -17.52% | -13.20% |
C-Class Shares with CDSC‡ | -35.62% | -17.52% | -13.20% |
H-Class Shares | -34.58% | -16.92% | -12.56% |
S&P 500 Index | 1.38% | 12.57% | 7.31% |
S&P GSCI | -32.86% | -15.18% | -10.56% |
* | The performance data above represents past performance that is not predictive of future results. The investment return and principal value of an investment in the Fund will fluctuate so that an investor’s shares, when redeemed, may be worth more or less than their original cost. Returns are historical and include changes in principal and reinvested dividends and capital gains and do not reflect the effect of taxes. The S&P GSCI and the S&P 500 Index are unmanaged indices and, unlike the Fund, have no management fees or operating expenses to reduce their reported returns. The graphs are based on A-Class shares and H-Class shares only; performance for C-Class shares will vary due to differences in fee structures. |
† | Fund returns are calculated using the maximum sales charge of 4.75%. |
‡ | Fund returns include a CDSC of 1% if redeemed within 12 months of purchase. |
52 | THE GUGGENHEIM FUNDS ANNUAL REPORT | |
CONSOLIDATED SCHEDULE OF INVESTMENTS | December 31, 2015 |
COMMODITIES STRATEGY FUND | |
| |
Shares
| | | Value | |
| | | | | | | |
MUTUAL FUNDS†,1 - 42.7% | |
Guggenheim Strategy Fund I | | | 126,253 | | | $ | 3,139,901 | |
Guggenheim Strategy Fund II | | | 40,036 | | | | 992,902 | |
Total Mutual Funds | | | | | | | | |
(Cost $4,132,861) | | | | | | | 4,132,803 | |
| | | | | | | | | |
| | | Face
Amount | | | | | |
| | | | | | | | | |
REPURCHASE AGREEMENTS††,2 - 43.1% | |
HSBC Group
issued 12/31/15 at 0.18%
due 01/04/16 | | $ | 3,753,814 | | | | 3,753,814 | |
Royal Bank of Canada
issued 12/31/15 at 0.24%
due 01/04/16 | | | 259,500 | | | | 259,500 | |
Mizuho Financial Group, Inc.
issued 12/31/15 at 0.18%
due 01/04/16 | | | 155,550 | | | | 155,550 | |
Total Repurchase Agreements | | | | | |
(Cost $4,168,864) | | | | | | | 4,168,864 | |
| | | | | | | | | |
Total Investments - 85.8% | | | | | |
(Cost $8,301,725) | | | | | | $ | 8,301,667 | |
Other Assets & Liabilities, net - 14.2% | | | | 1,375,942 | |
Total Net Assets - 100.0% | | | $ | 9,677,609 | |
| | | Contracts | | | Unrealized
Loss | |
| | | | | | | |
COMMODITY FUTURES CONTRACTS PURCHASED† | |
January 2016 Goldman Sachs Commodity Index
Futures Contracts
(Aggregate Value of
Contracts $9,748,438) | | | 125 | | | $ | (58,237 | ) |
† | Value determined based on Level 1 inputs — See Note 4. |
†† | Value determined based on Level 2 inputs — See Note 4. |
1 | Affiliated issuer — See Note 10. |
2 | Repurchase Agreements — See Note 5. |
| | |
| | See Sector Classification in Other Information section. |
SEE NOTES TO FINANCIAL STATEMENTS. | THE GUGGENHEIM FUNDS ANNUAL REPORT | 53 |
CONSOLIDATED SCHEDULE OF INVESTMENTS (concluded) | December 31, 2015 |
COMMODITIES STRATEGY FUND | |
The following table summarizes the inputs used to value the Fund’s investments at December 31, 2015 (See Note 4 in the Notes to Financial Statements):
Investments in Securities (Assets) | | Level 1 | | | Level 1 -
Other* | | | Level 2 | | | Level 3 | | | Total | |
Mutual Funds | | $ | 4,132,803 | | | $ | — | | | $ | — | | | $ | — | | | $ | 4,132,803 | |
Repurchase Agreements | | | — | | | | — | | | | 4,168,864 | | | | — | | | | 4,168,864 | |
Total | | $ | 4,132,803 | | | $ | — | | | $ | 4,168,864 | | | $ | — | | | $ | 8,301,667 | |
Investments in Securities (Liabilities) | | Level 1 | | | Level 1 -
Other* | | | Level 2 | | | Level 3 | | | Total | |
Futures Contracts | | $ | — | | | $ | 58,237 | | | $ | — | | | $ | — | | | $ | 58,237 | |
* | Other financial instruments include futures contracts which are reported as unrealized gain/loss at period end. |
For the year ended December 31, 2015, there were no transfers between levels.
54 | THE GUGGENHEIM FUNDS ANNUAL REPORT | SEE NOTES TO FINANCIAL STATEMENTS. |
CONSOLIDATED STATEMENT OF ASSETS AND LIABILITIES |
COMMODITIES STRATEGY FUND |
December 31, 2015
Assets: | |
Investments in affiliated issuers, at value (cost $4,132,861) | | $ | 4,132,803 | |
Repurchase agreements, at value (cost $4,168,864) | | | 4,168,864 | |
Total investments (cost $8,301,725) | | | 8,301,667 | |
Segregated cash with broker | | | 1,312,500 | |
Cash | | | 6 | |
Receivables: | |
Variation margin | | | 85,938 | |
Fund shares sold | | | 6,019 | |
Dividends | | | 3,602 | |
Interest | | | 21 | |
Total assets | | | 9,709,753 | |
| | | | | |
Liabilities: | |
Payable for: | |
Fund shares redeemed | | | 9,678 | |
Management fees | | | 8,343 | |
Securities purchased | | | 3,673 | |
Distribution and service fees | | | 3,129 | |
Transfer agent and administrative fees | | | 2,781 | |
Portfolio accounting fees | | | 1,112 | |
Miscellaneous | | | 3,428 | |
Total liabilities | | | 32,144 | |
Commitments and contingent liabilities (Note 13) | | | — | |
Net assets | | $ | 9,677,609 | |
| | | | | |
Net assets consist of: | |
Paid in capital | | $ | 32,400,530 | |
Accumulated net investment loss | | | (2,770,217 | ) |
Accumulated net realized loss on investments | | | (19,894,409 | ) |
Net unrealized depreciation on investments | | | (58,295 | ) |
Net assets | | $ | 9,677,609 | |
| | | | | |
A-Class: | |
Net assets | | $ | 620,644 | |
Capital shares outstanding | | | 96,005 | |
Net asset value per share | | $ | 6.46 | |
Maximum offering price per share (Net asset value divided by 95.25%) | | $ | 6.78 | |
| | | | | |
C-Class: | |
Net assets | | $ | 502,436 | |
Capital shares outstanding | | | 84,468 | |
Net asset value per share | | $ | 5.95 | |
| | | | | |
H-Class: | |
Net assets | | $ | 8,554,529 | |
Capital shares outstanding | | | 1,321,249 | |
Net asset value per share | | $ | 6.47 | |
SEE NOTES TO FINANCIAL STATEMENTS. | THE GUGGENHEIM FUNDS ANNUAL REPORT | 55 |
CONSOLIDATED STATEMENT OF OPERATIONS |
COMMODITIES STRATEGY FUND |
Year Ended December 31, 2015
Investment Income: | |
Dividends from securities of affiliated issuers | | $ | 22,432 | |
Interest | | | 1,913 | |
Total investment income | | | 24,345 | |
| | | | | |
Expenses: | |
Management fees | | | 68,499 | |
Transfer agent and administrative fees | | | 19,487 | |
Distribution and service fees: | |
A-Class | | | 2,603 | |
C-Class | | | 8,512 | |
H-Class | | | 14,756 | |
Portfolio accounting fees | | | 7,795 | |
Legal fees | | | 9,691 | |
Registration fees | | | 7,388 | |
Custodian fees | | | 1,033 | |
Trustees’ fees* | | | 693 | |
Miscellaneous | | | 2,081 | |
Total expenses | | | 142,538 | |
Less: | |
Expenses waived by Adviser | | | (9,718 | ) |
Net expenses | | | 132,820 | |
Net investment loss | | | (108,475 | ) |
| | | | | |
Net Realized and Unrealized Gain (Loss): | |
Net realized gain (loss) on: | |
Investments in affiliated issuers | | | 10,183 | |
Futures contracts | | | (4,947,756 | ) |
Net realized loss | | | (4,937,573 | ) |
Net change in unrealized appreciation (depreciation) on: | |
Investments in unaffiliated issuers | | | 3,305 | |
Investments in affiliated issuers | | | (58 | ) |
Futures contracts | | | 494,172 | |
Net change in unrealized appreciation (depreciation) | | | 497,419 | |
Net realized and unrealized loss | | | (4,440,154 | ) |
Net decrease in net assets resulting from operations | | $ | (4,548,629 | ) |
* | Relates to Trustees not deemed “interested persons” within the meaning of Section 2(a)(19) of the 1940 Act. |
56 | THE GUGGENHEIM FUNDS ANNUAL REPORT | SEE NOTES TO FINANCIAL STATEMENTS. |
CONSOLIDATED STATEMENTS OF CHANGES IN NET ASSETS |
COMMODITIES STRATEGY FUND | |
| | Year Ended
December 31,
2015 | | | Year Ended
December 31,
2014 | |
Increase (Decrease) in Net Assets from Operations: | | | | | | |
Net investment loss | | $ | (108,475 | ) | | $ | (220,015 | ) |
Net realized loss on investments | | | (4,937,573 | ) | | | (6,379,296 | ) |
Net change in unrealized appreciation (depreciation) on investments | | | 497,419 | | | | (635,572 | ) |
Net decrease in net assets resulting from operations | | | (4,548,629 | ) | | | (7,234,883 | ) |
| | | | | | | | | |
Capital share transactions: | | | | | | | | |
Proceeds from sale of shares | | | | | | | | |
A-Class | | | 14,899,309 | | | | 22,549,472 | |
C-Class | | | 200,478 | | | | 260,844 | |
H-Class | | | 148,883,679 | | | | 85,991,591 | |
Cost of shares redeemed | | | | | | | | |
A-Class | | | (17,157,407 | ) | | | (19,190,403 | ) |
C-Class | | | (514,210 | ) | | | (444,139 | ) |
H-Class | | | (144,799,682 | ) | | | (85,196,491 | ) |
Net increase from capital share transactions | | | 1,512,167 | | | | 3,970,874 | |
Net decrease in net assets | | | (3,036,462 | ) | | | (3,264,009 | ) |
| | | | | | | | | |
Net assets: | | | | | | | | |
Beginning of year | | | 12,714,071 | | | | 15,978,080 | |
End of year | | $ | 9,677,609 | | | $ | 12,714,071 | |
Accumulated net investment loss at end of year | | $ | (2,770,217 | ) | | $ | (2,770,217 | ) |
| | | | | | | | | |
Capital share activity: | | | | | | | | |
Shares sold | | | | | | | | |
A-Class | | | 1,690,984 | | | | 1,645,908 | |
C-Class | | | 24,552 | | | | 19,526 | |
H-Class | | | 17,705,540 | | | | 6,272,794 | |
Shares redeemed | | | | | | | | |
A-Class | | | (1,941,322 | ) | | | (1,432,812 | ) |
C-Class | | | (64,185 | ) | | | (35,150 | ) |
H-Class | | | (17,209,355 | ) | | | (6,253,169 | ) |
Net increase in shares | | | 206,214 | | | | 217,097 | |
SEE NOTES TO FINANCIAL STATEMENTS. | THE GUGGENHEIM FUNDS ANNUAL REPORT | 57 |
CONSOLIDATED FINANCIAL HIGHLIGHTS |
COMMODITIES STRATEGY FUND | |
This table is presented to show selected data for a share outstanding throughout each period and to assist shareholders in evaluating a Fund’s performance for the periods presented.
A-Class | | Year Ended
Dec. 31,
2015 | | | Year Ended
Dec. 31,
2014 | | | Year Ended
Dec. 31,
2013 | | | Year Ended
Dec. 31,
2012 | | | Year Ended
Dec. 31,
2011 | |
Per Share Data | | | | | | | | | | | | | | | |
Net asset value, beginning of period | | $ | 9.87 | | | $ | 14.93 | | | $ | 15.49 | | | $ | 16.18 | | | $ | 17.33 | |
Income (loss) from investment operations: | |
Net investment income (loss)a | | | (.11 | ) | | | (.15 | ) | | | (.23 | ) | | | (.23 | ) | | | (.26 | ) |
Net gain (loss) on investments (realized and unrealized) | | | (3.30 | ) | | | (4.91 | ) | | | (.33 | ) | | | (.05 | ) | | | (.36 | ) |
Total from investment operations | | | (3.41 | ) | | | (5.06 | ) | | | (.56 | ) | | | (.28 | ) | | | (.62 | ) |
Less distributions from: | |
Net investment income | | | — | | | | — | | | | — | | | | (.41 | ) | | | (.53 | ) |
Total distributions | | | — | | | | — | | | | — | | | | (.41 | ) | | | (.53 | ) |
Net asset value, end of period | | $ | 6.46 | | | $ | 9.87 | | | $ | 14.93 | | | $ | 15.49 | | | $ | 16.18 | |
| | |
Total Returnb | | | (34.55 | %) | | | (33.89 | %) | | | (3.62 | %) | | | (1.63 | %) | | | (3.61 | %) |
Ratios/Supplemental Data | |
Net assets, end of period (in thousands) | | $ | 621 | | | $ | 3,419 | | | $ | 1,990 | | | $ | 5,840 | | | $ | 5,223 | |
Ratios to average net assets: | |
Net investment income (loss) | | | (1.26 | %) | | | (1.03 | %) | | | (1.50 | %) | | | (1.40 | %) | | | (1.47 | %) |
Total expensesc | | | 1.75 | % | | | 1.64 | % | | | 1.63 | % | | | 1.59 | % | | | 1.66 | % |
Net expensesd | | | 1.62 | % | | | 1.56 | % | | | 1.53 | % | | | 1.49 | % | | | 1.55 | % |
Portfolio turnover rate | | | 486 | % | | | 238 | % | | | — | | | | — | | | | — | |
58 | THE GUGGENHEIM FUNDS ANNUAL REPORT | SEE NOTES TO FINANCIAL STATEMENTS. |
CONSOLIDATED FINANCIAL HIGHLIGHTS (continued) |
COMMODITIES STRATEGY FUND |
This table is presented to show selected data for a share outstanding throughout each period and to assist shareholders in evaluating a Fund’s performance for the periods presented.
C-Class | | Year Ended
Dec. 31,
2015 | | | Year Ended
Dec. 31,
2014 | | | Year Ended
Dec. 31,
2013 | | | Year Ended
Dec. 31,
2012 | | | Year Ended
Dec. 31,
2011 | |
Per Share Data | | | | | | | | | | | | | | | |
Net asset value, beginning of period | | $ | 9.15 | | | $ | 13.93 | | | $ | 14.56 | | | $ | 15.34 | | | $ | 16.58 | |
Income (loss) from investment operations: | |
Net investment income (loss)a | | | (.16 | ) | | | (.23 | ) | | | (.32 | ) | | | (.33 | ) | | | (.37 | ) |
Net gain (loss) on investments (realized and unrealized) | | | (3.04 | ) | | | (4.55 | ) | | | (.31 | ) | | | (.04 | ) | | | (.34 | ) |
Total from investment operations | | | (3.20 | ) | | | (4.78 | ) | | | (.63 | ) | | | (.37 | ) | | | (.71 | ) |
Less distributions from: | |
Net investment income | | | — | | | | — | | | | — | | | | (.41 | ) | | | (.53 | ) |
Total distributions | | | — | | | | — | | | | — | | | | (.41 | ) | | | (.53 | ) |
Net asset value, end of period | | $ | 5.95 | | | $ | 9.15 | | | $ | 13.93 | | | $ | 14.56 | | | $ | 15.34 | |
| | |
Total Returnb | | | (34.97 | %) | | | (34.31 | %) | | | (4.33 | %) | | | (2.38 | %) | | | (4.32 | %) |
Ratios/Supplemental Data | |
Net assets, end of period (in thousands) | | $ | 502 | | | $ | 1,135 | | | $ | 1,947 | | | $ | 2,575 | | | $ | 3,558 | |
Ratios to average net assets: | |
Net investment income (loss) | | | (1.95 | %) | | | (1.77 | %) | | | (2.25 | %) | | | (2.15 | %) | | | (2.22 | %) |
Total expensesc | | | 2.49 | % | | | 2.39 | % | | | 2.39 | % | | | 2.34 | % | | | 2.41 | % |
Net expensesd | | | 2.35 | % | | | 2.32 | % | | | 2.28 | % | | | 2.24 | % | | | 2.30 | % |
Portfolio turnover rate | | | 486 | % | | | 238 | % | | | — | | | | — | | | | — | |
SEE NOTES TO FINANCIAL STATEMENTS. | THE GUGGENHEIM FUNDS ANNUAL REPORT | 59 |
CONSOLIDATED FINANCIAL HIGHLIGHTS (concluded) |
COMMODITIES STRATEGY FUND |
This table is presented to show selected data for a share outstanding throughout each period and to assist shareholders in evaluating a Fund’s performance for the periods presented.
H-Class | | Year Ended
Dec. 31,
2015 | | | Year Ended
Dec. 31,
2014 | | | Year Ended
Dec. 31,
2013 | | | Year Ended
Dec. 31,
2012 | | | Year Ended
Dec. 31,
2011 | |
Per Share Data | | | | | | | | | | | | | | | |
Net asset value, beginning of period | | $ | 9.89 | | | $ | 14.95 | | | $ | 15.50 | | | $ | 16.18 | | | $ | 17.33 | |
Income (loss) from investment operations: | |
Net investment income (loss)a | | | (.11 | ) | | | (.15 | ) | | | (.23 | ) | | | (.23 | ) | | | (.27 | ) |
Net gain (loss) on investments (realized and unrealized) | | | (3.31 | ) | | | (4.91 | ) | | | (.32 | ) | | | (.04 | ) | | | (.35 | ) |
Total from investment operations | | | (3.42 | ) | | | (5.06 | ) | | | (.55 | ) | | | (.27 | ) | | | (.62 | ) |
Less distributions from: | |
Net investment income | | | — | | | | — | | | | — | | | | (.41 | ) | | | (.53 | ) |
Total distributions | | | — | | | | — | | | | — | | | | (.41 | ) | | | (.53 | ) |
Net asset value, end of period | | $ | 6.47 | | | $ | 9.89 | | | $ | 14.95 | | | $ | 15.50 | | | $ | 16.18 | |
| | |
Total Returnb | | | (34.58 | %) | | | (33.85 | %) | | | (3.55 | %) | | | (1.57 | %) | | | (3.67 | %) |
Ratios/Supplemental Data | |
Net assets, end of period (in thousands) | | $ | 8,555 | | | $ | 8,160 | | | $ | 12,042 | | | $ | 23,671 | | | $ | 14,982 | |
Ratios to average net assets: | |
Net investment income (loss) | | | (1.33 | %) | | | (1.05 | %) | | | (1.50 | %) | | | (1.40 | %) | | | (1.47 | %) |
Total expensesc | | | 1.75 | % | | | 1.65 | % | | | 1.63 | % | | | 1.60 | % | | | 1.66 | % |
Net expensesd | | | 1.63 | % | | | 1.57 | % | | | 1.53 | % | | | 1.49 | % | | | 1.56 | % |
Portfolio turnover rate | | | 486 | % | | | 238 | % | | | — | | | | — | | | | — | |
a | Net investment income (loss) per share was computed using average shares outstanding throughout the period. |
b | Total return does not reflect the impact of any applicable sales charges. |
c | Does not include expenses of the underlying funds in which the Fund invests. |
d | Net expense information reflects the expense ratios after expense waivers. |
60 | THE GUGGENHEIM FUNDS ANNUAL REPORT | SEE NOTES TO FINANCIAL STATEMENTS. |
NOTES TO CONSOLIDATED FINANCIAL STATEMENTS |
1. Organization, Consolidation of Subsidiary and Significant
Accounting Policies
Organization
The Rydex Series Funds (the “Trust”), a Delaware statutory trust, is registered with the SEC under the Investment Company Act of 1940 (”1940 Act”), as an open-ended investment company of the series type. Each series, in effect, is representing a separate Fund. The Trust is authorized to issue an unlimited number of no par value shares. The Trust accounts for the assets of each fund separately.
The Trust offers a combination of eight separate classes of shares: Investor Class shares, Advisor Class shares, A-Class shares, C-Class shares, H-Class shares, P-Class shares, Institutional Class shares and Money Market Class shares. Sales of shares of each Class are made without a front-end sales charge at the net asset value per share (“NAV”), with the exception of A-Class shares. A-Class shares are sold at the NAV, plus the applicable front-end sales charge. The sales charge varies depending on the amount purchased, but will not exceed 4.75%. A-Class share purchases of $1 million or more are exempt from the front-end sales charge but have a 1% contingent deferred sales charge (“CDSC”) if shares are redeemed within 12 months of purchase. C-Class shares have a 1% CDSC if shares are redeemed within 12 months of purchase. Institutional Class shares are offered primarily for direct investment by institutions such as pension and profit sharing plans, endowments, foundations and corporations. Institutional Class shares have a minimum initial investment of $2 million and a minimum account balance of $1 million. At December 31, 2015, the Trust consisted of fifty-three funds.
This report covers the Multi-Hedge Strategies Fund and Commodities Strategy Fund (the “Funds”), each a non-diversified investment company. Only A-Class, C-Class, H-Class, P-Class and Institutional Class had been issued by the Funds.
Guggenheim Investments (“GI”) provides advisory services, and Rydex Fund Services, LLC (“RFS”) provides transfer agent, administrative and accounting services to the Trust. Guggenheim Funds Distributors, LLC (“GFD”) acts as principal underwriter for the Trust. GI, RFS and GFD are affiliated entities.
Consolidation of Subsidiary
Each of the consolidated financial statements of the Funds includes the accounts of a wholly-owned and controlled Cayman Islands subsidiary (the “Subsidiary”). Significant inter-company accounts and transactions have been eliminated in consolidation for the Funds.
| | THE GUGGENHEIM FUNDS ANNUAL REPORT | 61 |
NOTES TO CONSOLIDATED FINANCIAL STATEMENTS (continued) |
Each Fund may invest up to 25% of its total assets in its Subsidiary which acts as an investment vehicle in order to effect certain investments consistent with the Fund’s investment objectives and policies.
A summary of each Fund’s investment in its respective Subsidiary is as follows:
Fund | Inception
Date of
Subsidiary | | Subsidiary
Net Assets at
December 31,
2015 | | | % of Net Assets
of the Fund at
December 31,
2015 | |
Multi-Hedge Strategies Fund | 09/18/09 | | $ | 6,789,575 | | | | 5.5 | % |
Commodities Stragegy Fund | 09/08/09 | | | 1,952,125 | | | | 20.2 | % |
Significant Accounting Policies
The Funds operate as investment companies and accordingly follow the investment company accounting and reporting guidance of the Financial Accounting Standards Board (“FASB”) Accounting Standards Codification Topic 946 Financial Services – Investment Companies.
The following significant accounting policies are in conformity with U.S. generally accepted accounting principles (“U.S. GAAP”) and are consistently followed by the Trust. This requires management to make estimates and assumptions that affect the reported amount of assets and liabilities and disclosure of contingent assets and liabilities at the date of the financial statements and the reported amounts of revenues and expenses during the reporting period. Actual results could differ from these estimates. All time references are based on Eastern Time.
The NAV of each Class of the Funds is calculated by dividing the market value of the Fund’s securities and other assets, less all liabilities, attributable to the Class by the number of outstanding shares of the Class.
A. The Board of Trustees of the Funds (the “Board”) has adopted policies and procedures for the valuation of the Funds’ investments (the “Valuation Procedures”). Pursuant to the Valuation Procedures, the Board has delegated to a valuation committee, consisting of representatives from Guggenheim’s investment management, fund administration, legal and compliance departments (the “Valuation Committee”), the day-to-day responsibility for implementing the Valuation Procedures, including, under most circumstances, the responsibility for determining the fair value of the Funds’ securities or other assets.
Valuations of the Funds’ securities are supplied primarily by pricing services appointed pursuant to the processes set forth in the Valuation Procedures. The Valuation Committee convenes monthly, or more frequently as needed and will review the valuation of all assets which have been fair valued for reasonableness.
62 | THE GUGGENHEIM FUNDS ANNUAL REPORT | |
NOTES TO CONSOLIDATED FINANCIAL STATEMENTS (continued) |
The Funds’ officers, through the Valuation Committee and consistent with the monitoring and review responsibilities set forth in the Valuation Procedures, regularly review procedures used by, and valuations provided by, the pricing services.
If the pricing service cannot or does not provide a valuation for a particular investment or such valuation is deemed unreliable, such investment is fair valued by the Valuation Committee.
Equity securities listed on an exchange (New York Stock Exchange (“NYSE”) or American Stock Exchange) are valued at the last quoted sales price as of the close of business on the NYSE, usually 4:00 p.m. on the valuation date. Equity securities listed on the NASDAQ market system are valued at the NASDAQ Official Closing Price on the valuation date, which may not necessarily represent the last sale price. If there has been no sale on such exchange or NASDAQ on a given day, the security is valued at the closing bid price on that day.
Generally, trading in foreign securities markets is substantially completed each day at various times prior to the close of the NYSE. The values of foreign securities are determined as of the close of such foreign markets or the close of the NYSE, if earlier. All investments quoted in foreign currency are valued in U.S. dollars on the basis of the foreign currency exchange rates prevailing at the close of business. Investments in foreign securities may involve risks not present in domestic investments. The Valuation Committee will determine the current value of such foreign securities by taking into consideration certain factors which may include those discussed above, as well as the following factors, among others: the value of the securities traded on other foreign markets, ADR trading, closed-end fund trading, foreign currency exchange activity, and the trading prices of financial products that are tied to foreign securities such as World Equity Benchmark Securities. In addition, the Board of Trustees has authorized the Valuation Committee and GI to use prices and other information supplied by a third party pricing vendor in valuing foreign securities.
Open-end investment companies (“Mutual Funds”) are valued at their NAV as of the close of business, on the valuation date. Exchange-traded funds (“ETFs”) and closed-end investment companies (“CEFs”) are valued at the last quoted sales price.
Repurchase agreements are valued at amortized cost, provided such amounts approximate market value.
Listed options are valued at the Official Settlement Price listed by the exchange, usually as of 4:00 p.m. Long options are valued using the bid price and short options are valued using the ask price. In the event that a settlement price is not
| | THE GUGGENHEIM FUNDS ANNUAL REPORT | 63 |
NOTES TO CONSOLIDATED FINANCIAL STATEMENTS (continued) |
available, fair valuation is enacted. Over-the-counter options are valued using the average bid price (for long options), or average ask price (for short options) obtained from one or more security dealers.
The value of futures contracts is accounted for using the unrealized gain or loss on the contracts that is determined by marking the contracts to their current realized settlement prices. Financial futures contracts are valued at the 4:00 p.m. price on the valuation date. In the event that the exchange for a specific futures contract closes earlier than 4:00 p.m., the futures contract is valued at the Official Settlement Price of the exchange. However, the underlying securities from which the futures contract value is derived are monitored until 4:00 p.m. to determine if fair valuation would provide a more accurate valuation.
The value of OTC swap agreements and credit default swap agreements entered into by a Fund is accounted for using the unrealized gain or loss on the agreements that is determined by marking the agreements to the last quoted value of the index that the swap pertains to at the close of the NYSE. The swap’s value is then adjusted to include dividends accrued, and financing charges and/or interest associated with the swap agreements.
Investments for which market quotations are not readily available are fair valued as determined in good faith by GI under the direction of the Board of Trustees using methods established or ratified by the Board of Trustees. Valuations in accordance with these methods are intended to reflect each security’s (or asset’s) “fair value.” Each such determination is based on a consideration of all relevant factors, which are likely to vary from one pricing context to another. Examples of such factors may include, but are not limited to: (i) the type of security, (ii) the initial cost of the security, (iii) the existence of any contractual restrictions on the security’s disposition, (iv) the price and extent of public trading in similar securities of the issuer or of comparable companies, (v) quotations or evaluated prices from broker-dealers and/or pricing services, (vi) information obtained from the issuer, analysts, and/or the appropriate stock exchange (for exchange-traded securities), (vii) an analysis of the company’s financial statements, and (viii) an evaluation of the forces that influence the issuer and the market(s) in which the security is purchased and sold (e.g. the existence of pending merger activity, public offerings or tender offers that might affect the value of the security). In connection with futures contracts and other derivative investments, such factors may include obtaining information as to how (a) these contracts and other derivative investments trade in the futures or other derivative markets, respectively, and (b) the securities underlying these contracts and other derivative investments trade in the cash market.
64 | THE GUGGENHEIM FUNDS ANNUAL REPORT | |
NOTES TO CONSOLIDATED FINANCIAL STATEMENTS (continued) |
B. When a Fund engages in a short sale of a security, an amount equal to the proceeds is reflected as an asset and an equivalent liability. The amount of the liability is subsequently marked-to-market to reflect the market value of the short sale. The Fund maintains a segregated account of cash and/or securities as collateral for short sales.
Fees, if any, paid to brokers to borrow securities in connection with short sales are recorded as interest expense. In addition, the Fund must pay out the dividend rate of the equity or coupon rate of the obligation to the lender and record this as an expense. Short dividend or interest expense is a cost associated with the investment objective of short sales transactions, rather than an operational cost associated with the day-to-day management of any mutual fund. The Funds may also receive rebate income from the broker resulting from the investment of the proceeds from securities sold short.
C. Upon the purchase of an option, the premium paid is recorded as an investment, the value of which is marked-to-market daily. If a purchased option expires, the Fund realizes a loss in the amount of the cost of the option. When the Fund enters into a closing sale transaction, it realizes a gain or loss depending on whether the proceeds from the closing sale transaction are greater or less than the cost of the option. If the Fund exercises a put option, it realizes a gain or loss from the sale of the underlying security and the proceeds from such sale will be decreased by the premium originally paid. When the Fund exercises a call option, the cost of the security purchased by the Fund upon exercise increases by the premium originally paid.
When the Fund writes (sells) an option, an amount equal to the premium received is entered in that Fund’s accounting records as an asset and equivalent liability. The amount of the liability is subsequently marked-to-market to reflect the current value of the option written. When a written option expires, or if the Fund enters into a closing purchase transaction, it realizes a gain (or loss if the cost of a closing purchase transaction exceeds the premium received when the option was sold).
D. Upon entering into a futures contract, a Fund deposits and maintains as collateral such initial margin as required by the exchange on which the transaction is affected. Pursuant to the contract, the Fund agrees to receive from or pay to the broker an amount of cash equal to the daily fluctuation in value of the contract. Such receipts or payments are known as variation margin and are recorded by the Fund as unrealized gains or losses. When the contract is closed, the Fund records a realized gain or loss equal to the difference between the value of the contract at the time it was opened and the value at the time it was closed.
| | THE GUGGENHEIM FUNDS ANNUAL REPORT | 65 |
NOTES TO CONSOLIDATED FINANCIAL STATEMENTS (continued) |
E. Swap agreements are marked-to-market daily and the change, if any, is recorded as unrealized gain or loss. Payments received or made as a result of an agreement or termination of the agreement are recognized as realized gains or losses.
Credit default swap agreements are marked-to-market daily and the change, if any, is recorded as unrealized gain or loss. Upfront payments received or made by a Fund on credit default swap agreements are amortized over the expected life of the agreement. Periodic payments received or made as a result of a credit event or termination of the contract are recognized, net of a proportional amount of the upfront payment, as realized gains or losses.
F. The accounting records of the Funds are maintained in U.S. dollars. All assets and liabilities initially expressed in foreign currencies are converted into U.S. dollars at prevailing exchange rates. Purchases and sales of investment securities, dividend and interest income, and certain expenses are translated at the rates of exchange prevailing on the respective dates of such transactions. Changes in the relationship of these foreign currencies to the U.S. dollar can significantly affect the value of the investments and earnings of the Funds. Foreign investments may also subject the Funds to foreign government exchange restrictions, expropriation, taxation or other political, social or economic developments, all of which could affect the market and/or credit risk of the investments. The Funds do not isolate that portion of the results of operations resulting from changes in the foreign exchange rates on investments from the fluctuations arising from changes in the market prices of securities held. Such fluctuations are included with the net realized and unrealized gain or loss on investments. Reported net realized foreign exchange gains and losses arise from sales of foreign currencies and currency gains or losses realized between the trade and settlement dates on investment transactions. Net unrealized exchange gains and losses arise from changes in the fair values of assets and liabilities other than investments in securities at the fiscal period end, resulting from changes in exchange rates.
G. Security transactions are recorded on the trade date for financial reporting purposes. Realized gains and losses from securities transactions are recorded using the identified cost basis. Proceeds from lawsuits related to investment holdings are recorded as realized gains in the respective Fund. Dividend income is recorded on the ex-dividend date, net of applicable taxes withheld by foreign countries. Taxable non-cash dividends are recorded as dividend income. Interest income, including amortization of premiums and accretion of discounts, is accrued on a daily basis. Dividend income from REITs is recorded based on the income included in the distributions received from the REIT investments using published REIT classifications, including some management estimates when actual amounts are not available. Distributions received in excess of this estimated amount
66 | THE GUGGENHEIM FUNDS ANNUAL REPORT | |
NOTES TO CONSOLIDATED FINANCIAL STATEMENTS (continued) |
are recorded as a reduction of the cost of investments or reclassified to capital gains. The actual amounts of income, return of capital, and capital gains are only determined by each REIT after its fiscal year-end, and may differ from the estimated amounts.
H. Distributions of net investment income and net realized gains, if any, are declared and paid at least annually. Dividends are reinvested in additional shares unless shareholders request payment in cash. Distributions are recorded on the ex-dividend date and are determined in accordance with income tax regulations which may differ from U.S. GAAP.
I. Interest and dividend income, most expenses, all realized gains and losses, and all unrealized gains and losses are allocated to the classes based upon the value of the outstanding shares in each Class. Certain costs, such as distribution and service fees are charged directly to specific classes. In addition, certain expenses have been allocated to the individual Funds in the Trust on a pro rata basis upon the respective aggregate net assets of each Fund included in the Trust.
J. The Funds may leave cash overnight in their cash account with the custodian. Periodically, a Fund may have cash due to the custodian bank as an overdraft balance. A fee is incurred on this overdraft, calculated by multiplying the overdraft by a rate based on the federal funds rate.
K. Under the Funds’ organizational documents, their Trustees and Officers are indemnified against certain liabilities arising out of the performance of their duties to the Trust. In addition, throughout the normal course of business, the Funds enter into contracts that contain a variety of representations and warranties which provide general indemnifications. The Funds’ maximum exposure under these arrangements is unknown, as this would involve future claims that may be made against the Funds and/or their affiliates that have not yet occurred. However, based on experience, the Funds expect the risk of loss to be remote.
2. Financial Instruments and Derivatives
As part of their investment strategy, the Funds utilize short sales and a variety of derivative instruments. These investments involve, to varying degrees, elements of market risk and risks in excess of the amounts recognized in the Statements of Assets and Liabilities. Valuation and accounting treatment of these instruments can be found under Significant Accounting Policies in Note 1 of these Notes to Financial Statements.
| | THE GUGGENHEIM FUNDS ANNUAL REPORT | 67 |
NOTES TO CONSOLIDATED FINANCIAL STATEMENTS (continued) |
Short Sales
A short sale is a transaction in which a Fund sells a security it does not own. If the security sold short decreases in price between the time the Fund sells the security and closes its short position, that Fund will realize a gain on the transaction. Conversely, if the security increases in price during the period, that Fund will realize a loss on the transaction. The risk of such price increases is the principal risk of engaging in short sales.
Derivatives
Derivatives are instruments whose values depend on, or are derived from, in whole or in part, the value of one or more other assets, such as securities, currencies, commodities or indices. Derivative instruments may be used to increase investment flexibility (including to maintain cash reserves while maintaining exposure to certain other assets), for risk management (hedging) purposes, to facilitate trading, to reduce transaction costs and to pursue higher investment returns. Derivative instruments may also be used to mitigate certain investment risks, such as foreign currency exchange rate risk, interest rate risk and credit risk. U.S. GAAP requires disclosures to enable investors to better understand how and why a Fund uses derivative instruments, how these derivative instruments are accounted for and their effects on the Fund’s financial position and results of operations. The Funds may utilize derivatives for the following purposes:
Duration: the use of an instrument to manage the interest rate risk of a portfolio.
Hedge: an investment made in order to reduce the risk of adverse price movements in a security, by taking an offsetting position to protect against broad market moves.
Income: the use of any instrument that distributes periodic cash flows typically based upon some rate of interest.
Index Exposure: the use of an instrument to obtain exposure to a listed or other type of index.
Leverage: gaining total exposure to equities or other assets on the long and short sides at greater than 100% of invested capital.
Liquidity: the ability to buy or sell exposure with little price/market impact.
Speculation: the use of an instrument to express macro-economic and other investment views.
68 | THE GUGGENHEIM FUNDS ANNUAL REPORT | |
NOTES TO CONSOLIDATED FINANCIAL STATEMENTS (continued) |
For any Fund whose investment strategy consistently involves applying leverage, the value of the Fund’s shares will tend to increase or decrease more than the value of any increase or decrease in the underlying index or other asset. In addition, because an investment in derivative instruments generally requires a small investment relative to the amount of investment exposure assumed, an opportunity for increased net income is created; but, at the same time, leverage risk will increase. The Fund’s use of leverage, through borrowings or instruments such as derivatives, may cause the Fund to be more volatile and riskier than if they had not been leveraged.
Options Written
The risk in writing a call option is that a Fund may incur a loss if the market price of the underlying security increases and the option is exercised. The risk in writing a put option is that a Fund may incur a loss if the market price of the underlying security decreases and the option is exercised. In addition, there may be an imperfect correlation between the movement in prices of options and the underlying securities where a Fund may not be able to enter into a closing transaction because of an illiquid secondary market; or, for OTC options, a Fund may be at risk because of the counterparty’s inability to perform.
The following tables represent the Funds’ use and activity of options written for the year ended December 31, 2015:
Fund | Use |
Multi-Hedge Strategies Fund | Hedge, Income |
Written Call Options | | | | | | |
| | | Multi-Hedge Strategies Fund | |
| | | Number of
Contracts | | | Premium
Amount | |
Balance at December 31, 2014 | | | — | | | $ | — | |
Options Written | | | 174 | | | | 10,572 | |
Options terminated in closing purchase transactions | | | — | | | | — | |
Options expired | | | (144 | ) | | | (9,223 | ) |
Options exercised | | | — | | | | — | |
Balance at December 31, 2015 | | | 30 | | | $ | 1,349 | |
| | THE GUGGENHEIM FUNDS ANNUAL REPORT | 69 |
NOTES TO CONSOLIDATED FINANCIAL STATEMENTS (continued) |
Futures
A futures contract is an agreement to purchase (long) or sell (short) an agreed amount of securities or other instruments at a set price for delivery at a future date. There are significant risks associated with a Funds use of futures contracts, including (i) there may be an imperfect or no correlation between the changes in market value of the underlying asset and the prices of futures contracts; (ii) there may not be a liquid secondary market for a futures contract; (iii) trading restrictions or limitations may be imposed by an exchange; and (iv) government regulations may restrict trading in futures contracts. When investing in futures, there is minimal counterparty credit risk to the Funds because futures are exchange-traded and the exchange’s clearinghouse, as counterparty to all exchange-traded futures, guarantees against default. Cash deposits are shown as segregated cash with broker on the Statements of Assets and Liabilities; securities held as collateral are noted on the Schedules of Investments.
The following table represents the Funds’ use and volume of futures for the year ended December 31, 2015:
| | | | Average Notional | |
Fund | Use | | Long | | | Short | |
Multi-Hedge Strategies Fund | Duration, Hedge, Index Exposure, Leverage, Liquidity, Speculation | | $ | 66,263,269 | | | $ | 24,766,021 | |
Commodities Strategy Fund | Index Exposure, Liquidity | | | 8,378,852 | | | | 148,538 | |
Swaps
A swap is an agreement that obligates two parties to exchange a series of cash flows at specified intervals based upon or calculated by reference to changes in specified prices or rates for a specified amount of an underlying asset. A Fund utilizing OTC swaps bears the risk of loss of the amount expected to be received under a swap agreement in the event of the default or bankruptcy of a swap agreement counterparty or if the underlying asset declines in value. Certain standardized swaps are subject to mandatory central clearing. Central clearing generally reduces counterparty credit risk and increases liquidity, but central clearing does not make swap transactions risk-free. Additionally, there is no guarantee that a Fund or an underlying fund could eliminate its exposure under an outstanding swap agreement by entering into an offsetting swap agreement with the same or another party.
70 | THE GUGGENHEIM FUNDS ANNUAL REPORT | |
NOTES TO CONSOLIDATED FINANCIAL STATEMENTS (continued) |
Total return swaps involve commitments where single or multiple cash flows are exchanged based on the price of an underlying reference asset (such as index or basket) or a fixed or variable interest rate. Index swaps will usually be computed based on the current index value as of the close of regular trading on the NYSE or other exchange, with the swap value being adjusted to include dividends accrued, financing charges and/or interest associated with the swap agreement. A fund utilizing a total return index swap bears the risk of loss of the amount expected to be received under a swap agreement in the event of the default or bankruptcy of a swap agreement counterparty or if the underlying index declines in value.
The following table represents the Funds’ use and volume of total return swaps on a quarterly basis:
| | | | Average Notional | |
Fund | Use | | Long | | | Short | |
Multi-Hedge Strategies Fund | Hedge, Index Exposure, Leverage, Liquidity, Speculation | | $ | 15,318,087 | | | $ | 6,418,169 | |
A credit default swap enables a Fund to buy or sell protection against a defined credit event of an issuer or a basket of securities. Generally, the seller of credit protection against an issuer or basket of securities receives a periodic payment from the buyer to compensate against potential default events. If a default event occurs, the seller must pay the buyer the full notional value of the reference obligation in exchange for the reference obligation. If no default occurs, the counterparty will pay the stream of payments and have no further obligations to the Fund selling the credit protection. A Fund bears the risk of loss of the amount expected to be received under a swap agreement in the event of the default or bankruptcy of a swap agreement counterparty, or in the case of a credit default swap in which the Fund is selling credit protection, the default of a third party issuer.
The following table represents the Funds’ use and volume of credit default swaps on a quarterly basis:
| | | | Average Notional | |
Fund | Use | | Long | | | Short | |
Multi-Hedge Strategies Fund | Hedge, Index Exposure, Leverage, Liquidity, Speculation | | $ | — | | | $ | 1,219,131 | |
| | THE GUGGENHEIM FUNDS ANNUAL REPORT | 71 |
NOTES TO CONSOLIDATED FINANCIAL STATEMENTS (continued) |
Derivative Investment Holdings Categorized by Risk Exposure
The following is a summary of the location of derivative investments on the Funds’ Statements of Assets and Liabilities as of December 31, 2015:
Derivative Investment Type | Asset Derivatives | Liability Derivatives |
Equity/Currency/Interest Rate/Commodity contracts | Variation margin | Variation margin |
Equity/Credit contracts | Unrealized appreciation on swap agreements | Unrealized depreciation on swap agreements |
Equity contracts | | Options written, at value |
The following table sets forth the fair value of the Funds’ derivative investments categorized by primary risk exposure at December 31, 2015:
Asset Derivative Investments Value | |
Fund | | Futures Equity Contracts* | | | Swaps Equity Contracts | | | Futures Currency Contracts* | | | Futures Interest Rate Contracts* | | | Futures Commodity Contracts* | | | Options Purchased Equity Contracts | | | Total Value at December 31, 2015 | |
Multi-Hedge Strategies Fund | | $ | 194,857 | | | $ | 341,822 | | | $ | 52,437 | | | $ | 137,308 | | | $ | 254,656 | | | $ | — | | | $ | 981,080 | |
Liability Derivative Investments Value | |
Fund | | Futures Equity Contracts* | | | Swaps Equity Contracts | | | Futures Currency Contracts* | | | Futures Interest Rate Contracts* | | | Futures Commodity Contracts* | | | Options Written Equity Contracts | | | Total Value at December 31, 2015 | |
Multi-Hedge Strategies Fund | | $ | 47,102 | | | $ | 444,693 | | | $ | 4,032 | | | $ | 10,734 | | | $ | 107,254 | | | $ | 450 | | | $ | 614,265 | |
Commodities Strategy Fund | | | — | | | | — | | | | — | | | | — | | | | 58,237 | | | | — | | | | 58,237 | |
* | Includes cumulative appreciation (depreciation) of futures contracts as reported on the Schedules of Investments. Only current day’s variation margin is reported within the Statements of Assets and Liabilities. |
72 | THE GUGGENHEIM FUNDS ANNUAL REPORT | |
NOTES TO CONSOLIDATED FINANCIAL STATEMENTS (continued) |
The following is a summary of the location of derivative investments on the Funds’ Statements of Operations for the year ended December 31, 2015:
Derivative Investment Type | Location of Gain (Loss) on Derivatives |
Equity/Currency/Interest Rate/Commodity contracts | Net realized gain (loss) on futures contracts |
| Net change in unrealized appreciation (depreciation) on futures contracts |
Equity/Credit contracts | Net realized gain (loss) on swap agreements |
| Net change in unrealized appreciation (depreciation) on swap agreements |
Equity contracts | Net realized gain (loss) on options purchased |
| | Net realized gain (loss) on options written |
| | Net change in unrealized appreciation (depreciation) on options written |
The following is a summary of the Funds’ realized gain (loss) and change in unrealized appreciation (depreciation) on derivative investments recognized on the Statements of Operations categorized by primary risk exposure for the year ended December 31, 2015:
Realized Gain (Loss) on Derivative Investments Recognized on the Statements of Operations | |
Fund | | Futures
Equity
Contracts | | | Swaps
Equity
Contracts | | | Futures
Currency
Contracts | | | Futures
Interest
Rate
Contracts | | | Futures
Commodity
Contracts | | | Swaps
Credit
Default
Contracts | | | Options
Written
Equity
Contracts | | | Options
Purchased Equity
Contracts | | | Total | |
Multi-Hedge Strategies Fund | | $ | 123,143 | | | $ | 691,354 | | | $ | (206,684 | ) | | $ | 615,518 | | | $ | 872,384 | | | $ | 98,948 | | | $ | 9,223 | | | $ | (1,121 | ) | | $ | 2,202,765 | |
Commodities Strategy Fund | | | — | | | | — | | | | — | | | | — | | | | (4,947,756 | ) | | | — | | | | — | | | | — | | | | (4,947,756 | ) |
Change in Unrealized Appreciation (Depreciation) on Derivative Investments Recognized on the Statements of Operations | |
Fund | | Futures
Equity
Contracts | | | Swaps
Equity
Contracts | | | Futures
Currency
Contracts | | | Futures
Interest
Rate
Contracts | | | Futures
Commodity
Contracts | | | Swaps
Credit
Default
Contracts | | | Options
Written
Equity
Contracts | | | Total | |
Multi-Hedge Strategies Fund | | $ | (168,140 | ) | | $ | (339,999 | ) | | $ | (21,120 | ) | | $ | (658,605 | ) | | $ | (303,211 | ) | | $ | (60,876 | ) | | $ | 899 | | | $ | (1,551,052 | ) |
Commodities Strategy Fund | | | — | | | | — | | | | — | | | | — | | | | 494,172 | | | | — | | | | — | | | | 494,172 | |
| | THE GUGGENHEIM FUNDS ANNUAL REPORT | 73 |
NOTES TO CONSOLIDATED FINANCIAL STATEMENTS (continued) |
In conjunction with the use of short sales and derivative instruments, the Funds are required to maintain collateral in various forms. The Funds use, where appropriate, depending on the financial instrument utilized and the broker involved, margin deposits at the broker, cash and/or securities segregated at the custodian bank, discount notes or the repurchase agreements allocated to each Fund.
The Trust has established counterparty credit guidelines and enters into transactions only with financial institutions of investment grade or better. The Trust monitors the counterparty credit risk.
3. Fees and Other Transactions with Affiliates
Under the terms of an investment advisory contract, the Funds and each Subsidiary pay GI investment advisory fees calculated at their annualized rates below, based on the average daily net assets of the Funds:
Fund | Management Fees
(as a % of Net Assets) |
Multi-Hedge Strategies Fund | 1.15% |
Commodities Strategy Fund | 0.75% |
GI has contractually agreed to waive the management fee it receives from the Subsidiary in an amount equal to the management fee paid to GI by the Subsidiary. This undertaking will continue in effect for so long as the Funds invest in the Subsidiary, and may not be terminated by GI unless GI obtains the prior approval of the Funds’ Board of Trustees for such termination.
As part of its agreement with the Trust, GI will pay all expenses of the Multi-Hedge Strategies Fund, including the cost of transfer agency, custody, fund administration, legal, audit and other services, except interest expense, taxes (expected to be de minimis), brokerage commissions and other expenses connected with execution of portfolio transactions, short dividend expenses, subsidiary expenses and extraordinary expenses.
RFS provides transfer agent and administrative services to the Commodities Strategy Fund for fees calculated at the annualized rate of 0.25% based on the average daily net assets of the Fund.
74 | THE GUGGENHEIM FUNDS ANNUAL REPORT | |
NOTES TO CONSOLIDATED FINANCIAL STATEMENTS (continued) |
RFS also provides accounting services to the Commodities Strategy Fund for fees calculated at annualized rates below, based on the average daily net assets of the Fund.
Fund Accounting Fees | (as a % of Net Assets) |
On the first $250 million | 0.10% |
On the next $250 million | 0.075% |
On the next $250 million | 0.05% |
Over $750 million | 0.03% |
RFS engages external service providers to perform other necessary services for the Trust, such as audit and accounting related services, legal services, custody, printing and mailing, etc., on a pass-through basis. Such expenses are allocated to various Funds within the complex based on relative net assets.
The Trust has adopted a Distribution Plan applicable to A-Class shares,H-Class shares and P-Class shares for which GFD and other firms that provide distribution and/or shareholder services (“Service Providers”) may receive compensation. If a Service Provider provides distribution services, the Funds will pay distribution fees to GFD at an annual rate not to exceed 0.25% of average daily net assets, pursuant to Rule 12b-1 of the 1940 Act. GFD, in turn, will pay the Service Provider out of its fees. GFD may, at its discretion, retain a portion of such payments to compensate itself for distribution services.
The Trust has adopted a separate Distribution and Shareholder Services Plan applicable to its C-Class shares that allows the Funds to pay annual distribution and service fees of 1.00% of the Funds’ C-Class shares average daily net assets. The annual 0.25% service fee compensates a shareholder’s financial adviser for providing ongoing services to the shareholder. The annual distribution fee of 0.75% reimburses GFD for paying the shareholder’s financial adviser an ongoing sales commission. GFD advances the first year’s service and distribution fees to the financial adviser. GFD retains the service and distribution fees on accounts with no authorized dealer of record.
If a Fund invests in an affiliated fund, the investing Fund’s Adviser has agreed to waive fees at the investing fund level. Fee waivers will be calculated at the investing Fund level without regard to any expense cap, if any, in effect for the investing Fund. Fees waived under this arrangement are not subject to reimbursement to GI. For the year ended December 31, 2015, the Multi-Hedge Strategies Fund waived $79 related to investments in affiliated funds.
For the year ended December 31, 2015, GFD retained sales charges of $366,266 relating to sales of A-Class shares of the Trust.
Certain trustees and officers of the Trust are also officers of GI, RFS and GFD.
| | THE GUGGENHEIM FUNDS ANNUAL REPORT | 75 |
NOTES TO CONSOLIDATED FINANCIAL STATEMENTS (continued) |
4. Fair Value Measurement
In accordance with U.S. GAAP, fair value is defined as the price that the Funds would receive to sell an investment or pay to transfer a liability in an orderly transaction with an independent buyer in the principal market, or in the absence of a principal market, the most advantageous market for the investment or liability. U.S. GAAP establishes a three-tier fair value hierarchy based on the types of inputs used to value assets and liabilities and requires corresponding disclosure. The hierarchy and the corresponding inputs are summarized below:
Level 1 — | quoted prices in active markets for identical assets or liabilities. |
Level 2 — | significant other observable inputs (for example quoted prices for securities that are similar based on characteristics such as interest rates, prepayment speeds, credit risk, etc.). |
Level 3 — | significant unobservable inputs based on the best information available under the circumstances, to the extent observable inputs are not available, which may include assumptions. |
The types of inputs available depend on a variety of factors, such as the type of security and the characteristics of the markets in which it trades, if any. Fair valuation determinations that rely on fewer or no observable inputs require greater judgment. Accordingly, fair value determinations for Level 3 securities require the greatest amount of judgment.
The inputs or methodologies used for valuing securities are not necessarily an indication of the risk associated with investing in those securities. The suitability of the techniques and sources employed to determine fair valuation are regularly monitored and subject to change.
5. Repurchase Agreements
The Funds transfer uninvested cash balances into a single joint account, the daily aggregate balance of which is invested in one or more repurchase agreements collateralized by obligations of the U.S. Treasury and U.S. Government Agencies. The collateral is in the possession of the Funds’ custodian and is evaluated to ensure that its market value exceeds, at a minimum, 102% of the original face amount of the repurchase agreements. Each Fund holds a pro rata share of the collateral based on the dollar amount of the repurchase agreement entered into by each Fund.
76 | THE GUGGENHEIM FUNDS ANNUAL REPORT | |
NOTES TO CONSOLIDATED FINANCIAL STATEMENTS (continued) |
At December 31, 2015, the repurchase agreements in the joint account were as follows:
Counterparty and
Terms of Agreement | Face
Value | Repurchase Price | | Collateral | Par
Value | Fair
Value |
Royal Bank of Canada | | | | U.S. TIP Notes | | |
0.24% | | | | 0.13% - 2.38% | | |
Due 01/04/16 | $250,241,221 | $250,247,894 | | 04/15/18 - 01/15/25 | $188,518,600 | $226,206,912 |
| | | | | U.S. Treasury Note | | |
| | | | | 1.50% | | |
| | | | | 05/31/20 | 29,220,000 | 29,039,171 |
| | | | | | $217,738,600 | $255,246,083 |
| | | | | | | |
Mizuho Financial Group, Inc. | | | | U.S. Treasury Notes | | |
0.18% | | | | 1.00% - 3.25% | | |
Due 01/04/16 | 150,000,000 | 150,003,000 | | 09/30/16 - 12/31/16 | 150,514,600 | 153,000,027 |
| | | | | | | |
HSBC Group | | | | U.S. Treasury Strips | | |
0.18% | | | | 0.00% | | |
Due 01/04/16 | 147,711,070 | 147,714,024 | | 11/15/40 - 02/15/43 | 349,130,000 | 150,665,329 |
In the event of counterparty default, the Funds have the right to collect the collateral to offset losses incurred. There is potential loss to the Funds in the event the Funds are delayed or prevented from exercising their rights to dispose of the collateral securities, including the risk of a possible decline in the value of the underlying securities during the period while the Funds seek to assert their rights. The Funds’ investment adviser, acting under the supervision of the Board of Trustees, reviews the value of the collateral and the creditworthiness of those banks and dealers with which the Funds enter into repurchase agreements to evaluate potential risks.
6. Portfolio Securities Loaned
During the year ended December 31, 2015, certain Funds lent their securities to approved brokers to earn additional income. Security lending income shown on the Statements of Operations are net of rebates paid to borrowers and earnings on cash collateral investments shared with the lending agent. As of December 31, 2015, all Funds had ceased participation in securities lending.
| | THE GUGGENHEIM FUNDS ANNUAL REPORT | 77 |
NOTES TO CONSOLIDATED FINANCIAL STATEMENTS (continued) |
7. Offsetting
In the normal course of business, the Funds enter into transactions subject to enforceable master netting arrangements or other similar arrangements. Generally, the right to offset in those agreements allows the Funds to counteract the exposure to a specific counterparty with collateral received or delivered to that counterparty based on the terms of the arrangements. These arrangements provide for the right to liquidate upon the occurrence of an event of default, credit event upon merger or additional termination event.
In order to better define their contractual rights and to secure rights that will help the Funds mitigate their counterparty risk, the Funds may enter into an International Swaps and Derivatives Association, Inc. Master Agreement (“ISDA Master Agreement”) or similar agreement with their derivative contract counterparties. An ISDA Master Agreement is a bilateral agreement between a Fund and a counterparty that governs OTC derivatives, including foreign exchange contracts, and typically contains, among other things, collateral posting terms and netting provisions in the event of a default and/or termination event. The provisions of the ISDA Master Agreement typically permit a single net payment in the event of a default (close-out netting) or similar event, including the bankruptcy or insolvency of the counterparty.
For derivatives traded under an ISDA Master Agreement, the collateral requirements are typically calculated by netting the mark to market amount for each transaction under such agreement and comparing that amount to the value of any collateral currently pledged by the Funds and the counterparty. For financial reporting purposes, cash collateral that has been pledged to cover obligations of the Funds and cash collateral received from the counterparty, if any, is reported separately on the Statements of Assets and Liabilities as segregated cash with broker/receivable for variation margin, or payable for swap settlement/variation margin. Generally, the amount of collateral due from or to a counterparty must exceed a minimum transfer amount threshold (e.g., $300,000) before a transfer is required to be made. To the extent amounts due to the Funds from their counterparties are not fully collateralized, contractually or otherwise, the Funds bear the risk of loss from counterparty nonperformance. The Funds attempt to mitigate counterparty risk by only entering into agreements with counterparties that they believe to be of good standing and by monitoring the financial stability of those counterparties.
For financial reporting purposes, the Funds do not offset derivative assets and derivative liabilities that are subject to netting arrangements in the Statements of Assets and Liabilities.
78 | THE GUGGENHEIM FUNDS ANNUAL REPORT | |
NOTES TO CONSOLIDATED FINANCIAL STATEMENTS (continued) |
The following tables present derivative financial instruments and secured financing transactions that are subject to enforceable netting arrangements and offset in the Statement of Assets and Liabilities in conformity with U.S. GAAP.
| | | | | | | | | | | | | Gross Amounts Not Offset
in the Statement of
Assets and Liabilities | | | | |
Fund | Instrument | | Gross Amounts of Recognized Assets1 | | | Gross Amounts Offset In the Statement
of Assets and Liabilities | | | Net Amount of Assets Presented on the
Statement
of Assets and Liabilities | | | Financial
Instruments | | | Cash Collateral Received | | | Net
Amount | |
Multi-Hedge Strategies Fund | Swap equity contracts | | $ | 341,822 | | | $ | — | | | $ | 341,822 | | | $ | 341,822 | | | $ | — | | | $ | — | |
| | | | | | | | | | | | | Gross Amounts Not Offset in the Statement of
Assets and Liabilities | | | | |
Fund | Instrument | | Gross Amounts of Recognized Liabilities1 | | | Gross Amounts Offset in the Statement
of Assets and Liabilities | | | Net Amount of Liabilities Presented
on the Statement
of Assets and Liabilities | | | Financial
Instruments | | | Cash Collateral Pledged | | | Net
Amount | |
Multi-Hedge Strategies Fund | Swap equity contracts | | $ | 444,693 | | | $ | — | | | $ | 444,693 | | | $ | 341,822 | | | $ | 102,871 | | | $ | — | |
1 | Exchange-traded futures are excluded from these reported amounts. |
8. Federal Income Tax Information
The Funds intend to comply with the provisions of Subchapter M of the Internal Revenue Code applicable to regulated investment companies and will distribute substantially all taxable net investment income and capital gains sufficient to relieve the Funds from all, or substantially all, federal income, excise and state income taxes. Therefore, no provision for federal or state income tax is required.
Tax positions taken or expected to be taken in the course of preparing the Funds’ tax returns are evaluated to determine whether the tax positions are “more-likely-than-not” of being sustained by the applicable tax authority. Tax positions not deemed to meet the more-likely-than-not threshold would be recorded as a
| | THE GUGGENHEIM FUNDS ANNUAL REPORT | 79 |
NOTES TO CONSOLIDATED FINANCIAL STATEMENTS (continued) |
tax benefit or expense in the current year. Management has analyzed the Funds’ tax positions taken, or to be taken, on Federal income tax returns for all open tax years, and has concluded that no provision for income tax is required in the Funds’ financial statements. The Funds’ federal tax returns are subject to examination by the Internal Revenue Service for a period of three years after they are filed.
The Funds intend to invest up to 25% of their assets in the Subsidiary which is expected to provide the Funds with exposure to the commodities markets within the limitations of the federal tax requirements under Subchapter M of the Internal Revenue Code. The Funds have received a private letter ruling from the IRS that concludes that the income the Funds receive from the Subsidiary will constitute qualifying income for purposes of Subchapter M of the Internal Revenue Code. The Subsidiary will be classified as a corporation for U.S. federal income tax purposes. A foreign corporation, such as the Subsidiary, will generally not be subject to U.S. federal income taxation unless it is deemed to be engaged in a U.S. trade or business.
Tax basis capital losses in excess of capital gains are carried forward to offset future net capital gains. For the year ended December 31, 2015, the following capital loss carryforward amounts expired, were used, or were permananetly lost due to loss limitation rules in Section 382 of the Internal Revenue Code:
Fund | | Amount | |
Multi-Hedge Strategies Fund | | $ | 2,473,427 | |
The tax character of distributions paid during the year ended December 31, 2015, are as follows:
Fund | | Ordinary
Income | | | Long-Term
Capital Gain | | | Total
Distributions | |
Multi-Hedge Strategies Fund | | $ | — | | | $ | — | | | $ | — | |
Commodities Strategy Fund | | | — | | | | — | | | | — | |
The tax character of distributions paid during the year ended December 31, 2014, were as follows:
Fund | | Ordinary
Income | | | Long-Term
Capital Gain | | | Total
Distributions | |
Multi-Hedge Strategies Fund | | $ | 800,775 | | | $ | — | | | $ | 800,775 | |
Commodities Strategy Fund | | | — | | | | — | | | | — | |
Note: For federal income tax purposes, short-term capital gain distributions are treated as ordinary income distributions.
80 | THE GUGGENHEIM FUNDS ANNUAL REPORT | |
NOTES TO CONSOLIDATED FINANCIAL STATEMENTS (continued) |
The tax character of distributable earnings/(accumulated losses) as of December 31, 2015, is as follows:
Fund | | Undistributed
Ordinary
Income | | | Undistributed
Long-Term
Capital Gain | | | Net Unrealized
Appreciation/
(Depreciation) | | | Capital Loss
Carryforward | |
Multi-Hedge Strategies Fund | | $ | 205,134 | | | $ | — | | | $ | (592,846 | ) | | $ | (41,445,037 | ) |
Commodities Strategy Fund | | | — | | | | — | | | | (2,838,313 | ) | | | (19,884,608 | ) |
For Federal income tax purposes capital loss carryfowards represent realized losses that may be carried forward and applied against future capital gains. For taxable years beginning on or before December 22, 2010, such capital losses may be carried forward for a maximum of eight years. Pursuant to the RIC Modernization Act of 2010, the Fund is permitted to carry forward capital losses incurred in taxable years beginning after December 22, 2010, without expiration and retain their short and/or long-term character. However, post-enactment losses must be utilized prior to pre-enactment capital loss carryfowards. As a result of this ordering rule pre-enactment carryfowards are more likely to expire unused. As of December 31, 2015, capital loss carryfowards for the Funds were as follows:
| | | | | | | | | | | | Unlimited | | | | |
Fund | | Expires in
2016 | | | Expires in
2017 | | | Expires in
2018 | | | Short-Term | | | Long-Term | | | Total
Capital Loss
Carryforward | |
Multi-Hedge Strategies Fund | | $ | (32,389,854 | ) | | $ | (8,823,539 | ) | | $ | (219,647 | ) | | $ | (2,783 | ) | | $ | (9,214 | ) | | $ | (41,445,037 | )* |
Commodities Strategy Fund | | | — | | | | (19,850,783 | ) | | | — | | | | (29,619 | ) | | | (4,206 | ) | | | (19,884,608 | ) |
* | In accordance with section 382 of the Internal revenue Code a portion of certain Fund losses are subject to an annual limitation. Note, this annual limitation is generally applicable to all of the capital loss carryforwards shown with respect to each Fund. |
Net investment income and net realized gains (losses) may differ for financial statement and tax purposes because of temporary or permanent book/tax differences. These differences are primarily due to wash sales, investments in subsidiary, net operating losses, and expired capital loss carryforwards. To the extent these differences are permanent, reclassifications are made to the appropriate equity accounts in the period that the differences arise. These reclassifications have no effect on net assets or NAV.
| | THE GUGGENHEIM FUNDS ANNUAL REPORT | 81 |
NOTES TO CONSOLIDATED FINANCIAL STATEMENTS (continued) |
On the Statements of Assets and Liabilities the following adjustments were made for permanent book/tax differences:
Fund | | Paid In
Capital | | | Accumulated
Net Investment
Loss | | | Accumulated
Net Realized
Gain (Loss) | |
Multi-Hedge Strategies Fund | | $ | 318,775 | | | $ | 335,890 | | | $ | (654,665 | ) |
Commodities Strategy Fund | | | (5,056,233 | ) | | | 108,475 | | | | 4,947,758 | |
At December 31, 2015, the cost of securities for Federal income tax purposes, the aggregate gross unrealized gain for all securities for which there was an excess of value over tax cost, and the aggregate gross unrealized loss for all securities for which there was an excess of tax cost over value was as follows:
Fund | | Tax
Cost | | | Tax
Unrealized
Gain | | | Tax
Unrealized
Loss | | | Net
Unrealized
Gain (Loss) | |
Multi-Hedge Strategies Fund | | $ | 105,846,286 | | | $ | 3,181,608 | | | $ | (3,002,199 | ) | | $ | 179,409 | |
Commodities Strategy Fund | | | 11,081,743 | | | | — | | | | (2,780,076 | ) | | | (2,780,076 | ) |
9. Securities Transactions
For the year ended December 31, 2015, the cost of purchases and proceeds from sales of investment securities, excluding government securities, short-term investments and derivatives, were as follows:
Fund | | Purchases | | | Sales | |
Multi-Hedge Strategies Fund | | $ | 211,535,816 | | | $ | 206,357,961 | |
Commodities Strategy Fund | | | 13,787,668 | | | | 36,630,000 | |
10. Affiliated Transactions
Investments representing 5% or more of the outstanding voting shares of a portfolio company of a fund, or control of or by, or common control under GI, result in that portfolio company being considered an affiliated company of such fund, as defined in the 1940 Act.
The Funds may invest in the Guggenheim Strategy Funds Trust consisting of Guggenheim Strategy Fund I, Guggenheim Strategy Fund II, Guggenheim Strategy Fund III, and Guggenheim Variable Insurance Strategy Fund III (collectively, the “Cash Management Funds”), open-end management investment companies managed by GI. The Cash Management Funds, which launched on March 11, 2014, are offered as cash management options only to mutual funds, trusts, and other accounts managed by GI and/or its affiliates, and are not available to the public. The Cash Management Funds pay no investment management fees. The
82 | THE GUGGENHEIM FUNDS ANNUAL REPORT | |
NOTES TO CONSOLIDATED FINANCIAL STATEMENTS (continued) |
Cash Management Funds’ annual report on Form N-CSR dated September 30, 2015, is available publicly or upon request. This information is available from the EDGAR database on the SEC’s website at http://www.sec.gov/Archives/edgar/data/1601445/000089180415000857/gug63224-ncsr.htm.
Transactions during the year ended December 31, 2015, in which the portfolio company is an “affiliated person” are as follows:
Affiliated issuers
by Fund | | Value
12/31/14 | | | Additions | | | Reductions | | | Value
12/31/15 | | | Shares
12/31/15 | | | Investment
Income | | | Realized
Gain (Loss) | |
Multi-Hedge Strategies Fund | | | | | | | | | | |
Advent Claymore Convertible Securities and Income Fund | | $ | — | | | $ | 11,288 | | | $ | — | | | $ | 9,667 | | | | 715 | | | $ | 386 | | | $ | — | |
Advent Claymore Convertible Securities and Income Fund II | | | — | | | | 222,581 | | | | (7,853 | ) | | | 191,447 | | | | 34,495 | | | | 10,283 | | | | (1,025 | ) |
Advent/Claymore Enhanced Growth & Income Fund | | | — | | | | 73,528 | | | | (8,304 | ) | | | 60,470 | | | | 7,312 | | | | 3,086 | | | | (1,405 | ) |
Guggenheim Enhanced Equity Income Fund | | | — | | | | 13,729 | | | | — | | | | 13,286 | | | | 1,730 | | | | 354 | | | | — | |
Guggenheim Enhanced Equity Strategy Fund | | | — | | | | 13,506 | | | | — | | | | 13,042 | | | | 827 | | | | 316 | | | | — | |
Guggenheim Equal Weight Enhanced Equity Income Fund | | | — | | | | 8,021 | | | | — | | | | 8,170 | | | | 500 | | | | 219 | | | | — | |
Guggenheim Strategy Fund I | | | — | | | | 19,800 | | | | — | | | | 19,796 | | | | 796 | | | | 212 | | | | 10,240 | |
Guggenheim Strategy Fund II | | | — | | | | 5,923 | | | | — | | | | 5,903 | | | | 238 | | | | 90 | | | | 1,865 | |
Managed Duration Investment Grade Municipal Fund | | | — | | | | 12,491 | | | | — | | | | 12,989 | | | | 944 | | | | — | | | | — | |
Western Asset/Claymore Inflation-Linked Opportunities & Income Fund | | | — | | | | 518,493 | | | | (72,248 | ) | | | 407,659 | | | | 39,617 | | | | 5,477 | | | | (11,453 | ) |
Western Asset/Claymore Inflation-Linked Securities & Income Fund | | | — | | | | 409,068 | | | | (10,859 | ) | | | 368,734 | | | | 34,885 | | | | 2,444 | | | | (1,721 | ) |
| | | $ | — | | | $ | 1,308,428 | | | $ | (99,264 | ) | | $ | 1,111,163 | | | | | | | $ | 22,867 | | | $ | (3,499 | ) |
| | | | | | | | | | | | | | | | | | | | | | | | | | | | | |
Commodities Strategy Fund | | | | | | | | | | | | | | | | | | | | | | | | | |
Guggenheim Strategy Fund I | | $ | — | | | $ | 12,537,952 | | | $ | (9,400,000 | ) | | $ | 3,139,901 | | | | 126,253 | | | $ | 8,227 | | | $ | 6,746 | |
Guggenheim Strategy Fund II | | | — | | | | 5,046,687 | | | | (4,050,000 | ) | | | 992,902 | | | | 40,036 | | | | 14,205 | | | | 3,437 | |
| | | $ | — | | | $ | 17,584,639 | | | $ | (13,450,000 | ) | | $ | 4,132,803 | | | | | | | $ | 22,432 | | | $ | 10,183 | |
| | THE GUGGENHEIM FUNDS ANNUAL REPORT | 83 |
NOTES TO CONSOLIDATED FINANCIAL STATEMENTS (continued) |
11. Line of Credit
The Trust, along with other affiliated trusts, secured an uncommitted $75,000,000 line of credit from U.S. Bank, N.A., which expires June 12, 2016. This line of credit is reserved for emergency or temporary purposes. Borrowings, if any, under this arrangement bear interest equal to the Prime Rate, minus 2%, which shall be paid monthly, averaging 1.25% for the year ended December 31, 2015. The Funds did not have any borrowings outstanding under this agreement at December 31, 2015, and did not participate in borrowing during the year.
12. Security Transactions with Affiliated Funds
The Funds are permitted to purchase or sell securities from or to certain affiliated funds under specified conditions outlined in procedures adopted by the Board of Trustees of the Trust. The procedures have been designed to ensure that any purchase or sale of securities by a Fund from or to another fund or portfolio that is or could be considered an affiliate by virtue of having a common investment adviser (or affiliated investment advisers), common Trustees and/or common officers complies with Rule 17a-7 of the 1940 Act. Further, as defined under these procedures, each transaction is effected at the current market price to save costs, where permissible. For the year ended December 31, 2015, the Funds engaged in purchases and sales of securities, pursuant to Rule 17a-7 of the 1940 Act, as follows:
Fund | | Purchases | | | Sales | |
Multi-Hedge Strategies Fund | | $ | — | | | $ | 367,299 | |
13. Legal Proceedings
Tribune Company
Rydex Series Funds has been named as a defendant and a putative member of the proposed defendant class of shareholders in the case entitled Kirschner v. FitzSimons, No. 12-2652 (S.D.N.Y.) (formerly Official Committee of Unsecured Creditors of Tribune Co. v. FitzSimons, Adv. Pro. No. 10-54010 (Bankr. D. Del.)) (the “FitzSimons action”), as a result of ownership by certain series of the Rydex Series Funds of shares in the Tribune Company (“Tribune”) in 2007, when Tribune effected a leveraged buyout transaction (“LBO”) by which Tribune converted to a privately-held company. In his complaint, the plaintiff has alleged that, in connection with the LBO, Tribune insiders and shareholders were overpaid for their Tribune stock using financing that the insiders knew would, and ultimately did, leave the Tribune Company insolvent. The plaintiff has asserted claims against certain insiders, major
84 | THE GUGGENHEIM FUNDS ANNUAL REPORT | |
NOTES TO CONSOLIDATED FINANCIAL STATEMENTS (continued) |
shareholders, professional advisers, and others involved in the LBO. The plaintiff is also attempting to obtain from former Tribune shareholders, including the Rydex Series Funds, the proceeds they received in connection with the LBO.
In June 2011, a group of Tribune creditors filed multiple actions against former Tribune shareholders involving state law constructive fraudulent conveyance claims arising out of the 2007 LBO (the “SLCFC actions”). Rydex Series Funds has been named as a defendant in one of the SLCFC actions: Deutsche Bank Trust Co. Americas v. McGurn, No. 11-1510 (S.D.N.Y.). In those actions, the creditors seek to recover from Tribune’s former shareholders the proceeds received in connection with the 2007 LBO.
The FitzSimons action and the SLCFC actions have been consolidated with the majority of the other Tribune LBO-related lawsuits in a multidistrict litigation proceeding captioned In re Tribune Company Fraudulent Conveyance Litig., No. 11-md-2696 (S.D.N.Y.) (the “MDL Proceeding”).
On September 23, 2013, the District Court granted the defendants’ omnibus motion to dismiss the SLCFC actions, on the basis that the creditors lacked standing. On September 30, 2013, the creditors filed a notice of appeal of the September 23 order. On October 28, 2013, the defendants filed a joint notice of cross-appeal of that same order.
The SLCFC appeals have been fully briefed, and oral argument in front of the U.S. Court of Appeals for the Second Circuit occurred on November 5, 2014. The Court has not yet issued a decision on the appeals.
On May 23, 2014, the defendants filed motions to dismiss the FitzSimons action, including a global motion to dismiss Count I, which is the claim brought against former Tribune shareholders for intentional fraudulent conveyance under U.S. federal law. The Court has not yet issued a decision on any of these motions.
None of these lawsuits alleges any wrongdoing on the part of Rydex Series Funds. The following series of Rydex Series Funds held shares of Tribune and tendered these shares as part of Tribune’s LBO: Nova Fund, S&P 500® Pure Value Fund, Multi-Cap Core Equity Fund, S&P 500® Fund, Multi-Hedge Strategies Fund and Hedged Equity Fund (the “Funds”). The value of the proceeds received by the foregoing Funds was $28,220, $109,242, $9,860, $3,400, $1,181,160, and $10,880, respectively. At this stage of the proceedings, Rydex Series Funds is not able to make a reliable predication as to the outcome of these lawsuits or the effect, if any, on a Fund’s net asset value.
| | THE GUGGENHEIM FUNDS ANNUAL REPORT | 85 |
NOTES TO CONSOLIDATED FINANCIAL STATEMENTS (continued) |
Lyondell Chemical Company
In December 2011, Rydex Series Funds was named as a defendant in Weisfelner, as Trustee of the LB Creditor Trust, v. Fund 1 (In re Lyondell Chemical Co.), Adv. Pro. No. 10-4609 (Bankr. S.D.N.Y.) (the “Creditor Trust action”).
Similar to the claims made in the Tribune matter, the Weisfelner complaint seeks to have set aside and recovered as fraudulent transfers from former Lyondell Chemical Company (“Lyondell”) shareholders the consideration paid to them pursuant to the cash out merger of Lyondell shareholders in connection with the combination of Lyondell and Basell AF in 2007. Lyondell filed for bankruptcy in 2008.
On April 7, 2014, the plaintiff filed a Third Amended Complaint. In the related action entitled Weisfelner, as Trustee of the LB Litigation Trust v. A. Holmes & H. Holmes TTEE (In re Lyondell Co.), Adv. Pro. No. 10-5525 (Bankr. S.D.N.Y.) (the “Litigation Trust action”), the plaintiff also filed a Second Amended Complaint that alleges a claim against the former Lyondell shareholders under federal law for intentional fraudulent transfer. A third related action against the former Lyondell shareholders, Weisfelner, as Trustee of the LB Creditor Trust v. Reichman, Adv. Pro. No. 12-1570 (Bankr. S.D.N.Y.) (the “Reichman action”), is pending as well.
On May 8, 2014, the plaintiff in the Litigation Trust action filed a motion to certify a defendant class generally comprised of all former Lyondell shareholders that received proceeds in exchange for their shares in the 2007 merger transaction.
On July 30, 2014, the defendants filed a motion to dismiss these lawsuits. The Bankruptcy Court held oral argument on the motion to dismiss and on the motion for class certification on January 14 and January 15, 2015. On September 15, 2015, the Bankruptcy Court denied the motion for class certification without prejudice to the plaintiff’s right to file a renewed motion. On November 18, 2015, the Bankruptcy Court granted the defendants’ motion to dismiss the Litigation Trust action and denied their motion to dismiss the Creditor Trust and Reichman actions. The Litigation Trust action is now over, but the plaintiff has appealed the dismissal to the U.S. District Court for the Southern District of New York. Discovery has commenced, and will continue, in the Creditor Trust and Reichman actions.
These lawsuits do not allege any wrongdoing on the part of Rydex Series Funds. The following series of Rydex Series Funds received cash proceeds from the cash out merger in the following amounts: Basic Materials Fund - $1,725,168; Long Short Equity Fund f/k/a U.S. Long Short Momentum Fund - $2,193,600; Global 130/30 Strategy Fund - $37,920; Hedged Equity Fund - $1,440; and Multi-Hedge
86 | THE GUGGENHEIM FUNDS ANNUAL REPORT | |
NOTES TO CONSOLIDATED FINANCIAL STATEMENTS (concluded) |
Strategies Fund - $1,116,480. At this stage of the proceedings, Rydex Series Funds is not able to make a reliable predication as to the outcome of these lawsuits or the effect, if any, on a Fund’s net asset value.
14. H-Class Shares
Effective following the close of business on April 30, 2015, (the “Redesignation Date”), all outstanding H-Class shares of the Guggenheim Multi-Hedge Strategies Fund were redesignated as P-Class shares, and the Fund will no longer offer H-Class shares.
| | THE GUGGENHEIM FUNDS ANNUAL REPORT | 87 |
REPORT OF INDEPENDENT REGISTERED PUBLIC ACCOUNTING FIRM |
The Board of Trustees and Shareholders
of Rydex Series Funds:
We have audited the accompanying consolidated statements of assets and liabilities, including the consolidated schedules of investments, of Guggenheim Multi-Hedge Strategies Fund and Rydex Commodities Strategy Fund (two of the series constituting the Rydex Series Funds) (the “Funds”) as of December 31, 2015, and the related consolidated statements of operations for the year then ended, the consolidated statements of changes in net assets for each of the two years in the period then ended, and the consolidated financial highlights for each of the five years in the period then ended. These financial statements and financial highlights are the responsibility of the Funds’ management. Our responsibility is to express an opinion on these financial statements and financial highlights based on our audits.
We conducted our audits in accordance with the standards of the Public Company Accounting Oversight Board (United States). Those standards require that we plan and perform the audit to obtain reasonable assurance about whether the financial statements and financial highlights are free of material misstatement. We were not engaged to perform an audit of the Funds’ internal control over financial reporting. Our audits included consideration of internal control over financial reporting as a basis for designing audit procedures that are appropriate in the circumstances, but not for the purpose of expressing an opinion on the effectiveness of the Funds’ internal control over financial reporting. Accordingly, we express no such opinion. An audit also includes examining, on a test basis, evidence supporting the amounts and disclosures in the financial statements and financial highlights, assessing the accounting principles used and significant estimates made by management, and evaluating the overall financial statement presentation. Our procedures included confirmation of securities owned as of December 31, 2015, by correspondence with the custodian, transfer agent, and brokers or by other appropriate auditing procedures where replies from brokers were not received. We believe that our audits provide a reasonable basis for our opinion.
In our opinion, the financial statements and financial highlights referred to above present fairly, in all material respects, the consolidated financial position of Guggenheim Multi-Hedge Strategies Fund and Rydex Commodities Strategy Fund (two of the series constituting the Rydex Series Funds) at December 31, 2015, the consolidated results of their operations for the year then ended, the consolidated changes in their net assets for each of the two years in the period then ended, and their consolidated financial highlights for each of the five years in the period then ended, in conformity with U.S. generally accepted accounting principles.

McLean, Virginia
February 26, 2016
88 | THE GUGGENHEIM FUNDS ANNUAL REPORT | |
OTHER INFORMATION (Unaudited) |
Proxy Voting Information
A description of the policies and procedures that the Trust uses to determine how to vote proxies relating to securities held in the Funds’ portfolios is available, without charge and upon request, by calling 800.820.0888. This information is also available from the EDGAR database on the SEC’s website at http://www.sec.gov.
Information regarding how the Funds voted proxies relating to portfolio securities during the most recent 12-month period ended June 30 is available without charge, upon request, by calling 800.820.0888. This information is also available from the EDGAR database on the SEC’s website at http://www.sec.gov.
Sector Classification
Information in the “Schedule of Investments” is categorized by sectors using sector-level Classifications defined by the Bloomberg Industry Classification System, a widely recognized industry classification system provider. Each Fund’s registration statement has investment policies relating to concentration in specific sectors/industries. For purposes of these investment policies, the Funds usually classify sectors/industries based on industry-level Classifications used by widely recognized industry classification system providers such as Bloomberg Industry Classification System, Global Industry Classification Standards and Barclays Global Classification Scheme.
Quarterly Portfolio Schedules Information
The Trust files its complete schedule of portfolio holdings with the SEC for the first and third quarters of each fiscal year on Form N-Q; which are available on the SEC’s website at http://www.sec.gov. The Funds’ Forms N-Q may be reviewed and copied at the SEC’s Public Reference Room in Washington, DC, and that information on the operation of the Public Reference Room may be obtained by calling 800-SEC-0330. Copies of the portfolio holdings are also available to shareholders, without charge and upon request, by calling 800.820.0888.
| | THE GUGGENHEIM FUNDS ANNUAL REPORT | 89 |
INFORMATION ON BOARD OF TRUSTEES AND OFFICERS (Unaudited) |
A Board of Trustees oversees the Trust, as well as other trusts of GI, in which its members have no stated term of service, and continue to serve after election until resignation. The Statement of Additional Information includes further information about Fund Trustees and Officers, and can be obtained without charge by visiting guggenheiminvestments.com or by calling 800.820.0888.
Name, Address* and Year of Birth of Trustee | Position(s) Held with the Trust, Term of Office and Length of Time Served | Principal Occupation(s) During Past 5 Years | Number of Portfolios in Fund Complex Overseen by Trustee*** | Other Directorships Held by Trustee |
INTERESTED TRUSTEE | | | |
Donald C. Cacciapaglia** (1951) | Trustee from 2012 to present. | Current: President and CEO, certain other funds in the Fund Complex (2012-present); Vice Chairman, Guggenheim Investments (2010-present). Former: and CEO, Channel Capital Group, Inc. (2002-2010). | 237 | Clear Spring Life Insurance Company (2015-present); Guggenheim Partners Japan, Ltd. (2014-present); Delaware Life (2013-present); Guggenheim Life and Annuity Company (2011-present); Paragon Life Insurance Company of Indiana (2011-present). |
INDEPENDENT TRUSTEES | | | |
Corey A. Colehour (1945) | Trustee from 1993 to present; Member of the Audit Committee from 1994 to present; Member of the Governance Committee from 2014 to present; and Member of the Investment and Performance Committee from 2014 to present. | Retired. | 133 | None. |
90 | THE GUGGENHEIM FUNDS ANNUAL REPORT | |
INFORMATION ON BOARD OF TRUSTEES AND OFFICERS (Unaudited)(continued) |
Name, Address* and Year of Birth of Trustee | Position(s) Held with the
Trust, Term of Office and
Length of Time Served | Principal Occupation(s)
During Past 5 Years | Number of Portfolios in Fund Complex Overseen by Trustee*** | Other
Directorships
Held by
Trustee |
INDEPENDENT TRUSTEES - continued |
J. Kenneth Dalton (1941) | Trustee from 1995 to present; Chairman and Member of the Audit Committee from 1997 to present; and Member of the Compliance and Risk Oversight Committee from 2010 to present. | Retired. | 133 | Epiphany Funds (4) (2009-present). |
John O. Demaret (1940) | Vice Chairman of the Board from 2014 to present (Chairman of the Board from 2006 to 2014); Trustee and Member of the Audit Committee from 1997 to present; Chairman (since 2014) and Member of the Compliance and Risk Oversight Committee from 2010 to present; Chairman and Member of the Investment and Performance Committee from 2014 to present; and Member of the Nominating Committee from 2014 to present. | Retired. | 133 | None. |
Werner E. Keller (1940) | Chairman of the Board from 2014 to present (Vice Chairman of the Board from 2010 to 2014); Trustee and Member of the Audit Committee from 2005 to present; and Member of the Investment and Performance Committee from 2014 to present. | Current: Founder and President, Keller Partners, LLC (investment research firm) (2005-present). | 133 | None. |
| | THE GUGGENHEIM FUNDS ANNUAL REPORT | 91 |
INFORMATION ON BOARD OF TRUSTEES AND OFFICERS (Unaudited)(continued) |
Name, Address* and Year of Birth of Trustee | Position(s) Held with the
Trust, Term of Office and
Length of Time Served | Principal Occupation(s)
During Past 5 Years | Number of Portfolios in Fund Complex Overseen by Trustee*** | Other
Directorships
Held by
Trustee |
INDEPENDENT TRUSTEES - concluded |
Thomas F. Lydon, Jr. (1960) | Trustee and Member of the Audit Committee from 2005 to present; Member of the Nominating Committee from 2005 to present; and Member of the Governance Committee from 2007 to present. | Current: President, Global Trends Investments (registered investment adviser) (1996-present). | 133 | US Global Investors (GROW) (1995-present). |
Patrick T. McCarville (1942) | Trustee from 1997 to present; Member of the Audit Committee from 1997 to present; Chairman and Member of the Nominating Committee from 2004 to present; Chairman and Member of the Governance Committee from 2007 to present; and Member of the Compliance and Risk Oversight Committee from 2014 to present. | Retired. Former: Chief Executive Officer, Par Industries, Inc., d/b/a Par Leasing (1977-2010). | 133 | None. |
Name, Address* and Year of Birth | Position(s) Held with the Trust, Term of Office and Length of Time Served | Principal Occupation(s)
During Past 5 Years |
OFFICERS | | |
Donald C. Cacciapaglia (1951) | President (2012-present). | Current: President and CEO, certain other funds in the Fund Complex (2012-present); Vice Chairman, Guggenheim Investments (2010-present). Former: Chairman and CEO, Channel Capital Group Inc. (2002-2010). |
92 | THE GUGGENHEIM FUNDS ANNUAL REPORT | |
INFORMATION ON BOARD OF TRUSTEES AND OFFICERS (Unaudited)(continued) |
Name, Address* and Year of Birth | Position(s) Held with th Trust, Term of Office and Length of Time Served | Principal Occupation(s)
During Past 5 Years |
OFFICERS - continued | |
Michael P. Byrum (1970) | Vice President (1999-present). | Current: Senior Vice President, Security Investors, LLC (2010-present); President and Chief Investment Officer, Rydex Holdings, LLC (2008-present); Director and Chairman, Advisory Research Center, Inc. (2006-present); Manager, Guggenheim Specialized Products, LLC (2005-present). Former: Vice President, Guggenheim Distributors, LLC (2009); Director (2009-2010) and Secretary (2002-2010), Rydex Fund Services, LLC; Director (2008-2010), Chief Investment Officer (2006-2010), President (2004-2010) and Secretary (2002-2010), Rydex Advisors, LLC; Director (2008-2010), Chief Investment Officer (2006-2010), President (2004-2010) and Secretary (2002-2010), Rydex Advisors II, LLC. |
Nikolaos Bonos (1963) | Vice President and Treasurer (2003-present). | Current: Senior Vice President, Security Investors, LLC (2010-present); Chief Executive Officer, Guggenheim Specialized Products, LLC (2009-present); Chief Executive Officer & President, Rydex Fund Services, LLC (2009-present); Vice President, Rydex Holdings, LLC (2008-present). Former: Senior Vice President, Security Global Investors, LLC (2010-2011); and Senior Vice President, Rydex Advisors, LLC and Rydex Advisors II, LLC (2006-2011). |
Elisabeth Miller (1968) | Chief Compliance Officer (2012-present). | Current: CCO, certain other funds in the Fund Complex (2012-present); CCO, Security Investors, LLC (2012-present); CCO, Guggenheim Funds Investment Advisors, LLC (2012-present); Managing Director, Guggenheim Investments (2012-present); Vice President, Guggenheim Funds Distributors, LLC (March 2014-present). Former: CCO, Guggenheim Distributors, LLC (2009-March 2014); Senior Manager, Security Investors, LLC (2004-2009); Senior Manager, Guggenheim Distributors, LLC (2004-2009). |
| | THE GUGGENHEIM FUNDS ANNUAL REPORT | 93 |
INFORMATION ON BOARD OF TRUSTEES AND OFFICERS (Unaudited)(concluded) |
Name, Address* and Year of Birth | Position(s) Held with the Trust, Term of Office and Length of Time Served | Principal Occupation(s)
During Past 5 Years |
OFFICERS - concluded | |
Joseph M. Arruda (1966) | Assistant Treasurer (2006-present). | Current: Assistant Treasurer, certain other funds in the Fund Complex (2006-present); Vice President, Security Investors, LLC (2010-present); CFO and Manager, Guggenheim Specialized Products, LLC (2009-present). Former: Vice President, Security Global Investors, LLC (2010-2011); Vice President, Rydex Advisors, LLC (2010); Vice President, Rydex Advisors II, LLC (2010). |
Paul J. Davio (1972) | Assistant Treasurer (2014-present). | Current: Assistant Treasurer, certain other funds in the Fund Complex (2014-present); Director, Guggenheim Investments (2006-present). Former: Manager, Mutual Fund Administration, Guggenheim Investments (2003-2006). |
Amy J. Lee (1961) | Vice President (2009-present) and Secretary (2012-present). | Current: Chief Legal Officer, certain other funds in the Fund Complex (2013-present); Senior Managing Director, Guggenheim Investments (2012-present). Former: Vice President, Associate General Counsel and Assistant Secretary, Security Benefit Life Insurance Company and Security Benefit Corporation (2004-2012). |
* | All Trustees and Officers may be reached c/o Guggenheim Investments, 805 King Farm Boulevard, Suite 600, Rockville, MD 20850. |
** | Mr. Cacciapaglia is an “interested” person of the Trust, as that term is defined in the 1940 Act by virtue of his affiliation with the Adviser’s parent company. |
*** | The “Fund Complex” includes all closed-end and open-end funds (including all of their portfolios) advised by the Adviser and any funds that have an investment adviser or servicing agent that is an affiliated person of the Adviser. Information provided is as of the date of this report. |
94 | THE GUGGENHEIM FUNDS ANNUAL REPORT | |
GUGGENHEIM INVESTMENTS PRIVACY POLICIES (Unaudited) |
Rydex Funds, Guggenheim Funds, Rydex Investments, Guggenheim Funds Distributors, LLC, Security Investors, LLC, Security Distributors, Inc., Guggenheim Partners Investment Managers, LLC, and Rydex Advisory Services (Collectively “Guggenheim Investments”).
Our Commitment to You
When you become a Guggenheim Investments investor, you entrust us with not only your hard-earned money but also with personal and financial information about you. We recognize that your relationship with us is based on trust and that you expect us to act responsibly and in your best interests. Because we have access to this private information about you, we hold ourselves to the highest standards in its safekeeping and use. This means, most importantly, that we do not sell client information to anyone—whether it is your personal information or if you are a current or former Guggenheim Investments client.
The Information We Collect About You
In the course of doing business with shareholders and investors, we collect nonpublic personal information about you. You typically provide personal information when you complete a Guggenheim Investments account application or when you request a transaction that involves Rydex and Guggenheim Investments funds or one of the Guggenheim Investments affiliated companies. “Nonpublic personal information” is personally identifiable private information about you. For example, it includes information regarding your name and address, Social Security or taxpayer identification number, assets, income, account balance, bank account information and investment activity (e.g., purchase and redemption history).
How We Handle Your Personal Information
As emphasized above, we do not sell information about current or former clients or their accounts to third parties. Nor do we share such information, except when necessary to complete transactions at your request or to make you aware of related investment products and services that we offer. Additional details about how we handle your personal information are provided below. To complete certain transactions or account changes that you direct, it may be necessary to provide identifying information to companies, individuals or groups that are not affiliated with Guggenheim Investments. For example, if you ask to transfer assets from another financial institution to Guggenheim Investments, we will need to provide certain information about you to that company to complete the transaction. To alert you to other Guggenheim Investments investment products and services, we may share your information within the Guggenheim Investments family of affiliated companies. This would include, for example, sharing your information within Guggenheim Investments so we can make you aware of
| | THE GUGGENHEIM FUNDS ANNUAL REPORT | 95 |
GUGGENHEIM INVESTMENTS PRIVACY POLICIES (Unaudited)(continued) |
new Rydex and Guggenheim Investments funds or the services offered through another Guggenheim Investments affiliated company. In certain instances, we may contract with nonaffiliated companies to perform services for us. Where necessary, we will disclose information we have about you to these third parties. In all such cases, we provide the third party with only the information necessary to carry out its assigned responsibilities and only for that purpose. And we require these third parties to treat your private information with the same high degree of confidentiality that we do. In certain instances, we may share information with other financial institutions regarding individuals and entities in response to the U.S.A. Patriot Act. Finally, we will release information about you if you direct us to do so, if we are compelled by law to do so or in other circumstances permitted by law.
Opt Out Provisions
We do not sell your personal information to anyone. The law allows you to “opt out” of only certain kinds of information sharing with third parties. The firm does not share personal information about you with any third parties that triggers this opt-out right. This means YOU ARE ALREADY OPTED OUT.
How We Protect Privacy Online
Our concern for the privacy of our shareholders also extends to those who use our web site, guggenheiminvestments.com. Our web site uses some of the most secure forms of online communication available, including encryption technology, Secure Socket Layer (SSL) protocol, firewalls and user names and passwords. These technologies provide a high level of security and privacy when you access your account information or initiate online transactions. The Guggenheim Investments web site offers customized features that require our use of “http cookies”—tiny pieces of information that we ask your browser to store. However, we make very limited use of these cookies. We only use cookies for session management and security features on the Guggenheim Investments web site. We do not use them to pull data from your hard drive, to learn your email address, or to view data in cookies created by other web sites. We will not share the information in our cookies or give others access to it. See the legal information area on our web site for more details about web site security and privacy features.
How We Safeguard Your Personal Information
We restrict access to nonpublic personal information about shareholders to our employees and in some cases to third parties (for example, the service providers described above) as permitted by law. We maintain strict physical, electronic and procedural safeguards that comply with federal standards to guard your nonpublic personal information.
96 | THE GUGGENHEIM FUNDS ANNUAL REPORT | |
GUGGENHEIM INVESTMENTS PRIVACY POLICIES (Unaudited)(concluded) |
We’ll Keep You Informed
As required by federal law, we will notify shareholders of our privacy policy annually. We reserve the right to modify this policy at any time, but rest assured that if we do change it, we will tell you promptly. You will also be able to access our privacy policy from our web site at guggenheiminvestments.com. Should you have any questions regarding our privacy policy, contact us at 800.820.0888 or 301.296.5100.
| | THE GUGGENHEIM FUNDS ANNUAL REPORT | 97 |
12.31.2015
Guggenheim Funds Annual Report
Guggenheim Alternative Fund |
Guggenheim Managed Futures Strategy Fund |
RMFSF-ANN-1215x1216 | guggenheiminvestments.com |
DEAR SHAREHOLDER | 2 |
ECONOMIC AND MARKET OVERVIEW | 4 |
ABOUT SHAREHOLDERS’ FUND EXPENSES | 6 |
MANAGED FUTURES STRATEGY FUND | 9 |
NOTES TO CONSOLIDATED FINANCIAL STATEMENTS | 27 |
REPORT OF INDEPENDENT REGISTERED PUBLIC ACCOUNTING FIRM | 46 |
OTHER INFORMATION | 48 |
INFORMATION ON BOARD OF TRUSTEES AND OFFICERS | 50 |
GUGGENHEIM INVESTMENTS PRIVACY POLICIES | 56 |
| | THE GUGGENHEIM FUNDS ANNUAL REPORT | 1 |
Dear Shareholder:
Security Investors, LLC (the “Investment Adviser”), is pleased to present the annual shareholder report for the Managed Futures Strategy Fund (the “Fund”) that is part of the Rydex Series Funds. This report covers performance of the Fund for the annual period ended December 31, 2015.
The Investment Adviser is a part of Guggenheim Investments, which represents the investment management businesses of Guggenheim Partners, LLC, a global, diversified financial services firm.
Guggenheim Funds Distributors, LLC is the distributor of the Funds. Guggenheim Funds Distributors, LLC is affiliated with Guggenheim Partners, LLC and Security Investors, LLC.
We encourage you to read the Economic and Market Overview section of the report, which follows this letter, and then the Performance Report and Fund Profile for each Fund.
We are committed to providing innovative investment solutions and appreciate the trust you place in us.
Sincerely,
Donald C. Cacciapaglia
President
January 31, 2016
Read a prospectus and summary prospectus (if available) carefully before investing. It contains the investment objectives, risks, charges, expenses and other information, which should be considered carefully before investing. Obtain a prospectus and summary prospectus (if available) at guggenheiminvestments.com or call 800.820.0888.
2 | THE GUGGENHEIM FUNDS ANNUAL REPORT | |
The Managed Futures Strategy Fund may not be suitable for all investors. ● The Fund’s investments in securities and derivatives, in general, are subject to market risks that may cause their prices, and therefore the Fund’s value, to fluctuate over time. An investment in the Fund may lose money. ● The Fund’s investments in derivatives may pose risks in addition to those associated with investing directly in securities or other investments, including illiquidity of the derivatives, imperfect correlations with underlying investments or the Fund’s other portfolio holdings, lack of availability and counterparty risk. To the extent the Fund invests in derivatives to seek to hedge risk or limit leveraged exposure created by other investments, there is no guarantee that such hedging strategies will be effective at managing risk or limiting exposure to leveraged investments. ● The Funds use of leverage will exaggerate the effect on net asset value of any increase or decrease in the market value of the Fund’s portfolio. ● The Fund’s use of short selling involves increased risk and costs. The Fund risks paying more for a security than it received from its sale. Theoretically, securities sold short have the risk of unlimited losses. ● The Fund’s investments in fixed income securities will change in value in response to interest rate changes and other factors. In general, bond prices rise when interest rates fall and vice versa. ● The Fund‘s exposure to high yield, asset backed and mortgaged backed securities may subject the Fund to greater volatility. ● The Fund’s indirect and direct exposure to foreign currencies subjects the Fund to the risk that those currencies will decline in value relative to the U.S. dollar, or, in the case of short positions, that the U.S. dollar will decline in value relative to the currency being hedged. ● The Fund’s exposure to the commodity markets may subject the fund to greater volatility as commodity-linked investments may be affected by changes in overall market movements, commodity index volatility, changes in interest rates or factors affecting a particular industry or commodity such as droughts, floods, weather, embargos, tariffs and international economic, political and regulatory developments. ● The Fund may invest in securities of foreign companies directly, or indirectly through the use of other investment companies and financial instruments that are linked to the performance of foreign issuers. Foreign securities markets generally have less trading volume and less liquidity than U.S. markets, and prices in some foreign markets may fluctuate more than those of securities traded on U.S. markets. ● This Fund is considered nondiversified and can invest a greater portion of its assets in securities of individual issuers than a diversified fund. As a result, changes in the market value of a single security could cause greater fluctuations in the value of fund shares than would occur in a more diversified fund. ● See the prospectus for more information on these and other risks.
| | THE GUGGENHEIM FUNDS ANNUAL REPORT | 3 |
ECONOMIC AND MARKET OVERVIEW (Unaudited) | December 31, 2015 |
As of December 16, 2015, the meeting of the Federal Open Market Committee of the U.S. Federal Reserve (the “Fed”) resulted in the Fed raising its target Federal Funds Rate by 25 basis points, its first hike in seven years. This decision to tighten monetary policy was in recognition that growth in the U.S. economy is sufficient to meet expectations in the current recovery. Historically, the period when the Fed begins to tighten leads to an initial sell-off in the bond market, as investors brace themselves for the ill-effects of restrictive monetary policy on the economy. Then, as investors realize the Fed is raising rates because the economy is strong, the fear of defaults diminishes and credit spreads tighten again.
The good news is that, while the U.S. economy may not be fast moving, it certainly has a lot of torque. This is creating strong tailwinds as we move into 2016. MasterCard Advisors’ data on holiday spending indicates that sales were up nearly 8% year over year. All told, the risk to fourth-quarter gross domestic product (GDP) is probably to the upside, even as most tracking estimates have been trimmed to around 1%. In addition, the El Niño weather pattern is moving into its most impactful period. Our research indicates that a strong El Niño can add 1% or more to GDP in the first quarter of the year.
A factor after the end of the period was market volatility, spurred by concerns over the price of oil and increasing anxiety over global growth. It was marked by turmoil across asset classes, with heavy drawdowns in a variety of indexes and geographies in the first half of January. The sell-off was brutal and unexpected, but initially there was not a corresponding spike in the key measure of equity market volatility, the VIX. However, the sell-off occurred in what is historically a seasonally strong time for equities, and the VIX did start to rise in January.
In China, the likely catalyst for the volatile start to the equity market in 2016 was the pending expiration of an insider selling ban. The ban was extended in response to the sell-off, but as expiring restrictions enable market participants to finally escape unwanted positions, a sell-off is inevitable. China’s problems extend beyond political interference in the markets and, despite attempts by policy-makers to quiet the turmoil, we expect to see more volatility. Chinese policymakers have also been struggling to protect the renminbi. Allowing it to depreciate in the short run could be negative for markets—particularly Chinese risk assets, and by extension, U.S. risk assets, as well as falling dollar prices for commodities, given China is a main consumer of commodities. In the long run, a depreciation would be positive for the Chinese manufacturing sector and European producers, who have significant exports to China.
Meanwhile, the persistent weakness in oil continues to exert its negative influence on all markets, especially corporate credit. Oil prices likely have further to fall: not until it reaches approximately $25 per barrel will we begin to see oil production shuttered, which should then set the stage to stabilize the energy sector.
4 | THE GUGGENHEIM FUNDS ANNUAL REPORT | |
ECONOMIC AND MARKET OVERVIEW (Unaudited)(concluded) | December 31, 2015 |
The next few months are likely to be extremely volatile as markets continue to digest the sell-off that began 2016. However, monetary conditions remain highly supportive for global economic growth, despite the Federal Reserve’s recent actions. The index of leading economic indicators, comprised of 10 components whose changes typically precede changes in the U.S. economy, remains in positive territory and shows no warning signs of recession.
Additionally, if market turmoil continues, and lower oil prices dampen headline inflation, the Fed may delay further rate increases. Given strong employment growth and continued wage growth, along with a stimulative fiscal policy now in place, the U.S. economy is likely to thrive in 2016.
For the year ended December 31, 2015, the Standard & Poor’s 500® (“S&P 500”) Index* returned 1.38%. The Morgan Stanley Capital International (“MSCI”) Europe-Australasia-Far East (“EAFE”) Index* returned -0.81%. The return of the MSCI Emerging Markets Index* was -14.92%.
In the bond market, the Barclays U.S. Aggregate Bond Index* posted a 0.55% return for the period, while the Barclays U.S. Corporate High Yield Index* returned -4.47%. The return of the Bank of America (“BofA”) Merrill Lynch 3-Month U.S. Treasury Bill Index* was 0.05% for the 12-month period.
The opinions and forecasts expressed may not actually come to pass. This information is subject to change at any time, based on market and other conditions, and should not be construed as a recommendation of any specific security or strategy.
*Index Definitions:
The following indices are referenced throughout this report. Indices are unmanaged and not available for direct investment. Index performance does not reflect transaction costs, fees, or expenses.
Barclays U.S. Aggregate Bond Index is a broad-based benchmark that measures the investment grade, U.S. dollar denominated, fixed-rate taxable bond market, including U.S. Treasuries, government-related and corporate securities, MBS (agency fixed-rate and hybrid ARM pass-throughs), ABS, and CMBS.
Barclays U.S. Corporate High Yield Index measures the market of U.S. dollar-denominated, non-investment grade, fixed-rate, taxable corporate bonds. Securities are classified as high yield if the middle rating of Moody’s, Fitch, and S&P is Ba1/BB +/BB + or below.
BofA Merrill Lynch 3-Month U.S. Treasury Bill Index is an unmanaged market index of U.S. Treasury securities maturing in 90 days that assumes reinvestment of all income.
MSCI EAFE Index is a free float-adjusted market capitalization index that is designed to measure the equity market performance of developed markets, excluding the US & Canada.
MSCI Emerging Markets Index is a free float-adjusted market capitalization weighted index that is designed to measure equity market performance in the global emerging markets.
S&P 500® Index is a capitalization-weighted index of 500 stocks designed to measure the performance of the broad economy, representing all major industries and is considered a representation of the U.S. stock market.
| | THE GUGGENHEIM FUNDS ANNUAL REPORT | 5 |
ABOUT SHAREHOLDERS’ FUND EXPENSES (Unaudited) |
All mutual funds have operating expenses and it is important for our shareholders to understand the impact of costs on their investments. Shareholders of a Fund incur two types of costs: (i) transaction costs, including sales charges (loads) on purchase payments, reinvested dividends, or other distributions; and exchange fees; and (ii) ongoing costs, including management fees, administrative services, and shareholder reports, among others. These ongoing costs, or operating expenses, are deducted from a fund’s gross income and reduce the investment return of the fund.
A fund’s expenses are expressed as a percentage of its average net assets, which is known as the expense ratio. The following examples are intended to help investors understand the ongoing costs (in dollars) of investing in a Fund and to compare these costs with the ongoing costs of investing in other mutual funds.
The examples are based on an investment of $1,000 made at the beginning of the period and held for the entire six-month period beginning June 30, 2015 and ending December 31, 2015.
The following tables illustrate a Fund’s costs in two ways:
Table 1. Based on actual Fund return. This section helps investors estimate the actual expenses paid over the period. The “Ending Account Value” shown is derived from the Fund’s actual return, and the fourth column shows the dollar amount that would have been paid by an investor who started with $1,000 in the Fund. Investors may use the information here, together with the amount invested, to estimate the expenses paid over the period. Simply divide the Fund’s account value by $1,000 (for example, an $8,600 account value divided by $1,000 = 8.6), then multiply the result by the number provided under the heading “Expenses Paid During Period.”
Table 2. Based on hypothetical 5% return. This section is intended to help investors compare a Fund’s cost with those of other mutual funds. The table provides information about hypothetical account values and hypothetical expenses based on the Fund’s actual expense ratio and an assumed rate of return of 5% per year before expenses, which is not the Fund’s actual return. The hypothetical account values and expenses may not be used to estimate the actual ending account balance or expenses paid during the period. The example is useful in making comparisons because the U.S. Securities and Exchange Commission (the “SEC”) requires all mutual funds to calculate expenses based on the 5% return. Investors can assess a Fund’s costs by comparing this hypothetical example with the hypothetical examples that appear in shareholder reports of other funds.
6 | THE GUGGENHEIM FUNDS ANNUAL REPORT | |
ABOUT SHAREHOLDERS’ FUND EXPENSES (Unaudited)(continued) |
The calculations illustrated above assume no shares were bought or sold during the period. Actual costs may have been higher or lower, depending on the amount of investment and the timing of any purchases or redemptions.
Please note that the expenses shown in the table are meant to highlight your ongoing costs only and do not reflect any transactional costs, such as sales charges (loads) on purchase payments, and contingent deferred sales charges (“CDSC”) on redemptions, if any. Therefore, the second table is useful in comparing ongoing costs only, and will not help you determine the relative total costs of owning different funds. In addition, if these transactional costs were included, your costs would have been higher.
More information about a Fund’s expenses, including annual expense ratios for the past five years, can be found in the Financial Highlights section of this report. For additional information on operating expenses and other shareholder costs, please refer to the appropriate Fund prospectus.
| | THE GUGGENHEIM FUNDS ANNUAL REPORT | 7 |
ABOUT SHAREHOLDERS’ FUND EXPENSES (Unaudited)(concluded) |
| | Expense Ratio1 | Fund
Return | Beginning
Account Value
June 30,
2015 | Ending
Account Value
December 31,
2015 | Expenses Paid During Period2 |
Table 1. Based on actual Fund return3 | | |
Managed Futures Strategy Fund | | | | | |
A-Class | 1.72% | (1.31%) | $1,000.00 | $986.90 | $8.61 |
C-Class | 2.47% | (1.71%) | 1,000.00 | 982.90 | 12.35 |
P-Class | 1.72% | (1.31%) | 1,000.00 | 986.90 | 8.61 |
Institutional Class | 1.47% | (1.17%) | 1,000.00 | 988.30 | 7.37 |
| |
Table 2. Based on hypothetical 5% return (before expenses) | | | |
Managed Futures Strategy Fund | | | | | |
A-Class | 1.72% | 5.00% | $1,000.00 | $1,016.53 | $8.74 |
C-Class | 2.47% | 5.00% | 1,000.00 | 1,012.75 | 12.53 |
P-Class | 1.72% | 5.00% | 1,000.00 | 1,016.53 | 8.74 |
Institutional Class | 1.47% | 5.00% | 1,000.00 | 1,017.80 | 7.48 |
1 | Annualized and excludes expenses of the underlying funds in which the Fund invests. |
2 | Expenses are equal to the Fund's annualized expense ratio, net of any applicable fee waivers, multiplied by the average account value over the period, multiplied by 184/365 (to reflect the one-half year period). |
3 | Actual cumulative return at net asset value for the period June 30, 2015 to December 31, 2015. |
8 | THE GUGGENHEIM FUNDS ANNUAL REPORT | |
PERFORMANCE REPORT AND FUND PROFILE (Unaudited) | December 31, 2015 |
MANAGED FUTURES STRATEGY FUND
OBJECTIVE: Seeks to achieve positive absolute returns.
For the one-year period ended December 31, 2015, the Managed Futures Strategy Fund Institutional shares returned -0.80%. The BofA Merrill Lynch 3-Month U.S. Treasury Bill Index, the Fund’s cash benchmark, returned 0.05%.
The Fund had a strong first quarter, with profits coming from all sectors, but most notably from Fixed Income, Equities, and Agriculturals. This was followed by a weak second quarter, driven largely by reversals in the Fixed Income and Agricultural markets. The third quarter was slightly negative, with Equities being the main detractor, and with Energies, Metals, and Fixed Income all contributing positively. The Fund was up in the fourth quarter, with Energies, Equities, and Fixed Income all contributing positively to performance.
Overall, 2015 was an extremely volatile year, with numerous reversals and aftershocks across all markets–difficult conditions for systematic trend-following strategies. For the year, positive contributions came from Energies, Metals, and Fixed Income, and losses from Agriculturals, Currencies, and Equities. The largest individual market gains came from Brent Crude, Gas Oil, the Japanese Government 10 Year Bond, Aluminum, and the MSCI Taiwan Index. The largest individual losses came from the Swiss Franc, Live Cattle, the FTSE 100, Coffee, and Chicago Wheat.
The Fund is comprised of several proprietary strategies which systematically exploit market inefficiencies and trade Commodity, Equity, Fixed Income, and Currency markets around the globe. In 2015, the individual strategies were mixed in their individual performances; some were up while others down.
The Fund holds derivatives for a number of reasons, including liquidity, leverage, speculation, and hedging. Derivatives are liquid and allow the fund to gain leveraged access to markets in order to express investment views and to hedge exposures.
The Fund takes advantage of Guggenheim’s fixed income expertise in managing the fund’s cash positions primarily through the use of the Guggenheim Strategy Funds.
Performance displayed represents past performance which is no guarantee of future results.
| | THE GUGGENHEIM FUNDS ANNUAL REPORT | 9 |
PERFORMANCE REPORT AND FUND PROFILE (Unaudited)(continued) | December 31, 2015 |
Consolidated Holdings Diversification (Market Exposure as % of Net Assets)

“Consolidated Holdings Diversification (Market Exposure as % of Net Assets)” excludes any temporary cash investments or investments in Guggenheim Strategy Funds Trust mutual funds. Investments in those Funds do not provide “market exposure” to meet the fund’s investment objective, but will significantly increase the portfolio’s exposure to certain other asset categories (and their associated risks), which may cause the Fund to deviate from its principal investment strategy, including: (i) high yield, high risk debt securities rated below the top four long-term rating categories by a nationally recognized statistical rating organization (also known as “junk bonds”); (ii) securities issued by the U.S. government or its agencies and instrumentalities; (iii) CLOs and similar investments; and (iv) other short-term fixed income securities.
Inception Dates: |
A-Class | March 2, 2007 |
C-Class | March 2, 2007 |
P-Class** | March 2, 2007 |
Institutional Class | May 3, 2010 |
Y-Class* | March 29, 2010 |
* | Y-Class closed on June 26, 2015 — See Note 12. |
** | H-Class shares redesignated as P-Class shares effective following the close of business on April 30, 2015 — See Note 13. |
The Fund invests principally in derivative investments such as futures contracts.
Largest Holdings (% of Total Net Assets) |
Guggenheim Strategy Fund I | 31.8% |
Guggenheim Strategy Fund II | 30.0% |
Guggenheim Strategy Fund III | 15.2% |
U.S. Treasury Notes | 4.5% |
Guggenheim Enhanced Short Duration ETF | 2.4% |
Morgan Stanley Reremic Trust 2012-10 | 0.4% |
Total | 84.3% |
| | |
“Largest Holdings” excludes any temporary cash or derivative investments. |
10 | THE GUGGENHEIM FUNDS ANNUAL REPORT | |
PERFORMANCE REPORT AND FUND PROFILE (Unaudited)(continued) | December 31, 2015 |
Cumulative Fund Performance*


| | THE GUGGENHEIM FUNDS ANNUAL REPORT | 11 |
PERFORMANCE REPORT AND FUND PROFILE (Unaudited)(concluded) | December 31, 2015 |
Average Annual Returns*
Periods Ended December 31, 2015
| | 1 Year | 5 Year | Since Inception
(03/02/07) |
A-Class Shares | -1.06% | -1.32% | 0.01% |
A-Class Shares with sales charge† | -5.76% | -2.28% | -0.54% |
C-Class Shares | -1.84% | -2.07% | -0.74% |
C-Class Shares with CDSC‡ | -2.79% | -2.07% | -0.74% |
P-Class Shares | -1.06% | -1.32% | 0.01% |
BofA Merrill Lynch 3-Month U.S. Treasury Bill Index | 0.05% | 0.08% | 0.77% |
| | | | |
| | 1 Year | 5 Year | Since Inception
(05/03/10) |
Institutional Class Shares | -0.80% | -1.08% | -0.78% |
BofA Merrill Lynch 3-Month U.S. Treasury Bill Index | 0.05% | 0.08% | 0.08% |
* | The performance data above represents past performance that is not predictive of future results. The investment return and principal value of an investment in the Fund will fluctuate so that an investor’s shares, when redeemed, may be worth more or less than their original cost. Returns are historical and include changes in principal and reinvested dividends and capital gains and do not reflect the effect of taxes. The BofA Merrill Lynch 3-Month U.S. Treasury Bill Index is an unmanaged index and, unlike the Fund, has no management fees or operating expenses to reduce its reported return. The graphs are based on A-Class shares and P-Class shares only; performance for C-Class shares and Institutional Class shares will vary due to difference in fee structure. |
† | Fund returns are calculated using the maximum sales charge of 4.75%. |
‡ | Fund returns include a CDSC of 1% if redeemed within 12 months of purchase. |
12 | THE GUGGENHEIM FUNDS ANNUAL REPORT | |
CONSOLIDATED SCHEDULE OF INVESTMENTS | December 31, 2015 |
MANAGED FUTURES STRATEGY FUND | |
| |
Shares
| | | Value | |
| | | | | | | |
EXCHANGE-TRADED FUNDS†,1 - 2.4% | |
Guggenheim Enhanced Short Duration ETF | | | 108,400 | | | $ | 5,405,908 | |
Total Exchange-Traded Funds | | | | | |
(Cost $5,429,550) | | | | | | | 5,405,908 | |
| | | | | | | | | |
MUTUAL FUNDS†,1 - 77.1% | |
Guggenheim Strategy Fund I | | | 2,860,708 | | | | 71,145,807 | |
Guggenheim Strategy Fund II | | | 2,702,649 | | | | 67,025,688 | |
Guggenheim Strategy Fund III | | | 1,369,458 | | | | 33,962,550 | |
Total Mutual Funds | | | | | | | | |
(Cost $172,788,302) | | | | | | | 172,134,045 | |
| | | | | | | | | |
| | | Face
Amount | | | | | |
| | | | | | | | | |
U.S. GOVERNMENT SECURITIES†† - 4.5% | |
U.S. Treasury Notes | | | | | | | | |
0.62% due 08/15/164 | | $ | 10,000,000 | | | | 9,997,660 | |
Total U.S. Treasury Notes | | | | | | | 9,997,660 | |
Total U.S. Government Securities | | | | | |
(Cost $10,016,228) | | | | | | | 9,997,660 | |
| | | | | | | | | |
ASSET-BACKED SECURITIES†† - 0.3% | |
Mortgage Securities - 0.3% | |
Morgan Stanley Reremic Trust | | | | | | | | |
2012-IO, 1.00% due 03/27/512 | | | 626,800 | | | | 622,338 | |
Total Asset-Backed Securities | | | | | |
(Cost $623,884) | | | | | | | 622,338 | |
| | | | | | | | | |
REPURCHASE AGREEMENTS††,3 - 8.1% | |
Royal Bank of Canada
issued 12/31/15 at 0.24%
due 01/04/16 | | | 8,405,112 | | | | 8,405,112 | |
Mizuho Financial Group, Inc.
issued 12/31/15 at 0.18%
due 01/04/16 | | | 5,038,206 | | | | 5,038,206 | |
HSBC Group
issued 12/31/15 at 0.18%
due 01/04/16 | | | 4,535,773 | | | | 4,535,773 | |
Total Repurchase Agreements | | | | | |
(Cost $17,979,091) | | | | | | | 17,979,091 | |
| | | | | | | | | |
Total Investments - 92.4% | | | | | |
(Cost $206,837,055) | | | | | | $ | 206,139,042 | |
Other Assets & Liabilities, net - 7.6% | | | | 17,076,000 | |
Total Net Assets - 100.0% | | | $ | 223,215,042 | |
| | Contracts | | | Unrealized
Gain | |
| | | | | | | |
INTEREST RATE FUTURES CONTRACTS PURCHASED† | |
March 2016 Japanese Government 10 Year Bond
Futures Contracts††
(Aggregate Value of
Contracts $451,335,774) | | | 364 | | | $ | 771,833 | |
March 2016 Euro - Bobl
Futures Contracts††
(Aggregate Value of
Contracts $131,493,659) | | | 924 | | | | 367,211 | |
March 2016 Canadian Government 10 Year Bond
Futures Contracts††
(Aggregate Value of
Contracts $73,005,953) | | | 717 | | | | 356,495 | |
March 2016 Euro - Schatz
Futures Contracts††
(Aggregate Value of
Contracts $561,648,987) | | | 4,633 | | | | 282,000 | |
March 2016 U.S. Treasury
10 Year Note
Futures Contracts
(Aggregate Value of
Contracts $7,175,766) | | | 57 | | | | 10,543 | |
SEE NOTES TO FINANCIAL STATEMENTS. | THE GUGGENHEIM FUNDS ANNUAL REPORT | 13 |
CONSOLIDATED SCHEDULE OF INVESTMENTS (continued) | December 31, 2015 |
MANAGED FUTURES STRATEGY FUND | |
| | Contracts | | | Unrealized
Gain (Loss) | |
| | | | | | | |
March 2016 U.S. Treasury Long Bond
Futures Contracts
(Aggregate Value of
Contracts $7,518,438) | | | 49 | | | $ | 3,802 | |
March 2016 Euro - Bund
Futures Contracts††
(Aggregate Value of
Contracts $859,658) | | | 5 | | | | 1,574 | |
(Total Aggregate Value of Contracts $1,233,038,235) | | | $ | 1,793,458 | |
| | | | | | | | | |
COMMODITY FUTURES CONTRACTS PURCHASED† | |
February 2016 LME Lead
Futures Contracts
(Aggregate Value of
Contracts $4,314,000) | | | 96 | | | $ | 128,392 | |
February 2016 Gasoline RBOB
Futures Contracts
(Aggregate Value of
Contracts $2,882,401) | | | 54 | | | | 99,171 | |
March 2016 Sugar #11
Futures Contracts
(Aggregate Value of
Contracts $4,650,610) | | | 273 | | | | 93,943 | |
March 2016 Silver
Futures Contracts
(Aggregate Value of
Contracts $5,456,925) | | | 79 | | | | (60,388 | ) |
(Total Aggregate Value of Contracts $17,303,936) | | | $ | 261,118 | |
| | | | | | | | | |
CURRENCY FUTURES CONTRACTS PURCHASED† | |
March 2016 Australian Dollar
Futures Contracts
(Aggregate Value of
Contracts $11,036,720) | | | 152 | | | $ | 21,151 | |
March 2016 Euro FX
Futures Contracts
(Aggregate Value of
Contracts $12,109,563) | | | 89 | | | | (33,397 | ) |
(Total Aggregate Value of Contracts $23,146,283) | | | $ | (12,246 | ) |
| | | | | | | | | |
EQUITY FUTURES CONTRACTS PURCHASED† | |
March 2016 Topix Index
Futures Contracts††
(Aggregate Value of
Contracts $6,104,666) | | | 48 | | | $ | 6,246 | |
January 2016 CAC 40 10 Euro Index
Futures Contracts††
(Aggregate Value of
Contracts $501,830) | | | 10 | | | | 4,387 | |
March 2016 Dow Jones Industrial Average Index
Mini Futures Contracts
(Aggregate Value of
Contracts $9,271,550) | | | 107 | | | | 1,908 | |
March 2016 SPI 200 Index
Futures Contracts††
(Aggregate Value of
Contracts $961,195) | | | 10 | | | | (3,224 | ) |
January 2016 IBEX 35 Index
Futures Contracts††
(Aggregate Value of
Contracts $1,948,670) | | | 19 | | | | (7,734 | ) |
March 2016 Nikkei 225
(OSE) Index
Futures Contracts††
(Aggregate Value of
Contracts $1,719,121) | | | 11 | | | | (14,916 | ) |
January 2016
Amsterdam Index
Futures Contracts††
(Aggregate Value of
Contracts $6,280,919) | | | 66 | | | | (22,498 | ) |
14 | THE GUGGENHEIM FUNDS ANNUAL REPORT | SEE NOTES TO FINANCIAL STATEMENTS. |
CONSOLIDATED SCHEDULE OF INVESTMENTS (continued) | December 31, 2015 |
MANAGED FUTURES STRATEGY FUND | |
| | Contracts | | | Unrealized
Gain (Loss) | |
| | | | | | | |
March 2016
NASDAQ-100 Index
Mini Futures Contracts
(Aggregate Value of
Contracts $19,629,150) | | | 214 | | | $ | (45,285 | ) |
March 2016 FTSE 100 Index
Futures Contracts††
(Aggregate Value of
Contracts $8,543,503) | | | 94 | | | | (47,991 | ) |
March 2016
Russell 2000 Index
Mini Futures Contracts
(Aggregate Value of
Contracts $11,409,970) | | | 101 | | | | (63,435 | ) |
(Total Aggregate Value of Contracts $66,370,574) | | | $ | (192,542 | ) |
| | | | | | | | | |
COMMODITY FUTURES CONTRACTS SOLD SHORT† | |
February 2016 Low
Sulphur Gas Oil
Futures Contracts
(Aggregate Value of
Contracts $14,432,400) | | | 422 | | | $ | 949,000 | |
February 2016 New York Harbor Ultra-Low
Sulfur Diesel
Futures Contracts
(Aggregate Value of
Contracts $10,662,435) | | | 225 | | | | 531,985 | |
March 2016 Hard Red
Winter Wheat
Futures Contracts
(Aggregate Value of
Contracts $15,594,249) | | | 670 | | | | 285,145 | |
February 2016 Gold 100 oz.
Futures Contracts
(Aggregate Value of
Contracts $12,823,580) | | | 121 | | | | 274,968 | |
March 2016 Brent Crude
Futures Contracts
(Aggregate Value of
Contracts $10,523,230) | | | 277 | | | | 270,387 | |
March 2016 Copper
Futures Contracts
(Aggregate Value of
Contracts $5,709,788) | | | 107 | | | | 142,861 | |
February 2016 WTI Crude
Futures Contracts
(Aggregate Value of
Contracts $4,436,400) | | | 120 | | | | 137,269 | |
March 2016 Corn
Futures Contracts
(Aggregate Value of
Contracts $8,359,300) | | | 467 | | | | 71,883 | |
March 2016 Soybean
Futures Contracts
(Aggregate Value of
Contracts $4,966,563) | | | 115 | | | | 37,973 | |
March 2016 Wheat
Futures Contracts
(Aggregate Value of
Contracts $2,699,625) | | | 115 | | | | 4,305 | |
February 2016 Live Cattle
Futures Contracts
(Aggregate Value of
Contracts $272,500) | | | 5 | | | | (147 | ) |
March 2016 Cotton #2
Futures Contracts
(Aggregate Value of
Contracts $1,393,040) | | | 44 | | | | (948 | ) |
February 2016 Lean Hogs
Futures Contracts
(Aggregate Value of
Contracts $6,586,250) | | | 275 | | | | (17,725 | ) |
February 2016 LME Nickel
Futures Contracts
(Aggregate Value of
Contracts $3,221,349) | | | 61 | | | | (26,008 | ) |
February 2016 LME Primary Aluminum
Futures Contracts
(Aggregate Value of
Contracts $9,467,406) | | | 251 | | | | (49,676 | ) |
SEE NOTES TO FINANCIAL STATEMENTS. | THE GUGGENHEIM FUNDS ANNUAL REPORT | 15 |
CONSOLIDATED SCHEDULE OF INVESTMENTS (continued) | December 31, 2015 |
MANAGED FUTURES STRATEGY FUND | |
| | Contracts | | | Unrealized
Gain (Loss) | |
| | | | | | | |
March 2016 Coffee ‘C’
Futures Contracts
(Aggregate Value of
Contracts $3,260,250) | | | 69 | | | $ | (153,580 | ) |
February 2016 LME Zinc
Futures Contracts
(Aggregate Value of
Contracts $8,943,694) | | | 223 | | | | (331,461 | ) |
February 2016 Natural Gas
Futures Contracts
(Aggregate Value of
Contracts $5,967,360) | | | 256 | | | | (478,888 | ) |
(Total Aggregate Value of Contracts $129,319,419) | | | $ | 1,647,343 | |
| | | | | | | | | |
CURRENCY FUTURES CONTRACTS SOLD SHORT† | |
March 2016 British Pound
Futures Contracts
(Aggregate Value of
Contracts $21,836,588) | | | 237 | | | $ | 229,241 | |
March 2016 Canadian Dollar
Futures Contracts
(Aggregate Value of
Contracts $31,220,640) | | | 432 | | | | 150,315 | |
March 2016 Swiss Franc
Futures Contracts
(Aggregate Value of
Contracts $6,759,450) | | | 54 | | | | 113,173 | |
March 2016 Japanese Yen
Futures Contracts
(Aggregate Value of
Contracts $17,184,750) | | | 165 | | | | (10,411 | ) |
(Total Aggregate Value of Contracts $77,001,428) | | | $ | 482,318 | |
| | | | | | | | | |
EQUITY FUTURES CONTRACTS SOLD SHORT† | |
January 2016 H-Shares Index
Futures Contracts††
(Aggregate Value of
Contracts $5,814,157) | | | 93 | | | $ | 149,844 | |
January 2016 MSCI Taiwan Stock Index
Futures Contracts††
(Aggregate Value of
Contracts $8,385,067) | | | 277 | | | | 120,646 | |
January 2016 Hang Seng Index
Futures Contracts††
(Aggregate Value of
Contracts $1,552,542) | | | 11 | | | | 20,943 | |
March 2016 DAX Index
Futures Contracts††
(Aggregate Value of
Contracts $2,014,726) | | | 7 | | | | 18,219 | |
March 2016 S&P MidCap 400 Index
Mini Futures Contracts
(Aggregate Value of
Contracts $556,920) | | | 4 | | | | 11,593 | |
March 2016 S&P 500 Index
Mini Futures Contracts
(Aggregate Value of
Contracts $406,900) | | | 4 | | | | 3,800 | |
(Total Aggregate Value of Contracts $18,730,312) | | | | | | $ | 325,045 | |
| | | | | | | | | |
INTEREST RATE FUTURES CONTRACTS SOLD SHORT† | |
March 2016 Long Gilt
Futures Contracts††
(Aggregate Value of
Contracts $16,003,376) | | | 93 | | | $ | 165,338 | |
March 2016 U.S. Treasury Ultra Long Bond
Futures Contracts
(Aggregate Value of
Contracts $5,536,563) | | | 35 | | | | 101,195 | |
March 2016 U.S. Treasury 5 Year Note
Futures Contracts
(Aggregate Value of
Contracts $34,677,008) | | | 293 | | | | 30,045 | |
16 | THE GUGGENHEIM FUNDS ANNUAL REPORT | SEE NOTES TO FINANCIAL STATEMENTS. |
CONSOLIDATED SCHEDULE OF INVESTMENTS (continued) | December 31, 2015 |
MANAGED FUTURES STRATEGY FUND | |
| | Contracts | | | Unrealized
Gain (Loss) | |
| | | | | | | |
March 2016 Australian Government 10 Year Bond
Futures Contracts††
(Aggregate Value of
Contracts $13,021,097) | | | 140 | | | $ | (21,150 | ) |
March 2016 Australian Government 3 Year Bond
Futures Contracts††
(Aggregate Value of
Contracts $49,685,910) | | | 611 | | | | (173,376 | ) |
(Total Aggregate Value of Contracts $118,923,954) | | | $ | 102,052 | |
† | Value determined based on Level 1 inputs, unless otherwise noted — See Note 4. |
†† | Value determined based on Level 2 inputs — See Note 4. |
1 | Affiliated issuer — See Note 8. |
2 | Security is a 144A or Section 4(a)(2) security. The total market value of 144A or Section 4(a)(2) security is $622,338 (cost $623,884), or 0.3% of total net assets. This security has been determined to be liquid under guidelines established by the Board of Trustees. |
3 | Repurchase Agreements — See Note 5. |
4 | All or a portion of this security is pledged as futures collateral at December 31, 2015. |
| | |
| | See Sector Classification in Other Information section. |
SEE NOTES TO FINANCIAL STATEMENTS. | THE GUGGENHEIM FUNDS ANNUAL REPORT | 17 |
CONSOLIDATED SCHEDULE OF INVESTMENTS (concluded) | December 31, 2015 |
MANAGED FUTURES STRATEGY FUND | |
The following table summarizes the inputs used to value the Fund’s investments at December 31, 2015 (See Note 4 in the Notes to Financial Statements):
Investments in Securities (Assets) | | Level 1 | | | Level 1 -
Other* | | | Level 2 | | | Level 2 -
Other* | | | Level 3 | | | Total | |
Asset-Backed Securities | | $ | — | | | $ | — | | | $ | 622,338 | | | $ | — | | | $ | — | | | $ | 622,338 | |
Exchange-Traded Funds | | | 5,405,908 | | | | — | | | | — | | | | — | | | | — | | | | 5,405,908 | |
Futures Contracts | | | — | | | | 3,704,048 | | | | — | | | | 2,264,736 | | | | — | | | | 5,968,784 | |
Mutual Funds | | | 172,134,045 | | | | — | | | | — | | | | — | | | | — | | | | 172,134,045 | |
Repurchase Agreements | | | — | | | | — | | | | 17,979,091 | | | | — | | | | — | | | | 17,979,091 | |
U.S. Government Securities | | | — | | | | — | | | | 9,997,660 | | | | — | | | | — | | | | 9,997,660 | |
Total | | $ | 177,539,953 | | | $ | 3,704,048 | | | $ | 28,599,089 | | | $ | 2,264,736 | | | $ | — | | | $ | 212,107,826 | |
| | |
Investments in Securities (Liabilities) | | Level 1 | | | Level 1 -
Other* | | | Level 2 | | | Level 2 -
Other* | | | Level 3 | | | Total | |
Futures Contracts | | $ | — | | | $ | 1,271,349 | | | $ | — | | | $ | 290,889 | | | $ | — | | | $ | 1,562,238 | |
Total | | $ | — | | | $ | 1,271,349 | | | $ | — | | | $ | 290,889 | | | $ | — | | | $ | 1,562,238 | |
* | Other financial instruments include futures contracts, which are reported as unrealized gain/loss at period end. |
For the year ended December 31, 2015, there were no transfers between levels.
18 | THE GUGGENHEIM FUNDS ANNUAL REPORT | SEE NOTES TO FINANCIAL STATEMENTS. |
CONSOLIDATED STATEMENT OF ASSETS AND LIABILITIES |
MANAGED FUTURES STRATEGY FUND |
December 31, 2015
Assets: | |
Investments in unaffiliated issuers, at value (cost $10,640,112) | | $ | 10,619,998 | |
Investments in affiliated issuers, at value (cost $178,217,852) | | | 177,539,953 | |
Repurchase agreements, at value (cost $17,979,091) | | | 17,979,091 | |
Total investments (cost $206,837,055) | | | 206,139,042 | |
Foreign currency, at value (cost $394,327) | | | 393,877 | |
Segregated cash with broker | | | 19,104,797 | |
Receivables: | |
Fund shares sold | | | 591,142 | |
Dividends | | | 240,390 | |
Interest | | | 24,400 | |
Total assets | | | 226,493,648 | |
| | | | | |
Liabilities: | |
Due to broker | | | 461,789 | |
Overdraft due to custodian bank | | | 185,821 | |
Payable for: | |
Fund shares redeemed | | | 1,018,185 | |
Variation margin | | | 940,111 | |
Securities Purchased | | | 248,220 | |
Management fees | | | 172,329 | |
Distribution and service fees | | | 59,974 | |
Transfer agent and administrative fees | | | 48,125 | |
Portfolio accounting fees | | | 19,249 | |
Miscellaneous | | | 124,803 | |
Total liabilities | | | 3,278,606 | |
Commitments and contingent liabilities (Note 11) | | | — | |
Net assets | | $ | 223,215,042 | |
| | | | | |
Net assets consist of: | |
Paid in capital | | $ | 308,225,331 | |
Accumulated net investment loss | | | (9,910,569 | ) |
Accumulated net realized loss on investments | | | (78,807,663 | ) |
Net unrealized appreciation on investments | | | 3,707,943 | |
Net assets | | $ | 223,215,042 | |
| | | | | |
A-Class: | |
Net assets | | $ | 27,828,450 | |
Capital shares outstanding | | | 1,199,184 | |
Net asset value per share | | $ | 23.21 | |
Maximum offering price per share (Net asset value divided by 95.25%) | | $ | 24.37 | |
| | | | | |
C-Class: | |
Net assets | | $ | 21,272,163 | |
Capital shares outstanding | | | 982,463 | |
Net asset value per share | | $ | 21.65 | |
| | | | | |
P-Class*: | |
Net assets | | $ | 165,085,741 | |
Capital shares outstanding | | | 7,114,689 | |
Net asset value per share | | $ | 23.20 | |
| | | | | |
Institutional Class: | |
Net assets | | $ | 9,028,688 | |
Capital shares outstanding | | | 383,253 | |
Net asset value per share | | $ | 23.56 | |
* | H-Class shares redesignated as P-Class shares effective following the close of business on April 30, 2015 — See Note 13. |
SEE NOTES TO FINANCIAL STATEMENTS. | THE GUGGENHEIM FUNDS ANNUAL REPORT | 19 |
CONSOLIDATED STATEMENT OF OPERATIONS |
MANAGED FUTURES STRATEGY FUND |
Year Ended December 31, 2015
Investment Income: | |
Dividends from securities of affiliated issuers | | $ | 2,337,773 | |
Interest | | | 408,142 | |
Income from securities lending, net | | | 8,319 | |
Total investment income | | | 2,754,234 | |
| | | | | |
Expenses: | |
Management fees | | | 2,380,609 | |
Transfer agent and administrative fees: | | | | |
A-Class | | | 70,172 | |
C-Class | | | 59,178 | |
P-Class*** | | | 455,550 | |
Institutional Class | | | 26,639 | |
Y-Class** | | | 537 | |
Distribution and service fees: | |
A-Class | | | 70,172 | |
C-Class | | | 236,711 | |
P-Class*** | | | 455,550 | |
Portfolio accounting fees | | | 243,780 | |
Custodian fees | | | 29,202 | |
Trustees' fees* | | | 15,605 | |
Miscellaneous | | | 441,662 | |
Total expenses | | | 4,485,367 | |
Less: | |
Expenses waived by Adviser | | | (191,947 | ) |
Net expenses | | | 4,293,420 | |
Net investment loss | | | (1,539,186 | ) |
| | | | | |
Net Realized and Unrealized Gain (Loss) | |
Net realized gain (loss) on: | |
Investments in unaffiliated issuers | | | 403,777 | |
Investments in affiliated issuers | | | (84,100 | ) |
Futures contracts | | | 4,525,825 | |
Foreign currency | | | 24,302 | |
Net realized gain on investments and foreign currency | | | 4,869,804 | |
Net change in unrealized appreciation
(depreciation) on: | |
Investments in unaffiliated issuers | | | (390,775 | ) |
Investments in affiliated issuers | | | 27,676 | |
Futures contracts | | | (6,771,074 | ) |
Foreign currency | | | 2,288 | |
Net change in unrealized appreciation
(depreciation) on investments and foreign currency | | | (7,131,885 | ) |
Net realized and unrealized loss | | | (2,262,081 | ) |
Net decrease in net assets resulting from operations | | $ | (3,801,267 | ) |
* | Relates to Trustees not deemed “interested persons” within the meaning of Section 2(a)(19) of the 1940 Act. |
** | Y-Class closed on June 26, 2015 — See Note 12. |
*** | H-Class shares redesignated as P-Class shares effective following the close of business on April 30, 2015 — See Note 13. |
20 | THE GUGGENHEIM FUNDS ANNUAL REPORT | SEE NOTES TO FINANCIAL STATEMENTS. |
CONSOLIDATED STATEMENTS OF CHANGES IN NET ASSETS |
MANAGED FUTURES STRATEGY FUND | |
| | Year Ended
December 31,
2015 | | | Year Ended
December 31,
2014 | |
Increase (Decrease) in Net Assets from Operations: | | | | | | |
Net investment loss | | $ | (1,539,186 | ) | | $ | (105,410 | ) |
Net realized gain on investments and foreign currency | | | 4,869,804 | | | | 27,332,335 | |
Net change in unrealized appreciation (depreciation) on investments and foreign currency | | | (7,131,885 | ) | | | (6,809,456 | ) |
Net increase (decrease) in net assets resulting from operations | | | (3,801,267 | ) | | | 20,417,469 | |
| | | | | | | | | |
Distributions to shareholders from: | | | | | | | | |
Net investment income | | | | | | | | |
A-Class | | | (659,707 | ) | | | (313,785 | ) |
C-Class | | | (603,205 | ) | | | (299,361 | ) |
P-Class** | | | (4,478,036 | ) | | | (2,130,001 | ) |
Institutional Class | | | (233,782 | ) | | | (125,944 | ) |
Y-Class* | | | — | | | | (7,829 | ) |
Total distributions to shareholders | | | (5,974,730 | ) | | | (2,876,920 | ) |
| | | | | | | | | |
Capital share transactions: | | | | | | | | |
Proceeds from sale of shares | | | | | | | | |
A-Class | | | 14,833,359 | | | | 8,716,439 | |
C-Class | | | 3,008,613 | | | | 3,028,191 | |
P-Class** | | | 113,741,530 | | | | 60,160,173 | |
Institutional Class | | | 3,251,329 | | | | 10,474,033 | |
Y-Class* | | | 8 | | | | 20,000 | |
Distributions reinvested | | | | | | | | |
A-Class | | | 600,241 | | | | 276,172 | |
C-Class | | | 576,733 | | | | 289,334 | |
P-Class** | | | 4,380,633 | | | | 2,043,559 | |
Institutional Class | | | 231,451 | | | | 124,839 | |
Y-Class* | | | — | | | | 3,281 | |
Cost of shares redeemed | | | | | | | | |
A-Class | | | (14,056,594 | ) | | | (60,395,444 | ) |
C-Class | | | (5,352,267 | ) | | | (10,427,970 | ) |
P-Class** | | | (126,557,150 | ) | | | (85,798,345 | ) |
Institutional Class | | | (5,112,553 | ) | | | (3,000,585 | ) |
Y-Class* | | | (623,374 | ) | | | (2,411,478 | ) |
Net decrease from capital share transactions | | | (11,078,041 | ) | | | (76,897,801 | ) |
Net decrease in net assets | | | (20,854,038 | ) | | | (59,357,252 | ) |
| | | | | | | | | |
Net assets: | | | | | | | | |
Beginning of year | | | 244,069,080 | | | | 303,426,332 | |
End of year | | $ | 223,215,042 | | | $ | 244,069,080 | |
Accumulated net investment loss at end of year | | $ | (9,910,569 | ) | | $ | (4,994,427 | ) |
SEE NOTES TO FINANCIAL STATEMENTS. | THE GUGGENHEIM FUNDS ANNUAL REPORT | 21 |
CONSOLIDATED STATEMENTS OF CHANGES IN NET ASSETS (concluded) |
MANAGED FUTURES STRATEGY FUND | |
| | Year Ended
December 31,
2015 | | | Year Ended
December 31,
2014 | |
| | | | | | | |
Capital share activity: | | | | | | |
Shares sold | | | | | | |
A-Class | | | 604,688 | | | | 395,808 | |
C-Class | | | 129,839 | | | | 144,551 | |
P-Class** | | | 4,570,087 | | | | 2,724,699 | |
Institutional Class | | | 131,429 | | | | 468,393 | |
Y-Class* | | | — | | | | 895 | |
Shares issued from reinvestment of distributions | | | | | | | | |
A-Class | | | 25,951 | | | | 11,848 | |
C-Class | | | 26,713 | | | | 13,175 | |
P-Class** | | | 189,391 | | | | 87,665 | |
Institutional Class | | | 9,857 | | | | 5,292 | |
Y-Class* | | | — | | | | 139 | |
Shares redeemed | | | | | | | | |
A-Class | | | (572,398 | ) | | | (2,738,853 | ) |
C-Class | | | (233,693 | ) | | | (506,997 | ) |
P-Class** | | | (5,145,916 | ) | | | (3,952,748 | ) |
Institutional Class | | | (208,931 | ) | | | (132,954 | ) |
Y-Class* | | | (24,965 | ) | | | (111,163 | ) |
Net decrease in shares | | | (497,948 | ) | | | (3,590,250 | ) |
* | Y-Class closed on June 26, 2015 — See Note 12. |
** | H-Class shares redesignated as P-Class shares effective following the close of business on April 30, 2015 — See Note 13. |
22 | THE GUGGENHEIM FUNDS ANNUAL REPORT | SEE NOTES TO FINANCIAL STATEMENTS. |
CONSOLIDATED FINANCIAL HIGHLIGHTS |
MANAGED FUTURES STRATEGY FUND | |
This table is presented to show selected data for a share outstanding throughout each period and to assist shareholders in evaluating a Fund’s performance for the periods presented.
A-Class | | Year Ended
Dec. 31,
2015 | | | Year Ended
Dec. 31,
2014 | | | Year Ended
Dec. 31,
2013 | | | Year Ended
Dec. 31,
2012 | | | Year Ended
Dec. 31,
2011 | |
Per Share Data | | | | | | | | | | | | | | | |
Net asset value, beginning of period | | $ | 24.12 | | | $ | 22.15 | | | $ | 21.23 | | | $ | 23.95 | | | $ | 25.78 | |
Income (loss) from investment operations: | |
Net investment income (loss)a | | | (.14 | ) | | | .02 | | | | (.19 | ) | | | (.39 | ) | | | (.44 | ) |
Net gain (loss) on investments (realized and unrealized) | | | (.15 | ) | | | 2.23 | | | | 1.11 | | | | (2.33 | ) | | | (1.39 | ) |
Total from investment operations | | | (.29 | ) | | | 2.25 | | | | .92 | | | | (2.72 | ) | | | (1.83 | ) |
Less distributions from: | |
Net investment income | | | (.62 | ) | | | (.28 | ) | | | — | | | | — | | | | — | |
Total distributions | | | (.62 | ) | | | (.28 | ) | | | — | | | | — | | | | — | |
Net asset value, end of period | | $ | 23.21 | | | $ | 24.12 | | | $ | 22.15 | | | $ | 21.23 | | | $ | 23.95 | |
| | |
Total Returnb | | | (1.06 | %) | | | 10.06 | % | | | 4.33 | % | | | (11.32 | %) | | | (7.14 | %) |
Ratios/Supplemental Data | |
Net assets, end of period (in thousands) | | $ | 27,828 | | | $ | 27,514 | | | $ | 76,900 | | | $ | 145,950 | | | $ | 733,469 | |
Ratios to average net assets: | |
Net investment income (loss) | | | (0.57 | %) | | | 0.07 | % | | | (0.89 | %) | | | (1.71 | %) | | | (1.76 | %) |
Total expensesc | | | 1.77 | % | | | 1.74 | % | | | 1.74 | % | | | 1.96 | % | | | 2.05 | % |
Net expensesd | | | 1.69 | % | | | 1.68 | % | | | 1.67 | % | | | 1.89 | % | | | 1.97 | % |
Portfolio turnover rate | | | 24 | % | | | 83 | % | | | 102 | % | | | 172 | % | | | 72 | % |
SEE NOTES TO FINANCIAL STATEMENTS. | THE GUGGENHEIM FUNDS ANNUAL REPORT | 23 |
CONSOLIDATED FINANCIAL HIGHLIGHTS (continued) |
MANAGED FUTURES STRATEGY FUND | |
This table is presented to show selected data for a share outstanding throughout each period and to assist shareholders in evaluating a Fund’s performance for the periods presented.
C-Class | | Year Ended
Dec. 31,
2015 | | | Year Ended
Dec. 31,
2014 | | | Year Ended
Dec. 31,
2013 | | | Year Ended
Dec. 31,
2012 | | | Year Ended
Dec. 31,
2011 | |
Per Share Data | | | | | | | | | | | | | | | |
Net asset value, beginning of period | | $ | 22.71 | | | $ | 21.04 | | | $ | 20.31 | | | $ | 23.09 | | | $ | 25.04 | |
Income (loss) from investment operations: | |
Net investment income (loss)a | | | (.30 | ) | | | (.15 | ) | | | (.33 | ) | | | (.53 | ) | | | (.61 | ) |
Net gain (loss) on investments (realized and unrealized) | | | (.14 | ) | | | 2.10 | | | | 1.06 | | | | (2.25 | ) | | | (1.34 | ) |
Total from investment operations | | | (.44 | ) | | | 1.95 | | | | .73 | | | | (2.78 | ) | | | (1.95 | ) |
Less distributions from: | |
Net investment income | | | (.62 | ) | | | (.28 | ) | | | — | | | | — | | | | — | |
Total distributions | | | (.62 | ) | | | (.28 | ) | | | — | | | | — | | | | — | |
Net asset value, end of period | | $ | 21.65 | | | $ | 22.71 | | | $ | 21.04 | | | $ | 20.31 | | | $ | 23.09 | |
| | |
Total Returnb | | | (1.84 | %) | | | 9.22 | % | | | 3.59 | % | | | (12.04 | %) | | | (7.79 | %) |
Ratios/Supplemental Data | |
Net assets, end of period (in thousands) | | $ | 21,272 | | | $ | 24,066 | | | $ | 29,637 | | | $ | 49,378 | | | $ | 96,647 | |
Ratios to average net assets: | |
Net investment income (loss) | | | (1.32 | %) | | | (0.72 | %) | | | (1.63 | %) | | | (2.45 | %) | | | (2.50 | %) |
Total expensesc | | | 2.52 | % | | | 2.50 | % | | | 2.48 | % | | | 2.70 | % | | | 2.80 | % |
Net expensesd | | | 2.44 | % | | | 2.43 | % | | | 2.42 | % | | | 2.64 | % | | | 2.72 | % |
Portfolio turnover rate | | | 24 | % | | | 83 | % | | | 102 | % | | | 172 | % | | | 72 | % |
24 | THE GUGGENHEIM FUNDS ANNUAL REPORT | SEE NOTES TO FINANCIAL STATEMENTS. |
CONSOLIDATED FINANCIAL HIGHLIGHTS (continued) |
MANAGED FUTURES STRATEGY FUND |
This table is presented to show selected data for a share outstanding throughout each period and to assist shareholders in evaluating a Fund’s performance for the periods presented.
P-Class* | | Year Ended
Dec. 31,
2015 | | | Year Ended
Dec. 31,
2014 | | | Year Ended
Dec. 31,
2013 | | | Year Ended
Dec. 31,
2012 | | | Year Ended
Dec. 31,
2011 | |
Per Share Data | | | | | | | | | | | | | | | |
Net asset value, beginning of period | | $ | 24.11 | | | $ | 22.15 | | | $ | 21.23 | | | $ | 23.95 | | | $ | 25.78 | |
Income (loss) from investment operations: | |
Net investment income (loss)a | | | (.14 | ) | | | — | e | | | (.20 | ) | | | (.38 | ) | | | (.44 | ) |
Net gain (loss) on investments (realized and unrealized) | | | (.15 | ) | | | 2.24 | | | | 1.12 | | | | (2.34 | ) | | | (1.39 | ) |
Total from investment operations | | | (.29 | ) | | | 2.24 | | | | .92 | | | | (2.72 | ) | | | (1.83 | ) |
Less distributions from: | |
Net investment income | | | (.62 | ) | | | (.28 | ) | | | — | | | | — | | | | �� | |
Total distributions | | | (.62 | ) | | | (.28 | ) | | | — | | | | — | | | | — | |
Net asset value, end of period | | $ | 23.20 | | | $ | 24.11 | | | $ | 22.15 | | | $ | 21.23 | | | $ | 23.95 | |
| | |
Total Returnb | | | (1.06 | %) | | | 10.06 | % | | | 4.33 | % | | | (11.32 | %) | | | (7.14 | %) |
Ratios/Supplemental Data | |
Net assets, end of period (in thousands) | | $ | 165,086 | | | $ | 180,872 | | | $ | 191,400 | | | $ | 501,109 | | | $ | 1,059,988 | |
Ratios to average net assets: | |
Net investment income (loss) | | | (0.57 | %) | | | 0.01 | % | | | (0.94 | %) | | | (1.70 | %) | | | (1.75 | %) |
Total expensesc | | | 1.77 | % | | | 1.75 | % | | | 1.75 | % | | | 1.95 | % | | | 2.05 | % |
Net expensesd | | | 1.69 | % | | | 1.68 | % | | | 1.68 | % | | | 1.89 | % | | | 1.97 | % |
Portfolio turnover rate | | | 24 | % | | | 83 | % | | | 102 | % | | | 172 | % | | | 72 | % |
* | H-Class shares redesignated as P-Class shares effective following the close of business on April 30, 2015 — See Note 13. |
SEE NOTES TO FINANCIAL STATEMENTS. | THE GUGGENHEIM FUNDS ANNUAL REPORT | 25 |
CONSOLIDATED FINANCIAL HIGHLIGHTS (concluded) |
MANAGED FUTURES STRATEGY FUND |
This table is presented to show selected data for a share outstanding throughout each period and to assist shareholders in evaluating a Fund’s performance for the periods presented.
Institutional Class | | Year Ended
Dec. 31,
2015 | | | Year Ended
Dec. 31,
2014 | | | Year Ended
Dec. 31,
2013 | | | Year Ended
Dec. 31,
2012 | | | Year Ended
Dec. 31,
2011 | |
Per Share Data | | | | | | | | | | | | | | | |
Net asset value, beginning of period | | $ | 24.41 | | | $ | 22.36 | | | $ | 21.38 | | | $ | 24.06 | | | $ | 25.84 | |
Income (loss) from investment operations: | |
Net investment income (loss)a | | | (.08 | ) | | | .05 | | | | (.19 | ) | | | (.33 | ) | | | (.38 | ) |
Net gain (loss) on investments (realized and unrealized) | | | (.15 | ) | | | 2.28 | | | | 1.17 | | | | (2.35 | ) | | | (1.40 | ) |
Total from investment operations | | | (.23 | ) | | | 2.33 | | | | .98 | | | | (2.68 | ) | | | (1.78 | ) |
Less distributions from: | |
Net investment income | | | (.62 | ) | | | (.28 | ) | | | — | | | | — | | | | — | |
Total distributions | | | (.62 | ) | | | (.28 | ) | | | — | | | | — | | | | — | |
Net asset value, end of period | | $ | 23.56 | | | $ | 24.41 | | | $ | 22.36 | | | $ | 21.38 | | | $ | 24.06 | |
| | |
Total Returnb | | | (0.80 | %) | | | 10.28 | % | | | 4.63 | % | | | (11.14 | %) | | | (6.85 | %) |
Ratios/Supplemental Data | |
Net assets, end of period (in thousands) | | $ | 9,029 | | | $ | 11,007 | | | $ | 2,464 | | | $ | 45,700 | | | $ | 101,549 | |
Ratios to average net assets: | |
Net investment income (loss) | | | (0.32 | %) | | | 0.21 | % | | | (0.86 | %) | | | (1.45 | %) | | | (1.50 | %) |
Total expensesc | | | 1.52 | % | | | 1.50 | % | | | 1.52 | % | | | 1.70 | % | | | 1.80 | % |
Net expensesd | | | 1.44 | % | | | 1.44 | % | | | 1.45 | % | | | 1.64 | % | | | 1.72 | % |
Portfolio turnover rate | | | 24 | % | | | 83 | % | | | 102 | % | | | 172 | % | | | 72 | % |
a | Net investment income (loss) per share was computed using average shares outstanding throughout the period. |
b | Total return does not reflect the impact of any applicable sales charges. |
c | Does not include expenses of the underlying funds in which the Fund invests. |
d | Net expense information reflects the expense ratios after expense waivers. |
e | Net investment income is less than $0.01 per share. |
26 | THE GUGGENHEIM FUNDS ANNUAL REPORT | SEE NOTES TO FINANCIAL STATEMENTS. |
NOTES TO CONSOLIDATED FINANCIAL STATEMENTS |
1. Organization, Consolidation of Subsidiary and Significant Accounting Policies
Organization
The Rydex Series Funds (the “Trust”), a Delaware statutory trust, is registered with the SEC under the Investment Company Act of 1940 (”1940 Act”), as an open-ended investment company of the series type. Each series, in effect, is representing a separate Fund. The Trust is authorized to issue an unlimited number of no par value shares. The Trust accounts for the assets of each fund separately.
The Trust offers a combination of nine separate classes of shares: Investor Class shares, Advisor Class shares, A-Class shares, C-Class shares, H-Class shares, Y-Class shares, P-Class shares, Institutional Class shares and Money Market Class shares. Sales of shares of each Class are made without a front-end sales charge at the net asset value per share (“NAV”), with the exception of A-Class shares. A-Class shares are sold at the NAV, plus the applicable front-end sales charge. The sales charge varies depending on the amount purchased, but will not exceed 4.75%. A-Class share purchases of $1 million or more are exempt from the front-end sales charge but have a 1% contingent deferred sales charge (“CDSC”) if shares are redeemed within 12 months of purchase. C-Class shares have a 1% CDSC if shares are redeemed within 12 months of purchase. Institutional Class shares are offered primarily for direct investment by institutions such as pension and profit sharing plans, endowments, foundations and corporations. Institutional Class shares have a minimum initial investment of $2 million and a minimum account balance of $1 million. At December 31, 2015, the Trust consisted of fifty-three funds (the “Funds”).
This report covers the Managed Futures Strategy Fund (the “Fund”), a non-diversified investment company. Only A-Class, C-Class, P-Class, Institutional Class and Y-Class shares had been issued by the Fund.
Guggenheim Investments (“GI”) provides advisory services, and Rydex Fund Services, LLC (“RFS”) provides transfer agent, administrative and accounting services to the Trust. Guggenheim Funds Distributors, LLC (“GFD”) acts as principal underwriter for the Trust. GI, RFS and GFD are affiliated entities.
Consolidation of Subsidiary
The consolidated financial statements of the Fund include the accounts of a wholly-owned and controlled Cayman Islands subsidiary (the “Subsidiary”). Significant inter-company accounts and transactions have been eliminated in consolidation for the Fund.
| | THE GUGGENHEIM FUNDS ANNUAL REPORT | 27 |
NOTES TO CONSOLIDATED FINANCIAL STATEMENTS (continued) |
The Fund may invest up to 25% of its total assets in its Subsidiary which acts as an investment vehicle in order to effect certain investments consistent with the Fund’s investment objectives and policies.
A summary of the Fund’s investment in its Subsidiary is as follows:
Fund | Inception
Date of
Subsidiary | | Subsidiary
Net Assets at December 31,
2015 | | | % of Net Assets
of the Fund at
December 31,
2015 | |
Managed Futures Strategy Fund | 05/01/08 | | $ | 24,453,213 | | | | 11.0 | % |
Significant Accounting Policies
The Fund operates as an investment company and accordingly follows the investment company accounting and reporting guidance of the Financial Accounting Standards Board (“FASB”) Accounting Standards Codification Topic 946 Financial Services – Investment Companies.
The following significant accounting policies are in conformity with U.S. generally accepted accounting principles (“U.S. GAAP”) and are consistently followed by the Trust. This requires management to make estimates and assumptions that affect the reported amount of assets and liabilities and disclosure of contingent assets and liabilities at the date of the financial statements and the reported amounts of revenues and expenses during the reporting period. Actual results could differ from these estimates. All time references are based on Eastern Time.
The NAV of each Class of the Fund is calculated by dividing the market value of the Fund’s securities and other assets, less all liabilities, attributable to the Class by the number of outstanding shares of the Class.
A. The Board of Trustees of the Fund (the “Board”) has adopted policies and procedures for the valuation of the Fund’s investments (the “Valuation Procedures”). Pursuant to the Valuation Procedures, the Board has delegated to a valuation committee, consisting of representatives from Guggenheim’s investment management, fund administration, legal and compliance departments (the “Valuation Committee”), the day-to-day responsibility for implementing the Valuation Procedures, including, under most circumstances, the responsibility for determining the fair value of the Fund’s securities or other assets.
28 | THE GUGGENHEIM FUNDS ANNUAL REPORT | |
NOTES TO CONSOLIDATED FINANCIAL STATEMENTS (continued) |
Valuations of the Fund’s securities are supplied primarily by pricing services appointed pursuant to the processes set forth in the Valuation Procedures. The Valuation Committee convenes monthly, or more frequently as needed and will review the valuation of all assets which have been fair valued for reasonableness. The Fund’s officers, through the Valuation Committee and consistent with the monitoring and review responsibilities set forth in the Valuation Procedures, regularly review procedures used by, and valuations provided by, the pricing services.
If the pricing service cannot or does not provide a valuation for a particular investment or such valuation is deemed unreliable, such investment is fair valued by the Valuation Committee.
Open-end investment companies (“Mutual Funds”) are valued at their NAV as of the close of business, on the valuation date. Exchange-traded funds (“ETFs”) and closed-end investment companies (“CEFs”) are valued at the last quoted sales price.
U.S. government securities are valued by either independent pricing services, the last traded fill price, or at the reported bid price at the close of business. Debt securities with a maturity of greater than 60 days at acquisition are valued at prices that reflect broker/dealer supplied valuations or are obtained from independent pricing services, which may consider the trade activity, treasury spreads, yields or price of bonds of comparable quality, coupon, maturity, and type, as well as prices quoted by dealers who make markets in such securities. Short-term debt securities with a maturity of 60 days or less at acquisition are valued at amortized cost, provided such amount approximates market value.
Repurchase agreements are valued at amortized cost, provided such amounts approximate market value.
The value of futures contracts is accounted for using the unrealized gain or loss on the contracts that is determined by marking the contracts to their current realized settlement prices. Financial futures contracts are valued at the 4:00 p.m. price on the valuation date. In the event that the exchange for a specific futures contract closes earlier than 4:00 p.m., the futures contract is valued at the Official Settlement Price of the exchange. However, the underlying securities from which the futures contract value is derived are monitored until 4:00 p.m. to determine if fair valuation would provide a more accurate valuation.
| | THE GUGGENHEIM FUNDS ANNUAL REPORT | 29 |
NOTES TO CONSOLIDATED FINANCIAL STATEMENTS (continued) |
Investments for which market quotations are not readily available are fair valued as determined in good faith by GI under the direction of the Board of Trustees using methods established or ratified by the Board of Trustees. Valuations in accordance with these methods are intended to reflect each security’s (or asset’s) “fair value.” Each such determination is based on a consideration of all relevant factors, which are likely to vary from one pricing context to another. Examples of such factors may include, but are not limited to: (i) the type of security, (ii) the initial cost of the security, (iii) the existence of any contractual restrictions on the security’s disposition, (iv) the price and extent of public trading in similar securities of the issuer or of comparable companies, (v) quotations or evaluated prices from broker-dealers and/or pricing services, (vi) information obtained from the issuer, analysts, and/or the appropriate stock exchange (for exchange-traded securities), (vii) an analysis of the company’s financial statements, and (viii) an evaluation of the forces that influence the issuer and the market(s) in which the security is purchased and sold (e.g. the existence of pending merger activity, public offerings or tender offers that might affect the value of the security). In connection with futures contracts and other derivative investments, such factors may include obtaining information as to how (a) these contracts and other derivative investments trade in the futures or other derivative markets, respectively, and (b) the securities underlying these contracts and other derivative investments trade in the cash market.
B. The Fund may purchase and sell interests in securities on a when-issued and delayed delivery basis, with payment and delivery scheduled for a future date. No income accrues to the Fund on such interests or securities in connection with such transactions prior to the date the Fund actually take delivery of such interests or securities. These transactions are subject to market fluctuations and are subject to the risk that the value at delivery may be more or less than the trade date purchase price. Although the Fund will generally purchase these securities with the intention of acquiring such securities, they may sell such securities before the settlement date.
C. Upon entering into a futures contract, the Fund deposits and maintains as collateral such initial margin as required by the exchange on which the transaction is affected. Pursuant to the contract, the Fund agrees to receive from or pay to the broker an amount of cash equal to the daily fluctuation in value of the contract. Such receipts or payments are known as variation margin and are recorded by the Fund as unrealized gains or losses. When the contract is closed, the Fund records a realized gain or loss equal to the difference between the value of the contract at the time it was opened and the value at the time it was closed.
30 | THE GUGGENHEIM FUNDS ANNUAL REPORT | |
NOTES TO CONSOLIDATED FINANCIAL STATEMENTS (continued) |
D. The accounting records of the Fund are maintained in U.S. dollars. All assets and liabilities initially expressed in foreign currencies are converted into U.S. dollars at prevailing exchange rates. Purchases and sales of investment securities, dividend and interest income, and certain expenses are translated at the rates of exchange prevailing on the respective dates of such transactions. Changes in the relationship of these foreign currencies to the U.S. dollar can significantly affect the value of the investments and earnings of the Funds. Foreign investments may also subject the Funds to foreign government exchange restrictions, expropriation, taxation or other political, social or economic developments, all of which could affect the market and/or credit risk of the investments.
The Fund does not isolate that portion of the results of operations resulting from changes in the foreign exchange rates on investments from the fluctuations arising from changes in the market prices of securities held. Such fluctuations are included with the net realized and unrealized gain or loss on investments.
Reported net realized foreign exchange gains and losses arise from sales of foreign currencies and currency gains or losses realized between the trade and settlement dates on investment transactions. Net unrealized exchange gains and losses arise from changes in the fair values of assets and liabilities other than investments in securities at the fiscal period end, resulting from changes in exchange rates.
E. Security transactions are recorded on the trade date for financial reporting purposes. Realized gains and losses from securities transactions are recorded using the identified cost basis. Proceeds from lawsuits related to investment holdings are recorded as realized gains in the Fund. Dividend income is recorded on the ex-dividend date, net of applicable taxes withheld by foreign countries. Taxable non-cash dividends are recorded as dividend income. Interest income, including amortization of premiums and accretion of discounts, is accrued on a daily basis.
F. Distributions of net investment income and net realized gains, if any, are declared and paid at least annually. Dividends are reinvested in additional shares unless shareholders request payment in cash. Distributions are recorded on the ex-dividend date and are determined in accordance with income tax regulations which may differ from U.S. GAAP.
G. Interest and dividend income, most expenses, all realized gains and losses, and all unrealized gains and losses are allocated to the classes based upon the value of the outstanding shares in each Class. Certain costs, such as distribution and service fees are charged directly to specific classes. In addition, certain expenses have been allocated to the individual Funds in the Trust on a pro rata basis upon the respective aggregate net assets of each Fund included in the Trust.
| | THE GUGGENHEIM FUNDS ANNUAL REPORT | 31 |
NOTES TO CONSOLIDATED FINANCIAL STATEMENTS (continued) |
H. The Fund may leave cash overnight in its cash account with the custodian. Periodically, the Fund may have cash due to the custodian bank as an overdraft balance. A fee is incurred on this overdraft, calculated by multiplying the overdraft by a rate based on the federal funds rate.
I. Under the Fund’s organizational documents, its Trustees and Officers are indemnified against certain liabilities arising out of the performance of their duties to the Trust. In addition, throughout the normal course of business, the Fund enters into contracts that contain a variety of representations and warranties which provide general indemnifications. The Fund’s maximum exposure under these arrangements is unknown, as this would involve future claims that may be made against the Fund and/or its affiliates that have not yet occurred. However, based on experience, the Fund expects the risk of loss to be remote.
2. Financial Instruments and Derivatives
As part of its investment strategy, the Fund utilizes derivative instruments. These investments involve, to varying degrees, elements of market risk and risks in excess of the amounts recognized in the Statement of Assets and Liabilities. Valuation and accounting treatment of these instruments can be found under Significant Accounting Policies in Note 1 of these Notes to Consolidated Financial Statements.
Derivatives
Derivatives are instruments whose values depend on, or are derived from, in whole or in part, the value of one or more other assets, such as securities, currencies, commodities or indices. Derivative instruments may be used to increase investment flexibility (including to maintain cash reserves while maintaining exposure to certain other assets), for risk management (hedging) purposes, to facilitate trading, to reduce transaction costs and to pursue higher investment returns. Derivative instruments may also be used to mitigate certain investment risks, such as foreign currency exchange rate risk, interest rate risk and credit risk. U.S. GAAP requires disclosures to enable investors to better understand how and why a Fund uses derivative instruments, how these derivative instruments are accounted for and their effects on the Fund’s financial position and results of operations.
The Fund utilizes derivatives for the following purposes:
Hedge: an investment made in order to reduce the risk of adverse price movements in a security, by taking an offsetting position to protect against broad market moves.
32 | THE GUGGENHEIM FUNDS ANNUAL REPORT | |
NOTES TO CONSOLIDATED FINANCIAL STATEMENTS (continued) |
Speculation: the use of an instrument to express macroeconomic and other investment views.
Leverage: gaining total exposure to equities or other assets on the long and short sides at greater than 100% of invested capital.
Liquidity: the ability to buy or sell exposure with little price/market impact.
For any Fund whose investment strategy consistently involves applying leverage, the value of the Fund’s shares will tend to increase or decrease more than the value of any increase or decrease in the underlying index or other asset. In addition, because an investment in derivative instruments generally requires a small investment relative to the amount of investment exposure assumed, an opportunity for increased net income is created; but, at the same time, leverage risk will increase. The Fund’s use of leverage, through borrowings or instruments such as derivatives, may cause the Fund to be more volatile and riskier than if they had not been leveraged.
Futures
A futures contract is an agreement to purchase (long) or sell (short) an agreed amount of securities or other instruments at a set price for delivery at a future date. There are significant risks associated with a Fund’s use of futures contracts, including (i) there may be an imperfect or no correlation between the changes in market value of the underlying asset and the prices of futures contracts; (ii) there may not be a liquid secondary market for a futures contract; (iii) trading restrictions or limitations may be imposed by an exchange; and (iv) government regulations may restrict trading in futures contracts. When investing in futures, there is minimal counterparty credit risk to the Fund because futures are exchange-traded and the exchange’s clearinghouse, as counterparty to all exchange-traded futures, guarantees against default. Cash deposits are shown as segregated cash with broker on the Statement of Assets and Liabilities; securities held as collateral are noted on the Schedule of Investments.
The following table represents the Fund’s use and volume of futures for the year ended December 31, 2015:
| | | | Average Notional | |
Fund | Use | | Long | | | Short | |
Managed Futures Strategy Fund | Hedge, Speculation, Leverage, Liquidity | | $ | 1,263,595,156 | | | $ | 260,965,298 | |
| | THE GUGGENHEIM FUNDS ANNUAL REPORT | 33 |
NOTES TO CONSOLIDATED FINANCIAL STATEMENTS (continued) |
Derivative Investment Holdings Categorized by Risk Exposure
The following is a summary of the location of derivative investments on the Fund’s Statement of Assets and Liabilities as of December 31, 2015:
Derivative Investment Type | Liability Derivatives |
Equity/Interest Rate/Currency/Commodity contracts | Variation margin |
The following table sets forth the fair value of the Fund’s derivative investments categorized by primary risk exposure at December 31, 2015:
Asset Derivative Investments Value | |
Fund | | Futures
Equity Contracts* | | | Futures
Currency
Contracts* | | | Futures
Interest Rate
Contracts* | | | Futures
Commodity
Contracts* | | | Total Value at
December 31,
2015 | |
Managed Futures Strategy Fund | | $ | 337,586 | | | $ | 513,880 | | | $ | 2,090,036 | | | $ | 3,027,282 | | | $ | 5,968,784 | |
Liability Derivative Investments Value | |
Fund | | Futures
Equity Contracts* | | | Futures
Currency
Contracts* | | | Futures
Interest Rate
Contracts* | | | Futures
Commodity
Contracts* | | | Total Value at
December 31,
2015 | |
Managed Futures Strategy Fund | | $ | 205,083 | | | $ | 43,808 | | | $ | 194,526 | | | $ | 1,118,821 | | | $ | 1,562,238 | |
* | Includes cumulative appreciation (depreciation) of futures contracts as reported on the Schedule of Investments. Only current day’s variation margin is reported within the Statement of Assets and Liabilities. |
The following is a summary of the location of derivative investments on the Fund’s Statement of Operations for the year ended December 31, 2015:
Derivative Investment Type | Location of Gain (Loss) on Derivatives |
Equity/Interest Rate/Currency/Commodity contracts | Net realized gain (loss) on futures contracts |
| Net change in unrealized appreciation (depreciation) on futures contracts |
34 | THE GUGGENHEIM FUNDS ANNUAL REPORT | |
NOTES TO CONSOLIDATED FINANCIAL STATEMENTS (continued) |
The following is a summary of the Fund’s realized gain (loss) and change in unrealized appreciation (depreciation) on derivative investments recognized on the Statement of Operations categorized by primary risk exposure for the year ended December 31, 2015:
Realized Gain (Loss) on Derivative Investments Recognized on the Statement of Operations | |
Fund | | Futures Equity Contracts | | | Futures
Currency
Contracts | | | Futures
Interest Rate
Contracts | | | Futures
Commodity
Contracts | | | Total | |
Managed Futures Strategy Fund | | $ | (4,188,586 | ) | | $ | (4,584,658 | ) | | $ | 3,994,710 | | | $ | 9,304,359 | | | $ | 4,525,825 | |
Change in Unrealized Appreciation (Depreciation) on Derivative Investments Recognized on the Statement of Operations | |
Fund | | Futures
Equity Contracts | | | Futures
Currency
Contracts | | | Futures
Interest Rate
Contracts | | | Futures
Commodity
Contracts | | | Total | |
Managed Futures Strategy Fund | | $ | (606,007 | ) | | $ | (173,004 | ) | | $ | (3,654,810 | ) | | $ | (2,337,253 | ) | | $ | (6,771,074 | ) |
In conjunction with the use of derivative instruments, the Fund is required to maintain collateral in various forms. The Fund uses, where appropriate, depending on the financial instrument utilized and the broker involved, margin deposits at the broker, cash and/or securities segregated at the custodian bank, discount notes or the repurchase agreements allocated to the Fund.
The Trust has established counterparty credit guidelines and enters into transactions only with financial institutions of investment grade or better. The Trust monitors the counterparty credit risk.
3. Fees and Other Transactions with Affiliates
Under the terms of an investment advisory contract, the Fund and the Subsidiary pay GI investment advisory fees calculated at an annualized rate of 0.90% of their average daily net assets.
GI has contractually agreed to waive the management fee it receives from the Subsidiary in an amount equal to the management fee paid to GI by the Subsidiary. This undertaking will continue in effect for so long as the Fund invests in the Subsidiary, and may not be terminated by GI unless GI obtains the prior approval of the Fund’s Board of Trustees for such termination.
RFS provides transfer agent and administrative services to the Fund calculated at the annualized rate of 0.20% of the average daily net assets of the Y-Class and 0.25% of the average daily net assets of the remaining classes, respectively.
| | THE GUGGENHEIM FUNDS ANNUAL REPORT | 35 |
NOTES TO CONSOLIDATED FINANCIAL STATEMENTS (continued) |
RFS also provides accounting services to the Fund for fees calculated at annualized rates below, based on the average daily net assets of the Fund.
Fund Accounting Fees | (as a % of Net Assets) |
On the first $250 million | 0.10% |
On the next $250 million | 0.075% |
On the next $250 million | 0.05% |
Over $750 million | 0.03% |
RFS engages external service providers to perform other necessary services for the Trust, such as audit and accounting related services, legal services, custody, printing and mailing, etc., on a pass-through basis. Such expenses are allocated to various Funds within the complex based on relative net assets.
The Trust has adopted a Distribution Plan applicable to A-Class shares and P-Class shares for which GFD and other firms that provide distribution and/or shareholder services (“Service Providers”) may receive compensation. If a Service Provider provides distribution services, the Fund will pay distribution fees to GFD at an annual rate not to exceed 0.25% of average daily net assets, pursuant to Rule 12b-1 of the 1940 Act. GFD, in turn, will pay the Service Provider out of its fees. GFD may, at its discretion, retain a portion of such payments to compensate itself for distribution services.
The Trust has adopted a separate Distribution and Shareholder Services Plan applicable to its C-Class shares that allows the Fund to pay annual distribution and service fees of 1.00% of the Fund’s C-Class shares average daily net assets. The annual 0.25% service fee compensates a shareholder’s financial adviser for providing ongoing services to the shareholder. The annual distribution fee of 0.75% reimburses GFD for paying the shareholder’s financial adviser an ongoing sales commission. GFD advances the first year’s service and distribution fees to the financial adviser. GFD retains the service and distribution fees on accounts with no authorized dealer of record.
If a Fund invests in an affiliated fund, the investing Fund’s Adviser has agreed to waive fees at the investing fund level. Fee waivers will be calculated at the investing Fund level without regard to any expense cap, if any, in effect for the investing Fund. Fees waived under this arrangement are not subject to reimbursement to GI. For the year ended December 31, 2015, the Fund waived $10,843 related to investments in affiliated funds.
For the year ended December 31, 2015, GFD retained sales charges of $366,266 relating to sales of A-Class shares of the Trust.
Certain trustees and officers of the Trust are also officers of GI, RFS and GFD.
36 | THE GUGGENHEIM FUNDS ANNUAL REPORT | |
NOTES TO CONSOLIDATED FINANCIAL STATEMENTS (continued) |
4. Fair Value Measurement
In accordance with U.S. GAAP, fair value is defined as the price that the Fund would receive to sell an investment or pay to transfer a liability in an orderly transaction with an independent buyer in the principal market, or in the absence of a principal market, the most advantageous market for the investment or liability. U.S. GAAP establishes a three-tier fair value hierarchy based on the types of inputs used to value assets and liabilities and requires corresponding disclosure. The hierarchy and the corresponding inputs are summarized below:
Level 1 — | quoted prices in active markets for identical assets or liabilities. |
Level 2 — | significant other observable inputs (for example quoted prices for securities that are similar based on characteristics such as interest rates, prepayment speeds, credit risk, etc.). |
Level 3 — | significant unobservable inputs based on the best information available under the circumstances, to the extent observable inputs are not available, which may include assumptions. |
The types of inputs available depend on a variety of factors, such as the type of security and the characteristics of the markets in which it trades, if any. Fair valuation determinations that rely on fewer or no observable inputs require greater judgment. Accordingly, fair value determinations for Level 3 securities require the greatest amount of judgment.
The inputs or methodologies used for valuing securities are not necessarily an indication of the risk associated with investing in those securities. The suitability of the techniques and sources employed to determine fair valuation are regularly monitored and subject to change.
5. Repurchase Agreements
The Funds transfer uninvested cash balances into a single joint account, the daily aggregate balance of which is invested in one or more repurchase agreements collateralized by obligations of the U.S. Treasury and U.S. Government Agencies. The collateral is in the possession of the Funds’ custodian and is evaluated to ensure that its market value exceeds, at a minimum, 102% of the original face amount of the repurchase agreements. Each Fund holds a pro rata share of the collateral based on the dollar amount of the repurchase agreement entered into by each Fund.
| | THE GUGGENHEIM FUNDS ANNUAL REPORT | 37 |
NOTES TO CONSOLIDATED FINANCIAL STATEMENTS (continued) |
At December 31, 2015, the repurchase agreements in the joint account were as follows:
Counterparty and
Terms of Agreement | Face Value | Repurchase Price | | Collateral | Par Value | Fair Value |
Royal Bank of Canada | | | | U.S. TIP Notes | | |
0.24% | | | | 0.13% - 2.38% | | |
Due 01/04/16 | $250,241,221 | $250,247,894 | | 04/15/18 - 01/15/25 | $188,518,600 | $226,206,912 |
| | | | | U.S. Treasury Note | | |
| | | | | 1.50% | | |
| | | | | 05/3120 | 29,220,000 | 29,039,171 |
| | | | | | $217,738,600 | $255,246,083 |
| | | | | | | |
Mizuho Financial Group, Inc. | | | U.S. Treasury Notes | | |
0.18% | | | | 1.00% - 3.25% | | |
Due 01/04/16 | 150,000,000 | 150,003,000 | | 09/30/16 - 12/31/16 | 150,51460 | 153,000027 |
| | | | | | | |
HSBC Group | | | | U.S. Treasury Strips | | |
0.18% | | | | 0.00% | | |
Due 01/04/16 | 135,041,297 | 135,043,998 | | 11/15/40 - 02/15/43 | 321,526,900 | 137,742,124 |
In the event of counterparty default, the Funds have the right to collect the collateral to offset losses incurred. There is potential loss to the Funds in the event the Funds are delayed or prevented from exercising their rights to dispose of the collateral securities, including the risk of a possible decline in the value of the underlying securities during the period while the Funds seek to assert their rights. The Funds’ investment adviser, acting under the supervision of the Board of Trustees, reviews the value of the collateral and the creditworthiness of those banks and dealers with which the Funds enter into repurchase agreements to evaluate potential risks.
6. Federal Income Tax Information
The Fund intends to comply with the provisions of Subchapter M of the Internal Revenue Code applicable to regulated investment companies and will distribute substantially all taxable net investment income and capital gains sufficient to relieve the Fund from all, or substantially all, federal income, excise and state income taxes. Therefore, no provision for federal or state income tax is required.
Tax positions taken or expected to be taken in the course of preparing the Fund’s tax returns are evaluated to determine whether the tax positions are “more-likely-than-not” of being sustained by the applicable tax authority. Tax positions not deemed to meet the more-likely-than-not threshold would be recorded as a tax benefit or expense in the current year. Management has analyzed the Fund’s tax positions taken, or to be taken, on Federal income tax returns for all open tax
38 | THE GUGGENHEIM FUNDS ANNUAL REPORT | |
NOTES TO CONSOLIDATED FINANCIAL STATEMENTS (continued) |
years, and has concluded that no provision for income tax is required in the Fund’s financial statements. The Fund’s federal tax returns are subject to examination by the Internal Revenue Service for a period of three years after they are filed.
The Fund intends to invest up to 25% of their assets in the Subsidiary which is expected to provide the Funds with exposure to the commodities markets within the limitations of the federal tax requirements under Subchapter M of the Internal Revenue Code. The Fund has received a private letter ruling from the IRS that concludes that the income the Fund receives from the Subsidiary will constitute qualifying income for purposes of Subchapter M of the Internal Revenue Code. The Subsidiary will be classified as a corporation for U.S. federal income tax purposes. A foreign corporation, such as the Subsidiary, will generally not be subject to U.S. federal income taxation unless it is deemed to be engaged in a U.S. trade or business.
The tax character of distributions paid during the year ended December 31, 2015 is as follows:
Fund | | Ordinary
Income | | | Long-Term
Capital Gain | | | Total
Distributions | |
Managed Futures Strategy Fund | | $ | 5,974,730 | | | $ | — | | | $ | 5,974,730 | |
The tax character of distributions paid during the year ended December 31, 2014 was as follows:
Fund | | Ordinary
Income | | | Long-Term
Capital Gain | | | Total
Distributions | |
Managed Futures Strategy Fund | | $ | 2,876,920 | | | $ | — | | | $ | 2,876,920 | |
Note: For federal income tax purposes, short-term capital gain distributions are treated as ordinary income distributions.
The tax character of distributable earnings/(accumulated losses) as of December 31, 2015 is as follows:
Fund | | Undistributed
Ordinary
Income | | | Undistributed
Long-Term
Capital Gain | | | Net Unrealized
Appreciation/
(Depreciation) | | | Capital Loss
Carryforward | |
Managed Futures Strategy Fund | | $ | 5,813,605 | | | $ | — | | | $ | (13,709,107 | ) | | $ | (77,114,787 | ) |
For Federal income tax purposes capital loss carryforwards represent realized losses that may be carried forward and applied against future capital gains. For taxable years beginning on or before December 22, 2010 such capital losses may be carried forward for a maximum of eight years. Pursuant to the RIC
| | THE GUGGENHEIM FUNDS ANNUAL REPORT | 39 |
NOTES TO CONSOLIDATED FINANCIAL STATEMENTS (continued) |
Modernization Act of 2010, the Fund is permitted to carry forward capital losses incurred in taxable years beginning after December 22, 2010 without expiration and retain their short and/or long-term character. However, post-enactment losses must be utilized prior to pre-enactment capital loss carryforwards. As a result of this ordering rule pre-enactment carryforwards are more likely to expire unused. As of December 31, 2015 capital loss carryforwards for the Fund were as follows:
| | | | | | | | |
Unlimited
| | | | |
Fund | | Expires in
2017 | | | Expires in
2018 | | | Short-Term | | | Long-Term | | | Total
Capital Loss
Carryforward | |
Managed Futures Strategy Fund | | $ | (42,873,423 | ) | | $ | (9,859,364 | ) | | $ | (2,556,504 | ) | | $ | (21,825,496 | ) | | $ | (77,114,787 | ) |
Net investment income and net realized gains (losses) may differ for financial statement and tax purposes because of temporary or permanent book/tax differences. These differences are primarily due to wash sales, foreign currency gains and losses, mark to market of derivatives, and investments in subsidiary. Additional differences may result from the tax treatment of net investment losses and expired capital loss carryforwards. To the extent these differences are permanent, reclassifications are made to the appropriate equity accounts in the period that the differences arise. These reclassifications have no effect on net assets or NAV.
On the Statement of Assets and Liabilities the following adjustments were made for permanent book/tax differences:
Fund | | Paid In
Capital | | | Accumulated
Net Investment
Loss | | | Accumulated
Net Realized
Gain (Loss) | |
Managed Futures Strategy Fund | | $ | 8,633,663 | | | $ | 2,597,774 | | | $ | (11,231,437 | ) |
At December 31, 2015, the cost of securities for Federal income tax purposes, the aggregate gross unrealized gain for all securities for which there was an excess of value over tax cost and the aggregate gross unrealized loss for all securities for which there was an excess of tax cost over value, were as follows:
Fund | | Tax
Cost | | | Tax
Unrealized
Gain | | | Tax
Unrealized
Loss | | | Net
Unrealized
Gain (Loss) | |
Managed Futures Strategy Fund | | $ | 222,582,635 | | | $ | — | | | $ | (16,443,593 | ) | | $ | (16,443,593 | ) |
40 | THE GUGGENHEIM FUNDS ANNUAL REPORT | |
NOTES TO CONSOLIDATED FINANCIAL STATEMENTS (continued) |
7. Securities Transactions
For the year ended December 31, 2015, the cost of purchases and proceeds from sales of investment securities, excluding government securities, short-term investments and derivatives, were as follows:
Fund | | Purchases | | | Sales | |
Managed Futures Strategy Fund | | $ | 44,907,314 | | | $ | 58,822,958 | |
8. Affiliated Transactions
Investments representing 5% or more of the outstanding voting shares of a portfolio company of a fund, or control of or by, or common control under GI, result in that portfolio company being considered an affiliated company of such fund, as defined in the 1940 Act.
The Fund may invest in the Guggenheim Strategy Funds Trust consisting of Guggenheim Strategy Fund I, Guggenheim Strategy Fund II, Guggenheim Strategy Fund III, and Guggenheim Variable Insurance Strategy Fund III (collectively, the “Cash Management Funds”), open-end management investment companies managed by GI. The Cash Management Funds, which launched on March 11, 2014, are offered as cash management options only to mutual funds, trusts, and other accounts managed by GI and/or its affiliates, and are not available to the public. The Cash Management Funds pay no investment management fees. The Cash Management Funds’ annual report on Form N-CSR dated September 30, 2015 is available publicly or upon request. This information is available from the EDGAR database on the SEC’s website at http://www.sec.gov/Archives/edgar/data/1601445/000089180415000857/gug63224-ncsr.htm.
Transactions during the year ended December 31, 2015, in which the portfolio company is an “affiliated person” are as follows:
Affiliated issuers by Fund | | Value
12/31/14 | | | Additions | | | Reductions | | | Value
12/31/15 | | | Shares
12/31/15 | | | Investment
Income | | | Realized
Loss | |
Managed Futures Strategy Fund | | | | | | | | | | |
Guggenheim Enhanced Short Duration ETF | | $ | — | | | $ | 5,411,328 | | | $ | — | | | $ | 5,405,908 | | | | 108,400 | | | $ | 63,230 | | | $ | — | |
Guggenheim Strategy Fund I | | | 57,871,940 | | | | 21,863,396 | | | | (8,650,000 | ) | | | 71,145,807 | | | | 2,860,708 | | | | 661,516 | | | | (19,144 | ) |
Guggenheim Strategy Fund II | | | 59,459,690 | | | | 14,684,920 | | | | (7,000,000 | ) | | | 67,025,688 | | | | 2,702,649 | | | | 819,967 | | | | (26,650 | ) |
Guggenheim Strategy Fund III | | | 41,599,972 | | | | 818,851 | | | | (8,400,000 | ) | | | 33,962,550 | | | | 1,369,458 | | | | 793,060 | | | | (38,306 | ) |
| | | $ | 158,931,602 | | | $ | 42,778,495 | | | $ | (24,050,000 | ) | | $ | 177,539,953 | | | | | | | $ | 2,337,773 | | | $ | (84,100 | ) |
| | THE GUGGENHEIM FUNDS ANNUAL REPORT | 41 |
NOTES TO CONSOLIDATED FINANCIAL STATEMENTS (continued) |
9. Line of Credit
The Trust, along with other affiliated trusts, secured an uncommitted, $75,000,000 line of credit from U.S. Bank, N.A., which expires June 12, 2016. This line of credit is reserved for emergency or temporary purposes. Borrowings, if any, under this arrangement bear interest equal to the Prime Rate, minus 2%, which shall be paid monthly, averaging 1.25% for the year ended December 31, 2015. The Fund did not have any borrowings outstanding under this agreement at December 31, 2015, and did not participate in borrowing during the year.
10. Security Transactions with Affiliated Funds
The Fund is permitted to purchase or sell securities from or to certain affiliated funds under specified conditions outlined in procedures adopted by the Board of Trustees of the Trust. The procedures have been designed to ensure that any purchase or sale of securities by the Fund from or to another fund or portfolio that is or could be considered an affiliate by virtue of having a common investment adviser (or affiliated investment advisers), common Trustees and/or common officers complies with Rule 17a-7 of the 1940 Act. Further, as defined under these procedures, each transaction is effected at the current market price to save costs, where permissible. For the year ended December 31, 2015, the Fund engaged in purchases of securities, pursuant to Rule 17a-7 of the 1940 Act as follows:
Fund | | Purchases | | | Sales | |
Managed Futures Strategy Fund | | $ | 7,997,543 | | | $ | — | |
11. Legal proceedings
Tribune Company
Rydex Series Funds has been named as a defendant and a putative member of the proposed defendant class of shareholders in the case entitled Kirschner v. FitzSimons, No. 12-2652 (S.D.N.Y.) (formerly Official Committee of Unsecured Creditors of Tribune Co. v. FitzSimons, Adv. Pro. No. 10-54010 (Bankr. D. Del.)) (the “FitzSimons action”), as a result of ownership by certain series of the Rydex Series Funds of shares in the Tribune Company (“Tribune”) in 2007, when Tribune effected a leveraged buyout transaction (“LBO”) by which Tribune converted to a privately-held company. In his complaint, the plaintiff has alleged that, in connection with the LBO, Tribune insiders and shareholders were overpaid for their Tribune stock using financing that the insiders knew would, and ultimately did, leave the Tribune Company insolvent. The plaintiff has asserted claims against certain insiders, major shareholders, professional advisers, and others
42 | THE GUGGENHEIM FUNDS ANNUAL REPORT | |
NOTES TO CONSOLIDATED FINANCIAL STATEMENTS (continued) |
involved in the LBO. The plaintiff is also attempting to obtain from former Tribune shareholders, including the Rydex Series Funds, the proceeds they received in connection with the LBO.
In June 2011, a group of Tribune creditors filed multiple actions against former Tribune shareholders involving state law constructive fraudulent conveyance claims arising out of the 2007 LBO (the “SLCFC actions”). Rydex Series Funds has been named as a defendant in one of the SLCFC actions: Deutsche Bank Trust Co. Americas v. McGurn, No. 11-1510 (S.D.N.Y.). In those actions, the creditors seek to recover from Tribune’s former shareholders the proceeds received in connection with the 2007 LBO.
The FitzSimons action and the SLCFC actions have been consolidated with the majority of the other Tribune LBO-related lawsuits in a multidistrict litigation proceeding captioned In re Tribune Company Fraudulent Conveyance Litig., No. 11-md-2696 (S.D.N.Y.) (the “MDL Proceeding”).
On September 23, 2013, the District Court granted the defendants’ omnibus motion to dismiss the SLCFC actions, on the basis that the creditors lacked standing. On September 30, 2013, the creditors filed a notice of appeal of the September 23 order. On October 28, 2013, the defendants filed a joint notice of cross-appeal of that same order.
The SLCFC appeals have been fully briefed, and oral argument in front of the U.S. Court of Appeals for the Second Circuit occurred on November 5, 2014. The Court has not yet issued a decision on the appeals.
On May 23, 2014, the defendants filed motions to dismiss the FitzSimons action, including a global motion to dismiss Count I, which is the claim brought against former Tribune shareholders for intentional fraudulent conveyance under U.S. federal law. The Court has not yet issued a decision on any of these motions.
None of these lawsuits alleges any wrongdoing on the part of Rydex Series Funds. The following series of Rydex Series Funds held shares of Tribune and tendered these shares as part of Tribune’s LBO: Nova Fund, S&P 500® Pure Value Fund, Multi-Cap Core Equity Fund, S&P 500® Fund, Multi-Hedge Strategies Fund and Hedged Equity Fund (the “Funds”). The value of the proceeds received by the foregoing Funds was $28,220, $109,242, $9,860, $3,400, $1,181,160, and $10,880, respectively. At this stage of the proceedings, Rydex Series Funds is not able to make a reliable predication as to the outcome of these lawsuits or the effect, if any, on a Fund’s net asset value.
| | THE GUGGENHEIM FUNDS ANNUAL REPORT | 43 |
NOTES TO CONSOLIDATED FINANCIAL STATEMENTS (continued) |
Lyondell Chemical Company
In December 2011, Rydex Series Funds was named as a defendant in Weisfelner, as Trustee of the LB Creditor Trust, v. Fund 1 (In re Lyondell Chemical Co.), Adv. Pro. No. 10-4609 (Bankr. S.D.N.Y.) (the “Creditor Trust action”).
Similar to the claims made in the Tribune matter, the Weisfelner complaint seeks to have set aside and recovered as fraudulent transfers from former Lyondell Chemical Company (“Lyondell”) shareholders the consideration paid to them pursuant to the cash out merger of Lyondell shareholders in connection with the combination of Lyondell and Basell AF in 2007. Lyondell filed for bankruptcy in 2008.
On April 7, 2014, the plaintiff filed a Third Amended Complaint. In the related action entitled Weisfelner, as Trustee of the LB Litigation Trust v. A. Holmes & H. Holmes TTEE (In re Lyondell Co.), Adv. Pro. No. 10-5525 (Bankr. S.D.N.Y.) (the “Litigation Trust action”), the plaintiff also filed a Second Amended Complaint that alleges a claim against the former Lyondell shareholders under federal law for intentional fraudulent transfer. A third related action against the former Lyondell shareholders, Weisfelner, as Trustee of the LB Creditor Trust v. Reichman, Adv. Pro. No. 12-1570 (Bankr. S.D.N.Y.) (the “Reichman action”), is pending as well.
On May 8, 2014, the plaintiff in the Litigation Trust action filed a motion to certify a defendant class generally comprised of all former Lyondell shareholders that received proceeds in exchange for their shares in the 2007 merger transaction.
On July 30, 2014, the defendants filed a motion to dismiss these lawsuits. The Bankruptcy Court held oral argument on the motion to dismiss and on the motion for class certification on January 14 and January 15, 2015. On September 15, 2015, the Bankruptcy Court denied the motion for class certification without prejudice to the plaintiff’s right to file a renewed motion. On November 18, 2015, the Bankruptcy Court granted the defendants’ motion to dismiss the Litigation Trust action and denied their motion to dismiss the Creditor Trust and Reichman actions. The Litigation Trust action is now over, but the plaintiff has appealed the dismissal to the U.S. District Court for the Southern District of New York. Discovery has commenced, and will continue, in the Creditor Trust and Reichman actions.
These lawsuits do not allege any wrongdoing on the part of Rydex Series Funds. The following series of Rydex Series Funds received cash proceeds from the cash out merger in the following amounts: Basic Materials Fund - $1,725,168; Long Short Equity Fund f/k/a U.S. Long Short Momentum Fund - $2,193,600; Global 130/30 Strategy Fund - $37,920; Hedged Equity Fund - $1,440; and Multi-Hedge
44 | THE GUGGENHEIM FUNDS ANNUAL REPORT | |
NOTES TO CONSOLIDATED FINANCIAL STATEMENTS (concluded) |
Strategies Fund - $1,116,480. At this stage of the proceedings, Rydex Series Funds is not able to make a reliable predication as to the outcome of these lawsuits or the effect, if any, on a Fund’s net asset value.
12. Y-Class Share Information
At a meeting of the Board of Trustees of Rydex Series Funds held on May 18, 2015, Security Investors, LLC, the investment adviser to the Managed Futures Strategy Fund, recommended, and the Board approved, the closing and subsequent liquidation of the Fund’s Class Y shares (the “Liquidation”). Accordingly, the Fund’s Class Y shares ceased operations, were liquidated, and the liquidation proceeds were distributed to Class Y shareholders of record on June 26, 2015 (the “Liquidation Date”).
13. H-Class Shares to be Redesignated P-Class Shares
Effective following the close of business on April 30, 2015, (the “Redesignation Date”), all outstanding H-Class shares of the Guggenheim Managed Futures Strategy Fund, were redesignated as P-Class shares, and the Fund will no longer offer H-Class shares.
14. Portfolio Securities Loaned
During the year ended December 31, 2015, the Fund lent its securities to approved brokers to earn additional income. Security lending income shown on the Statement of Operations is net of rebates paid to borrowers and earnings on cash collateral investments shared with the lending agent. As of December 31, 2015, the Fund had ceased participation in securities lending.
| | THE GUGGENHEIM FUNDS ANNUAL REPORT | 45 |
REPORT OF INDEPENDENT REGISTERED PUBLIC ACCOUNTING FIRM |
The Board of Trustees and Shareholders of Rydex Series Funds:
We have audited the accompanying consolidated statement of assets and liabilities, including the consolidated schedule of investments, of Managed Futures Strategy Fund (one of the series constituting the Rydex Series Funds) (the “Fund”) as of December 31, 2015, and the related consolidated statement of operations for the year then ended, the consolidated statements of changes in net assets for each of the two years in the period then ended, and the consolidated financial highlights for each of the five years in the period then ended. These financial statements and financial highlights are the responsibility of the Fund’s management. Our responsibility is to express an opinion on these financial statements and financial highlights based on our audits.
We conducted our audits in accordance with the standards of the Public Company Accounting Oversight Board (United States). Those standards require that we plan and perform the audit to obtain reasonable assurance about whether the financial statements and financial highlights are free of material misstatement. We were not engaged to perform an audit of the Fund’s internal control over financial reporting. Our audits included consideration of internal control over financial reporting as a basis for designing audit procedures that are appropriate in the circumstances, but not for the purpose of expressing an opinion on the effectiveness of the Fund’s internal control over financial reporting. Accordingly, we express no such opinion. An audit also includes examining, on a test basis, evidence supporting the amounts and disclosures in the financial statements and financial highlights, assessing the accounting principles used and significant estimates made by management, and evaluating the overall financial statement presentation. Our procedures included confirmation of securities owned as of December 31, 2015, by correspondence with the custodian, transfer agent, and brokers or by other appropriate auditing procedures where replies from brokers were not received. We believe that our audits provide a reasonable basis for our opinion.
46 | THE GUGGENHEIM FUNDS ANNUAL REPORT | |
REPORT OF INDEPENDENT REGISTERED PUBLIC ACCOUNTING FIRM (concluded) |
In our opinion, the financial statements and financial highlights referred to above present fairly, in all material respects, the consolidated financial position of Managed Futures Strategy Fund (one of the series constituting the Rydex Series Funds) at December 31, 2015, the consolidated results of its operations for the year then ended, the consolidated changes in its net assets for each of the two years in the period then ended, and its consolidated financial highlights for each of the five years in the period then ended, in conformity with U.S. generally accepted accounting principles.
McLean, Virginia
February 26, 2016
| | THE GUGGENHEIM FUNDS ANNUAL REPORT | 47 |
OTHER INFORMATION (Unaudited) |
Tax Information
Of the ordinary income distributions paid during the year, the Fund had the corresponding percentages qualify for the dividends received deduction for corporations:
Fund | % Qualifying |
Managed Futures Strategy Fund | 0.70% |
The following amounts of taxable ordinary income dividends paid during the fiscal year qualified for the lower income tax rate available to individuals under the Jobs and Growth Tax Relief Reconciliation Act of 2003:
Fund | Qualified
dividend income % |
Managed Futures Strategy Fund | 2.20% |
Proxy Voting Information
A description of the policies and procedures that the Trust uses to determine how to vote proxies relating to securities held in the Funds’ portfolios is available, without charge and upon request, by calling 800.820.0888. This information is also available from the EDGAR database on the SEC’s website at http://www.sec.gov.
Information regarding how the Funds voted proxies relating to portfolio securities during the most recent 12-month period ended June 30 is available without charge, upon request, by calling 800.820.0888. This information is also available from the EDGAR database on the SEC’s website at http://www.sec.gov.
Sector Classification
Information in the “Schedule of Investments” is categorized by sectors using sector-level Classifications defined by the Bloomberg Industry Classification System, a widely recognized industry classification system provider. Each Fund’s registration statement has investment policies relating to concentration in specific sectors/industries. For purposes of these investment policies, the Funds usually classify sectors/industries based on industry-level Classifications used by widely recognized industry classification system providers such as Bloomberg Industry Classification System, Global Industry Classification Standards and Barclays Global Classification Scheme.
48 | THE GUGGENHEIM FUNDS ANNUAL REPORT | |
OTHER INFORMATION (Unaudited)(concluded) |
Quarterly Portfolio Schedules Information
The Trust files its complete schedule of portfolio holdings with the SEC for the first and third quarters of each fiscal year on Form N-Q; which are available on the SEC’s website at http://www.sec.gov. The Funds’ Forms N-Q may be reviewed and copied at the SEC’s Public Reference Room in Washington, DC, and that information on the operation of the Public Reference Room may be obtained by calling 800-SEC-0330. Copies of the portfolio holdings are also available to shareholders, without charge and upon request, by calling 800.820.0888.
| | THE GUGGENHEIM FUNDS ANNUAL REPORT | 49 |
INFORMATION ON BOARD OF TRUSTEES AND OFFICERS (Unaudited) |
A Board of Trustees oversees the Trust, as well as other trusts of GI, in which its members have no stated term of service, and continue to serve after election until resignation. The Statement of Additional Information includes further information about Fund Trustees and Officers, and can be obtained without charge by visiting guggenheiminvestments.com or by calling 800.820.0888.
Name, Address* and Year of Birth of Trustee | Position(s) Held with the
Trust, Term of Office and
Length of Time Served | Principal
Occupation(s)
During Past
5 Years | Number of
Portfolios
in Fund
Complex
Overseen by
Trustee*** | Other
Directorships
Held by
Trustee |
INTERESTED TRUSTEE | | | |
Donald C. Cacciapaglia**
(1951) | Trustee from 2012 to present. | Current: President and CEO, certain other funds in the Fund Complex (2012-present); Vice Chairman, Guggenheim Investments (2010-present). Former: Chairman and CEO, Channel Capital Group, Inc. (2002-2010). | 237 | Clear Spring Life Insurance Company (2015-present); Guggenheim Partners Japan, Ltd. (2014-present); Delaware Life (2013-present); Guggenheim Life and Annuity Company (2011-present); Paragon Life Insurance Company of Indiana (2011-present). |
INDEPENDENT TRUSTEES | | | |
Corey A. Colehour
(1945) | Trustee from 1993 to present; Member of the Audit Committee from 1994 to present; Member of the Governance Committee from 2014 to present; and Member of the Investment and Performance Committee from 2014 to present. | Retired. | 133 | None. |
50 | THE GUGGENHEIM FUNDS ANNUAL REPORT | |
INFORMATION ON BOARD OF TRUSTEES AND OFFICERS (Unaudited)(continued) |
Name, Address* and Year of Birth of Trustee | Position(s) Held with the
Trust, Term of Office and
Length of Time Served | Principal Occupation(s) During Past
5 Years | Number of Portfolios in Fund Complex Overseen by Trustee*** | Other
Directorships
Held by
Trustee |
INDEPENDENT TRUSTEES - continued |
J. Kenneth Dalton
(1941) | Trustee from 1995 to present; Chairman and Member of the Audit Committee from 1997 to present; and Member of the Compliance and Risk Oversight Committee from 2010 to present. | Retired. | 133 | Epiphany Funds (4) (2009-present). |
John O. Demaret
(1940) | Vice Chairman of the Board from 2014 to present (Chairman of the Board from 2006 to 2014); Trustee and Member of the Audit Committee from 1997 to present; Chairman (since 2014) and Member of the Compliance and Risk Oversight Committee from 2010 to present; Chairman and Member of the Investment and Performance Committee from 2014 to present; and Member of the Nominating Committee from 2014 to present. | Retired. | 133 | None. |
| | THE GUGGENHEIM FUNDS ANNUAL REPORT | 51 |
INFORMATION ON BOARD OF TRUSTEES AND OFFICERS (Unaudited)(continued) |
Name, Address* and Year of Birth of Trustee | Position(s) Held with the
Trust, Term of Office and
Length of Time Served | Principal Occupation(s) During Past
5 Years | Number of Portfolios in Fund Complex Overseen by Trustee*** | Other
Directorships
Held by
Trustee |
INDEPENDENT TRUSTEES - concluded |
Werner E. Keller
(1940) | Chairman of the Board from 2014 to present (Vice Chairman of the Board from 2010 to 2014); Trustee and Member of the Audit Committee from 2005 to present; and Member of the Investment and Performance Committee from 2014 to present. | Current: Founder and President, Keller Partners, LLC (investment research firm) (2005-present). | 133 | None. |
Thomas F. Lydon, Jr. (1960) | Trustee and Member of the Audit Committee from 2005 to present; Member of the Nominating Committee from 2005 to present; and Member of the Governance Committee from 2007 to present. | Current: President, Global Trends Investments (registered investment adviser) (1996-present). | 133 | US Global Investors (GROW) (1995-present). |
Patrick T. McCarville (1942) | Trustee from 1997 to present; Member of the Audit Committee from 1997 to present; Chairman and Member of the Nominating Committee from 2004 to present; Chairman and Member of the Governance Committee from 2007 to present; and Member of the Compliance and Risk Oversight Committee from 2014 to present. | Retired. Former: Chief Executive Officer, Par Industries, Inc., d/b/a Par Leasing (1977-2010). | 133 | None. |
52 | THE GUGGENHEIM FUNDS ANNUAL REPORT | |
INFORMATION ON BOARD OF TRUSTEES AND OFFICERS (Unaudited)(continued) |
Name,
Address*
and Year
of Birth | Position(s) Held
with the
Trust, Term of
Office and
Length of Time
Served | Principal Occupation(s)
During Past 5 Years |
OFFICERS | | |
Donald C. Cacciapaglia
(1951) | President (2012-present). | Current: President and CEO, certain other funds in the Fund Complex (2012-present); Vice Chairman, Guggenheim Investments (2010-present). Former: Chairman and CEO, Channel Capital Group Inc. (2002-2010). |
Michael P. Byrum
(1970) | Vice President (1999-present). | Current: Senior Vice President, Security Investors, LLC (2010-present); President and Chief Investment Officer, Rydex Holdings, LLC (2008-present); Director and Chairman, Advisory Research Center, Inc. (2006-present); Manager, Guggenheim Specialized Products, LLC (2005-present). Former: Vice President, Guggenheim Distributors, LLC (2009); Director (2009-2010) and Secretary (2002-2010), Rydex Fund Services, LLC; Director (2008-2010), Chief Investment Officer (2006-2010), President (2004-2010) and Secretary (2002-2010), Rydex Advisors, LLC; Director (2008-2010), Chief Investment Officer (2006-2010), President (2004-2010) and Secretary (2002-2010), Rydex Advisors II, LLC. |
Nikolaos Bonos
(1963) | Vice President and Treasurer (2003-present). | Current: Senior Vice President, Security Investors, LLC (2010-present); Chief Executive Officer, Guggenheim Specialized Products, LLC (2009-present); Chief Executive Officer & President, Rydex Fund Services, LLC (2009-present); Vice President, Rydex Holdings, LLC (2008-present). Former: Senior Vice President, Security Global Investors, LLC (2010-2011); and Senior Vice President, Rydex Advisors, LLC and Rydex Advisors II, LLC (2006-2011). |
| | THE GUGGENHEIM FUNDS ANNUAL REPORT | 53 |
INFORMATION ON BOARD OF TRUSTEES AND OFFICERS (Unaudited)(continued) |
Name,
Address*
and Year
of Birth | Position(s) Held
with the
Trust, Term of
Office and
Length of Time
Served | Principal Occupation(s)
During Past 5 Years |
OFFICERS - continued | |
Elisabeth Miller
(1968) | Chief Compliance Officer (2012-present). | Current: CCO, certain other funds in the Fund Complex (2012-present); CCO, Security Investors, LLC (2012-present); CCO, Guggenheim Funds Investment Advisors, LLC (2012-present); Managing Director, Guggenheim Investments (2012-present); Vice President, Guggenheim Funds Distributors, LLC (March 2014-present). Former: CCO, Guggenheim Distributors, LLC (2009-March 2014); Senior Manager, Security Investors, LLC (2004-2009); Senior Manager, Guggenheim Distributors, LLC (2004-2009). |
Joseph M. Arruda
(1966) | Assistant Treasurer (2006-present). | Current: Assistant Treasurer, certain other funds in the Fund Complex (2006-present); Vice President, Security Investors, LLC (2010-present); CFO and Manager, Guggenheim Specialized Products, LLC (2009-present). Former: Vice President, Security Global Investors, LLC (2010-2011); Vice President, Rydex Advisors, LLC (2010); Vice President, Rydex Advisors II, LLC (2010). |
Paul J. Davio
(1972) | Assistant Treasurer (2014-present). | Current: Assistant Treasurer, certain other funds in the Fund Complex (2014-present); Director, Guggenheim Investments (2006-present). Former: Manager, Mutual Fund Administration, Guggenheim Investments (2003-2006). |
54 | THE GUGGENHEIM FUNDS ANNUAL REPORT | |
INFORMATION ON BOARD OF TRUSTEES AND OFFICERS (Unaudited)(concluded) |
Name,
Address*
and Year
of Birth | Position(s) Held
with the
Trust, Term of
Office and
Length of Time
Served | Principal Occupation(s)
During Past 5 Years |
OFFICERS - concluded | |
Amy J. Lee
(1961) | Vice President (2009-present) and Secretary (2012-present). | Current: Chief Legal Officer, certain other funds in the Fund Complex (2013-present); Senior Managing Director, Guggenheim Investments (2012-present). Former: Vice President, Associate General Counsel and Assistant Secretary, Security Benefit Life Insurance Company and Security Benefit Corporation (2004-2012). |
* | All Trustees and Officers may be reached c/o Guggenheim Investments, 805 King Farm Boulevard, Suite 600, Rockville, MD 20850. |
** | Mr. Cacciapaglia is an “interested” person of the Trust, as that term is defined in the 1940 Act by virtue of his affiliation with the Adviser’s parent company. |
*** | The “Fund Complex” includes all closed-end and open-end funds (including all of their portfolios) advised by the Adviser and any funds that have an investment adviser or servicing agent that is an affiliated person of the Adviser. Information provided is as of the date of this report. |
| | THE GUGGENHEIM FUNDS ANNUAL REPORT | 55 |
GUGGENHEIM INVESTMENTS PRIVACY POLICIES (Unaudited) |
Rydex Funds, Guggenheim Funds, Rydex Investments, Guggenheim Funds Distributors, LLC, Security Investors, LLC, Security Distributors, Inc., Guggenheim Partners Investment Managers, LLC, and Rydex Advisory Services (Collectively “Guggenheim Investments”).
Our Commitment to You
When you become a Guggenheim Investments investor, you entrust us with not only your hard-earned money but also with personal and financial information about you. We recognize that your relationship with us is based on trust and that you expect us to act responsibly and in your best interests. Because we have access to this private information about you, we hold ourselves to the highest standards in its safekeeping and use. This means, most importantly, that we do not sell client information to anyone—whether it is your personal information or if you are a current or former Guggenheim Investments client.
The Information We Collect About You
In the course of doing business with shareholders and investors, we collect nonpublic personal information about you. You typically provide personal information when you complete a Guggenheim Investments account application or when you request a transaction that involves Rydex and Guggenheim Investments funds or one of the Guggenheim Investments affiliated companies. “Nonpublic personal information” is personally identifiable private information about you. For example, it includes information regarding your name and address, Social Security or taxpayer identification number, assets, income, account balance, bank account information and investment activity (e.g., purchase and redemption history).
How We Handle Your Personal Information
As emphasized above, we do not sell information about current or former clients or their accounts to third parties. Nor do we share such information, except when necessary to complete transactions at your request or to make you aware of related investment products and services that we offer. Additional details about how we handle your personal information are provided below. To complete certain transactions or account changes that you direct, it may be necessary to provide identifying information to companies, individuals or groups that are not affiliated with Guggenheim Investments. For example, if you ask to transfer assets from another financial institution to Guggenheim Investments, we will need to provide certain information about you to that company to complete the transaction. To alert you to other Guggenheim Investments investment products and services, we may share your information within the Guggenheim Investments family of affiliated companies. This would include, for example, sharing your information within Guggenheim Investments so we can make you aware of
56 | THE GUGGENHEIM FUNDS ANNUAL REPORT | |
GUGGENHEIM INVESTMENTS PRIVACY POLICIES (Unaudited)(continued) |
new Rydex and Guggenheim Investments funds or the services offered through another Guggenheim Investments affiliated company. In certain instances, we may contract with nonaffiliated companies to perform services for us. Where necessary, we will disclose information we have about you to these third parties. In all such cases, we provide the third party with only the information necessary to carry out its assigned responsibilities and only for that purpose. And we require these third parties to treat your private information with the same high degree of confidentiality that we do. In certain instances, we may share information with other financial institutions regarding individuals and entities in response to the U.S.A. Patriot Act. Finally, we will release information about you if you direct us to do so, if we are compelled by law to do so or in other circumstances permitted by law.
Opt Out Provisions
We do not sell your personal information to anyone. The law allows you to “opt out” of only certain kinds of information sharing with third parties. The firm does not share personal information about you with any third parties that triggers this opt-out right. This means YOU ARE ALREADY OPTED OUT.
How We Protect Privacy Online
Our concern for the privacy of our shareholders also extends to those who use our web site, guggenheiminvestments.com. Our web site uses some of the most secure forms of online communication available, including encryption technology, Secure Socket Layer (SSL) protocol, firewalls and user names and passwords. These technologies provide a high level of security and privacy when you access your account information or initiate online transactions. The Guggenheim Investments web site offers customized features that require our use of “http cookies”—tiny pieces of information that we ask your browser to store. However, we make very limited use of these cookies. We only use cookies for session management and security features on the Guggenheim Investments web site. We do not use them to pull data from your hard drive, to learn your email address, or to view data in cookies created by other web sites. We will not share the information in our cookies or give others access to it. See the legal information area on our web site for more details about web site security and privacy features.
How We Safeguard Your Personal Information
We restrict access to nonpublic personal information about shareholders to our employees and in some cases to third parties (for example, the service providers described above) as permitted by law. We maintain strict physical, electronic and procedural safeguards that comply with federal standards to guard your nonpublic personal information.
| | THE GUGGENHEIM FUNDS ANNUAL REPORT | 57 |
GUGGENHEIM INVESTMENTS PRIVACY POLICIES (Unaudited)(concluded) |
We’ll Keep You Informed
As required by federal law, we will notify shareholders of our privacy policy annually. We reserve the right to modify this policy at any time, but rest assured that if we do change it, we will tell you promptly. You will also be able to access our privacy policy from our web site at guggenheiminvestments.com. Should you have any questions regarding our privacy policy, contact us at 800.820.0888 or 301.296.5100.
58 | THE GUGGENHEIM FUNDS ANNUAL REPORT | |
This page intentionally left blank.
This page intentionally left blank.
This page intentionally left blank.
This page intentionally left blank.
This page intentionally left blank.
This page intentionally left blank.
This page intentionally left blank.
Item 2. Code of Ethics.
The registrant’s Board of Trustees has adopted a code of ethics that applies to the registrant’s principal executive officer and principal financial officer. No substantive amendments were approved or waivers were granted to the Code during the period covered by this report. The Code is filed as an exhibit to this Form N-CSR.
Item 3. Audit Committee Financial Expert.
The registrant's Board of Trustees has determined that Werner Keller, an "independent" Trustee serving on the registrant's audit committee, is an "audit committee financial expert," as defined in Item 3 of Form N-CSR. Under applicable securities laws, a person who is determined to be an audit committee financial expert will not be deemed an "expert" for any purpose, including without limitation for the purposes of Section 11 of the Securities Act of 1933, as a result of being designated or identified as an audit committee financial expert. The designation or identification of a person as an audit committee financial expert does not impose on such person any duties, obligations, or liabilities that are greater than the duties, obligations, and liabilities imposed on such person as a member of the audit committee and Board of Trustees in the absence of such designation or identification.
Item 4. Principal Accountant Fees and Services.
(a) Audit Fees. The aggregate Audit Fees billed by the registrant’s principal accountant, for the audit of the annual financial statements in connection with statutory and regulatory filings for the fiscal years ended December 31, 2015 and December 31, 2014 were $91,221 and $70,782, respectively.
(b) Audit Related Fees. The aggregate Audit Related Fees by the registrant’s principal accountant billed for the fiscal years ended December 31, 2015 and December 31, 2014 were $0 and $0, respectively.
The aggregate fees billed in the Reporting Periods for assurance and related services by the Auditor to the registrant’s investment adviser (not including any sub‑investment adviser whose role is primarily portfolio management and is subcontracted with or overseen by another investment adviser), and any entity controlling, controlled by or under common control with the investment adviser that provides ongoing services to the registrant (“Service Affiliates”) which required pre‑approval by the Audit Committee which related to the review of the transfer agent function for the fiscal years ended December 31, 2015 and December 31, 2014 were $38,585 and $36,750, respectively.
(c) Tax Fees: The aggregate Tax Fees billed by the registrant’s principal accountant for professional services rendered for tax compliance, tax advice, and tax planning, including preparation of tax returns and distribution assistance, for the fiscal years ended December 31, 2015 and December 31, 2014 were $68,566 and $28,350, respectively.
(d) All Other Fees. The aggregate All Other Fees billed by the registrant’s principal accountant for products and services provided by the Auditor, other than the services reported in paragraphs (a) through (c) of this Item, for the fiscal years ended December 31, 2015 and December 31, 2014 were $0 and $0, respectively.
(e) Audit Committee Pre-Approval Policies and Procedures. The audit committee has adopted a policy whereby audit and non-audit services performed by the registrant’s principal accountant for the registrant, its investment advisor, and any entity controlling, controlled by, or under common control with the investment advisor that provides ongoing services to the registrant require pre-approval in advance at regularly scheduled audit committee meetings. If such service is required between regularly scheduled audit committee meetings, the chairman of the audit committee, J. Kenneth Dalton, is authorized to pre-approve the service with full committee approval at the next scheduled meeting. There shall be no waivers of the pre-approval process. No services described in (b)-(d) above were approved pursuant to paragraph (c)(7)(i)(C) of Rule 2-01 of Regulation S-X.
(f) Not applicable.
(g) Non-Audit Fees. The aggregate non-audit fees billed by the registrant’s accountant for the most recent fiscal year and the preceding fiscal year for services rendered to the registrant, the investment advisor, and any entity controlling, controlled by, or under common control with the advisor that provides ongoing services to the registrant were $107,151 and $65,100, respectively. These aggregate fees were less than the aggregate fees billed for the same periods by the registrant’s principal accountant for audit services rendered to the registrant, the investment advisor, and any entity controlling, controlled by, or under common control with the advisor that provides ongoing services to the registrant.
(h) Auditor Independence. All non-audit services rendered in (g) above were pre-approved by the registrant’s audit committee. As such, the audit committee has considered these services in maintaining the principal accountant’s independence.
Item 5. Audit Committee of Listed Registrants.
Not applicable.
Item 6. Investments.
Schedule of Investments is included as part of the report to shareholders filed under Item 1 of this form.
Item 7. Disclosure of Proxy Voting Policies and Procedures for Closed-End Management Investment Companies.
Not applicable.
Item 8. Portfolio Managers of Closed-End Management Investment Companies.
Not applicable.
Item 9. Purchases of Equity Securities by Closed-End Management Investment Company and Affiliated Purchasers.
Not applicable.
Item 10. Submission of Matters to a Vote of Security Holders.
Not applicable.
Item 11. Controls and Procedures.
(a) The registrant’s President (principal executive officer) and Treasurer (principal financial officer) have evaluated the registrant’s disclosure controls and procedures within 90 days of this filing and have concluded that the registrant’s disclosure controls and procedures were effective as of that date in ensuring that information required to be disclosed by the registrant in this Form N-CSR was recorded, processed, summarized, and reported timely.
(b) The registrant’s principal executive officer and principal financial officer are aware of no change in the registrant’s internal control over financial reporting that occurred during the registrant’s second fiscal quarter covered by this report that has materially affected, or is reasonably likely to materially affect, the registrant’s internal control over financial reporting.
Item 12. Exhibits.
(a)(1) The registrant’s code of ethics pursuant to Item 2 of Form N-CSR is attached.
(a)(2) Separate certifications by the President (principal executive officer) and Treasurer (principal financial officer) of the registrant as required by Rule 30a-2(a) under the Act (17 CFR 270.30a-2(a)) are attached.
(b) A certification by the registrant’s President (principal executive officer) and Treasurer (principal financial officer) as required by Rule 30a-2(b) under the Act (17 CFR 270.30a-2(b)) is attached.
SIGNATURES
Pursuant to the requirements of the Securities Exchange Act of 1934 and the Investment Company Act of 1940, the registrant has duly caused this report to be signed on its behalf by the undersigned, thereunto duly authorized.
| (Registrant) | Rydex Series Funds | |
| | | |
| By (Signature and Title)* | /s/ Donald C. Cacciapaglia | |
| | Donald C. Cacciapaglia, President and Chief Executive Officer |
| | | |
| Date | March 9, 2016 | |
| | | |
| Pursuant to the requirements of the Securities Exchange Act of 1934 and the Investment Company Act of 1940, this report has been signed below by the following persons on behalf of the registrant and in the capacities and on the dates indicated. |
| | |
| By (Signature and Title)* | /s/ Donald C. Cacciapaglia | |
| | Donald C. Cacciapaglia, President and Chief Executive Officer |
| | | |
| Date | March 9, 2016 | |
| | | |
| By (Signature and Title)* | /s/ Nikolaos Bonos | |
| | Nikolaos Bonos, Vice President and Treasurer | |
| | | |
| Date | March 9, 2016 | |
* Print the name and title of each signing officer under his or her signature.