0000899148 rsf:GuggenheimManagedFuturesStrategyFundInstitutionalClassICEBofA3MonthUSTreasuryBillIndexMember 2022-12-31
UNITED STATES
SECURITIES AND EXCHANGE COMMISSION
Washington, D.C. 20549
FORM N-CSR
CERTIFIED SHAREHOLDER REPORT OF REGISTERED MANAGEMENT INVESTMENT COMPANIES
Investment Company Act file number 811- 07584
Rydex Series Funds
(Exact name of registrant as specified in charter)
702 King Farm Boulevard, Suite 200
Rockville, Maryland 20850
(Address of principal executive offices) (Zip code)
Amy J. Lee
Rydex Series Funds
702 King Farm Boulevard, Suite 200
Rockville, Maryland 20850
(Name and address of agent for service)
Registrant's telephone number, including area code: (301) 296-5100
Date of fiscal year end: December 31
Date of reporting period: January 1, 2024 - December 31, 2024
Item 1. Reports to Stockholders.
| (a) | The registrant’s annual report transmitted to shareholders pursuant to Rule 30e-1 under the Investment Company Act of 1940, as amended (the “Investment Company Act”), is as follows: |

Annual Shareholder Report | 12.31.24
This annual shareholder report contains important information about the Commodities Strategy Fund for the period of January 1, 2024 to December 31, 2024. You can find additional information about the fund at https://www.guggenheiminvestments.com/mutual-funds/literature. You can also request this information by contacting 800 820 0888 or GuggenheimClientServices@mufg-is.com.
This report describes changes to the fund that occurred during the reporting period.
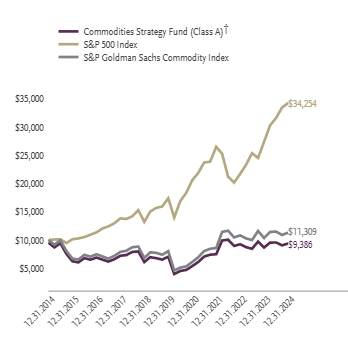
For the period of January 1, 2024 to December 31, 2024, the fund (Class A shares) returned 8.24%, underperforming the fund's benchmark, the S&P 500 Index, which returned 25.02% for the same period and underperforming the fund's secondary index, the S&P Goldman Sachs Commodity Index, which returned 9.25% for the same period.
The fund's broad-based securities market index was changed from the S&P Goldman Sachs Commodity Index to the S&P 500 Index to comply with the regulation that requires the fund's broad-based securities market index to represent the overall applicable market.
What factors materially affected the fund's performance over the last year?
The fund obtained exposure to the commodities markets through futures on the S&P Goldman Sachs Commodity Index. S&P Goldman Sachs Commodity Index futures had a strong first half of 2024 with headwinds from energy and industrial metals sectors in the second half of the year. Fifteen of the 24 index components had positive returns for the period. The components with some of the largest positive returns were cocoa, coffee and gold. The components with some of the largest negative returns were soybean, wheat, and cotton.
Cumulative performance* for the fund's most recently completed 10 years (as of 12.31.24), assuming a $10,000 initial investment.
| 12/31/2014 | 9527 | 10000 | 10000 |
| 03/31/2015 | 8697 | 10095 | 9178 |
| 06/30/2015 | 9431 | 10123 | 9979 |
| 09/30/2015 | 7539 | 9471 | 8054 |
| 12/31/2015 | 6236 | 10138 | 6714 |
| 03/31/2016 | 6042 | 10275 | 6547 |
| 06/30/2016 | 6795 | 10527 | 7376 |
| 09/30/2016 | 6515 | 10933 | 7070 |
| 12/31/2016 | 6896 | 11351 | 7477 |
| 03/31/2017 | 6534 | 12039 | 7100 |
| 06/30/2017 | 6182 | 12411 | 6712 |
| 09/30/2017 | 6593 | 12967 | 7196 |
| 12/31/2017 | 7218 | 13829 | 7909 |
| 03/31/2018 | 7334 | 13724 | 8082 |
| 06/30/2018 | 7889 | 14195 | 8728 |
| 09/30/2018 | 7982 | 15290 | 8845 |
| 12/31/2018 | 6102 | 13223 | 6816 |
| 03/31/2019 | 6959 | 15027 | 7836 |
| 06/30/2019 | 6790 | 15674 | 7725 |
| 09/30/2019 | 6531 | 15940 | 7403 |
| 12/31/2019 | 7046 | 17386 | 8017 |
| 03/31/2020 | 3977 | 13979 | 4622 |
| 06/30/2020 | 4516 | 16850 | 5106 |
| 09/30/2020 | 4707 | 18355 | 5342 |
| 12/31/2020 | 5385 | 20585 | 6115 |
| 03/31/2021 | 6099 | 21856 | 6944 |
| 06/30/2021 | 7067 | 23724 | 8036 |
| 09/30/2021 | 7400 | 23863 | 8455 |
| 12/31/2021 | 7488 | 26494 | 8583 |
| 03/31/2022 | 9911 | 25276 | 11426 |
| 06/30/2022 | 10060 | 21206 | 11656 |
| 09/30/2022 | 8954 | 20170 | 10454 |
| 12/31/2022 | 9249 | 21696 | 10813 |
| 03/31/2023 | 8732 | 23322 | 10279 |
| 06/30/2023 | 8447 | 25361 | 9999 |
| 09/30/2023 | 9719 | 24531 | 11597 |
| 12/31/2023 | 8671 | 27399 | 10352 |
| 03/31/2024 | 9542 | 30291 | 11425 |
| 06/30/2024 | 9564 | 31589 | 11499 |
| 09/30/2024 | 9058 | 33448 | 10894 |
| 12/31/2024 | 9386 | 34254 | 11309 |
| Class A (without sales charge) | 8.24% | 5.90% | -0.15% |
| Class A (with sales charge)† | 3.10% | 4.88% | -0.63% |
| S&P 500 Index | 25.02% | 14.53% | 13.10% |
| S&P Goldman Sachs Commodity Index | 9.25% | 7.12% | 1.24% |
The fund's past performance is not a good predictor of the fund's future performance. Visit GuggenheimInvestments.com/mutual-funds/performance for more recent performance information.
| Net Assets | $5,125,114 |
| Total Number of Portfolio Holdings | 6 |
| Portfolio Turnover Rate | 0% |
| Total Advisory Fees Paid | $36,503 |
| Commodities Strategy Fund | Class A | RYMEX | Annual Shareholder Report | December 31, 2024 |
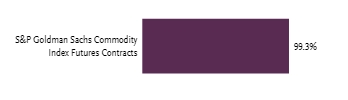
| S&P Goldman Sachs Commodity Index Futures Contracts | 99.3% |

| Guggenheim Ultra Short Duration Fund — Institutional Class | 15.9% |
| Guggenheim Strategy Fund II | 15.6% |
| Total | 31.5% |
| |
1 | "Consolidated Holdings Diversification (Market Exposure as a % of Net Assets)" excludes any temporary cash investments, investments in Guggenheim Strategy Funds Trust mutual funds, or investments in Guggenheim Ultra Short Duration Fund. |
| |
2 | "Largest Holdings (as a % of Net Assets)" excludes any temporary cash or derivative investments. |
| Guggenheim Ultra Short Duration Fund — Institutional Class | 15.9% |
| Guggenheim Strategy Fund II | 15.6% |
| Total | 31.5% |
| |
2 | "Largest Holdings (as a % of Net Assets)" excludes any temporary cash or derivative investments. |
There were no changes in or disagreements with fund accountants for the period.
This is a summary of certain changes to the fund since December 31, 2023. For more complete information, you may review the fund's next prospectus, which we expect to be available by April 30, 2025 at GuggenheimInvestments.com/services/prospectuses-and-reports or, by calling 800 820 0888.
Subsequent to the December 31, 2024 year-end, effective February 24, 2025, the fund executed a one-for-five reverse split of its issued and outstanding shares. There will be no difference in the aggregate value of assets as a result of this reverse split, nor will the increase in the net asset value of the fund be considered a taxable event. Please refer to a tax consultant for information regarding taxes.
| |  | Availability of Additional Information. For additional information, including the fund's prospectus, financial information, holdings and proxy voting information, go to https://www.guggenheiminvestments.com/mutual-funds/literature or, call 800 820 0888. |
AR-RYMEX-123124
Annual Shareholder Report | 12.31.24
This annual shareholder report contains important information about the Commodities Strategy Fund for the period of January 1, 2024 to December 31, 2024. You can find additional information about the fund at https://www.guggenheiminvestments.com/mutual-funds/literature. You can also request this information by contacting 800 820 0888 or GuggenheimClientServices@mufg-is.com.
This report describes changes to the fund that occurred during the reporting period.
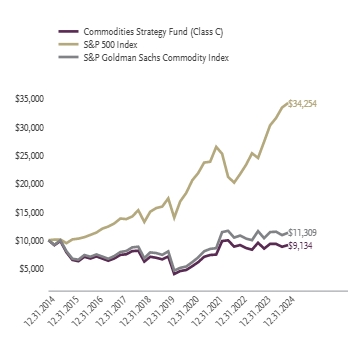
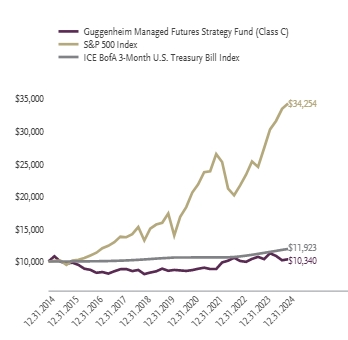
For the period of January 1, 2024 to December 31, 2024, the fund (Class C shares) returned 7.41%, underperforming the fund's benchmark, the S&P 500 Index, which returned 25.02% for the same period and underperforming the fund's secondary index, the S&P Goldman Sachs Commodity Index, which returned 9.25% for the same period.
The fund's broad-based securities market index was changed from the S&P Goldman Sachs Commodity Index to the S&P 500 Index to comply with the regulation that requires the fund's broad-based securities market index to represent the overall applicable market.
What factors materially affected the fund's performance over the last year?
The fund obtained exposure to the commodities markets through futures on the S&P Goldman Sachs Commodity Index. S&P Goldman Sachs Commodity Index futures had a strong first half of 2024 with headwinds from energy and industrial metals sectors in the second half of the year. Fifteen of the 24 index components had positive returns for the period. The components with some of the largest positive returns were cocoa, coffee and gold. The components with some of the largest negative returns were soybean, wheat, and cotton.
Cumulative performance* for the fund's most recently completed 10 years (as of 12.31.24), assuming a $10,000 initial investment.
| 12/31/2014 | 10000 | 10000 | 10000 |
| 03/31/2015 | 9115 | 10095 | 9178 |
| 06/30/2015 | 9858 | 10123 | 9979 |
| 09/30/2015 | 7869 | 9471 | 8054 |
| 12/31/2015 | 6503 | 10138 | 6714 |
| 03/31/2016 | 6284 | 10275 | 6547 |
| 06/30/2016 | 7060 | 10527 | 7376 |
| 09/30/2016 | 6754 | 10933 | 7070 |
| 12/31/2016 | 7131 | 11351 | 7477 |
| 03/31/2017 | 6744 | 12039 | 7100 |
| 06/30/2017 | 6364 | 12411 | 6712 |
| 09/30/2017 | 6774 | 12967 | 7196 |
| 12/31/2017 | 7402 | 13829 | 7909 |
| 03/31/2018 | 7507 | 13724 | 8082 |
| 06/30/2018 | 8060 | 14195 | 8728 |
| 09/30/2018 | 8140 | 15290 | 8845 |
| 12/31/2018 | 6210 | 13223 | 6816 |
| 03/31/2019 | 7070 | 15027 | 7836 |
| 06/30/2019 | 6885 | 15674 | 7725 |
| 09/30/2019 | 6610 | 15940 | 7403 |
| 12/31/2019 | 7117 | 17386 | 8017 |
| 03/31/2020 | 4011 | 13979 | 4622 |
| 06/30/2020 | 4545 | 16850 | 5106 |
| 09/30/2020 | 4728 | 18355 | 5342 |
| 12/31/2020 | 5399 | 20585 | 6115 |
| 03/31/2021 | 6105 | 21856 | 6944 |
| 06/30/2021 | 7060 | 23724 | 8036 |
| 09/30/2021 | 7378 | 23863 | 8455 |
| 12/31/2021 | 7455 | 26494 | 8583 |
| 03/31/2022 | 9846 | 25276 | 11426 |
| 06/30/2022 | 9974 | 21206 | 11656 |
| 09/30/2022 | 8862 | 20170 | 10454 |
| 12/31/2022 | 9139 | 21696 | 10813 |
| 03/31/2023 | 8611 | 23322 | 10279 |
| 06/30/2023 | 8314 | 25361 | 9999 |
| 09/30/2023 | 9547 | 24531 | 11597 |
| 12/31/2023 | 8503 | 27399 | 10352 |
| 03/31/2024 | 9336 | 30291 | 11425 |
| 06/30/2024 | 9342 | 31589 | 11499 |
| 09/30/2024 | 8832 | 33448 | 10894 |
| 12/31/2024 | 9134 | 34254 | 11309 |
| Class C (without CDSC) | 7.41% | 5.12% | -0.90% |
| Class C (with CDSC)‡ | 6.41% | 5.12% | -0.90% |
| S&P 500 Index | 25.02% | 14.53% | 13.10% |
| S&P Goldman Sachs Commodity Index | 9.25% | 7.12% | 1.24% |
The fund's past performance is not a good predictor of the fund's future performance. Visit GuggenheimInvestments.com/mutual-funds/performance for more recent performance information.
| Net Assets | $5,125,114 |
| Total Number of Portfolio Holdings | 6 |
| Portfolio Turnover Rate | 0% |
| Total Advisory Fees Paid | $36,503 |
| Commodities Strategy Fund | Class C | RYMJX | Annual Shareholder Report | December 31, 2024 |
| S&P Goldman Sachs Commodity Index Futures Contracts | 99.3% |
| Guggenheim Ultra Short Duration Fund — Institutional Class | 15.9% |
| Guggenheim Strategy Fund II | 15.6% |
| Total | 31.5% |
| |
1 | "Consolidated Holdings Diversification (Market Exposure as a % of Net Assets)" excludes any temporary cash investments, investments in Guggenheim Strategy Funds Trust mutual funds, or investments in Guggenheim Ultra Short Duration Fund. |
| |
2 | "Largest Holdings (as a % of Net Assets)" excludes any temporary cash or derivative investments. |
| Guggenheim Ultra Short Duration Fund — Institutional Class | 15.9% |
| Guggenheim Strategy Fund II | 15.6% |
| Total | 31.5% |
| |
2 | "Largest Holdings (as a % of Net Assets)" excludes any temporary cash or derivative investments. |
There were no changes in or disagreements with fund accountants for the period.
This is a summary of certain changes to the fund since December 31, 2023. For more complete information, you may review the fund's next prospectus, which we expect to be available by April 30, 2025 at GuggenheimInvestments.com/services/prospectuses-and-reports or, by calling 800 820 0888.
Subsequent to the December 31, 2024 year-end, effective February 24, 2025, the fund executed a one-for-five reverse split of its issued and outstanding shares. There will be no difference in the aggregate value of assets as a result of this reverse split, nor will the increase in the net asset value of the fund be considered a taxable event. Please refer to a tax consultant for information regarding taxes.
| |  | Availability of Additional Information. For additional information, including the fund's prospectus, financial information, holdings and proxy voting information, go to https://www.guggenheiminvestments.com/mutual-funds/literature or, call 800 820 0888. |
AR-RYMJX-123124
Annual Shareholder Report | 12.31.24
This annual shareholder report contains important information about the Commodities Strategy Fund for the period of January 1, 2024 to December 31, 2024. You can find additional information about the fund at https://www.guggenheiminvestments.com/mutual-funds/literature. You can also request this information by contacting 800 820 0888 or GuggenheimClientServices@mufg-is.com.
This report describes changes to the fund that occurred during the reporting period.
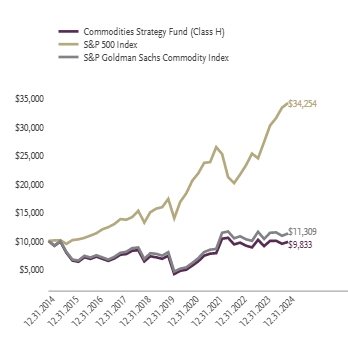
For the period of January 1, 2024 to December 31, 2024, the fund (Class H shares) returned 8.19%, underperforming the fund's benchmark, the S&P 500 Index, which returned 25.02% for the same period and underperforming the fund's secondary index, the S&P Goldman Sachs Commodity Index, which returned 9.25% for the same period.
The fund's broad-based securities market index was changed from the S&P Goldman Sachs Commodity Index to the S&P 500 Index to comply with the regulation that requires the fund's broad-based securities market index to represent the overall applicable market.
What factors materially affected the fund's performance over the last year?
The fund obtained exposure to the commodities markets through futures on the S&P Goldman Sachs Commodity Index. S&P Goldman Sachs Commodity Index futures had a strong first half of 2024 with headwinds from energy and industrial metals sectors in the second half of the year. Fifteen of the 24 index components had positive returns for the period. The components with some of the largest positive returns were cocoa, coffee and gold. The components with some of the largest negative returns were soybean, wheat, and cotton.
Cumulative performance* for the fund's most recently completed 10 years (as of 12.31.24), assuming a $10,000 initial investment.
| 12/31/2014 | 10000 | 10000 | 10000 |
| 03/31/2015 | 9130 | 10095 | 9178 |
| 06/30/2015 | 9889 | 10123 | 9979 |
| 09/30/2015 | 7917 | 9471 | 8054 |
| 12/31/2015 | 6542 | 10138 | 6714 |
| 03/31/2016 | 6330 | 10275 | 6547 |
| 06/30/2016 | 7118 | 10527 | 7376 |
| 09/30/2016 | 6835 | 10933 | 7070 |
| 12/31/2016 | 7230 | 11351 | 7477 |
| 03/31/2017 | 6850 | 12039 | 7100 |
| 06/30/2017 | 6480 | 12411 | 6712 |
| 09/30/2017 | 6910 | 12967 | 7196 |
| 12/31/2017 | 7567 | 13829 | 7909 |
| 03/31/2018 | 7688 | 13724 | 8082 |
| 06/30/2018 | 8269 | 14195 | 8728 |
| 09/30/2018 | 8367 | 15290 | 8845 |
| 12/31/2018 | 6394 | 13223 | 6816 |
| 03/31/2019 | 7293 | 15027 | 7836 |
| 06/30/2019 | 7115 | 15674 | 7725 |
| 09/30/2019 | 6845 | 15940 | 7403 |
| 12/31/2019 | 7384 | 17386 | 8017 |
| 03/31/2020 | 4168 | 13979 | 4622 |
| 06/30/2020 | 4734 | 16850 | 5106 |
| 09/30/2020 | 4932 | 18355 | 5342 |
| 12/31/2020 | 5643 | 20585 | 6115 |
| 03/31/2021 | 6393 | 21856 | 6944 |
| 06/30/2021 | 7403 | 23724 | 8036 |
| 09/30/2021 | 7752 | 23863 | 8455 |
| 12/31/2021 | 7847 | 26494 | 8583 |
| 03/31/2022 | 10385 | 25276 | 11426 |
| 06/30/2022 | 10541 | 21206 | 11656 |
| 09/30/2022 | 9383 | 20170 | 10454 |
| 12/31/2022 | 9693 | 21696 | 10813 |
| 03/31/2023 | 9152 | 23322 | 10279 |
| 06/30/2023 | 8853 | 25361 | 9999 |
| 09/30/2023 | 10184 | 24531 | 11597 |
| 12/31/2023 | 9088 | 27399 | 10352 |
| 03/31/2024 | 9999 | 30291 | 11425 |
| 06/30/2024 | 10022 | 31589 | 11499 |
| 09/30/2024 | 9490 | 33448 | 10894 |
| 12/31/2024 | 9833 | 34254 | 11309 |
| Class H | 8.19% | 5.90% | -0.17% |
| S&P 500 Index | 25.02% | 14.53% | 13.10% |
| S&P Goldman Sachs Commodity Index | 9.25% | 7.12% | 1.24% |
The fund's past performance is not a good predictor of the fund's future performance. Visit GuggenheimInvestments.com/mutual-funds/performance for more recent performance information.
| Net Assets | $5,125,114 |
| Total Number of Portfolio Holdings | 6 |
| Portfolio Turnover Rate | 0% |
| Total Advisory Fees Paid | $36,503 |
| Commodities Strategy Fund | Class H | RYMBX | Annual Shareholder Report | December 31, 2024 |
| S&P Goldman Sachs Commodity Index Futures Contracts | 99.3% |

| Guggenheim Ultra Short Duration Fund — Institutional Class | 15.9% |
| Guggenheim Strategy Fund II | 15.6% |
| Total | 31.5% |
| |
1 | "Consolidated Holdings Diversification (Market Exposure as a % of Net Assets)" excludes any temporary cash investments, investments in Guggenheim Strategy Funds Trust mutual funds, or investments in Guggenheim Ultra Short Duration Fund. |
| |
2 | "Largest Holdings (as a % of Net Assets)" excludes any temporary cash or derivative investments. |
| Guggenheim Ultra Short Duration Fund — Institutional Class | 15.9% |
| Guggenheim Strategy Fund II | 15.6% |
| Total | 31.5% |
| |
2 | "Largest Holdings (as a % of Net Assets)" excludes any temporary cash or derivative investments. |
There were no changes in or disagreements with fund accountants for the period.
This is a summary of certain changes to the fund since December 31, 2023. For more complete information, you may review the fund's next prospectus, which we expect to be available by April 30, 2025 at GuggenheimInvestments.com/services/prospectuses-and-reports or, by calling 800 820 0888.
Subsequent to the December 31, 2024 year-end, effective February 24, 2025, the fund executed a one-for-five reverse split of its issued and outstanding shares. There will be no difference in the aggregate value of assets as a result of this reverse split, nor will the increase in the net asset value of the fund be considered a taxable event. Please refer to a tax consultant for information regarding taxes.
| |  | Availability of Additional Information. For additional information, including the fund's prospectus, financial information, holdings and proxy voting information, go to https://www.guggenheiminvestments.com/mutual-funds/literature or, call 800 820 0888. |
AR-RYMBX-123124
Annual Shareholder Report | 12.31.24
This annual shareholder report contains important information about the Guggenheim Managed Futures Strategy Fund for the period of January 1, 2024 to December 31, 2024. You can find additional information about the fund at https://www.guggenheiminvestments.com/mutual-funds/literature. You can also request this information by contacting 800 820 0888 or GuggenheimClientServices@mufg-is.com.
This report describes changes to the fund that occurred during the reporting period.
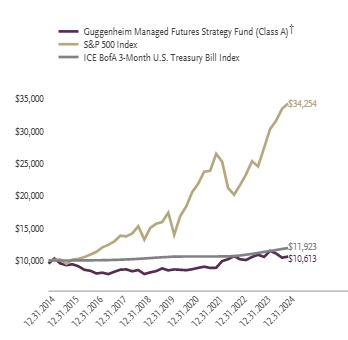
For the period of January 1, 2024 to December 31, 2024, the fund (Class A shares) returned 0.49%, underperforming the fund's benchmark, the S&P 500 Index, which returned 25.02% for the same period and underperforming the fund's secondary index, the ICE BofA 3-Month U.S. Treasury Bill Index, which returned 5.28% for the same period.
The fund's broad-based securities market index was changed from the ICE BofA 3-Month U.S. Treasury Bill Index to the S&P 500 Index to comply with the regulation that requires the fund's broad-based securities market index to represent the overall applicable market.
What factors materially affected the fund's performance over the last year?
Following a stable start to the year, market conditions became increasingly volatile during the second and third quarters, driven by unpredictable central bank policies, heightened geopolitical tensions, domestic political uncertainty in the United States, and changing economic expectations. This environment posed challenges for systematic strategies, and trend-following in particular, limiting their ability to generate consistent returns.
The fund posted positive performance in the first and fourth quarters, driven by strong gains in agricultural commodities and global equity indexes. It lost ground in the second and third quarters, however, primarily due to negative contributions from positions in metals, energies, and currencies.
The fund concluded the year with an overall positive return, supported by the significant contributions from global equity indexes and agricultural commodities.
Cumulative performance* for the fund's most recently completed 10 years (as of 12.31.24), assuming a $10,000 initial investment.
| 12/31/2014 | 9526 | 10000 | 10000 |
| 03/31/2015 | 10308 | 10095 | 10000 |
| 06/30/2015 | 9549 | 10123 | 10001 |
| 09/30/2015 | 9276 | 9471 | 10002 |
| 12/31/2015 | 9424 | 10138 | 10005 |
| 03/31/2016 | 9112 | 10275 | 10013 |
| 06/30/2016 | 8563 | 10527 | 10020 |
| 09/30/2016 | 8413 | 10933 | 10030 |
| 12/31/2016 | 7994 | 11351 | 10038 |
| 03/31/2017 | 8118 | 12039 | 10048 |
| 06/30/2017 | 7900 | 12411 | 10069 |
| 09/30/2017 | 8263 | 12967 | 10095 |
| 12/31/2017 | 8586 | 13829 | 10124 |
| 03/31/2018 | 8627 | 13724 | 10160 |
| 06/30/2018 | 8336 | 14195 | 10206 |
| 09/30/2018 | 8524 | 15290 | 10256 |
| 12/31/2018 | 7911 | 13223 | 10314 |
| 03/31/2019 | 8161 | 15027 | 10376 |
| 06/30/2019 | 8363 | 15674 | 10442 |
| 09/30/2019 | 8783 | 15940 | 10501 |
| 12/31/2019 | 8479 | 17386 | 10549 |
| 03/31/2020 | 8622 | 13979 | 10610 |
| 06/30/2020 | 8564 | 16850 | 10612 |
| 09/30/2020 | 8501 | 18355 | 10616 |
| 12/31/2020 | 8650 | 20585 | 10619 |
| 03/31/2021 | 8862 | 21856 | 10622 |
| 06/30/2021 | 9045 | 23724 | 10622 |
| 09/30/2021 | 8857 | 23863 | 10623 |
| 12/31/2021 | 8876 | 26494 | 10625 |
| 03/31/2022 | 9907 | 25276 | 10629 |
| 06/30/2022 | 10196 | 21206 | 10640 |
| 09/30/2022 | 10664 | 20170 | 10690 |
| 12/31/2022 | 10186 | 21696 | 10781 |
| 03/31/2023 | 10075 | 23322 | 10897 |
| 06/30/2023 | 10550 | 25361 | 11025 |
| 09/30/2023 | 10889 | 24531 | 11171 |
| 12/31/2023 | 10556 | 27399 | 11325 |
| 03/31/2024 | 11485 | 30291 | 11472 |
| 06/30/2024 | 11092 | 31589 | 11624 |
| 09/30/2024 | 10433 | 33448 | 11784 |
| 12/31/2024 | 10613 | 34254 | 11923 |
| Class A (without sales charge) | 0.49% | 4.59% | 1.09% |
| Class A (with sales charge)† | -4.28% | 3.57% | 0.60% |
| S&P 500 Index | 25.02% | 14.53% | 13.10% |
| ICE BofA 3-Month U.S. Treasury Bill Index | 5.28% | 2.48% | 1.77% |
The fund's past performance is not a good predictor of the fund's future performance. Visit GuggenheimInvestments.com/mutual-funds/performance for more recent performance information.
| Net Assets | $33,574,629 |
| Total Number of Portfolio Holdings | 76 |
| Portfolio Turnover Rate | 0% |
| Total Advisory Fees Paid | $529,624 |
| Guggenheim Managed Futures Strategy Fund | Class A | RYMTX | Annual Shareholder Report | December 31, 2024 |
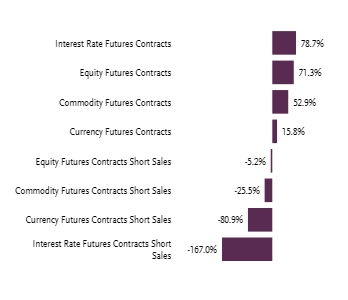
| Interest Rate Futures Contracts | 78.7% |
| Equity Futures Contracts | 71.3% |
| Commodity Futures Contracts | 52.9% |
| Currency Futures Contracts | 15.8% |
| Equity Futures Contracts Short Sales | -5.2% |
| Commodity Futures Contracts Short Sales | -25.5% |
| Currency Futures Contracts Short Sales | -80.9% |
| Interest Rate Futures Contracts Short Sales | -167.0% |

| Guggenheim Strategy Fund III | 14.3% |
| Guggenheim Strategy Fund II | 9.3% |
| Guggenheim Ultra Short Duration Fund — Institutional Class | 7.6% |
| Total | 31.2% |
| |
1 | "Consolidated Holdings Diversification (Market Exposure as a % of Net Assets)" excludes any temporary cash investments, investments in Guggenheim Strategy Funds Trust mutual funds, or investments in Guggenheim Ultra Short Duration Fund. |
| |
2 | "Largest Holdings (as a % of Net Assets)" excludes any temporary cash or derivative investments. |
| Guggenheim Strategy Fund III | 14.3% |
| Guggenheim Strategy Fund II | 9.3% |
| Guggenheim Ultra Short Duration Fund — Institutional Class | 7.6% |
| Total | 31.2% |
| |
2 | "Largest Holdings (as a % of Net Assets)" excludes any temporary cash or derivative investments. |
There were no changes in or disagreements with fund accountants for the period.
There were no material changes for the period.
| |  | Availability of Additional Information. For additional information, including the fund's prospectus, financial information, holdings and proxy voting information, go to https://www.guggenheiminvestments.com/mutual-funds/literature or, call 800 820 0888. |
AR-RYMTX-123124
Annual Shareholder Report | 12.31.24
This annual shareholder report contains important information about the Guggenheim Managed Futures Strategy Fund for the period of January 1, 2024 to December 31, 2024. You can find additional information about the fund at https://www.guggenheiminvestments.com/mutual-funds/literature. You can also request this information by contacting 800 820 0888 or GuggenheimClientServices@mufg-is.com.
This report describes changes to the fund that occurred during the reporting period.
For the period of January 1, 2024 to December 31, 2024, the fund (Class C shares) returned -0.25%, underperforming the fund's benchmark, the S&P 500 Index, which returned 25.02% for the same period and underperforming the fund's secondary index, the ICE BofA 3-Month U.S. Treasury Bill Index, which returned 5.28% for the same period.
The fund's broad-based securities market index was changed from the ICE BofA 3-Month U.S. Treasury Bill Index to the S&P 500 Index to comply with the regulation that requires the fund's broad-based securities market index to represent the overall applicable market.
What factors materially affected the fund's performance over the last year?
Following a stable start to the year, market conditions became increasingly volatile during the second and third quarters, driven by unpredictable central bank policies, heightened geopolitical tensions, domestic political uncertainty in the United States, and changing economic expectations. This environment posed challenges for systematic strategies, and trend-following in particular, limiting their ability to generate consistent returns.
The fund posted positive performance in the first and fourth quarters, driven by strong gains in agricultural commodities and global equity indexes. It lost ground in the second and third quarters, however, primarily due to negative contributions from positions in metals, energies, and currencies.
The fund concluded the year with an overall positive return, supported by the significant contributions from global equity indexes and agricultural commodities.
Cumulative performance* for the fund's most recently completed 10 years (as of 12.31.24), assuming a $10,000 initial investment.
| 12/31/2014 | 10000 | 10000 | 10000 |
| 03/31/2015 | 10802 | 10095 | 10000 |
| 06/30/2015 | 9987 | 10123 | 10001 |
| 09/30/2015 | 9683 | 9471 | 10002 |
| 12/31/2015 | 9816 | 10138 | 10005 |
| 03/31/2016 | 9476 | 10275 | 10013 |
| 06/30/2016 | 8887 | 10527 | 10020 |
| 09/30/2016 | 8715 | 10933 | 10030 |
| 12/31/2016 | 8264 | 11351 | 10038 |
| 03/31/2017 | 8379 | 12039 | 10048 |
| 06/30/2017 | 8140 | 12411 | 10069 |
| 09/30/2017 | 8499 | 12967 | 10095 |
| 12/31/2017 | 8813 | 13829 | 10124 |
| 03/31/2018 | 8838 | 13724 | 10160 |
| 06/30/2018 | 8526 | 14195 | 10206 |
| 09/30/2018 | 8697 | 15290 | 10256 |
| 12/31/2018 | 8062 | 13223 | 10314 |
| 03/31/2019 | 8299 | 15027 | 10376 |
| 06/30/2019 | 8491 | 15674 | 10442 |
| 09/30/2019 | 8899 | 15940 | 10501 |
| 12/31/2019 | 8571 | 17386 | 10549 |
| 03/31/2020 | 8702 | 13979 | 10610 |
| 06/30/2020 | 8627 | 16850 | 10612 |
| 09/30/2020 | 8551 | 18355 | 10616 |
| 12/31/2020 | 8678 | 20585 | 10619 |
| 03/31/2021 | 8879 | 21856 | 10622 |
| 06/30/2021 | 9047 | 23724 | 10622 |
| 09/30/2021 | 8841 | 23863 | 10623 |
| 12/31/2021 | 8841 | 26494 | 10625 |
| 03/31/2022 | 9850 | 25276 | 10629 |
| 06/30/2022 | 10122 | 21206 | 10640 |
| 09/30/2022 | 10567 | 20170 | 10690 |
| 12/31/2022 | 10075 | 21696 | 10781 |
| 03/31/2023 | 9950 | 23322 | 10897 |
| 06/30/2023 | 10396 | 25361 | 11025 |
| 09/30/2023 | 10710 | 24531 | 11171 |
| 12/31/2023 | 10366 | 27399 | 11325 |
| 03/31/2024 | 11257 | 30291 | 11472 |
| 06/30/2024 | 10854 | 31589 | 11624 |
| 09/30/2024 | 10188 | 33448 | 11784 |
| 12/31/2024 | 10340 | 34254 | 11923 |
| Class C (without CDSC) | -0.25% | 3.82% | 0.33% |
| Class C (with CDSC)‡ | -1.20% | 3.82% | 0.33% |
| S&P 500 Index | 25.02% | 14.53% | 13.10% |
| ICE BofA 3-Month U.S. Treasury Bill Index | 5.28% | 2.48% | 1.77% |
The fund's past performance is not a good predictor of the fund's future performance. Visit GuggenheimInvestments.com/mutual-funds/performance for more recent performance information.
| Net Assets | $33,574,629 |
| Total Number of Portfolio Holdings | 76 |
| Portfolio Turnover Rate | 0% |
| Total Advisory Fees Paid | $529,624 |
| Guggenheim Managed Futures Strategy Fund | Class C | RYMZX | Annual Shareholder Report | December 31, 2024 |
| Interest Rate Futures Contracts | 78.7% |
| Equity Futures Contracts | 71.3% |
| Commodity Futures Contracts | 52.9% |
| Currency Futures Contracts | 15.8% |
| Equity Futures Contracts Short Sales | -5.2% |
| Commodity Futures Contracts Short Sales | -25.5% |
| Currency Futures Contracts Short Sales | -80.9% |
| Interest Rate Futures Contracts Short Sales | -167.0% |

| Guggenheim Strategy Fund III | 14.3% |
| Guggenheim Strategy Fund II | 9.3% |
| Guggenheim Ultra Short Duration Fund — Institutional Class | 7.6% |
| Total | 31.2% |
| |
1 | "Consolidated Holdings Diversification (Market Exposure as a % of Net Assets)" excludes any temporary cash investments, investments in Guggenheim Strategy Funds Trust mutual funds, or investments in Guggenheim Ultra Short Duration Fund. |
| |
2 | "Largest Holdings (as a % of Net Assets)" excludes any temporary cash or derivative investments. |
| Guggenheim Strategy Fund III | 14.3% |
| Guggenheim Strategy Fund II | 9.3% |
| Guggenheim Ultra Short Duration Fund — Institutional Class | 7.6% |
| Total | 31.2% |
| |
2 | "Largest Holdings (as a % of Net Assets)" excludes any temporary cash or derivative investments. |
There were no changes in or disagreements with fund accountants for the period.
There were no material changes for the period.
| |  | Availability of Additional Information. For additional information, including the fund's prospectus, financial information, holdings and proxy voting information, go to https://www.guggenheiminvestments.com/mutual-funds/literature or, call 800 820 0888. |
AR-RYMZX-123124
Annual Shareholder Report | 12.31.24
This annual shareholder report contains important information about the Guggenheim Managed Futures Strategy Fund for the period of January 1, 2024 to December 31, 2024. You can find additional information about the fund at https://www.guggenheiminvestments.com/mutual-funds/literature. You can also request this information by contacting 800 820 0888 or GuggenheimClientServices@mufg-is.com.
This report describes changes to the fund that occurred during the reporting period.
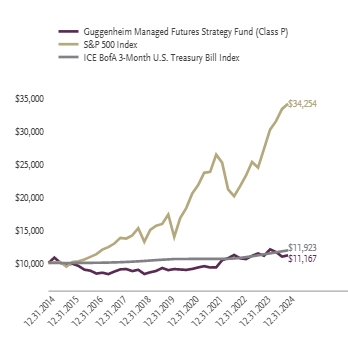
For the period of January 1, 2024 to December 31, 2024, the fund (Class P shares) returned 0.48%, underperforming the fund's benchmark, the S&P 500 Index, which returned 25.02% for the same period and underperforming the fund's secondary index, the ICE BofA 3-Month U.S. Treasury Bill Index, which returned 5.28% for the same period.
The fund's broad-based securities market index was changed from the ICE BofA 3-Month U.S. Treasury Bill Index to the S&P 500 Index to comply with the regulation that requires the fund's broad-based securities market index to represent the overall applicable market.
What factors materially affected the fund's performance over the last year?
Following a stable start to the year, market conditions became increasingly volatile during the second and third quarters, driven by unpredictable central bank policies, heightened geopolitical tensions, domestic political uncertainty in the United States, and changing economic expectations. This environment posed challenges for systematic strategies, and trend-following in particular, limiting their ability to generate consistent returns.
The fund posted positive performance in the first and fourth quarters, driven by strong gains in agricultural commodities and global equity indexes. It lost ground in the second and third quarters, however, primarily due to negative contributions from positions in metals, energies, and currencies.
The fund concluded the year with an overall positive return, supported by the significant contributions from global equity indexes and agricultural commodities.
Cumulative performance* for the fund's most recently completed 10 years (as of 12.31.24), assuming a $10,000 initial investment.
| 12/31/2014 | 10000 | 10000 | 10000 |
| 03/31/2015 | 10822 | 10095 | 10000 |
| 06/30/2015 | 10025 | 10123 | 10001 |
| 09/30/2015 | 9738 | 9471 | 10002 |
| 12/31/2015 | 9894 | 10138 | 10005 |
| 03/31/2016 | 9565 | 10275 | 10013 |
| 06/30/2016 | 8990 | 10527 | 10020 |
| 09/30/2016 | 8832 | 10933 | 10030 |
| 12/31/2016 | 8392 | 11351 | 10038 |
| 03/31/2017 | 8527 | 12039 | 10048 |
| 06/30/2017 | 8312 | 12411 | 10069 |
| 09/30/2017 | 8697 | | 10095 |
| 12/31/2017 | 9036 | 13829 | 10124 |
| 03/31/2018 | 9079 | 13724 | 10160 |
| 06/30/2018 | 8773 | 14195 | 10206 |
| 09/30/2018 | 8966 | 15290 | 10256 |
| 12/31/2018 | 8327 | 13223 | 10314 |
| 03/31/2019 | 8586 | 15027 | 10376 |
| 06/30/2019 | 8797 | 15674 | 10442 |
| 09/30/2019 | 9243 | 15940 | 10501 |
| 12/31/2019 | 8919 | 17386 | 10549 |
| 03/31/2020 | 9074 | 13979 | 10610 |
| 06/30/2020 | 9013 | 16850 | 10612 |
| 09/30/2020 | 8952 | 18355 | 10616 |
| 12/31/2020 | 9102 | 20585 | 10619 |
| 03/31/2021 | 9324 | 21856 | 10622 |
| 06/30/2021 | 9521 | 23724 | 10622 |
| 09/30/2021 | 9319 | 23863 | 10623 |
| 12/31/2021 | 9339 | 26494 | 10625 |
| 03/31/2022 | 10425 | 25276 | 10629 |
| 06/30/2022 | 10733 | 21206 | 10640 |
| 09/30/2022 | 11223 | 20170 | 10690 |
| 12/31/2022 | 10716 | 21696 | 10781 |
| 03/31/2023 | 10600 | 23322 | 10897 |
| 06/30/2023 | 11097 | 25361 | 11025 |
| 09/30/2023 | 11456 | 24531 | 11171 |
| 12/31/2023 | 11108 | 27399 | 11325 |
| 03/31/2024 | 12079 | 30291 | 11472 |
| 06/30/2024 | 11668 | 31589 | 11624 |
| 09/30/2024 | 10975 | 33448 | 11784 |
| 12/31/2024 | 11167 | 34254 | 11923 |
| Class P | 0.48% | 4.60% | 1.11% |
| S&P 500 Index | 25.02% | 14.53% | 13.10% |
| ICE BofA 3-Month U.S. Treasury Bill Index | 5.28% | 2.48% | 1.77% |
The fund's past performance is not a good predictor of the fund's future performance. Visit GuggenheimInvestments.com/mutual-funds/performance for more recent performance information.
| Net Assets | $33,574,629 |
| Total Number of Portfolio Holdings | 76 |
| Portfolio Turnover Rate | 0% |
| Total Advisory Fees Paid | $529,624 |
| Guggenheim Managed Futures Strategy Fund | Class P | RYMFX | Annual Shareholder Report | December 31, 2024 |
| Interest Rate Futures Contracts | 78.7% |
| Equity Futures Contracts | 71.3% |
| Commodity Futures Contracts | 52.9% |
| Currency Futures Contracts | 15.8% |
| Equity Futures Contracts Short Sales | -5.2% |
| Commodity Futures Contracts Short Sales | -25.5% |
| Currency Futures Contracts Short Sales | -80.9% |
| Interest Rate Futures Contracts Short Sales | -167.0% |
| Guggenheim Strategy Fund III | 14.3% |
| Guggenheim Strategy Fund II | 9.3% |
| Guggenheim Ultra Short Duration Fund — Institutional Class | 7.6% |
| Total | 31.2% |
| |
1 | "Consolidated Holdings Diversification (Market Exposure as a % of Net Assets)" excludes any temporary cash investments, investments in Guggenheim Strategy Funds Trust mutual funds, or investments in Guggenheim Ultra Short Duration Fund. |
| |
2 | "Largest Holdings (as a % of Net Assets)" excludes any temporary cash or derivative investments. |
| Guggenheim Strategy Fund III | 14.3% |
| Guggenheim Strategy Fund II | 9.3% |
| Guggenheim Ultra Short Duration Fund — Institutional Class | 7.6% |
| Total | 31.2% |
| |
2 | "Largest Holdings (as a % of Net Assets)" excludes any temporary cash or derivative investments. |
There were no changes in or disagreements with fund accountants for the period.
There were no material changes for the period.
| |  | Availability of Additional Information. For additional information, including the fund's prospectus, financial information, holdings and proxy voting information, go to https://www.guggenheiminvestments.com/mutual-funds/literature or, call 800 820 0888. |
AR-RYMFX-123124
Annual Shareholder Report | 12.31.24
This annual shareholder report contains important information about the Guggenheim Managed Futures Strategy Fund for the period of January 1, 2024 to December 31, 2024. You can find additional information about the fund at https://www.guggenheiminvestments.com/mutual-funds/literature. You can also request this information by contacting 800 820 0888 or GuggenheimClientServices@mufg-is.com.
This report describes changes to the fund that occurred during the reporting period.
| Institutional Class | $153 | 1.52% |
For the period of January 1, 2024 to December 31, 2024, the fund (Institutional Class shares) returned 0.72%, underperforming the fund's benchmark, the S&P 500 Index, which returned 25.02% for the same period and underperforming the fund's secondary index, the ICE BofA 3-Month U.S. Treasury Bill Index, which returned 5.28% for the same period.
The fund's broad-based securities market index was changed from the ICE BofA 3-Month U.S. Treasury Bill Index to the S&P 500 Index to comply with the regulation that requires the fund's broad-based securities market index to represent the overall applicable market.
What factors materially affected the fund's performance over the last year?
Following a stable start to the year, market conditions became increasingly volatile during the second and third quarters, driven by unpredictable central bank policies, heightened geopolitical tensions, domestic political uncertainty in the United States, and changing economic expectations. This environment posed challenges for systematic strategies, and trend-following in particular, limiting their ability to generate consistent returns.
The fund posted positive performance in the first and fourth quarters, driven by strong gains in agricultural commodities and global equity indexes. It lost ground in the second and third quarters, however, primarily due to negative contributions from positions in metals, energies, and currencies.
The fund concluded the year with an overall positive return, supported by the significant contributions from global equity indexes and agricultural commodities.
Cumulative performance* for the fund's most recently completed 10 years (as of 12.31.24), assuming a $2,000,000 initial investment.
| 12/31/2014 | 2000000 | 2000000 | 2000000 |
| 03/31/2015 | 2166530 | 2019011 | 2000067 |
| 06/30/2015 | 2007383 | 2024626 | 2000174 |
| 09/30/2015 | 1951600 | 1894271 | 2000429 |
| 12/31/2015 | 1983917 | 2027677 | 2001061 |
| 03/31/2016 | 1919077 | 2055006 | 2002526 |
| 06/30/2016 | 1804556 | 2105462 | 2003976 |
| 09/30/2016 | 1774241 | 2186566 | 2005901 |
| 12/31/2016 | 1687308 | 2270185 | 2007607 |
| 03/31/2017 | 1714751 | 2407897 | 2009674 |
| 06/30/2017 | 1668718 | 2482257 | 2013731 |
| 09/30/2017 | 1747506 | 2593471 | 2019061 |
| 12/31/2017 | 1817092 | 2765802 | 2024792 |
| 03/31/2018 | 1826354 | 2744806 | 2031972 |
| 06/30/2018 | 1766155 | 2839059 | 2041162 |
| 09/30/2018 | 1806905 | 3057972 | 2051193 |
| 12/31/2018 | 1678171 | 2644540 | 2062746 |
| 03/31/2019 | 1731887 | 3005466 | 2075115 |
| 06/30/2019 | 1776342 | 3134816 | 2088373 |
| 09/30/2019 | 1866178 | 3188054 | 2100115 |
| 12/31/2019 | 1802274 | 3477211 | 2109787 |
| 03/31/2020 | 1834689 | 2795747 | 2121908 |
| 06/30/2020 | 1823575 | 3370085 | 2122381 |
| 09/30/2020 | 1811536 | 3671014 | 2123216 |
| 12/31/2020 | 1843607 | 4116975 | 2123860 |
| 03/31/2021 | 1889498 | 4371197 | 2124394 |
| 06/30/2021 | 1930401 | 4744883 | 2124391 |
| 09/30/2021 | 1891493 | 4772501 | 2124698 |
| 12/31/2021 | 1897479 | 5298770 | 2124904 |
| 03/31/2022 | 2117954 | 5055105 | 2125736 |
| 06/30/2022 | 2181802 | 4241177 | 2127964 |
| 09/30/2022 | 2283559 | 4034097 | 2137954 |
| 12/31/2022 | 2182764 | 4339117 | 2156145 |
| 03/31/2023 | 2160769 | 4664424 | 2179447 |
| 06/30/2023 | 2264461 | 5072194 | 2205071 |
| 09/30/2023 | 2338825 | 4906160 | 2234204 |
| 12/31/2023 | 2269456 | 5479768 | 2264934 |
| 03/31/2024 | 2469889 | 6058208 | 2294352 |
| 06/30/2024 | 2388231 | 6317729 | 2324865 |
| 09/30/2024 | 2247186 | 6689627 | 2356799 |
| 12/31/2024 | 2286996 | 6850790 | 2384566 |
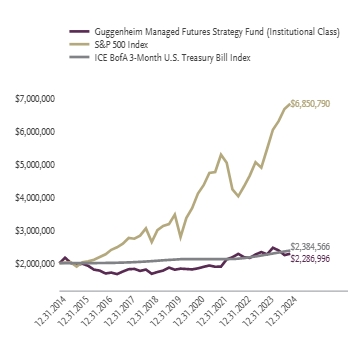
| Institutional Class | 0.72% | 4.88% | 1.35% |
| S&P 500 Index | 25.02% | 14.53% | 13.10% |
| ICE BofA 3-Month U.S. Treasury Bill Index | 5.28% | 2.48% | 1.77% |
The fund's past performance is not a good predictor of the fund's future performance. Visit GuggenheimInvestments.com/mutual-funds/performance for more recent performance information.
| Net Assets | $33,574,629 |
| Total Number of Portfolio Holdings | 76 |
| Portfolio Turnover Rate | 0% |
| Total Advisory Fees Paid | $529,624 |
| Guggenheim Managed Futures Strategy Fund | Institutional Class | RYIFX | Annual Shareholder Report | December 31, 2024 |
| Interest Rate Futures Contracts | 78.7% |
| Equity Futures Contracts | 71.3% |
| Commodity Futures Contracts | 52.9% |
| Currency Futures Contracts | 15.8% |
| Equity Futures Contracts Short Sales | -5.2% |
| Commodity Futures Contracts Short Sales | -25.5% |
| Currency Futures Contracts Short Sales | -80.9% |
| Interest Rate Futures Contracts Short Sales | -167.0% |

| Guggenheim Strategy Fund III | 14.3% |
| Guggenheim Strategy Fund II | 9.3% |
| Guggenheim Ultra Short Duration Fund — Institutional Class | 7.6% |
| Total | 31.2% |
| |
1 | "Consolidated Holdings Diversification (Market Exposure as a % of Net Assets)" excludes any temporary cash investments, investments in Guggenheim Strategy Funds Trust mutual funds, or investments in Guggenheim Ultra Short Duration Fund. |
| |
2 | "Largest Holdings (as a % of Net Assets)" excludes any temporary cash or derivative investments. |
| Guggenheim Strategy Fund III | 14.3% |
| Guggenheim Strategy Fund II | 9.3% |
| Guggenheim Ultra Short Duration Fund — Institutional Class | 7.6% |
| Total | 31.2% |
| |
2 | "Largest Holdings (as a % of Net Assets)" excludes any temporary cash or derivative investments. |
There were no changes in or disagreements with fund accountants for the period.
There were no material changes for the period.
| |  | Availability of Additional Information. For additional information, including the fund's prospectus, financial information, holdings and proxy voting information, go to https://www.guggenheiminvestments.com/mutual-funds/literature or, call 800 820 0888. |
AR-RYIFX-123124
Annual Shareholder Report | 12.31.24
This annual shareholder report contains important information about the Guggenheim Multi-Hedge Strategies Fund for the period of January 1, 2024 to December 31, 2024. You can find additional information about the fund at https://www.guggenheiminvestments.com/mutual-funds/literature. You can also request this information by contacting 800 820 0888 or GuggenheimClientServices@mufg-is.com.
This report describes changes to the fund that occurred during the reporting period.
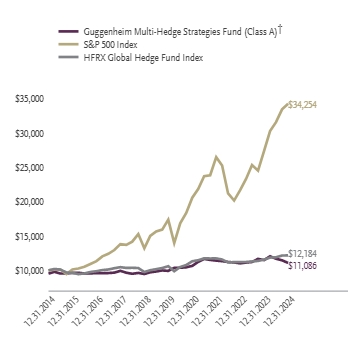
For the period of January 1, 2024 to December 31, 2024, the fund (Class A shares) returned -3.58%, underperforming the fund's benchmark, the S&P 500 Index, which returned 25.02% for the same period and underperforming the fund's secondary index, the HFRX Global Hedge Fund Index, which returned 5.26% for the same period.
What factors materially affected the fund's performance over the last year?
The fund's long/short equity strategy started the year off with a strong first quarter and, despite giving up some of its gains the remainder of the year, was the largest positive contributor of 2024. The fund's global macro strategies were the largest detractor for the period as positive contributions from value (driven by fixed income) were unable to compensate for negative performance in carry (hurt by equites), momentum (driven by fixed income and currencies), and flow (driven primarily by equities). Market neutral was the second most notable detractor to the fund's performance as positive returns in closed end fund arbitrage did not make up for the losses seen in the market neutral real estate strategy.
Cumulative performance* for the fund's most recently completed 10 years (as of 12.31.24), assuming a $10,000 initial investment.
| 12/31/2014 | 9526 | 10000 | 10000 |
| 03/31/2015 | 9789 | 10095 | 10206 |
| 06/30/2015 | 9542 | 10123 | 10127 |
| 09/30/2015 | 9546 | 9471 | 9695 |
| 12/31/2015 | 9642 | 10138 | 9636 |
| 03/31/2016 | 9658 | 10275 | 9456 |
| 06/30/2016 | 9546 | 10527 | 9556 |
| 09/30/2016 | 9562 | 10933 | 9765 |
| 12/31/2016 | 9600 | 11351 | 9877 |
| 03/31/2017 | 9584 | 12039 | 10041 |
| 06/30/2017 | 9612 | 12411 | 10130 |
| 09/30/2017 | 9672 | 12967 | 10315 |
| 12/31/2017 | 9935 | 13829 | 10469 |
| 03/31/2018 | 9660 | 13724 | 10363 |
| 06/30/2018 | 9505 | 14195 | 10381 |
| 09/30/2018 | 9628 | 15290 | 10340 |
| 12/31/2018 | 9472 | 13223 | 9766 |
| 03/31/2019 | 9720 | 15027 | 10019 |
| 06/30/2019 | 9840 | 15674 | 10178 |
| 09/30/2019 | 9991 | 15940 | 10342 |
| 12/31/2019 | 9926 | 17386 | 10608 |
| 03/31/2020 | 10371 | 13979 | 9880 |
| 06/30/2020 | 10383 | 16850 | 10492 |
| 09/30/2020 | 10448 | 18355 | 10780 |
| 12/31/2020 | 10660 | 20585 | 11330 |
| 03/31/2021 | 11236 | 21856 | 11476 |
| 06/30/2021 | 11669 | 23724 | 11753 |
| 09/30/2021 | 11525 | 23863 | 11736 |
| 12/31/2021 | 11424 | 26494 | 11744 |
| 03/31/2022 | 11345 | 25276 | 11585 |
| 06/30/2022 | 11225 | 21206 | 11151 |
| 09/30/2022 | 11154 | 20170 | 11208 |
| 12/31/2022 | 11027 | 21696 | 11226 |
| 03/31/2023 | 11137 | 23322 | 11226 |
| 06/30/2023 | 11222 | 25361 | 11297 |
| 09/30/2023 | 11677 | 24531 | 11382 |
| 12/31/2023 | 11498 | 27399 | 11575 |
| 03/31/2024 | 12055 | 30291 | 11866 |
| 06/30/2024 | 11698 | 31589 | 11909 |
| 09/30/2024 | 11467 | 33448 | 12162 |
| 12/31/2024 | 11086 | 34254 | 12184 |
| Class A (without sales charge) | -3.58% | 2.23% | 1.53% |
| Class A (with sales charge)† | -8.17% | 1.25% | 1.04% |
| S&P 500 Index | 25.02% | 14.53% | 13.10% |
| HFRX Global Hedge Fund Index | 5.26% | 2.81% | 1.99% |
The fund's past performance is not a good predictor of the fund's future performance. Visit GuggenheimInvestments.com/mutual-funds/performance for more recent performance information.
| Net Assets | $45,587,304 |
| Total Number of Portfolio Holdings | 325 |
| Portfolio Turnover Rate | 164% |
| Total Advisory Fees Paid | $838,778 |
| Guggenheim Multi-Hedge Strategies Fund | Class A | RYMQX | Annual Shareholder Report | December 31, 2024 |
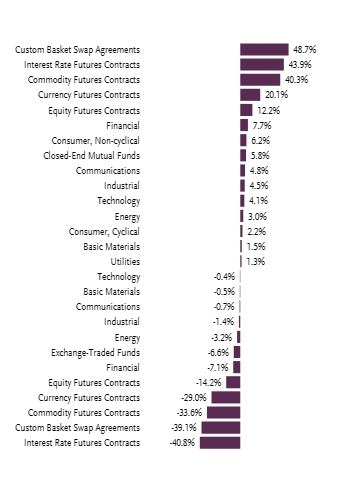
| Custom Basket Swap Agreements | 48.7% |
| Interest Rate Futures Contracts | 43.9% |
| Commodity Futures Contracts | 40.3% |
| Currency Futures Contracts | 20.1% |
| Equity Futures Contracts | 12.2% |
| Financial | 7.7% |
| Consumer, Non-cyclical | 6.2% |
| Closed-End Mutual Funds | 5.8% |
| Communications | 4.8% |
| Industrial | 4.5% |
| Technology | 4.1% |
| Energy | 3.0% |
| Consumer, Cyclical | 2.2% |
| Basic Materials | 1.5% |
| Utilities | 1.3% |
| Technology | -0.4% |
| Basic Materials | -0.5% |
| Communications | -0.7% |
| Industrial | -1.4% |
| Energy | -3.2% |
| Exchange-Traded Funds | -6.6% |
| Financial | -7.1% |
| Equity Futures Contracts | -14.2% |
| Currency Futures Contracts | -29.0% |
| Commodity Futures Contracts | -33.6% |
| Custom Basket Swap Agreements | -39.1% |
| Interest Rate Futures Contracts | -40.8% |

| Guggenheim Strategy Fund II | 9.9% |
| Guggenheim Ultra Short Duration Fund — Institutional Class | 8.2% |
| Guggenheim Strategy Fund III | 3.6% |
| Heartland Financial USA, Inc. | 2.3% |
| Discover Financial Services | 2.1% |
| HashiCorp, Inc. — Class A | 1.7% |
| Juniper Networks, Inc. | 1.7% |
| Surmodics, Inc. | 1.6% |
| Hess Corp. | 1.4% |
| ChampionX Corp. | 1.3% |
| Top 10 Total | 33.8% |
| |
1 | "Consolidated Holdings Diversification (Market Exposure as a % of Net Assets)" excludes any temporary cash investments, investments in Guggenheim Strategy Funds Trust mutual funds, or investments in Guggenheim Ultra Short Duration Fund. |
| |
2 | "10 Largest Holdings (as a % of Net Assets)" excludes any temporary cash or derivative investments. |
| Guggenheim Strategy Fund II | 9.9% |
| Guggenheim Ultra Short Duration Fund — Institutional Class | 8.2% |
| Guggenheim Strategy Fund III | 3.6% |
| Heartland Financial USA, Inc. | 2.3% |
| Discover Financial Services | 2.1% |
| HashiCorp, Inc. — Class A | 1.7% |
| Juniper Networks, Inc. | 1.7% |
| Surmodics, Inc. | 1.6% |
| Hess Corp. | 1.4% |
| ChampionX Corp. | 1.3% |
| Top 10 Total | 33.8% |
| |
2 | "10 Largest Holdings (as a % of Net Assets)" excludes any temporary cash or derivative investments. |
There were no changes in or disagreements with fund accountants for the period.
This is a summary of certain changes to the fund since December 31, 2023. For more complete information, you may review the fund's next prospectus, which we expect to be available by April 30, 2025 at GuggenheimInvestments.com/services/prospectuses-and-reports or, by calling 800 820 0888.
The fund's (Class A shares) net expense ratio, which reflects expense waivers and/or reimbursements and includes certain expenses that are outside of the contractual expense limit, was 1.88% for the year ended December 31, 2024, an increase of 0.09% compared to the prior year. The primary driver of the increase was an increase in dividend expense associated with short sales.
| |  | Availability of Additional Information. For additional information, including the fund's prospectus, financial information, holdings and proxy voting information, go to https://www.guggenheiminvestments.com/mutual-funds/literature or, call 800 820 0888. |
AR-RYMQX-123124
Annual Shareholder Report | 12.31.24
This annual shareholder report contains important information about the Guggenheim Multi-Hedge Strategies Fund for the period of January 1, 2024 to December 31, 2024. You can find additional information about the fund at https://www.guggenheiminvestments.com/mutual-funds/literature. You can also request this information by contacting 800 820 0888 or GuggenheimClientServices@mufg-is.com.
This report describes changes to the fund that occurred during the reporting period.
For the period of January 1, 2024 to December 31, 2024, the fund (Class C shares) returned -4.31%, underperforming the fund's benchmark, the S&P 500 Index, which returned 25.02% for the same period and underperforming the fund's secondary index, the HFRX Global Hedge Fund Index, which returned 5.26% for the same period.
What factors materially affected the fund's performance over the last year?
The fund's long/short equity strategy started the year off with a strong first quarter and, despite giving up some of its gains the remainder of the year, was the largest positive contributor of 2024. The fund's global macro strategies were the largest detractor for the period as positive contributions from value (driven by fixed income) were unable to compensate for negative performance in carry (hurt by equites), momentum (driven by fixed income and currencies), and flow (driven primarily by equities). Market neutral was the second most notable detractor to the fund's performance as positive returns in closed end fund arbitrage did not make up for the losses seen in the market neutral real estate strategy.
Cumulative performance* for the fund's most recently completed 10 years (as of 12.31.24), assuming a $10,000 initial investment.
| 12/31/2014 | 10000 | 10000 | 10000 |
| 03/31/2015 | 10256 | 10095 | 10206 |
| 06/30/2015 | 9978 | 10123 | 10127 |
| 09/30/2015 | 9964 | 9471 | 9695 |
| 12/31/2015 | 10045 | 10138 | 9636 |
| 03/31/2016 | 10045 | 10275 | 9456 |
| 06/30/2016 | 9910 | 10527 | 9556 |
| 09/30/2016 | 9906 | 10933 | 9765 |
| 12/31/2016 | 9926 | 11351 | 9877 |
| 03/31/2017 | 9890 | 12039 | 10041 |
| 06/30/2017 | 9904 | 12411 | 10130 |
| 09/30/2017 | 9944 | 12967 | 10315 |
| 12/31/2017 | 10196 | 13829 | 10469 |
| 03/31/2018 | 9895 | 13724 | 10363 |
| 06/30/2018 | 9719 | 14195 | 10381 |
| 09/30/2018 | 9827 | 15290 | 10340 |
| 12/31/2018 | 9657 | 13223 | 9766 |
| 03/31/2019 | 9895 | 15027 | 10019 |
| 06/30/2019 | 9998 | 15674 | 10178 |
| 09/30/2019 | 10133 | 15940 | 10342 |
| 12/31/2019 | 10048 | 17386 | 10608 |
| 03/31/2020 | 10479 | 13979 | 9880 |
| 06/30/2020 | 10470 | 16850 | 10492 |
| 09/30/2020 | 10515 | 18355 | 10780 |
| 12/31/2020 | 10708 | 20585 | 11330 |
| 03/31/2021 | 11272 | 21856 | 11476 |
| 06/30/2021 | 11678 | 23724 | 11753 |
| 09/30/2021 | 11516 | 23863 | 11736 |
| 12/31/2021 | 11394 | 26494 | 11744 |
| 03/31/2022 | 11295 | 25276 | 11585 |
| 06/30/2022 | 11155 | 21206 | 11151 |
| 09/30/2022 | 11060 | 20170 | 11208 |
| 12/31/2022 | 10919 | 21696 | 11226 |
| 03/31/2023 | 11002 | 23322 | 11226 |
| 06/30/2023 | 11066 | 25361 | 11297 |
| 09/30/2023 | 11495 | 24531 | 11382 |
| 12/31/2023 | 11297 | 27399 | 11575 |
| 03/31/2024 | 11821 | 30291 | 11866 |
| 06/30/2024 | 11453 | 31589 | 11909 |
| 09/30/2024 | 11208 | 33448 | 12162 |
| 12/31/2024 | 10810 | 34254 | 12184 |
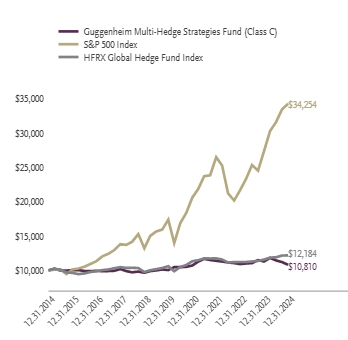
| Class C (without CDSC) | -4.31% | 1.47% | 0.78% |
| Class C (with CDSC)‡ | -5.25% | 1.47% | 0.78% |
| S&P 500 Index | 25.02% | 14.53% | 13.10% |
| HFRX Global Hedge Fund Index | 5.26% | 2.81% | 1.99% |
The fund's past performance is not a good predictor of the fund's future performance. Visit GuggenheimInvestments.com/mutual-funds/performance for more recent performance information.
| Net Assets | $45,587,304 |
| Total Number of Portfolio Holdings | 325 |
| Portfolio Turnover Rate | 164% |
| Total Advisory Fees Paid | $838,778 |
| Guggenheim Multi-Hedge Strategies Fund | Class C | RYMRX | Annual Shareholder Report | December 31, 2024 |
| Custom Basket Swap Agreements | 48.7% |
| Interest Rate Futures Contracts | 43.9% |
| Commodity Futures Contracts | 40.3% |
| Currency Futures Contracts | 20.1% |
| Equity Futures Contracts | 12.2% |
| Financial | 7.7% |
| Consumer, Non-cyclical | 6.2% |
| Closed-End Mutual Funds | 5.8% |
| Communications | 4.8% |
| Industrial | 4.5% |
| Technology | 4.1% |
| Energy | 3.0% |
| Consumer, Cyclical | 2.2% |
| Basic Materials | 1.5% |
| Utilities | 1.3% |
| Technology | -0.4% |
| Basic Materials | -0.5% |
| Communications | -0.7% |
| Industrial | -1.4% |
| Energy | -3.2% |
| Exchange-Traded Funds | -6.6% |
| Financial | -7.1% |
| Equity Futures Contracts | -14.2% |
| Currency Futures Contracts | -29.0% |
| Commodity Futures Contracts | -33.6% |
| Custom Basket Swap Agreements | -39.1% |
| Interest Rate Futures Contracts | -40.8% |

| Guggenheim Strategy Fund II | 9.9% |
| Guggenheim Ultra Short Duration Fund — Institutional Class | 8.2% |
| Guggenheim Strategy Fund III | 3.6% |
| Heartland Financial USA, Inc. | 2.3% |
| Discover Financial Services | 2.1% |
| HashiCorp, Inc. — Class A | 1.7% |
| Juniper Networks, Inc. | 1.7% |
| Surmodics, Inc. | 1.6% |
| Hess Corp. | 1.4% |
| ChampionX Corp. | 1.3% |
| Top 10 Total | 33.8% |
| |
1 | "Consolidated Holdings Diversification (Market Exposure as a % of Net Assets)" excludes any temporary cash investments, investments in Guggenheim Strategy Funds Trust mutual funds, or investments in Guggenheim Ultra Short Duration Fund. |
| |
2 | "10 Largest Holdings (as a % of Net Assets)" excludes any temporary cash or derivative investments. |
| Guggenheim Strategy Fund II | 9.9% |
| Guggenheim Ultra Short Duration Fund — Institutional Class | 8.2% |
| Guggenheim Strategy Fund III | 3.6% |
| Heartland Financial USA, Inc. | 2.3% |
| Discover Financial Services | 2.1% |
| HashiCorp, Inc. — Class A | 1.7% |
| Juniper Networks, Inc. | 1.7% |
| Surmodics, Inc. | 1.6% |
| Hess Corp. | 1.4% |
| ChampionX Corp. | 1.3% |
| Top 10 Total | 33.8% |
| |
2 | "10 Largest Holdings (as a % of Net Assets)" excludes any temporary cash or derivative investments. |
There were no changes in or disagreements with fund accountants for the period.
This is a summary of certain changes to the fund since December 31, 2023. For more complete information, you may review the fund's next prospectus, which we expect to be available by April 30, 2025 at Guggenheiminvestments.com/services/prospectuses-and-reports or, by calling 800 820 0888.
The fund's (Class C shares) net expense ratio, which reflects expense waivers and/or reimbursements and includes certain expenses that are outside of the contractual expense limit, was 2.63% for the year ended December 31, 2024, an increase of 0.09% compared to the prior year. The primary driver of the increase was an increase in dividend expense associated with short sales.
| |  | Availability of Additional Information. For additional information, including the fund's prospectus, financial information, holdings and proxy voting information, go to https://www.guggenheiminvestments.com/mutual-funds/literature or, call 800 820 0888. |
AR-RYMRX-123124
Annual Shareholder Report | 12.31.24
This annual shareholder report contains important information about the Guggenheim Multi-Hedge Strategies Fund for the period of January 1, 2024 to December 31, 2024. You can find additional information about the fund at https://www.guggenheiminvestments.com/mutual-funds/literature. You can also request this information by contacting 800 820 0888 or GuggenheimClientServices@mufg-is.com.
This report describes changes to the fund that occurred during the reporting period.
For the period of January 1, 2024 to December 31, 2024, the fund (Class P shares) returned -3.61%, underperforming the fund's benchmark, the S&P 500 Index, which returned 25.02% for the same period and underperforming the fund's secondary index, the HFRX Global Hedge Fund Index, which returned 5.26% for the same period.
What factors materially affected the fund's performance over the last year?
The fund's long/short equity strategy started the year off with a strong first quarter and, despite giving up some of its gains the remainder of the year, was the largest positive contributor of 2024. The fund's global macro strategies were the largest detractor for the period as positive contributions from value (driven by fixed income) were unable to compensate for negative performance in carry (hurt by equites), momentum (driven by fixed income and currencies), and flow (driven primarily by equities). Market neutral was the second most notable detractor to the fund's performance as positive returns in closed end fund arbitrage did not make up for the losses seen in the market neutral real estate strategy.
Cumulative performance* for the fund's most recently completed 10 years (as of 12.31.24), assuming a $10,000 initial investment.
| 12/31/2014 | 10000 | 10000 | 10000 |
| 03/31/2015 | 10276 | 10095 | 10206 |
| 06/30/2015 | 10013 | 10123 | 10127 |
| 09/30/2015 | 10021 | 9471 | 9695 |
| 12/31/2015 | 10121 | 10138 | 9636 |
| 03/31/2016 | 10138 | 10275 | 9456 |
| 06/30/2016 | 10017 | 10527 | 9556 |
| 09/30/2016 | 10033 | 10933 | 9765 |
| 12/31/2016 | 10073 | 11351 | 9877 |
| 03/31/2017 | 10057 | 12039 | 10041 |
| 06/30/2017 | 10086 | 12411 | 10130 |
| 09/30/2017 | 10153 | 12967 | 10315 |
| 12/31/2017 | 10425 | 13829 | 10469 |
| 03/31/2018 | 10136 | 13724 | 10363 |
| 06/30/2018 | 9986 | 14195 | 10381 |
| 09/30/2018 | 10115 | 15290 | 10340 |
| 12/31/2018 | 9957 | 13223 | 9766 |
| 03/31/2019 | 10217 | 15027 | 10019 |
| 06/30/2019 | 10347 | 15674 | 10178 |
| 09/30/2019 | 10506 | 15940 | 10342 |
| 12/31/2019 | 10433 | 17386 | 10608 |
| 03/31/2020 | 10903 | 13979 | 9880 |
| 06/30/2020 | 10916 | 16850 | 10492 |
| 09/30/2020 | 10980 | 18355 | 10780 |
| 12/31/2020 | 11205 | 20585 | 11330 |
| 03/31/2021 | 11814 | 21856 | 11476 |
| 06/30/2021 | 12263 | 23724 | 11753 |
| 09/30/2021 | 12112 | 23863 | 11736 |
| 12/31/2021 | 12008 | 26494 | 11744 |
| 03/31/2022 | 11929 | 25276 | 11585 |
| 06/30/2022 | 11799 | 21206 | 11151 |
| 09/30/2022 | 11725 | 20170 | 11208 |
| 12/31/2022 | 11594 | 21696 | 11226 |
| 03/31/2023 | 11705 | 23322 | 11226 |
| 06/30/2023 | 11797 | 25361 | 11297 |
| 09/30/2023 | 12275 | 24531 | 11382 |
| 12/31/2023 | 12087 | 27399 | 11575 |
| 03/31/2024 | 12674 | 30291 | 11866 |
| 06/30/2024 | 12296 | 31589 | 11909 |
| 09/30/2024 | 12055 | 33448 | 12162 |
| 12/31/2024 | 11651 | 34254 | 12184 |
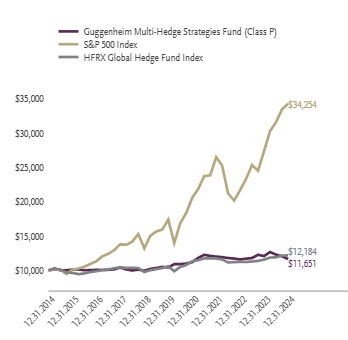
| Class P | -3.61% | 2.23% | 1.54% |
| S&P 500 Index | 25.02% | 14.53% | 13.10% |
| HFRX Global Hedge Fund Index | 5.26% | 2.81% | 1.99% |
The fund's past performance is not a good predictor of the fund's future performance. Visit GuggenheimInvestments.com/mutual-funds/performance for more recent performance information.
| Net Assets | $45,587,304 |
| Total Number of Portfolio Holdings | 325 |
| Portfolio Turnover Rate | 164% |
| Total Advisory Fees Paid | $838,778 |
| Guggenheim Multi-Hedge Strategies Fund | Class P | RYMSX | Annual Shareholder Report | December 31, 2024 |
| Custom Basket Swap Agreements | 48.7% |
| Interest Rate Futures Contracts | 43.9% |
| Commodity Futures Contracts | 40.3% |
| Currency Futures Contracts | 20.1% |
| Equity Futures Contracts | 12.2% |
| Financial | 7.7% |
| Consumer, Non-cyclical | 6.2% |
| Closed-End Mutual Funds | 5.8% |
| Communications | 4.8% |
| Industrial | 4.5% |
| Technology | 4.1% |
| Energy | 3.0% |
| Consumer, Cyclical | 2.2% |
| Basic Materials | 1.5% |
| Utilities | 1.3% |
| Technology | -0.4% |
| Basic Materials | -0.5% |
| Communications | -0.7% |
| Industrial | -1.4% |
| Energy | -3.2% |
| Exchange-Traded Funds | -6.6% |
| Financial | -7.1% |
| Equity Futures Contracts | -14.2% |
| Currency Futures Contracts | -29.0% |
| Commodity Futures Contracts | -33.6% |
| Custom Basket Swap Agreements | -39.1% |
| Interest Rate Futures Contracts | -40.8% |
| Guggenheim Strategy Fund II | 9.9% |
| Guggenheim Ultra Short Duration Fund — Institutional Class | 8.2% |
| Guggenheim Strategy Fund III | 3.6% |
| Heartland Financial USA, Inc. | 2.3% |
| Discover Financial Services | 2.1% |
| HashiCorp, Inc. — Class A | 1.7% |
| Juniper Networks, Inc. | 1.7% |
| Surmodics, Inc. | 1.6% |
| Hess Corp. | 1.4% |
| ChampionX Corp. | 1.3% |
| Top 10 Total | 33.8% |
| |
1 | "Consolidated Holdings Diversification (Market Exposure as a % of Net Assets)" excludes any temporary cash investments, investments in Guggenheim Strategy Funds Trust mutual funds, or investments in Guggenheim Ultra Short Duration Fund. |
| |
2 | "10 Largest Holdings (as a % of Net Assets)" excludes any temporary cash or derivative investments. |
| Guggenheim Strategy Fund II | 9.9% |
| Guggenheim Ultra Short Duration Fund — Institutional Class | 8.2% |
| Guggenheim Strategy Fund III | 3.6% |
| Heartland Financial USA, Inc. | 2.3% |
| Discover Financial Services | 2.1% |
| HashiCorp, Inc. — Class A | 1.7% |
| Juniper Networks, Inc. | 1.7% |
| Surmodics, Inc. | 1.6% |
| Hess Corp. | 1.4% |
| ChampionX Corp. | 1.3% |
| Top 10 Total | 33.8% |
| |
2 | "10 Largest Holdings (as a % of Net Assets)" excludes any temporary cash or derivative investments. |
There were no changes in or disagreements with fund accountants for the period.
This is a summary of certain changes to the fund since December 31, 2023. For more complete information, you may review the fund's next prospectus, which we expect to be available by April 30, 2025 at GuggenheimInvestments.com/services/prospectuses-and-reports or, by calling 800 820 0888.
The fund's (Class P shares) net expense ratio, which reflects expense waivers and/or reimbursements and includes certain expenses that are outside of the contractual expense limit, was 1.88% for the year ended December 31, 2024, an increase of 0.09% compared to the prior year. The primary driver of the increase was an increase in dividend expense associated with short sales.
| |  | Availability of Additional Information. For additional information, including the fund's prospectus, financial information, holdings and proxy voting information, go to https://www.guggenheiminvestments.com/mutual-funds/literature or, call 800 820 0888. |
AR-RYMSX-123124
Annual Shareholder Report | 12.31.24
This annual shareholder report contains important information about the Guggenheim Multi-Hedge Strategies Fund for the period of January 1, 2024 to December 31, 2024. You can find additional information about the fund at https://www.guggenheiminvestments.com/mutual-funds/literature. You can also request this information by contacting 800 820 0888 or GuggenheimClientServices@mufg-is.com.
This report describes changes to the fund that occurred during the reporting period.
| Institutional Class | $160 | 1.63% |
For the period of January 1, 2024 to December 31, 2024, the fund (Institutional Class shares) returned -3.36%, underperforming the fund's benchmark, the S&P 500 Index, which returned 25.02% for the same period and underperforming the fund's secondary index, the HFRX Global Hedge Fund Index, which returned 5.26% for the same period.
What factors materially affected the fund's performance over the last year?
The fund's long/short equity strategy started the year off with a strong first quarter and, despite giving up some of its gains the remainder of the year, was the largest positive contributor of 2024. The fund's global macro strategies were the largest detractor for the period as positive contributions from value (driven by fixed income) were unable to compensate for negative performance in carry (hurt by equites), momentum (driven by fixed income and currencies), and flow (driven primarily by equities). Market neutral was the second most notable detractor to the fund's performance as positive returns in closed end fund arbitrage did not make up for the losses seen in the market neutral real estate strategy.
Cumulative performance* for the fund's most recently completed 10 years (as of 12.31.24), assuming a $2,000,000 initial investment.
| 12/31/2014 | 2000000 | 2000000 | 2000000 |
| 03/31/2015 | 2056129 | 2019011 | 2041250 |
| 06/30/2015 | 2005778 | 2024626 | 2025427 |
| 09/30/2015 | 2007429 | 1894271 | 1939019 |
| 12/31/2015 | 2028890 | 2027677 | 1927217 |
| 03/31/2016 | 2033842 | 2055006 | 1891104 |
| 06/30/2016 | 2011556 | 2105462 | 1911294 |
| 09/30/2016 | 2015683 | 2186566 | 1952906 |
| 12/31/2016 | 2025240 | 2270185 | 1975460 |
| 03/31/2017 | 2022760 | 2407897 | 2008224 |
| 06/30/2017 | 2030199 | 2482257 | 2026001 |
| 09/30/2017 | 2044252 | 2593471 | 2063000 |
| 12/31/2017 | 2101289 | 2765802 | 2093876 |
| 03/31/2018 | 2044252 | 2744806 | 2072586 |
| 06/30/2018 | 2011187 | 2839059 | 2076116 |
| 09/30/2018 | 2038466 | 3057972 | 2068072 |
| 12/31/2018 | 2007985 | 2644540 | 1953136 |
| 03/31/2019 | 2062030 | 3005466 | 2003857 |
| 06/30/2019 | 2088637 | 3134816 | 2035604 |
| 09/30/2019 | 2122727 | 3188054 | 2068351 |
| 12/31/2019 | 2109339 | 3477211 | 2121503 |
| 03/31/2020 | 2205411 | 2795747 | 1976100 |
| 06/30/2020 | 2209662 | 3370085 | 2098473 |
| 09/30/2020 | 2224966 | 3671014 | 2155908 |
| 12/31/2020 | 2271720 | 4116975 | 2266035 |
| 03/31/2021 | 2395632 | 4371197 | 2295286 |
| 06/30/2021 | 2488566 | 4744883 | 2350522 |
| 09/30/2021 | 2460169 | 4772501 | 2347125 |
| 12/31/2021 | 2440509 | 5298770 | 2348750 |
| 03/31/2022 | 2424871 | 5055105 | 2317020 |
| 06/30/2022 | 2400544 | 4241177 | 2230202 |
| 09/30/2022 | 2386643 | 4034097 | 2241610 |
| 12/31/2022 | 2361956 | 4339117 | 2245270 |
| 03/31/2023 | 2385850 | 4664424 | 2245188 |
| 06/30/2023 | 2406204 | 5072194 | 2259453 |
| 09/30/2023 | 2505319 | 4906160 | 2276360 |
| 12/31/2023 | 2468402 | 5479768 | 2314968 |
| 03/31/2024 | 2588990 | 6058208 | 2373126 |
| 06/30/2024 | 2514079 | 6317729 | 2381842 |
| 09/30/2024 | 2466575 | 6689627 | 2432432 |
| 12/31/2024 | 2385499 | 6850790 | 2436750 |
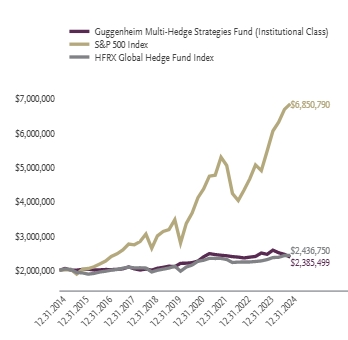
| Institutional Class | -3.36% | 2.49% | 1.78% |
| S&P 500 Index | 25.02% | 14.53% | 13.10% |
| HFRX Global Hedge Fund Index | 5.26% | 2.81% | 1.99% |
The fund's past performance is not a good predictor of the fund's future performance. Visit GuggenheimInvestments.com/mutual-funds/performance for more recent performance information.
| Net Assets | $45,587,304 |
| Total Number of Portfolio Holdings | 325 |
| Portfolio Turnover Rate | 164% |
| Total Advisory Fees Paid | $838,778 |
| Guggenheim Multi-Hedge Strategies Fund | Institutional Class | RYIMX | Annual Shareholder Report | December 31, 2024 |
| Custom Basket Swap Agreements | 48.7% |
| Interest Rate Futures Contracts | 43.9% |
| Commodity Futures Contracts | 40.3% |
| Currency Futures Contracts | 20.1% |
| Equity Futures Contracts | 12.2% |
| Financial | 7.7% |
| Consumer, Non-cyclical | 6.2% |
| Closed-End Mutual Funds | 5.8% |
| Communications | 4.8% |
| Industrial | 4.5% |
| Technology | 4.1% |
| Energy | 3.0% |
| Consumer, Cyclical | 2.2% |
| Basic Materials | 1.5% |
| Utilities | 1.3% |
| Technology | -0.4% |
| Basic Materials | -0.5% |
| Communications | -0.7% |
| Industrial | -1.4% |
| Energy | -3.2% |
| Exchange-Traded Funds | -6.6% |
| Financial | -7.1% |
| Equity Futures Contracts | -14.2% |
| Currency Futures Contracts | -29.0% |
| Commodity Futures Contracts | -33.6% |
| Custom Basket Swap Agreements | -39.1% |
| Interest Rate Futures Contracts | -40.8% |

| Guggenheim Strategy Fund II | 9.9% |
| Guggenheim Ultra Short Duration Fund — Institutional Class | 8.2% |
| Guggenheim Strategy Fund III | 3.6% |
| Heartland Financial USA, Inc. | 2.3% |
| Discover Financial Services | 2.1% |
| HashiCorp, Inc. — Class A | 1.7% |
| Juniper Networks, Inc. | 1.7% |
| Surmodics, Inc. | 1.6% |
| Hess Corp. | 1.4% |
| ChampionX Corp. | 1.3% |
| Top 10 Total | 33.8% |
| |
1 | "Consolidated Holdings Diversification (Market Exposure as a % of Net Assets)" excludes any temporary cash investments, investments in Guggenheim Strategy Funds Trust mutual funds, or investments in Guggenheim Ultra Short Duration Fund. |
| |
2 | "10 Largest Holdings (as a % of Net Assets)" excludes any temporary cash or derivative investments. |
| Guggenheim Strategy Fund II | 9.9% |
| Guggenheim Ultra Short Duration Fund — Institutional Class | 8.2% |
| Guggenheim Strategy Fund III | 3.6% |
| Heartland Financial USA, Inc. | 2.3% |
| Discover Financial Services | 2.1% |
| HashiCorp, Inc. — Class A | 1.7% |
| Juniper Networks, Inc. | 1.7% |
| Surmodics, Inc. | 1.6% |
| Hess Corp. | 1.4% |
| ChampionX Corp. | 1.3% |
| Top 10 Total | 33.8% |
| |
2 | "10 Largest Holdings (as a % of Net Assets)" excludes any temporary cash or derivative investments. |
There were no changes in or disagreements with fund accountants for the period.
This is a summary of certain changes to the fund since December 31, 2023. For more complete information, you may review the fund's next prospectus, which we expect to be available by April 30, 2025 at GuggenheimInvestments.com/services/prospectuses-and-reports or, by calling 800 820 0888.
The fund's (Institutional Class shares) net expense ratio, which reflects expense waivers and/or reimbursements and includes certain expenses that are outside of the contractual expense limit, was 1.63% for the year ended December 31, 2024, an increase of 0.09% compared to the prior year. The primary driver of the increase was an increase in dividend expense associated with short sales.
| |  | Availability of Additional Information. For additional information, including the fund's prospectus, financial information, holdings and proxy voting information, go to https://www.guggenheiminvestments.com/mutual-funds/literature or, call 800 820 0888. |
AR-RYIMX-123124
Item 2. Code of Ethics.
The registrant’s Board of Trustees has adopted a code of ethics that applies to the registrant’s principal executive officer and principal financial officer. No substantive amendments were approved or waivers were granted to the code of ethics during the period covered by this report. The code of ethics is filed as an exhibit to this Form N-CSR.
Item 3. Audit Committee Financial Expert.
The registrant's Board of Trustees has determined that it has at least one audit committee financial expert serving on its audit committee (the “Audit Committee”), Sandra G. Sponem. Ms. Sponem is “independent,” meaning that she is not an “interested person” of the registrant (as that term is defined in Section 2(a)(19) of the Investment Company Act) and she does not accept any consulting, advisory, or other compensatory fee from the registrant (except in her capacity as a Board or committee member).
(Under applicable securities laws, a person who is determined to be an audit committee financial expert will not be deemed an "expert" for any purpose, including without limitation for the purposes of Section 11 of the Securities Act of 1933, as amended, as a result of being designated or identified as an audit committee financial expert. The designation or identification of a person as an audit committee financial expert does not impose on such person any duties, obligations, or liabilities that are greater than the duties, obligations, and liabilities imposed on such person as a member of the Audit Committee and Board of Trustees in the absence of such designation or identification. The designation or identification of a person as an audit committee financial expert does not affect the duties, obligations or liability of any other member of the audit committee or Board of Trustees.)
Item 4. Principal Accountant Fees and Services.
(a) Audit Fees: the aggregate Audit Fees billed by the registrant’s principal accountant for professional services rendered for the audit of the annual financial statements, or services that are normally provided by the accountant in connection with statutory and regulatory filings or engagements were $103,747 and $99,823 for the fiscal years ended December 31, 2024 and December 31, 2023, respectively.
(b) Audit-Related Fees: the aggregate Audit-Related Fees billed by the registrant’s principal accountant for assurance and related services that are reasonably related to the performance of the audit of the registrant’s financial statements and are not reported under paragraph (a) of this Item 4 were $0 and $0 for fiscal years ended December 31, 2024 and December 31, 2023, respectively.
(c) Tax Fees: the aggregate Tax Fees billed by the registrant’s principal accountant for professional services rendered for tax compliance, tax advice and tax planning including preparation of tax returns and distribution assistance were $44,188 and $40,130 for the fiscal years ended December 31, 2024 and December 31, 2023, respectively. These services consisted of (i) preparation of U.S. federal, state and excise tax returns; (ii) U.S. federal and state tax planning, advice and assistance regarding statutory, regulatory or administrative developments, (iii) tax advice regarding tax qualification matters and/or treatment of various financial instruments held or proposed to be acquired and (iv) review of U.S. federal excise distribution calculations.
(d) All Other Fees: the aggregate All Other Fees billed by the registrant’s principal accountant for products and services provided by the principal accountant, other than the services reported in paragraphs (a) through (c) of this Item 4, were $0 and $0 for the fiscal years ended December 31, 2024 and December 31, 2023, respectively.
(e) Audit Committee Pre-Approval Policies and Procedures.
(1) The registrant’s pre-approval policy requires the Audit Committee to pre-approve any engagement of the registrant’s independent auditors to provide any services, other than “prohibited non-audit services,” to the registrant, including the fees and other compensation to be paid to the independent auditors (unless an exception is available under Rule 2-01 of Regulation S-X). The independent auditors or the Chief Accounting Officer of the registrant (or an officer of the registrant who reports to the Chief Accounting Officer) report to the Audit Committee at each of its regular scheduled meetings all audit, audit-related and permissible non-audit services initiated since the last such report (unless the services were contained in the initial audit plan, as previously presented to, and approved by, the Audit Committee). The report includes a general description of the services and projected fees, and the means by which such services were approved by the Audit Committee. The Audit Committee is also required to pre-approve any engagement of the registrant’s independent auditors, including the fees and other compensation to be paid to the independent auditors, to provide any non-audit services to the registrant’s investment adviser (or any “control affiliate” of the investment adviser providing ongoing services to the registrant), if the engagement relates directly to the operations or financial reporting of the registrant (unless an exception is available under Rule 2-01 of Regulation S-X).
(2) None of the services described in each of Items 4(b) through (d) were approved by the Audit Committee pursuant to paragraph (c)(7)(i)(C) of Rule 2-01 of Regulation S-X.
(f) Not applicable.
(g) Non-Audit Fees. The aggregate non-audit fees billed by the registrant's accountant for the most recent fiscal year and the preceding years for services rendered to the registrant, the investment adviser and any entity controlling, controlled by, or under common control with the adviser that provides ongoing services to the registrant were $44,188 and $40,130, respectively. These aggregate fees were less than the aggregate fees billed for the same periods by the registrant’s principal accountant for audit services rendered to the registrant, the investment advisor, and any entity controlling, controlled by, or under common control with the advisor that provides ongoing services to the registrant.
(h) Auditor Independence. The registrant’s Audit Committee was provided with information relating to the provision of non-audit services by Ernst & Young, LLP to the registrant’s investment adviser (not including any sub adviser whose role is primarily portfolio management and is subcontracted with or overseen by another investment adviser), and any entity controlling, controlled by, or under common control with the investment adviser that provides ongoing services to the registrant that were not pre-approved by the Audit Committee so that a determination could be made whether the provision of such services is compatible with maintaining Ernst & Young, LLP’s independence.
(i) Not applicable.
(j) Not applicable.
Item 5. Audit Committee of Listed Registrants.
(a) Not applicable to this registrant.
(b) Not applicable to this registrant.
Item 6. Investments.
(a) The Schedule of Investments is included under Item 7 of this Form.
(b) Not applicable.
Item 7. Financial Statements and Financial Highlights for Open-End Management Investment Companies.
12.31.2024
Guggenheim Funds Annual Financial Report
Rydex Commodities Fund |
Rydex Commodities Strategy Fund | | |
Guggenheim Alternative Funds |
Guggenheim Managed Futures Strategy Fund | | |
Guggenheim Multi-Hedge Strategies Fund | | |
GuggenheimInvestments.com | RSF-ANN-1224x1225 |
This report and the financial statements contained herein are submitted for the general information of our shareholders. The report is not authorized for distribution to prospective investors unless preceded or accompanied by an effective prospectus.
Distributed by Guggenheim Funds Distributors, LLC.
| | |
Item 7: Financial Statements and Financial Highlights for Open-End Management Investment Companies (Annual Financial Report) | |
COMMODITIES STRATEGY FUND | 2 |
MANAGED FUTURES STRATEGY FUND | 8 |
MULTI-HEDGE STRATEGIES FUND | 16 |
NOTES TO CONSOLIDATED FINANCIAL STATEMENTS | 35 |
REPORT OF INDEPENDENT REGISTERED PUBLIC ACCOUNTING FIRM | 50 |
OTHER INFORMATION | 51 |
Item 8: Changes in and Disagreements with Accountants for Open-End Management Investment Companies | 52 |
Item 9: Proxy Disclosures for Open-End Management Investment Companies | 53 |
Item 10: Renumeration Paid to Directors, Officers, and others of Open-End Management Investment Companies | 54 |
Item 11: Statement Regarding Basis for Approval of Investment Advisory Contract | 55 |
| | THE GUGGENHEIM FUNDS ANNUAL FINANCIAL REPORT | 1 |
CONSOLIDATED SCHEDULE OF INVESTMENTS | December 31, 2024 |
COMMODITIES STRATEGY FUND | |
| | Shares | | | Value | |
MUTUAL FUNDS† - 31.5% |
Guggenheim Ultra Short Duration Fund — Institutional Class1 | | | 81,258 | | | $ | 813,393 | |
Guggenheim Strategy Fund II1 | | | 32,137 | | | | 798,613 | |
Total Mutual Funds | | | | |
(Cost $1,609,630) | | | | | | | 1,612,006 | |
| | | | | | | | | |
| | | Face
Amount | | | | | |
U.S. TREASURY BILLS†† - 3.9% |
U.S. Treasury Bills |
4.21% due 01/16/252,3 | | $ | 200,000 | | | | 199,670 | |
Total U.S. Treasury Bills | | | | |
(Cost $199,639) | | | | | | | 199,670 | |
| | | | | | | | | |
| | Face
Amount | | | Value | |
REPURCHASE AGREEMENTS††,4 - 37.5% |
J.P. Morgan Securities LLC
issued 12/31/24 at 4.45%
due 01/02/25 | | $ | 1,076,206 | | | $ | 1,076,206 | |
BofA Securities, Inc.
issued 12/31/24 at 4.43%
due 01/02/25 | | | 845,941 | | | | 845,941 | |
Total Repurchase Agreements | | | | |
(Cost $1,922,147) | | | | | | | 1,922,147 | |
| | | | | | | | | |
Total Investments - 72.9% | | | | |
(Cost $3,731,416) | | $ | 3,733,823 | |
Other Assets & Liabilities, net - 27.1% | | | 1,391,291 | |
Total Net Assets - 100.0% | | $ | 5,125,114 | |
Futures Contracts |
Description | | Number of
Contracts | | | Expiration
Date | | | Notional
Amount | | | Value and
Unrealized
Appreciation** | |
Commodity Futures Contracts Purchased† |
S&P Goldman Sachs Commodity Index Futures Contracts | | | 37 | | | | Jan 2025 | | | $ | 5,089,813 | | | $ | 97,469 | |
** | Includes cumulative appreciation (depreciation). Variation margin is reported within the Consolidated Statement of Assets and Liabilities. |
† | Value determined based on Level 1 inputs — See Note 4. |
†† | Value determined based on Level 2 inputs — See Note 4. |
1 | Affiliated issuer. |
2 | All or a portion of this security is pledged as futures collateral at December 31, 2024. |
3 | Rate indicated is the effective yield at the time of purchase. |
4 | Repurchase Agreements — See Note 6. |
| | |
| | See Sector Classification in Other Information section. |
The following table summarizes the inputs used to value the Fund’s investments at December 31, 2024 (See Note 4 in the Notes to Consolidated Financial Statements):
Investments in Securities (Assets) | | Level 1
Quoted
Prices | | | Level 2
Significant
Observable
Inputs | | | Level 3
Significant
Unobservable
Inputs | | | Total | |
Mutual Funds | | $ | 1,612,006 | | | $ | — | | | $ | — | | | $ | 1,612,006 | |
U.S. Treasury Bills | | | — | | | | 199,670 | | | | — | | | | 199,670 | |
Repurchase Agreements | | | — | | | | 1,922,147 | | | | — | | | | 1,922,147 | |
Commodity Futures Contracts** | | | 97,469 | | | | — | | | | — | | | | 97,469 | |
Total Assets | | $ | 1,709,475 | | | $ | 2,121,817 | | | $ | — | | | $ | 3,831,292 | |
** | This derivative is reported as unrealized appreciation/depreciation at period end. |
2 | THE GUGGENHEIM FUNDS ANNUAL FINANCIAL REPORT | SEE NOTES TO CONSOLIDATED FINANCIAL STATEMENTS. |
CONSOLIDATED SCHEDULE OF INVESTMENTS (concluded) | December 31, 2024 |
COMMODITIES STRATEGY FUND | |
Affiliated Transactions
Investments representing 5% or more of the outstanding voting shares of a company, or control of or by, or common control under Guggenheim Investments (“GI”), result in that company being considered an affiliated person, as defined in the Investment Company Act of 1940 (“affiliated issuer”).
The Fund may invest in certain of the underlying series of Guggenheim Strategy Funds Trust, including Guggenheim Strategy Fund II and Guggenheim Strategy Fund III (collectively, the “Guggenheim Strategy Funds”), each of which are open-end management investment companies managed by GI. The Guggenheim Strategy Funds, which launched on March 11, 2014, are offered as short-term investment options only to mutual funds, trusts, and other accounts managed by GI and/or its affiliates, and are not available to the public. The Guggenheim Strategy Funds pay no investment management fees. The Guggenheim Strategy Funds’ annual report on Form N-CSR dated September 30, 2024 is available publicly or upon request. This information is available from the EDGAR database on the SEC’s website at https://www.sec.gov/ix?doc=/Archives/edgar/data/1601445/000139834424022509/fp0090292-6_ncsrixbrl.htm. The Fund also may invest in certain of the underlying series of Guggenheim Funds Trust, which are open-end management investment companies managed by GI, are available to the public and whose most recent annual report on Form N-CSR is available publicly or upon request.
Transactions during the year ended December 31, 2024, in which the company is an affiliated issuer, were as follows:
Security Name | | Value
12/31/23 | | | Additions | | | Reductions | | | Realized
Gain (Loss) | | | Change in
Unrealized
Appreciation
(Depreciation) | | | Value
12/31/24 | | | Shares
12/31/24 | | | Investment
Income | |
Mutual Funds | | | | | | | | | | | | | | | | | | | | | | | | | | | | | | | | |
Guggenheim Strategy Fund II | | $ | 1,384,699 | | | $ | — | | | $ | (600,000 | ) | | $ | (9,585 | ) | | $ | 23,499 | | | $ | 798,613 | | | | 32,137 | | | $ | 56,057 | |
Guggenheim Ultra Short Duration Fund — Institutional Class | | | 1,395,784 | | | | — | | | | (600,000 | ) | | | (3,076 | ) | | | 20,685 | | | | 813,393 | | | | 81,258 | | | | 51,636 | |
| | | $ | 2,780,483 | | | $ | — | | | $ | (1,200,000 | ) | | $ | (12,661 | ) | | $ | 44,184 | | | $ | 1,612,006 | | | | | | | $ | 107,693 | |
SEE NOTES TO CONSOLIDATED FINANCIAL STATEMENTS. | THE GUGGENHEIM FUNDS ANNUAL FINANCIAL REPORT | 3 |
COMMODITIES STRATEGY FUND | |
CONSOLIDATED STATEMENT OF ASSETS AND LIABILITIES |
December 31, 2024 |
Assets: |
Investments in unaffiliated issuers, at value (cost $199,639) | | $ | 199,670 | |
Investments in affiliated issuers, at value (cost $1,609,630) | | | 1,612,006 | |
Repurchase agreements, at value (cost $1,922,147) | | | 1,922,147 | |
Segregated cash with broker | | | 95,374 | |
Receivables: |
Fund shares sold | | | 1,280,861 | |
Variation margin on futures contracts | | | 15,369 | |
Dividends | | | 6,980 | |
Interest | | | 237 | |
Other assets | | | 291 | |
Total assets | | | 5,132,935 | |
| | | | | |
Liabilities: |
Payable for: |
Management fees | | | 2,137 | |
Distribution and service fees | | | 1,037 | |
Transfer agent fees | | | 923 | |
Portfolio accounting and administration fees | | | 315 | |
Trustees’ fees* | | | 37 | |
Miscellaneous | | | 3,372 | |
Total liabilities | | | 7,821 | |
Net assets | | $ | 5,125,114 | |
| | | | | |
Net assets consist of: |
Paid in capital | | $ | 16,783,523 | |
Total distributable earnings (loss) | | | (11,658,409 | ) |
Net assets | | $ | 5,125,114 | |
CLASS A: |
Net assets | | $ | 912,739 | |
Capital shares outstanding† | | | 6,068 | |
Net asset value per share† | | $ | 150.41 | |
Maximum offering price per share (Net asset value divided by 95.25%) | | $ | 157.91 | |
CLASS C: |
Net assets | | $ | 447,121 | |
Capital shares outstanding† | | | 5,367 | |
Net asset value per share† | | $ | 83.31 | |
CLASS H: |
Net assets | | $ | 3,765,254 | |
Capital shares outstanding† | | | 25,001 | |
Net asset value per share† | | $ | 150.60 | |
CONSOLIDATED STATEMENT OF OPERATIONS |
Year Ended December 31, 2024 |
Investment Income: |
Dividends from securities of affiliated issuers | | $ | 107,693 | |
Interest | | | 189,746 | |
Total investment income | | | 297,439 | |
| | | | | |
Expenses: |
Management fees | | | 48,822 | |
Distribution and service fees: |
Class A | | | 2,409 | |
Class C | | | 4,452 | |
Class H | | | 10,474 | |
Transfer agent fees | | | 11,959 | |
Professional fees | | | 13,147 | |
Portfolio accounting and administration fees | | | 8,537 | |
Trustees’ fees* | | | 1,010 | |
Custodian fees | | | 799 | |
Miscellaneous | | | 2,098 | |
Total expenses | | | 103,707 | |
Less: |
Expenses reimbursed by Adviser | | | (2,799 | ) |
Expenses waived by Adviser | | | (9,520 | ) |
Total waived/reimbursed expenses | | | (12,319 | ) |
Net expenses | | | 91,388 | |
Net investment income | | | 206,051 | |
| | | | | |
Net Realized and Unrealized Gain (Loss): |
Net realized gain (loss) on: |
Investments in unaffiliated issuers | | | 419 | |
Investments in affiliated issuers | | | (12,661 | ) |
Futures contracts | | | (457,238 | ) |
Net realized loss | | | (469,480 | ) |
Net change in unrealized appreciation (depreciation) on: |
Investments in unaffiliated issuers | | | 1 | |
Investments in affiliated issuers | | | 44,184 | |
Futures contracts | | | 11,778 | |
Net change in unrealized appreciation (depreciation) | | | 55,963 | |
Net realized and unrealized loss | | | (413,517 | ) |
Net decrease in net assets resulting from operations | | $ | (207,466 | ) |
† | Reverse share split — The shares outstanding and net asset value per share have been restated to reflect a 1:5 reverse share split effective February 24, 2025. See Note 13 in the Notes to Consolidated Financial Statements. |
* | Relates to Trustees not deemed “interested persons” within the meaning of Section 2(a)(19) of the Investment Company Act of 1940. |
4 | THE GUGGENHEIM FUNDS ANNUAL FINANCIAL REPORT | SEE NOTES TO CONSOLIDATED FINANCIAL STATEMENTS. |
COMMODITIES STRATEGY FUND | |
CONSOLIDATED STATEMENTS OF CHANGES IN NET ASSETS |
| | Year Ended
December 31,
2024 | | | Year Ended
December 31,
2023 | |
Increase (Decrease) in Net Assets from Operations: | | | | | | | | |
Net investment income | | $ | 206,051 | | | $ | 350,012 | |
Net realized loss on investments | | | (469,480 | ) | | | (1,562,745 | ) |
Net change in unrealized appreciation (depreciation) on investments | | | 55,963 | | | | (425,442 | ) |
Net decrease in net assets resulting from operations | | | (207,466 | ) | | | (1,638,175 | ) |
| | | | | | | | | |
Distributions to shareholders: | | | | | | | | |
Class A | | | — | | | | (48,321 | ) |
Class C | | | — | | | | (32,801 | ) |
Class H | | | — | | | | (271,706 | ) |
Total distributions to shareholders | | | — | | | | (352,828 | ) |
| | | | | | | | | |
Capital share transactions: | | | | | | | | |
Proceeds from sale of shares | | | | | | | | |
Class A | | | 398,357 | | | | 341,288 | |
Class C | | | 152,332 | | | | 2,400 | |
Class H | | | 61,293,637 | | | | 48,682,954 | |
Distributions reinvested | | | | | | | | |
Class A | | | — | | | | 47,800 | |
Class C | | | — | | | | 32,644 | |
Class H | | | — | | | | 260,601 | |
Cost of shares redeemed | | | | | | | | |
Class A | | | (429,413 | ) | | | (832,530 | ) |
Class C | | | (131,220 | ) | | | (279,051 | ) |
Class H | | | (60,293,249 | ) | | | (51,446,971 | ) |
Net increase (decrease) from capital share transactions | | | 990,444 | | | | (3,190,865 | ) |
Net increase (decrease) in net assets | | | 782,978 | | | | (5,181,868 | ) |
| | | | | | | | | |
Net assets: | | | | | | | | |
Beginning of year | | | 4,342,136 | | | | 9,524,004 | |
End of year | | $ | 5,125,114 | | | $ | 4,342,136 | |
| | | | | | | | | |
Capital share activity:* | | | | | | | | |
Shares sold | | | | | | | | |
Class A | | | 2,620 | | | | 2,219 | |
Class C | | | 1,815 | | | | 28 | |
Class H | | | 401,249 | | | | 310,593 | |
Shares issued from reinvestment of distributions | | | | | | | | |
Class A | | | — | | | | 344 | |
Class C | | | — | | | | 421 | |
Class H | | | — | | | | 1,874 | |
Shares redeemed | | | | | | | | |
Class A | | | (2,879 | ) | | | (5,640 | ) |
Class C | | | (1,578 | ) | | | (3,334 | ) |
Class H | | | (398,270 | ) | | | (337,506 | ) |
Net increase (decrease) in shares | | | 2,957 | | | | (31,001 | ) |
* | Reverse share split — Capital share activity for the years ended December 31, 2024 and 2023 have been restated to reflect a 1:5 reverse share split effective February 24, 2025. See Note 13 in the Notes to Consolidated Financial Statements. |
SEE NOTES TO CONSOLIDATED FINANCIAL STATEMENTS. | THE GUGGENHEIM FUNDS ANNUAL FINANCIAL REPORT | 5 |
CONSOLIDATED FINANCIAL HIGHLIGHTS |
COMMODITIES STRATEGY FUND |
This table is presented to show selected data for a share outstanding throughout each period and to assist shareholders in evaluating the Fund’s performance for the periods presented.
Class A | | Year Ended
December 31,
2024f | | | Year Ended
December 31,
2023 f | | | Year Ended
December 31,
2022 f | | | Year Ended
December 31,
2021 f | | | Year Ended
December 31,
2020 f | |
Per Share Data |
Net asset value, beginning of period | | $ | 138.95 | | | $ | 155.60 | | | $ | 147.93 | | | $ | 109.65 | | | $ | 305.29 | |
Income (loss) from investment operations: |
Net investment income (loss)a | | | 5.45 | | | | 5.25 | | | | (0.10 | ) | | | (2.00 | ) | | | (1.40 | ) |
Net gain (loss) on investments (realized and unrealized) | | | 6.01 | e | | | (15.00 | ) | | | 34.47 | | | | 44.68 | | | | (74.19 | ) |
Total from investment operations | | | 11.46 | | | | (9.75 | ) | | | 34.37 | | | | 42.68 | | | | (75.59 | ) |
Less distributions from: |
Net investment income | | | — | | | | (6.90 | ) | | | (26.70 | ) | | | (4.40 | ) | | | (120.05 | ) |
Total distributions | | | — | | | | (6.90 | ) | | | (26.70 | ) | | | (4.40 | ) | | | (120.05 | ) |
Net asset value, end of period | | $ | 150.41 | | | $ | 138.95 | | | $ | 155.60 | | | $ | 147.93 | | | $ | 109.65 | |
|
Total Returnb | | | 8.24 | % | | | (6.25 | %) | | | 23.52 | % | | | 39.06 | % | | | (23.58 | %) |
Ratios/Supplemental Data |
Net assets, end of period (in thousands) | | $ | 913 | | | $ | 879 | | | $ | 1,463 | | | $ | 724 | | | $ | 211 | |
Ratios to average net assets: |
Net investment income (loss) | | | 3.69 | % | | | 3.52 | % | | | (0.05 | %) | | | (1.43 | %) | | | (0.65 | %) |
Total expensesc | | | 1.81 | % | | | 1.75 | % | | | 1.74 | % | | | 1.78 | % | | | 1.79 | % |
Net expensesd | | | 1.58 | % | | | 1.56 | % | | | 1.60 | % | | | 1.63 | % | | | 1.61 | % |
Portfolio turnover rate | | | — | | | | — | | | | — | | | | — | | | | 5 | % |
Class C | | Year Ended
December 31,
2024f | | | Year Ended
December 31,
2023 f | | | Year Ended
December 31,
2022 f | | | Year Ended
December 31,
2021 f | | | Year Ended
December 31,
2020 f | |
Per Share Data |
Net asset value, beginning of period | | $ | 77.54 | | | $ | 90.78 | | | $ | 96.14 | | | $ | 72.95 | | | $ | 259.20 | |
Income (loss) from investment operations: |
Net investment income (loss)a | | | 2.40 | | | | 2.40 | | | | (.85 | ) | | | (2.05 | ) | | | (2.50 | ) |
Net gain (loss) on investments (realized and unrealized) | | | 3.37 | e | | | (8.74 | ) | | | 22.19 | | | | 29.64 | | | | (63.70 | ) |
Total from investment operations | | | 5.77 | | | | (6.34 | ) | | | 21.34 | | | | 27.59 | | | | (66.20 | ) |
Less distributions from: |
Net investment income | | | — | | | | (6.90 | ) | | | (26.70 | ) | | | (4.40 | ) | | | (120.05 | ) |
Total distributions | | | — | | | | (6.90 | ) | | | (26.70 | | | | (4.40 | ) | | | (120.05 | ) |
Net asset value, end of period | | $ | 83.31 | | | $ | 77.54 | | | $ | 90.78 | | | $ | 96.14 | | | $ | 72.95 | |
|
Total Returnb | | | 7.41 | % | | | (6.96 | %) | | | 22.60 | % | | | 38.08 | % | | | (24.15 | %) |
Ratios/Supplemental Data |
Net assets, end of period (in thousands) | | $ | 447 | | | $ | 398 | | | $ | 728 | | | $ | 183 | | | $ | 55 | |
Ratios to average net assets: |
Net investment income (loss) | | | 2.94 | % | | | 2.75 | % | | | (0.68 | %) | | | (2.18 | %) | | | (1.44 | %) |
Total expensesc | | | 2.57 | % | | | 2.50 | % | | | 2.49 | % | | | 2.53 | % | | | 2.54 | % |
Net expensesd | | | 2.34 | % | | | 2.30 | % | | | 2.35 | % | | | 2.38 | % | | | 2.36 | % |
Portfolio turnover rate | | | — | | | | — | | | | — | | | | — | | | | 5 | % |
6 | THE GUGGENHEIM FUNDS ANNUAL FINANCIAL REPORT | SEE NOTES TO CONSOLIDATED FINANCIAL STATEMENTS. |
CONSOLIDATED FINANCIAL HIGHLIGHTS (concluded) |
COMMODITIES STRATEGY FUND |
This table is presented to show selected data for a share outstanding throughout each period and to assist shareholders in evaluating the Fund’s performance for the periods presented.
Class H | | Year Ended
December 31,
2024f | | | Year Ended
December 31,
2023 f | | | Year Ended
December 31,
2022 f | | | Year Ended
December 31,
2021 f | | | Year Ended
December 31,
2020 f | |
Per Share Data |
Net asset value, beginning of period | | $ | 139.18 | | | $ | 155.82 | | | $ | 148.12 | | | $ | 109.79 | | | $ | 305.48 | |
Income (loss) from investment operations: |
Net investment income (loss)a | | | 5.65 | | | | 5.50 | | | | (1.15 | ) | | | (2.05 | ) | | | (1.70 | ) |
Net gain (loss) on investments (realized and unrealized) | | | 5.77 | e | | | (15.24 | ) | | | 35.55 | | | | 44.78 | | | | (73.94 | ) |
Total from investment operations | | | 11.42 | | | | (9.74 | ) | | | 34.40 | | | | 42.73 | | | | (75.64 | ) |
Less distributions from: |
Net investment income | | | — | | | | (6.90 | ) | | | (26.70 | ) | | | (4.40 | ) | | | (120.05 | ) |
Total distributions | | | — | | | | (6.90 | ) | | | (26.70 | ) | | | (4.40 | ) | | | (120.05 | ) |
Net asset value, end of period | | $ | 150.60 | | | $ | 139.18 | | | $ | 155.82 | | | $ | 148.12 | | | $ | 109.79 | |
|
Total Return | | | 8.19 | % | | | (6.24 | %) | | | 23.53 | % | | | 39.06 | % | | | (23.58 | %) |
Ratios/Supplemental Data |
Net assets, end of period (in thousands) | | $ | 3,765 | | | $ | 3,065 | | | $ | 7,333 | | | $ | 20,898 | | | $ | 855 | |
Ratios to average net assets: |
Net investment income (loss) | | | 3.76 | % | | | 3.59 | % | | | (0.58 | %) | | | (1.44 | %) | | | (0.77 | %) |
Total expensesc | | | 1.79 | % | | | 1.75 | % | | | 1.75 | % | | | 1.77 | % | | | 1.78 | % |
Net expensesd | | | 1.57 | % | | | 1.56 | % | | | 1.61 | % | | | 1.63 | % | | | 1.61 | % |
Portfolio turnover rate | | | — | | | | — | | | | — | | | | — | | | | 5 | % |
a | Net investment income (loss) per share was computed using average shares outstanding throughout the period. |
b | Total return does not reflect the impact of any applicable sales charges. |
c | Does not include expenses of the underlying funds in which the Fund invests. |
d | Net expense information reflects the expense ratios after expense waivers and reimbursements, as applicable. |
e | The amount shown for a share outstanding throughout the year does not agree with the aggregate net loss on investments for the year because of the sales and purchases of fund shares in relation to fluctuating market value of the investments of the Fund. |
f | Reverse share split — Per share amounts for the years presented through December 31, 2024 have been restated to reflect a 1:5 reverse share split effective February 24, 2025 — See Note 13 in the Notes to Consolidated Financial Statements. |
SEE NOTES TO CONSOLIDATED FINANCIAL STATEMENTS. | THE GUGGENHEIM FUNDS ANNUAL FINANCIAL REPORT | 7 |
CONSOLIDATED SCHEDULE OF INVESTMENTS | December 31, 2024 |
MANAGED FUTURES STRATEGY FUND | |
| | Shares | | | Value | |
MUTUAL FUNDS† - 31.2% |
Guggenheim Strategy Fund III1 | | | 193,266 | | | $ | 4,820,043 | |
Guggenheim Strategy Fund II1 | | | 126,104 | | | | 3,133,686 | |
Guggenheim Ultra Short Duration Fund — Institutional Class1 | | | 253,625 | | | | 2,538,790 | |
Total Mutual Funds | | | | |
(Cost $10,451,739) | | | | | | | 10,492,519 | |
| | | | | | | | | |
| | | Face
Amount | | | | | |
U.S. TREASURY BILLS†† - 9.9% |
U.S. Treasury Bills |
4.21% due 01/16/252,3 | | $ | 3,324,000 | | | | 3,318,525 | |
Total U.S. Treasury Bills | | | | |
(Cost $3,318,010) | | | | | | | 3,318,525 | |
| | Face
Amount | | | Value | |
REPURCHASE AGREEMENTS††,4 - 51.7% |
J.P. Morgan Securities LLC
issued 12/31/24 at 4.45%
due 01/02/25 | | $ | 9,714,907 | | | $ | 9,714,907 | |
BofA Securities, Inc.
issued 12/31/24 at 4.43%
due 01/02/25 | | | 7,636,310 | | | | 7,636,310 | |
Total Repurchase Agreements | | | | |
(Cost $17,351,217) | | | | | | | 17,351,217 | |
| | | | | | | | | |
Total Investments - 92.8% | | | | |
(Cost $31,120,966) | | $ | 31,162,261 | |
Other Assets & Liabilities, net - 7.2% | | | 2,412,368 | |
Total Net Assets - 100.0% | | $ | 33,574,629 | |
Futures Contracts |
Description | | Number of
Contracts | | | Expiration
Date | | | Notional
Amount | | | Value and
Unrealized
Appreciation
(Depreciation)** | |
Commodity Futures Contracts Purchased† |
Cocoa Futures Contracts | | | 9 | | | | Mar 2025 | | | $ | 1,039,050 | | | $ | 151,422 | |
Corn Futures Contracts | | | 43 | | | | Mar 2025 | | | | 986,312 | | | | 33,877 | |
Brent Crude Futures Contracts | | | 15 | | | | Jan 2025 | | | | 1,122,450 | | | | 17,855 | |
Gold 100 oz. Futures Contracts | | | 10 | | | | Feb 2025 | | | | 2,637,900 | | | | 15,192 | |
Low Sulphur Gas Oil Futures Contracts | | | 9 | | | | Feb 2025 | | | | 624,375 | | | | 12,410 | |
Cattle Feeder Futures Contracts | | | 9 | | | | Mar 2025 | | | | 1,184,400 | | | | 9,178 | |
LME Primary Aluminum Futures Contracts | | | 8 | | | | Feb 2025 | | | | 509,364 | | | | 9,131 | |
Coffee ‘C’ Futures Contracts | | | 18 | | | | Mar 2025 | | | | 2,165,738 | | | | 8,373 | |
Soybean Meal Futures Contracts | | | 18 | | | | Mar 2025 | | | | 571,140 | | | | 8,313 | |
Gasoline RBOB Futures Contracts | | | 6 | | | | Jan 2025 | | | | 506,772 | | | | 6,986 | |
WTI Crude Futures Contracts | | | 2 | | | | Jan 2025 | | | | 143,560 | | | | 5,415 | |
Live Cattle Futures Contracts | | | 2 | | | | Feb 2025 | | | | 153,280 | | | | 3,334 | |
Cotton #2 Futures Contracts | | | 6 | | | | Mar 2025 | | | | 205,140 | | | | (239 | ) |
Lean Hogs Futures Contracts | | | 41 | | | | Feb 2025 | | | | 1,336,190 | | | | (1,677 | ) |
Sugar #11 Futures Contracts | | | 45 | | | | Feb 2025 | | | | 972,216 | | | | (8,230 | ) |
LME Lead Futures Contracts | | | 29 | | | | Feb 2025 | | | | 1,406,884 | | | | (10,711 | ) |
LME Zinc Futures Contracts | | | 12 | | | | Feb 2025 | | | | 892,338 | | | | (22,147 | ) |
Silver Futures Contracts | | | 9 | | | | Mar 2025 | | | | 1,317,825 | | | | (67,890 | ) |
| | | | | | | | | | | $ | 17,774,934 | | | $ | 170,592 | |
Interest Rate Futures Contracts Purchased†† |
Canadian Government 10 Year Bond Futures Contracts | | | 37 | | | | Mar 2025 | | | $ | 3,158,138 | | | $ | 6,940 | |
Euro - Bobl Futures Contracts | | | 9 | | | | Mar 2025 | | | | 1,096,301 | | | | (888 | ) |
Euro - Schatz Futures Contracts | | | 200 | | | | Mar 2025 | | | | 22,167,651 | | | | (26,390 | ) |
| | | | | | | | | | | $ | 26,422,090 | | | $ | (20,338 | ) |
8 | THE GUGGENHEIM FUNDS ANNUAL FINANCIAL REPORT | SEE NOTES TO CONSOLIDATED FINANCIAL STATEMENTS. |
CONSOLIDATED SCHEDULE OF INVESTMENTS (continued) | December 31, 2024 |
MANAGED FUTURES STRATEGY FUND | |
Futures Contracts (continued) | | | | | | | | | | | | | | | | |
Description | | Number of
Contracts | | | Expiration
Date | | | Notional
Amount | | | Value and
Unrealized
Appreciation
(Depreciation)** | |
Currency Futures Contracts Purchased† |
British Pound Futures Contracts | | | 46 | | | | Mar 2025 | | | $ | 3,597,488 | | | $ | 2,653 | |
New Zealand Dollar Futures Contracts | | | 7 | | | | Mar 2025 | | | | 391,930 | | | | 44 | |
Mexican Peso Futures Contracts | | | 56 | | | | Mar 2025 | | | | 1,325,800 | | | | (25,456 | ) |
| | | | | | | | | | | $ | 5,315,218 | | | $ | (22,759 | ) |
Equity Futures Contracts Purchased† |
FTSE Taiwan Index Futures Contracts | | | 25 | | | | Jan 2025 | | | $ | 1,908,250 | | | $ | 12,735 | |
Nikkei 225 (OSE) Index Futures Contracts†† | | | 11 | | | | Mar 2025 | | | | 2,761,016 | | | | 10,387 | |
Tokyo Stock Price Index Futures Contracts†† | | | 6 | | | | Mar 2025 | | | | 1,051,309 | | | | 7,642 | |
Nikkei 225 (CME) Index Futures Contracts | | | 3 | | | | Mar 2025 | | | | 592,200 | | | | 1,289 | |
IBEX 35 Index Futures Contracts†† | | | 4 | | | | Jan 2025 | | | | 477,427 | | | | 565 | |
Russell 2000 Index Mini Futures Contracts | | | 4 | | | | Mar 2025 | | | | 449,900 | | | | (1,878 | ) |
S&P MidCap 400 Index Mini Futures Contracts | | | 1 | | | | Mar 2025 | | | | 314,670 | | | | (4,052 | ) |
FTSE/JSE TOP 40 Index Futures Contracts†† | | | 14 | | | | Mar 2025 | | | | 566,820 | | | | (4,279 | ) |
S&P/TSX 60 IX Index Futures Contracts | | | 18 | | | | Mar 2025 | | | | 3,721,754 | | | | (10,466 | ) |
FTSE 100 Index Futures Contracts†† | | | 9 | | | | Mar 2025 | | | | 913,598 | | | | (28,177 | ) |
NASDAQ-100 Index Mini Futures Contracts | | | 3 | | | | Mar 2025 | | | | 1,273,260 | | | | (34,459 | ) |
Dow Jones Industrial Average Index Mini Futures Contracts | | | 12 | | | | Mar 2025 | | | | 2,572,200 | | | | (38,509 | ) |
S&P 500 Index Mini Futures Contracts | | | 16 | | | | Mar 2025 | | | | 4,748,200 | | | | (61,697 | ) |
DAX Index Futures Contracts†† | | | 5 | | | | Mar 2025 | | | | 2,579,814 | | | | (94,436 | ) |
| | | | | | | | | | | $ | 23,930,418 | | | $ | (245,335 | ) |
Currency Futures Contracts Sold Short† |
Canadian Dollar Futures Contracts | | | 182 | | | | Mar 2025 | | | $ | 12,694,500 | | | $ | 162,939 | |
Australian Dollar Futures Contracts | | | 88 | | | | Mar 2025 | | | | 5,447,640 | | | | 145,261 | |
Japanese Yen Futures Contracts | | | 51 | | | | Mar 2025 | | | | 4,085,419 | | | | 84,970 | |
Euro FX Futures Contracts | | | 22 | | | | Mar 2025 | | | | 2,857,938 | | | | 60,848 | |
Swiss Franc Futures Contracts | | | 13 | | | | Mar 2025 | | | | 1,805,212 | | | | 30,632 | |
Mexican Peso Futures Contracts | | | 11 | | | | Mar 2025 | | | | 260,425 | | | | 7,203 | |
| | | | | | | | | | | $ | 27,151,134 | | | $ | 491,853 | |
Interest Rate Futures Contracts Sold Short† |
Long Gilt Futures Contracts†† | | | 24 | | | | Mar 2025 | | | $ | 2,760,517 | | | $ | 48,771 | |
U.S. Treasury 10 Year Note Futures Contracts | | | 52 | | | | Mar 2025 | | | | 5,654,188 | | | | 19,441 | |
Australian Government 10 Year Bond Futures Contracts†† | | | 35 | | | | Mar 2025 | | | | 2,430,176 | | | | 18,765 | |
U.S. Treasury Ultra Long Bond Futures Contracts | | | 11 | | | | Mar 2025 | | | | 1,304,531 | | | | 9,402 | |
Euro - Bund Futures Contracts†† | | | 30 | | | | Mar 2025 | | | | 4,134,287 | | | | 5,610 | |
Australian Government 3 Year Bond Futures Contracts†† | | | 21 | | | | Mar 2025 | | | | 1,378,162 | | | | 468 | |
U.S. Treasury Long Bond Futures Contracts | | | 2 | | | | Mar 2025 | | | | 227,437 | | | | (316 | ) |
U.S. Treasury 5 Year Note Futures Contracts | | | 7 | | | | Mar 2025 | | | | 744,242 | | | | (1,567 | ) |
U.S. Treasury 2 Year Note Futures Contracts | | | 182 | | | | Mar 2025 | | | | 37,423,750 | | | | (6,494 | ) |
| | | | | | | | | | | $ | 56,057,290 | | | $ | 94,080 | |
Equity Futures Contracts Sold Short† |
S&P MidCap 400 Index Mini Futures Contracts | | | 1 | | | | Mar 2025 | | | $ | 314,670 | | | $ | 18,535 | |
CAC 40 10 Euro Index Futures Contracts†† | | | 19 | | | | Jan 2025 | | | | 1,436,044 | | | | 13,642 | |
| | | | | | | | | | | $ | 1,750,714 | | | $ | 32,177 | |
Commodity Futures Contracts Sold Short† |
LME Nickel Futures Contracts | | | 8 | | | | Feb 2025 | | | $ | 731,098 | | | $ | 40,732 | |
Natural Gas Futures Contracts | | | 10 | | | | Jan 2025 | | | | 362,700 | | | | 30,874 | |
Soybean Oil Futures Contracts | | | 18 | | | | Mar 2025 | | | | 436,644 | | | | 9,415 | |
Cotton #2 Futures Contracts | | | 14 | | | | Mar 2025 | | | | 478,660 | | | | 7,106 | |
Copper Futures Contracts | | | 4 | | | | Mar 2025 | | | | 402,350 | | | | 5,988 | |
Sugar #11 Futures Contracts | | | 9 | | | | Feb 2025 | | | | 194,443 | | | | 559 | |
Corn Futures Contracts | | | 3 | | | | Mar 2025 | | | | 68,813 | | | | (47 | ) |
Hard Red Winter Wheat Futures Contracts | | | 20 | | | | Mar 2025 | | | | 559,750 | | | | (563 | ) |
SEE NOTES TO CONSOLIDATED FINANCIAL STATEMENTS. | THE GUGGENHEIM FUNDS ANNUAL FINANCIAL REPORT | 9 |
CONSOLIDATED SCHEDULE OF INVESTMENTS (continued) | December 31, 2024 |
MANAGED FUTURES STRATEGY FUND | |
Futures Contracts (continued) | | | | | | | | | | | | | | | | |
Description | | Number of
Contracts | | | Expiration
Date | | | Notional
Amount | | | Value and
Unrealized
Appreciation
(Depreciation)** | |
WTI Crude Futures Contracts | | | 2 | | | | Jan 2025 | | | $ | 143,560 | | | $ | (2,175 | ) |
Brent Crude Futures Contracts | | | 1 | | | | Jan 2025 | | | | 74,830 | | | | (2,272 | ) |
Live Cattle Futures Contracts | | | 8 | | | | Feb 2025 | | | | 613,120 | | | | (4,185 | ) |
Soybean Futures Contracts | | | 21 | | | | Mar 2025 | | | | 1,060,500 | | | | (4,191 | ) |
Soybean Meal Futures Contracts | | | 5 | | | | Mar 2025 | | | | 158,650 | | | | (15,616 | ) |
Wheat Futures Contracts | | | 63 | | | | Mar 2025 | | | | 1,735,650 | | | | (29,930 | ) |
NY Harbor ULSD Futures Contracts | | | 16 | | | | Jan 2025 | | | | 1,555,814 | | | | (48,729 | ) |
| | | | | | | | | | | $ | 8,576,582 | | | $ | (13,034 | ) |
** | Includes cumulative appreciation (depreciation). Variation margin is reported within the Consolidated Statement of Assets and Liabilities. |
† | Value determined based on Level 1 inputs, unless otherwise noted — See Note 4. |
†† | Value determined based on Level 2 inputs — See Note 4. |
1 | Affiliated issuer. |
2 | All or a portion of this security is pledged as futures collateral at December 31, 2024. |
3 | Rate indicated is the effective yield at the time of purchase. |
4 | Repurchase Agreements — See Note 6. |
| | CME — Chicago Mercantile Exchange |
| | |
| | See Sector Classification in Other Information section. |
The following table summarizes the inputs used to value the Fund’s investments at December 31, 2024 (See Note 4 in the Notes to Consolidated Financial Statements):
Investments in Securities (Assets) | | Level 1
Quoted
Prices | | | Level 2
Significant
Observable
Inputs | | | Level 3
Significant
Unobservable
Inputs | | | Total | |
Mutual Funds | | $ | 10,492,519 | | | $ | — | | | $ | — | | | $ | 10,492,519 | |
U.S. Treasury Bills | | | — | | | | 3,318,525 | | | | — | | | | 3,318,525 | |
Repurchase Agreements | | | — | | | | 17,351,217 | | | | — | | | | 17,351,217 | |
Currency Futures Contracts** | | | 494,550 | | | | — | | | | — | | | | 494,550 | |
Commodity Futures Contracts** | | | 376,160 | | | | — | | | | — | | | | 376,160 | |
Interest Rate Futures Contracts** | | | 28,843 | | | | 80,554 | | | | — | | | | 109,397 | |
Equity Futures Contracts** | | | 32,559 | | | | 32,236 | | | | — | | | | 64,795 | |
Total Assets | | $ | 11,424,631 | | | $ | 20,782,532 | | | $ | — | | | $ | 32,207,163 | |
Investments in Securities (Liabilities) | | Level 1
Quoted
Prices | | | Level 2
Significant
Observable
Inputs | | | Level 3
Significant
Unobservable
Inputs | | | Total | |
Equity Futures Contracts** | | $ | 151,061 | | | $ | 126,892 | | | $ | — | | | $ | 277,953 | |
Commodity Futures Contracts** | | | 218,602 | | | | — | | | | — | | | | 218,602 | |
Interest Rate Futures Contracts** | | | 8,377 | | | | 27,278 | | | | — | | | | 35,655 | |
Currency Futures Contracts** | | | 25,456 | | | | — | | | | — | | | | 25,456 | |
Total Liabilities | | $ | 403,496 | | | $ | 154,170 | | | $ | — | | | $ | 557,666 | |
** | This derivative is reported as unrealized appreciation/depreciation at period end. |
10 | THE GUGGENHEIM FUNDS ANNUAL FINANCIAL REPORT | SEE NOTES TO CONSOLIDATED FINANCIAL STATEMENTS. |
CONSOLIDATED SCHEDULE OF INVESTMENTS (concluded) | December 31, 2024 |
MANAGED FUTURES STRATEGY FUND | |
Affiliated Transactions
Investments representing 5% or more of the outstanding voting shares of a company, or control of or by, or common control under Guggenheim Investments (“GI”), result in that company being considered an affiliated person, as defined in the Investment Company Act of 1940 (“affiliated issuer”).
The Fund may invest in certain of the underlying series of Guggenheim Strategy Funds Trust, including Guggenheim Strategy Fund II and Guggenheim Strategy Fund III (collectively, the “Guggenheim Strategy Funds”), each of which are open-end management investment companies managed by GI. The Guggenheim Strategy Funds, which launched on March 11, 2014, are offered as short-term investment options only to mutual funds, trusts, and other accounts managed by GI and/or its affiliates, and are not available to the public. The Guggenheim Strategy Funds pay no investment management fees. The Guggenheim Strategy Funds’ annual report on Form N-CSR dated September 30, 2024 is available publicly or upon request. This information is available from the EDGAR database on the SEC’s website at https://www.sec.gov/ix?doc=/Archives/edgar/data/1601445/000139834424022509/fp0090292-6_ncsrixbrl.htm. The Fund also may invest in certain of the underlying series of Guggenheim Funds Trust, which are open-end management investment companies managed by GI, are available to the public and whose most recent annual report on Form N-CSR is available publicly or upon request.
Transactions during the year ended December 31, 2024, in which the company is an affiliated issuer, were as follows:
Security Name | | Value
12/31/23 | | | Additions | | | Reductions | | | Realized
Gain (Loss) | | | Change in
Unrealized
Appreciation
(Depreciation) | | | Value
12/31/24 | | | Shares
12/31/24 | | | Investment
Income | |
Mutual Funds | | | | | | | | | | | | | | | | | | | | | | | | | | | | | | | | |
Guggenheim Strategy Fund II | | $ | 4,087,969 | | | $ | 4,506 | | | $ | (1,017,597 | ) | | $ | 2,102 | | | $ | 56,706 | | | $ | 3,133,686 | | | | 126,104 | | | $ | 235,411 | |
Guggenheim Strategy Fund III | | | 5,774,042 | | | | 4,464 | | | | (1,050,608 | ) | | | (1,635 | ) | | | 93,780 | | | | 4,820,043 | | | | 193,266 | | | | 319,127 | |
Guggenheim Ultra Short Duration Fund — Institutional Class | | | 2,536,343 | | | | 153 | | | | (38,905 | ) | | | 478 | | | | 40,721 | | | | 2,538,790 | | | | 253,625 | | | | 132,775 | |
| | | $ | 12,398,354 | | | $ | 9,123 | | | $ | (2,107,110 | ) | | $ | 945 | | | $ | 191,207 | | | $ | 10,492,519 | | | | | | | $ | 687,313 | |
SEE NOTES TO CONSOLIDATED FINANCIAL STATEMENTS. | THE GUGGENHEIM FUNDS ANNUAL FINANCIAL REPORT | 11 |
MANAGED FUTURES STRATEGY FUND | |
CONSOLIDATED STATEMENT OF ASSETS AND LIABILITIES |
December 31, 2024 |
Assets: |
Investments in unaffiliated issuers, at value (cost $3,318,010) | | $ | 3,318,525 | |
Investments in affiliated issuers, at value (cost $10,451,739) | | | 10,492,519 | |
Repurchase agreements, at value (cost $17,351,217) | | | 17,351,217 | |
Segregated cash with broker | | | 2,082,420 | |
Receivables: |
Variation margin on futures contracts | | | 316,442 | |
Dividends | | | 46,315 | |
Fund shares sold | | | 45,870 | |
Interest | | | 2,141 | |
Other assets | | | 3,690 | |
Total assets | | | 33,659,139 | |
| | | | | |
Liabilities: |
Due to custodian | | | 3,090 | |
Payable for: |
Management fees | | | 24,435 | |
Fund shares redeemed | | | 11,537 | |
Professional fees | | | 10,600 | |
Transfer agent fees | | | 7,994 | |
Portfolio accounting and administration fees | | | 6,042 | |
Printing fees | | | 3,339 | |
Distribution and service fees | | | 2,729 | |
Trustees’ fees* | | | 375 | |
Miscellaneous | | | 14,369 | |
Total liabilities | | | 84,510 | |
Net assets | | $ | 33,574,629 | |
| | | | | |
Net assets consist of: |
Paid in capital | | $ | 74,639,405 | |
Total distributable earnings (loss) | | | (41,064,776 | ) |
Net assets | | $ | 33,574,629 | |
Class A: |
Net assets | | $ | 4,701,763 | |
Capital shares outstanding | | | 237,984 | |
Net asset value per share | | $ | 19.76 | |
Maximum offering price per share (Net asset value divided by 95.25%) | | $ | 20.75 | |
Class C: |
Net assets | | $ | 1,350,665 | |
Capital shares outstanding | | | 78,962 | |
Net asset value per share | | $ | 17.11 | |
Class P: |
Net assets | | $ | 5,730,272 | |
Capital shares outstanding | | | 287,880 | |
Net asset value per share | | $ | 19.91 | |
Institutional Class: |
Net assets | | $ | 21,791,929 | |
Capital shares outstanding | | | 1,063,458 | |
Net asset value per share | | $ | 20.49 | |
CONSOLIDATED STATEMENT OF OPERATIONS |
Year Ended December 31, 2024 |
Investment Income: |
Dividends from securities of affiliated issuers | | $ | 687,313 | |
Interest | | | 2,498,828 | |
Total investment income | | | 3,186,141 | |
| | | | | |
Expenses: |
Management fees | | | 631,038 | |
Distribution and service fees: |
Class A | | | 13,820 | |
Class C | | | 16,934 | |
Class P | | | 17,459 | |
Professional fees | | | 109,462 | |
Transfer agent fees | | | 98,831 | |
Portfolio accounting and administration fees | | | 90,747 | |
Registration fees | | | 58,184 | |
Trustees’ fees* | | | 8,510 | |
Custodian fees | | | 8,457 | |
Miscellaneous | | | 4,605 | |
Total expenses | | | 1,058,047 | |
Less: |
Expenses waived by Adviser | | | (101,414 | ) |
Net expenses | | | 956,633 | |
Net investment income | | | 2,229,508 | |
| | | | | |
Net Realized and Unrealized Gain (Loss): |
Net realized gain (loss) on: |
Investments in unaffiliated issuers | | | 4,770 | |
Investments in affiliated issuers | | | 945 | |
Futures contracts | | | (1,524,922 | ) |
Foreign currency transactions | | | 15,222 | |
Net realized loss | | | (1,503,985 | ) |
Net change in unrealized appreciation (depreciation) on: |
Investments in unaffiliated issuers | | | (1,070 | ) |
Investments in affiliated issuers | | | 191,207 | |
Futures contracts | | | (637,197 | ) |
Foreign currency translations | | | 273 | |
Net change in unrealized appreciation (depreciation) | | | (446,787 | ) |
Net realized and unrealized loss | | | (1,950,772 | ) |
Net increase in net assets resulting from operations | | $ | 278,736 | |
* | Relates to Trustees not deemed “interested persons” within the meaning of Section 2(a)(19) of the Investment Company Act of 1940. |
12 | THE GUGGENHEIM FUNDS ANNUAL FINANCIAL REPORT | SEE NOTES TO CONSOLIDATED FINANCIAL STATEMENTS. |
MANAGED FUTURES STRATEGY FUND | |
CONSOLIDATED STATEMENTS OF CHANGES IN NET ASSETS |
| | Year Ended
December 31,
2024 | | | Year Ended
December 31,
2023 | |
Increase (Decrease) in Net Assets from Operations: | | | | | | | | |
Net investment income | | $ | 2,229,508 | | | $ | 2,051,663 | |
Net realized loss on investments | | | (1,503,985 | ) | | | (886,248 | ) |
Net change in unrealized appreciation (depreciation) on investments | | | (446,787 | ) | | | (53,998 | ) |
Net increase in net assets resulting from operations | | | 278,736 | | | | 1,111,417 | |
| | | | | | | | | |
Distributions to shareholders: | | | | | | | | |
Class A | | | (235,128 | ) | | | (60,807 | ) |
Class C | | | (66,901 | ) | | | (10,786 | ) |
Class P | | | (279,027 | ) | | | (74,874 | ) |
Institutional Class | | | (1,106,452 | ) | | | (677,597 | ) |
Total distributions to shareholders | | | (1,687,508 | ) | | | (824,064 | ) |
| | | | | | | | | |
Capital share transactions: | | | | | | | | |
Proceeds from sale of shares | | | | | | | | |
Class A | | | 237,415 | | | | 673,620 | |
Class C | | | 23,465 | | | | 514,570 | |
Class P | | | 911,288 | | | | 34,686,211 | |
Institutional Class | | | 7,384,697 | | | | 51,051,944 | |
Distributions reinvested | | | | | | | | |
Class A | | | 228,848 | | | | 58,467 | |
Class C | | | 66,879 | | | | 10,783 | |
Class P | | | 276,784 | | | | 74,034 | |
Institutional Class | | | 1,103,349 | | | | 676,773 | |
Cost of shares redeemed | | | | | | | | |
Class A | | | (1,559,443 | ) | | | (1,396,454 | ) |
Class C | | | (461,347 | ) | | | (900,508 | ) |
Class P | | | (2,929,888 | ) | | | (35,050,246 | ) |
Institutional Class | | | (39,848,100 | ) | | | (19,431,389 | ) |
Net increase (decrease) from capital share transactions | | | (34,566,053 | ) | | | 30,967,805 | |
Net increase (decrease) in net assets | | | (35,974,825 | ) | | | 31,255,158 | |
| | | | | | | | | |
Net assets: | | | | | | | | |
Beginning of year | | | 69,549,454 | | | | 38,294,296 | |
End of year | | $ | 33,574,629 | | | $ | 69,549,454 | |
| | | | | | | | | |
Capital share activity: | | | | | | | | |
Shares sold | | | | | | | | |
Class A | | | 11,176 | | | | 32,583 | |
Class C | | | 1,238 | | | | 28,557 | |
Class P | | | 42,390 | | | | 1,653,977 | |
Institutional Class | | | 333,625 | | | | 2,388,138 | |
Shares issued from reinvestment of distributions | | | | | | | | |
Class A | | | 11,611 | | | | 2,820 | |
Class C | | | 3,918 | | | | 596 | |
Class P | | | 13,937 | | | | 3,548 | |
Institutional Class | | | 53,980 | | | | 31,551 | |
Shares redeemed | | | | | | | | |
Class A | | | (73,851 | ) | | | (67,605 | ) |
Class C | | | (25,453 | ) | | | (50,220 | ) |
Class P | | | (138,289 | ) | | | (1,702,669 | ) |
Institutional Class | | | (1,852,508 | ) | | | (911,234 | ) |
Net increase (decrease) in shares | | | (1,618,226 | ) | | | 1,410,042 | |
SEE NOTES TO CONSOLIDATED FINANCIAL STATEMENTS. | THE GUGGENHEIM FUNDS ANNUAL FINANCIAL REPORT | 13 |
CONSOLIDATED FINANCIAL HIGHLIGHTS |
MANAGED FUTURES STRATEGY FUND |
This table is presented to show selected data for a share outstanding throughout each period and to assist shareholders in evaluating the Fund’s performance for the periods presented.
Class A | | Year Ended
December 31,
2024 | | | Year Ended
December 31,
2023 | | | Year Ended
December 31,
2022 | | | Year Ended
December 31,
2021 | | | Year Ended
December 31,
2020 | |
Per Share Data |
Net asset value, beginning of period | | $ | 20.67 | | | $ | 20.16 | | | $ | 18.41 | | | $ | 17.96 | | | $ | 18.96 | |
Income (loss) from investment operations: |
Net investment income (loss)a | | | .75 | | | | .70 | | | | .05 | | | | (.18 | ) | | | (.12 | ) |
Net gain (loss) on investments (realized and unrealized) | | | (.65 | ) | | | .02 | | | | 2.67 | | | | .63 | | | | .48 | |
Total from investment operations | | | .10 | | | | .72 | | | | 2.72 | | | | .45 | | | | .36 | |
Less distributions from: |
Net investment income | | | (1.01 | ) | | | (.21 | ) | | | (.97 | ) | | | — | | | | (1.36 | ) |
Total distributions | | | (1.01 | ) | | | (.21 | ) | | | (.97 | ) | | | — | | | | (1.36 | ) |
Net asset value, end of period | | $ | 19.76 | | | $ | 20.67 | | | $ | 20.16 | | | $ | 18.41 | | | $ | 17.96 | |
|
Total Returnb | | | 0.49 | % | | | 3.63 | % | | | 14.76 | % | | | 2.51 | % | | | 2.01 | % |
Ratios/Supplemental Data |
Net assets, end of period (in thousands) | | $ | 4,702 | | | $ | 5,974 | | | $ | 6,478 | | | $ | 5,760 | | | $ | 6,306 | |
Ratios to average net assets: |
Net investment income (loss) | | | 3.54 | % | | | 3.39 | % | | | 0.22 | % | | | (0.99 | %) | | | (0.62 | %) |
Total expensesc | | | 1.99 | % | | | 1.89 | % | | | 1.91 | % | | | 1.88 | % | | | 1.87 | % |
Net expensesd | | | 1.82 | % | | | 1.74 | % | | | 1.75 | % | | | 1.73 | % | | | 1.75 | % |
Portfolio turnover rate | | | — | e | | | — | | | | 7 | % | | | 27 | % | | | 111 | % |
Class C | | Year Ended
December 31,
2024 | | | Year Ended
December 31,
2023 | | | Year Ended
December 31,
2022 | | | Year Ended
December 31,
2021 | | | Year Ended
December 31,
2020 | |
Per Share Data |
Net asset value, beginning of period | | $ | 18.03 | | | $ | 17.63 | | | $ | 16.28 | | | $ | 16.00 | | | $ | 17.03 | |
Income (loss) from investment operations: |
Net investment income (loss)a | | | .52 | | | | .48 | | | | (.06 | ) | | | (.29 | ) | | | (.23 | ) |
Net gain (loss) on investments (realized and unrealized) | | | (.57 | ) | | | .02 | | | | 2.33 | | | | .57 | | | | .41 | |
Total from investment operations | | | (.05 | ) | | | .50 | | | | 2.27 | | | | .28 | | | | .18 | |
Less distributions from: |
Net investment income | | | (.87 | ) | | | (.10 | ) | | | (.92 | ) | | | — | | | | (1.21 | ) |
Total distributions | | | (.87 | ) | | | (.10 | ) | | | (.92 | ) | | | — | | | | (1.21 | ) |
Net asset value, end of period | | $ | 17.11 | | | $ | 18.03 | | | $ | 17.63 | | | $ | 16.28 | | | $ | 16.00 | |
|
Total Returnb | | | (0.25 | %) | | | 2.88 | % | | | 13.96 | % | | | 1.75 | % | | | 1.25 | % |
Ratios/Supplemental Data |
Net assets, end of period (in thousands) | | $ | 1,351 | | | $ | 1,789 | | | $ | 2,121 | | | $ | 570 | | | $ | 1,121 | |
Ratios to average net assets: |
Net investment income (loss) | | | 2.81 | % | | | 2.67 | % | | | (0.31 | %) | | | (1.74 | %) | | | (1.37 | %) |
Total expensesc | | | 2.72 | % | | | 2.62 | % | | | 2.65 | % | | | 2.63 | % | | | 2.62 | % |
Net expensesd | | | 2.55 | % | | | 2.47 | % | | | 2.49 | % | | | 2.49 | % | | | 2.50 | % |
Portfolio turnover rate | | | — | e | | | — | | | | 7 | % | | | 27 | % | | | 111 | % |
14 | THE GUGGENHEIM FUNDS ANNUAL FINANCIAL REPORT | SEE NOTES TO CONSOLIDATED FINANCIAL STATEMENTS. |
CONSOLIDATED FINANCIAL HIGHLIGHTS (concluded) |
MANAGED FUTURES STRATEGY FUND |
This table is presented to show selected data for a share outstanding throughout each period and to assist shareholders in evaluating the Fund’s performance for the periods presented.
Class P | | Year Ended
December 31,
2024 | | | Year Ended
December 31,
2023 | | | Year Ended
December 31,
2022 | | | Year Ended
December 31,
2021 | | | Year Ended
December 31,
2020 | |
Per Share Data |
Net asset value, beginning of period | | $ | 20.81 | | | $ | 20.30 | | | $ | 18.48 | | | $ | 18.03 | | | $ | 19.00 | |
Income (loss) from investment operations: |
Net investment income (loss)a | | | .76 | | | | .71 | | | | .01 | | | | (.18 | ) | | | (.12 | ) |
Net gain (loss) on investments (realized and unrealized) | | | (.65 | ) | | | — | | | | 2.73 | | | | .63 | | | | .49 | |
Total from investment operations | | | .11 | | | | .71 | | | | 2.74 | | | | .45 | | | | .37 | |
Less distributions from: |
Net investment income | | | (1.01 | ) | | | (.20 | ) | | | (.92 | ) | | | — | | | | (1.34 | ) |
Total distributions | | | (1.01 | ) | | | (.20 | ) | | | (.92 | ) | | | — | | | | (1.34 | ) |
Net asset value, end of period | | $ | 19.91 | | | $ | 20.81 | | | $ | 20.30 | | | $ | 18.48 | | | $ | 18.03 | |
|
Total Return | | | 0.48 | % | | | 3.66 | % | | | 14.75 | % | | | 2.50 | % | | | 2.05 | % |
Ratios/Supplemental Data |
Net assets, end of period (in thousands) | | $ | 5,730 | | | $ | 7,696 | | | $ | 8,423 | | | $ | 6,697 | | | $ | 7,741 | |
Ratios to average net assets: |
Net investment income (loss) | | | 3.56 | % | | | 3.42 | % | | | 0.07 | % | | | (0.99 | %) | | | (0.63 | %) |
Total expensesc | | | 1.97 | % | | | 1.87 | % | | | 1.91 | % | | | 1.88 | % | | | 1.88 | % |
Net expensesd | | | 1.80 | % | | | 1.72 | % | | | 1.74 | % | | | 1.73 | % | | | 1.77 | % |
Portfolio turnover rate | | | — | e | | | — | | | | 7 | % | | | 27 | % | | | 111 | % |
Institutional Class | | Year Ended
December 31,
2024 | | | Year Ended
December 31,
2023 | | | Year Ended
December 31,
2022 | | | Year Ended
December 31,
2021 | | | Year Ended
December 31,
2020 | |
Per Share Data |
Net asset value, beginning of period | | $ | 21.39 | | | $ | 20.86 | | | $ | 19.00 | | | $ | 18.49 | | | $ | 19.48 | |
Income (loss) from investment operations: |
Net investment income (loss)a | | | .85 | | | | .80 | | | | .14 | | | | (.14 | ) | | | (.08 | ) |
Net gain (loss) on investments (realized and unrealized) | | | (.69 | ) | | | — | | | | 2.74 | | | | .65 | | | | .49 | |
Total from investment operations | | | .16 | | | | .80 | | | | 2.88 | | | | .51 | | | | .41 | |
Less distributions from: |
Net investment income | | | (1.06 | ) | | | (.27 | ) | | | (1.02 | ) | | | — | | | | (1.40 | ) |
Total distributions | | | (1.06 | ) | | | (.27 | ) | | | (1.02 | ) | | | — | | | | (1.40 | ) |
Net asset value, end of period | | $ | 20.49 | | | $ | 21.39 | | | $ | 20.86 | | | $ | 19.00 | | | $ | 18.49 | |
|
Total Return | | | 0.72 | % | | | 3.97 | % | | | 15.03 | % | | | 2.76 | % | | | 2.29 | % |
Ratios/Supplemental Data |
Net assets, end of period (in thousands) | | $ | 21,792 | | | $ | 54,090 | | | $ | 21,272 | | | $ | 8,169 | | | $ | 7,802 | |
Ratios to average net assets: |
Net investment income (loss) | | | 3.84 | % | | | 3.71 | % | | | 0.63 | % | | | (0.73 | %) | | | (0.38 | %) |
Total expensesc | | | 1.69 | % | | | 1.61 | % | | | 1.64 | % | | | 1.63 | % | | | 1.61 | % |
Net expensesd | | | 1.52 | % | | | 1.46 | % | | | 1.48 | % | | | 1.48 | % | | | 1.49 | % |
Portfolio turnover rate | | | — | e | | | — | | | | 7 | % | | | 27 | % | | | 111 | % |
a | Net investment income (loss) per share was computed using average shares outstanding throughout the period. |
b | Total return does not reflect the impact of any applicable sales charges. |
c | Does not include expenses of the underlying funds in which the Fund invests. |
d | Net expense information reflects the expense ratios after expense waivers and reimbursements, as applicable. |
e | Less than 1%. |
SEE NOTES TO CONSOLIDATED FINANCIAL STATEMENTS. | THE GUGGENHEIM FUNDS ANNUAL FINANCIAL REPORT | 15 |
CONSOLIDATED SCHEDULE OF INVESTMENTS | December 31, 2024 |
MULTI-HEDGE STRATEGIES FUND | |
| | Shares | | | Value | |
COMMON STOCKS† - 35.3% |
| | | | | | | | | |
Financial - 7.7% |
Heartland Financial USA, Inc.2 | | | 17,384 | | | $ | 1,065,731 | |
Discover Financial Services2 | | | 5,648 | | | | 978,403 | |
First Bancshares, Inc.2 | | | 10,421 | | | | 364,735 | |
Enstar Group Ltd.*,2 | | | 1,116 | | | | 359,408 | |
Premier Financial Corp.2 | | | 13,790 | | | | 352,610 | |
Independent Bank Group, Inc. | | | 3,925 | | | | 238,130 | |
Sandy Spring Bancorp, Inc. | | | 5,202 | | | | 175,359 | |
Total Financial | | | | | | | 3,534,376 | |
| | | | | | | | | |
Consumer, Non-cyclical - 6.2% |
Surmodics, Inc.* | | | 17,987 | | | | 712,286 | |
Avid Bioservices, Inc.*,2 | | | 34,691 | | | | 428,434 | |
Amedisys, Inc.*,2 | | | 4,153 | | | | 377,051 | |
Patterson Companies, Inc. | | | 12,120 | | | | 374,023 | |
Kellanova2 | | | 4,493 | | | | 363,798 | |
Cross Country Healthcare, Inc.* | | | 15,333 | | | | 278,447 | |
Revance Therapeutics, Inc.* | | | 91,072 | | | | 276,859 | |
Total Consumer, Non-cyclical | | | | | | | 2,810,898 | |
| | | | | | | | | |
Communications - 4.8% |
Juniper Networks, Inc.2 | | | 20,753 | | | | 777,200 | |
Endeavor Group Holdings, Inc. — Class A1,2 | | | 18,310 | | | | 572,920 | |
Infinera Corp.* | | | 85,267 | | | | 560,204 | |
Frontier Communications Parent, Inc.* | | | 4,854 | | | | 168,434 | |
Interpublic Group of Companies, Inc. | | | 4,392 | | | | 123,064 | |
Total Communications | | | | | | | 2,201,822 | |
| | | | | | | | | |
Industrial - 4.5% |
Spirit AeroSystems Holdings, Inc. — Class A*,2 | | | 16,760 | | | | 571,181 | |
Summit Materials, Inc. — Class A* | | | 9,836 | | | | 497,702 | |
Pactiv Evergreen, Inc. | | | 21,386 | | | | 373,613 | |
Barnes Group, Inc. | | | 7,226 | | | | 341,500 | |
Berry Global Group, Inc. | | | 3,853 | | | | 249,174 | |
Total Industrial | | | | | | | 2,033,170 | |
| | | | | | | | | |
Technology - 4.1% |
HashiCorp, Inc. — Class A*,2 | | | 23,127 | | | | 791,175 | |
Altair Engineering, Inc. — Class A* | | | 3,766 | | | | 410,908 | |
ANSYS, Inc.*,2 | | | 1,119 | | | | 377,472 | |
PlayAGS, Inc.*,2 | | | 24,807 | | | | 286,025 | |
Total Technology | | | | | | | 1,865,580 | |
| | | | | | | | | |
Energy - 3.0% |
Hess Corp.2 | | | 4,625 | | | | 615,171 | |
ChampionX Corp. | | | 21,696 | | | | 589,914 | |
Arch Resources, Inc. | | | 1,170 | | | | 165,228 | |
Total Energy | | | | | | | 1,370,313 | |
| | | | | | | | | |
Consumer, Cyclical - 2.2% |
Everi Holdings, Inc.*,2 | | | 42,461 | | | | 573,648 | |
Bally’s Corp.* | | | 24,463 | | | | 437,643 | |
Total Consumer, Cyclical | | | | | | | 1,011,291 | |
| | | | | | | | | |
Basic Materials - 1.5% |
Arcadium Lithium plc*,2 | | | 60,685 | | | | 311,314 | |
SilverCrest Metals, Inc.* | | | 23,910 | | | | 217,581 | |
Universal Stainless & Alloy Products, Inc.* | | | 3,825 | | | | 168,415 | |
Total Basic Materials | | | | | | | 697,310 | |
| | | | | | | | | |
Utilities - 1.3% |
ALLETE, Inc.2 | | | 8,866 | | | | 574,517 | |
| | | | | | | | | |
Total Common Stocks | | | | |
(Cost $15,766,433) | | | | | | | 16,099,277 | |
| | | | | | | | | |
RIGHTS† - 0.0% |
Consumer, Non-cyclical - 0.0% |
Novartis AG*,††† | | | 9,562 | | | | — | |
Bristol-Myers Squibb Co.* | | | 12,237 | | | | — | |
Johnson & Johnson*,††† | | | 3,841 | | | | — | |
Total Consumer, Non-cyclical | | | | | | | — | |
| | | | | | | | | |
Total Rights | | | | |
(Cost $3,729) | | | | | | | — | |
| | | | | | | | | |
MUTUAL FUNDS† - 21.7% |
Guggenheim Strategy Fund II3 | | | 180,814 | | | | 4,493,228 | |
Guggenheim Ultra Short Duration Fund — Institutional Class3 | | | 372,218 | | | | 3,725,902 | |
Guggenheim Strategy Fund III3 | | | 66,959 | | | | 1,669,953 | |
Total Mutual Funds | | | | |
(Cost $9,860,869) | | | | | | | 9,889,083 | |
| | | | | | | | | |
CLOSED-END MUTUAL FUNDS***,† - 5.8% |
Allspring Global Dividend Opportunity Fund | | | 16,587 | | | | 82,441 | |
General American Investors Company, Inc. | | | 1,607 | | | | 81,973 | |
abrdn Emerging Markets Equity Income Fund, Inc. | | | 15,613 | | | | 81,031 | |
Ellsworth Growth and Income Fund Ltd. | | | 8,289 | | | | 80,320 | |
Clough Global Equity Fund | | | 12,050 | | | | 80,253 | |
BlackRock Municipal 2030 Target Term Trust | | | 3,854 | | | | 79,354 | |
SRH Total Return Fund, Inc. | | | 4,937 | | | | 79,091 | |
Nuveen Dow 30sm Dynamic Overwrite Fund | | | 5,245 | | | | 78,990 | |
Royce Small-Capital Trust, Inc. | | | 4,961 | | | | 78,384 | |
Royce Micro-Capital Trust, Inc. | | | 8,004 | | | | 78,039 | |
Gabelli Dividend & Income Trust | | | 3,228 | | | | 77,956 | |
Tri-Continental Corp. | | | 2,396 | | | | 75,929 | |
Western Asset Inflation-Linked Opportunities & Income Fund | | | 8,645 | | | | 71,494 | |
Bancroft Fund Ltd. | | | 3,599 | | | | 63,738 | |
BNY Mellon Strategic Municipal Bond Fund, Inc. | | | 10,250 | | | | 59,553 | |
Sprott Focus Trust, Inc. | | | 7,876 | | | | 57,574 | |
Federated Hermes Premier Municipal Income Fund | | | 4,886 | | | | 53,306 | |
PIMCO New York Municipal Income Fund II | | | 7,331 | | | | 52,490 | |
16 | THE GUGGENHEIM FUNDS ANNUAL FINANCIAL REPORT | SEE NOTES TO CONSOLIDATED FINANCIAL STATEMENTS. |
CONSOLIDATED SCHEDULE OF INVESTMENTS (continued) | December 31, 2024 |
MULTI-HEDGE STRATEGIES FUND | |
| | Shares | | | Value | |
BlackRock New York Municipal Income Trust | | | 4,821 | | | $ | 49,126 | |
Virtus Total Return Fund, Inc. | | | 8,208 | | | | 48,099 | |
Allspring Utilities and High Income Fund | | | 4,409 | | | | 47,264 | |
BNY Mellon Municipal Bond Infrastructure Fund, Inc. | | | 4,238 | | | | 43,863 | |
Gabelli Healthcare & WellnessRx Trust | | | 4,379 | | | | 42,214 | |
Voya Emerging Markets High Dividend Equity Fund | | | 8,217 | | | | 41,167 | |
abrdn Australia Equity Fund, Inc. | | | 9,575 | | | | 40,120 | |
Voya Asia Pacific High Dividend Equity Income Fund | | | 6,545 | | | | 39,663 | |
abrdn Japan Equity Fund, Inc. | | | 6,477 | | | | 37,243 | |
Swiss Helvetia Fund, Inc. | | | 4,892 | | | | 36,641 | |
Templeton Emerging Markets Fund/United States | | | 3,057 | | | | 36,531 | |
Adams Diversified Equity Fund, Inc. | | | 1,740 | | | | 35,148 | |
BlackRock Enhanced Global Dividend Trust | | | 2,978 | | | | 32,073 | |
BlackRock Enhanced International Dividend Trust | | | 5,861 | | | | 31,122 | |
Nuveen NASDAQ 100 Dynamic Overwrite Fund | | | 1,029 | | | | 27,834 | |
John Hancock Hedged Equity & Income Fund | | | 2,195 | | | | 22,411 | |
BlackRock MuniHoldings California Quality Fund, Inc. | | | 1,906 | | | | 20,261 | |
New Germany Fund, Inc. | | | 2,419 | | | | 18,868 | |
Herzfeld Caribbean Basin Fund, Inc. | | | 7,122 | | | | 16,665 | |
Gabelli Global Small and Mid Capital Value Trust | | | 1,206 | | | | 14,110 | |
European Equity Fund, Inc. | | | 1,601 | | | | 13,034 | |
Virtus Convertible & Income Fund | | | 2,830 | | | | 9,820 | |
abrdn Total Dynamic Dividend Fund | | | 1,117 | | | | 9,394 | |
BlackRock MuniHoldings New Jersey Quality Fund, Inc. | | | 822 | | | | 9,100 | |
Royce Global Trust, Inc. | | | 768 | | | | 8,234 | |
abrdn Global Dynamic Dividend Fund | | | 806 | | | | 7,899 | |
Mexico Equity and Income Fund, Inc. | | | 938 | | | | 7,532 | |
Nuveen Missouri Quality Municipal Income Fund | | | 569 | | | | 6,822 | |
Nuveen AMT-Free Municipal Value Fund | | | 500 | | | | 6,790 | |
abrdn Global Infrastructure Income Fund | | | 337 | | | | 5,908 | |
Invesco California Value Municipal Income Trust | | | 521 | | | | 5,700 | |
PIMCO California Municipal Income Fund II | | | 985 | | | | 5,634 | |
Allspring Multi-Sector Income Fund | | | 606 | | | | 5,569 | |
MFS Charter Income Trust | | | 872 | | | | 5,563 | |
Nuveen S&P 500 Dynamic Overwrite Fund | | | 312 | | | | 5,538 | |
BlackRock Enhanced Large Capital Core Fund, Inc. | | | 274 | | | | 5,507 | |
Putnam Premier Income Trust | | | 1,547 | | | | 5,507 | |
Franklin Limited Duration Income Trust | | | 829 | | | | 5,496 | |
Flaherty & Crumrine Total Return Fund, Inc. | | | 329 | | | | 5,494 | |
Western Asset Investment Grade Income Fund, Inc. | | | 439 | | | | 5,492 | |
DTF Tax-Free Income 2028 Term Fund, Inc. | | | 489 | | | | 5,484 | |
Nuveen S&P 500 Buy-Write Income Fund | | | 392 | | | | 5,484 | |
MFS Multimarket Income Trust | | | 1,169 | | | | 5,483 | |
Eaton Vance Tax-Managed Buy-Write Income Fund | | | 365 | | | | 5,475 | |
BlackRock Virginia Municipal Bond Trust | | | 498 | | | | 5,473 | |
First Trust Enhanced Equity Income Fund | | | 264 | | | | 5,467 | |
Blackrock Science & Technology Trust | | | 149 | | | | 5,447 | |
Flaherty & Crumrine Preferred & Income Fund, Inc. | | | 483 | | | | 5,429 | |
Eaton Vance Tax Managed Global Buy Write Opportunities Fund | | | 643 | | | | 5,414 | |
Flaherty & Crumrine Preferred and Income Securities Fund, Inc. | | | 348 | | | | 5,404 | |
Nuveen New York Quality Municipal Income Fund | | | 474 | | | | 5,404 | |
Allspring Income Opportunities Fund | | | 784 | | | | 5,402 | |
MFS Intermediate High Income Fund | | | 3,120 | | | | 5,398 | |
Flaherty & Crumrine Preferred and Income Opportunity Fund, Inc. | | | 599 | | | | 5,397 | |
Pioneer High Income Fund, Inc. | | | 694 | | | | 5,378 | |
Nuveen Municipal Income Fund, Inc. | | | 570 | | | | 5,364 | |
John Hancock Income Securities Trust | | | 479 | | | | 5,362 | |
Nuveen California Quality Municipal Income Fund | | | 473 | | | | 5,340 | |
Nuveen Select Maturities Municipal Fund | | | 613 | | | | 5,339 | |
Cohen & Steers Select Preferred and Income Fund, Inc. | | | 270 | | | | 5,338 | |
MFS Investment Grade Municipal Trust | | | 668 | | | | 5,337 | |
Eaton Vance California Municipal Bond Fund | | | 582 | | | | 5,337 | |
Virtus Diversified Income & Convertible Fund | | | 243 | | | | 5,334 | |
Eaton Vance Tax-Managed Global Diversified Equity Income Fund | | | 652 | | | | 5,327 | |
Eaton Vance Municipal Bond Fund | | | 514 | | | | 5,325 | |
Western Asset Inflation-Linked Income Fund | | | 665 | | | | 5,320 | |
Nuveen Multi-Market Income Fund | | | 878 | | | | 5,312 | |
MFS High Yield Municipal Trust | | | 1,509 | | | | 5,312 | |
TCW Strategic Income Fund, Inc. | | | 1,104 | | | | 5,310 | |
Eaton Vance New York Municipal Bond Fund | | | 557 | | | | 5,308 | |
Nuveen California Municipal Value Fund | | | 628 | | | | 5,307 | |
Nuveen New Jersey Quality Municipal Income Fund | | | 436 | | | | 5,306 | |
Eaton Vance Tax-Advantaged Global Dividend Opportunities Fund | | | 210 | | | | 5,305 | |
Invesco Trust for Investment Grade Municipals | | | 525 | | | | 5,303 | |
Western Asset Emerging Markets Debt Fund, Inc. | | | 551 | | | | 5,301 | |
John Hancock Premium Dividend Fund | | | 416 | | | | 5,300 | |
Liberty All Star Growth Fund, Inc. | | | 938 | | | | 5,300 | |
SEE NOTES TO CONSOLIDATED FINANCIAL STATEMENTS. | THE GUGGENHEIM FUNDS ANNUAL FINANCIAL REPORT | 17 |
CONSOLIDATED SCHEDULE OF INVESTMENTS (continued) | December 31, 2024 |
MULTI-HEDGE STRATEGIES FUND | |
| | Shares | | | Value | |
John Hancock Investors Trust | | | 387 | | | $ | 5,294 | |
BlackRock California Municipal Income Trust | | | 472 | | | | 5,286 | |
Invesco Quality Municipal Income Trust | | | 536 | | | | 5,285 | |
Invesco Municipal Opportunity Trust | | | 543 | | | | 5,278 | |
Nuveen New York Municipal Value Fund | | | 656 | | | | 5,276 | |
Pioneer Diversified High Income Fund, Inc. | | | 447 | | | | 5,275 | |
Lazard Global Total Return and Income Fund, Inc. | | | 330 | | | | 5,273 | |
Eaton Vance Tax-Advantaged Global Dividend Income Fund | | | 289 | | | | 5,268 | |
Nuveen New York Select Tax-Free Income Portfolio | | | 464 | | | | 5,266 | |
Western Asset Managed Municipals Fund, Inc. | | | 516 | | | | 5,263 | |
BlackRock Municipal Income Fund, Inc. | | | 434 | | | | 5,260 | |
PIMCO California Municipal Income Fund III | | | 765 | | | | 5,256 | |
Invesco Municipal Trust | | | 535 | | | | 5,248 | |
BNY Mellon Municipal Income, Inc. | | | 739 | | | | 5,247 | |
Pioneer Municipal High Income Advantage Fund, Inc. | | | 621 | | | | 5,235 | |
BlackRock Health Sciences Trust | | | 138 | | | | 5,234 | |
Neuberger Berman Municipal Fund, Inc. | | | 505 | | | | 5,227 | |
Invesco Advantage Municipal Income Trust II | | | 598 | | | | 5,227 | |
Western Asset Intermediate Muni Fund, Inc. | | | 675 | | | | 5,225 | |
Nuveen Quality Municipal Income Fund | | | 448 | | | | 5,224 | |
BlackRock Municipal Income Trust II | | | 497 | | | | 5,223 | |
Nuveen AMT-Free Quality Municipal Income Fund | | | 463 | | | | 5,223 | |
MFS High Income Municipal Trust | | | 1,419 | | | | 5,222 | |
BlackRock MuniYield Quality Fund III, Inc. | | | 473 | | | | 5,222 | |
Voya Global Advantage and Premium Opportunity Fund | | | 567 | | | | 5,216 | |
BrandywineGLOBAL Global Income Opportunities Fund, Inc. | | | 652 | | | | 5,216 | |
BlackRock MuniYield New York Quality Fund, Inc. | | | 517 | | | | 5,211 | |
AllianceBernstein National Municipal Income Fund, Inc. | | | 479 | | | | 5,207 | |
Nuveen New York AMT-Free Quality Municipal Income Fund | | | 497 | | | | 5,199 | |
BlackRock Municipal Income Trust | | | 527 | | | | 5,196 | |
BlackRock MuniHoldings New York Quality Fund, Inc. | | | 502 | | | | 5,191 | |
Eaton Vance National Municipal Opportunities Trust | | | 315 | | | | 5,185 | |
BlackRock MuniYield Pennsylvania Quality Fund | | | 444 | | | | 5,179 | |
Virtus Convertible & Income Fund II | | | 1,654 | | | | 5,177 | |
BlackRock MuniVest Fund, Inc. | | | 735 | | | | 5,174 | |
MFS Municipal Income Trust | | | 966 | | | | 5,168 | |
BNY Mellon Strategic Municipals, Inc. | | | 855 | | | | 5,164 | |
Invesco Value Municipal Income Trust | | | 434 | | | | 5,160 | |
BlackRock MuniVest Fund II, Inc. | | | 489 | | | | 5,159 | |
Eaton Vance Municipal Income Trust | | | 510 | | | | 5,156 | |
Duff & Phelps Utility and Infrastructure Fund, Inc. | | | 441 | | | | 5,155 | |
Eaton Vance Tax-Advantaged Dividend Income Fund | | | 214 | | | | 5,147 | |
Putnam Municipal Opportunities Trust | | | 507 | | | | 5,136 | |
Nuveen Pennsylvania Quality Municipal Income Fund | | | 459 | | | | 5,132 | |
BlackRock MuniYield Michigan Quality Fund, Inc. | | | 459 | | | | 5,132 | |
John Hancock Tax-Advantaged Dividend Income Fund | | | 233 | | | | 5,131 | |
PIMCO California Municipal Income Fund | | | 567 | | | | 5,126 | |
BlackRock MuniHoldings Quality Fund II, Inc. | | | 512 | | | | 5,120 | |
Putnam Managed Municipal Income Trust | | | 856 | | | | 5,110 | |
NYLI MacKay DefinedTerm Muni Opportunities Fund | | | 342 | | | | 5,106 | |
PIMCO New York Municipal Income Fund | | | 687 | | | | 5,104 | |
BlackRock MuniHoldings Fund, Inc. | | | 437 | | | | 5,100 | |
BlackRock Municipal Income Quality Trust | | | 470 | | | | 5,100 | |
BlackRock MuniYield Quality Fund II, Inc. | | | 516 | | | | 5,088 | |
BlackRock Enhanced Equity Dividend Trust | | | 613 | | | | 5,076 | |
abrdn Healthcare Investors | | | 316 | | | | 5,072 | |
abrdn Life Sciences Investors | | | 386 | | | | 5,064 | |
Voya Infrastructure Industrials and Materials Fund | | | 497 | | | | 5,045 | |
Principal Real Estate Income Fund | | | 510 | | | | 5,039 | |
GAMCO Natural Resources Gold & Income Trust | | | 933 | | | | 4,936 | |
PIMCO New York Municipal Income Fund III | | | 855 | | | | 4,848 | |
Highland Opportunities and Income Fund | | | 272 | | | | 1,412 | |
Highland Global Allocation Fund | | | 199 | | | | 1,355 | |
Nuveen Global High Income Fund | | | 27 | | | | 347 | |
Nuveen Intermediate Duration Municipal Term Fund Liquidating Trust* | | | 955 | | | | — | |
Total Closed-End Funds | | | | |
(Cost $2,497,127) | | | | | | | 2,649,874 | |
| | | | | | | | | |
| | | Face
Amount | | | | | |
U.S. TREASURY BILLS†† - 12.6% |
U.S. Treasury Bills |
4.18% due 02/11/254,9 | | $ | 3,240,000 | | | | 3,224,939 | |
4.21% due 01/16/254,5 | | | 2,533,000 | | | | 2,528,827 | |
Total U.S. Treasury Bills | | | | |
(Cost $5,752,744) | | | | | | | 5,753,766 | |
| | | | | | | | | |
| |
18 | THE GUGGENHEIM FUNDS ANNUAL FINANCIAL REPORT | SEE NOTES TO CONSOLIDATED FINANCIAL STATEMENTS. |
CONSOLIDATED SCHEDULE OF INVESTMENTS (continued) | December 31, 2024 |
MULTI-HEDGE STRATEGIES FUND | |
| | Face
Amount | | | Value | |
REPURCHASE AGREEMENTS††,6 - 13.4% |
J.P. Morgan Securities LLC
issued 12/31/24 at 4.45%
due 01/02/25 | | $ | 3,410,967 | | | $ | 3,410,967 | |
BofA Securities, Inc.
issued 12/31/24 at 4.43%
due 01/02/25 | | | 2,681,158 | | | | 2,681,158 | |
Total Repurchase Agreements | | | | |
(Cost $6,092,125) | | | | | | | 6,092,125 | |
| | | | | | | | | |
| | | Shares | | | | | |
SECURITIES LENDING COLLATERAL†,7 - 0.0% |
Money Market Fund*** | | | | | | | | |
First American Government Obligations Fund - Class X, 4.41%8 | | | 9,952 | | | | 9,952 | |
Total Securities Lending Collateral | | | | |
(Cost $9,952) | | | | | | | 9,952 | |
| | | | | | | | | |
Total Investments - 88.8% | | | | |
(Cost $39,982,979) | | $ | 40,494,077 | |
| | | | | | | | | |
COMMON STOCKS SOLD SHORT† - (13.3)% |
Technology - (0.4)% |
Synopsys, Inc.* | | | 386 | | | | (187,356 | ) |
| | | | | | | | | |
Basic Materials - (0.5)% |
Coeur Mining, Inc.* | | | 38,309 | | | | (219,128 | ) |
| | | | | | | | | |
Communications - (0.7)% |
Omnicom Group, Inc. | | | 1,511 | | | | (130,007 | ) |
Nokia Oyj ADR | | | 45,660 | | | | (202,274 | ) |
Total Communications | | | | | | | (332,281 | ) |
| | | | | | | | | |
Industrial - (1.4)% |
Amcor plc | | | 27,934 | | | | (262,859 | ) |
Boeing Co.* | | | 2,072 | | | | (366,744 | ) |
Total Industrial | | | | | | | (629,603 | ) |
| | | | | | | | | |
Energy - (3.2)% |
Equities Corp. | | | 1 | | | | (46 | ) |
ConocoPhillips | | | 1 | | | | (99 | ) |
CONSOL Energy, Inc. | | | 1,551 | | | | (165,461 | ) |
Schlumberger N.V. | | | 15,947 | | | | (611,408 | ) |
Chevron Corp. | | | 4,741 | | | | (686,686 | ) |
Total Energy | | | | | | | (1,463,700 | ) |
| | | | | | | | | |
Financial - (7.1)% |
Atlantic Union Bankshares Corp. | | | 4,682 | | | | (177,354 | ) |
SouthState Corp. | | | 2,355 | | | | (234,275 | ) |
WesBanco, Inc. | | | 11,032 | | | | (358,981 | ) |
Renasant Corp. | | | 10,421 | | | | (372,551 | ) |
Capital One Financial Corp. | | | 5,756 | | | | (1,026,410 | ) |
| | | | | | | | | |
| | Shares | | | Value | |
UMB Financial Corp. | | | 9,561 | | | $ | (1,079,054 | ) |
Total Financial | | | | | | | (3,248,625 | ) |
| | | | | | | | | |
Total Common Stocks Sold Short | | | | |
(Proceeds $5,763,786) | | | | | | | (6,080,693 | ) |
| | | | | | | | | |
EXCHANGE-TRADED FUNDS SOLD SHORT***,† - (6.6)% |
iShares Mortgage Real Estate ETF | | | 17 | | | | (363 | ) |
iShares Agency Bond ETF | | | 4 | | | | (432 | ) |
iShares MBS ETF* | | | 13 | | | | (1,192 | ) |
Materials Select Sector SPDR Fund | | | 21 | | | | (1,767 | ) |
iShares U.S. Real Estate ETF | | | 19 | | | | (1,768 | ) |
SPDR Gold Shares — Class D* | | | 13 | | | | (3,148 | ) |
SPDR S&P Biotech ETF | | | 36 | | | | (3,242 | ) |
Technology Select Sector SPDR Fund | | | 15 | | | | (3,488 | ) |
iShares JP Morgan USD Emerging Markets Bond ETF | | | 55 | | | | (4,897 | ) |
VanEck Gold Miners ETF | | | 146 | | | | (4,951 | ) |
iShares Latin America 40 ETF | | | 526 | | | | (10,999 | ) |
Invesco Senior Loan ETF | | | 634 | | | | (13,358 | ) |
iShares iBoxx $ Investment Grade Corporate Bond ETF | | | 181 | | | | (19,338 | ) |
iShares 7-10 Year Treasury Bond ETF* | | | 227 | | | | (20,986 | ) |
iShares Preferred & Income Securities ETF* | | | 680 | | | | (21,379 | ) |
iShares Floating Rate Bond ETF | | | 447 | | | | (22,743 | ) |
iShares MSCI All Country Asia ex Japan ETF* | | | 360 | | | | (25,985 | ) |
Schwab U.S. Aggregate Bond ETF | | | 1,369 | | | | (31,076 | ) |
Health Care Select Sector SPDR Fund | | | 310 | | | | (42,647 | ) |
Utilities Select Sector SPDR Fund | | | 564 | | | | (42,689 | ) |
iShares Core High Dividend ETF | | | 444 | | | | (49,843 | ) |
iShares iBoxx $ High Yield Corporate Bond ETF | | | 845 | | | | (66,459 | ) |
iShares TIPS Bond ETF | | | 676 | | | | (72,028 | ) |
iShares Russell 1000 Growth ETF | | | 262 | | | | (105,214 | ) |
iShares MSCI Emerging Markets ETF | | | 2,873 | | | | (120,149 | ) |
VanEck High Yield Muni ETF | | | 2,568 | | | | (133,305 | ) |
SPDR Bloomberg Convertible Securities ETF | | | 2,234 | | | | (174,006 | ) |
iShares Russell 2000 Index ETF | | | 982 | | | | (216,983 | ) |
SPDR S&P 500 ETF Trust | | | 407 | | | | (238,534 | ) |
SPDR Nuveen Bloomberg High Yield Municipal Bond ETF | | | 9,387 | | | | (240,120 | ) |
iShares National Muni Bond ETF | | | 2,385 | | | | (254,122 | ) |
iShares Russell 1000 Value ETF | | | 1,481 | | | | (274,178 | ) |
iShares MSCI EAFE ETF | | | 4,777 | | | | (361,189 | ) |
SPDR Nuveen Bloomberg Municipal Bond ETF | | | 8,868 | | | | (404,558 | ) |
Total Exchange-Traded Funds Sold Short | | | | |
(Proceeds $3,085,735) | | | | | | | (2,987,136 | ) |
| | | | | | | | | |
Total Securities Sold Short - (19.9)% | | | | |
(Proceeds $8,849,521) | | $ | (9,067,829 | ) |
Other Assets & Liabilities, net - 31.1% | | | 14,161,056 | |
Total Net Assets - 100.0% | | $ | 45,587,304 | |
SEE NOTES TO CONSOLIDATED FINANCIAL STATEMENTS. | THE GUGGENHEIM FUNDS ANNUAL FINANCIAL REPORT | 19 |
CONSOLIDATED SCHEDULE OF INVESTMENTS (continued) | December 31, 2024 |
MULTI-HEDGE STRATEGIES FUND | |
Futures Contracts |
Description | | Number of
Contracts | | | Expiration
Date | | | Notional
Amount | | | Value and
Unrealized
Appreciation
(Depreciation)** | |
Commodity Futures Contracts Purchased† |
Natural Gas Futures Contracts | | | 38 | | | | Feb 2025 | | | $ | 1,188,260 | | | $ | 148,118 | |
Live Cattle Futures Contracts | | | 92 | | | | Jun 2025 | | | | 6,981,880 | | | | 132,860 | |
Gasoline RBOB Futures Contracts | | | 33 | | | | Jan 2025 | | | | 2,787,246 | | | | 79,646 | |
Cocoa Futures Contracts | | | 4 | | | | Mar 2025 | | | | 461,800 | | | | 72,227 | |
Cattle Feeder Futures Contracts | | | 7 | | | | Mar 2025 | | | | 921,200 | | | | 20,360 | |
Corn Futures Contracts | | | 19 | | | | Mar 2025 | | | | 435,813 | | | | 10,066 | |
Low Sulphur Gas Oil Futures Contracts | | | 2 | | | | Feb 2025 | | | | 138,750 | | | | 4,647 | |
Soybean Meal Futures Contracts | | | 8 | | | | Mar 2025 | | | | 253,840 | | | | 3,865 | |
WTI Crude Futures Contracts | | | 2 | | | | Jan 2025 | | | | 143,560 | | | | 3,815 | |
Brent Crude Futures Contracts | | | 2 | | | | Jan 2025 | | | | 149,660 | | | | 3,377 | |
NY Harbor ULSD Futures Contracts | | | 1 | | | | Jan 2025 | | | | 97,238 | | | | 2,365 | |
Gold 100 oz. Futures Contracts | | | 1 | | | | Feb 2025 | | | | 263,790 | | | | 2,183 | |
Lean Hogs Futures Contracts | | | 7 | | | | Feb 2025 | | | | 228,130 | | | | 468 | |
Coffee ‘C’ Futures Contracts | | | 6 | | | | Mar 2025 | | | | 721,913 | | | | 164 | |
Cotton #2 Futures Contracts | | | 8 | | | | Mar 2025 | | | | 273,520 | | | | (265 | ) |
LME Zinc Futures Contracts | | | 1 | | | | Feb 2025 | | | | 74,362 | | | | (3,146 | ) |
Silver Futures Contracts | | | 1 | | | | Mar 2025 | | | | 146,425 | | | | (9,028 | ) |
Sugar #11 Futures Contracts | | | 155 | | | | Apr 2025 | | | | 3,109,176 | | | | (368,614 | ) |
| | | | | | | | | | | $ | 18,376,563 | | | $ | 103,108 | |
Equity Futures Contracts Purchased† |
CBOE Volatility Index Futures Contracts | | | 38 | | | | Jan 2025 | | | $ | 665,000 | | | $ | 43,140 | |
CBOE Volatility Index Futures Contracts | | | 42 | | | | Feb 2025 | | | | 750,960 | | | | 37,227 | |
Russell 2000 Index Mini Futures Contracts | | | 2 | | | | Mar 2025 | | | | 224,950 | | | | 112 | |
S&P 500 Index Mini Futures Contracts | | | 1 | | | | Mar 2025 | | | | 296,763 | | | | (1,202 | ) |
FTSE 100 Index Futures Contracts†† | | | 20 | | | | Mar 2025 | | | | 2,030,218 | | | | (2,477 | ) |
OMX Stockholm 30 Index Futures Contracts†† | | | 3 | | | | Jan 2025 | | | | 66,899 | | | | (2,897 | ) |
FTSE MIB Index Futures Contracts†† | | | 1 | | | | Mar 2025 | | | | 177,081 | | | | (3,932 | ) |
SPI 200 Index Futures Contracts†† | | | 3 | | | | Mar 2025 | | | | 378,793 | | | | (6,458 | ) |
IBEX 35 Index Futures Contracts†† | | | 3 | | | | Jan 2025 | | | | 358,070 | | | | (7,716 | ) |
S&P/TSX 60 IX Index Futures Contracts | | | 3 | | | | Mar 2025 | | | | 620,292 | | | | (24,525 | ) |
| | | | | | | | | | | $ | 5,569,026 | | | $ | 31,272 | |
Interest Rate Futures Contracts Purchased† |
Canadian Government 10 Year Bond Futures Contracts†† | | | 23 | | | | Mar 2025 | | | $ | 1,963,167 | | | $ | 12,643 | |
U.S. Treasury 10 Year Note Futures Contracts | | | 31 | | | | Mar 2025 | | | | 3,370,766 | | | | 9,230 | |
Euro - 30 year Bond Futures Contracts†† | | | 4 | | | | Mar 2025 | | | | 546,803 | | | | (93 | ) |
Euro - BTP Italian Government Bond Futures Contracts†† | | | 22 | | | | Mar 2025 | | | | 2,728,857 | | | | (11,577 | ) |
Euro - Bund Futures Contracts†† | | | 32 | | | | Mar 2025 | | | | 4,409,906 | | | | (55,314 | ) |
Euro - OATS Futures Contracts†† | | | 55 | | | | Mar 2025 | | | | 7,014,765 | | | | (110,131 | ) |
| | | | | | | | | | | $ | 20,034,264 | | | $ | (155,242 | ) |
Currency Futures Contracts Purchased† |
Australian Dollar Futures Contracts | | | 20 | | | | Mar 2025 | | | $ | 1,238,100 | | | $ | (46,373 | ) |
New Zealand Dollar Futures Contracts | | | 23 | | | | Mar 2025 | | | | 1,287,770 | | | | (49,430 | ) |
British Pound Futures Contracts | | | 39 | | | | Mar 2025 | | | | 3,050,044 | | | | (62,423 | ) |
Japanese Yen Futures Contracts | | | 45 | | | | Mar 2025 | | | | 3,604,781 | | | | (153,128 | ) |
| | | | | | | | | | | $ | 9,180,695 | | | $ | (311,354 | ) |
Currency Futures Contracts Sold Short† |
Swiss Franc Futures Contracts | | | 76 | | | | Mar 2025 | | | $ | 10,553,550 | | | $ | 364,639 | |
Euro FX Futures Contracts | | | 13 | | | | Mar 2025 | | | | 1,688,781 | | | | 36,957 | |
Canadian Dollar Futures Contracts | | | 14 | | | | Mar 2025 | | | | 976,500 | | | | 15,832 | |
| | | | | | | | | | | $ | 13,218,831 | | | $ | 417,428 | |
20 | THE GUGGENHEIM FUNDS ANNUAL FINANCIAL REPORT | SEE NOTES TO CONSOLIDATED FINANCIAL STATEMENTS. |
CONSOLIDATED SCHEDULE OF INVESTMENTS (continued) | December 31, 2024 |
MULTI-HEDGE STRATEGIES FUND | |
Futures Contracts (continued) |
Description | | Number of
Contracts | | | Expiration
Date | | | Notional
Amount | | | Value and
Unrealized
Appreciation
(Depreciation)** | |
Interest Rate Futures Contracts Sold Short† |
Long Gilt Futures Contracts†† | | | 89 | | | | Mar 2025 | | | $ | 10,236,917 | | | $ | 235,457 | |
Australian Government 10 Year Bond Futures Contracts†† | | | 97 | | | | Mar 2025 | | | | 6,735,060 | | | | 41,144 | |
U.S. Treasury Ultra Long Bond Futures Contracts | | | 6 | | | | Mar 2025 | | | | 711,563 | | | | 993 | |
U.S. Treasury Long Bond Futures Contracts | | | 8 | | | | Mar 2025 | | | | 909,750 | | | | 759 | |
| | | | | | | | | | | $ | 18,593,290 | | | $ | 278,353 | |
Commodity Futures Contracts Sold Short† |
Sugar #11 Futures Contracts | | | 129 | | | | Feb 2025 | | | $ | 2,787,019 | | | $ | 349,632 | |
Soybean Oil Futures Contracts | | | 11 | | | | Mar 2025 | | | | 266,838 | | | | 13,603 | |
LME Lead Futures Contracts | | | 4 | | | | Feb 2025 | | | | 194,053 | | | | 11,927 | |
LME Nickel Futures Contracts | | | 2 | | | | Feb 2025 | | | | 182,775 | | | | 10,183 | |
Wheat Futures Contracts | | | 9 | | | | Mar 2025 | | | | 247,950 | | | | 3,797 | |
Hard Red Winter Wheat Futures Contracts | | | 25 | | | | Mar 2025 | | | | 699,688 | | | | 209 | |
Soybean Futures Contracts | | | 4 | | | | Mar 2025 | | | | 202,000 | | | | 87 | |
Live Cattle Futures Contracts | | | 4 | | | | Feb 2025 | | | | 306,560 | | | | (1,059 | ) |
Gasoline RBOB Futures Contracts | | | 32 | | | | Mar 2025 | | | | 2,996,717 | | | | (74,110 | ) |
Natural Gas Futures Contracts | | | 33 | | | | Jan 2025 | | | | 1,196,910 | | | | (84,473 | ) |
Live Cattle Futures Contracts | | | 80 | | | | Apr 2025 | | | | 6,220,800 | | | | (123,211 | ) |
| | | | | | | | | | | $ | 15,301,310 | | | $ | 106,585 | |
Equity Futures Contracts Sold Short† |
DAX Index Futures Contracts†† | | | 3 | | | | Mar 2025 | | | $ | 1,547,889 | | | $ | 7,307 | |
CAC 40 10 Euro Index Futures Contracts†† | | | 4 | | | | Jan 2025 | | | | 302,325 | | | | 5,711 | |
Euro STOXX 50 Index Futures Contracts†† | | | 27 | | | | Mar 2025 | | | | 1,361,115 | | | | 1,920 | |
CBOE Volatility Index Futures Contracts | | | 41 | | | | May 2025 | | | | 757,270 | | | | (496 | ) |
CBOE Volatility Index Futures Contracts | | | 32 | | | | Mar 2025 | | | | 580,800 | | | | (7,972 | ) |
CBOE Volatility Index Futures Contracts | | | 105 | | | | Apr 2025 | | | | 1,918,350 | | | | (65,606 | ) |
| | | | | | | | | | | $ | 6,467,749 | | | $ | (59,136 | ) |
Custom Basket Swap Agreements |
Counterparty | Reference Obligation | Type | Financing
Rate | | Payment
Frequency | | | Maturity
Date | | | Notional
Amount | | | Value and
Unrealized
Appreciation | |
OTC Custom Basket Swap Agreements†† |
Morgan Stanley Capital Services LLC | MS Long/Short Equity Custom Basket | Pay | 4.73% (Federal Funds Rate + 0.40%) | | | At Maturity | | | | 08/31/28 | | | $ | 9,426,364 | | | $ | 292,715 | |
Morgan Stanley Capital Services LLC | MS Equity Market Neutral Custom Basket | Pay | 4.73% (Federal Funds Rate + 0.40%) | | | At Maturity | | | | 08/31/28 | | | | 12,761,918 | | | | 216,963 | |
| | | | | | | | | | | | | | $ | 22,188,282 | | | $ | 509,678 | |
OTC Custom Basket Swap Agreements Sold Short†† |
Morgan Stanley Capital Services LLC | MS Equity Market Neutral Custom Basket | Receive | 3.98% (Federal Funds Rate - 0.35%) | | | At Maturity | | | | 08/31/28 | | | $ | 12,852,041 | | | $ | 109,719 | |
Morgan Stanley Capital Services LLC | MS Long/Short Equity Custom Basket | Receive | 4.03% (Federal Funds Rate - 0.30%) | | | At Maturity | | | | 08/31/28 | | | | 4,994,970 | | | | 24,920 | |
| | | | | | | | | | | | | | $ | 17,847,011 | | | $ | 134,639 | |
SEE NOTES TO CONSOLIDATED FINANCIAL STATEMENTS. | THE GUGGENHEIM FUNDS ANNUAL FINANCIAL REPORT | 21 |
CONSOLIDATED SCHEDULE OF INVESTMENTS (continued) | December 31, 2024 |
MULTI-HEDGE STRATEGIES FUND | |
| | Shares | | | Percentage
Notional
Amount | | | Value and
Unrealized
Appreciation
(Depreciation) | |
MS LONG/SHORT EQUITY LONG CUSTOM BASKET |
Communications | | | | | | | | | | | | |
AT&T, Inc. | | | 4,352 | | | | 1.03 | % | | $ | 18,784 | |
IDT Corp. — Class B | | | 1,560 | | | | 0.79 | % | | | 18,446 | |
T-Mobile US, Inc. | | | 340 | | | | 0.80 | % | | | 13,126 | |
F5, Inc. | | | 196 | | | | 0.52 | % | | | 7,797 | |
Verizon Communications, Inc. | | | 2,104 | | | | 0.89 | % | | | 7,210 | |
A10 Networks, Inc. | | | 1,882 | | | | 0.37 | % | | | 3,694 | |
HealthStream, Inc. | | | 1,336 | | | | 0.45 | % | | | 2,831 | |
Yelp, Inc. — Class A | | | 2,688 | | | | 1.10 | % | | | 2,034 | |
Fox Corp. — Class A | | | 1,662 | | | | 0.86 | % | | | 1,493 | |
Gen Digital, Inc. | | | 1,060 | | | | 0.31 | % | | | 1,430 | |
Spok Holdings, Inc. | | | 4,236 | | | | 0.72 | % | | | 1,200 | |
TEGNA, Inc. | | | 2,460 | | | | 0.48 | % | | | (361 | ) |
AST SpaceMobile, Inc. | | | 952 | | | | 0.21 | % | | | (1,834 | ) |
ePlus, Inc. | | | 766 | | | | 0.60 | % | | | (1,941 | ) |
Anterix, Inc. | | | 2,020 | | | | 0.66 | % | | | (2,626 | ) |
Lumen Technologies, Inc. | | | 7,454 | | | | 0.42 | % | | | (7,246 | ) |
Total Communications | | | | | | | | | | | 64,037 | |
| | | | | | | | | | | | | |
Industrial | | | | | | | | | | | | |
Mueller Industries, Inc. | | | 1,302 | | | | 1.08 | % | | | 27,486 | |
Apogee Enterprises, Inc. | | | 1,000 | | | | 0.76 | % | | | 12,594 | |
Owens Corning | | | 518 | | | | 0.94 | % | | | 10,449 | |
Snap-on, Inc. | | | 288 | | | | 1.04 | % | | | 10,204 | |
Teekay Corporation Ltd. | | | 7,874 | | | | 0.58 | % | | | 5,996 | |
Boise Cascade Co. | | | 342 | | | | 0.43 | % | | | 3,008 | |
UFP Industries, Inc. | | | 532 | | | | 0.64 | % | | | 2,734 | |
Acuity Brands, Inc. | | | 280 | | | | 0.87 | % | | | 1,881 | |
Mueller Water Products, Inc. — Class A | | | 1,748 | | | | 0.42 | % | | | 1,876 | |
Teekay Tankers Ltd. — Class A | | | 930 | | | | 0.39 | % | | | 1,523 | |
Benchmark Electronics, Inc. | | | 646 | | | | 0.31 | % | | | 1,248 | |
Scorpio Tankers, Inc. | | | 1,096 | | | | 0.58 | % | | | 893 | |
Watts Water Technologies, Inc. — Class A | | | 244 | | | | 0.53 | % | | | 856 | |
Knowles Corp. | | | 2,254 | | | | 0.48 | % | | | 798 | |
Ardmore Shipping Corp. | | | 2,580 | | | | 0.33 | % | | | 735 | |
Atkore, Inc. | | | 284 | | | | 0.25 | % | | | (972 | ) |
International Seaways, Inc. | | | 1,044 | | | | 0.40 | % | | | (1,842 | ) |
Gibraltar Industries, Inc. | | | 396 | | | | 0.25 | % | | | (1,905 | ) |
Masterbrand, Inc. | | | 2,096 | | | | 0.32 | % | | | (1,916 | ) |
Arrow Electronics, Inc. | | | 480 | | | | 0.58 | % | | | (1,996 | ) |
Avnet, Inc. | | | 1,890 | | | | 1.05 | % | | | (2,339 | ) |
Kennametal, Inc. | | | 2,572 | | | | 0.66 | % | | | (3,204 | ) |
Donaldson Company, Inc. | | | 1,032 | | | | 0.74 | % | | | (3,474 | ) |
TE Connectivity plc | | | 676 | | | | 1.03 | % | | | (3,735 | ) |
Granite Construction, Inc. | | | 820 | | | | 0.76 | % | | | (5,848 | ) |
Tennant Co. | | | 1,204 | | | | 1.04 | % | | | (8,136 | ) |
Total Industrial | | | | | | | | | | | 46,914 | |
| | | | | | | | | | | | | |
Financial | | | | | | | | | | | | |
Enova International, Inc. | | | 972 | | | | 0.99 | % | | | 15,182 | |
Synchrony Financial | | | 1,074 | | | | 0.74 | % | | | 15,085 | |
MGIC Investment Corp. | | | 4,040 | | | | 1.00 | % | | | 13,940 | |
Preferred Bank/Los Angeles CA | | | 952 | | | | 0.87 | % | | | 11,811 | |
NMI Holdings, Inc. — Class A | | | 2,626 | | | | 1.02 | % | | | 9,649 | |
Fidelity National Financial, Inc. | | | 1,674 | | | | 1.00 | % | | | 7,383 | |
Axis Capital Holdings Ltd. | | | 742 | | | | 0.70 | % | | | 7,217 | |
Essent Group Ltd. | | | 1,834 | | | | 1.06 | % | | | 7,097 | |
Enact Holdings, Inc. | | | 2,922 | | | | 1.00 | % | | | 6,446 | |
Janus Henderson Group plc | | | 1,902 | | | | 0.86 | % | | | 6,055 | |
OFG Bancorp | | | 1,782 | | | | 0.80 | % | | | 5,808 | |
Affiliated Managers Group, Inc. | | | 440 | | | | 0.86 | % | | | 4,892 | |
Hartford Financial Services Group, Inc. | | | 766 | | | | 0.89 | % | | | 4,708 | |
International Bancshares Corp. | | | 416 | | | | 0.28 | % | | | 4,057 | |
Reinsurance Group of America, Inc. — Class A | | | 466 | | | | 1.06 | % | | | 3,940 | |
Coastal Financial Corp. | | | 492 | | | | 0.44 | % | | | 3,306 | |
Cincinnati Financial Corp. | | | 594 | | | | 0.91 | % | | | 1,849 | |
RenaissanceRe Holdings Ltd. | | | 190 | | | | 0.50 | % | | | 1,791 | |
Everest Group Ltd. | | | 124 | | | | 0.48 | % | | | 493 | |
GCM Grosvenor, Inc. — Class A | | | 3,664 | | | | 0.48 | % | | | 374 | |
White Mountains Insurance Group Ltd. | | | 14 | | | | 0.29 | % | | | 45 | |
Chicago Atlantic Real Estate Finance, Inc. | | | 1,409 | | | | 0.23 | % | | | (883 | ) |
Ameriprise Financial, Inc. | | | 70 | | | | 0.40 | % | | | (938 | ) |
WP Carey, Inc. | | | 1,070 | | | | 0.62 | % | | | (1,198 | ) |
BancFirst Corp. | | | 244 | | | | 0.30 | % | | | (1,381 | ) |
Jackson Financial, Inc. — Class A | | | 308 | | | | 0.28 | % | | | (1,633 | ) |
Texas Capital Bancshares, Inc. | | | 384 | | | | 0.32 | % | | | (1,651 | ) |
Northeast Community Bancorp, Inc. | | | 1,790 | | | | 0.46 | % | | | (2,068 | ) |
McGrath RentCorp | | | 450 | | | | 0.53 | % | | | (2,397 | ) |
Simmons First National Corp. — Class A | | | 2,488 | | | | 0.59 | % | | | (2,689 | ) |
Arch Capital Group Ltd. | | | 768 | | | | 0.75 | % | | | (2,895 | ) |
Mercury General Corp. | | | 542 | | | | 0.38 | % | | | (3,635 | ) |
Fifth Third Bancorp | | | 1,888 | | | | 0.85 | % | | | (5,185 | ) |
QCR Holdings, Inc. | | | 964 | | | | 0.82 | % | | | (5,367 | ) |
Advanced Flower Capital, Inc. | | | 3,717 | | | | 0.33 | % | | | (5,410 | ) |
22 | THE GUGGENHEIM FUNDS ANNUAL FINANCIAL REPORT | SEE NOTES TO CONSOLIDATED FINANCIAL STATEMENTS. |
CONSOLIDATED SCHEDULE OF INVESTMENTS (continued) | December 31, 2024 |
MULTI-HEDGE STRATEGIES FUND | |
| | Shares | | | Percentage
Notional
Amount | | | Value and
Unrealized
Appreciation
(Depreciation) | |
Innovative Industrial Properties, Inc. | | | 312 | | | | 0.22 | % | | $ | (10,713 | ) |
Total Financial | | | | | | | | | | | 83,085 | |
| | | | | | | | | | | | | |
Consumer, Cyclical | | | | | | | | | | | | |
Allison Transmission Holdings, Inc. | | | 880 | | | | 1.01 | % | | | 25,243 | |
Monarch Casino & Resort, Inc. | | | 1,202 | | | | 1.01 | % | | | 9,612 | |
Buckle, Inc. | | | 786 | | | | 0.42 | % | | | 5,342 | |
Sonos, Inc. | | | 1,594 | | | | 0.25 | % | | | 2,723 | |
Lennar Corp. — Class A | | | 246 | | | | 0.36 | % | | | 2,590 | |
Phinia, Inc. | | | 820 | | | | 0.42 | % | | | 2,232 | |
PC Connection, Inc. | | | 1,078 | | | | 0.79 | % | | | 2,137 | |
Tapestry, Inc. | | | 400 | | | | 0.28 | % | | | 771 | |
Autoliv, Inc. | | | 302 | | | | 0.30 | % | | | (110 | ) |
Ethan Allen Interiors, Inc. | | | 1,358 | | | | 0.40 | % | | | (131 | ) |
BorgWarner, Inc. | | | 1,356 | | | | 0.46 | % | | | (529 | ) |
Harley-Davidson, Inc. | | | 782 | | | | 0.25 | % | | | (688 | ) |
PACCAR, Inc. | | | 444 | | | | 0.49 | % | | | (786 | ) |
ScanSource, Inc. | | | 1,326 | | | | 0.67 | % | | | (1,166 | ) |
Gentex Corp. | | | 1,958 | | | | 0.60 | % | | | (1,467 | ) |
GMS, Inc. | | | 410 | | | | 0.37 | % | | | (1,513 | ) |
H&E Equipment Services, Inc. | | | 738 | | | | 0.38 | % | | | (3,901 | ) |
Visteon Corp. | | | 1,026 | | | | 0.97 | % | | | (4,258 | ) |
Tri Pointe Homes, Inc. | | | 2,476 | | | | 0.95 | % | | | (6,341 | ) |
Lear Corp. | | | 582 | | | | 0.58 | % | | | (7,950 | ) |
Total Consumer, Cyclical | | | | | | | | | | | 21,810 | |
| | | | | | | | | | | | | |
Utilities | | | | | | | | | | | | |
National Fuel Gas Co. | | | 1,658 | | | | 1.06 | % | | | 10,342 | |
OGE Energy Corp. | | | 2,404 | | | | 1.04 | % | | | 9,548 | |
Black Hills Corp. | | | 1,654 | | | | 1.02 | % | | | 5,539 | |
Spire, Inc. | | | 1,462 | | | | 1.05 | % | | | 3,845 | |
Duke Energy Corp. | | | 914 | | | | 1.04 | % | | | 3,420 | |
Evergy, Inc. | | | 1,636 | | | | 1.07 | % | | | 2,411 | |
Southwest Gas Holdings, Inc. | | | 1,054 | | | | 0.79 | % | | | 555 | |
CMS Energy Corp. | | | 784 | | | | 0.55 | % | | | 34 | |
WEC Energy Group, Inc. | | | 1,062 | | | | 1.06 | % | | | (735 | ) |
MDU Resources Group, Inc. | | | 1,194 | | | | 0.23 | % | | | (898 | ) |
NextEra Energy, Inc. | | | 586 | | | | 0.45 | % | | | (1,279 | ) |
Avista Corp. | | | 2,784 | | | | 1.08 | % | | | (1,476 | ) |
American Electric Power Company, Inc. | | | 640 | | | | 0.63 | % | | | (1,546 | ) |
Southern Co. | | | 1,204 | | | | 1.05 | % | | | (2,143 | ) |
Clearway Energy, Inc. — Class C | | | 2,884 | | | | 0.80 | % | | | (3,656 | ) |
Otter Tail Corp. | | | 1,312 | | | | 1.03 | % | | | (8,568 | ) |
Total Utilities | | | | | | | | | | | 15,393 | |
| | | | | | | | | | | | | |
Consumer, Non-cyclical | | | | | | | | | | | | |
Cal-Maine Foods, Inc. | | | 630 | | | | 0.69 | % | | | 13,873 | |
United Therapeutics Corp. | | | 216 | | | | 0.81 | % | | | 13,469 | |
Gilead Sciences, Inc. | | | 680 | | | | 0.67 | % | | | 9,994 | |
Innoviva, Inc. | | | 4,310 | | | | 0.79 | % | | | 8,808 | |
Perdoceo Education Corp. | | | 1,462 | | | | 0.41 | % | | | 7,069 | |
Bristol-Myers Squibb Co. | | | 788 | | | | 0.47 | % | | | 6,171 | |
Catalyst Pharmaceuticals, Inc. | | | 2,342 | | | | 0.52 | % | | | 6,046 | |
Incyte Corp. | | | 756 | | | | 0.55 | % | | | 4,816 | |
Premier, Inc. — Class A | | | 3,632 | | | | 0.82 | % | | | 2,948 | |
Jazz Pharmaceuticals plc | | | 374 | | | | 0.49 | % | | | 2,735 | |
Alkermes plc | | | 1,470 | | | | 0.45 | % | | | 2,281 | |
Supernus Pharmaceuticals, Inc. | | | 1,068 | | | | 0.41 | % | | | 2,204 | |
Ingredion, Inc. | | | 156 | | | | 0.23 | % | | | 1,805 | |
Harmony Biosciences Holdings, Inc. | | | 1,348 | | | | 0.49 | % | | | 1,226 | |
Organon & Co. | | | 1,362 | | | | 0.22 | % | | | (116 | ) |
ADT, Inc. | | | 3,494 | | | | 0.26 | % | | | (144 | ) |
Alarm.com Holdings, Inc. | | | 1,504 | | | | 0.97 | % | | | (236 | ) |
Euronet Worldwide, Inc. | | | 354 | | | | 0.39 | % | | | (282 | ) |
Johnson & Johnson | | | 508 | | | | 0.78 | % | | | (312 | ) |
Utah Medical Products, Inc. | | | 606 | | | | 0.40 | % | | | (876 | ) |
Merck & Company, Inc. | | | 716 | | | | 0.76 | % | | | (1,191 | ) |
Royalty Pharma plc — Class A | | | 3,940 | | | | 1.07 | % | | | (1,546 | ) |
Inmode Ltd. | | | 1,984 | | | | 0.35 | % | | | (1,567 | ) |
Protagonist Therapeutics, Inc. | | | 944 | | | | 0.39 | % | | | (1,951 | ) |
Biogen, Inc. | | | 258 | | | | 0.42 | % | | | (2,040 | ) |
Universal Health Services, Inc. — Class B | | | 132 | | | | 0.25 | % | | | (2,168 | ) |
Exelixis, Inc. | | | 1,522 | | | | 0.54 | % | | | (2,278 | ) |
Hologic, Inc. | | | 1,366 | | | | 1.04 | % | | | (3,039 | ) |
Regeneron Pharmaceuticals, Inc. | | | 136 | | | | 1.03 | % | | | (22,151 | ) |
Total Consumer, Non-cyclical | | | | | | | | | | | 43,548 | |
| | | | | | | | | | | | | |
Technology | | | | | | | | | | | | |
Cirrus Logic, Inc. | | | 790 | | | | 0.83 | % | | | 8,203 | |
Zoom Communications, Inc. — Class A | | | 964 | | | | 0.83 | % | | | 7,757 | |
Adeia, Inc. | | | 1,962 | | | | 0.29 | % | | | 3,548 | |
NetApp, Inc. | | | 324 | | | | 0.40 | % | | | 1,812 | |
Dropbox, Inc. — Class A | | | 1,002 | | | | 0.32 | % | | | 730 | |
Akamai Technologies, Inc. | | | 274 | | | | 0.28 | % | | | (96 | ) |
Amdocs Ltd. | | | 1,092 | | | | 0.99 | % | | | (189 | ) |
Axcelis Technologies, Inc. | | | 496 | | | | 0.37 | % | | | (936 | ) |
QUALCOMM, Inc. | | | 354 | | | | 0.58 | % | | | (1,030 | ) |
Bandwidth, Inc. — Class A | | | 2,154 | | | | 0.39 | % | | | (3,409 | ) |
Photronics, Inc. | | | 2,508 | | | | 0.63 | % | | | (5,379 | ) |
Skyworks Solutions, Inc. | | | 862 | | | | 0.81 | % | | | (5,865 | ) |
Total Technology | | | | | | | | | | | 5,146 | |
| | | | | | | | | | | | | |
SEE NOTES TO CONSOLIDATED FINANCIAL STATEMENTS. | THE GUGGENHEIM FUNDS ANNUAL FINANCIAL REPORT | 23 |
CONSOLIDATED SCHEDULE OF INVESTMENTS (continued) | December 31, 2024 |
MULTI-HEDGE STRATEGIES FUND | |
| | Shares | | | Percentage
Notional
Amount | | | Value and
Unrealized
Appreciation
(Depreciation) | |
Energy | | | | | | | | | | | | |
SM Energy Co. | | | 878 | | | | 0.36 | % | | $ | (716 | ) |
DNOW, Inc. | | | 1,430 | | | | 0.20 | % | | | (1,533 | ) |
Total Energy | | | | | | | | | | | (2,249 | ) |
| | | | | | | | | | | | | |
Basic Materials | | | | | | | | | | | | |
LyondellBasell Industries N.V. — Class A | | | 272 | | | | 0.21 | % | | | (2,585 | ) |
| | | | | | | | | | | | | |
Government | | | | | | | | | | | | |
Banco Latinoamericano de Comercio Exterior S.A. — Class E | | | 2,516 | | | | 0.95 | % | | | 17,616 | |
Total MS Long/Short Equity Long Custom Basket | | | | | | $ | 292,715 | |
| | | | | | | | | |
MS LONG/SHORT EQUITY SHORT CUSTOM BASKET |
Technology | | | | | | | | | | | | |
Broadridge Financial Solutions, Inc. | | | 444 | | | | (2.02 | )% | | $ | 1,470 | |
ACV Auctions, Inc. — Class A | | | 2,192 | | | | (0.95 | )% | | | (75 | ) |
Dayforce, Inc. | | | 1,098 | | | | (1.60 | )% | | | (3,747 | ) |
Paycor HCM, Inc. | | | 2,242 | | | | (0.83 | )% | | | (4,161 | ) |
Take-Two Interactive Software, Inc. | | | 324 | | | | (1.19 | )% | | | (4,764 | ) |
Total Technology | | | | | | | | | | | (11,277 | ) |
| | | | | | | | | | | | | |
Financial | | | | | | | | | | | | |
New York Mortgage Trust, Inc. | | | 9,814 | | | | (1.19 | )% | | | 14,714 | |
St. Joe Co. | | | 1,780 | | | | (1.60 | )% | | | 10,087 | |
PotlatchDeltic Corp. | | | 2,380 | | | | (1.87 | )% | | | 8,458 | |
Lineage, Inc. | | | 1,166 | | | | (1.37 | )% | | | 6,362 | |
Weyerhaeuser Co. | | | 3,368 | | | | (1.90 | )% | | | 5,353 | |
Heritage Commerce Corp. | | | 6,778 | | | | (1.27 | )% | | | 4,653 | |
Newmark Group, Inc. — Class A | | | 3,008 | | | | (0.77 | )% | | | 3,807 | |
Valley National Bancorp | | | 5,182 | | | | (0.94 | )% | | | 3,562 | |
Kennedy-Wilson Holdings, Inc. | | | 7,448 | | | | (1.49 | )% | | | 3,221 | |
Cannae Holdings, Inc. | | | 2,684 | | | | (1.07 | )% | | | 3,055 | |
PennyMac Mortgage Investment Trust | | | 4,846 | | | | (1.22 | )% | | | 2,855 | |
Crown Castle, Inc. | | | 594 | | | | (1.08 | )% | | | 2,825 | |
Columbia Financial, Inc. | | | 2,444 | | | | (0.77 | )% | | | 2,274 | |
Dime Community Bancshares, Inc. | | | 744 | | | | (0.46 | )% | | | 2,269 | |
TFS Financial Corp. | | | 3,532 | | | | (0.89 | )% | | | 2,199 | |
American Tower Corp. — Class A | | | 164 | | | | (0.60 | )% | | | 1,885 | |
Digital Realty Trust, Inc. | | | 250 | | | | (0.89 | )% | | | 1,565 | |
SL Green Realty Corp. | | | 592 | | | | (0.80 | )% | | | 1,454 | |
FTAI Infrastructure, Inc. | | | 7,490 | | | | (1.09 | )% | | | 1,342 | |
Sun Communities, Inc. | | | 422 | | | | (1.04 | )% | | | 1,267 | |
HarborOne Bancorp, Inc. | | | 4,800 | | | | (1.14 | )% | | | 863 | |
Western Alliance Bancorporation | | | 578 | | | | (0.97 | )% | | | 522 | |
Kearny Financial Corp. | | | 4,968 | | | | (0.70 | )% | | | 499 | |
Carlyle Group, Inc. | | | 628 | | | | (0.63 | )% | | | 329 | |
PennyMac Financial Services, Inc. | | | 376 | | | | (0.77 | )% | | | 298 | |
Rithm Capital Corp. | | | 3,948 | | | | (0.86 | )% | | | 246 | |
SBA Communications Corp. | | | 136 | | | | (0.55 | )% | | | 178 | |
Redwood Trust, Inc. | | | 10,324 | | | | (1.35 | )% | | | 130 | |
CoStar Group, Inc. | | | 804 | | | | (1.15 | )% | | | 107 | |
JPMorgan Chase & Co. | | | 382 | | | | (1.83 | )% | | | (89 | ) |
Marcus & Millichap, Inc. | | | 2,532 | | | | (1.94 | )% | | | (351 | ) |
Iron Mountain, Inc. | | | 732 | | | | (1.54 | )% | | | (550 | ) |
Amerant Bancorp, Inc. | | | 2,752 | | | | (1.23 | )% | | | (764 | ) |
Capitol Federal Financial, Inc. | | | 10,778 | | | | (1.28 | )% | | | (1,055 | ) |
Howard Hughes Holdings, Inc. | | | 948 | | | | (1.46 | )% | | | (1,275 | ) |
Triumph Financial, Inc. | | | 592 | | | | (1.08 | )% | | | (2,749 | ) |
American Healthcare REIT, Inc. | | | 1,200 | | | | (0.68 | )% | | | (2,834 | ) |
Banc of California, Inc. | | | 4,068 | | | | (1.26 | )% | | | (3,667 | ) |
Brighthouse Financial, Inc. | | | 1,548 | | | | (1.49 | )% | | | (4,552 | ) |
Veris Residential, Inc. | | | 5,282 | | | | (1.76 | )% | | | (4,847 | ) |
Equinix, Inc. | | | 72 | | | | (1.36 | )% | | | (6,128 | ) |
CBRE Group, Inc. — Class A | | | 602 | | | | (1.58 | )% | | | (8,164 | ) |
State Street Corp. | | | 1,042 | | | | (2.05 | )% | | | (13,707 | ) |
Total Financial | | | | | | | | | | | 35,647 | |
| | | | | | | | | | | | | |
Consumer, Cyclical | | | | | | | | | | | | |
Jack in the Box, Inc. | | | 942 | | | | (0.79 | )% | | | 2,558 | |
VSE Corp. | | | 656 | | | | (1.25 | )% | | | (7 | ) |
Costco Wholesale Corp. | | | 22 | | | | (0.40 | )% | | | (42 | ) |
LGI Homes, Inc. | | | 380 | | | | (0.68 | )% | | | (373 | ) |
Sonic Automotive, Inc. — Class A | | | 488 | | | | (0.62 | )% | | | (1,547 | ) |
Southwest Airlines Co. | | | 2,010 | | | | (1.35 | )% | | | (2,582 | ) |
America’s Car-Mart, Inc. | | | 610 | | | | (0.63 | )% | | | (3,069 | ) |
JetBlue Airways Corp. | | | 3,118 | | | | (0.49 | )% | | | (4,134 | ) |
Tesla, Inc. | | | 94 | | | | (0.76 | )% | | | (5,285 | ) |
Citi Trends, Inc. | | | 1,332 | | | | (0.70 | )% | | | (5,728 | ) |
Allegiant Travel Co. — Class A | | | 338 | | | | (0.64 | )% | | | (8,678 | ) |
American Airlines Group, Inc. | | | 3,078 | | | | (1.07 | )% | | | (11,143 | ) |
Total Consumer, Cyclical | | | | | | | | | | | (40,030 | ) |
| | | | | | | | | | | | | |
Energy | | | | | | | | | | | | |
Valaris Ltd. | | | 1,974 | | | | (1.75 | )% | | | 26,936 | |
Core Laboratories, Inc. | | | 3,412 | | | | (1.18 | )% | | | 6,017 | |
Evolution Petroleum Corp. | | | 7,262 | | | | (0.76 | )% | | | (18 | ) |
24 | THE GUGGENHEIM FUNDS ANNUAL FINANCIAL REPORT | SEE NOTES TO CONSOLIDATED FINANCIAL STATEMENTS. |
CONSOLIDATED SCHEDULE OF INVESTMENTS (continued) | December 31, 2024 |
MULTI-HEDGE STRATEGIES FUND | |
| | Shares | | | Percentage
Notional
Amount | | | Value and
Unrealized
Appreciation
(Depreciation) | |
Bristow Group, Inc. | | | 1,042 | | | | (0.72 | )% | | $ | (1,761 | ) |
Oceaneering International, Inc. | | | 1,538 | | | | (0.80 | )% | | | (3,833 | ) |
Antero Resources Corp. | | | 1,930 | | | | (1.35 | )% | | | (7,890 | ) |
Total Energy | | | | | | | | | | | 19,451 | |
| | | | | | | | | | | | | |
Basic Materials | | | | | | | | | | | | |
Novagold Resources, Inc. | | | 16,232 | | | | (1.08 | )% | | | 6,087 | |
Ivanhoe Electric Incorporated / US | | | 6,036 | | | | (0.91 | )% | | | 4,666 | |
Radius Recycling, Inc. — Class A | | | 3,542 | | | | (1.08 | )% | | | 4,059 | |
Ingevity Corp. | | | 782 | | | | (0.64 | )% | | | 2,172 | |
Hecla Mining Co. | | | 7,938 | | | | (0.78 | )% | | | (112 | ) |
Total Basic Materials | | | | | | | | | | | 16,872 | |
| | | | | | | | | | | | | |
Industrial | | | | | | | | | | | | |
Old Dominion Freight Line, Inc. | | | 316 | | | | (1.12 | )% | | | 8,000 | |
Boeing Co. | | | 352 | | | | (1.25 | )% | | | 4,352 | |
Materion Corp. | | | 526 | | | | (1.04 | )% | | | 2,351 | |
XPO, Inc. | | | 384 | | | | (1.01 | )% | | | 1,283 | |
Quest Resource Holding Corp. | | | 4,472 | | | | (0.58 | )% | | | 1,047 | |
J.B. Hunt Transport Services, Inc. | | | 298 | | | | (1.02 | )% | | | (853 | ) |
Casella Waste Systems, Inc. — Class A | | | 932 | | | | (1.97 | )% | | | (2,713 | ) |
CH Robinson Worldwide, Inc. | | | 524 | | | | (1.08 | )% | | | (3,971 | ) |
Total Industrial | | | | | | | | | | | 9,496 | |
| | | | | | | | | | | | | |
Consumer, Non-cyclical | | | | | | | | | | | | |
GXO Logistics, Inc. | | | 1,432 | | | | (1.25 | )% | | | 4,080 | |
Insperity, Inc. | | | 1,260 | | | | (1.96 | )% | | | 2,716 | |
Utz Brands, Inc. | | | 1,686 | | | | (0.53 | )% | | | 1,161 | |
Alico, Inc. | | | 1,204 | | | | (0.63 | )% | | | 705 | |
Driven Brands Holdings, Inc. | | | 2,178 | | | | (0.70 | )% | | | 591 | |
Equifax, Inc. | | | 200 | | | | (1.02 | )% | | | 463 | |
Tejon Ranch Co. | | | 2,876 | | | | (0.92 | )% | | | (1,059 | ) |
Verisk Analytics, Inc. — Class A | | | 300 | | | | (1.65 | )% | | | (1,318 | ) |
Universal Corp. | | | 1,060 | | | | (1.16 | )% | | | (1,540 | ) |
TrueBlue, Inc. | | | 6,852 | | | | (1.15 | )% | | | (1,581 | ) |
NeoGenomics, Inc. | | | 2,374 | | | | (0.78 | )% | | | (1,650 | ) |
Matthews International Corp. — Class A | | | 1,244 | | | | (0.69 | )% | | | (2,855 | ) |
Total Consumer, Non-cyclical | | | | | | | | | | | (287 | ) |
| | | | | | | | | | | | | |
Communications | | | | | | | | | | | | |
BlackSky Technology, Inc. | | | 2,324 | | | | (0.50 | )% | | | (4,952 | ) |
Total MS Long/Short Equity Short Custom Basket | | | | | | $ | 24,920 | |
| | Shares | | | Percentage
Notional
Amount | | | Value and
Unrealized
Appreciation
(Depreciation) | |
MS EQUITY MARKET NEUTRAL LONG CUSTOM BASKET |
Financial | | | | | | | | | | | | |
Vornado Realty Trust | | | 12,937 | | | | 4.25 | % | | $ | 136,256 | |
Kimco Realty Corp. | | | 23,638 | | | | 4.34 | % | | | 84,802 | |
Digital Realty Trust, Inc. | | | 2,391 | | | | 3.32 | % | | | 67,166 | |
Sabra Health Care REIT, Inc. | | | 25,416 | | | | 3.45 | % | | | 52,023 | |
CareTrust REIT, Inc. | | | 13,309 | | | | 2.82 | % | | | 34,420 | |
Tanger, Inc. | | | 11,993 | | | | 3.21 | % | | | 33,098 | |
Kilroy Realty Corp. | | | 4,430 | | | | 1.40 | % | | | 22,585 | |
Simon Property Group, Inc. | | | 2,341 | | | | 3.16 | % | | | 9,182 | |
Ryman Hospitality Properties, Inc. | | | 748 | | | | 0.61 | % | | | 7,750 | |
InvenTrust Properties Corp. | | | 6,851 | | | | 1.62 | % | | | 6,516 | |
Equity Residential | | | 4,019 | | | | 2.26 | % | | | 6,487 | |
VICI Properties, Inc. | | | 3,039 | | | | 0.70 | % | | | 2,749 | |
Piedmont Office Realty Trust, Inc. — Class A | | | 30,118 | | | | 2.16 | % | | | 2,406 | |
Cousins Properties, Inc. | | | 5,566 | | | | 1.34 | % | | | 2,288 | |
UDR, Inc. | | | 10,910 | | | | 3.71 | % | | | 2,139 | |
AvalonBay Communities, Inc. | | | 1,294 | | | | 2.23 | % | | | 1,902 | |
Brixmor Property Group, Inc. | | | 9,930 | | | | 2.17 | % | | | 1,069 | |
Invitation Homes, Inc. | | | 3,447 | | | | 0.86 | % | | | 922 | |
Gladstone Commercial Corp. | | | 17,035 | | | | 2.17 | % | | | 629 | |
Federal Realty Investment Trust | | | 319 | | | | 0.28 | % | | | 210 | |
Douglas Emmett, Inc. | | | 1,878 | | | | 0.27 | % | | | 151 | |
Park Hotels & Resorts, Inc. | | | 18,297 | | | | 2.02 | % | | | (177 | ) |
Hudson Pacific Properties, Inc. | | | 20,228 | | | | 0.48 | % | | | (713 | ) |
CTO Realty Growth, Inc. | | | 2,438 | | | | 0.38 | % | | | (721 | ) |
Whitestone REIT — Class B | | | 20,079 | | | | 2.23 | % | | | (756 | ) |
Essential Properties Realty Trust, Inc. | | | 8,848 | | | | 2.17 | % | | | (1,263 | ) |
American Assets Trust, Inc. | | | 10,463 | | | | 2.15 | % | | | (1,269 | ) |
SL Green Realty Corp. | | | 623 | | | | 0.33 | % | | | (1,392 | ) |
Independence Realty Trust, Inc. | | | 12,345 | | | | 1.92 | % | | | (1,450 | ) |
Highwoods Properties, Inc. | | | 8,885 | | | | 2.13 | % | | | (1,659 | ) |
SITE Centers Corp. | | | 18,291 | | | | 2.19 | % | | | (1,885 | ) |
Omega Healthcare Investors, Inc. | | | 2,466 | | | | 0.73 | % | | | (1,932 | ) |
Kite Realty Group Trust | | | 6,392 | | | | 1.26 | % | | | (2,272 | ) |
LTC Properties, Inc. | | | 1,461 | | | | 0.40 | % | | | (2,612 | ) |
NexPoint Residential Trust, Inc. | | | 6,541 | | | | 2.14 | % | | | (2,668 | ) |
Centerspace | | | 4,140 | | | | 2.15 | % | | | (2,697 | ) |
Four Corners Property Trust, Inc. | | | 3,666 | | | | 0.78 | % | | | (2,915 | ) |
Prologis, Inc. | | | 453 | | | | 0.38 | % | | | (3,287 | ) |
SEE NOTES TO CONSOLIDATED FINANCIAL STATEMENTS. | THE GUGGENHEIM FUNDS ANNUAL FINANCIAL REPORT | 25 |
CONSOLIDATED SCHEDULE OF INVESTMENTS (continued) | December 31, 2024 |
MULTI-HEDGE STRATEGIES FUND | |
| | Shares | | | Percentage
Notional
Amount | | | Value and
Unrealized
Appreciation
(Depreciation) | |
Acadia Realty Trust | | | 6,711 | | | | 1.27 | % | | $ | (3,575 | ) |
Urban Edge Properties | | | 12,756 | | | | 2.15 | % | | | (4,502 | ) |
Alexander & Baldwin, Inc. | | | 5,928 | | | | 0.82 | % | | | (4,967 | ) |
Welltower, Inc. | | | 2,148 | | | | 2.12 | % | | | (5,236 | ) |
Public Storage | | | 513 | | | | 1.20 | % | | | (5,710 | ) |
CubeSmart | | | 3,599 | | | | 1.21 | % | | | (5,911 | ) |
Essex Property Trust, Inc. | | | 2,292 | | | | 5.13 | % | | | (6,177 | ) |
Ventas, Inc. | | | 4,571 | | | | 2.11 | % | | | (6,904 | ) |
Iron Mountain, Inc. | | | 2,418 | | | | 1.99 | % | | | (12,682 | ) |
LXP Industrial Trust | | | 21,687 | | | | 1.38 | % | | | (12,874 | ) |
Extra Space Storage, Inc. | | | 2,482 | | | | 2.91 | % | | | (17,317 | ) |
National Storage Affiliates Trust | | | 9,486 | | | | 2.82 | % | | | (20,098 | ) |
NNN REIT, Inc. | | | 10,683 | | | | 3.42 | % | | | (23,069 | ) |
Innovative Industrial Properties, Inc. | | | 2,498 | | | | 1.30 | % | | | (99,097 | ) |
Total Financial | | | | | | | | | | | 216,963 | |
Total MS Equity Market Neutral Long Custom Basket | | | | | | $ | 216,963 | |
| | | | | | | | | |
MS EQUITY MARKET NEUTRAL SHORT CUSTOM BASKET |
Financial | | | | | | | | | | | | |
Crown Castle, Inc. | | | 4,931 | | | | (3.47 | )% | | $ | 50,998 | |
Americold Realty Trust, Inc. | | | 15,141 | | | | (2.52 | )% | | | 35,054 | |
Rexford Industrial Realty, Inc. | | | 8,599 | | | | (2.59 | )% | | | 30,365 | |
Rayonier, Inc. | | | 9,134 | | | | (1.85 | )% | | | 24,975 | |
Pebblebrook Hotel Trust | | | 34,739 | | | | (3.66 | )% | | | 19,582 | |
EastGroup Properties, Inc. | | | 1,020 | | | | (1.27 | )% | | | 13,572 | |
Equity LifeStyle Properties, Inc. | | | 5,839 | | | | (3.03 | )% | | | 12,916 | |
Safehold, Inc. | | | 5,840 | | | | (0.84 | )% | | | 12,064 | |
Weyerhaeuser Co. | | | 9,283 | | | | (2.03 | )% | | | 10,584 | |
Sun Communities, Inc. | | | 3,189 | | | | (3.05 | )% | | | 10,262 | |
PotlatchDeltic Corp. | | | 6,673 | | | | (2.04 | )% | | | 9,886 | |
Medical Properties Trust, Inc. | | | 66,822 | | | | (2.05 | )% | | | 9,831 | |
Getty Realty Corp. | | | 11,815 | | | | (2.77 | )% | | | 9,811 | |
Armada Hoffler Properties, Inc. | | | 26,328 | | | | (2.10 | )% | | | 9,104 | |
American Tower Corp. — Class A | | | 818 | | | | (1.17 | )% | | | 9,040 | |
Elme Communities | | | 17,325 | | | | (2.06 | )% | | | 8,813 | |
Host Hotels & Resorts, Inc. | | | 22,334 | | | | (3.04 | )% | | | 8,533 | |
Healthpeak Properties, Inc. | | | 13,403 | | | | (2.11 | )% | | | 6,790 | |
Global Net Lease, Inc. | | | 47,141 | | | | (2.68 | )% | | | 5,683 | |
Diversified Healthcare Trust | | | 33,009 | | | | (0.59 | )% | | | 3,895 | |
Realty Income Corp. | | | 5,238 | | | | (2.18 | )% | | | 3,244 | |
Empire State Realty Trust, Inc. — Class A | | | 26,500 | | | | (2.13 | )% | | | 2,514 | |
Broadstone Net Lease, Inc. | | | 3,367 | | | | (0.42 | )% | | | 2,160 | |
Xenia Hotels & Resorts, Inc. | | | 18,694 | | | | (2.16 | )% | | | 1,985 | |
Gaming and Leisure Properties, Inc. | | | 1,912 | | | | (0.72 | )% | | | 1,577 | |
Healthcare Realty Trust, Inc. | | | 2,354 | | | | (0.31 | )% | | | 1,175 | |
STAG Industrial, Inc. | | | 1,303 | | | | (0.34 | )% | | | 1,014 | |
First Industrial Realty Trust, Inc. | | | 1,049 | | | | (0.41 | )% | | | 814 | |
Saul Centers, Inc. | | | 7,151 | | | | (2.16 | )% | | | 437 | |
WP Carey, Inc. | | | 2,193 | | | | (0.93 | )% | | | 332 | |
Easterly Government Properties, Inc. | | | 5,767 | | | | (0.51 | )% | | | 92 | |
BXP, Inc. | | | 1,362 | | | | (0.79 | )% | | | 27 | |
EPR Properties | | | 3,805 | | | | (1.31 | )% | | | (751 | ) |
American Homes 4 Rent — Class A | | | 2,140 | | | | (0.62 | )% | | | (1,567 | ) |
Terreno Realty Corp. | | | 8,477 | | | | (3.90 | )% | | | (2,874 | ) |
RLJ Lodging Trust | | | 21,975 | | | | (1.75 | )% | | | (4,330 | ) |
Camden Property Trust | | | 936 | | | | (0.85 | )% | | | (5,328 | ) |
Veris Residential, Inc. | | | 20,707 | | | | (2.68 | )% | | | (5,844 | ) |
Chatham Lodging Trust | | | 32,026 | | | | (2.23 | )% | | | (7,071 | ) |
Mid-America Apartment Communities, Inc. | | | 1,125 | | | | (1.35 | )% | | | (7,593 | ) |
DiamondRock Hospitality Co. | | | 47,096 | | | | (3.31 | )% | | | (9,388 | ) |
Paramount Group, Inc. | | | 59,517 | | | | (2.29 | )% | | | (10,869 | ) |
Regency Centers Corp. | | | 5,700 | | | | (3.28 | )% | | | (12,933 | ) |
Summit Hotel Properties, Inc. | | | 43,931 | | | | (2.34 | )% | | | (13,368 | ) |
Community Healthcare Trust, Inc. | | | 15,515 | | | | (2.32 | )% | | | (13,633 | ) |
Brandywine Realty Trust | | | 52,200 | | | | (2.27 | )% | | | (13,731 | ) |
Phillips Edison & Company, Inc. | | | 12,685 | | | | (3.70 | )% | | | (16,045 | ) |
Equinix, Inc. | | | 463 | | | | (3.40 | )% | | | (36,187 | ) |
Sunstone Hotel Investors, Inc. | | | 47,965 | | | | (4.42 | )% | | | (45,898 | ) |
Total Financial | | | | | | | | | | | 109,719 | |
Total MS Equity Market Neutral Short Custom Basket | | | | | | $ | 109,719 | |
26 | THE GUGGENHEIM FUNDS ANNUAL FINANCIAL REPORT | SEE NOTES TO CONSOLIDATED FINANCIAL STATEMENTS. |
CONSOLIDATED SCHEDULE OF INVESTMENTS (continued) | December 31, 2024 |
MULTI-HEDGE STRATEGIES FUND | |
* | Non-income producing security. |
** | Includes cumulative appreciation (depreciation). Variation margin is reported within the Consolidated Statement of Assets and Liabilities. |
*** | A copy of each underlying unaffiliated fund’s financial statements is available at the SEC’s website at www.sec.gov. |
† | Value determined based on Level 1 inputs, unless otherwise noted — See Note 4. |
†† | Value determined based on Level 2 inputs — See Note 4. |
††† | Value determined based on Level 3 inputs — See Note 4. |
1 | All or a portion of this security is on loan at December 31, 2024 — See Note 7. |
2 | All or a portion of this security is pledged as short security collateral at December 31, 2024. |
3 | Affiliated issuer. |
4 | Rate indicated is the effective yield at the time of purchase. |
5 | All or a portion of this security is pledged as futures collateral at December 31, 2024. |
6 | Repurchase Agreements — See Note 6. |
7 | Securities lending collateral — See Note 7. |
8 | Rate indicated is the 7-day yield as of December 31, 2024. |
9 | All or a portion of this security is pledged as equity custom basket swap collateral at December 31, 2024. |
| | ADR — American Depositary Receipt |
| | MS — Morgan Stanley Capital Services LLC |
| | plc — Public Limited Company |
| | REIT — Real Estate Investment Trust |
| | |
| | See Sector Classification in Other Information section. |
The following table summarizes the inputs used to value the Fund’s investments at December 31, 2024 (See Note 4 in the Notes to Consolidated Financial Statements):
Investments in Securities (Assets) | | Level 1
Quoted
Prices | | | Level 2
Significant
Observable
Inputs | | | Level 3
Significant
Unobservable
Inputs | | | Total | |
Common Stocks | | $ | 16,099,277 | | | $ | — | | | $ | — | | | $ | 16,099,277 | |
Rights | | | — | * | | | — | | | | — | * | | | — | |
Mutual Funds | | | 9,889,083 | | | | — | | | | — | | | | 9,889,083 | |
Closed-End Mutual Funds | | | 2,649,874 | | | | — | | | | — | | | | 2,649,874 | |
U.S. Treasury Bills | | | — | | | | 5,753,766 | | | | — | | | | 5,753,766 | |
Repurchase Agreements | | | — | | | | 6,092,125 | | | | — | | | | 6,092,125 | |
Securities Lending Collateral | | | 9,952 | | | | — | | | | — | | | | 9,952 | |
Commodity Futures Contracts** | | | 873,599 | | | | — | | | | — | | | | 873,599 | |
Currency Futures Contracts** | | | 417,428 | | | | — | | | | — | | | | 417,428 | |
Interest Rate Futures Contracts** | | | 10,982 | | | | 289,244 | | | | — | | | | 300,226 | |
Equity Futures Contracts** | | | 80,479 | | | | 14,938 | | | | — | | | | 95,417 | |
Equity Custom Basket Swap Agreements** | | | — | | | | 644,317 | | | | — | | | | 644,317 | |
Total Assets | | $ | 30,030,674 | | | $ | 12,794,390 | | | $ | — | | | $ | 42,825,064 | |
Investments in Securities (Liabilities) | | Level 1
Quoted
Prices | | | Level 2
Significant
Observable
Inputs | | | Level 3
Significant
Unobservable
Inputs | | | Total | |
Common Stocks Sold Short | | $ | 6,080,693 | | | $ | — | | | $ | — | | | $ | 6,080,693 | |
Exchange-Traded Funds Sold Short | | | 2,987,136 | | | | — | | | | — | | | | 2,987,136 | |
Commodity Futures Contracts** | | | 663,906 | | | | — | | | | — | | | | 663,906 | |
Currency Futures Contracts** | | | 311,354 | | | | — | | | | — | | | | 311,354 | |
Interest Rate Futures Contracts** | | | — | | | | 177,115 | | | | — | | | | 177,115 | |
Equity Futures Contracts** | | | 99,801 | | | | 23,480 | | | | — | | | | 123,281 | |
Total Liabilities | | $ | 10,142,890 | | | $ | 200,595 | | | $ | — | | | $ | 10,343,485 | |
* | Includes securities with a market value of $0. |
** | This derivative is reported as unrealized appreciation/depreciation at period end. |
SEE NOTES TO CONSOLIDATED FINANCIAL STATEMENTS. | THE GUGGENHEIM FUNDS ANNUAL FINANCIAL REPORT | 27 |
CONSOLIDATED SCHEDULE OF INVESTMENTS (concluded) | December 31, 2024 |
MULTI-HEDGE STRATEGIES FUND | |
Affiliated Transactions
Investments representing 5% or more of the outstanding voting shares of a company, or control of or by, or common control under Guggenheim Investments (“GI”), result in that company being considered an affiliated person, as defined in the Investment Company Act of 1940 (“affiliated issuer”).
The Fund may invest in certain of the underlying series of Guggenheim Strategy Funds Trust, including Guggenheim Strategy Fund II and Guggenheim Strategy Fund III (collectively, the “Guggenheim Strategy Funds”), each of which are open-end management investment companies managed by GI. The Guggenheim Strategy Funds, which launched on March 11, 2014, are offered as short-term investment options only to mutual funds, trusts, and other accounts managed by GI and/or its affiliates, and are not available to the public. The Guggenheim Strategy Funds pay no investment management fees. The Guggenheim Strategy Funds’ annual report on Form N-CSR dated September 30, 2024 is available publicly or upon request. This information is available from the EDGAR database on the SEC’s website at https://www.sec.gov/ix?doc=/Archives/edgar/data/1601445/000139834424022509/fp0090292-6_ncsrixbrl.htm. The Fund also may invest in certain of the underlying series of Guggenheim Funds Trust, which are open-end management investment companies managed by GI, are available to the public and whose most recent annual report on Form N-CSR is available publicly or upon request.
Transactions during the year ended December 31, 2024, in which the company is an affiliated issuer, were as follows:
Security Name | | Value
12/31/23 | | | Additions | | | Reductions | | | Realized
Gain (Loss) | | | Change in
Unrealized
Appreciation
(Depreciation) | | | Value
12/31/24 | | | Shares
12/31/24 | | | Investment
Income | |
Mutual Funds | | | | | | | | | | | | | | | | | | | | | | | | | | | | | | | | |
Guggenheim Strategy Fund II | | $ | 6,605,643 | | | $ | — | | | $ | (2,200,000 | ) | | $ | (17,600 | ) | | $ | 105,185 | | | $ | 4,493,228 | | | | 180,814 | | | $ | 337,142 | |
Guggenheim Strategy Fund III | | | 1,940,217 | | | | — | | | | (300,000 | ) | | | (3,515 | ) | | | 33,251 | | | | 1,669,953 | | | | 66,959 | | | | 101,354 | |
Guggenheim Ultra Short Duration Fund — Institutional Class | | | 5,143,454 | | | | — | | | | (1,500,000 | ) | | | 9,451 | | | | 72,997 | | | | 3,725,902 | | | | 372,218 | | | | 243,034 | |
| | | $ | 13,689,314 | | | $ | — | | | $ | (4,000,000 | ) | | $ | (11,664 | ) | | $ | 211,433 | | | $ | 9,889,083 | | | | | | | $ | 681,530 | |
28 | THE GUGGENHEIM FUNDS ANNUAL FINANCIAL REPORT | SEE NOTES TO CONSOLIDATED FINANCIAL STATEMENTS. |
MULTI-HEDGE STRATEGIES FUND |
CONSOLIDATED STATEMENT OF ASSETS AND LIABILITIES |
December 31, 2024 |
Assets: |
Investments in unaffiliated issuers, at value - including $9,731 of securities loaned (cost $24,029,985) | | $ | 24,512,869 | |
Investments in affiliated issuers, at value (cost $9,860,869) | | | 9,889,083 | |
Repurchase agreements, at value (cost $6,092,125) | | | 6,092,125 | |
Cash | | | 10,086,324 | |
Segregated cash with broker | | | 3,128,311 | |
Unrealized appreciation on OTC swap agreements | | | 644,317 | |
Receivables: |
Swap settlement | | | 787,303 | |
Variation margin on futures contracts | | | 146,053 | |
Securities sold | | | 140,688 | |
Dividends | | | 54,099 | |
Fund shares sold | | | 5,222 | |
Interest | | | 752 | |
Securities lending income | | | 88 | |
Other assets | | | 22,323 | |
Total assets | | | 55,509,557 | |
| | | | | |
Liabilities: |
Securities sold short, at value (proceeds $8,849,521) | | | 9,067,829 | |
Payable for: |
Securities purchased | | | 698,284 | |
Fund shares redeemed | | | 75,700 | |
Management fees | | | 44,691 | |
Return of securities lending collateral | | | 9,952 | |
Distribution and service fees | | | 1,921 | |
Trustees’ fees* | | | 514 | |
Miscellaneous | | | 23,362 | |
Total liabilities | | | 9,922,253 | |
Net assets | | $ | 45,587,304 | |
| | | | | |
Net assets consist of: |
Paid in capital | | $ | 56,830,965 | |
Total distributable earnings (loss) | | | (11,243,661 | ) |
Net assets | | $ | 45,587,304 | |
Class A: |
Net assets | | $ | 2,772,060 | |
Capital shares outstanding | | | 111,663 | |
Net asset value per share | | $ | 24.83 | |
Maximum offering price per share (Net asset value divided by 95.25%) | | $ | 26.07 | |
Class C: |
Net assets | | $ | 308,745 | |
Capital shares outstanding | | | 13,617 | |
Net asset value per share | | $ | 22.67 | |
Class P: |
Net assets | | $ | 5,117,049 | |
Capital shares outstanding | | | 205,236 | |
Net asset value per share | | $ | 24.93 | |
Institutional Class: |
Net assets | | $ | 37,389,450 | |
Capital shares outstanding | | | 1,471,938 | |
Net asset value per share | | $ | 25.40 | |
* | Relates to Trustees not deemed “interested persons” within the meaning of Section 2(a)(19) of the Investment Company Act of 1940. |
SEE NOTES TO CONSOLIDATED FINANCIAL STATEMENTS. | THE GUGGENHEIM FUNDS ANNUAL FINANCIAL REPORT | 29 |
MULTI-HEDGE STRATEGIES FUND |
CONSOLIDATED STATEMENT OF OPERATIONS |
Year Ended December 31, 2024 |
Investment Income: |
Dividends from securities of unaffiliated issuers (net of foreign withholding tax of $1,885) | | $ | 542,685 | |
Dividends from securities of affiliated issuers | | | 681,530 | |
Interest | | | 1,164,161 | |
Income from securities lending, net | | | 13,520 | |
Interest related to securities sold short | | | 433,512 | |
Total investment income | | | 2,835,408 | |
| | | | | |
Expenses: |
Management fees | | | 881,632 | |
Distribution and service fees: |
Class A | | | 8,040 | |
Class C | | | 7,184 | |
Class P | | | 14,337 | |
Short sales dividend expense | | | 343,313 | |
Miscellaneous | | | 25,441 | |
Total expenses | | | 1,279,947 | |
Less: |
Expenses waived by Adviser | | | (42,854 | ) |
Net expenses | | | 1,237,093 | |
Net investment income | | | 1,598,315 | |
| | | | | |
Net Realized and Unrealized Gain (Loss): |
Net realized gain (loss) on: |
Investments in unaffiliated issuers | | | 912,253 | |
Investments in affiliated issuers | | | (11,664 | ) |
Investments in unaffiliated issuers sold short | | | (777,104 | ) |
Swap agreements | | | 3,221,500 | |
Futures contracts | | | (3,734,588 | ) |
Foreign currency transactions | | | 14,129 | |
Net realized loss | | | (375,474 | ) |
Net change in unrealized appreciation (depreciation) on: |
Investments in unaffiliated issuers | | | (937,473 | ) |
Investments in affiliated issuers | | | 211,433 | |
Investments in unaffiliated issuers sold short | | | 615,113 | |
Swap agreements | | | (3,482,801 | ) |
Futures contracts | | | 526,941 | |
Foreign currency translations | | | 381 | |
Net change in unrealized appreciation (depreciation) | | | (3,066,406 | ) |
Net realized and unrealized loss | | | (3,441,880 | ) |
Net decrease in net assets resulting from operations | | $ | (1,843,565 | ) |
* | Relates to Trustees not deemed “interested persons” within the meaning of Section 2(a)(19) of the Investment Company Act of 1940. |
30 | THE GUGGENHEIM FUNDS ANNUAL FINANCIAL REPORT | SEE NOTES TO CONSOLIDATED FINANCIAL STATEMENTS. |
MULTI-HEDGE STRATEGIES FUND | |
CONSOLIDATED STATEMENTS OF CHANGES IN NET ASSETS |
| | Year Ended
December 31,
2024 | | | Year Ended
December 31,
2023 | |
Increase (Decrease) in Net Assets from Operations: | | | | | | | | |
Net investment income | | $ | 1,598,315 | | | $ | 2,109,996 | |
Net realized gain (loss) on investments | | | (375,474 | ) | | | 3,288,671 | |
Net change in unrealized appreciation (depreciation) on investments | | | (3,066,406 | ) | | | (1,655,913 | ) |
Net increase (decrease) in net assets resulting from operations | | | (1,843,565 | ) | | | 3,742,754 | |
| | | | | | | | | |
Distributions to shareholders: | | | | | | | | |
Class A | | | (80,544 | ) | | | (105,220 | ) |
Class C | | | (4,423 | ) | | | (31,420 | ) |
Class P | | | (143,238 | ) | | | (180,601 | ) |
Institutional Class | | | (1,177,035 | ) | | | (2,449,316 | ) |
Total distributions to shareholders | | | (1,405,240 | ) | | | (2,766,557 | ) |
| | | | | | | | | |
Capital share transactions: | | | | | | | | |
Proceeds from sale of shares | | | | | | | | |
Class A | | | 270,196 | | | | 185,475 | |
Class C | | | 152,838 | | | | 623,630 | |
Class P | | | 622,943 | | | | 1,084,291 | |
Institutional Class | | | 12,803,992 | | | | 20,117,754 | |
Distributions reinvested | | | | | | | | |
Class A | | | 74,318 | | | | 94,175 | |
Class C | | | 4,232 | | | | 30,133 | |
Class P | | | 142,335 | | | | 178,306 | |
Institutional Class | | | 1,177,035 | | | | 2,440,879 | |
Cost of shares redeemed | | | | | | | | |
Class A | | | (843,065 | ) | | | (788,304 | ) |
Class C | | | (719,459 | ) | | | (368,549 | ) |
Class P | | | (1,392,348 | ) | | | (4,427,076 | ) |
Institutional Class | | | (48,380,941 | ) | | | (58,269,766 | ) |
Net decrease from capital share transactions | | | (36,087,924 | ) | | | (39,099,052 | ) |
Net decrease in net assets | | | (39,336,729 | ) | | | (38,122,855 | ) |
| | | | | | | | | |
Net assets: | | | | | | | | |
Beginning of year | | | 84,924,033 | | | | 123,046,888 | |
End of year | | $ | 45,587,304 | | | $ | 84,924,033 | |
| | | | | | | | | |
Capital share activity: | | | | | | | | |
Shares sold | | | | | | | | |
Class A | | | 10,232 | | | | 6,984 | |
Class C | | | 6,270 | | | | 25,235 | |
Class P | | | 23,192 | | | | 40,440 | |
Institutional Class | | | 468,290 | | | | 733,922 | |
Shares issued from reinvestment of distributions | | | | | | | | |
Class A | | | 2,946 | | | | 3,515 | |
Class C | | | 184 | | | | 1,240 | |
Class P | | | 5,617 | | | | 6,628 | |
Institutional Class | | | 45,586 | | | | 89,116 | |
Shares redeemed | | | | | | | | |
Class A | | | (31,837 | ) | | | (29,852 | ) |
Class C | | | (30,209 | ) | | | (15,102 | ) |
Class P | | | (51,631 | ) | | | (165,826 | ) |
Institutional Class | | | (1,796,642 | ) | | | (2,164,138 | ) |
Net decrease in shares | | | (1,348,002 | ) | | | (1,467,838 | ) |
SEE NOTES TO CONSOLIDATED FINANCIAL STATEMENTS. | THE GUGGENHEIM FUNDS ANNUAL FINANCIAL REPORT | 31 |
CONSOLIDATED FINANCIAL HIGHLIGHTS |
MULTI-HEDGE STRATEGIES FUND |
This table is presented to show selected data for a share outstanding throughout each period and to assist shareholders in evaluating the Fund’s performance for the periods presented.
Class A | | Year Ended
December 31,
2024 | | | Year Ended
December 31,
2023 | | | Year Ended
December 31,
2022 | | | Year Ended
December 31,
2021 | | | Year Ended
December 31,
2020 | |
Per Share Data |
Net asset value, beginning of period | | $ | 26.46 | | | $ | 26.16 | | | $ | 27.52 | | | $ | 25.89 | | | $ | 24.36 | |
Income (loss) from investment operations: |
Net investment income (loss)a | | | .52 | | | | .54 | | | | .09 | | | | (.14 | ) | | | (.10 | ) |
Net gain (loss) on investments (realized and unrealized) | | | (1.43 | ) | | | .59 | | | | (1.01 | ) | | | 1.98 | | | | 1.90 | |
Total from investment operations | | | (.91 | ) | | | 1.13 | | | | (.92 | ) | | | 1.84 | | | | 1.80 | |
Less distributions from: |
Net investment income | | | (.72 | ) | | | (.83 | ) | | | (.44 | ) | | | (.21 | ) | | | (.27 | ) |
Total distributions | | | (.72 | ) | | | (.83 | ) | | | (.44 | ) | | | (.21 | ) | | | (.27 | ) |
Net asset value, end of period | | $ | 24.83 | | | $ | 26.46 | | | $ | 26.16 | | | $ | 27.52 | | | $ | 25.89 | |
|
Total Returnb | | | (3.58 | %) | | | 4.27 | % | | | (3.47 | %) | | | 7.17 | % | | | 7.39 | % |
Ratios/Supplemental Data |
Net assets, end of period (in thousands) | | $ | 2,772 | | | $ | 3,448 | | | $ | 3,915 | | | $ | 4,593 | | | $ | 4,019 | |
Ratios to average net assets: |
Net investment income (loss) | | | 1.95 | % | | | 2.04 | % | | | 0.32 | % | | | (0.52 | %) | | | (0.40 | %) |
Total expensesc | | | 1.94 | % | | | 1.85 | % | | | 1.80 | % | | | 2.18 | % | | | 1.93 | % |
Net expensesd,e | | | 1.88 | % | | | 1.79 | % | | | 1.76 | % | | | 2.11 | % | | | 1.87 | % |
Portfolio turnover rate | | | 164 | % | | | 197 | % | | | 203 | % | | | 205 | % | | | 248 | % |
Class C | | Year Ended
December 31,
2024 | | | Year Ended
December 31,
2023 | | | Year Ended
December 31,
2022 | | | Year Ended
December 31,
2021 | | | Year Ended
December 31,
2020 | |
Per Share Data |
Net asset value, beginning of period | | $ | 24.00 | | | $ | 23.90 | | | $ | 25.25 | | | $ | 23.75 | | | $ | 22.36 | |
Income (loss) from investment operations: |
Net investment income (loss)a | | | .29 | | | | .32 | | | | (.09 | ) | | | (.32 | ) | | | (.27 | ) |
Net gain (loss) on investments (realized and unrealized) | | | (1.31 | ) | | | .53 | | | | (.94 | ) | | | 1.82 | | | | 1.75 | |
Total from investment operations | | | (1.02 | ) | | | .85 | | | | (1.03 | ) | | | 1.50 | | | | 1.48 | |
Less distributions from: |
Net investment income | | | (.31 | ) | | | (.75 | ) | | | (.32 | ) | | | — | | | | (.09 | ) |
Total distributions | | | (.31 | ) | | | (.75 | ) | | | (.32 | ) | | | — | | | | (.09 | ) |
Net asset value, end of period | | $ | 22.67 | | | $ | 24.00 | | | $ | 23.90 | | | $ | 25.25 | | | $ | 23.75 | |
|
Total Returnb | | | (4.31 | %) | | | 3.46 | % | | | (4.16 | %) | | | 6.32 | % | | | 6.57 | % |
Ratios/Supplemental Data |
Net assets, end of period (in thousands) | | $ | 309 | | | $ | 897 | | | $ | 621 | | | $ | 488 | | | $ | 1,206 | |
Ratios to average net assets: |
Net investment income (loss) | | | 1.19 | % | | | 1.31 | % | | | (0.35 | %) | | | (1.26 | %) | | | (1.18 | %) |
Total expensesc | | | 2.69 | % | | | 2.60 | % | | | 2.56 | % | | | 2.93 | % | | | 2.68 | % |
Net expensesd,e | | | 2.63 | % | | | 2.54 | % | | | 2.51 | % | | | 2.86 | % | | | 2.62 | % |
Portfolio turnover rate | | | 164 | % | | | 197 | % | | | 203 | % | | | 205 | % | | | 248 | % |
32 | THE GUGGENHEIM FUNDS ANNUAL FINANCIAL REPORT | SEE NOTES TO CONSOLIDATED FINANCIAL STATEMENTS. |
CONSOLIDATED FINANCIAL HIGHLIGHTS (continued) |
MULTI-HEDGE STRATEGIES FUND |
This table is presented to show selected data for a share outstanding throughout each period and to assist shareholders in evaluating the Fund’s performance for the periods presented.
Class P | | Year Ended
December 31,
2024 | | | Year Ended
December 31,
2023 | | | Year Ended
December 31,
2022 | | | Year Ended
December 31,
2021 | | | Year Ended
December 31,
2020 | |
Per Share Data |
Net asset value, beginning of period | | $ | 26.57 | | | $ | 26.25 | | | $ | 27.61 | | | $ | 25.97 | | | $ | 24.42 | |
Income (loss) from investment operations: |
Net investment income (loss)a | | | .52 | | | | .54 | | | | .10 | | | | (.15 | ) | | | (.10 | ) |
Net gain (loss) on investments (realized and unrealized) | | | (1.44 | ) | | | .60 | | | | (1.04 | ) | | | 2.00 | | | | 1.90 | |
Total from investment operations | | | (.92 | ) | | | 1.14 | | | | (.94 | ) | | | 1.85 | | | | 1.80 | |
Less distributions from: |
Net investment income | | | (.72 | ) | | | (.82 | ) | | | (.42 | ) | | | (.21 | ) | | | (.25 | ) |
Total distributions | | | (.72 | ) | | | (.82 | ) | | | (.42 | ) | | | (.21 | ) | | | (.25 | ) |
Net asset value, end of period | | $ | 24.93 | | | $ | 26.57 | | | $ | 26.25 | | | $ | 27.61 | | | $ | 25.97 | |
|
Total Return | | | (3.61 | %) | | | 4.25 | % | | | (3.44 | %) | | | 7.16 | % | | | 7.40 | % |
Ratios/Supplemental Data |
Net assets, end of period (in thousands) | | $ | 5,117 | | | $ | 6,060 | | | $ | 9,105 | | | $ | 10,100 | | | $ | 7,676 | |
Ratios to average net assets: |
Net investment income (loss) | | | 1.95 | % | | | 2.02 | % | | | 0.38 | % | | | (0.53 | %) | | | (0.39 | %) |
Total expensesc | | | 1.94 | % | | | 1.85 | % | | | 1.80 | % | | | 2.18 | % | | | 1.93 | % |
Net expensesd,e | | | 1.88 | % | | | 1.79 | % | | | 1.76 | % | | | 2.12 | % | | | 1.87 | % |
Portfolio turnover rate | | | 164 | % | | | 197 | % | | | 203 | % | | | 205 | % | | | 248 | % |
SEE NOTES TO CONSOLIDATED FINANCIAL STATEMENTS. | THE GUGGENHEIM FUNDS ANNUAL FINANCIAL REPORT | 33 |
CONSOLIDATED FINANCIAL HIGHLIGHTS (concluded) |
MULTI-HEDGE STRATEGIES FUND |
This table is presented to show selected data for a share outstanding throughout each period and to assist shareholders in evaluating the Fund’s performance for the periods presented.
Institutional Class | | Year Ended
December 31,
2024 | | | Year Ended
December 31,
2023 | | | Year Ended
December 31,
2022 | | | Year Ended
December 31,
2021 | | | Year Ended
December 31,
2020 | |
Per Share Data |
Net asset value, beginning of period | | $ | 27.05 | | | $ | 26.71 | | | $ | 28.09 | | | $ | 26.41 | | | $ | 24.83 | |
Income (loss) from investment operations: |
Net investment income (loss)a | | | .60 | | | | .62 | | | | .18 | | | | (.08 | ) | | | (.04 | ) |
Net gain (loss) on investments (realized and unrealized) | | | (1.47 | ) | | | .60 | | | | (1.06 | ) | | | 2.03 | | | | 1.94 | |
Total from investment operations | | | (.87 | ) | | | 1.22 | | | | (.88 | ) | | | 1.95 | | | | 1.90 | |
Less distributions from: |
Net investment income | | | (.78 | ) | | | (.88 | ) | | | (.50 | ) | | | (.27 | ) | | | (.32 | ) |
Total distributions | | | (.78 | ) | | | (.88 | ) | | | (.50 | ) | | | (.27 | ) | | | (.32 | ) |
Net asset value, end of period | | $ | 25.40 | | | $ | 27.05 | | | $ | 26.71 | | | $ | 28.09 | | | $ | 26.41 | |
|
Total Return | | | (3.36 | %) | | | 4.51 | % | | | (3.22 | %) | | | 7.43 | % | | | 7.70 | % |
Ratios/Supplemental Data |
Net assets, end of period (in thousands) | | $ | 37,389 | | | $ | 74,519 | | | $ | 109,405 | | | $ | 55,461 | | | $ | 37,470 | |
Ratios to average net assets: |
Net investment income (loss) | | | 2.20 | % | | | 2.28 | % | | | 0.66 | % | | | (0.27 | %) | | | (0.15 | %) |
Total expensesc | | | 1.69 | % | | | 1.60 | % | | | 1.55 | % | | | 1.92 | % | | | 1.68 | % |
Net expensesd,e | | | 1.63 | % | | | 1.54 | % | | | 1.51 | % | | | 1.87 | % | | | 1.62 | % |
Portfolio turnover rate | | | 164 | % | | | 197 | % | | | 203 | % | | | 205 | % | | | 248 | % |
a | Net investment income (loss) per share was computed using average shares outstanding throughout the period. |
b | Total return does not reflect the impact of any applicable sales charges. |
c | Does not include expenses of the underlying funds in which the Fund invests. |
d | Net expense information reflects the expense ratios after expense waivers and reimbursements, as applicable. |
e | Excluding interest and/or dividend expense related to short sales, the net expense ratios for the years presented would be: |
| | | 12/31/24 | 12/31/23 | 12/31/22 | 12/31/21 | 12/31/20 |
| | Class A | 1.41% | 1.40% | 1.40% | 1.41% | 1.37% |
| | Class C | 2.16% | 2.14% | 2.15% | 2.16% | 2.12% |
| | Class P | 1.41% | 1.40% | 1.40% | 1.41% | 1.37% |
| | Institutional Class | 1.16% | 1.14% | 1.15% | 1.16% | 1.12% |
34 | THE GUGGENHEIM FUNDS ANNUAL FINANCIAL REPORT | SEE NOTES TO CONSOLIDATED FINANCIAL STATEMENTS. |
NOTES TO CONSOLIDATED FINANCIAL STATEMENTS |
Note 1 – Organization, Consolidation of Subsidiaries and Significant Accounting Policies
Organization
Rydex Series Funds (the “Trust”), a Delaware statutory trust, is registered with the U.S. Securities and Exchange Commission (the “SEC”) under the Investment Company Act of 1940 (the ”1940 Act”), as an open-ended investment company. The Trust consists of multiple series. Each series represents a separate fund (each, a “Fund” and collectively, the “Funds). The Trust may issue an unlimited number of authorized shares. The Trust accounts for the assets of each Fund separately.
The Trust offers a combination of seven separate classes of shares: Investor Class shares, Class A shares, Class C shares, Class H shares, Class P shares, Institutional Class shares and Money Market Class shares. Sales of shares of each Class are made without a front-end sales charge at the net asset value per share (“NAV”), with the exception of Class A shares. Class A shares are sold at the NAV, plus the applicable front-end sales charge. The sales charge varies depending on the amount purchased, but will not exceed 4.75%. Class A share purchases of $1 million or more are exempt from the front-end sales charge but have a 1% contingent deferred sales charge (“CDSC”) if shares are redeemed within 12 months of purchase. Class C shares have a 1% CDSC if shares are redeemed within 12 months of purchase. Class C shares of each Fund automatically convert to Class A shares of the same Fund on or about the 10th day of the month following the 8-year anniversary of the purchase of the Class C shares. This conversion will be executed without any sales charge, fee or other charge. After the conversion is completed, the shares will be subject to all features and expenses of Class A shares. Institutional Class shares are offered primarily for direct investment by institutions such as pension and profit sharing plans, endowments, foundations and corporations. Institutional Class shares require a minimum initial investment of $2 million and a minimum account balance of $1 million. At December 31, 2024, the Trust consisted of fifty-one Funds.
This report covers the following Funds:
Fund Name | | Investment
Company Type | |
Commodities Strategy Fund | | | Non-diversified | |
Managed Futures Strategy Fund | | | Diversified | |
Multi-Hedge Strategies Fund | | | Diversified | |
At December 31, 2024, Class A, Class C and Class H shares are offered by the Commodities Strategy Fund and Class A, Class C, Class P and Institutional Class shares are offered by the Managed Futures Strategy Fund and the Multi-Hedge Strategies Fund.
The Commodities Strategy Fund is designed and operated to accommodate frequent trading by shareholders and, unlike most mutual funds, offers unlimited exchange privileges with no minimum holding periods or transactions fees, which may cause the Fund to experience high portfolio turnover.
Security Investors, LLC (the “Adviser”), which operates under the name Guggenheim Investments (“GI”), provides advisory services to the Funds. Guggenheim Funds Distributors, LLC (“GFD”) serves as distributor of the Funds’ shares. GI and GFD are affiliated entities.
Consolidation of Subsidiaries
The consolidated financial statements of each Fund include the accounts of a wholly-owned and controlled Cayman Islands subsidiary (each, a “Subsidiary” and collectively, the “Subsidiaries”). Significant inter-company accounts and transactions have been eliminated in consolidation for the Funds.
Each Fund may invest up to 25% of its total assets in its respective Subsidiary, which is intended to provide the Fund with exposure to certain investments consistent with the Fund’s investment objective and policies while enabling the Fund to satisfy source-of-income requirements that apply to regulated investment companies (“RICs”) under the Internal Revenue Code of 1986, as amended (the “Internal Revenue Code”).
A summary of each Fund’s investment in its respective Subsidiary is as follows:
Fund | | Inception
Date of
Subsidiary | | | Subsidiary
Net Assets at
December 31,
2024 | | | % of Net Assets
of the Fund at
December 31,
2024 | |
Commodities Strategy Fund | | | 09/08/09 | | | $ | 709,691 | | | | 13.8 | % |
Managed Futures Strategy Fund | | | 05/01/08 | | | | 4,961,929 | | | | 14.8 | % |
Multi-Hedge Strategies Fund | | | 09/18/09 | | | | 1,635,865 | | | | 3.6 | % |
Significant Accounting Policies
The Funds operate as investment companies and, accordingly, follow the investment company accounting and reporting guidance of the Financial Accounting Standards Board (“FASB”) Accounting Standards Codification Topic 946 Financial Services – Investment Companies.
The following significant accounting policies are in conformity with U.S. generally accepted accounting principles (“U.S. GAAP”) and are consistently followed by the Trust. This requires management to make estimates and assumptions that affect the reported
| | THE GUGGENHEIM FUNDS ANNUAL FINANCIAL REPORT | 35 |
NOTES TO CONSOLIDATED FINANCIAL STATEMENTS (continued) |
amount of assets and liabilities, contingent assets and liabilities at the date of the consolidated financial statements, and the reported amounts of revenues and expenses during the reporting period. Actual results could differ from these estimates. All time references are based on Eastern Time.
The NAV of each share class of each Fund is calculated by dividing the market value of the Fund’s securities and other assets, less all liabilities attributable to the share class by the number of outstanding shares of the share class on the specified date.
(a) Valuation of Investments
The Board of Trustees of the Trust (the “Board”) has adopted policies and procedures for the valuation of the Funds’ investments (the “Fund Valuation Procedures”).
Pursuant to Rule 2a-5 under the 1940 Act, the Board designated the Adviser as the valuation designee to perform fair valuation determinations for the Funds with respect to all Fund investments and/or other assets. As the Funds’ valuation designee pursuant to Rule 2a-5, the Adviser has adopted separate procedures (the “Valuation Designee Procedures” and collectively with the Fund Valuation Procedures, the “Valuation Procedures”) reasonably designed to prevent violations of the requirements of Rule 2a-5 and Rule 31a-4 under the 1940 Act. The Adviser, in its role as valuation designee, utilizes the assistance of a valuation committee, consisting of representatives from Guggenheim’s investment management, fund administration, legal and compliance departments (the “Valuation Committee”), in determining the fair value of the Funds’ securities and/or other assets.
Valuations of the Funds’ securities and other assets are supplied primarily by independent third-party pricing services appointed pursuant to the processes set forth in the Valuation Procedures. The Adviser, with the assistance of the Valuation Committee, convenes monthly, or more frequently as needed, to review the valuation of all assets which have been fair valued. The Adviser, consistent with the monitoring and review responsibilities set forth in the Valuation Procedures, regularly reviews the appropriateness of the inputs, methods, models and assumptions employed by the independent third-party pricing services.
If the independent third-party pricing service cannot or does not provide a valuation for a particular investment or such valuation is deemed unreliable, such investment is fair valued by the Adviser.
Equity securities listed or traded on a recognized U.S. securities exchange or the Nasdaq Stock Market (“NASDAQ”) will generally be valued on the basis of the last sale price on the primary U.S. exchange or market on which the security is listed or traded; provided, however, that securities listed on NASDAQ will be valued at the NASDAQ official closing price, which may not necessarily represent the last sale price.
Open-end investment companies are valued at their NAV as of the close of business, on the valuation date. Exchange-traded funds and closed-end investment companies are generally valued at the last quoted sale price.
U.S. Government securities are valued by independent third-party pricing services, using the last traded fill price, or at the reported bid price at the close of business on the valuation date.
Repurchase agreements are generally valued at amortized cost, provided such amounts approximate market value.
Commercial paper and discount notes with a maturity of greater than 60 days at acquisition are valued at prices that reflect broker-dealer supplied valuations or are obtained from independent third-party pricing services, which may consider the trade activity, treasury spreads, yields or price of bonds of comparable quality, coupon, maturity, and type, as well as prices quoted by dealers who make markets in such securities. Commercial paper and discount notes with a maturity of 60 days or less at acquisition are valued at amortized cost, unless the Adviser concludes that amortized cost does not represent the fair value of the applicable asset in which case it will be valued using an independent third-party pricing service.
Futures contracts are valued on the basis of the last sale price as of 4:00 p.m. on the valuation date. In the event that the exchange for a specific futures contract closes earlier than 4:00 p.m., the futures contract is valued at the official settlement price of the exchange. However, the underlying securities from which the futures contract value is derived are monitored until 4:00 p.m. to determine if fair valuation of the underlying securities would provide a more accurate valuation of the futures contract.
Swap agreements entered into by a Fund are generally valued using an evaluated price provided by an independent third-party pricing service.
Investments for which market quotations are not readily available are fair valued as determined in good faith by the Adviser. Valuations in accordance with these methods are intended to reflect each security’s (or asset’s or liability’s) “fair value”. Each such determination is based on a consideration of all relevant factors, which are likely to vary from one pricing context to another. Examples of such factors may include, but are not limited to market prices; sale prices; broker quotes; and models which derive prices based on inputs such as prices of securities with comparable maturities and characteristics, or on inputs such as anticipated cash flows or collateral, spread over U.S. Treasury
36 | THE GUGGENHEIM FUNDS ANNUAL FINANCIAL REPORT | |
NOTES TO CONSOLIDATED FINANCIAL STATEMENTS (continued) |
securities, and other information analysis. In connection with futures contracts and other derivative investments, such factors may include obtaining information as to how (a) these contracts and other derivative investments trade in the futures or other derivative markets, respectively, and (b) the securities underlying these contracts and other derivative investments trade in the cash market.
(b) U.S. Government and Agency Obligations
Certain U.S. Government and Agency Obligations are traded on a discount basis; the interest rates shown on the Funds’ Consolidated Schedules of Investments reflect the effective rates paid at the time of purchase by the Funds. Other securities bear interest at the rates shown, payable at fixed dates through maturity.
(c) Short Sales
When a Fund engages in a short sale of a security, an amount equal to the proceeds is reflected as an asset and an equivalent liability. The amount of the liability is subsequently marked-to-market to reflect the market value of the short sale. The Fund maintains a segregated account of cash and/or securities as collateral for short sales.
Fees, if any, paid to brokers to borrow securities in connection with short sales are recorded as interest expense. In addition, the Fund must pay out the dividend rate of the equity or coupon rate of the obligation to the lender and record this as an expense. Short dividend or interest expense is a cost associated with the investment objective of short sales transactions, rather than an operational cost associated with the day-to-day management of any mutual fund. The Fund may also receive rebate income from the broker resulting from the investment of the proceeds from securities sold short.
(d) Futures Contracts
Upon entering into a futures contract, a Fund deposits and maintains as collateral such initial margin as required by the exchange on which the transaction is affected. Pursuant to the contract, the Fund agrees to receive from or pay to the broker an amount of cash equal to the daily fluctuation in value of the contract. Such receipts or payments are known as variation margin and are recorded by the Fund as unrealized appreciation or depreciation. When the contract is closed, the Fund records a realized gain or loss equal to the difference between the value of the contract at the time it was opened and the value at the time it was closed.
(e) Swap Agreements
Swap agreements are marked-to-market daily and the change, if any, is recorded as unrealized appreciation or depreciation. Payments received or made as a result of an agreement or termination of an agreement are recognized as realized gains or losses.
Upon entering into certain centrally-cleared swap transactions, a Fund is required to deposit with its clearing broker an amount of cash or securities as an initial margin. Subsequent variation margin receipts or payments are received or made by the Fund depending on fluctuations in the fair value of the reference entity and are recorded by the Fund as unrealized appreciation or depreciation. When the contract is closed, the Fund records a realized gain or loss equal to the difference between the value of the contract at the time it was opened and the value at the time it was closed.
(f) Currency Translations
The accounting records of the Funds are maintained in U.S. dollars. All assets and liabilities initially expressed in foreign currencies are converted into U.S. dollars at prevailing exchange rates. Purchases and sales of investment securities, dividend and interest income, and certain expenses are translated at the rates of exchange prevailing on the respective dates of such transactions. Changes in the relationship of these foreign currencies to the U.S. dollar can significantly affect the value of the investments and earnings of the Funds. Foreign investments may also subject the Funds to foreign government exchange restrictions, expropriation, taxation, or other political, social, geopolitical or economic developments, all of which could affect the market and/or credit risk of the investments.
The Funds do not isolate that portion of the results of operations resulting from changes in the foreign exchange rates on investments from the fluctuations arising from changes in the market prices of securities held. Such fluctuations are included with the net realized gain or loss and unrealized appreciation or depreciation on investments.
Reported net realized foreign exchange gains and losses arise from sales of foreign currencies and currency gains or losses realized between the trade and settlement dates on investment transactions. Net unrealized appreciation and depreciation arise from changes in the fair values of assets and liabilities other than investments in securities at the fiscal period end, resulting from changes in exchange rates.
| | THE GUGGENHEIM FUNDS ANNUAL FINANCIAL REPORT | 37 |
NOTES TO CONSOLIDATED FINANCIAL STATEMENTS (continued) |
(g) Foreign Taxes
The Funds may be subject to foreign taxes (a portion of which may be reclaimable) on income, stock dividends, capital gains on investments or certain foreign currency transactions. All foreign taxes are recorded in accordance with the applicable foreign tax regulations and rates that exist in the foreign jurisdictions in which the Funds invest. These foreign taxes, if any, are paid by the Funds and reflected in their Consolidated Statements of Operations as follows: foreign taxes withheld at source are presented as a reduction of income and foreign taxes on capital gains from sales of investments are included with the net realized gain (loss) on investments. Foreign taxes payable or deferred as of December 31, 2024, if any, are disclosed in the Funds’ Consolidated Statements of Assets and Liabilities.
(h) Security Transactions
Security transactions are recorded on the trade date for financial reporting purposes. Realized gains and losses from securities transactions are recorded using the identified cost basis. Proceeds from lawsuits related to investment holdings are recorded as a reduction to cost if the securities are still held and as realized gains if no longer held in the respective Fund. Dividend income is recorded on the ex-dividend date, net of applicable taxes withheld by foreign countries, if any. Taxable non-cash dividends are recorded as dividend income. Interest income, including amortization of premiums and accretion of discounts, is accrued on a daily basis. Dividend income from Real Estate Investment Trusts (“REITs”) is recorded based on the income included in the distributions received from the REIT investments using published REIT classifications, including some management estimates when actual amounts are not available. Distributions received in excess of this estimated amount are recorded as a reduction of the cost of investments or reclassified to realized gains. The actual amounts of income, return of capital, and realized gains are only determined by each REIT after its fiscal year-end, and may differ from the estimated amounts.
(i) Distributions
Distributions of net investment income and distributions of net realized gains, if any, are declared and paid at least annually. Dividends are reinvested in additional shares unless shareholders request payment in cash. Distributions are recorded on the ex-dividend date and are determined in accordance with U.S. federal income tax regulations which may differ from U.S. GAAP.
(j) Class Allocations
Interest and dividend income, most expenses, all realized gains and losses, and all unrealized appreciation and depreciation are allocated across share classes based upon the value of the outstanding shares in each share class. Certain costs, such as distribution and service fees are charged directly to specific share classes. In addition, certain expenses have been allocated to the individual Funds in the Trust based on the respective net assets of each Fund included in the Trust.
(k) Cash
The Funds may leave cash overnight in their cash account with their custodian. Periodically, a Fund may have cash due to the custodian bank as an overdraft balance. A fee is incurred on this overdraft, calculated by multiplying the overdraft by a rate based on the federal funds rate, which was 4.33% at December 31, 2024.
(l) Indemnifications
Under the Trust’s organizational documents, the Trustees and Officers of the Trust are indemnified against certain liabilities arising out of the performance of their duties to the Trust. In addition, throughout the normal course of business, the Trust, on behalf of the Funds, enters into contracts that contain a variety of representations and warranties which provide general indemnifications. The Funds’ maximum exposure under these arrangements is unknown, as this would involve future claims that may be made against the Funds and/or their affiliates that have not yet occurred. However, based on experience, the Funds expect the risk of loss to be remote.
Note 2 – Financial Instruments and Derivatives
As part of their investment strategies, the Funds may utilize short sales and a variety of derivative instruments. These investments involve, to varying degrees, elements of market risk and risks in excess of amounts recognized on the Funds’ Consolidated Statements of Assets and Liabilities. Valuation and accounting treatment of these instruments can be found under Significant Accounting Policies in Note 1 of these Notes to Consolidated Financial Statements.
Short Sales
A short sale is a transaction in which a Fund sells a security it does not own. If the security sold short decreases in price between the time the Fund sells the security and closes its short position, the Fund will realize a gain on the transaction. Conversely, if the security increases in price during the period, the Fund will realize a loss on the transaction. The risk of such price increases is the principal risk of engaging in short sales.
Derivatives
Derivatives are instruments whose values depend on, or are derived from, in whole or in part, the value of one or more other assets, such as securities, currencies, commodities or indices. Derivative instruments may be used for investment purposes (including to maintain cash reserves while maintaining exposure to certain other assets), for risk management (hedging) purposes,
38 | THE GUGGENHEIM FUNDS ANNUAL FINANCIAL REPORT | |
NOTES TO CONSOLIDATED FINANCIAL STATEMENTS (continued) |
to facilitate trading, to reduce transaction costs and to pursue higher investment returns. Derivative instruments may also be used to seek to mitigate certain investment risks, such as foreign currency exchange rate risk, interest rate risk and credit risk. U.S. GAAP requires disclosures to enable investors to better understand how and why a Fund uses derivative instruments, how these derivative instruments are accounted for and their effects on the Fund’s financial position and results of operations.
The Funds may utilize derivatives for the following purposes:
Duration: the use of an instrument to manage the interest rate risk of a portfolio.
Hedge: an investment made in order to reduce the risk of adverse price movements in a security, by taking an offsetting position to protect against broad market moves.
Index Exposure: the use of an instrument to obtain exposure to a listed or other type of index.
Leverage: gaining total exposure to equities or other assets on the long and short sides at greater than 100% of invested capital.
Liquidity: the ability to buy or sell exposure with little price/market impact.
Speculation: the use of an instrument to express macro-economic and other investment views.
If a Fund’s investment strategy consistently involves applying leverage, the value of the Fund’s shares will tend to increase or decrease more than the value of any increase or decrease in the underlying index or other asset. In addition, because an investment in derivative instruments generally requires a small investment relative to the amount of investment exposure assumed, an opportunity for increased net income is created; but, at the same time, leverage risk will increase. A Fund’s use of leverage, through borrowings or instruments such as derivatives, may cause the Fund to be more volatile and riskier than if the Fund had not been leveraged.
Futures Contracts
A futures contract is an agreement to purchase (long) or sell (short) an agreed amount of securities or other instruments at a set price for delivery at a future date. There are significant risks associated with a Fund’s use of futures contracts, including (i) there may be an imperfect or no correlation between the changes in market value of the underlying asset and the prices of futures contracts; (ii) there may not be a liquid secondary market for a futures contract; (iii) trading restrictions or limitations may be imposed by an exchange; and (iv) government regulations may restrict trading in futures contracts. When investing in futures, there is minimal counterparty credit risk to a Fund because futures are exchange-traded and the exchange’s clearinghouse, as counterparty to all exchange-traded futures, guarantees against default. Cash deposits are shown as segregated cash with broker on the Funds’ Consolidated Statements of Assets and Liabilities; securities held as collateral are noted on the Funds’ Consolidated Schedules of Investments.
The following table represents the Funds’ use and volume of futures on a monthly basis:
| | | | Average Notional Amount | |
Fund | Use | | Long | | | Short | |
Commodities Strategy Fund | Index exposure, Liquidity | | $ | 5,731,621 | | | $ | — | |
Managed Futures Strategy Fund | Hedge, Leverage, Liquidity, Speculation | | | 154,362,702 | | | | 143,067,998 | |
Multi-Hedge Strategies Fund | Duration, Hedge, Index exposure, Leverage, Liquidity, Speculation | | | 128,602,511 | | | | 96,628,097 | |
Swap Agreements
A swap is an agreement that obligates two parties to exchange a series of cash flows at specified intervals based upon or calculated by reference to changes in specified prices or rates for a specified amount of an underlying asset. When utilizing over-the-counter (“OTC”) swaps, a Fund bears the risk of loss of the amount expected to be received under a swap agreement in the event of the default or bankruptcy of a swap agreement counterparty or if the underlying asset declines in value. Certain standardized swaps are subject to mandatory central clearing and are executed on a multi-lateral or other trade facility platform, such as a registered exchange. There is limited counterparty credit risk with respect to
| | THE GUGGENHEIM FUNDS ANNUAL FINANCIAL REPORT | 39 |
NOTES TO CONSOLIDATED FINANCIAL STATEMENTS (continued) |
centrally-cleared swaps as the transaction is facilitated through a central clearinghouse, much like exchange-traded futures contracts. For a Fund utilizing centrally-cleared swaps, the exchange bears the risk of loss resulting from a counterparty not being able to pay. There is no guarantee that a Fund or an underlying fund could eliminate its exposure under an outstanding swap agreement by entering into an offsetting swap agreement with the same or another party.
Custom basket swaps involve commitments where single or multiple cash flows are exchanged based on the price of an underlying reference asset (such as a custom basket of securities) for a fixed or variable interest rate. Custom basket swaps will usually be computed based on the current value of the reference asset as of the close of regular trading on the NYSE or other exchange, with the swap value being adjusted to include dividends accrued, financing charges and/or interest associated with the swap agreement. When utilizing custom basket swaps, a Fund bears the risk of loss of the amount expected to be received under a swap agreement in the event of the default or bankruptcy of a swap agreement counterparty or if the underlying reference asset declines in value.
The following table represents the Funds’ use and volume of custom basket swaps on a monthly basis:
| | | | Average Notional Amount | |
Fund | Use | | Long | | | Short | |
Multi-Hedge Strategies Fund | Hedge, Index exposure, Leverage, Liquidity, Speculation | | $ | 52,409,801 | | | $ | 43,552,586 | |
Derivative Investment Holdings Categorized by Risk Exposure
The following is a summary of the location of derivative investments on the Funds’ Consolidated Statements of Assets and Liabilities as of December 31, 2024:
Derivative Investment Type | Asset Derivatives | Liability Derivatives |
Commodity/Currency/Equity/Interest rate futures contracts | Variation margin on futures contracts | — |
Equity swap agreements | Unrealized appreciation on OTC swap agreements | — |
The following tables set forth the fair value of the Funds’ derivative investments categorized by primary risk exposure at December 31, 2024:
Asset Derivative Investments Value |
Fund | | Futures
Equity
Risk* | | | Swaps
Equity
Risk | | | Futures
Foreign
Currency
Exchange
Risk* | | | Futures
Interest
Rate
Risk* | | | Futures
Commodity
Risk* | | | Total
Value at
December 31,
2024 | |
Commodities Strategy Fund | | $ | — | | | $ | — | | | $ | — | | | $ | — | | | $ | 97,469 | | | $ | 97,469 | |
Managed Futures Strategy Fund | | | 64,795 | | | | — | | | | 494,550 | | | | 109,397 | | | | 376,160 | | | | 1,044,902 | |
Multi-Hedge Strategies Fund | | | 95,417 | | | | 644,317 | | | | 417,428 | | | | 300,226 | | | | 873,599 | | | | 2,330,987 | |
Liability Derivative Investments Value |
Fund | | Futures
Equity
Risk* | | | Swaps
Equity
Risk | | | Futures
Foreign
Currency
Exchange
Risk* | | | Futures
Interest
Rate
Risk* | | | Futures
Commodity
Risk* | | | Total
Value at
December 31,
2024 | |
Managed Futures Strategy Fund | | $ | 277,953 | | | $ | — | | | $ | 25,456 | | | $ | 35,655 | | | $ | 218,602 | | | $ | 557,666 | |
Multi-Hedge Strategies Fund | | | 123,281 | | | | — | | | | 311,354 | | | | 177,115 | | | | 663,906 | | | | 1,275,656 | |
* | Includes cumulative appreciation (depreciation) of exchange-traded, OTC and centrally-cleared derivatives contracts as reported on the Funds’ Consolidated Schedules of Investments. For exchange-traded and centrally-cleared derivatives, variation margin is reported within the Funds’ Consolidated Statements of Assets and Liabilities. |
40 | THE GUGGENHEIM FUNDS ANNUAL FINANCIAL REPORT | |
NOTES TO CONSOLIDATED FINANCIAL STATEMENTS (continued) |
The following is a summary of the location of derivative investments on the Funds’ Consolidated Statements of Operations for the year ended December 31, 2024:
Derivative Investment Type | Location of Gain (Loss) on Derivatives |
Commodity/Currency/Equity/Interest rate futures contracts | Net realized gain (loss) on futures contracts |
| Net change in unrealized appreciation (depreciation) on futures contracts |
Equity swap agreements | Net realized gain (loss) on swap agreements |
| | Net change in unrealized appreciation (depreciation) on swap agreements |
The following is a summary of the Funds’ realized gain (loss) and change in unrealized appreciation (depreciation) on derivative investments recognized on the Funds’ Consolidated Statements of Operations categorized by primary risk exposure for the year ended December 31, 2024:
Realized Gain (Loss) on Derivative Investments Recognized on the Consolidated Statements of Operations |
Fund | | Futures
Equity
Risk | | | Swaps
Equity
Risk | | | Futures
Foreign
Currency
Exchange
Risk | | | Futures
Interest
Rate
Risk | | | Futures
Commodity
Risk | | | Total | |
Commodities Strategy Fund | | $ | — | | | $ | — | | | $ | — | | | $ | — | | | $ | (457,238 | ) | | $ | (457,238 | ) |
Managed Futures Strategy Fund | | | 4,692,229 | | | | — | | | | (2,804,270 | ) | | | (2,573,121 | ) | | | (839,760 | ) | | | (1,524,922 | ) |
Multi-Hedge Strategies Fund | | | (2,379,298 | ) | | | 3,221,500 | | | | (604,380 | ) | | | 75,161 | | | | (826,071 | ) | | | (513,088 | ) |
Change in Unrealized Appreciation (Depreciation) on Derivative Investments Recognized on the Consolidated Statements of Operations |
Fund | | Futures
Equity
Risk | | | Swaps
Equity
Risk | | | Futures
Foreign
Currency
Exchange
Risk | | | Futures
Interest
Rate
Risk | | | Futures
Commodity
Risk | | | Total | |
Commodities Strategy Fund | | $ | — | | | $ | — | | | $ | — | | | $ | — | | | $ | 11,778 | | | $ | 11,778 | |
Managed Futures Strategy Fund | | | (789,303 | ) | | | — | | | | (73,633 | ) | | | 300,443 | | | | (74,704 | ) | | | (637,197 | ) |
Multi-Hedge Strategies Fund | | | (201,682 | ) | | | (3,482,801 | ) | | | 422,124 | | | | 44,390 | | | | 262,109 | | | | (2,955,860 | ) |
In conjunction with short sales and the use of derivative instruments, the Funds are required to maintain collateral in various forms. Depending on the financial instrument utilized and the broker involved, the Funds use margin deposits at the broker, cash and/or securities segregated at the custodian bank, discount notes or repurchase agreements allocated to the Funds as collateral.
The Trust has established counterparty credit guidelines and enters into transactions only with financial institutions rated/identified as investment grade or better. The Trust monitors the counterparty credit risk associated with each such financial institution.
Note 3 – Offsetting
In the normal course of business, the Funds enter into transactions subject to enforceable master netting arrangements or other similar arrangements. Generally, the right to offset in those agreements allows the Funds to counteract the exposure to a specific counterparty with collateral received from or delivered to that counterparty based on the terms of the arrangements. These arrangements provide for the right to liquidate upon the occurrence of an event of default, credit event upon merger or additional termination event.
In order to better define their contractual rights and to secure rights that will help the Funds mitigate their counterparty risk, the Funds may enter into an International Swaps and Derivatives Association, Inc. Master Agreement (“ISDA Master Agreement”) or similar agreement with their derivative contract counterparties. An ISDA Master Agreement is a bilateral agreement between a fund and a counterparty that governs OTC derivatives, including foreign exchange contracts, and typically contains, among other things, collateral posting terms and netting provisions in the event of a default and/or termination event. The provisions of the ISDA Master Agreement typically permit a single net payment in the event of a default (close-out netting) or similar event, including the bankruptcy or insolvency of the counterparty.
| | THE GUGGENHEIM FUNDS ANNUAL FINANCIAL REPORT | 41 |
NOTES TO CONSOLIDATED FINANCIAL STATEMENTS (continued) |
For derivatives traded under an ISDA Master Agreement, the collateral requirements are typically calculated by netting the mark-to-market amount for each transaction under such agreement and comparing that amount to the value of any collateral currently pledged by the Funds and the counterparty. For financial reporting purposes, cash collateral that has been pledged to cover obligations of the Funds and cash collateral received from the counterparty, if any, are reported separately on the Funds’ Consolidated Statements of Assets and Liabilities as segregated cash with broker/receivable for variation margin, or payable for swap settlement/variation margin. Cash and/or securities pledged or received as collateral by the Funds in connection with an OTC derivative subject to an ISDA Master Agreement generally may not be invested, sold or rehypothecated by the counterparty or the Funds, as applicable, absent an event of default under such agreement, in which case such collateral generally may be applied towards obligations due to and payable by such counterparty or the Funds, as applicable. Generally, the amount of collateral due from or to a counterparty must exceed a minimum transfer amount threshold (e.g., $300,000) before a transfer is required to be made. To the extent amounts due to the Funds from their counterparties are not fully collateralized, contractually or otherwise, the Funds bear the risk of loss from counterparty nonperformance. The Funds attempt to mitigate counterparty risk by only entering into agreements with counterparties that they believe to be of good standing and by monitoring the financial stability of those counterparties.
For financial reporting purposes, the Funds do not offset derivative assets and derivative liabilities that are subject to netting arrangements in the Funds’ Consolidated Statements of Assets and Liabilities.
The following table presents derivative financial instruments and secured financing transactions that are subject to enforceable netting arrangements:
| | | | | | | | | | | | | | | | Gross Amounts Not Offset in
the Consolidated Statements
of Assets and Liabilities | | | | | |
Fund | Instrument | | Gross Amounts
of Recognized
Assets1 | | | Gross Amounts
Offset in the
Consolidated
Statements
of Assets and
Liabilities | | | Net Amount
of Assets
Presented on the
Consolidated
Statements
of Assets and
Liabilities | | | Financial
Instruments | | | Cash Collateral
Received | | | Net
Amount | |
Multi-Hedge Strategies Fund | Custom basket swap agreements | | $ | 644,317 | | | $ | — | | | $ | 644,317 | | | $ | — | | | $ | — | | | $ | 644,317 | |
1 | Exchange-traded or centrally-cleared derivatives are excluded from these reported amounts. |
The Funds have the right to offset deposits against any related derivative liabilities outstanding with each counterparty with the exception of exchange-traded or centrally-cleared derivatives. The following table presents deposits held by others in connection with derivative investments as of December 31, 2024.
Fund | Counterparty | Asset Type | | Cash Pledged | | | Cash Received | |
Commodities Strategy Fund | Goldman Sachs International | Futures contracts | | $ | 95,374 | | | $ | — | |
Managed Futures Strategy Fund | Goldman Sachs International | Futures contracts | | | 2,082,420 | | | | — | |
Multi-Hedge Strategies Fund | Goldman Sachs International | Custom basket swap agreements | | | 1,976,425 | | | | — | |
| | Goldman Sachs International | Futures contracts | | | 241,868 | | | | — | |
| | Morgan Stanley Capital Services LLC | Custom basket swap agreements | | | 910,018 | | | | — | |
| | | | | | 3,128,311 | | | | — | |
42 | THE GUGGENHEIM FUNDS ANNUAL FINANCIAL REPORT | |
NOTES TO CONSOLIDATED FINANCIAL STATEMENTS (continued) |
Note 4 – Fair Value Measurement
In accordance with U.S. GAAP, fair value is defined as the price that the Funds would receive to sell an investment or pay to transfer a liability in an orderly transaction between market participants at the measurement date. U.S. GAAP establishes a three-tier fair value hierarchy based on the types of inputs used to value assets and liabilities and requires corresponding disclosure. The hierarchy and the corresponding inputs are summarized below:
Level 1 — | unadjusted quoted prices in active markets for identical assets or liabilities. |
Level 2 — | significant other observable inputs (for example quoted prices for securities that are similar based on characteristics such as interest rates, prepayment speeds, credit risk, etc.). |
Level 3 — | significant unobservable inputs based on the best information available under the circumstances, to the extent observable inputs are not available, which may include assumptions. |
Rule 2a-5 sets forth a definition of “readily available market quotations,” which is consistent with the definition of a Level 1 input under U.S. GAAP. Rule 2a-5 provides that “a market quotation is readily available only when that quotation is a quoted price (unadjusted) in active markets for identical investments that the fund can access at the measurement date, provided that a quotation will not be readily available if it is not reliable.”
Securities for which market quotations are not readily available must be valued at fair value as determined in good faith. Accordingly, any security priced using inputs other than Level 1 inputs will be subject to fair value requirements. The types of inputs available depend on a variety of factors, such as the type of security and the characteristics of the markets in which it trades, if any. Fair valuation determinations that rely on fewer or no observable inputs require greater judgment. Accordingly, fair value determinations for Level 3 securities require the greatest amount of judgment.
The inputs or methodologies selected and applied for valuing securities or other assets are not necessarily an indication of the risk associated with investing in those securities. The suitability, appropriateness and accuracy of the techniques, methodologies and sources employed to determine fair valuation are periodically reviewed and subject to change.
Note 5 – Investment Advisory Agreement and Other Agreements
Under the terms of an investment advisory contract between the Trust, on behalf of the Funds, and the Adviser, the Funds pay GI investment advisory fees on a monthly basis calculated daily at the annualized rates below, based on the average daily net assets of the Funds:
Fund | | Management Fees
(as a % of Net Assets) | |
Commodities Strategy Fund | | | 0.75 | % |
Managed Futures Strategy Fund | | | 0.90 | % |
Multi-Hedge Strategies Fund | | | 1.15 | % |
When the aggregate assets of each series of the Trust (excluding the Managed Futures Strategy Fund and Multi-Hedge Strategies Fund) and each series of Rydex Dynamic Funds equal or exceed $10 billion, the advisory fee rate paid by each individual Fund (excluding the Managed Futures Strategy Fund and Multi-Hedge Strategies Fund) will be reduced in accordance with the asset level and breakpoint schedule set forth below.
Fund Assets Under Management | | Fund Asset-Based
Breakpoint Reductions | |
$500 million - $1 billion | | | 0.025 | % |
>$1 billion - $2 billion | | | 0.050 | % |
>$2 billion | | | 0.075 | % |
| | THE GUGGENHEIM FUNDS ANNUAL FINANCIAL REPORT | 43 |
NOTES TO CONSOLIDATED FINANCIAL STATEMENTS (continued) |
Each Fund invests in its respective Subsidiary. Each Subsidiary has entered into a separate advisory agreement with the Advisor for the management of that Subsidiary’s portfolio pursuant to which the Subsidiary pays the Advisor a management fee at the same rate that the Subsidiary’s corresponding Fund pays the Advisor for services provided to that Fund. The Advisor has contractually agreed to waive the management fee it receives from each Fund in an amount equal to the management fee paid to the Advisor by the Fund’s Subsidiary. Fees waived under this arrangement are not subject to reimbursement to GI. For the year ended December 31, 2024, the Commodities Strategy Fund, Managed Futures Strategy Fund and Multi-Hedge Strategies Fund waived $7,018, $95,010 and $31,123, respectively, related to advisory fees in their respective Subsidiaries.
For the Multi-Hedge Strategies Fund, GI has contractually agreed to pay all operating expenses of the Fund, excluding interest expense and taxes (expected to be de minimis), brokerage commissions and other expenses connected with the execution of portfolio transactions, short sales dividend and interest expense, and extraordinary expenses.
For the Commodities Strategy Fund, GI has agreed to waive and/or reimburse expenses in an amount equal to an annual percentage rate of 0.05% of the Fund’s average daily net assets. This fee waiver will be honored by the Adviser through May 1, 2025 and shall automatically renew for one-year terms, unless GI provides written notice to the Fund of the termination at least thirty days prior to the end of the then-current term. This agreement may be terminated at any time by the Fund’s Board upon sixty days’ written notice to the Adviser. In addition, the agreement will terminate automatically if the Advisory Agreement, with respect to the Fund, is terminated, with such termination effective upon the effective date of the termination of the Advisory Agreement.
GI pays operating expenses on behalf of the Trust, such as audit and accounting related services, legal services, custody, printing and mailing, among others, on a pass-through basis. Such expenses are allocated to various Funds within the complex based on relative net assets.
The Board has adopted separate Distribution Plans applicable to Class A shares, Class H shares and Class P shares of the Funds, pursuant to which GFD and other firms that provide distribution and/or shareholder services (“Service Providers”) may receive compensation. If a Service Provider provides distribution services, the Funds will pay distribution fees to GFD at an annual rate not to exceed 0.25% of average daily net assets, pursuant to Rule 12b-1 of the 1940 Act. GFD, in turn, will pay the Service Provider out of its fees. GFD may, at its discretion, retain a portion of such payments to compensate itself for distribution services it performs.
The Board has adopted a separate Distribution and Shareholder Services Plan applicable to Class C shares that allows the Funds to pay annual distribution and service fees of 1.00% of the Funds’ Class C shares average daily net assets. The annual 0.25% service fee compensates a shareholder’s financial adviser for providing ongoing services to the shareholder. The annual distribution fee of 0.75% reimburses GFD for paying the shareholder’s financial adviser an ongoing sales commission. GFD advances the first year’s service and distribution fees to the financial adviser. GFD retains the service and distribution fees on accounts with no authorized dealer of record.
For the year ended December 31, 2024, GFD retained sales charges of $110,116 relating to sales of Class A shares of the Trust.
If a Fund invests in a fund that is advised by the same adviser or an affiliated adviser, the investing Fund’s adviser has agreed to waive fees at the investing fund level to the extent necessary to offset the proportionate share of any management fee paid by each Fund with respect to its investment in such affiliated fund. Fee waivers will be calculated at the investing fund level without regard to any expense cap in effect for the investing fund. Fees waived under this arrangement are not subject to reimbursement to GI. For the year ended December 31, 2024, the following Funds waived fees related to investments in affiliated funds:
Fund | | Amount Waived | |
Commodities Strategy Fund | | $ | 2,502 | |
Managed Futures Strategy Fund | | | 6,404 | |
Multi-Hedge Strategies Fund | | | 11,731 | |
Certain trustees and officers of the Trust are also officers of GI and/or GFD. The Trust does not compensate its officers or trustees who are officers, directors and/or employees of GI or GFD.
44 | THE GUGGENHEIM FUNDS ANNUAL FINANCIAL REPORT | |
NOTES TO CONSOLIDATED FINANCIAL STATEMENTS (continued) |
MUFG Investor Services (US), LLC (“MUIS”) serves as the Funds’ administrator, transfer agent and accounting agent. As administrator, transfer agent and accounting agent, MUIS maintains the books and records of the Funds’ securities and cash. U.S. Bank, N.A. (“U.S. Bank”) acts as the Funds’ custodian. As custodian, U.S. Bank is responsible for the custody of the Funds’ assets. For providing the aforementioned services, MUIS and U.S. Bank are entitled to receive a monthly fee equal to an annual percentage of each Fund’s average daily net assets and out of pocket expenses.
Note 6 – Repurchase Agreements
The Funds transfer uninvested cash balances into a single joint account, the daily aggregate balance of which is invested in one or more repurchase agreements collateralized by obligations of the U.S. Treasury and U.S. government agencies. The joint account includes other funds in the Guggenheim complex not covered in this report. The collateral is in the possession of the Funds’ custodian and is evaluated to ensure that its market value exceeds, at a minimum, 102% of the original face amount of the repurchase agreements. Each Fund holds a pro rata share of the collateral based on the dollar amount of the repurchase agreement entered into by each Fund.
At December 31, 2024, the repurchase agreements in the joint account were as follows:
Counterparty and
Terms of Agreement | | Face Value | | | Repurchase Price | | | Collateral | | Par Value | | | Fair Value | |
J.P. Morgan Securities LLC | | | | | | | | | | U.S. Treasury Note | | | | | | | | |
4.45% | | | | | | | | | | 0.38% | | | | | | | | |
Due 01/02/25 | | $ | 116,353,080 | | | $ | 116,381,845 | | | Due 09/30/27 | | $ | 131,779,200 | | | $ | 118,680,190 | |
| | | | | | | | | | | | | | | | | | | |
BofA Securities, Inc. | | | | | | | | | | U.S. Treasury Note | | | | | | | | |
4.43% | | | | | | | | | | 4.38% | | | | | | | | |
Due 01/02/25 | | | 91,458,237 | | | | 91,480,746 | | | Due 12/31/29 | | | 55,664,000 | | | | 55,676,747 | |
| | | | | | | | | | | | | | | | | | | |
| | | | | | | | | | | U.S. Treasury Bonds | | | | | | | | |
| | | | | | | | | | | 3.00% - 6.38% | | | | | | | | |
| | | | | | | | | | | Due 08/15/27 - 05/15/42 | | | 44,033,000 | | | | 36,852,802 | |
| | | | | | | | | | | | | | | | | | | |
| | | | | | | | | | | U.S. Treasury Strip | | | | | | | | |
| | | | | | | | | | | 0.00% | | | | | | | | |
| | | | | | | | | | | Due 11/15/30 | | | 979,500 | | | | 757,870 | |
| | | | | | | | | | | | | | 100,676,500 | | | | 93,287,419 | |
In the event of counterparty default, the Funds have the right to collect the collateral to offset losses incurred. There is potential loss to the Funds in the event the Funds are delayed or prevented from exercising their rights to dispose of the collateral securities, including the risk of a possible decline in the value of the underlying securities during the period while the Funds seek to assert their rights. GI, acting under the supervision of the Board, reviews the value of the collateral and the creditworthiness of those banks and dealers with which the Funds enter into repurchase agreements to evaluate potential risks.
Note 7 – Portfolio Securities Loaned
The Funds may lend their securities to approved brokers to earn additional income. Securities lending income shown on the Funds’ Consolidated Statements of Operations is shown net of rebates paid to the borrowers and earnings on cash collateral investments shared with the lending agent. Within this arrangement, the Funds act as the lender, U.S. Bank acts as the lending agent, and other approved registered broker dealers act as the borrowers. The Funds receive cash collateral, valued at 102% of the value of the securities on loan. Under the terms of the Funds’ securities lending agreement with U.S. Bank, cash collateral and proceeds are invested in the First American Government Obligations Fund — Class X. The Funds bear the risk of loss on cash collateral investments. Collateral is maintained over the life of the loan in an amount not less than the value of loaned securities, as determined at the close of fund business each day; any additional collateral required due to changes in security values is delivered to the Funds the next business day. Although the collateral mitigates the risk, the Funds could experience a delay in recovering their securities and a possible loss of income or value if the borrower fails to return the securities. The Funds have the right under the securities lending agreement to recover the securities from the borrower on demand, including if a Fund determines it would like to vote a security on loan. The Adviser will vote such securities where the benefit of voting outweighs the costs to the Fund or administrative inconvenience of retrieving securities then on loan. Securities lending transactions are accounted for as secured borrowings. The remaining contractual maturity of the securities lending agreement is overnight and continuous.
| | THE GUGGENHEIM FUNDS ANNUAL FINANCIAL REPORT | 45 |
NOTES TO CONSOLIDATED FINANCIAL STATEMENTS (continued) |
At December 31, 2024, the following Funds participated in securities lending transactions, which are subject to enforceable netting arrangements, as follows:
| | | Gross Amounts Not Offset in the Consolidated
Statements of Assets and Liabilities | | | | Securities Lending Collateral | |
Fund | | Value of
Securities
Loaned | | | Collateral
Received(a) | | | Net
Amount | | | | Cash
Collateral
Invested | | | Cash
Collateral
Uninvested | | | Total
Collateral | |
Multi-Hedge Strategies Fund | $ 9,731 | | $ | (9,731 | ) | | $ | — | | | | $ | 9,952 | | | $ | — | | | $ | 9,952 | |
(a) | Actual collateral received by the Fund is generally greater than the amount shown due to overcollateralization. |
In the event of counterparty default, the Funds have the right to collect the collateral to offset losses incurred. There is potential loss to the Funds in the event the Funds are delayed or prevented from exercising their rights to dispose of the collateral securities, including the risk of a possible decline in the value of the underlying securities during the period while the Funds seek to assert their rights. GI, acting under the supervision of the Board, reviews the value of the collateral and the creditworthiness of such counterparties to evaluate potential risks.
Note 8 – Federal Income Tax Information
The Funds intend to comply with the provisions of Subchapter M of the Internal Revenue Code, applicable to regulated investment companies and will distribute substantially all taxable net investment income and capital gains sufficient to relieve the Funds from all, or substantially all, federal income, excise and state income taxes. Therefore, no provision for federal or state income tax or federal excise tax is required.
Tax positions taken or expected to be taken in the course of preparing the Funds’ tax returns are evaluated to determine whether the tax positions are “more-likely-than-not” of being sustained by the applicable tax authority. Tax positions not deemed to meet the “more-likely-than-not” threshold would be recorded as a tax benefit or expense in the current year. Management has analyzed the Funds’ tax positions taken, or to be taken, on U.S. federal income tax returns for all open tax years, and has concluded that no provision for income tax is required in the Funds’ consolidated financial statements. The Funds’ U.S. federal income tax returns are subject to examination by the Internal Revenue Service (“IRS”) for a period of three years after they are filed.
If a Fund makes a distribution to its shareholders in excess of its current and accumulated “earnings and profits” in any taxable year, the excess distribution will be treated as a return of capital to the extent of each shareholder’s basis (for tax purposes) in its shares, and any distribution in excess of basis will be treated as capital gain. A return of capital is not taxable, but it reduces the shareholder’s basis in its shares, which reduces the loss (or increases the gain) on a subsequent taxable disposition by such shareholder of the shares.
Each Fund intends to invest up to 25% of its assets in its respective Subsidiary, which is expected to provide the Fund with exposure to the commodities markets within the limitations of the U.S. federal income tax requirements under Subchapter M of the Internal Revenue Code. Each Fund has received a private letter ruling from the IRS that concludes that the income each Fund receives from its Subsidiary will constitute qualifying income for purposes of Subchapter M of the Internal Revenue Code. Each Subsidiary is classified as a corporation for U.S. federal income tax purposes. Foreign corporations, such as the Subsidiaries, will generally not be subject to U.S. federal income taxation unless they are deemed to be engaged in a U.S. trade or business. If, during a taxable year, a Subsidiary’s taxable losses (and other deductible items) exceed its income and gains, the net loss will not pass through to the respective Fund as a deductible amount for U.S. federal income tax purposes and cannot be carried forward to reduce future income from the Subsidiary in subsequent years.
The tax character of distributions paid during the year ended December 31, 2024 was as follows:
Fund | | Ordinary
Income | | | Long-Term
Capital Gain | | | Total
Distributions | |
Managed Futures Strategy Fund | | $ | 1,687,508 | | | $ | — | | | $ | 1,687,508 | |
Multi-Hedge Strategies Fund | | | 1,405,240 | | | | — | | | | 1,405,240 | |
46 | THE GUGGENHEIM FUNDS ANNUAL FINANCIAL REPORT | |
NOTES TO CONSOLIDATED FINANCIAL STATEMENTS (continued) |
The tax character of distributions paid during the year ended December 31, 2023 was as follows:
Fund | | Ordinary
Income | | | Long-Term
Capital Gain | | | Total
Distributions | |
Commodities Strategy Fund | | $ | 352,828 | | | $ | — | | | $ | 352,828 | |
Managed Futures Strategy Fund | | | 824,064 | | | | — | | | | 824,064 | |
Multi-Hedge Strategies Fund | | | 2,766,557 | | | | — | | | | 2,766,557 | |
Note: For U.S. federal income tax purposes, short-term capital gain distributions are treated as ordinary income distributions.
The tax components of distributable earnings/(loss) as of December 31, 2024 were as follows:
Fund | | Undistributed
Ordinary
Income | | | Undistributed
Long-Term
Capital Gain | | | Net Unrealized
Appreciation
(Depreciation) | | | Accumulated
Capital and
Other Losses | | | Total | |
Commodities Strategy Fund | | $ | 172,080 | | | $ | — | | | $ | (11,830,939 | ) | | $ | (73,118 | ) | | $ | (11,731,977 | ) |
Managed Futures Strategy Fund | | | 1,303,345 | | | | — | | | | (17,518,029 | ) | | | (25,019,102 | ) | | | (41,233,786 | ) |
Multi-Hedge Strategies Fund | | | 1,049,772 | | | | — | | | | (7,394,741 | ) | | | (4,687,550 | ) | | | (11,032,519 | ) |
For U.S. federal income tax purposes, capital loss carryforwards represent realized losses of the Funds that may be carried forward and applied against future capital gains. The Funds are permitted to carry forward capital losses for an unlimited period and such capital loss carryforwards retain their character as either short-term or long-term capital losses. As of December 31, 2024, capital loss carryforwards for the Funds were as follows:
| | | Unlimited | | | | | |
Fund | | Short-Term | | | Long-Term | | | Total
Capital Loss
Carryforward | |
Commodities Strategy Fund | | $ | (45,672 | ) | | $ | (27,446 | ) | | $ | (73,118 | ) |
Managed Futures Strategy Fund | | | (3,954,303 | ) | | | (21,064,799 | ) | | | (25,019,102 | ) |
Multi-Hedge Strategies Fund | | | (4,571,027 | ) | | | — | | | | (4,571,027 | ) |
For the year ended December 31, 2024, the following capital loss carryforward amounts were utilized:
| Fund | | | Utilized | |
| Multi-Hedge Strategies Fund | | | | $ | 879,634 | |
Net investment income and net realized gains (losses) may differ for financial statement and tax purposes because of temporary or permanent book/tax differences. These differences are primarily due to investments in subsidiaries, the “mark-to-market” of certain derivatives, investments in real estate investment trusts, straddle loss deferrals, foreign currency gains and losses, and losses deferred due to wash sales. To the extent these differences are permanent and would require a reclassification between Paid in Capital and Total Distributable Earnings (Loss), such reclassifications are made in the period that the differences arise. These reclassifications have no effect on net assets or NAV per share.
The following adjustments were made on the Consolidated Statements of Assets and Liabilities as of December 31, 2024 for permanent book/tax differences:
| Fund | | Paid In
Capital | | | Total
Distributable Earnings/(Loss) | |
| Commodities Strategy Fund | | $ | (423,741 | ) | | $ | 423,741 | |
| Managed Futures Strategy Fund | | | (507,074 | ) | | | 507,074 | |
| Multi-Hedge Strategies Fund | | | (770,409 | ) | | | 770,409 | |
| | THE GUGGENHEIM FUNDS ANNUAL FINANCIAL REPORT | 47 |
NOTES TO CONSOLIDATED FINANCIAL STATEMENTS (continued) |
At December 31, 2024, the cost of investments for U.S. federal income tax purposes, the aggregate gross unrealized appreciation for all investments for which there was an excess of value over tax cost and the aggregate gross unrealized depreciation for all investments for which there was an excess of tax cost over value, were as follows:
Fund | | Tax
Cost | | | Tax
Unrealized
Appreciation | | | Tax
Unrealized
Depreciation | | | Net Tax
Unrealized
Appreciation/
(Depreciation) | |
Commodities Strategy Fund | | $ | 16,159,852 | | | $ | — | | | $ | (11,830,939 | ) | | $ | (11,830,939 | ) |
Managed Futures Strategy Fund | | | 51,373,982 | | | | — | | | | (17,518,239 | ) | | | (17,518,239 | ) |
Multi-Hedge Strategies Fund | | | 40,609,416 | | | | — | | | | (7,395,302 | ) | | | (7,395,302 | ) |
Note 9 – Securities Transactions
For the year ended December 31, 2024, the cost of purchases and proceeds from sales of investment securities, excluding government securities, short-term investments and derivatives, were as follows:
Fund | | Purchases | | | Sales | |
Commodities Strategy Fund | | $ | — | | | $ | 1,200,000 | |
Managed Futures Strategy Fund | | | 9,123 | | | | 2,107,110 | |
Multi-Hedge Strategies Fund | | | 95,700,411 | | | | 115,273,267 | |
The Funds are permitted to purchase or sell securities from or to certain affiliated funds under specified conditions outlined in procedures adopted by the Board. The procedures have been designed to ensure that any purchase or sale of securities by a Fund from or to another fund or portfolio that is or could be considered an affiliate by virtue of having a common investment adviser (or affiliated investment advisers), common trustees and/or common officers complies with Rule 17a-7 of the 1940 Act. Further, as defined under these procedures, each transaction is effected at the current market price. For the year ended December 31, 2024, the Funds did not engage in purchases and sales of securities pursuant to Rule 17a-7 of the 1940 Act.
Note 10 – Line of Credit
The Trust, along with other affiliated trusts, secured an uncommitted $200,000,000 line of credit from U.S. Bank, N.A. On June 3, 2024, the line of credit agreement was renewed and on November 18, 2024, a new line of credit agreement was entered into which expires on November 17, 2025. This line of credit is reserved for emergency or temporary purposes. Borrowings, if any, under this arrangement bear interest equal to the Prime Rate, minus 2%, which shall be paid monthly, averaging 6.32% for the year ended December 31, 2024. The Funds did not have any borrowings outstanding under this agreement at December 31, 2024.
The average daily balances borrowed for the year ended December 31, 2024, were as follows:
Fund | | Average Daily Balance | |
Multi-Hedge Strategies Fund | | $ | 6,557 | |
Note 11 – Segment Reporting
In this reporting period, the Funds adopted FASB Accounting Standards Update 2023-07, Segment Reporting (Topic 280) - Improvements to Reportable Segment Disclosures (“ASU 2023-07”). Adoption of the new standard impacted financial statement disclosures only and did not affect the Funds’ financial position or the results of their operations. An operating segment is defined in Topic 280 as a component of a public entity that engages in business activities from which it may recognize revenues and incur expenses, has operating results that are regularly reviewed by the public entity’s chief operating decision maker (“CODM”) to make decisions about resources to be allocated to the segment and assess its performance, and has discrete financial information available. The Officers of the Trust, subject to the oversight and supervision of the Board, serve as the CODM for the Funds.
48 | THE GUGGENHEIM FUNDS ANNUAL FINANCIAL REPORT | |
NOTES TO CONSOLIDATED FINANCIAL STATEMENTS (concluded) |
Each of the Funds represents a single operating segment, as the CODM monitors the operating results of each Fund as a whole and each Fund’s long-term strategic asset allocation is pre-determined in accordance with the Fund’s investment objective which is executed by each Fund’s portfolio managers as a team. Each of the Funds uses a variety of investments to execute its investment strategy. Please refer to Note 1 – Organization, Consolidation of Subsidiaries and Significant Accounting Policies of these Notes to Consolidated Financial Statements for additional details on the significant accounting policies and investment types used by the Funds. Please refer to each Fund’s Consolidated Schedule of Investments for a breakdown of the types of investments from which each of the Funds generates its returns. Financial information in the form of total returns, expense ratios and changes in net assets (i.e., changes in net assets resulting from operations, subscriptions and redemptions), which are used by the CODM to assess the segment’s performance versus each Fund’s comparative benchmarks, among other metrics, and to make resource allocation decisions for each Fund’s single segment, is consistent with that presented within the Fund’s consolidated financial statements. Segment assets are reflected on each Fund’s Consolidated Statement of Assets and Liabilities as “total assets” and significant segment income, expenses, and gain(loss) are listed on each Fund’s Consolidated Statement of Operations.
Note 12 – Market Risks
The value of, or income generated by, the investments held by the Funds are subject to the possibility of rapid and unpredictable fluctuation, and loss that may result from various factors. These factors include, among others, developments affecting (or perceived to affect) individual companies, or issuers or particular industries, or from broader influences, including real or perceived changes in prevailing interest rates (which may change at any time based on changes in monetary policies and various market and other economic conditions), changes in inflation rates or expectations about inflation rates, deflation, adverse investor confidence or sentiment, general outlook for corporate earnings, changing economic, political (including geopolitical), social or financial market conditions, bank failures, increased instability or general uncertainty, extreme weather, natural/environmental or man-made disasters, or geological events, governmental actions, tariffs, public health emergencies (such as the spread of infectious diseases, pandemics and epidemics), debt crises, terrorism, actual or threatened wars or other armed conflicts (such as the conflict in the Middle East and the ongoing Russia-Ukraine conflict and its collateral economic and other effects, including, but not limited to, sanctions and other international trade barriers) or ratings downgrades, and other similar events, each of which may be temporary or last for extended periods. Different sectors, industries and security types may react differently to such developments. Moreover, changing economic, political, geopolitical, social, financial market or other conditions in one country, geographic region or industry could adversely affect the value, yield and return of the investments held by the Funds in a different country, geographic region, economy, industry or market because of the increasingly interconnected global economies and financial markets. The duration and extent of the foregoing types of factors or conditions are highly uncertain and difficult to predict and have in the past, and may in the future, cause volatility and distress in economies and financial markets or other adverse circumstances, which may negatively affect the value of the Funds’ investments and performance of the Funds.
Note 13 – Subsequent Events
Effective February 24, 2025, a one-for-five reverse share split occurred in the Commodities Strategy Fund. The effect of this transaction was to divide the number of outstanding shares of the Fund by five, resulting in a corresponding increase in the net asset value per share. The shares outstanding and net asset value per share on the Fund’s Consolidated Statement of Assets and Liabilities as of December 31, 2024, the share transactions presented in the Fund’s Consolidated Statements of Changes in Net Assets for each of the two years then ended, and the per share data in the financial highlights for each of the years in the five year period then ended, have been given retroactive effect to reflect the reverse share split. There were no changes in net assets, results of operations or total return as a result of the transaction.
The Funds evaluated subsequent events through the date the consolidated financial statements are issued and determined there were no additional material events that would require adjustment to or disclosure in the Funds’ consolidated financial statements.
| | THE GUGGENHEIM FUNDS ANNUAL FINANCIAL REPORT | 49 |
REPORT OF INDEPENDENT REGISTERED PUBLIC ACCOUNTING FIRM |
To the Shareholders of Guggenheim Multi-Hedge Strategies Fund, Guggenheim Managed Future Strategy Fund and Rydex Commodities Strategy Fund and the Board of Trustees of Rydex Series Funds
Opinion on the Financial Statements
We have audited the accompanying consolidated statements of assets and liabilities of Guggenheim Multi-Hedge Strategies Fund, Guggenheim Managed Future Strategy Fund and Rydex Commodities Strategy Fund (collectively referred to as the “Funds”), (three of the funds constituting Rydex Series Funds (the “Trust”)), including the consolidated schedules of investments, as of December 31, 2024, and the related consolidated statements of operations for the year then ended, the consolidated statements of changes in net assets for each of the two years in the period then ended, the consolidated financial highlights for each of the five years in the period then ended and the related notes (collectively referred to as the “financial statements”). In our opinion, the financial statements present fairly, in all material respects, the consolidated financial position of each of the Funds (three of the funds constituting Rydex Series Funds) at December 31, 2024, the consolidated results of their operations for the year then ended, the consolidated changes in their net assets for each of the two years in the period then ended and their consolidated financial highlights for each of the five years in the period then ended, in conformity with U.S. generally accepted accounting principles.
Basis for Opinion
These financial statements are the responsibility of the Trust’s management. Our responsibility is to express an opinion on each of the Funds’ financial statements based on our audits. We are a public accounting firm registered with the Public Company Accounting Oversight Board (United States) (“PCAOB”) and are required to be independent with respect to the Trust in accordance with the U.S. federal securities laws and the applicable rules and regulations of the Securities and Exchange Commission and the PCAOB.
We conducted our audits in accordance with the standards of the PCAOB. Those standards require that we plan and perform the audit to obtain reasonable assurance about whether the financial statements are free of material misstatement, whether due to error or fraud. The Trust is not required to have, nor were we engaged to perform, an audit of the Trust’s internal control over financial reporting. As part of our audits, we are required to obtain an understanding of internal control over financial reporting but not for the purpose of expressing an opinion on the effectiveness of the Trust’s internal control over financial reporting. Accordingly, we express no such opinion.
Our audits included performing procedures to assess the risks of material misstatement of the financial statements, whether due to error or fraud, and performing procedures that respond to those risks. Such procedures included examining, on a test basis, evidence regarding the amounts and disclosures in the financial statements. Our procedures included confirmation of securities owned as of December 31, 2024, by correspondence with the custodian, transfer agent and brokers; when replies were not received from transfer agents and brokers, we performed other auditing procedures. Our audits also included evaluating the accounting principles used and significant estimates made by management, as well as evaluating the overall presentation of the financial statements. We believe that our audits provide a reasonable basis for our opinion.

We have served as the auditor of one or more Guggenheim investment companies since 1979.
Tysons, Virginia
February 26, 2025
50 | THE GUGGENHEIM FUNDS ANNUAL FINANCIAL REPORT | |
OTHER INFORMATION (Unaudited) |
Federal Income Tax Information
This information is being provided as required by the Internal Revenue Code. Amounts shown may differ from those elsewhere in the report because of differences in tax and financial reporting practice.
In January 2025, shareholders will be advised on IRS Form 1099 DIV or substitute 1099 DIV as to the federal tax status of the distributions received by shareholders in the calendar year 2024.
The Funds’ investment income (dividend income plus short-term capital gains, if any) qualifies as follows:
Of the taxable ordinary income distributions paid during the fiscal year ended December 31, 2024, the following funds had the corresponding percentages qualify for the reduced tax rate pursuant to the Jobs and Growth Tax Relief and Reconciliation Act of 2003 or for the dividends received deduction for corporations. See the qualified dividend income and dividend received deduction columns, respectively, in the table below.
Additionally, of the taxable ordinary income distributions paid during the fiscal year ended December 31, 2024, the following funds had the corresponding percentages qualify as interest related dividends and qualified short-term capital gains as permitted by IRC Section 871(k)(1) and IRC Section 871(k)(2), respectively. See the qualified interest income and qualified short-term capital gain columns, respectively, in the table below.
Fund | | Qualified
Dividend
Income | | | Dividend
Received
Deduction | | | Qualified
Interest
Income | | | Qualified
Short-Term
Capital Gain | |
Commodities Strategy Fund | | | 0.00 | % | | | 0.00 | % | | | 0.00 | % | | | 0.00 | % |
Managed Futures Strategy Fund | | | 0.00 | % | | | 0.00 | % | | | 0.00 | % | | | 0.00 | % |
Multi-Hedge Strategies Fund | | | 75.33 | % | | | 64.70 | % | | | 0.00 | % | | | 0.00 | % |
Sector Classification
Information in the Consolidated Schedule of Investments is categorized by sectors using sector-level Classifications defined by the Bloomberg Industry Classification System, a widely recognized industry classification system provider. Each Fund’s registration statement has investment policies relating to concentration in specific sectors/industries. For purposes of these investment policies, the Funds usually classify sectors/industries based on industry-level Classifications used by widely recognized industry classification system providers such as Bloomberg Industry Classification System, Global Industry Classification Standards and Barclays Global Classification Scheme.
Quarterly Portfolio Schedules Information
The Trust files its complete schedule of portfolio holdings with the SEC for the first and third quarters of each fiscal year as an exhibit to its reports on Form N-PORT. The Funds’ Form N-PORT is available on the SEC’s website at https://www.sec.gov. The Funds’ complete schedules of securities holdings as of the end of each fiscal quarter will be made available to the public on the SEC’s website at www.sec.gov and on our website at www.guggenheiminvestments.com, and will be made available, upon request and without charge, by calling 800.820.0888.
| | THE GUGGENHEIM FUNDS ANNUAL FINANCIAL REPORT | 51 |
Item 8: Changes in and Disagreements with Accountants for Open-End Management Investment Companies |
Note: This is not applicable for any fund included in this document.
52 | THE GUGGENHEIM FUNDS ANNUAL FINANCIAL REPORT | |
Item 9: Proxy Disclosures for Open-End Management Investment Companies |
Note: This is not applicable for any fund included in this document.
| | THE GUGGENHEIM FUNDS ANNUAL FINANCIAL REPORT | 53 |
Item 10: Renumeration Paid to Directors, Officers, and others of Open-End Management Investment Companies
The remuneration paid to directors, officers, and others, if applicable, are included as part of the financial statements included under Item 7 of this Form.
54 | THE GUGGENHEIM FUNDS ANNUAL FINANCIAL REPORT | |
Item 11: Statement Regarding Basis for Approval of Investment Advisory Contract
Note: This is not applicable for any fund included in this document.
| | THE GUGGENHEIM FUNDS ANNUAL FINANCIAL REPORT | 55 |
This page intentionally left blank.
This page intentionally left blank.
This page intentionally left blank.
This page intentionally left blank.
This page intentionally left blank.
This page intentionally left blank.
Item 8. Changes in and Disagreements with Accountants for Open-End Management Investment Companies.
Not applicable
Item 9. Proxy Disclosures for Open-End Management Investment Companies.
The information is included as part of the material filed under Item 7 of this Form.
Item 10. Remuneration Paid to Directors, Officers, and Others of Open-End Management Investment Companies.
The information is included as part of the material filed under Item 7 of this Form.
Item 11. Statement Regarding Basis for Approval of Investment Advisory Contract.
Not applicable.
Item 12. Disclosure of Proxy Voting Policies and Procedures for Closed-End Management Investment Companies.
Not applicable to this registrant.
Item 13. Portfolio Managers of Closed-End Management Investment Companies.
Not applicable to this registrant.
Item 14. Purchases of Equity Securities by Closed-End Management Investment Company and Affiliated Purchases.
Not applicable to this registrant.
Item 15. Submission of Matters to a Vote of Security Holders.
There have been no changes to the procedures by which shareholders may recommend nominees to the registrant’s board of trustees.
Item 16. Controls and Procedures.
(a) The registrant’s President (principal executive officer) and Treasurer (principal financial officer) have evaluated the registrant’s disclosure controls and procedures (as defined in Rule 30a-3(c) under the Investment Company Act) as of a date within 90 days of this filing and have concluded that based on such evaluation as required by Rule 30a-3(b) under the Investment Company Act, that the registrant’s disclosure controls and procedures were effective as of that date in ensuring that information required to be disclosed by the registrant in this Form N-CSR was recorded, processed, summarized, and reported within the time periods specified in the Securities and Exchange Commission’s rules and forms.
(b) There were no changes in the registrant’s internal control over financial reporting (as defined in Rule 30a-3(d) under the Investment Company Act) that occurred during the period covered by this report that the officers listed above believe to have materially affected, or to be reasonably likely to materially affect, the registrant’s internal control over financial reporting.
Item 17. Disclosure of Securities Lending Activities for Closed-End Management Investment Companies.
Not applicable to this registrant.
Item 18. Recovery of Erroneously Awarded Compensation
Item 19. Exhibits.
(a)(1) Not applicable.
(a)(2) Separate certifications by the President (principal executive officer) and Treasurer (principal financial officer) of the registrant as required by Rule 30a-2(a) under the Investment Company Act (17 CFR 270.30a-2(a)) are attached.
(a)(3) Not applicable.
(a)(4) Not applicable.
(a)(5) Not applicable.
(b) A certification by the registrant’s President (principal executive officer) and Treasurer (principal financial officer) as required by Rule 30a-2(b) under the Investment Company Act Act (17 CFR 270.30a-2(b)) is attached.
SIGNATURES
Pursuant to the requirements of the Securities Exchange Act of 1934 and the Investment Company Act of 1940, the registrant has duly caused this report to be signed on its behalf by the undersigned, thereunto duly authorized.
(Registrant) | Rydex Series Funds | |
| | | |
| By (Signature and Title)* | /s/ Brian Binder |
| | Brian Binder, President and Chief Executive Officer |
| | | |
| Date | March 7, 2025 | |
Pursuant to the requirements of the Securities Exchange Act of 1934 and the Investment Company Act of 1940, this report has been signed below by the following persons on behalf of the registrant and in the capacities and on the dates indicated.
| By (Signature and Title)* | /s/ Brian Binder | |
| | Brian Binder, President and Chief Executive Officer | |
| | | |
| Date | March 7, 2025 | |
| | | |
| By (Signature and Title)* | /s/ James Howley | |
| | James Howley, Chief Financial Officer, Chief Accounting Officer and Treasurer | |
| | | |
| Date | March 7, 2025 | |
| * | Print the name and title of each signing officer under his or her signature. |