UNITED STATES
SECURITIES AND EXCHANGE COMMISSION
WASHINGTON, D.C. 20549
SCHEDULE 14A
Proxy Statement Pursuant to Section 14(a)
of the Securities Exchange Act of 1934
Filed by the Registrantx Filed by a Party other than the Registrant¨
Check the appropriate box:
| ¨ | Preliminary Proxy Statement. |
| ¨ | Confidential, for Use of the Commission Only (as permitted by Rule 14a-6(e)(2)). |
| ¨ | Definitive Proxy Statement. |
| x | Definitive Additional Materials. |
| ¨ | Soliciting Material Pursuant to §240.14a-12. |
CDW CORPORATION
(Name of Registrant as Specified In Its Charter)
(Name of Person(s) Filing Proxy Statement, if Other Than the Registrant)
Payment of Filing Fee (Check the appropriate box):
| x | No fee required. |
| ¨ | Fee computed on table below per Exchange Act Rules 14a-6(i)(1) and 0-11. |
| (1) | Title of each class of securities to which transaction applies: |
| (2) | Aggregate number of securities to which transaction applies: |
| (3) | Per unit price or other underlying value of transaction computed pursuant to Exchange Act Rule 0-11 (set forth the amount on which the filing fee is calculated and state how it was determined): |
| (4) | Proposed maximum aggregate value of transaction: |
| (5) | Total fee paid: |
| ¨ | Fee paid previously with preliminary materials. |
| ¨ | Check box if any part of the fee is offset as provided by Exchange Act Rule 0-11(a)(2) and identify the filing for which the offsetting fee was paid previously. Identify the previous filing by registration statement number, or the form or schedule and the date of its filing. |
| (1) | Amount Previously Paid: |
| (2) | Form, Schedule or Registration Statement No.: |
| (3) | Filing Party: |
| (4) | Date Filed: |
THIS FILING CONSISTS OF A NEWS RELEASE ISSUED BY CDW CORPORATION ON JULY 24, 2007 RELATING TO RESULTS FOR THE SECOND QUARTER OF 2007, THE TRANSCRIPT FROM A CONFERENCE CALL WITH INVESTORS HELD ON JULY 24, 2007 RELATING TO EARNINGS FOR THE SECOND QUARTER OF 2007 AND SLIDES FROM A RELATED WEBCAST PRESENTATION.

| Investor Inquiries | Media Inquiries | |
| Cindy Klimstra | Gary Ross | |
| Vice President, Investor Relations | Sr. Manager, Corporate Communications | |
| (847) 968-0268 | (847) 371-5048 |
CDW Reports Second Quarter Results
Company Achieves Record Quarter
| • | Sales: $2.033 billion, up 24.4% year-over-year |
| • | Average daily sales: $31.763 million, up 24.4% year-over-year |
| • | Gross profit: $328.0 million, up 24.2 % year-over-year |
| • | Operating income: $123.7 million, up 14.7% year-over-year (includes merger-related costs) |
| • | Net income: $80.1 million, up 9.5% year-over-year (includes merger-related costs) |
| • | Diluted earnings per share: $0.99, up 8.8% year-over-year (includes merger-related costs) |
| • | Non-GAAP diluted earnings per share: $1.05, up 15.4% year-over-year (excludes merger-related costs) |
VERNON HILLS, Ill. – July 24, 2007 – CDW Corporation (NASDAQ: CDWC), a leading provider of technology products and services to business, government and education, today announced record quarterly sales, gross profit, operating income, net income and diluted earnings per share in the second quarter of 2007. The Company previously announced June 2007 and second quarter of 2007 sales results.
Total sales in the second quarter of 2007 were $2.033 billion compared to $1.633 billion in the second quarter of 2006, an increase of 24.4 percent. Average daily sales in the second quarter of 2007 were $31.763 million compared to $25.523 million in the second quarter of 2006, representing a 24.4 percent increase. There were 64 billing days in both the second quarter of 2007 and the second quarter of 2006.
CDW completed the acquisition of Berbee Information Networks on October 11, 2006. Total sales for the second quarter of 2006 do not include Berbee sales, while the second quarter of 2007 sales include Berbee sales. Excluding Berbee sales in the second quarter of 2007, and therefore on a non-GAAP basis, total sales were $1.880 billion, an increase of 15.1 percent compared to total sales of $1.633 billion for the second quarter of 2006 and average daily sales for the second quarter of 2007 were $29.377 million, an increase of 15.1 percent compared to average daily sales for the second quarter of 2006 of $25.523 million.
Second Quarter of 2007 Highlights:
| • | Total corporate sector segment sales in the second quarter of 2007 were $1.237 billion compared to $1.112 billion in the second quarter of 2006, representing an increase of 11.2 percent. Second quarter of 2007 average daily sales for the corporate sector segment were $19.321 million compared to $17.373 million in the second quarter of 2006, representing an increase of 11.2 percent. |
Page 1 of 10
| • | Total public sector segment sales in the second quarter of 2007 were $643.6 million compared to $521.6 million in the second quarter of 2006, representing an increase of 23.4 percent. Second quarter of 2007 average daily sales for the public sector segment were $10.056 million compared to $8.150 million in the second quarter of 2006, representing an increase of 23.4 percent. |
| • | While CDW did not own Berbee prior to October 11, 2006, the Company is providing comparative information for Berbee. Total Berbee sales in the second quarter of 2007 were $152.7 million compared to $101.7 million in the second quarter of 2006, representing an increase of 50.1 percent. Second quarter of 2007 average daily sales for Berbee were $2.386 million compared to $1.590 million in the second quarter of 2006, representing an increase of 50.1 percent. Compared to the corporate sector and public sector segments, Berbee’s business model is more project oriented, which can result in a greater degree of variability in sales on a quarterly basis. |
| • | Product categories that achieved the strongest year-over-year unit volume growth for the second quarter of 2007 were notebook computers, desktop computers, data storage, software and video. Product categories exclude Berbee sales. |
| • | Direct web sales in the second quarter of 2007 were $588.9 million, representing a 19.3 percent increase compared to the prior year, and comprised 31.3 percent of total sales excluding Berbee. Berbee’s sales are not made on the web due to the higher services component of the sales. |
Gross profit for the second quarter of 2007 was $328.0 million compared to $264.0 million in the second quarter of 2006, representing a 24.2 percent increase. Gross profit margin was 16.1 percent of sales in the second quarter of 2007 compared to 16.2 percent of sales in the second quarter of 2006.
In the second quarter of 2007, CDW recorded $8.0 million pre-tax ($4.9 million after-tax) of costs associated with the previously announced merger agreement providing for the acquisition of CDW by VH Holdings, Inc., which upon closing of the merger will be controlled by investment funds affiliated with Madison Dearborn Partners, LLC and Providence Equity Partners Inc. (“merger-related costs”). See supplemental table at the end of the press release for a reconciliation of GAAP to non-GAAP financial measures.
Selling and administrative expenses as a percentage of sales were 8.5 percent in the second quarter of 2007 compared to 7.7 percent in the second quarter of 2006 and increased $45.9 million. The increase in selling and administrative expenses in the second quarter of 2007 was primarily due to the inclusion of Berbee’s operating expenses, increased payroll costs as a result of continued investment in expanding CDW’s sales force, and merger-related costs of $8.0 million pre-tax ($4.9 million after-tax). Non-GAAP selling and administrative expenses as a percentage of sales, which exclude merger-related costs, were 8.1 percent in the second quarter of 2007 compared to 7.7 percent in the second quarter of 2006. The non-GAAP selling and administrative expenses information is being presented to provide meaningful comparisons to the prior year quarterly period.
Advertising expense was $32.2 million, representing 1.6 percent of sales in the second quarter of 2007 compared to $30.0 million, representing 1.8 percent of sales in the second quarter of 2006.
Operating margin was 6.1 percent in the second quarter of 2007 compared to 6.6 percent in the second quarter of 2006. Operating income was $123.7 million in the second quarter of 2007 compared to $107.8 million in the second quarter of 2006. Operating income for the second quarter of 2007 included merger-related costs of $8.0 million pre-tax ($4.9 million after-tax). Non-GAAP operating margin based on non-GAAP operating income of $131.6 million, which excludes merger-related costs, was 6.5 percent in the second quarter of 2007 compared to 6.6 percent in the second quarter of 2006. The non-GAAP operating margin information is being presented to provide meaningful comparisons to the prior year quarterly period.
Page 2 of 10
Interest income was $5.3 million for the second quarter of 2007 compared to $5.5 million in the second quarter of 2006. The effective tax rate for the second quarter of 2007 was 38.0 percent compared to 35.4 percent for the second quarter of 2006. The effective tax rate for the second quarter of 2006 included a tax benefit of $2.3 million relating to the resolution of an audit of the Company’s 2003 federal income tax return that did not repeat in the second quarter of 2007.
Net income was $80.1 million in the second quarter of 2007 compared to $73.1 million in the second quarter of 2006, an increase of 9.5 percent. Net income in the second quarter of 2007 included merger-related costs of $8.0 million pre-tax ($4.9 million after-tax). Non-GAAP net income, which excludes merger-related costs, was $85.0 million in the second quarter of 2007 compared to $73.1 million in the second quarter of 2006, an increase of 16.3 percent. The non-GAAP net income information is being presented to provide meaningful comparisons to the prior year quarterly period.
Diluted earnings per share were $0.99 in the second quarter of 2007 compared to diluted earnings per share of $0.91 in the second quarter of 2006. Results for the second quarter of 2007 included merger-related costs of $8.0 million pre-tax ($4.9 million after-tax) or approximately $0.06 per diluted share. Non-GAAP diluted earnings per share based on non-GAAP net income of $85.0 million, which exclude merger-related costs, were $1.05 in the second quarter of 2007 compared to $0.91 in the second quarter of 2006. The non-GAAP diluted earnings per share information is being presented to provide meaningful comparisons to the prior year quarterly period.
The company plans to release July sales on Monday, August 13, 2007. July 2006 had 20 billing days and July 2007 will have 21 billing days.
About CDW
CDW®, ranked No. 342 on the FORTUNE 500, is a leading provider of technology solutions for business, government and education. CDW is a principal source of technology products and services including top name brands such as Acer, Adobe, APC, Apple, Cisco, EMC, Fujitsu, HP, IBM, Lenovo, Microsoft, Panasonic, Quantum, Samsung, Sony, Symantec, ViewSonic and Xerox. CDW’s direct model offers customers one-on-one relationships with knowledgeable account managers and access to approximately 820 on-staff engineers and advanced technology specialists who customize solutions for customers’ complex technology needs. CDW also provides same-day product shipping and post-sales technical support.
CDW was founded in 1984 and as of June 30, 2007, employed approximately 5,880 coworkers. In 2006, the company generated sales of $6.8 billion. For more information, visit CDW.com.
Where You Can Find Additional Information
In connection with the proposed merger between CDW and a subsidiary of VH Holdings, Inc., CDW filed with the SEC, and has furnished to its shareholders, a definitive proxy statement soliciting proxies for the meeting of its shareholders to be held with respect to the Merger on August 9, 2007. CDW SHAREHOLDERS ARE ADVISED TO READ THE PROXY STATEMENT CAREFULLY BECAUSE IT CONTAINS IMPORTANT INFORMATION. CDW shareholders and other interested parties can obtain, without charge, a copy of the proxy statement and other relevant documents filed with the SEC from the SEC’s website at http://www.sec.gov. CDW shareholders and other interested parties can also obtain, without charge, a copy of the proxy statement and other relevant documents by directing a request by mail or telephone to CDW Corporation, 200 N. Milwaukee Ave., Vernon Hills, Illinois 60061, Attention: Corporate Secretary, telephone: (847) 465-6000, or from CDW’s website, http://www.cdw.com.
Page 3 of 10
CDW and certain of its directors, executive officers and other members of management and employees may, under SEC rules, be deemed to be “participants” in the solicitation of proxies from shareholders of CDW with respect to the proposed transaction. Information regarding the persons who may be considered “participants” in the solicitation of proxies is set forth in the definitive proxy statement described above.
Statements about the expected timing, completion and effects of the proposed merger between CDW and a subsidiary of VH Holdings, Inc. and all other statements in this filing other than historical facts, constitute forward-looking statements within the meaning of the safe harbor provisions of the Private Securities Litigation Reform Act of 1995. Readers are cautioned not to place undue reliance on these forward-looking statements, each of which is qualified in its entirety by reference to the following cautionary statements. Forward-looking statements speak only as of the date hereof and are based on current expectations and involve a number of assumptions, risks and uncertainties that could cause actual results to differ materially from those projected in the forward-looking statements. CDW may not be able to complete the proposed merger because of a number of factors, including, among other things, the failure to obtain shareholder approval, the failure of financing or the failure to satisfy other closing conditions. Other risks and uncertainties that may affect forward-looking statements are described in the reports filed by CDW with the SEC under the Securities Exchange Act of 1934, as amended, including without limitation CDW’s Annual Report on Form 10-K for the year ended December 31, 2006, and the definitive proxy statement dated July 13, 2007, relating to the special meeting of shareholders to be held to vote on the merger agreement.
For more information about CDW:
Visit CDW on the Internet at http://www.cdw.com. Contact CDW Investor Relations via the Internet at
investorrelations@cdw.com or by telephone at 847-419-6328.
CDW is a registered trademark and CDW@work is a trademark of CDW Corporation. Other company and product names may be trademarks of their respective owners.
Page 4 of 10
CDW CORPORATION AND SUBSIDIARIES
CONDENSED CONSOLIDATED STATEMENTS OF INCOME
(in thousands, except per share data)
| Three Months Ended June 30, | Six Months Ended June 30, | ||||||||||||||
| 2007 | 2006 | 2007 | 2006 | ||||||||||||
Net sales | $ | 2,032,838 | $ | 1,633,458 | $ | 3,891,956 | $ | 3,222,087 | |||||||
Cost of sales | 1,704,851 | 1,369,421 | 3,262,650 | 2,704,161 | |||||||||||
Gross profit | 327,987 | 264,037 | 629,306 | 517,926 | |||||||||||
Selling and administrative expenses | 172,117 | 126,192 | 326,302 | 254,940 | |||||||||||
Advertising expense | 32,199 | 30,007 | 61,378 | 60,902 | |||||||||||
Income from operations | 123,671 | 107,838 | 241,626 | 202,084 | |||||||||||
Interest income | 5,336 | 5,492 | 9,700 | 10,699 | |||||||||||
Other income/(expense), net | 234 | (94 | ) | (171 | ) | (1,056 | ) | ||||||||
Income before income taxes | 129,241 | 113,236 | 251,155 | 211,727 | |||||||||||
Income tax provision | 49,150 | 40,125 | 94,284 | 76,938 | |||||||||||
Net income | $ | 80,091 | $ | 73,111 | $ | 156,871 | $ | 134,789 | |||||||
Earnings per share: | |||||||||||||||
Basic | $ | 1.01 | $ | 0.93 | $ | 1.99 | $ | 1.70 | |||||||
Diluted | $ | 0.99 | $ | 0.91 | $ | 1.95 | $ | 1.66 | |||||||
Weighted-average number of common shares outstanding: | |||||||||||||||
Basic | 79,103 | 78,994 | 78,856 | 79,488 | |||||||||||
Diluted | 80,995 | 80,564 | 80,621 | 81,268 | |||||||||||
Dividends per share | $ | — | $ | 0.52 | $ | — | $ | 0.52 | |||||||
Page 5 of 10
CDW CORPORATION AND SUBSIDIARIES
CONDENSED CONSOLIDATED BALANCE SHEETS
(in thousands)
| June 30, 2007 | December 31, 2006 | June 30, 2006 | |||||||
Assets | |||||||||
Current assets: | |||||||||
Cash, cash equivalents and marketable securities | $ | 580,320 | $ | 351,596 | $ | 444,925 | |||
Accounts receivable, net of allowance for doubtful accounts of $10,089, $9,995, and $9,574, respectively | 909,162 | 850,002 | 689,824 | ||||||
Merchandise inventory | 290,615 | 261,858 | 257,035 | ||||||
Miscellaneous receivables | 46,837 | 55,881 | 50,953 | ||||||
Deferred income taxes | 15,047 | 15,060 | 14,674 | ||||||
Prepaid expenses and other current assets | 18,146 | 15,139 | 12,072 | ||||||
Total current assets | 1,860,127 | 1,549,536 | 1,469,483 | ||||||
Marketable securities | — | 40,000 | 59,261 | ||||||
Property and equipment, net | 180,110 | 171,448 | 115,780 | ||||||
Goodwill and other intangible assets, net | 179,180 | 183,094 | 4,277 | ||||||
Other assets | 8,370 | 7,349 | 6,910 | ||||||
Total assets | $ | 2,227,787 | $ | 1,951,427 | $ | 1,655,711 | |||
Liabilities and Shareholders’ Equity | |||||||||
Current liabilities: | |||||||||
Accounts payable | $ | 421,229 | $ | 354,307 | $ | 277,317 | |||
Accrued expenses and other current liabilities | 183,840 | 175,074 | 134,764 | ||||||
Total current liabilities | 605,069 | 529,381 | 412,081 | ||||||
Long-term liabilities | 35,451 | 34,881 | 22,138 | ||||||
Shareholders’ equity: | |||||||||
Total shareholders’ equity | 1,587,267 | 1,387,165 | 1,221,492 | ||||||
Total liabilities and shareholders’ equity | $ | 2,227,787 | $ | 1,951,427 | $ | 1,655,711 | |||
Page 6 of 10
CDW CORPORATION AND SUBSIDIARIES
SEGMENT REPORTING INFORMATION
(in thousands)
| Three Months Ended June 30, 2007 | ||||||||||||||||
| Corporate Sector | Public Sector | Berbee | Headquarters / Other | Consolidated | ||||||||||||
Net sales | $ | 1,236,516 | $ | 643,603 | $ | 152,719 | $ | — | $ | 2,032,838 | ||||||
Income (loss) from operations | $ | 97,807 | $ | 36,185 | $ | 5,784 | $ | (16,105 | ) | $ | 123,671 | |||||
Net interest income and other expense | 5,570 | |||||||||||||||
Income before income taxes | $ | 129,241 | ||||||||||||||
Total assets | $ | 521,462 | $ | 323,215 | $ | 309,337 | $ | 1,073,773 | $ | 2,227,787 | ||||||
| Three Months Ended June 30, 2006 | ||||||||||||||||
| Corporate Sector | Public Sector | Berbee | Headquarters / Other | Consolidated | ||||||||||||
Net sales | $ | 1,111,879 | $ | 521,579 | $ | — | $ | — | $ | 1,633,458 | ||||||
Income (loss) from operations | $ | 88,896 | $ | 28,950 | $ | — | $ | (10,008 | ) | $ | 107,838 | |||||
Net interest income and other expense | 5,398 | |||||||||||||||
Income before income taxes | $ | 113,236 | ||||||||||||||
Total assets | $ | 596,065 | $ | 250,747 | $ | — | $ | 808,899 | $ | 1,655,711 | ||||||
Page 7 of 10
CDW CORPORATION AND SUBSIDIARIES
SEGMENT REPORTING INFORMATION
(in thousands)
| Six Months Ended June 30, 2007 | ||||||||||||||||
| Corporate Sector | Public Sector | Berbee | Headquarters / Other | Consolidated | ||||||||||||
Net sales | $ | 2,455,557 | $ | 1,140,999 | $ | 295,400 | $ | — | $ | 3,891,956 | ||||||
Income (loss) from operations | $ | 195,043 | $ | 61,408 | $ | 10,988 | $ | (25,813 | ) | $ | 241,626 | |||||
Net interest income and other expense | 9,529 | |||||||||||||||
Income before income taxes | $ | 251,155 | ||||||||||||||
Total assets | $ | 521,462 | $ | 323,215 | $ | 309,337 | $ | 1,073,773 | $ | 2,227,787 | ||||||
| Six Months Ended June 30, 2006 | ||||||||||||||||
| Corporate Sector | Public Sector | Berbee | Headquarters / Other | Consolidated | ||||||||||||
Net sales | $ | 2,262,063 | $ | 960,024 | $ | — | $ | — | $ | 3,222,087 | ||||||
Income (loss) from operations | $ | 178,194 | $ | 43,653 | $ | — | $ | (19,763 | ) | $ | 202,084 | |||||
Net interest income and other expense | 9,643 | |||||||||||||||
Income before income taxes | $ | 211,727 | ||||||||||||||
Total assets | $ | 596,065 | $ | 250,747 | $ | — | $ | 808,899 | $ | 1,655,711 | ||||||
Page 8 of 10
CDW CORPORATION AND SUBSIDIARIES
OPERATING DATA
| Three Months Ended June 30, | Six Months Ended June 30, | |||||||||||
| 2007 | 2006 | 2007 | 2006 | |||||||||
Direct web sales (000’s) | $ | 588,872 | $ | 493,522 | $ | 1,139,716 | $ | 994,489 | ||||
Sales force, end of period (1) | 2,722 | 2,179 | 2,722 | 2,179 | ||||||||
Annualized inventory turnover | 26 | 23 | 26 | 23 | ||||||||
Accounts receivable - days sales outstanding | 41 | 38 | 42 | 39 | ||||||||
| (1) | Sales force at June 30, 2007 includes 187 Berbee sales force coworkers. |
Page 9 of 10
CDW CORPORATION AND SUBSIDIARIES
RECONCILIATION OF GAAP TO NON-GAAP FINANCIAL MEASURES
(in thousands, except per share data)
| Three Months Ended June 30, 2007 | Six Months Ended June 30, 2007 | |||||||
Selling and administrative expenses | ||||||||
GAAP selling and administrative expenses | $ | 172,117 | $ | 326,302 | ||||
Adjusted for: | ||||||||
Merger-related costs | (7,970 | ) | (7,970 | ) | ||||
Non-GAAP selling and administrative expenses | $ | 164,147 | $ | 318,332 | ||||
Selling and administrative expenses as a percentage of net sales | ||||||||
GAAP selling and administrative expenses as a percentage of net sales | 8.5 | % | 8.4 | % | ||||
Adjusted for: | ||||||||
Merger-related costs | (0.4 | )% | (0.2 | )% | ||||
Non-GAAP selling and administrative expenses as a percentage of net sales | 8.1 | % | 8.2 | % | ||||
Income from operations | ||||||||
GAAP income from operations | $ | 123,671 | $ | 241,626 | ||||
Adjusted for: | ||||||||
Merger-related costs | 7,970 | 7,970 | ||||||
Non-GAAP income from operations | $ | 131,641 | $ | 249,596 | ||||
Income from operations as a percentage of net sales | ||||||||
GAAP income from operations as a percentage of net sales | 6.1 | % | 6.2 | % | ||||
Adjusted for: | ||||||||
Merger-related costs | 0.4 | % | 0.2 | % | ||||
Non-GAAP income from operations as a percentage of net sales | 6.5 | % | 6.4 | % | ||||
Net income | ||||||||
GAAP net income | $ | 80,091 | $ | 156,871 | ||||
Adjusted for: | ||||||||
Merger-related costs, net of income tax | 4,941 | 4,941 | ||||||
Non-GAAP net income | $ | 85,032 | $ | 161,812 | ||||
Diluted earnings per share | ||||||||
GAAP diluted earnings per share | $ | 0.99 | $ | 1.95 | ||||
Adjusted for: | ||||||||
Merger-related costs, net of income tax | 0.06 | 0.06 | ||||||
Non-GAAP diluted earnings per share | $ | 1.05 | $ | 2.01 | ||||
Page 10 of 10
| CDW IR Calls | Second Quarter 2007 Earnings |
Second Quarter 2007 Earnings
CDW IR Calls
18418974
John Edwardson
July 24, 2007
7:30 am Central Time
Operator: | Good morning ladies and gentlemen and welcome to the Second Quarter 2007 Earnings Conference Call. At this time all participants are in a listen-only mode. Please note that this conference is being recorded. I will now turn this call over to Mr. John Edwardson. Mr. Edwardson, you may begin. |
John Edwardson: | Thank you and good morning to all of you on the call and thank you for joining us to discuss CDW’s Second Quarter of 2007 Results. With me here in the room today are Jim Shanks, Executive Vice President; Harry Harczak, Executive Vice President; Barb Klein, Senior Vice President and Chief Financial Officer; and, of course, Cindy Klimstra, Vice President of Investor Relations. As usual, before we begin, Barb will present the Company’s Safe Harbor Disclosure Statement. Barb… |
Barbara Klein: | Thank you John and good morning. Any statements made by management in this conference call which are forward-looking, that is not historical in nature, are made pursuant to the save harbor provisions of the Private Securities Litigation Reform Act of 1995. Please be cautioned that such forward-looking statements involve risks and uncertainties and are based on the Company’s current expectations. Actual results could differ materially from such expectations. Certain risks, uncertainties, and other factors affecting the company’s business are contained in its filing with the SEC and are discussed in this conference call. Also, if you are listening to a playback of this conference call, please be advised |
| July 24, 2007, 7:30 am Central Time | Page 1 |
| CDW IR Calls | Second Quarter 2007 Earnings |
that our statements on this conference call are made as of the date of the call, are subject to future events, and should not be considered to represent the expectations of management other than as of the date of this call. Our press release and slides for today’s call are posted on the Investor Relations page of our website at cdw.com. Supporting materials on the Investor Relations page are under the heading entitled Webcast. In connection with the merger agreement relating to the proposed acquisition of CDW by an affiliate of Madison Dearborn Partners LLC and Providence Equity Partners Incorporated, we have filed a definitive proxy statement with the Securities and Exchange Commission and the proxy statement has been mailed to shareholders of record of the Company as of July 5, 2007. Before making any voting decisions, shareholders are urged to carefully read the proxy statement regarding the merger in its entirety because it will contain important information about the proposed merger. A copy of this transcript is being filed with the SEC as proxy listing materials relating to the Meeting of Shareholders to consider the merger agreement and additional information can be found in the definitive proxy statement filed with the SEC relating to that proposed transaction. |
So with that, let me turn it back to John. |
John Edwardson: | Thank you Barb. As Barb mentioned, and as most of you on the call probably know, we previously announced a merger agreement that provides for the acquisition of CDW by an affiliate of Madison Dearborn Partners and Providence Equity Partners. To summarize, upon closing of the merger, CDW will be controlled by investment funds affiliated with Madison Dearborn Partners, LLC and Providence Equity Partners Inc. We will be holding a special meeting of our shareholders on August 9th, 2007, to vote on the merger agreement and we filed |
| July 24, 2007, 7:30 am Central Time | Page 2 |
| CDW IR Calls | Second Quarter 2007 Earnings |
our definitive proxy statement with the SEC on July 13, 2007. Since we are in a proxy solicitation period relating to the pending merger transaction, we will not be holding a Q&A session on our call today. Details of the transaction can be found in the proxy statement. We currently expect to complete the merger in the second half of the third quarter or early in the fourth quarter of 2007. |
With that, please turn to Slide 5 of the webcast presentation that compares our financial results for the second quarter of 2007 to the second quarter of 2006. Thanks to our CDW coworkers’ efforts, we achieved record quarterly revenue, gross profit, operating income, net income, and diluted earnings per share in the second quarter of 2007. Total revenue increased 24.4% to $2.03 billion and includes approximately $153 million from Berbee. Excluding Berbee, and therefore on a non-GAAP basis, total revenue was $1.88 billion, an increase of 15.1% compared to the prior year period. Gross profit increased 24.2% to $328 million and gross profit margin was 16.1% of revenue. I’d like to mention that during the second quarter of 2007, we incurred costs related to our pending merger of $8.0 million pre-tax and $4.9 million after-tax. Our press release includes a reconciliation of GAAP to non-GAAP measures. Operating income increased 14.7% to $124 million and operating margin was 6.1% of revenue. Non-GAAP operating income, which excludes merger-related costs of $8 million per-tax and is explained in our press release, increased 22.1% to $132 million and non-GAAP operating margin was 6.5% of revenue. Net income increased 9.5% to $80 million. Net income on a non-GAAP basis, which once again excludes merger-related costs of $4.9 million after-tax and is explained in our press release, increased 16.3% to $85 million. Diluted earnings per share were $0.99 compared to $0.91 last year, representing an 8.8% increase. Diluted earnings per share on a non-GAAP basis, which excludes merger-related costs |
| July 24, 2007, 7:30 am Central Time | Page 3 |
| CDW IR Calls | Second Quarter 2007 Earnings |
of $8 million pre-tax and $4.9 million after-tax and, once again, as explained in our press release, were $1.05, which represented a 15.4% increase compared to last year. Our performance this quarter represents the continued execution of our existing strategies. We continue to remain focused on growing our revenue profitability and optimizing margins and keeping SG&A costs under control. Annualized revenue per coworker declined to $1.41 million in the second quarter of 2007 from $1.49 million in the second quarter of 2006. Annualized gross profit per coworker also declined to $228,000 in the second quarter of 2007 from $240,000 in the second quarter of 2006. The decrease in these metrics is primarily due to the increased number of sales force coworkers over the past three quarters and the fact that Berbee has less revenue per coworker. |
Slide 6 shows a return on equity and return on invested capital. In the second quarter of 2007, we achieved return on equity of 20.7% and return on invested capital of 31.4% including Berbee. Barb will give you more detail on these metrics later in her presentation. Berbee had solid performance this quarter as demand for unified communication solutions among Berbee customers remain strong. In addition, Berbee experience continues strength in its server and storage business. Due to its more project-oriented business model, Berbee’s growth rate can be more variable compared to our corporate and public sectors. Once again, I’d like to recognize the outstanding efforts of all of our CDW and Berbee coworkers. Thank you for remaining focused on providing unmatched service to our customers and helping them identify the right technology to enhance their business performance. |
| July 24, 2007, 7:30 am Central Time | Page 4 |
| CDW IR Calls | Second Quarter 2007 Earnings |
Jim Shanks will now discuss revenue results and sales force related items. Harry Harczak will review product trends and Barb Klein will give you more financial information later in the presentation. |
James Shanks: | Thank you John. In the second quarter of 2007, total corporate sector segment sales were $1.237 billion, representing an 11.2% increase over last year. Average daily sales in the second quarter of 2007 were $19.321 million compared to $17.373 million in the second quarter of 2006, which was also an increase of 11.2%. On an average daily sales basis, the corporate sector increased 12.3% in April, 10.5% in May, and 11.1% in June. The public sector segment generated total sales of $400, of excuse me, $643.6 million in the second quarter of 2007, which was a 23.4% increase from the second quarter of 2006. Average daily sales were $10.056 million in the second quarter of 2007 compared to $8.150 million in the second quarter of 2006, also representing a 23.4% increase from the prior year. On an average daily sales basis, the public sector grew 19.0% in April, 26.9% in May, and 25.1% in June. In the second quarter of 2007, all customer channels within the public sector had profitable double-digit sales growth, including federal government, state and local government, education, and healthcare. On June 30, 2007, our sales force, including Berbee, numbered 2,722 coworkers. This compares to 2,589 sales coworkers in December, on December 31, 2006, including Berbee, and 2,179 sales coworkers on June 30, 2006. Nearly 350 advanced technology specialists are included in the sales force for the second quarter of 2007 and we are on track to reach our goal of adding approximately 350 to 400 net new sales force coworkers in 2007. |
| July 24, 2007, 7:30 am Central Time | Page 5 |
| CDW IR Calls | Second Quarter 2007 Earnings |
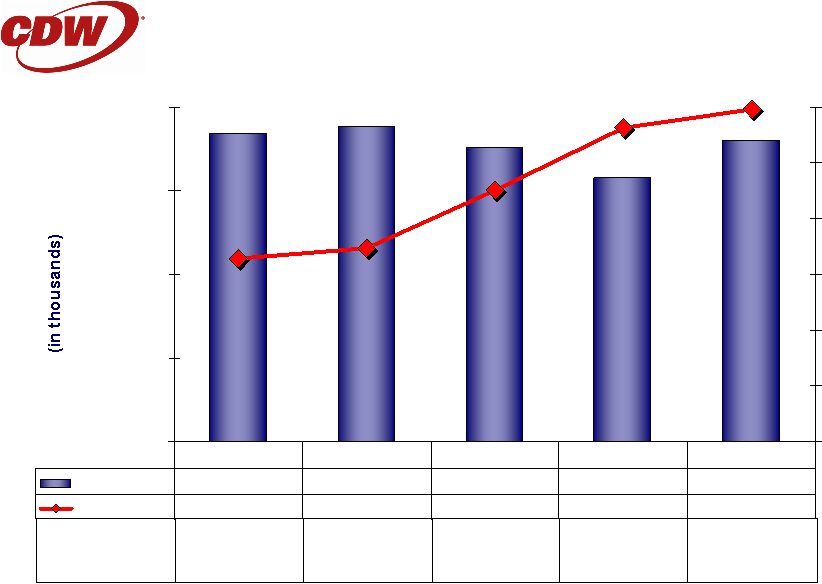
Turning to Slide 7, we show average daily sales per average sales force coworker, which includes Berbee. For the second quarter of 2007, average daily sales per average sales force coworker were approximately $11,800 compared to approximately $11,900 for the second quarter of 2006. |
Slide 8 shows gross profit dollars on an average daily basis including Berbee. Average daily gross profit dollars per average sales force coworker were approximately $1,900 for the second quarter of 2007 compared to approximately $1,920 for the second quarter of 2006. In the second quarter of 2007, the percentage of sales force turnover based on a trailing 12 months was in the low 20s compared to the mid 20s one-year ago. |
Slide 9 shows that the Web generated approximately $589 million in direct online sales for the second quarter of 2007, representing a 19.3% increase compared to the same period a year ago. Online sales in the second quarter of 2007 comprised 31.3% of total sales, excluding Berbee. Berbee sales are not generated on the Web due to the high service component of these sales. |
Harry will now comment on product trends. |
Harry Harczak: | Thank you Jim and good morning. Turning to Slide 10, we compare our product mix for the second quarter of 2007 to our product mix for the second quarter of 2006. As a reminder, our second quarter of 2007 product sales include Berbee product sales, which primarily impact the NetComm, Server, and data storage categories. In the second quarter of 2007, NetComm slightly exceeded software to become our largest product category comprising 16.1% of sales. Software |
| July 24, 2007, 7:30 am Central Time | Page 6 |
| CDW IR Calls | Second Quarter 2007 Earnings |
was second at 15.6%, desktop and servers was third at 13.9%, data storage fourth at 13%, and notebook and accessories was fifth at 12.4%. |
Slide 11 shows product category growth rates. Sales growth for NetComm products was 92.1%. Berbee contributed significantly to the NetComm category growth rate due to its focus on Cisco Advanced technologies in Voice over IP, security, and wireless. CDW sales of NetComm products, excluding Berbee, also had significant double-digit growth. Growth was driven by sales of networking switches, security hardware, and network routers, which accelerated in the second quarter of 2007 due to the Cisco Gold authorization we received in the first quarter of 2007 for the corporate sector. We now have Cisco Gold authorization for all three operating segments, which allows us to offer a broad array of Cisco products to all CDW customers, including Voice over IP and certain high end routers and switches. While not significant in terms of total sales dollars, telephony sales, which are included in the NetComm category, exhibited strong growth in the second quarter due to the Cisco Gold authorization, as well as leveraging our specialist team. Sales of the combined category of desktop and servers, which include Berbee server sales, increased 27.3% in the second quarter of 2007 compared to the prior year period. While the inclusion of Berbee server sales added significantly to the categories growth, both CDW server and CDW desktop sales, excluding Berbee, had double-digit growth. Sales of data storage devices increased 19.8% and include Berbee sales. Customers continue to store larger amounts of data, protect against threats of data loss, comply with increasing government legislation, and increase their access in secure stored data. Great adoption of disk space storage versus tape has also continued. The combined notebooks and accessories product category increased 15.9% driven by strong notebook sales which represent most |
| July 24, 2007, 7:30 am Central Time | Page 7 |
| CDW IR Calls | Second Quarter 2007 Earnings |
of the category. Software sales, which include Berbee, increased 13.2% versus the prior year period. Key growth drivers were desktop publishing graphics, network communication driven by virtualization and security software. We also had strong sales of Microsoft Enterprise agreements for which we receive a commission but do not include as revenue in the software category. We did not see significant adoption of Microsoft Vista by our customers in the second quarter of 2007. In May of 2007, we released the results of our second Microsoft Windows Vista Tracking Poll. We found the majority of survey respondents are not using or evaluating Windows Vista at this time. However, those who are testing and evaluating Windows Vista, the majority plan to implement Windows Vista within the next 12 months. CDW plans to conduct a third round of the survey later in 2007. In the meantime, we’ll continue to promote Vista and educate our customers as they prepare their adoption plans. Sales of video products increased 8.8%. While we experienced strong double-digit unit growth in the category, average selling prices continue to decline significantly. Products experiencing the strongest demand included medical displays, larger screen desktop displays, specifically in the 20-inch to 29-inch category, touch screen displays and video accessories such as video cards. Demand continues to increase for wide desktop LCD monitors that support Vista’s wide format, wide monitor format. This trend has also increased sales of video cards and memory updates, upgrades to support the wide video format. Projectors or related accessories grew at double-digit rates due to strength in the education segment. Sales of memory products rose 6.9%. Customers continue to add high performance memory products to desktops and notebooks to maximize their systems. The category is also being driven by customers adopting virtualization software and database applications in seeking to increase performance on dual and quad core systems. Memory products play a key role in our efforts to attach |
| July 24, 2007, 7:30 am Central Time | Page 8 |
| CDW IR Calls | Second Quarter 2007 Earnings |
products to anchor product categories. Sales of input devices grew 6.5%. The category continues to be driven by bar code scanners for point of sale and warehouse applications. Printer sales increased 1.3%. While ongoing customer migration to multifunction and laser printers drove unit growth, average selling prices continued to decline. We’re seeing steady growth in the thermal printing area as we target point of sale and warehouse solutions for our customers. We remain focused on our customer penetration program that targets existing customers who have not purchased printers from us before and are working closely with our partners as they launch new products and work to accelerate the category. |
Slide 12 shows the change in revenue, unit volume, and average selling prices for notebooks CPUs and desktop and server CPUs, excluding Berbee sales. Notebook CPU sales increased 17.9% and unit volume was up 20.2%, while the average selling price decreased slightly by 1.9% from a year ago. Sales were strong for most of our top brands and we continue to experience solid demand based primarily on the replacement of desktops with notebooks. As the price differential between desktops and notebooks has stabilized, we focused on up selling customers more feature-rich products such as ruggedized notebooks. Sales of PC tablets also supported the category’s results. Our focus on customer penetration continues, which emphasizes selling notebooks to existing customers who have not previously purchased notebooks from us. Sales from desktop computers and servers, excluding Berbee, grew 19.5% while unit volume increased 13.9%. The average selling price increased 5% from the prior period. We had double-digit sales growth in the server category, which reflected customers’ continued option of blade servers and multi-core servers. Customers continue to consolidate and use virtualization technology as a business solution |
| July 24, 2007, 7:30 am Central Time | Page 9 |
| CDW IR Calls | Second Quarter 2007 Earnings |
to improve efficiency and productivity. Desktop sales also produced double-digit results this quarter. The product mix continued to shift towards higher end workstations with dual core processors, added memory, and upgraded video cards which help to offset the continued decline of average selling prices of desktops. We continue to promote our Customer Penetration Program, which is a primary contributor to our success in the desktop category. |
Barb Klein will now review our financial results. |
Barbara Klein: | Thank you Harry. As John stated, in the second quarter of 2007, we set new quarterly records for sales, gross profit, operating income, net income, and diluted earnings per share. Gross profit margin was 16.1% of sales in the second quarter of 2007 compared to 16.2% of sales in the second quarter of 2006 and within our stated objective range of 15.5% to 16.2%. Gross profit margin was 16.2% in the first quarter of 2007. Slide 13 shows our operating statistics. Selling and administrate expenses as a percentage of sales were 8.5% in the second quarter of 2007 compared to 7.7% in the second quarter of 2006 and increased $45.9 million. The increase in selling and administrative expenses in the second quarter of 2007 was primarily due to the inclusion of Berbee’s operating expenses, increased payroll costs as a result of continued investment in expanding CDW’s sales force, and cost related to the previously announced merger agreement. Selling and administrative expenses in the second quarter of 2007 included approximately $8 million pre-tax of merger-related costs. Excluding these merger-elated costs, and therefore on a non-GAAP basis, selling and administrative expenses were 8.1% of sales in the second quarter of 2007. Selling and administrative expenses were 8.3% in the first quarter of 2007. Advertising expense was $32.2 million or 1.6% of sales in |
| July 24, 2007, 7:30 am Central Time | Page 10 |
| CDW IR Calls | Second Quarter 2007 Earnings |
the second quarter of 2007 compared to $30 million or 1.8% of sales in the second quarter of 2006. Operating margin was 6.1% in the second quarter of 2007 compared to 6.6% in the second quarter of 2006. Excluding merger-related costs of $8 million pre-tax, and therefore on a non-GAAP basis, operating margin was 6.5% in the second quarter of 2007. Our stated objective for operating margin is a range of 6% to 6.4%, so excluding the merger-related costs, the operating margin was slightly better than the objective range in the second quarter of 2007. We achieved solid revenue and profitability this quarter. Corporate sector revenue growth improved, gross margin was solid, and selling general and administrative expenses were well controlled. While we continue to expect to add a net new 350 to 400 sales force coworkers across the sales organization in 2007, plus additional engineers for Berbee, we will continue to tightly control costs increases in other areas of the business. The effective tax rate for the second quarter of 2007 was 38.0% compared to 35.4% for the second quarter of 2006. The tax rate in the second quarter of 2006 was favorably impacted by a benefit of $2.3 million related to the resolution of an audit of the Company’s 2003 federal income tax return which did not repeat in the second quarter of 2007. Due to our Board’s consideration of strategic alternatives, as detailed in the proxy statement related to the shareholder meeting to be held with respect to the merger agreement, we did not repurchase any shares of Company stock in the second quarter of 2007. Berbee was $0.03 per share accretive to the second quarter of 2007 diluted earnings per share net of lower interest income as a result of the purchase. |
Turning to the balance sheet, inventory turns on an annualized basis were 26 times in the second quarter of 2007 compared to 23 times in the second quarter of 2006. Berbee positively impacted inventory turnover in the second quarter of |
| July 24, 2007, 7:30 am Central Time | Page 11 |
| CDW IR Calls | Second Quarter 2007 Earnings |
2007 by approximately 1.5 days. Berbee has a predominately drop ship model due to the types of product it sells, yet Berbee’s impact to inventory turns can potentially have a greater degree of variability from quarter-to-quarter; therefore, our inventory turn objective remains at 23 to 24 turns on an annualized basis. Accounts receivable days sales outstanding were 41 days at the end of the second quarter of 2007 compared to 38 days at the end of the second quarter of 2006. Berbee impacted the metric by approximately 1 day because its billing and delivery of projects is spread out over a longer period of time compared to CDW’s more transactional business. Our DSO target is a range of 40 to 42 days including Berbee. As of June 30, 2007, our cash, cash equivalents, and marketable securities totaled approximately $580 million. In the second quarter of 2007, cash flow from operations was approximately $195 million and capital expenditures were approximately $26 million. We expect capital expenditures to be in the range of $55 million to $60 million in 2007. John mentioned that in the second quarter of 2007, we achieved return on equity of 20.7% and return on invested capital of 31.4%, including Berbee, which is shown in Slide 6. Both ROE and ROIC are calculated on a trailing four quarters basis. The addition of Berbee and our purchase of the Western Distribution Center in the fourth quarter of 2006, increased the average total assets while decreasing cash, which resulted in a lower ROIC for the fourth quarter of 2006, the first quarter of 2007, and the second quarter of 2007 as compared to previous quarters. |
Turning to segment results, corporate sector sales increased 11.2% and operating income increased 10% in the second quarter of 2007 compared to the prior year period. Operating income for the corporate sector increased primarily due to revenue growth and an increase in gross margin, which was partially offset by investment and selling resources. Corporate sector operating margin |
| July 24, 2007, 7:30 am Central Time | Page 12 |
| CDW IR Calls | Second Quarter 2007 Earnings |
was 7.9% in the second quarter of 2007 compared to 8% in the second quarter of 2006 and 8% in the first quarter of 2007. Public sector sales increased 23.4% and operating income increased to 25% in the second quarter of 2007 compared to the prior year period. Operating income for the public sector increased primarily due to revenue growth. Public sector operating margin was 5.6% in both the second quarter of 2007 and the second quarter of 2006 and was 5.1% in the first quarter of 2007. While we did not own Berbee prior to October 11, 2006, we are providing Berbee sales growth for comparative purposes, which was 50.1% in the second quarter of 2007 versus the prior year period. Berbee’s operating margin was 3.8% in the second quarter of 2006 and 3.6% in the first quarter, sorry, 3.8% in the second quarter of 2007 and 3.6% in the first quarter of 2007. As a reminder, Berbee’s operating margin is lower than the other segments due to the higher proportion of services in its business. Berbee’s operating income also includes amortization expense related to intangible assets. |
Thank you for your attention and I will now turn the call back to John. |
John Edwardson: | Thank you Barb. In closing, a big thank you goes out to all of our coworkers for their very hard work in providing unmatched customer service to each customer of CDW every day. Nobody does it better than you, our coworkers. |
As we stated earlier today, there will be no Q&A session and this could be, or as this could be, our last earnings call as a public company, I want to thank all of you for your confidence in and your support of CDW over the years, and, of course, for your business if you are customer. If you are not a customer, and I’ll always close with this, let our coworkers demonstrate their commitment to providing you the best customer service in the business. Call us at 1-800-800- |
| July 24, 2007, 7:30 am Central Time | Page 13 |
| CDW IR Calls | Second Quarter 2007 Earnings |
4CDW or visit us on our website at cdw.com. Thank you very much. That concludes the phone call for all of us and for Harry Harczak, his 53rd consecutive quarterly phone call to report great earnings to all of you. Thanks to all the CDW team for another great quarter. |
Operator: | Thank you ladies and gentlemen. This concludes today’s conference. Thank you for participating. You may all disconnect. |
| Please Note: | * Proper names/organizations spelling not verified. |
| [sic] Verbatim, might need confirmation. |
| July 24, 2007, 7:30 am Central Time | Page 14 |
 CDW Corporation: Second Quarter of 2007 Earnings Webcast |
 2 Safe Harbor Any statements made by management in this presentation which are forward-looking (that is, not historical in nature), are made pursuant to the safe harbor provisions of the Private Securities Litigation Reform Act of 1995. Such forward-looking statements involve risks and uncertainties and are based on the Company’s current expectations; actual results could differ materially from expectations. Such risks and uncertainties include: • Failure to obtain shareholder approval of the merger agreement or the failure to satisfy other closing conditions, including regulatory approvals, with respect to the proposed merger. • Failure of Parent to obtain the necessary financing arrangements to pay the aggregate merger consideration. • The occurrence of any event, change or other circumstance that could give rise to the termination of the merger agreement. • The failure of the proposed merger to close for any other reason. • The amount of the costs, fees, expenses and charges relating to the merger and the actual terms of financings that will need to be obtained for the merger. • The impact of substantial indebtedness that will need to be incurred to finance the consummation of the merger. • Changes in the economic environment. • Changes in the capital and technology spending patterns of existing and prospective customers. • The ability to add new customers and further penetrate our existing customer base. • The ability to hire and retain qualified account managers and sales force coworkers. • The ability to maintain or increase the productivity of our sales force. Continued… |
 3 Safe Harbor (continued) • Continued availability of products from vendors as well as the development by vendors of new technologies and products. • Continuation of key vendor relationships and support programs. • The ability to optimize our product mix and pricing strategies. • The ability to effectively manage operating costs. • Increased competition and pricing pressures. • Commercial delivery services. • Continuing development, maintenance and operation of our information technology systems. • Inventory risk. • Regulations governing sales to public sector customers. • Acquisitions and alliances. • Natural disasters or other adverse occurrences affecting our facilities or data centers. • Litigation risk. • Risks of a global market and uncertain geopolitical conditions. Certain risks, uncertainties and other factors affecting the company’s business are contained in its filings with the Securities and Exchange Commission. The Company assumes no obligation to update any of the information set forth herein, whether as a result of new information, future events or otherwise. Such risks and uncertainties include (continued): |
 4 Where You Can Find Additional Information In connection with the proposed merger between CDW and a subsidiary of VH Holdings, Inc., CDW filed with the SEC, and has furnished to its shareholders, a definitive proxy statement soliciting proxies for the meeting of its shareholders to be held with respect to the Merger on August 9, 2007. CDW SHAREHOLDERS ARE ADVISED TO READ THE PROXY STATEMENT CAREFULLY BECAUSE IT CONTAINS IMPORTANT INFORMATION. CDW shareholders and other interested parties can obtain, without charge, a copy of the proxy statement and other relevant documents filed with the SEC from the SEC’s website at http://www.sec.gov. CDW shareholders and other interested parties can also obtain, without charge, a copy of the proxy statement and other relevant documents by directing a request by mail or telephone to CDW Corporation, 200 N. Milwaukee Ave., Vernon Hills, Illinois 60061, Attention: Corporate Secretary, telephone: (847) 465- 6000, or from CDW’s website, http://www.cdw.com. CDW and certain of its directors, executive officers and other members of management and employees may, under SEC rules, be deemed to be “participants” in the solicitation of proxies from shareholders of CDW with respect to the proposed transaction. Information regarding the persons who may be considered “participants” in the solicitation of proxies is set forth in the definitive proxy statement described above. Statements about the expected timing, completion and effects of the proposed merger between CDW and a subsidiary of VH Holdings, Inc. and all other statements in this filing other than historical facts, constitute forward-looking statements within the meaning of the safe harbor provisions of the Private Securities Litigation Reform Act of 1995. Readers are cautioned not to place undue reliance on these forward-looking statements, each of which is qualified in its entirety by reference to the following cautionary statements. Forward-looking statements speak only as of the date hereof and are based on current expectations and involve a number of assumptions, risks and uncertainties that could cause actual results to differ materially from those projected in the forward-looking statements. CDW may not be able to complete the proposed merger because of a number of factors, including, among other things, the failure to obtain shareholder approval, the failure of financing or the failure to satisfy other closing conditions. Other risks and uncertainties that may affect forward-looking statements are described in the reports filed by CDW with the SEC under the Securities Exchange Act of 1934, as amended, including without limitation CDW’s Annual Report on Form 10-K for the year ended December 31, 2006, and the definitive proxy statement dated July 13, 2007, relating to the special meeting of shareholders to be held to vote on the merger agreement. |
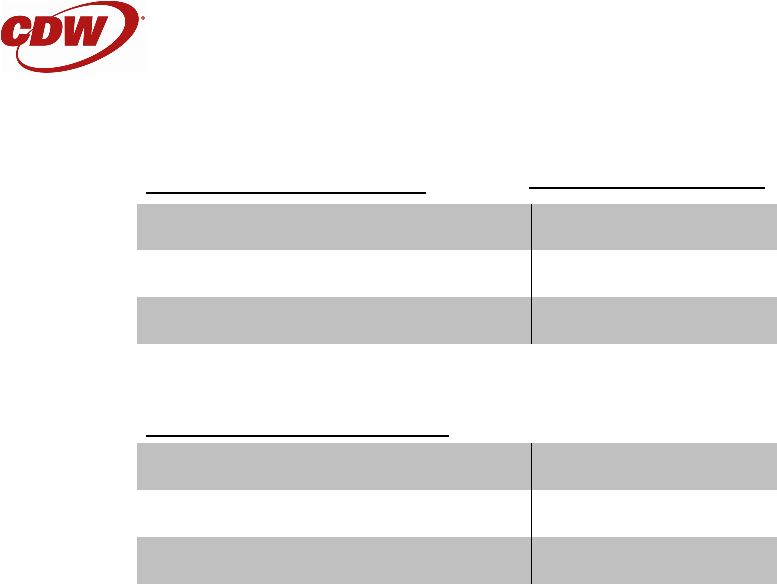
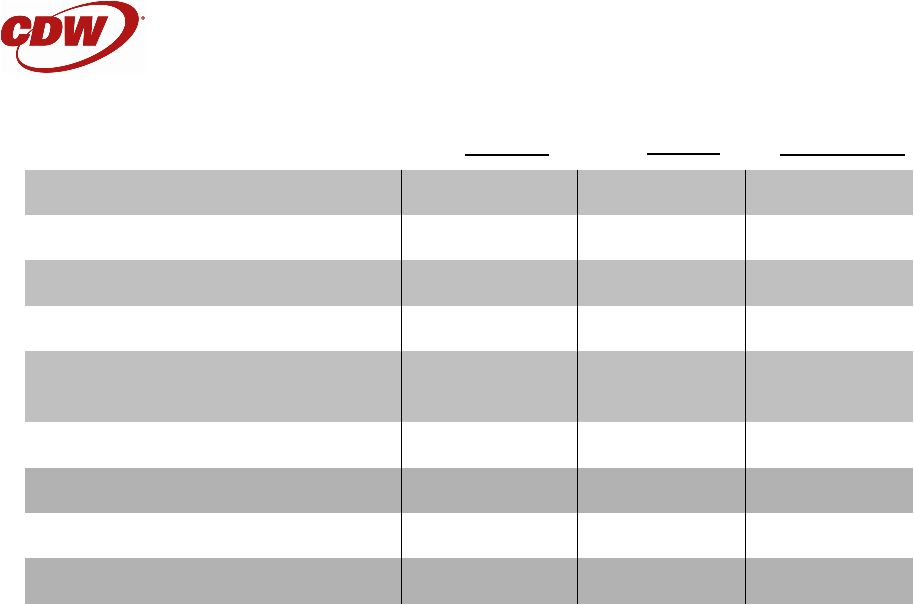 5 Summarized Financial Results ($ in 000’s except EPS) Q2’07* Q2’06 % change 8.8% $0.91 $0.99 Diluted Earnings per Share 9.5% $73,111 $80,091 Net Income -50 bp 6.6% 6.1% Operating Margin 14.7% $107,838 $123,671 Income from Operations 30.8% $156,199 $204,316 Total S&A (includes advertising) -10 bp 16.2% 16.1% Gross Profit Margin 24.2% $264,037 $327,987 Gross Profit 24.4% $25,523 $31,763 Average Daily Sales 24.4% $1,633,458 $2,032,838 Net Sales * Includes $8.0 million pre-tax ($4.9 million after-tax) of costs associated with the previously announced merger agreement providing for the acquisition of CDW by VH Holdings, Inc., which upon closing of the merger will be controlled by investment funds affiliated with Madison Dearborn Partners, LLC and Providence Equity Partners Inc. |
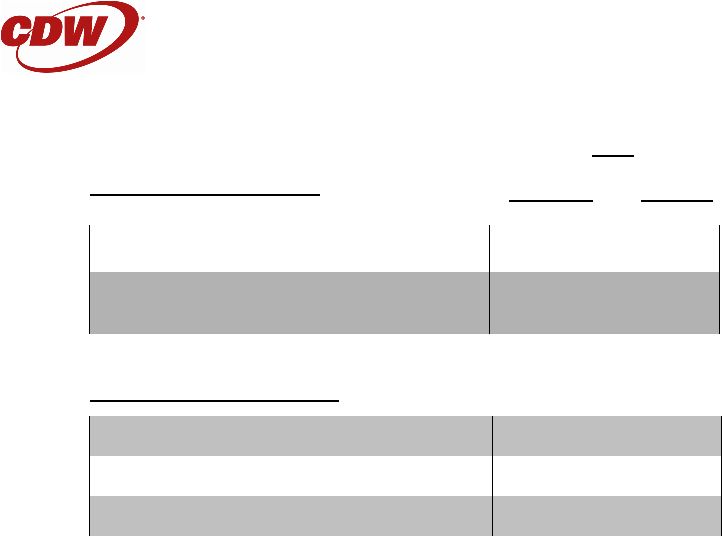
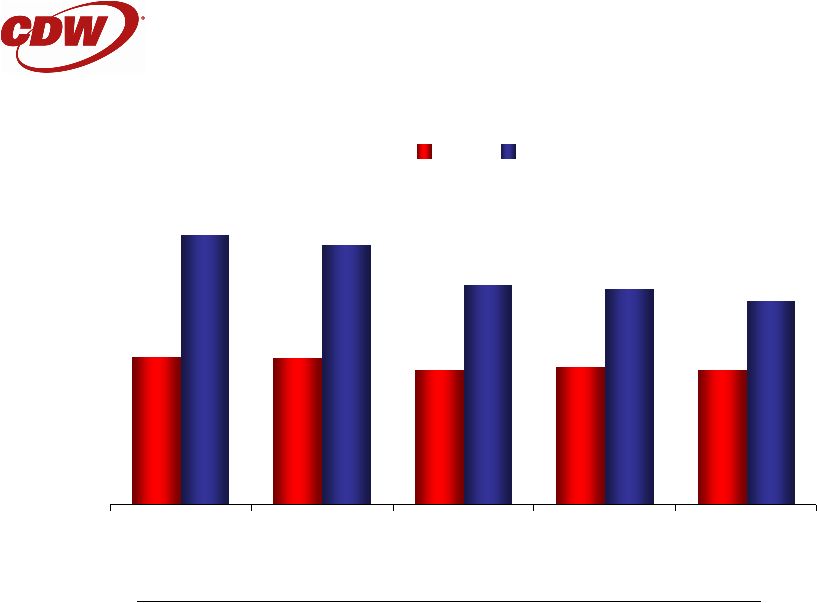 6 Return on Equity and Return on Invested Capital ^ROIC calculated as: Trailing 4 quarters income from operations x (1 – Tax Rate) 5-point quarter average of (Total Assets – Cash – Marketable Securities – Total Liabilities) 20.7% 21.2% 20.7% 22.6% 22.8% 31.4% 33.3% 33.9% 40.0% 41.6% Q2'06 Q3'06 Q4'06* Q1'07* Q2'07* ROE ROIC^ * Includes Berbee from date of acquisition |
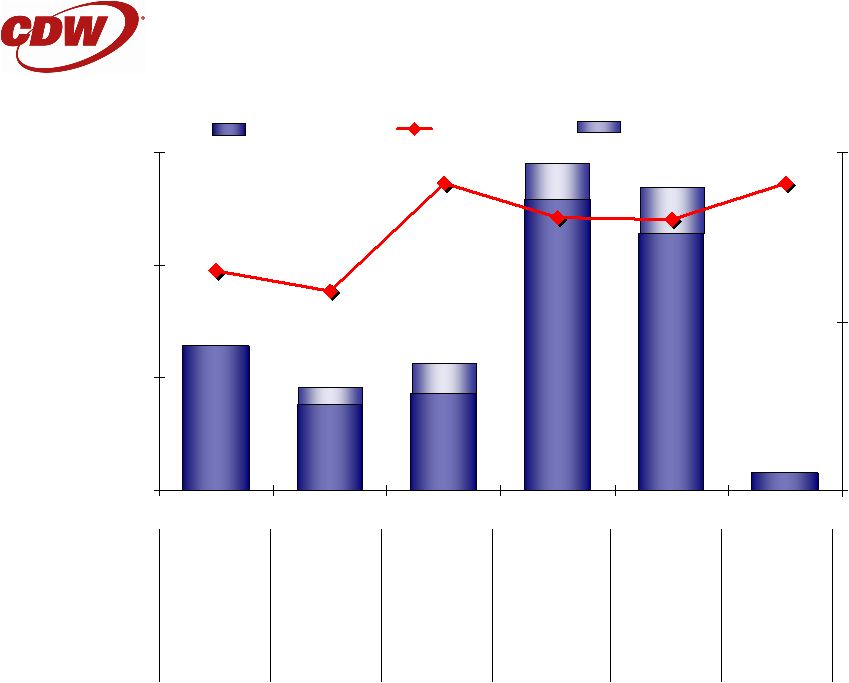
 7 $5 $8 $11 $14 1,500 1,700 1,900 2,100 2,300 2,500 2,700 ADS /ASF (1) $11.9 $12.6 $12.1 $11.1 $11.8 ASF (2) 2,154 2,195 2,400 2,626 2,692 Q2'06 Q3'06 Q4'06 (3) Q1'07 (3) Q2'07 (3) Average Daily Sales per Average Sales Force Coworker ADS: Average Daily Sales (in millions) $25.523 $27.610 $28.951 $31.763 (1) Average daily sales (ADS) per average sales force (ASF) coworker (in thousands). (2) Average sales force (ASF) is calculated using a 2-point average between the previous period's ending number of sales force coworkers and the current period’s ending number of sales force coworkers. Sales force coworkers include account managers, field sales, and product specialists. (3) Includes Berbee. $29.049 |
 8 Average Daily Gross Profit per Average Sales Force Coworker $1.00 $1.25 $1.50 $1.75 $2.00 1,500 1,700 1,900 2,100 2,300 2,500 2,700 ADGP/ASF(1) $1.92 $1.94 $1.88 $1.79 $1.90 ASF (2) 2,154 2,195 2,400 2,626 2,692 Q2'06 Q3'06 Q4'06 (3) Q1'07 (3) Q2'07 (3) ADGP: Average Daily Gross Profit (in millions) $4.126 $4.252 $4.509 $4.708 (1) Average daily gross profit (ADGP) per average sales force (ASF) coworker (in thousands). (2) Average sales force (ASF) is calculated using a 2-point average between the previous period's ending number of sales force coworkers and the current period’s ending number of sales force coworkers. Sales force coworkers include account managers, field sales, and product specialists. (3) Includes Berbee. $5.125 |
 9 $0 $100 $200 $300 $400 $500 $600 $700 Q2'05 Q3'05 Q4'05 Q1'06 Q2'06 Q3'06 Q4'06 Q1'07 Q2'07 0% 5% 10% 15% 20% 25% 30% 35% Web Sales in $ millions Web Sales % to Sales Direct Web Sales (Excludes Berbee) |
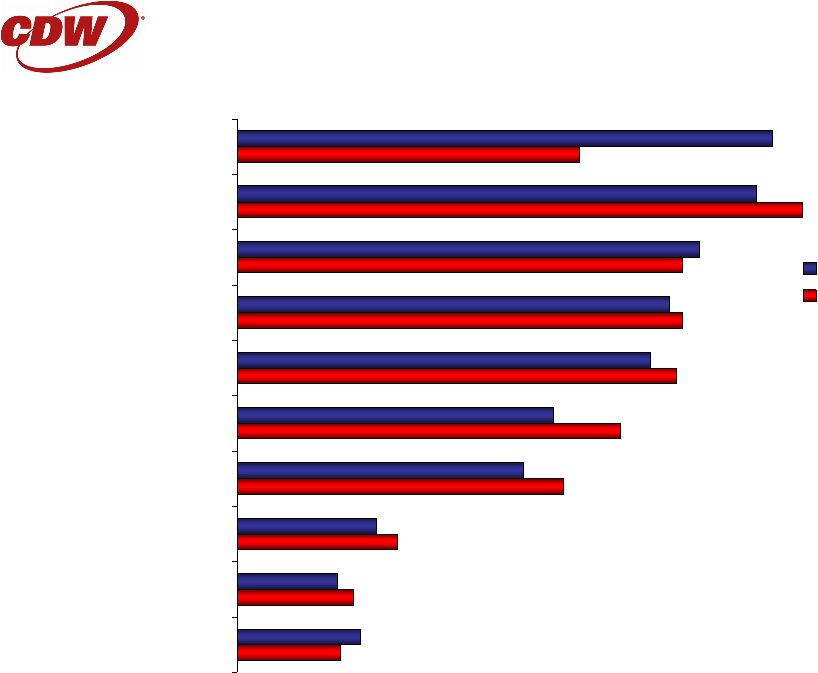 10 16.1% 15.6% 13.9% 13.0% 12.4% 9.5% 8.6% 4.2% 3.0% 3.7% NetComm Products Software Desktops & Servers Data Storage Devices Notebooks & Accessories Printers Video Memory Input Devices Other Q2'07^ Q2'06 Diversified Product Mix Percent of Product Sales* *Net sales of products by product category as a percentage of total net sales of products. Excludes items such as commission revenue or delivery charges to customers. ^Q2’07 includes Berbee |
 11 Q2’07^ vs. Q2’06 Percentage Change in Product Revenue* 6.9% Memory 8.8% Video 13.2% Software 15.9% Notebooks & Accessories 27.3% Desktops & Servers 19.8% Data Storage Devices 92.1% NetComm Products 6.5% Input Devices 1.3% Printers * Net sales of products by product category as a percentage of total net sales of products. Excludes items such as commission revenue or delivery charges to customers. ^ Includes Berbee |
 12 CPU Comparisons % change 5.0% Avg. Unit Selling Price 13.9% Unit Volume 19.5% Revenue Desktops & Servers -1.9% Avg. Unit Selling Price 20.2% Unit Volume 17.9% Revenue Notebooks (CPUs) Q2’07 vs. Q2’06 (Excludes Berbee) |
 13 Operating Data 2,179 2,722 Sales Force, end of period 7.7% 8.5% S&A^ as a % of Sales (excludes advertising) 86% 41 26 83% 38 23 % of Sales on Credit Days Sales Outstanding Inventory Turns Asset Utilization Operating Data Q2 2007* 2006 * Includes Berbee ^ Includes $8.0 million pre-tax ($4.9 million after-tax) of costs associated with the previously announced merger agreement providing for the acquisition of CDW by VH Holdings, Inc., which upon closing of the merger will be controlled by investment funds affiliated with Madison Dearborn Partners, LLC and Providence Equity Partners Inc. |
 14 Capital Returned to Shareholders (in millions) Dividend Total $63.53 $56.09 $41.20 $45.56 $63.60 $56.52 $0 $100 $200 $300 2002 2003 2004 2005 2006 2007* $0 $35 $70 Repurchases Share Cost 14.9 $924 $131 $793 80.62 0.3 $16 $0 $16 80.65 83.57 86.55 86.18 88.30 Average diluted outstanding shares 4.1 4.6 1.4 1.9 2.8 Total shares $269 $293 $116 $101 $128 Total $ returned $41 $35 $30 $25 $ 0 Dividends $228 $258 $86 $76 $128 Repurchases *First six months of 2007 |
 15 Strategies Capture greater share of customers’ spending Expand customer base Grow addressable market Optimize sales and marketing model Provide unmatched customer experience Do things, better, faster, cheaper Drive market advantage through coworkers and culture Business strategy: To be a single source provider of information technology products and services for our customers Growth strategies: |
 CDW Corporation: Second Quarter of 2007 Earnings Webcast |