Exhibit 99.2AC
ADIA—R
 EALTY TRUST—Q2 2018 SUPPLEMENTAL REPORTING INFORMATIO
Visit www.acadiarealty.com for additional investor and portfolio information
Supplemental Report – September 30, 2020 | | Company Information |
| | | | | | |
Acadia Realty Trust is a fully-integrated equity real estate investment trust, focused on the ownership, acquisition, redevelopment and management of high-quality retail properties located in key street and urban retail corridors as well as suburban locations within high-barrier-to-entry, densely-populated metropolitan areas. Acadia owns, or has an ownership interest in, these properties through its Core Portfolio and through a series of opportunistic/value-add investment funds. Additional information may be found on the Company’s website at www.acadiarealty.com. |
| |
| |
| |
| | | | | | |
| | | | | | |
Contact Information | | | | | |
| | | | | | |
| | Corporate Headquarters | | Investor Relations | | New York Stock Exchange |
| | 411 Theodore Fremd Avenue | | Amy Racanello | | Symbol AKR |
| | Suite 300 | | Senior Vice President, | | |
| | Rye, NY 10580 | | Capital Markets & Investments | | |
| | | | (914) 288-3345 | | |
| | | | aracanello@acadiarealty.com | | |
| | | | | | |
| | | | | | |
Analyst Coverage | | | | | |
| | | | | | |
| | Bank of America / Merrill Lynch | | Citigroup - Global Markets | | KeyBanc Capital Markets, Inc. |
| | Craig Schmidt - (646) 855-3640 | | Katy McConnell - (212) 816-4471 | | Todd Thomas - (917) 368-2286 |
| | craig.schmidt@baml.com | | katy.mcconnell@citi.com | | tthomas@key.com |
| | | | | | |
| | | | | | |
| | Green Street Advisors | | Compass Point Research & Trading | | J.P. Morgan Securities, Inc. |
| | Vince Tibone - (949) 640-8780 | | Floris van Dijkum - (646) 757-2621 | | Michael W. Mueller, CFA - (212) 622-6689 |
| | vtibone@greenstreetadvisors.com | | fvandijkum@compasspointllc.com | | michael.w.mueller@jpmorgan.com |
| | | | | | |
| | | | | | |
| | | | | | |
| | Jefferies | | SunTrust Bank |
| | Linda Tsai - (212) 778-8011 | | Ki Bin Kim, CFA – (212) 303-4124 | | |
| | ltsai@jefferies.com | | kibin.kim@suntrust.com | | |
| | | | | | |

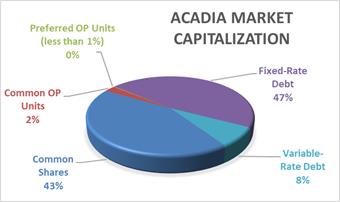
| Market Capitalization |
Supplemental Report – September 30, 2020 | (Including pro-rata share of Fund debt, in thousands) |
| | | | | | | | | | | | | | Changes in Total Outstanding Common | | | Weighted Average | |
| | Total Market | | | | | | | Capitalization | | | Shares and OP Units (in thousands) | | | Diluted EPS | | | FFO | |
| | Capitalization ($) | | | % | | | Based on Net Debt 1 | | | | | Common Shares | | | Common OP Units | | | Total | | | Quarter | | | YTD | | | Quarter | | | YTD | |
Equity Capitalization | | | | | | | | | | | | | | | | | | | | | | | | | | | | | | | | | | | | | | | | | | |
Common Shares | | | 86,266 | | | | | | | | | | | Balance at 12/31/2019 | | | 87,050 | | | | 5,015 | | | | 92,065 | | | | | | | | | | | | | | | | | |
Common Operating Partnership ("OP") Units | | | 4,891 | | | | | | | | | | | Other | | | 11 | | | | 233 | | | | 244 | | | | | | | | | | | | | | | | | |
Combined Common Shares and OP Units | | | 91,157 | | | | | | | | | | | Share repurchases | | | (1,219 | ) | | | — | | | | (1,219 | ) | | | | | | | | | | | | | | | | |
| | | | | | | | | | | | | | OP Conversions | | | 148 | | | | (113 | ) | | | 35 | | | | | | | | | | | | | | | | | |
Share Price at September 30, 2020 | | $ | 10.50 | | | | | | | | | | | Balance at 3/31/2020 | | | 85,990 | | | | 5,135 | | | | 91,125 | | | | 86,972 | | | | 86,972 | | | | 92,785 | | | | 92,785 | |
| | | | | | | | | | | | | | Other | | | 15 | | | | 16 | | | | 31 | | | | | | | | | | | | | | | | | |
Equity Capitalization - Common Shares and OP Units | | $ | 957,149 | | | | | | | | | | | OP Conversions | | | 260 | | | | (260 | ) | | | — | | | | | | | | | | | | | | | | | |
Preferred OP Units | | | 4,879 | | 2 | | | | | | | | | Balance at 6/30/2020 | | | 86,265 | | | | 4,891 | | | | 91,156 | | | | 86,180 | | | | 86,576 | | | | 91,648 | | | | 92,137 | |
Total Equity Capitalization | | | 962,028 | | | 46% | | | 46% | | | Other | | | 1 | | | | — | | | | 1 | | | | | | | | | | | | | | | | | |
| | | | | | | | | | | | | | Balance at 9/30/2020 | | | 86,266 | | | | 4,891 | | | | 91,157 | | | | 86,309 | | | | 86,486 | | | | 91,224 | | | | 91,978 | |
Debt Capitalization | | | | | | | | | | | | | | | | | | | | | | | | | | | | | | | | | | | | | | | | | | |
Consolidated debt | | | 1,796,275 | | | | | | | | | | | | | | | | | | | | | | | | | | | | | | | | | | | | | | | |
Adjustment to reflect pro-rata share of debt | | | (644,816 | ) | | | | | | | | | | | | | | | | | | | | | | | | | | | | | | | | | | | | | | |
Total Debt Capitalization | | | 1,151,459 | | | 54% | | | 54% | | | | | | | | | | | | | | | | | | | | | | | | | | | | | | | |
| | | | | | | | | | | | | | | | | | | | | | | | | | | | | | | | | | | | | | | | | | |
Total Market Capitalization | | $ | 2,113,487 | | 3 | 100% | | | 100% | | | | | | | | | | | | | | | | | | | | | | | | | | | | | | | |
__________
| 1. | Reflects debt net of Core Portfolio cash of $8,357 and pro-rata share of Funds cash of $3,908 for total cash netted against debt of $12,265. |
| 2. | Represents 188 Series A and 126,593 Series C Preferred OP Units convertible into 25,067 and 439,556 Common OP Units, respectively, multiplied by the Common Share price at quarter end. |
| 3. | Market capitalization comprises (fixed-rate debt includes notional principal fixed through interest rate swap transactions): |

| Consolidated Income Statement |
Supplemental Report – September 30, 2020 | (in thousands) |
| | | | | | | | |
| | September 30, 2020 1 | |
CONSOLIDATED INCOME STATEMENT | | Quarter | | | Year to Date | |
Revenues | | | | | | | | |
Rental income | | $ | 50,300 | | | $ | 183,396 | |
Other | | | 981 | | | | 3,078 | |
Total revenues | | | 51,281 | | | | 186,474 | |
Operating expenses | | | | | | | | |
Depreciation and amortization | | | 34,457 | | | | 101,627 | |
General and administrative | | | 8,625 | | | | 26,415 | |
Real estate taxes | | | 10,689 | | | | 31,833 | |
Property operating | | | 11,559 | | | | 41,685 | |
Impairment charges | | | — | | | | 51,549 | |
Total operating expenses | | | 65,330 | | | | 253,109 | |
| | | | | | | | |
Gain on disposition of properties | | | 24 | | | | 509 | |
Operating loss | | | (14,025 | ) | | | (66,126 | ) |
Equity in losses of unconsolidated affiliates | | | (624 | ) | | | (155 | ) |
Interest and other income | | | 2,132 | | | | 7,156 | |
Realized and unrealized holding (losses) gains on investments and other | | | (7,946 | ) | | | 79,335 | |
Interest expense | | | (17,752 | ) | | | (54,373 | ) |
Loss from continuing operations before income taxes | | | (38,215 | ) | | | (34,163 | ) |
Income tax (provision) benefit | | | (74 | ) | | | 741 | |
Net loss | | | (38,289 | ) | | | (33,422 | ) |
Net loss attributable to noncontrolling interests | | | 29,259 | | | | 35,388 | |
Net (loss) income attributable to Acadia | | $ | (9,030 | ) | | $ | 1,966 | |
| | | | | | | | |

| Income Statement - Detail |
Supplemental Report – September 30, 2020 | (in thousands) |
| | | | | | | | |
| | September 30, 2020 1 | |
CORE PORTFOLIO AND FUND INCOME | | Quarter | | | Year to Date | |
PROPERTY REVENUES | | | | | | | | |
Minimum rents | | $ | 46,142 | | | $ | 150,203 | |
Percentage rents | | | 42 | | | | 361 | |
Expense reimbursements - CAM | | | 5,671 | | | | 16,768 | |
Expense reimbursements - Taxes | | | 8,723 | | | | 24,903 | |
Other property income | | | 616 | | | | 2,027 | |
Total Property Revenues | | | 61,194 | | | | 194,262 | |
| | | | | | | | |
PROPERTY EXPENSES | | | | | | | | |
Property operating - CAM | | | 7,992 | | | | 26,081 | |
Other property operating (Non-CAM) | | | 3,966 | | | | 9,934 | |
Real estate taxes | | | 10,689 | | | | 31,833 | |
Total Property Expenses | | | 22,647 | | | | 67,848 | |
| | | | | | | | |
NET OPERATING INCOME - PROPERTIES | | | 38,547 | | | | 126,414 | |
| | | | | | | | |
OTHER INCOME (EXPENSE) | | | | | | | | |
Interest income | | | 2,132 | | | | 7,156 | |
Straight-line rent income (expense) | | | (12,051 | ) | | | (15,483 | ) |
Above/below-market rent income (expense) | | | 2,273 | | | | 8,115 | |
Interest expense 2 | | | (16,574 | ) | | | (48,897 | ) |
Amortization of finance costs | | | (1,121 | ) | | | (4,041 | ) |
Above/below-market interest income (expense) | | | 26 | | | | 78 | |
Asset and property management income (expense) | | | (69 | ) | | | (277 | ) |
Other income (expense) | | | 59 | | | | (207 | ) |
Finance lease interest expense | | | (83 | ) | | | (1,513 | ) |
Impairment charges | | | — | | | | (51,549 | ) |
CORE PORTFOLIO AND FUND INCOME | | | 13,139 | | | | 19,796 | |
| | | | | | | | |
FEE INCOME | | | | | | | | |
Asset and property management fees | | | 191 | | | | 524 | |
Net promote and other transactional income | | | (7,906 | ) | | | 73,048 | |
Transactional fees 3 | | | 43 | | | | 157 | |
Income tax (provision) benefit | | | (74 | ) | | | 741 | |
Total Fee (Loss) Income | | | (7,746 | ) | | | 74,470 | |
| | | | | | | | |
General and Administrative | | | (8,625 | ) | | | (26,415 | ) |
| | | | | | | | |
Depreciation and amortization | | | (34,357 | ) | | | (101,310 | ) |
Non-real estate depreciation and amortization | | | (100 | ) | | | (317 | ) |
Gain on disposition of properties | | | 24 | | | | 509 | |
(Loss) before equity in earnings and noncontrolling interests | | | (37,665 | ) | | | (33,267 | ) |
| | | | | | | | |
Equity in losses of unconsolidated affiliates | | | (624 | ) | | | (155 | ) |
Noncontrolling interests | | | 29,259 | | | | 35,388 | |
| | | | | | | | |
NET (LOSS) INCOME ATTRIBUTABLE TO ACADIA | | $ | (9,030 | ) | | $ | 1,966 | |
| | | | | | | | |

| Income Statement – Pro Rata Adjustments |
Supplemental Report – September 30, 2020 | (in thousands) |
| | | | | | | | | | | | | | | | |
| | Quarter Ended September 30, 2020 | | | Year to Date September 30, 2020 | |
CORE PORTFOLIO AND FUND INCOME | | Noncontrolling Interest in Consolidated Subsidiaries 4 | | | Company’s Interest in Unconsolidated Subsidiaries 5 | | | Noncontrolling Interest in Consolidated Subsidiaries 5 | | | Company’s Interest in Unconsolidated Subsidiaries 6 | |
PROPERTY REVENUES | | | | | | | | | | | | | | | | |
Minimum rents | | $ | (16,900 | ) | | $ | 7,951 | | | $ | (58,468 | ) | | $ | 27,103 | |
Percentage rents | | | (2 | ) | | | 1 | | | | (219 | ) | | | 43 | |
Expense reimbursements - CAM | | | (2,891 | ) | | | 852 | | | | (8,523 | ) | | | 2,818 | |
Expense reimbursements - Taxes | | | (2,491 | ) | | | 1,718 | | | | (7,548 | ) | | | 6,058 | |
Other property income | | | (352 | ) | | | 89 | | | | (1,086 | ) | | | 193 | |
Total Property Revenues | | | (22,636 | ) | | | 10,611 | | | | (75,844 | ) | | | 36,215 | |
| | | | | | | | | | | | | | | | |
PROPERTY EXPENSES | | | | | | | | | | | | | | | | |
Property operating - CAM | | | (3,793 | ) | | | 875 | | | | (13,462 | ) | | | 2,916 | |
Other property operating (Non-CAM) | | | (1,775 | ) | | | 209 | | | | (5,234 | ) | | | 728 | |
Real estate taxes | | | (3,628 | ) | | | 2,166 | | | | (10,948 | ) | | | 6,892 | |
Total Property Expenses | | | (9,196 | ) | | | 3,250 | | | | (29,644 | ) | | | 10,536 | |
NET OPERATING INCOME - PROPERTIES | | | (13,440 | ) | | | 7,361 | | | | (46,200 | ) | | | 25,679 | |
| | | | | | | | | | | | | | | | |
OTHER INCOME (EXPENSE) | | | | | | | | | | | | | | | | |
Interest income | | | (108 | ) | | | — | | | | (563 | ) | | | — | |
Straight-line rent income (expense) | | | 8,319 | | | | (817 | ) | | | 7,855 | | | | (1,054 | ) |
Above/below-market rent income (expense) | | | (2,323 | ) | | | 2,398 | | | | (4,540 | ) | | | 2,844 | |
Interest expense 2 | | | 8,871 | | | | (2,838 | ) | | | 26,775 | | | | (8,863 | ) |
Amortization of finance costs | | | 738 | | | | (243 | ) | | | 2,917 | | | | (882 | ) |
Above/below-market interest income (expense) | | | — | | | | 21 | | | | — | | | | 63 | |
Asset and property management income (expense) | | | 278 | | | | (382 | ) | | | 784 | | | | (1,066 | ) |
Other income (expense) | | | (213 | ) | | | 314 | | | | (515 | ) | | | 338 | |
Finance lease interest expense | | | 61 | | | | — | | | | 181 | | | | — | |
Impairment charges | | | — | | | | — | | | | 39,149 | | | | — | |
CORE PORTFOLIO AND FUND INCOME | | | 2,183 | | | | 5,814 | | | | 25,843 | | | | 17,059 | |
| | | | | | | | | | | | | | | | |
FEE INCOME | | | | | | | | | | | | | | | | |
Asset and property management fees | | | 3,504 | | | | 144 | | | | 11,232 | | | | 362 | |
Promote income from funds, net | | | — | | | | — | | | | — | | | | — | |
Net promote and other transactional income | | | 5,666 | | | | — | | | | (51,938 | ) | | | — | |
Transactional fees 3 | | | 1,423 | | | | 72 | | | | 4,620 | | | | 401 | |
Income tax (provision) benefit | | | 26 | | | | (12 | ) | | | 84 | | | | (27 | ) |
Total Fee (Loss) Income | | | 10,619 | | | | 204 | | | | (36,002 | ) | | | 736 | |
| | | | | | | | | | | | | | | | |
General and Administrative | | | 186 | | | | (80 | ) | | | 660 | | | | (199 | ) |
Depreciation and amortization | | | 15,813 | | | | (6,562 | ) | | | 45,477 | | | | (17,751 | ) |
Non-real estate depreciation and amortization | | | — | | | | — | | | | — | | | | — | |
Gain on disposition of properties | | | (18 | ) | | | — | | | | (392 | ) | | | — | |
(Loss) before equity in earnings and noncontrolling interests | | | 28,783 | | | | (624 | ) | | | 35,586 | | | | (155 | ) |
| | | | | | | | | | | | | | | | |
Equity in losses of unconsolidated affiliates | | | — | | | | — | | | | — | | | | — | |
Noncontrolling interests 6 | | | 476 | | | | — | | | | (198 | ) | | | — | |
| | | | | | | | | | | | | | | | |
NET (LOSS) INCOME ATTRIBUTABLE TO ACADIA | | $ | 29,259 | | | $ | (624 | ) | | $ | 35,388 | | | $ | (155 | ) |
| | | | | | | | | | | | | | | | |

| Balance Sheet |
Supplemental Report – September 30, 2020 | (in thousands) |
ASSETS | | Consolidated Balance Sheet | | | Line Item Details: | |
Real estate | | | | | | | | | | |
Land | | $ | 771,508 | | | The components of Real estate under development, at cost are as follows: | |
Buildings and improvements | | | 3,006,179 | | | Core | | $ | 63,946 | |
Construction in progress | | | 7,605 | | | Fund II | | | 39,921 | |
Right-of-use assets - finance leases | | | 25,086 | | | Fund III | | | 23,266 | |
Right-of-use assets - operating leases, net | | | 89,615 | | | Fund IV | | | 141,165 | |
| | | 3,899,993 | | | Total | | $ | 268,298 | |
Less: Accumulated depreciation and amortization | | | (552,562 | ) | | | | | | |
Operating real estate, net | | | 3,347,431 | | | Summary of other assets, net: | | | | |
Real estate under development | | | 268,298 | | | Deferred charges, net | | $ | 30,032 | |
Net investments in real estate | | | 3,615,729 | | | Prepaid expenses | | | 16,527 | |
Notes receivable, net | | | 134,798 | | | Other receivables | | | 4,755 | |
Investments in and advances to unconsolidated affiliates | | | 240,414 | | | Derivative financial instruments | | | — | |
Lease intangibles, net | | | 109,488 | | | Accrued interest receivable | | | 12,471 | |
Other assets, net | | | 73,682 | | | Income taxes receivable | | | 2,301 | |
Cash and cash equivalents | | | 16,108 | | | Due from seller | | | 3,682 | |
Restricted cash | | | 13,673 | | | Corporate assets, net | | | 1,288 | |
Straight-line rents receivable, net | | | 27,820 | | | Deposits | | | 1,712 | |
Rents receivable | | | 19,696 | | | Deferred tax assets | | | 914 | |
Total Assets | | $ | 4,251,408 | | | Total | | $ | 73,682 | |
| | | | | | | | | | |
LIABILITIES AND SHAREHOLDERS' EQUITY | | | | | | | | | | |
Mortgage and other notes payable, net | | $ | 1,159,688 | | | Summary of accounts payable and other liabilities: | | | | |
Unsecured notes payable, net | | | 502,500 | | | Lease liability - finance leases, net | | $ | 6,194 | |
Unsecured line of credit | | | 127,400 | | | Lease liability - operating leases, net | | | 89,437 | |
Accounts payable and other liabilities | | | 314,768 | | | Accounts payable and accrued expenses | | | 71,393 | |
Lease intangibles, net | | | 79,343 | | | Deferred income | | | 32,325 | |
Dividends and distributions payable | | | 147 | | | Tenant security deposits, escrow and other | | | 12,215 | |
Distributions in excess of income from, and investments in, unconsolidated affiliates | | | 15,462 | | | Derivative financial instruments | | | 103,204 | |
Total Liabilities | | | 2,199,308 | | | Total | | $ | 314,768 | |
Shareholders' Equity | | | | | | | | | | |
Common shares | | | 86 | | | | | | | |
Additional paid-in capital | | | 1,695,338 | | | | | | | |
Accumulated other comprehensive loss | | | (85,873 | ) | | | | | | |
Distributions in excess of accumulated earnings | | | (156,321 | ) | | | | | | |
Total Acadia shareholders’ equity | | | 1,453,230 | | | | | | | |
Noncontrolling interests | | | 598,870 | | | | | | | |
Total equity | | | 2,052,100 | | | | | | | |
Total Liabilities and Shareholders' Equity | | $ | 4,251,408 | | | | | | | |
| | | | | | | | | | |

| Balance Sheet – Pro-rata Adjustments7 |
Supplemental Report – September 30, 2020 | (in thousands) |
ASSETS | | Noncontrolling Interest in Consolidated Subsidiaries 5 | | | Company’s Interest in Unconsolidated Subsidiaries 6 | |
Real estate | | | | | | | | |
Land | | $ | (185,484 | ) | | $ | 68,567 | |
Buildings and improvements | | | (981,046 | ) | | | 270,574 | |
Construction in progress | | | (4,001 | ) | | | 256 | |
Right-of-use assets - finance leases | | | (4,129 | ) | | | 24,393 | |
Right-of-use assets - operating leases, net | | | (36,756 | ) | | | — | |
| | | (1,211,416 | ) | | | 363,790 | |
Less: Accumulated depreciation and amortization | | | 111,878 | | | | (50,381 | ) |
Operating real estate, net | | | (1,099,538 | ) | | | 313,409 | |
Real estate under development | | | (155,199 | ) | | | 4,201 | |
Net investments in real estate | | | (1,254,737 | ) | | | 317,610 | |
Notes receivable, net | | | (28,568 | ) | | | — | |
Investments in and advances to unconsolidated affiliates | | | (88,187 | ) | | | (133,883 | ) |
Lease intangibles, net | | | (31,999 | ) | | | 8,268 | |
Other assets, net | | | 4,554 | | | | 2,176 | |
Cash and cash equivalents | | | (8,253 | ) | | | 4,410 | |
Restricted cash | | | (9,801 | ) | | | 1,424 | |
Straight-line rents receivable, net | | | (6,639 | ) | | | 4,358 | |
Rents receivable | | | (7,115 | ) | | | 1,576 | |
Total Assets | | $ | (1,430,745 | ) | | $ | 205,939 | |
| | | | | | | | |
LIABILITIES AND SHAREHOLDERS' EQUITY | | | | | | | | |
Mortgage and other notes payable, net | | $ | (729,320 | ) | | $ | 180,481 | |
Unsecured notes payable, net | | | (92,347 | ) | | | — | |
Unsecured line of credit | | | — | | | | — | |
Accounts payable and other liabilities | | | (69,522 | ) | | | 23,470 | |
Lease intangibles, net | | | (20,885 | ) | | | 8,543 | |
Lease liability - finance leases | | | (4,514 | ) | | | 8,903 | |
Lease liability - operating leases | | | (38,000 | ) | | | 4 | |
Dividends and distributions payable | | | — | | | | — | |
Distributions in excess of income from, and investments in, unconsolidated affiliates | | | — | | | | (15,462 | ) |
Total Liabilities | | | (954,588 | ) | | | 205,939 | |
Shareholders' Equity | | | | | | | | |
Common shares | | | — | | | | — | |
Additional paid-in capital | | | — | | | | — | |
Accumulated other comprehensive loss | | | — | | | | — | |
Distributions in excess of accumulated earnings | | | — | | | | — | |
Total Acadia shareholders’ equity | | | — | | | | — | |
Noncontrolling interests | | | (476,157 | ) | | | — | |
Total equity | | | (476,157 | ) | | | — | |
Total Liabilities and Shareholders' Equity | | $ | (1,430,745 | ) | | $ | 205,939 | |
| | | | | | | | |

| Balance Sheet – Pro-rata Adjustments7 |
Supplemental Report – September 30, 2020 | (in thousands) |
__________
Notes to income statements, balance sheet and pro rata adjustments:
| 1. | Quarterly results are unaudited, although they reflect all adjustments, which in the opinion of management are necessary for a fair presentation of operating results for the interim periods. |
| 2. | Net of capitalized interest of $1.7 million for the three months ended September 30, 2020 and $6.3 million for the nine months ended September 30, 2020. |
| 3. | Consists of development, construction, leasing and legal fees. |
| 4. | Noncontrolling interests represent limited partners’ interests in consolidated partnerships’ activities. |
| 5. | Represents the Company’s share of co-investment partnerships’ activities, of which each are included on a single line presentation in the Company’s consolidated financial statements in accordance with GAAP. |
| 6. | Adjustment to noncontrolling interests exclude income allocable to Operating Partnership Units of $(0.5) million for the three months ended September 30, 2020 and $0.2 million for the nine months ended September 30, 2020 |
| 7. | The Company currently invests in Funds II, III, IV & V and Mervyns II which are consolidated within the Company's financial statements. |

| Funds from Operations (“FFO”), Adjusted Funds from Operations (“AFFO”) |
Supplemental Report – September 30, 2020 | (in thousands) |
| | | | | | | | | | | | | | | | | | | | | | | | |
| | Quarter Ended | | | Year to Date | | | Quarter Ended | | | Year to Date | |
| | March 31, 2020 | | | June 30, 2020 | | | September 30, 2020 | | | September 30, 2020 | | | September 30, 2019 | | | September 30, 2019 | |
Funds from operations ("FFO"): | | | | | | | | | | | | | | | | | | | | | | | | |
Net (Loss) Income | | $ | (8,414 | ) | | $ | 19,410 | | | $ | (9,030 | ) | | $ | 1,966 | | | $ | 10,458 | | | $ | 31,735 | |
Depreciation of real estate and amortization of leasing costs (net of noncontrolling interest share) | | | 24,088 | | | | 24,390 | | | | 25,106 | | | | 73,584 | | | | 22,436 | | | | 66,157 | |
Gain on disposition on real estate properties (net of noncontrolling interest share) | | | — | | | | (111 | ) | | | (6 | ) | | | (117 | ) | | | (2,758 | ) | | | (3,142 | ) |
Impairment charges (net of noncontrolling interest share) | | | 12,400 | | | | — | | | | — | | | | 12,400 | | | | 74 | | | | 395 | |
(Loss) income attributable to noncontrolling interests' share in Operating Partnership | | | (336 | ) | | | 1,259 | | | | (471 | ) | | | 571 | | | | 784 | | | | 2,436 | |
FFO to Common Shareholders and Common OP Unit holders | | $ | 27,738 | | | $ | 44,948 | | | $ | 15,599 | | | $ | 88,404 | | | $ | 30,994 | | | $ | 97,581 | |
| | | | | | | | | | | | | | | | | | | | | | | | |
Less: Albertsons unrealized holding loss (gain) (net of noncontrolling interest share) | | | — | | | | (18,397 | ) | | | 2,240 | | | | (16,157 | ) | | | — | | | | — | |
FFO before Special Items | | $ | 27,738 | | | $ | 26,551 | | | $ | 17,839 | | | $ | 72,247 | | | $ | 30,994 | | | $ | 97,581 | |
| | | | | | | | | | | | | | | | | | | | | | | | |
| | | | | | | | | | | | | | | | | | | | | | | | |
Adjusted Funds from operations ("AFFO"): | | | | | | | | | | | | | | | | | | | | | | | | |
FFO | | $ | 27,738 | | | $ | 44,948 | | | $ | 15,599 | | | $ | 88,404 | | | $ | 30,994 | | | $ | 97,581 | |
Unrealized gains | | | — | | | | (18,397 | ) | | | 2,240 | | | | (16,157 | ) | | | — | | | | — | |
Straight-line rent, net | | | 2,593 | | | | 1,540 | | | | 4,549 | | | | 8,682 | | | | (668 | ) | | | (2,347 | ) |
Above/below-market rent | | | (2,288 | ) | | | (1,783 | ) | | | (2,348 | ) | | | (6,419 | ) | | | (1,850 | ) | | | (11,644 | ) |
Amortization of finance costs | | | 749 | | | | 631 | | | | 626 | | | | 2,006 | | | | 733 | | | | 2,215 | |
Above/below-market interest | | | (47 | ) | | | (47 | ) | | | (47 | ) | | | (141 | ) | | | (47 | ) | | | (141 | ) |
Non-real estate depreciation | | | 109 | | | | 108 | | | | 100 | | | | 317 | | | | 112 | | | | 343 | |
Stock-based compensation 1 | | | 3,527 | | | | 2,014 | | | | 2,047 | | | | 7,588 | | | | 1,629 | | | | 6,523 | |
Leasing commissions | | | (380 | ) | | | (118 | ) | | | (37 | ) | | | (535 | ) | | | (312 | ) | | | (1,433 | ) |
Tenant improvements | | | (468 | ) | | | (426 | ) | | | (815 | ) | | | (1,709 | ) | | | (450 | ) | | | (4,094 | ) |
Maintenance capital expenditures | | | (951 | ) | | | (997 | ) | | | (81 | ) | | | (2,029 | ) | | | (1,220 | ) | | | (1,978 | ) |
AFFO to Common Shareholders and Common OP Unit holders | | $ | 30,582 | | | $ | 27,473 | | | $ | 21,833 | | | $ | 80,007 | | | $ | 28,921 | | | $ | 85,025 | |
| | | | | | | | | | | | | | | | | | | | | | | | |
Total weighted-average diluted shares and OP Units | | | 92,785 | | | | 91,648 | | | | 91,224 | | | | 91,978 | | | | 90,683 | | | | 89,404 | |
| | | | | | 91648 | | | | | | | | | | | | | | | | | |
Diluted FFO per Common share and OP Unit: | | | | | | | | | | | | | | | | | | | | | | | | |
FFO | | $ | 0.30 | | | $ | 0.49 | | | $ | 0.17 | | | $ | 0.96 | | | $ | 0.34 | | | $ | 1.09 | |
| | | | | | | | | | | | | | | | | | | | | | | | |
FFO before Special Items | | $ | 0.30 | | | $ | 0.29 | | | $ | 0.20 | | | $ | 0.79 | | | $ | 0.34 | | | $ | 1.09 | |
| | | | | | | | | | | | | | | | | | | | | | | | |
__________
| 1. | Amounts for prior periods have been updated to include stock-based compensation for comparability. |

| EBITDA |
Supplemental Report – September 30, 2020 | (in thousands) |
| | Quarter Ended September 30, 2020 | | | Year to Date September 30, 2020 | | | Quarter Ended September 30, 2019 | |
| | Core | | | | | | | | | | | Core | | | | | | | | | | | Core | | | | | | | | | |
| | Portfolio | | | Funds | | | Total | | | Portfolio | | | Funds | | | Total | | | Portfolio | | | Funds | | | Total | |
EBITDA: | | | | | | | | | | | | | | | | | | | | | | | | | | | | | | | | | | | | |
| | | | | | | | | | | | | | | | | | | | | | | | | | | | | | | | | | | | |
Net Income (Loss) Attributable to Acadia | | $ | (3,154 | ) | | $ | (5,876 | ) | | $ | (9,030 | ) | | $ | 24,352 | | | $ | (22,386 | ) | | $ | 1,966 | | | $ | 8,890 | | | $ | 1,568 | | | $ | 10,458 | |
| | | | | | | | | | | | | | | | | | | | | | | | | | | | | | | | | | | | |
Adjustments: | | | | | | | | | | | | | | | | | | | | | | | | | | | | | | | | | | | | |
Depreciation and amortization | | | 20,666 | | | | 4,540 | | | | 25,206 | | | | 60,895 | | | | 13,006 | | | | 73,901 | | | | 18,099 | | | | 4,449 | | | | 22,548 | |
Interest expense | | | 8,295 | | | | 2,246 | | | | 10,541 | | | | 24,193 | | | | 6,792 | | | | 30,985 | | | | 6,894 | | | | 2,541 | | | | 9,435 | |
Amortization of finance costs | | | 425 | | | | 201 | | | | 626 | | | | 1,172 | | | | 834 | | | | 2,006 | | | | 332 | | | | 401 | | | | 733 | |
Above/below-market interest | | | (47 | ) | | | — | | | | (47 | ) | | | (141 | ) | | | — | | | | (141 | ) | | | (47 | ) | | | — | | | | (47 | ) |
Gain on disposition of properties | | | — | | | | (6 | ) | | | (6 | ) | | | — | | | | (117 | ) | | | (117 | ) | | | — | | | | (2,758 | ) | | | (2,758 | ) |
Unrealized holding losses (gains) on investments | | | 2,240 | | | | — | | | | 2,240 | | | | (16,157 | ) | | | — | | | | (16,157 | ) | | | — | | | | — | | | | — | |
Provision (benefit) for income taxes | | | 53 | | | | 7 | | | | 60 | | | | (822 | ) | | | 24 | | | | (798 | ) | | | 1,397 | | | | 2 | | | | 1,399 | |
Impairment charges | | | — | | | | — | | | | — | | | | — | | | | 12,400 | | | | 12,400 | | | | — | | | | 74 | | | | 74 | |
Noncontrolling interest - OP | | | (476 | ) | | | — | | | | (476 | ) | | | 198 | | | | — | | | | 198 | | | | 649 | | | | — | | | | 649 | |
EBITDA | | $ | 28,002 | | | $ | 1,112 | | | $ | 29,114 | | | $ | 93,690 | | | $ | 10,553 | | | $ | 104,243 | | | $ | 36,214 | | | $ | 6,277 | | | $ | 42,491 | |
| | | | | | | | | | | | | | | | | | | | | | | | | | | | | | | | | | | | |
Adjusted EBITDA: | | | | | | | | | | | | | | | | | | | | | | | | | | | | | | | | | | | | |
| | | | | | | | | | | | | | | | | | | | | | | | | | | | | | | | | | | | |
EBITDA | | $ | 28,002 | | | $ | 1,112 | | | $ | 29,114 | | | $ | 93,690 | | | $ | 10,553 | | | $ | 104,243 | | | $ | 36,214 | | | $ | 6,277 | | | $ | 42,491 | |
Stock based compensation 1 | | | 2,047 | | | | — | | | | 2,047 | | | | 7,588 | | | | — | | | | 7,588 | | | | 1,629 | | | | — | | | | 1,629 | |
Adjusted EBITDA | | $ | 30,049 | | | $ | 1,112 | | | $ | 31,161 | | | $ | 101,278 | | | $ | 10,553 | | | $ | 111,831 | | | $ | 37,843 | | | $ | 6,277 | | | $ | 44,120 | |
| | | | | | | | | | | | | | | | | | | | | | | | | | | | | | | | | | | | |
__________
| 1. | Adjusted EBITDA eliminates stock-based compensation expense. Amounts for prior periods have been updated to include stock-based compensation for comparability. |

| Core Portfolio – Same Property Performance 1 |
Supplemental Report – September 30, 2020 | (in thousands) |
| | Quarter Ended | | | Change | | | Year to Date | | | Change | |
| | September 30, 2020 | | | September 30, 2019 | | | Favorable/ (Unfavorable) | | | September 30, 2020 | | | September 30, 2019 | | | Favorable/ (Unfavorable) | |
| | | | | | | | | | | | | | | | | | | | | | | | |
Summary | | | | | | | | | | | | | | | | | | | | | | | | |
Minimum rents | | $ | 27,775 | | | $ | 33,635 | | | | (17.4 | )% | | $ | 89,071 | | | $ | 100,991 | | | | (11.8 | )% |
Expense reimbursements | | | 9,125 | | | | 9,852 | | | | (7.4 | )% | | | 27,520 | | | | 29,548 | | | | (6.9 | )% |
Other property income | | | 260 | | | | 296 | | | | (12.2 | )% | | | 792 | | | | 949 | | | | (16.5 | )% |
| | | | | | | | | | | | | | | | | | | | | | | | |
Total Revenue | | | 37,160 | | | | 43,783 | | | | (15.1 | )% | | | 117,383 | | | | 131,488 | | | | (10.7 | )% |
| | | | | | | | | | | | | | | | | | | | | | | | |
Expenses | | | | | | | | | | | | | | | | | | | | | | | | |
Property operating - CAM & Real estate taxes | | | 10,803 | | | | 10,713 | | | | (0.8 | )% | | | 32,330 | | | | 33,209 | | | | 2.6 | % |
Other property operating (Non-CAM) | | | 1,032 | | | | 850 | | | | (21.4 | )% | | | 2,417 | | | | 2,309 | | | | (4.7 | )% |
| | | | | | | | | | | | | | | | | | | | | | | | |
Total Expenses | | | 11,835 | | | | 11,563 | | | | (2.4 | )% | | | 34,747 | | | | 35,518 | | | | 2.2 | % |
| | | | | | | | | | | | | | | | | | | | | | | | |
Same Property NOI - Core properties | | $ | 25,325 | | | $ | 32,220 | | | | (21.4 | )% | | $ | 82,636 | | | $ | 95,970 | | | | (13.9 | )% |
| | | | | | | | | | | | | | | | | | | | | | | | |
Reconciliation of Same Property NOI to Core NOI | | | | | | | | | | | | | | | | | | | | | | | | |
NOI of Properties excluded from Same Property NOI | | | 3,731 | | | | 3,015 | | | | | | | | 11,094 | | | | 8,700 | | | | | |
Core NOI | | $ | 29,056 | | | $ | 35,235 | | | | | | | $ | 93,730 | | | $ | 104,670 | | | | | |
| | | | | | | | | | | | | | | | | | | | | | | | |
| | | | | | | | | | | | | | | | | | | | | | | | |
Other same property information | | | | | | | | | | | | | | | | | | | | | | | | |
Physical Occupancy at the end of the period | | | 90.3 | % | | | 93.8 | % | | | | | | | | | | | | | | | | |
Leased Occupancy at the end of the period | | | 91.1 | % | | | 95.1 | % | | | | | | | | | | | | | | | | |
__________
| 1. | The above amounts include the pro-rata activity related to the Company's Core consolidated and unconsolidated investments. |

| Fee Income by Fund |
Supplemental Report – September 30, 2020 | (in thousands) |
| | Fund II | | | Fund III | | | Fund IV | | | Fund V | | | Other | | | Total | |
Year to Date September 30, 2020 | | | | | | | | | | | | | | | | | | | | | | | | |
Asset and property management fees | | $ | 1,575 | | | $ | 1,013 | | | $ | 3,347 | | | $ | 5,702 | | | $ | 481 | | | $ | 12,118 | |
Transactional fees | | | 406 | | | | 383 | | | | 2,090 | | | | 2,174 | | | | 125 | | | | 5,178 | |
Total fees | | $ | 1,981 | | | $ | 1,396 | | | $ | 5,437 | | | $ | 7,876 | | | $ | 606 | | | $ | 17,296 | |
| | | | | | | | | | | | | | | | | | | | | | | | |
Quarter Ended September 30, 2020 | | | | | | | | | | | | | | | | | | | | | | | | |
Asset and property management fees | | $ | 509 | | | $ | 227 | | | $ | 1,160 | | | $ | 1,770 | | | $ | 173 | | | $ | 3,839 | |
Transactional fees | | | 132 | | | | 131 | | | | 528 | | | | 709 | | | | 38 | | | | 1,538 | |
Total fees | | $ | 641 | | | $ | 358 | | | $ | 1,688 | | | $ | 2,479 | | | $ | 211 | | | $ | 5,377 | |
| | | | | | | | | | | | | | | | | | | | | | | | |
| | | | | | | | | | | | | | | | | | | | | | | | |
Quarter Ended June 30, 2020 | | | | | | | | | | | | | | | | | | | | | | | | |
Asset and property management fees | | $ | 525 | | | $ | 346 | | | $ | 1,035 | | | $ | 1,869 | | | $ | 132 | | | $ | 3,907 | |
Transactional fees | | | 146 | | | | 111 | | | | 782 | | | | 697 | | | | 51 | | | | 1,787 | |
Total fees | | $ | 671 | | | $ | 457 | | | $ | 1,817 | | | $ | 2,566 | | | $ | 183 | | | $ | 5,694 | |
| | | | | | | | | | | | | | | | | | | | | | | | |
Quarter Ended March 31, 2020 | | | | | | | | | | | | | | | | | | | | | | | | |
Asset and property management fees | | $ | 541 | | | $ | 440 | | | $ | 1,152 | | | $ | 2,063 | | | $ | 176 | | | $ | 4,372 | |
Transactional fees | | | 128 | | | | 141 | | | | 780 | | | | 768 | | | | 36 | | | | 1,853 | |
Total fees | | $ | 669 | | | $ | 581 | | | $ | 1,932 | | | $ | 2,831 | | | $ | 212 | | | $ | 6,225 | |

| Structured Financing Portfolio |
Supplemental Report – September 30, 2020 | (in thousands) |
| | June 30, 2020 | | | Quarter Ended September 30, 2020 | | | Stated | | | Effective | | | |
| | Principal | | | Accrued | | | Ending | | | | | | | Repayments/ | | | Current | | | Accrued | | | Ending | | | Interest | | | Interest | | | Maturity |
Investment | | Balance | | | Interest | | | Balance | | | Issuances | | | Conversions 1 | | | Principal | | | Interest | | | Balance | | | Rate | | | Rate | | | Dates |
First mortgage notes 2 | | $ | 31,332 | | | $ | 3,547 | | | $ | 34,879 | | | $ | — | | | $ | — | | | $ | 31,332 | | | $ | 3,865 | | | $ | 35,197 | | | | 5.57 | % | | | 5.77 | % | | Apr-20 to Oct-21 |
| | | | | | | | | | | | | | | | | | | | | | | | | | | | | | | | | | | | | | | | | | |
Other notes | | | 65,462 | | | | 2,456 | | | | 67,918 | | | | — | | | | — | | | | 65,462 | | | | 3,928 | | | | 69,390 | | | | 8.48 | % | | | 8.50 | % | | Apr-21 to Dec-27 |
| | | | | | | | | | | | | | | | | | | | | | | | | | | | | | | | | | | | | | | | | | |
Total Core notes receivable | | $ | 96,794 | | | $ | 6,003 | | | $ | 102,797 | | | $ | — | | | $ | — | | | $ | 96,794 | | | $ | 7,793 | | | $ | 104,587 | | | | 7.54 | % | | | 7.61 | % | | |
| | | | | | | | | | | | | | | | | | | | | | | | | | | | | | | | | | | | | | | | | | |
__________ | | | | | | | | | | | | | | | | | | | | | | | | | | | | | | | | | | | | | | | | | | |
| | | | | | | | | | | | | | | | | | | | | | | | | | | | | | | | | | | | | | | | | | |
| | | | | | | | | | | | | | | | | | | | | | | | | | | | | | | | | | | | | | | | | | |
Reconciliation of Notes Receivable to the Consolidated Balance Sheet (Pro Rata): | | | | | | | | | | | | | | | | | | | | | | | |
| | | | | | | | | | | | | | | | | | | | | | | |
Total Notes Receivable per above | | | $ | 96,794 | | | | | | | | | | | | | | | | | | | |
Pro-rata share of Fund loans | | | | 9,436 | | | | | | | | | | | | | | | | | | | |
| | | | | | | | | | | | | | | | | | | | | | | |
Total Pro-rata Notes Receivable | | | $ | 106,230 | | | | | | | | | | | | | | | | | | | |
________
| 2. | One Core note due April 20, 2020 in the amount of $17.8 million with accrued interest of $3.8 million was in default at September 30, 2020. |

| Transactional Activity |
Supplemental Report – September 30, 2020 | (in thousands) |
Fund
PROPERTY ACQUISTIONS AND DISPOSITIONS | |
| | | | | | | | | | | | | | | | | | | | |
Property Name | | Location | | Date of Transaction | | Transaction Amount | | | Ownership % 1 | | | Fund Share | | | Acadia Share | |
| | | | | | | | | | | | | | | | | | | | |
ACQUISITIONS 2 | | | | | | | | | | | | | | | | | | | | |
Core: | | | | | | | | | | | | | | | | | | | | |
| | | | | | | | | | | | | | | | | | | | |
37 Greene Street | | New York, NY | | January 9, 2020 | | $ | 15,689 | | | | 100.00 | % | | $ | — | | | | 15,689 | |
917 W. Armitage | | Chicago, IL | | February 13, 2020 | | | 3,515 | | | | 100.00 | % | | | — | | | | 3,515 | |
| | | | | | $ | 19,204 | | | | | | | $ | — | | | $ | 19,204 | |
| | | | | | | | | | | | | | | | | | | | |
DISPOSITIONS | | | | | | | | | | | | | | | | | | | | |
Fund IV: | | | | | | | | | | | | | | | | | | | | |
Colonie Plaza | | Albany, NY | | April 13, 2020 | | $ | 15,250 | | | | 100.00 | % | | $ | 15,250 | | | | 3,526 | |
Airport Mall (Parcel) | | Bangor, ME | | Sept 10, 2020 | | | 400 | | | | 100.00 | % | | | 400 | | | | 92 | |
| | | | | | $ | 15,650 | | | | | | | $ | 15,650 | | | $ | 3,618 | |
| | | | | | | | | | | | | | | | | | | | |
| | | | | | | | | | | | | | | | | | | | |
STRUCTURED FINANCING ACTIVITY | |
| | | | | | | | | | | | | | | | | | | | |
Note Description | | Transaction Type | | Date of Transaction | | Transaction Amount | | | Ownership % 1 | | | Fund Share | | | Acadia Share | |
| | | | | | | | | | | | | | | | | | | | |
Core: | | | | | | | | | | | | | | | | | | | | |
850 Third Avenue | | Other Loan | | January 17, 2020 | | $ | 54,000 | | | | 100.00 | % | | $ | — | | | | 54,000 | |
Georgetown LUF | | Other Loan | | February 6, 2020 | | | 5,000 | | | | 100.00 | % | | | — | | | | 5,000 | |
Town Center | | Conversion (non-cash) | | April 1, 2020 | | | (38,674 | ) | | | 100.00 | % | | | — | | | | (38,674 | ) |
| | | | | | $ | 20,326 | | | | | | | $ | — | | | $ | 20,326 | |
| | | | | | | | | | | | | | | | | | | | |
________
| 1. | Ownership percentages for Fund transactional activities represent the respective Fund’s ownership, not the Company’s proportionate share. |
| 2. | Acquisition amounts include capitalized acquisition costs, where applicable. |

| Net Asset Valuation Information |
Supplemental Report – September 30, 2020 | (in thousands) |
| | CORE | | | FUND II 2 | | | FUND III | | | FUND IV | | | FUND V | |
| | | | | | | | | | | | | | | | | | | | |
Ownership Percentage | | N/A | | | | 28.33 | % | | | 24.54 | % | | | 23.12 | % | | | 20.10 | % |
| | | | | | | | | | | | | | | | | | | | |
Current Quarter NOI | | | | | | | | | | | | | | | | | | | | |
Net Operating Income 1, 2 | | $ | 29,056 | | | N/A | | | $ | 696 | | | $ | 4,751 | | | $ | 11,540 | |
Less: | | | | | | | | | | | | | | | | | | | | |
(Income) loss from properties sold or under contract | | | — | | | N/A | | | | 10 | | | | 45 | | | | — | |
(Income) loss from pre-stabilized assets, development and redevelopment projects 3, 4 | | | (1,759 | ) | | N/A | | | | (593 | ) | | | 905 | | | | — | |
Net Operating Income of stabilized assets | | $ | 27,297 | | | N/A | | | $ | 113 | | | $ | 5,701 | | | $ | 11,540 | |
| | | | | | | | | | | | | | | | | | | | |
Costs to Date (Pro Rata) | | | | | | | | | | | | | | | | | | | | |
Pre-stabilized assets 3 | | $ | — | | | N/A | | | $ | 28,557 | | | $ | 33,042 | | | $ | — | |
Development and redevelopment projects 4 | | | 192,735 | | | N/A | | | | 4,490 | | | | 39,456 | | | | — | |
Total Costs to Date | | $ | 192,735 | | | N/A | | | $ | 33,047 | | | $ | 72,498 | | | $ | — | |
| | | | | | | | | | | | | | | | | | | | |
Debt (Pro Rata) | | $ | 882,169 | | | $ | 76,818 | | | $ | 15,010 | | | $ | 90,029 | | | $ | 87,433 | |
__________
| 1. | Does not include a full quarter of NOI for any assets purchased during the current quarter. See “Transactional Activity” page in this Supplemental Report for descriptions of those acquisitions. |
| 2. | Fund II has been substantially liquidated except for its investment in City Point with pre-stabilized assets of $531.6 million and debt of $285.5 million. |
| 3. | Pre-stabilized assets consist of the following projects for Fund III: 640 Broadway and Cortlandt Crossing; Fund IV: Paramus Plaza, 210 Bowery, 801 Madison, 27 E 61st Street and 1035 Third Avenue. |

| Selected Financial Ratios |
Supplemental Report – September 30, 2020 | (in thousands) |
| | | | | | | | | | | | | | | | |
| | Quarter Ended September 30, | | | Year to Date September 30, | | | | | Quarter Ended | |
COVERAGE RATIOS 1 | | 2020 | | | 2019 | | | 2020 | | | 2019 | | | LEVERAGE RATIOS | | September 30, 2020 | | | June 30, 2020 | |
Fixed-Charge Coverage Ratios | | | | | | | | | | | | | | | | | | Debt/Market Capitalization Ratios | | | | | | | | |
| | | | | | | | | | | | | | | | | | | | | | | | | | |
EBITDA 2 divided by: | | $ | 28,002 | | | $ | 36,214 | | | $ | 93,690 | | | $ | 112,262 | | | Debt + Preferred Equity (Preferred O.P. Units) | | $ | 1,156,338 | | | $ | 1,178,828 | |
Interest expense | | | 8,295 | | | | 6,894 | | | | 24,193 | | | | 19,700 | | | Total Market Capitalization | | | 2,113,487 | | | | 2,362,033 | |
Principal Amortization | | | 1,011 | | | | 1,036 | | | | 3,081 | | | | 3,053 | | | Debt + Preferred Equity/ | | | | | | | | |
Preferred Dividends 3 | | | 123 | | | | 135 | | | | 372 | | | | 405 | | | Total Market Capitalization | | | 55 | % | | | 50 | % |
Fixed-Charge Coverage Ratio - Core Portfolio | | | 3.0 | x | | | 4.5 | x | | | 3.4 | x | | | 4.8 | x | | | | | | | | | | |
| | | | | | | | | | | | | | | | | | | | | | | | | | |
EBITDA divided by: | | $ | 29,114 | | | $ | 42,491 | | | $ | 104,243 | | | $ | 128,107 | | | Debt 6 | | $ | 1,144,073 | | | $ | 1,160,717 | |
Interest expense | | | 10,541 | | | | 9,435 | | | | 30,985 | | | | 27,263 | | | Total Market Capitalization | | | 2,113,487 | | | | 2,362,033 | |
Principal Amortization | | | 1,139 | | | | 1,230 | | | | 3,525 | | | | 3,717 | | | Net Debt + Preferred Equity/ | | | | | | | | |
Preferred Dividends | | | 4 | | | | 135 | | | | 372 | | | | 405 | | | Total Market Capitalization | | | 54 | % | | | 49 | % |
Fixed-Charge Coverage Ratio - Core Portfolio and Funds | | | 2.5 | x | | | 3.9 | x | | | 3.0 | x | | | 4.1 | x | | Debt/EBITDA Ratios | | | | | | | | |
| | | | | | | | | | | | | | | | | | Core: | | | | | | | | |
Payout Ratios | | | | | | | | | | | | | | | | | | Debt | | $ | 882,169 | | | $ | 903,182 | |
| | | | | | | | | | | | | | | | | | Net debt 5 | | | 873,812 | | | | 893,833 | |
Dividends declared (per share/OP Unit) | | | | | | $ | 0.28 | | | | | | | $ | 0.84 | | | EBITDA | | | 131,942 | | | | 134,462 | |
| | | | | | | | | | | | | | | | | | Adjusted EBITDA | | | 133,568 | | | | 142,518 | |
Dividends (Shares) & Distributions (OP Units) declared | | | | | | $ | 23,710 | | | | | | | $ | 76,390 | | | Debt/EBITDA - Core Portfolio | | | 6.7 | x | | | 6.7 | x |
FFO | | | | | | | 30,103 | | | | | | | | 97,581 | | | Debt/Adjusted EBITDA - Core Portfolio | | | 6.6 | x | | | 6.3 | x |
FFO Payout Ratio 8 | | N/A | | | | 79 | % | | N/A | | | | 78 | % | | Net Debt/EBITDA - Core Portfolio | | | 6.6 | x | | | 6.6 | x |
| | | | | | | | | | | | | | | | | | Net Debt/ Adjusted EBITDA - Core Portfolio | | | 6.5 | x | | | 6.3 | x |
| | | | | | | | | | | | | | | | | | Core and Funds: | | | | | | | | |
Dividends (Shares) & Distributions (OP Units) declared | | | | | | $ | 23,710 | | | | | | | $ | 76,390 | | | Debt 4 | | $ | 1,151,459 | | | $ | 1,172,797 | |
AFFO 7 | | | | | | | 28,921 | | | | | | | | 85,025 | | | Net debt 6 | | | 1,139,194 | | | | 1,154,686 | |
AFFO Payout Ratio | | N/A | | | | 82 | % | | N/A | | | | 90 | % | | EBITDA | | | 148,802 | | | | 154,738 | |
| | | | | | | | | | | | | | | | | | Adjusted EBITDA | | | 151,465 | | | | 162,794 | |
| | | | | | | | | | | | | | | | | | Debt/EBITDA - Core and Funds | | | 7.7 | x | | | 7.6 | x |
| | | | | | | | | | | | | | | | | | Debt/Adjusted EBITDA - Core and Funds | | | 7.6 | x | | | 7.2 | x |
| | | | | | | | | | | | | | | | | | Net Debt/EBITDA - Core and Funds | | | 7.7 | x | | | 7.5 | x |
| | | | | | | | | | | | | | | | | | Net Debt/ Adjusted EBITDA - Core and Funds | | | 7.5 | x | | | 7.1 | x |
| | | | | | | | | | | | | | | | | | | | | | | | | | |

| Selected Financial Ratios |
Supplemental Report – September 30, 2020 | (in thousands) |
__________
| 1. | Quarterly results are unaudited, although they reflect all adjustments, which in the opinion of management, are necessary for a fair presentation of operating results for the interim periods. The coverage ratios include the Company's pro-rata share of FFO, AFFO, EBITDA, interest expense and principal amortization related to both the Company's consolidated and unconsolidated investments in joint ventures. |
| 2. | See EBITDA page in this Supplemental Report for a reconciliation of EBITDA to Net Income attributable to Acadia. |
| 3. | Represents preferred distributions on Preferred Operating partnership Units. |
| 4. | Includes the Company's pro-rata share of consolidated and unconsolidated joint venture debt. Excludes capital lease obligations. |
| 5. | Reflects debt net of the current Core Portfolio cash balance at end of period. |
| 6. | Reflects debt net of the current Core Portfolio and pro-rata share of the Funds cash balance at end of period. |
| 8. | Beginning with the second quarter of 2020, the Board of Trustees temporarily suspended distributions on common shares and common units, which suspension the Board has determined to continue through the fourth quarter of 2020. |
| | EBITDA | | | ADJUSTED EBITDA | |
| | Quarter Ended | | | Year Ended | | | Quarter Ended | | | Year Ended | |
Reconciliation of EBITDA to Annualized EBITDA | | September 30, 2020 | | | Dec 31, 2019 | | | September 30, 2020 | | | Dec 31, 2019 | |
| | | | | | | | | | | | | | | | |
Core EBITDA as reported | | $ | 28,002 | | | $ | 145,005 | | | $ | 28,002 | | | $ | 145,005 | |
Add back: Stock-based compensation, net of employee equity elections | | | — | | | | — | | | | 2,047 | | | | 10,151 | |
Add back: Credit losses and abatements in Q3 | | | 8,784 | | | | — | | | | 8,784 | | | | — | |
Subtotal | | | 36,786 | | | | 145,005 | | | | 38,833 | | | | 155,156 | |
| | | | | | | | | | | | | | | | |
Annualized Core EBITDA | | | 147,144 | | | | 145,005 | | | | 155,332 | | | | 155,156 | |
Subtract: Year to date credit losses related to COVID-19 | | | (21,764 | ) | | | — | | | | (21,764 | ) | | | — | |
Add back: Promote, realized gains | | | 6,562 | | | | — | | | | — | | | | — | |
Annualized Core EBITDA | | | 131,942 | | | | 145,005 | | | | 133,568 | | | | 155,156 | |
| | | | | | | | | | | | | | | | |
Funds EBITDA as reported | | | 1,112 | | | | 22,041 | | | | 1,112 | | | | 22,242 | |
Add back: Credit losses in Q3 | | | 4,483 | | | | — | | | | 4,483 | | | | — | |
Subtotal | | | 5,595 | | | | 22,041 | | | | 5,595 | | | | 22,242 | |
| | | | | | | | | | | | | | | | |
Annualized Fund EBITDA | | | 22,380 | | | | 22,041 | | | | 22,380 | | | | 22,242 | |
Subtract: Year to date credit losses related to COVID-19 | | | (5,520 | ) | | | — | | | | (4,483 | ) | | | — | |
Annualized Fund EBITDA | | | 16,860 | | | | 22,041 | | | | 17,897 | | | | 22,242 | |
Annualized EBITDA Core and Funds | | $ | 148,802 | | | $ | 167,046 | | | $ | 151,465 | | | $ | 177,398 | |

| Portfolio Debt - Summary |
Supplemental Report – September 30, 2020 | (in thousands) |
| | Acadia Pro-Rata Share of Debt 2 | | | | |
| | Core Portfolio | | | Funds | | | Total | | | Reconciliation to Consolidated Debt as Reported | |
Unsecured Debt | | Principal Balance | | | Interest Rate | | | WA Years to Maturity 6 | | | Principal Balance | | | Interest Rate | | | WA Years to Maturity 6 | | | Principal Balance | | | % | | | Interest Rate | | | WA Years to Maturity 6 | | | Add: Noncontrolling Interest Share of Debt 3 | | | Less: Pro-rata Share of Unconsolidated Debt 4 | | | Acadia Consolidated Debt as Reported | |
Fixed-Rate Debt 1 | | $ | 477,400 | | | | 3.4 | % | | | 2.3 | | | $ | 3,550 | | | | — | | | | — | | | $ | 480,950 | | | | 42 | % | | | 3.4 | % | | | 2.2 | | | $ | 10,756 | | | $ | — | | | $ | 491,706 | |
Variable-Rate Debt 5 | | | 30,000 | | | 3.3 | % | | | — | | | | 26,932 | | | | 2.3 | % | | | 0.9 | | | | 56,932 | | | | 5 | % | | | 1.1 | % | | | 0.4 | | | | 81,591 | | | | — | | | | 138,523 | |
| | | | | | | | | | | | | | | | | | | | | | | | | | | | | | | 47 | % | | | | | | | | | | | | | | | | | | | | |
Mortgage and Other Notes Payable | | | | | | | | | | | | | | | | | | | | | | | | | | | | | | | | | | | | | | | | | | | | | | | | | | | | |
| | | | | | | | | | | | | | | | | | | | | | | | | | | | | | | | | | | | | | | | | | | | | | | | | | | | |
Fixed-Rate Debt 1 | | | 341,886 | | | | 4.1 | % | | | 5.7 | | | | 162,883 | | | | 4.5 | % | | | 2.8 | | | | 504,769 | | | | 44 | % | | | 4.2 | % | | | 4.7 | | | | 518,830 | | | | (139,800 | ) | | | 883,799 | |
Variable-Rate Debt 5 | | | 32,883 | | | | 1.9 | % | | | 2.8 | | | | 75,925 | | | | 2.2 | % | | | 0.5 | | | | 108,808 | | | | 9 | % | | | 2.1 | % | | | 1.2 | | | | 214,930 | | | | (41,491 | ) | | | 282,247 | |
| | | | | | | | | | | | | | | | | | | | | | | | | | | | | | | 53 | % | | | | | | | | | | | | | | | | | | | | |
| | | | | | | | | | | | | | | | | | | | | | | | | | | | | | | | | | | | | | | | | | | | | | | | | | | | |
Total | | $ | 882,169 | | | | 3.5 | % | | | 3.5 | | | $ | 269,290 | | | | 3.5 | % | | | 1.9 | | | $ | 1,151,459 | | | | 100 | % | | | 3.5 | % | | | 3.2 | | | $ | 826,107 | | | $ | (181,291 | ) | | | 1,796,275 | |
| | | | | | | | | | | | | | | | | | | | | | | | | | | | | | | | | | | | | | | | | | | | | | | | | | | | |
Unamortized premium | | | | | | | | | | | | | | | | | | | | | | | | | | | | | | | | | | | | | | | | | | | | | | | | | | | 574 | |
Net unamortized loan costs | | | | | | | | | | | | | | | | | | | | | | | | | | | | | | | | | | | | | | | | | | | | | | | | (7,261 | ) |
Total | | | | | | | | | | | | | | | | | | | | | | | | | | | | | | | | | | | | | | | | | | | | | | | | | | $ | 1,789,588 | |
_________
| 1. | Fixed-rate debt includes notional principal fixed through swap transactions. |
| 2. | Represents the Company's pro-rata share of debt based on its percent ownership. |
| 3. | Represents the noncontrolling interest pro-rata share of consolidated partnership debt based on its percent ownership. |
| 4. | Represents the Company's pro-rata share of unconsolidated partnership debt based on its percent ownership. |
| 5. | Variable rate debt includes certain borrowings that are subject to interest rate cap agreements. |
| 6. | Based on debt maturity date without regard to swap expirations or available extension options. |

| Portfolio Debt - Detail |
Supplemental Report – September 30, 2020 | (in thousands) |
| | | | Principal Balance at | | | Acadia's Pro-rata Share | | | Interest | | | | | Extension |
Property | | | | September 30, 2020 | | | Percent | | | Amount | | | Rate | | | Maturity | | Options |
| | | | | | | | | | | | | | | | | | | | | | |
CORE PORTFOLIO | | | | | | | | | | | | | | | | | | | | | | |
| | | | | | | | | | | | | | | | | | | | | | |
Fixed-Rate Debt | | | | | | | | | | | | | | | | | | | | | | |
Brandywine 2 | | | | $ | 26,250 | | | | 22.22 | % | | $ | 5,833 | | | 6.00% | | | 07/01/16 | | None |
163 Highland Avenue | | | | | 8,371 | | | | 100.00 | % | | | 8,371 | | | 4.66% | | | 02/01/24 | | None |
Crossroads Shopping Center | | | | | 63,970 | | | | 49.00 | % | | | 31,345 | | | 3.94% | | | 10/06/24 | | None |
555 9th Street | | | | | 60,000 | | | | 100.00 | % | | | 60,000 | | | 3.99% | | | 01/01/25 | | None |
840 N. Michigan | | | | | 73,500 | | | | 88.43 | % | | | 64,996 | | | 4.36% | | | 02/10/25 | | None |
Georgetown Portfolio (2008 Investment) | | | | | 15,921 | | | | 50.00 | % | | | 7,961 | | | 4.72% | | | 12/10/27 | | None |
State & Washington | | | | | 23,446 | | | | 100.00 | % | | | 23,446 | | | 4.40% | | | 09/05/28 | | None |
239 Greenwich Avenue | | | | | 26,332 | | | | 75.00 | % | | | 19,749 | | | 3.88% | | | 01/10/29 | | None |
North & Kingsbury | | | | | 11,860 | | | | 100.00 | % | | | 11,860 | | | 4.01% | | | 11/05/29 | | None |
151 North State Street | | | | | 13,334 | | | | 100.00 | % | | | 13,334 | | | 4.03% | | | 12/01/29 | | None |
Concord & Milwaukee | | | | | 2,589 | | | | 100.00 | % | | | 2,589 | | | 4.40% | | | 06/01/30 | | None |
California & Armitage | | | | | 2,450 | | | | 100.00 | % | | | 2,450 | | | 5.89% | | | 04/15/35 | | None |
Unsecured interest rate swaps 1 | | | | | 477,400 | | | | 100.00 | % | | | 477,400 | | | 3.44% | | | 2.3 YRS | | |
Secured interest rate swaps 1 | | | | | 99,788 | | | | 90.14 | % | | | 89,952 | | | 3.78% | | | 5.8 YRS | | |
| | | | | | | | | | | | | | | | | | | | | | |
Sub-Total Fixed-Rate Debt | | | | | 905,211 | | | | | | | | 819,286 | | | 3.72% | | | | | |
| | | | | | | | | | | | | | | | | | | | | | |
Secured Variable-Rate Debt | | | | | | | | | | | | | | | | | | | | | | |
3104 M Street 5 | | | | | 4,416 | | | | 20.00 | % | | | 883 | | | Prime+50 | | | 12/10/21 | | None |
28 Jericho Turnpike | | | | | 13,028 | | | | 100.00 | % | | | 13,028 | | | LIBOR+190 | | | 01/23/23 | | None |
60 Orange Street | | | | | 6,797 | | | | 98.00 | % | | | 6,661 | | | LIBOR+175 | | | 04/03/23 | | None |
Gotham Plaza | | | | | 19,020 | | | | 49.00 | % | | | 9,320 | | | LIBOR+160 | | | 06/10/23 | | None |
Georgetown Portfolio (2016 Investment) | | | | | 160,000 | | | | 20.00 | % | | | 32,000 | | | LIBOR+170 | | | 08/01/23 | | None |
330-340 River Street | | | | | 10,943 | | | | 100.00 | % | | | 10,943 | | | LIBOR+170 | | | 06/01/26 | | None |
Sullivan Center | | | | | 50,000 | | | | 100.00 | % | | | 50,000 | | | LIBOR+150 | | | 11/16/28 | | None |
Secured interest rate swaps 1 | | | | | (99,788 | ) | | | 90.14 | % | | | (89,952 | ) | | LIBOR+362 | | | 5.8 YRS | | |
| | | | | | | | | | | | | | | | | | | | | | |
Unsecured Variable-Rate Debt | | | | | | | | | | | | | | | | | | | | | | |
Unsecured Term Loan | | | | | 30,000 | | | | 100.00 | % | | | 30,000 | | | 3.30% | | | 06/30/21 | | None |
Unsecured Line of Credit 3 | | | | | 127,400 | | | | 100.00 | % | | | 127,400 | | | LIBOR+115 | | | 03/31/22 | | 2 x 6 mos. |
Unsecured Term Loan | | | | | 350,000 | | | | 100.00 | % | | | 350,000 | | | LIBOR+125 | | | 03/31/23 | | None |
Unsecured interest rate swaps 1 | | | | | (477,400 | ) | | | 100.00 | % | | | (477,400 | ) | | LIBOR+328 | | | 2.3 YRS | | |
| | | | | | | | | | | | | | | | | | | | | | |
Sub-Total Variable-Rate Debt | | | | | 194,416 | | | | | | | | 62,883 | | | LIBOR+84 | | | | | |
| | | | | | | | | | | | | | | | | | | | | | |
Total Debt - Core Portfolio | | | | $ | 1,099,627 | | | | | | | $ | 882,169 | | | 3.52% | | | | | |
| | | | | | | | | | | | | | | | | | | | | | |
Funds | | | | | | | | | | | | | | | | | | | | | | |
Fixed-Rate Debt | | | | | | | | | | | | | | | | | | | | | | |
CityPoint 4 | | Fund II | | | 200,000 | | | | 26.67 | % | | | 53,340 | | | Prime+250 | | | 05/29/22 | | None |
1964 Union Street 4 | | Fund IV | | | 1,463 | | | | 20.80 | % | | | 304 | | | 3.80% | | | 10/01/25 | | None |
2207 Fillmore Street 4 | | Fund IV | | | 1,120 | | | | 20.80 | % | | | 233 | | | 4.50% | | | 10/31/25 | | None |
2208-2216 Fillmore Street 4 | | Fund IV | | | 5,606 | | | | 20.80 | % | | | 1,166 | | | 3.40% | | | 06/01/26 | | None |
Interest rate swaps 1 | | Funds II, IV & V | | | 570,933 | | | | 20.13 | % | | | 114,951 | | | 3.61% | | | 0.3 YRS | | |
Sub-Total Fixed-Rate Debt | | | | | 779,122 | | | | | | | | 169,994 | | | 4.28% | | | | | |
| | | | | | | | | | | | | | | | | | | | | | |
Variable-Rate Debt | | | | | | | | | | | | | | | | | | | | | | |
650 Bald Hill Road 4 | | Fund IV | | | 15,275 | | | | 20.81 | % | | | 3,179 | | | LIBOR+265 | | | 10/27/20 | | 1 x 6 mos. |
Eden Square 4 | | Fund IV | | | 23,833 | | | | 22.78 | % | | | 5,429 | | | LIBOR+215 | | | 12/01/20 | | 1 x 12 mos. |
717 N. Michigan Avenue | | Fund IV | | | 56,700 | | | | 23.12 | % | | | 13,109 | | | LIBOR+310 | | | 12/09/20 | | 1 x 12 mos. |
Acadia Strategic Opportunity IV LLC | | Fund IV | | | 3,604 | | | | 23.12 | % | | | 833 | | | LIBOR+165 | | | 12/31/20 | | None |
640 Broadway 4 | | Fund III | | | 39,470 | | | | 15.49 | % | | | 6,114 | | | LIBOR+310 | | | 01/09/21 | | 1 x 12 mos. |

| Portfolio Debt - Detail |
Supplemental Report – September 30, 2020 | (in thousands) |
| | | | Principal Balance at | | | Acadia's Pro-rata Share | | | Interest | | | | | Extension |
Property | | | | September 30, 2020 | | | Percent | | | Amount | | | Rate | | | Maturity | | Options |
| | | | | | | | | | | | | | | | | | | | | | |
New Towne Center | | Fund V | | | 16,780 | | | | 20.10 | % | | | 3,373 | | | LIBOR+220 | | | 02/01/21 | | 2 x 12 mos. |
Wake Forest Crossing | | Fund IV | | | 23,048 | | | | 23.12 | % | | | 5,329 | | | LIBOR+160 | | | 02/14/21 | | 1 x 12 mos. |
Lincoln Place | | Fund IV | | | 23,100 | | | | 23.12 | % | | | 5,341 | | | LIBOR+185 | | | 03/13/21 | | 1 x 12 mos. |
Broughton Street Portfolio | | Fund IV | | | 29,175 | | | | 23.12 | % | | | 6,745 | | | LIBOR+250 | | | 05/01/21 | | None |
Acadia Strategic Opportunity Fund V LLC | | Fund V | | | — | | | | 20.10 | % | | | — | | | LIBOR+160 | | | 05/03/21 | | None |
Fairlane Green | | Fund V | | | 40,300 | | | | 20.10 | % | | | 8,100 | | | LIBOR+190 | | | 06/05/21 | | 2 x 12 mos. |
17 E. 71st Street | | Fund IV | | | 15,385 | | | | 23.12 | % | | | 3,557 | | | LIBOR+300 | | | 06/09/21 | | None |
Trussville Promenade | | Fund V | | | 29,370 | | | | 20.10 | % | | | 5,903 | | | LIBOR+185 | | | 06/15/21 | | 2 x 12 mos. |
Cortlandt Crossing | | Fund III | | | 36,252 | | | | 24.54 | % | | | 8,896 | | | LIBOR+275 | | | 06/19/21 | | 1 x 12 mos. |
Acadia Strategic Opportunity IV LLC | | Fund IV | | | 79,225 | | | | 23.12 | % | | | 18,317 | | | LIBOR+200 | | | 06/30/21 | | None |
146 Geary Street | | Fund IV | | | 22,900 | | | | 23.12 | % | | | 5,294 | | | LIBOR+340 | | | 07/14/21 | | 1 x 12 mos. |
Restaurants at Fort Point | | Fund IV | | | 5,986 | | | | 23.12 | % | | | 1,384 | | | LIBOR+235 | | | 08/25/21 | | None |
Acadia Strategic Opportunity Fund II, LLC | | Fund II | | | 40,000 | | | | 28.33 | % | | | 11,332 | | | LIBOR+165 | | | 09/20/21 | | 1 x 12 mos. |
CityPoint 4 | | Fund II | | | 18,872 | | | | 26.67 | % | | | 5,033 | | | LIBOR+139 | | | 11/01/21 | | None |
Promenade at Manassas 4 | | Fund IV | | | 27,480 | | | | 22.78 | % | | | 6,260 | | | LIBOR+175 | | | 12/05/21 | | 2 x 12 mos. |
Airport Mall | | Fund IV | | | 5,224 | | | | 23.12 | % | | | 1,208 | | | LIBOR+200 | | | 04/01/22 | | None |
Dauphin Plaza | | Fund IV | | | 9,552 | | | | 23.12 | % | | | 2,208 | | | LIBOR+200 | | | 04/01/22 | | None |
Shaw's Plaza (Waterville) | | Fund IV | | | 7,532 | | | | 23.12 | % | | | 1,741 | | | LIBOR+200 | | | 04/01/22 | | None |
Wells Plaza | | Fund IV | | | 3,126 | | | | 23.12 | % | | | 723 | | | LIBOR+200 | | | 04/01/22 | | None |
CityPoint Phase III 4 | | Fund II | | | 26,670 | | | | 26.67 | % | | | 7,113 | | | LIBOR+300 | | | 03/01/22 | | 2 x 12 mos. |
Dauphin Plaza | | Fund IV | | | 3,000 | | | | 23.12 | % | | | 694 | | | LIBOR+200 | | | 04/01/22 | | None |
Wells Plaza - Second Mortgage | | Fund IV | | | 2,500 | | | | 23.12 | % | | | 578 | | | LIBOR+200 | | | 04/01/22 | | None |
Paramus Plaza 4 | | Fund IV | | | 20,810 | | | | 11.56 | % | | | 2,406 | | | LIBOR+175 | | | 04/26/22 | | None |
Riverdale 4 | | Fund V | | | 32,233 | | | | 17.97 | % | | | 5,794 | | | LIBOR+170 | | | 05/28/22 | | 2 x 12 mos. |
Shaw's Plaza (Windham) | | Fund IV | | | 5,589 | | | | 23.12 | % | | | 1,292 | | | LIBOR+200 | | | 12/01/22 | | None |
Mayfair Center | | Fund IV | | | 11,673 | | | | 23.12 | % | | | 2,699 | | | LIBOR+200 | | | 12/01/22 | | 2 x 12 mos. |
Elk Grove Commons | | Fund V | | | 41,500 | | | | 20.10 | % | | | 8,342 | | | LIBOR+150 | | | 01/01/23 | | 1 x 12 mos. |
Hiram Pavilion | | Fund V | | | 28,830 | | | | 20.10 | % | | | 5,795 | | | LIBOR+190 | | | 03/05/24 | | None |
Hickory Ridge | | Fund V | | | 30,000 | | | | 20.10 | % | | | 6,030 | | | LIBOR+190 | | | 10/05/24 | | None |
Tri-City Plaza 4 | | Fund V | | | 38,670 | | | | 18.09 | % | | | 6,995 | | | LIBOR+190 | | | 10/18/24 | | 1 x 12 mos. |
Landstown Commons | | Fund V | | | 60,900 | | | | 20.10 | % | | | 12,241 | | | LIBOR+170 | | | 10/24/24 | | None |
Lincoln Commons | | Fund V | | | 38,820 | | | | 20.10 | % | | | 7,803 | | | LIBOR+170 | | | 10/24/24 | | None |
Palm Coast Landing | | Fund V | | | 26,500 | | | | 20.10 | % | | | 5,327 | | | LIBOR+175 | | | 11/01/24 | | None |
Frederick Crossing 4 | | Fund V | | | 24,290 | | | | 18.09 | % | | | 4,394 | | | LIBOR+175 | | | 12/02/24 | | 1 x 12 mos. |
Plaza Santa Fe | | Fund V | | | 22,893 | | | | 20.10 | % | | | 4,601 | | | LIBOR+190 | | | 12/20/24 | | None |
Frederick County Square 4 | | Fund V | | | 15,120 | | | | 18.09 | % | | | 2,735 | | | LIBOR+240 | | | 01/01/25 | | 1 x 12 mos. |
Interest rate swaps 1 | | Funds II, IV & V | | | (570,933 | ) | | | 20.13 | % | | | (114,951 | ) | | LIBOR+346 | | | 0.3 YRS | | |
Sub-Total Variable-Rate Debt | | | | | 431,254 | | | | | | | | 99,296 | | | LIBOR+211 | | | | | |
Total Debt - Funds | | | | $ | 1,210,376 | | | | | | | $ | 269,290 | | | 3.54% | | | | | |
Total Debt - Core Portfolio and Funds | | | | $ | 2,310,003 | | | | | | | $ | 1,151,459 | | | 3.53% | | | | | |
_________
| 1. | The Company has hedged a portion of its variable-rate debt with variable to fixed-rate swap agreements. Maturity reflects the weighted-average years to maturity of the swapped loans without regard to the expiration of the related swap agreements. |
| 2. | This loan is in default as of September 30, 2020 and is accruing interest for accounting purposes at the default rate of 11%. |
| 3. | The interest rate on the unsecured revolving credit facility excludes a 20-basis point facility fee. |
| 4. | Acadia's interest in this Fund debt is also reflected net of other JV interests at the investment level. |
| 5. | Bears interest at the greater of 4% or the Prime Rate plus 50 basis points. |

| Future Debt Maturities 1 |
Supplemental Report – September 30, 2020 | (in thousands) |
Core Portfolio | | Contractual Debt Maturities | | | Acadia's Pro-Rata Share | | | Weighted Average Interest Rate | |
| | | | | | | | | | | | | | | | | | | | | | | | | | | | | | Fixed- | | | | | |
| | Scheduled | | | | | | | | | | | Scheduled | | | | | | | | | | | Total | | | Rate | | | Variable- | |
Year | | Amortization | | | Maturities | | | Total | | | Amortization | | | Maturities | | | Total | | | Debt | | | Debt | | | Rate Debt | |
| | | | | | | | | | | | | | | | | | | | | | | | | | | | | | | | | | | | |
2020 (Remainder) 2 | | $ | 1,423 | | | $ | 26,250 | | | $ | 27,673 | | | $ | 1,080 | | | $ | 5,833 | | | $ | 6,913 | | | 6.00% | | | 6.00% | | | n/a | |
2021 | | | 5,940 | | | | 34,178 | | | | 40,118 | | | | 4,489 | | | | 30,836 | | | | 35,325 | | | 3.75% | | | n/a | | | 3.75% | |
2022 | | | 5,987 | | | | 127,400 | | | | 133,387 | | | | 4,633 | | | | 127,400 | | | | 132,033 | | | 1.51% | | | n/a | | | 1.51% | |
2023 | | | 5,070 | | | | 545,353 | | | | 550,423 | | | | 3,843 | | | | 408,309 | | | | 412,152 | | | 1.48% | | | n/a | | | 1.48% | |
2024 | | | 4,235 | | | | 65,753 | | | | 69,988 | | | | 3,288 | | | | 35,960 | | | | 39,248 | | | 4.09% | | | 4.09% | | | n/a | |
Thereafter | | | 14,662 | | | | 263,376 | | | | 278,038 | | | | 13,258 | | | | 243,240 | | | | 256,498 | | | 3.57% | | | 4.18% | | | 1.69% | |
Total | | $ | 37,317 | | | $ | 1,062,310 | | | $ | 1,099,627 | | | $ | 30,591 | | | $ | 851,578 | | | $ | 882,169 | | | | | | | | | | | | | |
| | | | | | | | | | | | | | | | | | | | | | | | | | | | | | | | | | | | |
| | | | | | | | | | | | | | | | | | | | | | | | | | | | | | | | | | | | |
Funds | | Contractual Debt Maturities | | | Acadia's Pro-Rata Share | | | Weighted Average Interest Rate | |
| | | | | | | | | | | | | | | | | | | | | | | | | | | | | | Fixed- | | | | | |
| | Scheduled | | | | | | | | | | | Scheduled | | | | | | | | | | | Total | | | Rate | | | Variable- | |
Year | | Amortization | | | Maturities | | | Total | | | Amortization | | | Maturities | | | Total | | | Debt | | | Debt | | | Rate Debt | |
| | | | | | | | | | | | | | | | | | | | | | | | | | | | | | | | | | | | |
2020 (Remainder) | | $ | 1,102 | | | $ | 99,273 | | | $ | 100,375 | | | $ | 253 | | | $ | 22,519 | | | $ | 22,772 | | | 2.91% | | | n/a | | | 2.91% | |
2021 | | | 3,124 | | | | 445,989 | | | | 449,113 | | | | 708 | | | | 100,652 | | | | 101,360 | | | 2.34% | | | n/a | | | 2.34% | |
2022 | | | 3,221 | | | | 325,548 | | | | 328,769 | | | | 667 | | | | 79,250 | | | | 79,917 | | | 4.30% | | | 5.25% | | | 2.34% | |
2023 | | | 4,747 | | | | 40,947 | | | | 45,694 | | | | 936 | | | | 8,230 | | | | 9,166 | | | 1.66% | | | n/a | | | 1.66% | |
2024 | | | 3,436 | | | | 260,455 | | | | 263,891 | | | | 675 | | | | 51,125 | | | | 51,800 | | | 1.95% | | | n/a | | | 1.95% | |
Thereafter | | | 274 | | | | 22,260 | | | | 22,534 | | | | 54 | | | | 4,221 | | | | 4,275 | | | 2.94% | | | 3.64% | | | 2.56% | |
Total | | $ | 15,904 | | | $ | 1,194,472 | | | $ | 1,210,376 | | | $ | 3,293 | | | $ | 265,997 | | | $ | 269,290 | | | | | | | | | | | | | |
| | | | | | | | | | | | | | | | | | | | | | | | | | | | | | | | | | | | |
__________
| 1. | Does not include any applicable extension options or subsequent refinancings. |
| 2. | Includes $26.3 million related to a loan that was in default at September 30, 2020. For further information see our debt disclosures in our Annual Report on Form 10-K and Form 10-Q for the year ended December 31, 2019 and three months ended September 30, 2020, respectively. |

| Future Debt Maturities – As Extended 1 |
Supplemental Report – September 30, 2020 | (in thousands) |
Core Portfolio | | Extended Debt Maturities 1 | | | Acadia's Pro-Rata Share | | | Weighted Average Interest Rate | |
| | | | | | | | | | | | | | | | | | | | | | | | | | | | | | Fixed- | | | | | |
| | Scheduled | | | | | | | | | | | Scheduled | | | | | | | | | | | Total | | | Rate | | | Variable- | |
Year | | Amortization | | | Maturities | | | Total | | | Amortization | | | Maturities | | | Total | | | Debt | | | Debt | | | Rate Debt | |
| | | | | | | | | | | | | | | | | | | | | | | | | | | | | | | | | | | | |
2020 (Remainder) 2 | | $ | 1,423 | | | $ | 26,250 | | | $ | 27,673 | | | $ | 1,080 | | | $ | 5,833 | | | $ | 6,913 | | | 6.00% | | | 6.00% | | | n/a | |
2021 | | | 5,940 | | | | 34,178 | | | | 40,118 | | | | 4,489 | | | | 30,836 | | | | 35,325 | | | 3.75% | | | n/a | | | 3.75% | |
2022 | | | 5,987 | | | | — | | | | 5,987 | | | | 4,633 | | | | — | | | | 4,633 | | | n/a | | | n/a | | | n/a | |
2023 | | | 5,070 | | | | 672,753 | | | | 677,823 | | | | 3,843 | | | | 535,709 | | | | 539,552 | | | 1.48% | | | n/a | | | 1.48% | |
2024 | | | 4,235 | | | | 65,753 | | | | 69,988 | | | | 3,288 | | | | 35,960 | | | | 39,248 | | | 4.09% | | | 4.09% | | | n/a | |
Thereafter | | | 14,662 | | | | 263,376 | | | | 278,038 | | | | 13,258 | | | | 243,240 | | | | 256,498 | | | 3.57% | | | 4.18% | | | 1.69% | |
Total | | $ | 37,317 | | | $ | 1,062,310 | | | $ | 1,099,627 | | | $ | 30,591 | | | $ | 851,578 | | | $ | 882,169 | | | | | | | | | | | | | |
| | | | | | | | | | | | | | | | | | | | | | | | | | | | | | | | | | | | |
| | | | | | | | | | | | | | | | | | | | | | | | | | | | | | | | | | | | |
Funds | | Extended Debt Maturities 1 | | | Acadia's Pro-Rata Share | | | Weighted Average Interest Rate | |
| | | | | | | | | | | | | | | | | | | | | | | | | | | | | | Fixed- | | | | | |
| | Scheduled | | | | | | | | | | | Scheduled | | | | | | | | | | | Total | | | Rate | | | Variable- | |
Year | | Amortization | | | Maturities | | | Total | | | Amortization | | | Maturities | | | Total | | | Debt | | | Debt | | | Rate Debt | |
| | | | | | | | | | | | | | | | | | | | | | | | | | | | | | | | | | | | |
2020 (Remainder) | | $ | 1,102 | | | $ | 42,573 | | | $ | 43,675 | | | $ | 253 | | | $ | 9,410 | | | $ | 9,663 | | | 2.43% | | | n/a | | | 2.43% | |
2021 | | | 3,124 | | | | 232,286 | | | | 235,410 | | | | 708 | | | | 54,271 | | | | 54,979 | | | 2.53% | | | n/a | | | 2.53% | |
2022 | | | 3,221 | | | | 271,960 | | | | 275,181 | | | | 667 | | | | 58,392 | | | | 59,059 | | | 2.35% | | | n/a | | | 2.35% | |
2023 | | | 4,747 | | | | 286,328 | | | | 291,075 | | | | 936 | | | | 70,693 | | | | 71,629 | | | 4.10% | | | 4.75% | | | 2.10% | |
2024 | | | 3,437 | | | | 339,064 | | | | 342,501 | | | | 675 | | | | 69,010 | | | | 69,685 | | | 2.05% | | | n/a | | | 2.05% | |
Thereafter | | | 274 | | | | 22,260 | | | | 22,534 | | | | 54 | | | | 4,221 | | | | 4,275 | | | 2.94% | | | 3.64% | | | 2.56% | |
Total | | $ | 15,905 | | | $ | 1,194,471 | | | $ | 1,210,376 | | | $ | 3,293 | | | $ | 265,997 | | | $ | 269,290 | | | | | | | | | | | | | |
| | | | | | | | | | | | | | | | | | | | | | | | | | | | | | | | | | | | |
| 1. | Includes the effect of all available extension options (subject to customary conditions), excludes any subsequent refinancings. |
| 2. | Includes $26.3 million related to a loan that was in default at September 30, 2020. For further information see our debt disclosures in our Annual Report on Form 10-K and Form 10-Q for the year ended December 31, 2019 and three months ended September 30, 2020, respectively. |

| Core Portfolio Retail Properties - Detail |
Supplemental Report – September 30, 2020 | |
| | | | | | Year | | Acadia's | | | Gross Leasable Area (GLA) | | | In Place Occupancy | | | Leased Occupancy | | | Annualized Base Rent | | | ABR | |
Property | | Key Tenants | | | Acquired | | Interest | | | Street | | | Anchors | | | Shops | | | Total | | | Street | | | Anchors | | | Shops | | | Total | | | Total | | | (ABR) | | | PSF | |
| | | | | | | | | | | | | | | | | | | | | | | | | | | | | | | | | | | | | | | | | | | | | | | | | | | | | | |
STREET AND URBAN RETAIL | | | | | | | | | | | | | | | | | | | | | | | | | | | | | | | | | | | | | | | | | | | | | | | | | | | |
Chicago Metro | | | | | | | | | | | | | | | | | | | | | | | | | | | | | | | | | | | | | | | | | | | | | | | | | | | | | | |
664 N. Michigan Avenue | | Tommy Bahama, Ann Taylor Loft | | | 2013 | | | 100.0 | % | | | 18,141 | | | | — | | | | — | | | | 18,141 | | | | 100.0 | % | | | — | % | | | — | % | | | 100.0 | % | | | 100.0 | % | | $ | 4,963,891 | | | $ | 273.63 | |
840 N. Michigan Avenue | | H & M, Verizon Wireless | | | 2014 | | | 88.4 | % | | | 87,135 | | | | — | | | | — | | | | 87,135 | | | | 100.0 | % | | | — | % | | | — | % | | | 100.0 | % | | | 100.0 | % | | | 8,381,048 | | | | 96.18 | |
Rush and Walton Streets Collection (6 properties) | | Lululemon, BHLDN, Reformation, Sprinkles | | | 2011 2012 | | | 100.0 | % | | | 40,384 | | | | — | | | | — | | | | 40,384 | | | | 81.0 | % | | | — | % | | | — | % | | | 81.0 | % | | | 81.0 | % | | | 5,559,800 | | | | 169.94 | |
651-671 West Diversey | | Trader Joe's, Urban Outfitters | | | 2011 | | | 100.0 | % | | | 46,259 | | | | — | | | | — | | | | 46,259 | | | | 100.0 | % | | | — | % | | | — | % | | | 100.0 | % | | | 100.0 | % | | | 2,051,814 | | | | 44.35 | |
Clark Street and W. Diversey Collection (4 properties) | | Starbucks | | | 2011 2012 | | | 100.0 | % | | | 53,309 | | | | — | | | | — | | | | 53,309 | | | | 53.2 | % | | | — | % | | | — | % | | | 53.2 | % | | | 53.2 | % | | | 1,214,057 | | | | 42.79 | |
Halsted and Armitage Collection (13 properties) | | Serena and Lily, Bonobos, Allbirds Warby Parker, Marine Layer, Kiehl's | | | 2011 2012 2019 2020 | | | 100.0 | % | | | 52,804 | | | | — | | | | — | | | | 52,804 | | | | 100.0 | % | | | — | % | | | — | % | | | 100.0 | % | | | 100.0 | % | | | 2,518,721 | | | | 47.70 | |
North Lincoln Park Chicago Collection (6 properties) | | Champion, Carhartt | | | 2011 2014 | | | 100.0 | % | | | 22,125 | | | | — | | | | 27,796 | | | | 49,921 | | | | 27.7 | % | | | — | % | | | 62.0 | % | | | 46.8 | % | | | 46.8 | % | | | 860,193 | | | | 36.81 | |
State and Washington | | Nordstrom Rack, Uniqlo | | | 2016 | | | 100.0 | % | | | 78,771 | | | | — | | | | — | | | | 78,771 | | | | 100.0 | % | | | — | % | | | — | % | | | 100.0 | % | | | 100.0 | % | | | 3,309,875 | | | | 42.02 | |
151 N. State Street | | Walgreens | | | 2016 | | | 100.0 | % | | | 27,385 | | | | — | | | | — | | | | 27,385 | | | | 100.0 | % | | | — | % | | | — | % | | | 100.0 | % | | | 100.0 | % | | | 1,430,000 | | | | 52.22 | |
North and Kingsbury | | Old Navy | | | 2016 | | | 100.0 | % | | | 41,700 | | | | — | | | | — | | | | 41,700 | | | | 81.5 | % | | | — | % | | | — | % | | | 81.5 | % | | | 81.5 | % | | | 1,322,098 | | | | 38.89 | |
Concord and Milwaukee | | | — | | | 2016 | | | 100.0 | % | | | 13,105 | | | | — | | | | — | | | | 13,105 | | | | 100.0 | % | | | — | % | | | — | % | | | 100.0 | % | | | 100.0 | % | | | 429,240 | | | | 32.75 | |
California and Armitage | | | — | | | 2016 | | | 100.0 | % | | | — | | | | — | | | | 18,275 | | | | 18,275 | | | | — | % | | | — | % | | | 70.6 | % | | | 70.6 | % | | | 70.6 | % | | | 655,337 | | | | 50.83 | |
Roosevelt Galleria | | Petco, Vitamin Shoppe | | | 2015 | | | 100.0 | % | | | — | | | | — | | | | 37,995 | | | | 37,995 | | | | — | % | | | — | % | | | 47.7 | % | | | 47.7 | % | | | 47.7 | % | | | 604,179 | | | | 33.33 | |
Sullivan Center | | Target, DSW | | | 2016 | | | 100.0 | % | | | 176,181 | | | | — | | | | — | | | | 176,181 | | | | 95.4 | % | | | — | % | | | — | % | | | 95.4 | % | | | 95.4 | % | | | 6,342,903 | | | | 37.76 | |
| | | | | | | | | | | | | 657,299 | | | | — | | | | 84,066 | | | | 741,365 | | | | 90.2 | % | | | — | % | | | 57.4 | % | | | 86.5 | % | | | 87.8 | % | | | 39,643,156 | | | | 61.84 | |
New York Metro | | | | | | | | | | | | | | | | | | | | | | | | | | | | | | | | | | | | | | | | | | | | | | | | | | | | | | |
Soho Collection (11 properties) | | Paper Source, Faherty, ALC Stone Island, Taft, Frame, Theory | | | 2011 2014 2019 2020 | | | 100.0 | % | | | 36,769 | | | | — | | | | — | | | | 36,769 | | | | 90.8 | % | | | — | % | | | — | % | | | 90.8 | % | | | 90.8 | % | | | 10,246,707 | | | | 306.84 | |
5-7 East 17th Street | | Union Park Events | | | 2008 | | | 100.0 | % | | | 11,467 | | | | — | | | | — | | | | 11,467 | | | | 100.0 | % | | | — | % | | | — | % | | | 100.0 | % | | | 100.0 | % | | | 1,300,014 | | | | 113.37 | |
200 West 54th Street | | | — | | | 2007 | | | 100.0 | % | | | 5,777 | | | | — | | | | — | | | | 5,777 | | | | 48.0 | % | | | — | % | | | — | % | | | 48.0 | % | | | 48.0 | % | | | 1,188,283 | | | | 428.36 | |
61 Main Street | | | — | | | 2014 | | | 100.0 | % | | | 3,470 | | | | — | | | | — | | | | 3,470 | | | | — | % | | | — | % | | | — | % | | | — | % | | | 100.0 | % | | | — | | | | — | |
181 Main Street | | TD Bank | | | 2012 | | | 100.0 | % | | | 11,350 | | | | — | | | | — | | | | 11,350 | | | | 100.0 | % | | | — | % | | | — | % | | | 100.0 | % | | | 100.0 | % | | | 972,597 | | | | 85.69 | |
4401 White Plains Road | | Walgreens | | | 2011 | | | 100.0 | % | | | — | | | | 12,964 | | | | — | | | | 12,964 | | | | — | % | | | 100.0 | % | | | — | % | | | 100.0 | % | | | 100.0 | % | | | 625,000 | | | | 48.21 | |
Bartow Avenue | | | — | | | 2005 | | | 100.0 | % | | | — | | | | — | | | | 14,590 | | | | 14,590 | | | | — | % | | | — | % | | | 80.0 | % | | | 80.0 | % | | | 80.0 | % | | | 327,453 | | | | 28.04 | |
| Core Portfolio Retail Properties - Detail |
Supplemental Report – September 30, 2020 | |
| | | | | | Year | | Acadia's | | | Gross Leasable Area (GLA) | | | In Place Occupancy | | | Leased Occupancy | | | Annualized Base Rent | | | ABR | |
Property | | Key Tenants | | | Acquired | | Interest | | | Street | | | Anchors | | | Shops | | | Total | | | Street | | | Anchors | | | Shops | | | Total | | | Total | | | (ABR) | | | PSF | |
239 Greenwich Avenue | | Betteridge Jewelers | | | 1998 | | | 75.0 | % | | | 16,553 | | | | — | | | | — | | | | 16,553 | | | | 100.0 | % | | | — | % | | | — | % | | | 100.0 | % | | | 100.0 | % | | | 1,690,359 | | | | 102.12 | |
252-256 Greenwich Avenue | | Madewell, Blue Mercury | | | 2014 | | | 100.0 | % | | | 7,986 | | | | — | | | | — | | | | 7,986 | | | | 100.0 | % | | | — | % | | | — | % | | | 100.0 | % | | | 100.0 | % | | | 950,500 | | | | 119.02 | |
2914 Third Avenue | | Planet Fitness | | | 2006 | | | 100.0 | % | | | — | | | | 21,650 | | | | 18,670 | | | | 40,320 | | | | — | % | | | 100.0 | % | | | 44.7 | % | | | 74.4 | % | | | 74.4 | % | | | 768,172 | | | | 25.60 | |
868 Broadway | | Dr. Martens | | | 2013 | | | 100.0 | % | | | 2,031 | | | | — | | | | — | | | | 2,031 | | | | 100.0 | % | | | — | % | | | — | % | | | 100.0 | % | | | 100.0 | % | | | 814,426 | | | | 401.00 | |
313-315 Bowery 2 | | John Varvatos, Patagonia | | | 2013 | | | 100.0 | % | | | 6,600 | | | | — | | | | — | | | | 6,600 | | | | 100.0 | % | | | — | % | | | — | % | | | 100.0 | % | | | 100.0 | % | | | 479,160 | | | | 72.60 | |
120 West Broadway | | HSBC Bank | | | 2013 | | | 100.0 | % | | | 13,838 | | | | — | | | | — | | | | 13,838 | | | | 79.8 | % | | | — | % | | | — | % | | | 79.8 | % | | | 79.8 | % | | | 2,006,561 | | | | 181.78 | |
2520 Flatbush Avenue | | Bob's Disc. Furniture, Capital One | | | 2014 | | | 100.0 | % | | | — | | | | — | | | | 29,114 | | | | 29,114 | | | | — | % | | | — | % | | | 100.0 | % | | | 100.0 | % | | | 100.0 | % | | | 1,169,540 | | | | 40.17 | |
991 Madison Avenue | | Vera Wang, Gabriella Hearst | | | 2016 | | | 100.0 | % | | | 7,513 | | | | — | | | | — | | | | 7,513 | | | | 91.1 | % | | | — | % | | | — | % | | | 91.1 | % | | | 91.1 | % | | | 2,834,853 | | | | 414.01 | |
Shops at Grand | | Stop & Shop (Ahold) | | | 2014 | | | 100.0 | % | | | — | | | | 52,336 | | | | 47,349 | | | | 99,685 | | | | — | % | | | 100.0 | % | | | 100.0 | % | | | 100.0 | % | | | 100.0 | % | | | 3,339,339 | | | | 33.50 | |
Gotham Plaza | | Bank of America, Footlocker | | | 2016 | | | 49.0 | % | | | — | | | | — | | | | 25,927 | | | | 25,927 | | | | — | % | | | — | % | | | 50.2 | % | | | 50.2 | % | | | 58.3 | % | | | 856,195 | | | | 65.85 | |
| | | | | | | | | | | | | 123,354 | | | | 86,950 | | | | 135,650 | | | | 345,954 | | | | 89.2 | % | | | 100.0 | % | | | 80.7 | % | | | 88.6 | % | | | 90.2 | % | | | 29,569,159 | | | | 96.48 | |
San Francisco Metro | | | | | | | | | | | | | | | | | | | | | | | | | | | | | | | | | | | | | | | | | | | | | | | | | | | | | | |
555 9th Street | | Bed, Bath & Beyond, Nordstrom Rack | | | 2016 | | | 100.0 | % | | | — | | | | 119,862 | | | | 28,970 | | | | 148,832 | | | | — | % | | | 100.0 | % | | | 100.0 | % | | | 100.0 | % | | | 100.0 | % | | | 6,292,252 | | | | 42.28 | |
| | | | | | | | | | | | | — | | | | 119,862 | | | | 28,970 | | | | 148,832 | | | | — | % | | | 100.0 | % | | | 100.0 | % | | | 100.0 | % | | | 100.0 | % | | | 6,292,252 | | | | 42.28 | |
Los Angeles Metro | | | | | | | | | | | | | | | | | | | | | | | | | | | | | | | | | | | | | | | | | | | | | | | | | | | | | | |
Melrose Place Collection | | The Row, Chloe, Oscar de la Renta | | | 2019 | | | 100.0 | % | | | 14,000 | | | | — | | | | — | | | | 14,000 | | | | 100.0 | % | | | — | % | | | — | % | | | 100.0 | % | | | 100.0 | % | | | 2,446,433 | | | | 174.75 | |
| | | | | | | | | | | | | 14,000 | | | | — | | | | — | | | | 14,000 | | | | 100.0 | % | | | — | % | | | — | % | | | 100.0 | % | | | 100.0 | % | | | 2,446,433 | | | | 174.75 | |
District of Columbia Metro | | | | | | | | | | | | | | | | | | | | | | | | | | | | | | | | | | | | | | | | | | | | | | | | | | | | | | |
1739-53 & 1801-03 Connecticut Avenue | | TD Bank | | | 2012 | | | 100.0 | % | | | 20,669 | | | | — | | | | — | | | | 20,669 | | | | 65.0 | % | | | — | % | | | — | % | | | 65.0 | % | | | 65.0 | % | | | 871,514 | | | | 64.89 | |
Rhode Island Place Shopping Center | | Ross Dress for Less | | | 2012 | | | 100.0 | % | | | — | | | | 25,134 | | | | 32,533 | | | | 57,667 | | | | — | % | | | 100.0 | % | | | 80.7 | % | | | 89.1 | % | | | 93.4 | % | | | 1,617,822 | | | | 31.48 | |
M Street and Wisconsin Corridor (26 Properties) 3 | | Lululemon, Rent the Runway,CB2, The Reformation | | | 2011 2016 2019 | | | 25.2 | % | | | 244,259 | | | | — | | | | — | | | | 244,259 | | | | 71.1 | % | | | — | % | | | — | % | | | 71.1 | % | | | 74.5 | % | | | 13,064,636 | | | | 75.20 | |
| | | | | | | | | | | | | 264,928 | | | | 25,134 | | | | 32,533 | | | | 322,595 | | | | 70.6 | % | | | 100.0 | % | | | 80.7 | % | | | 73.9 | % | | | 77.2 | % | | | 15,553,972 | | | | 65.20 | |
Boston Metro | | | | | | | | | | | | | | | | | | | | | | | | | | | | | | | | | | | | | | | | | | | | | | | | | | | | | | |
330-340 River Street | | Whole Foods | | | 2012 | | | 100.0 | % | | | — | | | | 40,800 | | | | 13,426 | | | | 54,226 | | | | — | % | | | 100.0 | % | | | 100.0 | % | | | 100.0 | % | | | 100.0 | % | | | 1,243,517 | | | | 22.93 | |
165 Newbury Street | | Starbucks | | | 2016 | | | 100.0 | % | | | 1,050 | | | | — | | | | — | | | | 1,050 | | | | 100.0 | % | | | — | % | | | — | % | | | 100.0 | % | | | 100.0 | % | | | 277,719 | | | | 264.49 | |
| | | | | | | | | | | | | 1,050 | | | | 40,800 | | | | 13,426 | | | | 55,276 | | | | 100.0 | % | | | 100.0 | % | | | 100.0 | % | | | 100.0 | % | | | 100.0 | % | | | 1,521,236 | | | | 27.52 | |
| | | | | | | | | | | | | | | | | | | | | | | | | | | | | | | | | | | | | | | | | | | | | | | | | | | | | | |
Total Street and Urban Retail | | | | | | | | | | 1,060,631 | | | | 272,746 | | | | 294,645 | | | | 1,628,022 | | | | 85.3 | % | | | 100.0 | % | | | 76.8 | % | | | 86.3 | % | | | 87.9 | % | | $ | 95,026,208 | | | $ | 67.67 | |
| | | | | | | | | | | | | | | | | | | | | | | | | | | | | | | | | | | | | | | | | | | | | | | | | | | | | | |
Acadia Share Total Street and Urban Retail | | | | | | | | | | 860,060 | | | | 272,746 | | | | 281,422 | | | | 1,414,229 | | | | 88.2 | % | | | 100.0 | % | | | 78.1 | % | | | 88.4 | % | | | 89.8 | % | | $ | 83,758,006 | | | $ | 66.96 | |
| | | | | | | | | | | | | | | | | | | | | | | | | | | | | | | | | | | | | | | | | | | | | | | | | | | | | | |
| Core Portfolio Retail Properties - Detail |
Supplemental Report – September 30, 2020 | |
| | | | | | Year | | Acadia's | | | Gross Leasable Area (GLA) | | | In Place Occupancy | | | Leased Occupancy | | | Annualized Base Rent | | | ABR | |
Property | | Key Tenants | | | Acquired | | Interest | | | Street | | | Anchors | | | Shops | | | Total | | | Street | | | Anchors | | | Shops | | | Total | | | Total | | | (ABR) | | | PSF | |
SUBURBAN PROPERTIES | | | | | | | | | | | | | | | | | | | | | | | | | | | | | | | | | | | | | | | | | | | | | | | | | | | |
New Jersey | | | | | | | | | | | | | | | | | | | | | | | | | | | | | | | | | | | | | | | | | | | | | | | | | | | | | | |
Marketplace of Absecon | | Walgreens, Dollar Tree | | | 1998 | | | 100.0 | % | | | — | | | | 46,724 | | | | 57,832 | | | | 104,556 | | | | — | % | | | 100.0 | % | | | 75.0 | % | | | 86.2 | % | | | 86.2 | % | | | 1,343,094 | | | | 14.91 | |
60 Orange Street | | Home Depot | | | 2012 | | | 98.0 | % | | | — | | | | 101,715 | | | | — | | | | 101,715 | | | | — | % | | | 100.0 | % | | | — | % | | | 100.0 | % | | | 100.0 | % | | | 730,000 | | | | 7.18 | |
| | | | | | | | | | | | | | | | | | | | | | | | | | | | | | | | | | | | | | | | | | | | | | | | | | | | | | |
New York | | | | | | | | | | | | | | | | | | | | | | | | | | | | | | | | | | | | | | | | | | | | | | | | | | | | | | |
Village Commons Shopping Center | | | — | | | 1998 | | | 100.0 | % | | | — | | | | — | | | | 87,128 | | | | 87,128 | | | | — | % | | | — | % | | | 96.1 | % | | | 96.1 | % | | | 96.1 | % | | | 2,780,906 | | | | 33.20 | |
Branch Plaza | | LA Fitness, The Fresh Market | | | 1998 | | | 100.0 | % | | | — | | | | 76,264 | | | | 47,081 | | | | 123,345 | | | | — | % | | | 100.0 | % | | | 80.4 | % | | | 92.5 | % | | | 98.8 | % | | | 3,182,421 | | | | 27.88 | |
Amboy Center | | Stop & Shop (Ahold) | | | 2005 | | | 100.0 | % | | | — | | | | 37,266 | | | | 26,024 | | | | 63,290 | | | | — | % | | | 100.0 | % | | | 66.1 | % | | | 86.1 | % | | | 86.1 | % | | | 1,842,043 | | | | 33.82 | |
LA Fitness | | LA Fitness | | | 2007 | | | 100.0 | % | | | — | | | | 55,000 | | | | — | | | | 55,000 | | | | — | % | | | 100.0 | % | | | — | % | | | 100.0 | % | | | 100.0 | % | | | 1,485,287 | | | | 27.01 | |
Crossroads Shopping Center | | HomeGoods,Pet- Smart, Kmart | | | 1998 | | | 49.0 | % | | | — | | | | 202,727 | | | | 109,177 | | | | 311,904 | | | | — | % | | | 87.7 | % | | | 58.4 | % | | | 77.4 | % | | | 77.4 | % | | | 5,779,159 | | | | 23.93 | |
New Loudon Center | | Price Chopper, Marshalls | | | 1993 | | | 100.0 | % | | | — | | | | 242,058 | | | | 13,615 | | | | 255,673 | | | | — | % | | | 94.8 | % | | | 33.9 | % | | | 91.6 | % | | | 95.1 | % | | | 1,909,771 | | | | 8.16 | |
28 Jericho Turnpike | | Kohl's | | | 2012 | | | 100.0 | % | | | — | | | | 96,363 | | | | — | | | | 96,363 | | | | — | % | | | 100.0 | % | | | — | % | | | 100.0 | % | | | 100.0 | % | | | 1,815,000 | | | | 18.84 | |
Bedford Green | | Shop Rite, CVS | | | 2014 | | | 100.0 | % | | | — | | | | 37,981 | | | | 52,608 | | | | 90,589 | | | | — | % | | | 100.0 | % | | | 62.5 | % | | | 78.2 | % | | | 78.2 | % | | | 2,309,990 | | | | 32.61 | |
| | | | | | | | | | | | | | | | | | | | | | | | | | | | | | | | | | | | | | | | | | | | | | | | | | | | | | |
Connecticut | | | | | | | | | | | | | | | | | | | | | | | | | | | | | | | | | | | | | | | | | | | | | | | | | | | | | | |
Town Line Plaza 4 | | Wal-Mart, Stop & Shop (Ahold) | | | 1998 | | | 100.0 | % | | | — | | | | 163,159 | | | | 42,930 | | | | 206,089 | | | | — | % | | | 100.0 | % | | | 100.0 | % | | | 100.0 | % | | | 100.0 | % | | | 1,872,179 | | | | 17.21 | |
| | | | | | | | | | | | | | | | | | | | | | | | | | | | | | | | | | | | | | | | | | | | | | | | | | | | | | |
Massachusetts | | | | | | | | | | | | | | | | | | | | | | | | | | | | | | | | | | | | | | | | | | | | | | | | | | | | | | |
Methuen Shopping Center | | Wal-Mart, Market Basket | | | 1998 | | | 100.0 | % | | | — | | | | 120,004 | | | | 10,017 | | | | 130,021 | | | | — | % | | | 100.0 | % | | | 100.0 | % | | | 100.0 | % | | | 100.0 | % | | | 1,395,887 | | | | 10.74 | |
Crescent Plaza | | Home Depot, Shaw's (Supervalu) | | | 1993 | | | 100.0 | % | | | — | | | | 156,985 | | | | 61,163 | | | | 218,148 | | | | — | % | | | 100.0 | % | | | 67.7 | % | | | 90.9 | % | | | 90.9 | % | | | 1,909,447 | | | | 9.62 | |
201 Needham Street | | Michael's | | | 2014 | | | 100.0 | % | | | — | | | | 20,409 | | | | — | | | | 20,409 | | | | — | % | | | 100.0 | % | | | — | % | | | 100.0 | % | | | 100.0 | % | | | 646,965 | | | | 31.70 | |
163 Highland Avenue | | Staples, Petco | | | 2015 | | | 100.0 | % | | | — | | | | 40,505 | | | | — | | | | 40,505 | | | | — | % | | | 100.0 | % | | | — | % | | | 100.0 | % | | | 100.0 | % | | | 1,490,575 | | | | 36.80 | |
| | | | | | | | | | | | | | | | | | | | | | | | | | | | | | | | | | | | | | | | | | | | | | | | | | | | | | |
Vermont | | | | | | | | | | | | | | | | | | | | | | | | | | | | | | | | | | | | | | | | | | | | | | | | | | | | | | |
The Gateway Shopping Center | | Shaw's (Supervalu) | | | 1999 | | | 100.0 | % | | | — | | | | 73,184 | | | | 28,290 | | | | 101,474 | | | | — | % | | | 100.0 | % | | | 100.0 | % | | | 100.0 | % | | | 100.0 | % | | | 2,201,482 | | | | 21.70 | |
| | | | | | | | | | | | | | | | | | | | | | | | | | | | | | | | | | | | | | | | | | | | | | | | | | | | | | |
Illinois | | | | | | | | | | | | | | | | | | | | | | | | | | | | | | | | | | | | | | | | | | | | | | | | | | | | | | |
Hobson West Plaza | | Garden Fresh Markets | | | 1998 | | | 100.0 | % | | | — | | | | 51,692 | | | | 47,270 | | | | 98,962 | | | | — | % | | | 100.0 | % | | | 92.1 | % | | | 96.2 | % | | | 97.8 | % | | | 1,156,666 | | | | 12.15 | |
| | | | | | | | | | | | | | | | | | | | | | | | | | | | | | | | | | | | | | | | | | | | | | | | | | | | | | |
Indiana | | | | | | | | | | | | | | | | | | | | | | | | | | | | | | | | | | | | | | | | | | | | | | | | | | | | | | |
Merrillville Plaza | | Jo-Ann Fabrics, TJ Maxx | | | 1998 | | | 100.0 | % | | | — | | | | 123,220 | | | | 112,867 | | | | 236,087 | | | | — | % | | | 41.6 | % | | | 61.3 | % | | | 51.0 | % | | | 52.7 | % | | | 1,861,858 | | | | 15.46 | |
| | | | | | | | | | | | | | | | | | | | | | | | | | | | | | | | | | | | | | | | | | | | | | | | | | | | | | |
| Core Portfolio Retail Properties - Detail |
Supplemental Report – September 30, 2020 | |
| | | | | | Year | | Acadia's | | | Gross Leasable Area (GLA) | | | In Place Occupancy | | | Leased Occupancy | | | Annualized Base Rent | | | ABR | |
Property | | Key Tenants | | | Acquired | | Interest | | | Street | | | Anchors | | | Shops | | | Total | | | Street | | | Anchors | | | Shops | | | Total | | | Total | | | (ABR) | | | PSF | |
Michigan | | | | | | | | | | | | | | | | | | | | | | | | | | | | | | | | | | | | | | | | | | | | | | | | | | | | | | |
Bloomfield Town Square | | Best Buy, HomeGoods, TJ Maxx | | | 1998 | | | 100.0 | % | | | — | | | | 153,839 | | | | 81,183 | | | | 235,022 | | | | — | % | | | 100.0 | % | | | 73.6 | % | | | 90.9 | % | | | 90.9 | % | | | 3,626,229 | | | | 16.98 | |
| | | | | | | | | | | | | | | | | | | | | | | | | | | | | | | | | | | | | | | | | | | | | | | | | | | | | | |
Delaware | | | | | | | | | | | | | | | | | | | | | | | | | | | | | | | | | | | | | | | | | | | | | | | | | | | | | | |
Town Center and Other (2 properties) | | Lowes, Bed Bath & Beyond, Target | | | 2003 | | | 92.4 | % | | | — | | | | 748,210 | | | | 51,808 | | | | 800,018 | | | | — | % | | | 91.6 | % | | | 85.7 | % | | | 91.3 | % | | | 91.3 | % | | | 12,725,291 | | | | 17.43 | |
Market Square Shopping Center | | Trader Joe's, TJ Maxx | | | 2003 | | | 100.0 | % | | | — | | | | 42,850 | | | | 59,197 | | | | 102,047 | | | | — | % | | | 100.0 | % | | | 95.5 | % | | | 97.4 | % | | | 97.4 | % | | | 3,060,281 | | | | 30.80 | |
Naamans Road | | | — | | | 2006 | | | 100.0 | % | | | — | | | | — | | | | 19,850 | | | | 19,850 | | | | — | % | | | — | % | | | 30.1 | % | | | 30.1 | % | | | 30.1 | % | | | 433,785 | | | | 72.60 | |
| | | | | | | | | | | | | | | | | | | | | | | | | | | | | | | | | | | | | | | | | | | | | | | | | | | | | | |
Pennsylvania | | | | | | | | | | | | | | | | | | | | | | | | | | | | | | | | | | | | | | | | | | | | | | | | | | | | | | |
Mark Plaza | | Kmart | | | 1993 | | | 100.0 | % | | | — | | | | 104,956 | | | | 1,900 | | | | 106,856 | | | | — | % | | | 100.0 | % | | | 100.0 | % | | | 100.0 | % | | | 100.0 | % | | | 244,279 | | | | 2.29 | |
Plaza 422 | | Home Depot | | | 1993 | | | 100.0 | % | | | — | | | | 139,968 | | | | 16,311 | | | | 156,279 | | | | — | % | | | 100.0 | % | | | 100.0 | % | | | 100.0 | % | | | 100.0 | % | | | 894,880 | | | | 5.73 | |
Chestnut Hill | | | — | | | 2006 | | | 100.0 | % | | | — | | | | — | | | | 37,646 | | | | 37,646 | | | | — | % | | | — | % | | | 86.3 | % | | | 86.3 | % | | | 86.3 | % | | | 813,942 | | | | 25.05 | |
Abington Towne Center 5 | | Target, TJ Maxx | | | 1998 | | | 100.0 | % | | | — | | | | 184,616 | | | | 32,255 | | | | 216,871 | | | | — | % | | | 100.0 | % | | | 100.0 | % | | | 100.0 | % | | | 100.0 | % | | | 1,228,032 | | | | 20.72 | |
| | | | | | | | | | | | | | | | | | | | | | | | | | | | | | | | | | | | | | | | | | | | | | | | | | | | | | |
Total Suburban Properties | | | | | | | | | | — | | | | 3,019,695 | | | | 996,152 | | | | 4,015,847 | | | | — | % | | | 94.3 | % | | | 77.1 | % | | | 90.0 | % | | | 90.6 | % | | $ | 58,739,449 | | | $ | 17.35 | |
| | | | | | | | | | | | | | | | | | | | | | | | | | | | | | | | | | | | | | | | | | | | | | | | | | | | | | |
Acadia Share Total Suburban Properties | | | | | | | | | | — | | | | 2,857,471 | | | | 922,880 | | | | 3,780,351 | | | | — | % | | | 95.1 | % | | | 78.2 | % | | | 91.0 | % | | | 91.6 | % | | $ | 55,007,139 | | | $ | 17.15 | |
| | | | | | | | | | | | | | | | | | | | | | | | | | | | | | | | | | | | | | | | | | | | | | | | | | | | | | |
Total Core Properties | | | | | | | | | | 1,060,631 | | | | 3,292,441 | | | | 1,290,797 | | | | 5,643,869 | | | | 85.3 | % | | | 94.8 | % | | | 77.1 | % | | | 89.0 | % | | | 89.8 | % | | $ | 153,765,657 | | | $ | 32.08 | |
| | | | | | | | | | | | | | | | | | | | | | | | | | | | | | | | | | | | | | | | | | | | | | | | | | | | | | |
Acadia Share Total Core Properties | | | | | | | | | | 863,629 | | | | 3,130,217 | | | | 1,204,302 | | | | 5,198,149 | | | | 88.2 | % | | | 95.5 | % | | | 78.2 | % | | | 90.3 | % | | | 91.1 | % | | $ | 138,765,145 | | | $ | 31.09 | |
__________
| 1. | Excludes properties under development, redevelopment and pre-stabilized, see “Development and Redevelopment Activity” page of this Supplemental Report. The above occupancy and rent amounts do not include space which is currently leased, other than "leased occupancy," but for which rent payment has not yet commenced. |
| 2. | Represents the annual base rent paid to Acadia pursuant to a master lessee and does not reflect the rent paid by the retail tenants at the property. |
| 3. | Excludes 94,000 square feet of office GLA. |
| 4. | Anchor GLA includes a 97,300 square foot Wal-Mart store which is not owned by the Company. This square footage has been excluded for calculating annualized base rent per square foot. |
| 5. | Anchor GLA includes a 157,616 square foot Target store which is not owned by the Company. This square footage has been excluded for calculating annualized base rent per square foot. |

| Core Portfolio – Top Tenants 1 |
Supplemental Report – September 30, 2020 | (Pro Rata Basis) |
| | Number of | | | Combined | | | Percentage of Total | |
Tenant | | Stores | | | GLA | | | ABR | | | GLA | | | ABR | |
| | | | | | | | | | | | | | | | | | | | |
Target | | | 3 | | | | 431,480 | | | $ | 8,105,624 | | | | 8.3 | % | | | 5.8 | % |
Walgreens | | | 6 | | | | 95,189 | | | | 4,011,379 | | | | 1.8 | % | | | 2.9 | % |
Nordstrom Rack, Inc. | | | 2 | | | | 88,982 | | | | 3,515,492 | | | | 1.7 | % | | | 2.5 | % |
Bed, Bath, and Beyond 2 | | | 3 | | | | 135,098 | | | | 3,433,926 | | | | 2.6 | % | | | 2.5 | % |
Royal Ahold 3 | | | 3 | | | | 155,461 | | | | 3,268,460 | | | | 3.0 | % | | | 2.4 | % |
TJX Companies 4 | | | 8 | | | | 229,043 | | | | 2,631,830 | | | | 4.4 | % | | | 1.9 | % |
LA Fitness International LLC | | | 2 | | | | 100,000 | | | | 2,524,787 | | | | 1.9 | % | | | 1.8 | % |
Lululemon | | | 2 | | | | 7,533 | | | | 2,406,503 | | | | 0.1 | % | | | 1.7 | % |
Trader Joe's | | | 3 | | | | 40,862 | | | | 2,329,054 | | | | 0.8 | % | | | 1.7 | % |
Fast Retailing 5 | | | 2 | | | | 32,013 | | | | 2,250,611 | | | | 0.6 | % | | | 1.6 | % |
Gap 6 | | | 3 | | | | 44,895 | | | | 2,177,889 | | | | 0.9 | % | | | 1.6 | % |
Albertsons Companies7 | | | 2 | | | | 123,409 | | | | 1,980,640 | | | | 2.4 | % | | | 1.4 | % |
Home Depot | | | 3 | | | | 312,718 | | | | 1,964,443 | | | | 6.0 | % | | | 1.4 | % |
Bob's Discount Furniture | | | 2 | | | | 68,793 | | | | 1,843,336 | | | | 1.3 | % | | | 1.3 | % |
Tapestry 8 | | | 2 | | | | 4,250 | | | | 1,598,848 | | | | 0.1 | % | | | 1.2 | % |
Dick's Sporting Goods, Inc | | | 2 | | | | 98,805 | | | | 1,519,874 | | | | 1.9 | % | | | 1.1 | % |
Ulta Salon Cosmetic & Fragrance | | | 3 | | | | 31,497 | | | | 1,472,169 | | | | 0.6 | % | | | 1.1 | % |
DSW | | | 2 | | | | 35,842 | | | | 1,442,861 | | | | 0.7 | % | | | 1.0 | % |
JP Morgan Chase | | | 6 | | | | 23,853 | | | | 1,367,645 | | | | 0.5 | % | | | 1.0 | % |
Michael's | | | 2 | | | | 45,285 | | | | 1,318,617 | | | | 0.9 | % | | | 1.0 | % |
Citibank | | | 4 | | | | 16,160 | | | | 1,267,025 | | | | 0.3 | % | | | 0.9 | % |
TOTAL | | | 65 | | | | 2,121,168 | | | $ | 52,431,013 | | | | 40.8 | % | | | 37.8 | % |
__________
| 1. | Does not include tenants that operate at only one Acadia Core location |
| 2. | Bed Bath and Beyond (2 locations), Christmas Tree Shops (1 location) |
| 3. | Stop and Shop (3 locations) |
| 4. | TJ Maxx (5 locations), HomeGoods (2 locations), Marshalls (1 location) |
| 5. | Uniqlo (1 location), Theory (1 location) |
| 6. | Old Navy (2 locations), Banana Republic (1 location) |
| 8. | Kate Spade (2 locations) |

| Core Portfolio – Lease Expirations |
Supplemental Report – September 30, 2020 | (Pro Rata Basis) |
| | Street Tenants | | | Anchor Tenants | |
| | | | | | GLA | | | ABR | | | | | | | GLA | | | ABR | |
| | Leases | | | Expiring | | | Percent | | | | | | | Percent | | | Leases | | | Expiring | | | Percent | | | | | | | Percent | |
Year | | Expiring | | | SF | | | of Total | | | PSF | | | of Total | | | Expiring | | | SF | | | of Total | | | PSF | | | of Total | |
M to M 1 | | | 1 | | | | 440 | | | | 0.1 | % | | $ | 54.93 | | | | — | % | | | — | | | | — | | | | — | % | | $ | — | | | | — | % |
2020 (Remainder) | | | 2 | | | | 2,827 | | | | 0.4 | % | | | 56.09 | | | | 0.2 | % | | | — | | | | — | | | | — | % | | | — | | | | — | % |
2021 | | | 19 | | | | 50,782 | | | | 6.7 | % | | | 81.45 | | | | 6.3 | % | | | 8 | | | | 386,310 | | | | 14.1 | % | | | 16.49 | | | | 15.2 | % |
2022 | | | 13 | | | | 57,950 | | | | 7.6 | % | | | 119.09 | | | | 10.4 | % | | | 4 | | | | 178,543 | | | | 6.5 | % | | | 15.99 | | | | 6.8 | % |
2023 | | | 17 | | | | 129,417 | | | | 17.0 | % | | | 76.02 | | | | 14.9 | % | | | 7 | | | | 385,000 | | | | 14.1 | % | | | 19.20 | | | | 17.6 | % |
2024 | | | 14 | | | | 68,389 | | | | 9.0 | % | | | 96.49 | | | | 10.0 | % | | | 10 | | | | 433,331 | | | | 15.8 | % | | | 12.60 | | | | 13.0 | % |
2025 | | | 19 | | | | 61,346 | | | | 8.1 | % | | | 145.58 | | | | 13.5 | % | | | 9 | | | | 376,598 | | | | 13.8 | % | | | 18.65 | | | | 16.7 | % |
2026 | | | 19 | | | | 56,319 | | | | 7.4 | % | | | 119.65 | | | | 10.2 | % | | | 6 | | | | 193,250 | | | | 7.1 | % | | | 11.06 | | | | 5.1 | % |
2027 | | | 7 | | | | 15,831 | | | | 2.1 | % | | | 81.53 | | | | 2.0 | % | | | — | | | | — | | | | — | | | | — | | | | — | |
2028 | | | 11 | | | | 163,273 | | | | 21.4 | % | | | 58.28 | | | | 14.4 | % | | | 7 | | | | 452,708 | | | | 16.5 | % | | | 12.77 | | | | 13.8 | % |
2029 | | | 11 | | | | 43,084 | | | | 5.7 | % | | | 116.90 | | | | 7.6 | % | | | 5 | | | | 182,205 | | | | 6.7 | % | | | 15.79 | | | | 6.9 | % |
Thereafter | | | 11 | | | | 112,171 | | | | 14.5 | % | | | 62.33 | | | | 10.5 | % | | | 4 | | | | 147,504 | | | | 5.4 | % | | | 14.02 | | | | 4.9 | % |
Total | | | 144 | | | | 761,829 | | | | 100.0 | % | | $ | 86.84 | | | | 100.0 | % | | | 60 | | | | 2,735,449 | | | | 100.0 | % | | $ | 15.28 | | | | 100.0 | % |
| | | | | | | | | | | | | | | | | | | | | | | | | | | | | | | | | | | | | | | | |
Anchor GLA Owned by Tenants | | | | — | | | | | | | | | | | | | | | | | | | | 254,916 | | | | | | | | | | | | | |
Total Vacant | | | | 101,800 | | | | | | | | | | | | | | | | | | | | 139,852 | | | | | | | | | | | | | |
Total Square Feet | | | | 863,629 | | | | | | | | | | | | | | | | | | | | 3,130,217 | | | | | | | | | | | | | |
| | | | | | | | | | | | | | | | | | | | | | | | | | | | | | | | | | | | | | | | |
| | Shop Tenants | | | Total Tenants | |
| | | | | | GLA | | | ABR | | | | | | | GLA | | | ABR | |
| | Leases | | | Expiring | | | Percent | | | | | | | Percent | | | Leases | | | Expiring | | | Percent | | | | | | | Percent | |
Year | | Expiring | | | SF | | | of Total | | | PSF | | | of Total | | | Expiring | | | SF | | | of Total | | | PSF | | | of Total | |
M to M 1 | | | 3 | | | | 9,638 | | | | 1.0 | % | | $ | 25.85 | | | | 0.8 | % | | | 4 | | | | 10,078 | | | | 0.2 | % | | $ | 27.12 | | | | 0.2 | % |
2020 (Remainder) | | | 10 | | | | 20,824 | | | | 2.2 | % | | | 27.93 | | | | 1.9 | % | | | 12 | | | | 23,651 | | | | 0.5 | % | | | 31.29 | | | | 0.5 | % |
2021 | | | 35 | | | | 130,499 | | | | 13.9 | % | | | 22.86 | | | | 9.7 | % | | | 62 | | | | 567,591 | | | | 12.8 | % | | | 23.76 | | | | 9.7 | % |
2022 | | | 34 | | | | 99,890 | | | | 10.6 | % | | | 38.24 | | | | 12.5 | % | | | 51 | | | | 336,383 | | | | 7.6 | % | | | 40.36 | | | | 9.8 | % |
2023 | | | 35 | | | | 126,678 | | | | 13.5 | % | | | 30.11 | | | | 12.4 | % | | | 59 | | | | 641,095 | | | | 14.4 | % | | | 32.82 | | | | 15.2 | % |
2024 | | | 29 | | | | 106,661 | | | | 11.3 | % | | | 31.01 | | | | 10.8 | % | | | 53 | | | | 608,381 | | | | 13.7 | % | | | 25.26 | | | | 11.1 | % |
2025 | | | 31 | | | | 93,261 | | | | 9.9 | % | | | 30.65 | | | | 9.3 | % | | | 59 | | | | 531,205 | | | | 12.0 | % | | | 35.42 | | | | 13.6 | % |
2026 | | | 14 | | | | 55,144 | | | | 5.9 | % | | | 36.22 | | | | 6.5 | % | | | 39 | | | | 304,713 | | | | 6.9 | % | | | 35.68 | | | | 7.8 | % |
2027 | | | 16 | | | | 73,042 | | | | 7.8 | % | | | 27.67 | | | | 6.6 | % | | | 23 | | | | 88,873 | | | | 2.0 | % | | | 37.27 | | | | 2.4 | % |
2028 | | | 24 | | | | 107,494 | | | | 11.4 | % | | | 38.58 | | | | 13.5 | % | | | 42 | | | | 723,475 | | | | 16.3 | % | | | 26.88 | | | | 14.0 | % |
2029 | | | 10 | | | | 27,484 | | | | 2.9 | % | | | 28.36 | | | | 2.5 | % | | | 26 | | | | 252,773 | | | | 5.7 | % | | | 34.39 | | | | 6.3 | % |
Thereafter | | | 21 | | | | 90,766 | | | | 9.6 | % | | | 45.00 | | | | 13.5 | % | | | 36 | | | | 350,441 | | | | 7.9 | % | | | 37.50 | | | | 9.4 | % |
Total | | | 262 | | | | 941,381 | | | | 100.0 | % | | $ | 32.55 | | | | 100.0 | % | | | 466 | | | | 4,438,659 | | | | 100.0 | % | | $ | 31.09 | | | | 100.0 | % |
| | | | | | | | | | | | | | | | | | | | | | | | | | | | | | | | | | | | | | | | |
Anchor GLA Owned by Tenants | | | | — | | | | | | | | | | | | | | | | | | | | 254,916 | | | | | | | | | | | | | |
Total Vacant | | | | 262,921 | | | | | | | | | | | | | | | | | | | | 504,574 | | | | | | | | | | | | | |
Total Square Feet | | | | 1,204,302 | | | | | | | | | | | | | | | | | | | | 5,198,149 | | | | | | | | | | | | | |
| | | | | | | | | | | | | | | | | | | | | | | | | | | | | | | | | | | | | | | | |
_________
| 1. | Leases currently under month to month or in process of renewal |

| Core Portfolio – New and Renewal Rent Spreads 1 |
Supplemental Report – September 30, 2020 | |
| | Quarter Ended | | | Year to Date | |
| | March 31, 2020 | | | June 30, 2020 | | | | September 30, 2020 | | | September 30, 2020 | |
| | GAAP 2 | | | Cash 3 | | | GAAP 2 | | | Cash 3 | | | | GAAP 2 | | | Cash 3 | | | GAAP 2 | | | Cash 3 | |
New Leases | | | | | | | | | | | | | | | | | | | | | | | | | | | | | | | | | |
Number of new leases executed | | | 1 | | | | 1 | | | | 0 | | | | 0 | | | | | 2 | | | | 2 | | | | 3 | | | | 3 | |
GLA | | | 1,956 | | | | 1,956 | | | | — | | | | — | | | | | 8,300 | | | | 8,300 | | | | 10,256 | | | | 10,256 | |
New base rent | | $ | 27.74 | | | $ | 27.50 | | | $ | — | | | $ | — | | | | $ | 25.40 | | | $ | 23.12 | | | $ | 25.85 | | | $ | 23.96 | |
Previous base rent | | $ | 20.26 | | | $ | 20.26 | | | $ | — | | | $ | — | | | | $ | 20.34 | | | $ | 21.24 | | | $ | 20.32 | | | $ | 21.05 | |
Average cost per square foot | | $ | 46.41 | | | $ | 46.41 | | | $ | — | | | $ | — | | | | $ | 61.19 | | | $ | 61.19 | | | $ | 58.37 | | | $ | 58.37 | |
Weighted Average Lease Term (years) | | | 10.0 | | | | 10.0 | | | | 0.0 | | | | 0.0 | | | | | 10.0 | | | | 10.0 | | | | 10.0 | | | | 10.0 | |
Percentage growth in base rent | | | 36.9 | % | | | 35.7 | % | | | — | | | | — | | | | | 24.9 | % | | | 8.9 | % | | | 27.2 | % | | | 13.8 | % |
| | | | | | | | | | | | | | | | | | | | | | | | | | | | | | | | | |
Renewal Leases | | | | | | | | | | | | | | | | | | | | | | | | | | | | | | | | | |
Number of renewal leases executed | | | 5 | | | | 5 | | | | 10 | | | | 10 | | | | | 9 | | | | 9 | | | | 24 | | | | 24 | |
GLA | | | 29,657 | | | | 29,657 | | | | 189,020 | | | | 189,020 | | | | | 111,956 | | | | 111,956 | | | | 330,633 | | | | 330,633 | |
New base rent | | $ | 39.84 | | | $ | 36.26 | | | $ | 12.64 | | | $ | 12.45 | | | | $ | 29.67 | | | $ | 29.02 | | | $ | 20.85 | | | $ | 20.20 | |
Expiring base rent | | $ | 35.94 | | | $ | 36.87 | | | $ | 12.24 | | | $ | 12.75 | | | | $ | 26.55 | | | $ | 27.67 | | | $ | 19.21 | | | $ | 19.97 | |
Average cost per square foot | | $ | 5.02 | | | $ | 5.02 | | | $ | — | | | $ | — | | | | $ | — | | | $ | — | | | $ | 0.45 | | | $ | 0.45 | |
Weighted Average Lease Term (years) | | | 7.7 | | | | 7.7 | | | | 4.6 | | | | 4.6 | | | | | 9.2 | | | | 9.2 | | | | 6.5 | | | | 6.5 | |
Percentage growth in base rent | | | 10.9 | % | | | (1.7 | )% | | | 3.3 | % | | | (2.4 | )% | | | | 11.8 | % | | | 4.9 | % | | | 8.5 | % | | | 1.2 | % |
| | | | | | | | | | | | | | | | | | | | | | | | | | | | | | | | | |
Total New and Renewal Leases | | | | | | | | | | | | | | | | | | | | | | | | | | | | | | | | | |
Number of new and renewal leases executed | | | 6 | | | | 6 | | | | 10 | | | | 10 | | | | | 11 | | | | 11 | | | | 27 | | | | 27 | |
GLA commencing | | | 31,613 | | | | 31,613 | | | | 189,020 | | | | 189,020 | | | | | 120,256 | | | | 120,256 | | | | 340,889 | | | | 340,889 | |
New base rent | | $ | 39.09 | | | $ | 35.72 | | | $ | 12.64 | | | $ | 12.45 | | | | $ | 29.38 | | | $ | 28.61 | | | $ | 21.00 | | | $ | 20.31 | |
Expiring base rent | | $ | 34.97 | | | $ | 35.84 | | | $ | 12.24 | | | $ | 12.75 | | | | $ | 26.12 | | | $ | 27.23 | | | $ | 19.24 | | | $ | 20.00 | |
Average cost per square foot | | $ | 7.58 | | | $ | 7.58 | | | $ | — | | | $ | — | | | | $ | 4.22 | | | $ | 4.22 | | | $ | 2.19 | | | $ | 2.19 | |
Weighted Average Lease Term (years) | | | 7.9 | | | | 7.9 | | | | 4.6 | | | | 4.6 | | | | | 9.2 | | | | 9.2 | | | | 6.6 | | | | 6.6 | |
Percentage growth in base rent | | | 11.8 | % | | | (0.3 | )% | | | 3.3 | % | | | (2.4 | )% | | | | 12.5 | % | | | 5.1 | % | | | 9.1 | % | | | 1.5 | % |
| | | | | | | | | | | | | | | | | | | | | | | | | | | | | | | | | |
__________
| 1. | Based on lease execution dates. Does not include leased square footage and costs related to first generation space and the Company's major redevelopment projects; renewal leases include exercised options. |
| 2. | Rents are calculated on a straight-line ("GAAP") basis and do not incorporate above- or below-market lease adjustments. |
| 3. | Rents have not been calculated on a straight-line basis. Previous/expiring rent is that as of time of expiration and includes any percentage rent paid as well. New rent is that which is paid at commencement. |

| Core Portfolio – Capital Expenditures |
Supplemental Report – September 30, 2020 | |
| | | | | | | | | | | | | | | | | | | | |
| | Quarter Ended | | | Year to Date | |
| | March 31, 2020 | | | June 30, 2020 | | | September 30, 2020 | | | September 30, 2020 | | | December 31, 2019 | |
Leasing Commissions | | $ | 380 | | | $ | 118 | | | $ | 37 | | | $ | 535 | | | $ | 1,654 | |
Tenant Improvements | | | 468 | | | | 426 | | | | 815 | | | | 1,709 | | | | 5,599 | |
Maintenance Capital Expenditures | | | 951 | | | | 997 | | | | 81 | | | | 2,029 | | | | 3,713 | |
Total Capital Expenditures | | $ | 1,799 | | | $ | 1,541 | | | $ | 933 | | | $ | 4,273 | | | $ | 10,966 | |
| | | | | | | | | | | | | | | | | | | | |

| Fund Overview |
Supplemental Report – September 30, 2020 | |
I. KEY METRICS | | Fund I | | Fund II | | Fund III | | Fund IV | | Fund V | | Total |
General Information: | | | | | | | | | | | | | | | | | | | | | | | | | | | | | | | | | | | | | | | | | | |
Vintage | | | Sep-2001 | | | Jun-2004 | | | May-2007 | | | May-2012 | | | Aug-2016 | | | |
Fund Size | | $ | | 90.0 | | Million | | $ | | 300.0 | | Million | | $ | | 502.5 | | Million | | $ | | 540.6 | | Million | | $ | | 520.0 | | Million | | $ | | 1,953.1 | | Million |
Acadia's Commitment | | $ | | 20.0 | | Million | | $ | | 85.0 | | Million | | $ | | 123.3 | | Million | | $ | | 125.0 | | Million | | $ | | 104.5 | | Million | | $ | | 457.8 | | Million |
Acadia's Pro Rata Share | | | | 22.2 | | % | | | | | 28.3 | | % | | | | | 24.5 | | % | | | | | 23.1 | | % | | | | | 20.1 | | % | | | | | 23.4 | | % | |
Acadia's Promoted Share 1 | | | | 37.8 | | % | | | | | 42.7 | | % | | | | | 39.6 | | % | | | | | 38.5 | | % | | | | | 36.1 | | % | | | | | 38.8 | | % | |
Preferred Return | | | | 9.0 | | % | | | | | 8.0 | | % | | | | | 6.0 | | % | | | | | 6.0 | | % | | | | | 6.0 | | % | | | | 6.4 | | % | |
| | | | | | | | | | | | | | | | | | | | | | | | | | | | | | | | | | | | | | | | | | |
Current-Quarter, Fund-Level Information: | | | | | | | | | | | | | | | | | | | | | | | | | | | | | | | | | | | | | | | | | | |
Cumulative Contributions 2 | | $ | | 86.6 | | Million | | $ | | 369.6 | | Million | | $ | | 440.3 | | Million | | $ | | 457.1 | | Million | | $ | | 217.1 | | Million | | $ | | 1,570.7 | | Million |
Cumulative Net Distributions 3 | | $ | | 195.4 | | Million | | $ | | 169.8 | | Million | | $ | | 568.8 | | Million | | $ | | 193.1 | | Million | | $ | | 20.9 | | Million | | $ | | 1,148.1 | | Million |
Net Distributions/Contributions | | | | 225.6 | | % | | | | | 45.9 | | % | | | | | 129.2 | | % | | | | | 42.2 | | % | | | | | 9.6 | | % | | | | | 73.1 | | % | |
Unfunded Commitment 4 | | $ | | 0.0 | | Million | | $ | | 15.7 | | Million | | $ | | 9.7 | | Million | | $ | | 72.9 | | Million | | $ | | 302.9 | | Million | | $ | | 401.2 | | Million |
Acquisition Dry Powder 5 | | | N/A | | | | | | N/A | | | | | | N/A | | | | | | N/A | | | | | $ | | 208.0 | | Million | | $ | | 208.0 | | Million |
Investment Period Closes | | | Closed | | | | | | Closed | | | | | | Closed | | | | | | Closed | | | | | | Aug-2021 | | | | | | | | | | |
Currently in a Promote Position? (Yes/No) | | | No | | | | | | No | | | | | | No | | | | | | No | | | | | | No | | | | | | | | | | |
| | | | | | | | | | | | | | | | | | | | | | | | | | | | | | | | | | | | | | | | | | |
II. FEES & PRIORITY DISTRIBUTIONS EARNED BY ACADIA | | | | | | | | | | | | | | | | | | | | | | | | | | | | | | | |
| | | | | | | | | | | | | | | | | | | | | | | | | | | | | | | | | | | | | | | | | | |
Type: | | | Applicable to | | | Description |
Asset Management 6 | | | Fund I & II | | | 1.5% of Implied Capital |
Asset Management | | | Fund III | | | From mid-May 2020 to mid-May 2021; 0.75% of Implied Capital excluding the Unfunded Commitment; thereafter $0 |
Asset Management 6 | | | Fund IV | | | 1.5% of Implied Capital during the investment period; 1.25% of Implied Capital post-investment period |
Asset Management 7 | | | Fund V | | | 1.5% of Implied Capital for Yr 1-4 of the investment period; 1.5% of Allocated Capital Commitments for Yr 5 of the investment period (August 2020-August 2021); 1.25% of Implied Capital post-investment period |
Property Management | | | All funds | | | 4.0% of gross property revenues |
Leasing | | | All funds | | | Market-rate leasing commissions |
Construction/Project Management | | | All funds | | | Market-rate fees |
Development | | | Fund III, IV & V | | | 3.0% of total project costs |
__________
| 1. | Acadia's "Promoted Share" reflects Acadia's share of fund profits once all partners (including Acadia) have received a return of their cumulative contributions plus their cumulative preferred return. Acadia's Promoted Share equals a 20% promote plus Acadia's pro rata share of the remaining 80%. |
| 2. | With regard to Fund II, the additional contributions over original Fund Size reflects prior-period distributions that were re-contributed to the Fund during 2016 and 2020 to fund the on-going redevelopment of existing Fund II investments. |
| 3. | Net of fees and promote. Fund I has made its final distribution and was fully liquidated in 2018. |
| 4. | Unfunded Commitments are set aside to complete leasing and development at existing fund investments and to make new Fund V investments. The Unfunded Commitment will not equal Fund Size less Cumulative Contributions in those instances where certain fund distributions have been marked as recallable or where the fund has released commitments due to, among other reasons, the closing of the fund's investment period or accelerated asset sales. |
| 5. | Unfunded Commitments available to deploy into new unidentified investments. |
| 6. | Implied Capital is Fund Size less capital attributed to sold investments or released. Post-investment period, Fund IV Implied Capital also excludes $50.0 million of general reserves. |
| 7. | Implied Capital is Fund Size less capital attributed to sold investments or released. Allocated Capital Commitments are computed as the Fund Size less Acquisition Dry Powder and trued up on a quarterly basis with fees retroactive to August 2020. |

| Fund Portfolio Retail Properties – Detail 1 |
Supplemental Report – September 30, 2020 | |
| | | | Year | | Fund | | | Gross Leasable Area | | | In Place Occupancy | | | Leased | | | Annualized | | | | | |
Property | | Key Tenants | | Acquired | | Ownership % | | | Street | | | Anchors | | | Shops | | | Total | | | Street | | | Anchors | | | Shops | | | Total | | | Occupancy | | | Base Rent (ABR) | | | ABR PSF | |
| | | | | | | | | | | | | | | | | | | | | | | | | | | | | | | | | | | | | | | | | | | | | | | | | | | | |
Fund II Portfolio Detail | | | | | | | | | | | | | | | | | | | | | | | | | | | | | | | | | | | | | | | | | | | | | | | | | | | | |
| | | | | | | | | | | | | | | | | | | | | | | | | | | | | | | | | | | | | | | | | | | | | | | | | | | | |
NEW YORK | | | | | | | | | | | | | | | | | | | | | | | | | | | | | | | | | | | | | | | | | | | | | | | | | | | | |
New York | | | | | | | | | | | | | | | | | | | | | | | | | | | | | | | | | | | | | | | | | | | | | | | | | | | | |
City Point - Phase I and II | | Century 21, Target, Alamo Drafthouse | | 2007 | | | 94.2 | % | | | — | | | | 289,464 | | | | 180,054 | | | | 469,518 | | | | — | % | | | 91.5 | % | | | 21.5 | % | | | 64.7 | % | | | 86.8 | % | | $ | 9,240,080 | | | $ | 30.44 | |
| | | | | | | | | | | | | | | | | | | | | | | | | | | | | | | | | | | | | | | | | | | | | | | | | | | | |
Total - Fund II | | | | | | | | | | | — | | | | 289,464 | | | | 180,054 | | | | 469,518 | | | | — | % | | | 91.5 | % | | | 21.5 | % | | | 64.7 | % | | | 86.8 | % | | $ | 9,240,080 | | | $ | 30.44 | |
| | | | | | | | | | | | | | | | | | | | | | | | | | | | | | | | | | | | | | | | | | | | | | | | | | | | |
Fund III Portfolio Detail | | | | | | | | | | | | | | | | | | | | | | | | | | | | | | | | | | | | | | | | | | | | | | | | | | | | |
| | | | | | | | | | | | | | | | | | | | | | | | | | | | | | | | | | | | | | | | | | | | | | | | | | | | |
NEW YORK | | | | | | | | | | | | | | | | | | | | | | | | | | | | | | | | | | | | | | | | | | | | | | | | | | | | |
New York | | | | | | | | | | | | | | | | | | | | | | | | | | | | | | | | | | | | | | | | | | | | | | | | | | | | |
654 Broadway | | ─ | | 2011 | | | 100.0 | % | | | 2,896 | | | | — | | | | — | | | | 2,896 | | | | 100.0 | % | | | — | % | | | — | % | | | 100.0 | % | | | 100.0 | % | | $ | 455,000 | | | $ | 157.11 | |
640 Broadway | | Swatch | | 2012 | | | 63.1 | % | | | 4,637 | | | | — | | | | — | | | | 4,637 | | | | 100.0 | % | | | — | % | | | — | % | | | 100.0 | % | | | 100.0 | % | | | 1,139,949 | | | | 245.84 | |
Cortlandt Crossing | | ShopRite, HomeSense | | 2012 | | | 100.0 | % | | | — | | | | 92,868 | | | | 34,981 | | | | 127,849 | | | | — | % | | | 100.0 | % | | | 31.1 | % | | | 81.1 | % | | | 81.1 | % | | | 2,902,195 | | | | 27.97 | |
| | | | | | | | | | | | | | | | | | | | | | | | | | | | | | | | | | | | | | | | | | | | | | | | | | | | |
Total - Fund III | | | | | | | | | | | 7,533 | | | | 92,868 | | | | 34,981 | | | | 135,382 | | | | 100.0 | % | | | 100.0 | % | | | 31.1 | % | | | 82.2 | % | | | 82.2 | % | | $ | 4,497,144 | | | $ | 40.41 | |
| | | | | | | | | | | | | | | | | | | | | | | | | | | | | | | | | | | | | | | | | | | | | | | | | | | | |
Fund IV Portfolio Detail | | | | | | | | | | | | | | | | | | | | | | | | | | | | | | | | | | | | | | | | | | | | | | | | | | | | |
| | | | | | | | | | | | | | | | | | | | | | | | | | | | | | | | | | | | | | | | | | | | | | | | | | | | |
NEW YORK | | | | | | | | | | | | | | | | | | | | | | | | | | | | | | | | | | | | | | | | | | | | | | | | | | | | |
New York | | | | | | | | | | | | | | | | | | | | | | | | | | | | | | | | | | | | | | | | | | | | | | | | | | | | |
801 Madison Avenue | | ─ | | 2015 | | | 100.0 | % | | | 2,522 | | | | — | | | | — | | | | 2,522 | | | | — | % | | | — | % | | | — | % | | | — | % | | | — | % | | $ | — | | | $ | — | |
210 Bowery | | ─ | | 2012 | | | 100.0 | % | | | 2,538 | | | | — | | | | — | | | | 2,538 | | | | — | % | | | — | % | | | — | % | | | — | % | | | — | % | | | — | | | | — | |
27 East 61st Street | | ─ | | 2014 | | | 100.0 | % | | | 4,177 | | | | — | | | | — | | | | 4,177 | | | | — | % | | | — | % | | | — | % | | | — | % | | | — | % | | | — | | | | — | |
17 East 71st Street | | The Row | | 2014 | | | 100.0 | % | | | 8,432 | | | | — | | | | — | | | | 8,432 | | | | 100.0 | % | | | — | % | | | — | % | | | 100.0 | % | | | 100.0 | % | | | 2,026,754 | | | | 240.36 | |
1035 Third Avenue 2 | | ─ | | 2015 | | | 100.0 | % | | | 7,634 | | | | — | | | | — | | | | 7,634 | | | | 58.5 | % | | | — | % | | | — | % | | | 58.5 | % | | | 80.4 | % | | | 1,037,422 | | | | 232.14 | |
| | | | | | | | | | | | | | | | | | | | | | | | | | | | | | | | | | | | | | | | | | | | | | | | | | | | |
New Jersey | | | | | | | | | | | | | | | | | | | | | | | | | | | | | | | | | | | | | | | | | | | | | | | | | | | | |
Paramus Plaza | | Ashley Furniture, Marshalls | | 2013 | | | 50.0 | % | | | — | | | | 87,539 | | | | 65,955 | | | | 153,494 | | | | — | % | | | 28.6 | % | | | 100.0 | % | | | 59.3 | % | | | 100.0 | % | | | 2,104,536 | | | | 23.13 | |
| | | | | | | | | | | | | | | | | | | | | | | | | | | | | | | | | | | | | | | | | | | | | | | | | | | | |
BOSTON | | | | | | | | | | | | | | | | | | | | | | | | | | | | | | | | | | | | | | | | | | | | | | | | | | | | |
Massachusetts | | | | | | | | | | | | | | | | | | | | | | | | | | | | | | | | | | | | | | | | | | | | | | | | | | | | |
Restaurants at Fort Point | | ─ | | 2016 | | | 100.0 | % | | | 15,711 | | | | — | | | | — | | | | 15,711 | | | | 100.0 | % | | | — | % | | | — | % | | | 100.0 | % | | | 100.0 | % | | | 1,009,945 | | | | 64.28 | |
| | | | | | | | | | | | | | | | | | | | | | | | | | | | | | | | | | | | | | | | | | | | | | | | | | | | |
NORTHEAST | | | | | | | | | | | | | | | | | | | | | | | | | | | | | | | | | | | | | | | | | | | | | | | | | | | | |
Maine | | | | | | | | | | | | | | | | | | | | | | | | | | | | | | | | | | | | | | | | | | | | | | | | | | | | |
Airport Mall | | Hannaford, Marshalls | | 2016 | | | 100.0 | % | | | — | | | | 131,042 | | | | 91,058 | | | | 222,100 | | | | — | % | | | 100.0 | % | | | 67.4 | % | | | 86.6 | % | | | 86.6 | % | | | 1,280,285 | | | | 6.65 | |
Wells Plaza | | Reny's, Dollar Tree | | 2016 | | | 100.0 | % | | | — | | | | 62,471 | | | | 27,963 | | | | 90,434 | | | | — | % | | | 100.0 | % | | | 94.7 | % | | | 98.3 | % | | | 98.3 | % | | | 742,942 | | | | 8.35 | |
Shaw's Plaza (Waterville) | | Shaw's | | 2016 | | | 100.0 | % | | | — | | | | 87,492 | | | | 31,523 | | | | 119,015 | | | | — | % | | | 100.0 | % | | | 87.3 | % | | | 96.6 | % | | | 96.6 | % | | | 1,316,813 | | | | 11.45 | |
Shaw's Plaza (Windham) | | Shaw's | | 2017 | | | 100.0 | % | | | — | | | | 66,539 | | | | 57,632 | | | | 124,171 | | | | — | % | | | 100.0 | % | | | 75.0 | % | | | 88.4 | % | | | 88.4 | % | | | 981,866 | | | | 8.95 | |
| | | | | | | | | | | | | | | | | | | | | | | | | | | | | | | | | | | | | | | | | | | | | | | | | | | | |
Pennsylvania | | | | | | | | | | | | | | | | | | | | | | | | | | | | | | | | | | | | | | | | | | | | | | | | | | | | |
Dauphin Plaza | | Price Rite, Ashley Furniture | | 2016 | | | 100.0 | % | | | — | | | | 114,765 | | | | 91,441 | | | | 206,206 | | | | — | % | | | 100.0 | % | | | 79.9 | % | | | 91.1 | % | | | 91.1 | % | | | 1,873,272 | | | | 9.97 | |
Mayfair Shopping Center | | Planet Fitness, Dollar Tree | | 2016 | | | 100.0 | % | | | — | | | | 34,806 | | | | 80,605 | | | | 115,411 | | | | — | % | | | 100.0 | % | | | 94.7 | % | | | 96.3 | % | | | 96.3 | % | | | 1,908,927 | | | | 17.17 | |
| | | | | | | | | | | | | | | | | | | | | | | | | | | | | | | | | | | | | | | | | | | | | | | | | | | | |
Rhode Island | | | | | | | | | | | | | | | | | | | | | | | | | | | | | | | | | | | | | | | | | | | | | | | | | | | | |
650 Bald Hill Road | | Dick's Sporting Goods, Burlington Coat Factory | | 2015 | | | 90.0 | % | | | — | | | | 55,000 | | | | 105,448 | | | | 160,448 | | | | — | % | | | 100.0 | % | | | 77.7 | % | | | 85.4 | % | | | 85.4 | % | | | 1,978,902 | | | | 14.45 | |
| | | | | | | | | | | | | | | | | | | | | | | | | | | | | | | | | | | | | | | | | | | | | | | | | | | | |
| Fund Portfolio Retail Properties – Detail 1 |
Supplemental Report – September 30, 2020 | |
| | | | Year | | Fund | | | Gross Leasable Area | | | In Place Occupancy | | | Leased | | | Annualized | | | | | |
Property | | Key Tenants | | Acquired | | Ownership % | | | Street | | | Anchors | | | Shops | | | Total | | | Street | | | Anchors | | | Shops | | | Total | | | Occupancy | | | Base Rent (ABR) | | | ABR PSF | |
MID-ATLANTIC | | | | | | | | | | | | | | | | | | | | | | | | | | | | | | | | | | | | | | | | | | | | | | | | | | | | |
Virginia | | | | | | | | | | | | | | | | | | | | | | | | | | | | | | | | | | | | | | | | | | | | | | | | | | | | |
Promenade at Manassas | | Home Depot | | 2013 | | | 98.6 | % | | | — | | | | 209,356 | | | | 71,404 | | | | 280,760 | | | | — | % | | | 100.0 | % | | | 94.7 | % | | | 98.6 | % | | | 98.6 | % | | | 3,623,858 | | | | 13.08 | |
| | | | | | | | | | | | | | | | | | | | | | | | | | | | | | | | | | | | | | | | | | | | | | | | | | | | |
Delaware | | | | | | | | | | | | | | | | | | | | | | | | | | | | | | | | | | | | | | | | | | | | | | | | | | | | |
Eden Square | | Giant Food, LA Fitness | | 2014 | | | 98.6 | % | | | — | | | | 116,003 | | | | 113,837 | | | | 229,840 | | | | — | % | | | 100.0 | % | | | 79.2 | % | | | 89.7 | % | | | 89.7 | % | | | 3,068,056 | | | | 14.88 | |
| | | | | | | | | | | | | | | | | | | | | | | | | | | | | | | | | | | | | | | | | | | | | | | | | | | | |
MIDWEST | | | | | | | | | | | | | | | | | | | | | | | | | | | | | | | | | | | | | | | | | | | | | | | | | | | | |
Illinois | | | | | | | | | | | | | | | | | | | | | | | | | | | | | | | | | | | | | | | | | | | | | | | | | | | | |
Lincoln Place | | Kohl's, Marshall's, Ross | | 2017 | | | 100.0 | % | | | — | | | | 144,302 | | | | 127,758 | | | | 272,060 | | | | — | % | | | 100.0 | % | | | 90.5 | % | | | 95.6 | % | | | 95.6 | % | | | 3,053,530 | | | | 11.75 | |
| | | | | | | | | | | | | | | | | | | | | | | | | | | | | | | | | | | | | | | | | | | | | | | | | | | | |
SOUTHEAST | | | | | | | | | | | | | | | | | | | | | | | | | | | | | | | | | | | | | | | | | | | | | | | | | | | | |
Georgia | | | | | | | | | | | | | | | | | | | | | | | | | | | | | | | | | | | | | | | | | | | | | | | | | | | | |
Broughton Street Portfolio (13 properties) | | H&M, Lululemon, Michael Kors, Starbucks | | 2014 | | | 100.0 | % | | | 96,341 | | | | — | | | | — | | | | 96,341 | | | | 81.7 | % | | | — | % | | | — | % | | | 81.7 | % | | | 81.7 | % | | | 2,940,428 | | | | 37.38 | |
| | | | | | | | | | | | | | | | | | | | | | | | | | | | | | | | | | | | | | | | | | | | | | | | | | | | |
North Carolina | | | | | | | | | | | | | | | | | | | | | | | | | | | | | | | | | | | | | | | | | | | | | | | | | | | | |
Wake Forest Crossing | | Lowe's, TJ Maxx | | 2016 | | | 100.0 | % | | | — | | | | 113,353 | | | | 89,527 | | | | 202,880 | | | | — | % | | | 100.0 | % | | | 91.1 | % | | | 96.1 | % | | | 98.0 | % | | | 2,944,560 | | | | 15.11 | |
| | | | | | | | | | | | | | | | | | | | | | | | | | | | | | | | | | | | | | | | | | | | | | | | | | | | |
WEST | | | | | | | | | | | | | | | | | | | | | | | | | | | | | | | | | | | | | | | | | | | | | | | | | | | | |
California | | | | | | | | | | | | | | | | | | | | | | | | | | | | | | | | | | | | | | | | | | | | | | | | | | | | |
Union and Fillmore Collection (3 properties) | | Eileen Fisher, L'Occitane, Bonobos | | 2015 | | | 90.0 | % | | | 7,148 | | | | — | | | | — | | | | 7,148 | | | | 100.0 | % | | | — | % | | | — | % | | | 100.0 | % | | | 100.0 | % | | | 735,902 | | | | 102.95 | |
| | | | | | | | | | | | | | | | | | | | | | | | | | | | | | | | | | | | | | | | | | | | | | | | | | | | |
Total - Fund IV | | | | | | | | | | | 144,503 | | | | 1,222,668 | | | | 954,151 | | | | 2,321,322 | | | | 79.2 | % | | | 94.9 | % | | | 85.0 | % | | | 89.8 | % | | | 92.8 | % | | $ | 32,627,998 | | | $ | 15.65 | |
| | | | | | | | | | | | | | | | | | | | | | | | | | | | | | | | | | | | | | | | | | | | | | | | | | | | |
Fund V Portfolio Detail | | | | | | | | | | | | | | | | | | | | | | | | | | | | | | | | | | | | | | | | | | | | | | | | | | | | |
| | | | | | | | | | | | | | | | | | | | | | | | | | | | | | | | | | | | | | | | | | | | | | | | | | | | |
SOUTHWEST | | | | | | | | | | | | | | | | | | | | | | | | | | | | | | | | | | | | | | | | | | | | | | | | | | | | |
New Mexico | | | | | | | | | | | | | | | | | | | | | | | | | | | | | | | | | | | | | | | | | | | | | | | | | | | | |
Plaza Santa Fe | | TJ Maxx, Best Buy, Ross Dress for Less | | 2017 | | | 100.0 | % | | | — | | | | 153,983 | | | | 70,240 | | | | 224,223 | | | | — | % | | | 100.0 | % | | | 92.2 | % | | | 97.5 | % | | | 97.5 | % | | | 3,883,365 | | | | 17.76 | |
| | | | | | | | | | | | | | | | | | | | | | | | | | | | | | | | | | | | | | | | | | | | | | | | | | | | |
MIDWEST | | | | | | | | | | | | | | | | | | | | | | | | | | | | | | | | | | | | | | | | | | | | | | | | | | | | |
Michigan | | | | | | | | | | | | | | | | | | | | | | | | | | | | | | | | | | | | | | | | | | | | | | | | | | | | |
New Towne Plaza | | Kohl's, Jo-Ann's, DSW | | 2017 | | | 100.0 | % | | | — | | | | 145,389 | | | | 48,057 | | | | 193,446 | | | | — | % | | | 100.0 | % | | | 72.0 | % | | | 93.0 | % | | | 94.5 | % | | | 2,138,758 | | | | 11.88 | |
Fairlane Green | | TJ Maxx, Michaels, Bed Bath & Beyond | | 2017 | | | 100.0 | % | | | — | | | | 109,916 | | | | 142,988 | | | | 252,904 | | | | — | % | | | 100.0 | % | | | 84.9 | % | | | 91.5 | % | | | 91.5 | % | | | 4,876,989 | | | | 21.09 | |
| | | | | | | | | | | | | | | | | | | | | | | | | | | | | | | | | | | | | | | | | | | | | | | | | | | | |
NORTHEAST | | | | | | | | | | | | | | | | | | | | | | | | | | | | | | | | | | | | | | | | | | | | | | | | | | | | |
Maryland | | | | | | | | | | | | | | | | | | | | | | | | | | | | | | | | | | | | | | | | | | | | | | | | | | | | |
Frederick County (2 properties) | | Kohl's, Best Buy, Ross Dress for Less | | 2019 | | | 90.0 | % | | | — | | | | 267,699 | | | | 256,457 | | | | 524,156 | | | | — | % | | | 75.1 | % | | | 67.2 | % | | | 71.2 | % | | | 78.4 | % | | | 5,636,482 | | | | 15.10 | |
| | | | | | | | | | | | | | | | | | | | | | | | | | | | | | | | | | | | | | | | | | | | | | | | | | | | |
Connecticut | | | | | | | | | | | | | | | | | | | | | | | | | | | | | | | | | | | | | | | | | | | | | | | | | | | | |
Tri-City Plaza | | TJ Maxx, HomeGoods | | 2019 | | | 90.0 | % | | | — | | | | 129,940 | | | | 172,948 | | | | 302,888 | | | | — | % | | | 100.0 | % | | | 66.0 | % | | | 80.6 | % | | | 89.7 | % | | | 3,590,818 | | | | 14.71 | |
| | | | | | | | | | | | | | | | | | | | | | | | | | | | | | | | | | | | | | | | | | | | | | | | | | | | |
Rhode Island | | | | | | | | | | | | | | | | | | | | | | | | | | | | | | | | | | | | | | | | | | | | | | | | | | | | |
Lincoln Commons | | Stop and Shop, Marshalls, HomeGoods | | 2019 | | | 100.0 | % | | | — | | | | 194,470 | | | | 260,971 | | | | 455,441 | | | | — | % | | | 100.0 | % | | | 72.9 | % | | | 84.5 | % | | | 84.5 | % | | | 5,069,847 | | | | 13.18 | |
| | | | | | | | | | | | | | | | | | | | | | | | | | | | | | | | | | | | | | | | | | | | | | | | | | | | |
SOUTHEAST | | | | | | | | | | | | | | | | | | | | | | | | | | | | | | | | | | | | | | | | | | | | | | | | | | | | |
Virginia | | | | | | | | | | | | | | | | | | | | | | | | | | | | | | | | | | | | | | | | | | | | | | | | | | | | |
Landstown Commons | | Best Buy, Bed Bath & Beyond, Ross Dress for Less | | 2019 | | | 100.0 | % | | | — | | | | 87,883 | | | | 316,925 | | | | 404,808 | | | | — | % | | | 100.0 | % | | | 87.5 | % | | | 90.2 | % | | | 90.2 | % | | | 7,599,369 | | | | 20.82 | |
| | | | | | | | | | | | | | | | | | | | | | | | | | | | | | | | | | | | | | | | | | | | | | | | | | | | |
| Fund Portfolio Retail Properties – Detail 1 |
Supplemental Report – September 30, 2020 | |
| | | | Year | | Fund | | | Gross Leasable Area | | | In Place Occupancy | | | Leased | | | Annualized | | | | | |
Property | | Key Tenants | | Acquired | | Ownership % | | | Street | | | Anchors | | | Shops | | | Total | | | Street | | | Anchors | | | Shops | | | Total | | | Occupancy | | | Base Rent (ABR) | | | ABR PSF | |
Florida | | | | | | | | | | | | | | | | | | | | | | | | | | | | | | | | | | | | | | | | | | | | | | | | | | | | |
Palm Coast Landing | | TJ Maxx, PetSmart, Ross Dress for Less | | 2019 | | | 100.0 | % | | | — | | | | 73,241 | | | | 98,083 | | | | 171,324 | | | | — | % | | | 100.0 | % | | | 89.5 | % | | | 94.0 | % | | | 96.9 | % | | | 3,244,073 | | | | 20.15 | |
| | | | | | | | | | | | | | | | | | | | | | | | | | | | | | | | | | | | | | | | | | | | | | | | | | | | |
North Carolina | | | | | | | | | | | | | | | | | | | | | | | | | | | | | | | | | | | | | | | | | | | | | | | | | | | | |
Hickory Ridge | | Kohl's, Best Buy, Dick's | | 2017 | | | 100.0 | % | | | — | | | | 266,584 | | | | 113,981 | | | | 380,565 | | | | — | % | | | 86.9 | % | | | 83.0 | % | | | 85.7 | % | | | 85.7 | % | | | 3,752,198 | | | | 11.50 | |
| | | | | | | | | | | | | | | | | | | | | | | | | | | | | | | | | | | | | | | | | | | | | | | | | | | | |
| | | | | | | | | | | | | | | | | | | | | | | | | | | | | | | | | | | | | | | | | | | | | | | | | | | | |
Alabama | | | | | | | | | | | | | | | | | | | | | | | | | | | | | | | | | | | | | | | | | | | | | | | | | | | | |
Trussville Promenade | | Wal-Mart, Regal Cinemas | | 2018 | | | 100.0 | % | | | — | | | | 366,010 | | | | 97,715 | | | | 463,725 | | | | — | % | | | 100.0 | % | | | 74.9 | % | | | 94.7 | % | | | 94.7 | % | | | 4,479,949 | | | | 10.20 | |
| | | | | | | | | | | | | | | | | | | | | | | | | | | | | | | | | | | | | | | | | | | | | | | | | | | | |
Georgia | | | | | | | | | | | | | | | | | | | | | | | | | | | | | | | | | | | | | | | | | | | | | | | | | | | | |
Hiram Pavilion | | Kohl's, HomeGoods | | 2018 | | | 100.0 | % | | | — | | | | 209,423 | | | | 153,252 | | | | 362,675 | | | | — | % | | | 100.0 | % | | | 93.4 | % | | | 97.2 | % | | | 97.8 | % | | | 4,186,499 | | | | 11.87 | |
| | | | | | | | | | | | | | | | | | | | | | | | | | | | | | | | | | | | | | | | | | | | | | | | | | | | |
WEST | | | | | | | | | | | | | | | | | | | | | | | | | | | | | | | | | | | | | | | | | | | | | | | | | | | | |
California | | | | | | | | | | | | | | | | | | | | | | | | | | | | | | | | | | | | | | | | | | | | | | | | | | | | |
Elk Grove Commons | | Kohl's, HomeGoods | | 2018 | | | 100.0 | % | | | — | | | | 132,315 | | | | 88,411 | | | | 220,726 | | | | — | % | | | 86.2 | % | | | 79.8 | % | | | 83.6 | % | | | 83.6 | % | | | 4,235,460 | | | | 22.95 | |
| | | | | | | | | | | | | | | | | | | | | | | | | | | | | | | | | | | | | | | | | | | | | | | | | | | | |
Utah | | | | | | | | | | | | | | | | | | | | | | | | | | | | | | | | | | | | | | | | | | | | | | | | | | | | |
Family Center at Riverdale | | Target, Sportman's Warehouse | | 2019 | | | 89.4 | % | | | — | | | | 256,352 | | | | 171,476 | | | | 427,828 | | | | — | % | | | 80.6 | % | | | 86.6 | % | | | 83.0 | % | | | 83.0 | % | | | 3,656,156 | | | | 10.29 | |
| | | | | | | | | | | | | | | | | | | | | | | | | | | | | | | | | | | | | | | | | | | | | | | | | | | | |
Total - Fund V | | | | | | | | | | | — | | | | 2,393,205 | | | | 1,991,504 | | | | 4,384,709 | | | | — | % | | | 92.9 | % | | | 80.0 | % | | | 87.0 | % | | | 88.7 | % | | $ | 56,349,963 | | | $ | 14.77 | |
| | | | | | | | | | | | | | | | | | | | | | | | | | | | | | | | | | | | | | | | | | | | | | | | | | | | |
TOTAL FUND PROPERTIES | | | | 152,036 | | | | 3,998,205 | | | | 3,160,690 | | | | 7,310,931 | | | | 80.2 | % | | | 93.6 | % | | | 77.6 | % | | | 86.4 | % | | | 89.8 | % | | $ | 102,715,185 | | | $ | 16.26 | |
| | | | | | | | | | | | | | | | | | | | | | | | | | | | | | | | | | | | | | | | | | | | | | | | | | | | |
Acadia Share of Total Fund Properties | | | | 34,644 | | | | 837,866 | | | | 654,591 | | | | 1,527,101 | | | | 79.9 | % | | | 94.6 | % | | | 76.6 | % | | | 86.5 | % | | | 89.8 | % | | $ | 21,743,853 | | | $ | 16.45 | |
__________
| 1. | Excludes properties under development, see “Development and Redevelopment Activity” page of this Supplemental Report. The above occupancy and rent amounts do not include space which is currently leased, other than "leased occupancy," but for which rent payment has not yet commenced. Residential and office GLA is excluded. |
| 2. | Property also includes 12,371 sf of 2nd floor office space and 29,760 sf parking garage (131 spaces). |

| Fund Lease Expirations |
Supplemental Report – September 30, 2020 | (Pro Rata Basis) |
| | FUND II | | | | | | | | | | | FUND III | | | | | | | | | |
| | | | | | GLA | | | | | | | ABR | | | | | | | GLA | | | | | | | ABR | |
| | Leases | | | Expiring | | | Percent | | | | | | | | | | | Percent | | | Leases | | | Expiring | | | Percent | | | | | | | | | | | Percent | |
Year | | Expiring | | | SF | | | of Total | | | Amount | | | PSF | | | of Total | | | Expiring | | | SF | | | of Total | | | Amount | | | PSF | | | of Total | |
M to M 1 | | | — | | | | — | | | | — | % | | $ | — | | | $ | — | | | | — | % | | | — | | | | — | | | | — | % | | $ | — | | | $ | — | | | | — | % |
2020 (Remainder) | | | — | | | | — | | | | — | % | | | — | | | | — | | | | — | % | | | — | | | | — | | | | — | % | | | — | | | | — | | | | — | % |
2021 | | | — | | | | — | | | | — | % | | | — | | | | — | | | | — | % | | | — | | | | — | | | | — | % | | | — | | | | — | | | | — | % |
2022 | | | — | | | | — | | | | — | % | | | — | | | | — | | | | — | % | | | — | | | | — | | | | — | % | | | — | | | | — | | | | — | % |
2023 | | | — | | | | — | | | | — | % | | | — | | | | — | | | | — | % | | | 2 | | | | 161 | | | | 0.6 | % | | | 42,280 | | | | 262.61 | | | | 4.2 | % |
2024 | | | — | | | | — | | | | — | % | | | — | | | | — | | | | — | % | | | — | | | | — | | | | — | % | | | — | | | | — | | | | — | % |
2025 | | | — | | | | — | | | | — | % | | | — | | | | — | | | | — | % | | | — | | | | — | | | | — | % | | | — | | | | — | | | | — | % |
2026 | | | 1 | | | | 655 | | | | 0.8 | % | | | 67,187 | | | | 102.58 | | | | 2.7 | % | | | 1 | | | | 110 | | | | 0.4 | % | | | 35,924 | | | | 326.58 | | | | 3.6 | % |
2027 | | | 1 | | | | 774 | | | | 1.0 | % | | | 109,997 | | | | 142.11 | | | | 4.5 | % | | | — | | | | — | | | | — | % | | | — | | | | — | | | | — | % |
2028 | | | 2 | | | | 5,951 | | | | 7.3 | % | | | 389,962 | | | | 65.53 | | | | 15.8 | % | | | 2 | | | | 6,318 | | | | 23.5 | % | | | 184,275 | | | | 29.17 | | | | 18.4 | % |
2029 | | | 1 | | | | 254 | | | | 0.3 | % | | | 49,462 | | | | 194.73 | | | | 2.0 | % | | | 3 | | | | 1,910 | | | | 7.1 | % | | | 170,685 | | | | 89.36 | | | | 17.1 | % |
Thereafter | | | 4 | | | | 73,427 | | | | 90.6 | % | | | 1,850,493 | | | | 25.20 | | | | 75.0 | % | | | 5 | | | | 18,348 | | | | 68.4 | % | | | 566,041 | | | | 30.85 | | | | 56.7 | % |
Total | | | 9 | | | | 81,061 | | | | 100.0 | % | | $ | 2,467,101 | | | $ | 30.44 | | | | 100.0 | % | | | 13 | | | | 26,847 | | | | 100.0 | % | | $ | 999,205 | | | $ | 37.22 | | | | 100.0 | % |
| | | | | | | | | | | | | | | | | | | | | | | | | | | | | | | | | | | | | | | | | | | | | | | | |
| | | | | | | 44,300 | | | Total Vacant | | | | | | | | | | | | | | | | 5,904 | | | Total Vacant | | | | | | | | | |
| | | | | | | 125,361 | | | Total Square Feet | | | | | | | | | | | | | | | | 32,751 | | | Total Square Feet | | | | | | | | | |
| | | | | | | | | | | | | | | | | | | | | | | | | | | | | | | | | | | | | | | | | | | | | | | | |
| | | | | | | | | | | | | | | | | | | | | | | | | | | | | | | | | | | | | | | | | | | | | | | | |
| | FUND IV | | | | | | | | | | | FUND V | | | | | | | | | |
| | | | | | GLA | | | | | | | ABR | | | | | | | GLA | | | | | | | ABR | |
| | Leases | | | Expiring | | | Percent | | | | | | | | | | | Percent | | | Leases | | | Expiring | | | Percent | | | | | | | | | | | Percent | |
Year | | Expiring | | | SF | | | of Total | | | Amount | | | PSF | | | of Total | | | Expiring | | | SF | | | of Total | | | Amount | | | PSF | | | of Total | |
M to M 1 | | | 11 | | | | 5,387 | | | | 1.2 | % | | $ | 107,486 | | | $ | 19.95 | | | | 1.5 | % | | | 12 | | | | 7,076 | | | | 0.9 | % | | $ | 146,745 | | | $ | 20.74 | | | | 1.3 | % |
2020 (Remainder) | | | 3 | | | | 898 | | | | 0.2 | % | | | 29,473 | | | | 32.82 | | | | 0.4 | % | | | 7 | | | | 2,878 | | | | 0.4 | % | | | 67,181 | | | | 23.34 | | | | 0.6 | % |
2021 | | | 31 | | | | 60,637 | | | | 13.0 | % | | | 709,913 | | | | 11.71 | | | | 9.8 | % | | | 50 | | | | 63,929 | | | | 8.6 | % | | | 1,171,000 | | | | 18.32 | | | | 10.6 | % |
2022 | | | 21 | | | | 34,459 | | | | 7.4 | % | | | 510,756 | | | | 14.82 | | | | 7.1 | % | | | 60 | | | | 98,182 | | | | 13.1 | % | | | 1,613,395 | | | | 16.43 | | | | 14.6 | % |
2023 | | | 39 | | | | 34,837 | | | | 7.5 | % | | | 349,773 | | | | 10.04 | | | | 4.8 | % | | | 48 | | | | 80,511 | | | | 10.8 | % | | | 1,401,289 | | | | 17.40 | | | | 12.7 | % |
2024 | | | 19 | | | | 29,403 | | | | 6.3 | % | | | 381,610 | | | | 12.98 | | | | 5.3 | % | | | 50 | | | | 111,529 | | | | 14.9 | % | | | 1,658,873 | | | | 14.87 | | | | 15.0 | % |
2025 | | | 33 | | | | 56,055 | | | | 12.0 | % | | | 1,216,940 | | | | 21.71 | | | | 16.9 | % | | | 41 | | | | 176,126 | | | | 23.6 | % | | | 2,116,175 | | | | 12.02 | | | | 19.1 | % |
2026 | | | 21 | | | | 31,148 | | | | 6.7 | % | | | 671,117 | | | | 21.55 | | | | 9.3 | % | | | 23 | | | | 28,443 | | | | 3.8 | % | | | 561,253 | | | | 19.73 | | | | 5.1 | % |
2027 | | | 15 | | | | 22,198 | | | | 4.8 | % | | | 358,353 | | | | 16.14 | | | | 5.0 | % | | | 9 | | | | 45,378 | | | | 6.1 | % | | | 383,493 | | | | 8.45 | | | | 3.5 | % |
2028 | | | 10 | | | | 19,381 | | | | 4.2 | % | | | 269,497 | | | | 13.91 | | | | 3.7 | % | | | 16 | | | | 25,706 | | | | 3.4 | % | | | 464,760 | | | | 18.08 | | | | 4.2 | % |
2029 | | | 14 | | | | 61,018 | | | | 13.1 | % | | | 1,030,457 | | | | 16.89 | | | | 14.3 | % | | | 15 | | | | 39,396 | | | | 5.3 | % | | | 458,270 | | | | 11.63 | | | | 4.1 | % |
Thereafter | | | 24 | | | | 111,101 | | | | 23.6 | % | | | 1,577,155 | | | | 14.20 | | | | 21.9 | % | | | 24 | | | | 68,021 | | | | 9.1 | % | | | 1,022,583 | | | | 15.03 | | | | 9.2 | % |
Total | | | 241 | | | | 466,522 | | | | 100.0 | % | | $ | 7,212,530 | | | $ | 15.46 | | | | 100.0 | % | | | 355 | | | | 747,175 | | | | 100.0 | % | | $ | 11,065,017 | | | $ | 14.81 | | | | 100.0 | % |
| | | | | | | | | | | | | | | | | | | | | | | | | | | | | | | | | | | | | | | | | | | | | | | | |
| | | | | | | 46,665 | | | Total Vacant | | | | | | | | | | | | | | | | 108,626 | | | Total Vacant | | | | | | | | | |
| | | | | | | 513,187 | | | Total Square Feet | | | | | | | | | | | | | | | | 855,801 | | | Total Square Feet | | | | | | | | | |
__________
| 1. | Leases currently under month to month or in process of renewal |

| Development and Redevelopment Activity |
Supplemental Report – September 30, 2020 | |
| | | | | | | | | | Est. SQFT | | | | | | | | | | | Acquisition & Development Costs | |
Property | | Ownership 1 | | | Location | | Estimated Stabilization | | Upon Completion | | | Occupied/Leased Rate | | | Key Tenants | | Description | | Incurred 2 | | | Estimated Future Range | | | Estimated Total Range | |
Development: | | | | | | | | | | | | | | | | | | | | | | | | | | | | | | | | | | | | | | | | | | | | |
CORE | | | | | | | | | | | | | | | | | | | | | | | | | | | | | | | | | | | | | | | | | | | | |
1238 Wisconsin | | 80.0% | | | Washington DC | | 2023 | | | 29,000 | | | — | | | TBD | | Redevelopment/addition to existing building with ground level retail, upper floor office and residential units upon completion. Discretionary spend upon securing tenant(s) | | $ | 3.2 | | | | 29.4 | | | to | | | 30.8 | | | $ | 32.6 | | | to | | $ | 34.0 | |
| | | | | | | | | | | | | | | | | | | | | | | | | | | | | | | | | | | | | | | | | | | | |
FUND II | | | | | | | | | | | | | | | | | | | | | | | | | | | | | | | | | | | | | | | | | | | | |
City Point Phase III | | 94.2% | | | Brooklyn, NY | | 2021 | | | 72,000 | | | 0%/88% | | | BASIS Independent Schools | | Discretionary spend upon securing tenant(s) for lease up | | | 11.7 | | | | 20.3 | | | to | | | 23.3 | | | | 32.0 | | | to | | | 35.0 | |
| | | | | | | | | | | | | | | | | | | | | | | | | | | | | | | | | | | | | | | | | | | | |
FUND III | | | | | | | | | | | | | | | | | | | | | | | | | | | | | | | | | | | | | | | | | | | | |
Broad Hollow Commons | | 100.0% | | | Farmingdale, NY | | TBD | | TBD | | | — | | | TBD | | Discretionary spend upon securing necessary approvals and tenant(s) for lease up | | | 23.3 | | | | 26.7 | | | to | | | 36.7 | | | | 50.0 | | | to | | | 60.0 | |
| | | | | | | | | | | | | | | | | | | | | | | | | | | | | | | | | | | | | | | | | | | | |
FUND IV | | | | | | | | | | | | | | | | | | | | | | | | | | | | | | | | | | | | | | | | | | | | |
110 University Place | | 100.0% | | | New York, NY | | 2022 | | | 14,000 | | | — | | | TBD | | Discretionary spend upon securing tenant(s) for lease up. Excludes Parking Garage. | | | 14.0 | | | | 8.3 | | | to | | | 12.7 | | | | 22.3 | | | to | | | 26.7 | |
146 Geary | | 100.0% | | | San Francisco, CA | | 2022 | | | 13,000 | | | — | | | TBD | | Building out office space for floors 3 and 4. All other $'s are discretionary spend upon securing tenant(s) for lease up. | | | 46.3 | | | | 2.9 | | | to | | | 6.7 | | | | 49.2 | | | to | | | 53.0 | |
717 N. Michigan Avenue | | 100.0% | | | Chicago, IL | | 2023 | | | 62,000 | | | 30%/30% | | | Disney Store | | Discretionary spend upon securing tenant(s) for lease up | | | 116.3 | | | | 18.0 | | | to | | | 25.5 | | | | 134.3 | | | to | | | 141.8 | |
| | | | | | | | | | | | | | | | | | | | | | $ | 214.8 | | | $ | 105.6 | | | | | $ | 135.7 | | | $ | 320.4 | | | | | $ | 350.5 | |
Major Redevelopment: | | | | | | | | | | | | | | | | | | | | | | | | | | | | | | | | | | | | | | | | | | | | |
| | | | | | | | | | | | | | | | | | | | | | | | | | | | | | | | | | | | | | | | | | | | |
CORE | | | | | | | | | | | | | | | | | | | | | | | | | | | | | | | | | | | | | | | | | | | | |
City Center | | 100.0% | | | San Francisco, CA | | 2021 | | | 241,000 | | | 65%/98% | | | Target, Whole Foods, PetSmart | | Ground up development of pad sites and street level retail and re-tenanting/redevelopment for Whole Foods | | $ | 196.2 | | | | 8.4 | | | to | | | 12.4 | | | $ | 204.6 | | | to | | $ | 208.6 | |
Elmwood Park | | 100.0% | | | Elmwood Park, NJ | | 2021 | | | 144,000 | | | 51%/75% | | | Lidl | | Re-tenanting and split of former 48,000 square foot Acme with 28,000 square foot Lidl and 20,000 square feet of remaining for discretionary spend; façade upgrade | | | 1.0 | | | | 4.0 | | | to | | | 4.5 | | | | 5.0 | | | to | | | 5.5 | |
Route 6 Mall | | 100.0% | | | Honesdale, PA | | TBD | | TBD | | | 26%/26% | | | TBD | | Discretionary spend for re-tenanting former 120,000 square foot Kmart anchor space once tenant(s) are secured | | | — | | | | 5.0 | | | to | | | 7.0 | | | | 5.0 | | | to | | | 7.0 | |
Mad River | | 100.0% | | | Dayton, OH | | TBD | | TBD | | | 56%/56% | | | TBD | | Discretionary spend for the re-tenanting former 33,000 square foot Babies R Us space once tenant(s) are secured | | | — | | | | 1.9 | | | to | | | 2.3 | | | | 1.9 | | | to | | | 2.3 | |
| | | | | | | | | | | | | | | | | | | | | | $ | 197.2 | | | $ | 19.3 | | | | | $ | 26.2 | | | $ | 216.5 | | | | | $ | 223.4 | |
_________

| Development and Redevelopment Activity |
Supplemental Report – September 30, 2020 | |
__________
| 1. | Ownership percentage represents the Core or Fund level ownership and not Acadia’s pro rata share. |
| 2. | Incurred amounts include costs associated with the initial carrying value. Refer to “ Net Asset Valuation Information ” for pro-rata costs incurred. Reconciles to Consolidated Balance Sheet at September 30, 2020 as follows: |
Development costs above | | | | | | $ | 214.8 | |
Unconsolidated projects (a) | | | (3.2 | ) |
Projects in redevelopment or partial development (b) | | | 70.8 | |
Deferred costs and other amounts | | | (7.4 | ) |
Impairment charges taken | | | (6.7 | ) |
Total per consolidated balance sheet | | $ | 268.3 | |
| (a) | Relates to 1238 Wisconsin Avenue |
| (b) | Primarily relates to the portion of City Center that is still in Major Redevelopment. Total incurred amount of $196.2 reflects the historical carrying value of the entire property (including its initial acquisition cost). |

| Portfolio Composition 1 |
Supplemental Report – September 30, 2020 | |
| | | | | | | |
Billed Percentage | | Core | | | Core and Fund Pro-Rata | | | Core Street/Urban | | | Core Suburban | |
| | | | | | | | | | | | | | | | |
Essential | | | | | | | | | | | | | | | | |
Grocer / Mass Merchandiser 2 | | | 14 | % | | | 14 | % | | | 12 | % | | | 16 | % |
Drug / Dollar Store | | | 4 | % | | | 4 | % | | | 4 | % | | | 3 | % |
Banks | | | 4 | % | | | 4 | % | | | 5 | % | | | 4 | % |
Home Improvement / Auto | | | 3 | % | | | 4 | % | | | — | | | | 9 | % |
Communications / Electronics | | | 3 | % | | | 3 | % | | | 4 | % | | | 2 | % |
Other Essential | | | 3 | % | | | 3 | % | | | 1 | % | | | 6 | % |
Pets | | | 2 | % | | | 2 | % | | | 1 | % | | | 3 | % |
Total Essential | | | 33 | % | | | 34 | % | | | 27 | % | | | 43 | % |
| | | | | | | | | | | | | | | | |
Non-Essential | | | | | | | | | | | | | | | | |
Apparel | | | 19 | % | | | 21 | % | | | 33 | % | | | 3 | % |
Discount / Fast Fashion | | | 9 | % | | | 9 | % | | | 13 | % | | | 3 | % |
Restaurant / Food | | | 9 | % | | | 8 | % | | | 7 | % | | | 9 | % |
Hard Goods | | | 7 | % | | | 6 | % | | | 2 | % | | | 14 | % |
Personal / Professional Service | | | 7 | % | | | 6 | % | | | 6 | % | | | 7 | % |
Home | | | 8 | % | | | 8 | % | | | 7 | % | | | 10 | % |
Other | | | 4 | % | | | 4 | % | | | 4 | % | | | 3 | % |
Gym / Fitness | | | 3 | % | | | 3 | % | | | 1 | % | | | 6 | % |
Theater / Entertainment | | | 1 | % | | | 1 | % | | | — | | | | 2 | % |
Total Non-Essential | | | 67 | % | | | 66 | % | | | 73 | % | | | 57 | % |
| | | | | | | | | | | | | | | | |
Total | | | 100 | % | | | 100 | % | | | 100 | % | | | 100 | % |
__________
| 1. | Data as of September 30, 2020. Percentages based on billed September rents and recoveries. |
| 2. | Includes Walmart, Target and K-Mart. |

| Important Notes |
Supplemental Report – September 30, 2020 | |
SPECIAL NOTE REGARDING FORWARD-LOOKING STATEMENTS
Certain statements contained in this supplemental disclosure may contain forward-looking statements within the meaning of Section 27A of the Securities Act of 1933 and Section 21E of the Securities and Exchange Act of 1934 and as such may involve known and unknown risks, uncertainties and other factors which may cause the Company’s actual results, performance or achievements to be materially different from future results, performance or achievements expressed or implied by such forward-looking statements. Forward-looking statements, which are based on certain assumptions and describe the Company’s future plans, strategies and expectations are generally identifiable by use of the words “may,” “will,” “should,” “expect,” “anticipate,” “estimate,” “believe,” “intend” or “project” or the negative thereof or other variations thereon or comparable terminology. Factors which could have a material adverse effect on the operations and future prospects of the Company include, but are not limited to those set forth under the heading “Risk Factors” in the Company’s Annual Report on Form 10-K. These risks and uncertainties should be considered in evaluating any forward-looking statements contained or incorporated by reference herein.
USE OF FUNDS FROM OPERATIONS AS NON-GAAP FINANCIAL MEASURE
The Company considers funds from operations (“FFO”) as defined by the National Association of Real Estate Investment Trusts (“NAREIT”) to be an appropriate supplemental disclosure of operating performance for an equity REIT due to its widespread acceptance and use within the REIT and analyst communities. FFO is presented to assist investors in analyzing the performance of the Company. It is helpful as it excludes various items included in net income that are not indicative of the operating performance, such as gains (or losses) from sales of property and depreciation and amortization. Consistent with the NAREIT definition, the Company defines FFO as net income (computed in accordance with GAAP), excluding gains (or losses) from sales of depreciated property, plus depreciation and amortization, and after adjustments for unconsolidated partnerships and joint ventures. Also consistent with NAREIT’s definition of FFO, the Company has elected to include gains and losses incidental to its main business (including those related to its RCP investments such as Albertsons) in FFO.
The Company also provides another supplemental disclosure of operating performance, adjusted funds from operations (“AFFO”). The Company defines AFFO as FFO adjusted for straight line rent, non-real estate depreciation, stock-based compensation, amortization of finance costs and costs of management contracts, tenant improvements, leasing commissions and capital expenditures.
The Company may also provide from time to time another supplemental disclosure of operating performance, FFO Before Special Items. The Company defines FFO Before Special Items as FFO adjusted for certain unusual items including charges, income and gains that management believes are not comparable and indicative of the results of the Company’s operating real estate portfolio.
It should be noted that the Company’s methods of calculating FFO, AFFO or FFO Before Special Items may be different from methods used by other REITs and, accordingly, may not be comparable to such metrics used by other REITs. FFO, AFFO and FFO Before Special Items do not represent cash generated from operations as defined by generally accepted accounting principles (“GAAP”) and are not indicative of cash available to fund all cash needs, including distributions. None of these measures should be considered as an alternative to net income for the purpose of evaluating the Company’s performance or to cash flows as a measure of liquidity.
USE OF NON-GAAP FINANCIAL MEASURES
Non-GAAP financial measures such as EBITDA, NOI, Same-Property NOI and lease spreads are widely used financial measures in many industries, including the REIT industry, and are presented to assist investors and analysts in analyzing the performance of the Company. They are helpful as they exclude various items included in net income that are not indicative of operating performance, such as gains (or losses) from sales of property and depreciation and amortization and is used in computing various financial ratios as a measure of operational performance. The Company computes EBITDA as the sum of net income before extraordinary items plus interest expense, depreciation, income taxes and amortization, less any gains (losses including impairment charges) on the sale of income producing properties. The Company computes NOI by taking the difference between Property Revenues and Property Expenses as detailed in this reporting supplement. Same-Property NOI includes properties in our Core Portfolio that we owned for both the current and prior periods presented, but excludes those properties which we acquired, sold or expected to sell, and redeveloped during these periods. The Company’s method of calculating EBITDA, NOI and Same-Property NOI may be different from methods used by other REITs and, accordingly, may not be comparable to such other REITs. EBITDA, NOI and Same-Property NOI do not represent cash generated from operations as defined by GAAP and are not indicative of cash available to fund all cash needs, including distributions. They should not be considered as an alternative to net income for the purpose of evaluating the Company’s performance or to cash flows as a measure of liquidity.