QuickLinks -- Click here to rapidly navigate through this document
UNITED STATES
SECURITIES AND EXCHANGE COMMISSION
Washington, D.C. 20549
FORM 10-K
| (Mark One) | |
| /x/ | ANNUAL REPORT PURSUANT TO SECTION 13 OR 15(d) OF THE SECURITIES EXCHANGE ACT OF 1934 |
For the fiscal year ended December 31, 2001 | |
or | |
/ / | TRANSITION REPORT PURSUANT TO SECTION 13 OR 15(d) OF THE SECURITIES EXCHANGE ACT OF 1934 |
For the transition period from to | |
| Commission File Number | Registrant, State of Incorporation, Address and Telephone Number | I.R.S. Employer Identification No. | ||
|---|---|---|---|---|
| 1-11377 | CINERGY CORP. (A Delaware Corporation) 139 East Fourth Street Cincinnati, Ohio 45202 (513) 421-9500 | 31-1385023 | ||
1-1232 | THE CINCINNATI GAS & ELECTRIC COMPANY (An Ohio Corporation) 139 East Fourth Street Cincinnati, Ohio 45202 (513) 421-9500 | 31-0240030 | ||
1-3543 | PSI ENERGY, INC. (An Indiana Corporation) 1000 East Main Street Plainfield, Indiana 46168 (513) 421-9500 | 35-0594457 | ||
2-7793 | THE UNION LIGHT, HEAT AND POWER COMPANY (A Kentucky Corporation) 139 East Fourth Street Cincinnati, Ohio 45202 (513) 421-9500 | 31-0473080 | ||
Each of the following classes or series of securities registered pursuant to Section 12(b) of the Act is registered on the New York Stock Exchange:
| Registrant | Title of each class | ||
|---|---|---|---|
| Cinergy Corp. | Common Stock | ||
| Income PRIDES | |||
The Cincinnati Gas & Electric Company | Cumulative Preferred Stock | 4% | |
| Junior Subordinated Debentures | 8.28% | ||
PSI Energy, Inc. | Cumulative Preferred Stock | 4.32% | |
| Cumulative Preferred Stock | 4.16% | ||
| Cumulative Preferred Stock | 67/8% | ||
Securities registered pursuant to Section 12(g) of the Act: None
Indicate by check mark whether each registrant (1) has filed all reports required to be filed by Section 13 or 15(d) of the Securities Exchange Act of 1934 during the preceding 12 months (or for such shorter period that such registrant was required to file such reports), and (2) has been subject to such filing requirements for the past 90 days. Yes /x/ No / /
Indicate by check mark if disclosure of delinquent filers pursuant to Item 405 of Regulation S-K is not contained herein, and will not be contained, to the best of registrants' knowledge, in definitive proxy or information statements incorporated by reference in Part III of this Form 10-K or any amendment to this Form 10-K. /x/
Requirements pursuant to Item 405 of Regulation S-K are not applicable forThe Union Light, Heat and Power Company.
The Union Light, Heat and Power Company meets the conditions set forth in General Instruction I (1)(a) and (b) of Form 10-K and is therefore filing this Form 10-K with the reduced disclosure format specified in General Instruction I (2) of Form 10-K.
As of January 31, 2002, the aggregate market value of the common equity ofCinergy Corp. held by nonaffiliates (shareholders who are not directors or executive officers) was $5.1 billion. All of the common stock ofThe Cincinnati Gas & Electric Company andPSI Energy, Inc. is owned byCinergy Corp., and all of the common stock ofThe Union Light, Heat and Power Company is owned byThe Cincinnati Gas & Electric Company. As of January 31, 2002, each registrant had the following shares of common stock outstanding:
| Registrant | Description | Shares | ||
|---|---|---|---|---|
| Cinergy Corp. | Par value $.01 per share | 159,765,197 | ||
The Cincinnati Gas & Electric Company | Par value $8.50 per share | 89,663,086 | ||
PSI Energy, Inc. | Without par value, stated value $.01 per share | 53,913,701 | ||
The Union Light, Heat and Power Company | Par value $15.00 per share | 585,333 |
DOCUMENTS INCORPORATED BY REFERENCE
Portions of the Proxy Statement ofCinergy Corp. and the Information Statement ofPSI Energy, Inc. filed, or to be filed, with the Securities and Exchange Commission are incorporated by reference into Part III of this report.
This combined Form 10-K is separately filed byCinergy Corp.,The Cincinnati Gas & Electric Company,PSI Energy, Inc., andThe Union Light, Heat and Power Company. Information contained herein relating to any individual registrant is filed by such registrant on its own behalf. Each registrant makes no representation as to information relating to registrants other than itself.
| Item Number | | Page Number | ||
|---|---|---|---|---|
| Cautionary Statements Regarding Forward-Looking Information | 3 | |||
PART I | ||||
| 1 | Business | |||
| Organization | 5 | |||
| Current Trends | 7 | |||
| Business Units | 8 | |||
| Other Developments | 14 | |||
| Environmental Matters | 14 | |||
| Future Expectations/Trends | 15 | |||
| 2 | Properties | |||
| Energy Merchant | 16 | |||
| Regulated Businesses | 18 | |||
| 3 | Legal Proceedings | |||
| New Source Review and Notices of Violation | 19 | |||
| Manufactured Gas Plant Sites | 20 | |||
| M Metals Superfund Site | 21 | |||
| Gas Customer Choice | 21 | |||
| City of Newport, Kentucky | 22 | |||
| 4 | Submission of Matters to a Vote of Security Holders | 23 | ||
PART II | ||||
| 5 | Market for Registrant's Common Equity and Related Stockholder Matters | 24 | ||
| 6 | Selected Financial Data | 25 | ||
| 7 | Management's Discussion and Analysis of Financial Condition and Results of Operations | |||
| Introduction | 27 | |||
| Liquidity and Capital Resources | 27 | |||
| 2001 Results of Operations—Historical | 39 | |||
| 2000 Results of Operations—Historical | 43 | |||
| Results of Operations—Future | ||||
| 7A | Quantitative and Qualitative Disclosures About Market Risk | 64 | ||
| Index to Financial Statements and Financial Statement Schedules | 65 | |||
| 8 | Financial Statements and Supplementary Data | 66 | ||
| 9 | Changes in and Disagreements with Accountants on Accounting and Financial Disclosure | 145 | ||
PART III | ||||
| 10 | Directors and Executive Officers of the Registrants | |||
| Board of Directors | 146 | |||
| Executive Officers | 147 | |||
| 11 | Executive Compensation | 151 | ||
| 12 | Security Ownership of Certain Beneficial Owners and Management | 151 | ||
| 13 | Certain Relationships and Related Transactions | 152 | ||
PART IV | ||||
| 14 | Exhibits, Financial Statement Schedules, and Reports on Form 8-K | |||
| Financial Statements and Schedules | 153 | |||
| Reports on Form 8-K | 153 | |||
| Exhibits | 153 | |||
| Signatures | 166 |
2
In this reportCinergy (which includesCinergy Corp. and all of our regulated and non-regulated subsidiaries) is, at times, referred to in the first person as "we", "our", or "us".
CAUTIONARY STATEMENTS REGARDING FORWARD-LOOKING INFORMATION
In this report we discuss various matters that may make management's corporate vision of the future clearer for you. This report outlines management's goals and projections for the future. These goals and projections are considered forward-looking statements and are based on management's beliefs and assumptions. These forward-looking statements are identified by terms and phrases such as "anticipate", "believe", "intend", "estimate", "expect", "continue", "should", "could", "may", "plan", "project", "predict", "will", and similar expressions.
Forward-looking statements involve risks and uncertainties that may cause actual results to be materially different from the results predicted. Factors that could cause actual results to differ are often presented with forward-looking statements. In addition, other factors could cause actual results to differ materially from those indicated in any forward-looking statement. These include:
- •
- Factors affecting operations, such as:
- (1)
- unusual weather conditions;
- (2)
- catastrophic weather-related damage;
- (3)
- unscheduled generation outages;
- (4)
- unusual maintenance or repairs;
- (5)
- unanticipated changes in fossil fuel costs, gas supply costs, or availability constraints;
- (6)
- environmental incidents; and
- (7)
- electric transmission or gas pipeline system constraints.
- •
- Legislative and regulatory initiatives regarding deregulation of the industry or potential national deregulation legislation.
- •
- The timing and extent of the entry of additional competition in electric or gas markets and the effects of continued industry consolidation through the pursuit of mergers, acquisitions, and strategic alliances.
- •
- Regulatory factors such as changes in the policies or procedures that set rates; changes in our ability to recover capital expenditures for environmental compliance, purchased power costs and investments made under traditional regulation through rates; and changes to the frequency and timing of rate increases.
- •
- Financial or regulatory accounting principles or policies imposed by governing bodies.
- •
- Political, legal, and economic conditions and developments in the United States (U.S.) and the foreign countries in which we have a presence. This would include inflation rates and monetary fluctuations.
- •
- Changing market conditions and other factors related to physical energy and financial trading activities. These would include price, basis, credit, liquidity, volatility, capacity, transmission, currency exchange rates, interest rates, and warranty risks.
- •
- The performance of projects undertaken by our non-regulated businesses and the success of efforts to invest in and develop new opportunities.
- •
- Availability of, or cost of, capital.
3
- •
- Employee workforce factors, including changes in key executives, collective bargaining agreements with union employees, and work stoppages.
- •
- Legal and regulatory delays and other obstacles associated with mergers, acquisitions, and investments in joint ventures.
- •
- Costs and effects of legal and administrative proceedings, settlements, investigations, and claims. Examples can be found in Note 13 of the "Notes to Financial Statements" in "Item 8. Financial Statements and Supplementary Data".
- •
- Changes in international, federal, state, or local legislative requirements, such as changes in tax laws, tax rates, and environmental laws and regulations.
Unless we otherwise have a duty to do so, the Securities and Exchange Commission's (SEC) rules do not require forward-looking statements to be revised or updated (whether as a result of changes in actual results, changes in assumptions, or other factors affecting the statements). Our forward-looking statements reflect our best beliefs as of the time they are made and may not be updated for subsequent developments.
4
ORGANIZATION
Cinergy Corp., a Delaware corporation created in October 1994, owns all outstanding common stock of The Cincinnati Gas & Electric Company (CG&E) and PSI Energy, Inc. (PSI), both of which are public utility subsidiaries. As a result of this ownership, we are considered a utility holding company. Because we are a holding company with material utility subsidiaries operating in multiple states, we are registered with and are subject to regulation by the SEC under the Public Utility Holding Company Act of 1935, as amended (PUHCA). Our other principal subsidiaries are:
- •
- Cinergy Wholesale Energy, Inc. (Wholesale Energy);
- •
- Cinergy Services, Inc. (Services);
- •
- Cinergy Investments, Inc. (Investments);
- •
- Cinergy Global Resources, Inc. (Global Resources); and
- •
- Cinergy Technologies, Inc. (Technologies).
CG&E, an Ohio corporation, is a combination electric and gas public utility company that provides service in the southwestern portion of Ohio and, through its subsidiaries, in nearby areas of Kentucky and Indiana.CG&E's principal subsidiary, The Union Light, Heat and Power Company (ULH&P), is a Kentucky corporation that provides electric and gas service in northern Kentucky.CG&E's other subsidiaries are insignificant to its results of operations.
In 2001,CG&E began a transition to electric deregulation and customer choice. Currently, the competitive retail electric market in Ohio is in the development stage.CG&E is recovering its Public Utilities Commission of Ohio (PUCO) approved costs and retail electric rates are frozen during this market development period. See the "Retail Market Developments" section in "Item 7. Management's Discussion and Analysis of Financial Condition and Results of Operations" for a discussion of key elements on Ohio deregulation.
PSI, an Indiana corporation, is a vertically integrated and regulated electric utility that provides service in north central, central, and southern Indiana.
5
The following table presents further information related to the operations of our domestic utility companies (our operating companies):
| | | Principal Line(s) of Business | Major Cities Served | Approximate Population Served | ||||
|---|---|---|---|---|---|---|---|---|
| CG&Eand subsidiaries | • | Generation, transmission, distribution, and sale of electricity | Cincinnati, OH Middletown, OH Covington, KY | 2,012,000 | ||||
| • | Sale and/or transportation of natural gas | Florence, KY Newport, KY Lawrenceburg, IN | ||||||
| PSI | • | Generation, transmission, distribution, and sale of electricity | Bloomington, IN Carmel, IN Columbus, IN Kokomo, IN Lafayette, IN New Albany, IN Terre Haute, IN | 2,220,000 | ||||
| ULH&P | • | Transmission, distribution, and sale of electricity | Covington, KY Florence, KY Newport, KY | 338,000 | ||||
| • | Sale and transportation of natural gas |
Wholesale Energy is a holding company forCinergy's energy commodity businesses, including electric production, as the generation assets eventually become unbundled from the utility subsidiaries. See the "Retail Market Developments" section in "Item 7. Management's Discussion and Analysis of Financial Condition and Results of Operations" for a discussion on Ohio deregulation. Cinergy Power Generation Services, LLC (Generation Services), a wholly-owned subsidiary of Wholesale Energy, provides electric production-related construction, operation and maintenance services to certain affiliates and non-affiliated third parties.
Services is a service company that provides our subsidiaries with a variety of centralized administrative, management, and support services. Investments holds most of our domestic non-regulated, energy-related businesses and investments. Global Resources holds most of our international businesses and investments and directs our renewable energy investing activities (for example, wind farms). Technologies primarily holds our portfolio of technology-related investments.
We have collective bargaining agreements with the International Brotherhood of Electrical Workers (IBEW), the United Steelworkers of America (USWA), the Independent Utilities Union (IUU), and various international union organizations.
6
The following table indicates the number of employees by classification at December 31, 2001:
| | Regulated | Non-Regulated | | |||||||||||||
|---|---|---|---|---|---|---|---|---|---|---|---|---|---|---|---|---|
| Classification | CG&E(4) | PSI | ULH&P | Total Regulated | Domestic(5)(6) | International | Total Non- Regulated | Cinergy Total | ||||||||
| IBEW(1) | 525 | 1,313 | 58 | 1,896 | 946 | — | 946 | 2,842 | ||||||||
| USWA(2) | 296 | — | 90 | 386 | 16 | — | 16 | 402 | ||||||||
| IUU(3) | 428 | — | 61 | 489 | 423 | — | 423 | 912 | ||||||||
| Various Union Organizations | — | — | — | — | 51 | 492 | 543 | 543 | ||||||||
| Non-Bargaining | 234 | 410 | 25 | 669 | 3,007 | 394 | 3,401 | 4,070 | ||||||||
| 1,483 | 1,723 | 234 | 3,440 | 4,443 | 886 | 5,329 | 8,769 | |||||||||
- (1)
- IBEW #1347 contract will expire on April 1, 2006, IBEW #1393 contract will expire on April 30, 2002, and IBEW #399 contract will expire on November 15, 2006. The parties are currently negotiating an extension to the IBEW #1393 contract.
- (2)
- USWA #12049 and #5541-06 contracts will expire on May 15, 2007.
- (3)
- Contract will expire April 1, 2002. The parties are currently negotiating an extension to the IUU contract.
- (4)
- CG&E and subsidiaries excluding ULH&P.
- (5)
- Includes 2,601 Services' employees, who provide services to both regulated and non-regulated operations.
- (6)
- Includes 1,431 Generation Services' employees who provide services to certain affiliates and non-affiliated third parties.
CURRENT TRENDS
For many years our industry has been relatively stable and dominated by vertically integrated companies. However, in recent years a number of federal and state developments, aimed at promoting competition, initiated a de-integration of the traditional value chain and triggered industry restructuring.
New business models are emerging as market participants seek to exploit opportunities along the de-integrated value chain. The market place is being characterized by independent power producers, energy marketers and traders, energy merchants, transmission and distribution providers and retail energy suppliers. New market entrants and activity among the traditional participants, such as mergers, acquisitions, asset sales and spin-offs of lines of business, are reshaping the industry. Power generators are attempting to differentiate themselves to attract a new customer base; large wholesalers are expanding through acquisitions of regional businesses; transmission systems are being operated by Regional Transmission Operators; and the sale of retail energy is no longer the exclusive business of the traditional integrated utility.
By the end of 2000, approximately one-half of the states and the District of Columbia had adopted deregulation plans. However, recent events are significantly influencing political and legislative activity. In late 2000 and early 2001, California experienced unprecedented high prices, extreme price volatility, a lack of market liquidity and inadequate generation supply, leading to customer blackouts. Ultimately, California's two largest utilities accumulated significant unpaid obligations, which resulted in one of the utilities declaring bankruptcy during 2001. In December 2001, Enron Corp. (Enron), a dominant energy trader and seventh largest company of the Fortune 500 in terms of revenue, filed for bankruptcy protection after disclosing substantial third quarter losses and a restatement of prior period results,
7
which contributed to a significant downgrade in its credit ratings. The SEC, the Federal Energy Regulatory Commission (FERC), the U.S. Department of Justice (Justice Department) and numerous Congressional committees are investigating Enron's collapse. These recent events could significantly influence the future industry landscape. In 2001, eight of the states which had previously adopted deregulation plans, including California, decided to delay or suspend their activities. No additional states passed deregulation legislation in 2001.
Within our own service territory, in 1999 Ohio enacted legislation which deregulated electric generation and provided for retail competition beginning in January 2001. In December 2001, the PUCO indicated that while still in the early stages of electric choice, "the campaign is successfully on track". The states of Indiana and Kentucky have not passed restructuring legislation. A special Kentucky Electricity Restructuring Task Force established in 2000 found no compelling reasons for Kentucky to act on the issue of deregulation and recommended the Kentucky General Assembly wait until 2002 to reconsider any type of legislation.
BUSINESS UNITS
We conduct operations through our subsidiaries, and manage through the following three business units:
- •
- Energy Merchant Business Unit (Energy Merchant);
- •
- Regulated Businesses Business Unit (Regulated Businesses); and
- •
- Power Technology and Infrastructure Services Business Unit (Power Technology).
The following section describes the activities of our business units as of December 31, 2001. See Note 16 of the "Notes to Financial Statements" in "Item 8. Financial Statements and Supplementary Data" for financial information by business segment.
Energy Merchant
Energy Merchant manages wholesale generation and the domestic and foreign energy marketing and trading of energy commodities. Energy Merchant operates and maintains our regulated and non-regulated electric generating plants including some of our jointly-owned plants, both domestically and abroad. As of December 31, 2001, the total winter electric capability (including our portion of the total capacity for the jointly-owned plants) of our domestic generating plants was 13,088 megawatts (MW). Approximately 75% of this generation portfolio is coal-fired. See "Item 2. Properties" for a further discussion of the generating facilities.
Energy Merchant also conducts the following activities:
- •
- energy risk management;
- •
- financial restructuring services;
- •
- proprietary arbitrage activities;
- •
- customized energy solutions; and
- •
- directs our renewable energy investing activities.
See the "Market Risk Sensitive Instruments and Positions" section of "Item 7. Management's Discussion and Analysis of Financial Condition and Results of Operations" for information on risks associated with these activities.
8
Each year, throughCG&E andPSI, we purchase approximately 29 million tons of coal to generate electricity. We purchase approximately 80% of our coal supply through long-term coal supply agreements and approximately 20% through the spot market or through short-term supply agreements. We receive our coal supply primarily from mines located in Indiana, West Virginia, Ohio, Kentucky, Pennsylvania, and Illinois. In early 2001, the market price for coal increased due to the buildup of inventories at various generators and the low production levels of coal mines. However, we anticipate the market prices of coal to level off in 2002.
Cinergy has a fleet of natural gas-fired peaking plants that have a capacity of 2,695 MW. The fuel for these units is obtained through the natural gas open market. For further information on the risk of purchasing natural gas see the "Market Risk Sensitive Instruments and Positions" section of "Item 7. Management's Discussion and Analysis of Financial Condition and Results of Operations".
Energy Merchant monitors alternative sources of coal and gas to assure a continuing availability of economical fuel supplies. As such, it will maintain its practice of purchasing a portion of coal and gas requirements on the open market and will continue to investigate least-cost coal options to comply with new and existing environmental requirements.Cinergy,CG&E, andPSI believe that they can continue to obtain enough coal and gas to meet future needs. However, future environmental requirements may significantly impact the availability and price of these fuels.
At times, we purchase power to meet the energy needs of our wholesale customers and to meet the requirements of our retail native load customers (end-use customers within our operating companies' franchise territory). Factors that could causeCinergy to purchase power for retail native load customers include generating plant outages, extreme weather conditions, growth, and other factors associated with supplying full requirements electricity. We believe we can obtain enough purchased power to meet future needs. However, during periods of excessive demand, the price and availability of these purchases may be significantly impacted. See the "Significant Rate Developments" section of "Item 7. Management's Discussion and Analysis of Financial Condition and Results of Operations" for additional information onPSI's Purchased Power Tracker.
Trading Operations and Risk Management
Energy Merchant's energy marketing and trading activities principally consist of energy marketing and trading operations forCG&E,PSI, and Cinergy Capital & Trading, Inc. (Capital & Trading).CG&E andPSI principally market and trade over-the-counter (an informal market where the buying/selling of commodities occurs) contracts for the purchase and sale of electricity, primarily in the Midwest region of the U.S. Energy Merchant also actively markets physical natural gas through Cinergy Marketing & Trading, LP's gas trading operations. See the "Market Risk Sensitive Instruments and Positions" section of "Item 7. Management's Discussion and Analysis of Financial Condition and Results of Operations" for information on risks associated with these activities.
As of December 31, 2001, we had ownership interests in generation assets located in seven countries. The majority of these assets are district heating plants in the Czech Republic, of which we own 100% of four plants and have a minority interest in the fifth. These assets serve retail and wholesale customers in the Czech Republic.
9
Regulated Businesses
Regulated Businesses consists of a regulated, integrated utility, and regulated electric and gas transmission and distribution systems. Regulated Businesses plans, constructs, operates, and maintainsCinergy's transmission and distribution systems and delivers gas and electric energy to consumers, both domestically and abroad. Regulated Businesses operated approximately 46,100 circuit miles (the total length in miles of separate circuits) of domestic electric lines to provide regulated transmission and distribution service to 1.5 million customers as of December 31, 2001.
Regulated Businesses operated approximately 8,200 miles of gas mains (gas distribution lines that serve as a common source of supply for more than one service line) and service lines to provide domestic regulated transmission and distribution services to approximately 495,000 customers as of December 31, 2001. See "Item 2. Properties" for a further discussion of the transmission and distribution systems owned by our operating companies.
Regulated Businesses (through our operating companies) and other non-affiliated utilities in a nine-state region are parties to the East Central Area Reliability Council Agreement (ECAR Agreement). The ECAR Agreement coordinates the planning and operation of generation and transmission facilities, which provides for maximum reliability of regional bulk power supply.
10
Transmission System Interconnections
The following map illustrates the interconnections between our electric systems and other electric systems.
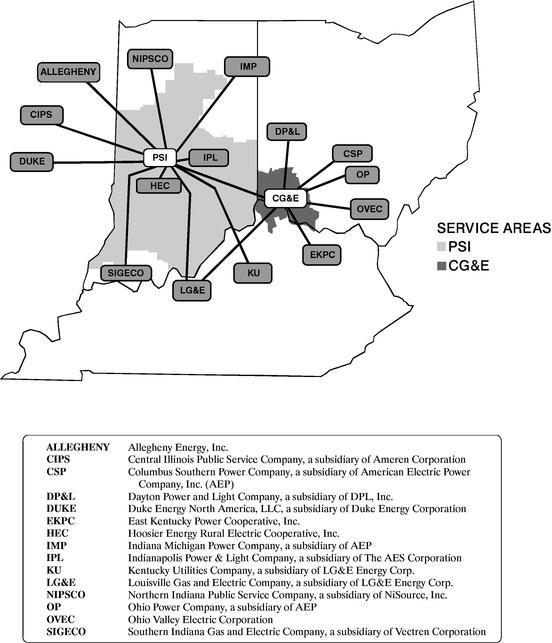
Midwest Independent Transmission System Operator, Inc. (Midwest ISO)
As part of the effort to create a competitive wholesale power marketplace, the FERC approved the formation of the Midwest ISO during 1998. In that same year,Cinergy agreed to join the Midwest ISO in preparation for meeting anticipated changes in the FERC regulations and future deregulation requirements. The Midwest ISO was established as a non-profit organization to maintain functional control over the combined transmission systems of its members. For further information on the Midwest ISO, see the "Midwest Independent Transmission System Operator, Inc." section of "Item 7. Management's Discussion and Analysis of Financial Condition and Results of Operations".
11
Regulated Businesses currently receives its electricity from Energy Merchant at a transfer price based upon current regulatory ratemaking methodology. With the implementation of electric deregulation in Ohio, effective January 1, 2001, Regulated Businesses continues, through a market development period, to acquire its electricity requirements through Energy Merchant for those retail customers who do not switch suppliers.
ULH&Ppurchases energy fromCG&E pursuant to a new contract effective January 1, 2002, which was approved by the FERC and the Kentucky Public Service Commission (KPSC). This five-year agreement is a negotiated fixed-rate contract withCG&E and replaces the previous cost of service based contract, which expired on December 31, 2001.
For further details on electricity supply ofCG&E,PSI, andULH&P, refer to the "Retail Market Developments" section of "Item 7. Management's Discussion and Analysis of Financial Condition and Results of Operations".
Regulated Businesses is responsible for the purchase and the subsequent delivery of natural gas to native load customers. Regulated Businesses' natural gas procurement strategy is to buy firm gas supplies (gas intended to be available at all times) and firm interstate pipeline capacity during the winter season (November through March) and buy spot supply and capacity during the non-heating season (April through October). This strategy allows Regulated Businesses to assure reliable gas supply for its high priority (non-curtailable) customers during peak winter conditions and provides Regulated Businesses the flexibility to reduce its contract commitments if firm customers choose alternate gas suppliers under the Regulated Businesses' customer choice/gas transportation programs. In 2001, firm supply purchase commitment agreements provided approximately 56% of the natural gas supply with the remaining gas purchased on the spot market. These firm supply agreements feature two levels of gas supply, specifically (1) base load, which is a continuous supply to meet normal demand requirements, and (2) swing load, which is gas available on a daily basis to accommodate changes in demand due primarily to changing weather conditions. Regulated Businesses pays reservation charges for base and swing load.
Regulated Businesses manages gas procurement-hedging programs forCG&E andULH&P. These programs include the use of fixed purchase prices as well as variable price arrangements (collars), which have a minimum (floor) and maximum (cap) established on the price to be paid.ULH&P has received approval from the KPSC for its hedging program. In accordance with a PUCO ruling,CG&E may apply for approval of its hedging program on an after-the-fact basis. As of December 31, 2001, bothCG&E andULH&P had hedged approximately 50% of their winter 2001/2002 base load requirements. See the "Gas Industry" section of "Item 7. Management's Discussion and Analysis of Financial Condition and Results of Operations" for further information.
Interstate pipelines either (1) transport gas purchased directly to the distribution systems or (2) inject gas purchased into pipeline storage facilities for future withdrawal and delivery. The majority of the gas supply comes from the Gulf of Mexico coastal areas of Texas and Louisiana. In addition, a limited supply comes from the mid-continent (Arkansas-Oklahoma) basin. Also, industrial transportation customers behindCinergy's city gate (point where the distribution system connects to an interstate gas pipeline) are obtaining methane gas recovered locally from an Ohio landfill.
Regulated Businesses expects the natural gas market will remain competitive in future years. Throughout the year 2001, natural gas prices returned to more normal levels. However, short-term price fluctuations, such as those that occurred in late 2000 and early 2001, could reappear, and reflect the effects of weather conditions, availability of supply, and changes in demand and storage inventories.
12
Currently, neitherCG&E norULH&P profit from changes in the cost of gas. Natural gas purchase costs are passed directly to the customer dollar-for-dollar under the gas cost recovery mechanism that is mandated under state law.
In December 2001,CG&E andULH&P entered into an agreement with Mirant Americas Energy Marketing, LP (Mirant) to manage their interstate pipeline transportation and storage capacity and gas supply contracts. Under this agreement, which expires in October 2003, Mirant is obligated to deliver gas to meetCG&E's andULH&P's firm requirements.
Regulated Businesses also manages our international electric transmission and distribution systems and natural-gas distribution systems business holdings, which include wholly-owned or jointly-owned companies in four foreign countries, namely Zambia, South Africa, Estonia, and Greece.
Revenue Data and Customer Base
The percent of retail operating revenues derived from electricity and gas sales, including transportation, for each of the three years ended December 31 were as follows:
| | Retail Operating Revenues | |||||||||||
|---|---|---|---|---|---|---|---|---|---|---|---|---|
| | 2001 | 2000 | 1999 | |||||||||
| Registrant | ||||||||||||
| Electric % | Gas % | Electric % | Gas % | Electric % | Gas % | |||||||
| Cinergy(1) | 81 | 19 | 84 | 16 | 87 | 13 | ||||||
| CG&Eand subsidiaries | 71 | 29 | 75 | 25 | 80 | 20 | ||||||
| PSI | 100 | — | 100 | — | 100 | — | ||||||
| ULH&P | 68 | 32 | 71 | 29 | 75 | 25 | ||||||
- (1)
- Excludes the results of our International business which are immaterial.
Electric and gas sales are seasonal. Electricity usage in our service territory peaks during the summer and gas usage peaks during the winter. Air conditioning increases electricity demand and heating increases electricity and gas demand.
The service territory ofCG&E and its utility subsidiaries, includingULH&P, is heavily populated and is characterized by a stable residential customer base and a diverse mix of industrial customers. The territory served byPSI is composed of residential, agricultural, and widely diversified industrial customers. No single customer provides more than ten percent of total operating revenues (electric or gas) for any of our operating companies.
Power Technology
Power Technology primarily manages the development, marketing, and sales of our non-regulated retail energy and energy-related businesses. This is accomplished through various subsidiaries and joint ventures and includes the following products and services:
- •
- providing energy management and consulting services to customers that operate retail facilities;
- •
- providing various utility operations and infrastructure services to utilities (for example, providing underground locating and construction services for utilities); and
- •
- building and maintaining fiber optic telecommunication networks for businesses, municipalities, telecommunications carriers, and schools.
13
Power Technology also manages Cinergy Ventures, LLC (Ventures),Cinergy's venture capital subsidiary. Ventures invests in emerging energy technologies that can benefit futureCinergy business development activities.
OTHER DEVELOPMENTS
Investment in "Exempt Wholesale Generators" (EWG) and "Foreign Utility Companies" (FUCO)
Our ability to invest in growth initiatives, such as EWGs and FUCOs is limited by certain legal and regulatory requirements, including the PUHCA. An EWG is an entity, certified by the FERC, devoted exclusively to owning and/or operating and selling power from one or more electric generating facilities. An EWG whose generating facilities are located in the U.S. is limited to making only wholesale sales of electricity. FUCOs are companies whose utility assets and operations are located outside the U.S. and which are used for the generation, transmission, or distribution of electric energy for sale at retail or wholesale, or the distribution of gas at retail. An entity claiming status as a FUCO must provide notification thereof to the SEC under PUHCA.
In March 1998, the SEC granted us authority under PUHCA to invest in EWGs and FUCOs in an aggregate amount equal to our consolidated retained earnings, as determined from time to time. Following our request for an increase in investment authority, in May 2001, the SEC issued a supplemental order, authorizing us to invest an additional $2 billion in EWGs and FUCOs, in addition to an amount equal to our consolidated retained earnings. See the "Liquidity and Capital Resources" section of "Item 7. Management's Discussion and Analysis of Financial Condition and Results of Operations" for information on other investing activities.
Sale of Common Stock
On February 19, 2002,Cinergy Corp. filed a registration statement to increase the available issuance under the shelf registration statement filed in November 2001, to approximately $200 million. On February 22, 2002,Cinergy Corp. sold 6.5 million shares of common stock ofCinergy Corp. with net proceeds of approximately $200 million under these registration statements. The net proceeds from the transaction were used to reduce short-term debt ofCinergy Corp. and its subsidiaries and for other general corporate purposes.
Sales of Accounts Receivable
On February 19, 2002,CG&E,PSI, andULH&P replaced their existing agreement to sell certain of their accounts receivable and related collections.Cinergy Corp. formed Cinergy Receivables Company, LLC (Cinergy Receivables) to purchase, on a revolving basis, nearly all of the retail accounts receivable and related collections ofCG&E,PSI, andULH&P in exchange for a note payable. Cinergy Receivables is not consolidated byCinergy Corp. since it meets the requirements of Statement of Financial Accounting Standards No. 140,Accounting for Transfers and Servicing of Financial Assets and Extinguishments of Liabilities to be considered a qualified special-purpose entity. Cinergy Receivables has an agreement with unrelated parties to borrow up to $400 million, collateralized by its purchased receivables. Cinergy Receivables uses the proceeds from those borrowings to reduce the note payable withCG&E,PSI, andULH&P.CG&E retains servicing responsibilities for its role as a collection agent on the amounts due on the sold receivables. However, Cinergy Receivables assumes the risk of collection on the purchased receivables without recourse toCG&E,PSI, andULH&P in the event of a loss.
ENVIRONMENTAL MATTERS
On December 21, 2000,Cinergy,CG&E, andPSI reached an agreement in principle with the U.S. Environmental Protection Agency (EPA), the Justice Department, three northeast states, and two
14
environmental groups that could serve as the basis for a negotiated resolution of Clean Air Act (CAA) Amendments claims and other related matters brought against coal-fired power plants owned and operated byCinergy's operating companies. The estimated cost for these capital expenditures is expected to be approximately $700 million. These capital expenditures are in addition to our previously announced commitment to install nitrogen oxide (NOX) controls at an estimated cost of approximately $800 million (in nominal dollars) between 2001 and 2005. In 2001, we spent $260 million for NOX and other environmental compliance projects. Forecasted expenditures for NOX and other environmental compliance projects (in nominal dollars) are approximately $250 million for 2002 and $600 million for the 2002-2006 period. See Note 13 of the "Notes to Financial Statements" in "Item 8. Financial Statements and Supplementary Data" for a discussion of the EPA Agreement and related environmental issues.
FUTURE EXPECTATIONS/TRENDS
See the information appearing under the same caption in "Item 7. Management's Discussion and Analysis of Financial Condition and Results of Operations" for the following discussions:
- •
- Wholesale Market Developments;
- •
- Retail Market Developments;
- •
- Midwest ISO;
- •
- Repeal of PUHCA;
- •
- Significant Rate Developments;
- •
- Gas Industry; and
- •
- Other Future Expectations.
15
ENERGY MERCHANT
Our operating companies' total winter electric capabilities, reflected in MW, as of December 31, 2001, are shown in the table that follows. Our electric generating plants are located in Ohio, Kentucky, and Indiana and are wholly-owned or jointly-owned facilities.
| Registrant(1) | Stations | Coal MW | Natural Gas MW | Oil MW | Hydro MW | Total MW | ||||||
|---|---|---|---|---|---|---|---|---|---|---|---|---|
| CG&E | 9 | 4,186 | 736 | 323 | — | 5,245 | ||||||
| PSI | 9 | 5,578 | 120 | 261 | 45 | 6,004 | ||||||
| Total | 18 | 9,764 | 856 | 584 | 45 | 11,249 | ||||||
- (1)
- This table includes only our portion of the total capacity for the jointly-owned plants. Refer to Note 14 of the "Notes to Financial Statements" in "Item 8. Financial Statements and Supplementary Data" for a discussion of the jointly-owned plants.
During 2001, electric generating plants, including those that we own but do not operate, performed reliably, as evidenced by our annual capacity factor of 68% (excluding natural gas and fuel oil peaking stations), a utilization factor at greater than 84% and an equivalent availability factor of 82%. A capacity factor is a percentage that indicates how much of a power plant's capacity is used over time. A utilization factor is a percentage that indicates how much of a power plant's capacity is used while being available. An equivalent availability factor is a percentage that indicates how much a unit is available to generate compared to its potential maximum generation.
In August 2001, we experienced record peak loads of 11,083 MW, 5,094 MW, and 6,019 MW forCinergy,CG&E, andPSI, respectively. At times, we purchase power to meet the energy needs of our wholesale customers and to meet the requirements of our retail native load customers. Factors that could causeCinergy to purchase power for retail native load customers include outages, extreme weather conditions, growth, economics, and other factors associated with supplying full requirements electricity. We believe we can obtain enough purchased power to meet future needs.
Ohio Deregulation
After receipt of FERC, SEC, and applicable third-party approvals and consents,CG&E anticipates transferring its generating stations and their related assets and obligations to an EWG affiliate. Subsequent to this transfer,CG&E will continue operations as a transmission and distribution company. To facilitate this transfer, the generation assets ofCG&E, as of August 2000, were released from the first mortgage indenture lien allowing them to move unencumbered to the EWG affiliate. Generating assets added after August 2000, remain subject to the lien ofCG&E's first mortgage bond indenture and will require release at some future date prior to being transferred. For a further discussion on Ohio deregulation, see the "Retail Market Developments" section of "Item 7. Management's Discussion and Analysis of Financial Condition and Results of Operations".
Merchant Plants
In March 2001, Capital & Trading completed the acquisition of the 480 MW Brownsville generation facility located in Haywood County, Tennessee and the 550 MW Caledonia generation facility located in Lowndes County, Mississippi. Brownsville has four natural gas-fired combustion turbines and Caledonia has six.
16
In June 2001, Capital & Trading and Duke announced they would dissolve their partnership, which was formed in 1999 for the purpose of jointly constructing and owning three wholesale generating facilities. In September 2001, the partnership was dissolved and Capital & Trading obtained ownership of the wholesale generating facilities located in Butler County, Ohio (680 MW) and Henry County, Indiana (129 MW). In exchange for the two generating facilities, Duke received the Vermillion County, Indiana (680 MW) generating facility, which will be operated byCinergy until June 2005. See the "Wholesale Market Developments" section of "Item 7. Management's Discussion and Analysis of Financial Condition and Results of Operations" for further discussion.
At December 31, 2001, our domestic merchant plant capacity consisted of four gas-fired peaking plants with a total capacity of 1,839 MW. However, in December 2001,PSI petitioned the Indiana Utility Regulatory Commission to transfer the Henry County, Indiana, and Butler County, Ohio, gas-fired peaking plants to its regulated operations to serve its growing demand in Indiana. See the "Significant Rate Developments" section of "Item 7. Management's Discussion and Analysis of Financial Condition and Results of Operations" for more information.
As of December 31, 2001, we had ownership interests in generation assets located in seven countries. The majority of these assets are district heating plants in the Czech Republic, of which we own 100% of four plants and have a minority interest in the fifth. These assets serve retail and wholesale customers in the Czech Republic.
Cogeneration
In 1997,Cinergy and Trigen Energy Corporation entered into a joint venture agreement to develop, construct, own, operate, and maintain combined heat and power facilities for large industrial customers. As of December 31, 2001, we had an ownership interest in and/or operated seven domestic cogeneration plants producing 548 MW of electricity through our Trigen-Cinergy Solutions LLC joint venture. Cogeneration is the simultaneous production of two or more forms of useable energy from a single fuel source. During 2002-2003, Cinergy Solutions, Inc. (Cinergy Solutions) anticipates completing construction of four new cogeneration plants, which will produce an additional 772 MW of electricity.
In October 2000, Cinergy Solutions announced a partnership with British Petroleum Global Power, Inc. (BP) to construct, own, and operate two new cogeneration plants for BP's Texas City, Texas, and Chocolate Bayou, Texas, refining and chemical sites. In May 2001, BP cancelled the Chocolate Bayou project. The operation of the Texas City cogeneration plant will coincide with the decommissioning of older, less efficient energy facilities. This new plant, along with existing facilities to be acquired by the partnership, will produce 705 MW of electricity. The Texas City plant is scheduled to be operational in 2004.
17
REGULATED BUSINESSES
Electric
Metrics for our operating companies' electric transmission and distribution systems located in Ohio, Kentucky, and Indiana (excluding our proportionate share of jointly-owned facilities) are as follows:
| Registrant | Electric Transmission Systems | Electric Distribution Systems | Substation Combined Capacity | ||||
|---|---|---|---|---|---|---|---|
| | (circuit miles) | (circuit miles) | (kilovolt-amperes)(1) | ||||
| CG&E | 1,652 | 15,489 | 20,951,521 | ||||
| ULH&P | 105 | 2,708 | 1,213,998 | ||||
| Other subsidiaries | 40 | — | — | ||||
| CG&E and subsidiaries | 1,797 | 18,197 | 22,165,519 | ||||
| PSI | 5,387 | 20,707 | 29,413,407 | ||||
| Total | 7,184 | 38,904 | 51,578,926 | ||||
- (1)
- Kilovolt-amperes (1,000 volt-amperes) are a broad measure of our substation transformer capacity.
At the end of 2001, our operating companies' electric systems were interconnected with fifteen other utilities.
Our electric transmission and distribution systems are designed and constructed to further the goal of providing reliable service to our customers. Every effort is made to ensure that sufficient facilities are in service to meet this goal without installing facilities beyond what is required to operate reliably and within the design or designed parameters. Through our ongoing review of these systems, enhancements are developed and constructed to meet our planning, loading, and reliability guidelines. This process allows us to prudently invest in capacity additions only when and where they are required.
Gas
As of December 31, 2001, the natural gas transmission and distribution systems ofCG&E and its subsidiaries had approximately 8,200 miles of mains and service lines located in southwestern Ohio, southeastern Indiana, and northern Kentucky.CG&E and its subsidiaries also jointly own three underground caverns with a total storage capacity of 22 million gallons of liquid propane. As of December 31, 2001, we had 17 million gallons of liquid propane in storage. This liquid propane is used in the three propane/air peak shaving plants located in Ohio and Kentucky to convert liquid propane into natural gas to be used only during peak demand periods and emergencies. During 2001,CG&E and its subsidiaries' natural gas transmission and distribution systems operated reliably, at a load factor of 37%.
In December 2001,CG&E andULH&P entered into an agreement with Mirant to manageCG&E's andULH&P's interstate pipeline transportation and storage capacity and gas supply contracts. The agreement expires in October 2003. Under this agreement, Mirant is obligated to deliver gas to meetCG&E's andULH&P's firm requirements.
International
We own interests in approximately 2,700 miles of gas and electric transmission and distribution systems through jointly-owned investments in four countries. We serve approximately 59,600 transmission and distribution customers. In November 2001, Attiki Denmark ApS, a joint venture between CGP Global Greece Holdings S.A., (an indirect wholly-owned subsidiary ofCinergy) and Shell Gas B.V. closed on its transaction to acquire a 49% interest in Attiki Gas Supply Company S.A. (Attiki Gas). Attiki Gas distributes, supplies, and sells natural gas to retail customers in the Athens, Greece area.
18
NEW SOURCE REVIEW (NSR) AND NOTICES OF VIOLATION (NOV)
The CAA's NSR provisions require that a company obtain a pre-construction permit if it plans to build a new stationary source of pollution or make a major modification to an existing facility, unless the changes are exempt. In July 1998, the EPA requested comments on proposed revisions to the NSR rules that could have the affect of changing NSR applicability by limiting exemptions contained in the current regulation. On June 22, 2001, the EPA issued an NSR 90-Day Review Paper and scheduled four public forums across the U.S. to gather more information on the impacts of NSR.Cinergy provided oral testimony at an EPA public forum held in Cincinnati, Ohio, on July 10, 2001, and submitted written comments as well.
Since July 1999,CG&E andPSI have received requests from the EPA (Region 5), under Section 114 of the CAA, seeking documents and information regarding capital and maintenance expenditures at several of their respective generating stations. These requests were part of an industry-wide investigation assessing compliance with the NSR and the New Source Performance Standards (NSPS) of the CAA at electric generating stations.
On September 15, 1999, November 3, 1999, and February 2, 2001, the Attorneys General of New York, Connecticut, and New Jersey, respectively, issued letters notifyingCinergy andCG&E of their intent to sue under the citizens' suit provisions of the CAA. These states allege violations of the CAA by constructing and continuing to operate a major modification ofCG&E's W.C. Beckjord Generating Station (Beckjord Station) without obtaining the required NSR pre-construction permits.
On November 3, 1999, the EPA sued a number of holding companies and electric utilities, includingCinergy,CG&E, andPSI, in various U.S. District Courts (District Court). TheCinergy,CG&E, andPSI suit alleged violations of the CAA at two of our generating stations relating to NSR and NSPS requirements. The suit sought (1) injunctive relief to require installation of pollution control technology on each of the generating units at Beckjord Station and atPSI's Cayuga Generating Station (Cayuga Station), and (2) civil penalties in amounts of up to $27,500 per day for each violation.
On March 1, 2000, the EPA filed an amended complaint againstCinergy,CG&E, andPSI. The amended complaint added alleged violations of the NSR requirements of the CAA at two of our generating stations contained in an NOV filed by the EPA on November 3, 1999. It also added claims for relief of alleged violations of nonattainment NSR, Indiana and Ohio State Implementation Plans (SIP), and particulate matter emission limits.
The amended complaint sought (1) injunctive relief to require installation of pollution control technology on each of the generating units at Beckjord Station andPSI's Cayuga Station, Wabash River Generating Station, and Gallagher Generating Station, and such other measures as necessary, and (2) civil penalties in amounts of up to $27,500 per day for each violation.
On March 1, 2000, the EPA also filed an amended complaint in a separate lawsuit alleging violations of the CAA relating to NSR, Prevention of Significant Deterioration (PSD), and Ohio SIP requirements regarding various generating stations, including a generating station operated by the CSP and jointly-owned by CSP, DP&L, andCG&E. The EPA is seeking injunctive relief and civil penalties of up to $27,500 per day for each violation. This suit is being defended by CSP. On April 4, 2001, the District Court in that case ruled that neither the Government nor the intervening plaintiff environmental groups could obtain civil penalties for any alleged violations that occurred more than five years prior to the filing of the complaint, but that both parties could seek injunctive relief for alleged violations that occurred more than five years before the filing of the complaint. Thus, if the plaintiffs prevail in their claims, any calculation for penalties will not start on the date of the alleged violations, unless those alleged violations occurred after November 3, 1994, but CSP would be forced to install the controls required under the CAA. Neither party appealed that decision.
19
On June 28, 2000, the EPA issued an NOV toCinergy,CG&E, andPSI for alleged violations of NSR, PSD, and SIP requirements atCG&E's Miami Fort Generating Station andPSI's Gibson Generating Station. In addition,Cinergy andCG&E have been informed by DP&L, the operator of J.M. Stuart Generating Station (Stuart Station), that on June 30, 2000, the EPA issued an NOV to DP&L for alleged violations of NSR, PSD, and SIP requirements at this station.CG&E owns 39% of Stuart Station. The NOVs indicated that the EPA may (1) issue an order requiring compliance with the requirements of the SIP, or (2) bring a civil action seeking injunctive relief and civil penalties of up to $27,500 per day for each violation.
On August 2, 2001, the states of New York, New Jersey, and Connecticut filed an Assented to Motion to Intervene in this litigation. Their motion was granted by the District Court on August 3, 2001. The states' proposed complaint is an exhibit to the motion to intervene.Cinergy,CG&E, andPSI are in the process of evaluating the states' complaint but, at this time, are unable to determine the effect, if any, this filing will have on the issues affecting us regarding NSR, as framed in the EPA's Amended Complaint.
See Note 13(f) of the "Notes to Financial Statements" in "Item 8. Financial Statements and Supplementary Data" for a discussion of the tentative EPA Agreement.
MANUFACTURED GAS PLANT SITES (MGP)
(i) General
Prior to the 1950s, gas was produced at MGP sites through a process that involved the heating of coal and/or oil. The gas produced from this process was sold for residential, commercial, and industrial uses.
(ii) PSI
Coal tar residues, related hydrocarbons, and various metals associated with MGP sites have been found at former MGP sites in Indiana, including at least 21 sites whichPSI or its predecessors previously owned.PSI acquired four of the sites from NIPSCO in 1931. At the same time,PSI sold NIPSCO the sites located in Goshen and Warsaw, Indiana. In 1945,PSI sold 19 of these sites (including the four sites it acquired from NIPSCO) to the predecessor of the Indiana Gas Company, Inc. (IGC). IGC later sold the site located in Rochester, Indiana to NIPSCO.
IGC (in 1994) and NIPSCO (in 1995) both made claims againstPSI. The basis of these claims was thatPSI is a Potentially Responsible Party with respect to the 21 MGP sites under the Comprehensive Environmental Response, Compensation and Liability Act (CERCLA). The claims further asserted thatPSI was legally responsible for the costs of investigating and remediating the sites. In August 1997, NIPSCO filed suit againstPSI in federal court, claiming recovery (pursuant to CERCLA) of NIPSCO's past and future costs of investigating and remediating MGP-related contamination at the Goshen MGP site.
In November 1998, NIPSCO, IGC, andPSI entered into a Site Participation and Cost Sharing Agreement (Agreement). This Agreement allocated CERCLA liability for past and future costs at seven MGP sites in Indiana among the three companies. As a result of the Agreement, NIPSCO's lawsuit againstPSI was dismissed. The parties have assigned lead responsibility for managing further investigation and remediation activities at each of the sites to one of the parties. Similar agreements were reached between IGC andPSI that allocate CERCLA liability at 14 MGP sites with which NIPSCO was not involved. These agreements concluded all CERCLA and similar claims between the three companies related to MGP sites. The parties continue to investigate and remediate the sites, as
20
appropriate under the agreements and applicable laws. The Indiana Department of Environmental Management (IDEM) oversees investigation and cleanup of some of the sites.
PSI notified its insurance carriers of the claims related to MGP sites raised by IGC, NIPSCO, and IDEM. In April 1998,PSI filed suit in Hendricks County Circuit Court in the State of Indiana against its general liability insurance carriers. Subsequently,PSI sought a declaratory judgment to obligate its insurance carriers to (1) defend MGP claims againstPSI, or (2) payPSI's costs of defense and compensatePSI for its costs of investigating, preventing, mitigating, and remediating damage to property and paying claims related to MGP sites. The lawsuit was moved to the Hendricks Superior Court (Superior Court) in July 1998. Discovery closed in the case at the end of August 2001.PSI and its insurance carriers filed briefs on various issues for decision by the Superior Court in hearings held in November 2001. In December 2001, the Superior Court rescheduled the trial to June 2002. On February 1, 2002, the Superior Court issued rulings on motions for summary judgment. The Superior Court granted the motions of several insurance carriers who claimed that there was insufficient evidence concerning the terms of their policies. The insurance policies in question were between 1950-1958 and 1961-1964. With respect to the remaining policies (between 1958-1961 and 1964-1984), the Superior Court denied all of the insurance carriers' motions. This included motions on the issues of Trigger of Coverage, Expected or Intended Damage, Late Notice and Voluntary Payments. The Superior Court found triable issues of fact for the jury to decide as to the former two issues, and ruled inPSI's favor, as a matter of law, on the latter two issues. The trial against the remaining insurance carriers will go forward in June 2002. At the present time,PSI cannot predict the outcome of this litigation.
PSI has accrued costs for the sites related to investigation, remediation, and groundwater monitoring to the extent such costs are probable and can be reasonably estimated.PSI does not believe it can provide an estimate of the reasonably possible total remediation costs for any site before a remedial investigation/feasibility study has been completed. To the extent remediation is necessary, the timing of the remediation activities impacts the cost of remediation. Therefore,PSI currently cannot determine the total costs that may be incurred in connection with the remediation of all sites, to the extent that remediation is required. According to current information, these future costs at the 21 Indiana MGP sites are not material to our financial condition or results of operations. Until investigation and remediation activities have been completed on these sites, we are unable to reasonably estimate the total costs and impact on our financial position or results of operations.
M METALS SUPERFUND SITE
On July 6, 2000, the EPA identifiedPSI and IPL, among others, as Potentially Responsible Parties for the release of hazardous substances at the M Metals Superfund Site (Site) located in Indianapolis, Indiana. The EPA advised that it had taken response actions relating to the Site and had incurred costs of approximately $500,000, for which it demanded reimbursement. On September 25, 2001,PSI and the EPA signed an Agreement for Recovery of Past Response Costs (The Agreement), which called forPSI to compensate the EPA $100,000 for costs incurred by the EPA in cleaning up the M Metals site. The Agreement became final on November 28, 2001, andPSI tendered payment to the EPA, closing this matter.
GAS CUSTOMER CHOICE
In January 2000, Investments sold Cinergy Resources, Inc. (Resources), a former subsidiary, to Licking Rural Electrification, Inc. doing business as The Energy Cooperative (Energy Cooperative). In February 2001,Cinergy,CG&E, and Resources were named as defendants in three class action lawsuits relating to Energy Cooperative's removal from the Ohio Gas Customer Choice program and the failure to deliver gas to customers. Subsequently, these class action suits were amended and consolidated into one suit.CG&E has been dismissed as a defendant in the consolidated suit. In March 2001,Cinergy,
21
CG&E, and Investments were named as defendants in a lawsuit filed by both Energy Cooperative and Resources. This lawsuit concerns any obligations or liabilities Investments may have to Energy Cooperative following its sale of Resources. We intend to vigorously defend these lawsuits. At the present time,Cinergy cannot predict the outcome of these suits.
CITY OF NEWPORT, KENTUCKY
On January 29, 2002,ULH&P instituted litigation proceedings in the Campbell County Circuit Court in the Commonwealth of Kentucky against the City of Newport, Kentucky, City of Newport doing business as (d/b/a/) the Newport Water Works and also known as (a/k/a) City of Newport Water Department and the Kentucky Risk Management Association. The complaint states that on or about October 5, 2000, a water main owned and under the control of the City of Newport and/or the City of Newport d/b/a/ Newport Water Works and a/k/a/ City of Newport Water Department located in and underground at the Newport Shopping Center on Monmouth Street, Newport, Campbell County, Kentucky ruptured. The water in the main was under pressure and upon the failure of the water main, the pressure, water, sand and gravel provided an environment which resulted in "cutting" a hole in the adjacent gas distribution main owned by and under the control ofULH&P. The hole that breached the adjacent natural gas main was caused by the abrasive action of the pressurized stream of water combined with the sand, gravel and dirt flowing directly on the surface of the natural gas main.ULH&P has incurred total damages in excess of $3.5 million.
22
ITEM 4. SUBMISSION OF MATTERS TO A VOTE OF SECURITY HOLDERS
In lieu of special meetings of shareholders ofCG&E andULH&P, resolutions were duly adopted via unanimous written consents of the respective sole shareholders ofCG&E andULH&P.Cinergy Corp. owns all of the 89,663,086 outstanding shares of common stock, representing a like number of votes, ofCG&E.CG&E owns all of the 585,333 outstanding shares of common stock, representing a like number of votes, ofULH&P. These written resolutions authorized the election of Mr. James L. Turner to the respective boards of directors ofCG&E andULH&P effective October 1, 2001. He is to serve as the successor-Director to Mr. William J. Grealis until the respective 2002 annual meetings of shareholders ofCG&E andULH&P. Mr. James E. Rogers and Mr. R. Foster Duncan continued their directorships on the boards of directors ofCG&E andULH&P. Their terms will also expire at the respective 2002 annual meetings of shareholders ofCG&E andULH&P.
23
ITEM 5. MARKET FOR REGISTRANT'S COMMON EQUITY AND RELATED STOCKHOLDER MATTERS
Cinergy Corp.'s common stock is listed on the New York Stock Exchange. The high and low stock prices for each quarter for the past two years are indicated below:
| | High | Low | ||||
|---|---|---|---|---|---|---|
| 2001 | ||||||
| First Quarter | $ | 35.15 | $ | 28.81 | ||
| Second Quarter | 35.60 | 32.20 | ||||
| Third Quarter | 35.00 | 28.00 | ||||
| Fourth Quarter | 33.85 | 28.16 | ||||
2000 | ||||||
| First Quarter | $ | 25.88 | $ | 20.00 | ||
| Second Quarter | 28.13 | 21.19 | ||||
| Third Quarter | 33.25 | 25.56 | ||||
| Fourth Quarter | 35.25 | 28.50 | ||||
Cinergy Corp.holds all outstandingCG&E andPSI common stock, andCG&E holds allULH&P common stock. Therefore, no public trading market exists for the common stock ofCG&E,PSI, andULH&P.
As of January 31, 2002,Cinergy Corp. had 58,601 common stockholders of record.
Cinergy Corp.declared dividends on its common stock of $.45 per share for each quarter of 2001 and 2000. The quarterly dividends paid toCinergy Corp. byCG&E andPSI, and toCG&E byULH&P for the past two years were as follows:
| Registrant | Quarter | 2001 | 2000 | |||||
|---|---|---|---|---|---|---|---|---|
| | | (in thousands) | ||||||
| CG&E | First | $ | 71,535 | $ | 53,600 | |||
| Second | 71,551 | 53,600 | ||||||
| Third | 71,588 | 53,600 | ||||||
| Fourth | 71,595 | 71,534 | ||||||
PSI | First | $ | — | $ | 18,000 | |||
| Second | — | 18,000 | ||||||
| Third | — | 18,000 | ||||||
| Fourth | — | — | ||||||
ULH&P | First | $ | — | $ | — | |||
| Second | 4,829 | 4,974 | ||||||
| Third | — | — | ||||||
| Fourth | 6,878 | 4,683 | ||||||
See Note 2(b) of the "Notes to Financial Statements" in "Item 8. Financial Statements and Supplementary Data" for a brief description of the registrants' common stock dividend restrictions.
24
ITEM 6. SELECTED FINANCIAL DATA
| | 2001 | 2000 | 1999 | 1998 | 1997 | |||||||||||||
|---|---|---|---|---|---|---|---|---|---|---|---|---|---|---|---|---|---|---|
| | (in millions, except per share amounts) | |||||||||||||||||
| Cinergy | ||||||||||||||||||
Operating revenues | $ | 12,923 | $ | 8,422 | $ | 5,938 | $ | 5,911 | $ | 4,387 | ||||||||
| Net income before extraordinary item | 442 | 399 | 404 | 261 | 363 | |||||||||||||
| Net income | 442 | 399 | 404 | (1) | 261 | 253 | (1) | |||||||||||
| Common stock | ||||||||||||||||||
| Earnings per share (EPS) | ||||||||||||||||||
| Net income before extraordinary item | 2.78 | 2.51 | 2.54 | 1.65 | 2.30 | |||||||||||||
| Net income | 2.78 | 2.51 | 2.54 | (1) | 1.65 | 1.61 | (1) | |||||||||||
| EPS—assuming dilution | ||||||||||||||||||
| Net income before extraordinary item | 2.75 | 2.50 | 2.53 | 1.65 | 2.28 | |||||||||||||
| Net income | 2.75 | 2.50 | 2.53 | (1) | 1.65 | 1.59 | (1) | |||||||||||
| Dividends declared per share | 1.80 | 1.80 | 1.80 | 1.80 | 1.80 | |||||||||||||
Total assets | 12,300 | 12,330 | 9,617 | 9,687 | 8,858 | |||||||||||||
| Long-term debt | 3,597 | 2,876 | 2,989 | 2,604 | 2,151 | |||||||||||||
| Long-term debt due within one year | 148 | 41 | 31 | 136 | 85 | |||||||||||||
| CG&E | ||||||||||||||||||
Operating revenues | $ | 4,694 | $ | 3,230 | $ | 2,551 | $ | 2,856 | $ | 2,452 | ||||||||
| Net income | 327 | 267 | 234 | 216 | 239 | |||||||||||||
Total assets | 5,360 | 5,987 | 4,917 | 5,154 | 4,914 | |||||||||||||
| Long-term debt | 1,105 | 1,205 | 1,206 | 1,220 | 1,324 | |||||||||||||
| Long-term debt due within one year | 100 | 1 | — | 130 | — | |||||||||||||
| PSI | ||||||||||||||||||
Operating revenues | $ | 4,075 | $ | 2,684 | $ | 2,136 | $ | 2,403 | $ | 1,960 | ||||||||
| Net income | 162 | 135 | 117 | 52 | 132 | |||||||||||||
Total assets | 4,571 | 4,630 | 3,835 | 3,584 | 3,406 | |||||||||||||
| Long-term debt | 1,325 | 1,074 | 1,212 | 1,026 | 826 | |||||||||||||
| Long-term debt due within one year | 23 | 38 | 31 | 6 | 85 | |||||||||||||
- (1)
- Included in net income for 1997 was a one-time extraordinary charge of $110 million ($.69 per share and diluted) for the windfall profits tax levied against our 50% ownership interest in Midlands Electricity plc (Midlands). In the third quarter of 1999, we sold our ownership interest in Midlands. For further information on the sale of our ownership interest in Midlands see Note 11 of the "Notes to Financial Statements" in "Item 8. Financial Statements and Supplementary Data".
25
ITEM 7. MANAGEMENT'S DISCUSSION AND ANALYSIS OF FINANCIAL CONDITION
AND RESULTS OF OPERATIONS
In this reportCinergy (which includesCinergy Corp. and all of our regulated and non-regulated subsidiaries) is, at times, referred to in the first person as "we", "our", or "us".
The following discussion should be read in conjunction with the accompanying financial statements and related notes included elsewhere in this report. The results discussed below are not necessarily indicative of the results to be expected in any future periods.
In Management's Discussion and Analysis of Financial Condition and Results of Operations (MD&A), we explain our general operating environment, as well as our liquidity, capital resources, and results of operations. Specifically, we discuss the following:
- •
- factors affecting current and future operations;
- •
- what our expenditures for construction and other commitments were during 2001, and what we expect them to be in 2002-2006;
- •
- potential sources of cash for future capital expenditures;
- •
- why revenues and expenses changed from period to period; and
- •
- how the above items affect our overall financial condition.
LIQUIDITY AND CAPITAL RESOURCES
Comparative Cash Flow Analysis
At December 31, 2001,Cinergy'sconsolidated cash and cash equivalents totaled $111.1 million compared to $93.1 million at December 31, 2000. The increase reflects increases in cash from operating activities and new financings, offset in part by additional expenditures for our operating companies' construction programs and additional investments, including peaking generation assets.
The Cincinnati Gas & Electric Company (CG&E)
At December 31, 2001,CG&E'sconsolidated cash and cash equivalents totaled $9.1 million compared to $20.6 million at December 31, 2000. Additional construction expenditures were largely offset by cash from operating activities.
PSI Energy, Inc. (PSI)
At December 31, 2001,PSI'sconsolidated cash and cash equivalents totaled $1.6 million as compared to $1.3 million at December 31, 2000. Increases in cash from operating activities and financing activities were offset by additional construction expenditures.
26
For each of the years ended December 31, 2001, 2000, and 1999, our cash flows from operating activities were as follows:
Net Cash Provided by (Used in) Operating Activities
| | 2001 | 2000 | 1999 | ||||||
|---|---|---|---|---|---|---|---|---|---|
| | (in thousands) | ||||||||
| Cinergy(1) | $ | 694,412 | $ | 618,001 | $ | 478,267 | |||
| CG&Eand subsidiaries | 333,099 | 463,875 | 399,008 | ||||||
| PSI | 388,171 | 339,115 | 124,053 | ||||||
| The Union Light, Heat and Power Company(ULH&P) | 46,513 | 49,258 | 32,537 | ||||||
- (1)
- The results ofCinergyalso include amounts related to non-registrants.
Cinergy'snet cash provided by operating activities increased during 2001, as compared to 2000, primarily due to increased income and a net cash inflow from working capital fluctuations.CG&E'snet cash provided by operating activities decreased primarily due to working capital fluctuations, offset in part by increased income.PSI'scash from operating activities increased primarily due to increased income.
Cinergy'sandPSI'snet cash provided by operating activities increased during 2000, as compared to 1999, primarily due to the one-time cash payment in 1999 for the purchase of the remainder of Dynegy Inc.'s 25 year contract for coal gasification services.CG&E's cash provided by operating activities increased primarily due to increased income and fluctuations in working capital.
The tariff-based gross margins of our operating companies continue to be the principal source of cash from operating activities. The diversified retail customer mix of residential, commercial, and industrial classes and a commodity mix of gas and electric service provides a reasonably predictable gross cash flow.
For each of the years ended December 31, 2001, 2000, and 1999, our cash flows from financing activities were as follows:
Net Cash Provided by (Used in) Financing Activities
| | 2001 | 2000 | 1999 | |||||||
|---|---|---|---|---|---|---|---|---|---|---|
| | (in thousands) | |||||||||
| Cinergy(1) | $ | 866,438 | $ | 157,771 | $ | (355,986 | ) | |||
| CG&Eand subsidiaries | 16,841 | (192,665 | ) | (222,311 | ) | |||||
| PSI | 34,723 | (77,955 | ) | 89,092 | ||||||
| ULH&P | (14,678 | ) | (18,006 | ) | (3,906 | ) | ||||
- (1)
- The results ofCinergyalso include amounts related to non-registrants.
Cinergy'snet cash provided by financing activities increased during 2001, as compared to 2000, primarily due to the net proceeds from the issuance ofPreferred trust securitiesand proceeds from debt issuances to fund the purchase of new generating facilities and environmental compliance expenditures as discussed in the "Investing Activities" section.CG&E'snet cash provided by financing activities increased primarily as the result of increased short-term borrowings offset by an increase in dividends
27
paid on common stock.PSI'snet cash provided by financing activities increased primarily as the result of no dividends paid on common stock in 2001 and the retirement of preferred stock in 2000.
Cinergy'snet cash provided by financing activities increased in 2000, as compared to 1999, primarily due to a net increase in long-term and short-term borrowings.CG&E'snet cash used in financing activities decreased primarily as a result of the redemption of $164 million in long-term debt that occurred during 1999 partially offset by a decrease in short-term borrowings.PSI'snet cash used in financing activities increased primarily due to a net reduction in short-term and long-term debt offset in part by fewer debt redemptions in 2000.
For each of the years ended December 31, 2001, 2000, and 1999, our cash flows used in investing activities were as follows:
Net Cash Used in Investing Activities
| | 2001 | 2000 | 1999 | |||||||
|---|---|---|---|---|---|---|---|---|---|---|
| | (in thousands) | |||||||||
| Cinergy(1) | $ | (1,542,837 | ) | $ | (764,637 | ) | $ | (140,516 | ) | |
| CG&Eand subsidiaries | (361,503 | ) | (260,127 | ) | (194,132 | ) | ||||
| PSI | (422,618 | ) | (268,691 | ) | (223,091 | ) | ||||
| ULH&P | (34,196 | ) | (28,433 | ) | (28,234 | ) | ||||
- (1)
- The results ofCinergyalso include amounts related to non-registrants.
Cinergy's,CG&E's, andPSI'snet cash used in investing activities increased in 2001, as compared to 2000, as a result of an increase in capital expenditures related to environmental compliance projects. See the "Environmental Commitment and Contingency Issues" section for further information.Cinergy'sincrease also reflects the acquisition of additional peaking capacity including the 480 megawatt (MW) Brownsville and the 550 MW Caledonia peaking stations.
The increase inCinergy'scash used in investing activities in 2000, as compared to 1999, primarily reflects the impact from proceeds of $690 million received in 1999 from the sale of our 50% ownership interest in Midlands Electricity plc (Midlands).CG&E'sandPSI'snet cash used in investing activities increased primarily as a result of an increase in construction expenditures.
28
Actual construction and other committed expenditures for 2001 and forecasted construction and other committed expenditures for the year 2002 and for the five-year period 2002-2006 (in nominal dollars), including allowance for funds used during construction, are presented in the table below:
Actual Capital and Investment Expenditures and Future Projections
| | | Forecasted Expenditures | |||||||
|---|---|---|---|---|---|---|---|---|---|
| | Actual Expenditures 2001 | ||||||||
| | 2002 | 2002-2006 | |||||||
| | (in millions) | ||||||||
| By Registrant | |||||||||
| Cinergy(1) | $ | 1,551 | $ | 889 | $ | 3,070 | |||
| CG&Eand subsidiaries | 364 | 275 | 1,135 | ||||||
| PSI | 429 | 478 | 1,522 | ||||||
| ULH&P | 34 | 43 | 212 | ||||||
- (1)
- The results ofCinergyalso include amounts related to non-registrants.
This forecast includes an estimate of expenditures in accordance with the companies' plans regarding nitrogen oxide (NOX) emission control standards and other environmental compliance (excluding implementation of the tentative United States (U.S.) Environmental Protection Agency (EPA) agreement), as discussed in EPA Agreement below.
All forecasted amounts and the underlying assumptions are subject to risks and uncertainties as disclosed in the "Cautionary Statements Regarding Forward-Looking Information."
Environmental Commitment and Contingency Issues
EPA Agreement
On December 21, 2000,Cinergy,CG&E, andPSIreached an agreement in principle with the EPA, the U.S. Department of Justice, three northeast states, and two environmental groups that could serve as the basis for a negotiated resolution of Clean Air Act Amendments claims and other related matters brought against coal-fired power plants owned and operated byCinergy'soperating companies. The estimated cost for these capital expenditures is expected to be approximately $700 million. These capital expenditures are in addition to our previously announced commitment to install NOX controls at an estimated cost of approximately $800 million (in nominal dollars) between 2001 and 2005. In 2001, we spent $260 million for NOX and other environmental compliance projects. Forecasted expenditures for NOX and other environmental compliance projects (in nominal dollars) are approximately $250 million for 2002 and $600 million for the 2002-2006 period. See Note 13 of the "Notes to Financial Statements" in "Item 8. Financial Statements and Supplementary Data" for a discussion of the EPA Agreement and related environmental issues.
Manufactured Gas Plant (MGP) Sites
In November 1998,PSIentered into a Site Participation and Cost Sharing Agreement with Northern Indiana Public Service Company and Indiana Gas Company, Inc. related to contamination at MGP sites, whichPSIor its predecessors previously owned. Until investigation and remediation activities have been completed on the sites, we are unable to reasonably estimate the total costs and impact on our financial position or results of operations. In relation to the MGP claims,PSIalso filed suit against its general liability insurance carriers. Subsequently,PSIsought a declaratory judgment to obligate its insurance carriers to (1) defend MGP claims againstPSI, or (2) payPSI'scosts of defense
29
and compensatePSIfor its costs of investigating, preventing, mitigating, and remediating damage to property and paying claims related to MGP sites. At the present time,PSIcannot predict the outcome of this litigation. See Note 13(g) of the "Notes to Financial Statements" in "Item 8. Financial Statements and Supplementary Data" for further information.
Ambient Air Standards
In 1997, the EPA revised the National Ambient Air Quality Standards for ozone and fine particulate matter. Fine particulate matter refers to very small solid or liquid particles in the air. The EPA has estimated that it will take up to five years to collect sufficient ambient air monitoring data to determine fine particulate matter non-attainment areas. A fine particulate monitoring network was put in place during 1999 and 2000. Following identification of non-attainment areas, the states will identify the sources of particulate emissions and develop emission reduction plans. These plans may be state-specific or regional. We currently cannot predict the exact amount and timing of required reductions.
On May 14, 1999, the U.S. Circuit Court of Appeals for the District of Columbia (Court of Appeals) ruled that the EPA's final rule establishing the new eight-hour ozone standard and the fine particulate matter standard constituted an invalid delegation of legislative authority. In June 1999, the EPA appealed the decision. On February 27, 2001, the U.S. Supreme Court (Supreme Court) reversed the Court of Appeals' ruling. However, the Supreme Court invalidated the EPA's implementation procedure for the portion of the case dealing with the eight-hour ozone standard. The EPA currently is evaluating approaches for implementing the eight-hour ozone standard in accordance with the Supreme Court's opinion. Meanwhile, the Court of Appeals continues to consider the validity of the eight-hour ozone standard and the fine particulate matter standard, as a number of issues that were raised by the parties were not addressed in its original opinion invalidating those standards. The parties have filed supplemental briefs on these issues, and further oral argument was held in December 2001. A decision by the Court of Appeals is expected in the spring of 2002. We currently cannot determine the outcome of this litigation or of future EPA actions in response to the litigation and the effects on future emissions reduction requirements.
Regional Haze
The EPA published the final regional haze rule on July 1, 1999. This rule established planning and emission reduction timelines for states to use to improve visibility in national parks throughout the U.S. The ultimate effect of the new regional haze rule could be requirements for (1) newer and cleaner technologies and additional controls on conventional particulates and (2) reductions in sulfur dioxide (SO2) and NOX emissions from utility sources. If more utility emissions reductions are required, the compliance cost could be significant. In August 1999, several industry groups (some of which we are a member) filed a challenge to the regional haze rules with the Court of Appeals. Parties have filed their briefs in this case and oral argument will be held in the first quarter of 2002. In addition, several industry groups (some of which we are a member) have petitioned the Bush Administration to reconsider its approach to regional haze, including possible modifications to the rule and/or settlement of the lawsuit. We currently cannot determine the outcome or effects of the EPA's, courts', or states' determinations.
In July 2001, the EPA proposed guidance to implement portions of the regional haze rule. This guidance recommends that states require widespread installation of scrubbers to reduce SO2 emissions. Several industry groups (some of which we are a member) commented that the EPA's recommendations exceed the scope of the law and the regional haze recommendations. We currently cannot determine whether or how the EPA will modify the scope of this guidance, or whether the states in which we operate will adopt the EPA's proposed guidance.
30
Global Climate
In December 1997, delegates to the United Nations' climate summit in Japan adopted an agreement, the Kyoto Protocol, to address global warming. The Kyoto Protocol establishes legally binding greenhouse gas emission (man-made pollutants thought to be artificially warming the earth's atmosphere) targets for developed nations. On November 12, 1998, the U.S. signed the Kyoto Protocol; however, it will not be effective in the U.S. until it is approved by a two-thirds vote of the U.S. Senate, which is currently deemed unlikely.
In March 2001, the Bush Administration announced that the U.S. was not interested in ratifying the Kyoto Protocol. Talks resumed without active U.S. participation at the Conference of the Parties in Bonn, Germany in July 2001, where the parties reached broad political agreement on the major outstanding issues. The Marrakech Accord, concluded at the seventh Conference of the Parties in November 2001, turned broad principles into a detailed set of rules that more clearly define the operating framework for the instruments and institutions created under the Kyoto Protocol. The Marrakech Accord set the stage for ratification of the Kyoto Protocol, although the U.S. continues to maintain its position against ratification. Because of a lack of U.S. support for the Kyoto Protocol or similar legislation, significant uncertainty exists about how and when greenhouse gas emissions reductions will be required. Our plan for managing the potential risk and uncertainty of regulations relating to climate change includes the following:
- •
- implementing cost-effective greenhouse gas emission reduction and offsetting activities;
- •
- funding research of more efficient and alternative electric generating technologies;
- •
- funding research to better understand the causes and consequences of climate change;
- •
- encouraging a global discussion of the issues and how best to manage them; and
- •
- advocating comprehensive legislation for fossil-fired power plants.
Mercury
The EPA's 1997 Mercury Study Report and Utility Report to Congress both conveyed that mercury is not a risk to the average American and expressed uncertainty about whether reductions in current domestic sources would reduce human mercury exposure. On December 14, 2000, the EPA made a determination that additional regulation of mercury emissions from coal-fired power plants was appropriate. It is currently developing a Maximum Achievable Control Technology standard for mercury. The EPA is expected to issue draft regulations in 2003 and final rules by 2004, with reductions required before 2010. We currently cannot predict the outcome or costs relating to the EPA's determination and subsequent regulation.
Our ability to invest in growth initiatives is limited by certain legal and regulatory requirements, including the Public Utility Holding Company Act of 1935, as amended (PUHCA). The PUHCA limits the types of non-utility businesses in whichCinergyand other registered holding companies under PUHCA can invest as well as the amount of capital that can be invested in permissible non-utility businesses. Also, the timing and amount of investments in the non-utility businesses is dependent on the development and favorable evaluations of opportunities. Under the PUHCA restrictions, we are allowed to invest or commit to invest in certain non-utility businesses, including:
- 1.
- Exempt Wholesale Generators (EWG) and Foreign Utility Companies (FUCO)
An EWG is an entity, certified by the Federal Energy Regulatory Commission (FERC), devoted exclusively to owning and/or operating, and selling power from one or more electric
31
- 2.
- Qualifying Facilities and Energy-Related Non-utility Entities
generating facilities. An EWG whose generating facilities are located in the U.S. is limited to making only wholesale sales of electricity.
A FUCO is a company all of whose utility assets and operations are located outside the U.S. and which are used for the generation, transmission, or distribution of electric energy for sale at retail or wholesale, or the distribution of gas at retail. An entity claiming status as a FUCO must provide notification thereof to the Securities and Exchange Commission (SEC) under PUHCA.
In May 2001, the SEC issued an order under PUHCA authorizingCinergyto invest (including by way of guarantees) an aggregate amount in EWGs and FUCOs equal to the sum of (1) our average consolidated retained earnings from time to time plus (2) $2 billion. As of December 31, 2001, we had invested or committed to invest $1.3 billion in EWGs and FUCOs, leaving available investment capacity under the May 2001 order of $2 billion.
SEC regulations under the PUHCA permitCinergyand other registered holding companies to invest and/or guarantee an amount equal to 15% of consolidated capitalization (consolidated capitalization is the sum ofNotes payable and other short-term obligations,Long-term debt(including amounts due within one year),Preferred Trust Securities,Cumulative preferred stock of subsidiaries, and totalCommon stock equity) in domestic qualifying cogeneration and small power production plants (qualifying facilities) and certain other domestic energy-related non-utility entities. At December 31, 2001, we had invested and/or guaranteed approximately $.5 billion of the $1.2 billion available.
32
The following table presentsCinergy's,PSI's,CG&E's, andULH&P'sfinancing obligations:
| | Payments Due by Period | ||||||||||||||||||||||
|---|---|---|---|---|---|---|---|---|---|---|---|---|---|---|---|---|---|---|---|---|---|---|---|
| Financing Obligations | |||||||||||||||||||||||
| 2002 | 2003 | 2004 | 2005 | 2006 | Thereafter | Total | |||||||||||||||||
| | (in millions) | ||||||||||||||||||||||
| Cinergy(1) | |||||||||||||||||||||||
| Notes payable and other short-term obligations | $ | 877 | $ | — | $ | — | $ | — | $ | — | $ | 279 | (2) | $ | 1,156 | ||||||||
| Capital lease obligations | 3 | 3 | 3 | 3 | 4 | 19 | 35 | ||||||||||||||||
| Operating leases | 45 | 36 | 26 | 21 | 18 | 61 | 207 | ||||||||||||||||
| Long-term debt (including due within one year) | 148 | 192 | (3) | 814 | 203 | (4)(5) | 334 | 2,065 | 3,756 | ||||||||||||||
| Preferred trust securities | — | — | — | — | — | 316 | 316 | ||||||||||||||||
| Total Cinergy | $ | 1,073 | $ | 231 | $ | 843 | $ | 227 | $ | 356 | $ | 2,740 | $ | 5,470 | |||||||||
| CG&Eand subsidiaries | |||||||||||||||||||||||
| Notes payable and other short-term obligations(6) | $ | 445 | $ | — | $ | — | $ | — | $ | — | $ | 196 | (2) | $ | 641 | ||||||||
| Capital lease obligations | 1 | 2 | 2 | 2 | 2 | 11 | 20 | ||||||||||||||||
| Operating leases | 20 | 15 | 10 | 7 | 6 | 15 | 73 | ||||||||||||||||
| Long-term debt (including due within one year) | 100 | 120 | (3) | 110 | 150 | (5) | — | 728 | 1,208 | ||||||||||||||
| Total CG&Eand subsidiaries | $ | 566 | $ | 137 | $ | 122 | $ | 159 | $ | 8 | $ | 950 | $ | 1,942 | |||||||||
| PSI | |||||||||||||||||||||||
| Notes payable and other short-term obligations(6) | $ | 43 | $ | — | $ | — | $ | — | $ | — | $ | 83 | (2) | $ | 126 | ||||||||
| Capital lease obligations | 2 | 1 | 1 | 1 | 2 | 8 | 15 | ||||||||||||||||
| Operating leases | 17 | 14 | 9 | 7 | 7 | 23 | 77 | ||||||||||||||||
| Long-term debt (including due within one year) | 23 | 58 | 1 | 51 | (4) | 328 | 895 | 1,356 | |||||||||||||||
| Total PSI | $ | 85 | $ | 73 | $ | 11 | $ | 59 | $ | 337 | $ | 1,009 | $ | 1,574 | |||||||||
| ULH&P | |||||||||||||||||||||||
| Notes payable and other short-term obligations(6) | $ | 26 | $ | — | $ | — | $ | — | $ | — | $ | — | $ | 26 | |||||||||
| Capital lease obligations | — | — | 1 | 1 | 1 | 3 | 6 | ||||||||||||||||
| Operating leases | 1 | 1 | — | — | — | — | 2 | ||||||||||||||||
| Long-term debt | — | 20 | — | — | — | 55 | 75 | ||||||||||||||||
| Total ULH&P | $ | 27 | $ | 21 | $ | 1 | $ | 1 | $ | 1 | $ | 58 | $ | 109 | |||||||||
- (1)
- Includes amounts for non-registrants.
- (2)
- Includes Variable Rate Pollution Control Notes depicted according to scheduled maturities, which the holders have the right to redeem on any business day, with the remainder being redeemable annually. See Variable Rate Pollution Control Notes below.
- (3)
- Includes 6.35% Debentures due June 15, 2038, reflected as maturing in 2003, as the interest rate resets on June 15, 2003.
- (4)
- Includes 6.50% Debentures due August 1, 2026, reflected as maturing in 2005, as the interest rate resets on August 1, 2005.
33
- (5)
- Includes 6.90% Debentures due June 1, 2025, reflected as maturing in 2005, as the debentures are putable toCG&Eat the option of the holders on June 1, 2005.
- (6)
- Includes netNotes receivable from/Notes payable to affiliated companies.
Notes Payable and Other Short-term Obligations
Short-term Borrowings
At December 31, 2001,Cinergy Corp.had $437 million remaining unused and available capacity relating to its $1.2 billion revolving credit facilities. The revolving credit facilities were comprised of $400 million under a three-year senior revolving credit facility expiring in May 2004 and $775 million in revolving facilities expiring during the first half of 2002. In early 2002,Cinergy Corp.placed a $600 million, 364-day senior revolving credit facility to replace the facilities expiring in 2002. At December 31, 2001, certain of our non-regulated subsidiaries had $8 million of unused and available revolving credit lines.
In May 2001,CG&Efiled an application with the Public Utilities Commission of Ohio (PUCO) to increase its short-term debt authority to $600 million and in June 2001, the PUCO granted this request. In April 2001,Cinergy Corp.filed an application with the SEC to increasePSI'sandULH&P'sshort-term debt authority to $600 million and $65 million, respectively. In August 2001, the SEC granted our request. As of December 31, 2001, our operating companies had regulatory authority to borrow up to a total of $1.27 billion in short-term debt ($671 million forCG&Eand its subsidiaries, including $65 million forULH&P, and $600 million forPSI.) As of December 31, 2001,CG&Eand its subsidiaries had $226 million (including $39 million forULH&P) unused and available andPSIhad $557 million unused and available under their respective regulatory authority.
Our short-term financial arrangements include customary default provisions that could impact the continued availability of credit or result in the acceleration of repayment. These events include bankruptcy, defaults in payment of other indebtedness, judgments againstCinergythat are not paid or insured, or failure to meet or maintain covenants.
Uncommitted Lines
In addition to revolving credit facilities,Cinergy,CG&E, andPSIalso maintain uncommitted lines of credit. These facilities are not firm sources of capital and represent an informal agreement to lend money, subject to availability, with pricing to be determined at the time of advance. At December 31, 2001,Cinergy Corp.'s$40 million uncommitted line andCG&E's$15 million uncommitted line were unused.PSI'suncommitted line of $60 million was fully drawn at year-end.
Commercial Paper
In early 2001,Cinergy Corp.expanded the commercial paper program to a maximum outstanding principal amount of $800 million and reduced the established lines of credit atCG&EandPSI. The expansion of the commercial paper program at theCinergy Corp.level will, in part, support the short-term borrowing needs ofCG&EandPSIand will eliminate the need for separate commercial paper programs. As of December 31, 2001,Cinergy Corp.'scommercial paper program was supported by $1.2 billion in revolving credit facilities, of which it had $125 million in commercial paper outstanding.
Variable Rate Pollution Control Notes
CG&EandPSIhave issued variable rate pollution control notes (tax-exempt notes obtained to finance equipment or land development for pollution control purposes). Because the holders of a
34
majority of these notes have the right to redeem their notes on any business day, with the remainder being redeemable annually, they are reflected inNotes payable and other short-term obligationsin the Balance Sheets forCinergy,CG&E, andPSI. At December 31, 2001,CG&Ehad $196 million andPSIhad $83 million outstanding in pollution control notes, classified as short-term debt.
Money Pool
Cinergy Corp., Cinergy Services, Inc. (Services), and our operating companies participate in a money pool arrangement to better manage cash and working capital requirements. Under this arrangement, those companies with surplus short-term funds provide short-term loans to affiliates (other thanCinergy Corp.) participating under this arrangement. This surplus cash may be from internal or external sources. The amounts outstanding under this money pool arrangement are shown asNotes receivable from affiliated companiesorNotes payable to affiliated companieson the Balance Sheets forCG&E,PSI, andULH&P.
Our operating companies are able to enter into capital leases subject to the authorization limitations of the applicable state utility commissions. Increases in these limits are subject to the approval of the respective commissions. As of December 31, 2001, unused capital lease authority was $74 million forCG&Eand $19 million forULH&P.PSIdid not have any remaining authority at December 31, 2001. During the first quarter of 2002,PSIintends to file an application with the Indiana Utility Regulatory Commission (IURC) requesting additional capital lease authority of up to $100 million. See Note 8(b) of the "Notes to Financial Statements" in "Item 8. Financial Statements and Supplementary Data" for additional information regarding capital leases.
We have entered into operating lease agreements for various facilities and properties such as computer, communication and transportation equipment, and office space. See Note 8(a) of the "Notes to Financial Statements" in "Item 8. Financial Statements and Supplementary Data" for additional information regarding operating leases.
We are required to secure authority to issue long-term debt from the SEC under the PUHCA and the state utility commissions of Ohio, Kentucky, and Indiana. The SEC under the PUHCA regulates the issuance of long-term debt byCinergy Corp.The respective state utility commissions regulate the issuance of long-term debt by our operating companies. In June 2000, the SEC issued an order under the PUHCA authorizingCinergy Corp., over a five-year period expiring in June 2005, to increase its total capitalization based on a balance at December 31, 1999 (excluding retained earnings and accumulated other comprehensive income (loss)) by an additional $5 billion, through the issuance of any combination of equity and debt securities. This increased authorization is subject to certain conditions, including, among others, that common equity comprises at least 30% ofCinergy Corp.'sconsolidated capital structure and thatCinergy Corp., under certain circumstances, maintains an investment grade rating on its senior debt obligations.
In May 2001,CG&Efiled an application with the PUCO to increase its long-term debt authority to $400 million and in June 2001, the PUCO granted this request. As of December 31, 2001, $400 million remained unused and available under the PUCO authorization.PSIintends to file an application with the IURC requesting additional long-term debt issuance authority of up to $500 million. In November 2001,Cinergy Corp.filed a shelf registration statement with the SEC with respect to the issuance of common stock, preferred stock, and other securities with an aggregate
35
amount of $800 million, and at December 31, 2001, $168 million remained unused and available under this registration statement. We may, at any time, seek to issue additional long-term debt, subject to regulatory approval.
As of December 31, 2001, through shelf registration statements filed with the SEC under the Securities Act of 1933, as amended, we could issue the following amounts of debt securities:
| | CG&E | PSI | ULH&P | ||||||
|---|---|---|---|---|---|---|---|---|---|
| | (in millions) | ||||||||
| First Mortgage Bonds and Other Secured Notes | $ | 300 | $ | 205 | $ | 20 | |||
| Senior or Junior Unsecured Debt | 50 | 400 | 30 | ||||||
Cinergyuses special-purpose entities (SPEs) from time to time to facilitate financing of various projects. Due to our lack of control of these entities, a substantive investment by unrelated parties, and various other criteria,Cinergydoes not consolidate these SPEs. The following describes the major off-balance sheet financings.
(i) Power Sales
Cinergy Capital & Trading, Inc. (Capital & Trading) is a 10% owner of two SPEs that were created to facilitate power sales to Central Maine Power (CMP). The SPEs raised capital to purchase CMP's existing power supply contracts from two independent power producers. The SPEs restructured the terms of the agreements, resulting in power sales contracts for approximately 45 MW, ending in 2009, and 35 MW, ending in 2016. Since the SPEs have no generation sources, power purchase agreements were entered into with Capital & Trading with near equivalent terms. The total debt outstanding at December 31, 2001, within these two SPEs is approximately $250 million. This debt is non-recourse toCinergyand Capital & Trading in the event of non-performance by CMP. A portion of the cash flows received by the SPEs from CMP is reserved to pay the interest and principal on the debt.
Capital & Trading provides various services, including certain credit support facilities. All but one of these credit support facilities is capped at immaterial amounts. The non-capped facility can only be called upon in the event the SPE breaches representations, violates covenants, or other unlikely events.
Capital & Trading accounts for its 10% interest in both SPEs under the equity method of accounting.
(ii) Leasing
Cinergyhas an arrangement with an SPE that has contracted to buy five combustion turbines from an unrelated party.Cinergywill act as agent for the SPE in all turbine-related matters. Progress payments are being made by the SPE as the turbines are constructed, with estimated completion in 2003 for two of the turbines and 2004 for the remaining three. Total cost of the turbines being constructed, including interest during construction, is estimated at $185 million. The arrangement with the SPE allowsCinergyto elect any of the following at construction completion: (a) purchase the turbines for the total costs incurred by the SPE, (b) enter into a five-year operating lease, or (c) remarket the turbines with the proceeds distributed first to the debt holders and then to the equity holders of the SPE. ShouldCinergyelect to remarket the turbines on behalf of the owners of the SPE, we are required to pay up to 89.9% of the turbine costs (including interest) to the SPE for use in payment of outstanding senior debt. The proceeds from the sales of turbines would then be used to recover the remaining turbine cost, with any residuals returned toCinergy. During the construction period,Cinergyhas agreed to indemnify the SPE for 89.9% of the construction cost of the turbines in
36
an event of default underCinergy'sagency agreement. At December 31, 2001, approximately $30 million of progress payments had been made by the SPE. Neither the turbines nor any related debt is reflected in the financial statements because we have no ownership in, nor control of, the SPE.Cinergyis uncertain whether it will exercise the purchase option or enter into the five-year operating lease at the completion of construction.
(iii) Sales of Accounts Receivable
CG&E,PSI, andULH&Phave an agreement to sell, on a revolving basis, undivided interests in certain accounts receivable. At December 31, 2001, approximately $322 million of receivables were sold. Cash proceeds from these sales, net of a purchaser holdback of approximately 20%, were $257 million. For a more detailed discussion of our sales of accounts receivable, see Note 7 of the "Notes to Financial Statements" in "Item 8. Financial Statements and Supplementary Data".
In addition to the items above,Cinergyholds investments in various unconsolidated subsidiaries which are accounted for under the equity method (see Note 1(b) of the "Notes to Financial Statements" in "Item 8. Financial Statements and Supplementary Data").Cinergyhas guaranteed approximately $12 million of the debt of these entities.
As of January 31, 2002, the major credit ratings agencies rated our securities as follows:
| | Fitch | Moody's(1) | S&P(2) | ||||
|---|---|---|---|---|---|---|---|
| Cinergy Corp. | |||||||
| Corporate Credit | BBB+ | Baa2 | BBB+/A-2 | ||||
| Senior Unsecured Debt | BBB+ | Baa2 | BBB+ | ||||
| Commercial Paper | F-2 | P-2 | A-2 | ||||
| Preferred Trust Securities | BBB+ | Baa2 | BBB | ||||
CG&E | |||||||
| Senior Secured Debt | A- | A3 | A- | ||||
| Senior Unsecured Debt | BBB+ | Baa1 | BBB+ | ||||
| Junior Unsecured Debt | BBB | Baa2 | BBB | ||||
| Preferred Stock | BBB | Baa3 | BBB | ||||
| Commercial Paper | F-2 | P-2 | Not Rated | ||||
PSI | |||||||
| Senior Secured Debt | A- | A3 | A- | ||||
| Senior Unsecured Debt | BBB+ | Baa1 | BBB+ | ||||
| Junior Unsecured Debt | BBB | Baa2 | BBB | ||||
| Preferred Stock | BBB | Baa3 | BBB | ||||
| Commercial Paper | F-2 | P-2 | Not Rated | ||||
ULH&P | |||||||
| Senior Unsecured Debt | Not Rated | Baa1 | BBB+ | ||||
- (1)
- Moody's Investors Service (Moody's)
- (2)
- Standard & Poor's Ratings Services (S&P)
On December 12, 2000, S&P placed its ratings ofCinergy Corp.and its operating affiliates,CG&EandPSI, on CreditWatch with negative implications. On January 22, 2001, Moody's announced it had assigned negative outlooks to the debt and preferred stock securities ofCinergy Corp.and all of its
37
subsidiaries. These actions were primarily in response toCinergy'sacquisition of the Brownsville and Caledonia power plants. See "Supply-side Actions" under "Electric Industry" for further discussion. Other items of concern included (1) the announcement thatCinergy Corp.,CG&E, andPSIhave reached an agreement in principle with the EPA; (2) the continuing uncertainty surroundingCG&E'spost-deregulation corporate and financial structure; (3) the absence of restructuring legislation and stranded investment resolution in Indiana; and (4) Cinergy'semphasis on higher-risk non-regulated activities.
On September 4, 2001, Moody's placed the debt ratings ofCinergy Corp.on review for possible downgrade. These actions are primarily in response toCinergy Corp.'sincreased debt associated with its growing portfolio of peaking generation.
On November 14, 2001, Fitch changed the outlook ofCinergy's'BBB+' Senior unsecured debt to negative from stable due to increased leverage and planned environmental expenditures.
These securities ratings may be revised or withdrawn at any time, and each rating should be evaluated independently of any other rating.
In addition to the authority to issue common stock pursuant to the SEC's June 2000 Order permittingCinergy Corp.to increase its total capitalization by $5 billion (as previously discussed),Cinergy Corp.may issue an additional 50 million shares of common stock for various stock-based plans, of which approximately 6 million shares had been issued as of December 31, 2001. We also have the option of purchasing shares of common stock on the open market to satisfy the obligations of our various stock-based plans. The proceeds from any new issuances will be used for general corporate purposes.
In November 2001,Cinergy Corp.chose to reinstitute the practice of issuing newCinergy Corp.common shares to meet its obligations under the various employee stock plans and theCinergy Corp.Direct Stock Purchase and Dividend Reinvestment Plan. This replaces the previous practice of purchasing open market shares to fulfill plan obligations.
The following table reflects the number of newly issued shares and purchased shares used to satisfy obligations under our various stock-based plans:
| | 2001 | 2000 | 1999 | |||
|---|---|---|---|---|---|---|
| | (in thousands) | |||||
| Purchased Shares | 820 | 2,299 | 748 | |||
| Issued Shares | 508 | 77 | 291 | |||
See Note 2(a) of the "Notes to Financial Statements" in "Item 8. Financial Statements and Supplementary Data" for additional information on issued shares.
In November 2001,Cinergyfiled a shelf registration statement with the SEC with respect to the issuance of common stock, preferred stock, and other securities with an aggregate amount of $800 million. In December 2001,Cinergyissued approximately $316 million notional amount of combined securities, a component of which was stock purchase contracts. These contracts obligate the holder to purchase common shares ofCinergy Corp.on or before February 2005. See Note 4 of the "Notes to Financial Statements" in "Item 8. Financial Statements and Supplementary Data" for additional information regarding the stock purchase contracts.
Cinergy Corp.'sability to pay dividends to holders of its common stock is principally dependent on the ability ofCG&EandPSIto payCinergy Corp.common dividends.Cinergy Corp.,CG&E, andPSI
38
cannot pay dividends on their common stock if preferred stock dividends or preferred trust dividends are in arrears. The amount of common stock dividends that each company can pay is also limited by certain capitalization and earnings requirements underCG&E'sandPSI'scredit instruments. Currently, these requirements do not impact the ability of either company to pay dividends on its common stock.
We are subject to an SEC order under the PUHCA, which limits the amountsCinergy Corp.can have outstanding under guarantees at any one time to $2 billion. As of December 31, 2001, we had $558 million outstanding under the guarantees issued, of which approximately 70% represents guarantees of obligations reflected onCinergy'sConsolidated Balance Sheet. The amount outstanding representsCinergy Corp.'sguarantees of liabilities and commitments of its consolidated subsidiaries, unconsolidated subsidiaries, and joint ventures. See Note 13(b) of the "Notes to Financial Statements" in "Item 8. Financial Statements and Supplementary Data" for a further discussion of guarantees.
Cinergyhas certain contracts in place, primarily with trading counterparties, that require the issuance of collateral in the event our debt ratings are downgraded below investment grade. Based upon our December 31, 2001 trading portfolio, if such an event were to occur,Cinergywould be required to issue up to approximately $30 million in collateral related to its gas trading operations.
Where subject to rate regulations, our operating companies have the ability to timely recover certain cash outlays through regulatory mechanisms such as fuel adjustment clause, purchased power tracker, gas cost recovery, and construction work in progress (CWIP) ratemaking. For further discussion see "Electric Industry" and "Gas Industry".
We are exploring opportunities to monetize certain non-core investments, which would include our international and renewable assets operated by Cinergy Global Resources, Inc. (Global Resources) and other technology investments. In that regard, management believes that the effects of potential asset dispositions will not result in material gains or losses or be material to our results of operations.
2001 RESULTS OF OPERATIONS—HISTORICAL
Electric and gas gross margins and net income forCinergy,CG&E, andPSI for the years ended December 31, 2001 and 2000 were as follows:
| | Cinergy(1) | CG&E and subsidiaries | PSI | |||||||||||||||
|---|---|---|---|---|---|---|---|---|---|---|---|---|---|---|---|---|---|---|
| | 2001 | 2000 | 2001 | 2000 | 2001 | 2000 | ||||||||||||
| | (in thousands) | |||||||||||||||||
| Electric gross margin | $ | 2,270,274 | $ | 2,229,869 | $ | 1,215,385 | $ | 1,183,816 | $ | 942,530 | $ | 959,541 | ||||||
| Gas gross margin | 231,017 | 267,304 | 199,665 | 224,633 | — | — | ||||||||||||
| Net income | 442,279 | 399,466 | 326,654 | 266,820 | 162,333 | 135,398 | ||||||||||||
- (1)
- The results ofCinergyalso include amounts related to non-registrants.
Diluted earnings per share (diluted EPS) for the year ended December 31, 2001, was $2.75 as compared to $2.50 for the year ended December 31, 2000. Included in 2000 results were previously reported one-time charges totaling $.11 per share related to a tentative agreement reached with the EPA and a limited early retirement program (LERP) offered to employees during 2000.
39
The increase in 2001 earnings was primarily attributable to increased electric gross margins within Energy Merchant Business Unit's (Energy Merchant) origination, marketing and trading segment, and reduced operating expenditures. Partially offsetting this increase were lower electric gross margins within our regulated operations, mainly driven by mild weather and a slowed economy, and increased depreciation and interest expenses associated with new investments. Gas gross margins decreased for the year ended December 31, 2001, as compared to the same period last year, primarily as a result of mild weather.
The explanations below follow the line items on the Statements of Income forCinergy,CG&E, andPSI. However, only the line items that varied significantly from prior periods are discussed.
| | Cinergy(1) | CG&E and subsidiaries | PSI | |||||||||||||||||||||||
|---|---|---|---|---|---|---|---|---|---|---|---|---|---|---|---|---|---|---|---|---|---|---|---|---|---|---|
| | 2001 | 2000 | % Change | 2001 | 2000 | % Change | 2001 | 2000 | % Change | |||||||||||||||||
| | (in millions) | |||||||||||||||||||||||||
| Retail | $ | 2,691 | $ | 2,692 | — | $ | 1,444 | $ | 1,482 | (3 | ) | $ | 1,247 | $ | 1,210 | 3 | ||||||||||
| Wholesale | 5,432 | 2,640 | 106 | 2,612 | 1,226 | 113 | 2,802 | 1,443 | 94 | |||||||||||||||||
| Transportation | 3 | — | — | 3 | — | — | — | — | — | |||||||||||||||||
| Other | 55 | 52 | 6 | 38 | 31 | 23 | 26 | 31 | (16 | ) | ||||||||||||||||
| Total | $ | 8,181 | $ | 5,384 | 52 | $ | 4,097 | $ | 2,739 | 50 | $ | 4,075 | $ | 2,684 | 52 | |||||||||||
- (1)
- The results ofCinergyalso include amounts related to non-registrants.
Electric operating revenues forCinergy,CG&E, andPSI increased for the year ended December 31, 2001, as compared to the same period last year, mainly due to an increase in volumes and average price per megawatt-hour (MWh) realized on non-firm wholesale transactions related to energy marketing and trading activities. Non-firm power is power without a guaranteed commitment for physical delivery.
| | Cinergy(1) | CG&E and subsidiaries | ||||||||||||||||
|---|---|---|---|---|---|---|---|---|---|---|---|---|---|---|---|---|---|---|
| | 2001 | 2000 | % Change | 2001 | 2000 | % Change | ||||||||||||
| | (in millions) | |||||||||||||||||
| Retail | $ | 547 | $ | 429 | 28 | $ | 547 | $ | 429 | 28 | ||||||||
| Wholesale | 4,071 | 2,454 | 66 | 3 | 1 | — | ||||||||||||
| Transportation | 40 | 56 | (29 | ) | 40 | 56 | (29 | ) | ||||||||||
| Other | 5 | 3 | 67 | 6 | 5 | 20 | ||||||||||||
| Total | $ | 4,663 | $ | 2,942 | 58 | $ | 596 | $ | 491 | 21 | ||||||||
- (1)
- The results ofCinergyalso include amounts related to non-registrants.
Gas operating revenues forCinergy andCG&E increased for the year ended December 31, 2001, as compared to the same period last year.Cinergy's increase was primarily the result of increased volumes sold by Cinergy Marketing & Trading, LP (Marketing & Trading).
CG&E's retail gas revenues increased primarily due to a higher price received per thousand cubic feet (mcf) sold. This increase was partially offset by a decrease in retail gas sales resulting from warmer weather during the fourth quarter of 2001. The higher price reflects a substantial increase in the wholesale gas commodity cost during the first six months, which is passed directly to the retail customer dollar-for-dollar under the gas cost recovery mechanism that is mandated by state law. Retail sales also
40
increased and transportation sales decreased due to transportation customers (customers who purchase gas directly from other suppliers) returning to full gas service (customers who purchase gas and utilize the transportation services ofCG&E).
| | Cinergy(1) | CG&E and subsidiaries | PSI | |||||||||||||||||||||||
|---|---|---|---|---|---|---|---|---|---|---|---|---|---|---|---|---|---|---|---|---|---|---|---|---|---|---|
| | 2001 | 2000 | % Change | 2001 | 2000 | % Change | 2001 | 2000 | % Change | |||||||||||||||||
| | (in millions) | |||||||||||||||||||||||||
| Fuel | $ | 771 | $ | 773 | — | $ | 307 | $ | 344 | (11 | ) | $ | 453 | $ | 407 | 11 | ||||||||||
| Purchased and exchanged power | 5,140 | 2,382 | 116 | 2,575 | 1,211 | 113 | 2,679 | 1,318 | 103 | |||||||||||||||||
| Gas purchased | 4,432 | 2,674 | 66 | 397 | 266 | 49 | — | — | — | |||||||||||||||||
| Operation and maintenance | 1,032 | 1,119 | (8 | ) | 442 | 492 | (10 | ) | 413 | 464 | (11 | ) | ||||||||||||||
| Depreciation | 378 | 344 | 10 | 187 | 181 | 3 | 150 | 141 | 6 | |||||||||||||||||
| Taxes other than income taxes | 228 | 268 | (15 | ) | 174 | 208 | (16 | ) | 50 | 57 | (12 | ) | ||||||||||||||
| Total | $ | 11,981 | $ | 7,560 | 58 | $ | 4,082 | $ | 2,702 | 51 | $ | 3,745 | $ | 2,387 | 57 | |||||||||||
- (1)
- The results ofCinergyalso include amounts related to non-registrants.
Fuel represents the cost of coal, natural gas, and oil that is used to generate electricity. The following table details the changes to fuel expense from the year ended December 31, 2000, to the year ended December 31, 2001:
| | Cinergy(1) | CG&E | PSI | |||||||
|---|---|---|---|---|---|---|---|---|---|---|
| | (in millions) | |||||||||
| 2000 fuel expense | $ | 773 | $ | 344 | $ | 407 | ||||
Increase (Decrease) due to changes in: | ||||||||||
| Price of fuel | 47 | 22 | 25 | |||||||
| Deferred fuel cost | 45 | 2 | 43 | |||||||
| MWh generation | (58 | ) | (36 | ) | (22 | ) | ||||
| Other(2) | (36 | ) | (25 | ) | — | |||||
2001 fuel expense | $ | 771 | $ | 307 | $ | 453 | ||||
- (1)
- The results ofCinergyalso include amounts related to non-registrants.
- (2)
- Includes fair value adjustments of contracted coal options. See Note 1(k) of the "Notes to Financial Statements" in "Item 8. Financial Statements and Supplementary Data" for further discussion.
Purchased and exchanged power expense forCinergy,CG&E, andPSI increased for the year ended December 31, 2001, as compared to the same period last year, primarily due to an increase in purchases of non-firm wholesale power, reflecting higher sales volumes and higher prices paid per MWh.
Gas purchased expense forCinergy increased for the year ended December 31, 2001, as compared to the same period last year, primarily due to an increase in gas commodity trading volumes.CG&E's
41
expense increased for the year ended December 31, 2001, as compared to the same period last year, primarily due to higher prices paid per mcf during the first six months of 2001.CG&E's wholesale gas commodity cost is passed directly to the retail customer dollar-for-dollar under the gas cost recovery mechanism that is mandated by state law.
Operation and maintenance expense forCinergy,CG&E, andPSI decreased for the year ended December 31, 2001, as compared to the same period last year, due in part to one-time charges related to a tentative agreement reached with the EPA in late 2000 and the LERP offered during 2000, as part of a corporate restructuring initiative.Cinergy's andCG&E's decrease is also attributable to a sale of emission allowances, due to decreased electric generation, andCinergy's andPSI's decrease reflects the reduction in amortization of demand-side management costs, resulting from the expiration of the agreement in May 2000.
Depreciation expense forCinergy increased for the year ended December 31, 2001, as compared to the same period last year. This increase was primarily attributable to the acquisition of additional depreciable plant, including investments in peaking generation.
Taxes other than income taxes expense forCinergy,CG&E, andPSI decreased for the year ended December 31, 2001, as compared to the same period last year, primarily due to reduced property tax expense and other tax changes associated with deregulation in Ohio.
Miscellaneous—net forPSI increased $15 million for the year ended December 31, 2001, as compared to the same period last year, primarily due to income associated with capitalized financing costs of its pollution control projects and gains associated with the demutualization of one of our medical insurance carriers.
Interest expense forCinergy increased $44 million for the year ended December 31, 2001, as compared to the same period last year, mainly due to debt issuances principally associated with the acquisition of additional peaking generation. Partially offsetting this increase was a decrease in short-term interest rates.
Income tax expense forCinergy,CG&E, andPSI increased $4 million, $27 million and $18 million, respectively for the year ended December 31, 2001, as compared to the same period last year, primarily due to an increase in taxable income.
The Results of Operations discussion forULH&P is presented only for the year ended December 31, 2001, in accordance with General Instruction I(2)(a).
42
Electric and gas margins and net income forULH&P for the year ended December 31, 2001 and 2000, were as follows:
| | ULH&P | |||||
|---|---|---|---|---|---|---|
| | 2001 | 2000 | ||||
| | (in thousands) | |||||
| Electric gross margin | $ | 79,398 | $ | 65,686 | ||
| Gas gross margin | 36,740 | 40,359 | ||||
| Net income | 35,924 | 24,632 | ||||
Electric gross margins increased for the year ended December 31, 2001, as compared to the same period last year, primarily due to the recognition of revenues previously reserved as they were subject to refund. These revenues were recorded in connection with a 2000 retail rate filing with the Kentucky Public Service Company (KPSC). A settlement agreement was reached with the KPSC in May 2001, which grantedULH&P retention of these revenues. For further information regarding the settlement agreement, see Note 13(j) of the "Notes to Financial Statements" in "Item 8. Financial Statements and Supplementary Data".
Gas gross margins decreased for the year ended December 31, 2001, as compared to the same period last year, as a result of milder weather and reduced industrial consumption.
The Results of Operations discussions forCinergy,CG&E, andPSI are combined within this section.
2000 RESULTS OF OPERATIONS—HISTORICAL
Electric and gas margins and net income forCinergy,CG&E, andPSI for the years ended December 31, 2000 and 1999, were as follows:
| | Cinergy(1) | CG&E and subsidiaries | PSI | |||||||||||||||
|---|---|---|---|---|---|---|---|---|---|---|---|---|---|---|---|---|---|---|
| | 2000 | 1999 | 2000 | 1999 | 2000 | 1999 | ||||||||||||
| | (in thousands) | |||||||||||||||||
| Electric gross margin | $ | 2,229,869 | $ | 2,052,602 | $ | 1,183,816 | $ | 1,108,371 | $ | 959,541 | $ | 922,053 | ||||||
| Gas gross margin | 267,304 | 212,153 | 224,633 | 204,016 | — | — | ||||||||||||
| Net income | 399,466 | 403,641 | 266,820 | 233,576 | 135,398 | 117,199 | ||||||||||||
- (1)
- The results ofCinergyalso include amounts related to non-registrants.
Our diluted EPS for the year ended December 31, 2000, was $2.50, as compared to $2.53 for the year ended December 31, 1999, mainly due to a decrease in contributions from our international operations, offset by increased earnings in our regulated business.
The contribution to earnings of our international operations decreased $.70 per share for the year ended December 31, 2000, as compared to 1999, primarily due to the loss of equity earnings and resulting gain from the sale of our share of Midlands, which took place in July 1999. For further details regarding this transaction, refer to Note 11 of the "Notes to Financial Statements" in "Item 8. Financial Statements and Supplementary Data". Earnings from our regulated operations had a net increase of $.66 per share for the year 2000, as compared to 1999. This increase was primarily attributable to growth in electric margins and continued improvement in our commodity supply business. Growth in residential, commercial, and industrial customer bases, along with improvements in cost of sales, were somewhat offset by the effects of mild weather experienced during 2000.
43
Partially offsetting the overall increase in regulated operations were one-time charges totaling $.11 per share related to a tentative agreement with the EPA and the LERP offered in 2000 as part of a corporate restructuring initiative.
The explanations below follow the line items on the Statements of Income forCinergy,CG&E, andPSI. However, only the line items that varied significantly from prior periods are discussed.
| | Cinergy(1) | CG&E and subsidiaries | PSI | |||||||||||||||||||||||
|---|---|---|---|---|---|---|---|---|---|---|---|---|---|---|---|---|---|---|---|---|---|---|---|---|---|---|
| | 2000 | 1999 | % Change | 2000 | 1999 | % Change | 2000 | 1999 | % Change | |||||||||||||||||
| | (in millions) | |||||||||||||||||||||||||
| Retail | $ | 2,692 | $ | 2,725 | (1 | ) | $ | 1,482 | $ | 1,468 | 1 | $ | 1,210 | $ | 1,258 | (4 | ) | |||||||||
| Wholesale | 2,640 | 1,539 | 72 | 1,226 | 687 | 78 | 1,443 | 840 | 72 | |||||||||||||||||
| Other | 52 | 49 | 6 | 31 | 20 | 55 | 31 | 38 | (18 | ) | ||||||||||||||||
| Total | $ | 5,384 | $ | 4,313 | 25 | $ | 2,739 | $ | 2,175 | 26 | $ | 2,684 | $ | 2,136 | 26 | |||||||||||
- (1)
- The results ofCinergyalso include amounts related to non-registrants.
Electric operating revenues forCinergy,CG&E, andPSI increased for the year ended December 31, 2000, as compared to 1999, mainly due to an increase in volumes and the average price per MWh realized on non-firm wholesale transactions related to energy marketing and trading activities.
The increase in other electric operating revenues forCinergy primarily reflected marketing activities of Capital & Trading, aCinergy non-regulated affiliate.
| | Cinergy(1) | CG&E and subsidiaries | |||||||||||||||
|---|---|---|---|---|---|---|---|---|---|---|---|---|---|---|---|---|---|
| | 2000 | 1999 | % Change | 2000 | 1999 | % Change | |||||||||||
| | (in millions) | ||||||||||||||||
| Retail | $ | 429 | $ | 320 | 34 | $ | 429 | $ | 320 | 34 | |||||||
| Wholesale | 2,454 | 1,222 | 101 | 1 | 1 | — | |||||||||||
| Transportation | 56 | 51 | 10 | 56 | 51 | 10 | |||||||||||
| Other | 3 | 3 | — | 5 | 4 | 25 | |||||||||||
| Total | $ | 2,942 | $ | 1,596 | 84 | $ | 491 | $ | 376 | 31 | |||||||
- (1)
- The results ofCinergyalso include amounts related to non-registrants.
Gas operating revenues forCinergy increased in 2000, as compared to 1999, primarily as a result of a higher price realized per mcf sold by Marketing & Trading.
CG&E's retail gas revenues increased primarily due to a higher price realized per mcf sold. Transportation revenues increased due to the continued trend of full-service customers (customers who purchase gas and utilize the transportation services ofCG&E) purchasing gas directly from other suppliers.
The market price of natural gas increased significantly in 2000, which causedCG&E to pay more for the gas it delivered to customers. The wholesale gas commodity cost is passed directly to the retail customer dollar-for-dollar under the gas cost recovery mechanism that is mandated by state law.
Other operating revenues forCinergy increased $67 million for 2000, as compared to 1999, primarily due to revenues resulting from the acquisition of an energy-related services affiliate in late 1999.
44
| | Cinergy(1) | CG&E and subsidiaries | PSI | ||||||||||||||||||||||
|---|---|---|---|---|---|---|---|---|---|---|---|---|---|---|---|---|---|---|---|---|---|---|---|---|---|
| | 2000 | 1999 | % Change | 2000 | 1999 | % Change | 2000 | 1999 | % Change | ||||||||||||||||
| | (in millions) | ||||||||||||||||||||||||
| Fuel | $ | 773 | $ | 761 | 2 | $ | 344 | $ | 341 | 1 | $ | 407 | $ | 397 | 3 | ||||||||||
| Purchased and exchanged power | 2,382 | 1,499 | 59 | 1,211 | 726 | 67 | 1,318 | 817 | 61 | ||||||||||||||||
| Gas purchased | 2,674 | 1,384 | 93 | 266 | 172 | 55 | — | — | — | ||||||||||||||||
| Operation and maintenance | 1,119 | 1,012 | 11 | 492 | 445 | 11 | 464 | 462 | — | ||||||||||||||||
| Depreciation | 344 | 323 | 7 | 181 | 175 | 3 | 141 | 135 | 4 | ||||||||||||||||
| Taxes other than income taxes | 268 | 266 | 1 | 208 | 212 | (2 | ) | 57 | 53 | 8 | |||||||||||||||
| Total | $ | 7,560 | $ | 5,245 | 44 | $ | 2,702 | $ | 2,071 | 30 | $ | 2,387 | $ | 1,864 | 28 | ||||||||||
- (1)
- The results ofCinergyalso include amounts related to non-registrants.
Fuel represents the cost of coal, natural gas, and oil that is used to generate electricity. The following table details the changes to fuel expense from 1999 to 2000:
| | Cinergy(1) | CG&E | PSI | |||||||
|---|---|---|---|---|---|---|---|---|---|---|
| | (in millions) | |||||||||
| 1999 fuel expense | $ | 761 | $ | 341 | $ | 397 | ||||
Increase (Decrease) due to changes in: | ||||||||||
| Price of fuel | (14 | ) | (12 | ) | (2 | ) | ||||
| Deferred fuel cost | (17 | ) | 9 | (26 | ) | |||||
| MWh generation | 44 | 6 | 38 | |||||||
| Other | (1 | ) | — | — | ||||||
2000 fuel expense | $ | 773 | $ | 344 | $ | 407 | ||||
- (1)
- The results ofCinergyalso include amounts related to non-registrants.
Purchased and exchanged power expense increased forCinergy,CG&E, andPSI for 2000, as compared to 1999. This increase was primarily due to an increase in purchases of non-firm wholesale power as a result of an increase in sales volumes from Marketing & Trading.
Gas purchased expense increased forCinergy in 2000, as compared to 1999, primarily due to increased gas commodity trading activity and, for bothCinergy andCG&E, an increase in the average cost per mcf of gas purchased.
45
Cinergy'sOperation and maintenance expense increased in 2000, as compared to 1999, primarily due to a full year's realization of operating expenses resulting from the acquisition of an energy-related services affiliate in late 1999. Additionally for 2000, operation expenses increased forCinergy,CG&E, andPSI as a result of one-time charges related to a tentative agreement reached with the EPA and the LERP offered as part of a corporate restructuring initiative.
Cinergy's,CG&E's, andPSI'sDepreciation expense increased in 2000, as compared to 1999, due to additions to depreciable plant.
EQUITY IN EARNINGS (LOSSES) OF UNCONSOLIDATED SUBSIDIARIES
Cinergy'sEquity in earnings (losses) of unconsolidated subsidiaries decreased $53 million in 2000, as compared to 1999. This decrease was primarily due to the loss in earnings resulting from the July 1999 sale of our 50% ownership interest in Midlands. For further information see Note 11 of the "Notes to Financial Statements" in "Item 8. Financial Statements and Supplementary Data".
PSI'sInterest expense decreased $8 million in 2000, as compared to 1999. This decrease was primarily due toPSI's net redemption of approximately $130 million of long-term debt during the year, which was slightly offset by an increase in average short-term interest rates.
In the "Future Expectations/Trends" section, we discuss electric and gas industry developments, market risk sensitive instruments and positions, inflation, accounting changes, and insurance. Each of these discussions will address the current status and potential future impact on our results of operations and financial condition.
The utility industry has traditionally operated as a regulated monopoly but is transitioning to an environment of increased wholesale and retail competition. Regulatory and legislative decisions being made at the federal and state levels are aimed at promoting customer choice and are shaping this transition. Customer choice provides the customer the ability to select an energy supplier (the company that generates or supplies the commodity) in an open and competitive marketplace. This emerging environment presents significant challenges, which are discussed below.
In 1996, the FERC issued orders to open the wholesale electric markets to competition. Competitors within the wholesale market include both utilities and non-utilities such as EWG's, independent power producers, and power marketers. We are involved in wholesale power marketing and trading and exempt wholesale generation through Energy Merchant.
In both 1998 and 1999, the Midwest wholesale electric power markets experienced record price spikes. These spikes were caused by a number of factors including unseasonably hot weather, unplanned generating unit outages, transmission constraints, and increased electric commodity market volatility. These simultaneous events created temporary but extreme prices in the Midwest electricity markets. In response to these events, we have aggressively adopted a model that is focused on a balance of supply and demand.
46
In September 1999, Capital & Trading formed a partnership (each party having a 50% ownership) with Duke Energy North America, LLC (Duke), to increase the available generating capacity for use during peak demand periods. The partnership was formed for the purpose of jointly constructing and owning three wholesale generating facilities.
In March 2000, the IURC issued an order, requiring the partnership to immediately suspend all construction activities at the site located in Henry County, Indiana (a peaking plant with a total capacity of 129 MW of which we owned 65 MW). In making this decision, the IURC found that it needed additional information related to the project before issuing a final decision. The issues raised were air quality, water supply, noise control, landscaping, plant abandonment, and emergency services training. The IURC held a hearing on this matter in November 2000, and a favorable ruling was received in April 2001. The plant, which began generating power commercially in the summer of 2001, consists of three gas turbine engines.
In June 2001, Capital & Trading and Duke announced they would dissolve their partnership. In September 2001, the partnership was dissolved and Capital & Trading obtained 100% ownership of the 680 MW wholesale generating facility located in Butler County, Ohio and the 129 MW wholesale generating facility located in Henry County, Indiana. In exchange for the Butler County, Ohio and Henry County, Indiana generating facilities, Duke received 100% ownership of the Vermillion County, Indiana generating facility (680 MW), which will be operated byCinergyfor five years.
In March 2001, Capital & Trading completed the acquisition of the 480 MW Brownsville generation facility located in Haywood County, Tennessee and the 550 MW Caledonia generation facility located in Lowndes County, Mississippi. Brownsville has four natural gas-fired combustion turbines and Caledonia has six natural gas-fired combustion turbines.
In December 2001, the IURC approvedPSI'splan for environmental improvements that will increase the electric generating capacity at its Noblesville generating station from 100 MW to 300 MW. In addition to increasing capacity, upon completion of the project, overall emissions to the environment will be reduced.
Pursuant to Ohio's customer choice legislation enacted in 2001, 20% ofCG&E'sretail electric load is expected to switch suppliers by December 2003.CG&Ecurrently has no plans to replace these customers by acquiring new retail customers, althoughCG&Ereserves the flexibility to replace load in the wholesale market to the extent it chooses. For a further discussion on Ohio deregulation, see "Retail Market Developments" of this section.
FERC Notice of Proposed Rulemaking
On September 27, 2001, the FERC issued a Notice of Proposed Rulemaking, proposing to promulgate new standards of conduct regulations that would apply uniformly to natural gas pipelines and transmitting public utilities that are currently subject to FERC's standards of conduct. The FERC is proposing to adopt one set of standards of conduct to govern the relationships between regulated transmission providers and all their energy affiliates, broadening the definition of an affiliate covered by the standards of conduct, from the more narrow definition in the existing regulations. At this time, we are unable to predict either the outcome of this proceeding or its effect onCinergy.
Currently, regulatory and legislative initiatives shaping the transition to a competitive retail market are the responsibilities of the individual states. Many states, including Ohio, have enacted electric utility
47
deregulation legislation. In general, these initiatives have sought to separate the electric utility service into its basic components (generation, transmission, and distribution) and offer each component separately for sale. This separation is referred to as unbundling of the integrated services. Under the customer choice initiatives in Ohio, we continue to transmit and distribute electricity; however, the customer can purchase electricity from any available supplier and we are compensated by a "wires" charge. The following sections further discuss the current status of federal energy policies and deregulation legislation in the states of Ohio, Indiana, and Kentucky, each of which includes a portion of our service territory.
President Bush has indicated that legislation addressing the energy security needs of America deserves prompt consideration. He appointed Vice President Cheney to head an inter-agency task force which recommended a number of actions, many of which are embodied in HR 4, which passed the House of Representatives last summer. This legislation includes a number of tax provisions, research and development provisions for clean coal technology, and provisions to increase supplies of natural gas.
Legislation considering many of the President's recommendations has also been developed by Senator Bingaman and other Senate leaders and is scheduled to be considered by the full Senate in February 2002.
The President also recognized the need to balance the energy and environmental needs of the country and supported combining the multitude of environmental regulations facing electric utilities into one legislative package. The intent is to give the industry one clear set of environmental goals, along with an appropriate amount of time to meet necessary emission reductions, while providing environmental benefits to consumers.Cinergyhas supported this approach within the industry, Congress, and the Bush Administration in the interest of achieving an energy and environmental balance in any final legislative package.
On July 6, 1999, Ohio Governor Robert Taft signed Amended Substitute Senate Bill No. 3 (Electric Restructuring Bill), beginning the transition to electric deregulation and customer choice for the State of Ohio. The Electric Restructuring Bill created a competitive electric retail service market effective January 1, 2001. The legislation provided for a market development period that began January 1, 2001, and ends no later than December 31, 2005.
On May 8, 2000,CG&Ereached a stipulated agreement with the PUCO staff and various other interested parties with respect to its proposal to implement electric customer choice in Ohio effective January 1, 2001. On August 31, 2000, the PUCO approvedCG&E'sstipulation agreement. The major features of the agreement include:
- •
- Residential customer rates are frozen through December 31, 2005;
- •
- Residential customers received a five-percent reduction in the generation portion of their electric rates, effective January 1, 2001;
- •
- CG&Ewill provide four million dollars from 2001 to 2005 in support of energy efficiency and weatherization services for low income customers;
- •
- The creation of a Regulatory Transition Charge designed to recoverCG&E'sregulatory assets and other transition costs over a ten-year period;
48
- •
- Authority forCG&Eto transfer its generation assets to one or more, non-regulated affiliates to provide flexibility to manage its generation asset portfolio in a manner that enhances opportunities in a competitive marketplace;
- •
- Authority forCG&Eto apply the proceeds of transition cost recovery to costs incurred during the transition period including implementation costs and purchased power costs that may be incurred byCG&Eto maintain an operating reserve margin sufficient to provide reliable service to its customers;
- •
- CG&Ewill provide standard offer default supplier service (i.e.,CG&Ewill be the supplier of last resort, so that no customer will be without an electric supplier); and
- •
- CG&Ehas agreed to provide shopping credits to switching customers.
With regard to the PUCO's order, two parties filed applications for rehearing with the PUCO. On October 18, 2000, the PUCO denied these applications. One of the parties appealed to the Ohio Supreme Court in the fourth quarter of 2000 andCG&Esubsequently intervened in that case. On April 6, 2001,CG&Efiled for dismissal of this appeal. On July 25, 2001, the Ohio Supreme Court deniedCG&E'smotion to dismiss.CG&E is unable to predict the outcome of this proceeding.
As indicated above, the August 31, 2000 order authorizesCG&Eto transfer its generation assets to a non-regulated affiliate. In addition to the regulatory approvals received from the PUCO, the IURC, and the KPSC, this transfer requires the approval of the FERC and the SEC under PUHCA. On October 29, 2001, Cinergy Power Investments, Inc., (Power Investments) filed an application with the FERC seeking EWG status.CG&Ealso filed an application seeking approval to transfer its generating assets to Power Investments. On December 21, 2001, the FERC issued an order certifying Power Investments' EWG status. As the transfer is contingent uponCG&Ereceiving FERC approval, SEC approval under PUHCA, and various third party consents, the timing and receipt of which are unknown, the completion date of the transfer of generation assets to Power Investments cannot be predicted.
In anticipation of transferring the generation assets, Cinergy Wholesale Energy, Inc. (Wholesale Energy) was formed in the fourth quarter of 2000. Wholesale Energy is a direct subsidiary ofCinergy Corp.and will be the holding company forCinergy'snon-regulated energy commodities businesses, including Power Investments and Cinergy Power Generation Services, LLC.
Upon FERC authorization, Power Investments will enter into a power sale arrangement withCG&Efor the duration of the market development period, which is scheduled to terminate no later than December 31, 2005. Power Investments will supplyCG&Ewith sufficient power to meet the standard service obligations ofCG&E'scustomers that do not choose an alternate electric commodity supplier. In addition, Power Investments will enter into a second power sale agreement withCG&Eto provide sufficient power to fulfill the electric commodity obligations ofCG&E'swholesale customers. Power Investments will also replaceCG&Eas the electric commodity supplier in a power sale arrangement withULH&P. This new contract will replace the power sales agreement that is in place betweenCG&EandULH&P.
The transfer ofCG&E'sgenerating assets to Power Investments will also affect the operating agreement betweenCG&E,PSI, and Services that has been in place since 1994. In 1994, when the operating agreement was entered into, bothCG&EandPSIwere vertically integrated regulated electric utilities.PSIis still a vertically integrated electric utility and the operations of its generating assets are still dedicated to Indiana ratepayers. Due to this situation, the IURC,CG&E,PSI, and Power Investments reached an agreement on a new Joint Generation Dispatch Agreement (JGDA). The JGDA allows for the joint dispatch of regulatedPSIgeneration with Power Investments deregulated generation. If energy is transferred betweenPSIand Power Investments it will be priced at market
49
rates. The majority ofPSI'selectric commodity requirements will be provided byPSI'sgeneration. For more information refer to the "Termination of Operating Agreement" of this section.
Indiana lawmakers are involved in creating an Energy Policy Commission to assist in completing a comprehensive energy plan. Indiana Governor Frank O'Bannon will appoint members representing various stakeholder groups, including state government, industry, labor, and environmental representatives. This commission is expected to present a final report in December 2002.
Throughout 1999, a special Kentucky Electricity Restructuring Task Force (Task Force), convened by the Kentucky legislature, studied the issues of electric deregulation. In January 2000, the Task Force issued a final report to Kentucky Governor Paul Patton recommending that lawmakers wait until the 2002 General Assembly before considering any deregulation that would open the state's electric industry to competition.
At the end of 2000, approximately one half of the states and the District of Columbia had adopted deregulation plans. However, recent events are significantly influencing political and legislative activity. At the end of 2001, eight of the states decided to delay or suspend their deregulation activities. While we believe the situation in Ohio, as described above, and generally within the Midwest are different, we cannot predict the consequences, if any, on efforts to deregulate or discontinue deregulation within our service territory or markets.
Under generally accepted accounting principles,CG&E,PSI, andULH&Papply the provisions of Statement of Financial Accounting Standards No. 71,Accounting for the Effects of Certain Types of Regulation(Statement 71) to the applicable rate-regulated portions of their businesses. The provisions of Statement 71 allowCG&E,PSI, andULH&Pto capitalize (record as a deferred asset) costs that would normally be charged to expense. These costs are classified as regulatory assets in the accompanying financial statements and the majority have been approved by regulators for future recovery from customers through our rates. As of December 31, 2001,CG&E,PSI, andULH&P have approximately $1 billion of net regulatory assets, of which $952 million have been approved for recovery.
Except with respect to the generation assets ofCG&E, as of December 31, 2001,CG&E,PSI, andULH&Pcontinue to meet each of the criteria required for the application of Statement 71. However, to the extent other states implement deregulation legislation, the application of Statement 71 will need to be reviewed. Based on our operating companies' current regulatory orders and the regulatory environment in which they currently operate, the future recovery of regulatory assets recognized in the accompanying Balance Sheets as of December 31, 2001, is probable. The effect of future discontinuance of Statement 71 on the results of operations, cash flows, or statements of position cannot be determined until deregulation legislation plans have been approved by each state in which we do business. See Note 1(c) of the "Notes to Financial Statements" in "Item 8. Financial Statements and Supplementary Data" for a further discussion of our regulatory assets.
50
Midwest Independent Transmission System Operator, Inc. (Midwest ISO)
As part of the effort to create a competitive wholesale power marketplace, the FERC approved the formation of the Midwest ISO during 1998. In that same year,Cinergyagreed to join the Midwest ISO in preparation for meeting anticipated changes in the FERC regulations and future deregulation requirements. The Midwest ISO was established as a non-profit organization to maintain functional control over the combined transmission systems of its members.
On December 19, 2001, the FERC issued several key orders having considerable impact upon the Midwest ISO and its transmission owning members. Among other determinations, the FERC approved the proposal of the Midwest ISO to become the first FERC-approved Regional Transmission Organization (RTO). It also denied a similar proposal from the companies seeking to form the Alliance Regional Transmission Organization (Alliance RTO) on the basis that the proposal lacked sufficient scope. The Alliance RTO is a planned for-profit transmission company involving various utilities, which have transmission systems that cover parts of Michigan, Ohio, Indiana, West Virginia, and Virginia. The FERC encouraged the Alliance RTO companies to explore joining the Midwest ISO and set a 60-day deadline for those companies to provide the FERC a statement of their plans to join an RTO. In addition, the FERC also directed the Midwest ISO to file a plan with the FERC within 60 days to address interim operations for the period of time in which the Midwest ISO is operational and the Alliance RTO companies have not yet joined an RTO.
In related activity, the FERC issued an order on December 14, 2001, in response to protests of the Midwest ISO's proposed methodology related to the calculation of its administrative adder fees for the services it provides.Cinergyand a number of other parties filed protests to the proposed methodology, suggesting, among other things, that the methodology was inconsistent with the transmission owners' prior agreement with the Midwest ISO, and selectively allowed only independent transmission companies to choose which unbundled administrative adder services they wished to purchase from the Midwest ISO. In its December 14, 2001 Order, the FERC found that the Midwest ISO's proposed methodology for determination of the administrative adder fees had not been shown to be just and reasonable, and provided the Midwest ISO and the protesting parties a period of 60 days to reach settlement on the issues before an evidentiary hearing would be conducted.
On November 30, 2001, the Midwest ISO and Mid-Continent Area Power Pool (MAPP) closed a financial transaction in which the Midwest ISO agreed to acquire certain assets and liabilities of MAPP, including its St. Paul, Minnesota control center. In addition, since the third quarter of 2001, the Midwest ISO and Southwest Power Pool (SPP) have been in a process of agreeing upon a definitive document to establish a business combination which would include the Midwest ISO's purchase of substantially all of the assets of SPP and the assumption of appropriate liabilities. A firm date for the closure of this transaction has not been established.
On December 15, 2001, the Midwest ISO initiated startup of its operations with the provision of a variety of support or stand alone services to its transmission owning members. The Midwest ISO achieved full startup, including implementation of tariff administration, on February 1, 2002.
State Regulatory Agencies Filings
In June 2001,Cinergyand various other Indiana Midwest ISO transmission owners made a joint state filing with the IURC seeking permission to transfer functional control of their transmission
51
facilities to the Midwest ISO. On December 17, 2001,Cinergyand four other transmission owning Indiana companies received conditional approval from the IURC to transfer functional control of their transmission facilities to the Midwest ISO. The conditional terms of the approval were satisfied prior to the Midwest ISO full startup date of February 1, 2002.
Early in 2001, S. 206, a bill to repeal the PUHCA, was introduced in the Senate. It was referred to the Senate Committee on Banking, Housing and Urban Affairs for action. Subsequently, a hearing was held in the Subcommittee on Securities and Investment to identify support for and opposition to this legislation. S. 206 was favorably reported out by a 19-1 vote by the full Senate Committee on Banking, Housing and Urban Affairs in April 2001. This legislation has been included as part of the Senate Energy Bill which will proceed directly to the Senate floor for debate. Issues surrounding the Enron Corp. (Enron) collapse may have an adverse impact on full repeal of PUHCA, and some Senators have indicated an interest in strengthening consumer protection aspects of the law. However, it currently remains as part of the Senate Energy Bill, scheduled for consideration in the first quarter of 2002.
In the House of Representatives, Subcommittee on Energy and Air Quality Chairman Joe Barton has drafted an electricity deregulation bill which includes PUHCA repeal. That legislation is also scheduled for consideration in the first quarter of 2002, but again several Committee members have expressed concern about PUHCA repeal in light of the Enron collapse.Cinergysupports PUHCA repeal and will continue to monitor developments as well as possibilities for limited repeal.
In May 1999,PSIfiled a petition with the IURC seeking approval of a purchased power tracking mechanism (Tracker). This request was designed to provide for the recovery of costs related to purchases of power necessary to meet native load requirements to the extent such costs are not recovered through the existing fuel adjustment clause.
A hearing was held before the IURC in February 2001, to determine whether it was appropriate forPSIto continue the Tracker for future periods. In April 2001, a favorable order was received extending the Tracker for two years, through the summer of 2002.PSIis authorized to recover 90% of its purchased power expenses through the Tracker (net of the displaced energy portion recovered through the fuel recovery process and net of the mitigation credit portions), with the remaining 10% deferred for subsequent recovery inPSI'snext general rate case (subject to a showing of prudence).
In March 2001, the IURC held a hearing to reviewPSI's2000 purchases and rule on its associated request for recovery of costs. In May 2001, the IURC issued an order approving the recovery ofPSI'ssummer 2000 purchased power costs ($18.5 million) via the Tracker.
In June 2001,PSIfiled a petition with the IURC seeking approval of the recovery through the Tracker of its summer 2001 purchased power costs. In October 2001,PSIfiled an amended petition with the IURC, seeking approval of the costs associated with additional power purchases made during July and August 2001. Hearings before the IURC were held in January 2002, with a decision expected in the second quarter of 2002.
ULH&Ppurchases energy fromCG&Epursuant to a new contract effective January 1, 2002, which was approved by the FERC and the KPSC. This five-year agreement is a negotiated fixed-rate contract withCG&Eand replaces the previous cost of service based contract, which expired on December 31, 2001.
52
Termination of Operating Agreement
Upon consummation of the merger betweenCG&Eand PSI Resources, Inc. in 1994, an operating agreement entered into betweenCG&E,PSI, and Services was filed with and approved by the FERC. This agreement was established to provide for the coordinated planning and operation of the two regulated entities' generation and transmission systems.
In October 2000,CG&E,PSI, and Services filed a notice of termination of the operating agreement with the FERC. The reason for the termination filing was that, with the introduction of deregulation in the State of Ohio, the companies no longer share the common characteristics that formed the basis for the operating agreement. In December 2000, the FERC ruled that the companies have the contractual right to terminate the operating agreement. Additionally, the FERC established a termination effective date of May 22, 2001, and set a May 1, 2001, hearing date on the issue of the reasonableness of termination.
Certain parties appealed the FERC's December 2000 decision. In March 2001, the IURC initiated an investigation proceeding into the termination of the operating agreement. In May 2001, the parties to the FERC proceeding reached a settlement resolving termination issues and certain compensation and damage issues. This settlement, which was approved by the FERC in June 2001, delayed the termination of the existing operating agreement until a new successor agreement has been approved by the FERC. The settlement also provided that the parties would engage in negotiations concerning the terms and conditions of a successor agreement(s).
In August 2001, the parties to both the IURC investigation proceeding and the previous FERC proceeding entered into two complementary settlement agreements. Both agreements addressed, among other things, the terms and conditions of a proposed new joint generation operating agreement and a proposed new joint transmission operating agreement. The IURC settlement agreement was approved by the IURC in September 2001. Both the IURC and the FERC settlement agreements are conditioned upon FERC acceptance of the proposed successor agreements.Cinergyfiled the successor agreements with the FERC in October 2001. At this time, we cannot predict the outcome or the timing of the FERC proceedings regarding the proposed successor agreements.
PSIdefers fuel costs that are recoverable in future periods subject to IURC approval under a fuel recovery mechanism. In June 2001, the IURC issued an order in aPSIfuel recovery proceeding, disallowing approximately $14 million of deferred costs. On June 26, 2001,PSI formally requested that the IURC reconsider its disallowance decision. In August 2001, the IURC indicated that it will reconsider its decision.PSIbelieves it has strong legal and factual arguments in its favor and that it will ultimately be permitted to recover these costs. However,PSIcannot definitively predict the ultimate outcome of this matter.
In June 2001,PSIfiled a petition with the IURC requesting authority to recover $16 million in under billed deferred fuel costs incurred from March 2001 through May 2001. The IURC approved recovery of these costs subject to refund pending the findings of an investigative sub-docket. The sub-docket was opened to investigate the reasonableness of, and underlying reasons for, the under billed deferred fuel costs. A hearing is scheduled for April 2002.
CWIP Ratemaking Treatment for NOX Equipment
During the third quarter of 2001,PSIfiled an application with the IURC requesting CWIP ratemaking treatment for costs related to NOX equipment currently being installed at certainPSIgeneration facilities. CWIP ratemaking treatment allows for the recovery of carrying costs on the equipment during the construction period.PSIfiled its case-in-chief testimony in January 2002.PSIanticipates that hearings before the IURC will be scheduled during the second quarter of 2002. At this time, we cannot predict the outcome of this matter.
53
Transfer of Generating Assets to PSI
In December 2001,PSIfiled a petition with the IURC requesting approval, under Indiana's Power Plant Construction Act, to acquire the Butler County, Ohio and Henry County, Indiana peaking plants from Capital & Trading in order to maintain adequate reserve margins. The IURC has scheduled a pre-hearing conference for February 2002 at which time the procedural schedule will be determined. This transfer is also contingent upon receipt of approval from the FERC and the SEC.PSIis unable to predict the outcome of this request.
On June 6, 2001,ULH&Pfiled a retail gas rate case with the KPSC seeking to increase base rates for natural gas distribution services by $7.3 million annually, or 8.4% overall. In addition to an increase in base rates,ULH&Prequested recovery through a tracking mechanism of the costs of an accelerated gas main replacement program with a capital cost of approximately $112 million over the next ten years. A hearing on this matter was held in November 2001 and an order was issued on January 31, 2002. In the order the KPSC authorized a base rate increase of $2.7 million or 2.8% overall, to be effective on January 31, 2002. In addition, the KPSC authorizedULH&Pto implement the tracking mechanism to recover the costs of the accelerated gas main replacement program for an initial period of three years, with the possibility of renewal for the full ten years. Per the terms of the order, the tracker will be set annually and the first filing will be made by March 31, 2002.ULH&Pwill request rehearing before the KPSC on selected items within the order. We expect a decision on these matters by the end of the first quarter 2002.
On July 31, 2001,CG&Efiled a retail gas rate case with the PUCO seeking to increase base rates for natural gas distribution services by approximately $26 million or 5% overall. We expect that any rate change as a result of this filing will be effective in the second quarter of 2002. Simultaneously,CG&Erequested recovery through a tracking mechanism of the costs of an accelerated gas main replacement program with a capital cost of approximately $716 million over the next ten years. A hearing in this case will be held in the first quarter of 2002.
As the result of the market price of natural gas increasing significantly in 2000,CG&E'sandULH&P'sgas supply costs increased. These costs are passed directly through to customers dollar-for-dollar under the gas cost recovery mechanisms that are mandated by state law in Ohio and Kentucky. During 2001, the market price of natural gas decreased andCG&EandULH&Plowered their rates in accordance with the downward trending gas prices.
On May 14, 2001,ULH&Pfiled an application with the KPSC requesting approval of a gas procurement-hedging program designed to mitigate the effects of gas price volatility on customers. On July 16, 2001, the KPSC approved the pilot program for the 2001-2002 heating season, subject to certain restrictions. The approved hedging program allows the pre-arranging of between 50-75% of winter heating season base load gas requirements.ULH&Pmade advance arrangements for approximately 50% of its winter 2001/2002 base load requirements under the program.
In July 2001,CG&Efiled an application with the PUCO requesting approval of its gas procurement-hedging program. This request was subsequently denied. However, in denyingCG&E'srequest for pre-approval of a hedging program, the PUCO order provided clarification that prudently incurred hedging costs are a valid component ofCG&E'sgas purchasing strategy. As a result,CG&E
54
has hedged approximately 50% of its winter 2001/2002 base load requirements andCG&Ewill seek PUCO approval for its hedging program on an after the fact basis. At this time, we cannot predict the outcome of this event.
MARKET RISK SENSITIVE INSTRUMENT AND POSITIONS
Energy Commodities Sensitivity
The transactions associated with Energy Merchant's energy marketing and trading activities give rise to various risks, including market risk. Market risk represents the potential risk of loss from adverse changes in market price of electricity or other energy commodities. As Energy Merchant continues to develop its energy marketing and trading business (and due to its substantial investment in generation assets), its exposure to movements in the price of electricity and other energy commodities may become greater. As a result, we may be subject to increased future earnings volatility.
The energy marketing and trading activities of Energy Merchant principally consist ofCG&E'sandPSI'spower marketing and trading operations and Marketing & Trading's natural gas marketing and trading operations. These operations market and trade over-the-counter (an informal market where the buying/selling of commodities occurs) contracts for the purchase and sale of electricity (primarily in the Midwest region of the U.S.), natural gas, and other energy-related products. In addition, Energy Merchant also trades natural gas and other energy-related products on the New York Mercantile Exchange. The power marketing and trading operation consists of both physical activities (accounted for when the transaction settles) and trading activities (accounted for on a fair value basis). Transactions are designated as a physical activity when there is intent and ability to physically deliver the power from company-owned generation. Substantially all of the electricity in the physical portfolio requires settlement by physical delivery. All other transactions (including most natural gas contracts) are considered trading activities due to (a) the intent to financially settle the contracts, (b) the lack of hard assets, or (c) the inability to serve with company-owned assets. Some contracts within the trading portfolio may require settlement by physical delivery, but often times can be netted in accordance with industry standards at time of settlement.
Many of the contracts in both the physical and trading portfolios commit us to purchase or sell electricity, natural gas, and other energy-related products at fixed prices in the future. The majority of the contracts in the natural gas and other energy-related product portfolios are financially settled contracts (i.e., there is no physical delivery related with these items). In addition, Energy Merchant also markets and trades over-the-counter option contracts. The use of these types of commodity instruments is designed to allow Energy Merchant to:
- •
- manage and economically hedge contractual commitments;
- •
- reduce exposure relative to the volatility of cash market prices;
- •
- take advantage of selected arbitrage opportunities; and
- •
- originate customized transactions with municipalities and end-use customers.
Energy Merchant structures and modifies its net position to capture the following:
- •
- expected changes in future demand;
- •
- seasonal market pricing characteristics;
- •
- overall market sentiment; and
- •
- price relationships between different time periods and trading regions.
At times, a net open position is created or is allowed to continue when Energy Merchant believes future changes in prices and market conditions may possibly result in profitable positions. Position
55
imbalances can also occur due to the basic lack of liquidity in the wholesale power market. The existence of net open positions can potentially result in an adverse impact on our financial condition or results of operations. This potential adverse impact could be realized if the market price of electric power does not react in the manner or direction expected.
Energy Merchant measures the market risk inherent in the trading portfolio employing value-at-risk (VaR) analysis and other methodologies, which utilize forward price curves in electric power markets to quantify estimates of the magnitude and probability of potential future losses related to open contract positions. VaR is a statistical measure used to quantify the potential loss in fair value of the trading portfolio over a particular period of time, with a specified likelihood of occurrence, due to an adverse market movement. Because most of the contracts in the physical portfolio require physical delivery of electricity and generally do not allow for net cash settlement, these contracts are not included in the VaR analysis.
Our VaR is reported as a percentage of operating income, based on a 95% confidence interval, utilizing one-day holding periods. This means that on a given day (one-day holding period) there is a 95% chance (confidence interval) that our trading portfolio will lose less than the stated percentage of operating income. We disclose our VaR for power activities as a percent of consolidated operating income on a one-day basis at December 31, the average one-day basis at the end of each quarter, and the daily basis at December 31 of each year. On a one-day basis as of December 31, 2001, the VaR for the power trading activity was less than 1% of 2001 consolidated operating income and as of December 31, 2000, was less than 1% of 2000 consolidated operating income. On a one-day basis at the end of each quarter, the VaR for the power trading activity was less than 2% of consolidated operating income in 2001, and less than 1% in 2000. The daily VaR for the power trading portfolio as of December 31, 2000, was less than 1% of 2001 consolidated operating income and as of December 31, 1999, was also less than 1% of 2000 consolidated operating income. The VaR model uses the variance-covariance statistical modeling technique and historical volatilities and correlations over the past 200-day period. The estimated market prices used to value these transactions for VaR purposes reflect the use of established pricing models and various factors including quotations from exchanges and over-the-counter markets, price volatility factors, the time value of money, and location differentials.
Energy Merchant, through some of our non-regulated subsidiaries, actively markets physical natural gas and actively trades derivative commodity instruments which are usually settled in cash including: forwards, futures, swaps, and options. The aggregated VaR amounts associated with these other trading and hedging activities were slightly more than one million dollars as of December 31, 2001, and less than one million dollars at December 31, 2000. On a one-day basis as of December 31, 2001, the VaR for the gas trading activity was less than 1% of 2001 consolidated operating income and as of December 31, 2000, was less than 1% of 2000 consolidated operating income. On a one-day basis at the end of each quarter, the VaR for the gas trading activity was less than 1% of consolidated operating income in 2001, and less than 1% in 2000. The daily VaR for gas trading portfolio as of December 31, 2000, was less than 1% of 2001 consolidated operating income and as of December 31, 1999, was also less than 1% of 2000 consolidated operating income. The VaR is calculated using a variance-covariance methodology and historical volatilities and correlations over the past 21-day period with a 95% confidence interval and a one-day holding period.
56
The changes in fair value of the energy risk management assets and liabilities for the year ended December 31, 2001, are presented in the table below:
Change in Fair Value for the Year Ended
December 31, 2001
(in millions)
| Fair value of contracts outstanding at the beginning of the period | $ | (78 | ) | ||
| Fair value of new contracts when entered into during the period: | |||||
| Options(1) | 15 | ||||
| Other trading instruments | 29 | ||||
| Changes in fair value attributable to changes in valuation techniques and assumptions | 10 | ||||
| Other changes in fair value | 53 | ||||
| Less: Contracts realized or otherwise settled during the period | 11 | ||||
| Fair value of contracts outstanding at the end of the period | $ | 18 | |||
- (1)
- Represents net option premiums paid.
The following table presents the expected maturity of the energy risk management assets and liabilities as of December 31, 2001:
| | Fair Value of Contracts at December 31, 2001 | |||||||||||||||
|---|---|---|---|---|---|---|---|---|---|---|---|---|---|---|---|---|
| | Maturing | | ||||||||||||||
| Source of Fair Value(1) | Total Fair Value | |||||||||||||||
| 2002 | 2003-2004 | 2005-2006 | Thereafter | |||||||||||||
| | (in millions) | |||||||||||||||
| Prices actively quoted | $ | 14 | $ | (27 | ) | $ | — | $ | — | $ | (13 | ) | ||||
| Prices based on models and other valuation methods | 6 | 6 | 10 | 9 | 31 | |||||||||||
| Total | $ | 20 | $ | (21 | ) | $ | 10 | $ | 9 | $ | 18 | |||||
- (1)
- Active quotes are considered to be available for two years for standard electricity transactions and three years for standard gas transactions. Non-standard transactions are classified based on the extent, if any, of modeling used in determining fair value.
Credit risk is the exposure to economic loss that would occur as a result of nonperformance by counterparties, pursuant to the terms of their contractual obligations. Specific components of credit risk include counterparty default risk, collateral risk, concentration risk, and settlement risk.
Trade Receivables and Physical Power Portfolio
Our concentration of credit risk with respect to trade accounts receivable from electric and gas retail customers is limited. The large number of customers and diversified customer base of residential, commercial, and industrial customers significantly reduces our credit risk. Contracts within the physical portfolio of power marketing and trading operations are primarily with the traditional electric cooperatives and municipalities and other investor-owned utilities. At December 31, 2001, we do not believe we had significant exposure to credit risk with our trade accounts receivable or our physical portfolio.
57
Energy Trading
Cinergy'sextension of credit for energy marketing and trading is governed by a Corporate Credit Policy. Written guidelines document the management approval levels for credit limits, evaluation of creditworthiness and credit risk mitigation procedures. Exposures to credit risks are monitored daily by the Corporate Credit Risk function. As of December 31, 2001, approximately 97% of the credit exposure related to energy trading and marketing activity was with counterparties rated Investment Grade or higher. Energy commodity prices can be extremely volatile and the market can, at times, lack liquidity. Because of these issues, credit risk is generally greater than with other commodity trading.
In December 2001, Enron filed for protection under Chapter 11 of the U.S. Bankruptcy Code in the Southern District of New York. We decreased our trading activities with Enron in the months prior to its bankruptcy filing. We intend to resolve any contract differences pursuant to the terms of those contracts, business practices and the applicable provisions of the Bankruptcy Code, as approved by the court. While we cannot predict the court's resolution of these matters, we do not believe that any exposure relating to those contracts would have a material impact on our financial position or results of operations. While most of our contracts with Enron were considered trading and thus recorded at fair value, a few contracts were accounted for utilizing the normal exemption under Statement of Financial Accounting Standards No. 133,Accounting for Derivatives Instruments and Hedging Activities(Statement 133) (see Note 1(k) of the "Notes to Financial Statements" in "Item 8. Financial Statements and Supplementary Data"). These contracts were recognized at fair value when the contracts were terminated in the fourth quarter of 2001. Fair value for these contracts, and all terminated contracts with Enron, is governed by the provisions of each contract, but typically approximates fair value at contract termination. However, the effect of the loss of Enron's participation in the energy markets on long-term liquidity and price volatility, or on the creditworthiness of common counterparties cannot be determined. We continually review and monitor our credit exposure to all counterparties and adjust the fair value of our position, as appropriate.
Financial Derivatives
Potential exposure to credit risk also exists from our use of financial derivatives such as currency swaps, foreign exchange forward contracts, and interest rate swaps. Because these financial instruments are transacted only with highly rated financial institutions, we do not anticipate nonperformance by any of the counterparties.
We manage, on a portfolio basis, the market risks in our energy marketing and trading transactions subject to parameters established by our Risk Policy Committee. Our market and credit risks are monitored by the Corporate Risk Management function to ensure compliance with stated risk management policies and procedures. The Corporate Risk Management function operates independently from the business units and other corporate functions, which originate and actively manage the market and credit risk exposures. Policies and procedures are periodically reviewed and monitored to ensure their responsiveness to changing market and business conditions. In addition, efforts are ongoing to develop systems to improve the timeliness and quality of market and credit risk information. Credit risk mitigation practices include requiring parent company guarantees, various forms of collateral, and the use of mutual netting/closeout agreements.
From time to time, we may utilize foreign exchange forward contracts and currency swaps to hedge foreign currency denominated purchase and sale commitments and certain of our net investments in
58
foreign operations. These contracts and swaps allow us to potentially hedge our position against currency exchange rate fluctuations and would qualify as derivatives.
Cinergyhas exposure to fluctuations in exchange rates between the U.S. dollar and the currencies of foreign countries where we have investments. When it is appropriate we will hedge our exposure to cash flow transactions, such as a dividend payment by one of our foreign subsidiaries. As of December 31, 2001, we had no outstanding foreign currency derivatives.
Our net exposure to changes in interest rates consists of short-term debt instruments (including netNotes receivable from/Notes payable to affiliated companies), pollution control debt, and sales of accounts receivable. The following table reflects the different instruments used and the method of benchmarking interest rates, as of December 31, 2001, and 2000:
| | Interest Benchmark | 2001 | 2000 | |||||||
|---|---|---|---|---|---|---|---|---|---|---|
| | | | (in millions) | |||||||
| Short-term Bank Loans/Commercial Paper | • Short-term Money Market • LIBOR(1) | Cinergy CG&E PSI ULH&P | $ | 877 445 43 26 | $ | 862 152 239 29 | ||||
Pollution Control Debt | • Daily Market • Auction Rate | Cinergy CG&E PSI | 279 196 83 | 267 184 83 | ||||||
Sales of Accounts Receivable | • Short-term Money Market | Cinergy CG&E PSI ULH&P | 257 150 107 22 | 257 156 101 26 | ||||||
Variable Rate Capital Leases | • LIBOR(1) | Cinergy CG&E | — — | 31 31 | ||||||
- (1)
- London Inter-Bank Offered Rate (LIBOR)
The weighted-average interest rates on the above instruments at December 31, 2001, and 2000, were as follows:
| | 2001 | 2000 | ||
|---|---|---|---|---|
| Short-term Bank Loans/Commercial Paper | 2.9% | 7.0% | ||
| Pollution Control Debt | 2.1% | 4.5% | ||
| Sales of Accounts Receivable | 2.4% | 7.0% | ||
| Variable Rate Capital Leases | — | 7.5% |
At December 31, 2001, forward yield curves project an increase in applicable short-term interest rates over the next five years.
59
The following table presents principal cash repayments, by maturity date and other selected information, for each registrant's long-term fixed-rate debt, other debt, and capital lease obligations as of December 31, 2001:
| | Expected Maturity Date | ||||||||||||||||||||||||
|---|---|---|---|---|---|---|---|---|---|---|---|---|---|---|---|---|---|---|---|---|---|---|---|---|---|
| Liabilities | 2002 | 2003 | 2004 | 2005 | 2006 | Thereafter | Total | Fair Value | |||||||||||||||||
| | (in millions) | ||||||||||||||||||||||||
| Cinergy | |||||||||||||||||||||||||
| Long-term Debt(1) | $ | 123 | $ | 178 | (4) | $ | 811 | $ | 201 | (5)(6) | $ | 328 | $ | 1,823 | $ | 3,464 | $ | 3,520 | |||||||
| Weighted-average interest rate(2) | 7.3 | % | 6.2 | % | 6.2 | % | 6.8 | % | 6.7 | % | 6.9 | % | 6.7 | % | |||||||||||
Other(3) | $ | 25 | $ | 14 | $ | 3 | $ | 2 | $ | 6 | $ | 242 | $ | 292 | $ | 285 | |||||||||
| Weighted-average interest rate(2) | 6.8 | % | 6.7 | % | 6.6 | % | 5.5 | % | 5.0 | % | 6.4 | % | 6.4 | % | |||||||||||
Capital Leases | |||||||||||||||||||||||||
| Fixed-rate leases | $ | 2.8 | $ | 3.0 | $ | 3.1 | $ | 3.3 | $ | 3.6 | $ | 19.1 | $ | 34.9 | $ | 34.9 | |||||||||
| Interest rate | 6.2 | % | 6.2 | % | 6.2 | % | 6.2 | % | 6.2 | % | 6.2 | % | 6.2 | % | |||||||||||
| CG&Eand subsidiaries | |||||||||||||||||||||||||
| Long-term Debt(1) | $ | 100 | $ | 120 | (4) | $ | 110 | $ | 150 | (6) | $ | — | $ | 728 | $ | 1,208 | $ | 1,214 | |||||||
| Weighted-average interest rate(2) | 7.3 | % | 6.3 | % | 6.5 | % | 6.9 | % | — | 7.0 | % | 6.9 | % | ||||||||||||
Capital Leases | |||||||||||||||||||||||||
| Fixed-rate leases | $ | 1.5 | $ | 1.6 | $ | 1.7 | $ | 1.9 | $ | 2.0 | $ | 10.8 | $ | 19.5 | $ | 19.5 | |||||||||
| Interest rate | 6.2 | % | 6.2 | % | 6.2 | % | 6.2 | % | 6.2 | % | 6.2 | % | 6.2 | % | |||||||||||
| PSI | |||||||||||||||||||||||||
| Long-term Debt(1) | $ | 23 | $ | 58 | $ | 1 | $ | 51 | (5) | $ | 328 | $ | 895 | $ | 1,356 | $ | 1,379 | ||||||||
| Weighted-average interest rate(2) | 7.6 | % | 5.9 | % | 6.0 | % | 6.5 | % | 6.7 | % | 7.1 | % | 6.9 | % | |||||||||||
Capital Leases | |||||||||||||||||||||||||
| Fixed-rate leases | $ | 1.3 | $ | 1.3 | $ | 1.4 | $ | 1.5 | $ | 1.6 | $ | 8.4 | $ | 15.5 | $ | 15.5 | |||||||||
| Interest rate | 6.2 | % | 6.2 | % | 6.2 | % | 6.2 | % | 6.2 | % | 6.2 | % | 6.2 | % | |||||||||||
| ULH&P | |||||||||||||||||||||||||
| Long-term Debt(1) | $ | — | $ | 20 | $ | — | $ | — | $ | — | $ | 55 | $ | 75 | $ | 76 | |||||||||
| Weighted-average interest rate(2) | — | 6.1 | % | — | — | — | 7.3 | % | 7.0 | % | |||||||||||||||
Capital Leases | |||||||||||||||||||||||||
| Fixed-rate leases | $ | 0.5 | $ | 0.5 | $ | 0.5 | $ | 0.5 | $ | 0.6 | $ | 3.2 | $ | 5.8 | $ | 5.8 | |||||||||
| Interest rate | 6.2 | % | 6.2 | % | 6.2 | % | 6.2 | % | 6.2 | % | 6.2 | % | 6.2 | % | |||||||||||
- (1)
- All long-term debt is fixed-rate and includes amounts reflected as long-term debt due within one year.
- (2)
- The weighted-average interest rate is calculated as follows: (1) for long-term debt obligations, the weighted-average interest rate is based on the coupon rates of the debt that is maturing in the year reported; (2) for the fixed-rate capital leases, the interest rate is fixed at approximately 6.2% with an amortizing principal structure; and (3) for the Global Resources investments, the interest rate is based on a spread over 6- and 12-month LIBOR.
- (3)
- Variable rate debt related to investments under Global Resources.
- (4)
- Includes 6.35% Debentures due June 15, 2038, reflected as maturing in 2003, as the interest rate resets on June 15, 2003.
- (5)
- Includes 6.50% Debentures due August 1, 2026, reflected as maturing in 2005, as the interest rate resets on August 1, 2005.
- (6)
- Includes 6.90% Debentures due June 1, 2025, reflected as maturing in 2005, as the debentures are putable toCG&Eat the option of the holders on June 1, 2005.
Our current policy in managing exposure to fluctuations in interest rates is to maintain the total amount of outstanding debt in floating interest rate debt instruments of approximately 30%. In maintaining this level of exposure, we use interest rate swaps. Under these swaps, we agree with other parties to exchange, at specified intervals, the difference between fixed-rate and floating-rate interest amounts calculated on an agreed notional amount.CG&E has an outstanding interest rate swap agreement that decreased the percentage of floating-rate debt. Under the provisions of the swap, which has a notional amount of $100 million,CG&E pays a fixed-rate and receives a floating-rate through October 2007. This swap qualifies as a cash flow hedge under the provisions of Statement 133. As the terms of the swap agreement mirror the terms of the debt agreement that it is hedging, we anticipate
60
that this swap will continue to be effective as a hedge. Changes in fair value of this swap are recorded inAccumulated other comprehensive income (loss), beginning with our adoption of Statement 133 on January 1, 2001. In October 2001,Cinergy Corp. executed three interest rate swaps with a combined notional amount of $250 million. Under the provisions of the swaps,Cinergy Corp. will receive fixed-rate interest payments and pay floating-rate interest payments through September 2004. These swaps qualify as fair value hedges under the provisions of Statement 133. We anticipate that these swaps will continue to be effective as hedges. See Note 1(l) of the "Notes to Financial Statements" in "Item 8. Financial Statements and Supplementary Data" for additional information on financial derivatives. In the future, we will continually monitor market conditions to evaluate whether to modify our level of exposure to fluctuations in interest rates.
We believe that the recent inflation rates do not materially impact our financial condition. However, under existing regulatory practice for all ofPSI,ULH&P, and the non-generating portion ofCG&E, only the historical cost of plant is recoverable from customers. As a result, cash flows designed to provide recovery of historical plant costs may not be adequate to replace plant in future years.
Fair Value Accounting for Energy Marketing and Trading
We use fair value accounting for energy trading contracts, which is required, with certain exceptions, by Statement 133 and Emerging Issues Task Force (EITF) 98-10,Accounting for Contracts Involved in Energy Trading and Risk Management Activities. Most of the contracts used in our trading activities are short-term in nature and are priced using exchange based or over-the-counter price quotes. Long-term contracts typically must be valued using model pricing due to the lack of actively quoted prices. The period for which actively quoted prices are available varies by commodity and pricing point, but is generally shorter for electricity than gas. Use of model pricing requires estimation surrounding factors such as volatility and future price expectations beyond the actively quoted portion of the price curve. In addition, some contracts do not have fixed notional amounts and therefore must be valued using estimates of volumes to be consumed by the counterparty.
We attempt to mitigate these risks by using complex valuation tools, both external and proprietary, which allow us to model prices for periods for which active quotes are unavailable. These models are dynamic and are constantly updated with the most recent data to improve estimates of future expectations. We attempt to mitigate risks for contracts that do not contain fixed notional amounts by obtaining historical data and projecting expected consumption. These models incorporate expectations surrounding the impacts that weather may play in future consumption. We also have a Corporate Risk Management function withinCinergy that is independent of the marketing and trading function and is under the oversight of a risk policy committee comprised primarily of senior company executives. This group's function is to provide an independent evaluation of both forward price curves and the valuation of energy contracts.
There is inherent risk in valuation modeling given the complexity and volatility of energy markets. Fair value accounting has risk, including its application to short-term contracts, as gains and losses recorded through its use are not yet realized. Therefore, it is possible that results in future periods may be materially different as contracts are ultimately settled.
61
Retail Customer Revenue Recognition
Our retail revenues include amounts that are not yet billed to customers. Customers are billed throughout the month as both gas and electric meters are read. We recognize revenues for retail energy sales that have not yet been billed, but where gas or electricity has been consumed. This is termed "unbilled revenue" and is a widely recognized and accepted practice for utilities. In making our estimates of unbilled revenue, we must estimate the effect of weather on consumption. We use complex systems that consider various factors, including weather, in estimation of retail customer consumption at the end of each month. Given the use of these systems and the fact that customers are billed monthly, we believe it is unlikely that materially different results will occur in future periods when revenue is billed.
Business Combinations and Intangible Assets
In June 2001, the Financial Accounting Standards Board (FASB) issued Statement of Financial Accounting Standards No. 141,Business Combinations(Statement 141), and No. 142,Goodwill and Other Intangible Assets (Statement 142). Statement 141 requires all business combinations initiated after June 30, 2001, to be accounted for using the purchase method. With the adoption of Statement 142, goodwill and other intangibles with indefinite lives will no longer be subject to amortization. Goodwill will be initially assessed for impairment shortly after adoption and at least annually thereafter by applying a fair-value-based test, as opposed to the undiscounted cash flow test applied under current accounting standards. This test must be applied at the "reporting unit" level, which is not permitted to be broader than the current business segments discussed in Note 16 of the "Notes to Financial Statements" in "Item 8. Financial Statements and Supplementary Data". Under Statement 142, an acquired intangible asset should be separately recognized if the benefit of the intangible asset is obtained through contractual or other legal rights, or if the intangible asset can be sold, transferred, licensed, rented, or exchanged, regardless of the acquirer's intent to do so. We began applying Statement 141 in the third quarter of 2001 and we will adopt Statement 142 in the first quarter of 2002. The discontinuance of amortization of goodwill beginning in the first quarter of 2002 will not be material to our results of operations. We have identified the reporting units forCinergy and are in the process of performing the initial impairment test. Preliminary estimates indicate that the effects of this test will not be material to our results of operations.
In July 2001, the FASB issued Statement of Financial Accounting Standards No. 143,Accounting for Asset Retirement Obligations (Statement 143). Statement 143 requires fair value recognition of legal obligations to retire long-lived assets at the time such obligations are incurred. The initial recognition of this liability will be accompanied by a corresponding increase in property, plant, and equipment. Subsequent to the initial recognition, the liability will be adjusted for any revisions to the expected cash flows of the retirement obligation (with corresponding adjustments to property, plant, and equipment), and for accretion of the liability due to the passage of time (recognized as an operation expense). Additional depreciation expense will be recorded prospectively for any property, plant, and equipment increases. We currently accrue costs of removal on many regulated, long-lived assets through depreciation expense, with a corresponding charge to accumulated depreciation, as allowed by each regulatory jurisdiction. For assets that we conclude have a retirement obligation under Statement 143, the accounting we currently use will be modified to comply with this standard. We will adopt Statement 143 in the first quarter of 2003. We are beginning to analyze the impact of this statement, but, at this time, we are unable to predict whether the implementation of this accounting standard will be material to our financial position or results of operations.
62
During 1998, the FASB issued Statement 133. This standard was effective forCinergy beginning in 2001, and requires us to record derivative instruments which are not exempt under certain provisions of Statement 133 as assets or liabilities, measured at fair value (i.e., mark-to-market). Our financial statements reflect the adoption of Statement 133 in the first quarter of 2001. Since many of our derivatives were previously required to use mark-to-market accounting, the effects of implementation were not material.
Our adoption did not reflect the potential impact of applying mark-to-market accounting to selected electricity options and capacity contracts. We had not historically marked these instruments to market because they are intended as either hedges of peak period exposure or sales contracts served with physical generation, neither of which were considered trading activities. At adoption, we classified these contracts as normal purchases or sales based on our interpretation of Statement 133 and in the absence of definitive guidance on such contracts. In June 2001, the FASB staff issued guidance on the application of the normal purchases and sales exemption to electricity contracts containing characteristics of options. While much of the criteria this guidance requires is consistent with the existing guidance in Statement 133, some criteria were added. We adopted the new guidance in the third quarter of 2001, and the effects of implementation for these contracts were not material. We will continue to apply this guidance to any new electricity contracts that meet the definition of a derivative.
In October 2001, the FASB staff posted revised guidance on the normal purchases and sales exemption for these contracts. This revised guidance proposed changes in certain quantitative criteria that were critical to determining whether or not a contract with option characteristics qualified for the normal exemption. In December 2001, the FASB staff again revised this guidance to make the changes proposed by the October guidance more qualitative than quantitative. This new guidance uses several factors to distinguish between capacity contracts, which qualify for the normal purchases and sales exemption, and options, which do not. These factors include deal tenor, pricing structure, specification of the source of power, and various other factors. Based on a review of existing contracts, we do not believe this revised guidance, which will be effective in the third quarter of 2002, will have a material impact on our financial position or results of operations upon adoption. However, given our activity in energy trading, it could increase volatility in future results.
In October 2001, the FASB staff released final guidance on the applicability of the normal purchases and sales exemption to contracts that contain a minimum quantity (a forward component) and flexibility to take additional quantity (an option component). While this guidance was issued primarily to address optionality in fuel supply contracts, it is applicable to all derivatives (subject to certain exceptions for capacity contracts in electricity discussed in the previous paragraphs). This guidance concludes that such contracts are not eligible for the normal purchases and sales exemption due to the existence of optionality in the contract.Cinergy has certain contracts that contain optionality, primarily coal contracts, for which the accounting may be impacted by this new guidance. We will adopt this guidance in the second quarter of 2002, consistent with the transition provisions. We have begun analyzing contracts to determine the applicability of this guidance and to determine the interaction between this guidance and Statement 71. Due to a lack of liquidity with respect to coal purchased under certain contracts, some of our contracts may fail to meet the net settlement criteria of Statement 133, which would preclude such contracts from being considered derivatives. For other possibly affected contracts, we are evaluating the potential for contract restructuring prior to the adoption of this new guidance. To the extent this restructuring results in separate forwards and options, we would plan to apply the normal exemption to the forwards. The options would either be accounted for as cash flow hedges, to the extent all criteria were met, or marked to market similar to all other energy trading contracts. Given these evaluations are ongoing, we are unable to predict whether the implementation of this accounting standard will be material to our results of operations or financial position.
63
In August 2001, the FASB issued Statement of Financial Accounting Standards No. 144,Accounting for the Impairment of Long-Lived Assets (Statement 144). Statement 144 addresses accounting and reporting for the impairment or disposal of long-lived assets. It supersedes previous guidance on (a) accounting for the impairment or disposal of long-lived assets and (b) accounting and reporting for the disposal of a segment of a business (commonly known as discontinued operations). While Statement 144 incorporates many of the impairment tests and criteria from previous guidance, it does include additional guidance and resolution of inconsistencies and overlaps with other pronouncements. These include adding clarity around when assets are considered held for disposal (which requires an immediate impairment charge if fair value is less than book value) and requiring the use of one accounting model for long-lived assets to be disposed of. We will begin applying Statement 144 in the first quarter of 2002. The impact of implementation on our results of operations and financial position is expected to be immaterial.
On September 11, 2001, the U.S. experienced terrorists' attacks which resulted in significant loss of life and property. As a result of this tragedy, insurers generally re-evaluated coverage limitations and premium levels. WhileCinergy is anticipating increases in its current premiums, we do not expect a material change in the availability of coverage. Management does not believe potential premium increases will be material to our results of operations.
ITEM 7A. QUANTITATIVE AND QUALITATIVE DISCLOSURES ABOUT MARKET RISK
Reference is made to the "Market Risk Sensitive Instruments and Positions" section of "Item 7. Management's Discussion and Analysis of Financial Condition and Results of Operations".
64
INDEX TO FINANCIAL STATEMENTS AND FINANCIAL STATEMENT SCHEDULES
| | Page Number | |||
|---|---|---|---|---|
| FINANCIAL STATEMENTS | ||||
Report of Independent Public Accountants | 66 | |||
Cinergy Corp. and Subsidiaries | ||||
| Consolidated Statements of Income for the three years ended December 31, 2001 | 68 | |||
| Consolidated Balance Sheets at December 31, 2001 and 2000 | 69 | |||
| Consolidated Statements of Changes in Common Stock Equity for the three years ended December 31, 2001 | 71 | |||
| Consolidated Statements of Cash Flows for the three years ended December 31, 2001 | 72 | |||
The Cincinnati Gas & Electric Company and Subsidiaries | ||||
| Consolidated Statements of Income for the three years ended December 31, 2001 | 74 | |||
| Consolidated Balance Sheets at December 31, 2001 and 2000 | 75 | |||
| Consolidated Statements of Changes in Common Stock Equity for the three years ended December 31, 2001 | 77 | |||
| Consolidated Statements of Cash Flows for the three years ended December 31, 2001 | 78 | |||
| Consolidated Statements of Capitalization at December 31, 2001, and 2000 | 79 | |||
PSI Energy, Inc. and Subsidiary | ||||
| Consolidated Statements of Income for the three years ended December 31, 2001 | 82 | |||
| Consolidated Balance Sheets at December 31, 2001 and 2000 | 83 | |||
| Consolidated Statements of Changes in Common Stock Equity for the three years ended December 31, 2001 | 85 | |||
| Consolidated Statements of Cash Flows for the three years ended December 31, 2001 | 86 | |||
| Consolidated Statements of Capitalization at December 31, 2001, and 2000 | 87 | |||
The Union Light, Heat and Power Company | ||||
| Statements of Income for the three years ended December 31, 2001 | 90 | |||
| Balance Sheets at December 31, 2001 and 2000 | 91 | |||
| Statements of Changes in Common Stock Equity for the three years ended December 31, 2001 | 93 | |||
| Statements of Cash Flows for the three years ended December 31, 2001 | 94 | |||
| Statements of Capitalization at December 31, 2001, and 2000 | 95 | |||
Notes to Financial Statements | 96 | |||
FINANCIAL STATEMENT SCHEDULES | ||||
| Schedule II—Valuation and Qualifying Accounts | ||||
| Cinergy | 162 | |||
| CG&E | 163 | |||
| PSI | 164 | |||
| ULH&P | 165 | |||
The information required to be submitted in schedules other than those indicated above has been included in the Balance Sheets, the Statements of Income, related schedules, the notes thereto, or omitted as not required by the Rules of Regulation S-X.
65
ITEM 8. FINANCIAL STATEMENTS AND SUPPLEMENTARY DATA
REPORT OF INDEPENDENT PUBLIC ACCOUNTANTS
To the Board of Directors of Cinergy Corp., The Cincinnati Gas & Electric Company, PSI Energy, Inc., and The Union Light, Heat and Power Company:
We have audited the financial statements of Cinergy Corp. (a Delaware Corporation), The Cincinnati Gas & Electric Company (an Ohio Corporation), PSI Energy, Inc. (an Indiana Corporation) and The Union Light, Heat and Power Company (a Kentucky Corporation), as of December 31, 2001 and 2000, and each of the three years in the period ended December 31, 2001, as listed in the Index to Financial Statements and Financial Statement Schedules. These financial statements and the schedules referred to below are the responsibility of the Company's management. Our responsibility is to express an opinion on these financial statements based on our audits.
We conducted our audits in accordance with auditing standards generally accepted in the United States. Those standards require that we plan and perform the audit to obtain reasonable assurance about whether the financial statements are free of material misstatement. An audit includes examining, on a test basis, evidence supporting the amounts and disclosures in the financial statements. An audit also includes assessing the accounting principles used and significant estimates made by management, as well as evaluating the overall financial statement presentation. We believe that our audits provide a reasonable basis for our opinion.
In our opinion, the financial statements referred to above present fairly, in all material respects, the financial position of Cinergy Corp., The Cincinnati Gas & Electric Company, PSI Energy, Inc., and The Union Light, Heat and Power Company as of December 31, 2001 and 2000, and the results of their operations and their cash flows for each of the three years in the period ended December 31, 2001, in conformity with accounting principles generally accepted in the United States.
Our audits were made for the purpose of forming an opinion on the basic financial statements taken as a whole. The schedules listed in the Index to Financial Statements and Financial Statement Schedules pursuant to Item 14, are presented for purposes of complying with the Securities and Exchange Commission's Rules of 1934 and are not part of the basic financial statements. The schedules have been subjected to the auditing procedures applied in our audits of the basic financial statements and, in our opinion, fairly state in all material respects the financial data required to be set forth therein in relation to the basic financial statements taken as a whole.
Arthur Andersen LLP
Cincinnati, Ohio
January 24, 2002
66
CINERGY CORP.
AND SUBSIDIARY COMPANIES
67
CINERGY CORP.
CONSOLIDATED STATEMENTS OF INCOME
| | 2001 | 2000 | 1999 | |||||||||
|---|---|---|---|---|---|---|---|---|---|---|---|---|
| | (dollars in thousands, except per share amounts) | |||||||||||
| Operating Revenues | ||||||||||||
| Electric | $ | 8,181,233 | $ | 5,384,082 | $ | 4,312,899 | ||||||
| Gas | 4,662,916 | 2,941,753 | 1,596,146 | |||||||||
| Other | 78,388 | 96,129 | 28,843 | |||||||||
| Total Operating Revenues | 12,922,537 | 8,421,964 | 5,937,888 | |||||||||
| Operating Expenses | ||||||||||||
| Fuel and purchased and exchanged power | 5,910,959 | 3,154,213 | 2,260,297 | |||||||||
| Gas purchased | 4,431,899 | 2,674,449 | 1,383,993 | |||||||||
| Operation and maintenance | 1,032,031 | 1,119,379 | 1,011,606 | |||||||||
| Depreciation | 378,140 | 343,949 | 323,268 | |||||||||
| Taxes other than income taxes | 227,652 | 268,346 | 265,501 | |||||||||
| Total Operating Expenses | 11,980,681 | 7,560,336 | 5,244,665 | |||||||||
| Operating Income | 941,856 | 861,628 | 693,223 | |||||||||
| Equity in Earnings (Losses) of Unconsolidated Subsidiaries | 2,266 | 5,048 | 58,021 | |||||||||
| Gain on Sale of Investment in Unconsolidated Subsidiary(Note 11) | — | — | 99,272 | |||||||||
| Miscellaneous — Net | 26,290 | 13,391 | 2,031 | |||||||||
| Interest | 268,127 | 224,459 | 234,778 | |||||||||
| Preferred Dividend Requirement of Subsidiary Trust(Note 4) | 1,067 | — | — | |||||||||
| Income Before Taxes | 701,218 | 655,608 | 617,769 | |||||||||
| Income Taxes(Note 12) | 255,506 | 251,557 | 208,671 | |||||||||
| Preferred Dividend Requirements of Subsidiaries | 3,433 | 4,585 | 5,457 | |||||||||
| Net Income | $ | 442,279 | $ | 399,466 | $ | 403,641 | ||||||
| Average Common Shares Outstanding | 159,110 | 158,938 | 158,863 | |||||||||
| Earnings Per Common Share(Note 17) | ||||||||||||
| Net Income | $ | 2.78 | $ | 2.51 | $ | 2.54 | ||||||
| Earnings Per Common Share — Assuming Dilution(Note 17) | ||||||||||||
| Net Income | $ | 2.75 | $ | 2.50 | $ | 2.53 | ||||||
| Dividends Declared Per Common Share | $ | 1.80 | $ | 1.80 | $ | 1.80 | ||||||
The accompanying notes as they relate to Cinergy Corp. are an integral part of these consolidated financial statements.
68
CINERGY CORP.
CONSOLIDATED BALANCE SHEETS
| | December 31 | ||||||||
|---|---|---|---|---|---|---|---|---|---|
| | 2001 | 2000 | |||||||
| | (dollars in thousands) | ||||||||
| ASSETS | |||||||||
| Current Assets | |||||||||
| Cash and cash equivalents | $ | 111,067 | $ | 93,054 | |||||
| Restricted deposits | 8,055 | 4,195 | |||||||
| Notes receivable | 31,173 | 35,945 | |||||||
| Accounts receivable less accumulated provision for doubtful accounts of $35,580 at December 31, 2001, and $29,951 at December 31, 2000 (Note 7) | 1,123,214 | 1,623,402 | |||||||
| Materials, supplies, and fuel — at average cost | 240,812 | 159,340 | |||||||
| Energy risk management current assets (Note 1(k)) | 449,397 | 1,438,233 | |||||||
| Prepayments and other | 110,311 | 116,257 | |||||||
| Total Current Assets | 2,074,029 | 3,470,426 | |||||||
Property, Plant, and Equipment — at Cost | |||||||||
| Utility plant in service | 8,089,961 | 7,681,612 | |||||||
| Construction work in progress | 464,560 | 323,350 | |||||||
| Total Utility Plant | 8,554,521 | 8,004,962 | |||||||
| Non-regulated property, plant, and equipment | 4,527,994 | 3,401,203 | |||||||
| Accumulated depreciation | 4,845,620 | 4,586,089 | |||||||
| Net Property, Plant, and Equipment | 8,236,895 | 6,820,076 | |||||||
Other Assets | |||||||||
| Regulatory assets (Note 1(c)) | 1,015,863 | 976,614 | |||||||
| Investments in unconsolidated subsidiaries | 339,059 | 538,322 | |||||||
| Energy risk management non-current assets (Note 1(k)) | 134,445 | 37,228 | |||||||
| Other investments | 164,155 | 146,986 | |||||||
| Goodwill | 53,587 | 58,997 | |||||||
| Other intangible assets | 22,250 | 18,500 | |||||||
| Other | 259,530 | 262,579 | |||||||
| Total Other Assets | 1,988,889 | 2,039,226 | |||||||
Total Assets | $ | 12,299,813 | $ | 12,329,728 | |||||
The accompanying notes as they relate to Cinergy Corp. are an integral part of these consolidated financial statements.
69
CINERGY CORP.
CONSOLIDATED BALANCE SHEETS
| | December 31 | |||||||||
|---|---|---|---|---|---|---|---|---|---|---|
| | 2001 | 2000 | ||||||||
| | (dollars in thousands) | |||||||||
| LIABILITIES AND SHAREHOLDERS' EQUITY | ||||||||||
| Current Liabilities | ||||||||||
| Accounts payable | $ | 1,029,173 | $ | 1,496,494 | ||||||
| Accrued taxes | 195,976 | 247,006 | ||||||||
| Accrued interest | 56,216 | 47,351 | ||||||||
| Notes payable and other short-term obligations (Note 6) | 1,155,786 | 1,128,657 | ||||||||
| Long-term debt due within one year (Note 5) | 148,431 | 40,545 | ||||||||
| Energy risk management current liabilities (Note 1(k)) | 429,794 | 1,456,375 | ||||||||
| Other | 127,375 | 106,679 | ||||||||
| Total Current Liabilities | 3,142,751 | 4,523,107 | ||||||||
Non-Current Liabilities | ||||||||||
| Long-term debt (Note 5) | 3,596,730 | 2,876,367 | ||||||||
| Deferred income taxes (Note 12) | 1,301,407 | 1,185,968 | ||||||||
| Unamortized investment tax credits | 127,385 | 137,965 | ||||||||
| Accrued pension and other postretirement benefit costs (Note 10) | 438,962 | 404,764 | ||||||||
| Energy risk management non-current liabilities (Note 1(k)) | 135,619 | 97,507 | ||||||||
| Other | 246,340 | 252,255 | ||||||||
| Total Non-Current Liabilities | 5,846,443 | 4,954,826 | ||||||||
Total Liabilities | 8,989,194 | 9,477,933 | ||||||||
Preferred Trust Securities (Note 4) | ||||||||||
| Company obligated, mandatorily redeemable, preferred trust securities of subsidiary, holding solely debt securities of the company | 306,327 | — | ||||||||
Cumulative Preferred Stock of Subsidiaries(Note 3) | ||||||||||
| Not subject to mandatory redemption | 62,833 | 62,834 | ||||||||
Common Stock Equity(Note 2) | ||||||||||
| Common Stock — $.01 par value; authorized shares — 600,000,000; outstanding shares — 159,402,839 at December 31, 2001, and 158,967,661 at December 31, 2000 | 1,594 | 1,590 | ||||||||
| Paid-in capital | 1,619,659 | 1,619,153 | ||||||||
| Retained earnings | 1,337,135 | 1,179,113 | ||||||||
| Accumulated other comprehensive income (loss) (Note 19) | (16,929 | ) | (10,895 | ) | ||||||
| Total Common Stock Equity | 2,941,459 | 2,788,961 | ||||||||
Commitments and Contingencies(Note 13) | ||||||||||
Total Liabilities and Shareholders' Equity | $ | 12,299,813 | $ | 12,329,728 | ||||||
The accompanying notes as they relate to Cinergy Corp. are an integral part of these consolidated financial statements.
70
CINERGY CORP.
CONSOLIDATED STATEMENTS OF CHANGES IN COMMON STOCK EQUITY
| | Common Stock | Paid-in Capital | Retained Earnings | Accumulated Other Comprehensive Income (Loss) | Total Common Stock Equity | |||||||||||||
|---|---|---|---|---|---|---|---|---|---|---|---|---|---|---|---|---|---|---|
| | (dollars in thousands) | |||||||||||||||||
| 1999 | ||||||||||||||||||
| Beginning balance | $ | 1,587 | $ | 1,595,237 | $ | 945,214 | $ | (807 | ) | $ | 2,541,231 | |||||||
| Comprehensive income: | ||||||||||||||||||
| Net income | — | — | 403,641 | — | 403,641 | |||||||||||||
| Other comprehensive income (loss), net of tax effect of $5,289 (Note 19) | ||||||||||||||||||
| Foreign currency translation adjustment | — | — | — | (9,781 | ) | (9,781 | ) | |||||||||||
| Minimum pension liability adjustment | — | — | — | (1,239 | ) | (1,239 | ) | |||||||||||
| Unrealized gain (loss) on investment trusts | — | — | — | 2,086 | 2,086 | |||||||||||||
| Total comprehensive income | — | — | — | — | 394,707 | |||||||||||||
| Issuance of 258,867 shares of common stock — net | 2 | 6,720 | — | — | 6,722 | |||||||||||||
| Treasury shares purchased | — | (233 | ) | — | — | (233 | ) | |||||||||||
| Treasury shares reissued | — | 3,660 | — | — | 3,660 | |||||||||||||
| Dividends on common stock ($1.80 per share) | — | — | (284,545 | ) | — | (284,545 | ) | |||||||||||
| Other | — | (7,830 | ) | 9 | — | (7,821 | ) | |||||||||||
| Ending balance | $ | 1,589 | $ | 1,597,554 | $ | 1,064,319 | $ | (9,741 | ) | $ | 2,653,721 | |||||||
2000 | ||||||||||||||||||
| Comprehensive income: | ||||||||||||||||||
| Net income | — | — | 399,466 | — | 399,466 | |||||||||||||
| Other comprehensive income (loss), net of tax effect of $2,755 (Note 19) | ||||||||||||||||||
| Foreign currency translation adjustment | — | — | — | 2,074 | 2,074 | |||||||||||||
| Minimum pension liability adjustment | — | — | — | (1,099 | ) | (1,099 | ) | |||||||||||
| Unrealized gain (loss) on investment trusts | — | — | — | (2,129 | ) | (2,129 | ) | |||||||||||
| Total comprehensive income | — | — | — | — | 398,312 | |||||||||||||
| Issuance of 44,262 shares of common stock — net | 1 | 1,769 | — | — | 1,770 | |||||||||||||
| Treasury shares purchased | — | (3,969 | ) | — | — | (3,969 | ) | |||||||||||
| Treasury shares reissued | — | 11,008 | — | — | 11,008 | |||||||||||||
| Dividends on common stock ($1.80 per share) | — | — | (285,242 | ) | — | (285,242 | ) | |||||||||||
| Other | — | 12,791 | 570 | — | 13,361 | |||||||||||||
| Ending balance | $ | 1,590 | $ | 1,619,153 | $ | 1,179,113 | $ | (10,895 | ) | $ | 2,788,961 | |||||||
2001 | ||||||||||||||||||
| Comprehensive income: | ||||||||||||||||||
| Net income | — | — | 442,279 | — | 442,279 | |||||||||||||
| Other comprehensive income (loss), net of tax effect of $1,454(Note 19) | ||||||||||||||||||
| Foreign currency translation adjustment | — | — | — | 1,641 | 1,641 | |||||||||||||
| Minimum pension liability adjustment | — | — | — | (1,555 | ) | (1,555 | ) | |||||||||||
| Unrealized gain (loss) on investment trusts | — | — | — | (841 | ) | (841 | ) | |||||||||||
| Cumulative effect of change in accounting principle | — | — | — | (2,500 | ) | (2,500 | ) | |||||||||||
| Cash flow hedges(Note 1(l)) | — | — | — | (2,779 | ) | (2,779 | ) | |||||||||||
| Total comprehensive income | — | — | — | — | 436,245 | |||||||||||||
| Issuance of 435,178 shares of common stock — net | 4 | 9,896 | — | — | 9,900 | |||||||||||||
| Treasury shares purchased | — | (10,015 | ) | — | — | (10,015 | ) | |||||||||||
| Treasury shares reissued | — | 9,157 | — | — | 9,157 | |||||||||||||
| Dividends on common stock($1.80 per share) | — | — | (286,289 | ) | — | (286,289 | ) | |||||||||||
| Stock purchase contracts(Note 4) | — | (23,200 | ) | — | — | (23,200 | ) | |||||||||||
| Other | — | 14,668 | 2,032 | — | 16,700 | |||||||||||||
| Ending balance | $ | 1,594 | $ | 1,619,659 | $ | 1,337,135 | $ | (16,929 | ) | $ | 2,941,459 | |||||||
The accompanying notes as they relate to Cinergy Corp. are an integral part of these consolidated financial statements.
71
CINERGY CORP.
CONSOLIDATED STATEMENTS OF CASH FLOWS
| | 2001 | 2000 | 1999 | |||||||||||
|---|---|---|---|---|---|---|---|---|---|---|---|---|---|---|
| | (dollars in thousands) | |||||||||||||
| Operating Activities | ||||||||||||||
| Net income | $ | 442,279 | $ | 399,466 | $ | 403,641 | ||||||||
| Items providing or (using) cash currently: | ||||||||||||||
| Depreciation | 378,140 | 343,949 | 323,268 | |||||||||||
| Change in net position of energy risk management activities | (96,850 | ) | (22,533 | ) | (47,192 | ) | ||||||||
| Deferred income taxes and investment tax credits — net | 124,577 | 47,404 | 96,067 | |||||||||||
| Gain on sale of investment in unconsolidated subsidiary | — | — | (99,272 | ) | ||||||||||
| Equity in earnings of unconsolidated subsidiaries | (2,266 | ) | (5,048 | ) | (44,904 | ) | ||||||||
| Allowance for equity funds used during construction | (8,628 | ) | (5,813 | ) | (3,633 | ) | ||||||||
| Regulatory assets deferrals | (141,324 | ) | (99,661 | ) | (306,340 | ) | ||||||||
| Regulatory assets amortization | 118,508 | 92,856 | 103,116 | |||||||||||
| Changes in current assets and current liabilities: | ||||||||||||||
| Restricted deposits | (1,409 | ) | (3,567 | ) | 2,959 | |||||||||
| Accounts and notes receivable, net of reserves on receivables sold | 492,183 | (963,309 | ) | (118,561 | ) | |||||||||
| Materials, supplies, and fuel | (81,465 | ) | 46,409 | (3,002 | ) | |||||||||
| Accounts payable | (469,965 | ) | 761,557 | 61,590 | ||||||||||
| Accrued taxes and interest | (42,165 | ) | 25,737 | (11,406 | ) | |||||||||
| Other items — net | (17,203 | ) | 554 | 121,936 | ||||||||||
| Net cash provided by (used in) operating activities | 694,412 | 618,001 | 478,267 | |||||||||||
Financing Activities | ||||||||||||||
| Change in short-term debt | 27,129 | 578,463 | (353,506 | ) | ||||||||||
| Issuance of long-term debt | 940,785 | 126,420 | 829,948 | |||||||||||
| Issuance of preferred trust securities | 306,327 | — | — | |||||||||||
| Redemption of long-term debt | (131,413 | ) | (234,247 | ) | (553,191 | ) | ||||||||
| Retirement of preferred stock of subsidiaries | (1 | ) | (29,393 | ) | (34 | ) | ||||||||
| Issuance of common stock | 9,900 | 1,770 | 6,722 | |||||||||||
| Dividends on common stock | (286,289 | ) | (285,242 | ) | (285,925 | ) | ||||||||
| Net cash provided by (used in) financing activities | 866,438 | 157,771 | (355,986 | ) | ||||||||||
Investing Activities | ||||||||||||||
| Construction expenditures (less allowance for equity funds used during construction) | (846,159 | ) | (514,193 | ) | (434,294 | ) | ||||||||
| Acquisitions and other investments | (696,678 | ) | (250,444 | ) | (396,491 | ) | ||||||||
| Sale of investment in unconsolidated subsidiary | — | — | 690,269 | |||||||||||
| Net cash provided by (used in) investing activities | (1,542,837 | ) | (764,637 | ) | (140,516 | ) | ||||||||
Net increase (decrease) in cash and cash equivalents | 18,013 | 11,135 | (18,235 | ) | ||||||||||
Cash and cash equivalents at beginning of period | 93,054 | 81,919 | 100,154 | |||||||||||
| Cash and cash equivalents at end of period | $ | 111,067 | $ | 93,054 | $ | 81,919 | ||||||||
Supplemental Disclosure of Cash Flow Information | ||||||||||||||
| Cash paid during the year for: | ||||||||||||||
| Interest (net of amount capitalized) | $ | 264,213 | $ | 223,666 | $ | 232,019 | ||||||||
| Income taxes | $ | 153,092 | $ | 216,556 | $ | 130,179 | ||||||||
The accompanying notes as they relate to Cinergy Corp. are an integral part of these consolidated financial statements.
72
THE CINCINNATI GAS & ELECTRIC COMPANY
AND SUBSIDIARY COMPANIES
73
THE CINCINNATI GAS & ELECTRIC COMPANY
CONSOLIDATED STATEMENTS OF INCOME
| | 2001 | 2000 | 1999 | ||||||||||
|---|---|---|---|---|---|---|---|---|---|---|---|---|---|
| | (dollars in thousands) | ||||||||||||
| Operating Revenues | |||||||||||||
| Electric | $ | 4,097,347 | $ | 2,738,775 | $ | 2,174,861 | |||||||
| Gas | 596,429 | 490,972 | 376,013 | ||||||||||
| Total Operating Revenues | 4,693,776 | 3,229,747 | 2,550,874 | ||||||||||
Operating Expenses | |||||||||||||
| Fuel and purchased and exchanged power | 2,881,962 | 1,554,959 | 1,066,490 | ||||||||||
| Gas purchased | 396,764 | 266,339 | 171,997 | ||||||||||
| Operation and maintenance | 442,173 | 491,545 | 445,737 | ||||||||||
| Depreciation | 186,986 | 180,978 | 174,988 | ||||||||||
| Taxes other than income taxes | 174,320 | 208,385 | 212,193 | ||||||||||
| Total Operating Expenses | 4,082,205 | 2,702,206 | 2,071,405 | ||||||||||
Operating Income | 611,571 | 527,541 | 479,469 | ||||||||||
Miscellaneous — Net | 4,657 | (2,119 | ) | (2,480 | ) | ||||||||
| Interest | 103,047 | 99,204 | 99,737 | ||||||||||
Income Before Taxes | 513,181 | 426,218 | 377,252 | ||||||||||
Income Taxes (Note 12) | 186,527 | 159,398 | 143,676 | ||||||||||
Net Income | $ | 326,654 | $ | 266,820 | $ | 233,576 | |||||||
Preferred Dividend Requirement | 846 | 847 | 856 | ||||||||||
Net Income Applicable to Common Stock | $ | 325,808 | $ | 265,973 | $ | 232,720 | |||||||
The accompanying notes as they relate to The Cincinnati Gas & Electric Company are an integral part of these consolidated financial statements.
74
THE CINCINNATI GAS & ELECTRIC COMPANY
CONSOLIDATED BALANCE SHEETS
| | December 31 | |||||||||
|---|---|---|---|---|---|---|---|---|---|---|
| | 2001 | 2000 | ||||||||
| | (dollars in thousands) | |||||||||
| ASSETS | ||||||||||
| Current Assets | ||||||||||
| Cash and cash equivalents | $ | 9,074 | $ | 20,637 | ||||||
| Restricted deposits | 3,540 | 160 | ||||||||
| Notes receivable from affiliated companies | — | 91,732 | ||||||||
| Accounts receivable less accumulated provision for doubtful accounts of $25,874 at December 31, 2001, and $19,044 at December 31, 2000 (Note 7) | 332,970 | 494,501 | ||||||||
| Accounts receivable from affiliated companies | 12,112 | 26,743 | ||||||||
| Materials, supplies, and fuel — at average cost | 138,119 | 99,061 | ||||||||
| Energy risk management current assets (Note 1(k)) | 44,360 | 697,488 | ||||||||
| Prepayments and other | 13,087 | 39,320 | ||||||||
| Total Current Assets | 553,262 | 1,469,642 | ||||||||
Property, Plant, and Equipment — at Cost | ||||||||||
| Utility plant in service | ||||||||||
| Electric | 2,000,595 | 1,905,795 | ||||||||
| Gas | 926,381 | 865,303 | ||||||||
| Common | 253,978 | 211,424 | ||||||||
| Total Utility Plant In Service | 3,180,954 | 2,982,522 | ||||||||
| Construction work in progress | 96,247 | 132,577 | ||||||||
| Total Utility Plant | 3,277,201 | 3,115,099 | ||||||||
| Non-regulated property, plant, and equipment | 3,314,285 | 3,181,076 | ||||||||
| Accumulated depreciation | 2,555,639 | 2,444,867 | ||||||||
| Net Property, Plant, and Equipment | 4,035,847 | 3,851,308 | ||||||||
Other Assets | ||||||||||
| Regulatory assets (Note 1(c)) | 592,491 | 502,328 | ||||||||
| Energy risk management non-current assets (Note 1(k)) | 48,982 | 7,000 | ||||||||
| Other | 129,162 | 156,692 | ||||||||
| Total Other Assets | 770,635 | 666,020 | ||||||||
Total Assets | $ | 5,359,744 | $ | 5,986,970 | ||||||
The accompanying notes as they relate to The Cincinnati Gas & Electric Company are an integral part of these consolidated financial statements.
75
THE CINCINNATI GAS & ELECTRIC COMPANY
CONSOLIDATED BALANCE SHEETS
| | December 31 | ||||||||||
|---|---|---|---|---|---|---|---|---|---|---|---|
| | 2001 | 2000 | |||||||||
| | (dollars in thousands) | ||||||||||
| LIABILITIES AND SHAREHOLDER'S EQUITY | |||||||||||
| Current Liabilities | |||||||||||
| Accounts payable | $ | 352,450 | $ | 543,006 | |||||||
| Accounts payable to affiliated companies | 30,419 | 23,927 | |||||||||
| Accrued taxes | 116,616 | 152,750 | |||||||||
| Accrued interest | 16,570 | 17,645 | |||||||||
| Notes payable and other short-term obligations (Note 6) | 196,100 | 264,000 | |||||||||
| Notes payable to affiliated companies | 444,801 | 163,478 | |||||||||
| Long-term debt due within one year (Note 5) | 100,000 | 1,200 | |||||||||
| Energy risk management current liabilities (Note 1(k)) | 23,341 | 717,902 | |||||||||
| Other | 33,217 | 37,603 | |||||||||
| Total Current Liabilities | 1,313,514 | 1,921,511 | |||||||||
Non-Current Liabilities | |||||||||||
| Long-term debt (Note 5) | 1,105,333 | 1,205,061 | |||||||||
| Deferred income taxes (Note 12) | 779,295 | 735,799 | |||||||||
| Unamortized investment tax credits | 91,246 | 98,624 | |||||||||
| Accrued pension and other postretirement benefit costs (Note 10) | 165,326 | 164,901 | |||||||||
| Energy risk management non-current liabilities (Note 1(k)) | 41,773 | 26,337 | |||||||||
| Other | 105,681 | 118,421 | |||||||||
| Total Non-Current Liabilities | 2,288,654 | 2,349,143 | |||||||||
Total Liabilities | 3,602,168 | 4,270,654 | |||||||||
Cumulative Preferred Stock | |||||||||||
| Not subject to mandatory redemption | 20,486 | 20,486 | |||||||||
Common Stock Equity(Note 2) | |||||||||||
| Common Stock — $8.50 par value; authorized shares — 120,000,000; outstanding shares — 89,663,086 at December 31, 2001, and December 31, 2000 | 762,136 | 762,136 | |||||||||
| Paid-in capital | 571,926 | 565,777 | |||||||||
| Retained earnings | 408,706 | 368,911 | |||||||||
| Accumulated other comprehensive income (loss) | (5,678 | ) | (994 | ) | |||||||
| Total Common Stock Equity | 1,737,090 | 1,695,830 | |||||||||
Commitments and Contingencies(Note 13) | |||||||||||
Total Liabilities and Shareholder's Equity | $ | 5,359,744 | $ | 5,986,970 | |||||||
The accompanying notes as they relate to The Cincinnati Gas & Electric Company are an integral part of these consolidated financial statements.
76
THE CINCINNATI GAS & ELECTRIC COMPANY
CONSOLIDATED STATEMENTS OF CHANGES IN COMMON STOCK EQUITY
| | Common Stock | Paid-in Capital | Retained Earnings | Accumulated Other Comprehensive Income (Loss) | Total Common Stock Equity | |||||||||||||
|---|---|---|---|---|---|---|---|---|---|---|---|---|---|---|---|---|---|---|
| | (dollars in thousands) | |||||||||||||||||
| 1999 | ||||||||||||||||||
| Beginning balance | $ | 762,136 | $ | 553,926 | $ | 351,505 | $ | (1,124 | ) | $ | 1,666,443 | |||||||
| Comprehensive income: | ||||||||||||||||||
| Net income | — | — | 233,576 | — | 233,576 | |||||||||||||
| Other comprehensive income (loss), net of tax effect of $(85) | ||||||||||||||||||
| Minimum pension liability adjustment | — | — | — | 158 | 158 | |||||||||||||
| Total comprehensive income | — | — | — | — | 233,734 | |||||||||||||
Dividends on preferred stock | — | — | (856 | ) | — | (856 | ) | |||||||||||
| Dividends on common stock | — | — | (250,100 | ) | — | (250,100 | ) | |||||||||||
| Contribution from parent company for reallocation of taxes | — | 8,920 | — | — | 8,920 | |||||||||||||
| Other | — | 5 | 1,019 | — | 1,024 | |||||||||||||
| Ending balance | $ | 762,136 | $ | 562,851 | $ | 335,144 | $ | (966 | ) | $ | 1,659,165 | |||||||
2000 | ||||||||||||||||||
| Comprehensive income: | ||||||||||||||||||
| Net income | — | — | 266,820 | — | 266,820 | |||||||||||||
| Other comprehensive income (loss), net of tax effect of $15 | ||||||||||||||||||
| Minimum pension liability adjustment | — | — | — | (28 | ) | (28 | ) | |||||||||||
| Total comprehensive income | — | — | — | — | 266,792 | |||||||||||||
Dividends on preferred stock | — | — | (847 | ) | — | (847 | ) | |||||||||||
| Dividends on common stock | — | — | (232,334 | ) | — | (232,334 | ) | |||||||||||
| Contribution from parent company for reallocation of taxes | — | 2,894 | — | — | 2,894 | |||||||||||||
| Other | — | 32 | 128 | — | 160 | |||||||||||||
| Ending balance | $ | 762,136 | $ | 565,777 | $ | 368,911 | $ | (994 | ) | $ | 1,695,830 | |||||||
2001 | ||||||||||||||||||
| Comprehensive income: | ||||||||||||||||||
| Net income | — | — | 326,654 | — | 326,654 | |||||||||||||
| Other comprehensive income (loss), net of tax effect of $2,970 | ||||||||||||||||||
| Minimum pension liability adjustment | — | — | — | 134 | 134 | |||||||||||||
| Unrealized gain (loss) on investment trust | — | — | — | 461 | 461 | |||||||||||||
| Cumulative effect of change in accounting principle | — | — | — | (2,500 | ) | (2,500 | ) | |||||||||||
| Cash flow hedges(Note 1(l)) | — | — | — | (2,779 | ) | (2,779 | ) | |||||||||||
| Total comprehensive income | — | — | — | — | 321,970 | |||||||||||||
Dividends on preferred stock | — | — | (846 | ) | — | (846 | ) | |||||||||||
| Dividends on common stock | — | — | (286,269 | ) | — | (286,269 | ) | |||||||||||
| Contribution from parent company for reallocation of taxes | — | 6,149 | — | — | 6,149 | |||||||||||||
| Other | — | — | 256 | — | 256 | |||||||||||||
| Ending balance | $ | 762,136 | $ | 571,926 | $ | 408,706 | $ | (5,678 | ) | $ | 1,737,090 | |||||||
The accompanying notes as they relate to The Cincinnati Gas & Electric Company are an integral part of these consolidated financial statements.
77
THE CINCINNATI GAS & ELECTRIC COMPANY
CONSOLIDATED STATEMENTS OF CASH FLOWS
| | 2001 | 2000 | 1999 | ||||||||||
|---|---|---|---|---|---|---|---|---|---|---|---|---|---|
| | (dollars in thousands) | ||||||||||||
| Operating Activities | |||||||||||||
| Net income | $ | 326,654 | $ | 266,820 | $ | 233,576 | |||||||
| Items providing or (using) cash currently: | |||||||||||||
| Depreciation | 186,986 | 180,978 | 174,988 | ||||||||||
| Deferred income taxes and investment tax credits — net | 43,834 | 36,238 | 2,366 | ||||||||||
| Change in net position of energy risk management activities | (67,979 | ) | (7,077 | ) | (27,245 | ) | |||||||
| Allowance for equity funds used during construction | (2,672 | ) | (4,459 | ) | (2,565 | ) | |||||||
| Regulatory assets deferrals | (116,365 | ) | (35,777 | ) | (11,868 | ) | |||||||
| Regulatory assets amortization | 55,867 | 18,154 | 26,193 | ||||||||||
| Changes in current assets and current liabilities: | |||||||||||||
| Restricted deposits | (3,380 | ) | (28 | ) | 1,040 | ||||||||
| Accounts and notes receivable, net of reserves on receivables sold | 174,385 | (235,094 | ) | (66,682 | ) | ||||||||
| Materials, supplies, and fuel | (39,058 | ) | (62 | ) | 16,295 | ||||||||
| Accounts payable | (184,064 | ) | 248,562 | 22,462 | |||||||||
| Accrued taxes and interest | (37,209 | ) | 16,902 | (18,533 | ) | ||||||||
| Other items — net | (3,900 | ) | (21,282 | ) | 48,981 | ||||||||
| Net cash provided by (used in) operating activities | 333,099 | 463,875 | 399,008 | ||||||||||
| Financing Activities | |||||||||||||
| Change in short-term debt, including net affiliate notes | 305,155 | 40,684 | 173,117 | ||||||||||
| Issuance of long-term debt | — | — | 19,818 | ||||||||||
| Redemption of long-term debt | (1,200 | ) | — | (164,264 | ) | ||||||||
| Retirement of preferred stock | — | (168 | ) | (26 | ) | ||||||||
| Dividends on preferred stock | (845 | ) | (847 | ) | (856 | ) | |||||||
| Dividends on common stock | (286,269 | ) | (232,334 | ) | (250,100 | ) | |||||||
| Net cash provided by (used in) financing activities | 16,841 | (192,665 | ) | (222,311 | ) | ||||||||
| Investing Activities | |||||||||||||
| Construction expenditures (less allowance for equity funds used during construction) | (361,503 | ) | (260,127 | ) | (194,132 | ) | |||||||
| Net cash provided by (used in) investing activities | (361,503 | ) | (260,127 | ) | (194,132 | ) | |||||||
| Net increase (decrease) in cash and cash equivalents | (11,563 | ) | 11,083 | (17,435 | ) | ||||||||
| Cash and cash equivalents at beginning of period | 20,637 | 9,554 | 26,989 | ||||||||||
| Cash and cash equivalents at end of period | $ | 9,074 | $ | 20,637 | $ | 9,554 | |||||||
| Supplemental Disclosure of Cash Flow Information | |||||||||||||
| Cash paid during the year for: | |||||||||||||
| Interest (net of amount capitalized) | $ | 108,079 | $ | 99,009 | $ | 101,264 | |||||||
| Income taxes | $ | 147,471 | $ | 121,158 | $ | 159,241 | |||||||
The accompanying notes as they relate to The Cincinnati Gas & Electric Company are an integral part of these consolidated financial statements.
78
THE CINCINNATI GAS & ELECTRIC COMPANY
CONSOLIDATED STATEMENTS OF CAPITALIZATION
| | December 31 | ||||||||||
|---|---|---|---|---|---|---|---|---|---|---|---|
| | 2001 | 2000 | |||||||||
| | (dollars in thousands) | ||||||||||
| Long-term Debt(excludes current portion) | |||||||||||
| CG&E | |||||||||||
| First Mortgage Bonds: | |||||||||||
| 71/4 % Series due September 1, 2002 | $ | — | $ | 100,000 | |||||||
| 6.45% Series due February 15, 2004 | 110,000 | 110,000 | |||||||||
| 7.20% Series due October 1, 2023 | 265,500 | 265,500 | |||||||||
| 5.45% Series due January 1, 2024 (Pollution Control) | 46,700 | 46,700 | |||||||||
| 51/2 % Series due January 1, 2024 (Pollution Control) | 48,000 | 48,000 | |||||||||
| Total First Mortgage Bonds | 470,200 | 570,200 | |||||||||
Pollution Control Notes: | |||||||||||
| 6.50% due November 15, 2022 | 12,721 | 12,721 | |||||||||
| Other Long-term Debt: | |||||||||||
| Liquid Asset Notes with Coupon Exchange due October 1, 2007 (Executed interest rate swap set at 6.87% through maturity commencing at October 19, 2000) | 100,000 | 100,000 | |||||||||
| 6.40% Debentures due April 1, 2008 | 100,000 | 100,000 | |||||||||
| 6.90% Debentures due June 1, 2025 (Redeemable at the option of the holders on June 1, 2005) | 150,000 | 150,000 | |||||||||
| 8.28% Junior Subordinated Debentures due July 1, 2025 | 100,000 | 100,000 | |||||||||
| 6.35% Debentures due June 15, 2038 (Interest rate resets June 15, 2003) | 100,000 | 100,000 | |||||||||
| Total Other Long-term Debt | 550,000 | 550,000 | |||||||||
Unamortized Premium and Discount — Net | (2,209 | ) | (2,449 | ) | |||||||
| Total Long-term Debt | 1,030,712 | 1,130,472 | |||||||||
ULH&P | |||||||||||
| Other Long-term Debt: | |||||||||||
| 6.11 % Debentures due December 8, 2003 | 20,000 | 20,000 | |||||||||
| 6.50 % Debentures due April 30, 2008 | 20,000 | 20,000 | |||||||||
| 7.65 % Debentures due July 15, 2025 | 15,000 | 15,000 | |||||||||
| 7.875% Debentures due September 15, 2009 | 20,000 | 20,000 | |||||||||
| Total Other Long-term Debt | 75,000 | 75,000 | |||||||||
| Unamortized Premium and Discount — Net | (379 | ) | (411 | ) | |||||||
| Total Long-term Debt | 74,621 | 74,589 | |||||||||
| Total CG&E Consolidated Long-term Debt | $ | 1,105,333 | $ | 1,205,061 | |||||||
79
THE CINCINNATI GAS & ELECTRIC COMPANY
CONSOLIDATED STATEMENTS OF CAPITALIZATION (cont.)
| Cumulative Preferred Stock | | | | | ||||||||||||||
|---|---|---|---|---|---|---|---|---|---|---|---|---|---|---|---|---|---|---|
| | | December 31 | ||||||||||||||||
| Par/Stated Value | Authorized Shares | Shares Outstanding at December 31, 2001 | | Mandatory Redemption | ||||||||||||||
| Series | 2001 | 2000 | ||||||||||||||||
| | | | | | (dollars in thousands) | |||||||||||||
| $100 | 6,000,000 | 204,859 | 4% - 43/4% | No | $ | 20,486 | $ | 20,486 | ||||||||||
Common Stock Equity | ||||||||||||||||||
| Common Stock — $8.50 par value; authorized shares — 120,000,000; outstanding shares — 89,663,086 at December 31, 2001, and December 31, 2000 | $ | 762,136 | $ | 762,136 | ||||||||||||||
| Paid-in capital | 571,926 | 565,777 | ||||||||||||||||
| Retained earnings | 408,706 | 368,911 | ||||||||||||||||
| Accumulated other comprehensive income (loss) | (5,678 | ) | (994 | ) | ||||||||||||||
| Total Common Stock Equity | 1,737,090 | 1,695,830 | ||||||||||||||||
Total Capitalization | $ | 2,862,909 | $ | 2,921,377 | ||||||||||||||
The accompanying notes as they relate to The Cincinnati Gas & Electric Company are an integral part of these consolidated financial statements.
80
PSI ENERGY, INC.
AND SUBSIDIARY COMPANY
81
PSI ENERGY, INC.
CONSOLIDATED STATEMENTS OF INCOME
| | 2001 | 2000 | 1999 | |||||||||
|---|---|---|---|---|---|---|---|---|---|---|---|---|
| | (dollars in thousands) | |||||||||||
| Operating Revenues | ||||||||||||
| Electric | $ | 4,075,024 | $ | 2,684,197 | $ | 2,135,706 | ||||||
Operating Expenses | ||||||||||||
| Fuel and purchased and exchanged power | 3,132,494 | 1,724,656 | 1,213,653 | |||||||||
| Operation and maintenance | 413,275 | 463,649 | 461,779 | |||||||||
| Depreciation | 149,467 | 141,512 | 135,330 | |||||||||
| Taxes other than income taxes | 49,955 | 56,908 | 52,920 | |||||||||
| Total Operating Expenses | 3,745,191 | 2,386,725 | 1,863,682 | |||||||||
Operating Income | 329,833 | 297,472 | 272,024 | |||||||||
Miscellaneous — Net | 19,541 | 4,723 | 655 | |||||||||
| Interest | 80,955 | 78,250 | 86,265 | |||||||||
Income Before Taxes | 268,419 | 223,945 | 186,414 | |||||||||
Income Taxes (Note 12) | 106,086 | 88,547 | 69,215 | |||||||||
Net Income | $ | 162,333 | $ | 135,398 | $ | 117,199 | ||||||
Preferred Dividend Requirement | 2,587 | 3,738 | 4,601 | |||||||||
| Net Income Applicable to Common Stock | $ | 159,746 | $ | 131,660 | $ | 112,598 | ||||||
The accompanying notes as they relate to PSI Energy, Inc. are an integral part of these consolidated financial statements.
82
PSI ENERGY, INC.
CONSOLIDATED BALANCE SHEETS
| | December 31 | |||||||||
|---|---|---|---|---|---|---|---|---|---|---|
| | 2001 | 2000 | ||||||||
| | (dollars in thousands) | |||||||||
| ASSETS | ||||||||||
| Current Assets | ||||||||||
| Cash and cash equivalents | $ | 1,587 | $ | 1,311 | ||||||
| Restricted deposits | 519 | 341 | ||||||||
| Notes receivable | — | 3 | ||||||||
| Notes receivable from affiliated companies | 444,801 | 12,798 | ||||||||
| Accounts receivable less accumulated provision for doubtful accounts of $6,773 at December 31, 2001, and $9,317 at December 31, 2000 (Note 7) | 336,994 | 464,930 | ||||||||
| Accounts receivable from affiliated companies | 10,470 | 5,385 | ||||||||
| Materials, supplies, and fuel — at average cost | 87,661 | 53,838 | ||||||||
| Energy risk management current assets (Note 1(k)) | 28,201 | 697,488 | ||||||||
| Prepayments and other | 41,041 | 49,049 | ||||||||
| Total Current Assets | 951,274 | 1,285,143 | ||||||||
Property, Plant, and Equipment — at Cost | ||||||||||
| Utility plant in service | 4,909,007 | 4,699,090 | ||||||||
| Construction work in progress | 368,313 | 190,773 | ||||||||
| Total Utility Plant | 5,277,320 | 4,889,863 | ||||||||
| Accumulated depreciation | 2,216,908 | 2,110,747 | ||||||||
| Net Property, Plant, and Equipment | 3,060,412 | 2,779,116 | ||||||||
Other Assets | ||||||||||
| Regulatory assets (Note 1(c)) | 423,372 | 474,286 | ||||||||
| Energy risk management non-current assets (Note 1(k)) | 30,164 | 7,000 | ||||||||
| Other investments | 57,633 | 51,343 | ||||||||
| Other | 47,927 | 32,887 | ||||||||
| Total Other Assets | 559,096 | 565,516 | ||||||||
Total Assets | $ | 4,570,782 | $ | 4,629,775 | ||||||
The accompanying notes as they relate to PSI Energy, Inc. are an integral part of these consolidated financial statements.
83
PSI ENERGY, INC.
CONSOLIDATED BALANCE SHEETS
| | December 31 | ||||||||||
|---|---|---|---|---|---|---|---|---|---|---|---|
| | 2001 | 2000 | |||||||||
| | (dollars in thousands) | ||||||||||
| LIABILITIES AND SHAREHOLDER'S EQUITY | |||||||||||
| Current Liabilities | |||||||||||
| Accounts payable | $ | 312,707 | $ | 392,206 | |||||||
| Accounts payable to affiliated companies | 27,370 | 32,448 | |||||||||
| Accrued taxes | 102,317 | 80,995 | |||||||||
| Accrued interest | 23,760 | 23,708 | |||||||||
| Notes payable and other short-term obligations (Note 6) | 148,600 | 188,391 | |||||||||
| Notes payable to affiliated companies | 422,263 | 146,381 | |||||||||
| Long-term debt due within one year (Note 5) | 23,000 | 38,325 | |||||||||
| Energy risk management current liabilities (Note 1(k)) | 23,185 | 717,902 | |||||||||
| Other | 41,695 | 12,748 | |||||||||
| Total Current Liabilities | 1,124,897 | 1,633,104 | |||||||||
Non-Current Liabilities | |||||||||||
| Long-term debt (Note 5) | 1,325,089 | 1,074,255 | |||||||||
| Deferred income taxes (Note 12) | 486,694 | 458,593 | |||||||||
| Unamortized investment tax credits | 36,139 | 39,341 | |||||||||
| Accrued pension and other postretirement benefit costs (Note 10) | 154,799 | 143,990 | |||||||||
| Energy risk management non-current liabilities (Note 1(k)) | 41,773 | 26,337 | |||||||||
| Other | 63,557 | 78,112 | |||||||||
| Total Non-Current Liabilities | 2,108,051 | 1,820,628 | |||||||||
Total Liabilities | 3,232,948 | 3,453,732 | |||||||||
Cumulative Preferred Stock (Note 3) | |||||||||||
| Not subject to mandatory redemption | 42,347 | 42,348 | |||||||||
Common Stock Equity(Note 2) | |||||||||||
| Common Stock — without par value; $.01 stated value; authorized shares — 60,000,000; outstanding shares — 53,913,701 at December 31, 2001, and December 31, 2000 | 539 | 539 | |||||||||
| Paid-in capital | 416,414 | 413,523 | |||||||||
| Retained earnings | 880,129 | 720,153 | |||||||||
| Accumulated other comprehensive income (loss) | (1,595 | ) | (520 | ) | |||||||
| Total Common Stock Equity | 1,295,487 | 1,133,695 | |||||||||
Commitments and Contingencies (Note 13) | |||||||||||
Total Liabilities and Shareholder's Equity | $ | 4,570,782 | $ | 4,629,775 | |||||||
The accompanying notes as they relate to PSI Energy, Inc. are an integral part of these consolidated financial statements.
84
PSI ENERGY, INC.
CONSOLIDATED STATEMENTS OF CHANGES IN COMMON STOCK EQUITY
| | Common Stock | Paid-in Capital | Retained Earnings | Accumulated Other Comprehensive Income (Loss) | Total Common Stock Equity | |||||||||||||
|---|---|---|---|---|---|---|---|---|---|---|---|---|---|---|---|---|---|---|
| | (dollars in thousands) | |||||||||||||||||
| 1999 | ||||||||||||||||||
| Beginning balance | $ | 539 | $ | 410,739 | $ | 564,865 | $ | (495 | ) | $ | 975,648 | |||||||
Comprehensive income: | ||||||||||||||||||
| Net income | — | — | 117,199 | — | 117,199 | |||||||||||||
| Other comprehensive income (loss), net of tax effect of $(418) | ||||||||||||||||||
| Minimum pension liability adjustment | — | — | — | (163 | ) | (163 | ) | |||||||||||
| Unrealized gain (loss) on investment trust | — | — | — | 2,049 | 2,049 | |||||||||||||
| Total comprehensive income | — | — | — | — | 119,085 | |||||||||||||
Dividends on preferred stock | — | — | (4,601 | ) | — | (4,601 | ) | |||||||||||
| Dividends on common stock | — | — | (35,900 | ) | — | (35,900 | ) | |||||||||||
| Contribution from parent company for reallocation of taxes | — | 457 | — | — | 457 | |||||||||||||
| Other | — | 2 | 1,006 | — | 1,008 | |||||||||||||
| Ending balance | $ | 539 | $ | 411,198 | $ | 642,569 | $ | 1,391 | $ | 1,055,697 | ||||||||
2000 | ||||||||||||||||||
| Comprehensive income: | ||||||||||||||||||
| Net income | — | — | 135,398 | — | 135,398 | |||||||||||||
| Other comprehensive income (loss), net of tax effect of $584 | ||||||||||||||||||
| Minimum pension liability adjustment | — | — | — | (47 | ) | (47 | ) | |||||||||||
| Unrealized gain (loss) on investment trust | — | — | — | (1,864 | ) | (1,864 | ) | |||||||||||
| Total comprehensive income | — | — | — | — | 133,487 | |||||||||||||
Dividends on preferred stock | — | — | (3,738 | ) | — | (3,738 | ) | |||||||||||
| Dividends on common stock | — | — | (54,000 | ) | — | (54,000 | ) | |||||||||||
| Contribution from parent company for reallocation of taxes | — | 1,989 | — | — | 1,989 | |||||||||||||
| Other | — | 336 | (76 | ) | — | 260 | ||||||||||||
| Ending balance | $ | 539 | $ | 413,523 | $ | 720,153 | $ | (520 | ) | $ | 1,133,695 | |||||||
2001 | ||||||||||||||||||
| Comprehensive income: | ||||||||||||||||||
| Net income | — | — | 162,333 | — | 162,333 | |||||||||||||
| Other comprehensive income (loss), net of tax effect of $538 | ||||||||||||||||||
| Minimum pension liability adjustment | — | — | — | (49 | ) | (49 | ) | |||||||||||
| Unrealized gain (loss) on investment trusts | — | — | — | (1,026 | ) | (1,026 | ) | |||||||||||
| Total comprehensive income | — | — | — | — | 161,258 | |||||||||||||
Dividends on preferred stock | — | — | (2,587 | ) | — | (2,587 | ) | |||||||||||
| Contribution from parent company for reallocation of taxes | — | 2,894 | — | — | 2,894 | |||||||||||||
| Other | — | (3 | ) | 230 | — | 227 | ||||||||||||
| Ending balance | $ | 539 | $ | 416,414 | $ | 880,129 | $ | (1,595 | ) | $ | 1,295,487 | |||||||
The accompanying notes as they relate to PSI Energy, Inc. are an integral part of these consolidated financial statements.
85
PSI ENERGY, INC.
CONSOLIDATED STATEMENTS OF CASH FLOWS
| | 2001 | 2000 | 1999 | ||||||||||
|---|---|---|---|---|---|---|---|---|---|---|---|---|---|
| | (dollars in thousands) | ||||||||||||
| Operating Activities | |||||||||||||
| Net income | $ | 162,333 | $ | 135,398 | $ | 117,199 | |||||||
| Items providing or (using) cash currently: | |||||||||||||
| Depreciation | 149,467 | 141,512 | 135,330 | ||||||||||
| Deferred income taxes and investment tax credits — net | 41,543 | (6,582 | ) | 102,878 | |||||||||
| Change in net position of energy risk management activities | (33,158 | ) | (7,077 | ) | (27,245 | ) | |||||||
| Allowance for equity funds used during construction | (5,956 | ) | (1,354 | ) | (1,068 | ) | |||||||
| Regulatory assets deferrals | (24,959 | ) | (63,884 | ) | (294,472 | ) | |||||||
| Regulatory assets amortization | 62,641 | 74,702 | 76,923 | ||||||||||
| Changes in current assets and current liabilities: | |||||||||||||
| Restricted deposits | (178 | ) | (341 | ) | 2,414 | ||||||||
| Accounts and notes receivable, net of reserves on receivables sold | 119,311 | (178,453 | ) | (74,847 | ) | ||||||||
| Materials, supplies, and fuel | (33,823 | ) | 49,652 | (23,045 | ) | ||||||||
| Accounts payable | (84,577 | ) | 176,820 | (270 | ) | ||||||||
| Accrued taxes and interest | 21,374 | (15,342 | ) | 32,809 | |||||||||
| Other items — net | 14,153 | 34,064 | 77,447 | ||||||||||
| Net cash provided by (used in) operating activities | 388,171 | 339,115 | 124,053 | ||||||||||
Financing Activities | |||||||||||||
| Change in short-term debt, including net affiliate notes | (195,912 | ) | 143,030 | (80,140 | ) | ||||||||
| Issuance of long-term debt | 322,471 | 53,075 | 589,225 | ||||||||||
| Redemption of long-term debt | (89,248 | ) | (187,097 | ) | (379,484 | ) | |||||||
| Retirement of preferred stock | (1 | ) | (29,225 | ) | (8 | ) | |||||||
| Dividends on preferred stock | (2,587 | ) | (3,738 | ) | (4,601 | ) | |||||||
| Dividends on common stock | — | (54,000 | ) | (35,900 | ) | ||||||||
| Net cash provided by (used in) financing activities | 34,723 | (77,955 | ) | 89,092 | |||||||||
Investing Activities | |||||||||||||
| Construction expenditures (less allowance for equity funds used during construction) | (414,047 | ) | (259,394 | ) | (189,207 | ) | |||||||
| Other investments | (8,571 | ) | (9,297 | ) | (33,884 | ) | |||||||
| Net cash provided by (used in) investing activities | (422,618 | ) | (268,691 | ) | (223,091 | ) | |||||||
Net increase (decrease) in cash and cash equivalents | 276 | (7,531 | ) | (9,946 | ) | ||||||||
Cash and cash equivalents at beginning of period | 1,311 | 8,842 | 18,788 | ||||||||||
Cash and cash equivalents at end of period | $ | 1,587 | $ | 1,311 | $ | 8,842 | |||||||
Supplemental Disclosure of Cash Flow Information | |||||||||||||
| Cash paid during the year for: | |||||||||||||
| Interest (net of amount capitalized) | $ | 84,306 | $ | 80,854 | $ | 86,256 | |||||||
| Income taxes | $ | 41,419 | $ | 112,210 | $ | (54,099 | ) | ||||||
The accompanying notes as they relate to PSI Energy, Inc. are an integral part of these consolidated financial statements.
86
PSI ENERGY, INC.
CONSOLIDATED STATEMENTS OF CAPITALIZATION
| | December 31 | ||||||||||
|---|---|---|---|---|---|---|---|---|---|---|---|
| | 2001 | 2000 | |||||||||
| | (dollars in thousands) | ||||||||||
| Long-term Debt (excludes current portion) | |||||||||||
First Mortgage Bonds: | |||||||||||
| Series ZZ, 53/4% due February 15, 2028 (Pollution Control) | $ | 50,000 | $ | 50,000 | |||||||
| Series AAA, 71/8% due February 1, 2024 | 30,000 | 30,000 | |||||||||
| Series BBB, 8.0% due July 15, 2009 | 124,665 | 124,665 | |||||||||
| Series CCC, 8.85% due January 15, 2022 | 53,055 | 53,055 | |||||||||
| Series DDD, 8.31% due September 1, 2032 | 38,000 | 38,000 | |||||||||
| Series EEE, 6.65% due June 15, 2006 | 325,000 | — | |||||||||
| Total First Mortgage Bonds | 620,720 | 295,720 | |||||||||
Secured Medium-term Notes: | |||||||||||
| Series A, 8.37% to 8.81%, due November 8, 2006 to June 1, 2022 | 34,300 | 57,300 | |||||||||
| Series B, 5.93% to 8.24%, due September 17, 2003 to August 22, 2022 | 126,000 | 126,000 | |||||||||
| (Series A and B, 7.105% weighted average interest rate and 8 year weighted average remaining life) | |||||||||||
| Total Secured Medium-term Notes | 160,300 | 183,300 | |||||||||
Other Long-term Debt: | |||||||||||
| Series 2000A, Pollution Control Revenue Refunding Bond, due May 1, 2035 | 44,025 | 44,025 | |||||||||
| Series 2000B, Pollution Control Revenue Refunding Bond, due April 1, 2022 | 10,000 | 10,000 | |||||||||
| 6.35% Debentures due November 15, 2006 | 50 | 50 | |||||||||
| 6.00% Debentures due December 14, 2016 (Note 5) | — | 50,000 | |||||||||
| 6.50% Synthetic Putable Yield Securities due August 1, 2026 (Interest rate resets August 1, 2005) | 50,000 | 50,000 | |||||||||
| 7.25% Junior Maturing Principal Securities due March 15, 2028 | 2,658 | 2,658 | |||||||||
| 6.00% Rural Utilities Service (RUS) Obligation payable in annual installments | 83,004 | 83,927 | |||||||||
| 6.52% Senior Notes due March 15, 2009 | 97,342 | 97,342 | |||||||||
| 7.85% Debentures due October 15, 2007 | 265,000 | 265,000 | |||||||||
| Total Other Long-term Debt | 552,079 | 603,002 | |||||||||
Unamortized Premium and Discount — Net | (8,010 | ) | (7,767 | ) | |||||||
| Total Long-term Debt | 1,325,089 | 1,074,255 | |||||||||
87
PSI ENERGY, INC.
CONSOLIDATED STATEMENTS OF CAPITALIZATION (cont.)
| Cumulative Preferred Stock | | | | | ||||||||||||||
|---|---|---|---|---|---|---|---|---|---|---|---|---|---|---|---|---|---|---|
| | | December 31 | ||||||||||||||||
| Par/Stated Value | Authorized Shares | Shares Outstanding at December 31, 2001 | | Mandatory Redemption | ||||||||||||||
| Series | 2001 | 2000 | ||||||||||||||||
| | | | | | (dollars in thousands) | |||||||||||||
| $100 | 5,000,000 | 347,581 | 31/2% - 67/8% | No | $ | 34,758 | $ | 34,759 | ||||||||||
| $25 | 5,000,000 | 303,544 | 4.16% – 4.32% | No | 7,589 | 7,589 | ||||||||||||
| Total Preferred Stock | 42,347 | 42,348 | ||||||||||||||||
Common Stock Equity | ||||||||||||||||||
| Common Stock — without par value; $0.01 stated value; authorized shares — 60,000,000; outstanding shares — 53,913,701 at December 31, 2001, and December 31, 2000 | $ | 539 | $ | 539 | ||||||||||||||
| Paid-in capital | 416,414 | 413,523 | ||||||||||||||||
| Retained earnings | 880,129 | 720,153 | ||||||||||||||||
| Accumulated other comprehensive income (loss) | (1,595 | ) | (520 | ) | ||||||||||||||
| Total Common Stock Equity | 1,295,487 | 1,133,695 | ||||||||||||||||
| Total Capitalization | $ | 2,662,923 | $ | 2,250,298 | ||||||||||||||
The accompanying notes as they relate to PSI Energy, Inc. are an integral part of these consolidated financial statements.
88
THE UNION LIGHT, HEAT
AND POWER COMPANY
89
THE UNION LIGHT, HEAT AND POWER COMPANY
STATEMENTS OF INCOME
| | 2001 | 2000 | 1999 | ||||||||
|---|---|---|---|---|---|---|---|---|---|---|---|
| | (dollars in thousands) | ||||||||||
| Operating Revenues | |||||||||||
| Electric | $ | 230,960 | $ | 225,601 | $ | 210,234 | |||||
| Gas | 109,333 | 91,950 | 70,728 | ||||||||
| Total Operating Revenues | 340,293 | 317,551 | 280,962 | ||||||||
Operating Expenses | |||||||||||
| Electricity purchased from parent company for resale (Note 1(o)) | 151,562 | 159,915 | 158,556 | ||||||||
| Gas purchased | 72,593 | 51,591 | 34,690 | ||||||||
| Operation and maintenance | 39,501 | 40,699 | 38,611 | ||||||||
| Depreciation | 17,039 | 15,685 | 14,830 | ||||||||
| Taxes other than income taxes | 3,901 | 3,938 | 4,136 | ||||||||
| Total Operating Expenses | 284,596 | 271,828 | 250,823 | ||||||||
Operating Income | 55,697 | 45,723 | 30,139 | ||||||||
Miscellaneous — Net | 239 | (982 | ) | (1,567 | ) | ||||||
| Interest | 6,313 | 6,308 | 6,114 | ||||||||
Income Before Taxes | 49,623 | 38,433 | 22,458 | ||||||||
Income Taxes (Note 12) | 13,699 | 13,801 | 10,184 | ||||||||
Net Income | $ | 35,924 | $ | 24,632 | $ | 12,274 | |||||
The accompanying notes as they relate to The Union Light, Heat and Power Company are an integral part of these financial statements.
90
THE UNION LIGHT, HEAT AND POWER COMPANY
BALANCE SHEETS
| | December 31 | |||||||||
|---|---|---|---|---|---|---|---|---|---|---|
| | 2001 | 2000 | ||||||||
| | (dollars in thousands) | |||||||||
| ASSETS | ||||||||||
| Current Assets | ||||||||||
| Cash and cash equivalents | $ | 4,099 | $ | 6,460 | ||||||
| Accounts receivable less accumulated provision for doubtful accounts of $1,196 at December 31, 2001, and $1,492 at December 31, 2000 (Note 7) | 16,785 | 28,518 | ||||||||
| Accounts receivable from affiliated companies | 2,401 | 2,279 | ||||||||
| Materials, supplies, and fuel — at average cost | 10,835 | 6,300 | ||||||||
| Prepayments and other | 300 | 274 | ||||||||
| Total Current Assets | 34,420 | 43,831 | ||||||||
Property, Plant, and Equipment — at Cost | ||||||||||
| Utility plant in service | ||||||||||
| Electric | 248,223 | 234,482 | ||||||||
| Gas | 197,301 | 184,878 | ||||||||
| Common | 50,289 | 44,603 | ||||||||
| Total Utility Plant In Service | 495,813 | 463,963 | ||||||||
| Construction work in progress | 11,004 | 15,069 | ||||||||
| Total Utility Plant | 506,817 | 479,032 | ||||||||
| Accumulated depreciation | 178,567 | 169,403 | ||||||||
| Net Property, Plant, and Equipment | 328,250 | 309,629 | ||||||||
Other Assets | ||||||||||
| Regulatory assets (Note 1(c)) | 7,838 | 10,177 | ||||||||
| Other | 6,582 | 5,110 | ||||||||
| Total Other Assets | 14,420 | 15,287 | ||||||||
Total Assets | $ | 377,090 | $ | 368,747 | ||||||
The accompanying notes as they relate to The Union Light, Heat and Power Company are an integral part of these financial statements.
91
THE UNION LIGHT, HEAT AND POWER COMPANY
BALANCE SHEETS
| | December 31 | ||||||||||
|---|---|---|---|---|---|---|---|---|---|---|---|
| | 2001 | 2000 | |||||||||
| | (dollars in thousands) | ||||||||||
| LIABILITIES AND SHAREHOLDER'S EQUITY | |||||||||||
| Current Liabilities | |||||||||||
| Accounts payable | $ | 7,960 | $ | 24,249 | |||||||
| Accounts payable to affiliated companies | 16,156 | 20,192 | |||||||||
| Accrued taxes | 7,051 | (5,760 | ) | ||||||||
| Accrued interest | 643 | 1,215 | |||||||||
| Notes payable to affiliated companies | 26,432 | 29,403 | |||||||||
| Other | 5,322 | 11,669 | |||||||||
| Total Current Liabilities | 63,564 | 80,968 | |||||||||
Non-Current Liabilities | |||||||||||
| Long-term debt (Note 5) | 74,621 | 74,589 | |||||||||
| Deferred income taxes (Note 12) | 28,323 | 35,822 | |||||||||
| Unamortized investment tax credits | 3,411 | 3,684 | |||||||||
| Accrued pension and other postretirement benefit costs (Note 10) | 13,198 | 13,041 | |||||||||
| Amounts due to customers — income taxes | 7,148 | 7,439 | |||||||||
| Other | 14,622 | 6,016 | |||||||||
| Total Non-Current Liabilities | 141,323 | 140,591 | |||||||||
Total Liabilities | 204,887 | 221,559 | |||||||||
Common Stock Equity(Note 2) | |||||||||||
| Common Stock — $15.00 par value; authorized shares — 1,000,000; outstanding shares — 585,333 at December 31, 2001, and December 31, 2000 | 8,780 | 8,780 | |||||||||
| Paid-in capital | 21,111 | 20,305 | |||||||||
| Retained earnings | 142,320 | 118,103 | |||||||||
| Accumulated other comprehensive income (loss) | (8 | ) | — | ||||||||
| Total Common Stock Equity | 172,203 | 147,188 | |||||||||
Commitments and Contingencies (Note 13) | |||||||||||
Total Liabilities and Shareholder's Equity | $ | 377,090 | $ | 368,747 | |||||||
The accompanying notes as they relate to The Union Light, Heat and Power Company are an integral part of these financial statements.
92
THE UNION LIGHT, HEAT AND POWER COMPANY
STATEMENTS OF CHANGES IN COMMON STOCK EQUITY
| | Common Stock | Paid-in Capital | Retained Earnings | Accumulated Other Comprehensive Income (Loss) | Total Common Stock Equity | ||||||||||||
|---|---|---|---|---|---|---|---|---|---|---|---|---|---|---|---|---|---|
| | (dollars in thousands) | ||||||||||||||||
| 1999 | |||||||||||||||||
| Beginning balance | $ | 8,780 | $ | 19,525 | $ | 100,513 | $ | — | $ | 128,818 | |||||||
Net income | — | — | 12,274 | — | 12,274 | ||||||||||||
| Dividends on common stock | — | — | (9,659 | ) | — | (9,659 | ) | ||||||||||
| Contribution from parent for reallocation of taxes | — | 617 | — | — | 617 | ||||||||||||
| Ending balance | $ | 8,780 | $ | 20,142 | $ | 103,128 | $ | — | $ | 132,050 | |||||||
2000 | |||||||||||||||||
| Net income | — | — | 24,632 | — | 24,632 | ||||||||||||
| Dividends on common stock | — | — | (9,657 | ) | — | (9,657 | ) | ||||||||||
| Contribution from parent for reallocation of taxes | — | 163 | — | — | 163 | ||||||||||||
| Ending balance | $ | 8,780 | $ | 20,305 | $ | 118,103 | $ | — | $ | 147,188 | |||||||
2001 | |||||||||||||||||
| Comprehensive income: | |||||||||||||||||
| Net income | — | — | 35,924 | — | 35,924 | ||||||||||||
| Other comprehensive income (loss), net of tax effect of $5 Minimum pension liability adjustment | — | — | — | (8 | ) | (8 | ) | ||||||||||
| Total comprehensive income (loss) | 35,916 | ||||||||||||||||
Dividends on common stock | — | — | (11,707 | ) | — | (11,707 | ) | ||||||||||
| Contribution from parent for reallocation of taxes | — | 806 | — | — | 806 | ||||||||||||
| Ending balance | $ | 8,780 | $ | 21,111 | $ | 142,320 | $ | (8 | ) | $ | 172,203 | ||||||
The accompanying notes as they relate to The Union Light, Heat and Power Company are an integral part of these financial statements.
93
THE UNION LIGHT, HEAT AND POWER COMPANY
STATEMENTS OF CASH FLOWS
| | 2001 | 2000 | 1999 | |||||||||||
|---|---|---|---|---|---|---|---|---|---|---|---|---|---|---|
| | (dollars in thousands) | |||||||||||||
| Operating Activities | ||||||||||||||
| Net income | $ | 35,924 | $ | 24,632 | $ | 12,274 | ||||||||
| Items providing or (using) cash currently: | ||||||||||||||
| Depreciation | 17,039 | 15,685 | 14,830 | |||||||||||
| Deferred income taxes and investment tax credits — net | (7,116 | ) | 8,926 | (738 | ) | |||||||||
| Allowance for equity funds used during construction | (143 | ) | (61 | ) | (36 | ) | ||||||||
| Regulatory assets deferrals | 1,098 | (12 | ) | — | ||||||||||
| Regulatory assets amortization | 901 | 271 | 138 | |||||||||||
| Changes in current assets and current liabilities: | ||||||||||||||
| Accounts and notes receivable, net of reserves on receivables sold | 12,112 | (14,269 | ) | (5,099 | ) | |||||||||
| Materials, supplies, and fuel | (4,535 | ) | 1,354 | 615 | ||||||||||
| Accounts payable | (20,325 | ) | 15,832 | 7,720 | ||||||||||
| Accrued taxes and interest | 12,239 | (6,582 | ) | (3,138 | ) | |||||||||
| Other items — net | (681 | ) | 3,482 | 5,971 | ||||||||||
| Net cash provided by (used in) operating activities | 46,513 | 49,258 | 32,537 | |||||||||||
Financing Activities | ||||||||||||||
| Change in short-term debt | (2,971 | ) | (8,349 | ) | 5,935 | |||||||||
| Issuance of long-term debt | — | — | 19,818 | |||||||||||
| Redemption of long-term debt | — | — | (20,000 | ) | ||||||||||
| Dividends on common stock | (11,707 | ) | (9,657 | ) | (9,659 | ) | ||||||||
| Net cash provided by (used in) financing activities | (14,678 | ) | (18,006 | ) | (3,906 | ) | ||||||||
Investing Activities | ||||||||||||||
| Construction expenditures (less allowance for equity funds used during construction) | (34,196 | ) | (28,433 | ) | (28,234 | ) | ||||||||
| Net cash provided by (used in) investing activities | (34,196 | ) | (28,433 | ) | (28,234 | ) | ||||||||
Net increase (decrease) in cash and cash equivalents | (2,361 | ) | 2,819 | 397 | ||||||||||
Cash and cash equivalents at beginning of period | 6,460 | 3,641 | 3,244 | |||||||||||
Cash and cash equivalents at end of period | $ | 4,099 | $ | 6,460 | $ | 3,641 | ||||||||
Supplemental Disclosure of Cash Flow Information | ||||||||||||||
| Cash paid during the year for: | ||||||||||||||
| Interest (net of amount capitalized) | $ | 6,775 | $ | 6,534 | $ | 6,691 | ||||||||
| Income taxes | $ | 10,848 | $ | 11,760 | $ | 12,794 | ||||||||
The accompanying notes as they relate to The Union Light, Heat and Power Company are an integral part of these financial statements.
94
THE UNION LIGHT, HEAT AND POWER COMPANY
STATEMENTS OF CAPITALIZATION
| | December 31 | ||||||||||
|---|---|---|---|---|---|---|---|---|---|---|---|
| | 2001 | 2000 | |||||||||
| | (dollars in thousands) | ||||||||||
| Long-term Debt (excludes current portion) | |||||||||||
Other Long-term Debt: | |||||||||||
| 6.11% Debentures due December 8, 2003 | $ | 20,000 | $ | 20,000 | |||||||
| 6.50% Debentures due April 30, 2008 | 20,000 | 20,000 | |||||||||
| 7.65% Debentures due July 15, 2025 | 15,000 | 15,000 | |||||||||
| 7.875% Debentures due September 15, 2009 | 20,000 | 20,000 | |||||||||
| Total Other Long-term Debt | 75,000 | 75,000 | |||||||||
Unamortized Premium and Discount — Net | (379 | ) | (411 | ) | |||||||
| Total Long-term Debt | 74,621 | 74,589 | |||||||||
Common Stock Equity | |||||||||||
| Common Stock — $15.00 par value; authorized shares — 1,000,000; outstanding shares — 585,333 at December 31, 2001, and December 31, 2000 | $ | 8,780 | $ | 8,780 | |||||||
| Paid-in capital | 21,111 | 20,305 | |||||||||
| Retained earnings | 142,320 | 118,103 | |||||||||
| Accumulated other comprehensive income (loss) | (8 | ) | — | ||||||||
| Total Common Stock Equity | 172,203 | 147,188 | |||||||||
Total Capitalization | $ | 246,824 | $ | 221,777 | |||||||
The accompanying notes as they relate to The Union Light, Heat and Power Company are an integral part of these financial statements.
95
In this reportCinergy (which includesCinergy Corp. and all of our regulated and non-regulated subsidiaries) is, at times, referred to in the first person as "we", "our", or "us".
1. Summary of Significant Accounting Policies
(a) Nature of Operations
Cinergy Corp., a Delaware corporation created in October 1994, owns all outstanding common stock of The Cincinnati Gas & Electric Company (CG&E) and PSI Energy, Inc. (PSI), both of which are public utility subsidiaries. As a result of this ownership, we are considered a utility holding company. Because we are a holding company with material utility subsidiaries operating in multiple states, we are registered with and are subject to regulation by the Securities and Exchange Commission (SEC) under the Public Utility Holding Company Act of 1935, as amended (PUHCA). Our other principal subsidiaries are:
- •
- Cinergy Wholesale Energy, Inc. (Wholesale Energy);
- •
- Cinergy Services, Inc. (Services);
- •
- Cinergy Investments, Inc. (Investments);
- •
- Cinergy Global Resources, Inc. (Global Resources); and
- •
- Cinergy Technologies, Inc. (Technologies).
CG&E, an Ohio corporation, is a combination electric and gas public utility company that provides service in the southwestern portion of Ohio and, through its subsidiaries, in nearby areas of Kentucky and Indiana.CG&E's principal subsidiary, The Union Light, Heat and Power Company (ULH&P), is a Kentucky corporation that provides electric and gas service in northern Kentucky.CG&E's other subsidiaries are insignificant to its results of operations.
In 2001,CG&E began a transition to electric deregulation and customer choice. Currently, the competitive retail electric market in Ohio is in the development stage.CG&E is recovering its Public Utilities Commission of Ohio (PUCO) approved costs and retail electric rates are frozen during this market development period. See Note 18 for a discussion of key elements on Ohio deregulation.
PSI, an Indiana corporation, is a vertically integrated and regulated electric utility that provides service in north central, central, and southern Indiana.
The following table presents further information related to the operations of our domestic utility companies (our operating companies):
| | Principal Line(s) of Business | |
|---|---|---|
| CG&E and subsidiaries | • Generation, transmission, distribution, and sale of electricity • Sale and/or transportation of natural gas | |
PSI | • Generation, transmission, distribution, and sale of electricity | |
ULH&P | • Transmission, distribution, and sale of electricity • Sale and transportation of natural gas | |
Wholesale Energy is a holding company forCinergy's energy commodity businesses, including electric production, as the generation assets eventually become unbundled from the utility subsidiaries. See Note 18 for a discussion on Ohio deregulation. Cinergy Power Generation Services, LLC (Generation Services), a wholly-owned subsidiary of Wholesale Energy, provides electric production-
96
related construction, operation and maintenance services to certain affiliates and non-affiliated third parties.
Services is a service company that provides our subsidiaries with a variety of centralized administrative, management, and support services. Investments holds most of our domestic non-regulated, energy-related businesses and investments. Global Resources holds most of our international businesses and investments and directs our renewable energy investing activities (for example, wind farms). Technologies primarily holds our portfolio of technology-related investments.
We conduct operations through our subsidiaries and manage through the following three business units:
- •
- Energy Merchant Business Unit (Energy Merchant);
- •
- Regulated Businesses Business Unit (Regulated Businesses); and
- •
- Power Technology and Infrastructure Services Business Unit (Power Technology).
For further discussion of business units see Note 16.
(b) Presentation
Management makes estimates and assumptions when preparing financial statements under generally accepted accounting principles (GAAP). Actual results could differ, as these estimates and assumptions involve judgment. These estimates and assumptions affect various matters, including:
- •
- the reported amounts of assets and liabilities in our Balance Sheets at the dates of the financial statements;
- •
- the disclosure of contingent assets and liabilities at the dates of the financial statements; and
- •
- the reported amounts of revenues and expenses in our Statements of Income during the reporting periods.
Additionally, we have reclassified certain prior-year amounts in the financial statements ofCinergy,CG&E,PSI, andULH&P to conform to current presentation.
We use three different methods to report investments in subsidiaries or other companies: the consolidation method, the equity method, and the cost method.
(i) Consolidation Method
We use the consolidation method when we own a majority of the voting stock of or have the ability to control a subsidiary. We eliminate all significant intercompany transactions when we consolidate these accounts. Our consolidated financial statements include the accounts ofCinergy,CG&E, andPSI, and their wholly-owned subsidiaries.
(ii) Equity Method
We use the equity method to report investments, joint ventures, partnerships, subsidiaries, and affiliated companies in which we do not have control, but have the ability to exercise influence over operating and financial policies (generally, 20% to 50% ownership). Under the equity method we report:
- •
- our investment in the entity asInvestments in unconsolidated subsidiaries in our Consolidated Balance Sheets; and
- •
- our percentage share of the earnings from the entity asEquity in earnings (losses) of unconsolidated subsidiaries in our Consolidated Statements of Income.
97
(iii) Cost Method
We use the cost method to report investments, joint ventures, partnerships, subsidiaries, and affiliated companies in which we do not have control and are unable to exercise significant influence over operating and financial policies (generally, up to 20% ownership). Under the cost method we report our investments in the entity asOther investments in our Consolidated Balance Sheets.
(c) Regulation
Our operating companies and certain of our non-utility subsidiaries must comply with the rules prescribed by the SEC under the PUHCA. Our operating companies must also comply with the rules prescribed by the Federal Energy Regulatory Commission (FERC) and the state utility commissions of Ohio, Indiana, and Kentucky.
Our operating companies use the same accounting policies and practices for financial reporting purposes as non-regulated companies under GAAP. However, sometimes actions by the FERC and the state utility commissions result in accounting treatment different from that used by non-regulated companies. When this occurs, we apply the provisions of Statement of Financial Accounting Standards No. 71,Accounting for the Effects of Certain Types of Regulation (Statement 71). In accordance with Statement 71, we record regulatory assets and liabilities (expenses deferred for future recovery from customers or obligations to be refunded to customers) on our Balance Sheets.
Comprehensive electric deregulation legislation was passed in Ohio on July 6, 1999. As required by the legislation,CG&E filed its Proposed Transition Plan for approval by the PUCO on December 28, 1999. On August 31, 2000, the PUCO approved a stipulation agreement relating toCG&E's transition plan. This plan created a Regulatory Transition Charge (RTC), designed to recoverCG&E's generation-related regulatory assets and transition costs over a ten-year period which began January 1, 2001. Accordingly, Statement 71 was discontinued for the generation portion ofCG&E's business and Statement of Financial Accounting Standards No. 101,Regulated Enterprises—Accounting for the Discontinuation of Application of FASB Statement No. 71 was applied. The effect of this change to the financial statements was immaterial. Except with respect to the generation-related assets and liabilities ofCG&E, as of December 31, 2001,PSI,CG&E, andULH&P continue to meet the criteria of Statement 71. However, as other states implement deregulation legislation, the application of Statement 71 will need to be reviewed. Based on our operating companies' current regulatory orders and the regulatory environment in which they currently operate, the recovery of regulatory assets recognized in the accompanying Balance Sheets as of December 31, 2001, is probable. The effect of future discontinuance of Statement 71 on results of operations, cash flows, or statements of position cannot be determined until deregulation legislation plans have been approved by each state in which we do business. For a further discussion of Ohio deregulation see Note 18.
98
Our regulatory assets and amounts authorized for recovery through regulatory orders at December 31, 2001, and 2000, are as follows:
| | 2001 | 2000 | |||||||||||||||||
|---|---|---|---|---|---|---|---|---|---|---|---|---|---|---|---|---|---|---|---|
| | CG&E(1) | PSI | Cinergy | CG&E(1) | PSI | Cinergy | |||||||||||||
| | (in millions) | ||||||||||||||||||
| Amounts due from customers — income taxes(2) | $ | 57 | $ | 5 | $ | 62 | $ | 53 | $ | 20 | $ | 73 | |||||||
| Gasification services agreement buyout costs(3) | — | 244 | 244 | — | 251 | 251 | |||||||||||||
| Post-in-service carrying costs and deferred operating expenses | — | 39 | 39 | — | 41 | 41 | |||||||||||||
| Coal contract buyout cost(4) | — | 26 | 26 | — | 53 | 53 | |||||||||||||
| Deferred demand-side management costs | — | 9 | 9 | — | — | — | |||||||||||||
| Deferred merger costs | 6 | 56 | 62 | 7 | 60 | 67 | |||||||||||||
| Unamortized costs of reacquiring debt | 10 | 33 | 43 | 11 | 31 | 42 | |||||||||||||
| Coal gasification services expenses | — | 8 | 8 | — | 12 | 12 | |||||||||||||
| RTC recoverable assets(5) | 511 | — | 511 | 432 | — | 432 | |||||||||||||
| Other | 9 | 3 | 12 | — | 6 | 6 | |||||||||||||
| Total regulatory assets | $ | 593 | $ | 423 | $ | 1,016 | $ | 503 | $ | 474 | $ | 977 | |||||||
| Authorized for recovery(6) | $ | 573 | $ | 379 | $ | 952 | $ | 494 | $ | 404 | $ | 898 | |||||||
- (1)
- Includes $8 million at December 31, 2001, and $10 million at December 31, 2000, related toULH&P. Of these amounts, $.6 million at December 31, 2001, and $3.4 million at December 31, 2000, have been authorized for recovery.
- (2)
- The various regulatory commissions overseeing the regulated business operations of our operating companies regulate income tax provisions reflected in customer rates. In accordance with the provisions of Statement 71, we have recorded net regulatory assets forCG&E andPSI and a regulatory liability forULH&P.
- (3)
- PSI reached an agreement with Dynegy, Inc. to purchase the remainder of its 25-year contract for coal gasification services. In accordance with an order from the Indiana Utility Regulatory Commission (IURC),PSI began recovering this asset over an 18-year period that commenced upon the termination of the gas services agreement in 2000.
- (4)
- In August 1996,PSI entered into a coal supply agreement, which expired December 31, 2000. The agreement provided for a buyout charge, which is being recovered through the fuel adjustment clause through December 2002.
- (5)
- In August 2000,CG&E's deregulation transition plan was approved. Effective January 1, 2001, a RTC went into effect and provides for recovery of all then existing generation-related regulatory assets and various transition costs over a ten-year period. Because a separate charge provides for recovery, these assets were aggregated and are included as a single amount in this presentation. The classification of all transmission and distribution related regulatory assets has remained the same.
- (6)
- At December 31, 2001, these amounts were being recovered through rates charged to customers over a period ranging from 1 to 22 years forCG&E, 1 to 32 years forPSI, and 1 to 19 years forULH&P.
(d) Statements of Cash Flows
We defineCash equivalents as investments with maturities of three months or less when acquired.
99
(e) Operating Revenues and Fuel Costs
Our operating companies recordOperating revenues for electric and gas service, including unbilled revenues and the associated expenses, when they provide the service to the customers. The associated expenses include:
- •
- fuel used to generate electricity;
- •
- electricity purchased from others;
- •
- natural gas purchased from others; and
- •
- transportation costs associated with the purchase of fuel, electricity, and natural gas.
These expenses are shown in our Statements of Income ofCinergy,CG&E, andPSI asFuel and purchased and exchanged power andGas purchased. These expenses are shown inULH&P's Statements of Income asElectricity purchased from parent for resale andGas purchased. Any portion of these costs that are recoverable or refundable to customers in future periods is deferred in eitherAccounts receivable orAccounts payable in our Balance Sheets.
Indiana law limits the amount of fuel costs thatPSI can recover to an amount that will not result in earning a return in excess of that allowed by the IURC. Due to deregulation in the state of Ohio, the recovery of fuel costs in retail rates has been frozen.
(f) Property, Plant, and Equipment
Property, plant, and equipment includes the utility and non-regulated business property and equipment that is in use, being held for future use, or under construction. We report ourProperty, plant, and equipment at its original cost, which includes:
- •
- materials;
- •
- salaries;
- •
- payroll taxes;
- •
- fringe benefits;
- •
- financing costs of funds used during construction (described below in (h) and (i)); and
- •
- other miscellaneous amounts.
In August 2000, the generation assets ofCG&E were released from the first mortgage indenture lien.CG&E's transmission assets, distribution assets, and any generating assets added after August 2000, remain subject to the lien of the first mortgage bond indenture. The utility property ofPSI is also subject to the lien of its first mortgage bond indenture.
(g) Depreciation
We determine the provisions for depreciation expense using the straight-line method. The depreciation rates are based on periodic studies of the estimated useful lives (the number of years we expect to be able to use the properties) and the net cost to remove the properties. The average
100
depreciation rates forProperty, plant, and equipment, excluding software, are presented in the table below.
| | 2001 | 2000 | 1999 | |||||
|---|---|---|---|---|---|---|---|---|
| Cinergy | ||||||||
| Non-regulated(1) | 4.2 | % | — | % | — | % | ||
CG&E and subsidiaries | ||||||||
| Electric | 2.5 | 2.6 | 2.9 | (2) | ||||
| Gas | 2.9 | 2.9 | 2.9 | |||||
| Common | 2.9 | 3.3 | 2.7 | |||||
| Non-regulated electric generation | 3.2 | 3.1 | — | |||||
PSI | 3.0 | 3.0 | 3.0 | |||||
ULH&P | ||||||||
| Electric | 3.2 | 3.3 | 3.3 | |||||
| Gas | 3.2 | 3.1 | 3.1 | |||||
| Common | 5.0 | 5.1 | 5.2 | |||||
- (1)
- ExcludingCG&E's electric generation. Amounts in 1999 and 2000 were immaterial.
- (2)
- Prior to Ohio deregulation in 2000, electric generation was included in the electric line item.
(h) Allowance for Funds Used During Construction (AFUDC)
Our operating companies finance construction projects with borrowed funds and equity funds. Regulatory authorities allow us to record the costs of these funds as part of the cost of construction projects. AFUDC is calculated using a methodology authorized by the regulatory authorities. AFUDC rates are compounded semi-annually and are as follows:
| | 2001 | 2000 | 1999 | ||||
|---|---|---|---|---|---|---|---|
| Cinergy average | 7.4 | % | 8.0 | % | 7.3 | % | |
| CG&E and subsidiaries average | 8.6 | 8.4 | 8.0 | ||||
| PSI average | 7.1 | 7.4 | 6.5 | ||||
| ULH&P average | 5.7 | 6.6 | 5.3 |
The borrowed funds component of AFUDC, which is recorded on a pre-tax basis, was as follows:
| | 2001 | 2000 | 1999 | ||||||
|---|---|---|---|---|---|---|---|---|---|
| | (in millions) | ||||||||
| Cinergy | $ | 8.4 | $ | 8.2 | $ | 5.6 | |||
| CG&Eand subsidiaries | 1.0 | 5.0 | 3.4 | ||||||
| PSI | 7.4 | 3.2 | 2.2 | ||||||
| ULH&P | 0.2 | 0.4 | 0.2 | ||||||
With the deregulation ofCG&E's generation assets, the AFUDC method is no longer used to capitalize the cost of funds used during generation-related construction atCG&E. See (i) below for a discussion of capitalized interest.
101
Cinergy capitalizes interest costs for non-regulated construction projects in accordance with Statement of Financial Accounting Standards No. 34,Capitalization of Interest Cost (Statement 34). The primary differences from AFUDC are that Statement 34 methodology does not include a component for equity funds and does not emphasize short-term borrowings over long-term borrowings. Capitalized interest costs, which are recorded on a pre-tax basis, were $7.1 million and $5.5 million forCinergy andCG&E, respectively, for the year ended December 31, 2001. Capitalized interest costs for the years 1999 and 2000 were immaterial.
(j) Federal and State Income Taxes
Statement of Financial Accounting Standards No. 109,Accounting for Income Taxes, requires an asset and liability approach for financial accounting and reporting of income taxes. The tax effects of differences between the financial reporting and tax basis of accounting are reported asDeferred income tax assets orliabilities in our Balance Sheets and are based on currently enacted income tax rates.
Investment tax credits, which have been used to reduce our federal income taxes payable, have been deferred for financial reporting purposes. These deferred investment tax credits are being amortized over the useful lives of the property to which they are related. For a further discussion of income taxes see Note 12.
(k) Energy Marketing and Trading
We market and trade electricity, natural gas, and other energy-related products. We designate transactions as physical or trading at the time they are originated. Physical refers to our intent and projected ability to fulfill substantially all obligations from company-owned assets. We sell generation to third parties when it is not required to meet native load requirements (end-use customers within our public utility companies' franchise service territory). All other energy contracts (including most natural gas contracts) are classified as trading. We account for physical transactions on a settlement basis and trading transactions using the mark-to-market method of accounting, consistent with our application of Emerging Issues Task Force (EITF) 98-10,Accounting for Contracts Involved in Energy Trading and Risk Management Activities. To the extent that physical transactions constitute derivatives under Statement of Financial Accounting Standards No. 133,Accounting for Derivatives and Hedging Activities, (Statement 133), we typically utilize the normal purchases and sales exemption when the criteria for the application of the normal exemption are met, the most critical criterion being probability of delivery under the contract. Should we determine that delivery under a previously exempted contract is no longer probable, that contract would be recognized at fair value and subsequently marked to market. To the extent trading transactions constitute derivatives under Statement 133, we typically do not attempt to identify them as a hedging instrument.
Under the mark-to-market method of accounting, trading transactions are shown at fair value in our Balance Sheets asEnergy risk management assets andEnergy risk management liabilities. We reflect changes in fair value resulting in unrealized gains and losses inFuel and purchased and exchanged power andGas purchased on our Statements of Income. We record the revenues and costs for all transactions in our Statements of Income when the contracts are settled. We recognize revenues inOperating revenues; costs are recorded inFuel and purchased and exchanged power andGas purchased.
Although we intend to settle physical electricity contracts with company-owned generation, occasionally we settle these contracts with power purchased on the open trading markets. The cost of these purchases could be in excess of the associated revenues. We recognize the gains or losses on these transactions as the power is delivered. Due to the infrequency of such settlements, both historical and projected, and the fact that physical power settlement to the customer still occurs, we continue to
102
apply the normal purchases and sales exemption to such physical contracts that constitute derivatives. Open market purchases may occur for the following reasons:
- •
- generating station outages;
- •
- least-cost alternative;
- •
- native load requirements; and
- •
- extreme weather.
We value contracts in the trading portfolio using end-of-the-period market prices, utilizing the following factors (as applicable):
- •
- closing exchange prices (that is, closing prices for standardized electricity and natural gas products traded on an organized exchange, such as the New York Mercantile Exchange);
- •
- broker-dealer and over-the-counter price quotations; and
- •
- model pricing (which considers time value and historical volatility factors of electricity and natural gas).
We anticipate that some of the electricity obligations, even though considered trading contracts, will ultimately be settled using company-owned generation. The cost of this generation is usually below the market price at which the trading portfolio has been valued. The potential for earnings volatility from period to period is increased due to the risks associated with marketing and trading electricity, natural gas, and other energy-related products.
Throughout 2001, our natural gas trading volumes increased substantially. Because of this volume change and the potential volatility of gas prices, our risk exposure to these markets has increased. However, we continue to employ value-at-risk analysis and other methodologies to mitigate our risks in all trading operations, including natural gas trading.
We are in the process of evaluating the feasibility of coal marketing as a commercial activity. While our review of establishing a dedicated commercial activity is ongoing, we executed a small number of sales contracts in the fourth quarter of 2001. These contracts were entered into primarily to balance forecasted supply and demand in 2002 as we had some coal under option, accounted for at fair value, that our forecast indicated would not be internally consumed. Since option contracts cannot utilize the normal exemption (see Note 1(m)(iii) for certain exceptions to this rule), the coal from this option was designated to source these sales contracts. We have concluded that these sales contracts meet the definition of a derivative and are therefore accounted for at fair value. Should coal begin to be marketed in 2002 under a formal commercial activity, it is likely that the volume of coal transactions accounted for under mark-to-market could increase substantially. Since we are still evaluating the viability of this as a commercial activity, the impact to either our financial position or results of operations cannot be determined at this time.
(l) Financial Derivatives
We use derivative financial instruments to manage:
- •
- funding costs;
- •
- exposure to fluctuations in interest rates; and
- •
- exposure to foreign currency exchange rates.
We account for derivatives under Statement 133, which requires all derivatives that are not exempted to be accounted for at fair value. Changes in the derivative's fair value must be recognized currently in earnings unless specific hedge accounting criteria are met. Gains and losses on derivatives
103
that qualify as hedges can (a) offset related fair value changes on the hedged item in the income statement for fair value hedges; or (b) be recorded in other comprehensive income for cash flow hedges. To qualify for hedge accounting, financial instruments must be designated as a hedge (for example, an offset of foreign exchange or interest rate risks) at the inception of the contract and must be effective at reducing the risk associated with the hedged item. Accordingly, changes in the fair values or cash flows of instruments designated as hedges must be highly correlated with changes in the fair values or cash flows of the related hedged items.
From time to time, we may use foreign currency contracts (for example, a contract obligating one party to buy, and the other to sell, a specified quantity of a foreign currency for a fixed price at a future date) and currency swaps (for example, a contract whereby two parties exchange principal and interest cash flows denominated in different currencies) to hedge foreign currency denominated purchase and sale commitments (cash flow hedges) and certain of our net investments in foreign operations (net investment hedges) against currency exchange rate fluctuations. Reclassification of unrealized gains or losses on foreign currency cash flow hedges from other comprehensive income occurs when the underlying hedged item is recorded in income.
We also use interest rate swaps (an agreement by two parties to exchange fixed-interest rate cash flows for floating-interest rate cash flows). Through December 31, 2000, we utilized the accrual method to account for these interest rate swaps. Accordingly, gains and losses were calculated based on the current period difference between the fixed-rate and the floating-rate interest amounts, using agreed upon notional amounts. These gains and losses were recognized in our Statements of Income as a component ofInterest over the life of the agreement. Effective with our adoption of Statement 133 in the first quarter of 2001, we began accounting for interest rate swaps using fair value accounting and are assessing the effectiveness of any swaps used in hedging activities. At December 31, 2001, the fair value, and ineffectiveness, of instruments that we have classified as fair value or cash flow hedges of debt instruments was not material. Reclassification of unrealized gains or losses on cash flow hedges of variable-rate debt instruments from other comprehensive income occurs as interest payments are accrued on the debt instrument. See Note 1(m)(iii) below for further discussion of Statement 133.
(m) Accounting Changes
(i) Business Combinations and Intangible Assets
In June 2001, the Financial Accounting Standards Board (FASB) issued Statement of Financial Accounting Standards No. 141,Business Combinations (Statement 141), and No. 142,Goodwill and Other Intangible Assets (Statement 142). Statement 141 requires all business combinations initiated after June 30, 2001, to be accounted for using the purchase method. With the adoption of Statement 142, goodwill and other intangibles with indefinite lives will no longer be subject to amortization. Goodwill will be initially assessed for impairment shortly after adoption and at least annually thereafter by applying a fair-value-based test, as opposed to the undiscounted cash flow test applied under current accounting standards. This test must be applied at the "reporting unit" level, which is not permitted to be broader than the current business segments discussed in Note 16. Under Statement 142, an acquired intangible asset should be separately recognized if the benefit of the intangible asset is obtained through contractual or other legal rights, or if the intangible asset can be sold, transferred, licensed, rented, or exchanged, regardless of the acquirer's intent to do so. We began applying Statement 141 in the third quarter of 2001 and we will adopt Statement 142 in the first quarter of 2002. The discontinuance of amortization of goodwill beginning in the first quarter of 2002 will not be material to our results of operations. We have identified the reporting units forCinergy and are in the process of performing the initial impairment test. Preliminary estimates indicate that the effects of this test will not be material to our results of operations.
104
(ii) Asset Retirement Obligations
In July 2001, the FASB issued Statement of Financial Accounting Standards No. 143,Accounting for Asset Retirement Obligations (Statement 143). Statement 143 requires fair value recognition of legal obligations to retire long-lived assets at the time such obligations are incurred. The initial recognition of this liability will be accompanied by a corresponding increase in property, plant, and equipment. Subsequent to the initial recognition, the liability will be adjusted for any revisions to the expected cash flows of the retirement obligation (with corresponding adjustments to property, plant, and equipment), and for accretion of the liability due to the passage of time (recognized as an operation expense). Additional depreciation expense will be recorded prospectively for any property, plant, and equipment increases. We currently accrue costs of removal on many regulated, long-lived assets through depreciation expense, with a corresponding charge to accumulated depreciation, as allowed by each regulatory jurisdiction. For assets that we conclude have a retirement obligation under Statement 143, the accounting we currently use will be modified to comply with this standard. We will adopt Statement 143 in the first quarter of 2003. We are beginning to analyze the impact of this statement, but, at this time, we are unable to predict whether the implementation of this accounting standard will be material to our financial position or results of operations.
(iii) Derivatives
During 1998, the FASB issued Statement 133. This standard was effective forCinergy beginning in 2001, and requires us to record derivative instruments which are not exempt under certain provisions of Statement 133 as assets or liabilities, measured at fair value (i.e., mark-to-market). Our financial statements reflect the adoption of Statement 133 in the first quarter of 2001. Since many of our derivatives were previously required to use mark-to-market accounting, the effects of implementation were not material.
Our adoption did not reflect the potential impact of applying mark-to-market accounting to selected electricity options and capacity contracts. We had not historically marked these instruments to market because they are intended as either hedges of peak period exposure or sales contracts served with physical generation, neither of which were considered trading activities. At adoption, we classified these contracts as normal purchases or sales based on our interpretation of Statement 133 and in the absence of definitive guidance on such contracts. In June 2001, the FASB staff issued guidance on the application of the normal purchases and sales exemption to electricity contracts containing characteristics of options. While much of the criteria this guidance requires is consistent with the existing guidance in Statement 133, some criteria were added. We adopted the new guidance in the third quarter of 2001, and the effects of implementation for these contracts were not material. We will continue to apply this guidance to any new electricity contracts that meet the definition of a derivative.
In October 2001, the FASB staff posted revised guidance on the normal purchases and sales exemption for these contracts. This revised guidance proposed changes in certain quantitative criteria that were critical to determining whether or not a contract with option characteristics qualified for the normal exemption. In December 2001, the FASB staff again revised this guidance to make the changes proposed by the October guidance more qualitative than quantitative. This new guidance uses several factors to distinguish between capacity contracts, which qualify for the normal purchases and sales exemption, and options, which do not. These factors include deal tenor, pricing structure, specification of the source of power, and various other factors. Based on a review of existing contracts, we do not believe this revised guidance, which will be effective in the third quarter of 2002, will have a material impact on our financial position or results of operations upon adoption. However, given our activity in energy trading, it could increase volatility in future results.
In October 2001, the FASB staff released final guidance on the applicability of the normal purchases and sales exemption to contracts that contain a minimum quantity (a forward component) and flexibility to take additional quantity (an option component). While this guidance was issued
105
primarily to address optionality in fuel supply contracts, it is applicable to all derivatives (subject to certain exceptions for capacity contracts in electricity discussed in the previous paragraphs). This guidance concludes that such contracts are not eligible for the normal purchases and sales exemption due to the existence of optionality in the contract.Cinergy has certain contracts that contain optionality, primarily coal contracts, for which the accounting may be impacted by this new guidance. We will adopt this guidance in the second quarter of 2002, consistent with the transition provisions. We have begun analyzing contracts to determine the applicability of this guidance and to determine the interaction between this guidance and Statement 71. Due to a lack of liquidity with respect to coal purchased under certain contracts, some of our contracts may fail to meet the net settlement criteria of Statement 133, which would preclude such contracts from being considered derivatives. For other possibly affected contracts, we are evaluating the potential for contract restructuring prior to the adoption of this new guidance. To the extent this restructuring results in separate forwards and options, we would plan to apply the normal exemption to the forwards. The options would either be accounted for as cash flow hedges, to the extent all criteria were met, or marked to market similar to all other energy trading contracts. Given these evaluations are ongoing, we are unable to predict whether the implementation of this accounting standard will be material to our results of operations or financial position.
(iv) Asset Impairment
In August 2001, the FASB issued Statement of Financial Accounting Standards No. 144,Accounting for the Impairment of Long-Lived Assets (Statement 144). Statement 144 addresses accounting and reporting for the impairment or disposal of long-lived assets. It supersedes previous guidance on (a) accounting for the impairment or disposal of long-lived assets and (b) accounting and reporting for the disposal of a segment of a business (commonly known as discontinued operations). While Statement 144 incorporates many of the impairment tests and criteria from previous guidance, it does include additional guidance and resolution of inconsistencies and overlaps with other pronouncements. These include adding clarity around when assets are considered held for disposal (which requires an immediate impairment charge if fair value is less than book value) and requiring the use of one accounting model for long-lived assets to be disposed of. We will begin applying Statement 144 in the first quarter of 2002. The impact of implementation on our results of operations and financial position is expected to be immaterial.
(n) Translation of Foreign Currency
We translate the assets and liabilities of foreign subsidiaries, whose functional currency (generally, the local currency of the country in which the subsidiary is located) is not the United States (U.S.) dollar, using the appropriate exchange rate as of the end of the year. We translate income and expense items using the average exchange rate prevailing during the month the respective transaction occurs. We record translation gains and losses inAccumulated other comprehensive income (loss), which is a component of common stock equity.
(o) Related Party Transactions
Cinergy and its subsidiaries engage in related party transactions. These transactions are generally performed at cost and in accordance with the SEC regulations under the PUHCA. The Balance Sheets of our operating companies reflect amounts payable to and/or receivable from related parties asAccounts payable to affiliated companies andAccounts receivable from affiliated companies. The significant related party transactions are disclosed below.
106
Services provides our regulated and non-regulated subsidiaries with a variety of centralized administrative, management, and support services in accordance with agreements approved by the SEC under the PUHCA. The cost of these services are charged to our operating companies on a direct basis or, for general costs which cannot be directly attributed, based on predetermined allocation factors, including the following ratios:
- •
- sales;
- •
- electric peak load;
- •
- number of employees;
- •
- number of customers;
- •
- construction expenditures; and
- •
- other statistical information.
These costs were as follows for the years ended December 31:
| | 2001 | 2000 | 1999 | ||||||
|---|---|---|---|---|---|---|---|---|---|
| | (in millions) | ||||||||
| Cinergy(1) | $ | 483 | $ | 479 | $ | 416 | |||
| CG&E and subsidiaries | 240 | 250 | 208 | ||||||
| PSI | 196 | 187 | 168 | ||||||
| ULH&P | 24 | 25 | 23 | ||||||
- (1)
- The results ofCinergyalso include amounts related to non-registrants.
Generation Services, which began operations on January 1, 2001, supplies electric production-related construction, operation and maintenance services to certain of our subsidiaries pursuant to agreements approved by the SEC under the PUHCA.
The cost of these services were as follows for the year ended December 31, 2001:
| | 2001 | ||
|---|---|---|---|
| | (in millions) | ||
| Cinergy(1) | $ | 92 | |
| CG&E | 67 | ||
| PSI | 21 | ||
- (1)
- The results ofCinergyalso include amounts related to non-registrants.
ULH&P purchases energy fromCG&E pursuant to a new contract effective January 1, 2002, which was approved by the FERC and the Kentucky Public Service Commission (KPSC). This five-year agreement is a negotiated fixed-rate contract withCG&E and replaces the previous cost-of-service based contract, which expired on December 31, 2001.
ULH&P purchased energy fromCG&E for resale in the amounts of $152 million, $160 million, and $159 million for the years ended 2001, 2000, and 1999, respectively.
Cinergy Corp. and our operating companies participate in a money pool arrangement by which those companies with surplus cash provide short-term loans to others. For a further discussion on the money pool agreement see Note 6.
107
2. Common Stock
(a) Changes In Common Stock Outstanding
The following table reflects information related to shares of common stock issued for stock-based plans.
| | Newly Issued Shares Used to Grant or Settle Awards | |||||
|---|---|---|---|---|---|---|
| | 2001 | 2000 | 1999 | |||
| Cinergy Corp. 1996 Long-term Incentive Compensation Plan (LTIP) | 64,851 | — | — | |||
| Cinergy Corp. Stock Option Plan (SOP) | 197,957 | 77,042 | 255,828 | |||
| Cinergy Corp. Employee Stock Purchase and Savings Plan | 1,504 | 208 | 266 | |||
| Cinergy Corp. UK Sharesave Scheme | 121 | — | — | |||
| Cinergy Corp. Retirement Plan for Directors | — | — | — | |||
| Cinergy Corp. Directors' Equity Compensation Plan | — | — | — | |||
| Cinergy Corp. Directors' Deferred Compensation Plan | — | — | — | |||
| Cinergy Corp. 401(k) Plans | 69,500 | — | — | |||
| Cinergy Corp. Direct Stock Purchase and Dividend Reinvestment Plan | 173,984 | — | — | |||
| Cinergy Corp. Performance Shares Plan | — | — | 34,550 | |||
| Cinergy Corp. Union Employees' Savings Incentive Plan | — | — | — | |||
We retired 72,739 shares of common stock in 2001; 32,988 shares in 2000; and 31,777 shares in 1999, mainly representing shares tendered as payment for the exercise of previously granted stock options.
In April of 2001,Cinergy adopted the Direct Stock Purchase and Dividend Reinvestment Plan, a plan designed to provide investors with a convenient method to purchase shares ofCinergy Corp. common stock and to reinvest cash dividends in the purchase of additional shares. This plan replaced the Dividend Reinvestment and Stock Purchase Plan.
In November 2001,Cinergy chose to reinstitute the practice of issuing newCinergy Corp. common shares to satisfy obligations under its various employee stock plans and theCinergy Corp. Direct Stock Purchase and Dividend Reinvestment Plan. This replaces our previous practice of purchasing shares in the open market to fulfill certain plan obligations.
In January 2002,Cinergy registered 100,000 shares of common stock under theCinergy Corp. 401(k) Excess Plan.
Cinergy Corp. owns all of the common stock ofCG&E andPSI. All ofULH&P's common stock is held byCG&E.
(b) Dividend Restrictions
Cinergy Corp.'s ability to pay dividends to holders of its common stock is principally dependent on the ability ofCG&E andPSI to payCinergy Corp. common dividends.Cinergy Corp.,CG&E, andPSI cannot pay dividends on their common stock if preferred stock dividends or preferred trust dividends are in arrears. The amount of common stock dividends that each company can pay is also limited by certain capitalization and earnings requirements underCG&E's andPSI's credit instruments. Currently, these requirements do not impact the ability of either company to pay dividends on its common stock.
(c) Stock-based Compensation Plans
We currently have the following stock-based compensation plans:
- •
- LTIP;
108
- •
- SOP;
- •
- Employee Stock Purchase and Savings Plan;
- •
- UK Sharesave Scheme;
- •
- Retirement Plan for Directors;
- •
- Directors' Equity Compensation Plan; and
- •
- Directors' Deferred Compensation Plan.
The LTIP, the SOP, and the Employee Stock Purchase and Savings Plan are discussed below. The activity in 2001, 2000, and 1999 for the remaining stock-based compensation plans was not significant.
We account for our stock-based compensation plans under Accounting Principles Board Opinion No. 25,Accounting for Stock Issued to Employees. In 2001, 2000, and 1999, we recognized compensation cost related to stock-based compensation plans, before income taxes, of $12.5 million, $12.8 million, and $(7) million, respectively, in the Statements of Income. The $7 million reduction in 1999 was a result of our revised estimates for the performance-based shares accrued under the LTIP plan for Performance Cycle (Cycle) I. These amounts primarily reflect compensation cost related to the LTIP performance-based shares. For further discussion see section (i) below.
Net income, assuming compensation cost for these plans had been determined at fair value, consistent with the provisions of Statement of Financial Accounting Standards No. 123,Accounting for Stock-Based Compensation (Statement 123), would have been decreased by $4.4 million for 2001, $4.0 million for 2000, and $2.6 million for 1999. Earnings per common share (EPS) would have been decreased by $.03 for both basic EPS and earnings per common share assuming dilution (EPS—assuming dilution) for 2001, $.03 for both basic and EPS—assuming dilution for 2000, and $.02 for both basic and EPS—assuming dilution for 1999.
In estimating the pro forma amounts, the fair value method of accounting was not applied to options granted prior to January 1, 1995. This is in accordance with the provisions of Statement 123. As a result, the pro forma effect on net income and EPS may not be representative of future years. In addition, the pro forma amounts reflect certain assumptions used in estimating fair values. These fair value assumptions are described, as applicable, below.
(i) LTIP
The LTIP was originally adopted in 1996. Under this plan, certain key employees may be granted stock options and the opportunity to earn performance-based shares. Stock options are granted to participants with an option price equal to the fair market value on the grant date and a vesting period of either three or five years. The vesting period begins on the grant date and all options expire ten years from that date. The number of shares of common stock issuable under the LTIP is limited to a total of 7,000,000 shares.
Entitlement to performance-based shares is based onCinergy's Total Shareholder Return (TSR) over designated Cycles as measured against a peer group. Target grants of performance-based shares were made for the following Cycles:
| Cycle | Grant Date | Performance Period | Target Grant of Shares | |||
|---|---|---|---|---|---|---|
| | | | (in thousands) | |||
| IV | 1/2000 | 2000-2002 | 359 | |||
| V | 1/2001 | 2001-2003 | 315 | |||
| VI | 1/2002 | 2002-2004 | 342 |
109
Participants may earn additional performance shares ifCinergy's TSR exceeds that of the peer group. For the 2000-2001 performance period (Cycle III), 372,149 shares were earned, based on a TSR of 140%.
(ii) SOP
The SOP is designed to align executive compensation with shareholder interests. Under the SOP, incentive and non-qualified stock options, stock appreciation rights (SARs), and SARs in tandem with stock options may be granted to key employees, officers, and outside directors. The activity under this plan has predominantly consisted of the issuance of stock options. Options are granted with an option price equal to the fair market value of the shares on the grant date. Options generally vest over five years at a rate of 20% per year, beginning on the grant date, and expire ten years from the grant date. The total number of shares of common stock issuable under the SOP may not exceed 5,000,000 shares. No stock options may be granted under the plan after October 24, 2004.
(iii) Employee Stock Purchase and Savings Plan
The Employee Stock Purchase and Savings Plan allows essentially all full-time, regular employees to purchase shares of common stock pursuant to a stock option feature. Under the Employee Stock Purchase and Savings Plan, after-tax funds are withheld from a participant's compensation during a 26-month offering period and are deposited in an interest-bearing account. At the end of the offering period, participants may apply amounts deposited in the account, plus interest, toward the purchase of shares of common stock. The purchase price is equal to 95% of the fair market value of a share of common stock on the first date of the offering period. Any funds not applied toward the purchase of shares are returned to the participant. A participant may elect to terminate participation in the plan at any time. Participation also will terminate if the participant's employment ceases. Upon termination of participation, all funds, including interest, are returned to the participant without penalty. The sixth (current) offering period began May 1, 2001, and ends June 30, 2003. The purchase price for all shares under this offering is $32.78. The fifth offering period ended April 30, 2001, with 227,968 shares purchased and the remaining cash distributed to the respective participants. The total number of shares of common stock issuable under the Employee Stock Purchase and Savings Plan may not exceed 2,000,000.
110
Activity for 2001, 2000, and 1999 for the LTIP, SOP, and Employee Stock Purchase and Savings Plan is summarized as follows:
| | LTIP and SOP | Employee Stock Purchase and Savings Plan | |||||||||
|---|---|---|---|---|---|---|---|---|---|---|---|
| | Shares Subject to Option | Weighted Average Exercise Price | Shares Subject to Option | Weighted Average Exercise Price | |||||||
| Balance at December 31, 1998 | 3,676,514 | $ | 28.28 | 297,374 | $ | 31.83 | |||||
Options granted | 2,866,100 | 25.41 | 368,889 | 27.73 | |||||||
| Options exercised | (259,865 | ) | 21.51 | (266 | ) | 31.83 | |||||
| Options forfeited | (95,500 | ) | 31.97 | (306,692 | ) | 31.70 | |||||
| Balance at December 31, 1999 | 6,187,249 | 27.17 | 359,305 | 27.73 | |||||||
Options granted | 1,329,800 | 24.59 | — | — | |||||||
| Options exercised | (123,978 | ) | 23.50 | (2,718 | ) | 27.73 | |||||
| Options forfeited | (402,200 | ) | 26.68 | (76,261 | ) | 27.73 | |||||
| Balance at December 31, 2000 | 6,990,871 | 26.77 | 280,326 | 27.73 | |||||||
Options granted | 811,700 | 33.90 | 299,793 | 32.78 | |||||||
| Options exercised | (275,393 | ) | 24.39 | (227,968 | ) | 27.73 | |||||
| Options forfeited | (79,400 | ) | 27.29 | (73,826 | ) | 29.20 | |||||
| Balance at December 31, 2001 | 7,447,778 | $ | 27.63 | 278,325 | $ | 32.78 | |||||
| Options Exercisable(1): | |||||||||||
| At December 31, 1999 | 1,986,749 | $ | 25.17 | ||||||||
| At December 31, 2000 | 3,195,191 | $ | 26.20 | ||||||||
| At December 31, 2001 | 3,763,558 | $ | 27.32 | ||||||||
- (1)
- The options under the Employee Stock Purchase and Savings Plan are only exercisable at the end of the offering period.
The weighted average fair value of options granted under the combined LTIP and the SOP plans was $5.42 in 2001, $2.75 in 2000, and $2.60 in 1999. The weighted average fair value of options granted under the Employee Stock Purchase and Savings Plan was $5.85 in 2001, and $3.89 in 1999 (no options were granted in 2000). The fair values of options granted were estimated as of the grant date using the Black-Scholes option-pricing model and the following assumptions:
| | LTIP and SOP | Employee Stock Purchase and Savings Plan(1) | |||||||||
|---|---|---|---|---|---|---|---|---|---|---|---|
| | 2001 | 2000 | 1999 | 2001 | 1999 | ||||||
| Risk-free interest rate | 4.78 | % | 6.57 | % | 5.86 | % | 4.22 | % | 4.98 | % | |
| Expected dividend yield | 5.42 | % | 7.32 | % | 7.13 | % | 5.26 | % | 6.17 | % | |
| Expected lives | 5.37 | yrs. | 4.86 | yrs. | 6.55 | yrs. | 2.17 | yrs. | 2.17 | yrs. | |
| Expected volatility | 25.01 | % | 20.18 | % | 19.42 | % | 30.67 | % | 22.79 | % | |
- (1)
- Options were not granted under the Employee Stock Purchase and Savings Plan in 2000.
111
Price ranges, along with certain other information, for options outstanding under the combined LTIP and SOP plan at December 31, 2001, were as follows:
| | Outstanding | Exercisable | ||||||||
|---|---|---|---|---|---|---|---|---|---|---|
| Exercise Price Range | Number of Shares | Weighted Average Exercise Price | Weighted Average Remaining Contractual Life | Number of Shares | Weighted Average Exercise Price | |||||
| $17.35 — $23.81 | 2,885,473 | $23.55 | 6.64 yrs. | 1,674,393 | $23.37 | |||||
| $23.88 — $32.65 | 2,489,905 | $25.67 | 6.23 yrs. | 1,089,165 | $25.24 | |||||
| $33.50 — $38.59 | 2,072,400 | $35.67 | 6.87 yrs. | 1,000,000 | $36.19 | |||||
(d) Director, Officer, and Key Employee Stock Purchase Program
In December 1999,Cinergy Corp. adopted the Director, Officer, and Key Employee Stock Purchase Program (the Program). The purpose of the Program is to facilitate the purchase and ownership ofCinergy Corp.'s common stock by its directors, officers, and key employees, thereby further aligning their interests with those of its shareholders.
In February 2000,Cinergy Corp. purchased approximately 1.6 million shares of common stock on behalf of the participants at an average price of $24.82 per share.
Participants had the option of financing the purchases through a five-year credit facility arranged byCinergy Corp. with a bank. Each participant is obligated to repay the bank any loan principal, interest, and prepayment fees, and each has assigned his or her dividend rights on the purchased shares to the bank to be applied to interest payments as due on the loan.
Services, and in part,Cinergy Corp., have guaranteed repayment to the bank of 100% of each participant's loan obligations and the associated interest, and each participant has agreed to indemnify the guarantor for any payments made by it under the guaranty on the participant's behalf. A participant's obligations to the bank are unsecured and no restrictions are placed on the participant's ability to sell, pledge, or otherwise encumber or dispose of his or her purchased shares.
(e) Stock Purchase Contracts
In December 2001,Cinergy Corp. issued approximately $316 million notional amount of combined securities, a component of which was stock purchase contracts. These contracts obligate the holder to purchase common shares ofCinergy Corp. stock on or before February 2005. The number of shares to be issued is contingent upon the market price ofCinergy Corp. stock, but subject to predetermined ceiling and floor prices. See Note 4 for further discussion of these securities.
3. Change in Preferred Stock of Subsidiaries
In 2000,PSI redeemed 289,250 shares of its $100 par value, 6.875% Series preferred stock for $29 million. All other preferred stock redemptions from 1999 to 2001 were immaterial forCG&E andPSI. Refer to the Statements of Capitalization ofCG&E andPSI for detailed information on preferred stock.
4. Preferred Trust Securities
In December 2001,Cinergy Corp. issued approximately $316 million notional amount of combined securities consisting of (a) 6.9% preferred trust securities, due February 2007, and (b) stock purchase contracts obligating the holders to purchase between 9.2 and 10.8 million shares ofCinergy Corp. common stock on or before February 2005. A $50 preferred trust security and stock purchase contract were sold together as a single security unit (Unit). The proceeds of $306 million, which is net of
112
approximately $10 million of issuance costs, were used to pay downCinergy Corp.'s short-term indebtedness. In February 2005, the preferred trust securities will be remarketed and the dividend rate reset, no lower than 6.9%, to yield $316 million in the remarketing. The holders will use the proceeds from this remarketing to fund their obligation to purchase shares ofCinergy Corp. common stock under the stock purchase contract. The holders will pay the market price for the stock at that time, subject to a ceiling of $34.40 per share and a floor of $29.15 per share. The number of shares to be issued will vary according to the stock price, subject to the total proceeds equaling $316 million. These securities were issued through a wholly-owned trust ofCinergy Corp. The preferred trust securities are recorded onCinergy Corp.'s Balance Sheets, net of discount and expense, asCompany obligated, mandatorily redeemable, preferred trust securities of subsidiary, holding solely debt securities of the company. The fair value of the stock purchase contract was charged toPaid-in capital with a corresponding credit toNon-current liabilities—other.
Each Unit will receive quarterly cash payments of 9.5% per annum of the notional amount, which includes the preferred trust security dividend of 6.9% and payment of 2.6%, which represents principal and interest on the stock purchase contract. Upon delivery of the shares, these stock purchase contract payments will cease.
113
5. Long-Term Debt
Refer to the Statements of Capitalization for detailed information forCG&E,PSI, andULH&P. In addition,Cinergy Corp. and Global Resources also have the following total long-term debt (excludingLong-term debt due within one year, which is reflected inCurrent liabilities in the Balance Sheets):
| | December 31 | |||||||||
|---|---|---|---|---|---|---|---|---|---|---|
| | 2001 | 2000 | ||||||||
| | (in thousands) | |||||||||
| Cinergy Corp. | ||||||||||
| Other Long-term Debt | ||||||||||
| 6.53% Debentures due December 16, 2008 | $ | 200,000 | $ | 200,000 | ||||||
| 6.125% Debentures due April 15, 2004 | 200,000 | 200,000 | ||||||||
| 6.25% Debentures due September 1, 2004 (Executed interest rate swaps of $250 million set at London Inter-Bank Offered Rate (LIBOR) plus 2.44%) | 500,341 | — | ||||||||
| Total Other Long-term Debt | 900,341 | 400,000 | ||||||||
| Unamortized Discount | (255 | ) | (265 | ) | ||||||
| Total—Cinergy Corp. | $ | 900,086 | $ | 399,735 | ||||||
| Global Resources | ||||||||||
| Other Long-term Debt | ||||||||||
| 6.20% Debentures due November 3, 2008 | $ | 150,000 | $ | 150,000 | ||||||
| Variable interest rate of LIBOR plus 1.75%, due July 2015 | 14,042 | 14,156 | ||||||||
| Variable interest rate of LIBOR plus 2.5%, due July 2015 | 5,840 | 6,323 | ||||||||
| Variable interest rates ranging between the 3 month Prague Inter-Bank Offered Rate plus 0.55% to the 3 month Euro Inter-Bank Offered Rate (EURIBOR) plus 4.12%, maturing March 2004 to March 2005 | 2,752 | 8,314 | ||||||||
| Fixed interest rates 6.1% - 7.4% maturing March 2003 to May 2003 | 10,271 | 18,783 | ||||||||
| Fixed interest rates ranging between 9.423% and 9.911%, maturing September 2010 to September 2019 | 13,420 | — | ||||||||
| Fixed interest rate of 11.5%, maturing December 2023 to March 2025 | 17,850 | — | ||||||||
| Variable interest rate of EURIBOR plus 1.2%, maturing November 2016 | 52,274 | — | ||||||||
| Total Other Long-term Debt | 266,449 | 197,576 | ||||||||
| Unamortized Discount | (227 | ) | (260 | ) | ||||||
| Total—Global Resources | 266,222 | 197,316 | ||||||||
| Operating Companies | ||||||||||
| CG&E and subsidiaries | $ | 1,105,333 | $ | 1,205,061 | ||||||
| PSI | 1,325,089 | 1,074,255 | ||||||||
| Total—Operating Companies | $ | 2,430,422 | $ | 2,279,316 | ||||||
| Total—Cinergy | $ | 3,596,730 | $ | 2,876,367 | ||||||
In January 2001,PSI retired $19.8 million principal amount of non-interest bearing Series 1994A Promissory Note, which had matured. The securities were not replaced by new issues of debt. In June 2001,PSI issued $325 million principal amount of First Mortgage Bonds Series EEE, 6.65% with a maturity date of June 15, 2006. The net proceeds of the offering were used to repay short-term indebtedness. In November 2001, the note holders exercised their option to call the $50 millionPSI 6% Putable/Callable Notes (Notes) on December 14, 2001, with the intent to reset the interest rate and
114
remarket the Notes. However, in December 2001,PSI exercised its option to purchase, and subsequently retired the Notes.
In September 2001,Cinergy Corp. issued $500 million principal amount of 6.25% debentures with a maturity date of September 1, 2004. The net proceeds of the offering were used to repay short-term indebtedness. In October 2001,Cinergy Corp. executed three receive-fixed, pay-floating interest rate swaps with a combined notional amount of $250 million. These swaps are designated as fair value hedges of 50% ofCinergy Corp.'s $500 million debentures issue.
During 2001, Global Resources borrowed funds at variable and fixed rates to fund various projects. These loans are classified asLong-term debt andLong-term debt due within one year based upon scheduled maturities.
The following table reflects the long-term debt maturities, excluding any redemptions due to the exercise of call or put provisions or capital lease obligations. Callable means the issuer has the right to buy back a given security from the holder at a specified price before maturity. Putable means the holder has the right to sell a given security back to the issuer at a specified price before maturity.
| | Cinergy(1) | CG&E and subsidiaries | PSI | ||||||
|---|---|---|---|---|---|---|---|---|---|
| | (in millions) | ||||||||
| 2002 | $ | 148 | $ | 100 | $ | 23 | |||
| 2003 | 92 | 20 | (2) | 58 | |||||
| 2004 | 814 | 110 | 1 | ||||||
| 2005 | 3 | — | 1 | ||||||
| 2006 | 334 | — | 328 | ||||||
| Thereafter(3) | 2,365 | 978 | 945 | ||||||
| $ | 3,756 | $ | 1,208 | $ | 1,356 | ||||
- (1)
- The results ofCinergy also include amounts related to non-registrants.
- (2)
- CG&E and subsidiaries includesULH&P's $20 million maturing in 2003.
- (3)
- Includes long-term debt with put provisions of $100 million in 2003 and $150 million in 2005 forCG&E and $50 million in 2005 forPSI.
Maintenance and replacement fund provisions contained inPSI's first mortgage bond indenture require: (1) cash payments, (2) bond retirements, or (3) pledges of unfunded property additions each year based on an amount related toPSI's net revenues.
6. Notes Payable and Other Short-term Obligations
Short-term obligations may include:
- •
- short-term notes;
- •
- commercial paper;
- •
- variable rate pollution control notes; and
- •
- money pooling.
Short-term Notes
Short-term borrowings mature within one year from the date of issuance. We primarily use unsecured revolving lines of credit for short-term borrowings. A portion of each company's revolving lines is used to provide credit support for commercial paper (discussed below). When revolving lines are reserved for commercial paper or backing letters of credit, they are not available for additional borrowings. The fees we paid to secure short-term borrowings were immaterial during each of the periods 1999, 2000, and 2001.
115
At December 31, 2001,Cinergy Corp. had $437 million remaining unused and available capacity relating to its $1.2 billion revolving credit facilities. In February 2001,Cinergy Corp. placed a $400 million, 364-day senior revolving credit facility and in March 2001,Cinergy Corp. placed a $500 million, 364-day senior revolving credit facility. These facilities provide short-term financing. Also, in May 2001,Cinergy Corp. placed a $400 million, three-year senior revolving credit facility. This facility replacedCinergy Corp.'s $400 million, five-year revolving credit facility that expired in May 2001, and its $200 million, three-year revolving credit facility that expired in July 2001. In December 2001,Cinergy Corp. permanently reduced the size of its $500 million, 364-day senior revolving credit facility to $225 million.
In early 2002,Cinergy Corp. placed a $600 million, 364-day senior revolving credit facility. This facility replaces the $400 million, 364-day senior revolving credit facility that expired in February 2002 and will replace the $225 million, 364-day senior revolving credit facility expiring in March 2002, and a $150 million, three-year senior revolving credit facility expiring in June 2002.
In addition to revolving credit facilities,Cinergy Corp.,CG&E, andPSI also maintain uncommitted lines of credit. These facilities are not guaranteed sources of capital and represent an informal agreement to lend money, subject to availability, with pricing to be determined at the time of advance. At December 31, 2001,Cinergy Corp.'s $40 million uncommitted line andCG&E's $15 million uncommitted line were unused.PSI's uncommitted line of $60 million was fully drawn at year-end.
Commercial Paper
In early 2001,Cinergy Corp. expanded the commercial paper program to a maximum outstanding principal amount of $800 million and reduced the established lines of credit atCG&E andPSI. The expansion of the commercial paper program at theCinergy Corp. level supports, in part, the short-term borrowing needs ofCG&E andPSI and eliminates their need for separate commercial paper programs. As of December 31, 2001,Cinergy Corp. had $125 million in commercial paper outstanding.
Variable Rate Pollution Control Notes
CG&E andPSI have issued variable rate pollution control notes (tax-exempt notes obtained to finance equipment or land development to control pollution). Because the holders of these notes have the right to redeem their notes on any business day, with the remainder being redeemable annually, they are reflected inNotes payable and other short-term obligations in the Balance Sheets ofCinergy,CG&E, andPSI.
In August 2001,CG&E issued $12.1 million of Ohio Air Quality Development Authority Air Quality Development Revenue Bonds 2001, Series A with a final maturity date of August 1, 2033, and an initial interest rate of 3.7%. The interest rate will reset annually on August 1, as negotiated, based on the Municipal Market Data Index as a benchmark. The net proceeds were used to finance the cost of air quality and solid waste disposal facilities at the William H. Zimmer Generating Station (Zimmer Station).
116
The following table summarizes ourNotes payable and other short-term obligations, excludingNotes payable to affiliated companies.
| | December 31, 2001 | December 31, 2000 | ||||||||||||||||
|---|---|---|---|---|---|---|---|---|---|---|---|---|---|---|---|---|---|---|
| | Established Lines | Outstanding | Weighted Average Rate | Established Lines | Outstanding | Weighted Average Rate | ||||||||||||
| | (in millions) | |||||||||||||||||
| Cinergy Corp. | ||||||||||||||||||
| Revolving lines(1) | $ | 1,175 | $ | 599 | 2.55 | % | $ | 750 | $ | 359 | 6.84 | % | ||||||
| Uncommitted lines | 40 | — | — | 45 | 12 | 7.25 | ||||||||||||
| Commercial paper | 800 | 125 | 3.49 | 400 | 216 | 7.06 | ||||||||||||
Operating companies | ||||||||||||||||||
| Revolving lines | — | — | — | 180 | 180 | 7.18 | ||||||||||||
| Uncommitted lines | 75 | 66 | 3.73 | 125 | 5 | 7.00 | ||||||||||||
| Pollution control notes | N/A | 279 | 2.10 | N/A | 267 | 4.52 | ||||||||||||
Non-regulated subsidiaries | ||||||||||||||||||
| Revolving lines | 46 | 38 | 3.37 | 13 | 11 | 5.86 | ||||||||||||
| Short-term debt | 49 | 49 | 4.90 | 79 | 79 | 6.77 | ||||||||||||
Cinergy Total | $ | 1,156 | 2.74 | % | $ | 1,129 | 6.38 | % | ||||||||||
CG&E and subsidiaries | ||||||||||||||||||
| Revolving lines | $ | — | $ | — | — | % | $ | 80 | $ | 80 | 7.06 | % | ||||||
| Uncommitted lines | 15 | — | — | 40 | — | — | ||||||||||||
| Pollution control notes | N/A | 196 | 2.00 | N/A | 184 | 4.61 | ||||||||||||
CG&E Total | $ | 196 | 2.00 | % | $ | 264 | 5.35 | % | ||||||||||
PSI | ||||||||||||||||||
| Revolving lines | $ | — | $ | — | — | % | $ | 100 | $ | 100 | 7.27 | % | ||||||
| Uncommitted lines | 60 | 66 | 3.73 | 85 | 5 | 7.00 | ||||||||||||
| Pollution control notes | N/A | 83 | 2.33 | N/A | 83 | 4.34 | ||||||||||||
PSI Total | $ | 149 | 2.95 | % | $ | 188 | 5.97 | % | ||||||||||
- (1)
- Excludes a $600 million credit facility placed in the first quarter of 2002.
Money Pool
Cinergy Corp., Services, and our operating companies participate in a money pool arrangement to better manage cash and working capital requirements. Under this arrangement, those companies with surplus short-term funds provide short-term loans to affiliates (other thanCinergy Corp.) participating under this arrangement. This surplus cash may be from internal or external sources. The amounts outstanding under this money pool arrangement are shown asNotes receivable from affiliated companies orNotes payable to affiliated companies on the Balance Sheets ofCG&E,PSI, andULH&P.
7. Sales of Accounts Receivable
CG&E,PSI, andULH&P have an agreement to sell, on a revolving basis, undivided percentage interests in certain of their accounts receivable and the related collections up to an aggregate maximum of $350 million.CG&E retains servicing responsibilities for its role as a collection agent of the amounts due on the sold receivables. However, the purchaser assumes the risk of collection on the sold
117
receivables without recourse toCG&E,PSI, andULH&P in the event of a loss. Proceeds from a portion of the sold receivables are held back as a reserve to reduce the purchaser's credit risk.CG&E,PSI, andULH&P do not retain any ownership interest in the sold receivables, but do retain undivided interests in their remaining balances of accounts receivable. The recorded amounts of the retained interests are measured at net realizable value.
TheAccounts receivable on the Balance Sheets ofCinergy,CG&E,PSI, andULH&P are net of the amounts sold at December 31, 2001, and 2000.
The following table shows the receivables sold, the associated reserves held back, and the net amounts received as of December 31, 2001, and 2000:
| | Receivables Sold | Reserves | Net Amount | ||||||
|---|---|---|---|---|---|---|---|---|---|
| | (in millions) | ||||||||
| 2001 | |||||||||
| Cinergy | $ | 322 | $ | 65 | $ | 257 | |||
| CG&E and subsidiaries | 188 | 38 | 150 | ||||||
| PSI | 134 | 27 | 107 | ||||||
| ULH&P | 27 | 5 | 22 | ||||||
2000 | |||||||||
| Cinergy | $ | 316 | $ | 59 | $ | 257 | |||
| CG&E and subsidiaries | 192 | 36 | 156 | ||||||
| PSI | 124 | 23 | 101 | ||||||
| ULH&P | 32 | 6 | 26 | ||||||
8. Leases
(a)Operating Leases
We have entered into operating lease agreements for various facilities and properties such as computer, communication and transportation equipment, and office space. Total rental payments on operating leases for each of the past three years are detailed in the table below. This table also shows future minimum lease payments required for operating leases with remaining non-cancelable lease terms in excess of one year as of December 31, 2001:
| | Actual Payments | Estimated Minimum Payments | ||||||||||||||||||||||||||||
|---|---|---|---|---|---|---|---|---|---|---|---|---|---|---|---|---|---|---|---|---|---|---|---|---|---|---|---|---|---|---|
| | 1999 | 2000 | 2001 | 2002 | 2003 | 2004 | 2005 | 2006 | After 2006 | Total | ||||||||||||||||||||
| | (in millions) | (in millions) | ||||||||||||||||||||||||||||
| Cinergy(1) | $ | 50 | $ | 56 | $ | 61 | $ | 45 | $ | 36 | $ | 26 | $ | 21 | $ | 18 | $ | 61 | $ | 207 | ||||||||||
| CG&E and subsidiaries | 27 | 30 | 33 | 20 | 15 | 10 | 7 | 6 | 15 | 73 | ||||||||||||||||||||
| PSI | 21 | 21 | 21 | 17 | 14 | 9 | 7 | 7 | 23 | 77 | ||||||||||||||||||||
| ULH&P(2) | 4 | 4 | 5 | — | — | — | — | — | — | — | ||||||||||||||||||||
- (1)
- The results ofCinergy also include amounts related to non-registrants.
- (2)
- Estimated minimum lease payments are immaterial.
(b) Capital Leases
In 2001, 2000, and 1999,CG&E,PSI, andULH&P entered into capital lease agreements to fund the purchase of gas and electric meters. The lease terms are for 120 months commencing December 2001, 2000, and 1999, with early buyout options at 48, 72, and 105 months. Since the objective is to own the meters indefinitely, the companies plan to exercise the buyout option at month
118
105. The lease rates used to determine the monthly payments were 6.00%, 6.09%, and 6.71% for 2001, 2000, and 1999, respectively. The meters are depreciated at the same rate as if they were owned by the companies.CG&E,PSI, andULH&P each recorded a capital lease obligation, included inNon-current liabilities— other.
The total minimum lease payments and the present values for these capital lease items are shown below:
| | Total Minimum Lease Payments | ||||||||||||
|---|---|---|---|---|---|---|---|---|---|---|---|---|---|
| | Cinergy | CG&E and subsidiaries | PSI | ULH&P | |||||||||
| | (in millions) | ||||||||||||
| Total minimum lease payments(1) | $ | 46 | $ | 26 | $ | 20 | $ | 8 | |||||
| Less: amount representing interest | (11 | ) | (6 | ) | (5 | ) | (2 | ) | |||||
| Present value of minimum lease payments | $ | 35 | $ | 20 | $ | 15 | $ | 6 | |||||
- (1)
- Annual minimum lease payments are immaterial.
In 2000,CG&E entered into a capital lease agreement to fund the purchase of equipment for Zimmer Station. In August 2001,CG&E purchased the equipment at Zimmer Station, effectively terminating the lease.
In 1996,CG&E entered into a sale-leaseback agreement for certain equipment at Woodsdale Generating Station. The lease was a capital lease with an initial lease term of five years expiring on October 31, 2001. At the end of this term,CG&E purchased the equipment.
9. Financial Instruments
(a)Financial Derivatives
We have entered into financial derivative contracts for the purposes described below.
(i) Interest Rate Risk Management
Our current policy in managing exposure to fluctuations in interest rates is to maintain the total amount of outstanding debt in floating interest rate debt instruments of approximately 30%. In maintaining this level of exposure, we use interest rate swaps. Under these swaps, we agree with other parties to exchange, at specified intervals, the difference between fixed-rate and floating-rate interest amounts calculated on an agreed notional amount.CG&E has an outstanding interest rate swap agreement that decreased the percentage of floating-rate debt. Under the provisions of the swap, which has a notional amount of $100 million,CG&E pays a fixed-rate and receives a floating-rate through October 2007. This swap qualifies as a cash flow hedge under the provisions of Statement 133. As the terms of the swap agreement mirror the terms of the debt agreement that it is hedging, we anticipate that this swap will continue to be effective as a hedge. Changes in fair value of this swap are recorded inAccumulated other comprehensive income (loss), beginning with our adoption of Statement 133 on January 1, 2001. In October 2001,Cinergy Corp. executed three interest rate swaps with a combined notional amount of $250 million. Under the provisions of the swaps,Cinergy Corp. will receive fixed-rate interest payments and pay floating-rate interest payments through September 2004. These swaps qualify as fair value hedges under the provisions of Statement 133. We anticipate that these swaps will continue to be effective as hedges. See Note 1(l) for additional information on financial derivatives. In the future, we will continually monitor market conditions to evaluate whether to modify our level of exposure to fluctuations in interest rates.
119
(ii) Foreign Exchange Hedging Activity
From time to time, we may utilize foreign exchange forward contracts and currency swaps to hedge foreign currency denominated purchase and sale commitments and certain of our net investments in foreign operations. These contracts and swaps allow us to potentially hedge our position against currency exchange rate fluctuations and would qualify as derivatives.
Cinergy has exposure to fluctuations in exchange rates between the U.S. dollar and the currencies of foreign countries where we have investments. When it is appropriate we will hedge our exposure to cash flow transactions, such as a dividend payment by one of our foreign subsidiaries. As of December 31, 2001, we had no outstanding foreign currency derivatives.
(b) Fair Value of Other Financial Instruments
The estimated fair values of other financial instruments were as follows (this information does not claim to be a valuation of the companies as a whole):
| | December 31, 2001 | December 31, 2000 | ||||||||||
|---|---|---|---|---|---|---|---|---|---|---|---|---|
| Financial Instruments | Carrying Amount | Fair Value | Carrying Amount | Fair Value | ||||||||
| | (in millions) | |||||||||||
| Cinergy(1) | ||||||||||||
| First mortgage bonds and other long-term debt (includes amounts reflected asLong-term debt due within one year) | $ | 3,745 | $ | 3,805 | $ | 2,917 | $ | 2,950 | ||||
CG&Eand subsidiaries | ||||||||||||
| First mortgage bonds and other long-term debt (includes amounts reflected asLong-term debt due within one year) | $ | 1,205 | $ | 1,214 | $ | 1,206 | $ | 1,203 | ||||
PSI | ||||||||||||
| First mortgage bonds and other long-term debt (includes amounts reflected asLong-term debt due within one year) | $ | 1,348 | $ | 1,379 | $ | 1,113 | $ | 1,136 | ||||
ULH&P | ||||||||||||
| Other long-term debt | $ | 75 | $ | 76 | $ | 75 | $ | 76 | ||||
- (1)
- The results ofCinergy also include amounts related to non-registrants.
The following methods and assumptions were used to estimate the fair values of each major class of instruments:
(i) Cash and cash equivalents, Restricted deposits, and Notes payable and other short-term obligations
Due to the short period to maturity, the carrying amounts reflected on the Balance Sheets approximate fair values.
(ii) Long-term debt
The fair values of long-term debt issues were estimated based on the latest quoted market prices or, if not listed on the New York Stock Exchange, on the present value of future cash flows. The discount rates used approximate the incremental borrowing costs for similar instruments.
120
(c)Concentrations of Credit Risk
Credit risk is the exposure to economic loss that would occur as a result of nonperformance by counterparties, pursuant to the terms of their contractual obligations. Specific components of credit risk include counterparty default risk, collateral risk, concentration risk, and settlement risk.
(i) Trade Receivables and Physical Power Portfolio
Our concentration of credit risk with respect to trade accounts receivable from electric and gas retail customers is limited. The large number of customers and diversified customer base of residential, commercial, and industrial customers significantly reduces our credit risk. Contracts within the physical portfolio of power marketing and trading operations are primarily with the traditional electric cooperatives and municipalities and other investor-owned utilities. At December 31, 2001, we do not believe we had significant exposure to credit risk with our trade accounts receivable or our physical portfolio.
(ii) Energy Trading
Cinergy's extension of credit for energy marketing and trading is governed by a Corporate Credit Policy. Written guidelines document the management approval levels for credit limits, evaluation of creditworthiness and credit risk mitigation procedures. Exposures to credit risks are monitored daily by the Corporate Credit Risk function. As of December 31, 2001, approximately 97% of the credit exposure related to energy trading and marketing activity was with counterparties rated Investment Grade or higher. Energy commodity prices can be extremely volatile and the market can, at times, lack liquidity. Because of these issues, credit risk is generally greater than with other commodity trading.
In December 2001, Enron Corp. (Enron) filed for protection under Chapter 11 of the U.S. Bankruptcy Code in the Southern District of New York. We decreased our trading activities with Enron in the months prior to its bankruptcy filing. We intend to resolve any contract differences pursuant to the terms of those contracts, business practices and the applicable provisions of the Bankruptcy Code, as approved by the court. While we cannot predict the courts resolution of these matters, we do not believe that any exposure relating to those contracts would have a material impact on our financial position or results of operations. While most of our contracts with Enron were considered trading and thus recorded at fair value, a few contracts were accounted for utilizing the normal exemption under Statement 133 (see Note 1(k)). These contracts were recognized at fair value when the contracts were terminated in the fourth quarter of 2001. Fair value for these contracts, and all terminated contracts with Enron, is governed by the provisions of each contract, but typically approximates fair value at contract termination. However, the effect of the loss of Enron's participation in the energy markets on long-term liquidity and price volatility, or on the creditworthiness of common counterparties cannot be determined. We continually review and monitor our credit exposure to all counterparties and adjust the fair value of our position, as appropriate.
(iii) Financial Derivatives
Potential exposure to credit risk also exists from our use of financial derivatives such as currency swaps, foreign exchange forward contracts, and interest rate swaps. Because these financial instruments are transacted only with highly rated financial institutions, we do not anticipate nonperformance by any of the counterparties.
10. Pension and Other Postretirement Benefits
We provide benefits to retirees in the form of pensions and other postretirement benefits.
121
Our defined benefit pension plans cover substantially all U.S. employees meeting certain minimum age and service requirements. A final average pay formula determines plan benefits. These plan benefits are based on:
- •
- years of participation;
- •
- age at retirement; and
- •
- the applicable average Social Security wage base or benefit amount.
Our pension plan funding policy for U.S. employees is to contribute at least the amount required by the Employee Retirement Income Security Act of 1974, and up to the amount deductible for income tax purposes. The pension plans' assets consist of investments in equity and fixed income securities.
We provide certain health care and life insurance benefits to retired U.S. employees and their eligible dependents. These benefits are subject to minimum age and service requirements. The health care benefits include medical coverage, dental coverage, and prescription drugs and are subject to certain limitations, such as deductibles and co-payments. NeitherCG&E norULH&P pre-fund their obligations for these postretirement benefits. In 1999,PSI began pre-funding its obligations through a grantor trust as authorized by the IURC.
In 2000,Cinergy offered early retirement plans to certain individuals under a Limited Early Retirement Program (LERP). In accordance with Statement of Financial Accounting Standards No. 88,Employers' Accounting for Settlements and Curtailments of Defined Benefit Pension Plans and for Termination Benefits (Statement 88),Cinergy recognized a one-time expense of $12.8 million in 2000.
Our benefit plans' costs for the past three years, as well as the actuarial assumptions used in determining these costs, included the following components:
| | Pension Benefits | Other Postretirement Benefits | ||||||||||||||||||
|---|---|---|---|---|---|---|---|---|---|---|---|---|---|---|---|---|---|---|---|---|
| | 2001 | 2000 | 1999 | 2001 | 2000 | 1999 | ||||||||||||||
| | (in millions) | |||||||||||||||||||
| Service cost | $ | 27.9 | $ | 27.4 | $ | 24.8 | $ | 3.8 | $ | 3.4 | $ | 3.5 | ||||||||
| Interest cost | 77.5 | 73.0 | 70.8 | 17.9 | 17.0 | 16.2 | ||||||||||||||
| Expected return on plans' assets | (81.9 | ) | (77.0 | ) | (72.0 | ) | — | — | — | |||||||||||
| Amortization of transition (asset) obligation | (1.3 | ) | (1.3 | ) | (1.3 | ) | 5.0 | 5.0 | 5.0 | |||||||||||
| Amortization of prior service cost | 4.6 | 4.5 | 4.5 | — | — | — | ||||||||||||||
| Recognized actuarial (gain) loss | (3.2 | ) | (2.4 | ) | 0.6 | 0.1 | — | 0.8 | ||||||||||||
| LERP Statement 88 cost | — | 11.9 | — | — | — | — | ||||||||||||||
| Net periodic benefit cost | $ | 23.6 | $ | 36.1 | $ | 27.4 | $ | 26.8 | $ | 25.4 | $ | 25.5 | ||||||||
Actuarial assumptions: | ||||||||||||||||||||
| Discount rate | 7.50 | % | 7.50 | % | 7.50 | % | 7.50 | % | 7.50 | % | 7.50 | % | ||||||||
| Rate of future compensation increase | 4.00 | 4.50 | 4.50 | N/A | N/A | N/A | ||||||||||||||
| Rate of return on plans' assets | 9.25 | 9.00 | 9.00 | N/A | N/A | N/A | ||||||||||||||
For measurement purposes, we assumed an eight percent annual rate of increase in the per capita cost of covered health care benefits for 2001. It was assumed that the rate would decrease gradually to five percent in 2008 and remain at that level thereafter.
122
The following table provides a reconciliation of the changes in the plans' benefit obligations and fair value of assets over the two-year period ended December 31, 2001, and a statement of the funded status as of December 31 of both years.
| | Pension Benefits | Other Postretirement Benefits | |||||||||||
|---|---|---|---|---|---|---|---|---|---|---|---|---|---|
| | 2001 | 2000 | 2001 | 2000 | |||||||||
| | (in millions) | ||||||||||||
| Change in benefit obligation | |||||||||||||
Benefit obligation at beginning of period | $ | 1,064.5 | $ | 1,002.0 | $ | 247.1 | $ | 234.4 | |||||
Service cost | 27.9 | 27.4 | 3.8 | 3.4 | |||||||||
| Interest cost | 77.5 | 73.0 | 17.9 | 17.0 | |||||||||
| Amendments(1) | 18.0 | 13.1 | — | — | |||||||||
| Actuarial (gain) loss | (43.6 | ) | 12.0 | 17.9 | 6.7 | ||||||||
| Benefits paid | (60.8 | ) | (63.0 | ) | (16.3 | ) | (14.4 | ) | |||||
Benefit obligation at end of period | 1,083.5 | 1,064.5 | 270.4 | 247.1 | |||||||||
Change in plan assets | |||||||||||||
| Fair value of plan assets at beginning of period | 1,043.6 | 946.1 | — | — | |||||||||
| Actual return on plan assets | (108.1 | ) | 160.5 | — | — | ||||||||
| Employer contribution | 0.7 | — | 16.3 | 14.4 | |||||||||
| Benefits paid | (60.8 | ) | (63.0 | ) | (16.3 | ) | (14.4 | ) | |||||
Fair value of plan assets at end of period | 875.4 | 1,043.6 | — | — | |||||||||
Funded status | (208.1 | ) | (20.9 | ) | (270.4 | ) | (247.1 | ) | |||||
Unrecognized prior service cost | 50.0 | 36.6 | — | — | |||||||||
| Unrecognized net actuarial (gain) loss | (100.1 | ) | (249.6 | ) | 45.7 | 26.6 | |||||||
| Unrecognized net transition (asset) obligation | (3.2 | ) | (4.5 | ) | 50.8 | 55.8 | |||||||
Accrued benefit cost at December 31 | $ | (261.4 | ) | $ | (238.4 | ) | $ | (173.9 | ) | $ | (164.7 | ) | |
- (1)
- For 2000, the amount of $13.1 million includes $11.9 million of LERP expenses in accordance with Statement 88, as previously discussed.
Assumed health care cost trend rates have a significant effect on the amounts reported for the health care plans. A one-percentage-point change in assumed health care cost trend rates would have the following effects:
| | One-Percentage- Point Increase | One-Percentage- Point Decrease | |||||
|---|---|---|---|---|---|---|---|
| | (in millions) | ||||||
| Effect on total of service and interest cost components | $ | 3.2 | $ | (2.8 | ) | ||
| Effect on postretirement benefit obligation | 34.7 | (30.3 | ) | ||||
In addition, we sponsor non-qualified pension plans (plans that do not meet the criteria for tax benefits) that cover officers, certain other key employees, and non-employee directors. We began funding certain of these non-qualified plans through a rabbi trust in 1999.
123
The pension benefit obligations and pension cost under these plans were as follows:
| | 2001 | 2000 | ||||
|---|---|---|---|---|---|---|
| | (in millions) | |||||
| Pension benefit obligation | $ | 70.9 | $ | 67.0 | ||
| Pension cost | 8.7 | 8.3 | ||||
11. Disposition of Unconsolidated Subsidiary
On July 15, 1999, we sold our 50% ownership interest in Midlands Electricity plc (Midlands) to GPU, Inc. In exchange for our interest in Midlands, we received 452.5 million pounds sterling (approximately $700 million). As a result of the transaction, we realized a net contribution to earnings of approximately $.43 EPS and EPS-assuming dilution, after deducting financing, transaction, and currency costs.
The pro forma information presented below reflectsCinergy's net income and EPS without the investment in Midlands for 1999.
| | Year Ended December 31 1999 | ||||||
|---|---|---|---|---|---|---|---|
| | Net Income | EPS(1) | |||||
| | (in millions, except for earnings per share) | ||||||
| Reported results | $ | 404 | $ | 2.54 | |||
Pro forma adjustments: | |||||||
| Equity in earnings of Midlands | (58 | ) | |||||
| Gain on sale of investment in Midlands | (99 | ) | |||||
| Interest | 21 | ||||||
| Income taxes | 40 | ||||||
Pro forma results | $ | 308 | $ | 1.94 | |||
- (1)
- Represents basic EPS. Actual EPS — assuming dilution were $2.53, and pro forma EPS — assuming dilution were $1.93.
124
12. Income Taxes
The following table shows the significant components ofCinergy's,CG&E's, andPSI's net deferred income tax liabilities as of December 31, 2001, and 2000:
| | Cinergy(1) | CG&E and subsidiaries | PSI | ||||||||||||||||
|---|---|---|---|---|---|---|---|---|---|---|---|---|---|---|---|---|---|---|---|
| | 2001 | 2000 | 2001 | 2000 | 2001 | 2000 | |||||||||||||
| | (in millions) | (in millions) | (in millions) | ||||||||||||||||
| Deferred Income Tax Liability | |||||||||||||||||||
| Property, plant, and equipment | $ | 1,172.0 | $ | 1,135.9 | $ | 708.0 | $ | 703.0 | $ | 453.2 | $ | 432.8 | |||||||
| Unamortized costs of reacquiring debt | 13.4 | 18.2 | 3.2 | 8.1 | 10.2 | 10.1 | |||||||||||||
| Deferred operating expenses and carrying costs | 10.3 | 60.2 | — | 40.7 | 10.3 | 19.5 | |||||||||||||
| Purchased power tracker | 9.7 | — | — | — | 9.7 | — | |||||||||||||
| RTC | 206.0 | — | 206.0 | — | — | — | |||||||||||||
| Net energy risk management assets | 12.2 | — | 8.4 | — | — | — | |||||||||||||
| Amounts due from customers—income taxes | 22.9 | 96.2 | 16.0 | 91.2 | 6.9 | 5.0 | |||||||||||||
| Gasification services agreement buyout costs | 92.3 | 94.8 | — | — | 92.3 | 94.8 | |||||||||||||
| Other | 47.6 | 60.9 | 8.7 | 37.0 | 2.3 | 9.0 | |||||||||||||
Total Deferred Income Tax Liability | 1,586.4 | 1,466.2 | 950.3 | 880.0 | 584.9 | 571.2 | |||||||||||||
Deferred Income Tax Asset | |||||||||||||||||||
| Unamortized investment tax credits | 45.9 | 56.1 | 36.0 | 42.8 | 10.0 | 13.2 | |||||||||||||
| Accrued pension and other benefit costs | 162.4 | 137.7 | 96.6 | 67.5 | 47.2 | 39.8 | |||||||||||||
| Net energy risk management liabilities | — | 24.6 | — | 6.1 | 5.5 | 18.5 | |||||||||||||
| Rural Utilities Service (RUS) obligation | 28.2 | 28.2 | — | — | 28.2 | 28.2 | |||||||||||||
| Other | 48.5 | 33.6 | 38.4 | 27.8 | 7.3 | 12.9 | |||||||||||||
Total Deferred Income Tax Asset | 285.0 | 280.2 | 171.0 | 144.2 | 98.2 | 112.6 | |||||||||||||
Net Deferred Income Tax Liability | $ | 1,301.4 | $ | 1,186.0 | $ | 779.3 | $ | 735.8 | $ | 486.7 | $ | 458.6 | |||||||
- (1)
- The results ofCinergy also include amounts related to non-registrants.
We will file a consolidated federal income tax return for the year ended December 31, 2001. The current tax liability is allocated among the members of theCinergy consolidated group, pursuant to a tax sharing agreement filed with the SEC under the PUHCA.
125
The following table summarizes federal and state income taxes charged (credited) to income forCinergy,CG&E, andPSI:
| | Cinergy(1) | CG&E and subsidiaries | PSI | |||||||||||||||||||||||||||
|---|---|---|---|---|---|---|---|---|---|---|---|---|---|---|---|---|---|---|---|---|---|---|---|---|---|---|---|---|---|---|
| | 2001 | 2000 | 1999 | 2001 | 2000 | 1999 | 2001 | 2000 | 1999 | |||||||||||||||||||||
| | (in millions) | (in millions) | (in millions) | |||||||||||||||||||||||||||
| Current Income Taxes | ||||||||||||||||||||||||||||||
| Federal | $ | 122.4 | $ | 187.3 | $ | 114.0 | $ | 135.1 | $ | 121.5 | $ | 137.3 | $ | 59.9 | $ | 84.4 | $ | (30.6 | ) | |||||||||||
| State | 9.3 | 16.9 | (1.5 | ) | 7.6 | 1.6 | 4.0 | 4.6 | 10.8 | (3.1 | ) | |||||||||||||||||||
| Total Current Income Taxes | 131.7 | 204.2 | 112.5 | 142.7 | 123.1 | 141.3 | 64.5 | 95.2 | (33.7 | ) | ||||||||||||||||||||
Deferred Income Taxes | ||||||||||||||||||||||||||||||
| Federal | ||||||||||||||||||||||||||||||
| Depreciation and other property, plant, and equipment-related items | 42.7 | 26.1 | 24.0 | 23.3 | 19.0 | 13.8 | 10.7 | 7.1 | 10.2 | |||||||||||||||||||||
| Pension and other benefit costs | (11.8 | ) | (21.3 | ) | (10.5 | ) | (4.2 | ) | (7.5 | ) | (5.3 | ) | (7.6 | ) | (11.5 | ) | (5.0 | ) | ||||||||||||
| Deferred excise taxes | 14.5 | — | — | 14.5 | — | — | — | — | — | |||||||||||||||||||||
| Unrealized energy risk management transactions | 44.0 | 10.9 | (5.1 | ) | 23.9 | 5.6 | (11.6 | ) | 11.6 | 2.0 | 6.5 | |||||||||||||||||||
| Fuel costs | 5.7 | 28.7 | 4.3 | (8.0 | ) | 26.7 | 2.7 | 13.7 | 2.0 | 1.6 | ||||||||||||||||||||
| Purchased power tracker | 8.5 | — | — | — | — | — | 8.5 | — | — | |||||||||||||||||||||
| Gasification services agreement buyout costs | (2.2 | ) | (0.1 | ) | 83.6 | — | — | — | (2.2 | ) | (0.1 | ) | 83.6 | |||||||||||||||||
| Other—net | 16.1 | 11.0 | (5.1 | ) | (4.8 | ) | (3.0 | ) | 8.3 | 5.3 | (1.2 | ) | (4.5 | ) | ||||||||||||||||
Total Deferred Federal Income Taxes | 117.5 | 55.3 | 91.2 | 44.7 | 40.8 | 7.9 | 40.0 | (1.7 | ) | 92.4 | ||||||||||||||||||||
State | 15.4 | 1.7 | 14.2 | 5.0 | 1.5 | 0.6 | 4.8 | (1.4 | ) | 13.6 | ||||||||||||||||||||
Total Deferred Income Taxes | 132.9 | 57.0 | 105.4 | 49.7 | 42.3 | 8.5 | 44.8 | (3.1 | ) | 106.0 | ||||||||||||||||||||
Investment Tax Credits—Net | (9.1 | ) | (9.6 | ) | (9.2 | ) | (5.9 | ) | (6.0 | ) | (6.1 | ) | (3.2 | ) | (3.6 | ) | (3.1 | ) | ||||||||||||
Total Income Taxes | $ | 255.5 | $ | 251.6 | $ | 208.7 | $ | 186.5 | $ | 159.4 | $ | 143.7 | $ | 106.1 | $ | 88.5 | $ | 69.2 | ||||||||||||
- (1)
- The results ofCinergy also include amounts related to non-registrants.
126
The following table presents a reconciliation of federal income taxes (which are calculated by multiplying the statutory federal income tax rate by book income before federal income tax) to the federal income tax expense reported in the Statements of Income forCinergy,CG&E, andPSI.
| | Cinergy(1) | CG&Eand subsidiaries | PSI | ||||||||||||||||||||||||||
|---|---|---|---|---|---|---|---|---|---|---|---|---|---|---|---|---|---|---|---|---|---|---|---|---|---|---|---|---|---|
| | 2001 | 2000 | 1999 | 2001 | 2000 | 1999 | 2001 | 2000 | 1999 | ||||||||||||||||||||
| | (in millions) | (in millions) | (in millions) | ||||||||||||||||||||||||||
| Statutory federal income tax provision | $ | 235.6 | $ | 221.3 | $ | 209.9 | $ | 175.2 | $ | 148.1 | $ | 130.4 | $ | 90.7 | $ | 75.1 | $ | 61.6 | |||||||||||
| Increases (Reductions) in taxes resulting from: | |||||||||||||||||||||||||||||
| Amortization of investment tax credits | (9.1 | ) | (9.6 | ) | (9.2 | ) | (5.9 | ) | (6.0 | ) | (6.1 | ) | (3.2 | ) | (3.6 | ) | (3.1 | ) | |||||||||||
| Depreciation and other property, plant, and equipment-related differences | 3.2 | 17.7 | 14.4 | 2.6 | 14.0 | 11.6 | 0.6 | 3.6 | 2.8 | ||||||||||||||||||||
| Preferred dividend requirements of subsidiaries | 1.2 | 1.6 | 1.9 | — | — | — | — | — | — | ||||||||||||||||||||
| Foreign tax adjustments | (1.3 | ) | — | (15.5 | ) | — | — | — | — | — | — | ||||||||||||||||||
| Other—net | 1.2 | 2.0 | (5.5 | ) | 2.0 | 0.2 | 3.2 | 8.6 | 4.0 | (2.6 | ) | ||||||||||||||||||
Federal Income Tax Expense | $ | 230.8 | $ | 233.0 | $ | 196.0 | $ | 173.9 | $ | 156.3 | $ | 139.1 | $ | 96.7 | $ | 79.1 | $ | 58.7 | |||||||||||
- (1)
- The results ofCinergyalso include amounts related to non-registrants.
The following table shows the significant components ofULH&P's net deferred income tax liability as of December 31, 2001 and 2000:
| | ULH&P | ||||||
|---|---|---|---|---|---|---|---|
| | 2001 | 2000 | |||||
| | (in thousands) | ||||||
| Deferred Income Tax Liability | |||||||
| Property, plant, and equipment | $ | 34,218 | $ | 32,674 | |||
| Unamortized costs of reacquiring debt | 699 | 747 | |||||
| Deferred fuel costs | — | 6,934 | |||||
| Other | 4,158 | 3,620 | |||||
Total Deferred Income Tax Liability | 39,075 | 43,975 | |||||
Deferred Income Tax Asset | |||||||
| Unamortized investment tax credits | 1,035 | 1,309 | |||||
| Amounts due to customers-income taxes | 2,524 | 2,627 | |||||
| Deferred fuel costs | 520 | — | |||||
| Accrued pension and other benefit costs | 3,947 | 2,660 | |||||
| Other | 2,726 | 1,557 | |||||
Total Deferred Income Tax Asset | 10,752 | 8,153 | |||||
Net Deferred Income Tax Liability | $ | 28,323 | $ | 35,822 | |||
127
The following table summarizes federal and state income taxes charged (credited) to income forULH&P:
| | ULH&P | |||||||||||
|---|---|---|---|---|---|---|---|---|---|---|---|---|
| | 2001 | 2000 | 1999 | |||||||||
| | (in thousands) | |||||||||||
| Current Income Taxes | ||||||||||||
| Federal | $ | 23,109 | $ | 5,003 | $ | 8,668 | ||||||
| State | (2,293 | ) | (129 | ) | 2,253 | |||||||
| Total Current Income Taxes | 20,816 | 4,874 | 10,921 | |||||||||
Deferred Income Taxes | ||||||||||||
| Federal | ||||||||||||
| Depreciation and other property, plant, and equipment-related items | 1,042 | 1,059 | 831 | |||||||||
| Pension and other benefit costs | (140 | ) | (605 | ) | 40 | |||||||
| Fuel costs | (7,338 | ) | 8,564 | (1,385 | ) | |||||||
| Unamortized costs of reacquiring debt | (30 | ) | (30 | ) | (39 | ) | ||||||
| Service company allocations | 192 | 251 | 324 | |||||||||
| Other—net | 212 | (338 | ) | (155 | ) | |||||||
Total Deferred Federal Income Taxes | (6,062 | ) | 8,901 | (384 | ) | |||||||
Deferred State Income Taxes | (781 | ) | 303 | (76 | ) | |||||||
Total Deferred Income Taxes | (6,843 | ) | 9,204 | (460 | ) | |||||||
Investment Tax Credits—Net | (274 | ) | (277 | ) | (277 | ) | ||||||
Total Income Taxes | $ | 13,699 | $ | 13,801 | $ | 10,184 | ||||||
The following table presents a reconciliation of federal income taxes (which are calculated by multiplying the statutory federal income tax rate by book income before federal income tax) to the federal income tax expense reported in the Statements of Income forULH&P.
| | ULH&P | ||||||||||
|---|---|---|---|---|---|---|---|---|---|---|---|
| | 2001 | 2000 | 1999 | ||||||||
| | (in thousands) | ||||||||||
| Statutory federal income tax provision | $ | 18,444 | $ | 13,391 | $ | 7,098 | |||||
| Increases (Reductions) in taxes resulting from: | |||||||||||
| Amortization of investment tax credits | (274 | ) | (277 | ) | (277 | ) | |||||
| Depreciation and other property, plant, and equipment-related differences | 23 | 830 | 94 | ||||||||
| Other—net | (1,420 | ) | (317 | ) | 1,092 | ||||||
Federal Income Tax Expense | $ | 16,773 | $ | 13,627 | $ | 8,007 | |||||
128
13. Commitments and Contingencies
(a)Construction and Other Commitments
Forecasted construction and other committed expenditures, including AFUDC, for the year 2002 and for the five-year period 2002-2006 (in nominal dollars) are presented in the table below:
| | 2002 | 2002-2006 | ||||
|---|---|---|---|---|---|---|
| | (in millions) | |||||
| Cinergy(1) | $ | 889 | $ | 3,070 | ||
| CG&E and subsidiaries | 275 | 1,135 | ||||
| PSI | 478 | 1,522 | ||||
| ULH&P | 43 | 212 | ||||
- (1)
- The results ofCinergyalso include amounts related to non-registrants.
This forecast includes an estimate of expenditures in accordance with the companies' plans regarding nitrogen oxide (NOX) emission control standards and other environmental compliance (excluding implementation of the tentative U.S. Environmental Protection Agency (EPA) Agreement), as discussed below.
(b)Guarantees
Cinergy Corp.has made separate guarantees to certain counterparties regarding performance of commitments by our consolidated subsidiaries, unconsolidated subsidiaries and joint ventures. We are subject to an SEC order under PUHCA, which limits the amount we can have outstanding under guarantees at any one time to $2 billion. As of December 31, 2001, we had $558 million outstanding under the guarantees issued, of which approximately 70% represents guarantees of obligations reflected onCinergy's Consolidated Balance Sheet. These outstanding guarantees relate to subsidiary and joint venture indebtedness and performance commitments.
(c)Ozone Transport Rulemakings
In June 1997, the Ozone Transport Assessment Group, which consisted of 37 states, made a wide range of recommendations to the EPA to address the impact of ozone transport on serious non-attainment areas (geographic areas defined by the EPA as non-compliant with ozone standards) in the Northeast, Midwest, and South. Ozone transport refers to wind-blown movement of ozone and ozone-causing materials across city and state boundaries. In late 1997, the EPA published a proposed call for revisions to State Implementation Plans (SIPs) for achieving emissions reductions to address air quality concerns. The EPA must approve all SIPs.
(i) NOX SIP Call
In October 1998, the EPA finalized its ozone transport rule, also known as the NOX SIP Call. It applied to 22 states in the Eastern half of the U.S., including the three states in which our electric utilities operate, and proposed a model NOX emission allowance-trading program. This rule recommended states reduce NOX emissions primarily from industrial and utility sources to a certain level by May 2003. The EPA gave the affected states until September 30, 1999, to incorporate
NOX reductions and, at the discretion of the state, a NOX trading program into their SIPs. The EPA proposed to implement a federal plan to accomplish the equivalent NOX reductions by May 1, 2003, if states failed to revise their SIPs.
Ohio, Indiana, a number of other states, and various industry groups (some of which we are a member), filed legal challenges to the NOX SIP Call with the U.S. Circuit Court of Appeals for the District of Columbia (Court of Appeals).
129
Following a number of rulings and appeals, in August 2000, the Court of Appeals extended the deadline for NOX reductions to May 31, 2004. The states and other groups sought review of the Court of Appeals ruling by the U.S. Supreme Court (Supreme Court). In March 2001, the Supreme Court decided not to grant that review.
In June 2001, the Court of Appeals remanded portions of the NOX SIP Call to the EPA for reconsideration of how growth was factored into the state NOX budgets. It is unclear whether this decision will result in an increase or decrease in the size of the NOX reduction requirement. On August 3, 2001, the EPA published, in the Federal Register, a notice of data availability for justification of the state NOX budgets. Comments on the justification were filed prior to the September 19, 2001 deadline by various industry groups (some of which we are members) and states.
The states of Indiana and Kentucky developed final NOX SIP rules in response to the NOX SIP Call, through cap and trade programs, in June and July of 2001, respectively. On November 8, 2001, the EPA approved Indiana's SIP rules which became effective December 10, 2001. The EPA is expected to approve Kentucky's rules in the near future. The state of Ohio is still in the process of developing its NOX SIP rules in response to the NOX SIP Call.Cinergy's current plans for compliance with the EPA's NOX SIP Call would also satisfy compliance with Indiana's SIP rules and Kentucky's proposed rules.
On September 25, 2000,Cinergy announced a plan for its subsidiaries,CG&E andPSI, to invest in pollution control equipment and other methods to reduce NOX emissions. The current estimate of additional expenditures for this investment is approximately $550 million (in nominal dollars) and includes the following:
- •
- install selective catalytic reduction units (SCRs) at several different generating stations;
- •
- install other pollution control technologies, including new computer software, at all generating stations;
- •
- make combustion improvements; and
- •
- utilize market opportunities to buy and sell NOX allowances.
SCRs are the most proven technology currently available for reducing NOX emissions produced in coal-fired generating stations.
(ii) Section 126 Petitions
In February 1998, several northeast states filed petitions seeking the EPA's assistance in reducing ozone in the Eastern U.S. under Section 126 of the Clean Air Act (CAA). The EPA believes that Section 126 petitions allow a state to claim that sources in another state are contributing to its air quality problem and request that the EPA require the upwind sources to reduce their emissions.
In December 1999, the EPA granted four Section 126 petitions relating to NOX emissions. This ruling affected all of our Ohio and Kentucky facilities, as well as some of our Indiana facilities, and requires us to reduce our NOX emissions to a certain level by May 2003. In May 2001, the Court of Appeals substantially upheld a challenge to the Section 126 requirements, and remanded portions of the rule to the EPA for reconsideration of how growth was factored into the emission limitations. On August 24, 2001, the Court of Appeals temporarily suspended the Section 126 compliance deadline, pending the EPA's reconsideration of growth factors. On January 19, 2002, the EPA issued a memorandum to all Regional Air Division Directors confirming that the Agency would extend the Section 126 rule compliance deadline to May 31, 2004, thus harmonizing the deadline with that for NOX SIP Call.
130
(iii) State Ozone Plans
On November 15, 1999, the states of Indiana and Kentucky (along with Jefferson County, Kentucky) jointly filed an amendment to their attainment demonstration on how they intend to bring the Greater Louisville Area, (including Floyd and Clark Counties in Indiana), into attainment with the one-hour ozone standard. The Greater Louisville Area has since attained the one-hour ozone standard, and on October 23, 2001, the EPA re-designated the area as being in attainment with that standard. Previous SIP amendments called for, among other things, statewide NOX reductions from utilities in Indiana, Kentucky, and surrounding states which are less stringent than the EPA's NOX SIP Call. Indiana and Kentucky committed to adopt utility NOX control rules by December 2000, that would require controls be installed by May 2003. However, Indiana halted the rulemaking for NOX controls at this level, but completed NOX SIP Call level reduction regulations. Kentucky has completed its rulemaking, and issued a final rule that changed the compliance deadline to mirror the NOX SIP Call of May 31, 2004. However, on November 1, 2001, the intent to withdraw the regulation was noted in the Kentucky Administrative Register.
See (f) below for a discussion of the tentative EPA Agreement, the implementation of which could affect our strategy for compliance with the final NOX SIP Call.
(d)New Source Review (NSR)
The CAA's NSR provisions require that a company obtain a pre-construction permit if it plans to build a new stationary source of pollution or make a major modification to an existing facility, unless the changes are exempt. In July 1998, the EPA requested comments on proposed revisions to the NSR rules that could have the affect of changing NSR applicability by limiting exemptions contained in the current regulation. On June 22, 2001, the EPA issued an NSR 90-Day Review Paper and scheduled four public forums across the U.S. to gather more information on the impacts of NSR.Cinergy provided oral testimony at an EPA public forum held in Cincinnati, Ohio, on July 10, 2001, and submitted written comments as well.
Since July 1999,CG&E andPSI have received requests from the EPA (Region 5), under Section 114 of the CAA, seeking documents and information regarding capital and maintenance expenditures at several of their respective generating stations. These requests were part of an industry-wide investigation assessing compliance with the NSR and the New Source Performance Standards (NSPS) of the CAA at electric generating stations.
On September 15, 1999, November 3, 1999, and February 2, 2001, the Attorneys General of New York, Connecticut, and New Jersey, respectively, issued letters notifyingCinergy andCG&E of their intent to sue under the citizens' suit provisions of the CAA. These states allege violations of the CAA by constructing and continuing to operate a major modification ofCG&E's W.C. Beckjord Generating Station (Beckjord Station) without obtaining the required NSR pre-construction permits.
On November 3, 1999, the EPA sued a number of holding companies and electric utilities, includingCinergy,CG&E, andPSI, in various U.S. District Courts (District Court). TheCinergy,CG&E, andPSI suit alleged violations of the CAA at two of our generating stations relating to NSR and NSPS requirements. The suit sought (1) injunctive relief to require installation of pollution control technology on each of the generating units at Beckjord Station and atPSI's Cayuga Generating Station (Cayuga Station), and (2) civil penalties in amounts of up to $27,500 per day for each violation.
On March 1, 2000, the EPA filed an amended complaint againstCinergy,CG&E, andPSI. The amended complaint added alleged violations of the NSR requirements of the CAA at two of our generating stations contained in a notice of violation (NOV) filed by the EPA on November 3, 1999. It also added claims for relief of alleged violations of nonattainment NSR, Indiana and Ohio SIPs, and particulate matter emission limits (as discussed below in the "Beckjord Station NOV" section).
131
The amended complaint sought (1) injunctive relief to require installation of pollution control technology on each of the generating units at Beckjord Station andPSI's Cayuga Station, Wabash River Generating Station, and Gallagher Generating Station, and such other measures as necessary, and (2) civil penalties in amounts of up to $27,500 per day for each violation.
On March 1, 2000, the EPA also filed an amended complaint in a separate lawsuit alleging violations of the CAA relating to NSR, Prevention of Significant Deterioration (PSD), and Ohio SIP requirements regarding various generating stations, including a generating station operated by the Columbus Southern Power Company (CSP) and jointly-owned by CSP, the Dayton Power and Light Company (DP&L), andCG&E. The EPA is seeking injunctive relief and civil penalties of up to $27,500 per day for each violation. This suit is being defended by CSP. On April 4, 2001, the District Court in that case ruled that neither the Government nor the intervening plaintiff environmental groups could obtain civil penalties for any alleged violations that occurred more than five years prior to the filing of the complaint, but that both parties could seek injunctive relief for alleged violations that occurred more than five years before the filing of the complaint. Thus, if the plaintiffs prevail in their claims, any calculation for penalties will not start on the date of the alleged violations, unless those alleged violations occurred after November 3, 1994, but CSP would be forced to install the controls required under the CAA. Neither party appealed that decision.
On June 28, 2000, the EPA issued an NOV toCinergy,CG&E, andPSI for alleged violations of NSR, PSD, and SIP requirements atCG&E's Miami Fort Generating Station (Miami Fort Station) andPSI's Gibson Generating Station (Gibson Station). In addition,Cinergy andCG&E have been informed by DP&L, the operator of J.M. Stuart Generating Station (Stuart Station), that on June 30, 2000, the EPA issued an NOV to DP&L for alleged violations of NSR, PSD, and SIP requirements at this station.CG&E owns 39% of Stuart Station. The NOVs indicated that the EPA may (1) issue an order requiring compliance with the requirements of the SIP, or (2) bring a civil action seeking injunctive relief and civil penalties of up to $27,500 per day for each violation.
On August 2, 2001, the states of New York, New Jersey, and Connecticut filed an Assented to Motion to Intervene in this litigation. Their motion was granted by the District Court on August 3, 2001. The states' proposed complaint is an exhibit to the motion to intervene.Cinergy,CG&E, andPSI are in the process of evaluating the states' complaint but, at this time, are unable to determine the effect, if any, this filing will have on the issues affecting us regarding NSR, as framed in the EPA's Amended Complaint.
See (f) below for a discussion of the tentative EPA Agreement, which relates to matters discussed within this note.
(e)Beckjord Station NOV
On November 30, 1999, the EPA filed an NOV againstCinergy andCG&E, alleging that emissions of particulate matter at the Beckjord Station exceeded the allowable limit. The NOV indicated that the EPA may (1) issue an administrative penalty order, or (2) file a civil action seeking injunctive relief and civil penalties of up to $27,500 per day for each violation. The allegations contained in this NOV were incorporated within the March 1, 2000 amended complaint, as discussed in (d) above. On June 22, 2000, the EPA issued an NOV and a finding of violation (FOV) alleging additional particulate emission violations at Beckjord Station and offered us an opportunity to meet and discuss the allegations and corrective measures. The NOV/FOV indicated the EPA may issue an administrative compliance order, issue an administrative penalty order, or bring a civil or criminal action.
See (f) below for a discussion of the tentative EPA Agreement, which relates to matters discussed within this note.
132
(f)EPA Agreement
On December 21, 2000,Cinergy,CG&E, andPSI reached an agreement in principle with the EPA, the U.S. Department of Justice (Justice Department), three northeast states, and two environmental groups that could serve as the basis for a negotiated resolution of CAA claims and other related matters brought against coal-fired power plants owned and operated byCinergy's operating subsidiaries. The complete resolution of these issues is contingent upon establishing a final agreement with the EPA and other parties. If a final agreement is reached with these parties, it would resolve past claims of NSR violations as well as the Beckjord Station NOVs/FOV discussed previously under (d) and (e).
Under the terms of the tentative agreement, the EPA and the other plaintiffs have agreed to drop all challenges of past maintenance and repair activities at our coal-fired generation plants. In addition, the intent of the tentative agreement is that we would be allowed to continue on-going activities to maintain reliability and availability without subjecting the plants to future litigation regarding federal permitting requirements.
In return for resolution of claims regarding past maintenance activities as well as future operational certainty, and demand growth, we have tentatively agreed to:
- •
- shut down or repower with natural gas nine small coal-fired boilers at three power plants beginning in 2004;
- •
- build four additional sulfur dioxide (SO2) scrubbers, the first of which must be operational by December 31, 2007;
- •
- upgrade existing particulate control systems;
- •
- phase in the operation of NOX reduction technology year-round starting in 2004;
- •
- retire 50,000 tons of SO2 allowances between 2001 and 2005 and reduce our SO2 cap by 35% in 2013;
- •
- pay a civil penalty of $8.5 million to the U.S. government; and
- •
- implement $21.5 million in environmental mitigation projects.
The estimated cost for these capital expenditures is expected to be approximately $700 million. These capital expenditures are in addition to our previously announced commitment to install NOX controls over the next four years as previously discussed in "Ozone Transport Rulemaking".
In reaching the tentative agreement, we did not admit any wrongdoing and remain free to continue our current maintenance practices, as well as implement future projects for improved reliability.
In January 2002, the Justice Department completed its review of NSR, after considering dismissal of the lawsuits, and decided to pursue the pending lawsuits, including the suit againstCinergy,CG&E, andPSI. We will continue to pursue a negotiated settlement of these lawsuits if that continues to be in the best interests of the company. If the settlement is not completed, we intend to defend against the allegations, discussed in (d) and (e) above, vigorously in court. In such an event, it is not possible to determine the likelihood that the plaintiffs would prevail on their claims or whether resolution of these matters would have a material effect on our financial condition or results of operations.
133
(g)Manufactured Gas Plant (MGP) Sites
(i) General
Prior to the 1950s, gas was produced at MGP sites through a process that involved the heating of coal and/or oil. The gas produced from this process was sold for residential, commercial, and industrial uses.
(ii)PSI
Coal tar residues, related hydrocarbons, and various metals associated with MGP sites have been found at former MGP sites in Indiana, including at least 21 sites whichPSI or its predecessors previously owned.PSI acquired four of the sites from Northern Indiana Public Service Company (NIPSCO) in 1931. At the same time,PSI sold NIPSCO the sites located in Goshen and Warsaw, Indiana. In 1945,PSI sold 19 of these sites (including the four sites it acquired from NIPSCO) to the predecessor of the Indiana Gas Company, Inc. (IGC). IGC later sold the site located in Rochester, Indiana to NIPSCO.
IGC (in 1994) and NIPSCO (in 1995) both made claims againstPSI. The basis of these claims was thatPSI is a Potentially Responsible Party with respect to the 21 MGP sites under the Comprehensive Environmental Response, Compensation and Liability Act (CERCLA). The claims further asserted thatPSI was legally responsible for the costs of investigating and remediating the sites. In August 1997, NIPSCO filed suit againstPSI in federal court, claiming recovery (pursuant to CERCLA) of NIPSCO's past and future costs of investigating and remediating MGP-related contamination at the Goshen MGP site.
In November 1998, NIPSCO, IGC, andPSI entered into a Site Participation and Cost Sharing Agreement (Agreement). This Agreement allocated CERCLA liability for past and future costs at seven MGP sites in Indiana among the three companies. As a result of the Agreement, NIPSCO's lawsuit againstPSI was dismissed. The parties have assigned lead responsibility for managing further investigation and remediation activities at each of the sites to one of the parties. Similar agreements were reached between IGC andPSI that allocate CERCLA liability at 14 MGP sites with which NIPSCO was not involved. These agreements concluded all CERCLA and similar claims between the three companies related to MGP sites. The parties continue to investigate and remediate the sites, as appropriate under the agreements and applicable laws. The Indiana Department of Environmental Management (IDEM) oversees investigation and cleanup of some of the sites.
PSI notified its insurance carriers of the claims related to MGP sites raised by IGC, NIPSCO, and IDEM. In April 1998,PSI filed suit in Hendricks County Circuit Court in the State of Indiana against its general liability insurance carriers. Subsequently,PSI sought a declaratory judgment to obligate its insurance carriers to (1) defend MGP claims againstPSI, or (2) payPSI's costs of defense and compensatePSI for its costs of investigating, preventing, mitigating, and remediating damage to property and paying claims related to MGP sites. The lawsuit was moved to the Hendricks Superior Court (Superior Court) in July 1998. Discovery closed in the case at the end of August 2001.PSI and its insurance carriers filed briefs on various issues for decision by the Superior Court in hearings held in November 2001. In December 2001, the Superior Court rescheduled the trial to June 2002. On February 1, 2002, the Superior Court issued rulings on motions for summary judgment. The Superior Court granted the motions of several insurance carriers who claimed that there was insufficient evidence concerning the terms of their policies. The insurance policies in question were between 1950-1958 and 1961-1964. With respect to the remaining policies (between 1958-1961 and 1964-1984), the Superior Court denied all of the insurance carriers' motions. This included motions on the issues of Trigger of Coverage, Expected or Intended Damage, Late Notice and Voluntary Payments. The Superior Court found triable issues of fact for the jury to decide as to the former two issues, and ruled inPSI's favor, as a matter of law, on the latter two issues. The trial against the remaining insurance
134
carriers will go forward in June 2002. At the present time,PSI cannot predict the outcome of this litigation.
PSI has accrued costs for the sites related to investigation, remediation, and groundwater monitoring to the extent such costs are probable and can be reasonably estimated.PSI does not believe it can provide an estimate of the reasonably possible total remediation costs for any site before a remedial investigation/feasibility study has been completed. To the extent remediation is necessary, the timing of the remediation activities impacts the cost of remediation. Therefore,PSI currently cannot determine the total costs that may be incurred in connection with the remediation of all sites, to the extent that remediation is required. According to current information, these future costs at the 21 Indiana MGP sites are not material to our financial condition or results of operations. Until investigation and remediation activities have been completed on these sites, we are unable to reasonably estimate the total costs and impact on our financial position or results of operations.
(iii)CG&E
CG&E and its utility subsidiaries are aware of potential sites where MGP activities have occurred at some time in the past. None of these sites is known to present a risk to the environment.CG&E and its utility subsidiaries have begun preliminary site assessments to obtain information about some of these MGP sites.
(h)Gas Customer Choice
In January 2000, Investments sold Cinergy Resources, Inc. (Resources), a former subsidiary, to Licking Rural Electrification, Inc., doing business as The Energy Cooperative (Energy Cooperative). In February 2001,Cinergy,CG&E, and Resources were named as defendants in three class action lawsuits relating to Energy Cooperative's removal from the Ohio Gas Customer Choice program and the failure to deliver gas to customers. Subsequently, these class action suits were amended and consolidated into one suit.CG&E has been dismissed as a defendant in the consolidated suit. In March 2001,Cinergy,CG&E, and Investments were named as defendants in a lawsuit filed by both Energy Cooperative and Resources. This lawsuit concerns any obligations or liabilities Investments may have to Energy Cooperative following its sale of Resources. We intend to vigorously defend these lawsuits. At the present time,Cinergy cannot predict the outcome of these suits.
(i)PSI Fuel Adjustment Charge
PSI defers fuel costs that are recoverable in future periods subject to IURC approval under a fuel recovery mechanism. In June 2001, the IURC issued an order in aPSI fuel recovery proceeding, disallowing approximately $14 million of deferred costs. On June 26, 2001,PSI formally requested that the IURC reconsider its disallowance decision. In August 2001, the IURC indicated that it will reconsider its decision.PSI believes it has strong legal and factual arguments in its favor and that it will ultimately be permitted to recover these costs. However,PSI cannot definitively predict the ultimate outcome of this matter.
In June 2001,PSI filed a petition with the IURC requesting authority to recover $16 million in under billed deferred fuel costs incurred from March 2001 through May 2001. The IURC approved recovery of these costs subject to refund pending the findings of an investigative sub-docket. The sub-docket was opened to investigate the reasonableness of, and underlying reasons for, the under billed deferred fuel costs. A hearing is scheduled for April 2002.
(j)Other
In compliance with an electric wholesale rate case settlement adopted by the FERC, effective February 2000,CG&E reduced the cost of fuel reflected in its wholesale base rates and revised its
135
wholesale fuel adjustment factor. Beginning March 1, 2000,ULH&P began passing through to retail customers the fuel costs incurred pursuant to the revised wholesale fuel adjustment factor, but did not synchronize the cost of fuel reflected in retail base rates with the reduced cost of fuel reflected in wholesale base rates.
In May 2001, the KPSC approved an offer of settlement byULH&P, which allows it to maintain existing retail electric base rates and fuel adjustment clause at current levels through December 2003 and limits electric rate increases for three years thereafter, resolving all related matters previously pending before the KPSC. The settlement also approved the proposed wholesale power supply contract betweenULH&P andCG&E, beginning January 1, 2002, and made the necessary determinations under the PUHCA, forCG&E to transfer its generating assets and liabilities to an exempt wholesale generator. In connection with this settlement,ULH&P recognized revenues of approximately $7.3 million in 2001, which had been previously reserved in 2000 subject to refund.
14. Jointly-Owned Plant
CG&E, CSP, and DP&L jointly own electric generating units and related transmission facilities.PSI is a joint-owner of Gibson Station Unit No. 5 with Wabash Valley Power Association, Inc. (WVPA), and Indiana Municipal Power Agency (IMPA). Additionally,PSI is a joint-owner with WVPA and IMPA of certain transmission property and local facilities. These facilities constitute part of the integrated transmission and distribution systems, which are operated and maintained byPSI. The Statements of Income reflectCG&E's andPSI's portions of all operating costs associated with the jointly-owned facilities.
CG&E's andPSI's investments in jointly-owned plant or facilities are as follows:
| | Ownership Share | Property, Plant, and Equipment | Accumulated Depreciation | Construction Work in Progress | |||||||||
|---|---|---|---|---|---|---|---|---|---|---|---|---|---|
| | (in millions) | ||||||||||||
| CG&E | |||||||||||||
| Production: | |||||||||||||
| Miami Fort Station (Units 7 and 8) | 64.00 | % | $ | 222 | $ | 127 | $ | 68 | |||||
| Beckjord Station (Unit 6) | 37.50 | 43 | 28 | 3 | |||||||||
| Stuart Station(1) | 39.00 | 292 | 148 | 42 | |||||||||
| Conesville Station (Unit 4)(1) | 40.00 | 77 | 45 | — | |||||||||
| Zimmer Station | 46.50 | 1,235 | 367 | 7 | |||||||||
| East Bend Station | 69.00 | 336 | 194 | 36 | |||||||||
| Killen Station(1) | 33.00 | 187 | 105 | 7 | |||||||||
| Transmission | Various | 84 | 36 | — | |||||||||
PSI | |||||||||||||
| Production: | |||||||||||||
| Gibson Station (Unit 5) | 50.05 | 213 | 113 | 2 | |||||||||
| Transmission and local facilities | 94.68 | 2 | 1 | — | |||||||||
- (1)
- Station is not operated byCG&E.
136
15. Quarterly Financial Data (unaudited)
| | | | CG&Eand subsidiaries | | | ||||||||||||||
|---|---|---|---|---|---|---|---|---|---|---|---|---|---|---|---|---|---|---|---|
| | Cinergy(1) | PSI | |||||||||||||||||
| Quarter Ended | |||||||||||||||||||
| 2001 | 2000 | 2001 | 2000 | 2001 | 2000 | ||||||||||||||
| | (in millions, except per share amounts) | ||||||||||||||||||
| March 31 | |||||||||||||||||||
| Operating Revenues | $ | 3,707 | $ | 1,583 | $ | 1,258 | $ | 716 | $ | 916 | $ | 534 | |||||||
| Operating Income | 249 | 274 | 154 | 181 | 85 | 102 | |||||||||||||
| Net Income | 120 | 138 | 82 | 96 | 41 | 50 | |||||||||||||
| Basic EPS | .76 | .87 | N/A | N/A | N/A | N/A | |||||||||||||
| EPS — assuming dilution | .75 | .87 | N/A | N/A | N/A | N/A | |||||||||||||
June 30 | |||||||||||||||||||
| Operating Revenues | $ | 3,642 | $ | 1,770 | $ | 1,277 | $ | 707 | $ | 1,184 | $ | 620 | |||||||
| Operating Income | 178 | 167 | 98 | 113 | 66 | 49 | |||||||||||||
| Net Income | 83 | 75 | 49 | 56 | 34 | 19 | |||||||||||||
| Basic EPS | .51 | .47 | N/A | N/A | N/A | N/A | |||||||||||||
| EPS — assuming dilution | .51 | .47 | N/A | N/A | N/A | N/A | |||||||||||||
September 30 | |||||||||||||||||||
| Operating Revenues | $ | 3,324 | $ | 2,300 | $ | 1,321 | $ | 840 | $ | 1,258 | $ | 804 | |||||||
| Operating Income | 275 | 196 | 166 | 81 | 110 | 63 | |||||||||||||
| Net Income | 128 | 94 | 89 | 39 | 57 | 31 | |||||||||||||
| Basic EPS | .81 | .59 | N/A | N/A | N/A | N/A | |||||||||||||
| EPS — assuming dilution | .80 | .58 | N/A | N/A | N/A | N/A | |||||||||||||
December 31 | |||||||||||||||||||
| Operating Revenues | $ | 2,250 | $ | 2,769 | $ | 838 | $ | 967 | $ | 717 | $ | 726 | |||||||
| Operating Income | 240 | 225 | 194 | 153 | 69 | 83 | |||||||||||||
| Net Income | 111 | 92 | 107 | 76 | 30 | 35 | |||||||||||||
| Basic EPS | .70 | .58 | N/A | N/A | N/A | N/A | |||||||||||||
| EPS — assuming dilution | .69 | .58 | N/A | N/A | N/A | N/A | |||||||||||||
Total | |||||||||||||||||||
| Operating Revenues | $ | 12,923 | $ | 8,422 | $ | 4,694 | $ | 3,230 | $ | 4,075 | $ | 2,684 | |||||||
| Operating Income | 942 | 862 | 612 | 528 | 330 | 297 | |||||||||||||
| Net Income | 442 | 399 | 327 | 267 | 162 | 135 | |||||||||||||
| Basic EPS | 2.78 | 2.51 | N/A | N/A | N/A | N/A | |||||||||||||
| EPS — assuming dilution | 2.75 | 2.50 | N/A | N/A | N/A | N/A | |||||||||||||
- (1)
- The results ofCinergyalso include amounts related to non-registrants.
16. Financial Information by Business Segment
We conduct operations through our subsidiaries, and manage through the following three business units:
- •
- Energy Merchant Business Unit (Energy Merchant);
- •
- Regulated Businesses Business Unit (Regulated Businesses); and
- •
- Power Technology and Infrastructure Services Business Unit (Power Technology).
The following section describes the activities of our business units as of December 31, 2001.
137
Energy Merchant manages wholesale generation and the domestic and foreign energy marketing and trading of energy commodities. Energy Merchant operates and maintains our regulated and non-regulated electric generating plants including some of our jointly-owned plants, both domestically and abroad. Energy Merchant also conducts the following activities:
- •
- energy risk management;
- •
- financial restructuring services;
- •
- proprietary arbitrage activities;
- •
- customized energy solutions; and
- •
- directs our renewable energy investing activities.
Regulated Businesses consists of a regulated, integrated utility, and regulated electric and gas transmission and distribution systems. Regulated Businesses plans, constructs, operates, and maintainsCinergy's transmission and distribution systems and delivers gas and electric energy to consumers, both domestically and abroad. Regulated Businesses also earns revenues from wholesale customers primarily by transmitting electric power throughCinergy's transmission system.
Power Technology primarily manages the development, marketing, and sales of our non-regulated retail energy and energy-related businesses. This is accomplished through various subsidiaries and joint ventures and includes the following products and services:
- •
- providing energy management and consulting services to customers that operate retail facilities;
- •
- providing various utility operations and infrastructure services to utilities (for example, providing underground locating and construction services for utilities); and
- •
- building and maintaining fiber optic telecommunication networks for businesses, municipalities, telecommunications carriers, and schools.
Power Technology also manages Cinergy Ventures, LLC (Ventures),Cinergy's venture capital subsidiary. Ventures invests in emerging energy technologies that can benefit futureCinergy business development activities.
Financial information by (1) business units, (2) products and services, and (3) geographic areas and long-lived assets for the years ending December 31, 2001, 2000, and 1999, are as follows:
Business Units
| | 2001 | |||||||||||||||||||||
|---|---|---|---|---|---|---|---|---|---|---|---|---|---|---|---|---|---|---|---|---|---|---|
| | Cinergy Business Units | | | | ||||||||||||||||||
| | Energy Merchant | Regulated Businesses | Power Technology | Total | All Other(1) | Reconciling Eliminations(2) | Consolidated | |||||||||||||||
| | (in millions) | |||||||||||||||||||||
| Operating revenues — | ||||||||||||||||||||||
| External customers(3) | $ | 10,024 | $ | 2,850 | $ | 49 | $ | 12,923 | $ | — | $ | — | $ | 12,923 | ||||||||
| Intersegment revenues(4) | 144 | — | — | 144 | — | (144 | ) | — | ||||||||||||||
| Depreciation(5) | 137 | 238 | 3 | 378 | — | — | 378 | |||||||||||||||
| Equity in earnings (losses) of unconsolidated subsidiaries | 3 | 7 | (8 | ) | 2 | — | — | 2 | ||||||||||||||
| Interest(6) | 110 | 144 | 14 | 268 | — | — | 268 | |||||||||||||||
| Income taxes | 103 | 162 | (9 | ) | 256 | — | — | 256 | ||||||||||||||
| Segment profit (loss)(7) | 196 | 265 | (19 | ) | 442 | — | — | 442 | ||||||||||||||
| Total segment assets | 4,803 | 7,238 | 213 | 12,254 | 46 | — | 12,300 | |||||||||||||||
| Investments in unconsolidated subsidiaries | 131 | 132 | 76 | 339 | — | — | 339 | |||||||||||||||
| Total expenditures for long-lived assets | 769 | 630 | — | 1,399 | — | — | 1,399 | |||||||||||||||
- (1)
- The All Other category represents miscellaneous corporate items, which are not allocated to business units for purposes of segment performance measurement.
- (2)
- The Reconciling Eliminations category eliminates the intersegment revenues of Energy Merchant.
- (3)
- The increase in 2001, as compared to 2000, is primarily due to the increase in volumes and average price realized on wholesale commodity transactions.
- (4)
- In connection with deregulation in Ohio, beginning in 2001, certain revenues which were previously recorded through intersegment transfer pricing, are now directly recorded to the business segment.
- (5)
- The components of Depreciation include depreciation of fixed assets and amortization of intangible assets.
- (6)
- Interest income is deemed immaterial.
- (7)
- Management utilizes segment profit (loss) after taxes to evaluate segment profitability.
138
Business Units (cont.)
| | 2000 | |||||||||||||||||||||
|---|---|---|---|---|---|---|---|---|---|---|---|---|---|---|---|---|---|---|---|---|---|---|
| | Cinergy Business Units | | | | ||||||||||||||||||
| | Energy Merchant(7) | Regulated Businesses(7) | Power Technology | Total | All Other(1) | Reconciling Eliminations(2) | Consolidated | |||||||||||||||
| | (in millions) | |||||||||||||||||||||
| Operating revenues — | ||||||||||||||||||||||
| External customers(3) | $ | 4,831 | $ | 3,515 | $ | 76 | $ | 8,422 | $ | — | $ | — | $ | 8,422 | ||||||||
| Intersegment revenues | 1,021 | — | — | 1,021 | �� | — | (1,021 | ) | — | |||||||||||||
| Depreciation(4) | 121 | 220 | 3 | 344 | — | — | 344 | |||||||||||||||
| Equity in earnings (losses) of unconsolidated subsidiaries | (1 | ) | 7 | (1 | ) | 5 | — | — | 5 | |||||||||||||
| Interest(5) | 82 | 133 | 9 | 224 | — | — | 224 | |||||||||||||||
| Income taxes | 94 | 165 | (7 | ) | 252 | — | — | 252 | ||||||||||||||
| Segment profit (loss)(6) | 152 | 260 | (13 | ) | 399 | — | — | 399 | ||||||||||||||
| Total segment assets | 5,949 | 6,162 | 177 | 12,288 | 42 | — | 12,330 | |||||||||||||||
| Investments in unconsolidated subsidiaries | 453 | 33 | 52 | 538 | — | — | 538 | |||||||||||||||
| Total expenditures for long-lived assets | 130 | 387 | — | 517 | 3 | — | 520 | |||||||||||||||
- (1)
- The All Other category represents miscellaneous corporate items, which are not allocated to business units for purposes of segment performance measurement.
- (2)
- The Reconciling Eliminations category eliminates the intersegment revenues of Energy Merchant.
- (3)
- The increase in 2000, as compared to 1999, is primarily due to the increase in volumes and average price realized on wholesale commodity transactions.
- (4)
- The components of Depreciation include depreciation of fixed assets and amortization of intangible assets.
- (5)
- Interest income is deemed immaterial.
- (6)
- Management utilizes segment profit (loss) after taxes to evaluate segment profitability.
- (7)
- Effective January 2001, electric customer choice legislation was implemented in Ohio. For comparative purposes, the estimated pro forma adjustment to reflect this effect on the twelve months ended December 31, 2000 results would be as follows:
| | Energy Merchant | Regulated Businesses | ||||
|---|---|---|---|---|---|---|
| Operating revenues | $ | (119 | ) | $ | 119 | |
| Segment profit (loss) | $ | (41 | ) | $ | 41 | |
139
Business Units (cont.)
| | 1999 | |||||||||||||||||||||
|---|---|---|---|---|---|---|---|---|---|---|---|---|---|---|---|---|---|---|---|---|---|---|
| | Cinergy Business Units | | | | ||||||||||||||||||
| | Energy Merchant | Regulated Businesses | Power Technology | Total | All Other(1) | Reconciling Eliminations(2) | Consolidated | |||||||||||||||
| | (in millions) | |||||||||||||||||||||
| Operating revenues — | ||||||||||||||||||||||
| External customers | $ | 2,561 | $ | 3,318 | $ | 59 | $ | 5,938 | $ | — | $ | — | $ | 5,938 | ||||||||
| Intersegment revenues | 988 | — | — | 988 | — | (988 | ) | — | ||||||||||||||
| Depreciation(3) | 113 | 210 | — | 323 | — | — | 323 | |||||||||||||||
| Gain on sale of investment in unconsolidated subsidiary | 99 | — | — | 99 | — | — | 99 | |||||||||||||||
| Equity in earnings (losses) of unconsolidated subsidiaries | 59 | 1 | (2 | ) | 58 | — | — | 58 | ||||||||||||||
| Interest(4) | 89 | 142 | 3 | 234 | 1 | — | 235 | |||||||||||||||
| Income taxes | 50 | 165 | (6 | ) | 209 | — | — | 209 | ||||||||||||||
| Segment profit (loss)(5) | 169 | 245 | (10 | ) | 404 | — | — | 404 | ||||||||||||||
| Total segment assets | 3,584 | 5,889 | 97 | 9,570 | 47 | — | 9,617 | |||||||||||||||
| Investments in unconsolidated subsidiaries | 334 | 17 | 8 | 359 | — | — | 359 | |||||||||||||||
| Total expenditures for long-lived assets | 171 | 304 | 2 | 477 | — | — | 477 | |||||||||||||||
- (1)
- The All Other category represents miscellaneous corporate items, which are not allocated to business units for purposes of segment performance measurement.
- (2)
- The Reconciling Eliminations category eliminates the intersegment revenues of Energy Merchant.
- (3)
- The components of Depreciation include depreciation of fixed assets and amortization of intangible assets.
- (4)
- Interest income is deemed immaterial.
- (5)
- Management utilizes segment profit (loss) after taxes to evaluate segment profitability.
Products and Services
(in millions)
| | Revenues | |||||||||||||||||||||||
|---|---|---|---|---|---|---|---|---|---|---|---|---|---|---|---|---|---|---|---|---|---|---|---|---|
| | Utility | Energy Marketing and Trading | | | ||||||||||||||||||||
| Year | Electric | Gas | Total | Electric | Gas | Total | Other | Consolidated | ||||||||||||||||
| 2001 | $ | 2,248 | $ | 595 | $ | 2,843 | $ | 5,933 | $ | 4,068 | $ | 10,001 | $ | 79 | $ | 12,923 | ||||||||
| 2000 | 3,019 | 497 | 3,516 | 2,365 | 2,445 | 4,810 | 96 | 8,422 | ||||||||||||||||
| 1999 | 2,944 | 420 | 3,364 | 1,369 | 1,176 | 2,545 | 29 | 5,938 | ||||||||||||||||
140
Geographic Areas and Long-Lived Assets
(in millions)
| | Revenues | ||||||||||||||
|---|---|---|---|---|---|---|---|---|---|---|---|---|---|---|---|
| | | International | | ||||||||||||
| Year | Domestic | United Kingdom(1) | All Other(2) | Total | Consolidated | ||||||||||
| 2001 | $ | 12,748 | $ | — | $ | 175 | $ | 175 | $ | 12,923 | |||||
| 2000 | 8,339 | — | 83 | 83 | 8,422 | ||||||||||
| 1999 | 5,877 | — | 61 | 61 | 5,938 | ||||||||||
| | Long-Lived Assets | ||||||||||||||
|---|---|---|---|---|---|---|---|---|---|---|---|---|---|---|---|
| | | International | | ||||||||||||
| Year | Domestic | United Kingdom(1) | All Other(2) | Total | Consolidated | ||||||||||
| 2001 | $ | 9,682 | $ | — | $ | 482 | $ | 482 | $ | 10,164 | |||||
| 2000 | 8,267 | — | 328 | 328 | 8,595 | ||||||||||
| 1999 | 7,841 | 2 | 277 | 279 | 8,120 | ||||||||||
- (1)
- As discussed in Note 11, on July 15, 1999, we sold our 50% ownership interest in Midlands. Prior to the sale, Midlands had provided the majority of our international earnings.
- (2)
- International revenues are primarily from assets which we own in the Czech Republic, the majority of which are four district heating plants. The Czech Republic assets and results of operations are consolidated into our financial statements.
141
17. Earnings Per Common Share
A reconciliation of EPS to EPS—assuming dilution is presented below:
| | Income | Shares | EPS | ||||||
|---|---|---|---|---|---|---|---|---|---|
| | (in thousands, except per share amounts) | ||||||||
| Year ended December 31, 2001 | |||||||||
| EPS: | |||||||||
| Net income | $ | 442,279 | 159,110 | $ | 2.78 | ||||
Effect of dilutive securities: | |||||||||
| Common stock options | 975 | ||||||||
| Directors' compensation plans | 152 | ||||||||
| Contingently issuable common stock | 810 | ||||||||
EPS — assuming dilution: | |||||||||
| Net income plus assumed conversions | $ | 442,279 | 161,047 | $ | 2.75 | ||||
Year ended December 31, 2000 | |||||||||
| EPS: | |||||||||
| Net income | $ | 399,466 | 158,938 | $ | 2.51 | ||||
Effect of dilutive securities: | |||||||||
| Common stock options | 491 | ||||||||
| Directors' compensation plans | 177 | ||||||||
| Contingently issuable common stock | 262 | ||||||||
EPS — assuming dilution: | |||||||||
| Net income plus assumed conversions | $ | 399,466 | 159,868 | $ | 2.50 | ||||
Year ended December 31, 1999 | |||||||||
| EPS: | |||||||||
| Net income | $ | 403,641 | 158,863 | $ | 2.54 | ||||
Effect of dilutive securities: | |||||||||
| Common stock options | 344 | ||||||||
| Employee stock purchase and savings plan | 22 | ||||||||
| Contingently issuable common stock | 26 | ||||||||
EPS — assuming dilution: | |||||||||
| Net income plus assumed conversions | $ | 403,641 | 159,255 | $ | 2.53 | ||||
Options to purchase shares of common stock are excluded from the calculation of EPS—assuming dilution when the exercise prices of these options are greater than the average market price of the common shares during the period. For 2001, 2000, and 1999, approximately two million shares per year were excluded from the EPS—assuming dilution calculation.
18. Ohio Deregulation
On July 6, 1999, Ohio Governor Robert Taft signed Amended Substitute Senate Bill No. 3 (Electric Restructuring Bill), beginning the transition to electric deregulation and customer choice for the State of Ohio. The Electric Restructuring Bill created a competitive electric retail service market effective January 1, 2001. The legislation provided for a market development period that began January 1, 2001, and ends no later than December 31, 2005.
142
On May 8, 2000,CG&E reached a stipulated agreement with the PUCO staff and various other interested parties with respect to its proposal to implement electric customer choice in Ohio effective January 1, 2001. On August 31, 2000, the PUCO approvedCG&E's stipulation agreement. The major features of the agreement include:
- •
- Residential customer rates are frozen through December 31, 2005;
- •
- Residential customers received a five-percent reduction in the generation portion of their electric rates, effective January 1, 2001;
- •
- CG&E will provide four million dollars from 2001 to 2005 in support of energy efficiency and weatherization services for low income customers;
- •
- The creation of a RTC designed to recoverCG&E's regulatory assets and other transition costs over a ten-year period;
- •
- Authority forCG&E to transfer its generation assets to one or more non-regulated affiliates to provide flexibility to manage its generation asset portfolio in a manner that enhances opportunities in a competitive marketplace;
- •
- Authority forCG&E to apply the proceeds of transition cost recovery to costs incurred during the transition period including implementation costs and purchased power costs that may be incurred byCG&E to maintain an operating reserve margin sufficient to provide reliable service to its customers;
- •
- CG&E will provide standard offer default supplier service (i.e.,CG&E will be the supplier of last resort, so that no customer will be without an electric supplier); and
- •
- CG&E has agreed to provide shopping credits to switching customers.
With regard to the PUCO's order, two parties filed applications for rehearing with the PUCO. On October 18, 2000, the PUCO denied these applications. One of the parties appealed to the Ohio Supreme Court in the fourth quarter of 2000 andCG&E subsequently intervened in that case. On April 6, 2001,CG&E filed for dismissal of this appeal. On July 25, 2001, the Ohio Supreme Court deniedCG&E's motion to dismiss.CG&E is unable to predict the outcome of this proceeding.
As indicated above, the August 31, 2000 order authorizesCG&E to transfer its generation assets to a non-regulated affiliate. In addition to the regulatory approvals received from the PUCO, the IURC, and the KPSC, this transfer requires the approval of the FERC and the SEC under PUHCA. On October 29, 2001,CG&E filed an application with the FERC seeking authorization to transfer these assets. As the transfer is contingent uponCG&E receiving FERC approval, SEC approval under PUHCA, and various third party consents, the timing and receipt of which are unknown, the completion date of the transfer of generation assets to a non-regulated affiliate cannot be predicted.
143
19. Comprehensive Income
The elements ofComprehensive income and their related tax effects for the years ended 2001, 2000 and 1999 are as follows:
| | Comprehensive Income | ||||||||||||||||||||||||||||
|---|---|---|---|---|---|---|---|---|---|---|---|---|---|---|---|---|---|---|---|---|---|---|---|---|---|---|---|---|---|
| | 2001 | 2000 | 1999 | ||||||||||||||||||||||||||
| | Before-tax Amount | Tax (Expense) Benefit | Net-of-Tax Amount | Before-tax Amount | Tax (Expense) Benefit | Net-of-Tax Amount | Before-tax Amount | Tax (Expense) Benefit | Net-of-Tax Amount | ||||||||||||||||||||
| | (dollars in thousands) | ||||||||||||||||||||||||||||
| Cinergy(1) | |||||||||||||||||||||||||||||
| Net income | $ | 697,785 | $ | (255,506 | ) | $ | 442,279 | $ | 651,023 | $ | (251,557 | ) | $ | 399,466 | $ | 612,312 | $ | (208,671 | ) | $ | 403,641 | ||||||||
Other comprehensive income (loss): | |||||||||||||||||||||||||||||
| Foreign currency translation adjustment | 4,996 | (3,355 | ) | 1,641 | 721 | 1,353 | 2,074 | (14,771 | ) | 4,990 | (9,781 | ) | |||||||||||||||||
| Minimum pension liability adjustment | (2,636 | ) | 1,081 | (1,555 | ) | (1,852 | ) | 753 | (1,099 | ) | (2,081 | ) | 842 | (1,239 | ) | ||||||||||||||
| Unrealized gain (loss) on investment trusts | (1,345 | ) | 504 | (841 | ) | (2,778 | ) | 649 | (2,129 | ) | 2,629 | (543 | ) | 2,086 | |||||||||||||||
| Cumulative effect of change in accounting principle | (4,026 | ) | 1,526 | (2,500 | ) | — | — | — | — | — | — | ||||||||||||||||||
| Cash flow hedges | (4,477 | ) | 1,698 | (2,779 | ) | — | — | — | — | — | — | ||||||||||||||||||
| Total other comprehensive income (loss) | (7,488 | ) | 1,454 | (6,034 | ) | (3,909 | ) | 2,755 | (1,154 | ) | (14,223 | ) | 5,289 | (8,934 | ) | ||||||||||||||
Total comprehensive income | $ | 690,297 | $ | (254,052 | ) | $ | 436,245 | $ | 647,114 | $ | (248,802 | ) | $ | 398,312 | $ | 598,089 | $ | (203,382 | ) | $ | 394,707 | ||||||||
- (1)
- The results ofCinergyalso include amounts related to non-registrants. Individual amounts forCG&E,PSI, andULH&Pare deemed immaterial.
The after-tax components ofAccumulated other comprehensive income (loss) as of December 31, 2001, 2000, and 1999 are as follows:
| | Accumulated Other Comprehensive Income (Loss) Classification | ||||||||||||||||
|---|---|---|---|---|---|---|---|---|---|---|---|---|---|---|---|---|---|
| | Foreign Currency Translation Adjustment | Minimum Pension Liability Adjustment | Unrealized Gain (Loss) on Investment Trusts | Cash Flow Hedges | Total Other Comprehensive Income (Loss) | ||||||||||||
| | (dollars in thousands) | ||||||||||||||||
| Cinergy(1) | |||||||||||||||||
Balance at December 31, 1998 | $ | 1,635 | $ | (2,442 | ) | $ | — | $ | — | $ | (807 | ) | |||||
| Current-period change | (9,781 | ) | (1,239 | ) | 2,086 | — | (8,934 | ) | |||||||||
Balance at December 31, 1999 | $ | (8,146 | ) | $ | (3,681 | ) | $ | 2,086 | $ | — | $ | (9,741 | ) | ||||
| Current-period change | 2,074 | (1,099 | ) | (2,129 | ) | — | (1,154 | ) | |||||||||
Balance at December 31, 2000 | $ | (6,072 | ) | $ | (4,780 | ) | $ | (43 | ) | $ | — | $ | (10,895 | ) | |||
| Cumulative effect of change in accounting principle | — | — | — | (2,500 | ) | (2,500 | ) | ||||||||||
| Current-period change | 1,641 | (1,555 | ) | (841 | ) | (2,779 | ) | (3,534 | ) | ||||||||
Balance at December 31, 2001 | $ | (4,431 | ) | $ | (6,335 | ) | $ | (884 | ) | $ | (5,279 | ) | $ | (16,929 | ) | ||
- (1)
- The results ofCinergyalso include amounts related to non-registrants. Individual amounts forCG&E,PSI, andULH&Pare deemed immaterial.
144
ITEM 9. CHANGES IN AND DISAGREEMENTS WITH ACCOUNTANTS ON ACCOUNTING AND FINANCIAL DISCLOSURE
None.
145
ITEM 10. DIRECTORS AND EXECUTIVE OFFICERS OF THE REGISTRANTS
BOARD OF DIRECTORS
Information regardingCinergy Corp.'s directors is incorporated by reference from its definitive Proxy Statement for the 2002 Annual Meeting of Shareholders.
The directors of The Cincinnati Gas & Electric Company (CG&E) at January 31, 2002, are as follows:
- •
- R. Foster Duncan—Mr. Duncan, age 47, is Executive Vice President and Chief Financial Officer ofCG&E, a position he has held since February 2001. He has served as director ofCG&E since April 2001. His current term as director expires May 1, 2002.
- •
- James E. Rogers—Mr. Rogers, age 54, is Chairman of the Board and Chief Executive Officer ofCG&E. He has served as a director ofCG&E since 1994. His current term as director expires May 1, 2002.
- •
- James L. Turner—Mr. Turner, age 42, is Vice President ofCG&E, a position he has held since July 2000. He served as a director ofCG&E from February 15, 1999 to April 30, 2001, at which time Mr. William J. Grealis was elected as successor-director to Mr. Turner. Mr. Turner was re-elected, effective October 1, 2001, as successor-director to Mr. Grealis. Mr. Turner's current term as director expires May 1, 2002.
Additional information on each of the directors ofCG&E is presented in the following "Executive Officers" section.
Information regarding PSI Energy, Inc.'s (PSI) directors is incorporated by reference fromPSI's 2002 Information Statement.
146
The names of the executive officers of each registrant, their ages (as of December 31, 2001), the positions they hold, held, or have been elected to as of this report filing date, and their business experience during the past five years is included in the chart below.
| | | Positions and Length of Service | ||||||
|---|---|---|---|---|---|---|---|---|
| Name | | |||||||
| Age | Cinergy Corp. | CG&E | PSI | |||||
| Wendy Aumiller | 49 | Acting Treasurer 10/01 - present Assistant Treasurer 10/00 - 10/01 General Manager, Generation Financial Planning 6/00 - 10/00 Assistant Treasurer 9/96 - 6/00 | ||||||
| John Bryant(1) | 55 | Vice President 1/98 - present President, International Business Unit 7/00 - 2/01 | ||||||
| Michael J. Cyrus(2) | 46 | Executive Vice President 2/01 - present Chief Executive Officer, Energy Merchant Business Unit 2/01 - present President, Energy Commodities Business Unit 3/99 - 2/01 Vice President 4/98 - 2/01 Chief Operating Officer, Energy Commodities Business Unit 11/98 - 3/99 | Executive Vice President 2/01 - present Vice President 4/99 - 2/01 | Executive Vice President 2/01 - present Vice President 4/99 - 2/01 | ||||
| R. Foster Duncan(3) | 47 | Executive Vice President and Chief Financial Officer 2/01 - present | Executive Vice President and Chief Financial Officer 2/01 - present | Executive Vice President and Chief Financial Officer 2/01 - present | ||||
| Douglas F. Esamann | 44 | Vice President and Chief Financial Officer, Energy Merchant Business Unit 2/01 - 10/01 Vice President and Chief Financial Officer, Energy Commodities Business Unit 3/99 - 2/01 General Manager, Business Development, Energy Commodities Business Unit 3/98 - 3/99 Finance Manager, Energy Commodities Business Unit 5/96 - 3/98 | President 10/01 - present | |||||
147
| Gregory C. Ficke | 49 | Vice President and Chief Information Officer, Regulated Businesses Business Unit 2/01 - 10/01 Vice President and Chief Information Officer, Energy Delivery Business Unit 7/00 - 2/01 Vice President, Operations Services, Energy Delivery Business Unit 4/99 - 7/00 Vice President, Gas Operations, Energy Delivery Business Unit 12/98 - 4/99 General Manager, Gas Operations, Energy Delivery Business Unit 8/96 - 12/98 | President 10/01 - present | |||||
| William J. Grealis(4) | 56 | Executive Vice President 7/00 - present Chief Executive Officer, Regulated Businesses Business Unit 2/01 - 10/01 Chief of Staff 7/00 - 2/01 Vice President, Corporate Services, and Chief Strategic Officer 8/98 - 7/00 Vice President 1/95 - 8/98 | Executive Vice President 7/00 - present Chief of Staff 7/00 - 2/01 Vice President, Corporate Services, and Chief Strategic Officer 8/98 - 7/00 Vice President 4/98 - 8/98 President 1/95 - 3/98 | Executive Vice President 7/00 - present Chief of Staff 7/00 - 2/01 Vice President, Corporate Services, and Chief Strategic Officer 8/98 - 7/00 Vice President 4/98 - 8/98 | ||||
| J. Joseph Hale, Jr.(5) | 52 | Vice President 12/96 - present | Vice President 10/01 - present President 7/00 - 10/01 Vice President 8/98 - 7/00 General Manager, Marketing Operations 1/95 - 8/98 | Vice President 10/01 - present Vice President 2/00 - 7/00 Interim President 6/99 - 2/00 Vice President 8/98 - 6/99 | ||||
| M. Stephen Harkness(6) | 53 | Vice President 12/96 - present | ||||||
| Donald B. Ingle, Jr.(7) | 52 | President, Power Technology and Infrastructure Services Business Unit 2/01 - present President, Cinergy Investments Business Unit 3/99 - 2/01 Vice President 10/97 - present | Vice President 10/97 - 3/99 | Vice President 10/97 - 3/99 | ||||
| Julia S. Janson | 37 | Secretary 7/00 - present Senior Counsel 7/98 - present Counsel 5/96 - 7/98 | Assistant Secretary 7/00 - present Senior Counsel 7/98 - present Counsel 5/96 - 7/98 | Secretary 7/00 - present Senior Counsel 7/98 - present Counsel 5/96 - 7/98 |
148
| Bernard F. Roberts | 49 | Vice President and Comptroller 3/99 - present Vice President and Chief Financial Officer, Energy Commodities Business Unit 7/96 - 3/99 | Vice President and Comptroller 3/99 - present | Vice President and Comptroller 3/99 - present | ||||
| James E. Rogers | 54 | Chairman of the Board 12/00 - present President and Chief Executive Officer 12/95 - present Vice Chairman 12/95 - 12/00 | Chairman of the Board 12/00 - present Chief Executive Officer 12/95 - present Vice Chairman 12/95 - 12/00 | Chairman of the Board 12/00 - present Chief Executive Officer 12/95 - present Vice Chairman 12/95 - 12/00 | ||||
| Larry E. Thomas(8) | 56 | Executive Vice President 2/01 - present Chief Executive Officer, Power Technology and Infrastructure Services Business Unit 2/01 - 7/01 Group President 7/00 - 2/01 Vice President 4/97 - 7/00 President, Energy Delivery Business Unit 5/96 - 7/00 Group Vice President and Chief Transformation Officer 9/95 - 4/97 | Executive Vice President 2/01 - present Group President 7/00 - 2/01 Vice President 4/97 - 7/00 Group Vice President and Chief Transformation Officer 9/95 - 4/97 | Vice Chairman 7/01 - present Executive Vice President 2/01 - 7/01 Group President 7/00 - 2/01 Vice President 4/97 - 7/00 Group Vice President and Chief Transformation Officer 9/95 - 4/97 | ||||
| James L. Turner(9) | 42 | Executive Vice President 10/01 - present Chief Executive Officer, Regulated Businesses Business Unit 12/01 - present President, Regulated Businesses Business Unit 2/01 - 12/01 President, Energy Delivery Business Unit 7/00 - 2/01 Vice President 4/99 - 12/01 Senior Counsel 6/95 - 3/97 | Vice President 7/00 - present President 2/99 - 7/00 | Vice President 7/00 - present | ||||
| Jerome A. Vennemann | 51 | Vice President and General Counsel 1/00 - present Acting General Counsel 3/99 - 1/00 Associate General Counsel 2/96 - 3/99 Assistant Secretary 12/94 - present | Vice President and General Counsel 1/00 - present Acting General Counsel 3/99 - 1/00 Secretary 4/98 - present Associate General Counsel 2/96 - 3/99 Assistant Secretary 1/95 - 4/98 | Vice President and General Counsel 1/00 - present Acting General Counsel 3/99 - 1/00 Associate General Counsel 2/96 - 3/99 Assistant Secretary 12/94 - present | ||||
| Timothy J. Verhagen(10) | 55 | Vice President 1/01 - present |
149
| Charles J. Winger | 56 | Vice President 4/97 - present Acting Chief Financial Officer 6/00 - 2/01 Chief Financial Officer 4/98 - 3/99 Comptroller 12/94 - 8/97 | Vice President and Acting Chief Financial Officer 6/00 - 2/01 Vice President and Chief Financial Officer 4/98 - 3/99 Vice President 4/97 - 8/97 Comptroller 1/95 - 8/97 | Vice President and Acting Chief Financial Officer 6/00 - 2/01 Vice President and Chief Financial Officer 4/98 - 3/99 Vice President 4/97 - 8/97 Comptroller 3/84 - 8/97 |
None of the officers are related in any manner. Our executive officers hold the offices set opposite their names until the next annual meeting of the Board of Directors and until their successors have been elected and qualified.
- (1)
- Mr. Bryant also serves as the President of Cinergy Global Resources, Inc. (Global Resources) and Cinergy Global Power, Inc., and as the Managing Director of Cinergy Global Power Services Limited,Cinergy's (which includesCinergy Corp. and all of our regulated and non-regulated subsidiaries) international project development subsidiary from 1997 to present. Previously, he served as the Executive Generation Director of Midlands Electricity plc (Midlands; a non-affiliate ofCinergy) from 1996 to 1997, and Generation Director of Midlands from 1992 to 1996.
- (2)
- Prior to joiningCinergy, Mr. Cyrus was Senior Vice President of Trading and Operations with Electric Clearinghouse, Inc. (a non-affiliate ofCinergy), the power subsidiary of Natural Gas Clearinghouse (NGC; a non-affiliate ofCinergy) in Houston, Texas, a position he had held since 1997. Prior to that, Mr. Cyrus was President of NGC Canada and Executive Vice President of Novagas Clearinghouse, Ltd. Previously, Mr. Cyrus held various executive positions involving energy trading, marketing, and risk management with NGC since 1993.
150
- (3)
- Prior to joiningCinergy, Mr. Duncan was Executive Vice President and Chief Financial Officer of LG&E Energy Corporation (LG&E) (a non-affiliate ofCinergy) in Louisville, Kentucky since December 1998. Prior to that, he was Executive Vice President of Planning and Corporate Development at LG&E from January 1998 to December 1998. Prior to joining LG&E, in January 1998, he was Vice President and Treasurer of Freeport-McMoRan, Inc. and Freeport-McMoRan Copper & Gold (non-affiliates ofCinergy), global natural resource companies headquartered in New Orleans, Louisiana since May 1994.
- (4)
- As Executive Vice President and Chief of Staff, Mr. Grealis had responsibility for all shared service functions, including legal, external communications, human resources, creative services, information technology, budgets and certain accounting functions. Mr. Grealis served as President of Cinergy Investments, Inc. (Investments) from 1995 to March 1999. Mr. Grealis also served as President of the former Energy Services Business Unit from 1996 to May 1997.
- (5)
- Since 1992, Mr. Hale has served as President of Cinergy Foundation, Inc., aCinergy affiliate that is organized and operated exclusively for charitable purposes.
- (6)
- Mr. Harkness also serves as Chief Operating and Chief Financial Officer of the Energy Merchant Business Unit.
- (7)
- From 1995 to March 1999, Mr. Ingle served as Contract Consultant for Investments. Mr. Ingle also served as President of the former Energy Services Business Unit from 1997 to March 1999.
- (8)
- As Group President, Mr. Thomas had responsibility forCinergy's new technology initiatives and energy delivery. Effective January 10, 2000, Cinergy's Economic Development, Community Affairs, State Regulatory Affairs and State Governmental Affairs were merged into the former Energy Delivery Business Unit.
- (9)
- In March 1997, Mr. Turner was appointed Vice President of Cinergy Services, Inc., (Services) having responsibility for the coordination of transition issues across all corporate subsidiaries in the move for full customer choice. Beginning in April 1998 until January 2000, Mr. Turner had full responsibility forCinergy's Government and Regulatory Affairs Department. Mr. Turner served as Vice President of Customer Services from January 2000 until July 2000.
- (10)
- Prior to joiningCinergy, Mr. Verhagen served as Senior Vice President, Human Resources and Administration of United Dominion Industries Ltd. (United Dominion; a non-affiliate ofCinergy), a diversified manufacturer of industrial test equipment in Charlotte, North Carolina, from 1998 to 2000. From 1993 to 1998 he served as Vice President, Human Resources of United Dominion.
ITEM 11. EXECUTIVE COMPENSATION
Information in response to this item forCinergy Corp. andCG&E is incorporated by reference fromCinergy Corp.'s definitive Proxy Statement for the 2002 Annual Meeting of the Shareholders.
AllCG&E directors currently are employees ofCinergy Corp. orCG&E, and receive no compensation for their services as directors.
Information in response to this item forPSI executive compensation is incorporated by reference fromPSI's 2002 Information Statement.
ITEM 12. SECURITY OWNERSHIP OF CERTAIN BENEFICIAL OWNERS AND MANAGEMENT
Information in response to this item forCinergy Corp. is incorporated by reference from its definitive Proxy Statement for the 2002 Annual Meeting of Shareholders.
Cinergy Corp. owns all outstanding shares of common stock ofCG&E,CG&E's only voting security. Pursuant to Section 13(d) of the Securities Exchange Act of 1934, a beneficial owner of a security is any person who directly or indirectly has or shares voting or investment power over such security. No person or group is known by the management ofCG&E to be the beneficial owner of more than 5% of any series ofCG&E's class of cumulative preferred stock as of December 31, 2001.
CG&E's directors and executive officers did not beneficially own shares of any series of the class ofCG&E's cumulative preferred stock as of January 31, 2002. The beneficial ownership ofCinergy
151
Corp. common stock by each director and named executive officer ofCG&E as of January 31, 2002, is set forth in the following table:
| Name of Beneficial Owner(1) | Amount and Nature of Beneficial Ownership(2) | |
|---|---|---|
| Michael J. Cyrus | 213,528 shares | |
| R. Foster Duncan | 44,704 shares | |
| William J. Grealis | 340,697 shares | |
| James E. Rogers | 1,276,277 shares | |
| Larry E. Thomas | 360,589 shares | |
| James L. Turner | 33,890 shares | |
| All directors and executive officers as a group (10 persons) | 2,489,486 shares (representing 1.56% of the class) |
- (1)
- No individual listed beneficially owned more than 0.80% of the outstanding shares of our common stock.
- (2)
- Includes shares which there is a right to acquire within 60 days pursuant to the exercise of stock options in the following amounts: Mr. Cyrus—108,600; Mr. Duncan—40,000; Mr. Grealis—201,535; Mr. Rogers—931,829; Mr. Thomas—193,345; Mr. Turner—16,900; and all directors and executive officers as a group—1,615,787.
Information in response to this item forPSI is incorporated by reference from its 2002 Information Statement.
ITEM 13. CERTAIN RELATIONSHIPS AND RELATED TRANSACTIONS
Information in response to this item forCinergy Corp. andCG&E is incorporated by reference fromCinergy Corp.'s definitive Proxy Statement for the 2002 Annual Meeting of Shareholders.
Information in response to this item forPSI is incorporated by reference fromPSI's 2002 Information Statement.
152
ITEM 14. EXHIBITS, FINANCIAL STATEMENT SCHEDULES, AND REPORTS ON FORM 8-K
FINANCIAL STATEMENTS AND SCHEDULES
Refer to the page captioned "Index to Financial Statements and Financial Statement Schedules" for an index of the financial statements and financial statement schedules included in this report.
REPORTS ON FORM 8-K
The following reports on Form 8-K were filed during the quarter ended December 31, 2001:
| Date of Filing | Registrant(s) | Item Filed | ||
|---|---|---|---|---|
| December 19, 2001 | Cinergy Corp. | Item 5. Other Events Item 7. Financial Statements and Exhibits |
EXHIBITS
The documents listed below are being filed or have previously been filed on behalf ofCinergy Corp.,CG&E,PSI, and The Union Light, Heat and Power Company (ULH&P) and are incorporated herein by reference from the documents indicated and made a part hereof. Exhibits not identified as previously filed are filed herewith:
| Exhibit Designation | Registrant(s)(1) | Nature of Exhibit | Previously Filed as Exhibit to: | |||
|---|---|---|---|---|---|---|
| Articles of Incorporation/ By-laws | ||||||
| 3-a | Cinergy Corp. | Certificate of Incorporation ofCinergy Corp., a Delaware corporation, as amended December 14, 2000. | Cinergy Corp. March 31, 2001, Form 10-Q | |||
| 3-b | Cinergy Corp. | By-Laws ofCinergy Corp., as amended on December 14, 2000. | Cinergy Corp. 2000 Form 10-K | |||
| 3-c | CG&E | Amended Articles of Incorporation ofCG&E effective October 23, 1996. | CG&E September 30, 1996, Form 10-Q | |||
| 3-d | CG&E | Regulations ofCG&E, as amended, April 25, 1996. | CG&E March 31, 1996, Form 10-Q | |||
| 3-e | PSI | Amended Articles of Consolidation ofPSI, as amended April 20, 1995. | PSI June 30, 1995, Form 10-Q | |||
| 3-f | PSI | Amendment to Article D of the Amended Articles of Consolidation ofPSI, effective July 10, 1997. | Cinergy Corp. 1997 Form 10-K | |||
| 3-g | PSI | By-Laws ofPSI, as amended to December 17, 1996. | PSI March 31, 1997, Form 10-Q | |||
| 3-h | ULH&P | Restated Articles of Incorporation made effective May 7, 1976. | ULH&P Form 8-K, May 1976 | |||
| 3-i | ULH&P | By-Laws ofULH&P as amended, adopted May 8, 1996. | ULH&P March 31, 1996, Form 10-Q | |||
| 3-j | ULH&P | Amendment to Restated Articles of Incorporation ofULH&P (Article Third) and Amendment to the By-Laws ofULH&P (Article 1), both effective July 24, 1997. | Cinergy Corp. 1997 Form 10-K |
153
| Instruments defining the rights of holders, incl. Indentures | ||||||
| 4-a | Cinergy Corp. PSI | Original Indenture (First Mortgage Bonds) dated September 1, 1939, betweenPSI and The First National Bank of Chicago, as Trustee, and LaSalle National Bank, as Successor Trustee. | Exhibit A-Part 3 in File No. 70-258 Supplemental Indenture dated March 30, 1984 | |||
| 4-b | Cinergy Corp. PSI | Twenty-fifth Supplemental Indenture betweenPSI and The First National Bank of Chicago dated September 1, 1978. | File No. 2-62543 | |||
| 4-c | Cinergy Corp. PSI | Thirty-fifth Supplemental Indenture betweenPSI and The First National Bank of Chicago dated March 30, 1984. | PSI 1984 Form 10-K | |||
| 4-d | Cinergy Corp. PSI | Forty-second Supplemental Indenture betweenPSI and LaSalle National Bank dated August 1, 1988. | PSI 1988 Form 10-K | |||
| 4-e | Cinergy Corp. PSI | Forty-fourth Supplemental Indenture betweenPSI and LaSalle National Bank dated March 15, 1990. | PSI 1990 Form 10-K | |||
| 4-f | Cinergy Corp. PSI | Forty-fifth Supplemental Indenture betweenPSI and LaSalle National Bank dated March 15, 1990. | PSI 1990 Form 10-K | |||
| 4-g | Cinergy Corp. PSI | Forty-sixth Supplemental Indenture betweenPSI and LaSalle National Bank dated June 1, 1990. | PSI 1991 Form 10-K | |||
| 4-h | Cinergy Corp. PSI | Forty-seventh Supplemental Indenture betweenPSI and LaSalle National Bank dated July 15, 1991. | PSI 1991 Form 10-K | |||
| 4-i | Cinergy Corp. PSI | Forty-eighth Supplemental Indenture betweenPSI and LaSalle National Bank dated July 15, 1992. | PSI 1992 Form 10-K | |||
| 4-j | Cinergy Corp. PSI | Forty-ninth Supplemental Indenture betweenPSI and LaSalle National Bank dated February 15, 1993. | PSI 1992 Form 10-K | |||
| 4-k | Cinergy Corp. PSI | Fiftieth Supplemental Indenture betweenPSI and LaSalle National Bank dated February 15, 1993. | PSI 1992 Form 10-K | |||
| 4-l | Cinergy Corp. PSI | Fifty-first Supplemental Indenture betweenPSI and LaSalle National Bank dated February 1, 1994. | PSI 1993 Form 10-K | |||
| 4-m | Cinergy Corp. PSI | Fifty-second Supplemental Indenture betweenPSI and LaSalle National Bank, as Trustee, dated as of April 30, 1999. | PSI March 31, 1999, Form 10-Q | |||
| 4-n | Cinergy Corp. PSI | Fifty-third Supplemental Indenture betweenPSI and LaSalle National Bank dated June 15, 2001. | Cinergy Corp. June 30, 2001, Form 10-Q | |||
| 4-o | Cinergy Corp. PSI | Indenture (Secured Medium-term Notes, Series A), dated July 15, 1991, betweenPSI and LaSalle National Bank, as Trustee. | PSI Form 10-K/A, Amendment No. 2, dated July 15, 1993 | |||
| 4-p | Cinergy Corp. PSI | Indenture (Secured Medium-term Notes, Series B), dated July 15, 1992, betweenPSI and LaSalle National Bank, as Trustee. | PSI Form 10-K/A, Amendment No. 2, dated July 15, 1993 | |||
| 4-q | Cinergy Corp. PSI | Loan Agreement betweenPSI and the City of Princeton, Indiana dated as of November 7, 1996. | PSI September 30, 1996, Form 10-Q |
154
| 4-r | Cinergy Corp. PSI | Loan Agreement betweenPSI and the City of Princeton, Indiana dated as of February 1, 1997. | Cinergy Corp. 1996 Form 10-K | |||
| 4-s | Cinergy Corp. PSI | Indenture dated November 15, 1996, betweenPSI and The Fifth Third Bank, as Trustee. | Cinergy Corp. 1996 Form 10-K | |||
| 4-t | Cinergy Corp. PSI | First Supplemental Indenture dated November 15, 1996, betweenPSI and The Fifth Third Bank, as Trustee. | Cinergy Corp. 1996 Form 10-K | |||
| 4-u | Cinergy Corp. PSI | Third Supplemental Indenture dated as of March 15, 1998, betweenPSI and The Fifth Third Bank, as Trustee. | Cinergy Corp. 1997 Form 10-K | |||
| 4-v | Cinergy Corp. PSI | Fourth Supplemental Indenture dated as of August 5, 1998, betweenPSI and The Fifth Third Bank, as Trustee. | PSI June 30, 1998, Form 10-Q | |||
| 4-w | Cinergy Corp. PSI | Fifth Supplemental Indenture dated as of December 15, 1998, betweenPSI and The Fifth Third Bank, as Trustee. | PSI 1998 Form 10-K | |||
| 4-x | Cinergy Corp. PSI | Sixth Supplemental Indenture dated as of April 30, 1999, betweenPSI and Fifth Third Bank, as Trustee. | PSI March 31, 1999, Form 10-Q | |||
| 4-y | Cinergy Corp. PSI | Seventh Supplemental Indenture dated as of October 20, 1999, betweenPSI and Fifth Third Bank, as Trustee. | PSI September 30, 1999, Form 10-Q | |||
| 4-z | Cinergy Corp. PSI | Unsecured Promissory Note dated October 14, 1998, betweenPSI and the Rural Utilities Service. | PSI 1998 Form 10-K | |||
| 4-aa | Cinergy Corp. PSI | Loan Agreement betweenPSI and the Indiana Development Finance Authority dated as of July 15, 1998. | PSI June 30, 1998, Form 10-Q | |||
| 4-bb | Cinergy Corp. PSI | Loan Agreement betweenPSI and the Indiana Development Finance Authority dated as of May 1, 2000. | PSI June 30, 2000, Form 10-Q | |||
| 4-cc | Cinergy Corp. CG&E | Original Indenture (First Mortgage Bonds) betweenCG&E and The Bank of New York (as Trustee) dated as of August 1, 1936. | CG&E Registration Statement No. 2-2374 | |||
| 4-dd | Cinergy Corp. CG&E | Fourteenth Supplemental Indenture betweenCG&E and The Bank of New York dated as of November 2, 1972. | CG&E Registration Statement No. 2-60961 | |||
| 4-ee | Cinergy Corp. CG&E | Thirty-third Supplemental Indenture betweenCG&E and The Bank of New York dated as of September 1, 1992. | CG&E Registration Statement No. 33-53578 | |||
| 4-ff | Cinergy Corp. CG&E | Thirty-fourth Supplemental Indenture betweenCG&E and The Bank of New York dated as of October 1, 1993. | CG&E September 30, 1993, Form 10-Q | |||
| 4-gg | Cinergy Corp. CG&E | Thirty-fifth Supplemental Indenture betweenCG&E and The Bank of New York dated as of January 1, 1994. | CG&E Registration Statement No. 33-52335 | |||
| 4-hh | Cinergy Corp. CG&E | Thirty-sixth Supplemental Indenture betweenCG&E and The Bank of New York dated as of February 15, 1994. | CG&E Registration Statement No. 33-52335 | |||
| 4-ii | Cinergy Corp. CG&E | Thirty-seventh Supplemental Indenture betweenCG&E and The Bank of New York dated as of October 14, 1996. | Cinergy Corp. 1996 Form 10-K |
155
| 4-jj | Cinergy Corp. CG&E | Thirty-eighth Supplemental Indenture betweenCG&E and The Bank of New York dated as of February 1, 2001. | Cinergy Corp. March 31, 2001, Form 10-Q | |||
| 4-kk | Cinergy Corp. CG&E | Loan Agreement betweenCG&E and the County of Boone, Kentucky dated as of February 1, 1985. | CG&E 1984 Form 10-K | |||
| 4-ll | Cinergy Corp. CG&E | Repayment Agreement betweenCG&E and The Dayton Power and Light Company dated as of December 23, 1992. | CG&E 1992 Form 10-K | |||
| 4-mm | Cinergy Corp. CG&E | Loan Agreement betweenCG&E and the County of Boone, Kentucky dated as of January 1, 1994. | CG&E 1993 Form 10-K | |||
| 4-nn | Cinergy Corp. CG&E | Loan Agreement betweenCG&E and the State of Ohio Air Quality Development Authority dated as of December 1, 1985. | CG&E 1985 Form 10-K | |||
| 4-oo | Cinergy Corp. CG&E | Loan Agreement betweenCG&E and the State of Ohio Air Quality Development Authority dated as of September 13, 1995. | CG&E September 30, 1995, Form 10-Q | |||
| 4-pp | Cinergy Corp. CG&E | Loan Agreement betweenCG&E and the State of Ohio Water Development Authority dated as of January 1, 1994. | CG&E 1993 Form 10-K | |||
| 4-qq | Cinergy Corp. CG&E | Loan Agreement betweenCG&E and the State of Ohio Air Quality Development Authority dated as of January 1, 1994. | CG&E 1993 Form 10-K | |||
| 4-rr | CG&E | Loan Agreement betweenCG&E and the State of Ohio Air Quality Development Authority dated August 1, 2001. | Cinergy Corp. September 30, 2001, Form 10-Q | |||
| 4-ss | Cinergy Corp. CG&E | Original Indenture (Unsecured Debt Securities) betweenCG&E and The Fifth Third Bank dated as of May 15, 1995. | CG&E Form 8-A dated July 24, 1995 | |||
| 4-tt | Cinergy Corp. CG&E | First Supplemental Indenture betweenCG&E and The Fifth Third Bank dated as of June 1, 1995. | CG&E June 30, 1995, Form 10-Q | |||
| 4-uu | Cinergy Corp. CG&E | Second Supplemental Indenture betweenCG&E and The Fifth Third Bank dated as of June 30, 1995. | CG&E Form 8-A dated July 24, 1995 | |||
| 4-vv | Cinergy Corp. CG&E | Third Supplemental Indenture betweenCG&E and The Fifth Third Bank dated as of October 9, 1997. | CG&E September 30, 1997, Form 10-Q | |||
| 4-ww | Cinergy Corp. CG&E | Fourth Supplemental Indenture betweenCG&E and The Fifth Third Bank dated as of April 1, 1998. | CG&E March 31, 1998, Form 10-Q | |||
| 4-xx | Cinergy Corp. CG&E | Fifth Supplemental Indenture betweenCG&E and The Fifth Third Bank dated as of June 9, 1998. | CG&E June 30, 1998, Form 10-Q | |||
| 4-yy | Cinergy Corp. CG&E ULH&P | Original Indenture (First Mortgage Bonds) betweenULH&P and The Bank of New York dated as of February 1, 1949. | ULH&P Registration Statement No. 2-7793 | |||
| 4-zz | Cinergy Corp. CG&E ULH&P | Fifth Supplemental Indenture betweenULH&P and The Bank of New York dated as of January 1, 1967. | CG&E Registration Statement No. 2-60961 | |||
| 4-aaa | Cinergy Corp. CG&E ULH&P | Thirteenth Supplemental Indenture betweenULH&P and The Bank of New York dated as of August 1, 1992. | ULH&P 1992 Form 10-K | |||
| 4-bbb | Cinergy Corp. CG& ULH&P | Original Indenture (Unsecured Debt Securities) betweenULH&P and The Fifth Third Bank dated as of July 1, 1995. | ULH&P June 30, 1995, Form 10-Q |
156
| 4-ccc | Cinergy Corp. CG&E ULH&P | First Supplemental Indenture betweenULH&P and The Fifth Third Bank dated as of July 15, 1995. | ULH&P June 30, 1995, Form 10-Q | |||
| 4-ddd | Cinergy Corp. CG&E ULH&P | Second Supplemental Indenture betweenULH&P and The Fifth Third Bank dated as of April 30, 1998. | ULH&P March 31, 1998, Form 10-Q | |||
| 4-eee | Cinergy Corp. CG&E ULH&P | Third Supplemental Indenture betweenULH&P and The Fifth Third Bank dated as of December 8, 1998. | ULH&P 1998 Form 10-K | |||
| 4-fff | Cinergy Corp. CG&E ULH&P | Fourth Supplemental Indenture betweenULH&P and The Fifth Third Bank, as Trustee, dated as of September 17, 1999. | ULH&P September 30, 1999, Form 10-Q | |||
| 4-ggg | Cinergy Corp. | Base Indenture dated as of October 15, 1998, between Global Resources and The Fifth Third Bank, as Trustee. | Cinergy Corp. September 30, 1998, Form 10-Q | |||
| 4-hhh | Cinergy Corp. | First Supplemental Indenture dated as of October 15, 1998, between Global Resources and The Fifth Third Bank, as Trustee. | Cinergy Corp. September 30, 1998, Form 10-Q | |||
| 4-iii | Cinergy Corp. | Indenture dated as of December 16, 1998, betweenCinergy Corp. and The Fifth Third Bank. | Cinergy Corp. 1998 Form 10-K | |||
| 4-jjj | Cinergy Corp. | Indenture betweenCinergy Corp. and The Fifth Third Bank, as Trustee, dated as of April 15, 1999. | Cinergy Corp. March 31, 1999, Form 10-Q | |||
| 4-kkk | Cinergy Corp. | Indenture betweenCinergy Corp. and The Fifth Third Bank, as Trustee, dated September 12, 2001. | Cinergy Corp. September 30, 2001, Form 10-Q | |||
| 4-lll | Cinergy Corp. | First Supplemental Indenture betweenCinergy Corp. and The Fifth Third Bank, as Trustee, dated September 12, 2001. | Cinergy Corp. September 30, 2001, Form 10-Q | |||
| 4-mmm | Cinergy Corp. | Second Supplemental Indenture, dated December 18, 2001, betweenCinergy Corp. and The Fifth Third Bank, as Trustee. | Cinergy Corp. Form 8-K, December 19, 2001 | |||
| 4-nnn | Cinergy Corp. | Rights Agreement betweenCinergy Corp. and The Fifth Third Bank, as Rights Agent, dated October 16, 2000. | Cinergy Corp. Registration Statement on Form 8-A dated October 16, 2000 | |||
| 4-ooo | Cinergy Corp. | Purchase Contract Agreement, dated December 18, 2001, betweenCinergy Corp. and The Bank of New York, as Purchase Contract Agent. | Cinergy Corp. Form 8-K, December 19, 2001 | |||
| 4-ppp | Cinergy Corp. | Pledge Agreement, dated December 18, 2001, amongCinergy Corp., JP Morgan Chase Bank, as Collateral Agent, Custodial Agent and Securities Intermediary, and The Bank of New York, as Purchase Contract Agent. | Cinergy Corp. Form 8-K, December 19, 2001 | |||
| Material contracts | ||||||
| 10-a | Cinergy Corp. CG&E PSI | Amended and Restated Employment Agreement dated October 24, 1994, amongCG&E,Cinergy Corp., PSI Resources, Inc., andPSI, and Jackson H. Randolph. | Cinergy Corp. 1994 Form 10-K | |||
| 10-b | Cinergy Corp. CG&E PSI | Amended and Restated Employment Agreement dated December 30, 1999, among Services,CG&E, andPSI, and James E. Rogers. | Cinergy Corp. 1999 Form 10-K |
157
| 10-c | Cinergy Corp. CG&E PSI | Amended and Restated Employment Agreement dated December 30, 1999, amongCinergy Corp., Services,CG&E, andPSI, and William J. Grealis. | Cinergy Corp. 1999 Form 10-K | |||
| 10-d | Cinergy Corp. CG&E PSI | Amended and Restated Employment Agreement dated December 30, 1999, amongCinergy Corp., Services,CG&E, andPSI, and Larry E. Thomas. | Cinergy Corp. 1999 Form 10-K | |||
| 10-e | Cinergy Corp. CG&E PSI | Amended and Restated Employment Agreement dated December 30, 1999, amongCinergy Corp., Services,CG&E, andPSI, and Donald B. Ingle, Jr. | Cinergy Corp. 1999 Form 10-K | |||
| 10-f | Cinergy Corp. CG&E PSI | Amended and Restated Employment Agreement dated December 30, 1999, amongCinergy Corp., Services,CG&E, andPSI, and Michael J. Cyrus. | Cinergy Corp. 1999 Form 10-K | |||
| 10-g | Cinergy Corp. CG&E PSI | Employment Agreement dated December 30, 1999, amongCinergy Corp., Services,CG&E, andPSI, and Jerome A. Vennemann. | Cinergy Corp. 1999 Form 10-K | |||
| 10-h | Cinergy Corp. CG&E PSI | Amended and Restated Employment Agreement dated August 31, 2001, amongCinergy Corp., Services,CG&E, andPSI, and Charles J. Winger. | ||||
| 10-i | Cinergy Corp. CG&E PSI | Employment Agreement dated February 12, 2001, amongCinergy Corp., Services,CG&E, andPSI, and R. Foster Duncan. | Cinergy Corp. 2000 Form 10-K | |||
| 10-j | Cinergy Corp. CG&E | Employment Agreement dated May 15, 2001, amongCinergy Corp., andCG&E, and J. Joseph Hale, Jr. | Cinergy Corp. June 30, 2001, Form 10-Q | |||
| 10-k | Cinergy Corp. | Employment Agreement dated May 15, 2001, betweenCinergy Corp. and M. Stephen Harkness. | Cinergy Corp. June 30, 2001, Form 10-Q | |||
| 10-l | Cinergy Corp. CG&E PSI | Employment Agreement dated May 15, 2001, amongCinergy Corp.,CG&E, andPSI, and Bernard F. Roberts. | Cinergy Corp. June 30, 2001, Form 10-Q | |||
| 10-m | Cinergy Corp. | Employment Agreement dated March 9, 2001, betweenCinergy Corp. and Timothy J. Verhagen. | Cinergy Corp. June 30, 2001, Form 10-Q | |||
| 10-n | Cinergy Corp. | Amended and Restated Separation and Retirement Agreement and Waiver and Release of Liability dated February 15, 2002, betweenCinergy Corp. and Larry E. Thomas. | ||||
| 10-o | Cinergy Corp. PSI | Deferred Compensation Agreement, effective as of January 1, 1992, betweenPSI and James E. Rogers. | PSI Form 10-K/A, Amendment No. 1, dated April 29, 1993 | |||
| 10-p | Cinergy Corp. PSI | Split Dollar Life Insurance Agreement, effective as of January 1, 1992, betweenPSI and James E. Rogers. | PSI Form 10-K/A, Amendment No. 1, dated April 29, 1993 | |||
| 10-q | Cinergy Corp. PSI | First Amendment to Split Dollar Life Insurance Agreement betweenPSI and James E. Rogers dated December 11, 1992. | PSI Form 10-K/A, Amendment No. 1, dated April 29, 1993 | |||
| 10-r | Cinergy Corp. CG&E | Deferred Compensation Agreement betweenCG&E and Jackson H. Randolph dated January 1, 1992. | CG&E 1992 Form 10-K |
158
| 10-s | Cinergy Corp. CG&E | Split Dollar Insurance Agreement, effective as of May 1, 1993, betweenCG&E and Jackson H. Randolph. | Cinergy Corp. 1994 Form 10-K | |||
| 10-t | Cinergy Corp. CG&E | Amended and Restated Supplemental Retirement Income Agreement betweenCG&E and Jackson H. Randolph dated January 1, 1995. | Cinergy Corp. 1995 Form 10-K | |||
| 10-u | Cinergy Corp. CG&E | Amended and Restated Supplemental Executive Retirement Income Agreement betweenCG&E and certain executive officers. | Cinergy Corp. 1997 Form 10-K | |||
| 10-v | Cinergy Corp. | Cinergy Corp. Union Employees' Savings Incentive Plan as amended and restated effective January 1, 1998, adopted December 18, 1997. | Cinergy Corp. 1999 Form 10-K | |||
| 10-w | Cinergy Corp. | Amendment toCinergy Corp. Union Employees' Savings Incentive Plan, effective December 1, 1999, adopted December 10, 1999. | Cinergy Corp. 1999 Form 10-K | |||
| 10-x | Cinergy Corp. | Amendment toCinergy Corp. Union Employees' Savings Incentive Plan, adopted January 1, 1998, effective January 1, 2001. | Cinergy Corp. June 30, 2001, Form 10-Q | |||
| 10-y | Cinergy Corp. | Cinergy Corp. Supplemental Executive Retirement Plan amended and restated effective January 1, 1999, adopted October 15, 1998. | Cinergy Corp. 1999 Form 10-K | |||
| 10-z | Cinergy Corp. | 1997 Amendments to Various Compensation and Benefit Plans ofCinergy Corp., adopted January 30, 1997. | Cinergy Corp. 1997 Form 10-K | |||
| 10-aa | Cinergy Corp. | Cinergy Corp. Stock Option Plan, adopted October 18, 1994, effective October 24, 1994. | Cinergy Corp. Form S-8, filed October 19, 1994 | |||
| 10-bb | Cinergy Corp. | Amendment toCinergy Corp. Stock Option Plan, amended October 22, 1996, effective November 1, 1996. | Cinergy Corp. September 30, 1996, Form 10-Q | |||
| 10-cc | Cinergy Corp. | Cinergy Corp. Annual Incentive Plan, adopted October 18, 1994, effective October 24, 1994. | Cinergy Corp. 1994 Form 10-K | |||
| 10-dd | Cinergy Corp. | Amendment toCinergy Corp. Annual Incentive Plan, amended January 25, 1996, effective January 1, 1996. | Cinergy Corp. 1996 Form 10-K | |||
| 10-ee | Cinergy Corp. | Amended and RestatedCinergy Corp. Annual Incentive Plan, effective January 25, 2002. | ||||
| 10-ff | Cinergy Corp. | Cinergy Corp. Employee Stock Purchase and Savings Plan, adopted October 18, 1994, effective October 24, 1994. | Cinergy Corp. Form S-8, filed October 19, 1994 | |||
| 10-gg | Cinergy Corp. | Amendment toCinergy Corp. Employee Stock Purchase and Savings Plan, adopted April 26, 1996, effective January 1, 1996. | Cinergy Corp. June 30, 1996, Form 10-Q | |||
| 10-hh | Cinergy Corp. | Amendment toCinergy Corp. Employee Stock Purchase and Savings Plan, adopted October 22, 1996, effective November 1, 1996. | Cinergy Corp. September 30, 1996, Form 10-Q | |||
| 10-ii | Cinergy Corp. | Cinergy Corp. UK Sharesave Scheme, adopted and effective December 16, 1999. | Cinergy Corp. 1999 Form 10-K | |||
| 10-jj | Cinergy Corp. | Cinergy Corp. Directors' Deferred Compensation Plan, adopted October 18, 1994, effective October 24, 1994. | Cinergy Corp. Form S-8, filed October 19, 1994 | |||
| 10-kk | Cinergy Corp. | Amendment toCinergy Corp. Directors' Deferred Compensation Plan, adopted October 22, 1996. | Cinergy Corp. September 30, 1996, Form 10-Q |
159
| 10-ll | Cinergy Corp. | Cinergy Corp. Retirement Plan for Directors, amended and restated effective January 1, 1999, adopted October 15, 1998. | Cinergy Corp. Schedule 14A Definitive Proxy Statement filed March 12, 1999 | |||
| 10-mm | Cinergy Corp. | Cinergy Corp. Directors' Equity Compensation Plan adopted October 15, 1998, effective January 1, 1999. | Cinergy Corp. Schedule 14A Definitive Proxy Statement filed March 12, 1999 | |||
| 10-nn | Cinergy Corp. | Cinergy Corp. Executive Supplemental Life Insurance Program adopted October 18, 1994, effective October 24, 1994, consisting of Defined Benefit Deferred Compensation Agreement, Executive Supplemental Life Insurance Program Split Dollar Agreement I, and Executive Supplemental Life Insurance Program Split Dollar Agreement II. | Cinergy Corp. 1994 Form 10-K | |||
| 10-oo | Cinergy Corp. | Cinergy Corp. 1996 Long-term Incentive Compensation Plan, adopted April 26, 1996. | Cinergy Corp. Schedule 14A Definitive Proxy Statement filed March 13, 1996 | |||
| 10-pp | Cinergy Corp. | Amendment toCinergy Corp. 1996 Long-term Incentive Compensation Plan, adopted October 22, 1996, effective November 1, 1996. | Cinergy Corp. September 30, 1996, Form 10-Q | |||
| 10-qq | Cinergy Corp. | Amended and RestatedCinergy Corp. 1996 Long-term Incentive Compensation Plan, effective January 25, 2002. | ||||
| 10-rr | Cinergy Corp. | Cinergy Corp. 401(k) Excess Plan, effective January 1, 1997, adopted December 17, 1996. | Cinergy Corp. 1996 Form 10-K | |||
| 10-ss | Cinergy Corp. | Amendment toCinergy Corp. 401(k) Excess Plan, adopted January 24, 2002, effective January 1, 2002. | Cinergy Corp. Form S-8, filed January 31, 2002 | |||
| 10-tt | Cinergy Corp. | Cinergy Corp. Nonqualified Deferred Incentive Compensation Plan, effective January 1, 1997, adopted December 17, 1996. | Cinergy Corp. 1996 Form 10-K | |||
| 10-uu | Cinergy Corp. | Cinergy Corp. Director, Officer and Key Employee Stock Purchase Program, effective January 7, 2000, adopted December 10, 1999. | Cinergy Corp. 1999 Form 10-K | |||
| 10-vv | Cinergy Corp. | Cinergy Corp. Non-Union Employees' Pension Plan as amended and restated effective January 1, 1998, adopted December 18, 1997. | Cinergy Corp. 1999 Form 10-K | |||
| 10-ww | Cinergy Corp. | Cinergy Corp. Non-Union Employees' Severance Opportunity Plan as amended and restated effective June 1, 2001, adopted May 30, 2001. | Cinergy Corp. June 30, 2001, Form 10-Q | |||
| 10-xx | Cinergy Corp. | Cinergy Corp. Union Employees' Retirement Income Plan as amended and restated effective January 1, 1998, adopted December 18, 1997. | Cinergy Corp. 1999 Form 10-K | |||
| Subsidiaries of the registrant | ||||||
| 21 | Cinergy Corp. CG&E PSI | Subsidiaries ofCinergy Corp.,CG&E, andPSI |
160
| Consent of experts and counsel | ||||||
| 23 | Cinergy Corp. CG&E PSI ULH&P | Consent of Independent Public Accountants | ||||
| Power of attorney | ||||||
| 24 | Cinergy Corp. CG&E PSI ULH&P | Power of Attorney |
- (1)
- Regulation S-K 229.10(d) requires Registrants to identify the physical location, by SEC file number reference, all documents that are incorporated by reference and have been on file with the SEC for more than five years. The SEC file number references forCinergy and its subsidiaries, which are registrants are provided below:
Cinergy Corp. in file number 1-11377
CG&E in file number 1-1232
PSI in file number 1-3543
ULH&P in file number 2-7793Each registrant hereby undertakes to furnish to the Commission upon request a copy of any long-term debt instrument not listed above.
161
CINERGY CORP.
SCHEDULE II—VALUATION AND QUALIFYING ACCOUNTS
FOR THE THREE YEARS ENDED DECEMBER 31, 2001
(in thousands)
| Col. A | Col. B | Col. C | Col. D | Col. E | ||||||||||||||||
|---|---|---|---|---|---|---|---|---|---|---|---|---|---|---|---|---|---|---|---|---|
| | | Additions | Deductions | | ||||||||||||||||
| Description | Balance at Beginning of Period | Charged to Expenses | Charged to Other Accounts | For Purposes for Which Reserves Were Created | Other | Balance at Close of Period | ||||||||||||||
| Accumulated Provisions Deducted from Applicable Assets | ||||||||||||||||||||
Allowance for Doubtful Accounts | ||||||||||||||||||||
2001 | $ | 29,951 | $ | 41,163 | $ | 5,254 | $ | 40,788 | $ | — | $ | 35,580 | ||||||||
2000 | $ | 26,811 | $ | 22,746 | $ | 4,486 | $ | 24,092 | $ | — | $ | 29,951 | ||||||||
1999 | $ | 25,622 | $ | 20,805 | $ | 3,777 | $ | 23,393 | $ | — | $ | 26,811 | ||||||||
162
THE CINCINNATI GAS & ELECTRIC COMPANY
SCHEDULE II—VALUATION AND QUALIFYING ACCOUNTS
FOR THE THREE YEARS ENDED DECEMBER 31, 2001
(in thousands)
| Col. A | Col. B | Col. C | Col. D | Col. E | ||||||||||||||||
|---|---|---|---|---|---|---|---|---|---|---|---|---|---|---|---|---|---|---|---|---|
| | | Additions | Deductions | | ||||||||||||||||
| Description | Balance at Beginning of Period | Charged to Expenses | Charged to Other Accounts | For Purposes for Which Reserves Were Created | Other | Balance at Close of Period | ||||||||||||||
| Accumulated Provisions Deducted from Applicable Assets | ||||||||||||||||||||
Allowance for Doubtful Accounts | ||||||||||||||||||||
2001 | $ | 19,044 | $ | 30,166 | $ | 4,089 | $ | 27,425 | $ | — | $ | 25,874 | ||||||||
2000 | $ | 16,740 | $ | 14,056 | $ | 4,486 | $ | 16,238 | $ | — | $ | 19,044 | ||||||||
1999 | $ | 17,607 | $ | 9,754 | $ | 4,017 | $ | 14,638 | $ | — | $ | 16,740 | ||||||||
163
PSI ENERGY, INC.
SCHEDULE II—VALUATION AND QUALIFYING ACCOUNTS
FOR THE THREE YEARS ENDED DECEMBER 31, 2001
(in thousands)
| Col. A | Col. B | Col. C | Col. D | Col. E | ||||||||||||||||
|---|---|---|---|---|---|---|---|---|---|---|---|---|---|---|---|---|---|---|---|---|
| | | Additions | Deductions | | ||||||||||||||||
| Description | Balance at Beginning of Period | Charged to Expenses | Charged to Other Accounts | For Purposes for Which Reserves Were Created | Other | Balance at Close of Period | ||||||||||||||
| Accumulated Provisions Deducted from Applicable Assets | ||||||||||||||||||||
Allowance for Doubtful Accounts | ||||||||||||||||||||
2001 | $ | 9,317 | $ | 8,339 | $ | 1,165 | $ | 12,048 | $ | — | $ | 6,773 | ||||||||
2000 | $ | 9,934 | $ | 7,088 | $ | — | $ | 7,705 | $ | — | $ | 9,317 | ||||||||
1999 | $ | 7,893 | $ | 11,036 | $ | (240 | ) | $ | 8,755 | $ | — | $ | 9,934 | |||||||
164
THE UNION LIGHT, HEAT AND POWER COMPANY
SCHEDULE II—VALUATION AND QUALIFYING ACCOUNTS
FOR THE THREE YEARS ENDED DECEMBER 31, 2001
(in thousands)
| Col. A | Col. B | Col. C | Col. D | Col. E | ||||||||||||||||
|---|---|---|---|---|---|---|---|---|---|---|---|---|---|---|---|---|---|---|---|---|
| | | Additions | Deductions | | ||||||||||||||||
| Description | Balance at Beginning of Period | Charged to Expenses | Charged to Other Accounts | For Purposes for Which Reserves Were Created | Other | Balance at Close of Period | ||||||||||||||
| Accumulated Provisions Deducted from Applicable Assets | ||||||||||||||||||||
Allowance for Doubtful Accounts | ||||||||||||||||||||
2001 | $ | 1,492 | $ | 3,050 | $ | 4 | $ | 3,350 | $ | — | $ | 1,196 | ||||||||
2000 | $ | 1,513 | $ | 2,555 | $ | 746 | $ | 3,322 | $ | — | $ | 1,492 | ||||||||
1999 | $ | 1,248 | $ | 2,169 | $ | 693 | $ | 2,597 | $ | — | $ | 1,513 | ||||||||
165
Pursuant to the requirements of Section 13 or 15(d) of the Securities Exchange Act of 1934, Cinergy Corp., The Cincinnati Gas & Electric Company, PSI Energy, Inc., and The Union Light, Heat and Power Company each duly has caused this report to be signed on its behalf by the undersigned, thereunto duly authorized.
| CINERGY CORP. THE CINCINNATI GAS & ELECTRIC COMPANY PSI ENERGY, INC. THE UNION LIGHT, HEAT AND POWER COMPANY Registrants |
Date: February 28, 2002 | ||||
By | /s/ JAMES E. ROGERS James E. Rogers Chairman |
166
Pursuant to the requirements of the Securities Exchange Act of 1934, this report has been signed by the following persons on behalf of the indicated registrants and in the capacities and on the dates indicated:
| Signature | Title | Date | |||
|---|---|---|---|---|---|
| Cinergy Corp. | |||||
| Phillip R. Cox* | Director of Cinergy Corp. | ||||
| George C. Juilfs* | Director of Cinergy Corp. | ||||
| Thomas E. Petry* | Director of Cinergy Corp. | ||||
| Jackson H. Randolph* | Director of Cinergy Corp. | ||||
| Mary L. Schapiro* | Director of Cinergy Corp. | ||||
| John J. Schiff, Jr.* | Director of Cinergy Corp. | ||||
| Philip R. Sharp* | Director of Cinergy Corp. | ||||
| Dudley S. Taft* | Director of Cinergy Corp. | ||||
Cinergy Corp. and PSI | |||||
| James K. Baker* | Director of Cinergy Corp. | ||||
| Michael G. Browning* | Director of Cinergy Corp. | ||||
| John A. Hillenbrand II* | Director of Cinergy Corp. | ||||
CG&E and ULH&P | |||||
| James L. Turner* | Vice President and Director of CG&E and ULH&P | ||||
PSI | |||||
| Larry E. Thomas* | Vice Chairman and Director of PSI | ||||
Cinergy Corp., CG&E, PSI, and ULH&P | |||||
/s/ JAMES E. ROGERS James E. Rogers | Chairman, Chief Executive Officer, and Director of Cinergy Corp., CG&E, PSI, and ULH&P (Principal Executive Officer) | February 28, 2002 | |||
/s/ R. FOSTER DUNCAN R. Foster Duncan | Executive Vice President and Chief Financial Officer of Cinergy Corp., CG&E, PSI, and ULH&P and Director of CG&E and ULH&P (Principal Financial Officer) | February 28, 2002 | |||
/s/ BERNARD F. ROBERTS Bernard F. Roberts | Vice President and Comptroller of Cinergy Corp., CG&E, PSI, and ULH&P (Principal Accounting Officer) | February 28, 2002 | |||
167
- *
- The undersigned, by signing his name hereto, does hereby execute this Form 10-K on behalf of the officers and directors of the registrant indicated above by asterisks, pursuant to powers of attorney duly executed by such officers and directors and incorporated by reference as an exhibit to this Form 10-K.
| /s/ JAMES E. ROGERS James E. Rogers Attorney-In-Fact February 28, 2002 | ||
/s/ R. FOSTER DUNCAN R. Foster Duncan Attorney-In-Fact February 28, 2002 |
168
TABLE OF CONTENTS
PART I
- ITEM 1. BUSINESS
Fuel Supply
Purchased Power
Trading Operations and Risk Management
International
Electric Operations
- Transmission System Interconnections
Midwest Independent Transmission System Operator, Inc. (Midwest ISO)
Electricity Supply
Gas Supply
International
Revenue Data and Customer Base
- ITEM 5. MARKET FOR REGISTRANT'S COMMON EQUITY AND RELATED STOCKHOLDER MATTERS
ITEM 6. SELECTED FINANCIAL DATA
- ITEM 7. MANAGEMENT'S DISCUSSION AND ANALYSIS OF FINANCIAL CONDITION AND RESULTS OF OPERATIONS
INTRODUCTION
LIQUIDITY AND CAPITAL RESOURCES
Comparative Cash Flow Analysis
Cinergy
Operating Activities
Financing Activities
Investing Activities
Capital Requirements
Environmental Commitment and Contingency Issues
- Other Investing Activities
Financing Obligations
Capital Resources
Notes Payable and Other Short-term Obligations
Capital Leases
Operating Leases
Long-term Debt
Off-Balance Sheet Financing
Securities Ratings
Equity Securities
Dividend Restrictions
Guarantees
Collateral Requirements
Other
2001 RESULTS OF OPERATIONS—HISTORICAL
SUMMARY OF RESULTS
- ELECTRIC OPERATING REVENUES
GAS OPERATING REVENUES
OPERATING EXPENSES
Fuel
Purchased and Exchanged Power
Gas Purchased
Operation and Maintenance
Depreciation
Taxes Other Than Income Taxes
MISCELLANEOUS—NET
INTEREST
INCOME TAXES
ULH&P
2000 RESULTS OF OPERATIONS—HISTORICAL
SUMMARY OF RESULTS
ELECTRIC OPERATING REVENUES
GAS OPERATING REVENUES
OTHER REVENUES
OPERATING EXPENSES
Fuel
Purchased and Exchanged Power
Gas Purchased
- Operation and Maintenance
Depreciation
EQUITY IN EARNINGS (LOSSES) OF UNCONSOLIDATED SUBSIDIARIES
INTEREST
FUTURE EXPECTATIONS/TRENDS
ELECTRIC INDUSTRY
Wholesale Market Developments
Supply-side Actions
Demand-side Actions
FERC Notice of Proposed Rulemaking
Retail Market Developments
Federal Update
Ohio
Indiana
Kentucky
Other States
Other
Midwest Independent Transmission System Operator, Inc. (Midwest ISO)
Historical
FERC Orders
Operations Updates
State Regulatory Agencies Filings
Repeal of PUHCA
Significant Rate Developments
Purchased Power Tracker
Purchased Power Agreement
Termination of Operating Agreement
PSI Fuel Adjustment Charge
CWIP Ratemaking Treatment for NOX Equipment
- Transfer of Generating Assets to PSI
GAS INDUSTRY
ULH&P Gas Rate Case
CG&E Gas Rate Case
Gas Prices
MARKET RISK SENSITIVE INSTRUMENT AND POSITIONS
Energy Commodities Sensitivity
Concentrations of Credit Risk
Risk Management
Exchange Rate Sensitivity
Interest Rate Sensitivity
- INFLATION
ACCOUNTING MATTERS
Accounting Estimates
Fair Value Accounting for Energy Marketing and Trading
Retail Customer Revenue Recognition
Accounting Changes
Business Combinations and Intangible Assets
Asset Retirement Obligations
Derivatives
Asset Impairment
INSURANCE
ITEM 7A. QUANTITATIVE AND QUALITATIVE DISCLOSURES ABOUT MARKET RISK
REPORT OF INDEPENDENT PUBLIC ACCOUNTANTS
CINERGY CORP. AND SUBSIDIARY COMPANIES
CINERGY CORP. CONSOLIDATED STATEMENTS OF INCOME
CINERGY CORP. CONSOLIDATED BALANCE SHEETS
CINERGY CORP. CONSOLIDATED STATEMENTS OF CHANGES IN COMMON STOCK EQUITY
CINERGY CORP. CONSOLIDATED STATEMENTS OF CASH FLOWS
THE CINCINNATI GAS & ELECTRIC COMPANY AND SUBSIDIARY COMPANIES
THE CINCINNATI GAS & ELECTRIC COMPANY CONSOLIDATED STATEMENTS OF INCOME
THE CINCINNATI GAS & ELECTRIC COMPANY CONSOLIDATED BALANCE SHEETS
THE CINCINNATI GAS & ELECTRIC COMPANY CONSOLIDATED BALANCE SHEETS
THE CINCINNATI GAS & ELECTRIC COMPANY CONSOLIDATED STATEMENTS OF CHANGES IN COMMON STOCK EQUITY
THE CINCINNATI GAS & ELECTRIC COMPANY CONSOLIDATED STATEMENTS OF CASH FLOWS
THE CINCINNATI GAS & ELECTRIC COMPANY CONSOLIDATED STATEMENTS OF CAPITALIZATION
PSI ENERGY, INC. AND SUBSIDIARY COMPANY
PSI ENERGY, INC. CONSOLIDATED STATEMENTS OF INCOME
PSI ENERGY, INC. CONSOLIDATED BALANCE SHEETS
PSI ENERGY, INC. CONSOLIDATED BALANCE SHEETS
PSI ENERGY, INC. CONSOLIDATED STATEMENTS OF CHANGES IN COMMON STOCK EQUITY
PSI ENERGY, INC. CONSOLIDATED STATEMENTS OF CASH FLOWS
PSI ENERGY, INC. CONSOLIDATED STATEMENTS OF CAPITALIZATION
THE UNION LIGHT, HEAT AND POWER COMPANY
THE UNION LIGHT, HEAT AND POWER COMPANY STATEMENTS OF INCOME
THE UNION LIGHT, HEAT AND POWER COMPANY BALANCE SHEETS
THE UNION LIGHT, HEAT AND POWER COMPANY BALANCE SHEETS
THE UNION LIGHT, HEAT AND POWER COMPANY STATEMENTS OF CHANGES IN COMMON STOCK EQUITY
THE UNION LIGHT, HEAT AND POWER COMPANY STATEMENTS OF CASH FLOWS
THE UNION LIGHT, HEAT AND POWER COMPANY STATEMENTS OF CAPITALIZATION
NOTES TO FINANCIAL STATEMENTS
Products and Services (in millions)
Geographic Areas and Long-Lived Assets (in millions)
PART III
- ITEM 10. DIRECTORS AND EXECUTIVE OFFICERS OF THE REGISTRANTS
EXECUTIVE OFFICERS
ITEM 11. EXECUTIVE COMPENSATION
ITEM 12. SECURITY OWNERSHIP OF CERTAIN BENEFICIAL OWNERS AND MANAGEMENT
ITEM 13. CERTAIN RELATIONSHIPS AND RELATED TRANSACTIONS
CINERGY CORP. SCHEDULE II—VALUATION AND QUALIFYING ACCOUNTS FOR THE THREE YEARS ENDED DECEMBER 31, 2001 (in thousands)
THE CINCINNATI GAS & ELECTRIC COMPANY SCHEDULE II—VALUATION AND QUALIFYING ACCOUNTS FOR THE THREE YEARS ENDED DECEMBER 31, 2001 (in thousands)
PSI ENERGY, INC. SCHEDULE II—VALUATION AND QUALIFYING ACCOUNTS FOR THE THREE YEARS ENDED DECEMBER 31, 2001 (in thousands)
THE UNION LIGHT, HEAT AND POWER COMPANY SCHEDULE II—VALUATION AND QUALIFYING ACCOUNTS FOR THE THREE YEARS ENDED DECEMBER 31, 2001 (in thousands)
SIGNATURES