| | | | | | | | | | | | | | | | | |
| INDEX | | | | | |
| | Page | |
| FINANCIAL HIGHLIGHTS AND BUSINESS DEVELOPMENTS | | - | | |
| DEBT AND CAPITALIZATION | | | | |
| Unsecured Notes Covenant Ratios and Credit Ratings | | | | |
| Liquidity and Capitalization | | | | |
| Net Debt to EBITDAre, As Adjusted / Debt Snapshot | | | | |
| Hedging Instruments | | | | |
| Consolidated Debt Maturities | | - | | |
| PROPERTY STATISTICS | | | | |
| Top 15 Tenants | | | | |
| Lease Expirations | | | | |
| DEVELOPMENT ACTIVITY | | | | |
| Development/Redevelopment - Active Projects | | | | |
| APPENDIX: DEFINITIONS AND NON-GAAP RECONCILIATIONS | | - | | |
Certain statements contained herein constitute forward-looking statements as such term is defined in Section 27A of the Securities Act of 1933, as amended, and Section 21E of the Securities Exchange Act of 1934, as amended. Forward-looking statements are not guarantees of future performance. They represent our intentions, plans, expectations and beliefs and are subject to numerous assumptions, risks and uncertainties. Our future results, financial condition and business may differ materially from those expressed in these forward-looking statements. You can find many of these statements by looking for words such as "approximates," "believes," "expects," "anticipates," "estimates," "intends," "plans," "would," "may" or other similar expressions in this supplemental package. We also note the following forward-looking statements: in the case of our development and redevelopment projects, the estimated completion date, estimated project cost, projected incremental cash yield, stabilization date and cost to complete; estimates of future capital expenditures, dividends to common and preferred shareholders and operating partnership distributions. Many of the factors that will determine the outcome of these and our other forward-looking statements are beyond our ability to control or predict. Currently, some of the factors are the increased interest rates and effects of inflation on our business, financial condition, results of operations, cash flows, operating performance and the effect that these factors have had and may continue to have on our tenants, the global, national, regional and local economies and financial markets and the real estate market in general. For further discussion of factors that could materially affect the outcome of our forward-looking statements, see "Item 1A. Risk Factors" in Part I of our Annual Report on Form 10-K for the year ended December 31, 2023. For these statements, we claim the protection of the safe harbor for forward-looking statements contained in the Private Securities Litigation Reform Act of 1995. You are cautioned not to place undue reliance on our forward-looking statements, which speak only as of the date of this supplemental package. All subsequent written and oral forward-looking statements attributable to us or any person acting on our behalf are expressly qualified in their entirety by the cautionary statements contained or referred to in this section. We do not undertake any obligation to release publicly any revisions to our forward-looking statements to reflect events or circumstances occurring after the date of this supplemental package. This supplemental package includes certain non-GAAP financial measures, which are accompanied by what Vornado Realty Trust and subsidiaries (the "Company") considers the most directly comparable financial measures calculated and presented in accordance with accounting principles generally accepted in the United States of America ("GAAP"). These include Earnings Before Interest, Taxes, Depreciation and Amortization for Real Estate ("EBITDAre"). Quantitative reconciliations of the differences between the most directly comparable GAAP financial measures and the non-GAAP financial measures presented are provided within this supplemental package. Definitions of these non-GAAP financial measures and statements of the reasons why management believes the non-GAAP measures provide useful information to investors about the Company's financial condition and results of operations, and, if applicable, the purposes for which management uses the measures, can be found in the Definitions section of this supplemental package on page ii in the Appendix.
This supplemental package should be read in conjunction with the Company’s Quarterly Report on Form 10-Q for the quarter ended March 31, 2024 and the Company’s Supplemental Operating and Financial Data package for the quarter ended March 31, 2024, both of which can be accessed at the Company’s website www.vno.com.
| | | | | | | | | | | | | | |
| FINANCIAL HIGHLIGHTS AND BUSINESS DEVELOPMENTS (unaudited) |
First Quarter 2024 Financial Highlights
Net loss attributable to common shareholders for the quarter ended March 31, 2024 was $9.0 million, or $0.05 per diluted share, compared to net income attributable to common shareholders of $5.2 million, or $0.03 per diluted share, for the prior year's quarter.
EBITDAre, as adjusted (non-GAAP) for the quarter ended March 31, 2024 was $255.9 million, compared to $254.1 million for the prior year’s quarter.
Liquidity
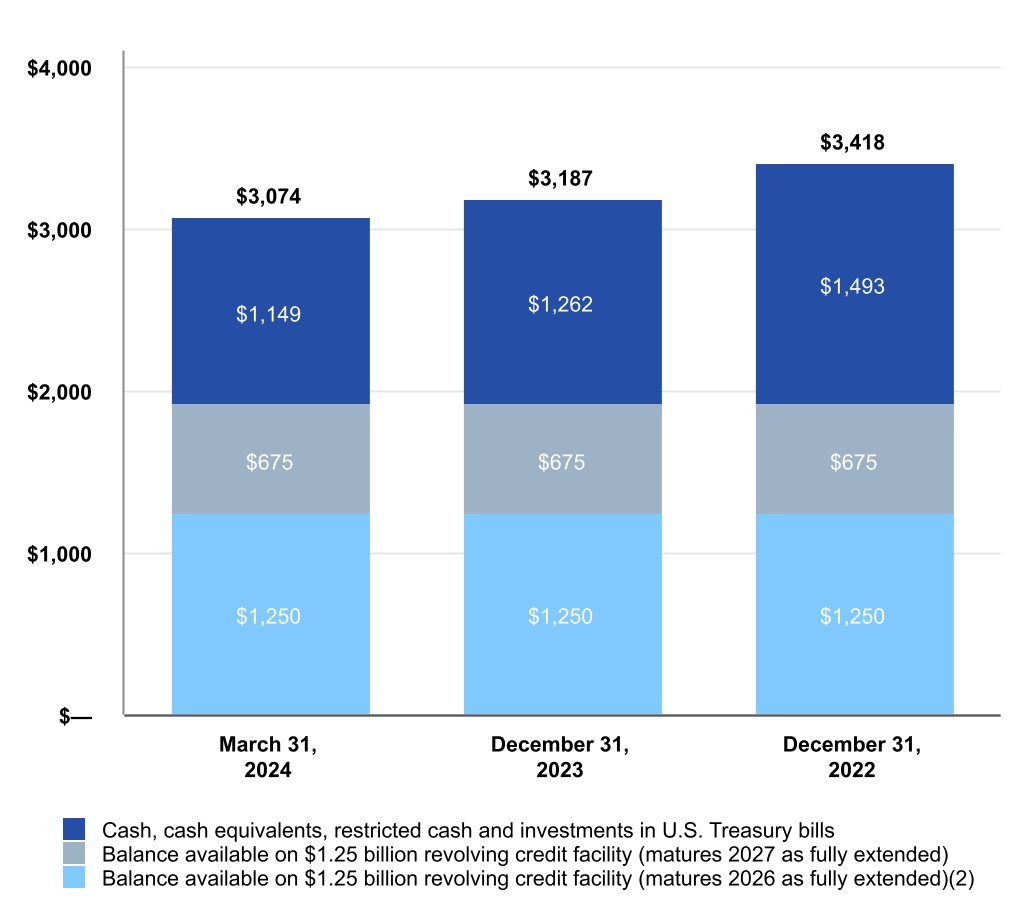
As of March 31, 2024, we had $3.0 billion of liquidity comprised of $1.1 billion of cash and cash equivalents and restricted cash and $1.9 billion available on our $2.5 billion revolving credit facilities. Following the May 2024 amendment and extension of one of our two revolving credit facilities, we had $2.7 billion of liquidity.
Active Development
As of March 31, 2024, we have expended $711.9 million of cash with an estimated $138.1 million remaining to be spent for PENN 2 and PENN districtwide improvements.
We have a 49.9% interest in a joint venture that is developing Sunset Pier 94 Studios. As of March 31, 2024, we have funded $8.0 million of our estimated $34.0 million share of cash contributions to the project.
There can be no assurance that the above projects will be completed, completed on schedule or within budget. In addition, there can be no assurance that the Company will be successful in leasing the properties on the expected schedule or at the assumed rental rates.
2024 Business Developments
Financing Activity
280 Park Avenue
On April 4, 2024, a joint venture, in which we have a 50% interest, amended and extended the $1.1 billion mortgage loan on 280 Park Avenue. The maturity date on the amended loan was extended to September 2026, with options to fully extend to September 2028, subject to certain conditions. The interest rate on the amended loan remains at SOFR plus 1.78%. Additionally, on April 4, 2024, the joint venture amended and extended the $125.0 million mezzanine loan, and subsequently repaid the loan for $62.5 million.
435 Seventh Avenue
On April 9, 2024, we completed a $75.0 million refinancing of 435 Seventh Avenue, of which $37.5 million is recourse to the Operating Partnership. The interest-only loan bears a rate of SOFR plus 2.10% and matures in April 2028. The interest rate on the loan was swapped to a fixed rate of 6.96% through April 2026. The loan replaces the previous $95.7 million fully recourse loan, which bore interest at SOFR plus 1.41%.
Unsecured Revolving Credit Facility
On May 3, 2024, we extended one of our two unsecured revolving credit facilities to April 2029 (as fully extended). The new $915.0 million facility replaces the existing $1.25 billion facility that was due to mature in April 2026. The new facility currently bears interest at a rate of SOFR plus 1.20% with a facility fee of 25 basis points. Our $1.25 billion revolving credit facility matures in December 2027 (as fully extended) and has an interest rate of SOFR plus 1.14% and a facility fee of 25 basis points.
Please refer to the Appendix for reconciliations of GAAP to non-GAAP measures.
| | | | | | | | | | | | | | |
| FINANCIAL HIGHLIGHTS AND BUSINESS DEVELOPMENTS (unaudited) |
2024 Business Developments - continuedFinancing Activity - continued
Interest Rate Swap and Cap Arrangements
We entered into the following interest rate swap and cap arrangements during the three months ended March 31, 2024. See page 8 for further information on our interest rate swap and cap arrangements: | | | | | | | | | | | | | | | | | | | | | | | | | | |
| (Amounts in thousands) | | Notional Amount
(at share) | | All-In Swapped Rate | | Expiration Date | | Variable Rate Spread |
| Interest rate swaps: | | | | | | | | |
PENN 11(1) | | $ | 250,000 | | | 6.21% | | 10/25 | | S+206 |
| | | | | | | | |
| | | | Index Strike Rate | | | | |
| Interest rate caps: | | | | | | | | |
| 61 Ninth Avenue (45.1% interest) | | $ | 75,543 | | | 4.39% | | 01/26 | | S+146 |
______________________________(1)Together with the existing $250,000 swap arrangement on the $500,000 PENN 11 mortgage loan, the loan will bear interest at an all-in swapped rate of 6.28% through October 2025.
Dispositions
On April 12, 2024, we closed on the sale of two condominium units at 220 CPS for net proceeds of $31.6 million; four units remain unsold.
Alexander’s
On May 3, 2024, Alexander’s, Inc., in which we own a 32.4% common equity interest, and Bloomberg L.P. reached an agreement to extend the leases covering approximately 947,000 square feet at 731 Lexington Avenue that were scheduled to expire in February 2029 for a term of eleven years to February 2040.
Leasing Activity
The leasing activity and related statistics below are based on leases signed during the period and are not intended to coincide with the commencement of rental revenue in accordance with GAAP. Second generation relet space represents square footage that has not been vacant for more than nine months and tenant improvements and leasing commissions are based on our share of square feet leased during the period.
For the Three Months Ended March 31, 2024
291,000 square feet of New York Office space (250,000 square feet at share) at an initial rent of $89.23 per square foot and a weighted average lease term of 11.1 years. The changes in the GAAP and cash mark-to-market rent on the 95,000 square feet of second generation space were positive 2.8% and positive 2.4%, respectively. Tenant improvements and leasing commissions were $12.98 per square foot per annum, or 14.5% of initial rent.
36,000 square feet of New York Retail space (33,000 square feet at share) at an initial rent of $253.83 per square foot and a weighted average lease term of 3.8 years. The changes in the GAAP and cash mark-to-market rent on the 27,000 square feet of second generation space were positive 4.4% and negative 18.1%, respectively. Tenant improvements and leasing commissions were $29.16 per square foot per annum, or 11.5% of initial rent.
51,000 square feet at THE MART (all at share) at an initial rent of $64.02 per square foot and a weighted average lease term of 4.5 years. The changes in the GAAP and cash mark-to-market rent on the 43,000 square feet of second generation space were positive 6.4% and negative 0.1%, respectively. Tenant improvements and leasing commissions were $8.37 per square foot per annum, or 13.1% of initial rent.
41,000 square feet at 315 Montgomery Street in San Francisco (29,000 square feet at share) at an initial rent of $67.57 per square foot and a weighted average lease term of 5.4 years. The changes in the GAAP and cash mark-to-market rent on the 29,000 square feet of second generation space were negative 25.3% and negative 30.1%, respectively. Tenant improvements and leasing commissions were $4.01 per square foot per annum, or 5.9% of initial rent.
| | | | | | | | | | | | | | | | | | | | | | | | | | | | | | | | |
| UNSECURED NOTES COVENANT RATIOS AND CREDIT RATINGS (unaudited) |
| (Amounts in thousands) | | | | | | | | |
| | | | | | | | | | | | | | | | | | | | | | | | | | | | | | | | |
| | | | As of |
Unsecured Notes Covenant Ratios(1) | | Required | | March 31,
2024 | | December 31,
2023 | | September 30,
2023 | | June 30,
2023 |
Total outstanding debt/total assets(2) | | Less than 65% | | 52% | | 50% | | 50% | | 49% |
| Secured debt/total assets | | Less than 50% | | 34% | | 33% | | 33% | | 33% |
| Interest coverage ratio (annualized combined EBITDA to annualized interest expense) | | Greater than 1.50 | | 1.93 | | 2.15 | | 2.17 | | 2.30 |
| Unencumbered assets/unsecured debt | | Greater than 150% | | 321% | | 320% | | 319% | | 320% |
| | | | | | | | |
Consolidated Unencumbered EBITDA(1) (non-GAAP): | | Q1 2024
Annualized |
| New York | | $ | 267,908 | |
| Other | | 83,976 | |
| Total | | $ | 351,884 | |
| | | | | | | | | | | | | | |
Credit Ratings(3): | | Rating | | Outlook |
| Moody’s | | Ba1 | | Stable |
| S&P | | BBB- | | Negative |
| Fitch | | BB+ | | Stable |
________________________________
(1)Our debt covenant ratios and consolidated unencumbered EBITDA are computed in accordance with the terms of our senior unsecured notes. The methodology used for these computations may differ significantly from similarly titled ratios and amounts of other companies. For additional information regarding the methodology used to compute these ratios and amounts, please see our filings with the SEC of our senior debt indentures and applicable prospectuses and prospectus supplements.
(2)Total assets include EBITDA capped at 7.0% per the terms of our senior unsecured notes covenants.
(3)Credit ratings are provided for informational purposes only and are not a recommendation to buy or sell our securities.
| | | | | | | | | | | |
| LIQUIDITY AND CAPITALIZATION (unaudited) |
| (Amounts in millions, except per share amounts) | |
| | | | | | | | | | | | | | |
| | | | |
| (1) | The debt balances presented represent contractual debt balances. See reconciliation on page iii in the Appendix of consolidated debt, net as presented on our consolidated balance sheets to consolidated contractual debt as of March 31, 2024. |
| (2) | On May 3, 2024, we amended one of our two revolving credit facilities, extending the maturity date to April 2029. See page 3 for additional details. |
| (3) | Based on the Vornado Realty Trust (NYSE: VNO) March 31, 2024 quarter end closing common share price of $28.77. |
| | | | | | | | | | | | | | | |
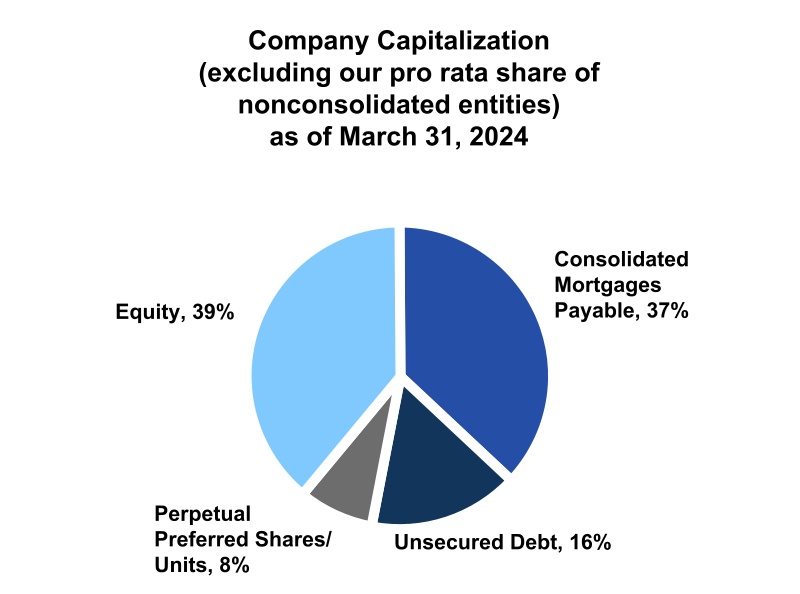
Company capitalization(1): | Amount | | | % Total |
| Consolidated mortgages payable (at 100%) | $ | 5,730 | | | | 37% |
Unsecured debt (contractual)(2) | 2,575 | | | | 16% |
| Perpetual preferred shares/units | 1,223 | | | | 8% |
Equity(3) | 6,023 | | | | 39% |
| Total | 15,551 | | | | 100% |
| Pro rata share of debt of non-consolidated entities | 2,654 | | | | |
| Less: Noncontrolling interests' share of consolidated debt | (682) | | | | |
| Total at share | $ | 17,523 | | | | |
| | | | | | | | | | | | | | | | | | | | | | | |
| NET DEBT TO EBITDAre, AS ADJUSTED (unaudited) | | | | |
| (Amounts in millions) | | | | | | | |
| As of and For the Trailing Twelve Months Ended March 31, 2024 | | As of and For the Year Ended December 31, |
| | 2023 | | 2022 | | 2021 |
| Secured debt | $ | 5,730 | | | $ | 5,730 | | | $ | 5,878 | | | $ | 6,099 | |
| Unsecured debt | 2,575 | | | 2,575 | | | 2,575 | | | 2,575 | |
| Pro rata share of debt of non-consolidated entities | 2,654 | | | 2,654 | | | 2,697 | | | 2,700 | |
| Less: Noncontrolling interests’ share of consolidated debt | (682) | | | (682) | | | (682) | | | (682) | |
| Company’s pro rata share of total debt | $ | 10,277 | | | $ | 10,277 | | | $ | 10,468 | | | $ | 10,692 | |
| % Unsecured debt | 25% | | 25% | | 25% | | 24% |
| | | | | | | |
| Company’s pro rata share of total debt | $ | 10,277 | | | $ | 10,277 | | | $ | 10,468 | | | $ | 10,692 | |
| Less: Cash and cash equivalents and investments in U.S. Treasury bills | (893) | | | (997) | | | (1,362) | | | (1,760) | |
| Less: Escrowed cash included within restricted cash on our balance sheet | (234) | | | (222) | | | (94) | | | (131) | |
| Less: Pro rata share of unconsolidated partially owned entities’ cash and cash equivalents and escrowed cash | (316) | | | (296) | | | (316) | | | (291) | |
| Plus: Noncontrolling interests’ share of cash and cash equivalents, escrowed cash and investments in U.S. Treasury bills | 104 | | | 102 | | | 94 | | | 110 | |
| Less: Participation in 150 West 34th Street mortgage loan | — | | | — | | | (105) | | | (105) | |
| Less: Projected cash proceeds from 220 Central Park South | (70) | | | (70) | | | (90) | | | (148) | |
| Net debt | $ | 8,868 | | | $ | 8,794 | | | $ | 8,595 | | | $ | 8,367 | |
| EBITDAre, as adjusted (non-GAAP) | $ | 1,083 | | | $ | 1,081 | | | $ | 1,091 | | | $ | 949 | |
| Net debt / EBITDAre, as adjusted (non-GAAP) | 8.2 | x | | 8.1 | x | | 7.9 | x | | 8.8 | x |
See page ii in the Appendix for definitions of EBITDAre and net debt to EBITDAre, as adjusted. See reconciliation of net (loss) income to EBITDAre on page iv in the Appendix and reconciliation of EBITDAre to EBITDAre, as adjusted on page v in the Appendix. | | | | | | | | | | | | | | | | | | | | | | | | | | | | | | | | | | | |
| DEBT SNAPSHOT (unaudited) | | | | | | | | | | | |
| (Amounts in millions) | | | | | | | | | | | |
| As of March 31, 2024 |
| Total | | Variable | | Fixed(1) |
| (Contractual debt balances) | Amount | | Weighted
Average
Interest Rate | | Amount | | Weighted
Average
Interest Rate | | Amount | | Weighted
Average
Interest Rate |
Consolidated debt(2) | $ | 8,305 | | 4.18% | | $ | 1,312 | | 6.25% | | $ | 6,993 | | 3.79% |
| Pro rata share of debt of non-consolidated entities | 2,654 | | 5.36% | | 1,453 | | 6.60% | | 1,201 | | 3.87% |
| Total | 10,959 | | 4.46% | | 2,765 | | 6.43% | | 8,194 | | 3.80% |
| Less: Noncontrolling interests' share of consolidated debt (primarily 1290 Avenue of the Americas and 555 California Street) | (682) | | | | (397) | | | | (285) | | | |
| Company's pro rata share of total debt | $ | 10,277 | | 4.41% | | $ | 2,368 | | 6.30% | | $ | 7,909 | | 3.84% |
| | | | | | | | | | | |
| | | | | | | | | | | |
As of March 31, 2024, $1,304 of variable rate debt (at share) is subject to interest rate cap arrangements, the $1,063 of variable rate debt not subject to interest rate cap arrangements represents 10% of our total pro rata share of debt. See the following page for details.
________________________________
(1) Includes variable rate debt with interest rates fixed by interest rate swap arrangements and the $950 1290 Avenue of the Americas mortgage loan which is subject to a 1.00% SOFR interest rate cap arrangement.
(2) See reconciliation on page iii in the Appendix of consolidated debt, net as presented on our consolidated balance sheets to consolidated contractual debt as of March 31, 2024.
| | | | | | | | | | | | | | | | | | | | | | | | | | | | | | | | | | | | | | | | | | | | | | | | | | | | | | | | | | | | | | | | | |
| HEDGING INSTRUMENTS AS OF MARCH 31, 2024 (unaudited) |
| (Amounts in thousands) | | | | | | | | | | | | | | | | | | | | | |
| Debt Information | | Swap / Cap Information |
| Balance at Share | | Maturity Date(1) | | Variable Rate Spread | | Notional Amount at Share | | Expiration Date | | All-In Swapped Rate | | | | |
| | | | | | | | | |
| Interest Rate Swaps: | | | | | | | | | | | | | | | | | | | | | |
| Consolidated: | | | | | | | | | | | | | | | | | | | | | |
| 555 California Street mortgage loan | | | | | | | | | | | | | | | | | | | | | |
| In-place swap | $ | 840,000 | | | | 05/28 | | | | S+205 | | | $ | 840,000 | | | | 05/24 | | | 2.29% | | | | |
| Forward swap (effective 05/24) | | | | | | | | | | | 840,000 | | | | 05/26 | | | 6.03% | | | | |
| 770 Broadway mortgage loan | 700,000 | | | | 07/27 | | | | S+225 | | | 700,000 | | | | 07/27 | | | 4.98% | | | | |
| PENN 11 mortgage loan | 500,000 | | | | 10/25 | | | | S+206 | | | 500,000 | | | | 10/25 | | | 6.28% | | | | |
| Unsecured revolving credit facility | 575,000 | | | | 12/27 | | | | S+114 | | | 575,000 | | | | 08/27 | | | 3.87% | | | | |
| Unsecured term loan | 800,000 | | | | 12/27 | | | | S+129 | | | | | | | | | | | | | |
| Through 07/25 | | | | | | | | | | | 700,000 | | | | 07/25 | | | 4.52% | | | | |
| 07/25 through 10/26 | | | | | | | | | | | 550,000 | | | | 10/26 | | | 4.35% | | | | |
| 10/26 through 8/27 | | | | | | | | | | | 50,000 | | | | 08/27 | | | 4.03% | | | | |
| 100 West 33rd Street mortgage loan | 480,000 | | | | 06/27 | | | | S+165 | | | 480,000 | | | | 06/27 | | | 5.06% | | | | |
| 888 Seventh Avenue mortgage loan | 259,800 | | | | 12/25 | | | | S+180 | | | 200,000 | | | | 09/27 | | | 4.76% | | | | |
| 4 Union Square South mortgage loan | 120,000 | | | | 08/25 | | | | S+150 | | | 97,750 | | | | 01/25 | | | 3.74% | | | | |
| Unconsolidated: | | | | | | | | | | | | | | | | | | | | | |
| 731 Lexington Avenue - retail condominium mortgage loan | 97,200 | | | | 08/25 | | | | S+151 | | | 97,200 | | | | 05/25 | | | 1.76% | | | | |
| 50-70 West 93rd Street mortgage loan | 41,667 | | | | 12/24 | | | | S+164 | | | 41,168 | | | | 06/24 | | | 3.14% | | | | |
| Interest Rate Caps: | | | | | | | | | | | | | | | | | Index Strike Rate | | Cash Interest Rate(2) | | Effective Interest Rate(3) |
| Consolidated: | | | | | | | | | | | | | | | | | | |
| 1290 Avenue of the Americas mortgage loan | $ | 665,000 | | | | 11/28 | | | | S+162 | | | $ | 665,000 | | | | 11/25 | | | 1.00% | | 2.62% | | 5.94% |
| One Park Avenue mortgage loan | 525,000 | | | | 03/26 | | | | S+122 | | | 525,000 | | | | 03/25 | | | 3.89% | | 5.11% | | 6.16% |
| 150 West 34th Street mortgage loan | 75,000 | | | | 02/28 | | | | S+215 | | | 75,000 | | | | 02/26 | | | 5.00% | | 7.15% | | 7.75% |
| 606 Broadway mortgage loan | 37,060 | | | | 09/24 | | | | S+191 | | | 37,060 | | | | 09/24 | | | 4.00% | | 5.91% | | 5.95% |
| Unconsolidated: | | | | | | | | | | | | | | | | | | | | | |
| | | | | | | | | | | | | | | | | | | | | |
| 640 Fifth Avenue mortgage loan | 259,925 | | | | 05/24 | | | | S+111 | | | 259,925 | | | | 05/24 | | | 4.00% | | 5.11% | | 6.03% |
| 731 Lexington Avenue - office condominium mortgage loan | 162,000 | | | | 06/24 | | | | Prime+0 | | | 162,000 | | | | 06/24 | | | 6.00% | | 6.00% | | 8.46% |
| 61 Ninth Avenue mortgage loan | 75,543 | | | | 01/26 | | | | S+146 | | | 75,543 | | | | 01/26 | | | 4.39% | | 5.85% | | 6.31% |
| 512 West 22nd Street mortgage loan | 69,952 | | | | 06/25 | | | | S+200 | | | 69,952 | | | | 06/25 | | | 4.50% | | 6.50% | | 7.16% |
| Rego Park II mortgage loan | 65,624 | | | | 12/25 | | | | S+145 | | | 65,624 | | | | 11/24 | | | 4.15% | | 5.60% | | 6.28% |
| Fashion Centre Mall/Washington Tower mortgage loan | 34,125 | | | | 05/26 | | | | S+305 | | | 34,125 | | | | 05/24 | | | 3.89% | | 6.94% | | 6.98% |
| | | | | | | | | | | | | | | | | | | | | |
| Debt subject to interest rate swaps and subject to a 1.00% SOFR interest rate cap | | | | | | | | | | $ | 4,896,118 | | | | | | | | | | | |
| Variable rate debt subject to interest rate caps | | | | | | | | | | | 1,304,229 | | | | | | | | | | | |
| Fixed rate debt per loan agreements | | | | | | | | | | | 3,012,851 | | | | | | | | | | | |
| Variable rate debt not subject to interest rate swaps or caps | | | | | | | | | | | 1,063,403 | | (4) | | | | | | | | | |
| Total debt at share | | | | | | | | | | | $ | 10,276,601 | | | | | | | | | | | |
________________________________
(1)Assumes the exercise of as-of-right extension options.
(2)Equals the sum of (i) the index rate in effect as of the most recent contractual reset date, adjusted for hedging instruments, and (ii) the contractual spread.
(3)Equals the sum of (i) the cash interest rate and (ii) the effect of amortization of the interest rate cap premium over the term.
(4)Our exposure to SOFR index increases is partially mitigated by an increase in interest income on our cash, cash equivalents and restricted cash.
See page 4 for details of interest rate hedging arrangements entered into during 2024.
| | | | | | | | | | | | | | |
| CONSOLIDATED DEBT MATURITIES (CONTRACTUAL BALANCES) (unaudited) |
| (Amounts in millions) | | | | |
| | |
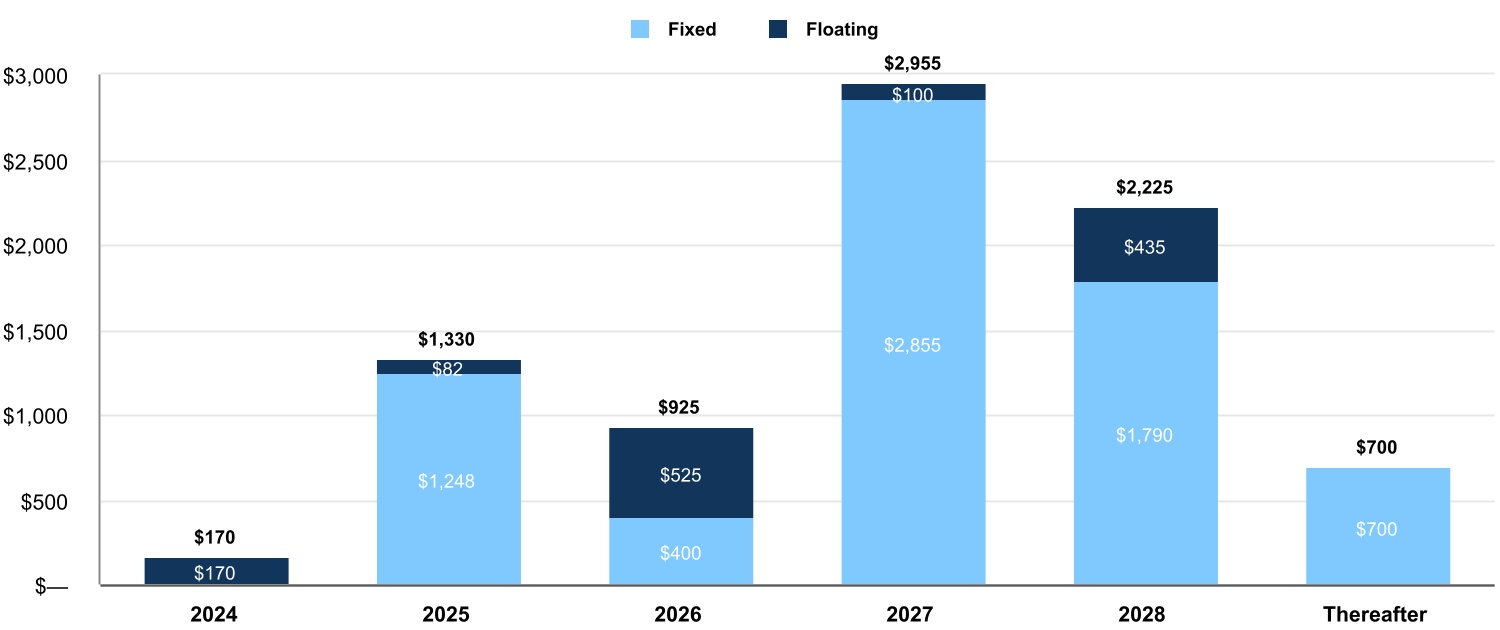
Consolidated Debt Maturity Schedule(1) as of March 31, 2024 (Excludes pro rata share of JV debt)(2) |
| | | | | | | | | | | | | | | | | | | | | | | | | | | | | | | | | | | | | | | | | | | | |
| Consolidated (100%): | | | | | | | | | | | | |
| Secured | $ | 170 | | (3) | $ | 880 | | | $ | 525 | | | $ | 1,580 | | | $ | 2,225 | | | $ | 350 | | |
| Unsecured | — | | | 450 | | | 400 | | | 1,375 | | | — | | | 350 | | |
| Total consolidated debt (100%) | $ | 170 | | | $ | 1,330 | | | $ | 925 | | | $ | 2,955 | | | $ | 2,225 | | | $ | 700 | | |
| % of total consolidated debt | 2.0 | % | | 16.0 | % | | 11.1 | % | | 35.6 | % | | 26.8 | % | | 8.5 | % | |
| Debt maturities at share: | | | | | | | | | | | | |
| Consolidated debt (100%) | $ | 170 | | | $ | 1,330 | | | $ | 925 | | | $ | 2,955 | | | $ | 2,225 | | | $ | 700 | | |
| Pro rata share of debt of non-consolidated entities | 1,064 | | (4) | 575 | | | 620 | | | 40 | | | 159 | | | 196 | | |
| Less: Noncontrolling interests' share of consolidated debt | (37) | | | — | | | — | | | — | | | (645) | | | — | | |
| Total debt at share | $ | 1,197 | | | $ | 1,905 | | | $ | 1,545 | | | $ | 2,995 | | | $ | 1,739 | | | $ | 896 | | |
| % of total debt at share | 11.6 | % | | 18.5 | % | | 15.0 | % | | 29.1 | % | | 16.9 | % | | 8.9 | % | |
_______________________________
(1)Assumes the exercise of as-of-right extension options. Debt classified as fixed rate includes the effect of interest rate swap arrangements which may expire prior to debt maturity, and the $950 1290 Avenue of the Americas mortgage loan which is subject to a 1.00% SOFR interest rate cap arrangement. See the previous page for information on interest rate swap arrangements.
(2)Vornado Realty L.P. guarantees an aggregate $803 of JV partnership debt, primarily comprised of the $500 mortgage loan on 640 Fifth Avenue included in the Fifth Avenue and Times Square JV and the $300 mortgage loan on 7 West 34th Street. These amounts are excluded from the consolidated debt maturity chart presented above.
(3)On April 9, 2024, we completed a $75 refinancing of 435 Seventh Avenue, extending the maturity date to April 2028. See page 3 for details. (4)On April 4, 2024, the 280 Park Avenue joint venture, in which we have a 50% interest, amended and extended the $1,075 mortgage loan to September 2026, with options to fully extend to September 2028, subject to certain conditions. Additionally, on April 4, 2024, the joint venture amended and extended the $125 mezzanine loan, and subsequently repaid the loan for $62.5. See page 3 for details.
| | | | | | | | | | | | | | | | | | | | | | | | | | | | | | | | | | | | | | | | | | | | | | | | | | | | | | | | | | | | | | | | | | | | |
| CONSOLIDATED DEBT MATURITIES AT 100% (CONTRACTUAL BALANCES) (unaudited) |
| (Amounts in thousands) | | | | | | | | | | | | | | | | | | | | | | |
| Property | | Maturity Date(1) | | Spread over SOFR | | Interest Rate(2) | | 2024 | | 2025 | | 2026 | | 2027 | | 2028 | | Thereafter | | Total |
| Secured Debt: | | | | | | | | | | | | | | | | | | | | | | |
435 Seventh Avenue(3) | | 04/24 | | | S+141 | | | 6.74% | | $ | 95,696 | | $ | — | | $ | — | | $ | — | | $ | — | | $ | — | | $ | 95,696 |
| 606 Broadway (50.0% interest) | | 09/24 | | | S+191 | | | 5.91% | | 74,119 | | — | | — | | — | | — | | — | | 74,119 |
| 4 Union Square South | | 08/25 | | | S+150 | (4) | | 4.31% | | — | | 120,000 | | — | | — | | — | | — | | 120,000 |
| PENN 11 | | 10/25 | | | | | | 6.28% | | — | | 500,000 | | — | | — | | — | | — | | 500,000 |
888 Seventh Avenue(5) | | 12/25 | | | S+180 | (4) | | 5.30% | | — | | 259,800 | | — | | — | | — | | — | | 259,800 |
| One Park Avenue | | 03/26 | | | S+122 | | | 5.11% | | — | | — | | 525,000 | | — | | — | | — | | 525,000 |
| 350 Park Avenue | | 01/27 | | | | | | 3.92% | | — | | — | | — | | 400,000 | | — | | — | | 400,000 |
| 100 West 33rd Street | | 06/27 | | | | | | 5.06% | | — | | — | | — | | 480,000 | | — | | — | | 480,000 |
| 770 Broadway | | 07/27 | | | | | | 4.98% | | — | | — | | — | | 700,000 | | — | | — | | 700,000 |
| 150 West 34th Street | | 02/28 | | | S+215 | | | 7.15% | | — | | — | | — | | — | | 75,000 | | — | | 75,000 |
| 555 California Street (70.0% interest) | | 05/28 | | | S+205 | (4) | | 3.81% | | — | | — | | — | | — | | 1,200,000 | | — | | 1,200,000 |
| 1290 Avenue of the Americas (70.0% interest) | | 11/28 | | | | | | 2.62% | | — | | — | | — | | — | | 950,000 | | — | | 950,000 |
| 909 Third Avenue | | 04/31 | | | | | | 3.23% | | — | | — | | — | | — | | — | | 350,000 | | 350,000 |
| Total Secured Debt | | | | | | | | | | 169,815 | | 879,800 | | 525,000 | | 1,580,000 | | 2,225,000 | | 350,000 | | 5,729,615 |
| Unsecured Debt: | | | | | | | | | | | | | | | | | | | | | | |
| Senior unsecured notes due 2025 | | 01/25 | | | | | | 3.50% | | — | | 450,000 | | — | | — | | — | | — | | 450,000 |
$1.25 Billion unsecured revolving credit facility(6) | | 04/26 | | | S+119 | | | — | | — | | — | | — | | — | | — | | — | | — |
| Senior unsecured notes due 2026 | | 06/26 | | | | | | 2.15% | | — | | — | | 400,000 | | — | | — | | — | | 400,000 |
| $1.25 Billion unsecured revolving credit facility | | 12/27 | | | | | | 3.87% | (7) | — | | — | | — | | 575,000 | | — | | — | | 575,000 |
| $800 Million unsecured term loan | | 12/27 | | | S+129 | (4) | | 4.78% | (7) | — | | — | | — | | 800,000 | | — | | — | | 800,000 |
| Senior unsecured notes due 2031 | | 06/31 | | | | | | 3.40% | | — | | — | | — | | — | | — | | 350,000 | | 350,000 |
| Total Unsecured Debt | | | | | | | | | | — | | 450,000 | | 400,000 | | 1,375,000 | | — | | 350,000 | | 2,575,000 |
| Total Debt | | | | | | | | | | $ | 169,815 | | $ | 1,329,800 | | $ | 925,000 | | $ | 2,955,000 | | $ | 2,225,000 | | $ | 700,000 | | $ | 8,304,615 |
| Weighted average rate | | | | | | | | | | 6.38% | | 4.97% | | 3.83% | | 4.58% | | 3.42% | | 3.32% | | 4.18% |
| | | | | | | | | | | | | | | | | | | | | | |
Fixed rate debt(8) | | | | | | | | | | $ | — | | $ | 1,247,750 | | $ | 400,000 | | $ | 2,855,000 | | $ | 1,790,000 | | $ | 700,000 | | $ | 6,992,750 |
| Fixed weighted average rate expiring | | | | | | | | | | — | | 4.83% | | 2.15% | | 4.51% | | 2.47% | | 3.32% | | 3.79% |
| Floating rate debt | | | | | | | | | | $ | 169,815 | | $ | 82,050 | | $ | 525,000 | | $ | 100,000 | | $ | 435,000 | | $ | — | | $ | 1,311,865 |
| Floating weighted average rate expiring | | | | | | | | | | 6.38% | | 7.04% | | 5.11% | | 6.62% | | 7.34% | | — | | 6.25% |
________________________________
(1)Assumes the exercise of as-of-right extension options.
(2)Represents the interest rate in effect as of period end based on the appropriate reference rate as of the contractual reset date plus contractual spread, adjusted for hedging instruments, as applicable. See page 8 for information on interest rate swap and interest rate cap arrangements. (3)On April 9, 2024, we completed a $75,000 refinancing of 435 Seventh Avenue, extending the maturity date to April 2028. See page 3 for details. (4)Balance is partially hedged by interest rate swap arrangements. See page 8 for details. (5)In December 2023, we entered into a loan modification pursuant to which principal amortization is waived for a period of time.
(6)On May 3, 2024, we amended one of our two revolving credit facilities, extending the maturity date to April 2029. See page 3 for details. (7)Reflects a 0.01% interest rate reduction that we qualified for by achieving certain sustainability key performance indicator (KPI) metrics. We must achieve the KPI metrics annually in order to receive the interest rate reduction.
(8)Debt classified as fixed rate includes the effect of interest rate swap arrangements which may expire prior to debt maturity, and the $950,000 1290 Avenue of the Americas mortgage loan which is subject to a 1.00% SOFR interest rate cap arrangement. See the previous page for information on interest rate swap arrangements.
| | | | | | | | | | | | | | | | | | | | |
| TOP 15 TENANTS (unaudited) | | | | | | | |
| (Amounts in thousands, except square feet) | | | | | | | |
| Tenants | | | Square Footage At Share | | Annualized Escalated Rents At Share(1) | | % of Total Annualized Escalated Rents
At Share |
| Meta Platforms, Inc. | | | 1,451,153 | | | $ | 167,395 | | | 9.5 | % |
| IPG and affiliates | | | 1,029,557 | | | 68,207 | | | 3.9 | % |
| Citadel | | | 585,460 | | | 62,498 | | | 3.6 | % |
| New York University | | | 685,290 | | | 48,886 | | | 2.7 | % |
| Bloomberg L.P. | | | 306,768 | | | 43,277 | | | 2.4 | % |
| Google/Motorola Mobility (guaranteed by Google) | | | 759,446 | | | 42,537 | | | 2.4 | % |
| Amazon (including its Whole Foods subsidiary) | | | 312,694 | | | 30,699 | | | 1.7 | % |
| Neuberger Berman Group LLC | | | 306,612 | | | 28,184 | | | 1.6 | % |
| Swatch Group USA | | | 11,957 | | | 27,515 | | | 1.5 | % |
| AMC Networks, Inc. | | | 326,717 | | | 25,830 | | | 1.5 | % |
| LVMH Brands | | | 65,060 | | | 25,692 | | | 1.4 | % |
| Bank of America | | | 247,615 | | | 24,521 | | | 1.4 | % |
| Apple Inc. | | | 412,434 | | | 24,076 | | | 1.4 | % |
| Madison Square Garden & Affiliates | | | 314,765 | | | 20,908 | | | 1.2 | % |
| Victoria's Secret | | | 33,156 | | | 20,087 | | | 1.1 | % |
| | | | | | | | 37.3 | % |
________________________________
(1)Represents monthly contractual base rent before free rent plus tenant reimbursements multiplied by 12. Annualized escalated rents at share include leases signed but not yet commenced in place of current tenants or vacancy in the same space.
| | | | | | | | | | | | | | |
| LEASE EXPIRATIONS (unaudited) | | | | |
| (Amounts in thousands) | | | | |
| | |
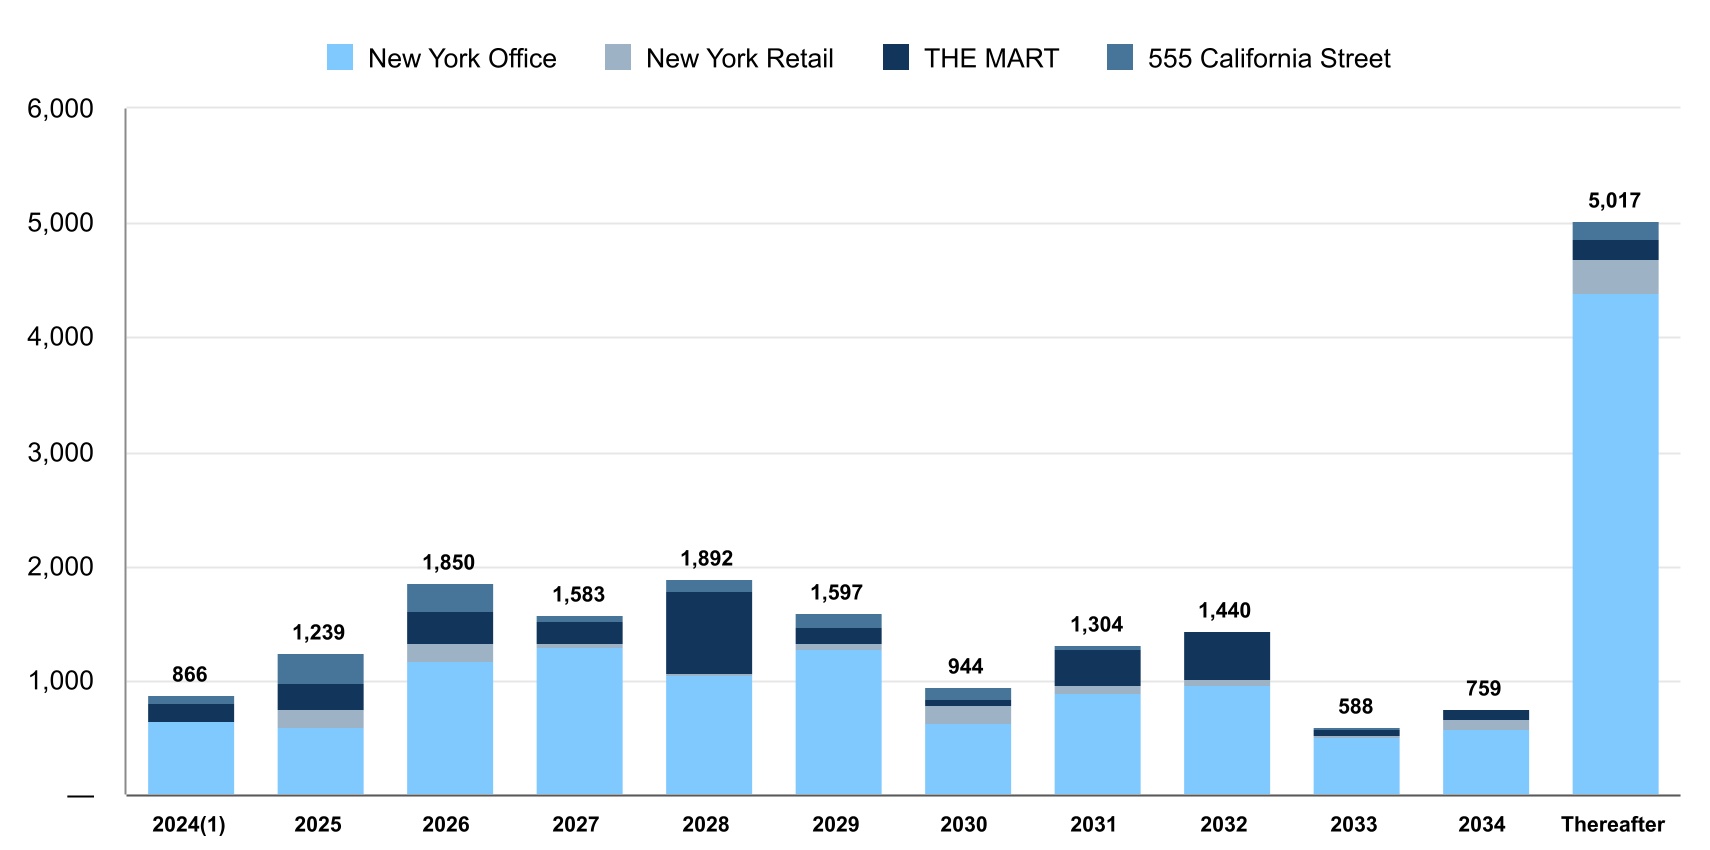
Our Share of Square Feet of Expiring Leases
As of March 31, 2024 |
| | | | | | | | | | | | | | | | | | | | | | | | | | | | | | | | | | | | | | | | | | | | | | | | | | | | | | | | | | | | | | | | | | | | | | | | | | |
| | | | | | | | | | | | | | | | | | | | | | | | |
| New York Office | 640 | | | 601 | | | 1,169 | | | 1,294 | | | 1,044 | | | 1,269 | | | 634 | | | 898 | | | 958 | | | 502 | | | 584 | | | 4,384 | | |
| New York Retail | 12 | | | 157 | | | 160 | | | 32 | | | 31 | | | 53 | | | 154 | | | 68 | | | 57 | | | 17 | | | 81 | | | 300 | | |
| THE MART | 149 | | | 215 | | | 283 | | | 192 | | | 705 | | | 155 | | | 47 | | | 309 | | | 420 | | | 54 | | | 94 | | | 180 | | |
| 555 California Street | 65 | | | 266 | | | 238 | | | 65 | | | 112 | | | 120 | | | 109 | | | 29 | | | 5 | | | 15 | | | — | | | 153 | | |
| Total | 866 | | | 1,239 | | | 1,850 | | | 1,583 | | | 1,892 | | | 1,597 | | | 944 | | | 1,304 | | | 1,440 | | | 588 | | | 759 | | | 5,017 | | |
| % of total | 4.5% | | 6.5% | | 9.7% | | 8.3% | | 9.9% | | 8.4% | | 4.9% | | 6.8% | | 7.5% | | 3.1% | | 4.0% | | 26.4% | |
_______________________________
(1) Includes month-to-month leases, holdover tenants, and leases expiring on the last day of the current quarter.
| | | | | | | | | | | | | | | | | | | | | | | | | | | | | | | | | | | | | | | | | | | | |
| DEVELOPMENT/REDEVELOPMENT - ACTIVE PROJECTS | |
| (Amounts in thousands, except square feet) | | | | |
| | | | (at Vornado’s share) | | | | Projected Incremental
Cash Yield |
New York segment: | | Property
Rentable
Sq. Ft. | | Budget | | Cash Amount
Expended | | Remaining Expenditures | | Stabilization Year | |
| PENN District: | | | | | | | | | | | | | | |
| PENN 2 | | 1,795,000 | | | $ | 750,000 | | | $ | 659,108 | | | $ | 90,892 | | | 2026 | | | 9.5% | |
| | | | | | | | | | | | | | |
| Districtwide Improvements | | N/A | | 100,000 | | | 52,785 | | | 47,215 | | | N/A | | | N/A | |
| Total PENN District | | | | 850,000 | | (1) | 711,893 | | | 138,107 | | | | | | | |
| | | | | | | | | | | | | | |
Sunset Pier 94 Studios (49.9% interest)(2) | | 266,000 | | | 125,000 | | (2) | 7,994 | | | 117,006 | | | 2026 | | | 10.3% | |
| | | | | | | | | | | | | | |
| Total Active Development Projects | | | | $ | 975,000 | | | $ | 719,887 | | | $ | 255,113 | | | | | | | |
________________________________(1)Excluding debt and equity carry.
(2)Represents our 49.9% share of the $350,000 development budget, excluding the $40,000 value of our contributed leasehold interest and net of an estimated $9,000 for our share of development fees and reimbursement for overhead costs incurred by us. $34,000 will be funded via cash contributions, of which $7,994 has been funded as of March 31, 2024.
There can be no assurance that the above projects will be completed, completed on schedule or within budget. In addition, there can be no assurance that the Company will be successful in leasing the properties on the expected schedule or at the assumed rental rates.
APPENDIX
DEFINITIONS AND NON-GAAP RECONCILIATIONS
| | | | | | | | | | | | | | | | | | | | | | | | | | | | | | | | | | | |
FIXED INCOME SUPPLEMENTAL DEFINITIONS |
The fixed income supplement includes various non-GAAP financial measures. Descriptions of these non-GAAP measures are provided below. Reconciliations of these non-GAAP measures to the most directly comparable GAAP measures are provided within this supplemental package.
EBITDAre - EBITDAre (i.e., EBITDA for real estate companies) is a non-GAAP financial measure established by the National Association of Real Estate Investment Trusts ("NAREIT"), which may not be comparable to EBITDA reported by other REITs that do not compute EBITDAre in accordance with the NAREIT definition. NAREIT defines EBITDAre as GAAP net income or loss, plus interest expense, plus income tax expense, plus depreciation and amortization, plus (minus) losses and gains on the disposition of depreciated property including losses and gains on change of control, plus impairment write-downs of depreciated property and of investments in unconsolidated entities caused by a decrease in value of depreciated property in the joint venture, plus adjustments to reflect the entity's share of EBITDA of unconsolidated entities. The Company has included EBITDAre because it is a performance measure used by other REITs and therefore may provide useful information to investors in comparing Vornado's performance to that of other REITs.
Net Debt to EBITDAre, as adjusted - Net debt to EBITDAre, as adjusted represents the ratio of net debt to annualized EBITDAre, as adjusted. Net debt is calculated as (i) the Company’s consolidated debt less noncontrolling interests’ share of consolidated debt plus the Company’s pro rata share of debt of unconsolidated entities less (ii) the Company’s consolidated cash and cash equivalents, cash held in escrow and investments in U.S. Treasury bills less noncontrolling interests’ share of these amounts plus the Company’s pro rata share of these amounts for unconsolidated entities. Cash held in escrow represents cash escrowed under loan agreements including for debt service, real estate taxes, property insurance, and capital improvements, and the Company is not able to direct the use of this cash. The availability of cash and cash equivalents for use in debt reduction cannot be assumed, as the Company may use its cash and cash equivalents for other purposes. Further, the Company may not be able to direct the use of its pro rata share of cash and cash equivalents of unconsolidated entities. The Company discloses net debt to EBITDAre, as adjusted because management believes it is useful to investors as a supplemental measure in evaluating the Company’s balance sheet leverage. Net debt to EBITDAre, as adjusted may not be comparable to similarly titled measures employed by other companies.
| | | | | | | | | | | | | | | | | |
NON-GAAP RECONCILIATIONS RECONCILIATION OF CONSOLIDATED DEBT, NET TO CONSOLIDATED CONTRACTUAL DEBT (unaudited) | |
| (Amounts in thousands) |
| As of March 31, 2024 |
| Consolidated Debt, Net | | Deferred Financing Costs, Net and Other | | Consolidated Contractual Debt |
| Mortgages payable | $ | 5,690,639 | | $ | 38,976 | | $ | 5,729,615 |
| Senior unsecured notes | 1,194,383 | | 5,617 | | 1,200,000 |
| $800 Million unsecured term loan | 794,906 | | 5,094 | | 800,000 |
| $2.5 Billion unsecured revolving credit facilities | 575,000 | | | — | | 575,000 |
| $ | 8,254,928 | | $ | 49,687 | | $ | 8,304,615 |
| | | | | | | | | | | | | | | | | | | | | | | |
NON-GAAP RECONCILIATIONS RECONCILIATION OF NET (LOSS) INCOME TO EBITDAre (unaudited) |
| (Amounts in thousands) | | | | | |
| | | | | | | | | | | | | | | | | | | | | | | | | | | | | | | | | | | |
| For the Three Months Ended March 31, | | For the Trailing Twelve Months Ended | | For the Year Ended December 31, |
| 2024 | | 2023 | | March 31, 2024 | | 2023 | | 2022 | | 2021 |
| Reconciliation of net (loss) income to EBITDAre (non-GAAP): | | | | | | | | | | | |
| Net (loss) income | $ | (6,273) | | | $ | 11,198 | | | $ | 15,417 | | | $ | 32,888 | | | $ | (382,612) | | | $ | 207,553 | |
| Less net loss (income) attributable to noncontrolling interests in consolidated subsidiaries | 11,982 | | | 9,928 | | | 78,021 | | | 75,967 | | | 5,737 | | | (24,014) | |
| Net income (loss) attributable to the Operating Partnership | 5,709 | | | 21,126 | | | 93,438 | | | 108,855 | | | (376,875) | | | 183,539 | |
| EBITDAre adjustments at share: | | | | | | | | | | | |
| Depreciation and amortization expense | 124,374 | | | 123,492 | | | 500,239 | | | 499,357 | | | 593,322 | | | 526,539 | |
| Interest and debt expense | 117,340 | | | 111,117 | | | 464,623 | | | 458,400 | | | 362,321 | | | 297,116 | |
| Real estate impairment losses | — | | | — | | | 73,289 | | | 73,289 | | | 595,488 | | | 7,880 | |
| Income tax expense (benefit) | 7,426 | | | 4,954 | | | 32,937 | | | 30,465 | | | 23,404 | | | (9,813) | |
| Net gains on sale of real estate | — | | | — | | | (72,955) | | | (72,955) | | | (58,920) | | | (15,675) | |
| EBITDAre at share | 254,849 | | | 260,689 | | | 1,091,571 | | | 1,097,411 | | | 1,138,740 | | | 989,586 | |
| EBITDAre attributable to noncontrolling interests in consolidated subsidiaries | 12,076 | | | 12,186 | | | 39,295 | | | 39,405 | | | 71,786 | | | 75,987 | |
| EBITDAre (non-GAAP) | $ | 266,925 | | | $ | 272,875 | | | $ | 1,130,866 | | | $ | 1,136,816 | | | $ | 1,210,526 | | | $ | 1,065,573 | |
| | | | | | | | | | | | | | | | | | | | | | | | | | | | | | | | | | | |
NON-GAAP RECONCILIATIONS RECONCILIATION OF EBITDAre TO EBITDAre, AS ADJUSTED (unaudited) |
| (Amounts in thousands) | | | | | | | | | | | |
| For the Three Months Ended March 31, | | For the Trailing Twelve Months Ended | | For the Year Ended December 31, |
| 2024 | | 2023 | | March 31, 2024 | | 2023 | | 2022 | | 2021 |
| EBITDAre (non-GAAP) | $ | 266,925 | | | $ | 272,875 | | | $ | 1,130,866 | | | $ | 1,136,816 | | | $ | 1,210,526 | | | $ | 1,065,573 | |
| | | | | | | | | | | |
| EBITDAre attributable to noncontrolling interests in consolidated subsidiaries | (12,076) | | | (12,186) | | | (39,295) | | | (39,405) | | | (71,786) | | | (75,987) | |
| | | | | | | | | | | |
| Certain expense (income) items that impact EBITDAre: | | | | | | | | | | | |
| Gain on sale of 220 CPS condominium units and ancillary amenities | — | | | (7,520) | | | (6,607) | | | (14,127) | | | (41,874) | | | (50,318) | |
| Net gains on disposition of wholly owned and partially owned assets | — | | | (129) | | | (889) | | | (1,018) | | | (17,372) | | | (643) | |
| Other | 1,009 | | | 1,075 | | | (1,000) | | | (934) | | | 11,070 | | | 10,351 | |
| Total of certain expense (income) items that impact EBITDAre | 1,009 | | | (6,574) | | | (8,496) | | | (16,079) | | | (48,176) | | | (40,610) | |
| | | | | | | | | | | |
| EBITDAre, as adjusted (non-GAAP) | $ | 255,858 | | | $ | 254,115 | | | $ | 1,083,075 | | | $ | 1,081,332 | | | $ | 1,090,564 | | | $ | 948,976 | |