Exhibit 99.2
Tanger Factory Outlet Centers, Inc.
Supplemental Operating and Financial Data
September 30, 2014
1
Supplemental Operating and Financial Data for the
Quarter Ended 9/30/2014
Notice
For a more detailed discussion of the factors that affect our operating results, interested parties should review the Tanger Factory Outlet Centers, Inc. Annual Report on Form 10-K for the fiscal year ended December 31, 2013.
This Supplemental Operating and Financial Data is not an offer to sell or a solicitation to buy any securities of the Company. Any offers to sell or solicitations to buy any securities of the Company shall be made only by means of a prospectus.
2
Supplemental Operating and Financial Data for the
Quarter Ended 9/30/2014
Table of Contents
|
| |
| Section | |
| | |
| Portfolio Data: | |
| | |
| Geographic Diversification | |
| Property Summary - Occupancy at End of Each Period Shown | |
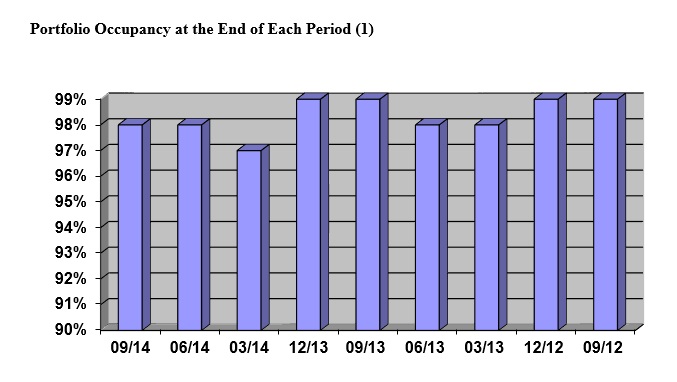
| Portfolio Occupancy at the End of Each Period | |
| Major Tenants | |
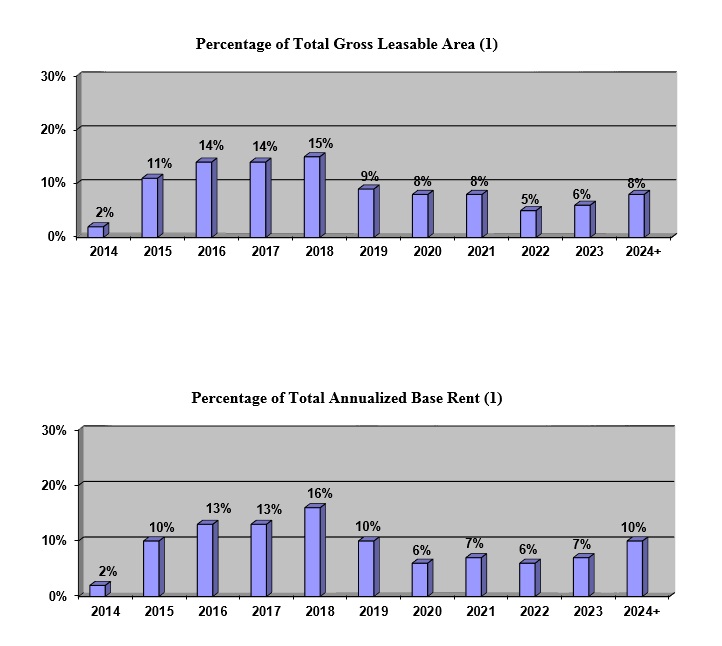
| Lease Expirations as of September 30, 2014 | |
| Leasing Activity | |
| | |
| | |
| Financial Data: | |
| | |
| Consolidated Balance Sheets | |
| Consolidated Statements of Operations | |
| FFO and FAD Analysis | |
| Unconsolidated Joint Venture Information | |
| Pro Rata Balance Sheet | |
| Pro Rata Statement of Operations | |
| Development Summary | |
| Debt Outstanding Summary | |
| Future Scheduled Principal Payments | |
| Senior Unsecured Notes Financial Covenants | |
| | |
| Investor Information | |
3
Supplemental Operating and Financial Data for the
Quarter Ended 9/30/2014
Geographic Diversification
Consolidated Properties
|
| | | | | | | | |
| As of September 30, 2014 |
| State | # of Centers | | GLA | | % of GLA |
| South Carolina | 5 |
| | 1,593,898 |
| | 14 | % |
| New York | 2 |
| | 1,478,808 |
| | 13 | % |
| Pennsylvania | 3 |
| | 874,460 |
| | 8 | % |
| Georgia | 2 |
| | 692,478 |
| | 6 | % |
| Texas | 2 |
| | 619,621 |
| | 5 | % |
| Delaware | 1 |
| | 564,593 |
| | 5 | % |
| Alabama | 1 |
| | 557,014 |
| | 5 | % |
| North Carolina | 3 |
| | 505,225 |
| | 4 | % |
| New Jersey | 1 |
| | 489,706 |
| | 4 | % |
| Tennessee | 1 |
| | 438,335 |
| | 4 | % |
| Michigan | 2 |
| | 431,859 |
| | 4 | % |
| Ohio | 1 |
| | 411,776 |
| | 4 | % |
| Louisiana | 1 |
| | 318,666 |
| | 3 | % |
| Missouri | 1 |
| | 302,922 |
| | 3 | % |
| Utah | 1 |
| | 298,391 |
| | 2 | % |
| Connecticut | 1 |
| | 289,898 |
| | 2 | % |
| Iowa | 1 |
| | 277,230 |
| | 2 | % |
| Oregon | 1 |
| | 270,212 |
| | 2 | % |
| Illinois | 1 |
| | 250,439 |
| | 2 | % |
| New Hampshire | 1 |
| | 245,698 |
| | 2 | % |
| Florida | 1 |
| | 198,877 |
| | 2 | % |
| Maryland | 1 |
| | 198,840 |
| | 2 | % |
| California | 1 |
| | 171,300 |
| | 1 | % |
| Maine | 2 |
| | 76,356 |
| | 1 | % |
| Total | 37 |
| | 11,556,602 |
| | 100 | % |
Unconsolidated Joint Venture Properties |
| | | | | | | | |
| | # of Centers | | GLA | | Ownership % |
| Charlotte, NC | 1 |
| | 398,314 |
| | 50.00 | % |
| Texas City, TX | 1 |
| | 352,705 |
| | 50.00 | % |
| National Harbor, MD | 1 |
| | 338,786 |
| | 50.00 | % |
| Glendale, AZ | 1 |
| | 331,744 |
| | 58.00 | % |
| Wisconsin Dells, WI | 1 |
| | 265,086 |
| | 50.00 | % |
| Bromont, QC | 1 |
| | 161,449 |
| | 50.00 | % |
| Cookstown, ON | 1 |
| | 155,302 |
| | 50.00 | % |
| Saint-Sauveur, QC | 1 |
| | 115,697 |
| | 50.00 | % |
| Total | 8 |
| | 2,119,083 |
| | |
4
Supplemental Operating and Financial Data for the
Quarter Ended 9/30/2014
Property Summary - Occupancy at End of Each Period Shown
|
| | | | | | | | | | | | | | | | | |
| Consolidated properties | | | | | | | | | | |
| Location | Total GLA 9/30/14 | | % Occupied 9/30/14 | | % Occupied 6/30/14 | | % Occupied
3/31/14 | | % Occupied
12/31/13 | | % Occupied
9/30/13 |
| Deer Park, NY | 749,074 |
| | 95 | % | | 94 | % | | 92 | % | | 95 | % | | 95 | % |
| Riverhead, NY | 729,734 |
| | 98 | % | | 99 | % | | 98 | % | | 100 | % | | 100 | % |
| Rehoboth Beach, DE | 564,593 |
| | 98 | % | | 100 | % | | 98 | % | | 100 | % | | 100 | % |
| Foley, AL | 557,014 |
| | 96 | % | | 98 | % | | 96 | % | | 97 | % | | 98 | % |
| Atlantic City, NJ | 489,706 |
| | 90 | % | | 93 | % | | 93 | % | | 96 | % | | 95 | % |
| San Marcos, TX | 441,821 |
| | 99 | % | | 100 | % | | 100 | % | | 100 | % | | 99 | % |
| Sevierville, TN | 438,335 |
| | 100 | % | | 100 | % | | 99 | % | | 99 | % | | 99 | % |
| Myrtle Beach Hwy 501, SC | 425,247 |
| | 98 | % | | 98 | % | | 98 | % | | 99 | % | | 100 | % |
| Jeffersonville, OH | 411,776 |
| | 97 | % | | 97 | % | | 95 | % | | 100 | % | | 100 | % |
| Myrtle Beach Hwy 17, SC | 402,791 |
| | 100 | % | | 100 | % | | 99 | % | | 100 | % | | 99 | % |
| Charleston, SC | 382,117 |
| | 99 | % | | 99 | % | | 98 | % | | 100 | % | | 100 | % |
| Pittsburgh, PA | 372,958 |
| | 100 | % | | 100 | % | | 96 | % | | 100 | % | | 100 | % |
| Commerce II, GA | 371,408 |
| | 99 | % | | 100 | % | | 94 | % | | 99 | % | | 99 | % |
| Locust Grove, GA | 321,070 |
| | 100 | % | | 99 | % | | 99 | % | | 100 | % | | 99 | % |
| Howell, MI | 319,289 |
| | 98 | % | | 98 | % | | 98 | % | | 99 | % | | 99 | % |
| Mebane, NC | 318,910 |
| | 99 | % | | 100 | % | | 99 | % | | 100 | % | | 100 | % |
| Gonzales, LA | 318,666 |
| | 100 | % | | 97 | % | | 98 | % | | 100 | % | | 100 | % |
| Branson, MO | 302,922 |
| | 100 | % | | 100 | % | | 99 | % | | 100 | % | | 100 | % |
| Park City, UT | 298,391 |
| | 100 | % | | 99 | % | | 97 | % | | 100 | % | | 99 | % |
| Westbrook, CT | 289,898 |
| | 95 | % | | 97 | % | | 99 | % | | 100 | % | | 99 | % |
| Williamsburg, IA | 277,230 |
| | 100 | % | | 100 | % | | 100 | % | | 100 | % | | 99 | % |
| Lincoln City, OR | 270,212 |
| | 98 | % | | 100 | % | | 99 | % | | 100 | % | | 99 | % |
| Lancaster, PA | 254,002 |
| | 100 | % | | 100 | % | | 99 | % | | 100 | % | | 100 | % |
| Tuscola, IL | 250,439 |
| | 87 | % | | 90 | % | | 90 | % | | 92 | % | | 95 | % |
| Hershey, PA | 247,500 |
| | 100 | % | | 100 | % | | 100 | % | | 100 | % | | 100 | % |
| Tilton, NH | 245,698 |
| | 98 | % | | 96 | % | | 98 | % | | 100 | % | | 100 | % |
| Hilton Head II, SC | 206,544 |
| | 100 | % | | 100 | % | | 97 | % | | 100 | % | | 100 | % |
| Fort Myers, FL | 198,877 |
| | 90 | % | | 90 | % | | 93 | % | | 94 | % | | 91 | % |
| Ocean City, MD | 198,840 |
| | 99 | % | | 99 | % | | 97 | % | | 100 | % | | 100 | % |
| Terrell, TX | 177,800 |
| | 100 | % | | 93 | % | | 97 | % | | 99 | % | | 99 | % |
| Hilton Head I, SC | 177,199 |
| | 99 | % | | 99 | % | | 98 | % | | 98 | % | | 99 | % |
| Barstow, CA | 171,300 |
| | 100 | % | | 100 | % | | 100 | % | | 100 | % | | 100 | % |
| West Branch, MI | 112,570 |
| | 94 | % | | 94 | % | | 98 | % | | 100 | % | | 98 | % |
| Blowing Rock, NC | 104,154 |
| | 97 | % | | 100 | % | | 100 | % | | 100 | % | | 100 | % |
| Nags Head, NC | 82,161 |
| | 100 | % | | 100 | % | | 100 | % | | 100 | % | | 100 | % |
| Kittery I, ME | 51,737 |
| | 93 | % | | 100 | % | | 100 | % | | 100 | % | | 100 | % |
| Kittery II, ME | 24,619 |
| | 100 | % | | 100 | % | | 100 | % | | 100 | % | | 100 | % |
| Total | 11,556,602 |
| | 98 | % | | 98 | % | | 97 | % | | 99 | % | | 99 | % |
5
Supplemental Operating and Financial Data for the
Quarter Ended 9/30/2014
|
| | | | | | | | | | | | | | | | | |
| Unconsolidated joint venture properties | | | | | | | | | | |
| Location | Total GLA
9/30/14 | | % Occupied
9/30/14 | | % Occupied
6/30/14 | | % Occupied
3/31/14 | | % Occupied
12/31/13 | | % Occupied
9/30/13 |
Charlotte, NC (1) | 398,314 |
| | 99 | % | | N/A |
| | N/A |
| | N/A |
| | N/A |
|
| Texas City, TX | 352,705 |
| | 100 | % | | 99 | % | | 99 | % | | 100 | % | | 100 | % |
| National Harbor, MD | 338,786 |
| | 100 | % | | 97 | % | | 97 | % | | 99 | % | | N/A |
|
| Glendale, AZ | 331,744 |
| | 100 | % | | 99 | % | | 99 | % | | 100 | % | | 100 | % |
| Wisconsin Dells, WI | 265,086 |
| | 100 | % | | 100 | % | | 97 | % | | 100 | % | | 100 | % |
| Bromont, QC | 161,449 |
| | 81 | % | | 81 | % | | 81 | % | | 84 | % | | 93 | % |
| Cookstown, ON | 155,302 |
| | 95 | % | | 98 | % | | 98 | % | | 100 | % | | 95 | % |
| Saint-Sauveur, QC | 115,697 |
| | 100 | % | | 100 | % | | 100 | % | | 100 | % | | 100 | % |
| |
| (1) | Center opened on July 31, 2014. |
6
Supplemental Operating and Financial Data for the
Quarter Ended 9/30/2014
| |
| (1) | Excludes unconsolidated outlet centers. See table on page 4. |
7
Supplemental Operating and Financial Data for the
Quarter Ended 9/30/2014
Major Tenants (1)
|
| | | | | | | | |
| Ten Largest Tenants as of September 30, 2014 |
| Tenant | # of Stores |
| | GLA |
| | % of Total GLA |
|
| The Gap, Inc. | 84 |
| | 903,879 |
| | 7.8 | % |
| Dress Barn, Inc. | 90 |
| | 518,798 |
| | 4.5 | % |
| Phillips-Van Heusen | 91 |
| | 459,578 |
| | 4.0 | % |
| Nike | 36 |
| | 389,970 |
| | 3.4 | % |
| VF Outlet, Inc. | 46 |
| | 385,092 |
| | 3.3 | % |
| G-III Apparel | 68 |
| | 336,697 |
| | 2.9 | % |
| Ann Taylor | 49 |
| | 334,229 |
| | 2.9 | % |
| Polo Ralph Lauren | 30 |
| | 308,549 |
| | 2.7 | % |
| Adidas | 44 |
| | 302,384 |
| | 2.6 | % |
| Carter's | 61 |
| | 284,949 |
| | 2.5 | % |
| Total of All Listed Above | 599 |
| | 4,224,125 |
| | 36.6 | % |
| |
| (1) | Excludes unconsolidated outlet centers. See table on page 4. |
8
Supplemental Operating and Financial Data for the
Quarter Ended 9/30/2014
Lease Expirations as of September 30, 2014
| |
| (1) | Excludes unconsolidated outlet centers. See table on page 4. |
9
Supplemental Operating and Financial Data for the
Quarter Ended 9/30/2014
Leasing Activity (1) |
| | | | | | | | | | | | | | | | | | | | | |
| | 3/31/2014 | | 6/30/2014 | | 9/30/2014 | | 12/31/2014 | | Year to Date | | Prior Year to Date |
| Re-tenanted Space: | | | |
| | |
| | | | |
| | |
|
| Number of leases | 75 |
| | 36 |
| | 22 |
| |
| | 133 |
| | 154 |
|
| Gross leasable area | 272,801 |
| | 112,392 |
| | 84,722 |
| |
| | 469,915 |
| | 510,355 |
|
| New initial base rent per square foot | $ | 29.43 |
| | $ | 28.84 |
| | $ | 32.59 |
| |
| | $ | 29.86 |
| | $ | 27.63 |
|
| Prior expiring base rent per square foot | $ | 23.96 |
| | $ | 23.92 |
| | $ | 25.46 |
| |
| | $ | 24.22 |
| | $ | 22.83 |
|
| Percent increase | 22.8 | % | | 20.6 | % | | 28.0 | % | |
| | 23.3 | % | | 21.0 | % |
| | | | | | | | | | | | |
| New straight line base rent per square foot | $ | 32.14 |
| | $ | 32.21 |
| | $ | 34.34 |
| |
| | $ | 32.55 |
| | $ | 30.57 |
|
| Prior straight line base rent per square foot | $ | 23.66 |
| | $ | 23.74 |
| | $ | 25.69 |
| |
| | $ | 24.04 |
| | $ | 22.19 |
|
| Percent increase | 35.9 | % | | 35.8 | % | | 33.7 | % | |
| | 35.4 | % | | 37.8 | % |
| | | | | | | | | | | | |
| Renewed Space: | | | | | | | | | | | |
| Number of leases | 177 |
| | 32 |
| | 30 |
| |
| | 239 |
| | 306 |
|
| Gross leasable area | 848,238 |
| | 162,316 |
| | 119,027 |
| |
| | 1,129,581 |
| | 1,456,973 |
|
| New initial base rent per square foot | $ | 22.21 |
| | $ | 20.73 |
| | $ | 21.32 |
| |
| | $ | 21.90 |
| | $ | 22.72 |
|
| Prior expiring base rent per square foot | $ | 20.11 |
| | $ | 19.18 |
| | $ | 18.80 |
| |
| | $ | 19.84 |
| | $ | 20.38 |
|
| Percent increase | 10.5 | % | | 8.1 | % | | 13.4 | % | |
| | 10.4 | % | | 11.5 | % |
| | | | | | | | | | | | |
| New straight line base rent per square foot | $ | 23.21 |
| | $ | 21.38 |
| | $ | 22.24 |
| |
| | $ | 22.85 |
| | $ | 23.61 |
|
| Prior straight line base rent per square foot | $ | 19.62 |
| | $ | 19.55 |
| | $ | 18.65 |
| |
| | $ | 19.51 |
| | $ | 20.03 |
|
| Percent increase | 18.3 | % | | 9.3 | % | | 19.3 | % | |
| | 17.1 | % | | 17.9 | % |
| | | | | | | | | | | | |
| Total Re-tenanted and Renewed Space: | | | | | | | | | | | |
| Number of leases | 252 |
| | 68 |
| | 52 |
| |
| | 372 |
| | 460 |
|
| Gross leasable area | 1,121,039 |
| | 274,708 |
| | 203,749 |
| |
| | 1,599,496 |
| | 1,967,328 |
|
| New initial base rent per square foot | $ | 23.97 |
| | $ | 24.05 |
| | $ | 26.01 |
| |
| | $ | 24.24 |
| | $ | 23.99 |
|
| Prior expiring base rent per square foot | $ | 21.05 |
| | $ | 21.12 |
| | $ | 21.57 |
| |
| | $ | 21.13 |
| | $ | 21.02 |
|
| Percent increase | 13.9 | % | | 13.9 | % | | 20.6 | % | |
| | 14.7 | % | | 14.2 | % |
| | | | | | | | | | | | |
| New straight line base rent per square foot | $ | 25.38 |
| | $ | 25.81 |
| | $ | 27.27 |
| |
| | $ | 25.70 |
| | $ | 25.42 |
|
| Prior straight line base rent per square foot | $ | 20.60 |
| | $ | 21.27 |
| | $ | 21.58 |
| |
| | $ | 20.84 |
| | $ | 20.59 |
|
| Percent increase | 23.2 | % | | 21.3 | % | | 26.4 | % | |
| | 23.3 | % | | 23.4 | % |
| |
| (1) | Excludes unconsolidated outlet centers. See table on page 4. |
10
Supplemental Operating and Financial Data for the
Quarter Ended 9/30/2014
Consolidated Balance Sheets (dollars in thousands)
|
| | | | | | | | | | | | | | | | | | | |
| | 9/30/2014 | | 6/30/2014 | | 3/31/2014 | | 12/31/2013 | | 9/30/2013 |
| ASSETS | | | | | | | | | |
| Rental property | | | | | | | | | |
| Land | $ | 230,415 |
| | $ | 230,415 |
| | $ | 230,415 |
| | $ | 230,415 |
| | $ | 230,417 |
|
| Buildings, improvements and fixtures | 2,043,583 |
| | 2,029,321 |
| | 2,013,520 |
| | 2,009,971 |
| | 2,004,882 |
|
| Construction in progress | 75,000 |
| | 37,553 |
| | 20,848 |
| | 9,433 |
| | 4,375 |
|
| | 2,348,998 |
| | 2,297,289 |
| | 2,264,783 |
| | 2,249,819 |
| | 2,239,674 |
|
| Accumulated depreciation | (708,515 | ) | | (691,339 | ) | | (671,807 | ) | | (654,631 | ) | | (636,035 | ) |
| Total rental property, net | 1,640,483 |
| | 1,605,950 |
| | 1,592,976 |
| | 1,595,188 |
| | 1,603,639 |
|
| Cash and cash equivalents | 10,824 |
| | 13,240 |
| | 16,906 |
| | 15,241 |
| | 10,482 |
|
| Investments in unconsolidated joint ventures | 249,659 |
| | 210,131 |
| | 171,040 |
| | 140,214 |
| | 136,922 |
|
| Deferred lease costs and other intangibles, net | 146,642 |
| | 151,738 |
| | 157,627 |
| | 163,581 |
| | 171,702 |
|
| Deferred debt origination costs, net | 9,794 |
| | 9,652 |
| | 10,276 |
| | 10,818 |
| | 7,275 |
|
| Prepaids and other assets | 82,715 |
| | 77,905 |
| | 81,068 |
| | 81,414 |
| | 71,943 |
|
| Total assets | $ | 2,140,117 |
| | $ | 2,068,616 |
| | $ | 2,029,893 |
| | $ | 2,006,456 |
| | $ | 2,001,963 |
|
| LIABILITIES AND EQUITY | | | | | | | | | |
| Liabilities | | | | | | | | | |
| Debt | | | | | | | | | |
| Senior, unsecured notes, net of discounts | $ | 794,729 |
| | $ | 794,567 |
| | $ | 794,407 |
| | $ | 794,248 |
| | $ | 548,247 |
|
| Unsecured term loans, net of discounts | 267,219 |
| | 267,180 |
| | 267,141 |
| | 267,104 |
| | 267,065 |
|
| Mortgages payable, including premiums | 247,240 |
| | 248,336 |
| | 249,418 |
| | 250,497 |
| | 251,533 |
|
| Unsecured lines of credit | 139,800 |
| | 91,200 |
| | 46,900 |
| | 16,200 |
| | 259,000 |
|
| Total debt | 1,448,988 |
| | 1,401,283 |
| | 1,357,866 |
| | 1,328,049 |
| | 1,325,845 |
|
| Construction trade payables | 23,216 |
| | 15,352 |
| | 13,471 |
| | 9,776 |
| | 5,272 |
|
| Accounts payable and accruals | 56,011 |
| | 39,411 |
| | 46,401 |
| | 49,686 |
| | 48,400 |
|
| Deferred financing obligation | 28,388 |
| | 28,388 |
| | 28,388 |
| | 28,388 |
| | 28,388 |
|
| Other liabilities | 29,300 |
| | 30,024 |
| | 31,942 |
| | 32,962 |
| | 33,101 |
|
| Total liabilities | 1,585,903 |
| | 1,514,458 |
| | 1,478,068 |
| | 1,448,861 |
| | 1,441,006 |
|
| Commitments and contingencies | — |
| | — |
| | — |
| | — |
| | — |
|
| Equity | | | | | | | | | |
| Tanger Factory Outlet Centers, Inc. | | | | | | | | | |
| Common shares | 959 |
| | 959 |
| | 958 |
| | 945 |
| | 945 |
|
| Paid in capital | 801,363 |
| | 797,286 |
| | 793,059 |
| | 788,984 |
| | 785,515 |
|
| Accumulated distributions in excess of net income | (276,218 | ) | | (276,224 | ) | | (272,085 | ) | | (265,242 | ) | | (262,173 | ) |
| Accumulated other comprehensive income | (7,382 | ) | | (3,265 | ) | | (5,515 | ) | | (2,428 | ) | | 1,179 |
|
Equity attributable to Tanger Factory Outlet Centers, Inc. | 518,722 |
| | 518,756 |
| | 516,417 |
| | 522,259 |
| | 525,466 |
|
| Equity attributable to noncontrolling interests | | | | | | | | | |
| Noncontrolling interests in Operating Partnership | 27,595 |
| | 27,602 |
| | 27,606 |
| | 28,432 |
| | 28,615 |
|
| Noncontrolling interest in other consolidated partnerships | 7,897 |
| | 7,800 |
| | 7,802 |
| | 6,904 |
| | 6,876 |
|
| Total equity | 554,214 |
| | 554,158 |
| | 551,825 |
| | 557,595 |
| | 560,957 |
|
| Total liabilities and equity | $ | 2,140,117 |
| | $ | 2,068,616 |
| | $ | 2,029,893 |
| | $ | 2,006,456 |
| | $ | 2,001,963 |
|
11
Supplemental Operating and Financial Data for the
Quarter Ended 9/30/2014
Consolidated Statements of Operations (dollars and shares in thousands)
|
| | | | | | | | | | | | | | | | | | | | | | | | | | | | |
| | | | Three Months Ended | | YTD |
| | 9/30/14 | | 6/30/14 | | 3/31/14 | | 12/31/13 | | 9/30/13 | | | 9/30/14 | | 9/30/13 |
| REVENUES | | | | | | | | | | | | | | |
| Base rentals | $ | 69,612 |
| | $ | 68,160 |
| | $ | 66,976 |
| | $ | 68,811 |
| | $ | 64,301 |
| | | $ | 204,748 |
| | $ | 184,591 |
|
| Percentage rentals | 2,634 |
| | 1,915 |
| | 2,083 |
| | 4,295 |
| | 3,084 |
| | | 6,632 |
| | 6,956 |
|
| Expense reimbursements | 29,463 |
| | 29,452 |
| | 31,542 |
| | 31,110 |
| | 27,414 |
| | | 90,457 |
| | 78,544 |
|
| Other income | 3,588 |
| | 2,749 |
| | 2,241 |
| | 3,186 |
| | 3,104 |
| | | 8,578 |
| | 7,516 |
|
| Total revenues | 105,297 |
| | 102,276 |
| | 102,842 |
| | 107,402 |
| | 97,903 |
| | | 310,415 |
| | 277,607 |
|
| EXPENSES | | | | | | | | | | | | | | |
| Property operating | 32,798 |
| | 33,629 |
| | 36,027 |
| | 34,227 |
| | 29,863 |
| | | 102,454 |
| | 86,819 |
|
| General and administrative | 11,334 |
| | 10,761 |
| | 10,722 |
| | 9,879 |
| | 9,754 |
| | | 32,817 |
| | 29,240 |
|
| Acquisition costs | — |
| | — |
| | 7 |
| | 240 |
| | 532 |
| | | 7 |
| | 963 |
|
| Abandoned pre-development costs | — |
| | — |
| | 1,596 |
| | — |
| | — |
| | | 1,596 |
| | — |
|
| Depreciation and amortization | 25,774 |
| | 25,197 |
| | 26,063 |
| | 27,063 |
| | 24,223 |
| | | 77,034 |
| | 68,683 |
|
| Total expenses | 69,906 |
| | 69,587 |
| | 74,415 |
| | 71,409 |
| | 64,372 |
| | | 213,908 |
| | 185,705 |
|
| Operating income | 35,391 |
| | 32,689 |
| | 28,427 |
| | 35,993 |
| | 33,531 |
| | | 96,507 |
| | 91,902 |
|
| Interest expense | (13,902 | ) | | (14,582 | ) | | (14,920 | ) | | (13,790 | ) | | (12,367 | ) | | | (43,404 | ) | | (37,826 | ) |
Casualty gain
| 329 |
| | — |
| | — |
| | — |
| | — |
| | | 329 |
| | — |
|
| Gain on previously held interest in acquired joint venture | — |
| | — |
| | — |
| | — |
| | 26,002 |
| | | — |
| | 26,002 |
|
| Income before equity in earnings of unconsolidated joint ventures | 21,818 |
| | 18,107 |
| | 13,507 |
| | 22,203 |
| | 47,166 |
| | | 53,432 |
| | 80,078 |
|
| Equity in earnings of unconsolidated joint ventures | 2,479 |
| | 1,788 |
| | 1,933 |
| | 933 |
| | 9,014 |
| | | 6,200 |
| | 10,107 |
|
| Net income | 24,297 |
| | 19,895 |
| | 15,440 |
| | 23,136 |
| | 56,180 |
| | | 59,632 |
| | 90,185 |
|
| Noncontrolling interests in Operating Partnership | (1,252 | ) | | (1,028 | ) | | (803 | ) | | (1,208 | ) | | (2,787 | ) | | | (3,083 | ) | | (4,435 | ) |
| Noncontrolling interests in other consolidated partnerships | (42 | ) | | (17 | ) | | (21 | ) | | 8 |
| | (99 | ) | | | (80 | ) | | (129 | ) |
| Net income attributable to Tanger Factory Outlet Centers, Inc. | 23,003 |
| | 18,850 |
| | 14,616 |
| | 21,936 |
| | 53,294 |
| | | 56,469 |
| | 85,621 |
|
| Allocation to participating securities | (481 | ) | | (481 | ) | | (429 | ) | | (230 | ) | | (609 | ) | | | (1,391 | ) | | (932 | ) |
| Net income available to common shareholders | $ | 22,522 |
| | $ | 18,369 |
| | $ | 14,187 |
| | $ | 21,706 |
| | $ | 52,685 |
| | | $ | 55,078 |
| | $ | 84,689 |
|
| Basic earnings per common share | | | | | | | | | | | | | | |
| Net income | $ | 0.24 |
| | $ | 0.20 |
| | $ | 0.15 |
| | $ | 0.23 |
| | $ | 0.56 |
| | | $ | 0.59 |
| | $ | 0.91 |
|
| Diluted earnings per common share | | | | | | | | | | | | | | |
| Net income | $ | 0.24 |
| | $ | 0.20 |
| | $ | 0.15 |
| | $ | 0.23 |
| | $ | 0.56 |
| | | $ | 0.59 |
| | $ | 0.90 |
|
| Weighted average common shares | | | | | | | | | | | | | | |
| Basic | 93,834 |
| | 93,800 |
| | 93,580 |
| | 93,408 |
| | 93,368 |
| | | 93,741 |
| | 93,278 |
|
| Diluted | 93,902 |
| | 93,874 |
| | 93,649 |
| | 94,354 |
| | 94,300 |
| | | 93,811 |
| | 94,210 |
|
12
Supplemental Operating and Financial Data for the
Quarter Ended 9/30/2014
FFO and FAD Analysis (dollars and shares in thousands)
|
| | | | | | | | | | | | | | | | | | | | | | | | | | | | |
| | | | Three Months Ended | | YTD |
| | 9/30/14 | | 6/30/14 | | 3/31/14 | | 12/31/13 | | 9/30/13 | | | 9/30/14 | | 9/30/13 |
| Funds from operations: | | | | | | | | | | | | |
| | |
|
| Net income | $ | 24,297 |
| | $ | 19,895 |
| | $ | 15,440 |
| | $ | 23,136 |
| | $ | 56,180 |
| | | $ | 59,632 |
| | $ | 90,185 |
|
| Adjusted for - | | | | | | | | | | | | | | |
| Depreciation and amortization of real estate assets - consolidated properties | 25,425 |
| | 24,782 |
| | 25,702 |
| | 26,717 |
| | 23,888 |
| | | 75,909 |
| | 67,798 |
|
| Depreciation and amortization of real estate assets - unconsolidated joint ventures | 3,040 |
| | 2,403 |
| | 2,605 |
| | 2,954 |
| | 2,861 |
| | | 8,048 |
| | 9,465 |
|
| Gain on previously held interest in acquired joint venture | — |
| | — |
| | — |
| | — |
| | (26,002 | ) | | | — |
| | (26,002 | ) |
| Funds from operations | 52,762 |
| | 47,080 |
| | 43,747 |
| | 52,807 |
| | 56,927 |
| | | 143,589 |
| | 141,446 |
|
| FFO attributable to noncontrolling interests in other consolidated partnerships | (62 | ) | | (37 | ) | | (40 | ) | | (12 | ) | | (117 | ) | | | (139 | ) | | (190 | ) |
| Allocation to participating securities | (1,045 | ) | | (949 | ) | | (864 | ) | | (524 | ) | | (614 | ) | | | (2,858 | ) | | (1,501 | ) |
Funds from operations available to common shareholders | $ | 51,655 |
| | $ | 46,094 |
| | $ | 42,843 |
| | $ | 52,271 |
| | $ | 56,196 |
| | | $ | 140,592 |
| | $ | 139,755 |
|
| Funds from operations per share | $ | 0.52 |
| | $ | 0.47 |
| | $ | 0.43 |
| | $ | 0.53 |
| | $ | 0.57 |
| | | $ | 1.42 |
| | $ | 1.41 |
|
| Funds available for distribution to common shareholders: | | |
| | |
| | | | | |
|
| Funds from operations | $ | 51,655 |
| | $ | 46,094 |
| | $ | 42,843 |
| | $ | 52,271 |
| | $ | 56,196 |
| | | $ | 140,592 |
| | $ | 139,755 |
|
| Adjusted for - | | | | | | | | | | | | | | |
| Corporate depreciation excluded above | 349 |
| | 415 |
| | 361 |
| | 346 |
| | 335 |
| | | 1,125 |
| | 885 |
|
| Amortization of finance costs | 547 |
| | 554 |
| | 553 |
| | 399 |
| | 594 |
| | | 1,654 |
| | 1,795 |
|
| Amortization of net debt discount (premium) | (92 | ) | | (92 | ) | | (89 | ) | | (119 | ) | | (254 | ) | | | (273 | ) | | (767 | ) |
| Amortization of share-based compensation | 3,813 |
| | 3,772 |
| | 3,349 |
| | 3,012 |
| | 2,964 |
| | | 10,934 |
| | 8,363 |
|
| Straight line rent adjustment | (1,666 | ) | | (1,522 | ) | | (1,838 | ) | | (1,461 | ) | | (1,587 | ) | | | (5,027 | ) | | (4,067 | ) |
| Market rent adjustment | 734 |
| | 845 |
| | 669 |
| | 752 |
| | 235 |
| | | 2,247 |
| | 389 |
|
2nd generation tenant allowances | (2,570 | ) | | (2,876 | ) | | (3,378 | ) | | (5,081 | ) | | (4,435 | ) | | | (8,824 | ) | | (11,762 | ) |
| Capital improvements | (12,701 | ) | | (12,341 | ) | | (4,209 | ) | | (2,187 | ) | | (3,404 | ) | | | (29,251 | ) | | (13,021 | ) |
| Adjustments from unconsolidated joint ventures | (286 | ) | | (39 | ) | | (218 | ) | | 47 |
| | (4,711 | ) | | | (543 | ) | | (4,960 | ) |
| Funds available for distribution | $ | 39,783 |
| | $ | 34,810 |
| | $ | 38,043 |
| | $ | 47,979 |
| | $ | 45,933 |
| | | $ | 112,634 |
| | $ | 116,610 |
|
Funds available for distribution per share | $ | 0.40 |
| | $ | 0.35 |
| | $ | 0.39 |
| | $ | 0.48 |
| | $ | 0.46 |
| | | $ | 1.14 |
| | $ | 1.18 |
|
| Dividends paid per share | $ | 0.240 |
| | $ | 0.240 |
| | $ | 0.225 |
| | $ | 0.225 |
| | $ | 0.225 |
| | | $ | 0.705 |
| | $ | 0.660 |
|
| FFO payout ratio | 46 | % | | 51 | % | | 52 | % | | 43 | % | | 40 | % | | | 50 | % | | 47 | % |
| FAD payout ratio | 60 | % | | 69 | % | | 58 | % | | 48 | % | | 50 | % | | | 62 | % | | 56 | % |
| Diluted weighted average common shs. | 99,003 |
| | 98,989 |
| | 98,789 |
| | 99,499 |
| | 99,178 |
| | | 98,930 |
| | 99,004 |
|
13
Supplemental Operating and Financial Data for the
Quarter Ended 9/30/2014
Unconsolidated Joint Venture Information
The following table details certain information as of September 30, 2014, except for Net Operating Income ("NOI") which is for the nine months ended September 30, 2014, about various unconsolidated real estate joint ventures in which we have an ownership interest (dollars in millions):
|
| | | | | | | | | | | | | | | | | | | | |
| Joint Venture | | Center Location | | Ownership % | | Square Feet | | Tanger's Share of Total Assets | | Tanger's Share of NOI | | Tanger's Share of Debt |
Charlotte (1) | | Charlotte, NC | | 50.0 | % | | 398,314 |
| | $ | 40.7 |
| | $ | 1.1 |
| | $ | — |
|
| | | | | | | | | | | | | |
| Galveston/Houston | | Texas City, TX | | 50.0 | % | | 352,705 |
| | 39.3 |
| | 3.7 |
| | 32.5 |
|
| | | | | | | | | | | | | |
| National Harbor | | National Harbor, MD | | 50.0 | % | | 338,786 |
| | 52.1 |
| | 3.9 |
| | 31.0 |
|
| | | | | | | | | | | | | |
RioCan Canada (2) | | Various | | 50.0 | % | | 432,448 |
| | 129.4 |
| | 2.4 |
| | 8.3 |
|
| | | | | | | | | | | | | |
Savannah (3) | | Savannah, GA | | 50.0 | % | | — |
| | 59.6 |
| | — |
| | 1.7 |
|
| | | | | | | | | | | | | |
| Westgate | | Glendale, AZ | | 58.0 | % | | 331,744 |
| | 44.6 |
| | 3.5 |
| | 28.9 |
|
| | | | | | | | | | | | | |
| Wisconsin Dells | | Wisconsin Dells, WI | | 50.0 | % | | 265,086 |
| | 14.9 |
| | 1.8 |
| | 12.1 |
|
| | | | | | | | | | | | | |
| Other | | | | | | | | 1.7 |
| | — |
| | — |
|
| | | | | | | | | | | | | |
| Total | | | | | | | | $ | 382.3 |
| | $ | 16.4 |
| | $ | 114.5 |
|
| |
| (1) | Center opened on July 31, 2014. |
| |
| (2) | Includes a 155,302 square foot center in Cookstown, Ontario that was acquired in December of 2011, a 161,449 square foot center in Bromont, Quebec and a 115,697 square foot center in Saint-Sauveur, Quebec, both of which were acquired in November of 2012, as well as investments related to the construction and development of an outlet center in Ottawa, Ontario, which opened on October 17, 2014, an expansion of the outlet center in Cookstown, Ontario, and due diligence costs for additional potential sites in Canada. |
| |
| (3) | Based on capital contribution and distribution provisions in the joint venture agreement, we expect our economic interest in the venture's cash flow to be greater than indicated in the Tanger Ownership column, which in this case, states our legal interest in this venture. Our economic interest may fluctuate based on a number of factors,including mortgage financing, partnership capital contributions and distributions, and proceeds from gains or losses of asset sales. |
14
Supplemental Operating and Financial Data for the
Quarter Ended 9/30/2014
Pro Rata Balance Sheet (dollars in thousands) as of September 30, 2014
|
| | | | | | | | | | | | | | | | | | | |
| | Consolidated | | Noncontrolling interests | | Company | | Prorata portion unconsolidated joint ventures | | Prorata balance sheet |
| ASSETS | | | | | | | | | |
| Rental property | | | | | | | | | |
| Land | $ | 230,415 |
| | $ | (610 | ) | | $ | 229,805 |
| | $ | 37,914 |
| | $ | 267,719 |
|
| Buildings, improvements and fixtures | 2,043,583 |
| | (8,544 | ) | | 2,035,039 |
| | 202,460 |
| | 2,237,499 |
|
| Construction in progress | 75,000 |
| | — |
| | 75,000 |
| | 125,555 |
| | 200,555 |
|
| | 2,348,998 |
| | (9,154 | ) | | 2,339,844 |
| | 365,929 |
| | 2,705,773 |
|
| Accumulated depreciation | (708,515 | ) | | 1,068 |
| | (707,447 | ) | | (21,522 | ) | | (728,969 | ) |
| Total rental property, net | 1,640,483 |
| | (8,086 | ) | | 1,632,397 |
| | 344,407 |
| | 1,976,804 |
|
| Cash and cash equivalents | 10,824 |
| | (564 | ) | | 10,260 |
| | 18,199 |
| | 28,459 |
|
| Investments in unconsolidated joint ventures | 249,659 |
| | (506 | ) | | 249,153 |
| | (249,153 | ) | | — |
|
| Deferred lease costs and other intangibles, net | 146,642 |
| | (742 | ) | | 145,900 |
| | 11,782 |
| | 157,682 |
|
| Deferred debt origination costs, net | 9,794 |
| | — |
| | 9,794 |
| | 2,055 |
| | 11,849 |
|
| Prepaids and other assets | 82,715 |
| | 3,006 |
| | 85,721 |
| | 9,912 |
| | 95,633 |
|
| Total assets | $ | 2,140,117 |
| | $ | (6,892 | ) | | $ | 2,133,225 |
| | $ | 137,202 |
| | $ | 2,270,427 |
|
| LIABILITIES AND EQUITY | | | | | | | | | |
| Liabilities | | | | | | | | | |
| Debt | | | | | | | | | |
| Senior, unsecured notes, net of discounts | $ | 794,729 |
| | $ | — |
| | $ | 794,729 |
| | $ | — |
| | $ | 794,729 |
|
| Unsecured term loans, net of discounts | 267,219 |
| | — |
| | 267,219 |
| | — |
| | 267,219 |
|
| Mortgages payable, including premiums | 247,240 |
| | — |
| | 247,240 |
| | 114,527 |
| | 361,767 |
|
| Unsecured lines of credit | 139,800 |
| | — |
| | 139,800 |
| | — |
| | 139,800 |
|
| Total debt | 1,448,988 |
| | — |
| | 1,448,988 |
| | 114,527 |
| | 1,563,515 |
|
| Construction trade payables | 23,216 |
| | — |
| | 23,216 |
| | 12,678 |
| | 35,894 |
|
| Accounts payable and accruals | 56,011 |
| | — |
| | 56,011 |
| | 9,997 |
| | 66,008 |
|
| Deferred financing obligation | 28,388 |
| | — |
| | 28,388 |
| | — |
| | 28,388 |
|
| Other liabilities | 29,300 |
| | — |
| | 29,300 |
| | — |
| | 29,300 |
|
| Total liabilities | 1,585,903 |
| | — |
| | 1,585,903 |
| | 137,202 |
| | 1,723,105 |
|
| Commitments and contingencies | — |
| | — |
| | — |
| | — |
| | — |
|
| Equity | | | | | | | | | |
| Tanger Factory Outlet Centers, Inc. | | | | | | | | | |
| Common shares | 959 |
| | — |
| | 959 |
| | — |
| | 959 |
|
| Paid in capital | 801,363 |
| | 1,005 |
| | 802,368 |
| | — |
| | 802,368 |
|
| Accumulated distributions in excess of net income | (276,218 | ) | | — |
| | (276,218 | ) | | — |
| | (276,218 | ) |
| Accumulated other comprehensive income | (7,382 | ) | | — |
| | (7,382 | ) | | — |
| | (7,382 | ) |
| Equity attributable to Tanger Factory Outlet Centers, Inc. | 518,722 |
| | 1,005 |
| | 519,727 |
| | — |
| | 519,727 |
|
| Equity attributable to noncontrolling interests | | | | | | | | | |
| Noncontrolling interests in Operating Partnership | 27,595 |
| | — |
| | 27,595 |
| | — |
| | 27,595 |
|
| Noncontrolling interest in other consolidated partnerships | 7,897 |
| | (7,897 | ) | | — |
| | — |
| | — |
|
| Total equity | 554,214 |
| | (6,892 | ) | | 547,322 |
| | — |
| | 547,322 |
|
| Total liabilities and equity | $ | 2,140,117 |
| | $ | (6,892 | ) | | $ | 2,133,225 |
| | $ | 137,202 |
| | $ | 2,270,427 |
|
15
Supplemental Operating and Financial Data for the
Quarter Ended 9/30/2014
Pro Rata Statement of Operations (dollars in thousands) year to date September 30, 2014
|
| | | | | | | | | | | | | | | | | | | | |
| | | | |
| | Consolidated | | Noncontrolling interests | | Company | | Prorata portion unconsolidated joint ventures | | Prorata statement of operations | |
| REVENUES | | | | | | | | | | |
| Base rentals | $ | 204,748 |
| | $ | (435 | ) | | $ | 204,313 |
| | $ | 16,659 |
| | $ | 220,972 |
| |
| Percentage rentals | 6,632 |
| | (17 | ) | | 6,615 |
| | 873 |
| | 7,488 |
| |
| Expense reimbursements | 90,457 |
| | (153 | ) | | 90,304 |
| | 9,120 |
| | 99,424 |
| |
| Other income | 8,578 |
| | (6 | ) | | 8,572 |
| | 488 |
| | 9,060 |
| |
| Total revenues | 310,415 |
| | (611 | ) | | 309,804 |
| | 27,140 |
| | 336,944 |
| |
| EXPENSES | | | | | | | | | | |
| Property operating | 102,454 |
| | (200 | ) | | 102,254 |
| | 10,526 |
| | 112,780 |
| |
| General and administrative | 32,817 |
| | (5 | ) | | 32,812 |
| | 186 |
| | 32,998 |
| |
| Acquisition costs | 7 |
| | — |
| | 7 |
| | — |
| | 7 |
| |
| Abandoned pre-development costs | 1,596 |
| | — |
| | 1,596 |
| | 236 |
| | 1,832 |
| |
| Depreciation and amortization | 77,034 |
| | (281 | ) | | 76,753 |
| | 7,994 |
| | 84,747 |
| |
| Total expenses | 213,908 |
| | (486 | ) | | 213,422 |
| | 18,942 |
| | 232,364 |
| |
| Operating income | 96,507 |
| | (125 | ) | | 96,382 |
| | 8,198 |
| | 104,580 |
| |
| Interest expense | (43,404 | ) | | 91 |
| | (43,313 | ) | | (2,044 | ) | | (45,357 | ) | |
| Casualty gain | 329 |
| | — |
| | 329 |
| | — |
| | 329 |
| |
| Income before equity in earnings of unconsolidated joint ventures | 53,432 |
| | (34 | ) | | 53,398 |
| | 6,154 |
| | 59,552 |
| |
| Equity in earnings of unconsolidated joint ventures | 6,200 |
| | (46 | ) | | 6,154 |
| | (6,154 | ) | | — |
| |
| Net income | 59,632 |
| | (80 | ) | | 59,552 |
| | — |
| | 59,552 |
| |
| Noncontrolling interests in Operating Partnership | (3,083 | ) | | — |
| | (3,083 | ) | | — |
| | (3,083 | ) | |
| Noncontrolling interests in other consolidated partnerships | (80 | ) | | 80 |
| | — |
| | — |
| | — |
| |
| Net income attributable to Tanger Factory Outlet Centers, Inc. | 56,469 |
| | — |
| | 56,469 |
| | — |
| | 56,469 |
| |
| Allocation to participating securities | (1,391 | ) | | — |
| | (1,391 | ) | | — |
| | (1,391 | ) | |
| Net income available to common shareholders | $ | 55,078 |
| | $ | — |
| | $ | 55,078 |
| | $ | — |
| | $ | 55,078 |
| |
16
Supplemental Operating and Financial Data for the
Quarter Ended 9/30/2014
External Growth Pipeline Summary As of September 30, 2014
|
| | | | | | | | | | | | | | | | | | | | | |
| Project/Market | Projected Opening | Approx Size in Sq Ft (000s) | Est
Total Net Cost
(millions) | Cost to Date
(millions) | Tanger Ownership Percentage | Est Total Construction Loan (millions) | Amount Drawn
(millions) | Est Future Tanger Capital Requirement (millions) | Projected Stabilized Yield (1) |
| | | | | | | | | | | |
| UNDER CONSTRUCTION: | | | | | | | | | |
| New Developments - | | | | | | | | | |
| Kanata, ON (Ottawa) | 10/17/14 | 316 |
| $ | 117.4 |
| $ | 83.6 |
| 50% | $ | — |
| $ | — |
| $ | 16.9 |
| 7.0% - 8.0% |
Foxwoods, Mashantucket, CT (2) | 2Q 2015 | 314 |
| $ | 118.0 |
| $ | 46.7 |
| 67% | $ | 70.3 |
| $ | — |
| $ | — |
| 8.5% - 9.5% |
Savannah, GA (2) | 2Q 2015 | 377 |
| $ | 110.1 |
| $ | 55.5 |
| 50% | $ | 92.0 |
| $ | 3.4 |
| $ | — |
| 10.0% - 11.0% |
| Grand Rapids, MI | 3Q 2015 | 358 |
| $ | 76.8 |
| $ | 11.1 |
| 100% | $ | — |
| $ | — |
| $ | 65.7 |
| TBD |
| Total New Developments | | 1,365 |
| $ | 422.3 |
| $ | 196.9 |
| | $ | 162.3 |
| $ | 3.4 |
| $ | 82.6 |
| 9.2% |
| | | | | | | | | | |
| Expansions - | | | | | | | | | |
| Cookstown, ON (N. Toronto) | 11/07/14 | 153 |
| $ | 72.7 |
| $ | 48.3 |
| 50% | $ | — |
| $ | — |
| $ | 12.2 |
| 7.0% - 8.0% |
| Park City, UT | 4Q 2014 | 21 |
| $ | 7.4 |
| $ | 1.9 |
| 100% | $ | — |
| $ | — |
| $ | 5.5 |
| 8.5% - 9.5% |
| Branson, MO | 4Q 2014 | 25 |
| $ | 7.6 |
| $ | 2.7 |
| 100% | $ | — |
| $ | — |
| $ | 4.9 |
| 11.0% - 12.0% |
| Glendale, AZ (Westgate) | 4Q 2014 | 78 |
| $ | 20.6 |
| $ | 5.0 |
| 58% | $ | 20.6 |
| $ | 5.0 |
| $ | — |
| 7.5% - 8.5% |
| Total Expansions | | 277 |
| $ | 108.3 |
| $ | 57.9 |
| | $ | 20.6 |
| $ | 5.0 |
| $ | 22.6 |
| 8.0% |
| Total Under Construction | | 1,642 |
| $ | 530.6 |
| $ | 254.8 |
| | $ | 182.9 |
| $ | 8.4 |
| $ | 105.2 |
| 8.9% |
| | | | | | | | | | |
| PRE-DEVELOPMENT: | | | | | | | | | |
Columbus, OH (3) | 1H 2016 | 350 |
| $ | 90.7 |
| $ | 1.6 |
| 50% | $ | — |
| $ | — |
| $ | 44.6 |
| TBD |
| | | | | | | | | | |
| | |
| (1) | While actual yields for individual projects may vary, the company's current targeted stabilized yield on estimated total net cost for development projects is 9% - 11% in the United States and 7% - 9% in Canada. Weighted average projected stabilized yields for projects under construction are calculated using the midpoint of the projected stabilized yield disclosed for each project, or the midpoint of the company's targeted stabilized yield for projects labeled TBD. |
| (2) | Based on capital contribution and distribution provisions in the joint venture agreement, we expect our economic interest in the venture's cash flow to be greater than indicated in the Tanger Ownership Percentage column, which in this case, states the company's legal interest in this venture. The company's economic interest may fluctuate based on a number of factors, including mortgage financing, partnership capital contributions and distributions, and proceeds from the gain or losses of asset sales. |
| (3) | The company and its 50/50 joint venture partner have delayed commencement of construction for Tanger Outlets Columbus in order to secure public financing for the necessary off-site improvements. The partners are currently targeting a mid 2016 opening. |
| | |
| The company's estimates, projections and judgments with respect to projected opening date, approximate size, estimated total net cost, Tanger ownership percentage, estimated total construction loan, estimated future Tanger capital required and projected stabilized yield for new development and expansion projects are subject to adjustment prior to and during the development process. Projected total cost shown net of outparcel sales. There are risks inherent to real estate development, some of which are not under the direct control of the company. Please refer to the company's filings with the Securities and Exchange Commission on Form10-K and Form 10-Q for a discussion of these risks. |
17
Supplemental Operating and Financial Data for the
Quarter Ended 9/30/2014
Debt Outstanding Summary (dollars in thousands)
|
| | | | | | | | | |
| As of September 30, 2014 |
| | Principal Balance | | Stated Interest Rate | | Effective Interest Rate | | Maturity Date |
| Unsecured debt: | |
| | | | | | |
Unsecured lines of credit (1) | $ | 139,800 |
| | LIBOR + 1.00% | | | | 10/24/2017 |
| 2015 Senior unsecured notes | 250,000 |
| | 6.150% | | 6.150% | | 11/15/2015 |
| 2020 Senior unsecured notes | 300,000 |
| | 6.125% | | 6.219% | | 6/1/2020 |
| 2023 Senior unsecured notes | 250,000 |
| | 3.875% | | 4.076% | | 12/1/2023 |
Unsecured term loan (2) | 250,000 |
| | LIBOR + 1.05% | | | | 2/23/2019 |
| Unsecured term note | 7,500 |
| | LIBOR + 1.30% | | | | 8/28/2017 |
| Unsecured note | 10,000 |
| | 1.50% | | 3.153% | | 6/30/2016 |
| Net debt discounts | (5,552 | ) | | | | | | |
| Total unsecured debt | $ | 1,201,748 |
| | | | | | |
| Secured mortgage debt: | | | | | | | |
Atlantic City, NJ (including premium of $3,793) (3) | $ | 50,439 |
| | 5.14% - 7.65% | | 5.05% | | 11/15/2021 - 12/15/2026 |
Deer Park, NY (net of discount of $1,240) (4) | 148,760 |
| | LIBOR + 1.50% | | 2.80% | | 8/30/2018 |
Hershey, PA (including premium of $548) (3) | 29,998 |
| | 5.17% - 8.00% | | 3.40% | | 8/1/2015 |
Ocean City, MD (including premium of $123) (3) | 18,043 |
| | 5.24% | | 4.68% | | 1/6/2016 |
| Total secured mortgage debt | $ | 247,240 |
| | | | | | |
| Tanger's share of unconsolidated JV debt: | |
| | | | | | |
Galveston/Houston (5) | $ | 32,500 |
| | LIBOR + 1.50% | | | | 7/01/2017 |
National Harbor (6) | 31,000 |
| | LIBOR + 1.65% | | | | 5/16/2016 |
RioCan Canada (including premium of $493) (7) | 8,309 |
| | 5.10% - 5.75% | | 3.93% - 4.18% | | 6/22/2015 - 5/10/2020 |
Savannah (8) | 1,685 |
| | LIBOR + 1.65% | | | | 5/21/2017 |
Westgate (9) | 28,908 |
| | LIBOR + 1.75% | | | | 6/27/2015 |
Wisconsin Dells (10) | 12,125 |
| | LIBOR + 2.25% | | | | 12/17/2022 |
| Total Tanger's share of unconsolidated JV debt | $ | 114,527 |
| | | | | | |
| |
| (1) | The Company has an unsecured, syndicated credit line with a borrowing capacity totaling $500.0 million and a separate cash management line of credit with a borrowing capacity of $20.0 million with one of the participants in the syndication. Both lines expire on October 24, 2017 with the option to further extend the maturity for one additional year. Facility fees of 15 basis points annually are charged in arrears based on the full amount of the commitment. |
| |
| (2) | On July 2, 2014, the credit agreement for the unsecured term loan due February 23, 2019 was amended and restated to change the interest rate from LIBOR + 1.60% to LIBOR + 1.05%, and the prepayment penalty was removed. |
| |
| (3) | Represents mortgages assumed in the acquisitions of various properties owned by joint ventures which are consolidated for financial reporting purposes. |
| |
| (4) | On August 30, 2013, as part of the acquisition of a controlling interest in Deer Park, we assumed an interest-only mortgage loan that has a 5 year term and carries an interest rate of LIBOR + 1.50%. In October 2013, we entered into interest rate swap agreements that fix the base LIBOR rate at an average of 1.30%, creating a contractual interest rate of 2.80%. |
| |
| (5) | In July 2013, the joint venture closed on a $70.0 million mortgage loan with a maturity date of July 1, 2017, with the option to extend the maturity for one additional year. As of September 30, 2014, the balance on the loan was $65 million. |
18
Supplemental Operating and Financial Data for the
Quarter Ended 9/30/2014
| |
| (6) | In May 2013, the joint venture closed on a construction loan with the ability to borrow up to $62.0 million, with a maturity date of May 16, 2016, with the option to extend the maturity date for two additional years. As of September 30, 2014, the balance on the loan was $62.0 million. |
| |
| (7) | Represents the mortgages assumed related to the acquisition of the Saint-Sauveur, Quebec property by the RioCan co-owners in November 2012. The mortgages have a principal balance of $15.6 million and carry a weighted average interest rate of 5.7% and mature in 2015 and 2020, respectively. |
| |
| (8) | In May 2014, the joint venture closed on a construction loan with the ability to borrow up to $97.7 million, with a maturity date of May 21, 2017, with two options to extend the maturity date each for one additional year. As of September 30, 2014, the balance on the loan was $3.4 million. |
| |
| (9) | In May 2014, the joint venture amended and restated the original construction loan from June 2012, with a maturity date of June 27, 2015 and the option to extend the maturity date for two additional years. The amended and restated construction loan provides the joint venture with the ability to borrow up to $62.0 million. As of September 30, 2014, the balance on the loan was $49.8 million. |
| |
| (10) | In December 2012, the joint venture closed on the refinance of its $24.3 million mortgage loan which had an initial maturity date of December 17, 2012. The refinanced interest-only, non-recourse mortgage loan has a 10 year term. |
19
Supplemental Operating and Financial Data for the
Quarter Ended 9/30/2014
Future Scheduled Principal Payments (dollars in thousands)
|
| | | | | | | | | | | |
| As of September 30, 2014 |
| Year | Tanger Consolidated Payments | | Tanger's Share of Unconsolidated JV Payments | | Total Scheduled Payments |
| 2014 | $ | 921 |
| | $ | 80 |
| | $ | 1,001 |
|
| 2015 | 282,343 |
| | 29,977 |
| | 312,320 |
|
| 2016 | 30,283 |
| | 31,305 |
| | 61,588 |
|
2017 (1) | 150,308 |
| | 34,508 |
| | 184,816 |
|
| 2018 | 153,183 |
| | 342 |
| | 153,525 |
|
| 2019 | 253,369 |
| | 361 |
| | 253,730 |
|
| 2020 | 303,566 |
| | 5,336 |
| | 308,902 |
|
| 2021 | 5,793 |
| | — |
| | 5,793 |
|
| 2022 | 4,436 |
| | 12,125 |
| | 16,561 |
|
| 2023 | 254,768 |
| | — |
| | 254,768 |
|
| 2024 & thereafter | 12,346 |
| | — |
| | 12,346 |
|
| | $ | 1,451,316 |
| | $ | 114,034 |
| | $ | 1,565,350 |
|
| Net Discount on Debt | (2,328 | ) | | 493 |
| | (1,835 | ) |
| | $ | 1,448,988 |
| | $ | 114,527 |
| | $ | 1,563,515 |
|
Senior Unsecured Notes Financial Covenants (2)
|
| | | | | | |
| As of September 30, 2014 |
| | Required | | Actual | | Compliance |
| Total Consolidated Debt to Adjusted Total Assets | <60% | | 49 | % | | Yes |
| Total Secured Debt to Adjusted Total Assets | <40% | | 8 | % | | Yes |
| Total Unencumbered Assets to Unsecured Debt | >150% | | 174 | % | | Yes |
| Consolidated Income Available for Debt Service to Annual Debt Service Charge | >1.5 | | 4.34 |
| | Yes |
| |
| (1) | Includes balances of $139.8 million outstanding under the company's unsecured lines of credit. |
| |
| (2) | For a complete listing of all Debt Covenants related to the Company's Senior Unsecured Notes, as well as definitions of the above terms, please refer to the Company's filings with the Securities and Exchange Commission. |
20
Supplemental Operating and Financial Data for the
Quarter Ended 9/30/2014
Investor Information
Tanger Outlet Centers welcomes any questions or comments from shareholders, analysts, investment managers, media and prospective investors. Please address all inquiries to our Investor Relations Department.
|
| |
| Tanger Factory Outlet Centers, Inc. |
| Investor Relations |
| Phone: | (336) 834-6892 |
| Fax: | (336) 297-0931 |
| e-mail: | tangermail@tangeroutlet.com |
| Mail: | Tanger Factory Outlet Centers, Inc. |
| | 3200 Northline Avenue |
| | Suite 360 |
| | Greensboro, NC 27408 |
21
Supplemental Operating and Financial Data for the
Quarter Ended 9/30/2014