| 2Q2021 | ||
| Supplemental Information | ||
| FURNISHED AS OF AUGUST 4, 2021 - UNAUDITED | ||
 | ||
| FORWARD LOOKING STATEMENTS & RISK FACTORS | ||
This Supplemental Information report contains disclosures that are “forward-looking statements” as defined in Section 27A of the Securities Act of 1933, as amended, and Section 21E of the Securities Exchange Act of 1934, as amended. Forward-looking statements include all statements that do not relate solely to historical or current facts and can be identified by the use of words and phrases such as “can,” “may,” “payable,” “indicative,” "predictive," “annualized,” “expect,” “expected,” “range of expectations,” "would have been," "budget," and other comparable terms in this report. These forward-looking statements are made as of the date of this report and are not guarantees of future performance. These statements are based on the current plans and expectations of Company management and are subject to a number of unknown risks, uncertainties, assumptions and other factors that could cause actual results to differ materially from those described in this release or implied by such forward-looking statements. Such risks and uncertainties include, among other things, the following: the impact of the COVID-19 pandemic on occupancy rates and on the operations of the Company and its tenants; actions governments take in response to the COVID-19 pandemic, including the introduction of public health measures and other regulations affecting the Company’s properties and the operations of the Company and its tenants; general economic uncertainty in key markets as a result of the COVID-19 pandemic and a worsening of global economic conditions or low levels of economic growth changes in the economy; increases in interest rates; the availability and cost of capital at expected rates; competition for quality assets; negative developments in the operating results or financial condition of the Company's tenants, including, but not limited to, their ability to pay rent; the Company's ability to reposition or sell facilities with profitable results; the Company's ability to re-lease space at similar rates as vacancies occur; the Company's ability to renew expiring leases; government regulations affecting tenants' Medicare and Medicaid reimbursement rates and operational requirements; unanticipated difficulties and/or expenditures relating to future acquisitions and developments; changes in rules or practices governing the Company's financial reporting; the Company may be required under purchase options to sell properties and may not be able to reinvest the proceeds from such sales at rates of return equal to the return received on the properties sold; uninsured or underinsured losses related to casualty or liability; the incurrence of impairment charges on its real estate properties or other assets; and other legal and operational matters. Other risks, uncertainties and factors that could cause actual results to differ materially from those projected are detailed under the heading “Risk Factors,” in the Company's Annual Report on Form 10-K filed with the Securities and Exchange Commission (“SEC”) for the year ended December 31, 2020, under the heading "Risk Factors" and other risks described from time to time thereafter in the Company's SEC filings. The Company undertakes no obligation to publicly update or revise any forward-looking statements, whether as a result of new information, future events or otherwise.
| Table of Contents | ||
| Highlights | |||||
| Salient Facts | |||||
| Corporate Information | |||||
| Balance Sheet | |||||
| Statements of Income | |||||
| FFO, Normalized FFO, & FAD | |||||
| Capital Funding & Commitments | |||||
| Debt Metrics | |||||
| Debt Covenants | |||||
| Acquisition & Disposition Activity | |||||
| Re/Development Activity | |||||
| Portfolio | |||||
| Associated Health Systems | |||||
| Top Tenants | |||||
| MOB Proximity to Hospital | |||||
| Lease Maturity, Lease & Building Size | |||||
| Historical Occupancy | |||||
| Occupancy Reconciliation | |||||
| Same Store Leasing Statistics | |||||
| NOI Performance | |||||
| NOI Reconciliations | |||||
| EBITDA Reconciliations | |||||
| Components of Net Asset Value | |||||
| Components of Expected FFO | |||||
Copies of this report may be obtained at www.healthcarerealty.com or by contacting Investor Relations at 615.269.8175 or communications@healthcarerealty.com.
HEALTHCARE REALTY | 2Q 2021 SUPPLEMENTAL INFORMATION 3 | ||||
| Highlights | ||
| QUARTERLY HIGHLIGHTS | ||
•Normalized FFO per share totaled $0.43, an increase from $0.42 in the second quarter of 2020.
•Same store cash NOI for the second quarter increased 2.9% over the second quarter of 2020. For the trailing twelve months ended June 30, 2021, same store cash NOI grew 2.3%.
•Predictive growth measures in the same store portfolio include:
◦Average in-place rent increases of 2.87%
◦Future annual contractual increases of 3.1% for leases commencing in the quarter
◦Weighted average cash leasing spreads of 2.8% on 285,000 square feet renewed:
▪8% (<0% spread)
▪9% (0-3%)
▪59% (3-4%)
▪24% (>4%)
◦Tenant retention of 74.9%
•Portfolio leasing activity in the second quarter totaled 485,000 square feet related to 141 leases:
◦331,000 square feet of renewals
◦154,000 square feet of new and expansion leases
•During the second quarter, the Company acquired eight medical office buildings for $216.9 million totaling 467,000 square feet.
◦In San Diego, a 160,000 square foot building for $102.7 million on BBB rated Palomar Health's Medical Center Poway Campus, the Company's fourth property in the San Diego market.
◦In Los Angeles, two buildings totaling 131,000 square feet for $55.9 million on AA- rated MemorialCare Health System's Saddleback Medical Center campus. The buildings were acquired under the TIAA joint venture. The Company now owns five buildings on or near this campus and nineteen properties in the Los Angeles market.
◦In Baltimore, an off campus 33,000 square foot building for $14.6 million located near A rated University of Maryland Medical System's Upper Chesapeake Medical Center. The Company owns two other buildings on this campus.
◦In San Antonio, an off campus 45,000 square foot building for $13.6 million leased to a diverse mix of specialty and primary care providers, including Baptist Health System, and acquired under the TIAA joint venture. The Company now owns seven buildings in the San Antonio market.
◦In Houston, a 45,000 square foot building for $13.5 million adjacent to AA rated Houston Methodist Willowbrook Hospital, the Company's eleventh property in the Houston market.
◦In Greensboro, an off campus 25,000 square foot building for $9.4 million anchored by AA- rated Cone Health. The Company owns four other buildings adjacent to the nearby Moses H. Cone Memorial Hospital campus.
◦In Colorado Springs, an off campus, 28,000 square foot building for $7.2 million leased to a diverse mix of tenants. This property was acquired through the TIAA joint venture.
◦The Company funded $178.5 million in these properties, net of TIAA's 50% joint venture contribution.
•Subsequent to the end of the quarter, the Company acquired six medical office buildings for $119.4 million totaling 371,000 square feet.
◦In Denver, three buildings totaling 260,000 square feet for $70.4 million on AA- rated AdventHealth's Porter Adventist Hospital campus, operated by Centura Health. The Company now owns sixteen properties in the Denver market.
◦In Colorado Springs, a 70,000 square foot building for $33.4 million on BBB+ rated CommonSpirit Health's Penrose Hospital campus, operated by Centura Health.
◦In Colorado Springs, an off campus 24,000 square foot property for $9.1 million, which included a three-acre land parcel for future development. The building is anchored by Centura Health and is located near the Penrose Hospital campus. The investment was made through the TIAA joint venture and is the Company's eighth property in the Colorado Springs market.
HEALTHCARE REALTY | 2Q 2021 SUPPLEMENTAL INFORMATION 4 | ||||
◦In Greensboro, an 18,000 square foot building for $6.4 million adjacent to AA- rated Cone Health's Alamance Regional Medical Center campus. The Company owns one other building on this campus and now owns eight buildings in the Greensboro market.
◦The Company funded $114.8 million in these properties, net of TIAA's 50% joint venture contribution.
•Year-to-date, the Company acquired twenty-one buildings totaling 1.1 million square feet for $412.8 million ($362.7 million net of joint venture contributions) at a weighted average cap rate of 5.3%.
•Year-to-date, the Company sold eleven medical office buildings totaling 547,000 square feet for $114.6 million at a weighted average cap rate of 4.1%.
•In July, the Company commenced the development of a new 106,000 square foot medical office building located on AA+ rated Ascension Health's St. Thomas Midtown Hospital campus in Nashville. The project consists of the demolition of an existing building, and construction of a new medical office building, parking garage and shared hospital front entrance. The project has a total budget of $44 million, including a $5 million non-cash allocation for the existing land value. The Company owns an additional 333,000 square feet on or adjacent to this campus.
•During the second quarter, the Company settled 3.8 million shares through its forward equity program, generating $116.1 million in net proceeds.
◦The Company currently has approximately 3.7 million shares to be settled through forward equity contracts and expects gross proceeds of approximately $114.8 million, before cost of borrowing under the forward contracts.
•In June, the Company repriced its $150 million term loan due June 2026, reducing the interest rate to LIBOR plus 95 basis points, representing a savings of 65 basis points. The Company also added a sustainability-linked incentive.
•As of June 30, 2021, the Company had cash of $18.7 million and $687 million available on its revolver.
•Net debt to adjusted EBITDA was 5.1 times at the end of the quarter, down from 5.3 times at the end of the first quarter.
•A dividend of $0.3025 per share was paid during the quarter, which equaled 90.2% of FAD. Year to date, dividends paid equaled 85.3% of FAD.
•A dividend of $0.3025 per share is payable on August 31, 2021 for stockholders of record on August 16, 2021.
| OTHER ITEMS OF NOTE | ||
•In the third quarter, the Company has historically experienced a $1.5 million sequential increase in operating expenses due to the impact of seasonally high temperatures on utility expenses.
HEALTHCARE REALTY | 2Q 2021 SUPPLEMENTAL INFORMATION 5 | ||||
Salient Facts 1 | ||
| AS OF JUNE 30, 2021 | ||
| Properties | 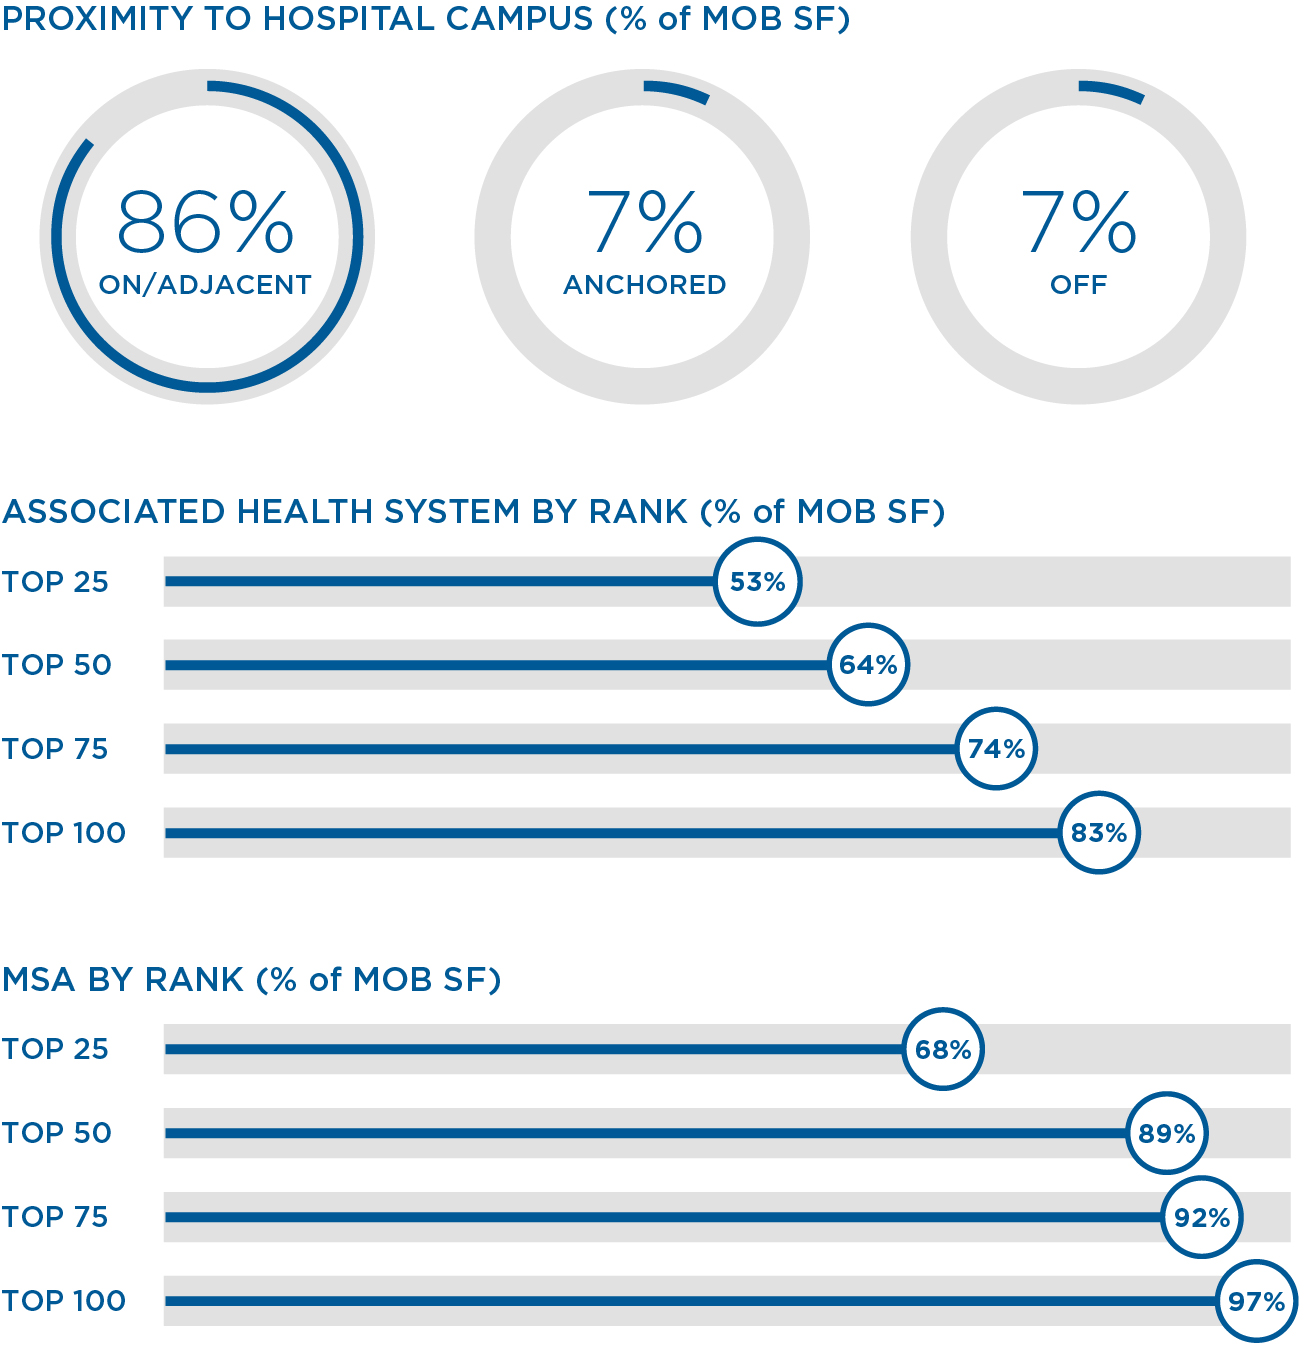 | ||||||||||
| $4.9B invested in 236 properties | |||||||||||
| 16.9M SF owned in 24 states | |||||||||||
| 13.4M SF managed by Healthcare Realty | |||||||||||
| 95.4% medical office and outpatient | |||||||||||
| 63.7% of NOI in Top 10 Markets | |||||||||||
| Capitalization | |||||||||||
| $6.2B enterprise value as of 7/30/21 | |||||||||||
| $4.6B market capitalization as of 7/30/21 | |||||||||||
| 145.5M shares outstanding as of 6/30/21 | |||||||||||
| $0.3025 quarterly dividend per share | |||||||||||
| BBB/Baa2/BBB+ S&P/Moody's/Fitch | |||||||||||
| 26.8% net debt to enterprise value at 6/30/21 | |||||||||||
| 5.1x net debt to adjusted EBITDA at 6/30/21 | |||||||||||
1Property counts and square footage include properties in the Company's unconsolidated JV.
HEALTHCARE REALTY | 2Q 2021 SUPPLEMENTAL INFORMATION 6 | ||||
| Corporate Information | ||
Healthcare Realty Trust is a real estate investment trust that integrates owning, managing, financing and developing income-producing real estate properties associated primarily with the delivery of outpatient healthcare services throughout the United States. As of June 30, 2021, the Company was invested in 236 real estate properties in 24 states totaling 16.9 million square feet and had an enterprise value of approximately $6.0 billion, defined as equity market capitalization plus the principal amount of debt less cash. The Company provided leasing and property management services to 13.4 million square feet nationwide.
| EXECUTIVE OFFICERS | ||
| BOARD OF DIRECTORS | ||
Todd J. Meredith
President and Chief Executive Officer
John M. Bryant, Jr.
Executive Vice President and General Counsel
J. Christopher Douglas
Executive Vice President and Chief Financial Officer
Robert E. Hull
Executive Vice President - Investments
Julie F. Wilson
Executive Vice President - Operations
| CORPORATE HEADQUARTERS | ||
Healthcare Realty Trust Incorporated
3310 West End Avenue, Suite 700
Nashville, Tennessee 37203
Phone 615.269.8175 Fax 615.269.8461
communications@healthcarerealty.com
www.healthcarerealty.com
| ANALYST COVERAGE | ||
BMO Capital Markets
Berenberg Capital Markets LLC
BTIG, LLC
CapitalOne Securities, Inc.
Citi Research
Green Street Advisors, Inc.
J.P. Morgan Securities LLC
Jefferies LLC
KeyBanc Capital Markets Inc.
Morgan Stanley & Co, LLC
Raymond James & Associates
Scotiabank
SMBC Nikko Securities America, Inc.
Stifel, Nicolaus & Company, Inc.
Wells Fargo Securities, LLC
J. Knox Singleton
Chairman, Healthcare Realty Trust Incorporated
Retired Chief Executive Officer, Inova Health System
Todd J. Meredith
President and Chief Executive Officer
Healthcare Realty Trust Incorporated
John V. Abbott
Retired Chief Executive Officer
Aviation Asset Management Group, General Electric Company
Nancy H. Agee
President and Chief Executive Officer
Carilion Clinic
Edward H. Braman
Retired Audit Partner
Ernst & Young LLP
Ajay Gupta
Chief Executive Officer
Physician Rehabilitation Network
James J. Kilroy
President and Portfolio Manager
Willis Investment Counsel
Peter F. Lyle
Executive Vice President
Medical Management Associates, Inc.
Christann M. Vasquez
Executive Vice President and Chief Operating Officer
Ascension Texas
David R. Emery (1944-2019)
Chairman Emeritus
Healthcare Realty Trust Incorporated
HEALTHCARE REALTY | 2Q 2021 SUPPLEMENTAL INFORMATION 7 | ||||
| Balance Sheet | ||
| DOLLARS IN THOUSANDS, EXCEPT PER SHARE DATA | ||
| ASSETS | ||||||||||||||||||||
| 2Q 2021 | 1Q 2021 | 4Q 2020 | 3Q 2020 | 2Q 2020 | ||||||||||||||||
| Real estate properties | ||||||||||||||||||||
| Land | $375,374 | $369,202 | $362,695 | $330,840 | $312,139 | |||||||||||||||
| Buildings, improvements and lease intangibles | 4,249,352 | 4,201,251 | 4,220,297 | 4,014,740 | 3,937,657 | |||||||||||||||
| Personal property | 11,589 | 11,370 | 11,195 | 10,962 | 10,849 | |||||||||||||||
Investment in financing receivable, net 1 | 104,642 | — | — | — | — | |||||||||||||||
| Construction in progress | 1,147 | — | — | — | — | |||||||||||||||
| Land held for development | 27,226 | 27,226 | 27,226 | 24,647 | 24,647 | |||||||||||||||
| Total real estate properties | 4,769,330 | 4,609,049 | 4,621,413 | 4,381,189 | 4,285,292 | |||||||||||||||
| Less accumulated depreciation and amortization | (1,285,251) | (1,238,044) | (1,239,224) | (1,198,444) | (1,169,298) | |||||||||||||||
| Total real estate properties, net | 3,484,079 | 3,371,005 | 3,382,189 | 3,182,745 | 3,115,994 | |||||||||||||||
| Cash and cash equivalents | 18,739 | 12,087 | 15,303 | 121,992 | 43,680 | |||||||||||||||
Restricted cash 2 | — | — | — | 60,644 | — | |||||||||||||||
| Assets held for sale, net | 21,065 | 64,578 | 20,646 | 20,051 | — | |||||||||||||||
| Operating lease right-of-use assets | 121,288 | 120,890 | 125,198 | 123,807 | 124,398 | |||||||||||||||
| Financing lease right-of-use assets | 19,450 | 19,559 | 19,667 | 19,776 | 19,884 | |||||||||||||||
| Net investment in sales-type leases | — | — | — | — | 244,381 | |||||||||||||||
| Investments in unconsolidated joint ventures | 117,935 | 83,943 | 73,137 | 7,743 | 7,819 | |||||||||||||||
| Other assets | 182,123 | 182,043 | 176,120 | 174,693 | 175,797 | |||||||||||||||
| Total assets | $3,964,679 | $3,854,105 | $3,812,260 | $3,711,451 | $3,731,953 | |||||||||||||||
| LIABILITIES AND STOCKHOLDERS' EQUITY | ||||||||||||||||||||
| 2Q 2021 | 1Q 2021 | 4Q 2020 | 3Q 2020 | 2Q 2020 | ||||||||||||||||
| Liabilities | ||||||||||||||||||||
| Notes and bonds payable | $1,614,479 | $1,609,251 | $1,602,769 | $1,554,395 | $1,554,936 | |||||||||||||||
| Accounts payable and accrued liabilities | 74,927 | 66,407 | 81,174 | 79,528 | 65,485 | |||||||||||||||
| Liabilities of properties held for sale | 942 | 1,342 | 1,216 | 548 | — | |||||||||||||||
| Operating lease liabilities | 92,110 | 91,921 | 92,273 | 91,466 | 91,259 | |||||||||||||||
| Financing lease liabilities | 18,648 | 18,722 | 18,837 | 18,697 | 18,595 | |||||||||||||||
| Other liabilities | 67,319 | 68,353 | 67,615 | 66,442 | 72,317 | |||||||||||||||
| Total liabilities | 1,868,425 | 1,855,996 | 1,863,884 | 1,811,076 | 1,802,592 | |||||||||||||||
| Commitments and contingencies | ||||||||||||||||||||
| Stockholders' equity | ||||||||||||||||||||
| Preferred stock, $.01 par value; 50,000 shares authorized | — | — | — | — | — | |||||||||||||||
| Common stock, $.01 par value; 300,000 shares authorized | 1,455 | 1,417 | 1,395 | 1,361 | 1,360 | |||||||||||||||
| Additional paid-in capital | 3,818,592 | 3,699,867 | 3,635,341 | 3,532,130 | 3,529,559 | |||||||||||||||
| Accumulated other comprehensive loss | (13,580) | (13,887) | (17,832) | (19,267) | (20,294) | |||||||||||||||
| Cumulative net income attributable to common stockholders | 1,246,617 | 1,223,521 | 1,199,499 | 1,215,362 | 1,207,132 | |||||||||||||||
| Cumulative dividends | (2,956,830) | (2,912,809) | (2,870,027) | (2,829,211) | (2,788,396) | |||||||||||||||
| Total stockholders' equity | 2,096,254 | 1,998,109 | 1,948,376 | 1,900,375 | 1,929,361 | |||||||||||||||
| Total liabilities and stockholders' equity | $3,964,679 | $3,854,105 | $3,812,260 | $3,711,451 | $3,731,953 | |||||||||||||||
1In 2Q 2021, the Company acquired a single-tenant net lease property in San Diego, CA in a sale leaseback transaction which was accounted for as a financing arrangement as required under ASC 842, Leases.
2Restricted cash in 3Q 2020 included cash held in escrow from the sale of a property in Oklahoma. These proceeds were disbursed as the Company acquired real estate investments in like-kind exchanges under Section 1031 of the Internal Revenue Code of 1986, as amended.
HEALTHCARE REALTY | 2Q 2021 SUPPLEMENTAL INFORMATION 8 | ||||
| Statements of Income | ||
| DOLLARS IN THOUSANDS | ||
| 2Q 2021 | 1Q 2021 | 4Q 2020 | 3Q 2020 | 2Q 2020 | 1Q 2020 | 4Q 2019 | 3Q 2019 | |||||||||||||||||||||||||
| Revenues | ||||||||||||||||||||||||||||||||
| Rental income | $128,486 | $128,389 | $123,877 | $123,384 | $122,358 | $122,644 | $119,438 | $117,740 | ||||||||||||||||||||||||
Interest from financing receivable, net 1 | 510 | — | — | — | — | — | — | — | ||||||||||||||||||||||||
| Other operating | 2,427 | 1,950 | 2,003 | 1,868 | 1,332 | 2,163 | 2,086 | 2,059 | ||||||||||||||||||||||||
| 131,423 | 130,339 | 125,880 | 125,252 | 123,690 | 124,807 | 121,524 | 119,799 | |||||||||||||||||||||||||
| Expenses | ||||||||||||||||||||||||||||||||
| Property operating | 51,509 | 52,215 | 50,210 | 50,171 | 46,580 | 49,552 | 46,214 | 46,777 | ||||||||||||||||||||||||
| General and administrative | 8,545 | 8,499 | 7,206 | 7,299 | 7,434 | 8,766 | 7,669 | 10,802 | ||||||||||||||||||||||||
Acquisition and pursuit costs 2 | 670 | 744 | 939 | 440 | 431 | 750 | 515 | 501 | ||||||||||||||||||||||||
| Depreciation and amortization | 49,826 | 50,079 | 48,104 | 47,143 | 47,691 | 47,497 | 46,134 | 45,137 | ||||||||||||||||||||||||
| 110,550 | 111,537 | 106,459 | 105,053 | 102,136 | 106,565 | 100,532 | 103,217 | |||||||||||||||||||||||||
| Other income (expense) | ||||||||||||||||||||||||||||||||
| Gain (loss) on sales of real estate properties | 20,970 | 18,890 | (34) | 2,177 | 68,267 | (49) | 20,036 | 200 | ||||||||||||||||||||||||
| Interest expense | (13,261) | (13,262) | (13,618) | (14,154) | (14,442) | (13,960) | (13,816) | (14,181) | ||||||||||||||||||||||||
| Loss on extinguishment of debt | — | — | (21,503) | — | — | — | — | — | ||||||||||||||||||||||||
| Impairment of real estate assets | (5,078) | (834) | — | — | — | — | (7) | — | ||||||||||||||||||||||||
| Equity loss from unconsolidated joint ventures | (146) | (74) | (269) | (66) | (116) | (11) | (2) | (13) | ||||||||||||||||||||||||
| Interest and other income (expense), net | (262) | 500 | 140 | 74 | 250 | 93 | 7 | 13 | ||||||||||||||||||||||||
| 2,223 | 5,220 | (35,284) | (11,969) | 53,959 | (13,927) | 6,218 | (13,981) | |||||||||||||||||||||||||
| Net income (loss) | $23,096 | $24,022 | ($15,863) | $8,230 | $75,513 | $4,315 | $27,210 | $2,601 | ||||||||||||||||||||||||
1In 2Q 2021, the Company acquired a single-tenant net lease property in San Diego, CA in a sale leaseback transaction which was accounted for as a financing arrangement as required under ASC 842, Leases. Rental income due under the lease is recorded as interest income.
2Includes third party and travel costs related to the pursuit of acquisitions and developments.
HEALTHCARE REALTY | 2Q 2021 SUPPLEMENTAL INFORMATION 9 | ||||
FFO, Normalized FFO, & FAD 1, 2 | ||
| DOLLARS IN THOUSANDS, EXCEPT PER SHARE DATA | ||
| 2Q 2021 | 1Q 2021 | 4Q 2020 | 3Q 2020 | 2Q 2020 | 1Q 2020 | 4Q 2019 | 3Q 2019 | ||||||||||||||||||||||||||||||||||||||||||||||
| Net income (loss) | $23,096 | $24,022 | $(15,863) | $8,230 | $75,513 | $4,315 | $27,210 | $2,601 | |||||||||||||||||||||||||||||||||||||||||||||
| (Gain) loss on sales of real estate assets | (20,970) | (18,890) | 34 | (2,177) | (68,267) | 49 | (20,036) | (200) | |||||||||||||||||||||||||||||||||||||||||||||
| Impairments of real estate assets | 5,078 | 834 | — | — | — | — | 7 | — | |||||||||||||||||||||||||||||||||||||||||||||
| Real estate depreciation and amortization | 51,199 | 51,311 | 49,251 | 48,215 | 48,577 | 48,531 | 46,962 | 45,846 | |||||||||||||||||||||||||||||||||||||||||||||
| Unconsolidated JV depreciation and amortization | 1,354 | 813 | 323 | 80 | 80 | 80 | 80 | 80 | |||||||||||||||||||||||||||||||||||||||||||||
| FFO | $59,757 | $58,090 | $33,745 | $54,348 | $55,903 | $52,975 | $54,223 | $48,327 | |||||||||||||||||||||||||||||||||||||||||||||
Acquisition and pursuit costs 3 | 670 | 744 | 939 | 440 | 431 | 750 | 515 | 501 | |||||||||||||||||||||||||||||||||||||||||||||
| Lease intangible amortization | (6) | (72) | (4) | (35) | (16) | 745 | 4 | 5 | |||||||||||||||||||||||||||||||||||||||||||||
Accelerated stock awards 4 | — | — | — | — | — | — | — | 2,854 | |||||||||||||||||||||||||||||||||||||||||||||
| Forfeited earnest money received | — | (500) | — | — | — | — | — | — | |||||||||||||||||||||||||||||||||||||||||||||
| Debt financing costs | 283 | — | 21,920 | — | — | — | — | — | |||||||||||||||||||||||||||||||||||||||||||||
Unconsolidated JV normalizing items 5 | 55 | 27 | 16 | — | — | — | — | — | |||||||||||||||||||||||||||||||||||||||||||||
| Normalized FFO | $60,759 | $58,289 | $56,616 | $54,753 | $56,318 | $54,470 | $54,742 | $51,687 | |||||||||||||||||||||||||||||||||||||||||||||
| Non-real estate depreciation and amortization | 641 | 673 | 724 | 785 | 822 | 823 | 838 | 838 | |||||||||||||||||||||||||||||||||||||||||||||
Non-cash interest amortization 6 | 897 | 894 | 976 | 934 | 1,035 | 746 | 731 | 727 | |||||||||||||||||||||||||||||||||||||||||||||
| Provision for bad debt, net | 57 | (79) | (511) | (144) | 945 | (83) | 124 | (32) | |||||||||||||||||||||||||||||||||||||||||||||
| Straight-line rent income, net | (1,194) | (1,094) | (645) | (543) | (390) | (668) | (789) | (387) | |||||||||||||||||||||||||||||||||||||||||||||
| Stock-based compensation | 2,627 | 3,019 | 2,472 | 2,445 | 2,405 | 2,599 | 2,133 | 2,375 | |||||||||||||||||||||||||||||||||||||||||||||
Unconsolidated JV non-cash items 7 | (354) | (357) | 4 | 8 | 8 | 8 | 8 | 8 | |||||||||||||||||||||||||||||||||||||||||||||
| Normalized FFO adjusted for non-cash items | 63,433 | 61,345 | 59,636 | 58,238 | 61,143 | 57,895 | 57,787 | 55,216 | |||||||||||||||||||||||||||||||||||||||||||||
| 2nd generation TI | (4,748) | (5,189) | (8,841) | (5,323) | (6,005) | (6,040) | (12,126) | (6,114) | |||||||||||||||||||||||||||||||||||||||||||||
| Leasing commissions paid | (3,804) | (1,193) | (3,288) | (1,999) | (2,258) | (2,824) | (4,970) | (2,697) | |||||||||||||||||||||||||||||||||||||||||||||
| Capital expenditures | (6,077) | (2,019) | (8,931) | (4,580) | (4,777) | (3,470) | (5,159) | (3,543) | |||||||||||||||||||||||||||||||||||||||||||||
| Maintenance cap ex | (14,629) | (8,401) | (21,060) | (11,902) | (13,040) | (12,334) | (22,255) | (12,354) | |||||||||||||||||||||||||||||||||||||||||||||
| FAD | $48,804 | $52,944 | $38,576 | $46,336 | $48,103 | $45,561 | $35,532 | $42,862 | |||||||||||||||||||||||||||||||||||||||||||||
| Dividends paid | $44,021 | $42,782 | $40,816 | $40,815 | $40,510 | $40,416 | $40,121 | $38,852 | |||||||||||||||||||||||||||||||||||||||||||||
| TTM dividend payout (dividends paid/FAD) | 90.2 | % | 88.7 | % | 91.0 | % | 92.2 | % | 92.9 | % | 95.4 | % | 95.0 | % | 92.4 | % | |||||||||||||||||||||||||||||||||||||
| FFO per common share - diluted | $0.42 | $0.42 | $0.25 | $0.40 | $0.42 | $0.40 | $0.41 | $0.37 | |||||||||||||||||||||||||||||||||||||||||||||
| Normalized FFO per common share - diluted | $0.43 | $0.42 | $0.42 | $0.41 | $0.42 | $0.41 | $0.41 | $0.40 | |||||||||||||||||||||||||||||||||||||||||||||
| TTM Normalized FFO per common share - diluted | $1.67 | $1.66 | $1.65 | $1.64 | $1.64 | $1.62 | $1.60 | $1.58 | |||||||||||||||||||||||||||||||||||||||||||||
FFO wtd avg common shares outstanding - diluted 8 | 142,914 | 139,714 | 135,701 | 135,159 | 134,464 | 133,980 | 133,125 | 129,015 | |||||||||||||||||||||||||||||||||||||||||||||
1Funds from operations (“FFO”) and FFO per share are operating performance measures adopted by the National Association of Real Estate Investment Trusts, Inc. (“NAREIT”). NAREIT defines FFO as “net income (computed in accordance with GAAP) excluding depreciation and amortization related to real estate, gains and losses from the sale of certain real estate assets, gains and losses from change in control, and impairment write-downs of certain real assets and investments in entities when the impairment is directly attributable to decreases in the value of depreciable real estate held by the entity.”
2FFO, Normalized FFO and Funds Available for Distribution ("FAD") do not represent cash generated from operating activities determined in accordance with accounting principles generally accepted in the United States of America and is not necessarily indicative of cash available to fund cash needs. FFO, Normalized FFO and FAD should not be considered alternatives to net income attributable to common stockholders as indicators of the Company's operating performance or as alternatives to cash flow as measures of liquidity.
3Acquisition and pursuit costs include third party and travel costs related to the pursuit of acquisitions and developments.
4The Company's former Executive Chairman, David R. Emery, died on September 30, 2019 resulting in $2.9 million of expenses recorded in the third quarter of 2019 associated with the acceleration of his outstanding non-vested share-based awards.
5Includes the Company's proportionate share of normalizing items related to unconsolidated joint ventures such as lease intangibles and acquisition and pursuit costs.
6Includes the amortization of deferred financing costs, discounts and premiums, and non-cash financing receivable amortization.
7Includes the Company's proportionate share of straight-line rent, net related to unconsolidated joint ventures.
8The Company utilizes the treasury stock method which includes the dilutive effect of nonvested share-based awards outstanding of 865,304 for the three months ended June 30, 2021.
HEALTHCARE REALTY | 2Q 2021 SUPPLEMENTAL INFORMATION 10 | ||||
| Capital Funding & Commitments | ||
| DOLLARS IN THOUSANDS, EXCEPT PER SHARE DATA | ||
| ACQUISITION AND RE/DEVELOPMENT FUNDING | ||||||||||||||||||||||||||||||||||||||
| 2Q 2021 | 1Q 2021 | 4Q 2020 | 3Q 2020 | 2Q 2020 | ||||||||||||||||||||||||||||||||||
Acquisitions 1 | $178,508 | $69,403 | $273,757 | $108,127 | $— | |||||||||||||||||||||||||||||||||
| Re/development | 5,719 | 9,336 | 9,204 | 4,709 | 5,664 | |||||||||||||||||||||||||||||||||
1st gen. TI & acquisition capex 2 | 5,975 | 3,808 | 6,327 | 6,471 | 4,991 | |||||||||||||||||||||||||||||||||
| MAINTENANCE CAPITAL EXPENDITURES FUNDING | ||||||||||||||||||||||||||||||||||||||
| 2Q 2021 | 1Q 2021 | 4Q 2020 | 3Q 2020 | 2Q 2020 | ||||||||||||||||||||||||||||||||||
| 2nd generation TI | $4,748 | $5,189 | $8,841 | $5,323 | $6,005 | |||||||||||||||||||||||||||||||||
| Leasing commissions paid | 3,804 | 1,193 | 3,288 | 1,999 | 2,258 | |||||||||||||||||||||||||||||||||
| Capital expenditures | 6,077 | 2,019 | 8,931 | 4,580 | 4,777 | |||||||||||||||||||||||||||||||||
| $14,629 | $8,401 | $21,060 | $11,902 | $13,040 | ||||||||||||||||||||||||||||||||||
| % of Cash NOI | ||||||||||||||||||||||||||||||||||||||
| 2nd generation TI | 5.9 | % | 6.7 | % | 11.8 | % | 7.1 | % | 7.8 | % | ||||||||||||||||||||||||||||
| Leasing commissions paid | 4.8 | % | 1.5 | % | 4.4 | % | 2.7 | % | 2.9 | % | ||||||||||||||||||||||||||||
| Capital expenditures | 7.6 | % | 2.6 | % | 11.9 | % | 6.1 | % | 6.2 | % | ||||||||||||||||||||||||||||
| 18.3 | % | 10.8 | % | 28.1 | % | 15.9 | % | 17.0 | % | |||||||||||||||||||||||||||||
LEASING COMMITMENTS 3 | ||||||||||||||||||||||||||||||||||||||
| 2Q 2021 | 1Q 2021 | 4Q 2020 | 3Q 2020 | 2Q 2020 | ||||||||||||||||||||||||||||||||||
| Renewals | ||||||||||||||||||||||||||||||||||||||
| Square feet | 285,412 | 616,129 | 421,652 | 669,687 | 393,496 | |||||||||||||||||||||||||||||||||
| 2nd generation TI/square foot/lease year | $1.87 | $1.27 | $1.48 | $1.49 | $1.78 | |||||||||||||||||||||||||||||||||
| Leasing commissions/square foot/lease year | $1.03 | $0.79 | $0.85 | $1.13 | $0.86 | |||||||||||||||||||||||||||||||||
| Renewal commitments as a % of annual net rent | 13.3 | % | 9.1 | % | 9.0 | % | 11.2 | % | 13.0 | % | ||||||||||||||||||||||||||||
WALT (in months) 4 | 53.1 | 47.3 | 53.3 | 48.8 | 45.1 | |||||||||||||||||||||||||||||||||
| New leases | ||||||||||||||||||||||||||||||||||||||
| Square feet | 106,950 | 47,530 | 82,538 | 111,310 | 108,485 | |||||||||||||||||||||||||||||||||
| 2nd generation TI/square foot/lease year | $5.96 | $5.38 | $6.28 | $5.38 | $6.40 | |||||||||||||||||||||||||||||||||
| Leasing commissions/square foot/lease year | $1.21 | $1.72 | $1.48 | $1.01 | $1.30 | |||||||||||||||||||||||||||||||||
| New lease commitments as a % of annual net rent | 33.3 | % | 36.9 | % | 35.9 | % | 28.3 | % | 42.3 | % | ||||||||||||||||||||||||||||
WALT (in months) 4 | 79.6 | 70.3 | 77.3 | 89.0 | 74.8 | |||||||||||||||||||||||||||||||||
| All | ||||||||||||||||||||||||||||||||||||||
| Square feet | 392,362 | 663,659 | 504,190 | 780,997 | 501,981 | |||||||||||||||||||||||||||||||||
| Leasing commitments as a % of annual net rent | 20.4 | % | 11.6 | % | 13.9 | % | 15.0 | % | 21.3 | % | ||||||||||||||||||||||||||||
WALT (in months) 4 | 60.3 | 48.9 | 57.3 | 54.6 | 51.5 | |||||||||||||||||||||||||||||||||
1Acquisitions include properties acquired through joint ventures at the Company's ownership percentage.
2Acquisition capex includes near-term fundings underwritten as part of recent acquisitions.
3Beginning in the first quarter of 2021, the Company began excluding properties categorized as re/development and acquisitions to align leasing commitments with the Maintenance Capital Expenditure Funding table above.
4WALT = weighted average lease term.
HEALTHCARE REALTY | 2Q 2021 SUPPLEMENTAL INFORMATION 11 | ||||
| Debt Metrics | ||
| DOLLARS IN THOUSANDS | ||
| SUMMARY OF INDEBTEDNESS AS OF JUNE 30, 2021 | ||||||||||||||||||||
| PRINCIPAL BALANCE | BALANCE 1 | INTEREST EXPENSE | MONTHS TO MATURITY | CONTRACTUAL RATE | EFFECTIVE RATE | |||||||||||||||
Senior notes due May 2025 2 | $250,000 | $248,906 | $2,469 | 46 | 3.88 | % | 4.08 | % | ||||||||||||
| Senior notes due January 2028 | 300,000 | 296,365 | 2,778 | 78 | 3.63 | % | 3.84 | % | ||||||||||||
Senior notes due March 2030 3 | 300,000 | 296,640 | 1,929 | 105 | 2.40 | % | 2.71 | % | ||||||||||||
Senior notes due March 2031 | 300,000 | 295,149 | 1,590 | 117 | 2.05 | % | 2.24 | % | ||||||||||||
| Total senior notes outstanding | $1,150,000 | $1,137,060 | $8,766 | 88 | 2.95 | % | 3.18 | % | ||||||||||||
| $700 million unsecured credit facility due May 2023 | 13,000 | 13,000 | 11 | 23 | LIBOR + 0.90% | 1.00 | % | |||||||||||||
$200 million unsecured term loan facility due May 2024 4 | 200,000 | 199,348 | 988 | 35 | LIBOR + 1.00% | 1.95 | % | |||||||||||||
$150 million unsecured term loan facility due June 2026 5 | 150,000 | 149,306 | 1,103 | 59 | LIBOR + 0.95% | 2.48 | % | |||||||||||||
| Mortgage notes payable, net | 115,296 | 115,765 | 1,124 | 38 | 4.20 | % | 4.07 | % | ||||||||||||
| Total outstanding notes and bonds payable | $1,628,296 | $1,614,479 | $11,992 | 75 | 2.85 | % | 3.01 | % | ||||||||||||
| Interest cost capitalization | (36) | |||||||||||||||||||
| Unsecured credit facility fee and deferred financing costs | 1,058 | |||||||||||||||||||
| Financing lease right-of-use assets | 247 | |||||||||||||||||||
| Total quarterly consolidated interest expense | $13,261 | |||||||||||||||||||
| DEBT MATURITIES SCHEDULE AS OF JUNE 30, 2021 | ||||||||||||||||||||||||||||||||
| PRINCIPAL PAYMENTS | WEIGHTED AVERAGE RATE | |||||||||||||||||||||||||||||||
| BANK LOANS | SENIOR NOTES | MORTGAGE NOTES | TOTAL | BANK LOANS | SENIOR NOTES | MORTGAGE NOTES | TOTAL | |||||||||||||||||||||||||
| 2021 | $1,988 | $1,988 | — | % | — | % | 4.52 | % | 4.52 | % | ||||||||||||||||||||||
| 2022 | 13,434 | 13,434 | — | % | — | % | 3.81 | % | 3.81 | % | ||||||||||||||||||||||
| 2023 | $13,000 | 30,701 | 43,701 | 1.00 | % | — | % | 4.21 | % | 3.25 | % | |||||||||||||||||||||
| 2024 | 200,000 | 26,449 | 226,449 | 1.95 | % | — | % | 4.48 | % | 2.24 | % | |||||||||||||||||||||
| 2025 | $250,000 | 17,415 | 267,415 | — | % | 3.88 | % | 4.35 | % | 3.91 | % | |||||||||||||||||||||
| 2026 | 150,000 | 24,879 | 174,879 | 2.48 | % | — | % | 3.93 | % | 2.68 | % | |||||||||||||||||||||
| 2027 | 430 | 430 | — | % | — | % | 6.17 | % | 6.17 | % | ||||||||||||||||||||||
| 2028 | 300,000 | 300,000 | — | % | 3.63 | % | — | % | 3.63 | % | ||||||||||||||||||||||
| 2029 | — | — | % | — | % | — | % | — | % | |||||||||||||||||||||||
| Thereafter | 600,000 | 600,000 | — | % | 2.23 | % | — | % | 2.23 | % | ||||||||||||||||||||||
| Total | $363,000 | $1,150,000 | $115,296 | $1,628,296 | 2.13 | % | 2.95 | % | 4.20 | % | 2.85 | % | ||||||||||||||||||||
1Balances are reflected net of discounts and deferred financing costs and include premiums.
2The effective interest rate includes the impact of the $1.7 million settlement of a forward-starting interest rate swap that is included in accumulated other comprehensive income on the Company's Condensed Consolidated Balance Sheets.
3The effective interest rate includes the impact of the $4.3 million settlement of forward interest rate hedges that are included in accumulated other comprehensive income on the Company's Condensed Consolidated Balance Sheets.
4The effective interest rate includes the impact of interest rate swaps on $75.0 million at a weighted average rate of 2.37% (plus the applicable margin rate, currently 100 basis points).
5The effective interest rate includes the impact of interest rate swaps on $100.0 million at a weighted average rate of 2.23% (plus the applicable margin rate, currently 95 basis points).
HEALTHCARE REALTY | 2Q 2021 SUPPLEMENTAL INFORMATION 12 | ||||
| Debt Covenants | ||
| DOLLARS IN THOUSANDS | ||
SELECTED FINANCIAL DEBT COVENANTS TTM ENDED JUNE 30, 2021 1 | |||||||||||
| CALCULATION | REQUIREMENT | PER DEBT COVENANTS | |||||||||
Revolving credit facility and term loan 2 | |||||||||||
| Leverage ratio | Total debt/total capital | Not greater than 60% | 32.7 | % | |||||||
| Secured leverage ratio | Total secured debt/total capital | Not greater than 30% | 2.3 | % | |||||||
| Unencumbered leverage ratio | Unsecured debt/unsecured real estate | Not greater than 60% | 34.7 | % | |||||||
| Fixed charge coverage ratio | EBITDA/fixed charges | Not less than 1.50x | 4.8x | ||||||||
| Unsecured coverage ratio | Unsecured EBITDA/unsecured interest | Not less than 1.75x | 5.3x | ||||||||
| Construction and development | CIP/total assets | Not greater than 15% | 0.0 | % | |||||||
| Unconsolidated joint ventures | Unconsolidated JVs/total assets | Not greater than 15% | 3.1 | % | |||||||
| Asset investments | Unimproved land, JVs & mortgages/total assets | Not greater than 20% | 6.5 | % | |||||||
Senior Notes due 2030 and 2031 3 | |||||||||||
| Incurrence of total debt | Total debt/total assets | Not greater than 60% | 32.5 | % | |||||||
| Incurrence of debt secured by any lien | Secured debt/total assets | Not greater than 40% | 2.3 | % | |||||||
| Maintenance of total unsecured assets | Unencumbered assets/unsecured debt | Not less than 150% | 303.1 | % | |||||||
| Debt service coverage | EBITDA/interest expense | Not less than 1.5x | 5.5X | ||||||||
Other Senior Notes 4 | |||||||||||
| Incurrence of total debt | Total debt/total assets | Not greater than 60% | 33.9 | % | |||||||
| Incurrence of debt secured by any lien | Secured debt/total assets | Not greater than 40% | 2.4 | % | |||||||
| Maintenance of total unsecured assets | Unencumbered assets/unsecured debt | Not less than 150% | 291.0 | % | |||||||
| Debt service coverage | EBITDA/interest expense | Not less than 1.5x | 5.4x | ||||||||
| Other | |||||||||||
Net debt to adjusted EBITDA 5 | Net debt (debt less cash)/adjusted EBITDA | Not required | 5.1x | ||||||||
Net debt to enterprise value 6 | Net Debt/enterprise value | Not required | 26.8 | % | |||||||
1Does not include all financial and non-financial covenants and restrictions that are required by the Company's various debt agreements. Financial measures include the Company's proportionate share of unconsolidated joint ventures, as applicable.
2As part of the Company's amendment to the credit facility and term loan agreements during the second quarter of 2019, the financial covenants were updated to exclude the impact of Topic 842, Lease Accounting from the covenant calculations.
3The financial covenants for the Senior Note due 2030 exclude the impact of Topic 842, Lease Accounting from the financial covenant calculations.
4The senior note covenants calculations apply to the Senior Notes due 2025 and 2028. The Senior Notes due 2023 have similar covenants but contain a less restrictive definition of total assets.
5Adjusted EBITDA is based on the current quarter results, annualized. See page 27 for a reconciliation of adjusted EBITDA. Net debt does not include lease liabilities.
6Based on the closing price of $30.20 on June 30, 2021 and 145,529,572 shares outstanding. Debt does not include lease liabilities.
HEALTHCARE REALTY | 2Q 2021 SUPPLEMENTAL INFORMATION 13 | ||||
| Acquisition & Disposition Activity | ||
| DOLLARS IN THOUSANDS | ||
| ACQUISITION ACTIVITY | ||||||||||||||||||||||||||
| MARKET | MILES TO CAMPUS | ASSOCIATED HEALTH SYSTEM/TENANCY | CLOSING | SQUARE FEET | LEASED % | PURCHASE PRICE 1 | % OWNERSHIP | |||||||||||||||||||
San Diego, CA 2 | 0.02 | Scripps Health/UCSD | 1/7/2021 | 22,461 | 100 | % | $17,150 | 100 | % | |||||||||||||||||
Dallas, TX 3 | 0.00 | Baylor Scott & White Health | 2/1/2021 | 121,709 | 66 | % | 22,515 | 100 | % | |||||||||||||||||
Atlanta, GA 3 | 0.00/0.19 | Wellstar Health System | 2/17/2021 | 44,567 | 88 | % | 9,800 | 100 | % | |||||||||||||||||
| Washington, D.C. | 0.09 | Sentara Healthcare | 3/3/2021 | 26,496 | 100 | % | 12,750 | 100 | % | |||||||||||||||||
| Denver, CO | 0.60 | HCA | 3/30/2021 | 59,359 | 91 | % | 14,375 | 50 | % | |||||||||||||||||
| Colorado Springs, CO | 4.70 | None | 4/1/2021 | 27,510 | 100 | % | 7,200 | 50 | % | |||||||||||||||||
| Los Angeles, CA | 0.00 | MemorialCare Health System | 4/8/2021 | 57,573 | 80 | % | 31,335 | 50 | % | |||||||||||||||||
| San Antonio, TX | 0.90 | CHRISTUS Health/Baptist Health | 4/30/2021 | 45,000 | 100 | % | 13,600 | 50 | % | |||||||||||||||||
| Los Angeles, CA | 0.00 | MemorialCare Health System | 5/10/2021 | 73,078 | 82 | % | 24,600 | 50 | % | |||||||||||||||||
| Houston, TX | 0.03 | Houston Methodist | 5/14/2021 | 45,393 | 96 | % | 13,500 | 100 | % | |||||||||||||||||
San Diego, CA 4 | 0.00 | Palomar Health | 5/28/2021 | 160,394 | 100 | % | 102,650 | 100 | % | |||||||||||||||||
| Greensboro, NC | 0.60 | Cone Health | 6/28/2021 | 25,168 | 100 | % | 9,390 | 100 | % | |||||||||||||||||
| Baltimore, MD | 1.50 | University of Maryland Health | 6/29/2021 | 33,316 | 100 | % | 14,600 | 100 | % | |||||||||||||||||
Denver, CO 5 | 0.00 | Centura Health (AdventHealth) | 7/16/2021 | 259,555 | 80 | % | 70,426 | 100 | % | |||||||||||||||||
Greensboro, NC 2 | 0.18 | Cone Health | 7/19/2021 | 18,119 | 100 | % | 6,400 | 100 | % | |||||||||||||||||
| Colorado Springs, CO | 0.00 | Centura Health (CommonSpirit) | 7/27/2021 | 69,526 | 100 | % | 33,400 | 100 | % | |||||||||||||||||
Colorado Springs, CO 6 | 1.90 | Centura Health (CommonSpirit) | 7/27/2021 | 23,956 | 100 | % | 9,133 | 50 | % | |||||||||||||||||
| YTD total | 1,113,180 | 88 | % | $412,824 | ||||||||||||||||||||||
| JV Contribution | (50,122) | |||||||||||||||||||||||||
| YTD total, net | $362,702 | |||||||||||||||||||||||||
Average cap rate for YTD total 7 | 5.3 | % | ||||||||||||||||||||||||
| DISPOSITION ACTIVITY | ||||||||||||||||||||||||||
| LOCATION | TYPE 8 | MILES TO CAMPUS | ASSOCIATED HEALTH SYSTEM | CLOSING | SQUARE FEET | LEASED % | SALES PRICE | |||||||||||||||||||
Los Angeles, CA 9 | MOB | 0.00 | Valley Presbyterian Hospital | 3/11/2021 | 73,906 | 84 | % | $26,000 | ||||||||||||||||||
| Atlanta, GA | MOB | 13.00 | Piedmont Healthcare | 4/12/2021 | 19,732 | 100 | % | 8,050 | ||||||||||||||||||
| Richmond, VA | MOB | 0.00 | Bon Secours Health System | 5/18/2021 | 142,856 | 63 | % | 52,000 | ||||||||||||||||||
Gadsden, AL 5 | MOB | 0.00 | Community Health Systems | 5/19/2021 | 120,192 | 58 | % | 5,500 | ||||||||||||||||||
Dallas, TX 10 | MOB | 0.00 | US Dept of Veteran Affairs | 7/9/2021 | 190,160 | 44 | % | 23,000 | ||||||||||||||||||
| YTD total | 546,846 | 59 | % | $114,550 | ||||||||||||||||||||||
Average cap rate for YTD total 11 | 4.1 | % | ||||||||||||||||||||||||
1Includes joint venture acquisitions at full acquisition price.
2Represents a single-tenant property.
3Includes two properties.
4In 2Q 2021, the Company acquired a single-tenant net lease property in San Diego, CA in a sale leaseback transaction which was accounted for as a financing arrangement as required under ASC 842, Leases.
5Includes three properties.
6Includes purchase of adjoining 3.0 acre land parcel.
7For acquisitions, cap rate represents the forecasted first year NOI divided by purchase price. Does not include fees earned related to the unconsolidated joint venture.
8MOB = medical office building
9Includes two properties sold to a single purchaser in two transactions which closed on March 5 and March 11, 2021.
10Includes four properties and a land parcel sold under a single purchase agreement.
11For dispositions, cap rate represents the in-place cash NOI divided by sales price.
HEALTHCARE REALTY | 2Q 2021 SUPPLEMENTAL INFORMATION 14 | ||||
| Re/Development Activity | ||
| DOLLARS IN THOUSANDS | ||
| UNDER RE/DEVELOPMENT | |||||||||||||||||||||||||||||||||||
| EXPECTED NOI TIMING | |||||||||||||||||||||||||||||||||||
| MARKET | ASSOCIATED HEALTH SYSTEM | MILES TO CAMPUS | STATUS 1 | SQUARE FEET | BUDGET | REMAINING FUNDINGS | CURRENT LEASED % | EXPECTED QTR NOI AT CURRENT LEASED % | INITIAL LEASE(S) | CURRENT LEASED % | |||||||||||||||||||||||||
Memphis 2 | Baptist Memorial | 0.26 | TI | 110,883 | $30,200 | $2,133 | 97 | % | $560 | 1Q 2021 | 1Q 2022 | ||||||||||||||||||||||||
Dallas 3 | Baylor Scott & White | 0.00 | UC | 110,860 | 16,900 | 16,377 | 47 | % | 30 | 1Q 2022 | 2Q 2022 | ||||||||||||||||||||||||
Tacoma 4 | MultiCare Health | 0.10 | UC | 23,000 | 12,400 | 11,138 | 100 | % | 190 | 2Q 2022 | 3Q 2022 | ||||||||||||||||||||||||
Nashville 5 | Ascension Health | 0.00 | PC | 106,194 | 44,000 | 43,320 | 50 | % | 185 | 2Q 2023 | 3Q 2023 | ||||||||||||||||||||||||
| Total | 350,937 | $103,500 | $72,968 | 67 | % | $965 | |||||||||||||||||||||||||||||
| Projected average stabilized yield | 6.8 | % | |||||||||||||||||||||||||||||||||
| HISTORICAL INVESTMENT ACTIVITY | ||||||||||||||||||||||||||
ACQUISITIONS 6 | RE/DEVELOPMENT FUNDING | TOTAL INVESTMENTS | DISPOSITIONS | NET INVESTMENTS | ||||||||||||||||||||||
| 2017 | $327,167 | $32,305 | $359,472 | $122,700 | $236,772 | |||||||||||||||||||||
| 2018 | 111,450 | 35,567 | 147,017 | 98,691 | 48,326 | |||||||||||||||||||||
| 2019 | 381,314 | 28,584 | 409,898 | 54,860 | 355,038 | |||||||||||||||||||||
| 2020 | 546,853 | 26,493 | 573,346 | 249,443 | 323,903 | |||||||||||||||||||||
| YTD 2021 | 412,824 | 15,054 | 427,878 | 114,550 | 313,328 | |||||||||||||||||||||
| Average (2017-2020) | $341,696 | $30,737 | $372,433 | $131,424 | $241,009 | |||||||||||||||||||||
| % of Total | 91.7 | % | 8.3 | % | 100.0 | % | ||||||||||||||||||||
1TI = completing tenant build outs; UC = under construction; PC = pre-construction
2The project includes the acquisition of a 110,883 square foot medical office building for $8.7 million and redevelopment costs related to the property.
3The project includes the redevelopment of a 110,860 square foot fitness center located in a 217,114 square foot medical office building. The current fitness center lease will be reduced to 51,740 square foot when the tenant commences operations, which is expected to occur in Q1 2022.
4Redevelopment project is a 23,000 square foot expansion to an existing medical office building. When complete, the building will be approximately 56,000 square feet.
5Includes a non-cash $5.0 million allocation for the to-be demolished existing building.
6Includes joint venture acquisitions on the full acquisition price and was not adjusted for the Company's ownership percentage.
HEALTHCARE REALTY | 2Q 2021 SUPPLEMENTAL INFORMATION 15 | ||||
Portfolio 1, 2 | ||
| DOLLARS IN THOUSANDS | ||
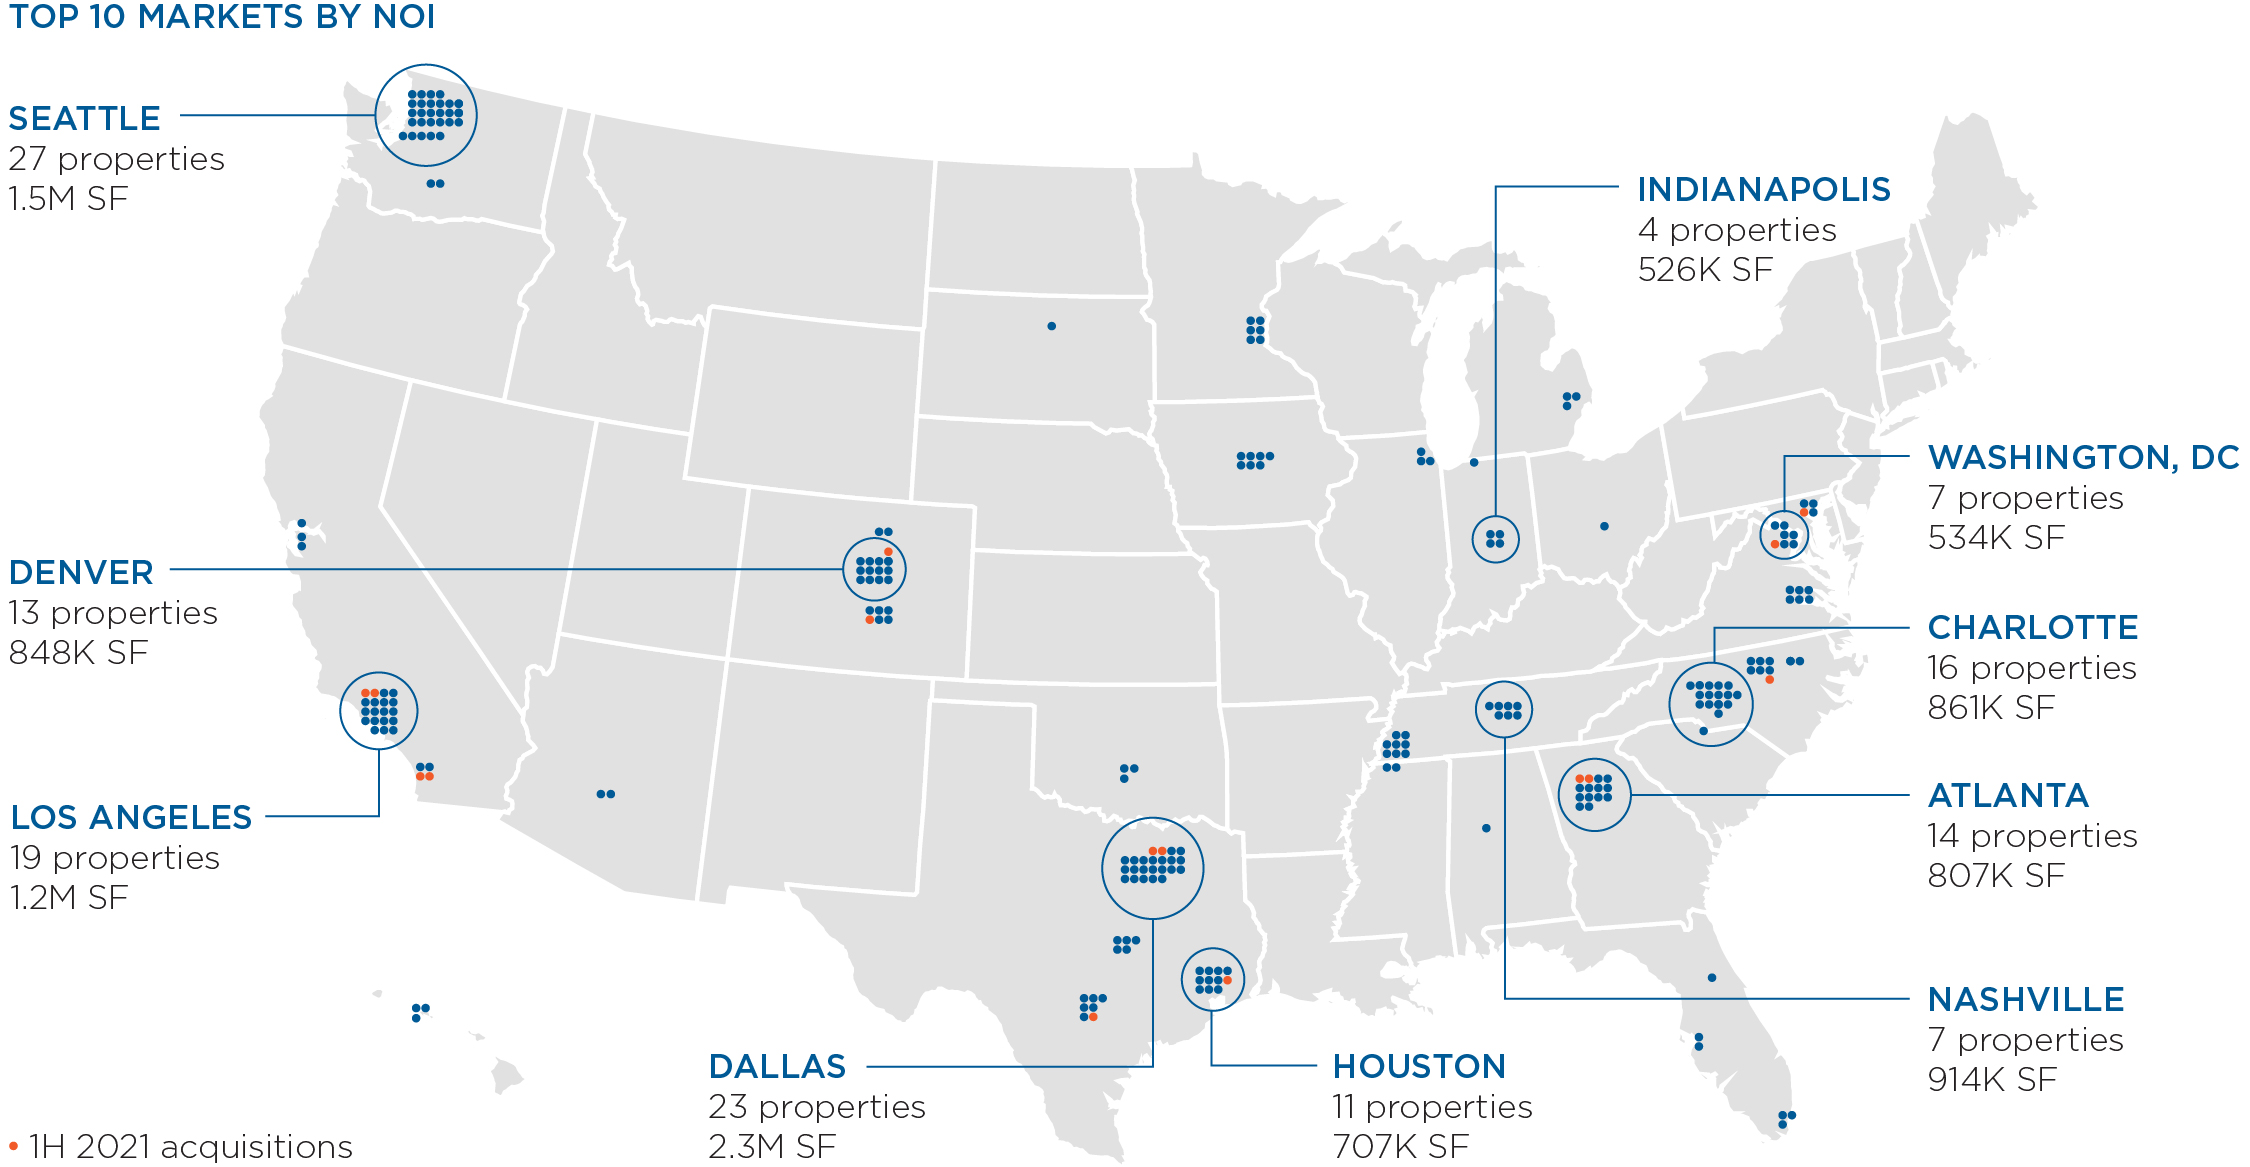
| MARKETS | ||||||||||||||||||||||||||||||||||||||||||||
| SQUARE FEET | ||||||||||||||||||||||||||||||||||||||||||||
| MOB 95.4% | NON-MOB 4.6% | |||||||||||||||||||||||||||||||||||||||||||
| MARKET | MSA RANK | INVESTMENT 1 | COUNT | CONSOLIDATED | JOINT VENTURE | INPATIENT/SURGICAL | OFFICE | TOTAL | % OF NOI | CUMULATIVE % OF NOI | ||||||||||||||||||||||||||||||||||
| Seattle, WA | 15 | 669,441 | 27 | 1,545,539 | 1,545,539 | 14.1 | % | 14.1 | % | |||||||||||||||||||||||||||||||||||
| Dallas, TX | 4 | 521,773 | 23 | 2,004,747 | 156,245 | 145,365 | 2,306,357 | 12.1 | % | 26.2 | % | |||||||||||||||||||||||||||||||||
| Los Angeles, CA | 2 | 408,769 | 19 | 796,914 | 315,314 | 63,000 | 1,175,228 | 7.9 | % | 34.1 | % | |||||||||||||||||||||||||||||||||
| Charlotte, NC | 22 | 183,244 | 16 | 860,735 | 860,735 | 5.8 | % | 39.9 | % | |||||||||||||||||||||||||||||||||||
| Atlanta, GA | 9 | 312,742 | 14 | 806,757 | 806,757 | 4.8 | % | 44.7 | % | |||||||||||||||||||||||||||||||||||
| Denver, CO | 19 | 202,507 | 13 | 694,362 | 59,359 | 93,869 | 847,590 | 4.5 | % | 49.2 | % | |||||||||||||||||||||||||||||||||
| Houston, TX | 5 | 177,035 | 11 | 649,388 | 57,170 | 706,558 | 3.8 | % | 53.0 | % | ||||||||||||||||||||||||||||||||||
| Washington, DC | 6 | 162,803 | 7 | 533,832 | 533,832 | 3.7 | % | 56.7 | % | |||||||||||||||||||||||||||||||||||
| Nashville, TN | 36 | 224,588 | 7 | 805,259 | 108,691 | 913,950 | 3.7 | % | 60.4 | % | ||||||||||||||||||||||||||||||||||
| Indianapolis, IN | 33 | 120,792 | 4 | 526,194 | 526,194 | 3.3 | % | 63.7 | % | |||||||||||||||||||||||||||||||||||
| Des Moines, IA | 82 | 139,108 | 7 | 379,955 | 152,655 | 532,610 | 3.2 | % | 66.9 | % | ||||||||||||||||||||||||||||||||||
| Memphis, TN | 43 | 165,460 | 10 | 802,221 | 802,221 | 3.1 | % | 70.0 | % | |||||||||||||||||||||||||||||||||||
| Honolulu, HI | 56 | 145,212 | 3 | 298,427 | 298,427 | 3.0 | % | 73.0 | % | |||||||||||||||||||||||||||||||||||
| Austin, TX | 29 | 109,035 | 5 | 374,886 | 374,886 | 2.7 | % | 75.7 | % | |||||||||||||||||||||||||||||||||||
| Richmond, VA | 44 | 108,949 | 6 | 405,945 | 405,945 | 2.5 | % | 78.2 | % | |||||||||||||||||||||||||||||||||||
| San Francisco, CA | 12 | 121,810 | 3 | 286,270 | 286,270 | 2.5 | % | 80.7 | % | |||||||||||||||||||||||||||||||||||
| San Antonio, TX | 24 | 103,153 | 7 | 473,673 | 45,000 | 518,673 | 2.0 | % | 82.7 | % | ||||||||||||||||||||||||||||||||||
| Co Springs, CO | 78 | 78,343 | 6 | 312,154 | 27,510 | 339,664 | 1.9 | % | 84.6 | % | ||||||||||||||||||||||||||||||||||
| Chicago, IL | 3 | 90,695 | 3 | 352,800 | 352,800 | 1.9 | % | 86.5 | % | |||||||||||||||||||||||||||||||||||
| Minneapolis, MN | 16 | 79,184 | 3 | 207,508 | 140,733 | 348,241 | 1.6 | % | 88.1 | % | ||||||||||||||||||||||||||||||||||
| Other (16 markets) | 729,293 | 42 | 2,446,419 | 2,446,419 | 11.9 | % | 100.0 | % | ||||||||||||||||||||||||||||||||||||
| Total | $4,853,936 | 236 | 15,563,985 | 587,916 | 219,245 | 557,750 | 16,928,896 | 100.0 | % | |||||||||||||||||||||||||||||||||||
| Number of properties | 220 | 9 | 2 | 5 | 236 | |||||||||||||||||||||||||||||||||||||||
| % of square feet | 91.9 | % | 3.5 | % | 1.3 | % | 3.3 | % | 100.0 | % | ||||||||||||||||||||||||||||||||||
| % multi-tenant | 95.0 | % | 100.0 | % | — | % | 100.0 | % | 94.1 | % | ||||||||||||||||||||||||||||||||||
Investment 1 | $4,479,242 | $118,518 | $111,152 | $145,024 | $4,853,936 | |||||||||||||||||||||||||||||||||||||||
Quarterly cash NOI 1 | $73,974 | $1,035 | $3,095 | $1,321 | $79,425 | |||||||||||||||||||||||||||||||||||||||
| % of cash NOI | 93.1 | % | 1.3 | % | 3.9 | % | 1.7 | % | 100.0 | % | ||||||||||||||||||||||||||||||||||
| BY BUILDING TYPE | ||||||||||||||
| CONSOLIDATED | ||||||||||||||
| MULTI-TENANT | SINGLE-TENANT | JOINT VENTURE | TOTAL | |||||||||||
| Number of properties | 213 | 14 | 9 | 236 | ||||||||||
| Square feet | 15,345,618 | 995,362 | 587,916 | 16,928,896 | ||||||||||
| % of square feet | 90.6 | % | 5.9 | % | 3.5 | % | 100.0 | % | ||||||
Investment 1 | $4,351,159 | $384,259 | $118,518 | $4,853,936 | ||||||||||
Quarterly cash NOI 1 | $71,419 | $6,971 | $1,035 | $79,425 | ||||||||||
| % of cash NOI | 89.9 | % | 8.8 | % | 1.3 | % | 100.0 | % | ||||||
1Gross investment and quarterly cash NOI are reflected at the Company's ownership percentage.
2Excludes assets held for sale, land held for development, construction in progress and corporate property.
HEALTHCARE REALTY | 2Q 2021 SUPPLEMENTAL INFORMATION 16 | ||||
Associated Health Systems 1,2 | ||
| MOB PORTFOLIO (BY SQUARE FEET) | ||||||||||||||||||||||||||
SYSTEM RANK 3 | CREDIT RATING | ON/ADJACENT | OFF CAMPUS | % OF NOI | ||||||||||||||||||||||
| HEALTH SYSTEM | ON | ADJACENT 4 | ANCHORED 5 | <= 2 MILES 6 | TOTAL | |||||||||||||||||||||
| Baylor Scott & White Health | 21 | AA-/Aa3 | 1,765,805 | 280,941 | 163,188 | — | 2,209,934 | 13.9 | % | |||||||||||||||||
| CommonSpirit Health | 4 | BBB+/Baa1 | 807,182 | 311,310 | 95,486 | 205,840 | 1,419,818 | 8.7 | % | |||||||||||||||||
| Ascension Health | 3 | AA+/Aa2 | 1,080,681 | 194,617 | — | — | 1,275,298 | 6.0 | % | |||||||||||||||||
| Atrium Health | 16 | AA-/Aa3 | 393,815 | 98,066 | 313,513 | — | 805,394 | 5.5 | % | |||||||||||||||||
| UW Medicine (Seattle) | 91 | AA+/Aaa | 345,567 | 102,540 | 44,166 | 125,543 | 617,816 | 5.3 | % | |||||||||||||||||
| Tenet Healthcare | 6 | B/B2 | 570,264 | 67,790 | — | 135,270 | 773,324 | 4.4 | % | |||||||||||||||||
| Wellstar Health System | 75 | A/A2 | 492,221 | 141,169 | — | — | 633,390 | 3.9 | % | |||||||||||||||||
| Providence St. Joseph Health | 5 | AA-/Aa3 | 176,854 | 153,433 | — | 31,601 | 361,888 | 3.3 | % | |||||||||||||||||
| Indiana University Health | 26 | AA/Aa2 | 423,628 | 102,566 | — | — | 526,194 | 3.3 | % | |||||||||||||||||
| Hawaii Pacific Health | 181 | --/A1 | 173,502 | — | — | 124,925 | 298,427 | 3.0 | % | |||||||||||||||||
| UCHealth | 46 | AA/Aa3 | 150,291 | 298,093 | 33,850 | — | 482,234 | 2.9 | % | |||||||||||||||||
| Overlake Health System | 291 | A/A2 | 191,051 | 39,659 | — | — | 230,710 | 2.7 | % | |||||||||||||||||
| Bon Secours Mercy Health | 22 | A+/A1 | 405,945 | — | — | — | 405,945 | 2.5 | % | |||||||||||||||||
| HCA | 1 | BB+/Baa3 | 151,340 | 167,017 | 78,305 | 59,359 | 456,021 | 2.5 | % | |||||||||||||||||
| Baptist Memorial Health Care | 89 | BBB+/-- | 464,498 | — | 150,228 | — | 614,726 | 2.5 | % | |||||||||||||||||
| Medstar Health | 45 | A/A2 | 241,739 | — | — | — | 241,739 | 2.0 | % | |||||||||||||||||
| MultiCare Health System | 82 | AA-/Aa3 | 154,452 | 84,348 | — | — | 238,800 | 1.8 | % | |||||||||||||||||
| Inova Health System | 70 | AA+/Aa2 | 262,121 | — | — | — | 262,121 | 1.8 | % | |||||||||||||||||
| Trinity Health | 7 | AA-/Aa3 | 267,952 | 73,331 | — | — | 341,283 | 1.7 | % | |||||||||||||||||
| Memorial Hermann | 39 | A+/A1 | — | 246,325 | — | — | 246,325 | 1.6 | % | |||||||||||||||||
| Huntington Memorial Hospital | 273 | A-/-- | — | 165,419 | — | — | 165,419 | 1.5 | % | |||||||||||||||||
| Other (29 credit rated systems) | 1,484,545 | 1,385,434 | 197,125 | 262,038 | 3,329,142 | 16.4 | % | |||||||||||||||||||
Subtotal - credit rated7 | 10,003,453 | 3,912,058 | 1,075,861 | 944,576 | 15,935,948 | 97.2 | % | |||||||||||||||||||
Other non-credit rated 8 | 28,649 | — | — | — | 28,649 | 0.1 | % | |||||||||||||||||||
Other non-associated 9 | — | — | — | 187,304 | 187,304 | 2.7 | % | |||||||||||||||||||
| Total | 10,032,102 | 3,912,058 | 1,075,861 | 1,131,880 | 16,151,901 | 100.0 | % | |||||||||||||||||||
| % of total | 62.1 | % | 24.2 | % | 6.7 | % | 7.0 | % | ||||||||||||||||||
1Includes joint venture properties at total square feet. Excludes construction in progress and assets classified as held for sale.
2Includes buildings located on-campus, adjacent and off-campus that are anchored by healthcare systems or located within two miles of a hospital campus.
3Ranked by revenue based on Modern Healthcare's Healthcare Systems Financials Database.
4The Company defines an adjacent property as being no more than 0.25 miles from a hospital campus.
5Includes off campus buildings where health systems lease 40% or more of the property.
6Consistent with the methodology used on the MOB Portfolio Comparison page in the Company's Investor Presentation; assumes that any off campus building within two miles from a hospital campus is associated with that health system.
7Based on square footage, 93.3% is associated with an investment-grade rated healthcare provider.
8Includes one property associated with a hospital system that is not credit rated.
9Includes off campus buildings that are not anchored by a health system and are more than two miles from a hospital campus.
HEALTHCARE REALTY | 2Q 2021 SUPPLEMENTAL INFORMATION 17 | ||||
Top Tenants 1 | ||
| TENANT | SYSTEM RANK 2 | CREDIT RATING | # OF ASSOCIATED PROPERTIES | # OF LEASES | LEASED SQUARE FEET | % OF TOTAL LEASED | % OF TTM REVENUE | |||||||||||||||||||||||||||||||
| Baylor Scott & White Health | 21 | AA-/Aa3 | 23 | 139 | 1,066,405 | 7.2 | % | 7.9 | % | |||||||||||||||||||||||||||||
| Atrium Health | 16 | AA-/Aa3 | 17 | 72 | 651,768 | 4.4 | % | 4.0 | % | |||||||||||||||||||||||||||||
| CommonSpirit Health | 4 | BBB+/Baa1 | 17 | 74 | 568,337 | 3.9 | % | 3.8 | % | |||||||||||||||||||||||||||||
| Indiana University Health | 26 | AA/Aa2 | 4 | 62 | 437,462 | 3.0 | % | 2.7 | % | |||||||||||||||||||||||||||||
| Ascension Health | 3 | AA+/Aa2 | 11 | 64 | 382,571 | 2.6 | % | 2.6 | % | |||||||||||||||||||||||||||||
| UW Medicine (Seattle) | 91 | AA+/Aaa | 9 | 28 | 236,170 | 1.6 | % | 2.4 | % | |||||||||||||||||||||||||||||
| WellStar Health System | 75 | A/A2 | 11 | 57 | 379,696 | 2.6 | % | 2.3 | % | |||||||||||||||||||||||||||||
| Baptist Memorial Health Care | 89 | BBB+/-- | 8 | 50 | 318,134 | 2.2 | % | 1.7 | % | |||||||||||||||||||||||||||||
| UCHealth | 46 | AA/Aa3 | 8 | 14 | 221,718 | 1.5 | % | 1.7 | % | |||||||||||||||||||||||||||||
| Proliance Surgeons | — | - | 7 | 18 | 146,539 | 1.0 | % | 1.6 | % | |||||||||||||||||||||||||||||
| Tenet Healthcare | 6 | B/B2 | 10 | 25 | 168,771 | 1.1 | % | 1.3 | % | |||||||||||||||||||||||||||||
| Bon Secours Mercy Health | 22 | A+/A1 | 6 | 40 | 190,712 | 1.3 | % | 1.2 | % | |||||||||||||||||||||||||||||
| Medstar Health | 45 | A/A2 | 3 | 54 | 153,353 | 1.0 | % | 1.2 | % | |||||||||||||||||||||||||||||
| Trinity Health | 7 | AA-/Aa3 | 3 | 32 | 165,250 | 1.1 | % | 1.1 | % | |||||||||||||||||||||||||||||
| Providence St. Joseph Health | 5 | AA-/Aa3 | 7 | 23 | 101,590 | 0.7 | % | 1.0 | % | |||||||||||||||||||||||||||||
| MultiCare Health System | 82 | AA-/Aa3 | 5 | 18 | 150,201 | 1.0 | % | 1.0 | % | |||||||||||||||||||||||||||||
| Eating Recovery Center | — | - | 4 | 6 | 100,946 | 0.7 | % | 0.9 | % | |||||||||||||||||||||||||||||
| Hawaii Pacific Health | 181 | --/A1 | 3 | 35 | 91,247 | 0.6 | % | 0.8 | % | |||||||||||||||||||||||||||||
USPI 3 | — | - | 5 | 10 | 109,113 | 0.7 | % | 0.8 | % | |||||||||||||||||||||||||||||
| DaVita | — | BB/Ba2 | 11 | 13 | 101,160 | 0.7 | % | 0.8 | % | |||||||||||||||||||||||||||||
| Kaiser Permanente | 2 | AA-/-- | 4 | 10 | 101,830 | 0.7 | % | 0.8 | % | |||||||||||||||||||||||||||||
| Labcorp of America | — | BBB/Baa2 | 22 | 24 | 178,541 | 1.2 | % | 0.7 | % | |||||||||||||||||||||||||||||
| Inova Health | 70 | AA+/Aa2 | 4 | 10 | 92,436 | 0.6 | % | 0.7 | % | |||||||||||||||||||||||||||||
| Overlake Health System | 291 | A/A2 | 2 | 8 | 73,676 | 0.5 | % | 0.7 | % | |||||||||||||||||||||||||||||
| HCA | 1 | BB+/Baa3 | 7 | 15 | 88,072 | 0.6 | % | 0.7 | % | |||||||||||||||||||||||||||||
| Memorial Hermann | 39 | A+/A1 | 2 | 2 | 99,874 | 0.7 | % | 0.7 | % | |||||||||||||||||||||||||||||
| Allina Health | 57 | AA-/Aa3 | 3 | 14 | 94,599 | 0.6 | % | 0.5 | % | |||||||||||||||||||||||||||||
| Advocate Health Care | 14 | AA/Aa3 | 2 | 9 | 58,166 | 0.4 | % | 0.5 | % | |||||||||||||||||||||||||||||
| Government Services Assoc | — | AA+/Aaa | 4 | 7 | 127,651 | 0.9 | % | 0.5 | % | |||||||||||||||||||||||||||||
| Univ. of MD Medical Center | 61 | A/A2 | 2 | 10 | 75,495 | 0.5 | % | 0.5 | % | |||||||||||||||||||||||||||||
| Top 30 tenants | 943 | 6,731,483 | 45.6 | % | 47.1 | % | ||||||||||||||||||||||||||||||||
Total investment-grade tenants 4 | 960 | 6,889,339 | 46.8 | % | 44.8 | % | ||||||||||||||||||||||||||||||||
1Includes joint venture properties and excludes construction in progress and assets classified as held for sale.
2Ranked by revenue based on Modern Healthcare's Healthcare Systems Financials Database.
3As of June 30, 2021, USPI is approximately 95% owned by Tenet Health.
4Includes affiliates of investment grade tenants.
HEALTHCARE REALTY | 2Q 2021 SUPPLEMENTAL INFORMATION 18 | ||||
MOB Proximity to Hospital 1, 2 | ||
| MEDICAL OFFICE BUILDINGS BY LOCATION | ||||||||||||||||||||
| CONSOLIDATED | JOINT VENTURE | TOTAL | ||||||||||||||||||
| On campus | 62.2 | % | 61.0 | % | 62.1 | % | ||||||||||||||
Adjacent to campus 3 | 25.1 | % | — | % | 24.2 | % | ||||||||||||||
| Total on/adjacent | 87.3 | % | 61.0 | % | 86.3 | % | ||||||||||||||
Off campus - anchored by health system 4 | 6.6 | % | 7.7 | % | 6.7 | % | ||||||||||||||
| Off campus | 6.1 | % | 31.3 | % | 7.0 | % | ||||||||||||||
| 100.0 | % | 100.0 | % | 100.0 | % | |||||||||||||||
| Square feet | 15,563,985 | 587,916 | 16,151,901 | |||||||||||||||||
| % of total | 96.4 | % | 3.6 | % | 100.0 | % | ||||||||||||||
| DISTANCE TO HOSPITAL CAMPUS | ||||||||||||||||||||||||||||||||
| GROUND LEASE PROPERTIES | ||||||||||||||||||||||||||||||||
| GREATER THAN | LESS THAN OR EQUAL TO | CAMPUS PROXIMITY | # OF PROPERTIES | SQUARE FEET | % OF TOTAL | CUMULATIVE % | # OF PROPERTIES | SQUARE FEET | % OF TOTAL | |||||||||||||||||||||||
| 0.00 | On campus | 122 | 10,032,102 | 62.1 | % | 62.1 | % | 88 | 7,734,210 | 89.4 | % | |||||||||||||||||||||
| 0.00 | 250 yards | Adjacent 3 | 45 | 2,419,594 | 15.0 | % | 77.1 | % | 2 | 128,717 | 1.5 | % | ||||||||||||||||||||
| 250 yards | 0.25 miles | 28 | 1,492,464 | 9.2 | % | 86.3 | % | 4 | 120,036 | 1.4 | % | |||||||||||||||||||||
| 0.25 miles | 0.50 | Off campus | 5 | 397,701 | 2.5 | % | 88.8 | % | 1 | 124,925 | 1.4 | % | ||||||||||||||||||||
| 0.50 | 1.00 | 6 | 545,670 | 3.4 | % | 92.2 | % | — | — | — | % | |||||||||||||||||||||
| 1.00 | 2.00 | 8 | 472,451 | 2.9 | % | 95.1 | % | 4 | 319,446 | 3.7 | % | |||||||||||||||||||||
| 2.00 | 5.00 | 10 | 473,577 | 2.9 | % | 98.0 | % | 1 | 13,818 | 0.2 | % | |||||||||||||||||||||
| 5.00 | 10.00 | 3 | 205,631 | 1.3 | % | 99.3 | % | 3 | 205,631 | 2.4 | % | |||||||||||||||||||||
| 10.00 | 2 | 112,711 | 0.7 | % | 100.0 | % | — | — | — | % | ||||||||||||||||||||||
| Total | 229 | 16,151,901 | 100.0 | % | 103 | 8,646,783 | 100.0 | % | ||||||||||||||||||||||||
1Includes joint venture properties and excludes construction in progress and assets classified as held for sale.
2Proximity to hospital campus includes acute care hospitals with inpatient beds. The Company does not consider inpatient rehab hospitals (IRFs), skilled nursing facilities (SNFs) or long-term acute care hospitals (LTACHs) to be hospital campuses for distance calculations.
3The Company defines an adjacent property as being no more than 0.25 miles from a hospital campus.
4Includes buildings where health systems lease 40% or more of the property.
HEALTHCARE REALTY | 2Q 2021 SUPPLEMENTAL INFORMATION 19 | ||||
Lease Maturity, Lease & Building Size 1 | ||
| LEASE MATURITY SCHEDULE | ||||||||||||||||||||||||||||||||
| MULTI-TENANT | SINGLE-TENANT | TOTAL | ||||||||||||||||||||||||||||||
| # OF LEASES | SQUARE FEET | % OF SQUARE FEET | # OF LEASES | SQUARE FEET | % OF SQUARE FEET | # OF LEASES | SQUARE FEET | % OF TOTAL SQUARE FEET | % OF BASE REVENUE 2 | |||||||||||||||||||||||
| 2021 | 395 | 1,233,675 | 9.0 | % | — | — | — | % | 395 | 1,233,675 | 8.4 | % | 7.9 | % | ||||||||||||||||||
| 2022 | 627 | 2,028,142 | 14.8 | % | 1 | 58,285 | 5.8 | % | 628 | 2,086,427 | 14.2 | % | 14.8 | % | ||||||||||||||||||
| 2023 | 502 | 2,035,288 | 14.8 | % | — | — | — | % | 502 | 2,035,288 | 13.8 | % | 14.2 | % | ||||||||||||||||||
| 2024 | 542 | 2,378,152 | 17.3 | % | 1 | 63,000 | 6.3 | % | 543 | 2,441,152 | 16.6 | % | 16.1 | % | ||||||||||||||||||
| 2025 | 412 | 1,869,110 | 13.6 | % | 3 | 114,022 | 11.5 | % | 415 | 1,983,132 | 13.5 | % | 13.1 | % | ||||||||||||||||||
| 2026 | 249 | 914,494 | 6.7 | % | 1 | 83,318 | 8.4 | % | 250 | 997,812 | 6.8 | % | 6.5 | % | ||||||||||||||||||
| 2027 | 135 | 634,691 | 4.6 | % | 1 | 156,245 | 15.7 | % | 136 | 790,936 | 5.4 | % | 6.5 | % | ||||||||||||||||||
| 2028 | 148 | 803,080 | 5.9 | % | 1 | 35,419 | 3.6 | % | 149 | 838,499 | 5.7 | % | 5.6 | % | ||||||||||||||||||
| 2029 | 115 | 659,703 | 4.8 | % | 3 | 165,342 | 16.6 | % | 118 | 825,045 | 5.6 | % | 5.7 | % | ||||||||||||||||||
| 2030 | 107 | 443,697 | 3.2 | % | 1 | 138,028 | 13.8 | % | 108 | 581,725 | 3.9 | % | 3.4 | % | ||||||||||||||||||
| Thereafter | 138 | 722,440 | 5.3 | % | 2 | 181,703 | 18.3 | % | 140 | 904,143 | 6.1 | % | 6.2 | % | ||||||||||||||||||
| Total leased | 3,370 | 13,722,472 | 86.1 | % | 14 | 995,362 | 100.0 | % | 3,384 | 14,717,834 | 86.9 | % | 100.0 | % | ||||||||||||||||||
| Total building | 15,933,534 | 100.0 | % | 995,362 | 100.0 | % | 16,928,896 | 100.0 | % | |||||||||||||||||||||||
WALTR (months) 3 | 44.6 | 89.1 | 47.6 | |||||||||||||||||||||||||||||
WALT (months) 3 | 85.4 | 155.2 | 90.1 | |||||||||||||||||||||||||||||
| # OF LEASES BY SIZE | BY BUILDING SIZE | |||||||||||||||||||||||||
| LEASED SQUARE FEET | MULTI-TENANT 4 | SINGLE-TENANT | BUILDING SQUARE FEET | % OF TOTAL | TOTAL SQUARE FOOTAGE | AVERAGE SQUARE FEET | # OF PROPERTIES | |||||||||||||||||||
| 0 - 2,500 | 1,802 | — | >100,000 | 39.1 | % | 6,615,703 | 143,820 | 46 | ||||||||||||||||||
| 2,501 - 5,000 | 824 | — | <100,000 and >75,000 | 25.0 | % | 4,231,604 | 86,359 | 49 | ||||||||||||||||||
| 5,001 - 7,500 | 279 | — | <75,000 and >50,000 | 17.4 | % | 2,951,822 | 62,805 | 47 | ||||||||||||||||||
| 7,501 - 10,000 | 159 | — | <50,000 and >25,000 | 16.1 | % | 2,726,066 | 38,395 | 71 | ||||||||||||||||||
| 10,001 + | 306 | 14 | <25,000 | 2.4 | % | 403,701 | 17,552 | 23 | ||||||||||||||||||
| Total Leases | 3,370 | 14 | Total | 100.0 | % | 16,928,896 | 71,733 | 236 | ||||||||||||||||||
1Includes joint venture properties and excludes land held for development, construction in progress, corporate property and assets classified as held for sale.
2Represents the current annualized minimum rents on in-place leases, excluding the impact of potential lease renewals and straight-line rent.
3WALTR = weighted average lease term remaining; WALT = weighted average lease term.
4The average lease size in the multi-tenant properties is 4,072 square feet.
HEALTHCARE REALTY | 2Q 2021 SUPPLEMENTAL INFORMATION 20 | ||||
Historical Occupancy 1 | ||
| DOLLARS IN THOUSANDS | ||
| SAME STORE PROPERTIES | ||||||||||||||||||||||||||||||||
| 2Q 2021 | 1Q 2021 | 4Q 2020 | 3Q 2020 | 2Q 2020 | 1Q 2020 | |||||||||||||||||||||||||||
| Multi-tenant | ||||||||||||||||||||||||||||||||
| Number of properties | 163 | 156 | 158 | 156 | 161 | 157 | ||||||||||||||||||||||||||
| Total building square feet | 12,510,863 | 12,190,136 | 12,167,287 | 11,984,473 | 12,519,841 | 12,243,069 | ||||||||||||||||||||||||||
| Period end % occupied | 87.5 | % | 87.9 | % | 87.6 | % | 87.6 | % | 87.7 | % | 87.9 | % | ||||||||||||||||||||
| Single-tenant | ||||||||||||||||||||||||||||||||
| Number of properties | 11 | 11 | 12 | 12 | 12 | 14 | ||||||||||||||||||||||||||
| Total building square feet | 791,198 | 791,198 | 810,930 | 810,930 | 810,930 | 1,196,930 | ||||||||||||||||||||||||||
| Period end % occupied | 100.0 | % | 100.0 | % | 100.0 | % | 100.0 | % | 100.0 | % | 100.0 | % | ||||||||||||||||||||
| Total same store properties | ||||||||||||||||||||||||||||||||
| Number of properties | 174 | 167 | 170 | 168 | 173 | 171 | ||||||||||||||||||||||||||
| Total building square feet | 13,302,061 | 12,981,334 | 12,978,217 | 12,795,403 | 13,330,771 | 13,439,999 | ||||||||||||||||||||||||||
| Period end % occupied | 88.3 | % | 88.6 | % | 88.4 | % | 88.4 | % | 88.4 | % | 89.0 | % | ||||||||||||||||||||
| PROPERTIES NOT IN SAME STORE | ||||||||||||||||||||||||||||||||
| 2Q 2021 | 1Q 2021 | 4Q 2020 | 3Q 2020 | 2Q 2020 | 1Q 2020 | |||||||||||||||||||||||||||
Acquisitions 2 | ||||||||||||||||||||||||||||||||
| Number of properties | 44 | 45 | 42 | 31 | 26 | 31 | ||||||||||||||||||||||||||
| Total building square feet | 2,062,568 | 2,091,663 | 2,178,267 | 1,667,990 | 1,455,265 | 1,826,029 | ||||||||||||||||||||||||||
| Period end % occupied | 91.8 | % | 89.8 | % | 89.2 | % | 91.4 | % | 89.2 | % | 86.9 | % | ||||||||||||||||||||
| Development completions | ||||||||||||||||||||||||||||||||
| Number of properties | 2 | 2 | 1 | 1 | 1 | 1 | ||||||||||||||||||||||||||
| Total building square feet | 261,914 | 261,914 | 151,031 | 151,031 | 151,031 | 151,031 | ||||||||||||||||||||||||||
| Period end % occupied | 64.5 | % | 64.5 | % | 60.5 | % | 60.5 | % | 60.5 | % | 20.2 | % | ||||||||||||||||||||
| % leased | 75.9 | % | 75.9 | % | 60.5 | % | 60.5 | % | 60.5 | % | 60.0 | % | ||||||||||||||||||||
Reposition 3 | ||||||||||||||||||||||||||||||||
| Number of properties | 7 | 9 | 10 | 11 | 10 | 9 | ||||||||||||||||||||||||||
| Total building square feet | 714,437 | 741,798 | 799,764 | 859,004 | 523,159 | 429,167 | ||||||||||||||||||||||||||
| Period end % occupied | 57.5 | % | 59.7 | % | 61.0 | % | 62.1 | % | 46.9 | % | 41.9 | % | ||||||||||||||||||||
| Joint Venture | ||||||||||||||||||||||||||||||||
| Number of properties | 9 | 5 | 4 | — | — | — | ||||||||||||||||||||||||||
| Total building square feet | 587,916 | 384,755 | 325,396 | — | — | — | ||||||||||||||||||||||||||
| Period end % occupied | 85.3 | % | 84.3 | % | 72.4 | % | — | % | — | % | — | % | ||||||||||||||||||||
| % leased | 85.3 | % | 84.3 | % | 87.4 | % | — | % | — | % | — | % | ||||||||||||||||||||
| TOTAL PROPERTIES | ||||||||||||||||||||||||||||||||
| 2Q 2021 | 1Q 2021 | 4Q 2020 | 3Q 2020 | 2Q 2020 | 1Q 2020 | |||||||||||||||||||||||||||
| Number of properties | 236 | 228 | 227 | 211 | 210 | 212 | ||||||||||||||||||||||||||
| Total building square feet | 16,928,896 | 16,461,464 | 16,432,675 | 15,473,428 | 15,460,226 | 15,846,226 | ||||||||||||||||||||||||||
| Period end % occupied | 86.9 | % | 87.0 | % | 86.6 | % | 87.0 | % | 86.8 | % | 86.8 | % | ||||||||||||||||||||
1Includes joint venture properties and excludes land held for development, construction in progress, corporate property and assets classified as held for sale.
2Acquisitions includes properties acquired within the last 8 quarters of the period presented and are excluded from same store.
3Reposition includes properties that meet any of the Company-defined criteria: properties having less than 60% occupancy that is expected to last at least two quarters; properties that experience a loss of occupancy over 30% in a single quarter; or properties with negative net operating income that is expected to last at least two quarters. In addition, the Company reclassified a property to reposition during third quarter of 2020 due to strategic reposition. This reclassification is described in more detail in Trends and Matters Impacting Operating Results of the Company's 2020 Form 10-K.
HEALTHCARE REALTY | 2Q 2021 SUPPLEMENTAL INFORMATION 21 | ||||
| Occupancy Reconciliation | ||
| SQUARE FEET | ||
| SEQUENTIAL | |||||||||||||||||||||||||||||
| PORTFOLIO | SAME STORE | ||||||||||||||||||||||||||||
| COUNT | OCCUPIED | TOTAL | % | COUNT | OCCUPIED | TOTAL | % | ||||||||||||||||||||||
| Beginning March 31, 2021 | 228 | 14,319,718 | 16,461,464 | 87.0 | % | 167 | 11,505,657 | 12,981,334 | 88.6 | % | |||||||||||||||||||
| Portfolio activity | |||||||||||||||||||||||||||||
Acquisitions 1 | 8 | 439,016 | 467,432 | 93.9 | % | NA | NA | NA | NA | ||||||||||||||||||||
| Re/development completions | — | — | — | — | % | — | — | — | — | % | |||||||||||||||||||
Dispositions 2 | — | — | — | — | % | — | — | — | — | % | |||||||||||||||||||
| Same store reclassifications | |||||||||||||||||||||||||||||
| Acquisitions | NA | NA | NA | NA | 5 | 263,440 | 293,366 | 89.8 | % | ||||||||||||||||||||
| Development completions | NA | NA | NA | NA | — | — | — | — | % | ||||||||||||||||||||
| Reposition to same store | NA | NA | NA | NA | 2 | 23,765 | 27,361 | 86.9 | % | ||||||||||||||||||||
| Reposition from same store | NA | NA | NA | NA | — | — | — | — | % | ||||||||||||||||||||
| 236 | 14,758,734 | 16,928,896 | 87.2 | % | 174 | 11,792,862 | 13,302,061 | 88.7 | % | ||||||||||||||||||||
| Leasing activity | |||||||||||||||||||||||||||||
| New leases/expansions | NA | 154,261 | NA | NA | NA | 115,734 | NA | NA | |||||||||||||||||||||
| Move-outs/contractions | NA | (195,161) | NA | NA | NA | (164,710) | NA | NA | |||||||||||||||||||||
| Net absorption | NA | (40,900) | NA | NA | NA | (48,976) | NA | NA | |||||||||||||||||||||
| Ending June 30, 2021 | 236 | 14,717,834 | 16,928,896 | 86.9 | % | 174 | 11,743,886 | 13,302,061 | 88.3 | % | |||||||||||||||||||
| YEAR-OVER-YEAR | |||||||||||||||||||||||||||||
| PORTFOLIO | SAME STORE | ||||||||||||||||||||||||||||
| COUNT | OCCUPIED | TOTAL | % | COUNT | OCCUPIED | TOTAL | % | ||||||||||||||||||||||
| Beginning June 30, 2020 | 210 | 13,423,187 | 15,460,226 | 86.8 | % | 173 | 11,788,219 | 13,330,771 | 88.4 | % | |||||||||||||||||||
| Portfolio activity | |||||||||||||||||||||||||||||
Acquisitions 1 | 37 | 1,684,764 | 1,931,080 | 87.2 | % | NA | NA | NA | NA | ||||||||||||||||||||
| Re/development completions | 1 | 77,508 | 110,883 | 69.9 | % | — | — | — | — | % | |||||||||||||||||||
Dispositions 2 | (12) | (374,992) | (573,293) | 65.4 | % | (9) | (311,890) | (407,716) | 76.5 | % | |||||||||||||||||||
| Same store reclassifications | |||||||||||||||||||||||||||||
| Acquisitions | NA | NA | NA | NA | 10 | 654,988 | 735,861 | 89.0 | % | ||||||||||||||||||||
| Development completions | NA | NA | NA | NA | — | — | — | — | % | ||||||||||||||||||||
| Reposition to same store | NA | NA | NA | NA | 3 | 62,325 | 86,601 | 72.0 | % | ||||||||||||||||||||
| Reposition from same store | NA | NA | NA | NA | (3) | (379,197) | (443,456) | 85.5 | % | ||||||||||||||||||||
| 236 | 14,810,467 | 16,928,896 | 87.5 | % | 174 | 11,814,445 | 13,302,061 | 88.8 | % | ||||||||||||||||||||
| Leasing activity | |||||||||||||||||||||||||||||
| New leases/expansions | NA | 616,800 | NA | NA | NA | 441,704 | NA | NA | |||||||||||||||||||||
| Move-outs/contractions | NA | (709,433) | NA | NA | NA | (512,263) | NA | NA | |||||||||||||||||||||
| Net absorption | NA | (92,633) | NA | NA | NA | (70,559) | NA | NA | |||||||||||||||||||||
| Ending June 30, 2021 | 236 | 14,717,834 | 16,928,896 | 86.9 | % | 174 | 11,743,886 | 13,302,061 | 88.3 | % | |||||||||||||||||||
1Includes joint venture properties.
2Includes properties reclassified as held for sale.
HEALTHCARE REALTY | 2Q 2021 SUPPLEMENTAL INFORMATION 22 | ||||
Same Store Leasing Statistics 1 | ||
| 2Q 2021 | 1Q 2021 | 4Q 2020 | 3Q 2020 | 2Q 2020 | 1Q 2020 | 4Q 2019 | 3Q 2019 | |||||||||||||||||||||||||||||||||||||||||||
| Average in-place contractual increases | ||||||||||||||||||||||||||||||||||||||||||||||||||
| Multi-tenant | 2.91 | % | 2.91 | % | 2.91 | % | 2.90 | % | 2.89 | % | 2.89 | % | 2.90 | % | 2.93 | % | ||||||||||||||||||||||||||||||||||
| Single-tenant | 2.34 | % | 2.34 | % | 2.27 | % | 2.27 | % | 2.13 | % | 2.10 | % | 2.10 | % | 2.12 | % | ||||||||||||||||||||||||||||||||||
| 2.87 | % | 2.86 | % | 2.86 | % | 2.85 | % | 2.83 | % | 2.79 | % | 2.80 | % | 2.82 | % | |||||||||||||||||||||||||||||||||||
Renewals 2 | ||||||||||||||||||||||||||||||||||||||||||||||||||
| Cash leasing spreads | 2.8 | % | 4.4 | % | 2.8 | % | 4.5 | % | 4.5 | % | 4.4 | % | 4.2 | % | 3.3 | % | ||||||||||||||||||||||||||||||||||
| Tenant retention rate | 74.9 | % | 88.5 | % | 84.2 | % | 85.1 | % | 84.6 | % | 84.0 | % | 86.6 | % | 90.2 | % | ||||||||||||||||||||||||||||||||||
AVERAGE IN-PLACE CONTRACTUAL INCREASES 3 | ||||||||||||||||||||||||||
| MULTI-TENANT | SINGLE-TENANT | TOTAL | ||||||||||||||||||||||||
| % INCREASE | % OF BASE RENT | % INCREASE | % OF BASE RENT | % INCREASE | % OF BASE RENT | |||||||||||||||||||||
| Annual increase | ||||||||||||||||||||||||||
| CPI | 1.84 | % | 2.20 | % | 1.30 | % | 11.31 | % | 1.68 | % | 2.87 | % | ||||||||||||||
| Fixed | 2.99 | % | 95.11 | % | 2.75 | % | 42.42 | % | 2.99 | % | 91.19 | % | ||||||||||||||
| Non-annual increase (annualized) | ||||||||||||||||||||||||||
| CPI | 1.16 | % | 0.33 | % | 0.50 | % | 4.48 | % | 0.81 | % | 0.64 | % | ||||||||||||||
| Fixed | 1.55 | % | 1.23 | % | 2.40 | % | 41.79 | % | 2.17 | % | 4.25 | % | ||||||||||||||
| No increase | ||||||||||||||||||||||||||
| Term > 1 year | — | % | 1.13 | % | — | % | — | % | — | % | 1.05 | % | ||||||||||||||
Total 3 | 2.91 | % | 100.00 | % | 2.34 | % | 100.00 | % | 2.87 | % | 100.00 | % | ||||||||||||||
| TYPE AND OWNERSHIP STRUCTURE (% OF SQUARE FEET) | ||||||||||||||
| MULTI-TENANT | SINGLE-TENANT | TOTAL | ||||||||||||
| Tenant type | ||||||||||||||
| Hospital | 50.1 | % | 82.6 | % | 52.3 | % | ||||||||
| Physician and other | 49.9 | % | 17.4 | % | 47.7 | % | ||||||||
| Lease structure | ||||||||||||||
| Gross | 10.8 | % | — | % | 10.1 | % | ||||||||
| Modified gross | 29.7 | % | — | % | 27.7 | % | ||||||||
| Net | 59.5 | % | — | % | 55.4 | % | ||||||||
Absolute net 4 | — | % | 100.0 | % | 6.8 | % | ||||||||
| Ownership type | ||||||||||||||
| Ground lease | 62.1 | % | 15.9 | % | 59.3 | % | ||||||||
| Fee simple | 37.9 | % | 84.1 | % | 40.7 | % | ||||||||
1Excludes recently acquired or disposed properties, construction in progress, land held for development, corporate property, reposition properties and assets classified as held for sale.
2Beginning in the first quarter of 2021, metrics are for combined multi-tenant and single-tenant net leases. Prior periods include only multi-tenant leases.
3Excludes leases with terms of one year or less.
4Tenant is typically responsible for operating expenses and capital obligations.
HEALTHCARE REALTY | 2Q 2021 SUPPLEMENTAL INFORMATION 23 | ||||
NOI Performance 1 | ||
| DOLLARS IN THOUSANDS, EXCEPT PER SQUARE FOOT DATA | ||
| SAME STORE CASH NOI | |||||||||||||||||||||||||||||||||||||||||
| TTM 2021 | 2Q 2021 | 1Q 2021 | 4Q 2020 | 3Q 2020 | TTM 2020 | 2Q 2020 | 1Q 2020 | 4Q 2019 | 3Q 2019 | ||||||||||||||||||||||||||||||||
| Revenues | $428,764 | $107,647 | $107,326 | $106,554 | $107,237 | $420,599 | $103,854 | $106,191 | $105,288 | $105,266 | |||||||||||||||||||||||||||||||
| Expenses | 162,733 | 40,375 | 40,860 | 40,133 | 41,365 | 160,613 | 38,506 | 41,038 | 39,946 | 41,123 | |||||||||||||||||||||||||||||||
| Cash NOI | $266,031 | $67,272 | $66,466 | $66,421 | $65,872 | $259,986 | $65,348 | $65,153 | $65,342 | $64,143 | |||||||||||||||||||||||||||||||
Revenue per occ SF 2 | $36.36 | $36.59 | $36.39 | $36.11 | $36.32 | $35.44 | $35.11 | $35.77 | $35.43 | $35.43 | |||||||||||||||||||||||||||||||
| Margin | 62.0 | % | 62.5 | % | 61.9 | % | 62.3 | % | 61.4 | % | 61.8 | % | 62.9 | % | 61.4 | % | 62.1 | % | 60.9 | % | |||||||||||||||||||||
| Average occupancy | 88.6 | % | 88.5 | % | 88.7 | % | 88.7 | % | 88.8 | % | 89.2 | % | 89.0 | % | 89.3 | % | 89.4 | % | 89.3 | % | |||||||||||||||||||||
| Number of properties | 174 | 174 | 174 | 174 | 174 | 174 | 174 | 174 | 174 | 174 | |||||||||||||||||||||||||||||||
| SAME STORE GROWTH | |||||||||||||||||||||||
| YEAR-OVER-YEAR | |||||||||||||||||||||||
| TTM 2021 | 2Q 2021 | 1Q 2021 | 4Q 2020 | 3Q 2020 | |||||||||||||||||||
Revenue per occ SF 2 | 2.6 | % | 4.2 | % | 1.7 | % | 1.9 | % | 2.5 | % | |||||||||||||
| Avg occupancy (bps) | -60 | -50 | -60 | -70 | -50 | ||||||||||||||||||
| Revenues | 1.9 | % | 3.7 | % | 1.1 | % | 1.2 | % | 1.9 | % | |||||||||||||
| Expenses | 1.3 | % | 4.9 | % | (0.4 | %) | 0.5 | % | 0.6 | % | |||||||||||||
| Cash NOI | 2.3 | % | 2.9 | % | 2.0 | % | 1.7 | % | 2.7 | % | |||||||||||||
| TOTAL CASH NOI | |||||||||||||||||||||||
| 2Q 2021 | 2Q 2020 | % CHANGE | TTM 2Q 2021 | TTM 2Q 2020 | % CHANGE | ||||||||||||||||||
| Same store cash NOI | $67,272 | $65,348 | 2.9 | % | $266,031 | $259,986 | 2.3 | % | |||||||||||||||
| Reposition | 788 | 1,512 | (47.9 | %) | 3,563 | 5,611 | (36.5 | %) | |||||||||||||||
| $68,060 | $66,860 | 1.8 | % | $269,594 | $265,597 | 1.5 | % | ||||||||||||||||
| Acquisitions/development completions | 10,330 | 3,952 | 161.5 | % | 31,125 | 8,567 | 263.4 | % | |||||||||||||||
| Dispositions/assets held for sale/other | 425 | 6,002 | (92.9 | %) | 5,015 | 25,111 | (80.0 | %) | |||||||||||||||
| Joint venture property cash NOI | 1,035 | 1 | 103,400.1 | % | 1,654 | 240 | 589.3 | % | |||||||||||||||
| Cash NOI | $79,850 | $76,815 | 4.0 | % | $307,388 | $299,515 | 2.6 | % | |||||||||||||||
1Excludes recently acquired or disposed properties, development completions, construction in progress, land held for development, corporate property, reposition properties and assets classified as held for sale.
2Revenue per occ SF is calculated by dividing revenue by the average of the occupied SF for the period provided. Quarterly revenue per occ SF is annualized.
HEALTHCARE REALTY | 2Q 2021 SUPPLEMENTAL INFORMATION 24 | ||||
| NOI Reconciliations | ||
| DOLLARS IN THOUSANDS | ||
| BOTTOM UP RECONCILIATION | |||||||||||||||||||||||||||||||||||||||||||||||||||||
| 2Q 2021 | 1Q 2021 | 4Q 2020 | 3Q 2020 | 2Q 2020 | 1Q 2020 | 4Q 2019 | 3Q 2019 | ||||||||||||||||||||||||||||||||||||||||||||||
| Net income (loss) | $23,096 | $24,022 | ($15,863) | $8,230 | $75,513 | $4,315 | $27,210 | $2,601 | |||||||||||||||||||||||||||||||||||||||||||||
| Other income (expense) | (2,223) | (5,220) | 35,284 | 11,969 | (53,959) | 13,927 | (6,218) | 13,981 | |||||||||||||||||||||||||||||||||||||||||||||
| General and administrative expense | 8,545 | 8,499 | 7,206 | 7,299 | 7,434 | 8,766 | 7,669 | 10,802 | |||||||||||||||||||||||||||||||||||||||||||||
| Depreciation and amortization expense | 49,826 | 50,079 | 48,104 | 47,143 | 47,691 | 47,497 | 46,134 | 45,137 | |||||||||||||||||||||||||||||||||||||||||||||
Other expenses 1 | 2,840 | 2,783 | 2,919 | 2,364 | 2,185 | 3,365 | 2,200 | 2,079 | |||||||||||||||||||||||||||||||||||||||||||||
| Straight-line rent expense | 369 | 367 | 369 | 373 | 374 | 375 | 378 | 383 | |||||||||||||||||||||||||||||||||||||||||||||
| Straight-line rent revenue | (1,563) | (1,461) | (1,013) | (915) | (764) | (1,043) | (1,167) | (770) | |||||||||||||||||||||||||||||||||||||||||||||
Other revenue 2 | (2,075) | (1,865) | (2,145) | (1,609) | (1,660) | (2,004) | (1,430) | (1,726) | |||||||||||||||||||||||||||||||||||||||||||||
| Joint venture property cash NOI | 1,035 | 465 | 135 | 19 | 1 | 78 | 86 | 75 | |||||||||||||||||||||||||||||||||||||||||||||
| Cash NOI | $79,850 | $77,669 | $74,996 | $74,873 | $76,815 | $75,276 | $74,862 | $72,562 | |||||||||||||||||||||||||||||||||||||||||||||
| Acquisitions/development completions | (10,330) | (9,147) | (6,357) | (5,291) | (3,952) | (2,849) | (1,630) | (136) | |||||||||||||||||||||||||||||||||||||||||||||
| Dispositions/assets held for sale/other | (425) | (774) | (1,178) | (2,638) | (6,002) | (5,916) | (6,422) | (6,771) | |||||||||||||||||||||||||||||||||||||||||||||
| Joint venture property cash NOI | (1,035) | (465) | (135) | (19) | (1) | (78) | (86) | (75) | |||||||||||||||||||||||||||||||||||||||||||||
| Same store cash NOI and reposition | 68,060 | 67,283 | 67,326 | 66,925 | 66,860 | 66,433 | 66,724 | 65,580 | |||||||||||||||||||||||||||||||||||||||||||||
| Reposition | (788) | (817) | (905) | (1,053) | (1,512) | (1,280) | (1,382) | (1,437) | |||||||||||||||||||||||||||||||||||||||||||||
| Same store cash NOI | $67,272 | $66,466 | $66,421 | $65,872 | $65,348 | $65,153 | $65,342 | $64,143 | |||||||||||||||||||||||||||||||||||||||||||||
| TOP DOWN RECONCILIATION | |||||||||||||||||||||||||||||||||||||||||||||||||||||
| 2Q 2021 | 1Q 2021 | 4Q 2020 | 3Q 2020 | 2Q 2020 | 1Q 2020 | 4Q 2019 | 3Q 2019 | ||||||||||||||||||||||||||||||||||||||||||||||
| Rental income before rent concessions | $129,609 | $129,466 | $124,537 | $124,079 | $122,958 | $123,518 | $119,931 | $118,254 | |||||||||||||||||||||||||||||||||||||||||||||
| Rent concessions | (1,123) | (1,077) | (660) | (695) | (600) | (874) | (493) | (514) | |||||||||||||||||||||||||||||||||||||||||||||
| Rental income | 128,486 | 128,389 | 123,877 | 123,384 | 122,358 | 122,644 | 119,438 | 117,740 | |||||||||||||||||||||||||||||||||||||||||||||
| Parking income | 1,880 | 1,658 | 1,678 | 1,764 | 1,227 | 2,051 | 1,982 | 1,935 | |||||||||||||||||||||||||||||||||||||||||||||
| Interest from financing receivable, net | 510 | — | — | — | — | — | — | — | |||||||||||||||||||||||||||||||||||||||||||||
| Exclude straight-line rent revenue | (1,563) | (1,461) | (1,013) | (915) | (764) | (1,043) | (1,167) | (770) | |||||||||||||||||||||||||||||||||||||||||||||
Exclude other non-cash revenue 3 | (1,528) | (1,573) | (1,820) | (1,505) | (1,555) | (1,892) | (1,326) | (1,601) | |||||||||||||||||||||||||||||||||||||||||||||
| Revenue | 127,785 | 127,013 | 122,722 | 122,728 | 121,266 | 121,760 | 118,927 | 117,304 | |||||||||||||||||||||||||||||||||||||||||||||
| Property operating expense | (51,509) | (52,215) | (50,210) | (50,171) | (46,580) | (49,552) | (46,214) | (46,777) | |||||||||||||||||||||||||||||||||||||||||||||
Exclude non-cash expenses 4 | 2,539 | 2,406 | 2,349 | 2,297 | 2,128 | 2,990 | 2,063 | 1,960 | |||||||||||||||||||||||||||||||||||||||||||||
| Joint venture property cash NOI | 1,035 | 465 | 135 | 19 | 1 | 78 | 86 | 75 | |||||||||||||||||||||||||||||||||||||||||||||
| Cash NOI | $79,850 | $77,669 | $74,996 | $74,873 | $76,815 | $75,276 | $74,862 | $72,562 | |||||||||||||||||||||||||||||||||||||||||||||
| Acquisitions/development completions | (10,330) | (9,147) | (6,357) | (5,291) | (3,952) | (2,849) | (1,630) | (136) | |||||||||||||||||||||||||||||||||||||||||||||
| Dispositions/assets held for sale/other | (425) | (774) | (1,178) | (2,638) | (6,002) | (5,916) | (6,422) | (6,771) | |||||||||||||||||||||||||||||||||||||||||||||
| Joint venture property cash NOI | (1,035) | (465) | (135) | (19) | (1) | (78) | (86) | (75) | |||||||||||||||||||||||||||||||||||||||||||||
| Same store cash NOI and reposition | 68,060 | 67,283 | 67,326 | 66,925 | 66,860 | 66,433 | 66,724 | 65,580 | |||||||||||||||||||||||||||||||||||||||||||||
| Reposition | (788) | (817) | (905) | (1,053) | (1,512) | (1,280) | (1,382) | (1,437) | |||||||||||||||||||||||||||||||||||||||||||||
| Same store cash NOI | $67,272 | $66,466 | $66,421 | $65,872 | $65,348 | $65,153 | $65,342 | $64,143 | |||||||||||||||||||||||||||||||||||||||||||||
1Includes acquisition and pursuit costs, bad debt, above and below market ground lease intangible amortization, and leasing commission amortization.
2Includes management fee income, interest, above and below market lease intangible amortization, lease inducement amortization, lease termination fees, deferred financing cost amortization and principle related to investment in financing receivable and tenant improvement overage amortization.
3Includes above and below market lease intangibles, lease inducements, lease termination fees, deferred financing cost amortization, financing receivable non-cash adjustments, and TI amortization.
4Includes above and below market ground lease intangible amortization, leasing commission amortization, and ground lease straight-line rent.
HEALTHCARE REALTY | 2Q 2021 SUPPLEMENTAL INFORMATION 25 | ||||
| NOI Reconciliations | ||
| DOLLARS IN THOUSANDS | ||
| RECONCILIATION OF NOI TO FFO AND NORMALIZED FFO | |||||||||||||||||||||||||||||||||||
| 2Q 2021 | 1Q 2021 | 4Q 2020 | 3Q 2020 | 2Q 2020 | 1Q 2020 | 4Q 2019 | 3Q 2019 | ||||||||||||||||||||||||||||
| Cash NOI | $79,850 | $77,669 | $74,996 | $74,873 | $76,815 | $75,276 | $74,862 | $72,562 | |||||||||||||||||||||||||||
| General and administrative expense | (8,545) | (8,499) | (7,206) | (7,299) | (7,434) | (8,766) | (7,669) | (10,802) | |||||||||||||||||||||||||||
| Straight-line rent | 1,563 | 1,461 | 1,013 | 915 | 764 | 1,043 | 1,167 | 770 | |||||||||||||||||||||||||||
| Interest and other income (expense), net | (262) | 500 | 140 | 74 | 250 | 93 | 7 | 13 | |||||||||||||||||||||||||||
| Management fees and other income | 547 | 292 | 325 | 104 | 105 | 112 | 103 | 124 | |||||||||||||||||||||||||||
Other non-cash revenue 1 | 1,528 | 1,573 | 1,820 | 1,505 | 1,555 | 1,892 | 1,326 | 1,601 | |||||||||||||||||||||||||||
Other non-cash expenses 2 | (2,539) | (2,406) | (2,349) | (2,297) | (2,128) | (2,990) | (2,063) | (1,960) | |||||||||||||||||||||||||||
| Unconsolidated JV adjustments | 181 | 276 | (73) | (5) | (37) | (9) | (8) | (8) | |||||||||||||||||||||||||||
| Debt Covenant EBITDA | $72,323 | $70,866 | $68,666 | $67,870 | $69,890 | $66,651 | $67,725 | $62,300 | |||||||||||||||||||||||||||
| Interest expense | (13,261) | (13,262) | (13,618) | (14,154) | (14,442) | (13,960) | (13,816) | (14,181) | |||||||||||||||||||||||||||
| Loss on extinguishment of debt | — | — | (21,503) | — | — | — | — | — | |||||||||||||||||||||||||||
| Acquisition and pursuit costs | (670) | (744) | (939) | (440) | (431) | (750) | (515) | (501) | |||||||||||||||||||||||||||
Leasing commission amortization 3 | 2,258 | 2,111 | 2,033 | 1,971 | 1,795 | 1,893 | 1,667 | 1,547 | |||||||||||||||||||||||||||
| Non-real estate depreciation and amortization | (885) | (879) | (886) | (899) | (909) | (859) | (838) | (838) | |||||||||||||||||||||||||||
| Unconsolidated JV adjustments | (8) | (2) | (8) | — | — | — | — | — | |||||||||||||||||||||||||||
| FFO | $59,757 | $58,090 | $33,745 | $54,348 | $55,903 | $52,975 | $54,223 | $48,327 | |||||||||||||||||||||||||||
| Acquisition and pursuit costs | 670 | 744 | 939 | 440 | 431 | 750 | 515 | 501 | |||||||||||||||||||||||||||
| Lease intangible amortization | (6) | (72) | (4) | (35) | (16) | 745 | 4 | 5 | |||||||||||||||||||||||||||
Accelerated amortization of restricted stock awards | — | — | — | — | — | — | — | 2,854 | |||||||||||||||||||||||||||
| Forfeited earnest money received | — | (500) | — | — | — | — | — | — | |||||||||||||||||||||||||||
| Debt financing costs | 283 | — | 21,920 | — | — | — | — | — | |||||||||||||||||||||||||||
| Unconsolidated JV normalizing items | 55 | 27 | 16 | — | — | — | — | — | |||||||||||||||||||||||||||
| Normalized FFO | $60,759 | $58,289 | $56,616 | $54,753 | $56,318 | $54,470 | $54,742 | $51,687 | |||||||||||||||||||||||||||
1Includes above and below market lease intangibles, interest income related to sales-type leases, lease inducements, lease termination fees, deferred financing cost amortization and principle related to investment in financing receivable and TI amortization.
2Includes above and below market ground lease intangible amortization, leasing commission amortization, and ground lease straight-line rent.
3Leasing commission amortization is included in the real estate depreciation and amortization add-back for FFO.
HEALTHCARE REALTY | 2Q 2021 SUPPLEMENTAL INFORMATION 26 | ||||
| EBITDA Reconciliations | ||
| DOLLARS IN THOUSANDS | ||
| RECONCILIATION OF EBITDA | ||||||||||||||||||||
| TTM | 2Q 2021 | 1Q 2021 | 4Q 2020 | 3Q 2020 | ||||||||||||||||
| Net income (loss) | $39,485 | $23,096 | $24,022 | ($15,863) | $8,230 | |||||||||||||||
| Interest expense | 54,295 | 13,261 | 13,262 | 13,618 | 14,154 | |||||||||||||||
| Depreciation and amortization | 195,152 | 49,826 | 50,079 | 48,104 | 47,143 | |||||||||||||||
| Unconsolidated JV depreciation and amortization | 2,570 | 1,354 | 813 | 323 | 80 | |||||||||||||||
| EBITDA | $291,502 | $87,537 | $88,176 | $46,182 | $69,607 | |||||||||||||||
Other amortization 1 | 8,373 | 2,258 | 2,111 | 2,033 | 1,971 | |||||||||||||||
| (Gain) loss on sales of real estate properties | (42,003) | (20,970) | (18,890) | 34 | (2,177) | |||||||||||||||
| Impairments on real estate assets | 5,912 | 5,078 | 834 | — | — | |||||||||||||||
EBITDAre 2 | $263,784 | $73,903 | $72,231 | $48,249 | $69,401 | |||||||||||||||
| EBITDA | $291,502 | $87,537 | $88,176 | $46,182 | $69,607 | |||||||||||||||
| Acquisition and pursuit costs | 2,793 | 670 | 744 | 939 | 440 | |||||||||||||||
| (Gain) loss on sales of real estate properties | (42,003) | (20,970) | (18,890) | 34 | (2,177) | |||||||||||||||
| Impairments on real estate assets | 5,912 | 5,078 | 834 | — | — | |||||||||||||||
| Loss on extinguishment of debt | 21,503 | — | — | 21,503 | — | |||||||||||||||
| Unconsolidated JV adjustments | 18 | 8 | 2 | 8 | — | |||||||||||||||
| Debt Covenant EBITDA | $279,725 | $72,323 | $70,866 | $68,666 | $67,870 | |||||||||||||||
Other amortization 1 | 8,373 | 2,258 | 2,111 | 2,033 | 1,971 | |||||||||||||||
| Lease intangible amortization | (117) | (6) | (72) | (4) | (35) | |||||||||||||||
Acquisition/disposition timing impact 3 | 4,127 | 1,150 | 396 | 3,468 | (887) | |||||||||||||||
| Stock based compensation | 10,563 | 2,627 | 3,019 | 2,472 | 2,445 | |||||||||||||||
| Unconsolidated JV adjustments | 78 | 46 | 25 | 7 | — | |||||||||||||||
| Adjusted EBITDA | $302,749 | $78,398 | $76,345 | $76,642 | $71,364 | |||||||||||||||
1Includes leasing commission amortization.
2Earnings before interest, taxes, depreciation and amortization for real estate ("EBITDAre") is an operating performance measure adopted by NAREIT. NAREIT defines EBITDAre equal to “net income (computed in accordance with GAAP) plus interest expense, income tax expense, depreciation and amortization, impairments and minus gains on the disposition of depreciated property.”
3Adjusted to reflect quarterly EBITDA from properties acquired or disposed in the quarter.
4Adjusted to reflect quarterly EBITDA at fully stabilized development NOI.
HEALTHCARE REALTY | 2Q 2021 SUPPLEMENTAL INFORMATION 27 | ||||
| Components of Net Asset Value | ||
| DOLLARS IN THOUSANDS, EXCEPT PER SHARE DATA | ||
| CASH NOI BY PROPERTY TYPE | ||||||||||||||||||||||||||
| 2Q 2021 | ||||||||||||||||||||||||||
| ASSET TYPE | SAME STORE 1 | ACQ./DEV. COMPLETIONS 2 | JOINT VENTURE | REPOSITION 3 | TIMING ADJUSTMENTS 4 | ADJUSTED CASH NOI | ANNUALIZED ADJUSTED NOI | |||||||||||||||||||
| MOB/outpatient | $62,989 | $10,330 | $1,035 | $788 | $3,055 | $78,197 | $312,788 | |||||||||||||||||||
| Inpatient/Surgical | 3,095 | — | — | — | — | 3,095 | 12,380 | |||||||||||||||||||
| Office | 1,188 | — | — | — | — | 1,188 | 4,752 | |||||||||||||||||||
| Total Cash NOI | $67,272 | $10,330 | $1,035 | $788 | $3,055 | $82,480 | $329,920 | |||||||||||||||||||
| DEVELOPMENT PROPERTIES | TOTAL SHARES OUTSTANDING | ||||||||||||||||
| Land held for development | $27,226 | As of July 30, 2021 8 | 145,529,657 | ||||||||||||||
| OTHER ASSETS | |||||||||||||||||
Assets held for sale 5 | $23,000 | ||||||||||||||||
Cash and other assets 6 | 128,647 | ||||||||||||||||
| $151,647 | |||||||||||||||||
| DEBT | IMPLIED CAP RATE | ||||||||||||||||
| Unsecured credit facility | $13,000 | STOCK PRICE | IMPLIED CAP RATE | ||||||||||||||
| Unsecured term loan due 2024 | 200,000 | As of 7/30/21 | $31.88 | 5.28 | % | ||||||||||||
| Unsecured term loan due 2026 | 150,000 | ||||||||||||||||
| Senior notes | 1,150,000 | ||||||||||||||||
| Mortgage notes payable | 115,296 | 2Q 2021 high | $32.64 | 5.19 | % | ||||||||||||
| Remaining re/development funding | 72,968 | 2Q 2021 low | $29.97 | 5.53 | % | ||||||||||||
Other liabilities 7 | 87,032 | ||||||||||||||||
| $1,788,296 | |||||||||||||||||
1See Same Store Performance schedule on page 24 for details on same store NOI.
2Adjusted to reflect quarterly NOI from properties acquired or stabilized developments completed during the full eight quarter period that are not included in same store NOI.
3Reposition properties includes 7 properties which comprise 714,437 square feet. The NOI table above includes 6 of these properties comprising 633,460 square feet that generated positive NOI. The remaining property comprising 80,977 square feet generated negative NOI of $0.2 million. The Company has begun a redevelopment project related to this property.
4Timing adjustments include current quarter acquisitions of $1.5 million as well as development completion adjustments of $1.6 million to reflect full quarterly stabilized NOI from a recently completed development.
5Assets held for sale includes four real estate properties that are excluded from same store NOI and reflect the contractual sale prices.
6Includes cash of $18.7 million, prepaid assets of $63.5 million, accounts receivable of $11.5 million, and prepaid ground leases of $21.5 million. In addition, includes the Company's occupied portion of its corporate headquarters of $13.4 million.
7Includes only liabilities that are expected to reduce future cash or NOI and that are currently producing non-cash benefits to NOI. Included are accounts payable and accrued liabilities of $75.5 million, security deposits of $10.3 million, and deferred operating expense reimbursements of $1.2 million.
8Total shares outstanding do not reflect the shares associated with forward equity contracts. As of July 30, 2021, the Company had 3.7 million shares to be settled in the future under forward equity contracts.
HEALTHCARE REALTY | 2Q 2021 SUPPLEMENTAL INFORMATION 28 | ||||
| Components of Expected FFO | ||
| DOLLARS IN THOUSANDS, EXCEPT PER SHARE DATA | ||
| SAME STORE EXPECTATIONS | ||||||||||||||
| EXPECTED 2021 | ACTUAL | |||||||||||||
| LOW | HIGH | Q2 2021 | ||||||||||||
| TTM Average Occupancy | ||||||||||||||
| Multi-tenant | 87.5 | % | 88.5 | % | 87.9 | % | ||||||||
| Single-tenant | 100.0 | % | 100.0 | % | 100.0 | % | ||||||||
| Total | 88.2 | % | 89.2 | % | 88.6 | % | ||||||||
| TTM Revenue per occupied square foot | $36.00 | $37.00 | $36.36 | |||||||||||
| TTM Cash NOI margin | 61.5 | % | 62.5 | % | 62.0 | % | ||||||||
| Cash leasing spreads | 3.0 | % | 4.0 | % | 2.8 | % | ||||||||
| Lease retention rate | 75.0 | % | 90.0 | % | 74.9 | % | ||||||||
| TTM Cash NOI growth | 2.0 | % | 3.0 | % | 2.3 | % | ||||||||
| ANNUAL EXPECTATIONS | ||||||||||||||
| LOW | HIGH | YTD | ||||||||||||
| Normalized G&A | $33,000 | $36,000 | $17,044 | |||||||||||
Straight-line rent, net 1 | 3,000 | 5,000 | 2,289 | |||||||||||
| Funding activity | ||||||||||||||
Acquisitions (YTD actual)2 | 500,000 | 600,000 | 412,824 | |||||||||||
| Dispositions (YTD actual) | (115,000) | (175,000) | (114,550) | |||||||||||
| Re/development | 20,000 | 40,000 | 15,054 | |||||||||||
| 1st generation TI and acq. capex | 20,000 | 30,000 | 9,783 | |||||||||||
| 2nd generation TI | 28,000 | 34,000 | 9,937 | |||||||||||
| Leasing commissions paid | 10,000 | 14,000 | 4,997 | |||||||||||
| Capital expenditures | 18,000 | 23,000 | 8,096 | |||||||||||
| Total maintenance capex | 56,000 | 71,000 | 23,030 | |||||||||||
| Cash yield | ||||||||||||||
| Acquisitions | 5.0 | % | 5.8 | % | 5.3 | % | ||||||||
| Dispositions | 4.1 | % | 5.3 | % | 4.1 | % | ||||||||
| Re/development (stabilized) | 6.0 | % | 7.5 | % | NA | |||||||||
| Leverage (debt/cap) | 32.0 | % | 36.0 | % | 32.7 | % | ||||||||
| Net debt to adjusted EBITDA | 5.0x | 5.5x | 5.1x | |||||||||||
1This guidance range is based on current in-place leases.
2Includes joint venture acquisitions at full acquisition price.
HEALTHCARE REALTY | 2Q 2021 SUPPLEMENTAL INFORMATION 29 | ||||