UNITED STATES
SECURITIES AND EXCHANGE COMMISSION
Washington, D.C. 20549
(Mark One)
| x | ANNUAL REPORT PURSUANT TO SECTION 13 OR 15(d) OF THE SECURITIES EXCHANGE ACT OF 1934 |
For the fiscal year ended December 31, 2006
or
| o | TRANSITION REPORT PURSUANT TO SECTION 13 OR 15(d) OF THE SECURITIES EXCHANGE ACT OF 1934 |
Commission file number 1-12936
TITAN INTERNATIONAL, INC.
(Exact name of registrant as specified in its charter)
Illinois | | 36-3228472 |
(State or other jurisdiction of incorporation or organization) | | (I.R.S. Employer Identification No.) |
2701 Spruce Street, Quincy, IL 62301
(Address of principal executive offices)
(217) 228-6011
(Registrant’s telephone number, including area code)
Securities registered pursuant to Section 12(b) of the Act:
| Title of each class | Name of each exchange on which registered |
| Common stock, no par value | New York Stock Exchange (Symbol: TWI) |
Securities registered pursuant to Section 12(g) of the Act: None
Indicate by check mark if the registrant is a well-known seasoned issuer, as defined by Rule 405 of the Securities Act. Yes o No x
Indicate by check mark if the registrant is not required to file reports pursuant to Section 13 or Section 15(d) of the Act. Yes o No x
Indicate by check mark whether the registrant (1) has filed all reports required to be filed by Section 13 or 15(d) of the Securities Exchange Act of 1934 during the preceding 12 months (or such shorter period that the registrant was required to file such reports) and (2) has been subject to such filing requirements for the past 90 days. Yes x No o
Indicate by check mark if disclosure of delinquent filers pursuant to Item 405 of Regulation S-K is not contained herein, and will not be contained, to the best of registrant's knowledge, in definitive proxy or information statements incorporated by reference in Part III of this Form 10-K or any amendment to this Form 10-K. x
Indicate by check mark whether the registrant is a large accelerated filer, an accelerated filer, or a non-accelerated filer.
Large accelerated filer o Accelerated filer x Non-accelerated filer o
Indicate by check mark whether the registrant is a shell company (as defined in Rule 12b-2 of the Act). Yes o No x
The aggregate market value of the shares of common stock of the registrant held by non-affiliates was $227,988,853 based upon the closing price of the common stock on the New York Stock Exchange on June 30, 2006.
As of February 15, 2007, 20,024,032 shares of common stock of the registrant were outstanding.
DOCUMENTS INCORPORATED BY REFERENCE
Part III incorporates information by reference from the registrant's definitive proxy statement for its annual meeting of stockholders to be held May 17, 2007.
TITAN INTERNATIONAL, INC.
Index to Annual Report on Form 10-K
| | | |
| Part I. | | Page |
| | | |
Item 1. | Business | 3-9 |
| | | |
Item 1A. | Risk Factors | 9 |
| | | |
Item 1B. | Unresolved Staff Comments | 9 |
| | | |
Item 2. | Properties | 10 |
| | | |
Item 3. | Legal Proceedings | 10 |
| | | |
Item 4. | Submission of Matters to a Vote of Security Holders. | 10 |
| | | |
| Part II. | | |
| | | |
Item 5. | Market for Registrant’s Common Equity, Related Stockholder Matters and Issuer Purchases of Equity Securities | 11 |
| | | |
Item 6. | Selected Financial Data | 12 |
| | | |
Item 7. | Management’s Discussion and Analysis of Financial Condition and Results of Operations | 13-32 |
| | | |
Item 7A. | Quantitative and Qualitative Disclosures about Market Risk | 33 |
| | | |
Item 8. | Financial Statements and Supplementary Data | 33 |
| | | |
Item 9. | Changes in and Disagreements with Accountants on Accounting and Financial Disclosure | 33 |
| | | |
Item 9A. | Controls and Procedures | 33 |
| | | |
Item 9B. | Other Information | 33 |
| | | |
| Part III. | | |
| | | |
Item 10. | Directors, Executive Officers and Corporate Governance | 34 |
| | | |
Item 11. | Executive Compensation | 34 |
| | | |
Item 12. | Security Ownership of Certain Beneficial Owners and Management and Related Stockholder Matters | 35 |
| | | |
Item 13. | Certain Relationships and Related Transactions, and Director Independence | 35 |
| | | |
Item 14. | Principal Accounting Fees and Services | 35 |
| | | |
| Part IV. | | |
| | | |
Item 15. | Exhibits, Financials Statement Schedules | 36 |
| | | |
| | Signatures | 37 |
PART I
ITEM 1 - BUSINESS
INTRODUCTION
Titan International, Inc. and its subsidiaries (Titan or the Company) are leading manufacturers of wheels, tires and assemblies for off-highway vehicles used in the agricultural, earthmoving/construction and consumer markets. Titan’s earthmoving/construction market also includes products supplied to the U.S. government, while the consumer market includes products for all-terrain vehicles (ATVs) and recreational/utility trailer applications. Titan manufactures both wheels and tires for the majority of these market applications, allowing the Company to provide the value-added service of delivering complete wheel and tire assemblies. The Company offers a broad range of products that are manufactured in relatively short production runs to meet the specifications of original equipment manufacturers (OEMs) and/or the requirements of aftermarket customers.
As one of the few companies dedicated to the off-highway wheel and tire market, Titan’s engineering and manufacturing resources are focused on addressing the real-life concerns of the end-users of our products. Titan’s commitment to product innovation is demonstrated by the development of the low sidewall (LSW) series of wheel and tire assemblies, which considerably enhances the performance of off-highway vehicles by pairing a larger diameter wheel with a shorter sidewall tire.
In 2006, Titan’s agricultural market sales represented 62% of net sales, the earthmoving/construction market represented 27% and the consumer market represented 11% of net sales. For information concerning the revenues, certain expenses, income from operations and assets attributable to each of the segments in which the Company operates, see Note 28 to the consolidated financial statements of Titan, included in Item 8 herein.
COMPETITIVE STRENGTHS
Titan’s competitive strengths include the Company’s strong market position in the off-highway wheel and tire market and the Company’s long-term core customer relationships. These competitive strengths along with Titan’s dedication to the off-highway tire and wheel market continue to drive the Company forward.
Strong Market Position The Company has achieved a strong position in the domestic market for off-highway wheels, tires and assembly products. Titan’s ability to offer a broad range of different products has increased the Company’s visibility and has enhanced its ability to cross-sell products and consolidate market positions. Innovative marketing programs have strengthened Titan’s image in the marketplace, and the Company is reaching an increasing number of customers in the aftermarket. Years of product design and engineering experience have enabled Titan to improve existing products and develop new ones that have been well received in the marketplace. In addition, Titan believes it has benefited from significant barriers to entry, such as the substantial investment necessary to replicate the Company’s manufacturing equipment and numerous tools, dies and molds.
Long-Term Core Customer Relationships The Company’s top customers, including global leaders in agricultural and construction equipment manufacturing, have been purchasing wheels from Titan or its predecessors for many decades on average. Customers including AGCO Corporation, Caterpillar Inc., CNH Global N.V., Deere & Company, Kubota Corporation and the U.S. Government have helped sustain Titan’s leadership in wheel, tire and assembly innovation.
BUSINESS STRATEGY
Titan’s business strategy is to increase its penetration of the aftermarket for tires and the private branding business, to continue to improve operating efficiencies, to maintain emphasis on new product development and to explore possible additional strategic acquisitions.
Increase Aftermarket Tire Business and Private Branding Business The Company has concentrated on increasing its penetration of the tire aftermarket. The aftermarket offers higher profit margins and the tire aftermarket is larger and somewhat less cyclical than the OEM market. Additionally, Titan has developed a unique and efficient method of private branding the sidewall of its tires for sale through OEM retail distribution networks.
Improve Operating Efficiencies The Company continually works to improve the operating efficiency of its assets and manufacturing facilities. Titan integrates each facility’s strength, which may include transferring equipment and business to the facilities that are best equipped to handle the work. This provides capacity to increase utilization and spread operating costs over a greater volume of products. Titan is also continuing a comprehensive program to refurbish, modernize and enhance the computer technology of its manufacturing equipment. The Company has centralized and streamlined inventory controls. These efforts have led to improved management of order backlogs and have substantially improved Titan’s ability to respond to customer orders on a timely basis.
Improve Design Capacity and Increase New Product Development Equipment manufacturers constantly face changing industry dynamics. Titan directs its business and marketing strategy to understand and address the needs of its customers and demonstrate the advantages of its products. In particular, the Company often collaborates with customers in the design of new and upgraded products. Titan will occasionally recommend modified products to its customers based on its own market information. The Company tests new designs and technologies and develops methods of manufacturing to improve product quality and performance. These value-added services enhance Titan’s relationships with its customers.
Explore Additional Strategic Acquisitions The Company’s expertise in the manufacture of off-highway steel wheels and tires has permitted it to take advantage of opportunities to acquire businesses in the United States that complement this product line, including companies engaged in the tire market and companies that have wheel and tire assembly capabilities. In the future, Titan may make additional strategic acquisitions of businesses that have an off-highway focus.
ACQUISITION OF CONTINENTAL’S OTR ASSETS
On July 31, 2006, Titan Tire Corporation of Bryan, a subsidiary of Titan International, Inc., acquired the off-the-road (OTR) tire assets of Continental Tire North America, Inc. (Continental) in Bryan, Ohio. Titan Tire Corporation of Bryan purchased the assets of Continental’s OTR tire facility for approximately $53 million in cash proceeds. The assets purchased included Continental’s OTR plant, property and equipment located in Bryan, Ohio, and inventory and other current assets. The acquisition included an agreement with Continental to use the Continental and General trademarks on OTR tires.
ACQUISITION OF GOODYEAR’S NORTH AMERICAN FARM TIRE ASSETS
On December 28, 2005, Titan Tire Corporation, a subsidiary of Titan International, Inc., acquired The Goodyear Tire & Rubber Company’s North American farm tire assets. Titan Tire purchased the assets of Goodyear’s North American farm tire business for approximately $100 million in cash proceeds. The assets purchased include Goodyear’s North American plant, property and equipment located in Freeport, Illinois, and Goodyear’s North American farm tire inventory. The acquisition included a long-term license agreement with The Goodyear Tire & Rubber Company to manufacture and sell certain off-highway tires in North America, which includes the right to use the Goodyear trademark.
AGRICULTURAL MARKET
Titan’s agricultural rims, wheels and tires are manufactured for use on various agricultural and forestry equipment, including tractors, combines, skidders, plows, planters and irrigation equipment, and are sold directly to OEMs and to the aftermarket through independent distributors, equipment dealers and Titan’s own distribution centers. The wheels and rims range in diameter from 9” to 54” with the 54” diameter being the largest agricultural wheel manufactured in North America. Basic configurations are combined with distinct variations (such as different centers and a wide range of material thickness) allowing the Company to offer a broad line of product models to meet customer specifications. Titan’s agricultural tires range from 8” to 85” in diameter and from 4.8” to 44” in width. The Company offers the added value of delivering a complete wheel and tire assembly to customers.
EARTHMOVING/CONSTRUCTION MARKET
The Company manufactures rims, wheels and tires for various types of earthmoving, mining, military and construction equipment, including skid steers, aerial lifts, cranes, graders and levelers, scrapers, self-propelled shovel loaders, articulated dump trucks, load transporters, haul trucks and backhoe loaders. The Company provides customers with a broad range of earthmoving/construction wheels ranging in diameter from 20” to 63” and in weight from 125 pounds to 7,000 pounds. The 63” diameter wheel is the largest manufactured in North America for the earthmoving/construction market. The earthmoving/construction wheels and tires produced by Titan are sold to OEMs and the aftermarket. Titan’s earthmoving/construction tires range from 30” to 109” in diameter and in weight from 50 pounds to 6,200 pounds. The Company offers the added value of wheel and tire assembly for certain applications in the earthmoving/construction market.
CONSUMER MARKET
Titan builds a variety of products for all-terrain vehicles (ATV), turf, golf and trailer applications. Consumer wheels and rims range from 8” to 16” in diameter. Likewise, Titan produces a variety of tires for the consumer market. ATV tires using the new stripwinding manufacturing process have been introduced to the marketplace, which improves tread durability. Titan’s sales in the consumer market include sales to Goodyear, which include an off-take/mixing agreement. This agreement includes mixed stock, which is a prepared rubber compound used in tire production. For the domestic boat, recreational and utility trailer markets, the Company provides wheels and tires and assembles brakes, actuators and components. The Company also offers the value-added service of a wheel and tire assembly for the consumer market.
MARKET CONDITIONS OUTLOOK
The Company experienced a softening in demand from OEMs for the Company’s products in 2006. The Company recorded an increase in sales as a result of the Goodyear North American farm tire acquisition and the Continental OTR acquisition. Titan is using the expanded agricultural product offering of Goodyear branded farm tires and the expanded earthmoving/construction product offering supplied by the Bryan facility, along with added manufacturing capacity from the Freeport and Bryan facilities to expand market share. Anticipated market conditions are as follows: (i) the agricultural market is expected to maintain current sales levels in 2007, (ii) the earthmoving/ construction market is anticipated to remain strong as a result of strong energy and mining markets, (iii) the performance of the consumer market, Titan’s smallest market, is largely tied to recreational spending habits and many other factors including weather, competitive pricing, energy prices and consumer attitude. Consumer market sales to Goodyear fluctuate significantly based upon their future product requirements. However, the Company expects the remaining consumer market sales to remain relatively stable in 2007.
OPERATIONS
Titan’s operations include manufacturing wheels, manufacturing tires, and combining these wheels and tires into assemblies for use in the agricultural, earthmoving/construction and consumer markets. These operations entail many manufacturing processes in order to complete the finished products.
Wheel Manufacturing Process Most agricultural wheels are produced using a rim and a center disc. A rim is produced by first cutting large steel sheets to required width and length specifications. These steel sections are rolled and welded to form a circular rim, which is flared and formed in the rollform operation. The majority of discs are manufactured using presses that both blank and form the center to specifications in multiple stage operations. The Company e-coats wheels using a multi-step process prior to the final paint top coating.
Large earthmoving/construction steel wheels are manufactured from hot and cold-rolled steel sections. Hot-rolled sections are generally used to increase cross section thickness in high stress areas of large diameter wheels. A special cold forming process for certain wheels is used to increase cross section thickness while reducing the number of wheel components. Rims are built from a series of hoops that are welded together to form a rim base. The complete rim base is made from either three or five separate parts that lock together after the rubber tire has been fitted to the wheel and inflated.
For most consumer market wheels, the Company manufactures rims and center discs from steel sheets. Rims are rolled and welded, and discs are stamped and formed from the sheets. The manufacturing process then entails welding the rims to the centers and painting the assembled product.
Tire Manufacturing Process The first stage in tire production is the mixing of rubber, carbon black and chemicals to form various rubber compounds. These rubber compounds are then extruded and processed with textile or steel materials to make specific components. These components - beads (wire bundles that anchor the tire with the wheel), plies (layers of fabric that give the tire strength), belts (fabric or steel fabric wrapped under the tread in some tires), tread and sidewall - are then assembled into an uncured tire carcass. The uncured carcass is placed into a press that molds and vulcanizes the carcass under set time, temperature and pressure into a finished tire.
Wheel and Tire Assemblies The Company’s position as a manufacturer of both wheels and tires allows Titan to mount and deliver one of the largest selections of off-highway assemblies in North America. Titan offers this value-added service of one-stop shopping for wheel and tire assemblies for the agricultural, earthmoving/construction and consumer markets. Customer orders are entered into the Company’s system either through electronic data interchange or manually. The appropriate wheel-tire assembly delivery schedule is formulated based on each customer’s requirements and products are received by the customer on a just-in-time basis.
Quality Control The Company is ISO certified at all five main manufacturing facilities located in Bryan, Ohio; Des Moines, Iowa; Freeport, Illinois; Quincy, Illinois; and Saltville, Virginia. The ISO series is a set of related and internationally recognized standards of management and quality assurance. The standards specify guidelines for establishing, documenting and maintaining a system to ensure quality. The ISO certifications are a testament to Titan’s dedication to providing quality products for its customers.
RAW MATERIALS
Steel and rubber are the primary raw materials used by the Company in all segments. To ensure a consistent steel supply, Titan purchases raw steel from key steel mills and maintains relationships with steel processors for steel preparation. The Company is not dependent on any single producer for its steel supply. Rubber and other raw materials for tire manufacture represent some of the Company’s largest commodity expenses. Titan buys rubber in markets where there are several sources of supply. In addition to the development of key domestic suppliers, the Company’s strategic procurement plan includes international steel and rubber suppliers to assure competitive price and quality in the global marketplace. As is customary in the industry, the Company does not have long-term contracts for the purchase of steel or rubber and, therefore, purchases are subject to price fluctuations.
CAPITAL EXPENDITURES
Capital expenditures for 2006, 2005 and 2004 were $8.3 million, $6.8 million and $4.3 million, respectively. Capital expenditures in 2006 were used primarily for updating manufacturing equipment, expanding manufacturing capacity and for further automation at the Company’s facilities. Capital expenditures for 2007 are forecasted to be approximately $16 million to $18 million and will be used to enhance the Company’s existing facilities and manufacturing capabilities including additional capacity for OTR tire production.
PATENTS AND TRADEMARKS
The Company owns various patents and trademarks and continues to apply for patent protection for new products. While patents are considered significant to the operations of the business, at this time Titan does not consider any one of them to be of such importance that the patent’s expiration or invalidity could materially affect the Company’s business. However, due to the difficult nature of predicting the interpretation of patent laws, the Company cannot anticipate or predict the material adverse effect on its operations, cash flows or financial condition as a result of associated liabilities created under such patent interpretations.
MARKETING AND DISTRIBUTION
The Company employs an internal sales force and utilizes several manufacturing representative firms for sales in North America. Sales representatives are primarily organized within geographic regions.
Titan distributes wheels and tires directly to OEMs. The distribution of aftermarket tires occurs primarily through a network of independent and OEM-affiliated dealers. The Company distributes wheel and tire assemblies directly to OEMs and aftermarket customers through its distribution network consisting of nine facilities in the United States.
SEASONALITY
Agricultural equipment sales are seasonal by nature. Farmers generally order equipment to be delivered before the growing season. Shipments to OEMs usually peak during the Company’s first and second quarters for the spring planting period. Earthmoving/construction and consumer markets also historically tend to experience higher demand in the first and second quarters. These markets are affected by mining, building and economic conditions.
RESEARCH, DEVELOPMENT AND ENGINEERING
The Company’s research, development and engineering staff tests original designs and technologies and develop new manufacturing methods to improve product performance. These services enhance the Company’s relationships with customers. The Company continues to develop and introduce new LSW wheel and tire assemblies for the agricultural, earthmoving/construction and consumer markets. LSW wheel and tire assemblies reduce bounce, power hop, road lope and heat build-up, and provide more stability and safety for operators, which in turn may lead to greater productivity. The key to the success of the LSW is an increase in wheel diameter while maintaining the original outside tire diameter. This is accomplished by lowering the sidewall (LSW is an acronym for low sidewall) and increasing its strength. Maintaining the original outside diameter of the tire allows the LSW to improve the performance of agricultural, earthmoving/construction and consumer equipment without further modification.
CUSTOMERS
The Company’s 10 largest customers accounted for approximately 53% of net sales for the year ended December 31, 2006, compared to 55% for the year ended December 31, 2005. Net sales to Deere & Company in Titan’s agricultural, earthmoving/construction and consumer markets combined represented 17% of the Company’s consolidated revenues for the year ended December 31, 2006, and 20% for the year ended 2005. Net sales to CNH Global N.V. in Titan’s three markets represented 11% of the Company’s consolidated revenues for both of the years ended December 31, 2006 and 2005. No other customer accounted for more than 10% of the Company’s net sales in 2006 or 2005. Management believes the Company is not totally dependent on any single customer, however, certain products are dependent on a few customers. While the loss of any substantial customer could impact Titan’s business, the Company believes that its diverse product mix and customer base minimizes a longer-term impact caused by any such loss.
ORDER BACKLOG
As of January 31, 2007, Titan estimates $171 million in firm orders compared to $122 million at January 31, 2006, for the Company’s operations. The large increase in firm orders is primarily due to the Company’s recent acquisitions. Orders are considered firm if the customer would be obligated to accept the product if manufactured and delivered pursuant to the terms of such orders. The Company believes that the majority of the current order backlog will be filled during the present year.
INTERNATIONAL OPERATIONS
The Company accounted for its interest in Titan Europe Plc as an equity investment subsequent to the sale of a majority interest in April 2004. In December 2005, Titan Europe Plc issued additional shares of stock for an acquisition. As a result of these additional shares, the Company’s interest in Titan Europe Plc was diluted and decreased from 29.3% at December 31, 2004, to 15.4% at December 31, 2005. The Company recorded the gain resulting from the change in ownership interest to equity in accordance with SAB 51. With the decreased ownership percentage, effective December 2005, the Company no longer uses the equity method to account for its interest in Titan Europe Plc.
In accordance with Statement of Financial Accounting Standards (SFAS) No. 115, the Company records the Titan Europe Plc investment as an available-for-sale security and reports the investment at fair value, with unrealized gains and losses excluded from earnings and reported as a separate component of comprehensive income in stockholders’ equity. The Company’s stock ownership interest in Titan Europe Plc was 17.3% at December 31, 2006, and 15.4% at December 31, 2005. The increase in ownership percentage resulted from a December 2006 transaction in which Titan Europe Plc issued additional shares to the Company in payment of approximately $7.9 million U.S. dollars of debt, representing the entire remaining long-term debt owed by Titan Europe Plc to the Company. The fair value of the Company’s investment in Titan Europe Plc was $65.9 million and $48.5 million at December 31, 2006 and 2005. Titan Europe Plc is publicly traded on the AIM market in London, England.
For the year ended December 31, 2004, the Company generated $49.4 million, or approximately 10% percent, of its net sales from foreign operations. All of these sales were recorded in the first quarter, prior to the Titan Europe sale.
EMPLOYEES
At December 31, 2006, the Company employed approximately 2,700 people in the United States. Approximately 48% of the Company’s employees in the United States were covered by collective bargaining agreements. In December 2005, the workers at the Des Moines and Freeport facilities ratified new labor agreements through November 2010. The workers at the Bryan facility ratified a new labor agreement in July 2006 with the same November 2010 expiration date. The Company believes employee relations are generally good.
EXPORT SALES
The Company had total aggregate export sales of approximately $57.4 million, $39.0 million and $56.2 million, for the years ended December 31, 2006, 2005 and 2004, respectively.
Exports to foreign markets are subject to a number of special risks, including but not limited to risks with respect to currency exchange rates, economic and political destabilization, other disruption of markets and restrictive actions by foreign governments (such as restrictions on transfer of funds, export duties and quotas and foreign customs). Other risks include changes in foreign laws regarding trade and investment, difficulties in obtaining distribution and support, nationalization, reforms of laws and policies of the United States affecting trade, foreign investment and loans and foreign tax laws. There can be no assurance that one, or a combination, of these factors will not have a material adverse effect on the Company’s ability to increase or maintain its export sales.
The Company purchases a portion of its raw materials from foreign suppliers. The production costs, profit margins and competitive position of the Company are affected by the strength of the currencies in countries where Titan purchases goods, relative to the strength of the currencies in countries where the products are sold. The Company’s results of operations, cash flows and financial position may be affected by fluctuations in foreign currencies.
ENVIRONMENTAL LAWS AND REGULATIONS
In the ordinary course of business, like other industrial companies, Titan is subject to extensive and evolving federal, state and local environmental laws and regulations, and has made provisions for the estimated financial impact of environmental cleanup. The Company’s policy is to accrue environmental cleanup-related costs of a non-capital nature when those costs are believed to be probable and can be reasonably estimated. Expenditures that extend the life of the related property, or mitigate or prevent future environmental contamination, are capitalized. The Company does not currently anticipate any material capital expenditures for environmental control facilities. The quantification of environmental exposures requires an assessment of many factors, including changing laws and regulations, advances in environmental technologies, the quality of information available related to specific sites, the assessment stage of the site investigation, preliminary findings and the length of time involved in remediation or settlement. Due to the difficult nature of predicting future environmental costs, the Company cannot anticipate or predict the material adverse effect on its operations, cash flows or financial condition as a result of efforts to comply with, or its liabilities under, environmental laws.
COMPETITION
The Company competes with several domestic and international companies, some of which are larger and have greater financial and marketing resources than Titan. The Company believes it is a primary source of steel wheels and rims to the majority of its North American customers. Major competitors in the off-highway wheel market include Carlisle Companies Incorporated, GKN Wheels, Ltd., Topy Industries, Ltd. and certain other foreign competitors. Significant competitors in the off-highway tire market include Bridgestone/Firestone, Carlisle Companies Incorporated, Michelin and certain other foreign competitors.
The Company competes primarily on the basis of price, quality, customer service, design capability and delivery time. The Company’s ability to compete with international competitors may be adversely affected by currency fluctuations. In addition, certain of the Company’s OEM customers could, under individual circumstances, elect to manufacture the Company’s products to meet their requirements or to otherwise compete with the Company. There can be no assurance that the Company will not be adversely affected by increased competition in the markets in which it operates, or that competitors will not develop products that are more effective, less expensive or otherwise render certain of Titan’s products less competitive. From time to time, certain of the Company’s competitors have reduced their prices in particular product categories, which has prompted Titan to reduce prices as well. There can be no assurance that competitors of the Company will not further reduce prices in the future or that any such reductions would not have a material adverse effect on the Company.
NEW YORK STOCK EXCHANGE CERTIFICATION
The Company submitted to the New York Stock Exchange during fiscal 2006 the Annual CEO Certification required by Section 303A.12(a) of the New York Stock Exchange Listed Company Manual.
AVAILABLE INFORMATION
The Company’s annual report on Form 10-K, quarterly reports on Form 10-Q, current reports on Form 8-K, and any amendments to those reports are made available, without charge, through the Company’s website located at www.titan-intl.com as soon as reasonably practicable after they are filed with the Securities and Exchange Commission (SEC). The SEC maintains an Internet site that contains reports, proxy and information statements, and other information regarding issuers that file electronically with the SEC at www.sec.gov website. The following documents are also posted on the Company’s website:
Audit Committee Charter
Compensation Committee Charter
Nominating/Corporate Governance Committee Charter
Business Conduct Policy
Printed copies of these documents are available, without charge, by writing to: Secretary of Titan International, Inc., 2701 Spruce Street, Quincy, IL 62301.
ITEM 1A - RISK FACTORS
The Company is subject to various risks and uncertainties relating to or arising out of the nature of its business and general business, economic, financing, legal and other factors or conditions that may affect the Company. Realization of any of the following risks could have a material adverse effect on Titan’s business, financial condition, cash flows and results of operations.
| · | The Company operates in cyclical industries and, accordingly, its business is subject to the numerous and continuing changes in the economy. |
| · | The Company’s debt and related interest expense may limit Titan’s financial and operating flexibility. |
| · | The Company has incurred, and may incur in the future, net losses. |
| · | The Company is exposed to price fluctuations of key commodities, which are primarily steel and rubber. |
| · | The Company relies on a limited number of suppliers for key commodities, which consist primarily of steel and rubber. |
| · | The Company’s revenues are seasonal due to Titan’s dependence on agricultural, construction and recreational industries, which are seasonal and typically have lower sales in the second half of the year. |
| · | The Company may be adversely affected by changes in government regulations and policies, especially those related to farm and ethanol subsidies and those related to infrastructure construction. |
| · | The Company is subject to corporate governance requirements, and costs related to compliance with, or failure to comply with, existing and future requirements could adversely affect Titan’s business. |
| · | The Company’s customer base is relatively concentrated with Titan’s ten largest customers historically accounting for over 50% of sales. |
| · | The Company faces substantial competition from domestic and international companies, some of which operate in low wage markets. |
| · | The Company’s business could be negatively impacted if Titan fails to maintain satisfactory labor relations. |
| · | Unfavorable outcomes of legal proceedings could adversely affect the Company’s financial condition and results of operations. |
| · | Acquisitions may require significant resources and/or result in significant unanticipated losses, costs or liabilities for the Company. |
| · | The Company may be subject to claims for damages for defective products. |
| · | The Company is subject to risks associated with environmental laws and regulations. |
ITEM 1B - UNRESOLVED STAFF COMMENTS
None.
ITEM 2 - PROPERTIES
The Company’s properties are detailed by the location, size and focus of each facility as provided in the table below:
| | | Approximate square footage | | | | | |
| Location | | Owned | | Leased | | Use | | Segment | |
| Des Moines, Iowa | | | 2,207,000 | | | | | | Manufacturing, distribution | | | All segments | |
| Freeport, Illinois | | | 1,202,000 | | | 211,000 | | | Manufacturing, distribution | | | All segments | |
| Quincy, Illinois | | | 1,134,000 | | | | | | Manufacturing, distribution | | | All segments | |
| Brownsville, Texas | | | 993,000 | | | | | | Storage | | | See note(a) | |
| Bryan, Ohio | | | 500,000 | | | | | | Manufacturing, distribution | | | All segments | |
| Walcott, Iowa | | | 378,000 | | | | | | Storage | | | See note(a) | |
| Greenwood, S. Carolina | | | 110,000 | | | | | | Storage | | | See note(a) | |
| Dublin, Georgia | | | 20,000 | | | | | | Distribution | | | All segments | |
| Saltville, Virginia | | | 14,000 | | | 245,000 | | | Manufacturing, distribution | | | Earthmoving/Construction | |
| Natchez, Mississippi | | | | | | 1,203,000 | | | Storage | | | See note(a) | |
| Cartersville, Georgia | | | | | | 169,000 | | | Distribution | | | All segments | |
| Pendergrass, Georgia | | | | | | 120,000 | | | Distribution | | | All segments | |
| Elko, Nevada | | | | | | 4,000 | | | Distribution | | | Earthmoving/Construction | |
| (a) | The Brownsville, Greenwood and Natchez facilities are currently being used for storage. The Company’s facilities in Brownsville, Texas, Greenwood, South Carolina, Natchez, Mississippi, and Walcott, Iowa, are not in operation. The Company has a contract for sale on the Walcott building. |
The Company considers each of its facilities to be in good condition and adequate for present use. Management believes that the Company has sufficient capacity to meet current market demand with the active facilities. The Company has no current plans to restart manufacturing at the storage facilities described in note (a) above.
ITEM 3 - LEGAL PROCEEDINGS
The Company is a party to routine legal proceedings arising out of the normal course of business. Although it is not possible to predict with certainty the outcome of these unresolved legal actions or the range of possible loss, the Company believes at this time that none of these actions, individually or in the aggregate, will have a material adverse effect on the consolidated financial condition, results of operations or cash flows of the Company. However, due to the difficult nature of predicting future legal claims, the Company cannot anticipate or predict the material adverse effect on its consolidated financial condition, results of operations or cash flows as a result of efforts to comply with or its liabilities pertaining to legal judgments.
ITEM 4 - SUBMISSION OF MATTERS TO A VOTE OF SECURITY HOLDERS
No matters were submitted to the vote of security holders during the fourth quarter of 2006.
PART II
ITEM 5 - MARKET FOR THE REGISTRANT’S COMMON EQUITY, RELATED STOCKHOLDER MATTERS AND ISSUER PURCHASES OF EQUITY SECURITIES
The Company’s common stock is traded on the New York Stock Exchange (NYSE) under the symbol TWI. On February 15, 2007, there were approximately 800 holders of record of Titan common stock and an estimated 2,800 beneficial stockholders. The following table sets forth the high and low sales prices per share of common stock as reported on the NYSE, as well as information concerning per share dividends declared for the periods indicated.
2006 | | High | | Low | | Dividends Declared | |
| First quarter | | $ | 17.64 | | $ | 16.55 | | $ | 0.005 | |
| Second quarter | | | 19.76 | | | 16.20 | | | 0.005 | |
| Third quarter | | | 19.40 | | | 16.65 | | | 0.005 | |
| Fourth quarter | | | 20.85 | | | 17.52 | | | 0.005 | |
| | | | | | | | | | | |
2005 | | | | | | | | | | |
| First quarter | | $ | 15.45 | | $ | 12.30 | | $ | 0.005 | |
| Second quarter | | | 15.85 | | | 13.12 | | | 0.005 | |
| Third quarter | | | 14.58 | | | 12.64 | | | 0.005 | |
| Fourth quarter | | | 18.17 | | | 13.15 | | | 0.005 | |
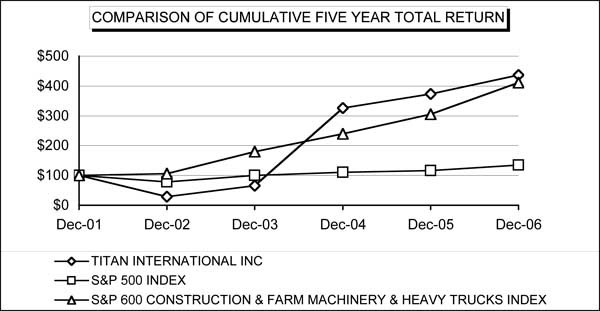
PERFORMANCE COMPARISON GRAPH
The following performance graph compares cumulative total return for the Company’s common stockholders over the past five years against the cumulative total return of the Standard & Poor’s 500 Stock Index, and against the Standard & Poor’s 600 Construction and Farm Machinery and Heavy Trucks Index. The graph depicts the value on December 31, 2006, of a $100 investment made on December 31, 2001, in Company common stock and each of the other two indices, with all dividends reinvested. The Company’s common stock is currently traded on the New York Stock Exchange under the symbol TWI.
Fiscal Year Ended December 31,
| | | 2001 | | 2002 | | 2003 | | 2004 | | 2005 | | 2006 | |
| Titan International, Inc. | | $ | 100.00 | | $ | 28.49 | | $ | 65.97 | | $ | 326.28 | | $ | 373.25 | | $ | 436.47 | |
| S&P 500 Index | | | 100.00 | | | 77.90 | | | 100.25 | | | 111.15 | | | 116.61 | | | 135.03 | |
| S&P 600 Const. & Farm Machinery Index | | | 100.00 | | | 106.30 | | | 179.20 | | | 240.18 | | | 305.31 | | | 411.72 | |
ITEM 6 - SELECTED FINANCIAL DATA
The selected financial data presented below, as of and for the years ended December 31, 2006, 2005, 2004, 2003, and 2002, are derived from the Company’s consolidated financial statements, as audited by PricewaterhouseCoopers LLP, an independent registered public accounting firm, and should be read in conjunction with the Company’s audited consolidated financial statements and notes thereto.
(All amounts in thousands, except per share data)
| | | Year Ended December 31, | |
| | | 2006 | | 2005 | | 2004 | | 2003 | | 2002 | |
| Net sales | | $ | 679,454 | | $ | 470,133 | | $ | 510,571 | | $ | 491,672 | | $ | 462,820 | |
| Gross profit | | | 72,778 | | | 64,210 | | | 79,500 | | | 29,703 | | | 29,741 | |
| Income (loss) from operations | | | 22,011 | | | 11,999 | | | 33,322 | | | (16,220 | ) | | (14,086 | ) |
| Income (loss) before income taxes | | | 8,574 | | | (2,885 | ) | | 15,215 | | | (33,668 | ) | | (44,293 | ) |
| Net income (loss) | | | 5,144 | | | 11,042 | | | 11,107 | | | (36,657 | ) | | (35,877 | ) |
| Net income (loss) per share - basic | | | .26 | | | .61 | | | .62 | | | (1.75 | ) | | (1.73 | ) |
| Net income (loss) per share - diluted | | | .26 | | | .60 | | | .61 | | | (1.75 | ) | | (1.73 | ) |
| Dividends declared per common share | | | .02 | | | .02 | | | .02 | | | .02 | | | .02 | |
| | | | |
| (All amounts in thousands) | | As of December 31, | |
| | | 2006 | | 2005 | | 2004 | | 2003 | | 2002 | |
| Working capital | | $ | 247,009 | | $ | 157,984 | | $ | 114,898 | (a) | $ | 183,971 | | $ | 170,263 | |
| Current assets | | | 309,933 | | | 206,167 | | | 154,668 | (a) | | 286,946 | | | 254,569 | |
| Total assets | | | 585,126 | | | 440,756 | | | 354,166 | (a) | | 523,084 | | | 531,999 | |
| Long-term debt (b) | | | 291,266 | | | 190,464 | | | 169,688 | (a) | | 248,397 | | | 249,119 | |
| Stockholders’ equity | | | 187,177 | | | 167,813 | | | 106,881 | (a) | | 111,956 | | | 144,027 | |
(a) Amounts were affected by the April 2004 sale of a majority interest in Titan Europe, which is no longer consolidated. (b) Excludes amounts due within one year and classified as a current liability. |
ITEM 7 - MANAGEMENT’S DISCUSSION AND ANALYSIS OF FINANCIAL CONDITION AND RESULTS OF OPERATIONS
MANAGEMENT’S DISCUSSION AND ANALYSIS
Management’s discussion and analysis of financial condition and results of operations (MD&A) is designed to provide readers of these financial statements with a narrative from the perspective of the management of Titan International, Inc. (Titan or the Company) on Titan’s financial condition, results of operations, liquidity and other factors which may affect the Company’s future results.
FORWARD-LOOKING STATEMENTS
This Form 10-K contains forward-looking statements, including statements regarding, among other items:
| · | Anticipated trends in the Company’s business |
| · | Future expenditures for capital projects |
| · | The Company’s ability to continue to control costs and maintain quality |
| · | Ability to meet financial covenants and conditions of loan agreements |
| · | The Company’s business strategies, including its intention to introduce new products |
| · | Expectations concerning the performance and success of the Company’s existing and new products |
| · | The Company’s intention to consider and pursue acquisitions and divestitures |
Readers of this Form 10-K should understand that these forward-looking statements are based on the Company’s expectations and are subject to a number of risks and uncertainties, certain of which are beyond the Company’s control.
Actual results could differ materially from these forward-looking statements as a result of certain factors, including:
| · | Changes in the Company’s end-user markets as a result of world economic or regulatory influences |
| · | Fluctuations in currency translations |
| · | Changes in the marketplace, including new products and pricing changes by the Company’s competitors |
| · | Availability and price of raw materials |
| · | Levels of operating efficiencies |
| · | Actions of domestic and foreign governments |
| · | Ability to secure financing at reasonable terms |
Any changes in such factors could lead to significantly different results. The Company undertakes no obligation to publicly update or revise any forward-looking statements, whether as a result of new information, future events or otherwise. In light of these risks and uncertainties, there can be no assurance that the forward-looking information contained in this document will in fact transpire.
OVERVIEW
Titan International, Inc. and its subsidiaries are leading manufacturers of wheels, tires and assemblies for off-highway vehicles used in the agricultural, earthmoving/construction and consumer markets. Titan’s earthmoving/construction market also includes products supplied to the U.S. government, while the consumer market includes products for all-terrain vehicles (ATVs) and recreational/utility trailer applications. Titan manufactures both wheels and tires for the majority of these market applications, allowing the Company to provide the value-added service of delivering complete wheel and tire assemblies. The Company offers a broad range of products that are manufactured in relatively short production runs to meet the specifications of original equipment manufacturers (OEMs) and/or the requirements of aftermarket customers.
The Company’s major OEM customers include large manufacturers of off-highway equipment such as AGCO Corporation, Caterpillar Inc., CNH Global N.V., Deere & Company and Kubota Corporation, in addition to many other off-highway equipment manufacturers. The Company distributes products to OEMs, independent and OEM-affiliated dealers, and through a network of distribution facilities.
The following table provides highlights for the year ended December 31, 2006, compared to 2005 (amounts in thousands):
| | | 2006 | | 2005 | | % Increase (Decrease) | |
| Net sales | | $ | 679,454 | | $ | 470,133 | | | 45 | % |
| Income from operations | | | 22,011 | | | 11,999 | | | 83 | % |
| Net income | | | 5,144 | | | 11,042 | | | (53 | %) |
The Company recorded sales of $679.5 million for 2006, which were 45% higher than 2005 sales of $470.1 million. The significantly higher sales level was attributed to the expanded agricultural product offering of Goodyear branded farm tires and the expanded earthmoving, construction and mining product offering of Continental & General branded off-the-road (OTR) tires. These product offerings came with the added manufacturing capacity from the Freeport, Illinois, facility, which was acquired in December 2005, and the Bryan, Ohio, OTR facility, which was acquired in July 2006.
Income from operations was $22.0 million for 2006 as compared to $12.0 million in 2005. Titan’s net income was $5.1 million for 2006, compared to $11.0 million in 2005. Basic earnings per share were $.26 in 2006, compared to $.61 in 2005. The Company’s net income was lower in 2006 as compared to 2005 as the result of a higher effective tax rate of 40% in 2006 as compared to a tax benefit recorded in 2005, resulting in an increase in income tax expense of $17.4 million in 2006 when compared to 2005.
RECENT DEVELOPMENTS
Convertible Note Conversion Offer
In January 2007, the Company filed a registration statement relating to an offer to the holders of its 5.25% senior unsecured convertible notes due 2009 to convert their notes into Titan’s common stock at an increased conversion rate (the “Conversion Offer”). Per the Offer, each $1,000 principal amount of notes is convertible into 81.0000 shares of common stock, which is equivalent to a conversion price of approximately $12.35 per share. The offering price set forth will not include accrued interest; therefore, no accrued interest will be paid on the notes that accept this offering. Prior to the Offer, each $1,000 principal amount of notes was convertible into 74.0741 shares of common stock, which was equivalent to a conversion price of approximately $13.50 per share. The registration statement relating to the shares of common stock to be offered was declared effective on February 21, 2007. The offer is scheduled to expire on March 20, 2007, unless extended or terminated.
Credit Facility Amendment
On February 8, 2007, the Company amended its revolving credit facility with LaSalle Bank National Association. The amendment extended the termination date to October 2009 (previously October 2008). The amendment also lowered borrowing rates, which will be based on a pricing grid. The borrowings under the facility will bear interest at a floating rate of LIBOR plus 1% to 2% (previously 2.75%). The amendment lowered the revolving loan availability from $250 million to $125 million with the ability to request an increase back to $250 million.
RESULTS OF OPERATIONS
The following table sets forth the Company’s statement of operations expressed as a percentage of net sales for the periods indicated. This table and subsequent discussions should be read in conjunction with the Company’s audited consolidated financial statements and notes thereto.
As a Percentage of Net Sales
Year ended December 31,
| | | 2006 | | 2005 | | 2004 | |
| Net sales | | | 100.0 | % | | 100.0 | % | | 100.0 | % |
| Cost of sales | | | 89.3 | | | 86.3 | | | 84.4 | |
| Gross profit | | | 10.7 | | | 13.7 | | | 15.6 | |
| | | | | | | | | | | |
| Selling, general and administrative expenses | | | 6.2 | | | 6.9 | | | 7.5 | |
| Royalty expense | | | 0.7 | | | 0.0 | | | 0.0 | |
| Idled assets marketed for sale depreciation | | | 0.5 | | | 1.0 | | | 1.0 | |
| Dyneer legal charge | | | 0.0 | | | 3.2 | | | 0.0 | |
| Goodwill impairment on Titan Europe | | | 0.0 | | | 0.0 | | | 0.6 | |
| Income from operations | | | 3.3 | | | 2.6 | | | 6.5 | |
| | | | | | | | | | |
| Interest expense | | | (2.5 | ) | | (1.8 | ) | | (3.2 | ) |
| Noncash convertible debt conversion charge | | | 0.0 | | | (1.6 | ) | | 0.0 | |
| Debt termination expense | | | 0.0 | | | 0.0 | | | (0.7 | ) |
| Other income, net | | | 0.5 | | | 0.2 | | | 0.4 | |
| Income (loss) before income taxes | | | 1.3 | | | (0.6 | ) | | 3.0 | |
| Provision (benefit) for income taxes | | | 0.5 | | | (2.9 | ) | | 0.8 | |
| Net income | | | 0.8 | % | | 2.3 | % | | 2.2 | % |
In addition, the following table sets forth components of the Company’s net sales classified by segment for the years ended December 31, (in thousands):
| | | 2006 | | 2005 | | 2004 | |
| Agricultural | | $ | 421,096 | | $ | 310,361 | | $ | 316,235 | |
| Earthmoving/Construction | | | 183,357 | | | 131,982 | | | 160,297 | |
| Consumer | | | 75,001 | | | 27,790 | | | 34,039 | |
| Total | | $ | 679,454 | | $ | 470,133 | | $ | 510,571 | |
The following is a summary of the Titan Europe results included in the historical results of the Company for the years ended December 31, (in thousands):
| | | 2006 (a) | | 2005 (a) | | 2004 (a) | |
| Agricultural | | $ | 0 | | $ | 0 | | $ | 24,264 | |
| Earthmoving/Construction | | | 0 | | | 0 | | | 23,460 | |
| Consumer | | | 0 | | | 0 | | | 1,722 | |
| Total | | $ | 0 | | $ | 0 | | $ | 49,446 | |
| (a) | Majority interest in Titan Europe sold in April 2004. |
SENIOR UNSECURED NOTES
In December 2006, the Company closed its offering of $200 million 8% senior unsecured notes. The notes were sold at par and are due January 2012. Titan used the net proceeds from this offering to repay outstanding existing debt at the time of closing, excluding the 5.25 percent senior unsecured convertible notes. The outstanding balance on the Company’s revolving credit facility was paid down in December and had no cash borrowings at December 31, 2006. The Company anticipates paying off approximately $10 million of industrial revenue bonds in the first quarter of 2007 and will use the remaining cash for general corporate purposes.
ACQUISITION OF CONTINENTAL’S OTR ASSETS
On July 31, 2006, Titan Tire Corporation of Bryan, a subsidiary of Titan International, Inc., acquired the off-the-road (OTR) tire assets of Continental Tire North America, Inc. (Continental) in Bryan, Ohio. Titan Tire Corporation of Bryan purchased the assets of Continental’s OTR tire facility for approximately $53 million in cash proceeds. The assets purchased included Continental’s OTR plant, property and equipment located in Bryan, Ohio, inventory and other current assets. The acquisition included an agreement with Continental to use the Continental and General trademarks on OTR tires. In addition, the Company recorded intangibles related to the acquisition as noncurrent assets and assumed warranty liabilities. This acquisition expanded Titan’s product offering into larger earthmoving, construction and mining tires and added the manufacturing capacity of the Bryan, Ohio, facility.
The productivity obtained since startup after the July 31 acquisition date associated with the Bryan facility is meeting Titan’s current expectations. The Bryan facility achieved a manufacturing output of approximately $41 million since the July 31, 2006, acquisition date through year-end December 31, 2006.
ACQUISITION OF GOODYEAR’S NORTH AMERICAN FARM TIRE ASSETS
On December 28, 2005, Titan Tire Corporation, a subsidiary of Titan International, Inc., acquired The Goodyear Tire & Rubber Company’s North American farm tire assets. Titan Tire purchased the assets of Goodyear’s North American farm tire business for approximately $100 million in cash proceeds. The assets purchased include Goodyear’s North American plant, property and equipment located in Freeport, Illinois, and Goodyear’s North American farm tire inventory. In addition, the Company recorded intangibles related to the acquisition as noncurrent assets. This acquisition expanded Titan’s product offering into Goodyear branded farm tires and added the manufacturing capacity of the Freeport, Illinois, facility.
The productivity obtained during 2006 associated with the Freeport facility is meeting Titan’s current expectations. The Freeport facility achieved a manufacturing output of approximately $186 million during the year ended December 31, 2006.
OTR PRODUCTION REALIGNMENT
Due to capacity constraints at Titan’s Bryan, Ohio, OTR tire facility, the Company is adding OTR tire capacity at its Freeport, Illinois, and Des Moines, Iowa, facilities. Titan is aligning synergies, which includes retooling, retraining personnel and movement of equipment at the Bryan, Freeport and Des Moines facilities. This realignment decreased the Company’s gross margin for the fourth quarter of 2006 as labor costs that are normally dedicated to making products were instead used for retooling, retraining and movement of equipment.
IDLED ASSETS MARKETED FOR SALE
The idled assets marketed for sale had no balance at December 31, 2006, and a balance of $18.3 million at December 31, 2005. The idled assets marketed for sale were being depreciated in accordance with SFAS No. 144. Depreciation on these idled assets was $3.6 million, $4.7 million, and $5.3 million for the years ended December 31, 2006, 2005 and 2004, respectively.
As a result of the Goodyear North American farm tire asset acquisition and the Continental OTR asset acquisition, the Company is placing these assets back into service primarily at the Des Moines, Iowa, Freeport, Illinois, and Bryan, Ohio facilities. Therefore, the idled assets marketed for sale balance, of approximately $14 million, at December 31, 2006, was reclassified to property, plant and equipment.
TERMINATION OF CASH MERGER OFFER
On October 11, 2005, the Company received an offer from One Equity Partners LLC (One Equity), a private equity affiliate of JPMorgan Chase & Co., indicating One Equity’s interest in acquiring Titan International, Inc. in a cash merger for $18.00 per share of Titan common stock. On April 12, 2006, Titan and One Equity announced the termination of discussions regarding the proposed cash merger. On April 17, 2006, the Company’s Board of Directors met and thanked the Special Committee, which had been formed to pursue discussions regarding One Equity’s proposed cash merger, for all their efforts expended and agreed that their Special Committee responsibilities have been completed.
CONVERTIBLE NOTE CONVERSION
In June of 2005, Titan finalized a private transaction in which the Company issued 3,022,275 shares of common stock in exchange for the cancellation of $33.8 million principal amount of the Company’s outstanding 5.25% senior convertible notes due 2009, as proposed to the Company by certain note holders. Titan recognized a noncash charge of $7.2 million in connection with this exchange in accordance with SFAS No. 84, “Induced Conversions of Convertible Debt.”
SALE OF A MAJORITY INTEREST IN TITAN EUROPE
In April 2004, Titan Luxembourg Sarl, a wholly-owned European subsidiary of the Company, sold 70% of the common stock of Titan Europe to the public on the AIM market in London. Titan Luxembourg was the largest single stockholder in Titan Europe Plc, retaining a 30% interest on the date of the transaction. In the first quarter of 2004, the Company recognized a $3.0 million goodwill impairment charge on the pending sale of a majority interest in Titan Europe in accordance with the Company’s goodwill impairment process. The historical results of the Company for the year ended December 31, 2004, included Titan Europe results of $49.4 million in net sales, $8.3 million in gross profit and $0.4 million in income from operations.
The Company accounted for its interest in Titan Europe Plc as an equity investment subsequent to the sale of a majority interest in April 2004. The Company recognized equity income on its investment in Titan Europe Plc of $2.9 million in 2005 and $1.3 million in 2004. In December 2005, Titan Europe Plc issued additional shares of stock for an acquisition. As a result of these additional shares, the Company’s interest in Titan Europe Plc was diluted and decreased from 29.3% at December 31, 2004, to a 15.4% ownership position at December 31, 2005. The Company recorded the gain resulting from the change in ownership interest to equity in accordance with SAB 51. With the decreased ownership percentage, effective December 2005, the Company no longer uses the equity method to account for its interest in Titan Europe Plc.
In accordance with SFAS No. 115, the Company records the Titan Europe Plc investment as an available-for-sale security and reports the investment at fair value, with unrealized gains and losses excluded from earnings and reported as a separate component of comprehensive income in stockholders’ equity. The Company’s stock ownership interest in Titan Europe Plc was 17.3% at December 31, 2006, and 15.4% at December 31, 2005. The increase in ownership percentage resulted from a December 2006 transaction in which Titan Europe Plc issued additional shares to the Company in payment of approximately $7.9 million U.S. dollars of debt, representing the entire remaining long-term debt owed by Titan Europe Plc to the Company. The fair value of the Company’s investment in Titan Europe Plc was $65.9 million and $48.5 million at December 31, 2006 and 2005, respectively. Cash dividends received from Titan Europe Plc were $1.3 million, $0.9 million and $0.3 million for the years ended December 31, 2006, 2005 and 2004, respectively. Titan Europe Plc is publicly traded on the AIM market in London, England.
CRITICAL ACCOUNTING ESTIMATES
Preparation of the financial statements and related disclosures in compliance with accounting principles generally accepted in the United States of America requires the application of appropriate technical accounting rules and guidance, as well as the use of estimates. The Company’s application of these policies involves assumptions that require difficult subjective judgments regarding many factors, which, in and of themselves, could materially impact the financial statements and disclosures. A future change in the estimates, assumptions or judgments applied in determining the following matters, among others, could have a material impact on future financial statements and disclosures.
Inventories
Inventories are valued at the lower of cost or market. Cost is determined using the first-in, first-out (FIFO) method in 2006 for approximately 74% of inventories and the last-in, first-out (LIFO) method for approximately 26% of inventories. The major rubber material inventory and related work-in-process and their finished goods are accounted for under the FIFO method. The major steel material inventory and related work-in-process and their finished goods are accounted for under the LIFO method. Market value is estimated based on current selling prices. Estimated provisions are established for excess and obsolete inventory, as well as inventory carried above market price based on historical experience. Should this experience change, adjustments to the estimated provisions would be necessary.
Impairment of Goodwill
The Company reviews goodwill to assess recoverability from future operations during the fourth quarter of each annual reporting period, and whenever events and circumstances indicate that the carrying values may not be recoverable. The Company’s goodwill was $11.7 million at December 31, 2006 and 2005. Significant assumptions relating to future operations must be made when estimating future cash flows in analyzing goodwill for impairment. Should unforeseen events occur or operating trends change significantly, impairment losses could occur.
Valuation of Investment Accounted for as Available-for-Sale Security
The Company has an investment in Titan Europe Plc of $65.9 million as of December 31, 2006, representing a 17.3% ownership position. Titan Europe Plc is publicly traded on the AIM market in London, England. This investment is recorded as “Investment in Titan Europe Plc” on the consolidated balance sheet. In accordance with SFAS No. 115, the Company records the Titan Europe Plc investment as an available-for-sale security and reports this investment at fair value, with unrealized gains and losses excluded from earnings and reported in a separate component of stockholders’ equity. Should the fair value decline below the cost basis, the Company would be required to determine if this decline is other than temporary. If the decline in fair value were judged to be other than temporary, an impairment charge would be recorded. Should unforeseen events occur or investment trends change significantly, impairment losses could occur. Declared dividends on this investment are recorded in income as a component of other income.
Income taxes
Deferred income tax provisions are determined using the liability method whereby deferred tax assets and liabilities are recognized based upon temporary differences between the financial statement and income tax basis of assets and liabilities. The Company assesses the realizability of its deferred tax asset positions to determine if a valuation allowance is necessary.
Asset and Business Acquisitions
The allocation of purchase price for asset and business acquisitions requires management estimates and judgment as to expectations for future cash flows of the acquired assets and business and the allocation of those cash flows to identifiable intangible assets in determining the estimated fair value for purchase price allocations. If the actual results differ from the estimates and judgments used in determining the purchase price allocations, impairment losses could occur relating to any intangibles recorded in the acquisition. To aid in establishing the value of any intangible assets at the time of acquisition, the Company typically engages a professional appraisal firm.
Retirement Benefit Obligations
Pension benefit obligations are based on various assumptions used by third-party actuaries in calculating these amounts. These assumptions include discount rates, expected return on plan assets, mortality rates and other factors. Revisions in assumptions and actual results that differ from the assumptions affect future expenses, cash funding requirements and obligations. The Company has two frozen defined benefit pension plans and one defined benefit plan that purchased a final annuity settlement in 2002. The Company expects to contribute approximately $5 million to these frozen defined benefit pension plans in 2007. For more information concerning these costs and obligations, see the discussion of the “Pensions” and Note 21 to the Company’s financial statements.
The effect of hypothetical changes to selected assumptions on the Company’s frozen pension benefit obligations would be as follows (in thousands):
| | | December 31, 2006 | | 2007 |
| | | Increase | Increase | | Increase |
| | Percentage | (Decrease) | (Decrease) | | (Decrease) |
| Assumptions | Change | PBO (a) | Equity (b) | | Expense |
| Pension | | | | | |
| Discount rate (c) | +/-.5 | $(2,876)/$3,113 | $2,876/$(3,113) | | $(74)/$76 |
| Expected return on assets | +/-.5 | | | | $(296)/$296 |
| (a) | Projected benefit obligation (PBO) for pension plans. |
| (b) | Pretax minimum pension liability adjustment. |
| (c) | Pretax impact on service cost, interest cost and amortization of gains or losses. |
FISCAL YEAR ENDED DECEMBER 31, 2006, COMPARED TO FISCAL YEAR ENDED
DECEMBER 31, 2005
RESULTS OF OPERATIONS
The following tables and discussions provide highlights for the year ended December 31, 2006, compared to 2005 (amounts in thousands):
| | | 2006 | | 2005 | | % Increase | |
| Net sales | | $ | 679,454 | | $ | 470,133 | | | 45 | % |
| Gross profit | | | 72,778 | | | 64,210 | | | 13 | % |
Gross profit percentage | | | 10.7 | % | | 13.7 | % | | | |
Net Sales
Net sales for the year ended December 31, 2006, were $679.5 million compared to $470.1 million for the year ended December 31, 2005. The large sales improvement of $209.4 million, or 45%, for the year ended December 31, 2006, was attributed to the expanded agricultural product offering of Goodyear branded farm tires and the expanded earthmoving, construction and mining product offering of Continental & General branded off-the-road (OTR) tires. These product offerings came with the added manufacturing capacity from the Freeport, Illinois, facility, which was approximately $186 million in 2006, and the Bryan, Ohio, OTR facility, which was approximately $41 million since the acquisition date of July 31, 2006.
Cost of Sales and Gross Profit
Cost of sales was $606.7 million for the year ended December 31, 2006, as compared to $405.9 million in 2005. Gross profit for the year 2006 was $72.8 million or 10.7% of net sales, compared to $64.2 million, or 13.7% of net sales for 2005. Due to capacity constraints at Titan’s Bryan, Ohio, OTR tire facility, the Company is adding OTR tire capacity at its Freeport, Illinois, and Des Moines, Iowa, tire facilities. Titan is aligning synergies, which includes retooling, retraining personnel and movement of equipment at the Bryan, Freeport and Des Moines facilities. These realignment costs of approximately $9 million to $11 million lowered the Company’s gross profit for the fourth quarter of 2006, as labor costs that are normally dedicated to making products were instead used for retooling, retraining and movement of equipment. These costs resulted in an approximate 2% reduction in the annual gross profit percentage.
Administrative Expenses
Selling, general and administrative expenses were as follows (amounts in thousands):
| | | 2006 | | 2005 | | % Increase | |
| Selling, general and administrative | | $ | 42,142 | | $ | 32,270 | | | 31 | % |
Percentage of net sales | | | 6.2 | % | | 6.9 | % | | | |
Selling, general and administrative (SG&A) expenses were $42.1 million or 6.2% of net sales for the year ended December 31, 2006, as compared to $32.3 million or 6.9% of net sales for 2005. Research and development (R&D) expenses, which were previously shown separately, have been combined with the SG&A expenses due to the reduced level of R&D expenditures. R&D expenses were $1.3 million and $0.8 million for the years ended December 31, 2006 and 2005, respectively. SG&A expenses for the year ended December 31, 2006, were approximately $5 million higher as a result of the Freeport and Bryan acquisitions and their associated selling expenses. However, as a result of the higher sales levels, SG&A expenses decreased by approximately 1% when expressed as a percentage of net sales.
Royalty Expense
Royalty expense was as follows (amounts in thousands):
| | | 2006 | | 2005 | | % Increase | |
| Royalty expense | | $ | 5,001 | | $ | 0 | | | n/a | |
The December 2005 Goodyear North American farm tire asset acquisition included a license agreement with The Goodyear Tire & Rubber Company to manufacture and sell certain off-highway tires in North America. Royalty expenses for the year ended December 31, 2006, were $5.0 million. No royalty expense was recorded in the year ended December 31, 2005, as this license agreement was not yet in place.
Idled Assets Marketed for Sale
Idled asset marketed for sale depreciation was as follows (amounts in thousands):
| | | 2006 | | 2005 | | % Decrease | |
| Idled assets depreciation | | $ | 3,624 | | $ | 4,736 | | | (23 | %) |
The Company’s profit margins have been negatively affected by the depreciation associated with the idled assets marketed for sale. The Company incurred $3.6 million and $4.7 million in depreciation related to the idled assets for the years ended December 31, 2006 and 2005, respectively. As a result of the Goodyear North American farm tire asset acquisition and the Continental OTR asset acquisition, the Company is placing these assets back into service primarily at the Des Moines, Iowa, Freeport, Illinois, and Bryan, Ohio facilities. Therefore, in December 2006, the idled assets balance of approximately $14 million was reclassified to property, plant and equipment, leaving no balance at December 31, 2006.
Dyneer Legal Charge
The State Court of California in 2005 allowed the disbursement of restricted cash funds held in the Vehicular Technologies case. In 2005, Titan recognized the Dyneer legal charge of approximately $15.2 million for the judgment related to this case, which is now closed.
Income from Operations
Income from operations was as follows (amounts in thousands):
| | | 2006 | | 2005 | | % Increase | |
| Income from operations | | $ | 22,011 | | $ | 11,999 | | | 83 | % |
Percentage of net sales | | | 3.2 | % | | 2.6 | % | | | |
Income from operations for the year ended December 31, 2006, was $22.0 million or 3.2% of net sales, compared to $12.0 million or 2.6% in 2005. Income from operations was affected by the items previously discussed in the cost of sales, administrative, royalty, idled assets, and legal charge line items.
Interest Expense
Interest expense was as follows (amounts in thousands):
| | | 2006 | | 2005 | | % Increase | |
| Interest expense | | $ | 17,001 | | $ | 8,617 | | | 97 | % |
Net interest expense for the year 2006 was $17.0 million compared to $8.6 million in 2005. The Company’s average debt balances in 2006 were substantially higher when compared to 2005. The average 2006 debt balances were higher with the Goodyear farm asset acquisition of approximately $100 million and the Continental OTR asset acquisition of approximately $53 million. These higher average debt balances in 2006 resulted in an increase in interest expense of approximately $5 million when compared to 2005. The Company’s average interest rates were 7.7% in 2006, compared to 6.2% in 2005, resulting in an increase in interest expense of approximately $3 million.
Noncash Convertible Debt Conversion Charge
In June 2005, Titan finalized a private transaction in which the Company issued 3,022,275 shares of common stock in exchange for the cancellation of $33.8 million principal amount of the Company’s outstanding 5.25% senior convertible notes due 2009, as proposed to the Company by certain note holders. The Company recognized a noncash charge of $7.2 million in connection with this exchange in accordance with SFAS No. 84, “Induced Conversions of Convertible Debt.”
Other Income
Other income was as follows (amounts in thousands):
| | | 2006 | | 2005 | | % Increase | |
| Other income | | $ | 3,564 | | $ | 958 | | | 272 | % |
Other income of $3.6 million in 2006 included (i) interest income of $1.7 million, (ii) dividend income from the Titan Europe Plc investment of $1.3 million, (iii) currency exchange gain of $1.0 million and (iv) other expense of $0.4 million. The $3.6 million of other income in 2006 compares to $1.0 million in 2005.
Income Tax Expense
The Company recorded an income tax expense of $3.4 million in 2006 as compared to an income tax benefit of $13.9 million in 2005. As a result of several years of previous losses, the Company recorded a valuation allowance against its net deferred tax asset, consistent with the Company’s accounting policies. As a result of anticipated utilization of net operating loss carryforward in connection with its future Federal income tax filings, the Company recorded a tax benefit of $13.9 million in 2005 as a result of the reversal of the Company’s valuation allowance in accordance with SFAS 109. The Company’s net operating loss carryforward of approximately $32 million expires in 2023.
Net Income
Net income was as follows (amounts in thousands):
| | | 2006 | | 2005 | | % Decrease | |
| Net income | | $ | 5,144 | | $ | 11,042 | | | (53 | %) |
Net income for the year ended December 31, 2006, was $5.1 million, compared to $11.0 million in 2005. Basic earnings per share were $.26 for the year ended December 31, 2006, as compared to $.61 in 2005. Diluted earnings per share were $.26 for the year ended December 31, 2006, as compared to $.60 in 2005.
Agricultural Segment Results
Agricultural segment results were as follows (amounts in thousands):
| | | 2006 | | 2005 | | % Increase (Decrease) | |
| Net sales | | $ | 421,096 | | $ | 310,361 | | | 36 | % |
| Income from operations | | | 27,351 | | | 31,750 | | | (14 | %) |
Net sales in the agricultural market were $421.1 million for the year ended December 31, 2006, as compared to $310.4 million in 2005. The expanded product offering of Goodyear branded farm tires, along with the added manufacturing capacity from the Freeport, Illinois, facility accounted for the agricultural market higher sales levels.
Income from operations in the agricultural market was $27.4 million for the year 2006 as compared to $31.8 million in 2005. The decrease in income from operations in the agricultural market was attributed to higher sales volumes in relation to higher fixed overhead costs including fourth quarter of 2006 costs normally dedicated to making products were instead used for retooling, retraining and movement of equipment.
Earthmoving/Construction Segment Results
Earthmoving/construction segment results were as follows (amounts in thousands):
| | | 2006 | | 2005 | | % Increase | |
| Net sales | | $ | 183,357 | | $ | 131,982 | | | 39 | % |
| Income from operations | | | 21,837 | | | 17,664 | | | 24 | % |
The Company’s earthmoving/construction market net sales were $183.4 million for the year ended December 31, 2006, as compared to $132.0 million in 2005. The expanded product offering of the Continental and General brands for OTR tires, along with added manufacturing capacity from the Bryan, Ohio, facility accounted for the earthmoving/construction market higher sales levels in 2006. These sales increases were offset by a decrease in sales to the United States government, which were approximately $21 million lower in 2006 as compared to 2005. Sales to the United States government are dependent on government appropriations and have a tendency for significant fluctuations.
The Company’s earthmoving/construction market income from operations was $21.8 million for the year 2006, up from $17.7 million in 2005. The Bryan, Ohio, facility produces tires for earthmoving, construction, and mining machinery in sizes larger than the Company was able to produce before this facility was acquired on July 31, 2006. The increase in income from operations in the earthmoving/construction segment is the result of margins realized on these larger earthmoving, construction and mining tires.
Consumer Segment Results
Consumer segment results were as follows (amounts in thousands):
| | | 2006 | | 2005 | | % Increase (Decrease) | |
| Net sales | | $ | 75,001 | | $ | 27,790 | | | 170 | % |
| Income from operations | | | 1,655 | | | 1,825 | | | (9 | %) |
Consumer market net sales were $75.0 million for the year ended December 31, 2006, as compared to $27.8 million in 2005. The Goodyear farm tire acquisition included an off-take/mixing agreement for certain product sales to Goodyear, the majority of which are included in the consumer segment. Sales to The Goodyear Tire and Rubber Company under this agreement of approximately $48 million in 2006 were the reason for the substantial increase in consumer market sales. Consumer market income from operations remained stable at $1.7 million for the year 2006 as compared to $1.8 million in 2005.
Corporate Expenses
Income from operations on a segment basis does not include corporate expenses or depreciation and amortization expense related to property, plant and equipment carried at the corporate level totaling $28.8 million for the year ended December 31, 2006, as compared to $24.0 million in 2005. The increase in corporate expenses related primarily to higher sales and marketing expenses related to the acquisition of Freeport and Bryan of approximately $3 million for 2006 as compared to 2005.
FISCAL YEAR ENDED DECEMBER 31, 2005, COMPARED TO FISCAL YEAR ENDED
DECEMBER 31, 2004
RESULTS OF OPERATIONS
The following table provides highlights for the year ended December 31, 2005, compared to 2004
(amounts in thousands, except per share data):
| | | 2005 | | 2004 | |
| | | | | | | | |
| Net sales | | $ | 470,133 | | $ | 510,571 | |
| Gross profit | | | 64,210 | | | 79,500 | |
Gross profit percentage | | | 13.7 | % | | 15.6 | % |
Income from operations | | | 11,999 | | | 33,322 | |
| Net income | | | 11,042 | | | 11,107 | |
Earnings per share - Basic | | | .61 | | | .62 | |
Earnings per share - Diluted | | | .60 | | | .61 | |
The following is a summary of the Titan Europe results included in the historical results of the Company for the year ended December 31, 2005, compared to 2004 (amounts in thousands, except per share data):
| | | 2005 (a) | | 2004 (a) | |
| | | | | | |
| Net sales | | $ | 0 | | $ | 49,446 | |
| Gross profit | | | 0 | | | 8,272 | |
Gross profit percentage | | | 0.0 | % | | 16.7 | % |
Income from operations | | | 0 | | | 420 | |
| (a) | A majority interest in Titan Europe sold in April 2004. |
Net Sales
Net sales for the year ended December 31, 2005, were $470.1 million compared to $510.6 million for the year ended December 31, 2004. Had the sale of the majority interest in Titan Europe occurred on January 1, 2004, pro forma net sales would have been $470.1 million and $461.1 million for the years ended December 31, 2005 and 2004, respectively. Sales on a comparative basis were higher by $9.0 million, a 2% increase.
Cost of Sales and Gross Profit
Cost of sales was $405.9 million for the year ended December 31, 2005, as compared to $431.1 million in 2004. Gross profit for the year 2005 was $64.2 million or 13.7% of net sales, compared to $79.5 million, or 15.6% of net sales for 2004. Had the sale of the majority interest in Titan Europe occurred on January 1, 2004, pro forma gross profit would have been $71.2 million, or 15.4% of net sales for 2004. Gross profit was negatively impacted by higher raw material and energy costs. Raw material and energy costs increased by approximately $7 million in 2005 over 2004, accounting for a gross profit decrease of 1.7% of net sales.
Administrative Expenses
Selling, general and administrative (SG&A) and research and development (R&D) expenses were $32.3 million or 6.9% of net sales for the year ended December 31, 2005, as compared to $37.9 million or 7.4% of net sales for 2004. Administrative expenses as a percentage of net sales were positively impacted by the sale of a majority interest in Titan Europe, which had administrative expenses that averaged 10% to 11% on a historical basis. Titan Europe administrative expenses of $7.9 million were included in 2004.
Idled Assets Marketed for Sale
The Company’s profit margins have been negatively affected by the depreciation associated with the idled assets marketed for sale. The idled assets balance at December 31, 2005, was $18.3 million. Included in the December 31, 2005, balance is land and a building at the Company’s idled facility in Greenwood, South Carolina, of $1.9 million. Machinery and equipment located at the Company’s idled facilities in Brownsville, Texas, and Natchez, Mississippi, totaling $16.4 million are also included in idled assets at December 31, 2005. With the sales process extending more than 12 months, the idled assets were depreciated during the fourth quarter of 2004 in accordance with SFAS No. 144, and the Company incurred $4.7 million and $5.3 million in depreciation related to the idled assets for the years ended December 31, 2005 and 2004, respectively.
Dyneer Legal Charge
The State Court of California in 2005 allowed the disbursement of the $24.5 million of restricted cash funds held in the Vehicular Technologies case. In 2005, Titan recognized the Dyneer legal charge of approximately $15.2 million for the judgment related to this case, which is now closed. The Company received $4.3 million of the cash funds.
Income from Operations
Income from operations for the year ended December 31, 2005, was $12.0 million or 2.6% of net sales, compared to $33.3 million or 6.5% in 2004. Excluding the Dyneer legal charge, income from operations for the year ended December 31, 2005, was $27.2 million or 5.8% of net sales. The Company recognized a $3.0 million goodwill impairment charge in the first quarter of 2004 on the pending sale of a majority interest in Titan Europe in accordance with the Company’s goodwill impairment process. The decreased income from operations in 2005 as compared to 2004 resulted primarily from the decreased gross profit of $15.3 million and the Dyneer legal charge of $15.2 million offset by the administrative expense decrease of $5.6 million and the $3.0 million goodwill impairment charge in 2004.
Interest Expense
Net interest expense for the year 2005 was $8.6 million compared to $16.2 million in 2004. The Company’s average debt balances were approximately $83 million lower when compared to 2004, resulting in a reduction of interest expense of $6.1 million. The Company’s average interest rates were 6.2%, approximately one percentage point lower in 2005 than the average 2004 interest rate resulting in an interest savings of $1.5 million.
Noncash Convertible Debt Conversion Charge
In June 2005, Titan finalized a private transaction in which the Company issued 3,022,275 shares of common stock in exchange for the cancellation of $33.8 million principal amount of the Company’s outstanding 5.25% senior convertible notes due 2009, as proposed to the Company by certain note holders. The Company recognized a noncash charge of $7.2 million in connection with this exchange in accordance with SFAS No. 84, “Induced Conversions of Convertible Debt.”
Debt Termination Expense
In connection with the termination of the Company’s prior revolving loan agreement and term loan and the redemption of the 8.75% senior subordinated notes, Titan recorded expenses of $3.7 million in the third quarter of 2004. These expenses were related to the (i) redemption premium on the subordinated notes of $2.0 million, (ii) unamortized deferred financing fees of $1.5 million, and (iii) prepayment penalty of $0.2 million.
Other Income
Other income was $1.0 million in 2005 as compared to $1.7 million in 2004. Included in other income is equity income on the Titan Europe Plc investment of $2.9 million in 2005 as compared to $1.3 million in 2004. Currency exchange, which is also included in other income, was a loss of $1.3 million in 2005 as compared to gain of $0.5 million in 2004.
Income Tax Expense
The Company recorded an income tax benefit of $13.9 million and an income tax expense of $4.1 million for the years ended December 31, 2005 and 2004, respectively. As a result of several years of previous losses, the Company recorded a valuation allowance against its net deferred tax asset, consistent with the Company’s accounting policies. As a result of anticipated utilization of net operating loss carryforward in connection with its future Federal income tax filings, the Company recorded a tax benefit of $13.9 million as a result of the reversal of the Company’s valuation allowance.
Net Income
Net income for the year ended December 31, 2005, was $11.0 million, compared to $11.1 million in 2004. Basic earnings per share were $.61 for the year ended December 31, 2005, as compared to $.62 in 2004. Diluted earnings per share were $.60 for the year ended December 31, 2005, as compared to $.61 in 2004.
Agricultural Segment Results
Net sales in the agricultural market were $310.4 million for the year ended December 31, 2005, as compared to $316.2 million in 2004. Had the sale of the majority interest in Titan Europe occurred on January 1, 2004, net sales in the agricultural market for the year ended December 31, 2005, would have been $310.4 million, as compared to $292.0 million in 2004. Income from operations in the agricultural market was $31.8 million for the year 2005 as compared to $38.6 million in 2004. Income from operations in the agricultural market was negatively affected by higher raw material and energy costs of approximately $5 million.
Earthmoving/Construction Segment Results
The Company’s earthmoving/construction market net sales were $132.0 million for the year ended December 31, 2005, as compared to $160.3 million in 2004. Had the sale of the majority interest in Titan Europe occurred on January 1, 2004, net sales in the earthmoving/construction market for years ended December 31, 2005 and 2004, would have been $132.0 million and $136.8 million, respectively. The Company’s earthmoving/construction market income from operations was $17.7 million for the year 2005, up from $16.6 million in 2004 due to higher margins related to product mix that offset the higher raw material and energy costs of approximately $2 million.
Consumer Segment Results
Consumer market net sales were $27.8 million for the year ended December 31, 2005, as compared to $34.0 million in 2004. Had the sale of the majority interest in Titan Europe occurred on January 1, 2004, net sales in the consumer market for the years ended December 31, 2005 and 2004, would have been $27.8 million and $32.3 million, respectively. Consumer market income from operations remained relatively stable at $1.8 million for the year 2005 as compared to $1.9 million in 2004.
Foreign Subsidiaries Sales
Net sales at foreign subsidiaries were $0.0 million for the year ended December 31, 2005, as compared to $49.4 million in 2004. The sales decrease at foreign subsidiaries was due to the April 2004 sale of a majority interest in Titan Europe, which comprised all of the Company’s foreign subsidiary sales. Titan retains a 15.4% ownership in Titan Europe Plc at December 31, 2005. Titan Europe’s sales were no longer consolidated with Titan beginning in the second quarter of 2004 as a result of the ownership decrease to approximately 30% upon the April 2004 transaction.
Corporate Expenses
Income from operations on a segment basis does not include corporate expenses carried at the corporate level totaling $24.0 million for the year ended December 31, 2005, as compared to $23.8 million in 2004. The Dyneer legal charge of $15.2 million is also not included in income from operations on a segment basis.
TITAN EUROPE SEGMENT RESULTS
The following is a summary of the Titan Europe results included in the historical results of the Company for the year ended December 31, 2004 (in millions):
2004 | | Agricultural | | Earthmoving/ Construction | | Consumer | | Reconciling Items | | Consolidated Totals | |
| Revenues from external customers | | $ | 24.3 | | $ | 23.4 | | $ | 1.7 | | $ | 0.0 | | $ | 49.4 | |
| Income (loss) from operations | | | 0.8 | | | 0.5 | | | (0.1 | ) | | (0.8 | ) (a) | | 0.4 | |
| (a) | Represents corporate expenses. |
LIQUIDITY AND CAPITAL RESOURCES
Cash Flows
As of December 31, 2006, the Company had $33.4 million of cash balances within various bank accounts. This cash balance increased by $32.8 million from December 31, 2005, due to the following cash flow discussion items.
Operating cash flows
For the year ended December 31, 2006, cash of $5.5 million was used for operating activities. This usage was primarily the result of increases in accounts receivable and inventories of $26.8 million and $19.5 million, respectively, offset by an increase in other current liabilities of $13.4 million and noncash charges included in net income of $26.9 million for depreciation and amortization. Net income of $5.1 million was offset by other operating activities.
In comparison, for the year ended December 31, 2005, positive cash flows from operating activities of $22.9 million resulted primarily from net income of $11.0 million, noncash charges included in net income of $20.7 million for depreciation and amortization and a $7.2 million noncash convertible debt conversion charge offset by a noncash deferred income tax benefit of $14.5 million.
For the year ended December 31, 2004, positive cash flows from operating activities of $18.1 million resulted primarily from income of $11.1 million and noncash depreciation and amortization charges included in net income of $24.9 million offset by accounts receivable and inventories increases of $10.8 million and $8.8 million.
Investing cash flows
Net cash used for investing activities was $52.7 million in 2006, as compared to $76.7 million used in 2005 and $62.4 million positive cash flows in 2004. Titan invested $44.6 million for the Continental OTR tire acquisition in 2006, while the Company invested $100.0 million for the Goodyear North American farm tire acquisition in 2005. In 2004, the Titan Europe Plc sale provided $40.8 million in cash.
The Company invested a total of $8.3 million in capital expenditures in 2006, compared to $6.8 million in 2005 and $4.3 million in 2004. The Company estimates that capital expenditures for 2007 could range between $16 million and $18 million. A decrease in restricted cash provided $24.5 million and asset sales provided $5.5 million in 2005.
Financing cash flows
Net cash provided by financing activities in 2006 was $91.1 million. This cash was primarily provided by $88.9 million of net debt proceeds. In addition, the exercise of stock options provided $5.4 million in cash and the payment of financing fees used $3.7 million of cash. In 2005, cash of $53.3 million was provided by financing activities, the result of net debt proceeds of $53.4 million. In 2004, $85.8 million in cash was used for financing activities, primarily the result of net debt payments of $65.8 million.
Debt Covenants
The Company’s revolving credit facility contains various covenants and restrictions. The financial covenants in this agreement require that:
| · | Collateral coverage be equal to or greater than 1.20 times the outstanding revolver balance. |
| · | If the 30-day average of the outstanding revolver balance exceeds $100 million, the fixed charge coverage ratio be equal to or greater than a 1.0 to 1.0 ratio. |
Restrictions include:
| · | Limits on payments of dividends and repurchases of the Company’s stock. |
| · | Restrictions on the ability of the Company to make additional borrowings, or to consolidate, merge or otherwise fundamentally change the ownership of the Company. |
| · | Limitations on investments, dispositions of assets and guarantees of indebtedness. |
| · | Other customary affirmative and negative covenants. |
These covenants and restrictions could limit the Company’s ability to respond to market conditions, to provide for unanticipated capital investments, to raise additional debt or equity capital, to pay dividends or to take advantage of business opportunities, including future acquisitions. The failure by Titan to meet these covenants could result in the Company ultimately being in default on these loan agreements.
The Company is in compliance with these covenants and restrictions as of December 31, 2006. The collateral coverage was calculated to be 23.4 times the outstanding revolver balance at December 31, 2006.
The fixed charge coverage ratio did not apply for the quarter ended December 31, 2006. The credit facility usage was $15.7 million at December 31, 2006, consisting exclusively of letters of credit of $15.7 million with no cash borrowings.
Other Issues
The Company’s business is subject to seasonal variations in sales that affect inventory levels and accounts receivable balances. Historically, Titan tends to experience higher sales demand in the first and second quarters.
The Company’s Board of Directors authorized Titan to repurchase up to 10.0 million shares of its common stock. No Titan stock was repurchased in 2006 or 2005. The Company repurchased 7.5 million shares in prior years leaving Titan with authorization to repurchase an additional 2.5 million common shares subject to debt agreement covenants.
LIQUIDITY OUTLOOK
At December 31, 2006, the Company had unrestricted cash and cash equivalents of $33.4 million and $109.3 million of unused availability under the terms of its revolving credit facility. The availability under the Company’s $125 million revolving credit facility was reduced by $15.7 million for outstanding letters of credit. The Company estimates that capital expenditures for 2007 could range between $16 million and $18 million.
The Company has scheduled debt principal payments amounting to $0.1 million due during 2007. However, the Company anticipates paying off approximately $10 million of industrial revenue bonds in the first quarter of 2007. The Company expects to contribute approximately $5 million to its frozen defined benefit pension plans during 2007. The Company has a net operating loss carryforward of approximately $32 million, expiring in 2023, which is expected to reduce the Company’s income tax payments in the future.
Cash on hand, anticipated internal cash flows from operations and utilization of remaining available borrowings are expected to provide sufficient liquidity for working capital needs, capital expenditures, and payments required on short-term debt. However, if the Company were to exhaust all currently available working capital sources or were not to meet the financial covenants and conditions of its loan agreements, the Company’s ability to secure additional funding may be negatively impacted.
INFLATION
The Company is subject to the effect of price fluctuations. During 2006, 2005 and 2004, the Company realized price increases for purchases of steel and rubber used in the manufacture of its products. While the cost outlook for commodities used in the Company’s production is not certain, management believes it can manage these inflationary pressures by introducing appropriate sales price adjustments.
CONTRACTUAL OBLIGATIONS
The Company’s contractual obligations at December 31, 2006, consisted of the following (in thousands):
| | | Payments due by period | |
Contractual Obligations | | Total | | Less than 1 year | | 1-3 years | | 3-5 years | | More than 5 years | |
| Long-term debt (a) | | $ | 291,364 | | $ | 98 | | $ | 81,766 | | $ | 9,500 | | $ | 200,000 | |
| Interest expense (b) | | | 91,733 | | | 20,330 | | | 38,736 | | | 32,000 | | | 667 | |
| Operating leases | | | 6,071 | | | 2,575 | | | 2,487 | | | 1,009 | | | 0 | |
| Purchase obligations | | | 2,825 | | | 1,408 | | | 1,355 | | | 62 | | | 0 | |
| Other long-term liabilities (c) | | | 8,200 | | | 5,000 | | | 3,200 | | | 0 | | | 0 | |
| Total | | $ | 400,193 | | $ | 29,411 | | $ | 127,544 | | $ | 42,571 | | $ | 200,667 | |
| (a) | Long-term debt includes current maturities. |
| (b) | Interest expense is estimated based on the Company’s year-end 2006 debt balances and maturities including interest rates that are anticipated to remain at the current rates. The estimates assume no conversion of convertible notes and no revolver borrowings. The Company’s actual debt balances and interest rates may fluctuate in the future. Therefore, actual interest payments may vary from those payments detailed in the above table. |
| (c) | Other long-term liabilities represent the Company’s estimated funding requirements for the frozen defined benefit pension plans. The Company’s liability for pensions is based on a number of assumptions, including discount rates, rates of return on investments, mortality rates and other factors. Certain of these assumptions are determined with the assistance of outside actuaries. Assumptions are based on past experience and anticipated future trends and are subject to a number of risks and uncertainties and may lead to significantly different pension liability funding requirements. |
OFF-BALANCE SHEET ARRANGEMENTS
The Company has no material off-balance sheet arrangements.
MARKET RISK SENSITIVE INSTRUMENTS
Exchange Rate Sensitivity
The Company is exposed to fluctuations in the British pound and Euro world currencies. Titan does not hedge foreign currency transaction or translation exposures. The Company’s net investment in foreign entities translated into U.S. dollars was $65.9 million at December 31, 2006, and $56.9 million at December 31, 2005. The hypothetical potential loss in value of the Company’s net investment in foreign entities resulting from a 10% adverse change in foreign currency exchange rates at December 31, 2006, would amount to approximately $7 million.
Commodity Price Sensitivity
The Company does not generally enter into long-term commodity contracts and does not use derivative commodity instruments to hedge its exposures to commodity market price fluctuations. Therefore, the Company is exposed to price fluctuations of its key commodities, which consist primarily of steel and rubber. The Company attempts to pass on certain material price increases and decreases to its customers, depending on market conditions.
Interest Rate Sensitivity
The Company has a revolving credit facility and an industrial revenue bond that have variable interest rates. If the revolving credit facility were fully drawn, a 1% change in the interest rate would change the Company’s interest expense by approximately $1 million.
At December 31, 2006, the fair value of the Company’s senior unsecured convertible notes, based upon quoted market prices obtained through independent pricing sources, was $130.8 million, compared to the carrying value of $81.2 million. The Company believes the carrying value of its other debt reasonably approximates fair value at December 31, 2006.
MARKET CONDITIONS AND OUTLOOK
In 2006, the Company experienced a softening in demand from OEMs for the Company’s agricultural and military products. In December of 2005, the Company acquired the Goodyear North American farm tire assets, which included a manufacturing facility in Freeport, Illinois. The transaction also included a license agreement with Goodyear for Titan to manufacture and sell Goodyear branded farm tires in North America. On July 31, 2006, Titan Tire Corporation of Bryan, a subsidiary of the Company, acquired the OTR tire facility of Continental Tire North America, Inc. in Bryan, Ohio. The Bryan facility produces tires for earthmoving, construction and mining equipment in larger sizes than Titan previously produced.
Titan is using the expanded agricultural product offering of Goodyear branded farm tires and the expanded earthmoving/construction product offering supplied by the Bryan facility, along with added manufacturing capacity from the Freeport and Bryan facilities to expand market share. Due to capacity constraints at Titan’s Bryan, Ohio, OTR tire facility, the Company is adding OTR tire capacity at its Freeport, Illinois, and Des Moines, Iowa, tire facilities.
Higher energy, raw material and petroleum-based product costs may continue to negatively impact the Company’s margins. Many of Titan’s overhead expenses are fixed; therefore, lower seasonal trends may cause negative fluctuations in quarterly profit margins and affect the financial condition of the Company.
AGRICULTURAL MARKET OUTLOOK
Agricultural market sales are forecasted to be stable for 2007. The farm economy is being helped by strong commodity prices. However, the farm economy is also affected by high input costs for fuel and fertilizer. A continuing increase in the use of grain-based ethanol and soybean-based biodiesel fuel should support commodity prices and farm income levels in the long-term. The Company believes the increasing demand for biofuels may possibly result in a stronger market than is now being forecasted. The Company’s largest customer, Deere & Company, extended its long-term wheel agreement with Titan from an expiration date of October 31, 2007, to October 31, 2010. Many variables, including weather, grain prices, export markets, and future government policies and payments can greatly influence the overall health of the agricultural economy.
EARTHMOVING/CONSTRUCTION MARKET OUTLOOK
Sales for the earthmoving/construction market are expected to remain strong in 2007. Metals, oil and gas prices have declined from their 2006 highs. However, these commodity prices remain at levels that are attractive for continued investment, which will maintain support for earthmoving and mining sales. The Bryan facility produces tires for large earthmoving, construction and mining machinery, which Titan did not previously produce. Therefore, Titan’s 2007 sales in this segment are expected to be higher than those in 2006. The Company’s OTR production realignment will allow Titan to expand production in earthmoving/construction tire sizes that are in short supply. The earthmoving/construction segment is affected by many variables, including commodity prices, road construction, infrastructure, government appropriations and housing starts. Many of these items are very sensitive to interest rate fluctuations.
CONSUMER MARKET OUTLOOK
Titan’s sales in the consumer market include sales to Goodyear, which fluctuate significantly based upon their future product requirements, including an off-take/mixing agreement. This agreement includes mixed stock, which is a prepared rubber compound used in tire production. The Company’s consumer market sales will fluctuate significantly related to sales volumes under the off-take/mixing agreement with Goodyear. However, the Company expects the remaining consumer market sales to remain relatively stable in 2007. The all-terrain vehicle (ATV) wheel and tire market is expected to offer future long-term growth opportunities for Titan. Many factors affect the consumer market including weather, competitive pricing, energy prices and consumer attitude.
PENSIONS
The Company has two frozen defined benefit pension plans and one defined benefit plan that purchased a final annuity settlement in October 2002. These plans are described in Note 21 of the Company’s Notes to Consolidated Financial Statements.
The Company’s recorded liability for pensions is based on a number of assumptions, including discount rates, rates of return on investments, mortality rates and other factors. Certain of these assumptions are determined with the assistance of outside actuaries. Assumptions are based on past experience and anticipated future trends. These assumptions are reviewed on a regular basis and revised when appropriate. Revisions in assumptions and actual results that differ from the assumptions affect future expenses, cash funding requirements and the carrying value of the related obligations. During the twelve months ended December 31, 2006, the Company contributed $4.0 million to its pension plans. The Company expects to contribute approximately $5 million to these frozen defined benefit pension plans during 2007.
Titan’s projected benefit obligation at December 31, 2006, was $68.8 million as compared to $71.8 million at December 31, 2005. During 2006, the Company recorded net periodic pension cost of $1.2 million. Accumulated other comprehensive income recorded for defined benefit pension plans, net of tax, was $18.6 million and $17.2 million at December 31, 2006 and 2005, respectively. Other comprehensive income is recorded as a direct charge to stockholders’ equity and does not affect net income. Titan will be required to record net periodic pension cost in the future; these costs may fluctuate based upon revised assumptions and could negatively affect the Company’s financial position, cash flows and results of operations.
RECENTLY ISSUED ACCOUNTING STANDARDS
Financial Accounting Standards Board Interpretation Number 48
In July 2006, Financial Accounting Standards Board Interpretation (FIN) No. 48, “Accounting for Uncertainty in Income Taxes-an Interpretation of FASB Statement No. 109,” was issued. FIN No. 48 prescribes a recognition threshold and measurement attribute for the financial statement recognition and measurement of a tax position taken or expected to be taken in a tax return. This interpretation also provides guidance on derecognition, classification, interest and penalties, accounting in interim periods, and disclosure requirements for uncertain tax positions. FIN No. 48 is effective for fiscal years beginning after December 15, 2006. The Company is evaluating the effect the adoption of this interpretation will have on its consolidated financial position, results of operations and cash flows.
Statement of Financial Accounting Standards Number 157
In September 2006, Statement of Financial Accounting Standards (SFAS) No. 157, “Fair Value Measurements,” was issued. This statement defines fair value, establishes a framework for measuring fair value in generally accepted accounting principles, and expands disclosures about fair value measurements. This Statement applies under other accounting pronouncements that require or permit fair value measurements. This statement is effective for financial statements issued for fiscal years beginning after November 15, 2007, and interim periods within those fiscal years. The Company is evaluating the effect the adoption of this standard will have on its consolidated financial position, results of operations and cash flows.
Statement of Financial Accounting Standards Number 158
In September 2006, SFAS No. 158, “Employers’ Accounting for Defined Benefit Pension and Other Postretirement Plans,” was issued. This statement requires an employer to recognize the overfunded or underfunded status of a defined benefit postretirement plan as an asset or liability in its statement of financial position and to recognize changes in that funded status in the year in which the changes occur through comprehensive income. An employer with publicly traded equity securities is required to initially recognize the funded status of a defined benefit postretirement plan and to provide the required disclosures as of the end of the fiscal year ending after December 15, 2006. The Company adopted SFAS No. 158 as of December 31, 2006. The adoption of this statement had no material effect on the Company’s consolidated results of operations or cash flows. See Note 21 to the consolidated financial statements of Titan International, Inc., included in Item 8 herein for the effect this statement had on the Company’s consolidated financial position.
Staff Accounting Bulletin Number 108
In September 2006, the SEC staff issued Staff Accounting Bulletin (SAB) 108, “Considering the Effects of Prior Year Misstatements when Quantifying Misstatements in Current Year Financial Statements.” SAB 108 requires that public companies utilize a “dual-approach” when assessing the quantitative effects of financial misstatements. This dual approach includes both an income statement focused assessment and a balance sheet focused assessment. The guidance in SAB 108 is effective for annual financial statements for fiscal years ending after November 15, 2006. The adoption of this guidance had no material effect on the Company’s consolidated financial position, results of operations and cash flows.
ITEM 7A - QUANTITATIVE AND QUALITATIVE DISCLOSURES ABOUT MARKET RISK
Reference is made to Item 7, Part II of this report.
ITEM 8 - FINANCIAL STATEMENTS AND SUPPLEMENTARY DATA
Reference is made to Item 15, Part IV of this report, “Exhibits, Financial Statement Schedules.”
ITEM 9 - CHANGES IN AND DISAGREEMENTS WITH ACCOUNTANTS ON ACCOUNTING AND FINANCIAL DISCLOSURE
None.
ITEM 9A - CONTROLS AND PROCEDURES
Evaluation of Disclosure Controls and Procedures
The Company’s principal executive officer and principal financial officer believe the Company’s disclosure controls and procedures (as defined in Exchange Act Rules 13a-15(e) and 15d-15(e)) are effective as of the end of the period covered by this Form 10-K based on an evaluation of the effectiveness of disclosure controls and procedures.
Changes in Internal Controls
There were no material changes in internal control over financial reporting (as defined in Exchange Act Rules 13a-15(f) and 15d-15(f)) that occurred during the fourth quarter that have materially affected, or are reasonably likely to materially affect, the Company’s internal control over financial reporting.
Because of its inherent limitations, internal controls over financial reporting may not prevent or detect misstatements. Also, projections of any evaluations of the effectiveness to future periods are subject to the risk that the controls may become inadequate because of changes in conditions, or that the degree of compliance with the policies or procedures may deteriorate.
ITEM 9B - OTHER INFORMATION
None.
PART III
ITEM 10 - DIRECTORS, EXECUTIVE OFFICERS AND CORPORATE GOVERNANCE
Directors
The information required by this item regarding the Company’s directors is incorporated by reference to the Company’s 2007 Proxy Statement under the captions “Election of Mr. Campbell and Mr. Taylor as Directors”, “Election of Mr. Akers as a Director Contingent upon Amendment to Bylaws”, “Directors Continuing in Office”, “Committees and Meetings of the Board of Directors” and “Corporate Governance.”
Executive Officers
The names, ages and positions of all executive officers of the Company are listed below, followed by a brief account of their business experience during the past five years. Officers are normally appointed annually by the Board of Directors at a meeting immediately following the Annual Meeting of Stockholders. The Chief Executive Officer and Secretary are brother and sister. There is no arrangement or understanding between any officer and any other person pursuant to which an officer was selected.
Maurice M. Taylor Jr., 62, has been Chief Executive Officer and a Director of the Company since 1990, when Titan was acquired in a management-led buyout by investors, including Mr. Taylor. Mr. Taylor served as President of the Company from 1990 to 2005 and was appointed Chairman in 2005.
Ernest J. Rodia, 63, joined the Company in 2005 as Executive Vice President and Chief Operating Officer. Prior to Titan, Mr. Rodia was employed for nearly 40 years by Goodyear Tire and Rubber Company, holding various engineering and manufacturing positions.
Kent W. Hackamack, 48, served as Corporate Controller of the Company from 1994 to 1996. Mr. Hackamack was appointed Vice President of Finance and Treasurer in 1996.
Cheri T. Holley, 59, joined the Company in 1994 as General Counsel and Secretary. Ms. Holley was appointed Vice President in 1996.
Section 16(a) beneficial ownership reporting compliance
The information required by this item regarding beneficial ownership reporting compliance is incorporated by reference to the Company’s 2007 Proxy Statement under the caption “Section 16(a) Beneficial Ownership Reporting Compliance.”
Business conduct policy
The Company adopted a business conduct policy, which is applicable to directors, officers and employees. The Company has also adopted corporate governance guidelines. The business conduct policy and corporate governance guidelines are available under the investor information category of the Company’s website, www.titan-intl.com. The Company intends to satisfy disclosure requirements regarding amendments to or waivers from its business conduct policy by posting such information on its website. A printed copy of the business conduct policy and corporate governance guidelines are available, without charge, by writing to: Secretary of Titan International, Inc., 2701 Spruce Street, Quincy, IL 62301.
ITEM 11 - EXECUTIVE COMPENSATION
The information required by this item is incorporated by reference to the Company’s 2007 Proxy Statement under the caption “Compensation of Executive Officers.”
ITEM 12 - SECURITY OWNERSHIP OF CERTAIN BENEFICIAL OWNERS AND MANAGEMENT AND RELATED STOCKHOLDER MATTERS
Except for the information concerning equity compensation plans, the information required by this item is incorporated by reference to the Company’s 2007 Proxy Statement under the caption “Security Ownership of Certain Beneficial Owners and Management.”
The following table provides information about shares of Titan common stock that may be issued under Titan’s equity compensation plans, as of December 31, 2006:
Plan Category | | (i) Number of securities to be issued upon exercise of outstanding options, warrants and rights | | (ii) Weighted-average exercise price of outstanding options, warrants and rights | | (iii) Number of securities remaining available for future issuance under equity compensation plans (excluding securities reflected in column (i)) | |
| Equity compensation plans approved by security holders | | | 1,150,060 | (a) | | 13.29 | | | 1,213,720 | |
| Equity compensation plans not approved by security holders | | | 0 | | | n/a | | | 0 | |
| Total | | | 1,150,060 | | | 13.29 | | | 1,213,720 | |
| (a) | Amount includes outstanding options under the Company’s 1993 Stock Incentive Plan, 1994 Non-Employee Director Stock Option Plan and 2005 Equity Incentive Plan. |
For additional information regarding the Company’s stock option plans, please see Note 22 of the Company’s Notes to Consolidated Financial Statements.
ITEM 13 - CERTAIN RELATIONSHIPS AND RELATED TRANSACTIONS, AND DIRECTOR INDEPENDENCE
The information required by this item is incorporated by reference to the Company’s 2007 Proxy Statement under the caption “Related Party Transactions” and “Corporate Governance” and also appears in Note 26 of the Company’s Notes to Consolidated Financial Statements.
ITEM 14 - PRINCIPAL ACCOUNTING FEES AND SERVICES
The information required by this item is incorporated by reference to the Company’s 2007 Proxy Statement under the caption “Audit and Other Fees.”
PART IV
ITEM 15 - | EXHIBITS, FINANCIAL STATEMENT SCHEDULES | |
| | | |
(a) 1. | Financial Statements | |
| | | |
| | Management’s Responsibility for Financial Statements and Report on Internal Control Over Financial Reporting | F-1 |
| | | |
| | Report of Independent Registered Public Accounting Firm | F-2 through F-3 |
| | | |
| | Consolidated Statements of Operations for the years ended December 31, 2006, 2005 and 2004 | F-4 |
| | | |
| | Consolidated Balance Sheets at December 31, 2006 and 2005 | F-5 |
| | | |
| | Consolidated Statements of Changes in Stockholders’ Equity for the years ended December 31, 2006, 2005 and 2004 | F-6 |
| | | |
| | Consolidated Statements of Cash Flows for the years ended December 31, 2006, 2005 and 2004 | F-7 |
| | | |
| | Notes to Consolidated Financial Statements | F-8 through F-32 |
| | | |
2. | Financial Statement Schedule | |
| | | |
| | Schedule II - Valuation Reserves | S-1 |
| | | |
3. | Exhibits | |
| | | |
| | The accompanying Exhibit Index is incorporated herein by reference. | |
| | | |
| | | |
| | | |
SIGNATURES
Pursuant to the requirements of Sections 13 or 15(d) of the Securities Exchange Act of 1934, the registrant has duly caused this Report to be signed on its behalf by the undersigned, thereunto duly authorized.
| | TITAN INTERNATIONAL, INC. |
| | (Registrant) |
Date: | February 27, 2007 | By: | /s/ MAURICE M. TAYLOR JR. |
| | | | Maurice M. Taylor Jr. |
| | | | Chairman and Chief Executive Officer |
Pursuant to the requirements of the Securities Exchange Act of 1934, this Report has been signed below by the following persons on behalf of the registrant and in the capacities indicated on February 27, 2007.
| Signatures | Capacity |
| | |
/S/ MAURICE M. TAYLOR JR. | Chairman and Chief Executive Officer |
Maurice M. Taylor Jr. | (Principal Executive Officer) |
| | |
| | |
/S/ KENT W. HACKAMACK | Vice President of Finance and Treasurer |
Kent W. Hackamack | (Principal Financial Officer and |
| | Principal Accounting Officer) |
| | |
/S/ ERWIN H. BILLIG | Director |
Erwin H. Billig | |
| | |
/S/ EDWARD J. CAMPBELL | Director |
Edward J. Campbell | |
| | |
/S/ RICHARD M. CASHIN JR. | Director |
Richard M. Cashin Jr. | |
| | |
/S/ ALBERT J. FEBBO | Director |
Albert J. Febbo | |
| | |
/S/ MITCHELL I. QUAIN | Director |
Mitchell I. Quain | |
| | |
/S/ ANTHONY L. SOAVE | Director |
Anthony L. Soave | |
TITAN INTERNATIONAL, INC.
Exhibit Index
Annual Report on Form 10-K
| Exhibit | |
| No. | DESCRIPTION |
| 3.1 (a) | Amended Restated Articles of Incorporation of the Company |
| 3.2 (b) | Bylaws of the Company |
| 10.1 (c) | 1994 Non-Employee Director Stock Option Plan |
| 10.2 (c) | 1993 Stock Incentive Plan |
| 10.3 (d) | Credit Agreement dated July 23, 2004, among the Company and LaSalle Bank National Association and General Electric Capital Corporation |
| 10.4 (d) | Indenture between the Company and U.S. Bank National Association dated July 26, 2004 |
| 10.5 (e) | First Amendment to Credit Agreement among the Company and LaSalle Bank National Association and General Electric Capital Corporation dated February 16, 2005 |
| 10.6 (f) | 2005 Equity Incentive Plan |
| 10.7 (g) | Second Amendment to Credit Agreement among the Company and LaSalle Bank National Association dated October 21, 2005 |
| 10.8 (h) | Third Amendment to Credit Agreement among the Company and LaSalle Bank National Association dated June 28, 2006 |
| 10.9 (i) | Fourth Amendment to Credit Agreement among the Company and LaSalle Bank National Association dated February 8, 2007 |
| 21* | Subsidiaries of the Registrant |
| 23* | Consent of Independent Registered Public Accounting Firm |
| 31.1* | Certification of the Principal Executive Officer pursuant to Section 302 of the Sarbanes-Oxley Act of 2002 |
| 31.2* | Certification of the Principal Financial Officer pursuant to Section 302 of the Sarbanes-Oxley Act of 2002 |
| 32* | Certification pursuant to Section 906 of the Sarbanes-Oxley Act of 2002 |
*Filed herewith
| (a) | Incorporated by reference to the same numbered exhibit contained in the Company’s Form 10-Q for the quarterly period ended September 30, 1998 (No. 001-12936). |
| (b) | Incorporated by reference to the same numbered exhibit contained in the Company’s Registration Statement on Form S-4 (No. 33-69228). |
| (c) | Incorporated by reference to the Company’s Registration Statement on Form S-3 (No. 333-61743). |
| (d) | Incorporated by reference to the same numbered exhibit contained in the Company’s Form 10-Q for the quarterly period ended June 30, 2004 (No. 001-12936). |
| (e) | Incorporated by reference to the same numbered exhibit contained in the Company’s Annual Report on Form 10-K for the year ended December 31, 2005 (No. 001-12936). |
| (f) | Incorporated by reference to Appendix A of the Company’s Definitive Proxy Statement filed on March 30, 2005. |
| (g) | Incorporated by reference to the same numbered exhibit contained in the Company’s Current Report on Form 8-K filed on October 24, 2005. |
| (h) | Incorporated by reference to the same numbered exhibit contained in the Company’s Current Report on Form 8-K filed on June 29, 2006. |
| (i) | Incorporated by reference to the same numbered exhibit contained in the Company’s Current Report on Form 8-K filed on February 8, 2007. |
Management’s Responsibility for Financial Statements
Management is responsible for the preparation of the Company’s consolidated financial statements included in this annual report on Form 10-K. Management believes that the consolidated financial statements fairly reflect the transactions and the financial statements reasonably present the Company’s financial position and results of operations in conformity with accounting principles generally accepted in the United States of America.
The Board of Directors of the Company has an Audit Committee comprised entirely of outside directors who are independent of management. The Committee meets periodically with management, the internal auditors and the independent registered public accounting firm to review accounting control, auditing and financial reporting matters. The Audit Committee is responsible for the appointment of the independent registered public accounting firm and approval of their fees.
The independent registered public accounting firm audits the Company’s consolidated financial statements in accordance with the standards of the Public Company Accounting Oversight Board (United States). The consolidated financial statements as of December 31, 2006, have been audited by PricewaterhouseCoopers LLP, an independent registered public accounting firm, as stated in their report, which is included herein.
Management’s Report on Internal Control Over Financial Reporting
Management is responsible for establishing and maintaining adequate internal control over financial reporting. Because of its inherent limitations, internal control over financial reporting may not prevent or detect misstatements. Also, projections of any evaluation of effectiveness to future periods are subject to the risk that controls may become inadequate because of changes in conditions, or that the degree of compliance with the policies or procedures may deteriorate.
Management has performed an evaluation of the effectiveness of the Company’s internal control over financial reporting as of December 31, 2006, based on criteria for effective internal control over financial reporting described in “Internal Control-Integrated Framework” issued by the Committee of Sponsoring Organizations of the Treadway Commission. Based on this assessment, management concluded the Company maintained effective internal control over financial reporting as of December 31, 2006. Management’s assessment of the effectiveness of the Company’s internal controls over financial reporting as of December 31, 2006, has been audited by PricewaterhouseCoopers LLP, an independent registered public accounting firm, as stated in their report which is included herein.
The audited consolidated financial statements of the Company include the results of the Company’s facility in Bryan, Ohio, which was acquired on July 31, 2006. The Bryan facility accounted for approximately 9% of the Company’s total assets at December 31, 2006, and Bryan’s manufacturing output accounted for approximately 7% of the Company’s total cost of sales for the year ended December 31, 2006. The Bryan facility was excluded from the management’s evaluation of the effectiveness of the Company’s internal control over financial reporting as of December 31, 2006.
Report of Independent Registered Public Accounting Firm
To the Board of Directors
and Stockholders of
Titan International, Inc.:
We have completed integrated audits of Titan International Inc.’s consolidated financial statements and of its internal control over financial reporting as of December 31, 2006, in accordance with the standards of the Public Company Accounting Oversight Board (United States). Our opinions, based on our audits, are presented below.
Consolidated financial statements
In our opinion, the accompanying consolidated financial statements listed in the appendix under Item 15(a)(1) present fairly, in all material respects, the financial position of Titan International Inc. and its subsidiaries at December 31, 2006 and 2005, and the results of their operations and their cash flows for each of the three years in the period ended December 31, 2006 in conformity with accounting principles generally accepted in the United States of America. In addition, in our opinion, the financial statement schedule listed in the index appearing under Item 15(a)(2) presents fairly, in all material respects, the information set forth therein when read in conjunction with the related consolidated financial statements. These financial statements are the responsibility of the Company’s management. Our responsibility is to express an opinion on these financial statements based on our audits. We conducted our audits of these statements in accordance with the standards of the Public Company Accounting Oversight Board (United States). Those standards require that we plan and perform the audit to obtain reasonable assurance about whether the financial statements are free of material misstatement. An audit of financial statements includes examining, on a test basis, evidence supporting the amounts and disclosures in the financial statements, assessing the accounting principles used and significant estimates made by management, and evaluating the overall financial statement presentation. We believe that our audits provide a reasonable basis for our opinion.
Internal control over financial reporting
Also, in our opinion, management’s assessment, included in Management's Report on Internal Control Over Financial Reporting appearing on page F-1, that the Company maintained effective internal control over financial reporting as of December 31, 2006 based on criteria established in Internal Control - Integrated Framework issued by the Committee of Sponsoring Organizations of the Treadway Commission (COSO), is fairly stated, in all material respects, based on those criteria. Furthermore, in our opinion, the Company maintained, in all material respects, effective internal control over financial reporting as of December 31, 2006, based on criteria established in Internal Control - Integrated Framework issued by the COSO. The Company’s management is responsible for maintaining effective internal control over financial reporting and for its assessment of the effectiveness of internal control over financial reporting. Our responsibility is to express opinions on management’s assessment and on the effectiveness of the Company’s internal control over financial reporting based on our audit. We conducted our audit of internal control over financial reporting in accordance with the standards of the Public Company Accounting Oversight Board (United States). Those standards require that we plan and perform the audit to obtain reasonable assurance about whether effective internal control over financial reporting was maintained in all material respects. An audit of internal control over financial reporting includes obtaining an understanding of internal control over financial reporting, evaluating management’s assessment, testing and evaluating the design and operating effectiveness of internal control, and performing such other procedures as we consider necessary in the circumstances. We believe that our audit provides a reasonable basis for our opinions.
A company’s internal control over financial reporting is a process designed to provide reasonable assurance regarding the reliability of financial reporting and the preparation of financial statements for external purposes in accordance with generally accepted accounting principles. A company’s internal control over financial reporting includes those policies and procedures that (i) pertain to the maintenance of records that, in reasonable detail, accurately and fairly reflect the transactions and dispositions of the assets of the company; (ii) provide reasonable assurance that transactions are recorded as necessary to permit preparation of financial statements in accordance with generally accepted accounting principles, and that receipts and expenditures of the company are being made only in accordance with authorizations of management and directors of the company; and (iii) provide reasonable assurance regarding prevention or timely detection of unauthorized acquisition, use, or disposition of the company’s assets that could have a material effect on the financial statements.
Because of its inherent limitations, internal control over financial reporting may not prevent or detect misstatements. Also, projections of any evaluation of effectiveness to future periods are subject to the risk that controls may become inadequate because of changes in conditions, or that the degree of compliance with the policies or procedures may deteriorate.
As described in Management’s Report on Internal Control Over Financial Reporting, management has excluded the Bryan, Ohio facility from its assessment of internal control over financial reporting as of December 31, 2006 because it was acquired by the Company in a purchase business combination during 2006. We have also excluded the Bryan, Ohio facility from our audit of internal control over financial reporting. The Bryan, Ohio facility is a wholly-owned subsidiary whose total assets and total output represent 9% and 7%, respectively, of the related consolidated financial statement amounts as of and for the year ended December 31, 2006.
PricewaterhouseCoopers LLP
St. Louis, Missouri
February 26, 2007
TITAN INTERNATIONAL, INC.
CONSOLIDATED STATEMENTS OF OPERATIONS
(All amounts in thousands, except per share data)
| | | Year ended December 31, | |
| | | 2006 | | 2005 | | 2004 | |
| Net sales | | $ | 679,454 | | $ | 470,133 | | $ | 510,571 | |
| Cost of sales | | | 606,676 | | | 405,923 | | | 431,071 | |
| Gross profit | | | 72,778 | | | 64,210 | | | 79,500 | |
| Selling, general and administrative expenses | | | 42,142 | | | 32,270 | | | 37,915 | |
| Royalty expense | | | 5,001 | | | 0 | | | 0 | |
| Idled assets marketed for sale depreciation | | | 3,624 | | | 4,736 | | | 5,275 | |
| Dyneer legal charge | | | 0 | | | 15,205 | | | 0 | |
| Goodwill impairment on Titan Europe | | | 0 | | | 0 | | | 2,988 | |
| Income from operations | | | 22,011 | | | 11,999 | | | 33,322 | |
| Interest expense | | | (17,001 | ) | | (8,617 | ) | | (16,159 | ) |
| Noncash convertible debt conversion charge | | | 0 | | | (7,225 | ) | | 0 | |
| Debt termination expense | | | 0 | | | 0 | | | (3,654 | ) |
| Other income, net | | | 3,564 | | | 958 | | | 1,706 | |
| Income (loss) before income taxes | | | 8,574 | | | (2,885 | ) | | 15,215 | |
| Provision (benefit) for income taxes | | | 3,430 | | | (13,927 | ) | | 4,108 | |
| Net income | | $ | 5,144 | | $ | 11,042 | | $ | 11,107 | |
Income per common share: | | | | | | | | | | |
| Basic | | $ | .26 | | $ | .61 | | $ | .62 | |
| Diluted | | | .26 | | | .60 | | | .61 | |
Average common shares and equivalents outstanding: | | | | | | | | | | |
| Basic | | | 19,702 | | | 18,053 | | | 17,798 | |
| Diluted | | | 20,044 | | | 18,284 | | | 21,574 | |
See accompanying Notes to Consolidated Financial Statements.
TITAN INTERNATIONAL, INC.
CONSOLIDATED BALANCE SHEETS
(All amounts in thousands, except share data)
| | | December 31, | |
Assets | | 2006 | | 2005 | |
| Current assets | | | | | | | |
| Cash and cash equivalents | | $ | 33,412 | | $ | 592 | |
| Accounts receivable (net of allowance of $4,818 and $5,654, respectively) | | | 73,882 | | | 47,112 | |
| Inventories | | | 154,604 | | | 122,692 | |
| Deferred income taxes | | | 29,234 | | | 20,141 | |
| Prepaid and other current assets | | | 18,801 | | | 15,630 | |
| Total current assets | | | 309,933 | | | 206,167 | |
| | | | | | | | |
| Property, plant and equipment, net | | | 184,616 | | | 140,382 | |
| Idled assets marketed for sale | | | 0 | | | 18,267 | |
| Investment in Titan Europe Plc | | | 65,881 | | | 48,467 | |
| Goodwill | | | 11,702 | | | 11,702 | |
| Other assets | | | 12,994 | | | 15,771 | |
| | | | | | | | |
| Total assets | | $ | 585,126 | | $ | 440,756 | |
| | | | | | | | |
Liabilities and Stockholders’ Equity | | | | | | | |
| Current liabilities | | | | | | | |
| Short-term debt (including current portion of long-term debt) | | $ | 98 | | $ | 11,995 | |
| Accounts payable | | | 25,884 | | | 24,435 | |
| Other current liabilities | | | 36,942 | | | 11,753 | |
| Total current liabilities | | | 62,924 | | | 48,183 | |
| | | | | | | | |
| Long-term debt | | | 291,266 | | | 190,464 | |
| Deferred income taxes | | | 27,924 | | | 13,581 | |
| Other long-term liabilities | | | 15,835 | | | 20,715 | |
| Total liabilities | | | 397,949 | | | 272,943 | |
| | | | | | | | |
| Commitments and contingencies: Notes 14, 23 and 24 | | | | | | | |
| | | | | | | | |
| Stockholders’ equity | | | | | | | |
| Common stock (no par, 60,000,000 shares authorized, 30,577,356 issued) | | | 30 | | | 30 | |
| Additional paid-in capital | | | 258,071 | | | 255,299 | |
| Retained earnings | | | 36,802 | | | 32,053 | |
| Treasury stock (at cost, 10,678,454 and 11,074,150 shares, respectively) | | | (96,264 | ) | | (99,817 | ) |
| Accumulated other comprehensive loss | | | (11,462 | ) | | (19,752 | ) |
| Total stockholders’ equity | | | 187,177 | | | 167,813 | |
| | | | | | | | |
| Total liabilities and stockholders’ equity | | $ | 585,126 | | $ | 440,756 | |
See accompanying Notes to Consolidated Financial Statements.
TITAN INTERNATIONAL, INC.
CONSOLIDATED STATEMENTS OF CHANGES IN STOCKHOLDERS’ EQUITY
(All amounts in thousands, except share data)
| | | Number of common shares | | Common Stock | | Additional paid-in capital | | Retained earnings | | Treasury stock | | Accumulated other comprehensive income (loss) | | Total | |
| | | | | | | | | | | | | | | | |
Balance January 1, 2004 | | | #21,197,320 | | $ | 27 | | $ | 203,050 | | $ | 10,629 | | $ | (81,204 | ) | $ | (20,546 | ) | $ | 111,956 | |
| | | | | | | | | | | | | | | | | | | | | | | |
| Comprehensive income (loss): | | | | | | | | | | | | | | | | | | | | | | |
| Net income | | | | | | | | | | | | 11,107 | | | | | | | | | 11,107 | |
| Currency translation adjustment | | | | | | | | | | | | | | | | | | (584 | ) | | (584 | ) |
| Minimum pension liability, net of tax | | | | | | | | | | | | | | | | | | 4,564 | | | 4,564 | |
| Comprehensive income | | | | | | | | | | | | 11,107 | | | | | | 3,980 | | | 15,087 | |
| Dividends paid on common stock | | | | | | | | | | | | (351 | ) | | | | | | | | (351 | ) |
| Exercise of stock options | | | 23,570 | | | | | | 189 | | | | | | | | | | | | 189 | |
| Treasury stock purchases | | | (4,894,464 | ) | | | | | | | | | | | (20,000 | ) | | | | | (20,000 | ) |
| | | | | | | | | | | | | | | | | | | | | | | |
Balance December 31, 2004 | | | 16,326,426 | | | 27 | | | 203,239 | | | 21,385 | | | (101,204 | ) | | (16,566 | ) | | 106,881 | |
| | | | | | | | | | | | | | | | | | | | | | | |
| Comprehensive income (loss): | | | | | | | | | | | | | | | | | | | | | | |
| Net income | | | | | | | | | | | | 11,042 | | | | | | | | | 11,042 | |
| Currency translation adjustment | | | | | | | | | | | | | | | | | | (3,168 | ) | | (3,168 | ) |
| Minimum pension liability, net of tax | | | | | | | | | | | | | | | | | | (18 | ) | | (18 | ) |
| Comprehensive income | | | | | | | | | | | | 11,042 | | | | | | (3,186 | ) | | 7,856 | |
| Dividends paid on common stock | | | | | | | | | | | | (374 | ) | | | | | | | | (374 | ) |
| Gain on investee transaction, net of tax | | | | | | | | | 10,471 | | | | | | | | | | | | 10,471 | |
| Bond conversion | | | 3,022,275 | | | 3 | | | 40,928 | | | | | | | | | | | | 40,931 | |
| Exercise of stock options | | | 135,860 | | | | | | 568 | | | | | | 1,220 | | | | | | 1,788 | |
| Issuance of treasury stock under 401(k) plan | | | 18,645 | | | | | | 93 | | | | | | 167 | | | | | | 260 | |
| | | | | | | | | | | | | | | | | | | | | | | |
Balance December 31, 2005 | | | 19,503,206 | | | 30 | | | 255,299 | | | 32,053 | | | (99,817 | ) | | (19,752 | ) | | 167,813 | |
| | | | | | | | | | | | | | | | | | | | | | | |
| Comprehensive income (loss): | | | | | | | | | | | | | | | | | | | | | | |
| Net income | | | | | | | | | | | | 5,144 | | | | | | | | | 5,144 | |
| Unrealized gain on investment, net of tax | | | | | | | | | | | | | | | | | | 6,126 | | | 6,126 | |
| Minimum pension liability, net of tax | | | | | | | | | | | | | | | | | | 3,225 | | | 3,225 | |
| Comprehensive income | | | | | | | | | | | | 5,144 | | | | | | 9,351 | | | 14,495 | |
| Adjustment to initially apply SFAS No. 158, net of tax | | | | | | | | | | | | | | | | | | (1,061 | ) | | (1,061 | ) |
| Dividends paid on common stock | | | | | | | | | | | | (395 | ) | | | | | | | | (395 | ) |
| Exercise of stock options | | | 382,190 | | | | | | 2,647 | | | | | | 3,432 | | | | | | 6,079 | |
| Issuance of treasury stock under 401(k) plan | | | 13,506 | | | | | | 125 | | | | | | 121 | | | | | | 246 | |
| | | | | | | | | | | | | | | | | | | | | | | |
Balance December 31, 2006 | | | #19,898,902 | | $ | 30 | | $ | 258,071 | | $ | 36,802 | | $ | (96,264 | ) | $ | (11,462 | ) | $ | 187,177 | |
See accompanying Notes to Consolidated Financial Statements.
TITAN INTERNATIONAL, INC.
CONSOLIDATED STATEMENTS OF CASH FLOWS
(All amounts in thousands)
| | | Year ended December 31, | |
Cash flows from operating activities: | | 2006 | | 2005 | | 2004 | |
| Net income | | $ | 5,144 | | $ | 11,042 | | $ | 11,107 | |
Adjustments to reconcile net income to net cash provided by operating activities: | | | | | | | | | | |
| Depreciation and amortization | | | 26,850 | | | 20,746 | | | 24,907 | |
| Deferred income tax provision (benefit) | | | 2,597 | | | (14,476 | ) | | 0 | |
| Noncash convertible debt conversion charge | | | 0 | | | 7,225 | | | 0 | |
| Goodwill impairment | | | 0 | | | 0 | | | 2,988 | |
| Noncash debt termination expense | | | 0 | | | 0 | | | 1,486 | |
| Undistributed earnings of unconsolidated affiliate | | | 0 | | | (2,024 | ) | | (1,022 | ) |
| Excess tax benefit from stock options exercised | | | (646 | ) | | 0 | | | 0 | |
| (Increase) decrease in current assets: | | | | | | | | | | |
| Accounts receivable | | | (26,770 | ) | | 5,669 | | | (10,822 | ) |
| Inventories | | | (19,509 | ) | | 2,212 | | | (8,804 | ) |
| Prepaid and other current assets | | | (3,675 | ) | | 1,938 | | | (944 | ) |
| Increase (decrease) in current liabilities: | | | | | | | | | | |
| Accounts payable | | | 1,449 | | | (2,298 | ) | | 4,689 | |
| Other current liabilities | | | 13,443 | | | (260 | ) | | 140 | |
| Other, net | | | (4,423 | ) | | (6,875 | ) | | (5,576 | ) |
Net cash (used for) provided by operating activities | | | (5,540 | ) | | 22,899 | | | 18,149 | |
| | | | | | | | | | | |
Cash flows from investing activities: | | | | | | | | | | |
| Continental off-the-road (OTR) asset acquisition | | | (44,642 | ) | | 0 | | | 0 | |
| Goodyear North American farm tire acquisition | | | 0 | | | (100,000 | ) | | 0 | |
| Capital expenditures | | | (8,282 | ) | | (6,752 | ) | | (4,328 | ) |
| Decrease in restricted cash deposits | | | 0 | | | 24,500 | | | 24,609 | |
| Titan Europe Plc sale | | | 0 | | | 0 | | | 40,757 | |
| Asset disposals | | | 0 | | | 5,509 | | | 1,354 | |
| Other, net | | | 198 | | | 0 | | | 0 | |
Net cash (used for) provided by investing activities | | | (52,726 | ) | | (76,743 | ) | | 62,392 | |
| | | | | | | | | | | |
Cash flows from financing activities: | | | | | | | | | | |
| Proceeds from borrowings | | | 200,000 | | | 0 | | | 115,348 | |
| Payment of debt | | | (11,995 | ) | | (1,296 | ) | | (225,525 | ) |
| (Payment) proceeds on revolving credit facility, net | | | (99,100 | ) | | 54,700 | | | 44,400 | |
| Proceeds from exercise of stock options | | | 5,407 | | | 1,500 | | | 0 | |
| Excess tax benefit from stock options exercised | | | 646 | | | 0 | | | 0 | |
| Repurchase of common stock | | | 0 | | | 0 | | | (15,000 | ) |
| Payment of financing fees | | | (3,725 | ) | | (1,500 | ) | | (4,788 | ) |
| Dividends paid | | | (393 | ) | | (358 | ) | | (375 | ) |
| Other, net | | | 246 | | | 260 | | | 189 | |
Net cash provided by (used for) financing activities | | | 91,086 | | | 53,306 | | | (85,751 | ) |
| | | | | | | | | | | |
| Effect of exchange rate changes on cash | | | 0 | | | 0 | | | (216 | ) |
| Net increase (decrease) in cash and cash equivalents | | | 32,820 | | | (538 | ) | | (5,426 | ) |
| Cash and cash equivalents, beginning of year | | | 592 | | | 1,130 | | | 6,556 | |
| Cash and cash equivalents, end of year | | $ | 33,412 | | $ | 592 | | $ | 1,130 | |
See accompanying Notes to Consolidated Financial Statements.
TITAN INTERNATIONAL, INC.
NOTES TO CONSOLIDATED FINANCIAL STATEMENTS
| 1. | DESCRIPTION OF BUSINESS AND SIGNIFICANT ACCOUNTING POLICIES |
Business
Titan International, Inc. and its subsidiaries (Titan or the Company) are leading manufacturers of wheels, tires and assemblies for off-highway vehicles used in the agricultural, earthmoving/construction and consumer markets. Titan’s earthmoving/construction market also includes products supplied to the U.S. military and other government entities, while the consumer market includes all-terrain vehicles (ATVs) and recreational/utility trailer applications. Titan manufactures both wheels and tires for the majority of these market applications, allowing the Company to provide the value-added service of delivering complete wheel and tire assemblies. The Company offers a broad range of products that are manufactured in relatively short production runs to meet the specifications of original equipment manufacturers (OEMs) and/or the requirements of aftermarket customers.
Principles of consolidation
The consolidated financial statements include the accounts of the Company and its wholly- and majority-owned subsidiaries. Titan records its investment in each unconsolidated affiliated company (20% to 49% ownership) at its related equity in the net assets of such affiliate, as adjusted for equity earnings and losses. Investments of less than 20% of non-publicly traded entities are carried at cost. Investments of less than 20% of publicly traded entities are carried at fair value in accordance with Statement of Financial Accounting Standards (SFAS) No. 115, “Accounting for Certain Investments in Debt and Equity Securities.” The Company records change of interest gains and losses directly to equity. All significant intercompany accounts and transactions have been eliminated.
Inventories
Inventories are valued at the lower of cost or market. Cost is determined using the first-in, first-out (FIFO) method in 2006 for approximately 74% of inventories and the last-in, first-out (LIFO) method for approximately 26% of inventories. The major rubber material inventory and related work-in-process and their finished goods are accounted for under the FIFO method. The major steel material inventory and related work-in-process and their finished goods are accounted for under the LIFO method. Market value is estimated based on current selling prices. Estimated provisions are established for excess and obsolete inventory, as well as inventory carried above market price based on historical experience.
Fixed assets
Property, plant and equipment have been recorded at cost. Depreciation is provided using the straight-line method over the following estimated useful lives of the related assets:
| | | Years | |
| Building and improvements | | | 25 | |
| Machinery and equipment | | | 10 | |
| Tools, dies and molds | | | 5 | |
Maintenance and repairs are expensed as incurred. When property, plant and equipment are retired or otherwise disposed of, the related cost and accumulated depreciation are eliminated, and any gain or loss on disposition is included in the accompanying consolidated statements of operations.
TITAN INTERNATIONAL, INC.
NOTES TO CONSOLIDATED FINANCIAL STATEMENTS
Deferred financing costs
Deferred financing costs are costs incurred in connection with the Company’s (i) revolving credit facility, (ii) senior unsecured notes, (iii) senior unsecured convertible notes and (iv) industrial revenue bonds. The costs associated with the revolving credit facility are being amortized over the remaining term of the facility. The costs associated with the senior unsecured notes are amortized straight line over five years, the term of the notes. The costs associated with the senior unsecured convertible notes are amortized straight line over five years, the term of the notes. The costs associated with the industrial revenue bonds are being amortized over the life of the bonds on a straight-line basis. Amortization of deferred financing costs for the various debt facilities approximates the effective interest rate method.
Fair value of financial instruments
The Company records all financial instruments, including cash and cash equivalents, accounts receivable, notes receivable, accounts payable, other accruals and notes payable at cost, which approximates fair value. Investments in marketable equity securities are recorded at fair value. The convertible notes due 2009 are the only significant financial instrument of the Company with a fair value different than the recorded value. At December 31, 2006, the fair value of the convertible notes, based on quoted market prices obtained through independent pricing sources, was approximately $130.8 million, compared to a carrying value of $81.2 million.
Available-for-sale securities
The Company has an investment in Titan Europe Plc of $65.9 million as of December 31, 2006, representing a 17.3% ownership position. Due to the dilution in the Company’s ownership interest from 29.3% at December 31, 2004, the Company began accounting for its investment in Titan Europe Plc as an available-for-sale security during 2005. Accordingly, this investment is recorded as “Investment in Titan Europe Plc” on the consolidated balance sheet. The Company reports this investment at fair value, with unrealized gains and losses excluded from earnings and reported in a separate component of stockholders’ equity. If the fair value declines below the amortized cost basis, the Company determines if this decline is other than temporary. If the decline in fair value is judged to be other than temporary, an impairment charge is recorded.
Impairment of fixed assets
The Company reviews fixed assets to assess recoverability from future operations whenever events and circumstances indicate that the carrying values may not be recoverable. Impairment losses are recognized in operating results when expected undiscounted future cash flows are less than the carrying value of the asset. Impairment losses are measured as the excess of the carrying value of the asset over the discounted expected future cash flows or the estimated fair value of the asset.
Foreign currency translation
The financial statements of the Company’s foreign subsidiaries are translated to United States currency in accordance with SFAS No. 52, “Foreign Currency Translation.” Assets and liabilities are translated to United States dollars at period-end exchange rates. Income and expense items are translated at average rates of exchange prevailing during the period. Translation adjustments are included in “Accumulated other comprehensive loss” in stockholders’ equity. As of December 2006, the Company’s investment in Titan Europe Plc was classified as available-for-sale securities and this investment is recorded as “Investment in Titan Europe Plc” on the consolidated balance sheet. Gains and losses that result from foreign currency transactions are included in the accompanying consolidated statements of operations.
Impairment of goodwill
The Company reviews goodwill to assess recoverability from future operations during the fourth quarter of each annual reporting period, and whenever events and circumstances indicate that the carrying values may not be recoverable, as required by the adoption of SFAS No. 142, Goodwill and Other Intangible Assets. The carrying amount of $11.7 million of goodwill by segment at December 31, 2006, was (i) agricultural of $6.9 million, (ii) earthmoving/construction of $3.6 million and (iii) consumer of $1.2 million. Based on a discounted cash flow method at December 31, 2006, the Company’s computation showed no impairment. See Notes 9 and 18 for additional information.
TITAN INTERNATIONAL, INC.
NOTES TO CONSOLIDATED FINANCIAL STATEMENTS
Revenue recognition
The Company records sales revenue when products are shipped to customers and both title and the risks and rewards of ownership are transferred. Provisions are established for sales returns and uncollectible accounts based on historical experience. Should these trends change, adjustments would be necessary to the estimated provisions.
Cost of sales
Cost of sales is comprised primarily of direct materials and supplies consumed in the manufacturing of the Company’s products, as well as manufacturing labor, depreciation expense and overhead expense necessary to acquire and convert the purchased materials and supplies into a finished product. Cost of sales also includes all purchasing, receiving, inspection, internal transfers, and related distribution costs.
Selling, general and administrative expense
Selling, general and administrative expense is comprised primarily of sales commissions, marketing expense, selling and administrative wages, management information system costs, legal fees, bank charges, audit fees, research and development, depreciation and amortization expense on non-manufacturing assets, and other administrative items.
Research and development expense
Research and development (R&D) expenses are expensed as incurred and included as part of selling, general and administrative expense. R&D costs were $1.3 million, $0.8 million and $1.9 million for the years of 2006, 2005 and 2004, respectively.
Advertising
Advertising expenses are included in selling, general and administrative expense and are expensed as incurred. Advertising expenses were less than $1 million for each of the years ended December 31, 2006, 2005 and 2004.
Warranty costs
The Company provides limited warranties on workmanship on its products in all market segments. The provision for estimated warranty costs is made in the period when such costs become probable and is based on past warranty experience. Warranty costs were $5.5 million, $2.6 million and $2.4 million for the years of 2006, 2005 and 2004, respectively. The warranty costs in 2006 increased approximately $3 million due to the acquisition of the Freeport and Bryan facilities.
Income taxes
Deferred income tax provisions are determined using the liability method whereby deferred tax assets and liabilities are recognized based upon temporary differences between the financial statement and income tax basis of assets and liabilities. The Company assesses the realizability of its deferred tax asset positions to determine if a valuation allowance is necessary.
Earnings per share
Basic earnings per share (EPS) is computed by dividing consolidated net earnings by the weighted average number of common shares outstanding. Diluted EPS is computed by dividing adjusted consolidated net earnings by the sum of the weighted average number of common shares outstanding and the weighted average number of potential common shares outstanding. Potential common shares consist of outstanding options under the Company’s stock option plans and the conversion of the Company’s senior unsecured convertible notes.
Statement of cash flows
For purposes of the Consolidated Statements of Cash Flows, the Company considers short-term debt securities with an original maturity of three months or less to be cash equivalents.
Interest paid
The Company paid $15.6 million, $7.5 million and $17.9 million for interest in 2006, 2005 and 2004, respectively. In 2006, the increase in interest paid of approximately $8 million was due to borrowings related to acquisition of the Freeport and Bryan facilities.
TITAN INTERNATIONAL, INC.
NOTES TO CONSOLIDATED FINANCIAL STATEMENTS
Income taxes paid
Titan paid $0.2 million, $1.9 million and $0.7 million for income taxes in 2006, 2005 and 2004, respectively.
Global market risk
The Company manufactures and sells products and purchases goods in the United States and foreign countries. The Company is potentially subject to foreign currency exchange risk relating to receipts from customers and payments to suppliers in foreign currencies. As a result, the Company’s financial results could be affected by factors such as changes in foreign currency exchange rates or weak economic conditions in the foreign markets in which the Company conducts business. Gains and losses arising from the settlement of foreign currency transactions are charged to the Consolidated Statement of Operations for the related period. Translation adjustments arising from the translation of foreign subsidiary financial statements are recorded in accumulated other comprehensive income in stockholders’ equity in the accompanying consolidated balance sheets.
Environmental liabilities
Environmental expenditures that relate to current operations are expensed or capitalized as appropriate. Expenditures that relate to an existing condition caused by past operations and that do not contribute to current or future revenue are expensed. Liabilities are recorded when environmental assessments and/or remedial efforts are probable and can be reasonably estimated.
Stock-based compensation
At December 31, 2006, the Company has three stock-based compensation plans, which are described in Note 22. In 2005 and prior years, the Company applied the recognition and measurement principles of Accounting Principles Board (APB) Opinion No. 25, “Accounting for Stock Issued to Employees,” and related Interpretations in accounting for those plans. No stock-based compensation expense was recorded in the consolidated financial statements under this method, as any options granted had an exercise price equal to the market value of the underlying common stock on the date of the grant. The following table illustrates the effect on net income and income per share if the Company had applied the fair value recognition provisions of SFAS No. 123, “Accounting for Stock-Based Compensation,” to stock-based compensation (in thousands, except share data):
| | | 2005 | | 2004 | |
| Net income - as reported | | $ | 11,042 | | $ | 11,107 | |
| Deduct: Total stock-based compensation expense | | | | | | | |
| determined under fair value method for all awards, | | | | | | | |
| net of related tax effects | | | (5,255 | ) | | 0 | |
| Pro forma net income | | $ | 5,787 | | $ | 11,107 | |
| | | | | | | | |
| Income per share: | | | | | | | |
| Basic - as reported | | $ | .61 | | $ | .62 | |
| Basic - pro forma | | | .32 | | | .62 | |
| | | | | | | | |
| Diluted - as reported | | $ | .60 | | $ | .61 | |
| Diluted - pro forma | | | .32 | | | .61 | |
The Company granted no stock options in 2006 or 2004. The weighted-average fair value of options granted in 2005 was $9.56 and was calculated at the time of issue using the Black-Scholes option-pricing model with the following assumptions used for grants in 2005:
| | | 2006 (a) | | 2005 | | 2004 (a) | |
| Stock price volatility | | | n/a | | | 66 | % | | n/a | |
| Risk-free interest rate | | | n/a | | | 3.7% - 4.4 | % | | n/a | |
| Expected life of options | | | n/a | | | 6 years | | | n/a | |
| Dividend yield | | | n/a | | | .43% - .62 | % | | n/a | |
| (a) | The Company granted no options during 2006 or 2004. |
TITAN INTERNATIONAL, INC.
NOTES TO CONSOLIDATED FINANCIAL STATEMENTS
Reclassification
Certain amounts from prior years have been reclassified to conform to the current year’s presentation. The 2005 and 2004 Consolidated Statements of Operations have been revised to combine research and development (R&D) expenses, which were previously shown separately, with the selling, general and administrative expenses due to the reduced level of R&D expenditures.
Use of estimates
The policies utilized by the Company in the preparation of the financial statements conform to accounting principles generally accepted in the United States of America and require management to make estimates, assumptions and judgments that affect the reported amount of assets and liabilities, and disclosure of contingent assets and liabilities, at the date of the financial statements and the reported amounts of revenues and expenses during the reporting period. Actual amounts could differ from these estimates and assumptions.
Recently issued accounting standards
Financial Accounting Standards Board Interpretation Number 48
In July 2006, Financial Accounting Standards Board Interpretation (FIN) No. 48, “Accounting for Uncertainty in Income Taxes-an Interpretation of FASB Statement No. 109,” was issued. FIN No. 48 prescribes a recognition threshold and measurement attribute for the financial statement recognition and measurement of a tax position taken or expected to be taken in a tax return. This interpretation also provides guidance on derecognition, classification, interest and penalties, accounting in interim periods, and disclosure requirements for uncertain tax positions. FIN No. 48 is effective for fiscal years beginning after December 15, 2006. The Company is evaluating the effect the adoption of this interpretation will have on its consolidated financial position, results of operations and cash flows.
Statement of Financial Accounting Standards Number 157
In September 2006, Statement of Financial Accounting Standards (SFAS) No. 157, “Fair Value Measurements,” was issued. This statement defines fair value, establishes a framework for measuring fair value in generally accepted accounting principles and expands disclosures about fair value measurements. This Statement applies under other accounting pronouncements that require or permit fair value measurements. This statement is effective for financial statements issued for fiscal years beginning after November 15, 2007, and interim periods within those fiscal years. The Company is evaluating the effect the adoption of this standard will have on its consolidated financial position, results of operations and cash flows.
Statement of Financial Accounting Standards Number 158
In September 2006, SFAS No. 158, “Employers’ Accounting for Defined Benefit Pension and Other Postretirement Plans,” was issued. This statement requires an employer to recognize the overfunded or underfunded status of a defined benefit postretirement plan as an asset or liability in its statement of financial position and to recognize changes in that funded status in the year in which the changes occur through comprehensive income. An employer with publicly traded equity securities is required to initially recognize the funded status of a defined benefit postretirement plan and to provide the required disclosures as of the end of the fiscal year ending after December 15, 2006. The Company adopted SFAS No. 158 as of December 31, 2006. The adoption of this statement had no material effect on the Company’s consolidated results of operations or cash flows. See Note 21 for the effect this statement had on the Company’s consolidated financial position.
Staff Accounting Bulletin Number 108
In September 2006, the SEC staff issued Staff Accounting Bulletin (SAB) 108, “Considering the Effects of Prior Year Misstatements when Quantifying Misstatements in Current Year Financial Statements.” SAB 108 requires that public companies utilize a “dual-approach” when assessing the quantitative effects of financial misstatements. This dual approach includes both an income statement focused assessment and a balance sheet focused assessment. The guidance in SAB 108 is effective for annual financial statements for fiscal years ending after November 15, 2006. The adoption of this guidance had no material effect on the Company’s consolidated financial position, results of operations and cash flows.
TITAN INTERNATIONAL, INC.
NOTES TO CONSOLIDATED FINANCIAL STATEMENTS
Acquisition of Continental’s OTR Assets
On July 31, 2006, Titan Tire Corporation of Bryan, a subsidiary of Titan International, Inc., acquired the off-the-road (OTR) tire assets of Continental Tire North America, Inc. (Continental) in Bryan, Ohio. Titan Tire Corporation of Bryan purchased the assets of Continental’s OTR tire facility for approximately $53 million in cash proceeds, including an initial cash payment of approximately $44 million and subsequent payment due of approximately $9 million. The assets purchased included Continental’s OTR plant, property and equipment located in Bryan, Ohio, inventory and other current assets. In addition, the Company recorded intangibles related to the acquisition as noncurrent assets and assumed warranty liabilities. This acquisition expanded Titan’s product offering into larger earthmoving, construction and mining tires and added the manufacturing capacity of the Bryan, Ohio, facility.
The allocation of the Continental OTR asset acquisition was as follows (in thousands):
| Inventory | | $ | 11,053 | |
| Prepaid and other current assets | | | 1,350 | |
| Property, plant and equipment | | | 42,197 | |
Noncurrent assets | | | 742 | |
| Liabilities assumed | | | (1,800 | ) |
| | | $ | 53,542 | |
The allocation of the Continental OTR asset acquisition may be subsequently adjusted to reflect additional information relating to the estimates and judgments used in determining the purchase price allocation. Any changes to the acquisition allocation will be made by July 2007.
Acquisition of Goodyear’s North American Farm Tire Assets
On December 28, 2005, Titan Tire Corporation, a subsidiary of Titan International, Inc., acquired The Goodyear Tire & Rubber Company’s North American farm tire assets. Titan Tire purchased the assets of Goodyear’s North American farm tire business for approximately $100 million in cash proceeds. The assets purchased include Goodyear’s North American plant, property and equipment located in Freeport, Illinois, and Goodyear’s North American farm tire inventory. In addition, the Company recorded intangibles related to the acquisition as noncurrent assets. This acquisition expanded Titan’s product offering into Goodyear branded farm tires and added the manufacturing capacity of the Freeport, Illinois, facility.
The allocation of the Goodyear North American farm tire acquisition was as follows (in thousands):
| Inventory | | $ | 40,246 | |
| Prepaid and other current assets | | | 4,680 | |
| Property, plant and equipment | | | 55,074 | |
| Noncurrent assets | | | 604 | |
| | | $ | 100,604 | |
TITAN INTERNATIONAL, INC.
NOTES TO CONSOLIDATED FINANCIAL STATEMENTS
Pro forma financial information
The following unaudited pro forma financial information gives effect to the acquisition of Continental’s OTR assets and the acquisition of Goodyear’s North American farm tire assets as if the acquisitions had taken place on January 1, 2005. The pro forma information for the Bryan, Ohio, facility was derived from a carve-out of Continental’s OTR historical accounting records. The pro forma information for the Freeport, Illinois, facility was derived from a carve-out of The Goodyear Tire & Rubber Company’s historical accounting records.
Pro forma information for the year (in thousands, except per share data):
| | | 2006 | | 2005 | |
| Net sales | | $ | 761,796 | | $ | 828,183 | |
| Income before income taxes | | | 21,786 | | | 8,383 | |
| Net income | | | 13,072 | | | 17,803 | |
| Diluted earnings per share | | | .61 | | | .92 | |
The pro forma information is presented for illustrative purposes only and may not be indicative of the results that would have been obtained had the acquisitions actually occurred on January 1, 2005, nor is it necessarily indicative of Titan’s future consolidated results of operations or financial position.
The Company had net accounts receivable of $73.9 million and $47.1 million at December 31, 2006 and 2005, respectively. These amounts are net of allowance for doubtful accounts of $4.8 million and $5.7 million for the years ended 2006 and 2005, respectively.
Inventories at December 31, 2006 and 2005, consisted of the following (in thousands):
| | | 2006 | | 2005 | |
| Raw material | | $ | 57,814 | | $ | 42,511 | |
| Work-in-process | | | 16,738 | | | 10,939 | |
| Finished goods | | | 84,863 | | | 74,793 | |
| | | | 159,415 | | | 128,243 | |
| Adjustment to LIFO basis | | | (4,811 | ) | | (5,551 | ) |
| | | $ | 154,604 | | $ | 122,692 | |
Included in the above inventory balances at December 31, 2006, and December 31, 2005, are reserves for slow-moving and obsolete inventory of $3.2 million and $2.7 million respectively.
TITAN INTERNATIONAL, INC.
NOTES TO CONSOLIDATED FINANCIAL STATEMENTS
| 5. | PREPAID AND OTHER CURRENT ASSETS |
Prepaid and other current assets at December 31, 2006 and 2005, consisted of the following (in thousands):
| | | 2006 | | 2005 | |
| Prepaid supplies | | $ | 9,227 | | $ | 8,051 | |
| Other | | | 9,574 | | | 7,579 | |
| | | $ | 18,801 | | $ | 15,630 | |
| 6. | PROPERTY, PLANT AND EQUIPMENT |
Property, plant and equipment at December 31, 2006 and 2005, consisted of the following (in thousands):
| | | 2006 | | 2005 | |
| Land and improvements | | $ | 3,088 | | $ | 2,521 | |
| Buildings and improvements | | | 78,230 | | | 63,572 | |
| Machinery and equipment | | | 269,730 | | | 202,598 | |
| Tools, dies and molds | | | 52,205 | | | 51,859 | |
| Construction-in-process | | | 4,587 | | | 2,284 | |
| | | | 407,840 | | | 322,834 | |
| Less accumulated depreciation | | | (223,224 | ) | | (182,452 | ) |
| | | $ | 184,616 | | $ | 140,382 | |
The significant increase in property, plant and equipment resulted from the July 2006 purchase of Continental’s OTR assets. The property, plant and equipment included in this purchase totaled $42.2 million. See Note 2 for additional information. Depreciation on fixed assets for the years 2006, 2005 and 2004 totaled $20.7 million, $14.3 million, and $17.4 million, respectively. In addition, $3.6 million, $4.7 million, and $5.3 million of depreciation was recorded on idled assets marketed for sale in 2006, 2005, and 2004, respectively.
| 7. | IDLED ASSETS MARKETED FOR SALE |
The idled assets marketed for sale had no balance at December 31, 2006, and a balance of $18.3 million at December 31, 2005. The idled assets marketed for sale were being depreciated in accordance with SFAS No. 144. Depreciation on these idled assets was $3.6 million, $4.7 million and $5.3 million for the years ended December 31, 2006, 2005 and 2004, respectively.
As a result of the expectation that the Company can use these assets to refurbish or increase capacity at the plants associated with the Goodyear North American farm tire asset acquisition and the Continental OTR asset acquisition, the Company is placing these assets back into service primarily at the Des Moines, Iowa, Freeport, Illinois, and Bryan, Ohio facilities. Therefore, in December 2006, the idled assets balance of approximately $14 million was reclassified to property, plant and equipment leaving no remaining balance at December 31, 2006.
TITAN INTERNATIONAL, INC.
NOTES TO CONSOLIDATED FINANCIAL STATEMENTS
| 8. | INVESTMENT IN TITAN EUROPE |
Investment in Titan Europe Plc consisted of the following (in thousands):
| | | 2006 | | 2005 | |
| Investment in Titan Europe Plc | | $ | 65,881 | | $ | 48,467 | |
In April 2004, Titan Luxembourg Sarl, a wholly-owned European subsidiary of the Company, sold 70% of the common stock of Titan Europe to the public on the AIM market in London, England. Titan Luxembourg was the largest single stockholder in Titan Europe Plc, retaining a 30% interest on the date of the transaction. In the first quarter of 2004, the Company recognized a $3.0 million goodwill impairment charge on the pending sale of a majority interest in Titan Europe in accordance with the Company’s goodwill impairment process. The historical results of the Company for the year ended December 31, 2004, included Titan Europe results of $49.4 million in net sales, $8.3 million in gross profit and $0.4 million in income from operations.
The Company accounted for its interest in Titan Europe Plc as an equity investment subsequent to the sale of a majority interest in April 2004. The Company recognized equity income on its investment in Titan Europe Plc of $2.9 million in 2005 and $1.3 million in 2004. In December 2005, Titan Europe Plc issued additional shares of stock for an acquisition. As a result of these additional shares, the Company’s interest in Titan Europe Plc was diluted and decreased from 29.3% at December 31, 2004, to a 15.4% ownership position at December 31, 2005. The Company recorded the gain resulting from the change in ownership interest to equity in accordance with SAB 51. With the decreased ownership percentage, effective December 2005, the Company no longer uses the equity method to account for its interest in Titan Europe Plc.
In accordance with SFAS No. 115, the Company records the Titan Europe Plc investment as an available-for-sale security and reports the investment at fair value, with unrealized gains and losses excluded from earnings and reported as a separate component of comprehensive income in stockholders’ equity. The Company’s stock ownership interest in Titan Europe Plc was 17.3% at December 31, 2006, and 15.4% at December 31, 2005. The increase in ownership percentage resulted from a December 2006 transaction in which Titan Europe Plc issued additional shares to the Company in payment of approximately $7.9 million U.S. dollars of debt, representing the entire remaining long-term debt owed by Titan Europe Plc to the Company.
The fair value of the Company’s investment in Titan Europe Plc was $65.9 million and $48.5 million at December 31, 2006 and 2005, respectively. Cash dividends received from Titan Europe Plc were $1.3 million, $0.9 million and $0.3 million for the years ended December 31, 2006, 2005 and 2004, respectively.
The carrying amount of goodwill by segment at December 31, 2006 and 2005, was (i) agricultural of $6.9 million, (ii) earthmoving/construction of $3.6 million, and (iii) consumer of $1.2 million.
The Company reviews goodwill to assess recoverability from future operations during the fourth quarter of each annual reporting period, and whenever events and circumstances indicate that the carrying values may not be recoverable as required by the adoption of SFAS No. 142, Goodwill and Other Intangible Assets. Based on a discounted cash flow method at December 31, 2006, the Company’s computation showed no impairment. There can be no assurance that future goodwill tests will not result in an impairment charge.
TITAN INTERNATIONAL, INC.
NOTES TO CONSOLIDATED FINANCIAL STATEMENTS
Other assets at December 31, 2006 and 2005, consisted of the following (in thousands):
| | | 2006 | | 2005 | |
| Deferred financing | | $ | 7,534 | | $ | 4,014 | |
| Note receivable from Titan Europe Plc | | | 0 | | | 5,191 | |
| Other | | | 5,460 | | | 6,566 | |
| | | $ | 12,994 | | $ | 15,771 | |
The increase in deferred financing is the result of additional deferred financing related to the December 2006 issuance of the Company’s $200 million senior unsecured notes due 2012. The decrease in the note receivable is the result of Titan Europe Plc issuing additional shares to the Company in December 2006 in satisfaction of the note.
| 11. | OTHER CURRENT LIABILITIES |
Other current liabilities at December 31, 2006 and 2005, consisted of the following accruals (in thousands):
| | | 2006 | | 2005 | |
| Off-the-road acquisition | | $ | 8,900 | | $ | 0 | |
| Wages and commissions | | | 8,800 | | | 3,381 | |
| Warranty | | | 4,688 | | | 1,838 | |
| Insurance | | | 4,458 | | | 2,430 | |
| Other | | | 10,096 | | | 4,104 | |
| | | $ | 36,942 | | $ | 11,753 | |
The off-the-road (OTR) acquisition liability is the remaining amount due on the Continental OTR asset acquisition after final settlement. The increase in wages and commissions results from the accrued wages for the Freeport and Bryan facilities. The employees of these facilities became part of Titan in 2006.
The Company provides limited warranties on workmanship on its products in all market segments. The majority of the Company’s products have a limited warranty that ranges from zero to ten years with certain products being prorated after the first year. The Company calculates a provision for warranty expense based on past warranty experience. Warranty accruals are included as a component of other current liabilities on the Consolidated Balance Sheets. Changes in the warranty liability consisted of the following (in thousands):
| | | 2006 | | 2005 | |
| Warranty liability, January 1 | | $ | 1,838 | | $ | 1,762 | |
| Warranty assumed with asset purchase | | | 1,800 | | | 0 | |
| Provision for warranty liabilities | | | 5,534 | | | 2,622 | |
| Warranty payments made | | | (4,484 | ) | | (2,546 | ) |
| Warranty liability, December 31 | | $ | 4,688 | | $ | 1,838 | |
| 13. | OTHER LONG-TERM LIABILITIES |
Other long-term liabilities at December 31, 2006 and 2005, consisted of the following (in thousands):
| | | 2006 | | 2005 | |
| Accrued pension liabilities | | $ | 8,682 | | $ | 15,476 | |
| Accrued employment liabilities | | | 4,741 | | | 2,775 | |
| Other | | | 2,412 | | | 2,464 | |
| | | $ | 15,835 | | $ | 20,715 | |
See Note 21 for additional information regarding the decrease in accrued pension liabilities. Accrued employment liabilities at December 31, 2006, includes approximately $2 million for contractual and performance obligations upon retirement for certain executive officers.
TITAN INTERNATIONAL, INC.
NOTES TO CONSOLIDATED FINANCIAL STATEMENTS
| 14. | REVOLVING CREDIT FACILITY AND LONG-TERM DEBT |
Long-term debt at December 31, 2006 and 2005, consisted of the following (in thousands):
| | | 2006 | | 2005 | |
| Senior unsecured notes | | $ | 200,000 | | $ | 0 | |
| Revolving credit facility | | | 0 | | | 99,100 | |
| Senior unsecured convertible notes | | | 81,200 | | | 81,200 | |
| Industrial revenue bonds and other | | | 10,164 | | | 22,159 | |
| | | | 291,364 | | | 202,459 | |
| Less amounts due within one year | | | 98 | | | 11,995 | |
| | | $ | 291,266 | | $ | 190,464 | |
Aggregate maturities of long-term debt are as follows (in thousands):
| 2007 | | $ | 98 | |
| 2008 | | | 566 | |
| 2009 | | | 81,200 | |
| 2010 | | | 9,500 | |
| 2011 | | | 0 | |
| Thereafter | | | 200,000 | |
| | | $ | 291,364 | |
Senior unsecured notes
In December 2006, the Company closed its offering of $200 million 8% senior unsecured notes. The notes were sold at par and are due January 2012. Titan used the net proceeds from this offering to repay outstanding existing debt at the time of closing, excluding the 5.25 percent senior unsecured convertible notes. The outstanding balance on the Company’s revolving credit facility was paid down in December and had no cash borrowings at December 31, 2006. The Company anticipates paying off approximately $10 million of industrial revenue bonds in the first quarter of 2007 and will use the remaining cash for general corporate purposes.
Revolving credit facility
The Company’s revolving credit facility with agent LaSalle Bank National Association had a 2008 termination date and is collateralized by a first priority security interest in certain assets of Titan and its domestic subsidiaries. At December 31, 2006, the borrowings under the facility bore interest at a floating rate of prime rate plus 1.25% or LIBOR plus 2.75%. There were no borrowings under this facility at December 31, 2006. The facility contains certain financial covenants, restrictions and other customary affirmative and negative covenants. The Company is in compliance with these covenants and restrictions as of December 31, 2006.
Credit facility amendments
In October 2005, the revolving credit facility was amended. The amendment increased the revolving loan availability to $200 million from $100 million, extended the termination date to October 2008 from the previous termination date of July 2007 and removed General Electric Capital Corporation as a participant. In July 2006, upon the closing of Titan’s acquisition of the Continental OTR assets, the facility was amended increasing the loan availability from $200 million to $250 million.
Recent Development On February 8, 2007, the Company amended its revolving credit facility with LaSalle Bank National Association. The amendment extended the termination date to October 2009 (previously October 2008). The amendment also lowered borrowing rates, which will be based on a pricing grid. The borrowings under the facility will bear interest at a floating rate of LIBOR plus 1% to 2% (previously 2.75%). The amendment lowered the revolving loan availability from $250 million to $125 million with the ability to request an increase back to $250 million.
TITAN INTERNATIONAL, INC.
NOTES TO CONSOLIDATED FINANCIAL STATEMENTS
Senior unsecured convertible notes
The $81.2 million of 5.25% senior unsecured convertible notes are due 2009. These notes are convertible into shares of the Company’s stock at any time on or before maturity at a conversion rate of 74.0741 shares per $1,000 principal amount of notes ($13.50 per common share), subject to adjustment. This conversion rate would convert all of the notes into approximately 6.0 million shares of the Company’s common stock. In June of 2005, Titan finalized a private transaction to exchange $33.8 million of the Company’s outstanding 5.25% senior unsecured convertible notes due 2009 for 3,022,275 shares of common stock as proposed to the Company by certain note holders. The Company recognized a noncash charge of $7.2 million in connection with this exchange in accordance with SFAS No. 84, “Induced Conversions of Convertible Debt,” during the second quarter of 2005.
Recent Development In January 2007, Titan filed a Form S-4 registration statement relating to an offer to the holders of the senior unsecured convertible notes to convert their notes into Titan’s common stock at an increased conversion rate. See Note 27 for additional information.
Industrial revenue bonds and other
Other debt primarily consists of industrial revenue bonds, loans from local and state entities, and other long-term notes. Maturity dates on this debt range from one to three years and interest rates ranged from 3% to 4% rate.
Recent Development In January 2007, the Company issued a notice of redemption for $9.5 million in industrial revenue bonds. These bonds, which were previously due February 2010, are expected to be redeemed in the first quarter of 2007.
Redemption of 8.75% senior subordinated notes
On July 26, 2004, the Company notified the trustee to redeem all of Titan’s outstanding 8.75% senior subordinated notes. On August 26, 2004, the Company redeemed all of the outstanding principal amount ($136.8 million) of these notes at a redemption price of 101.458% per note (expressed as a percentage of the principal amount).
Debt termination expenses
In connection with the termination of the Company’s prior revolving loan agreement and term loan, and in addition to the redemption of the 8.75% senior subordinated notes, Titan recorded expenses of $3.7 million in the third quarter of 2004. These expenses were related to the (i) redemption premium on the subordinated notes of $2.0 million, (ii) unamortized deferred financing fees of $1.5 million and (iii) prepayment penalty of $0.2 million.
| 15. | ACCUMULATED OTHER COMPREHENSIVE INCOME (LOSS) |
Accumulated other comprehensive income (loss) consisted of the following (in thousands):
| | | Currency Translation Adjustments | | Unrealized Gain on Investments | | Minimum Pension Liability Adjustment | | Unrecognized Losses and Prior Service Cost | | Total | |
Balance at January 1, 2005 | | $ | 1,985 | | $ | 0 | | $ | (18,551 | ) | $ | 0 | | $ | (16,566 | ) |
| Currency translation adjustments | | | (3,168 | ) | | 0 | | | 0 | | | 0 | | | (3,168 | ) |
Minimum pension liability adjustment, net of tax of $10 | | | 0 | | | 0 | | | (18 | ) | | 0 | | | (18 | ) |
Balance at December 31, 2005 | | | (1,183 | ) | | 0 | | | (18,569 | ) | | 0 | | | (19,752 | ) |
Unrealized gain on investment, net of tax of $3,299 | | | 0 | | | 6,126 | | | 0 | | | 0 | | | 6,126 | |
Minimum pension liability adjustment, net of tax of $595 | | | 0 | | | 0 | | | 3,225 | | | 0 | | | 3,225 | |
Adoption of SFAS No. 158, net of tax of $651 | | | 0 | | | 0 | | | 15,344 | | | (16,405 | ) | | (1,061 | ) |
Balance at December 31, 2006 | | $ | (1,183 | ) | $ | 6,126 | | $ | 0 | | $ | (16,405 | ) | $ | (11,462 | ) |
TITAN INTERNATIONAL, INC.
NOTES TO CONSOLIDATED FINANCIAL STATEMENTS
In June of 2005, Titan finalized a private transaction to exchange $33.8 million of the Company’s outstanding 5.25% senior unsecured convertible notes due 2009 for 3,022,275 shares of common stock as proposed to the Company by certain note holders. The Company recognized a noncash charge of $7.2 million in connection with this exchange in accordance with SFAS No. 84, “Induced Conversions of Convertible Debt,” during the second quarter of 2005.
The Company is authorized by the Board of Directors to repurchase an additional 2.5 million common shares subject to debt agreement covenants. The Company paid cash dividends of $.02 per share of common stock per year for 2006, 2005 and 2004.
The December 2005 Goodyear North American farm tire asset acquisition included a license agreement with The Goodyear Tire & Rubber Company to manufacture and sell certain off-highway tires in North America. Royalty expenses recorded for the year ended December 31, 2006, were $5.0 million. No royalty expense was recorded in 2005 and 2004, as this license agreement was not yet in place during those years.
| 18. | GOODWILL IMPAIRMENT ON TITAN EUROPE |
On April 7, 2004, Titan Luxembourg Sarl, a wholly-owned European subsidiary of the Company, sold 70% of the common stock of Titan Europe to the public on the AIM market in London. In the first quarter of 2004, the Company recognized a $3.0 million goodwill impairment charge on the pending sale of a majority interest in Titan Europe based on the valuation of Titan Europe inherent in the April 2004 public offering in accordance with the Company’s goodwill impairment policy. The April 2004 consideration for the entire Titan Europe offering was $89.5 million as compared to a book value of $92.5 million, resulting in a goodwill impairment charge of $3.0 million.
Other income consisted of the following (in thousands):
| | | 2006 | | 2005 | | 2004 | |
| Interest income | | $ | 1,681 | | $ | 367 | | $ | 669 | |
| Dividend income - Titan Europe Plc | | | 1,281 | | | 0 | | | 0 | |
| Foreign exchange gain (loss) | | | 975 | | | (1,338 | ) | | 537 | |
| Equity income - Titan Europe Plc | | | 0 | | | 2,938 | | | 1,278 | |
| Other (expense) | | | (373 | ) | | (1,009 | ) | | (778 | ) |
| | | $ | 3,564 | | $ | 958 | | $ | 1,706 | |
Interest income for the year ended December 31, 2006, includes $1.1 million of interest income received in March 2006 regarding the final calculation of interest earned associated with restricted cash previously on deposit. As a result of decreased ownership percentage in Titan Europe Plc, effective December 2005, the Company no longer uses the equity method to account for its interest in Titan Europe Plc.
TITAN INTERNATIONAL, INC.
NOTES TO CONSOLIDATED FINANCIAL STATEMENTS
Income (loss) before income taxes, consisted of the following (in thousands):
| | | | 2006 | | | 2005 | | | 2004 | |
| Domestic | | $ | 5,310 | | $ | (5,048 | ) | $ | 12,533 | |
| Foreign | | | 3,264 | | | 2,163 | | | 2,682 | |
| | | $ | 8,574 | | $ | (2,885 | ) | $ | 15,215 | |
The provision (benefit) for income taxes, was as follows (in thousands):
| | | | 2006 | | | 2005 | | | 2004 | |
| Current | | | | | | | | | | |
| Federal | | $ | 120 | | $ | 549 | | $ | 2,571 | |
| State | | | 475 | | | 0 | | | 0 | |
| Foreign | | | 183 | | | 87 | | | 1,537 | |
| | | | 778 | | | 636 | | | 4,108 | |
| Deferred | | | | | | | | | | |
| Federal | | | 2,442 | | | (13,413 | ) | | 0 | |
| State | | | 210 | | | (1,150 | ) | | 0 | |
| Foreign | | | 0 | | | 0 | | | 0 | |
| | | | 2,652 | | | (14,563 | ) | | 0 | |
| Provision (benefit) for income taxes | | $ | 3,430 | | $ | (13,927 | ) | $ | 4,108 | |
The provision (benefit) for income taxes differs from the amount of income tax determined by applying the statutory U.S. federal income tax rate to pre-tax income (loss) as a result of the following:
| | | 2006 | | 2005 | | 2004 | |
| Statutory U.S. federal tax rate | | | 35.0 | % | | (35.0 | )% | | 35.0 | % |
Valuation allowance | | | 0.0 | | | (488.7 | ) | | (47.3 | ) |
| Nondeductible convertible debt conversion charge | | | 0.0 | | | 87.7 | | | 0.0 | |
| Dyneer legal charge | | | 0.0 | | | (60.7 | ) | | 0.0 | |
| State tax rate change | | | 0.0 | | | 21.2 | | | 0.0 | |
Repatriation of foreign earnings, net of American Jobs Creation Act benefit | | | 11.6 | | | 19.0 | | | 29.3 | |
| Nondeductible goodwill write-off | | | 0.0 | | | 0.0 | | | 6.9 | |
| Foreign taxes, net | | | (12.0 | ) | | (18.1 | ) | | 0.0 | |
| State taxes, net | | | 6.2 | | | (2.9 | ) | | 0.0 | |
| Other, net | | | (0.8 | ) | | (5.2 | ) | | 3.1 | |
| Effective tax rate | | | 40.0 | % | | (482.7 | )% | | 27.0 | % |
-
Federal income taxes are provided on earnings of foreign subsidiaries except to the extent that such earnings are expected to be indefinitely reinvested abroad.
TITAN INTERNATIONAL, INC.
NOTES TO CONSOLIDATED FINANCIAL STATEMENTS
Deferred income taxes reflect the net tax effects of temporary differences between the carrying amounts of assets and liabilities for financial reporting purposes and the amounts used for income tax purposes. Significant components of the Company’s deferred tax assets and liabilities at December 31, 2006 and 2005, are as follows (in thousands):
| | | 2006 | | 2005 | |
| Deferred tax assets: | | | | | | | |
| Net operating loss carryforward | | $ | 12,618 | | $ | 14,120 | |
| Pension | | | 4,501 | | | 5,619 | |
| Employee benefits and related costs | | | 3,720 | | | 2,050 | |
| Allowance for bad debts | | | 1,830 | | | 2,148 | |
| Inventory | | | 1,351 | | | 459 | |
| EPA reserve | | | 1,226 | | | 1,236 | |
| Warranty | | | 1,112 | | | 699 | |
| Other | | | 2,876 | | | 3,025 | |
| Deferred tax assets | | | 29,234 | | | 29,356 | |
| | | | | | | | |
| Deferred tax liabilities: | | | | | | | |
| Fixed assets | | | (16,534 | ) | | (14,705 | ) |
| Unrealized gain on available-for-sale security | | | (8,937 | ) | | (5,638 | ) |
| Foreign deferred gain | | | (2,453 | ) | | (2,453 | ) |
| Deferred tax liabilities | | | (27,924 | ) | | (22,796 | ) |
| | | | | | | | |
| Net deferred tax asset | | $ | 1,310 | | $ | 6,560 | |
The Company recorded an income tax expense of $3.4 million, an income tax benefit of $13.9 million and an income tax expense of $4.1 million for the years ended December 31, 2006, 2005 and 2004, respectively. As a result of several years of previous losses, the Company recorded a valuation allowance against its net deferred tax asset, consistent with the Company’s accounting policies. As a result of anticipated utilization of net operating loss carryforward in connection with its future Federal income tax filings, the Company recorded a tax benefit of $13.9 million in 2005 as a result of the reversal of the Company’s valuation allowance in accordance with SFAS 109. The Company’s net operating loss carryforward of approximately $32 million expires in 2023.
American Jobs Creation Act of 2004
In October 2004, the American Jobs Creation Act of 2004 was signed into law by the President of the United States of America. This legislation resulted in sweeping revisions to the U.S. Internal Revenue Code and related regulations. The Act provides for a number of changes, including providing taxpayers with an opportunity to repatriate foreign-source income in the U.S. if such repatriated income is invested in the U.S. under a properly approved domestic reinvestment plan. The repatriation provisions of this Act benefited the Company by preserving net operating loss carryforwards.
During 2004, prior to the passage of the Act, the Company had estimated a $15 million reduction to the valuation allowance related to its net deferred tax asset position. The $7.1 million reduction in this estimate at December 31, 2004, was due to the repatriation, under the provisions of the Act, of foreign earnings associated with the sale of a majority interest in Titan Europe. This repatriation under the Act allowed the Company to pay a current tax rate of 5.25% on the repatriated foreign earnings rather than utilizing net operating loss carryforwards.
TITAN INTERNATIONAL, INC.
NOTES TO CONSOLIDATED FINANCIAL STATEMENTS
| 21. | EMPLOYEE BENEFIT PLANS |
Pension plans
The Company has a frozen defined benefit pension plan covering certain employees of Titan Tire Corporation. The Company also has a frozen contributory defined benefit pension plan covering certain former eligible bargaining employees of its Walcott, Iowa, facility. Additionally, the Company maintains a contributory defined benefit plan that covered former eligible bargaining employees of Dico, Inc. This Dico plan purchased a final annuity settlement contract in October 2002. The Company’s policy is to fund pension costs as required by law, which is consistent with the funding requirements of federal laws and regulations.
The Company’s defined benefit plans have been aggregated in the following table. Included in the December 31, 2006, presentation are the Titan Tire and Walcott plans, which have a projected benefit obligation and accumulated benefit obligation of $68.8 million, exceeding the fair value of plan assets of $60.2 million at December 31, 2006. At December 31, 2005, these plans had a projected benefit obligation and accumulated benefit obligation of $71.8 million, exceeding the fair value of plan assets of $56.3 million. The projected benefit obligation and the accumulated benefit obligation are the same amount since the Plans are frozen and there are no future compensation levels to factor into the obligations. The Company absolved itself from the liabilities associated with the Dico plan with the purchase of a final annuity settlement contract in October 2002. Therefore, the plan no longer maintains a projected or accumulated benefit obligation. The fair value of the Dico plan assets was $0.5 million at December 31, 2006, 2005 and 2004.
The following table provides the change in benefit obligation, change in plan assets, funded status and amounts recognized in the consolidated balance sheet of the defined benefit pension plans as of December 31, 2006 and 2005 (in thousands):
Change in benefit obligation: | | 2006 | | 2005 | |
| Benefit obligation at beginning of year | | $ | 71,796 | | $ | 75,748 | |
| Interest cost | | | 3,934 | | | 4,158 | |
| Actuarial gain | | | (144 | ) | | (1,342 | ) |
| Benefits paid | | | (6,742 | ) | | (6,768 | ) |
| Benefit obligation at end of year | | $ | 68,844 | | $ | 71,796 | |
| | | | | | | | |
Change in plan assets: | | | | | | | |
| Fair value of plan assets at beginning of year | | $ | 56,802 | | $ | 57,985 | |
| Actual return on plan assets | | | 6,578 | | | 1,753 | |
| Employer contributions | | | 4,028 | | | 3,832 | |
| Benefits paid | | | (6,742 | ) | | (6,768 | ) |
| Fair value of plan assets at end of year | | $ | 60,666 | | $ | 56,802 | |
| | | | | | | | |
Unfunded status at end of year | | $ | (8,178 | ) | $ | (14,994 | ) |
| Unrecognized prior service cost | | | | | | 1,848 | |
| Unrecognized net loss | | | | | | 28,906 | |
| Unrecognized deferred tax liability | | | | | | (337 | ) |
| Net amount recognized | | | | | $ | 15,423 | |
| | | | | | | | |
Amounts recognized in consolidated balance sheet: | | | | | | | |
| Current assets | | $ | 0 | | $ | n/a | |
| Noncurrent assets | | | 504 | | | n/a | |
| Noncurrent liabilities | | | (8,682 | ) | | n/a | |
| Prepaid benefit cost | | | n/a | | | 483 | |
| Intangible asset | | | n/a | | | 1,848 | |
| Accrued benefit costs | | | n/a | | | (15,476 | ) |
| Accumulated other comprehensive loss | | | n/a | | | 28,568 | |
| Net amount recognized in the consolidated balance sheet | | $ | (8,178 | ) | $ | 15,423 | |
TITAN INTERNATIONAL, INC.
NOTES TO CONSOLIDATED FINANCIAL STATEMENTS
Amounts recognized in accumulated other comprehensive loss at December 31, 2006: | |
| Unrecognized prior service cost | | $ | (1,711 | ) |
| Unrecognized net loss | | | (25,030 | ) |
| Unrecognized deferred tax liability | | | 281 | |
| Deferred tax effect of unrecognized items | | | 10,055 | |
| Net amount recognized in accumulated other comprehensive loss | | $ | (16,405 | ) |
The weighted-average assumptions used in the actuarial computation that derived the benefit obligations at December 31 were as follows:
| | 2006 | | 2005 | |
| Discount rate | | | 5.75 | % | | 5.75 | % |
| Expected long-term return on plan assets | | | 8.50 | % | | 8.50 | % |
The Company adopted SFAS No. 158 as of December 31, 2006. The incremental effect of applying SFAS No. 158 on individual line items in the consolidated balance sheet at December 31, 2006, is as follows (in thousands):
| | | Before application of SFAS 158 | | Adjustments | | After application of SFAS 158 | |
| Deferred tax asset | | $ | 28,583 | | $ | 651 | | $ | 29,234 | |
| Other assets | | | 14,705 | | | (1,711 | ) | | 12,994 | |
| Accumulated other comprehensive loss, net of tax | | | (10,401 | ) | | (1,061 | ) | | (11,462 | ) |
| Total stockholders’ equity | | | 188,238 | | | (1,061 | ) | | 187,177 | |
The following table provides the components of net periodic pension cost for the plans, settlement cost and the assumptions used in the measurement of the Company’s benefit obligation for the years ended December 31, 2006, 2005 and 2004 (in thousands):
Components of net periodic benefit cost and other amounts recognized in other comprehensive income | | | | | | | |
| Net periodic benefit cost: | | | 2006 | | | 2005 | | | 2004 | |
| Interest cost | | $ | 3,934 | | $ | 4,158 | | $ | 4,465 | |
| Assumed return on assets | | | (4,673 | ) | | (4,809 | ) | | (4,394 | ) |
| Amortization of unrecognized prior service cost | | | 137 | | | 137 | | | 136 | |
| Amortization of unrecognized deferred taxes | | | (56 | ) | | (56 | ) | | (56 | ) |
| Amortization of net unrecognized loss | | | 1,848 | | | 1,754 | | | 1,609 | |
| Net periodic pension cost | | $ | 1,190 | | $ | 1,184 | | $ | 1,760 | |
The estimated net loss, prior service cost, and deferred taxes that will be amortized from accumulated other comprehensive income into net periodic benefit cost over the next fiscal year are $1.6 million, $0.1 and $(0.1) million, respectively.
The weighted-average assumptions used in the actuarial computation that derived net periodic pension cost for the years ended December 31, 2006, 2005 and 2004:
| | | 2006 | | 2005 | | 2004 | |
| Discount rate | | | 5.75 | % | | 5.75 | % | | 6.25 | % |
| Expected long-term return on plan assets | | | 8.50 | % | | 8.50 | % | | 8.50 | % |
TITAN INTERNATIONAL, INC.
NOTES TO CONSOLIDATED FINANCIAL STATEMENTS
The allocation of the fair value of plan assets was as follows:
| | | Percentage of Plan Assets at December 31, | | Target Allocation | |
Asset Category | | 2006 | | 2005 | | 2007 | |
| U.S. equities (a) | | | 65 | % | | 64 | % | | 44% - 80 | % |
| Fixed income | | | 21 | % | | 20 | % | | 20% - 40 | % |
| Cash and cash equivalents | | | 5 | % | | 8 | % | | 0% - 20 | % |
| International equities (a) | | | 9 | % | | 8 | % | | 0% - 16 | % |
| | | | 100 | % | | 100 | % | | | |
| (a) | Total equities may not exceed 80% of total plan assets. |
The Company invests in a diversified portfolio consisting of an array of asset classes in an attempt to maximize returns while minimizing volatility. These asset classes include U.S. equities, fixed income, cash and cash equivalents, and international equities. The investment objectives are to provide for the growth and preservation of plan assets on a long-term basis through investments in: (i) investment grade securities that provide investment returns that meet or exceed the Standard & Poor’s 500 Index and (ii) investment grade fixed income securities that provide investment returns that meet or exceed the Lehman Government / Corporate Index. The U.S. equities asset category included the Company’s common stock in the amount of $2.3 million (four percent of total plan assets) and $2.7 million (five percent of total plan assets) at December 31, 2006 and 2005, respectively.
The long-term rate of return for plan assets is determined using a weighted-average of long-term historical returns on cash and cash equivalents, fixed income securities, and equity securities considering the anticipated investment allocation within the plans. The expected return on plan assets is anticipated to be 8.5% over the long-term. This rate assumes historical returns of 10% for equities and 7% for fixed income securities using the plans’ target allocation percentages. Professional investment firms, none of which are Titan employees, manage the plan assets.
Although the 2007 minimum pension funding calculations are not finalized, the Company estimates those funding requirements will be approximately $5 million.
Projected benefit payments from the plans as of December 31, 2006, are estimated as follows (in thousands):
| 2007 | | $ | 6,170 | |
| 2008 | | | 6,036 | |
| 2009 | | | 5,927 | |
| 2010 | | | 5,764 | |
| 2011 | | | 5,578 | |
| 2012-2016 | | | 26,460 | |
401(k)
The Company sponsors four 401(k) retirement savings plans. One plan is for the benefit of substantially all employees who are not covered by a collective bargaining arrangement. Beginning in July of 2004, Titan provides a 25% matching contribution in the form of the Company’s common stock on the first 6% of the employee’s contribution in this plan. The Company issued 13,506 shares and 18,645 shares of treasury stock in connection with this 401(k) plan during 2006 and 2005, respectively. Expenses to the Company related to this 401(k) plan were $0.3 million for each of 2006 and 2005. There was no treasury stock issued or expense recorded for the 401(k) plan in 2004 as the Company used forfeited shares within the plan to satisfy matching contributions.
A second plan is for employees covered by a collective bargaining arrangement at Titan Tire Corporation and does not include a Company matching contribution. Employees are fully vested with respect to their contributions.
The Company’s third plan received a 401(k) plan transfer in 2006 for the employees covered by a collective bargaining agreement of Titan Tire Corporation of Freeport. This plan does not include a Company matching contribution. Employees are fully vested with respect to their contributions.
TITAN INTERNATIONAL, INC.
NOTES TO CONSOLIDATED FINANCIAL STATEMENTS
Previously, the Company adopted 401(k) plans for the employees of Titan Tire Corporation of Texas and the employees of Titan Tire Corporation of Natchez. These plans relate to the non-operational facilities in Brownsville, Texas, and Natchez, Mississippi. The matching contributions on these 401(k) plans were discontinued in November 2003.
On January 1, 2006, the Company adopted SFAS 123(R), “Share-Based Payment,” using the modified prospective method of adoption, which does not require restatement of prior periods. The Company previously applied the recognition and measurement principles of APB Opinion No. 25, “Accounting for Stock Issued to Employees,” and related Interpretations in accounting for share-based option awards. SFAS 123(R) requires companies to estimate the fair value of share-based option awards on the date of the grant using an option-pricing model. The value of the portion of the award that is ultimately expected to vest is recognized as expense over the vesting period. No stock-based compensation expense was recorded during 2006, 2005 or 2004. See Note 1 for 2005 pro forma information illustrating the effect on net income and income per share if the Company had applied the provisions of SFAS 123(R). The Company granted no options during 2006 or 2004. All previously granted options were fully vested before January 1, 2006.
In accordance with SFAS 123(R), cash flows from income tax benefits resulting from tax deductions in excess of compensation cost recognized for share-based option awards have been classified as financing cash flows prospectively from January 1, 2006. Previously, these excess tax benefits were presented as operating cash flows.
Stock Incentive Plan
The Company adopted the 1993 Stock Incentive Plan (the Plan) to provide grants of stock options as a means of attracting and retaining qualified employees for the Company. There will be no additional issuance of stock options under this plan as it has expired. Options previously granted were fully vested in 2005 and expire 10 years from the grant date of the option.
Non-Employee Director Stock Option Plan
The Company adopted the 1994 Non-Employee Director Stock Option Plan (the Director Plan) to provide for grants of stock options as a means of attracting and retaining qualified independent directors for the Company. There will be no additional issuance of stock options under this plan as it has expired. Options previously granted were fully vested in 2005 and expire 10 years from the grant date of the option.
2005 Equity Incentive Plan
The Company adopted the 2005 Equity Incentive Plan to provide stock options as a means of attracting and retaining qualified independent directors and employees for the Company. A total of 2.1 million shares are reserved for the plan. The exercise price of stock options may not be less than the fair market value of the common stock on the date of the grant. The vesting and term of each option is set by the Board of Directors. In 2006 no options were granted under this plan. In 2005, a total of 890,380 options were granted under this plan. These options were fully vested in 2005 and expire 10 years from the grant date of the option.
Stock options outstanding and exercisable as of December 31, 2006, were as follows:
| | | | | Options Outstanding | | Options Exercisable | |
Price Range | | Weighted Average Contractual Life | | | | Weighted Average Exercise Price | | | | Weighted Average Exercise Price | |
| $ 4.54-$ 6.69 | | | 4.3 years | | | 135,000 | | $ | 5.47 | | | 135,000 | | $ | 5.47 | |
| $ 8.00-$ 9.50 | | | 2.2 years | | | 169,870 | | $ | 8.40 | | | 169,870 | | $ | 8.40 | |
| $12.75-$14.45 | | | 6.6 years | | | 389,215 | | $ | 13.35 | | | 389,215 | | $ | 13.35 | |
| $16.00-$18.00 | | | 7.1 years | | | 455,975 | | $ | 17.37 | | | 455,975 | | $ | 17.37 | |
| | | | | | | 1,150,060 | | $ | 13.29 | | | 1,150,060 | | $ | 13.29 | |
TITAN INTERNATIONAL, INC.
NOTES TO CONSOLIDATED FINANCIAL STATEMENTS
The following is a summary of activity in the stock option plans for 2004, 2005 and 2006:
| | | Shares Subject to Option | | Weighted- Average Exercise Price | |
Outstanding, January 1, 2004 | | | 948,650 | | $ | 11.29 | |
| Granted | | | 0 | | | - | (a) |
| Exercised | | | (23,570 | ) | | 8.00 | |
| Canceled/Expired | | | (122,690 | ) | | 12.16 | |
Outstanding, December 31, 2004 | | | 802,390 | | | 11.25 | |
| Granted | | | 890,380 | | | 15.20 | |
| Exercised | | | (135,860 | ) | | 11.04 | |
| Canceled/Expired | | | (9,400 | ) | | 13.47 | |
Outstanding, December 31, 2005 | | | 1,547,510 | | | 13.53 | |
| Granted | | | 0 | | | - | (a) |
| Exercised | | | (382,190 | ) | | 14.15 | |
| Canceled/Expired | | | (15,260 | ) | | 16.00 | |
Outstanding, December 31, 2006 | | | 1,150,060 | | $ | 13.29 | |
| (a) | The Company granted no options during 2004 or 2006. |
The total intrinsic value of options exercised in 2006 was $1.7 million. Cash received from the exercise of options was $5.4 million for 2006. The tax benefit realized for the tax deductions from options exercised was $0.6 million for 2006.
The Company currently uses treasury shares to satisfy any stock option exercises. At December 31, 2006, the Company had 10.7 million shares of treasury stock.
The Company leases certain buildings and equipment under operating leases. Certain lease agreements provide for renewal options, fair value purchase options, and payment of property taxes, maintenance and insurance by the Company. Total rental expense was $3.2 million, $3.2 million and $2.9 million for the years ended December 31, 2006, 2005 and 2004, respectively.
At December 31, 2006, future minimum rental commitments under noncancellable operating leases with initial or remaining terms in excess of one year are as follows (in thousands):
| 2007 | | $ | 2,575 | |
| 2008 | | | 1,525 | |
| 2009 | | | 962 | |
| 2010 | | | 660 | |
| 2011 | | | 349 | |
| Thereafter | | | 0 | |
| Total future minimum lease payments | | $ | 6,071 | |
TITAN INTERNATIONAL, INC.
NOTES TO CONSOLIDATED FINANCIAL STATEMENTS
The Company is a party to routine legal proceedings arising out of the normal course of business. Although it is not possible to predict with certainty the outcome of these unresolved legal actions or the range of possible loss, the Company believes at this time that none of these actions, individually or in the aggregate, will have a material adverse effect on the consolidated financial condition, results of operations or cash flows of the Company. However, due to the difficult nature of predicting future legal claims, the Company cannot anticipate or predict the material adverse effect on its consolidated financial condition, results of operations or cash flows as a result of efforts to comply with or its liabilities pertaining to legal judgments.
| 25. | CONCENTRATION OF CREDIT RISK |
Net sales to Deere & Company in Titan’s agricultural, earthmoving/construction and consumer markets represented 17%, 20% and 22% of the Company’s consolidated revenues for the years ended December 31, 2006, 2005 and 2004, respectively. Net sales to CNH Global N.V. in Titan’s three markets represented 11% of the Company’s consolidated revenues for each of the years ended December 31, 2006, 2005 and 2004. No other customer accounted for more than 10% of Titan’s net sales in 2006, 2005 or 2004.
| 26. | RELATED PARTY TRANSACTIONS |
The Company sells products and pays commissions to companies controlled by persons related to the chief executive officer of the Company. During 2006, 2005 and 2004, sales of Titan product to these companies were approximately $6.4 million, $6.5 million and $4.6 million, respectively. On other sales referred to Titan from these manufacturing representative companies, commissions were approximately $2.0 million, $1.6 million and $1.5 million during 2006, 2005 and 2004, respectively. These sales and commissions were made in the ordinary course of business and were made on terms no less favorable to Titan than comparable sales and commissions to unaffiliated third parties. At December 31, 2006 and 2005, Titan had trade receivables of approximately $0.6 million and $0.9 million due from these companies, respectively.
Convertible Note Conversion Offer
In January 2007, the Company filed a registration statement relating to an offer to the holders of its 5.25% senior unsecured convertible notes due 2009 to convert their notes into Titan’s common stock at an increased conversion rate (the “Conversion Offer”). Per the Offer, each $1,000 principal amount of notes is convertible into 81.0000 shares of common stock, which is equivalent to a conversion price of approximately $12.35 per share. The offering price set forth will not include accrued interest; therefore, no accrued interest will be paid on the notes that accept this offering. Prior to the Offer, each $1,000 principal amount of notes was convertible into 74.0741 shares of common stock, which was equivalent to a conversion price of approximately $13.50 per share. The registration statement relating to the shares of common stock to be offered was declared effective on February 21, 2007. The offer is scheduled to expire on March 20, 2007, unless extended or terminated.
Credit Facility Amendment
On February 8, 2007, the Company amended its revolving credit facility with LaSalle Bank National Association. The amendment extended the termination date to October 2009 (previously October 2008). The amendment also lowered borrowing rates, which will be based on a pricing grid. The borrowings under the facility will bear interest at a floating rate of LIBOR plus 1% to 2% (previously 2.75%). The amendment lowered the revolving loan availability from $250 million to $125 million with the ability to request an increase back to $250 million.
TITAN INTERNATIONAL, INC.
NOTES TO CONSOLIDATED FINANCIAL STATEMENTS
| 28. | SEGMENT AND GEOGRAPHICAL INFORMATION |
The Company has aggregated its operating units into reportable segments based on its three customer markets: agricultural, earthmoving/construction and consumer. These segments are based on the information used by the chief executive officer and chief operating officer to make certain operating decisions, allocate portions of capital expenditures and assess segment performance. The accounting policies of the segments are the same as those described in Note 1, “Description of Business and Significant Accounting Policies.” Segment external revenues, expenses and income from operations are determined on the basis of the results of operations of operating units of manufacturing facilities. Segment assets are generally determined on the basis of the tangible assets located at such operating units’ manufacturing facilities and the intangible assets associated with the acquisitions of such operating units. However, certain operating units’ goodwill and property, plant and equipment balances are carried at the corporate level.
Titan is organized primarily on the basis of products being included in three marketing segments, with each reportable segment including wheels, tires and wheel/tire assemblies.
The table below presents information about certain revenues and expenses, income (loss) from operations and segment assets used by the chief operating decision maker of the Company as of and for the years ended December 31, 2006, 2005 and 2004 (in thousands):
2006 | | Agricultural | | Earthmoving/ Construction | | Consumer | | Reconciling Items | | Consolidated Totals | |
| Revenues from external customers | | $ | 421,096 | | $ | 183,357 | | $ | 75,001 | | $ | 0 | | $ | 679,454 | |
| Depreciation & amortization | | | 15,324 | | | 7,402 | | | 1,409 | | | 2,715 | (a) | | 26,850 | |
| Income (loss) from operations | | | 27,351 | | | 21,837 | | | 1,655 | | | (28,832 | ) (b) | | 22,011 | |
| Total assets | | | 273,787 | | | 145,964 | | | 22,678 | | | 142,697 | (c) | | 585,126 | |
| Capital expenditures | | | 5,184 | | | 2,192 | | | 339 | | | 567 | (d) | | 8,282 | |
| | | | | | | | | | | | | | | | | |
2005 | | | | | | | | | | | | | | | | |
| Revenues from external customers | | $ | 310,361 | | $ | 131,982 | | $ | 27,790 | | $ | 0 | | $ | 470,133 | |
| Depreciation & amortization | | | 11,738 | | | 5,183 | | | 1,447 | | | 2,378 | (a) | | 20,746 | |
| Income (loss) from operations | | | 31,750 | | | 17,664 | | | 1,825 | | | (39,240 | ) (b) | | 11,999 | |
| Total assets | | | 239,581 | | | 89,241 | | | 22,963 | | | 88,971 | (c) | | 440,756 | |
| Capital expenditures | | | 3,365 | | | 1,615 | | | 230 | | | 1,542 | (d) | | 6,752 | |
| | | | | | | | | | | | | | | | | |
2004 | | | | | | | | | | | | | | | | |
| Revenues from external customers | | $ | 316,235 | | $ | 160,297 | | $ | 34,039 | | $ | 0 | | $ | 510,571 | |
| Depreciation & amortization | | | 12,084 | | | 6,980 | | | 1,585 | | | 4,258 | (a) | | 24,907 | |
| Income (loss) from operations | | | 38,585 | | | 16,627 | | | 1,891 | | | (23,781 | ) (b) | | 33,322 | |
| Total assets | | | 173,335 | | | 78,116 | | | 17,211 | | | 85,504 | (c) | | 354,166 | |
| Capital expenditures | | | 2,493 | | | 1,417 | | | 185 | | | 233 | (d) | | 4,328 | |
| (a) | Represents depreciation expense related to property, plant and equipment carried at the corporate level. |
| (b) | Represents corporate expenses including those referred to in (a). Includes Dyneer legal charge of $15.2 million in 2005. |
| (c) | Represents property, plant and equipment and goodwill related to certain acquisitions and other corporate assets. Approximately $37 million of the increase in 2006 from 2005 related to the higher 2006 year-end cash balance. |
| (d) | Represents corporate capital expenditures. |
TITAN INTERNATIONAL, INC.
NOTES TO CONSOLIDATED FINANCIAL STATEMENTS
The table below presents information by geographic area as of and for the years ended December 31, 2006, 2005 and 2004 (in thousands):
2006 | | United States | | Italy | | Other Countries | | Consolidated Totals | |
| Revenues from external customers | | $ | 679,454 | | $ | 0 | | $ | 0 | | $ | 679,454 | |
| Long-lived assets (a) | | | 196,318 | | | 0 | | | 0 | | | 196,318 | |
| | | | | | | | | | | | | | |
2005 | | | | | | | | | | | | | |
| Revenues from external customers | | $ | 470,133 | | $ | 0 | | $ | 0 | | $ | 470,133 | |
| Long-lived assets (b) | | | 152,084 | | | 0 | | | 0 | | | 152,084 | |
| | | | | | | | | | | | | | |
2004 | | | | | | | | | | | | | |
| Revenues from external customers | | $ | 461,125 | | $ | 29,584 | | $ | 19,862 | | $ | 510,571 | |
| Long-lived assets (c) | | | 92,346 | | | 0 | | | 0 | | | 92,346 | |
| (a) | Idled assets marketed for sale in the amount of $14 million reclassed/included in the 2006 long-lived assets. |
| (b) | Idled assets marketed for sale in the amount of $18 million are not included in the 2005 long-lived assets. |
| (c) | Idled assets marketed for sale in the amount of $31 million are not included in the 2004 long-lived assets. |
TITAN INTERNATIONAL, INC.
NOTES TO CONSOLIDATED FINANCIAL STATEMENTS
Earnings per share for 2006, 2005 and 2004, are (amounts in thousands, except share and per share data):
2006 | | | Net income | | | Weighted- average shares | | | Per share amount | |
| Basic earnings per share | | $ | 5,144 | | | 19,701,614 | | $ | .26 | |
| Effect of stock options | | | 0 | | | 342,685 | | | | |
| Diluted earnings per share (a) | | $ | 5,144 | | | 20,044,299 | | $ | .26 | |
| | | | | | | | | | | |
2005 | | | | | | | | | | |
| Basic earnings per share | | $ | 11,042 | | | 18,052,946 | | $ | .61 | |
| Effect of stock options | | | 0 | | | 230,663 | | | | |
| Diluted earnings per share (b) | | $ | 11,042 | | | 18,283,609 | | $ | .60 | |
| | | | | | | | | | | |
2004 | | | | | | | | | | |
| Basic earnings per share | | $ | 11,107 | | | 17,798,483 | | $ | .62 | |
| Effect of stock options | | | 0 | | | 75,247 | | | | |
| Effect of convertible notes | | | 2,137 | | | 3,700,669 | | | | |
| Diluted earnings per share | | $ | 13,244 | | | 21,574,399 | | $ | .61 | |
| (a) | The effect of convertible notes has not been included as they were anti-dilutive. The weighted-average share amount excluded for convertible notes totaled 6,014,815 shares. |
| (b) | The effect of convertible notes has not been included as they were anti-dilutive. The weighted-average share amount excluded for convertible notes totaled 7,146,627 shares. |
TITAN INTERNATIONAL, INC.
NOTES TO CONSOLIDATED FINANCIAL STATEMENTS
| 30. | SUPPLEMENTARY DATA - QUARTERLY FINANCIAL INFORMATION (UNAUDITED) |
(All amounts in thousands, except per share data)
Quarter ended | | March 31 | | June 30 | | September 30 | | December 31 | | Year ended December 31 | |
| | | | | | | | | | | | |
2006 | | | | | | | | | | | | | | | | |
| Net sales | | $ | 182,577 | | $ | 175,194 | | $ | 156,120 | | $ | 165,563 | | $ | 679,454 | |
| Gross profit | | | 31,114 | | | 22,442 | | | 17,080 | | | 2,142 | | | 72,778 | |
| Net income (loss) | | | 8,593 | | | 5,603 | | | 488 | | | (9,540 | ) | | 5,144 | |
| Per share amounts: | | | | | | | | | | | | | | | | |
| Basic | | | .44 | | | .28 | | | .02 | | | (.48 | ) | | .26 | |
| Diluted (a) | | | .36 | | | .24 | | | .02 | | | (.48 | ) | | .26 | |
| | | | | | | | | | | | | | | | | |
2005 | | | | | | | | | | | | | | | | |
| Net sales | | $ | 136,129 | | $ | 134,709 | | $ | 102,712 | | $ | 96,583 | | $ | 470,133 | |
| Gross profit | | | 24,081 | | | 22,502 | | | 10,973 | | | 6,654 | | | 64,210 | |
| Net income (loss) | | | 11,201 | | | 4,200 | (b) | | 1,182 | | | (5,541 | ) | | 11,042 | |
| Per share amounts: (a) | | | | | | | | | | | | | | | | |
| Basic | | | .68 | | | .25 | (b) | | .06 | | | (.28 | ) | | .61 | |
| Diluted | | | .51 | | | .23 | (b) | | .06 | | | (.28 | ) | | .60 | |
| (a) | As a result of the variances in the outstanding share balances, the year-end per share amounts do not agree to the sum of the quarters. |
| (b) | Noncash convertible debt conversion charge of $7.2 million was included in the quarter ended June 30, 2005. |
TITAN INTERNATIONAL, INC.
SCHEDULE II - VALUATION RESERVES
Description | | Balance at beginning of year | | Additions to costs and expenses | | Deductions | | Balance at end of year | |
Year ended December 31, 2006 | | | | | | | | | | | | | |
| Reserve deducted in the balance sheet from the assets to which it applies | | | | | | | | | | | | | |
| Allowance for doubtful accounts | | $ | 5,654,000 | | $ | 1,596,000 | | $ | (2,432,000 | ) | $ | 4,818,000 | |
| | | | | | | | | | | | | | |
Year ended December 31, 2005 | | | | | | | | | | | | | |
| Reserve deducted in the balance sheet from the assets to which it applies | | | | | | | | | | | | | |
| Allowance for doubtful accounts | | $ | 4,259,000 | | $ | 1,455,000 | | $ | (60,000 | ) | $ | 5,654,000 | |
| | | | | | | | | | | | | | |
Year ended December 31, 2004 | | | | | | | | | | | | | |
| Reserve deducted in the balance sheet from the assets to which it applies | | | | | | | | | | | | | |
| Allowance for doubtful accounts | | $ | 5,331,000 | | $ | 1,698,000 | | $ | (2,770,000 | ) | $ | 4,259,000 | |