Life is Complex.
Nuveen makes things e-simple.
It only takes a minute to sign up for e-Reports. Once enrolled, you’ll receive an e-mail as soon as your Nuveen Fund information is ready—no more waiting for delivery by regular mail. Just click on the link within the e-mail to see the report and save it on your computer if you wish.
Free e-Reports
right to your e-mail!
www.investordelivery.com
If you receive your Nuveen Fund
dividends and statements from your
financial advisor or brokerage account.
or
www.nuveen.com/client-access
If you receive your Nuveen Fund
dividends and statements directly from
Nuveen.
NOT FDIC INSURED MAY LOSE
VALUE NO BANK GUARANTEE
Table of Contents
| | |
| Chairman’s Letter to Shareholders | 4 |
| | |
| Portfolio Manager’s Comments | 5 |
| | |
| Fund Leverage | 10 |
| | |
| Common Share Information | 11 |
| | |
| Risk Considerations | 13 |
| | |
| Performance Overview and Holding Summaries | 14 |
| | |
| Shareholder Meeting Report | 18 |
| | |
| Report of Independent Registered Public Accounting Firm | 19 |
| | |
| Portfolios of Investments | 20 |
| | |
| Statement of Assets and Liabilities | 33 |
| | |
| Statement of Operations | 34 |
| | |
| Statement of Changes in Net Assets | 35 |
| | |
| Statement of Cash Flows | 36 |
| | |
| Financial Highlights | 38 |
| | |
| Notes to Financial Statements | 41 |
| | |
| Additional Fund Information | 54 |
| | |
| Glossary of Terms Used in this Report | 55 |
| | |
| Reinvest Automatically, Easily and Conveniently | 57 |
| | |
| Annual Investment Management Agreement Approval Process | 58 |
| | |
| Board Members & Officers | 66 |
3
Chairman’s Letter
to Shareholders
Dear Shareholders,
The worries weighing on markets at the end of 2018 appeared to dissipate in early 2019 as positive economic and corporate earnings news, more dovish signals from central banks and trade progress boosted investor confidence. However, political noise and trade disputes continue to drive short-term market volatility and weigh on longer-term outlooks. Investors are concerned that increased tariffs and a protracted stalemate between the U.S. and its trading partners could dampen business and consumer sentiment, weakening spending and potentially impacting the global economy. Additionally, political uncertainty and the risk of policy error appear elevated. In the U.S. in particular, low interest rate levels and the widening federal deficit have constrained the available policy tools for countering recessionary pressures. As the current U.S. economic expansion has reached the 10-year mark this summer, it’s important to note that economic expansions don’t die of old age, but mature economic cycles can be more vulnerable to an exogenous shock.
Until a clearer picture on trade emerges, more bouts of market turbulence are likely in the meantime. While the downside risks warrant careful monitoring, we believe the likelihood of a near-term recession remains low. Global economic growth is moderating, with demand driven by the historically low unemployment in the U.S., Japan and across Europe. Central banks across the developed world continue to emphasize their readiness to adjust policy, and China’s authorities remain committed to keeping economic growth rates steady with fiscal and monetary policy.
The opportunity set may be narrower, but we believe there is still scope for gains in this environment. Patience and maintaining perspective can help you weather periodic market volatility. We encourage you to work with your financial advisor to assess short-term market movements in the context of your time horizon, risk tolerance and investment goals. On behalf of the other members of the Nuveen Fund Board, we look forward to continuing to earn your trust in the months and years ahead.
Sincerely,
Terence J. Toth
Chairman of the Board
July 23, 2019
4
Portfolio Manager’s Comments
Nuveen Connecticut Quality Municipal Income Fund (NTC)
Nuveen Massachusetts Quality Municipal Income Fund (NMT)
These Funds feature portfolio management by Nuveen Asset Management, LLC (NAM), an affiliate of Nuveen, LLC. Portfolio manager Michael S. Hamilton discusses U.S. economic and municipal market conditions, key investment strategies and the twelve-month performance of the Nuveen Connecticut and Massachusetts Funds. Michael assumed portfolio management responsibility for these Funds in 2011.
During May 2019, the Board of Trustees approved the merger of the Nuveen Connecticut Quality Municipal Income Fund (NTC) into the acquiring Fund, the Nuveen AMT-Free Municipal Credit Income Fund (NVG). In order for the reorganization to occur, it must be approved by shareholders. If shareholders approve the reorganization, Nuveen Connecticut Quality Municipal Income Fund shareholders will receive a cash distribution prior to the closing of the reorganization of approximately 10% of net asset value per share.
What factors affected the U.S. economy and the national municipal market during the twelve-month reporting period ended May 31, 2019?
The U.S. economy continued its solid expansion, with economic activity rebounding in early 2019 after a slump at the end of 2018. In the first quarter of 2019, gross domestic product (GDP), which measures the value of goods and services produced by the nation’s economy less the value of the goods and services used up in production, adjusted for price changes, grew at an annualized rate of 3.1%, according to the Bureau of Economic Analysis “second” estimate. A jump in exports and a buildup of inventories helped offset slower consumer and business spending in the first three months of 2019. For the full year 2018, U.S. GDP growth came in at 2.9%, as economic activity cooled over the second half of 2018 after peaking at 4.2% (annualized) in the second quarter of 2018.
Consumer spending, the largest driver of the economy, remained well supported by low unemployment, wage gains and tax cuts. As reported by the Bureau of Labor Statistics, the unemployment rate fell to 3.6% in May 2019 from 3.8% in May 2018 and job gains averaged around 196,000 per month for the past twelve months. As the jobs market has tightened, average hourly earnings grew at an annualized rate of 3.1% in May 2019. However, falling energy prices led to a slower rate of inflation over the past twelve months.
This material is not intended to be a recommendation or investment advice, does not constitute a solicitation to buy, sell or hold a security or an investment strategy and is not provided in a fiduciary capacity. The information provided does not take into account the specific objectives or circumstances of any particular investor, or suggest any specific course of action. Investment decisions should be made based on an investor’s objectives and circumstances and in consultation with his or her advisors.Certain statements in this report are forward-looking statements. Discussions of specific investments are for illustration only and are not intended as recommendations of individual investments. The forward-looking statements and other views expressed herein are those of the portfolio manager as of the date of this report. Actual future results or occurrences may differ significantly from those anticipated in any forward-looking statements, and the views expressed herein are subject to change at any time, due to numerous market and other factors. The Funds disclaim any obligation to update publicly or revise any forward-looking statements or views expressed herein.
For financial reporting purposes, the ratings disclosed are the highest rating given by one of the following national rating agencies: Standard & Poor’s Group (S&P), Moody’s Investors Service, Inc. (Moody’s) or Fitch, Inc. (Fitch). This treatment of split-rated securities may differ from that used for other purposes, such as for Fund investment policies. Credit ratings are subject to change. AAA, AA, A and BBB are investment grade ratings, while BB, B, CCC, CC, C and D are below investment grade ratings. Holdings designated N/R are not rated by these national rating agencies.
Bond insurance guarantees only the payment of principal and interest on the bond when due, and not the value of the bonds themselves, which will fluctuate with the bond market and the financial success of the issuer and the insurer. Insurance relates specifically to the bonds in the portfolio and not to the share prices of a Fund. No representation is made as to the insurers’ ability to meet their commitments.
Refer to the Glossary of Terms Used in this Report for further definition of the terms used within this section.
5
Portfolio Manager’s Comments (continued)
The Consumer Price Index (CPI) increased 1.8% over the twelve-month reporting period ended May 31, 2019 before seasonal adjustment, as reported by the Bureau of Labor Statistics.
Low mortgage rates and low inventory drove home prices higher during this economic cycle. But the pace of price increases has slowed along with declining new home sales and housing starts. The S&P CoreLogic Case-Shiller U.S. National Home Price Index, which covers all nine U.S. census divisions, was up 3.5% year-over-year in April 2019 (most recent data available at the time this report was prepared). The 10-City and 20-City Composites reported year-over-year increases of 2.3% and 2.5%, respectively.
As some data began pointing to slower momentum in the overall economy, the Federal Reserve (Fed) notably shifted its stance. From December 2015 through December 2018, the Fed had gradually lifted its main policy interest rate to prevent the economy from overheating. In its final meeting of 2018, the Fed indicated that two more rate hikes might be forthcoming in 2019, roiling the markets, which had expected a more dovish tone. However, as more recent data revealed a mixed picture of the economy, the Fed said it would adopt a more “patient” approach, signaling the possibility of no rate hikes in 2019. Markets began to speculate that the Fed’s next move would be a rate cut, rather than a rate increase, particularly after trade tensions intensified between the U.S. and China. However, the minutes from the Fed’s April 30-May 1 meeting showed that the Fed was in no hurry to make any policy adjustment. The Fed kept rates unchanged in its first three policy meetings of 2019, as expected, and in March announced its plan to discontinue rolling assets off its balance sheet.
During the twelve-month reporting period, geopolitical news remained a prominent market driver. Tariff and trade policy topped the list of concerns. Hope for a China-U.S. trade deal dimmed after the latest round of negotiations ended with an impasse and both countries levied tariff increases. Additionally, the U.S. blacklisted Chinese company Huawei, banning companies from doing business with the telecom giant without U.S. government approval. In response, China announced its own “Unreliable Entity” list. Further roiling markets was President Trump’s surprise announcement that he would impose tariffs on Mexico if the country didn’t take more action to curb illegal immigration. (Subsequent to the end of the reporting period, the two countries announced a joint agreement and the U.S. administration suspended its tariff plan.) Meanwhile, as agreed in July 2018, the U.S. and the European Union continued to withhold further tariffs. Later in 2018, the U.S., Mexico and Canada agreed to a new trade deal to replace the North American Free Trade Agreement, but it has not yet been ratified by the countries’ legislatures. With no clear path forward on U.S.-China trade policy, markets grew increasingly worried that trade conflicts would dampen global growth, as negative sentiment could inhibit business, consumer and investor confidence and spending.
In the U.K., Prime Minister Theresa May was unable to secure a Brexit deal before the original March 29, 2019 deadline. The European Union extended the deadline to October 31, 2019, and Prime Minister May announced she would resign effective June 7, 2019, raising the possibility that her successor could favor a no-deal Brexit. Europe also contended with Italy’s euroskeptic coalition government and its challenging fiscal condition, the “yellow vest” protests in France, immigration policy concerns, Russian sanctions and political risk in Turkey.
Elections around the world also remained a source of uncertainty. Investors grew more skeptical that Brazil’s newly elected president could deliver reforms, while some of the market’s initial fears about Mexico’s new president subsided. Europe’s traditional centrist parties lost seats in the Parliamentary elections and populist parties saw marginal gains. The ruling parties in India and South Africa maintained their majorities, where slower economic growth could complicate their respective reform mandates.
6
The twelve-month reporting period began on a weak note for municipal bonds but turned strongly positive in the second half of the period. With the economy strengthening and the labor market tightening throughout the second half of 2018, the Fed continued to increase its main policy interest rate. The prevailing economic outlook was generally positive, driving the 10-year U.S. Treasury yield to a high of 3.24% in November 2018. However, interest rates declined significantly over the remainder of the reporting period on signs of a weaker macroeconomic environment, more dovish central bank policy, geopolitical tensions (especially regarding trade) and bouts of equity market volatility. The U.S. Treasury yield curve flattened overall, with a portion of the curve inverting. However, the municipal yield curve “twisted” by flattening at the short end and steepening at the long end of the curve.
Along with the falling interest rate environment, favorable supply-demand conditions were supportive of municipal bond performance. Issuance has been subdued since the passage of the Tax Cuts and Jobs Act of 2017. Because new issue advance refunding bonds are no longer tax exempt under the new tax law, the total supply of municipal bonds has decreased, boosting the scarcity value of existing municipal bonds. Municipal bond gross issuance nationwide totaled $338.6 billion in this reporting period, a 19.2% decrease from the issuance for the twelve-month reporting period ended May 31, 2018. Nevertheless, the overall low level of interest rates encouraged issuers to continue to actively refund their outstanding debt. In these transactions the issuers are issuing new bonds and taking the bond proceeds and redeeming (calling) old bonds. These refunding transactions have ranged from 40% to 60% of total issuance over the past few years. Thus, the net issuance (all bonds issued less bonds redeemed) is actually much lower than the gross issuance. So, while gross issuance volume has been strong, the net has not, and this was an overall positive technical factor on municipal bond investment performance in recent years. Although the pace of refundings is slowing, net negative issuance is expected to continue.
Low global interest rates have continued to drive investors toward higher after-tax yielding assets, including U.S. municipal bonds. The Fed’s pivot to a more dovish stance in early 2019 also brought investors back to fixed income markets, including municipal bonds, driving large inflows into the asset class in the early months of 2019. Additionally, as tax payers have begun to assess the impact of the 2017 tax law, which caps the state and local tax (SALT) deduction for individuals, there has been increased demand for tax-exempt municipal bonds in 2019 to date, especially in states with high income and/or property taxes.
What were the economic and market conditions in Connecticut and Massachusetts during the twelve-month reporting period ended May 31, 2019?
Though showing steady growth, Connecticut’s economy continues to lag the national recovery. Total non-farm employment is still below the 2008 peak. Weakness in the financial services and government sectors are undermining growth. As of May 2019, Connecticut’s unemployment rate was 3.8%, marginally higher than the national rate of 3.6%. Connecticut has a high number of defense-related industries that make it more sensitive to both cuts and increases in federal defense spending. On October 31, 2017, the Governor signed the $41.3 billion 2018-2019 biennium budget, 123 days late. It is 2.5% larger than the adopted 2016-2017 biennium budget. It contains no increases in broad-based taxes but does rely on a complex maneuver designed to increase federal Medicaid reimbursement to the State. Legislation adopted with the biennium budget imposed stricter budget controls, which helped Connecticut post a sizeable General Fund surplus in Fiscal Year 2018 and make a significant deposit to the State’s rainy day reserve fund. Connecticut’s pensions remain among the worst funded in the nation, which are likely to be a source of future financial strain at the state level. According to Moody’s Investors Service, Inc. (Moody’s), Connecticut’s per-capita debt burden was the highest in the nation at $6,544 in 2017, in contrast to the national median of $987. Connecticut enjoys the highest per-capita income of the 50 states, at 139% of the national average in 2017. At the end of the reporting period, Moody’s rated Connecticut “A1” with a
7
Portfolio Manager’s Comments (continued)
stable outlook. Moody’s had downgraded its rating to A1 from Aa3 on May 15, 2017, citing the State’s weakening demographics and high fixed costs. S&P rates Connecticut “A” with a positive outlook. Though S&P downgraded its rating to A from A+ on April 13, 2018, citing the State’s high fixed costs and heavy debt load, it has since shifted its outlook to positive. On April 19, 2019, S&P formally changed its outlook to positive, citing the State’s replenished reserves and increased financial controls. Approximately $6.0 billion in Connecticut municipal bonds were issued during the twelve months ending May 31, 2019, a gross issuance decrease of 5.7% year-over-year.
Massachusetts continues to benefit from a highly diverse economy. Biotechnology, pharmaceuticals, finance and software development are increasingly driving the Massachusetts economy, aided by the Commonwealth’s extensive education and health care sectors. Among the 50 states, Massachusetts has the highest percentage of population over 25 with a bachelor's degree, at approximately 43%. This compares with the national average of 31%. Job growth in Massachusetts is strong and exceeds the national average. Unemployment in the Commonwealth was 3.0% in May 2019, below the national average of 3.6% for the same period. According to the U.S. Department of Commerce, Bureau of Economic Analysis, Massachusetts’ per capita income is second highest among the 50 states. At $65,890 for calendar year 2017, it is 131% of the national average. The Commonwealth’s $41.2 billion Fiscal Year 2019 budget represents a 2.3% increase over the adopted Fiscal 2018 budget. The 2019 budget calls for no hikes in sales or income taxes. It calls for a $96 million deposit into the Commonwealth’s rainy day fund and a reduction in onetime revenue solutions. According to Moody's, Massachusetts' debt burden is second highest in the nation (after Connecticut) on a per capita basis ($6,085 versus the median of $987) and third highest as a percentage of the state GDP (8.3% versus the median of 2.1%). As of May 2019, Moody’s rated Massachusetts Aa1 with a stable outlook, and S&P rated the Commonwealth AA with a stable outlook. S&P had downgraded its rating from AA+ to AA on June 9, 2017, citing a reduction in the Commonwealth’s reserve levels. For the twelve months ended May 31, 2019, Massachusetts’ tax-exempt bond supply totaled $9.3 billion, a 21.5% decrease over the prior twelve months.
What key strategies were used to manage these Funds during the twelve-month reporting period ended May 31, 2019?
Municipal bonds benefited from fundamental and technical tailwinds in this reporting period. Falling interest rates, favorable credit conditions, strong municipal bond demand and low supply propelled municipal bond returns higher in the reporting period. Connecticut’s municipal bond market outperformed the national municipal market, while the Massachusetts municipal market lagged the national market. During this time, we continued to take a bottom-up approach to discovering sectors that appeared undervalued as well as individual credits that we believed had the potential to perform well over the long term.
Our trading activity continued to focus on pursuing the Funds’ investment objectives. The Funds’ positioning emphasized longer maturities, lower rated credits and/or sectors offering higher yields. For NTC, we bought maturities 12 years and longer across a diverse group of sectors including local general obligations (GOs), state of Connecticut GOs, water and sewer, higher education and student loans. NMT added bonds mainly in the 12- to 25-year maturity range from the health care, higher education, water and sewer, ports and state of Massachusetts GO sectors.
Most of the new purchases were funded from the proceeds of called and maturing bonds. We also sold some shorter-dated bonds, which we considered placeholders that could be sold and reinvested in more attractive long-term opportunities as they arise. Additionally, higher prevailing interest rates in the third and fourth quarters of 2018 presented favorable conditions to sell some depreciated bonds and buy similarly structured, higher yielding bonds. These bond exchanges helped boost tax efficiencies, as the
8
loss on the depreciated bonds we sold can be used to offset capital gains in the future, and helped increase the Fund’s income distribution capabilities. Both NTC and NMT were active with this trading strategy during the reporting period.
As of May 31, 2019, the Funds continued to use inverse floating rate securities. We employ inverse floaters for a variety of reasons, including duration management, income enhancement and total return enhancement.
How did the Funds perform during the twelve-month reporting period ended May 31, 2019?
The tables in each Fund's Performance Overview and Holding Summaries section of this report provide the Funds’ total returns for the one-year, five-year and ten-year periods ended May 31, 2019. Each Fund's total returns at common share net asset value (NAV) are compared with the performance of a corresponding market index.
For the twelve months ended May 31, 2019, the total returns at common share NAV for NTC and NMT outperformed the returns for the national S&P Municipal Bond Index and their respective state’s S&P Municipal Bond Index.
The Funds’ performance was affected by duration and yield curve positioning, credit ratings allocations, sector allocations and individual credit selection. In addition, the use of regulatory leverage was a factor affecting performance of the Funds. Leverage is discussed in more detail later in the Fund Leverage section of this report.
Duration and yield curve positioning was the largest positive contributor to relative performance. In this reporting period, long duration bonds outperformed and short duration bonds underperformed. The Funds’ underweights in shorter durations, especially six years and shorter for NTC and eight years and shorter for NMT, and overweights in longer durations, particularly durations longer than six years in NTC and eight years in NMT, aided performance.
Credit ratings allocation was a small positive contributor to the Funds’ performance. In Connecticut, the highest grade credits under-performed the broad market, while lower rated bonds beat the overall market. NTC’s underweight allocations to AAA and AA rated paper and overweight to single A and lower rated credits boosted relative performance. For the Massachusetts Fund, an underweight to AAA rated bonds, which lagged the broad market, and an overweight to credits rated AA and lower, which outperformed the broad market, were advantageous. Especially beneficial were NMT’s overweight allocations to single A and BBB rated bonds.
Sector positioning added value to NTC’s performance but slightly detracted from NMT’s performance. NTC was most helped by the tax-supported sector, where positions in state GO bonds rebounded as the state’s government took steps to improve its financial situation, helping credit spreads narrow during this reporting period. For NMT, an underweight to the tax-supported sector, and particularly an underweight to state and local GOs, dampened relative performance. NMT’s positioning in higher education bonds was also unfavorable, as the Fund held higher education credits with shorter effective durations that underperformed the market.
Individual credits that contributed the most to performance tended to be lower rated, higher effective duration structures. Standout performers in NTC included state of Connecticut GOs held in a tender option bond (TOB) trust, Sacred Heart University revenue bonds and local GOs issued for Bridgeport, Connecticut. NMT benefited from positions in Emerson College revenue bonds and WGBH Educational Foundation revenue bonds.
9
Fund Leverage
IMPACT OF THE FUNDS’ LEVERAGE STRATEGIES ON PERFORMANCE
One important factor impacting the returns of the Funds’ common shares relative to their comparative benchmarks was the Funds’ use of leverage through their issuance of preferred shares and/or investments in inverse floating rate securities, which represent leveraged investments in underlying bonds. The Funds use leverage because our research has shown that, over time, leveraging provides opportunities for additional income, particularly in the recent market environment where short-term market rates are at or near historical lows, meaning that the short-term rates the Fund has been paying on its leveraging instruments in recent years have been much lower than the interest the Fund has been earning on its portfolio of long-term bonds that it has bought with the proceeds of that leverage.
However, use of leverage can expose Fund common shares to additional price volatility. When a Fund uses leverage, the Fund common shares will experience a greater increase in their net asset value if the municipal bonds acquired through the use of leverage increase in value, but will also experience a correspondingly larger decline in their net asset value if the bonds acquired through leverage decline in value, which will make the shares’ net asset value more volatile, and total return performance more variable, over time.
In addition, common share income in levered funds will typically decrease in comparison to unlevered funds when short-term interest rates increase and increase when short-term interest rates decrease. Over the last few quarters, short-term interest rates have indeed increased from their extended lows after the 2007-09 financial crisis. This increase has reduced common share net income, and also reduced potential for long-term total returns. Nevertheless, the ability to effectively borrow at current short-term rates is still resulting in enhanced common share income, and management believes that the advantages of continuation of leverage outweigh the associated increase in risk and volatility described above.
Leverage from issuance of preferred shares had a positive impact on the total return performance of the Funds over the reporting period. The use of leverage through inverse floating rate securities had a negligible impact on the total return performance of the Funds over the reporting period.
As of May 31, 2019, the Funds’ percentages of leverage are as shown in the accompanying table.
| | | |
| | NTC | NMT |
| Effective Leverage* | 37.74% | 37.20% |
| Regulatory Leverage* | 35.48% | 35.02% |
| | |
| * | Effective Leverage is a Fund’s effective economic leverage, and includes both regulatory leverage and the leverage effects of certain derivative and other investments in a Fund’s portfolio that increase the Fund’s investment exposure. Currently, the leverage effects of Tender Option Bond (TOB) inverse floater holdings are included in effective leverage values, in addition to any regulatory leverage. Regulatory leverage consists of preferred shares issued or borrowings of a Fund. Both of these are part of a Fund’s capital structure. A Fund, however, may from time to time borrow on a typically transient basis in connection with its day-to-day operations, primarily in connection with the need to settle portfolio trades. Such incidental borrowings are excluded from the calculation of a Fund’s effective leverage ratio. Regulatory leverage is subject to asset coverage limits set forth in the Investment Company Act of 1940. |
THE FUNDS’ REGULATORY LEVERAGE
As of May 31, 2019, the Funds have issued and outstanding preferred shares as shown in the accompanying table.
| | | | | | | |
| | | Variable Rate Preferred* | | | Variable Rate Remarketed Preferred** | |
| | | Shares Issued at Liquidation Preference | | | Shares Issued at Liquidation Preference | |
| NTC | | $ | 112,000,000 | | | $ | — | |
| NMT | | $ | 74,000,000 | | | $ | — | |
| | |
| * | Preferred shares of the Fund featuring a floating rate dividend based on a predetermined formula or spread to an index rate. Includes the following preferred shares AMTP, iMTP, VMTP, MFP-VRM and VRDP in Special Rate Mode, where applicable. See Notes to Financial Statements, Note 4 – Fund Shares, Preferred Shares for further details. |
| ** | Preferred shares of the Fund featuring floating rate dividends set by a remarketing agent via a regular remarketing. Includes the following preferred shares VRDP not in Special Rate Mode, MFP-VRRM and MFP-VRDM, where applicable. See Notes to Financial Statements, Note 4 – Fund Shares, Preferred Shares for further details. |
Refer to Notes to Financial Statements, Note 4 — Fund Shares, Preferred Shares for further details on preferred shares and each Fund’s respective transactions.
10
Common Share Information
COMMON SHARE DISTRIBUTION INFORMATION
The following information regarding the Funds’ distributions is current as of May 31, 2019. Each Fund’s distribution levels may vary over time based on each Fund’s investment activity and portfolio investments value changes.
During the current reporting period, each Fund’s distributions to common shareholders were as shown in the accompanying table.
| | | | | | | |
| | | Per Common | |
| | | Share Amounts | |
| Monthly Distributions (Ex-Dividend Date) | | NTC | | | NMT | |
| June 2018 | | $ | 0.0410 | | | $ | 0.0445 | |
| July | | | 0.0410 | | | | 0.0445 | |
| August | | | 0.0410 | | | | 0.0445 | |
| September | | | 0.0410 | | | | 0.0410 | |
| October | | | 0.0410 | | | | 0.0410 | |
| November | | | 0.0410 | | | | 0.0410 | |
| December | | | 0.0410 | | | | 0.0410 | |
| January | | | 0.0410 | | | | 0.0410 | |
| February | | | 0.0410 | | | | 0.0410 | |
| March | | | 0.0410 | | | | 0.0410 | |
| April | | | 0.0410 | | | | 0.0410 | |
| May 2019 | | | 0.0410 | | | | 0.0410 | |
| Total Distributions from Net Investment Income | | $ | 0.4920 | | | $ | 0.5025 | |
| Yields | | | | | | | | |
| Market Yield* | | | 3.75 | % | | | 3.83 | % |
| Taxable-Equivalent Yield* | | | 5.33 | % | | | 5.40 | % |
| | |
| * | Market Yield is based on the Fund’s current annualized monthly dividend divided by the Fund’s current market price as of the end of the reporting period. Taxable-Equivalent Yield represents the yield that must be earned on a fully taxable investment in order to equal the yield of the Fund on an after-tax basis. It is based on a combined federal and state income tax rate of 29.7% and 29.1% for NTC and NMT, respectively. Your actual combined federal and state income tax rate may differ from the assumed rate. The Taxable-Equivalent Yield also takes into account the percentage of the Fund’s income generated and paid by the Fund (based on payments made during the previous calendar year) that was either exempt from federal income tax but not from state income tax (e.g., income from an out-of-state municipal bond), or was exempt from neither federal nor state income tax. Separately, if the comparison were instead to investments that generate qualified dividend income, which is taxable at a rate lower than an individual’s ordinary graduated tax rate, the fund’s Taxable- Equivalent Yield would be lower. |
Each Fund seeks to pay regular monthly dividends out of its net investment income at a rate that reflects its past and projected net income performance. To permit each Fund to maintain a more stable monthly dividend, the Fund may pay dividends at a rate that may be more or less than the amount of net income actually earned by the Fund during the period. Distributions to shareholders are determined on a tax basis, which may differ from amounts recorded in the accounting records. In instances where the monthly dividend exceeds the earned net investment income, the Fund would report a negative undistributed net ordinary income. Refer to Note 6 – Income Tax Information for additional information regarding the amounts of undistributed net ordinary income and undistributed net long-term capital gains and the character of the actual distributions paid by the Fund during the period.
11
Common Share Information (continued)
All monthly dividends paid by each Fund during the current reporting period were paid from net investment income. If a portion of the Fund’s monthly distributions is sourced or comprised of elements other than net investment income, including capital gains and/or a return of capital, shareholders will be notified of those sources. For financial reporting purposes, the per share amounts of each Fund’s distributions for the reporting period are presented in this report’s Financial Highlights. For income tax purposes, distribution information for each Fund as of its most recent tax year end is presented in Note 6 – Income Tax Information within the Notes to Financial Statements of this report.
COMMON SHARE REPURCHASES
During August 2018, the Funds’ Board of Trustees reauthorized an open-market share repurchase program, allowing each Fund to repurchase an aggregate of up to approximately 10% of its outstanding shares.
As of May 31, 2019, and since the inception of the Funds’ repurchase programs, the Funds have cumulatively repurchased and retired their outstanding common shares as shown in the accompanying table.
| | | | | | | |
| | | NTC | | | NMT | |
| Common shares cumulatively repurchased and retired | | | 360,000 | | | | 26,148 | |
| Common shares authorized for repurchase | | | 1,445,000 | | | | 935,000 | |
During the current reporting period, the Funds repurchased and retired their common shares at a weighted average price per share and a weighted average discount per share as shown in the accompanying table.
| | | | | | | |
| | | NTC | | | NMT | |
| Common shares repurchased and retired | | | 99,200 | | | | 26,148 | |
| Weighted average price per common share repurchased and retired | | $ | 11.23 | | | $ | 11.67 | |
| Weighted average discount per common share repurchased and retired | | | 15.96 | % | | | 15.20 | % |
Each Fund may repurchase its common shares on a dynamic basis with the goal of providing liquidity in circumstances when sufficient natural demand may not otherwise exist. This typically occurs in adverse market environments when a Fund’s common shares are trading at a significant discount to their current net asset value. By providing liquidity in such circumstances, a Fund seeks over time to enable common shareholders to sell their shares more efficiently, and thereby enable its common shares to trade at a narrower discount to their then-current net asset value.
By repurchasing its common shares below net asset value, and retiring those shares at net asset value, a Fund also generates immediate benefits for common shareholders through accretion to net assets as well as common net earnings. As reflected under “Discount Per Share Repurchased and Retired” in the Financial Highlights section of the financial statements, such net asset value accretion during the fiscal year was $0.01 per common share for NTC and NMT.
OTHER COMMON SHARE INFORMATION
As of May 31, 2019, and during the current reporting period, the Funds’ common share prices were trading at a premium/(discount) to their common share NAVs as shown in the accompanying table.
| | | | | | | |
| | | NTC | | | NMT | |
| Common share NAV | | $ | 14.21 | | | $ | 14.73 | |
| Common share price | | $ | 13.13 | | | $ | 12.84 | |
| Premium/(Discount) to NAV | | | (7.60 | )% | | | (12.83 | )% |
| 12-month average premium/(discount) to NAV | | | (14.03 | )% | | | (12.84 | )% |
12
Risk Considerations
Fund shares are not guaranteed or endorsed by any bank or other insured depository institution, and are not federally insured by the Federal Deposit Insurance Corporation.
Nuveen Connecticut Quality Municipal Income Fund (NTC)
Investing in closed-end funds involves risk; principal loss is possible. There is no guarantee the Fund’s investment objectives will be achieved. Closed-end fund shares may frequently trade at a discount or premium to their net asset value. Debt or fixed income securities such as those held by the Fund, are subject to market risk, credit risk, interest rate risk, derivatives risk, liquidity risk, and income risk. As interest rates rise, bond prices fall. Leverage increases return volatility and magnifies the Fund’s potential return and its risks; there is no guarantee a fund’s leverage strategy will be successful. State concentration makes the Fund more susceptible to local adverse economic, political, or regulatory changes affecting municipal bond issuers. These and other risk considerations such as inverse floater risk and tax risk are described in more detail on the Fund’s web page at www.nuveen.com/NTC.
Nuveen Massachusetts Quality Municipal Income Fund (NMT)
Investing in closed-end funds involves risk; principal loss is possible. There is no guarantee the Fund’s investment objectives will be achieved. Closed-end fund shares may frequently trade at a discount or premium to their net asset value. Debt or fixed income securities such as those held by the Fund, are subject to market risk, credit risk, interest rate risk, derivatives risk, liquidity risk, and income risk. As interest rates rise, bond prices fall. Leverage increases return volatility and magnifies the Fund’s potential return and its risks; there is no guarantee a fund’s leverage strategy will be successful. State concentration makes the Fund more susceptible to local adverse economic, political, or regulatory changes affecting municipal bond issuers. These and other risk considerations such as inverse floater risk and tax risk are described in more detail on the Fund’s web page at www.nuveen.com/NMT.
13
| | |
NTC | Nuveen Connecticut Quality Municipal |
| | Income Fund |
| | Performance Overview and Holding Summaries as of May 31, 2019 |
| | | | |
| Refer to the Glossary of Terms Used in this Report for further definition of the terms used within this section. |
Average Annual Total Returns as of May 31, 2019 |
| |
| | Average Annual |
| | 1-Year | 5-Year | 10-Year |
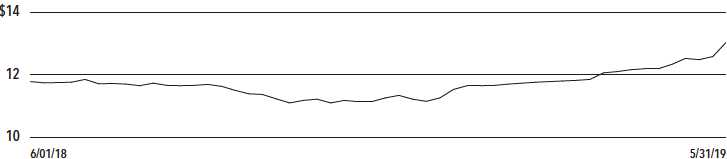
| NTC at Common Share NAV | 7.92% | 4.14% | 5.12% |
| NTC at Common Share Price | 16.51% | 5.65% | 4.96% |
| S&P Municipal Bond Connecticut Index | 6.72% | 2.91% | 3.48% |
| S&P Municipal Bond Index | 6.06% | 3.55% | 4.73% |
Past performance is not predictive of future results. Current performance may be higher or lower than the data shown. Returns do not reflect the deduction of taxes that shareholders may have to pay on Fund distributions or upon the sale of Fund shares. Returns at NAV are net of Fund expenses, and assume reinvestment of distributions. Comparative index return information is provided for the Fund’s shares at NAV only. Indexes are not available for direct investment.
Common Share Price Performance — Weekly Closing Price
14
This data relates to the securities held in the Fund’s portfolio of investments as of the end of the reporting period. It should not be construed as a measure of performance for the Fund itself. Holdings are subject to change.
For financial reporting purposes, the ratings disclosed are the highest rating given by one of the following national rating agencies: Standard & Poor’s Group, Moody’s Investors Service, Inc. or Fitch, Inc. This treatment of split-rated securities may differ from that used for other purposes, such as for Fund investment policies. Credit ratings are subject to change. AAA, AA, A and BBB are investment grade ratings; BB, B, CCC, CC, C and D are below investment grade ratings. Holdings designated N/R are not rated by these national rating agencies.
| | |
Fund Allocation | |
(% of net assets) | |
| Long-Term Municipal Bonds | 154.9% |
| Other Assets Less Liabilities | 3.1% |
Net Assets Plus Floating Rate Obligations | |
and AMTP Shares, net of deferred | |
offering costs | 158.0% |
| Floating Rate Obligations | (3.1)% |
| AMTP Shares, net of deferred | |
| offering costs | (54.9)% |
Net Assets | 100% |
| | |
States and Territories | |
(% of total municipal bonds) | |
| Connecticut | 90.2% |
| Guam | 4.6% |
| New York | 2.5% |
| Oregon | 1.3% |
| Puerto Rico | 0.8% |
| Virgin Islands | 0.6% |
Total | 100% |
| | |
Portfolio Composition | |
(% of total investments) | |
| Tax Obligation/General | 27.2% |
| Health Care | 20.4% |
| Water and Sewer | 13.8% |
| Tax Obligation/Limited | 13.6% |
| Education and Civic Organizations | 11.0% |
| U.S. Guaranteed | 10.1% |
| Other | 3.9% |
Total | 100% |
| | |
Portfolio Credit Quality | |
(% of total investment exposure) | |
| U.S. Guaranteed | 9.9% |
| AAA | 2.2% |
| AA | 32.7% |
| A | 45.9% |
| BBB | 6.5% |
| BB or Lower | 2.0% |
| N/R (not rated) | 0.8% |
Total | 100% |
15
| | |
NMT | Nuveen Massachusetts Quality Municipal |
| | Income Fund |
| | Performance Overview and Holding Summaries as of May 31, 2019 |
| | | | |
| Refer to the Glossary of Terms Used in this Report for further definition of the terms used within this section. |
Average Annual Total Returns as of May 31, 2019 |
| |
| | Average Annual |
| | 1-Year | 5-Year | 10-Year |
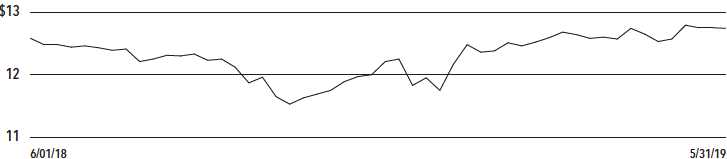
| NMT at Common Share NAV | 6.87% | 4.56% | 6.01% |
| NMT at Common Share Price | 5.80% | 4.03% | 4.85% |
| S&P Municipal Bond Massachusetts Index | 5.93% | 3.24% | 4.23% |
| S&P Municipal Bond Index | 6.06% | 3.55% | 4.73% |
Past performance is not predictive of future results. Current performance may be higher or lower than the data shown. Returns do not reflect the deduction of taxes that shareholders may have to pay on Fund distributions or upon the sale of Fund shares. Returns at NAV are net of Fund expenses, and assume reinvestment of distributions. Comparative index return information is provided for the Fund’s shares at NAV only. Indexes are not available for direct investment.
Common Share Price Performance — Weekly Closing Price
16
This data relates to the securities held in the Fund’s portfolio of investments as of the end of the reporting period. It should not be construed as a measure of performance for the Fund itself. Holdings are subject to change.
For financial reporting purposes, the ratings disclosed are the highest rating given by one of the following national rating agencies: Standard & Poor’s Group, Moody’s Investors Service, Inc. or Fitch, Inc. This treatment of split-rated securities may differ from that used for other purposes, such as for Fund investment policies. Credit ratings are subject to change. AAA, AA, A and BBB are investment grade ratings; BB, B, CCC, CC, C and D are below investment grade ratings. Holdings designated N/R are not rated by these national rating agencies.
| | |
Fund Allocation | |
(% of net assets) | |
| Long-Term Municipal Bonds | 152.3% |
| Other Assets Less Liabilities | 1.4% |
Net Assets Plus VRDP Shares, | |
net of deferred offering costs | 153.7% |
| VRDP Shares, net of deferred | |
| offering costs | (53.7)% |
Net Assets | 100% |
| | |
States and Territories | |
(% of total municipal bonds) | |
| Massachusetts | 93.8% |
| Guam | 4.9% |
| Virgin Islands | 0.8% |
| Puerto Rico | 0.5% |
Total | 100% |
| | |
Portfolio Composition | |
(% of total investments) | |
| Education and Civic Organizations | 29.7% |
| Health Care | 21.0% |
| U.S. Guaranteed | 12.0% |
| Tax Obligation/Limited | 11.5% |
| Tax Obligation/General | 10.9% |
| Transportation | 6.5% |
| Water and Sewer | 5.3% |
| Other | 3.1% |
Total | 100% |
| | |
Portfolio Credit Quality | |
(% of total investment exposure) | |
| U.S. Guaranteed | 11.6% |
| AAA | 4.1% |
| AA | 49.4% |
| A | 23.0% |
| BBB | 7.7% |
| BB or Lower | 4.2% |
Total | 100% |
17
Shareholder Meeting Report
The annual meeting of shareholders was held in the offices of Nuveen on April 10, 2019 for NTC; at this meeting the shareholders were asked to elect Board Members.
| | | | |
| | | NTC | |
| | Common and | | |
| | Preferred | | |
| | shares voting | | |
| | together | | Preferred |
| | as a class | | Shares |
Approval of the Board Members was reached as follows: | | | |
| Judith M. Stockdale | | | |
| For | 11,045,423 | | — |
| Withhold | 2,026,081 | | — |
| Total | 13,071,504 | | — |
| Carole E. Stone | | | |
| For | 11,032,363 | | — |
| Withhold | 2,039,141 | | — |
| Total | 13,071,504 | | — |
| Margaret L. Wolff | | | |
| For | 11,039,650 | | — |
| Withhold | 2,031,854 | | — |
| Total | 13,071,504 | | — |
| William C. Hunter | | | |
| For | — | | 1,120 |
| Withhold | — | | — |
| Total | — | | 1,120 |
| Albin F. Moschner | | | |
| For | — | | 1,120 |
| Withhold | — | | — |
| Total | — | | 1,120 |
18
Report of Independent Registered Public Accounting Firm
To the Shareholders and Board of Trustees of
Nuveen Connecticut Quality Municipal Income Fund
Nuveen Massachusetts Quality Municipal Income Fund:
Opinion on the Financial Statements
We have audited the accompanying statements of assets and liabilities of Nuveen Connecticut Quality Municipal Income Fund and Nuveen Massachusetts Quality Municipal Income Fund (the “Funds”), including the portfolios of investments, as of May 31, 2019, the related statements of operations for the year then ended, the statements of changes in net assets for each of the years in the two-year period then ended, the statements of cash flows for the year then ended, and the related notes (collectively, the “financial statements”) and the financial highlights for each of the years in the five-year period then ended. In our opinion, the financial statements and financial highlights present fairly, in all material respects, the financial position of the Funds as of May 31, 2019, the results of their operations and their cash flows for the year then ended, the changes in their net assets for each of the years in the two-year period then ended, and the financial highlights for each of the years in the five-year period then ended, in conformity with U.S. generally accepted accounting principles.
Fund Reorganization
As discussed in note 1 to the financial statements, during May 2019, the Funds’ Board of Trustees approved the reorganization of Nuveen Connecticut Quality Municipal Income Fund into Nuveen AMT-Free Municipal Credit Income Fund. The reorganization requires shareholder approval; therefore, the reorganization date is yet to be determined.
Basis for Opinion
These financial statements and financial highlights are the responsibility of the Funds’ management. Our responsibility is to express an opinion on these financial statements and financial highlights based on our audits. We are a public accounting firm registered with the Public Company Accounting Oversight Board (United States) (PCAOB) and are required to be independent with respect to the Funds in accordance with the U.S. federal securities laws and the applicable rules and regulations of the Securities and Exchange Commission and the PCAOB.
We conducted our audits in accordance with the standards of the PCAOB. Those standards require that we plan and perform the audit to obtain reasonable assurance about whether the financial statements and financial highlights are free of material misstatement, whether due to error or fraud. Our audits included performing procedures to assess the risks of material misstatement of the financial statements and financial highlights, whether due to error or fraud, and performing procedures that respond to those risks. Such procedures included examining, on a test basis, evidence regarding the amounts and disclosures in the financial statements and financial highlights. Such procedures also included confirmation of securities owned as of May 31, 2019, by correspondence with custodians and brokers or other appropriate auditing procedures. Our audits also included evaluating the accounting principles used and significant estimates made by management, as well as evaluating the overall presentation of the financial statements and financial highlights. We believe that our audits provide a reasonable basis for our opinion.
/s/ KPMG LLP
We have served as the auditor of one or more Nuveen investment companies since 2014.
Chicago, Illinois
July 26, 2019
19
| | |
NTC | Nuveen Connecticut Quality Municipal |
| | Income Fund |
| | Portfolio of Investments |
| | May 31, 2019 |
| | | | | | |
Principal | | | Optional Call | | |
Amount (000) | | Description (1) | Provisions (2) | Ratings (3) | Value |
| | | LONG-TERM INVESTMENTS – 154.9% (100.0% of Total Investments) | | | |
| | | MUNICIPAL BONDS – 154.9% (100.0% of Total Investments) | | | |
| | | Education and Civic Organizations – 17.0% (11.0% of Total Investments) | | | |
| $ 4,250 | | Connecticut Health and Educational Facilities Authority, Revenue Bonds, Connecticut | 7/26 at 100.00 | A2 | $ 4,540,870 |
| | | College, Refunding Series 2016L-1, 4.000%, 7/01/46 | | | |
| 1,150 | | Connecticut Health and Educational Facilities Authority, Revenue Bonds, Connecticut | 7/21 at 100.00 | A2 | 1,210,639 |
| | | College, Series 2011H, 5.000%, 7/01/41 | | | |
| 5,565 | | Connecticut Health and Educational Facilities Authority, Revenue Bonds, Fairfield | 7/26 at 100.00 | A– | 6,402,811 |
| | | University, Series 2016Q-1, 5.000%, 7/01/46 | | | |
| 1,125 | | Connecticut Health and Educational Facilities Authority, Revenue Bonds, Norwich Free | 7/23 at 100.00 | A1 | 1,183,208 |
| | | Academy, Series 2013B, 4.000%, 7/01/34 | | | |
| 7,030 | | Connecticut Health and Educational Facilities Authority, Revenue Bonds, Quinnipiac | 7/25 at 100.00 | A– | 7,901,017 |
| | | University, Refunding Series 2015L, 5.000%, 7/01/45 | | | |
| | | Connecticut Health and Educational Facilities Authority, Revenue Bonds, Quinnipiac | | | |
| | | University, Series 2016M: | | | |
| 500 | | 5.000%, 7/01/34 | 7/26 at 100.00 | A– | 581,590 |
| 1,500 | | 5.000%, 7/01/36 | 7/26 at 100.00 | A– | 1,736,535 |
| 6,145 | | Connecticut Health and Educational Facilities Authority, Revenue Bonds, Sacred Heart | 7/27 at 100.00 | A | 7,153,087 |
| | | University, Series 2017I-1, 5.000%, 7/01/42 | | | |
| | | Connecticut Health and Educational Facilities Authority, Revenue Bonds, The Loomis | | | |
| | | Chaffee School Issue, Series 2011-I: | | | |
| 560 | | 5.000%, 7/01/23 – AGM Insured | 7/21 at 100.00 | A1 | 596,809 |
| 225 | | 5.000%, 7/01/24 – AGM Insured | 7/21 at 100.00 | A1 | 239,551 |
| 2,250 | | Connecticut Health and Educational Facilities Authority, Revenue Bonds, University of | 7/28 at 100.00 | BBB | 2,589,457 |
| | | New Haven, Series 2018K-1, 5.000%, 7/01/38 | | | |
| 515 | | University of Connecticut, Student Fee Revenue Bonds, Refunding Series 2010A, | 11/19 at 100.00 | Aa3 | 522,694 |
| | | 5.000%, 11/15/27 | | | |
| 30,815 | | Total Education and Civic Organizations | | | 34,658,268 |
| | | Health Care – 31.6% (20.4% of Total Investments) | | | |
| 5,500 | | Connecticut Health and Educational Facilities Authority Revenue Bonds, Hartford | 7/25 at 100.00 | A | 6,004,570 |
| | | HealthCare, Series 2015F, 5.000%, 7/01/45 | | | |
| 7,025 | | Connecticut Health and Educational Facilities Authority, Revenue Bonds, Hartford | 7/21 at 100.00 | A | 7,393,953 |
| | | HealthCare, Series 2011A, 5.000%, 7/01/41 | | | |
| 500 | | Connecticut Health and Educational Facilities Authority, Revenue Bonds, Hartford | 7/24 at 100.00 | A | 555,625 |
| | | HealthCare, Series 2014E, 5.000%, 7/01/42 | | | |
| 1,915 | | Connecticut Health and Educational Facilities Authority, Revenue Bonds, Middlesex | 7/25 at 100.00 | A3 | 2,125,133 |
| | | Hospital, Series 2015O, 5.000%, 7/01/36 | | | |
| 1,275 | | Connecticut Health and Educational Facilities Authority, Revenue Bonds, Stamford | 7/20 at 100.00 | BBB+ | 1,312,409 |
| | | Hospital, Series 2010-I, 5.000%, 7/01/30 | | | |
| | | Connecticut Health and Educational Facilities Authority, Revenue Bonds, Stamford | | | |
| | | Hospital, Series 2012J: | | | |
| 1,000 | | 5.000%, 7/01/37 | 7/22 at 100.00 | BBB+ | 1,069,480 |
| 7,155 | | 5.000%, 7/01/42 | 7/22 at 100.00 | BBB+ | 7,636,818 |
| 4,000 | | Connecticut Health and Educational Facilities Authority, Revenue Bonds, Stamford | 7/26 at 100.00 | BBB+ | 4,167,120 |
| | | Hospital, Series 2016K, 4.000%, 7/01/46 | | | |
20
| | | | | | |
Principal | | | Optional Call | | |
Amount (000) | | Description (1) | Provisions (2) | Ratings (3) | Value |
| | | Health Care (continued) | | | |
| | | Connecticut Health and Educational Facilities Authority, Revenue Bonds, Trinity Health | | | |
| | | Credit Group, Series 2016CT: | | | |
| $ 2,650 | | 5.000%, 12/01/41 | 6/26 at 100.00 | AA– | $ 3,066,606 |
| 770 | | 5.000%, 12/01/45 | 6/26 at 100.00 | AA– | 888,796 |
| 5,915 | | Connecticut Health and Educational Facilities Authority, Revenue Bonds, Western | 7/21 at 100.00 | A | 6,264,103 |
| | | Connecticut Health, Series 2011M, 5.375%, 7/01/41 | | | |
| 4,000 | | Connecticut Health and Educational Facilities Authority, Revenue Bonds, Western | 7/21 at 100.00 | A | 4,225,920 |
| | | Connecticut Health, Series 2011N, 5.000%, 7/01/29 | | | |
| | | Connecticut Health and Educational Facilities Authority, Revenue Bonds, Yale-New Haven | | | |
| | | Health Issue, Series 2014E: | | | |
| 2,610 | | 5.000%, 7/01/32 | 7/24 at 100.00 | AA– | 2,974,017 |
| 2,740 | | 5.000%, 7/01/33 | 7/24 at 100.00 | AA– | 3,112,147 |
| 900 | | 5.000%, 7/01/34 | 7/24 at 100.00 | AA– | 1,018,449 |
| 4,540 | | Connecticut Health and Educational Facilities Authority, Revenue Bonds, Ascension Health | 11/19 at 100.00 | AA+ | 4,604,967 |
| | | Series 2010A, 5.000%, 11/15/40 | | | |
| 7,475 | | Monroe County Industrial Development Corporation, New York, FHA Insured Mortgage Revenue | 2/21 at 100.00 | AA | 7,948,541 |
| | | Bonds, Unity Hospital of Rochestor Project, Series 2010, 5.500%, 8/15/40 | | | |
| 59,970 | | Total Health Care | | | 64,368,654 |
| | | Long-Term Care – 1.5% (1.0% of Total Investments) | | | |
| 1,100 | | Connecticut Health and Educational Facilities Authority, Revenue Bonds, Duncaster, Inc, | 8/24 at 100.00 | BBB | 1,169,135 |
| | | Series 2014A, 5.000%, 8/01/44 | | | |
| 630 | | Connecticut Health and Educational Facilities Authority, Revenue Bonds, Healthcare | 9/26 at 100.00 | BB | 666,389 |
| | | Facility Expansion Church Home of Hartford Inc Project, Series 2016A, 5.000%, 9/01/46, 144A | | | |
| 1,260 | | Connecticut Housing Finance Authority, State Supported Special Obligation Bonds, | 6/20 at 100.00 | A1 | 1,300,710 |
| | | Refunding Series 2010-16, 5.000%, 6/15/30 | | | |
| 2,990 | | Total Long-Term Care | | | 3,136,234 |
| | | Tax Obligation/General – 42.1% (27.2% of Total Investments) | | | |
| | | Bridgeport, Connecticut, General Obligation Bonds, Series 2014A: | | | |
| 2,345 | | 5.000%, 7/01/32 – AGM Insured | 7/24 at 100.00 | AA | 2,625,251 |
| 1,600 | | 5.000%, 7/01/34 – AGM Insured | 7/24 at 100.00 | AA | 1,782,912 |
| 2,800 | | Bridgeport, Connecticut, General Obligation Bonds, Series 2016D, 5.000%, 8/15/41 – | 8/26 at 100.00 | AA | 3,178,056 |
| | | AGM Insured | | | |
| | | Bridgeport, Connecticut, General Obligation Bonds, Series 2017A: | | | |
| 1,470 | | 5.000%, 11/01/36 | 11/27 at 100.00 | A | 1,704,112 |
| 750 | | 5.000%, 11/01/37 | 11/27 at 100.00 | A | 866,873 |
| | | City of New Haven, Connecticut, General Obligation Bonds, Series 2017A: | | | |
| 1,000 | | 5.000%, 8/01/35 | 8/27 at 100.00 | BBB+ | 1,135,150 |
| 1,425 | | 5.000%, 8/01/36 | 8/27 at 100.00 | BBB+ | 1,612,900 |
| 5,580 | | Connecticut Health and Educational Facilities Authority, Revenue Bonds, Connecticut | 11/23 at 100.00 | A1 | 6,224,602 |
| | | State University System, Series 2013N, 5.000%, 11/01/31 | | | |
| 3,075 | | Connecticut Health and Educational Facilities Authority, Revenue Bonds, Connecticut | 11/26 at 100.00 | A1 | 3,687,571 |
| | | State University System, Series 2016P-1, 5.000%, 11/01/29 | | | |
| 1,000 | | Connecticut State, General Obligation Bonds, Series 2011D, 5.000%, 11/01/31 | 11/21 at 100.00 | AA | 1,069,490 |
| 2,600 | | Connecticut State, General Obligation Bonds, Series 2014A, 5.000%, 3/01/31 | 3/24 at 100.00 | A1 | 2,933,788 |
| 3,500 | | Connecticut State, General Obligation Bonds, Series 2014F, 5.000%, 11/15/34 | 11/24 at 100.00 | A1 | 3,977,540 |
| 4,580 | | Connecticut State, General Obligation Bonds, Series 2015A, 4.500%, 3/15/33 | 3/25 at 100.00 | A1 | 5,086,411 |
| 2,630 | | Connecticut State, General Obligation Bonds, Series 2015F, 5.000%, 11/15/34 | 11/25 at 100.00 | A1 | 3,046,539 |
| | | Connecticut State, General Obligation Bonds, Series 2017A: | | | |
| 4,000 | | 5.000%, 4/15/34 | 4/27 at 100.00 | A1 | 4,725,080 |
| 3,730 | | 5.000%, 4/15/35 | 4/27 at 100.00 | A1 | 4,392,373 |
21
| | |
NTC | Nuveen Connecticut Quality Municipal Income Fund |
| | Portfolio of Investments (continued) |
| | May 31, 2019 |
| | | | | | |
Principal | | | Optional Call | | |
Amount (000) | | Description (1) | Provisions (2) | Ratings (3) | Value |
| | | Tax Obligation/General (continued) | | | |
| | | Connecticut State, General Obligation Bonds, Series 2018A: | | | |
| $ 3,500 | | 5.000%, 4/15/35 (UB) (4) | 4/28 at 100.00 | A1 | $ 4,189,150 |
| 5,000 | | 5.000%, 4/15/38 (UB) (4) | 4/28 at 100.00 | A1 | 5,929,550 |
| 2,300 | | Connecticut State, General Obligation Bonds, Series 2019A, 5.000%, 4/15/36 | 4/29 at 100.00 | A1 | 2,784,058 |
| 225 | | Hamden, Connecticut, General Obligation Bonds, Series 2016, 5.000%, 8/15/32 – | 8/24 at 100.00 | AA | 256,084 |
| | | BAM Insured | | | |
| 870 | | Hartford, Connecticut, General Obligation Bonds, Series 2009A, 5.000%, 8/15/28 – | 8/19 at 100.00 | AA | 875,638 |
| | | AGC Insured | | | |
| | | Milford, Connecticut, General Obligation Bonds, Series 2018: | | | |
| 1,055 | | 4.000%, 11/01/36 | 11/24 at 100.00 | AAA | 1,123,807 |
| 1,055 | | 4.000%, 11/01/37 | 11/24 at 100.00 | AAA | 1,119,302 |
| | | New Haven, Connecticut, General Obligation Bonds, Refunding Series 2016A: | | | |
| 1,000 | | 5.000%, 8/15/32 – AGM Insured | 8/26 at 100.00 | AA | 1,159,150 |
| 1,550 | | 5.000%, 8/15/35 – AGM Insured | 8/26 at 100.00 | AA | 1,784,701 |
| 985 | | New Haven, Connecticut, General Obligation Bonds, Series 2014A, 5.000%, 8/01/33 – | 8/24 at 100.00 | AA | 1,096,679 |
| | | AGM Insured | | | |
| | | New Haven, Connecticut, General Obligation Bonds, Series 2015: | | | |
| 790 | | 5.000%, 9/01/32 – AGM Insured | 9/25 at 100.00 | AA | 897,803 |
| 1,620 | | 5.000%, 9/01/33 – AGM Insured | 9/25 at 100.00 | AA | 1,838,765 |
| 500 | | 5.000%, 9/01/35 – AGM Insured | 9/25 at 100.00 | AA | 567,335 |
| 900 | | North Haven, Connecticut, General Obligation Bonds, Series 2006, 5.000%, 7/15/24 | No Opt. Call | Aa1 | 1,054,935 |
| 1,670 | | Oregon State, General Obligation Bonds, Oregon University System Projects, Series 2011G, | 8/21 at 100.00 | AA+ | 1,784,028 |
| | | 5.000%, 8/01/36 | | | |
| 600 | | Stratford, Connecticut, General Obligation Bonds, Series 2014, 5.000%, 12/15/32 | 12/22 at 100.00 | AA– | 662,202 |
| 1,500 | | Stratford, Connecticut, General Obligation Bonds, Series 2017, 4.000%, 1/01/39 – | 1/27 at 100.00 | AA | 1,628,715 |
| | | BAM Insured | | | |
| | | Suffield, Connecticut, General Obligation Bonds, Refunding Series 2005: | | | |
| 820 | | 5.000%, 6/15/19 | No Opt. Call | AA+ | 820,943 |
| 1,400 | | 5.000%, 6/15/21 | No Opt. Call | AA+ | 1,505,224 |
| 2,285 | | The Metropolitan District Hartford County, Connecticut General Obligation Bonds, Series | 7/28 at 100.00 | AA | 2,760,029 |
| | | 2018, 5.000%, 7/15/36 | | | |
| 1,000 | | Town of Hamden, Connecticut, General Obligation Bonds, Refunding Series 2018A, 5.000%, | 8/28 at 100.00 | AA | 1,198,510 |
| | | 8/15/30 – BAM Insured | | | |
| | | Waterbury, Connecticut, General Obligation Bonds, Lot A Series 2015: | | | |
| 445 | | 5.000%, 8/01/30 – BAM Insured | 8/25 at 100.00 | AA | 523,115 |
| 390 | | 5.000%, 8/01/31 – BAM Insured | 8/25 at 100.00 | AA | 457,805 |
| 610 | | 5.000%, 8/01/32 – BAM Insured | 8/25 at 100.00 | AA | 714,280 |
| 445 | | 5.000%, 8/01/33 – BAM Insured | 8/25 at 100.00 | AA | 520,178 |
| 445 | | 5.000%, 8/01/34 – BAM Insured | 8/25 at 100.00 | AA | 519,021 |
| 75,045 | | Total Tax Obligation/General | | | 85,819,655 |
| | | Tax Obligation/Limited – 21.2% (13.6% of Total Investments) | | | |
| 1,000 | | Connecticut State Higher Education Supplement Loan Authority, Revenue Bonds, Series 2019B, | 11/27 at 100.00 | A1 | 1,002,500 |
| | | 3.250%, 11/15/35 (AMT) | | | |
| 3,855 | | Connecticut State, Special Tax Obligation Bonds, Transportation Infrastructure Purposes | 10/23 at 100.00 | A+ | 4,304,146 |
| | | Series 2013A, 5.000%, 10/01/33 | | | |
| 1,380 | | Connecticut State, Special Tax Obligation Bonds, Transportation Infrastructure Purposes | 8/25 at 100.00 | A+ | 1,592,423 |
| | | Series 2015A, 5.000%, 8/01/33 | | | |
| | | Connecticut State, Special Tax Obligation Bonds, Transportation Infrastructure Purposes | | | |
| | | Series 2016A: | | | |
| 5,300 | | 5.000%, 9/01/33 | 9/26 at 100.00 | A+ | 6,234,496 |
| 1,075 | | 5.000%, 9/01/34 | 9/26 at 100.00 | A+ | 1,260,567 |
22
| | | | | | |
Principal | | | Optional Call | | |
Amount (000) | | Description (1) | Provisions (2) | Ratings (3) | Value |
| | | Tax Obligation/Limited (continued) | | | |
| | | Connecticut State, Special Tax Obligation Bonds, Transportation Infrastructure Purposes, | | | |
| | | Series 2014A: | | | |
| $ 3,500 | | 5.000%, 9/01/33 | 9/24 at 100.00 | A+ | $ 3,984,715 |
| 1,000 | | 5.000%, 9/01/34 | 9/24 at 100.00 | A+ | 1,135,790 |
| 1,500 | | Government of Guam, Business Privilege Tax Bonds, Refunding Series 2015D, | 11/25 at 100.00 | BB | 1,640,085 |
| | | 5.000%, 11/15/39 | | | |
| | | Government of Guam, Business Privilege Tax Bonds, Series 2011A: | | | |
| 840 | | 5.250%, 1/01/36 | 1/22 at 100.00 | BB | 882,680 |
| 3,200 | | 5.125%, 1/01/42 | 1/22 at 100.00 | BB | 3,336,992 |
| 2,315 | | Harbor Point Infrastructure Improvement District, Connecticut, Special Obligation | 4/27 at 100.00 | N/R | 2,578,771 |
| | | Revenue Bonds, Harbor Point Project, Refunding Series 2017, 5.000%, 4/01/39, 144A | | | |
| 1,500 | | Puerto Rico Municipal Finance Agency, Series 2002A, 5.250%, 8/01/21 – AGM Insured | 7/19 at 100.00 | AA | 1,521,030 |
| 1,010 | | Puerto Rico Public Finance Corporation, Commonwealth Appropriation Bonds, Series 1998A, | No Opt. Call | Aaa | 1,110,051 |
| | | 5.125%, 6/01/24 – AMBAC Insured | | | |
| 2,600 | | University of Connecticut, General Obligation Bonds, Series 2010A, 5.000%, 2/15/28 | 2/20 at 100.00 | A+ | 2,656,030 |
| 2,500 | | University of Connecticut, General Obligation Bonds, Series 2013A, 5.000%, 8/15/32 | 8/23 at 100.00 | A+ | 2,771,550 |
| 760 | | University of Connecticut, General Obligation Bonds, Series 2014A, 5.000%, 2/15/31 | 2/24 at 100.00 | A+ | 855,365 |
| | | University of Connecticut, General Obligation Bonds, Series 2015A: | | | |
| 2,250 | | 5.000%, 3/15/31 | 3/26 at 100.00 | A+ | 2,647,687 |
| 1,415 | | 5.000%, 2/15/34 | 2/25 at 100.00 | A+ | 1,616,836 |
| 1,790 | | Virgin Islands Public Finance Authority, Gross Receipts Taxes Loan Note, Refunding | 10/22 at 100.00 | AA | 1,946,267 |
| | | Series 2012A, 5.000%, 10/01/32 – AGM Insured | | | |
| 38,790 | | Total Tax Obligation/Limited | | | 43,077,981 |
| | | Transportation – 0.8% (0.5% of Total Investments) | | | |
| 1,500 | | Connecticut Airport Authority, Connecticut, Customer Facility Charge Revenue Bonds, | 7/29 at 100.00 | A– | 1,599,915 |
| | | Ground Transportation Center Project, Series 2019A, 4.000%, 7/01/49 (AMT) | | | |
| | | U.S. Guaranteed ��� 15.6% (10.1% of Total Investments) (5) | | | |
| 2,500 | | Connecticut Health and Educational Facilities Authority, Revenue Bonds, Fairfield | 7/20 at 100.00 | A– | 2,596,225 |
| | | University, Series 2010-O, 5.000%, 7/01/40 (Pre-refunded 7/01/20) | | | |
| 2,000 | | Connecticut Health and Educational Facilities Authority, Revenue Bonds, Lawrence and | 7/21 at 100.00 | N/R | 2,138,640 |
| | | Memorial Hospitals, Series 2011F, 5.000%, 7/01/36 (Pre-refunded 7/01/21) | | | |
| | | Connecticut Health and Educational Facilities Authority, Revenue Bonds, Middlesex | | | |
| | | Hospital, Series 2011N: | | | |
| 1,105 | | 5.000%, 7/01/25 (Pre-refunded 7/01/21) | 7/21 at 100.00 | A3 | 1,185,124 |
| 400 | | 5.000%, 7/01/26 (Pre-refunded 7/01/21) | 7/21 at 100.00 | A3 | 429,004 |
| 500 | | 5.000%, 7/01/27 (Pre-refunded 7/01/21) | 7/21 at 100.00 | A3 | 536,255 |
| | | Connecticut Health and Educational Facilities Authority, Revenue Bonds, Sacred Heart | | | |
| | | University, Series 2011G: | | | |
| 250 | | 5.125%, 7/01/26 (Pre-refunded 7/01/21) | 7/21 at 100.00 | A | 268,765 |
| 3,260 | | 5.625%, 7/01/41 (Pre-refunded 7/01/21) | 7/21 at 100.00 | A | 3,537,882 |
| 3,000 | | Connecticut Health and Educational Facilities Authority, Revenue Bonds, Wesleyan | 7/20 at 100.00 | AA | 3,115,470 |
| | | University, Series 2010G, 5.000%, 7/01/35 (Pre-refunded 7/01/20) | | | |
| 1,240 | | Connecticut Health and Educational Facilities Authority, Revenue Bonds, Yale-New Haven | 7/20 at 100.00 | Aa3 | 1,292,948 |
| | | Hospital, Series 2010M, 5.500%, 7/01/40 (Pre-refunded 7/01/20) | | | |
| 1,010 | | Connecticut Health and Educational Facilities Authority, Revenue Bonds, Catholic Health | 11/20 at 100.00 | AA– | 1,057,106 |
| | | East Series 2010, 4.750%, 11/15/29 (Pre-refunded 11/15/20) | | | |
| 2,050 | | Guam Government Waterworks Authority, Water and Wastewater System Revenue Bonds, Series | 7/20 at 100.00 | A– | 2,140,938 |
| | | 2010, 5.625%, 7/01/40 (Pre-refunded 7/01/20) | | | |
| 3,000 | | Harbor Point Infrastructure Improvement District, Connecticut, Special Obligation | 4/20 at 100.00 | N/R | 3,156,900 |
| | | Revenue Bonds, Harbor Point Project, Series 2010A, 7.875%, 4/01/39 (Pre-refunded 4/01/20) | | | |
23
| | |
NTC | Nuveen Connecticut Quality Municipal Income Fund |
| | Portfolio of Investments (continued) |
| | May 31, 2019 |
| | | | | | |
Principal | | | Optional Call | | |
Amount (000) | | Description (1) | Provisions (2) | Ratings (3) | Value |
| | | U.S. Guaranteed (5) (continued) | | | |
| $ 870 | | Hartford, Connecticut, General Obligation Bonds, Series 2009A, 5.000%, 8/15/28 | 8/19 at 100.00 | AA | $ 876,038 |
| | | (Pre-refunded 8/15/19) – AGC Insured | | | |
| 2,220 | | Oregon State, General Obligation Bonds, Oregon University System Projects, Series 2011G, | 8/21 at 100.00 | N/R | 2,385,057 |
| | | 5.000%, 8/01/36 (Pre-refunded 8/02/21) | | | |
| 4,870 | | South Central Connecticut Regional Water Authority, Water System Revenue Bonds, | 8/21 at 100.00 | AA– | 5,242,458 |
| | | Twentieth-Sixth Series, 2011, 5.000%, 8/01/41 (Pre-refunded 8/01/21) | | | |
| 1,725 | | Stamford, Connecticut, Special Obligation Revenue Bonds, Mill River Corridor Project, | 4/21 at 100.00 | N/R | 1,893,808 |
| | | Series 2011A, 7.000%, 4/01/41 (Pre-refunded 4/01/21) | | | |
| 30,000 | | Total U.S. Guaranteed | | | 31,852,618 |
| | | Utilities – 3.7% (2.4% of Total Investments) | | | |
| | | Connecticut Municipal Electric Energy Cooperative, Power Supply System Revenue Bonds, | | | |
| | | Tender Option Bond Trust 2016-XG0059: | | | |
| 1,295 | | 13.351%, 1/01/32, 144A (IF) (4) | 1/23 at 100.00 | Aa3 | 1,846,579 |
| 410 | | 13.241%, 1/01/38, 144A (IF) (4) | 1/23 at 100.00 | Aa3 | 575,976 |
| | | Connecticut Transmission Municipal Electric Energy Cooperative, Transmission System | | | |
| | | Revenue Bonds, Series 2012A: | | | |
| 655 | | 5.000%, 1/01/31 | 1/22 at 100.00 | Aa3 | 707,577 |
| 500 | | 5.000%, 1/01/32 | 1/22 at 100.00 | Aa3 | 539,475 |
| 2,830 | | 5.000%, 1/01/42 | 1/22 at 100.00 | Aa3 | 3,050,599 |
| 500 | | Eastern Connecticut Resource Recovery Authority, Solid Waste Revenue Bonds, Wheelabrator | 7/19 at 100.00 | A– | 507,550 |
| | | Lisbon Project, Series 1993A, 5.500%, 1/01/20 (AMT) | | | |
| 250 | | Guam Power Authority, Revenue Bonds, Series 2012A, 5.000%, 10/01/34 – AGM Insured | 10/22 at 100.00 | AA | 274,145 |
| 6,440 | | Total Utilities | | | 7,501,901 |
| | | Water and Sewer – 21.4% (13.8% of Total Investments) | | | |
| | | Connecticut, State Revolving Fund General Revenue Bonds, Green Bonds, Series 2017A: | | | |
| 1,500 | | 5.000%, 5/01/36 | 5/27 at 100.00 | AAA | 1,810,290 |
| 1,500 | | 5.000%, 5/01/37 | 5/27 at 100.00 | AAA | 1,804,560 |
| | | Greater New Haven Water Pollution Control Authority, Connecticut, Regional Wastewater | | | |
| | | System Revenue Bonds, Refunding Series 2014B: | | | |
| 500 | | 5.000%, 8/15/30 | 8/24 at 100.00 | AA | 575,730 |
| 1,000 | | 5.000%, 8/15/31 | 8/24 at 100.00 | AA | 1,149,060 |
| 500 | | 5.000%, 8/15/32 | 8/24 at 100.00 | AA | 573,845 |
| 55 | | Greater New Haven Water Pollution Control Authority, Connecticut, Regional Wastewater | 7/19 at 100.00 | AA | 55,154 |
| | | System Revenue Bonds, Series 2005A, 5.000%, 8/15/35 – NPFG Insured | | | |
| | | Guam Government Waterworks Authority, Water and Wastewater System Revenue Bonds, | | | |
| | | Refunding Series 2017: | | | |
| 1,335 | | 5.000%, 7/01/36 | 7/27 at 100.00 | A– | 1,513,957 |
| 890 | | 5.000%, 7/01/40 | 7/27 at 100.00 | A– | 999,532 |
| 3,045 | | Guam Government Waterworks Authority, Water and Wastewater System Revenue Bonds, Series | 7/23 at 100.00 | A– | 3,327,332 |
| | | 2013, 5.500%, 7/01/43 | | �� | |
| 235 | | Guam Government Waterworks Authority, Water and Wastewater System Revenue Bonds, Series | 7/26 at 100.00 | A– | 260,086 |
| | | 2016, 5.000%, 1/01/46 | | | |
| 10,015 | | Hartford County Metropolitan District, Connecticut, Clean Water Project Revenue Bonds, | 11/24 at 100.00 | Aa2 | 11,314,146 |
| | | Refunding Green Bond Series 2014A, 5.000%, 11/01/42 | | | |
| | | Hartford County Metropolitan District, Connecticut, Clean Water Project Revenue Bonds, | | | |
| | | Series 2013A: | | | |
| 4,100 | | 5.000%, 4/01/36 | 4/22 at 100.00 | Aa2 | 4,437,430 |
| 2,500 | | 5.000%, 4/01/39 | 4/22 at 100.00 | Aa2 | 2,702,350 |
| 795 | | South Central Connecticut Regional Water Authority Water System Revenue Bonds, Thirtieth | 8/24 at 100.00 | AA– | 898,358 |
| | | Series 2014A, 5.000%, 8/01/44 | | | |
24
| | | | | | |
Principal | | | Optional Call | | |
Amount (000) | | Description (1) | Provisions (2) | Ratings (3) | Value |
| | | Water and Sewer (continued) | | | |
| | | South Central Connecticut Regional Water Authority, Water System Revenue Bonds, | | | |
| | | Refunding Thirty-Second Series 2016B: | | | |
| $ 2,715 | | 4.000%, 8/01/36 | 8/26 at 100.00 | AA– | $ 2,985,278 |
| 2,220 | | 5.000%, 8/01/37 | 8/26 at 100.00 | AA– | 2,602,373 |
| 1,270 | | South Central Connecticut Regional Water Authority, Water System Revenue Bonds, | 8/28 at 100.00 | AA– | 1,528,001 |
| | | Thirty-third Series 2018A, 5.000%, 8/01/42 | | | |
| 4,000 | | South Central Connecticut Regional Water Authority, Water System Revenue Bonds, | 8/22 at 100.00 | AA– | 4,380,320 |
| | | Twenty-Seventh Series 2012, 5.000%, 8/01/33 | | | |
| 500 | | Stamford, Connecticut, Water Pollution Control System and Facility Revenue Bonds, Series | 8/23 at 100.00 | AA+ | 568,745 |
| | | 2013A, 5.250%, 8/15/43 | | | |
| 38,675 | | Total Water and Sewer | | | 43,486,547 |
| $ 284,225 | | Total Long-Term Investments (cost $300,123,527) | | | 315,501,773 |
| | | Floating Rate Obligations – (3.1)% | | | (6,375,000) |
| | | Adjustable Rate MuniFund Term Preferred Shares, net of deferred offering costs – (54.9)% (6) | | | (111,837,892) |
| | | Other Assets Less Liabilities – 3.1% | | | 6,385,232 |
| | | Net Assets Applicable to Common Shares – 100% | | | $ 203,674,113 |
| | |
| (1) | All percentages shown in the Portfolio of Investments are based on net assets applicable to common shares unless otherwise noted. |
| (2) | Optional Call Provisions: Dates (month and year) and prices of the earliest optional call or redemption. There may be other call provisions at varying prices at later dates. Certain mortgage-backed securities may be subject to periodic principal paydowns. Optional Call Provisions are not covered by the report of independent registered public accounting firm. |
| (3) | For financial reporting purposes, the ratings disclosed are the highest of Standard & Poor’s Group (“Standard & Poor’s”), Moody’s Investors Service, Inc. (“Moody’s”) or Fitch, Inc. (“Fitch”) rating. This treatment of split-rated securities may differ from that used for other purposes, such as for Fund investment policies. Ratings below BBB by Standard & Poor’s, Baa by Moody’s or BBB by Fitch are considered to be below investment grade. Holdings designated N/R are not rated by any of these national rating agencies. Ratings are not covered by the report of independent registered public accounting firm. |
| (4) | Investment, or portion of investment, has been pledged to collateralize the net payment obligations for investments in inverse floating rate transactions. |
| (5) | Backed by an escrow or trust containing sufficient U.S. Government or U.S. Government agency securities, which ensure the timely payment of principal and interest. |
| (6) | Adjustable Rate MuniFund Term Preferred Shares, net of deferred offering costs as a percentage of Total Investments is 35.4%. |
| 144A | Investment is exempt from registration under Rule 144A of the Securities Act of 1933, as amended. These investments may only be resold in transactions exempt from registration, which are normally those transactions with qualified institutional buyers. |
| AMT | Alternative Minimum Tax. |
| IF | Inverse floating rate security issued by a tender option bond (“TOB”) trust, the interest rate on which varies inversely with the Securities Industry Financial Markets Association (SIFMA) short-term rate, which resets weekly, or a similar short-term rate, and is reduced by the expenses related to the TOB trust. |
| UB | Underlying bond of an inverse floating rate trust reflected as a financing transaction. See Notes to Financial Statements, Note 3 – Portfolio Securities and Investments in Derivatives, Inverse Floating Rate Securities for more information. |
| | See accompanying notes to financial statements. |
25
| | |
NMT | Nuveen Massachusetts Quality Municipal |
| | Income Fund |
| | Portfolio of Investments |
| | May 31, 2019 |
| | | | | | |
Principal | | | Optional Call | | |
Amount (000) | | Description (1) | Provisions (2) | Ratings (3) | Value |
| | | LONG-TERM INVESTMENTS – 152.3% (100.0% of Total Investments) | | | |
| | | MUNICIPAL BONDS – 152.3% (100.0% of Total Investments) | | | |
| | | Education and Civic Organizations – 45.2% (29.7% of Total Investments) | | | |
| $ 3,515 | | Massachusetts Development Finance Agency, Revenue Bonds, Berklee College of Music, | 10/26 at 100.00 | A | $ 4,135,292 |
| | | Series 2016, 5.000%, 10/01/39 | | | |
| 2,200 | | Massachusetts Development Finance Agency, Revenue Bonds, Boston College, Series 2013S, | 7/23 at 100.00 | AA– | 2,463,450 |
| | | 5.000%, 7/01/38 | | | |
| 730 | | Massachusetts Development Finance Agency, Revenue Bonds, Boston College, Series 2017T, | 7/27 at 100.00 | AA– | 868,985 |
| | | 5.000%, 7/01/42 | | | |
| | | Massachusetts Development Finance Agency, Revenue Bonds, Boston University, Tender | | | |
| | | Option Bond Trust 2016-XG0070: | | | |
| 1,880 | | 13.237%, 10/01/48, 144A (IF) (4) | 10/23 at 100.00 | AA– | 2,732,824 |
| 575 | | 13.169%, 10/01/48, 144A (IF) (4) | 10/23 at 100.00 | AA– | 835,515 |
| | | Massachusetts Development Finance Agency, Revenue Bonds, Emerson College, Series 2017A: | | | |
| 2,000 | | 5.000%, 1/01/34 | 1/28 at 100.00 | BBB+ | 2,354,020 |
| 2,240 | | 5.000%, 1/01/37 | 1/28 at 100.00 | BBB+ | 2,610,787 |
| 2,150 | | Massachusetts Development Finance Agency, Revenue Bonds, Lesley University, Series | 7/21 at 100.00 | AA | 2,313,636 |
| | | 2011B-1, 5.250%, 7/01/33 – AGM Insured | | | |
| 1,955 | | Massachusetts Development Finance Agency, Revenue Bonds, Lesley University, Series 2016, | 7/26 at 100.00 | A– | 2,275,952 |
| | | 5.000%, 7/01/35 | | | |
| | | Massachusetts Development Finance Agency, Revenue Bonds, MCPHS University Issue, Series | | | |
| | | Series 2015H: | | | |
| 450 | | 3.500%, 7/01/35 | 7/25 at 100.00 | AA | 466,268 |
| 190 | | 5.000%, 7/01/37 | 7/25 at 100.00 | AA | 219,085 |
| 1,200 | | Massachusetts Development Finance Agency, Revenue Bonds, Merrimack College, Series 2017, | 7/26 at 100.00 | BBB– | 1,326,960 |
| | | 5.000%, 7/01/47 | | | |
| 550 | | Massachusetts Development Finance Agency, Revenue Bonds, Northeastern University, Series | 10/22 at 100.00 | A1 | 604,918 |
| | | 2012, 5.000%, 10/01/31 | | | |
| | | Massachusetts Development Finance Agency, Revenue Bonds, Northeastern University, | | | |
| | | Series 2014A: | | | |
| 875 | | 5.000%, 3/01/39 | 3/24 at 100.00 | A1 | 990,482 |
| 1,400 | | 5.000%, 3/01/44 | 3/24 at 100.00 | A1 | 1,578,402 |
| 500 | | Massachusetts Development Finance Agency, Revenue Bonds, Simmons College, Series 2013J, | 10/23 at 100.00 | BBB+ | 553,380 |
| | | 5.250%, 10/01/39 | | | |
| 1,230 | | Massachusetts Development Finance Agency, Revenue Bonds, Sterling and Francine Clark Art | 7/25 at 100.00 | AA | 1,446,259 |
| | | Institute, Series 2015, 5.000%, 7/01/33 | | | |
| 450 | | Massachusetts Development Finance Agency, Revenue Bonds, Suffolk University, Refunding | 7/29 at 100.00 | Baa2 | 535,086 |
| | | Series 2019, 5.000%, 7/01/36 | | | |
| | | Massachusetts Development Finance Agency, Revenue Bonds, The Broad Institute, | | | |
| | | Series 2017: | | | |
| 2,200 | | 5.000%, 4/01/35 | 10/27 at 100.00 | AA– | 2,683,714 |
| 1,250 | | 5.000%, 4/01/36 | 10/27 at 100.00 | AA– | 1,520,325 |
| 875 | | Massachusetts Development Finance Agency, Revenue Bonds, Tufts University, Series 2015Q, | 8/25 at 100.00 | Aa2 | 1,013,145 |
| | | 5.000%, 8/15/38 | | | |
| 1,325 | | Massachusetts Development Finance Agency, Revenue Bonds, Wheaton College, Series 2017H, | 1/28 at 100.00 | A3 | 1,544,287 |
| | | 5.000%, 1/01/42 | | | |
| 1,510 | | Massachusetts Development Finance Agency, Revenue Bonds, Woods Hole Oceanographic | 6/28 at 100.00 | AA– | 1,816,213 |
| | | Institution, Series 2018, 5.000%, 6/01/43 | | | |
| 1,365 | | Massachusetts Development Finance Agency, Revenue Bonds, Worcester Polytechnic | 9/22 at 100.00 | A1 | 1,476,985 |
| | | Institute, Series 2012, 5.000%, 9/01/50 | | | |
26
| | | | | | |
Principal | | | Optional Call | | |
Amount (000) | | Description (1) | Provisions (2) | Ratings (3) | Value |
| | | Education and Civic Organizations (continued) | | | |
| $ 840 | | Massachusetts Development Finance Agency, Revenue Bonds, Worcester Polytechnic | 9/26 at 100.00 | A1 | $ 978,146 |
| | | Institute, Series 2016, 5.000%, 9/01/37 | | | |
| | | Massachusetts Development Finance Agency, Revenue Bonds, Worcester Polytechnic | | | |
| | | Institute, Series 2017: | | | |
| 550 | | 5.000%, 9/01/42 | 9/27 at 100.00 | A1 | 645,805 |
| 700 | | 5.000%, 9/01/47 | 9/27 at 100.00 | A1 | 818,804 |
| 2,500 | | Massachusetts Development Finance Agency, Revenue Bonds, Worcester Polytechnic | 9/27 at 100.00 | A1 | 2,935,475 |
| | | Institute, Series 2017B, 5.000%, 9/01/42 | | | |
| 500 | | Massachusetts Development Finance Authority, Revenue Bonds, Suffolk University, | 7/27 at 100.00 | Baa2 | 579,875 |
| | | Refunding Series 2017, 5.000%, 7/01/35 | | | |
| 3,000 | | Massachusetts Development Finance Authority, Revenue Bonds, WGBH Educational Foundation, | No Opt. Call | AA– | 4,317,480 |
| | | Series 2002A, 5.750%, 1/01/42 – AMBAC Insured | | | |
| 2,495 | | Massachusetts Development Finance Authority, Revenue Bonds, WGBH Educational Foundation, | 7/26 at 100.00 | AA– | 2,914,809 |
| | | Series 2016, 5.000%, 1/01/40 | | | |
| | | Massachusetts Development Finance Authority, Revenue Refunding Bonds, Boston University, | | | |
| | | Series 1999P: | | | |
| 1,090 | | 6.000%, 5/15/29 | No Opt. Call | Aa3 | 1,415,725 |
| 1,000 | | 6.000%, 5/15/59 | 5/29 at 105.00 | Aa3 | 1,302,820 |
| 385 | | Massachusetts Educational Financing Authority, Education Loan Revenue Bonds, Series | 7/21 at 100.00 | AA | 405,178 |
| | | 2011J, 5.625%, 7/01/33 (AMT) | | | |
| 255 | | Massachusetts Health and Educational Facilities Authority, Revenue Bonds, Northeastern | 10/20 at 100.00 | A1 | 264,591 |
| | | University, Series 2010A, 4.875%, 10/01/35 | | | |
| 165 | | Massachusetts Health and Educational Facilities Authority, Revenue Bonds, Suffolk | 7/19 at 100.00 | Baa2 | 165,526 |
| | | University, Refunding Series 2009A, 5.750%, 7/01/39 | | | |
| 2,000 | | University of Massachusetts Building Authority, Project Revenue Bonds, Senior Series | 11/24 at 100.00 | Aa2 | 2,296,860 |
| | | 2014-1, 5.000%, 11/01/44 | | | |
| 4,000 | | University of Massachusetts Building Authority, Project Revenue Bonds, Senior Series | 11/25 at 100.00 | Aa2 | 4,686,560 |
| | | 2015-1, 5.000%, 11/01/40 | | | |
| 52,095 | | Total Education and Civic Organizations | | | 62,093,624 |
| | | Health Care – 32.0% (21.0% of Total Investments) | | | |
| 1,000 | | Massachusetts Development Finance Agency Revenue Bonds, Children?s Hospital Issue, | 10/24 at 100.00 | AA | 1,123,060 |
| | | Series 2014P, 5.000%, 10/01/46 | | | |
| 1,340 | | Massachusetts Development Finance Agency Revenue Bonds, South Shore Hospital, Series | 7/26 at 100.00 | A– | 1,519,319 |
| | | 2016I, 5.000%, 7/01/41 | | | |
| 1,410 | | Massachusetts Development Finance Agency, Hospital Revenue Bonds, Cape Cod Healthcare | 11/23 at 100.00 | A+ | 1,559,460 |
| | | Obligated Group, Series 2013, 5.250%, 11/15/41 | | | |
| 1,000 | | Massachusetts Development Finance Agency, Revenue Bonds, Baystate Medical Center Issue, | 7/24 at 100.00 | A+ | 1,098,400 |
| | | Series 2014N, 5.000%, 7/01/44 | | | |
| | | Massachusetts Development Finance Agency, Revenue Bonds, Berkshire Health Systems, | | | |
| | | Series 2012G: | | | |
| 895 | | 5.000%, 10/01/29 | 10/21 at 100.00 | AA– | 958,366 |
| 700 | | 5.000%, 10/01/31 | 10/21 at 100.00 | AA– | 748,566 |
| 500 | | Massachusetts Development Finance Agency, Revenue Bonds, Boston Medical Center Issue, | 7/26 at 100.00 | BBB | 575,725 |
| | | Series 2016E, 5.000%, 7/01/32 | | | |
| 1,675 | | Massachusetts Development Finance Agency, Revenue Bonds, CareGroup Issue, Refunding | 7/26 at 100.00 | A– | 1,956,450 |
| | | Series 2016-I, 5.000%, 7/01/30 | | | |
| | | Massachusetts Development Finance Agency, Revenue Bonds, CareGroup Issue, | | | |
| | | Series 2015H-1: | | | |
| 900 | | 5.000%, 7/01/30 | 7/25 at 100.00 | A– | 1,032,471 |
| 1,000 | | 5.000%, 7/01/32 | 7/25 at 100.00 | A– | 1,138,930 |
| 500 | | 5.000%, 7/01/33 | 7/25 at 100.00 | A– | 567,935 |
27
| | |
NMT | Nuveen Massachusetts Quality Municipal Income Fund |
| | Portfolio of Investments (continued) |
| |
| | May 31, 2019 |
| |
| |
| |
| |
Principal | | | Optional Call | | |
Amount (000) | | Description (1) | Provisions (2) | Ratings (3) | Value |
| | | Health Care (continued) | | | |
| $ 1,500 | | Massachusetts Development Finance Agency, Revenue Bonds, CareGroup Issue, Series | 7/28 at 100.00 | A– | $ 1,750,860 |
| | | 2018J-2, 5.000%, 7/01/38 | | | |
| 1,000 | | Massachusetts Development Finance Agency, Revenue Bonds, Covenant Health System | 7/22 at 100.00 | BBB+ | 1,060,050 |
| | | Obligated Group, Series 2012, 5.000%, 7/01/31 | | | |
| 2,800 | | Massachusetts Development Finance Agency, Revenue Bonds, Dana-Farber Cancer Institute | 12/26 at 100.00 | A1 | 3,236,604 |
| | | Issue, Series 2016N, 5.000%, 12/01/46 | | | |
| 3,500 | | Massachusetts Development Finance Agency, Revenue Bonds, Lahey Health System Obligated | 8/25 at 100.00 | A | 3,897,005 |
| | | Group Issue, Series 2015F, 5.000%, 8/15/45 | | | |
| 1,080 | | Massachusetts Development Finance Agency, Revenue Bonds, Milford Regional Medical Center | 7/23 at 100.00 | BB+ | 1,176,541 |
| | | Issue, Series 2014F, 5.750%, 7/15/43 | | | |
| 3,450 | | Massachusetts Development Finance Agency, Revenue Bonds, Partners HealthCare System | 7/26 at 100.00 | AA– | 3,987,476 |
| | | Issue, Series 2016Q, 5.000%, 7/01/47 | | | |
| | | Massachusetts Development Finance Agency, Revenue Bonds, Partners HealthCare System | | | |
| | | Issue, Series 2017S-1: | | | |
| 2,200 | | 5.000%, 7/01/37 | 1/28 at 100.00 | AA– | 2,637,800 |
| 2,100 | | 4.000%, 7/01/41 | 1/28 at 100.00 | AA– | 2,301,915 |
| 5 | | Massachusetts Development Finance Agency, Revenue Bonds, Partners HealthCare System, | 7/21 at 100.00 | AA– | 5,313 |
| | | Series 2012L, 5.000%, 7/01/36 | | | |
| 820 | | Massachusetts Development Finance Agency, Revenue Bonds, Southcoast Health System | 7/23 at 100.00 | BBB+ | 898,392 |
| | | Obligated Group Issue, Series 2013F, 5.000%, 7/01/37 | | | |
| | | Massachusetts Development Finance Agency, Revenue Bonds, The Lowell General Hospital, | | | |
| | | Series 2013G: | | | |
| 1,000 | | 5.000%, 7/01/37 | 7/23 at 100.00 | BBB+ | 1,082,290 |
| 2,200 | | 5.000%, 7/01/44 | 7/23 at 100.00 | BBB+ | 2,379,784 |
| 610 | | Massachusetts Development Finance Agency, Revenue Bonds, UMass Memorial Health Care | 1/27 at 100.00 | A– | 696,931 |
| | | Obligated Group Issue, Series 2017K, 5.000%, 7/01/38 | | | |
| | | Massachusetts Development Finance Agency, Revenue Bonds, UMass Memorial Health Care | | | |
| | | Obligated Group Issue, Series 2017L: | | | |
| 400 | | 3.625%, 7/01/37 | 7/27 at 100.00 | A– | 409,244 |
| 1,095 | | 5.000%, 7/01/44 | 7/27 at 100.00 | A– | 1,247,588 |
| 445 | | Massachusetts Development Finance Agency, Revenue Bonds, UMass Memorial Health Care, | 7/26 at 100.00 | A– | 510,210 |
| | | Series 2016I, 5.000%, 7/01/36 | | | |
| 25 | | Massachusetts Development Finance Agency, Revenue Bonds, UMass Memorial Health, Series | 7/21 at 100.00 | BBB+ | 26,816 |
| | | 2011H, 5.500%, 7/01/31 | | | |
| 280 | | Massachusetts Development Finance Agency, Revenue Bonds, Wellforce Issue, Series 2019A, | 1/29 at 100.00 | BBB+ | 326,035 |
| | | 5.000%, 7/01/44 | | | |
| 2,500 | | Massachusetts Health and Educational Facilities Authority, Revenue Bonds, Dana-Farber | 7/19 at 100.00 | A1 | 2,521,350 |
| | | Cancer Institute, Series 2008K, 5.000%, 12/01/37 | | | |
| 1,495 | | Massachusetts Health and Educational Facilities Authority, Revenue Bonds, Milford | 7/19 at 100.00 | BB+ | 1,508,455 |
| | | Regional Medical Center, Series 2007E, 5.000%, 7/15/32 | | | |
| 39,425 | | Total Health Care | | | 43,939,341 |
| | | Housing/Multifamily – 0.5% (0.3% of Total Investments) | | | |
| 495 | | Boston Housing Authority, Massachusetts, Capital Program Revenue Bonds, Series 2008, | 7/19 at 100.00 | AA | 496,396 |
| | | 5.000%, 4/01/20 – AGM Insured | | | |
| 215 | | Massachusetts Housing Finance Agency, Housing Bonds, Series 2003H, 5.125%, 6/01/43 | 6/19 at 100.00 | AA | 217,474 |
| 710 | | Total Housing/Multifamily | | | 713,870 |
| | | Long-Term Care – 3.2% (2.1% of Total Investments) | | | |
| | | Massachusetts Development Finance Agency Revenue Refunding Bonds, NewBridge on the | | | |
| | | Charles, Inc Issue, Series 2017: | | | |
| 1,040 | | 4.125%, 10/01/42, 144A | 10/22 at 105.00 | BB+ | 1,063,889 |
| 250 | | 5.000%, 10/01/47, 144A | 10/22 at 105.00 | BB+ | 272,300 |
28
| | | | | | |
Principal | | | Optional Call | | |
Amount (000) | | Description (1) | Provisions (2) | Ratings (3) | Value |
| | | Long-Term Care (continued) | | | |
| $ 460 | | Massachusetts Development Finance Agency, Revenue Bonds, Berkshire Retirement Community | 7/25 at 100.00 | A+ | $ 523,264 |
| | | Lennox, Series 2015, 5.000%, 7/01/31 | | | |
| 285 | | Massachusetts Development Finance Agency, Revenue Bonds, Carleton-Willard Village, | 12/19 at 100.00 | A– | 290,244 |
| | | Series 2010, 5.625%, 12/01/30 | | | |
| 1,000 | | Massachusetts Development Finance Agency, Revenue Bonds, Loomis Communities, Series | 1/23 at 100.00 | BBB | 1,102,100 |
| | | 2013A, 5.250%, 1/01/26 | | | |
| 1,000 | | Massachusetts Development Finance Agency, Revenue Bonds, Orchard Cove, Inc, Refunding | 10/24 at 104.00 | BBB+ | 1,117,910 |
| | | Series 2019, 5.000%, 10/01/49 | | | |
| 4,035 | | Total Long-Term Care | | | 4,369,707 |
| | | Tax Obligation/General – 16.5% (10.9% of Total Investments) | | | |
| 1,250 | | Hudson, Massachusetts, General Obligation Bonds, Municipal Purpose Loan Series 2011, | 2/20 at 100.00 | AA | 1,281,963 |
| | | 5.000%, 2/15/32 | | | |
| 640 | | Massachusetts Bay Transportation Authority, General Obligation Transportation System | No Opt. Call | Aa1 | 684,294 |
| | | Bonds, Series 1991A, 7.000%, 3/01/21 | | | |
| 1,500 | | Massachusetts State, General Obligation Bonds, Consolidated Loan, Series 2004B, 5.250%, | No Opt. Call | Aa1 | 1,622,640 |
| | | 8/01/21 – AGM Insured | | | |
| 2,000 | | Massachusetts State, General Obligation Bonds, Consolidated Loan, Series 2015C, | 7/25 at 100.00 | Aa1 | 2,308,220 |
| | | 5.000%, 7/01/45 | | | |
| 3,895 | | Massachusetts State, General Obligation Bonds, Consolidated Loan, Series 2017F, | 11/27 at 100.00 | Aa1 | 4,620,522 |
| | | 5.000%, 11/01/46 | | | |
| 4,000 | | Massachusetts State, General Obligation Bonds, Consolidated Loan, Series 2019A, | 1/29 at 100.00 | Aa1 | 4,971,480 |
| | | 5.250%, 1/01/44 | | | |
| 1,775 | | North Reading, Massachusetts, General Obligation Bonds, Municipal Purpose Loan Series | 5/22 at 100.00 | Aa2 | 1,941,051 |
| | | 2012, 5.000%, 5/15/35 | | | |
| 1,760 | | Norwell, Massachusetts, General Obligation Bonds, Series 2003, 5.000%, 11/15/20 – | No Opt. Call | AAA | 1,819,066 |
| | | FGIC Insured | | | |
| | | Quincy, Massachusetts, General Obligation Bonds, State Qualified Municipal Purpose Loan | | | |
| | | Series 2011: | | | |
| 1,280 | | 5.125%, 12/01/33 | 12/20 at 100.00 | Aa2 | 1,344,998 |
| 2,000 | | 5.250%, 12/01/38 | 12/20 at 100.00 | Aa2 | 2,107,340 |
| 20,100 | | Total Tax Obligation/General | | | 22,701,574 |
| | | Tax Obligation/Limited – 17.6% (11.5% of Total Investments) | | | |
| | | Government of Guam, Business Privilege Tax Bonds, Series 2011A: | | | |
| 2,000 | | 5.250%, 1/01/36 | 1/22 at 100.00 | BB | 2,101,620 |
| 1,310 | | 5.125%, 1/01/42 | 1/22 at 100.00 | BB | 1,366,081 |
| | | Government of Guam, Business Privilege Tax Bonds, Series 2012B-1: | | | |
| 400 | | 5.000%, 1/01/37 | 1/22 at 100.00 | BB | 416,912 |
| 1,115 | | 5.000%, 1/01/42 | 1/22 at 100.00 | BB | 1,157,927 |
| 855 | | Martha’s Vineyard Land Bank, Massachusetts, Revenue Bonds, Refunding Green Series 2014, | 11/24 at 100.00 | AA | 992,416 |
| | | 5.000%, 5/01/33 – BAM Insured | | | |
| 500 | | Martha’s Vineyard Land Bank, Massachusetts, Revenue Bonds, Refunding Green Series 2017, | 5/27 at 100.00 | AA | 598,685 |
| | | 5.000%, 5/01/35 | | | |
| 1,000 | | Massachusetts Bay Transportation Authority, Assessment Bonds, Series 2012A, | 7/22 at 100.00 | AAA | 1,092,090 |
| | | 5.000%, 7/01/41 | | | |
| 770 | | Massachusetts Bay Transportation Authority, Sales Tax Revenue Bonds, Refunding Senior | No Opt. Call | AA | 831,238 |
| | | Lien Series 2004C, 5.250%, 7/01/21 | | | |
| 1,610 | | Massachusetts College Building Authority, Project Revenue Bonds, Green Series 2014B, | 5/24 at 100.00 | Aa2 | 1,803,570 |
| | | 5.000%, 5/01/44 | | | |
| 1,000 | | Massachusetts College Building Authority, Project Revenue Bonds, Refunding Series 2003B, | No Opt. Call | Aa2 | 1,148,290 |
| | | 5.375%, 5/01/23 – SYNCORA GTY Insured | | | |
29
| | |
NMT | Nuveen Massachusetts Quality Municipal Income Fund |
| | Portfolio of Investments (continued) |
| | May 31, 2019 |
| | | | | | |
Principal | | | Optional Call | | |
Amount (000) | | Description (1) | Provisions (2) | Ratings (3) | Value |
| | | Tax Obligation/Limited (continued) | | | |
| $ 855 | | Massachusetts College Building Authority, Revenue Bonds, Refunding Series 2012B, | 5/22 at 100.00 | Aa2 | $ 923,332 |
| | | 5.000%, 5/01/37 | | | |
| 1,350 | | Massachusetts School Building Authority, Dedicated Sales Tax Revenue Bonds, Senior | 8/25 at 100.00 | AAA | 1,581,417 |
| | | Refunding Series 2015C, 5.000%, 8/15/37 | | | |
| 1,875 | | Massachusetts School Building Authority, Dedicated Sales Tax Revenue Bonds, Senior | 5/23 at 100.00 | AAA | 2,083,069 |
| | | Series 2013A, 5.000%, 5/15/38 | | | |
| 1,000 | | Massachusetts School Building Authority, Dedicated Sales Tax Revenue Bonds, Series | 10/21 at 100.00 | AAA | 1,071,470 |
| | | 2011B, 5.000%, 10/15/41 | | | |
| 2,000 | | Massachusetts School Building Authority, Dedicated Sales Tax Revenue Bonds, Subordinated | 2/28 at 100.00 | AA+ | 2,433,080 |
| | | Series 2018A, 5.250%, 2/15/48 | | | |
| 1,070 | | Massachusetts State, Special Obligation Dedicated Tax Revenue Bonds, Refunding Series | No Opt. Call | A1 | 1,092,160 |
| | | 2005, 5.000%, 1/01/20 – FGIC Insured | | | |
| 1,500 | | Massachusetts State, Transportation Fund Revenue Bonds, Rail Enhancement Program, Series | 6/25 at 100.00 | AA+ | 1,733,775 |
| | | 2015A, 5.000%, 6/01/45 | | | |
| 520 | | Virgin Islands Public Finance Authority, Gross Receipts Taxes Loan Note, Refunding | 10/22 at 100.00 | AA | 565,396 |
| | | Series 2012A, 5.000%, 10/01/32 – AGM Insured | | | |
| 1,000 | | Virgin Islands Public Finance Authority, Matching Fund Loan Notes Revenue Bonds, Series | 10/22 at 100.00 | AA | 1,087,300 |
| | | 2012A, 5.000%, 10/01/32 – AGM Insured | | | |
| 21,730 | | Total Tax Obligation/Limited | | | 24,079,828 |
| | | Transportation – 9.9% (6.5% of Total Investments) | | | |
| 400 | | Massachusetts Department of Transportation, Metropolitan Highway System Revenue Bonds, | 1/20 at 100.00 | AA+ | 407,796 |
| | | Commonwealth Contract Assistance Secured, Series 2010B, 5.000%, 1/01/35 | | | |
| 2,500 | | Massachusetts Port Authority, Revenue Bonds, Refunding Series 2017A, 5.000%, | 7/27 at 100.00 | AA | 2,923,150 |
| | | 7/01/47 (AMT) | | | |
| 1,000 | | Massachusetts Port Authority, Revenue Bonds, Series 2010A, 5.000%, 7/01/30 | 7/20 at 100.00 | AA | 1,036,950 |
| 1,000 | | Massachusetts Port Authority, Revenue Bonds, Series 2012B, 5.000%, 7/01/33 | 7/22 at 100.00 | AA | 1,095,860 |
| | | Massachusetts Port Authority, Revenue Bonds, Series 2014A: | | | |
| 1,000 | | 5.000%, 7/01/39 | 7/24 at 100.00 | AA | 1,143,870 |
| 2,500 | | 5.000%, 7/01/44 | 7/24 at 100.00 | AA | 2,852,350 |
| | | Massachusetts Port Authority, Revenue Bonds, Series 2015A: | | | |
| 715 | | 5.000%, 7/01/40 | 7/25 at 100.00 | AA | 828,942 |
| 1,000 | | 5.000%, 7/01/45 | 7/25 at 100.00 | AA | 1,154,730 |
| 1,400 | | Massachusetts Port Authority, Special Facilities Revenue Bonds, BOSFUEL Corporation, | 7/19 at 100.00 | A1 | 1,404,018 |
| | | Series 2007, 5.000%, 7/01/32 – FGIC Insured (AMT) | | | |
| 730 | | Metropolitan Boston Transit Parking Corporation, Massachusetts, Systemwide Parking | 7/21 at 100.00 | A+ | 772,603 |
| | | Revenue Bonds, Senior Lien Series 2011, 5.000%, 7/01/41 | | | |
| 12,245 | | Total Transportation | | | 13,620,269 |
| | | U.S. Guaranteed – 18.4% (12.0% of Total Investments) (5) | | | |
| 500 | | Boston Water and Sewer Commission, Massachusetts, General Revenue Bonds, Refunding | 11/19 at 100.00 | AA+ | 507,295 |
| | | Senior Lien Series 2010A, 5.000%, 11/01/30 (Pre-refunded 11/01/19) | | | |
| 2,580 | | Guam Power Authority, Revenue Bonds, Series 2010A, 5.000%, 10/01/37 (Pre-refunded | 10/20 at 100.00 | AA | 2,701,466 |
| | | 10/01/20) – AGM Insured | | | |
| 2,000 | | Hampden-Wilbraham Regional School District, Hampden County, Massachusetts, General | 2/21 at 100.00 | Aa3 | 2,121,000 |
| | | Obligation Bonds, Series 2011, 5.000%, 2/15/41 (Pre-refunded 2/15/21) | | | |
| 750 | | Massachusetts Development Finance Agency, Revenue Bonds, Boston University, Series | 10/19 at 100.00 | Aa3 | 758,828 |
| | | 2009V-1, 5.000%, 10/01/29 (Pre-refunded 10/01/19) | | | |
| | | Massachusetts Development Finance Agency, Revenue Bonds, Emerson College, Series 2010A: | | | |
| 1,275 | | 5.000%, 1/01/40 (Pre-refunded 1/01/20) | 1/20 at 100.00 | N/R | 1,301,482 |
| 125 | | 5.000%, 1/01/40 (Pre-refunded 1/01/20) | 1/20 at 100.00 | BBB+ | 127,596 |
| 467 | | Massachusetts Development Finance Agency, Revenue Bonds, North Hill Communities Issue, | 11/23 at 100.00 | N/R | 545,615 |
| | | Series 2013A, 6.250%, 11/15/28, 144A (Pre-refunded 11/15/23) | | | |
30
| | | | | | |
Principal | | | Optional Call | | |
Amount (000) | | Description (1) | Provisions (2) | Ratings (3) | Value |
| | | U.S. Guaranteed (5) (continued) | | | |
| $ 2,200 | | Massachusetts Development Finance Agency, Revenue Bonds, Partners HealthCare System, | 7/20 at 100.00 | AA– | $ 2,289,826 |
| | | Series 2011K-6, 5.375%, 7/01/41 (Pre-refunded 7/01/20) | | | |
| 995 | | Massachusetts Development Finance Agency, Revenue Bonds, Partners HealthCare System, | 7/21 at 100.00 | N/R | 1,065,028 |
| | | Series 2012L, 5.000%, 7/01/36 (Pre-refunded 7/01/21) | | | |
| 1,000 | | Massachusetts Development Finance Agency, Revenue Bonds, Sterling and Francine Clark Art | 7/21 at 100.00 | AA | 1,072,510 |
| | | Institute, Series 2011A, 5.000%, 7/01/41 (Pre-refunded 7/01/21) | | | |
| 3,000 | | Massachusetts Development Finance Agency, Revenue Bonds, The Broad Institute, Series | 4/21 at 100.00 | Aa3 | 3,207,900 |
| | | 2011A, 5.250%, 4/01/37 (Pre-refunded 4/01/21) | | | |
| 475 | | Massachusetts Development Finance Agency, Revenue Bonds, UMass Memorial Health, Series | 7/21 at 100.00 | N/R | 513,261 |
| | | 2011H, 5.500%, 7/01/31 (Pre-refunded 7/01/21) | | | |
| 160 | | Massachusetts Health and Educational Facilities Authority, Revenue Bonds, Baystate | 7/19 at 100.00 | N/R | 160,517 |
| | | Medical Center, Series 2009I, 5.750%, 7/01/36 (Pre-refunded 7/01/19) | | | |
| 500 | | Massachusetts Health and Educational Facilities Authority, Revenue Bonds, Cape Cod Healthcare | 11/19 at 100.00 | AA | 508,270 |
| | | Obligated Group, Series 2004D, 5.125%, 11/15/35 (Pre-refunded 11/15/19) – AGC Insured | | | |
| 410 | | Massachusetts Health and Educational Facilities Authority, Revenue Bonds, CareGroup Inc, | 7/21 at 100.00 | N/R | 433,669 |
| | | Series 1998A, 5.000%, 7/01/25 (Pre-refunded 7/01/21) – NPFG Insured | | | |
| 2,000 | | Massachusetts Health and Educational Facilities Authority, Revenue Bonds, Children’s | 12/19 at 100.00 | Aa2 | 2,039,540 |
| | | Hospital, Series 2009M, 5.500%, 12/01/39 (Pre-refunded 12/01/19) | | | |
| 335 | | Massachusetts Health and Educational Facilities Authority, Revenue Bonds, Suffolk | 7/19 at 100.00 | N/R | 336,095 |
| | | University, Refunding Series 2009A, 5.750%, 7/01/39 (Pre-refunded 7/01/19) | | | |
| 2,030 | | Massachusetts Health and Educational Facilities Authority, Revenue Bonds, Wheaton | 1/20 at 100.00 | N/R | 2,072,163 |
| | | College Issues, Series 2010F, 5.000%, 1/01/41 (Pre-refunded 1/01/20) | | | |
| 1,500 | | Massachusetts State, Transportation Fund Revenue Bonds, Rail Enhancement Program, Series | 6/21 at 100.00 | AA+ | 1,606,005 |
| | | 2013A, 5.000%, 6/01/38 (Pre-refunded 6/01/21) | | | |
| 1,065 | | Puerto Rico, Highway Revenue Bonds, Highway and Transportation Authority, Series 2003AA, | No Opt. Call | N/R | 1,068,163 |
| | | 5.500%, 7/01/19 – NPFG Insured (ETM) | | | |
| 720 | | Springfield Water and Sewer Commission, Massachusetts, General Revenue Bonds, Refunding | 11/20 at 100.00 | AA | 757,217 |
| | | Series 2010B, 5.000%, 11/15/30 (Pre-refunded 11/15/20) – AGC Insured | | | |
| 24,087 | | Total U.S. Guaranteed | | | 25,193,446 |
| | | Utilities – 1.0% (0.7% of Total Investments) | | | |
| 1,265 | | Massachusetts Clean Energy Cooperative Corporation, Revenue Bonds, Massachusetts | 7/23 at 100.00 | A1 | 1,428,185 |
| | | Municipal Lighting Plant Cooperative, Series 2013, 5.000%, 7/01/32 | | | |
| | | Water and Sewer – 8.0% (5.3% of Total Investments) | | | |
| 565 | | Guam Government Waterworks Authority, Water and Wastewater System Revenue Bonds, | 7/24 at 100.00 | A– | 626,969 |
| | | Refunding Series 2014A, 5.000%, 7/01/29 | | | |
| 1,250 | | Guam Government Waterworks Authority, Water and Wastewater System Revenue Bonds, | 7/27 at 100.00 | A– | 1,413,100 |
| | | Refunding Series 2017, 5.000%, 7/01/37 | | | |
| 420 | | Guam Government Waterworks Authority, Water and Wastewater System Revenue Bonds, Series | 7/26 at 100.00 | A– | 464,835 |
| | | 2016, 5.000%, 1/01/46 | | | |
| 415 | | Lynn Water and Sewer Commission, Massachusetts, General Revenue Bonds, Series 2003A, | 7/19 at 100.00 | A1 | 416,141 |
| | | 5.000%, 12/01/32 – NPFG Insured | | | |
| 1,000 | | Massachusetts Clean Water Trust, State Revolving Fund Bonds, Green 18 Series 2015, | 2/24 at 100.00 | AAA | 1,128,210 |
| | | 5.000%, 2/01/45 | | | |
| 60 | | Massachusetts Water Pollution Abatement Trust, Pooled Loan Program Bonds, Series 2003-9, | 7/19 at 100.00 | AAA | 60,167 |
| | | 5.000%, 8/01/22 | | | |
| 140 | | Massachusetts Water Pollution Abatement Trust, Revenue Bonds, MWRA Loan Program, Series | 7/19 at 100.00 | AAA | 140,408 |
| | | 2002A, 5.250%, 8/01/20 | | | |
| 500 | | Massachusetts Water Resources Authority, General Revenue Bonds, Refunding Series 2016B, | 8/26 at 100.00 | AA+ | 592,750 |
| | | 5.000%, 8/01/40 | | | |
| 1,000 | | Massachusetts Water Resources Authority, General Revenue Bonds, Series 2002J, 5.250%, | No Opt. Call | AA+ | 1,006,170 |
| | | 8/01/19 – AGM Insured | | | |
31
| | |
NMT | Nuveen Massachusetts Quality Municipal Income Fund |
| | Portfolio of Investments (continued) |
| | May 31, 2019 |
| | | | | | |
Principal | | | Optional Call | | |
Amount (000) | | Description (1) | Provisions (2) | Ratings (3) | Value |
| | | Water and Sewer (continued) | | | |
| $ 1,230 | | Massachusetts Water Resources Authority, General Revenue Bonds, Series 2017B, | 8/27 at 100.00 | AA+ | $ 1,471,314 |
| | | 5.000%, 8/01/42 | | | |
| 2,000 | | Massachusetts Water Resources Authority, General Revenue Bonds, Series 2019B, | 8/29 at 100.00 | AA+ | 2,457,900 |
| | | 5.000%, 8/01/44 | | | |
| 1,000 | | Springfield Water and Sewer Commission, Massachusetts, General Revenue Bonds, Series | 4/27 at 100.00 | AA | 1,200,550 |
| | | 2017C, 5.000%, 4/15/37 | | | |
| 9,580 | | Total Water and Sewer | | | 10,978,514 |
| $ 185,272 | | Total Long-Term Investments (cost $195,897,817) | | | 209,118,358 |
| | | Variable Rate Demand Preferred Shares, net of deferred offering costs – (53.7)% (6) | | | (73,729,267) |
| | | Other Assets Less Liabilities – 1.4% | | | 1,892,297 |
| | | Net Assets Applicable to Common Shares – 100% | | | $ 137,281,388 |
| | |
| (1) | All percentages shown in the Portfolio of Investments are based on net assets applicable to common shares unless otherwise noted. |
| (2) | Optional Call Provisions: Dates (month and year) and prices of the earliest optional call or redemption. There may be other call provisions at varying prices at later dates. Certain mortgage-backed securities may be subject to periodic principal paydowns. Optional Call Provisions are not covered by the report of independent registered public accounting firm. |
| (3) | For financial reporting purposes, the ratings disclosed are the highest of Standard & Poor’s Group (“Standard & Poor’s”), Moody’s Investors Service, Inc. (“Moody’s”) or Fitch, Inc. (“Fitch”) rating. This treatment of split-rated securities may differ from that used for other purposes, such as for Fund investment policies. Ratings below BBB by Standard & Poor’s, Baa by Moody’s or BBB by Fitch are considered to be below investment grade. Holdings designated N/R are not rated by any of these national rating agencies. Ratings are not covered by the report of independent registered public accounting firm. |
| (4) | Investment, or portion of investment, has been pledged to collateralize the net payment obligations for investments in inverse floating rate transactions. |
| (5) | Backed by an escrow or trust containing sufficient U.S. Government or U.S. Government agency securities, which ensure the timely payment of principal and interest. |
| (6) | Variable Rate Demand Preferred Shares, net of deferred offering costs as a percentage of Total Investments is 35.3%. |
| 144A | Investment is exempt from registration under Rule 144A of the Securities Act of 1933, as amended. These investments may only be resold in transactions exempt from registration, which are normally those transactions with qualified institutional buyers. |
| AMT | Alternative Minimum Tax. |
| ETM | Escrowed to maturity. |
| IF | Inverse floating rate security issued by a tender option bond (“TOB”) trust, the interest rate on which varies inversely with the Securities Industry Financial Markets Association (SIFMA) short-term rate, which resets weekly, or a similar short-term rate, and is reduced by the expenses related to the TOB trust. |
| | See accompanying notes to financial statements. |
32
Statement of Assets and Liabilities
May 31, 2019
| | | | | | | |
| | | NTC | | | NMT | |
Assets | | | | | | |
| Long-term investments, at value (cost $300,123,527 and $195,897,817, respectively) | | $ | 315,501,773 | | | $ | 209,118,358 | |
| Cash | | | 811,045 | | | | — | |
| Receivable for: | | | | | | | | |
| Interest | | | 4,228,561 | | | | 3,005,253 | |
| Investments sold | | | 3,435,472 | | | | — | |
| Other assets | | | 20,784 | | | | 9,448 | |
| Total assets | | | 323,997,635 | | | | 212,133,059 | |
Liabilities | | | | | | | | |
| Cash overdraft | | | — | | | | 564,312 | |
| Floating rate obligations | | | 6,375,000 | | | | — | |
| Payable for: | | | | | | | | |
| Dividends | | | 571,936 | | | | 371,168 | |
| Interest | | | 231,288 | | | | — | |
| Investments purchased | | | 1,003,583 | | | | — | |
| Offering costs | | | 55,236 | | | | — | |
| Adjustable Rate MuniFund Term Preferred (“AMTP”) Shares, net of deferred offering costs | | | | | | | | |
| (liquidation preference $112,000,000 and $—, respectively) | | | 111,837,892 | | | | — | |
| Variable Rate Demand Preferred (“VRDP”) Shares, net of deferred offering costs | | | | | | | | |
| (liquidation preference $— and $74,000,000, respectively) | | | — | | | | 73,729,267 | |
| Accrued expenses: | | | | | | | | |
| Management fees | | | 165,042 | | | | 111,327 | |
| Trustees fees | | | 19,166 | | | | 2,033 | |
| Other | | | 64,379 | | | | 73,564 | |
| Total liabilities | | | 120,323,522 | | | | 74,851,671 | |
| Net assets applicable to common shares | | $ | 203,674,113 | | | $ | 137,281,388 | |
| Common shares outstanding | | | 14,328,976 | | | | 9,322,751 | |
| Net asset value (“NAV”) per common share outstanding | | $ | 14.21 | | | $ | 14.73 | |
Net assets applicable to common shares consist of: | | | | | | | | |
| Common shares, $0.01 par value per share | | $ | 143,290 | | | $ | 93,228 | |
| Paid-in surplus | | | 198,144,646 | | | | 129,293,907 | |
| Total distributable earnings | | | 5,386,177 | | | | 7,894,253 | |
| Net assets applicable to common shares | | $ | 203,674,113 | | | $ | 137,281,388 | |
| Authorized shares: | | | | | | | | |
| Common | | Unlimited | | | Unlimited | |
| Preferred | | Unlimited | | | Unlimited | |
See accompanying notes to financial statements.
33
Statement of Operations
Year Ended May 31, 2019
| | | | | | | |
| | | NTC | | | NMT | |
Investment Income | | $ | 12,042,805 | | | $ | 8,106,114 | |
Expenses | | | | | | | | |
| Management fees | | | 1,909,915 | | | | 1,286,787 | |
| Interest expense and amortization of offering costs | | | 2,838,700 | | | | 1,713,702 | |
| Custodian fees | | | 41,511 | | | | 34,640 | |
| Trustees fees | | | 9,302 | | | | 6,216 | |
| Professional fees | | | 35,557 | | | | 138,043 | |
| Shareholder reporting expenses | | | 24,727 | | | | 2,318 | |
| Shareholder servicing agent fees | | | 19,680 | | | | 240 | |
| Stock exchange listing fees | | | 6,809 | | | | 6,810 | |
| Investor relations expenses | | | 875 | | | | 448 | |
| Other | | | 36,528 | | | | 41,758 | |
| Total expenses | | | 4,923,604 | | | | 3,230,962 | |
| Net investment income (loss) | | | 7,119,201 | | | | 4,875,152 | |
Realized and Unrealized Gain (Loss) | | | | | | | | |
| Net realized gain (loss) from investments | | | (411,390 | ) | | | (762,614 | ) |
| Change in net unrealized appreciation (depreciation) of investments | | | 8,157,107 | | | | 4,696,560 | |
| Net realized and unrealized gain (loss) | | | 7,745,717 | | | | 3,933,946 | |
| Net increase (decrease) in net assets applicable to common shares from operations | | $ | 14,864,918 | | | $ | 8,809,098 | |
See accompanying notes to financial statements.
34
Statement of Changes in Net Assets
| | | | | | | | | | | | | |
| | | NTC | | | NMT | |
| | | Year | | | Year(1) | | | Year | | | Year(1) | |
| | | Ended | | | Ended | | | Ended | | | Ended | |
| | | 5/31/19 | | | 5/31/18 | | | 5/31/19 | | | 5/31/18 | |
Operations | | | | | | | | | | | | |
| Net investment income (loss) | | $ | 7,119,201 | | | $ | 7,452,636 | | | $ | 4,875,152 | | | $ | 5,482,300 | |
| Net realized gain (loss) from investments | | | (411,390 | ) | | | (450,839 | ) | | | (762,614 | ) | | | 137,549 | |
| Change in net unrealized appreciation | | | | | | | | | | | | | | | | |
| (depreciation) of investments | | | 8,157,107 | | | | (6,611,292 | ) | | | 4,696,560 | | | | (3,940,236 | ) |
| Net increase (decrease) in net assets | | | | | | | | | | | | | | | | |
| applicable to common shares | | | | | | | | | | | | | | | | |
| from operations | | | 14,864,918 | | | | 390,505 | | | | 8,809,098 | | | | 1,679,613 | |
Distributions to Common Shareholders(2) | | | | | | | | | | | | | | | | |
Dividends(3) | | | (7,072,661 | ) | | | (7,654,756 | ) | | | (4,689,887 | ) | | | (5,861,517 | ) |
| Decrease in net assets applicable to | | | | | | | | | | | | | | | | |
| common shares from distributions | | | | | | | | | | | | | | | | |
| to common shareholders | | | (7,072,661 | ) | | | (7,654,756 | ) | | | (4,689,887 | ) | | | (5,861,517 | ) |
Capital Share Transactions | | | | | | | | | | | | | | | | |
| Common shares: | | | | | | | | | | | | | | | | |
| Net proceeds from shares issued | | | | | | | | | | | | | | | | |
| to shareholders due to | | | | | | | | | | | | | | | | |
| reinvestment of distributions | | | — | | | | — | | | | — | | | | 10,822 | |
| Cost of shares repurchased and retired | | | (1,115,508 | ) | | | (1,242,632 | ) | | | (305,767 | ) | | | — | |
| Net increase (decrease) in net assets | | | | | | | | | | | | | | | | |
| applicable to common shares | | | | | | | | | | | | | | | | |
| from capital share transactions | | | (1,115,508 | ) | | | (1,242,632 | ) | | | (305,767 | ) | | | 10,822 | |
| Net increase (decrease) in net assets | | | | | | | | | | | | | | | | |
| applicable to common shares | | | 6,676,749 | | | | (8,506,883 | ) | | | 3,813,444 | | | | (4,171,082 | ) |
| Net assets applicable to common | | | | | | | | | | | | | | | | |
| shares at the beginning of period | | | 196,997,364 | | | | 205,504,247 | | | | 133,467,944 | | | | 137,639,026 | |
| Net assets applicable to common | | | | | | | | | | | | | | | | |
| shares at the end of period | | $ | 203,674,113 | | | $ | 196,997,364 | | | $ | 137,281,388 | | | $ | 133,467,944 | |
| | |
| (1) | Prior period amounts have been conformed to current year presentation. See Notes to Financial Statements, Note 9 – New Accounting Pronouncements for further details. |
| (2) | The composition and per share amounts of the Funds’ distributions are presented in the Financial Highlights. The distribution information for the Funds as of its most recent tax year end is presented within the Notes to Financial Statements, Note 6 – Income Tax Information. |
| (3) | For the fiscal year ended May 31, 2018 the Funds' distributions to shareholders were paid from net investment income. |
See accompanying notes to financial statements.
35
Statement of Cash Flows
Year Ended May 31, 2019
| | | | | | | |
| | | NTC | | | NMT | |
Cash Flows from Operating Activities: | | | | | | |
Net Increase (Decrease) in Net Assets Applicable to Common Shares from Operations | | $ | 14,864,918 | | | $ | 8,809,098 | |
| Adjustments to reconcile the net increase (decrease) in net assets applicable to common shares from operations | | | | | | | | |
| to net cash provided by (used in) operating activities: | | | | | | | | |
| Purchases of investments | | | (25,613,915 | ) | | | (34,586,361 | ) |
| Proceeds from sales and maturities of investments | | | 26,955,867 | | | | 32,430,309 | |
| Taxes paid | | | (923 | ) | | | — | |
| Amortization (Accretion) of premiums and discounts, net | | | 2,520,951 | | | | 1,457,472 | |
| Amortization of deferred offering costs | | | 17,460 | | | | 9,786 | |
| (Increase) Decrease in: | | | | | | | | |
| Receivable for interest | | | 211,817 | | | | (34,152 | ) |
| Receivable for investments sold | | | (3,300,472 | ) | | | — | |
| Other assets | | | (724 | ) | | | (57 | ) |
| Increase (Decrease) in: | | | | | | | | |
| Payable for interest | | | 6,398 | | | | — | |
| Payable for investments purchased | | | 1,003,583 | | | | — | |
| Payable for offering costs | | | 55,236 | | | | — | |
| Accrued management fees | | | 2,849 | | | | 1,704 | |
| Accrued Trustees fees | | | 750 | | | | (284 | ) |
| Accrued other expenses | | | (19,503 | ) | | | (31,867 | ) |
| Net realized (gain) loss from investments | | | 411,390 | | | | 762,614 | |
| Change in net unrealized (appreciation) depreciation of investments | | | (8,157,107 | ) | | | (4,696,560 | ) |
| Net cash provided by (used in) operating activities | | | 8,958,575 | | | | 4,121,702 | |
Cash Flows from Financing Activities: | | | | | | | | |
| Proceeds from borrowings | | | 525,371 | | | | 552,003 | |
| (Repayments) of borrowings | | | (525,371 | ) | | | (552,003 | ) |
| (Payments for) deferred offering costs | | | (170,000 | ) | | | — | |
| Proceeds from AMTP Shares issued, at liquidation preference | | | 112,000,000 | | | | — | |
| (Payments for) VMTP Shares redeemed, at liquidation preference | | | (112,000,000 | ) | | | — | |
| Increase (Decrease) in cash overdraft | | | — | | | | 564,312 | |
| Cash distributions paid to common shareholders | | | (7,075,675 | ) | | | (4,771,180 | ) |
| Cost of common shares repurchased and retired | | | (1,115,508 | ) | | | (305,767 | ) |
| Net cash provided by (used in) financing activities | | | (8,361,183 | ) | | | (4,512,635 | ) |
Net Increase (Decrease) in Cash | | | 597,392 | | | | (390,933 | ) |
| Cash at the beginning of period | | | 213,653 | | | | 390,933 | |
| Cash at the end of period | | $ | 811,045 | | | $ | — | |
| | |
Supplemental Disclosure of Cash Flow Information | | NTC | | | NMT | |
| Cash paid for interest (excluding amortization of offering costs) | | $ | 2,832,302 | | | $ | 1,713,702 | |
See accompanying notes to financial statements.
36
THIS PAGE INTENTIONALLY LEFT BLANK
37
| |
| Financial Highlights |
| |
| |
| |
| |
| Selected data for a common share outstanding throughout each period: |
| |
| |
| | | | | | Investment Operations | | | Less Distributions to Common Shareholders | | | Common Share | |
| | | Beginning Common Share NAV | | | Net Investment Income (Loss) | | | Net Realized/ Unrealized Gain (Loss) | | | Total | | | From Net Investment Income | | | From Accum- ulated Net Realized Gains | | | Total | | | Discount Per Share Repurchased and Retired | | | Ending NAV | | | Ending Share Price | |
NTC | | | | | | | | | | | | | | | | | | | | | | | | | | | | | | |
| Year Ended 5/31: | | | | | | | | | | | | | | | | | | | | | | | | | | | | | | |
| 2019 | | $ | 13.65 | | | $ | 0.50 | | | $ | 0.54 | | | $ | 1.04 | | | $ | (0.49 | ) | | $ | — | | | $ | (0.49 | ) | | $ | 0.01 | | | $ | 14.21 | | | $ | 13.13 | |
| 2018 | | | 14.14 | | | | 0.51 | | | | (0.49 | ) | | | 0.02 | | | | (0.53 | ) | | | — | | | | (0.53 | ) | | | 0.02 | | | | 13.65 | | | | 11.75 | |
| 2017 | | | 14.92 | | | | 0.57 | | | | (0.73 | ) | | | (0.16 | ) | | | (0.62 | ) | | | — | | | | (0.62 | ) | | | — | | | | 14.14 | | | | 12.47 | |
| 2016 | | | 14.35 | | | | 0.67 | | | | 0.59 | | | | 1.26 | | | | (0.69 | ) | | | — | | | | (0.69 | ) | | | — | | | | 14.92 | | | | 13.54 | |
| 2015 | | | 14.33 | | | | 0.70 | | | | (0.01 | ) | | | 0.69 | | | | (0.68 | ) | | | — | | | | (0.68 | ) | | | 0.01 | | | | 14.35 | | | | 12.62 | |
NMT | | | | | | | | | | | | | | | | | | | | | | | | | | | | | | | | | | | | | | | | |
| Year Ended 5/31: | | | | | | | | | | | | | | | | | | | | | | | | | | | | | | | | | | | | | | | | |
| 2019 | | | 14.28 | | | | 0.52 | | | | 0.42 | | | | 0.94 | | | | (0.50 | ) | | | — | | | | (0.50 | ) | | | 0.01 | | | | 14.73 | | | | 12.84 | |
| 2018 | | | 14.72 | | | | 0.59 | | | | (0.40 | ) | | | 0.19 | | | | (0.63 | ) | | | — | | | | (0.63 | ) | | | — | | | | 14.28 | | | | 12.64 | |
| 2017 | | | 15.34 | | | | 0.64 | | | | (0.58 | ) | | | 0.06 | | | | (0.68 | ) | | | — | | | | (0.68 | ) | | | — | | | | 14.72 | | | | 13.90 | |
| 2016 | | | 14.67 | | | | 0.69 | | | | 0.69 | | | | 1.38 | | | | (0.71 | ) | | | — | | | | (0.71 | ) | | | — | | | | 15.34 | | | | 14.99 | |
| 2015 | | | 14.65 | | | | 0.65 | | | | 0.05 | | | | 0.70 | | | | (0.68 | ) | | | — | | | | (0.68 | ) | | | — | | | | 14.67 | | | | 13.14 | |
| | |
| (a) | Total Return Based on Common Share NAV is the combination of changes in common share NAV, reinvested dividend income at NAV and reinvested capital gains distributions at NAV, if any. The last dividend declared in the period, which is typically paid on the first business day of the following month, is assumed to be reinvested at the ending NAV. The actual reinvest price for the last dividend declared in the period may often be based on the Fund’s market price (and not its NAV), and therefore may be different from the price used in the calculation. Total returns are not annualized. |
| | Total Return Based on Common Share Price is the combination of changes in the market price per share and the effect of reinvested dividend income and reinvested capital gains distributions, if any, at the average price paid per share at the time of reinvestment. The last dividend declared in the period, which is typically paid on the first business day of the following month, is assumed to be reinvested at the ending market price. The actual reinvestment for the last dividend declared in the period may take place over several days, and in some instances may not be based on the market price, so the actual reinvestment price may be different from the price used in the calculation. Total returns are not annualized. |
38
| | | | | | | | | | | | | | | | | |
| | | | | | | Common Share Supplemental Data/ Ratios Applicable to Common Shares | |
Common Share Total Returns | | | | | | Ratios to Average Net Assets(b) | | | | |
| | |
| | |
| | | | Based | | | Ending | | | | | | Net | | | | |
Based | | | on | | | Net | | | | | | | Investment | | | Portfolio | |
on | | | Share | | | Assets | | | | | | | Income | | | Turnover | |
NAV(a) | | | Price(a) | | | | (000 | ) | | Expenses(c) | | | (Loss) | | | Rate(d) | |
| | |
| | |
| | 7.92 | % | | | 16.51 | % | | $ | 203,674 | | | | 2.52 | % | | | 3.64 | % | | | 8 | % |
| | 0.28 | | | | (1.55 | ) | | | 196,997 | | | | 2.15 | | | | 3.70 | | | | 17 | |
| | (1.07 | ) | | | (3.46 | ) | | | 205,504 | | | | 2.08 | | | | 3.98 | | | | 20 | |
| | 8.97 | | | | 13.19 | | | | 216,788 | | | | 1.66 | | | | 4.61 | | | | 11 | |
| | 4.96 | | | | 5.03 | | | | 208,580 | | | | 1.68 | | | | 4.85 | | | | 15 | |
| | |
| | |
| | 6.87 | | | | 5.80 | | | | 137,281 | | | | 2.45 | | | | 3.70 | | | | 16 | |
| | 1.29 | | | | (4.84 | ) | | | 133,468 | | | | 2.13 | | | | 4.04 | | | | 17 | |
| | 0.43 | | | | (2.78 | ) | | | 137,639 | | | | 1.91 | | | | 4.29 | | | | 12 | |
| | 9.64 | | | | 20.01 | | | | 143,395 | | | | 1.62 | | | | 4.65 | | | | 13 | |
| | 4.84 | | | | 3.75 | | | | 137,130 | | | | 1.96 | | | | 4.57 | | | | 14 | |
| | |
| (b) | Net Investment Income (Loss) ratios reflect income earned and expenses incurred on assets attributable to preferred shares issued by the Fund. |
| (c) | The expense ratios reflect, among other things, all interest expense and other costs related to preferred shares (as described in Note 4 – Fund Shares, Preferred Shares) and/or the interest expense deemed to have been paid by the Fund on the floating rate certificates issued by the special purpose trusts for the self-deposited inverse floaters held by the Fund (as described in Note 3 – Portfolio Securities and Investments in Derivatives, Inverse Floating Rate Securities), where applicable, as follows: |
| | | | | |
NTC | | | NMT | |
| Year Ended 5/31: | | | Year Ended 5/31: | |
| 2019 | 1.45% | | 2019 | 1.30% |
| 2018 | 1.10 | | 2018 | 1.00 |
| 2017 | 1.01 | | 2017 | 0.83 |
| 2016 | 0.60 | | 2016 | 0.58 |
| 2015 | 0.58 | | 2015 | 0.86 |
| | |
| (d) | Portfolio Turnover Rate is calculated based on the lesser of long-term purchases or sales (as disclosed in Note 5 – Investment Transactions) divided by the average long-term market value during the period. |
See accompanying notes to financial statements.
39
| |
| Financial Highlights (continued) |
| |
| |
| |
| |
| | | AMTP Shares at the End of Period | | | VMTP Shares at the End of Period | | | VRDP Shares at the End of Period | |
| | |
| | | Aggregate Amount Outstanding (000) | | | Asset Coverage Per $100,000 Share | | | Aggregate Amount Outstanding (000) | | | Asset Coverage Per $100,000 Share | | | Aggregate Amount Outstanding (000) | | | Asset Coverage Per $100,000 Share | |
NTC | | | | | | | | | | | | | | | | | | |
| Year Ended 5/31: | | | | | | | | | | | | | | | | | | |
| 2019 | | $ | 112,000 | | | $ | 281,852 | | | $ | — | | | $ | — | | | $ | — | | | $ | — | |
| 2018 | | | — | | | | — | | | | 112,000 | | | | 275,891 | | | | — | | | | — | |
| 2017 | | | — | | | | — | | | | 112,000 | | | | 283,486 | | | | — | | | | — | |
| 2016 | | | — | | | | — | | | | 106,000 | | | | 304,517 | | | | — | | | | — | |
| 2015 | | | — | | | | — | | | | 106,000 | | | | 296,773 | | | | — | | | | — | |
NMT | | | | | | | | | | | | | | | | | | | | | | | | |
| Year Ended 5/31: | | | | | | | | | | | | | | | | | | | | | | | | |
| 2019 | | | — | | | | — | | | | — | | | | — | | | | 74,000 | | | | 285,515 | |
| 2018 | | | — | | | | — | | | | — | | | | — | | | | 74,000 | | | | 280,362 | |
| 2017 | | | — | | | | — | | | | — | | | | — | | | | 74,000 | | | | 285,999 | |
| 2016 | | | — | | | | — | | | | 74,000 | | | | 293,776 | | | | — | | | | — | |
| 2015(a) | | | — | | | | — | | | | 74,000 | | | | 285,311 | | | | — | | | | — | |
| | |
| (a) | The Ending and Average Market Value Per Share for each Series of the Fund’s MTP Shares were as follows: |
| | |
| | 2015 |
NMT | |
Series 2015 (NMT PRC) | |
| Ending Market Value per Share | — |
| Average Market Value per Share | 10.02Ω |
Series 2016 (NMT PRD) | |
| Ending Market Value per Share | — |
| Average Market Value per Share | 10.03Ω |
Series 2015 (NMT PRE) (b) | |
| Ending Market Value per Share | — |
| Average Market Value per Share | 10.00Δ |
Series 2015-1 (NMT PRF) (b) | |
| Ending Market Value per Share | — |
| Average Market Value per Share | 10.00Δ |
| | |
| (b) | MTP Shares issued in connection with the reorganizations. |
| Ω | For the period June 1, 2014 through July 11, 2014. |
| Δ | For the period June 9, 2014 (effective date of the reorganizations) through July 11, 2014. |
See accompanying notes to financial statements.
40
Notes to
Financial Statements
1. General Information and Significant Accounting Policies
General Information
Fund Information
The funds covered in this report and their corresponding New York Stock Exchange (“NYSE”) symbols are as follows (each a “Fund” and collectively, the “Funds”):
| · | Nuveen Connecticut Quality Municipal Income Fund (NTC) |
| · | Nuveen Massachusetts Quality Municipal Income Fund (NMT) |
The Funds are registered under the Investment Company Act of 1940 (the “1940 Act”), as amended, as diversified closed-end management investment companies. NTC and NMT were organized as Massachusetts business trusts on January 12, 1993.
The end of the reporting period for the Funds is May 31, 2019, and the period covered by these Notes to Financial Statements is the fiscal year ended May 31, 2019 (the “current fiscal period”).
Investment Adviser
The Funds’ investment adviser is Nuveen Fund Advisors, LLC (the “Adviser”), subsidiary of Nuveen, LLC (“Nuveen”). Nuveen is the investment management arm of Teachers Insurance and Annuity Association of America (TIAA). The Adviser has overall responsibility for management of the Funds, oversees the management of the Funds’ portfolios, manages the Funds’ business affairs and provides certain clerical, bookkeeping and other administrative services, and, if necessary, asset allocation decisions. The Adviser has entered into sub-advisory agreements with Nuveen Asset Management, LLC (the “Sub-Adviser”), a subsidiary of the Adviser, under which the Sub-Adviser manages the investment portfolios of the Funds.
Investment Objectives and Principal Investment Strategies
Each Fund seeks to provide current income exempt from both regular federal and designated state income taxes by investing primarily in a portfolio of municipal obligations issued by state and local government authorities within a single state or certain U.S. territories. Under normal market conditions, each Fund invests at least 80% of the sum of its net assets and the amount of any borrowings for investment purposes in municipal bonds that pay interest that is exempt from regular federal personal income tax and a single state’s personal income tax. Each Fund may invest up to 20% in municipal securities that are exempt from regular federal income tax, but not from that single state’s income tax if, in the Sub-Adviser’s judgement, such purchases are expected to enhance the Fund’s after-tax total return potential. To the extent that the Fund invests in bonds of municipal issuers located in other states, the Fund may have income that is not exempt from state personal income tax.
Fund Merger
During May 2019, the Board approved the merger of NTC (the “Target Fund”) into the Nuveen AMT-Free Municipal Credit Income Fund (NVG) (the “Acquiring Fund”) (the “Merger”). The Merger is intended to create one larger fund with lower operating expenses and increased trading volume on the exchange for common shares.
The Merger is subject to customary conditions, including shareholder approval at annual shareholder meetings. If shareholders approve the Merger, Target Fund shareholders will receive a cash distribution prior to the closing of the Merger of approximately 10% of net asset value (“NAV”) per share.
Upon the closing of the Merger, the Target Fund will transfer its assets to the Acquiring Fund in exchange for common and preferred shares of the Acquiring Fund and the assumption by the Acquiring Fund of the liabilities of the Target Fund. The Target Fund will then be liquidated, dissolved and terminated in accordance with its Declaration of Trust. Shareholders of the Target Fund will become shareholders of the Acquiring Fund. Holders of common shares of the Target Fund will receive newly issued common shares of the Acquiring Fund, the aggregate NAV of which is equal to the aggregate NAV of the common shares of the Target Fund held immediately prior to the Merger (including for this purpose fractional Acquiring Fund shares to which shareholders would be entitled). Holders of preferred shares of the Target Fund will receive on a one-for-one basis newly issued preferred shares of the Acquiring Fund, in exchange for preferred shares of the Target Fund held immediately prior to the Merger.
41
Notes to Financial Statements (continued)
Significant Accounting Policies
Each Fund is an investment company and follows accounting and reporting guidance under Financial Accounting Standards Board (“FASB”) Accounting Standards Codification (ASC) Topic 946 “Financial Services – Investment Companies.” The following is a summary of significant accounting policies followed by the Funds in the preparation of their financial statements in accordance with U.S. generally accepted accounting principles (“U.S. GAAP”).
Investment Transactions
Investment transactions are recorded on a trade date basis. Realized gains and losses from investment transactions are determined on the specific identification method, which is the same basis used for federal income tax purposes. Investments purchased on a when-issued/delayed delivery basis may have extended settlement periods. Any investments so purchased are subject to market fluctuation during this period. The Funds have earmarked securities in their portfolios with a current value at least equal to the amount of the when-issued/delayed delivery purchase commitments.
As of the end of the reporting period, the Funds did not have any outstanding when-issued/delayed delivery purchase commitments.
Investment Income
Investment income is comprised of interest income, which reflects the amortization of premiums and accretion of discounts for financial reporting purposes, and is recorded on an accrual basis. Investment income also reflects payment-in-kind (“PIK”) interest and paydown gains and losses, if any. PIK interest represents income received in the form of securities in lieu of cash.
Professional Fees
Professional fees presented on the Statement of Operations consist of legal fees incurred in the normal course of operations, audit fees, tax consulting fees and, in some cases, workout expenditures. Workout expenditures are incurred in an attempt to protect or enhance an investment or to pursue other claims or legal actions on behalf of Fund shareholders. If a refund is received for workout expenditures paid in a prior reporting period, such amounts will be recognized as “Legal fee refund” on the Statement of Operations.
Dividends and Distributions to Common Shareholders
Dividends from net investment income, if any, are declared monthly. Net realized capital gains and/or market discount from investment transactions, if any, are distributed to shareholders at least annually. Furthermore, capital gains are distributed only to the extent they exceed available capital loss carryforwards.
Distributions to common shareholders of net investment income, net realized capital gains and/or market discount, if any, are recorded on the ex-dividend date. The amount and timing of distributions are determined in accordance with federal income tax regulations, which may differ from U.S. GAAP.
Compensation
The Funds pay no compensation directly to those of its trustees who are affiliated with the Adviser or to its officers, all of whom receive remuneration for their services to the Funds from the Adviser or its affiliates. The Funds’ Board of Trustees (the “Board”) has adopted a deferred compensation plan for independent trustees that enables trustees to elect to defer receipt of all or a portion of the annual compensation they are entitled to receive from certain Nuveen-advised funds. Under the plan, deferred amounts are treated as though equal dollar amounts had been invested in shares of select Nuveen-advised funds.
Indemnifications
Under the Funds’ organizational documents, their officers and trustees are indemnified against certain liabilities arising out of the performance of their duties to the Funds. In addition, in the normal course of business, the Funds enter into contracts that provide general indemnifications to other parties. The Funds’ maximum exposure under these arrangements is unknown as this would involve future claims that may be made against the Funds that have not yet occurred. However, the Funds have not had prior claims or losses pursuant to these contracts and expect the risk of loss to be remote.
Netting Agreements
In the ordinary course of business, the Funds may enter into transactions subject to enforceable International Swaps and Derivatives Association, Inc. (ISDA) master agreements or other similar arrangements (“netting agreements”). Generally, the right to offset in netting agreements allows each Fund to offset certain securities and derivatives with a specific counterparty, when applicable, as well as any collateral received or delivered to that counterparty based on the terms of the agreements. Generally, each Fund manages its cash collateral and securities collateral on a counterparty basis.
The Funds’ investments subject to netting agreements as of the end of the reporting period, if any, are further described in Note 3 – Portfolio Securities and Investments in Derivatives.
42
Use of Estimates
The preparation of financial statements in conformity with U.S. GAAP requires management to make estimates and assumptions that affect the reported amounts of assets and liabilities at the date of the financial statements and the reported amounts of increases and decreases in net assets applicable to common shares from operations during the current fiscal period. Actual results may differ from those estimates.
2. Investment Valuation and Fair Value Measurements
The fair valuation input levels as described below are for fair value measurement purposes.
Fair value is defined as the price that would be received upon selling an investment or transferring a liability in an orderly transaction to an independent buyer in the principal or most advantageous market for the investment. A three-tier hierarchy is used to maximize the use of observable market data and minimize the use of unobservable inputs and to establish classification of fair value measurements for disclosure purposes. Observable inputs reflect the assumptions market participants would use in pricing the asset or liability. Observable inputs are based on market data obtained from sources independent of the reporting entity. Unobservable inputs reflect the reporting entity’s own assumptions about the assumptions market participants would use in pricing the asset or liability. Unobservable inputs are based on the best information available in the circumstances. The following is a summary of the three-tiered hierarchy of valuation input levels.
Level 1 – Inputs are unadjusted and prices are determined using quoted prices in active markets for identical securities.
Level 2 – Prices are determined using other significant observable inputs (including quoted prices for similar securities, interest rates, credit spreads, etc.).
Level 3 – Prices are determined using significant unobservable inputs (including management’s assumptions in determining the fair value of investments).
Prices of fixed income securities are provided by an independent pricing service (“pricing service”) approved by the Board. The pricing service establishes a security’s fair value using methods that may include consideration of the following: yields or prices of investments of comparable quality, type of issue, coupon, maturity and rating, market quotes or indications of value from security dealers, evaluations of anticipated cash flows or collateral, general market conditions and other information and analysis, including the obligor’s credit characteristics considered relevant. These securities are generally classified as Level 2. In pricing certain securities, particularly less liquid and lower quality securities, the pricing service may consider information about a security, its issuer or market activity, provided by the Adviser. These securities are generally classified as Level 2 or Level 3 depending on the observability of the significant inputs.
Certain securities may not be able to be priced by the pre-established pricing methods as described above. Such securities may be valued by the Board and/or its appointee at fair value. These securities generally include, but are not limited to, restricted securities (securities which may not be publicly sold without registration under the Securities Act of 1933, as amended) for which a pricing service is unable to provide a market price; securities whose trading has been formally suspended; debt securities that have gone into default and for which there is no current market quotation; a security whose market price is not available from a pre-established pricing source; a security with respect to which an event has occurred that is likely to materially affect the value of the security after the market has closed but before the calculation of a Fund’s NAV (as may be the case in non-U.S. markets on which the security is primarily traded) or make it difficult or impossible to obtain a reliable market quotation; and a security whose price, as provided by the pricing service, is not deemed to reflect the security’s fair value. As a general principle, the fair value of a security would appear to be the amount that the owner might reasonably expect to receive for it in a current sale. A variety of factors may be considered in determining the fair value of such securities, which may include consideration of the following: yields or prices of investments of comparable quality, type of issue, coupon, maturity and rating, market quotes or indications of value from security dealers, evaluations of anticipated cash flows or collateral, general market conditions and other information and analysis, including the obligor’s credit characteristics considered relevant. These securities are generally classified as Level 2 or Level 3 depending on the observability of the significant inputs. Regardless of the method employed to value a particular security, all valuations are subject to review by the Board and/or its appointee.
The inputs or methodologies used for valuing securities are not an indication of the risks associated with investing in those securities. The following is a summary of each Fund’s fair value measurements as of the end of the reporting period:
| | | | | | | | | | | | | |
NTC | | Level 1 | | | Level 2 | | | Level 3 | | | Total | |
Long-Term Investments*: | | | | | | | | | | | | |
| Municipal Bonds | | $ | — | | | $ | 315,501,773 | | | $ | — | | | $ | 315,501,773 | |
NMT | | | | | | | | | | | | | | | | |
Long-Term Investments*: | | | | | | | | | | | | | | | | |
| Municipal Bonds | | $ | — | | | $ | 209,118,358 | | | $ | — | | | $ | 209,118,358 | |
| | |
* | Refer to the Fund’s Portfolio of Investments for industry classifications. |
43
Notes to Financial Statements (continued)
3. Portfolio Securities and Investments in Derivatives
Portfolio Securities
Inverse Floating Rate Securities
Each Fund is authorized to invest in inverse floating rate securities. An inverse floating rate security is created by depositing a municipal bond (referred to as an “Underlying Bond”), typically with a fixed interest rate, into a special purpose tender option bond (“TOB”) trust (referred to as the “TOB Trust”) created by or at the direction of one or more Funds. In turn, the TOB Trust issues (a) floating rate certificates (referred to as “Floaters”), in face amounts equal to some fraction of the Underlying Bond’s par amount or market value, and (b) an inverse floating rate certificate (referred to as an “Inverse Floater”) that represents all remaining or residual interest in the TOB Trust. Floaters typically pay short-term tax-exempt interest rates to third parties who are also provided a right to tender their certificate and receive its par value, which may be paid from the proceeds of a remarketing of the Floaters, by a loan to the TOB Trust from a third party liquidity provider (“Liquidity Provider”), or by the sale of assets from the TOB Trust. The Inverse Floater is issued to a long term investor, such as one or more of the Funds. The income received by the Inverse Floater holder varies inversely with the short-term rate paid to holders of the Floaters, and in most circumstances the Inverse Floater holder bears substantially all of the Underlying Bond’s downside investment risk and also benefits disproportionately from any potential appreciation of the Underlying Bond’s value. The value of an Inverse Floater will be more volatile than that of the Underlying Bond because the interest rate is dependent on not only the fixed coupon rate of the Underlying Bond but also on the short-term interest paid on the Floaters, and because the Inverse Floater essentially bears the risk of loss (and possible gain) of the greater face value of the Underlying Bond.
The Inverse Floater held by a Fund gives the Fund the right to (a) cause the holders of the Floaters to tender their certificates at par (or slightly more than par in certain circumstances) and (b) have the trustee of the TOB Trust (the “Trustee”) transfer the Underlying Bond held by the TOB Trust to the Fund, thereby collapsing the TOB Trust.
The Fund may acquire an Inverse Floater in a transaction where it (a) transfers an Underlying Bond that it owns to a TOB Trust created by a third party or (b) transfers an Underlying Bond that it owns, or that it has purchased in a secondary market transaction for the purpose of creating an Inverse Floater, to a TOB Trust created at its direction, and in return receives the Inverse Floater of the TOB Trust (referred to as a “self-deposited Inverse Floater”). A Fund may also purchase an Inverse Floater in a secondary market transaction from a third party creator of the TOB Trust without first owning the Underlying Bond (referred to as an “externally-deposited Inverse Floater”).
An investment in a self-deposited Inverse Floater is accounted for as a “financing” transaction (i.e., a secured borrowing). For a self-deposited Inverse Floater, the Underlying Bond deposited into the TOB Trust is identified in the Fund’s Portfolio of Investments as “(UB) – Underlying bond of an inverse floating rate trust reflected as a financing transaction,” with the Fund recognizing as liabilities, labeled “Floating rate obligations” on the Statement of Assets and Liabilities, (a) the liquidation value of Floaters issued by the TOB Trust, and (b) the amount of any borrowings by the TOB Trust from a Liquidity Provider to enable the TOB Trust to purchase outstanding Floaters in lieu of a remarketing. In addition, the Fund recognizes in “Investment Income” the entire earnings of the Underlying Bond, and recognizes (a) the interest paid to the holders of the Floaters or on the TOB Trust’s borrowings, and (b) other expenses related to remarketing, administration, trustee, liquidity and other services to a TOB Trust, as a component of “Interest expense and amortization of offering costs” on the Statement of Operations.
In contrast, an investment in an externally-deposited Inverse Floater is accounted for as a purchase of the Inverse Floater and is identified in the Fund’s Portfolio of Investments as “(IF) – Inverse floating rate investment.” For an externally-deposited Inverse Floater, a Fund’s Statement of Assets and Liabilities recognizes the Inverse Floater and not the Underlying Bond as an asset, and the Fund does not recognize the Floaters, or any related borrowings from a Liquidity Provider, as a liability. Additionally, the Fund reflects in “Investment Income” only the net amount of earnings on the Inverse Floater (net of the interest paid to the holders of the Floaters or the Liquidity Provider as lender, and the expenses of the Trust), and does not show the amount of that interest paid or the expenses of the TOB Trust as described above as interest expense on the Statement of Operations.
Fees paid upon the creation of a TOB Trust for self-deposited Inverse Floaters and externally-deposited Inverse Floaters are recognized as part of the cost basis of the Inverse Floater and are capitalized over the term of the TOB Trust.
As of the end of the reporting period, the aggregate value of Floaters issued by each Fund’s TOB Trust for self-deposited Inverse Floaters and externally-deposited Inverse Floaters was as follows:
| | | | | | | |
Floating Rate Obligations Outstanding | | NTC | | | NMT | |
| Floating rate obligations: self-deposited Inverse Floaters | | $ | 6,375,000 | | | $ | — | |
| Floating rate obligations: externally-deposited Inverse Floaters | | | 5,085,000 | | | | 7,325,000 | |
| Total | | $ | 11,460,000 | | | $ | 7,325,000 | |
44
During the current fiscal period, the average amount of Floaters (including any borrowings from a Liquidity Provider) outstanding, and the average annual interest rate and fees related to self-deposited Inverse Floaters, were as follows:
| | | | | | | |
Self-Deposited Inverse Floaters | | NTC | | | NMT | |
| Average floating rate obligations outstanding | | $ | 6,375,000 | | | $ | — | |
| Average annual interest rate and fees | | | 2.08 | % | | | — | % |
TOB Trusts are supported by a liquidity facility provided by a Liquidity Provider pursuant to which the Liquidity Provider agrees, in the event that Floaters are (a) tendered to the Trustee for remarketing and the remarketing does not occur, or (b) subject to mandatory tender pursuant to the terms of the TOB Trust agreement, to either purchase Floaters or to provide the Trustee with an advance from a loan facility to fund the purchase of Floaters by the TOB Trust. In certain circumstances, the Liquidity Provider may otherwise elect to have the Trustee sell the Underlying Bond to retire the Floaters that were tendered and not remarketed prior to providing such a loan. In these circumstances, the Liquidity Provider remains obligated to provide a loan to the extent that the proceeds of the sale of the Underlying Bond are not sufficient to pay the purchase price of the Floaters.
The size of the commitment under the loan facility for a given TOB Trust is at least equal to the balance of that TOB Trust’s outstanding Floaters plus any accrued interest. In consideration of the loan facility, fee schedules are in place and are charged by the Liquidity Provider(s). Any loans made by the Liquidity Provider will be secured by the purchased Floaters held by the TOB Trust. Interest paid on any outstanding loan balances will be effectively borne by the Fund that owns the Inverse Floaters of the TOB Trust that has incurred the borrowing and may be at a rate that is greater than the rate that would have been paid had the Floaters been successfully remarketed.
The amount of outstanding borrowings under a liquidity facility are recognized as a component of “Floating rate obligations” on the Statement of Assets and Liabilities by the Fund holding the corresponding self-deposited Inverse Floaters. As of the end of the reporting period, the Funds did not have any outstanding borrowings under such liquidity facilities related to self-deposited Inverse Floaters. As of the end of the reporting period, NTC and NMT had outstanding borrowings of $262,003 and $0, respectively, under such liquidity facilities related to certain externally-deposited Inverse Floaters.
Each Fund may also enter into shortfall and forbearance agreements (sometimes referred to as a “recourse arrangement”) (TOB Trusts involving such agreements are referred to herein as “Recourse Trusts”), under which a Fund agrees to reimburse the Liquidity Provider for the Trust’s Floaters, in certain circumstances, for the amount (if any) by which the liquidation value of the Underlying Bond held by the TOB Trust may fall short of the sum of the liquidation value of the Floaters issued by the TOB Trust plus any amounts borrowed by the TOB Trust from the Liquidity Provider, plus any shortfalls in interest cash flows. Under these agreements, a Fund’s potential exposure to losses related to or on an Inverse Floater may increase beyond the value of the Inverse Floater as a Fund may potentially be liable to fulfill all amounts owed to holders of the Floaters or the Liquidity Provider. Any such shortfall amount in the aggregate is recognized as “Unrealized depreciation on Recourse Trusts” on the Statement of Assets and Liabilities.
As of the end of the reporting period, each Fund’s maximum exposure to the Floaters issued by Recourse Trusts for self-deposited Inverse Floaters and externally-deposited Inverse Floaters was as follows:
| | | | | | | |
Floating Rate Obligations – Recourse Trusts | | NTC | | | NMT | |
| Maximum exposure to Recourse Trusts: self-deposited Inverse Floaters | | $ | 6,375,000 | | | $ | — | |
| Maximum exposure to Recourse Trusts: externally-deposited Inverse Floaters | | | 5,085,000 | | | | 7,325,000 | |
| Total | | $ | 11,460,000 | | | $ | 7,325,000 | |
Zero Coupon Securities
A zero coupon security does not pay a regular interest coupon to its holders during the life of the security. Income to the holder of the security comes from accretion of the difference between the original purchase price of the security at issuance and the par value of the security at maturity and is effectively paid at maturity. The market prices of zero coupon securities generally are more volatile than the market prices of securities that pay interest periodically.
Investments in Derivatives
In addition to the inverse floating rate securities in which each Fund may invest, which are considered portfolio securities for financial reporting purposes, each Fund is authorized to invest in certain derivative instruments such as futures, options and swap contracts. Each Fund limits its investments in futures, options on futures and swap contracts to the extent necessary for the Adviser to claim the exclusion from registration by the Commodity Futures Trading Commission as a commodity pool operator with respect to the Fund. The Funds record derivative instruments at fair value, with changes in fair value recognized on the Statement of Operations, when applicable. Even though the Funds’ investments in derivatives may represent economic hedges, they are not considered to be hedge transactions for financial reporting purposes.
Although the Funds are authorized to invest in derivative instruments and may do so in the future, they did not make any such investments during the current fiscal period.
45
Notes to Financial Statements (continued)
Market and Counterparty Credit Risk
In the normal course of business each Fund may invest in financial instruments and enter into financial transactions where risk of potential loss exists due to changes in the market (market risk) or failure of the other party to the transaction to perform (counterparty credit risk). The potential loss could exceed the value of the financial assets recorded on the financial statements. Financial assets, which potentially expose each Fund to counterparty credit risk, consist principally of cash due from counterparties on forward, option and swap transactions, when applicable. The extent of each Fund’s exposure to counterparty credit risk in respect to these financial assets approximates their carrying value as recorded on the Statement of Assets and Liabilities.
Each Fund helps manage counterparty credit risk by entering into agreements only with counterparties the Adviser believes have the financial resources to honor their obligations and by having the Adviser monitor the financial stability of the counterparties. Additionally, counterparties may be required to pledge collateral daily (based on the daily valuation of the financial asset) on behalf of each Fund with a value approximately equal to the amount of any unrealized gain above a pre-determined threshold. Reciprocally, when each Fund has an unrealized loss, the Funds have instructed the custodian to pledge assets of the Funds as collateral with a value approximately equal to the amount of the unrealized loss above a pre-determined threshold. Collateral pledges are monitored and subsequently adjusted if and when the valuations fluctuate, either up or down, by at least the pre-determined threshold amount.
4. Fund Shares
Common Share Transactions
Transactions in common shares for the Funds during the Funds’ current and prior fiscal period, where applicable, were as follows:
| | | | | | | | | | | | | |
| | | NTC | | | NMT | |
| | | Year | | | Year | | | Year | | | Year | |
| | | Ended | | | Ended | | | Ended | | | Ended | |
| | | 5/31/19 | | | 5/31/18 | | | 5/31/19 | | | 5/31/18 | |
| Common shares: | | | | | | | | | | | | |
| Issued to shareholders due to reinvestment of distributions | | | — | | | | — | | | | — | | | | 739 | |
| Repurchased and retired | | | (99,200 | ) | | | (105,800 | ) | | | (26,148 | ) | | | — | |
| Weighted average common share: | | | | | | | | | | | | | | | | |
| Price per share repurchased and retired | | $ | 11.23 | | | $ | 11.73 | | | $ | 11.67 | | | | — | |
| Discount per share repurchased and retired | | | 15.96 | % | | | 14.96 | % | | | 15.20 | % | | | — | |
Preferred Shares
Adjustable Rate MuniFund Term Preferred Shares
NTC has issued and has outstanding Adjustable Rate MuniFund Term Preferred (“AMTP”) Shares, with a $100,000 liquidation preference per share. AMTP Shares are issued via private placement and are not publicly available.
The details of NTC’s AMTP Shares outstanding as of the end of the reporting period, were as follows:
| | | | | |
| | | | | Liquidation |
| | | | | Preference |
| | | | | Net of |
| | | Shares | Liquidation | Deferred |
Fund | Series | Outstanding | Preference | Offering Costs |
NTC | 2028 | 1,120 | $112,000,000 | $111,837,892 |
The Fund is obligated to redeem its AMTP Shares by the date as specified in its offering document (“Term Redemption Date”), unless earlier redeemed by the Fund. AMTP Shares are subject to optional and mandatory redemption in certain circumstances. The AMTP Shares may be redeemed at the option of the Fund, subject to payment of premium for approximately six months following the date of issuance (“Premium Expiration Date”), and at the redemption price per share thereafter. The redemption price per share is equal to the sum of the liquidation preference per share plus any accumulated but unpaid dividends.
AMTP Shares are short-term or short/intermediate-term instruments that pay a variable dividend rate tied to a short-term index, plus an additional fixed “spread” amount which is initially established at the time of issuance and may be adjusted in the future based upon a mutual agreement between the majority owner and the Fund. From time-to-time the majority owner may propose to the Fund an adjustment to the dividend rate. Should the majority owner and the Fund fail to agree upon an adjusted dividend rate, and such proposed dividend rate adjustment is not withdrawn, the Fund will be required to redeem all outstanding shares upon the end of a notice period.
46
In addition, the Fund may be obligated to redeem a certain amount of the AMTP Shares if the Fund fails to maintain certain asset coverage and leverage ratio requirements and such failures are not cured by the applicable cure date. The Term Redemption Date and Premium Expiration Date for the Fund’s AMTP Shares are as follows:
| | | | | |
| | | | Term | Premium |
| | Notice | | Redemption | Expiration |
Fund | Period | Series | Date | Date |
NTC | 540-day | 2028 | December 1, 2028* | February 13, 2019 |
| |
| * Subject to early termination by either the Fund or the holder |
The average liquidation preference of AMTP Shares outstanding and annualized dividend rate for the Fund during the current fiscal period were as follows:
| | | | |
| | | NTC* | |
| Average liquidation preference of AMTP Shares outstanding | | $ | 112,000,000 | |
| Annualized dividend rate | | | 2.44 | % |
| | | | | |
| * For the period December 14, 2018 (first issuance of shares) through May 31, 2019 |
AMTP Shares are subject to restrictions on transfer, generally do not trade, and market quotations are generally not available. The fair value of AMTP Shares is expected to be approximately their liquidation preference so long as the fixed “spread” on the AMTP Shares remains roughly in line with the “spread” being demanded by investors on instruments having similar terms in the current market environment. In present market conditions, the Funds’ Adviser has determined that the fair value of AMTP Shares is approximately their liquidation preference, but their fair value could vary if market conditions change materially. For financial reporting purposes, the liquidation preference of AMTP Shares is a liability and is recognized as a component of “Adjustable Rate MuniFund Term Preferred (“AMTP”) Shares, net of deferred offering costs” on the Statement of Assets and Liabilities.
AMTP Share dividends are treated as interest payments for financial reporting purposes. Unpaid dividends on AMTP Shares are recognized as a component of “Interest payable” on the Statement of Assets and Liabilities. Dividends accrued on AMTP Shares are recognized as a component of “Interest expense and amortization of offering costs” on the Statement of Operations.
NTC incurred offering costs of $170,000 in connection with its offering of AMTP Shares, which were recorded as deferred charges and are amortized over the life of the shares. These offering costs are recognized as components of “Adjustable Rate MuniFund Term Preferred (“AMTP”) Shares, net of deferred offering costs” on the Statement of Assets and Liabilities and “Interest expense and amortization of offering costs” on the Statement of Operations.
Variable Rate MuniFund Term Preferred Shares
On December 14, 2018, NTC redeemed all of its outstanding Series 2019 Variable Rate Munifund Term Preferred (VMTP) Shares. The Fund’s VMTP Shares were redeemed at their $100,000 liquidation value per share, plus dividend amounts owed, using proceeds from its issuance of AMTP Shares (as described above in Adjustable Rate MuniFund Term Preferred Shares).
The average liquidation preference of VMTP Shares outstanding and annualized dividend rate for the Fund during the current fiscal period were as follows:
| | | | |
| | | NTC* | |
| Average liquidation preference of VMTP Shares outstanding | | $ | 112,000,000 | |
| Annualized dividend rate | | | 2.37 | % |
| | | | | |
| * For the period June 1, 2018 through December 13, 2018. |
VMTP Shares are subject to restrictions on transfer, generally do not trade, and market quotations are generally not available. VMTP Shares are short-term or short/intermediate-term instruments that pay a variable dividend rate tied to a short-term index, plus an additional fixed “spread” amount established at the time of issuance. The fair value of VMTP Shares is expected to be approximately their liquidation preference so long as the fixed “spread” on the VMTP Shares remains roughly in line with the “spread” being demanded by investors on instruments having similar terms in the current market environment. In present market conditions, the Funds’ Adviser has determined that fair value of VMTP Shares is approximately their liquidation preference, but their fair value could vary if market conditions change materially. For financial reporting purposes, the liquidation preference of VMTP Shares is a liability and is recognized as a component of “Variable Rate MuniFund Term Preferred (“VMTP”) Shares, net of deferred offering costs” on the Statement of Assets and Liabilities.
47
Notes to Financial Statements (continued)
Dividends on the VMTP shares (which are treated as interest payments for financial reporting purposes) are set weekly. Unpaid dividends on VMTP Shares are recognized as a component of “Interest payable” on the Statement of Assets and Liabilities. Dividends accrued on VMTP Shares are recognized as a component of “Interest expense and amortization of offering costs” on the Statement of Operations.
Costs incurred in connection with the Fund’s offering of VMTP Shares were recorded as a deferred charge, which were amortized over the life of the shares and were recognized as components of “Variable Rate MuniFund Term Preferred (“VMTP”) shares, net of deferred offering costs” on the Statement of Assets and Liabilities and “Interest expense and amortization of offering costs” on the Statement of Operations.
In conjunction with NTC’s redemption of VMTP Shares, the remaining deferred costs of $5,472 were fully expensed during the current fiscal period, as the redemptions were deemed an extinguishment of debt.
Variable Rate Demand Preferred Shares
The following Fund has issued and has outstanding Variable Rate Demand Preferred (“VRDP”) Shares, with a $100,000 liquidation preference per share. VRDP Shares are issued via private placement and are not publicly available.
As of the end of the reporting period, details of the Fund’s VRDP Shares outstanding were as follows:
| | | | | | | |
| | | | | Liquidation | | |
| | | | | Preference | | |
| | | Shares | Liquidation | Net of Deferred | Special Rate | |
Fund | Series | Outstanding | Preference | Offering Costs | Period Expiration | Maturity |
NMT | 1 | 740 | $74,000,000 | $73,729,267 | March 1, 2047 | March 1, 2047 |
VRDP Shares include a liquidity feature that allows VRDP shareholders to have their shares purchased by a liquidity provider with whom the Fund has contracted in the event that VRDP Shares are not able to be successfully remarketed. The Fund is required to redeem any VRDP Shares that are still owned by the liquidity provider after six months of continuous, unsuccessful remarketing. The Fund pays an annual remarketing fee of 0.10% on the aggregate principal amount of all VRDP Shares outstanding.
NMT’s Series 1 VRDP Shares are considered to be Special Rate Period VRDP, which are sold to institutional investors. During the special rate period, the VRDP Shares will not be remarketed by a remarketing agent, be subject to optional or mandatory tender events, or be supported by a liquidity provider. During the special rate period, VRDP dividends will be set monthly as a floating rate based on the predetermined formula. Following the initial special rate period, Special Rate Period VRDP Shares will transition to traditional VRDP Shares with dividends set at weekly remarketings, and be supported by a designated liquidity provider, unless the Board approves a subsequent special rate period.
Dividends on the VRDP Shares (which are treated as interest payments for financial reporting purposes) are set at a rate established by a remarketing agent; therefore, the market value of the VRDP Shares is expected to approximate its liquidation preference. In the event that VRDP Shares are unable to be successfully remarketed, the dividend rate will be the maximum rate which is designed to escalate according to a specified schedule in order to enhance the remarketing agent’s ability to successfully remarket the VRDP Shares.
Subject to certain conditions, VRDP Shares may be redeemed, in whole or in part, at any time at the option of the Fund. The Fund may also redeem certain of the VRDP Shares if the Fund fails to maintain certain asset coverage requirements and such failures are not cured by the applicable cure date. The redemption price per share is equal to the sum of the liquidation preference per share plus any accumulated but unpaid dividends.
The average liquidation preference of VRDP Shares outstanding and annualized dividend rate for the Fund during the current fiscal period were as follows:
| | | | |
| | | NMT | |
| Average liquidation preference of VRDP Shares outstanding | | $ | 74,000,000 | |
| Annualized dividend rate | | | 2.30 | % |
For financial reporting purposes, the liquidation preference of VRDP Shares is a liability and is recognized as a component of “Variable Rate Demand Preferred (“VRDP”) Shares, net of deferred offering costs” on the Statement of Assets and Liabilities. Unpaid dividends on VRDP Shares are recognized as a component of “Interest payable” on the Statement of Assets and Liabilities, when applicable. Dividends accrued on VRDP Shares are recognized as a component of “Interest expense and amortization of offering costs” on the Statement of Operations. Costs incurred by the Fund in connection with its offerings of VRDP Shares was recorded as a deferred charge, which is amortized over the life of the shares and is recognized as a component of “Variable Rate Demand Preferred (“VRDP”) Shares, net of deferred offering costs” on the Statement of Assets and Liabilities and “Interest expense and amortization of offerings costs” on the Statement of Operations. In addition to interest expense, the Fund also pays a per annum liquidity fee to the liquidity provider, as well as a remarketing fee, which are recognized as “Liquidity fees” and “Remarketing fees,” respectively, on the Statement of Operations, when applicable.
48
Preferred Share Transactions
Transactions in preferred shares for the Funds during the Funds’ current and prior fiscal period, where applicable, are noted in the following tables.
Transactions in AMTP Shares for the Fund, where applicable, were as follows:
| | | | |
| | Year Ended May 31, 2019 |
NTC | Series | Shares | Amount |
| AMTP Shares issued | 2028 | 1,120 | $112,000,000 |
Transactions in VMTP Shares for the Fund, where applicable, were as follows:
| | | | |
| | Year Ended May 31, 2019 |
NTC | Series | Shares | Amount |
| VMTP Shares redeemed | 2019 | (1,120) | $(112,000,000) |
5. Investment Transactions
Long-term purchases and sales (including maturities) during the current fiscal period were as follows:
| | | | | | | |
| | | NTC | | | NMT | |
| Purchases | | $ | 25,613,915 | | | $ | 34,586,361 | |
| Sales and maturities | | | 26,955,867 | | | | 32,430,309 | |
6. Income Tax Information
Each Fund is a separate taxpayer for federal income tax purposes. Each Fund intends to distribute substantially all of its net investment income and net capital gains to shareholders and to otherwise comply with the requirements of Subchapter M of the Internal Revenue Code applicable to regulated investment companies. Therefore, no federal income tax provision is required. Furthermore, each Fund intends to satisfy conditions that will enable interest from municipal securities, which is exempt from regular federal and designated state income taxes, to retain such tax-exempt status when distributed to shareholders of the Funds. Net realized capital gains and ordinary income distributions paid by the Funds are subject to federal taxation.
For all open tax years and all major taxing jurisdictions, management of the Funds has concluded that there are no significant uncertain tax positions that would require recognition in the financial statements. Open tax years are those that are open for examination by taxing authorities (i.e., generally the last four tax year ends and the interim tax period since then). Furthermore, management of the Funds is also not aware of any tax positions for which it is reasonably possible that the total amounts of unrecognized tax benefits will significantly change in the next twelve months.
The following information is presented on an income tax basis. Differences between amounts for financial statement and federal income tax purposes are primarily due to timing differences in recognizing taxable market discount, timing differences in recognizing certain gains and losses on investment transactions and the treatment of investments in inverse floating rate securities reflected as financing transactions, if any. To the extent that differences arise that are permanent in nature, such amounts are reclassified within the capital accounts as detailed below. Temporary differences do not require reclassification. Temporary and permanent differences do not impact the NAVs of the Funds.
The table below presents the cost and unrealized appreciation (depreciation) of each Fund’s investment portfolio, as determined on a federal income tax basis, as of May 31, 2019.
| | | | | | | |
| | | NTC | | | NMT | |
| Tax cost of investments | | $ | 293,764,985 | | | $ | 195,884,864 | |
| Gross unrealized: | | | | | | | | |
| Appreciation | | $ | 15,420,453 | | | $ | 13,250,600 | |
| Depreciation | | | (58,681 | ) | | | (17,106 | ) |
| Net unrealized appreciation (depreciation) of investments | | $ | 15,361,772 | | | $ | 13,233,494 | |
Permanent differences, primarily due to federal taxes paid, taxable market discount, and nondeductible offering costs, resulted in reclassifications among the Funds’ components of common share net assets as of May 31, 2019, the Funds’ tax year end.
49
Notes to Financial Statements (continued)
The tax components of undistributed net tax-exempt income, net ordinary income and net long-term capital gains as of May 31, 2019, the Funds’ tax year end, were as follows:
| | | | | | | |
| | | NTC | | | NMT | |
Undistributed net tax-exempt income1 | | $ | 455,371 | | | $ | 196,312 | |
Undistributed net ordinary income2 | | | 16,797 | | | | 40,864 | |
| Undistributed net long-term capital gains | | | — | | | | — | |
| | |
| 1 | Undistributed net tax-exempt income (on a tax basis) has not been reduced for the dividend declared on May 1, 2019, paid on June 3, 2019. |
| 2 | Net ordinary income consists of taxable market discount income and net short-term capital gains, if any. |
The tax character of distributions paid during the Funds’ tax years ended May 31, 2019 and May 31, 2018 was designated for purposes of the dividends paid deduction as follows:
| | | | | | | |
2019 | | NTC | | | NMT | |
Distributions from net tax-exempt income3 | | $ | 9,749,738 | | | $ | 6,479,015 | |
Distributions from net ordinary income2 | | | 9,436 | | | | — | |
| Distributions from net long-term capital gains | | | — | | | | — | |
2018 | | NTC | | | NMT | |
| Distributions from net tax-exempt income | | $ | 9,950,822 | | | $ | 7,254,568 | |
Distributions from net ordinary income2 | | | 18,890 | | | | — | |
| Distributions from net long-term capital gains | | | — | | | | — | |
| | |
| 2 | Net ordinary income consists of taxable market discount income and net short-term capital gains, if any. |
| 3 | The Funds hereby designate these amounts paid during the fiscal year ended May 31, 2019 as Exempt Interest Dividends. |
As of May 31, 2019 the Funds’ tax year end, the Funds had unused capital losses carrying forward available for federal income tax purposes to be applied against future capital gains, if any. The capital losses are not subject to expiration.
| | | | | | | |
| | | NTC | | | NMT | |
| Not subject to expiration: | | | | | | |
| Short-term | | $ | 2,817,224 | | | $ | 1,580,494 | |
| Long-term | | | 6,811,763 | | | | 3,613,690 | |
| Total | | $ | 9,628,987 | | | $ | 5,194,184 | |
7. Management Fees and Other Transactions with Affiliates
Management Fees
Each Fund’s management fee compensates the Adviser for overall investment advisory and administrative services and general office facilities. The Sub-Adviser is compensated for its services to the Funds from the management fees paid to the Adviser.
Each Fund’s management fee consists of two components – a fund-level fee, based only on the amount of assets within each individual Fund, and a complex-level fee, based on the aggregate amount of all eligible fund assets managed by the Adviser. This pricing structure enables Fund shareholders to benefit from growth in the assets within their respective Fund as well as from growth in the amount of complex-wide assets managed by the Adviser.
The annual fund-level fee, payable monthly, for each Fund is calculated according to the following schedule:
| | | | |
Average Daily Managed Assets* | | Fund-Level Fee Rate | |
| For the first $125 million | | | 0.4500 | % |
| For the next $125 million | | | 0.4375 | |
| For the next $250 million | | | 0.4250 | |
| For the next $500 million | | | 0.4125 | |
| For the next $1 billion | | | 0.4000 | |
| For the next $3 billion | | | 0.3750 | |
| For managed assets over $5 billion | | | 0.3625 | |
50
The annual complex-level fee, payable monthly, for each Fund is calculated by multiplying the current complex-wide fee rate, determined according to the following schedule by the Fund’s daily managed assets:
| | | | |
Complex-Level Eligible Asset Breakpoint Level* | | Effective Complex-Level Fee Rate at Breakpoint Level | |
| $55 billion | | | 0.2000 | % |
| $56 billion | | | 0.1996 | |
| $57 billion | | | 0.1989 | |
| $60 billion | | | 0.1961 | |
| $63 billion | | | 0.1931 | |
| $66 billion | | | 0.1900 | |
| $71 billion | | | 0.1851 | |
| $76 billion | | | 0.1806 | |
| $80 billion | | | 0.1773 | |
| $91 billion | | | 0.1691 | |
| $125 billion | | | 0.1599 | |
| $200 billion | | | 0.1505 | |
| $250 billion | | | 0.1469 | |
| $300 billion | | | 0.1445 | |
| | |
| * | For the complex-level fees, managed assets include closed-end fund assets managed by the Adviser that are attributable to certain types of leverage. For these purposes, leverage includes the funds’ use of preferred stock and borrowings and certain investments in the residual interest certificates (also called inverse floating rate securities) in tender option bond (TOB) trusts, including the portion of assets held by the TOB trust that has been effectively financed by the trust’s issuance of floating rate securities, subject to an agreement by the Adviser as to certain funds to limit the amount of such assets for determining managed assets in certain circumstances. The complex-level fee is calculated based upon the aggregate daily managed assets of all Nuveen open-end and closed-end funds that constitute “eligible assets.” Eligible assets do not include assets attributable to investments in other Nuveen funds or assets in excess of a determined amount (originally $2 billion) added to the Nuveen fund complex in connection with the Adviser’s assumption of the management of the former First American Funds effective January 1, 2011. As of May 31, 2019, the complex-level fee for each Fund was 0.1580%. |
Other Transactions with Affiliates
Each Fund is permitted to purchase or sell securities from or to certain other funds managed by the Adviser (“inter-fund trade”) under specified conditions outlined in procedures adopted by the Board. These procedures have been designed to ensure that any inter-fund trade of securities by the Fund from or to another fund that is, or could be, considered an affiliate of the Fund under certain limited circumstances by virtue of having a common investment adviser (or affiliated investment adviser), common officer and/or common trustee complies with Rule 17a-7 of the 1940 Act. Further, as defined under these procedures, each inter-fund trade is effected at the current market price as provided by an independent pricing service. Unsettled inter-fund trades as of the end of the reporting period are recognized as a component of “Receivable for investments sold” and/or “Payable for investments purchased” on the Statement of Assets and Liabilities, when applicable.
During the current fiscal period, the Funds engaged in inter-fund trades pursuant to these procedures as follows:
| | | | | | | |
Inter-Fund Trades | | NTC | | | NMT | |
| Purchases | | $ | 3,618,987 | | | $ | 17,022,495 | |
| Sales | | | 3,534,556 | | | | 12,641,791 | |
8. Borrowing Arrangements
Committed Line of Credit
The Funds, along with certain other funds managed by the Adviser (“Participating Funds”), have established a 364-day, approximately $2.65 billion standby credit facility with a group of lenders, under which the Participating Funds may borrow for various purposes other than leveraging for investment purposes. Each Participating Fund is allocated a designated proportion of the facility’s capacity (and its associated costs, as described below) based upon a multi-factor assessment of the likelihood and frequency of its need to draw on the facility, the size of the Fund and its anticipated draws, and the potential importance of such draws to the operations and well-being of the Fund, relative to those of the other Funds. A Fund may effect draws on the facility in excess of its designated capacity if and to the extent that other Participating Funds have undrawn capacity. The credit facility expires in June 2020 unless extended or renewed.
The credit facility has the following terms: a fee of 0.15% per annum on unused commitment amounts, and interest at a rate equal to the higher of (a) one-month LIBOR (London Inter-Bank Offered Rate) plus 1.00% per annum or (b) the Fed Funds rate plus 1.00% per annum on amounts borrowed. Participating Funds paid administration, legal and arrangement fees, which are recognized as a component of “Other expenses” on the Statement of Operations, and along with commitment fees, have been allocated among such Participating Funds based upon the relative proportions of the facility’s aggregate capacity reserved for them and other factors deemed relevant by the Adviser and the Board of each Participating Fund.
51
Notes to Financial Statements (continued)
During the current fiscal period, the Funds utilized this facility. The Funds’ maximum outstanding balance during the utilization period was as follows:
| | | | | | | |
| | | NTC | | | NMT | |
| Maximum outstanding balance | | $ | 525,371 | | | $ | 552,003 | |
During the Funds’ utilization period(s), during the current fiscal period, the average daily balance outstanding and average annual interest rate on the Borrowings were as follows:
| | | | | | | |
| | | NTC | | | NMT | |
| Average daily balance outstanding | | $ | 525,371 | | | $ | 552,003 | |
| Average annual interest rate | | | 3.50 | % | | | 3.50 | % |
Borrowings outstanding as of the end of the reporting period are recognized as “Borrowings” on the Statement of Assets and Liabilities, where applicable.
Inter-Fund Borrowing and Lending
The Securities and Exchange Commission (“SEC”) has granted an exemptive order permitting registered open-end and closed-end Nuveen funds to participate in an inter-fund lending facility whereby the Nuveen funds may directly lend to and borrow money from each other for temporary purposes (e.g., to satisfy redemption requests or when a sale of securities “fails,” resulting in an unanticipated cash shortfall) (the “Inter-Fund Program”). The closed-end Nuveen funds, including the Funds covered by this shareholder report, will participate only as lenders, and not as borrowers, in the Inter-Fund Program because such closed-end funds rarely, if ever, need to borrow cash to meet redemptions. The Inter-Fund Program is subject to a number of conditions, including, among other things, the requirements that (1) no fund may borrow or lend money through the Inter-Fund Program unless it receives a more favorable interest rate than is typically available from a bank or other financial institution for a comparable transaction; (2) no fund may borrow on an unsecured basis through the Inter-Fund Program unless the fund’s outstanding borrowings from all sources immediately after the inter-fund borrowing total 10% or less of its total assets; provided that if the borrowing fund has a secured borrowing outstanding from any other lender, including but not limited to another fund, the inter-fund loan must be secured on at least an equal priority basis with at least an equivalent percentage of collateral to loan value; (3) if a fund’s total outstanding borrowings immediately after an inter-fund borrowing would be greater than 10% of its total assets, the fund may borrow through the inter-fund loan on a secured basis only; (4) no fund may lend money if the loan would cause its aggregate outstanding loans through the Inter-Fund Program to exceed 15% of its net assets at the time of the loan; (5) a fund’s inter-fund loans to any one fund shall not exceed 5% of the lending fund’s net assets; (6) the duration of inter-fund loans will be limited to the time required to receive payment for securities sold, but in no event more than seven days; and (7) each inter-fund loan may be called on one business day’s notice by a lending fund and may be repaid on any day by a borrowing fund. In addition, a Nuveen fund may participate in the Inter-Fund Program only if and to the extent that such participation is consistent with the fund’s investment objective and investment policies. The Board is responsible for overseeing the Inter-Fund Program.
The limitations detailed above and the other conditions of the SEC exemptive order permitting the Inter-Fund Program are designed to minimize the risks associated with Inter-Fund Program for both the lending fund and the borrowing fund. However, no borrowing or lending activity is without risk. When a fund borrows money from another fund, there is a risk that the loan could be called on one day’s notice or not renewed, in which case the fund may have to borrow from a bank at a higher rate or take other actions to payoff such loan if an inter-fund loan is not available from another fund. Any delay in repayment to a lending fund could result in a lost investment opportunity or additional borrowing costs.
During the current reporting period, none of the Funds covered by this shareholder report have entered into any inter-fund loan activity.
9. New Accounting Pronouncements
Disclosure Update and Simplification
During August 2018, the SEC issued Final Rule Release No. 33-10532, Disclosure Update and Simplification (“Final Rule Release No. 33-10532”). Final Rule Release No. 33-10532 amends certain financial statement disclosure requirements to conform to U.S. GAAP. The amendments to Rule 6-04.17 of Regulation S-X (balance sheet) remove the requirement to separately state the book basis components of net assets: undistributed (over-distribution of) net investment income (“UNII”), accumulated undistributed net realized gains (losses), and net unrealized appreciation (depreciation) at the balance sheet date. Instead, consistent with U.S. GAAP, funds will be required to disclose total distributable earnings. The amendments to Rule 6-09 of Regulation S-X (statement of changes in net assets) remove the requirement to separately state the sources of distributions paid. Instead, consistent with U.S. GAAP, funds will be required to disclose the total amount of distributions paid, except that any tax return of capital must be separately disclosed. The amendments also remove the requirement to parenthetically state the book basis amount of UNII on the statement of changes in net assets.
52
The requirements of Final Rule Release No. 33-10532 are effective November 5, 2018, and the Funds’ Statement of Assets and Liabilities and Statement of Changes in Net Assets for the current reporting period have been modified accordingly. In addition, certain amounts within each Fund’s Statement of Changes in Net Assets for the prior fiscal period have been modified to conform to Final Rule Release No. 33-10532.
For the prior fiscal period, the total amount of distributions paid to shareholders from net investment income and from accumulated net realized gains, if any, are recognized as “Dividends” on the Statement of Changes in Net Assets.
As of May 31, 2018, the Funds’ Statement of Changes in Net Assets reflected the following UNII balances.
| | | | | | | |
| | | NTC | | | NMT | |
| UNII at the end of period | | $ | (380,422 | ) | | $ | (309,344 | ) |
Fair Value Measurement: Disclosure Framework
During August 2018, the FASB issued Accounting Standards Update (“ASU”) 2018-13 (“ASU 2018-13”), Fair Value Measurement: Disclosure Framework – Changes to the Disclosure Requirements for Fair Value Measurements. ASU 2018-13 modifies the disclosures required by Topic 820, Fair Value Measurements. The amendments in ASU 2018-13 are effective for all entities for fiscal years, and interim periods within those fiscal years, beginning after December 15, 2019. During the current reporting period, management early implemented this guidance. This implementation did not have a material impact on the Funds’ financial statements.
53
Additional Fund Information (Unaudited)
| | | | | |
Board of Trustees | | | | |
| Margo Cook* | Jack B. Evans | William C. Hunter | Albin F. Moschner | John K. Nelson |
| Judith M. Stockdale | Carole E. Stone | Terence J. Toth | Margaret L Wolff | Robert L. Young |
| |
| * Interested Board Member. |
| | | | | |
Fund Manager | Custodian | Legal Counsel | Independent Registered | Transfer Agent and |
| Nuveen Fund Advisors, LLC | State Street Bank | Chapman and Cutler LLP | Public Accounting Firm | Shareholder Services |
| 333 West Wacker Drive | & Trust Company | Chicago, IL 60603 | KPMG LLP | Computershare Trust |
| Chicago, IL 60606 | One Lincoln Street | | 200 East Randolph Street | Company, N.A. |
| | Boston, MA 02111 | | Chicago, IL 60601 | 250 Royall Street |
| | | | | Canton, MA 02021 |
| | | | | (800) 257-8787 |
Portfolio of Investments Information
Each Fund is required to file its complete schedule of portfolio holdings with the Securities and Exchange Commission (SEC) for the first and third quarters of each fiscal year as an exhibit to its report on Form N-PORT. You may obtain this information on the SEC’s website at http://www.sec.gov.
Nuveen Funds’ Proxy Voting InformationYou may obtain (i) information regarding how each fund voted proxies relating to portfolio securities held during the most recent twelve-month period ended June 30, without charge, upon request, by calling Nuveen toll-free at (800) 257-8787 or on Nuveen’s website at www.nuveen.com and (ii) a description of the policies and procedures that each fund used to determine how to vote proxies relating to portfolio securities without charge, upon request, by calling Nuveen toll free at (800) 257-8787. You may also obtain this information directly from the SEC. Visit the SEC on-line at http://www.sec.gov.
CEO Certification DisclosureEach Fund’s Chief Executive Officer (CEO) has submitted to the New York Stock Exchange (NYSE) the annual CEO certification as required by Section 303A.12(a) of the NYSE Listed Company Manual. Each Fund has filed with the SEC the certification of its CEO and Chief Financial Officer required by Section 302 of the Sarbanes-Oxley Act.
Common Share RepurchasesEach Fund intends to repurchase, through its open-market share repurchase program, shares of its own common stock at such times and in such amounts as is deemed advisable. During the period covered by this report, each Fund repurchased shares of its common stock, as shown in the accompanying table. Any future repurchases will be reported to shareholders in the next annual or semi-annual report.
| | | | | | | |
| | | NTC | | | NMT | |
| Common shares repurchased | | | 99,200 | | | | 26,148 | |
FINRA BrokerCheck
The Financial Industry Regulatory Authority (FINRA) provides information regarding the disciplinary history of FINRA member firms and associated investment professionals. This information as well as an investor brochure describing FINRA BrokerCheck is available to the public by calling the FINRA BrokerCheck Hotline number at (800) 289-9999 or by visiting www.FINRA.org.
54Glossary of Terms Used in this Report (Unaudited)
| · | Auction Rate Bond: An auction rate bond is a security whose interest payments are adjusted periodically through an auction process, which process typically also serves as a means for buying and selling the bond. Auctions that fail to attract enough buyers for all the shares offered for sale are deemed to have “failed,” with current holders receiving a formula-based interest rate until the next scheduled auction. |
| · | Average Annual Total Return: This is a commonly used method to express an investment’s performance over a particular, usually multi-year time period. It expresses the return that would have been necessary each year to equal the investment’s actual cumulative performance (including change in NAV or market price and reinvested dividends and capital gains distributions, if any) over the time period being considered. |
| · | Duration: Duration is a measure of the expected period over which a bond’s principal and interest will be paid, and consequently is a measure of the sensitivity of a bond’s or bond fund’s value to changes when market interest rates change. Generally, the longer a bond’s or fund’s duration, the more the price of the bond or fund will change as interest rates change. |
| · | Effective Leverage: Effective leverage is a fund’s effective economic leverage, and includes both regulatory leverage (see leverage) and the leverage effects of certain derivative investments in the fund’s portfolio. Currently, the leverage effects of Tender Option Bond (TOB) inverse floater holdings are included in effective leverage values, in addition to any regulatory leverage. |
| · | Escrowed to Maturity Bond: When proceeds of a refunding issue are deposited in an escrow account for investment in an amount sufficient to pay the principal and interest on the issue being refunded. In some cases, though, an issuer may expressly reserve its right to exercise an early call of bonds that have been escrowed to maturity. |
| · | Gross Domestic Product (GDP): The total market value of all final goods and services produced in a country/region in a given year, equal to total consumer, investment and government spending, plus the value of exports, minus the value of imports. |
| · | Inverse Floating Rate Securities: Inverse floating rate securities, also known as inverse floaters or tender option bonds (TOBs), are created by depositing a municipal bond, typically with a fixed interest rate, into a special purpose trust. This trust, in turn, (a) issues floating rate certificates typically paying short-term tax-exempt interest rates to third parties in amounts equal to some fraction of the deposited bond’s par amount or market value, and (b) issues an inverse floating rate certificate (sometimes referred to as an “inverse floater”) to an investor (such as a Fund) interested in gaining investment exposure to a long-term municipal bond. The income received by the holder of the inverse floater varies inversely with the short-term rate paid to the floating rate certificates’ holders, and in most circumstances the holder of the inverse floater bears substantially all of the underlying bond’s downside investment risk. The holder of the inverse floater typically also benefits disproportionately from any potential appreciation of the underlying bond’s value. Hence, an inverse floater essentially represents an investment in the underlying bond on a leveraged basis. |
| · | Leverage: Leverage is created whenever a fund has investment exposure (both reward and/or risk) equivalent to more than 100% of the investment capital. |
| · | Net Asset Value (NAV) Per Share: A fund’s Net Assets is equal to its total assets (securities, cash, accrued earnings and receivables) less its total liabilities. NAV per share is equal to the fund’s Net Assets divided by its number of shares outstanding. |
| · | Pre-Refunding: Pre-Refunding, also known as advanced refundings or refinancings, is a procedure used by state and local governments to refinance municipal bonds to lower interest expenses. The issuer sells new bonds with a lower yield and uses the proceeds to buy U.S. Treasury securities, the interest from which is used to make payments on the higher-yielding bonds. Because of this collateral, pre-refunding generally raises a bond’s credit rating and thus its value. |
55
Glossary of Terms Used in this Report (continued)
| · | Regulatory Leverage: Regulatory Leverage consists of preferred shares issued by or borrowings of a fund. Both of these are part of a fund’s capital structure. Regulatory leverage is subject to asset coverage limits set in the Investment Company Act of 1940. |
| · | S&P Municipal Bond Connecticut Index: An unleveraged, market value-weighted index designed to measure the performance of the tax-exempt, investment-grade Connecticut municipal bond market. Index returns assume reinvestment of distributions, but do not reflect any applicable sales charges or management fees. |
| · | S&P Municipal Bond Index: An unleveraged, market value-weighted index designed to measure the performance of the tax- exempt, investment-grade U.S. municipal bond market. Index returns assume reinvestment of distributions, but do not reflect any applicable sales charges or management fees. |
| · | S&P Municipal Bond Massachusetts Index: An unleveraged, market value-weighted index designed to measure the performance of the tax-exempt, investment-grade Massachusetts municipal bond market. Index returns assume reinvestment of distributions, but do not reflect any applicable sales charges or management fees. |
| · | Total Investment Exposure: Total investment exposure is a fund’s assets managed by the Adviser that are attributable to financial leverage. For these purposes, financial leverage includes a fund’s use of preferred stock and borrowings and investments in the residual interest certificates (also called inverse floating rate securities) in tender option bond (TOB) trusts, including the portion of assets held by a TOB trust that has been effectively financed by the trust’s issuance of floating rate securities. |
| · | Zero Coupon Bond: A zero coupon bond does not pay a regular interest coupon to its holders during the life of the bond. Income to the holder of the bond comes from accretion of the difference between the original purchase price of the bond at issuance and the par value of the bond at maturity and is effectively paid at maturity. The market prices of zero coupon bonds generally are more volatile than the market prices of bonds that pay interest periodically. |
56
Reinvest Automatically, Easily and Conveniently
Nuveen makes reinvesting easy. A phone call is all it takes to set up your reinvestment account.
Nuveen Closed-End Funds Automatic Reinvestment PlanNuveen Closed-End Fund allows you to conveniently reinvest distributions in additional Fund shares. By choosing to reinvest, you’ll be able to invest money regularly and automatically, and watch your investment grow through the power of compounding. Just like distributions in cash, there may be times when income or capital gains taxes may be payable on distributions that are reinvested. It is important to note that an automatic reinvestment plan does not ensure a profit, nor does it protect you against loss in a declining market.
Easy and convenient
To make recordkeeping easy and convenient, each month you’ll receive a statement showing your total distributions, the date of investment, the shares acquired and the price per share, and the total number of shares you own.
How shares are purchased
The shares you acquire by reinvesting will either be purchased on the open market or newly issued by the Fund. If the shares are trading at or above net asset value at the time of valuation, the Fund will issue new shares at the greater of the net asset value or 95% of the then-current market price. If the shares are trading at less than net asset value, shares for your account will be purchased on the open market. If the Plan Agent begins purchasing Fund shares on the open market while shares are trading below net asset value, but the Fund’s shares subsequently trade at or above their net asset value before the Plan Agent is able to complete its purchases, the Plan Agent may cease open-market purchases and may invest the uninvested portion of the distribution in newly-issued Fund shares at a price equal to the greater of the shares’ net asset value or 95% of the shares’ market value on the last business day immediately prior to the purchase date. Distributions received to purchase shares in the open market will normally be invested shortly after the distribution payment date. No interest will be paid on distributions awaiting reinvestment. Because the market price of the shares may increase before purchases are completed, the average purchase price per share may exceed the market price at the time of valuation, resulting in the acquisition of fewer shares than if the distribution had been paid in shares issued by the Fund. A pro rata portion of any applicable brokerage commissions on open market purchases will be paid by Plan participants. These commissions usually will be lower than those charged on individual transactions.
Flexible
You may change your distribution option or withdraw from the Plan at any time, should your needs or situation change. You can reinvest whether your shares are registered in your name, or in the name of a brokerage firm, bank, or other nominee. Ask your investment advisor if his or her firm will participate on your behalf. Participants whose shares are registered in the name of one firm may not be able to transfer the shares to another firm and continue to participate in the Plan. The Fund reserves the right to amend or terminate the Plan at any time. Although the Fund reserves the right to amend the Plan to include a service charge payable by the participants, there is no direct service charge to participants in the Plan at this time.
Call today to start reinvesting distributions
For more information on the Nuveen Automatic Reinvestment Plan or to enroll in or withdraw from the Plan, speak with your financial advisor or call us at (800) 257-8787.
57
Annual Investment Management Agreement Approval Process (Unaudited)
At a meeting held on May 21-23, 2019 (the “May Meeting”), the Board of Trustees (each, a “Board” and each Trustee, a “Board Member”) of each Fund, including the Board Members who are not “interested persons” (as defined under the Investment Company Act of 1940 (the “1940 Act”)) (the “Independent Board Members”), approved, for its respective Fund, the renewal of the management agreement (each, an “Investment Management Agreement”) with Nuveen Fund Advisors, LLC (the “Adviser”) pursuant to which the Adviser serves as investment adviser to such Fund and the sub-advisory agreement (each, a “Sub-Advisory Agreement”) with Nuveen Asset Management, LLC (the “Sub-Adviser”) pursuant to which the Sub-Adviser serves as the sub-adviser to such Fund. Following an initial two-year period, the Board, including the Independent Board Members, is required under the 1940 Act to review and approve each Investment Management Agreement and Sub-Advisory Agreement on behalf of the applicable Fund on an annual basis. The Investment Management Agreements and Sub-Advisory Agreements are collectively referred to as the “Advisory Agreements” and the Adviser and the Sub-Adviser are collectively, the “Fund Advisers” and each, a “Fund Adviser.”
In response to a request on behalf of the Independent Board Members by independent legal counsel, the Board received and reviewed prior to the May Meeting extensive materials specifically prepared for the annual review of Advisory Agreements by the Adviser as well as by Broadridge Financial Solutions, Inc. (“Broadridge”), an independent provider of investment company data. The materials provided in connection with the annual review covered a breadth of subject matter including, but not limited to, a description of the nature, extent and quality of services provided by the Fund Advisers; a review of the Sub-Adviser and investment team; an analysis of fund performance in absolute terms and as compared to the performance of certain peer funds and benchmarks with a focus on any performance outliers; an analysis of the fees and expense ratios of the Nuveen funds in absolute terms and as compared to those of certain peer funds with a focus on any expense outliers; a description of portfolio manager compensation; a review of the secondary market trading of shares of the Nuveen closed-end funds (including, among other things, an analysis of performance, distribution and valuation and capital raising trends in the broader closed-end fund market and in particular with respect to Nuveen closed-end funds; a review of the leverage management actions taken on behalf of the Nuveen closed-end funds and their resulting impact on performance; and a description of the distribution management process and any capital management activities); a review of the performance of various service providers; a description of various initiatives Nuveen had undertaken or continued during the year for the benefit of particular fund(s) and/or the complex; a description of the profitability or financial data of Nuveen and the Sub-Adviser; and a description of indirect benefits received by the Fund Advisers as a result of their relationships with the Nuveen funds. The Board Members held an in-person meeting on April 17-18, 2019 (the “April Meeting”), in part, to review and discuss the performance of the Nuveen funds and the Adviser’s evaluation of the various sub-advisers to the Nuveen funds. The Independent Board Members asked questions and requested additional information that was provided for the May Meeting.
The information prepared specifically for the annual review of the Advisory Agreements supplemented the information provided to the Board and its committees throughout the year. The Board and its committees met regularly during the year and the information provided and topics discussed were relevant to the review of the Advisory Agreements. Some of these reports and other data included, among other things, materials that outlined the investment performance of the Nuveen funds; strategic plans of the Adviser which may impact the services it provides to the Nuveen funds; the review of the Nuveen funds and applicable investment teams; the management of leverage financing for closed-end funds; the secondary market trading of the closed-end funds and any actions to address discounts; compliance, regulatory and risk management matters; the trading practices of the various sub-advisers; valuation of securities; fund expenses; and overall market and regulatory developments. The Board further continued its practice of seeking to meet periodically with the various sub-advisers to the Nuveen funds and their investment teams, when feasible. The Independent Board Members considered the review of the Advisory Agreements to be an ongoing process and employed the accumulated information, knowledge, and experience the Board Members had gained during their tenure on the boards governing the Nuveen funds and working with the Fund Advisers in their review of the Advisory Agreements. The contractual arrangements are a result of
58
multiple years of review, negotiation and information provided in connection with the boards’ annual review of the Nuveen funds’ advisory arrangements and oversight of the Nuveen funds.
The Independent Board Members were advised by independent legal counsel during the annual review process as well as throughout the year, including meeting in executive sessions with such counsel at which no representatives from the Adviser or the Sub-Adviser were present. In connection with their annual review, the Independent Board Members also received a memorandum from independent legal counsel outlining their fiduciary duties and legal standards in reviewing the Advisory Agreements.
In deciding to renew the Advisory Agreements, the Independent Board Members did not identify a particular factor or information as determinative or controlling, but rather the decision reflected the comprehensive consideration of all the information provided, and each Board Member may have attributed different levels of importance to the various factors and information considered in connection with the approval process. The following summarizes the principal factors and information, but not all the factors, the Board considered in deciding to renew the Advisory Agreements and its conclusions.
A. Nature, Extent and Quality of Services
In evaluating the renewal of the Advisory Agreements, the Independent Board Members received and considered information regarding the nature, extent and quality of the applicable Fund Adviser’s services provided to the respective Fund with particular focus on the services and enhancements to such services provided during the last year. The Board recognized that the Adviser provides a comprehensive set of services necessary to operate the Nuveen funds in a highly regulated industry and noted that the scope of such services has expanded over the years as a result of regulatory, market and other developments, such as the development of the liquidity management program and expanded compliance programs. Some of the functions the Adviser is responsible for include, but are not limited to: product management (such as analyzing a fund’s position in the marketplace, setting dividends, preparing shareholder and intermediary communications and other due diligence support); investment oversight (such as analyzing fund performance, sub-advisers and investment teams and analyzing trade executions of portfolio transactions, soft dollar practices and securities lending activities); securities valuation services (such as executing the daily valuation process for portfolio securities and developing and recommending changes to valuation policies and procedures); risk management (such as overseeing operational and investment risks, including stress testing); fund administration (such as preparing fund tax returns and other tax compliance services, overseeing the Nuveen funds’ independent public accountants and other service providers; managing fund budgets and expenses; and helping to fulfill the funds’ regulatory filing requirements); oversight of shareholder services and transfer agency functions (such as oversight and liaison of transfer agent service providers which include registered shareholder customer service and transaction processing); Board relations services (such as organizing and administering Board and committee meetings, preparing various reports to the Board and committees and providing other support services); compliance and regulatory oversight services (such as developing and maintaining a compliance program to ensure compliance with applicable laws and regulations, monitoring compliance with applicable fund policies and procedures and adherence to investment restrictions, and evaluating the compliance programs of the Nuveen fund sub-advisers and certain other service providers); legal support and oversight of outside law firms (such as with respect to filing and updating registration statements; maintaining various regulatory registrations; and providing legal interpretations regarding fund activities, applicable regulations and implementation of policies and procedures); and leverage, capital and distribution management services. In reviewing the scope and quality of services, the Board recognized the continued efforts and resources the Adviser and its affiliates have employed to continue to enhance their services for the benefit of the complex as well as particular Nuveen funds over recent years. Such service enhancements have included, but are not limited to:
| · | Fund Improvements and Product Management Initiatives – continuing to proactively manage the Nuveen fund complex as a whole and at the individual fund level with an aim to enhance the shareholder outcomes through, among other things, repositioning funds, merging funds, reviewing and updating investment policies and benchmarks, modifying the composition of certain portfolio management teams and analyzing various data to help devise such improvements; |
59
Annual Investment Management Agreement Approval Process (Unaudited) (continued)
| ● | Capital Initiatives – continuing to invest capital to support new funds with initial capital as well as to facilitate modifications to the strategies or structure of existing funds; |
| | |
| ● | Compliance Program Initiatives – continuing efforts to enhance the compliance program through, among other things, internally integrating various portfolio management teams and aligning compliance support accordingly, completing a comprehensive review of existing policies and procedures and revising such policies and procedures as appropriate, enhancing compliance-related technologies and workflows, and optimizing compliance shared services across the organization and affiliates; |
| | |
| ● | Risk Management and Valuation Services - continuing efforts to strengthen the risk management functions, including through, among other things, enhancing the interaction and reporting between the investment risk management team and various affiliates, increasing the efficiency of risk monitoring performed on the Nuveen funds through improved reporting, continuing to implement risk programs designed to provide a more disciplined and consistent approach to identifying and mitigating operational risks, continuing progress on implementing a liquidity program that complies with the new liquidity regulatory requirements and continuing to oversee the daily valuation process; |
| | |
| ● | Additional Compliance Services – continuing investment of time and resources necessary to develop the compliance policies and procedures and other related tools necessary to meet the various new regulatory requirements affecting the Nuveen funds that have been adopted over recent years; |
| | |
| ● | Government Relations – continuing efforts of various Nuveen teams and affiliates to advocate and communicate their positions with lawmakers and other regulatory bodies on issues that will impact the Nuveen funds; |
| | |
| ● | Business Continuity, Disaster Recovery and Information Services – establishing an information security program to help identify and manage information security risks, periodically testing disaster recovery plans, maintaining and updating business continuity plans and providing reports to the Board, at least annually, addressing, among other things, management’s security risk assessment, cyber risk profile, incident tracking and other relevant information technology risk-related reports; |
| | |
| ● | Expanded Dividend Management Services – continuing to expand the services necessary to manage the dividends among the varying types of Nuveen funds that have developed as the Nuveen complex has grown in size and scope; and |
| | |
| ● | with respect specifically to closed-end funds, such initiatives also included: |
| | |
| | ●● Leverage Management Services – continuing to actively manage leverage including developing new leverage instruments, refinancing existing leverage and negotiating reductions in associated leverage expenses; |
| | |
| | ●● Capital Management Services – ongoing capital management efforts through a share repurchase program as well as a shelf offering program that raises additional equity capital in seeking to enhance shareholder value; |
| | |
| | ●● Data and Market Analytics – continuing focus on analyzing data and market analytics to better understand the ownership cycles and secondary market experience of closed-end funds; and |
| | |
| | ●● Closed-end Fund Investor Relations Program – maintaining the closed-end fund investor relations program which, among other things, raises awareness, provides educational materials and cultivates advocacy for closed-end funds and the Nuveen closed-end fund product line. |
In addition to the services provided by the Adviser, the Board also considered the risks borne by the Adviser and its affiliates in managing the Nuveen funds, including entrepreneurial, operational, reputational, regulatory and litigation risks.
The Board further considered the division of responsibilities between the Adviser and the Sub-Adviser and recognized that the Sub-Adviser and its investment personnel generally are responsible for the management of each Fund’s portfolio. The Board noted that the Adviser oversees the Sub-Adviser and considered an analysis of the Sub-Adviser provided by the Adviser which
60
included, among other things, the Sub-Adviser’s assets under management and changes thereto, a summary of the investment team and changes thereto, the investment approach of the team and the performance of the funds sub-advised by the Sub-Adviser over various periods. The Board further considered at the May Meeting or prior meetings evaluations of the Sub-Adviser’s compliance program and trade execution. The Board noted that the Adviser recommended the renewal of the Sub-Advisory Agreements.
Based on its review, the Board determined, in the exercise of its reasonable business judgment, that it was satisfied with the nature, extent and quality of services provided to the respective Funds under each applicable Advisory Agreement.
B. The Investment Performance of the Funds and Fund Advisers
In evaluating the quality of the services provided by the Fund Advisers, the Board also received and considered the investment performance of the Nuveen funds they advise. In this regard, the Board reviewed Fund performance over the quarter, one-, three- and five-year periods ending December 31, 2018 as well as performance data for the first quarter of 2019 ending March 29, 2019. Unless otherwise indicated, the performance data referenced below reflects the periods ended December 31, 2018. The Board considered the Adviser’s analysis of each fund’s performance, with particular focus on funds that were considered performance outliers and the factors contributing to their performance. The Board also noted that it received performance data of the Nuveen funds during its quarterly meetings throughout the year and took into account the discussions that occurred at these Board meetings regarding fund performance. In this regard, in its evaluation of Nuveen fund performance at meetings throughout the year, the Board considered performance information for the funds for different time periods, both absolute and relative to appropriate benchmarks and peers, with particular attention to information indicating underperformance of the respective funds and discussed with the Adviser the reasons for such underperformance.
The Board reviewed both absolute and relative fund performance during the annual review. With respect to the latter, the Board considered fund performance in comparison to the performance of peer funds (the “Performance Peer Group”) and recognized and/or customized benchmarks (i.e., generally benchmarks derived from multiple recognized benchmarks). In considering performance data, the Board is aware of certain inherent limitations with such data, including that differences between the objective(s), strategies and other characteristics of the Nuveen funds compared to the respective Performance Peer Group and/or benchmark(s) (such as differences in the use of leverage) will necessarily contribute to differences in performance results and limit the value of the comparative information. To assist the Board in its review of the comparability of the relative performance, the Adviser has ranked the relevancy of the peer group to the funds as low, medium or high. Depending on the facts and circumstances, however, the Board may be satisfied with a fund’s performance notwithstanding that its performance may be below its benchmark or peer group for certain periods. In addition, the performance data may vary significantly depending on the end date selected, and shareholders may evaluate fund performance based on their own holding period which may differ from the performance periods reviewed by the Board leading to different results. Further, the Board considered a fund’s performance in light of the overall financial market conditions during the respective periods. As noted above, the Board reviewed, among other things, Nuveen fund performance over various periods ended December 31, 2018, and the Board was aware of the market decline in the fourth quarter of 2018 and considered performance from the first quarter of 2019 as well. The Board also noted that a shorter period of underperformance may significantly impact longer term performance.
In addition to the foregoing, the Board recognized the importance of secondary market trading to shareholders and considered the evaluation of premiums and discounts at which the shares of the Nuveen closed-end funds trade to be a continuing priority for the Board. The Board and/or its Closed-end Fund committee consider premium and discount data at each quarterly meeting throughout the year as well as during the annual review.
In their review of performance, the Independent Board Members focused, in particular, on the Adviser’s analysis of Nuveen funds determined to be underperforming performance outliers. The Board recognized that some periods of underperformance may only be temporary while other periods of underperformance may indicate a broader issue that may require a corrective action.
61
Annual Investment Management Agreement Approval Process (Unaudited) (continued)
Accordingly, with respect to any Nuveen funds for which the Board had identified performance issues, the Board monitors such funds closely until performance improves, discusses with the Adviser the reasons for such results, considers whether any steps are necessary or appropriate to address such issues, and reviews the results of any efforts undertaken.
The Board’s determinations with respect to each Fund are summarized below.
For Nuveen Connecticut Quality Municipal Income Fund (the “Connecticut Fund”), the Board noted that although the Fund ranked in the fourth quartile of its Performance Peer Group for the three- and five-year periods, the Fund ranked in the second quartile in the one-year period. In addition, the Fund’s performance was below the performance of its benchmark for the one-and three-year periods; however, the Fund outperformed its benchmark for the five-year period. The Board considered the Adviser’s explanation of the factors that detracted from Fund performance and was satisfied with the Adviser’s explanation. At the May Meeting, the Board approved the reorganization of the Fund into the Nuveen AMT-Free Municipal Credit Income Fund, subject to various conditions including shareholder approval.
For Nuveen Massachusetts Quality Municipal Income Fund (the “Massachusetts Fund”), the Board noted that although the Fund ranked in the fourth quartile of its Performance Peer Group and underperformed its benchmark in the one-year period, the Board ranked in the third quartile of its Performance Peer Group and outperformed its benchmark in the three- and five-year periods. The Board was satisfied with the Fund’s overall performance.
C. Fees, Expenses and Profitability
1. Fees and Expenses
In its annual review, the Board considered the fees paid to the Fund Advisers and the total operating expense ratio of each Nuveen fund. More specifically, the Independent Board Members reviewed, among other things, each fund’s gross and net management fee rates and net total expense ratio in relation to those of a comparable universe of funds (the “Peer Universe”) established by Broadridge. The Independent Board Members reviewed the methodology Broadridge employed to establish its Peer Universe and recognized that differences between the applicable fund and its respective Peer Universe as well as changes to the composition of the Peer Universe from year to year may limit some of the value of the comparative data. The Independent Board Members also considered a fund’s operating expense ratio as it more directly reflected the shareholder’s costs in investing in the respective fund.
In their review, the Independent Board Members considered, in particular, each fund with a net expense ratio (excluding investment-related costs of leverage) of six basis points or higher compared to that of its peer average (each, an “Expense Outlier Fund”), and an analysis as to the factors contributing to each such fund’s higher relative net expense ratio. In addition, although the Board reviewed a fund’s total net expenses both including and excluding investment-related expenses (i.e., leverage costs) and taxes for certain of the closed-end funds, the Board recognized that leverage expenses will vary across the Nuveen funds and in comparison to peers because of differences in the forms and terms of leverage employed by the respective fund. Accordingly, in reviewing the comparative data between a fund and its peers, the Board generally considered the fund’s net expense ratio and fees (excluding leverage costs and leveraged assets) to be higher if they were over 10 basis points higher, slightly higher if they were 6 to 10 basis points higher, in line if they were within approximately 5 basis points higher than the peer average and below if they were below the peer average of the Peer Universe. The Independent Board Members also considered, in relevant part, a fund’s net management fee and net total expense ratio in light of its performance history.
In their review of the fee arrangements for the Nuveen funds, the Independent Board Members considered the management fee schedules, including the complex-wide and fund-level breakpoint schedules, as applicable. The Board noted that across the Nuveen fund complex, the complex-wide fee breakpoints reduced fees by $51.5 million and fund-level breakpoints reduced fees by $55.1 million in 2018.
62
With respect to the Sub-Adviser, the Board considered the sub-advisory fee paid to the Sub-Adviser, including any breakpoint schedule, and as described below, comparative data of the fees the Sub-Adviser charges to other clients, if any.
The Independent Board Members noted that the Connecticut Fund had a net management fee slightly higher than its peer average but a net expense ratio below its peer average and the Massachusetts Fund had a net management fee slightly higher than its peer average but a net expense ratio in line with its peer average. Based on its review of the information provided, the Board determined that each Fund’s management fees (as applicable) to a Fund Adviser were reasonable in light of the nature, extent and quality of services provided to the Fund.
2. Comparisons with the Fees of Other Clients
In determining the appropriateness of fees, the Board also reviewed information regarding the fee rates the respective Fund Advisers charged to certain other types of clients and the type of services provided to these other clients. With respect to the Adviser and/or the Sub-Adviser, such other clients may include retail and institutional managed accounts, passively managed exchange-traded funds sub-advised by the Sub-Adviser but that are offered by another fund complex and municipal managed accounts offered by an unaffiliated adviser. With respect to the Sub-Adviser, the Board reviewed, among other things, the fee range and average fee of municipal retail wrap accounts and municipal institutional accounts.
In addition to the comparative fee data, the Board also reviewed, among other things, a description of the different levels of services provided to the clients noted above compared to the services provided to the Nuveen funds as well as the differences in portfolio investment policies, investor profiles, account sizes and regulatory requirements, all of which contribute to the variations in the fee schedules. The Board noted, among other things, the wide range of services in addition to investment management services provided to the Nuveen funds when the Adviser is principally responsible for all aspects of operating the funds, including the increased regulatory requirements that must be met in managing the funds, the larger account sizes of managed accounts and the increased entrepreneurial, legal and regulatory risks that the Adviser incurs in sponsoring and managing the funds. In general, higher fee levels reflect higher levels of service provided by the Adviser, increased investment management complexity, greater product management requirements, and higher levels of business risk or some combination of these factors. The Board further considered that the Sub-Adviser’s fee is essentially for portfolio management services and therefore more comparable to the fees it receives for retail wrap accounts and other external sub-advisory mandates. The Board concluded the varying levels of fees were justified given, among other things, the inherent differences in the products and the level of services provided to the Nuveen funds versus other clients, the differing regulatory requirements and legal liabilities and the entrepreneurial, legal and regulatory risks incurred in sponsoring and advising a registered investment company.
3. Profitability of Fund Advisers
In conjunction with their review of fees, the Independent Board Members considered information regarding Nuveen’s level of profitability for its advisory services to the Nuveen funds for the calendar years 2018 and 2017. The Board reviewed, among other things, Nuveen’s net margins (pre-tax) (both including and excluding distribution expenses); gross and net revenue margins (pre- and post-tax); revenues, expenses, and net income (pre-tax and after-tax and before distribution) of Nuveen for fund advisory services; and comparative profitability data comparing the adjusted margins of Nuveen compared to the adjusted margins of certain peers with publicly available data and with the most comparable assets under management (based on asset size and asset composition) for each of the last two calendar years. The Board also reviewed the revenues and expenses the Adviser derived from its exchange-traded fund product line that was launched in 2016. The Independent Board Members noted that Nuveen’s net margins were higher in 2018 than the previous year and considered the key drivers behind the revenue and expense changes that impacted Nuveen’s net margins between the years. The Board considered the costs of investments in the Nuveen business, including the investment of seed capital in certain Nuveen funds and additional investments in infrastructure and technology. The Independent Board Members also noted that Nuveen’s adjusted margins from its relationships with the Nuveen funds were on the low range compared to the adjusted margins of the peers; however, the Independent Board Members recognized the inherent limitations of the comparative data of other publicly traded peers given that the calculation of
63
Annual Investment Management Agreement Approval Process (Unaudited) (continued)
profitability is rather subjective and numerous factors (such as types of funds, business mix, cost of capital, methodology to allocate expenses and other factors) can have a significant impact on the results.
The Independent Board Members also reviewed a description of the expense allocation methodology employed to develop the financial information and a summary of the history of changes to the methodology over the ten-year period from 2008 to 2018, and recognized that other reasonable allocation methodologies could be employed and lead to significantly different results. The Board noted that two Independent Board Members, along with independent counsel, serve as the Board’s liaisons to review profitability and discuss any proposed changes to the methodology prior to the full Board’s review.
Aside from Nuveen’s profitability, the Board recognized that the Adviser is a subsidiary of Nuveen, LLC, the investment management arm of Teachers Insurance and Annuity Association of America (“TIAA”). As such, the Board also reviewed a balance sheet for TIAA reflecting its assets, liabilities and capital and contingency reserves for the 2018 and 2017 calendar years to consider the financial strength of TIAA having recognized the importance of having an adviser with significant resources.
In addition to Nuveen, the Independent Board Members also considered the profitability of the Sub-Adviser from its relationships with the Nuveen funds. In this regard, the Independent Board Members reviewed the Sub-Adviser’s revenues, expenses and revenue margins (pre- and post-tax) for its advisory activities for the calendar year ended December 31, 2018. The Independent Board Members also reviewed a profitability analysis reflecting the revenues, expenses and revenue margin (pre-and post-tax) by asset type for the Sub-Adviser for the calendar year ending December 31, 2018 and the pre- and post-tax revenue margin from 2018 and 2017.
In evaluating the reasonableness of the compensation, the Independent Board Members also considered any other ancillary benefits derived by the respective Fund Adviser from its relationship with the Nuveen funds as discussed in further detail below.
Based on a consideration of all the information provided, the Board noted that Nuveen’s and the Sub-Adviser’s level of profitability was acceptable and not unreasonable in light of the services provided.
D. Economies of Scale and Whether Fee Levels Reflect These Economies of Scale
With respect to economies of scale, the Independent Board Members noted that although economies of scale are difficult to measure, the Adviser shares the benefits of economies of scale in various ways including breakpoints in the management fee schedule (subject to limited exceptions), fee waivers and/or expense limitations, the pricing of Nuveen funds at scale at inception and investments in its business which can enhance the services provided to the funds for the fees paid. With respect to breakpoint schedules, because the Board had previously recognized that economies of scale may occur not only when the assets of a particular Nuveen fund grow but also when the assets in the complex grow, the Nuveen funds generally pay the Adviser a management fee comprised of a fund-level component and a complex-level component each with its own breakpoint schedule, subject to certain exceptions. In general terms, the breakpoint schedule at the fund level reduces fees as assets in the particular fund pass certain thresholds and the breakpoint schedule at the complex level reduces fees on the Nuveen funds as the eligible assets in the complex pass certain thresholds. The Independent Board Members reviewed, among other things, the fund-level and complex-level fee schedules. In addition, with respect to the Nuveen closed-end funds, the Independent Board Members noted that, although such funds may from time-to-time make additional share offerings, the growth of their assets would occur primarily through the appreciation of such funds’ investment portfolios.
In addition, the Independent Board Members recognized the Adviser’s continued reinvestment in its business through, among other things, investments in its business infrastructure and information technology, portfolio accounting system as well as other systems and platforms that will, among other things, support growth, simplify and enhance information sharing, and enhance the investment process to the benefit of all of the Nuveen funds.
Based on its review, the Board concluded that the current fee arrangements together with the Adviser’s reinvestment in its business appropriately shared any economies of scale with shareholders.
64
E. Indirect Benefits
The Independent Board Members received and considered information regarding other benefits the respective Fund Adviser or its affiliates may receive as a result of their relationship with the Nuveen funds. The Board considered that an affiliate of the Adviser serves as co-manager in the initial public offerings of new closed-end funds for which it may receive revenue and serves as an underwriter on shelf offerings of existing closed-end funds for which it receives compensation. In addition, the Independent Board Members also noted that the Sub-Adviser engages in soft dollar transactions pursuant to which it may receive the benefit of research products and other services provided by broker-dealers executing portfolio transactions on behalf of the applicable Nuveen funds.
The Board, however, noted that the benefits for the Sub-Adviser when transacting in fixed-income securities may be more limited as such securities generally trade on a principal basis and therefore do not generate brokerage commissions. Further, the Board noted that although the Sub-Adviser may benefit from the receipt of research and other services that it may otherwise have to pay for out of its own resources, the research may also benefit the Nuveen funds to the extent it enhances the ability of the Sub-Adviser to manage such funds or is acquired through the commissions paid on portfolio transactions of other clients.
Based on their review, the Board concluded that any indirect benefits received by a Fund Adviser as a result of its relationship with the Funds were reasonable and within acceptable parameters.
F. Other Considerations
The Board Members did not identify any single factor discussed previously as all-important or controlling. The Board Members, including the Independent Board Members, concluded that the terms of each Advisory Agreement were fair and reasonable, that the respective Fund Adviser’s fees were reasonable in light of the services provided to each Fund and that the Advisory Agreements be renewed.
65
Board Members & Officers (Unaudited)
The management of the Funds, including general supervision of the duties performed for the Funds by the Adviser, is the responsibility of the Board of Trustees of the Funds. The number of trustees of the Funds is set at ten. None of the trustees who are not “interested” persons of the Funds (referred to herein as “independent board members”) has ever been a director or employee of, or consultant to, Nuveen or its affiliates. The names and business addresses of the trustees and officers of the Funds, their principal occupations and other affiliations during the past five years, the number of portfolios each oversees and other directorships they hold are set forth below.
| | | | | |
Name, | Position(s) Held | Year First | Principal | Number |
Year of Birth | with the Funds | Elected or | Occupation(s) | of Portfolios |
& Address | | Appointed | Including other | in Fund Complex |
| | | and Term(1) | Directorships | Overseen by |
| | | | During Past 5 Years | Board Member |
| |
| Independent Board Members: |
| |
■ TERENCE J. TOTH 1959 333 W. Wacker Drive Chicago, IL 6o6o6 | Chairman and Board Member | 2008 Class II | Formerly, a Co-Founding Partner, Promus Capital (2008-2017); Director, Fulcrum IT Service LLC (since 2010) and Quality Control Corporation (since 2012); member: Catalyst Schools of Chicago Board (since 2008) and Mather Foundation Board (since 2012), and chair of its Investment Committee; formerly, Director, Legal & General Investment Management America, Inc. (2008-2013); formerly, CEO and President, Northern Trust Global Investments (2004-2007): Executive Vice President, Quantitative Management & Securities Lending (2000-2004); prior thereto, various positions with Northern Trust Company (since 1994); formerly, Member, Northern Trust Mutual Funds Board (2005-2007), Northern Trust Global Investments Board (2004-2007), Northern Trust Japan Board (2004-2007), Northern Trust Securities Inc. Board (2003- 2007) and Northern Trust Hong Kong Board (1997-2004). | 163 |
| |
■ JACK B. EVANS 1948 333 W. Wacker Drive Chicago, IL 6o6o6 | Board Member | 1999 Class III | Chairman (since 2019), formerly, President (1996-2019), The Hall-Perrine Foundation, a private philanthropic corporation; Director and Chairman, United Fire Group, a publicly held company; Director, Public Member, American Board of Orthopaedic Surgery (since 2015); Life Trustee of Coe College and the Iowa College Foundation; formerly, President Pro-Tem of the Board of Regents for the State of Iowa University System; formerly, Director, Alliant Energy and The Gazette Company; formerly, Director, Federal Reserve Bank of Chicago; formerly, President and Chief Operating Officer, SCI Financial Group, Inc., a regional financial services firm. | 163 |
| |
■ WILLIAM C. HUNTER 1948 333 W. Wacker Drive Chicago, IL 6o6o6 | Board Member | 2003 Class I | Dean Emeritus, formerly, Dean, Tippie College of Business, University of Iowa(2006-2012); Director of Wellmark, Inc. (since 2009); past Director (2005-2015), and past President (2010-2014) Beta Gamma Sigma, Inc., The International Business Honor Society; formerly, Director (2004-2018) of Xerox Corporation; Dean and Distinguished Professor of Finance, School of Business at the University of Connecticut (2003-2006); previously, Senior Vice President and Director of Research at the Federal Reserve Bank of Chicago (1995-2003); formerly, Director (1997-2007), Credit Research Center at Georgetown University. | 163 |
| |
■ ALBIN F. MOSCHNER 1952 333 W. Wacker Drive Chicago, IL 6o6o6 | Board Member | 2016 Class III | Founder and Chief Executive Officer, Northcroft Partners, LLC, a management consulting firm (since 2012); Chairman (since 2019), and Director (since 2012), USA Technologies, Inc., a provider of solutions and services to facilitate electronic payment transactions (since 2012); formerly, Director, Wintrust Financial Corporation (1996-2016); previously, held positions at Leap Wireless International, Inc., including Consultant (2011-2012), Chief Operating Officer (2008-2011), and Chief Marketing Officer (2004-2008); formerly, President, Verizon Card Services division of Verizon Communications, Inc. (2000-2003); formerly, President, One Point Services at One Point Communications (1999- 2000); formerly, Vice Chairman of the Board, Diba, Incorporated (1996-1997); formerly, various executive positions (1991-1996) and Chief Executive Officer (1995-1996) of Zenith Electronics Corporation. | 163 |
66
| | | | | |
Name, | Position(s) Held | Year First | Principal | Number |
Year of Birth | with the Funds | Elected or | Occupation(s) | of Portfolios |
& Address | | Appointed | Including other | in Fund Complex |
| | | and Term(1) | Directorships | Overseen by |
| | | | During Past 5 Years | Board Member |
| |
| Independent Board Members (continued): |
| |
■ JOHN K. NELSON 1962 333 W. Wacker Drive Chicago, IL 6o6o6 | Board Member | 2013 Class II | Member of Board of Directors of Core12 LLC (since 2008), a private firm which develops branding, marketing and communications strategies for clients; serves on The President’s Council, Fordham University (since 2010); and previously was a Director of The Curran Center for Catholic American Studies (2009-2018) formerly, senior external advisor to the financial services practice of Deloitte Consulting LLP (2012-2014): formerly, Chairman of the Board of Trustees of Marian University (2010 as trustee, 2011-2014 as Chairman); formerly, Chief Executive Officer of ABN AMRO N.V. North America, and Global Head of its Financial Markets Division (2007-2008); prior senior positions held at ABN AMRO include Corporate Executive Vice President and Head of Global Markets-the Americas (2006-2007), CEO of Wholesale Banking North America and Global Head of Foreign Exchange and Futures Markets (2001-2006), and Regional Commercial Treasurer and Senior Vice President Trading-North America (1996-2001); formerly, Trustee at St. Edmund Preparatory School in New York City. | 163 |
| |
■ JUDITH M. STOCKDALE 1947 333 W. Wacker Drive Chicago, IL 6o6o6 | Board Member | 1997 Class I | Board Member, Land Trust Alliance (since 2013) and U.S. Endowment for Forestry and Communities (since 2013); formerly, Executive Director (1994-2012), Gaylord and Dorothy Donnelley Foundation; prior thereto, Executive Director, Great Lakes Protection Fund (1990-1994). | 163 |
| |
■ CAROLE E. STONE 1947 333 W. Wacker Drive Chicago, IL 6o6o6 | Board Member | 2007 Class I | Former Director, Chicago Board Options Exchange, Inc. (2006-2017); and C2 Options Exchange, Incorporated (2009-2017); Director, Cboe, L.C. Global Markets, Inc., formerly, CBOE Holdings, Inc. (since 2010); formerly, Commissioner, New York State Commission on Public Authority Reform (2005-2010). | 163 |
| |
■ MARGARET L. WOLFF 1955 333 W. Wacker Drive Chicago, IL 6o6o6 | Board Member | 2016 Class I | Formerly, member of the Board of Directors (2013-2017) of Travelers Insurance Company of Canada and The Dominion of Canada General Insurance Company (each, a part of Travelers Canada, the Canadian operation of The Travelers Companies, Inc.); formerly, Of Counsel, Skadden, Arps, Slate, Meagher & Flom LLP (Mergers & Acquisitions Group) (2005-2014); Member of the Board of Trustees of New York- Presbyterian Hospital (since 2005); Member (since 2004) and Chair (since 2015) of the Board of Trustees of The John A. Hartford Foundation (a philanthropy dedicated to improving the care of older adults); formerly, Member (2005-2015) and Vice Chair (2011-2015) of the Board of Trustees of Mt. Holyoke College. | 163 |
| |
■ ROBERT L. YOUNG(2) 1963 333 W. Wacker Drive Chicago, IL 6o6o6 | Board Member | 2017 Class II | Formerly, Chief Operating Officer and Director, J.P.Morgan Investment Management Inc. (2010-2016); formerly, President and Principal Executive Officer (2013-2016), and Senior Vice President and Chief Operating Officer (2005-2010), of J.P.Morgan Funds; formerly, Director and various officer positions for J.P.Morgan Investment Management Inc. (formerly, JPMorgan Funds Management, Inc. and formerly, One Group Administrative Services) and JPMorgan Distribution Services, Inc. (formerly, One Group Dealer Services, Inc.) (1999-2017). | 161 |
67
| |
| Board Members & Officers (Unaudited) (continued) |
| | | | | |
Name, | Position(s) Held | Year First | Principal | Number |
Year of Birth | with the Funds | Elected or | Occupation(s) | of Portfolios |
& Address | | Appointed | Including other | in Fund Complex |
| | | and Term(1) | Directorships | Overseen by |
| | | | During Past 5 Years | Board Member |
| |
| Interested Board Member: |
| |
■ MARGO L. COOK(3) 1964 333 W. Wacker Drive Chicago, IL 6o6o6 | Board Member | 2016 Class III | President (since 2017), formerly, Co-Chief Executive Officer and Co-President (2016-2017), formerly, Senior Executive Vice President of Nuveen Investments, Inc.; President, Global Products and Solutions (since 2017), and, Co-Chief Executive Officer (since 2015), formerly, Executive Vice President (2013-2015), of Nuveen Securities, LLC; Executive Vice President (since 2017) of Nuveen, LLC; President (since August 2017), formerly Co-President (2016- 2017), formerly, Senior Executive Vice President of Nuveen Fund Advisors, LLC (Executive Vice President 2011-2015); President (since 2017), Nuveen Alternative Investments, LLC; Chartered Financial Analyst. | 163 |
| Name, | | | |
Year of Birth | Position(s) Held | Year First | Principal |
& Address | with the Funds | Elected or Appointed(4) | During Occupation(s) Past 5 Years |
| |
| Officers of the Funds: |
| |
■ CEDRIC H. ANTOSIEWICZ 1962 333 W. Wacker Drive Chicago, IL 6o6o6 | Chief Administrative Officer | 2007 | Senior Managing Director (since 2017), formerly, Managing Director (2004-2017) of Nuveen Securities, LLC; Senior Managing Director (since 2017), formerly, Managing Director (2014-2017) of Nuveen Fund Advisors, LLC. |
| |
■ NATHANIEL T. JONES 1979 333 W. Wacker Drive Chicago, IL 6o6o6 | Vice President and Treasurer | 2016 | Managing Director (since 2017), formerly, Senior Vice President (2016-2017), formerly, Vice President (2011-2016) of Nuveen; Managing Director of Nuveen Fund Advisors, LLC; Chartered Financial Analyst. |
| |
■ WALTER M. KELLY 1970 333 W. Wacker Drive Chicago, IL 6o6o6 | Chief Compliance Officer and Vice President | 2003 | Managing Director (since 2017), formerly, Senior Vice President (2008-2017) of Nuveen. |
| |
■ DAVID J. LAMB 1963 333 W. Wacker Drive Chicago, IL 6o6o6 | Vice President | 2015 | Managing Director (since 2017), formerly, Senior Vice President of Nuveen (since 2006), Vice President prior to 2006. |
| |
■ TINA M. LAZAR 1961 333 W. Wacker Drive Chicago, IL 6o6o6 | Vice President | 2002 | Managing Director (since 2017), formerly, Senior Vice President (2014-2017) of Nuveen Securities, LLC. |
68
| Name, | | | |
Year of Birth | Position(s) Held | Year First | Principal |
& Address | with the Funds | Elected or Appointed(4) | During Occupation(s) Past 5 Years |
| |
| Officers of the Funds (continued): |
| |
■ KEVIN J. MCCARTHY 1966 333 W. Wacker Drive Chicago, IL 6o6o6 | Vice President and Assistant Secretary | 2007 | Senior Managing Director (since 2017) and Secretary and General Counsel (since 2016) of Nuveen Investments, Inc., formerly, Executive Vice President (2016-2017) and Managing Director and Assistant Secretary (2008-2016); Senior Managing Director (since 2017) and Assistant Secretary (since 2008) of Nuveen Securities, LLC, formerly Executive Vice President (2016-2017) and Managing Director (2008-2016); Senior Managing Director (since 2017), Secretary (since 2016) and Co-General Counsel (since 2011) of Nuveen Fund Advisors, LLC, formerly, Executive Vice President (2016-2017), Managing Director (2008-2016) and Assistant Secretary (2007-2016); Senior Managing Director (since 2017), Secretary (since 2016) and Associate General Counsel (since 2011) of Nuveen Asset Management, LLC, formerly Executive Vice President (2016-2017) and Managing Director and Assistant Secretary (2011-2016); Senior Managing Director (since 2017) and Secretary (since 2016) of Nuveen Investments Advisers, LLC, formerly Executive Vice President (2016-2017); Vice President (since 2007) and Secretary (since 2016), formerly, Assistant Secretary, of NWQ Investment Management Company, LLC, Symphony Asset Management LLC, Santa Barbara Asset Management, LLC and Winslow Capital Management, LLC (since 2010). Senior Managing Director (since 2017) and Secretary (since 2016) of Nuveen Alternative Investments, LLC. |
| |
■ WILLIAM T. MEYERS 1966 333 W. Wacker Drive Chicago, IL 60606 | Vice President | 2018 | Senior Managing Director (since 2017), formerly, Managing Director (2016-2017), Senior Vice President (2010-2016) of Nuveen Securities, LLC; and Nuveen Fund Advisors, LLC; Senior Managing Director (since 2017), formerly, Managing Director (2016-2017), Senior Vice President (2010-2016) of Nuveen, has held various positions with Nuveen since 1991. |
| |
■ MICHAEL A. PERRY 1967 333 W. Wacker Drive Chicago, IL 6o6o6 | Vice President | 2017 | Executive Vice President (since 2017), previously Managing Director from 2016), of Nuveen Fund Advisors, LLC and Nuveen Alternative Investments, LLC; Executive Vice President (since 2017), formerly, Managing Director (2015-2017), of Nuveen Securities, LLC; formerly, Managing Director (2010-2015) of UBS Securities, LLC. |
| |
■ CHRISTOPHER M. ROHRBACHER 1971 333 W. Wacker Drive Chicago, IL 6o6o6 | Vice President and Assistant Secretary | 2008 | Managing Director (since 2017) and Assistant Secretary of Nuveen Securities, LLC; Managing Director (since 2017), formerly, Senior Vice President (2016-2017) and Assistant Secretary (since 2016) of Nuveen Fund Advisors, LLC. |
| |
■ WILLIAM A. SIFFERMANN 1975 333 W. Wacker Drive Chicago, IL 6o6o6 | | 2017 | Managing Director (since 2017), formerly Senior Vice President (2016-2017) and Vice President (2011-2016) of Nuveen. |
| |
■ JOEL T. SLAGER 1978 333 W. Wacker Drive Chicago, IL 6o6o6 | Vice President and Assistant Secretary | 2013 | Fund Tax Director for Nuveen Funds (since 2013); previously, Vice President of Morgan Stanley Investment Management, Inc., Assistant Treasurer of the Morgan Stanley Funds (from 2010 to 2013). |
| |
■ E. SCOTT WICKERHAM 1973 TIAA 730 Third Avenue New York, NY 10017 | Vice President and Controller | 2019 | Senior Managing Director, Head of Fund Administration at Nuveen, LLC (since 2019), formerly, Managing Director; Senior Managing Director (since 2019), Nuveen Fund Advisers, LLC; Principal Financial Officer, Principal Accounting Officer and Treasurer (since 2017) to the TIAA-CREF Funds, the TIAA-CREF Life Funds, the TIAA Separate Account VA-1 and the Treasurer (since 2017) to the CREF Accounts; Senior Director, TIAA-CREF Fund Administration (2014-2015); has held various positions with TIAA since 2006. |
69
Board Members & Officers (Unaudited) (continued)
| Name, | | | |
Year of Birth | Position(s) Held | Year First | Principal |
& Address | with the Funds | Elected or Appointed(4) | During Occupation(s) Past 5 Years |
| |
| Officers of the Funds (continued): |
| |
■ MARK L. WINGET 1968 333 W. Wacker Drive Chicago, IL 60606 | Vice President and Assistant Secretary | 2008 | Vice President and Assistant Secretary of Nuveen Securities, LLC (since 2008); Vice President (since 2010) and Associate General Counsel (since 2008) of Nuveen. |
| |
■ GIFFORD R. ZIMMERMAN 1956 333 W. Wacker Drive Chicago, IL 60606 | Vice President Secretary | 1988 | Managing Director (since 2002), and Assistant Secretary of Nuveen Securities, LLC; Managing Director (since 2004) and Assistant Secretary (since 1994) of Nuveen Investments, Inc.; Managing Director (since 2002), Assistant Secretary (since 1997) and Co-General Counsel (since 2011) of Nuveen Fund Advisors, LLC; Managing Director, Assistant Secretary and Associate General Counsel of Nuveen Asset Management, LLC (since 2011); Vice President (since 2017), formerly, Managing Director (2003-2017) and Assistant Secretary (since 2003) of Symphony Asset Management LLC; Managing Director and Assistant Secretary (since 2002) of Nuveen Investments Advisers, LLC; Vice President and Assistant Secretary of NWQ Investment Management Company, LLC (since 2002), Santa Barbara Asset Management, LLC (since 2006), and of Winslow Capital Management, LLC, (since 2010); Chartered Financial Analyst. |
| | |
| (1) | The Board of Trustees is divided into three classes, Class I, Class II, and Class III, with each being elected to serve until the third succeeding annual shareholders’ meeting subsequent to its election or thereafter in each case when its respective successors are duly elected or appointed, except two board members are elected by the holders of Preferred Shares, when applicable, to serve until the next annual shareholders’ meeting subsequent to its election or thereafter in each case when its respective successors are duly elected or appointed. The year first elected or appointed represents the year in which the board member was first elected or appointed to any fund in the Nuveen Complex. |
| (2) | On May 25, 2017, Mr. Young was appointed as a Board Member, effective July 1, 2017. He is a Board Member of each of the Nuveen Funds, except Nuveen Diversified Dividend and Income Fund and Nuveen Real Estate Income Fund. |
| (3) | “Interested person” as defined in the 1940 Act, by reason of her position with Nuveen, LLC. and certain of its subsidiaries, which are affiliates of the Nuveen Funds. |
| (4) | Officers serve one year terms through August of each year. The year first elected or appointed represents the year in which the Officer was first elected or appointed to any fund in the Nuveen Complex. |
70
Notes
71
Nuveen:
Serving Investors for Generations
Since 1898, financial advisors and their clients have relied on Nuveen to provide dependable investment solutions through continued adherence to proven, long-term investing principles. Today, we offer a range of high quality solutions designed to be integral components of a well-diversified core portfolio.
Focused on meeting investor needs.
Nuveen is the investment manager of TIAA. We have grown into one of the world’s premier global asset managers, with specialist knowledge across all major asset classes and particular strength in solutions that provide income for investors and that draw on our expertise in alternatives and responsible investing. Nuveen is driven not only by the independent investment processes across the firm, but also the insights, risk management, analytics and other tools and resources that a truly world-class platform provides. As a global asset manager, our mission is to work in partnership with our clients to create solutions which help them secure their financial future.
Find out how we can help you.
To learn more about how the products and services of Nuveen may be able to help you meet your financial goals, talk to your financial advisor, or call us at (800) 257-8787. Please read the information provided carefully before you invest. Investors should consider the investment objective and policies, risk considerations, charges and expenses of any investment carefully. Where applicable, be sure to obtain a prospectus, which contains this and other relevant information. To obtain a prospectus, please contact your securities representative or Nuveen, 333 W. Wacker Dr., Chicago, IL 60606. Please read the prospectus carefully before you invest or send money.
Learn more about Nuveen Funds at: www.nuveen.com/closed-end-funds
Nuveen Securities, LLC member of FINRA and SIPC | 333 West Wacker Drive Chicago, IL 60606 | www.nuveen.com | |
EAN-B-0519D 894596-INV-Y-07/20