Washington, D.C. 20549
Kevin J. McCarthy
Form N-CSR is to be used by management investment companies to file reports with the Commission not later than 10 days after the transmission to stockholders of any report that is required to be transmitted to stockholders under Rule 30e-1 under the Investment Company Act of 1940 (17 CFR 270.30e-1). The Commission may use the information provided on Form N-CSR in its regulatory, disclosure review, inspection, and policymaking roles.
A registrant is required to disclose the information specified by Form N-CSR, and the Commission will make this information public. A registrant is not required to respond to the collection of information contained in Form N-CSR unless the Form displays a currently valid Office of Management and Budget (“OMB”) control number. Please direct comments concerning the accuracy of the information collection burden estimate and any suggestions for reducing the burden to Secretary, Securities and Exchange Commission, 450 Fifth Street, NW, Washington, DC 20549-0609. The OMB has reviewed this collection of information under the clearance requirements of 44 U.S.C. ss. 3507.
ITEM 1. REPORTS TO STOCKHOLDERS.
LIFE IS COMPLEX.
Nuveen makes things e-simple.
It only takes a minute to sign up for e-Reports. Once enrolled, you’ll receive an e-mail as soon as your Nuveen Fund information is ready. No more waiting for delivery by regular mail. Just click on the link within the e-mail to see the report and save it on your computer if you wish.
Free e-Reports right to your e-mail!
www.investordelivery.com
If you receive your Nuveen Fund distributions and statements from your financial advisor or brokerage account.
OR
www.nuveen.com/accountaccess
If you receive your Nuveen Fund distributions and statements directly from Nuveen.
Table of Contents
| Chairman’s Letter to Shareholders | 4 |
| | |
| Portfolio Managers’ Comments | 5 |
| | |
| Fund Leverage | 12 |
| | |
| Common Share Information | 14 |
| | |
| Risk Considerations | 16 |
| | |
| Performance Overview and Holding Summaries | 17 |
| | |
| Shareholder Meeting Report | 22 |
| | |
| Report of Independent Registered Public Accounting Firm | 25 |
| | |
| Portfolios of Investments | 26 |
| | |
| Statement of Assets and Liabilities | 63 |
| | |
| Statement of Operations | 64 |
| | |
| Statement of Changes in Net Assets | 65 |
| | |
| Statement of Cash Flows | 67 |
| | |
| Financial Highlights | 70 |
| | |
| Notes to Financial Statements | 79 |
| | |
| Board Members & Officers | 93 |
| | |
| Annual Investment Management Agreement Approval Process | 98 |
| | |
| Reinvest Automatically, Easily and Conveniently | 106 |
| | |
| Glossary of Terms Used in this Report | 108 |
| | |
| Additional Fund Information | 111 |
Chairman’s
Letter to Shareholders
Dear Shareholders,
After nine years of serving as lead director and independent chairman of the Nuveen Fund Board, my term of office is coming to an end. It has been a privilege to use this space to communicate with you on some of the broad economic trends in the U.S. and abroad and how they are impacting the investment environment in which your funds operate. In addition, I have enjoyed offering some perspective on how your Board views the various Nuveen investment teams as they apply their investment disciplines in that investment environment.
My term has coincided with a particularly challenging period for both mutual fund sponsors and investors. Since 2000 there have been three periods of unusually strong stock market growth and two major market declines. Recent years have been characterized by a search for yield in fixed income securities to compensate for an extended period of very low interest rates. Funds are investing more in foreign and emerging markets that require extensive research capabilities to overcome the more limited transparency and higher volatility in those markets. New fund concepts often incorporate derivative financial instruments that offer efficient ways to hedge investment risk or gain exposure to selected markets. Fund trading teams operate in many new domestic and international venues with quite different characteristics. Electronic trading and global communication networks mean that fund managers must be able to thrive in financial markets that react instantaneously to newsworthy events and are more interconnected than ever.
Nuveen has committed additional resources to respond to these changes in the fund industry environment. It has added IT and research resources to assemble and evaluate the increased flow of detailed information on economies, markets and individual companies. Based on its experience during the financial crisis of 2008-09, Nuveen has expanded its resources dedicated to valuing and trading portfolio securities with a particular focus on stressed financial market conditions. It has added systems and experienced risk management professionals to work with investment teams to better help evaluate whether their funds’ risk exposures are appropriate in view of the return targets. The investment teams have also reflected on recent experience to reaffirm or modify their investment disciplines. Finally, experienced professionals and IT resources have been added to address new regulatory requirements designed to better inform and protect investors. The Board has enthusiastically encouraged these initiatives.
The Nuveen Fund Board has always viewed itself as your representatives to assure that Nuveen brings together experienced people, proven technologies and effective processes designed to produce results that meet investor expectations. It is important to note that our activities are highlighted by the annual contract renewal process. Despite its somewhat formal language, I strongly encourage you to read the summary because it offers an insight into our oversight process. The report is included in the back of this or a subsequent shareholder report. The renewal process is very comprehensive and includes a number of evaluations and discussions between the Board and Nuveen during the year. The summary also describes what has been achieved across the Nuveen fund complex and at individual funds such as yours.
As I leave the chairmanship and resume my role as a member of the Board, please be assured that I and my fellow Board members will continue to hold your interests uppermost in our minds as we oversee the management of your funds and that we greatly appreciate your confidence in your Nuveen fund.
Very sincerely,
Robert P. Bremner
Chairman of the Board
July 23, 2013
Portfolio Managers’ Comments
Nuveen Georgia Dividend Advantage Municipal Fund 2 (NKG)
Nuveen Maryland Premium Income Municipal Fund (NMY)
Nuveen Missouri Premium Income Municipal Fund (NOM)
Nuveen North Carolina Premium Income Municipal Fund (NNC)
Nuveen Virginia Premium Income Municipal Fund (NPV)
Portfolio managers Daniel Close, Chris Drahn and Tom Spalding review economic and municipal market conditions at the national and state levels, key investment strategies and the twelve-month performance of these five Funds. Dan assumed portfolio management responsibility for the Nuveen Georgia and North Carolina Funds in 2007. Chris took on portfolio management responsibility for the Nuveen Missouri Fund in 2011 and Tom assumed portfolio management responsibility for the Nuveen Maryland and Virginia Funds in 2011.
FUND REORGANIZATIONS
Effective before the opening of business on July 9, 2012, certain Georgia and North Carolina funds and on August 6, 2012, certain Maryland and Virginia funds were reorganized into four of the larger-state funds included in this report as follows:
| Acquired Funds | | Symbol | | Acquiring Fund | | Symbol |
| Georgia Funds | | | | | | |
| Nuveen Georgia Premium Income Municipal Fund | | NPG | | Nuveen Georgia Dividend Advantage Municipal Fund 2 | | NKG |
| Nuveen Georgia Dividend Advantage Municipal Fund | | NZX | | | | |
| Maryland Funds | | | | | | |
| Nuveen Maryland Dividend Advantage Municipal Fund | | NFM | | Nuveen Maryland Premium Income Municipal Fund | | NMY |
| Nuveen Maryland Dividend Advantage Municipal Fund 2 | | NZR | | | | |
| Nuveen Maryland Dividend Advantage Municipal Fund 3 | | NWI | | | | |
| North Carolina Funds | | | | | | |
| Nuveen North Carolina Dividend Advantage Municipal Fund | | NRB | | Nuveen North Carolina Premium Income Municipal Fund | | NNC |
| Nuveen North Carolina Dividend Advantage Municipal Fund 2 | | NNO | | | | |
| Nuveen North Carolina Dividend Advantage Municipal Fund 3 | | NII | | | | |
| Virginia Funds | | | | | | |
| Nuveen Virginia Dividend Advantage Municipal Fund | | NGB | | Nuveen Virginia Premium Income Municipal Fund | | NPV |
| Nuveen Virginia Dividend Advantage Municipal Fund 2 | | NNB | | | | |
Upon the closing of the reorganizations, the Acquired Funds transferred their assets to the Acquiring Funds in exchange for common and preferred shares of the Acquiring Funds and the assumption by the Acquiring Funds of the liabilities of the Acquired Funds. The Acquired Funds were then liquidated, dissolved and terminated in accordance with their Declaration of Trust. Shareholders of the Acquired Funds became shareholders of the Acquiring Funds. Holders of common shares of the Acquired Funds received newly issued common shares of the Acquiring Funds, the aggregate net asset value of which was equal to the aggregate net asset value of the common shares of the Acquired
| |
| Certain statements in this report are forward-looking statements. Discussions of specific investments are for illustration only and are not intended as recommendations of individual investments. The forward-looking statements and other views expressed herein are those of the portfolio managers as of the date of this report. Actual future results or occurrences may differ significantly from those anticipated in any forward-looking statements, and the views expressed herein are subject to change at any time, due to numerous market and other factors. The Funds disclaim any obligation to update publicly or revise any forward-looking statements or views expressed herein. |
| |
| Ratings shown are the highest rating given by one of the following national rating agencies: Standard & Poor’s, Moody’s Investors Service, Inc., or Fitch, Inc. Credit ratings are subject to change. AAA, AA, A, and BBB are investment grade ratings; BB, B, CCC, CC, C and D are below investment grade ratings. Certain bonds backed by U.S. government or agency securities are regarded as having an implied rating equal to the rating of such securities. Holdings designated N/R are not rated by these national rating agencies. |
Funds held immediately prior to the reorganizations (including for this purpose fractional Acquiring Funds shares to which shareholders would be entitled). Fractional shares were sold on the open market and shareholders received cash in lieu of such fractional shares. Holders of MuniFund Term Preferred (MTP) Shares of the Acquired Funds received on a one-for-one basis newly issued MTP Shares of the Acquiring Funds, in exchange for their MTP Shares of the Acquired Funds held immediately prior to the reorganizations.
What factors affected the U.S. economy and the national municipal bond market during the twelve-month period ended May 31, 2013?
During this reporting period, the U.S. economy’s progress toward recovery from recession continued at a moderate pace. The Federal Reserve (Fed) maintained its efforts to improve the overall economic environment by holding the benchmark fed funds rate at the record low level of zero to 0.25% that it established in December 2008. The Fed also continued its monthly purchases of $40 billion of mortgage-backed securities and $45 billion of longer-term Treasury securities in an open-ended effort to bolster growth. However, at its June 2013 meeting (subsequent to the end of this reporting period), the Central Bank indicated that downside risks to the economy had diminished since the fall of 2012. Although the Fed made no changes to its highly accommodative monetary policies at the June meeting, Chairman Bernanke’s remarks afterward indicated the Central Bank could slow the pace of its bond buying program later this year if the economy continues to improve.
As measured by gross domestic product (GDP), the U.S. economy grew at an annualized rate of 1.8% in the first quarter of 2013, compared with 0.4% for the fourth quarter of 2012, continuing the pattern of positive economic growth for the 15th consecutive quarter. The Consumer Price Index (CPI) rose 1.4% year-over-year as of May 2013, while the core CPI (which excludes food and energy) increased 1.7% during the period, staying within the Fed’s unofficial objective of 2.0% or lower for this inflation measure. Meanwhile, labor market conditions continued to slowly show signs of improvement, although unemployment remained above the Central Bank’s 6.5% target. As of May 2013, the national unemployment rate was 7.6%, down from 8.2% a year ago. The housing market, long a major weak spot in the U.S. economic recovery, also delivered some good news as the average home price in the S&P/Case-Shiller Index of 20 major metropolitan areas rose 12.1% for the twelve months ended April 2013 (most recent data available at the time this report was prepared). This marked the largest twelve-month percentage gain for the index since 2006.
However, the outlook for the U.S. economy continued to be clouded by uncertainty about global financial markets and the outcome of the “fiscal cliff.” The tax consequences of the fiscal cliff situation, which had been scheduled to become effective in January 2013, were averted through a last minute deal that raised payroll taxes, but left in place a number of tax breaks. However, lawmakers postponed and then failed to reach a resolution on $1.2 trillion in spending cuts intended to address the federal budget deficit. As a result, automatic spending cuts (or sequestration) affecting both defense and non-defense programs (excluding Social Security and Medicaid) took effect March 1, 2013, with potential implications for U.S. economic growth over the next decade. In late March 2013, Congress passed legislation that established federal funding levels for the remainder of fiscal 2013, which ends on September 30, 2013, preventing a federal government shutdown. The proposed federal budget for fiscal 2014 remains under debate.
Municipal bond prices generally rallied nationally during this period, as strong demand and tight supply combined to create favorable market conditions for municipal bonds. However, the market also encountered some additional volatility generated by the political environment, particularly the fiscal cliff at the end of 2012 and the approach of federal tax season. Although the total volume of tax-exempt supply improved over that of the same period a year earlier, the issuance pattern remained light compared with long-term historical trends and new money issuance was relatively flat. This supply/demand dynamic served as a key driver of performance. At the state level, state governments in aggregate appeared to have made good progress in dealing with budget issues. On the revenue side, state tax
collections have grown for 13 straight quarters, exceeding pre-recession levels beginning in September 2011, while on the expense side, the states made headway in cutting and controlling costs. The current low level of municipal issuance reflects the current political distaste for additional borrowing by state and local governments facing fiscal constraints and the prevalent atmosphere of municipal budget austerity. During this period, we continued to see municipal yields remain relatively low. Borrowers seeking to take advantage of the low rate environment sparked an increase in refunding activity, with approximately 50% of municipal paper issued by borrowers that were calling existing debt and refinancing at lower rates.
Over the twelve months ended May 31, 2013, municipal bond issuance nationwide totaled $376 billion, an increase of 5.2% over the issuance for the twelve-month period ended May 31, 2012. As previously mentioned, the majority of this supply was attributable to refunding issues, rather than new money issuance. During this reporting period, demand for municipal bonds remained very strong, especially from individual investors, but also from mutual funds, banks and insurance companies.
How were the economic and market conditions in Georgia, Maryland, Missouri, North Carolina and Virginia during this reporting period?
Georgia continued to recover from the recent recession during this reporting period. In 2012, the state saw its economy expand at a rate of 2.1%, compared with the national average of 2.5%, ranking Georgia 24th in the nation in terms of GDP growth by state. Job growth has picked up pace in Georgia in recent months. As of May 2013, unemployment in Georgia was 8.3%, its lowest level since December 2008, but still higher than the national rate of 7.6%. Georgia’s growth has been supported by a diverse economic base including service industries, transportation, tourism, agriculture and manufacturing. The state’s transportation capabilities include one of the world’s busiest airports (Hartsfield-Jackson Atlanta International Airport) and the Port of Savannah, a major east coast port facility. The deepening of the Port of Savannah in preparation for the Panama Canal’s expansion is expected to lead to further growth in the state’s economy by way of increasing its export business. In May 2013, Georgia adopted a $19.9 billion state budget for fiscal 2014, increasing spending by 4.6% from fiscal 2013. As of May 2013, Georgia’s general obligation debt continued to be rated Aaa and AAA with stable outlooks from both Moody’s and S&P, respectively. For the twelve months ended May 31, 2013, municipal issuance in Georgia totaled $5.2 billion, a decrease of 33% over the twelve months ended May 31, 2012.
In Maryland, the state’s credit profile remains relatively strong due to sound fiscal management and a diverse economy. In 2012, Maryland’s economy expanded at a rate of 2.4%, up significantly from the prior year. The national average was 2.5%, ranking Maryland 15th in the nation in terms of GDP growth by state. Job growth in health care and professional services has buoyed the market and has lowered the statewide unemployment as of May 30, 2013 to 6.7%. Employment in the manufacturing and financial services sectors continues to decline and Maryland’s proximity to Washington D.C. results in a greater dependency on federal employment than most states, leaving it vulnerable to federal cost cutting and reductions in government employment. The state’s largest employer is Fort George G. Meade, with more than 56,000 workers. Maryland has one of the nation’s best educated workforces, which has facilitated the development of advanced technology and the growth of public and private research facilities. Combined with the influence of the government sector and the presence of 56 universities, this has made Maryland a center for national security and medical and biomedical research. Regarding the state’s financial operations, Maryland passed its fiscal 2014 budget with a 3% increase in revenues and expenditures and an allocation to increase the state’s rainy day fund $921 million or 6% of budget. As of May 2013, Moody’s and S&P rated Maryland general obligation debt at Aaa with a negative outlook and AAA with a stable outlook, respectively. During the twelve months ended May 31, 2013, municipal issuance in the state totaled $7.3 billion, up 17% from the previous twelve-month period.
For 2012, the national recovery of 2.5% continued to outpace Missouri’s state GDP growth of 2.0%, ranking Missouri’s growth 26th among all states. Continued job losses in the government sector were offset by employment growth in the transportation, leisure and hospitality, education and health services sectors. As of May 2013, Missouri’s seasonally adjusted unemployment rate was 6.8%. Missouri’s overexposure to defense related manufacturing jobs continues to cause a drag on the state’s recovery, but efforts to transition part of the state economy away from traditional defense related manufacturing jobs into the development of biotechnology and alternative energy industries should help diversify the economy. Governor Nixon’s priority to expand exports experienced a slight step backwards with exports falling 1.4% in 2012 compared to 2011, but increases in exports to Mexico helped offset declines in exports to Canada and China. For fiscal 2014, the $25 billion Missouri state budget, which was introduced in January 2013 and sent to the Governor for approval in May 2013, focused on Medicaid expansion, job creation, increased K-12 education funding and increased higher education funding. The Governor’s budget, which contained no new taxes, also called for eliminating 190 additional state jobs, bringing total reductions to 4,500 since 2009 and resulting in the smallest state workforce since 1997. As of May 2013, Moody’s and S&P rated Missouri general obligation debt at Aaa and AAA, respectively, with stable outlooks. During the twelve months ended May 31, 2013, municipal issuance in Missouri totaled $6.2 billion, a 33.5% increase from the twelve months ended May 31, 2012.
In North Carolina, the uptick in economic growth that started at the end of 2011 has continued into 2013. In 2012, the state’s economy expanded 2.7%, compared with the national average of 2.5%, ranking North Carolina 11th in the nation in terms of GDP growth by state. The state’s manufacturing sector, once a leader in textiles, furniture and tobacco, is not expected to resume its role as a major driver in the North Carolina economy, as overseas competitors take the lead in those industries. However, the sector posted steady employment gains in 2012 by adding jobs in computer and electronic parts manufacturing. While North Carolina has worked to transition its economy away from old-line manufacturing into sectors oriented toward research, technology and services, manufacturing continues to represent 11% of the state’s jobs. At the same time, job losses in the public sector resulting from tight state budgets finally appear to be curtailed. Two of North Carolina’s top three employers include U.S. military bases (Fort Bragg and Camp Lejeune), supporting more than 110,000 workers. As of May 2013, the unemployment rate remains high at 8.8%. In the state’s housing market, single-family housing permits and starts have continued to increase each quarter since mid-2011. This is driven by population growth that is outpacing the national average and healthy demographics. According to the S&P/Case-Schiller Index of 20 major metropolitan areas, housing prices in Charlotte rose 7.3% during the twelve months ended April 2013 (most recent data available at the time this report was prepared), compared with a 12.1% price increase nationally. In June 2011, North Carolina enacted a two-year budget for fiscal 2012 and 2013. The state’s key revenue sources are personal income tax and sales tax collections. In fiscal 2012, personal income tax collections exceeded budget though sales tax collections lagged just slightly. As of May 2013, North Carolina is one of only eight states to carry a AAA rating by all three major rating agencies. During the twelve months ended May 31, 2013, municipal issuance in North Carolina totaled $8.7 billion, an increase of 55% from that issued during the twelve months ended May 31, 2012.
The economic recovery in Virginia continues at a relatively slow pace. In 2012, Virginia posted growth of 1.1%, compared with the national GDP of 2.5% for 2012, which ranked Virginia 42nd in economic growth by state. However, economic indicators pointed to an economy that’s still relatively healthy. As of May 2013, unemployment in the commonwealth fell to 5.3%, just above its lowest point since January 2009. Job growth in Virginia was led by the education and health services as well as transportation and utilities sectors but the looming effects of sequestration could hit this job market hard as federal employment and federal spending are well above average. Virginia continues to be a center for research and development facilities, with Richmond, Charlottesville and Northern Virginia forming a research triangle. In recent months, home prices in the Virginia area have risen. According to the S&P/Case-Shiller Index of 20 major metropolitan areas, the Washington D.C. area posted a 7.2% gain for the twelve months ended April 2013 (most
recent data available at the time this report was prepared), compared with a 12.1% rise in home prices nationally. Virginia’s $85 billion biennium budget for fiscal 2013 and 2014 was signed into law in May 2012. It included $34.5 billion in general fund spending and several fee increases and cuts to various state services and programs. In March 2012, Virginia passed a wide ranging pension reform measure that required full funding of the Virginia retirement system within eight years, altered benefits and contribution rates and established a hybrid defined benefit/defined contribution plan for new employees. As of May 2013, Moody’s and S&P rated Virginia general obligation debt at Aaa with a negative outlook and AAA with a stable outlook, respectively. During the twelve months ended May 31, 2013, issuance in Virginia totaled $9.6 billion, an increase of 10.6% from the previous twelve months.
What key strategies were used to manage these Funds during the twelve-month reporting period ended May 31, 2013?
During this reporting period, municipal bond prices generally rallied, as strong demand and tight supply combined to create favorable market conditions for municipal bonds. However, the municipal market also encountered some additional volatility generated by the political environment, particularly the “fiscal cliff” at the end of 2012 and the approach of federal tax season. Although the total volume of tax-exempt supply improved, the issuance pattern remained light compared with long-term historical trends. This supply/demand dynamic served as a key driver of performance. Concurrent with rising prices, yields continued to decline across most maturities, especially at the longer end of the municipal yield curve. During this period, we saw an increased number of borrowers come to market seeking to take advantage of the low rate environment through refunding activity, with approximately 50% of new municipal paper issued by borrowers that were calling existing debt and refinancing at lower rates.
In this environment, we continued to take a bottom-up approach to discovering sectors that appeared undervalued as well as individual credits that had the potential to perform well over the long term. During this reporting period, NKG and NNC found value to varying degrees in several areas of the market, including health care, water and sewer bonds, as well as multi-family and airport bonds in NKG and higher education and utility bonds in NNC. NOM and NMY added local general obligations (GO) credits. NMY also added transportation and dedicated tax bonds. In NPV, we continued to add to our positions in the transportation sector, including bonds issued by the Virginia Small Business Financing Authority for the Elizabeth River Crossing. In North Carolina, the health care sector was the predominant issuer during this time, offering attractive opportunities from a number of hospitals across the state, with credit quality of A and BBB and intermediate and longer maturities.
During this period, we emphasized bonds with longer maturities. The purchase of longer maturity bonds helped to extend the Funds’ durations, and enabled us to take advantage of more attractive yields at the longer end of the municipal yield curve. We also purchased lower rated bonds when we found attractive opportunities, as we believed these bonds continued to offer relative value. Our opportunities were somewhat constrained by the structure of bonds typically issued as part of refinancing deals, which tended to be characterized by shorter maturities and higher quality. During the second half of the reporting period, NMY and NPV generally focused on the shorter and intermediate end of the yield curve with the goal of positioning these two Funds slightly more conservatively.
Because the issuance of new municipal supply in the primary market continued to be sporadic, especially in Georgia and North Carolina, we looked to the secondary market as an additional source of attractive opportunities. When in-state paper was scarce, NMY also purchased territorial bonds to keep the Fund as fully invested as possible, including dedicated sales tax bonds issued by the Puerto Rico Sales Tax Financing Corporation (COFINA). These territorial bonds offered higher yields, added diversification and triple exemption (i.e., exemption from federal, state and local taxes).
Cash for new purchases during this period was generated primarily by the proceeds from an increased number of bond calls resulting from the growth in refinancings. The elevated number of bond calls provided a meaningful source of liquidity, which drove much of our activity during this period as we worked to redeploy these proceeds, as well as those from maturing bonds, to keep the Funds fully invested and support their income streams. Overall, selling was minimal.
As of May 31, 2013, all of these Funds continued to use inverse floating rate securities. We employ inverse floaters for a variety of reasons, including duration management, income enhancement and total return enhancement.
How did the Funds perform during the twelve-month reporting period ended May 31, 2013?
The tables in each Fund’s Performance Overview and Holding Summaries section of this report provide total returns for the Funds for the one-year, five-year and ten-year periods ended May 31, 2013. Each Fund’s total returns are compared with performance of a corresponding market index and Lipper classification average.
For the twelve-months ended May 31, 2013, the cumulative returns on common share net asset value (NAV) for NKG, NMY and NOM exceeded the returns for their respective state’s S&P Municipal Bond Index as well as the national S&P Municipal Bond Index. For the same period NNC underperformed both the state and national S&P Municipal Bond Index, while NPV outperformed the state S&P Municipal Bond Index and performed in line with the national S&P Municipal Bond Index. For the same period, NOM outperformed the average return for the Lipper Other States Municipal Debt Funds Classification Average. NMY performed in line with the average return for the national S&P Municipal Bond Index and the Lipper Other States Municipal Debt Funds Classification Average, while the rest of the Funds underperformed. Shareholders should note that the performance of the Lipper Other States classification represents the overall average of returns for funds from ten states with a wide variety of municipal market conditions, making direct comparisons less meaningful.
Key management factors that influenced the Funds’ returns during this period included duration and yield curve positioning, credit exposure and sector allocation.
Generally speaking, credits at the longest end of the municipal yield curve posted the strongest returns, while bonds at the shortest end produced the weakest results. Duration and yield curve positioning was a net positive contributor to the performance of these Funds. These Funds benefited from being overweight in the longer part of the yield curve that performed well. However, their performance was somewhat restrained by overweightings at the underperforming shortest end of the curve, especially in NKG.
Credit exposure was another factor in the Funds’ performance during this reporting period, as lower quality bonds generally outperformed higher quality bonds. This outperformance was due in part to the greater demand for lower rated bonds as investors looked for investment vehicles offering higher yields. As investors became more comfortable taking on additional investment risk, credit spreads, or the difference in yield spreads between U.S. Treasury securities and comparable investments such as municipal bonds, narrowed through a variety of rating categories. As a result of this spread compression, the Funds generally benefited from their holdings of lower rated credits, with NKG, NMY, NOM and NPV having an overweight in bonds rated BBB. NKG and NOM were also helped by being underweighted in the underperforming AAA quality sector. NNC and NPV had a higher allocation to AAA/AA quality sectors, while NNC also had a lower allocation to the better performing BBB quality sector, which slightly detracted from performance.
During this period, revenue bonds as a whole outperformed the general municipal market. Holdings that generally made positive contributions to the Funds’ returns included health care (together with hospitals), education and certain transportation bonds. In particular, NNC’s overweight in toll roads was positive for performance, while NKG benefited from its pre-paid gas credits. NOM was positively impacted by its holdings in the health care sector. During this period,
tobacco credits backed by the 1998 master tobacco settlement agreement, as well as Puerto Rico backed tobacco credits, also performed well. NMY and NPV benefited from their holdings of tobacco credits as these bonds continued to perform well. NPV’s Virginia Small Business Financing Authority for the Elizabeth River Crossing positively contributed to performance as well.
In contrast, pre-refunded bonds, which are often backed by U.S. Treasury securities, were among the poorest performing market segments during this period. The under-performance of these bonds can be attributed primarily to their shorter effective maturities and higher credit quality. NNC, NKG and NOM had a heavier weighting in pre-refunded bonds, which detracted from their performance for the period. We continued to hold these pre-refunded bonds in our portfolios due to the higher yields they provided. In addition, GO bonds lagged the performance of the general municipal market for this period. NKG benefited from being underweight GO bonds.
Shareholders also should be aware of issues impacting some of the Funds’ non-state holdings. In December 2012, Moody’s downgraded Puerto Rico GO bonds to Baa3 from Baa1 based on Puerto Rico’s ongoing economic problems, unfunded pension liabilities, elevated debt levels and structural budget gaps. In addition, during July 2012, bonds issued by the Puerto Rico Sales Tax Financing Corporation (COFINA) also were downgraded by Moody’s to Aa3 from Aa2. The downgrade of the COFINA bonds was due mainly to the performance of Puerto Rico’s economy and its impact on the projected growth of sales tax revenues. In addition, the COFINA bonds were able to maintain a higher rating than the GOs because, unlike the revenue streams supporting some Puerto Rican issues, the sales taxes supporting the COFINA bonds cannot be diverted and used to support the commonwealth’s GO bonds. NMY, NPV and NOM have exposure to Puerto Rico bonds, the majority of which had lower duration risk than their respective index. The Funds were also underweight their allocation to Puerto Rico bonds versus their index. As a result, the Funds’ Puerto Rico holdings positively contributed to performance.
Fund Leverage
IMPACT OF THE FUNDS’ LEVERAGE STRATEGIES ON PERFORMANCE
One important factor impacting the returns of all these Funds relative to the comparative indexes was the Funds’ use of leverage. The Funds use leverage because their managers believe that, over time, leveraging provides opportunities for additional income and total return for common shareholders. However, use of leverage also can expose common shareholders to additional volatility. For example, as the prices of securities held by a Fund decline, the negative impact of these valuation changes on common share net asset value and common shareholder total return is magnified by the use of leverage. Conversely, leverage may enhance common share returns during periods when the prices of securities held by a Fund generally are arising. Leverage made a positive contribution to the performance of NKG, NMY, NOM and NPV, but detracted modestly from the performance of NNC over this reporting period.
As of May 31, 2013, the Funds’ percentages of effective and regulatory leverage are shown in the accompanying table.
| | | | | | | | |
| | | | Effective | | | Regulatory | |
| | | | Leverage | * | | Leverage | * |
| NKG | | | 35.27 | % | | 32.76 | % |
| NMY | | | 34.18 | % | | 30.69 | % |
| NOM | | | 37.15 | % | | 34.46 | % |
| NNC | | | 37.42 | % | | 33.43 | % |
| NPV | | | 36.23 | % | | 31.59 | % |
| * | Effective Leverage is a Fund’s effective economic leverage, and includes both regulatory leverage and the leverage effects of certain derivative and other investments in a Fund’s portfolio that increase the Fund’s investment exposure. Currently, the leverage effects of Tender Option Bond (TOB) inverse floater holdings are included in effective leverage values, in addition to any regulatory leverage. Regulatory leverage consists of preferred shares issued or borrowings of a Fund. Both of these are part of a Fund’s capital structure. Regulatory leverage is sometimes referred to as “40 Act Leverage” and is subject to asset coverage limits set forth in the Investment Company Act of 1940. |
THE FUNDS’ REGULATORY LEVERAGE
As of May 31, 2013, the Funds have issued and outstanding MTP Shares as shown in the accompanying table.
| | | | | | | | | | | | | | |
| | | | | MTP Shares Issued | | | Annual | | NYSE/NYSE | |
| Fund | | | Series | At Liquidation Value | | | Interest Rate | | MKT Ticker | |
| Georgia | | | | | | | | | | | | | |
| NKG | | | 2015 | | $ | 32,265,000 | | | 2.65 | % | | NKG PrC | |
| | | | 2015-1 | * | $ | 28,340,000 | | | 2.65 | % | | NKG PrD | |
| | | | 2015-2 | * | $ | 14,340,000 | | | 2.65 | % | | NKG PrE | |
| Maryland | | | | | | | | | | | | | |
| NMY | | | 2015 | | $ | 38,775,000 | | | 2.65 | % | | NMY PrC | |
| | | | 2016 | | $ | 35,818,000 | | | 2.90 | % | | NMY PrD | |
| | | | 2015 | * | $ | 26,485,000 | | | 2.60 | % | | NMY PrE | |
| | | | 2015-1 | * | $ | 27,300,000 | | | 2.60 | % | | NMY PrF | |
| | | | 2015-1 | * | $ | 20,700,000 | | | 2.65 | % | | NMY PrG | |
| | | | 2016 | * | $ | 17,066,000 | | | 2.85 | % | | NMY PrH | |
| * | MTP Shares issued in connection with the reorganization. |
| | | | | MTP Shares Issued | | | Annual | | NYSE/NYSE | |
| Fund | | | Series | At Liquidation Value | | | Interest Rate | | MKT Ticker | |
| Missouri | | | | | | | | | | | | | |
| NOM | | | 2015 | | $ | 17,800,000 | | | 2.10 | % | | NOM PrC | |
| North Carolina | | | | | | | | | | | | | |
| NNC | | | 2015 | | $ | 24,300,000 | | | 2.65 | % | | NNC PrC | |
| | | | 2016 | | $ | 25,535,000 | | | 2.60 | % | | NNC PrD | |
| | | | 2015 | * | $ | 16,600,000 | | | 2.60 | % | | NNC PrE | |
| | | | 2015-1 | * | $ | 29,700,000 | | | 2.60 | % | | NNC PrF | |
| | | | 2015-1 | * | $ | 28,725,000 | | | 2.65 | % | | NNC PrG | |
| Virginia | | | | | | | | | | | | | |
| NPV | | | 2014 | | $ | 29,203,000 | | | 2.25 | % | | NPV PrA | |
| | | | 2015 | | $ | 32,205,000 | | | 2.65 | % | | NPV PrC | |
| | | | 2014 | * | $ | 22,800,000 | | | 2.80 | % | | NPV PrD | |
| | | | 2014-1 | * | $ | 43,200,000 | | | 2.80 | % | | NPV PrE | |
| * | MTP Shares issued in connection with the reorganization. |
Refinancing of MTP Shares
During July 2013 (subsequent to the close of this reporting period), the Funds’ Board of Trustees approved NPV’s plans to redeem at their $10.00 liquidation value per share, plus an additional amount representing any dividend amounts owed, the shares of all series of their MTP Shares with the proceeds of newly issued Variable Rate Demand Preferred (VRDP) shares, subject to completion of all aspects of VRDP share placement, which may not occur as planned. NPV intends to offer VRDP shares to qualified institutional buyers in a private offering pursuant to Rule 144A of the Securities Act of 1933, and to complete the MTP refinancing before October 1, 2013.
Refer to Notes to Financial Statements, Footnote 1 – General Information and Significant Accounting Policies for further details on MTP Shares.
Common Share Information
COMMON SHARE DIVIDEND INFORMATION
During the current reporting period ended May 31, 2013, the Funds’ monthly dividends to common shareholders were shown in the accompanying table.
| | | Per Common Share Amounts |
| | | | NKG | | | NMY | | | NOM | | | NNC | | | NPV | |
| June | | $ | 0.0560 | | $ | 0.0645 | | $ | 0.0610 | | $ | 0.0570 | | $ | 0.0645 | |
| July | | | 0.0560 | | | 0.0645 | | | 0.0610 | | | 0.0571 | | | 0.0645 | |
| August | | | 0.0575 | | | 0.0645 | *** | | 0.0610 | | | 0.0590 | | | 0.0645 | **** |
| September | | | 0.0575 | | | 0.0645 | *** | | 0.0610 | | | 0.0590 | | | 0.0645 | **** |
| October | | | 0.0575 | | | 0.0675 | | | 0.0610 | | | 0.0590 | | | 0.0660 | |
| November | | | 0.0575 | | | 0.0675 | | | 0.0610 | | | 0.0590 | | | 0.0660 | |
| December | | | 0.0560 | | | 0.0640 | | | 0.0610 | | | 0.0550 | | | 0.0620 | |
| January | | | 0.0560 | | | 0.0640 | | | 0.0610 | | | 0.0550 | | | 0.0620 | |
| February | | | 0.0560 | | | 0.0640 | | | 0.0610 | | | 0.0550 | | | 0.0620 | |
| March | | | 0.0535 | | | 0.0605 | | | 0.0610 | | | 0.0503 | | | 0.0595 | |
| April | | | 0.0535 | | | 0.0605 | | | 0.0610 | | | 0.0503 | | | 0.0595 | |
| May | | | 0.0535 | | | 0.0605 | | | 0.0610 | | | 0.0503 | | | 0.0595 | |
| | | | | | | | | | | | | | | | | |
| Long-Term Capital Gain* | | | — | | | — | | | — | | | — | | $ | 0.0153 | |
| Short-Term Capital Gain* | | | — | | | — | | | — | | | — | | $ | 0.0016 | |
| Ordinary Income Distribution* | | | — | | | — | | | — | | | — | | $ | 0.0012 | |
| | | | | | | | | | | | | | | | | |
| Market Yield** | | | 4.79 | % | | 5.25 | % | | 4.56 | % | | 4.35 | % | | 4.99 | % |
| Taxable-Equivalent Yield** | | | 7.08 | % | | 7.72 | % | | 6.74 | % | | 6.55 | % | | 7.35 | % |
| * | Distribution paid in December 2012. |
| | |
| ** | Market Yield is based on the Fund’s current annualized monthly dividend divided by the Fund’s current market price as of the end of the reporting period. Taxable-Equivalent Yield represents the yield that must be earned on a fully taxable investment in order to equal the yield of the Fund on an after-tax basis. It is based on a combined federal and state income tax rate of 32.3%, 32.0%, 32.3%, 33.6% and 32.10% for Georgia, Maryland, Missouri, North Carolina and Virginia, respectively. When comparing a Fund to investments that generate qualified dividend income, the Taxable-Equivalent Yield is lower. |
| | |
| *** | In connection with the Fund’s Reorganization, the Fund had dividends of $0.0207 and $0.0438 per Common share with ex-dividend dates of August 1, 2012, and August 14, 2012, respectively, both payable on October 1, 2012. These distributions were in addition to the Fund’s monthly tax-free dividend of $0.0645 with an ex-dividend date of August 1, 2012 that was payable September 4, 2012. |
| | |
| **** | In connection with the Fund’s Reorganization, the Fund had dividends of $0.0457 and $0.0188 per Common share with ex-dividend dates of August 1, 2012, and August 14, 2012, respectively, both payable on October 1, 2012. These distributions were in addition to the Fund’s monthly tax-free dividend of $0.0645 with an ex-dividend date of August 1, 2012 that was payable September 4, 2012. |
All of the Funds in this report seek to pay stable dividends at rates that reflect each Fund’s past results and projected future performance. During certain periods, each Fund may pay dividends at a rate that may be more or less than the amount of net investment income actually earned by the Fund during the period. If a Fund has cumulatively earned more than it has paid in dividends, it holds the excess in reserve as undistributed net investment income (UNII) as part of the Fund’s NAV. Conversely, if a Fund has cumulatively paid dividends in excess of its earnings, the excess
constitutes negative UNII that is likewise reflected in the Fund’s NAV. Each Fund will, over time, pay all of its net investment income as dividends to shareholders. As of May 31, 2013, all of these Funds had positive UNII balances for tax purposes and for financial reporting purposes.
COMMON SHARE EQUITY SHELF PROGRAM
During March 2013, NPV filed a preliminary prospectus with the Securities and Exchange Commission (SEC) for an equity shelf program, pursuant to which the Fund may issue an additional 1,700,000 common shares. As of the time this report was prepared, this equity shelf program was not yet effective.
Refer to Notes to Financial Statements, Footnote 1 — General Information and Significant Accounting Policies for further details on the Fund’s equity shelf program.
COMMON SHARE REPURCHASES
Since the inception of the Funds’ repurchase programs, the Funds have not repurchased any of their outstanding common shares.
COMMON SHARE OTHER INFORMATION
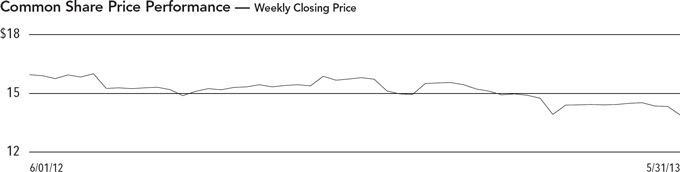
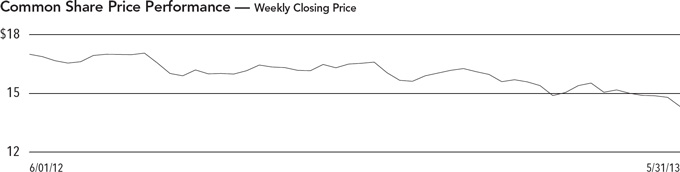
As of May 31, 2013, and during the current reporting period, the Funds’ common share prices were trading at a premium/(discount) to their common share NAVs as shown in the accompanying table.
| | | | NKG | | | NMY | | | NOM | | | NNC | | | NPV | |
| Common Share NAV | | $ | 14.58 | | $ | 15.56 | | $ | 14.61 | | $ | 15.02 | | $ | 15.38 | |
| Common Share Price | | $ | 13.39 | | $ | 13.82 | | $ | 16.04 | | $ | 13.88 | | $ | 14.32 | |
| Premium/(Discount) to NAV | | | -8.16 | % | | -11.18 | % | | 9.79 | % | | -7.59 | % | | -6.89 | % |
| 12-Month Average Premium/(Discount) to NAV | | | -1.05 | % | | -2.68 | % | | 15.06 | % | | -1.61 | % | | -2.16 | % |
Risk Considerations
Fund shares are not guaranteed or endorsed by any bank or other insured depository institution, and are not federally insured by the Federal Deposit Insurance Corporation. Past performance is no guarantee of future results. Fund common shares are subject to a variety of risks, including:
Investment, Price and Market Risk. An investment in shares is subject to investment risk, including the possible loss of the entire principal amount that you invest. Your investment in shares represents an indirect investment in the municipal securities owned by the Fund, which generally trade in the over-the-counter markets. Shares of closed-end investment companies like these Funds frequently trade at a discount to their net asset value (NAV). Your shares at any point in time may be worth less than your original investment, even after taking into account the reinvestment of Fund dividends and distributions.
Tax Risk. The tax treatment of Fund distributions may be affected by new IRS interpretations of the Internal Revenue Code and future changes in tax laws and regulations.
Issuer Credit Risk. This is the risk that a security in a Fund’s portfolio will fail to make dividend or interest payments when due.
Interest Rate Risk. Fixed-income securities such as bonds, preferred, convertible and other debt securities will decline in value if market interest rates rise.
Reinvestment Risk. If market interest rates decline, income earned from a Fund’s portfolio may be reinvested at rates below that of the original bond that generated the income.
Call Risk or Prepayment Risk. Issuers may exercise their option to prepay principal earlier than scheduled, forcing a Fund to reinvest in lower-yielding securities.
Inverse Floater Risk. The Funds may invest in inverse floaters. Due to their leveraged nature, these investments can greatly increase a Fund’s exposure to interest rate risk and credit risk. In addition, investments in inverse floaters involve the risk that the Fund could lose more than its original principal investment.
Leverage Risk. Each Fund’s use of leverage creates the possibility of higher volatility for the Fund’s per share NAV, market price, distributions and returns. There is no assurance that a Fund’s leveraging strategy will be successful.
Nuveen Georgia Dividend Advantage Municipal Fund 2 (NKG)
Performance Overview and Holding Summaries as of May 31, 2013
Average Annual Total Returns as of May 31, 2013
| | Average Annual |
| | 1-Year | 5-Year | 10-Year |
| NKG at Common Share NAV | 3.68% | 6.00% | 4.76% |
| NKG at Common Share Price | (4.83)% | 5.58% | 4.10% |
| S&P Municipal Bond Georgia Index | 3.12% | 5.27% | 4.45% |
| S&P Municipal Bond Index | 3.62% | 5.71% | 4.80% |
| Lipper Other States Municipal Debt Funds Classification Average | 4.17% | 7.02% | 5.43% |
Past performance is not predictive of future results. Current performance may be higher or lower than the data shown. Returns do not reflect the deduction of taxes that shareholders may have to pay on Fund distributions or upon the sale of Fund shares. Comparative index and Lipper return information is provided for the Fund’s shares at NAV only. Indexes and Lipper averages are not available for direct investment.
Portfolio Composition1 | |
| (as a % of total investments) | |
| Tax Obligation/General | 20.7% |
| Tax Obligation/Limited | 17.4% |
| Water and Sewer | 15.6% |
| Health Care | 11.6% |
| Education and Civic Organizations | 9.6% |
| Utilities | 6.8% |
| Transportation | 5.2% |
| Other | 13.1% |
Credit Quality1,2,3 | |
| (as a % of total investment exposure) | |
| AAA/U.S. Guaranteed | 13.7% |
| AA | 45.3% |
| A | 22.9% |
| BBB | 10.4% |
| BB or Lower | 3.4% |
| N/R | 2.7% |
Refer to the Glossary of Terms Used in this Report for further definition of the terms used within this page.
| 1 | Holdings are subject to change. |
| 2 | Ratings shown are the highest rating given by one of the following national rating agencies: Standard & Poor’s Group, Moody’s Investors Service, Inc. or Fitch, Inc. Credit ratings are subject to change. AAA, AA, A and BBB are investment grade ratings; BB, B, CCC, CC, C and D are below investment grade ratings. Certain bonds backed by U.S. Government or agency securities are regarded as having an implied rating equal to the rating of such securities. Holdings designated N/R are not rated by these national rating agencies. |
| 3 | Percentages may not add up to 100% due to the exclusion of Other Assets Less Liabilities from the table. |
Nuveen Maryland Premium Income Municipal Fund (NMY)
Performance Overview and Holding Summaries as of May 31, 2013
Average Annual Total Returns as of May 31, 2013
| | Average Annual |
| | 1-Year | 5-Year | 10-Year |
| NMY at Common Share NAV | 4.18% | 7.15% | 5.64% |
| NMY at Common Share Price | (7.10)% | 6.58% | 3.14% |
| S&P Municipal Bond Maryland Index | 2.54% | 5.12% | 4.39% |
| S&P Municipal Bond Index | 3.62% | 5.71% | 4.80% |
| Lipper Other States Municipal Debt Funds Classification Average | 4.17% | 7.02% | 5.43% |
Past performance is not predictive of future results. Current performance may be higher or lower than the data shown. Returns do not reflect the deduction of taxes that shareholders may have to pay on Fund distributions or upon the sale of Fund shares. Comparative index and Lipper return information is provided for the Fund’s shares at NAV only. Indexes and Lipper averages are not available for direct investment.
Portfolio Composition1 | |
| (as a % of total investments) | |
| Health Care | 21.2% |
| Tax Obligation/Limited | 16.3% |
| U.S. Guaranteed | 15.0% |
| Education and Civic Organizations | 7.8% |
| Tax Obligation/General | 7.7% |
| Housing/Single Family | 6.4% |
| Consumer Staples | 5.5% |
| Transportation | 3.9% |
| Long-Term Care | 3.8% |
| Other | 12.4% |
Credit Quality1,2,3 | |
| (as a % of total investment exposure) | |
| AAA/U.S. Guaranteed | 24.1% |
| AA | 23.7% |
| A | 20.3% |
| BBB | 18.3% |
| BB or Lower | 8.6% |
| N/R | 4.0% |
Refer to the Glossary of Terms Used in this Report for further definition of the terms used within this page.
| 1 | Holdings are subject to change. |
| 2 | Ratings shown are the highest rating given by one of the following national rating agencies: Standard & Poor’s Group, Moody’s Investors Service, Inc. or Fitch, Inc. Credit ratings are subject to change. AAA, AA, A and BBB are investment grade ratings; BB, B, CCC, CC, C and D are below investment grade ratings. Certain bonds backed by U.S. Government or agency securities are regarded as having an implied rating equal to the rating of such securities. Holdings designated N/R are not rated by these national rating agencies. |
| 3 | Percentages may not add up to 100% due to the exclusion of Other Assets Less Liabilities from the table. |
Nuveen Missouri Premium Income Municipal Fund (NOM)
Performance Overview and Holding Summaries as of May 31, 2013
Average Annual Total Returns as of May 31, 2013
| | Average Annual |
| | 1-Year | 5-Year | 10-Year |
| NOM at Common Share NAV | 4.98% | 7.17% | 5.17% |
| NOM at Common Share Price | (0.67)% | 6.95% | 4.73% |
| S&P Municipal Bond Missouri Index | 3.36% | 5.74% | 4.87% |
| S&P Municipal Bond Index | 3.62% | 5.71% | 4.80% |
| Lipper Other States Municipal Debt Funds Classification Average | 4.17% | 7.02% | 5.43% |
Past performance is not predictive of future results. Current performance may be higher or lower than the data shown. Returns do not reflect the deduction of taxes that shareholders may have to pay on Fund distributions or upon the sale of Fund shares. Comparative index and Lipper return information is provided for the Fund’s shares at NAV only. Indexes and Lipper averages are not available for direct investment.
Portfolio Composition1 | |
| (as a % of total investments) | |
| Health Care | 17.9% |
| Tax Obligation/Limited | 16.5% |
| Water and Sewer | 11.8% |
| Education and Civic Organizations | 11.3% |
| Tax Obligation/General | 11.0% |
| Transportation | 8.5% |
| Long-Term Care | 8.3% |
| U.S. Guaranteed | 6.4% |
| Other | 8.3% |
Credit Quality1,2,3 | |
| (as a % of total investment exposure) | |
| AAA/U.S. Guaranteed | 7.8% |
| AA | 36.7% |
| A | 28.6% |
| BBB | 17.7% |
| N/R | 6.2% |
Refer to the Glossary of Terms Used in this Report for further definition of the terms used within this page.
| 1 | Holdings are subject to change. |
| 2 | Ratings shown are the highest rating given by one of the following national rating agencies: Standard & Poor’s Group, Moody’s Investors Service, Inc. or Fitch, Inc. Credit ratings are subject to change. AAA, AA, A and BBB are investment grade ratings; BB, B, CCC, CC, C and D are below investment grade ratings. Certain bonds backed by U.S. Government or agency securities are regarded as having an implied rating equal to the rating of such securities. Holdings designated N/R are not rated by these national rating agencies. |
| 3 | Percentages may not add up to 100% due to the exclusion of Other Assets Less Liabilities from the table. |
Nuveen North Carolina Premium Income Municipal Fund (NNC)
Performance Overview and Holding Summaries as of May 31, 2013
Average Annual Total Returns as of May 31, 2013
| | Average Annual |
| | 1-Year | 5-Year | 10-Year |
| NNC at Common Share NAV | 2.50% | 6.39% | 4.91% |
| NNC at Common Share Price | (9.16)% | 5.88% | 3.08% |
| S&P Municipal Bond North Carolina Index | 2.63% | 5.47% | 4.67% |
| S&P Municipal Bond Index | 3.62% | 5.71% | 4.80% |
| Lipper Other States Municipal Debt Funds Classification Average | 4.17% | 7.02% | 5.43% |
Past performance is not predictive of future results. Current performance may be higher or lower than the data shown. Returns do not reflect the deduction of taxes that shareholders may have to pay on Fund distributions or upon the sale of Fund shares. Comparative index and Lipper return information is provided for the Fund’s shares at NAV only. Indexes and Lipper averages are not available for direct investment.
Portfolio Composition1 | |
| (as a % of total investments) | |
| Health Care | 22.5% |
| Water and Sewer | 20.1% |
| U.S. Guaranteed | 14.4% |
| Tax Obligation/Limited | 11.5% |
| Transportation | 10.1% |
| Education and Civic Organizations | 7.8% |
| Utilities | 6.1% |
| Other | 7.5% |
Credit Quality1,2,3 | |
| (as a % of total investment exposure) | |
| AAA/U.S. Guaranteed | 30.1% |
| AA | 41.4% |
| A | 18.7% |
| BBB | 4.5% |
| N/R | 2.5% |
Refer to the Glossary of Terms Used in this Report for further definition of the terms used within this page.
| 1 | Holdings are subject to change. |
| 2 | Ratings shown are the highest rating given by one of the following national rating agencies: Standard & Poor’s Group, Moody’s Investors Service, Inc. or Fitch, Inc. Credit ratings are subject to change. AAA, AA, A and BBB are investment grade ratings; BB, B, CCC, CC, C and D are below investment grade ratings. Certain bonds backed by U.S. Government or agency securities are regarded as having an implied rating equal to the rating of such securities. Holdings designated N/R are not rated by these national rating agencies. |
| 3 | Percentages may not add up to 100% due to the exclusion of Other Assets Less Liabilities from the table. |
Nuveen Virginia Premium Income Municipal Fund (NPV)
Performance Overview and Holding Summaries as of May 31, 2013
Average Annual Total Returns as of May 31, 2013
| | Average Annual |
| | 1-Year | 5-Year | 10-Year |
| NPV at Common Share NAV | 3.56% | 6.93% | 5.29% |
| NPV at Common Share Price | (11.76)% | 5.94% | 3.34% |
| S&P Municipal Bond Virginia Index | 2.97% | 5.08% | 4.55% |
| S&P Municipal Bond Index | 3.62% | 5.71% | 4.80% |
| Lipper Other States Municipal Debt Funds Classification Average | 4.17% | 7.02% | 5.43% |
Past performance is not predictive of future results. Current performance may be higher or lower than the data shown. Returns do not reflect the deduction of taxes that shareholders may have to pay on Fund distributions or upon the sale of Fund shares. Comparative index and Lipper return information is provided for the Fund’s shares at NAV only. Indexes and Lipper averages are not available for direct investment.
Portfolio Composition1 | |
| (as a % of total investments) | |
| Tax Obligation/Limited | 23.4% |
| Health Care | 15.5% |
| U.S. Guaranteed | 13.2% |
| Transportation | 12.7% |
| Tax Obligation/General | 7.8% |
| Education and Civic Organizations | 5.9% |
| Long-Term Care | 5.8% |
| Consumer Staples | 5.7% |
| Other | 10.0% |
Credit Quality1,2,3 | |
| (as a % of total investment exposure) | |
| AAA/U.S. Guaranteed | 26.0% |
| AA | 30.0% |
| A | 12.8% |
| BBB | 21.8% |
| BB or Lower | 4.6% |
| N/R | 3.4% |
Refer to the Glossary of Terms Used in this Report for further definition of the terms used within this page.
| 1 | Holdings are subject to change. |
| 2 | Ratings shown are the highest rating given by one of the following national rating agencies: Standard & Poor’s Group, Moody’s Investors Service, Inc. or Fitch, Inc. Credit ratings are subject to change. AAA, AA, A and BBB are investment grade ratings; BB, B, CCC, CC, C and D are below investment grade ratings. Certain bonds backed by U.S. Government or agency securities are regarded as having an implied rating equal to the rating of such securities. Holdings designated N/R are not rated by these national rating agencies. |
| 3 | Percentages may not add up to 100% due to the exclusion of Other Assets Less Liabilities from the table. |
| NKG | | Shareholder Meeting Report |
| NNC | | The annual meeting of shareholders was held in the offices of Nuveen Investments on November 14, 2012; at this meeting the shareholders were asked to vote on the election of Board Members. The meeting was subsequently adjourned to December 14, 2012. Further information from the January 31, 2012 shareholder meeting for NNC and NKG and May 17, 2012 shareholder meeting for NPV and NMY to approve the issuance of additional common shares in connection with each Reorganization is included. |
| | | NKG | | NNC | |
| | | | | | | | | | | | | | | | | | | | |
| | | Common and | | | | | | | | Common and | | | | | | | |
| | | Preferred shares | | Preferred Shares | | | | | Preferred shares | | Preferred shares | | | | |
| | | voting together | | voting together | | Common | | voting together | | voting together | | Common | |
| | | | as a class | | | as a class | | | Shares | | | as a class | | | as a class | | | Shares | |
| To approve the issuance of additional common shares in connection with each Reorganization. | | | | | | | | | | | | | | | | | | | |
| For | | | — | | | — | | | 2,303,616 | | | — | | | — | | | 3,775,530 | |
| Against | | | — | | | — | | | 217,161 | | | — | | | — | | | 179,156 | |
| Abstain | | | — | | | — | | | 106,744 | | | — | | | — | | | 144,758 | |
| Broker Non-Votes | | | — | | | — | | | 582,756 | | | — | | | — | | | 843,037 | |
| Total | | | — | | | — | | | 3,210,277 | | | — | | | — | | | 4,942,481 | |
| Approval of the Board Members was reached as follows: | | | | | | | | | | | | | | | | | | | |
| Robert P. Bremner | | | | | | | | | | | | | | | | | | | |
| For | | | 16,850,255 | | | — | | | — | | | 26,418,361 | | | — | | | — | |
| Withhold | | | 541,089 | | | — | | | — | | | 927,600 | | | — | | | — | |
| Total | | | 17,391,344 | | | — | | | — | | | 27,345,961 | | | — | | | — | |
| Jack B. Evans | | | | | | | | | | | | | | | | | | | |
| For | | | 16,854,415 | | | — | | | — | | | 26,472,550 | | | — | | | — | |
| Withhold | | | 536,929 | | | — | | | — | | | 873,411 | | | — | | | — | |
| Total | | | 17,391,344 | | | — | | | — | | | 27,345,961 | | | — | | | — | |
| William C. Hunter | | | | | | | | | | | | | | | | | | | |
| For | | | — | | | 7,035,728 | | | — | | | — | | | 11,229,078 | | | — | |
| Withhold | | | — | | | 274,562 | | | — | | | — | | | 2,291,367 | | | — | |
| Total | | | — | | | 7,310,290 | | | — | | | — | | | 13,520,445 | | | — | |
| William J. Schneider | | | | | | | | | | | | | | | | | | | |
| For | | | — | | | 7,035,728 | | | — | | | — | | | 11,227,478 | | | — | |
| Withhold | | | — | | | 274,562 | | | — | | | — | | | 292,967 | | | — | |
| Total | | | — | | | 7,310,290 | | | — | | | — | | | 11,520,445 | | | — | |
| | | NMY | | NPV | |
| | | | | | | | | | | | | | | | | | | | |
| | | Common and | | | | | | | | Common and | | | | | | | |
| | | Preferred shares | | Preferred Shares | | | | | Preferred shares | | Preferred shares | | | | |
| | | voting together | | voting together | | Common | | voting together | | voting together | | Common | |
| | | | as a class | | | as a class | | | Shares | | | as a class | | | as a class | | | Shares | |
| To approve the issuance of additional common shares in connection with each Reorganization. | | | | | | | | | | | | | | | | | | | |
| For | | | — | | | — | | | 5,730,888 | | | — | | | — | | | 5,178,155 | |
| Against | | | — | | | — | | | 385,894 | | | — | | | — | | | 193,166 | |
| Abstain | | | — | | | — | | | 219,708 | | | — | | | — | | | 206,146 | |
| Broker Non-Votes | | | — | | | — | | | — | | | — | | | — | | | — | |
| Total | | | — | | | — | | | 6,336,490 | | | — | | | — | | | 5,577,467 | |
| Approval of the Board Members was reached as follows: | | | | | | | | | | | | | | | | | | | |
| Robert P. Bremner | | | | | | | | | | | | | | | | | | | |
| For | | | 38,473,790 | | | — | | | — | | | 26,984,965 | | | — | | | — | |
| Withhold | | | 747,638 | | | — | | | — | | | 997,116 | | | — | | | — | |
| Total | | | 39,221,428 | | | — | | | — | | | 27,982,081 | | | — | | | — | |
| Jack B. Evans | | | | | | | | | | | | | | | | | | | |
| For | | | 38,480,518 | | | — | | | — | | | 26,996,355 | | | — | | | — | |
| Withhold | | | 740,910 | | | — | | | — | | | 985,726 | | | — | | | — | |
| Total | | | 39,221,428 | | | — | | | — | | | 27,982,081 | | | — | | | — | |
| William C. Hunter | | | | | | | | | | | | | | | | | | | |
| For | | | — | | | 15,842,099 | | | — | | | — | | | 11,323,196 | | | — | |
| Withhold | | | — | | | 404,208 | | | — | | | — | | | 602,462 | | | — | |
| Total | | | — | | | 16,246,307 | | | — | | | — | | | 11,925,658 | | | — | |
| William J. Schneider | | | | | | | | | | | | | | | | | | | |
| For | | | — | | | 15,842,099 | | | — | | | — | | | 11,316,670 | | | — | |
| Withhold | | | — | | | 404,208 | | | — | | | — | | | 608,988 | | | — | |
| Total | | | — | | | 16,246,307 | | | — | | | — | | | 11,925,658 | | | — | |
| | | Shareholder Meeting Report (continued) |
| NOM | | |
| | | |
| | | NOM | |
| | | Common and | | | | |
| | | | Preferred | | | | |
| | | | shares voting | | | | |
| | | | together | | | Preferred | |
| | | | as a class | | | shares | |
| To approve the issuance of additional common shares in connection with each Reorganization. | | | | | | | |
| For | | | — | | | — | |
| Against | | | — | | | — | |
| Abstain | | | — | | | — | |
| Broker Non-Votes | | | — | | | — | |
| Total | | | — | | | — | |
| Approval of the Board Members was reached as follows: | | | | | | | |
| Robert P. Bremner | | | — | | | — | |
| For | | | 3,614,918 | | | — | |
| Withhold | | | 159,507 | | | — | |
| Total | | | 3,774,425 | | | — | |
| Jack B. Evans | | | | | | | |
| For | | | 3,621,209 | | | — | |
| Withhold | | | 153,216 | | | — | |
| Total | | | 3,774,425 | | | — | |
| William C. Hunter | | | | | | | |
| For | | | — | | | 1,570,672 | |
| Withhold | | | — | | | 105,775 | |
| Total | | | — | | | 1,676,447 | |
| William J. Schneider | | | | | | | |
| For | | | — | | | 1,570,672 | |
| Withhold | | | — | | | 105,775 | |
| Total | | | — | | | 1,676,447 | |
Report of Independent
Registered Public Accounting Firm
The Board of Trustees and Shareholders
Nuveen Georgia Dividend Advantage Municipal Fund 2
Nuveen Maryland Premium Income Municipal Fund
Nuveen Missouri Premium Income Municipal Fund
Nuveen North Carolina Premium Income Municipal Fund
Nuveen Virginia Premium Income Municipal Fund
We have audited the accompanying statements of assets and liabilities, including the portfolios of investments, of Nuveen Georgia Dividend Advantage Municipal Fund 2, Nuveen Maryland Premium Income Municipal Fund, Nuveen Missouri Premium Income Municipal Fund, Nuveen North Carolina Premium Income Municipal Fund, and Nuveen Virginia Premium Income Municipal Fund (the “Funds”) as of May 31, 2013, and the related statements of operations and cash flows for the year then ended, the statements of changes in net assets for each of the two years in the period then ended, and the financial highlights for each of the five years in the period then ended. These financial statements and financial highlights are the responsibility of the Funds’ management. Our responsibility is to express an opinion on these financial statements and financial highlights based on our audits.
We conducted our audits in accordance with the standards of the Public Company Accounting Oversight Board (United States). Those standards require that we plan and perform the audits to obtain reasonable assurance about whether the financial statements and financial highlights are free of material misstatement. We were not engaged to perform an audit of the Funds’ internal control over financial reporting. Our audits included consideration of internal control over financial reporting as a basis for designing audit procedures that are appropriate in the circumstances, but not for the purpose of expressing an opinion on the effectiveness of the Funds’ internal control over financial reporting. Accordingly, we express no such opinion. An audit also includes examining, on a test basis, evidence supporting the amounts and disclosures in the financial statements and financial highlights, assessing the accounting principles used and significant estimates made by management, and evaluating the overall financial statement presentation. Our procedures included confirmation of securities owned as of May 31, 2013, by correspondence with the custodian and brokers or by other appropriate auditing procedures where replies from brokers were not received. We believe that our audits provide a reasonable basis for our opinion.
In our opinion, the financial statements and financial highlights referred to above present fairly, in all material respects, the financial positions of Nuveen Georgia Dividend Advantage Municipal Fund 2, Nuveen Maryland Premium Income Municipal Fund, Nuveen Missouri Premium Income Municipal Fund, Nuveen North Carolina Premium Income Municipal Fund, and Nuveen Virginia Premium Income Municipal Fund at May 31, 2013, and the results of their operations and their cash flows for the year then ended, the changes in their net assets for each of the two years in the period then ended, and the financial highlights for each of the five years in the period then ended, in conformity with U.S. generally accepted accounting principles.
Chicago, Illinois
July 25, 2013
| | | Nuveen Georgia Dividend Advantage Municipal Fund 2 |
| NKG | | Portfolio of Investments |
May 31, 2013
| | Principal | | | | Optional Call | | | | |
| | Amount (000) | | Description (1) | | Provisions (2) | Ratings (3) | | Value | |
| | | | Consumer Staples – 4.7% (3.1% of Total Investments) | | | | | | |
| $ | 45,000 | | Puerto Rico, The Children’s Trust Fund, Tobacco Settlement Asset-Backed Bonds, Series 2005A, 0.000%, 5/15/50 | | 5/15 at 11.19 | BB– | $ | 4,146,750 | |
| | 3,000 | | Puerto Rico, The Children’s Trust Fund, Tobacco Settlement Asset-Backed Refunding Bonds, Series 2002, 5.500%, 5/15/39 | | 11/13 at 100.00 | BBB | | 3,033,720 | |
| | 48,000 | | Total Consumer Staples | | | | | 7,180,470 | |
| | | | Education and Civic Organizations – 14.2% (9.6% of Total Investments) | | | | | | |
| | 1,750 | | Athens Housing Authority, Georgia, Student Housing Lease Revenue Bonds, UGAREF East Campus Housing LLC Project, Series 2009, 5.250%, 6/15/35 | | 6/19 at 100.00 | Aa2 | | 1,895,075 | |
| | 5,000 | | Atlanta Development Authority, Georgia, Educational Facilities Revenue Bonds, Science Park LLC Project, Series 2007, 5.000%, 7/01/39 | | 7/17 at 100.00 | Aa3 | | 5,362,200 | |
| | 700 | | Carrollton Payroll Development Authority, Georgia, Student Housing Revenue Bonds, University of West Georgia, Series 2004A, 5.000%, 9/01/21 – SYNCORA GTY Insured | | 9/14 at 100.00 | A1 | | 738,822 | |
| | 2,000 | | Fulton County Development Authority, Georgia, Revenue Bonds, Georgia Tech – Klaus Parking and Family Housing, Series 2003, 5.000%, 11/01/23 – NPFG Insured | | 11/13 at 100.00 | Aa3 | | 2,035,600 | |
| | 625 | | Fulton County Development Authority, Georgia, Revenue Bonds, Georgia Tech Foundation Technology Square Project, Series 2012A, 5.000%, 11/01/31 | | 5/22 at 100.00 | AA+ | | 718,188 | |
| | 1,535 | | Fulton County Development Authority, Georgia, Revenue Bonds, Georgia Tech Molecular Science Building, Series 2004, 5.250%, 5/01/15 – NPFG Insured | | 5/14 at 100.00 | Aa3 | | 1,602,294 | |
| | 1,050 | | Fulton County Development Authority, Georgia, Revenue Bonds, TUFF Morehouse Project, Series 2002A, 5.000%, 2/01/34 – AMBAC Insured | | 8/13 at 100.00 | Baa1 | | 1,053,066 | |
| | 150 | | Georgia Higher Education Facilities Authority, Revenue Bonds, USG Real Estate Foundation I LLC Project, Series 2008, 6.000%, 6/15/28 | | 6/18 at 100.00 | A2 | | 174,033 | |
| | 730 | | Private Colleges and Universities Authority, Georgia, Revenue Bonds, Emory University, Series 2009, Trust 3404-1, 17.207%, 3/01/17 (IF) | | No Opt. Call | AA+ | | 1,131,595 | |
| | 1,150 | | Private Colleges and Universities Authority, Georgia, Revenue Bonds, Mercer University, Series 2009, Trust 3404-2, 17.235%, 3/01/17 (IF) | | No Opt. Call | AA+ | | 1,757,384 | |
| | 1,325 | | Private Colleges and Universities Authority, Georgia, Revenue Bonds, Mercer University Project, Refunding Series 2012C, 5.250%, 10/01/30 | | 10/22 at 100.00 | Baa2 | | 1,463,198 | |
| | 1,000 | | Private Colleges and Universities Authority, Georgia, Revenue Bonds, Mercer University, Series 2012A, 5.000%, 10/01/32 | | 10/21 at 100.00 | Baa2 | | 1,073,520 | |
| | 1,180 | | Savannah Economic Development Authority, Georgia, Revenue Bonds, Armstrong Atlantic State University, Compass Point LLC Project, Series 2005, 5.000%, 7/01/25 – SYNCORA GTY Insured | | 7/15 at 100.00 | A2 | | 1,280,135 | |
| | 1,490 | | Savannah Economic Development Authority, Georgia, Revenue Bonds, Armstrong Center LLC, Series 2005A, 5.000%, 12/01/34 – SYNCORA GTY Insured | | 12/15 at 100.00 | A3 | | 1,592,125 | |
| | 19,685 | | Total Education and Civic Organizations | | | | | 21,877,235 | |
| | | | Health Care – 17.2% (11.6% of Total Investments) | | | | | | |
| | | | Baldwin County Hospital Authority, Georgia, Revenue Bonds, Oconee Regional Medical Center, Series 1998: | | | | | | |
| | 205 | | 5.250%, 12/01/22 | | 6/13 at 100.00 | B+ | | 201,991 | |
| | 745 | | 5.375%, 12/01/28 | | 12/13 at 100.00 | B+ | | 721,041 | |
| | | | Coffee County Hospital Authority, Georgia, Revenue Bonds, Coffee County Regional Medical Center, Series 2004: | | | | | | |
| | 285 | | 5.000%, 12/01/19 | | 12/14 at 100.00 | BB– | | 289,338 | |
| | 2,400 | | 5.250%, 12/01/22 | | 12/14 at 100.00 | BB– | | 2,434,344 | |
| | 255 | | 5.000%, 12/01/26 | | 12/14 at 100.00 | BB– | | 256,958 | |
| | 715 | | Coweta County Development Authority, Georgia, Revenue Bonds, Piedmont Healthcare, Inc. Project, Series 2010, 5.000%, 6/15/40 | | 6/20 at 100.00 | AA– | | 760,052 | |
| | Principal | | | | Optional Call | | | | |
| | Amount (000) | | Description (1) | | Provisions (2) | Ratings (3) | | Value | |
| | | | Health Care (continued) | | | | | | |
| $ | 2,500 | | Franklin County Industrial Building Authority, Georgia, Revenue Bonds, Ty Cobb Regional Medical Center Project, Series 2010, 8.000%, 12/01/40 | | 12/20 at 100.00 | N/R | $ | 2,787,275 | |
| | | | Gainesville and Hall County Hospital Authority, Georgia, Revenue Anticipation Certificates, Northeast Georgia Health Services Inc., Series 2010B: | | | | | | |
| | 1,000 | | 5.125%, 2/15/40 | | 2/20 at 100.00 | AA– | | 1,077,420 | |
| | 3,945 | | 5.250%, 2/15/45 | | 2/41 at 100.00 | AA– | | 4,272,080 | |
| | 1,620 | | Greene County Development Authority, Georgia, Health System Revenue Bonds, Catholic Health East Issue, Series 2012, 5.000%, 11/15/37 | | No Opt. Call | A+ | | 1,755,092 | |
| | 2,540 | | Houston County Hospital Authority, Georgia, Revenue Bonds, Houston Healthcare Project, Series 2007, 5.250%, 10/01/35 | | 10/17 at 100.00 | A+ | | 2,687,295 | |
| | | | Macon-Bibb County Hospital Authority, Georgia, Revenue Anticipation Certificates, Medical Center of Central Georgia Inc., Series 2009: | | | | | | |
| | 425 | | 5.000%, 8/01/32 | | 8/19 at 100.00 | AA | | 470,645 | |
| | 975 | | 5.000%, 8/01/35 | | 8/19 at 100.00 | AA | | 1,065,909 | |
| | 1,470 | | Medical Center Hospital Authority, Georgia, Revenue Anticipation Certificates, Columbus Regional Healthcare System, Inc. Project, Series 2010, 5.000%, 8/01/21 – AGM Insured | | No Opt. Call | AA– | | 1,707,978 | |
| | 3,500 | | Savannah Hospital Authority, Georgia, Revenue Bonds, St. Joseph’s/Candler Health System, Series 2003, 5.250%, 7/01/23 – RAAI Insured | | 1/14 at 100.00 | A3 | | 3,582,635 | |
| | 2,300 | | Valdosta and Lowndes County Hospital Authority, Georgia, Revenue Certificates, South Georgia Medical Center, Series 2007, 5.000%, 10/01/33 | | 10/17 at 100.00 | A+ | | 2,389,171 | |
| | 24,880 | | Total Health Care | | | | | 26,459,224 | |
| | | | Housing/Multifamily – 4.7% (3.2% of Total Investments) | | | | | | |
| | 1,205 | | Atlanta Urban Residential Finance Authority, Georgia, Multifamily Housing Revenue Bonds, Trestletree Village Apartments, Series 2013A, 4.500%, 11/01/35 | | 11/23 at 100.00 | A– | | 1,147,702 | |
| | 1,600 | | Cobb County Development Authority, Georgia, Revenue Bonds, KSU University II Real Estate Foundation, LLC Project, Series 2011, 5.000%, 7/15/41 �� AGM Insured | | 7/21 at 100.00 | AA– | | 1,739,440 | |
| | 1,375 | | Cobb County Development Authority, Georgia, Student Housing Revenue Bonds, KSU Village II Real Estate Foundation LLC Project, Series 2007A, 5.250%, 7/15/38 – AMBAC Insured | | 7/17 at 100.00 | Baa2 | | 1,401,675 | |
| | | | Savannah Economic Development Authority, Georgia, GNMA Collateralized Multifamily Housing Revenue Bonds, Snap I-II-III Apartments, Series 2002A: | | | | | | |
| | 500 | | 5.150%, 11/20/22 (Alternative Minimum Tax) | | 11/13 at 101.00 | AA+ | | 510,740 | |
| | 980 | | 5.200%, 11/20/27 (Alternative Minimum Tax) | | 11/13 at 101.00 | AA+ | | 1,000,747 | |
| | 1,465 | | 5.250%, 11/20/32 (Alternative Minimum Tax) | | 11/13 at 101.00 | AA+ | | 1,493,275 | |
| | 7,125 | | Total Housing/Multifamily | | | | | 7,293,579 | |
| | | | Housing/Single Family – 0.8% (0.5% of Total Investments) | | | | | | |
| | | | Georgia Housing and Finance Authority, Single Family Mortgage Bonds, Series 2006C-2: | | | | | | |
| | 1,000 | | 4.500%, 12/01/27 (Alternative Minimum Tax) | | 12/15 at 100.00 | AAA | | 1,024,580 | |
| | 170 | | 4.550%, 12/01/31 (Alternative Minimum Tax) | | 12/15 at 100.00 | AAA | | 172,385 | |
| | 1,170 | | Total Housing/Single Family | | | | | 1,196,965 | |
| | | | Industrials – 2.8% (1.9% of Total Investments) | | | | | | |
| | 2,190 | | Cobb County Development Authority, Georgia, Solid Waste Disposal Revenue Bonds, Georgia Waste Management Project, Series 2004A, 5.000%, 4/01/33 (Alternative Minimum Tax) | | 4/16 at 101.00 | BBB | | 2,335,569 | |
| | 2,000 | | Fulton County Development Authority, Georgia, Local District Cooling Authority Revenue Bonds, Maxon Atlantic Station LLC, Series 2005A, 5.125%, 3/01/26 (Mandatory put 3/01/15) (Alternative Minimum Tax) | | 9/15 at 100.00 | BBB | | 2,033,540 | |
| | 4,190 | | Total Industrials | | | | | 4,369,109 | |
| | | Nuveen Georgia Dividend Advantage Municipal Fund 2 (continued) |
| NKG | | Portfolio of Investments |
May 31, 2013
| | Principal | | | | Optional Call | | | | |
| | Amount (000) | | Description (1) | | Provisions (2) | Ratings (3) | | Value | |
| | | | Materials – 2.1% (1.5% of Total Investments) | | | | | | |
| $ | 2,000 | | Richmond County Development Authority, Georgia, Environmental Improvement Revenue Bonds, International Paper Company, Series 2001A, 6.250%, 2/01/25 (Alternative Minimum Tax) | | 8/13 at 100.00 | BBB | $ | 2,008,300 | |
| | 20 | | Richmond County Development Authority, Georgia, Environmental Improvement Revenue Bonds, International Paper Company, Series 2003A, 5.750%, 11/01/27 (Alternative Minimum Tax) | | 11/13 at 100.00 | BBB | | 20,374 | |
| | 850 | | Richmond County Development Authority, Georgia, Environmental Improvement Revenue Refunding Bonds, International Paper Company, Series 2002A, 6.000%, 2/01/25 (Alternative Minimum Tax) | | 8/13 at 100.00 | BBB | | 853,358 | |
| | 390 | | Savannah Economic Development Authority, Georgia, Pollution Control Revenue Bonds, Union Camp Corporation, Series 1995, 6.150%, 3/01/17 | | No Opt. Call | Baa3 | | 432,584 | |
| | 3,260 | | Total Materials | | | | | 3,314,616 | |
| | | | Tax Obligation/General – 30.6% (20.7% of Total Investments) | | | | | | |
| | 2,000 | | Chatham County Hospital Authority, Georgia, Seven Mill Tax Pledge Refunding and Improvement Revenue Bonds, Memorial Health University Medical Center Inc., Series 2012A, 5.000%, 1/01/31 | | 1/22 at 100.00 | AA | | 2,254,680 | |
| | 1,500 | | Cherokee County Resource Recovery Development Authority, Georgia, Solid Waste Disposal Revenue Bonds, Ball Ground Recycling LLC Project, Series 2007A, 5.000%, 7/01/37 – AMBAC Insured (Alternative Minimum Tax) | | 7/17 at 100.00 | AA+ | | 1,574,730 | |
| | 1,000 | | Clarke County Hospital Authority, Georgia, Hospital Revenue Bonds, Athens Regional Medical Center, Series 2007, 5.000%, 1/01/27 – NPFG Insured | | 1/17 at 100.00 | Aa1 | | 1,101,950 | |
| | 600 | | Clarke County Hospital Authority, Georgia, Hospital Revenue Certificates, Athens Regional Medical Center, Series 2012, 5.000%, 1/01/32 | | 1/22 at 100.00 | Aa1 | | 668,802 | |
| | 3,315 | | Decatur, Georgia, General Obligation Bonds, Series 2007, 5.000%, 1/01/31 – AGM Insured | | 1/17 at 100.00 | AA+ | | 3,644,511 | |
| | 1,090 | | Floyd County Hospital Authority, Georgia, Revenue Anticipation Certificates, Floyd Medical Center, Series 2003, 5.000%, 7/01/19 – NPFG Insured | | 7/13 at 101.00 | Aa2 | | 1,104,955 | |
| | 1,135 | | Floyd County Hospital Authority, Georgia, Revenue Anticipation Certificates, Floyd Medical Center, Series 2012B, 5.000%, 7/01/23 | | No Opt. Call | Aa2 | | 1,350,083 | �� |
| | 1,500 | | Forsyth County Water and Sewerage Authority, Georgia, Revenue Bonds, Series 2007, 5.000%, 4/01/37 – AGM Insured | | 4/17 at 100.00 | Aaa | | 1,659,390 | |
| | 6,400 | | Georgia Environmental Loan Acquisition Corporation, Local Government Loan Securitization Bonds, Loan Pool Series 2011, 5.125%, 3/15/31 | | 3/21 at 100.00 | Aaa | | 7,208,320 | |
| | | | Georgia Municipal Association Inc., Certificates of Participation, Riverdale Public Purpose Project, Series 2009: | | | | | | |
| | 905 | | 5.375%, 5/01/32 – AGC Insured | | 5/19 at 100.00 | AA– | | 989,636 | |
| | 1,165 | | 5.500%, 5/01/38 – AGC Insured | | 5/19 at 100.00 | AA– | | 1,259,726 | |
| | 750 | | Georgia State, General Obligation Bonds, Series 1998D, 5.250%, 10/01/15 | | No Opt. Call | AAA | | 835,598 | |
| | 2,500 | | Georgia State, General Obligation Bonds, Series 2005B, 5.000%, 7/01/15 | | No Opt. Call | AAA | | 2,743,575 | |
| | 2,500 | | Georgia State, General Obligation Bonds, Series 2007E, 5.000%, 8/01/24 | | 8/17 at 100.00 | AAA | | 2,885,200 | |
| | 1,000 | | Georgia State, General Obligation Bonds, Series 2009B, 5.000%, 1/01/26 | | 1/19 at 100.00 | AAA | | 1,162,600 | |
| | 4,900 | | Gwinnett County School District, Georgia, General Obligation Bonds, Series 2008, 5.000%, 2/01/36 (UB) | | 2/18 at 100.00 | AAA | | 5,544,889 | |
| | 1,560 | | Henry County Hospital Authority, Georgia, Revenue Certificates, Henry Medical Center, Series 2004, 5.000%, 7/01/20 – NPFG Insured | | 7/14 at 101.00 | Aa1 | | 1,649,950 | |
| | 445 | | La Grange-Troup County Hospital Authority, Georgia, Revenue Anticipation Certificates, Series 2008A, 5.500%, 7/01/38 | | 7/18 at 100.00 | Aa2 | | 492,059 | |
| | Principal | | | | Optional Call | | | | |
| | Amount (000) | | Description (1) | | Provisions (2) | Ratings (3) | | Value | |
| | | | Tax Obligation/General (continued) | | | | | | |
| $ | 2,475 | | Paulding County School District, Georgia, General Obligation Bonds, Series 2007, 5.000%, 2/01/33 | | 2/17 at 100.00 | AA+ | $ | 2,736,459 | |
| | 2,250 | | Valdosta and Lowndes County Hospital Authority, Georgia, Revenue Certificates, South Georgia Medical Center Project, Series 2011B, 5.000%, 10/01/41 | | 10/21 at 100.00 | Aa2 | | 2,438,685 | |
| | 1,450 | | Wayne County Hospital Authority, Georgia, Hospital Revenue Bonds, Series 2006, 5.000%, 3/01/23 – SYNCORA GTY Insured | | 3/16 at 100.00 | N/R | | 1,475,970 | |
| | 2,000 | | Winder-Barrow Industrial Building Authority, Georgia, Revenue Bonds, City of Winder Project, Refunding Series 2012, 5.000%, 12/01/29 – AGM Insured | | 12/21 at 100.00 | A1 | | 2,287,660 | |
| | 42,440 | | Total Tax Obligation/General | | | | | 47,069,428 | |
| | | | Tax Obligation/Limited – 25.8% (17.4% of Total Investments) | | | | | | |
| | | | Atlanta, Georgia, Tax Allocation Bonds Atlanta Station Project, Series 2007: | | | | | | |
| | 110 | | 5.250%, 12/01/19 – AGC Insured | | 12/17 at 100.00 | AA– | | 121,737 | |
| | 50 | | 5.250%, 12/01/20 – AGC Insured | | No Opt. Call | AA– | | 55,027 | |
| | 80 | | 5.250%, 12/01/21 – AGC Insured | | 12/17 at 100.00 | AA– | | 87,295 | |
| | 1,080 | | 5.000%, 12/01/23 – AGC Insured | | 12/17 at 100.00 | AA– | | 1,153,860 | |
| | 1,500 | | Atlanta, Georgia, Tax Allocation Bonds, Beltline Project Series 2008B. Remarketed, 7.375%, 1/01/31 | | 1/19 at 100.00 | A2 | | 1,832,850 | |
| | 280 | | Atlanta, Georgia, Tax Allocation Bonds, Beltline Project Series 2008C. Remarketed, 7.500%, 1/01/31 | | 1/19 at 100.00 | A2 | | 343,756 | |
| | 730 | | Atlanta, Georgia, Tax Allocation Bonds, Eastside Project, Series 2005A, 5.625%, 1/01/16 (Alternative Minimum Tax) | | 7/15 at 100.00 | A– | | 785,429 | |
| | | | Atlanta, Georgia, Tax Allocation Bonds, Eastside Project, Series 2005B: | | | | | | |
| | 830 | | 5.400%, 1/01/20 | | 7/15 at 100.00 | A– | | 889,652 | |
| | 1,175 | | 5.600%, 1/01/30 | | 7/15 at 100.00 | A– | | 1,262,513 | |
| | 1,650 | | Atlanta, Georgia, Tax Allocation Bonds, Princeton Lakes Project, Series 2006, 5.500%, 1/01/31 | | 1/16 at 100.00 | BBB– | | 1,673,678 | |
| | 2,000 | | Cobb-Marietta Coliseum and Exhibit Hall Authority, Cobb County, Georgia, Revenue Bonds, Performing Arts Center, Series 2004, 5.000%, 1/01/22 | | 1/14 at 100.00 | AAA | | 2,053,360 | |
| | 375 | | Cobb-Marietta Coliseum and Exhibit Hall Authority, Georgia, Revenue Bonds, Refunding Series 2005, 5.500%, 10/01/26 – NPFG Insured | | No Opt. Call | A+ | | 452,209 | |
| | | | Cobb-Marietta Coliseum and Exhibit Hall Authority, Georgia, Revenue Refunding Bonds, Series 1993: | | | | | | |
| | 460 | | 5.500%, 10/01/18 – NPFG Insured | | No Opt. Call | A | | 493,777 | |
| | 5,745 | | 5.625%, 10/01/26 – NPFG Insured | | 10/19 at 100.00 | A | | 6,544,876 | |
| | 1,990 | | Georgia Local Governments, Certificates of Participation, Georgia Municipal Association, Series 1998A, 4.750%, 6/01/28 – NPFG Insured | | No Opt. Call | A | | 2,005,960 | |
| | 750 | | Georgia Municipal Association Inc., Certificates of Participation, Atlanta Court Project, Series 2002, 5.125%, 12/01/21 – AMBAC Insured | | 6/13 at 100.00 | N/R | | 751,283 | |
| | 405 | | Government of Guam, Business Privilege Tax Bonds, Series 2011A, 5.125%, 1/01/42 | | 1/22 at 100.00 | A | | 440,114 | |
| | 1,608 | | Liberty County Industrial Authority, Georgia, Revenue Bonds, Series 2011A-1, 4.600%, 7/01/26 | | No Opt. Call | N/R | | 1,425,860 | |
| | | Nuveen Georgia Dividend Advantage Municipal Fund 2 (continued) |
| NKG | | Portfolio of Investments |
May 31, 2013
| | Principal | | | | Optional Call | | | | |
| | Amount (000) | | Description (1) | | Provisions (2) | Ratings (3) | | Value | |
| | | | Tax Obligation/Limited (continued) | | | | | | |
| | | | Macon-Bibb County Urban Development Authority, Georgia, Revenue Refunding Bonds, Public Facilities Projects, Series 2002A: | | | | | | |
| $ | 1,525 | | 5.000%, 8/01/14 | | 8/13 at 100.00 | AA | $ | 1,537,200 | |
| | 2,600 | | 5.375%, 8/01/17 | | 8/13 at 100.00 | AA | | 2,621,736 | |
| | 3,500 | | Metropolitan Atlanta Rapid Transit Authority, Georgia, Sales Tax Revenue Refunding Bonds, Series 1992P, 6.250%, 7/01/20 – AMBAC Insured | | No Opt. Call | Aa2 | | 4,021,464 | |
| | 25,000 | | Puerto Rico Sales Tax Financing Corporation, Sales Tax Revenue Bonds, Series 2007A, 0.000%, 8/01/54 – AMBAC Insured | | No Opt. Call | AA– | | 2,159,500 | |
| | 810 | | Tift County Hospital Authority, Georgia, Revenue Anticipation Certificates Series 2012, 5.000%, 12/01/38 | | No Opt. Call | AA– | | 891,316 | |
| | 5,500 | | Virgin Islands Public Finance Authority, Gross Receipts Taxes Loan Note, Refunding Series 2012A, 5.000%, 10/01/32 | | No Opt. Call | BBB+ | | 6,016,505 | |
| | 59,753 | | Total Tax Obligation/Limited | | | | | 39,620,957 | |
| | | | Transportation – 7.7% (5.2% of Total Investments) | | | | | | |
| | 2,290 | | Atlanta, Georgia, Airport General Revenue Bonds, Series 2004G, 5.000%, 1/01/26 – AGM Insured | | 1/15 at 100.00 | AA– | | 2,407,340 | |
| | 2,000 | | Atlanta, Georgia, Airport General Revenue Bonds, Series 2012B, 5.000%, 1/01/31 | | No Opt. Call | A+ | | 2,254,680 | |
| | 2,710 | | Atlanta, Georgia, Airport General Revenue Bonds, Series 2012C, 5.000%, 1/01/42 (Alternative Minimum Tax) | | 1/22 at 100.00 | A+ | | 2,861,786 | |
| | 2,000 | | Atlanta, Georgia, Airport General Revenue Refunding Bonds, Series 2011B, 5.000%, 1/01/30 | | 1/21 at 100.00 | A+ | | 2,190,560 | |
| | 1,000 | | Atlanta, Georgia, Airport Passenger Facilities Charge Revenue Bonds, Refunding Series 2004C, 5.000%, 1/01/33 – AGM Insured | | 7/14 at 100.00 | AA– | | 1,038,680 | |
| | 1,000 | | Atlanta, Georgia, Airport Passenger Facilities Charge Revenue Bonds, Series 2004J, 5.000%, 1/01/34 – AGM Insured | | 1/15 at 100.00 | AA– | | 1,050,760 | |
| | 11,000 | | Total Transportation | | | | | 11,803,806 | |
| | | | U.S. Guaranteed – 4.3% (2.9% of Total Investments) (4) | | | | | | |
| | 1,550 | | Bulloch County Development Authority, Georgia, Student Housing and Athletic Facility Lease Revenue Bonds, Georgia Southern University, Series 2004, 5.250%, 8/01/21 (Pre-refunded 8/01/14) – SYNCORA GTY Insured | | 8/14 at 100.00 | A1 (4) | | 1,638,722 | |
| | 1,000 | | Cherokee County School System, Georgia, General Obligation Bonds, Series 2003, 5.000%, 8/01/16 (Pre-refunded 8/01/13) – NPFG Insured | | 8/13 at 100.00 | AA+ (4) | | 1,007,970 | |
| | 1,000 | | Forsyth County, Georgia, General Obligation Bonds, Series 2004, 5.250%, 3/01/19 (Pre-refunded 3/01/14) | | 3/14 at 101.00 | Aaa | | 1,047,560 | |
| | | | Fulton County, Georgia, Water and Sewerage Revenue Bonds, Series 2004: | | | | | | |
| | 2,450 | | 5.000%, 1/01/22 (Pre-refunded 1/01/14) – FGIC Insured | | 1/14 at 100.00 | AA– (4) | | 2,518,453 | |
| | 385 | | 5.000%, 1/01/35 (Pre-refunded 1/01/14) – FGIC Insured | | 1/14 at 100.00 | AA– (4) | | 395,757 | |
| | 25 | | Georgia Municipal Electric Authority, Senior Lien General Power Revenue Bonds, Series 1993Z, 5.500%, 1/01/20 (Pre-refunded 1/01/17) – FGIC Insured | | 1/17 at 100.00 | A+ (4) | | 28,192 | |
| | 6,410 | | Total U.S. Guaranteed | | | | | 6,636,654 | |
| | Principal | | | | Optional Call | | | | |
| | Amount (000) | | Description (1) | | Provisions (2) | Ratings (3) | | Value | |
| | | | Utilities – 10.0% (6.8% of Total Investments) | | | | | | |
| $ | 525 | | Burke County Development Authority, Georgia, Pollution Control Revenue Bonds, Georgia Power Company – Vogtle Plant, First Series 2012, 1.750%, 12/01/49 (Mandatory put 6/01/17) | | No Opt. Call | A | $ | 537,626 | |
| | 2,000 | | Georgia Municipal Electric Authority, General Power Revenue Bonds, Project 1, Series 2007A, 5.000%, 1/01/25 – NPFG Insured | | 1/17 at 100.00 | A+ | | 2,197,420 | |
| | 3,000 | | Georgia Municipal Electric Authority, General Power Revenue Bonds, Series 2012GG, 5.000%, 1/01/43 | | 1/23 at 100.00 | A+ | | 3,288,060 | |
| | 755 | | Georgia Municipal Electric Authority, Senior Lien General Power Revenue Bonds, Series 1993Z, 5.500%, 1/01/20 – FGIC Insured | | No Opt. Call | A+ | | 822,323 | |
| | | | Main Street Natural Gas Inc., Georgia, Gas Project Revenue Bonds, Series 2006B: | | | | | | |
| | 1,000 | | 5.000%, 3/15/20 | | No Opt. Call | A | | 1,138,990 | |
| | 1,300 | | 5.000%, 3/15/21 | | No Opt. Call | A | | 1,487,005 | |
| | 1,500 | | 5.000%, 3/15/22 | | No Opt. Call | A | | 1,733,700 | |
| | | | Main Street Natural Gas Inc., Georgia, Gas Project Revenue Bonds, Series 2007A: | | | | | | |
| | 350 | | 5.125%, 9/15/17 | | No Opt. Call | A | | 396,169 | |
| | 950 | | 5.000%, 3/15/18 | | No Opt. Call | A+ | | 1,084,758 | |
| | | | Municipal Electric Authority of Georgia, Combustion Turbine Revenue Bonds, Series 2003A: | | | | | | |
| | 500 | | 5.250%, 11/01/15 – NPFG Insured | | 11/13 at 100.00 | A1 | | 509,910 | |
| | 1,000 | | 5.000%, 11/01/20 – NPFG Insured | | 11/13 at 100.00 | A1 | | 1,017,380 | |
| | 1,200 | | Virgin Islands Water and Power Authority, Electric System Revenue Bonds, Series 2007B, 5.000%, 7/01/31 | | 7/17 at 100.00 | Baa3 | | 1,220,760 | |
| | 14,080 | | Total Utilities | | | | | 15,434,101 | |
| | | | Water and Sewer – 23.2% (15.6% of Total Investments) | | | | | | |
| | 190 | | Atlanta, Georgia, Water and Wastewater Revenue Bonds, Series 1999A, 5.000%, 11/01/38 – FGIC Insured | | 11/13 at 100.00 | A1 | | 190,557 | |
| | | | Atlanta, Georgia, Water and Wastewater Revenue Bonds, Series 2004: | | | | | | |
| | 500 | | 5.250%, 11/01/15 – AGM Insured | | 11/14 at 100.00 | AA– | | 533,715 | |
| | 2,425 | | 5.000%, 11/01/24 – AGM Insured | | 11/14 at 100.00 | AA– | | 2,558,424 | |
| | 260 | | 5.750%, 11/01/30 – AGM Insured | | No Opt. Call | AA– | | 340,408 | |
| | 700 | | 5.000%, 11/01/37 – AGM Insured | | 11/14 at 100.00 | AA– | | 731,752 | |
| | 5,105 | | Cherokee County Water and Sewerage Authority, Georgia, Revenue Bonds, Series 2001, 5.000%, 8/01/35 – AGM Insured | | 8/18 at 100.00 | AA | | 5,680,793 | |
| | 335 | | Coweta County Water and Sewer Authority, Georgia, Revenue Bonds, Series 2001, 5.250%, 6/01/26 – AMBAC Insured | | 6/13 at 100.00 | Aa2 | | 336,263 | |
| | | | Coweta County Water and Sewer Authority, Georgia, Revenue Bonds, Series 2007: | | | | | | |
| | 1,000 | | 5.000%, 6/01/32 | | 6/18 at 100.00 | Aa2 | | 1,106,610 | |
| | 1,000 | | 5.000%, 6/01/37 | | 6/18 at 100.00 | Aa2 | | 1,084,920 | |
| | | | DeKalb County, Georgia, Water and Sewerage Revenue Bonds, Refunding Series 2006B: | | | | | | |
| | 6,000 | | 5.250%, 10/01/32 – AGM Insured | | 10/26 at 100.00 | Aa2 | | 7,242,720 | |
| | 300 | | 5.000%, 10/01/35 – AGM Insured | | No Opt. Call | Aa2 | | 350,925 | |
| | 5,350 | | DeKalb County, Georgia, Water and Sewerage Revenue Bonds, Second Resolution Series 2011A, 5.250%, 10/01/41 | | 10/21 at 100.00 | Aa3 | | 6,039,990 | |
| | 2,225 | | Douglasville-Douglas County Water and Sewer Authority, Georgia, Water and Sewage Revenue Bonds, Series 2007, 5.000%, 6/01/37 – NPFG Insured | | 6/17 at 100.00 | Aa2 | | 2,465,634 | |
| | 1,000 | | Douglasville-Douglas County Water and Sewer Authority, Georgia, Water and Sewer Revenue Bonds, Series 2005, 5.000%, 6/01/29 – NPFG Insured | | 12/15 at 100.00 | Aa2 | | 1,087,060 | |
| | | Nuveen Georgia Dividend Advantage Municipal Fund 2 (continued) |
| NKG | | Portfolio of Investments |
May 31, 2013
| | Principal | | | | Optional Call | | | | |
| | Amount (000) | | Description (1) | | Provisions (2) | Ratings (3) | | Value | |
| | | | Water and Sewer (continued) | | | | | | |
| $ | 750 | | Fulton County, Georgia, Water and Sewerage Revenue Bonds, Refunding Series 2013, 5.000%, 1/01/33 | | 1/23 at 100.00 | AA– | $ | 853,012 | |
| | 500 | | Georgia Environmental Loan Acquisition Corporation, Local Government Loan Securitization Bonds, Cobb County-Marietta Water Authority Loans, Series 2011, 5.250%, 2/15/36 | | 2/21 at 100.00 | Aaa | | 561,674 | |
| | 1,000 | | Milledgeville, Georgia, Water and Sewerage Revenue Refunding Bonds, Series 1996, 6.000%, 12/01/21 – AGM Insured | | No Opt. Call | AA– | | 1,205,209 | |
| | 1,000 | | Unified Government of Athens-Clarke County, Georgia, Water and Sewerage Revenue Bonds, Series 2008, 5.500%, 1/01/38 | | 1/19 at 100.00 | AA+ | | 1,152,869 | |
| | 1,975 | | Walton County Water and Sewerage Authority, Georgia, Revenue Bonds, The Oconee-Hard Creek Reservoir Project, Series 2008, 5.000%, 2/01/38 – AGM Insured | | 2/18 at 100.00 | Aa2 | | 2,123,361 | |
| | 31,615 | | Total Water and Sewer | | | | | 35,645,896 | |
| $ | 273,608 | | Total Investments (cost $213,950,456) – 148.1% | | | | | 227,902,040 | |
| | | | Floating Rate Obligations – (2.1)% | | | | | (3,245,000 | ) |
| | | | MuniFund Term Preferred Shares, at Liquidation Value – (48.7)% (5) | | | | | (74,945,000 | ) |
| | | | Other Assets Less Liabilities – 2.7% | | | | | 4,120,412 | |
| | | | Net Assets Applicable to Common Shares – 100% | | | | $ | 153,832,452 | |
| (1) | All percentages shown in the Portfolio of Investments are based on net assets applicable to Common shares unless otherwise noted. |
| (2) | Optional Call Provisions (not covered by the report of independent registered public accounting firm): Dates (month and year) and prices of the earliest optional call or redemption. There may be other call provisions at varying prices at later dates. Certain mortgage-backed securities may be subject to periodic principal paydowns. |
| (3) | Ratings (not covered by the report of independent registered public accounting firm): Using the highest of Standard & Poor’s Group (“Standard & Poor’s”), Moody’s Investors Service, Inc. (“Moody’s”) or Fitch, Inc. (“Fitch”) rating. Ratings below BBB by Standard & Poor’s, Baa by Moody’s or BBB by Fitch are considered to be below investment grade. Holdings designated N/R are not rated by any of these national rating agencies. |
| (4) | Backed by an escrow or trust containing sufficient U.S. Government or U.S. Government agency securities, which ensure the timely payment of principal and interest. Certain bonds backed by U.S. Government or agency securities are regarded as having an implied rating equal to the rating of such securities. |
| (5) | MuniFund Term Preferred Shares, at Liquidation Value as a percentage of Total Investments is 32.9%. |
| N/R | Not rated. |
| (IF) | Inverse floating rate investment. |
| (UB) | Underlying bond of an inverse floating rate trust reflected as a financing transaction. See Notes to Financial Statements, Footnote 1 – General Information and Significant Accounting Policies, Inverse Floating Rate Securities for more information. |
See accompanying notes to financial statements.
| | | Nuveen Maryland Premium Income Municipal Fund |
| NMY | | Portfolio of Investments |
May 31, 2013
| | Principal | | | | Optional Call | | | | |
| | Amount (000) | | Description (1) | | Provisions (2) | Ratings (3) | | Value | |
| | | | Consumer Discretionary – 4.4% (3.0% of Total Investments) | | | | | | |
| | | | Baltimore, Maryland, Senior Lien Convention Center Hotel Revenue Bonds, Series 2006A: | | | | | | |
| $ | 540 | | 5.000%, 9/01/16 – SYNCORA GTY Insured | | No Opt. Call | BB+ | $ | 568,728 | |
| | 400 | | 5.250%, 9/01/19 – SYNCORA GTY Insured | | 9/16 at 100.00 | BB+ | | 422,060 | |
| | 185 | | 5.250%, 9/01/25 – SYNCORA GTY Insured | | 9/16 at 100.00 | BB+ | | 190,406 | |
| | 350 | | 5.250%, 9/01/27 – SYNCORA GTY Insured | | 9/16 at 100.00 | BB+ | | 359,160 | |
| | 250 | | 4.600%, 9/01/30 – SYNCORA GTY Insured | | 9/16 at 100.00 | BB+ | | 250,170 | |
| | 100 | | 5.000%, 9/01/32 – SYNCORA GTY Insured | | 9/16 at 100.00 | BB+ | | 100,962 | |
| | 12,140 | | 5.250%, 9/01/39 – SYNCORA GTY Insured | | 9/16 at 100.00 | BB+ | | 12,329,020 | |
| | 1,000 | | Baltimore, Maryland, Subordinate Lien Convention Center Hotel Revenue Bonds, Series 2006B, 5.875%, 9/01/39 | | 9/16 at 100.00 | Ba2 | | 1,025,110 | |
| | 2,000 | | Maryland Economic Development Corporation, Revenue Bonds, Chesapeake Bay Hyatt Conference Center, Series 2006A, 5.000%, 12/01/31 | | 12/16 at 100.00 | N/R | | 1,319,500 | |
| | 16,965 | | Total Consumer Discretionary | | | | | 16,565,116 | |
| | | | Consumer Staples – 8.2% (5.5% of Total Investments) | | | | | | |
| | | | Guam Economic Development & Commerce Authority, Tobacco Settlement Asset-Backed Bonds, Series 2007A: | | | | | | |
| | 3,055 | | 5.250%, 6/01/32 | | 6/17 at 100.00 | B+ | | 2,993,869 | |
| | 2,665 | | 5.625%, 6/01/47 | | 6/17 at 100.00 | B+ | | 2,387,254 | |
| | 155,700 | | Puerto Rico, The Children’s Trust Fund, Tobacco Settlement Asset-Backed Bonds, Series 2005A, 0.000%, 5/15/50 | | 5/15 at 11.19 | BB– | | 14,347,755 | |
| | | | Puerto Rico, The Children’s Trust Fund, Tobacco Settlement Asset-Backed Refunding Bonds, Series 2002: | | | | | | |
| | 6,715 | | 5.375%, 5/15/33 | | 11/13 at 100.00 | BBB+ | | 6,790,477 | |
| | 3,270 | | 5.500%, 5/15/39 | | 11/13 at 100.00 | BBB | | 3,306,755 | |
| | 800 | | Tobacco Settlement Financing Corporation, Virgin Islands, Tobacco Settlement Asset-Backed Bonds, Series 2001, 5.000%, 5/15/31 | | 11/13 at 100.00 | A3 | | 796,232 | |
| | 172,205 | | Total Consumer Staples | | | | | 30,622,342 | |
| | | | Education and Civic Organizations – 11.6% (7.8% of Total Investments) | | | | | | |
| | 2,375 | | Frederick County, Maryland, Educational Facilities Revenue Bonds, Mount Saint Mary’s University, Series 2006, 5.625%, 9/01/38 | | 9/16 at 100.00 | BB+ | | 2,392,623 | |
| | 3,020 | | Hartford County, Maryland, Economic Development Revenue Bonds, Battelle Memorial Institute, Series 2004, 5.250%, 4/01/34 | | 4/14 at 100.00 | A+ | | 3,110,177 | |
| | 1,750 | | Maryland Health and Higher Educational Facilities Authority, Educational Facilities Leasehold Mortgage Revenue Bonds, McLean School, Series 2001, 6.000%, 7/01/31 | | 7/13 at 100.00 | BB+ | | 1,750,770 | |
| | 700 | | Maryland Health and Higher Educational Facilities Authority, Revenue Bonds, Goucher College, Series 2012A, 5.000%, 7/01/34 | | 7/22 at 100.00 | A– | | 779,639 | |
| | 530 | | Maryland Health and Higher Educational Facilities Authority, Revenue Bonds, Johns Hopkins University, Series 2008A, 5.250%, 7/01/38 | | No Opt. Call | AA+ | | 612,028 | |
| | 3,335 | | Maryland Health and Higher Educational Facilities Authority, Revenue Bonds, Johns Hopkins University, Series 2004, Trust 1003, 13.827%, 3/13/14 (IF) | | No Opt. Call | AA+ | | 3,747,173 | |
| | 3,500 | | Maryland Health and Higher Educational Facilities Authority, Revenue Bonds, Maryland Institute College of Art, Series 2006, 5.000%, 6/01/30 | | 6/16 at 100.00 | Baa1 | | 3,630,585 | |
| | 1,130 | | Maryland Health and Higher Educational Facilities Authority, Revenue Bonds, Maryland Institute College of Art, Series 2007, 5.000%, 6/01/36 | | 6/17 at 100.00 | Baa1 | | 1,179,245 | |
| | 1,500 | | Maryland Health and Higher Educational Facilities Authority, Revenue Bonds, Maryland Institute College of Art, Series 2012, 5.000%, 6/01/47 | | 6/22 at 100.00 | Baa1 | | 1,594,710 | |
| | 745 | | Maryland Health and Higher Educational Facilities Authority, Revenue Bonds, Patterson Park Public Charter School Issue, Series 2010, 6.000%, 7/01/40 | | 7/20 at 100.00 | BBB– | | 793,260 | |
| | 2,100 | | Maryland Industrial Development Financing Authority, Revenue Bonds, Our Lady of Good Counsel High School, Series 2005A, 6.000%, 5/01/35 | | 5/15 at 100.00 | N/R | | 2,179,023 | |
| | | Nuveen Maryland Premium Income Municipal Fund (continued) |
| NMY | | Portfolio of Investments |
May 31, 2013
| | Principal | | | | Optional Call | | | | |
| | Amount (000) | | Description (1) | | Provisions (2) | Ratings (3) | | Value | |
| | | | Education and Civic Organizations (continued) | | | | | | |
| | | | Montgomery County Revenue Authority, Maryland, Lease Revenue Bonds, Montgomery College Arts Center Project, Series 2005A: | | | | | | |
| $ | 1,300 | | 5.000%, 5/01/18 | | 5/15 at 100.00 | AA | $ | 1,401,790 | |
| | 1,365 | | 5.000%, 5/01/19 | | 5/15 at 100.00 | AA | | 1,469,163 | |
| | 615 | | 5.000%, 5/01/20 | | 5/15 at 100.00 | AA | | 660,707 | |
| | 625 | | Morgan State University, Maryland, Student Tuition and Fee Revenue Bonds, Academic Fees and Auxiliary Facilities, Series 2012, 5.000%, 7/01/29 | | 7/22 at 100.00 | Aa3 | | 717,031 | |
| | 9,445 | | Morgan State University, Maryland, Student Tuition and Fee Revenue Refunding Bonds, Academic Fees and Auxiliary Facilities, Series 1993, 6.100%, 7/01/20 – NPFG Insured | | No Opt. Call | Aa3 | | 11,346,089 | |
| | 265 | | University of Puerto Rico, University System Revenue Bonds, Series 2006P, 5.000%, 6/01/23 | | 6/16 at 100.00 | BBB– | | 260,588 | |
| | 1,145 | | University of Puerto Rico, University System Revenue Bonds, Series 2006Q, 5.000%, 6/01/19 | | 6/16 at 100.00 | BBB– | | 1,150,965 | |
| | | | Westminster, Maryland, Educational Facilities Revenue Bonds, McDaniel College, Series 2006: | | | | | | |
| | 2,000 | | 5.000%, 11/01/31 | | 11/16 at 100.00 | BBB+ | | 2,081,700 | |
| | 2,750 | | 4.500%, 11/01/36 | | 11/16 at 100.00 | BBB+ | | 2,766,775 | |
| | 40,195 | | Total Education and Civic Organizations | | | | | 43,624,041 | |
| | | | Health Care – 31.5% (21.2% of Total Investments) | | | | | | |
| | 500 | | Fredericksburg Economic Development Authority, Virginia, Hospital Facilities Revenue Bonds, MediCorp Health System, Series 2007, 5.000%, 6/15/14 | | No Opt. Call | Baa1 | | 520,945 | |
| | 2,445 | | Maryland Health and Higher Educational Facilities Authority, Revenue Bonds Doctors Community Hospital, Refunding Series 2010, 5.750%, 7/01/38 | | 7/20 at 100.00 | Baa3 | | 2,702,605 | |
| | | | Maryland Health and Higher Educational Facilities Authority, Revenue Bonds, Adventist Healthcare, Series 2011A: | | | | | | |
| | 1,350 | | 6.250%, 1/01/31 | | 1/22 at 100.00 | Baa2 | | 1,597,320 | |
| | 375 | | 6.125%, 1/01/36 | | 1/22 at 100.00 | Baa2 | | 440,588 | |
| | 1,500 | | Maryland Health and Higher Educational Facilities Authority, Revenue Bonds, Anne Arundel Health System, Series 2009A, 6.750%, 7/01/39 | | 7/19 at 100.00 | A– | | 1,847,175 | |
| | 2,500 | | Maryland Health and Higher Educational Facilities Authority, Revenue Bonds, Anne Arundel Health System, Series 2010, 5.000%, 7/01/40 | | 7/19 at 100.00 | A– | | 2,684,675 | |
| | 3,075 | | Maryland Health and Higher Educational Facilities Authority, Revenue Bonds, Calvert Memorial Hospital, Series 2004, 5.500%, 7/01/36 | | 7/14 at 100.00 | A | | 3,143,511 | |
| | 2,550 | | Maryland Health and Higher Educational Facilities Authority, Revenue Bonds, Carroll Hospital Center, Series 2006, 5.000%, 7/01/40 | | 7/16 at 100.00 | A3 | | 2,646,824 | |
| | | | Maryland Health and Higher Educational Facilities Authority, Revenue Bonds, Carroll Hospital Center, Series 2012A: | | | | | | |
| | 1,000 | | 4.000%, 7/01/30 | | 7/22 at 100.00 | A3 | | 1,021,780 | |
| | 1,775 | | 5.000%, 7/01/37 | | 7/22 at 100.00 | A3 | | 1,932,283 | |
| | 4,050 | | Maryland Health and Higher Educational Facilities Authority, Revenue Bonds, Doctors Community Hospital, Series 2007A, 5.000%, 7/01/29 | | 7/17 at 100.00 | Baa3 | | 4,162,631 | |
| | 3,335 | | Maryland Health and Higher Educational Facilities Authority, Revenue Bonds, Frederick Memorial Hospital Issue, Series 2012A, 4.250%, 7/01/32 | | No Opt. Call | Baa1 | | 3,386,426 | |
| | | | Maryland Health and Higher Educational Facilities Authority, Revenue Bonds, Johns Hopkins Health System Obligated Group Issue, Series 2011A: | | | | | | |
| | 500 | | 5.000%, 5/15/25 | | 5/21 at 100.00 | AA– | | 580,775 | |
| | 500 | | 5.000%, 5/15/26 | | 5/21 at 100.00 | AA– | | 578,635 | |
| | 4,225 | | Maryland Health and Higher Educational Facilities Authority, Revenue Bonds, Kaiser Permanente System, Series 1998A, 5.375%, 7/01/15 | | 7/13 at 100.00 | A+ | | 4,240,675 | |
| | 6,800 | | Maryland Health and Higher Educational Facilities Authority, Revenue Bonds, Kennedy Krieger Institute, Series 2003, 5.500%, 7/01/33 | | 7/13 at 100.00 | Baa3 | | 6,808,092 | |
| | 2,735 | | Maryland Health and Higher Educational Facilities Authority, Revenue Bonds, LifeBridge Health System, Series 2008, 5.000%, 7/01/28 – AGC Insured | | 7/17 at 100.00 | AA– | | 2,914,963 | |
| | 1,000 | | Maryland Health and Higher Educational Facilities Authority, Revenue Bonds, LifeBridge Health System, Series 2011, 6.000%, 7/01/41 | | 7/21 at 100.00 | A | | 1,175,810 | |
| | 1,250 | | Maryland Health and Higher Educational Facilities Authority, Revenue Bonds, Loyola University Maryland, Series 2012A, 5.000%, 10/01/39 | | 10/22 at 100.00 | A | | 1,383,963 | |
| | Principal | | | | Optional Call | | | | |
| | Amount (000) | | Description (1) | | Provisions (2) | Ratings (3) | | Value | |
| | | | Health Care (continued) | | | | | | |
| | | | Maryland Health and Higher Educational Facilities Authority, Revenue Bonds, MedStar Health, Series 2004: | | | | | | |
| $ | 1,000 | | 5.000%, 8/15/13 | | No Opt. Call | A2 | $ | 1,009,660 | |
| | 4,060 | | 5.375%, 8/15/24 | | 8/14 at 100.00 | A2 | | 4,249,967 | |
| | 7,720 | | Maryland Health and Higher Educational Facilities Authority, Revenue Bonds, MedStar Health, Series 2007, 5.250%, 5/15/46 – BHAC Insured | | 5/16 at 100.00 | AA+ | | 8,424,064 | |
| | 2,850 | | Maryland Health and Higher Educational Facilities Authority, Revenue Bonds, Mercy Medical Center, Series 2011, 5.000%, 7/01/31 | | 7/22 at 100.00 | BBB | | 3,109,407 | |
| | | | Maryland Health and Higher Educational Facilities Authority, Revenue Bonds, Mercy Medical Center Project, Series 2007A: | | | | | | |
| | 2,375 | | 5.000%, 7/01/37 | | 7/17 at 100.00 | BBB | | 2,497,835 | |
| | 2,905 | | 5.500%, 7/01/42 | | 7/17 at 100.00 | BBB | | 3,122,468 | |
| | 3,950 | | Maryland Health and Higher Educational Facilities Authority, Revenue Bonds, Peninsula Regional Medical Center, Series 2006, 5.000%, 7/01/36 | | 7/16 at 100.00 | A | | 4,176,138 | |
| | 4,450 | | Maryland Health and Higher Educational Facilities Authority, Revenue Bonds, The Johns Hopkins Health System Obligated Group Issue, Series 2010, 5.000%, 5/15/40 | | 5/20 at 100.00 | AA– | | 4,848,809 | |
| | | | Maryland Health and Higher Educational Facilities Authority, Revenue Bonds, Union Hospital of Cecil County, Series 2005: | | | | | | |
| | 1,000 | | 5.000%, 7/01/35 | | 7/15 at 100.00 | A | | 1,051,320 | |
| | 1,500 | | 5.000%, 7/01/40 | | 7/15 at 100.00 | A | | 1,562,175 | |
| | | | Maryland Health and Higher Educational Facilities Authority, Revenue Bonds, University of Maryland Medical System Issue, Series 2013A: | | | | | | |
| | 9,500 | | 5.000%, 7/01/43 | | 7/22 at 100.00 | A2 | | 10,176,115 | |
| | 3,750 | | 4.000%, 7/01/43 | | 7/22 at 100.00 | A2 | | 3,576,225 | |
| | | | Maryland Health and Higher Educational Facilities Authority, Revenue Bonds, University of Maryland Medical System, Series 2006: | | | | | | |
| | 700 | | 5.000%, 7/01/31 | | 7/16 at 100.00 | A2 | | 737,436 | |
| | 1,325 | | 5.000%, 7/01/36 | | 7/16 at 100.00 | A2 | | 1,389,885 | |
| | 4,155 | | Maryland Health and Higher Educational Facilities Authority, Revenue Bonds, University of Maryland Medical System, Series 2010, 5.125%, 7/01/39 | | 7/19 at 100.00 | A2 | | 4,506,555 | |
| | | | Maryland Health and Higher Educational Facilities Authority, Revenue Bonds, Washington County Hospital, Series 2008: | | | | | | |
| | 7,075 | | 5.750%, 1/01/38 | | 1/18 at 100.00 | BBB | | 7,580,933 | |
| | 1,950 | | 6.000%, 1/01/43 | | 1/18 at 100.00 | BBB | | 2,109,647 | |
| | | | Maryland Health and Higher Educational Facilities Authority, Revenue Bonds, Western Maryland Health, Series 2006A: | | | | | | |
| | 2,910 | | 4.500%, 1/01/22 – NPFG Insured | | 7/16 at 100.00 | A | | 3,164,771 | |
| | 95 | | 5.000%, 7/01/34 – NPFG Insured | | 7/16 at 100.00 | A | | 98,663 | |
| | 775 | | Maryland Health and Higher Educational Facilities Authority, Revenue Refunding Bonds, Adventist Healthcare, Series 2003A, 5.750%, 1/01/25 | | 1/14 at 100.00 | Baa2 | | 783,835 | |
| | | | Prince George’s County, Maryland, Revenue Bonds, Dimensions Health Corporation, Series 1994: | | | | | | |
| | 3,605 | | 5.375%, 7/01/14 | | 7/13 at 100.00 | B3 | | 3,605,829 | |
| | 2,595 | | 5.300%, 7/01/24 | | 7/13 at 100.00 | B3 | | 2,536,664 | |
| | 111,710 | | Total Health Care | | | | | 118,088,077 | |
| | | | Housing/Multifamily – 4.7% (3.1% of Total Investments) | | | | | | |
| | 2,050 | | Anne Arundel County, Maryland, FNMA Multifamily Housing Revenue Bonds, Glenview Gardens Apartments Project, Series 2009, 5.000%, 1/01/28 (Mandatory put 1/01/27) | | 1/20 at 102.00 | AA+ | | 2,282,532 | |
| | 2,500 | | Maryland Community Development Administration, Housing Revenue Bonds, Series 1999A, 5.350%, 7/01/41 (Alternative Minimum Tax) | | 7/13 at 100.00 | Aa2 | | 2,502,275 | |
| | 980 | | Maryland Community Development Administration, Housing Revenue Bonds, Series 2002B, 4.950%, 7/01/32 (Alternative Minimum Tax) | | 7/13 at 100.00 | Aa2 | | 980,892 | |
| | 2,110 | | Maryland Community Development Administration, Multifamily Housing Revenue Bonds, Princess Anne Apartments, Series 2001D, 5.450%, 12/15/33 (Alternative Minimum Tax) | | 6/13 at 100.00 | Aaa | | 2,112,553 | |
| | | | Maryland Economic Development Corporation, Senior Lien Student Housing Revenue Bonds, University of Maryland – Baltimore, Series 2003A: | | | | | | |
| | 50 | | 5.000%, 10/01/15 | | 10/13 at 100.00 | B3 | | 49,998 | |
| | 3,460 | | 5.625%, 10/01/23 | | 10/13 at 100.00 | B3 | | 3,453,011 | |
| | | Nuveen Maryland Premium Income Municipal Fund (continued) |
| NMY | | Portfolio of Investments |
May 31, 2013
| | Principal | | | | Optional Call | | | | |
| | Amount (000) | | Description (1) | | Provisions (2) | Ratings (3) | | Value | |
| | | | Housing/Multifamily (continued) | | | | | | |
| | | | Maryland Economic Development Corporation, Student Housing Revenue Bonds, Salisbury University Project, Refunding Series 2013: | | | | | | |
| $ | 500 | | 5.000%, 6/01/27 (WI/DD, Settling 6/03/13) | | 6/23 at 100.00 | Baa3 | $ | 548,660 | |
| | 500 | | 5.000%, 6/01/34 (WI/DD, Settling 6/03/13) | | 6/23 at 100.00 | Baa3 | | 535,765 | |
| | 1,500 | | Maryland Economic Development Corporation, Student Housing Revenue Bonds, Sheppard Pratt University Village, Series 2012, 5.000%, 7/01/33 | | No Opt. Call | BBB– | | 1,630,530 | |
| | 2,615 | | Maryland Economic Development Corporation, Student Housing Revenue Refunding Bonds, University of Maryland College Park Projects, Series 2006, 5.000%, 6/01/33 – CIFG Insured | | 6/16 at 100.00 | AA– | | 2,696,823 | |
| | 235 | | Montgomery County Housing Opportunities Commission, Maryland, GNMA/FHA-Insured Multifamily Housing Revenue Bonds, Series 1995A, 5.900%, 7/01/15 | | 7/13 at 100.00 | Aa2 | | 235,912 | |
| | 405 | | Montgomery County Housing Opportunities Commission, Maryland, Multifamily Housing Development Bonds, Series 2000B, 6.200%, 7/01/30 (Alternative Minimum Tax) | | 7/13 at 100.00 | Aaa | | 405,757 | |
| | 16,905 | | Total Housing/Multifamily | | | | | 17,434,708 | |
| | | | Housing/Single Family – 9.4% (6.4% of Total Investments) | | | | | | |
| | 5,425 | | Maryland Community Development Administration, Department of Housing and Community Development, Residential Revenue Bonds, Series 2005E, 4.900%, 9/01/36 (Alternative Minimum Tax) (UB) (4) | | 9/14 at 100.00 | Aa2 | | 5,483,754 | |
| | 1,800 | | Maryland Community Development Administration, Department of Housing and Community Development, Residential Revenue Bonds, Series 2006B, 4.750%, 9/01/25 (Alternative Minimum Tax) (UB) (4) | | 9/15 at 100.00 | Aa2 | | 1,850,346 | |
| | 2,345 | | Maryland Community Development Administration, Department of Housing and Community Development, Residential Revenue Bonds, Series 2006F, 4.900%, 9/01/26 (Alternative Minimum Tax) (UB) (4) | | 9/15 at 100.00 | Aa2 | | 2,414,718 | |
| | 7,500 | | Maryland Community Development Administration, Department of Housing and Community Development, Residential Revenue Bonds, Series 2006I, 4.875%, 9/01/26 (Alternative Minimum Tax) (UB) (4) | | 3/16 at 100.00 | Aa2 | | 7,766,776 | |
| | 4,075 | | Maryland Community Development Administration, Department of Housing and Community Development, Residential Revenue Bonds, Series 2006L, 4.900%, 9/01/31 (Alternative Minimum Tax) (UB) (4) | | 9/16 at 100.00 | Aa2 | | 4,223,005 | |
| | 2,820 | | Maryland Community Development Administration, Department of Housing and Community Development, Residential Revenue Bonds, Series 2007D, 4.850%, 9/01/37 (Alternative Minimum Tax) (UB) (4) | | 3/17 at 100.00 | Aa2 | | 2,887,568 | |
| | 1,500 | | Maryland Community Development Administration, Department of Housing and Community Development, Residential Revenue Bonds, Series 2007H, 5.000%, 9/01/27 (Alternative Minimum Tax) (UB) (4) | | 3/17 at 100.00 | Aa2 | | 1,576,474 | |
| | 3,535 | | Maryland Community Development Administration, Department of Housing and Community Development, Residential Revenue Bonds, Series 2008C, 5.375%, 9/01/39 | | 9/18 at 100.00 | Aa2 | | 3,787,081 | |
| | 3,000 | | Maryland Community Development Administration, Department of Housing and Community Development, Residential Revenue Bonds, Series 2009B, 4.750%, 9/01/39 | | 9/18 at 100.00 | Aa2 | | 3,132,870 | |
| | 2,130 | | Maryland Community Development Administration, Department of Housing and Community Development, Residential Revenue Bonds, Series 2010B, 5.250%, 9/01/35 | | 3/20 at 100.00 | Aa2 | | 2,282,103 | |
| | 34,130 | | Total Housing/Single Family | | | | | 35,404,695 | |
| | | | Industrials – 2.8% (1.8% of Total Investments) | | | | | | |
| | 5,895 | | Maryland Economic Development Corporation, Economic Development Revenue Bonds, Transportation Facilities Project, Series 2010A, 5.750%, 6/01/35 | | 6/20 at 100.00 | Baa3 | | 6,675,026 | |
| | 3,340 | | Maryland Economic Development Corporation, Solid Waste Disposal Revenue Bonds, Waste Management Inc., Series 2002, 4.600%, 4/01/16 (Alternative Minimum Tax) | | No Opt. Call | BBB | | 3,627,841 | |
| | 9,235 | | Total Industrials | | | | | 10,302,867 | |
| | Principal | | | | Optional Call | | | | |
| | Amount (000) | | Description (1) | | Provisions (2) | Ratings (3) | | Value | |
| | | | Long-Term Care – 5.6% (3.8% of Total Investments) | | | | | | |
| $ | 5,215 | | Baltimore County, Maryland, Revenue Bonds, Oak Crest Village, Series 2007A, 5.000%, 1/01/37 | | 1/17 at 100.00 | A– | $ | 5,420,002 | |
| | 2,050 | | Gaithersburg, Maryland, Economic Development Revenue Bonds, Asbury Methodist Homes Inc., Series 2009B, 6.000%, 1/01/23 | | 1/20 at 100.00 | BBB | | 2,307,890 | |
| | | | Maryland Health and Higher Educational Facilities Authority, Revenue Bonds, Charlestown Community Issue, Series 2010: | | | | | | |
| | 1,685 | | 6.125%, 1/01/30 | | 1/21 at 100.00 | A | | 1,923,663 | |
| | 5,000 | | 6.250%, 1/01/45 | | 1/21 at 100.00 | A | | 5,654,400 | |
| | 1,000 | | Maryland Health and Higher Educational Facilities Authority, Revenue Bonds, Edenwald, Series 2006A, 5.400%, 1/01/31 | | 7/16 at 100.00 | N/R | | 1,026,040 | |
| | | | Maryland Health and Higher Educational Facilities Authority, Revenue Bonds, King Farm Presbyterian Community, Series 2007A: | | | | | | |
| | 780 | | 5.000%, 1/01/17 | | No Opt. Call | N/R | | 798,970 | |
| | 1,460 | | 5.250%, 1/01/27 | | 1/17 at 100.00 | N/R | | 1,454,321 | |
| | 2,480 | | Maryland Health and Higher Educational Facilities Authority, Revenue Bonds, Mercy Ridge Retirement Community, Series 2007, 4.750%, 7/01/34 | | 7/17 at 100.00 | A– | | 2,529,203 | |
| | 19,670 | | Total Long-Term Care | | | | | 21,114,489 | |
| | | | Tax Obligation/General – 11.5% (7.7% of Total Investments) | | | | | | |
| | 1,565 | | Anne Arundel County, Maryland, General Obligation Bonds, Series 2006, 5.000%, 3/01/21 | | 3/16 at 100.00 | AAA | | 1,741,469 | |
| | 685 | | Anne Arundel County, Maryland, Water and Sewer Revenue Bonds, Series 2006, 5.000%, 3/01/17 | | 3/16 at 100.00 | AAA | | 765,789 | |
| | 1,000 | | Baltimore County, Maryland, Consolidated General Obligation Public Improvement Bonds, Series 2004, 5.000%, 8/01/13 | | No Opt. Call | AAA | | 1,008,120 | |
| | 350 | | Baltimore County, Maryland, General Obligation Bonds, Consolidated Public Improvement Series 2009, 5.000%, 8/01/14 | | No Opt. Call | AAA | | 369,607 | |
| | 2,020 | | Baltimore County, Maryland, General Obligation Bonds, Metropolitan District 73rd Issue, Series 2010, 5.000%, 11/01/13 | | No Opt. Call | AAA | | 2,061,006 | |
| | | | Baltimore, Maryland, General Obligation Bonds, Consolidated Public Improvements, Series 2011A: | | | | | | |
| | 1,000 | | 5.000%, 10/15/29 | | 10/21 at 100.00 | Aa2 | | 1,157,090 | |
| | 1,200 | | 5.000%, 10/15/30 | | 10/21 at 100.00 | Aa2 | | 1,382,724 | |
| | 150 | | Calvert County, Maryland, Consolidated General Obligation Public Improvement Refunding Bonds, Series 2003, 4.000%, 7/15/13 | | No Opt. Call | AAA | | 150,710 | |
| | | | Charles County, Maryland, Consolidated General Obligation Public Improvement Bonds, Series 2006: | | | | | | |
| | 2,145 | | 5.000%, 3/01/14 | | No Opt. Call | AA+ | | 2,223,314 | |
| | 805 | | 5.000%, 3/01/16 | | No Opt. Call | AA+ | | 904,321 | |
| | 4,000 | | Harford County, Maryland, General Obligation Bonds, Consolidated Public Improvement Series 2009, 5.000%, 7/01/13 | | No Opt. Call | Aaa | | 4,016,320 | |
| | 1,820 | | Harford County, Maryland, General Obligation Bonds, Consolidated Public Improvement Series 2013A, 3.000%, 2/01/14 | | No Opt. Call | Aaa | | 1,854,525 | |
| | 2,305 | | Maryland National Capital Park Planning Commission, Prince George’s County, General Obligation Bonds, Park Acquisition and Development, Series 2004EE-2, 5.000%, 1/15/17 | | 1/14 at 100.00 | AAA | | 2,371,453 | |
| | 95 | | Maryland, General Obligation Bonds, State and Local Facilities Loan, Second Series 2009B, 5.250%, 8/15/14 | | No Opt. Call | AAA | | 100,783 | |
| | | | Maryland, General Obligation Bonds, State and Local Facilities Loan, Second Series 2010B: | | | | | | |
| | 1,500 | | 5.000%, 8/01/13 | | No Opt. Call | AAA | | 1,512,180 | |
| | 1,000 | | 5.000%, 8/01/14 | | No Opt. Call | AAA | | 1,056,020 | |
| | 1,315 | | Montgomery County, Maryland, Consolidated General Obligation Public Improvement Bonds, Refunding Series 2010A, 5.000%, 8/01/13 | | No Opt. Call | AAA | | 1,325,678 | |
| | 5,850 | | Montgomery County, Maryland, Consolidated General Obligation Public Improvement Bonds, Series 2005A, 5.000%, 7/01/15 | | No Opt. Call | AAA | | 6,419,966 | |
| | | Nuveen Maryland Premium Income Municipal Fund (continued) |
| NMY | | Portfolio of Investments |
May 31, 2013
| | Principal | | | | Optional Call | | | | |
| | Amount (000) | | Description (1) | | Provisions (2) | Ratings (3) | | Value | |
| | | | Tax Obligation/General (continued) | | | | | | |
| $ | 2,800 | | Montgomery County, Maryland, Consolidated General Obligation Public Improvement Bonds, Series 2006A, 5.000%, 5/01/16 | | No Opt. Call | AAA | $ | 3,165,092 | |
| | 2,000 | | Montgomery County, Maryland, Consolidated General Obligation Public Improvement Bonds, Series 2008A, 5.000%, 8/01/13 | | No Opt. Call | AAA | | 2,016,240 | |
| | 1,315 | | Prince George’s County, Maryland, General Obligation Consolidated Public Improvement Bonds, Series 2004F, 5.000%, 12/01/15 | | No Opt. Call | AAA | | 1,406,997 | |
| | 2,270 | | Puerto Rico, General Obligation and Public Improvement Bonds, Series 2002A, 5.500%, 7/01/20 – NPFG Insured | | No Opt. Call | A | | 2,408,447 | |
| | 2,155 | | Puerto Rico, General Obligation Bonds, Public Improvement Refunding Series 2007A, 5.500%, 7/01/20 – NPFG Insured | | No Opt. Call | A | | 2,286,433 | |
| | 1,500 | | Washington Suburban Sanitary District, Montgomery and Prince George’s Counties, Maryland, General Obligation Bonds, Consolidated Public Improvement, Series 2009A, 4.000%, 6/01/13 | | No Opt. Call | AAA | | 1,500,000 | |
| | 40,845 | | Total Tax Obligation/General | | | | | 43,204,284 | |
| | | | Tax Obligation/Limited – 24.2% (16.3% of Total Investments) | | | | | | |
| | 1,200 | | Anne Arundel County, Maryland, Consolidated Special Taxing District Revenue Bonds, Villages of Dorchester & Farmington Village Projects, Series 2013, 5.000%, 7/01/32 | | 7/23 at 100.00 | A+ | | 1,343,664 | |
| | 865 | | Anne Arundel County, Maryland, Special Obligation Bonds, National Business
Park – North Project, Series 2010, 6.100%, 7/01/40 | | 7/18 at 102.00 | N/R | | 938,551 | |
| | 385 | | Baltimore County, Maryland, Certificates of Participation, Equipment Acquisition Program, Series 2012, 4.000%, 10/01/14 | | No Opt. Call | AA+ | | 403,515 | |
| | 120 | | Baltimore, Maryland, Revenue Refunding Bonds, Convention Center, Series 1998, 5.000%, 9/01/19 – NPFG Insured | | 9/13 at 100.00 | A | | 120,408 | |
| | 300 | | Baltimore, Maryland, Special Obligation Bonds, North Locust Point Project, Series 2005, 5.500%, 9/01/34 | | 9/15 at 101.00 | N/R | | 305,685 | |
| | | | Frederick County, Maryland, Lake Linganore Village Community Development Special Obligation Bonds, Series 2001A: | | | | | | |
| | 119 | | 5.600%, 7/01/20 – RAAI Insured | | 7/13 at 100.00 | N/R | | 119,200 | |
| | 450 | | 5.700%, 7/01/29 – RAAI Insured | | 7/13 at 100.00 | N/R | | 450,365 | |
| | | | Frederick County, Maryland, Special Obligation Bonds, Urbana Community Development Authority, Series 2010A: | | | | | | |
| | 5,350 | | 5.000%, 7/01/30 | | 7/20 at 100.00 | A– | | 5,872,321 | |
| | 2,355 | | 5.000%, 7/01/40 | | 7/20 at 100.00 | A– | | 2,538,831 | |
| | 1,000 | | Government of Guam, Business Privilege Tax Bonds, Series 2011A, 5.250%, 1/01/36 | | 1/22 at 100.00 | A | | 1,102,630 | |
| | 2,050 | | Hyattsville, Maryland, Special Obligation Bonds, University Town Center Project, Series 2004, 5.750%, 7/01/34 | | 7/14 at 102.00 | N/R | | 2,083,969 | |
| | 11,750 | | Maryland Department of Transportation, Consolidated Transportation Revenue Bonds, Series 2002, 5.500%, 2/01/16 | | No Opt. Call | AAA | | 13,303,585 | |
| | 1,000 | | Maryland Department of Transportation, Consolidated Transportation Revenue Bonds, Series 2006, 5.000%, 2/15/14 | | No Opt. Call | AAA | | 1,034,000 | |
| | 1,000 | | Maryland Economic Development Corporation, Lease Revenue Bonds, Department of Transportation Headquarters Building, Series 2010, 4.000%, 6/01/13 | | No Opt. Call | Aa2 | | 1,000,000 | |
| | 920 | | Maryland Stadium Authority, Lease Revenue Bonds, Montgomery County Conference Center, Series 2012, 4.000%, 6/15/14 | | No Opt. Call | AA+ | | 955,264 | |
| | 1,675 | | Montgomery County, Maryland, Special Obligation Bonds, West Germantown Development District, Senior Series 2002A, 5.500%, 7/01/27 – RAAI Insured | | 7/14 at 100.00 | A+ | | 1,686,139 | |
| | 3,000 | | Prince George’s County, Maryland, Certificates of Participation, Equipment Acquisition Program, Series 2012, 3.000%, 10/15/14 | | No Opt. Call | AA+ | | 3,112,350 | |
| | 740 | | Prince George’s County, Maryland, Lease Revenue Bonds, Upper Marlboro Justice Center, Series 2003A, 5.000%, 6/30/14 – NPFG Insured | | 6/13 at 100.00 | AA+ | | 742,871 | |
| | Principal | | | | Optional Call | | | | |
| | Amount (000) | | Description (1) | | Provisions (2) | Ratings (3) | | Value | |
| | | | Tax Obligation/Limited (continued) | | | | | | |
| $ | 4,650 | | Prince George’s County, Maryland, Special Obligation Bonds, National Harbor Project, Series 2005, 5.200%, 7/01/34 | | 7/15 at 100.00 | N/R | $ | 4,781,874 | |
| | 1,414 | | Prince George’s County, Maryland, Special Tax District Bonds, Victoria Falls Project, Series 2005, 5.250%, 7/01/35 | | 7/13 at 100.00 | N/R | | 1,414,184 | |
| | 1,000 | | Puerto Rico Highway and Transportation Authority, Highway Revenue Bonds, Series 2005L, 5.250%, 7/01/35 – NPFG Insured | | No Opt. Call | A | | 1,000,600 | |
| | | | Puerto Rico Highway and Transportation Authority, Highway Revenue Bonds, Series 2007N: | | | | | | |
| | 1,100 | | 5.500%, 7/01/29 – AMBAC Insured | | No Opt. Call | Baa3 | | 1,124,156 | |
| | 7,025 | | 5.250%, 7/01/31 – AMBAC Insured | | No Opt. Call | BBB | | 6,947,936 | |
| | 1,850 | | 5.250%, 7/01/33 – NPFG Insured | | No Opt. Call | A | | 1,862,506 | |
| | 1,000 | | Puerto Rico Highway and Transportation Authority, Subordinate Lien Highway Revenue Bonds, Series 2003, 5.250%, 7/01/15 – FGIC Insured | | 7/13 at 100.00 | BBB– | | 1,002,960 | |
| | 1,530 | | Puerto Rico Infrastructure Financing Authority, Special Tax Revenue Bonds, Series 2005A, 0.000%, 7/01/44 – AMBAC Insured | | No Opt. Call | BBB+ | | 206,978 | |
| | 5,605 | | Puerto Rico Infrastructure Financing Authority, Special Tax Revenue Bonds, Series 2005C, 5.500%, 7/01/26 – AMBAC Insured | | No Opt. Call | BBB+ | | 5,738,791 | |
| | 2,100 | | Puerto Rico Municipal Finance Agency, Series 2002A, 5.250%, 8/01/21 – AGM Insured | | 8/13 at 100.00 | AA– | | 2,104,788 | |
| | 525 | | Puerto Rico Public Buildings Authority, Guaranteed Government Facilities Revenue Bonds, Series 2004I, 5.250%, 7/01/33 | | 7/14 at 100.00 | BBB– | | 522,716 | |
| | | | Puerto Rico Sales Tax Financing Corporation, Sales Tax Revenue Bonds, First Subordinate Series 2009A: | | | | | | |
| | 970 | | 0.000%, 8/01/32 | | 8/26 at 100.00 | A+ | | 993,726 | |
| | 1,500 | | 5.750%, 8/01/37 | | 8/19 at 100.00 | A+ | | 1,618,725 | |
| | | | Puerto Rico Sales Tax Financing Corporation, Sales Tax Revenue Bonds, First Subordinate Series 2010A: | | | | | | |
| | 1,425 | | 5.375%, 8/01/39 | | 2/20 at 100.00 | A+ | | 1,497,290 | |
| | 200 | | 5.500%, 8/01/42 | | 2/20 at 100.00 | A+ | | 211,454 | |
| | 4,310 | | Puerto Rico Sales Tax Financing Corporation, Sales Tax Revenue Bonds, First Subordinate Series 2010C, 5.250%, 8/01/41 | | 8/20 at 100.00 | A+ | | 4,496,494 | |
| | | | Puerto Rico Sales Tax Financing Corporation, Sales Tax Revenue Bonds, Series 2007A: | | | | | | |
| | 7,000 | | 0.000%, 8/01/40 – NPFG Insured | | No Opt. Call | AA– | | 1,588,650 | |
| | 8,000 | | 0.000%, 8/01/41 – NPFG Insured | | No Opt. Call | AA– | | 1,713,520 | |
| | 210 | | 0.000%, 8/01/47 – AMBAC Insured | | No Opt. Call | AA– | | 29,971 | |
| | 12,140 | | 0.000%, 8/01/56 | | No Opt. Call | AA– | | 914,628 | |
| | | | Puerto Rico, Highway Revenue Bonds, Highway and Transportation Authority, Series 2003AA: | | | | | | |
| | 520 | | 5.500%, 7/01/19 – NPFG Insured | | No Opt. Call | A | | 559,416 | |
| | 2,350 | | 5.300%, 7/01/35 | | 7/20 at 100.00 | BBB+ | | 2,330,260 | |
| | 820 | | Puerto Rico, Highway Revenue Bonds, Highway and Transportation Authority, Series 2005BB, 5.250%, 7/01/22 – AGM Insured | | No Opt. Call | AA– | | 902,992 | |
| | | | Puerto Rico, Highway Revenue Bonds, Highway and Transportation Authority, Series 2007CC: | | | | | | |
| | 765 | | 5.500%, 7/01/28 – NPFG Insured | | No Opt. Call | A | | 808,054 | |
| | 1,200 | | 5.500%, 7/01/30 | | No Opt. Call | BBB+ | | 1,223,304 | |
| | 2,300 | | 5.500%, 7/01/30 – AGM Insured | | No Opt. Call | AA– | | 2,512,934 | |
| | 3,500 | | Virgin Islands Public Finance Authority, Matching Fund Loan Notes Revenue Bonds, Senior Lien Series 2010A, 5.000%, 10/01/29 | | 10/20 at 100.00 | BBB+ | | 3,821,440 | |
| | 1,645 | | Virgin Islands Public Finance Authority, Matching Fund Loan Notes Revenue Bonds, Subordinate Lien Series 2010B, 5.250%, 10/01/29 | | 10/20 at 100.00 | Baa2 | | 1,780,466 | |
| | 110,933 | | Total Tax Obligation/Limited | | | | | 90,824,161 | |
| | | Nuveen Maryland Premium Income Municipal Fund (continued) |
| NMY | | Portfolio of Investments |
May 31, 2013
| | Principal | | | | Optional Call | | | | |
| | Amount (000) | | Description (1) | | Provisions (2) | Ratings (3) | | Value | |
| | | | Transportation – 5.8% (3.9% of Total Investments) | | | | | | |
| | | | Baltimore, Maryland, Revenue Refunding Bonds, Parking System Facilities, Series 1998A: | | | | | | |
| $ | 1,060 | | 5.250%, 7/01/17 – FGIC Insured | | No Opt. Call | A1 | $ | 1,167,653 | |
| | 110 | | 5.250%, 7/01/21 – FGIC Insured | | No Opt. Call | A1 | | 126,690 | |
| | 265 | | Guam International Airport Authority, Revenue Bonds, Series 2003A, 5.250%, 10/01/21 – NPFG Insured | | 10/13 at 100.00 | A | | 268,347 | |
| | 725 | | Guam International Airport Authority, Revenue Bonds, Series 2003B, 5.250%, 10/01/19 – NPFG Insured | | 10/13 at 100.00 | A | | 734,157 | |
| | | | Maryland Health and Higher Educational Facilities Authority, Parking Facilities Revenue Bonds, Johns Hopkins Hospital, Series 2001: | | | | | | |
| | 1,300 | | 5.000%, 7/01/27 – AMBAC Insured | | 7/13 at 100.00 | N/R | | 1,301,222 | |
| | 1,000 | | 5.000%, 7/01/34 – AMBAC Insured | | 7/13 at 100.00 | N/R | | 1,000,520 | |
| | 460 | | Maryland Health and Higher Educational Facilities Authority, Parking Facilities Revenue Bonds, Johns Hopkins Medical Institution, Series 1996, 5.500%,
7/01/26 – AMBAC Insured | | 7/13 at 100.00 | N/R | | 460,736 | |
| | 750 | | Maryland Health and Higher Educational Facilities Authority, Parking Facilities Revenue Bonds, Johns Hopkins Medical Institution, Series 2004B, 5.000%, 7/01/15 – AMBAC Insured | | 1/15 at 100.00 | N/R | | 798,045 | |
| | 2,000 | | Maryland Transportation Authority, Revenue Bonds, Grant Anticipation Series 2008, 5.250%, 3/01/16 | | No Opt. Call | AAA | | 2,255,700 | |
| | 10,110 | | Maryland Transportation Authority, Revenue Bonds, Transportation Facilities Projects, Series 2007, 5.000%, 7/01/30 – AGM Insured (UB) | | 7/17 at 100.00 | AA– | | 11,249,498 | |
| | | | Port Authority of New York and New Jersey, Special Project Bonds, JFK International Air Terminal LLC, Sixth Series 1997: | | | | | | |
| | 20 | | 5.750%, 12/01/22 – NPFG Insured (Alternative Minimum Tax) | | 12/13 at 100.00 | A | | 20,474 | |
| | 70 | | 5.750%, 12/01/25 – NPFG Insured (Alternative Minimum Tax) | | 12/13 at 100.00 | A | | 71,660 | |
| | 2,075 | | Puerto Rico Ports Authority, Special Facilities Revenue Bonds, American Airlines Inc., Series 1996A, 6.250%, 6/01/26 (Alternative Minimum Tax) (5) | | 12/13 at 100.00 | N/R | | 2,365,500 | |
| | 19,945 | | Total Transportation | | | | | 21,820,202 | |
| | | | U.S. Guaranteed – 22.2% (15.0% of Total Investments) (6) | | | | | | |
| | 2,030 | | Anne Arundel County, Maryland, General Obligation Bonds, Series 2004, 5.000%, 4/01/16 (Pre-refunded 4/01/14) | | 4/14 at 100.00 | AAA | | 2,110,733 | |
| | 500 | | Baltimore County, Maryland, Revenue Bonds, Catholic Health Initiatives, Series 2006A, 5.000%, 9/01/36 (Pre-refunded 9/01/16) | | 9/16 at 100.00 | Aa3 (6) | | 569,160 | |
| | 1,540 | | Baltimore, Maryland, General Obligation Consolidated Public Improvement Bonds, Series 2004A, 5.000%, 10/15/22 (Pre-refunded 10/15/14) – AMBAC Insured | | 10/14 at 100.00 | Aa2 (6) | | 1,639,422 | |
| | 2,000 | | Baltimore, Maryland, Revenue Bonds, Wastewater Projects, Series 2003A, 5.000%, 7/01/33 (Pre-refunded 7/01/13) – FGIC Insured | | 7/13 at 100.00 | AA (6) | | 2,008,060 | |
| | 3,120 | | Baltimore, Maryland, Revenue Refunding Bonds, Water Projects, Series 1998A, 5.000%, 7/01/28 – FGIC Insured (ETM) | | No Opt. Call | AA (6) | | 3,831,516 | |
| | 2,000 | | Baltimore, Maryland, Revenue Refunding Bonds, Water System Projects, Series 1994A, 5.000%, 7/01/24 – FGIC Insured (ETM) | | No Opt. Call | AA (6) | | 2,484,660 | |
| | 1,500 | | Baltimore, Maryland, Wastewater Project Revenue Bonds, Series 2006C, 5.000%, 7/01/31 (Pre-refunded 7/01/16) – AMBAC Insured | | 7/16 at 100.00 | AA (6) | | 1,705,530 | |
| | 1,680 | | Carroll County, Maryland, Consolidated Public Improvement Bonds, Series 2005A, 5.000%, 12/01/16 (Pre-refunded 12/01/15) | | 12/15 at 100.00 | AAA | | 1,869,655 | |
| | | | Charles County, Maryland, Consolidated General Obligation Public Improvement Bonds, Series 2006: | | | | | | |
| | 40 | | 5.000%, 3/01/14 (ETM) | | No Opt. Call | Aa1 (6) | | 41,428 | |
| | 15 | | 5.000%, 3/01/16 (ETM) | | No Opt. Call | Aa1 (6) | | 16,829 | |
| | 1,910 | | Frederick, Maryland, General Obligation Bonds, Series 2005, 5.000%, 8/01/16 (Pre-refunded 8/01/15) – NPFG Insured | | 8/15 at 100.00 | AA (6) | | 2,099,033 | |
| | Principal | | | | Optional Call | | | | |
| | Amount (000) | | Description (1) | | Provisions (2) | Ratings (3) | | Value | |
| | | | U.S. Guaranteed (6) (continued) | | | | | | |
| | | | Howard County, Maryland, General Obligation Consolidated Public Improvement Bonds, Series 2004B: | | | | | | |
| $ | 1,000 | | 5.000%, 8/15/16 (Pre-refunded 2/15/14) | | 2/14 at 100.00 | AAA | $ | 1,033,620 | |
| | 1,625 | | 5.000%, 8/15/17 (Pre-refunded 2/15/14) | | 2/14 at 100.00 | AAA | | 1,679,633 | |
| | 1,180 | | 5.000%, 8/15/19 (Pre-refunded 2/15/14) | | 2/14 at 100.00 | AAA | | 1,219,672 | |
| | 750 | | Maryland Department of Transportation, Consolidated Transportation Revenue Bonds, Series 2004, 5.000%, 5/01/15 (Pre-refunded 5/01/14) | | 5/14 at 100.00 | AAA | | 782,775 | |
| | 1,000 | | Maryland, General Obligation Bonds, State and Local Facilities Loan, Second Series 2003, 5.000%, 8/01/17 (Pre-refunded 8/01/13) | | 8/13 at 100.00 | AAA | | 1,008,060 | |
| | 4,805 | | Maryland Health and Higher Educational Facilities Authority, Revenue Bonds, Civista Medical Center, Series 2005, 5.000%, 7/01/37 (Pre-refunded 7/01/14) – RAAI Insured | | 7/14 at 100.00 | N/R (6) | | 5,049,334 | |
| | 2,875 | | Maryland Health and Higher Educational Facilities Authority, Revenue Bonds, Goucher College, Series 2004, 5.125%, 7/01/34 (Pre-refunded 7/01/14) | | 7/14 at 100.00 | A– (6) | | 3,026,053 | |
| | | | Maryland Health and Higher Educational Facilities Authority, Revenue Bonds, Helix Health, Series 1997: | | | | | | |
| | 1,265 | | 5.000%, 7/01/17 – AMBAC Insured (ETM) | | No Opt. Call | N/R (6) | | 1,380,077 | |
| | 3,240 | | 5.000%, 7/01/27 – AMBAC Insured (ETM) | | No Opt. Call | N/R (6) | | 4,024,145 | |
| | 3,125 | | Maryland Health and Higher Educational Facilities Authority, Revenue Bonds, Howard County General Hospital, Series 1993, 5.500%, 7/01/25 (ETM) | | 7/13 at 100.00 | N/R (6) | | 3,395,594 | |
| | 3,875 | | Maryland Health and Higher Educational Facilities Authority, Revenue Bonds, LifeBridge Health System, Series 2004A, 5.125%, 7/01/34 (Pre-refunded 7/01/14) | | 7/14 at 100.00 | N/R (6) | | 4,074,679 | |
| | 1,000 | | Maryland Health and Higher Educational Facilities Authority, Revenue Bonds, University of Maryland Medical System, Series 2004B, 5.000%, 7/01/24 (Pre-refunded 7/01/13) – AMBAC Insured | | 7/13 at 100.00 | A2 (6) | | 1,003,970 | |
| | 885 | | Maryland National Capital Park Planning Commission, Prince George’s County, General Obligation Bonds, Park Acquisition and Development, Series 2004EE-2, 5.000%, 1/15/17 (Pre-refunded 1/15/14) | | 1/14 at 100.00 | Aaa | | 911,010 | |
| | | | Maryland Stadium Authority, Lease Revenue Bonds, Montgomery County Conference Center Facilities, Series 2003: | | | | | | |
| | 1,465 | | 5.000%, 6/15/21 (Pre-refunded 6/15/13) | | 6/13 at 100.00 | AA+ (6) | | 1,467,710 | |
| | 1,620 | | 5.000%, 6/15/23 (Pre-refunded 6/15/13) | | 6/13 at 100.00 | AA+ (6) | | 1,622,997 | |
| | 1,700 | | 5.000%, 6/15/24 (Pre-refunded 6/15/13) | | 6/13 at 100.00 | AA+ (6) | | 1,703,145 | |
| | 1,555 | | Maryland Transportation Authority, Revenue Refunding Bonds, Transportation Facilities Projects, First Series 1978, 6.800%, 7/01/16 (ETM) | | No Opt. Call | Aaa | | 1,710,718 | |
| | 1,670 | | Maryland, General Obligation Bonds, State and Local Facilities Loan, Second Series 2003, 5.000%, 8/01/15 (Pre-refunded 8/01/13) | | 8/13 at 100.00 | AAA | | 1,683,460 | |
| | | | Morgan State University, Maryland, Student Tuition and Fee Revenue Bonds, Academic Fees and Auxiliary Facilities, Series 2003A: | | | | | | |
| | 500 | | 5.000%, 7/01/20 (Pre-refunded 7/01/13) – FGIC Insured | | 7/13 at 100.00 | Aa3 (6) | | 501,985 | |
| | 1,000 | | 5.000%, 7/01/32 (Pre-refunded 7/01/13) – FGIC Insured | | 7/13 at 100.00 | Aa3 (6) | | 1,003,970 | |
| | | | Prince George’s County, Maryland, General Obligation Consolidated Public Improvement Bonds, Series 2003A: | | | | | | |
| | 1,500 | | 5.000%, 10/01/17 (Pre-refunded 10/01/13) | | 10/13 at 100.00 | AAA | | 1,524,150 | |
| | 5,770 | | 5.000%, 10/01/18 (Pre-refunded 10/01/13) | | 10/13 at 100.00 | AAA | | 5,862,896 | |
| | 1,315 | | Puerto Rico Housing Finance Authority, Capital Fund Program Revenue Bonds, Series 2003, 5.000%, 12/01/19 (Pre-refunded 12/01/13) | | 12/13 at 100.00 | Aaa | | 1,346,809 | |
| | 1,100 | | Puerto Rico Public Finance Corporation, Commonwealth Appropriation Bonds, Series 1998A, 5.125%, 6/01/24 – AMBAC Insured (ETM) | | No Opt. Call | Aaa | | 1,349,469 | |
| | | Nuveen Maryland Premium Income Municipal Fund (continued) |
| NMY | | Portfolio of Investments |
May 31, 2013
| | Principal | | | | Optional Call | | | | |
| | Amount (000) | | Description (1) | | Provisions (2) | Ratings (3) | | Value | |
| | | | U.S. Guaranteed (6) (continued) | | | | | | |
| $ | 1,000 | | Puerto Rico, Highway Revenue Bonds, Highway and Transportation Authority, Series 1996Y, 5.500%, 7/01/36 (Pre-refunded 7/01/16) | | 7/16 at 100.00 | Aaa | $ | 1,150,960 | |
| | 2,380 | | Puerto Rico, Highway Revenue Bonds, Highway and Transportation Authority, Series 2003AA, 5.500%, 7/01/19 – NPFG Insured (ETM) | | No Opt. Call | A (6) | | 2,981,878 | |
| | 3,135 | | University of Maryland, Auxiliary Facility and Tuition Revenue Bonds, Series 2006A, 5.000%, 10/01/22 (Pre-refunded 10/01/16) | | 10/16 at 100.00 | AA+ (6) | | 3,583,368 | |
| | | | Washington Suburban Sanitary District, Montgomery and Prince George’s Counties, Maryland, Sewerage Disposal Bonds, Series 2005: | | | | | | |
| | 4,500 | | 5.000%, 6/01/16 (Pre-refunded 6/01/15) | | 6/15 at 100.00 | AAA | | 4,912,560 | |
| | 1,235 | | 5.000%, 6/01/23 (Pre-refunded 6/01/15) | | 6/15 at 100.00 | AAA | | 1,348,225 | |
| | 1,235 | | 5.000%, 6/01/24 (Pre-refunded 6/01/15) | | 6/15 at 100.00 | AAA | | 1,348,225 | |
| | 1,235 | | 5.000%, 6/01/25 (Pre-refunded 6/01/15) | | 6/15 at 100.00 | AAA | | 1,348,225 | |
| | 76,875 | | Total U.S. Guaranteed | | | | | 83,415,398 | |
| | | | Utilities – 2.9% (2.0% of Total Investments) | | | | | | |
| | 550 | | Puerto Rico Electric Power Authority, Power Revenue Bonds, Series 2002LL, 5.500%, 7/01/17 – NPFG Insured | | No Opt. Call | A | | 595,754 | |
| | 2,015 | | Puerto Rico Electric Power Authority, Power Revenue Bonds, Series 2004OO, 5.000%, 7/01/13 – CIFG Insured | | No Opt. Call | AA– | | 2,021,408 | |
| | 3,600 | | Puerto Rico Electric Power Authority, Power Revenue Bonds, Series 2004PP, 5.000%, 7/01/22 – FGIC Insured | | 7/14 at 100.00 | A | | 3,644,352 | |
| | 1,570 | | Puerto Rico Electric Power Authority, Power Revenue Bonds, Series 2005RR, 5.000%, 7/01/22 – FGIC Insured | | 7/15 at 100.00 | A | | 1,590,834 | |
| | 1,040 | | Puerto Rico Electric Power Authority, Power Revenue Bonds, Series 2010XX, 5.250%, 7/01/40 | | 7/20 at 100.00 | BBB+ | | 1,036,225 | |
| | 1,225 | | Puerto Rico Electric Power Authority, Power Revenue Refunding Bonds, Series 2002JJ, 5.250%, 7/01/15 – NPFG Insured | | No Opt. Call | A | | 1,288,357 | |
| | 730 | | Virgin Islands Water and Power Authority, Electric System Revenue Bonds, Refunding Series 2007A, 5.000%, 7/01/24 | | 7/17 at 100.00 | Baa3 | | 755,557 | |
| | 10,730 | | Total Utilities | | | | | 10,932,487 | |
| | Principal | | | | Optional Call | | | | |
| | Amount (000) | | Description (1) | | Provisions (2) | Ratings (3) | | Value | |
| | | | Water and Sewer – 3.8% (2.5% of Total Investments) | | | | | | |
| $ | 2,690 | | Baltimore, Maryland, Revenue Refunding Bonds, Wastewater Projects, Series 2002A, 5.125%, 7/01/42 – NPFG Insured | | 7/13 at 100.00 | AA | $ | 2,699,037 | |
| | 1,045 | | Baltimore, Maryland, Revenue Refunding Bonds, Water System Projects, Series 1994A, 5.000%, 7/01/24 – FGIC Insured | | No Opt. Call | AA | | 1,226,798 | |
| | 2,570 | | Baltimore, Maryland, Wastewater Project Revenue Bonds, Series 2006C, 5.000%, 7/01/31 – AMBAC Insured | | 7/16 at 100.00 | AA | | 2,804,230 | |
| | 3,000 | | Baltimore, Maryland, Wastewater Project Revenue Bonds, Series 2007D, 5.000%, 7/01/32 – AMBAC Insured | | 7/17 at 100.00 | AA | | 3,334,380 | |
| | 2,000 | | Baltimore, Maryland, Wastewater Project Revenue Bonds, Series 2011A, 5.000%, 7/01/41 | | 7/21 at 100.00 | AA | | 2,235,700 | |
| | 1,645 | | Maryland Water Quality Financing Administration, Revolving Loan Fund Revenue Bonds, Series 2005A, 5.000%, 9/01/15 | | No Opt. Call | AAA | | 1,816,853 | |
| | 12,950 | | Total Water and Sewer | | | | | 14,116,998 | |
| $ | 693,293 | | Total Investments (cost $521,030,299) – 148.6% | | | | | 557,469,865 | |
| | | | Floating Rate Obligations – (5.9)% | | | | | (21,995,000 | ) |
| | | | MuniFund Term Preferred Shares, at Liquidation Value – (44.3)% (7) | | | | | (166,144,000 | ) |
| | | | Other Assets Less Liabilities – 1.6% | | | | | 5,831,060 | |
| | | | Net Assets Applicable to Common Shares – 100% | | | | $ | 375,161,925 | |
| (1) | All percentages shown in the Portfolio of Investments are based on net assets applicable to Common shares unless otherwise noted. |
| (2) | Optional Call Provisions (not covered by the report of independent registered public accounting firm): Dates (month and year) and prices of the earliest optional call or redemption. There may be other call provisions at varying prices at later dates. Certain mortgage-backed securities may be subject to periodic principal paydowns. |
| (3) | Ratings (not covered by the report of independent registered public accounting firm): Using the highest of Standard & Poor’s Group (“Standard & Poor’s”), Moody’s Investors Service, Inc. (“Moody’s”) or Fitch, Inc. (“Fitch”) rating. Ratings below BBB by Standard & Poor’s, Baa by Moody’s or BBB by Fitch are considered to be below investment grade. Holdings designated N/R are not rated by any of these national rating agencies. |
| (4) | Investment, or portion of investment, has been pledged to collateralize the net payment obligations for investments in inverse floating rate transactions. |
| (5) | At or subsequent to the end of the reporting period, this security is non-income producing. Non-income producing security, in the case of a fixed-income security, generally denotes that the issuer has (1) defaulted on the payment of principal or interest, (2) is under the protection of the Federal Bankruptcy Court or (3) the Fund’s Adviser has concluded that the issue is not likely to meet its future interest payment obligations and has directed the Fund’s custodian to cease accruing additional income on the Fund’s records. |
| (6) | Backed by an escrow or trust containing sufficient U.S. Government or U.S. Government agency securities, which ensure the timely payment of principal and interest. Certain bonds backed by U.S. Government or agency securities are regarded as having an implied rating equal to the rating of such securities. |
| (7) | MuniFund Term Preferred Shares, at Liquidation Value as a percentage of Total Investments is 29.8%. |
| N/R | Not rated. |
| WI/DD | Investment, or portion of investment, purchased on a when-issued or delayed delivery basis. |
| (ETM) | Escrowed to maturity. |
| (IF) | Inverse floating rate investment. |
| (UB) | Underlying bond of an inverse floating rate trust reflected as a financing transaction. See Notes to Financial Statements, Footnote 1 – General Information and Significant Accounting Policies, Inverse Floating Rate Securities for more information. |
See accompanying notes to financial statements.
| | | Nuveen Missouri Premium Income Municipal Fund |
| NOM | | Portfolio of Investments |
May 31, 2013
| | Principal | | | | Optional Call | | | | |
| | Amount (000) | | Description (1) | | Provisions (2) | Ratings (3) | | Value | |
| | | | Consumer Staples – 3.6% (2.3% of Total Investments) | | | | | | |
| $ | 1,010 | | Missouri Development Finance Board, Solid Waste Disposal Revenue Bonds, Procter and Gamble Inc., Series 1999, 5.200%, 3/15/29 (Alternative Minimum Tax) | | No Opt. Call | AA– | $ | 1,208,011 | |
| | | | Education and Civic Organizations – 17.4% (11.3% of Total Investments) | | | | | | |
| | 1,400 | | Fort Zumwalt School District, Callaway County, Missouri, General Obligation Bonds, Series 2013C, 4.000%, 3/01/32 (WI/DD, Settling 6/04/13) | | 3/22 at 100.00 | AA+ | | 1,467,928 | |
| | 670 | | Joplin, Missouri, General Obligation Bonds, School Building, Direct Deposit Program Series 2013, 5.000%, 3/01/33 | | 3/23 at 100.00 | AA+ | | 758,594 | |
| | 250 | | Lincoln University, Missouri, Auxiliary System Revenue Bonds, Series 2007, 5.125%, 6/01/37 – AGC Insured | | 6/17 at 100.00 | AA– | | 261,203 | |
| | 600 | | Missouri Health and Educational Facilities Authority, Educational Facilities Revenue Bonds, Southwest Baptist University Project, Series 2012, 5.000%, 10/01/33 | | 10/22 at 100.00 | BBB– | | 631,266 | |
| | 630 | | Missouri Health and Educational Facilities Authority, Revenue Bonds, A.T. Still University of Health Sciences, Series 2011, 5.250%, 10/01/41 | | 10/21 at 100.00 | A– | | 692,685 | |
| | 700 | | Missouri Health and Educational Facilities Authority, Revenue Bonds, Rockhurst University, Series 2011A, 6.500%, 10/01/35 | | 10/18 at 103.00 | BBB– | | 803,187 | |
| | 550 | | Missouri Health and Educational Facilities Authority, Revenue Bonds, Washington University, Series 2011B, 5.000%, 11/15/37 | | 11/21 at 100.00 | AAA | | 630,944 | |
| | 600 | | Missouri Health and Educational Facilities Authority, Revenue Bonds, Webster University, Series 2011, 5.000%, 4/01/36 | | 4/21 at 100.00 | A2 | | 655,368 | |
| | 5,400 | | Total Education and Civic Organizations | | | | | 5,901,175 | |
| | | | Health Care – 27.5% (17.9% of Total Investments) | | | | | | |
| | 525 | | Cape Girardeau County Industrial Development Authority, Missouri, Health Facilities Revenue Bonds, Saint Francis Medical Center, Series 2009A, 5.750%, 6/01/39 | | 6/19 at 100.00 | AA– | | 582,288 | |
| | 760 | | Cape Girardeau County Industrial Development Authority, Missouri, Health Facilities Revenue Bonds, Southeast Missouri Hospital Association, Series 2007, 5.000%, 6/01/27 | | 6/17 at 100.00 | BBB+ | | 778,430 | |
| | 930 | | Cass County, Missouri, Hospital Revenue Bonds, Series 2007, 5.625%, 5/01/38 | | 11/16 at 100.00 | BBB– | | 950,348 | |
| | 480 | | Clinton County Industrial Development Authority, Missouri, Revenue Bonds, Cameron Regional Medical Center, Series 2007, 5.000%, 12/01/37 | | 12/17 at 100.00 | N/R | | 469,061 | |
| | 750 | | Joplin Industrial Development Authority, Missouri, Health Facilities Revenue Bonds, Freeman Health System, Series 2004, 5.500%, 2/15/29 | | 2/15 at 102.00 | BBB+ | | 781,770 | |
| | 200 | | Joplin Industrial Development Authority, Missouri, Health Facilities Revenue Bonds, Freeman Health System, Series 2011, 5.500%, 2/15/31 | | 2/21 at 100.00 | BBB+ | | 219,226 | |
| | 540 | | Missouri Health and Educational Facilities Authority, Health Facilities Revenue Bonds, Capital Region Medical Center, Series 2011, 5.000%, 11/01/27 | | 11/20 at 100.00 | A3 | | 585,819 | |
| | 335 | | Missouri Health and Educational Facilities Authority, Health Facilities Revenue Bonds, Heartland Regional Medical Center, Series 2012, 5.000%, 2/15/37 | | 2/22 at 100.00 | A1 | | 362,346 | |
| | 750 | | Missouri Health and Educational Facilities Authority, Health Facilities Revenue Bonds, Mercy Health, Series 2012, 4.000%, 11/15/42 | | No Opt. Call | AA– | | 734,085 | |
| | 500 | | Missouri Health and Educational Facilities Authority, Health Facilities Revenue Bonds, St. Luke’s Episcopal and Presbyterian Hospitals, Series 2011, 5.000%, 12/01/25 | | 12/21 at 100.00 | A+ | | 557,715 | |
| | 2,000 | | Missouri Health and Educational Facilities Authority, Health Facility Revenue Bonds, St. Lukes’s Health System, Series 2010A, 5.000%, 11/15/30 | | 11/20 at 100.00 | A+ | | 2,190,520 | |
| | 720 | | Saline County Industrial Development Authority, Missouri, Health Facilities Revenue Bonds, John Fitzgibbon Memorial Hospital Inc., Series 2010, 5.600%, 12/01/28 | | 12/20 at 100.00 | BBB– | | 803,146 | |
| | 350 | | St. Louis County Industrial Development Authority, Missouri, Healthcare Facilities Revenue Bonds, Ranken-Jordan Project, Refunding Series 2007, 5.000%, 11/15/27 | | 11/16 at 100.00 | N/R | | 354,305 | |
| | 8,840 | | Total Health Care | | | | | 9,369,059 | |
| | | | Housing/Multifamily – 1.2% (0.8% of Total Investments) | | | | | | |
| | 95 | | Missouri Housing Development Commission, Multifamily Housing Revenue Bonds, Series 2001II, 5.250%, 12/01/16 | | 12/13 at 100.00 | AA | | 95,401 | |
| | Principal | | | | Optional Call | | | | |
| | Amount (000) | | Description (1) | | Provisions (2) | Ratings (3) | | Value | |
| | | | Housing/Multifamily (continued) | | | | | | |
| $ | 350 | | Northwest Missouri State University, Housing System Revenue Bonds, Refunding Series 2012, 3.125%, 6/01/29 | | No Opt. Call | A3 | $ | 317,548 | |
| | 445 | | Total Housing/Multifamily | | | | | 412,949 | |
| | | | Housing/Single Family – 1.9% (1.3% of Total Investments) | | | | | | |
| | 255 | | Missouri Housing Development Commission, Single Family Mortgage Revenue Bonds, Homeownership Loan Program, Series 2007A-1, 4.700%, 9/01/27 (Alternative Minimum Tax) | | 9/16 at 100.00 | AA+ | | 264,494 | |
| | 380 | | Missouri Housing Development Commission, Single Family Mortgage Revenue Bonds, Homeownership Loan Program, Series 2007C-1, 4.800%, 9/01/38 (Alternative Minimum Tax) | | 3/17 at 100.00 | AA+ | | 396,982 | |
| | 635 | | Total Housing/Single Family | | | | | 661,476 | |
| | | | Long-Term Care – 12.8% (8.3% of Total Investments) | | | | | | |
| | 250 | | Bridgeton Industrial Development Authority, Missouri, Senior Housing Revenue Bonds, The Sarah Community Project, Series 2013, 4.500%, 5/01/28 | | 5/18 at 100.00 | N/R | | 245,990 | |
| | 1,750 | | Cole County Industrial Development Authority, Missouri, Revenue Bonds, Lutheran Senior Services – Heisinger Project, Series 2004, 5.500%, 2/01/35 | | 2/14 at 100.00 | BBB+ | | 1,763,370 | |
| | 500 | | Joplin Industrial Development Authority, Missouri, Revenue Bonds, Christian Homes Inc., Series 2007F, 5.750%, 5/15/31 | | 5/17 at 100.00 | BBB– | | 529,175 | |
| | 475 | | Lees Summit Industrial Development Authority, Missouri, Revenue Bonds, John Knox Village Obligated Group, Series 2007A, 5.125%, 8/15/32 | | 8/17 at 100.00 | BBB– | | 480,600 | |
| | 250 | | Missouri Health and Educational Facilities Authority, Revenue Bonds, Lutheran Senior Services Projects, Series 2011, 6.000%, 2/01/41 | | 2/21 at 100.00 | BBB+ | | 279,308 | |
| | 100 | | St. Louis County Industrial Development Authority, Missouri, Revenue Bonds, Friendship Village of Chesterfield, Series 2012, 5.000%, 9/01/42 | | No Opt. Call | BBB– | | 96,638 | |
| | 425 | | St. Louis County Industrial Development Authority, Missouri, Revenue Bonds, Friendship Village of Sunset Hills, Series 2012, 5.000%, 9/01/42 | | 9/22 at 100.00 | A | | 449,310 | |
| | 500 | | St. Louis County Industrial Development Authority, Missouri, Revenue Bonds, Friendship Village of West County, Series 2007A, 5.500%, 9/01/28 | | 9/17 at 100.00 | BBB– | | 514,140 | |
| | 4,250 | | Total Long-Term Care | | | | | 4,358,531 | |
| | | | Tax Obligation/General – 17.0% (11.0% of Total Investments) | | | | | | |
| | 600 | | Branson Reorganized School District R-4, Taney County, Missouri, General Obligation Bonds, School Building Series 2012, 4.375%, 3/01/32 | | 3/22 at 100.00 | A+ | | 636,228 | |
| | 1,500 | | Camdenton Reorganized School District R3, Camden County, Missouri, General Obligation Bonds, Series 2005, 5.250%, 3/01/24 – AGM Insured | | 3/15 at 100.00 | AA– | | 1,619,909 | |
| | 1,685 | | Independence School District, Jackson County, Missouri, General Obligation Bonds, Series 2010, 5.000%, 3/01/27 | | 3/20 at 100.00 | AA+ | | 1,917,411 | |
| | 500 | | Missouri School Boards Association, Lease Participation Certificates, Clay County School District 53 Liberty, Series 2007, 5.250%, 3/01/27 – AGM Insured | | 3/17 at 100.00 | AA– | | 557,490 | |
| | 1,000 | | Puerto Rico, General Obligation and Public Improvement Bonds, Series 2002A, 5.500%, 7/01/20 – NPFG Insured | | No Opt. Call | A | | 1,060,990 | |
| | 5,285 | | Total Tax Obligation/General | | | | | 5,792,028 | |
| | | | Tax Obligation/Limited – 25.4% (16.5% of Total Investments) | | | | | | |
| | 600 | | Chesterfield, Missouri, Certificates of Participation, Series 2005, 5.000%, 12/01/24 – FGIC Insured | | 12/15 at 100.00 | Aa1 | | 661,950 | |
| | 90 | | Fenton, Missouri, Tax Increment Revenue Bonds, Gravois Bluffs Redevelopment Project, Series 2006, 4.500%, 4/01/21 | | 4/14 at 100.00 | BBB+ | | 91,208 | |
| | 315 | | Fulton, Missouri, Tax Increment Revenue Bonds, Fulton Commons Redevelopment Project, Series 2006, 5.000%, 6/01/28 | | 6/16 at 100.00 | N/R | | 257,317 | |
| | 455 | | Government of Guam, Business Privilege Tax Bonds, Series 2012B-1, 5.000%, 1/01/42 | | 1/22 at 100.00 | A | | 490,335 | |
| | | | Howard Bend Levee District, St. Louis County, Missouri, Levee District Improvement Bonds, Series 2013B: | | | | | | |
| | 180 | | 4.875%, 3/01/33 | | 3/23 at 100.00 | BBB+ | | 187,796 | |
| | 115 | | 5.000%, 3/01/38 | | 3/23 at 100.00 | BBB+ | | 119,629 | |
| | 485 | | Jackson County, Missouri, Special Obligation Bonds, Truman Medical Center Project, Series 2011B, 4.350%, 12/01/23 | | 12/21 at 100.00 | Aa3 | | 532,870 | |
| | | Nuveen Missouri Premium Income Municipal Fund (continued) |
| NOM | | Portfolio of Investments |
May 31, 2013
| | Principal | | | | Optional Call | | | | |
| | Amount (000) | | Description (1) | | Provisions (2) | Ratings (3) | | Value | |
| | | | Tax Obligation/Limited (continued) | | | | | | |
| $ | 300 | | Kansas City Industrial Development Authority, Missouri, Downtown Redevelopment District Revenue Bonds, Series 2011A, 5.000%, 9/01/32 | | 9/21 at 100.00 | AA– | $ | 321,867 | |
| | 475 | | Kansas City Tax Increment Financing Commission, Missouri, Tax Increment Revenue Bonds, Briarcliff West Project, Series 2006A, 5.400%, 6/01/24 | | 6/14 at 102.00 | N/R | | 491,825 | |
| | 100 | | Kansas City Tax Increment Financing Commission, Missouri, Tax Increment Revenue Bonds, Shoal Creek Parkway Project, Series 2011, 5.000%, 6/01/21 | | 6/16 at 100.00 | N/R | | 103,832 | |
| | 360 | | Missouri Development Finance Board, Infrastructure Facilities Revenue Bonds, Branson Landing Project, Series 2005A, 5.000%, 6/01/35 | | 6/15 at 100.00 | A | | 367,304 | |
| | 415 | | Missouri Development Finance Board, Infrastructure Facilities Revenue Bonds, City of Independence, Crackerneck Creek Project, Series 2006C, 5.000%, 3/01/28 | | 3/16 at 100.00 | A– | | 421,947 | |
| | 245 | | Monarch-Chesterfield Levee District, St. Louis County, Missouri, Levee District Improvement Bonds, Series 1999, 5.750%, 3/01/19 – NPFG Insured | | 9/13 at 100.00 | A | | 245,985 | |
| | 500 | | Osage Beach, Missouri, Tax Increment Revenue Bonds, Prewitt’s Point Transportation Development District, Series 2006, 5.000%, 5/01/23 | | 5/14 at 100.00 | N/R | | 477,020 | |
| | 1,750 | | Puerto Rico Sales Tax Financing Corporation, Sales Tax Revenue Bonds, First Subordinate Series 2009A, 6.000%, 8/01/42 | | 8/19 at 100.00 | A+ | | 1,931,947 | |
| | 225 | | Puerto Rico Sales Tax Financing Corporation, Sales Tax Revenue Bonds, Senior Series 2011C, 0.000%, 8/01/41 | | No Opt. Call | AA– | | 48,472 | |
| | 1,500 | | Puerto Rico Sales Tax Financing Corporation, Sales Tax Revenue Bonds, Series 2007A, 0.000%, 8/01/41 – NPFG Insured | | No Opt. Call | AA– | | 321,285 | |
| | 600 | | Riverside, Missouri, L-385 Levee Redevelopment Plan Tax Increment Revenue Bonds, Series 2004, 5.250%, 5/01/20 | | 5/15 at 100.00 | A | | 631,296 | |
| | | | St. Joseph Industrial Development Authority, Missouri, Tax Increment Bonds, Shoppes at North Village Project, Series 2005A: | | | | | | |
| | 340 | | 5.375%, 11/01/24 | | 11/14 at 100.00 | N/R | | 341,292 | |
| | 400 | | 5.500%, 11/01/27 | | 11/14 at 100.00 | N/R | | 401,112 | |
| | 200 | | St. Joseph Industrial Development Authority, Missouri, Tax Increment Bonds, Shoppes at North Village Project, Series 2005B, 5.500%, 11/01/27 | | 11/14 at 100.00 | N/R | | 200,556 | |
| | 9,650 | | Total Tax Obligation/Limited | | | | | 8,646,845 | |
| | | | Transportation – 13.1% (8.5% of Total Investments) | | | | | | |
| | 500 | | Kansas City, Missouri, Passenger Facility Charge Revenue Bonds, Kansas City International Airport, Series 2001, 5.000%, 4/01/23 – AMBAC Insured (Alternative Minimum Tax) | | 10/13 at 100.00 | A | | 501,865 | |
| | 1,000 | | St. Louis, Missouri, Airport Revenue Bonds, Lambert-St. Louis International Airport, Series 2005, 5.500%, 7/01/18 – NPFG Insured | | No Opt. Call | A | | 1,174,980 | |
| | 2,500 | | St. Louis, Missouri, Airport Revenue Bonds, Lambert-St. Louis International Airport, Series 2007A, 5.000%, 7/01/21 – AGM Insured | | 7/17 at 100.00 | AA– | | 2,770,300 | |
| | 4,000 | | Total Transportation | | | | | 4,447,145 | |
| | | | U.S. Guaranteed – 9.9% (6.4% of Total Investments) (4) | | | | | | |
| | 80 | | Cottleville, Missouri, Certificates of Participation, Series 2006, 5.250%, 8/01/31 (Pre-refunded 8/01/14) | | 8/14 at 100.00 | N/R (4) | | 84,606 | |
| | 500 | | Missouri Health and Educational Facilities Authority, Revenue Bonds, Lake Regional Health System, Series 2003, S, 5.700%, 2/15/34 (Pre-refunded 2/15/14) | | 2/14 at 100.00 | BBB+ (4) | | 518,975 | |
| | 1,395 | | Springfield Public Building Corporation, Missouri, Lease Revenue Bonds, Jordan Valley Park Projects, Series 2000A, 6.125%, 6/01/21 – AMBAC Insured (ETM) | | 6/13 at 100.00 | N/R (4) | | 1,777,607 | |
| | | | St. Louis County Pattonville School District R3, Missouri, General Obligation Bonds, Series 2004: | | | | | | |
| | 80 | | 5.250%, 3/01/20 (Pre-refunded 3/01/14) – AGM Insured | | 3/14 at 100.00 | AA (4) | | 82,988 | |
| | 250 | | 5.250%, 3/01/20 (Pre-refunded 3/01/14) – AGM Insured | | 3/14 at 100.00 | AA– (4) | | 259,338 | |
| | 20 | | 5.250%, 3/01/20 (Pre-refunded 3/01/14) – AGM Insured | | 3/14 at 100.00 | AA (4) | | 20,752 | |
| | 500 | | St. Louis County, Missouri, GNMA Collateralized Mortgage Revenue Bonds, Series 1993D, 5.650%, 7/01/20 (Alternative Minimum Tax) (ETM) | | No Opt. Call | AA+ (4) | | 617,370 | |
| | 2,825 | | Total U.S. Guaranteed | | | | | 3,361,636 | |
| | Principal | | | | Optional Call | | | | |
| | Amount (000) | | Description (1) | | Provisions (2) | Ratings (3) | | Value | |
| | | | Utilities – 6.0% (3.9% of Total Investments) | | | | | | |
| $ | 110 | | Missouri Joint Municipal Electric Utility Commission, Iatan 2 Power Project Revenue Bonds, Series 2006A, 4.125%, 1/01/21 – AMBAC Insured | | 1/16 at 100.00 | A2 | $ | 118,086 | |
| | 500 | | Missouri Joint Municipal Electric Utility Commission, Plum Point Project, Revenue Bonds, Series 2006, 5.000%, 1/01/34 – NPFG Insured | | 1/16 at 100.00 | A | | 514,305 | |
| | | | Missouri Joint Municipal Electric Utility Commission, Power Supply System Revenue Bonds, MoPEP Facilities, Series 2012: | | | | | | |
| | 400 | | 5.000%, 1/01/32 | | 1/21 at 100.00 | A2 | | 432,860 | |
| | 425 | | 5.000%, 1/01/37 | | 1/21 at 100.00 | A2 | | 453,841 | |
| | 530 | | Puerto Rico Electric Power Authority, Power Revenue Bonds, Series 2010XX, 5.250%, 7/01/40 | | 7/20 at 100.00 | BBB+ | | 528,076 | |
| | 1,965 | | Total Utilities | | | | | 2,047,168 | |
| | | | Water and Sewer – 18.3% (11.8% of Total Investments) | | | | | | |
| | 600 | | Carroll County Public Water Supply District 1, Missouri, Water System Revenue Bonds, Refunding Series 2009, 6.000%, 3/01/39 | | 3/18 at 100.00 | A | | 663,834 | |
| | 1,150 | | Kansas City, Missouri, Water Revenue Bonds, Series 2012A, 4.500%, 12/01/36 | | 12/21 at 100.00 | AA+ | | 1,256,466 | |
| | 1,000 | | Kansas City, Missouri, Water Revenue Bonds, Series 2013A, 4.000%, 12/01/37 | | 12/21 at 100.00 | AA+ | | 1,027,219 | |
| | 200 | | Metropolitan St. Louis Sewerage District, Missouri, Wastewater System Revenue Bonds, Series 2006C, 5.000%, 5/01/36 – NPFG Insured | | 5/17 at 100.00 | AAA | | 221,606 | |
| | 2,965 | | Missouri Environmental Improvement and Energy Resources Authority, Water Facility Revenue Bonds, Missouri-American Water Company, Series 2006, 4.600%, 12/01/36 – AMBAC Insured (Alternative Minimum Tax) (UB) (5) | | 12/16 at 100.00 | AA+ | | 3,040,370 | |
| | 5,915 | | Total Water and Sewer | | | | | 6,209,495 | |
| $ | 50,220 | | Total Investments (cost $49,518,493) – 154.1% | | | | | 52,415,518 | |
| | | | Floating Rate Obligations – (6.5)% | | | | | (2,225,000 | ) |
| | | | MuniFund Term Preferred Shares, at Liquidation Value – (52.6)% (6) | | | | | (17,880,000 | ) |
| | | | Other Assets Less Liabilities – 5.0% | | | | | 1,700,010 | |
| | | | Net Assets Applicable to Common Shares – 100% | | | | $ | 34,010,528 | |
| (1) | All percentages shown in the Portfolio of Investments are based on net assets applicable to Common shares unless otherwise noted. |
| (2) | Optional Call Provisions (not covered by the report of independent registered public accounting firm): Dates (month and year) and prices of the earliest optional call or redemption. There may be other call provisions at varying prices at later dates. Certain mortgage-backed securities may be subject to periodic principal paydowns. |
| (3) | Ratings (not covered by the report of independent registered public accounting firm): Using the highest of Standard & Poor’s Group (“Standard & Poor’s”), Moody’s Investors Service, Inc. (“Moody’s”) or Fitch, Inc. (“Fitch”) rating. Ratings below BBB by Standard & Poor’s, Baa by Moody’s or BBB by Fitch are considered to be below investment grade. Holdings designated N/R are not rated by any of these national rating agencies. |
| (4) | Backed by an escrow or trust containing sufficient U.S. Government or U.S. Government agency securities, which ensure the timely payment of principal and interest. Certain bonds backed by U.S. Government or agency securities are regarded as having an implied rating equal to the rating of such securities. |
| (5) | Investment, or portion of investment, has been pledged to collateralize the net payment obligations for investments in inverse floating rate transactions. |
| (6) | MuniFund Term Preferred Shares, at Liquidation Value as a percentage of Total Investments is 34.1%. |
| N/R | Not rated. |
| WI/DD | Investment, or portion of investment, purchased on a when-issued or delayed delivery basis. |
| (ETM) | Escrowed to maturity. |
| (UB) | Underlying bond of an inverse floating rate trust reflected as a financing transaction. See Notes to Financial Statements, Footnote 1 – General Information and Significant Accounting Policies, Inverse Floating Rate Securities for more information. |
See accompanying notes to financial statements.
| | | Nuveen North Carolina Premium Income Municipal Fund |
| NNC | | Portfolio of Investments |
May 31, 2013
| | Principal | | | | Optional Call | | | | |
| | Amount (000) | | Description (1) | | Provisions (2) | Ratings (3) | | Value | |
| | | | Consumer Staples – 0.8% (0.5% of Total Investments) | | | | | | |
| $ | 2,000 | | Puerto Rico, The Children’s Trust Fund, Tobacco Settlement Asset-Backed Refunding Bonds, Series 2002, 5.500%, 5/15/39 | | 11/13 at 100.00 | BBB | $ | 2,022,480 | |
| | | | Education and Civic Organizations – 12.1% (7.8% of Total Investments) | | | | | | |
| | 30 | | Appalachian State University, North Carolina, Revenue Bonds, Series 2005, 5.250%, 7/15/17 – NPFG Insured | | No Opt. Call | Aa3 | | 35,156 | |
| | 1,500 | | Fayetteville State University, North Carolina, Limited Obligation Revenue Bonds, Student Housing Project, Series 2011, 5.000%, 4/01/43 – AGM Insured | | 4/21 at 100.00 | AA– | | 1,603,590 | |
| | 2,500 | | North Carolina Capital Facilities Financing Agency, Revenue Bonds, Duke University, Series 2005A, 5.000%, 10/01/41 (UB) | | 10/15 at 100.00 | AA+ | | 2,676,900 | |
| | | | North Carolina Capital Facilities Financing Agency, Revenue Bonds, Johnson and Wales University, Series 2003A: | | | | | | |
| | 970 | | 5.250%, 4/01/23 – SYNCORA GTY Insured | | 10/13 at 100.00 | N/R | | 971,610 | |
| | 1,650 | | 5.000%, 4/01/33 – SYNCORA GTY Insured | | 10/13 at 100.00 | N/R | | 1,651,205 | |
| | 2,500 | | North Carolina Capital Facilities Finance Agency, Revenue Bonds, The Methodist University, Series 2012, 5.000%, 3/01/34 | | 3/22 at 100.00 | BBB | | 2,664,850 | |
| | | | University of North Carolina System, Pooled Revenue Bonds, Series 2005A: | | | | | | |
| | 1,530 | | 5.000%, 4/01/15 – AMBAC Insured | | No Opt. Call | A+ | | 1,658,138 | |
| | 445 | | 5.000%, 4/01/22 – AMBAC Insured | | 4/15 at 100.00 | A+ | | 475,839 | |
| | | | University of North Carolina Wilmington, Certificates of Participation, Student Housing Project Revenue Bonds, Series 2006: | | | | | | |
| | 1,000 | | 5.000%, 6/01/21 – FGIC Insured | | 6/16 at 100.00 | A | | 1,073,480 | |
| | 1,430 | | 5.000%, 6/01/23 – FGIC Insured | | 6/16 at 100.00 | A | | 1,521,620 | |
| | 1,505 | | 5.000%, 6/01/24 – FGIC Insured | | 6/16 at 100.00 | A | | 1,594,186 | |
| | 10,200 | | University of North Carolina, Chapel Hill, System Net Revenue Bonds, Series 2007, 5.000%, 12/01/36 | | 12/17 at 100.00 | Aaa | | 11,551,296 | |
| | 250 | | University of North Carolina, Charlotte, Certificates of Participation, Student Housing Project, Series 2005, 5.000%, 3/01/21 – AMBAC Insured | | 3/15 at 100.00 | A | | 268,673 | |
| | | | University of North Carolina, System Pooled Revenue Bonds, Series 2009C: | | | | | | |
| | 1,000 | | 5.250%, 10/01/28 | | 10/19 at 100.00 | A3 | | 1,120,590 | |
| | 1,000 | | 5.375%, 10/01/29 | | 10/19 at 100.00 | A3 | | 1,123,450 | |
| | 27,510 | | Total Education and Civic Organizations | | | | | 29,990,583 | |
| | | | Health Care – 34.9% (22.5% of Total Investments) | | | | | | |
| | | | Albemarle Hospital Authority, North Carolina, Health Care Facilities Revenue Bonds, Series 2007: | | | | | | |
| | 1,840 | | 5.250%, 10/01/27 | | 10/17 at 100.00 | N/R | | 1,895,494 | |
| | 1,725 | | 5.250%, 10/01/38 | | 10/17 at 100.00 | N/R | | 1,751,220 | |
| | 2,750 | | Charlotte-Mecklenburg Hospital Authority, North Carolina, Health Care Revenue Bonds, DBA Carolinas HealthCare System, Refunding Series 2009A, 5.250%, 1/15/39 | | 1/19 at 100.00 | AA– | | 3,007,510 | |
| | 4,950 | | Charlotte-Mecklenburg Hospital Authority, North Carolina, Health Care Revenue Bonds, DBA Carolinas HealthCare System, Series 2008A, 5.000%, 1/15/47 | | 1/18 at 100.00 | AA– | | 5,241,951 | |
| | 2,000 | | Charlotte-Mecklenburg Hospital Authority, North Carolina, Health Care Revenue Bonds, DBA Carolinas HealthCare System, Series 2011A, 5.250%, 1/15/42 | | 1/21 at 100.00 | AA– | | 2,241,540 | |
| | 5,250 | | Charlotte-Mecklenburg Hospital Authority, North Carolina, Health Care Revenue Bonds, DBA Carolinas HealthCare System, Refunding Series 2012A, 5.000%, 1/15/43 | | 1/22 at 100.00 | AA– | | 5,727,435 | |
| | 2,270 | | Johnston Memorial Hospital Authority, North Carolina, Mortgage Revenue Bonds, Johnston Memorial Hospital Project, Series 2008A, 5.250%, 10/01/36 – AGM Insured | | 4/18 at 100.00 | AA– | | 2,435,211 | |
| | 3,860 | | Nash Health Care Systems, North Carolina, Health Care Facilities Revenue Bonds, Series 2012, 5.000%, 11/01/41 | | 5/22 at 100.00 | A | | 4,086,080 | |
| | 555 | | New Hanover County, North Carolina, Hospital Revenue Bonds, New Hanover Regional Medical Center, Series 2006B, 5.125%, 10/01/31 – AGM Insured | | 10/19 at 100.00 | AA– | | 603,341 | |
| | Principal | | | | Optional Call | | | | |
| | Amount (000) | | Description (1) | | Provisions (2) | Ratings (3) | | Value | |
| | | | Health Care (continued) | | | | | | |
| | | | North Carolina Medical Care Commission Health Care Facilities Revenue Bonds Novant Health Inc., Series 2010A: | | | | | | |
| $ | 4,750 | | 5.250%, 11/01/40 | | 11/20 at 100.00 | AA– | $ | 5,160,970 | |
| | 5,000 | | 5.000%, 11/01/43 | | 11/20 at 100.00 | AA– | | 5,346,150 | |
| | 2,750 | | North Carolina Medical Care Commission, Health Care Facilities Refunding Revenue Bonds, Blue Ridge HealthCare, Series 2010A, 5.000%, 1/01/36 | | 1/20 at 100.00 | A | | 2,850,485 | |
| | | | North Carolina Medical Care Commission, Health Care Facilities Revenue and Refunding Revenue Bonds, Columbus Regional Healthcare System, Series 2013A: | | | | | | |
| | 2,000 | | 3.750%, 10/01/33 | | 10/22 at 100.00 | BBB | | 1,943,000 | |
| | 2,000 | | 4.000%, 10/01/42 | | 10/22 at 100.00 | BBB | | 1,889,280 | |
| | 2,680 | | North Carolina Medical Care Commission, Health Care Facilities Revenue Bonds, Appalachian Regional HealthCare System, Series 2011A, 6.500%, 7/01/31 | | 7/21 at 100.00 | BBB+ | | 3,174,326 | |
| | 2,000 | | North Carolina Medical Care Commission, Health Care Facilities Revenue Bonds, Duke University Health System, Series 2012A, 5.000%, 6/01/42 | | 6/22 at 100.00 | AA | | 2,219,300 | |
| | 2,335 | | North Carolina Medical Care Commission, Health Care Facilities Revenue Bonds, FirstHealth of the Carolinas Project, Refunding Series 2012A, 4.000%, 10/01/39 | | 10/17 at 100.00 | AA | | 2,244,706 | |
| | 9,000 | | North Carolina Medical Care Commission, Health Care Facilities Revenue Bonds, Wake Forest Baptist Obligated Group, Series 2012A, 4.000%, 12/01/45 | | 12/22 at 100.00 | AA– | | 8,522,100 | |
| | 2,375 | | North Carolina Medical Care Commission, Health Care Facilities Revenue Refunding Bonds, Cape Fear Valley Health System, Series 2012A, 5.000%, 10/01/27 | | No Opt. Call | A– | | 2,644,444 | |
| | 2,000 | | North Carolina Medical Care Commission, Health Care Facilities Revenue Refunding Bonds, WakeMed, Series 2012A, 5.000%, 10/01/27 | | 10/22 at 100.00 | AA– | | 2,286,660 | |
| | | | North Carolina Medical Care Commission, Healthcare Facilities Revenue Bonds, Novant Health Obligated Group, Series 2003A: | | | | | | |
| | 2,000 | | 5.000%, 11/01/18 | | 11/13 at 100.00 | AA– | | 2,038,160 | |
| | 2,000 | | 5.000%, 11/01/19 | | 11/13 at 100.00 | AA– | | 2,036,540 | |
| | 2,000 | | 5.000%, 11/01/20 | | 11/13 at 100.00 | AA– | | 2,033,060 | |
| | 2,000 | | North Carolina Medical Care Commission, Healthcare Facilities Revenue Bonds, Stanly Memorial Hospital, Series 1999, 6.375%, 10/01/29 | | 10/13 at 100.00 | BBB+ | | 2,008,060 | |
| | 2,930 | | North Carolina Medical Care Commission, Hospital Revenue Bonds, Southeastern Regional Medical Center, Refunding Series 2012, 5.000%, 6/01/32 | | 6/22 at 100.00 | A | | 3,239,408 | |
| | | | North Carolina Medical Care Commission, Hospital Revenue Bonds, Wilson Medical Center, Series 2007: | | | | | | |
| | 500 | | 5.000%, 11/01/20 | | 11/17 at 100.00 | A– | | 553,530 | |
| | 3,425 | | 5.000%, 11/01/27 | | 11/17 at 100.00 | A– | | 3,614,540 | |
| | 3,295 | | North Carolina Medical Care Commission, Revenue Bonds, Blue Ridge Healthcare System, Series 2005, 5.000%, 1/01/33 – FGIC Insured | | 1/15 at 100.00 | A | | 3,329,562 | |
| | 750 | | Northern Hospital District of Surry County, North Carolina, Health Care Facilities Revenue Bonds, Series 2008, 6.250%, 10/01/38 | | 4/18 at 100.00 | BBB | | 803,527 | |
| | 1,660 | | Onslow County Hospital Authority, North Carolina, FHA Insured Mortgage Revenue Bonds, Onslow Memorial Hospital Project, Series 2006, 5.000%, 4/01/31 – NPFG Insured | | 10/16 at 100.00 | A | | 1,726,216 | |
| | 82,650 | | Total Health Care | | | | | 86,653,806 | |
| | | | Housing/Multifamily – 1.7% (1.1% of Total Investments) | | | | | | |
| | | | Mecklenburg County, North Carolina, FNMA Multifamily Housing Revenue Bonds, Little Rock Apartments, Series 2003: | | | | | | |
| | 930 | | 5.150%, 1/01/22 (Alternative Minimum Tax) | | 7/13 at 105.00 | AA+ | | 977,886 | |
| | 2,260 | | 5.375%, 1/01/36 (Alternative Minimum Tax) | | 7/13 at 105.00 | AA+ | | 2,375,260 | |
| | 1,000 | | North Carolina Capital Facilities Financing Agency, Housing Revenue Bonds, Elizabeth City State University, Series 2003A, 5.000%, 6/01/28 – AMBAC Insured | | 6/13 at 100.00 | N/R | | 1,000,470 | |
| | 4,190 | | Total Housing/Multifamily | | | | | 4,353,616 | |
| | | | Housing/Single Family – 2.3% (1.5% of Total Investments) | | | | | | |
| | 1,475 | | North Carolina Housing Finance Agency, Home Ownership Revenue Bonds, Series 2007-29A, 4.800%, 7/01/33 (Alternative Minimum Tax) | | 1/17 at 100.00 | AA | | 1,521,197 | |
| | 2,200 | | North Carolina Housing Finance Agency, Home Ownership Revenue Bonds, Series 2011-1, 4.500%, 1/01/28 | | 1/21 at 100.00 | AA | | 2,378,860 | |
| | | Nuveen North Carolina Premium Income Municipal Fund (continued) |
| NNC | | Portfolio of Investments |
May 31, 2013
| | Principal | | | | Optional Call | | | | |
| | Amount (000) | | Description (1) | | Provisions (2) | Ratings (3) | | Value | |
| | | | Housing/Single Family (continued) | | | | | | |
| $ | 1,890 | | North Carolina Housing Finance Agency, Home Ownership Revenue Bonds, Series 25-A, 4.900%, 7/01/37 (Alternative Minimum Tax) | | 7/16 at 100.00 | AA | $ | 1,937,723 | |
| | 5,565 | | Total Housing/Single Family | | | | | 5,837,780 | |
| | | | Long-Term Care – 1.5% (0.9% of Total Investments) | | | | | | |
| | | | North Carolina Medical Care Commission, Healthcare Facilities Revenue Bonds, Presbyterian Homes, Series 2006: | | | | | | |
| | 700 | | 5.400%, 10/01/27 | | 10/16 at 100.00 | N/R | | 726,166 | |
| | 1,500 | | 5.500%, 10/01/31 | | 10/16 at 100.00 | N/R | | 1,553,595 | |
| | 900 | | North Carolina Medical Care Commission, Revenue Bonds, Pines at Davidson, Series 2006A, 5.000%, 1/01/36 | | 1/16 at 100.00 | A– | | 912,033 | |
| | 450 | | North Carolina Medical Care Commission, Revenue Bonds, United Methodist Retirement Homes Inc., Refunding Series 2013A, 5.000%, 10/01/33 | | 10/23 at 100.00 | N/R | | 467,649 | |
| | 3,550 | | Total Long-Term Care | | | | | 3,659,443 | |
| | | | Materials – 0.6% (0.4% of Total Investments) | | | | | | |
| | 1,400 | | Columbus County Industrial Facilities and Pollution Control Financing Authority, North Carolina, Environmental Improvement Revenue Bonds, International Paper Company Project, Series 2007A, 4.625%, 3/01/27 | | 3/17 at 100.00 | BBB | | 1,465,618 | |
| | | | Tax Obligation/General – 4.8% (3.1% of Total Investments) | | | | | | |
| | | | Durham, North Carolina, General Obligation Bonds, Series 2007: | | | | | | |
| | 2,820 | | 5.000%, 4/01/21 | | 4/17 at 100.00 | AAA | | 3,215,702 | |
| | 1,475 | | 5.000%, 4/01/22 | | 4/17 at 100.00 | AAA | | 1,689,126 | |
| | 1,050 | | Forsyth County, North Carolina, General Obligation Bonds, Limited Obligation Series 2009, 5.000%, 4/01/30 | | 4/20 at 100.00 | AA+ | | 1,175,045 | |
| | 5,100 | | Wake County, North Carolina, Limited Obligation Bonds, Series 2010, 5.000%, 1/01/37 | | 1/20 at 100.00 | AA+ | | 5,789,214 | |
| | 10,445 | | Total Tax Obligation/General | | | | | 11,869,087 | |
| | | | Tax Obligation/Limited – 17.9% (11.5% of Total Investments) | | | | | | |
| | 2,405 | | Charlotte, North Carolina, Certificates of Participation, Transit Projects Phase 2, Series 2008A, 5.000%, 6/01/33 | | 6/18 at 100.00 | AA+ | | 2,642,494 | |
| | 2,085 | | Dare County, North Carolina, Installment Purchase Contract, Limited Obligation Series 2012B, 5.000%, 6/01/28 | | 6/22 at 100.00 | AA– | | 2,382,613 | |
| | 850 | | Davidson County, North Carolina, Certificates of Participation, Series 2004, 5.250%, 6/01/14 – AMBAC Insured | | No Opt. Call | Aa3 | | 889,058 | |
| | 1,390 | | Durham, North Carolina, Certificates of Participation, Series 2005B, 5.000%, 6/01/25 | | 6/15 at 100.00 | AA+ | | 1,511,750 | |
| | 1,060 | | Government of Guam, Business Privilege Tax Bonds, Series 2011A, 5.125%, 1/01/42 | | 1/22 at 100.00 | A | | 1,151,902 | |
| | | | Harnett County, North Carolina, Certificates of Participation, Series 2009: | | | | | | |
| | 1,000 | | 5.000%, 6/01/28 – AGC Insured | | 6/19 at 100.00 | AA– | | 1,092,140 | |
| | 500 | | 5.000%, 6/01/29 – AGC Insured | | 6/19 at 100.00 | AA– | | 543,800 | |
| | | | Jacksonville Public Facilities Corporation, North Carolina, Limited Obligation Bonds, Series 2012: | | | | | | |
| | 1,065 | | 5.000%, 4/01/29 | | 4/22 at 100.00 | A1 | | 1,210,128 | |
| | 1,165 | | 5.000%, 4/01/30 | | 4/22 at 100.00 | A1 | | 1,318,011 | |
| | 1,000 | | 5.000%, 4/01/31 | | 4/22 at 100.00 | A1 | | 1,125,630 | |
| | 200 | | 5.000%, 4/01/32 | | 4/22 at 100.00 | A1 | | 223,504 | |
| | 400 | | Mecklenburg County, North Carolina, Certificates of Participation, Series 2009A, 5.000%, 2/01/27 | | 2/19 at 100.00 | AA+ | | 441,920 | |
| | 8,065 | | North Carolina Turnpike Authority, Monroe Connector System State Appropriation Bonds, Series 2011, 5.000%, 7/01/41 | | 7/21 at 100.00 | AA | | 8,877,307 | |
| | 2,000 | | Puerto Rico Highway and Transportation Authority, Grant Anticipation Revenue Bonds, Series 2004, 5.000%, 9/15/21 – NPFG Insured | | 3/14 at 100.00 | A | | 2,026,940 | |
| | 9,450 | | Puerto Rico Sales Tax Financing Corporation, Sales Tax Revenue Bonds, First Subordinate Series 2010A, 0.000%, 8/01/35 | | No Opt. Call | A+ | | 2,646,567 | |
| | Principal | | | | Optional Call | | | | |
| | Amount (000) | | Description (1) | | Provisions (2) | Ratings (3) | | Value | |
| | | | Tax Obligation/Limited (continued) | | | | | | |
| | | | Raleigh, North Carolina, Certificates of Participation, Downtown Improvement Project, Series 2004B: | | | | | | |
| $ | 1,275 | | 5.000%, 6/01/20 | | 6/14 at 100.00 | AA+ | $ | 1,332,745 | |
| | 1,310 | | 5.000%, 6/01/21 | | 6/14 at 100.00 | AA+ | | 1,369,330 | |
| | 1,135 | | Raleigh, North Carolina, Certificates of Participation, Series 2007, 5.000%, 2/01/27 | | 2/17 at 100.00 | AA+ | | 1,253,006 | |
| | 2,250 | | Rutherford County, North Carolina, Certificates of Participation, Series 2007, 5.000%, 12/01/27 – AGM Insured | | 12/17 at 100.00 | AA– | | 2,456,730 | |
| | 5,000 | | Sampson County, North Carolina, Certificates of Participation, Series 2006, 5.000%, 6/01/34 – AGM Insured (UB) | | 6/17 at 100.00 | AA– | | 5,349,151 | |
| | 2,450 | | Wilmington, North Carolina, Certificates of Participation, Series 2008A, 5.000%, 6/01/29 | | 6/18 at 100.00 | AA | | 2,712,885 | |
| | 1,750 | | Wilson County, North Carolina, Certificates of Participation, School Facilities Project, Series 2007, 5.000%, 4/01/25 – AMBAC Insured | | 4/17 at 100.00 | Aa3 | | 1,975,206 | |
| | 47,805 | | Total Tax Obligation/Limited | | | | | 44,532,817 | |
| | | | Transportation – 15.7% (10.1% of Total Investments) | | | | | | |
| | 5,000 | | Charlotte, North Carolina, Airport Revenue Bonds, Charlotte Douglas International Refunding Series 2010A, 5.000%, 7/01/39 | | 7/20 at 100.00 | Aa3 | | 5,498,050 | |
| | 10 | | Charlotte, North Carolina, Airport Revenue Bonds, Charlotte Douglas International Refunding Series 2010B, 5.375%, 7/01/28 (Alternative Minimum Tax) | | 7/20 at 100.00 | Aa3 | | 11,224 | |
| | 1,400 | | Charlotte, North Carolina, Airport Revenue Bonds, Charlotte Douglas International, Series 2010B, 5.000%, 7/01/36 (Alternative Minimum Tax) | | 7/21 at 100.00 | Aa3 | | 1,500,338 | |
| | | | Charlotte, North Carolina, Airport Revenue Bonds, Series 2004A: | | | | | | |
| | 600 | | 5.250%, 7/01/24 – NPFG Insured | | 7/14 at 100.00 | Aa3 | | 630,246 | |
| | 2,710 | | 5.000%, 7/01/29 – NPFG Insured | | 7/14 at 100.00 | Aa3 | | 2,812,113 | |
| | 1,935 | | 5.000%, 7/01/34 – NPFG Insured | | 7/14 at 100.00 | Aa3 | | 2,008,762 | |
| | 2,725 | | North Carolina State Ports Authority, Port Facilities Revenue Bonds, Senior Lien Series 2010A, 5.250%, 2/01/40 | | 2/20 at 100.00 | A3 | | 3,001,969 | |
| | 515 | | North Carolina State Ports Authority, Port Facilities Revenue Bonds, Senior Lien Series 2010B, 5.000%, 2/01/29 | | 2/20 at 100.00 | A3 | | 564,564 | |
| | | | North Carolina Turnpike Authority, Triangle Expressway System Revenue Bonds, Series 2009A: | | | | | | |
| | 140 | | 5.000%, 1/01/21 – AGC Insured | | 1/19 at 100.00 | AA– | | 159,894 | |
| | 265 | | 5.375%, 1/01/26 – AGC Insured | | 1/19 at 100.00 | AA– | | 299,233 | |
| | 1,430 | | 5.500%, 1/01/29 – AGC Insured | | 1/19 at 100.00 | AA– | | 1,617,587 | |
| | 7,235 | | 5.750%, 1/01/39 – AGC Insured | | 1/19 at 100.00 | AA– | | 8,212,810 | |
| | | | North Carolina Turnpike Authority, Triangle Expressway System Senior Lien Revenue Bonds, Series 2009B: | | | | | | |
| | 150 | | 0.000%, 1/01/31 – AGC Insured | | No Opt. Call | AA– | | 71,054 | |
| | 4,355 | | 0.000%, 1/01/33 – AGC Insured | | No Opt. Call | AA– | | 1,858,845 | |
| | 2,300 | | 0.000%, 1/01/34 – AGC Insured | | No Opt. Call | AA– | | 932,512 | |
| | 2,345 | | 0.000%, 1/01/35 – AGC Insured | | No Opt. Call | AA– | | 900,668 | |
| | 7,505 | | 0.000%, 1/01/37 – AGC Insured | | No Opt. Call | AA– | | 2,631,778 | |
| | 1,325 | | 0.000%, 1/01/38 – AGC Insured | | No Opt. Call | AA– | | 441,265 | |
| | 1,235 | | Piedmont Triad Airport Authority, North Carolina, Airport Revenue Bonds, Series 2005A, 5.000%, 7/01/20 – SYNCORA GTY Insured | | 7/15 at 100.00 | A– | | 1,346,397 | |
| | 4,125 | | Raleigh Durham Airport Authority, North Carolina, Airport Revenue Bonds, Refunding Series 2010A, 5.000%, 5/01/36 | | 5/20 at 100.00 | Aa3 | | 4,564,808 | |
| | 47,305 | | Total Transportation | | | | | 39,064,117 | |
| | | | U.S. Guaranteed – 22.3% (14.4% of Total Investments) (4) | | | | | | |
| | | | Catawba County, North Carolina, Certificates of Participation, Series 2004: | | | | | | |
| | 1,800 | | 5.250%, 6/01/21 (Pre-refunded 6/01/14) – NPFG Insured | | 6/14 at 100.00 | Aa2 (4) | | 1,889,154 | |
| | 1,800 | | 5.250%, 6/01/22 (Pre-refunded 6/01/14) – NPFG Insured | | 6/14 at 100.00 | Aa2 (4) | | 1,889,154 | |
| | 500 | | Charlotte-Mecklenburg Hospital Authority, North Carolina, Healthcare System Revenue Bonds, DBA Carolinas Healthcare System, Series 2005A, 5.000%, 1/15/45 (Pre-refunded 1/15/15) | | 1/15 at 100.00 | AA+ (4) | | 537,270 | |
| | | | Craven County, North Carolina, Certificates of Participation, Series 2007: | | | | | | |
| | 160 | | 5.000%, 6/01/23 (Pre-refunded 6/01/17) – NPFG Insured | | 6/17 at 100.00 | AA– (4) | | 186,536 | |
| | 3,000 | | 5.000%, 6/01/27 (Pre-refunded 6/01/17) – NPFG Insured | | 6/17 at 100.00 | AA– (4) | | 3,497,550 | |
| | | Nuveen North Carolina Premium Income Municipal Fund (continued) |
| NNC | | Portfolio of Investments |
| | Principal | | | | Optional Call | | | | |
| | Amount (000) | | Description (1) | | Provisions (2) | Ratings (3) | | Value | |
| | | | U.S. Guaranteed (4) (continued) | | | | | | |
| $ | 1,250 | | Davidson County, North Carolina, Certificates of Participation, Series 2004, 5.250%, 6/01/21 (Pre-refunded 6/01/14) – AMBAC Insured | | 6/14 at 100.00 | Aa3 (4) | $ | 1,311,913 | |
| | | | Greensboro, North Carolina, Combined Enterprise System Revenue Bonds, Series 2005A: | | | | | | |
| | 500 | | 5.000%, 6/01/25 (Pre-refunded 6/01/15) | | 6/15 at 100.00 | AAA | | 545,840 | |
| | 1,295 | | 5.000%, 6/01/26 (Pre-refunded 6/01/15) | | 6/15 at 100.00 | AAA | | 1,413,726 | |
| | | | Lee County, North Carolina, Certificates of Participation, Public Schools and Community College, Series 2004: | | | | | | |
| | 1,715 | | 5.250%, 4/01/18 (Pre-refunded 4/01/14) – AGM Insured | | 4/14 at 100.00 | AA– (4) | | 1,786,035 | |
| | 1,715 | | 5.250%, 4/01/20 (Pre-refunded 4/01/14) – AGM Insured | | 4/14 at 100.00 | AA– (4) | | 1,786,035 | |
| | 1,000 | | 5.250%, 4/01/22 (Pre-refunded 4/01/14) – AGM Insured | | 4/14 at 100.00 | AA– (4) | | 1,041,420 | |
| | 1,500 | | North Carolina Infrastructure Finance Corporation, Certificates of Participation, Correctional Facilities, Series 2004A, 5.000%, 2/01/23 (Pre-refunded 2/01/14) | | 2/14 at 100.00 | AA+ (4) | | 1,547,383 | |
| | 1,680 | | North Carolina Medical Care Commission, Health Care Facilities Revenue Bonds, Cleveland County Healthcare System, Refunding Series 2011A, 5.750%, 1/01/35 (Pre-refunded 1/01/21) | | 1/21 at 100.00 | AA– (4) | | 2,165,604 | |
| | 2,250 | | North Carolina Medical Care Commission, Health Care Facilities Revenue Bonds, WakeMed, Series 2009A, 5.625%, 10/01/38 (Pre-refunded 10/01/14) – AGC Insured | | 10/14 at 100.00 | AA– (4) | | 2,409,930 | |
| | | | North Carolina Medical Care Commission, Revenue Bonds, Cleveland County Healthcare System, Series 2004A: | | | | | | |
| | 1,195 | | 5.250%, 7/01/20 (Pre-refunded 7/01/14) – AMBAC Insured | | 7/14 at 100.00 | AA– (4) | | 1,258,992 | |
| | 1,000 | | 5.250%, 7/01/22 (Pre-refunded 7/01/14) – AMBAC Insured | | 7/14 at 100.00 | AA– (4) | | 1,053,550 | |
| | 2,035 | | North Carolina Medical Care Commission, Revenue Bonds, Northeast Medical Center, Series 2004, 5.000%, 11/01/24 (Pre-refunded 11/01/14) | | 11/14 at 100.00 | N/R (4) | | 2,168,740 | |
| | 4,260 | | North Carolina Municipal Power Agency 1, Catawba Electric Revenue Bonds, Series 1986, 5.000%, 1/01/20 (ETM) | | No Opt. Call | Aaa | | 5,198,776 | |
| | 2,285 | | North Carolina State University at Raleigh, General Revenue Bonds, Series 2003A, 5.000%, 10/01/15 (Pre-refunded 10/01/13) | | 10/13 at 100.00 | Aa1 (4) | | 2,321,400 | |
| | | | North Carolina State, General Obligation Bonds, Series 2004A: | | | | | | |
| | 1,000 | | 5.000%, 3/01/18 (Pre-refunded 3/01/14) | | 3/14 at 100.00 | AAA | | 1,035,840 | |
| | 1,800 | | 5.000%, 3/01/22 (Pre-refunded 3/01/14) | | 3/14 at 100.00 | AAA | | 1,864,512 | |
| | 2,500 | | North Carolina, Certificates of Participation, Repair and Renovation Project, Series 2004B, 5.000%, 6/01/20 (Pre-refunded 6/01/14) | | 6/14 at 100.00 | AA+ (4) | | 2,617,575 | |
| | | | Pasquotank County, North Carolina, Certificates of Participation, Series 2004: | | | | | | |
| | 460 | | 5.000%, 6/01/25 (Pre-refunded 6/01/14) | | 6/14 at 100.00 | A (4) | | 481,358 | |
| | 920 | | 5.000%, 6/01/25 (Pre-refunded 6/01/14) | | 6/14 at 100.00 | A (4) | | 963,001 | |
| | 2,070 | | Pitt County, North Carolina, Certificates of Participation, School Facilities Project, Series 2004B, 5.000%, 4/01/29 (Pre-refunded 4/01/14) – AMBAC Insured | | 4/14 at 100.00 | AA (4) | | 2,151,434 | |
| | | | Raleigh, North Carolina, Combined Enterprise System Revenue Bonds, Series 2004: | | | | | | |
| | 1,000 | | 5.000%, 3/01/21 (Pre-refunded 3/01/14) | | 3/14 at 100.00 | AAA | | 1,035,840 | |
| | 1,250 | | 5.000%, 3/01/22 (Pre-refunded 3/01/14) | | 3/14 at 100.00 | AAA | | 1,294,800 | |
| | 500 | | Raleigh, North Carolina, Combined Enterprise System Revenue Bonds, Series 2006A, 5.000%, 3/01/31 (Pre-refunded 3/01/16) | | 3/16 at 100.00 | AAA | | 561,250 | |
| | 2,000 | | Randolph County, North Carolina, Certificates of Participation, Series 2004, 5.000%, 6/01/20 (Pre-refunded 6/01/14) – AGM Insured | | 6/14 at 102.00 | AA– (4) | | 2,133,940 | |
| | 555 | | University of North Carolina System, Pooled Revenue Bonds, Series 2005A, 5.000%, 4/01/22 (Pre-refunded 4/01/15) – AMBAC Insured | | 4/15 at 100.00 | N/R (4) | | 600,998 | |
| | | | University of North Carolina, Chapel Hill, System Net Revenue Bonds, Series 2003: | | | | | | |
| | 2,380 | | 5.000%, 12/01/19 (Pre-refunded 12/01/13) | | 12/13 at 100.00 | Aaa | | 2,436,763 | |
| | 2,725 | | 5.000%, 12/01/21 (Pre-refunded 12/01/13) | | 12/13 at 100.00 | Aaa | | 2,789,991 | |
| | 1,500 | | 5.000%, 12/01/23 (Pre-refunded 12/01/13) | | 12/13 at 100.00 | Aaa | | 1,535,774 | |
| | 51,600 | | Total U.S. Guaranteed | | | | | 55,512,084 | |
| | | | Utilities – 9.4% (6.1% of Total Investments) | | | | | | |
| | 2,500 | | North Carolina Eastern Municipal Power Agency, Power System Revenue Bonds, Series 2005, 5.250%, 1/01/20 – AMBAC Insured | | 1/16 at 100.00 | A– | | 2,778,075 | |
| | 1,400 | | North Carolina Eastern Municipal Power Agency, Power System Revenue Bonds, Series 2009B, 5.000%, 1/01/26 | | 1/19 at 100.00 | A– | | 1,560,062 | |
| | Principal | | | | Optional Call | | | | |
| | Amount (000) | | Description (1) | | Provisions (2) | Ratings (3) | | Value | |
| | | | Utilities (continued) | | | | | | |
| $ | 3,500 | | North Carolina Eastern Municipal Power Agency, Power System Revenue Bonds, Series 2012A, 5.000%, 1/01/25 | | 7/22 at 100.00 | A– | $ | 4,057,407 | |
| | | | North Carolina Eastern Municipal Power Agency, Power System Revenue Refunding Bonds, Series 1993B: | | | | | | |
| | 95 | | 6.000%, 1/01/22 | | No Opt. Call | A– | | 119,995 | |
| | 180 | | 6.000%, 1/01/22 – FGIC Insured | | No Opt. Call | Baa1 | | 227,360 | |
| | 1,100 | | North Carolina Municipal Power Agency 1, Catawba Electric Revenue Bonds, Refunding Series 2009A, 5.000%, 1/01/30 | | 1/19 at 100.00 | A | | 1,213,784 | |
| | | | North Carolina Municipal Power Agency 1, Catawba Electric Revenue Bonds, Refunding Series 2012A: | | | | | | |
| | 4,000 | | 5.000%, 1/01/18 | | No Opt. Call | A | | 4,680,720 | |
| | 2,000 | | 5.000%, 1/01/19 | | No Opt. Call | A | | 2,375,320 | |
| | 1,050 | | 4.000%, 1/01/20 | | No Opt. Call | A | | 1,193,147 | |
| | 250 | | North Carolina Municipal Power Agency 1, Catawba Electric Revenue Bonds, Series 2008A, 5.250%, 1/01/20 | | 1/18 at 100.00 | A | | 287,480 | |
| | 5,000 | | Wake County Industrial Facilities and Pollution Control Financing Authority, North Carolina, Pollution Control Revenue Refunding Bonds, Duke Energy Progress, Inc. Project, Series 2013, 4.000%, 6/01/41 (WI/DD, Settling 6/06/13) | | 6/23 at 100.00 | A+ | | 4,880,550 | |
| | 21,075 | | Total Utilities | | | | | 23,373,900 | |
| | | | Water and Sewer – 31.2% (20.1% of Total Investments) | | | | | | |
| | 1,605 | | Broad River Water Authority, North Carolina, Water System Revenue Bonds, Series 2005, 5.000%, 6/01/20 – SYNCORA GTY Insured | | 6/15 at 100.00 | A2 | | 1,692,681 | |
| | 3,100 | | Brunswick County, North Carolina, Enterprise System Revenue Bonds, Series 2008A, 5.000%, 4/01/31 – AGM Insured | | 4/18 at 100.00 | AA– | | 3,473,581 | |
| | 1,145 | | Brunswick County, North Carolina, Enterprise Systems Revenue Refunding Bonds, Series 2012A, 5.000%, 4/01/25 | | 4/22 at 100.00 | AA– | | 1,356,138 | |
| | | | Cape Fear Public Utility Authority, North Carolina, Water & Sewer System Revenue Bonds, Series 2008: | | | | | | |
| | 425 | | 5.000%, 8/01/28 | | 8/18 at 100.00 | AA | | 490,119 | |
| | 1,005 | | 5.000%, 8/01/35 | | 8/18 at 100.00 | AA | | 1,118,354 | |
| | 2,135 | | Cape Fear Public Utility Authority, North Carolina, Water & Sewer System Revenue Bonds, Series 2011, 5.000%, 8/01/31 | | 8/21 at 100.00 | AA | | 2,429,737 | |
| | 1,520 | | Charlotte, North Carolina, Water and Sewerage System Revenue Bonds, Series 2002A, 5.250%, 7/01/13 | | No Opt. Call | AAA | | 1,526,430 | |
| | 1,000 | | Charlotte, North Carolina, Water and Sewerage System Revenue Bonds, Series 2008, 5.000%, 7/01/38 | | 7/18 at 100.00 | AAA | | 1,121,210 | |
| | | | Dare County, North Carolina, Utilities System Revenue Bonds, Series 2011: | | | | | | |
| | 3,860 | | 5.000%, 2/01/36 | | 2/21 at 100.00 | AA | | 4,285,951 | |
| | 1,250 | | 5.000%, 2/01/41 | | 2/21 at 100.00 | AA | | 1,372,863 | |
| | 8,600 | | Durham, North Carolina, Utility System Revenue Bonds, Refunding Series 2011, 5.000%, 6/01/41 | | 6/21 at 100.00 | AAA | | 9,572,660 | |
| | 1,535 | | Mooresville, North Carolina, Enterprise System Revenue Bonds, Refunding Series 2012, 5.000%, 5/01/28 | | 5/22 at 100.00 | AA– | | 1,776,839 | |
| | 1,210 | | Oak Island, North Carolina, Enterprise System Revenue Bonds, Series 2008A, 5.000%, 6/01/23 – NPFG Insured | | 6/18 at 100.00 | A | | 1,394,114 | |
| | | | Oak Island, North Carolina, Enterprise System Revenue Bonds, Series 2009A: | | | | | | |
| | 2,020 | | 6.000%, 6/01/34 – AGC Insured | | 6/19 at 100.00 | AA– | | 2,292,922 | |
| | 1,020 | | 6.000%, 6/01/36 – AGC Insured | | 6/19 at 100.00 | AA– | | 1,156,048 | |
| | | | Oak Island, North Carolina, Enterprise System Revenue Bonds, Series 2011: | | | | | | |
| | 600 | | 5.625%, 6/01/30 – AGC Insured | | 6/21 at 100.00 | AA– | | 698,982 | |
| | 2,100 | | 5.750%, 6/01/36 – AGC Insured | | 6/21 at 100.00 | AA– | | 2,422,791 | |
| | 1,400 | | Onslow County, North Carolina, Combined Enterprise System Revenue Bonds, Series 2004B, 5.000%, 6/01/23 – SYNCORA GTY Insured | | 6/14 at 100.00 | A+ | | 1,458,100 | |
| | 1,550 | | Puerto Rico Aqueduct and Sewerage Authority, Revenue Bonds, Senior Lien Series 2008A, 6.000%, 7/01/44 | | 7/18 at 100.00 | BBB– | | 1,589,045 | |
| | | Nuveen North Carolina Premium Income Municipal Fund (continued) |
| NNC | | Portfolio of Investments |
May 31, 2013
| | Principal | | | | Optional Call | | | | |
| | Amount (000) | | Description (1) | | Provisions (2) | Ratings (3) | | Value | |
| | | | Water and Sewer (continued) | | | | | | |
| | | | Raleigh, North Carolina, Combined Enterprise System Revenue Bonds, Refunding Series 2012A: | | | | | | |
| $ | 550 | | 5.000%, 3/01/30 | | 3/22 at 100.00 | AAA | $ | 641,212 | |
| | 1,600 | | 5.000%, 3/01/31 | | 3/22 at 100.00 | AAA | | 1,857,280 | |
| | | | Raleigh, North Carolina, Combined Enterprise System Revenue Bonds, Series 2006A: | | | | | | |
| | 12,485 | | 5.000%, 3/01/31 (UB) | | 3/16 at 100.00 | AAA | | 14,014,413 | |
| | 6,975 | | 5.000%, 3/01/36 (UB) | | 3/16 at 100.00 | AAA | | 7,599,890 | |
| | 40 | | Raleigh, North Carolina, Combined Enterprise System Revenue Bonds, Series 2006A, Residuals Series II-R-645-1, 13.564%, 3/01/14 (IF) | | No Opt. Call | AAA | | 54,697 | |
| | 10 | | Raleigh, North Carolina, Combined Enterprise System Revenue Bonds, Series 2006A Residuals, Series II-R-645-2, 13.866%, 3/01/14 (IF) | | No Opt. Call | AAA | | 12,686 | |
| | 1,000 | | Wilmington, North Carolina, Water and Sewer Revenue Bonds, Series 2005, 5.000%, 6/01/25 – AGM Insured | | 6/15 at 100.00 | AA | | 1,081,590 | |
| | 9,900 | | Winston-Salem, North Carolina, Water and Sewer System Revenue Bonds, Series 2007A, 5.000%, 6/01/37 (UB) | | 6/17 at 100.00 | AAA | | 10,998,801 | |
| | 69,640 | | Total Water and Sewer | | | | | 77,489,134 | |
| $ | 374,735 | | Total Investments (cost $363,339,627) – 155.2% | | | | | 385,824,465 | |
| | | | Floating Rate Obligations – (9.5)% | | | | | (23,715,000 | ) |
| | | | MuniFund Term Preferred Shares, at Liquidation Value – (50.2)% (5) | | | | | (124,860,000 | ) |
| | | | Other Assets Less Liabilities – 4.5% | | | | | 11,351,333 | |
| | | | Net Assets Applicable to Common Shares – 100% | | | | $ | 248,600,798 | |
| (1) | All percentages shown in the Portfolio of Investments are based on net assets applicable to Common shares unless otherwise noted. |
| (2) | Optional Call Provisions (not covered by the report of independent registered public accounting firm): Dates (month and year) and prices of the earliest optional call or redemption. There may be other call provisions at varying prices at later dates. Certain mortgage-backed securities may be subject to periodic principal paydowns. |
| (3) | Ratings (not covered by the report of independent registered public accounting firm): Using the highest of Standard & Poor’s Group (“Standard & Poor’s”), Moody’s Investors Service, Inc. (“Moody’s”) or Fitch, Inc. (“Fitch”) rating. Ratings below BBB by Standard & Poor’s, Baa by Moody’s or BBB by Fitch are considered to be below investment grade. Holdings designated N/R are not rated by any of these national rating agencies. |
| (4) | Backed by an escrow or trust containing sufficient U.S. Government or U.S. Government agency securities, which ensure the timely payment of principal and interest. Certain bonds backed by U.S. Government or agency securities are regarded as having an implied rating equal to the rating of such securities. |
| (5) | MuniFund Term Preferred Shares, at Liquidation Value as a percentage of Total Investments is 32.4%. |
| N/R | Not rated. |
| WI/DD | Investment, or portion of investment, purchased on a when-issued or delayed delivery basis. |
| (ETM) | Escrowed to maturity. |
| (IF) | Inverse floating rate investment. |
| (UB) | Underlying bond of an inverse floating rate trust reflected as a financing transaction. See Notes to Financial Statements, Footnote 1 – General Information and Significant Accounting Policies, Inverse Floating Rate Securities for more information. |
See accompanying notes to financial statements.
| | | Nuveen Virginia Premium Income Municipal Fund |
| NPV | | Portfolio of Investments |
May 31, 2013
| | Principal | | | | Optional Call | | | | |
| | Amount (000) | | Description (1) | | Provisions (2) | Ratings (3) | | Value | |
| | | | Consumer Staples – 8.3% (5.7% of Total Investments) | | | | | | |
| | | | Guam Economic Development & Commerce Authority, Tobacco Settlement Asset-Backed Bonds, Series 2007A: | | | | | | |
| $ | 855 | | 5.250%, 6/01/32 | | 6/17 at 100.00 | B+ | $ | 837,891 | |
| | 700 | | 5.625%, 6/01/47 | | 6/17 at 100.00 | B+ | | 627,046 | |
| | 73,500 | | Puerto Rico, The Children’s Trust Fund, Tobacco Settlement Asset-Backed Bonds, Series 2005A, 0.000%, 5/15/50 | | 5/15 at 11.19 | BB– | | 6,773,025 | |
| | | | Puerto Rico, The Children’s Trust Fund, Tobacco Settlement Asset-Backed Refunding Bonds, Series 2002: | | | | | | |
| | 2,915 | | 5.375%, 5/15/33 | | 11/13 at 100.00 | BBB+ | | 2,947,765 | |
| | 325 | | 5.500%, 5/15/39 | | 11/13 at 100.00 | BBB | | 328,653 | |
| | 11,425 | | Tobacco Settlement Financing Corporation of Virginia, Tobacco Settlement Asset Backed Bonds, Series 2007B1, 5.000%, 6/01/47 | | 6/17 at 100.00 | B2 | | 9,646,128 | |
| | 2,145 | | Tobacco Settlement Financing Corporation of Virginia, Tobacco Settlement Asset-Backed Bonds, Series 2007B2, 5.200%, 6/01/46 | | 6/17 at 100.00 | B2 | | 1,874,816 | |
| | 91,865 | | Total Consumer Staples | | | | | 23,035,324 | |
| | | | Education and Civic Organizations – 8.6% (5.9% of Total Investments) | | | | | | |
| | 1,615 | | Alexandria Industrial Development Authority, Virginia, Educational Facilities Revenue Bonds, Episcopal High School, Series 2012, 3.750%, 1/01/30 | | No Opt. Call | A1 | | 1,621,686 | |
| | 580 | | Amherst Industrial Development Authority, Virginia, Revenue Bonds, Sweet Briar College, Series 2006, 5.000%, 9/01/26 | | 9/16 at 100.00 | BBB | | 607,022 | |
| | 1,000 | | Fairfax County Economic Development Authority, Virginia, Revenue Bonds, National Wildlife Federation, Series 1999, 5.375%, 9/01/29 – NPFG Insured | | 9/13 at 100.00 | A3 | | 1,003,470 | |
| | 1,000 | | Lexington Industrial Development Authority, Virginia, Educational Facilities Revenue Bonds, VMI Development Board Project, Series 2006C, 5.000%, 12/01/36 | | 6/19 at 100.00 | Aa2 | | 1,112,270 | |
| | 1,630 | | Prince William County Industrial Development Authority, Virginia, Student Housing Revenue Bonds, George Mason University Foundation Prince William Housing LLC Project, Series 2011A, 5.125%, 9/01/41 | | 9/21 at 100.00 | A | | 1,770,213 | |
| | 1,890 | | Puerto Rico Industrial, Tourist, Educational, Medical and Environmental Control Facilities Financing Authority, Higher Education Revenue Refunding Bonds, Ana G. Mendez University System, Series 2002, 5.375%, 12/01/21 | | 12/13 at 100.00 | BBB– | | 1,899,658 | |
| | 995 | | The Rector and Visitors of the University of Virginia, General Revenue Bonds, Series 2005, 5.000%, 6/01/37 | | 6/15 at 100.00 | AAA | | 1,067,486 | |
| | 6,000 | | The Rector and Visitors of the University of Virginia, General Revenue Bonds, Series 2008, 5.000%, 6/01/40 (WI/DD, Settling 6/03/13) | | 6/18 at 100.00 | AAA | | 6,695,220 | |
| | 390 | | University of Puerto Rico, University System Revenue Bonds, Series 2006P, 5.000%, 6/01/14 | | No Opt. Call | BBB– | | 396,833 | |
| | 3,600 | | Virginia College Building Authority, Educational Facilities Revenue Bonds, Public Higher Education Financing Program, Series 2009A, 5.000%, 9/01/28 | | 9/18 at 100.00 | Aa1 | | 4,110,120 | |
| | 750 | | Virginia College Building Authority, Educational Facilities Revenue Bonds, Public Higher Education Financing Program, Series 2010B, 5.000%, 9/01/13 | | No Opt. Call | Aa1 | | 759,098 | |
| | 500 | | Virginia College Building Authority, Educational Facilities Revenue Refunding Bonds, Marymount University, Series 1998, 5.100%, 7/01/18 – RAAI Insured | | 7/13 at 100.00 | N/R | | 501,180 | |
| | 1,635 | | Virginia Commonwealth University, Revenue Bonds, Series 2004A, 5.000%,
5/01/17 – AMBAC Insured | | 5/14 at 101.00 | Aa2 | | 1,719,382 | |
| | 500 | | Virginia Small Business Finance Authority, Educational Facilities Revenue Bonds, Roanoke College, Series 2011, 5.750%, 4/01/41 | | 4/20 at 100.00 | A– | | 552,620 | |
| | 22,085 | | Total Education and Civic Organizations | | | | | 23,816,258 | |
| | | | Health Care – 22.9% (15.5% of Total Investments) | | | | | | |
| | 5,000 | | Arlington County Industrial Development Authority, Virginia, Hospital Revenue Bonds, Virginia Hospital Center Arlington Health System, Refunding Series 2010, 5.000%, 7/01/31 | | 7/20 at 100.00 | A1 | | 5,396,800 | |
| | | | Charlotte County Industrial Development Authority, Virginia, Hospital Revenue Bonds, Halifax Regional Hospital Incorporated, Series 2007: | | | | | | |
| | 1,545 | | 5.000%, 9/01/27 | | 9/17 at 100.00 | BBB+ | | 1,627,688 | |
| | 250 | | 5.000%, 9/01/37 | | 9/17 at 100.00 | BBB+ | | 260,113 | |
| | | Nuveen Virginia Premium Income Municipal Fund (continued) |
| NPV | | Portfolio of Investments |
May 31, 2013
| | Principal | | | | Optional Call | | | | |
| | Amount (000) | | Description (1) | | Provisions (2) | Ratings (3) | | Value | |
| | | | Health Care (continued) | | | | | | |
| $ | 2,145 | | Chesterfield County Economic Development Authority, Virginia, Revenue Bonds, Bon Secours Health, Series 2010C-2, 5.000%, 11/01/42 – AGC Insured | | 11/20 at 100.00 | AA– | $ | 2,294,914 | |
| | 3,340 | | Fairfax County Industrial Development Authority, Virginia, Healthcare Revenue Bonds, Inova Health System, Series 2009, Trust 11733, 14.796%, 11/15/29 (IF) | | 5/19 at 100.00 | AA+ | | 4,661,972 | |
| | 1,000 | | Fairfax County Industrial Development Authority, Virginia, Healthcare Revenue Bonds, Inova Health System, Series 2012A, 5.000%, 5/15/40 | | 5/22 at 100.00 | AA+ | | 1,108,370 | |
| | 4,950 | | Fairfax County Industrial Development Authority, Virginia, Hospital Revenue Refunding Bonds, Inova Health System, Series 1993A, 5.000%, 8/15/23 | | No Opt. Call | AA+ | | 6,031,872 | |
| | | | Fredericksburg Economic Development Authority, Virginia, Hospital Facilities Revenue Bonds, MediCorp Health System, Series 2007: | | | | | | |
| | 1,080 | | 5.250%, 6/15/18 | | No Opt. Call | Baa1 | | 1,238,544 | |
| | 2,500 | | 5.250%, 6/15/23 | | No Opt. Call | Baa1 | | 2,953,850 | |
| | 2,480 | | Fredericksburg Industrial Development Authority, Virginia, Revenue Bonds, MediCorp Health System, Series 2002B, 5.125%, 6/15/33 | | 6/13 at 100.00 | Baa1 | | 2,482,331 | |
| | 795 | | Hanover County Industrial Development Authority, Virginia, Hospital Revenue Bonds, Memorial Regional Medical Center, Series 1995, 6.375%, 8/15/18 – NPFG Insured | | No Opt. Call | A | | 875,931 | |
| | 5,345 | | Harrisonburg Industrial Development Authority, Virginia, Hospital Facilities Revenue Bonds, Rockingham Memorial Hospital, Series 2006, 5.000%, 8/15/31 – AMBAC Insured | | 8/16 at 100.00 | AA | | 5,814,932 | |
| | 1,500 | | Henrico County Industrial Development Authority, Virginia, Healthcare Revenue Bonds, Bon Secours Health System, Series 1996, 6.250%, 8/15/20 – NPFG Insured | | No Opt. Call | A | | 1,747,935 | |
| | 3,155 | | Prince William County Industrial Development Authority, Virginia, Health Care Facilities Revenue Refunding Bonds, Novant Health Obligated Group-Prince William Hospital, Series 2013B, 5.000%, 11/01/46 | | 11/22 at 100.00 | AA– | | 3,399,134 | |
| | | | Stafford County Economic Development Authority, Virginia, Hospital Facilities Revenue Bonds, MediCorp Health System, Series 2006: | | | | | | |
| | 2,000 | | 5.250%, 6/15/25 | | 6/16 at 100.00 | Baa1 | | 2,097,440 | |
| | 2,000 | | 5.250%, 6/15/26 | | 6/16 at 100.00 | Baa1 | | 2,093,380 | |
| | 2,025 | | 5.250%, 6/15/31 | | 6/16 at 100.00 | Baa1 | | 2,106,425 | |
| | 3,395 | | 5.250%, 6/15/37 | | 6/16 at 100.00 | Baa1 | | 3,514,742 | |
| | 2,550 | | Virginia Small Business Finance Authority, Healthcare Facilities Revenue Bonds, Sentara Healthcare, Refunding Series 2010, 5.000%, 11/01/40 | | 5/20 at 100.00 | AA | | 2,770,856 | |
| | 4,425 | | Virginia Small Business Financing Authority, Wellmont Health System Project Revenue Bonds, Series 2007A, 5.250%, 9/01/37 | | 9/17 at 100.00 | BBB+ | | 4,559,520 | |
| | 1,620 | | Winchester Industrial Development Authority, Virginia, Hospital Revenue Bonds Valley Health System Obligated Group, Series 2009E, 5.625%, 1/01/44 | | 1/19 at 100.00 | A+ | | 1,825,983 | |
| | 2,855 | | Winchester Industrial Development Authority, Virginia, Hospital Revenue Bonds, Winchester Medical Center, Series 2007, 5.125%, 1/01/31 | | 1/17 at 100.00 | A+ | | 3,104,670 | |
| | 1,020 | | Wisconsin Health and Educational Facilities Authority, Revenue Bonds, Aurora Health Care, Inc., Series 2010A, 5.625%, 4/15/39 | | 4/20 at 100.00 | A | | 1,141,747 | |
| | 56,975 | | Total Health Care | | | | | 63,109,149 | |
| | | | Housing/Multifamily – 1.3% (0.8% of Total Investments) | | | | | | |
| | 955 | | Arlington County Industrial Development Authority, Virginia, Multifamily Housing Mortgage Revenue Bonds, Arlington View Terrace Apartments, Series 2001, 5.150%, 11/01/31 (Mandatory put 11/01/19) (Alternative Minimum Tax) | | 6/13 at 101.00 | AA+ | | 966,011 | |
| | 400 | | Virginia Housing Development Authority, Rental Housing Bonds, Series 2010A, 5.000%, 4/01/45 | | 10/19 at 100.00 | AA+ | | 424,460 | |
| | 530 | | Virginia Housing Development Authority, Rental Housing Bonds, Series 2010C, 4.550%, 8/01/32 | | 2/20 at 100.00 | AA+ | | 562,166 | |
| | 1,435 | | Waynesboro Redevelopment and Housing Authority, Virginia, Multifamily Housing Revenue Bonds, Epworth Manor, GNMA Collateralized Series 2010, 5.000%, 10/20/51 | | 4/20 at 100.00 | AA+ | | 1,525,893 | |
| | 3,320 | | Total Housing/Multifamily | | | | | 3,478,530 | |
| | | | Housing/Single Family – 6.3% (4.2% of Total Investments) | | | | | | |
| | 2,600 | | Virginia Housing Development Authority, Commonwealth Mortgage Bonds, Series 2005C-2, 4.750%, 10/01/32 (Alternative Minimum Tax) | | 1/15 at 100.00 | AAA | | 2,637,726 | |
| | 3,615 | | Virginia Housing Development Authority, Commonwealth Mortgage Bonds, Series 2006D-1, 4.900%, 1/01/33 (Alternative Minimum Tax) | | 7/15 at 100.00 | AAA | | 3,703,640 | |
| | Principal | | | | Optional Call | | | | |
| | Amount (000) | | Description (1) | | Provisions (2) | Ratings (3) | | Value | |
| | | | Housing/Single Family (continued) | | | | | | |
| $ | 2,740 | | Virginia Housing Development Authority, Commonwealth Mortgage Bonds, Series 2006, 4.800%, 7/01/29 (Alternative Minimum Tax) | | 7/15 at 100.00 | AAA | $ | 2,810,062 | |
| | 7,900 | | Virginia Housing Development Authority, Commonwealth Mortgage Bonds, Series 2007B, 4.750%, 7/01/32 (Alternative Minimum Tax) | | 7/16 at 100.00 | AAA | | 8,117,329 | |
| | 16,855 | | Total Housing/Single Family | | | | | 17,268,757 | |
| | | | Long-Term Care – 8.5% (5.8% of Total Investments) | | | | | | |
| | 2,000 | | Albemarle County Industrial Development Authority, Virginia, Residential Care Facilities Mortgage Revenue Bonds, Westminster-Canterbury of the Blue Ridge, Series 2007, 5.000%, 1/01/31 | | 1/17 at 100.00 | N/R | | 2,044,300 | |
| | 1,000 | | Chesterfield County Health Center Commission, Virginia, Mortgage Revenue Bonds, Lucy Corr Village, Series 2005, 5.625%, 12/01/39 | | 12/15 at 100.00 | N/R | | 827,010 | |
| | 5,585 | | Fairfax County Economic Development Authority, Virginia, Residential Care Facilities Mortgage Revenue Bonds, Goodwin House, Inc., Series 2007A, 5.125%, 10/01/37 | | 10/17 at 100.00 | BBB | | 5,833,533 | |
| | | | Fairfax County Economic Development Authority, Virginia, Retirement Center Revenue Bonds, Greenspring Village, Series 2006A: | | | | | | |
| | 1,000 | | 4.750%, 10/01/26 | | 10/16 at 100.00 | A | | 1,043,280 | |
| | 800 | | 4.875%, 10/01/36 | | 10/16 at 100.00 | A | | 831,352 | |
| | | | Henrico County Economic Development Authority, Virginia, Residential Care Facility Revenue Bonds, Westminster Canterbury of Richmond, Series 2006: | | | | | | |
| | 100 | | 5.000%, 10/01/27 | | 10/17 at 100.00 | BBB | | 102,577 | |
| | 4,740 | | 5.000%, 10/01/35 | | 10/13 at 100.00 | BBB | | 4,861,012 | |
| | 3,590 | | Industrial Development Authority of the County of Prince William, Virginia, Residential Care Facility Revenue Bonds, Westminster at Lake, First Mortgage, Series 2006, 5.125%, 1/01/26 | | 1/17 at 100.00 | N/R | | 2,905,567 | |
| | 1,000 | | Roanoke Economic Development Authority, Virginia, Residential Care Facility Mortgage Revenue Refunding Bonds, Virginia Lutheran Homes Brandon Oaks Project, Series 2012, 4.625%, 12/01/27 | | 12/22 at 100.00 | N/R | | 1,004,970 | |
| | 1,500 | | Roanoke Industrial Development Authority, Virginia, Residential Revenue Bonds, Virginia Lutheran Homes Incorporated, Series 2006, 5.000%, 12/01/39 | | 12/16 at 100.00 | N/R | | 1,489,110 | |
| | 1,000 | | Suffolk Industrial Development Authority, Virginia, Retirement Facilities First Mortgage Revenue Bonds, Lake Prince Center, Series 2006, 5.300%, 9/01/31 | | 9/16 at 100.00 | N/R | | 1,025,230 | |
| | 1,000 | | Virginia Beach Development Authority, Virginia, Residential Care Facility Mortgage Revenue Bonds, Westminster Canterbury on Chesapeake Bay, Series 2005, 5.000%, 11/01/22 | | 11/15 at 100.00 | N/R | | 1,027,310 | |
| | 500 | | Winchester Industrial Development Authority, Virginia, Residential Care Facility Revenue Bonds, Westminster-Canterbury of Winchester Inc., Series 2005A, 5.200%, 1/01/27 | | 1/15 at 100.00 | BBB+ | | 508,770 | |
| | 23,815 | | Total Long-Term Care | | | | | 23,504,021 | |
| | | | Tax Obligation/General – 11.4% (7.8% of Total Investments) | | | | | | |
| | 1,440 | | Bristol, Virginia, General Obligation Bonds, Refunding & Improvement Series 2010, 5.000%, 7/15/25 | | 7/20 at 100.00 | Aa2 | | 1,706,875 | |
| | 1,000 | | Loudoun County, Virginia, General Obligation Bonds, Public Improvement Series 2009A, 4.000%, 7/01/14 | | No Opt. Call | AAA | | 1,041,270 | |
| | 1,700 | | Loudoun County, Virginia, General Obligation Bonds, Series 2006B, 5.000%, 12/01/25 | | 12/16 at 100.00 | AAA | | 1,938,034 | |
| | 1,070 | | Norfolk, Virginia, General Obligation Bonds, Series 2005, 5.000%, 3/01/15 – NPFG Insured | | No Opt. Call | AA+ | | 1,157,023 | |
| | 6,050 | | Portsmouth, Virginia, General Obligation Bonds, Refunding Series 2010D, 5.000%, 7/15/34 | | 7/20 at 100.00 | AA | | 6,797,054 | |
| | 1,280 | | Portsmouth, Virginia, General Obligation Bonds, Series 2005A, 5.000%, 4/01/15 – NPFG Insured | | No Opt. Call | AA | | 1,388,301 | |
| | 380 | | Puerto Rico Government Development Bank, Adjustable Refunding Bonds, Variable Rate Demand Obligations, Series 1985, 4.750%, 12/01/15 – NPFG Insured | | 12/13 at 100.00 | A | | 388,295 | |
| | 610 | | Puerto Rico, General Obligation and Public Improvement Bonds, Series 1998, 6.000%, 7/01/15 – NPFG Insured | | No Opt. Call | A | | 647,064 | |
| | 850 | | Puerto Rico, General Obligation and Public Improvement Bonds, Series 2002A, 5.500%, 7/01/20 – NPFG Insured | | No Opt. Call | A | | 901,842 | |
| | 560 | | Puerto Rico, General Obligation Bonds, Series 2004A, 5.000%, 7/01/15 – AGM Insured | | 7/14 at 100.00 | AA– | | 576,716 | |
| | 895 | | Richmond, Virginia, General Obligation Bonds, Refunding & Improvement Series 2012B, 2.000%, 7/15/13 | | No Opt. Call | AA+ | | 897,032 | |
| | 1,150 | | Suffolk, Virginia, General Obligation Bonds, Public Improvements, Refunding Series 2010A, 5.000%, 8/01/13 | | No Opt. Call | AA+ | | 1,159,350 | |
| | | Nuveen Virginia Premium Income Municipal Fund (continued) |
| NPV | | Portfolio of Investments |
May 31, 2013
| | Principal | | | | Optional Call | | | | |
| | Amount (000) | | Description (1) | | Provisions (2) | Ratings (3) | | Value | |
| | | | Tax Obligation/General (continued) | | | | | | |
| $ | 1,535 | | Suffolk, Virginia, General Obligation Bonds, Series 2005, 5.000%, 12/01/15 Virginia Beach, Virginia, General Obligation Bonds, Series 2008: | | No Opt. Call | AA+ | $ | 1,710,665 | |
| | 4,500 | | 5.000%, 10/01/26 (UB) | | 10/17 at 100.00 | AAA | | 5,137,740 | |
| | 4,500 | | 5.000%, 10/01/27 (UB) | | 10/17 at 100.00 | AAA | | 5,106,645 | |
| | 1,000 | | Virginia State, General Obligation Bonds, Series 2004B, 5.000%, 6/01/14 | | No Opt. Call | AAA | | 1,048,130 | |
| | 28,520 | | Total Tax Obligation/General | | | | | 31,602,036 | |
| | | | Tax Obligation/Limited – 34.5% (23.4% of Total Investments) | | | | | | |
| | 154 | | Bell Creek Community Development Authority, Virginia, Special Assessment Bonds, Series 2003A, 6.750%, 3/01/22 | | 3/14 at 100.00 | N/R | | 155,400 | |
| | | | Buena Vista Public Recreational Facilities Authority, Virginia, Lease Revenue Bonds, Golf Course Project, Series 2005A: | | | | | | |
| | 665 | | 5.250%, 7/15/25 – ACA Insured | | 7/15 at 100.00 | N/R | | 601,659 | |
| | 520 | | 5.500%, 7/15/35 – ACA Insured | | 7/15 at 100.00 | N/R | | 443,612 | |
| | 1,340 | | Culpeper Industrial Development Authority, Virginia, Lease Revenue Bonds, School Facilities Project, Series 2005, 5.000%, 1/01/20 – NPFG Insured | | 1/15 at 100.00 | AA– | | 1,435,301 | |
| | 1,375 | | Cumberland County, Virginia, Certificates of Participation, Series 1997, 6.375%, 7/15/17 | | No Opt. Call | N/R | | 1,508,293 | |
| | 600 | | Dulles Town Center Community Development Authority, Loudon County, Virginia Special Assessment Refunding Bonds, Dulles Town Center Project, Series 2012, 4.250%, 3/01/26 | | No Opt. Call | N/R | | 590,106 | |
| | 2,300 | | Fairfax County Economic Development Authority, Virginia, Lease Revenue Bonds, Joint Public Uses Community Project, Series 2006, 5.000%, 5/15/18 | | 5/16 at 100.00 | AA+ | | 2,549,734 | |
| | | | Government of Guam, Business Privilege Tax Bonds, Series 2011A: | | | | | | |
| | 1,020 | | 5.000%, 1/01/31 | | 1/22 at 100.00 | A | | 1,119,470 | |
| | 500 | | 5.250%, 1/01/36 | | 1/22 at 100.00 | A | | 551,315 | |
| | 5,600 | | Greater Richmond Convention Center Authority, Virginia, Hotel Tax Revenue Bonds, Series 2005, 5.000%, 6/15/30 – NPFG Insured | | 6/15 at 100.00 | A+ | | 5,936,784 | |
| | 1,270 | | James City County Economic Development Authority, Virginia, Lease Revenue Bonds, County Government Projects, Series 2005, 5.000%, 7/15/19 | | 7/15 at 100.00 | AA+ | | 1,387,716 | |
| | 890 | | Montgomery County Industrial Development Authority, Virginia, Public Facility Lease Revenue Bonds, Public Projects Series 2008, 5.000%, 2/01/29 | | 2/18 at 100.00 | AA– | | 962,704 | |
| | 2,895 | | Puerto Rico Highway and Transportation Authority, Highway Revenue Bonds, Series 2002D, 5.000%, 7/01/32 – AGM Insured | | 7/13 at 100.00 | AA– | | 2,895,261 | |
| | 680 | | Puerto Rico Highway and Transportation Authority, Highway Revenue Bonds, Series 2003G, 5.000%, 7/01/33 | | 7/13 at 100.00 | BBB | | 658,614 | |
| | | | Puerto Rico Highway and Transportation Authority, Highway Revenue Bonds, Series 2007N: | | | | | | |
| | 645 | | 5.500%, 7/01/29 – AMBAC Insured | | No Opt. Call | Baa3 | | 659,164 | |
| | 1,465 | | 5.250%, 7/01/30 – AMBAC Insured | | No Opt. Call | BBB | | 1,452,709 | |
| | 5,565 | | 5.250%, 7/01/31 – AMBAC Insured | | No Opt. Call | BBB | | 5,503,952 | |
| | 955 | | Puerto Rico Highway and Transportation Authority, Subordinate Lien Highway Revenue Bonds, Series 1998, 5.000%, 7/01/28 | | 7/13 at 100.00 | BBB– | | 927,868 | |
| | | | Puerto Rico Highway and Transportation Authority, Subordinate Lien Highway Revenue Bonds, Series 2003: | | | | | | |
| | 1,000 | | 5.250%, 7/01/15 – FGIC Insured | | 7/13 at 100.00 | BBB– | | 1,002,960 | |
| | 1,500 | | 5.250%, 7/01/17 – FGIC Insured | | 7/13 at 100.00 | BBB– | | 1,504,185 | |
| | | | Puerto Rico Infrastructure Financing Authority, Special Tax Revenue Bonds, Series 2005A: | | | | | | |
| | 5,000 | | 0.000%, 7/01/29 – AMBAC Insured | | No Opt. Call | BBB+ | | 1,939,700 | |
| | 5,000 | | 0.000%, 7/01/43 – AMBAC Insured | | No Opt. Call | BBB+ | | 723,800 | |
| | | | Puerto Rico Infrastructure Financing Authority, Special Tax Revenue Bonds, Series 2005C: | | | | | | |
| | 2,000 | | 5.500%, 7/01/26 – AMBAC Insured | | No Opt. Call | BBB+ | | 2,047,740 | |
| | 5,875 | | 0.000%, 7/01/28 – AMBAC Insured | | No Opt. Call | BBB+ | | 2,445,880 | |
| | 2,900 | | Puerto Rico Public Buildings Authority, Guaranteed Government Facilities Revenue Bonds, Series 2007M, 6.000%, 7/01/27 – NPFG Insured | | 7/18 at 100.00 | A | | 3,031,921 | |
| | | | Puerto Rico Public Buildings Authority, Guaranteed Government Facilities Revenue Refunding Bonds, Series 2002D: | | | | | | |
| | 665 | | 5.250%, 7/01/27 | | 7/13 at 100.00 | BBB– | | 664,641 | |
| | 320 | | 5.250%, 7/01/36 | | 7/13 at 100.00 | BBB– | | 316,816 | |
| | Principal | | | | Optional Call | | | | |
| | Amount (000) | | Description (1) | | Provisions (2) | Ratings (3) | | Value | |
| | | | Tax Obligation/Limited (continued) | | | | | | |
| | | | Puerto Rico Sales Tax Financing Corporation, Sales Tax Revenue Bonds, First Subordinate Series 2009A: | | | | | | |
| $ | 1,190 | | 5.750%, 8/01/37 | | 8/19 at 100.00 | A+ | $ | 1,284,189 | |
| | 3,400 | | 6.000%, 8/01/42 | | 8/19 at 100.00 | A+ | | 3,753,498 | |
| | 3,705 | | Puerto Rico Sales Tax Financing Corporation, Sales Tax Revenue Bonds, First Subordinate Series 2010A, 5.500%, 8/01/42 | | 2/20 at 100.00 | A+ | | 3,917,185 | |
| | 3,195 | | Puerto Rico Sales Tax Financing Corporation, Sales Tax Revenue Bonds, First Subordinate Series 2010C, 6.000%, 8/01/39 | | 8/20 at 100.00 | A+ | | 3,552,744 | |
| | 10,000 | | Puerto Rico Sales Tax Financing Corporation, Sales Tax Revenue Bonds, Series 2007A, 0.000%, 8/01/41 – NPFG Insured | | No Opt. Call | AA– | | 2,141,900 | |
| | 1,000 | | Puerto Rico, Highway Revenue Bonds, Highway and Transportation Authority, Series 1996Y, 6.250%, 7/01/13 | | No Opt. Call | BBB+ | | 1,003,500 | |
| | 5 | | Puerto Rico, Highway Revenue Bonds, Highway and Transportation Authority, Series 2003AA, 5.500%, 7/01/18 – NPFG Insured | | No Opt. Call | A | | 5,385 | |
| | | | Puerto Rico, Highway Revenue Bonds, Highway and Transportation Authority, Series 2005BB: | | | | | | |
| | 1,080 | | 5.250%, 7/01/17 – AMBAC Insured | | No Opt. Call | BBB+ | | 1,141,409 | |
| | 1,290 | | 5.250%, 7/01/22 – AGM Insured | | No Opt. Call | AA– | | 1,420,561 | |
| | | | Puerto Rico, Highway Revenue Bonds, Highway and Transportation Authority, Series 2007CC: | | | | | | |
| | 760 | | 5.500%, 7/01/28 – NPFG Insured | | No Opt. Call | A | | 802,773 | |
| | 1,000 | | 5.500%, 7/01/30 – AGM Insured | | No Opt. Call | AA– | | 1,092,580 | |
| | 2,490 | | Stafford County and Staunton Industrial Development Authority, Virginia, Revenue Bonds, Virginia Municipal League and Virginia Association of Counties Finance Program, Series 2006A, 5.000%, 8/01/23 – NPFG Insured | | 8/16 at 100.00 | Baa1 | | 2,640,047 | |
| | 500 | | Stafford County and Staunton Industrial Development Authority, Virginia, Revenue Bonds, Virginia Municipal League and Virginia Association of Counties Finance Program, Series 2007C, 5.000%, 2/01/37 – SYNCORA GTY Insured | | 2/17 at 100.00 | N/R | | 516,440 | |
| | 5,000 | | Stafford County Economic Development Authority, Virginia, Lease Revenue Bonds, Public Facility Projects, Series 2008, 5.000%, 4/01/33 – AGC Insured (UB) | | 4/18 at 100.00 | AA | | 5,455,550 | |
| | 1,550 | | Virgin Islands Public Finance Authority, Gross Receipts Taxes Loan Note, Series 2003, 5.000%, 10/01/31 – ACA Insured | | 10/14 at 100.00 | BBB+ | | 1,596,655 | |
| | 3,000 | | Virgin Islands Public Finance Authority, Matching Fund Loan Notes Revenue Bonds, Senior Lien Series 2010A, 5.000%, 10/01/29 | | 10/20 at 100.00 | BBB+ | | 3,275,520 | |
| | 1,000 | | Virgin Islands Public Finance Authority, Matching Fund Loan Notes Revenue Bonds, Series 2009B, 5.000%, 10/01/25 | | 10/19 at 100.00 | BBB+ | | 1,099,100 | |
| | 1,950 | | Virgin Islands Public Finance Authority, Matching Fund Loan Notes Revenue Bonds, Subordinate Lien Series 2010B, 5.250%, 10/01/29 | | 10/20 at 100.00 | Baa2 | | 2,110,583 | |
| | 1,665 | | Virginia College Building Authority, Educational Facilities Revenue Bonds, 21st Century College Program, Series 2009, Trust 09-3B, 13.655%, 2/01/27 (IF) (4) | | 2/19 at 100.00 | AA+ | | 2,440,041 | |
| | 1,665 | | Virginia College Building Authority, Educational Facilities Revenue Bonds, 21st Century College Program, Series 2009, Trust 09-4B, 13.715%, 2/01/28 (IF) (4) | | 2/19 at 100.00 | AA+ | | 2,433,398 | |
| | 500 | | Virginia Commonwealth Transportation Board, Federal Transportation Grant Anticipation Revenue Notes, Series 2012A, 5.000%, 9/15/14 | | No Opt. Call | Aa1 | | 530,705 | |
| | 825 | | Virginia Public Building Authority, Public Facilities Revenue Bonds, Series 2007A, 5.000%, 8/01/14 | | No Opt. Call | AA+ | | 871,184 | |
| | 475 | | Virginia Public Building Authority, Public Facilities Revenue Bonds, Series 2008B, 5.000%, 8/01/14 | | No Opt. Call | AA+ | | 501,591 | |
| | 1,500 | | Virginia Public School Authority, School Financing Bonds, 1997 Resolution, Series 2005B, 5.250%, 8/01/13 | | No Opt. Call | AA+ | | 1,512,795 | |
| | 1,000 | | Virginia Public School Authority, School Financing Bonds, 1997 Resolution, Series 2007B, 5.000%, 8/01/14 | | No Opt. Call | AA+ | | 1,055,740 | |
| | 2,000 | | Virginia Public School Authority, School Financing Bonds, 1997 Resolution, Series 2009C, 5.000%, 8/01/13 | | No Opt. Call | AA+ | | 2,016,260 | |
| | 95 | | Virginia Resources Authority, Infrastructure Revenue Bonds, Pre-refunded-Pooled Loan Bond Program, Series 2002A, 5.000%, 5/01/19 | | 11/13 at 100.00 | AA | | 95,368 | |
| | | Nuveen Virginia Premium Income Municipal Fund (continued) |
| NPV | | Portfolio of Investments |
May 31, 2013
| | Principal | | | | Optional Call | | | | |
| | Amount (000) | | Description (1) | | Provisions (2) | Ratings (3) | | Value | |
| | | | Tax Obligation/Limited (continued) | | | | | | |
| | | | Virginia Transportation Board, Transportation Revenue Bonds, U.S. Route 58 Corridor Development Program, Series 2004B: | | | | | | |
| $ | 2,000 | | 5.000%, 5/15/15 | | 5/14 at 100.00 | AA+ | $ | 2,090,420 | |
| | 750 | | 5.000%, 5/15/17 | | 5/14 at 100.00 | AA+ | | 782,768 | |
| | 1,000 | | Virginia Transportation Board, Transportation Revenue Bonds, U.S. Route 58 Corridor Development Program, Series 2006C, 5.000%, 5/15/23 | | No Opt. Call | AA+ | | 1,120,390 | |
| | 108,289 | | Total Tax Obligation/Limited | | | | | 95,277,584 | |
| | | | Transportation – 18.7% (12.7% of Total Investments) | | | | | | |
| | 1,000 | | Chesapeake Bay Bridge and Tunnel Commission, Virginia, General Resolution Revenue Refunding Bonds, Series 1998, 5.500%, 7/01/25 – NPFG Insured | | No Opt. Call | A | | 1,149,330 | |
| | 4,125 | | Chesapeake, Virginia, Transportation System Senior Toll Road Revenue Bonds, Capital Appreciation Series 2012B, 0.000%, 7/15/40 | | 7/28 at 100.00 | BBB | | 2,343,248 | |
| | | | Metropolitan Washington Airports Authority, Virginia, Dulles Toll Road Revenue Bonds, Capital Appreciation Series 2009B-2: | | | | | | |
| | 4,000 | | 0.000%, 10/01/26 – AGC Insured | | No Opt. Call | AA– | | 2,264,600 | |
| | 11,825 | | 0.000%, 10/01/34 – AGC Insured | | No Opt. Call | AA– | | 4,121,131 | |
| | 1,135 | | 0.000%, 10/01/36 – AGC Insured | | No Opt. Call | AA– | | 348,774 | |
| | 5,010 | | 0.000%, 10/01/39 – AGC Insured | | No Opt. Call | AA– | | 1,272,740 | |
| | 6,700 | | Metropolitan Washington Airports Authority, Virginia, Dulles Toll Road Revenue Bonds, Dulles Metrorail Capital Appreciation, Series 2010B, 0.000%, 10/01/44 | | 10/28 at 100.00 | BBB+ | | 5,806,622 | |
| | 750 | | Metropolitan Washington D.C. Airports Authority, District of Columbia, Airport System Revenue Bonds, Refunding Series 2010B, 5.000%, 10/01/26 (Alternative Minimum Tax) | | 10/20 at 100.00 | AA– | | 842,408 | |
| | 1,200 | | Metropolitan Washington D.C. Airports Authority, District of Columbia, Airport System Revenue Bonds, Series 2009C, 5.000%, 10/01/28 | | 10/18 at 100.00 | AA– | | 1,346,904 | |
| | | | Metropolitan Washington D.C. Airports Authority, District of Columbia, Airport System Revenue Bonds, Series 2010A: | | | | | | |
| | 3,000 | | 5.000%, 10/01/30 | | 10/20 at 100.00 | AA– | | 3,418,050 | |
| | 420 | | 5.000%, 10/01/35 | | 10/20 at 100.00 | AA– | | 466,007 | |
| | 2,500 | | Metropolitan Washington D.C. Airports Authority, District of Columbia, System Revenue Bonds, Series 2007B, 5.000%, 10/01/35 – AMBAC Insured (Alternative Minimum Tax) | | 10/17 at 100.00 | AA– | | 2,634,525 | |
| | 3,000 | | Norfolk, Virginia, Parking System Revenue Bonds, Series 2005A, 5.000%, 2/01/23 – NPFG Insured | | 2/15 at 100.00 | A | | 3,080,910 | |
| | 3,000 | | Richmond Metropolitan Authority, Virginia, Revenue Refunding Bonds, Expressway System, Series 2002, 5.250%, 7/15/22 – FGIC Insured | | No Opt. Call | A | | 3,477,720 | |
| | 3,195 | | Virginia Port Authority, Port Facilities Revenue Refunding Bonds Series 2010, 5.000%, 7/01/40 | | 7/19 at 100.00 | Aa3 | | 3,469,131 | |
| | 3,415 | | Virginia Port Authority, Revenue Bonds, Port Authority Facilities, Series 2006, 5.000%, 7/01/36 – FGIC Insured (Alternative Minimum Tax) | | 7/13 at 100.00 | Aa3 | | 3,424,801 | |
| | | | Virginia Small Business Financing Authority, Senior Lien Revenue Bonds, Elizabeth River Crossing, Opco LLC Project, Series 2012: | | | | | | |
| | 500 | | 5.250%, 1/01/32 (Alternative Minimum Tax) | | 7/22 at 100.00 | BBB– | | 536,595 | |
| | 5,000 | | 6.000%, 1/01/37 (Alternative Minimum Tax) | | 7/22 at 100.00 | BBB– | | 5,569,700 | |
| | 5,500 | | 5.500%, 1/01/42 (Alternative Minimum Tax) | | 7/22 at 100.00 | BBB– | | 5,897,704 | |
| | 65,275 | | Total Transportation | | | | | 51,470,900 | |
| | | | U.S. Guaranteed – 19.4% (13.2% of Total Investments) (5) | | | | | | |
| | 1,750 | | Bristol, Virginia, General Obligation Utility System Revenue Bonds, Series 2002, 5.000%, 11/01/24 – AGM Insured (ETM) | | No Opt. Call | AA– (5) | | 2,129,313 | |
| | 1,000 | | Bristol, Virginia, Utility System Revenue Refunding Bonds, Series 2001, 5.000%, 7/15/21 – AGM Insured (ETM) | | No Opt. Call | AA– (5) | | 1,194,390 | |
| | | | Bristol, Virginia, Utility System Revenue Refunding Bonds, Series 2003: | | | | | | |
| | 1,705 | | 5.250%, 7/15/14 (Pre-refunded 7/15/13) – NPFG Insured | | 7/13 at 100.00 | A (5) | | 1,715,365 | |
| | 1,800 | | 5.250%, 7/15/15 (Pre-refunded 7/15/13) – NPFG Insured | | 7/13 at 100.00 | A (5) | | 1,810,943 | |
| | 2,775 | | 5.250%, 7/15/23 (Pre-refunded 7/15/13) – NPFG Insured | | 7/13 at 100.00 | A (5) | | 2,791,872 | |
| | 1,000 | | Capital Region Airport Commission, Virginia, Airport Revenue Bonds, Refunding Series 2005A, 5.000%, 7/01/18 (Pre-refunded 7/01/15) – AGM Insured | | 7/15 at 100.00 | AA– (5) | | 1,093,690 | |
| | | | Dinwiddie County Industrial Development Authority, Virginia, Lease Revenue Bonds, Refunding Series 2004B: | | | | | | |
| | 1,000 | | 5.125%, 2/15/16 (Pre-refunded 2/15/14) – NPFG Insured | | 2/14 at 100.00 | A+ (5) | | 1,031,860 | |
| | 750 | | 5.000%, 2/15/24 (Pre-refunded 2/15/14) – NPFG Insured | | 2/14 at 100.00 | A+ (5) | | 773,235 | |
| | Principal | | | | Optional Call | | | | |
| | Amount (000) | | Description (1) | | Provisions (2) | Ratings (3) | | Value | |
| | | | U.S. Guaranteed (5) (continued) | | | | | | |
| $ | 2,000 | | District of Columbia, Revenue Bonds, National Public Radio, Series 2010A, 5.000%, 4/01/43 (Pre-refunded 4/01/15) | | 4/15 at 100.00 | AA– (5) | $ | 2,163,839 | |
| | 1,660 | | Front Royal and Warren County Industrial Development Authority, Virginia, Lease Revenue Bonds, Series 2004B, 5.000%, 4/01/18 (Pre-refunded 4/01/14) – AGM Insured | | 4/14 at 100.00 | AA– (5) | | 1,724,524 | |
| | 1,000 | | Loudoun County Sanitation Authority, Virginia, Water and Sewerage System Revenue Bonds, Series 2004, 5.000%, 1/01/26 (Pre-refunded 1/01/15) | | 1/15 at 100.00 | AAA | | 1,071,950 | |
| | 500 | | Loudoun County, Virginia, General Obligation Public Improvement Bonds, Series 2005B, 5.000%, 6/01/18 (Pre-refunded 6/01/15) | | 6/15 at 100.00 | AAA | | 546,260 | |
| | 1,185 | | Lynchburg, Virginia, General Obligation Bonds, Series 2004, 5.000%, 6/01/21 (Pre-refunded 6/01/14) | | 6/14 at 100.00 | AA+ (5) | | 1,240,387 | |
| | 1,000 | | Newport News, Virginia, General Obligation Bonds, Series 2003B, 5.000%, 11/01/22 (Pre-refunded 11/01/13) | | 11/13 at 100.00 | Aa1 (5) | | 1,019,660 | |
| | 1,000 | | Newport News, Virginia, General Obligation Bonds, Series 2004A, 5.000%, 7/15/17 (Pre-refunded 7/15/14) | | 7/14 at 101.00 | Aa1 (5) | | 1,061,880 | |
| | 2,145 | | Newport News, Virginia, General Obligation Bonds, Series 2004C, 5.000%, 5/01/16 (Pre-refunded 5/01/14) | | 5/14 at 101.00 | Aa1 (5) | | 2,257,890 | |
| | 2,500 | | Prince William County Industrial Development Authority, Virginia, Educational Facilities Revenue Bonds, Catholic Diocese of Arlington, Series 2003, 5.500%, 10/01/33 (Pre-refunded 10/01/13) | | 10/13 at 101.00 | A2 (5) | | 2,568,725 | |
| | 580 | | Prince William County, Virginia, Certificates of Participation, County Facilities, Series 2005, 5.000%, 6/01/20 (Pre-refunded 6/01/15) – AMBAC Insured | | 6/15 at 100.00 | Aa1 (5) | | 633,174 | |
| | 1,015 | | Puerto Rico Housing Finance Authority, Capital Fund Program Revenue Bonds, Series 2003, 5.000%, 12/01/18 (Pre-refunded 12/01/13) | | 12/13 at 100.00 | Aaa | | 1,039,553 | |
| | 145 | | Puerto Rico, Highway Revenue Bonds, Highway and Transportation Authority, Series 2003AA, 5.500%, 7/01/18 – NPFG Insured (ETM) | | No Opt. Call | A (5) | | 178,070 | |
| | 710 | | Puerto Rico, Highway Revenue Bonds, Highway and Transportation Authority, Series 2005BB, 5.250%, 7/01/22 – AGM Insured (ETM) | | No Opt. Call | AA– (5) | | 906,223 | |
| | 1,480 | | Richmond, Virginia, General Obligation Bonds, Series 2004A, 5.000%, 7/15/21 (Pre-refunded 7/15/14) – AGM Insured | | 7/14 at 100.00 | AA+ (5) | | 1,556,842 | |
| | 620 | | Richmond, Virginia, General Obligation Bonds, Series 2005A, 5.000%, 7/15/17 (Pre-refunded 7/15/15) – AGM Insured | | 7/15 at 100.00 | AA+ (5) | | 680,760 | |
| | | | Spotsylvania County Industrial Development Authority, Virginia, Lease Revenue Bonds, School Facilities, Series 2003B: | | | | | | |
| | 1,110 | | 4.375%, 8/01/20 (Pre-refunded 8/01/13) – AMBAC Insured | | 8/13 at 100.00 | N/R (5) | | 1,117,581 | |
| | 2,000 | | 5.125%, 8/01/23 (Pre-refunded 8/01/13) – AMBAC Insured | | 8/13 at 100.00 | N/R (5) | | 2,016,160 | |
| | 710 | | Stafford County and Staunton Industrial Development Authority, Virginia, Revenue Bonds, Virginia Municipal League and Virginia Association of Counties Finance Program, Series 2006A, 5.000%, 8/01/23 (Pre-refunded 8/01/16) – NPFG Insured | | 8/16 at 100.00 | Baa1 (5) | | 805,403 | |
| | 1,000 | | Staunton, Virginia, General Obligation Bonds, Series 2004, 6.250%, 2/01/25 (Pre-refunded 2/01/14) – AMBAC Insured | | 2/14 at 101.00 | Aa2 (5) | | 1,050,200 | |
| | | | Tobacco Settlement Financing Corporation of Virginia, Tobacco Settlement Asset-Backed Bonds, Series 2005: | | | | | | |
| | 5,065 | | 5.500%, 6/01/26 (Pre-refunded 6/01/15) | | 6/15 at 100.00 | Aaa | | 5,368,394 | |
| | 1,860 | | 5.625%, 6/01/37 (Pre-refunded 6/01/15) | | 6/15 at 100.00 | Aaa | | 2,052,157 | |
| | 2,135 | | The Rector and Visitors of the University of Virginia, General Revenue Bonds, Series 2005, 5.000%, 6/01/37 (Pre-refunded 6/01/15) | | 6/15 at 100.00 | N/R (5) | | 2,290,535 | |
| | 2,295 | | Virginia Beach Development Authority, Public Facilities Revenue Bonds, Series 2005A, 5.000%, 5/01/22 (Pre-refunded 5/01/15) | | 5/15 at 100.00 | AA+ (5) | | 2,498,589 | |
| | 2,100 | | Virginia Beach, Virginia, General Obligation Bonds, Series 2005, 5.000%, 1/15/20 (Pre-refunded 1/15/16) | | 1/16 at 100.00 | AAA | | 2,343,642 | |
| | 2,540 | | Virginia Public School Authority, School Financing Bonds, 1997 Resolution, Series 2005C, 5.000%, 8/01/17 (Pre-refunded 8/01/15) | | 8/15 at 100.00 | AA+ (5) | | 2,786,761 | |
| | 50,135 | | Total U.S. Guaranteed | | | | | 53,519,827 | |
| | | Nuveen Virginia Premium Income Municipal Fund (continued) |
| NPV | | Portfolio of Investments |
May 31, 2013
| | Principal | | | | Optional Call | | | | |
| | Amount (000) | | Description (1) | | Provisions (2) | Ratings (3) | | Value | |
| | | | Utilities – 0.8% (0.5% of Total Investments) | | | | | | |
| $ | 395 | | Guam Power Authority, Revenue Bonds, Series 2012A, 5.000%, 10/01/34 | | 10/22 at 100.00 | BBB | $ | 429,989 | |
| | 200 | | Puerto Rico Electric Power Authority, Power Revenue Bonds, Series 2004OO, 5.000%, 7/01/13 – CIFG Insured | | No Opt. Call | AA– | | 200,632 | |
| | 655 | | Puerto Rico Electric Power Authority, Power Revenue Bonds, Series 2007UU, 5.000%, 7/01/19 – NPFG Insured | | No Opt. Call | A | | 698,427 | |
| | 730 | | Virgin Islands Water and Power Authority, Electric System Revenue Bonds, Refunding Series 2007A, 5.000%, 7/01/24 | | 7/17 at 100.00 | Baa3 | | 755,556 | |
| | 1,980 | | Total Utilities | | | | | 2,084,604 | |
| | | | Water and Sewer – 6.6% (4.5% of Total Investments) | | | | | | |
| | 1,000 | | Fairfax County, Virginia, Sewerage Revenue Bonds, Series 2004, 5.000%, 7/15/27 | | No Opt. Call | AAA | | 1,047,020 | |
| | 4,000 | | Hampton Roads Sanitation District, Virginia, Wastewater Revenue Bonds, Series 2012A, 5.000%, 1/01/39 | | No Opt. Call | AAA | | 4,482,720 | |
| | | | Henry County Public Service Authority, Virginia, Water and Sewerage Revenue Refunding Bonds, Series 2001: | | | | | | |
| | 1,265 | | 5.500%, 11/15/17 – AGM Insured | | No Opt. Call | AA– | | 1,462,530 | |
| | 3,000 | | 5.500%, 11/15/19 – AGM Insured | | No Opt. Call | AA– | | 3,614,370 | |
| | 3,300 | | Virginia Beach, Virginia, Water and Sewer System Revenue Bonds, Series 2005, 5.000%, 10/01/30 | | 10/15 at 100.00 | AAA | | 3,574,494 | |
| | 3,050 | | Virginia State Resources Authority, Clean Water Revenue Bonds, Series 2007, Trust 3036, 13.468%, 10/01/15 (IF) | | No Opt. Call | AAA | | 3,934,073 | |
| | 15,615 | | Total Water and Sewer | | | | | 18,115,207 | |
| $ | 484,729 | | Total Investments (cost $383,697,822) – 147.3% | | | | | 406,282,197 | |
| | | | Floating Rate Obligations – (3.4)% | | | | | (9,250,000 | ) |
| | | | MuniFund Term Preferred Shares, at Liquidation Value – (46.2)% (6) | | | | | (127,408,000 | ) |
| | | | Other Assets Less Liabilities – 2.3% | | | | | 6,241,150 | |
| | | | Net Assets Applicable to Common Shares – 100% | | | | $ | 275,865,347 | |
| (1) | All percentages shown in the Portfolio of Investments are based on net assets applicable to Common shares unless otherwise noted. |
| (2) | Optional Call Provisions (not covered by the report of independent registered public accounting firm): Dates (month and year) and prices of the earliest optional call or redemption. There may be other call provisions at varying prices at later dates. Certain mortgage-backed securities may be subject to periodic principal paydowns. |
| (3) | Ratings (not covered by the report of independent registered public accounting firm): Using the highest of Standard & Poor’s Group (“Standard & Poor’s”), Moody’s Investors Service, Inc. (“Moody’s”) or Fitch, Inc. (“Fitch”) rating. Ratings below BBB by Standard & Poor’s, Baa by Moody’s or BBB by Fitch are considered to be below investment grade. Holdings designated N/R are not rated by any of these national rating agencies. |
| (4) | Investment, or portion of investment, has been pledged to collateralize the net payment obligations for investments in inverse floating rate transactions. |
| (5) | Backed by an escrow or trust containing sufficient U.S. Government or U.S. Government agency securities, which ensure the timely payment of principal and interest. Certain bonds backed by U.S. Government or agency securities are regarded as having an implied rating equal to the rating of such securities. |
| (6) | MuniFund Term Preferred Shares, at Liquidation Value as a percentage of Total Investments is 31.4%. |
| N/R | Not rated. |
| WI/DD | Investment, or portion of investment, purchased on a when-issued or delayed delivery basis. |
| (ETM) | Escrowed to maturity. |
| (IF) | Inverse floating rate investment. |
| (UB) | Underlying bond of an inverse floating rate trust reflected as a financing transaction. See Notes to Financial Statements, Footnote 1 – General Information and Significant Accounting Policies, Inverse Floating Rate Securities for more information. |
See accompanying notes to financial statements.
| | | Statement of |
| | | Assets & Liabilities |
May 31, 2013
| | | | | | | | | | | | | North | | | | |
| | | | Georgia | | | Maryland | | | Missouri | | | Carolina | | | Virginia | |
| | | | Dividend | | | Premium | | | Premium | | | Premium | | | Premium | |
| | | Advantage 2 | | | Income | | | Income | | | Income | | | Income | |
| | | | (NKG | ) | | (NMY | ) | | (NOM | ) | | (NNC | ) | | (NPV | ) |
| Assets | | | | | | | | | | | | | | | | |
| Investments, at value (cost $213,950,456 $521,030,299, $49,518,493, $363,339,627 and $383,697,822, respectively) | | $ | 227,902,040 | | $ | 557,469,865 | | $ | 52,415,518 | | $ | 385,824,465 | | $ | 406,282,197 | |
| Cash | | | 1,175,533 | | | — | | | 1,679,857 | | | 199,634 | | | — | |
| Receivables: | | | | | | | | | | | | | | | | |
| Interest | | | 3,250,969 | | | 9,053,147 | | | 744,266 | | | 6,048,269 | | | 6,188,941 | |
| Investments sold | | | 10,000 | | | 705,000 | | | 767,500 | | | 19,270,163 | | | 14,713,333 | |
| Deferred offering costs | | | 657,592 | | | 1,761,210 | | | 295,709 | | | 1,270,031 | | | 908,891 | |
| Other assets | | | 18,917 | | | 61,454 | | | 9,081 | | | 52,135 | | | 43,013 | |
| Total assets | | | 233,015,051 | | | 569,050,676 | | | 55,911,931 | | | 412,664,697 | | | 428,136,375 | |
| Liabilities | | | | | | | | | | | | | | | | |
| Cash overdraft | | | — | | | 2,054,404 | | | — | | | — | | | 5,982,898 | |
| Floating rate obligations | | | 3,245,000 | | | 21,995,000 | | | 2,225,000 | | | 23,715,000 | | | 9,250,000 | |
| Payables: | | | | | | | | | | | | | | | | |
| Common share dividends | | | 547,475 | | | 1,406,086 | | | 133,881 | | | 807,530 | | | 996,206 | |
| Interest | | | 165,511 | | | 374,966 | | | 31,290 | | | 272,737 | | | 279,885 | |
| Investments purchased | | | — | | | 1,100,410 | | | 1,490,258 | | | 13,824,593 | | | 7,870,495 | |
| Offering costs | | | — | | | 276,836 | | | 70,439 | | | 236,204 | | | 84,870 | |
| MuniFund Term Preferred (MTP) Shares, at liquidation value | | | 74,945,000 | | | 166,144,000 | | | 17,880,000 | | | 124,860,000 | | | 127,408,000 | |
| Accrued expenses: | | | | | | | | | | | | | | | | |
| Management fees | | | 122,609 | | | 284,836 | | | 27,455 | | | 194,663 | | | 214,775 | |
| Reorganization | | | 72,523 | | | — | | | — | | | 36,350 | | | — | |
| Trustees fees | | | 818 | | | 4,970 | | | 184 | | | 3,537 | | | 3,729 | |
| Other | | | 83,663 | | | 247,243 | | | 42,896 | | | 113,285 | | | 180,170 | |
| Total liabilities | | | 79,182,599 | | | 193,888,751 | | | 21,901,403 | | | 164,063,899 | | | 152,271,028 | |
| Net assets applicable to Common shares | | $ | 153,832,452 | | $ | 375,161,925 | | $ | 34,010,528 | | $ | 248,600,798 | | $ | 275,865,347 | |
| Common shares outstanding | | | 10,548,790 | | | 24,104,666 | | | 2,327,543 | | | 16,548,509 | | | 17,933,251 | |
| Net asset value per Common share outstanding (net assets applicable to Common shares, divided by Common shares outstanding) | | $ | 14.58 | | $ | 15.56 | | $ | 14.61 | | $ | 15.02 | | $ | 15.38 | |
| Net assets applicable to Common shares consist of: | | | | | | | | | | | | | | | | |
| Common shares, $.01 par value per share | | $ | 105,488 | | $ | 241,047 | | $ | 23,275 | | $ | 165,485 | | $ | 179,333 | |
| Paid-in surplus | | | 143,031,830 | | | 339,757,300 | | | 30,926,859 | | | 226,692,622 | | | 251,837,000 | |
| Undistributed (Over-distribution of) net investment income | | | 219,838 | | | 2,034,851 | | | 332,733 | | | 8,852 | | | 1,096,134 | |
| Accumulated net realized gain (loss) | | | (3,476,288 | ) | | (3,310,839 | ) | | (169,364 | ) | | (750,999 | ) | | 168,505 | |
| Net unrealized appreciation (depreciation) | | | 13,951,584 | | | 36,439,566 | | | 2,897,025 | | | 22,484,838 | | | 22,584,375 | |
| Net assets applicable to Common shares | | $ | 153,832,452 | | $ | 375,161,925 | | $ | 34,010,528 | | $ | 248,600,798 | | $ | 275,865,347 | |
| Authorized shares: | | | | | | | | | | | | | | | | |
| Common | | | Unlimited | | | Unlimited | | | Unlimited | | | Unlimited | | | Unlimited | |
| Preferred | | | Unlimited | | | Unlimited | | | Unlimited | | | Unlimited | | | Unlimited | |
See accompanying notes to financial statements.
Year Ended May 31, 2013
| | | | | | | | | | | | | North | | | | |
| | | | Georgia | | | Maryland | | | Missouri | | | Carolina | | | Virginia | |
| | | | Dividend | | | Premium | | | Premium | | | Premium | | | Premium | |
| | | Advantage 2 | | | Income | | | Income | | | Income | | | Income | |
| | | | (NKG | ) | | (NMY | ) | | (NOM | ) | | (NNC | ) | | (NPV | ) |
| Investment Income | | $ | 9,943,103 | | $ | 22,794,416 | | $ | 2,483,032 | | $ | 15,722,087 | | $ | 17,250,135 | |
| Expenses | | | | | | | | | | | | | | | | |
| Management fees | | | 1,367,506 | | | 3,039,708 | | | 323,337 | | | 2,170,225 | | | 2,319,905 | |
| Shareholder servicing agent fees and expenses | | | 49,420 | | | 80,351 | | | 19,132 | | | 71,376 | | | 59,990 | |
| Interest expense and amortization of offering costs | | | 2,225,992 | | | 4,954,610 | | | 497,868 | | | 3,821,466 | | | 3,679,619 | |
| Custodian fees and expenses | | | 39,869 | | | 86,405 | | | 13,863 | | | 58,249 | | | 66,502 | |
| Trustees fees and expenses | | | 5,805 | | | 12,642 | | | 1,545 | | | 9,373 | | | 9,660 | |
| Professional fees | | | 36,749 | | | 52,071 | | | 25,531 | | | 50,822 | | | 47,639 | |
| Shareholder reporting expenses | | | 77,916 | | | 171,732 | | | 21,056 | | | 121,941 | | | 126,123 | |
| Stock exchange listing fees | | | 22,229 | | | 63,304 | | | 15,287 | | | 57,387 | | | 51,617 | |
| Investor relations expenses | | | 24,192 | | | 49,016 | | | 6,062 | | | 38,918 | | | 41,398 | |
| Reorganization expenses | | | 14,627 | | | 170,742 | | | — | | | 6,211 | | | 81,398 | |
| Other expenses | | | 58,289 | | | 92,798 | | | 28,553 | | | 76,928 | | | 69,180 | |
| Total expenses | | | 3,922,594 | | | 8,773,379 | | | 952,234 | | | 6,482,896 | | | 6,553,031 | |
| Net investment income (loss) | | | 6,020,509 | | | 14,021,037 | | | 1,530,798 | | | 9,239,191 | | | 10,697,104 | |
| Realized and Unrealized Gain (Loss) | | | | | | | | | | | | | | | | |
| Net realized gain (loss) from investments | | | 226,296 | | | 268,979 | | | 14,851 | | | 327,862 | | | 443,695 | |
| Change in net unrealized appreciation (depreciation) of investments | | | (747,566 | ) | | (2,621,007 | ) | | 131,347 | | | (3,568,579 | ) | | (4,173,812 | ) |
| Net realized and unrealized gain (loss) | | | (521,270 | ) | | (2,352,028 | ) | | 146,198 | | | (3,240,717 | ) | | (3,730,117 | ) |
| Net increase (decrease) in net assets applicable to Common shares from operations | | $ | 5,499,239 | | $ | 11,669,009 | | $ | 1,676,996 | | $ | 5,998,474 | | $ | 6,966,987 | |
See accompanying notes to financial statements.
| | | Statement of |
| | | Changes in Net Assets |
| | | Georgia Dividend Advantage 2 (NKG) | | Maryland Premium Income (NMY) | | Missouri Premium Income (NOM) | |
| | | | Year | | | Year | | | Year | | | Year | | | Year | | | Year | |
| | | | Ended | | | Ended | | | Ended | | | Ended | | | Ended | | | Ended | |
| | | | 5/31/13 | | | 5/31/12 | | | 5/31/13 | | | 5/31/12 | | | 5/31/13 | | | 5/31/12 | |
| Operations | | | | | | | | | | | | | | | | | | | |
| Net investment income (loss) | | $ | 6,020,509 | | $ | 2,794,038 | | $ | 14,021,037 | | $ | 7,296,589 | | $ | 1,530,798 | | $ | 1,601,799 | |
| Net realized gain (loss) from investments | | | 226,296 | | | 242,277 | | | 268,979 | | | 98,201 | | | 14,851 | | | 29,398 | |
| Change in net unrealized appreciation (depreciation) of investments | | | (747,566 | ) | | 4,370,828 | | | (2,621,007 | ) | | 14,845,670 | | | 131,347 | | | 3,488,918 | |
| Net increase (decrease) in net assets applicable to Common shares from operations | | | 5,499,239 | | | 7,407,143 | | | 11,669,009 | | | 22,240,460 | | | 1,676,996 | | | 5,120,115 | |
| Distributions to Common Shareholders | | | | | | | | | | | | | | | | | | | |
| From net investment income | | | (6,448,188 | ) | | (3,157,205 | ) | | (15,597,256 | ) | | (8,215,471 | ) | | (1,702,603 | ) | | (1,810,947 | ) |
| From accumulated net realized gains | | | — | | | — | | | — | | | — | | | — | | | — | |
| Decrease in net assets applicable to Common shares from distributions to Common shareholders | | | (6,448,188 | ) | | (3,157,205 | ) | | (15,597,256 | ) | | (8,215,471 | ) | | (1,702,603 | ) | | (1,810,947 | ) |
| Capital Share Transactions | | | | | | | | | | | | | | | | | | | |
| Common shares: | | | | | | | | | | | | | | | | | | | |
Issued in the Reorganizations(1) | | | 87,714,734 | | | — | | | 211,807,271 | | | — | | | — | | | — | |
| Net proceeds issued to shareholders due to reinvestment of distributions | | | 27,755 | | | 12,432 | | | 75,351 | | | 100,957 | | | 57,168 | | | 74,892 | |
| Net increase (decrease) in net assets applicable to Common shares from capital share transactions | | | 87,742,489 | | | 12,432 | | | 211,882,622 | | | 100,957 | | | 57,168 | | | 74,892 | |
| Net increase (decrease) in net assets applicable to Common shares | | | 86,793,540 | | | 4,262,370 | | | 207,954,375 | | | 14,125,946 | | | 31,561 | | | 3,384,060 | |
| Net assets applicable to Common shares at the beginning of period | | | 67,038,912 | | | 62,776,542 | | | 167,207,550 | | | 153,081,604 | | | 33,978,967 | | | 30,594,907 | |
| Net assets applicable to Common shares at the end of period | | $ | 153,832,452 | | $ | 67,038,912 | | $ | 375,161,925 | | $ | 167,207,550 | | $ | 34,010,528 | | $ | 33,978,967 | |
| Undistributed (Over-distribution of) net investment income at the end of period | | $ | 219,838 | | $ | 209,556 | | $ | 2,034,851 | | $ | 2,387,326 | | $ | 332,733 | | $ | 386,458 | |
(1) Refer to Footnote 1 – General Information and Significant Accounting Policies, Fund Reorganizations for further details.
See accompanying notes to financial statements.
| | | Statement of |
| | | Changes in Net Assets (continued) |
| | | North Carolina Premium Income (NNC) | | Virginia Premium Income (NPV) | |
| | | | Year | | | Year | | | Year | | | Year | |
| | | | Ended | | | Ended | | | Ended | | | Ended | |
| | | | 5/31/13 | | | 5/31/12 | | | 5/31/13 | | | 5/31/12 | |
| Operations | | | | | | | | | | | | | |
| Net investment income (loss) | | $ | 9,239,191 | | $ | 3,645,610 | | $ | 10,697,104 | | $ | 6,106,911 | |
| Net realized gain (loss) from investments | | | 327,862 | | | 158,661 | | | 443,695 | | | 336,954 | |
| Change in net unrealized appreciation (depreciation) of investments | | | (3,568,579 | ) | | 6,853,662 | | | (4,173,812 | ) | | 11,664,825 | |
| Net increase (decrease) in net assets applicable to Common shares from operations | | | 5,998,474 | | | 10,657,933 | | | 6,966,987 | | | 18,108,690 | |
| Distributions to Common Shareholders | | | | | | | | | | | | | |
| From net investment income | | | (10,348,434 | ) | | (4,508,294 | ) | | (11,424,132 | ) | | (7,259,759 | ) |
| From accumulated net realized gains | | | — | | | — | | | (302,943 | ) | | (214,014 | ) |
| Decrease in net assets applicable to Common shares from distributions to Common shareholders | | | (10,348,434 | ) | | (4,508,294 | ) | | (11,727,075 | ) | | (7,473,773 | ) |
| Capital Share Transactions | | | | | | | | | | | | | |
| Common shares: | | | | | | | | | | | | | |
Issued in the Reorganizations(1) | | | 155,423,952 | | | — | | | 139,077,537 | | | — | |
| Net proceeds issued to shareholders due to reinvestment of distributions | | | 29,851 | | | 91,188 | | | 449,003 | | | 432,067 | |
| Net increase (decrease) in net assets applicable to Common shares from capital share transactions | | | 155,453,803 | | | 91,188 | | | 139,526,540 | | | 432,067 | |
| Net increase (decrease) in net assets applicable to Common shares | | | 151,103,843 | | | 6,240,827 | | | 134,766,452 | | | 11,066,984 | |
| Net assets applicable to Common shares at the beginning of period | | | 97,496,955 | | | 91,256,128 | | | 141,098,895 | | | 130,031,911 | |
| Net assets applicable to Common shares at the end of period | | $ | 248,600,798 | | $ | 97,496,955 | | $ | 275,865,347 | | $ | 141,098,895 | |
| Undistributed (Over-distribution of) net investment income at the end of period | | $ | 8,852 | | $ | 438,594 | | $ | 1,096,134 | | $ | 1,026,466 | |
(1) Refer to Footnote 1 – General Information and Significant Accounting Policies, Fund Reorganizations for further details.
See accompanying notes to financial statements.
Year Ended May 31, 2013
| | | | Georgia | | | Maryland | | | Missouri | |
| | | | Dividend | | | Premium | | | Premium | |
| | | Advantage 2 | | | Income | | | Income | |
| | | | (NKG | ) | | (NMY | ) | | (NOM | ) |
| Cash Flows from Operating Activities: | | | | | | | | | | |
| Net Increase (Decrease) in Net Assets Applicable to Common Shares from Operations | | $ | 5,499,239 | | $ | 11,669,009 | | $ | 1,676,996 | |
| Adjustments to reconcile the net increase (decrease) in net assets applicable to Common shares from operations to net cash provided by (used in) operating activities: | | | | | | | | | | |
| Purchases of investments | | | (42,159,814 | ) | | (91,455,860 | ) | | (6,622,162 | ) |
| Proceeds from sales and maturities of investments | | | 36,902,123 | | | 84,637,675 | | | 7,397,500 | |
| Amortization (Accretion) of premiums and discounts, net | | | 332,022 | | | 1,234,216 | | | 82,118 | |
| Assets and (Liabilities) acquired in the Reorganizations, net | | | (35,001,647 | ) | | (82,738,631 | ) | | — | |
| (Increase) Decrease in: | | | | | | | | | | |
| Receivable for interest | | | (1,694,174 | ) | | (4,853,623 | ) | | (14,416 | ) |
| Receivable for investments sold | | | (10,000 | ) | | 2,484,375 | | | (752,500 | ) |
| Other assets | | | (7,315 | ) | | (33,058 | ) | | 1,109 | |
| Increase (Decrease) in: | | | | | | | | | | |
| Payable for interest | | | 87,125 | | | 185,558 | | | (3,129 | ) |
| Payable for investments purchased | | | — | | | 682,339 | | | 1,006,466 | |
| Accrued management fees | | | 68,993 | | | 154,648 | | | 134 | |
| Accrued reorganization expenses | | | 72,523 | | | — | | | — | |
| Accrued Trustees fees | | | 428 | | | 4,025 | | | (19 | ) |
| Accrued other expenses | | | (79,651 | ) | | (176,557 | ) | | 3,124 | |
| Net realized (gain) loss from investments | | | (226,296 | ) | | (268,979 | ) | | (14,851 | ) |
| Change in net unrealized (appreciation) depreciation of investments | | | 747,566 | | | 2,621,007 | | | (131,347 | ) |
| Taxes paid on undistributed capital gains | | | (1,471 | ) | | (14,777 | ) | | — | |
| Net cash provided by (used in) operating activities | | | (35,470,349 | ) | | (75,868,633 | ) | | 2,629,023 | |
| Cash Flows from Financing Activities: | | | | | | | | | | |
| (Increase) Decrease in deferred offering costs | | | (263,471 | ) | | (644,655 | ) | | 118,080 | |
| Increase (Decrease) in: | | | | | | | | | | |
| Cash overdraft | | | — | | | (385,457 | ) | | — | |
| Payable for offering costs | | | (16,250 | ) | | 107,398 | | | 1,882 | |
| MTP Shares, at liquidation value | | | 42,680,000 | | | 91,551,000 | | | — | |
| Cash distributions paid to Common shareholders | | | (6,122,540 | ) | | (14,759,653 | ) | | (1,652,689 | ) |
| Net cash provided by (used in) financing activities | | | 36,277,739 | | | 75,868,633 | | | (1,532,727 | ) |
| Net Increase (Decrease) in Cash | | | 807,390 | | | — | | | 1,096,296 | |
| Cash at the beginning of period | | | 368,143 | | | — | | | 583,561 | |
| Cash at the End of Period | | $ | 1,175,533 | | $ | — | | $ | 1,679,857 | |
Supplemental Disclosure of Cash Flow Information
Non-cash financing activities not included herein consist of reinvestments of Common share distributions as follows:
| | | | Georgia | | | Maryland | | | Missouri | |
| | | | Dividend | | | Premium | | | Premium | |
| | | Advantage 2 | | | Income | | | Income | |
| | | | (NKG | ) | | (NMY | ) | | (NOM | ) |
| | | $ | 27,755 | | $ | 75,351 | | $ | 57,168 | |
Cash paid for interest (excluding amortization of offering costs) was as follows:
| | | | Georgia | | | Maryland | | | Missouri | |
| | | | Dividend | | | Premium | | | Premium | |
| | | Advantage 2 | | | Income | | | Income | |
| | | | (NKG | ) | | (NMY | ) | | (NOM | ) |
| | | $ | 1,789,124 | | $ | 4,033,914 | | $ | 382,917 | |
See accompanying notes to financial statements.
| | | Statement of |
| | | Cash Flows (continued) |
| | | | North | | | | |
| | | | Carolina | | | Virginia | |
| | | | Premium | | | Premium | |
| | | | Income | | | Income | |
| | | | (NNC | ) | | (NPV | ) |
| Cash Flows from Operating Activities: | | | | | | | |
| Net Increase (Decrease) in Net Assets Applicable to Common Shares from Operations | | $ | 5,998,474 | | $ | 6,966,987 | |
| Adjustments to reconcile the net increase (decrease) in net assets applicable to Common shares from operations to net cash provided by (used in) operating activities: | | | | | | | |
| Purchases of investments | | | (65,655,971 | ) | | (76,300,461 | ) |
| Proceeds from sales and maturities of investments | | | 62,871,450 | | | 75,853,390 | |
| Amortization (Accretion) of premiums and discounts, net | | | 1,169,113 | | | 381,270 | |
| Assets and (Liabilities) acquired in the Reorganizations, net | | | (63,243,549 | ) | | (62,237,994 | ) |
| (Increase) Decrease in: | | | | | | | |
| Receivable for interest | | | (3,608,707 | ) | | (3,153,105 | ) |
| Receivable for investments sold | | | (14,988,165 | ) | | (12,637,223 | ) |
| Other assets | | | (26,118 | ) | | (15,034 | ) |
| Increase (Decrease) in: | | | | | | | |
| Payable for interest | | | 152,851 | | | 141,411 | |
| Payable for investments purchased | | | 12,470,285 | | | 7,241,552 | |
| Accrued management fees | | | 116,373 | | | 105,246 | |
| Accrued reorganization expenses | | | 36,350 | | | — | |
| Accrued Trustees fees | | | 2,959 | | | 2,936 | |
| Accrued other expenses | | | (282,523 | ) | | (215,187 | ) |
| Net realized (gain) loss from investments | | | (327,862 | ) | | (443,695 | ) |
| Change in net unrealized (appreciation) depreciation of investments | | | 3,568,579 | | | 4,173,812 | |
| Taxes paid on undistributed capital gains | | | (3,249 | ) | | (33,199 | ) |
| Net cash provided by (used in) operating activities | | | (61,749,710 | ) | | (60,169,294 | ) |
| Cash Flows from Financing Activities: | | | | | | | |
| (Increase) Decrease in deferred offering costs | | | (415,347 | ) | | (98,595 | ) |
| Increase (Decrease) in: | | | | | | | |
| Cash overdraft | | | (2,841,072 | ) | | 5,213,965 | |
| Payable for offering costs | | | 32,122 | | | (117,700 | ) |
| MTP Shares, at liquidation value | | | 75,025,000 | | | 66,000,000 | |
| Cash distributions paid to Common shareholders | | | (9,851,359 | ) | | (10,828,376 | ) |
| Net cash provided by (used in) financing activities | | | 61,949,344 | | | 60,169,294 | |
| Net Increase (Decrease) in Cash | | | 199,634 | | | — | |
| Cash at the beginning of period | | | — | | | — | |
| Cash at the End of Period | | $ | 199,634 | | $ | — | |
Supplemental Disclosure of Cash Flow Information
Non-cash financing activities not included herein consist of reinvestments of Common share distributions as follows:
| | | | North | | | | |
| | | | Carolina | | | Virginia | |
| | | | Premium | | | Premium | |
| | | | Income | | | Income | |
| | | | (NNC | ) | | (NPV | ) |
| | | $ | 29,851 | | $ | 449,003 | |
Cash paid for interest (excluding amortization of offering costs) was as follows:
| | | | North | | | | |
| | | | Carolina | | | Virginia | |
| | | | Premium | | | Premium | |
| | | | Income | | | Income | |
| | | | (NNC | ) | | (NPV | ) |
| | | $ | 3,055,364 | | $ | 2,911,241 | |
See accompanying notes to financial statements.
THIS PAGE INTENTIONALLY LEFT BLANK
| | | Financial |
| | | Highlights |
| | | |
| | Selected data for a Common share outstanding throughout each period: |
| | | | | Investment Operations | | Less Distributions | | | | | |
| | | Beginning Common Share Net Asset Value | | Net Investment Income (Loss) | | Net Realized/ Unrealized Gain (Loss) | | Distributions from Net Investment Income to Auction Rate Preferred Share- holders | (a) | Distributions from Accumulated Net Realized Gains to Auction Rate Preferred Share- holders | (a) | Total | | From Net Investment Income to Common Share- holders | | From Accumulated Net Realized Gains to Common Share- holders | | Total | | Ending Common Share Net Asset Value | | Ending Market Value | |
| Georgia Dividend Advantage 2 (NKG) | | | | | | | | | | | | | | | | | | | | | | | | | |
| Year Ended 5/31: | | | | | | | | | | | | | | | | | | | | | | | | | | | | | | | |
| 2013 | | $ | 14.71 | | $ | .60 | | $ | (.06 | ) | $ | — | | $ | — | | $ | .54 | | $ | (.67 | ) | $ | — | | $ | (.67 | ) | $ | 14.58 | | $ | 13.39 | |
| 2012 | | | 13.78 | | | .61 | | | 1.01 | | | — | | | — | | | 1.62 | | | (.69 | ) | | — | | | (.69 | ) | | 14.71 | | | 14.73 | |
| 2011 | | | 14.21 | | | .65 | | | (.36 | ) | | — | | | — | | | .29 | | | (.72 | ) | | — | | | (.72 | ) | | 13.78 | | | 13.92 | |
| 2010 | | | 13.27 | | | .78 | | | .87 | | | (.02 | ) | | — | | | 1.63 | | | (.69 | ) | | — | | | (.69 | ) | | 14.21 | | | 14.00 | |
| 2009 | | | 13.92 | | | .87 | | | (.73 | ) | | (.16 | ) | | — | | | (.02 | ) | | (.63 | ) | | — | | | (.63 | ) | | 13.27 | | | 11.88 | |
| | | | | | | | | | | | | | | | | | | | | | | | | | | | | | | | | | | |
| Maryland Premium Income (NMY) | | | | | | | | | | | | | | | | | | | | | | | | | |
| Year Ended 5/31: | | | | | | | | | | | | | | | | | | | | | | | | | | | | | | | |
| 2013 | | | 15.68 | | | .58 | | | .07 | | | — | | | — | | | .65 | | | (.77 | ) | | — | | | (.77 | ) | | 15.56 | | | 13.82 | |
| 2012 | | | 14.37 | | | .68 | | | 1.40 | | | — | | | — | | | 2.08 | | | (.77 | ) | | — | | | (.77 | ) | | 15.68 | | | 15.64 | |
| 2011 | | | 14.77 | | | .80 | | | (.43 | ) | | (.01 | ) | | — | | | .36 | | | (.76 | ) | | — | | | (.76 | ) | | 14.37 | | | 14.00 | |
| 2010 | | | 13.58 | | | .84 | | | 1.10 | | | (.02 | ) | | — | | | 1.92 | | | (.73 | ) | | — | | | (.73 | ) | | 14.77 | | | 14.43 | |
| 2009 | | | 14.19 | | | .89 | | | (.67 | ) | | (.16 | ) | | (.01 | ) | | .05 | | | (.63 | ) | | (.03 | ) | | (.66 | ) | | 13.58 | | | 12.68 | |
| (a) | The amounts shown are based on Common share equivalents. |
| (b) | Total Return Based on Market Value is the combination of changes in the market price per share and the effect of reinvested dividend income and reinvested capital gains distributions, if any, at the average price paid per share at the time of reinvestment. The last dividend declared in the period, which is typically paid on the first business day of the following month, is assumed to be reinvested at the ending market price. The actual reinvestment for the last dividend declared in the period may take place over several days, and in some instances may not be based on the market price, so the actual reinvestment price may be different from the price used in the calculation. Total returns are not annualized. |
| | |
| | Total Return Based on Common Share Net Asset Value is the combination of changes in Common share net asset value, reinvested dividend income at net asset value and reinvested capital gains distributions at net asset value, if any. The last dividend declared in the period, which is typically paid on the first business day of the following month, is assumed to be reinvested at the ending net asset value. The actual reinvest price for the last dividend declared in the period may often be based on the Fund’s market price (and not its net asset value), and therefore may be different from the price used in the calculation. Total returns are not annualized. |
| | | | Ratios/Supplemental Data |
| | Total Returns | | | | Ratios to Average Net Assets Applicable to Common Shares Before Reimbursement(c) | | Ratios to Average Net Assets Applicable to Common Shares After Reimbursement(c)(d) | | | |
| | | | | | | | | | | | | | | | | |
| | Based on Market Value | (b) | Based on Common Share Net Asset Value | (b) | Ending Net Assets Applicable to Common Shares (000) | | Expenses | (e) | Net Investment Income (Loss) | | Expenses | (e) | Net Investment Income (Loss) | | Portfolio Turnover Rate | |
| | | | | | | | | | | | | | | | | | | | | | | | | |
| | | | | | | | | | | | | | | | | | | | | | | | | |
| | | (4.83 | )% | | 3.68 | % | $ | 153,832 | | | 2.66 | % | | 4.09 | % | | N/A | | | N/A | | | 18 | % |
| | | 11.12 | | | 12.04 | | | 67,039 | | | 2.95 | | | 4.30 | | | N/A | | | N/A | | | 11 | |
| | | 4.84 | | | 2.13 | | | 62,777 | | | 2.79 | | | 4.64 | | | 2.75 | % | | 4.68 | % | | 4 | |
| | | 24.23 | | | 12.54 | | | 64,721 | | | 1.75 | | | 5.43 | | | 1.59 | | | 5.59 | | | 3 | |
| | | (4.77 | ) | | .20 | | | 60,419 | | | 1.42 | | | 6.54 | | | 1.13 | | | 6.84 | | | 13 | |
| | | | | | | | | | | | | | | | | | | | | | | | | |
| | | | | | | | | | | | | | | | | | | | | | | | | |
| | | (7.10 | ) | | 4.18 | | | 375,162 | | | 2.58 | | | 4.12 | | | N/A | | | N/A | | | 17 | |
| | | 17.69 | | | 14.82 | | | 167,208 | | | 2.91 | | | 4.54 | | | N/A | | | N/A | | | 7 | |
| | | 2.32 | | | 2.53 | | | 153,082 | | | 2.10 | | | 5.48 | | | N/A | | | N/A | | | 6 | |
| | | 19.89 | | | 14.44 | | | 157,243 | | | 1.49 | | | 5.88 | | | N/A | | | N/A | | | 2 | |
| | | 2.57 | | | .66 | | | 144,504 | | | 1.35 | | | 6.80 | | | N/A | | | N/A | | | 5 | |
| (c) | Ratios do not reflect the effect of dividend payments to Auction Rate Preferred shareholders, where applicable; Net Investment Income (Loss) ratios reflect income earned and expenses incurred on assets attributable to Auction Rate Preferred Shares (“ARPS”) and/or MTP Shares, where applicable. |
| (d) | After expense reimbursement from the Adviser, where applicable. As of September 30, 2010, the Adviser is no longer reimbursing Georgia Dividend Advantage 2 (NKG) for any fees and expenses. |
| (e) | The expense ratios reflect, among other things, all interest expense and other costs related to MTP Shares and/or the interest expense deemed to have been paid by the Fund on the floating rate certificates issued by the special purpose trusts for the self-deposited inverse floaters held by the Fund, where applicable, both as described in Footnote 1 – General Information and Significant Accounting Policies, MuniFund Term Preferred Shares and Inverse Floating Rate Securities, respectively, as follows: |
| Georgia Dividend Advantage 2 (NKG) | | | | |
| Year Ended 5/31: | | | | |
| 2013 | | | 1.51 | % |
| 2012 | | | 1.56 | |
| 2011 | | | 1.60 | |
| 2010 | | | .55 | |
| 2009 | | | .10 | |
| | | | | |
| Maryland Premium Income (NMY) | | | | |
| Year Ended 5/31: | | | | |
| 2013 | | | 1.46 | % |
| 2012 | | | 1.56 | |
| 2011 | | | 1.00 | |
| 2010 | | | .32 | |
| 2009 | | | .05 | |
| N/A | Fund does not have, or no longer has, a contractual reimbursement agreement with the Adviser. |
See accompanying notes to financial statements.
| | | Financial |
| | | Highlights (continued) |
| | | |
| | Selected data for a Common share outstanding throughout each period: |
| | | | | Investment Operations | | Less Distributions | | | | | |
| | | Beginning Common Share Net Asset Value | | Net Investment Income (Loss) | | Net Realized/ Unrealized Gain (Loss) | | Distributions from Net Investment Income to Auction Rate Preferred Share- holders | (a) | Distributions from Accumulated Net Realized Gains to Auction Rate Preferred Share- holders | (a) | Total | | From Net Investment Income to Common Share- holders | | From Accumulated Net Realized Gains to Common Share- holders | | Total | | Ending Common Share Net Asset Value | | Ending Market Value | |
| Missouri Premium Income (NOM) | | | | | | | | | | | | | | | | | | | | | | | | | |
| Year Ended 5/31: | | | | | | | | | | | | | | | | | | | | | | | | | | | | | | | |
| 2013 | | $ | 14.62 | | $ | .66 | | $ | .06 | | $ | — | | $ | — | | $ | .72 | | $ | (.73 | ) | $ | — | | $ | (.73 | ) | | 14.61 | | $ | 16.04 | |
| 2012 | | | 13.19 | | | .69 | | | 1.52 | | | — | | | — | | | 2.21 | | | (.78 | ) | | — | | | (.78 | ) | | 14.62 | | | 16.90 | |
| 2011 | | | 13.55 | | | .78 | | | (.35 | ) | | (.01 | ) | | — | | | .42 | | | (.78 | ) | | — | | | (.78 | ) | | 13.19 | | | 13.88 | |
| 2010 | | | 12.44 | | | .83 | | | .99 | | | (.03 | ) | | — | | | 1.79 | | | (.68 | ) | | — | | | (.68 | ) | | 13.55 | | | 16.50 | |
| 2009 | | | 13.52 | | | .85 | | | (1.12 | ) | | (.16 | ) | | — | | | (.43 | ) | | (.65 | ) | | — | | | (.65 | ) | | 12.44 | | | 12.90 | |
| | | | | | | | | | | | | | | | | | | | | | | | | | | | | | | | | | | |
| North Carolina Premium Income (NNC) | | | | | | | | | | | | | | | | | | | | | | | | | |
| Year Ended 5/31: | | | | | | | | | | | | | | | | | | | | | | | | | | | | | | | |
| 2013 | | | 15.30 | | | .56 | | | (.17 | ) | | — | | | — | | | .39 | | | (.67 | ) | | — | | | (.67 | ) | | 15.02 | | | 13.88 | |
| 2012 | | | 14.34 | | | .57 | | | 1.10 | | | — | | | — | | | 1.67 | | | (.71 | ) | | — | | | (.71 | ) | | 15.30 | | | 15.97 | |
| 2011 | | | 14.72 | | | .69 | | | (.32 | ) | | (.01 | ) | | — | | | .36 | | | (.74 | ) | | — | | | (.74 | ) | | 14.34 | | | 14.41 | |
| 2010 | | | 13.78 | | | .81 | | | .87 | | | (.03 | ) | | — | | | 1.65 | | | (.71 | ) | | — | | | (.71 | ) | | 14.72 | | | 15.37 | |
| 2009 | | | 13.98 | | | .85 | | | (.27 | ) | | (.17 | ) | | — | | | .41 | | | (.61 | ) | | — | | | (.61 | ) | | 13.78 | | | 12.60 | |
| (a) | The amounts shown are based on Common share equivalents. |
| (b) | Total Return Based on Market Value is the combination of changes in the market price per share and the effect of reinvested dividend income and reinvested capital gains distributions, if any, at the average price paid per share at the time of reinvestment. The last dividend declared in the period, which is typically paid on the first business day of the following month, is assumed to be reinvested at the ending market price. The actual reinvestment for the last dividend declared in the period may take place over several days, and in some instances may not be based on the market price, so the actual reinvestment price may be different from the price used in the calculation. Total returns are not annualized. |
| | |
| | Total Return Based on Common Share Net Asset Value is the combination of changes in Common share net asset value, reinvested dividend income at net asset value and reinvested capital gains distributions at net asset value, if any. The last dividend declared in the period, which is typically paid on the first business day of the following month, is assumed to be reinvested at the ending net asset value. The actual reinvest price for the last dividend declared in the period may often be based on the Fund’s market price (and not its net asset value), and therefore may be different from the price used in the calculation. Total returns are not annualized. |
| | | | Ratios/Supplemental Data |
| | Total Returns | | | | Ratios to Average Net Assets Applicable to Common Shares(c) | | | |
| | | | | | | | | | | | | |
| | Based on Market Value | (b) | Based on Common Share Net Asset Value | (b) | Ending Net Assets Applicable to Common Shares (000) | | Expenses | (d) | Net Investment Income (Loss) | | Portfolio Turnover Rate | |
| | | | | | | | | | | | | | | | | | | |
| | | | | | | | | | | | | | | | | | | |
| | | (.67 | )% | | 4.98 | % | $ | 34,011 | | | 2.77 | % | | 4.45 | % | | 12 | % |
| | | 28.21 | | | 17.16 | | | 33,979 | | | 2.95 | | | 4.93 | | | 13 | |
| | | (11.29 | ) | | 3.22 | | | 30,595 | | | 2.30 | | | 5.90 | | | 11 | |
| | | 34.31 | | | 14.69 | | | 31,348 | | | 1.37 | | | 6.37 | | | 7 | |
| | | (7.83 | ) | | (2.92 | ) | | 28,734 | | | 1.55 | | | 6.96 | | | 2 | |
| | | | | | | | | | | | | | | | | | | |
| | | | | | | | | | | | | | | | | | | |
| | | (9.16 | ) | | 2.50 | | | 248,601 | | | 2.72 | | | 3.88 | | | 17 | |
| | | 16.23 | | | 11.88 | | | 97,497 | | | 3.28 | | | 3.85 | | | 18 | |
| | | (1.27 | ) | | 2.57 | | | 91,256 | | | 2.49 | | | 4.77 | | | 10 | |
| | | 28.20 | | | 12.24 | | | 93,570 | | | 1.54 | | | 5.68 | | | 6 | |
| | | (.44 | ) | | 3.22 | | | 87,558 | | | 1.39 | | | 6.43 | | | 7 | |
| (c) | Ratios do not reflect the effect of dividend payments to Auction Rate Preferred shareholders, where applicable; Net Investment Income (Loss) ratios reflect income earned and expenses incurred on assets attributable to ARPS and/or MTP Shares, where applicable. |
| (d) | The expense ratios reflect, among other things, all interest expense and other costs related to MTP Shares and/or the interest expense deemed to have been paid by the Fund on the floating rate certificates issued by the special purpose trusts for the self-deposited inverse floaters held by the Fund, where applicable, both as described in Footnote 1 – General Information and Significant Accounting Policies, MuniFund Term Preferred Shares and Inverse Floating Rate Securities, respectively, as follows: |
| Missouri Premium Income (NOM) | | | | |
| Year Ended 5/31: | | | | |
| 2013 | | | 1.45 | % |
| 2012 | | | 1.55 | |
| 2011 | | | .93 | |
| 2010 | | | .03 | |
| 2009 | | | 13 | |
| North Carolina Premium Income (NNC) | | | | |
| Year Ended 5/31: | | | | |
| 2013 | | | 1.60 | % |
| 2012 | | | 1.71 | |
| 2011 | | | 1.29 | |
| 2010 | | | .34 | |
| 2009 | | | .07 | |
See accompanying notes to financial statements.
| | | Financial |
| | | Highlights (continued) |
| | | |
| | Selected data for a Common share outstanding throughout each period: |
| | | | | Investment Operations | | Less Distributions | | | | | |
| | | Beginning Common Share Net Asset Value | | Net Investment Income (Loss) | | Net Realized/ Unrealized Gain (Loss) | | Distributions from Net Investment Income to Auction Rate Preferred Share- holders | (a) | Distributions from Accumulated Net Realized Gains to Auction Rate Preferred Share- holders | (a) | Total | | From Net Investment Income to Common Share- holders | | From Accumulated Net Realized Gains to Common Share- holders | | Total | | Ending Common Share Net Asset Value | | Ending Market Value | |
| Virginia Premium Income (NPV) | | | | | | | | | | | | | | | | | | | | | | | | | |
| Year Ended 5/31: | | | | | | | | | | | | | | | | | | | | | | | | | | | | | | | |
| 2013 | | $ | 15.60 | | $ | .66 | | $ | (.10 | ) | $ | — | | $ | — | | $ | .56 | | $ | (.76 | ) | $ | (.02 | ) | $ | (.78 | ) | $ | 15.38 | | $ | 14.32 | |
| 2012 | | | 14.42 | | | .68 | | | 1.32 | | | — | | | — | | | 2.00 | | | (.80 | ) | | (.02 | ) | | (.82 | ) | | 15.60 | | | 17.05 | |
| 2011 | | | 14.73 | | | .77 | | | (.27 | ) | | (.01 | ) | | — | | | .49 | | | (.80 | ) | | — | | | (.80 | ) | | 14.42 | | | 14.92 | |
| 2010 | | | 13.76 | | | .88 | | | .93 | | | (.03 | ) | | — | | | 1.78 | | | (.81 | ) | | — | | | (.81 | ) | | 14.73 | | | 15.85 | |
| 2009 | | | 14.39 | | | .90 | | | (.66 | ) | | (.15 | ) | | (.02 | ) | | .07 | | | (.65 | ) | | (.05 | ) | | (.70 | ) | | 13.76 | | | 14.36 | |
| (a) | The amounts shown are based on Common share equivalents. |
| (b) | Total Return Based on Market Value is the combination of changes in the market price per share and the effect of reinvested dividend income and reinvested capital gains distributions, if any, at the average price paid per share at the time of reinvestment. The last dividend declared in the period, which is typically paid on the first business day of the following month, is assumed to be reinvested at the ending market price. The actual reinvestment for the last dividend declared in the period may take place over several days, and in some instances may not be based on the market price, so the actual reinvestment price may be different from the price used in the calculation. Total returns are not annualized. |
| | |
| | Total Return Based on Common Share Net Asset Value is the combination of changes in Common share net asset value, reinvested dividend income at net asset value and reinvested capital gains distributions at net asset value, if any. The last dividend declared in the period, which is typically paid on the first business day of the following month, is assumed to be reinvested at the ending net asset value. The actual reinvest price for the last dividend declared in the period may often be based on the Fund’s market price (and not its net asset value), and therefore may be different from the price used in the calculation. Total returns are not annualized. |
| | | | Ratios/Supplemental Data |
| | Total Returns | | | | Ratios to Average Net Assets Applicable to Common Shares(c) | | | |
| | | | | | | | | | | | | |
| | Based on Market Value | (b) | Based on Common Share Net Asset Value | (b) | Ending Net Assets Applicable to Common Shares (000) | | Expenses | (d) | Net Investment Income (Loss) | | Portfolio Turnover Rate | |
| | | | | | | | | | | | | | | | | | | |
| | | | | | | | | | | | | | | | | | | |
| | | (11.76 | )% | | 3.56 | % | $ | 275,865 | | | 2.57 | % | | 4.19 | % | | 21 | % |
| | | 20.61 | | | 14.26 | | | 141,099 | | | 2.78 | | | 4.49 | | | 12 | |
| | | (.58 | ) | | 3.48 | | | 130,032 | | | 2.11 | | | 5.36 | | | 12 | |
| | | 16.60 | | | 13.19 | | | 132,302 | | | 1.45 | | | 6.14 | | | 3 | |
| | | 8.05 | | | .88 | | | 123,119 | | | 1.36 | | | 6.82 | | | 6 | |
| (c) | Ratios do not reflect the effect of dividend payments to Auction Rate Preferred shareholders, where applicable; Net Investment Income (Loss) ratios reflect income earned and expenses incurred on assets attributable to ARPS and/or MTP Shares, where applicable. |
| (d) | The expense ratios reflect, among other things, all interest expense and other costs related to MTP Shares and/or the interest expense deemed to have been paid by the Fund on the floating rate certificates issued by the special purpose trusts for the self-deposited inverse floaters held by the Fund, where applicable, both as described in Footnote 1 – General Information and Significant Accounting Policies, MuniFund Term Preferred Shares and Inverse Floating Rate Securities, respectively, as follows: |
| Virginia Premium Income (NPV) | | | | |
| Year Ended 5/31: | | | | |
| 2013 | | | 1.44 | % |
| 2012 | | | 1.41 | |
| 2011 | | | .93 | |
| 2010 | | | .29 | |
| 2009 | | | .08 | |
See accompanying notes to financial statements.
| | | Financial |
| | | Highlights (continued) |
| | | | | | | | | | | | | | | ARPS and MTP | |
| | | | | | | | | | | | | | | Shares at the | |
| | | ARPS at the End of Period | | MTP Shares at the End of Period(a) | | End of Period | |
| | | Aggregate Amount | | Asset | | Aggregate Amount | | Asset | | Asset Coverage | |
| | | Outstanding | | Coverage | | Outstanding | | Coverage | | Per $1 Liquidation | |
| | | (000 | ) | Per $25,000 Share | | (000 | ) | Per $10 Share | | Preference | |
| Georgia Dividend Advantage 2 (NKG) | | | | | | | | | | | | | | | | |
| Year Ended 5/31: | | | | | | | | | | | | | | | | |
| 2013 | | $ | — | | $ | — | | $ | 74,945 | | $ | 30.53 | | $ | — | |
| 2012 | | | — | | | — | | | 32,265 | | | 30.78 | | | — | |
| 2011 | | | — | | | — | | | 32,265 | | | 29.46 | | | — | |
| 2010 | | | — | | | — | | | 32,265 | | | 30.06 | | | — | |
| 2009 | | | 31,700 | | | 72,649 | | | — | | | — | | | — | |
| | | | | | | | | | | | | | | | | |
| Maryland Premium Income (NMY) | | | | | | | | | | | | | | | | |
| Year Ended 5/31: | | | | | | | | | | | | | | | | |
| 2013 | | | — | | | — | | | 166,144 | | | 32.58 | | | — | |
| 2012 | | | — | | | — | | | 74,593 | | | 32.42 | | | — | |
| 2011 | | | — | | | — | | | 74,593 | | | 30.52 | | | — | |
| 2010 | | | 32,975 | | | 79,788 | | | 38,775 | | | 31.92 | | | 3.19 | |
| 2009 | | | 70,875 | | | 75,972 | | | — | | | — | | | — | |
| (a) | The Ending and Average Market Value Per Share for each Series of the Fund’s MTP Shares were as follows: |
| | | | 2013 | | | 2012 | | | 2011 | | | 2010 | (c) |
| Georgia Dividend Advantage 2 (NKG) | | | | | | | | | | | | | |
| Series 2015 (NKG PrC) | | | | | | | | | | | | | |
| Ending Market Value per Share | | $ | 10.08 | | $ | 10.10 | | $ | 10.06 | | $ | 9.99 | |
| Average Market Value per Share | | | 10.08 | | | 10.07 | | | 10.02 | | | 9.99 | ^ |
| Series 2015-1 (NKG PrD) (b) | | | | | | | | | | | | | |
| Ending Market Value per Share | | | 10.10 | | | — | | | — | | | — | |
| Average Market Value per Share | | | 10.07 | Ω | | — | | | — | | | — | |
| Series 2015-2 (NKG PrE) (b) | | | | | | | | | | | | | |
| Ending Market Value per Share | | | 10.12 | | | — | | | — | | | — | |
| Average Market Value per Share | | | 10.07 | Ω | | — | | | — | | | — | |
| | | | | | | | | | | | | | |
| Maryland Premium Income (NMY) | | | | | | | | | | | | | |
| Series 2015 (NMY PrC) | | | | | | | | | | | | | |
| Ending Market Value per Share | | | 10.06 | | | 10.06 | | | 10.09 | | | 10.00 | |
| Average Market Value per Share | | | 10.09 | | | 10.10 | | | 10.04 | | | 10.01 | ^ |
| Series 2016 (NMY PrD) | | | | | | | | | | | | | |
| Ending Market Value per Share | | | 10.16 | | | 10.11 | | | 10.10 | | | — | |
| Average Market Value per Share | | | 10.17 | | | 10.14 | | | 10.04 | ^^ | | — | |
| Series 2015 (NMY PrE) (b) | | | | | | | | | | | | | |
| Ending Market Value per Share | | | 10.05 | | | — | | | — | | | — | |
| Average Market Value per Share | | | 10.07 | ΩΩ | | — | | | — | | | — | |
| Series 2015-1(NMY PrF) (b) | | | | | �� | | | | | | | | |
| Ending Market Value per Share | | | 10.06 | | | — | | | — | | | — | |
| Average Market Value per Share | | | 10.07 | ΩΩ | | — | | | — | | | — | |
| Series 2015-1(NMY PrG) (b) | | | | | | | | | | | | | |
| Ending Market Value per Share | | | 10.05 | | | — | | | — | | | — | |
| Average Market Value per Share | | | 10.08 | ΩΩ | | — | | | — | | | — | |
| Series 2016 (NMY PrH) (b) | | | | | | | | | | | | | |
| Ending Market Value per Share | | | 10.13 | | | — | | | — | | | — | |
| Average Market Value per Share | | | 10.14 | ΩΩ | | — | | | — | | | — | |
| (b) | MTP Shares issued in connection with the Reorganizations as further described in Footnote 1, General Information and Significant Accounting Policies, Fund Reorganizations and MuniFund Term Preferred Shares. |
| (c) | The Funds did not issue MTP Shares prior to the fiscal year ended May 31, 2010. |
| ^ | For the period January 29, 2010 (first issuance date of shares) through May 31, 2010. |
| ^^ | For the period March 15, 2011 (first issuance date of shares) through May 31, 2011. |
| Ω | For the period July 9, 2012 (effective date of the Reorganizations) through May 31, 2013. |
| ΩΩ | For the period August 6, 2012 (effective date of the Reorganizations) through May 31, 2013. |
| | | | | | | | | | | | | | | ARPS and MTP | |
| | | | | | | | | | | | | | | Shares at the | |
| | | ARPS at the End of Period | | MTP Shares at the End of Period(a) | | End of Period | |
| | | Aggregate Amount | | Asset | | Aggregate Amount | | Asset | | Asset Coverage | |
| | | Outstanding | | Coverage | | Outstanding | | Coverage | | Per $1 Liquidation | |
| | | (000 | ) | Per $25,000 Share | | (000 | ) | Per $10 Share | | Preference | |
| Missouri Premium Income (NOM) | | | | | | | | | | | | | | | | |
| Year Ended 5/31: | | | | | | | | | | | | | | | | |
| 2013 | | $ | — | | $ | — | | $ | 17,880 | | $ | 29.02 | | $ | — | |
| 2012 | | | — | | | — | | | 17,880 | | | 29.00 | | | — | |
| 2011 | | | — | | | — | | | 17,880 | | | 27.11 | | | — | |
| 2010 | | | 16,000 | | | 73,981 | | | — | | | — | | | — | |
| 2009 | | | 16,000 | | | 69,897 | | | — | | | — | | | — | |
| | | | | | | | | | | | | | | | | |
| North Carolina Premium Income (NNC) | | | | | | | | | | | | | | | | |
| Year Ended 5/31: | | | | | | | | | | | | | | | | |
| 2013 | | | — | | | — | | | 124,860 | | | 29.91 | | | — | |
| 2012 | | | — | | | — | | | 49,835 | | | 29.56 | | | — | |
| 2011 | | | — | | | — | | | 49,835 | | | 28.31 | | | — | |
| 2010 | | | 21,550 | | | 76,020 | | | 24,300 | | | 30.41 | | | 3.04 | |
| 2009 | | | 46,800 | | | 71,773 | | | — | | | — | | | — | |
| (a) | The Ending and Average Market Value Per Share for each Series of the Fund’s MTP Shares were as follows: |
| | | | 2013 | | | 2012 | | | 2011 | | | 2010 | (c) |
| Missouri Premium Income (NOM) | | | | | | | | | | | | | |
| Series 2015 (NOM PrC) | | | | | | | | | | | | | |
| Ending Market Value per Share | | $ | 10.03 | | $ | 10.40 | | $ | 13.88 | | $ | — | |
| Average Market Value per Share | | | 10.08 | | | 9.98 | | | 15.41 | Δ | | — | |
| | | | | | | | | | | | | | |
| North Carolina Premium Income (NNC) | | | | | | | | | | | | | |
| Series 2015 (NNC PrC) | | | | | | | | | | | | | |
| Ending Market Value per Share | | | 10.07 | | | 10.11 | | | 10.04 | | | 9.99 | |
| Average Market Value per Share | | | 10.10 | | | 10.09 | | | 10.04 | | | 10.01 | ΔΔ |
| Series 2016 (NNC PrD) | | | | | | | | | | | | | |
| Ending Market Value per Share | | | 10.08 | | | 10.10 | | | 10.00 | | | — | |
| Average Market Value per Share | | | 10.09 | | | 10.07 | | | 9.94 | ΔΔΔ | | — | |
| Series 2015 (NNC PrE) (b) | | | | | | | | | | | | | |
| Ending Market Value per Share | | | 10.06 | | | — | | | — | | | — | |
| Average Market Value per Share | | | 10.07 | Ω | | — | | | — | | | — | |
| Series 2015-1 (NNC PrF) (b) | | | | | | | | | | | | | |
| Ending Market Value per Share | | | 10.06 | | | — | | | — | | | — | |
| Average Market Value per Share | | | 10.07 | Ω | | — | | | — | | | — | |
| Series 2015-1 (NNC PrG) (b) | | | | | | | | | | | | | |
| Ending Market Value per Share | | | 10.06 | | | — | | | — | | | — | |
| Average Market Value per Share | | | 10.07 | Ω | | — | | | — | | | — | |
| (b) | MTP Shares issued in connection with the Reorganizations as further described in Footnote 1, General Information and Significant Accounting Policies, Fund Reorganizations and MuniFund Term Preferred Shares. |
| (c) | Missouri Premium Income (NOM) and North Carolina Premium Income (NNC) did not issue MTP Shares prior to the fiscal year ended May 31, 2011 and May 31, 2010, respectively. |
| Δ | For the period November 9, 2010 (first issuance date of shares) through May 31, 2011. |
| ΔΔ | For the period January 21, 2010 (first issuance date of shares) through May 31, 2010. |
| ΔΔΔ | For the period December 14, 2010 (first issuance date of shares) through May 31, 2011. |
| Ω | For the period July 9, 2012 (effective date of the Reorganizations) through May 31, 2013. |
See accompanying notes to financial statements.
| | | Financial |
| | | Highlights (continued) |
| | | | | | | | | | | | | | | ARPS and | |
| | | | | | | | | | | | | | | MTP Shares | |
| | | | | | | | | | | | | | | at the | |
| | | ARPS at the End of Period | | MTP Shares at the End of Period(a) | | End of Period | |
| | | Aggregate Amount | | Asset | | Aggregate Amount | | Asset | | Asset Coverage | |
| | | Outstanding | | Coverage | | Outstanding | | Coverage | | Per $1 Liquidation | |
| | | (000 | ) | Per $25,000 Share | | (000 | ) | Per $10 Share | | Preference | |
| Virginia Premium Income (NPV) | | | | | | | | | | | | | | | | |
| Year Ended 5/31: | | | | | | | | | | | | | | | | |
| 2013 | | $ | — | | $ | — | | $ | 127,408 | | $ | 31.65 | | $ | — | |
| 2012 | | | — | | | — | | | 61,408 | | | 32.98 | | | — | |
| 2011 | | | — | | | — | | | 61,408 | | | 31.18 | | | — | |
| 2010 | | | 25,550 | | | 82,269 | | | 32,205 | | | 32.91 | | | 3.29 | |
| 2009 | | | 63,800 | | | 73,244 | | | — | | | — | | | — | |
| (a) | The Ending and Average Market Value Per Share for each Series of the Fund’s MTP Shares were as follows: |
| | | | 2013 | | | 2012 | | | 2011 | | | 2010 | (c) |
| Virginia Premium Income (NPV) | | | | | | | | | | | | | |
| Series 2014 (NPV PrA) | | | | | | | | | | | | | |
| Ending Market Value per Share | | $ | 10.03 | | $ | 10.12 | | $ | 10.03 | | $ | — | |
| Average Market Value per Share | | | 10.08 | | | 10.10 | | | 10.02 | * | | — | |
| Series 2015 (NPV PrC) | | | | | | | | | | | | | |
| Ending Market Value per Share | | | 10.09 | | | 10.13 | | | 10.01 | | | 10.00 | |
| Average Market Value per Share | | | 10.09 | | | 10.09 | | | 10.07 | | | 10.00 | ** |
| Series 2014 (NPV PrD) (b) | | | | | | | | | | | | | |
| Ending Market Value per Share | | | 10.06 | | | — | | | — | | | — | |
| Average Market Value per Share | | | 10.09 | ΩΩ | | — | | | — | | | — | |
| Series 2014-1 (NPV PrE) (b) | | | | | | | | | | | | | |
| Ending Market Value per Share | | | 10.09 | | | — | | | — | | | — | |
| Average Market Value per Share | | | 10.09 | ΩΩ | | — | | | — | | | — | |
| (b) | MTP Shares issued in connection with the Reorganizations as further described in Footnote 1, General Information and Significant Accounting Policies, Fund Reorganizations and MuniFund Term Preferred Shares. |
| (c) | The Fund did not issue MTP Shares prior to the fiscal year ended May 31, 2010. |
| * | For the period March 14, 2011 (first issuance date of shares) through May 31, 2011. |
| ** | For the period January 26, 2010 (first issuance date of shares) through May 31, 2010. |
| ΩΩ | For the period August 6, 2012 (effective date of the Reorganizations) through May 31, 2013. |
| | | Notes to |
| | | Financial Statements |
1. General Information and Significant Accounting Policies
General Information
The state funds covered in this report and their corresponding Common share stock exchange symbols are Nuveen Georgia Dividend Advantage Municipal Fund 2 (NKG), Nuveen Maryland Premium Income Municipal Fund (NMY), Nuveen Missouri Premium Income Municipal Fund (NOM), Nuveen North Carolina Premium Income Municipal Fund (NNC) and Nuveen Virginia Premium Income Municipal Fund (NPV) (each a “Fund” and collectively, the “Funds”). Common shares of Maryland Premium Income (NMY) and Virginia Premium Income (NPV) are traded on the New York Stock Exchange (“NYSE”) while common shares of Georgia Dividend Advantage 2 (NKG), North Carolina Premium Income (NNC) and Missouri Premium Income (NOM) are traded on the NYSE MKT. The Funds are registered under the Investment Company Act of 1940, as amended, as diversified, closed-end registered investment companies.
On December 31, 2012, the Funds’ investment adviser converted from a Delaware corporation to a Delaware limited liability company. As a result, Nuveen Fund Advisers, Inc., a wholly-owned subsidiary of Nuveen Investments, Inc. (“Nuveen”), changed its name to Nuveen Fund Advisers, LLC (the “Adviser”). There were no changes to the identities or roles of any personnel as a result of the change.
Each Fund seeks to provide current income exempt from both regular federal and designated state income taxes by investing primarily in a portfolio of municipal obligations issued by state and local government authorities within a single state or certain U.S. territories.
Fund Reorganizations
Effective before the opening of business on July 9, 2012, certain Georgia and North Carolina funds and effective before the opening of business on August 6, 2012, certain Maryland and Virginia funds were reorganized in four of the larger-state funds included in this report as follows:
| | Acquired Funds | | Acquiring Funds |
| | Georgia Funds | | |
| | Nuveen Georgia Premium Income Municipal Fund (NPG) (“Georgia Premium Income (NPG)”) | | Georgia Dividend Advantage 2 (NKG) |
| | Nuveen Georgia Dividend Advantage Municipal Fund (NZX) (“Georgia Dividend Advantage (NZX)”) | | |
| | | | |
| | Maryland Funds | | |
| | Nuveen Maryland Dividend Advantage Municipal Fund (NFM) (“Maryland Dividend Advantage (NFM)”) | | Maryland Premium Income (NMY) |
| | Nuveen Maryland Dividend Advantage Municipal Fund 2 (NZR) (“Maryland Dividend Advantage 2 (NZR)”) | | |
| | Nuveen Maryland Dividend Advantage Municipal Fund 3 (NWI) (“Maryland Dividend Advantage 3 (NWI)”) | | |
| | | | |
| | North Carolina Funds | | |
| | Nuveen North Carolina Dividend Advantage Municipal Fund (NRB) (“North Carolina Dividend Advantage (NRB)”) | | North Carolina Premium Income (NNC) |
| | Nuveen North Carolina Dividend Advantage Municipal Fund 2 (NNO) (“North Carolina Dividend Advantage 2 (NNO)”) | | |
| | Nuveen North Carolina Dividend Advantage Municipal Fund 3 (NII) (“North Carolina Dividend Advantage 3 (NII)”) | | |
| | | | |
| | Virginia Funds | | |
| | Nuveen Virginia Dividend Advantage Municipal Fund (NGB) (“Virginia Dividend Advantage (NGB)”) | | Virginia Premium Income (NPV) |
| | Nuveen Virginia Dividend Advantage Municipal Fund 2 (NNB) (“Virginia Dividend Advantage 2 (NNB)”) | | |
The reorganizations of the Georgia, Maryland, North Carolina and Virginia Funds were approved by the shareholders of the Acquired Funds at a special meeting on May 15, 2012, July 18, 2012, May 14, 2012 and June 22, 2012, respectively.
Upon the closing of each Fund’s reorganization (each a “Reorganization” and collectively, the “Reorganizations”), the Acquired Funds transferred their assets to the Acquiring Funds in exchange for common and preferred shares of the Acquiring Funds and the assumption by the Acquiring Funds of the liabilities of the Acquired Funds. The Acquired Funds were then liquidated, dissolved and terminated in accordance with their Declaration of Trust. Shareholders of the Acquired Funds became shareholders of the Acquiring Funds. Holders of common shares of the Acquired Funds received newly issued common shares of the Acquiring Funds, the aggregate net asset value of which was equal to the aggregate net asset value of the common shares of the Acquired Funds held immediately prior to the Reorganizations (including for this purpose fractional Acquiring Funds shares to which shareholders would be entitled). Fractional shares were sold on the open market and shareholders received cash in lieu of such fractional shares. Holders of preferred shares of the Acquired Funds received on a one-for-one basis newly issued preferred shares of the Acquiring Funds, in exchange for preferred shares of the Acquired Funds held immediately prior to the Reorganizations. Details of each state’s Reorganizations are further described in the MuniFund Term Preferred Shares section of this footnote and Footnote 8 – Fund Reorganizations.
| | | Notes to |
| | | Financial Statements (continued) |
Significant Accounting Policies
The following is a summary of significant accounting policies followed by the Funds in the preparation of their financial statements in accordance with U.S. generally accepted accounting principles (“U.S. GAAP”).
Investment Valuation
Prices of municipal bonds are provided by a pricing service approved by the Funds’ Board of Trustees. These securities are generally classified as Level 2 for fair value measurement purposes. The pricing service establishes a security’s fair value using methods that may include consideration of the following: yields or prices of investments of comparable quality, type of issue, coupon, maturity and rating, market quotes or indications of value from security dealers, evaluations of anticipated cash flows or collateral, general market conditions and other information and analysis, including the obligor’s credit characteristics considered relevant. In pricing certain securities, particularly less liquid and lower quality securities, the pricing service may consider information about a security, its issuer, or market activity, provided by the Adviser. These securities are generally classified as Level 2 or Level 3 depending on the priority of the significant inputs.
Certain securities may not be able to be priced by the pre-established pricing methods as described above. Such securities may be valued by the Funds’ Board of Trustees or its designee at fair value. These securities generally include, but are not limited to, restricted securities (securities which may not be publicly sold without registration under the Securities Act of 1933, as amended) for which a pricing service is unable to provide a market price; securities whose trading has been formally suspended; debt securities that have gone into default and for which there is no current market quotation; a security whose market price is not available from a pre-established pricing source; a security with respect to which an event has occurred that is likely to materially affect the value of the security after the market has closed but before the calculation of a Fund’s net asset value (as may be the case in non-U.S. markets on which the security is primarily traded) or make it difficult or impossible to obtain a reliable market quotation; and a security whose price, as provided by the pricing service, is not deemed to reflect the security’s fair value. As a general principle, the fair value of a security would appear to be the amount that the owner might reasonably expect to receive for it in a current sale. A variety of factors may be considered in determining the fair value of these securities, which may include consideration of the following: yields or prices of investments of comparable quality, type of issue, coupon, maturity and rating, market quotes or indications of value from security dealers, evaluations of anticipated cash flows or collateral, general market conditions and other information and analysis, including the obligor’s credit characteristics considered relevant. These securities are generally classified as Level 2 or Level 3 depending on the priority of the significant inputs. Regardless of the method employed to value a particular security, all valuations are subject to review by the Funds’ Board of Trustees or its designee.
Refer to Footnote 2 – Fair Value Measurements for further details on the leveling of securities held by the Funds as of the end of the reporting period.
Investment Transactions
Investment transactions are recorded on a trade date basis. Realized gains and losses from transactions are determined on the specific identification method, which is the same basis used for federal income tax purposes. Investments purchased on a when-issued/delayed delivery basis may have extended settlement periods. Any investments so purchased are subject to market fluctuation during this period. The Funds have instructed the custodian to earmark securities in the Funds’ portfolios with a current value at least equal to the amount of the when-issued/delayed delivery purchase commitments. As of May 31, 2013, Maryland Premium Income (NMY), Missouri Premium Income (NOM), North Carolina Premium Income (NNC) and Virginia Premium Income (NPV) had outstanding delayed delivery purchase commitments of $1,100,410, $1,490,258, $5,000,000 and $6,762,407, respectively. There were no such outstanding purchase commitments in Georgia Dividend Advantage 2 (NKG).
Investment Income
Investment income, which reflects the amortization of premiums and includes accretion of discounts for financial reporting purposes, is recorded on an accrual basis. Investment income also reflects paydown gains and losses, if any.
Professional Fees
Professional fees presented on the Statement of Operations consist of legal fees incurred in the normal course of operations, audit fees, tax consulting fees and, in some cases, workout expenditures. Workout expenditures are incurred in an attempt to protect or enhance an investment, or to pursue other claims or legal actions on behalf of Fund shareholders. Legal fee refund presented on the Statement of Operations reflects a refund of workout expenditures paid in a prior reporting period, when applicable.
Income Taxes
Each Fund is a separate taxpayer for federal income tax purposes. Each Fund intends to distribute substantially all of its net investment income and net capital gains to shareholders and to otherwise comply with the requirements of Subchapter M of the Internal Revenue Code applicable to regulated investment companies. Therefore, no federal income tax provision is required. Furthermore, each Fund intends to satisfy conditions that will enable interest from municipal securities, which is exempt from regular federal and designated state income taxes, to retain such tax-exempt status when distributed to shareholders of the Funds. Net realized capital gains and ordinary income distributions paid by the Funds are subject to federal taxation.
For all open tax years and all major taxing jurisdictions, management of the Funds has concluded that there are no significant uncertain tax positions that would require recognition in the financial statements. Open tax years are those that are open for examination by taxing authorities (i.e., generally
the last four tax year ends and the interim tax period since then). Furthermore, management of the Funds is also not aware of any tax positions for which it is reasonably possible that the total amounts of unrecognized tax benefits will significantly change in the next twelve months.
Dividends and Distributions to Common Shareholders
Dividends from net investment income are declared monthly. Net realized capital gains and/or market discount from investment transactions, if any, are distributed to shareholders at least annually. Furthermore, capital gains are distributed only to the extent they exceed available capital loss carryforwards.
Distributions to Common shareholders of net investment income, net realized capital gains and/or market discount, if any, are recorded on the ex-dividend date. The amount and timing of distributions are determined in accordance with federal income tax regulations, which may differ from U.S. GAAP.
Auction Rate Preferred Shares
Each Fund is authorized to issue Auction Rate Preferred Shares (“ARPS”). During prior fiscal periods, the Funds redeemed all of their outstanding ARPS, at liquidation value.
MuniFund Term Preferred Shares
The Funds have issued and outstanding MuniFund Term Preferred Shares, with a $10 stated (“par”) value per share. Each Fund’s MTP Shares may be issued in one or more Series and trade on the NYSE/NYSE MKT. Dividends on MTP Shares, which are recognized as interest expense for financial reporting purposes, are paid monthly at a fixed annual rate, subject to adjustments in certain circumstances.
In connection with Georgia Dividend Advantage 2’s (NKG), Maryland Premium Income’s (NMY), North Carolina Premium Income’s (NNC) and Virginia Premium Income’s (NPV) Reorganizations, holders of MTP Shares of the Acquired Funds received on a one-for-one basis newly issued MTP Shares of the Acquiring Funds, in exchange for MTP Shares of the Acquired Funds held immediately prior to the Reorganizations.
Prior to the closing of the Reorganizations, details of each the Acquired Funds’ outstanding MTP Shares and annual interest rate by NYSE or NYSE MKT “ticker” symbol were as follows:
| | | | | | | | | | | | | | | | | |
| | | | | | | | | | | | | Shares | | | | |
| | | | | | | NYSE/ | | | | | | Outstanding | | | Annual |
| | | | | | | NYSE MKT | | | Shares | | at $10 Per Share | | | Interest |
| | | | Series | | | Ticker | | | Outstanding | | Liquidation Value | | | Rate |
| Georgia Premium Income (NPG) | | | | | | | | | | | | | | | | |
| | | | 2015 | | | NPG PrC | | | 2,834,000 | | $ | 28,340,000 | | | 2.65 | % |
| | | | | | | | | | | | | | | | | |
| Georgia Dividend Advantage (NZX) | | | | | | | | | | | | | | | | |
| | | | 2015 | | | NZX PrC | | | 1,434,000 | | $ | 14,340,000 | | | 2.65 | % |
| | | | | | | | | | | | | | | | | |
| Maryland Dividend Advantage (NFM) | | | | | | | | | | | | | | | | |
| | | | 2015 | | | NFM PrC | | | 2,648,500 | | $ | 26,485,000 | | | 2.60 | % |
| | | | | | | | | | | | | | | | | |
| Maryland Dividend Advantage 2 (NZR) | | | | | | | | | | | | | | | | |
| | | | 2015 | | | NZR PrC | | | 2,730,000 | | $ | 27,300,000 | | | 2.60 | % |
| | | | | | | | | | | | | | | | | |
| Maryland Dividend Advantage 3 (NWI) | | | | | | | | | | | | | | | | |
| | | | 2015 | | | NWI PrC | | | 2,070,000 | | $ | 20,700,000 | | | 2.65 | % |
| | | | 2016 | | | NWI PrD | | | 1,706,600 | | | 17,066,000 | | | 2.85 | |
| | | | | | | | | | | | | | | | | |
| North Carolina Dividend Advantage (NRB) | | | | | | | | | | | | | | | | |
| | | | 2015 | | | NRB PrC | | | 1,660,000 | | $ | 16,600,000 | | | 2.60 | % |
| | | | | | | | | | | | | | | | | |
| North Carolina Dividend Advantage 2 (NNO) | | | | | | | | | | | | | | | | |
| | | | 2015 | | | NNO PrC | | | 2,970,000 | | $ | 29,700,000 | | | 2.60 | % |
| | | | | | | | | | | | | | | | | |
| North Carolina Dividend Advantage 3 (NII) | | | | | | | | | | | | | | | | |
| | | | 2015 | | | NII PrC | | | 2,872,500 | | $ | 28,725,000 | | | 2.65 | % |
| | | | | | | | | | | | | | | | | |
| Virginia Dividend Advantage (NGB) | | | | | | | | | | | | | | | | |
| | | | 2014 | | | NGB PrC | | | 2,280,000 | | $ | 22,800,000 | | | 2.80 | % |
| | | | | | | | | | | | | | | | | |
| Virginia Dividend Advantage 2 (NNB) | | | | | | | | | | | | | | | | |
| | | | 2014 | | | NNB PrC | | | 4,320,000 | | $ | 43,200,000 | | | 2.80 | % |
| | | Notes to |
| | | Financial Statements (continued) |
As of May 31, 2013, the details of each Fund’s MTP Shares outstanding were as follows:
| | | | | | | | | | | | | Shares | | | | |
| | | | | | | NYSE/ | | | | | | Outstanding | | | Annual |
| | | | | | | NYSE MKT | | | Shares | | at $10 Per Share | | | Interest |
| | | | Series | | | Ticker | | | Outstanding | | Liquidation Value | | | Rate |
| Georgia Dividend Advantage 2 (NKG) | | | | | | | | | | | | | | | | |
| | | | 2015 | | | NKG PrC | | | 3,226,500 | | $ | 32,265,000 | | | 2.65 | % |
| | | | 2015-1 * | | | NKG PrD | | | 2,834,000 | | | 28,340,000 | | | 2.65 | |
| | | | 2015-2 * | | | NKG PrE | | | 1,434,000 | | | 14,340,000 | | | 2.65 | |
| | | | | | | | | | | | | | | | | |
| Maryland Premium Income (NMY) | | | | | | | | | | | | | | | | |
| | | | 2015 | | | NMY PrC | | | 3,877,500 | | | 38,775,000 | | | 2.65 | % |
| | | | 2016 | | | NMY PrD | | | 3,581,800 | | | 35,818,000 | | | 2.90 | |
| | | | 2015 * | | | NMY PrE | | | 2,648,500 | | | 26,485,000 | | | 2.60 | |
| | | | 2015-1 * | | | NMY PrF | | | 2,730,000 | | | 27,300,000 | | | 2.60 | |
| | | | 2015-1 * | | | NMY PrG | | | 2,070,000 | | | 20,700,000 | | | 2.65 | |
| | | | 2016 * | | | NMY PrH | | | 1,706,600 | | | 17,066,000 | | | 2.85 | |
| | | | | | | | | | | | | | | | | |
| Missouri Premium Income (NOM) | | | | | | | | | | | | | | | | |
| | | | 2015 | | | NOM PrC | | | 1,780,000 | | | 17,800,000 | | | 2.10 | % |
| | | | | | | | | | | | | | | | | |
| North Carolina Premium Income (NNC) | | | | | | | | | | | | | | | | |
| | | | 2015 | | | NNC PrC | | | 2,430,000 | | | 24,300,000 | | | 2.65 | % |
| | | | 2016 | | | NNC PrD | | | 2,553,500 | | | 25,535,000 | | | 2.60 | |
| | | | 2015 * | | | NNC PrE | | | 1,660,000 | | | 16,600,000 | | | 2.60 | |
| | | | 2015-1 * | | | NNC PrF | | | 2,970,000 | | | 29,700,000 | | | 2.60 | |
| | | | 2015-1 * | | | NNC PrG | | | 2,872,500 | | | 28,725,000 | | | 2.65 | |
| | | | | | | | | | | | | | | | | |
| Virginia Premium Income (NPV) | | | | | | | | | | | | | | | | |
| | | | 2014 | | | NPV PrA | | | 2,920,300 | | | 29,203,000 | | | 2.25 | % |
| | | | 2015 | | | NPV PrC | | | 3,220,500 | | | 32,205,000 | | | 2.65 | |
| | | | 2014 * | | | NPV PrD | | | 2,280,000 | | | 22,800,000 | | | 2.80 | |
| | | | 2014-1 * | | | NPV PrE | | | 4,320,000 | | | 43,200,000 | | | 2.80 | |
* MTP Shares issued in connection with the Reorganizations.
Each Fund is obligated to redeem its MTP Shares by the date as specified in its offering document (“Term Redemption Date”), unless earlier redeemed or repurchased by the Fund. MTP Shares are subject to optional and mandatory redemption in certain circumstances. MTP Shares will be subject to redemption at the option of each Fund (“Optional Redemption Date”), subject to a payment of premium for one year following the Optional Redemption Date (“Premium Expiration Date”), and at par thereafter. MTP Shares also will be subject to redemption, at the option of each Fund, at par in the event of certain changes in the credit rating of the MTP Shares. Each Fund may be obligated to redeem certain of the MTP Shares if the Fund fails to maintain certain asset coverage and leverage ratio requirements and such failures are not cured by the applicable cure date. The redemption price per share is equal to the sum of the liquidation value per share plus any accumulated but unpaid dividends. The Term Redemption Date, Optional Redemption Date and Premium Expiration Date for each Fund’s series of MTP Shares by NYSE or NYSE MKT ticker symbol are as follows:
| | | | | NYSE/ | | Term | | Optional | | Premium | |
| | | | | NYSE MKT | | Redemption | | Redemption | | Expiration | |
| | | Series | | Ticker | | Date | | Date | | Date | |
| Georgia Dividend Advantage 2 (NKG) | | | | | | | | | | | |
| | | 2015 | | NKG PrC | | February 1, 2015 | | February 1, 2011 | | January 31, 2012 | |
| | | 2015-1 * | | NKG PrD | | March 1, 2015 | | March 1, 2012 | | February 28, 2013 | |
| | | 2015-2 * | | NKG PrE | | March 1, 2015 | | March 1, 2012 | | February 28, 2013 | |
| | | | | | | | | | | | |
| Maryland Premium Income (NMY) | | | | | | | | | | | |
| | | 2015 | | NMY PrC | | February 1, 2015 | | February 1, 2011 | | January 31, 2012 | |
| | | 2016 | | NMY PrD | | April 1, 2016 | | April 1, 2012 | | March 31, 2013 | |
| | | 2015 * | | NMY PrE | | May 1, 2015 | | May 1, 2012 | | April 30, 2013 | |
| | | 2015-1 * | | NMY PrF | | May 1, 2015 | | May 1, 2012 | | April 30, 2013 | |
| | | 2015-1 * | | NMY PrG | | March 1, 2015 | | March 1, 2012 | | February 28, 2013 | |
| | | 2016 * | | NMY PrH | | February 1, 2016 | | February 1, 2013 | | January 31, 2014 | |
* MTP Shares issued in connection with the Reorganizations.
| | | | | NYSE/ | | Term | | Optional | | Premium | |
| | | | | NYSE MKT | | Redemption | | Redemption | | Expiration | |
| | | Series | | Ticker | | Date | | Date | | Date | |
| Missouri Premium Income (NOM) | | | | | | | | | | | |
| | | 2015 | | NOM PrC | | December 1, 2015 | | December 1, 2011 | | November 30, 2012 | |
| | | | | | | | | | | | |
| North Carolina Premium Income (NNC) | | | | | | | | | | | |
| | | 2015 | | NNC PrC | | February 1, 2015 | | February 1, 2011 | | January 31, 2012 | |
| | | 2016 | | NNC PrD | | January 1, 2016 | | January 1, 2012 | | December 31, 2012 | |
| | | 2015 * | | NNC PrE | | April 1, 2015 | | April 1, 2012 | | March 31, 2013 | |
| | | 2015-1 * | | NNC PrF | | April 1, 2015 | | April 1, 2012 | | March 31, 2013 | |
| | | 2015-1 * | | NNC PrG | | March 1, 2015 | | March 1, 2012 | | February 28, 2013 | |
| | | | | | | | | | | | |
| Virginia Premium Income (NPV) | | | | | | | | | | | |
| | | 2014 | | NPV PrA | | April 1, 2014 | | April 1, 2012 | | March 31, 2013 | |
| | | 2015 | | NPV PrC | | February 1, 2015 | | February 1, 2011 | | January 31, 2012 | |
| | | 2014 * | | NPV PrD | | December 1, 2014 | | December 1, 2011 | | November 30, 2012 | |
| | | 2014-1 * | | NPV PrE | | December 1, 2014 | | December 1, 2011 | | November 30, 2012 | |
* MTP Shares issued in connection with the Reorganizations.
The average liquidation value for all series of each Fund’s MTP Shares outstanding during the fiscal year ended May 31, 2013, was as follows:
| | | | | | | | | | | | | North | | | | |
| | | | Georgia | | | Maryland | | | Missouri | | | Carolina | | | Virginia | |
| | | | Dividend | | | Premium | | | Premium | | | Premium | | | Premium | |
| | | Advantage 2 | | | Income | | | Income | | | Income | | | Income | |
| | | | (NKG | ) ** | | (NMY | ) ** | | (NOM | ) | | (NNC | ) ** | | (NPV | ) ** |
| Average liquidation value of MTP Shares outstanding | | $ | 70,384,671 | | $ | 149,338,748 | | $ | 17,880,000 | | $ | 116,843,630 | | $ | 115,292,932 | |
| ** | Includes MTP Shares issued in connection with the Reorganizations. |
For financial reporting purposes only, the liquidation value of MTP Shares is recorded as a liability and recognized as “MuniFund Term Preferred (MTP) Shares, at liquidation value” on the Statement of Assets and Liabilities. Unpaid dividends on MTP Shares are recognized as a component of “Interest payable” on the Statement of Assets and Liabilities. Dividends paid on MTP Shares are recognized as a component of “Interest expense and amortization of offering costs” on the Statement of Operations. Costs incurred by the Funds in connection with their offerings of MTP Shares were recorded as a deferred charge, which are amortized over the life of the shares and are recognized as components of “Deferred offering costs” on the Statement of Assets and Liabilities and “Interest expense and amortization of offering costs” on the Statement of Operations.
Inverse Floating Rate Securities
Each Fund is authorized to invest in inverse floating rate securities. An inverse floating rate security is created by depositing a municipal bond, typically with a fixed interest rate, into a special purpose trust created by a broker-dealer. In turn, this trust (a) issues floating rate certificates, in face amounts equal to some fraction of the deposited bond’s par amount or market value, that typically pay short-term tax-exempt interest rates to third parties, and (b) issues to a long-term investor (such as one of the Funds) an inverse floating rate certificate (sometimes referred to as an “inverse floater”) that represents all remaining or residual interest in the trust. The income received by the inverse floater holder varies inversely with the short-term rate paid to the floating rate certificates’ holders, and in most circumstances the inverse floater holder bears substantially all of the underlying bond’s downside investment risk and also benefits disproportionately from any potential appreciation of the underlying bond’s value. The price of an inverse floating rate security will be more volatile than that of the underlying bond because the interest rate is dependent on not only the fixed coupon rate of the underlying bond but also on the short-term interest paid on the floating rate certificates, and because the inverse floating rate security essentially bears the risk of loss of the greater face value of the underlying bond.
A Fund may purchase an inverse floating rate security in a secondary market transaction without first owning the underlying bond (referred to as an “externally-deposited inverse floater”), or instead by first selling a fixed-rate bond to a broker-dealer for deposit into the special purpose trust and receiving in turn the residual interest in the trust (referred to as a “self-deposited inverse floater”). The inverse floater held by a Fund gives the Fund the right (a) to cause the holders of the floating rate certificates to tender their notes at par, and (b) to have the broker transfer the fixed-rate bond held by the trust to the Fund, thereby collapsing the trust. An investment in an externally-deposited inverse floater is identified in the Portfolio of Investments as “(IF) – Inverse floating rate investment.” An investment in a self-deposited inverse floater is accounted for as a financing transaction. In such instances, a fixed-rate bond deposited into a special purpose trust is identified in the Portfolio of Investments as “(UB) – Underlying bond of an inverse floating rate trust reflected as a financing transaction,” with the Fund accounting for the short-term floating rate certificates issued by the trust, at their liquidation value, as “Floating rate obligations” on the Statement of Assets and Liabilities. In addition, the Fund reflects in “Investment Income” the entire earnings of the underlying bond and recognizes the related interest paid to the holders of the short-term floating rate certificates as a component of “Interest expense and amortization of offering costs” on the Statement of Operations.
| | | Notes to |
| | | Financial Statements (continued) |
During the fiscal year ended May 31, 2013, each Fund invested in externally-deposited inverse floaters and/or self-deposited inverse floaters.
Each Fund may also enter into shortfall and forbearance agreements (sometimes referred to as a “recourse trust” or “credit recovery swap”) (such agreements referred to herein as “Recourse Trusts”) with a broker-dealer by which a Fund agrees to reimburse the broker-dealer, in certain circumstances, for the difference between the liquidation value of the fixed-rate bond held by the trust and the liquidation value of the floating rate certificates issued by the trust plus any shortfalls in interest cash flows. Under these agreements, a Fund’s potential exposure to losses related to or on inverse floaters may increase beyond the value of a Fund’s inverse floater investments as a Fund may potentially be liable to fulfill all amounts owed to holders of the floating rate certificates. At period end, any such shortfall is recognized as “Unrealized depreciation on Recourse Trusts” on the Statement of Assets and Liabilities.
As of May 31, 2013, Virginia Premium Income (NPV) was invested in externally-deposited Recourse Trusts. The Fund’s maximum exposure to the floating rate obligations issued by externally-deposited Recourse Trusts was $13,330,000. As of May 31, 2013, none of the other Funds were invested in externally-deposited Recourse Trusts.
The average floating rate obligations outstanding and average annual interest rate and fees related to self-deposited inverse floaters during the fiscal year ended May 31, 2013, were as follows:
| | | | | | | | | | | | | North | | | | |
| | | | Georgia | | | Maryland | | | Missouri | | | Carolina | | | Virginia | |
| | | | Dividend | | | Premium | | | Premium | | | Premium | | | Premium | |
| | | Advantage 2 | | | Income | | | Income | | | Income | | | Income | |
| | | | (NKG | ) | | (NMY | ) | | (NOM | ) | | (NNC | ) | | (NPV | ) |
| Average floating rate obligations outstanding | | $ | 3,245,000 | | $ | 21,995,000 | | $ | 2,225,000 | | $ | 23,715,000 | | $ | 9,250,000 | |
| Average annual interest rate and fees | | | 0.52 | % | | 0.80 | % | | 0.33 | % | | 0.65 | % | | 0.43 | % |
Market and Counterparty Credit Risk
In the normal course of business each Fund may invest in financial instruments and enter into financial transactions where risk of potential loss exists due to changes in the market (market risk) or failure of the other party to the transaction to perform (counterparty credit risk). The potential loss could exceed the value of the financial assets recorded on the financial statements. Financial assets, which potentially expose each Fund to counterparty credit risk, consist principally of cash due from counterparties on forward, option and swap transactions, when applicable. The extent of each Fund’s exposure to counterparty credit risk in respect to these financial assets approximates their carrying value as recorded on the Statement of Assets and Liabilities. Futures contracts, when applicable, expose a Fund to minimal counterparty credit risk as they are exchange traded and the exchange’s clearinghouse, which is counterparty to all exchange traded futures, guarantees the futures contracts against default.
Each Fund helps manage counterparty credit risk by entering into agreements only with counterparties the Adviser believes have the financial resources to honor their obligations and by having the Adviser monitor the financial stability of the counterparties. Additionally, counterparties may be required to pledge collateral daily (based on the daily valuation of the financial asset) on behalf of each Fund with a value approximately equal to the amount of any unrealized gain above a pre-determined threshold. Reciprocally, when each Fund has an unrealized loss, the Funds have instructed the custodian to pledge assets of the Funds as collateral with a value approximately equal to the amount of the unrealized loss above a pre-determined threshold. Collateral pledges are monitored and subsequently adjusted if and when the valuations fluctuate, either up or down, by at least the predetermined threshold amount.
Zero Coupon Securities
Each Fund is authorized to invest in zero coupon securities. A zero coupon security does not pay a regular interest coupon to its holders during the life of the security. Income to the holder of the security comes from accretion of the difference between the original purchase price of the security at issuance and the par value of the security at maturity and is effectively paid at maturity. The market prices of zero coupon securities generally are more volatile than the market prices of securities that pay interest periodically.
Common Shares Equity Shelf Programs and Offering Costs
During the current reporting period, Virginia Premium Income (NPV) filed an initial registration statement with the Securities and Exchange Commission authorizing the Fund to issue 1.7 million additional Common shares through an equity shelf program (“Shelf Offering”), which is not yet effective.
Under this Shelf Offering, the Fund, subject to market conditions, may raise additional equity capital from time to time in varying amounts and offering methods at a net price at or above the Fund’s net asset value (“NAV”) per Common share.
Costs incurred by the Fund in connection with its initial Shelf Offering are recorded as a deferred charge, which will be amortized over the period such additional Common shares are sold not to exceed the one-year life of the Shelf Offering period. Ongoing Shelf Offering costs, and any additional costs the Fund may incur in connection with the Shelf Offering, are expensed as incurred and recorded as a reduction of proceeds from shelf offering.
Indemnifications
Under the Funds’ organizational documents, their officers and trustees are indemnified against certain liabilities arising out of the performance of their duties to the Funds. In addition, in the normal course of business, the Funds enter into contracts that provide general indemnifications to other parties. The Funds’ maximum exposure under these arrangements is unknown as this would involve future claims that may be made against the Funds that have not yet occurred. However, the Funds have not had prior claims or losses pursuant to these contracts and expect the risk of loss to be remote.
Use of Estimates
The preparation of financial statements in conformity with U.S. GAAP requires management to make estimates and assumptions that affect the reported amounts of assets and liabilities at the date of the financial statements and the reported amounts of increases and decreases in net assets applicable to Common shares from operations during the reporting period. Actual results may differ from those estimates.
2. Fair Value Measurements
Fair value is defined as the price that the Funds would receive upon selling an investment or transferring a liability in an orderly transaction to an independent buyer in the principal or most advantageous market for the investment. A three-tier hierarchy is used to maximize the use of observable market data and minimize the use of unobservable inputs and to establish classification of fair value measurements for disclosure purposes. Observable inputs reflect the assumptions market participants would use in pricing the asset or liability. Observable inputs are based on market data obtained from sources independent of the reporting entity. Unobservable inputs reflect the reporting entity’s own assumptions about the assumptions market participants would use in pricing the asset or liability. Unobservable inputs are based on the best information available in the circumstances. The following is a summary of the three-tiered hierarchy of valuation input levels.
| Level 1 – | Inputs are unadjusted and prices are determined using quoted prices in active markets for identical securities. |
| Level 2 – | Prices are determined using other significant observable inputs (including quoted prices for similar securities, interest rates, prepayment speeds, credit risk, etc.). |
| Level 3 – | Prices are determined using significant unobservable inputs (including management’s assumptions in determining the fair value of investments). |
The inputs or methodologies used for valuing securities are not an indication of the risks associated with investing in those securities. The following is a summary of each Fund’s fair value measurements as of the end of the reporting period:
| Georgia Dividend Advantage 2 (NKG) | | | Level 1 | | | Level 2 | | | Level 3 | | | Total | |
| Long-Term Investments*: | | | | | | | | | | | | | |
| Municipal Bonds | | $ | — | | $ | 227,902,040 | | $ | — | | $ | 227,902,040 | |
| | | | | | | | | | | | | | |
| Maryland Premium Income (NMY) | | | Level 1 | | | Level 2 | | | Level 3 | | | Total | |
| Long-Term Investments*: | | | | | | | | | | | | | |
| Municipal Bonds | | $ | — | | $ | 557,469,865 | | $ | — | | $ | 557,469,865 | |
| | | | | | | | | | | | | | |
| Missouri Premium Income (NOM) | | | Level 1 | | | Level 2 | | | Level 3 | | | Total | |
| Long-Term Investments*: | | | | | | | | | | | | | |
| Municipal Bonds | | $ | — | | $ | 52,415,518 | | $ | — | | $ | 52,415,518 | |
| | | | | | | | | | | | | | |
| North Carolina Premium Income (NNC) | | | Level 1 | | | Level 2 | | | Level 3 | | | Total | |
| Long-Term Investments*: | | | | | | | | | | | | | |
| Municipal Bonds | | $ | — | | $ | 385,824,465 | | $ | — | | $ | 385,824,465 | |
| | | | | | | | | | | | | | |
| Virginia Premium Income (NPV) | | | Level 1 | | | Level 2 | | | Level 3 | | | Total | |
| Long-Term Investments*: | | | | | | | | | | | | | |
| Municipal Bonds | | $ | — | | $ | 406,282,197 | | $ | — | | $ | 406,282,197 | |
* Refer to the Fund’s Portfolio of Investments for industry classifications.
The Nuveen funds’ Board of Directors/Trustees is responsible for the valuation process and has delegated the oversight of the daily valuation process to the Adviser’s Valuation Committee. The Valuation Committee, pursuant to the valuation policies and procedures adopted by the Board of Directors/Trustees, is responsible for making fair value determinations, evaluating the effectiveness of the funds’ pricing policies, and reporting to the Board of Directors/Trustees. The Valuation Committee is aided in its efforts by the Adviser’s dedicated Securities Valuation Team, which is responsible for administering the daily valuation process and applying fair value methodologies as approved by the Valuation Committee. When determining the reliability of independent pricing services for investments owned by the funds, the Valuation Committee, among other things, conducts due diligence reviews of the pricing services and monitors the quality of security prices received through various testing reports conducted by the Securities Valuation Team.
| | | Notes to |
| | | Financial Statements (continued) |
The Valuation Committee will consider pricing methodologies it deems relevant and appropriate when making a fair value determination, based on the facts and circumstances specific to the portfolio instrument. Fair value determinations generally will be derived as follows, using public or private market information:
| | (i.) | If available, fair value determinations shall be derived by extrapolating from recent transactions or quoted prices for identical or comparable securities. |
| | (ii.) | If such information is not available, an analytical valuation methodology may be used based on other available information including, but not limited to: analyst appraisals, research reports, corporate action information, issuer financial statements and shelf registration statements. Such analytical valuation methodologies may include, but are not limited to: multiple of earnings, discount from market value of a similar freely-traded security, discounted cash flow analysis, book value or a multiple thereof, risk premium/yield analysis, yield to maturity and/or fundamental investment analysis. |
The purchase price of a portfolio instrument will be used to fair value the instrument only if no other valuation methodology is available or deemed appropriate, and it is determined that the purchase price fairly reflects the instrument’s current value.
For each portfolio security that has been fair valued pursuant to the policies adopted by the Board of Directors/Trustees, the fair value price is compared against the last available and next available market quotations. The Valuation Committee reviews the results of such testing and fair valuation occurrences are reported to the Board of Directors/Trustees.
3. Derivative Instruments and Hedging Activities
Each Fund is authorized to invest in certain derivative investments, including futures, options and swap contracts. The Funds record derivative instruments at fair value, with changes in fair value recognized on the Statement of Operations, when applicable. Even though the Funds’ investments in derivatives may represent economic hedges, they are not considered to be hedge transactions for financial reporting purposes. Although the Funds are authorized to invest in such derivatives, and may do so in the future, they did not make any such investments during the fiscal year ended May 31, 2013.
4. Fund Shares
Common Shares
Since the inception of the Funds’ repurchase programs, the Funds have not repurchased any of their outstanding Common shares.
Transactions in Common shares were as follows:
| | | Georgia Dividend | | | Maryland Premium | | Missouri Premium | |
| | | Advantage 2 (NKG) | | Income (NMY) | | Income (NOM) | |
| | | | Year Ended | | | Year Ended | | | Year Ended | | | Year Ended | | | Year Ended | | | Year Ended | |
| | | | 5/31/13 | | | 5/31/12 | | | 5/31/13 | | | 5/31/12 | | | 5/31/13 | | | 5/31/12 | |
| Common shares: | | | | | | | | | | | | | | | | | | | |
Issued in the Reorganizations (1) | | | 5,990,755 | | | — | | | 13,439,122 | | | — | | | — | | | — | |
| Issued to shareholders due to reinvestment of distributions | | | 1,859 | | | 877 | | | 4,796 | | | 6,501 | | | 3,547 | | | 5,049 | |
| | | | North Carolina | | | Virginia Premium | |
| | | | Premium Income (NNC) | | | Income (NPV) | |
| | | | Year Ended | | | Year Ended | | | Year Ended | | | Year Ended | |
| | | | 5/31/13 | | | 5/31/12 | | | 5/31/13 | | | 5/31/12 | |
| Common shares: | | | | | | | | | | | | | |
Issued in the Reorganizations (1) | | | 10,175,659 | | | — | | | 8,861,589 | | | — | |
| Issued to shareholders due to reinvestment of distributions | | | 1,941 | | | 6,117 | | | 28,384 | | | 28,499 | |
| (1) | Refer to Footnote 8–Fund Reorganizations for further details. |
Preferred Shares
The Funds did not have any transactions in MTP Shares during the fiscal year ended May 31, 2012. Missouri Premium Income (NOM) did not have any transactions in MTP Shares during the fiscal year ended May 31, 2013. Transactions in MTP Shares during the fiscal year ended May 31, 2013 for the other Funds were as follows:
| | | Year ended May 31, 2013 | |
| | | | | | | NYSE/ | | | | | | | |
| | | | | | | NYSE MKT | | | | | | | |
| | | | Series | | | Ticker | | | Shares | | | Amount | |
| Georgia Dividend Advantage 2 (NKG) | | | | | | | | | | | | | |
| | | | 2015-1 * | | | NKG PrD | | | 2,834,000 | | $ | 28,340,000 | |
| | | | 2015-2 * | | | NKG PrE | | | 1,434,000 | | | 14,340,000 | |
| Total | | | | | | | | | 4,268,000 | | $ | 42,680,000 | |
| | | | | | | | | | | | | | |
| Maryland Premium Income (NMY) | | | | | | | | | | | | | |
| | | | 2015 * | | | NMY PrE | | | 2,648,500 | | $ | 26,485,000 | |
| | | | 2015-1 * | | | NMY PrF | | | 2,730,000 | | | 27,300,000 | |
| | | | 2015-1 * | | | NMY PrG | | | 2,070,000 | | | 20,700,000 | |
| | | | 2016 * | | | NMY PrH | | | 1,706,600 | | | 17,066,000 | |
| Total | | | | | | | | | 9,155,100 | | $ | 91,551,000 | |
| | | | | | | | | | | | | | |
| North Carolina Premium Income (NNC) | | | | | | | | | | | | | |
| | | | 2015 * | | | NNC PrE | | | 1,660,000 | | $ | 16,600,000 | |
| | | | 2015-1 * | | | NNC PrF | | | 2,970,000 | | | 29,700,000 | |
| | | | 2015-1 * | | | NNC PrG | | | 2,872,500 | | | 28,725,000 | |
| Total | | | | | | | | | 7,502,500 | | $ | 75,025,000 | |
| | | | | | | | | | | | | | |
| Virginia Premium Income (NPV) | | | | | | | | | | | | | |
| | | | 2014 * | | | NPV PrD | | | 2,280,000 | | $ | 22,800,000 | |
| | | | 2014-1 * | | | NPV PrE | | | 4,320,000 | | | 43,200,000 | |
| Total | | | | | | | | | 6,600,000 | | $ | 66,000,000 | |
* MTP Shares issued in connection with the Reorganizations.
5. Investment Transactions
Purchases and sales (including maturities but excluding short-term investments, where applicable) during the fiscal year ended May 31, 2013, were as follows:
| | | | | | | | | | | | | North | | | | |
| | | | Georgia | | | Maryland | | | Missouri | | | Carolina | | | Virginia | |
| | | | Dividend | | | Premium | | | Premium | | | Premium | | | Premium | |
| | | Advantage 2 | | | Income | | | Income | | | Income | | | Income | |
| | | | (NKG | ) | | (NMY | ) | | (NOM | ) | | (NNC | ) | | (NPV | ) |
| Purchases | | $ | 42,159,814 | | $ | 91,455,860 | | $ | 6,622,162 | | $ | 65,655,971 | | $ | 76,300,461 | |
| Sales and maturities | | | 36,902,123 | | | 84,637,675 | | | 7,397,500 | | | 62,871,450 | | | 75,853,390 | |
6. Income Tax Information
The following information is presented on an income tax basis. Differences between amounts for financial statement and federal income tax purposes are primarily due to timing differences in recognizing taxable market discount, timing differences in recognizing certain gains and losses on investment transactions and the treatment of investments in inverse floating rate securities reflected as financing transactions, if any. To the extent that differences arise that are permanent in nature, such amounts are reclassified within the capital accounts as detailed below. Temporary differences do not require reclassification. Temporary and permanent differences do not impact the net asset values of the Funds.
| | | Notes to |
| | | Financial Statements (continued) |
As of May 31, 2013, the cost and unrealized appreciation (depreciation) of investments, as determined on a federal income tax basis, were as follows:
| | | | | | | | | | | | | North | | | | |
| | | | Georgia | | | Maryland | | | Missouri | | | Carolina | | | Virginia | |
| | | | Dividend | | | Premium | | | Premium | | | Premium | | | Premium | |
| | | Advantage 2 | | | Income | | | Income | | | Income | | | Income | |
| | | | (NKG | ) | | (NMY | ) | | (NOM | ) | | (NNC | ) | | (NPV | ) |
| Cost of investments | | $ | 210,594,990 | | $ | 500,542,198 | | $ | 47,242,802 | | $ | 339,522,913 | | $ | 374,144,473 | |
| Gross unrealized: | | | | | | | | | | | | | | | | |
| Appreciation | | $ | 14,988,234 | | $ | 40,525,618 | | $ | 3,259,874 | | $ | 24,000,516 | | $ | 28,355,799 | |
| Depreciation | | | (925,706 | ) | | (5,592,854 | ) | | (312,314 | ) | | (1,415,394 | ) | | (5,468,075 | ) |
| Net unrealized appreciation (depreciation) of investments | | $ | 14,062,528 | | $ | 34,932,764 | | $ | 2,947,560 | | $ | 22,585,122 | | $ | 22,887,724 | |
Permanent differences, primarily due to federal taxes paid, taxable market discount, nondeductible offering costs, reorganization adjustments, distribution character reclassifications, and nondeductible reorganization expenses resulted in reclassifications among the Funds’ components of Common share net assets as of May 31, 2013, the Funds’ tax year end as follows:
| | | | | | | | | | | | | North | | | | |
| | | | Georgia | | | Maryland | | | Missouri | | | Carolina | | | Virginia | |
| | | | Dividend | | | Premium | | | Premium | | | Premium | | | Premium | |
| | | Advantage 2 | | | Income | | | Income | | | Income | | | Income | |
| | | | (NKG | ) | | (NMY | ) | | (NOM | ) | | (NNC | ) | | (NPV | ) |
| Paid-in-surplus | | $ | 614,102 | | $ | 898,200 | | $ | (118,080 | ) | $ | 16,497 | | $ | (472,332 | ) |
| Undistributed (Over-distribution of) net investment income | | | 437,961 | | | 1,223,744 | | | 118,080 | | | 679,501 | | | 796,696 | |
| Accumulated net realized gain (loss) | | | (1,052,063 | ) | | (2,121,944 | ) | | — | | | (695,998 | ) | | (324,364 | ) |
The tax components of undistributed net tax-exempt income, net ordinary income and net long-term capital gains as of May 31, 2013, the Funds’ tax year end, were as follows:
| | | | | | | | | | | | | North | | | | |
| | | | Georgia | | | Maryland | | | Missouri | | | Carolina | | | Virginia | |
| | | | Dividend | | | Premium | | | Premium | | | Premium | | | Premium | |
| | | Advantage 2 | | | Income | | | Income | | | Income | | | Income | |
| | | | (NKG | ) | | (NMY | ) | | (NOM | ) | | (NNC | ) | | (NPV | ) |
Undistributed net tax-exempt income1 | | $ | 757,287 | | $ | 2,684,045 | | $ | 455,468 | | $ | 933,722 | | $ | 2,025,182 | |
Undistributed net ordinary income2 | | | — | | | 20,205 | | | — | | | — | | | 10,980 | |
| Undistributed net long-term capital gains | | | — | | | — | | | — | | | — | | | 177,475 | |
| 1 | Undistributed net tax-exempt income (on a tax basis) has not been reduced for the dividend declared on May 1, 2013, paid on June 3, 2013. |
| 2 | Net ordinary income consists of taxable market discount income and net short-term capital gains, if any. |
The tax character of distributions paid during the Funds’ tax years ended May 31, 2013 and May 31, 2012, was designated for purposes of the dividends paid deduction as follows:
| | | | | | | | | | | | | North | | | | |
| | | | Georgia | | | Maryland | | | Missouri | | | Carolina | | | Virginia | |
| | | | Dividend | | | Premium | | | Premium | | | Premium | | | Premium | |
| | | Advantage 2 | | | Income | | | Income | | | Income | | | Income | |
| 2013 | | | (NKG | ) | | (NMY | ) | | (NOM | ) | | (NNC | ) | | (NPV | ) |
Distributions from net tax-exempt income3 | | $ | 7,902,906 | | $ | 18,685,110 | | $ | 2,087,163 | | $ | 12,772,122 | | $ | 13,813,122 | |
Distributions from net ordinary income2 | | | 8,446 | | | — | | | — | | | 8,772 | | | 50,192 | |
Distributions from net long-term capital gains4 | | | — | | | — | | | — | | | — | | | 274,262 | |
| 2 | Net ordinary income consists of taxable market discount income and net short-term capital gains, if any. |
| 3 | The Funds hereby designate these amounts paid during the fiscal year ended May 31, 2013, as Exempt Interest Dividends. |
| 4 | The Funds designated as a long-term capital gain dividend, pursuant to the Internal Revenue Code Section 852(b)(3), the amount necessary to reduce earnings and profits of the Funds related to net capital gain to zero for the tax year ended May 31, 2013. |
| | | | | | | | | | | | | North | | | | |
| | | | Georgia | | | Maryland | | | Missouri | | | Carolina | | | Virginia | |
| | | | Dividend | | | Premium | | | Premium | | | Premium | | | Premium | |
| | | Advantage 2 | | | Income | | | Income | | | Income | | | Income | |
| 2012 | | | (NKG | ) | | (NMY | ) | | (NOM | ) | | (NNC | ) | | (NPV | ) |
| Distributions from net tax-exempt income | | $ | 4,030,387 | | $ | 10,273,550 | | $ | 2,186,098 | | $ | 5,847,630 | | $ | 8,769,902 | |
Distributions from net ordinary income2 | | | — | | | — | | | — | | | — | | | — | |
| Distributions from net long-term capital gains | | | — | | | — | | | — | | | — | | | 214,014 | |
| 2 | Net ordinary income consists of taxable market discount income and net short-term capital gains, if any. |
As of May 31, 2013, the Funds’ tax year end, the following Funds had unused capital loss carryforwards available for federal income tax purposes to be applied against future capital gains, if any. If not applied, the carryforwards will expire as shown in the following table. The losses not subject to expiration retain the character reflected and will be utilized first by a Fund, while the losses subject to expiration are considered short-term:
| | | | | | | | | | | | | North | |
| | | | Georgia | | | Maryland | | | Missouri | | | Carolina | |
| | | | Dividend | | | Premium | | | Premium | | | Premium | |
| | | Advantage 2 | | | Income | | | Income | | | Income | |
| | | | (NKG | ) | | (NMY* | ) | | (NOM | ) | | (NNC | ) |
| Expiration: | | | | | | | | | | | | | |
| May 31, 2015 | | $ | — | | $ | — | | $ | — | | $ | 112,402 | |
| May 31, 2016 | | | 462,549 | | | 851,610 | | | — | | | 42,115 | |
| May 31, 2017 | | | 1,635,823 | | | 172,377 | | | 77,824 | | | 226,390 | |
| May 31, 2018 | | | 1,329,548 | | | — | | | 91,539 | | | 353,181 | |
| May 31, 2019 | | | 48,370 | | | — | | | — | | | — | |
| Not subject to expiration: | | | | | | | | | | | | | |
| Short-term losses | | | — | | | — | | | — | | | — | |
| Long-term losses | | | — | | | — | | | — | | | — | |
| Total | | $ | 3,476,290 | | $ | 1,023,987 | | $ | 169,363 | | $ | 734,088 | |
| * | A portion of Maryland Premium Income’s (NMY) capital loss carryforward is subject to limitation under the Internal Revenue Code and related regulations. |
During the Funds’ tax year ended May 31, 2013, the Funds utilized capital loss carryforwards as follows:
| | | | | | | | | | | | | North | | | | |
| | | | Georgia | | | Maryland | | | Missouri | | | Carolina | | | Virginia | |
| | | | Dividend | | | Premium | | | Premium | | | Premium | | | Premium | |
| | | Advantage 2 | | | Income | | | Income | | | Income | | | Income | |
| | | | (NKG | ) | | (NMY | ) | | (NOM | ) | | (NNC | ) | | (NPV | ) |
| Utilized capital loss carryforwards | | $ | 226,587 | | $ | 304,972 | | $ | 14,851 | | $ | 394,092 | | $ | 286,137 | |
7. Management Fees and Other Transactions with Affiliates
Each Fund’s management fee consists of two components – a fund-level fee, based only on the amount of assets within the Fund, and a complex-level fee, based on the aggregate amount of all eligible fund assets managed by the Adviser. This pricing structure enables Fund shareholders to benefit from growth in the assets within their respective Fund as well as from growth in the amount of complex-wide assets managed by the Adviser.
The annual fund-level fee for each Fund, payable monthly, is calculated according to the following schedules:
| | Georgia Dividend Advantage 2 (NKG) |
| Average Daily Managed Assets* | Fund-Level Fee Rate |
| For the first $125 million | .4500 | % |
| For the next $125 million | .4375 | |
| For the next $250 million | .4250 | |
| For the next $500 million | .4125 | |
| For the next $1 billion | .4000 | |
| For managed assets over $2 billion | .3750 | |
| | | Notes to |
| | | Financial Statements (continued) |
| | North Carolina Premium Income (NNC) |
| | Maryland Premium Income (NMY) |
| | Missouri Premium Income (NOM) |
| | Virginia Premium Income (NPV) |
| Average Daily Managed Assets* | Fund-Level Fee Rate |
| For the first $125 million | .4500 | % |
| For the next $125 million | .4375 | |
| For the next $250 million | .4250 | |
| For the next $500 million | .4125 | |
| For the next $1 billion | .4000 | |
| For the next $3 billion | .3875 | |
| For managed assets over $5 billion | .3750 | |
The annual complex-level fee for each Fund, payable monthly, is calculated according to the following schedule:
| Complex-Level Managed Asset Breakpoint Level* | Effective Rate at Breakpoint Level |
| $55 billion | .2000 | % |
| $56 billion | .1996 | |
| $57 billion | .1989 | |
| $60 billion | .1961 | |
| $63 billion | .1931 | |
| $66 billion | .1900 | |
| $71 billion | .1851 | |
| $76 billion | .1806 | |
| $80 billion | .1773 | |
| $91 billion | .1691 | |
| $125 billion | .1599 | |
| $200 billion | .1505 | |
| $250 billion | .1469 | |
| $300 billion | .1445 | |
| * | For the fund-level and complex-level fees, managed assets include closed-end fund assets managed by the Adviser that are attributable to financial leverage. For these purposes, financial leverage includes the funds’ use of preferred stock and borrowings and certain investments in the residual interest certificates (also called inverse floating rate securities) in tender option bond (TOB) trusts, including the portion of assets held by a TOB trust that has been effectively financed by the trust’s issuance of floating rate securities, subject to an agreement by the Adviser as to certain funds to limit the amount of such assets for determining managed assets in certain circumstances. The complex-level fee is calculated based upon the aggregate daily managed assets of all Nuveen Funds that constitute “eligible assets.” Eligible assets do not include assets attributable to investments in other Nuveen Funds or assets in excess of $2 billion added to the Nuveen Fund complex in connection with the Adviser’s assumption of the management of the former First American Funds effective January 1, 2011. As of May 31, 2013, the complex-level fee rate for each of these Funds was .1661%. |
The management fee compensates the Adviser for overall investment advisory and administrative services and general office facilities. The Adviser is responsible of each Fund’s overall strategy and asset allocation decisions. The Adviser has entered into sub-advisory agreements with Nuveen Asset Management, LLC, (the”Sub-Adviser”), a wholly-owned subsidiary of the Adviser, under which the Sub-Adviser manages the investment portfolios of the Funds. The Sub-Adviser is compensated for its services to the Funds from the management fees paid to the Adviser.
The Funds pay no compensation directly to those of its trustees who are affiliated with the Adviser or to its officers, all of whom receive remuneration for their services to the Funds from the Adviser or its affiliates. The Board of Trustees has adopted a deferred compensation plan for independent trustees that enables trustees to elect to defer receipt of all or a portion of the annual compensation they are entitled to receive from certain Nuveen-advised funds. Under the plan, deferred amounts are treated as though equal dollar amounts had been invested in shares of select Nuveen-advised funds.
8. Fund Reorganizations
The Reorganizations were structured to qualify as tax-free reorganizations under the Internal Revenue Code for federal income tax purposes, and the Acquired Funds’ shareholders will recognize no gain or loss for federal income tax purposes as a result of the Reorganizations. Prior to the closing of each of the Reorganizations, the Acquired Funds distributed all of their net investment income and capital gains, if any. Such a distribution may be taxable to the Acquired Funds’ shareholders for federal income tax purposes.
The cost, fair value and net unrealized appreciation (depreciation) of the investments of the Acquired Funds as of the date of their respective Reorganization, were as follows:
| | | | Georgia | | | Georgia | | | Maryland | | | Maryland | | | Maryland | |
| | | | Premium | | | Dividend | | | Dividend | | | Dividend | | | Dividend | |
| | | | Income | | | Advantage | | | Advantage | | | Advantage 2 | | | Advantage 3 | |
| | | | (NPG | ) | | (NZX | ) | | (NFM | ) | | (NZR | ) | | (NWI | ) |
| Cost of investments | | $ | 74,023,324 | | $ | 39,598,253 | | $ | 82,829,435 | | $ | 82,417,114 | | $ | 109,258,185 | |
| Fair value of investments | | | 80,083,798 | | | 42,632,583 | | | 88,564,164 | | | 88,714,979 | | | 117,266,759 | |
| Net unrealized appreciation (depreciation) of investments | | | 6,060,474 | | | 3,034,330 | | | 5,734,729 | | | 6,297,865 | | | 8,008,574 | |
| | | | North | | | North | | | North | | | | | | | |
| | | | Carolina | | | Carolina | | | Carolina | | | Virginia | | | Virginia | |
| | | | Dividend | | | Dividend | | | Dividend | | | Dividend | | | Dividend | |
| | | | Advantage | | | Advantage 2 | | | Advantage 3 | | | Advantage | | | Advantage 2 | |
| | | | (NRB | ) | | (NNO | ) | | (NII | ) | | (NGB | ) | | (NNB | ) |
| Cost of investments | | $ | 44,956,748 | | $ | 77,258,450 | | $ | 80,525,486 | | $ | 65,656,871 | | $ | 122,078,841 | |
| Fair value of investments | | | 48,849,544 | | | 83,400,020 | | | 86,417,939 | | | 70,027,790 | | | 131,287,742 | |
| Net unrealized appreciation (depreciation) of investments | | | 3,892,796 | | | 6,141,570 | | | 5,892,453 | | | 4,370,919 | | | 9,208,901 | |
For financial reporting purposes, assets received and shares issued by the Acquiring Funds were recorded at fair value; however, the cost basis of the investments received from the Acquired Funds were carried forward to align ongoing reporting of the Acquiring Funds’ realized and unrealized gains and losses with amounts distributable to shareholders for tax purposes.
For accounting and performance reporting purposes, the Acquiring Funds are the survivors. The shares outstanding, net assets and NAV per Common share immediately before and after the Reorganizations are as follows:
| | | | Georgia | | | Georgia | | | Maryland | | | Maryland | | | Maryland | |
| | | | Premium | | | Dividend | | | Dividend | | | Dividend | | | Dividend | |
| | | | Income | | | Advantage | | | Advantage | | | Advantage 2 | | | Advantage 3 | |
| Acquired Funds – Prior to Reorganizations | | | (NPG | ) | | (NZX | ) | | (NFM | ) | | (NZR | ) | | (NWI | ) |
| Common shares outstanding | | | 3,810,299 | | | 1,975,018 | | | 4,197,999 | | | 4,204,113 | | | 5,366,559 | |
| Net assets applicable to Common shares | | $ | 57,081,247 | | $ | 30,633,487 | | $ | 64,327,256 | | $ | 65,104,341 | | $ | 82,375,675 | |
| NAV per Common share outstanding | | $ | 14.98 | | $ | 15.51 | | $ | 15.32 | | $ | 15.49 | | $ | 15.35 | |
| | | | North | | | North | | | North | | | | | | | |
| | | | Carolina | | | Carolina | | | Carolina | | | Virginia | | | Virginia | |
| | | | Dividend | | | Dividend | | | Dividend | | | Dividend | | | Dividend | |
| | | | Advantage | | | Advantage 2 | | | Advantage 3 | | | Advantage | | | Advantage 2 | |
| Acquired Funds – Prior to Reorganizations | | | (NRB | ) | | (NNO | ) | | (NII | ) | | (NGB | ) | | (NNB | ) |
| Common shares outstanding | | | 2,275,204 | | | 3,755,555 | | | 3,939,410 | | | 3,148,929 | | | 5,770,011 | |
| Net assets applicable to Common shares | | $ | 35,996,337 | | $ | 58,882,419 | | $ | 60,545,196 | | $ | 48,481,366 | | $ | 90,596,172 | |
| NAV per Common share outstanding | | $ | 15.82 | | $ | 15.68 | | $ | 15.37 | | $ | 15.40 | | $ | 15.70 | |
| | | | | | | | | | North | | | | |
| | | | Georgia | | | Maryland | | | Carolina | | | Virginia | |
| | | | Dividend | | | Premium | | | Premium | | | Premium | |
| | | | Advantage 2 | | | Income | | | Income | | | Income | |
| Acquiring Funds – Prior to Reorganizations | | | (NKG | ) | | (NMY | ) | | (NNC | ) | | (NPV | ) |
| Common shares outstanding | | | 4,556,373 | | | 10,663,947 | | | 6,372,067 | | | 9,048,006 | |
| Net assets applicable to Common shares | | $ | 66,712,868 | | $ | 168,069,475 | | $ | 97,327,475 | | $ | 142,002,913 | |
| NAV per Common share outstanding | | $ | 14.64 | | $ | 15.76 | | $ | 15.27 | | $ | 15.69 | |
| | | Notes to |
| | | Financial Statements (continued) |
| | | | | | | | | | North | | | | |
| | | | Georgia | | | Maryland | | | Carolina | | | Virginia | |
| | | | Dividend | | | Premium | | | Premium | | | Premium | |
| | | | Advantage 2 | | | Income | | | Income | | | Income | |
| Acquiring Funds – Post Reorganizations | | | (NKG | ) | | (NMY | ) | | (NNC | ) | | (NPV | ) |
| Common shares outstanding | | | 10,547,129 | | | 24,103,070 | | | 16,547,726 | | | 17,909,595 | |
| Net assets applicable to Common shares | | $ | 154,427,602 | | $ | 379,876,747 | | $ | 252,751,427 | | $ | 281,080,451 | |
| NAV per Common share outstanding | | $ | 14.64 | | $ | 15.76 | | $ | 15.27 | | $ | 15.69 | |
The beginning of the Acquired Funds’ current fiscal period was June 1, 2012. Assuming the Reorganizations had been completed on June 1, 2012, the beginning of the Acquiring Funds’ current fiscal period, the pro forma results of operations for the fiscal year ended May 31, 2013, are as follows:
| | | | | | | | | | North | | | | |
| | | | Georgia | | | Maryland | | | Carolina | | | Virginia | |
| | | | Dividend | | | Premium | | | Premium | | | Premium | |
| | | | Advantage 2 | | | Income | | | Income | | | Income | |
| Acquiring Funds – Pro Forma Results of Operations | | | (NKG | ) | | (NMY | ) | | (NNC | ) | | (NPV | ) |
| Net investment income (loss) | | $ | 6,384,892 | | $ | 15,859,430 | | $ | 9,914,242 | | $ | 11,843,447 | |
| Net realized and unrealized gains (losses) | | | (699,127 | ) | | (36,525 | ) | | (3,513,672 | ) | | (1,603,565 | ) |
| Change in net assets resulting from operations | | | 5,685,765 | | | 15,822,907 | | | 6,400,568 | | | 10,239,882 | |
Because the combined investment portfolios for each Reorganization have been managed as a single integrated portfolio since each Reorganization was completed, it is not practicable to separate the amounts of revenue and earnings of the Acquired Funds that have been included in the Statement of Operations for the Acquiring Fund since the Reorganizations were consummated.
In connection with the Reorganizations, the Acquiring Funds incurred certain associated costs and expenses. Such amounts were included as components of “Accrued reorganization expenses” on the Statement of Assets and Liabilities and “Reorganization expenses” on the Statement of Operations.
9. New Accounting Pronouncements
Financial Accounting Standards Board (“FASB”) Balance Sheet (Topic 210): Disclosures about Offsetting Assets and Liabilities
In January 2013, Accounting Standards Update (“ASU”) 2013-01, Clarifying the Scope of Disclosures about Offsetting Assets and Liabilities, replaced ASU 2011-11, Disclosures about Offsetting Assets and Liabilities. ASU 2013-01 is effective for fiscal years beginning on or after January 1, 2013. ASU 2011-11 was intended to enhance disclosure requirements on the offsetting of financial assets and liabilities. ASU 2013-01 limits the scope of the new balance sheet offsetting disclosures to derivatives, repurchase agreements and securities lending transactions to the extent that they are (1) offset in the financial statements or (2) subject to an enforceable master netting arrangement or similar agreement. Management is currently evaluating the application of ASU 2013-01 and its impact to the financial statements and footnote disclosures, if any.
10. Subsequent Event
Refinancing of MTP Shares
During July 2013 (subsequent to the close of this reporting period), the Funds’ Board of Trustees approved Virginia Premium Income’s (NPV) plans to redeem at their $10.00 liquidation value per share, plus an additional amount representing any dividend amounts owed, the shares of all series of their MTP Shares with the proceeds of newly issued Variable Rate Demand Preferred (“VRDP”) shares, subject to completion of all aspects of VRDP share placement, which may not occur as planned. Virginia Premium Income (NPV) intends to offer VRDP shares to qualified institutional buyers in a private offering pursuant to Rule 144A of the Securities Act of 1933, and to complete the MTP refinancing before October 1, 2013.
Board Members & Officers (Unaudited)
| | | The management of the Funds, including general supervision of the duties performed for the Funds by the Adviser, is the responsibility of the Board of Trustees of the Funds. The number of trustees of the Funds is currently set at ten. None of the trustees who are not “interested” persons of the Funds (referred to herein as “independent trustees”) has ever been a director or employee of, or consultant to, Nuveen or its affiliates. The names and business addresses of the trustees and officers of the Funds, their principal occupations and other affiliations during the past five years, the number of portfolios each oversees and other directorships they hold are set forth below. |
| | Name, | | Position(s) Held | | Year First | | Principal | | Number |
| | Year of Birth | | with the Funds | | Elected or | | Occupation(s) | | of Portfolios |
| | & Address | | | | Appointed | | including other | | in Fund Complex |
| | | | | | and Term(1) | | Directorships | | Overseen by |
| | | | | | | | During Past 5 Years | | Board Member |
| | | | | | | | | | |
| Independent Board Members: | | | | | | |
| ■ | ROBERT P. BREMNER 1940 333 W. Wacker Drive Chicago, IL 60606 | | Board Member | | 1996 Class III | | Private Investor and Management Consultant; Treasurer and Director, Humanities Council of Washington, D.C.; Board Member, Independent Directors Council affiliated with the Investment Company Institute. | | 210 |
| | | | | | | | | | |
| ■ | JACK B. EVANS 1948 333 W. Wacker Drive Chicago, IL 60606 | | Board Member | | 1999 Class III | | President, The Hall-Perrine Foundation, a private philanthropic corporation (since 1996); Chairman, United Fire Group, a publicly held company; formerly, President of the Board of Regents for the State of Iowa University System; Director, Source Media Group; Life Trustee of Coe College; formerly, Director, Alliant Energy; formerly, Director, Federal Reserve Bank of Chicago; formerly, President and Chief Operating Officer, SCI Financial Group, Inc., a regional financial services firm. | | 210 |
| | | | | | | | | | |
| ■ | WILLIAM C. HUNTER 1948 333 W. Wacker Drive Chicago, IL 60606 | | Board Member | | 2004 Class I | | Dean Emeritus (since June 30, 2012), formerly, Dean, Tippie College of Business, University of Iowa (2006-2012); Director (since 2004) of Xerox Corporation; Director (since 2005), and President (since July 2012) Beta Gamma Sigma, Inc., The International Honor Society; Director of Wellmark, Inc. (since 2009); formerly, Dean and Distinguished Professor of Finance, School of Business at the University of Connecticut (2003-2006); previously, Senior Vice President and Director of Research at the Federal Reserve Bank of Chicago (1995-2003); formerly, Director (1997-2007), Credit Research Center at Georgetown University. | | 210 |
| | | | | | | | | | |
| ■ | DAVID J. KUNDERT 1942 333 W. Wacker Drive Chicago, IL 60606 | | Board Member | | 2005 Class II | | Formerly, Director, Northwestern Mutual Wealth Management Company; (2006-2013) retired (since 2004) as Chairman, JPMorgan Fleming Asset Management, President and CEO, Banc One Investment Advisors Corporation, and President, One Group Mutual Funds; prior thereto, Executive Vice President, Banc One Corporation and Chairman and CEO, Banc One Investment Management Group; Regent Emeritus, Member of Investment Committee, Luther College; member of the Wisconsin Bar Association; member of Board of Directors, Friends of Boerner Botanical Gardens; member of Board of Directors and Chair of Investment Committee, Greater Milwaukee Foundation; member of the Board of Directors (Milwaukee), College Possible. | | 210 |
| | | | | | | | | | |
| ■ | WILLIAM J. SCHNEIDER 1944 333 W. Wacker Drive Chicago, IL 60606 | | Board Member | | 1996 Class III | | Chairman of Miller-Valentine Partners Ltd., a real estate investment company; formerly, Senior Partner and Chief Operating Officer (retired 2004) of Miller-Valentine Group; an owner in several other Miller Valentine entities ; member, Mid-America Health System; Board Member of Tech Town, Inc., a not-for-profit community development company; Board Member of WDPR Public Radio station; formerly, member, Business Advisory Council, Cleveland Federal Reserve Bank and University of Dayton Business School Advisory Council. | | 210 |
Board Members & Officers (Unaudited) (continued)
| | Name, | | Position(s) Held | | Year First | | Principal | | Number |
| | Year of Birth | | with the Funds | | Elected or | | Occupation(s) | | of Portfolios |
| | & Address | | | | Appointed | | Including other | | in Fund Complex |
| | | | | | and Term(1) | | Directorships | | Overseen by |
| | | | | | | | During Past 5 Years | | Board Member |
| | | | | | | | | | |
| Independent Board Members: | | | | | | |
| ■ | JUDITH M. STOCKDALE 1947 333 W. Wacker Drive Chicago, IL 60606 | | Board Member | | 1997 Class I | | Formerly, Executive Director (1994-2012), Gaylord and Dorothy Donnelley Foundation (since 1994); prior thereto, Executive Director, Great Lakes Protection Fund (1990-1994). | | 210 |
| | | | | | | | | | |
| ■ | CAROLE E. STONE 1947 333 W. Wacker Drive Chicago, IL 60606 | | Board Member | | 2007 Class I | | Director, Chicago Board Options Exchange (since 2006); Director, C2 Options Exchange, Incorporated (since 2009); formerly, Commissioner, New York State Commission on Public Authority Reform (2005-2010); formerly, Chair, New York Racing Association Oversight Board (2005-2007). | | 210 |
| | | | | | | | | | |
| ■ | VIRGINIA L. STRINGER 1944 333 W. Wacker Drive Chicago, IL 60606 | | Board Member | | 2011 Class I | | Board Member, Mutual Fund Directors Forum; former governance consultant and non-profit board member; former Owner and President, Strategic Management Resources, Inc. a management consulting firm; former Member, Governing Board, Investment Company Institute’s Independent Directors Council; previously, held several executive positions in general management, marketing and human resources at IBM and The Pillsbury Company; Independent Director, First American Fund Complex (1987-2010) and Chair (1997-2010). | | 210 |
| | | | | | | | | | |
| ■ | TERENCE J. TOTH 1959 333 W. Wacker Drive Chicago, IL 60606 | | Board Member | | 2008 Class II | | Managing Partner, Promus Capital (since 2008); Director, Fulcrum IT Service LLC (since 2010), Quality Control Corporation (since 2012) and LogicMark LLC (since 2012); formerly, Director, Legal & General Investment Management America, Inc. (2008-2013); formerly, CEO and President, Northern Trust Global Investments (2004-2007); Executive Vice President, Quantitative Management & Securities Lending (2000-2004); prior thereto, various positions with Northern Trust Company (since 1994); member: Chicago Fellowship Board (since 2005), Catalyst Schools of Chicago Board (since 2008) and Chairman, and Mather Foundation Board (since 2012), and a member of its investment committee; formerly, Member, Northern Trust Mutual Funds Board (2005-2007), Northern Trust Global Investments Board (2004-2007), Northern Trust Japan Board (2004-2007), Northern Trust Securities Inc. Board (2003-2007) and Northern Trust Hong Kong Board (1997-2004). | | 210 |
| | | | | | | | | |
| Interested Board Member: | | | | | | | | |
| ■ | JOHN P. AMBOIAN(2) 1961 333 W. Wacker Drive Chicago, IL 60606 | | Board Member | | 2008 Class II | | Chief Executive Officer and Chairman (since 2007) and Director (since 1999) of Nuveen Investments, Inc., formerly, President (1999-2007); Chief Executive Officer (since 2007) of Nuveen Investments Advisers, Inc.; Director (since 1998) formerly, Chief Executive Officer (2007-2010) of Nuveen Fund Advisors, LLC. | | 210 |
| | Name, | | Position(s) Held | | Year First | | Principal | | Number |
| | Year of Birth | | with the Funds | | Elected or | | Occupation(s) | | of Portfolios |
| | and Address | | | | Appointed(3) | | During Past 5 Years | | in Fund Complex |
| | | | | | | | | | Overseen |
| | | | | | | | | | by Officer |
| | | | | | | | | | |
| Officers of the Funds: | | | | | | | | |
| ■ | GIFFORD R. ZIMMERMAN 1956 333 W. Wacker Drive Chicago, IL 60606 | | Chief Administrative Officer | | 1988 | | Managing Director (since 2002), and Assistant Secretary of Nuveen Securities, LLC; Managing Director (since 2004) and Assistant Secretary (since 1994) of Nuveen Investments, Inc.; Managing Director (since 2002), Assistant Secretary (since 1997) and Co-General Counsel (since 2011) of Nuveen Fund Advisors, LLC; Managing Director, Assistant Secretary and Associate General Counsel of Nuveen Asset Management, LLC (since 2011); Managing Director, Associate General Counsel and Assistant Secretary, of Symphony Asset Management LLC (since 2003); Vice President and Assistant Secretary of NWQ Investment Management Company, LLC (since 2002), Nuveen Investments Advisers Inc. (since 2002), Santa Barbara Asset Management, LLC (since 2006), and of Winslow Capital Management, LLC, (since 2010); Vice President and Assistant Secretary (since 2013), formerly, Chief Administrative Officer and Chief Compliance Officer (2006-2013) of Nuveen Commodities Asset Management, LLC; Chartered Financial Analyst. | | 210 |
| | | | | | | | | | |
| ■ | WILLIAM ADAMS IV 1955 333 W. Wacker Drive Chicago, IL 60606 | | Vice President | | 2007 | | Senior Executive Vice President, Global Structured Products (since 2010), formerly, Executive Vice President (1999-2010) of Nuveen Securities, LLC; Co-President of Nuveen Fund Advisors, LLC (since 2011); President (since 2011), formerly, Managing Director (2010-2011) of Nuveen Commodities Asset Management, LLC. | | 103 |
| | | | | | | | | | |
| ■ | CEDRIC H. ANTOSIEWICZ 1962 333 W. Wacker Drive Chicago, IL 60606 | | Vice President | | 2007 | | Managing Director of Nuveen Securities, LLC. | | 103 |
| | | | | | | | | | |
| ■ | MARGO L. COOK 1964 333 W. Wacker Drive Chicago, IL 60606 | | Vice President | | 2009 | | Executive Vice President (since 2008) of Nuveen Investments, Inc. and of Nuveen Fund Advisors, LLC (since 2011); Managing Director-Investment Services of Nuveen Commodities Asset Management, LLC (since August 2011), previously, Head of Institutional Asset Management (2007-2008) of Bear Stearns Asset Management; Head of Institutional Asset Management (1986-2007) of Bank of NY Mellon; Chartered Financial Analyst. | | 210 |
| | | | | | | | | | |
| ■ | LORNA C. FERGUSON 1945 333 W. Wacker Drive Chicago, IL 60606 | | Vice President | | 1998 | | Managing Director (since 2005) of Nuveen Fund Advisors, LLC and Nuveen Securities, LLC (since 2004). | | 210 |
| | | | | | | | | | |
| ■ | STEPHEN D. FOY 1954 333 W. Wacker Drive Chicago, IL 60606 | | Vice President and Controller | | 1998 | | Senior Vice President (2010-2011), formerly, Vice President (2005-2010) and Funds Controller of Nuveen Securities, LLC; Senior Vice President (since 2013), formerly, Vice President of Nuveen Fund Advisors, LLC; Chief Financial Officer of Nuveen Commodities Asset Management, LLC (since 2010); Certified Public Accountant. | | 210 |
Board Members & Officers (Unaudited) (continued)
| | Name, | | Position(s) Held | | Year First | | Principal | | Number |
| | Year of Birth | | with the Funds | | Elected or | | Occupation(s) | | of Portfolios |
| | and Address | | | | Appointed(3) | | During Past 5 Years | | in Fund Complex |
| | | | | | | | | | Overseen |
| | | | | | | | | | by Officer |
| | | | | | | | | | |
| Officers of the Funds: | | | | | | | | |
| ■ | SCOTT S. GRACE 1970 333 W. Wacker Drive Chicago, IL 60606 | | Vice President and Treasurer | | 2009 | | Managing Director, Corporate Finance & Development, Treasurer (since 2009) of Nuveen Securities, LLC; Managing Director and Treasurer (since 2009) of Nuveen Fund Advisors, LLC, Nuveen Investments Advisers, Inc., Nuveen Investments Holdings Inc. and (since 2011) Nuveen Asset Management, LLC; Vice President and Treasurer of NWQ Investment Management Company, LLC, Tradewinds Global Investors, LLC, Symphony Asset Management LLC and Winslow Capital Management, LLC.; Vice President of Santa Barbara Asset Management, LLC; formerly, Treasurer (2006-2009), Senior Vice President (2008-2009), previously, Vice President (2006-2008) of Janus Capital Group, Inc.; formerly, Senior Associate in Morgan Stanley’s Global Financial Services Group (2000-2003); Chartered Accountant Designation. | | 210 |
| | | | | | | | | | |
| ■ | WALTER M. KELLY 1970 333 W. Wacker Drive Chicago, IL 60606 | | Chief Compliance Officer and Vice President | | 2003 | | Senior Vice President (since 2008) and Assistant Secretary (since 2003) of Nuveen Fund Advisors, LLC; Senior Vice President (since 2008) of Nuveen Investment Holdings, Inc.; formerly, Senior Vice President (2008-2011) of Nuveen Securities, LLC. | | 210 |
| | | | | | | | | | |
| ■ | TINA M. LAZAR 1961 333 W. Wacker Drive Chicago, IL 60606 | | Vice President | | 2002 | | Senior Vice President (since 2010), formerly, Vice President (2005-2010) of Nuveen Fund Advisors, LLC. | | 210 |
| | | | | | | | | | |
| ■ | KEVIN J. MCCARTHY 1966 333 W. Wacker Drive Chicago, IL 60606 | | Vice President and Secretary | | 2007 | | Managing Director and Assistant Secretary (since 2008), Nuveen Securities, LLC; Managing Director (since 2008), Assistant Secretary (since 2007) and Co-General Counsel (since 2011) of Nuveen Fund Advisors, LLC; Managing Director, Assistant Secretary and Associate General Counsel (since 2011) of Nuveen Asset Management, LLC; Managing Director (since 2008), and Assistant Secretary, Nuveen Investment Holdings, Inc.; Vice President (since 2007) and Assistant Secretary of Nuveen Investments Advisers Inc., NWQ Investment Management Company, LLC, NWQ Holdings, LLC, Symphony Asset Management LLC, Santa Barbara Asset Management, LLC, and of Winslow Capital Management, LLC. (since 2010); Vice President and Secretary (since 2010) of Nuveen Commodities Asset Management, LLC. | | 210 |
| | Name, | | Position(s) Held | | Year First | | Principal | | Number |
| | Year of Birth | | with the Funds | | Elected or | | Occupation(s) | | of Portfolios |
| | and Address | | | | Appointed(3) | | During Past 5 Years | | in Fund Complex |
| | | | | | | | | | Overseen |
| | | | | | | | | | by Officer |
| | | | | | | | | | |
| Officers of the Funds: | | | | | | | | |
| ■ | KATHLEEN L. PRUDHOMME 1953 901 Marquette Avenue Minneapolis, MN 55402 | | Vice President and Assistant Secretary | | 2011 | | Managing Director, Assistant Secretary and Co-General Counsel (since 2011) of Nuveen Fund Advisors, LLC; Managing Director, Assistant Secretary and Associate General Counsel (since 2011) of Nuveen Asset Management, LLC; Managing Director and Assistant Secretary (since 2011) of Nuveen Securities, LLC; formerly, Deputy General Counsel, FAF Advisors, Inc. (2004-2010). | | 210 |
| (1) | Board Members serve three year terms, except for two board members who are elected by the holders of Preferred Shares. The Board of Trustees is divided into three classes, Class I, Class II, and Class III, with each being elected to serve until the third succeeding annual shareholders’ meeting subsequent to its election or thereafter in each case when its respective successors are duly elected or appointed, except two board members are elected by the holders of Preferred Shares to serve until the next annual shareholders’ meeting subsequent to its election or thereafter in each case when its respective successors are duly elected or appointed. The first year elected or appointed represents the year in which the board member was first elected or appointed to any fund in the Nuveen Complex. |
| (2) | Mr. Amboian is an interested trustee because of his position with Nuveen Investments, Inc. and certain of its subsidiaries, which are affiliates of the Nuveen Funds. |
| (3) | Officers serve one year terms through August of each year. The year first elected or appointed represents the year in which the Officer was first elected or appointed to any fund in the Nuveen Complex. |
Annual Investment Management
Agreement Approval Process (Unaudited)
The Board of Trustees (each, a “Board” and each Trustee, a “Board Member”) of the Funds, including the Board Members who are not parties to the Funds’ advisory or sub-advisory agreements or “interested persons” of any such parties (the “Independent Board Members”), is responsible for approving the advisory agreements (each, an “Investment Management Agreement”) between each Fund and Nuveen Fund Advisors, LLC (the “Advisor”) and the sub-advisory agreements (each, a “Sub-Advisory Agreement”) between the Advisor and Nuveen Asset Management, LLC (the “Sub-Advisor”) (the Investment Management Agreements and the Sub-Advisory Agreements are referred to collectively as the “Advisory Agreements”) and their periodic continuation. Pursuant to the Investment Company Act of 1940, as amended (the “1940 Act”), the Board is required to consider the continuation of the Advisory Agreements on an annual basis. Accordingly, at an in-person meeting held on May 20-22, 2013 (the “May Meeting”), the Board, including a majority of the Independent Board Members, considered and approved the continuation of the Advisory Agreements for the Funds for an additional one-year period.
In preparation for its considerations at the May Meeting, the Board requested and received extensive materials prepared in connection with the review of the Advisory Agreements. The materials provided a broad range of information regarding the Funds, the Advisor and the Sub-Advisor (the Advisor and the Sub-Advisor are collectively, the “Fund Advisers” and each, a “Fund Adviser”). As described in more detail below, the information provided included, among other things, a review of Fund performance, including Fund investment performance assessments against peer groups and appropriate benchmarks; a comparison of Fund fees and expenses relative to peers; a description and assessment of shareholder service levels for the Funds; a summary of the performance of certain service providers; a review of product initiatives and shareholder communications; and an analysis of the Advisor’s profitability with comparisons to comparable peers in the managed fund business. As part of its annual review, the Board also held a separate meeting on April 17-18, 2013, to review the Funds’ investment performance and consider an analysis provided by the Advisor of the Sub-Advisor which generally evaluated the Sub-Advisor’s investment team, investment mandate, organizational structure and history, investment philosophy and process, performance of the applicable Fund, and significant changes to the foregoing. As a result of its review of the materials and discussions, the Board presented the Advisor with questions and the Advisor responded.
The materials and information prepared in connection with the annual review of the Advisory Agreements supplement the information and analysis provided to the Board during the year. In this regard, throughout the year, the Board, acting directly or through its committees, regularly reviews the performance and various services provided by the Advisor and the Sub-Advisor. The Board meets at least quarterly as well as at other times as the need arises. At its quarterly meetings, the Board reviews reports by the Advisor regarding, among other things, fund performance, fund expenses, premium and discount levels of closed-end funds, the performance of the investment teams, and compliance, regulatory and risk management matters. In addition to regular reports, the Advisor provides special reports to the Board or a committee thereof from time to time to enhance the Board’s understanding of various topics that impact some or all the Nuveen funds (such as accounting and financial statement presentations of the various forms of leverage that may be used by a closed-end fund or an update on the valuation policies and procedures), to update the Board on regulatory developments impacting the investment company industry or to update the Board on the
business plans or other matters impacting the Advisor. The Board also meets with key investment personnel managing the fund portfolios during the year. In October 2011, the Board also created two standing committees (the Open-End Fund Committee and the Closed-End Fund Committee) to assist the full Board in monitoring and gaining a deeper insight into the distinctive business practices of open-end and closed-end funds. These Committees meet prior to each quarterly Board meeting, and the Advisor provides presentations to these Committees permitting them to delve further into specific matters or initiatives impacting the respective product line.
In addition, the Board continues its program of seeking to have the Board Members or a subset thereof visit each sub-advisor to the Nuveen funds at least once over a multiple year rotation, meeting with key investment and business personnel. In this regard, the Independent Board Members visited certain of the Sub-Advisor’s investment teams in Minneapolis in September 2012, and the Sub-Advisor’s municipal team in November 2012. In addition, the ad hoc Securities Lending Committee of the Board met with certain service providers and the Audit Committee of the Board made a site visit to three pricing service providers.
The Board considers the information provided and knowledge gained at these meetings and visits during the year when performing its annual review of the Advisory Agreements. The Independent Board Members also are assisted throughout the process by independent legal counsel. Counsel provided materials describing applicable law and the duties of directors or trustees in reviewing advisory contracts. During the course of the year and during their deliberations regarding the review of advisory contracts, the Independent Board Members met with independent legal counsel in executive sessions without management present. In addition, it is important to recognize that the management arrangements for the Nuveen funds are the result of many years of review and discussion between the Independent Board Members and fund management and that the Board Members’ conclusions may be based, in part, on their consideration of fee arrangements and other factors developed in previous years.
The Board considered all factors it believed relevant with respect to each Fund, including among other factors: (a) the nature, extent and quality of the services provided by the Fund Advisers, (b) the investment performance of the Fund and Fund Advisers, (c) the advisory fees and costs of the services to be provided to the Fund and the profitability of the Fund Advisers, (d) the extent of any economies of scale, (e) any benefits derived by the Fund Advisers from the relationship with the Fund and (f) other factors. Each Board Member may have accorded different weight to the various factors in reaching his or her conclusions with respect to a Fund’s Advisory Agreements. The Independent Board Members did not identify any single factor as all important or controlling. The Independent Board Members’ considerations were instead based on a comprehensive consideration of all the information presented. The principal factors considered by the Board and its conclusions are described below.
A. Nature, Extent and Quality of Services
In considering renewal of the Advisory Agreements, the Independent Board Members considered the nature, extent and quality of the Fund Adviser’s services, including advisory services and the resulting Fund performance and administrative services. The Independent Board Members further considered the overall reputation and capabilities of the Advisor and its affiliates, the commitment of the Advisor to provide high quality service to the Funds, their overall confidence in the capability and integrity of the Advisor and its staff and the Advisor’s responsiveness to questions and concerns raised by them. The Independent Board Members reviewed materials outlining, among other things, the Fund Adviser’s organization and business; the types of services that the Fund Adviser or its affiliates provide to the Funds; the performance record of the applicable Fund (as described in further detail below); and any applicable initiatives Nuveen had taken for the closed-end fund product line.
Annual Investment Management Agreement
Approval Process (Unaudited) (continued)
In considering advisory services, the Board recognized that the Advisor provides various oversight, administrative, compliance and other services for the Funds and the Sub-Advisor generally provides the portfolio investment management services to the Funds. In reviewing the portfolio management services provided to each Fund, the Board reviewed the materials provided by the Nuveen Investment Services Oversight Team analyzing, among other things, the Sub-Advisor’s investment team and changes thereto, organization and history, assets under management, the investment team’s philosophy and strategies in managing the Fund, developments affecting the Sub-Advisor or Fund and Fund performance. The Independent Board Members also reviewed portfolio manager compensation arrangements to evaluate each Fund Adviser’s ability to attract and retain high quality investment personnel, preserve stability, and reward performance but not provide an inappropriate incentive to take undue risks. In addition, the Board considered the Advisor’s execution of its oversight responsibilities over the Sub-Advisor. Given the importance of compliance, the Independent Board Members also considered Nuveen’s compliance program, including the report of the chief compliance officer regarding the Funds’ compliance policies and procedures; the resources dedicated to compliance; and the record of compliance with the policies and procedures. Given the Advisor’s emphasis on business risk, the Board also appointed an Independent Board Member as a point person to review and keep the Board apprised of developments in this area during the year.
In addition to advisory services, the Board considered the quality and extent of administrative and other non-investment advisory services the Advisor and its affiliates provide to the Funds, including product management, investment services (such as oversight of investment policies and procedures, risk management, and pricing), fund administration, oversight of service providers, shareholder services and communications, administration of Board relations, regulatory and portfolio compliance, legal support, managing leverage and promoting an orderly secondary market for common shares. The Board further recognized Nuveen’s additional investments in personnel, including in compliance and risk management.
In reviewing the services provided, the Board considered the new services and service enhancements that the Advisor has implemented since the various advisory agreements were last reviewed. In reviewing the activities of 2012, the Board recognized the Advisor’s focus on product rationalization for both closed-end and open-end funds during the year, consolidating certain Nuveen funds through mergers that were designed to improve efficiencies and economies of scale for shareholders, repositioning various Nuveen funds through updates in their investment policies and guidelines with the expectation of bringing greater value to shareholders, and liquidating certain Nuveen funds. The Board recognized the Advisor’s significant investment in technology initiatives to, among other things, create a central repository for fund and other Nuveen product data, develop a group within the Advisor designed to handle and analyze fund performance data, and implement a data system to support the risk oversight group. The Board also recognized the enhancements in the valuation group within the Advisor, including upgrading the team and process and automating certain basic systems, and in the compliance group with the addition of personnel, particularly within the testing group. With the advent of the Open-End Fund Committee and Closed-End Fund Committee, the Board also noted the enhanced support and comprehensive in-depth presentations provided by the Advisor to these committees.
In addition to the foregoing actions, the Board also considered other initiatives related to the Nuveen closed-end funds, including the significant level of oversight and administration necessary to manage leverage that has become increasingly varied and complex and the ongoing redesign of technology systems to manage and track the various forms of leverage; continued capital management services, including developing shelf offering programs for various funds; the implementation of projects designed to enhance data integrity for information published on the web and to increase the use of data received from third parties to gain market intelligence; and the continued communication
efforts with shareholders, fund analysts and financial advisers. With respect to the latter, the Independent Board Members noted Nuveen’s continued commitment to supporting the secondary market for the common shares of its closed-end funds through a comprehensive secondary market communication program and campaigns designed to raise investor and analyst awareness and understanding of closed-end funds. Nuveen’s support services included, among other things: developing materials covering the Nuveen closed-end Fund product line and educational materials regarding closed-end funds; designing and executing various marketing campaigns; supporting and promoting the alternative minimum tax (AMT)-free funds; sponsoring and participating in conferences; communicating with closed-end fund analysts and financial advisors throughout the year; providing marketing and product updates for the closed-end funds; and maintaining and enhancing a closed-end fund website.
Based on their review, the Independent Board Members found that, overall, the nature, extent and quality of services provided to the respective Funds under each applicable Advisory Agreement were satisfactory.
B. The Investment Performance of the Funds and Fund Advisers
The Board, including the Independent Board Members, considered the performance history of each Fund over various time periods. The Board reviewed reports, including an analysis of the Funds’ performance and the applicable investment team. In general, in considering a fund’s performance, the Board recognized that a fund’s performance can be reviewed through various measures including the fund’s absolute return, the fund’s return compared to the performance of other peer funds, and the fund’s performance compared to its respective benchmark. Accordingly, the Board reviewed, among other things, each Fund’s historic investment performance as well as information comparing the Fund’s performance information with that of other funds (the “Performance Peer Group”) and with recognized and/or customized benchmarks (i.e., benchmarks derived from multiple recognized benchmarks) for the quarter, one-, three-and five-year periods ending December 31, 2012 as well as performance information reflecting the first quarter of 2013. In addition, with respect to closed-end funds (such as the Funds), the Independent Board Members also reviewed historic premium and discount levels, including a summary of actions taken to address or discuss other developments affecting the secondary market discounts of various funds. This information supplemented the fund performance information provided to the Board at each of its quarterly meetings.
In evaluating performance, the Board recognized several factors that may impact the performance data as well as the consideration given to particular performance data. The Board recognized that the performance data reflects a snapshot of time, in this case as of the end of the most recent calendar year or quarter. The Board noted that selecting a different performance period could derive significantly different results. Further, the Board recognized that it is possible that long-term performance can be adversely affected by even one period of significant underperformance so that a single investment decision or theme has the ability to disproportionately affect long-term performance. The Independent Board Members also noted that the investment experience of a particular shareholder in the Nuveen funds will vary depending on when such shareholder invests in the applicable fund, the class held (if multiple classes are offered in a fund) and the performance of the fund (or respective class) during that shareholder’s investment period.
With respect to the comparative performance information, the Board recognized that the usefulness of comparative performance data as a frame of reference to measure a fund’s performance may be limited because the Performance Peer Group, among other things, does not adequately reflect the objectives and strategies of the fund, has a different investable universe, or the composition of the peer set may be limited in size or number as well as other factors. In this regard, the Board noted that the Advisor classified, in relevant part, the Performance Peer Groups of certain funds as having significant differences from the funds but to still be somewhat relevant while the Performance Peer Groups of
Annual Investment Management Agreement
Approval Process (Unaudited) (continued)
other funds (including each of the Funds) were classified as having such significant differences as to be irrelevant. Accordingly, while the Board is cognizant of the relative performance of a fund’s peer set and/or benchmark(s), the Board evaluated fund performance in light of the respective fund’s investment objectives, investment parameters and guidelines and considered that the variations between the objectives and investment parameters or guidelines of the funds with their peers and/or benchmarks result in differences in performance results. In addition, with respect to any Nuveen funds for which the Board has identified performance concerns, the Board monitors such funds closely until performance improves, discusses with the Advisor the reasons for such results, considers those steps necessary or appropriate to address such issues, and reviews the results of any efforts undertaken.
In considering the performance data for the Funds, given that, as noted above, the Performance Peer Group for each Fund was classified as irrelevant, limiting the usefulness of the peer comparison data, the Board also considered the Funds’ performance compared to their respective benchmarks and noted that each Fund outperformed its benchmark over the one-, three- and five-year periods.
Based on their review, the Independent Board Members determined that each Fund’s investment performance had been satisfactory.
C. Fees, Expenses and Profitability
1. Fees and Expenses
The Board evaluated the management fees and expenses of each Fund reviewing, among other things, such Fund’s gross management fees, net management fees and net expense ratios in absolute terms as well as compared to the fees and expenses of a comparable universe of funds provided by an independent fund data provider (the “Peer Universe”) and any expense limitations.
The Independent Board Members further reviewed the methodology regarding the construction of the applicable Peer Universe. In reviewing the comparisons of fee and expense information, the Independent Board Members took into account that in certain instances various factors such as: the limited size and particular composition of the Peer Universe (including the inclusion of other Nuveen funds in the peer set); expense anomalies; changes in the funds comprising the Peer Universe from year to year; levels of reimbursement or fee waivers; the timing of information used; the differences in the type and use of leverage; and differences in the states reflected in the Peer Universe may impact the comparative data, thereby limiting somewhat the ability to make a meaningful comparison with peers.
In reviewing the fee schedule for a Fund, the Independent Board Members also considered the fund-level and complex-wide breakpoint schedules (described in further detail below) and any fee waivers and reimbursements provided by Nuveen. In reviewing fees and expenses (excluding leverage costs and leveraged assets, as applicable), the Board considered the expenses and fees to be higher if they were over 10 basis points higher, slightly higher if they were approximately 6 to 10 basis points higher, in line if they were within approximately 5 basis points higher than the peer average and below if they were below the peer average of the Peer Universe. In reviewing the reports, the Board noted that the majority of the Nuveen funds were at, close to or below their peer set average based on the net total expense ratio.
The Independent Board Members noted that the Nuveen Maryland Premium Income Municipal Fund had a net management fee and a net expense ratio (including fee waivers and expense reimbursements) in line with its peer averages. In addition, they noted that the Nuveen Missouri Premium Income Municipal Fund had a slightly higher
net management fee and net expense ratio compared to its peer averages (generally due in part to certain limitations within the peer group). Finally, the Independent Board Members noted that the Nuveen Virginia Premium Income Municipal Fund, the Nuveen Georgia Dividend Advantage Municipal Fund 2, and the Nuveen North Carolina Premium Income Municipal Fund each had a net expense ratio that was slightly higher or higher than its respective peer average, but a net management fee in line with its respective peer average.
Based on their review of the fee and expense information provided, the Independent Board Members determined that each Fund’s management fees were reasonable in light of the nature, extent and quality of services provided to the Fund.
2. Comparisons with the Fees of Other Clients
The Board recognized that all Nuveen funds have a sub-advisor (which, in the case of the Funds, is an affiliated sub-advisor), and therefore, the overall fund management fee can be divided into two components, the fee retained by the Advisor and the fee paid to the sub-advisor. In general terms, the fee to the Advisor reflects the administrative services it provides to support the funds, and while some administrative services may occur at the sub-advisor level, the fee generally reflects the portfolio management services provided by the sub-advisor. The Independent Board Members reviewed information regarding the nature of services provided by the Advisor, including through the Sub-Advisor, and the range of fees and average fee the Sub-Advisor assessed for such services to other clients. Such other clients include municipal separately managed accounts and passively managed exchange traded funds (ETFs) sub-advised by the Advisor. In evaluating the comparisons of fees, the Independent Board Members noted that the fee rates charged to the Funds and other clients vary, among other things, because of the different services involved and the additional regulatory and compliance requirements associated with registered investment companies, such as the Funds. Accordingly, the Independent Board Members considered the differences in the product types, including, but not limited to, the services provided, the structure and operations, product distribution and costs thereof, portfolio investment policies, investor profiles, account sizes and regulatory requirements. The Independent Board Members noted, in particular, that the range of services provided to the Funds (as discussed above) is much more extensive than that provided to separately managed accounts. Many of the additional administrative services provided by the Advisor are not required for institutional clients. Given the inherent differences in the various products, particularly the extensive services provided to the Funds, the Independent Board Members believe such facts justify the different levels of fees.
3. Profitability of Fund Advisers
In conjunction with their review of fees, the Independent Board Members also considered the profitability of Nuveen for its advisory activities and its financial condition. The Independent Board Members reviewed the revenues and expenses of Nuveen’s advisory activities for the last two calendar years, the allocation methodology used in preparing the profitability data and an analysis of the key drivers behind the changes in revenues and expenses that impacted profitability in 2012. The Independent Board Members noted this information supplemented the profitability information requested and received during the year to help keep them apprised of developments affecting profitability (such as changes in fee waivers and expense reimbursement commitments). In this regard, the Independent Board Members noted that they have an Independent Board Member serve as a point person to review and keep them apprised of changes to the profitability analysis and/or methodologies during the year. The Independent Board Members also considered Nuveen’s revenues for advisory activities, expenses, and profit margin compared to that of various unaffiliated management firms with comparable assets under management (based on asset size and asset composition).
Annual Investment Management Agreement
Approval Process (Unaudited) (continued)
In reviewing profitability, the Independent Board Members recognized the Advisor’s continued investment in its business to enhance its services, including capital improvements to investment technology, updated compliance systems, and additional personnel. In addition, in evaluating profitability, the Independent Board Members also recognized the subjective nature of determining profitability which may be affected by numerous factors including the allocation of expenses and that various allocation methodologies may each be reasonable but yield different results. Further, the Independent Board Members recognized the difficulties in making comparisons as the profitability of other advisers generally is not publicly available and the profitability information that is available for certain advisers or management firms may not be representative of the industry and may be affected by, among other things, the adviser’s particular business mix, capital costs, types of funds managed and expense allocations. Notwithstanding the foregoing, the Independent Board Members reviewed Nuveen’s methodology and assumptions for allocating expenses across product lines to determine profitability. Based on their review, the Independent Board Members concluded that the Advisor’s level of profitability for its advisory activities was reasonable in light of the services provided.
With respect to sub-advisors affiliated with Nuveen, including the Sub-Advisor, the Independent Board Members reviewed the sub-advisor’s revenues, expenses and profitability margins (pre- and post-tax) for its advisory activities and the methodology used for allocating expenses among the internal sub-advisors. Based on their review, the Independent Board Members were satisfied that the Sub-Advisor’s level of profitability was reasonable in light of the services provided.
In evaluating the reasonableness of the compensation, the Independent Board Members also considered other amounts paid to a Fund Adviser by the Funds as well as indirect benefits (such as soft dollar arrangements), if any, the Fund Adviser and its affiliates receive, or are expected to receive, that are directly attributable to the management of the Funds. See Section E below for additional information on indirect benefits a Fund Adviser may receive as a result of its relationship with the Funds. Based on their review of the overall fee arrangements of each Fund, the Independent Board Members determined that the advisory fees and expenses of the respective Fund were reasonable.
D. Economies of Scale and Whether Fee Levels Reflect These Economies of Scale
With respect to economies of scale, the Independent Board Members have recognized the potential benefits resulting from the costs of a fund being spread over a larger asset base, although economies of scale are difficult to measure and predict with precision, particularly on a fund-by-fund basis. One method to help ensure the shareholders share in these benefits is to include breakpoints in the advisory fee schedule. Generally, management fees for funds in the Nuveen complex are comprised of a fund-level component and a complex-level component, subject to certain exceptions. Accordingly, the Independent Board Members reviewed and considered the applicable fund-level breakpoints in the advisory fee schedules that reduce advisory fees as asset levels increase. Further, the Independent Board Members noted that although closed-end funds may from time-to-time make additional share offerings, the growth of their assets will occur primarily through the appreciation of such funds’ investment portfolio.
In addition to fund-level advisory fee breakpoints, the Board also considered the Funds’ complex-wide fee arrangement. Pursuant to the complex-wide fee arrangement, the fees of the funds in the Nuveen complex are generally reduced as the assets in the fund complex reach certain levels. The complex-wide fee arrangement seeks to provide the benefits of economies of scale to fund shareholders when total fund complex assets increase, even if assets of a particular fund are unchanged or have decreased. The approach reflects the notion that some of Nuveen’s costs are attributable to services provided to all its funds in the complex and therefore all funds benefit if these costs are spread
over a larger asset base. In addition, with the acquisition of the funds previously advised by FAF Advisors, Inc. at the end of 2010, the Board noted that a portion of such funds’ assets at the time of acquisition were deemed eligible to be included in the complex-wide fee calculation in order to deliver fee savings to shareholders in the combined complex and such funds were subject to differing complex-level fee rates.
Based on their review, the Independent Board Members concluded that the breakpoint schedules and complex-wide fee arrangement were acceptable and reflect economies of scale to be shared with shareholders when assets under management increase.
E. Indirect Benefits
In evaluating fees, the Independent Board Members received and considered information regarding potential “fall out” or ancillary benefits the respective Fund Adviser or its affiliates may receive as a result of its relationship with each Fund. In this regard, the Independent Board Members considered any revenues received by affiliates of the Advisor for serving as co-manager in initial public offerings of new closed-end funds as well as revenues received in connection with secondary offerings.
In addition to the above, the Independent Board Members considered whether the Fund Advisers received any benefits from soft dollar arrangements whereby a portion of the commissions paid by a Fund for brokerage may be used to acquire research that may be useful to the Fund Adviser in managing the assets of the Funds and other clients. The Funds’ portfolio transactions are determined by the Sub-Advisor. Accordingly, the Independent Board Members considered that the Sub-Advisor may benefit from its soft dollar arrangements pursuant to which it receives research from brokers that execute the Funds’ portfolio transactions. With respect to fixed income securities, however, the Board recognized that such securities generally trade on a principal basis that does not generate soft dollar credits. Nevertheless, the Sub-Advisor may engage in soft dollar arrangements on behalf of other clients, and the Funds as well as the Sub-Advisor may benefit from the research or other services received. Similarly, the Board recognized that the research received pursuant to soft dollar arrangements by the Sub-Advisor may also benefit a Fund and shareholders to the extent the research enhances the ability of the Sub-Advisor to manage the Fund. The Independent Board Members noted that the Sub-Advisor’s profitability may be somewhat lower if it did not receive the research services pursuant to the soft dollar arrangements and had to acquire such services directly.
Based on their review, the Independent Board Members concluded that any indirect benefits received by a Fund Adviser as a result of its relationship with the Funds were reasonable and within acceptable parameters.
F. Other Considerations
The Independent Board Members did not identify any single factor discussed previously as all-important or controlling. The Board Members, including the Independent Board Members, unanimously concluded that the terms of each Advisory Agreement are fair and reasonable, that the respective Fund Adviser’s fees are reasonable in light of the services provided to each Fund and that the Advisory Agreements be renewed.
Reinvest Automatically,
Easily and Conveniently
Nuveen makes reinvesting easy. A phone call is all it takes to set up your reinvestment account.
Nuveen Closed-End Funds Automatic Reinvestment Plan
Your Nuveen Closed-End Fund allows you to conveniently reinvest distributions in additional Fund shares.
By choosing to reinvest, you’ll be able to invest money regularly and automatically, and watch your investment grow through the power of compounding. Just like distributions in cash, there may be times when income or capital gains taxes may be payable on distributions that are reinvested.
It is important to note that an automatic reinvestment plan does not ensure a profit, nor does it protect you against loss in a declining market.
Easy and convenient
To make recordkeeping easy and convenient, each month you’ll receive a statement showing your total distributions, the date of investment, the shares acquired and the price per share, and the total number of shares you own.
How shares are purchased
The shares you acquire by reinvesting will either be purchased on the open market or newly issued by the Fund. If the shares are trading at or above net asset value at the time of valuation, the Fund will issue new shares at the greater of the net asset value or 95% of the then-current market price. If the shares are trading at less than net asset value, shares for your account will be purchased on the open market. If the Plan Agent begins purchasing Fund shares on the open market while shares are trading below net asset value, but the Fund’s shares subsequently trade at or above their net asset value before the Plan Agent is able to complete its purchases, the Plan Agent may cease open-market purchases and may invest the uninvested portion of the distribution in newly-issued Fund shares at a price equal to the greater of the shares’ net asset value or 95% of the shares’ market value on the last business day immediately prior to the purchase date. Distributions received to purchase shares in the open market will normally be invested shortly after the distribution payment date. No interest will be paid on distributions awaiting reinvestment. Because the market price of the shares may increase before purchases are completed, the average purchase price per share may exceed the market price at the time of valuation, resulting in the acquisition of fewer shares than if the distribution had been paid in shares issued by the Fund. A pro rata portion of any applicable brokerage commissions on open market purchases will be paid by Plan participants. These commissions usually will be lower than those charged on individual transactions.
Flexible
You may change your distribution option or withdraw from the Plan at any time, should your needs or situation change.
You can reinvest whether your shares are registered in your name, or in the name of a brokerage firm, bank, or other nominee. Ask your investment advisor if his or her firm will participate on your behalf. Participants whose shares are registered in the name of one firm may not be able to transfer the shares to another firm and continue to participate in the Plan.
The Fund reserves the right to amend or terminate the Plan at any time. Although the Fund reserves the right to amend the Plan to include a service charge payable by the participants, there is no direct service charge to participants in the Plan at this time.
Call today to start reinvesting distributions
For more information on the Nuveen Automatic Reinvestment Plan or to enroll in or withdraw from the Plan, speak with your financial advisor or call us at (800) 257-8787.
Glossary of Terms
Used in this Report
| ■ | Auction Rate Bond: An auction rate bond is a security whose interest payments are adjusted periodically through an auction process, which process typically also serves as a means for buying and selling the bond. Auctions that fail to attract enough buyers for all the shares offered for sale are deemed to have “failed,” with current holders receiving a formula-based interest rate until the next scheduled auction. |
| | |
| ■ | Average Annual Total Return: This is a commonly used method to express an investment’s performance over a particular, usually multi-year time period. It expresses the return that would have been necessary each year to equal the investment’s actual cumulative performance (including change in NAV or market price and reinvested dividends and capital gains distributions, if any) over the time period being considered. |
| | |
| ■ | Duration: Duration is a measure of the expected period over which a bond’s principal and interest will be paid, and consequently is a measure of the sensitivity of a bond’s or bond Fund’s value to changes when market interest rates change. Generally, the longer a bond’s or Fund’s duration, the more the price of the bond or Fund will change as interest rates change. |
| | |
| ■ | Effective Leverage: Effective leverage is a Fund’s effective economic leverage, and includes both regulatory leverage (see Leverage) and the leverage effects of certain derivative investments in the Fund’s portfolio. Currently, the leverage effects of Tender Option Bond (TOB) inverse floater holdings are included in effective leverage values, in addition to any regulatory leverage. |
| | |
| ■ | Gross Domestic Product (GDP): The total market value of all final goods and services produced in a country/region in a given year, equal to total consumer, investment and government spending, plus the value of exports, minus the value of imports. |
| | |
| ■ | Inverse Floating Rate Securities: Inverse floating rate securities, also known as inverse floaters or tender option bonds (TOBs), are created by depositing a municipal bond, typically with a fixed interest rate, into a special purpose trust created by a broker dealer. This trust, in turn, (a) issues floating rate certificates typically paying short-term tax-exempt interest rates to third parties in amounts equal to some fraction of the deposited bond’s par amount or market value, and (b) issues an inverse floating rate certificate (sometimes referred to as an “inverse floater”) to an investor (such as a Fund) interested in gaining investment exposure to a long-term municipal bond. The income received by the holder of the inverse floater varies inversely with the short term rate paid to the floating rate certificates’ holders, and in most circumstances the holder of the inverse floater bears substantially all of the underlying bond’s downside investment risk. The holder of the inverse floater typically also benefits disproportionately from any potential appreciation of the underlying bond’s value. Hence, an inverse floater essentially represents an investment in the underlying bond on a leveraged basis. |
| | |
| ■ | Leverage: Using borrowed money to invest in securities or other assets, seeking to increase the return of an investment or portfolio. |
| | |
| ■ | Lipper Other States Municipal Debt Funds Classification Average: Calculated using the returns of all closed-end funds in this category. Lipper returns account for the effects of management fees and assume reinvestment of distributions, but do not reflect any applicable sales charges. |
| | |
| ■ | Net Asset Value (NAV): The net market value of all securities held in a portfolio. |
| ■ | Net Asset Value (NAV) Per Share: The market value of one share of a mutual fund or closed-end fund. For a Fund, the NAV is calculated daily by taking the Fund’s total assets (securities, cash, and accrued earnings), subtracting the Fund’s liabilities, and dividing by the number of shares outstanding. |
| | |
| ■ | Pre-Refunding: Pre-Refunding, also known as advanced refundings or refinancings, is a procedure used by state and local governments to refinance municipal bonds to lower interest expenses. The issuer sells new bonds with a lower yield and uses the proceeds to buy U.S. Treasury securities, the interest from which is used to make payments on the higher-yielding bonds. Because of this collateral, pre-refunding generally raises a bond’s credit rating and thus its value. |
| | |
| ■ | Regulatory Leverage: Regulatory Leverage consists of preferred shares issued by or borrowings of a Fund. Both of these are part of a Fund’s capital structure. Regulatory leverage is sometimes referred to as “40 Act Leverage” and is subject to asset coverage limits set in the Investment Company Act of 1940. |
| | |
| ■ | S&P Municipal Bond Georgia Index: An unleveraged, market value-weighted index designed to measure the performance of the tax-exempt, investment-grade Georgia municipal bond market. Index returns assume reinvestment of distributions, but do not reflect any applicable sales charges or management fees. |
| | |
| ■ | S&P Municipal Bond Index: An unleveraged, market value-weighted index designed to measure the performance of the tax-exempt, investment-grade U.S. municipal bond market. Index returns assume reinvestment of distributions, but do not reflect any applicable sales charges or management fees. |
| | |
| ■ | S&P Municipal Bond Maryland Index: An unleveraged, market value-weighted index designed to measure the performance of the tax-exempt, investment-grade Maryland municipal bond market. Index returns assume reinvestment of distributions, but do not reflect any applicable sales charges or management fees. |
| | |
| ■ | S&P Municipal Bond Missouri Index: An unleveraged, market value-weighted index designed to measure the performance of the tax-exempt, investment-grade Missouri municipal bond market. Index returns assume reinvestment of distributions, but do not reflect any applicable sales charges or management fees. |
| | |
| ■ | S&P Municipal Bond North Carolina Index: An unleveraged, market value-weighted index designed to measure the performance of the tax-exempt, investment-grade North Carolina municipal bond market. Index returns assume reinvestment of distributions, but do not reflect any applicable sales charges or management fees. |
| | |
| ■ | S&P Municipal Bond Virginia Index: An unleveraged, market value-weighted index designed to measure the performance of the tax-exempt, investment-grade Virginia municipal bond market. Index returns assume reinvestment of distributions, but do not reflect any applicable sales charges or management fees. |
| | |
| ■ | Total Investment Exposure: Total investment exposure is a Fund’s assets managed by the Adviser that are attributable to financial leverage. For these purposes, financial leverage includes a Fund’s use of preferred stock and borrowings and investments in the residual interest certificates (also called inverse floating rate securities) in tender option bond (TOB) trusts, including the portion of assets held by a TOB trust that has been effectively financed by the trust’s issuance of floating rate securities. |
| | |
| ■ | Zero Coupon Bond: A zero coupon bond does not pay a regular interest coupon to its holders during the life of the bond. Tax-exempt income to the holder of the bond comes from accretion of the difference between the original purchase price of the bond at issuance and the par value of the bond at maturity and is effectively paid at maturity. The market prices of zero coupon bonds generally are more volatile than the market prices of bonds that pays interest periodically. |
Notes
Additional Fund Information
| Board of Trustees |
| John P. Amboian |
| Robert P. Bremner |
| Jack B. Evans |
| William C. Hunter |
| David J. Kundert |
| William J. Schneider |
| Judith M. Stockdale |
| Carole E. Stone |
| Virginia L. Stringer |
| Terence J. Toth |
| |
| Fund Manager |
| Nuveen Fund Advisors, LLC |
| 333 West Wacker Drive |
| Chicago, IL 60606 |
| |
| Custodian |
| State Street Bank |
| & Trust Company |
| Boston, MA |
| |
| Transfer Agent and |
| Shareholder Services |
| State Street Bank & Trust |
| Company |
| Nuveen Funds |
| P.O. Box 43071 |
| Providence, RI 02940-3071 |
| (800) 257-8787 |
| |
| Legal Counsel |
| Chapman and Cutler LLP |
| Chicago, IL |
| |
| Independent Registered |
| Public Accounting Firm |
| Ernst & Young LLP |
| Chicago, IL |
Quarterly Form N-Q Portfolio of Investments Information
Each Fund is required to file its complete schedule of portfolio holdings with the Securities and Exchange Commission (SEC) for the first and third quarters of each fiscal year on Form N-Q. You may obtain this information directly from the SEC. Visit the SEC on-line at http://www.sec.gov or in person at the SEC’s Public Reference Room in Washington, D.C. Call the SEC toll-free at (800) SEC -0330 for room hours and operation.
Nuveen Funds’ Proxy Voting Information
You may obtain (i) information regarding how each Fund voted proxies relating to portfolio securities held during the most recent twelve-month period ended June 30, without charge, upon request, by calling Nuveen Investments toll-free at (800) 257-8787 or on Nuveen’s website at www.nuveen.com and (ii) a description of the policies and procedures that each Fund used to determine how to vote proxies relating to portfolio securities without charge, upon request, by calling Nuveen Investments toll-free at (800) 257-8787. You may also obtain this information directly from the SEC. Visit the SEC on-line at http://www.sec.gov.
CEO Certification Disclosure
Each Fund’s Chief Executive Officer (CEO) has submitted to the New York Stock Exchange (NYSE) the annual CEO certification as required by Section 303A.12(a) of the NYSE Listed Company Manual.
Each Fund has filed with the SEC the certification of its Chief Executive Officer and Chief Financial Officer required by Section 302 of the Sarbanes-Oxley Act.
Common Share Information
Each Fund intends to repurchase shares of its own common stock at such times and in such amounts as is deemed advisable. During the period covered by this report, the Funds repurchased shares of their common stock as shown in the accompanying table.
| | Common Shares |
| Fund | Repurchased |
| NKG | — |
| NMY | — |
| NOM | — |
| NNC | — |
| NPV | — |
Any future repurchases will be reported to shareholders in the next annual or semi-annual report.
Nuveen Investments:
Serving Investors for Generations
Since 1898, financial advisors and their clients have relied on Nuveen Investments to provide dependable investment solutions through continued adherence to proven, long-term investing principles. Today, we offer a range of high quality equity and fixed-income solutions designed to be integral components of a well-diversified core portfolio.
Focused on meeting investor needs.
Nuveen Investments provides high-quality investment services designed to help secure the long-term goals of institutional and individual investors as well as the consultants and financial advisors who serve them. Nuveen Investments markets a wide range of specialized investment solutions which provide investors access to capabilities of its high-quality boutique investment affiliates—Nuveen Asset Management, Symphony Asset Management, NWQ Investment Management Company, Santa Barbara Asset Management, Tradewinds Global Investors, Winslow Capital Management and Gresham Investment Management. In total, Nuveen Investments managed $224 billion as of March 31, 2013.
Find out how we can help you.
To learn more about how the products and services of Nuveen Investments may be able to help you meet your financial goals, talk to your financial advisor, or call us at (800) 257-8787. Please read the information provided carefully before you invest. Investors should consider the investment objective and policies, risk considerations, charges and expenses of any investment carefully. Where applicable, be sure to obtain a prospectus, which contains this and other relevant information. To obtain a prospectus, please contact your securities representative or Nuveen Investments, 333 W. Wacker Dr., Chicago, IL 60606. Please read the prospectus carefully before you invest or send money.
Learn more about Nuveen Funds at: www.nuveen.com/cef
Distributed by
Nuveen Securities, LLC
333 West Wacker Drive
Chicago, IL 60606
www.nuveen.com
EAN-A-0513D
ITEM 2. CODE OF ETHICS.
As of the end of the period covered by this report, the registrant has adopted a code of ethics that applies to the registrant's principal executive officer, principal financial officer, principal accounting officer or controller, or persons performing similar functions. There were no amendments to or waivers from the Code during the period covered by this report. The registrant has posted the code of ethics on its website at www.nuveen.com/CEF/Shareholder/FundGovernance.aspx. (To view the code, click on Code of Conduct.)
ITEM 3. AUDIT COMMITTEE FINANCIAL EXPERT.
The registrant's Board of Directors or Trustees (“Board”) determined that the registrant has at least one “audit committee financial expert” (as defined in Item 3 of Form N-CSR) serving on its Audit Committee. The registrant's audit committee financial expert is Carole E. Stone, who is “independent” for purposes of Item 3 of Form N-CSR.
Ms. Stone served for five years as Director of the New York State Division of the Budget. As part of her role as Director, Ms. Stone was actively involved in overseeing the development of the State's operating, local assistance and capital budgets, its financial plan and related documents; overseeing the development of the State's bond-related disclosure documents and certifying that they fairly presented the State's financial position; reviewing audits of various State and local agencies and programs; and coordinating the State's system of internal audit and control. Prior to serving as Director, Ms. Stone worked as a budget analyst/examiner with increasing levels of responsibility over a 30 year period, including approximately five years as Deputy Budget Director. Ms. Stone has also served as Chair of the New York State Racing Association Oversight Board, as Chair of the Public Authorities Control Board, as a Commissioner on the New York State Commission on Public Authority Reform and as a member of the Boards of Directors of several New York State public authorities. These positions have involved overseeing operations and finances of certain entities and assessing the adequacy of project/entity financing and financial reporting. Currently, Ms. Stone is on the Board of Directors of CBOE Holdings, Inc., of the Chicago Board Options Exchange, and of C2 Options Exchange. Ms. Stone's position on the boards of these entities and as a member of both CBOE Holdings' Audit Committee and its Finance Committee has involved, among other things, the oversight of audits, audit plans and preparation of financial statements.
ITEM 4. PRINCIPAL ACCOUNTANT FEES AND SERVICES.
The following tables show the amount of fees that Ernst & Young LLP, the Fund's auditor, billed to the Fund during the Fund's last two full fiscal years. For engagements with Ernst & Young LLP the Audit Committee approved in advance all audit services and non-audit services that Ernst & Young LLP provided to the Fund, except for those non-audit services that were subject to the pre-approval exception under Rule 2-01 of Regulation S-X (the “pre-approval exception”). The pre-approval exception for services provided directly to the Fund waives the pre-approval requirement for services other than audit, review or attest services if: (A) the aggregate amount of all such services provided constitutes no more than 5% of the total amount of revenues paid by the Fund to its accountant during the fiscal year in which the services are provided; (B) the Fund did not recognize the services as non-audit services at the time of the engagement; and (C) the services are promptly brought to the Audit Committee's attention, and the Committee (or its delegate) approves the services before the audit is completed.
The Audit Committee has delegated certain pre-approval responsibilities to its Chairman (or, in his absence, any other member of the Audit Committee).
SERVICES THAT THE FUND'S AUDITOR BILLED TO THE ADVISER AND AFFILIATED FUND SERVICE PROVIDERS
The tables also show the percentage of fees subject to the pre-approval exception. The pre-approval exception for services provided to the Adviser and any Affiliated Fund Service Provider (other than audit, review or attest services) waives the pre-approval requirement if: (A) the aggregate amount of all such services provided constitutes no more than 5% of the total amount of revenues paid to Ernst & Young LLP by the Fund, the Adviser and Affiliated Fund Service Providers during the fiscal year in which the services are provided that would have to be pre-approved by the Audit Committee; (B) the Fund did not recognize the services as non-audit services at the time of the engagement; and (C) the services are promptly brought to the Audit Committee's attention, and the Committee (or its delegate) approves the services before the Fund's audit is completed.
The following table shows the amount of fees that Ernst & Young LLP billed during the Fund's last two full fiscal years for non-audit services. The Audit Committee is required to pre-approve non-audit services that Ernst & Young LLP provides to the Adviser and any Affiliated Fund Services Provider, if the engagement related directly to the Fund's operations and financial reporting (except for those subject to the pre-approval exception described above). The Audit Committee requested and received information from Ernst & Young LLP about any non-audit services that Ernst & Young LLP rendered during the Fund's last fiscal year to the Adviser and any Affiliated Fund Service Provider. The Committee considered this information in evaluating Ernst & Young LLP's independence.
ITEM 5. AUDIT COMMITTEE OF LISTED REGISTRANTS.
ITEM 6. SCHEDULE OF INVESTMENTS.
a) See Portfolio of Investments in Item 1.
b) Not applicable.
ITEM 7. DISCLOSURE OF PROXY VOTING POLICIES AND PROCEDURES FOR CLOSED-END MANAGEMENT INVESTMENT COMPANIES.
ITEM 9. PURCHASES OF EQUITY SECURITIES BY CLOSED-END MANAGEMENT INVESTMENT COMPANY AND AFFILIATED PURCHASERS.
Not applicable.
ITEM 10. SUBMISSION OF MATTERS TO A VOTE OF SECURITY HOLDERS.
There have been no material changes to the procedures by which shareholders may recommend nominees to the registrant's Board implemented after the registrant last provided disclosure in response to this Item.
ITEM 11. CONTROLS AND PROCEDURES.
ITEM 12. EXHIBITS.
File the exhibits listed below as part of this Form.
Pursuant to the requirements of the Securities Exchange Act of 1934 and the Investment Company Act of 1940, the registrant has duly caused this report to be signed on its behalf by the undersigned, thereunto duly authorized.
Kevin J. McCarthy
Pursuant to the requirements of the Securities Exchange Act of 1934 and the Investment Company Act of 1940, this report has been signed below by the following persons on behalf of the registrant and in the capacities and on the dates indicated.
Gifford R. Zimmerman
Stephen D. Foy