UNITED STATES
SECURITIES AND EXCHANGE COMMISSION
WASHINGTON, D.C. 20549
FORM N-CSR
CERTIFIED SHAREHOLDER REPORT OF REGISTERED
MANAGEMENT INVESTMENT COMPANIES
Investment Company Act file number: 811-07618
AB MUNICIPAL INCOME FUND II
(Exact name of registrant as specified in charter)
1345 Avenue of the Americas, New York, New York 10105
(Address of principal executive offices) (Zip code)
Stephen M. Woetzel
AllianceBernstein L.P.
1345 Avenue of the Americas
New York, New York 10105
(Name and address of agent for service)
Registrant’s telephone number, including area code: (800) 221-5672
Date of fiscal year end: May 31, 2024
Date of reporting period: May 31, 2024
ITEM 1. REPORTS TO STOCKHOLDERS.
Please scan QR code for
Fund Information
Annual Shareholder Report
This annual shareholder report contains important information about the AB Arizona Portfolio (the “Fund”) for the period of June 1, 2023 to May 31, 2024. You can find additional information about the Fund at https://www.abfunds.com/link/AB/AAZYX-A. You can also request this information by contacting us at (800) 227 4618.
What were the Fund costs for the last year?
(Based on a hypothetical $10,000 investment)
| Class Name | Cost of a $10,000 investment | Costs paid as a percentage of a $10,000 investment |
|---|
| Advisor Class | $54 | 0.53% |
How did the Fund perform last year? What affected the Fund’s performance?
For the 12-month period, all share classes, except Class C, outperformed the Bloomberg Municipal Bond Index, before sales charges. Sector and security selection, as well as an overweight to credit contributed to performance, relative to the benchmark. Security selection within water and sewer and prepay energy contributed, while selection within miscellaneous revenue and not-for-profit health care detracted.
The Fund used derivatives for hedging purposes in the form of interest rate swaps, which contributed to performance, and Consumer Price Index swaps, which had no material impact on performance.
Top contributors to performance:
Top detractors from performance:
Security Selection
Top contributors
Sector
Top contributors
Public Primary/Secondary Education
Top detractors
Not-for-Profit Health Care
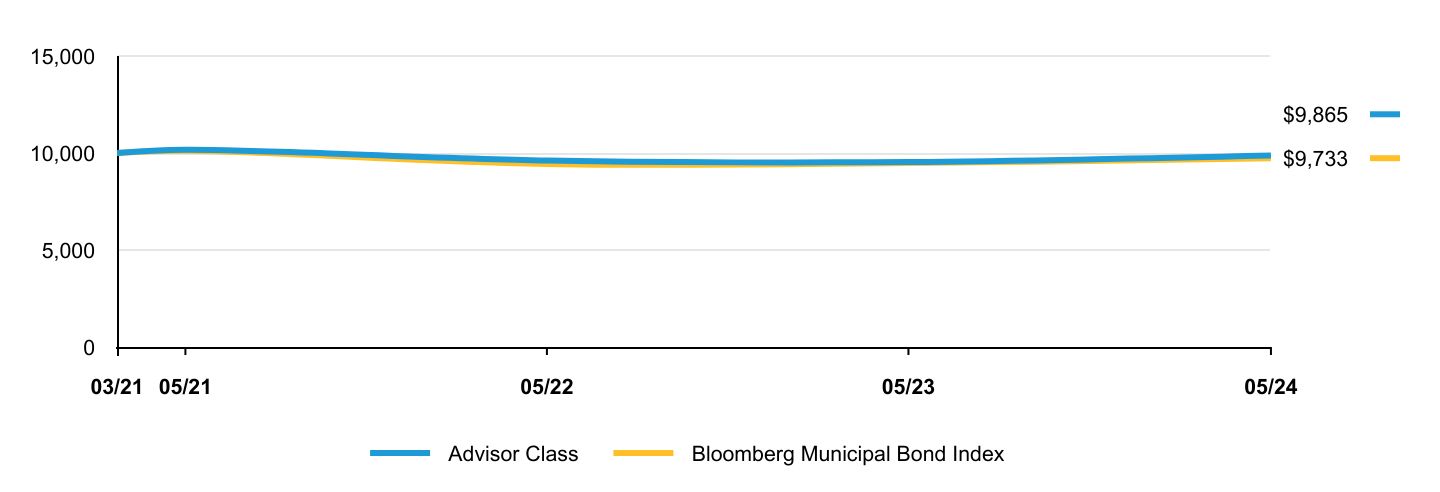
The following graph shows the performance of hypothetical $10,000 investments in the Fund and a broad-based securities market index over the most recently completed 10 fiscal years of the Fund. The Fund's performance reflects sales charges and assumes the reinvestment of dividends.
| Advisor Class | Bloomberg Municipal Bond Index |
|---|
| 03/21 | $10,000 | $10,000 |
| 05/21 | $10,166 | $10,121 |
| 05/22 | $9,617 | $9,433 |
| 05/23 | $9,536 | $9,479 |
| 05/24 | $9,865 | $9,733 |
Average Annual Total Returns
| 1 Year | Since Inception 3/24/21 |
|---|
| Advisor Class (without sales charge) | 3.45% | |
| Advisor Class (with sales charge) | 3.45% | -0.42% |
| Bloomberg Municipal Bond Index | 2.67% | |
The Fund’s past performance is not a good predictor of the Fund’s future performance.
The graph and table do not reflect the deduction of taxes that a shareholder would pay on Fund distributions or redemption of Fund shares.
Visit https://www.abfunds.com/link/AB/AAZYX-A for the most recent performance information.
| Net Assets | $80,415,523 |
| # of Portfolio Holdings | 97 |
| Portfolio Turnover Rate | 5% |
| Total Advisory Fees Paid | $128,253 |
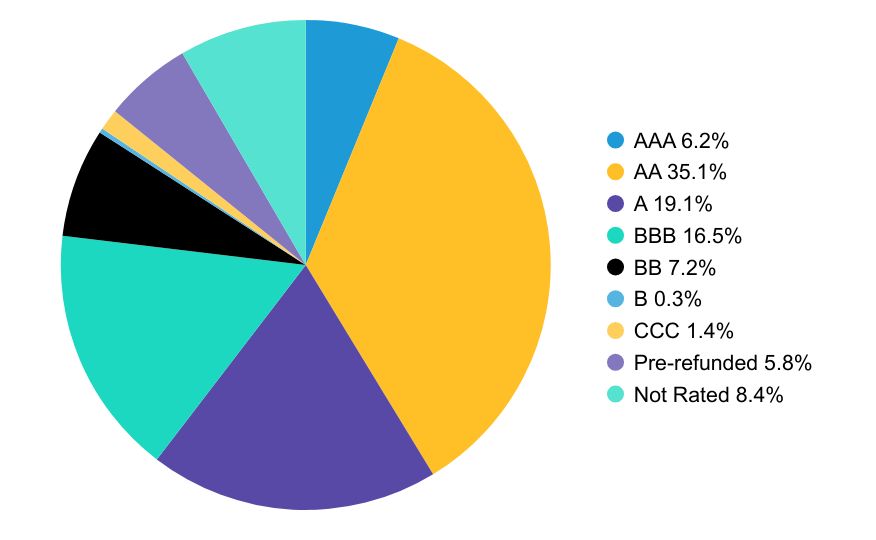
Graphical Representation of Holdings
Credit Rating BreakdownFootnote Reference*
| Value | Value |
|---|
| AAA | 6.2% |
| AA | 35.1% |
| A | 19.1% |
| BBB | 16.5% |
| BB | 7.2% |
| B | 0.3% |
| CCC | 1.4% |
| Pre-refunded | 5.8% |
| Not Rated | 8.4% |
*The Fund’s quality rating breakdown is expressed as a percentage of the Fund’s total investments in municipal securities and may vary over time. The quality ratings are determined by using the S&P Global Ratings (“S&P”), Moody’s Investors Services, Inc. (“Moody’s”) and Fitch Ratings, Ltd. (“Fitch”). The Fund considers the credit ratings issued by S&P, Moody’s and Fitch and uses the highest rating used by the agencies. These ratings are a measure of the quality and safety of a bond or portfolio, based on the issuer’s financial condition. AAA is the highest (best) and D is the lowest (worst). If applicable, the pre-refunded category includes bonds which are secured by U.S. Government securities and therefore are deemed high-quality investment grade by Alliance Bernstein L.P. (the “Adviser”). If applicable, Not Applicable (N/A) includes non-credit worthy investments; such as, currency contracts, futures and options. If applicable, the Not Rated category includes bonds that are not rated by a nationally recognized statistical rating organization. The Adviser evaluates the creditworthiness of non-rated securities based on a number of factors including, but not limited to, cash flows, enterprise value and economic environment.
Availability of Additional Information
You can find additional information on the Fund’s website at https://www.abfunds.com/link/AB/AAZYX-A, including the Fund's:
• Prospectus
• Financial information
• Fund holdings
• Proxy voting information
You can also request this information by contacting us at (800) 227 4618.
Shareholders who have consented to receive a single annual or semi-annual shareholder report at a shared address may revoke this consent by contacting us at (800) 227 4618.
Information Regarding the Review and Approval of the Fund’s Advisory Agreement
Information regarding the Fund’s Board of Directors’/Trustees’ review of the advisory agreement is available on the Fund’s website https://www.abfunds.com/link/AB/AAZYX-A. You can request this information, free of charge, by contacting us at (800) 227 4618 or by scanning the QR code below.
The [A/B] logo is a registered service mark of AllianceBernstein and AllianceBernstein® is a registered service mark used by permission of the owner, AllianceBernstein L.P.
Please scan QR code for
Fund Information
Please scan QR code for
Fund Information
Annual Shareholder Report
This annual shareholder report contains important information about the AB Arizona Portfolio (the “Fund”) for the period of June 1, 2023 to May 31, 2024. You can find additional information about the Fund at https://www.abfunds.com/link/AB/AAZAX-A. You can also request this information by contacting us at (800) 227 4618.
What were the Fund costs for the last year?
(Based on a hypothetical $10,000 investment)
| Class Name | Cost of a $10,000 investment | Costs paid as a percentage of a $10,000 investment |
|---|
| Class A | $79 | 0.78% |
How did the Fund perform last year? What affected the Fund’s performance?
For the 12-month period, all share classes, except Class C, outperformed the Bloomberg Municipal Bond Index, before sales charges. Sector and security selection, as well as an overweight to credit contributed to performance, relative to the benchmark. Security selection within water and sewer and prepay energy contributed, while selection within miscellaneous revenue and not-for-profit health care detracted.
The Fund used derivatives for hedging purposes in the form of interest rate swaps, which contributed to performance, and Consumer Price Index swaps, which had no material impact on performance.
Top contributors to performance:
Top detractors from performance:
Security Selection
Top contributors
Sector
Top contributors
Public Primary/Secondary Education
Top detractors
Not-for-Profit Health Care
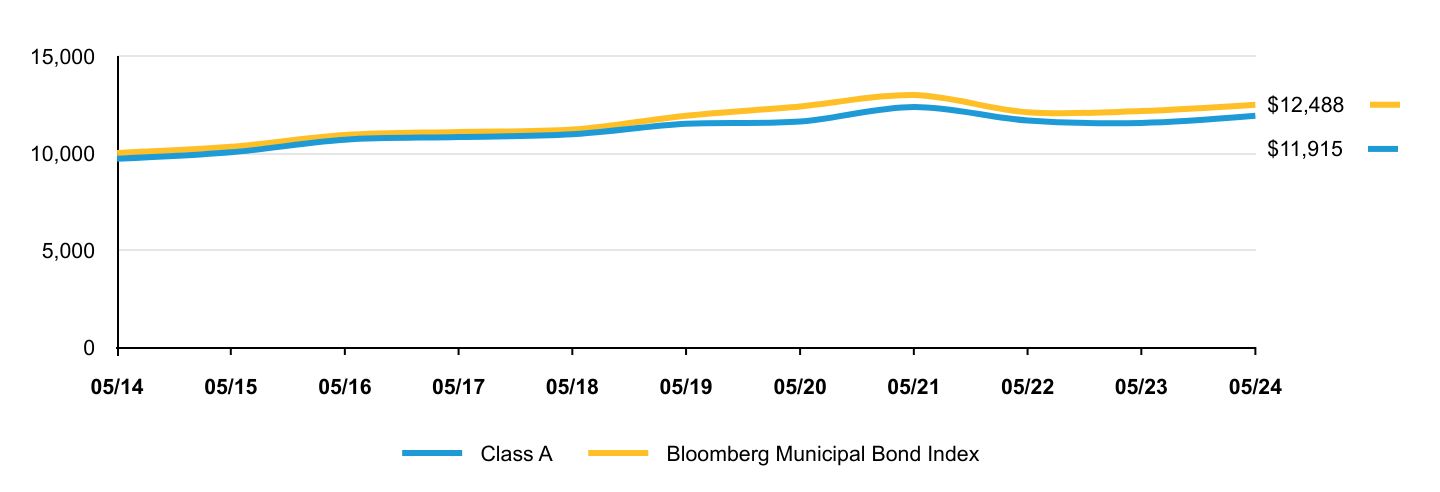
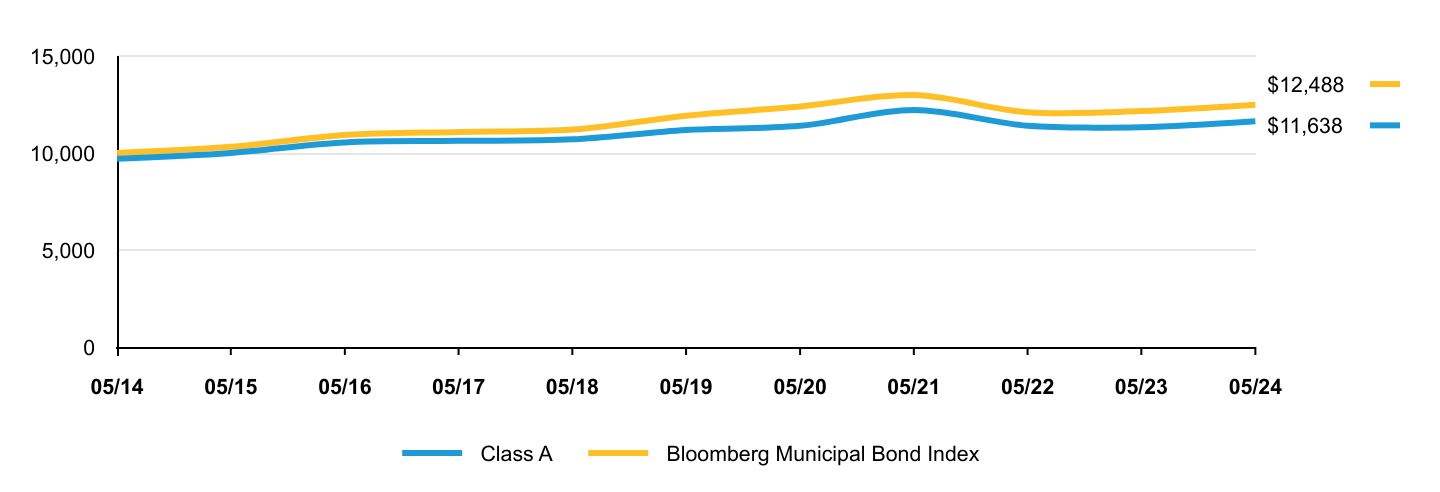
The following graph shows the performance of hypothetical $10,000 investments in the Fund and a broad-based securities market index over the most recently completed 10 fiscal years of the Fund. The Fund's performance reflects sales charges and assumes the reinvestment of dividends.
| Class A | Bloomberg Municipal Bond Index |
|---|
| 05/14 | $9,701 | $10,000 |
| 05/15 | $10,033 | $10,318 |
| 05/16 | $10,685 | $10,924 |
| 05/17 | $10,822 | $11,083 |
| 05/18 | $10,963 | $11,207 |
| 05/19 | $11,504 | $11,925 |
| 05/20 | $11,620 | $12,399 |
| 05/21 | $12,371 | $12,986 |
| 05/22 | $11,675 | $12,104 |
| 05/23 | $11,547 | $12,163 |
| 05/24 | $11,915 | $12,488 |
Average Annual Total Returns
| 1 Year | 5 Years | 10 Years |
|---|
| Class A (without sales charge) | 3.18% | 0.66% | 2.08% |
| Class A (with sales charge) | 0.12% | 0.04% | 1.77% |
| Bloomberg Municipal Bond Index | 2.67% | 0.93% | 2.25% |
The Fund’s past performance is not a good predictor of the Fund’s future performance.
The graph and table do not reflect the deduction of taxes that a shareholder would pay on Fund distributions or redemption of Fund shares.
Visit https://www.abfunds.com/link/AB/AAZAX-A for the most recent performance information.
| Net Assets | $80,415,523 |
| # of Portfolio Holdings | 97 |
| Portfolio Turnover Rate | 5% |
| Total Advisory Fees Paid | $128,253 |
Graphical Representation of Holdings
Credit Rating BreakdownFootnote Reference*
| Value | Value |
|---|
| AAA | 6.2% |
| AA | 35.1% |
| A | 19.1% |
| BBB | 16.5% |
| BB | 7.2% |
| B | 0.3% |
| CCC | 1.4% |
| Pre-refunded | 5.8% |
| Not Rated | 8.4% |
*The Fund’s quality rating breakdown is expressed as a percentage of the Fund’s total investments in municipal securities and may vary over time. The quality ratings are determined by using the S&P Global Ratings (“S&P”), Moody’s Investors Services, Inc. (“Moody’s”) and Fitch Ratings, Ltd. (“Fitch”). The Fund considers the credit ratings issued by S&P, Moody’s and Fitch and uses the highest rating used by the agencies. These ratings are a measure of the quality and safety of a bond or portfolio, based on the issuer’s financial condition. AAA is the highest (best) and D is the lowest (worst). If applicable, the pre-refunded category includes bonds which are secured by U.S. Government securities and therefore are deemed high-quality investment grade by Alliance Bernstein L.P. (the “Adviser”). If applicable, Not Applicable (N/A) includes non-credit worthy investments; such as, currency contracts, futures and options. If applicable, the Not Rated category includes bonds that are not rated by a nationally recognized statistical rating organization. The Adviser evaluates the creditworthiness of non-rated securities based on a number of factors including, but not limited to, cash flows, enterprise value and economic environment.
Availability of Additional Information
You can find additional information on the Fund’s website at https://www.abfunds.com/link/AB/AAZAX-A, including the Fund's:
• Prospectus
• Financial information
• Fund holdings
• Proxy voting information
You can also request this information by contacting us at (800) 227 4618.
Shareholders who have consented to receive a single annual or semi-annual shareholder report at a shared address may revoke this consent by contacting us at (800) 227 4618.
Information Regarding the Review and Approval of the Fund’s Advisory Agreement
Information regarding the Fund’s Board of Directors’/Trustees’ review of the advisory agreement is available on the Fund’s website https://www.abfunds.com/link/AB/AAZAX-A. You can request this information, free of charge, by contacting us at (800) 227 4618 or by scanning the QR code below.
The [A/B] logo is a registered service mark of AllianceBernstein and AllianceBernstein® is a registered service mark used by permission of the owner, AllianceBernstein L.P.
Please scan QR code for
Fund Information
Please scan QR code for
Fund Information
Annual Shareholder Report
This annual shareholder report contains important information about the AB Arizona Portfolio (the “Fund”) for the period of June 1, 2023 to May 31, 2024. You can find additional information about the Fund at https://www.abfunds.com/link/AB/AAZCX-A. You can also request this information by contacting us at (800) 227 4618.
What were the Fund costs for the last year?
(Based on a hypothetical $10,000 investment)
| Class Name | Cost of a $10,000 investment | Costs paid as a percentage of a $10,000 investment |
|---|
| Class C | $155 | 1.53% |
How did the Fund perform last year? What affected the Fund’s performance?
For the 12-month period, all share classes, except Class C, outperformed the Bloomberg Municipal Bond Index, before sales charges. Sector and security selection, as well as an overweight to credit contributed to performance, relative to the benchmark. Security selection within water and sewer and prepay energy contributed, while selection within miscellaneous revenue and not-for-profit health care detracted.
The Fund used derivatives for hedging purposes in the form of interest rate swaps, which contributed to performance, and Consumer Price Index swaps, which had no material impact on performance.
Top contributors to performance:
Top detractors from performance:
Security Selection
Top contributors
Sector
Top contributors
Public Primary/Secondary Education
Top detractors
Not-for-Profit Health Care
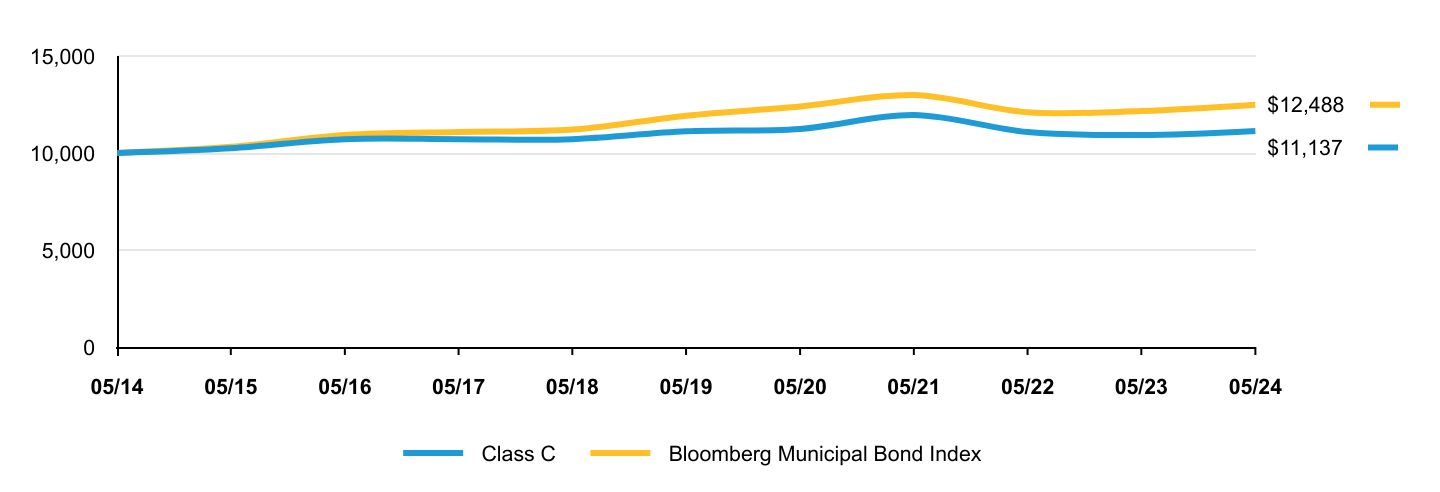
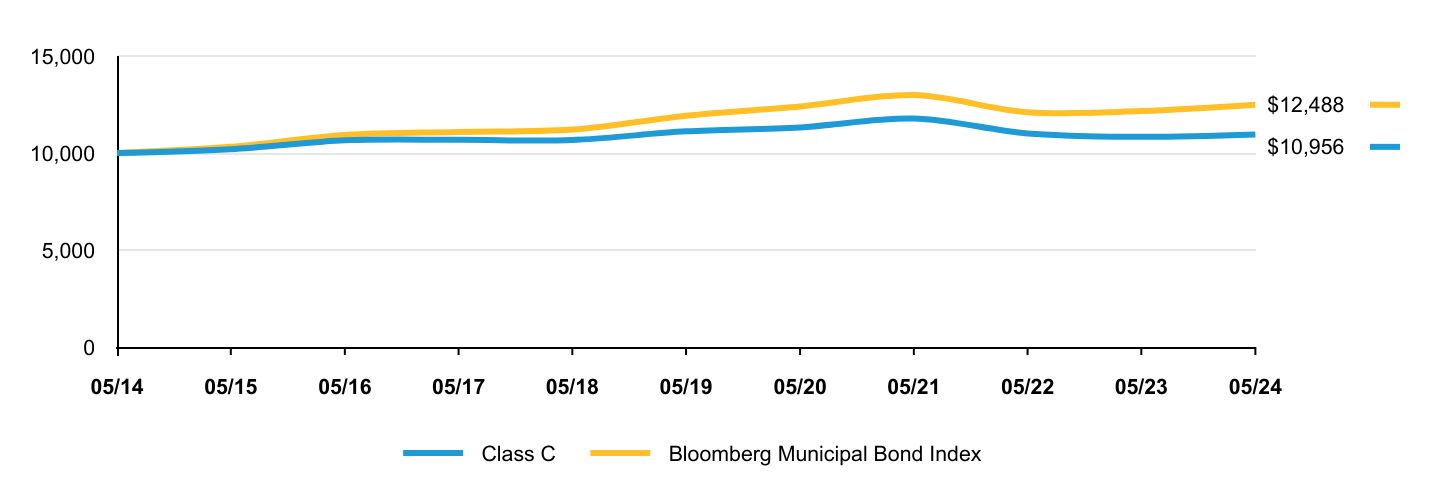
The following graph shows the performance of hypothetical $10,000 investments in the Fund and a broad-based securities market index over the most recently completed 10 fiscal years of the Fund. The Fund's performance reflects sales charges and assumes the reinvestment of dividends.
| Class C | Bloomberg Municipal Bond Index |
|---|
| 05/14 | $10,000 | $10,000 |
| 05/15 | $10,260 | $10,318 |
| 05/16 | $10,856 | $10,924 |
| 05/17 | $10,904 | $11,083 |
| 05/18 | $10,963 | $11,207 |
| 05/19 | $11,427 | $11,925 |
| 05/20 | $11,449 | $12,399 |
| 05/21 | $12,099 | $12,986 |
| 05/22 | $11,341 | $12,104 |
| 05/23 | $11,134 | $12,163 |
| 05/24 | $11,392 | $12,488 |
Average Annual Total Returns
| 1 Year | 5 Years | 10 Years |
|---|
| Class C (without sales charge) | 2.31% | | 1.31% |
| Class C (with sales charge) | 1.31% | -0.10% | 1.31% |
| Bloomberg Municipal Bond Index | 2.67% | 0.93% | 2.25% |
The Fund’s past performance is not a good predictor of the Fund’s future performance.
The graph and table do not reflect the deduction of taxes that a shareholder would pay on Fund distributions or redemption of Fund shares.
Visit https://www.abfunds.com/link/AB/AAZCX-A for the most recent performance information.
| Net Assets | $80,415,523 |
| # of Portfolio Holdings | 97 |
| Portfolio Turnover Rate | 5% |
| Total Advisory Fees Paid | $128,253 |
Graphical Representation of Holdings
Credit Rating BreakdownFootnote Reference*
| Value | Value |
|---|
| AAA | 6.2% |
| AA | 35.1% |
| A | 19.1% |
| BBB | 16.5% |
| BB | 7.2% |
| B | 0.3% |
| CCC | 1.4% |
| Pre-refunded | 5.8% |
| Not Rated | 8.4% |
*The Fund’s quality rating breakdown is expressed as a percentage of the Fund’s total investments in municipal securities and may vary over time. The quality ratings are determined by using the S&P Global Ratings (“S&P”), Moody’s Investors Services, Inc. (“Moody’s”) and Fitch Ratings, Ltd. (“Fitch”). The Fund considers the credit ratings issued by S&P, Moody’s and Fitch and uses the highest rating used by the agencies. These ratings are a measure of the quality and safety of a bond or portfolio, based on the issuer’s financial condition. AAA is the highest (best) and D is the lowest (worst). If applicable, the pre-refunded category includes bonds which are secured by U.S. Government securities and therefore are deemed high-quality investment grade by Alliance Bernstein L.P. (the “Adviser”). If applicable, Not Applicable (N/A) includes non-credit worthy investments; such as, currency contracts, futures and options. If applicable, the Not Rated category includes bonds that are not rated by a nationally recognized statistical rating organization. The Adviser evaluates the creditworthiness of non-rated securities based on a number of factors including, but not limited to, cash flows, enterprise value and economic environment.
Availability of Additional Information
You can find additional information on the Fund’s website at https://www.abfunds.com/link/AB/AAZCX-A, including the Fund's:
• Prospectus
• Financial information
• Fund holdings
• Proxy voting information
You can also request this information by contacting us at (800) 227 4618.
Shareholders who have consented to receive a single annual or semi-annual shareholder report at a shared address may revoke this consent by contacting us at (800) 227 4618.
Information Regarding the Review and Approval of the Fund’s Advisory Agreement
Information regarding the Fund’s Board of Directors’/Trustees’ review of the advisory agreement is available on the Fund’s website https://www.abfunds.com/link/AB/AAZCX-A. You can request this information, free of charge, by contacting us at (800) 227 4618 or by scanning the QR code below.
The [A/B] logo is a registered service mark of AllianceBernstein and AllianceBernstein® is a registered service mark used by permission of the owner, AllianceBernstein L.P.
Please scan QR code for
Fund Information
AB Massachusetts Portfolio
Please scan QR code for
Fund Information
Annual Shareholder Report
This annual shareholder report contains important information about the AB Massachusetts Portfolio (the “Fund”) for the period of June 1, 2023 to May 31, 2024. You can find additional information about the Fund at https://www.abfunds.com/link/AB/AMAYX-A. You can also request this information by contacting us at (800) 227 4618.
What were the Fund costs for the last year?
(Based on a hypothetical $10,000 investment)
| Class Name | Cost of a $10,000 investment | Costs paid as a percentage of a $10,000 investment |
|---|
| Advisor Class | $53 | 0.52% |
How did the Fund perform last year? What affected the Fund’s performance?
For the 12-month period, all share classes, except Class C, outperformed the Bloomberg Municipal Bond Index, before sales charges. Security selection and an overweight to credit contributed to performance, relative to the benchmark. Security selection within private higher education and special tax contributed, while selection in the not-for-profit health care and utility Industrial Development Revenue (“IDR”) detracted.
The Fund used derivatives for hedging purposes in the form of interest rate swaps, which added to performance, and Consumer Price Index swaps, which had no material impact on performance.
Top contributors to performance:
Top detractors from performance:
Security Selection
Top contributors
Top detractors
Not-for-Profit Health Care
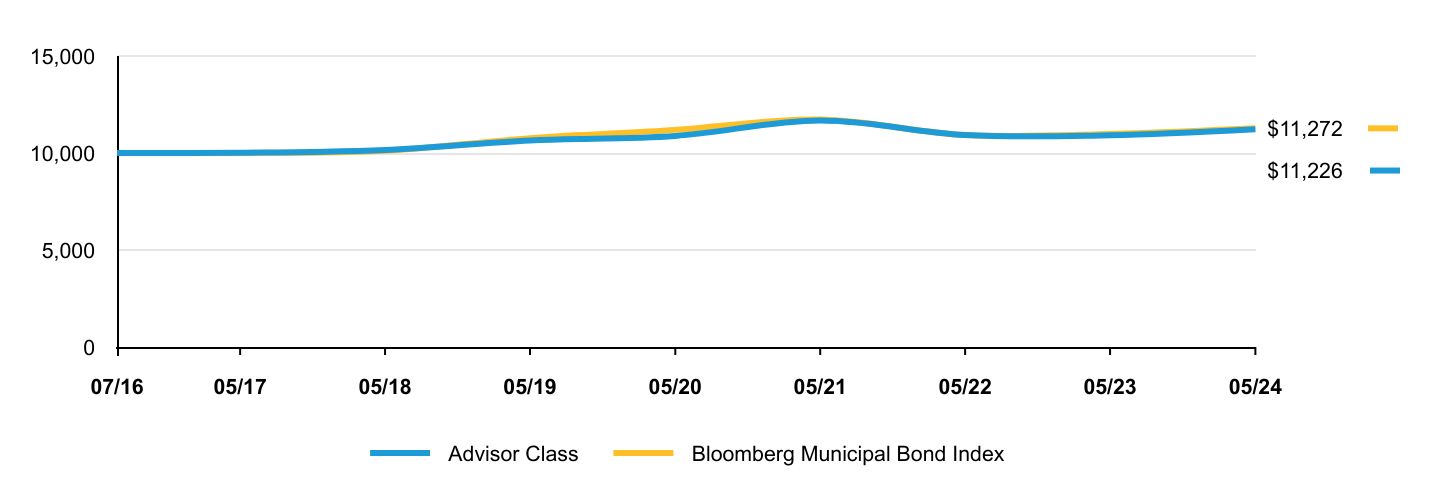
The following graph shows the performance of hypothetical $10,000 investments in the Fund and a broad-based securities market index over the most recently completed 10 fiscal years of the Fund. The Fund's performance reflects sales charges and assumes the reinvestment of dividends.
| Advisor Class | Bloomberg Municipal Bond Index |
|---|
| 07/16 | $10,000 | $10,000 |
| 05/17 | $9,952 | $10,004 |
| 05/18 | $10,052 | $10,116 |
| 05/19 | $10,529 | $10,764 |
| 05/20 | $10,770 | $11,192 |
| 05/21 | $10,569 | $11,722 |
| 05/22 | $10,830 | $10,925 |
| 05/23 | $10,787 | $10,979 |
| 05/24 | $11,095 | $11,272 |
Average Annual Total Returns
| 1 Year | 5 Years | Since Inception 7/26/16 |
|---|
| Advisor Class (without sales charge) | 2.85% | 1.00% | 1.33% |
| Advisor Class (with sales charge) | 2.85% | 1.00% | 1.33% |
| Bloomberg Municipal Bond Index | 2.67% | 0.93% | 1.54% |
The Fund’s past performance is not a good predictor of the Fund’s future performance.
The graph and table do not reflect the deduction of taxes that a shareholder would pay on Fund distributions or redemption of Fund shares.
Visit https://www.abfunds.com/link/AB/AMAYX-A for the most recent performance information.
| Net Assets | $232,659,080 |
| # of Portfolio Holdings | 141 |
| Portfolio Turnover Rate | 15% |
| Total Advisory Fees Paid | $731,658 |
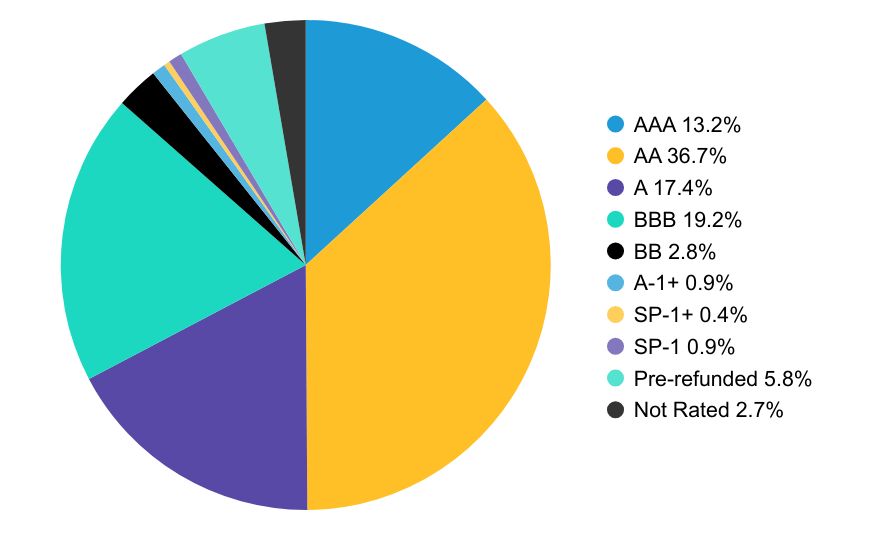
Graphical Representation of Holdings
Credit Rating BreakdownFootnote Reference*
| Value | Value |
|---|
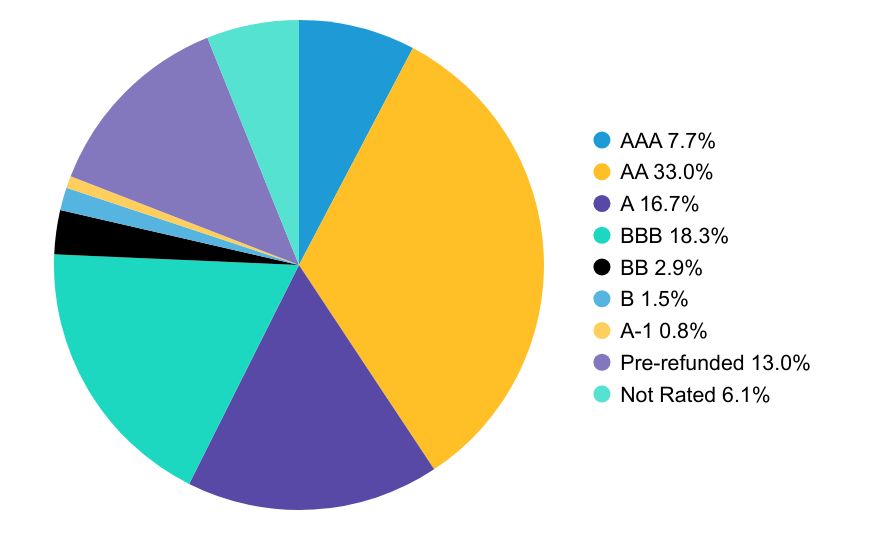
| AAA | 13.2% |
| AA | 36.7% |
| A | 17.4% |
| BBB | 19.2% |
| BB | 2.8% |
| A-1+ | 0.9% |
| SP-1+ | 0.4% |
| SP-1 | 0.9% |
| Pre-refunded | 5.8% |
| Not Rated | 2.7% |
*The Fund’s quality rating breakdown is expressed as a percentage of the Fund’s total investments in municipal securities and may vary over time. The quality ratings are determined by using the S&P Global Ratings (“S&P”), Moody’s Investors Services, Inc. (“Moody’s”) and Fitch Ratings, Ltd. (“Fitch”). The Fund considers the credit ratings issued by S&P, Moody’s and Fitch and uses the highest rating used by the agencies. These ratings are a measure of the quality and safety of a bond or portfolio, based on the issuer’s financial condition. AAA is the highest (best) and D is the lowest (worst). If applicable, the pre-refunded category includes bonds which are secured by U.S. Government securities and therefore are deemed high-quality investment grade by Alliance Bernstein L.P. (the “Adviser”). If applicable, Not Applicable (N/A) includes non-credit worthy investments; such as, currency contracts, futures and options. If applicable, the Not Rated category includes bonds that are not rated by a nationally recognized statistical rating organization. The Adviser evaluates the creditworthiness of non-rated securities based on a number of factors including, but not limited to, cash flows, enterprise value and economic environment.
Availability of Additional Information
You can find additional information on the Fund’s website at https://www.abfunds.com/link/AB/AMAYX-A, including the Fund's:
• Prospectus
• Financial information
• Fund holdings
• Proxy voting information
You can also request this information by contacting us at (800) 227 4618.
Shareholders who have consented to receive a single annual or semi-annual shareholder report at a shared address may revoke this consent by contacting us at (800) 227 4618.
Information Regarding the Review and Approval of the Fund’s Advisory Agreement
Information regarding the Fund’s Board of Directors’/Trustees’ review of the advisory agreement is available on the Fund’s website https://www.abfunds.com/link/AB/AMAYX-A. You can request this information, free of charge, by contacting us at (800) 227 4618 or by scanning the QR code below.
The [A/B] logo is a registered service mark of AllianceBernstein and AllianceBernstein® is a registered service mark used by permission of the owner, AllianceBernstein L.P.
Please scan QR code for
Fund Information
AB Massachusetts Portfolio
Please scan QR code for
Fund Information
Annual Shareholder Report
This annual shareholder report contains important information about the AB Massachusetts Portfolio (the “Fund”) for the period of June 1, 2023 to May 31, 2024. You can find additional information about the Fund at https://www.abfunds.com/link/AB/AMAAX-A. You can also request this information by contacting us at (800) 227 4618.
What were the Fund costs for the last year?
(Based on a hypothetical $10,000 investment)
| Class Name | Cost of a $10,000 investment | Costs paid as a percentage of a $10,000 investment |
|---|
| Class A | $78 | 0.77% |
How did the Fund perform last year? What affected the Fund’s performance?
For the 12-month period, all share classes, except Class C, outperformed the Bloomberg Municipal Bond Index, before sales charges. Security selection and an overweight to credit contributed to performance, relative to the benchmark. Security selection within private higher education and special tax contributed, while selection in the not-for-profit health care and utility Industrial Development Revenue (“IDR”) detracted.
The Fund used derivatives for hedging purposes in the form of interest rate swaps, which added to performance, and Consumer Price Index swaps, which had no material impact on performance.
Top contributors to performance:
Top detractors from performance:
Security Selection
Top contributors
Top detractors
Not-for-Profit Health Care
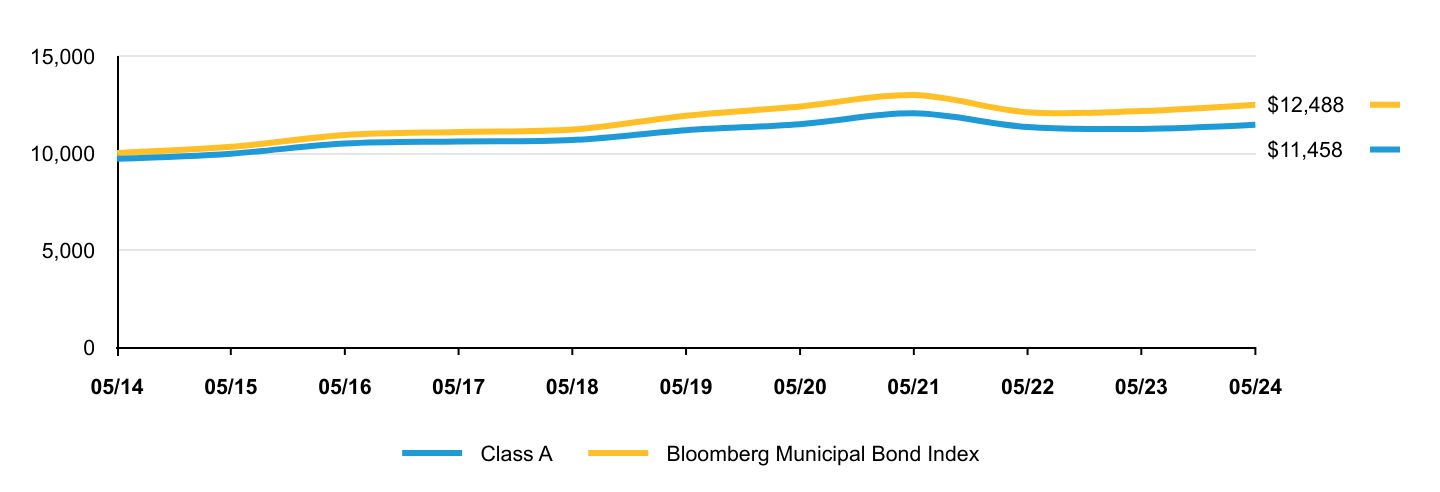
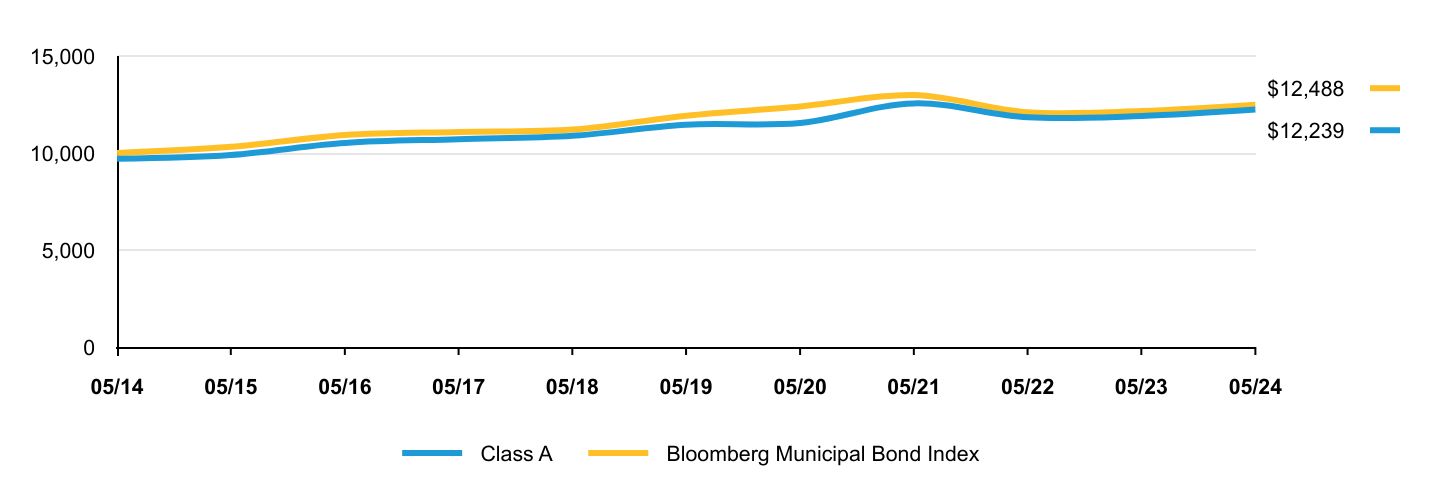
The following graph shows the performance of hypothetical $10,000 investments in the Fund and a broad-based securities market index over the most recently completed 10 fiscal years of the Fund. The Fund's performance reflects sales charges and assumes the reinvestment of dividends.
| Class A | Bloomberg Municipal Bond Index |
|---|
| 05/14 | $9,702 | $10,000 |
| 05/15 | $10,005 | $10,318 |
| 05/16 | $10,544 | $10,924 |
| 05/17 | $10,626 | $11,083 |
| 05/18 | $10,705 | $11,207 |
| 05/19 | $11,186 | $11,925 |
| 05/20 | $11,401 | $12,399 |
| 05/21 | $12,217 | $12,986 |
| 05/22 | $11,407 | $12,104 |
| 05/23 | $11,333 | $12,163 |
| 05/24 | $11,638 | $12,488 |
Average Annual Total Returns
| 1 Year | 5 Years | 10 Years |
|---|
| Class A (without sales charge) | 2.69% | 0.75% | 1.84% |
| Class A (with sales charge) | -0.40% | 0.13% | 1.53% |
| Bloomberg Municipal Bond Index | 2.67% | 0.93% | 2.25% |
The Fund’s past performance is not a good predictor of the Fund’s future performance.
The graph and table do not reflect the deduction of taxes that a shareholder would pay on Fund distributions or redemption of Fund shares.
Visit https://www.abfunds.com/link/AB/AMAAX-A for the most recent performance information.
| Net Assets | $232,659,080 |
| # of Portfolio Holdings | 141 |
| Portfolio Turnover Rate | 15% |
| Total Advisory Fees Paid | $731,658 |
Graphical Representation of Holdings
Credit Rating BreakdownFootnote Reference*
| Value | Value |
|---|
| AAA | 13.2% |
| AA | 36.7% |
| A | 17.4% |
| BBB | 19.2% |
| BB | 2.8% |
| A-1+ | 0.9% |
| SP-1+ | 0.4% |
| SP-1 | 0.9% |
| Pre-refunded | 5.8% |
| Not Rated | 2.7% |
*The Fund’s quality rating breakdown is expressed as a percentage of the Fund’s total investments in municipal securities and may vary over time. The quality ratings are determined by using the S&P Global Ratings (“S&P”), Moody’s Investors Services, Inc. (“Moody’s”) and Fitch Ratings, Ltd. (“Fitch”). The Fund considers the credit ratings issued by S&P, Moody’s and Fitch and uses the highest rating used by the agencies. These ratings are a measure of the quality and safety of a bond or portfolio, based on the issuer’s financial condition. AAA is the highest (best) and D is the lowest (worst). If applicable, the pre-refunded category includes bonds which are secured by U.S. Government securities and therefore are deemed high-quality investment grade by Alliance Bernstein L.P. (the “Adviser”). If applicable, Not Applicable (N/A) includes non-credit worthy investments; such as, currency contracts, futures and options. If applicable, the Not Rated category includes bonds that are not rated by a nationally recognized statistical rating organization. The Adviser evaluates the creditworthiness of non-rated securities based on a number of factors including, but not limited to, cash flows, enterprise value and economic environment.
Availability of Additional Information
You can find additional information on the Fund’s website at https://www.abfunds.com/link/AB/AMAAX-A, including the Fund's:
• Prospectus
• Financial information
• Fund holdings
• Proxy voting information
You can also request this information by contacting us at (800) 227 4618.
Shareholders who have consented to receive a single annual or semi-annual shareholder report at a shared address may revoke this consent by contacting us at (800) 227 4618.
Information Regarding the Review and Approval of the Fund’s Advisory Agreement
Information regarding the Fund’s Board of Directors’/Trustees’ review of the advisory agreement is available on the Fund’s website https://www.abfunds.com/link/AB/AMAAX-A. You can request this information, free of charge, by contacting us at (800) 227 4618 or by scanning the QR code below.
The [A/B] logo is a registered service mark of AllianceBernstein and AllianceBernstein® is a registered service mark used by permission of the owner, AllianceBernstein L.P.
Please scan QR code for
Fund Information
AB Massachusetts Portfolio
Please scan QR code for
Fund Information
Annual Shareholder Report
This annual shareholder report contains important information about the AB Massachusetts Portfolio (the “Fund”) for the period of June 1, 2023 to May 31, 2024. You can find additional information about the Fund at https://www.abfunds.com/link/AB/AMACX-A. You can also request this information by contacting us at (800) 227 4618.
What were the Fund costs for the last year?
(Based on a hypothetical $10,000 investment)
| Class Name | Cost of a $10,000 investment | Costs paid as a percentage of a $10,000 investment |
|---|
| Class C | $153 | 1.52% |
How did the Fund perform last year? What affected the Fund’s performance?
For the 12-month period, all share classes, except Class C, outperformed the Bloomberg Municipal Bond Index, before sales charges. Security selection and an overweight to credit contributed to performance, relative to the benchmark. Security selection within private higher education and special tax contributed, while selection in the not-for-profit health care and utility Industrial Development Revenue (“IDR”) detracted.
The Fund used derivatives for hedging purposes in the form of interest rate swaps, which added to performance, and Consumer Price Index swaps, which had no material impact on performance.
Top contributors to performance:
Top detractors from performance:
Security Selection
Top contributors
Top detractors
Not-for-Profit Health Care
The following graph shows the performance of hypothetical $10,000 investments in the Fund and a broad-based securities market index over the most recently completed 10 fiscal years of the Fund. The Fund's performance reflects sales charges and assumes the reinvestment of dividends.
| Class C | Bloomberg Municipal Bond Index |
|---|
| 05/14 | $10,000 | $10,000 |
| 05/15 | $10,240 | $10,318 |
| 05/16 | $10,712 | $10,924 |
| 05/17 | $10,715 | $11,083 |
| 05/18 | $10,714 | $11,207 |
| 05/19 | $11,121 | $11,925 |
| 05/20 | $11,243 | $12,399 |
| 05/21 | $11,959 | $12,986 |
| 05/22 | $11,080 | $12,104 |
| 05/23 | $10,926 | $12,163 |
| 05/24 | $11,137 | $12,488 |
Average Annual Total Returns
| 1 Year | 5 Years | 10 Years |
|---|
| Class C (without sales charge) | 1.92% | | 1.08% |
| Class C (with sales charge) | 0.93% | -0.01% | 1.08% |
| Bloomberg Municipal Bond Index | 2.67% | 0.93% | 2.25% |
The Fund’s past performance is not a good predictor of the Fund’s future performance.
The graph and table do not reflect the deduction of taxes that a shareholder would pay on Fund distributions or redemption of Fund shares.
Visit https://www.abfunds.com/link/AB/AMACX-A for the most recent performance information.
| Net Assets | $232,659,080 |
| # of Portfolio Holdings | 141 |
| Portfolio Turnover Rate | 15% |
| Total Advisory Fees Paid | $731,658 |
Graphical Representation of Holdings
Credit Rating BreakdownFootnote Reference*
| Value | Value |
|---|
| AAA | 13.2% |
| AA | 36.7% |
| A | 17.4% |
| BBB | 19.2% |
| BB | 2.8% |
| A-1+ | 0.9% |
| SP-1+ | 0.4% |
| SP-1 | 0.9% |
| Pre-refunded | 5.8% |
| Not Rated | 2.7% |
*The Fund’s quality rating breakdown is expressed as a percentage of the Fund’s total investments in municipal securities and may vary over time. The quality ratings are determined by using the S&P Global Ratings (“S&P”), Moody’s Investors Services, Inc. (“Moody’s”) and Fitch Ratings, Ltd. (“Fitch”). The Fund considers the credit ratings issued by S&P, Moody’s and Fitch and uses the highest rating used by the agencies. These ratings are a measure of the quality and safety of a bond or portfolio, based on the issuer’s financial condition. AAA is the highest (best) and D is the lowest (worst). If applicable, the pre-refunded category includes bonds which are secured by U.S. Government securities and therefore are deemed high-quality investment grade by Alliance Bernstein L.P. (the “Adviser”). If applicable, Not Applicable (N/A) includes non-credit worthy investments; such as, currency contracts, futures and options. If applicable, the Not Rated category includes bonds that are not rated by a nationally recognized statistical rating organization. The Adviser evaluates the creditworthiness of non-rated securities based on a number of factors including, but not limited to, cash flows, enterprise value and economic environment.
Availability of Additional Information
You can find additional information on the Fund’s website at https://www.abfunds.com/link/AB/AMACX-A, including the Fund's:
• Prospectus
• Financial information
• Fund holdings
• Proxy voting information
You can also request this information by contacting us at (800) 227 4618.
Shareholders who have consented to receive a single annual or semi-annual shareholder report at a shared address may revoke this consent by contacting us at (800) 227 4618.
Information Regarding the Review and Approval of the Fund’s Advisory Agreement
Information regarding the Fund’s Board of Directors’/Trustees’ review of the advisory agreement is available on the Fund’s website https://www.abfunds.com/link/AB/AMACX-A. You can request this information, free of charge, by contacting us at (800) 227 4618 or by scanning the QR code below.
The [A/B] logo is a registered service mark of AllianceBernstein and AllianceBernstein® is a registered service mark used by permission of the owner, AllianceBernstein L.P.
Please scan QR code for
Fund Information
Please scan QR code for
Fund Information
Annual Shareholder Report
This annual shareholder report contains important information about the AB Minnesota Portfolio (the “Fund”) for the period of June 1, 2023 to May 31, 2024. You can find additional information about the Fund at https://www.abfunds.com/link/AB/AMNAX-A. You can also request this information by contacting us at (800) 227 4618.
What were the Fund costs for the last year?
(Based on a hypothetical $10,000 investment)
| Class Name | Cost of a $10,000 investment | Costs paid as a percentage of a $10,000 investment |
|---|
| Class A | $86 | 0.85% |
How did the Fund perform last year? What affected the Fund’s performance?
For the 12-month period, both share classes underperformed the Bloomberg Municipal Bond Index, before sales charges. Sector and security selection detracted from overall performance, relative to the benchmark. Specifically, security selection within local general obligation and not-for-profit health care detracted, while selection within miscellaneous revenue and senior living contributed.
The Fund used derivatives for hedging purposes in the form of interest rate swaps, which contributed to performance, and Consumer Price Index swaps, which had no material impact on performance.
Top contributors to performance:
Top detractors from performance:
During the 12-month period, negative sector allocation and security selection detracted from overall performance. Specifically, an underweight to toll roads and an overweight to local general obligation detracted.
Security Selection
Top contributors
Sector
Top contributors
Not-for-Profit Health Care
Top detractors
Not-for-Profit Health Care
The following graph shows the performance of hypothetical $10,000 investments in the Fund and a broad-based securities market index over the most recently completed 10 fiscal years of the Fund. The Fund's performance reflects sales charges and assumes the reinvestment of dividends.
| Class A | Bloomberg Municipal Bond Index |
|---|
| 05/14 | $9,702 | $10,000 |
| 05/15 | $9,966 | $10,318 |
| 05/16 | $10,488 | $10,924 |
| 05/17 | $10,596 | $11,083 |
| 05/18 | $10,669 | $11,207 |
| 05/19 | $11,178 | $11,925 |
| 05/20 | $11,485 | $12,399 |
| 05/21 | $12,044 | $12,986 |
| 05/22 | $11,339 | $12,104 |
| 05/23 | $11,243 | $12,163 |
| 05/24 | $11,458 | $12,488 |
Average Annual Total Returns
| 1 Year | 5 Years | 10 Years |
|---|
| Class A (without sales charge) | 1.92% | 0.45% | 1.68% |
| Class A (with sales charge) | -1.13% | -0.16% | 1.37% |
| Bloomberg Municipal Bond Index | 2.67% | 0.93% | 2.25% |
The Fund’s past performance is not a good predictor of the Fund’s future performance.
The graph and table do not reflect the deduction of taxes that a shareholder would pay on Fund distributions or redemption of Fund shares.
Visit https://www.abfunds.com/link/AB/AMNAX-A for the most recent performance information.
| Net Assets | $30,611,642 |
| # of Portfolio Holdings | 42 |
| Portfolio Turnover Rate | 4% |
| Total Advisory Fees Paid | $(88,989) |
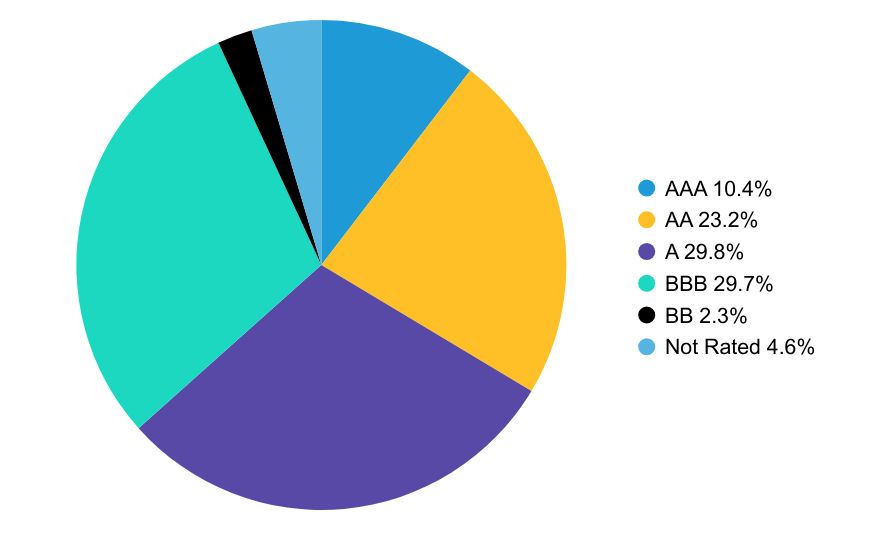
Graphical Representation of Holdings
Credit Rating BreakdownFootnote Reference*
| Value | Value |
|---|
| AAA | 10.4% |
| AA | 23.2% |
| A | 29.8% |
| BBB | 29.7% |
| BB | 2.3% |
| Not Rated | 4.6% |
*The Fund’s quality rating breakdown is expressed as a percentage of the Fund’s total investments in municipal securities and may vary over time. The quality ratings are determined by using the S&P Global Ratings (“S&P”), Moody’s Investors Services, Inc. (“Moody’s”) and Fitch Ratings, Ltd. (“Fitch”). The Fund considers the credit ratings issued by S&P, Moody’s and Fitch and uses the highest rating used by the agencies. These ratings are a measure of the quality and safety of a bond or portfolio, based on the issuer’s financial condition. AAA is the highest (best) and D is the lowest (worst). If applicable, the pre-refunded category includes bonds which are secured by U.S. Government securities and therefore are deemed high-quality investment grade by Alliance Bernstein L.P. (the “Adviser”). If applicable, Not Applicable (N/A) includes non-credit worthy investments; such as, currency contracts, futures and options. If applicable, the Not Rated category includes bonds that are not rated by a nationally recognized statistical rating organization. The Adviser evaluates the creditworthiness of non-rated securities based on a number of factors including, but not limited to, cash flows, enterprise value and economic environment.
Availability of Additional Information
You can find additional information on the Fund’s website at https://www.abfunds.com/link/AB/AMNAX-A, including the Fund's:
• Prospectus
• Financial information
• Fund holdings
• Proxy voting information
You can also request this information by contacting us at (800) 227 4618.
Shareholders who have consented to receive a single annual or semi-annual shareholder report at a shared address may revoke this consent by contacting us at (800) 227 4618.
Information Regarding the Review and Approval of the Fund’s Advisory Agreement
Information regarding the Fund’s Board of Directors’/Trustees’ review of the advisory agreement is available on the Fund’s website https://www.abfunds.com/link/AB/AMNAX-A. You can request this information, free of charge, by contacting us at (800) 227 4618 or by scanning the QR code below.
The [A/B] logo is a registered service mark of AllianceBernstein and AllianceBernstein® is a registered service mark used by permission of the owner, AllianceBernstein L.P.
Please scan QR code for
Fund Information
Please scan QR code for
Fund Information
Annual Shareholder Report
This annual shareholder report contains important information about the AB Minnesota Portfolio (the “Fund”) for the period of June 1, 2023 to May 31, 2024. You can find additional information about the Fund at https://www.abfunds.com/link/AB/AMNCX-A. You can also request this information by contacting us at (800) 227 4618.
What were the Fund costs for the last year?
(Based on a hypothetical $10,000 investment)
| Class Name | Cost of a $10,000 investment | Costs paid as a percentage of a $10,000 investment |
|---|
| Class C | $161 | 1.60% |
How did the Fund perform last year? What affected the Fund’s performance?
For the 12-month period, both share classes underperformed the Bloomberg Municipal Bond Index, before sales charges. Sector and security selection detracted from overall performance, relative to the benchmark. Specifically, security selection within local general obligation and not-for-profit health care detracted, while selection within miscellaneous revenue and senior living contributed.
The Fund used derivatives for hedging purposes in the form of interest rate swaps, which contributed to performance, and Consumer Price Index swaps, which had no material impact on performance.
Top contributors to performance:
Top detractors from performance:
During the 12-month period, negative sector allocation and security selection detracted from overall performance. Specifically, an underweight to toll roads and an overweight to local general obligation detracted.
Security Selection
Top contributors
Sector
Top contributors
Not-for-Profit Health Care
Top detractors
Not-for-Profit Health Care
The following graph shows the performance of hypothetical $10,000 investments in the Fund and a broad-based securities market index over the most recently completed 10 fiscal years of the Fund. The Fund's performance reflects sales charges and assumes the reinvestment of dividends.
| Class C | Bloomberg Municipal Bond Index |
|---|
| 05/14 | $10,000 | $10,000 |
| 05/15 | $10,198 | $10,318 |
| 05/16 | $10,652 | $10,924 |
| 05/17 | $10,681 | $11,083 |
| 05/18 | $10,674 | $11,207 |
| 05/19 | $11,117 | $11,925 |
| 05/20 | $11,318 | $12,399 |
| 05/21 | $11,779 | $12,986 |
| 05/22 | $11,007 | $12,104 |
| 05/23 | $10,832 | $12,163 |
| 05/24 | $10,956 | $12,488 |
Average Annual Total Returns
| 1 Year | 5 Years | 10 Years |
|---|
| Class C (without sales charge) | 1.15% | | 0.92% |
| Class C (with sales charge) | 0.15% | -0.32% | 0.92% |
| Bloomberg Municipal Bond Index | 2.67% | 0.93% | 2.25% |
The Fund’s past performance is not a good predictor of the Fund’s future performance.
The graph and table do not reflect the deduction of taxes that a shareholder would pay on Fund distributions or redemption of Fund shares.
Visit https://www.abfunds.com/link/AB/AMNCX-A for the most recent performance information.
| Net Assets | $30,611,642 |
| # of Portfolio Holdings | 42 |
| Portfolio Turnover Rate | 4% |
| Total Advisory Fees Paid | $(88,989) |
Graphical Representation of Holdings
Credit Rating BreakdownFootnote Reference*
| Value | Value |
|---|
| AAA | 10.4% |
| AA | 23.2% |
| A | 29.8% |
| BBB | 29.7% |
| BB | 2.3% |
| Not Rated | 4.6% |
*The Fund’s quality rating breakdown is expressed as a percentage of the Fund’s total investments in municipal securities and may vary over time. The quality ratings are determined by using the S&P Global Ratings (“S&P”), Moody’s Investors Services, Inc. (“Moody’s”) and Fitch Ratings, Ltd. (“Fitch”). The Fund considers the credit ratings issued by S&P, Moody’s and Fitch and uses the highest rating used by the agencies. These ratings are a measure of the quality and safety of a bond or portfolio, based on the issuer’s financial condition. AAA is the highest (best) and D is the lowest (worst). If applicable, the pre-refunded category includes bonds which are secured by U.S. Government securities and therefore are deemed high-quality investment grade by Alliance Bernstein L.P. (the “Adviser”). If applicable, Not Applicable (N/A) includes non-credit worthy investments; such as, currency contracts, futures and options. If applicable, the Not Rated category includes bonds that are not rated by a nationally recognized statistical rating organization. The Adviser evaluates the creditworthiness of non-rated securities based on a number of factors including, but not limited to, cash flows, enterprise value and economic environment.
Availability of Additional Information
You can find additional information on the Fund’s website at https://www.abfunds.com/link/AB/AMNCX-A, including the Fund's:
• Prospectus
• Financial information
• Fund holdings
• Proxy voting information
You can also request this information by contacting us at (800) 227 4618.
Shareholders who have consented to receive a single annual or semi-annual shareholder report at a shared address may revoke this consent by contacting us at (800) 227 4618.
Information Regarding the Review and Approval of the Fund’s Advisory Agreement
Information regarding the Fund’s Board of Directors’/Trustees’ review of the advisory agreement is available on the Fund’s website https://www.abfunds.com/link/AB/AMNCX-A. You can request this information, free of charge, by contacting us at (800) 227 4618 or by scanning the QR code below.
The [A/B] logo is a registered service mark of AllianceBernstein and AllianceBernstein® is a registered service mark used by permission of the owner, AllianceBernstein L.P.
Please scan QR code for
Fund Information
Please scan QR code for
Fund Information
Annual Shareholder Report
This annual shareholder report contains important information about the AB New Jersey Portfolio (the “Fund”) for the period of June 1, 2023 to May 31, 2024. You can find additional information about the Fund at https://www.abfunds.com/link/AB/ANJAX-A. You can also request this information by contacting us at (800) 227 4618.
What were the Fund costs for the last year?
(Based on a hypothetical $10,000 investment)
| Class Name | Cost of a $10,000 investment | Costs paid as a percentage of a $10,000 investment |
|---|
| Class A | $83 | 0.82% |
How did the Fund perform last year? What affected the Fund’s performance?
For the 12-month period, Class A outperformed the Bloomberg Municipal Bond Index, while Class C underperformed, before sales charges. Sector and security selection, as well as an overweight to credit contributed to performance, relative to the benchmark. Security selection within ports and water and sewer contributed, while selection within utility Industrial Development Revenue (“IDR”) and airline IDR detracted from overall performance.
The Fund used derivatives for hedging purposes in the form of interest rate swaps, which contributed to performance, and Consumer Price Index swaps, which had no material impact on performance.
Top contributors to performance:
Top detractors from performance:
Security Selection
Top contributors
Sector
Top contributors
Public Primary/Secondary Education
MSA Tobacco Securitization
Top detractors
Public Primary/Secondary Education
The following graph shows the performance of hypothetical $10,000 investments in the Fund and a broad-based securities market index over the most recently completed 10 fiscal years of the Fund. The Fund's performance reflects sales charges and assumes the reinvestment of dividends.
| Class A | Bloomberg Municipal Bond Index |
|---|
| 05/14 | $9,704 | $10,000 |
| 05/15 | $9,899 | $10,318 |
| 05/16 | $10,520 | $10,924 |
| 05/17 | $10,711 | $11,083 |
| 05/18 | $10,887 | $11,207 |
| 05/19 | $11,459 | $11,925 |
| 05/20 | $11,547 | $12,399 |
| 05/21 | $12,557 | $12,986 |
| 05/22 | $11,840 | $12,104 |
| 05/23 | $11,905 | $12,163 |
| 05/24 | $12,239 | $12,488 |
Average Annual Total Returns
| 1 Year | 5 Years | 10 Years |
|---|
| Class A (without sales charge) | 2.81% | 1.27% | 2.35% |
| Class A (with sales charge) | -0.28% | 0.67% | 2.04% |
| Bloomberg Municipal Bond Index | 2.67% | 0.93% | 2.25% |
The Fund’s past performance is not a good predictor of the Fund’s future performance.
The graph and table do not reflect the deduction of taxes that a shareholder would pay on Fund distributions or redemption of Fund shares.
Visit https://www.abfunds.com/link/AB/ANJAX-A for the most recent performance information.
| Net Assets | $63,272,727 |
| # of Portfolio Holdings | 81 |
| Portfolio Turnover Rate | 14% |
| Total Advisory Fees Paid | $38,715 |
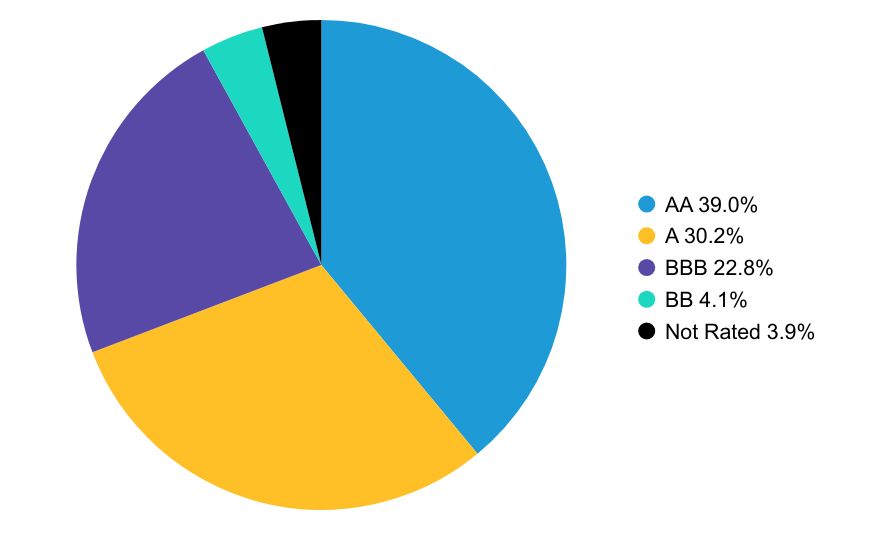
Graphical Representation of Holdings
Credit Rating BreakdownFootnote Reference*
| Value | Value |
|---|
| AA | 39.0% |
| A | 30.2% |
| BBB | 22.8% |
| BB | 4.1% |
| Not Rated | 3.9% |
*The Fund’s quality rating breakdown is expressed as a percentage of the Fund’s total investments in municipal securities and may vary over time. The quality ratings are determined by using the S&P Global Ratings (“S&P”), Moody’s Investors Services, Inc. (“Moody’s”) and Fitch Ratings, Ltd. (“Fitch”). The Fund considers the credit ratings issued by S&P, Moody’s and Fitch and uses the highest rating used by the agencies. These ratings are a measure of the quality and safety of a bond or portfolio, based on the issuer’s financial condition. AAA is the highest (best) and D is the lowest (worst). If applicable, the pre-refunded category includes bonds which are secured by U.S. Government securities and therefore are deemed high-quality investment grade by Alliance Bernstein L.P. (the “Adviser”). If applicable, Not Applicable (N/A) includes non-credit worthy investments; such as, currency contracts, futures and options. If applicable, the Not Rated category includes bonds that are not rated by a nationally recognized statistical rating organization. The Adviser evaluates the creditworthiness of non-rated securities based on a number of factors including, but not limited to, cash flows, enterprise value and economic environment.
Availability of Additional Information
You can find additional information on the Fund’s website at https://www.abfunds.com/link/AB/ANJAX-A, including the Fund's:
• Prospectus
• Financial information
• Fund holdings
• Proxy voting information
You can also request this information by contacting us at (800) 227 4618.
Shareholders who have consented to receive a single annual or semi-annual shareholder report at a shared address may revoke this consent by contacting us at (800) 227 4618.
Information Regarding the Review and Approval of the Fund’s Advisory Agreement
Information regarding the Fund’s Board of Directors’/Trustees’ review of the advisory agreement is available on the Fund’s website https://www.abfunds.com/link/AB/ANJAX-A. You can request this information, free of charge, by contacting us at (800) 227 4618 or by scanning the QR code below.
The [A/B] logo is a registered service mark of AllianceBernstein and AllianceBernstein® is a registered service mark used by permission of the owner, AllianceBernstein L.P.
Please scan QR code for
Fund Information
Please scan QR code for
Fund Information
Annual Shareholder Report
This annual shareholder report contains important information about the AB New Jersey Portfolio (the “Fund”) for the period of June 1, 2023 to May 31, 2024. You can find additional information about the Fund at https://www.abfunds.com/link/AB/ANJCX-A. You can also request this information by contacting us at (800) 227 4618.
What were the Fund costs for the last year?
(Based on a hypothetical $10,000 investment)
| Class Name | Cost of a $10,000 investment | Costs paid as a percentage of a $10,000 investment |
|---|
| Class C | $159 | 1.57% |
How did the Fund perform last year? What affected the Fund’s performance?
For the 12-month period, Class A outperformed the Bloomberg Municipal Bond Index, while Class C underperformed, before sales charges. Sector and security selection, as well as an overweight to credit contributed to performance, relative to the benchmark. Security selection within ports and water and sewer contributed, while selection within utility Industrial Development Revenue (“IDR”) and airline IDR detracted from overall performance.
The Fund used derivatives for hedging purposes in the form of interest rate swaps, which contributed to performance, and Consumer Price Index swaps, which had no material impact on performance.
Top contributors to performance:
Top detractors from performance:
Security Selection
Top contributors
Sector
Top contributors
Public Primary/Secondary Education
MSA Tobacco Securitization
Top detractors
Public Primary/Secondary Education
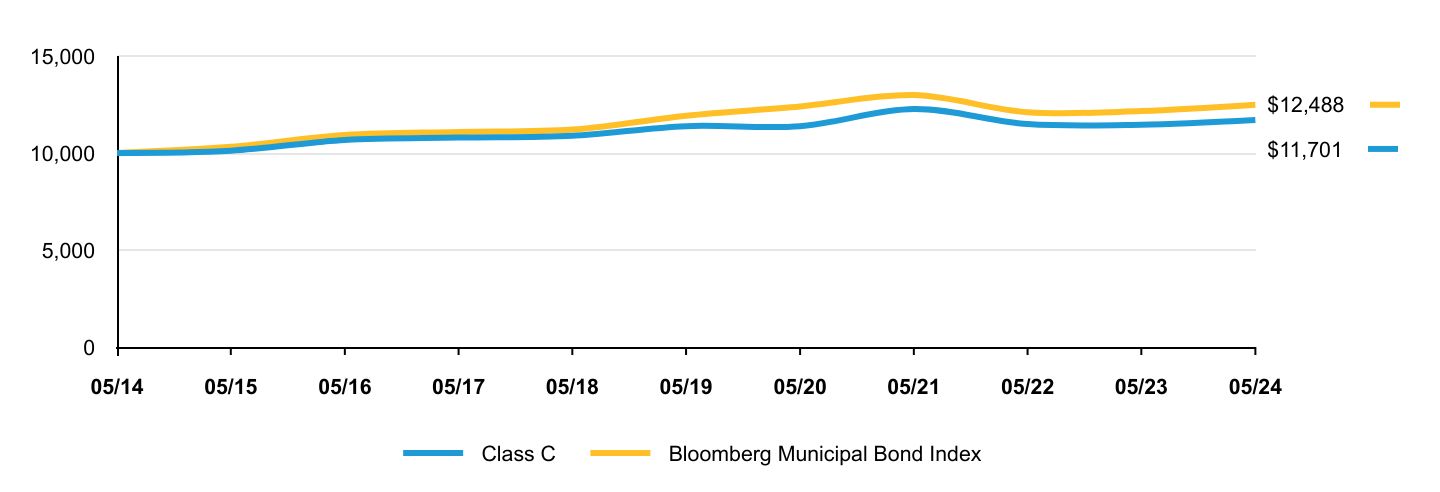
The following graph shows the performance of hypothetical $10,000 investments in the Fund and a broad-based securities market index over the most recently completed 10 fiscal years of the Fund. The Fund's performance reflects sales charges and assumes the reinvestment of dividends.
| Class C | Bloomberg Municipal Bond Index |
|---|
| 05/14 | $10,000 | $10,000 |
| 05/15 | $10,119 | $10,318 |
| 05/16 | $10,672 | $10,924 |
| 05/17 | $10,796 | $11,083 |
| 05/18 | $10,891 | $11,207 |
| 05/19 | $11,384 | $11,925 |
| 05/20 | $11,379 | $12,399 |
| 05/21 | $12,268 | $12,986 |
| 05/22 | $11,491 | $12,104 |
| 05/23 | $11,455 | $12,163 |
| 05/24 | $11,701 | $12,488 |
Average Annual Total Returns
| 1 Year | 5 Years | 10 Years |
|---|
| Class C (without sales charge) | 2.14% | 0.51% | 1.58% |
| Class C (with sales charge) | 1.15% | 0.51% | 1.58% |
| Bloomberg Municipal Bond Index | 2.67% | 0.93% | 2.25% |
The Fund’s past performance is not a good predictor of the Fund’s future performance.
The graph and table do not reflect the deduction of taxes that a shareholder would pay on Fund distributions or redemption of Fund shares.
Visit https://www.abfunds.com/link/AB/ANJCX-A for the most recent performance information.
| Net Assets | $63,272,727 |
| # of Portfolio Holdings | 81 |
| Portfolio Turnover Rate | 14% |
| Total Advisory Fees Paid | $38,715 |
Graphical Representation of Holdings
Credit Rating BreakdownFootnote Reference*
| Value | Value |
|---|
| AA | 39.0% |
| A | 30.2% |
| BBB | 22.8% |
| BB | 4.1% |
| Not Rated | 3.9% |
*The Fund’s quality rating breakdown is expressed as a percentage of the Fund’s total investments in municipal securities and may vary over time. The quality ratings are determined by using the S&P Global Ratings (“S&P”), Moody’s Investors Services, Inc. (“Moody’s”) and Fitch Ratings, Ltd. (“Fitch”). The Fund considers the credit ratings issued by S&P, Moody’s and Fitch and uses the highest rating used by the agencies. These ratings are a measure of the quality and safety of a bond or portfolio, based on the issuer’s financial condition. AAA is the highest (best) and D is the lowest (worst). If applicable, the pre-refunded category includes bonds which are secured by U.S. Government securities and therefore are deemed high-quality investment grade by Alliance Bernstein L.P. (the “Adviser”). If applicable, Not Applicable (N/A) includes non-credit worthy investments; such as, currency contracts, futures and options. If applicable, the Not Rated category includes bonds that are not rated by a nationally recognized statistical rating organization. The Adviser evaluates the creditworthiness of non-rated securities based on a number of factors including, but not limited to, cash flows, enterprise value and economic environment.
Availability of Additional Information
You can find additional information on the Fund’s website at https://www.abfunds.com/link/AB/ANJCX-A, including the Fund's:
• Prospectus
• Financial information
• Fund holdings
• Proxy voting information
You can also request this information by contacting us at (800) 227 4618.
Shareholders who have consented to receive a single annual or semi-annual shareholder report at a shared address may revoke this consent by contacting us at (800) 227 4618.
Information Regarding the Review and Approval of the Fund’s Advisory Agreement
Information regarding the Fund’s Board of Directors’/Trustees’ review of the advisory agreement is available on the Fund’s website https://www.abfunds.com/link/AB/ANJCX-A. You can request this information, free of charge, by contacting us at (800) 227 4618 or by scanning the QR code below.
The [A/B] logo is a registered service mark of AllianceBernstein and AllianceBernstein® is a registered service mark used by permission of the owner, AllianceBernstein L.P.
Please scan QR code for
Fund Information
Please scan QR code for
Fund Information
Annual Shareholder Report
This annual shareholder report contains important information about the AB Ohio Portfolio (the “Fund”) for the period of June 1, 2023 to May 31, 2024. You can find additional information about the Fund at https://www.abfunds.com/link/AB/AOHAX-A. You can also request this information by contacting us at (800) 227 4618.
What were the Fund costs for the last year?
(Based on a hypothetical $10,000 investment)
| Class Name | Cost of a $10,000 investment | Costs paid as a percentage of a $10,000 investment |
|---|
| Class A | $82 | 0.81% |
How did the Fund perform last year? What affected the Fund’s performance?
For the 12-month period, Class A shares outperformed the Bloomberg Municipal Bond Index, while the Class C underperformed the benchmark, before sales charges. Sector and security selection, as well as an overweight to credit, contributed to performance, relative to the benchmark. Security selection within private higher education and miscellaneous revenue contributed, while selection within utility Industrial Development Revenue (“IDR”) and multi-family housing detracted.
The Fund used derivatives for hedging purposes in the form of interest rate swaps, which contributed to performance, and Consumer Price Index swaps, which had no material impact on performance.
Top contributors to performance:
During the 12-month period, security selection, specifically overweights to private higher education and miscellaneous revenue, was the primary contributor to performance.
Top detractors from performance:
Security Selection
Top contributors
Not-for-Profit Health Care
Sector
Top contributors
Not-for-Profit Health Care
The following graph shows the performance of hypothetical $10,000 investments in the Fund and a broad-based securities market index over the most recently completed 10 fiscal years of the Fund. The Fund's performance reflects sales charges and assumes the reinvestment of dividends.
| Class A | Bloomberg Municipal Bond Index |
|---|
| 05/14 | $9,697 | $10,000 |
| 05/15 | $9,991 | $10,318 |
| 05/16 | $10,619 | $10,924 |
| 05/17 | $10,757 | $11,083 |
| 05/18 | $10,819 | $11,207 |
| 05/19 | $11,313 | $11,925 |
| 05/20 | $11,506 | $12,399 |
| 05/21 | $12,357 | $12,986 |
| 05/22 | $11,611 | $12,104 |
| 05/23 | $11,514 | $12,163 |
| 05/24 | $11,908 | $12,488 |
Average Annual Total Returns
| 1 Year | 5 Years | 10 Years |
|---|
| Class A (without sales charge) | 3.42% | 0.98% | 2.08% |
| Class A (with sales charge) | 0.35% | 0.37% | 1.76% |
| Bloomberg Municipal Bond Index | 2.67% | 0.93% | 2.25% |
The Fund’s past performance is not a good predictor of the Fund’s future performance.
The graph and table do not reflect the deduction of taxes that a shareholder would pay on Fund distributions or redemption of Fund shares.
Visit https://www.abfunds.com/link/AB/AOHAX-A for the most recent performance information.
| Net Assets | $43,760,522 |
| # of Portfolio Holdings | 70 |
| Portfolio Turnover Rate | 16% |
| Total Advisory Fees Paid | $(46,474) |
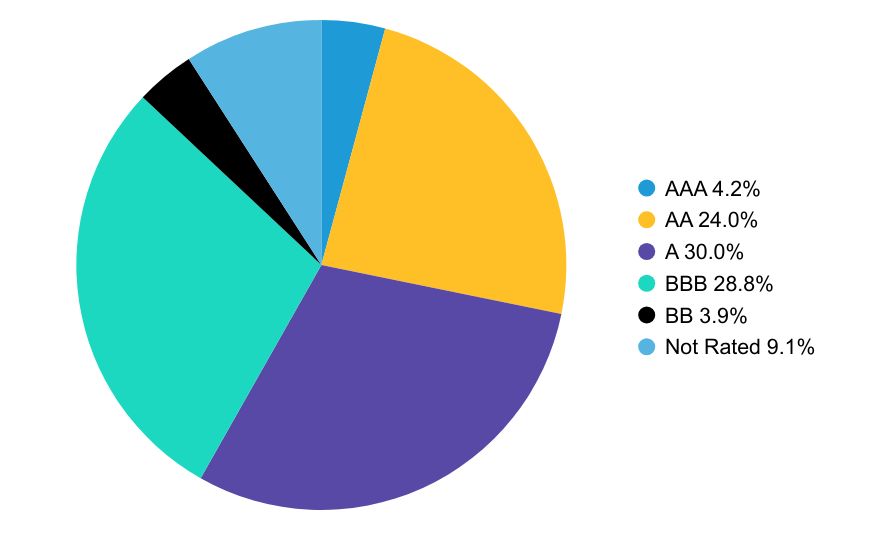
Graphical Representation of Holdings
Credit Rating BreakdownFootnote Reference*
| Value | Value |
|---|
| AAA | 4.2% |
| AA | 24.0% |
| A | 30.0% |
| BBB | 28.8% |
| BB | 3.9% |
| Not Rated | 9.1% |
*The Fund’s quality rating breakdown is expressed as a percentage of the Fund’s total investments in municipal securities and may vary over time. The quality ratings are determined by using the S&P Global Ratings (“S&P”), Moody’s Investors Services, Inc. (“Moody’s”) and Fitch Ratings, Ltd. (“Fitch”). The Fund considers the credit ratings issued by S&P, Moody’s and Fitch and uses the highest rating used by the agencies. These ratings are a measure of the quality and safety of a bond or portfolio, based on the issuer’s financial condition. AAA is the highest (best) and D is the lowest (worst). If applicable, the pre-refunded category includes bonds which are secured by U.S. Government securities and therefore are deemed high-quality investment grade by Alliance Bernstein L.P. (the “Adviser”). If applicable, Not Applicable (N/A) includes non-credit worthy investments; such as, currency contracts, futures and options. If applicable, the Not Rated category includes bonds that are not rated by a nationally recognized statistical rating organization. The Adviser evaluates the creditworthiness of non-rated securities based on a number of factors including, but not limited to, cash flows, enterprise value and economic environment.
Availability of Additional Information
You can find additional information on the Fund’s website at https://www.abfunds.com/link/AB/AOHAX-A, including the Fund's:
• Prospectus
• Financial information
• Fund holdings
• Proxy voting information
You can also request this information by contacting us at (800) 227 4618.
Shareholders who have consented to receive a single annual or semi-annual shareholder report at a shared address may revoke this consent by contacting us at (800) 227 4618.
Information Regarding the Review and Approval of the Fund’s Advisory Agreement
Information regarding the Fund’s Board of Directors’/Trustees’ review of the advisory agreement is available on the Fund’s website https://www.abfunds.com/link/AB/AOHAX-A. You can request this information, free of charge, by contacting us at (800) 227 4618 or by scanning the QR code below.
The [A/B] logo is a registered service mark of AllianceBernstein and AllianceBernstein® is a registered service mark used by permission of the owner, AllianceBernstein L.P.
Please scan QR code for
Fund Information
Please scan QR code for
Fund Information
Annual Shareholder Report
This annual shareholder report contains important information about the AB Ohio Portfolio (the “Fund”) for the period of June 1, 2023 to May 31, 2024. You can find additional information about the Fund at https://www.abfunds.com/link/AB/AOHCX-A. You can also request this information by contacting us at (800) 227 4618.
What were the Fund costs for the last year?
(Based on a hypothetical $10,000 investment)
| Class Name | Cost of a $10,000 investment | Costs paid as a percentage of a $10,000 investment |
|---|
| Class C | $158 | 1.56% |
How did the Fund perform last year? What affected the Fund’s performance?
For the 12-month period, Class A shares outperformed the Bloomberg Municipal Bond Index, while the Class C underperformed the benchmark, before sales charges. Sector and security selection, as well as an overweight to credit, contributed to performance, relative to the benchmark. Security selection within private higher education and miscellaneous revenue contributed, while selection within utility Industrial Development Revenue (“IDR”) and multi-family housing detracted.
The Fund used derivatives for hedging purposes in the form of interest rate swaps, which contributed to performance, and Consumer Price Index swaps, which had no material impact on performance.
Top contributors to performance:
During the 12-month period, security selection, specifically overweights to private higher education and miscellaneous revenue, was the primary contributor to performance.
Top detractors from performance:
Security Selection
Top contributors
Not-for-Profit Health Care
Sector
Top contributors
Not-for-Profit Health Care
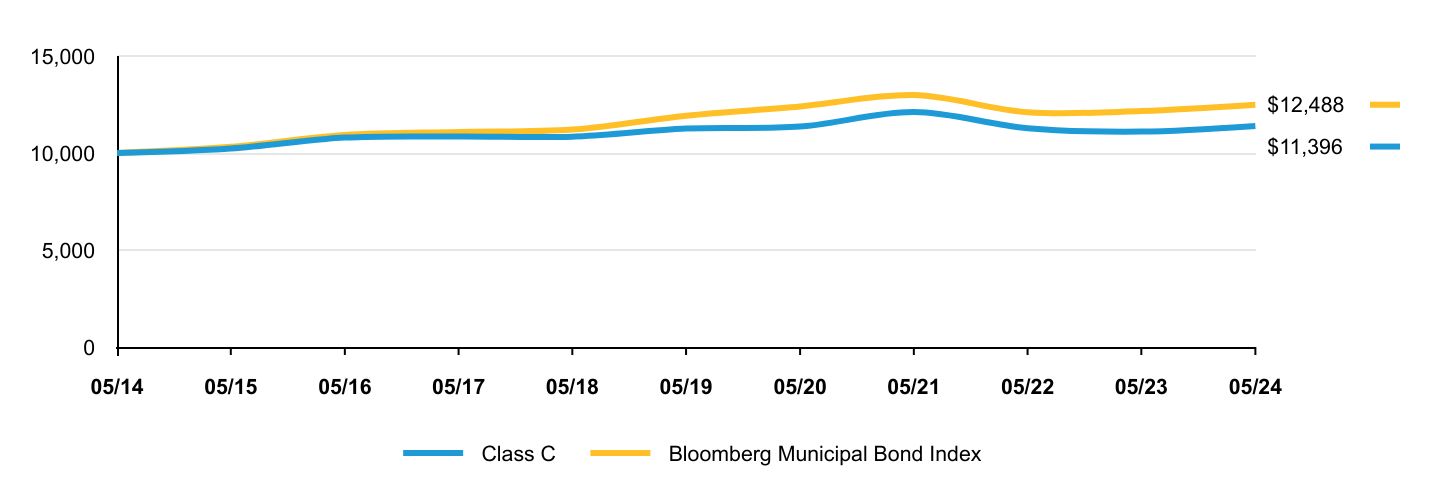
The following graph shows the performance of hypothetical $10,000 investments in the Fund and a broad-based securities market index over the most recently completed 10 fiscal years of the Fund. The Fund's performance reflects sales charges and assumes the reinvestment of dividends.
| Class C | Bloomberg Municipal Bond Index |
|---|
| 05/14 | $10,000 | $10,000 |
| 05/15 | $10,230 | $10,318 |
| 05/16 | $10,793 | $10,924 |
| 05/17 | $10,851 | $11,083 |
| 05/18 | $10,843 | $11,207 |
| 05/19 | $11,261 | $11,925 |
| 05/20 | $11,360 | $12,399 |
| 05/21 | $12,109 | $12,986 |
| 05/22 | $11,280 | $12,104 |
| 05/23 | $11,102 | $12,163 |
| 05/24 | $11,396 | $12,488 |
Average Annual Total Returns
| 1 Year | 5 Years | 10 Years |
|---|
| Class C (without sales charge) | 2.65% | 0.20% | 1.32% |
| Class C (with sales charge) | 1.65% | 0.20% | 1.32% |
| Bloomberg Municipal Bond Index | 2.67% | 0.93% | 2.25% |
The Fund’s past performance is not a good predictor of the Fund’s future performance.
The graph and table do not reflect the deduction of taxes that a shareholder would pay on Fund distributions or redemption of Fund shares.
Visit https://www.abfunds.com/link/AB/AOHCX-A for the most recent performance information.
| Net Assets | $43,760,522 |
| # of Portfolio Holdings | 70 |
| Portfolio Turnover Rate | 16% |
| Total Advisory Fees Paid | $(46,474) |
Graphical Representation of Holdings
Credit Rating BreakdownFootnote Reference*
| Value | Value |
|---|
| AAA | 4.2% |
| AA | 24.0% |
| A | 30.0% |
| BBB | 28.8% |
| BB | 3.9% |
| Not Rated | 9.1% |
*The Fund’s quality rating breakdown is expressed as a percentage of the Fund’s total investments in municipal securities and may vary over time. The quality ratings are determined by using the S&P Global Ratings (“S&P”), Moody’s Investors Services, Inc. (“Moody’s”) and Fitch Ratings, Ltd. (“Fitch”). The Fund considers the credit ratings issued by S&P, Moody’s and Fitch and uses the highest rating used by the agencies. These ratings are a measure of the quality and safety of a bond or portfolio, based on the issuer’s financial condition. AAA is the highest (best) and D is the lowest (worst). If applicable, the pre-refunded category includes bonds which are secured by U.S. Government securities and therefore are deemed high-quality investment grade by Alliance Bernstein L.P. (the “Adviser”). If applicable, Not Applicable (N/A) includes non-credit worthy investments; such as, currency contracts, futures and options. If applicable, the Not Rated category includes bonds that are not rated by a nationally recognized statistical rating organization. The Adviser evaluates the creditworthiness of non-rated securities based on a number of factors including, but not limited to, cash flows, enterprise value and economic environment.
Availability of Additional Information
You can find additional information on the Fund’s website at https://www.abfunds.com/link/AB/AOHCX-A, including the Fund's:
• Prospectus
• Financial information
• Fund holdings
• Proxy voting information
You can also request this information by contacting us at (800) 227 4618.
Shareholders who have consented to receive a single annual or semi-annual shareholder report at a shared address may revoke this consent by contacting us at (800) 227 4618.
Information Regarding the Review and Approval of the Fund’s Advisory Agreement
Information regarding the Fund’s Board of Directors’/Trustees’ review of the advisory agreement is available on the Fund’s website https://www.abfunds.com/link/AB/AOHCX-A. You can request this information, free of charge, by contacting us at (800) 227 4618 or by scanning the QR code below.
The [A/B] logo is a registered service mark of AllianceBernstein and AllianceBernstein® is a registered service mark used by permission of the owner, AllianceBernstein L.P.
Please scan QR code for
Fund Information
AB Pennsylvania Portfolio
Please scan QR code for
Fund Information
Annual Shareholder Report
This annual shareholder report contains important information about the AB Pennsylvania Portfolio (the “Fund”) for the period of June 1, 2023 to May 31, 2024. You can find additional information about the Fund at https://www.abfunds.com/link/AB/APAAX-A. You can also request this information by contacting us at (800) 227 4618.
What were the Fund costs for the last year?
(Based on a hypothetical $10,000 investment)
| Class Name | Cost of a $10,000 investment | Costs paid as a percentage of a $10,000 investment |
|---|
| Class A | $86 | 0.85% |
How did the Fund perform last year? What affected the Fund’s performance?
During the 12-month period ended May 31, 2024, all share classes underperformed the Bloomberg Municipal Bond Index, before sales charges. Sector and security selection detracted, while an overweight to credit contributed to performance, relative to the benchmark. Security selection within utility Industrial Development Revenue ("IDR") and senior living detracted, while selection within private higher education and not-for-profit health care contributed.
The Fund used derivatives for hedging purposes in the form interest rate swaps, which added for the 12-month period, and Consumer Price Index swaps, which had no material impact on performance.
Top contributors to performance:
Top detractors from performance:
Security Selection
Top contributors
Not-for-Profit Health Care
Sector
Top contributors
Public Primary/Secondary Education
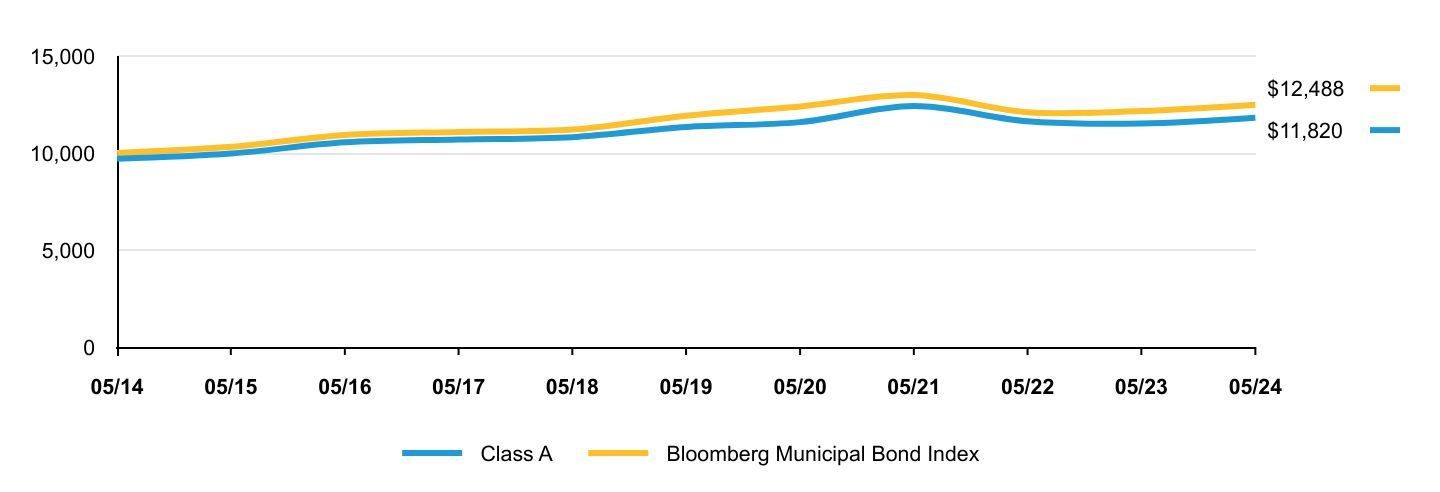
The following graph shows the performance of hypothetical $10,000 investments in the Fund and a broad-based securities market index over the most recently completed 10 fiscal years of the Fund. The Fund's performance reflects sales charges and assumes the reinvestment of dividends.
| Class A | Bloomberg Municipal Bond Index |
|---|
| 05/14 | $9,703 | $10,000 |
| 05/15 | $9,971 | $10,318 |
| 05/16 | $10,552 | $10,924 |
| 05/17 | $10,700 | $11,083 |
| 05/18 | $10,818 | $11,207 |
| 05/19 | $11,341 | $11,925 |
| 05/20 | $11,592 | $12,399 |
| 05/21 | $12,421 | $12,986 |
| 05/22 | $11,637 | $12,104 |
| 05/23 | $11,519 | $12,163 |
| 05/24 | $11,820 | $12,488 |
Average Annual Total Returns
| 1 Year | 5 Years | 10 Years |
|---|
| Class A (without sales charge) | 2.61% | 0.78% | 1.99% |
| Class A (with sales charge) | -0.50% | 0.16% | 1.69% |
| Bloomberg Municipal Bond Index | 2.67% | 0.93% | 2.25% |
The Fund’s past performance is not a good predictor of the Fund’s future performance.
The graph and table do not reflect the deduction of taxes that a shareholder would pay on Fund distributions or redemption of Fund shares.
Visit https://www.abfunds.com/link/AB/APAAX-A for the most recent performance information.
| Net Assets | $47,178,230 |
| # of Portfolio Holdings | 75 |
| Portfolio Turnover Rate | 19% |
| Total Advisory Fees Paid | $(27,642) |
Graphical Representation of Holdings
Credit Rating BreakdownFootnote Reference*
| Value | Value |
|---|
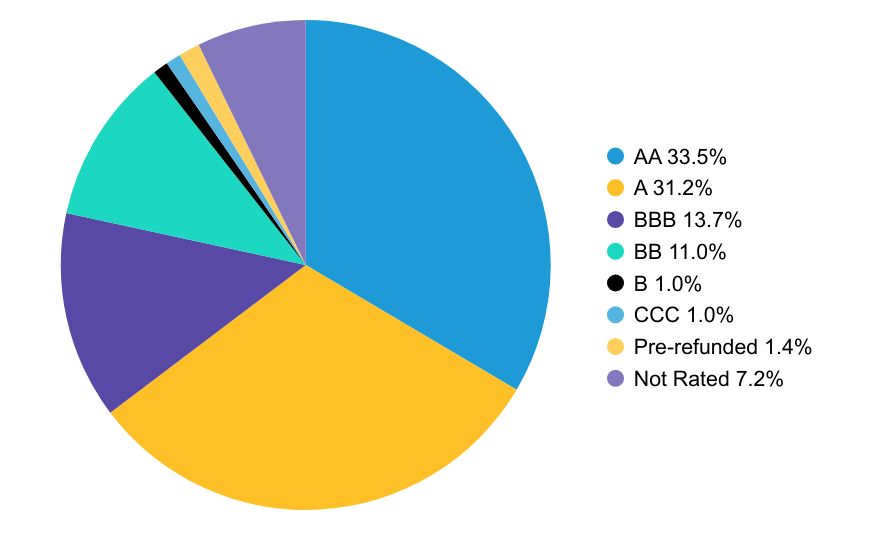
| AA | 33.5% |
| A | 31.2% |
| BBB | 13.7% |
| BB | 11.0% |
| B | 1.0% |
| CCC | 1.0% |
| Pre-refunded | 1.4% |
| Not Rated | 7.2% |
*The Fund’s quality rating breakdown is expressed as a percentage of the Fund’s total investments in municipal securities and may vary over time. The quality ratings are determined by using the S&P Global Ratings (“S&P”), Moody’s Investors Services, Inc. (“Moody’s”) and Fitch Ratings, Ltd. (“Fitch”). The Fund considers the credit ratings issued by S&P, Moody’s and Fitch and uses the highest rating used by the agencies. These ratings are a measure of the quality and safety of a bond or portfolio, based on the issuer’s financial condition. AAA is the highest (best) and D is the lowest (worst). If applicable, the pre-refunded category includes bonds which are secured by U.S. Government securities and therefore are deemed high-quality investment grade by Alliance Bernstein L.P. (the “Adviser”). If applicable, Not Applicable (N/A) includes non-credit worthy investments; such as, currency contracts, futures and options. If applicable, the Not Rated category includes bonds that are not rated by a nationally recognized statistical rating organization. The Adviser evaluates the creditworthiness of non-rated securities based on a number of factors including, but not limited to, cash flows, enterprise value and economic environment.
Availability of Additional Information
You can find additional information on the Fund’s website at https://www.abfunds.com/link/AB/APAAX-A, including the Fund's:
• Prospectus
• Financial information
• Fund holdings
• Proxy voting information
You can also request this information by contacting us at (800) 227 4618.
Shareholders who have consented to receive a single annual or semi-annual shareholder report at a shared address may revoke this consent by contacting us at (800) 227 4618.
Information Regarding the Review and Approval of the Fund’s Advisory Agreement
Information regarding the Fund’s Board of Directors’/Trustees’ review of the advisory agreement is available on the Fund’s website https://www.abfunds.com/link/AB/APAAX-A. You can request this information, free of charge, by contacting us at (800) 227 4618 or by scanning the QR code below.
The [A/B] logo is a registered service mark of AllianceBernstein and AllianceBernstein® is a registered service mark used by permission of the owner, AllianceBernstein L.P.
Please scan QR code for
Fund Information
AB Pennsylvania Portfolio
Please scan QR code for
Fund Information
Annual Shareholder Report
This annual shareholder report contains important information about the AB Pennsylvania Portfolio (the “Fund”) for the period of June 1, 2023 to May 31, 2024. You can find additional information about the Fund at https://www.abfunds.com/link/AB/APACX-A. You can also request this information by contacting us at (800) 227 4618.
What were the Fund costs for the last year?
(Based on a hypothetical $10,000 investment)
| Class Name | Cost of a $10,000 investment | Costs paid as a percentage of a $10,000 investment |
|---|
| Class C | $162 | 1.60% |
How did the Fund perform last year? What affected the Fund’s performance?
During the 12-month period ended May 31, 2024, all share classes underperformed the Bloomberg Municipal Bond Index, before sales charges. Sector and security selection detracted, while an overweight to credit contributed to performance, relative to the benchmark. Security selection within utility Industrial Development Revenue ("IDR") and senior living detracted, while selection within private higher education and not-for-profit health care contributed.
The Fund used derivatives for hedging purposes in the form interest rate swaps, which added for the 12-month period, and Consumer Price Index swaps, which had no material impact on performance.
Top contributors to performance:
Top detractors from performance:
Security Selection
Top contributors
Not-for-Profit Health Care
Sector
Top contributors
Public Primary/Secondary Education
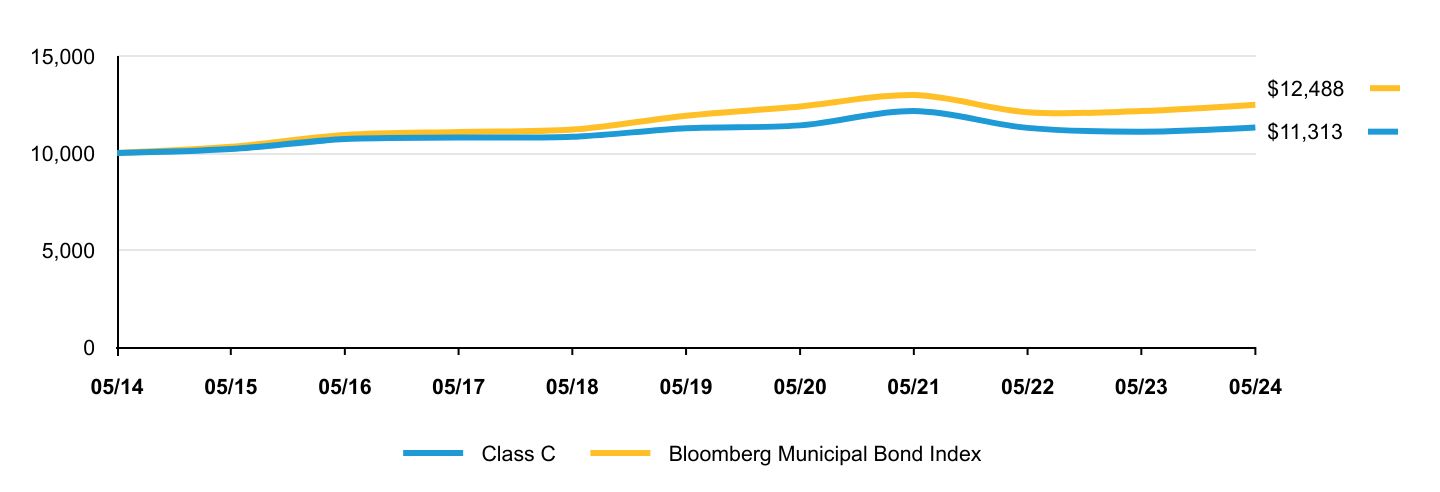
The following graph shows the performance of hypothetical $10,000 investments in the Fund and a broad-based securities market index over the most recently completed 10 fiscal years of the Fund. The Fund's performance reflects sales charges and assumes the reinvestment of dividends.
| Class C | Bloomberg Municipal Bond Index |
|---|
| 05/14 | $10,000 | $10,000 |
| 05/15 | $10,203 | $10,318 |
| 05/16 | $10,717 | $10,924 |
| 05/17 | $10,796 | $11,083 |
| 05/18 | $10,834 | $11,207 |
| 05/19 | $11,279 | $11,925 |
| 05/20 | $11,424 | $12,399 |
| 05/21 | $12,160 | $12,986 |
| 05/22 | $11,295 | $12,104 |
| 05/23 | $11,097 | $12,163 |
| 05/24 | $11,313 | $12,488 |
Average Annual Total Returns
| 1 Year | 5 Years | 10 Years |
|---|
| Class C (without sales charge) | 1.95% | 0.02% | 1.24% |
| Class C (with sales charge) | 0.95% | 0.02% | 1.24% |
| Bloomberg Municipal Bond Index | 2.67% | 0.93% | 2.25% |
The Fund’s past performance is not a good predictor of the Fund’s future performance.
The graph and table do not reflect the deduction of taxes that a shareholder would pay on Fund distributions or redemption of Fund shares.
Visit https://www.abfunds.com/link/AB/APACX-A for the most recent performance information.
| Net Assets | $47,178,230 |
| # of Portfolio Holdings | 75 |
| Portfolio Turnover Rate | 19% |
| Total Advisory Fees Paid | $(27,642) |
Graphical Representation of Holdings
Credit Rating BreakdownFootnote Reference*
| Value | Value |
|---|
| AA | 33.5% |
| A | 31.2% |
| BBB | 13.7% |
| BB | 11.0% |
| B | 1.0% |
| CCC | 1.0% |
| Pre-refunded | 1.4% |
| Not Rated | 7.2% |
*The Fund’s quality rating breakdown is expressed as a percentage of the Fund’s total investments in municipal securities and may vary over time. The quality ratings are determined by using the S&P Global Ratings (“S&P”), Moody’s Investors Services, Inc. (“Moody’s”) and Fitch Ratings, Ltd. (“Fitch”). The Fund considers the credit ratings issued by S&P, Moody’s and Fitch and uses the highest rating used by the agencies. These ratings are a measure of the quality and safety of a bond or portfolio, based on the issuer’s financial condition. AAA is the highest (best) and D is the lowest (worst). If applicable, the pre-refunded category includes bonds which are secured by U.S. Government securities and therefore are deemed high-quality investment grade by Alliance Bernstein L.P. (the “Adviser”). If applicable, Not Applicable (N/A) includes non-credit worthy investments; such as, currency contracts, futures and options. If applicable, the Not Rated category includes bonds that are not rated by a nationally recognized statistical rating organization. The Adviser evaluates the creditworthiness of non-rated securities based on a number of factors including, but not limited to, cash flows, enterprise value and economic environment.
Availability of Additional Information
You can find additional information on the Fund’s website at https://www.abfunds.com/link/AB/APACX-A, including the Fund's:
• Prospectus
• Financial information
• Fund holdings
• Proxy voting information
You can also request this information by contacting us at (800) 227 4618.
Shareholders who have consented to receive a single annual or semi-annual shareholder report at a shared address may revoke this consent by contacting us at (800) 227 4618.
Information Regarding the Review and Approval of the Fund’s Advisory Agreement
Information regarding the Fund’s Board of Directors’/Trustees’ review of the advisory agreement is available on the Fund’s website https://www.abfunds.com/link/AB/APACX-A. You can request this information, free of charge, by contacting us at (800) 227 4618 or by scanning the QR code below.
The [A/B] logo is a registered service mark of AllianceBernstein and AllianceBernstein® is a registered service mark used by permission of the owner, AllianceBernstein L.P.
Please scan QR code for
Fund Information
Please scan QR code for
Fund Information
Annual Shareholder Report
This annual shareholder report contains important information about the AB Virginia Portfolio (the “Fund”) for the period of June 1, 2023 to May 31, 2024. You can find additional information about the Fund at https://www.abfunds.com/link/AB/AVAYX-A. You can also request this information by contacting us at (800) 227 4618.
What were the Fund costs for the last year?
(Based on a hypothetical $10,000 investment)
| Class Name | Cost of a $10,000 investment | Costs paid as a percentage of a $10,000 investment |
|---|
| Advisor Class | $56 | 0.55% |
How did the Fund perform last year? What affected the Fund’s performance?
For the 12-month period, all share classes, except the Advisor class, underperformed the Bloomberg Municipal Bond Index, before sales charges. Sector and security selection, as well as credit contributed to performance, relative to the benchmark. Specifically, security selection within toll roads/transit and special tax contributed, while selection within ports and senior living detracted.
The Fund used derivatives for hedging purposes in the form of interest rate swaps, which contributed to performance and Consumer Price Index swaps, which had no material impact on performance.
Top contributors to performance:
Top detractors from performance:
Security Selection
Top contributors
The following graph shows the performance of hypothetical $10,000 investments in the Fund and a broad-based securities market index over the most recently completed 10 fiscal years of the Fund. The Fund's performance reflects sales charges and assumes the reinvestment of dividends.
| Advisor Class | Bloomberg Municipal Bond Index |
|---|
| 07/16 | $10,000 | $10,000 |
| 05/17 | $10,014 | $10,004 |
| 05/18 | $10,150 | $10,116 |
| 05/19 | $10,645 | $10,764 |
| 05/20 | $10,882 | $11,192 |
| 05/21 | $11,673 | $11,722 |
| 05/22 | $10,924 | $10,925 |
| 05/23 | $10,911 | $10,979 |
| 05/24 | $11,226 | $11,272 |
Average Annual Total Returns
| 1 Year | 5 Years | Since Inception 7/26/16 |
|---|
| Advisor Class (without sales charge) | 2.89% | 1.02% | 1.48% |
| Advisor Class (with sales charge) | 2.89% | 1.02% | 1.48% |
| Bloomberg Municipal Bond Index | 2.67% | 0.93% | 1.54% |
The Fund’s past performance is not a good predictor of the Fund’s future performance.
The graph and table do not reflect the deduction of taxes that a shareholder would pay on Fund distributions or redemption of Fund shares.
Visit https://www.abfunds.com/link/AB/AVAYX-A for the most recent performance information.
| Net Assets | $191,595,197 |
| # of Portfolio Holdings | 119 |
| Portfolio Turnover Rate | 15% |
| Total Advisory Fees Paid | $716,706 |
Graphical Representation of Holdings
Credit Rating BreakdownFootnote Reference*
| Value | Value |
|---|
| AAA | 7.7% |
| AA | 33.0% |
| A | 16.7% |
| BBB | 18.3% |
| BB | 2.9% |
| B | 1.5% |
| A-1 | 0.8% |
| Pre-refunded | 13.0% |
| Not Rated | 6.1% |
*The Fund’s quality rating breakdown is expressed as a percentage of the Fund’s total investments in municipal securities and may vary over time. The quality ratings are determined by using the S&P Global Ratings (“S&P”), Moody’s Investors Services, Inc. (“Moody’s”) and Fitch Ratings, Ltd. (“Fitch”). The Fund considers the credit ratings issued by S&P, Moody’s and Fitch and uses the highest rating used by the agencies. These ratings are a measure of the quality and safety of a bond or portfolio, based on the issuer’s financial condition. AAA is the highest (best) and D is the lowest (worst). If applicable, the pre-refunded category includes bonds which are secured by U.S. Government securities and therefore are deemed high-quality investment grade by Alliance Bernstein L.P. (the “Adviser”). If applicable, Not Applicable (N/A) includes non-credit worthy investments; such as, currency contracts, futures and options. If applicable, the Not Rated category includes bonds that are not rated by a nationally recognized statistical rating organization. The Adviser evaluates the creditworthiness of non-rated securities based on a number of factors including, but not limited to, cash flows, enterprise value and economic environment.
Availability of Additional Information
You can find additional information on the Fund’s website at https://www.abfunds.com/link/AB/AVAYX-A, including the Fund's:
• Prospectus
• Financial information
• Fund holdings
• Proxy voting information
You can also request this information by contacting us at (800) 227 4618.
Shareholders who have consented to receive a single annual or semi-annual shareholder report at a shared address may revoke this consent by contacting us at (800) 227 4618.
Information Regarding the Review and Approval of the Fund’s Advisory Agreement
Information regarding the Fund’s Board of Directors’/Trustees’ review of the advisory agreement is available on the Fund’s website https://www.abfunds.com/link/AB/AVAYX-A. You can request this information, free of charge, by contacting us at (800) 227 4618 or by scanning the QR code below.
The [A/B] logo is a registered service mark of AllianceBernstein and AllianceBernstein® is a registered service mark used by permission of the owner, AllianceBernstein L.P.
Please scan QR code for
Fund Information
Please scan QR code for
Fund Information
Annual Shareholder Report
This annual shareholder report contains important information about the AB Virginia Portfolio (the “Fund”) for the period of June 1, 2023 to May 31, 2024. You can find additional information about the Fund at https://www.abfunds.com/link/AB/AVAAX-A. You can also request this information by contacting us at (800) 227 4618.
What were the Fund costs for the last year?
(Based on a hypothetical $10,000 investment)
| Class Name | Cost of a $10,000 investment | Costs paid as a percentage of a $10,000 investment |
|---|
| Class A | $81 | 0.80% |
How did the Fund perform last year? What affected the Fund’s performance?
For the 12-month period, all share classes, except the Advisor class, underperformed the Bloomberg Municipal Bond Index, before sales charges. Sector and security selection, as well as credit contributed to performance, relative to the benchmark. Specifically, security selection within toll roads/transit and special tax contributed, while selection within ports and senior living detracted.
The Fund used derivatives for hedging purposes in the form of interest rate swaps, which contributed to performance and Consumer Price Index swaps, which had no material impact on performance.
Top contributors to performance:
Top detractors from performance:
Security Selection
Top contributors
The following graph shows the performance of hypothetical $10,000 investments in the Fund and a broad-based securities market index over the most recently completed 10 fiscal years of the Fund. The Fund's performance reflects sales charges and assumes the reinvestment of dividends.
| Class A | Bloomberg Municipal Bond Index |
|---|
| 05/14 | $9,703 | $10,000 |
| 05/15 | $10,033 | $10,318 |
| 05/16 | $10,612 | $10,924 |
| 05/17 | $10,743 | $11,083 |
| 05/18 | $10,861 | $11,207 |
| 05/19 | $11,355 | $11,925 |
| 05/20 | $11,577 | $12,399 |
| 05/21 | $12,399 | $12,986 |
| 05/22 | $11,575 | $12,104 |
| 05/23 | $11,532 | $12,163 |
| 05/24 | $11,824 | $12,488 |
Average Annual Total Returns
| 1 Year | 5 Years | 10 Years |
|---|
| Class A (without sales charge) | 2.53% | 0.76% | 2.00% |
| Class A (with sales charge) | -0.55% | 0.15% | 1.69% |
| Bloomberg Municipal Bond Index | 2.67% | 0.93% | 2.25% |
The Fund’s past performance is not a good predictor of the Fund’s future performance.
The graph and table do not reflect the deduction of taxes that a shareholder would pay on Fund distributions or redemption of Fund shares.
Visit https://www.abfunds.com/link/AB/AVAAX-A for the most recent performance information.
| Net Assets | $191,595,197 |
| # of Portfolio Holdings | 119 |
| Portfolio Turnover Rate | 15% |
| Total Advisory Fees Paid | $716,706 |
Graphical Representation of Holdings
Credit Rating BreakdownFootnote Reference*
| Value | Value |
|---|
| AAA | 7.7% |
| AA | 33.0% |
| A | 16.7% |
| BBB | 18.3% |
| BB | 2.9% |
| B | 1.5% |
| A-1 | 0.8% |
| Pre-refunded | 13.0% |
| Not Rated | 6.1% |
*The Fund’s quality rating breakdown is expressed as a percentage of the Fund’s total investments in municipal securities and may vary over time. The quality ratings are determined by using the S&P Global Ratings (“S&P”), Moody’s Investors Services, Inc. (“Moody’s”) and Fitch Ratings, Ltd. (“Fitch”). The Fund considers the credit ratings issued by S&P, Moody’s and Fitch and uses the highest rating used by the agencies. These ratings are a measure of the quality and safety of a bond or portfolio, based on the issuer’s financial condition. AAA is the highest (best) and D is the lowest (worst). If applicable, the pre-refunded category includes bonds which are secured by U.S. Government securities and therefore are deemed high-quality investment grade by Alliance Bernstein L.P. (the “Adviser”). If applicable, Not Applicable (N/A) includes non-credit worthy investments; such as, currency contracts, futures and options. If applicable, the Not Rated category includes bonds that are not rated by a nationally recognized statistical rating organization. The Adviser evaluates the creditworthiness of non-rated securities based on a number of factors including, but not limited to, cash flows, enterprise value and economic environment.
Availability of Additional Information
You can find additional information on the Fund’s website at https://www.abfunds.com/link/AB/AVAAX-A, including the Fund's:
• Prospectus
• Financial information
• Fund holdings
• Proxy voting information
You can also request this information by contacting us at (800) 227 4618.
Shareholders who have consented to receive a single annual or semi-annual shareholder report at a shared address may revoke this consent by contacting us at (800) 227 4618.
Information Regarding the Review and Approval of the Fund’s Advisory Agreement
Information regarding the Fund’s Board of Directors’/Trustees’ review of the advisory agreement is available on the Fund’s website https://www.abfunds.com/link/AB/AVAAX-A. You can request this information, free of charge, by contacting us at (800) 227 4618 or by scanning the QR code below.
The [A/B] logo is a registered service mark of AllianceBernstein and AllianceBernstein® is a registered service mark used by permission of the owner, AllianceBernstein L.P.
Please scan QR code for
Fund Information
Please scan QR code for
Fund Information
Annual Shareholder Report
This annual shareholder report contains important information about the AB Virginia Portfolio (the “Fund”) for the period of June 1, 2023 to May 31, 2024. You can find additional information about the Fund at https://www.abfunds.com/link/AB/AVACX-A. You can also request this information by contacting us at (800) 227 4618.
What were the Fund costs for the last year?
(Based on a hypothetical $10,000 investment)
| Class Name | Cost of a $10,000 investment | Costs paid as a percentage of a $10,000 investment |
|---|
| Class C | $156 | 1.55% |
How did the Fund perform last year? What affected the Fund’s performance?
For the 12-month period, all share classes, except the Advisor class, underperformed the Bloomberg Municipal Bond Index, before sales charges. Sector and security selection, as well as credit contributed to performance, relative to the benchmark. Specifically, security selection within toll roads/transit and special tax contributed, while selection within ports and senior living detracted.
The Fund used derivatives for hedging purposes in the form of interest rate swaps, which contributed to performance and Consumer Price Index swaps, which had no material impact on performance.
Top contributors to performance:
Top detractors from performance:
Security Selection
Top contributors
The following graph shows the performance of hypothetical $10,000 investments in the Fund and a broad-based securities market index over the most recently completed 10 fiscal years of the Fund. The Fund's performance reflects sales charges and assumes the reinvestment of dividends.
| Class C | Bloomberg Municipal Bond Index |
|---|
| 05/14 | $10,000 | $10,000 |
| 05/15 | $10,269 | $10,318 |
| 05/16 | $10,782 | $10,924 |
| 05/17 | $10,834 | $11,083 |
| 05/18 | $10,871 | $11,207 |
| 05/19 | $11,290 | $11,925 |
| 05/20 | $11,428 | $12,399 |
| 05/21 | $12,139 | $12,986 |
| 05/22 | $11,245 | $12,104 |
| 05/23 | $11,119 | $12,163 |
| 05/24 | $11,327 | $12,488 |
Average Annual Total Returns
| 1 Year | 5 Years | 10 Years |
|---|
| Class C (without sales charge) | 1.87% | 0.03% | 1.25% |
| Class C (with sales charge) | 0.87% | 0.03% | 1.25% |
| Bloomberg Municipal Bond Index | 2.67% | 0.93% | 2.25% |
The Fund’s past performance is not a good predictor of the Fund’s future performance.
The graph and table do not reflect the deduction of taxes that a shareholder would pay on Fund distributions or redemption of Fund shares.
Visit https://www.abfunds.com/link/AB/AVACX-A for the most recent performance information.
| Net Assets | $191,595,197 |
| # of Portfolio Holdings | 119 |
| Portfolio Turnover Rate | 15% |
| Total Advisory Fees Paid | $716,706 |
Graphical Representation of Holdings
Credit Rating BreakdownFootnote Reference*
| Value | Value |
|---|
| AAA | 7.7% |
| AA | 33.0% |
| A | 16.7% |
| BBB | 18.3% |
| BB | 2.9% |
| B | 1.5% |
| A-1 | 0.8% |
| Pre-refunded | 13.0% |
| Not Rated | 6.1% |
*The Fund’s quality rating breakdown is expressed as a percentage of the Fund’s total investments in municipal securities and may vary over time. The quality ratings are determined by using the S&P Global Ratings (“S&P”), Moody’s Investors Services, Inc. (“Moody’s”) and Fitch Ratings, Ltd. (“Fitch”). The Fund considers the credit ratings issued by S&P, Moody’s and Fitch and uses the highest rating used by the agencies. These ratings are a measure of the quality and safety of a bond or portfolio, based on the issuer’s financial condition. AAA is the highest (best) and D is the lowest (worst). If applicable, the pre-refunded category includes bonds which are secured by U.S. Government securities and therefore are deemed high-quality investment grade by Alliance Bernstein L.P. (the “Adviser”). If applicable, Not Applicable (N/A) includes non-credit worthy investments; such as, currency contracts, futures and options. If applicable, the Not Rated category includes bonds that are not rated by a nationally recognized statistical rating organization. The Adviser evaluates the creditworthiness of non-rated securities based on a number of factors including, but not limited to, cash flows, enterprise value and economic environment.
Availability of Additional Information
You can find additional information on the Fund’s website at https://www.abfunds.com/link/AB/AVACX-A, including the Fund's:
• Prospectus
• Financial information
• Fund holdings
• Proxy voting information
You can also request this information by contacting us at (800) 227 4618.
Shareholders who have consented to receive a single annual or semi-annual shareholder report at a shared address may revoke this consent by contacting us at (800) 227 4618.
Information Regarding the Review and Approval of the Fund’s Advisory Agreement
Information regarding the Fund’s Board of Directors’/Trustees’ review of the advisory agreement is available on the Fund’s website https://www.abfunds.com/link/AB/AVACX-A. You can request this information, free of charge, by contacting us at (800) 227 4618 or by scanning the QR code below.
The [A/B] logo is a registered service mark of AllianceBernstein and AllianceBernstein® is a registered service mark used by permission of the owner, AllianceBernstein L.P.
Please scan QR code for
Fund Information
ITEM 2. CODE OF ETHICS.
(a) The registrant has adopted a code of ethics that applies to its principal executive officer, principal financial officer and principal accounting officer. A copy of the registrant’s code of ethics is filed herewith as Exhibit 19(a)(1).
(b) During the period covered by this report, no material amendments were made to the provisions of the code of ethics adopted in 2(a) above.
(c) During the period covered by this report, no implicit or explicit waivers to the provisions of the code of ethics adopted in 2(a) above were granted.
ITEM 3. AUDIT COMMITTEE FINANCIAL EXPERT.
The registrant’s Board of Directors has determined that independent directors Garry L. Moody, Marshall C. Turner, Jr., Jorge A. Bermudez and Carol C. McMullen qualify as audit committee financial experts.
ITEM 4. PRINCIPAL ACCOUNTANT FEES AND SERVICES.
(a) - (c) The following table sets forth the aggregate fees billed* by the independent registered public accounting firm Ernst & Young LLP, for the Fund’s last two fiscal years, for professional services rendered for: (i) the audit of the Fund’s annual financial statements included in the Fund’s annual report to stockholders; (ii) assurance and related services that are reasonably related to the performance of the audit of the Fund’s financial statements and are not reported under (i), which include advice and education related to accounting and auditing issues, quarterly press release review (for those Funds that issue quarterly press releases), and preferred stock maintenance testing (for those Funds that issue preferred stock); and (iii) tax compliance, tax advice and tax return preparation.
| | | | | | | | | | | | | | | | |
| | | | | | Audit Fees | | | Audit-Related
Fees | | | Tax Fees | |
Arizona Portfolio | | | 2023 | | | $ | 30,340 | | | $ | — | | | $ | 17,577 | |
| | | 2024 | | | $ | 30,340 | | | $ | — | | | $ | 18,290 | |
Massachusetts Portfolio | | | 2023 | | | $ | 32,320 | | | $ | — | | | $ | 18,445 | |
| | | 2024 | | | $ | 32,320 | | | $ | — | | | $ | 18,290 | |
Minnesota Portfolio | | | 2023 | | | $ | 32,320 | | | $ | — | | | $ | 18,445 | |
| | | 2024 | | | $ | 32,320 | | | $ | — | | | $ | 18,290 | |
New Jersey Portfolio | | | 2023 | | | $ | 32,320 | | | $ | — | | | $ | 18,445 | |
| | | 2024 | | | $ | 32,320 | | | $ | — | | | $ | 18,290 | |
Ohio Portfolio | | | 2023 | | | $ | 32,320 | | | $ | — | | | $ | 18,445 | |
| | | 2024 | | | $ | 32,320 | | | $ | — | | | $ | 18,290 | |
Pennsylvania Portfolio | | | 2023 | | | $ | 30,340 | | | $ | — | | | $ | 18,445 | |
| | | 2024 | | | $ | 30,340 | | | $ | — | | | $ | 18,290 | |
Virginia Portfolio | | | 2023 | | | $ | 32,320 | | | $ | — | | | $ | 18,445 | |
| | | 2024 | | | $ | 32,320 | | | $ | — | | | $ | 18,290 | |
(d) Not applicable.
(e) (1) Beginning with audit and non-audit service contracts entered into on or after May 6, 2003, the Fund’s Audit Committee policies and procedures require the pre-approval of all audit and non-audit services provided to the Fund by the Fund’s independent registered public accounting firm. The Fund’s Audit Committee policies and procedures also require pre-approval of all audit and non-audit services provided to the Adviser and Service Affiliates to the extent that these services are directly related to the operations or financial reporting of the Fund.
(e) (2) No percentage of services addressed by (b) and (c) of this Item 4 were approved pursuant to the waiver provision of paragraph (c)(7)(i)(C) of Rule 2-01 of Regulation S-X. No amounts are reported for Item 4 (d).
(f) Not applicable.
(g) The following table sets forth the aggregate non-audit services provided to the Fund, the Fund’s Adviser and entities that control, are controlled by or under common control with the Adviser that provide ongoing services to the Fund (“Service Affiliates”):
| | | | | | | | | | | | |
| | | | | | All Fees for
Non-Audit Services
Provided to the
Portfolio, the Adviser
and Service Affiliates | | | Total Amount of
Foregoing Column Pre-
approved by the Audit
Committee
(Portion Comprised of
Audit Related Fees)
(Portion Comprised of
Tax Fees) | |
Arizona Portfolio | | | 2023 | | | $ | 1,964,129 | | | $ | 17,577 | |
| | | | | | | | | | $ | — | |
| | | | | | | | | | $ | (17,577 | ) |
| | | 2024 | | | $ | 2,070,376 | | | $ | 18,290 | |
| | | | | | | | | | $ | — | |
| | | | | | | | | | $ | (18,290 | ) |
Massachusetts Portfolio | | | 2023 | | | $ | 1,964,997 | | | $ | 18,445 | |
| | | | | | | | | | $ | — | |
| | | | | | | | | | $ | (18,445 | ) |
| | | 2024 | | | $ | 2,070,376 | | | $ | 18,290 | |
| | | | | | | | | | $ | — | |
| | | | | | | | | | $ | (18,290 | ) |
Minnesota Portfolio | | | 2023 | | | $ | 1,964,997 | | | $ | 18,445 | |
| | | | | | | | | | $ | — | |
| | | | | | | | | | $ | (18,445 | ) |
| | | 2024 | | | $ | 2,070,376 | | | $ | 18,290 | |
| | | | | | | | | | $ | — | |
| | | | | | | | | | $ | (18,290 | ) |
New Jersey Portfolio | | | 2023 | | | $ | 1,964,997 | | | $ | 18,445 | |
| | | | | | | | | | $ | — | |
| | | | | | | | | | $ | (18,445 | ) |
| | | 2024 | | | $ | 2,070,376 | | | $ | 18,290 | |
| | | | | | | | | | $ | — | |
| | | | | | | | | | $ | (18,290 | ) |
Ohio Portfolio | | | 2023 | | | $ | 1,964,997 | | | $ | 18,445 | |
| | | | | | | | | | $ | — | |
| | | | | | | | | | $ | (18,445 | ) |
| | | 2024 | | | $ | 2,070,376 | | | $ | 18,290 | |
| | | | | | | | | | $ | — | |
| | | | | | | | | | $ | (18,290 | ) |
Pennsylvania Portfolio | | | 2023 | | | $ | 1,964,997 | | | $ | 18,445 | |
| | | | | | | | | | $ | — | |
| | | | | | | | | | $ | (18,445 | ) |
| | | 2024 | | | $ | 2,070,376 | | | $ | 18,290 | |
| | | | | | | | | | $ | — | |
| | | | | | | | | | $ | (18,290 | ) |
Virginia Portfolio | | | 2023 | | | $ | 1,964,997 | | | $ | 18,445 | |
| | | | | | | | | | $ | — | |
| | | | | | | | | | $ | (18,445 | ) |
| | | 2024 | | | $ | 2,070,376 | | | $ | 18,290 | |
| | | | | | | | | | $ | — | |
| | | | | | | | | | $ | (18,290 | ) |
(h) The Audit Committee of the Fund has considered whether the provision of any non-audit services not pre-approved by the Audit Committee provided by the Fund’s independent registered public accounting firm to the Adviser and Service Affiliates is compatible with maintaining the auditor’s independence.
(i) Not applicable.
(j) Not applicable.
ITEM 5. AUDIT COMMITTEE OF LISTED REGISTRANTS.
Not applicable to the registrant.
ITEM 6. INVESTMENTS.
Please see Schedule of Investments contained in the Financial Statements included under Item 7 of this Form N-CSR.
ITEM 7. FINANCIAL STATEMENTS AND FINANCIAL HIGHLIGHTS FOR OPEN-END MANAGEMENT INVESTMENT COMPANIES.
MAY 05.31.24

ANNUAL REPORT
AB MUNICIPAL INCOME FUND II
| + | | AB MASSACHUSETTS PORTFOLIO |
| + | | AB NEW JERSEY PORTFOLIO |
| + | | AB PENNSYLVANIA PORTFOLIO |

| | |
| |
| Investment Products Offered | | • Are Not FDIC Insured • May Lose Value • Are Not Bank Guaranteed |
Investors should consider the investment objectives, risks, charges and expenses of the Fund carefully before investing. For copies of our prospectus or summary prospectus, which contain this and other information, visit us online at www.abfunds.com or contact your AB representative. Please read the prospectus and/or summary prospectus carefully before investing.
This shareholder report must be preceded or accompanied by the Fund’s prospectus for individuals who are not current shareholders of the Fund.
You may obtain a description of the Fund’s proxy voting policies and procedures, and information regarding how the Fund voted proxies relating to portfolio securities during the most recent 12-month period ended June 30, without charge. Simply visit AB’s website at www.abfunds.com, or go to the Securities and Exchange Commission’s (the “Commission”) website at www.sec.gov, or call AB at (800) 227 4618.
The Fund files its complete schedule of portfolio holdings with the Commission for the first and third quarters of each fiscal year as an exhibit to its reports on Form N-PORT. The Fund’s Form N-PORT reports are available on the Commission’s website at www.sec.gov. AB publishes full portfolio holdings for the Fund monthly at www.abfunds.com.
AllianceBernstein Investments, Inc. (ABI) is the distributor of the AB family of mutual funds. ABI is a member of FINRA and is an affiliate of AllianceBernstein L.P., the Adviser of the funds.
The [A/B] logo is a registered service mark of AllianceBernstein and AllianceBernstein® is a registered service mark used by permission of the owner, AllianceBernstein L.P.
PORTFOLIO OF INVESTMENTS
AB ARIZONA PORTFOLIO
May 31, 2024
| | | | | | | | |
| | | Principal
Amount
(000) | | | U.S. $ Value | |
| |
MUNICIPAL OBLIGATIONS – 98.5% | | | | | | | | |
Long-Term Municipal Bonds – 98.5% | | | | | | | | |
Arizona – 87.5% | | | | | | | | |
Arizona Board of Regents
(Pre-refunded – US Govt Agencies)
Series 2014
5.00%, 08/01/2033 | | $ | 2,050 | | | $ | 2,053,795 | |
Arizona Game & Fish Department & Commission
(Arizona Game & Fish Department & Commission State Lease)
Series 2006
5.00%, 07/01/2026 | | | 635 | | | | 635,461 | |
Arizona Health Facilities Authority
(HonorHealth Obligated Group)
Series 2014-A
5.00%, 12/01/2034 | | | 3,000 | | | | 3,016,609 | |
Arizona Industrial Development Authority
(Benjamin Franklin Charter School Obligated Group)
Series 2023
5.50%, 07/01/2058(a) | | | 500 | | | | 500,243 | |
Arizona Industrial Development Authority
(Equitable School Revolving Fund LLC Obligated Group)
Series 2020
4.00%, 11/01/2045 | | | 1,000 | | | | 925,120 | |
4.00%, 11/01/2050 | | | 2,000 | | | | 1,786,602 | |
Arizona Industrial Development Authority
(Heritage Academy Laveen & Gateway Obligated Group)
Series 2021
5.00%, 07/01/2051(a) | | | 250 | | | | 217,772 | |
Arizona Industrial Development Authority
(KIPP Nashville Obligated Group)
Series 2022-A
5.00%, 07/01/2057 | | | 1,500 | | | | 1,494,990 | |
Arizona Industrial Development Authority
(KIPP NYC Public Charter Schools)
Series 2021-B
4.00%, 07/01/2051 | | | 1,000 | | | | 862,070 | |
Arizona Industrial Development Authority
(Legacy Cares, Inc.)
Series 2020
7.75%, 07/01/2050(b)(c)(d) | | | 300 | | | | 18,000 | |
| | |
| |
| abfunds.com | | AB MUNICIPAL INCOME FUND II | 1 |
PORTFOLIO OF INVESTMENTS (continued)
AB ARIZONA PORTFOLIO
| | | | | | | | |
| | | Principal
Amount
(000) | | | U.S. $ Value | |
| |
Arizona Industrial Development Authority
(North Carolina Central University Project)
BAM Series 2019
5.00%, 06/01/2058 | | $ | 2,300 | | | $ | 2,342,625 | |
Arizona Industrial Development Authority
(Phoenix Children’s Hospital Obligated Group)
Series 2020
5.00%, 02/01/2037 | | | 1,000 | | | | 1,066,617 | |
Series 2021
4.00%, 02/01/2038 | | | 1,500 | | | | 1,492,221 | |
Arizona Industrial Development Authority
(Pinecrest Academy of Nevada)
Series 2020-A
4.00%, 07/15/2050(a) | | | 600 | | | | 484,521 | |
Arizona Industrial Development Authority
(Provident Group – EMU Properties LLC)
Series 2018
5.00%, 05/01/2043(b)(c) | | | 1,000 | | | | 550,000 | |
5.00%, 05/01/2048(b)(c) | | | 1,100 | | | | 605,000 | |
Arizona Sports & Tourism Authority
BAM Series 2022
5.00%, 07/01/2031 | | | 2,000 | | | | 2,144,941 | |
Chandler Industrial Development Authority
(Intel Corp.)
Series 2022
5.00%, 09/01/2042 | | | 2,000 | | | | 2,041,511 | |
Series 2024
4.00%, 06/01/2049(e) | | | 2,000 | | | | 1,981,984 | |
City of Buckeye AZ Excise Tax Revenue
Series 2015
5.00%, 07/01/2035 | | | 3,450 | | | | 3,491,563 | |
City of Glendale AZ
(City of Glendale AZ COP)
Series 2021
2.222%, 07/01/2030 | | | 2,000 | | | | 1,718,307 | |
City Of Glendale Municipal Property Corp.
(Pre-refunded – US Treasuries)
Series 2012-C
5.00%, 07/01/2038 | | | 2,500 | | | | 2,506,177 | |
City of Phoenix Civic Improvement Corp.
(Phoenix Sky Harbor International Airport)
Series 2017-A
5.00%, 07/01/2033 | | | 750 | | | | 770,559 | |
Series 2019
5.00%, 07/01/2049 | | | 2,500 | | | | 2,600,951 | |
Series 2019-B
4.00%, 07/01/2038 | | | 2,200 | | | | 2,146,836 | |
| | |
| |
2 | AB MUNICIPAL INCOME FUND II | | abfunds.com |
PORTFOLIO OF INVESTMENTS (continued)
AB ARIZONA PORTFOLIO
| | | | | | | | |
| | | Principal
Amount
(000) | | | U.S. $ Value | |
| |
City of Tempe AZ
(City of Tempe AZ COP)
Series 2021
1.951%, 07/01/2031 | | $ | 1,250 | | | $ | 1,018,082 | |
Gilbert Water Resource Municipal Property Corp. (Town of Gilbert AZ Waterworks & Sewer System Revenue)
Series 2022
4.00%, 07/15/2042 | | | 5,000 | | | | 4,923,611 | |
Glendale Industrial Development Authority
(Beatitudes Campus Obligated Group (The))
Series 2017
5.00%, 11/15/2036 | | | 1,000 | | | | 903,361 | |
Glendale Industrial Development Authority
(Royal Oaks Life Care Community)
Series 2016
5.00%, 05/15/2039 | | | 1,000 | | | | 966,257 | |
Industrial Development Authority of the City of Phoenix Arizona (The)
(AZ GFF Tiyan LLC Lease)
Series 2014
5.00%, 02/01/2029 | | | 250 | | | | 238,655 | |
Industrial Development Authority of the City of Phoenix Arizona (The)
(Downtown Phoenix Student Housing LLC)
Series 2018-A
5.00%, 07/01/2037 | | | 1,000 | | | | 1,005,570 | |
5.00%, 07/01/2042 | | | 1,250 | | | | 1,252,219 | |
Industrial Development Authority of the County of Pima (The)
(La Posada at Park Centre, Inc. Obligated Group)
Series 2022
7.00%, 11/15/2057(a) | | | 335 | | | | 356,253 | |
Industrial Development Authority of the County of Pima (The)
(TMC HealthCare Obligated Group)
Series 2021
5.00%, 04/01/2034 | | | 1,590 | | | | 1,681,304 | |
La Paz County Industrial Development Authority
(Harmony Public Schools)
Series 2016
5.00%, 02/15/2036(a) | | | 1,200 | | | | 1,205,392 | |
Series 2021
4.00%, 02/15/2051 | | | 580 | | | | 459,103 | |
4.00%, 02/15/2041 | | | 205 | | | | 176,946 | |
4.00%, 02/15/2046 | | | 345 | | | | 285,424 | |
| | |
| |
| abfunds.com | | AB MUNICIPAL INCOME FUND II | 3 |
PORTFOLIO OF INVESTMENTS (continued)
AB ARIZONA PORTFOLIO
| | | | | | | | |
| | | Principal
Amount
(000) | | | U.S. $ Value | |
| |
Maricopa County Industrial Development Authority
(Arizona Autism Charter Schools Obligated Group)
Series 2021
4.00%, 07/01/2061(a) | | $ | 990 | | | $ | 745,426 | |
Maricopa County Industrial Development Authority
(Banner Health Obligated Group)
Series 2016-A
5.00%, 01/01/2035 | | | 2,000 | | | | 2,046,971 | |
Maricopa County Industrial Development Authority
(Benjamin Franklin Charter School Ltd.)
Series 2018-A
6.00%, 07/01/2052(a) | | | 830 | | | | 847,201 | |
Maricopa County Industrial Development Authority
(Commercial Metals Co.)
Series 2022
4.00%, 10/15/2047(a) | | | 500 | | | | 437,771 | |
Maricopa County Industrial Development Authority
(GreatHearts Arizona Obligated Group)
Series 2017-A
5.00%, 07/01/2037 | | | 750 | | | | 763,673 | |
Maricopa County Industrial Development Authority
(HonorHealth Obligated Group)
Series 2024-D
5.00%, 12/01/2042(e) | | | 1,000 | | | | 1,047,992 | |
Maricopa County Industrial Development Authority
(Legacy Traditional School Obligated Group)
Series 2019
5.00%, 07/01/2049(a) | | | 500 | | | | 478,284 | |
Maricopa County Industrial Development Authority
(Morrison Education Group Obligated Group)
Series 2024-A
6.75%, 07/01/2063(a) | | | 250 | | | | 258,557 | |
Maricopa County Industrial Development Authority
(Reid Traditional Schools Obligated Group)
Series 2016
5.00%, 07/01/2036 | | | 750 | | | | 755,488 | |
5.00%, 07/01/2047 | | | 1,700 | | | | 1,666,828 | |
| | |
| |
4 | AB MUNICIPAL INCOME FUND II | | abfunds.com |
PORTFOLIO OF INVESTMENTS (continued)
AB ARIZONA PORTFOLIO
| | | | | | | | |
| | | Principal
Amount
(000) | | | U.S. $ Value | |
| |
Maricopa County Industrial Development Authority
(Valley Christian Schools)
Series 2023
6.25%, 07/01/2053(a) | | $ | 250 | | | $ | 253,581 | |
McAllister Academic Village LLC
(Arizona State University)
Series 2016
5.00%, 07/01/2037 | | | 1,500 | | | | 1,531,143 | |
Northern Arizona University
BAM Series 2015
5.00%, 06/01/2034 | | | 1,000 | | | | 1,008,027 | |
Salt Verde Financial Corp.
(Citigroup, Inc.)
Series 2007
5.00%, 12/01/2037 | | | 2,500 | | | | 2,652,182 | |
Student & Academic Services LLC
(Northern Arizona University)
BAM Series 2014
5.00%, 06/01/2044 | | | 1,200 | | | | 1,169,078 | |
Tempe Industrial Development Authority
(Friendship Village of Tempe)
Series 2019
5.00%, 12/01/2054 | | | 815 | | | | 746,099 | |
Tempe Industrial Development Authority
(Mirabella at ASU, Inc.)
Series 2017-A
6.125%, 10/01/2047(a) | | | 400 | | | | 245,502 | |
University of Arizona (The)
Series 2014
5.00%, 08/01/2033 | | | 1,765 | | | | 1,766,779 | |
| | | | | | | | |
| | | | | | | 70,347,234 | |
| | | | | | | | |
American Samoa – 0.3% | | | | | | | | |
American Samoa Economic Development Authority (Territory of American Samoa)
Series 2018
7.125%, 09/01/2038(a) | | | 225 | | | | 241,422 | |
| | | | | | | | |
| | |
Delaware – 0.6% | | | | | | | | |
Delaware State Economic Development Authority (Newark Charter School, Inc.)
Series 2016
5.00%, 09/01/2036 | | | 520 | | | | 527,709 | |
| | | | | | | | |
| | |
| |
| abfunds.com | | AB MUNICIPAL INCOME FUND II | 5 |
PORTFOLIO OF INVESTMENTS (continued)
AB ARIZONA PORTFOLIO
| | | | | | | | |
| | | Principal
Amount
(000) | | | U.S. $ Value | |
| |
Guam – 3.3% | | | | | | | | |
Antonio B Won Pat International Airport Authority
Series 2021-A
3.839%, 10/01/2036 | | $ | 100 | | | $ | 83,367 | |
Series 2023
5.25%, 10/01/2031 | | | 150 | | | | 149,782 | |
Guam Department of Education
(Guam Department of Education COP) | | | | | | | | |
Series 2020
5.00%, 02/01/2040 | | | 310 | | | | 298,727 | |
Guam Power Authority
Series 2017-A
5.00%, 10/01/2036 | | | 170 | | | | 173,944 | |
5.00%, 10/01/2040 | | | 705 | | | | 714,976 | |
Series 2022-A
5.00%, 10/01/2044 | | | 200 | | | | 203,230 | |
Territory of Guam
Series 2019
5.00%, 11/15/2031 | | | 75 | | | | 75,379 | |
Territory of Guam
(Territory of Guam Business Privilege Tax)
Series 2021-F
4.00%, 01/01/2042 | | | 1,000 | | | | 927,511 | |
| | | | | | | | |
| | | | | | | 2,626,916 | |
| | | | | | | | |
Illinois – 0.4% | | | | | | | | |
Chicago Board of Education
Series 2018-A
5.00%, 12/01/2031 | | | 335 | | | | 346,219 | |
| | | | | | | | |
| | |
Indiana – 0.1% | | | | | | | | |
Indiana Finance Authority
(Brightmark Plastics Renewal Indiana LLC)
Series 2019
7.00%, 03/01/2039(d) | | | 135 | | | | 93,556 | |
| | | | | | | | |
| | |
Kentucky – 1.2% | | | | | | | | |
Kentucky Economic Development Finance Authority
(Owensboro Health, Inc. Obligated Group)
Series 2017-A
5.25%, 06/01/2041 | | | 1,000 | | | | 1,006,112 | |
| | | | | | | | |
| | |
| |
6 | AB MUNICIPAL INCOME FUND II | | abfunds.com |
PORTFOLIO OF INVESTMENTS (continued)
AB ARIZONA PORTFOLIO
| | | | | | | | |
| | | Principal
Amount
(000) | | | U.S. $ Value | |
| |
Louisiana – 0.6% | | | | | | | | |
Louisiana Local Government Environmental Facilities & Community Development Auth
(St. James Place of Baton Rouge)
Series 2015-A
6.25%, 11/15/2045 | | $ | 500 | | | $ | 483,941 | |
| | | | | | | | |
| | |
Michigan – 0.1% | | | | | | | | |
City of Detroit MI
Series 2018
5.00%, 04/01/2036 | | | 50 | | | | 50,916 | |
| | | | | | | | |
| | |
North Carolina – 0.9% | | | | | | | | |
North Carolina Medical Care Commission
(Aldersgate United Methodist Retirement Community, Inc.)
Series 2015
4.70%, 07/01/2037 | | | 300 | | | | 252,195 | |
North Carolina Medical Care Commission
(Pennybyrn at Maryfield)
Series 2015
5.00%, 10/01/2035 | | | 500 | | | | 487,310 | |
| | | | | | | | |
| | | | | | | 739,505 | |
| | | | | | | | |
Puerto Rico – 2.8% | | | | | | | | |
Commonwealth of Puerto Rico
Series 2021-A
Zero Coupon, 07/01/2024 | | | 0 | ** | | | 471 | |
Zero Coupon, 07/01/2033 | | | 144 | | | | 95,259 | |
4.00%, 07/01/2046 | | | 103 | | | | 92,911 | |
5.625%, 07/01/2027 | | | 303 | | | | 316,789 | |
Series 2022-C
Zero Coupon, 11/01/2043 | | | 18 | | | | 11,094 | |
Puerto Rico Commonwealth Aqueduct & Sewer Authority
Series 2020-A
5.00%, 07/01/2030(a) | | | 250 | | | | 262,400 | |
5.00%, 07/01/2035(a) | | | 250 | | | | 260,350 | |
Puerto Rico Electric Power Authority
AGM Series 2007-V
5.25%, 07/01/2031 | | | 100 | | | | 99,529 | |
NATL Series 2007-V
5.25%, 07/01/2032 | | | 150 | | | | 147,631 | |
| | |
| |
| abfunds.com | | AB MUNICIPAL INCOME FUND II | 7 |
PORTFOLIO OF INVESTMENTS (continued)
AB ARIZONA PORTFOLIO
| | | | | | | | |
| | | Principal
Amount
(000) | | | U.S. $ Value | |
| |
Puerto Rico Industrial Tourist Educational Medical & Environmental Control Facilities Financing Auth
Series 2023-A
6.625%, 01/01/2027 | | $ | 28 | | | $ | 27,634 | |
6.625%, 01/01/2028 | | | 214 | | | | 210,276 | |
Puerto Rico Industrial Tourist Educational Medical & Environmental Control Facilities Financing Auth
(AES Puerto Rico LP)
12.50%, 12/15/2025(f)(g) | | | 50 | | | | 48,284 | |
Puerto Rico Sales Tax Financing Corp. Sales Tax Revenue
Series 2018-A
Zero Coupon, 07/01/2029 | | | 130 | | | | 107,328 | |
Series 2019-A
4.329%, 07/01/2040 | | | 105 | | | | 104,311 | |
5.00%, 07/01/2058 | | | 480 | | | | 478,421 | |
| | | | | | | | |
| | | | | | | 2,262,688 | |
| | | | | | | | |
Tennessee – 0.2% | | | | | | | | |
Bristol Industrial Development Board
(Bristol Industrial Development Board Sales Tax)
Series 2016-A
5.00%, 12/01/2035(a) | | | 165 | | | | 151,181 | |
| | | | | | | | |
| | |
Texas – 0.4% | | | | | | | | |
Mission Economic Development Corp.
(Natgasoline LLC)
Series 2018
4.625%, 10/01/2031(a) | | | 290 | | | | 287,967 | |
| | | | | | | | |
| | |
Washington – 0.1% | | | | | | | | |
Washington State Housing Finance Commission
(Presbyterian Retirement Communities Northwest Obligated Group)
Series 2019-A
5.00%, 01/01/2055(a) | | | 100 | | | | 75,816 | |
| | | | | | | | |
| | |
Total Municipal Obligations
(cost $84,266,836) | | | | | | | 79,241,182 | |
| | | | | | | | |
| | |
| |
8 | AB MUNICIPAL INCOME FUND II | | abfunds.com |
PORTFOLIO OF INVESTMENTS (continued)
AB ARIZONA PORTFOLIO
| | | | | | | | |
| | | Principal
Amount
(000) | | | U.S. $ Value | |
| |
COMMERCIAL MORTGAGE-BACKED SECURITY – 1.1% | | | | | | | | |
Non-Agency Fixed Rate CMBS – 1.1% | | | | | | | | |
Arizona Industrial Development Authority
Series 2019-2, Class A
3.625%, 05/20/2033
(cost $1,057,634) | | $ | 990 | | | $ | 895,119 | |
| | | | | | | | |
| | |
ASSET-BACKED SECURITIES – 0.3% | | | | | | | | |
Other ABS - Fixed Rate – 0.3% | | | | | | | | |
HTA TRRB Custodial Trust
Series 2022
5.25%, 07/01/2034 | | | 107 | | | | 104,020 | |
5.25%, 07/01/2036 | | | 107 | | | | 107,231 | |
| | | | | | | | |
| | |
Total Asset-Backed Securities
(cost $212,772) | | | | | | | 211,251 | |
| | | | | | | | |
| | |
| | | Shares | | | | |
PREFERRED STOCKS – 0.0% | | | | | | | | |
Utility – 0.0% | | | | | | | | |
Electric – 0.0% | | | | | | | | |
AES Puerto Rico LP
0.00%(b)(f)(g)
(cost $84,582) | | | 4,712 | | | | 13,712 | |
| | | | | | | | |
| | |
SHORT-TERM INVESTMENTS – 1.9% | | | | | | | | |
Investment Companies – 1.9% | | | | | | | | |
AB Fixed Income Shares, Inc. – Government Money Market Portfolio – Class AB,
5.22%(h)(i)(j)
(cost $1,538,648) | | | 1,538,648 | | | | 1,538,648 | |
| | | | | | | | |
| | |
Total Investments – 101.8%
(cost $87,160,472) | | | | | | | 81,899,912 | |
Other assets less liabilities – (1.8)% | | | | | | | (1,484,389 | ) |
| | | | | | | | |
| | |
Net Assets – 100.0% | | | | | | $ | 80,415,523 | |
| | | | | | | | |
| | |
| |
| abfunds.com | | AB MUNICIPAL INCOME FUND II | 9 |
PORTFOLIO OF INVESTMENTS (continued)
AB ARIZONA PORTFOLIO
CENTRALLY CLEARED INTEREST RATE SWAPS (see Note D)
| | | | | | | | | | | | | | | | | | | | | | | | | | |
| | | | Rate Type | | | |
Notional
Amount
(000) | | | Termination
Date | | | Payments
made
by the
Fund | | Payments
received
by the
Fund | | Payment
Frequency
Paid/
Received | | Market
Value | | | Upfront
Premiums
Paid
(Received) | | | Unrealized
Appreciation
(Depreciation) | |
USD | | | 5,700 | | | | 01/15/2027 | | | 1 Day SOFR | | 2.445% | | Annual | | $ | (365,511 | ) | | $ | – 0 | – | | $ | (365,511 | ) |
USD | | | 2,300 | | | | 07/31/2029 | | | 1 Day SOFR | | 3.975% | | Annual | | | (39,051 | ) | | | – 0 | – | | | (39,051 | ) |
USD | | | 1,300 | | | | 11/01/2030 | | | 1 Day SOFR | | 3.641% | | Annual | | | (49,587 | ) | | | – 0 | – | | | (49,587 | ) |
USD | | | 2,200 | | | | 07/31/2031 | | | 1 Day SOFR | | 4.059% | | Annual | | | (17,935 | ) | | | 249 | | | | (18,184 | ) |
| | | | | | | | | | | | | | | | | | | | | | | | | | |
| | $ | (472,084 | ) | | $ | 249 | | | $ | (472,333 | ) |
| | | | | | | | | | | | | | | | | | | | | | | | | | |
INTEREST RATE SWAPS (see Note D)
| | | | | | | | | | | | | | | | | | | | | | | | | | | | | | | | | | | | |
| | | | | | | | | | | | Rate Type | | | | | | | | | | | | | |
Swap
Counterparty | | Notional
Amount
(000) | | | Termination
Date | | | Payments
made
by the
Fund | | | Payments
received
by the
Fund | | | Payment
Frequency
Paid/
Received | | | Market
Value | | | Upfront
Premiums
Paid
(Received) | | | Unrealized
Appreciation
(Depreciation) | |
Citibank, NA | | | USD | | | | 1,675 | | | | 10/09/2029 | | | | 1.125 | % | | | SIFMA | * | | | Quarterly | | | $ | 173,080 | | | $ | – 0 | – | | $ | 173,080 | |
| * | Variable interest rate based on the Securities Industry & Financial Markets Association (SIFMA) Municipal Swap Index. |
| ** | Principal amount less than 500. |
| (a) | Security is exempt from registration under Rule 144A or Regulation S of the Securities Act of 1933. These securities are considered restricted, but liquid and may be resold in transactions exempt from registration. At May 31, 2024, the aggregate market value of these securities amounted to $7,309,639 or 9.1% of net assets. |
| (b) | Non-income producing security. |
| (d) | Security is exempt from registration under Rule 144A or Regulation S of the Securities Act of 1933. These securities, which represent 0.14% of net assets as of May 31, 2024, are considered illiquid and restricted. Additional information regarding such securities follows: |
| | | | | | | | | | | | | | | | |
144A/Restricted &
Illiquid Securities | | Acquisition
Date | | | Cost | | | Market
Value | | | Percentage of
Net Assets | |
Arizona Industrial Development Authority
(Legacy Cares, Inc.)
Series 2020
7.75%, 07/01/2050 | | | 06/09/2022 - 06/10/2022 | | | $ | 336,463 | | | $ | 18,000 | | | | 0.02 | % |
Indiana Finance Authority
(Brightmark Plastics Renewal Indiana LLC)
Series 2019
7.00%, 03/01/2039 | | | 03/29/2019 | | | | 139,337 | | | | 93,556 | | | | 0.12 | % |
| (e) | When-Issued or delayed delivery security. |
| (f) | Fair valued by the Adviser. |
| | |
| |
10 | AB MUNICIPAL INCOME FUND II | | abfunds.com |
PORTFOLIO OF INVESTMENTS (continued)
AB ARIZONA PORTFOLIO
| (g) | Security in which significant unobservable inputs (Level 3) were used in determining fair value. |
| (h) | Affiliated investments. |
| (i) | The rate shown represents the 7-day yield as of period end. |
| (j) | To obtain a copy of the fund’s shareholder report, please go to the Securities and Exchange Commission’s website at www.sec.gov, or call AB at (800) 227-4618. |
As of May 31, 2024, the Portfolio’s percentages of investments in municipal bonds that are insured and in insured municipal bonds that have been pre-refunded or escrowed to maturity are 8.7% and 0.0%, respectively.
Glossary:
ABS – Asset-Backed Securities
AGM – Assured Guaranty Municipal
BAM – Build American Mutual
CMBS – Commercial Mortgage-Backed Securities
COP – Certificate of Participation
NATL – National Interstate Corporation
SOFR – Secured Overnight Financing Rate
See notes to financial statements.
| | |
| |
| abfunds.com | | AB MUNICIPAL INCOME FUND II | 11 |
PORTFOLIO OF INVESTMENTS
AB MASSACHUSETTS PORTFOLIO
May 31, 2024
| | | | | | | | |
| | | Principal
Amount
(000) | | | U.S. $ Value | |
| |
MUNICIPAL OBLIGATIONS – 97.5% | | | | | | | | |
Long-Term Municipal Bonds – 96.6% | | | | | | | | |
Massachusetts – 85.9% | | | | | | | | |
Bristol-Plymouth Regional Vocational Technical School District/MA
Series 2024
4.00%, 02/28/2025 | | $ | 1,000 | | | $ | 1,002,444 | |
City of Boston MA
Series 2023
5.00%, 11/01/2041 | | | 1,000 | | | | 1,112,353 | |
City of Quincy MA
Series 2022-A
5.00%, 06/01/2047 | | | 3,060 | | | | 3,449,888 | |
City of Worcester MA
Series 2024
5.00%, 02/15/2025 | | | 7,730 | | | | 7,813,157 | |
AGM Series 2022
3.00%, 02/01/2046 | | | 2,600 | | | | 1,970,072 | |
Commonwealth of Massachusetts
Series 2015-A
5.00%, 07/01/2035 | | | 10,000 | | | | 10,131,967 | |
Series 2018-A
5.00%, 01/01/2042 | | | 5,000 | | | | 5,185,708 | |
Series 2021-B
5.00%, 11/01/2024 | | | 5,000 | | | | 5,028,325 | |
Series 2022-B
3.00%, 02/01/2045 | | | 4,965 | | | | 3,937,696 | |
Series 2022-C
5.00%, 10/01/2052 | | | 2,005 | | | | 2,127,231 | |
Series 2023
5.00%, 05/01/2053 | | | 2,000 | | | | 2,126,268 | |
Series 2023-B
5.00%, 05/01/2041 | | | 2,000 | | | | 2,198,917 | |
Series 2024-A
5.00%, 01/01/2040 | | | 1,000 | | | | 1,111,134 | |
Commonwealth of Massachusetts
(Commonwealth of Massachusetts COVID-19 Recovery Assessment Revenue)
Series 2022-B
4.11%, 07/15/2031 | | | 1,319 | | | | 1,281,665 | |
Commonwealth of Massachusetts Transportation Fund Revenue
Series 2022
5.00%, 06/01/2050 | | | 2,000 | | | | 2,109,411 | |
Series 2022-B
5.00%, 06/01/2052 | | | 3,000 | | | | 3,176,483 | |
| | |
| |
12 | AB MUNICIPAL INCOME FUND II | | abfunds.com |
PORTFOLIO OF INVESTMENTS (continued)
AB MASSACHUSETTS PORTFOLIO
| | | | | | | | |
| | | Principal
Amount
(000) | | | U.S. $ Value | |
| |
Series 2023
5.00%, 06/01/2053 | | $ | 1,405 | | | $ | 1,499,680 | |
Series 2023-B
5.00%, 06/01/2051 | | | 3,000 | | | | 3,205,944 | |
Martha’s Vineyard Land Bank
BAM Series 2014
5.00%, 05/01/2031 | | | 1,000 | | | | 1,003,729 | |
Massachusetts Bay Transportation Authority Assessment Revenue
Series 2022-A
4.00%, 07/01/2040 | | | 1,000 | | | | 1,013,197 | |
Massachusetts Bay Transportation Authority Sales Tax Revenue
Series 2017-A
5.00%, 07/01/2040 | | | 2,000 | | | | 2,067,956 | |
Series 2020
5.00%, 07/01/2050 | | | 3,000 | | | | 3,085,293 | |
Series 2023-A
5.25%, 07/01/2053 | | | 5,000 | | | | 5,441,239 | |
Massachusetts Clean Water Trust (The)
(Massachusetts Clean Water State Revolving Fund)
Series 2023-2
5.00%, 02/01/2040 | | | 600 | | | | 668,220 | |
5.00%, 02/01/2042 | | | 1,050 | | | | 1,159,393 | |
5.00%, 02/01/2044 | | | 1,500 | | | | 1,641,545 | |
Massachusetts Development Finance Agency
(Baystate Medical Obligated Group)
Series 2014-N
5.00%, 07/01/2044 | | | 7,000 | | | | 7,001,135 | |
Massachusetts Development Finance Agency
(Beth Israel Lahey Health Obligated Group)
Series 2018-J
5.00%, 07/01/2053 | | | 5,000 | | | | 5,032,081 | |
Series 2023 5.00%, 07/01/2034 | | | 2,000 | | | | 2,242,119 | |
Massachusetts Development Finance Agency
(Boston Medical Center Corp. Obligated Group)
Series 2015-D
5.00%, 07/01/2044 | | | 3,755 | | | | 3,659,825 | |
Series 2023
5.25%, 07/01/2048 | | | 2,000 | | | | 2,111,363 | |
Massachusetts Development Finance Agency
(Brandeis University)
Series 2019-S
5.00%, 10/01/2035 | | | 1,795 | | | | 1,935,464 | |
5.00%, 10/01/2039 | | | 1,780 | | | | 1,885,514 | |
| | |
| |
| abfunds.com | | AB MUNICIPAL INCOME FUND II | 13 |
PORTFOLIO OF INVESTMENTS (continued)
AB MASSACHUSETTS PORTFOLIO
| | | | | | | | |
| | | Principal
Amount
(000) | | | U.S. $ Value | |
| |
Massachusetts Development Finance Agency
(Children’s Hospital Corp. Obligated Group (The))
Series 2024-T
5.25%, 03/01/2054 | | $ | 2,000 | | | $ | 2,154,665 | |
Massachusetts Development Finance Agency
(Emerson College)
Series 2016-A
5.00%, 01/01/2034 | | | 700 | | | | 713,902 | |
5.00%, 01/01/2035 | | | 735 | | | | 748,834 | |
5.00%, 01/01/2036 | | | 1,000 | | | | 1,017,780 | |
5.25%, 01/01/2042 | | | 1,000 | | | | 1,012,783 | |
Massachusetts Development Finance Agency
(Emmanuel College/MA)
Series 2016-A
5.00%, 10/01/2031 | | | 2,000 | | | | 2,025,141 | |
5.00%, 10/01/2034 | | | 2,100 | | | | 2,121,452 | |
Massachusetts Development Finance Agency
(Equitable School Revolving Fund LLC Obligated Group)
Series 2021
4.00%, 11/01/2046 | | | 1,000 | | | | 931,830 | |
Massachusetts Development Finance Agency
(Lasell University)
Series 2021
4.00%, 07/01/2040 | | | 2,000 | | | | 1,749,460 | |
4.00%, 07/01/2050 | | | 1,000 | | | | 801,219 | |
Massachusetts Development Finance Agency
(Lesley University)
Series 2016
5.00%, 07/01/2039 | | | 2,055 | | | | 2,068,855 | |
Massachusetts Development Finance Agency
(Mass General Brigham, Inc.)
Series 2015-O
4.00%, 07/01/2045 | | | 5,855 | | | | 5,486,480 | |
Massachusetts Development Finance Agency
(MCPHS University)
Series 2013-F
4.00%, 07/01/2032 | | | 1,000 | | | | 988,307 | |
Massachusetts Development Finance Agency
(Merrimack College)
Series 2017
5.00%, 07/01/2047 | | | 3,200 | | | | 3,207,046 | |
Series 2022 5.00%, 07/01/2052 | | | 1,000 | | | | 991,624 | |
| | |
| |
14 | AB MUNICIPAL INCOME FUND II | | abfunds.com |
PORTFOLIO OF INVESTMENTS (continued)
AB MASSACHUSETTS PORTFOLIO
| | | | | | | | |
| | | Principal
Amount
(000) | | | U.S. $ Value | |
| |
Massachusetts Development Finance Agency
(NewBridge on the Charles, Inc. Obligated Group)
Series 2017
4.00%, 10/01/2024(a) | | $ | 250 | | | $ | 250,018 | |
Massachusetts Development Finance Agency
(NewBridge on the Charles, Inc.)
Series 2017
5.00%, 10/01/2047(a) | | | 2,000 | | | | 1,997,127 | |
Massachusetts Development Finance Agency
(Northeastern University)
Series 2022
5.00%, 10/01/2041 | | | 1,500 | | | | 1,628,511 | |
5.00%, 10/01/2042 | | | 5,000 | | | | 5,417,358 | |
Massachusetts Development Finance Agency
(Pre-refunded – US Treasuries)
Series 2014-P
5.00%, 10/01/2034 | | | 1,055 | | | | 1,059,252 | |
Series 2019-A 5.00%, 06/01/2039 | | | 1,400 | | | | 1,501,307 | |
Massachusetts Development Finance Agency
(President & Fellows of Harvard College)
Series 2016-A
5.00%, 07/15/2036 | | | 700 | | | | 821,693 | |
Massachusetts Development Finance Agency
(Salem Community Corp. Obligated Group)
Series 2022
5.125%, 01/01/2040 | | | 1,020 | | | | 976,161 | |
Massachusetts Development Finance Agency
(Simmons University)
Series 2018-L
5.00%, 10/01/2035 | | | 2,455 | | | | 2,508,092 | |
Series 2020-M
4.00%, 10/01/2050 | | | 1,000 | | | | 816,536 | |
Massachusetts Development Finance Agency
(South Shore Hospital, Inc. Obligated Group)
Series 2016-I
4.00%, 07/01/2036 | | | 2,000 | | | | 1,845,693 | |
5.00%, 07/01/2041 | | | 2,500 | | | | 2,501,959 | |
Massachusetts Development Finance Agency
(Southcoast Health System Obligated Group)
Series 2021-G
5.00%, 07/01/2050 | | | 1,500 | | | | 1,530,637 | |
Massachusetts Development Finance Agency
(Springfield College)
Series 2021
4.00%, 06/01/2056 | | | 3,000 | | | | 2,378,679 | |
| | |
| |
| abfunds.com | | AB MUNICIPAL INCOME FUND II | 15 |
PORTFOLIO OF INVESTMENTS (continued)
AB MASSACHUSETTS PORTFOLIO
| | | | | | | | |
| | | Principal
Amount
(000) | | | U.S. $ Value | |
| |
Series 2021-B
4.00%, 06/01/2050 | | $ | 1,000 | | | $ | 820,121 | |
Massachusetts Development Finance Agency
(Suffolk University)
Series 2017
5.00%, 07/01/2033 | | | 1,250 | | | | 1,277,225 | |
Series 2020-A
4.00%, 07/01/2045 | | | 1,400 | | | | 1,212,116 | |
Series 2021
4.00%, 07/01/2046 | | | 1,270 | | | | 1,091,404 | |
4.00%, 07/01/2051 | | | 1,000 | | | | 824,423 | |
Massachusetts Development Finance Agency
(Trustees of Boston College)
Series 2017-T
5.00%, 07/01/2037 | | | 1,000 | | | | 1,042,128 | |
Massachusetts Development Finance Agency
(Trustees of The Deerfield Academy (The))
Series 2023
5.00%, 10/01/2032 | | | 1,300 | | | | 1,484,093 | |
5.00%, 10/01/2033 | | | 1,000 | | | | 1,155,290 | |
Massachusetts Development Finance Agency
(Tufts Medicine Obligated Group)
Series 2019-A
5.00%, 07/01/2038 | | | 1,000 | | | | 987,107 | |
Massachusetts Development Finance Agency
(UMass Memorial Health Care Obligated Group)
Series 2016
5.00%, 07/01/2036 | | | 1,500 | | | | 1,522,290 | |
Massachusetts Development Finance Agency
(Woods Hole Oceanographic Institution State Lease)
Series 2018
5.00%, 06/01/2048 | | | 3,000 | | | | 3,070,802 | |
Massachusetts Health & Educational Facilities Authority
(Trustees of Boston College)
Series 2008
5.50%, 06/01/2035 | | | 1,710 | | | | 2,008,642 | |
Massachusetts Port Authority
Series 2019-A
5.00%, 07/01/2032 | | | 4,685 | | | | 4,942,376 | |
5.00%, 07/01/2038 | | | 2,500 | | | | 2,612,928 | |
Series 2019-C
5.00%, 07/01/2049 | | | 1,000 | | | | 1,021,606 | |
Series 2021-E
5.00%, 07/01/2051 | | | 1,000 | | | | 1,028,125 | |
| | |
| |
16 | AB MUNICIPAL INCOME FUND II | | abfunds.com |
PORTFOLIO OF INVESTMENTS (continued)
AB MASSACHUSETTS PORTFOLIO
| | | | | | | | |
| | | Principal
Amount
(000) | | | U.S. $ Value | |
| |
Massachusetts Port Authority
(Bosfuel Corp.)
Series 2019-A
5.00%, 07/01/2033 | | $ | 2,000 | | | $ | 2,090,771 | |
Massachusetts School Building Authority
(Massachusetts School Building Authority Sales Tax)
Series 2009
5.715%, 08/15/2039 | | | 4,000 | | | | 4,064,025 | |
Massachusetts School Building Authority
(Pre-refunded – US Govt Agencies)
Series 2015-B
5.00%, 01/15/2030 | | | 1,770 | | | | 1,784,611 | |
Massachusetts Transportation Trust Fund Metropolitan Highway System Revenue
(Massachusetts Transportation Trust Fund Metropolitan Highway System Rev State Lease)
Series 2019-C
5.00%, 01/01/2034 | | | 1,000 | | | | 1,072,443 | |
Massachusetts Water Resources Authority
(Pre-refunded – US Treasuries)
Series 2016-C
5.00%, 08/01/2033 | | | 5,500 | | | | 5,682,673 | |
Town of Hingham MA
Series 2024
4.00%, 02/14/2025 | | | 1,000 | | | | 1,001,989 | |
Town of Nantucket MA
Series 2023
5.00%, 06/28/2024 | | | 1,000 | | | | 1,000,659 | |
Town of Weymouth MA
Series 2021
2.00%, 09/15/2045 | | | 2,000 | | | | 1,229,187 | |
University of Massachusetts Building Authority
(Pre-refunded – US Treasuries)
Series 2014-1
5.00%, 11/01/2044 | | | 2,000 | | | | 2,010,485 | |
University of Massachusetts Building Authority
(University of Massachusetts)
Series 2017
5.00%, 11/01/2034 | | | 2,500 | | | | 2,628,994 | |
Series 2020
3.013%, 11/01/2043 | | | 2,000 | | | | 1,485,534 | |
| | | | | | | | |
| | | | | | | 199,820,864 | |
| | | | | | | | |
| | |
| |
| abfunds.com | | AB MUNICIPAL INCOME FUND II | 17 |
PORTFOLIO OF INVESTMENTS (continued)
AB MASSACHUSETTS PORTFOLIO
| | | | | | | | |
| | | Principal
Amount
(000) | | | U.S. $ Value | |
| |
American Samoa – 0.2% | |
American Samoa Economic Development Authority
(Territory of American Samoa)
Series 2018
7.125%, 09/01/2038(a) | | $ | 395 | | | $ | 423,829 | |
| | | | | | | | |
|
Arizona – 0.3% | |
Salt Verde Financial Corp.
(Citigroup, Inc.)
Series 2007
5.00%, 12/01/2037 | | | 660 | | | | 700,176 | |
| | | | | | | | |
|
Connecticut – 0.4% | |
State of Connecticut
Series 2015-F
5.00%, 11/15/2032 | | | 1,000 | | | | 1,014,849 | |
| | | | | | | | |
|
Florida – 1.3% | |
County of Miami-Dade FL Aviation Revenue
Series 2014
5.00%, 10/01/2027 | | | 3,000 | | | | 3,002,516 | |
Palm Beach County Health Facilities Authority
(Federation CCRC Operations Corp. Obligated Group)
Series 2022
4.25%, 06/01/2056 | | | 100 | | | | 79,265 | |
| | | | | | | | |
| | | | | | | 3,081,781 | |
| | | | | | | | |
|
Guam – 2.6% | |
Antonio B Won Pat International Airport Authority
Series 2021-A
4.46%, 10/01/2043 | | | 535 | | | | 431,661 | |
Series 2023
5.25%, 10/01/2036 | | | 100 | | | | 98,804 | |
5.375%, 10/01/2043 | | | 200 | | | | 193,545 | |
Guam Government Waterworks Authority
(Guam Waterworks Authority Water And Wastewater System)
Series 2024-A
5.00%, 01/01/2046 | | | 1,125 | | | | 1,182,692 | |
Guam Power Authority
Series 2017-A
5.00%, 10/01/2036 | | | 350 | | | | 358,121 | |
5.00%, 10/01/2040 | | | 1,420 | | | | 1,440,094 | |
| | |
| |
18 | AB MUNICIPAL INCOME FUND II | | abfunds.com |
PORTFOLIO OF INVESTMENTS (continued)
AB MASSACHUSETTS PORTFOLIO
| | | | | | | | |
| | | Principal
Amount
(000) | | | U.S. $ Value | |
| |
Territory of Guam
Series 2019
5.00%, 11/15/2031 | | $ | 190 | | | $ | 190,960 | |
Territory of Guam
(Territory of Guam Business Privilege Tax)
Series 2021-F
4.00%, 01/01/2042 | | | 2,255 | | | | 2,091,537 | |
| | | | | | | | |
| | | | | | | 5,987,414 | |
| | | | | | | | |
Illinois – 0.8% | |
Chicago Board of Education
Series 2018-A
5.00%, 12/01/2031 | | | 650 | | | | 671,768 | |
Illinois Finance Authority
(Pre-refunded – US Treasuries)
Series 2015
5.00%, 05/15/2037 | | | 1,050 | | | | 1,061,116 | |
| | | | | | | | |
| | | | | | | 1,732,884 | |
| | | | | | | | |
Indiana – 0.1% | |
Indiana Finance Authority
(Brightmark Plastics Renewal Indiana LLC)
Series 2019
7.00%, 03/01/2039(b) | | | 250 | | | | 173,252 | |
| | | | | | | | |
|
Michigan – 0.0% | |
City of Detroit MI
Series 2018
5.00%, 04/01/2036 | | | 90 | | | | 91,649 | |
| | | | | | | | |
|
New Jersey – 0.5% | |
New Jersey Transportation Trust Fund Authority
(New Jersey Transportation Fed Hwy Grant)
Series 2016
5.00%, 06/15/2029 | | | 1,170 | | | | 1,195,458 | |
| | | | | | | | |
|
North Carolina – 0.6% | |
North Carolina Medical Care Commission
(Aldersgate United Methodist Retirement Community, Inc.)
Series 2015
4.70%, 07/01/2037 | | | 540 | | | | 453,951 | |
North Carolina Turnpike Authority
Series 2017
5.00%, 01/01/2032 | | | 1,000 | | | | 1,022,666 | |
| | | | | | | | |
| | | | | | | 1,476,617 | |
| | | | | | | | |
| | |
| |
| abfunds.com | | AB MUNICIPAL INCOME FUND II | 19 |
PORTFOLIO OF INVESTMENTS (continued)
AB MASSACHUSETTS PORTFOLIO
| | | | | | | | |
| | | Principal
Amount
(000) | | | U.S. $ Value | |
| |
Pennsylvania – 0.5% | |
City of Philadelphia PA
Series 2017-A
5.00%, 08/01/2033 | | $ | 1,000 | | | $ | 1,035,247 | |
| | | | | | | | |
|
Puerto Rico – 2.2% | |
Commonwealth of Puerto Rico
Series 2021-A
Zero Coupon, 07/01/2024 | | | 63 | | | | 63,167 | |
Zero Coupon, 07/01/2033 | | | 205 | | | | 135,864 | |
5.625%, 07/01/2027 | | | 300 | | | | 313,445 | |
5.625%, 07/01/2029 | | | 120 | | | | 128,991 | |
Puerto Rico Commonwealth Aqueduct & Sewer Authority
Series 2020-A
5.00%, 07/01/2030(a) | | | 610 | | | | 640,255 | |
5.00%, 07/01/2035(a) | | | 500 | | | | 520,699 | |
Puerto Rico Electric Power Authority AGM
Series 2007-V
5.25%, 07/01/2031 | | | 240 | | | | 238,869 | |
NATL Series 2007-V
5.25%, 07/01/2032 | | | 300 | | | | 295,262 | |
Puerto Rico Industrial Tourist Educational Medical & Environmental Control Facilities Financing Auth
Series 2023-A
6.625%, 01/01/2027 | | | 52 | | | | 51,257 | |
6.625%, 01/01/2028 | | | 397 | | | | 390,028 | |
Puerto Rico Industrial Tourist Educational Medical & Environmental Control Facilities Financing Auth
(AES Puerto Rico LP)
12.50%, 12/15/2025(c)(d) | | | 92 | | | | 89,558 | |
Puerto Rico Industrial Tourist Educational Medical & Environmental Control Facilities Financing Auth
(San Juan Cruise Port LLC)
Series 2024
6.75%, 01/01/2045 | | | 600 | | | | 711,066 | |
Puerto Rico Sales Tax Financing Corp. Sales Tax Revenue
Series 2018-A | | | | | | | | |
Zero Coupon, 07/01/2029 | | | 238 | | | | 196,493 | |
Zero Coupon, 07/01/2046 | | | 1,000 | | | | 318,521 | |
Series 2019-A
4.329%, 07/01/2040 | | | 180 | | | | 178,820 | |
4.55%, 07/01/2040 | | | 22 | | | | 22,133 | |
| | |
| |
20 | AB MUNICIPAL INCOME FUND II | | abfunds.com |
PORTFOLIO OF INVESTMENTS (continued)
AB MASSACHUSETTS PORTFOLIO
| | | | | | | | |
| | | Principal
Amount
(000) | | | U.S. $ Value | |
| |
5.00%, 07/01/2058 | | $ | 815 | | | $ | 812,319 | |
| | | | | | | | |
| | | | | | | 5,106,747 | |
| | | | | | | | |
Tennessee – 0.1% | |
Bristol Industrial Development Board
(Bristol Industrial Development Board Sales Tax)
Series 2016-A
5.00%, 12/01/2035(a) | | | 310 | | | | 284,037 | |
| | | | | | | | |
|
Texas – 0.7% | |
Mission Economic Development Corp.
(Natgasoline LLC)
Series 2018
4.625%, 10/01/2031(a) | | | 540 | | | | 536,215 | |
North Texas Tollway Authority
(North Texas Tollway System)
Series 2015-A
5.00%, 01/01/2034 | | | 1,000 | | | | 1,004,481 | |
| | | | | | | | |
| | | | | | | 1,540,696 | |
| | | | | | | | |
Wisconsin – 0.4% | |
Wisconsin Public Finance Authority
(Celanese US Holdings LLC)
Series 2016-B
5.00%, 12/01/2025 | | | 1,000 | | | | 1,009,950 | |
| | | | | | | | |
Total Long-Term Municipal Bonds
(cost $232,882,236) | | | | | | | 224,675,450 | |
| | | | | | | | |
|
Short-Term Municipal Notes – 0.9% | |
Massachusetts – 0.9% | |
Massachusetts Development Finance Agency
(Children’s Hospital Corp. Obligated Group (The))
Series 2024
4.00%, 03/01/2048(e) | | | 1,000 | | | | 1,000,000 | |
Massachusetts Health & Educational Facilities Authority
(Mass General Brigham, Inc.)
Series 2011
3.25%, 07/01/2040(e) | | | 1,000 | | | | 1,000,000 | |
| | | | | | | | |
Total Short-Term Municipal Notes
(cost $2,000,000) | | | | | | | 2,000,000 | |
| | | | | | | | |
Total Municipal Obligations
(cost $234,882,236) | | | | | | | 226,675,450 | |
| | | | | | | | |
| | |
| |
| abfunds.com | | AB MUNICIPAL INCOME FUND II | 21 |
PORTFOLIO OF INVESTMENTS (continued)
AB MASSACHUSETTS PORTFOLIO
| | | | | | | | |
| | | Principal
Amount
(000) | | | U.S. $ Value | |
| |
ASSET-BACKED SECURITIES – 0.2% | |
Other ABS – Fixed Rate – 0.2% | |
HTA TRRB Custodial Trust
Series 2022
5.25%, 07/01/2034 | | $ | 214 | | | $ | 208,040 | |
5.25%, 07/01/2036 | | | 189 | | | | 189,717 | |
5.25%, 07/01/2041 | | | 82 | | | | 79,976 | |
| | | | | | | | |
Total Asset-Backed Securities
(cost $482,726) | | | | | | | 477,733 | |
| | | | | | | | |
| | |
COLLATERALIZED MORTGAGE OBLIGATIONS – 0.0% | | | | | | | | |
Non-Agency Fixed Rate – 0.0% | | | | | | | | |
Village of Bolingbrook IL Sales Tax Revenue
Series 2005
6.25%, 01/01/2024(f)(g)
(cost $90,478) | | | 90 | | | | 90,478 | |
| | | | | | | | |
| | |
| | | Shares | | | | |
PREFERRED STOCKS – 0.0% | | | | | | | | |
Utility – 0.0% | | | | | | | | |
Electric – 0.0% | | | | | | | | |
AES Puerto Rico LP
0.00%(c)(d)(f)
(cost $156,813) | | | 8,741 | | | | 25,436 | |
| | | | | | | | |
| | |
SHORT-TERM INVESTMENTS – 0.1% | | | | | | | | |
Investment Companies – 0.1% | | | | | | | | |
AB Fixed Income Shares, Inc. – Government Money Market Portfolio – Class AB, 5.22%(h)(i)(j)
(cost $338,267) | | | 338,267 | | | | 338,267 | |
| | | | | | | | |
| | |
Total Investments – 97.8%
(cost $235,950,520) | | | | | | | 227,607,364 | |
Other assets less liabilities – 2.2% | | | | | | | 5,051,716 | |
| | | | | | | | |
| | |
Net Assets – 100.0% | | | | | | $ | 232,659,080 | |
| | | | | | | | |
| | |
| |
22 | AB MUNICIPAL INCOME FUND II | | abfunds.com |
PORTFOLIO OF INVESTMENTS (continued)
AB MASSACHUSETTS PORTFOLIO
CENTRALLY CLEARED INFLATION (CPI) SWAPS (see Note D)
| | | | | | | | | | | | | | | | | | | | | | | | | | | | | | | | |
| | | | | | | | | Rate Type | | | | | | | | | | | | | |
Notional
Amount
(000) | | | Termination
Date | | | Payments
made
by the
Fund | | | Payments
received
by the
Fund | | | Payment
Frequency
Paid/
Received | | | Market
Value | | | Upfront
Premiums
Paid
(Received) | | | Unrealized
Appreciation
(Depreciation) | |
USD | | | 1,325 | | | | 01/15/2025 | | | | 2.565 | % | | | CPI | # | | | Maturity | | | $ | 150,144 | | | $ | – 0 | – | | $ | 150,144 | |
USD | | | 663 | | | | 01/15/2025 | | | | 2.613 | % | | | CPI | # | | | Maturity | | | | 73,813 | | | | – 0 | – | | | 73,813 | |
USD | | | 662 | | | | 01/15/2025 | | | | 2.585 | % | | | CPI | # | | | Maturity | | | | 74,462 | | | | – 0 | – | | | 74,462 | |
USD | | | 510 | | | | 01/15/2025 | | | | 4.028 | % | | | CPI | # | | | Maturity | | | | 25,974 | | | | – 0 | – | | | 25,974 | |
USD | | | 2,270 | | | | 01/15/2026 | | | | CPI | # | | | 3.765 | % | | | Maturity | | | | (92,496 | ) | | | – 0 | – | | | (92,496 | ) |
USD | | | 2,060 | | | | 01/15/2027 | | | | CPI | # | | | 3.466 | % | | | Maturity | | | | (94,858 | ) | | | (1,472 | ) | | | (93,386 | ) |
USD | | | 2,050 | | | | 01/15/2027 | | | | CPI | # | | | 3.320 | % | | | Maturity | | | | (113,222 | ) | | | – 0 | – | | | (113,222 | ) |
USD | | | 1,660 | | | | 01/15/2027 | | | | CPI | # | | | 3.323 | % | | | Maturity | | | | (91,370 | ) | | | – 0 | – | | | (91,370 | ) |
USD | | | 5,260 | | | | 01/15/2028 | | | | 1.230 | % | | | CPI | # | | | Maturity | | | | 1,006,028 | | | | – 0 | – | | | 1,006,028 | |
USD | | | 3,970 | | | | 01/15/2028 | | | | 0.735 | % | | | CPI | # | | | Maturity | | | | 902,917 | | | | – 0 | – | | | 902,917 | |
USD | | | 3,900 | | | | 01/15/2029 | | | | CPI | # | | | 3.390 | % | | | Maturity | | | | (129,648 | ) | | | – 0 | – | | | (129,648 | ) |
USD | | | 2,420 | | | | 01/15/2029 | | | | CPI | # | | | 3.735 | % | | | Maturity | | | | (10,385 | ) | | | – 0 | – | | | (10,385 | ) |
USD | | | 1,250 | | | | 01/15/2029 | | | | CPI | # | | | 3.331 | % | | | Maturity | | | | (47,658 | ) | | | – 0 | – | | | (47,658 | ) |
USD | | | 870 | | | | 01/15/2030 | | | | 1.572 | % | | | CPI | # | | | Maturity | | | | 157,485 | | | | – 0 | – | | | 157,485 | |
USD | | | 870 | | | | 01/15/2030 | | | | 1.587 | % | | | CPI | # | | | Maturity | | | | 156,298 | | | | – 0 | – | | | 156,298 | |
USD | | | 1,300 | | | | 01/15/2031 | | | | 2.782 | % | | | CPI | # | | | Maturity | | | | 100,820 | | | | – 0 | – | | | 100,820 | |
USD | | | 1,130 | | | | 01/15/2031 | | | | 2.680 | % | | | CPI | # | | | Maturity | | | | 98,794 | | | | – 0 | – | | | 98,794 | |
USD | | | 1,000 | | | | 01/15/2031 | | | | 2.989 | % | | | CPI | # | | | Maturity | | | | 57,290 | | | | – 0 | – | | | 57,290 | |
USD | | | 1,000 | | | | 01/15/2032 | | | | CPI | # | | | 3.064 | % | | | Maturity | | | | (44,700 | ) | | | – 0 | – | | | (44,700 | ) |
USD | | | 950 | | | | 04/15/2032 | | | | CPI | # | | | 2.909 | % | | | Maturity | | | | (54,699 | ) | | | – 0 | – | | | (54,699 | ) |
| | | | | | | | | | | | | | | | | | | | | | | | | | | | | | | | |
| | | | | | | | | | | | | | | | | | | | | | $ | 2,124,989 | | | $ | (1,472 | ) | | $ | 2,126,461 | |
| | | | | | | | | | | | | | | | | | | | | | | | | | | | | | | | |
| # | Variable interest rate based on the rate of inflation as determined by the Consumer Price Index (CPI). |
CENTRALLY CLEARED INTEREST RATE SWAPS (see Note D)
| | | | | | | | | | | | | | | | | | | | | | | | | | | | | | | | |
| | | | | | | | | Rate Type | | | | | | | | | | | | | |
Notional
Amount
(000) | | | Termination
Date | | | Payments
made
by the
Fund | | | Payments
received
by the
Fund | | | Payment
Frequency Paid/
Received | | | Market
Value | | | Upfront
Premiums
Paid
(Received) | | | Unrealized
Appreciation
(Depreciation) | |
USD | | | 5,100 | | | | 07/31/2029 | | |
| 1 Day
SOFR |
| | | 4.109 | % | | | Annual | | | $ | (46,774 | ) | | $ | – 0 | – | | $ | (46,774 | ) |
USD | | | 5,600 | | | | 07/31/2030 | | |
| 1 Day
SOFR |
| | | 4.615 | % | | | Annual | | | | 93,479 | | | | – 0 | – | | | 93,479 | |
USD | | | 9,700 | | | | 11/01/2030 | | |
| 1 Day
SOFR |
| | | 4.492 | % | | | Annual | | | | 100,325 | | | | – 0 | – | | | 100,325 | |
USD | | | 4,300 | | | | 11/01/2030 | | |
| 1 Day
SOFR |
| | | 4.518 | % | | | Annual | | | | 51,314 | | | | – 0 | – | | | 51,314 | |
USD | | | 6,900 | | | | 07/31/2031 | | |
| 1 Day
SOFR |
| | | 4.059 | % | | | Annual | | | | (56,250 | ) | | | 782 | | | | (57,032 | ) |
USD | | | 4,500 | | | | 12/19/2033 | | | | 3.571 | % | |
| 1 Day
SOFR |
| | | Annual | | | | 239,811 | | | | – 0 | – | | | 239,811 | |
| | | | | | | | | | | | | | | | | | | | | | | | | | | | | | | | |
| | | $ | 381,905 | | | $ | 782 | | | $ | 381,123 | |
| | | | | | | | | | | | | | | | | | | | | | | | | | | | | | | | |
| | |
| |
| abfunds.com | | AB MUNICIPAL INCOME FUND II | 23 |
PORTFOLIO OF INVESTMENTS (continued)
AB MASSACHUSETTS PORTFOLIO
INTEREST RATE SWAPS (see Note D)
| | | | | | | | | | | | | | | | | | | | | | | | | | | | | | | | | | | | |
| | | | | | | | | | | | Rate Type | | | | | | | | | | | | | |
Swap
Counterparty | | Notional
Amount
(000) | | | Termination
Date | | | Payments
made
by the
Fund | | | Payments
received
by the
Fund | | | Payment
Frequency
Paid/
Received | | | Market
Value | | | Upfront
Premiums
Paid
(Received) | | | Unrealized
Appreciation
(Depreciation) | |
Citibank, NA | | | USD | | | | 3,025 | | | | 10/09/2029 | | | | 1.125 | % | | | SIFMA | * | | | Quarterly | | | $ | 312,578 | | | $ | – 0 | – | | $ | 312,578 | |
| * | Variable interest rate based on the Securities Industry & Financial Markets Association (SIFMA) Municipal Swap Index. |
| (a) | Security is exempt from registration under Rule 144A or Regulation S of the Securities Act of 1933. These securities are considered restricted, but liquid and may be resold in transactions exempt from registration. At May 31, 2024, the aggregate market value of these securities amounted to $4,652,180 or 2.0% of net assets. |
| (b) | Security is exempt from registration under Rule 144A or Regulation S of the Securities Act of 1933. These securities, which represent 0.07% of net assets as of May 31, 2024, are considered illiquid and restricted. Additional information regarding such securities follows: |
| | | | | | | | | | | | | | | | |
144A/Restricted & Illiquid
Securities | | Acquisition
Date | | | Cost | | | Market
Value | | | Percentage of
Net Assets | |
Indiana Finance Authority
(Brightmark Plastics Renewal Indiana LLC)
Series 2019
7.00%, 03/01/2039 | | | 03/29/2019 | | | $ | 258,021 | | | $ | 173,252 | | | | 0.07 | % |
| (c) | Fair valued by the Adviser. |
| (d) | Security in which significant unobservable inputs (Level 3) were used in determining fair value. |
| (e) | Variable Rate Demand Notes are instruments whose interest rates change on a specific date (such as coupon date or interest payment date) or whose interest rates vary with changes in a designated base rate (such as the prime interest rate). This instrument is payable on demand and is secured by letters of credit or other credit support agreements from major banks. |
| (f) | Non-income producing security. |
| (g) | Defaulted matured security. |
| (h) | Affiliated investments. |
| (i) | The rate shown represents the 7-day yield as of period end. |
| (j) | To obtain a copy of the fund’s shareholder report, please go to the Securities and Exchange Commission’s website at www.sec.gov, or call AB at (800) 227-4618. |
As of May 31, 2024, the Portfolio’s percentages of investments in municipal bonds that are insured and in insured municipal bonds that have been pre-refunded or escrowed to maturity are 1.6% and 0.0%, respectively.
Glossary:
ABS – Asset-Backed Securities
AGM – Assured Guaranty Municipal
BAM – Build American Mutual
NATL – National Interstate Corporation
SOFR – Secured Overnight Financing Rate
See notes to financial statements.
| | |
| |
24 | AB MUNICIPAL INCOME FUND II | | abfunds.com |
PORTFOLIO OF INVESTMENTS
AB MINNESOTA PORTFOLIO
May 31, 2024
| | | | | | | | |
| | | Principal
Amount
(000) | | | U.S. $ Value | |
| |
MUNICIPAL OBLIGATIONS – 94.9% | |
Long-Term Municipal Bonds – 94.9% | |
Minnesota – 94.9% | |
Anoka-Hennepin Independent School District No. 11
(Anoka-Hennepin Independent School District No.11 COP)
Series 2014-A
5.00%, 02/01/2034 | | $ | 1,695 | | | $ | 1,695,830 | |
City of Apple Valley MN
(PHS Apple Valley Senior Housing, Inc.)
Series 2021
4.00%, 09/01/2051 | | | 270 | | | | 221,701 | |
City of Center City MN
(Hazelden Betty Ford Foundation)
Series 2014
5.00%, 11/01/2029 | | | 200 | | | | 200,648 | |
5.00%, 11/01/2044 | | | 500 | | | | 500,502 | |
Series 2019
4.00%, 11/01/2041 | | | 850 | | | | 770,334 | |
City of Duluth MN
Series 2016-A
5.00%, 02/01/2034 | | | 1,000 | | | | 1,015,847 | |
City of Fridley MN
(Roers Fridley Apartments Owner II LLC)
Series 2023-A
5.75%, 06/01/2041(a) | | | 200 | | | | 198,927 | |
City of Maple Grove MN
(Maple Grove Hospital Corp.)
Series 2017
5.00%, 05/01/2031 | | | 1,000 | | | | 1,016,692 | |
City of Minneapolis MN
(Allina Health Obligated Group)
Series 2023-A
5.00%, 11/15/2052 | | | 1,000 | | | | 1,046,582 | |
City of Minneapolis MN
(Fairview Health Services Obligated Group)
Series 2018-A
5.00%, 11/15/2036 | | | 2,000 | | | | 2,056,065 | |
City of Minneapolis MN
(Hennepin Schools)
Series 2021-A
4.00%, 07/01/2056 | | | 300 | | | | 201,943 | |
City of Ramsey MN
(Pact Charter School)
Series 2022-A
5.00%, 06/01/2032 | | | 200 | | | | 201,049 | |
| | |
| |
| abfunds.com | | AB MUNICIPAL INCOME FUND II | 25 |
PORTFOLIO OF INVESTMENTS (continued)
AB MINNESOTA PORTFOLIO
| | | | | | | | |
| | | Principal
Amount
(000) | | | U.S. $ Value | |
| |
City of St. Paul MN Water Revenue
Series 2023-A
4.00%, 12/01/2045 | | $ | 1,000 | | | $ | 981,461 | |
City of Wayzata MN
(Wayzata Bay Senior Housing, Inc.) | | | | | | | | |
Series 2019
5.00%, 08/01/2049 | | | 395 | | | | 392,177 | |
City of Woodbury MN
(Woodbury Leadership Academy) | | | | | | | | |
Series 2021
4.00%, 07/01/2056 | | | 215 | | | | 149,120 | |
Cloquet Independent School District No. 94 | | | | | | | | |
Series 2015-B
5.00%, 02/01/2031 | | | 1,200 | | | | 1,209,910 | |
Duluth Economic Development Authority
(Benedictine Health System Obligated Group) | | | | | | | | |
Series 2021
4.00%, 07/01/2036 | | | 400 | | | | 348,508 | |
Housing & Redevelopment Authority of The City of St. Paul Minnesota
(Amherst H Wilder Foundation/MN) | | | | | | | | |
Series 2020
5.00%, 12/01/2036 | | | 1,575 | | | | 1,621,601 | |
Housing & Redevelopment Authority of The City of St. Paul Minnesota
(HealthPartners Obligated Group) | | | | | | | | |
Series 2015-A
5.00%, 07/01/2032 | | | 1,000 | | | | 1,006,240 | |
Housing & Redevelopment Authority of The City of St. Paul Minnesota
(Hmong College Prep Academy) | | | | | | | | |
Series 2020
5.00%, 09/01/2040 | | | 110 | | | | 106,821 | |
Housing & Redevelopment Authority of The City of St. Paul Minnesota
(Minnesota Math & Science Academy) | | | | | | | | |
Series 2021
4.00%, 06/01/2041(a) | | | 100 | | | | 77,121 | |
4.00%, 06/01/2051(a) | | | 125 | | | | 85,892 | |
Hutchinson Utilities Commission | | | | | | | | |
Series 2012-A
5.00%, 12/01/2025 | | | 420 | | | | 420,420 | |
Minneapolis Special School District No. 1 | | | | | | | | |
Series 2016
5.00%, 02/01/2031 | | | 1,000 | | | | 1,041,608 | |
| | |
| |
26 | AB MUNICIPAL INCOME FUND II | | abfunds.com |
PORTFOLIO OF INVESTMENTS (continued)
AB MINNESOTA PORTFOLIO
| | | | | | | | |
| | | Principal
Amount
(000) | | | U.S. $ Value | |
| |
Minneapolis-St. Paul Metropolitan Airports Commission | | | | | | | | |
Series 2019-B
5.00%, 01/01/2035 | | $ | 1,000 | | | $ | 1,048,018 | |
Minnesota Higher Education Facilities Authority
(College of St. Scholastica, Inc.) | | | | | | | | |
Series 2019
4.00%, 12/01/2040 | | | 1,000 | | | | 869,690 | |
Minnesota Higher Education Facilities Authority
(Hamline University) | | | | | | | | |
Series 2017-B
5.00%, 10/01/2036 | | | 500 | | | | 503,314 | |
Minnesota Higher Education Facilities Authority
(St. Catherine University) | | | | | | | | |
Series 2018-A
5.00%, 10/01/2045 | | | 1,100 | | | | 1,082,802 | |
Minnesota Higher Education Facilities Authority
(St. Olaf College) | | | | | | | | |
Series 2021
3.00%, 10/01/2041 | | | 1,000 | | | | 804,192 | |
Series 2015-8
5.00%, 12/01/2032 | | | 650 | | | | 660,128 | |
Minnesota Higher Education Facilities Authority
(University of St. Thomas/Minneapolis) | | | | | | | | |
Series 2017-A
4.00%, 10/01/2034 | | | 800 | | | | 801,121 | |
Minnesota Housing Finance Agency
(Minnesota Housing Finance Agency State Lease) | | | | | | | | |
Series 2019-A
4.00%, 08/01/2031 | | | 50 | | | | 51,416 | |
Minnesota Municipal Gas Agency
(Royal Bank of Canada) | | | | | | | | |
Series 2022-A
4.00%, 12/01/2052 | | | 1,000 | | | | 1,001,398 | |
Minnesota Municipal Power Agency | | | | | | | | |
Series 2014
5.00%, 10/01/2032 | | | 750 | | | | 752,549 | |
New Prague Independent School District No. 721 | | | | | | | | |
Series 2015-A
4.00%, 02/01/2032 | | | 1,000 | | | | 1,000,940 | |
North St. Paul-Maplewood-Oakdale Independent School District No. 622 | | | | | | | | |
Series 2019-A
3.00%, 02/01/2038 | | | 1,000 | | | | 857,172 | |
3.00%, 02/01/2039 | | | 1,000 | | | | 836,007 | |
| | |
| |
| abfunds.com | | AB MUNICIPAL INCOME FUND II | 27 |
PORTFOLIO OF INVESTMENTS (continued)
AB MINNESOTA PORTFOLIO
| | | | | | | | |
| | | Principal
Amount
(000) | | | U.S. $ Value | |
| |
Northern Municipal Power Agency | | | | | | | | |
Series 2017
5.00%, 01/01/2033 | | $ | 235 | | | $ | 242,244 | |
5.00%, 01/01/2034 | | | 215 | | | | 221,420 | |
5.00%, 01/01/2041 | | | 700 | | | | 711,674 | |
Southern Minnesota Municipal Power Agency | | | | | | | | |
Series 2017-A
5.00%, 01/01/2047 | | | 1,000 | | | | 1,030,422 | |
| | | | | | | | |
| | |
Total Municipal Obligations
(cost $30,699,151) | | | | | | | 29,041,506 | |
| | | | | | | | |
| | |
| | | Shares | | | | |
SHORT-TERM INVESTMENTS – 3.0% | |
Investment Companies – 3.0% | |
AB Fixed Income Shares, Inc. – Government Money Market Portfolio – Class AB,
5.22%(b)(c)(d)
(cost $925,927) | | | 925,927 | | | | 925,927 | |
| | | | | | | | |
| | |
Total Investments – 97.9%
(cost $31,625,078) | | | | | | | 29,967,433 | |
Other assets less liabilities – 2.1% | | | | | | | 644,209 | |
| | | | | | | | |
| | |
Net Assets – 100.0% | | | | | | $ | 30,611,642 | |
| | | | | | | | |
CENTRALLY CLEARED INFLATION (CPI) SWAPS (see Note D)
| | | | | | | | | | | | | | | | | | | | | | | | | | |
| | | | Rate Type | | | |
Notional
Amount
(000) | | | Termination
Date | | | Payments
made
by the
Fund | | Payments
received
by the
Fund | | Payment
Frequency
Paid/
Received | | Market
Value | | | Upfront
Premiums
Paid
(Received) | | | Unrealized
Appreciation
(Depreciation) | |
USD | | | 365 | | | | 01/15/2025 | | | 2.565% | | CPI# | | Maturity | | $ | 41,361 | | | $ | – 0 | – | | $ | 41,361 | |
USD | | | 183 | | | | 01/15/2025 | | | 2.585% | | CPI# | | Maturity | | | 20,584 | | | | – 0 | – | | | 20,584 | |
USD | | | 182 | | | | 01/15/2025 | | | 2.613% | | CPI# | | Maturity | | | 20,262 | | | | – 0 | – | | | 20,262 | |
USD | | | 120 | | | | 01/15/2025 | | | 4.028% | | CPI# | | Maturity | | | 6,111 | | | | – 0 | – | | | 6,111 | |
USD | | | 680 | | | | 01/15/2026 | | | CPI# | | 3.765% | | Maturity | | | (27,708 | ) | | | – 0 | – | | | (27,708 | ) |
USD | | | 570 | | | | 01/15/2027 | | | CPI# | | 3.466% | | Maturity | | | (26,248 | ) | | | (407 | ) | | | (25,841 | ) |
USD | | | 500 | | | | 01/15/2027 | | | CPI# | | 3.320% | | Maturity | | | (27,615 | ) | | | – 0 | – | | | (27,615 | ) |
USD | | | 420 | | | | 01/15/2027 | | | CPI# | | 3.323% | | Maturity | | | (23,118 | ) | | | – 0 | – | | | (23,118 | ) |
USD | | | 1,410 | | | | 01/15/2028 | | | 1.230% | | CPI# | | Maturity | | | 269,677 | | | | – 0 | – | | | 269,677 | |
USD | | | 1,070 | | | | 01/15/2028 | | | 0.735% | | CPI# | | Maturity | | | 243,356 | | | | – 0 | – | | | 243,356 | |
USD | | | 1,050 | | | | 01/15/2029 | | | CPI# | | 3.390% | | Maturity | | | (34,905 | ) | | | – 0 | – | | | (34,905 | ) |
USD | | | 620 | | | | 01/15/2029 | | | CPI# | | 3.735% | | Maturity | | | (2,661 | ) | | | – 0 | – | | | (2,661 | ) |
USD | | | 330 | | | | 01/15/2029 | | | CPI# | | 3.331% | | Maturity | | | (12,582 | ) | | | – 0 | – | | | (12,582 | ) |
USD | | | 255 | | | | 01/15/2030 | | | 1.572% | | CPI# | | Maturity | | | 46,159 | | | | – 0 | – | | | 46,159 | |
USD | | | 255 | | | | 01/15/2030 | | | 1.587% | | CPI# | | Maturity | | | 45,812 | | | | –0 | – | | | 45,812 | |
USD | | | 300 | | | | 01/15/2031 | | | 2.680% | | CPI# | | Maturity | | | 26,228 | | | | –0 | – | | | 26,228 | |
USD | | | 300 | | | | 01/15/2031 | | | 2.782% | | CPI# | | Maturity | | | 23,266 | | | | – 0 | – | | | 23,266 | |
USD | | | 250 | | | | 01/15/2031 | | | 2.989% | | CPI# | | Maturity | | | 14,323 | | | | – 0 | – | | | 14,323 | |
| | |
| |
28 | AB MUNICIPAL INCOME FUND II | | abfunds.com |
PORTFOLIO OF INVESTMENTS (continued)
AB MINNESOTA PORTFOLIO
| | | | | | | | | | | | | | | | | | | | | | | | | | |
| | | | Rate Type | | | |
Notional
Amount
(000) | | | Termination
Date | | | Payments
made
by the
Fund | | Payments
received
by the
Fund | | Payment
Frequency
Paid/
Received | | Market
Value | | | Upfront
Premiums
Paid
(Received) | | | Unrealized
Appreciation
(Depreciation) | |
USD | | | 260 | | | | 01/15/2032 | | | CPI# | | 3.064% | | Maturity | | $ | (11,622 | ) | | $ | – 0 | – | | $ | (11,622 | ) |
USD | | | 260 | | | | 04/15/2032 | | | CPI# | | 2.909% | | Maturity | | | (14,970 | ) | | | – 0 | – | | | (14,970 | ) |
| | | | | | | | | | | | | | | | | | | | | | | | | | |
| | $ | 575,710 | | | $ | (407 | ) | | $ | 576,117 | |
| | | | | | | | | | | | | | | | | | | | | | | | | | |
| # | Variable interest rate based on the rate of inflation as determined by the Consumer Price Index (CPI). |
CENTRALLY CLEARED INTEREST RATE SWAPS (see Note D)
| | | | | | | | | | | | | | | | | | | | | | | | | | | | | | | | |
| | | | Rate Type | | | | |
Notional
Amount
(000) | | | Termination
Date | | | Payments
made
by the
Fund | | | Payments
received
by the
Fund | | | Payment
Frequency
Paid/
Received | | | Market
Value | | | Upfront
Premiums
Paid
(Received) | | | Unrealized
Appreciation
(Depreciation) | |
USD | | | 3,400 | | | | 01/15/2027 | | | | 1 Day SOFR | | | | 3.943 | % | | | Annual | | | $ | (74,221 | ) | | $ | – 0 | – | | $ | (74,221 | ) |
USD | | | 500 | | | | 01/15/2027 | | | | 1 Day SOFR | | | | 3.941 | % | | | Annual | | | | (10,950 | ) | | | – 0 | – | | | (10,950 | ) |
USD | | | 600 | | | | 07/31/2029 | | | | 1 Day SOFR | | | | 3.975 | % | | | Annual | | | | (10,187 | ) | | | – 0 | – | | | (10,187 | ) |
USD | | | 1,100 | | | | 04/30/2030 | | | | 1 Day SOFR | | | | 3.486 | % | | | Annual | | | | (44,427 | ) | | | – 0 | – | | | (44,427 | ) |
USD | | | 800 | | | | 04/30/2030 | | | | 1 Day SOFR | | | | 3.369 | % | | | Annual | | | | (37,230 | ) | | | – 0 | – | | | (37,230 | ) |
USD | | | 710 | | | | 04/30/2030 | | | | 1 Day SOFR | | | | 3.075 | % | | | Annual | | | | (44,013 | ) | | | – 0 | – | | | (44,013 | ) |
USD | | | 530 | | | | 04/30/2030 | | | | 1 Day SOFR | | | | 3.500 | % | | | Annual | | | | (21,016 | ) | | | – 0 | – | | | (21,016 | ) |
USD | | | 600 | | | | 07/31/2030 | | | | 1 Day SOFR | | | | 4.016 | % | | | Annual | | | | (13,003 | ) | | | – 0 | – | | | (13,003 | ) |
USD | | | 200 | | | | 11/01/2030 | | | | 1 Day SOFR | | | | 4.280 | % | | | Annual | | | | (492 | ) | | | – 0 | – | | | (492 | ) |
USD | | | 500 | | | | 01/08/2031 | | | | 1 Day SOFR | | | | 3.580 | % | | | Annual | | | | (20,807 | ) | | | – 0 | – | | | (20,807 | ) |
USD | | | 740 | | | | 04/30/2031 | | | | 1 Day SOFR | | | | 4.285 | % | | | Annual | | | | 3,097 | | | | – 0 | – | | | 3,097 | |
USD | | | 700 | | | | 12/19/2033 | | | | 1 Day SOFR | | | | 3.565 | % | | | Annual | | | | (37,615 | ) | | | – 0 | – | | | (37,615 | ) |
| | | | | | | | | | | | | | | | | | | | | | | | | | | | | | | | |
| | | | | | | | | | | | | | | | | | | | | | $ | (310,864 | ) | | $ | – 0 | – | | $ | (310,864 | ) |
| | | | | | | | | | | | | | | | | | | | | | | | | | | | | | | | |
INTEREST RATE SWAPS (see Note D)
| | | | | | | | | | | | | | | | | | | | | | | | | | | | | | | | | | | | |
| | | | Rate Type | | | | |
Swap
Counterparty | | Notional
Amount
(000) | | | Termination
Date | | | Payments
made
by the
Fund | | | Payments
received
by the
Fund | | | Payment
Frequency
Paid/
Received | | | Market
Value | | | Upfront
Premiums
Paid
(Received) | | | Unrealized
Appreciation
(Depreciation) | |
Citibank, NA | | | USD | | | | 835 | | | | 10/09/2029 | | | | 1.125 | % | | | SIFMA | * | | | Quarterly | | | $ | 86,282 | | | $ | – 0 – | | | $ | 86,282 | |
| * | Variable interest rate based on the Securities Industry & Financial Markets Association (SIFMA) Municipal Swap Index. |
| (a) | Security is exempt from registration under Rule 144A or Regulation S of the Securities Act of 1933. These securities are considered restricted, but liquid and may be resold in transactions exempt from registration. At May 31, 2024, the aggregate market value of these securities amounted to $361,940 or 1.2% of net assets. |
| (b) | Affiliated investments. |
| (c) | The rate shown represents the 7-day yield as of period end. |
| (d) | To obtain a copy of the fund’s shareholder report, please go to the Securities and Exchange Commission’s website at www.sec.gov, or call AB at (800) 227-4618. |
Glossary:
COP – Certificate of Participation
SOFR – Secured Overnight Financing Rate
See notes to financial statements.
| | |
| |
| abfunds.com | | AB MUNICIPAL INCOME FUND II | 29 |
PORTFOLIO OF INVESTMENTS
AB NEW JERSEY PORTFOLIO
May 31, 2024
| | | | | | | | |
| | | Principal
Amount
(000) | | | U.S. $ Value | |
| |
MUNICIPAL OBLIGATIONS – 103.3% | | | | | | | | |
Long-Term Municipal Bonds – 103.3% | | | | | | | | |
New Jersey – 95.5% | | | | | | | | |
Camden County Improvement Authority (The)
(KIPP Cooper Norcross Obligated Group)
Series 2022
6.00%, 06/15/2052 | | $ | 1,000 | | | $ | 1,061,081 | |
Casino Reinvestment Development Authority, Inc.
Series 2014
5.25%, 11/01/2044 | | | 1,000 | | | | 1,000,541 | |
City of Jersey City NJ
Series 2017-A
5.00%, 11/01/2031 | | | 500 | | | | 524,319 | |
County of Cape May NJ
Series 2017
4.00%, 09/01/2024 | | | 600 | | | | 600,364 | |
Essex County Improvement Authority
(Friends of TEAM Academy Charter School Obligated Group)
Series 2021
4.00%, 06/15/2051 | | | 500 | | | | 431,098 | |
Jersey City Board of Education
AGM Series 2023
4.125%, 08/15/2042 | | | 1,000 | | | | 1,010,393 | |
Morris-Union Jointure Commission
(Morris-Union Jointure Commission COP)
AGM Series 2013
5.00%, 08/01/2026 | | | 2,320 | | | | 2,322,422 | |
New Jersey Economic Development Authority
(Bancroft Neurohealth Obligated Group)
Series 2016-A
5.00%, 06/01/2041 | | | 1,000 | | | | 916,289 | |
New Jersey Economic Development Authority
(Lutheran Social Ministries at Crane’s Mill, Inc.)
Series 2018
5.00%, 01/01/2049 | | | 500 | | | | 445,527 | |
New Jersey Economic Development Authority
(Middlesex Water Co.)
Series 2019
4.00%, 08/01/2059 | | | 2,000 | | | | 1,763,038 | |
New Jersey Economic Development Authority
(New Jersey Economic Development Authority State Lease)
Series 2023
5.298%, 03/01/2032 | | | 1,050 | | | | 1,057,041 | |
| | |
| |
30 | AB MUNICIPAL INCOME FUND II | | abfunds.com |
PORTFOLIO OF INVESTMENTS (continued)
AB NEW JERSEY PORTFOLIO
| | | | | | | | |
| | | Principal
Amount
(000) | | | U.S. $ Value | |
| |
NATL Series 1997-A
7.425%, 02/15/2029 | | $ | 1,000 | | | $ | 1,058,423 | |
New Jersey Economic Development Authority
(New Jersey-American Water Co., Inc.)
Series 2023
3.75%, 11/01/2034 | | | 1,500 | | | | 1,467,258 | |
New Jersey Economic Development Authority
(NJ Metromall Urban Renewal, Inc.)
Series 2002
6.50%, 04/01/2028 | | | 703 | | | | 703,101 | |
New Jersey Economic Development Authority
(North Star Academy Charter School of Newark, Inc.)
Series 2017
5.00%, 07/15/2032 | | | 1,000 | | | | 1,022,954 | |
New Jersey Economic Development Authority
(NYNJ Link Borrower LLC)
Series 2013
5.00%, 01/01/2028 | | | 1,000 | | | | 1,000,488 | |
5.125%, 01/01/2034 | | | 500 | | | | 500,220 | |
5.50%, 01/01/2027 | | | 1,000 | | | | 1,000,948 | |
New Jersey Economic Development Authority
(Port Newark Container Terminal LLC)
Series 2017
5.00%, 10/01/2047 | | | 2,500 | | | | 2,516,992 | |
New Jersey Economic Development Authority
(Seeing Eye, Inc. (The))
Series 2017
5.00%, 06/01/2032 | | | 1,765 | | | | 1,821,167 | |
New Jersey Economic Development Authority
(State of New Jersey)
Series 2024-S
5.25%, 06/15/2039 | | | 1,000 | | | | 1,118,432 | |
New Jersey Economic Development Authority
(United Airlines, Inc.)
Series 2012
5.25%, 09/15/2029 | | | 1,165 | | | | 1,166,313 | |
New Jersey Educational Facilities Authority
(Kean University)
AGM Series 2015-H
5.00%, 07/01/2034 | | | 2,500 | | | | 2,544,591 | |
New Jersey Educational Facilities Authority
(Montclair State University, Inc.)
AGM Series 2024
5.00%, 07/01/2041 | | | 1,000 | | | | 1,102,683 | |
| | |
| |
| abfunds.com | | AB MUNICIPAL INCOME FUND II | 31 |
PORTFOLIO OF INVESTMENTS (continued)
AB NEW JERSEY PORTFOLIO
| | | | | | | | |
| | | Principal
Amount
(000) | | | U.S. $ Value | |
| |
New Jersey Educational Facilities Authority
(Stevens Institute of Technology International, Inc.)
Series 2017
5.00%, 07/01/2047 | | $ | 1,750 | | | $ | 1,758,582 | |
New Jersey Health Care Facilities Financing Authority
(AHS Hospital Corp.)
Series 2016
4.00%, 07/01/2041 | | | 2,000 | | | | 1,946,481 | |
New Jersey Health Care Facilities Financing Authority
(Inspira Health Obligated Group)
Series 2017-A
5.00%, 07/01/2035 | | | 1,835 | | | | 1,887,799 | |
New Jersey Health Care Facilities Financing Authority
(RWJ Barnabas Health Obligated Group)
Series 2021
4.00%, 07/01/2051 | | | 1,000 | | | | 923,988 | |
Series 2024
5.25%, 07/01/2044 | | | 1,000 | | | | 1,101,413 | |
New Jersey Health Care Facilities Financing Authority
(Valley Health System Obligated Group/NJ)
Series 2019
4.00%, 07/01/2039 | | | 2,500 | | | | 2,474,761 | |
New Jersey Transportation Trust Fund Authority
(New Jersey Transportation Fed Hwy Grant)
Series 2016
5.00%, 06/15/2029 | | | 1,750 | | | | 1,788,079 | |
New Jersey Transportation Trust Fund Authority
(New Jersey Transportation Trust Fund Authority State Lease)
Series 2015-A
5.25%, 06/15/2041 | | | 1,250 | | | | 1,261,842 | |
Series 2018-A
5.00%, 12/15/2035 | | | 1,750 | | | | 1,838,456 | |
Series 2023-A
5.00%, 06/15/2039 | | | 1,000 | | | | 1,089,590 | |
AGM Series 2006-C
Zero Coupon, 12/15/2033 | | | 1,000 | | | | 685,664 | |
New Jersey Turnpike Authority
Series 2019-A
5.00%, 01/01/2048 | | | 680 | | | | 703,681 | |
| | |
| |
32 | AB MUNICIPAL INCOME FUND II | | abfunds.com |
PORTFOLIO OF INVESTMENTS (continued)
AB NEW JERSEY PORTFOLIO
| | | | | | | | |
| | | Principal
Amount
(000) | | | U.S. $ Value | |
| |
Series 2024-A
4.00%, 01/01/2035(a) | | $ | 1,000 | | | $ | 1,040,913 | |
5.00%, 01/01/2034(a) | | | 1,000 | | | | 1,130,881 | |
Series 2024-C
5.00%, 01/01/2043(a) | | | 1,000 | | | | 1,070,434 | |
5.00%, 01/01/2044(a) | | | 1,000 | | | | 1,065,598 | |
Passaic County Improvement Authority (The)
(Paterson Arts & Science Charter School)
Series 2023
5.50%, 07/01/2058 | | | 1,000 | | | | 1,018,084 | |
Rahway Valley Sewerage Authority (The)
NATL Series 2005-A
Zero Coupon, 09/01/2035 | | | 3,445 | | | | 2,194,638 | |
South Jersey Transportation Authority
Series 2022
4.625%, 11/01/2047 | | | 1,000 | | | | 1,004,792 | |
BAM Series 2022
5.25%, 11/01/2052 | | | 1,000 | | | | 1,065,264 | |
Tobacco Settlement Financing Corp./NJ
Series 2018-B
5.00%, 06/01/2046 | | | 2,330 | | | | 2,345,042 | |
Union County Utilities Authority
(County of Union NJ Lease)
Series 2011-A
5.25%, 12/01/2031 | | | 2,900 | | | | 2,901,971 | |
| | | | | | | | |
| | | | | | | 60,453,636 | |
| | | | | | | | |
American Samoa – 0.3% | | | | | | | | |
American Samoa Economic Development Authority (Territory of American Samoa)
Series 2018
7.125%, 09/01/2038(b) | | | 145 | | | | 155,583 | |
| | | | | | | | |
| | |
Arizona – 0.2% | | | | | | | | |
Maricopa County Industrial Development Authority
(Benjamin Franklin Charter School Ltd.)
Series 2018-A
6.00%, 07/01/2052(b) | | | 100 | | | | 102,072 | |
| | | | | | | | |
| | |
Florida – 0.1% | | | | | | | | |
Palm Beach County Health Facilities Authority
(Federation CCRC Operations Corp. Obligated Group)
Series 2020
5.00%, 06/01/2055 | | | 100 | | | | 91,220 | |
| | | | | | | | |
| | |
| |
| abfunds.com | | AB MUNICIPAL INCOME FUND II | 33 |
PORTFOLIO OF INVESTMENTS (continued)
AB NEW JERSEY PORTFOLIO
| | | | | | | | |
| | | Principal
Amount
(000) | | | U.S. $ Value | |
| |
Guam – 3.2% | | | | | | | | |
Antonio B Won Pat International Airport Authority
Series 2021-A
3.839%, 10/01/2036 | | $ | 100 | | | $ | 83,367 | |
Guam Power Authority
Series 2017-A
5.00%, 10/01/2036 | | | 150 | | | | 153,480 | |
5.00%, 10/01/2040 | | | 655 | | | | 664,269 | |
Territory of Guam
(Guam Section 30 Income Tax)
Series 2016-A
5.00%, 12/01/2046 | | | 720 | | | | 716,614 | |
Territory of Guam
(Territory of Guam Business Privilege Tax)
Series 2021-F
4.00%, 01/01/2042 | | | 440 | | | | 408,105 | |
| | | | | | | | |
| | | | | | | 2,025,835 | |
| | | | | | | | |
Illinois – 0.5% | | | | | | | | |
Chicago Board of Education
Series 2018-A
5.00%, 12/01/2031 | | | 305 | | | | 315,214 | |
| | | | | | | | |
| | |
Michigan – 0.1% | | | | | | | | |
City of Detroit MI
Series 2018
5.00%, 04/01/2036 | | | 50 | | | | 50,916 | |
| | | | | | | | |
| | |
Nevada – 0.1% | | | | | | | | |
City of Reno NV
(County of Washoe NV Sales Tax Revenue)
Series 2018-C
Zero Coupon, 07/01/2058(b) | | | 500 | | | | 63,924 | |
| | | | | | | | |
| | |
North Dakota – 0.0% | | | | | | | | |
County of Grand Forks ND
(Red River Biorefinery LLC)
Series 2021
6.625%, 12/15/2031(c)(d)(e)(f)(g) | | | 110 | | | | 1,430 | |
7.00%, 12/15/2043(c)(d)(e)(f)(g) | | | 110 | | | | 1,430 | |
| | | | | | | | |
| | | | | | | 2,860 | |
| | | | | | | | |
Ohio – 0.2% | | | | | | | | |
Buckeye Tobacco Settlement Financing Authority
Series 2020-B
5.00%, 06/01/2055 | | | 165 | | | | 147,628 | |
| | | | | | | | |
| | |
| |
34 | AB MUNICIPAL INCOME FUND II | | abfunds.com |
PORTFOLIO OF INVESTMENTS (continued)
AB NEW JERSEY PORTFOLIO
| | | | | | | | |
| | | Principal
Amount
(000) | | | U.S. $ Value | |
| |
Puerto Rico – 2.4% | | | | | | | | |
Commonwealth of Puerto Rico
Series 2021-A
Zero Coupon, 07/01/2033 | | $ | 100 | | | $ | 66,275 | |
4.00%, 07/01/2046 | | | 100 | | | | 90,062 | |
Puerto Rico Commonwealth Aqueduct & Sewer Authority
Series 2020-A
5.00%, 07/01/2030(b) | | | 250 | | | | 262,399 | |
Puerto Rico Electric Power Authority
AGM Series 2007-V
5.25%, 07/01/2031 | | | 155 | | | | 154,270 | |
Puerto Rico Industrial Tourist Educational Medical & Environmental Control Facilities Financing Auth
Series 2023-A
6.625%, 01/01/2027 | | | 24 | | | | 24,069 | |
6.625%, 01/01/2028 | | | 187 | | | | 183,144 | |
Puerto Rico Industrial Tourist Educational Medical & Environmental Control Facilities Financing Auth
(AES Puerto Rico LP)
12.50%, 12/15/2025(e)(f) | | | 43 | | | | 42,053 | |
Puerto Rico Industrial Tourist Educational Medical & Environmental Control Facilities Financing Auth
(San Juan Cruise Port LLC)
Series 2024
6.75%, 01/01/2045 | | | 200 | | | | 237,022 | |
Puerto Rico Sales Tax Financing Corp. Sales Tax Revenue
Series 2018-A
Zero Coupon, 07/01/2029 | | | 104 | | | | 85,862 | |
Series 2019-A
4.329%, 07/01/2040 | | | 70 | | | | 69,541 | |
5.00%, 07/01/2058 | | | 305 | | | | 303,997 | |
| | | | | | | | |
| | | | | | | 1,518,694 | |
| | | | | | | | |
Tennessee – 0.3% | | | | | | | | |
Bristol Industrial Development Board
(Bristol Industrial Development Board Sales Tax)
Series 2016-A
5.00%, 12/01/2035(b) | | | 145 | | | | 132,856 | |
| | |
| |
| abfunds.com | | AB MUNICIPAL INCOME FUND II | 35 |
PORTFOLIO OF INVESTMENTS (continued)
AB NEW JERSEY PORTFOLIO
| | | | | | | | |
| | | Principal
Amount
(000) | | | U.S. $ Value | |
| |
Metropolitan Government Nashville & Davidson County Health & Educational Facilities Board
(Trousdale Foundation Obligated Group)
Series 2018-A
6.25%, 04/01/2049(c)(d)(g) | | $ | 260 | | | $ | 68,380 | |
| | | | | | | | |
| | | | | | | 201,236 | |
| | | | | | | | |
Texas – 0.4% | | | | | | | | |
Mission Economic Development Corp.
(Natgasoline LLC)
Series 2018
4.625%, 10/01/2031(b) | | | 245 | | | | 243,282 | |
| | | | | | | | |
| | |
Total Municipal Obligations
(cost $66,260,458) | | | | | | | 65,372,100 | |
| | | | | | | | |
| | | | | | | | |
ASSET-BACKED SECURITIES – 0.2% | | | | | | | | |
Other ABS - Fixed Rate – 0.2% | | | | | | | | |
HTA TRRB Custodial Trust | | | | | | | | |
Series 2022
5.25%, 07/01/2036
(cost $118,629) | | | 119 | | | | 119,604 | |
| | | | | | | | |
| | | | | | | | |
CORPORATES - NON-INVESTMENT GRADE – 0.0% | | | | | | | | |
Industrial – 0.0% | | | | | | | | |
Energy – 0.0% | | | | | | | | |
Red River Biorefinery LLC
Series 2024
15.00%, 07/31/2024(e)(f)(g) | | | 10 | | | | 3,000 | |
Series 23A
15.00%, 07/31/2024(e)(f)(g) | | | 15 | | | | 4,500 | |
| | | | | | | | |
| | | | | | | 7,500 | |
| | | | | | | | |
Other Industrial – 0.0% | | | | | | | | |
Cincinnati Sr Care/Dayton/Florida/Nashville/Sebring/Trousdale/Waynesboro HC
Series 2023
12.00%, 12/31/2023(e)(f)(g) | | | 10 | | | | 10,000 | |
| | | | | | | | |
| | |
Total Corporates – Non-Investment Grade
(cost $35,000) | | | | | | | 17,500 | |
| | | | | | | | |
| | |
| |
36 | AB MUNICIPAL INCOME FUND II | | abfunds.com |
PORTFOLIO OF INVESTMENTS (continued)
AB NEW JERSEY PORTFOLIO
| | | | | | | | |
| | | Shares | | | U.S. $ Value | |
| |
PREFERRED STOCKS – 0.0% | | | | | | | | |
Utility – 0.0% | | | | | | | | |
Electric – 0.0% | | | | | | | | |
AES Puerto Rico LP
0.00%(c)(e)(f)
(cost $73,616) | | | 4,104 | | | $ | 11,943 | |
| | | | | | | | |
| | | | | | | | |
SHORT-TERM INVESTMENTS – 1.4% | | | | | | | | |
Investment Companies – 1.4% | | | | | | | | |
AB Fixed Income Shares, Inc. – Government Money Market Portfolio – Class AB, 5.22%(h)(i)(j)
(cost $883,573) | | | 883,573 | | | | 883,573 | |
| | | | | | | | |
| | |
Total Investments – 104.9%
(cost $67,371,276) | | | | | | | 66,404,720 | |
Other assets less liabilities – (4.9)% | | | | | | | (3,131,993 | ) |
| | | | | | | | |
| | |
Net Assets – 100.0% | | | | | | $ | 63,272,727 | |
| | | | | | | | |
CENTRALLY CLEARED INFLATION (CPI) SWAPS (see Note D)
| | | | | | | | | | | | | | | | | | | | | | | | | | |
| | | | | | | | | Rate Type | | | | | | | | | | | |
Notional
Amount
(000) | | | Termination
Date | | | Payments
made
by the
Fund | | Payments
received
by the
Fund | | Payment
Frequency
Paid/
Received | | Market
Value | | | Upfront
Premiums
Paid
(Received) | | | Unrealized
Appreciation
(Depreciation) | |
| USD | | | 465 | | | | 01/15/2025 | | | 2.565% | | CPI# | | Maturity | | $ | 52,692 | | | $ | – 0 | – | | $ | 52,692 | |
| USD | | | 233 | | | | 01/15/2025 | | | 2.585% | | CPI# | | Maturity | | | 26,208 | | | | – 0 | – | | | 26,208 | |
| USD | | | 232 | | | | 01/15/2025 | | | 2.613% | | CPI# | | Maturity | | | 25,829 | | | | – 0 | – | | | 25,829 | |
| USD | | | 870 | | | | 01/15/2026 | | | CPI# | | 3.611% | | Maturity | | | (42,604 | ) | | | – 0 | – | | | (42,604 | ) |
| USD | | | 800 | | | | 01/15/2026 | | | CPI# | | 3.766% | | Maturity | | | (32,555 | ) | | | – 0 | – | | | (32,555 | ) |
| USD | | | 2,070 | | | | 01/15/2028 | | | 1.230% | | CPI# | | Maturity | | | 395,909 | | | | – 0 | – | | | 395,909 | |
| USD | | | 1,640 | | | | 01/15/2028 | | | 0.735% | | CPI# | | Maturity | | | 372,994 | | | | – 0 | – | | | 372,994 | |
| USD | | | 3,470 | | | | 01/15/2029 | | | CPI# | | 3.406% | | Maturity | | | (110,746 | ) | | | – 0 | – | | | (110,746 | ) |
| USD | | | 530 | | | | 01/15/2029 | | | CPI# | | 3.735% | | Maturity | | | (2,274 | ) | | | – 0 | – | | | (2,274 | ) |
| USD | | | 240 | | | | 01/15/2029 | | | CPI# | | 3.408% | | Maturity | | | (7,620 | ) | | | – 0 | – | | | (7,620 | ) |
| USD | | | 225 | | | | 01/15/2030 | | | 1.572% | | CPI# | | Maturity | | | 40,729 | | | | – 0 | – | | | 40,729 | |
| USD | | | 225 | | | | 01/15/2030 | | | 1.587% | | CPI# | | Maturity | | | 40,422 | | | | – 0 | – | | | 40,422 | |
| USD | | | 450 | | | | 01/15/2031 | | | 2.782% | | CPI# | | Maturity | | | 34,899 | | | | – 0 | – | | | 34,899 | |
| USD | | | 370 | | | | 01/15/2031 | | | 2.680% | | CPI# | | Maturity | | | 32,348 | | | | – 0 | – | | | 32,348 | |
| | | | | | | | | | | | | | | | | | | | | | | | | | |
| | $ | 826,231 | | | $ | – 0 | – | | $ | 826,231 | |
| | | | | | | | | | | | | | | | | | | | | | | | | | |
| # | Variable interest rate based on the rate of inflation as determined by the Consumer Price Index (CPI). |
| | |
| |
| abfunds.com | | AB MUNICIPAL INCOME FUND II | 37 |
PORTFOLIO OF INVESTMENTS (continued)
AB NEW JERSEY PORTFOLIO
CENTRALLY CLEARED INTEREST RATE SWAPS (see Note D)
| | | | | | | | | | | | | | | | | | | | | | | | | | |
| | | | | | | | | Rate Type | | | | | | | | | | | |
Notional
Amount
(000) | | | Termination
Date | | | Payments
made
by the
Fund | | Payments
received
by the
Fund | | Payment
Frequency
Paid/
Received | | Market
Value | | | Upfront
Premiums
Paid
(Received) | | | Unrealized
Appreciation
(Depreciation) | |
| USD | | | 1,500 | | | | 07/31/2029 | | | 1 Day SOFR | | 4.461% | | Annual | | $ | 11,932 | | | $ | – 0 | – | | $ | 11,932 | |
| USD | | | 1,300 | | | | 07/31/2029 | | | 1 Day SOFR | | 3.986% | | Annual | | | (22,263 | ) | | | – 0 | – | | | (22,263 | ) |
| USD | | | 1,700 | | | | 04/30/2030 | | | 1 Day SOFR | | 3.837% | | Annual | | | (37,341 | ) | | | – 0 | – | | | (37,341 | ) |
| USD | | | 1,400 | | | | 04/30/2030 | | | 1 Day SOFR | | 3.369% | | Annual | | | (65,153 | ) | | | – 0 | – | | | (65,153 | ) |
| USD | | | 1,100 | | | | 11/01/2030 | | | 1 Day SOFR | | 3.878% | | Annual | | | (28,238 | ) | | | – 0 | – | | | (28,238 | ) |
| USD | | | 600 | | | | 11/01/2030 | | | 1 Day SOFR | | 3.636% | | Annual | | | (24,055 | ) | | | – 0 | – | | | (24,055 | ) |
| | | | | | | | | | | | | | | | | | | | | | | | | | |
| | $ | (165,118 | ) | | $ | – 0 | – | | $ | (165,118 | ) |
| | | | | | | | | | | | | | | | | | | | | | | | | | |
INTEREST RATE SWAPS (see Note D)
| | | | | | | | | | | | | | | | | | | | | | | | | | | | |
| | | | | | | | | | | Rate Type | | | | | | | | | | | |
Swap
Counterparty | | Notional
Amount
(000) | | | Termination
Date | | Payments
made
by the
Fund | | Payments
received
by the
Fund | | Payment
Frequency
Paid/
Received | | Market
Value | | | Upfront
Premiums
Paid
(Received) | | | Unrealized
Appreciation
(Depreciation) | |
Citibank, NA | | | USD | | | | 1,235 | | | 10/09/2029 | | 1.125% | | SIFMA* | | Quarterly | | $ | 127,614 | | | $ | – 0 | – | | $ | 127,614 | |
| * | Variable interest rate based on the Securities Industry & Financial Markets Association (SIFMA) Municipal Swap Index. |
| (a) | When-Issued or delayed delivery security. |
| (b) | Security is exempt from registration under Rule 144A or Regulation S of the Securities Act of 1933. These securities are considered restricted, but liquid and may be resold in transactions exempt from registration. At May 31, 2024, the aggregate market value of these securities amounted to $960,116 or 1.5% of net assets. |
| (c) | Non-income producing security. |
| (e) | Fair valued by the Adviser. |
| (f) | Security in which significant unobservable inputs (Level 3) were used in determining fair value. |
| (g) | Security is exempt from registration under Rule 144A or Regulation S of the Securities Act of 1933. These securities, which represent 0.15% of net assets as of May 31, 2024, are considered illiquid and restricted. Additional information regarding such securities follows: |
| | | | | | | | | | | | | | | | |
144A/Restricted & Illiquid
Securities | | Acquisition
Date | | | Cost | | | Market
Value | | | Percentage of
Net Assets | |
Cincinnati Sr Care/Dayton/Florida/Nashville/Sebring/Trousdale/Waynesboro HC
Series 2023
12.00%, 12/31/2023 | | | 08/24/2023 | | | $ | 10,000 | | | $ | 10,000 | | | | 0.02 | % |
County of Grand Forks ND
(Red River Biorefinery LLC)
Series 2021
6.625%, 12/15/2031 | | | 05/21/2021 | | | | 110,000 | | | | 1,430 | | | | 0.00 | % |
| | |
| |
38 | AB MUNICIPAL INCOME FUND II | | abfunds.com |
PORTFOLIO OF INVESTMENTS (continued)
AB NEW JERSEY PORTFOLIO
| | | | | | | | | | | | | | | | |
144A/Restricted & Illiquid
Securities | | Acquisition
Date | | | Cost | | | Market
Value | | | Percentage of
Net Assets | |
County of Grand Forks ND
(Red River Biorefinery LLC)
Series 2021
7.00%, 12/15/2043 | | | 05/21/2021 | | | $ | 110,000 | | | $ | 1,430 | | | | 0.00 | % |
Metropolitan Government Nashville & Davidson County Health & Educational Facilities Board
(Trousdale Foundation Obligated Group)
Series 2018-A
6.25%, 04/01/2049 | | | 08/29/2018 | | | | 258,237 | | | | 68,380 | | | | 0.11 | % |
Red River Biorefinery LLC
Series 2024
15.00%, 07/31/2024 | | | 01/25/2024 | | | | 10,000 | | | | 3,500 | | | | 0.01 | % |
Red River Biorefinery LLC
Series 23A
15.00%, 07/31/2024 | | | 05/31/2023 | | | | 15,000 | | | | 4,500 | | | | 0.01 | % |
| (h) | Affiliated investments. |
| (i) | The rate shown represents the 7-day yield as of period end. |
| (j) | To obtain a copy of the fund’s shareholder report, please go to the Securities and Exchange Commission’s website at www.sec.gov, or call AB at (800) 227-4618. |
As of May 31, 2024, the Portfolio’s percentages of investments in municipal bonds that are insured and in insured municipal bonds that have been pre-refunded or escrowed to maturity are 18.6% and 0.0%, respectively.
Glossary:
ABS – Asset-Backed Securities
AGM – Assured Guaranty Municipal
BAM – Build American Mutual
CCRC – Congregate Care Retirement Center
COP – Certificate of Participation
NATL – National Interstate Corporation
SOFR – Secured Overnight Financing Rate
See notes to financial statements.
| | |
| |
| abfunds.com | | AB MUNICIPAL INCOME FUND II | 39 |
PORTFOLIO OF INVESTMENTS
AB OHIO PORTFOLIO
May 31, 2024
| | | | | | | | |
| | | Principal
Amount
(000) | | | U.S. $ Value | |
| |
MUNICIPAL OBLIGATIONS – 97.3% | |
Long-Term Municipal Bonds – 97.3% | |
Ohio – 88.4% | |
Akron Bath Copley Joint Township Hospital District (Summa Health System Obligated Group)
Series 2020
4.00%, 11/15/2035 | | $ | 1,000 | | | $ | 950,869 | |
American Municipal Power, Inc.
(American Municipal Power Combined Hydroelectric Revenue)
Series 2016-A
5.00%, 02/15/2034 | | | 1,000 | | | | 1,019,855 | |
American Municipal Power, Inc.
(American Municipal Power Prairie State Energy Campus Revenue)
Series 2019
4.00%, 02/15/2039 | | | 1,000 | | | | 987,359 | |
Buckeye Tobacco Settlement Financing Authority Series 2020-B
5.00%, 06/01/2055 | | | 500 | | | | 447,356 | |
City of Chillicothe OH
(Adena Health System Obligated Group)
Series 2017
4.00%, 12/01/2042 | | | 505 | | | | 453,919 | |
5.00%, 12/01/2037 | | | 1,700 | | | | 1,735,176 | |
City of Cleveland OH
Series 2012
5.00%, 12/01/2028 | | | 25 | | | | 25,019 | |
Cleveland Department of Public Utilities Division of Public Power
AGM Series 2018
5.00%, 11/15/2035 | | | 1,100 | | | | 1,157,550 | |
Cleveland-Cuyahoga County Port Authority
(Cleveland-Cuyahoga County Port Authority Flats East Bank TIF District)
Series 2021
4.00%, 12/01/2055(a) | | | 480 | | | | 379,095 | |
County of Allen OH Hospital Facilities Revenue
(Bon Secours Mercy Health, Inc.)
Series 2017-A
5.00%, 08/01/2042 | | | 1,650 | | | | 1,687,234 | |
County of Cuyahoga OH
(MetroHealth System (The))
Series 2017
5.00%, 02/15/2037 | | | 1,400 | | | | 1,413,989 | |
| | |
| |
40 | AB MUNICIPAL INCOME FUND II | | abfunds.com |
PORTFOLIO OF INVESTMENTS (continued)
AB OHIO PORTFOLIO
| | | | | | | | |
| | | Principal
Amount
(000) | | | U.S. $ Value | |
| |
County of Darke OH
(Wayne Hospital Co. Obligated Group)
Series 2019-A
5.00%, 09/01/2049 | | $ | 190 | | | $ | 165,692 | |
County of Franklin OH
(Agler Green LP)
Series 2002-A
5.65%, 05/20/2032 | | | 650 | | | | 650,874 | |
5.80%, 05/20/2044 | | | 1,150 | | | | 1,151,099 | |
County of Franklin OH
(First Community Village Obligated Group)
Series 2019
5.00%, 07/01/2049 | | | 150 | | | | 125,244 | |
County of Hamilton OH
(Christ Hospital Obligated Group)
Series 2023
5.00%, 06/01/2042 | | | 1,000 | | | | 1,001,285 | |
County of Hardin OH
(Ohio Northern University)
Series 2020
5.25%, 05/01/2040 | | | 500 | | | | 473,374 | |
County of Marion OH
(United Church Homes, Inc. Obligated Group)
Series 2019
5.00%, 12/01/2039 | | | 200 | | | | 168,213 | |
County of Montgomery OH
(Trousdale Foundation Obligated Group)
Series 2018-A
6.25%, 04/01/2049(b)(c)(d) | | | 450 | | | | 118,350 | |
County of Washington OH
(Marietta Area Health Care, Inc. Obligated Group)
Series 2022
6.625%, 12/01/2042 | | | 220 | | | | 237,499 | |
Jefferson County Port Authority/OH
(JSW Steel USA Ohio, Inc.)
Series 2021
3.50%, 12/01/2051(a) | | | 550 | | | | 412,718 | |
JobsOhio Beverage System
Series 2023
4.433%, 01/01/2033 | | | 915 | | | | 893,231 | |
Miami University/Oxford OH
Series 2021-A
5.00%, 09/01/2028 | | | 800 | | | | 852,001 | |
Ohio Air Quality Development Authority
(American Electric Power Co., Inc.)
Series 2019
2.10%, 10/01/2028 | | | 1,000 | | | | 987,067 | |
| | |
| |
| abfunds.com | | AB MUNICIPAL INCOME FUND II | 41 |
PORTFOLIO OF INVESTMENTS (continued)
AB OHIO PORTFOLIO
| | | | | | | | |
| | | Principal
Amount
(000) | | | U.S. $ Value | |
| |
Ohio Air Quality Development Authority
(Duke Energy Corp.)
Series 2022
4.25%, 11/01/2039 | | $ | 1,000 | | | $ | 995,915 | |
Ohio Air Quality Development Authority
(Ohio Valley Electric Corp.)
Series 2019
3.25%, 09/01/2029
| | | 640 | | | | 607,713 | |
Series 2021
1.50%, 02/01/2026 | | | 1,000 | | | | 943,148 | |
Ohio Higher Educational Facility Commission
(Ashtabula County Medical Center Obligated Group)
Series 2022
5.25%, 01/01/2047 | | | 1,000 | | | | 1,026,198 | |
5.25%, 01/01/2052 | | | 1,000 | | | | 1,022,971 | |
Ohio Higher Educational Facility Commission
(Case Western Reserve University)
Series 2016
4.00%, 12/01/2033 | | | 2,000 | | | | 2,000,577 | |
Ohio Higher Educational Facility Commission
(John Carroll University)
Series 2022
4.00%, 10/01/2042 | | | 2,000 | | | | 1,830,113 | |
Ohio Higher Educational Facility Commission
(Kenyon College)
Series 2017
5.00%, 07/01/2042 | | | 1,045 | | | | 1,067,033 | |
Ohio Higher Educational Facility Commission
(University of Dayton)
Series 2022
5.00%, 02/01/2044 | | | 2,000 | | | | 2,113,849 | |
Ohio State University (The)
Series 2023
5.25%, 12/01/2046 | | | 2,000 | | | | 2,202,163 | |
Ohio Turnpike & Infrastructure Commission
Series 2022
5.00%, 02/15/2039 | | | 1,000 | | | | 1,100,976 | |
Port of Greater Cincinnati Development Authority
Series 2024
5.00%, 12/01/2063 | | | 1,000 | | | | 1,027,836 | |
Port of Greater Cincinnati Development Authority
(St. Xavier High School, Inc./OH)
Series 2020
4.00%, 04/01/2040 | | | 415 | | | | 383,421 | |
| | |
| |
42 | AB MUNICIPAL INCOME FUND II | | abfunds.com |
PORTFOLIO OF INVESTMENTS (continued)
AB OHIO PORTFOLIO
| | | | | | | | |
| | | Principal
Amount
(000) | | | U.S. $ Value | |
| |
Toledo-Lucas County Port Authority
(ParkUToledo, Inc.)
Series 2021
4.00%, 01/01/2046 | | $ | 1,000 | | | $ | 896,369 | |
University of Akron (The)
Series 2014-A
5.00%, 01/01/2032 | | | 2,080 | | | | 2,080,341 | |
University of Toledo
Series 2023-B
4.617% (SOFR + 0.90%), 06/01/2036(d)(e) | | | 1,955 | | | | 1,898,457 | |
| | | | | | | | |
| | | | | | | 38,691,148 | |
| | | | | | | | |
American Samoa – 0.3% | |
American Samoa Economic Development Authority (Territory of American Samoa)
Series 2018
7.125%, 09/01/2038(a) | | | 140 | | | | 150,218 | |
| | | | | | | | |
|
Arizona – 0.2% | |
Maricopa County Industrial Development Authority
(Benjamin Franklin Charter School Ltd.)
Series 2018-A
6.00%, 07/01/2052(a) | | | 100 | | | | 102,073 | |
| | | | | | | | |
|
California – 0.5% | |
California Pollution Control Financing Authority
(Poseidon Resources Channelside LP)
Series 2012
5.00%, 07/01/2037(a) | | | 220 | | | | 220,550 | |
State of California
Series 2004
5.25%, 04/01/2029 | | | 5 | | | | 5,005 | |
| | | | | | | | |
| | | | | | | 225,555 | |
| | | | | | | | |
Connecticut – 1.0% | |
Connecticut State Health & Educational Facilities Authority
(University of New Haven, Inc.)
Series 2018-K1
5.00%, 07/01/2037 | | | 415 | | | | 414,992 | |
| | | | | | | | |
|
Guam – 2.0% | |
Antonio B Won Pat International Airport Authority
Series 2021-A
3.839%, 10/01/2036 | | | 100 | | | | 83,367 | |
Series 2023
5.25%, 10/01/2031 | | | 100 | | | | 99,854 | |
| | |
| |
| abfunds.com | | AB MUNICIPAL INCOME FUND II | 43 |
PORTFOLIO OF INVESTMENTS (continued)
AB OHIO PORTFOLIO
| | | | | | | | |
| | | Principal
Amount
(000) | | | U.S. $ Value | |
| |
Guam Power Authority | | | | | | | | |
Series 2017-A | | | | | | | | |
5.00%, 10/01/2036 | | $ | 150 | | | $ | 153,481 | |
5.00%, 10/01/2038 | | | 540 | | | | 549,732 | |
| | | | | | | | |
| | | | | | | 886,434 | |
| | | | | | | | |
Indiana – 0.2% | |
Indiana Finance Authority
(Brightmark Plastics Renewal Indiana LLC)
Series 2019
7.00%, 03/01/2039(d) | | | 100 | | | | 69,301 | |
| | | | | | | | |
|
Kansas – 0.5% | |
Wyandotte County-Kansas City Unified Government
(Wyandotte County-Kansas City Unified Government Sales Tax)
Series 2018
4.50%, 06/01/2040 | | | 225 | | | | 214,127 | |
| | | | | | | | |
|
Michigan – 0.1% | |
City of Detroit MI
Series 2018
5.00%, 04/01/2036 | | | 50 | | | | 50,916 | |
| | | | | | | | |
|
North Carolina – 0.8% | |
North Carolina Medical Care Commission
(Pennybyrn at Maryfield)
Series 2015
5.00%, 10/01/2035 | | | 375 | | | | 365,482 | |
| | | | | | | | |
|
Puerto Rico – 2.0% | |
Commonwealth of Puerto Rico
Series 2021-A
Zero Coupon, 07/01/2024 | | | 38 | | | | 37,900 | |
Puerto Rico Commonwealth Aqueduct & Sewer Authority
Series 2020-A
5.00%, 07/01/2030(a) | | | 250 | | | | 262,400 | |
Puerto Rico Electric Power Authority
AGM Series 2007-V
5.25%, 07/01/2031 | | | 100 | | | | 99,529 | |
Puerto Rico Industrial Tourist Educational Medical & Environmental Control Facilities Financing Auth | | | | | | | | |
Series 2023-A
6.625%, 01/01/2027 | | | 21 | | | | 20,503 | |
6.625%, 01/01/2028 | | | 159 | | | | 156,011 | |
| | |
| |
44 | AB MUNICIPAL INCOME FUND II | | abfunds.com |
PORTFOLIO OF INVESTMENTS (continued)
AB OHIO PORTFOLIO
| | | | | | | | |
| | | Principal
Amount
(000) | | | U.S. $ Value | |
| |
Puerto Rico Industrial Tourist Educational Medical & Environmental Control Facilities Financing Auth
(AES Puerto Rico LP)
12.50%, 12/15/2025(f)(g) | | $ | 37 | | | $ | 35,823 | |
Puerto Rico Sales Tax Financing Corp. Sales Tax Revenue
Series 2018-A
Zero Coupon, 07/01/2029 | | | 100 | | | | 82,560 | |
Series 2019-A
4.329%, 07/01/2040 | | | 70 | | | | 69,541 | |
5.00%, 07/01/2058 | | | 100 | | | | 99,671 | |
| | | | | | | | |
| | | | | | | 863,938 | |
| | | | | | | | |
Tennessee – 0.3% | |
Bristol Industrial Development Board
(Bristol Industrial Development Board Sales Tax)
Series 2016-A
5.00%, 12/01/2035(a) | | | 125 | | | | 114,531 | |
| | | | | | | | |
|
Texas – 1.0% | |
City of Houston TX Airport System Revenue
(United Airlines, Inc.)
Series 2018
5.00%, 07/15/2028 | | | 215 | | | | 219,022 | |
Mission Economic Development Corp.
(Natgasoline LLC)
Series 2018
4.625%, 10/01/2031(a) | | | 215 | | | | 213,493 | |
| | | | | | | | |
| | | | | | | 432,515 | |
| | | | | | | | |
Total Municipal Obligations
(cost $44,711,368) | | | | | | | 42,581,230 | |
| | | | | | | | |
| | | | | | | | |
ASSET-BACKED SECURITIES – 0.5% | |
Other ABS - Fixed Rate – 0.5% | |
HTA TRRB Custodial Trust | | | | | |
Series 2022
5.25%, 07/01/2034 | | | 99 | | | | 96,018 | |
5.25%, 07/01/2036 | | | 99 | | | | 98,983 | |
| | | | | | | | |
| | |
Total Asset-Backed Securities
(cost $196,405) | | | | | | | 195,001 | |
| | | | | | | | |
| | |
| |
| abfunds.com | | AB MUNICIPAL INCOME FUND II | 45 |
PORTFOLIO OF INVESTMENTS (continued)
AB OHIO PORTFOLIO
| | | | | | | | |
| | | Shares | | | U.S. $ Value | |
| |
PREFERRED STOCKS – 0.0% | |
Utility – 0.0% | |
Electric – 0.0% | |
AES Puerto Rico LP
0.00%(b)(f)(g)
(cost $62,685) | | | 3,496 | | | $ | 10,173 | |
| | | | | | | | |
| | |
| | | Principal
Amount
(000) | | | | |
CORPORATES - NON-INVESTMENT
GRADE – 0.0% | | | | | | | | |
Industrial – 0.0% | |
Other Industrial – 0.0% | |
Cincinnati Sr
Care/Dayton/Florida/Nashville/Sebring/Trousdale/Waynesboro HC
Series 2023
12.00%, 12/31/2023(d)(f)(g)
(cost $10,000) | | $ | 10 | | | | 10,000 | |
| | | | | | | | |
| | |
Total Investments – 97.8%
(cost $44,980,458) | | | | | | | 42,796,404 | |
Other assets less liabilities – 2.2% | | | | | | | 964,118 | |
| | | | | | | | |
| | |
Net Assets – 100.0% | | | | | | $ | 43,760,522 | |
| | | | | | | | |
CENTRALLY CLEARED INTEREST RATE SWAPS (see Note D)
| | | | | | | | | | | | | | | | | | | | | | | | | | | | | | | | |
| | | | Rate Type | | | | |
Notional
Amount
(000) | | | Termination
Date | | | Payments
made
by the
Fund | | | Payments
received
by the
Fund | | | Payment
Frequency Paid/
Received | | | Market
Value | | | Upfront
Premiums
Paid
(Received) | | | Unrealized
Appreciation
(Depreciation) | |
USD | | | 1,900 | | | | 01/15/2027 | | | | 1 Day SOFR | | | | 4.217 | % | | | Annual | | | $ | (26,858 | ) | | $ | –0 | – | | $ | (26,858 | ) |
USD | | | 1,610 | | | | 07/31/2029 | | | | 1 Day SOFR | | | | 3.988 | % | | | Annual | | | | (26,691 | ) | | | – 0 | – | | | (26,691 | ) |
USD | | | 1,400 | | | | 07/31/2029 | | | | 1 Day SOFR | | | | 4.032 | % | | | Annual | | | | (19,014 | ) | | | – 0 | – | | | (19,014 | ) |
USD | | | 900 | | | | 04/30/2030 | | | | 1 Day SOFR | | | | 3.706 | % | | | Annual | | | | (25,966 | ) | | | – 0 | – | | | (25,966 | ) |
USD | | | 900 | | | | 07/31/2030 | | | | 1 Day SOFR | | | | 3.897 | % | | | Annual | | | | (25,449 | ) | | | – 0 | – | | | (25,449 | ) |
USD | | | 900 | | | | 07/31/2031 | | | | 1 Day SOFR | | | | 4.059 | % | | | Annual | | | | (7,337 | ) | | | 102 | | | | (7,439 | ) |
| | | | | | | | | | | | | | | | | | | | | | | | | | | | | | | | |
| | | $ | (131,315 | ) | | $ | 102 | | | $ | (131,417 | ) |
| | | | | | | | | | | | | | | | | | | | | | | | | | | | | | | | |
| | |
| |
46 | AB MUNICIPAL INCOME FUND II | | abfunds.com |
PORTFOLIO OF INVESTMENTS (continued)
AB OHIO PORTFOLIO
INTEREST RATE SWAPS (see Note D)
| | | | | | | | | | | | | | | | | | | | | | | | | | | | | | | | | | | | |
| | | | Rate Type | | | | | | | | | | |
| Swap Counterparty | | Notional
Amount
(000) | | | Termination
Date | | | Payments
made
by the
Fund | | | Payments
received
by the
Fund | | | Payment
Frequency
Paid/
Received | | | Market
Value | | | Upfront
Premiums
Paid
(Received) | | | Unrealized
Appreciation
(Depreciation) | |
Citibank, NA | | | USD | | | | 1,175 | | | | 10/09/2029 | | | | 1.125 | % | | | SIFMA | * | | | Quarterly | | | $ | 121,414 | | | $ | – 0 – | | | $ | 121,414 | |
| * | Variable interest rate based on the Securities Industry & Financial Markets Association (SIFMA) Municipal Swap Index. |
| (a) | Security is exempt from registration under Rule 144A or Regulation S of the Securities Act of 1933. These securities are considered restricted, but liquid and may be resold in transactions exempt from registration. At May 31, 2024, the aggregate market value of these securities amounted to $1,855,078 or 4.2% of net assets. |
| (b) | Non-income producing security. |
| (d) | Security is exempt from registration under Rule 144A or Regulation S of the Securities Act of 1933. These securities, which represent 4.79% of net assets as of May 31, 2024, are considered illiquid and restricted. Additional information regarding such securities follows: |
| | | | | | | | | | | | | | | | |
144A/Restricted &
Illiquid Securities | | Acquisition
Date | | | Cost | | | Market
Value | | | Percentage of
Net Assets | |
Cincinnati Sr Care/Dayton/Florida/Nashville/Sebring/Trousdale/Waynesboro HC
Series 2023
12.00%, 12/31/2023 | | | 08/24/2023 | | | $ | 10,000 | | | $ | 10,000 | | | | 0.02 | % |
County of Montgomery OH
(Trousdale Foundation Obligated Group)
Series 2018-A
6.25%, 04/01/2049 | | | 08/29/2018 | | | | 446,949 | | | | 118,350 | | | | 0.27 | % |
Indiana Finance Authority
(Brightmark Plastics Renewal Indiana LLC)
Series 2019
7.00%, 03/01/2039 | | | 03/29/2019 | | | | 103,209 | | | | 69,301 | | | | 0.16 | % |
University of Toledo
Series 2023-B
4.617%, 06/01/2036 | | | 06/30/2023 | | | | 1,955,000 | | | | 1,898,457 | | | | 4.34 | % |
| (e) | Floating Rate Security. Stated interest/floor/ceiling rate was in effect at May 31, 2024. |
| (f) | Fair valued by the Adviser. |
| (g) | Security in which significant unobservable inputs (Level 3) were used in determining fair value. |
As of May 31, 2024, the Portfolio’s percentages of investments in municipal bonds that are insured and in insured municipal bonds that have been pre-refunded or escrowed to maturity are 3.0% and 0.0%, respectively.
Glossary:
ABS – Asset-Backed Securities
AGM – Assured Guaranty Municipal
SOFR – Secured Overnight Financing Rate
See notes to financial statements.
| | |
| |
| abfunds.com | | AB MUNICIPAL INCOME FUND II | 47 |
PORTFOLIO OF INVESTMENTS
AB PENNSYLVANIA PORTFOLIO
May 31, 2024
| | | | | | | | |
| | | Principal
Amount
(000) | | | U.S. $ Value | |
| |
MUNICIPAL OBLIGATIONS – 98.9% | | | | | | | | |
Long-Term Municipal Bonds – 98.9% | | | | | | | | |
Pennsylvania – 92.5% | | | | | | | | |
Allegheny County Hospital Development Authority
(Allegheny Health Network Obligated Group)
Series 2018-A
5.00%, 04/01/2036 | | $ | 1,600 | | | $ | 1,652,797 | |
Allentown Neighborhood Improvement Zone Development Authority
(Allentown Neighborhood Improvement Zone Center City Investment Corp. Revenue)
Series 2022
5.25%, 05/01/2042(a) | | | 480 | | | | 463,415 | |
Berks County Industrial Development Authority
(Pre-refunded – US Treasuries)
Series 2018
5.00%, 05/15/2043 | | | 500 | | | | 515,413 | |
Berks County Municipal Authority (The)
(Tower Health Obligated Group)
Series 2020-B
5.00%, 02/01/2040 | | | 750 | | | | 485,693 | |
Bucks County Industrial Development Authority
(Grand View Hospital/Sellersville PA Obligated Group)
Series 2021
5.00%, 07/01/2027 | | | 420 | | | | 411,651 | |
Bucks County Water and Sewer Authority
AGM Series 2015-A
5.00%, 12/01/2037 | | | 780 | | | | 784,435 | |
Centre County Hospital Authority
(Mount Nittany Medical Center Obligated Group)
Series 2018-A
5.00%, 11/15/2042 | | | 1,000 | | | | 1,015,111 | |
Chambersburg Area Municipal Authority
(Wilson College)
Series 2018
5.75%, 10/01/2043 | | | 650 | | | | 632,558 | |
Chester County Industrial Development Authority
(Collegium Charter School)
Series 2022
6.00%, 10/15/2052(a) | | | 200 | | | | 201,090 | |
Chester County Industrial Development Authority
(Woodlands at Greystone Neighborhood Improvement District)
Series 2018
5.00%, 03/01/2038(a) | | | 300 | | | | 287,532 | |
| | |
| |
48 | AB MUNICIPAL INCOME FUND II | | abfunds.com |
PORTFOLIO OF INVESTMENTS (continued)
AB PENNSYLVANIA PORTFOLIO
| | | | | | | | |
| | | Principal
Amount
(000) | | | U.S. $ Value | |
| |
City of Erie Higher Education Building Authority
(Gannon University)
Series 2021
4.00%, 05/01/2036 | | $ | 300 | | | $ | 270,419 | |
4.00%, 05/01/2041 | | | 250 | | | | 208,588 | |
City of Philadelphia PA Water & Wastewater Revenue
Series 2018-A
5.00%, 10/01/2048 | | | 1,000 | | | | 1,033,023 | |
Commonwealth Financing Authority
(Commonwealth Financing Authority State Lease)
Series 2018
5.00%, 06/01/2031 | | | 2,500 | | | | 2,615,674 | |
Commonwealth of Pennsylvania
(Commonwealth of Pennsylvania COP)
Series 2018-A
5.00%, 07/01/2034 | | | 450 | | | | 471,941 | |
5.00%, 07/01/2035 | | | 750 | | | | 785,912 | |
5.00%, 07/01/2036 | | | 1,000 | | | | 1,045,805 | |
Crawford County Hospital Authority
(Meadville Medical Center Obligated Group)
Series 2016-A
6.00%, 06/01/2046 | | | 635 | | | | 638,730 | |
Delaware County Authority
(Elwyn Obligated Group)
Series 2017
5.00%, 06/01/2032 | | | 1,625 | | | | 1,585,298 | |
Hospitals & Higher Education Facilities Authority of Philadelphia (The)
(Temple University Health System Obligated Group)
Series 2017
5.00%, 07/01/2033 | | | 660 | | | | 664,552 | |
Lehigh County General Purpose Authority
(Muhlenberg College)
Series 2024
5.25%, 02/01/2054(b) | | | 1,000 | | | | 1,032,888 | |
Montgomery County Higher Education and Health Authority
(HumanGood Pennsylvania Obligated Group)
Series 2017
5.00%, 12/01/2037 | | | 1,100 | | | | 1,105,242 | |
| | |
| |
| abfunds.com | | AB MUNICIPAL INCOME FUND II | 49 |
PORTFOLIO OF INVESTMENTS (continued)
AB PENNSYLVANIA PORTFOLIO
| | | | | | | | |
| | | Principal
Amount
(000) | | | U.S. $ Value | |
| |
Montgomery County Higher Education and Health Authority
(Thomas Jefferson University Obligated Group)
Series 2022
5.00%, 05/01/2052 | | $ | 1,000 | | | $ | 1,024,504 | |
Moon Industrial Development Authority
(Baptist Homes Society)
Series 2015
5.75%, 07/01/2035 | | | 765 | | | | 636,566 | |
Northeastern Pennsylvania Hospital and Education Authority
(Wilkes University)
Series 2016-B
5.25%, 03/01/2037 | | | 520 | | | | 505,659 | |
Pennsylvania Economic Development Financing Authority
(Commonwealth of Pennsylvania Department of Transportation)
Series 2022
6.00%, 06/30/2061 | | | 1,000 | | | | 1,095,500 | |
Pennsylvania Economic Development Financing Authority
(PA Bridges Finco LP)
Series 2015
5.00%, 06/30/2042 | | | 1,000 | | | | 982,931 | |
Pennsylvania Economic Development Financing Authority
(Reworld Holding Corp.)
Series 2019
3.25%, 08/01/2039(a) | | | 270 | | | | 208,593 | |
Pennsylvania Economic Development Financing Authority
(UPMC Obligated Group)
Series 2022-C
4.06% (MUNIPSA + 0.70%), 11/15/2047(c) | | | 1,000 | | | | 995,096 | |
Pennsylvania Economic Development Financing Authority
(Villanova University)
Series 2024
5.00%, 08/01/2049 | | | 1,000 | | | | 1,072,677 | |
Pennsylvania State University (The)
Series 2020-A
4.00%, 09/01/2050 | | | 500 | | | | 474,576 | |
Series 2020-D
2.79%, 09/01/2043 | | | 1,000 | | | | 730,423 | |
| | |
| |
50 | AB MUNICIPAL INCOME FUND II | | abfunds.com |
PORTFOLIO OF INVESTMENTS (continued)
AB PENNSYLVANIA PORTFOLIO
| | | | | | | | |
| | | Principal
Amount
(000) | | | U.S. $ Value | |
| |
Pennsylvania Turnpike Commission
Series 2021-C
4.00%, 12/01/2043 | | $ | 1,290 | | | $ | 1,274,551 | |
Pennsylvania Turnpike Commission Oil Franchise Tax Revenue
Series 2018-B
5.00%, 12/01/2038 | | | 1,000 | | | | 1,048,725 | |
5.00%, 12/01/2043 | | | 1,000 | | | | 1,033,497 | |
Pennsylvania Turnpike Commission Registration Fee Revenue
Series 2023
3.36% (MUNIPSA + 0.85%), 07/15/2041(c) | | | 1,000 | | | | 1,000,334 | |
Philadelphia Authority for Industrial Development
(Greater Philadelphia Health Action, Inc.)
Series 2015-A
6.375%, 06/01/2040 | | | 400 | | | | 400,131 | |
Philadelphia Authority for Industrial Development
(MaST Community Charter School III)
Series 2021
5.00%, 08/01/2030 | | | 220 | | | | 220,110 | |
Philadelphia Authority for Industrial Development
(Philadelphia Electrical & Technology Charter High School)
Series 2021
4.00%, 06/01/2056 | | | 500 | | | | 381,232 | |
Philadelphia Authority for Industrial Development
(Philadelphia Performing Arts Charter School)
Series 2020
5.00%, 06/15/2040(a) | | | 1,000 | | | | 1,003,741 | |
Philadelphia Authority for Industrial Development
(St Joseph’s University)
Series 2022
5.50%, 11/01/2060 | | | 2,000 | | | | 2,118,484 | |
Philadelphia Authority for Industrial Development
(Tacony Academy Charter School)
Series 2023
5.50%, 06/15/2043(a) | | | 500 | | | | 505,801 | |
Philadelphia Authority for Industrial Development
(Temple University-of The Commonwealth System of Higher Education)
Series 2016-2
5.00%, 04/01/2029 | | | 1,000 | | | | 1,009,005 | |
Philadelphia Energy Authority (The)
(City of Philadelphia PA Lease)
Series 2023
5.00%, 11/01/2040 | | | 1,200 | | | | 1,288,901 | |
| | |
| |
| abfunds.com | | AB MUNICIPAL INCOME FUND II | 51 |
PORTFOLIO OF INVESTMENTS (continued)
AB PENNSYLVANIA PORTFOLIO
| | | | | | | | |
| | | Principal
Amount
(000) | | | U.S. $ Value | |
| |
Pittsburgh Water & Sewer Authority
AGM Series 2023-C
4.524% (SOFR + 0.80%), 09/01/2040(a)(c) | | $ | 2,000 | | | $ | 1,938,059 | |
School District of Philadelphia (The)
Series 2019-A
5.00%, 09/01/2044 | | | 750 | | | | 773,391 | |
Series 2023-A
5.25%, 09/01/2043 | | | 1,000 | | | | 1,082,316 | |
Scranton School District/PA
BAM Series 2017-E
5.00%, 12/01/2033 | | | 500 | | | | 520,676 | |
5.00%, 12/01/2034 | | | 800 | | | | 833,683 | |
5.00%, 12/01/2035 | | | 500 | | | | 520,724 | |
State Public School Building Authority
(Harrisburg School District)
AGM Series 2016
5.00%, 12/01/2029 | | | 865 | | | | 891,536 | |
State Public School Building Authority
(Pre-refunded – US Treasuries)
AGM Series 2016
5.00%, 12/01/2029 | | | 135 | | | | 139,922 | |
| | | | | | | | |
| | | | | | | 43,619,111 | |
| | | | | | | | |
American Samoa – 0.3% | | | | | | | | |
American Samoa Economic Development Authority
(Territory of American Samoa)
Series 2018
7.125%, 09/01/2038(a) | | | 135 | | | | 144,853 | |
| | | | | | | | |
| | |
Arizona – 0.2% | | | | | | | | |
Maricopa County Industrial Development Authority
(Benjamin Franklin Charter School Ltd.)
Series 2018-A
6.00%, 07/01/2052(a) | | | 100 | | | | 102,072 | |
| | | | | | | | |
| | |
Guam – 2.8% | | | | | | | | |
Antonio B Won Pat International Airport Authority
Series 2021-A
3.839%, 10/01/2036 | | | 100 | | | | 83,367 | |
Series 2023
5.25%, 10/01/2031 | | | 100 | | | | 99,854 | |
Guam Education Financing Foundation
(Guam Education Financing Foundation COP)
Series 2016-B
5.00%, 10/01/2026(a) | | | 250 | | | | 245,283 | |
| | |
| |
52 | AB MUNICIPAL INCOME FUND II | | abfunds.com |
PORTFOLIO OF INVESTMENTS (continued)
AB PENNSYLVANIA PORTFOLIO
| | | | | | | | |
| | | Principal
Amount
(000) | | | U.S. $ Value | |
| |
Guam Power Authority
Series 2017-A
5.00%, 10/01/2036 | | $ | 120 | | | $ | 122,784 | |
5.00%, 10/01/2040 | | | 525 | | | | 532,429 | |
Territory of Guam
Series 2019
5.00%, 11/15/2031 | | | 75 | | | | 75,379 | |
Territory of Guam
(Guam Section 30 Income Tax)
Series 2016-A
5.00%, 12/01/2046 | | | 150 | | | | 149,295 | |
| | | | | | | | |
| | | | | | | 1,308,391 | |
| | | | | | | | |
Michigan – 0.1% | | | | | | | | |
City of Detroit MI
Series 2018
5.00%, 04/01/2036 | | | 35 | | | | 35,641 | |
| | | | | | | | |
| | |
New Jersey – 0.8% | | | | | | | | |
Tobacco Settlement Financing Corp./NJ
Series 2018-B
5.00%, 06/01/2046 | | | 370 | | | | 372,389 | |
| | | | | | | | |
| | |
New York – 0.4% | | | | | | | | |
Build NYC Resource Corp.
(Albert Einstein College of Medicine, Inc.)
Series 2016
5.50%, 09/01/2045(a) | | | 180 | | | | 180,124 | |
| | | | | | | | |
| | |
Puerto Rico – 1.6% | | | | | | | | |
Commonwealth of Puerto Rico
Series 2021-A
Zero Coupon, 07/01/2033 | | | 100 | | | | 66,275 | |
Puerto Rico Electric Power Authority
AGM Series 2007-V
5.25%, 07/01/2031 | | | 100 | | | | 99,529 | |
Puerto Rico Industrial Tourist Educational Medical & Environmental Control Facilities Financing Auth
Series 2023-A
6.625%, 01/01/2027 | | | 20 | | | | 20,058 | |
6.625%, 01/01/2028 | | | 156 | | | | 152,619 | |
Puerto Rico Industrial Tourist Educational Medical & Environmental Control Facilities Financing Auth
(AES Puerto Rico LP)
12.50%, 12/15/2025(d)(e) | | | 36 | | | | 35,044 | |
| | |
| |
| abfunds.com | | AB MUNICIPAL INCOME FUND II | 53 |
PORTFOLIO OF INVESTMENTS (continued)
AB PENNSYLVANIA PORTFOLIO
| | | | | | | | |
| | | Principal
Amount
(000) | | | U.S. $ Value | |
| |
Puerto Rico Sales Tax Financing Corp. Sales Tax Revenue
Series 2018-A
Zero Coupon, 07/01/2029 | | $ | 100 | | | $ | 82,560 | |
Series 2019-A
4.329%, 07/01/2040 | | | 65 | | | | 64,574 | |
5.00%, 07/01/2058 | | | 250 | | | | 249,178 | |
| | | | | | | | |
| | | | | | | 769,837 | |
| | | | | | | | |
Tennessee – 0.2% | | | | | | | | |
Bristol Industrial Development Board
(Bristol Industrial Development Board Sales Tax)
Series 2016-A
5.00%, 12/01/2035(a) | | | 120 | | | | 109,950 | |
| | | | | | | | |
| | |
Total Municipal Obligations
(cost $47,927,418) | | | | | | | 46,642,368 | |
| | | | | | | | |
| | |
| | | Shares | | | | |
PREFERRED STOCKS – 0.0% | | | | | | | | |
Utility – 0.0% | | | | | | | | |
Electric – 0.0% | | | | | | | | |
AES Puerto Rico LP
0.00%(d)(e)(f)
(cost $61,349) | | | 3,420 | | | | 9,952 | |
| | | | | | | | |
| | | | | | | | |
SHORT-TERM INVESTMENTS – 1.3% | | | | | | | | |
Investment Companies – 1.3% | | | | | | | | |
AB Fixed Income Shares, Inc. – Government Money Market Portfolio –
Class AB, 5.22%(g)(h)(i)
(cost $611,032) | | | 611,032 | | | | 611,032 | |
| | | | | | | | |
| | |
Total Investments – 100.2%
(cost $48,599,799) | | | | | | | 47,263,352 | |
Other assets less liabilities – (0.2)% | | | | | | | (85,122 | ) |
| | | | | | | | |
| | |
Net Assets – 100.0% | | | | | | $ | 47,178,230 | |
| | | | | | | | |
| | |
| |
54 | AB MUNICIPAL INCOME FUND II | | abfunds.com |
PORTFOLIO OF INVESTMENTS (continued)
AB PENNSYLVANIA PORTFOLIO
CENTRALLY CLEARED INTEREST RATE SWAPS (see Note D)
| | | | | | | | | | | | | | | | | | | | | | | | | | |
| | | | | | | | | Rate Type | | | | | | | | | | | |
Notional
Amount
(000) | | | Termination
Date | | | Payments
made
by the
Fund | | Payments
received
by the
Fund | | Payment
Frequency
Paid/
Received | | Market
Value | | | Upfront
Premiums
Paid
(Received) | | | Unrealized
Appreciation
(Depreciation) | |
| USD | | | 2,500 | | | | 01/15/2027 | | | 1 Day SOFR | | 3.892% | | Annual | | $ | (58,166 | ) | | $ | – 0 | – | | $ | (58,166 | ) |
| USD | | | 2,300 | | | | 04/20/2028 | | | 1 Day SOFR | | 3.394% | | Annual | | | (86,442 | ) | | | – 0 | – | | | (86,442 | ) |
| USD | | | 900 | | | | 07/31/2029 | | | 1 Day SOFR | | 4.461% | | Annual | | | 7,159 | | | | – 0 | – | | | 7,159 | |
| USD | | | 850 | | | | 04/30/2030 | | | 1 Day SOFR | | 3.075% | | Annual | | | (52,692 | ) | | | – 0 | – | | | (52,692 | ) |
| USD | | | 800 | | | | 11/01/2030 | | | 1 Day SOFR | | 4.190% | | Annual | | | (6,406 | ) | | | – 0 | – | | | (6,406 | ) |
| USD | | | 3,000 | | | | 07/31/2031 | | | 1 Day SOFR | | 4.059% | | Annual | | | (24,457 | ) | | | 340 | | | | (24,797 | ) |
| | | | | | | | | | | | | | | | | | | | | | | | | | |
| | $ | (221,004 | ) | | $ | 340 | | | $ | (221,344 | ) |
| | | | | | | | | | | | | | | | | | | | | | | | | | |
INTEREST RATE SWAPS (see Note D)
| | | | | | | | | | | | | | | | | | | | | | | | | | | | | | |
| | | | Rate Type | | | |
Swap
Counterparty | | Notional
Amount
(000) | | | Termination
Date | | | Payments
made
by the
Fund | | Payments
received
by the
Fund | | Payment
Frequency
Paid/
Received | | Market
Value | | | Upfront
Premiums
Paid
(Received) | | | Unrealized
Appreciation
(Depreciation) | |
Citibank, NA | | | USD | | | | 1,140 | | | | 10/09/2029 | | | 1.125% | | SIFMA* | | Quarterly | | $ | 117,798 | | | $ | – 0 | – | | $ | 117,798 | |
| * | Variable interest rate based on the Securities Industry & Financial Markets Association (SIFMA) Municipal Swap Index. |
| (a) | Security is exempt from registration under Rule 144A or Regulation S of the Securities Act of 1933. These securities are considered restricted, but liquid and may be resold in transactions exempt from registration. At May 31, 2024, the aggregate market value of these securities amounted to $5,390,513 or 11.4% of net assets. |
| (b) | When-Issued or delayed delivery security. |
| (c) | Floating Rate Security. Stated interest/floor/ceiling rate was in effect at May 31, 2024. |
| (d) | Fair valued by the Adviser. |
| (e) | Security in which significant unobservable inputs (Level 3) were used in determining fair value. |
| (f) | Non-income producing security. |
| (g) | Affiliated investments. |
| (h) | The rate shown represents the 7-day yield as of period end. |
| (i) | To obtain a copy of the fund’s shareholder report, please go to the Securities and Exchange Commission’s website at www.sec.gov, or call AB at (800) 227-4618. |
As of May 31, 2024, the Portfolio’s percentages of investments in municipal bonds that are insured and in insured municipal bonds that have been pre-refunded or escrowed to maturity are 12.3% and 0.0%, respectively.
Glossary:
AGM – Assured Guaranty Municipal
BAM – Build American Mutual
COP – Certificate of Participation
MUNIPSA – SIFMA Municipal Swap Index
SOFR – Secured Overnight Financing Rate
UPMC – University of Pittsburgh Medical Center
See notes to financial statements.
| | |
| |
| abfunds.com | | AB MUNICIPAL INCOME FUND II | 55 |
PORTFOLIO OF INVESTMENTS
AB VIRGINIA PORTFOLIO
May 31, 2024
| | | | | | | | |
| | | Principal
Amount
(000) | | | U.S. $ Value | |
| |
MUNICIPAL OBLIGATIONS – 96.4% | | | | | | | | |
Long-Term Municipal Bonds – 95.2% | | | | | | | | |
Virginia – 70.3% | | | | | | | | |
Align Affordable Housing Bond Fund LP
(Park Landing LP)
Series 2022-2
5.66%, 08/01/2052 | | $ | 1,000 | | | $ | 965,739 | |
Arlington County Industrial Development Authority
(Virginia Hospital Center Arlington Health System Obligated Group)
Series 2020
4.00%, 07/01/2045 | | | 4,000 | | | | 3,754,340 | |
Cherry Hill Community Development Authority
(Potomac Shores Project)
Series 2015
5.40%, 03/01/2045(a) | | | 585 | | | | 585,389 | |
Chesapeake Bay Bridge & Tunnel District
Series 2016
5.00%, 07/01/2046 | | | 4,000 | | | | 4,013,514 | |
City of Richmond VA Public Utility Revenue
(Pre-refunded – US Govt Agencies)
Series 2016
5.00%, 01/15/2030 | | | 4,000 | | | | 4,099,968 | |
5.00%, 01/15/2034 | | | 5,000 | | | | 5,124,960 | |
County of Fairfax
Series 2023-A
4.00%, 10/01/2041 | | | 4,445 | | | | 4,462,775 | |
County of Loudoun VA
Series 2016-A
4.00%, 12/01/2025 | | | 1,000 | | | | 1,009,111 | |
Culpeper County Economic Development Authority
(County of Culpeper VA Lease)
Series 2014
4.00%, 06/01/2029 | | | 2,955 | | | | 2,941,524 | |
Dulles Town Center Community Development Authority
Series 2012
4.25%, 03/01/2026 | | | 655 | | | | 638,184 | |
Fairfax County Economic Development Authority
(Pre-refunded – US Treasuries)
Series 2016
4.00%, 04/01/2035 | | | 415 | | | | 419,231 | |
| | |
| |
56 | AB MUNICIPAL INCOME FUND II | | abfunds.com |
PORTFOLIO OF INVESTMENTS (continued)
AB VIRGINIA PORTFOLIO
| | | | | | | | |
| | | Principal
Amount
(000) | | | U.S. $ Value | |
| |
Fairfax County Industrial Development Authority
(Inova Health System Obligated Group)
Series 2014-A
5.00%, 05/15/2044 | | $ | 2,000 | | | $ | 1,999,992 | |
Series 2018-A
4.00%, 05/15/2048 | | | 1,500 | | | | 1,437,936 | |
Series 2022
4.00%, 05/15/2042 | | | 2,000 | | | | 1,963,651 | |
Greater Richmond Convention Center Authority
(Pre-refunded – US Treasuries)
Series 2015
5.00%, 06/15/2030 | | | 3,000 | | | | 3,039,811 | |
5.00%, 06/15/2031 | | | 2,000 | | | | 2,026,541 | |
Hampton Roads Sanitation District
Series 2017-A
5.00%, 10/01/2033 | | | 3,550 | | | | 3,738,588 | |
Hampton Roads Transportation Accountability Commission
(Pre-refunded – US Govt Agencies)
Series 2021-A
5.00%, 07/01/2026 | | | 5,000 | | | | 5,138,968 | |
Hampton Roads Transportation Accountability Commission
(Pre-refunded – US Treasuries)
Series 2018-A
5.00%, 07/01/2035 | | | 4,000 | | | | 4,234,397 | |
Henrico County Economic Development Authority
(Westminster-Canterbury Corp. Obligated Group)
Series 2022
5.00%, 10/01/2047 | | | 1,000 | | | | 1,027,683 | |
James City County Economic Development Authority
(Williamsburg Landing, Inc. Obligated Group)
Series 2021-A
4.00%, 12/01/2050 | | | 1,575 | | | | 1,220,143 | |
Series 2024-A
6.875%, 12/01/2058 | | | 500 | | | | 542,786 | |
Lexington Industrial Development Authority
(Kendal at Lexington)
Series 2016
4.00%, 01/01/2031 | | | 1,500 | | | | 1,491,388 | |
Lynchburg Economic Development Authority
(Centra Health Obligated Group)
Series 2017-A
5.00%, 01/01/2047 | | | 1,750 | | | | 1,756,061 | |
| | |
| |
| abfunds.com | | AB MUNICIPAL INCOME FUND II | 57 |
PORTFOLIO OF INVESTMENTS (continued)
AB VIRGINIA PORTFOLIO
| | | | | | | | |
| | | Principal
Amount
(000) | | | U.S. $ Value | |
| |
Norfolk Airport Authority/VA
Series 2019
5.00%, 07/01/2043 | | $ | 2,870 | | | $ | 2,963,833 | |
Richmond Redevelopment & Housing Authority
(American Tobacco Holdings LLC)
Series 2017
5.55%, 01/01/2037(a) | | | 960 | | | | 918,098 | |
Roanoke County Economic Development Authority
(City of Roanoke VA Lease)
Series 2015
5.00%, 10/15/2035 | | | 1,750 | | | | 1,774,887 | |
Roanoke Economic Development Authority
(Carilion Clinic Obligated Group)
Series 2020
4.00%, 07/01/2036 | | | 1,000 | | | | 1,006,073 | |
4.00%, 07/01/2038 | | | 1,550 | | | | 1,537,595 | |
Roanoke Economic Development Authority
(Lynchburg College)
Series 2018-A
5.00%, 09/01/2033 | | | 1,125 | | | | 1,139,194 | |
5.00%, 09/01/2038 | | | 1,535 | | | | 1,538,708 | |
5.00%, 09/01/2043 | | | 1,000 | | | | 972,120 | |
Rockingham County Economic Development Authority
(Sentara Healthcare Obligated Group)
Series 2021
3.00%, 11/01/2046 | | | 1,265 | | | | 991,610 | |
Rockingham County Economic Development Authority
(Sunnyside Presbyterian Home Obligated Group)
Series 2020
4.00%, 12/01/2032 | | | 1,085 | | | | 1,078,819 | |
5.00%, 12/01/2039 | | | 1,000 | | | | 1,017,766 | |
Southampton County Industrial Development Authority
(PRTI-Virginia One LLC)
Series 2023
4.875%, 11/01/2053 | | | 2,000 | | | | 1,996,286 | |
Suffolk Economic Development Authority
(EveryAge Obligated Group)
Series 2016
5.00%, 09/01/2031 | | | 1,000 | | | | 983,833 | |
Tobacco Settlement Financing Corp./VA
Series 2007-B1
5.00%, 06/01/2047 | | | 2,000 | | | | 1,843,460 | |
| | |
| |
58 | AB MUNICIPAL INCOME FUND II | | abfunds.com |
PORTFOLIO OF INVESTMENTS (continued)
AB VIRGINIA PORTFOLIO
| | | | | | | | |
| | | Principal
Amount
(000) | | | U.S. $ Value | |
| |
University of Virginia
Series 2020
2.256%, 09/01/2050 | | $ | 1,000 | | | $ | 585,246 | |
US Bank Trust Co. NA
(Park Landing LP)
Series 2022-B
5.90%, 08/01/2052 | | | 295 | | | | 266,325 | |
Virginia Beach Development Authority
(Westminster-Canterbury on Chesapeake Bay Obligated Group)
Series 2023
7.00%, 09/01/2059 | | | 500 | | | | 554,604 | |
Virginia College Building Authority
(Marymount University)
Series 2015
5.00%, 07/01/2045(a) | | | 1,000 | | | | 916,486 | |
Series 2015-A
5.00%, 07/01/2030(a) | | | 1,615 | | | | 1,616,618 | |
Virginia College Building Authority
(Regent University)
Series 2021
4.00%, 06/01/2036 | | | 3,125 | | | | 2,954,032 | |
Virginia College Building Authority
(Virginia College Building Authority State Lease)
Series 2019-B
3.00%, 02/01/2037 | | | 9,140 | | | | 7,873,943 | |
Virginia Commonwealth University Health System Authority
(Virginia Commonwealth University Health System Authority Obligated Group)
Series 2017-B
5.00%, 07/01/2046 | | | 2,000 | | | | 2,028,407 | |
Virginia Port Authority
Series 2016-B
5.00%, 07/01/2035 | | | 2,000 | | | | 2,024,197 | |
5.00%, 07/01/2036 | | | 4,160 | | | | 4,204,465 | |
Virginia Public Building Authority
(Virginia Public Building Authority State Lease)
Series 2024-A
5.00%, 08/01/2044(b) | | | 2,000 | | | | 2,191,447 | |
Virginia Resources Authority
Series 2011-B
5.00%, 11/01/2026 | | | 20 | | | | 20,016 | |
| | |
| |
| abfunds.com | | AB MUNICIPAL INCOME FUND II | 59 |
PORTFOLIO OF INVESTMENTS (continued)
AB VIRGINIA PORTFOLIO
| | | | | | | | |
| | | Principal
Amount
(000) | | | U.S. $ Value | |
| |
Series 2016-C
4.00%, 11/01/2034 | | $ | 2,000 | | | $ | 2,001,157 | |
Virginia Small Business Financing Authority
(95 Express Lanes LLC)
Series 2022
5.00%, 07/01/2035 | | | 4,580 | | | | 4,814,241 | |
Virginia Small Business Financing Authority
(Bon Secours Mercy Health, Inc.)
Series 2020
4.00%, 12/01/2049 | | | 3,500 | | | | 3,239,777 | |
Virginia Small Business Financing Authority
(Elizabeth River Crossings OpCo LLC)
Series 2022
4.00%, 01/01/2040 | | | 4,825 | | | | 4,585,346 | |
Virginia Small Business Financing Authority
(Hampton University)
Series 2014
5.25%, 10/01/2029 | | | 4,125 | | | | 4,138,399 | |
Virginia Small Business Financing Authority
(I-66 Express Mobility Partners LLC)
Series 2017
5.00%, 12/31/2052 | | | 3,350 | | | | 3,365,017 | |
Virginia Small Business Financing Authority
(National Senior Campuses, Inc. Obligated Group)
Series 2020
4.00%, 01/01/2051 | | | 1,500 | | | | 1,290,987 | |
Virginia Small Business Financing Authority
(Pure Salmon Virginia LLC)
Series 2023
5.00%, 11/01/2052 | | | 4,000 | | | | 3,999,939 | |
Virginia Small Business Financing Authority
(Reworld Holding Corp.)
Series 2018
5.00%, 01/01/2048(a) | | | 1,000 | | | | 977,864 | |
Winchester Economic Development Authority
(Valley Health Obligated Group)
Series 2015
5.00%, 01/01/2034 | | | 2,000 | | | | 2,027,101 | |
5.00%, 01/01/2035 | | | 1,500 | | | | 1,520,043 | |
| | | | | | | | |
| | | | | | | 134,590,619 | |
| | | | | | | | |
American Samoa – 0.2% | |
American Samoa Economic Development Authority
(Territory of American Samoa)
Series 2018
7.125%, 09/01/2038(a) | | | 420 | | | | 450,654 | |
| | | | | | | | |
| | |
| |
60 | AB MUNICIPAL INCOME FUND II | | abfunds.com |
PORTFOLIO OF INVESTMENTS (continued)
AB VIRGINIA PORTFOLIO
| | | | | | | | |
| | | Principal
Amount
(000) | | | U.S. $ Value | |
| |
Arizona – 0.5% | |
Maricopa County Industrial Development Authority
(Benjamin Franklin Charter School Ltd.)
Series 2018-A
6.00%, 07/01/2052(a) | | $ | 200 | | | $ | 204,145 | |
Salt Verde Financial Corp.
(Citigroup, Inc.)
Series 2007
5.00%, 12/01/2037 | | | 705 | | | | 747,915 | |
| | | | | | | | |
| | | | | | | 952,060 | |
| | | | | | | | |
District of Columbia – 15.4% | |
Metropolitan Washington Airports Authority Aviation Revenue
Series 2018-A
5.00%, 10/01/2038 | | | 2,330 | | | | 2,410,768 | |
Series 2020-A
4.00%, 10/01/2035 | | | 2,000 | | | | 1,973,053 | |
Series 2021-A
5.00%, 10/01/2036 | | | 2,250 | | | | 2,400,515 | |
5.00%, 10/01/2046 | | | 5,000 | | | | 5,157,571 | |
Metropolitan Washington Airports Authority Dulles Toll Road Revenue
Series 2010-B
6.50%, 10/01/2044 | | | 4,300 | | | | 4,674,611 | |
Series 2019
5.00%, 10/01/2034 | | | 1,500 | | | | 1,580,097 | |
AGM Series 2022
4.00%, 10/01/2052 | | | 3,000 | | | | 2,807,474 | |
Washington Metropolitan Area Transit Authority
Series 2017-A
5.00%, 07/01/2031 | | | 1,145 | | | | 1,191,515 | |
5.00%, 07/01/2032 | | | 3,950 | | | | 4,102,100 | |
Washington Metropolitan Area Transit Authority Dedicated Revenue
(Washington Metropolitan Area Transit Authority Dedicated Revenue Lease)
Series 2023
5.00%, 07/15/2048 | | | 3,000 | | | | 3,211,800 | |
| | | | | | | | |
| | | | | | | 29,509,504 | |
| | | | | | | | |
Georgia – 0.1% | |
Municipal Electric Authority of Georgia
Series 2019
5.00%, 01/01/2039 | | | 100 | | | | 103,338 | |
| | | | | | | | |
| | |
| |
| abfunds.com | | AB MUNICIPAL INCOME FUND II | 61 |
PORTFOLIO OF INVESTMENTS (continued)
AB VIRGINIA PORTFOLIO
| | | | | | | | |
| | | Principal
Amount
(000) | | | U.S. $ Value | |
| |
Guam – 3.4% | |
Antonio B Won Pat International Airport Authority
Series 2021-A
4.46%, 10/01/2043 | | $ | 1,015 | | | $ | 818,946 | |
Guam Department of Education
(Guam Department of Education COP)
Series 2020
5.00%, 02/01/2040 | | | 1,095 | | | | 1,055,181 | |
Guam Power Authority
Series 2017-A
5.00%, 10/01/2036 | | | 1,630 | | | | 1,667,821 | |
Territory of Guam
Series 2019
5.00%, 11/15/2031 | | | 190 | | | | 190,960 | |
Territory of Guam
(Territory of Guam Business Privilege Tax)
Series 2021-F
4.00%, 01/01/2042 | | | 1,370 | | | | 1,270,690 | |
Territory of Guam
(Territory of Guam Hotel Occupancy Tax)
Series 2021-A
5.00%, 11/01/2035 | | | 1,500 | | | | 1,547,958 | |
| | | | | | | | |
| | | | | | | 6,551,556 | |
| | | | | | | | |
Illinois – 1.2% | |
Metropolitan Pier & Exposition Authority
Series 2015-B
5.00%, 12/15/2045 | | | 2,200 | | | | 2,211,115 | |
| | | | | | | | |
|
Michigan – 0.0% | |
City of Detroit MI
Series 2018
5.00%, 04/01/2036 | | | 85 | | | | 86,557 | |
| | | | | | | | |
|
Nevada – 0.0% | |
City of Reno NV
(County of Washoe NV Sales Tax Revenue)
Series 2018-C
Zero Coupon, 07/01/2058(a) | | | 500 | | | | 63,924 | |
| | | | | | | | |
|
North Carolina – 0.2% | |
North Carolina Medical Care Commission
(Aldersgate United Methodist Retirement Community, Inc.)
Series 2015
4.70%, 07/01/2037 | | | 560 | | | | 470,764 | |
| | | | | | | | |
| | |
| |
62 | AB MUNICIPAL INCOME FUND II | | abfunds.com |
PORTFOLIO OF INVESTMENTS (continued)
AB VIRGINIA PORTFOLIO
| | | | | | | | |
| | | Principal
Amount
(000) | | | U.S. $ Value | |
| |
Puerto Rico – 3.1% | |
Commonwealth of Puerto Rico
Series 2021-A
Zero Coupon, 07/01/2024 | | $ | 43 | | | $ | 43,109 | |
Zero Coupon, 07/01/2033 | | | 369 | | | | 244,378 | |
4.00%, 07/01/2046 | | | 103 | | | | 92,911 | |
5.625%, 07/01/2027 | | | 303 | | | | 316,789 | |
Series 2022-C
Zero Coupon, 11/01/2043 | | | 18 | | | | 11,094 | |
Puerto Rico Commonwealth Aqueduct & Sewer Authority
Series 2020-A
5.00%, 07/01/2030(a) | | | 855 | | | | 897,406 | |
5.00%, 07/01/2035(a) | | | 250 | | | | 260,350 | |
Puerto Rico Electric Power Authority
AGM Series 2007-V
5.25%, 07/01/2031 | | | 235 | | | | 233,893 | |
NATL Series 2007-V
5.25%, 07/01/2032 | | | 300 | | | | 295,262 | |
Puerto Rico Industrial Tourist Educational Medical & Environmental Control Facilities Financing Auth
Series 2023-A
6.625%, 01/01/2027 | | | 50 | | | | 49,474 | |
6.625%, 01/01/2028 | | | 384 | | | | 376,462 | |
Puerto Rico Industrial Tourist Educational Medical & Environmental Control Facilities Financing Auth
(AES Puerto Rico LP)
12.50%, 12/15/2025(c)(d) | | | 89 | | | | 86,442 | |
Puerto Rico Industrial Tourist Educational Medical & Environmental Control Facilities Financing Auth
(Hospital Auxilio Mutuo Obligated Group)
Series 2021
4.00%, 07/01/2038 | | | 275 | | | | 248,487 | |
4.00%, 07/01/2040 | | | 295 | | | | 261,503 | |
5.00%, 07/01/2034 | | | 110 | | | | 114,744 | |
5.00%, 07/01/2035 | | | 115 | | | | 119,923 | |
Puerto Rico Industrial Tourist Educational Medical & Environmental Control Facilities Financing Auth
(San Juan Cruise Port LLC)
Series 2024
6.75%, 01/01/2045 | | | 500 | | | | 592,555 | |
| | |
| |
| abfunds.com | | AB MUNICIPAL INCOME FUND II | 63 |
PORTFOLIO OF INVESTMENTS (continued)
AB VIRGINIA PORTFOLIO
| | | | | | | | |
| | | Principal
Amount
(000) | | | U.S. $ Value | |
| |
Puerto Rico Sales Tax Financing Corp. Sales Tax Revenue
Series 2018-A
Zero Coupon, 07/01/2029 | | $ | 223 | | | $ | 184,109 | |
Zero Coupon, 07/01/2046 | | | 1,000 | | | | 318,521 | |
Series 2019-A
4.329%, 07/01/2040 | | | 180 | | | | 178,820 | |
5.00%, 07/01/2058 | | | 955 | | | | 951,859 | |
| | | | | | | | |
| | | | | | | 5,878,091 | |
| | | | | | | | |
Tennessee – 0.1% | |
Bristol Industrial Development Board
(Bristol Industrial Development Board Sales Tax)
Series 2016-A
5.00%, 12/01/2035(a) | | | 295 | | | | 270,293 | |
| | | | | | | | |
|
Texas – 0.3% | |
Mission Economic Development Corp.
(Natgasoline LLC)
Series 2018
4.625%, 10/01/2031(a) | | | 520 | | | | 516,354 | |
Tarrant County Cultural Education Facilities Finance Corp.
Series 2015-B
5.00%, 11/15/2036(c)(d)(e)(f)(g) | | | 941 | | | | – 0 | – |
| | | | | | | | |
| | | | | | | 516,354 | |
| | | | | | | | |
Washington – 0.4% | |
Pend Oreille County Public Utility District No. 1 Box Canyon
Series 2018
5.00%, 01/01/2044 | | | 650 | | | | 653,315 | |
Washington State Housing Finance Commission
(Presbyterian Retirement Communities Northwest Obligated Group)
Series 2019-A
5.00%, 01/01/2055(a) | | | 100 | | | | 75,816 | |
| | | | | | | | |
| | | | | | | 729,131 | |
| | | | | | | | |
Total Long-Term Municipal Bonds
(cost $189,812,835) | | | | | | | 182,383,960 | |
| | | | | | | | |
| | | | | | | | |
Short-Term Municipal Notes – 1.2% | | | | | | | | |
Virginia – 1.2% | | | | | | | | |
Roanoke Economic Development Authority
(Carilion Clinic Obligated Group)
Series 2020
3.35%, 07/01/2052(h) | | | 1,000 | | | | 1,000,000 | |
| | |
| |
64 | AB MUNICIPAL INCOME FUND II | | abfunds.com |
PORTFOLIO OF INVESTMENTS (continued)
AB VIRGINIA PORTFOLIO
| | | | | | | | |
| | | Principal
Amount
(000) | | | U.S. $ Value | |
| |
Virginia Small Business Financing Authority
(Carilion Clinic Obligated Group)
Series 2019
3.35%, 07/01/2042(h) | | $ | 1,310 | | | $ | 1,310,000 | |
| | | | | | | | |
| | |
Total Short-Term Municipal Notes
(cost $2,310,000) | | | | | | | 2,310,000 | |
| | | | | | | | |
| | |
Total Municipal Obligations
(cost $192,122,835) | | | | | | | 184,693,960 | |
| | | | | | | | |
| | | | | | | | |
ASSET-BACKED SECURITIES – 0.3% | | | | | | | | |
Other ABS – Fixed Rate – 0.3% | | | | | | | | |
HTA TRRB Custodial Trust
Series 2022
5.25%, 07/01/2034 | | | 156 | | | | 152,029 | |
5.25%, 07/01/2036 | | | 185 | | | | 185,592 | |
5.25%, 07/01/2041 | | | 173 | | | | 167,949 | |
| | | | | | | | |
| | |
Total Asset-Backed Securities
(cost $511,234) | | | | | | | 505,570 | |
| | | | | | | | |
| | |
| | | Shares | | | | |
PREFERRED STOCKS – 0.0% | | | | | | | | |
Utility – 0.0% | | | | | | | | |
Electric – 0.0% | | | | | | | | |
AES Puerto Rico LP
0.00%(c)(d)(e)
(cost $151,336) | | | 8,437 | | | | 24,552 | |
| | | | | | | | |
| | | | | | | | |
SHORT-TERM INVESTMENTS – 2.6% | | | | | | | | |
Investment Companies – 2.6% | | | | | | | | |
AB Fixed Income Shares, Inc. – Government Money Market Portfolio – Class AB, 5.22%(i)(j)(k)
(cost $5,009,549) | | | 5,009,549 | | | | 5,009,549 | |
| | | | | | | | |
| | |
Total Investments – 99.3%
(cost $197,794,954) | | | | | | | 190,233,631 | |
Other assets less liabilities – 0.7% | | | | | | | 1,361,566 | |
| | | | | | | | |
| | |
Net Assets – 100.0% | | | | | | $ | 191,595,197 | |
| | | | | | | | |
| | |
| |
| abfunds.com | | AB MUNICIPAL INCOME FUND II | 65 |
PORTFOLIO OF INVESTMENTS (continued)
AB VIRGINIA PORTFOLIO
CENTRALLY CLEARED INTEREST RATE SWAPS (see Note D)
| | | | | | | | | | | | | | | | | | | | | | | | | | |
| | | | | | | | | Rate Type | | | | | | | | | | | |
Notional
Amount
(000) | | | Termination
Date | | | Payments
made
by the
Fund | | Payments
received
by the
Fund | | Payment
Frequency
Paid/
Received | | Market
Value | | | Upfront
Premiums
Paid
(Received) | | | Unrealized
Appreciation
(Depreciation) | |
| USD | | | 4,200 | | | | 07/31/2029 | | | 1 Day SOFR | | 4.461% | | Annual | | $ | 33,410 | | | $ | –0 | – | | $ | 33,410 | |
| USD | | | 1,200 | | | | 07/31/2029 | | | 1 Day SOFR | | 3.975% | | Annual | | | (20,349 | ) | | | – 0 | – | | | (20,349 | ) |
| USD | | | 4,400 | | | | 04/30/2030 | | | 1 Day SOFR | | 3.075% | | Annual | | | (272,758 | ) | | | – 0 | – | | | (272,758 | ) |
| USD | | | 6,400 | | | | 07/31/2030 | | | 1 Day SOFR | | 4.016% | | Annual | | | (138,697 | ) | | | – 0 | – | | | (138,697 | ) |
| USD | | | 3,300 | | | | 07/31/2030 | | | 1 Day SOFR | | 3.806% | | Annual | | | (116,432 | ) | | | – 0 | – | | | (116,432 | ) |
| USD | | | 3,300 | | | | 07/31/2030 | | | 1 Day SOFR | | 4.504% | | Annual | | | 31,515 | | | | – 0 | – | | | 31,515 | |
| USD | | | 2,300 | | | | 11/01/2030 | | | 1 Day SOFR | | 4.105% | | Annual | | | (29,716 | ) | | | – 0 | – | | | (29,716 | ) |
| USD | | | 4,700 | | | | 07/31/2031 | | | 1 Day SOFR | | 4.059% | | Annual | | | (38,315 | ) | | | 533 | | | | (38,848 | ) |
| | | | | | | | | | | | | | | | | | | | | | | | | | |
| | $ | (551,342 | ) | | $ | 533 | | | $ | (551,875 | ) |
| | | | | | | | | | | | | | | | | | | | | | | | | | |
INTEREST RATE SWAPS (see Note D)
| | | | | | | | | | | | | | | | | | | | | | | | | | | | | | |
| | | | Rate Type | | | |
Swap
Counterparty | | Notional
Amount
(000) | | | Termination
Date | | | Payments
made
by the
Fund | | Payments
received
by the
Fund | | Payment
Frequency
Paid/
Received | | Market
Value | | | Upfront
Premiums
Paid
(Received) | | | Unrealized
Appreciation
(Depreciation) | |
Citibank, NA | | | USD | | | | 2,965 | | | | 10/09/2029 | | | 1.125% | | SIFMA* | | Quarterly | | $ | 306,378 | | | $ | – 0 | – | | $ | 306,378 | |
| * | Variable interest rate based on the Securities Industry & Financial Markets Association (SIFMA) Municipal Swap Index. |
| (a) | Security is exempt from registration under Rule 144A or Regulation S of the Securities Act of 1933. These securities are considered restricted, but liquid and may be resold in transactions exempt from registration. At May 31, 2024, the aggregate market value of these securities amounted to $7,753,397 or 4.0% of net assets. |
| (b) | When-Issued or delayed delivery security. |
| (c) | Fair valued by the Adviser. |
| (d) | Security in which significant unobservable inputs (Level 3) were used in determining fair value. |
| (e) | Non-income producing security. |
| (g) | Restricted and illiquid security. |
| | | | | | | | | | | | | | | | |
| Restricted & Illiquid Securities | | Acquisition
Date | | | Cost | | | Market
Value | | | Percentage of
Net Assets | |
Tarrant County Cultural Education Facilities Finance Corp.
Series 2015-B
5.00%, 11/15/2036 | | | 05/22/2015 | | | $ | 950,418 | | | $ | – 0 | – | | | 0.00 | % |
| (h) | Variable Rate Demand Notes are instruments whose interest rates change on a specific date (such as coupon date or interest payment date) or whose interest rates vary with changes in a designated base rate (such as the prime interest rate). This instrument is payable on demand and is secured by letters of credit or other credit support agreements from major banks. |
| (i) | Affiliated investments. |
| (j) | The rate shown represents the 7-day yield as of period end. |
| | |
| |
66 | AB MUNICIPAL INCOME FUND II | | abfunds.com |
PORTFOLIO OF INVESTMENTS (continued)
AB VIRGINIA PORTFOLIO
| (k) | To obtain a copy of the fund’s shareholder report, please go to the Securities and Exchange Commission’s website at www.sec.gov, or call AB at (800) 227-4618. |
As of May 31, 2024, the Portfolio’s percentages of investments in municipal bonds that are insured and in insured municipal bonds that have been pre-refunded or escrowed to maturity are 1.8% and 0.0%, respectively.
Glossary:
ABS – Asset-Backed Securities
AGM – Assured Guaranty Municipal
COP – Certificate of Participation
NATL – National Interstate Corporation
SOFR – Secured Overnight Financing Rate
See notes to financial statements.
| | |
| |
| abfunds.com | | AB MUNICIPAL INCOME FUND II | 67 |
STATEMENT OF ASSETS & LIABILITIES
May 31, 2024
| | | | | | | | |
| | | AB Arizona | | | AB Massachusetts | |
| Assets | |
Investments in securities, at value | | | | | | | | |
Unaffiliated issuers (cost $85,621,824 and $235,612,253, respectively) | | $ | 80,361,264 | | | $ | 227,269,097 | |
Affiliated issuers (cost $1,538,648 and $338,267, respectively) | | | 1,538,648 | | | | 338,267 | |
Cash | | | 17 | | | | – 0 | – |
Cash collateral due from broker | | | 309,364 | | | | 919,290 | |
Interest receivable | | | 1,334,210 | | | | 3,717,981 | |
Unrealized appreciation on interest rate swaps | | | 173,080 | | | | 312,578 | |
Receivable for variation margin on centrally cleared swaps | | | 67,413 | | | | 103,141 | |
Receivable for shares of beneficial interest sold | | | 53,839 | | | | 616,734 | |
Receivable due from Adviser | | | 13,828 | | | | 26,661 | |
Affiliated dividends receivable | | | 6,192 | | | | 6,010 | |
| | | | | | | | |
Total assets | | | 83,857,855 | | | | 233,309,759 | |
| | | | | | | | |
| Liabilities | |
Payable for investment securities purchased | | | 3,062,540 | | | | – 0 | – |
Custody and accounting fees payable | | | 124,592 | | | | 143,666 | |
Payable for shares of beneficial interest redeemed | | | 87,566 | | | | 215,282 | |
Payable for terminated centrally cleared interest rate swaps | | | 45,229 | | | | – 0 | – |
Advisory fee payable | | | 30,677 | | | | 89,009 | |
Administrative fee payable | | | 24,562 | | | | 30,884 | |
Distribution fee payable | | | 15,343 | | | | 19,884 | |
Trustees’ fees payable | | | 5,399 | | | | 5,947 | |
Transfer Agent fee payable | | | 1,449 | | | | 2,136 | |
Dividends payable | | | – 0 | – | | | 89,650 | |
Accrued expenses | | | 44,975 | | | | 54,221 | |
| | | | | | | | |
Total liabilities | | | 3,442,332 | | | | 650,679 | |
| | | | | | | | |
Net Assets | | $ | 80,415,523 | | | $ | 232,659,080 | |
| | | | | | | | |
| Composition of Net Assets | |
Shares of beneficial interest, at par | | $ | 79,166 | | | $ | 226,666 | |
Additional paid-in capital | | | 87,390,583 | | | | 241,070,240 | |
Accumulated loss | | | (7,054,226 | ) | | | (8,637,826 | ) |
| | | | | | | | |
| | $ | 80,415,523 | | | $ | 232,659,080 | |
| | | | | | | | |
| | |
| |
68 | AB MUNICIPAL INCOME FUND II | | abfunds.com |
STATEMENT OF ASSETS & LIABILITIES (continued)
Net Asset Value Per Share—unlimited shares authorized, $.01 par value
| | | | | | | | | | | | |
| AB Arizona Portfolio | | Net Assets | | | Shares
Outstanding | | | Net Asset
Value | |
| |
| Class A | | $ | 65,259,346 | | | | 6,424,659 | | | $ | 10.16 | * |
| |
| Class C | | $ | 1,716,899 | | | | 169,252 | | | $ | 10.14 | |
| |
| Advisor Class | | $ | 13,439,278 | | | | 1,322,669 | | | $ | 10.16 | |
| |
|
| AB Massachusetts Portfolio | |
| |
| Class A | | $ | 77,740,978 | | | | 7,570,581 | | | $ | 10.27 | * |
| |
| Class C | | $ | 3,663,614 | | | | 357,500 | | | $ | 10.25 | |
| |
| Advisor Class | | $ | 151,254,488 | | | | 14,738,540 | | | $ | 10.26 | |
| |
| * | The maximum offering price per share for Class A of AB Arizona Portfolio and AB Massachusetts Portfolio were $10.47 and $10.59, respectively, which reflects a sales charge of 3.00%. |
See notes to financial statements.
| | |
| |
| abfunds.com | | AB MUNICIPAL INCOME FUND II | 69 |
STATEMENT OF ASSETS & LIABILITIES (continued)
| | | | | | | | |
| | | AB Minnesota | | | AB New Jersey | |
| Assets | |
Investments in securities, at value | | | | | | | | |
Unaffiliated issuers (cost $30,699,151 and $66,487,703, respectively) | | $ | 29,041,506 | | | $ | 65,521,147 | |
Affiliated issuers (cost $925,927 and $883,573, respectively) | | | 925,927 | | | | 883,573 | |
Cash collateral due from broker | | | 290,135 | | | | 252,367 | |
Interest receivable | | | 416,129 | | | | 1,047,670 | |
Unrealized appreciation on interest rate swaps | | | 86,282 | | | | 127,614 | |
Receivable for variation margin on centrally cleared swaps | | | 30,208 | | | | 26,582 | |
Receivable due from Adviser | | | 12,360 | | | | 26,823 | |
Affiliated dividends receivable | | | 1,104 | | | | 3,532 | |
Receivable for shares of beneficial interest sold | | | 203 | | | | 18,575 | |
Receivable for investment securities sold | | | – 0 | – | | | 165,000 | |
| | | | | | | | |
Total assets | | | 30,803,854 | | | | 68,072,883 | |
| | | | | | | | |
| Liabilities | |
Custody and accounting fees payable | | | 105,572 | | | | 114,902 | |
Audit and tax fee payable | | | 29,122 | | | | 29,122 | |
Payable for shares of beneficial interest redeemed | | | 14,164 | | | | 144,464 | |
Advisory fee payable | | | 11,863 | | | | 24,587 | |
Distribution fee payable | | | 7,370 | | | | 14,181 | |
Trustees’ fees payable | | | 5,212 | | | | 5,320 | |
Transfer Agent fee payable | | | 1,449 | | | | 1,449 | |
Dividends payable | | | 203 | | | | 19,960 | |
Payable for investment securities purchased | | | – 0 | – | | | 4,397,080 | |
Administrative fee payable | | | – 0 | – | | | 31,827 | |
Accrued expenses | | | 17,257 | | | | 17,264 | |
| | | | | | | | |
Total liabilities | | | 192,212 | | | | 4,800,156 | |
| | | | | | | | |
Net Assets | | $ | 30,611,642 | | | $ | 63,272,727 | |
| | | | | | | | |
| Composition of Net Assets | |
Shares of beneficial interest, at par | | $ | 32,675 | | | $ | 70,368 | |
Additional paid-in capital | | | 32,149,560 | | | | 64,564,656 | |
Accumulated loss | | | (1,570,593 | ) | | | (1,362,297 | ) |
| | | | | | | | |
| | $ | 30,611,642 | | | $ | 63,272,727 | |
| | | | | | | | |
Net Asset Value Per Share—unlimited shares authorized, $.01 par value
| | | | | | | | | | | | |
| AB Minnesota Portfolio | | Net Assets | | | Shares
Outstanding | | | Net Asset
Value | |
| |
| Class A | | $ | 29,387,476 | | | | 3,136,990 | | | $ | 9.37 | * |
| |
| Class C | | $ | 1,224,166 | | | | 130,532 | | | $ | 9.38 | |
| |
|
| AB New Jersey Portfolio | |
| |
| Class A | | $ | 62,536,566 | | | | 6,954,961 | | | $ | 8.99 | * |
| |
| Class C | | $ | 736,161 | | | | 81,810 | | | $ | 9.00 | |
| |
| * | The maximum offering price per share for Class A of AB Minnesota Portfolio and AB New Jersey Portfolio were $9.66 and $9.27, respectively, which reflects a sales charge of 3.00%. |
See notes to financial statements.
| | |
| |
70 | AB MUNICIPAL INCOME FUND II | | abfunds.com |
STATEMENT OF ASSETS & LIABILITIES (continued)
| | | | | | | | |
| | | AB Ohio | | | AB Pennsylvania | |
| Assets | |
Investments in securities, at value | | | | | | | | |
Unaffiliated issuers (cost $44,980,458 and $47,988,767, respectively) | | $ | 42,796,404 | | | $ | 46,652,320 | |
Affiliated issuers (cost $0 and $611,032, respectively) | | | – 0 | – | | | 611,032 | |
Cash | | | 131,817 | | | | – 0 | – |
Cash collateral due from broker | | | 204,235 | | | | 292,272 | |
Interest receivable | | | 645,411 | | | | 702,628 | |
Unrealized appreciation on interest rate swaps | | | 121,414 | | | | 117,798 | |
Receivable for investment securities sold | | | 60,000 | | | | 25,000 | |
Receivable for variation margin on centrally cleared swaps | | | 33,950 | | | | 22,003 | |
Receivable due from Adviser | | | 13,956 | | | | 19,594 | |
Receivable for shares of beneficial interest sold | | | 5,439 | | | | 18,705 | |
Affiliated dividends receivable | | | 313 | | | | 2,019 | |
| | | | | | | | |
Total assets | | | 44,012,939 | | | | 48,463,371 | |
| | | | | | | | |
| Liabilities | |
Custody and accounting fees payable | | | 106,991 | | | | 114,069 | |
Payable for shares of beneficial interest redeemed | | | 43,141 | | | | 36,383 | |
Audit and tax fee payable | | | 29,122 | | | | 27,143 | |
Payable for terminated centrally cleared interest rate swaps | | | 17,113 | | | | – 0 | – |
Advisory fee payable | | | 16,858 | | | | 18,161 | |
Distribution fee payable | | | 10,326 | | | | 10,439 | |
Trustees’ fees payable | | | 5,268 | | | | 5,274 | |
Dividends payable | | | 4,486 | | | | 5,401 | |
Transfer Agent fee payable | | | 1,449 | | | | 1,453 | |
Payable for investment securities purchased | | | – 0 | – | | | 1,046,720 | |
Accrued expenses | | | 17,663 | | | | 20,098 | |
| | | | | | | | |
Total liabilities | | | 252,417 | | | | 1,285,141 | |
| | | | | | | | |
Net Assets | | $ | 43,760,522 | | | $ | 47,178,230 | |
| | | | | | | | |
| Composition of Net Assets | |
Shares of beneficial interest, at par | | $ | 47,631 | | | $ | 49,534 | |
Additional paid-in capital | | | 49,371,242 | | | | 49,538,313 | |
Accumulated loss | | | (5,658,351 | ) | | | (2,409,617 | ) |
| | | | | | | | |
| | $ | 43,760,522 | | | $ | 47,178,230 | |
| | | | | | | | |
| | |
| |
| abfunds.com | | AB MUNICIPAL INCOME FUND II | 71 |
STATEMENT OF ASSETS & LIABILITIES (continued)
Net Asset Value Per Share—unlimited shares authorized, $.01 par value
| | | | | | | | | | | | |
| AB Ohio Portfolio | | Net Assets | | | Shares
Outstanding | | | Net Asset
Value | |
| |
| Class A | | $ | 42,261,338 | | | | 4,599,820 | | | $ | 9.19 | * |
| |
| Class C | | $ | 1,499,184 | | | | 163,288 | | | $ | 9.18 | |
| |
|
| AB Pennsylvania Portfolio | |
| |
| Class A | | $ | 46,646,515 | | | | 4,897,591 | | | $ | 9.52 | * |
| |
| Class C | | $ | 531,715 | | | | 55,819 | | | $ | 9.53 | |
| |
| * | The maximum offering price per share for Class A of AB Ohio Portfolio and AB Pennsylvania Portfolio were $9.47 and $9.81, respectively, which reflects a sales charge of 3.00%. |
See notes to financial statements.
| | |
| |
72 | AB MUNICIPAL INCOME FUND II | | abfunds.com |
STATEMENT OF ASSETS & LIABILITIES (continued)
| | | | |
| | | AB Virginia | |
| Assets | |
Investments in securities, at value | |
Unaffiliated issuers (cost $192,785,405) | | $ | 185,224,082 | |
Affiliated issuers (cost $5,009,549) | | | 5,009,549 | |
Cash collateral due from broker | | | 977,141 | |
Interest receivable | | | 2,788,910 | |
Unrealized appreciation on interest rate swaps | | | 306,378 | |
Receivable for variation margin on centrally cleared swaps | | | 148,151 | |
Receivable for shares of beneficial interest sold | | | 45,153 | |
Receivable due from Adviser | | | 13,242 | |
Affiliated dividends receivable | | | 11,622 | |
| | | | |
Total assets | | | 194,524,228 | |
| | | | |
| Liabilities | |
Payable for investment securities purchased | | | 2,258,040 | |
Payable for shares of beneficial interest redeemed | | | 231,402 | |
Advisory fee payable | | | 73,758 | |
Payable for terminated centrally cleared interest rate swaps | | | 64,674 | |
Dividends payable | | | 36,480 | |
Administrative fee payable | | | 31,434 | |
Distribution fee payable | | | 26,967 | |
Trustees’ fees payable | | | 5,808 | |
Transfer Agent fee payable | | | 1,581 | |
Accrued expenses | | | 198,887 | |
| | | | |
Total liabilities | | | 2,929,031 | |
| | | | |
Net Assets | | $ | 191,595,197 | |
| | | | |
| Composition of Net Assets | |
Shares of beneficial interest, at par | | $ | 185,973 | |
Additional paid-in capital | | | 203,921,689 | |
Accumulated loss | | | (12,512,465 | ) |
| | | | |
| | $ | 191,595,197 | |
| | | | |
Net Asset Value Per Share—unlimited shares authorized, $.01 par value
| | | | | | | | | | | | |
| AB Virginia Portfolio | | Net Assets | | | Shares
Outstanding | | | Net Asset
Value | |
| |
| Class A | | $ | 105,807,431 | | | | 10,270,977 | | | $ | 10.30 | * |
| |
| Class C | | $ | 5,032,627 | | | | 489,803 | | | $ | 10.27 | |
| |
| Advisor Class | | $ | 80,755,139 | | | | 7,836,479 | | | $ | 10.31 | |
| |
| * | The maximum offering price per share for Class A shares was $10.62 which reflects a sales charge of 3.00%. |
See notes to financial statements.
| | |
| |
| abfunds.com | | AB MUNICIPAL INCOME FUND II | 73 |
STATEMENT OF OPERATIONS
Year Ended May 31, 2024
| | | | | | | | |
| | | AB Arizona | | | AB Massachusetts | |
| Investment Income | | | | | | | | |
Interest | | $ | 3,255,610 | | | $ | 7,930,327 | |
Dividends – Affiliated issuers | | | 41,059 | | | | 273,591 | |
Other income | | | 468 | | | | 2,746 | |
| | | | | | | | |
Total income | | | 3,297,137 | | | | 8,206,664 | |
| | | | | | | | |
| Expenses | | | | | | | | |
Advisory fee (see Note B) | | | 385,161 | | | | 996,094 | |
Distribution fee – Class A | | | 175,333 | | | | 205,207 | |
Distribution fee – Class C | | | 25,382 | | | | 49,540 | |
Transfer agency – Class A | | | 29,947 | | | | 30,843 | |
Transfer agency – Class C | | | 1,129 | | | | 1,928 | |
Transfer agency – Advisor Class | | | 5,507 | | | | 52,281 | |
Administrative | | | 70,120 | | | | 77,228 | |
Custody and accounting | | | 56,212 | | | | 68,183 | |
Audit and tax | | | 45,460 | | | | 47,440 | |
Legal | | | 35,959 | | | | 37,073 | |
Printing | | | 20,601 | | | | 25,612 | |
Registration fees | | | 20,193 | | | | 24,406 | |
Trustees’ fees | | | 19,728 | | | | 21,575 | |
Miscellaneous | | | 19,428 | | | | 25,442 | |
| | | | | | | | |
Total expenses before bank overdraft expense | | | 910,160 | | | | 1,662,852 | |
Bank overdraft expense | | | 1,604 | | | | 446 | |
| | | | | | | | |
Total expenses | | | 911,764 | | | | 1,663,298 | |
Less: expenses waived and reimbursed by the Adviser (see Note B) | | | (256,908 | ) | | | (264,436 | ) |
| | | | | | | | |
Net expenses | | | 654,856 | | | | 1,398,862 | |
| | | | | | | | |
Net investment income | | | 2,642,281 | | | | 6,807,802 | |
| | | | | | | | |
| Realized and Unrealized Gain (Loss) on Investment Transactions | | | | | | | | |
Net realized gain (loss) on: | | | | | | | | |
Investment transactions | | | (384,279 | ) | | | (2,274,693 | ) |
Swaps | | | 955,006 | | | | 60,155 | |
Net change in unrealized appreciation/depreciation of: | | | | | | | | |
Investments | | | 860,398 | | | | 3,378,315 | |
Swaps | | | (1,541,894 | ) | | | (241,162 | ) |
| | | | | | | | |
Net gain (loss) on investment transactions | | | (110,769 | ) | | | 922,615 | |
| | | | | | | | |
Net Increase in Net Assets from Operations | | $ | 2,531,512 | | | $ | 7,730,417 | |
| | | | | | | | |
See notes to financial statements.
| | |
| |
74 | AB MUNICIPAL INCOME FUND II | | abfunds.com |
STATEMENT OF OPERATIONS (continued)
| | | | | | | | |
| | | AB Minnesota | | | AB New Jersey | |
| Investment Income | | | | | | | | |
Interest | | $ | 1,144,905 | | | $ | 2,571,638 | |
Dividends – Affiliated issuers | | | 22,382 | | | | 68,943 | |
Other income | | | 87 | | | | 765 | |
| | | | | | | | |
Total income | | | 1,167,374 | | | | 2,641,346 | |
| | | | | | | | |
| Expenses | | | | | | | | |
Advisory fee (see Note B) | | | 148,127 | | | | 279,672 | |
Distribution fee – Class A | | | 78,645 | | | | 152,214 | |
Distribution fee – Class C | | | 14,592 | | | | 12,635 | |
Transfer agency – Class A | | | 25,707 | | | | 32,110 | |
Transfer agency – Class C | | | 1,320 | | | | 713 | |
Administrative | | | 79,569 | | | | 74,511 | |
Audit and tax | | | 47,440 | | | | 47,440 | |
Custody and accounting | | | 42,716 | | | | 56,424 | |
Legal | | | 32,133 | | | | 35,856 | |
Trustees’ fees | | | 19,037 | | | | 19,415 | |
Printing | | | 15,342 | | | | 20,757 | |
Registration fees | | | 7,011 | | | | 9,827 | |
Miscellaneous | | | 15,657 | | | | 16,814 | |
| | | | | | | | |
Total expenses before bank overdraft expense | | | 527,296 | | | | 758,388 | |
Bank overdraft expense | | | 1,524 | | | | 921 | |
| | | | | | | | |
Total expenses | | | 528,820 | | | | 759,309 | |
Less: expenses waived and reimbursed by the Adviser (see Note B) | | | (237,116 | ) | | | (240,957 | ) |
| | | | | | | | |
Net expenses | | | 291,704 | | | | 518,352 | |
| | | | | | | | |
Net investment income | | | 875,670 | | | | 2,122,994 | |
| | | | | | | | |
| Realized and Unrealized Loss on Investment Transactions | | | | | | | | |
Net realized loss on: | |
Investment transactions | | | (80,582 | ) | | | (220,368 | ) |
Swaps | | | (40,814 | ) | | | (134,978 | ) |
Net change in unrealized appreciation/depreciation of: | | | | | | | | |
Investments | | | 157,287 | | | | 64,796 | |
Swaps | | | (322,666 | ) | | | (143,909 | ) |
| | | | | | | | |
Net loss on investment transactions | | | (286,775 | ) | | | (434,459 | ) |
| | | | | | | | |
Net Increase in Net Assets from Operations | | $ | 588,895 | | | $ | 1,688,535 | |
| | | | | | | | |
See notes to financial statements.
| | |
| |
| abfunds.com | | AB MUNICIPAL INCOME FUND II | 75 |
STATEMENT OF OPERATIONS (continued)
| | | | | | | | |
| | | AB Ohio | | | AB Pennsylvania | |
| Investment Income | | | | | | | | |
Interest | | $ | 1,810,246 | | | $ | 1,998,183 | |
Dividends – Affiliated issuers | | | 34,244 | | | | 40,719 | |
Other income | | | 219 | | | | 166 | |
| | | | | | | | |
Total income | | | 1,844,709 | | | | 2,039,068 | |
| | | | | | | | |
| Expenses | | | | | | | | |
Advisory fee (see Note B) | | | 214,451 | | | | 220,931 | |
Distribution fee – Class A | | | 115,357 | | | | 120,958 | |
Distribution fee – Class C | | | 15,128 | | | | 7,125 | |
Transfer agency – Class A | | | 31,981 | | | | 33,603 | |
Transfer agency – Class C | | | 1,114 | | | | 526 | |
Administrative | | | 79,569 | | | | 80,751 | |
Audit and tax | | | 47,440 | | | | 45,460 | |
Custody and accounting | | | 45,733 | | | | 55,957 | |
Legal | | | 35,787 | | | | 35,745 | |
Printing | | | 20,208 | | | | 17,768 | |
Trustees’ fees | | | 19,236 | | | | 19,253 | |
Registration fees | | | 10,225 | | | | 15,703 | |
Miscellaneous | | | 16,408 | | | | 16,384 | |
| | | | | | | | |
Total expenses before bank overdraft expense | | | 652,637 | | | | 670,164 | |
Bank overdraft expense | | | 3,343 | | | | 1,574 | |
| | | | | | | | |
Total expenses | | | 655,980 | | | | 671,738 | |
Less: expenses waived and reimbursed by the Adviser (see Note B) | | | (260,925 | ) | | | (248,573 | ) |
| | | | | | | | |
Net expenses | | | 395,055 | | | | 423,165 | |
| | | | | | | | |
Net investment income | | | 1,449,654 | | | | 1,615,903 | |
| | | | | | | | |
| Realized and Unrealized Gain (Loss) on Investment Transactions | | | | | | | | |
Net realized gain (loss) on: | |
Investment transactions | | | (663,689 | ) | | | (297,964 | ) |
Swaps | | | (104,947 | ) | | | 543,934 | |
Net change in unrealized appreciation/depreciation of: | | | | | | | | |
Investments | | | 1,088,973 | | | | 277,323 | |
Swaps | | | (185,393 | ) | | | (921,668 | ) |
| | | | | | | | |
Net gain (loss) on investment transactions | | | 134,944 | | | | (398,375 | ) |
| | | | | | | | |
Net Increase in Net Assets from Operations | | $ | 1,584,598 | | | $ | 1,217,528 | |
| | | | | | | | |
See notes to financial statements.
| | |
| |
76 | AB MUNICIPAL INCOME FUND II | | abfunds.com |
STATEMENT OF OPERATIONS (continued)
| | | | |
| | | AB Virginia | |
| Investment Income | | | | |
Interest | | $ | 6,978,334 | |
Dividends – Affiliated issuers | | | 162,962 | |
Other income | | | 2,348 | |
| | | | |
Total income | | | 7,143,644 | |
| | | | |
| Expenses | | | | |
Advisory fee (see Note B) | | | 903,864 | |
Distribution fee – Class A | | | 275,681 | |
Distribution fee – Class C | | | 61,398 | |
Transfer agency – Class A | | | 34,504 | |
Transfer agency – Class C | | | 2,062 | |
Transfer agency – Advisor Class | | | 26,391 | |
Administrative | | | 77,870 | |
Custody and accounting | | | 65,182 | |
Audit and tax | | | 47,440 | |
Legal | | | 38,961 | |
Printing | | | 25,238 | |
Trustees’ fees | | | 21,225 | |
Registration fees | | | 20,501 | |
Miscellaneous | | | 24,678 | |
| | | | |
Total expenses before bank overdraft expense | | | 1,624,995 | |
Bank overdraft expense | | | 36 | |
| | | | |
Total expenses | | | 1,625,031 | |
Less: expenses waived and reimbursed by the Adviser (see Note B) | | | (187,158 | ) |
| | | | |
Net expenses | | | 1,437,873 | |
| | | | |
Net investment income | | | 5,705,771 | |
| | | | |
| Realized and Unrealized Gain (Loss) on Investment Transactions | | | | |
Net realized gain (loss) on: | |
Investment transactions | | | (2,409,854 | ) |
Swaps | | | 1,190,938 | |
Net change in unrealized appreciation/depreciation of: | | | | |
Investments | | | 2,965,693 | |
Swaps | | | (2,551,660 | ) |
| | | | |
Net loss on investment transactions | | | (804,883 | ) |
| | | | |
Net Increase in Net Assets from Operations | | $ | 4,900,888 | |
| | | | |
See notes to financial statements.
| | |
| |
| abfunds.com | | AB MUNICIPAL INCOME FUND II | 77 |
STATEMENT OF CHANGES IN NET ASSETS
| | | | | | | | |
| | | AB Arizona | |
| | | Year Ended
May 31,
2024 | | | Year Ended
May 31,
2023 | |
| Increase (Decrease) in Net Assets from Operations | | | | | | | | |
Net investment income | | $ | 2,642,281 | | | $ | 2,834,934 | |
Net realized gain (loss) on investment transactions | | | 570,727 | | | | (97,682 | ) |
Net change in unrealized appreciation (depreciation) of investments | | | (681,496 | ) | | | (4,312,158 | ) |
| | | | | | | | |
Net increase (decrease) in net assets from operations | | | 2,531,512 | | | | (1,574,906 | ) |
Distributions to Shareholders | |
Class A | | | (1,988,797 | ) | | | (2,453,678 | ) |
Class C | | | (52,679 | ) | | | (85,382 | ) |
Advisor Class | | | (399,473 | ) | | | (323,906 | ) |
Transactions in Shares of Beneficial Interest | | | | | | | | |
Net decrease | | | (12,185,252 | ) | | | (14,781,893 | ) |
| | | | | | | | |
Total decrease | | | (12,094,689 | ) | | | (19,219,765 | ) |
| Net Assets | |
Beginning of period | | | 92,510,212 | | | | 111,729,977 | |
| | | | | | | | |
End of period | | $ | 80,415,523 | | | $ | 92,510,212 | |
| | | | | | | | |
See notes to financial statements.
| | |
| |
78 | AB MUNICIPAL INCOME FUND II | | abfunds.com |
STATEMENT OF CHANGES IN NET ASSETS (continued)
| | | | | | | | |
| | | AB Massachusetts | |
| | | Year Ended
May 31,
2024 | | | Year Ended
May 31,
2023 | |
| Increase (Decrease) in Net Assets from Operations | | | | | | | | |
Net investment income | | $ | 6,807,802 | | | $ | 5,726,699 | |
Net realized gain (loss) on investment transactions | | | (2,214,538 | ) | | | 1,089,886 | |
Net change in unrealized appreciation (depreciation) of investments | | | 3,137,153 | | | | (8,428,052 | ) |
| | | | | | | | |
Net increase (decrease) in net assets from operations | | | 7,730,417 | | | | (1,611,467 | ) |
Distributions to Shareholders | |
Class A | | | (2,416,314 | ) | | | (2,606,046 | ) |
Class C | | | (108,793 | ) | | | (148,949 | ) |
Advisor Class | | | (4,308,545 | ) | | | (3,223,039 | ) |
Transactions in Shares of Beneficial Interest | | | | | | | | |
Net increase (decrease) | | | 28,195,590 | | | | (11,005,961 | ) |
| | | | | | | | |
Total increase (decrease) | | | 29,092,355 | | | | (18,595,462 | ) |
| Net Assets | |
Beginning of period | | | 203,566,725 | | | | 222,162,187 | |
| | | | | | | | |
End of period | | $ | 232,659,080 | | | $ | 203,566,725 | |
| | | | | | | | |
See notes to financial statements.
| | |
| |
| abfunds.com | | AB MUNICIPAL INCOME FUND II | 79 |
STATEMENT OF CHANGES IN NET ASSETS (continued)
| | | | | | | | |
| | | AB Minnesota | |
| | | Year Ended
May 31,
2024 | | | Year Ended
May 31,
2023 | |
| Increase (Decrease) in Net Assets from Operations | | | | | | | | |
Net investment income | | $ | 875,670 | | | $ | 965,581 | |
Net realized gain (loss) on investment transactions | | | (121,396 | ) | | | 186,735 | |
Net change in unrealized appreciation (depreciation) of investments | | | (165,379 | ) | | | (1,693,300 | ) |
| | | | | | | | |
Net increase (decrease) in net assets from operations | | | 588,895 | | | | (540,984 | ) |
Distributions to Shareholders | |
Class A | | | (730,761 | ) | | | (977,061 | ) |
Class C | | | (22,907 | ) | | | (41,726 | ) |
| Transactions in Shares of Beneficial Interest | | | | | | | | |
Net decrease | | | (4,897,025 | ) | | | (13,115,480 | ) |
| | | | | | | | |
Total decrease | | | (5,061,798 | ) | | | (14,675,251 | ) |
| Net Assets | |
Beginning of period | | | 35,673,440 | | | | 50,348,691 | |
| | | | | | | | |
End of period | | $ | 30,611,642 | | | $ | 35,673,440 | |
| | | | | | | | |
See notes to financial statements.
| | |
| |
80 | AB MUNICIPAL INCOME FUND II | | abfunds.com |
STATEMENT OF CHANGES IN NET ASSETS (continued)
| | | | | | | | |
| | | AB New Jersey | |
| | | Year Ended
May 31,
2024 | | | Year Ended
May 31,
2023 | |
| Increase (Decrease) in Net Assets from Operations | | | | | | | | |
Net investment income | | $ | 2,122,994 | | | $ | 1,875,610 | |
Net realized loss on investment transactions | | | (355,346 | ) | | | (103,870 | ) |
Net change in unrealized appreciation (depreciation) of investments | | | (79,113 | ) | | | (1,625,960 | ) |
| | | | | | | | |
Net increase in net assets from operations | | | 1,688,535 | | | | 145,780 | |
Distributions to Shareholders | |
Class A | | | (2,023,212 | ) | | | (1,907,453 | ) |
Class C | | | (32,493 | ) | | | (47,615 | ) |
| Transactions in Shares of Beneficial Interest | | | | | | | | |
Net increase (decrease) | | | 2,087,139 | | | | (995,078 | ) |
| | | | | | | | |
Total increase (decrease) | | | 1,719,969 | | | | (2,804,366 | ) |
| Net Assets | | | | | | | | |
Beginning of period | | | 61,552,758 | | | | 64,357,124 | |
| | | | | | | | |
End of period | | $ | 63,272,727 | | | $ | 61,552,758 | |
| | | | | | | | |
See notes to financial statements.
| | |
| |
| abfunds.com | | AB MUNICIPAL INCOME FUND II | 81 |
STATEMENT OF CHANGES IN NET ASSETS (continued)
| | | | | | | | |
| | | AB Ohio | |
| | | Year Ended
May 31,
2024 | | | Year Ended
May 31,
2023 | |
| Increase (Decrease) in Net Assets from Operations | | | | | | | | |
Net investment income | | $ | 1,449,654 | | | $ | 1,615,055 | |
Net realized loss on investment transactions | | | (768,636 | ) | | | (649,429 | ) |
Net change in unrealized appreciation (depreciation) of investments | | | 903,580 | | | | (1,786,894 | ) |
| | | | | | | | |
Net increase (decrease) in net assets from operations | | | 1,584,598 | | | | (821,268 | ) |
Distributions to Shareholders | |
Class A | | | (1,351,186 | ) | | | (1,609,700 | ) |
Class C | | | (33,003 | ) | | | (35,703 | ) |
| Transactions in Shares of Beneficial Interest | | | | | | | | |
Net decrease | | | (7,542,854 | ) | | | (19,645,557 | ) |
| | | | | | | | |
Total decrease | | | (7,342,445 | ) | | | (22,112,228 | ) |
| Net Assets | | | | | | | | |
Beginning of period | | | 51,102,967 | | | | 73,215,195 | |
| | | | | | | | |
End of period | | $ | 43,760,522 | | | $ | 51,102,967 | |
| | | | | | | | |
See notes to financial statements.
| | |
| |
82 | AB MUNICIPAL INCOME FUND II | | abfunds.com |
STATEMENT OF CHANGES IN NET ASSETS (continued)
| | | | | | | | |
| | | AB Pennsylvania | |
| | | Year Ended
May 31,
2024 | | | Year Ended
May 31,
2023 | |
| Increase (Decrease) in Net Assets from Operations | | | | | | | | |
Net investment income | | $ | 1,615,903 | | | $ | 1,518,588 | |
Net realized gain (loss) on investment transactions | | | 245,970 | | | | (988,352 | ) |
Net change in unrealized appreciation (depreciation) of investments | | | (644,345 | ) | | | (1,231,199 | ) |
| | | | | | | | |
Net increase (decrease) in net assets from operations | | | 1,217,528 | | | | (700,963 | ) |
Distributions to Shareholders | |
Class A | | | (1,499,825 | ) | | | (1,541,606 | ) |
Class C | | | (16,598 | ) | | | (21,648 | ) |
| Transactions in Shares of Beneficial Interest | | | | | | | | |
Net decrease | | | (3,633,524 | ) | | | (5,648,882 | ) |
| | | | | | | | |
Total decrease | | | (3,932,419 | ) | | | (7,913,099 | ) |
| Net Assets | | | | | | | | |
Beginning of period | | | 51,110,649 | | | | 59,023,748 | |
| | | | | | | | |
End of period | | $ | 47,178,230 | | | $ | 51,110,649 | |
| | | | | | | | |
See notes to financial statements.
| | |
| |
| abfunds.com | | AB MUNICIPAL INCOME FUND II | 83 |
STATEMENT OF CHANGES IN NET ASSETS (continued)
| | | | | | | | |
| | | AB Virginia | |
| | | Year Ended
May 31,
2024 | | | Year Ended
May 31,
2023 | |
| Increase (Decrease) in Net Assets from Operations | | | | | | | | |
Net investment income | | $ | 5,705,771 | | | $ | 5,255,709 | |
Net realized loss on investment transactions | | | (1,218,916 | ) | | | (1,665,130 | ) |
Net change in unrealized appreciation (depreciation) of investments | | | 414,033 | | | | (5,506,022 | ) |
| | | | | | | | |
Net increase (decrease) in net assets from operations | | | 4,900,888 | | | | (1,915,443 | ) |
Distributions to Shareholders | | | | | | | | |
Class A | | | (2,864,329 | ) | | | (3,091,853 | ) |
Class C | | | (113,702 | ) | | | (138,559 | ) |
Advisor Class | | | (2,402,647 | ) | | | (2,222,100 | ) |
Transactions in Shares of Beneficial Interest | | | | | | | | |
Net decrease | | | (15,794,931 | ) | | | (17,651,484 | ) |
| | | | | | | | |
Total decrease | | | (16,274,721 | ) | | | (25,019,439 | ) |
| Net Assets | | | | | | | | |
Beginning of period | | | 207,869,918 | | | | 232,889,357 | |
| | | | | | | | |
End of period | | $ | 191,595,197 | | | $ | 207,869,918 | |
| | | | | | | | |
See notes to financial statements.
| | |
| |
84 | AB MUNICIPAL INCOME FUND II | | abfunds.com |
NOTES TO FINANCIAL STATEMENTS
May 31, 2024
NOTE A
Significant Accounting Policies
AB Municipal Income Fund II (the “Fund”) which is a Massachusetts Business Trust, is registered under the Investment Company Act of 1940 (the “1940 Act”), as a diversified, open-end management investment company. The Fund operates as a series company currently comprised of seven portfolios: AB Arizona Portfolio, AB Massachusetts Portfolio, AB Minnesota Portfolio, AB New Jersey Portfolio, AB Ohio Portfolio, AB Pennsylvania Portfolio and AB Virginia Portfolio (the “Portfolios”). Each series is considered to be a separate entity for financial reporting and tax purposes. Each Portfolio offers Class A and Class C shares. Class B shares, Class T shares and Class Z shares have been authorized but currently are not offered. AB Arizona Portfolio, AB Massachusetts Portfolio and AB Virginia Portfolio offer Advisor Class shares. Advisor Class shares for AB Minnesota Portfolio, AB New Jersey Portfolio, AB Ohio Portfolio and AB Pennsylvania Portfolio have been authorized but currently are not offered. Class A shares are sold with a front-end sales charge of up to 3% for purchases up to $500,000; purchases of $500,000 or more are not subject to a sales charge. With respect to purchases of $500,000 or more, Class A shares redeemed within one year of purchase may be subject to a contingent deferred sales charge of 1%. Class C shares are subject to a contingent deferred sales charge of 1% on redemptions made within the first year after purchase, and 0% after the first year of purchase. Class C shares automatically convert to Class A shares eight years after the end of the calendar month of purchase. Advisor Class shares are sold without any initial or contingent deferred sales charge and are not subject to ongoing distribution expenses. All six classes of shares have identical voting, dividend, liquidation and other rights, except that the classes bear different distribution and transfer agency expenses. Each class has exclusive voting rights with respect to its distribution plan. The financial statements have been prepared in conformity with U.S. generally accepted accounting principles (“U.S. GAAP”), which require management to make certain estimates and assumptions that affect the reported amounts of assets and liabilities in the financial statements and amounts of income and expenses during the reporting period. Actual results could differ from those estimates. Each Portfolio is an investment company under U.S. GAAP and follows the accounting and reporting guidance applicable to investment companies. The following is a summary of significant accounting policies followed by the Portfolios.
1. Security Valuation
Portfolio securities are valued at market value determined on the basis of market quotations or, if market quotations are not readily available or are unreliable, at “fair value” as determined in accordance with procedures approved by and under the oversight of the Fund’s Board of Trustees (the
| | |
| |
| abfunds.com | | AB MUNICIPAL INCOME FUND II | 85 |
NOTES TO FINANCIAL STATEMENTS (continued)
“Board”). Pursuant to these procedures, AllianceBernstein L.P. (the “Adviser”) serves as the Portfolios’ valuation designee pursuant to Rule 2a-5 of the 1940 Act. In this capacity, the Adviser is responsible, among other things, for making all fair value determinations relating to the Portfolios’ portfolio investments, subject to the Board’s oversight.
In general, the market values of securities which are readily available and deemed reliable are determined as follows: securities listed on a national securities exchange (other than securities listed on the NASDAQ Stock Market, Inc. (“NASDAQ”)) or on a foreign securities exchange are valued at the last sale price at the close of the exchange or foreign securities exchange. If there has been no sale on such day, the securities are valued at the last traded price from the previous day. Securities listed on more than one exchange are valued by reference to the principal exchange on which the securities are traded; securities listed only on NASDAQ are valued in accordance with the NASDAQ Official Closing Price; listed or over the counter (“OTC”) market put or call options are valued at the mid level between the current bid and ask prices. If either a current bid or current ask price is unavailable, the Adviser will have discretion to determine the best valuation (e.g., last trade price in the case of listed options); open futures are valued using the closing settlement price or, in the absence of such a price, the most recent quoted bid price. If there are no quotations available for the day of valuation, the last available closing settlement price is used; U.S. Government securities and any other debt instruments having 60 days or less remaining until maturity are generally valued at market by an independent pricing vendor, if a market price is available. If a market price is not available, the securities are valued at amortized cost. This methodology is commonly used for short term securities that have an original maturity of 60 days or less, as well as short term securities that had an original term to maturity that exceeded 60 days. In instances when amortized cost is utilized, the Valuation Committee (the “Committee”) must reasonably conclude that the utilization of amortized cost is approximately the same as the fair value of the security. Factors the Committee will consider include, but are not limited to, an impairment of the creditworthiness of the issuer or material changes in interest rates. Fixed-income securities, including mortgage-backed and asset-backed securities, may be valued on the basis of prices provided by a pricing service or at a price obtained from one or more of the major broker-dealers. In cases where broker-dealer quotes are obtained, the Adviser may establish procedures whereby changes in market yields or spreads are used to adjust, on a daily basis, a recently obtained quoted price on a security. Swaps and other derivatives are valued daily, primarily using independent pricing services, independent pricing models using market inputs, as well as third party broker-dealers or counterparties. Open-end mutual funds are valued at the closing net asset value per share, while exchange-traded funds are valued at the closing market price per share.
| | |
| |
86 | AB MUNICIPAL INCOME FUND II | | abfunds.com |
NOTES TO FINANCIAL STATEMENTS (continued)
Securities for which market quotations are not readily available (including restricted securities) or are deemed unreliable are valued at fair value as deemed appropriate by the Adviser. Factors considered in making this determination may include, but are not limited to, information obtained by contacting the issuer, analysts, analysis of the issuer’s financial statements or other available documents. In addition, the Portfolios may use fair value pricing for securities primarily traded in non-U.S. markets because most foreign markets close well before the Portfolios value their securities at 4:00 p.m., Eastern Time. The earlier close of these foreign markets gives rise to the possibility that significant events, including broad market moves, may have occurred in the interim and may materially affect the value of those securities. To account for this, the Portfolios generally value many of their foreign equity securities using fair value prices based on third party vendor modeling tools to the extent available.
2. Fair Value Measurements
In accordance with U.S. GAAP regarding fair value measurements, fair value is defined as the price that the Portfolios would receive to sell an asset or pay to transfer a liability in an orderly transaction between market participants at the measurement date. U.S. GAAP establishes a framework for measuring fair value, and a three-level hierarchy for fair value measurements based upon the transparency of inputs to the valuation of an asset or liability (including those valued based on their market values as described in Note A.1 above). Inputs may be observable or unobservable and refer broadly to the assumptions that market participants would use in pricing the asset or liability. Observable inputs reflect the assumptions market participants would use in pricing the asset or liability based on market data obtained from sources independent of the Portfolios. Unobservable inputs reflect the Portfolios’ own assumptions about the assumptions that market participants would use in pricing the asset or liability based on the best information available in the circumstances. Each investment is assigned a level based upon the observability of the inputs which are significant to the overall valuation. The three-tier hierarchy of inputs is summarized below.
| | • | | Level 1—quoted prices in active markets for identical investments |
| | • | | Level 2—other significant observable inputs (including quoted prices for similar investments, interest rates, prepayment speeds, credit risk, etc.) |
| | • | | Level 3—significant unobservable inputs (including the Portfolios’ own assumptions in determining the fair value of investments) |
The fair value of debt instruments, such as bonds, and over-the-counter derivatives is generally based on market price quotations, recently executed market transactions (where observable) or industry recognized modeling techniques and are generally classified as Level 2. Pricing vendor
| | |
| |
| abfunds.com | | AB MUNICIPAL INCOME FUND II | 87 |
NOTES TO FINANCIAL STATEMENTS (continued)
inputs to Level 2 valuations may include quoted prices for similar investments in active markets, interest rate curves, coupon rates, currency rates, yield curves, option adjusted spreads, default rates, credit spreads and other unique security features in order to estimate the relevant cash flows which are then discounted to calculate fair values. If these inputs are unobservable and significant to the fair value, these investments will be classified as Level 3.
Other fixed income investments, including non-U.S. government and corporate debt, are generally valued using quoted market prices, if available, which are typically impacted by current interest rates, maturity dates and any perceived credit risk of the issuer. Additionally, in the absence of quoted market prices, these inputs are used by pricing vendors to derive a valuation based upon industry or proprietary models which incorporate issuer specific data with relevant yield/spread comparisons with more widely quoted bonds with similar key characteristics. Those investments for which there are observable inputs are classified as Level 2. Where the inputs are not observable, the investments are classified as Level 3.
The following tables summarize the valuation of the Portfolios’ investments by the above fair value hierarchy levels as of May 31, 2024:
| | | | | | | | | | | | | | | | |
| AB Arizona Portfolio | |
Investments in
Securities: | | Level 1 | | | Level 2 | | | Level 3 | | | Total | |
Assets: | |
Long-Term Municipal Bonds | | $ | – 0 | – | | $ | 79,192,898 | | | $ | 48,284 | | | $ | 79,241,182 | |
Commercial Mortgage-Backed Securities | | | – 0 | – | | | 895,119 | | | | – 0 | – | | | 895,119 | |
Asset-Backed Securities | | | – 0 | – | | | 211,251 | | | | – 0 | – | | | 211,251 | |
Preferred Stocks | | | – 0 | – | | | – 0 | – | | | 13,712 | | | | 13,712 | |
Short-Term Investments | | | 1,538,648 | | | | – 0 | – | | | – 0 | – | | | 1,538,648 | |
| | | | | | | | | | | | | | | | |
Total Investments in Securities | | | 1,538,648 | | | | 80,299,268 | | | | 61,996 | | | | 81,899,912 | |
Other Financial Instruments(a): | | | | | | | | | | | | | | | | |
Assets: | | | | | | | | | | | | | | | | |
Interest Rate Swaps | | | – 0 | – | | | 173,080 | | | | – 0 | – | | | 173,080 | |
Liabilities: | | | | | | | | | | | | | | | | |
Centrally Cleared Interest Rate Swaps | | | – 0 | – | | | (472,084 | ) | | | – 0 | – | | | (472,084 | )(b) |
| | | | | | | | | | | | | | | | |
Total | | $ | 1,538,648 | | | $ | 80,000,264 | | | $ | 61,996 | | | $ | 81,600,908 | |
| | | | | | | | | | | | | | | | |
| | |
| |
88 | AB MUNICIPAL INCOME FUND II | | abfunds.com |
NOTES TO FINANCIAL STATEMENTS (continued)
| | | | | | | | | | | | | | | | |
| AB Massachusetts Portfolio | |
| Investments in Securities: | | Level 1 | | | Level 2 | | | Level 3 | | | Total | |
Assets: | |
Long-Term Municipal Bonds | | $ | – 0 | – | | $ | 224,585,892 | | | $ | 89,558 | | | $ | 224,675,450 | |
Short-Term Municipal Notes | | | – 0 | – | | | 2,000,000 | | | | – 0 | – | | | 2,000,000 | |
Asset-Backed Securities | | | – 0 | – | | | 477,733 | | | | – 0 | – | | | 477,733 | |
Collateralized Mortgage Obligations | | | – 0 | – | | | 90,478 | | | | – 0 | – | | | 90,478 | |
Preferred Stocks | | | – 0 | – | | | – 0 | – | | | 25,436 | | | | 25,436 | |
Short-Term Investments | | | 338,267 | | | | – 0 | – | | | – 0 | – | | | 338,267 | |
| | | | | | | | | | | | | | | | |
Total Investments in Securities | | | 338,267 | | | | 227,154,103 | | | | 114,994 | | | | 227,607,364 | |
Other Financial Instruments(a): | | | | | | | | | | | | | | | | |
Assets: | | | | | | | | | | | | | | | | |
Centrally Cleared Inflation (CPI) Swaps | | | – 0 | – | | | 2,804,025 | | | | – 0 | – | | | 2,804,025 | (b) |
Centrally Cleared Interest Rate Swaps | | | – 0 | – | | | 484,929 | | | | – 0 | – | | | 484,929 | (b) |
Interest Rate Swaps | | | – 0 | – | | | 312,578 | | | | – 0 | – | | | 312,578 | |
Liabilities: | | | | | | | | | | | | | | | | |
Centrally Cleared Inflation (CPI) Swaps | | | – 0 | – | | | (679,036 | ) | | | – 0 | – | | | (679,036 | )(b) |
Centrally Cleared Interest Rate Swaps | | | – 0 | – | | | (103,024 | ) | | | – 0 | – | | | (103,024 | )(b) |
| | | | | | | | | | | | | | | | |
Total | | $ | 338,267 | | | $ | 229,973,575 | | | $ | 114,994 | | | $ | 230,426,836 | |
| | | | | | | | | | | | | | | | |
|
| AB Minnesota Portfolio | |
| Investments in Securities: | | Level 1 | | | Level 2 | | | Level 3 | | | Total | |
Assets: | |
Long-Term Municipal Bonds | | $ | – 0 | – | | $ | 29,041,506 | | | $ | – 0 | – | | $ | 29,041,506 | |
Short-Term Investments | | | 925,927 | | | | – 0 | – | | | – 0 | – | | | 925,927 | |
| | | | | | | | | | | | | | | | |
Total Investments in Securities | | | 925,927 | | | | 29,041,506 | | | | – 0 | – | | | 29,967,433 | |
Other Financial Instruments(a): | | | | | | | | | | | | | | | | |
Assets: | | | | | | | | | | | | | | | | |
Centrally Cleared Inflation (CPI) Swaps | | | – 0 | – | | | 757,139 | | | | – 0 | – | | | 757,139 | (b) |
Centrally Cleared Interest Rate Swaps | | | – 0 | – | | | 3,097 | | | | – 0 | – | | | 3,097 | (b) |
Interest Rate Swaps | | | – 0 | – | | | 86,282 | | | | – 0 | – | | | 86,282 | |
Liabilities: | | | | | | | | | | | | | | | | |
Centrally Cleared Inflation (CPI) Swaps | | | – 0 | – | | | (181,429 | ) | | | – 0 | – | | | (181,429 | )(b) |
Centrally Cleared Interest Rate Swaps | | | – 0 | – | | | (313,961 | ) | | | – 0 | – | | | (313,961 | )(b) |
| | | | | | | | | | | | | | | | |
Total | | $ | 925,927 | | | $ | 29,392,634 | | | $ | – 0 | – | | $ | 30,318,561 | |
| | | | | | | | | | | | | | | | |
| | |
| |
| abfunds.com | | AB MUNICIPAL INCOME FUND II | 89 |
NOTES TO FINANCIAL STATEMENTS (continued)
| | | | | | | | | | | | | | | | |
| AB New Jersey Portfolio | |
Investments in
Securities: | | Level 1 | | | Level 2 | | | Level 3 | | | Total | |
Assets: | |
Long-Term Municipal Bonds | | $ | – 0 | – | | $ | 65,327,187 | | | $ | 44,913 | | | $ | 65,372,100 | |
Asset-Backed Securities | | | – 0 | – | | | 119,604 | | | | – 0 | – | | | 119,604 | |
Corporates—Non-Investment Grade | | | – 0 | – | | | – 0 | – | | | 17,500 | | | | 17,500 | |
Preferred Stocks | | | – 0 | – | | | – 0 | – | | | 11,943 | | | | 11,943 | |
Short-Term Investments | | | 883,573 | | | | – 0 | – | | | – 0 | – | | | 883,573 | |
| | | | | | | | | | | | | | | | |
Total Investments in Securities | | | 883,573 | | | | 65,446,791 | | | | 74,356 | | | | 66,404,720 | |
Other Financial Instruments(a): | | | | | | | | | | | | | | | | |
Assets: | | | | | | | | | | | | | | | | |
Centrally Cleared Inflation (CPI) Swaps | | | – 0 | – | | | 1,022,030 | | | | – 0 | – | | | 1,022,030 | (b) |
Centrally Cleared Interest Rate Swaps | | | – 0 | – | | | 11,932 | | | | – 0 | – | | | 11,932 | (b) |
Interest Rate Swaps | | | – 0 | – | | | 127,614 | | | | – 0 | – | | | 127,614 | |
Liabilities: | | | | | | | | | | | | | | | | |
Centrally Cleared Inflation (CPI) Swaps | | | – 0 | – | | | (195,799 | ) | | | – 0 | – | | | (195,799 | )(b) |
Centrally Cleared Interest Rate Swaps | | | – 0 | – | | | (177,050 | ) | | | – 0 | – | | | (177,050 | )(b) |
| | | | | | | | | | | | | | | | |
Total | | $ | 883,573 | | | $ | 66,235,518 | | | $ | 74,356 | | | $ | 67,193,447 | |
| | | | | | | | | | | | | | | | |
|
| AB Ohio Portfolio | |
Investments in
Securities: | | Level 1 | | | Level 2 | | | Level 3 | | | Total | |
Assets: | |
Long-Term Municipal Bonds | | $ | – 0 | – | | $ | 42,545,407 | | | $ | 35,823 | | | $ | 42,581,230 | |
Asset-Backed Securities | | | – 0 | – | | | 195,001 | | | | – 0 | – | | | 195,001 | |
Preferred Stocks | | | – 0 | – | | | – 0 | – | | | 10,173 | | | | 10,173 | |
Corporates—Non-Investment Grade | | | – 0 | – | | | – 0 | – | | | 10,000 | | | | 10,000 | |
| | | | | | | | | | | | | | | | |
Total Investments in Securities | | | – 0 | – | | | 42,740,408 | | | | 55,996 | | | | 42,796,404 | |
Other Financial Instruments(a): | | | | | | | | | | | | | | | | |
Assets: | | | | | | | | | | | | | | | | |
Interest Rate Swaps | | | – 0 | – | | | 121,414 | | | | – 0 | – | | | 121,414 | |
Liabilities: | | | | | | | | | | | | | | | | |
Centrally Cleared Interest Rate Swaps | | | – 0 | – | | | (131,315 | ) | | | – 0 | – | | | (131,315 | )(b) |
| | | | | | | | | | | | | | | | |
Total | | $ | – 0 | – | | $ | 42,730,507 | | | $ | 55,996 | | | $ | 42,786,503 | |
| | | | | | | | | | | | | | | | |
| | |
| |
90 | AB MUNICIPAL INCOME FUND II | | abfunds.com |
NOTES TO FINANCIAL STATEMENTS (continued)
| | | | | | | | | | | | | | | | |
| AB Pennsylvania Portfolio | |
Investments in
Securities: | | Level 1 | | | Level 2 | | | Level 3 | | | Total | |
Assets: | |
Long-Term Municipal Bonds | | $ | – 0 | – | | $ | 46,607,324 | | | $ | 35,044 | | | $ | 46,642,368 | |
Preferred Stocks | | | – 0 | – | | | – 0 | – | | | 9,952 | | | | 9,952 | |
Short-Term Investments | | | 611,032 | | | | – 0 | – | | | – 0 | – | | | 611,032 | |
| | | | | | | | | | | | | | | | |
Total Investments in Securities | | | 611,032 | | | | 46,607,324 | | | | 44,996 | | | | 47,263,352 | |
Other Financial Instruments(a): | | | | | | | | | | | | | | | | |
Assets: | | | | | | | | | | | | | | | | |
Centrally Cleared Interest Rate Swaps | | | – 0 | – | | | 7,159 | | | | – 0 | – | | | 7,159 | (b) |
Interest Rate Swaps | | | – 0 | – | | | 117,798 | | | | – 0 | – | | | 117,798 | |
Liabilities: | | | | | | | | | | | | | | | | |
Centrally Cleared Interest Rate Swaps | | | – 0 | – | | | (228,163 | ) | | | – 0 | – | | | (228,163 | )(b) |
| | | | | | | | | | | | | | | | |
Total | | $ | 611,032 | | | $ | 46,504,118 | | | $ | 44,996 | | | $ | 47,160,146 | |
| | | | | | | | | | | | | | | | |
|
| AB Virginia Portfolio | |
Investments in
Securities: | | Level 1 | | | Level 2 | | | Level 3 | | | Total | |
Assets: | |
Long-Term Municipal Bonds | | $ | – 0 | – | | $ | 182,297,518 | | | $ | 86,442 | (c) | | $ | 182,383,960 | |
Short-Term Municipal Notes | | | – 0 | – | | | 2,310,000 | | | | – 0 | – | | | 2,310,000 | |
Asset-Backed Securities | | | – 0 | – | | | 505,570 | | | | – 0 | – | | | 505,570 | |
Preferred Stocks | | | – 0 | – | | | – 0 | – | | | 24,552 | | | | 24,552 | |
Short-Term Investments | | | 5,009,549 | | | | – 0 | – | | | – 0 | – | | | 5,009,549 | |
| | | | | | | | | | | | | | | | |
Total Investments in Securities | | | 5,009,549 | | | | 185,113,088 | | | | 110,994 | (c) | | | 190,233,631 | |
Other Financial Instruments(a): | | | | | | | | | | | | | | | | |
Assets: | | | | | | | | | | | | | | | | |
Centrally Cleared Interest Rate Swaps | | | – 0 | – | | | 64,925 | | | | – 0 | – | | | 64,925 | (b) |
Interest Rate Swaps | | | – 0 | – | | | 306,378 | | | | – 0 | – | | | 306,378 | |
Liabilities: | | | | | | | | | | | | | | | | |
Centrally Cleared Interest Rate Swaps | | | – 0 | – | | | (616,267 | ) | | | – 0 | – | | | (616,267 | )(b) |
| | | | | | | | | | | | | | | | |
Total | | $ | 5,009,549 | | | $ | 184,868,124 | | | $ | 110,994 | (c) | | $ | 189,988,667 | |
| | | | | | | | | | | | | | | | |
| | |
| |
| abfunds.com | | AB MUNICIPAL INCOME FUND II | 91 |
NOTES TO FINANCIAL STATEMENTS (continued)
| (a) | Other financial instruments include reverse repurchase agreements and derivative instruments, such as futures, forwards and swaps. Derivative instruments are valued at the unrealized appreciation (depreciation) on the instrument. Other financial instruments may also include swaps with upfront premiums, written options and written swaptions which are valued at market value. |
| (b) | Only variation margin receivable (payable) at period end is reported within the statement of assets and liabilities. This amount reflects cumulative unrealized appreciation (depreciation) on futures and centrally cleared swaps as reported in the portfolio of investments. Where applicable, centrally cleared swaps with upfront premiums are presented here at market value. |
| (c) | The Fund held securities with zero market value at period end. |
3. Taxes
It is each Portfolio’s policy to meet the requirements of the Internal Revenue Code applicable to regulated investment companies and to distribute all of its investment company taxable income and net realized gains, if any, to shareholders. Therefore, no provisions for federal income or excise taxes are required. The Portfolios have a tax year-end of November 30 concurrent with the filing of the Portfolios’ tax returns.
In accordance with U.S. GAAP requirements regarding accounting for uncertainties in income taxes, management has analyzed the Portfolios’ tax positions taken or expected to be taken on federal and state income tax returns for all open tax years (the current and the prior three tax years) and has concluded that no provision for income tax is required in the Portfolios’ financial statements.
4. Investment Income and Investment Transactions
Dividend income is recorded on the ex-dividend date or as soon as the Portfolios are informed of the dividend. Interest income is accrued daily. Investment transactions are accounted for on the date the securities are purchased or sold. Investment gains or losses are determined on the identified cost basis. Non-cash dividends, if any, are recorded on the ex-dividend date at the fair value of the securities received. The Portfolios amortize premiums and accrete original issue and market discounts as adjustments to interest income. The Portfolio accounts for distributions received from real estate investment trust (“REIT”) investments or from regulated investment companies as dividend income, realized gain, or return of capital based on information provided by the REIT or the investment company.
5. Class Allocations
All income earned and expenses incurred by the Portfolios are borne on a pro-rata basis by each settled class of shares, based on the proportionate interest in each Portfolio represented by the net assets of such class, except for class specific expenses which are allocated to the respective class. Expenses of the Fund are charged proportionately to the Portfolios or based on other appropriate methods. Realized and unrealized gains and
| | |
| |
92 | AB MUNICIPAL INCOME FUND II | | abfunds.com |
NOTES TO FINANCIAL STATEMENTS (continued)
losses are allocated among the various share classes based on respective net assets.
6. Dividends and Distributions
Dividends and distributions to shareholders, if any, are recorded on the ex-dividend date. Income dividends and capital gains distributions are determined in accordance with federal tax regulations and may differ from those determined in accordance with U.S. GAAP. To the extent these differences are permanent, such amounts are reclassified within the capital accounts based on their federal tax basis treatment; temporary differences do not require such reclassification.
7. Cash and Short-Term Investments
Cash and short-term investments include cash on hand and short-term investments with maturities of less than one year when purchased.
NOTE B
Advisory Fee and Other Transactions with Affiliates
Under the terms of the investment advisory agreement, each Portfolio pays the Adviser an advisory fee at an annual rate of .45% of the first $2.5 billion, .40% of the next $2.5 billion and .35% in excess of $5 billion, of each Portfolio’s average daily net assets. Such fee is accrued daily and paid monthly.
The Adviser has agreed to waive its fees and bear certain expenses to the extent necessary to limit the total portfolio operating expenses as a percentage of daily average net assets on an annual basis (the “Expense Caps”) as follows:
| | | | | | | | | | | | |
| Portfolio | | Class A | | | Class C | | | Advisor Class | |
AB Arizona | | | .78% | | | | 1.53% | | | | .53% | |
AB Massachusetts | | | .77% | | | | 1.52% | | | | .52% | |
AB Minnesota | | | .85% | | | | 1.60% | | | | N/A | |
AB New Jersey | | | .82% | | | | 1.57% | | | | N/A | |
AB Ohio | | | .80% | | | | 1.55% | | | | N/A | |
AB Pennsylvania | | | .85% | | | | 1.60% | | | | N/A | |
AB Virginia | | | .80% | | | | 1.55% | | | | .55% | |
The Expense Caps will extend through September 30, 2024 and then may be extended by the Adviser for additional one year terms. For the year ended May 31, 2024, such reimbursements/waivers amounted to $255,811, $257,065, $156,986, $239,289, $180,475, $166,755 and $183,193 for AB Arizona Portfolio, AB Massachusetts Portfolio, AB Minnesota Portfolio, AB New Jersey Portfolio, AB Ohio Portfolio, AB Pennsylvania Portfolio and AB Virginia Portfolio, respectively.
| | |
| |
| abfunds.com | | AB MUNICIPAL INCOME FUND II | 93 |
NOTES TO FINANCIAL STATEMENTS (continued)
Pursuant to the investment advisory agreement, each Portfolio may reimburse the Adviser for certain legal and accounting services provided to each Portfolio by the Adviser. For the year ended May 31, 2024, the reimbursement for such services amounted to $70,120, $77,228, $74,511 and $77,870 for AB Arizona Portfolio, AB Massachusetts Portfolio, AB New Jersey Portfolio and AB Virginia Portfolio, respectively.
For the year ended May 31, 2024, the Adviser voluntarily agreed to waive such fees in the amount of $79,569, $79,569 and $80,751 for AB Minnesota Portfolio, AB Ohio Portfolio and AB Pennsylvania Portfolio, respectively.
The Portfolios compensate AllianceBernstein Investor Services, Inc. (“ABIS”), a wholly-owned subsidiary of the Adviser, under a Transfer Agency Agreement for providing personnel and facilities to perform transfer agency services for the Portfolios. ABIS may make payments to intermediaries that provide omnibus account services, sub-accounting services and/or networking services. For the year ended May 31, 2024, such compensation retained by ABIS amounted to: $17,981, $23,586, $17,806, $18,020, $17,995, $18,000 and $19,842 for AB Arizona Portfolio, AB Massachusetts Portfolio, AB Minnesota Portfolio, AB New Jersey Portfolio, AB Ohio Portfolio, AB Pennsylvania Portfolio and AB Virginia Portfolio, respectively.
AllianceBernstein Investments, Inc. (the “Distributor”), a wholly-owned subsidiary of the Adviser, serves as the distributor of the Portfolios’ shares. The Distributor has advised the Portfolios that it has retained front-end sales charges from the sale of Class A shares and received contingent deferred sales charges imposed upon redemptions by shareholders of Class A and Class C shares for each Portfolio for the year ended May 31, 2024, as follows:
| | | | | | | | | | | | |
| | | Front-End Sales
Charges | | | Contingent Deferred Sales
Charges | |
| Portfolio | | Class A | | | Class A | | | Class C | |
AB Arizona | | $ | 18 | | | $ | – 0 | – | | $ | – 0 | – |
AB Massachusetts | | | – 0 | – | | | 4,230 | | | | 1,191 | |
AB Minnesota | | | – 0 | – | | | – 0 | – | | | 129 | |
AB New Jersey | | | 29 | | | | – 0 | – | | | 6 | |
AB Ohio | | | – 0 | – | | | – 0 | – | | | 59 | |
AB Pennsylvania | | | 57 | | | | – 0 | – | | | – 0 | – |
AB Virginia | | | 18 | | | | – 0 | – | | | 77 | |
The Portfolios may invest in AB Government Money Market Portfolio (the “Government Money Market Portfolio”) which has a contractual annual advisory fee rate of .20% of the portfolio’s average daily net assets and bears its own expenses. The Adviser had contractually agreed to waive .10% of the advisory fee of Government Money Market Portfolio (resulting in a net advisory fee of .10%) until August 31, 2023. Effective
| | |
| |
94 | AB MUNICIPAL INCOME FUND II | | abfunds.com |
NOTES TO FINANCIAL STATEMENTS (continued)
September 1, 2023, the Adviser has contractually agreed to waive .05% of the advisory fee of Government Money Market Portfolio (resulting in a net advisory fee of .15%) until August 31, 2024. In connection with the investment by the Portfolios in Government Money Market Portfolio, the Adviser has contractually agreed to waive its advisory fee from the Portfolios in an amount equal to each Portfolio’s pro rata share of the effective advisory fee of Government Money Market Portfolio, as borne indirectly by the Portfolios as an acquired fund fee and expense. For the year ended May 31, 2024, such waiver amounted to:
| | | | | | | | | | |
| Portfolio | | Amount | | | Portfolio | | Amount | |
Arizona | | $ | 1,097 | | | Ohio | | $ | 881 | |
Massachusetts | | | 7,371 | | | Pennsylvania | | | 1,067 | |
Minnesota | | | 561 | | | Virginia | | | 3,965 | |
New Jersey | | | 1,668 | | | | | | | |
A summary of the Portfolios’ transactions in the Government Money Market Portfolio for the year ended May 31, 2024 is as follows:
| | | | | | | | | | | | | | | | | | | | |
| Portfolio | | Market
Value 5/31/23 (000) | | | Purchases at Cost (000) | | | Sales Proceeds (000) | | | Market
Value 5/31/24 (000) | | | Dividend Income (000) | |
AB Arizona | | $ | 366 | | | $ | 15,144 | | | $ | 13,971 | | | $ | 1,539 | | | $ | 41 | |
AB Massachusetts | | | 288 | | | | 100,422 | | | | 100,372 | | | | 338 | | | | 274 | |
AB Minnesota | | | 813 | | | | 6,802 | | | | 6,689 | | | | 926 | | | | 22 | |
AB New Jersey | | | 2,657 | | | | 17,487 | | | | 19,260 | | | | 884 | | | | 69 | |
AB Ohio | | | 373 | | | | 15,670 | | | | 16,043 | | | | – 0 | – | | | 34 | |
AB Pennsylvania | | | 1,301 | | | | 10,924 | | | | 11,614 | | | | 611 | | | | 41 | |
AB Virginia | | | 5,178 | | | | 41,226 | | | | 41,394 | | | | 5,010 | | | | 163 | |
NOTE C
Distribution Services Agreement
The Portfolios have adopted a Distribution Services Agreement (the “Agreement”) pursuant to Rule 12b-1 under the 1940 Act. Under the Agreement, the Portfolios pay distribution and servicing fees to the Distributor at an annual rate of up to .30% of the Portfolios’ average daily net assets attributable to Class A shares and 1% of the Portfolios’ average daily net assets attributable to Class C shares. Payments under the Agreement in respect of Class A shares are currently limited to an annual rate of .25% of Class A shares’ average daily net assets. There are no distribution and servicing fees on the Advisor Class shares. The fees are accrued daily and paid monthly. The Agreement provides that the Distributor will use such payments in their entirety for distribution assistance and promotional activities. Since the commencement of the Portfolios’
| | |
| |
| abfunds.com | | AB MUNICIPAL INCOME FUND II | 95 |
NOTES TO FINANCIAL STATEMENTS (continued)
operations, the distributor has incurred expenses in excess of the distribution costs reimbursed by each Portfolio as follows:
| | | | |
Portfolio | | Class C | |
AB Arizona | | $ | 2,283,635 | |
AB Massachusetts | | | 4,177,151 | |
AB Minnesota | | | 2,873,961 | |
AB New Jersey | | | 3,846,753 | |
AB Ohio | | | 4,087,464 | |
AB Pennsylvania | | | 3,606,501 | |
AB Virginia | | | 3,517,389 | |
While such costs may be recovered from the Portfolios in future periods so long as the Agreement is in effect, the rate of the distribution and servicing fees payable under the Agreement may not be increased without a shareholder vote. In accordance with the Agreement, there is no provision for recovery of unreimbursed distribution costs incurred by the Distributor beyond the current fiscal year for Class A shares. The Agreement also provides that the Adviser may use its own resources to finance the distribution of the Portfolios’ shares.
NOTE D
Investment Transactions
Purchases and sales of investment securities (excluding short-term investments) for the year ended May 31, 2024, were as follows:
| | | | | | | | | | | | | | | | |
| | | Purchases | | | Sales | |
Portfolio | | Investments | | | Government
Securities | | | Investments | | | Government
Securities | |
AB Arizona | | $ | 4,055,316 | | | $ | – 0 | – | | $ | 10,050,558 | | | $ | – 0 | – |
AB Massachusetts | | | 63,702,729 | | | | – 0 | – | | | 30,198,224 | | | | – 0 | – |
AB Minnesota | | | 1,194,676 | | | | – 0 | – | | | 5,068,458 | | | | – 0 | – |
AB New Jersey | | | 13,434,179 | | | | – 0 | – | | | 8,558,806 | | | | – 0 | – |
AB Ohio | | | 7,289,383 | | | | – 0 | – | | | 15,860,056 | | | | – 0 | – |
AB Pennsylvania | | | 9,305,838 | | | | – 0 | – | | | 10,343,789 | | | | – 0 | – |
AB Virginia | | | 28,337,601 | | | | – 0 | – | | | 32,507,964 | | | | – 0 | – |
As of May 31, 2024, the cost of investments for federal income tax purposes, gross unrealized appreciation and unrealized depreciation are as follows:
| | | | | | | | | | | | | | | | |
| | | | | | Gross Unrealized | | | Net
Unrealized
Depreciation | |
Portfolio | | Cost | | | Appreciation | | | (Depreciation) | |
AB Arizona | | $ | 87,159,456 | | | $ | 627,815 | | | $ | (6,033,023 | ) | | $ | (5,405,208 | ) |
AB Massachusetts | | | 235,950,520 | | | | 4,888,892 | | | | (10,524,771 | ) | | | (5,635,879 | ) |
AB Minnesota | | | 31,625,078 | | | | 931,834 | | | | (2,163,546 | ) | | | (1,231,712 | ) |
AB New Jersey | | | 67,371,276 | | | | 1,838,408 | | | | (1,989,395 | ) | | | (150,987 | ) |
AB Ohio | | | 44,981,992 | | | | 279,408 | | | | (2,433,783 | ) | | | (2,154,375 | ) |
AB Pennsylvania | | | 48,599,799 | | | | 525,160 | | | | (1,916,071 | ) | | | (1,390,911 | ) |
AB Virginia | | | 197,793,940 | | | | 1,975,540 | | | | (9,640,042 | ) | | | (7,664,502 | ) |
| | |
| |
96 | AB MUNICIPAL INCOME FUND II | | abfunds.com |
NOTES TO FINANCIAL STATEMENTS (continued)
1. Derivative Financial Instruments
Each Portfolio may use derivatives in an effort to earn income and enhance returns, to replace more traditional direct investments, to obtain exposure to otherwise inaccessible markets (collectively, “investment purposes”), or to hedge or adjust the risk profile of its portfolio.
The principal type of derivative utilized by the Portfolios, as well as the methods in which they may be used are:
Each Portfolio may enter into swaps for investment purposes or to hedge its exposure to interest rates or credit risk. A swap is an agreement that obligates two parties to exchange a series of cash flows at specified intervals based upon or calculated by reference to changes in specified prices, rates or indexes for a specified amount of an underlying asset or inflation. The payment flows are usually netted against each other, with the difference being paid by one party to the other. In addition, collateral may be pledged or received by the Portfolios in accordance with the terms of the respective swaps to provide value and recourse to the Portfolios or their counterparties in the event of default, bankruptcy or insolvency by one of the parties to the swap.
Risks may arise as a result of the failure of the counterparty to the swap to comply with the terms of the swap. The loss incurred by the failure of a counterparty is generally limited to the net interim payment to be received by the Portfolio, and/or the termination value at the end of the contract. Therefore, the Portfolio considers the creditworthiness of each counterparty to a swap in evaluating potential counterparty risk. This risk is mitigated by having a netting arrangement between the Portfolio and the counterparty and by the posting of collateral by the counterparty to the Portfolio to cover the Portfolios’ exposure to the counterparty. Additionally, risks may arise from unanticipated movements in interest rates, inflation or in the value of the underlying securities. The Portfolio accrues for the interim payments on swaps on a daily basis, with the net amount recorded within unrealized appreciation/(depreciation) of swaps on the statement of assets and liabilities, where applicable. Once the interim payments are settled in cash, the net amount is recorded as realized gain/(loss) on swaps on the statement of operations, in addition to any realized gain/(loss) recorded upon the termination of swaps. Upfront premiums paid or received for swaps are recognized as cost or proceeds on the statement of assets and liabilities and are amortized on a straight line basis over the life of the contract. Amortized upfront premiums are included in net realized gain/(loss) from swaps on the statement of operations. Fluctuations in the value of swaps are recorded as a
| | |
| |
| abfunds.com | | AB MUNICIPAL INCOME FUND II | 97 |
NOTES TO FINANCIAL STATEMENTS (continued)
component of net change in unrealized appreciation/depreciation of swaps on the statement of operations.
Certain standardized swaps, including certain interest rate swaps and credit default swaps, are subject to mandatory central clearing. Cleared swaps are transacted through futures commission merchants (“FCMs”) that are members of central clearinghouses, with the clearinghouse serving as central counterparty, similar to transactions in futures contracts. Centralized clearing will be required for additional categories of swaps on a phased-in basis based on requirements published by the Securities and Exchange Commission and Commodity Futures Trading Commission.
At the time the Portfolios enter into a centrally cleared swap, each Portfolio deposits with the broker or segregates at its custodian cash or securities as collateral to satisfy initial margin requirements set by the clearinghouse on which the transaction is effected. Pursuant to the contract, with respect to cash collateral, the Portfolios agree to receive from or pay to the broker an amount of cash equal to the daily fluctuation in the value of the contract; in the case of securities collateral, the Portfolios agree to adjust the securities position held in the segregated account accordingly. Such receipts, payments or adjustments are known as variation margin and are recorded by the Portfolios as unrealized gains or losses. Risks may arise from the potential inability of a counterparty to meet the terms of the contract. The credit/counterparty risk for centrally cleared swaps is generally less than non-centrally cleared swaps, since the clearinghouse, which is the issuer or counterparty to each centrally cleared swap, has robust risk mitigation standards, including the requirement to provide initial and variation margin. When the contract is closed, the Portfolios record a realized gain or loss equal to the difference between the value of the contract at the time it was opened and the time it was closed.
Interest Rate Swaps:
Each Portfolio is subject to interest rate risk exposure in the normal course of pursuing its investment objectives. Because the Portfolios hold fixed rate bonds, the value of these bonds may decrease if interest rates rise. To help hedge against this risk and to maintain its ability to generate income at prevailing market rates, the Portfolios may enter into interest rate swaps. Interest rate swaps are agreements between two parties to exchange cash flows based on a notional amount. The Portfolios may elect to pay a fixed rate and receive a floating rate, or, receive a fixed rate and pay a floating rate on a notional amount.
| | |
| |
98 | AB MUNICIPAL INCOME FUND II | | abfunds.com |
NOTES TO FINANCIAL STATEMENTS (continued)
In addition, the Portfolios may also enter into interest rate swap transactions to preserve a return or spread on a particular investment or portion of its portfolio, or protecting against an increase in the price of securities the Portfolios anticipate purchasing at a later date. Interest rate swaps involve the exchange by the Portfolio with another party of their respective commitments to pay or receive interest (e.g., an exchange of floating rate payments for fixed rate payments) computed based on a contractually-based principal (or “notional”) amount. Interest rate swaps are entered into on a net basis (i.e., the two payment streams are netted out, with the Portfolios receiving or paying, as the case may be, only the net amount of the two payments).
During the year ended May 31, 2024, the Portfolios held interest rate swaps for hedging purposes.
Inflation (CPI) Swaps:
Inflation swap agreements are contracts in which one party agrees to pay the cumulative percentage increase in a price index (the Consumer Price Index with respect to CPI swaps) over the term of the swap (with some lag on the inflation index), and the other pays a compounded fixed rate. Inflation swaps may be used to protect the net asset value, or NAV, of a Portfolio against an unexpected change in the rate of inflation measured by an inflation index since the value of these agreements is expected to increase if there are unexpected inflation increases.
During the year ended May 31, 2024, the AB Arizona Portfolio, AB Massachusetts Portfolio, AB Minnesota Portfolio, AB New Jersey Portfolio, AB Pennsylvania Portfolio and AB Virginia Portfolio held inflation (CPI) swaps for hedging purposes.
The Portfolios typically enter into International Swaps and Derivatives Association, Inc. Master Agreements (“ISDA Master Agreement”) with its OTC derivative contract counterparties in order to, among other things, reduce its credit risk to OTC counterparties. ISDA Master Agreements include provisions for general obligations, representations, collateral and events of default or termination. Under an ISDA Master Agreement, the Portfolios typically may offset with the OTC counterparty certain derivative financial instruments’ payables and/or receivables with collateral held and/or posted and create one single net payment (close-out netting) in the event of default or termination. In the event of a default by an OTC counterparty, the return of collateral with market value in excess of the Portfolios’ net liability, held by the defaulting party, may be delayed or denied.
The Portfolios’ ISDA Master Agreements may contain provisions for early termination of OTC derivative transactions in the event the net assets of the
| | |
| |
| abfunds.com | | AB MUNICIPAL INCOME FUND II | 99 |
NOTES TO FINANCIAL STATEMENTS (continued)
Portfolios decline below specific levels (“net asset contingent features”). If these levels are triggered, the Portfolios’ OTC counterparty has the right to terminate such transaction and require the Portfolios to pay or receive a settlement amount in connection with the terminated transaction. If OTC derivatives were held at period end, please refer to netting arrangements by the OTC counterparty tables below for additional details.
During the year ended May 31, 2024, the Portfolios had entered into the following derivatives:
| | | | | | | | | | | | |
| AB Arizona Portfolio | | | | | | |
| | | Asset Derivatives | | | Liability Derivatives | |
Derivative Type | | Statement of
Assets and
Liabilities
Location | | Fair Value | | | Statement of
Assets and
Liabilities
Location | | Fair Value | |
Interest rate contracts | | | | | | | | Payable for variation margin on centrally cleared swaps | | $ | 472,333 | * |
| | | | |
Interest rate contracts | | Unrealized appreciation on interest rate swaps | | $ | 173,080 | | | | | | | |
| | | | | | | | | | | | |
Total | | | | $ | 173,080 | | | | | $ | 472,333 | |
| | | | | | | | | | | | |
| * | Only variation margin receivable/payable at period end is reported within the statement of assets and liabilities. This amount reflects cumulative unrealized appreciation (depreciation) on futures and centrally cleared swaps as reported in the portfolio of investments. |
| | | | | | | | | | |
Derivative Type | | Location of
Gain or (Loss)
on Derivatives
Within Statement
of Operations | | Realized Gain
or (Loss) on
Derivatives | | | Change in
Unrealized
Appreciation or
(Depreciation) | |
Interest rate contracts | | Net realized gain (loss) on swaps; Net change in unrealized appreciation (depreciation) of swaps | | $ | 955,006 | | | $ | (1,541,894 | ) |
| | | | | | | | | | |
Total | | | | $ | 955,006 | | | $ | (1,541,894 | ) |
| | | | | | | | | | |
| | |
| |
100 | AB MUNICIPAL INCOME FUND II | | abfunds.com |
NOTES TO FINANCIAL STATEMENTS (continued)
| | | | | | | | | | | | |
| AB Massachusetts Portfolio | | | | | | |
| | | Asset Derivatives | | | Liability Derivatives | |
Derivative Type | | Statement of
Assets and
Liabilities
Location. | | Fair Value | | | Statement of
Assets and
Liabilities
Location | | Fair Value | |
Interest rate contracts | | Receivable for variation margin on centrally cleared swaps | | $ | 3,288,954 | * | | Payable for variation margin on centrally cleared swaps | | $ | 781,370 | * |
| | | | |
Interest rate contracts | | Unrealized appreciation on interest rate swaps | | | 312,578 | | | | | | | |
| | | | | | | | | | | | |
Total | | | | $ | 3,601,532 | | | | | $ | 781,370 | |
| | | | | | | | | | | | |
| * | Only variation margin receivable/payable at period end is reported within the statement of assets and liabilities. This amount reflects cumulative unrealized appreciation (depreciation) on futures and centrally cleared swaps as reported in the portfolio of investments. |
| | | | | | | | | | |
Derivative Type | | Location of
Gain or (Loss)
on Derivatives
Within Statement
of Operations | | Realized Gain
or (Loss) on
Derivatives | | | Change in
Unrealized
Appreciation or
(Depreciation) | |
Interest rate contracts | | Net realized gain (loss) on swaps; Net change in unrealized appreciation (depreciation) of swaps | | $ | 60,155 | | | $ | (241,162 | ) |
| | | | | | | | | | |
Total | | | | $ | 60,155 | | | $ | (241,162 | ) |
| | | | | | | | | | |
| | | | | | | | | | | | |
| AB Minnesota Portfolio | | | | | | |
| | | Asset Derivatives | | | Liability Derivatives | |
Derivative Type | | Statement of
Assets and
Liabilities
Location | | Fair Value | | | Statement of
Assets and
Liabilities
Location | | Fair Value | |
Interest rate contracts | | Receivable for variation margin on centrally cleared swaps | | $ | 760,236 | * | | Payable for variation margin on centrally cleared swaps | | $ | 494,983 | * |
| | | | |
Interest rate contracts | | Unrealized appreciation on interest rate swaps | | | 86,282 | | | | | | | |
| | | | | | | | | | | | |
Total | | | | $ | 846,518 | | | | | $ | 494,983 | |
| | | | | | | | | | | | |
| * | Only variation margin receivable/payable at period end is reported within the statement of assets and liabilities. This amount reflects cumulative unrealized appreciation (depreciation) on futures and centrally cleared swaps as reported in the portfolio of investments. |
| | |
| |
| abfunds.com | | AB MUNICIPAL INCOME FUND II | 101 |
NOTES TO FINANCIAL STATEMENTS (continued)
| | | | | | | | | | |
Derivative Type | | Location of
Gain or (Loss)
on Derivatives
Within Statement
of Operations | | Realized Gain
or (Loss) on
Derivatives | | | Change in
Unrealized
Appreciation or
(Depreciation) | |
Interest rate contracts | | Net realized gain (loss) on swaps; Net change in unrealized appreciation (depreciation) of swaps | | $ | (40,814 | ) | | $ | (322,666 | ) |
| | | | | | | | | | |
Total | | | | $ | (40,814 | ) | | $ | (322,666 | ) |
| | | | | | | | | | |
| | | | | | | | | | | | |
| AB New Jersey Portfolio | | | | | | |
| | | Asset Derivatives | | | Liability Derivatives | |
Derivative Type | | Statement of
Assets and
Liabilities
Location | | Fair Value | | | Statement of
Assets and
Liabilities
Location | | Fair Value | |
Interest rate contracts | | Receivable for variation margin on centrally cleared swaps | | $ | 1,033,962 | * | | Payable for variation margin on centrally cleared swaps | | $ | 372,849 | * |
| | | | |
Interest rate contracts | | Unrealized appreciation on interest rate swaps | | | 127,614 | | | | | | | |
| | | | | | | | | | | | |
Total | | | | $ | 1,161,576 | | | | | $ | 372,849 | |
| | | | | | | | | | | | |
| * | Only variation margin receivable/payable at period end is reported within the statement of assets and liabilities. This amount reflects cumulative unrealized appreciation (depreciation) on futures and centrally cleared swaps as reported in the portfolio of investments. |
| | | | | | | | | | |
Derivative Type | | Location of
Gain or (Loss)
on Derivatives
Within Statement
of Operations | | Realized Gain
or (Loss) on
Derivatives | | | Change in
Unrealized
Appreciation or
(Depreciation) | |
Interest rate contracts | | Net realized gain (loss) on swaps; Net change in unrealized appreciation (depreciation) of swaps | | $ | (134,978 | ) | | $ | (143,909 | ) |
| | | | | | | | | | |
Total | | | | $ | (134,978 | ) | | $ | (143,909 | ) |
| | | | | | | | | | |
| | |
| |
102 | AB MUNICIPAL INCOME FUND II | | abfunds.com |
NOTES TO FINANCIAL STATEMENTS (continued)
| | | | | | | | | | | | |
| AB Ohio Portfolio | | | | | | |
| | | Asset Derivatives | | | Liability Derivatives | |
Derivative Type | | Statement of
Assets and
Liabilities
Location | | Fair Value | | | Statement of
Assets and
Liabilities
Location | | Fair Value | |
Interest rate contracts | | | | | | | | Payable for variation margin on centrally cleared swaps | | $ | 131,417 | * |
| | | | |
Interest rate contracts | | Unrealized appreciation on interest rate swaps | | $ | 121,414 | | | | | | | |
| | | | | | | | | | | | |
Total | | | | $ | 121,414 | | | | | $ | 131,417 | |
| | | | | | | | | | | | |
| * | Only variation margin receivable/payable at period end is reported within the statement of assets and liabilities. This amount reflects cumulative unrealized appreciation (depreciation) on futures and centrally cleared swaps as reported in the portfolio of investments. |
| | | | | | | | | | |
Derivative Type | | Location of
Gain or (Loss)
on Derivatives
Within Statement
of Operations | | Realized Gain
or (Loss) on
Derivatives | | | Change in
Unrealized
Appreciation or
(Depreciation) | |
Interest rate contracts | | Net realized gain (loss) on swaps; Net change in unrealized appreciation (depreciation) of swaps | | $ | (104,947 | ) | | $ | (185,393 | ) |
| | | | | | | | | | |
Total | | | | $ | (104,947 | ) | | $ | (185,393 | ) |
| | | | | | | | | | |
| | | | | | | | | | | | |
| AB Pennsylvania Portfolio | | | | | | |
| | | Asset Derivatives | | | Liability Derivatives | |
Derivative Type | | Statement of
Assets and
Liabilities
Location | | Fair Value | | | Statement of
Assets and
Liabilities
Location | | Fair Value | |
Interest rate contracts | | Receivable for variation margin on centrally cleared swaps | | $ | 7,159 | * | | Payable for variation margin on centrally cleared swaps | | $ | 228,503 | * |
| | | | |
Interest rate contracts | | Unrealized appreciation on interest rate swaps | | | 117,798 | | | | | | | |
| | | | | | | | | | | | |
Total | | | | $ | 124,957 | | | | | $ | 228,503 | |
| | | | | | | | | | | | |
| * | Only variation margin receivable/payable at period end is reported within the statement of assets and liabilities. This amount reflects cumulative unrealized appreciation (depreciation) on futures and centrally cleared swaps as reported in the portfolio of investments. |
| | |
| |
| abfunds.com | | AB MUNICIPAL INCOME FUND II | 103 |
NOTES TO FINANCIAL STATEMENTS (continued)
| | | | | | | | | | |
Derivative Type | | Location of
Gain or (Loss)
on Derivatives
Within Statement
of Operations | | Realized Gain
or (Loss) on
Derivatives | | | Change in
Unrealized
Appreciation or
(Depreciation) | |
Interest rate contracts | | Net realized gain (loss) on swaps; Net change in unrealized appreciation (depreciation) of swaps | | $ | 543,934 | | | $ | (921,668 | ) |
| | | | | | | | | | |
Total | | | | $ | 543,934 | | | $ | (921,668 | ) |
| | | | | | | | | | |
| | | | | | | | | | | | |
| AB Virginia Portfolio | | | | | | |
| | | Asset Derivatives | | | Liability Derivatives | |
Derivative Type | | Statement of
Assets and
Liabilities Location | | Fair Value | | | Statement of
Assets and
Liabilities
Location | | Fair Value | |
Interest rate contracts | | Receivable for variation margin on centrally cleared swaps | | $ | 64,925 | * | | Payable for variation margin on centrally cleared swaps | | $ | 616,800 | * |
| | | | |
Interest rate contracts | | Unrealized appreciation on interest rate swaps | | | 306,378 | | | | | | | |
| | | | | | | | | | | | |
Total | | | | $ | 371,303 | | | | | $ | 616,800 | |
| | | | | | | | | | | | |
| * | Only variation margin receivable/payable at period end is reported within the statement of assets and liabilities. This amount reflects cumulative unrealized appreciation (depreciation) on futures and centrally cleared swaps as reported in the portfolio of investments. |
| | | | | | | | | | |
Derivative Type | | Location of
Gain or (Loss)
on Derivatives
Within Statement
of Operations | | Realized Gain
or (Loss) on
Derivatives | | | Change in
Unrealized
Appreciation or
(Depreciation) | |
Interest rate contracts | | Net realized gain (loss) on swaps; Net change in unrealized appreciation (depreciation) of swaps | | $ | 1,190,938 | | | $ | (2,551,660 | ) |
| | | | | | | | | | |
Total | | | | $ | 1,190,938 | | | $ | (2,551,660 | ) |
| | | | | | | | | | |
The following tables represent the average monthly volume of the Portfolios’ derivative transactions during the year ended May 31, 2024:
| | | | |
AB Arizona Portfolio | | | | |
Interest Rate Swaps: | | | | |
Average notional amount | | $ | 1,675,000 | |
Centrally Cleared Interest Rate Swaps: | | | | |
Average notional amount | | $ | 12,320,769 | |
Centrally Cleared Inflation Swaps: | | | | |
Average notional amount | | $ | 19,080,000 | (a) |
| (a) | Positions were open for four months during the year. |
| | |
| |
104 | AB MUNICIPAL INCOME FUND II | | abfunds.com |
NOTES TO FINANCIAL STATEMENTS (continued)
| | | | |
AB Massachusetts Portfolio | | | | |
Interest Rate Swaps: | | | | |
Average notional amount | | $ | 3,025,000 | |
Centrally Cleared Interest Rate Swaps: | | | | |
Average notional amount | | $ | 39,202,308 | |
Centrally Cleared Inflation Swaps: | | | | |
Average notional amount | | $ | 35,120,000 | |
| | | | |
AB Minnesota Portfolio | | | | |
Interest Rate Swaps: | | | | |
Average notional amount | | $ | 835,000 | |
Centrally Cleared Interest Rate Swaps: | | | | |
Average notional amount | | $ | 11,856,923 | |
Centrally Cleared Inflation Swaps: | | | | |
Average notional amount | | $ | 9,380,000 | |
| | | | |
AB New Jersey Portfolio | | | | |
Interest Rate Swaps: | | | | |
Average notional amount | | $ | 1,235,000 | |
Centrally Cleared Interest Rate Swaps: | | | | |
Average notional amount | | $ | 5,627,692 | |
Centrally Cleared Inflation Swaps: | | | | |
Average notional amount | | $ | 11,820,000 | |
| | | | |
AB Ohio Portfolio | | | | |
Interest Rate Swaps: | | | | |
Average notional amount | | $ | 1,175,000 | |
Centrally Cleared Interest Rate Swaps: | | | | |
Average notional amount | | $ | 7,704,615 | |
| | | | |
AB Pennsylvania Portfolio | | | | |
Interest Rate Swaps: | | | | |
Average notional amount | | $ | 1,140,000 | |
Centrally Cleared Interest Rate Swaps: | | | | |
Average notional amount | | $ | 12,165,385 | |
Centrally Cleared Inflation Swaps: | | | | |
Average notional amount | | $ | 11,600,000 | (a) |
| (a) | Positions were open for four months during the year. |
| | | | |
AB Virginia Portfolio | | | | |
Interest Rate Swaps: | | | | |
Average notional amount | | $ | 2,965,000 | |
Centrally Cleared Interest Rate Swaps: | | | | |
Average notional amount | | $ | 24,064,615 | |
Centrally Cleared Inflation Swaps: | | | | |
Average notional amount | | $ | 37,080,000 | (a) |
| (a) | Positions were open for ten months during the year. |
For financial reporting purposes, the Portfolios do not offset derivative assets and derivative liabilities that are subject to netting arrangements in the statement of assets and liabilities.
| | |
| |
| abfunds.com | | AB MUNICIPAL INCOME FUND II | 105 |
NOTES TO FINANCIAL STATEMENTS (continued)
All OTC derivatives held at period end were subject to netting arrangements. The following tables present the Portfolios’ derivative assets and liabilities by OTC counterparty net of amounts available for offset under ISDA Master Agreements (“MA”) and net of the related collateral received/pledged by the Portfolios as of May 31, 2024. Exchange-traded derivatives and centrally cleared swaps are not subject to netting arrangements and as such are excluded from the tables.
| | | | | | | | | | | | | | | | | | | | |
| AB Arizona Portfolio | |
Counterparty | | Derivative
Assets
Subject
to a MA | | | Derivatives
Available
for Offset | | | Cash
Collateral
Received* | | | Security
Collateral
Received* | | | Net Amount of
Derivative
Assets | |
Citibank, NA | | $ | 173,080 | | | $ | – 0 | – | | $ | – 0 | – | | $ | – 0 | – | | $ | 173,080 | |
| | | | | | | | | | | | | | | | | | | | |
Total | | $ | 173,080 | | | $ | – 0 | – | | $ | – 0 | – | | $ | – 0 | – | | $ | 173,080 | ^ |
| | | | | | | | | | | | | | | | | | | | |
| * | The actual collateral received/pledged may be more than the amount reported due to over-collateralization. |
| ^ | Net amount represents the net receivable/payable that would be due from/to the counterparty in the event of default or termination. The net amount from OTC financial derivative instruments can only be netted across transactions governed under the same master agreement with the same counterparty. |
| | | | | | | | | | | | | | | | | | | | |
| AB Massachusetts Portfolio | |
Counterparty | | Derivative
Assets
Subject
to a MA | | | Derivatives
Available
for Offset | | | Cash
Collateral
Received* | | | Security
Collateral
Received* | | | Net Amount of
Derivative
Assets | |
Citibank, NA | | $ | 312,578 | | | $ | – 0 | – | | $ | – 0 | – | | $ | (261,803 | ) | | $ | 50,775 | |
| | | | | | | | | | | | | | | | | | | | |
Total | | $ | 312,578 | | | $ | – 0 | – | | $ | – 0 | – | | $ | (261,803 | ) | | $ | 50,775 | ^ |
| | | | | | | | | | | | | | | | | | | | |
| * | The actual collateral received/pledged may be more than the amount reported due to over-collateralization. |
| ^ | Net amount represents the net receivable/payable that would be due from/to the counterparty in the event of default or termination. The net amount from OTC financial derivative instruments can only be netted across transactions governed under the same master agreement with the same counterparty. |
| | | | | | | | | | | | | | | | | | | | |
| AB Minnesota Portfolio | |
Counterparty | | Derivative
Assets
Subject
to a MA | | | Derivatives
Available
for Offset | | | Cash
Collateral
Received* | | | Security
Collateral
Received* | | | Net Amount of
Derivative
Assets | |
Citibank, NA | | $ | 86,282 | | | $ | – 0 | – | | $ | – 0 | – | | $ | – 0 | – | | $ | 86,282 | |
| | | | | | | | | | | | | | | | | | | | |
Total | | $ | 86,282 | | | $ | – 0 | – | | $ | – 0 | – | | $ | – 0 | – | | $ | 86,282 | ^ |
| | | | | | | | | | | | | | | | | | | | |
| * | The actual collateral received/pledged may be more than the amount reported due to over-collateralization. |
| ^ | Net amount represents the net receivable/payable that would be due from/to the counterparty in the event of default or termination. The net amount from OTC financial derivative instruments can only be netted across transactions governed under the same master agreement with the same counterparty. |
| | |
| |
106 | AB MUNICIPAL INCOME FUND II | | abfunds.com |
NOTES TO FINANCIAL STATEMENTS (continued)
| | | | | | | | | | | | | | | | | | | | |
| AB New Jersey Portfolio | |
Counterparty | | Derivative
Assets
Subject
to a MA | | | Derivatives
Available
for Offset | | | Cash
Collateral
Received* | | | Security
Collateral
Received* | | | Net Amount of
Derivative
Assets | |
Citibank, NA | | $ | 127,614 | | | $ | – 0 | – | | $ | – 0 | – | | $ | – 0 | – | | $ | 127,614 | |
| | | | | | | | | | | | | | | | | | | | |
Total | | $ | 127,614 | | | $ | – 0 | – | | $ | – 0 | – | | $ | – 0 | – | | $ | 127,614 | ^ |
| | | | | | | | | | | | | | | | | | | | |
| * | The actual collateral received/pledged may be more than the amount reported due to over-collateralization. |
| ^ | Net amount represents the net receivable/payable that would be due from/to the counterparty in the event of default or termination. The net amount from OTC financial derivative instruments can only be netted across transactions governed under the same master agreement with the same counterparty. |
| | | | | | | | | | | | | | | | | | | | |
| AB Ohio Portfolio | |
Counterparty | | Derivative
Assets
Subject
to a MA | | | Derivatives
Available
for Offset | | | Cash
Collateral
Received* | | | Security
Collateral
Received* | | | Net Amount of
Derivative
Assets | |
Citibank, NA | | $ | 121,414 | | | $ | – 0 | – | | $ | – 0 | – | | $ | – 0 | – | | $ | 121,414 | |
| | | | | | | | | | | | | | | | | | | | |
Total | | $ | 121,414 | | | $ | – 0 | – | | $ | – 0 | – | | $ | – 0 | – | | $ | 121,414 | ^ |
| | | | | | | | | | | | | | | | | | | | |
| * | The actual collateral received/pledged may be more than the amount reported due to over-collateralization. |
| ^ | Net amount represents the net receivable/payable that would be due from/to the counterparty in the event of default or termination. The net amount from OTC financial derivative instruments can only be netted across transactions governed under the same master agreement with the same counterparty. |
| | | | | | | | | | | | | | | | | | | | |
| AB Pennsylvania Portfolio | |
Counterparty | | Derivative
Assets
Subject
to a MA | | | Derivatives
Available
for Offset | | | Cash
Collateral
Received* | | | Security
Collateral
Received* | | | Net Amount of
Derivative
Assets | |
Citibank, NA | | $ | 117,798 | | | $ | – 0 | – | | $ | – 0 | – | | $ | – 0 | – | | $ | 117,798 | |
| | | | | | | | | | | | | | | | | | | | |
Total | | $ | 117,798 | | | $ | – 0 | – | | $ | – 0 | – | | $ | – 0 | – | | $ | 117,798 | ^ |
| | | | | | | | | | | | | | | | | | | | |
| * | The actual collateral received/pledged may be more than the amount reported due to over-collateralization. |
| ^ | Net amount represents the net receivable/payable that would be due from/to the counterparty in the event of default or termination. The net amount from OTC financial derivative instruments can only be netted across transactions governed under the same master agreement with the same counterparty. |
| | | | | | | | | | | | | | | | | | | | |
| AB Virginia Portfolio | | | | | | | | | | |
Counterparty | | Derivative
Assets
Subject
to a MA | | | Derivatives
Available
for Offset | | | Cash
Collateral
Received* | | | Security
Collateral
Received* | | | Net Amount of
Derivative
Assets | |
Citibank, NA | | $ | 306,378 | | | $ | – 0 | – | | $ | – 0 | – | | $ | (244,721 | ) | | $ | 61,657 | |
| | | | | | | | | | | | | | | | | | | | |
Total | | $ | 306,378 | | | $ | – 0 | – | | $ | – 0 | – | | $ | (244,721 | ) | | $ | 61,657 | ^ |
| | | | | | | | | | | | | | | | | | | | |
| * | The actual collateral received/pledged may be more than the amount reported due to over-collateralization. |
| ^ | Net amount represents the net receivable/payable that would be due from/to the counterparty in the event of default or termination. The net amount from OTC financial derivative instruments can only be netted across transactions governed under the same master agreement with the same counterparty. |
| | |
| |
| abfunds.com | | AB MUNICIPAL INCOME FUND II | 107 |
NOTES TO FINANCIAL STATEMENTS (continued)
NOTE E
Shares of Beneficial Interest
Transactions in shares of beneficial interest for each Portfolio were as follows:
| | | | | | | | | | | | | | | | | | | | | | | | |
| | | | | | | | | | | | | | | | | | | | | | | | |
| | | AB Arizona Portfolio | | | | |
| | | Shares | | | | | | Amount | | | | |
| | | Year Ended
May 31,
2024 | | | Year Ended
May 31,
2023 | | | | | | Year Ended
May 31,
2024 | | | Year Ended
May 31,
2023 | | | | |
| | | | | | | | |
| Class A | | | | | | | | | | | | | | | | | | | | | | | | |
Shares sold | | | 242,360 | | | | 976,602 | | | | | | | $ | 2,472,366 | | | $ | 10,017,113 | | | | | |
| | | | | |
Shares issued in reinvestment of dividends | | | 107,932 | | | | 131,144 | | | | | | | | 1,090,301 | | | | 1,336,610 | | | | | |
| | | | | |
Shares converted from Class C | | | 89,232 | | | | 34,592 | | | | | | | | 902,885 | | | | 350,566 | | | | | |
| | | | | |
Shares redeemed | | | (1,778,232 | ) | | | (2,767,797 | ) | | | | | | | (17,974,343 | ) | | | (28,191,287 | ) | | | | |
| | | | | |
Net decrease | | | (1,338,708 | ) | | | (1,625,459 | ) | | | | | | $ | (13,508,791 | ) | | $ | (16,486,998 | ) | | | | |
| | | | | |
| | | | | | | | | | | | | | | | | | | | | | | | |
| Class C | | | | | | | | | | | | | | | | | | | | | | | | |
Shares sold | | | 6,886 | | | | 36,887 | | | | | | | $ | 68,907 | | | $ | 373,574 | | | | | |
| | | | | |
Shares issued in reinvestment of dividends | | | 3,755 | | | | 6,032 | | | | | | | | 37,855 | | | | 61,365 | | | | | |
| | | | | |
Shares converted to Class A | | | (89,382 | ) | | | (34,637 | ) | | | | | | | (902,885 | ) | | | (350,566 | ) | | | | |
| | | | | |
Shares redeemed | | | (101,168 | ) | | | (94,747 | ) | | | | | | | (1,023,687 | ) | | | (962,790 | ) | | | | |
| | | | | |
Net decrease | | | (179,909 | ) | | | (86,465 | ) | | | | | | $ | (1,819,810 | ) | | $ | (878,417 | ) | | | | |
| | | | | |
| | | | | | | | | | | | | | | | | | | | | | | | |
| Advisor Class | | | | | | | | | | | | | | | | | | | | | | | | |
Shares sold | | | 858,573 | | | | 765,538 | | | | | | | $ | 8,720,167 | | | $ | 7,821,695 | | | | | |
| | | | | |
Shares issued in reinvestment of dividends | | | 23,618 | | | | 13,374 | | | | | | | | 238,659 | | | | 136,236 | | | | | |
| | | | | |
Shares redeemed | | | (579,373 | ) | | | (535,021 | ) | | | | | | | (5,815,477 | ) | | | (5,374,409 | ) | | | | |
| | | | | |
Net increase | | | 302,818 | | | | 243,891 | | | | | | | $ | 3,143,349 | | | $ | 2,583,522 | | | | | |
| | | | | |
| | |
| |
108 | AB MUNICIPAL INCOME FUND II | | abfunds.com |
NOTES TO FINANCIAL STATEMENTS (continued)
| | | | | | | | | | | | | | | | | | | | | | | | |
| | | | | | | | | | | | | | | | | | | | | | | | |
| | | AB Massachusetts Portfolio | | | | |
| | | Shares | | | | | | Amount | | | | |
| | | Year Ended
May 31,
2024 | | | Year Ended
May 31,
2023 | | | | | | Year Ended
May 31,
2024 | | | Year Ended
May 31,
2023 | | | | |
| | | | | | | | |
| Class A | | | | | | | | | | | | | | | | | | | | | | | | |
Shares sold | | | 733,471 | | | | 814,946 | | | | | | | $ | 7,521,158 | | | $ | 8,494,068 | | | | | |
| | | | | |
Shares issued in reinvestment of dividends | | | 155,754 | | | | 166,957 | | | | | | | | 1,598,848 | | | | 1,723,630 | | | | | |
| | | | | |
Shares converted from Class C | | | 133,271 | | | | 128,710 | | | | | | | | 1,373,564 | | | | 1,339,523 | | | | | |
| | | | | |
Shares redeemed | | | (1,796,712 | ) | | | (2,528,630 | ) | | | | | | | (18,385,205 | ) | | | (26,050,756 | ) | | | | |
| | | | | |
Net decrease | | | (774,216 | ) | | | (1,418,017 | ) | | | | | | $ | (7,891,635 | ) | | $ | (14,493,535 | ) | | | | |
| | | | | |
| | | | | | | | | | | | | | | | | | | | | | | | |
| Class C | | | | | | | | | | | | | | | | | | | | | | | | |
Shares sold | | | 16,438 | | | | 40,715 | | | | | | | $ | 165,386 | | | $ | 421,549 | | | | | |
| | | | | |
Shares issued in reinvestment of dividends | | | 9,561 | | | | 11,778 | | | | | | | | 97,879 | | | | 121,330 | | | | | |
| | | | | |
Shares converted to Class A | | | (133,533 | ) | | | (128,958 | ) | | | | | | | (1,373,564 | ) | | | (1,339,523 | ) | | | | |
| | | | | |
Shares redeemed | | | (132,763 | ) | | | (162,277 | ) | | | | | | | (1,368,285 | ) | | | (1,673,092 | ) | | | | |
| | | | | |
Net decrease | | | (240,297 | ) | | | (238,742 | ) | | | | | | $ | (2,478,584 | ) | | $ | (2,469,736 | ) | | | | |
| | | | | |
| | | | | | | | | | | | | | | | | | | | | | | | |
| Advisor Class | | | | | | | | | | | | | | | | | | | | | | | | |
Shares sold | | | 8,420,487 | | | | 6,904,856 | | | | | | | $ | 84,501,292 | | | $ | 71,194,909 | | | | | |
| | | | | |
Shares issued in reinvestment of dividends | | | 270,173 | | | | 175,545 | | | | | | | | 2,780,151 | | | | 1,812,941 | | | | | |
| | | | | |
Shares redeemed | | | (4,777,045 | ) | | | (6,496,045 | ) | | | | | | | (48,715,634 | ) | | | (67,050,540 | ) | | | | |
| | | | | |
Net increase | | | 3,913,615 | | | | 584,356 | | | | | | | $ | 38,565,809 | | | $ | 5,957,310 | | | | | |
| | | | | |
| | | | | | | | | | | | | | | | | | | | | | | | |
| | | | | | | | | | | | | | | | | | | | | | | | |
| | | AB Minnesota Portfolio | | | | |
| | | Shares | | | | | | Amount | | | | |
| | | Year Ended
May 31,
2024 | | | Year Ended
May 31,
2023 | | | | | | Year Ended
May 31,
2024 | | | Year Ended
May 31,
2023 | | | | |
| | | | | | | | |
| Class A | | | | | | | | | | | | | | | | | | | | | | | | |
Shares sold | | | 142,555 | | | | 424,294 | | | | | | | $ | 1,340,657 | | | $ | 4,013,726 | | | | | |
| | | | | |
Shares issued in reinvestment of dividends | | | 53,815 | | | | 67,209 | | | | | | | | 503,557 | | | | 635,070 | | | | | |
| | | | | |
Shares converted from Class C | | | 19,675 | | | | 17,850 | | | | | | | | 182,803 | | | | 170,276 | | | | | |
| | | | | |
Shares redeemed | | | (670,994 | ) | | | (1,778,988 | ) | | | | | | | (6,283,754 | ) | | | (16,898,447 | ) | | | | |
| | | | | |
Net decrease | | | (454,949 | ) | | | (1,269,635 | ) | | | | | | $ | (4,256,737 | ) | | $ | (12,079,375 | ) | | | | |
| | | | | |
| | |
| |
| abfunds.com | | AB MUNICIPAL INCOME FUND II | 109 |
NOTES TO FINANCIAL STATEMENTS (continued)
| | | | | | | | | | | | | | | | | | | | | | | | |
| | | | | | | | | | | | | | | | | | | | | | | | |
| | | AB Minnesota Portfolio | | | | |
| | | Shares | | | | | | Amount | | | | |
| | | Year Ended
May 31,
2024 | | | Year Ended
May 31,
2023 | | | | | | Year Ended
May 31,
2024 | | | Year Ended
May 31,
2023 | | | | |
| | | | | | | | |
| Class C | | | | | | | | | | | | | | | | | | | | | | | | |
Shares sold | | | 5,612 | | | | 16,334 | | | | | | | $ | 52,610 | | | $ | 156,260 | | | | | |
| | | | | |
Shares issued in reinvestment of dividends | | | 2,231 | | | | 4,236 | | | | | | | | 20,873 | | | | 40,071 | | | | | |
| | | | | |
Shares converted to Class A | | | (19,653 | ) | | | (17,831 | ) | | | | | | | (182,803 | ) | | | (170,276 | ) | | | | |
| | | | | |
Shares redeemed | | | (56,389 | ) | | | (113,622 | ) | | | | | | | (530,968 | ) | | | (1,062,160 | ) | | | | |
| | | | | |
Net decrease | | | (68,199 | ) | | | (110,883 | ) | | | | | | $ | (640,288 | ) | | $ | (1,036,105 | ) | | | | |
| | | | | |
| | | | | | | | | | | | | | | | | | | | | | | | |
| | | | | | | | | | | | | | | | | | | | | | | | |
| | | AB New Jersey Portfolio | | | | |
| | | Shares | | | | | | Amount | | | | |
| | | Year Ended
May 31,
2024 | | | Year Ended
May 31,
2023 | | | | | | Year Ended
May 31,
2024 | | | Year Ended
May 31,
2023 | | | | |
| | | | | | | | |
| Class A | | | | | | | | | | | | | | | | | | | | | | | | |
Shares sold | | | 1,391,585 | | | | 856,008 | | | | | | | $ | 12,564,181 | | | $ | 7,762,589 | | | | | |
| | | | | |
Shares issued in reinvestment of dividends | | | 130,741 | | | | 118,266 | | | | | | | | 1,174,259 | | | | 1,066,386 | | | | | |
| | | | | |
Shares converted from Class C | | | 49,850 | | | | 68,189 | | | | | | | | 446,523 | | | | 614,165 | | | | | |
| | | | | |
Shares redeemed | | | (1,257,806 | ) | | | (1,075,895 | ) | | | | | | | (11,292,815 | ) | | | (9,703,958 | ) | | | | |
| | | | | |
Net increase (decrease) | | | 314,370 | | | | (33,432 | ) | | | | | | $ | 2,892,148 | | | $ | (260,818 | ) | | | | |
| | | | | |
| | | | | | | | | | | | | | | | | | | | | | | | |
| Class C | | | | | | | | | | | | | | | | | | | | | | | | |
Shares sold | | | 9,036 | | | | 23,924 | | | | | | | $ | 82,324 | | | $ | 216,367 | | | | | |
| | | | | |
Shares issued in reinvestment of dividends | | | 2,604 | | | | 514 | | | | | | | | 23,321 | | | | 5,334 | | | | | |
| | | | | |
Shares converted to Class A | | | (49,807 | ) | | | (68,158 | ) | | | | | | | (446,523 | ) | | | (614,165 | ) | | | | |
| | | | | |
Shares redeemed | | | (51,517 | ) | | | (38,347 | ) | | | | | | | (464,131 | ) | | | (341,796 | ) | | | | |
| | | | | |
Net decrease | | | (89,684 | ) | | | (82,067 | ) | | | | | | $ | (805,009 | ) | | $ | (734,260 | ) | | | | |
| | | | | |
| | |
| |
110 | AB MUNICIPAL INCOME FUND II | | abfunds.com |
NOTES TO FINANCIAL STATEMENTS (continued)
| | | | | | | | | | | | | | | | | | | | | | | | |
| | | | | | | | | | | | | | | | | | | | | | | | |
| | | AB Ohio Portfolio | | | | |
| | | Shares | | | | | | Amount | | | | |
| | | Year Ended
May 31,
2024 | | | Year Ended
May 31,
2023 | | | | | | Year Ended
May 31,
2024 | | | Year Ended
May 31,
2023 | | | | |
| | | | | | | | |
| Class A | | | | | | | | | | | | | | | | | | | | | | | | |
Shares sold | | | 198,926 | | | | 670,606 | | | | | | | $ | 1,830,573 | | | $ | 6,105,466 | | | | | |
| | | | | |
Shares issued in reinvestment of dividends | | | 89,309 | | | | 105,356 | | | | | | | | 815,353 | | | | 966,530 | | | | | |
| | | | | |
Shares converted from Class C | | | 17,470 | | | | 31,112 | | | | | | | | 158,025 | | | | 289,706 | | | | | |
| | | | | |
Shares redeemed | | | (1,124,582 | ) | | | (2,897,489 | ) | | | | | | | (10,303,476 | ) | | | (26,738,110 | ) | | | | |
| | | | | |
Net decrease | | | (818,877 | ) | | | (2,090,415 | ) | | | | | | $ | (7,499,525 | ) | | $ | (19,376,408 | ) | | | | |
| | | | | |
| | | | | | | | | | | | | | | | | | | | | | | | |
| Class C | | | | | | | | | | | | | | | | | | | | | | | | |
Shares sold | | | 11,022 | | | | 39,722 | | | | | | | $ | 100,712 | | | $ | 362,246 | | | | | |
| | | | | |
Shares issued in reinvestment of dividends | | | 3,466 | | | | 3,663 | | | | | | | | 31,617 | | | | 33,579 | | | | | |
| | | | | |
Shares converted to Class A | | | (17,487 | ) | | | (31,144 | ) | | | | | | | (158,025 | ) | | | (289,706 | ) | | | | |
| | | | | |
Shares redeemed | | | (1,957 | ) | | | (41,000 | ) | | | | | | | (17,633 | ) | | | (375,268 | ) | | | | |
| | | | | |
Net decrease | | | (4,956 | ) | | | (28,759 | ) | | | | | | $ | (43,329 | ) | | $ | (269,149 | ) | | | | |
| | | | | |
| | | | | | | | | | | | | | | | | | | | | | | | |
| | | | | | | | | | | | | | | | | | | | | | | | |
| | | AB Pennsylvania Portfolio | | | | |
| | | Shares | | | | | | Amount | | | | |
| | | Year Ended
May 31,
2024 | | | Year Ended
May 31,
2023 | | | | | | Year Ended
May 31,
2024 | | | Year Ended
May 31,
2023 | | | | |
| | | | | | | | |
| Class A | | | | | | | | | | | | | | | | | | | | | | | | |
Shares sold | | | 432,436 | | | | 556,078 | | | | | | | $ | 4,128,716 | | | $ | 5,301,598 | | | | | |
| | | | | |
Shares issued in reinvestment of dividends | | | 102,104 | | | | 102,513 | | | | | | | | 970,438 | | | | 985,728 | | | | | |
| | | | | |
Shares converted from Class C | | | 23,498 | | | | 21,399 | | | | | | | | 223,895 | | | | 211,888 | | | | | |
| | | | | |
Shares redeemed | | | (893,086 | ) | | | (1,266,356 | ) | | | | | | | (8,467,958 | ) | | | (12,152,248 | ) | | | | |
| | | | | |
Net decrease | | | (335,048 | ) | | | (586,366 | ) | | | | | | $ | (3,144,909 | ) | | $ | (5,653,034 | ) | | | | |
| | | | | |
| | | | | | | | | | | | | | | | | | | | | | | | |
| Class C | | | | | | | | | | | | | | | | | | | | | | | | |
Shares sold | | | 3,749 | | | | 21,576 | | | | | | | $ | 36,000 | | | $ | 202,642 | | | | | |
| | | | | |
Shares issued in reinvestment of dividends | | | 983 | | | | 1,426 | | | | | | | | 9,342 | | | | 13,728 | | | | | |
| | | | | |
Shares converted to Class A | | | (23,497 | ) | | | (21,397 | ) | | | | | | | (223,895 | ) | | | (211,888 | ) | | | | |
| | | | | |
Shares redeemed | | | (32,942 | ) | | | (34 | ) | | | | | | | (310,062 | ) | | | (330 | ) | | | | |
| | | | | |
Net increase (decrease) | | | (51,707 | ) | | | 1,571 | | | | | | | $ | (488,615 | ) | | $ | 4,152 | | | | | |
| | | | | |
| | |
| |
| abfunds.com | | AB MUNICIPAL INCOME FUND II | 111 |
NOTES TO FINANCIAL STATEMENTS (continued)
| | | | | | | | | | | | | | | | | | | | | | | | |
| | | | | | | | | | | | | | | | | | | | | | | | |
| | | AB Virginia Portfolio | | | | |
| | | Shares | | | | | | Amount | | | | |
| | | Year Ended
May 31,
2024 | | | Year Ended
May 31,
2023 | | | | | | Year Ended
May 31,
2024 | | | Year Ended
May 31,
2023 | | | | |
| | | | | | | | |
| Class A | | | | | | | | | | | | | | | | | | | | | | | | |
Shares sold | | | 419,411 | | | | 896,713 | | | | | | | $ | 4,304,367 | | | $ | 9,303,151 | | | | | |
| | | | | |
Shares issued in reinvestment of dividends | | | 175,135 | | | | 180,358 | | | | | | | | 1,801,969 | | | | 1,859,464 | | | | | |
| | | | | |
Shares converted from Class C | | | 115,113 | | | | 66,508 | | | | | | | | 1,185,772 | | | | 682,992 | | | | | |
| | | | | |
Shares redeemed | | | (1,649,606 | ) | | | (2,517,834 | ) | | | | | | | (16,929,656 | ) | | | (25,973,402 | ) | | | | |
| | | | | |
Net decrease | | | (939,947 | ) | | | (1,374,255 | ) | | | | | | $ | (9,637,548 | ) | | $ | (14,127,795 | ) | | | | |
| | | | | |
| | | | | | | | | | | | | | | | | | | | | | | | |
| Class C | | | | | | | | | | | | | | | | | | | | | | | | |
Shares sold | | | 56,502 | | | | 140,321 | | | | | | | $ | 587,233 | | | $ | 1,437,680 | | | | | |
| | | | | |
Shares issued in reinvestment of dividends | | | 8,679 | | | | 10,374 | | | | | | | | 89,001 | | | | 106,715 | | | | | |
| | | | | |
Shares converted to Class A | | | (115,405 | ) | | | (66,682 | ) | | | | | | | (1,185,772 | ) | | | (682,992 | ) | | | | |
| | | | | |
Shares redeemed | | | (156,851 | ) | | | (185,254 | ) | | | | | | | (1,624,520 | ) | | | (1,909,367 | ) | | | | |
| | | | | |
Net decrease | | | (207,075 | ) | | | (101,241 | ) | | | | | | $ | (2,134,058 | ) | | $ | (1,047,964 | ) | | | | |
| | | | | |
| | | | | | | | | | | | | | | | | | | | | | | | |
| Advisor Class | | | | | | | | | | | | | | | | | | | | | | | | |
Shares sold | | | 3,400,459 | | | | 4,951,888 | | | | | | | $ | 34,715,054 | | | $ | 51,254,070 | | | | | |
| | | | | |
Shares issued in reinvestment of dividends | | | 142,762 | | | | 121,707 | | | | | | | | 1,469,715 | | | | 1,255,816 | | | | | |
| | | | | |
Shares redeemed | | | (3,967,787 | ) | | | (5,362,318 | ) | | | | | | | (40,208,094 | ) | | | (54,985,611 | ) | | | | |
| | | | | |
Net decrease | | | (424,566 | ) | | | (288,723 | ) | | | | | | $ | (4,023,325 | ) | | $ | (2,475,725 | ) | | | | |
| | | | | |
NOTE F
Risks Involved in Investing in the Portfolios
Market Risk—The value of the Portfolios’ assets will fluctuate as the bond market fluctuates. The value of the Portfolios’ investments may decline, sometimes rapidly and unpredictably, simply because of economic changes or other events, including public health crises (including the occurrence of a contagious disease or illness) and regional and global conflicts, that affect large portions of the market.
Interest-Rate Risk—Changes in interest rates will affect the value of investments in fixed-income securities. When interest rates rise, the value of existing investments in fixed-income securities tends to fall and this decrease in value may not be offset by higher income from new investments. Interest-rate risk is generally greater for fixed-income securities with longer maturities or durations. The Portfolios may be subject to a greater
| | |
| |
112 | AB MUNICIPAL INCOME FUND II | | abfunds.com |
NOTES TO FINANCIAL STATEMENTS (continued)
risk of rising interest rates than would normally be the case due to the recent end of a period of historically low rates and the effects of potential central bank monetary policy, and government fiscal policy, initiatives and market reactions to those initiatives.
Duration Risk—Duration is a measure that relates the expected price volatility of a fixed-income security to changes in interest rates. The duration of a fixed-income security may be shorter than or equal to the full maturity of a fixed-income security. Fixed-income securities with longer durations have more risk and will decrease in price as interest rates rise.
Municipal Market Risk—This is the risk that special factors may adversely affect the value of municipal securities and have a significant effect on the yield or value of the Portfolios’ investments in municipal securities. These factors include economic conditions, political or legislative changes, catastrophic natural disasters, public health crises, uncertainties related to the tax status of municipal securities, and the rights of investors in these securities. To the extent that the Portfolios invest more of their assets in a particular state’s municipal securities, the Portfolios are vulnerable to events adversely affecting that state, including economic, political and regulatory occurrences, court decisions, terrorism, and public health crises (including the occurrence of a contagious disease or illness). The Portfolios’ investments in certain municipal securities with principal and interest payments that are made from the revenues of a specific project or facility, and not general tax revenues, may have increased risks. Factors affecting the project or facility, such as local business or economic conditions, could have a significant effect on the project’s ability to make payments of principal and interest on these securities.
In addition, changes in tax rates or the treatment of income from certain types of municipal securities, among other things, could negatively affect the municipal securities markets.
The municipal securities issued by Puerto Rico and its government agencies and municipalities may have more risks than those of other U.S. issuers of municipal securities. Puerto Rico continues to face a challenging economic and fiscal environment. If the general economic situation in Puerto Rico continues to persist or worsens, the volatility and credit quality of Puerto Rican municipal securities could continue to be adversely affected, and the market for such securities may deteriorate further.
Credit Risk—An issuer or guarantor of a fixed-income security, or the counterparty to a derivatives or other contract, may be unable or unwilling to make timely payments of interest or principal, or to otherwise honor its obligations. The issuer or guarantor may default, causing a loss of the full
| | |
| |
| abfunds.com | | AB MUNICIPAL INCOME FUND II | 113 |
NOTES TO FINANCIAL STATEMENTS (continued)
principal amount of a security and accrued interest. The degree of risk for a particular security may be reflected in its credit rating. There is the possibility that the credit rating of a fixed-income security may be downgraded after purchase, which may adversely affect the value of the security. Investments in fixed-income securities with lower ratings tend to have a higher probability that an issuer will default or fail to meet its payment obligations.
Tax Risk—There is no guarantee that the income on the Portfolios’ municipal securities will be exempt from regular federal, and if applicable, state income taxes. From time to time, the U.S. Government and the U.S. Congress consider changes in federal tax law that could limit or eliminate the federal tax exemption for municipal bond income, which would in effect reduce the income received by shareholders from the Portfolios by increasing taxes on that income. In such event, the Portfolios’ net asset value, or NAV, could also decline as yields on municipal bonds, which are typically lower than those on taxable bonds, would be expected to increase to approximately the yield of comparable taxable bonds. Actions or anticipated actions affecting the tax exempt status of municipal bonds could also result in significant shareholder redemptions of portfolio shares as investors anticipate adverse effects on the Portfolios or seek higher yields to offset the potential loss of the tax deduction. As a result, the Portfolio would be required to maintain higher levels of cash to meet the redemptions, which would negatively affect the Portfolios’ yield.
Inflation Risk—This is the risk that the value of assets or income from investments will be less in the future as inflation decreases the value of money. As inflation increases, the value of the Portfolios’ assets can decline as can the value of the Portfolios’ distributions. This risk is significantly greater for fixed-income securities with longer maturities.
Illiquid Investments Risk—Illiquid investments risk exists when certain investments are or become difficult to purchase or sell. Difficulty in selling such investments may result in sales at disadvantageous prices affecting the value of your investment in the Portfolio. Causes of illiquid investments risk may include low trading volumes, large positions and heavy redemptions of Portfolio shares. Illiquid investments risk may be higher in a rising interest rate environment, when the value and liquidity of fixed-income securities generally decline. Municipal securities may have more illiquid investments risk than other fixed-income securities because they trade less frequently and the market for municipal securities is generally smaller than many other markets.
Derivatives Risk—Derivatives may be difficult to price or unwind and leveraged so that small changes may produce disproportionate losses for
| | |
| |
114 | AB MUNICIPAL INCOME FUND II | | abfunds.com |
NOTES TO FINANCIAL STATEMENTS (continued)
the Portfolios. A short position in a derivative instrument involves the risk of a theoretically unlimited increase in the value of the underlying asset, reference rate or index, which could cause the Portfolios to suffer a potentially unlimited loss. Derivatives, especially over-the-counter derivatives, are also subject to counterparty risk, which is the risk that the counterparty (the party on the other side of the transaction) on a derivative transaction will be unable or unwilling to honor its contractual obligations to the Portfolios.
LIBOR Replacement Risk—The Portfolios may be exposed to debt securities, derivatives or other financial instruments that recently transitioned from the London Interbank Offered Rate (“LIBOR”) as a benchmark or reference rate for various interest rate calculations. The use of LIBOR was phased out in June 2023 and transitioned to the Secured Overnight Financing Rate (“SOFR”). SOFR is a broad measure of the cost of borrowing cash overnight collateralized by U.S. Treasury securities in the repurchase agreement (repo) market. There can be no assurance that instruments linked to SOFR will have the same volume or liquidity as did the market for LIBOR-linked financial instruments prior to LIBOR’s discontinuance or unavailability.
Indemnification Risk—In the ordinary course of business, the Portfolios enter into contracts that contain a variety of indemnifications. The Portfolios’ maximum exposure under these arrangements is unknown. However, the Portfolios have not had prior claims or losses pursuant to these indemnification provisions and expect the risk of loss thereunder to be remote. Therefore, the Portfolios have not accrued any liability in connection with these indemnification provisions.
Management Risk—The Portfolios are subject to management risk because they are actively-managed investment funds. The Adviser will apply its investment techniques and risk analyses in making investment decisions, but there is no guarantee that its techniques will produce the intended results. Some of these techniques may incorporate, or rely upon, quantitative models, but there is no guarantee that these models will generate accurate forecasts, reduce risk or otherwise perform as expected.
NOTE G
Joint Credit Facility
A number of open-end mutual funds managed by the Adviser, including the Portfolios, participate in a $325 million revolving credit facility (the “Facility”) intended to provide short-term financing related to redemptions and other short term liquidity requirements, subject to certain restrictions. Commitment fees related to the Facility are paid by the participating funds and are included in miscellaneous expenses in the statement of operations. The Portfolios did not utilize the Facility during the year ended May 31, 2024.
| | |
| |
| abfunds.com | | AB MUNICIPAL INCOME FUND II | 115 |
NOTES TO FINANCIAL STATEMENTS (continued)
NOTE H
Distributions to Shareholders
The tax character of distributions paid during the tax years ended November 30, 2023 and November 30, 2022 were as follows:
| | | | | | | | |
| AB Arizona Portfolio | | December 1,
2022 to
November 30,
2023 | | | December 1,
2021 to
November 30,
2022 | |
Distributions paid from: | | | | | | | | |
Ordinary income | | $ | 170,580 | | | $ | 78,300 | |
| | | | | | | | |
Total taxable distributions | | | 170,580 | | | | 78,300 | |
Tax exempt distributions | | | 2,401,928 | | | | 2,821,654 | |
| | | | | | | | |
Total distributions paid | | $ | 2,572,508 | | | $ | 2,899,954 | |
| | | | | | | | |
| | | | | | | | |
| AB Massachusetts Portfolio | | December 1,
2022 to
November 30,
2023 | | | December 1,
2021 to
November 30,
2022 | |
Distributions paid from: | | | | | | | | |
Ordinary income | | $ | 790,969 | | | $ | 278,803 | |
| | | | | | | | |
Total taxable distributions | | | 790,969 | | | | 278,803 | |
Tax exempt distributions | | | 5,480,325 | | | | 5,069,730 | |
| | | | | | | | |
Total distributions paid | | $ | 6,271,294 | | | $ | 5,348,533 | |
| | | | | | | | |
| | | | | | | | |
| AB Minnesota Portfolio | | December 1,
2022 to
November 30,
2023 | | | December 1,
2021 to
November 30,
2022 | |
Distributions paid from: | | | | | | | | |
Ordinary income | | $ | 66,886 | | | $ | 82,286 | |
| | | | | | | | |
Total taxable distributions | | | 66,886 | | | | 82,286 | |
Tax exempt distributions | | | 796,513 | | | | 1,023,480 | |
| | | | | | | | |
Total distributions paid | | $ | 863,399 | | | $ | 1,105,766 | |
| | | | | | | | |
| | | | | | | | |
| AB New Jersey Portfolio | | December 1,
2022 to
November 30,
2023 | | | December 1,
2021 to
November 30,
2022 | |
Distributions paid from: | | | | | | | | |
Ordinary income | | $ | 130,145 | | | $ | 108,341 | |
| | | | | | | | |
Total taxable distributions | | | 130,145 | | | | 108,341 | |
Tax exempt distributions | | | 1,859,279 | | | | 1,816,637 | |
| | | | | | | | |
Total distributions paid | | $ | 1,989,424 | | | $ | 1,924,978 | |
| | | | | | | | |
| | | | | | | | |
| | |
| |
116 | AB MUNICIPAL INCOME FUND II | | abfunds.com |
NOTES TO FINANCIAL STATEMENTS (continued)
| | | | | | | | |
| AB Ohio Portfolio | | December 1,
2022 to
November 30,
2023 | | | December 1,
2021 to
November 30,
2022 | |
Distributions paid from: | | | | | | | | |
Ordinary income | | $ | 84,616 | | | $ | 30,295 | |
| | | | | | | | |
Total taxable distributions | | | 84,616 | | | | 30,295 | |
Tax exempt distributions | | | 1,397,092 | | | | 1,614,922 | |
| | | | | | | | |
Total distributions paid | | $ | 1,481,708 | | | $ | 1,645,217 | |
| | | | | | | | |
| | | | | | | | |
| AB Pennsylvania Portfolio | | December 1,
2022 to
November 30,
2023 | | | December 1,
2021 to
November 30,
2022 | |
Distributions paid from: | | | | | | | | |
Ordinary income | | $ | 99,980 | | | $ | 51,765 | |
| | | | | | | | |
Total taxable distributions | | | 99,980 | | | | 51,765 | |
Tax exempt distributions | | | 1,446,609 | | | | 1,530,796 | |
| | | | | | | | |
Total distributions paid | | $ | 1,546,589 | | | $ | 1,582,561 | |
| | | | | | | | |
| | | | | | | | |
| AB Virginia Portfolio | | December 1,
2022 to
November 30,
2023 | | | December 1,
2021 to
November 30,
2022 | |
Distributions paid from: | | | | | | | | |
Ordinary income | | $ | 390,452 | | | $ | 224,071 | |
| | | | | | | | |
Total taxable distributions | | | 390,452 | | | | 224,071 | |
Tax exempt distributions | | | 5,086,938 | | | | 5,072,334 | |
| | | | | | | | |
Total distributions paid | | $ | 5,477,390 | | | $ | 5,296,405 | |
| | | | | | | | |
As of November 30, 2023, the Portfolios’ most recent tax year end, the components of accumulated earnings (deficit) on a tax basis were as follows:
| | | | | | | | | | | | | | | | |
| Portfolio | | Undistributed Ordinary Income(a) | | | Accumulated Capital and
Other Losses(b) | | | Unrealized Appreciation (Depreciation)(c) | | | Total Accumulated Earnings (Deficit)(d) | |
AB Arizona | | $ | – 0 | – | | $ | (1,144,913 | ) | | $ | (6,389,374 | ) | | $ | (7,534,287 | ) |
AB Massachusetts | | | 31,949 | | | | (2,495,601 | ) | | | (5,470,978 | ) | | | (7,934,630 | ) |
AB Minnesota | | | – 0 | – | | | (301,426 | ) | | | (1,277,214 | ) | | | (1,578,640 | ) |
AB New Jersey | | | – 0 | – | | | (1,124,410 | ) | | | (112,374 | ) | | | (1,236,784 | ) |
AB Ohio | | | 1,867 | | | | (2,985,443 | ) | | | (3,019,516 | ) | | | (6,003,092 | ) |
AB Pennsylvania | | | 1,066 | | | | (1,050,216 | ) | | | (1,538,903 | ) | | | (2,588,053 | ) |
AB Virginia | | | – 0 | – | | | (5,712,937 | ) | | | (7,035,853 | ) | | | (12,748,790 | ) |
| (a) | These amounts represent 100% tax exempt income. |
| | |
| |
| abfunds.com | | AB MUNICIPAL INCOME FUND II | 117 |
NOTES TO FINANCIAL STATEMENTS (continued)
| (b) | At November 30, 2022, AB Arizona Portfolio, AB Massachusetts Portfolio, AB Minnesota Portfolio, AB New Jersey Portfolio, AB Ohio Portfolio, AB Pennsylvania Portfolio, and AB Virginia Portfolio had capital loss carryforwards for federal income tax purposes. During the fiscal year, AB Arizona Portfolio, AB Massachusetts Portfolio, AB Minnesota Portfolio, AB New Jersey Portfolio, AB Ohio Portfolio, AB Pennsylvania Portfolio, and AB Virginia Portfolio had net capital loss carryforwards of $1,144,913, $2,495,601, $301,426, $1,124,410, $2,985,443, $1,050,216, and $5,712,937, respectively. |
| (c) | The differences between book-basis and tax-basis unrealized appreciation (depreciation) are attributable primarily to the tax deferral of losses on wash sales, debt restructuring, and the tax treatment of swaps. |
| (d) | The difference between book-basis and tax-basis components of accumulated earnings (deficit) is attributable primarily to dividends payable. |
For tax purposes, net realized capital losses may be carried over to offset future capital gains, if any. Funds are permitted to carry forward capital losses for an indefinite period, and such losses will retain their character as either short-term or long-term capital losses.
As of November 30, 2023, the Portfolios’ most recent tax year end, the Portfolios’ had net capital loss carryforwards as follows:
| | | | | | | | |
| Portfolio | | Short-Term
Amount | | | Long-Term
Amount | |
AB Arizona | | $ | 1,144,913 | | | $ | – 0 | – |
AB Massachusetts | | | 2,495,601 | | | | – 0 | – |
AB Minnesota | | | 301,426 | | | | – 0 | – |
AB New Jersey | | | 1,124,410 | | | | – 0 | – |
AB Ohio | | | 2,985,443 | | | | – 0 | – |
AB Pennsylvania | | | 1,050,216 | | | | – 0 | – |
AB Virginia | | | 5,712,937 | | | | – 0 | – |
During the current fiscal year, the Portfolios had adjustments due to permanent differences. Permanent differences have no effect on net assets. The effect of such permanent differences on each Portfolio — primarily due to return of capital distributions — is reflected as an adjustment to the components of capital as of May 31, 2024 as shown below:
| | | | | | | | |
| Portfolio | | Increase (Decrease) to Additional Paid-In Capital | | | Increase (Decrease) to Distributable Earnings /
(Accumulated Loss) | |
AB Arizona | | $ | (5,087 | ) | | $ | 5,087 | |
AB Massachusetts | | | – 0 | – | | | – 0 | – |
AB Minnesota | | | (955 | ) | | | 955 | |
AB New Jersey | | | (1,299 | ) | | | 1,299 | |
AB Ohio | | | – 0 | – | | | – 0 | – |
AB Pennsylvania | | | – 0 | – | | | – 0 | – |
AB Virginia | | | (2,887 | ) | | | 2,887 | |
| | |
| |
118 | AB MUNICIPAL INCOME FUND II | | abfunds.com |
NOTES TO FINANCIAL STATEMENTS (continued)
NOTE I
Recent Accounting Pronouncements
In December 2022, the Financial Accounting Standards Board issued an Accounting Standards Update, ASU 2022-06, “Reference Rate Reform (Topic 848) – Deferral of the Sunset Date of Topic 848”. ASU 2022-06 is an amendment to ASU 2020-04, which provided optional guidance to ease the potential accounting burden due to the discontinuation of the LIBOR and other interbank-offered based reference rates and which was effective as of March 12, 2020 through December 31, 2022. ASU 2022-06 extends the effective period through December 31, 2024. Management is currently evaluating the impact, if any, of applying ASU 2022-06.
NOTE J
Subsequent Events
Management has evaluated subsequent events for possible recognition or disclosure in the financial statements through the date the financial statements are issued. Management has determined that there are no material events that would require disclosure in the Portfolios’ financial statements through this date.
| | |
| |
| abfunds.com | | AB MUNICIPAL INCOME FUND II | 119 |
FINANCIAL HIGHLIGHTS
Selected Data For A Share Of Beneficial Interest Outstanding Throughout Each Period
| | | | | | | | | | | | | | | | | | | | |
| | | AB Arizona Portfolio | |
| | | Class A | |
| | | Year Ended May 31, | |
| | | 2024 | | | 2023 | | | 2022 | | | 2021 | | | 2020 | |
| | | | |
| | | | | | | | | | | | | | | | | | | | |
Net asset value, beginning of period | | | $ 10.13 | | | | $ 10.54 | | | | $ 11.43 | | | | $ 11.01 | | | | $ 11.22 | |
| | | | |
Income From Investment Operations | | | | | | | | | | | | | | | | | | | | |
| | | | | |
Net investment income(a)(b) | | | .31 | | | | .29 | | | | .26 | | | | .28 | | | | .30 | |
| | | | | |
Net realized and unrealized gain (loss) on investment transactions | | | .01 | (f) | | | (.41 | ) | | | (.89 | ) | | | .43 | | | | (.21 | ) |
| | | | |
Net increase (decrease) in net asset value from operations | | | .32 | | | | (.12 | ) | | | (.63 | ) | | | .71 | | | | .09 | |
| | | | |
Less: Dividends | | | | | | | | | | | | | | | | | | | | |
| | | | | |
Dividends from net investment income | | | (.29 | ) | | | (.29 | ) | | | (.26 | ) | | | (.29 | ) | | | (.30 | ) |
| | | | |
Net asset value, end of period | | | $ 10.16 | | | | $ 10.13 | | | | $ 10.54 | | | | $ 11.43 | | | | $ 11.01 | |
| | | | |
| | | | | |
Total Return | | | | | | | | | | | | | | | | | | | | |
| | | | | |
Total investment return based on net asset value(c) | | | 3.18 | % | | | (1.09 | )% | | | (5.63 | )% | | | 6.47 | % | | | .77 | % |
| | | | | |
Ratios/Supplemental Data | | | | | | | | | | | | | | | | | | | | |
| | | | | |
Net assets, end of period (000’s omitted) | | | $65,260 | | | | $78,643 | | | | $98,963 | | | | $109,779 | | | | $105,315 | |
| | | | | |
Ratio to average net assets of: | | | | | | | | | | | | | | | | | | | | |
| | | | | |
Expenses, net of waivers/reimbursements(d) | | | .78 | % | | | .79 | % | | | .78 | % | | | .78 | % | | | .78 | % |
| | | | | |
Expenses, before waivers/reimbursements(d) | | | 1.08 | % | | | 1.08 | % | | | .99 | % | | | 1.02 | % | | | 1.00 | % |
| | | | | |
Net investment income(b) | | | 3.07 | % | | | 2.83 | % | | | 2.34 | % | | | 2.47 | % | | | 2.69 | % |
| | | | | |
Portfolio turnover rate | | | 5 | % | | | 16 | % | | | 7 | % | | | 6 | % | | | 13 | % |
See footnote summary on pages 137.
| | |
| |
120 | AB MUNICIPAL INCOME FUND II | | abfunds.com |
FINANCIAL HIGHLIGHTS (continued)
Selected Data For A Share Of Beneficial Interest Outstanding Throughout Each Period
| | | | | | | | | | | | | | | | | | | | |
| | | AB Arizona Portfolio | |
| | | Class C | |
| | | Year Ended May 31, | |
| | | 2024 | | | 2023 | | | 2022 | | | 2021 | | | 2020 | |
| | | | |
| | | | | | | | | | | | | | | | | | | | |
Net asset value, beginning of period | | | $ 10.12 | | | | $ 10.53 | | | | $ 11.41 | | | | $ 10.99 | | | | $ 11.20 | |
| | | | |
Income From Investment Operations | | | | | | | | | | | | | | | | | | | | |
| | | | | |
Net investment income(a)(b) | | | .23 | | | | .21 | | | | .18 | | | | .20 | | | | .22 | |
| | | | | |
Net realized and unrealized gain (loss) on investment transactions | | | 0 | (f) | | | (.40 | ) | | | (.89 | ) | | | .42 | | | | (.22 | ) |
| | | | |
Net increase (decrease) in net asset value from operations | | | .23 | | | | (.19 | ) | | | (.71 | ) | | | .62 | | | | – 0 | – |
| | | | |
Less: Dividends | | | | | | | | | | | | | | | | | | | | |
| | | | | |
Dividends from net investment income | | | (.21 | ) | | | (.22 | ) | | | (.17 | ) | | | (.20 | ) | | | (.21 | ) |
| | | | |
Net asset value, end of period | | | $ 10.14 | | | | $ 10.12 | | | | $ 10.53 | | | | $ 11.41 | | | | $ 10.99 | |
| | | | |
| | | | | |
Total Return | | | | | | | | | | | | | | | | | | | | |
| | | | | |
Total investment return based on net asset value(c) | | | 2.31 | % | | | (1.83 | )% | | | (6.26 | )% | | | 5.68 | % | | | .02 | % |
| | | | | |
Ratios/Supplemental Data | | | | | | | | | | | | | | | | | | | | |
| | | | | |
Net assets, end of period (000’s omitted) | | | $1,717 | | | | $3,532 | | | | $4,585 | | | | $5,901 | | | | $8,935 | |
| | | | | |
Ratio to average net assets of: | | | | | | | | | | | | | | | | | | | | |
| | | | | |
Expenses, net of waivers/reimbursements(d) | | | 1.53 | % | | | 1.54 | % | | | 1.53 | % | | | 1.53 | % | | | 1.53 | % |
| | | | | |
Expenses, before waivers/reimbursements(d) | | | 1.84 | % | | | 1.83 | % | | | 1.74 | % | | | 1.77 | % | | | 1.75 | % |
| | | | | |
Net investment income(b) | | | 2.30 | % | | | 2.09 | % | | | 1.59 | % | | | 1.73 | % | | | 1.95 | % |
| | | | | |
Portfolio turnover rate | | | 5 | % | | | 16 | % | | | 7 | % | | | 6 | % | | | 13 | % |
See footnote summary on pages 137-138.
| | |
| |
| abfunds.com | | AB MUNICIPAL INCOME FUND II | 121 |
FINANCIAL HIGHLIGHTS (continued)
Selected Data For A Share Of Beneficial Interest Outstanding Throughout Each Period
| | | | | | | | | | | | | | | | |
| | | AB Arizona Portfolio | |
| | | Advisor Class | |
| | | Year Ended May 31, | | | March 25 2021(e) to May 31, | |
| | | 2024 | | | 2023 | | | 2022 | | | 2021 | |
| | | | |
Net asset value, beginning of period | | | $ 10.13 | | | | $ 10.54 | | | | $ 11.43 | | | | $ 11.30 | |
| | | | |
Income From Investment Operations | |
| | | | |
Net investment income(a)(b) | | | .34 | | | | .32 | | | | .29 | | | | .06 | |
| | | | |
Net realized and unrealized gain (loss) on investment transactions | | | .01 | (f) | | | (.41 | ) | | | (.89 | ) | | | .13 | |
| | | | |
Net increase (decrease) in net asset value from operations | | | .35 | | | | (.09 | ) | | | (.60 | ) | | | .19 | |
| | | | |
| | | | |
Dividends from net investment income | | | (.32 | ) | | | (.32 | ) | | | (.29 | ) | | | (.06 | ) |
| | | | |
Net asset value, end of period | | | $ 10.16 | | | | $ 10.13 | | | | $ 10.54 | | | | $ 11.43 | |
| | | | |
|
Total Return | |
| | | | |
Total investment return based on net asset value(c) | | | 3.45 | % | | | (.84 | )% | | | (5.39 | )% | | | 1.66 | % |
|
Ratios/Supplemental Data | |
| | | | |
Net assets, end of period (000’s omitted) | | | $13,439 | | | | $10,335 | | | | $8,182 | | | | $3,859 | |
|
Ratio to average net assets of: | |
| | | | |
Expenses, net of waivers/reimbursements(d) | | | .53 | % | | | .54 | % | | | .53 | % | | | .53 | %^ |
| | | | |
Expenses, before waivers/reimbursements(d) | | | .83 | % | | | .83 | % | | | .74 | % | | | 1.00 | %^ |
| | | | |
Net investment income(b) | | | 3.33 | % | | | 3.09 | % | | | 2.60 | % | | | 2.70 | %^ |
| | | | |
Portfolio turnover rate | | | 5 | % | | | 16 | % | | | 7 | % | | | 6 | % |
See footnote summary on pages 137-138.
| | |
| |
122 | AB MUNICIPAL INCOME FUND II | | abfunds.com |
FINANCIAL HIGHLIGHTS (continued)
Selected Data For A Share Of Beneficial Interest Outstanding Throughout Each Period
| | | | | | | | | | | | | | | | | | | | |
| | | AB Massachusetts Portfolio | |
| | | Class A | |
| | | Year Ended May 31, | |
| | | 2024 | | | 2023 | | | 2022 | | | 2021 | | | 2020 | |
| | | | |
| | | | | | | | | | | | | | | | | | | | |
Net asset value, beginning of period | | | $ 10.30 | | | | $ 10.66 | | | | $ 11.66 | | | | $ 11.15 | | | | $ 11.28 | |
| | | | |
Income From Investment Operations | | | | | | | | | | | | | | | | | | | | |
| | | | | |
Net investment income(a)(b) | | | .30 | | | | .27 | | | | .24 | | | | .27 | | | | .31 | |
| | | | | |
Net realized and unrealized gain (loss) on investment transactions | | | (.03 | )(f) | | | (.34 | ) | | | (1.00 | ) | | | .52 | | | | (.12 | ) |
| | | | |
Net increase (decrease) in net asset value from operations | | | .27 | | | | (.07 | ) | | | (.76 | ) | | | .79 | | | | .19 | |
| | | | |
Less: Dividends | | | | | | | | | | | | | | | | | | | | |
| | | | | |
Dividends from net investment income | | | (.30 | ) | | | (.29 | ) | | | (.24 | ) | | | (.28 | ) | | | (.32 | ) |
| | | | |
Net asset value, end of period | | | $ 10.27 | | | | $ 10.30 | | | | $ 10.66 | | | | $ 11.66 | | | | $ 11.15 | |
| | | | |
Total Return | | | | | | | | | | | | | | | | | | | | |
| | | | | |
Total investment return based on net asset value(c) | | | 2.69 | % | | | (.64 | )% | | | (6.63 | )% | | | 7.15 | % | | | 1.67 | % |
| | | | | |
Ratios/Supplemental Data | | | | | | | | | | | | | | | | | | | | |
| | | | | |
Net assets, end of period (000’s omitted) | | | $77,741 | | | | $85,971 | | | | $104,117 | | | | $121,419 | | | | $114,592 | |
| | | | | |
Ratio to average net assets of: | | | | | | | | | | | | | | | | | | | | |
| | | | | |
Expenses, net of waivers/reimbursements(d) | | | .77 | % | | | .77 | % | | | .77 | % | | | .77 | % | | | .77 | % |
| | | | | |
Expenses, before waivers/reimbursements(d) | | | .89 | % | | | .90 | % | | | .87 | % | | | .90 | % | | | .90 | % |
| | | | | |
Net investment income(b) | | | 2.94 | % | | | 2.65 | % | | | 2.08 | % | | | 2.36 | % | | | 2.76 | % |
| | | | | |
Portfolio turnover rate | | | 15 | % | | | 14 | % | | | 11 | % | | | 4 | % | | | 13 | % |
See footnote summary on pages 137-138.
| | |
| |
| abfunds.com | | AB MUNICIPAL INCOME FUND II | 123 |
FINANCIAL HIGHLIGHTS (continued)
Selected Data For A Share Of Beneficial Interest Outstanding Throughout Each Period
| | | | | | | | | | | | | | | | | | | | |
| | | AB Massachusetts Portfolio | |
| | | Class C | |
| | | Year Ended May 31, | |
| | | 2024 | | | 2023 | | | 2022 | | | 2021 | | | 2020 | |
| | | | |
| | | | | | | | | | | | | | | | | | | | |
Net asset value, beginning of period | | | $ 10.28 | | | | $ 10.64 | | | | $ 11.64 | | | | $ 11.13 | | | | $ 11.26 | |
| | | | |
Income From Investment Operations | | | | | | | | | | | | | | | | | | | | |
| | | | | |
Net investment income(a)(b) | | | .22 | | | | .20 | | | | .15 | | | | .19 | | | | .23 | |
| | | | | |
Net realized and unrealized gain (loss) on investment transactions | | | (.02 | )(f) | | | (.35 | ) | | | (1.00 | ) | | | .51 | | | | (.13 | ) |
| | | | |
Net increase (decrease) in net asset value from operations | | | .20 | | | | (.15 | ) | | | (.85 | ) | | | .70 | | | | .10 | |
| | | | |
Less: Dividends | | | | | | | | | | | | | | | | | | | | |
| | | | | |
Dividends from net investment income | | | (.23 | ) | | | (.21 | ) | | | (.15 | ) | | | (.19 | ) | | | (.23 | ) |
| | | | |
Net asset value, end of period | | | $ 10.25 | | | | $ 10.28 | | | | $ 10.64 | | | | $ 11.64 | | | | $ 11.13 | |
| | | | |
Total Return | | | | | | | | | | | | | | | | | | | | |
| | | | | |
Total investment return based on net asset value(c) | | | 1.92 | % | | | (1.39 | )% | | | (7.35 | )% | | | 6.36 | % | | | .91 | % |
| | | | | |
Ratios/Supplemental Data | | | | | | | | | | | | | | | | | | | | |
| | | | | |
Net assets, end of period (000’s omitted) | | | $3,664 | | | | $6,146 | | | | $8,904 | | | | $16,789 | | | | $22,940 | |
| | | | | |
Ratio to average net assets of: | | | | | | | | | | | | | | | | | | | | |
| | | | | |
Expenses, net of waivers/reimbursements(d) | | | 1.52 | % | | | 1.52 | % | | | 1.52 | % | | | 1.52 | % | | | 1.52 | % |
| | | | | |
Expenses, before waivers/reimbursements(d) | | | 1.64 | % | | | 1.65 | % | | | 1.62 | % | | | 1.65 | % | | | 1.65 | % |
| | | | | |
Net investment income(b) | | | 2.19 | % | | | 1.90 | % | | | 1.32 | % | | | 1.62 | % | | | 2.02 | % |
| | | | | |
Portfolio turnover rate | | | 15 | % | | | 14 | % | | | 11 | % | | | 4 | % | | | 13 | % |
See footnote summary on pages 137-138.
| | |
| |
124 | AB MUNICIPAL INCOME FUND II | | abfunds.com |
FINANCIAL HIGHLIGHTS (continued)
Selected Data For A Share Of Beneficial Interest Outstanding Throughout Each Period
| | | | | | | | | | | | | | | | | | | | |
| | | AB Massachusetts Portfolio | |
| | | Advisor Class | |
| | | Year Ended May 31, | |
| | | 2024 | | | 2023 | | | 2022 | | | 2021 | | | 2020 | |
| | | | |
| | | | | | | | | | | | | | | | | | | | |
Net asset value, beginning of period | | | $ 10.30 | | | | $ 10.66 | | | | $ 11.66 | | | | $ 11.15 | | | | $ 11.27 | |
| | | | |
Income From Investment Operations | | | | | | | | | | | | | | | | | | | | |
| | | | | |
Net investment income(a)(b) | | | .33 | | | | .30 | | | | .27 | | | | .30 | | | | .34 | |
| | | | | |
Net realized and unrealized gain (loss) on investment transactions | | | (.04 | )(f) | | | (.35 | ) | | | (1.00 | ) | | | .52 | | | | (.11 | ) |
| | | | |
Net increase (decrease) in net asset value from operations | | | .29 | | | | (.05 | ) | | | (.73 | ) | | | .82 | | | | .23 | |
| | | | |
Less: Dividends | | | | | | | | | | | | | | | | | | | | |
| | | | | |
Dividends from net investment income | | | (.33 | ) | | | (.31 | ) | | | (.27 | ) | | | (.31 | ) | | | (.35 | ) |
| | | | |
Net asset value, end of period | | | $ 10.26 | | | | $ 10.30 | | | | $ 10.66 | | | | $ 11.66 | | | | $ 11.15 | |
| | | | |
Total Return | | | | | | | | | | | | | | | | | | | | |
| | | | | |
Total investment return based on net asset value(c) | | | 2.85 | % | | | (.39 | )% | | | (6.39 | )% | | | 7.42 | % | | | 2.01 | % |
| | | | | |
Ratios/Supplemental Data | | | | | | | | | | | | | | | | | | | | |
| | | | | |
Net assets, end of period (000’s omitted) | | | $151,254 | | | | $111,450 | | | | $109,141 | | | | $78,396 | | | | $61,825 | |
| | | | | |
Ratio to average net assets of: | | | | | | | | | | | | | | | | | | | | |
| | | | | |
Expenses, net of waivers/reimbursements(d) | | | .52 | % | | | .52 | % | | | .52 | % | | | .52 | % | | | .52 | % |
| | | | | |
Expenses, before waivers/reimbursements(d) | | | .64 | % | | | .65 | % | | | .62 | % | | | .65 | % | | | .65 | % |
| | | | | |
Net investment income(b) | | | 3.19 | % | | | 2.91 | % | | | 2.34 | % | | | 2.61 | % | | | 3.00 | % |
| | | | | |
Portfolio turnover rate | | | 15 | % | | | 14 | % | | | 11 | % | | | 4 | % | | | 13 | % |
See footnote summary on pages 137-138.
| | |
| |
| abfunds.com | | AB MUNICIPAL INCOME FUND II | 125 |
FINANCIAL HIGHLIGHTS (continued)
Selected Data For A Share Of Beneficial Interest Outstanding Throughout Each Period
| | | | | | | | | | | | | | | | | | | | |
| | | AB Minnesota Portfolio | |
| | | Class A | |
| | | Year Ended May 31, | |
| | | 2024 | | | 2023 | | | 2022 | | | 2021 | | | 2020 | |
| | | | |
| | | | | | | | | | | | | | | | | | | | |
Net asset value, beginning of period | | | $ 9.41 | | | | $ 9.74 | | | | $ 10.56 | | | | $ 10.32 | | | | $ 10.33 | |
| | | | |
Income From Investment Operations | | | | | | | | | | | | | | | | | | | | |
| | | | | |
Net investment income(a)(b) | | | .25 | | | | .23 | | | | .21 | | | | .22 | | | | .25 | |
| | | | | |
Net realized and unrealized gain (loss) on investment transactions | | | (.07 | ) | | | (.31 | ) | | | (.82 | ) | | | .28 | | | | .01 | (f) |
| | | | |
Net increase (decrease) in net asset value from operations | | | .18 | | | | (.08 | ) | | | (.61 | ) | | | .50 | | | | .26 | |
| | | | |
Less: Dividends | | | | | | | | | | | | | | | | | | | | |
| | | | | |
Dividends from net investment income | | | (.22 | ) | | | (.25 | ) | | | (.21 | ) | | | (.26 | ) | | | (.27 | ) |
| | | | |
Net asset value, end of period | | | $ 9.37 | | | | $ 9.41 | | | | $ 9.74 | | | | $ 10.56 | | | | $ 10.32 | |
| | | | |
Total Return | | | | | | | | | | | | | | | | | | | | |
| | | | | |
Total investment return based on net asset value(c) | | | 1.92 | % | | | (.84 | )% | | | (5.85 | )% | | | 4.87 | % | | | 2.51 | % |
| | | | | |
Ratios/Supplemental Data | | | | | | | | | | | | | | | | | | | | |
| | | | | |
Net assets, end of period (000’s omitted) | | | $29,388 | | | | $33,801 | | | | $47,331 | | | | $54,933 | | | | $49,723 | |
| | | | | |
Ratio to average net assets of: | | | | | | | | | | | | | | | | | | | | |
| | | | | |
Expenses, net of waivers/reimbursements(d) | | | .85 | % | | | .85 | % | | | .85 | % | | | .85 | % | | | .85 | % |
| | | | | |
Expenses, before waivers/reimbursements(d) | | | 1.57 | % | | | 1.52 | % | | | 1.10 | % | | | 1.22 | % | | | 1.26 | % |
| | | | | |
Net investment income(b) | | | 2.69 | % | | | 2.45 | % | | | 2.01 | % | | | 2.07 | % | | | 2.44 | % |
| | | | | |
Portfolio turnover rate | | | 4 | % | | | 17 | % | | | 9 | % | | | 5 | % | | | 10 | % |
See footnote summary on pages 137-138.
| | |
| |
126 | AB MUNICIPAL INCOME FUND II | | abfunds.com |
FINANCIAL HIGHLIGHTS (continued)
Selected Data For A Share Of Beneficial Interest Outstanding Throughout Each Period
| | | | | | | | | | | | | | | | | | | | |
| | | AB Minnesota Portfolio | |
| | | Class C | |
| | | Year Ended May 31, | |
| | | 2024 | | | 2023 | | | 2022 | | | 2021 | | | 2020 | |
| | | | |
| | | | | | | | | | | | | | | | | | | | |
Net asset value, beginning of period | | | $ 9.42 | | | | $ 9.75 | | | | $ 10.57 | | | | $ 10.33 | | | | $ 10.35 | |
| | | | |
Income From Investment Operations | | | | | | | | | | | | | | | | | | | | |
| | | | | |
Net investment income(a)(b) | | | .18 | | | | .16 | | | | .13 | | | | .14 | | | | .18 | |
| | | | | |
Net realized and unrealized gain (loss) on investment transactions | | | (.07 | ) | | | (.32 | ) | | | (.82 | ) | | | .28 | | | | (.01 | ) |
| | | | |
Net increase (decrease) in net asset value from operations | | | .11 | | | | (.16 | ) | | | (.69 | ) | | | .42 | | | | .17 | |
| | | | |
Less: Dividends | | | | | | | | | | | | | | | | | | | | |
| | | | | |
Dividends from net investment income | | | (.15 | ) | | | (.17 | ) | | | (.13 | ) | | | (.18 | ) | | | (.19 | ) |
| | | | |
Net asset value, end of period | | | $ 9.38 | | | | $ 9.42 | | | | $ 9.75 | | | | $ 10.57 | | | | $ 10.33 | |
| | | | |
Total Return | | | | | | | | | | | | | | | | | | | | |
| | | | | |
Total investment return based on net asset value(c) | | | 1.15 | % | | | (1.59 | )% | | | (6.56 | )% | | | 4.08 | % | | | 1.64 | % |
| | | | | |
Ratios/Supplemental Data | | | | | | | | | | | | | | | | | | | | |
| | | | | |
Net assets, end of period (000’s omitted) | | | $1,224 | | | | $1,872 | | | | $3,018 | | | | $4,420 | | | | $4,922 | |
| | | | | |
Ratio to average net assets of: | | | | | | | | | | | | | | | | | | | | |
| | | | | |
Expenses, net of waivers/reimbursements(d) | | | 1.60 | % | | | 1.60 | % | | | 1.60 | % | | | 1.60 | % | | | 1.60 | % |
| | | | | |
Expenses, before waivers/reimbursements(d) | | | 2.33 | % | | | 2.27 | % | | | 1.86 | % | | | 1.97 | % | | | 2.02 | % |
| | | | | |
Net investment income(b) | | | 1.94 | % | | | 1.70 | % | | | 1.25 | % | | | 1.31 | % | | | 1.69 | % |
| | | | | |
Portfolio turnover rate | | | 4 | % | | | 17 | % | | | 9 | % | | | 5 | % | | | 10 | % |
See footnote summary on pages 137-138.
| | |
| |
| abfunds.com | | AB MUNICIPAL INCOME FUND II | 127 |
FINANCIAL HIGHLIGHTS (continued)
Selected Data For A Share Of Beneficial Interest Outstanding Throughout Each Period
| | | | | | | | | | | | | | | | | | | | |
| | | AB New Jersey Portfolio | |
| | | Class A | |
| | | Year Ended May 31, | |
| | | 2024 | | | 2023 | | | 2022 | | | 2021 | | | 2020 | |
| | | | |
| | | | | | | | | | | | | | | | | | | | |
Net asset value, beginning of period | | | $ 9.04 | | | | $ 9.29 | | | | $ 10.13 | | | | $ 9.59 | | | | $ 9.84 | |
| | | | |
Income From Investment Operations | | | | | | | | | | | | | | | | | | | | |
| | | | | |
Net investment income(a)(b) | | | .31 | | | | .28 | | | | .27 | | | | .28 | | | | .30 | |
| | | | | |
Net realized and unrealized gain (loss) on investment transactions | | | (.06 | ) | | | (.23 | ) | | | (.84 | ) | | | .55 | | | | (.25 | ) |
| | | | |
Net increase (decrease) in net asset value from operations | | | .25 | | | | .05 | | | | (.57 | ) | | | .83 | | | | .05 | |
| | | | |
Less: Dividends | | | | | | | | | | | | | | | | | | | | |
| | | | | |
Dividends from net investment income | | | (.30 | ) | | | (.30 | ) | | | (.27 | ) | | | (.29 | ) | | | (.30 | ) |
| | | | |
Net asset value, end of period | | | $ 8.99 | | | | $ 9.04 | | | | $ 9.29 | | | | $ 10.13 | | | | $ 9.59 | |
| | | | |
Total Return | | | | | | | | | | | | | | | | | | | | |
| | | | | |
Total investment return based on net asset value(c) | | | 2.81 | % | | | .55 | % | | | (5.71 | )% | | | 8.74 | % | | | .50 | % |
| | | | | |
Ratios/Supplemental Data | | | | | | | | | | | | | | | | | | | | |
| | | | | |
Net assets, end of period (000’s omitted) | | | $62,537 | | | | $60,002 | | | | $62,000 | | | | $70,145 | | | | $66,446 | |
| | | | | |
Ratio to average net assets of: | | | | | | | | | | | | | | | | | | | | |
| | | | | |
Expenses, net of waivers/reimbursements(d) | | | .82 | % | | | .82 | % | | | .82 | % | | | .82 | % | | | .84 | % |
| | | | | |
Expenses, before waivers/reimbursements(d) | | | 1.21 | % | | | 1.27 | % | | | 1.15 | % | | | 1.14 | % | | | 1.12 | % |
| | | | | |
Net investment income(b) | | | 3.43 | % | | | 3.14 | % | | | 2.70 | % | | | 2.78 | % | | | 3.09 | % |
| | | | | |
Portfolio turnover rate | | | 14 | % | | | 26 | % | | | 21 | % | | | 22 | % | | | 10 | % |
See footnote summary on pages 137-138.
| | |
| |
128 | AB MUNICIPAL INCOME FUND II | | abfunds.com |
FINANCIAL HIGHLIGHTS (continued)
Selected Data For A Share Of Beneficial Interest Outstanding Throughout Each Period
| | | | | | | | | | | | | | | | | | | | |
| | | AB New Jersey Portfolio | |
| | | Class C | |
| | | Year Ended May 31, | |
| | | 2024 | | | 2023 | | | 2022 | | | 2021 | | | 2020 | |
| | | | |
| | | | | | | | | | | | | | | | | | | | |
Net asset value, beginning of period | | | $ 9.04 | | | | $ 9.30 | | | | $ 10.13 | | | | $ 9.60 | | | | $ 9.85 | |
| | | | |
Income From Investment Operations | | | | | | | | | | | | | | | | | | | | |
| | | | | |
Net investment income(a)(b) | | | .24 | | | | .21 | | | | .19 | | | | .20 | | | | .23 | |
| | | | | |
Net realized and unrealized gain (loss) on investment transactions | | | (.05 | ) | | | (.24 | ) | | | (.82 | ) | | | .54 | | | | (.25 | ) |
| | | | |
Net increase (decrease) in net asset value from operations | | | .19 | | | | (.03 | ) | | | (.63 | ) | | | .74 | | | | (.02 | ) |
| | | | |
Less: Dividends | | | | | | | | | | | | | | | | | | | | |
| | | | | |
Dividends from net investment income | | | (.23 | ) | | | (.23 | ) | | | (.20 | ) | | | (.21 | ) | | | (.23 | ) |
| | | | |
Net asset value, end of period | | | $ 9.00 | | | | $ 9.04 | | | | $ 9.30 | | | | $ 10.13 | | | | $ 9.60 | |
| | | | |
Total Return | | | | | | | | | | | | | | | | | | | | |
| | | | | |
Total investment return based on net asset value(c) | | | 2.14 | % | | | (.31 | )% | | | (6.33 | )% | | | 7.81 | % | | | (.25 | )% |
| | | | | |
Ratios/Supplemental Data | | | | | | | | | | | | | | | | | | | | |
| | | | | |
Net assets, end of period (000’s omitted) | | | $736 | | | | $1,551 | | | | $2,357 | | | | $5,269 | | | | $7,891 | |
| | | | | |
Ratio to average net assets of: | | | | | | | | | | | | | | | | | | | | |
| | | | | |
Expenses, net of waivers/reimbursements(d) | | | 1.57 | % | | | 1.57 | % | | | 1.57 | % | | | 1.57 | % | | | 1.59 | % |
| | | | | |
Expenses, before waivers/reimbursements(d) | | | 1.95 | % | | | 2.02 | % | | | 1.89 | % | | | 1.89 | % | | | 1.87 | % |
| | | | | |
Net investment income(b) | | | 2.67 | % | | | 2.37 | % | | | 1.92 | % | | | 2.05 | % | | | 2.34 | % |
| | | | | |
Portfolio turnover rate | | | 14 | % | | | 26 | % | | | 21 | % | | | 22 | % | | | 10 | % |
See footnote summary on pages 137-138.
| | |
| |
| abfunds.com | | AB MUNICIPAL INCOME FUND II | 129 |
FINANCIAL HIGHLIGHTS (continued)
Selected Data For A Share Of Beneficial Interest Outstanding Throughout Each Period
| | | | | | | | | | | | | | | | | | | | |
| | | AB Ohio Portfolio | |
| | | Class A | |
| | | Year Ended May 31, | |
| | | 2024 | | | 2023 | | | 2022 | | | 2021 | | | 2020 | |
| | | | |
| | | | | | | | | | | | | | | | | | | | |
Net asset value, beginning of period | | | $ 9.15 | | | | $ 9.50 | | | | $ 10.34 | | | | $ 9.88 | | | | $ 10.01 | |
| | | | |
Income From Investment Operations | | | | | | | | | | | | | | | | | | | | |
| | | | | |
Net investment income(a)(b) | | | .28 | | | | .26 | | | | .23 | | | | .26 | | | | .28 | |
| | | | | |
Net realized and unrealized gain (loss) on investment transactions | | | .03 | | | | (.34 | ) | | | (.84 | ) | | | .46 | | | | (.13 | ) |
| | | | |
Net increase (decrease) in net asset value from operations | | | .31 | | | | (.08 | ) | | | (.61 | ) | | | .72 | | | | .15 | |
| | | | |
Less: Dividends | | | | | | | | | | | | | | | | | | | | |
| | | | | |
Dividends from net investment income | | | (.27 | ) | | | (.27 | ) | | | (.23 | ) | | | (.26 | ) | | | (.28 | ) |
| | | | |
Net asset value, end of period | | | $ 9.19 | | | | $ 9.15 | | | | $ 9.50 | | | | $ 10.34 | | | | $ 9.88 | |
| | | | |
Total Return | | | | | | | | | | | | | | | | | | | | |
| | | | | |
Total investment return based on net asset value(c) | | | 3.42 | % | | | (.84 | )% | | | (6.04 | )% | | | 7.40 | % | | | 1.45 | % |
| | | | | |
Ratios/Supplemental Data | | | | | | | | | | | | | | | | | | | | |
| | | | | |
Net assets, end of period (000’s omitted) | | | $42,262 | | | | $49,565 | | | | $71,345 | | | | $69,533 | | | | $66,573 | |
| | | | | |
Ratio to average net assets of: | | | | | | | | | | | | | | | | | | | | |
| | | | | |
Expenses, net of waivers/reimbursements(d) | | | .81 | % | | | .81 | % | | | .80 | % | | | .80 | % | | | .81 | % |
| | | | | |
Expenses, before waivers/reimbursements(d) | | | 1.35 | % | | | 1.31 | % | | | 1.15 | % | | | 1.16 | % | | | 1.13 | % |
| | | | | |
Net investment income(b) | | | 3.07 | % | | | 2.83 | % | | | 2.32 | % | | | 2.52 | % | | | 2.78 | % |
| | | | | |
Portfolio turnover rate | | | 16 | % | | | 12 | % | | | 15 | % | | | 17 | % | | | 19 | % |
See footnote summary on pages 137-138.
| | |
| |
130 | AB MUNICIPAL INCOME FUND II | | abfunds.com |
FINANCIAL HIGHLIGHTS (continued)
Selected Data For A Share Of Beneficial Interest Outstanding Throughout Each Period
| | | | | | | | | | | | | | | | | | | | |
| | | AB Ohio Portfolio | |
| | | Class C | |
| | | Year Ended May 31, | |
| | | 2024 | | | 2023 | | | 2022 | | | 2021 | | | 2020 | |
| | | | |
| | | | | | | | | | | | | | | | | | | | |
Net asset value, beginning of period | | | $ 9.14 | | | | $ 9.49 | | | | $ 10.34 | | | | $ 9.88 | | | | $ 10.01 | |
| | | | |
Income From Investment Operations | | | | | | | | | | | | | | | | | | | | |
| | | | | |
Net investment income(a)(b) | | | .21 | | | | .19 | | | | .16 | | | | .18 | | | | .20 | |
| | | | | |
Net realized and unrealized gain (loss) on investment transactions | | | .03 | | | | (.34 | ) | | | (.86 | ) | | | .47 | | | | (.13 | ) |
| | | | |
Net increase (decrease) in net asset value from operations | | | .24 | | | | (.15 | ) | | | (.70 | ) | | | .65 | | | | .07 | |
| | | | |
Less: Dividends | | | | | | | | | | | | | | | | | | | | |
| | | | | |
Dividends from net investment income | | | (.20 | ) | | | (.20 | ) | | | (.15 | ) | | | (.19 | ) | | | (.20 | ) |
| | | | |
Net asset value, end of period | | | $ 9.18 | | | | $ 9.14 | | | | $ 9.49 | | | | $ 10.34 | | | | $ 9.88 | |
| | | | |
Total Return | | | | | | | | | | | | | | | | | | | | |
| | | | | |
Total investment return based on net asset value(c) | | | 2.65 | % | | | (1.58 | )% | | | (6.85 | )% | | | 6.60 | % | | | .70 | % |
| | | | | |
Ratios/Supplemental Data | | | | | | | | | | | | | | | | | | | | |
| | | | | |
Net assets, end of period (000’s omitted) | | | $1,499 | | | | $1,538 | | | | $1,870 | | | | $3,986 | | | | $5,728 | |
| | | | | |
Ratio to average net assets of: | | | | | | | | | | | | | | | | | | | | |
| | | | | |
Expenses, net of waivers/reimbursements(d) | | | 1.56 | % | | | 1.56 | % | | | 1.55 | % | | | 1.55 | % | | | 1.56 | % |
| | | | | |
Expenses, before waivers/reimbursements(d) | | | 2.11 | % | | | 2.07 | % | | | 1.90 | % | | | 1.91 | % | | | 1.88 | % |
| | | | | |
Net investment income(b) | | | 2.32 | % | | | 2.10 | % | | | 1.55 | % | | | 1.78 | % | | | 2.03 | % |
| | | | | |
Portfolio turnover rate | | | 16 | % | | | 12 | % | | | 15 | % | | | 17 | % | | | 19 | % |
See footnote summary on pages 137-138.
| | |
| |
| abfunds.com | | AB MUNICIPAL INCOME FUND II | 131 |
FINANCIAL HIGHLIGHTS (continued)
Selected Data For A Share Of Beneficial Interest Outstanding Throughout Each Period
| | | | | | | | | | | | | | | | | | | | |
| | | AB Pennsylvania Portfolio | |
| | | Class A | |
| | | Year Ended May 31, | |
| | | 2024 | | | 2023 | | | 2022 | | | 2021 | | | 2020 | |
| | | | |
| | | | | | | | | | | | | | | | | | | | |
Net asset value, beginning of period | | | $ 9.57 | | | | $ 9.96 | | | | $ 10.90 | | | | $ 10.45 | | | | $ 10.55 | |
| | | | |
Income From Investment Operations | | | | | | | | | | | | | | | | | | | | |
| | | | | |
Net investment income(a)(b) | | | .31 | | | | .28 | | | | .26 | | | | .28 | | | | .31 | |
| | | | | |
Net realized and unrealized gain (loss) on investment transactions | | | (.06 | ) | | | (.38 | ) | | | (.93 | ) | | | .46 | | | | (.11 | ) |
| | | | |
Net increase (decrease) in net asset value from operations | | | .25 | | | | (.10 | ) | | | (.67 | ) | | | .74 | | | | .20 | |
| | | | |
Less: Dividends | | | | | | | | | | | | | | | | | | | | |
| | | | | |
Dividends from net investment income | | | (.30 | ) | | | (.29 | ) | | | (.27 | ) | | | (.29 | ) | | | (.30 | ) |
| | | | |
Net asset value, end of period | | | $ 9.52 | | | | $ 9.57 | | | | $ 9.96 | | | | $ 10.90 | | | | $ 10.45 | |
| | | | |
Total Return | | | | | | | | | | | | | | | | | | | | |
| | | | | |
Total investment return based on net asset value(c) | | | 2.61 | % | | | (1.01 | )% | | | (6.31 | )% | | | 7.15 | % | | | 1.95 | % |
| | | | | |
Ratios/Supplemental Data | | | | | | | | | | | | | | | | | | | | |
| | | | | |
Net assets, end of period (000’s omitted) | | | $46,646 | | | | $50,082 | | | | $57,968 | | | | $64,592 | | | | $66,575 | |
| | | | | |
Ratio to average net assets of: | | | | | | | | | | | | | | | | | | | | |
| | | | | |
Expenses, net of waivers/reimbursements(d) | | | .85 | % | | | .85 | % | | | .85 | % | | | .85 | % | | | .85 | % |
| | | | | |
Expenses, before waivers/reimbursements(d) | | | 1.36 | % | | | 1.35 | % | | | 1.18 | % | | | 1.19 | % | | | 1.14 | % |
| | | | | |
Net investment income(b) | | | 3.30 | % | | | 2.88 | % | | | 2.46 | % | | | 2.64 | % | | | 2.91 | % |
| | | | | |
Portfolio turnover rate | | | 19 | % | | | 15 | % | | | 13 | % | | | 12 | % | | | 11 | % |
See footnote summary on pages 137-138.
| | |
| |
132 | AB MUNICIPAL INCOME FUND II | | abfunds.com |
FINANCIAL HIGHLIGHTS (continued)
Selected Data For A Share Of Beneficial Interest Outstanding Throughout Each Period
| | | | | | | | | | | | | | | | | | | | |
| | | AB Pennsylvania Portfolio | |
| | | Class C | |
| | | Year Ended May 31, | |
| | | 2024 | | | 2023 | | | 2022 | | | 2021 | | | 2020 | |
| | | | |
| | | | | | | | | | | | | | | | | | | | |
Net asset value, beginning of period | | | $ 9.57 | | | | $ 9.96 | | | | $ 10.91 | | | | $ 10.45 | | | | $ 10.56 | |
| | | | |
Income From Investment Operations | | | | | | | | | | | | | | | | | | | | |
| | | | | |
Net investment income(a)(b) | | | .24 | | | | .21 | | | | .18 | | | | .20 | | | | .23 | |
| | | | | |
Net realized and unrealized gain (loss) on investment transactions | | | (.06 | ) | | | (.39 | ) | | | (.95 | ) | | | .47 | | | | (.12 | ) |
| | | | |
Net increase (decrease) in net asset value from operations | | | .18 | | | | (.18 | ) | | | (.77 | ) | | | .67 | | | | .11 | |
| | | | |
Less: Dividends | | | | | | | | | | | | | | | | | | | | |
| | | | | |
Dividends from net investment income | | | (.22 | ) | | | (.21 | ) | | | (.18 | ) | | | (.21 | ) | | | (.22 | ) |
| | | | |
Net asset value, end of period | | | $ 9.53 | | | | $ 9.57 | | | | $ 9.96 | | | | $ 10.91 | | | | $ 10.45 | |
| | | | |
Total Return | | | | | | | | | | | | | | | | | | | | |
| | | | | |
Total investment return based on net asset value(c) | | | 1.95 | % | | | (1.76 | )% | | | (7.11 | )% | | | 6.45 | % | | | 1.09 | % |
| | | | | |
Ratios/Supplemental Data | | | | | | | | | | | | | | | | | | | | |
| | | | | |
Net assets, end of period (000’s omitted) | | | $532 | | | | $1,029 | | | | $1,056 | | | | $3,136 | | | | $4,181 | |
| | | | | |
Ratio to average net assets of: | | | | | | | | | | | | | | | | | | | | |
| | | | | |
Expenses, net of waivers/reimbursements(d) | | | 1.60 | % | | | 1.60 | % | | | 1.60 | % | | | 1.60 | % | | | 1.60 | % |
| | | | | |
Expenses, before waivers/reimbursements(d) | | | 2.11 | % | | | 2.10 | % | | | 1.93 | % | | | 1.94 | % | | | 1.89 | % |
| | | | | |
Net investment income(b) | | | 2.52 | % | | | 2.13 | % | | | 1.70 | % | | | 1.89 | % | | | 2.16 | % |
| | | | | |
Portfolio turnover rate | | | 19 | % | | | 15 | % | | | 13 | % | | | 12 | % | | | 11 | % |
See footnote summary on pages 137-138.
| | |
| |
| abfunds.com | | AB MUNICIPAL INCOME FUND II | 133 |
FINANCIAL HIGHLIGHTS (continued)
Selected Data For A Share Of Beneficial Interest Outstanding Throughout Each Period
| | | | | | | | | | | | | | | | | | | | |
| | | AB Virginia Portfolio | |
| | | Class A | |
| | | Year Ended May 31, | |
| | | 2024 | | | 2023 | | | 2022 | | | 2021 | | | 2020 | |
| | | | |
| | | | | | | | | | | | | | | | | | | | |
Net asset value, beginning of period | | | $ 10.31 | | | | $ 10.62 | | | | $ 11.61 | | | | $ 11.09 | | | | $ 11.19 | |
| | | | |
Income From Investment Operations | | | | | | | | | | | | | | | | | | | | |
| | | | | |
Net investment income(a)(b) | | | .28 | | | | .26 | | | | .23 | | | | .26 | | | | .29 | |
| | | | | |
Net realized and unrealized gain (loss) on investment transactions | | | (.02 | ) | | | (.30 | ) | | | (.99 | ) | | | .52 | | | | (.10 | ) |
| | | | |
Net increase (decrease) in net asset value from operations | | | .26 | | | | (.04 | ) | | | (.76 | ) | | | .78 | | | | .19 | |
| | | | |
Less: Dividends | | | | | | | | | | | | | | | | | | | | |
| | | | | |
Dividends from net investment income | | | (.27 | ) | | | (.27 | ) | | | (.23 | ) | | | (.26 | ) | | | (.29 | ) |
| | | | |
Net asset value, end of period | | | $ 10.30 | | | | $ 10.31 | | | | $ 10.62 | | | | $ 11.61 | | | | $ 11.09 | |
| | | | |
Total Return | | | | | | | | | | | | | | | | | | | | |
| | | | | |
Total investment return based on net asset value(c) | | | 2.53 | % | | | (.37 | )% | | | (6.64 | )% | | | 7.10 | % | | | 1.71 | % |
| | | | | |
Ratios/Supplemental Data | | | | | | | | | | | | | | | | | | | | |
| | | | | |
Net assets, end of period (000’s omitted) | | | $105,807 | | | | $115,542 | | | | $133,626 | | | | $147,660 | | | | $133,346 | |
| | | | | |
Ratio to average net assets of: | | | | | | | | | | | | | | | | | | | | |
| | | | | |
Expenses, net of waivers/reimbursements(d) | | | .80 | % | | | .80 | % | | | .80 | % | | | .80 | % | | | .80 | % |
| | | | | |
Expenses, before waivers/reimbursements(d) | | | .89 | % | | | .91 | % | | | .86 | % | | | .89 | % | | | .90 | % |
| | | | | |
Net investment income(b) | | | 2.76 | % | | | 2.49 | % | | | 2.04 | % | | | 2.27 | % | | | 2.62 | % |
| | | | | |
Portfolio turnover rate | | | 15 | % | | | 13 | % | | | 13 | % | | | 9 | % | | | 16 | % |
See footnote summary on pages 137-138.
| | |
| |
134 | AB MUNICIPAL INCOME FUND II | | abfunds.com |
FINANCIAL HIGHLIGHTS (continued)
Selected Data For A Share Of Beneficial Interest Outstanding Throughout Each Period
| | | | | | | | | | | | | | | | | | | | |
| | | AB Virginia Portfolio | |
| | | Class C | |
| | | Year Ended May 31, | |
| | | 2024 | | | 2023 | | | 2022 | | | 2021 | | | 2020 | |
| | | | |
| | | | | | | | | | | | | | | | | | | | |
Net asset value, beginning of period | | | $ 10.28 | | | | $ 10.59 | | | | $ 11.58 | | | | $ 11.07 | | | | $ 11.16 | |
| | | | |
Income From Investment Operations | | | | | | | | | | | | | | | | | | | | |
| | | | | |
Net investment income(a)(b) | | | .21 | | | | .18 | | | | .15 | | | | .17 | | | | .21 | |
| | | | | |
Net realized and unrealized gain (loss) on investment transactions | | | (.03 | ) | | | (.30 | ) | | | (1.00 | ) | | | .51 | | | | (.09 | ) |
| | | | |
Net increase (decrease) in net asset value from operations | | | .18 | | | | (.12 | ) | | | (.85 | ) | | | .68 | | | | .12 | |
| | | | |
Less: Dividends | | | | | | | | | | | | | | | | | | | | |
| | | | | |
Dividends from net investment income | | | (.19 | ) | | | (.19 | ) | | | (.14 | ) | | | (.17 | ) | | | (.21 | ) |
| | | | |
Net asset value, end of period | | | $ 10.27 | | | | $ 10.28 | | | | $ 10.59 | | | | $ 11.58 | | | | $ 11.07 | |
| | | | |
Total Return | | | | | | | | | | | | | | | | | | | | |
| | | | | |
Total investment return based on net asset value(c) | | | 1.87 | % | | | (1.11 | )% | | | (7.37 | )% | | | 6.22 | % | | | 1.04 | % |
| | | | | |
Ratios/Supplemental Data | | | | | | | | | | | | | | | | | | | | |
| | | | | |
Net assets, end of period (000’s omitted) | | | $5,033 | | | | $7,163 | | | | $8,452 | | | | $13,118 | | | | $20,540 | |
| | | | | |
Ratio to average net assets of: | | | | | | | | | | | | | | | | | | | | |
| | | | | |
Expenses, net of waivers/reimbursements(d) | | | 1.55 | % | | | 1.55 | % | | | 1.55 | % | | | 1.55 | % | | | 1.55 | % |
| | | | | |
Expenses, before waivers/reimbursements(d) | | | 1.64 | % | | | 1.67 | % | | | 1.61 | % | | | 1.64 | % | | | 1.65 | % |
| | | | | |
Net investment income(b) | | | 2.01 | % | | | 1.74 | % | | | 1.29 | % | | | 1.53 | % | | | 1.89 | % |
| | | | | |
Portfolio turnover rate | | | 15 | % | | | 13 | % | | | 13 | % | | | 9 | % | | | 16 | % |
See footnote summary on pages 137-138.
| | |
| |
| abfunds.com | | AB MUNICIPAL INCOME FUND II | 135 |
FINANCIAL HIGHLIGHTS (continued)
Selected Data For A Share Of Beneficial Interest Outstanding Throughout Each Period
| | | | | | | | | | | | | | | | | | | | |
| | | AB Virginia Portfolio | |
| | | Advisor Class | |
| | | Year Ended May 31, | |
| | | 2024 | | | 2023 | | | 2022 | | | 2021 | | | 2020 | |
| | | | |
| | | | | | | | | | | | | | | | | | | | |
Net asset value, beginning of period | | | $ 10.31 | | | | $ 10.62 | | | | $ 11.61 | | | | $ 11.10 | | | | $ 11.20 | |
| | | | |
Income From Investment Operations | | | | | | | | | | | | | | | | | | | | |
| | | | | |
Net investment income(a)(b) | | | .31 | | | | .28 | | | | .26 | | | | .29 | | | | .32 | |
| | | | | |
Net realized and unrealized gain (loss) on investment transactions | | | (.01 | ) | | | (.30 | ) | | | (.99 | ) | | | .51 | | | | (.10 | ) |
| | | | |
Net increase (decrease) in net asset value from operations | | | .30 | | | | (.02 | ) | | | (.73 | ) | | | .80 | | | | .22 | |
| | | | |
Less: Dividends | | | | | | | | | | | | | | | | | | | | |
| | | | | |
Dividends from net investment income | | | (.30 | ) | | | (.29 | ) | | | (.26 | ) | | | (.29 | ) | | | (.32 | ) |
| | | | |
Net asset value, end of period | | | $ 10.31 | | | | $ 10.31 | | | | $ 10.62 | | | | $ 11.61 | | | | $ 11.10 | |
| | | | |
Total Return | | | | | | | | | | | | | | | | | | | | |
| | | | | |
Total investment return based on net asset value(c) | | | 2.89 | % | | | (.12 | )% | | | (6.41 | )% | | | 7.27 | % | | | 1.96 | % |
| | | | | |
Ratios/Supplemental Data | | | | | | | | | | | | | | | | | | | | |
| | | | | |
Net assets, end of period (000’s omitted) | | | $80,755 | | | | $85,165 | | | | $90,811 | | | | $75,692 | | | | $56,772 | |
| | | | | |
Ratio to average net assets of: | | | | | | | | | | | | | | | | | | | | |
| | | | | |
Expenses, net of waivers/reimbursements(d) | | | .55 | % | | | .55 | % | | | .55 | % | | | .55 | % | | | .55 | % |
| | | | | |
Expenses, before waivers/reimbursements(d) | | | .64 | % | | | .66 | % | | | .61 | % | | | .64 | % | | | .65 | % |
| | | | | |
Net investment income(b) | | | 3.01 | % | | | 2.73 | % | | | 2.30 | % | | | 2.51 | % | | | 2.87 | % |
| | | | | |
Portfolio turnover rate. | | | 15 | % | | | 13 | % | | | 13 | % | | | 9 | % | | | 16 | % |
See footnote summary on pages 137-138.
| | |
| |
136 | AB MUNICIPAL INCOME FUND II | | abfunds.com |
FINANCIAL HIGHLIGHTS (continued)
Selected Data For A Share Of Beneficial Interest Outstanding Throughout Each Period
| (a) | Based on average shares outstanding. |
| (b) | Net of expenses waived/reimbursed by the Adviser. |
| (c) | Total investment return is calculated assuming an initial investment made at the net asset value at the beginning of the period, reinvestment of all dividends and distributions at net asset value during the period, and redemption on the last day of the period. Initial sales charges or contingent deferred sales charges are not reflected in the calculation of total investment return. Total return does not reflect the deduction of taxes that a shareholder would pay on fund distributions or the redemption of fund shares. Total investment return calculated for a period of less than one year is not annualized. |
| (d) | The expense ratios presented below exclude interest/bank overdraft expense: |
| | | | | | | | | | | | | | | | | | | | |
| | | Year Ended May 31, | |
| | | 2024 | | | 2023 | | | 2022 | | | 2021 | | | 2020 | |
| | | | | | | | | | | | | | | | | | | | |
AB Arizona Portfolio | | | | | | | | | | | | | | | | | | | | |
Class A | |
Net of waivers/reimbursements | | | .78 | % | | | .78 | % | | | .78 | % | | | .78 | % | | | .78 | % |
Before waivers/reimbursements | | | 1.08 | % | | | 1.07 | % | | | .99 | % | | | 1.02 | % | | | 1.00 | % |
Class C | |
Net of waivers/reimbursements | | | 1.53 | % | | | 1.53 | % | | | 1.53 | % | | | 1.53 | % | | | 1.53 | % |
Before waivers/reimbursements | | | 1.83 | % | | | 1.82 | % | | | 1.74 | % | | | 1.77 | % | | | 1.75 | % |
Advisor Class | |
Net of waivers/reimbursements | | | .53 | % | | | .53 | % | | | .53 | % | | | .53 | %^ | | | N/A | |
Before waivers/reimbursements | | | .83 | % | | | .82 | % | | | .74 | % | | | 1.00 | %^ | | | N/A | |
| | | | | |
AB Massachusetts Portfolio | | | | | | | | | | | | | | | | | | | | |
Class A | |
Net of waivers/reimbursements | | | .77 | % | | | .77 | % | | | .77 | % | | | .77 | % | | | .77 | % |
Before waivers/reimbursements | | | .89 | % | | | .90 | % | | | .87 | % | | | .90 | % | | | .90 | % |
Class C | |
Net of waivers/reimbursements | | | 1.52 | % | | | 1.52 | % | | | 1.52 | % | | | 1.52 | % | | | 1.52 | % |
Before waivers/reimbursements | | | 1.64 | % | | | 1.65 | % | | | 1.62 | % | | | 1.65 | % | | | 1.65 | % |
Advisor Class | |
Net of waivers/reimbursements | | | .52 | % | | | .52 | % | | | .52 | % | | | .52 | % | | | .52 | % |
Before waivers/reimbursements | | | .64 | % | | | .65 | % | | | .62 | % | | | .65 | % | | | .65 | % |
| | | | | |
AB Minnesota Portfolio | | | | | | | | | | | | | | | | | | | | |
Class A | |
Net of waivers/reimbursements | | | .85 | % | | | .85 | % | | | .85 | % | | | .85 | % | | | .85 | % |
Before waivers/reimbursements | | | 1.57 | % | | | 1.52 | % | | | 1.10 | % | | | 1.22 | % | | | 1.26 | % |
Class C | |
Net of waivers/reimbursements | | | 1.60 | % | | | 1.60 | % | | | 1.60 | % | | | 1.60 | % | | | 1.60 | % |
Before waivers/reimbursements | | | 2.33 | % | | | 2.27 | % | | | 1.86 | % | | | 1.97 | % | | | 2.02 | % |
| | | | | |
AB New Jersey Portfolio | | | | | | | | | | | | | | | | | | | | |
Class A | |
Net of waivers/reimbursements | | | .82 | % | | | .82 | % | | | .82 | % | | | .82 | % | | | .82 | % |
Before waivers/reimbursements | | | 1.21 | % | | | 1.27 | % | | | 1.15 | % | | | 1.14 | % | | | 1.10 | % |
Class C | |
Net of waivers/reimbursements | | | 1.57 | % | | | 1.57 | % | | | 1.57 | % | | | 1.57 | % | | | 1.57 | % |
Before waivers/reimbursements | | | 1.94 | % | | | 2.02 | % | | | 1.89 | % | | | 1.89 | % | | | 1.85 | % |
| | | | | |
AB Ohio Portfolio | | | | | | | | | | | | | | | | | | | | |
Class A | |
Net of waivers/reimbursements | | | .80 | % | | | .80 | % | | | .80 | % | | | .80 | % | | | .80 | % |
Before waivers/reimbursements | | | 1.35 | % | | | 1.30 | % | | | 1.15 | % | | | 1.16 | % | | | 1.12 | % |
Class C | |
Net of waivers/reimbursements | | | 1.55 | % | | | 1.55 | % | | | 1.55 | % | | | 1.55 | % | | | 1.55 | % |
Before waivers/reimbursements | | | 2.10 | % | | | 2.06 | % | | | 1.90 | % | | | 1.91 | % | | | 1.87 | % |
| | |
| |
| abfunds.com | | AB MUNICIPAL INCOME FUND II | 137 |
FINANCIAL HIGHLIGHTS (continued)
Selected Data For A Share Of Beneficial Interest Outstanding Throughout Each Period
| | | | | | | | | | | | | | | | | | | | |
| | | Year Ended May 31, | |
| | | 2024 | | | 2023 | | | 2022 | | | 2021 | | | 2020 | |
| | | | | | | | | | | | | | | | | | | | |
AB Pennsylvania Portfolio | | | | | | | | | | | | | | | | | | | | |
Class A | |
Net of waivers/reimbursements | | | .85 | % | | | .85 | % | | | .85 | % | | | .85 | % | | | .85 | % |
Before waivers/reimbursements | | | 1.35 | % | | | 1.35 | % | | | 1.18 | % | | | 1.19 | % | | | 1.14 | % |
Class C | |
Net of waivers/reimbursements | | | 1.60 | % | | | 1.60 | % | | | 1.60 | % | | | 1.60 | % | | | 1.60 | % |
Before waivers/reimbursements | | | 2.10 | % | | | 2.10 | % | | | 1.93 | % | | | 1.94 | % | | | 1.89 | % |
| | | | | |
AB Virginia Portfolio | | | | | | | | | | | | | | | | | | | | |
Class A | |
Net of waivers/reimbursements | | | .80 | % | | | .80 | % | | | .80 | % | | | .80 | % | | | .80 | % |
Before waivers/reimbursements | | | .89 | % | | | .91 | % | | | .86 | % | | | .89 | % | | | .90 | % |
Class C | |
Net of waivers/reimbursements | | | 1.55 | % | | | 1.55 | % | | | 1.55 | % | | | 1.55 | % | | | 1.55 | % |
Before waivers/reimbursements | | | 1.64 | % | | | 1.66 | % | | | 1.61 | % | | | 1.64 | % | | | 1.65 | % |
Advisor Class | |
Net of waivers/reimbursements | | | .55 | % | | | .55 | % | | | .55 | % | | | .55 | % | | | .55 | % |
Before waivers/reimbursements | | | .64 | % | | | .66 | % | | | .61 | % | | | .64 | % | | | .65 | % |
| (e) | Commencement of distribution. |
| (f) | Due to timing of sales and repurchase of capital shares, the net realized and unrealized gain (loss) per share is not in accordance with the Portfolio’s change in net realized and unrealized gain (loss) on investment transactions for the period. |
See notes to financial statements.
| | |
| |
138 | AB MUNICIPAL INCOME FUND II | | abfunds.com |
REPORT OF INDEPENDENT REGISTERED
PUBLIC ACCOUNTING FIRM
To the Shareholders and the Board of Trustees of
AB Municipal Income Fund II:
Opinion on the Financial Statements
We have audited the accompanying statements of assets and liabilities of AB Municipal Income Fund II (the “Fund”) (comprising the AB Arizona Portfolio, AB Massachusetts Portfolio, AB Minnesota Portfolio, AB New Jersey Portfolio, AB Ohio Portfolio, AB Pennsylvania Portfolio and AB Virginia Portfolio (collectively referred to as the “Portfolios”)), including the portfolios of investments, as of May 31, 2024, and the related statements of operations for the year then ended, the statements of changes in net assets for each of the two years in the period then ended, the financial highlights for each of the five years in the period then ended and the related notes (collectively referred to as the “financial statements”). In our opinion, the financial statements present fairly, in all material respects, the financial position of each of the Portfolios comprising AB Municipal Income Fund II at May 31, 2024, the results of their operations for the year then ended, the changes in their net assets for each of the two years in the period then ended and their financial highlights for each of the five years in the period then ended, in conformity with U.S. generally accepted accounting principles.
Basis for Opinion
These financial statements are the responsibility of the Fund’s management. Our responsibility is to express an opinion on the Portfolio’s financial statements based on our audits. We are a public accounting firm registered with the Public Company Accounting Oversight Board (United States) (“PCAOB”) and are required to be independent with respect to the Fund in accordance with the U.S. federal securities laws and the applicable rules and regulations of the Securities and Exchange Commission and the PCAOB.
We conducted our audits in accordance with the standards of the PCAOB. Those standards require that we plan and perform the audit to obtain reasonable assurance about whether the financial statements are free of material misstatement, whether due to error or fraud. The Fund is not required to have, nor were we engaged to perform, an audit of the Fund’s internal control over financial reporting. As part of our audits, we are required to obtain an understanding of internal control over financial reporting but not for the purpose of expressing an opinion on the effectiveness of the Fund’s internal control over financial reporting. Accordingly, we express no such opinion.
| | |
| |
| abfunds.com | | AB MUNICIPAL INCOME FUND II | 139 |
REPORT OF INDEPENDENT REGISTERED
PUBLIC ACCOUNTING FIRM (continued)
Our audits included performing procedures to assess the risks of material misstatement of the financial statements, whether due to error or fraud, and performing procedures that respond to those risks. Such procedures included examining, on a test basis, evidence regarding the amounts and disclosures in the financial statements. Our procedures included confirmation of securities owned as of May 31, 2024, by correspondence with the custodian, brokers and others; when replies were not received from brokers or others, we performed other auditing procedures. Our audits also included evaluating the accounting principles used and significant estimates made by management, as well as evaluating the overall presentation of the financial statements. We believe that our audits provide a reasonable basis for our opinion.

We have served as the auditor of one or more of the AB investment companies since 1968.
New York, New York
July 29, 2024
| | |
| |
140 | AB MUNICIPAL INCOME FUND II | | abfunds.com |
Information Regarding the Review and Approval of the Advisory Agreement in Respect of Each Fund
The disinterested trustees (the “directors”) of AB Municipal Income Fund II (the “Company”) unanimously approved the continuance of the Company’s Advisory Agreement with the Adviser in respect of each of the portfolios listed below (each, a “Fund” and collectively, the “Funds”) at a meeting held in-person on August 1-2, 2023 (the “Meeting”):
| | • | | AB Massachusetts Portfolio |
| | • | | AB New Jersey Portfolio |
| | • | | AB Pennsylvania Portfolio |
Prior to approval of the continuance of the Advisory Agreement in respect of each Fund, the directors had requested from the Adviser, and received and evaluated, extensive materials. They reviewed the proposed continuance of the Advisory Agreement with the Adviser and with experienced counsel who are independent of the Adviser, who advised on the relevant legal standards. The directors also reviewed additional materials, including comparative analytical data prepared by the Senior Vice President of each Fund. The directors also discussed the proposed continuances in private sessions with counsel.
The directors considered their knowledge of the nature and quality of the services provided by the Adviser to the Funds gained from their experience as directors or trustees of most of the registered investment companies advised by the Adviser, their overall confidence in the Adviser’s integrity and competence they have gained from that experience, the Adviser’s initiative in identifying and raising potential issues with the directors and its responsiveness, frankness and attention to concerns raised by the directors in the past, including the Adviser’s willingness to consider and implement organizational and operational changes designed to improve investment results and the services provided to the AB Funds. The directors noted that they have four regular meetings each year, at each of which they review extensive materials and information from the Adviser, including information on the investment performance of the Funds and the money market fund advised by the Adviser in which the Funds invest a portion of their assets.
The directors also considered all factors they believed relevant, including the specific matters discussed below. During the course of their deliberations, the directors evaluated, among other things, the reasonableness of the advisory fee in respect of each Fund. The directors did not identify any
| | |
| |
| abfunds.com | | AB MUNICIPAL INCOME FUND II | 141 |
particular information that was all-important or controlling, and different directors may have attributed different weights to the various factors. The directors determined that the selection of the Adviser to manage each Fund and the overall arrangements between each Fund and the Adviser, as provided in the Advisory Agreement, including the advisory fee, were fair and reasonable in light of the services performed, expenses incurred and such other matters as the directors considered relevant in the exercise of their business judgment. The material factors and conclusions that formed the basis for the directors’ determinations included the following:
Nature, Extent and Quality of Services Provided
The directors considered the scope and quality of services provided by the Adviser under the Advisory Agreement, including the quality of the investment research capabilities of the Adviser and the other resources it has dedicated to performing services for each Fund. The directors noted that the Adviser from time to time reviews each Fund’s investment strategies and from time to time proposes changes intended to improve a Fund’s relative or absolute performance for the directors’ consideration. They also noted the professional experience and qualifications of each Fund’s portfolio management team and other senior personnel of the Adviser. The directors also considered that the Advisory Agreement provides that each Fund will reimburse the Adviser for the cost to it of providing certain clerical, accounting, administrative and other services to such Fund by employees of the Adviser or its affiliates. Requests for these reimbursements are made on a quarterly basis and subject to approval by the directors. Reimbursements, to the extent requested and paid in respect of a Fund, result in a higher rate of total compensation from such Fund to the Adviser than the fee rate stated in the Advisory Agreement. The directors noted that the methodology used to determine the reimbursement amounts had been reviewed by an independent consultant at the request of the directors. The quality of administrative and other services, including the Adviser’s role in coordinating the activities of each Fund’s other service providers, also was considered. The directors concluded that, overall, they were satisfied with the nature, extent and quality of services provided to each of the Funds under the Advisory Agreement.
Costs of Services Provided and Profitability
The directors reviewed a schedule of the revenues and expenses and related notes indicating the profitability of each Fund to the Adviser for calendar years 2021 and 2022 that had been prepared with an expense allocation methodology arrived at in consultation with an independent consultant at the request of the directors. The directors noted the assumptions and methods of allocation used by the Adviser in preparing fund-specific profitability data and understood that there are a number of potentially acceptable allocation methodologies for information of this type. The directors noted that the profitability information reflected all revenues and expenses of the Adviser’s relationships with the Funds, including
| | |
| |
142 | AB MUNICIPAL INCOME FUND II | | abfunds.com |
those relating to its subsidiaries that provide transfer agency and distribution services to the Funds. The directors recognized that it is difficult to make comparisons of the profitability of the Advisory Agreement with the profitability of fund advisory contracts for unaffiliated funds because comparative information is not generally publicly available and is affected by numerous factors. The directors focused on the profitability of the Adviser’s relationships with the Funds before taxes and distribution expenses. The directors noted that AB Minnesota Portfolio was not profitable to the Adviser in the periods reviewed. The directors concluded that the Adviser’s level of profitability from its relationship with each other Fund was not unreasonable.
Fall-Out Benefits
The directors considered the other benefits to the Adviser and its affiliates from their relationships with the Funds and the money market fund advised by the Adviser in which the Funds invest, including, but not limited to, benefits relating to 12b-1 fees and sales charges received by the Funds’ principal underwriter (which is a wholly owned subsidiary of the Adviser) in respect of certain classes of the Funds’ shares; and transfer agency fees paid by the Funds to a wholly owned subsidiary of the Adviser. The directors recognized that the Adviser’s profitability would be somewhat lower, and that AB Minnesota Portfolio’s unprofitability to the Adviser would be exacerbated, without these benefits. The directors understood that the Adviser also might derive reputational and other benefits from its association with the Funds.
Investment Results
In addition to the information reviewed by the directors in connection with the Meeting, the directors receive detailed performance information for each Fund at each regular Board meeting during the year.
At the Meeting, the directors reviewed performance information prepared by an independent service provider (the “15(c) service provider”), showing the performance of the Advisor Class shares (in the case of AB Arizona Portfolio, AB Massachusetts Portfolio and AB Virginia Portfolio) and the Class A Shares (in the case of each other Fund) against a group of similar funds (“peer group”) and a larger group of similar funds (“peer universe”), each selected by the 15(c) service provider, and information prepared by the Adviser showing performance of the Advisor Class shares (in the case of AB Arizona Portfolio, AB Massachusetts Portfolio and AB Virginia Portfolio) and the Class A Shares (in the case of each other Fund) against a broad-based securities market index, in each case for the 1-, 3-, 5- and 10-year periods, as applicable, ended May 31, 2023 and (in the case of comparisons with the broad-based securities market index) for the period from inception, as applicable. Based on their review, and after discussing with the Adviser the reasons for AB Arizona Portfolio’s underperformance in the most recent period, the directors concluded that each Fund’s investment performance was acceptable.
| | |
| |
| abfunds.com | | AB MUNICIPAL INCOME FUND II | 143 |
Advisory Fees and Other Expenses
The directors considered the advisory fee rate payable by each Fund to the Adviser and information prepared by the 15(c) service provider concerning advisory fee rates payable by other funds in the same category as such Fund. The directors recognized that it is difficult to make comparisons of advisory fees because there are variations in the services that are included in the fees payable by other funds. The directors compared each Fund’s contractual effective advisory fee rate with a peer group median and noted that it was lower than the median. They also noted that the Adviser’s total rate of compensation, taking into account the impact of the administrative expense reimbursement paid to the Adviser in the latest fiscal year, was lower than the median in the case of AB Minnesota Portfolio, equal to the median in the case of AB Massachusetts Portfolio, and above the median in the case of each of AB Arizona Portfolio, AB New Jersey Portfolio, AB Ohio Portfolio, AB Pennsylvania Portfolio and AB Virginia Portfolio.
The Adviser informed the directors that there were no institutional products managed by the Adviser that utilize investment strategies similar to those of any of the Funds.
In connection with their review of each Fund’s advisory fee, the directors also considered the total expense ratio of the Advisor Class shares (in the case of AB Arizona Portfolio, AB Massachusetts Portfolio and AB Virginia Portfolio) and the Class A shares (in the case of AB Minnesota Portfolio, AB New Jersey Portfolio, AB Ohio Portfolio and AB Pennsylvania Portfolio) in comparison to the medians for a peer group and a peer universe selected by the 15(c) service provider. The expense ratio of each Fund was based on the Fund’s latest fiscal year and reflected the impact of the Adviser’s expense cap for each Fund. The directors noted that it was likely that the expense ratios of some of the other funds in each Fund’s category were lowered by waivers or reimbursements by those funds’ investment advisers, which in some cases might be voluntary or temporary. The directors view expense ratio information as relevant to their evaluation of the Adviser’s services because the Adviser is responsible for coordinating services provided to the Funds by others. Based on their review, the directors concluded that the expense ratio for each of AB Arizona Portfolio and AB Massachusetts Portfolio was acceptable. The directors noted that the expense ratio for each of AB Minnesota Portfolio, AB New Jersey Portfolio, AB Ohio Portfolio and AB Pennsylvania Portfolio was above the medians, and that the expense ratio for AB Virginia Portfolio was above a median. After reviewing and discussing the Adviser’s explanations of the reasons for this, the directors concluded that each Fund’s expense ratio was acceptable.
| | |
| |
144 | AB MUNICIPAL INCOME FUND II | | abfunds.com |
Economies of Scale
The directors noted that the advisory fee schedule for the Funds contains breakpoints that reduce the fee rates on assets above specified levels. The directors took into consideration prior presentations by an independent consultant on economies of scale in the mutual fund industry and for the AB Funds, and presentations from time to time by the Adviser concerning certain of its views on economies of scale. The directors also had requested and received from the Adviser certain updates on economies of scale in advance of the Meeting. The directors believe that economies of scale may be realized (if at all) by the Adviser across a variety of products and services, and not only in respect of a single fund. The directors noted that there is no established methodology for setting breakpoints that give effect to the fund-specific services provided by a fund’s adviser and to the economies of scale that an adviser may realize in its overall mutual fund business or those components of it which directly or indirectly affect a fund’s operations. The directors observed that in the mutual fund industry as a whole, as well as among funds similar to the Funds, there is no uniformity or pattern in the fees and asset levels at which breakpoints (if any) apply. The directors also noted that the advisory agreements for many funds do not have breakpoints at all. Having taken these factors into account, the directors concluded that the Funds’ shareholders would benefit from a sharing of economies of scale in the event a Fund’s net assets exceed a breakpoint in the future.
| | |
| |
| abfunds.com | | AB MUNICIPAL INCOME FUND II | 145 |
NOTES
| | |
| |
146 | AB MUNICIPAL INCOME FUND II | | abfunds.com |
NOTES
| | |
| |
| abfunds.com | | AB MUNICIPAL INCOME FUND II | 147 |
NOTES
| | |
| |
148 | AB MUNICIPAL INCOME FUND II | | abfunds.com |
AB MUNICIPAL INCOME FUND II
1345 Avenue of the Americas
New York, NY 10105
800 221 5672
MIFII-0151-0524 
ITEM 8. CHANGES IN AND DISAGREEMENTS WITH ACCOUNTANTS FOR OPEN-END MANAGEMENT INVESTMENT COMPANIES.
There were no disagreements with accountants during the reporting period.
ITEM 9. PROXY DISCLOSURES FOR OPEN-END MANAGEMENT INVESTMENT COMPANIES
There were no shareholder meetings during the reporting period.
ITEM 10. REMUNERATION PAID TO DIRECTORS, OFFICERS, AND OTHERS OF OPEN-END MANAGEMENT INVESTMENT COMPANIES.
Aggregate remuneration paid to all Directors and advisory board members are included within the Financial Statements under Item 7 of this Form N-CSR.
ITEM 11. STATEMENT REGARDING BASIS FOR APPROVAL OF INVESTMENT ADVISORY CONTRACT.
Statement regarding basis for Approval of Investment Advisory Contract included within the Financial Statements under Item 7 of this Form N-CSR.
ITEM 12. DISCLOSURE OF PROXY VOTING POLICIES AND PROCEDURES FOR CLOSED-END MANAGEMENT INVESTMENT COMPANIES.
Not applicable to the registrant.
ITEM 13. PORTFOLIO MANAGERS OF CLOSED END MANAGEMENT INVESTMENT COMPANIES.
Not applicable to the registrant.
ITEM 14. PURCHASES OF EQUITY SECURITIES BY CLOSED-END MANAGEMENT INVESTMENT COMPANY OF AND AFFILIDATED PURCHASERS.
Not applicable to the registrant.
ITEM 15. SUBMISSION OF MATTERS TO A VOTE OF SECURITY HOLDERS.
There have been no material changes to the procedures by which shareholders may recommend nominees to the Fund’s Board of Directors since the Fund last provided disclosure in response to this item.
ITEM 16. CONTROLS AND PROCEDURES.
(a) The registrant’s principal executive officer and principal financial officer have concluded that the registrant’s disclosure controls and procedures (as defined in Rule 30a-2(c) under the Investment Company Act of 1940, as amended) are effective at the reasonable assurance level based on their evaluation of these controls and procedures as of a date within 90 days of the filing date of this document.
(b) There were no changes in the registrant’s internal controls over financial reporting that occurred during the period covered by this report that has materially affected, or is reasonably likely to materially affect, the registrant’s internal control over financial reporting.
ITEM 17. DISCLOSURE OF SECURITIES LENDING ACTIVITIES FOR CLOSED-END MANAGEMENT INVESTMENT COMPANIES.
Not applicable to the registrant.
ITEM 18. RECOVERY OF ERRONEOUSLY AWARDED COMPENSATION.
Not applicable to the registrant
ITEM 19. EXHIBITS.
The following exhibits are attached to this Form N-CSR:
SIGNATURES
Pursuant to the requirements of the Securities Exchange Act of 1934 and the Investment Company Act of 1940, the registrant has duly caused this report to be signed on its behalf by the undersigned, thereunto duly authorized.
| | |
| (Registrant): AB Municipal Income Fund II |
| |
| By: | | /s/ Onur Erzan |
| | Onur Erzan |
| | President |
| |
| Date: | | July 30, 2024 |
Pursuant to the requirements of the Securities Exchange Act of 1934 and the Investment Company Act of 1940, this report has been signed below by the following persons on behalf of the registrant and in the capacities and on the dates indicated.
| | |
| By: | | /s/ Onur Erzan |
| | Onur Erzan |
| | President |
| |
| Date: | | July 30, 2024 |
| |
| By: | | /s/ Stephen M. Woetzel |
| | Stephen M. Woetzel |
| | Treasurer and Chief Financial Officer |
| |
| Date: | | July 30, 2024 |