
Myriad Genetics Fiscal First Quarter 2016 Earnings Call 11/03/2015 Exhibit 99.2 Copyright © 2015 Myriad Genetics, Inc., all rights reserved. www.Myriad.com.
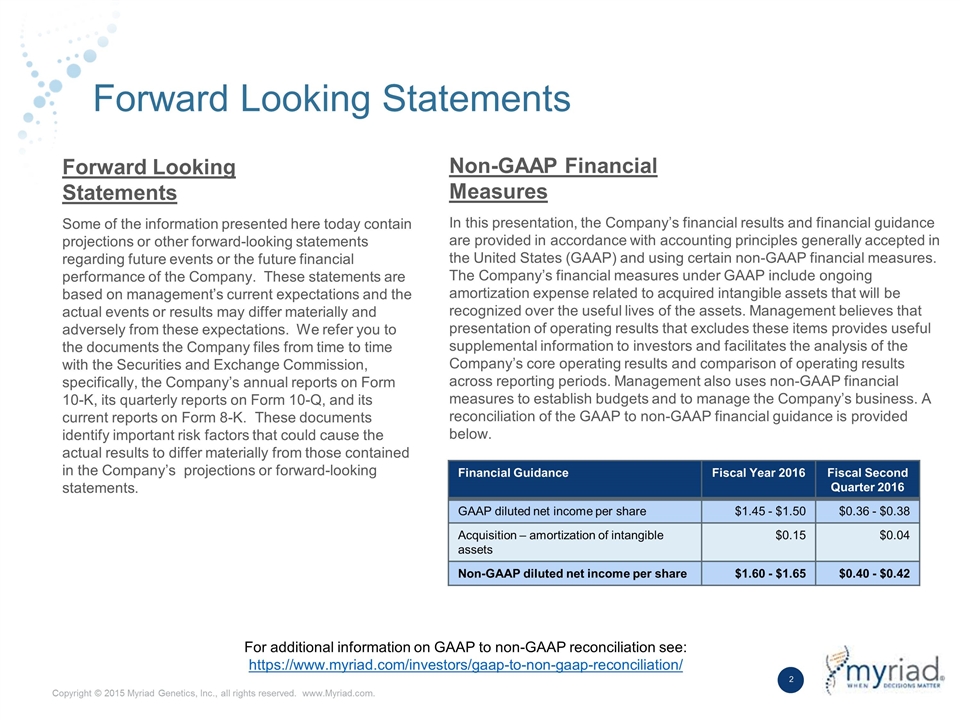
Forward Looking Statements Some of the information presented here today contain projections or other forward-looking statements regarding future events or the future financial performance of the Company. These statements are based on management’s current expectations and the actual events or results may differ materially and adversely from these expectations. We refer you to the documents the Company files from time to time with the Securities and Exchange Commission, specifically, the Company’s annual reports on Form 10-K, its quarterly reports on Form 10-Q, and its current reports on Form 8-K. These documents identify important risk factors that could cause the actual results to differ materially from those contained in the Company’s projections or forward-looking statements. In this presentation, the Company’s financial results and financial guidance are provided in accordance with accounting principles generally accepted in the United States (GAAP) and using certain non-GAAP financial measures. The Company’s financial measures under GAAP include ongoing amortization expense related to acquired intangible assets that will be recognized over the useful lives of the assets. Management believes that presentation of operating results that excludes these items provides useful supplemental information to investors and facilitates the analysis of the Company’s core operating results and comparison of operating results across reporting periods. Management also uses non-GAAP financial measures to establish budgets and to manage the Company’s business. A reconciliation of the GAAP to non-GAAP financial guidance is provided below. Forward Looking Statements Non-GAAP Financial Measures Financial Guidance Fiscal Year 2016 Fiscal Second Quarter 2016 GAAP diluted net income per share $1.45 - $1.50 $0.36 - $0.38 Acquisition – amortization of intangible assets $0.15 $0.04 Non-GAAP diluted net income per share $1.60 - $1.65 $0.40 - $0.42 For additional information on GAAP to non-GAAP reconciliation see: https://www.myriad.com/investors/gaap-to-non-gaap-reconciliation/
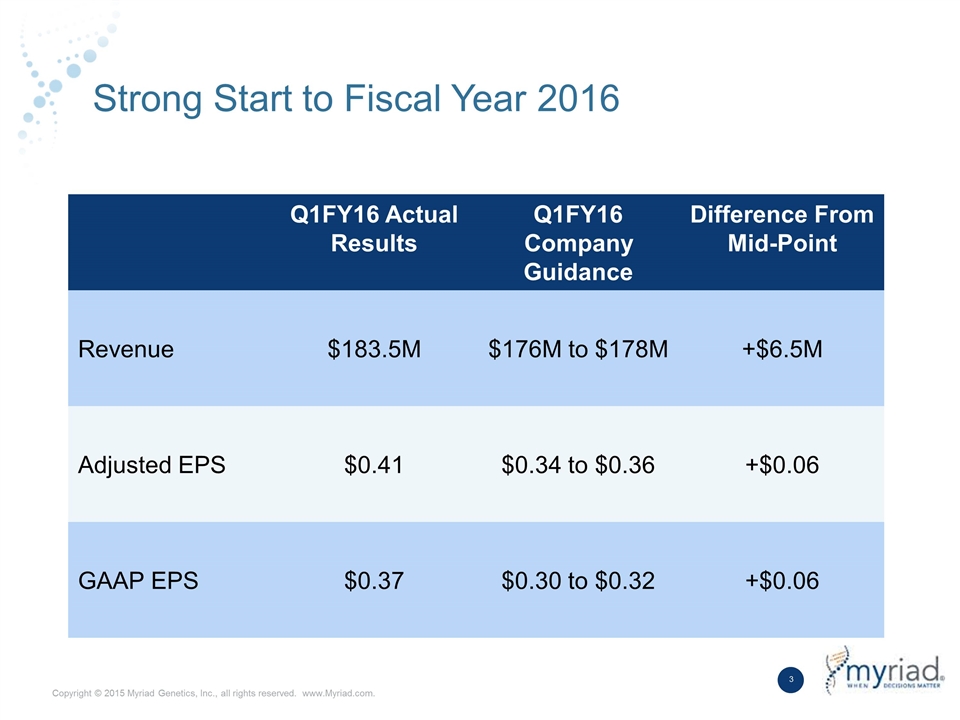
Strong Start to Fiscal Year 2016 Q1FY16 Actual Results Q1FY16 Company Guidance Difference From Mid-Point Revenue $183.5M $176M to $178M +$6.5M Adjusted EPS $0.41 $0.34 to $0.36 +$0.06 GAAP EPS $0.37 $0.30 to $0.32 +$0.06
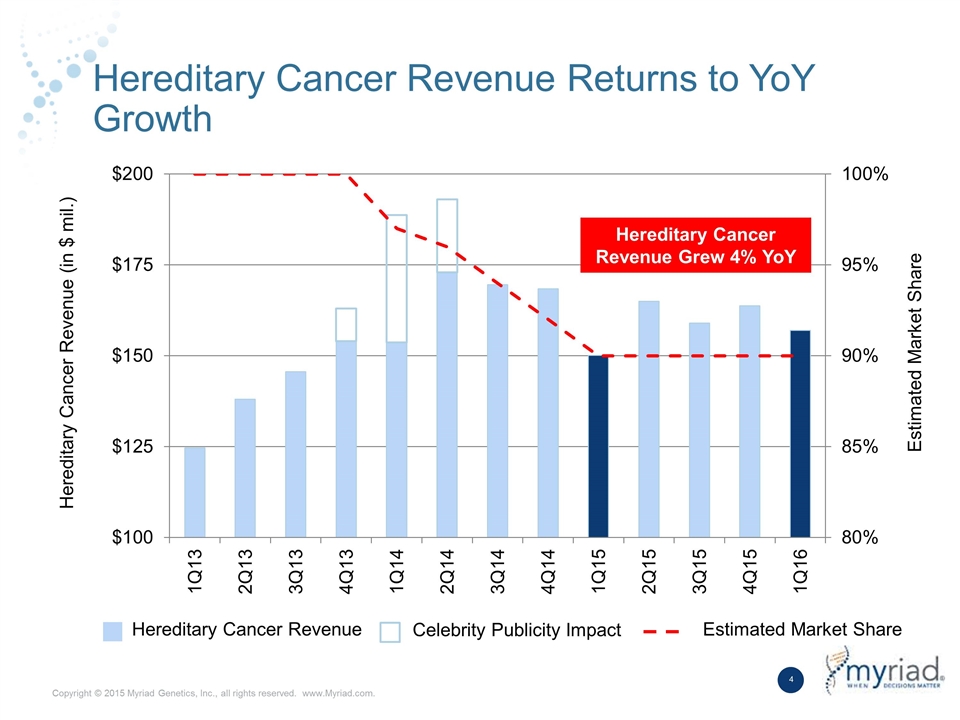
Hereditary Cancer Revenue Returns to YoY Growth Hereditary Cancer Revenue Grew 4% YoY Hereditary Cancer Revenue Celebrity Publicity Impact Estimated Market Share Hereditary Cancer Revenue (in $ mil.) Estimated Market Share
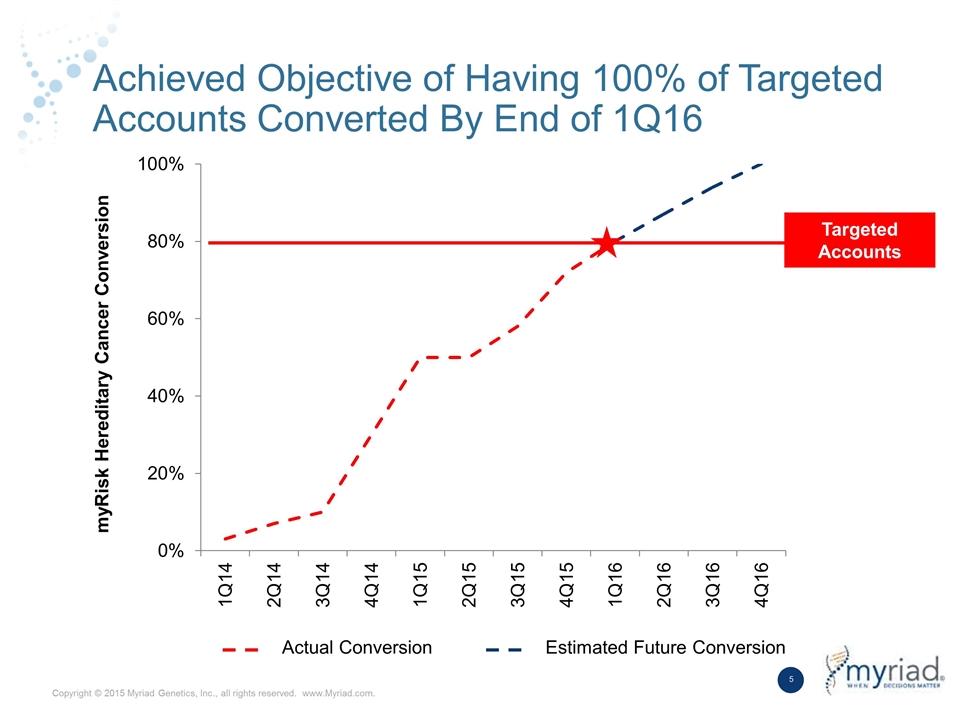
Achieved Objective of Having 100% of Targeted Accounts Converted By End of 1Q16 myRisk Hereditary Cancer Conversion Targeted Accounts Actual Conversion Estimated Future Conversion
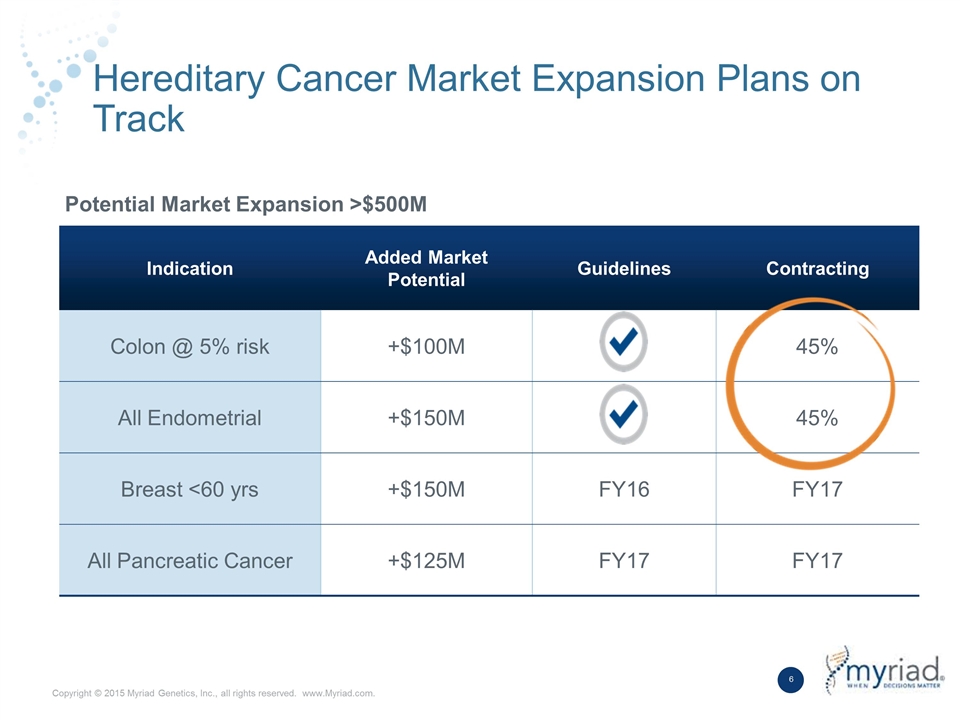
Hereditary Cancer Market Expansion Plans on Track Indication Added Market Potential Guidelines Contracting Colon @ 5% risk +$100M 45% All Endometrial +$150M 45% Breast <60 yrs +$150M FY16 FY17 All Pancreatic Cancer +$125M FY17 FY17 Potential Market Expansion >$500M
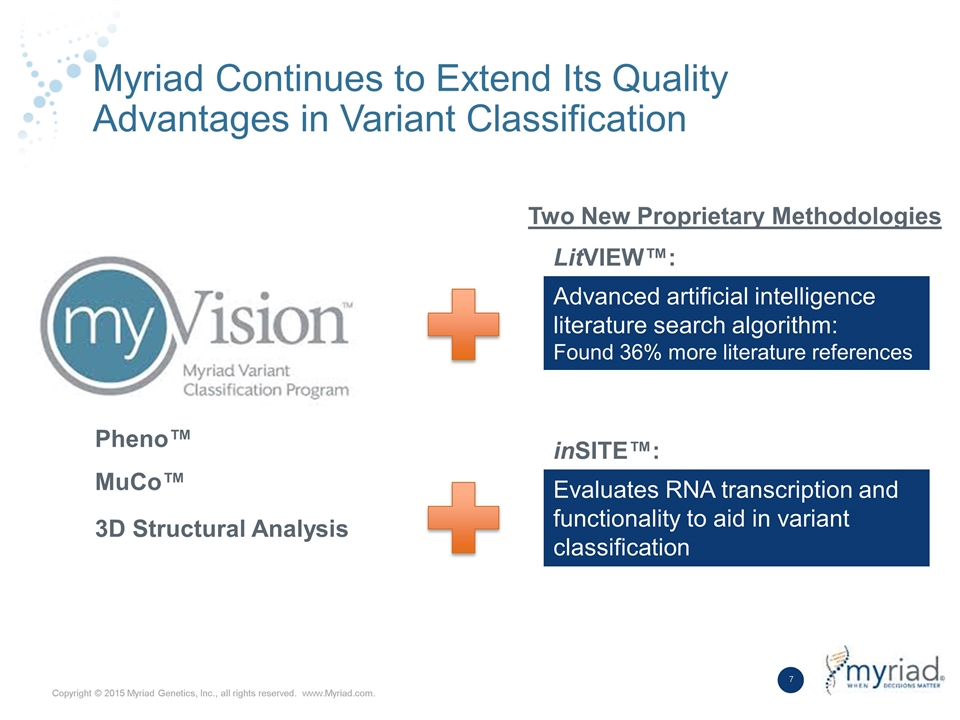
Myriad Continues to Extend Its Quality Advantages in Variant Classification Two New Proprietary Methodologies Advanced artificial intelligence literature search algorithm: Found 36% more literature references Evaluates RNA transcription and functionality to aid in variant classification LitVIEW™: inSITE™: Pheno™ MuCo™ 3D Structural Analysis
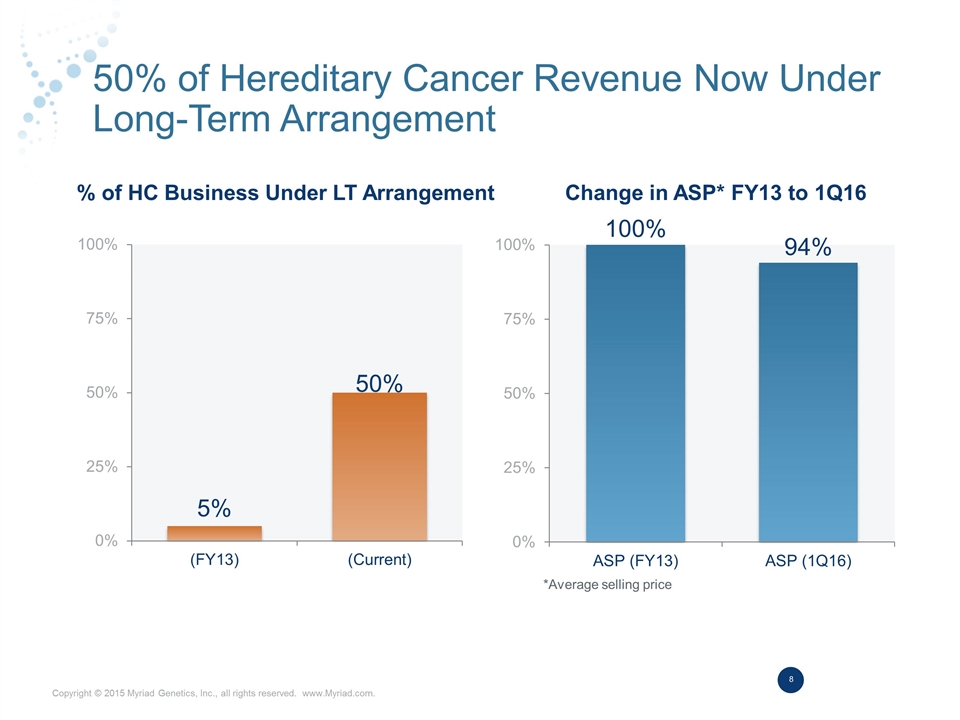
50% of Hereditary Cancer Revenue Now Under Long-Term Arrangement % of HC Business Under LT Arrangement Change in ASP* FY13 to 1Q16 *Average selling price
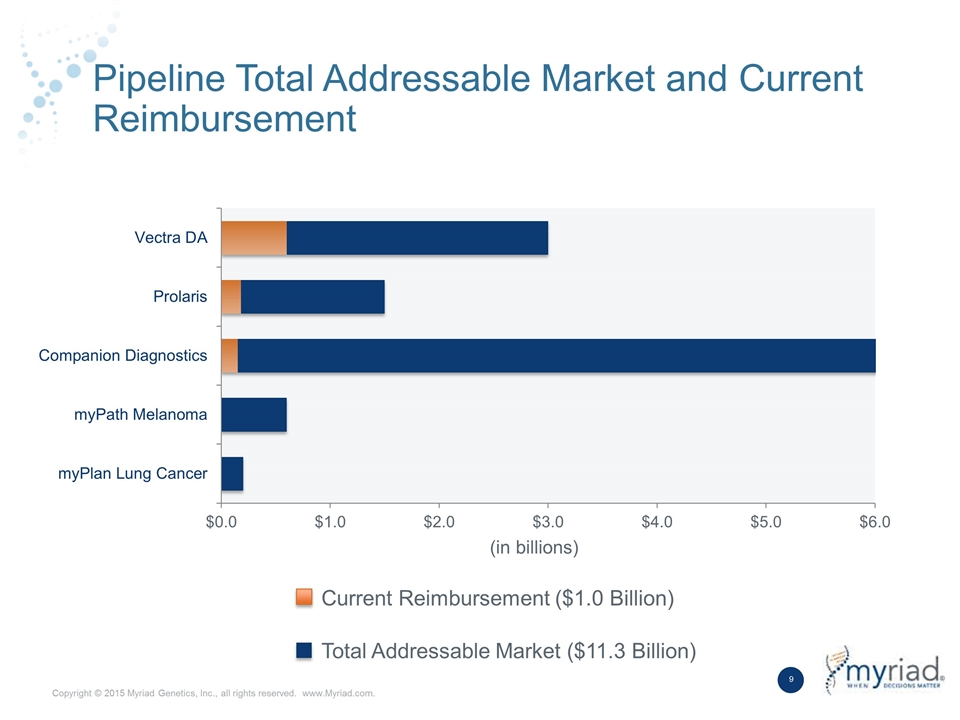
Pipeline Total Addressable Market and Current Reimbursement Current Reimbursement ($1.0 Billion) Total Addressable Market ($11.3 Billion) (in billions)
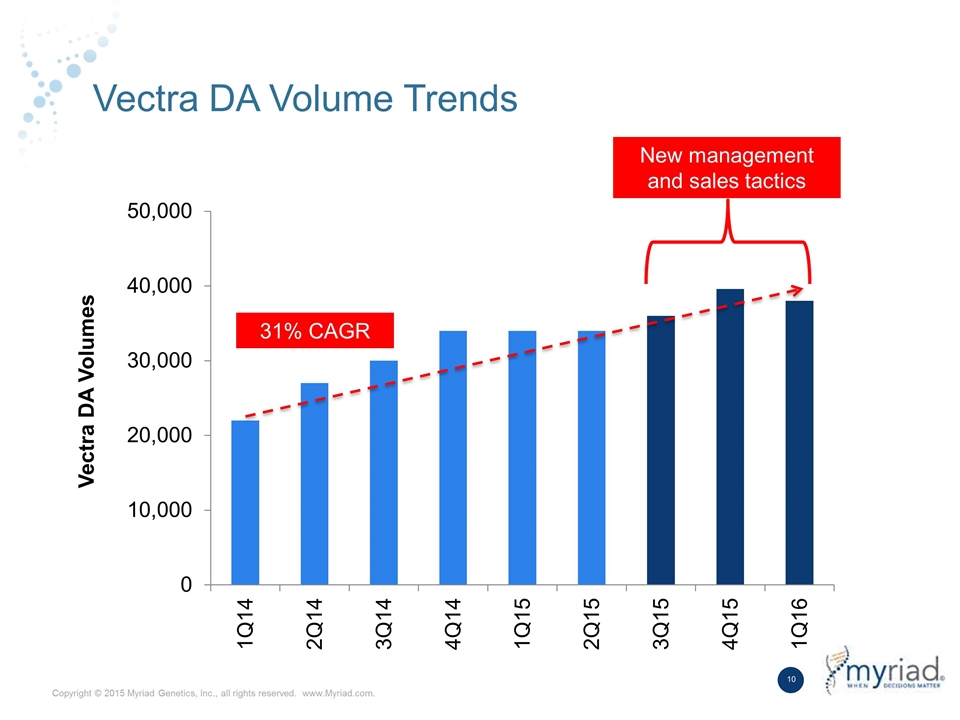
Vectra DA Volume Trends Vectra DA Volumes New management and sales tactics 31% CAGR
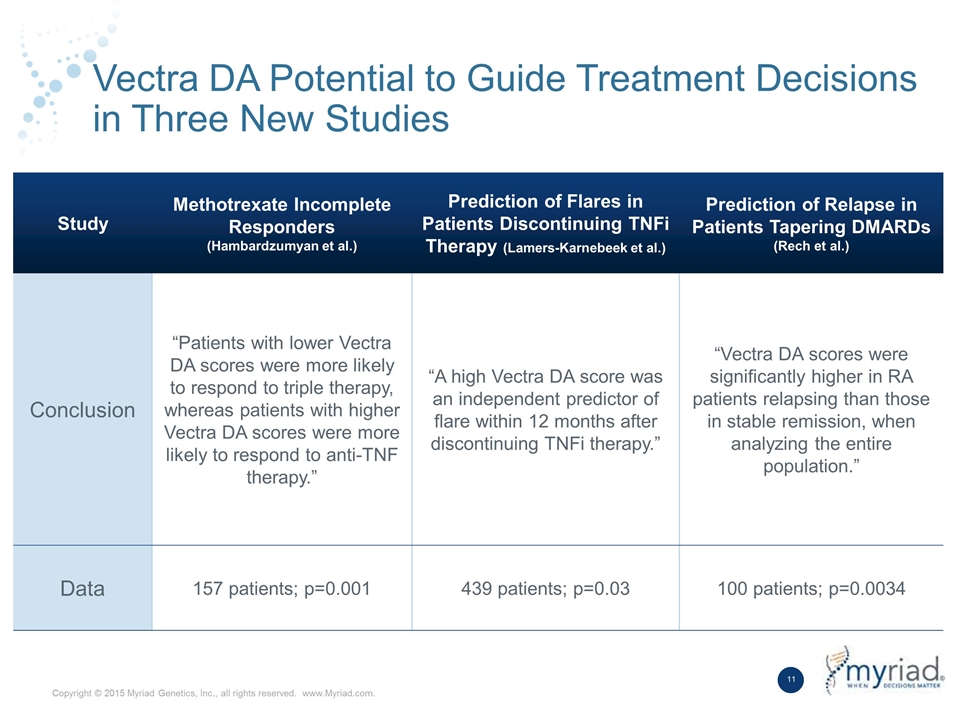
Vectra DA Potential to Guide Treatment Decisions in Three New Studies Study Methotrexate Incomplete Responders (Hambardzumyan et al.) Prediction of Flares in Patients Discontinuing TNFi Therapy (Lamers-Karnebeek et al.) Prediction of Relapse in Patients Tapering DMARDs (Rech et al.) Conclusion “Patients with lower Vectra DA scores were more likely to respond to triple therapy, whereas patients with higher Vectra DA scores were more likely to respond to anti-TNF therapy.” “A high Vectra DA score was an independent predictor of flare within 12 months after discontinuing TNFi therapy.” “Vectra DA scores were significantly higher in RA patients relapsing than those in stable remission, when analyzing the entire population.” Data 157 patients; p=0.001 439 patients; p=0.03 100 patients; p=0.0034
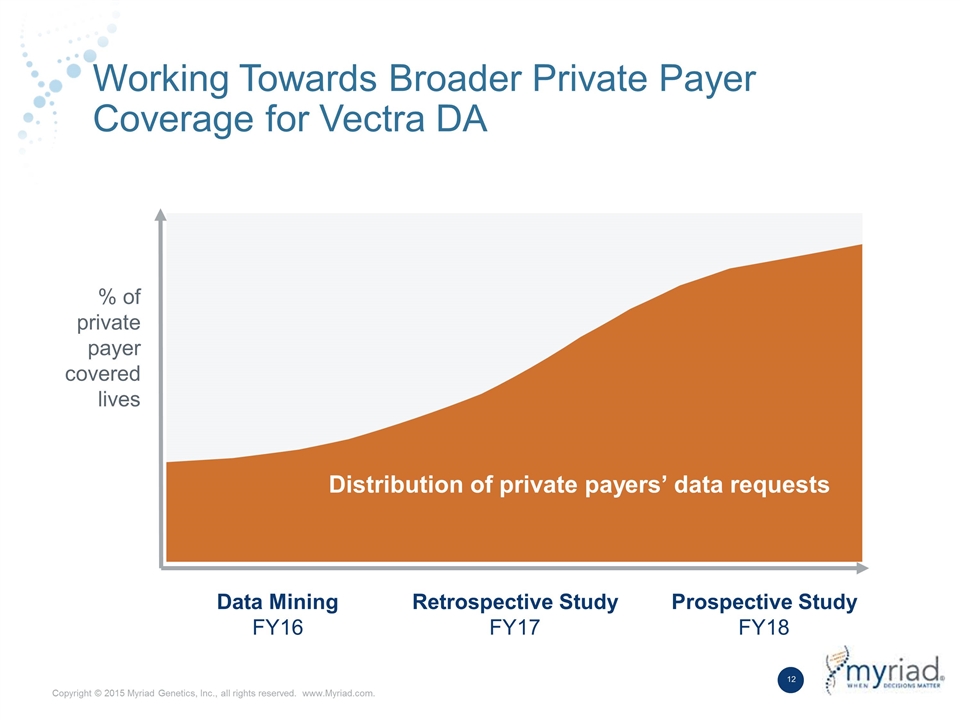
Working Towards Broader Private Payer Coverage for Vectra DA Data Mining FY16 Retrospective Study FY17 Prospective Study FY18 % of private payer covered lives Distribution of private payers’ data requests
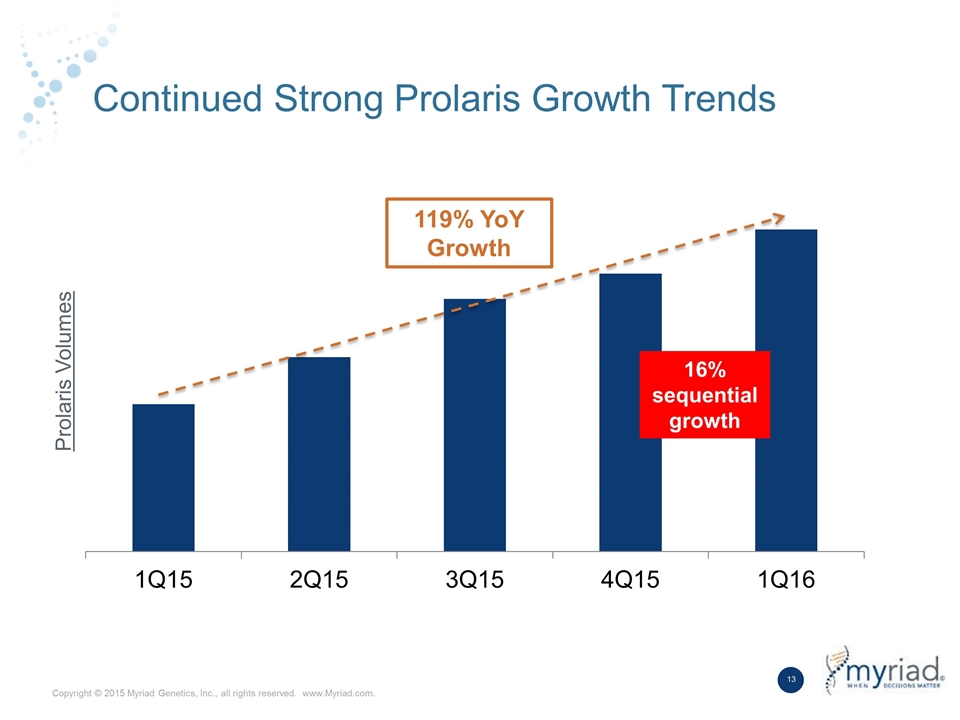
Continued Strong Prolaris Growth Trends Prolaris Volumes 16% sequential growth 119% YoY Growth
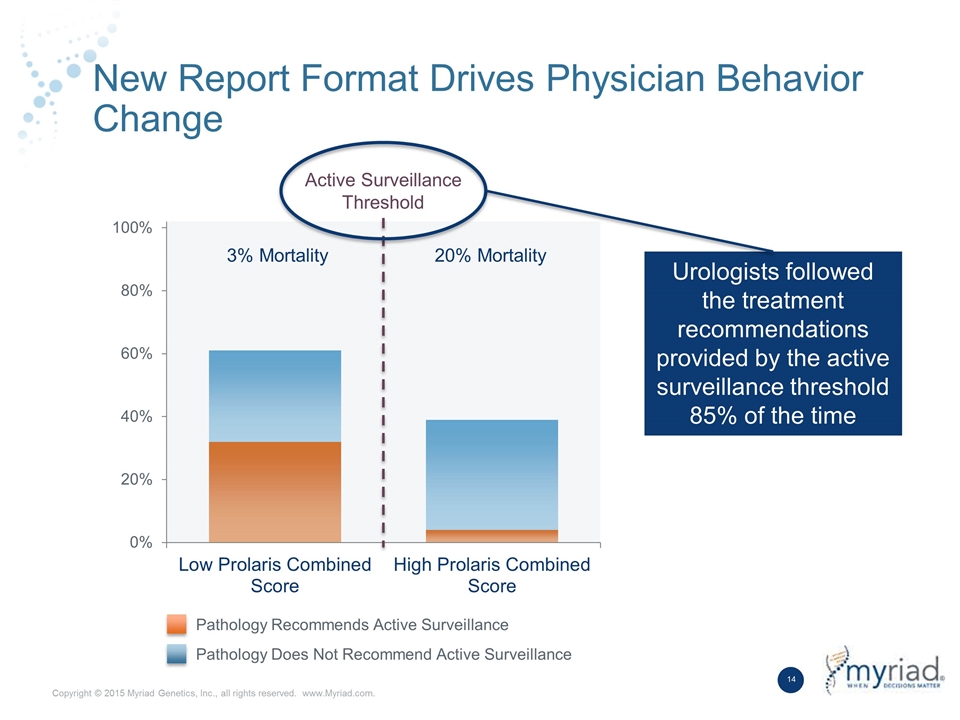
New Report Format Drives Physician Behavior Change Active Surveillance Threshold 3% Mortality 20% Mortality Urologists followed the treatment recommendations provided by the active surveillance threshold 85% of the time Pathology Recommends Active Surveillance Pathology Does Not Recommend Active Surveillance
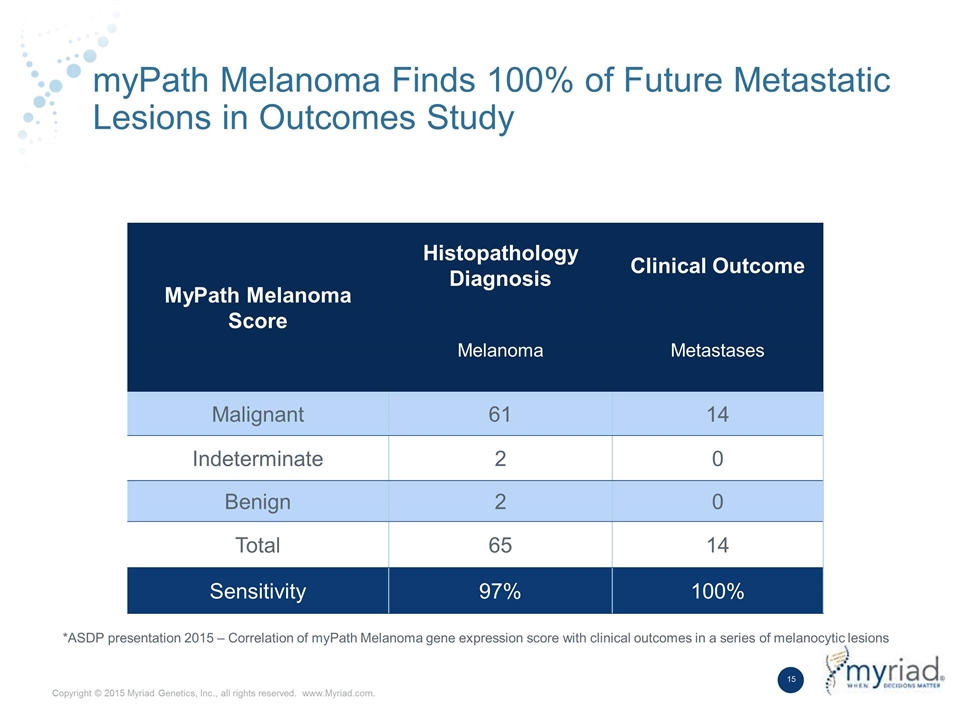
myPath Melanoma Finds 100% of Future Metastatic Lesions in Outcomes Study MyPath Melanoma Score Histopathology Diagnosis Clinical Outcome Melanoma Metastases Malignant 61 14 Indeterminate 2 0 Benign 2 0 Total 65 14 Sensitivity 97% 100% *ASDP presentation 2015 – Correlation of myPath Melanoma gene expression score with clinical outcomes in a series of melanocytic lesions
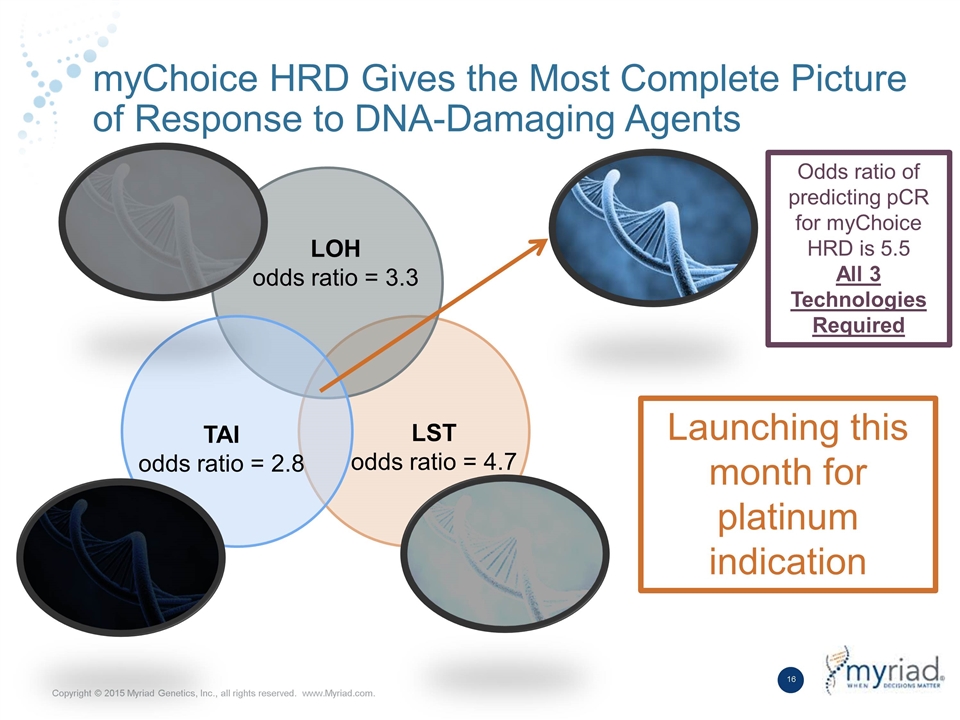
myChoice HRD Gives the Most Complete Picture of Response to DNA-Damaging Agents LST odds ratio = 4.7 LOH odds ratio = 3.3 Odds ratio of predicting pCR for myChoice HRD is 5.5 All 3 Technologies Required TAI odds ratio = 2.8 Launching this month for platinum indication
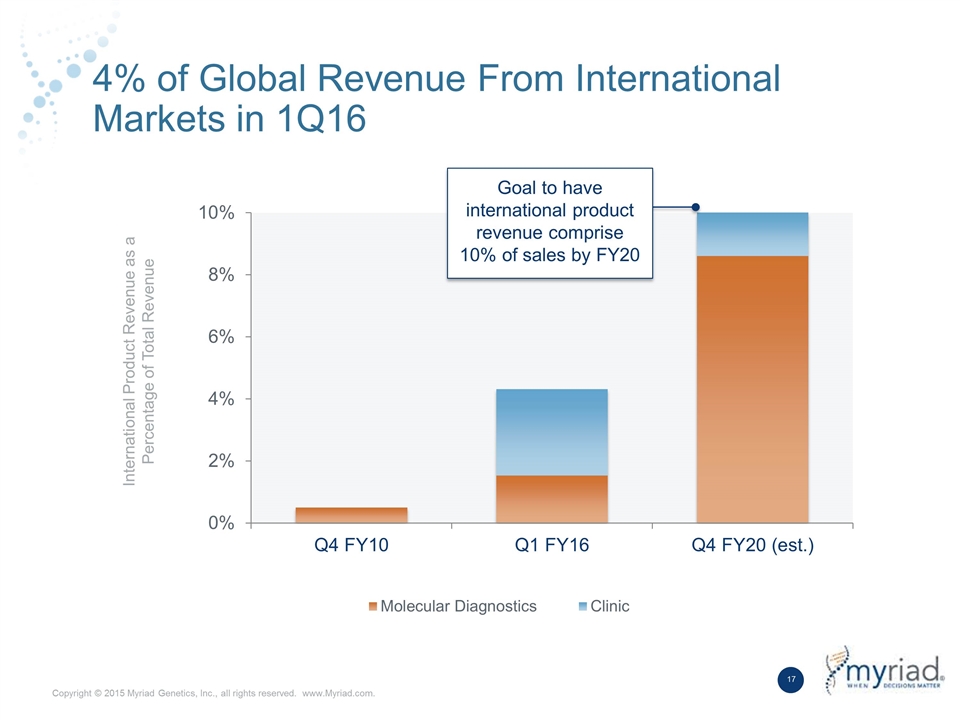
4% of Global Revenue From International Markets in 1Q16 International Product Revenue as a Percentage of Total Revenue Goal to have international product revenue comprise 10% of sales by FY20
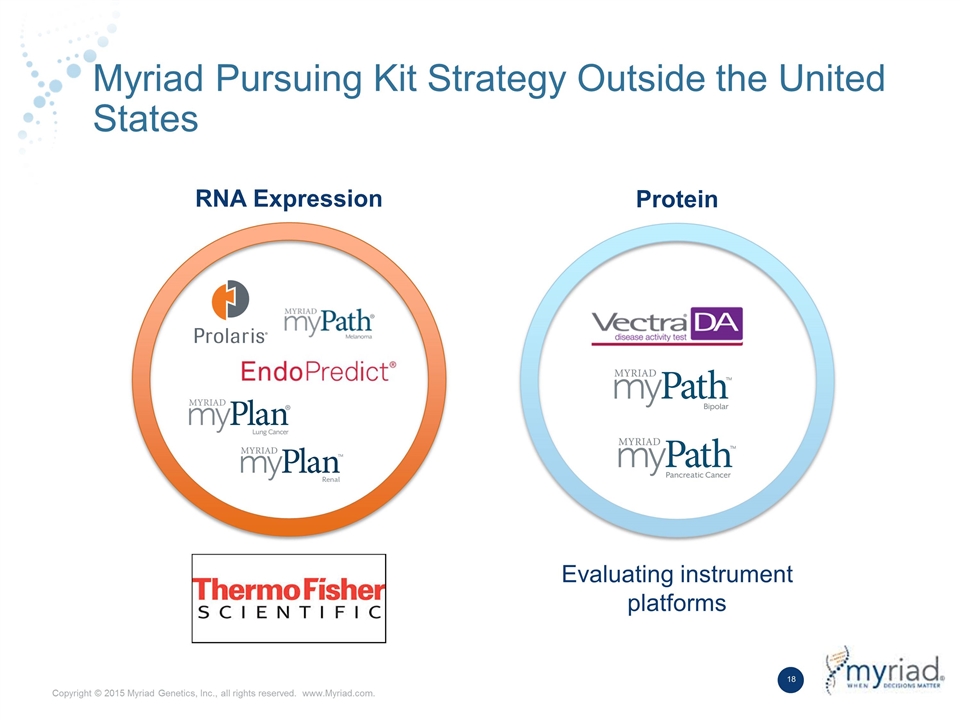
Myriad Pursuing Kit Strategy Outside the United States RNA Expression Protein Evaluating instrument platforms
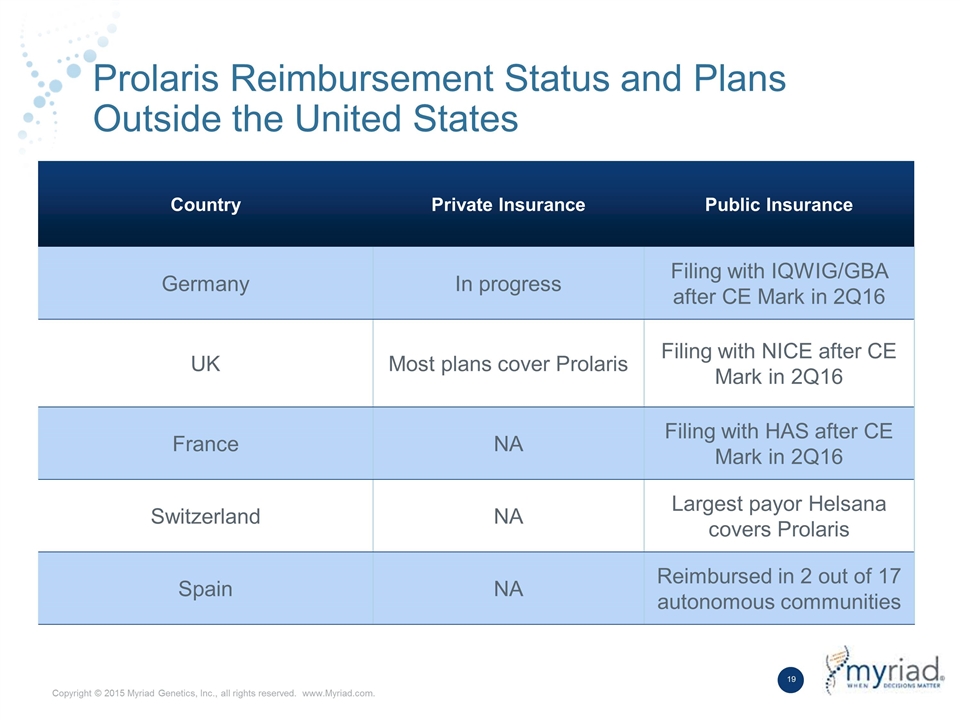
Prolaris Reimbursement Status and Plans Outside the United States Country Private Insurance Public Insurance Germany In progress Filing with IQWIG/GBA after CE Mark in 2Q16 UK Most plans cover Prolaris Filing with NICE after CE Mark in 2Q16 France NA Filing with HAS after CE Mark in 2Q16 Switzerland NA Largest payor Helsana covers Prolaris Spain NA Reimbursed in 2 out of 17 autonomous communities
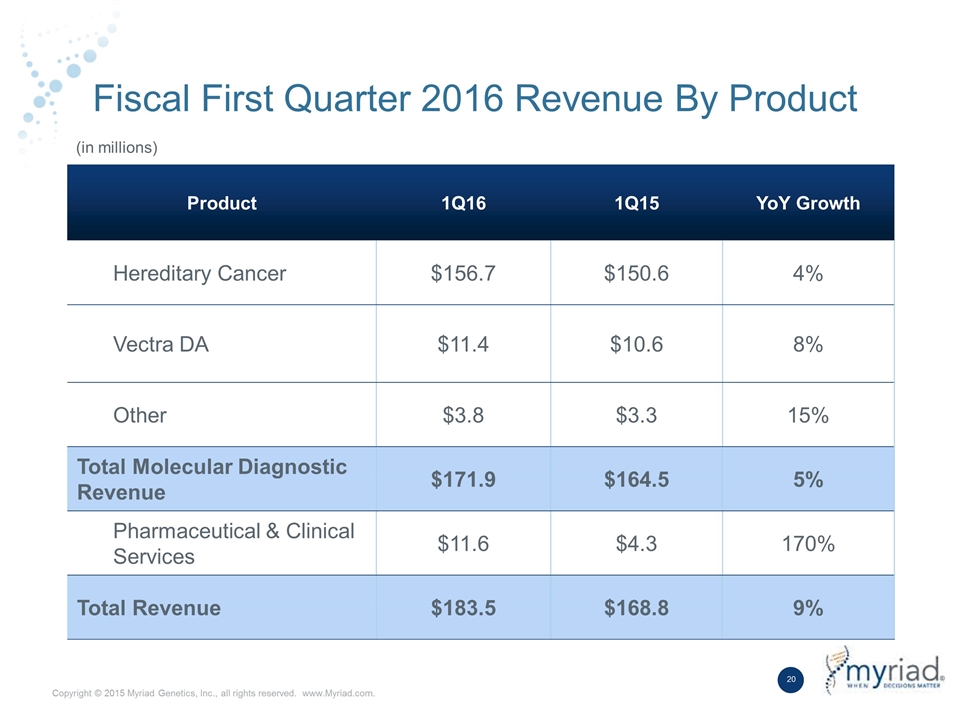
Fiscal First Quarter 2016 Revenue By Product Product 1Q16 1Q15 YoY Growth Hereditary Cancer $156.7 $150.6 4% Vectra DA $11.4 $10.6 8% Other $3.8 $3.3 15% Total Molecular Diagnostic Revenue $171.9 $164.5 5% Pharmaceutical & Clinical Services $11.6 $4.3 170% Total Revenue $183.5 $168.8 9% (in millions)
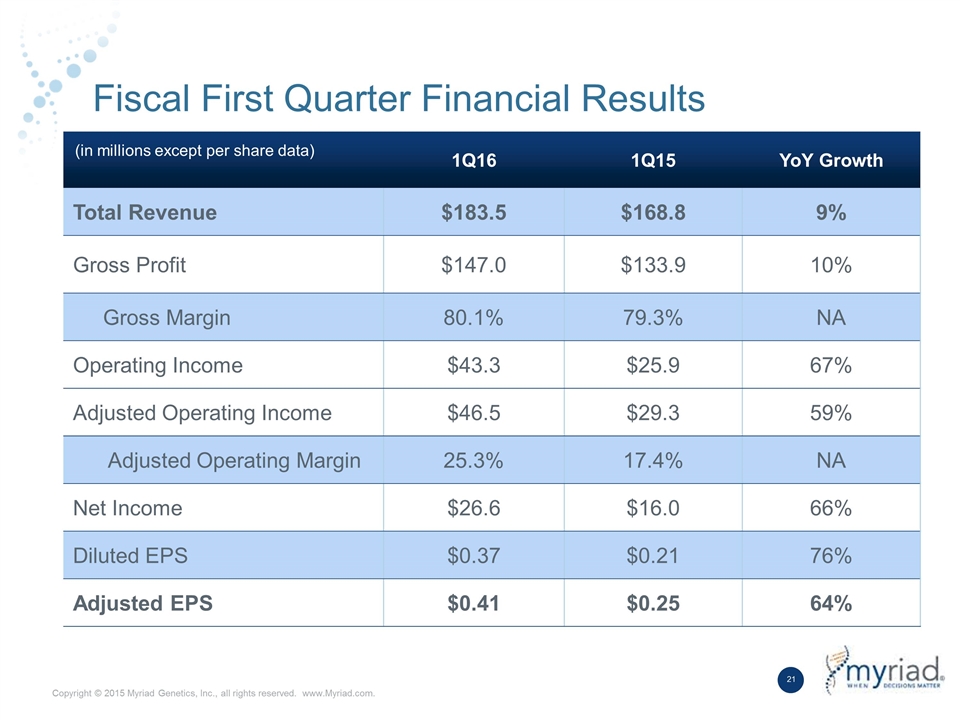
Fiscal First Quarter Financial Results 1Q16 1Q15 YoY Growth Total Revenue $183.5 $168.8 9% Gross Profit $147.0 $133.9 10% Gross Margin 80.1% 79.3% NA Operating Income $43.3 $25.9 67% Adjusted Operating Income $46.5 $29.3 59% Adjusted Operating Margin 25.3% 17.4% NA Net Income $26.6 $16.0 66% Diluted EPS $0.37 $0.21 76% Adjusted EPS $0.41 $0.25 64% (in millions except per share data)
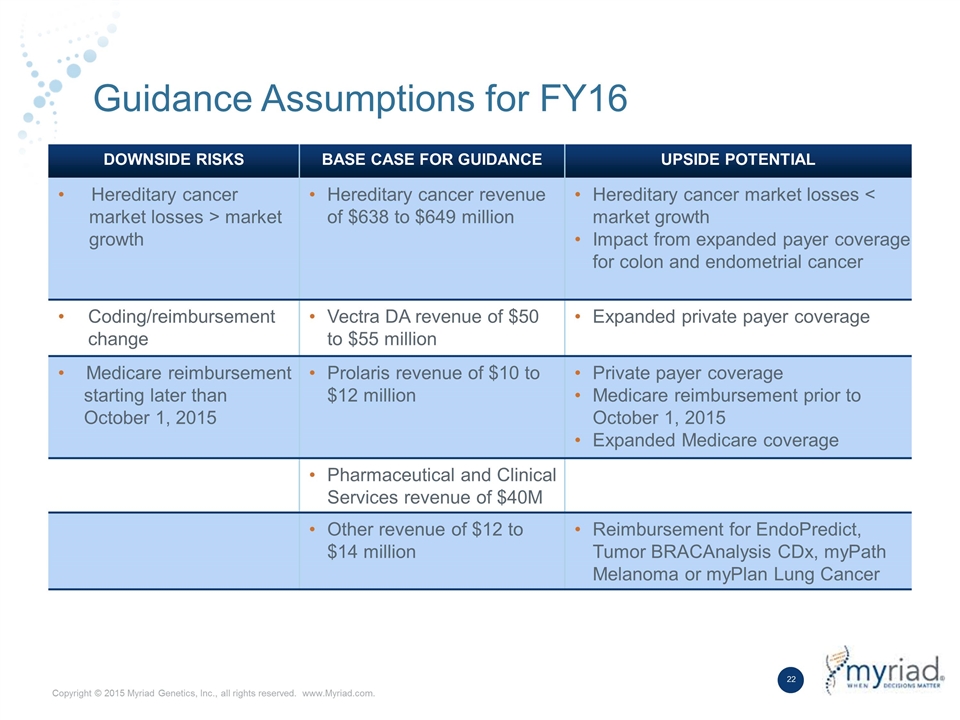
Guidance Assumptions for FY16 DOWNSIDE RISKS BASE CASE FOR GUIDANCE UPSIDE POTENTIAL Hereditary cancer market losses > market growth Hereditary cancer revenue of $638 to $649 million Hereditary cancer market losses < market growth Impact from expanded payer coverage for colon and endometrial cancer Coding/reimbursement change Vectra DA revenue of $50 to $55 million Expanded private payer coverage Medicare reimbursement starting later than October 1, 2015 Prolaris revenue of $10 to $12 million Private payer coverage Medicare reimbursement prior to October 1, 2015 Expanded Medicare coverage Pharmaceutical and Clinical Services revenue of $40M Other revenue of $12 to $14 million Reimbursement for EndoPredict, Tumor BRACAnalysis CDx, myPath Melanoma or myPlan Lung Cancer
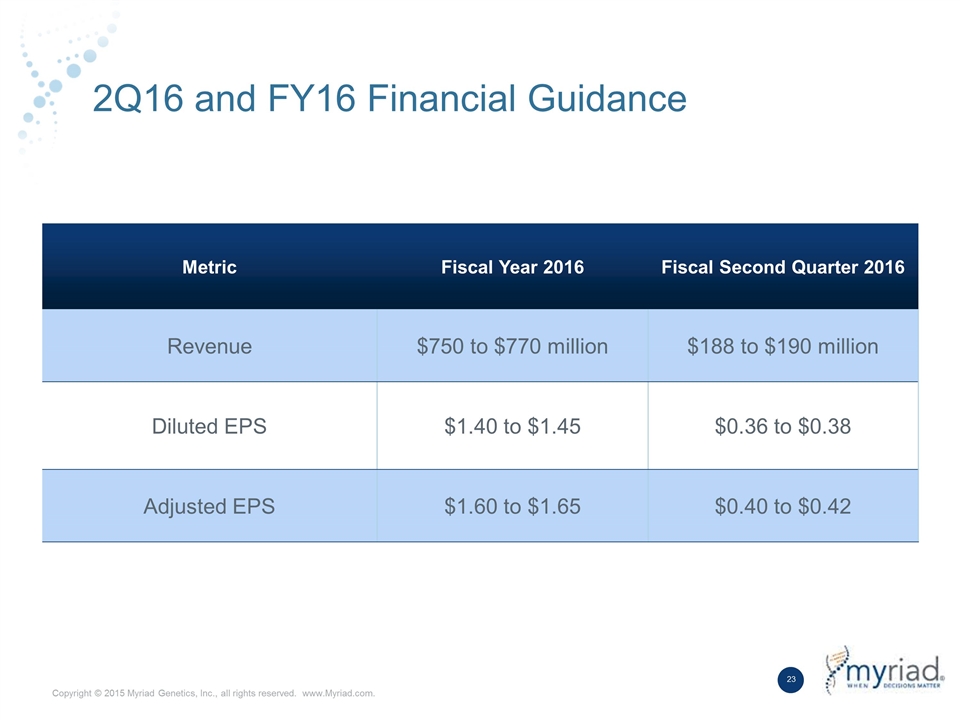
2Q16 and FY16 Financial Guidance Metric Fiscal Year 2016 Fiscal Second Quarter 2016 Revenue $750 to $770 million $188 to $190 million Diluted EPS $1.40 to $1.45 $0.36 to $0.38 Adjusted EPS $1.60 to $1.65 $0.40 to $0.42


