
Myriad Genetics Fiscal Fourth-Quarter 2019 Earnings Call August 13, 2019 Exhibit 99.2
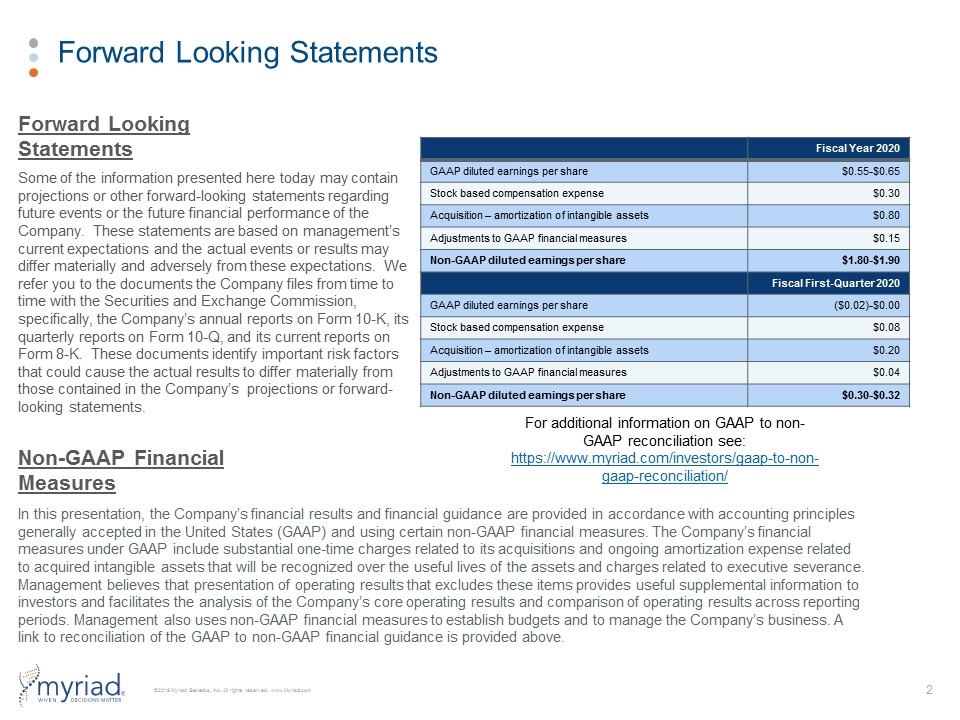
Forward Looking Statements Some of the information presented here today may contain projections or other forward-looking statements regarding future events or the future financial performance of the Company. These statements are based on management’s current expectations and the actual events or results may differ materially and adversely from these expectations. We refer you to the documents the Company files from time to time with the Securities and Exchange Commission, specifically, the Company’s annual reports on Form 10-K, its quarterly reports on Form 10-Q, and its current reports on Form 8-K. These documents identify important risk factors that could cause the actual results to differ materially from those contained in the Company’s projections or forward-looking statements. In this presentation, the Company’s financial results and financial guidance are provided in accordance with accounting principles generally accepted in the United States (GAAP) and using certain non-GAAP financial measures. The Company’s financial measures under GAAP include substantial one-time charges related to its acquisitions and ongoing amortization expense related to acquired intangible assets that will be recognized over the useful lives of the assets and charges related to executive severance. Management believes that presentation of operating results that excludes these items provides useful supplemental information to investors and facilitates the analysis of the Company’s core operating results and comparison of operating results across reporting periods. Management also uses non-GAAP financial measures to establish budgets and to manage the Company’s business. A link to reconciliation of the GAAP to non-GAAP financial guidance is provided above. Forward Looking Statements Non-GAAP Financial Measures For additional information on GAAP to non-GAAP reconciliation see: https://www.myriad.com/investors/gaap-to-non-gaap-reconciliation/ Fiscal Year 2020 GAAP diluted earnings per share $0.55-$0.65 Stock based compensation expense $0.30 Acquisition – amortization of intangible assets $0.80 Adjustments to GAAP financial measures $0.15 Non-GAAP diluted earnings per share $1.80-$1.90 Fiscal First-Quarter 2020 GAAP diluted earnings per share ($0.02)-$0.00 Stock based compensation expense $0.08 Acquisition – amortization of intangible assets $0.20 Adjustments to GAAP financial measures $0.04 Non-GAAP diluted earnings per share $0.30-$0.32
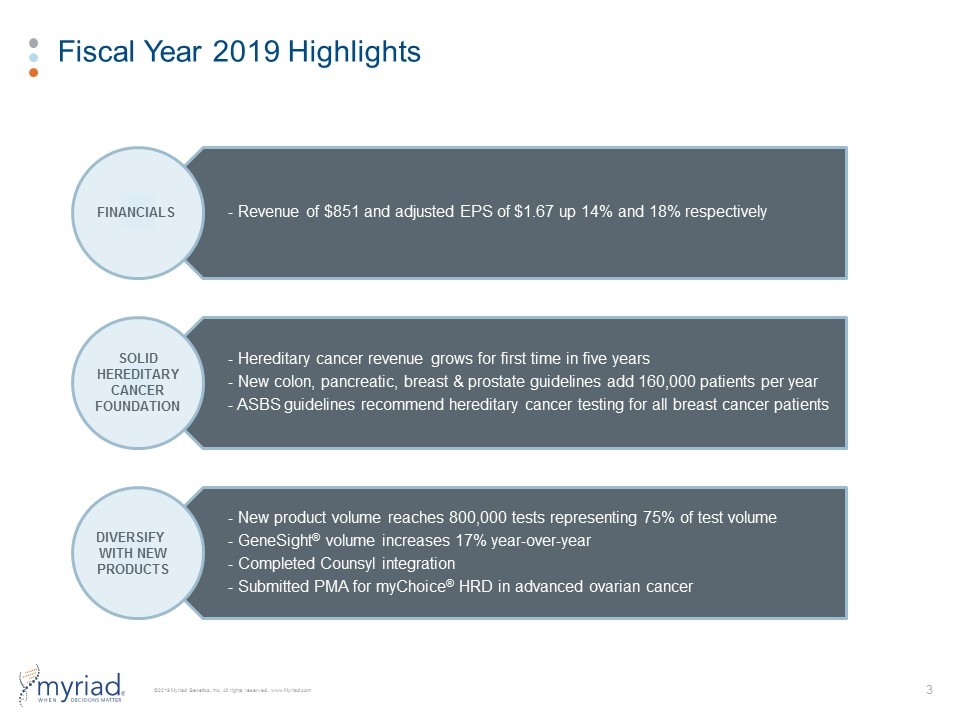
Fiscal Year 2019 Highlights FINANCIALS SOLID HEREDITARY CANCER FOUNDATION DIVERSIFY WITH NEW PRODUCTS - Revenue of $851 and adjusted EPS of $1.67 up 14% and 18% respectively - Hereditary cancer revenue grows for first time in five years - New colon, pancreatic, breast & prostate guidelines add 160,000 patients per year - ASBS guidelines recommend hereditary cancer testing for all breast cancer patients - New product volume reaches 800,000 tests representing 75% of test volume - GeneSight ® volume increases 17% year-over-year - Completed Counsyl integration - Submitted PMA for myChoice ® HRD in advanced ovarian cancer
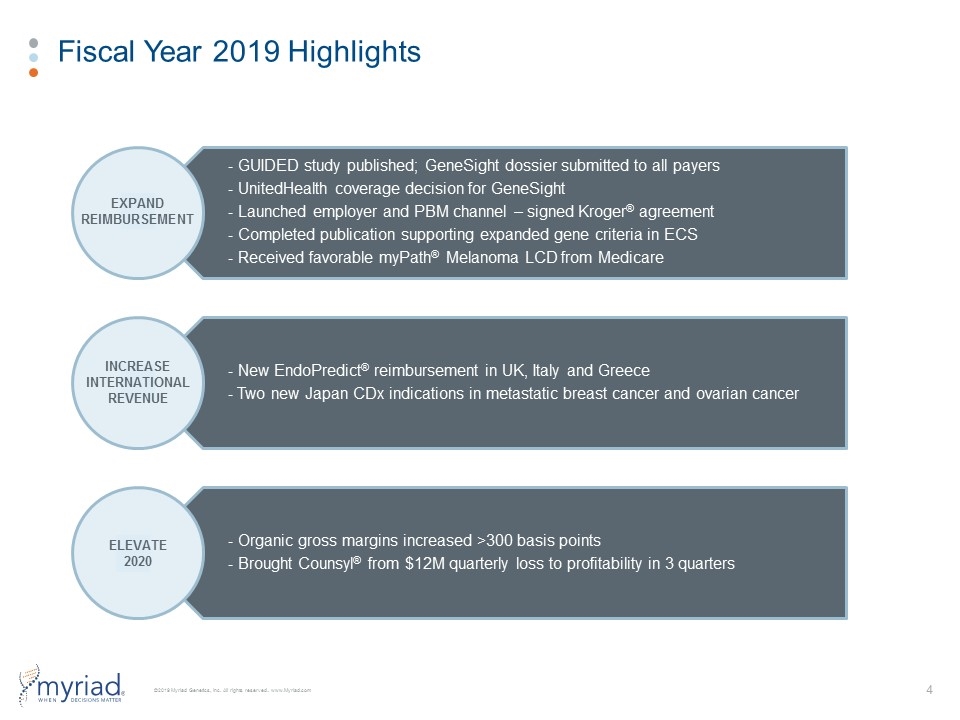
Fiscal Year 2019 Highlights EXPAND REIMBURSEMENT INCREASE INTERNATIONAL REVENUE ELEVATE 2020 - GUIDED study published; GeneSight dossier submitted to all payers - UnitedHealth coverage decision for GeneSight - Launched employer and PBM channel – signed Kroger ® agreement - Completed publication supporting expanded gene criteria in ECS - Received favorable myPath ® Melanoma LCD from Medicare - New EndoPredict ® reimbursement in UK, Italy and Greece - Two new Japan CDx indications in metastatic breast cancer and ovarian cancer - Organic gross margins increased >300 basis points - Brought Counsyl ® from $12M quarterly loss to profitability in 3 quarters

Financial Overview
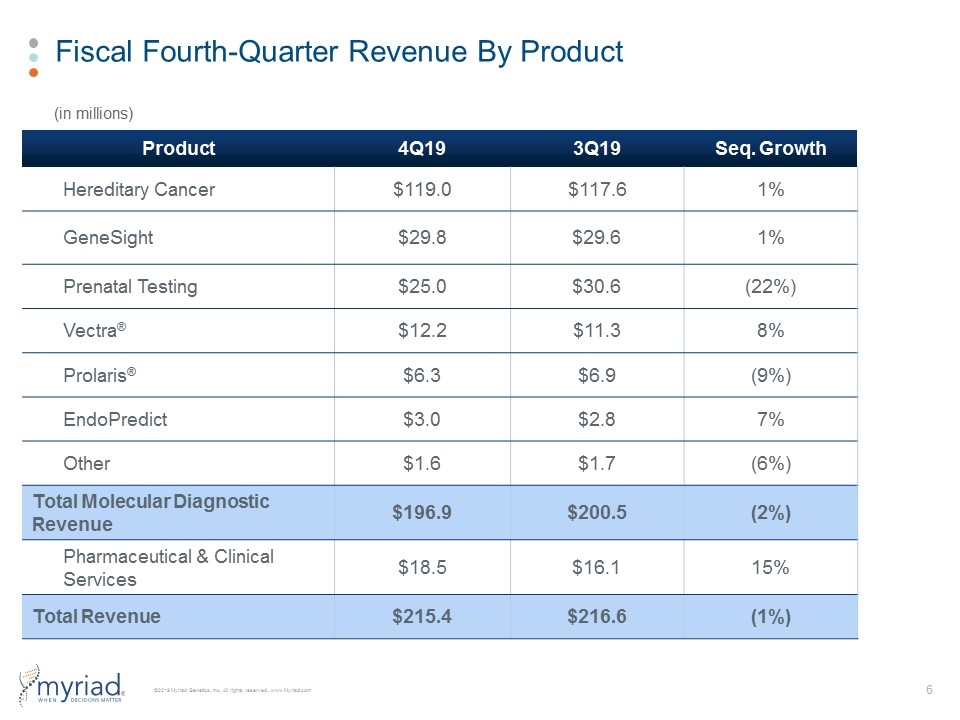
Fiscal Fourth-Quarter Revenue By Product Product 4Q19 3Q19 Seq. Growth Hereditary Cancer $119.0 $117.6 1% GeneSight $29.8 $29.6 1% Prenatal Testing $25.0 $30.6 (22%) Vectra® $12.2 $11.3 8% Prolaris® $6.3 $6.9 (9%) EndoPredict $3.0 $2.8 7% Other $1.6 $1.7 (6%) Total Molecular Diagnostic Revenue $196.9 $200.5 (2%) Pharmaceutical & Clinical Services $18.5 $16.1 15% Total Revenue $215.4 $216.6 (1%) (in millions)
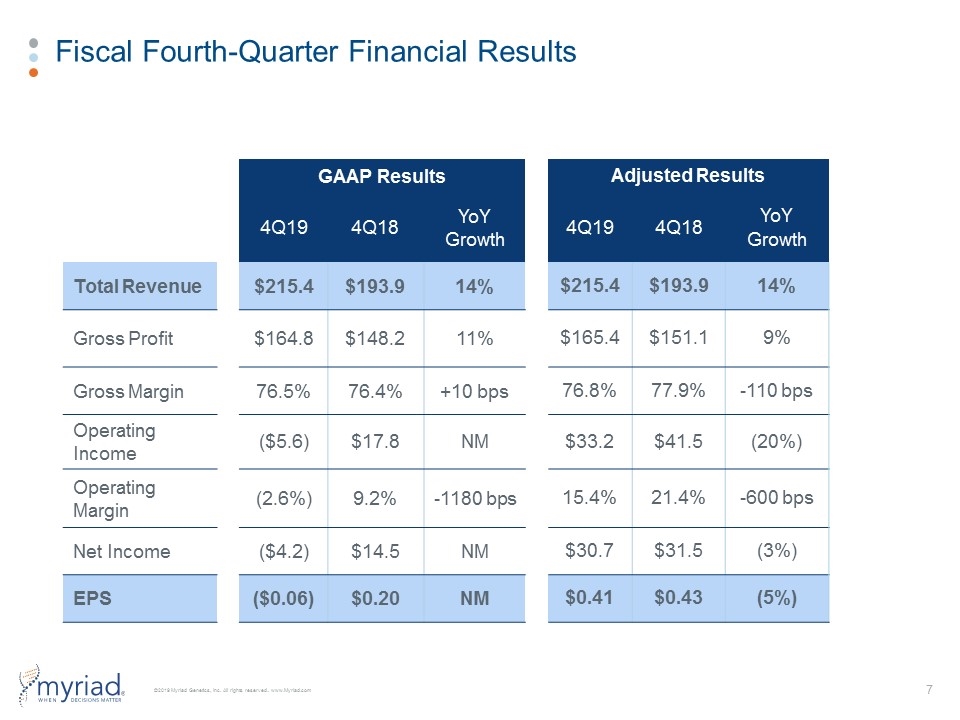
Fiscal Fourth-Quarter Financial Results GAAP Results Adjusted Results 4Q19 4Q18 YoY Growth 4Q19 4Q18 YoY Growth Total Revenue $215.4 $193.9 14% $215.4 $193.9 14% Gross Profit $164.8 $148.2 11% $165.4 $151.1 9% Gross Margin 76.5% 76.4% +10 bps 76.8% 77.9% -110 bps Operating Income ($5.6) $17.8 NM $33.2 $41.5 (20%) Operating Margin (2.6%) 9.2% -1180 bps 15.4% 21.4% -600 bps Net Income ($4.2) $14.5 NM $30.7 $31.5 (3%) EPS ($0.06) $0.20 NM $0.41 $0.43 (5%)
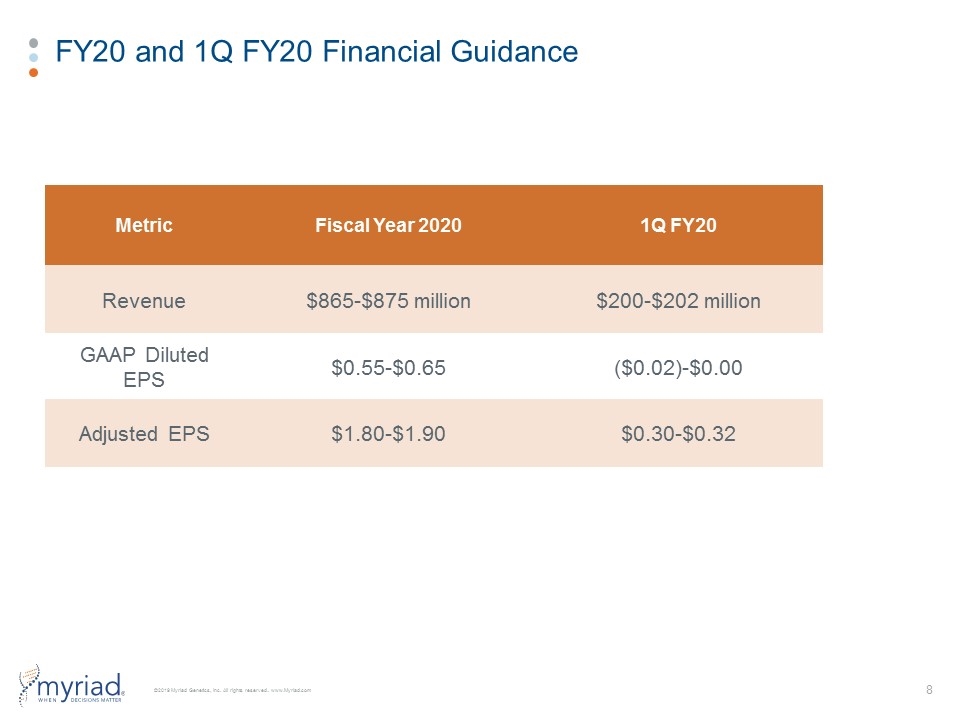
FY20 and 1Q FY20 Financial Guidance Metric Fiscal Year 2020 1Q FY20 Revenue $865-$875 million $200-$202 million GAAP Diluted EPS $0.55-$0.65 ($0.02)-$0.00 Adjusted EPS $1.80-$1.90 $0.30-$0.32
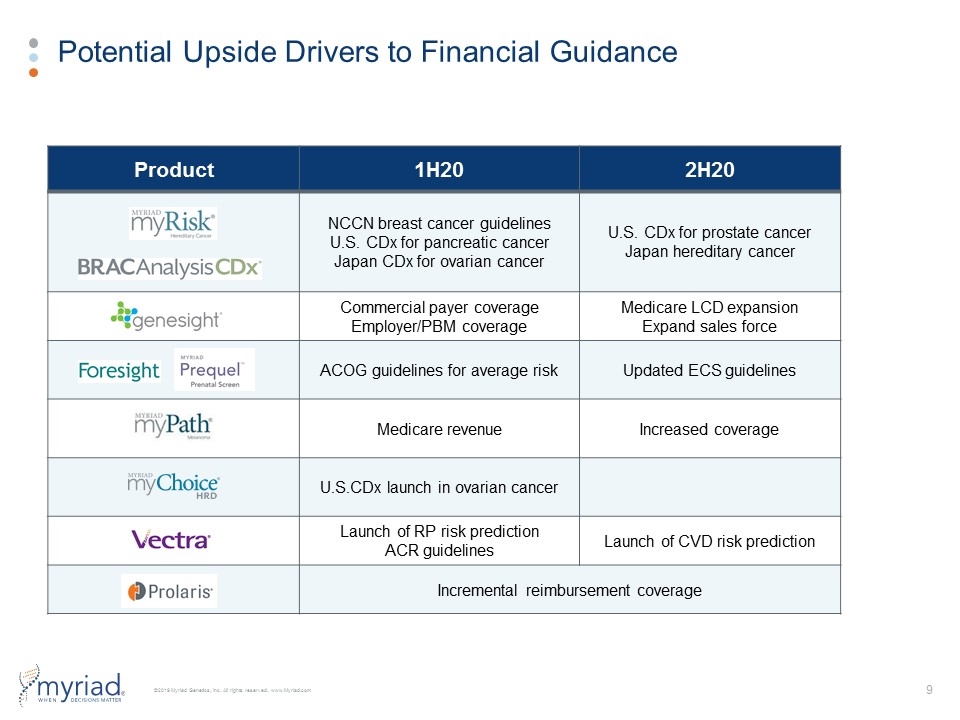
Potential Upside Drivers to Financial Guidance Product 1H20 2H20 NCCN breast cancer guidelines U.S. CDx for pancreatic cancer Japan CDx for ovarian cancer U.S. CDx for prostate cancer Japan hereditary cancer Commercial payer coverage Employer/PBM coverage Medicare LCD expansion Expand sales force ACOG guidelines for average risk Updated ECS guidelines Medicare revenue Increased coverage U.S.CDx launch in ovarian cancer Launch of RP risk prediction ACR guidelines Launch of CVD risk prediction Incremental reimbursement coverage
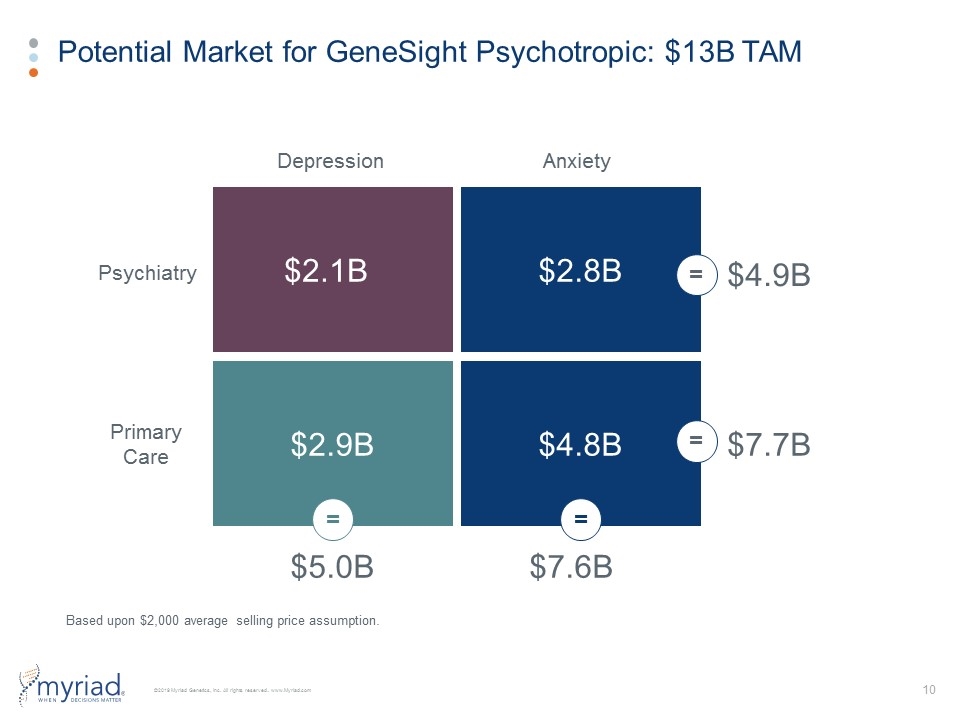
Potential Market for GeneSight Psychotropic: $13B TAM Based upon $2,000 average selling price assumption. Depression Anxiety Psychiatry Primary Care $2.1B $2.8B $2.9B $4.8B $5.0B $7.6B $7.7B $4.9B = = = =
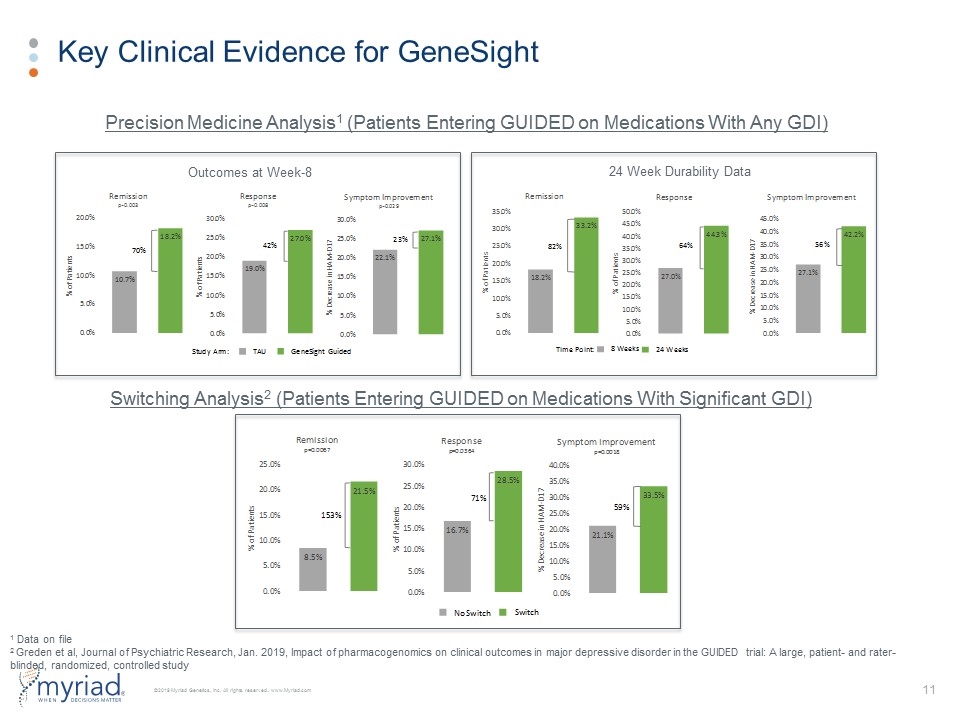
Key Clinical Evidence for GeneSight Switching Analysis2 (Patients Entering GUIDED on Medications With Significant GDI) Precision Medicine Analysis1 (Patients Entering GUIDED on Medications With Any GDI) Outcomes at Week-8 24 Week Durability Data 1 Data on file 2 Greden et al, Journal of Psychiatric Research, Jan. 2019, Impact of pharmacogenomics on clinical outcomes in major depressive disorder in the GUIDED trial: A large, patient- and rater-blinded, randomized, controlled study
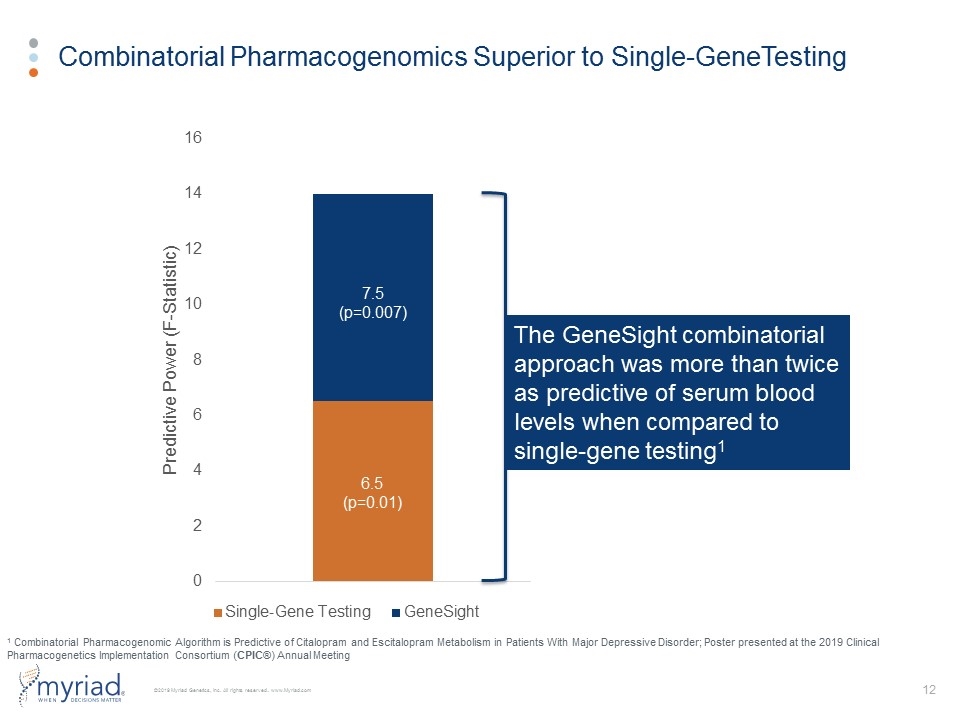
Combinatorial Pharmacogenomics Superior to Single-GeneTesting The GeneSight combinatorial approach was more than twice as predictive of serum blood levels when compared to single-gene testing1 6.5 (p=0.01) 7.5 (p=0.007) 1 Combinatorial Pharmacogenomic Algorithm is Predictive of Citalopram and Escitalopram Metabolism in Patients With Major Depressive Disorder; Poster presented at the 2019 Clinical Pharmacogenetics Implementation Consortium (CPIC®) Annual Meeting
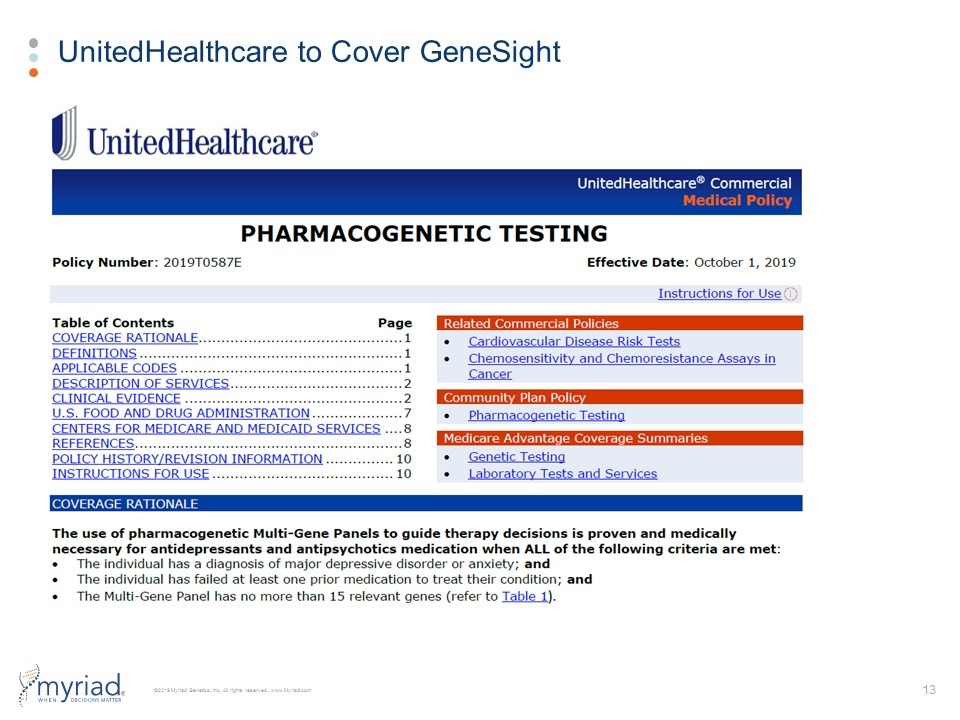
UnitedHealthcare to Cover GeneSight
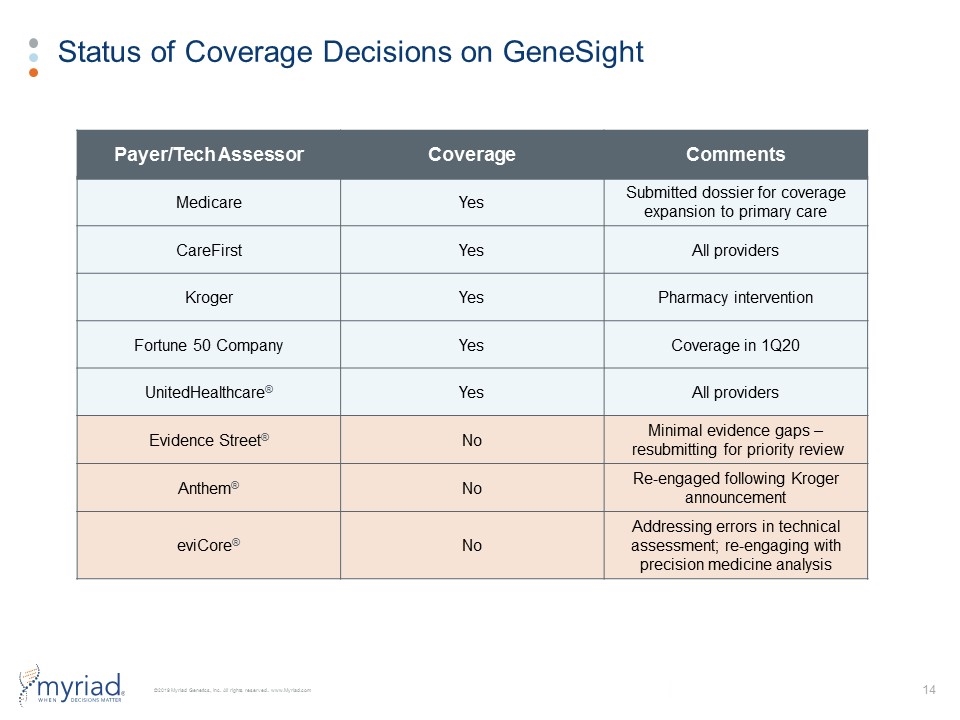
Status of Coverage Decisions on GeneSight Payer/Tech Assessor Coverage Comments Medicare Yes Submitted dossier for coverage expansion to primary care CareFirst Yes All providers Kroger Yes Pharmacy intervention Fortune 50 Company Yes Coverage in 1Q20 UnitedHealthcare® Yes All providers Evidence Street® No Minimal evidence gaps – resubmitting for priority review Anthem® No Re-engaged following Kroger announcement eviCore® No Addressing errors in technical assessment; re-engaging with precision medicine analysis
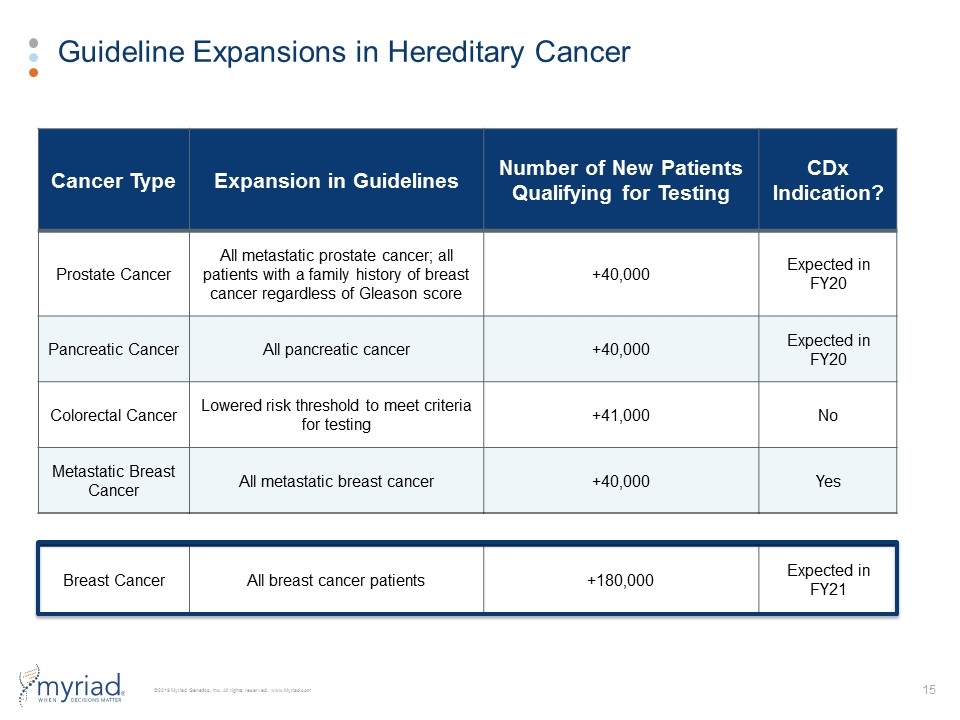
Guideline Expansions in Hereditary Cancer Cancer Type Expansion in Guidelines Number of New Patients Qualifying for Testing CDx Indication? Prostate Cancer All metastatic prostate cancer; all patients with a family history of breast cancer regardless of Gleason score +40,000 Expected in FY20 Pancreatic Cancer All pancreatic cancer +40,000 Expected in FY20 Colorectal Cancer Lowered risk threshold to meet criteria for testing +41,000 No Metastatic Breast Cancer All metastatic breast cancer +40,000 Yes Breast Cancer All breast cancer patients +180,000 Expected in FY21
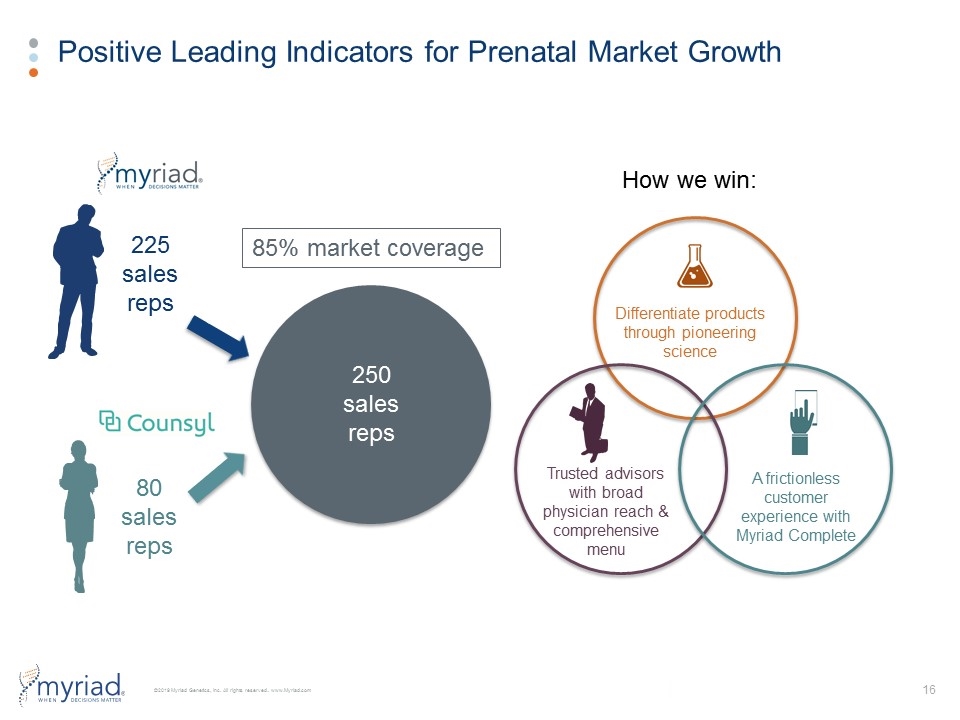
Positive Leading Indicators for Prenatal Market Growth 225 sales reps 80 sales reps 250 sales reps 85% market coverage A frictionless customer experience with Myriad Complete Trusted advisors with broad physician reach & comprehensive menu Differentiate products through pioneering science How we win:
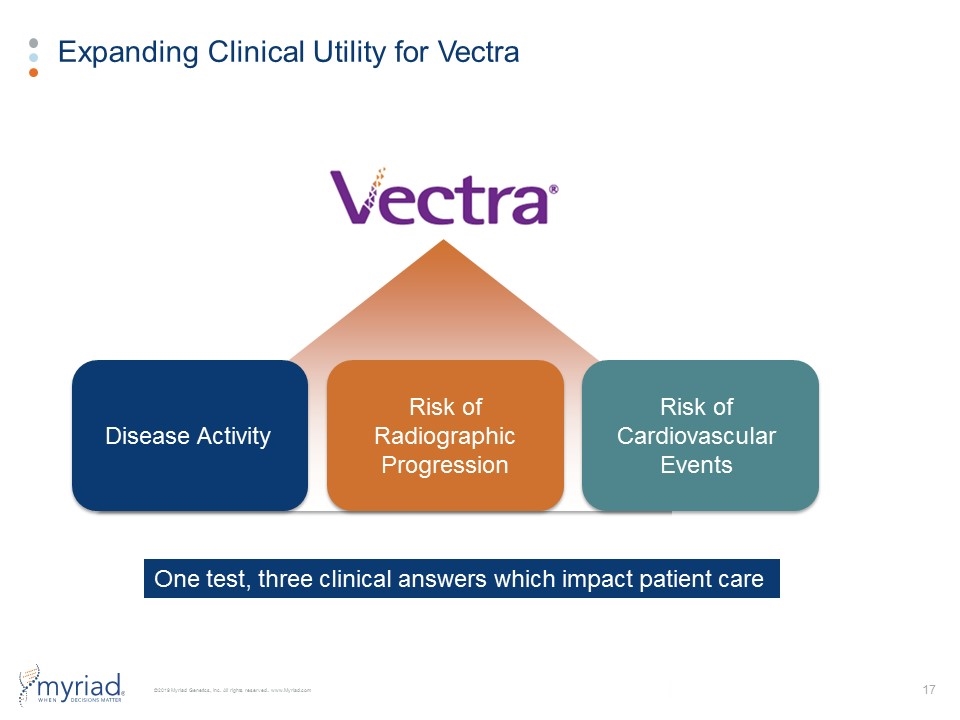
Expanding Clinical Utility for Vectra Disease Activity Risk of Radiographic Progression Risk of Cardiovascular Events One test, three clinical answers which impact patient care
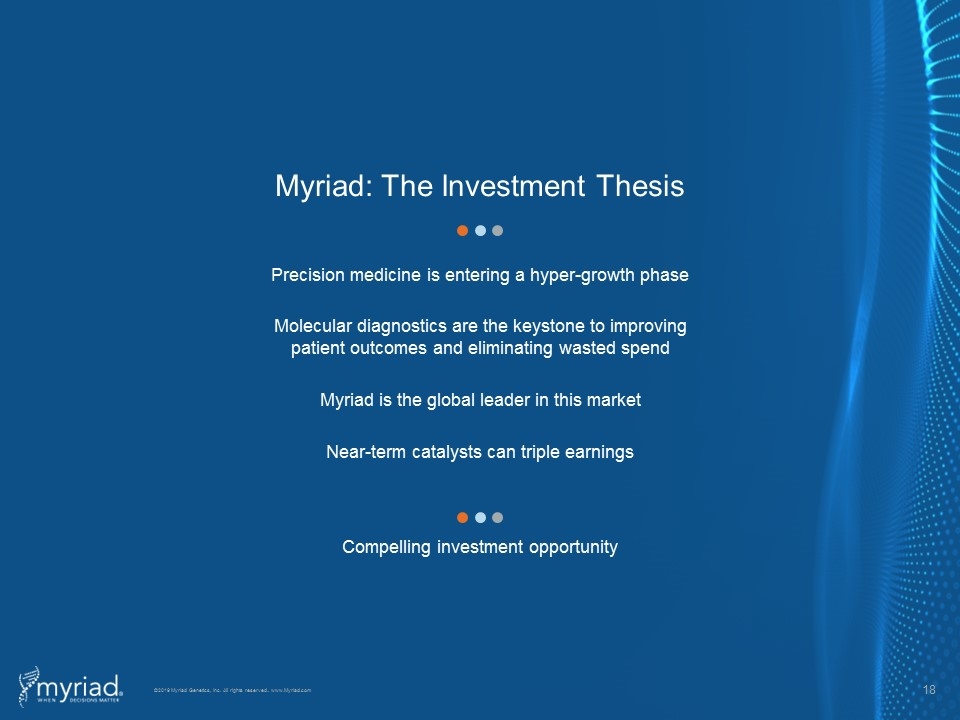
Precision medicine is entering a hyper-growth phase Molecular diagnostics are the keystone to improving patient outcomes and eliminating wasted spend Myriad is the global leader in this market Near-term catalysts can triple earnings Compelling investment opportunity Myriad: The Investment Thesis


