| | |
| UNITED STATES
SECURITIES AND EXCHANGE COMMISSION |
| | |
| CERTIFIED SHAREHOLDER REPORT OF REGISTERED
MANAGEMENT INVESTMENT COMPANIES
|
| | |
| Investment Company Act file number: | (811-07626) |
| | |
| Exact name of registrant as specified in charter: | Putnam Municipal Opportunities Trust |
| | |
| Address of principal executive offices: | 100 Federal Street, Boston, Massachusetts 02110 |
| | |
| Name and address of agent for service: | Stephen Tate, Vice President
100 Federal Street
Boston, Massachusetts 02110 |
| | |
| Copy to: | Bryan Chegwidden, Esq.
Ropes & Gray LLP
1211 Avenue of the Americas
New York, New York 10036 |
| | |
| Registrant’s telephone number, including area code: | (617) 292-1000 |
| | |
| Date of fiscal year end: | April 30, 2022 |
| | |
| Date of reporting period: | May 1, 2021 – October 31, 2021 |
| | |
|
Item 1. Report to Stockholders: | |
| | |
| The following is a copy of the report transmitted to stockholders pursuant to Rule 30e-1 under the Investment Company Act of 1940: | |

Putnam Municipal
Opportunities
Trust
Semiannual report
10 | 31 | 21
The fund has adopted a managed distribution policy (the “Distribution Policy”) with the goal of providing shareholders with a consistent, although not guaranteed, monthly distribution. In accordance with the Distribution Policy, the fund currently expects to make monthly distributions to common shareholders at a distribution rate per share of $0.0531. Distributions may include ordinary and/or tax-exempt income, net capital gains, and/or a return of capital of your investment in the fund. You should not draw any conclusions about the fund’s investment performance from the amount of this distribution or from the terms of the Distribution Policy. The Distribution Policy provides that the Board of Trustees may amend or terminate the Distribution Policy at any time without prior notice to fund shareholders.
Message from the Trustees
December 15, 2021
Dear Fellow Shareholder:
In 2021, the stock market had another above-average year. Corporate earnings rose as the economy reopened and stimulus policies helped increase demand. Bonds, on the other hand, had a subpar year amid higher inflation. To respond to inflation risk, in part, the U.S. Federal Reserve has begun to reduce its monthly asset purchases, a program put in place during the Covid-19 pandemic.
Changes and opportunities lie ahead. In November, Congress passed the bipartisan Infrastructure Investment and Jobs Act. It will increase funding for roads, ports, rail, and other projects in the coming decade.
As companies continue to adapt to the pandemic, many of them face new challenges, like rebuilding supply chains, hiring workers, and addressing climate risk. Amid all of it, Putnam’s researchers will be actively looking for potential investments to meet the goals of your fund.
Thank you for investing with Putnam.


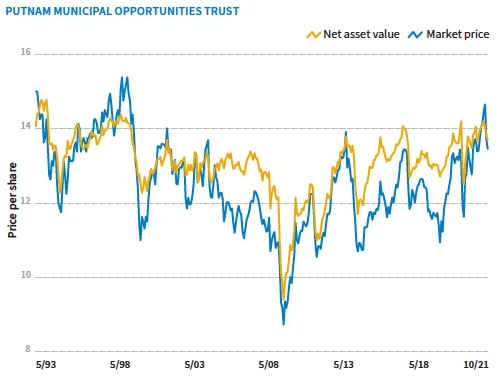
Putnam Municipal Opportunities Trust has the flexibility to invest in municipal bonds issued by any U.S. state or territory. As a closed-end fund, it shares some common characteristics with open-end mutual funds, but there are some key differences that investors should understand as they consider their portfolio.

|
| 2 Municipal Opportunities Trust |
Looking at a closed-end fund’s performance
You will usually see that the NAV and the market price differ. The market price can be influenced by several factors that cause it to vary from the NAV, including fund distributions, changes in supply and demand for the fund’s shares, changing market conditions, and investor perceptions of the fund or its investment manager.
A mix of credit qualities
In addition to its flexible geographical focus, Putnam Municipal Opportunities Trust combines bonds of differing credit quality. The fund invests in high-quality bonds, but also includes an allocation to lower-rated bonds, which may offer higher income in return for more risk.
|
| Municipal Opportunities Trust 3 |
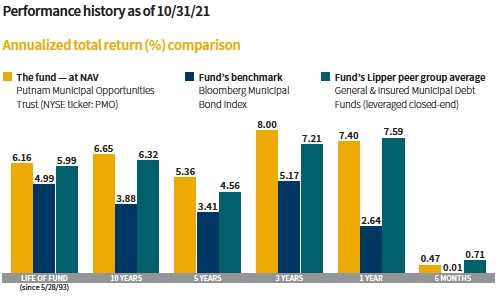
Data are historical. Past performance does not guarantee future results. More recent returns may be less or more than those shown. Investment return and net asset value will fluctuate, and you may have a gain or a loss when you sell your shares. Performance assumes reinvestment of distributions and does not account for taxes. Fund returns in the bar chart are at NAV. See below and pages 10–11 for additional performance information, including fund returns at market price. Index and Lipper results should be compared with fund performance at NAV. Fund results reflect the use of leverage, while index results are unleveraged and Lipper results reflect varying use of, and methods for, leverage.
All Bloomberg indices provided by Bloomberg Index Services Limited.
Lipper peer group average provided by Lipper, a Refinitiv company.
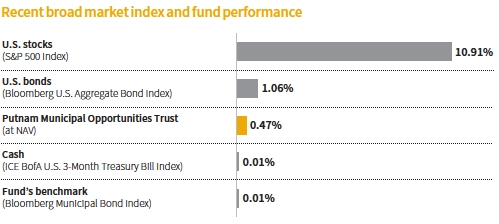
This comparison shows your fund’s performance in the context of broad market indexes for the six months ended 10/31/21. See above and pages 10–11 for additional fund performance information. Index descriptions can be found on page 13.
All Bloomberg are indices provided by Bloomberg Index Services Limited.
|
| 4 Municipal Opportunities Trust |


Paul, how did municipal bonds perform during the reporting period?
Municipal bonds encountered headwinds but delivered slightly positive performance. Mixed economic data, inflation fears, and a spike in Covid-19 cases due to the Delta variant weighed on the asset class in the later months of the period.
Municipal credit fundamentals continued to improve during the period. President Biden’s signing of the $1.9 trillion American Rescue Plan [ARP] in March 2021, which provided a windfall of $350 billion in direct aid to states and local governments, remained a tailwind for the asset class. This aid, coupled with the fact that state budgets have generally outperformed conservative forecasts, has improved our outlook for some of the largest credits in the municipal bond market. Furthermore, local municipalities have benefited from a strong housing market and higher revenue from local property taxes.
The asset class also benefited from favorable supply/demand dynamics, which tightened credit spreads. [Credit spreads reflect the difference in yield between higher- and lower-rated municipal bonds.] Demand was particularly strong and helped to support prices. This was
|
| Municipal Opportunities Trust 5 |
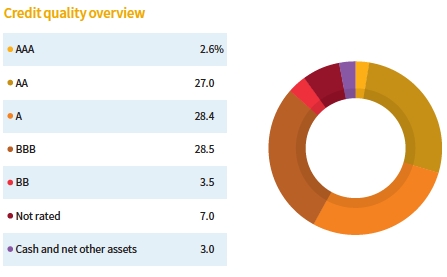
Credit qualities are shown as a percentage of the fund’s net assets (common and preferred shares) as of 10/31/21. A bond rated BBB or higher (SP-3 or higher, for short-term debt) is considered investment grade. This chart reflects the highest security rating provided by one or more of Standard & Poor’s, Moody’s, and Fitch. Ratings may vary over time.
Cash and net other assets, if any, represent the market value weights of cash, derivatives, and short-term securities in the portfolio. The fund itself has not been rated by an independent rating agency.
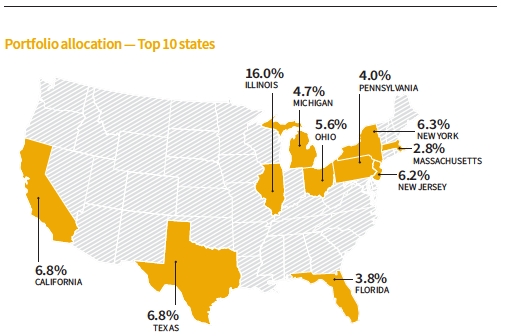
Top 10 state allocations are shown as a percentage of the fund’s net assets (common and preferred shares) as of 10/31/21. As of 10/31/21, the fund did not have any investments in Puerto Rico. Summary information may differ from the portfolio schedule included in the financial statements due to the differing treatment of interest accruals, the floating-rate portion of tender option bonds, derivative securities, if any, and the use of different classifications of securities for presentation purposes. Holdings and allocations may vary over time.
|
| 6 Municipal Opportunities Trust |
due to Treasury yields sitting at historically low levels, which pushed investors to seek alternative income opportunities. The pace of inflows into municipal bond mutual funds increased considerably as a result. Given the heightened demand, the 2021 calendar year will be the largest inflow year on record, according to Lipper, a Refinitiv company. Supply has been consistent with that of 2020. However, the composition of supply is a bit different, with more tax-exempt issuance coming to market than taxable issuance. We believe this was due to the tax policy uncertainty in Washington, D.C., in the first half of 2021.
In September 2021, the Federal Reserve’s messaging became more hawkish when it stated it might begin tapering asset purchases as early as November 2021. Interest rates moved higher in response to the announcement and inflation fears, weighing on the performance of rate-sensitive fixed income securities. The inflation concerns were stoked by the prospect of higher prices due to supply chain disruptions, rising labor costs, and higher commodity prices. After telegraphing its intentions for months, the Fed announced its long-awaited decision in early November 2021, just after the close of the period. It would reduce its monthly purchases of Treasury bonds by $10 billion and mortgage-backed securities by $5 billion per month beginning that month.
How did the fund perform during the reporting period?
For the six months ended October 31, 2021, the fund outperformed its municipal benchmark but underperformed the average return of its Lipper peer group, General & Insured Municipal Debt Funds [leveraged closed-end].
Note, the Lipper peer group contains funds with a range of investment strategies. Some funds use forms of leverage or other return-enhancing methods that would have improved their returns in the recent period, when tax-exempt bonds generally performed well, and lifted the category’s average return significantly above that of the benchmark index, which does not benefit from such return-enhancing strategies.

What strategies influenced the fund’s performance during the period?
At period-end, the fund held an overweight exposure to investment-grade bonds rated A and BBB, which are at the lower end of the investment-grade spectrum, and an underweight exposure to high-yield bonds relative to its Lipper peer group. From a sector- or industry-positioning perspective, we favored state-backed, continuing-care retirement community, and charter school bonds relative to the fund’s Lipper peer group. Duration positioning, a measure of the fund’s interest-rate sensitivity, was generally neutral relative to the level of its Lipper peer group at period-end.
Regarding our strategy for state debt, the fund held an overweight exposure to Illinois relative to the Lipper peer group. We believe Illinois’s financial profile continues to stabilize, and its flexibility and credit fundamentals appear to have improved since the onset of the Covid-19 pandemic in the United States. During the period, we decreased the overweight position slightly as credit spreads tightened due to improving municipal credit fundamentals and strong market technicals.
We remain cautious about Puerto Rico due to what we believe to be its seemingly fragile economy, weak demographic trends, poor-quality infrastructure, volatile political environment, and history of fiscal
|
| Municipal Opportunities Trust 7 |
mismanagement. As such, the fund, which didn’t have any investments in Puerto Rico at period-end, remained underweight in its exposure to Puerto Rico municipal debt relative to its Lipper peer group. We continue to monitor the Commonwealth’s ongoing restructuring efforts for potential opportunities.
How did you use derivatives during the period?
We utilized swaps to hedge or gain exposure to interest-rate and term-structure risk and to hedge or gain exposure to inflation.
What is your outlook for the municipal bond market as 2022 begins?
The recent infusions under the ARP, fiscal stimulus, and a pickup in economic activity should help many state and local governments enter their 2022 budget sessions with enough cash on hand to help absorb the economic stress of the pandemic, in our view. In August 2021, the Senate passed a $1.2 trillion bipartisan infrastructure bill to repair the nation’s deteriorating roads and bridges, fund new broadband and climate initiatives, and modernize the power grid. [The House subsequently passed the infrastructure bill in November 2021.] Depending on the details of the infrastructure bill, we believe it would likely be a positive development for many municipal borrowers, particularly state and local governments, transit agencies, airports, and other entities that typically finance transportation infrastructure. In our view, federal grants for these projects would reduce the need for municipal borrowers to issue debt to cover these essential services. This could increase fiscal flexibility for these borrowers while avoiding higher tax burdens.
We believe the current uncertainties surrounding the path of inflation and the course of the pandemic could lead to increased interest-rate volatility. The pandemic-related supply chain and labor market disruptions have been more persistent than we had initially expected, leading to delays and output shortages that could be with us for some time. The near-term result is an elevated inflation backdrop that, in our view, will likely weigh on consumer sentiment and erode demand or encourage the Fed to tighten monetary policy
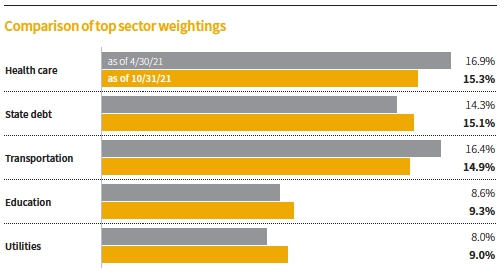
This chart shows how the fund’s top weightings have changed over the past six months. Allocations are shown as a percentage of the fund’s net assets (common and preferred shares). Current period summary information may differ from the information in the portfolio schedule notes included in the financial statements due to the inclusion of derivative securities, any interest accruals, the timing of matured security transactions, the use of different classifications of securities for presentation purposes, and rounding. Holdings and allocations may vary over time.
|
| 8 Municipal Opportunities Trust |
more quickly. In either case, our near-term outlook is for slower growth than previously expected and modestly elevated inflation.
Municipals were one of the best-performing fixed income asset classes during the first half of 2021. Given this result, we believe municipal bond returns in the second half of 2021 are unlikely to match the relatively strong results of the first half. With current valuations at rich levels versus history, we would view any rate volatility or a market sell-off as a potential buying opportunity. We believe the lower tiers of the investment-grade municipal market, particularly BBB-rated securities, and the high-yield market represent some of the best income and return opportunities today, but we are being selective.
We continue to believe municipals offer a high-quality, tax-free strategy to garner income in today’s historically low rate environment.
Thank you, Paul, for your time and insights today.
The views expressed in this report are exclusively those of Putnam Management and are subject to change. They are not meant as investment advice.
Please note that the holdings discussed in this report may not have been held by the fund for the entire period. Portfolio composition is subject to review in accordance with the fund’s investment strategy and may vary in the future. Current and future portfolio holdings are subject to risk. Statements in the Q&A concerning the fund’s performance or portfolio composition relative to those of the fund’s Lipper peer group may reference information produced by Lipper Inc. or through a third party.
|
| Municipal Opportunities Trust 9 |
Your fund’s performance
This section shows your fund’s performance, price, and distribution information for periods ended October 31, 2021, the end of the first half of its current fiscal year. In accordance with regulatory requirements for mutual funds, we also include performance information as of the most recent calendar quarter-end. Performance should always be considered in light of a fund’s investment strategy. Data represent past performance. Past performance does not guarantee future results. More recent returns may be less or more than those shown. Investment return, net asset value, and market price will fluctuate, and you may have a gain or a loss when you sell your shares.
Fund performance Total return and comparative index results for periods ended 10/31/21
| | | | | | | | | |
| | Annual | | | | | | | | |
| | average | | | | | | | | |
| | Life of | | | | | | | | |
| | fund | | | | | | | | |
| | (since | | Annual | | Annual | | Annual | | |
| | 5/28/93) | 10 years | average | 5 years | average | 3 years | average | 1 year | 6 months |
| NAV | 6.16% | 90.33% | 6.65% | 29.82% | 5.36% | 25.96% | 8.00% | 7.40% | 0.47% |
| Market price | 6.09 | 100.35 | 7.20 | 40.24 | 7.00 | 44.51 | 13.06 | 11.42 | 0.36 |
| Bloomberg Municipal | | | | | | | | | |
| Bond Index | 4.99 | 46.27 | 3.88 | 18.28 | 3.41 | 16.34 | 5.17 | 2.64 | 0.01 |
| Lipper General & Insured | | | | | | | | | |
| Municipal Debt Funds | | | | | | | | | |
| (leveraged closed-end) | | | | | | | | | |
| category average* | 5.99 | 85.20 | 6.32 | 25.07 | 4.56 | 23.29 | 7.21 | 7.59 | 0.71 |
Performance assumes reinvestment of distributions and does not account for taxes.
Index and Lipper results should be compared with fund performance at net asset value. Fund results reflect the use of leverage, while index results are unleveraged and Lipper results reflect varying use of, and methods for, leverage.
All Bloomberg indices are provided by Bloomberg Index Services Limited.
* Over the 6-month, 1-year, 3-year, 5-year, 10-year, and life-of-fund periods ended 10/31/21, there were 59, 58, 51, 50, 45, and 23 funds, respectively, in this Lipper category.
Performance includes the deduction of management fees and administrative expenses.
|
| 10 Municipal Opportunities Trust |
Fund price and distribution information For the six-month period ended 10/31/21
| | | |
| Distributions | | | |
| Number | | 6 | |
| Income1 | | $0.3186 | |
| Capital gains2 | | — | |
| Total | | $0.3186 | |
| | Series B | | Series C |
| Distributions — Preferred shares | (2,876 shares) | | (2,673 shares) |
| Number | — | | — |
| Income1 | $10.83 | | $10.71 |
| Capital gains2 | — | | — |
| Total | $10.83 | | $10.71 |
| Share value | NAV | | Market price |
| 4/30/21 | $13.95 | | $13.72 |
| 10/31/21 | 13.70 | | 13.46 |
| Current dividend rate (end of period) | NAV | | Market price |
| Current dividend rate3 | 4.65% | | 4.73% |
| Taxable equivalent4 | 7.85 | | 7.99 |
The classification of distributions, if any, is an estimate. Final distribution information will appear on your year-end tax forms.
1 For some investors, investment income may be subject to the federal alternative minimum tax. Income from federally exempt funds may be subject to state and local taxes.
2 Capital gains, if any, are taxable for federal and, in most cases, state purposes.
3 Most recent distribution, including any return of capital and excluding capital gains, annualized and divided by NAV or market price at end of period.
4 Assumes maximum 40.80% federal tax rate for 2021. Results for investors subject to lower tax rates would not be as advantageous.
Fund performance as of most recent calendar quarter Total return for periods ended 9/30/21
| | | | | | | | | |
| | Annual | | | | | | | | |
| | average | | | | | | | | |
| | Life of | | | | | | | | |
| | fund (since | | Annual | | Annual | | Annual | | |
| | 5/28/93) | 10 years | average | 5 years | average | 3 years | average | 1 year | 6 months |
| NAV | 6.20% | 90.44% | 6.65% | 28.08% | 5.07% | 25.22% | 7.79% | 7.47% | 2.51% |
| Market price | 6.16 | 103.93 | 7.39 | 33.44 | 5.94 | 40.90 | 12.11 | 11.68 | 4.59 |
See the discussion following the fund performance table on page 10 for information about the calculation of fund performance.
|
| Municipal Opportunities Trust 11 |
Consider these risks before investing
Lower-rated bonds may offer higher yields in return for more risk. Bond investments are subject to interest-rate risk (the risk of bond prices falling if interest rates rise) and credit risk (the risk of an issuer defaulting on interest or principal payments). Interest-rate risk is generally greater for longer-term bonds, and credit risk is generally greater for below-investment-grade bonds. Unlike bonds, funds that invest in bonds have fees and expenses.
The value of investments in the fund’s portfolio may fall or fail to rise over extended periods of time for a variety of reasons, including general economic, political, or financial market conditions; investor sentiment and market perceptions; government actions; geopolitical events or changes; and factors related to a specific issuer, geography, industry, or sector. These and other factors may lead to increased volatility and reduced liquidity in the fund’s portfolio holdings. The fund’s shares trade on a stock exchange at market prices, which may be lower than the fund’s net asset value.
Our investment techniques, analyses, and judgments may not produce the outcome we intend. The investments we select for the fund may not perform as well as other securities that we do not select for the fund. We, or the fund’s other service providers, may experience disruptions or operating errors that could have a negative effect on the fund. You can lose money by investing in the fund.
|
| 12 Municipal Opportunities Trust |
Terms and definitions
Important terms
Total return shows how the value of the fund’s shares changed over time, assuming you held the shares through the entire period and reinvested all distributions in the fund.
Net asset value (NAV) is the value of all your fund’s assets, minus any liabilities, divided by the number of outstanding shares.
Market price is the current trading price of one share of the fund. Market prices are set by transactions between buyers and sellers on exchanges such as the New York Stock Exchange.
Fixed-income terms
Current rate is the annual rate of return earned from dividends or interest of an investment. Current rate is expressed as a percentage of the price of a security, fund share, or principal investment.
Yield curve is a graph that plots the yields of bonds with equal credit quality against their differing maturity dates, ranging from shortest to longest. It is used as a benchmark for other debt, such as mortgage or bank lending rates.
Comparative indexes
Bloomberg Municipal Bond Index is an unmanaged index of long-term fixed-rate investment-grade tax-exempt bonds.
Bloomberg U.S. Aggregate Bond Index is an unmanaged index of U.S. investment-grade fixed-income securities.
ICE BofA (Intercontinental Exchange Bank of America) U.S. 3-Month Treasury Bill Index is an unmanaged index that seeks to measure the performance of U.S. Treasury bills available in the marketplace.
S&P 500® Index is an unmanaged index of common stock performance.
Indexes assume reinvestment of all distributions and do not account for fees. Securities and performance of a fund and an index will differ. You cannot invest directly in an index.
BLOOMBERG® is a trademark and service mark of Bloomberg Finance L.P. and its affiliates (collectively “Bloomberg”). Bloomberg or Bloomberg’s licensors own all proprietary rights in the Bloomberg Indices. Neither Bloomberg nor Bloomberg’s licensors approve or endorse this material, or guarantee the accuracy or completeness of any information herein, or make any warranty, express or implied, as to the results to be obtained therefrom, and to the maximum extent allowed by law, neither shall have any liability or responsibility for injury or damages arising in connection therewith.
ICE Data Indices, LLC (“ICE BofA”), used with permission. ICE BofA permits use of the ICE BofA indices and related data on an “as is” basis; makes no warranties regarding same; does not guarantee the suitability, quality, accuracy, timeliness, and/or completeness of the ICE BofA indices or any data included in, related to, or derived therefrom; assumes no liability in connection with the use of the foregoing; and does not sponsor, endorse, or recommend Putnam Investments, or any of its products or services.
Lipper, a Refinitiv company, is a third-party industry-ranking entity that ranks mutual funds. Its rankings do not reflect sales charges. Lipper rankings are based on total return at net asset value relative to other funds that have similar current investment styles or objectives as determined by Lipper. Lipper may change a fund’s category assignment at its discretion. Lipper category averages reflect performance trends for funds within a category.
|
| Municipal Opportunities Trust 13 |
Other information for shareholders
Important notice regarding share repurchase program
In September 2021, the Trustees of your fund approved the renewal of a share repurchase program that had been in effect since 2005. This renewal allows your fund to repurchase, in the 365 days beginning October 1, 2021, up to 10% of the fund’s common shares outstanding as of September 30, 2021.
Important notice regarding delivery of shareholder documents
In accordance with Securities and Exchange Commission (SEC) regulations, Putnam sends a single notice of internet availability, or a single printed copy, of annual and semiannual shareholder reports, prospectuses, and proxy statements to Putnam shareholders who share the same address, unless a shareholder requests otherwise. If you prefer to receive your own copy of these documents, please call Putnam at 1-800-225-1581, and Putnam will begin sending individual copies within 30 days.
Proxy voting
Putnam is committed to managing our mutual funds in the best interests of our shareholders. The Putnam funds’ proxy voting guidelines and procedures, as well as information regarding how your fund voted proxies relating to portfolio securities during the 12-month period ended June 30, 2021, are available in the Individual Investors section of putnam.com and on the SEC’s website, www.sec.gov. If you have questions about finding forms on the SEC’s website, you may call the SEC at 1-800-SEC-0330. You may also obtain the Putnam funds’ proxy voting guidelines and procedures at no charge by calling Putnam’s Shareholder Services at 1-800-225-1581.
Fund portfolio holdings
The fund will file a complete schedule of its portfolio holdings with the SEC for the first and third quarters of each fiscal year on Form N-PORT within 60 days of the end of such fiscal quarter. Shareholders may obtain the fund’s Form N-PORT on the SEC’s website at www.sec.gov.
Prior to its use of Form N-PORT, the fund filed its complete schedule of its portfolio holdings with the SEC on Form N-Q, which is available online at www.sec.gov.
Trustee and employee fund ownership
Putnam employees and members of the Board of Trustees place their faith, confidence, and, most importantly, investment dollars in Putnam mutual funds. As of October 31, 2021, Putnam employees had approximately $584,000,000 and the Trustees had approximately $82,000,000 invested in Putnam mutual funds. These amounts include investments by the Trustees’ and employees’ immediate family members as well as investments through retirement and deferred compensation plans.
|
| 14 Municipal Opportunities Trust |
Summary of Putnam closed-end funds’ amended
and restated dividend reinvestment plans
Putnam Managed Municipal Income Trust, Putnam Master Intermediate Income Trust, Putnam Municipal Opportunities Trust and Putnam Premier Income Trust (each, a “Fund” and collectively, the “Funds”) each offer a dividend reinvestment plan (each, a “Plan” and collectively, the “Plans”). If you participate in a Plan, all income dividends and capital gain distributions are automatically reinvested in Fund shares by the Fund’s agent, Putnam Investor Services, Inc. (the “Agent”). If you are not participating in a Plan, every month you will receive all dividends and other distributions in cash, paid by check and mailed directly to you.
Upon a purchase (or, where applicable, upon registration of transfer on the shareholder records of a Fund) of shares of a Fund by a registered shareholder, each such shareholder will be deemed to have elected to participate in that Fund’s Plan. Each such shareholder will have all distributions by a Fund automatically reinvested in additional shares, unless such shareholder elects to terminate participation in a Plan by instructing the Agent to pay future distributions in cash. Shareholders who were not participants in a Plan as of January 31, 2010, will continue to receive distributions in cash but may enroll in a Plan at any time by contacting the Agent.
If you participate in a Fund’s Plan, the Agent will automatically reinvest subsequent distributions, and the Agent will send you a confirmation in the mail telling you how many additional shares were issued to your account.
To change your enrollment status or to request additional information about the Plans, you may contact the Agent either in writing, at P.O. Box 8383, Boston, MA 02266-8383, or by telephone at 1-800-225-1581 during normal East Coast business hours.
How you acquire additional shares through a Plan If the market price per share for your Fund’s shares (plus estimated brokerage commissions) is greater than or equal to their net asset value per share on the payment date for a distribution, you will be issued shares of the Fund at a value equal to the higher of the net asset value per share on that date or 95% of the market price per share on that date.
If the market price per share for your Fund’s shares (plus estimated brokerage commissions) is less than their net asset value per share on the payment date for a distribution, the Agent will buy Fund shares for participating accounts in the open market. The Agent will aggregate open-market purchases on behalf of all participants, and the average price (including brokerage commissions) of all shares purchased by the Agent will be the price per share allocable to each participant. The Agent will generally complete these open-market purchases within five business days following the payment date. If, before the Agent has completed open-market purchases, the market price per share (plus estimated brokerage commissions) rises to exceed the net asset value per share on the payment date, then the purchase price may exceed the net asset value per share, potentially resulting in the acquisition of fewer shares than if the distribution had been paid in newly issued shares.
How to withdraw from a Plan Participants may withdraw from a Fund’s Plan at any time by notifying the Agent, either in writing or by telephone. Such withdrawal will be effective immediately if notice is received by the Agent with sufficient time prior to any distribution record date; otherwise, such withdrawal will be effective with respect to any subsequent distribution following notice of withdrawal. There is no penalty for withdrawing from or not participating in a Plan.
Plan administration The Agent will credit all shares acquired for a participant under a Plan to the account in which the participant’s common shares are held. Each participant will
|
| Municipal Opportunities Trust 15 |
be sent reasonably promptly a confirmation by the Agent of each acquisition made for his or her account.
About brokerage fees Each participant pays a proportionate share of any brokerage commissions incurred if the Agent purchases additional shares on the open market, in accordance with the Plans. There are no brokerage charges applied to shares issued directly by the Funds under the Plans.
About taxes and Plan amendments
Reinvesting dividend and capital gain distributions in shares of the Funds does not relieve you of tax obligations, which are the same as if you had received cash distributions. The Agent supplies tax information to you and to the IRS annually. Each Fund reserves the right to amend or terminate its Plan upon 30 days’ written notice. However, the Agent may assign its rights, and delegate its duties, to a successor agent with the prior consent of a Fund and without prior notice to Plan participants.
If your shares are held in a broker or nominee name If your shares are held in the name of a broker or nominee offering a dividend reinvestment service, consult your broker or nominee to ensure that an appropriate election is made on your behalf. If the broker or nominee holding your shares does not provide a reinvestment service, you may need to register your shares in your own name in order to participate in a Plan.
In the case of record shareholders such as banks, brokers or nominees that hold shares for others who are the beneficial owners of such shares, the Agent will administer the Plan on the basis of the number of shares certified by the record shareholder as representing the total amount registered in such shareholder’s name and held for the account of beneficial owners who are to participate in the Plan.
|
| 16 Municipal Opportunities Trust |
Trustee approval of management contract
General conclusions
The Board of Trustees of The Putnam Funds oversees the management of each fund and, as required by law, determines annually whether to approve the continuance of your fund’s management contract with Putnam Investment Management, LLC (“Putnam Management”) and the sub-management contract with respect to your fund between Putnam Management and its affiliate, Putnam Investments Limited (“PIL”). The Board, with the assistance of its Contract Committee, requests and evaluates all information it deems reasonably necessary under the circumstances in connection with its annual contract review. The Contract Committee consists solely of Trustees who are not “interested persons” (as this term is defined in the Investment Company Act of 1940, as amended (the “1940 Act”)) of The Putnam Funds (“Independent Trustees”).
At the outset of the review process, members of the Board’s independent staff and independent legal counsel considered any possible changes to the annual contract review materials furnished to the Contract Committee during the course of the previous year’s review and, as applicable, identified those changes to Putnam Management. Following these discussions and in consultation with the Contract Committee, the Independent Trustees’ independent legal counsel requested that Putnam Management and its affiliates furnish specified information, together with any additional information that Putnam Management considered relevant, to the Contract Committee. Over the course of several months ending in June 2021, the Contract Committee met on a number of occasions with representatives of Putnam Management, and separately in executive session, to consider the information that Putnam Management provided. Throughout this process, the Contract Committee was assisted by the members of the Board’s independent staff and by independent legal counsel for The Putnam Funds and the Independent Trustees.
In May 2021, the Contract Committee met in executive session to discuss and consider its recommendations with respect to the continuance of the contracts. At the Trustees’ June 2021 meeting, the Contract Committee met in executive session with the other Independent Trustees to review a summary of the key financial, performance and other data that the Contract Committee considered in the course of its review. The Contract Committee then presented its written report, which summarized the key factors that the Committee had considered and set forth its recommendations. The Contract Committee recommended, and the Independent Trustees approved, the continuance of your fund’s management and sub-management contracts, effective July 1, 2021. (Because PIL is an affiliate of Putnam Management and Putnam Management remains fully responsible for all services provided by PIL, the Trustees have not attempted to evaluate PIL as a separate entity, and all subsequent references to Putnam Management below should be deemed to include reference to PIL as necessary or appropriate in the context.)
The Independent Trustees’ approval was based on the following conclusions:
• That the fee schedule in effect for your fund represented reasonable compensation in light of the nature and quality of the services being provided to the fund, the fees paid by competitive funds and the costs incurred by Putnam Management in providing services to the fund; and
• That the fee schedule in effect for your fund represented an appropriate sharing between fund shareholders and Putnam Management of any economies of scale as may exist in the management of the fund at current asset levels.
These conclusions were based on a comprehensive consideration of all information provided to the Trustees and were not the result of any single factor. Some of the factors that figured particularly in the Trustees’ deliberations and how the Trustees considered these factors are described below, although individual Trustees may have evaluated the information presented differently, giving different weights to various factors. It is also important to recognize that the management arrangements for your fund and the other Putnam funds are the result of many years of review and discussion between the Independent Trustees and Putnam Management, that some aspects of the arrangements may receive greater scrutiny in some years than others and that the Trustees’ conclusions may be based, in part, on their consideration of fee arrangements in previous years.
|
| Municipal Opportunities Trust 17 |
Management fee schedules and total expenses
The Trustees reviewed the management fee schedules in effect for all Putnam funds, including fee levels and breakpoints. Under its management contract, your fund has the benefit of breakpoints in its management fee schedule that provide shareholders with reduced fee rates as the fund’s assets under management increase. The Trustees noted, however, that because your fund is a closed-end management investment company, it has relatively stable levels of assets under management and is not expected to be affected significantly by breakpoints in its management fee schedule. The Trustees also reviewed the total expenses of each Putnam fund, recognizing that in most cases management fees represented the major, but not the sole, determinant of total costs to fund shareholders. (Two funds have implemented so-called “all-in” management fees covering substantially all routine fund operating costs.)
In reviewing fees and expenses, the Trustees generally focus their attention on material changes in circumstances — for example, changes in assets under management, changes in a fund’s investment strategy, changes in Putnam Management’s operating costs or profitability, or changes in competitive practices in the mutual fund industry — that suggest that consideration of fee changes might be warranted. The Trustees concluded that the circumstances did not indicate that changes to the management fee schedule for your fund would be appropriate at this time.
The Trustees reviewed comparative fee and expense information for a custom group of competitive funds selected by Broadridge Financial Solutions, Inc. (“Broadridge”). This comparative information included your fund’s percentile ranking for effective management fees and total expenses, which provides a general indication of your fund’s relative standing. In the custom peer group, your fund ranked in the first quintile in effective management fees (determined for your fund and the other funds in the custom peer group based on fund asset size and the applicable contractual management fee schedule) and in the third quintile in total expenses as of December 31, 2020. The first quintile represents the least expensive funds and the fifth quintile the most expensive funds. The fee and expense data reported by Broadridge as of December 31, 2020 reflected the most recent fiscal year-end data available in Broadridge’s database at that time.
In connection with their review of fund management fees and total expenses, the Trustees also reviewed the costs of the services provided and the profits realized by Putnam Management and its affiliates from their contractual relationships with the funds. This information included trends in revenues, expenses and profitability of Putnam Management and its affiliates relating to the investment management, investor servicing and distribution services provided to the funds. In this regard, the Trustees also reviewed an analysis of the revenues, expenses and profitability of Putnam Management and its affiliates, allocated on a fund-by-fund basis, with respect to the funds’ management, distribution and investor servicing contracts. For each fund, the analysis presented information about revenues, expenses and profitability for each of the agreements separately and for the agreements taken together on a combined basis. The Trustees concluded that, at current asset levels, the fee schedules in place for the Putnam funds, including the fee schedule for your fund, represented reasonable compensation for the services being provided and represented an appropriate sharing between fund shareholders and Putnam Management of any economies of scale as may exist in the management of the Putnam funds at that time.
The information examined by the Trustees in connection with their annual contract review for the Putnam funds included information regarding services provided and fees charged by Putnam Management and its affiliates to other clients, including defined benefit pension and profit-sharing plans, sub-advised mutual funds, private funds sponsored by affiliates of Putnam Management, model-only separately managed accounts and Putnam Management’s newly launched exchange-traded funds. This information included, in cases where a product’s investment strategy corresponds with a fund’s strategy, comparisons of those fees with fees charged to the Putnam funds, as well as an assessment of the differences in the services provided to these clients as compared to the services provided to the Putnam funds. The Trustees observed that the differences in fee rates between these clients and the Putnam funds are by no means uniform when examined by individual asset sectors, suggesting that differences in the pricing of investment management services to these types of clients may reflect, among other things, historical competitive forces operating in separate marketplaces. The
|
| 18 Municipal Opportunities Trust |
Trustees considered the fact that in many cases fee rates across different asset classes are higher on average for mutual funds than for other clients, and the Trustees also considered the differences between the services that Putnam Management provides to the Putnam funds and those that it provides to its other clients. The Trustees did not rely on these comparisons to any significant extent in concluding that the management fees paid by your fund are reasonable.
Investment performance
The quality of the investment process provided by Putnam Management represented a major factor in the Trustees’ evaluation of the quality of services provided by Putnam Management under your fund’s management contract. The Trustees were assisted in their review of Putnam Management’s investment process and performance by the work of the investment oversight committees of the Trustees and the full Board of Trustees, which meet on a regular basis with individual portfolio managers and with senior management of Putnam Management’s Investment Division throughout the year. The Trustees concluded that Putnam Management generally provides a high-quality investment process — based on the experience and skills of the individuals assigned to the management of fund portfolios, the resources made available to them and in general Putnam Management’s ability to attract and retain high-quality personnel — but also recognized that this does not guarantee favorable investment results for every fund in every time period.
The Trustees considered that, in the aggregate, The Putnam Funds generally performed well in 2020, which Putnam Management characterized as a challenging year with significant volatility and varied market dynamics. On an asset-weighted basis, the Putnam funds ranked in the second quartile of their peers as determined by Lipper Inc. (“Lipper”) for the year ended December 31, 2020 and, on an asset-weighted-basis, delivered a gross return that was 2.3% ahead of their benchmarks in 2020. In addition to the performance of the individual Putnam funds, the Trustees considered, as they had in prior years, the performance of The Putnam Fund complex versus competitor fund complexes. In this regard, the Trustees observed that The Putnam Funds’ relative performance, as reported in the Barron’s/Lipper Fund Families survey, continued to be exceptionally strong over the long term, with The Putnam Funds ranking as the 3rd best performing mutual fund complex out of 44 complexes for the ten-year period, with 2020 marking the fourth consecutive year that The Putnam Funds have ranked in the top ten fund complexes for the ten-year period. The Trustees noted that The Putnam Funds’ performance was solid over the one- and five-year periods, with The Putnam Funds ranking 22nd out of 53 complexes and 14th out of 50 complexes, respectively. In addition to the Barron’s/Lipper Fund Families Survey, the Trustees also considered the funds’ ratings assigned by Morningstar Inc., noting that 26 of the funds were four- or five-star rated at the end of 2020 (representing an increase of four funds year-over-year) and that this included seven funds that had achieved a five-star rating (representing an increase of two funds year-over-year). They also noted, however, the disappointing investment performance of some funds for periods ended December 31, 2020 and considered information provided by Putnam Management regarding the factors contributing to the underperformance and actions being taken to improve the performance of these particular funds. The Trustees indicated their intention to continue to monitor closely the performance of those funds and evaluate whether additional actions to address areas of underperformance may be warranted.
For purposes of the Trustees’ evaluation of the Putnam funds’ investment performance, the Trustees generally focus on a competitive industry ranking of each fund’s total net return over a one-year, three-year and five-year period. For a number of Putnam funds with relatively unique investment mandates for which Putnam Management informed the Trustees that meaningful competitive performance rankings are not considered to be available, the Trustees evaluated performance based on their total gross and net returns and comparisons of those returns to the returns of selected investment benchmarks. In the case of your fund, the Trustees considered that its common share cumulative total return performance at net asset value was in the following quartiles of its Lipper peer group (Lipper General & Insured Municipal Debt Funds (Leveraged) (closed-end)) for the one-year, three-year and five-year periods ended December 31, 2020 (the first quartile representing the best-performing funds and the fourth quartile the worst-performing funds):
| |
| One-year period | 1st |
| Three-year period | 1st |
| Five-year period | 1st |
|
| Municipal Opportunities Trust 19 |
For the one-year and three-year periods ended December 31, 2020, your fund’s performance was in the top decile of its Lipper peer group. Over the one-year, three-year and five-year periods ended December 31, 2020, there were 64, 59 and 59 funds, respectively, in your fund’s Lipper peer group. (When considering performance information, shareholders should be mindful that past performance is not a guarantee of future results.)
The Trustees considered Putnam Management’s continued efforts to support fund performance through certain initiatives, including structuring compensation for portfolio managers to enhance accountability for fund performance, emphasizing accountability in the portfolio management process and affirming its commitment to a fundamental-driven approach to investing. The Trustees noted further that Putnam Management had made selective hires and internal promotions in 2020 to strengthen its investment team.
Brokerage and soft-dollar allocations; investor servicing
The Trustees considered various potential benefits that Putnam Management may receive in connection with the services it provides under the management contract with your fund. These include benefits related to brokerage allocation and the use of soft dollars, whereby a portion of the commissions paid by a fund for brokerage may be used to acquire research services that are expected to be useful to Putnam Management in managing the assets of the fund and of other clients. Subject to policies established by the Trustees, soft dollars generated by these means are used predominantly to acquire brokerage and research services (including third-party research and market data) that enhance Putnam Management’s investment capabilities and supplement Putnam Management’s internal research efforts. The Trustees indicated their continued intent to monitor regulatory and industry developments in this area with the assistance of their Brokerage Committee. In addition, with the assistance of their Brokerage Committee, the Trustees indicated their continued intent to monitor the allocation of the Putnam funds’ brokerage in order to ensure that the principle of seeking best price and execution remains paramount in the portfolio trading process.
Putnam Management may also receive benefits from payments that the funds make to Putnam Management’s affiliates for investor services. In conjunction with the annual review of your fund’s management and sub-management contracts, the Trustees reviewed your fund’s investor servicing agreement with PSERV, which is an affiliate of Putnam Management. The Trustees concluded that the fees payable by the funds to PSERV for such services are fair and reasonable in relation to the nature and quality of such services, the fees paid by competitive funds and the costs incurred by PSERV in providing such services. Furthermore, the Trustees were of the view that the investor services provided by PSERV were required for the operation of the funds, and that they were of a quality at least equal to those provided by other providers.
|
| 20 Municipal Opportunities Trust |
Financial statements
These sections of the report, as well as the accompanying Notes, constitute the fund’s financial statements.
The fund’s portfolio lists all the fund’s investments and their values as of the last day of the reporting period. Holdings are organized by asset type and industry sector, country, or state to show areas of concentration and diversification.
Statement of assets and liabilities shows how the fund’s net assets and share price are determined. All investment and non-investment assets are added together. Any unpaid expenses and other liabilities are subtracted from this total. The result is divided by the number of shares to determine the net asset value per share. (For funds with preferred shares, the amount subtracted from total assets includes the liquidation preference of preferred shares.)
Statement of operations shows the fund’s net investment gain or loss. This is done by first adding up all the fund’s earnings — from dividends and interest income — and subtracting its operating expenses to determine net investment income (or loss). Then, any net gain or loss the fund realized on the sales of its holdings — as well as any unrealized gains or losses over the period — is added to or subtracted from the net investment result to determine the fund’s net gain or loss for the fiscal period.
Statement of changes in net assets shows how the fund’s net assets were affected by the fund’s net investment gain or loss, by distributions to shareholders, and by changes in the number of the fund’s shares. It lists distributions and their sources (net investment income or realized capital gains) over the current reporting period and the most recent fiscal year-end. The distributions listed here may not match the sources listed in the Statement of operations because the distributions are determined on a tax basis and may be paid in a different period from the one in which they were earned. Dividend sources are estimated at the time of declaration. Actual results may vary. Any non-taxable return of capital cannot be determined until final tax calculations are completed after the end of the fund’s fiscal period.
Statement of cash flows shows changes in the fund’s cash balance during the period as results of cash flows from operating and financing activities.
Financial highlights provide an overview of the fund’s investment results, per-share distributions, expense ratios, net investment income ratios, and portfolio turnover in one summary table, reflecting the five most recent reporting periods. In a semiannual report, the highlights table also includes the current reporting period.
|
| Municipal Opportunities Trust 21 |
| | |
| The fund’s portfolio 10/31/21 (Unaudited) | | |
|
Key to holding’s abbreviations
|
| ABAG Association Of Bay Area Governments |
| AGM Assured Guaranty Municipal Corporation |
| AMBAC AMBAC Indemnity Corporation |
| BAM Build America Mutual |
| FRB Floating Rate Bonds: the rate shown is the current interest rate at the close of the reporting period. Rates may be subject to a cap or floor. For certain securities, |
| the rate may represent a fixed rate currently in place at the close of the reporting period. |
| G.O. Bonds General Obligation Bonds |
| NATL National Public Finance Guarantee Corporation |
| PSFG Permanent School Fund Guaranteed |
| Q-SBLF Qualified School Board Loan Fund |
| U.S. Govt. Coll. U.S. Government Collateralized |
|
| | | | |
| MUNICIPAL BONDS AND NOTES (136.7%)* | Rating** | | Principal amount | Value |
| Alabama (1.1%) |
| Jefferson Cnty., Swr. Rev. Bonds, Ser. D, 6.50%, 10/1/53 | BBB | | $2,000,000 | $2,303,489 |
| Jefferson, Cnty. Rev. Bonds, (Refunding warrants) | | | | |
| 5.00%, 9/15/34 | AA | | 2,075,000 | 2,488,847 |
| 5.00%, 9/15/33 | AA | | 275,000 | 329,974 |
| | | | 5,122,310 |
| Alaska (1.4%) |
| AK State Indl. Dev. & Export Auth. Rev. Bonds, (Tanana Chiefs Conference), Ser. A | | | | |
| 4.00%, 10/1/49 | A+/F | | 1,500,000 | 1,665,107 |
| 4.00%, 10/1/44 | A+/F | | 4,180,000 | 4,668,096 |
| | | | 6,333,203 |
| Arizona (3.4%) |
AZ Indl. Dev. Auth. Student Hsg. Rev. Bonds,
(NCCU Properties, LLC Central U.), BAM, 5.00%, 6/1/49 | AA | | 2,000,000 | 2,399,729 |
AZ State Indl. Dev. Auth. Rev. Bonds,
(Equitable School Revolving Fund, LLC Oblig. Group), 4.00%, 11/1/50 | A | | 2,855,000 | 3,227,286 |
AZ State Indl. Dev. Auth. Ed. Rev. Bonds,
(KIPP New York, Inc., Jerome Fac.), Ser. B | | | | |
| 4.00%, 7/1/61 | BBB− | | 1,380,000 | 1,447,462 |
| 4.00%, 7/1/41 | BBB− | | 720,000 | 764,947 |
AZ State Indl. Dev. Auth. Ed. 144A Rev. Bonds,
(BASIS Schools, Inc.), Ser. D, 5.00%, 7/1/51 | BB | | 510,000 | 582,128 |
| Maricopa Cnty., Indl. Dev. Auth. Ed. Rev. Bonds | | | | |
| (Reid Traditional Schools Painted Rock Academy), 5.00%, 7/1/36 | Baa3 | | 350,000 | 396,124 |
| (Horizon Cmnty. Learning Ctr.), 5.00%, 7/1/35 | BB+ | | 750,000 | 818,557 |
Phoenix, Indl. Dev. Auth. Ed. Rev. Bonds,
(Great Hearts Academies), 3.75%, 7/1/24 | BBB− | | 300,000 | 313,271 |
| Phoenix, Indl. Dev. Auth. Ed. 144A Rev. Bonds, (BASIS Schools, Inc.), 5.00%, 7/1/35 | BB | | 1,000,000 | 1,108,442 |
| Salt Verde, Fin. Corp. Gas Rev. Bonds, 5.50%, 12/1/29 | A3 | | 1,350,000 | 1,742,927 |
Yavapai Cnty., Indl. Dev. Auth. Hosp. Fac. Rev.
Bonds, (Yavapai Regl. Med. Ctr.), 5.00%, 8/1/34 | A2 | | 500,000 | 581,060 |
Yuma, Indl. Dev. Auth. Hosp. Rev. Bonds,
(Yuma Regl. Med. Ctr.), Ser. A, 5.00%, 8/1/32 | A | | 2,065,000 | 2,300,398 |
| | | | 15,682,331 |
| |
22 Municipal Opportunities Trust |
| | | | |
| MUNICIPAL BONDS AND NOTES (136.7%)* cont. | Rating** | | Principal amount | Value |
| California (10.2%) |
| ABAG Fin. Auth. for Nonprofit Corps. Rev. Bonds, (Episcopal Sr. Cmntys.), Ser. A, 5.00%, 7/1/32 (Prerefunded 7/1/22) | A−/F | | $550,000 | $567,610 |
| CA Cmnty. Hsg. Agcy. Essential Hsg. 144A Rev. Bonds | | | | |
| (Aster Apt.), Ser. A-1, 4.00%, 2/1/56 | BB+/P | | 550,000 | 580,905 |
| (Stoneridge Apt.), Ser. A, 4.00%, 2/1/56 | BB/P | | 2,125,000 | 2,225,352 |
| CA Hsg. Fin. Agcy. Muni. Certif. Rev. Bonds, Ser. 21-1, Class A, 3.50%, 11/20/35 | BBB+ | | 2,082,535 | 2,402,128 |
| CA State G.O. Bonds 4.00%, 11/1/33 T | Aa2 | | 10,000,000 | 11,689,018 |
| CA State Muni. Fin. Auth Mobile Home Park Rev. Bonds, (Caritas Affordable Hsg., Inc.), 5.25%, 8/15/39 | A− | | 400,000 | 432,440 |
CA State Muni. Fin. Auth. Rev. Bonds,
(HumanGood CA Oblig. Group), 4.00%, 10/1/49 | A−/F | | 2,200,000 | 2,525,499 |
CA State Poll. Control Fin. Auth. Rev. Bonds,
(San Jose Wtr. Co.) | | | | |
| 5.10%, 6/1/40 | A | | 3,500,000 | 3,511,261 |
| 4.75%, 11/1/46 | A | | 750,000 | 844,054 |
CA State Pub. Wks. Board Rev. Bonds,
(Various Cap. Projects.), Ser. A, 5.00%, 8/1/33 ### | Aa3 | | 3,000,000 | 3,873,355 |
| CA Statewide Cmnty. Dev. Auth. Rev. Bonds | | | | |
| (899 Charleston, LLC), Ser. A, 5.25%, 11/1/44 | BB/P | | 450,000 | 478,949 |
| (Front Porch Cmnty. & Svcs. Oblig. Group), Ser. A, 3.00%, 4/1/51 | A− | | 3,440,000 | 3,496,010 |
CSCDA Cmnty. Impt. Auth. Rev. Bonds,
(Pasadena Portfolio), Ser. A-2, 3.00%, 12/1/56 | BBB−/P | | 1,635,000 | 1,520,606 |
| CSCDA Cmnty. Impt. Auth. 144A Rev. Bonds | | | | |
| (City of Orange Portfolio), 3.00%, 3/1/57 | BBB−/P | | 650,000 | 602,420 |
| (Essential Hsg.), Ser. A-2, 3.00%, 2/1/57 | BBB−/P | | 1,900,000 | 1,748,196 |
| Golden State Tobacco Securitization Corp. Rev. Bonds, Ser. A-2, 5.00%, 6/1/47 | BB/P | | 2,500,000 | 2,560,028 |
| Los Angeles, Cmnty. Fac. Dist. No. 11 Special Tax, 4.00%, 9/1/38 | BB/P | | 1,000,000 | 1,149,826 |
| Mount Diablo Unified School Dist. G.O. Bonds, Ser. B | | | | |
| 4.00%, 6/1/37 ### | Aa3 | | 1,625,000 | 1,903,869 |
| 4.00%, 8/1/34 ### | Aa3 | | 2,745,000 | 3,256,080 |
| North Natomas, Cmnty. Fac. Special Tax Bonds, (Dist. No. 4), Ser. E, 5.00%, 9/1/30 | BBB+ | | 1,250,000 | 1,339,461 |
| San Bernardino Cnty., FRB, Ser. C, 0.316%, 8/1/23 | AA+ | | 1,125,000 | 1,115,008 |
| | | | 47,822,075 |
| Colorado (3.0%) |
| CO State Hlth. Fac. Auth. Rev. Bonds | | | | |
| (Valley View Hosp. Assn.), 5.00%, 5/15/40 | A− | | 1,000,000 | 1,129,755 |
| (Covenant Retirement Cmnty.), Ser. A, 5.00%, 12/1/35 | A−/F | | 1,000,000 | 1,113,645 |
| CO State Hlth. Fac. Auth. Hosp. Rev. Bonds | | | | |
| (Christian Living Neighborhood), 5.00%, 1/1/37 | BB/P | | 550,000 | 588,104 |
| (Covenant Living Cmnty. and Svcs. Oblig. Group), 4.00%, 12/1/50 | A−/F | | 2,700,000 | 3,054,153 |
Park Creek, Metro. Dist. Tax Allocation Bonds,
(Sr. Ltd. Property Tax Supported), Ser. A, 5.00%, 12/1/45 | A/F | | 200,000 | 225,541 |
| |
Municipal Opportunities Trust 23 |
| | | | |
| MUNICIPAL BONDS AND NOTES (136.7%)* cont. | Rating** | | Principal amount | Value |
| Colorado cont. |
Pub. Auth. for CO Energy Rev. Bonds,
(Natural Gas Purchase), 6.50%, 11/15/38 | A2 | | $2,250,000 | $3,419,723 |
Regl. Trans. Dist. Rev. Bonds,
(Denver Transit Partners, LLC) | | | | |
| 4.00%, 7/15/38 | Baa1 | | 800,000 | 932,467 |
| 3.00%, 7/15/37 | Baa1 | | 850,000 | 893,313 |
| Sterling Ranch Cmnty. Auth. Board Rev. Bonds, (Metro. Dist. No. 2), Ser. A, 4.25%, 12/1/50 | BB/P | | 550,000 | 606,105 |
| Vauxmont, Metro. Dist. G.O. Bonds, AGM | | | | |
| 5.00%, 12/1/33 | AA | | 255,000 | 322,754 |
| 5.00%, 12/15/32 | AA | | 160,000 | 183,018 |
| 5.00%, 12/15/31 | AA | | 135,000 | 154,625 |
| 5.00%, 12/1/30 | AA | | 215,000 | 272,956 |
| 5.00%, 12/1/29 | AA | | 210,000 | 267,765 |
| 5.00%, 12/15/28 | AA | | 130,000 | 149,559 |
| 5.00%, 12/1/28 | AA | | 210,000 | 262,873 |
| 5.00%, 12/1/27 | AA | | 200,000 | 245,019 |
| 5.00%, 12/15/26 | AA | | 135,000 | 156,086 |
| 5.00%, 12/1/26 | AA | | 190,000 | 227,552 |
| | | | 14,205,013 |
| Connecticut (1.3%) |
| CT State Special Tax, 4.00%, 5/1/39 | AA− | | 1,700,000 | 1,996,354 |
| CT State Hlth. & Edl. Fac. Auth. Rev. Bonds, (Stamford Hosp. Oblig. Group (The)), Ser. M | | | | |
| 5.00%, 7/1/34 ### | BBB+ | | 1,900,000 | 2,401,268 |
| 4.00%, 7/1/41 ### | BBB+ | | 580,000 | 658,121 |
| Harbor Point Infrastructure Impt. Dist. 144A Tax Alloc. Bonds, (Harbor Point Ltd.), 5.00%, 4/1/39 | BB/P | | 1,000,000 | 1,137,374 |
| | | | 6,193,117 |
| District of Columbia (2.4%) |
| DC Rev. Bonds | | | | |
| (Ingleside at Rock Creek), Ser. A, 5.00%, 7/1/52 | BB−/P | | 500,000 | 531,775 |
| (Two Rivers Pub. Charter School, Inc.), 5.00%, 6/1/50 | Baa3 | | 1,500,000 | 1,708,239 |
| (Latin American Montessori Bilingual Pub. Charter School Oblig. Group), 5.00%, 6/1/40 | BB+ | | 2,000,000 | 2,353,529 |
| (Two Rivers Pub. Charter School, Inc.), 5.00%, 6/1/40 | Baa3 | | 1,500,000 | 1,733,202 |
| Metro. Washington DC, Arpt. Auth. Dulles Toll Rd. Rev. Bonds | | | | |
| (Dulles Metrorail & Cap. Impt. Proj.), Ser. B, 4.00%, 10/1/44 T | A− | | 1,285,000 | 1,448,702 |
| (Dulles Metrorail & Cap. Impt. Proj.), 4.00%, 10/1/53 T | A− | | 1,290,000 | 1,439,742 |
| Metro. Washington, Arpt. Auth. Dulles Toll Rd. Rev. Bonds, (Metrorail), Ser. A, zero %, 10/1/37 | A− | | 3,700,000 | 2,143,489 |
| | | | 11,358,678 |
| Florida (4.9%) |
| FL State Higher Edl. Fac. Financial Auth. Rev. Bonds | | | | |
| (St. Leo U.), 5.00%, 3/1/44 | BBB− | | 1,500,000 | 1,719,123 |
| (Florida Inst. of Tech., Inc.), 4.00%, 10/1/39 | BBB− | | 800,000 | 879,631 |
| |
24 Municipal Opportunities Trust |
| | | | |
| MUNICIPAL BONDS AND NOTES (136.7%)* cont. | Rating** | | Principal amount | Value |
| Florida cont. |
| Halifax Hosp. Med. Ctr. Rev. Bonds, 5.00%, 6/1/36 | A− | | $2,250,000 | $2,606,963 |
Lakeland, Hosp. Syst. Rev. Bonds,
(Lakeland Regl. Hlth.), 5.00%, 11/15/40 | A2 | | 1,350,000 | 1,517,684 |
| Miami-Dade Cnty., Aviation Rev. Bonds, Ser. A | | | | |
| 5.00%, 10/1/36 | A2 | | 5,000,000 | 5,595,580 |
| 5.00%, 10/1/32 | A2 | | 3,790,000 | 4,244,947 |
| Orange Cnty., Hlth. Fac. Auth. Rev. Bonds, (Presbyterian Retirement Cmntys.), 5.00%, 8/1/34 | A−/F | | 1,350,000 | 1,487,702 |
Pinellas Cnty., Indl. Dev. Auth. Rev. Bonds,
(2017 Foundation for Global Understanding, Inc.), 5.00%, 7/1/39 | AAA/P | | 500,000 | 565,800 |
| Southeast Overtown Park West Cmnty. Redev. Agcy. 144A Tax Alloc. Bonds, Ser. A-1, 5.00%, 3/1/30 | BBB+ | | 360,000 | 390,270 |
| Village, 144A Special Assmt., (Village Cmnty. Dev. Dist. No. 13), 3.00%, 5/1/35 | BB−/P | | 2,495,000 | 2,583,040 |
Volusia Cnty., Edl. Fac. Auth. Rev. Bonds,
(Embry-Riddle Aeronautical University, Inc.), Ser. A | | | | |
| 4.00%, 10/15/39 | A2 | | 600,000 | 685,439 |
| 4.00%, 10/15/36 | A2 | | 500,000 | 575,007 |
| | | | 22,851,186 |
| Georgia (2.7%) |
| Atlanta, Tax Alloc. Bonds, (Atlantic Station), 5.00%, 12/1/22 | A3 | | 1,625,000 | 1,704,106 |
| Atlanta, Arpt. Rev. Bonds, (Dept. of Aviation), Ser. C, 4.00%, 7/1/42 | Aa3 | | 800,000 | 929,549 |
| Gainesville & Hall Cnty., Dev. Auth. Edl. Fac. Rev. Bonds, (Riverside Military Academy), 5.00%, 3/1/37 | BB/F | | 1,100,000 | 1,106,056 |
Geo L Smith II GA Congress Ctr. Rev. Bonds,
(Signia Hotel Mgt., LLC.), 4.00%, 1/1/54 | BBB− | | 1,600,000 | 1,793,781 |
Muni. Election Auth. of GA Rev. Bonds,
(Plant Vogtle Units 3 & 4) | | | | |
| Ser. A, 5.50%, 7/1/60 | A | | 3,500,000 | 4,011,799 |
| AGM, 5.00%, 1/1/62 | AA | | 1,000,000 | 1,212,170 |
| 5.00%, 1/1/56 | BBB+ | | 650,000 | 775,031 |
| 4.00%, 1/1/51 | A2 | | 500,000 | 555,380 |
| 4.00%, 1/1/51 | BBB+ | | 425,000 | 468,769 |
| | | | 12,556,641 |
| Hawaii (0.5%) |
| HI State Harbor Syst. Rev. Bonds | | | | |
| Ser. C, 4.00%, 7/1/40 | Aa3 | | 300,000 | 353,861 |
| Ser. A, 4.00%, 7/1/35 | Aa3 | | 1,700,000 | 1,996,550 |
| | | | 2,350,411 |
| Illinois (20.5%) |
| Chicago, G.O. Bonds | | | | |
| Ser. A, 6.00%, 1/1/38 | BBB+ | | 1,920,000 | 2,331,918 |
| Ser. G-07, 5.50%, 1/1/35 | BBB+ | | 3,175,000 | 3,555,812 |
| Ser. A, 5.00%, 1/1/27 | BBB+ | | 1,850,000 | 2,196,948 |
| Chicago, Board of Ed. G.O. Bonds | | | | |
| Ser. C, 5.25%, 12/1/39 | BB | | 2,250,000 | 2,480,214 |
| Ser. H, 5.00%, 12/1/36 | BB | | 500,000 | 589,669 |
| (School Reform), Ser. B-1, NATL, zero %, 12/1/21 | Baa2 | | 3,500,000 | 3,498,702 |
| |
Municipal Opportunities Trust 25 |
| | | | |
| MUNICIPAL BONDS AND NOTES (136.7%)* cont. | Rating** | | Principal amount | Value |
| Illinois cont. |
| Chicago, Motor Fuel Tax Rev. Bonds, 5.00%, 1/1/29 | BBB− | | $500,000 | $532,449 |
| Chicago, O’Hare Intl. Arpt. Rev. Bonds | | | | |
| Ser. C, 5.375%, 1/1/39 | A2 | | 1,250,000 | 1,317,103 |
| Ser. C, 5.25%, 1/1/28 | A2 | | 1,320,000 | 1,391,334 |
| Ser. C, 5.25%, 1/1/27 | A2 | | 2,125,000 | 2,240,093 |
| Ser. A, 5.00%, 1/1/38 | A | | 100,000 | 121,048 |
| Ser. A, 5.00%, 1/1/37 | A | | 300,000 | 363,799 |
| Chicago, Trans. Auth. Sales Tax Rev. Bonds, 5.25%, 12/1/49 | AA | | 3,000,000 | 3,404,026 |
| Chicago, Waste Wtr. Transmission Rev. Bonds | | | | |
| Ser. C, 5.00%, 1/1/39 | A | | 900,000 | 1,014,006 |
| (2nd Lien), 5.00%, 1/1/39 | A | | 1,835,000 | 1,999,547 |
| Ser. A, NATL, zero %, 1/1/24 | A+ | | 1,600,000 | 1,577,327 |
| IL State G.O. Bonds | | | | |
| 5.50%, 7/1/38 | Baa2 | | 2,280,000 | 2,452,397 |
| 5.50%, 5/1/30 | Baa2 | | 1,250,000 | 1,599,311 |
| 5.00%, 11/1/41 | Baa2 | | 1,000,000 | 1,148,150 |
| 5.00%, 1/1/41 | Baa2 | | 500,000 | 575,068 |
| 5.00%, 2/1/39 | Baa2 | | 300,000 | 325,825 |
| Ser. A, 5.00%, 5/1/38 | Baa2 | | 1,500,000 | 1,756,946 |
| 5.00%, 1/1/35 | Baa2 | | 1,000,000 | 1,152,993 |
| Ser. A, 5.00%, 12/1/31 | Baa2 | | 5,750,000 | 6,776,416 |
| Ser. C, 5.00%, 11/1/29 | Baa2 | | 1,850,000 | 2,192,579 |
| 5.00%, 2/1/29 | Baa2 | | 1,425,000 | 1,669,117 |
| Ser. A, 5.00%, 12/1/28 | Baa2 | | 2,500,000 | 2,983,575 |
| Ser. D, 5.00%, 11/1/28 | Baa2 | | 2,250,000 | 2,683,844 |
| Ser. D, 5.00%, 11/1/27 | Baa2 | | 1,000,000 | 1,199,641 |
| Ser. A, 4.00%, 3/1/40 | Baa2 | | 1,500,000 | 1,694,171 |
| IL State Fin. Auth. Mandatory Put Bonds (9/1/22), (Field Museum of Natural History), 0.559%, 11/1/34 | A2 | | 3,865,000 | 3,864,751 |
| IL State Fin. Auth. Rev. Bonds | | | | |
| (Lifespace Cmntys, Inc.), Ser. A, 5.00%, 5/15/35 | BBB/F | | 1,025,000 | 1,132,424 |
| (Riverside Hlth. Syst.), 4.00%, 11/15/34 | A+ | | 500,000 | 556,467 |
IL State Fin. Auth. Academic Fac. Rev. Bonds,
(U. of Illinois at Urbana-Champaign), Ser. A | | | | |
| 5.00%, 10/1/44 | A1 | | 1,100,000 | 1,338,373 |
| 5.00%, 10/1/36 | A1 | | 600,000 | 744,316 |
| 5.00%, 10/1/34 | A1 | | 500,000 | 622,543 |
| IL State Fin. Auth. Student Hsg. & Academic Fac. Rev. Bonds | | | | |
| (U. of IL Chicago), 5.00%, 2/15/50 | Baa3 | | 2,000,000 | 2,263,120 |
| (U. of IL-CHF-Chicago, LLC), Ser. A, 5.00%, 2/15/37 | Baa3 | | 1,000,000 | 1,146,044 |
| Lake Cnty., Cmnty. Cons. School Dist. No. 73 Hawthorn G.O. Bonds, NATL, zero %, 12/1/21 | AA+ | | 1,300,000 | 1,299,497 |
| Metro. Pier & Exposition Auth. Rev. Bonds, (McCormick Place Expansion) | | | | |
| 4.00%, 12/15/42 ### | BBB+ | | 1,000,000 | 1,125,645 |
| Ser. B, stepped-coupon zero % (4.700%, 6/15/31), 12/15/37 †† | BBB+ | | 1,000,000 | 841,437 |
| |
26 Municipal Opportunities Trust |
| | | | |
| MUNICIPAL BONDS AND NOTES (136.7%)* cont. | Rating** | | Principal amount | Value |
| Illinois cont. |
| Metro. Pier & Exposition Auth. Dedicated State Tax Rev. Bonds, (McCormick), Ser. A, NATL, zero %, 12/15/30 | BBB+ | | $12,000,000 | $9,932,418 |
| Metro. Wtr. Reclamation Dist. of Greater Chicago G.O. Bonds, (Green Bond), Ser. E, 5.00%, 12/1/30 | AA | | 1,310,000 | 1,583,368 |
| Railsplitter Tobacco Settlement Auth. Rev. Bonds, 5.00%, 6/1/24 | A | | 1,500,000 | 1,670,369 |
| Sales Tax Securitization Corp. Rev. Bonds | | | | |
| Ser. C, 5.50%, 1/1/36 | AA− | | 3,500,000 | 4,411,161 |
| Ser. A, 5.00%, 1/1/36 | AA− | | 1,400,000 | 1,756,322 |
| Ser. A, 4.00%, 1/1/39 | AA− | | 2,000,000 | 2,321,066 |
| Ser. A, 4.00%, 1/1/38 | AA− | | 500,000 | 581,549 |
| Southern IL U. Rev. Bonds, (Hsg. & Auxiliary), Ser. A, NATL, zero %, 4/1/25 | Baa2 | | 1,870,000 | 1,757,955 |
| | | | 95,772,853 |
| Indiana (1.6%) |
| Hammond, Multi-School Bldg. Corp. Rev. Bonds, 5.00%, 7/15/38 | AA+ | | 1,750,000 | 2,101,224 |
| IN State Fin. Auth. Rev. Bonds, (BHI Sr. Living), 5.75%, 11/15/41 (Prerefunded 11/15/21) | BBB/F | | 1,000,000 | 1,001,987 |
| IN State Fin. Auth. Hosp. Mandatory Put Bonds (11/1/26), (Goshen Hlth. Oblig. Group), Ser. B, 2.10%, 11/1/49 | A− | | 2,700,000 | 2,818,194 |
| Silver Creek, School Bldg. Corp. Rev. Bonds, 3.00%, 1/15/42 | AA+ | | 1,600,000 | 1,723,414 |
| | | | 7,644,819 |
| Iowa (0.8%) |
| IA State Fin. Auth. Rev. Bonds, (Lifespace Cmnty., Inc. Oblig. Group), Ser. A, 4.00%, 5/15/53 | BBB/F | | 2,000,000 | 2,159,611 |
| IA Tobacco Settlement Auth. Rev. Bonds, Ser. B-1, Class 2, 4.00%, 6/1/49 | BBB | | 1,250,000 | 1,384,124 |
| | | | 3,543,735 |
| Kentucky (3.0%) |
KY Pub. Trans. Infrastructure Auth. Rev. Bonds,
(1st Tier Downtown Crossing), Ser. A, 6.00%, 7/1/53 (Prerefunded 7/1/23) | Baa2 | | 1,000,000 | 1,095,232 |
| KY State Property & Bldg. Comm. Rev. Bonds | | | | |
| (No. 119), 5.00%, 5/1/36 | A1 | | 1,000,000 | 1,219,082 |
| (No. 122), Ser. A, 4.00%, 11/1/34 | A1 | | 750,000 | 878,305 |
| KY State Pub. Energy Auth. Gas Supply | | | | |
| Mandatory Put Bonds (6/1/25), Ser. C-1, 4.00%, 12/1/49 | A1 | | 5,500,000 | 6,088,966 |
| Mandatory Put Bonds (1/1/25), Ser. B, 4.00%, 1/1/49 | A1 | | 3,000,000 | 3,293,050 |
| Louisville, Regl. Arpt. Auth. Syst. Rev. Bonds, Ser. A | | | | |
| 5.00%, 7/1/32 | A | | 1,030,000 | 1,143,832 |
| 5.00%, 7/1/31 | A | | 385,000 | 427,873 |
| | | | 14,146,340 |
| |
Municipal Opportunities Trust 27 |
| | | | |
| MUNICIPAL BONDS AND NOTES (136.7%)* cont. | Rating** | | Principal amount | Value |
| Louisiana (1.3%) |
| LA State Offshore Term. Auth. Deepwater Port Mandatory Put Bonds (12/1/23), (Loop, LLC), Ser. A, 1.65%, 9/1/33 | A3 | | $1,600,000 | $1,631,582 |
| St. John The Baptist Parish Mandatory Put Bonds (7/1/26), (Marathon Oil Corp.), Ser. A-3, 2.20%, 6/1/37 | Baa3 | | 3,010,000 | 3,134,962 |
Tangipahoa Parish, Hosp. Svcs. Rev. Bonds,
(North Oaks Hlth. Syst.), 4.00%, 2/1/42 | BBB+ | | 1,250,000 | 1,430,974 |
| | | | 6,197,518 |
| Maryland (0.4%) |
Gaithersburg, Econ. Dev. Rev. Bonds,
(Asbury, Oblig. Group), Ser. A, 5.00%, 1/1/36 | BBB/F | | 450,000 | 497,423 |
| MD Econ. Dev. Corp. Rev. Bonds, (Morgan State U.), 4.25%, 7/1/50 | BBB− | | 1,350,000 | 1,516,192 |
| | | | 2,013,615 |
| Massachusetts (4.6%) |
| MA State Dev. Fin. Agcy. Rev. Bonds | | | | |
| (Milford Regl. Med. Ctr. Oblig. Group), Ser. F, 5.75%, 7/15/43 | BB+ | | 500,000 | 528,340 |
| (Loomis Cmntys.), Ser. A, 5.75%, 1/1/28 | BBB | | 1,100,000 | 1,174,632 |
| (Intl. Charter School), 5.00%, 4/15/33 | BBB− | | 1,000,000 | 1,108,106 |
| (Atrius Hlth. Oblig. Group), Ser. A, 4.00%, 6/1/49 | BBB | | 5,470,000 | 6,093,049 |
| (Lasell U.), 4.00%, 7/1/45 | BB+ | | 1,200,000 | 1,328,650 |
| (Linden Ponds, Inc.), Ser. B, zero %, 11/15/56 | B−/P | | 187,307 | 118,437 |
MA State Dev. Fin. Agcy. 144A Rev. Bonds,
(Linden Ponds, Inc. Fac.), 5.00%, 11/15/38 | BB/F | | 1,410,000 | 1,557,941 |
MA State Edl. Fin. Auth. Rev. Bonds,
(Ed. Loan — Issue 1) | | | | |
| 5.00%, 1/1/27 | AA | | 800,000 | 901,606 |
| 4.375%, 1/1/32 | AA | | 100,000 | 102,911 |
MA State Trans. Fund Rev. Bonds,
(Rail Enhancement & Accelerated
Bridge Program), 5.00%, 6/1/48 T | Aa1 | | 7,000,000 | 8,599,736 |
| | | | 21,513,408 |
| Michigan (9.0%) |
| Detroit, G.O. Bonds, AMBAC, 5.25%, 4/1/24 | A−/P | | 222,425 | 222,646 |
| Detroit, City School Dist. G.O. Bonds, Ser. A, AGM, 6.00%, 5/1/29 | Aa1 | | 1,000,000 | 1,222,879 |
Kentwood, Economic Dev. Rev. Bonds,
(Holland Home Oblig. Group), 5.00%, 11/15/37 | BBB−/F | | 1,750,000 | 1,964,610 |
| MI State Bldg. Auth. Rev. Bonds, Ser. I, 4.00%, 10/15/49 | Aa2 | | 4,630,000 | 5,347,971 |
| MI State Fin. Auth. Rev. Bonds | | | | |
| Ser. H-1, 5.00%, 10/1/39 (Prerefunded 10/1/24) | AA− | | 1,575,000 | 1,761,734 |
| (MidMichigan Hlth.), 5.00%, 6/1/39 (Prerefunded 6/1/24) | A+ | | 1,000,000 | 1,120,439 |
| (Local Govt. Loan Program — Detroit Wtr. & Swr. Dept. (DWSD)), Ser. C, 5.00%, 7/1/35 | A+ | | 1,100,000 | 1,262,233 |
| (Local Govt. Loan Program — Detroit Wtr. & Swr. Dept. (DWSD)), Ser. C, 5.00%, 7/1/34 | A+ | | 1,900,000 | 2,180,962 |
| (Trinity Health Corp. Oblig. Group), Ser. A, 4.00%, 12/1/49 T | AA− | | 2,575,000 | 2,946,817 |
| |
28 Municipal Opportunities Trust |
| | | | |
| MUNICIPAL BONDS AND NOTES (136.7%)* cont. | Rating** | | Principal amount | Value |
| Michigan cont. |
| MI State Fin. Auth. Rev. Bonds | | | | |
| (Local Govt. Loan Program — Detroit Wtr. & Swr. Dept. (DWSD)), Ser. D-2, 5.00%, 7/1/34 | A+ | | $1,000,000 | $1,147,875 |
| (Local Govt. Program Detroit Wtr. & Swr.), Ser. D4, 5.00%, 7/1/34 | AA− | | 100,000 | 111,502 |
| (Detroit Wtr. & Swr.), Ser. C-6, 5.00%, 7/1/33 | AA− | | 850,000 | 948,483 |
| (Detroit), Ser. C-3, 5.00%, 4/1/27 | Aa2 | | 750,000 | 907,300 |
| MI State Hosp. Fin. Auth. Rev. Bonds, (Trinity Health Corp. Oblig. Group), Ser. A, U.S. Govt. Coll, 5.00%, 12/1/47 (Prerefunded 12/1/22) T | Aa3 | | 8,500,000 | 8,941,351 |
| MI State Hsg. Dev. Auth. Rev. Bonds, (Rental Hsg.), Ser. D, 3.95%, 10/1/37 (Prerefunded 4/1/22) | AA | | 1,050,000 | 1,066,168 |
Pontiac City, G.O. Bonds,
(Pontiac School Dist.), Q-SBLF | | | | |
| 4.00%, 5/1/45 T | Aa1 | | 4,423,529 | 5,149,725 |
| 4.00%, 5/1/50 T | Aa1 | | 4,976,471 | 5,785,401 |
| | | | 42,088,096 |
| Mississippi (0.4%) |
| MS State Bus. Fin. Corp. Rev. Bonds, (System Energy Resources, Inc.), 2.375%, 6/1/44 | A | | 2,025,000 | 1,887,253 |
| | | | 1,887,253 |
| Missouri (3.6%) |
| Kansas City, Indl. Dev. Auth. Arpt. Special Oblig. Rev. Bonds | | | | |
| (Kansas City Intl. Arpt. Terminal), Ser. B, 5.00%, 3/1/36 | A2 | | 5,000,000 | 6,092,528 |
| AGM, 4.00%, 3/1/57 | AA | | 6,000,000 | 6,686,335 |
| MO State Dev. Fin. Board Infrastructure Fac. Rev. Bonds, (City of Independence), 4.00%, 3/1/51 | BBB+ | | 1,500,000 | 1,659,604 |
| St. Louis, Muni. Fin. Corp. Rev. Bonds, AGM, 5.00%, 10/1/45 | AA | | 2,000,000 | 2,458,903 |
| | | | 16,897,370 |
| Nebraska (0.5%) |
| Central Plains Energy Project Gas Supply Mandatory Put Bonds (8/1/25), 4.00%, 12/1/49 | Aa2 | | 2,150,000 | 2,408,252 |
| | | | 2,408,252 |
| Nevada (1.2%) |
| North Las Vegas, G.O. Bonds, AGM, 4.00%, 6/1/34 | AA | | 3,600,000 | 4,172,597 |
| Sparks, Tourism Impt. Dist. No. 1 144A Rev. Bonds, Ser. A | | | | |
| 2.75%, 6/15/28 | Ba2 | | 1,200,000 | 1,234,470 |
| 2.50%, 6/15/24 | Ba2 | | 330,000 | 334,499 |
| | | | 5,741,566 |
| New Hampshire (2.1%) |
| National Fin. Auth. Rev. Bonds, (Caritas Acquisitions VII, LLC), Ser. A | | | | |
| 4.50%, 8/15/55 | BBB/P | | 2,540,000 | 2,650,550 |
| 4.25%, 8/15/46 | BBB/P | | 1,210,000 | 1,254,438 |
| 4.125%, 8/15/40 | BBB/P | | 1,070,000 | 1,112,226 |
| |
Municipal Opportunities Trust 29 |
| | | | |
| MUNICIPAL BONDS AND NOTES (136.7%)* cont. | Rating** | | Principal amount | Value |
| New Hampshire cont. |
| NH State Hlth. & Ed. Fac. Auth. Rev. Bonds | | | | |
| (Catholic Med. Ctr.), 5.00%, 7/1/44 | BBB+ | | $1,000,000 | $1,147,583 |
| (Elliot Hosp.), 5.00%, 10/1/38 | A3 | | 500,000 | 580,560 |
| (Southern NH Med. Ctr.), 5.00%, 10/1/37 | A− | | 2,500,000 | 2,903,976 |
| | | | 9,649,333 |
| New Jersey (8.0%) |
| Bayonne, G.O. Bonds, (Qualified Gen. Impt.), BAM, 5.00%, 7/1/39 (Prerefunded 7/1/26) | AA | | 1,300,000 | 1,560,218 |
| NJ State Econ. Dev. Auth. Rev. Bonds | | | | |
| (NYNJ Link Borrower, LLC), 5.375%, 1/1/43 | BBB | | 500,000 | 549,763 |
| Ser. WW, 5.25%, 6/15/32 | Baa1 | | 1,500,000 | 1,732,041 |
| Ser. EEE, 5.00%, 6/15/48 | Baa1 | | 3,000,000 | 3,576,710 |
| Ser. AAA, 5.00%, 6/15/36 | Baa1 | | 750,000 | 880,456 |
| (Biomedical Research), Ser. A, 5.00%, 7/15/29 | Baa1 | | 400,000 | 470,395 |
| Ser. B, 5.00%, 11/1/26 | Baa1 | | 4,500,000 | 5,396,926 |
| 5.00%, 6/15/26 | Baa2 | | 500,000 | 512,862 |
| NJ State Econ. Dev. Auth. Special Fac. Rev. Bonds, (Port Newark Container Term., LLC), 5.00%, 10/1/37 | Baa3 | | 2,000,000 | 2,323,335 |
NJ State Hlth. Care Fac. Fin. Auth. Rev. Bonds,
(St. Peter’s U. Hosp.), 5.75%, 7/1/37 | BBB− | | 1,500,000 | 1,504,539 |
| NJ State Trans. Trust Fund Auth. Rev. Bonds | | | | |
| Ser. AA, 5.00%, 6/15/38 | Baa1 | | 1,225,000 | 1,484,538 |
| Ser. AA, 5.00%, 6/15/37 ### | Baa1 | | 600,000 | 750,380 |
| Ser. A, 5.00%, 12/15/36 | Baa1 | | 1,000,000 | 1,217,026 |
| Ser. A, 5.00%, 12/15/34 | Baa1 | | 4,920,000 | 6,007,499 |
| (Federal Hwy. Reimbursement Notes), 5.00%, 6/15/30 | A+ | | 1,900,000 | 2,224,249 |
| Ser. A, 4.00%, 6/15/42 ### | Baa1 | | 1,000,000 | 1,132,213 |
| Ser. A, 4.00%, 6/15/39 ### | Baa1 | | 1,500,000 | 1,713,401 |
| Ser. A, 4.00%, 6/15/38 ### | Baa1 | | 3,750,000 | 4,296,138 |
| | | | 37,332,689 |
| New Mexico (0.5%) |
| Sante Fe, Retirement Fac. Rev. Bonds | | | | |
| (El Castillo Retirement Residences), Ser. A, 5.00%, 5/15/44 | BB+/F | | 975,000 | 1,088,878 |
| (El Castillo Retirement Res.), 5.00%, 5/15/42 | BB+/F | | 1,460,000 | 1,476,957 |
| | | | 2,565,835 |
| New York (11.6%) |
| Metro. Trans. Auth. Rev. Bonds | | | | |
| (Green Bond), Ser. C-1, 5.00%, 11/15/50 | A3 | | 1,500,000 | 1,785,037 |
| Ser. C-1, 4.00%, 11/15/35 | A3 | | 1,000,000 | 1,107,092 |
| Metro. Trans. Auth. Dedicated Tax Mandatory Put Bonds (6/1/22), Ser. A-2A, 0.50%, 11/1/26 | AA | | 2,810,000 | 2,813,897 |
| NY City, Transitional Fin. Auth. Rev. Bonds | | | | |
| Ser. C-1, 5.00%, 5/1/41 | AAA | | 1,000,000 | 1,265,618 |
| (Future Tax), Ser. C-1, 4.00%, 5/1/40 | AAA | | 500,000 | 583,009 |
| (Future Tax), Ser. C-1, 4.00%, 5/1/40 T | AAA | | 11,825,000 | 13,787,844 |
| Ser. C-1, 4.00%, 5/1/39 | AAA | | 500,000 | 584,198 |
| 4.00%, 5/1/38 | AAA | | 700,000 | 819,843 |
| |
30 Municipal Opportunities Trust |
| | | | |
| MUNICIPAL BONDS AND NOTES (136.7%)* cont. | Rating** | | Principal amount | Value |
| New York cont. |
| NY State Dorm. Auth. Personal Income Tax Rev. Bonds, Ser. D | | | | |
| 4.00%, 2/15/47 | Aa2 | | $4,750,000 | $5,461,127 |
| 4.00%, 2/15/40 | Aa2 | | 1,500,000 | 1,748,325 |
| 4.00%, 2/15/39 | Aa2 | | 1,200,000 | 1,401,321 |
NY State Dorm. Auth. Sales Tax Rev. Bonds,
(Group C), Ser. A, 5.00%, 3/15/42 T | Aa2 | | 10,845,000 | 13,008,298 |
| NY State Liberty Dev. Corp. 144A Rev. Bonds, (3 World Trade Ctr., LLC), Class 1-3, 5.00%, 11/15/44 | BB−/P | | 2,000,000 | 2,182,058 |
| NY State Trans. Special Fac. Dev. Corp. Rev. Bonds | | | | |
| (Laguardia Arpt. Term. B Redev. Program), Ser. A, 5.00%, 7/1/41 | Baa3 | | 1,000,000 | 1,109,056 |
| (Delta Air Lines, Inc.), 5.00%, 10/1/40 | Baa3 | | 2,000,000 | 2,457,516 |
| Port Auth. of NY & NJ Rev. Bonds, Ser. 207, 5.00%, 9/15/31 | Aa3 | | 3,150,000 | 3,848,468 |
| | | | 53,962,707 |
| North Carolina (0.9%) |
| NC State Cap. Fac. Fin. Agcy. Edl. Fac. Rev. Bonds, (High Point U.), 4.00%, 5/1/34 | A− | | 900,000 | 1,056,433 |
| NC State Med. Care Comm. Hlth. Care Fac. Rev. Bonds, (Lutheran Svcs. for the Aging, Inc. Oblig. Group), 4.00%, 3/1/51 | BB/P | | 2,250,000 | 2,412,909 |
| NC State Med. Care Comm. Retirement Fac. Rev. Bonds, (Maryfield, Inc. Oblig. Group), 5.00%, 10/1/45 | BB/P | | 500,000 | 556,813 |
| | | | 4,026,155 |
| Ohio (8.8%) |
| Akron, Income Tax Rev. Bonds | | | | |
| 4.00%, 12/1/37 | AA− | | 525,000 | 588,963 |
| 4.00%, 12/1/36 | AA− | | 655,000 | 736,168 |
| 4.00%, 12/1/35 | AA− | | 1,260,000 | 1,418,114 |
| Buckeye, Tobacco Settlement Fin. Auth. Rev. Bonds | | | | |
| Ser. B-2, Class 2, 5.00%, 6/1/55 | BB/P | | 5,155,000 | 5,788,715 |
| Ser. A-2, Class 1, 4.00%, 6/1/48 | BBB+ | | 1,250,000 | 1,383,792 |
| Cleveland-Cuyahoga Cnty., Port Auth. Cultural Fac. Rev. Bonds, (Playhouse Square Foundation), 5.50%, 12/1/53 | BB+ | | 500,000 | 577,124 |
| Franklin Cnty., Hlth. Care Fac. Rev. Bonds, (Ohio Living) | | | | |
| 6.00%, 7/1/35 (Prerefunded 7/1/22) | BBB/F | | 1,060,000 | 1,099,688 |
| 6.00%, 7/1/35 (Prerefunded 7/1/22) | AAA/P | | 65,000 | 67,434 |
| Franklin Cnty., Hosp. Fac. Rev. Bonds, (Nationwide Children’s Hosp.), Ser. A, 4.00%, 11/1/44 | Aa2 | | 2,050,000 | 2,334,975 |
| Lancaster, Port Auth. Mandatory Put Bonds (2/1/25), Ser. A, 5.00%, 8/1/49 | Aa2 | | 2,850,000 | 3,243,558 |
Northeast Ohio Regl. Swr. Dist. Rev. Bonds,
U.S. Govt. Coll., 5.00%, 11/15/44
(Prerefunded 11/15/24) T | Aa1 | | 10,000,000 | 11,402,816 |
| OH State Higher Edl. Fac. Comm. Rev. Bonds | | | | |
| (John Carroll U.), 4.00%, 10/1/50 | A3 | | 3,500,000 | 3,901,923 |
| (Kenyon College 2020), 4.00%, 7/1/44 | A2 | | 3,555,000 | 4,041,346 |
| OH State Private Activity Rev. Bonds, (Portsmouth Bypass), AGM, 5.00%, 12/31/35 | AA | | 1,125,000 | 1,269,945 |
| |
Municipal Opportunities Trust 31 |
| | | | |
| MUNICIPAL BONDS AND NOTES (136.7%)* cont. | Rating** | | Principal amount | Value |
| Ohio cont. |
Scioto Cnty., Hosp. Rev. Bonds,
(Southern OH Med. Ctr.) | | | | |
| 5.00%, 2/15/33 | A3 | | $605,000 | $701,452 |
| 5.00%, 2/15/32 | A3 | | 745,000 | 865,235 |
| Southeastern OH Port Auth. Hosp. Fac. Rev. Bonds | | | | |
| 5.75%, 12/1/32 | BB−/F | | 625,000 | 648,079 |
| (Memorial Hlth. Syst. Oblig. Group), 5.50%, 12/1/43 | BB−/F | | 120,000 | 129,007 |
Warren Cnty., Hlth. Care Fac. Rev. Bonds,
(Otterbein Homes Oblig. Group) | | | | |
| 5.00%, 7/1/33 | A | | 500,000 | 544,912 |
| 5.00%, 7/1/32 | A | | 250,000 | 272,658 |
| | | | 41,015,904 |
| Oregon (1.5%) |
Clackamas Cnty., Hosp. Fac. Auth. Rev. Bonds,
(Rose Villa, Inc.), Ser. A, 5.25%, 11/15/50 | BB/P | | 1,000,000 | 1,095,825 |
| Gilliam Cnty., Solid Waste Disp. Mandatory Put Bonds (5/2/22), (Waste Management, Inc.), Ser. A, 2.40%, 7/1/38 | A− | | 2,250,000 | 2,270,642 |
| Keizer, Special Assmt. Bonds, (Keizer Station), Ser. A, 5.20%, 6/1/31 | Aa3 | | 1,195,000 | 1,199,559 |
| Multnomah Cnty., Hosp. Fac. Auth. Rev. Bonds, (Terwilliger Plaza, Inc.), 5.00%, 12/1/36 | BB+/F | | 650,000 | 731,361 |
| Salem, Hosp. Fac. Auth. Rev. Bonds, (Salem Hlth.), Ser. A, 5.00%, 5/15/33 | A+ | | 1,500,000 | 1,745,778 |
| | | | 7,043,165 |
| Pennsylvania (5.2%) |
| Allegheny Cnty., Arpt. Auth. Rev. Bonds, Ser. A, 4.00%, 1/1/56 | AA | | 6,500,000 | 7,259,028 |
Cumberland Cnty., Muni. Auth. Rev. Bonds,
(Diakon Lutheran Social Ministries) | | | | |
| 5.00%, 1/1/32 | BBB+/F | | 200,000 | 226,074 |
| 5.00%, 1/1/31 | BBB+/F | | 1,000,000 | 1,133,386 |
| Lancaster Cnty., Hosp. & Hlth. Ctr. Auth. Rev. Bonds, (St. Anne’s Retirement Cmnty.) | | | | |
| 5.00%, 3/1/50 | BB+/F | | 500,000 | 559,016 |
| 5.00%, 3/1/40 | BB+/F | | 500,000 | 564,320 |
| Lancaster Cnty., Hosp. Auth. Hlth. Care Fac. Rev. Bonds, (Moravian Manors, Inc.), Ser. A, 5.00%, 6/15/44 | BB+/F | | 1,000,000 | 1,118,270 |
| PA State Econ. Dev. Fin. Auth. Exempt Fac. Rev. Bonds, (Amtrak), Ser. A, 5.00%, 11/1/32 | A1 | | 1,000,000 | 1,041,824 |
| PA State Econ. Dev. Fin. Auth. Solid Waste Disp. Mandatory Put Bonds (8/1/24), (Waste Management, Inc.), Ser. A, 1.75%, 8/1/38 | A− | | 5,000,000 | 5,128,485 |
| PA State Higher Edl. Fac. Auth. Rev. Bonds, (Gwynedd Mercy College), Ser. KK1, 5.375%, 5/1/42 | BBB | | 500,000 | 508,768 |
| PA State Tpk. Comm. Rev. Bonds, zero %, 12/1/44 | A2 | | 4,385,000 | 4,999,091 |
| Philadelphia, Gas Wks. Rev. Bonds, 5.00%, 8/1/32 | A | | 1,000,000 | 1,154,243 |
| Westmoreland Cnty., Muni. Auth. Rev. Bonds, BAM, 5.00%, 8/15/27 | AA | | 450,000 | 524,214 |
| | | | 24,216,719 |
| |
32 Municipal Opportunities Trust |
| | | | |
| MUNICIPAL BONDS AND NOTES (136.7%)* cont. | Rating** | | Principal amount | Value |
| Rhode Island (0.6%) |
| Tobacco Settlement Fin. Corp. Rev. Bonds, Ser. B, 5.00%, 6/1/50 | BBB−/P | | $2,750,000 | $3,015,273 |
| | | | 3,015,273 |
| South Carolina (2.5%) |
| SC State Pub. Svcs. Auth. Rev. Bonds | | | | |
| Ser. A, 5.50%, 12/1/54 | A2 | | 4,000,000 | 4,474,622 |
| Ser. E, 5.50%, 12/1/53 | A2 | | 1,025,000 | 1,124,828 |
| Ser. B, 5.00%, 12/1/56 | A2 | | 210,000 | 246,476 |
| Ser. A, 5.00%, 12/1/55 | A2 | | 2,000,000 | 2,272,206 |
| Ser. C, 5.00%, 12/1/46 | A2 | | 1,120,000 | 1,260,154 |
| Ser. A, 5.00%, 12/1/36 | A2 | | 2,000,000 | 2,343,178 |
| | | | 11,721,464 |
| South Dakota (0.2%) |
Lincoln Cnty., Econ. Dev. Rev. Bonds,
(Augustana College Assn. (The)), 4.00%, 8/1/51 | BBB− | | 1,000,000 | 1,096,178 |
| | | | 1,096,178 |
| Tennessee (0.5%) |
| Metro. Govt. Nashville & Davidson Cnty., Hlth. & Edl. Fac. Board Rev. Bonds, (Blakeford at Green Hills Oblig. Group), Ser. A, 4.00%, 11/1/45 | BBB−/F | | 2,250,000 | 2,384,646 |
| | | | 2,384,646 |
| Texas (10.4%) |
Arlington, Higher Ed. Fin. Corp. Rev. Bonds,
(Uplift Ed.), Ser. A | | | | |
| 5.00%, 12/1/36 | BBB− | | 500,000 | 576,449 |
| PSFG, 5.00%, 12/1/35 | AAA | | 500,000 | 597,968 |
| Austin-Bergstrom Landhost Enterprises, Inc. Rev. Bonds | | | | |
| 5.00%, 10/1/35 | A3 | | 1,045,000 | 1,195,848 |
| 5.00%, 10/1/34 | A3 | | 530,000 | 607,129 |
| Central TX Regl. Mobility Auth. Rev. Bonds, (Sr. Lien), Ser. A, 5.00%, 1/1/33 (Prerefunded 1/1/23) | A3 | | 425,000 | 448,325 |
| Clifton, Higher Ed. Fin. Corp. Rev. Bonds | | | | |
| (Intl. Leadership), Ser. D, 6.125%, 8/15/48 | BB−/P | | 1,150,000 | 1,316,671 |
| (IDEA Pub. Schools), 5.00%, 8/15/28 | A− | | 300,000 | 352,005 |
| Harris Cnty., Cultural Ed. Fac. Fin. Corp. Rev. Bonds | | | | |
| (YMCA of the Greater Houston Area), Ser. A, 5.00%, 6/1/38 | Baa2 | | 1,500,000 | 1,534,494 |
| (Brazos Presbyterian Homes, Inc.), 5.00%, 1/1/37 | BBB−/F | | 1,000,000 | 1,103,644 |
| (YMCA of the Greater Houston Area), Ser. A, 5.00%, 6/1/33 | Baa2 | | 800,000 | 821,877 |
| Love Field Arpt. Modernization Corp. Rev. Bonds, AGM, 4.00%, 11/1/37 | AA | | 4,680,000 | 5,501,183 |
| Love Field, Gen. Arpt. Modernization Corp. Rev. Bonds, 5.00%, 11/1/35 | A1 | | 1,000,000 | 1,153,269 |
| Lower CO River Auth. Rev. Bonds, AGM | | | | |
| 5.00%, 5/15/39 ## | AA | | 1,730,000 | 2,162,654 |
| 5.00%, 5/15/38 ## | AA | | 1,265,000 | 1,586,358 |
Matagorda Cnty., Poll. Control Rev. Bonds,
(Dist. No. 1), Ser. A, AMBAC, 4.40%, 5/1/30 | A− | | 1,500,000 | 1,789,125 |
| |
Municipal Opportunities Trust 33 |
| | | | |
| MUNICIPAL BONDS AND NOTES (136.7%)* cont. | Rating** | | Principal amount | Value |
| Texas cont. |
| New Hope, Cultural Ed. Fac. Fin. Corp. Rev. Bonds | | | | |
| (Wesleyan Homes, Inc.), 5.50%, 1/1/43 | BB−/P | | $500,000 | $519,791 |
| (TX Woman’s U. CHF-Collegiate Hsg. Dining), Ser. B-1, AGM, 4.125%, 7/1/53 | AA | | 1,000,000 | 1,111,431 |
| (Woman’s U.-Collegiate Hsg. Denton, LLC), Ser. A-1, AGM, 4.125%, 7/1/53 | AA | | 1,000,000 | 1,111,431 |
| (Children’s Hlth. Syst. of TX), Ser. A, 4.00%, 8/15/34 | Aa3 | | 600,000 | 678,395 |
| North TX, Tollway Auth. Rev. Bonds, (1st Tier), Ser. I, 6.50%, 1/1/43 (Prerefunded 1/1/25) | A1 | | 4,000,000 | 4,754,959 |
| Tarrant Cnty., Cultural Ed. Fin. Corp. Retirement Fac. Rev. Bonds, (Buckner Retirement Svcs.), Ser. B, 5.00%, 11/15/40 | A/F | | 2,000,000 | 2,297,784 |
| TX Private Activity Surface Trans. Corp. Rev. Bonds, (Segment 3C), 5.00%, 6/30/58 | Baa3 | | 3,000,000 | 3,570,529 |
TX State Private Activity Bond Surface Trans. Corp. Rev. Bonds, (Blueridge Trans. Group, LLC
(SH 288 Toll Lane)), 5.00%, 12/31/50 | Baa3 | | 2,000,000 | 2,221,484 |
| TX State Transportation Commission G.O. Bonds, 5.00% 10/1/44 (Prerefunded 10/1/24) T | AAA | | 9,855,000 | 11,171,803 |
| Uptown Dev. Auth. Tax Alloc. Bonds, Ser. A, 5.00%, 9/1/40 | BBB | | 300,000 | 337,162 |
| | | | 48,521,768 |
| Utah (0.4%) |
| Mida Mountain Village Pub. Infrastructure Dist. 144A Special Assmt. Bonds, (Mountain Village Assmt. Area No. 2), 4.00%, 8/1/50 | B/P | | 1,625,000 | 1,664,070 |
| | | | 1,664,070 |
| Virginia (1.2%) |
| Fairfax Cnty., Econ. Dev. Auth. Res. Care Fac. Rev. Bonds, (Goodwin House, Inc.), Ser. A, 5.00%, 10/1/42 | BBB+/F | | 425,000 | 470,470 |
| Small Bus. Fin. Auth. Private Activity Rev. Bonds, (Transform 66-P3), 5.00%, 12/31/52 | Baa3 | | 4,250,000 | 5,006,303 |
| | | | 5,476,773 |
| Washington (2.1%) |
| King Cnty., Public Hosp. Dist. No. 1 G.O. Bonds, (Valley Med. Ctr.), 5.00%, 12/1/38 | A2 | | 2,365,000 | 2,910,289 |
| Port of Seattle, Rev. Bonds, Ser. C, 5.00%, 4/1/40 | A1 | | 875,000 | 969,599 |
| Tobacco Settlement Auth. of WA Rev. Bonds, 5.25%, 6/1/32 | A− | | 1,310,000 | 1,322,362 |
| WA State Hlth. Care Fac. Auth. Mandatory Put Bonds (7/1/22), (Fred Hutchinson Cancer Research Ctr.), Ser. B, 1.158%, 1/1/42 | A+ | | 1,500,000 | 1,501,473 |
WA State Hsg. Fin. Comm. Rev. Bonds,
(Social Certif.), Ser. A-1, 3.50%, 12/20/35 | BBB+ | | 2,689,250 | 3,086,773 |
| | | | 9,790,496 |
| Wisconsin (2.4%) |
| Pub. Fin. Auth. Arpt. Fac. Rev. Bonds, (Sr. Oblig. Group), 5.25%, 7/1/28 | BBB+ | | 350,000 | 358,909 |
| Pub. Fin. Auth. Conference Ctr. & Hotel Rev. Bonds, (U. of NC Charlotte Foundation), Ser. A, 4.00%, 9/1/56 | BB+/P | | 1,000,000 | 1,045,330 |
| |
34 Municipal Opportunities Trust |
| | | | |
| MUNICIPAL BONDS AND NOTES (136.7%)* cont. | Rating** | | Principal amount | Value |
| Wisconsin cont. |
Pub. Fin. Auth. Higher Ed. Fac. Rev. Bonds,
(Gannon U.), 5.00%, 5/1/42 | BBB+ | | $1,100,000 | $1,268,740 |
| Pub. Fin. Auth. Student Hsg. Fac. Rev. Bonds, (Appalachian State U.), Ser. A, AGM | | | | |
| 4.00%, 7/1/50 | AA | | 700,000 | 776,711 |
| 4.00%, 7/1/45 | AA | | 600,000 | 668,301 |
| 4.00%, 7/1/40 | AA | | 500,000 | 562,196 |
| 4.00%, 7/1/38 | AA | | 435,000 | 491,944 |
| 4.00%, 7/1/36 | AA | | 340,000 | 385,989 |
| 4.00%, 7/1/34 | AA | | 300,000 | 341,880 |
| WI State Hlth. & Edl. Fac. Auth. Rev. Bonds | | | | |
| (Hmong American Peace Academy, Ltd.), 5.00%, 3/15/50 | BBB | | 1,000,000 | 1,183,461 |
| (Three Pillars Sr. Living), 5.00%, 8/15/33 (Prerefunded 8/15/23) | BBB+/F | | 430,000 | 466,196 |
| (Advocate Aurora Hlth. Oblig. Group), Ser. A, 4.00%, 8/15/35 | AA | | 3,000,000 | 3,472,278 |
| WI State Pub. Fin. Auth Sr. Living 144A Rev. Bonds, (Mary’s Woods at Marylhurst), Ser. A, 5.25%, 5/15/37 | BB/F | | 250,000 | 272,530 |
| | | | 11,294,465 |
| Total municipal bonds and notes (cost $596,163,675) | $639,107,430 |
|
| | | |
| SHORT-TERM INVESTMENTS (9.5%)* | Principal amount/
shares | Value |
| Putnam Short Term Investment Fund Class P 0.09% L | Shares | 43,135,524 | $43,135,524 |
| U.S. Treasury Bills 0.049%, 3/24/22 # ∆ | | $400,000 | 399,906 |
| U.S. Treasury Bills 0.035%, 4/21/22 # § | | 800,000 | 799,763 |
| Total short-term investments (cost $44,335,314) | $44,335,193 |
|
| |
| TOTAL INVESTMENTS |
| Total investments (cost $640,498,989) | $683,442,623 |
|
| | | |
| Notes to the fund’s portfolio |
| Unless noted otherwise, the notes to the fund’s portfolio are for the close of the fund’s reporting period, which ran from May 1, 2021 through October 31, 2021 (the reporting period). Within the following notes to the portfolio, references to “Putnam Management” represent Putnam Investment Management, LLC, the fund’s manager, an indirect wholly-owned subsidiary of Putnam Investments, LLC and references to “ASC 820” represent Accounting Standards Codification 820 Fair Value Measurements and Disclosures. |
| * | Percentages indicated are based on net assets of $467,416,420. |
| ** | The Moody’s, Standard & Poor’s or Fitch ratings indicated are believed to be the most recent ratings available at the close of the reporting period for the securities listed. Ratings are generally ascribed to securities at the time of issuance. While the agencies may from time to time revise such ratings, they undertake no obligation to do so, and the ratings do not necessarily represent what the agencies would ascribe to these securities at the close of the reporting period. Securities rated by Fitch are indicated by “/F.” Securities rated by Putnam are indicated by “/P.” The Putnam rating categories are comparable to the Standard & Poor’s classifications. If a security is insured, it will usually be rated by the ratings organizations based on the financial strength of the insurer. |
| †† | The interest rate and date shown parenthetically represent the new interest rate to be paid and the date the fund will begin accruing interest at this rate. |
| # | This security, in part or in entirety, was pledged and segregated with the broker to cover margin requirements for futures contracts at the close of the reporting period. Collateral at period end totaled $255,943 and is included in Investments in securities on the Statement of assets and liabilities (Notes 1 and 10). |
| |
Municipal Opportunities Trust 35 |
| | | |
| ∆ | This security, in part or in entirety, was pledged and segregated with the custodian for collateral on certain derivative contracts at the close of the reporting period. Collateral at period end totaled $130,974 and is included in Investments in securities on the Statement of assets and liabilities (Notes 1 and 10). |
| § | This security, in part or in entirety, was pledged and segregated with the custodian for collateral on the initial margin on certain centrally cleared derivative contracts at the close of the reporting period. Collateral at period end totaled $716,785 and is included in Investments in securities on the Statement of assets and liabilities (Notes 1 and 10). |
| ### | When issued security (Note 1). |
| ## | Forward commitment, in part or in entirety (Note 1). |
| L | Affiliated company (Note 6). The rate quoted in the security description is the annualized 7-day yield of the fund at the close of the reporting period. |
| T | Underlying security in a tender option bond transaction. This security has been segregated as collateral for financing transactions. |
| At the close of the reporting period, the fund maintained liquid assets totaling $138,811,881 to cover certain derivative contracts, tender option bonds and the settlement of certain securities. |
| Unless otherwise noted, the rates quoted in Short-term investments security descriptions represent the weighted average yield to maturity. |
| 144A after the name of an issuer represents securities exempt from registration under Rule 144A of the Securities Act of 1933, as amended. These securities may be resold in transactions exempt from registration, normally to qualified institutional buyers. |
| The dates shown parenthetically on prerefunded bonds represent the next prerefunding dates. |
| The dates shown on debt obligations are the original maturity dates. |
| The fund had the following sector concentrations greater than 10% at the close of the reporting period (as a percentage of net assets): |
| Health care | 21.3% |
| State debt | 19.9 |
| Transportation | 18.8 |
| Tax bonds | 16.0 |
| Utilities | 13.1 |
| Education | 11.9 |
| Local debt | 10.7 |
|
| | | | | |
| FUTURES CONTRACTS OUTSTANDING at 10/31/21 (Unaudited) |
| Number of
contracts | Notional
amount | Value | Expiration
date | Unrealized
appreciation/
(depreciation) |
| U.S. Treasury Note 5 yr (Short) | 279 | $33,968,250 | $33,968,250 | Dec-21 | $442,037 |
| U.S. Treasury Note Ultra 10 yr (Short) | 23 | 3,335,719 | 3,335,719 | Dec-21 | 6,776 |
| Unrealized appreciation | | | | 448,813 |
| Unrealized (depreciation) | | | | — |
| Total | $448,813 |
|
| |
36 Municipal Opportunities Trust |
| | | | | | | |
| OTC TOTAL RETURN SWAP CONTRACTS OUTSTANDING at 10/31/21 (Unaudited) |
Swap counterparty/
Notional amount | Value | Upfront
premium
received
(paid) | Termination
date | Payments
received (paid)
by fund | Total return
received by
or paid by fund | Unrealized
appreciation/
(depreciation) |
| Morgan Stanley & Co. International PLC |
| | $5,000,000 | $35,425 | $— | 11/18/21 | — | 1.16% minus Municipal Market Data Index AAA municipal yields 10 Year rate — At maturity | $(35,425) |
| | 5,000,000 | 40,425 | — | 11/18/21 | — | 1.15% minus Municipal Market Data Index AAA municipal yields 10 Year rate — At maturity | (40,425) |
| | 6,500,000 | 114,069 | — | 11/2/21 | — | 1.00% minus Municipal Market Data Index AAA municipal yields 10 Year rate — At maturity | (114,068) |
| | 2,500,000 | 9,735 | — | 11/18/21 | — | 1.70% minus Municipal Market Data Index AAA municipal yields 30 Year rate — At maturity | 9,735 |
| | 2,500,000 | 9,735 | — | 11/18/21 | — | 1.70% minus Municipal Market Data Index AAA municipal yields 30 Year rate — At maturity | 9,735 |
| Upfront premium received | — | | Unrealized appreciation | 19,470 |
| Upfront premium (paid) | — | | Unrealized (depreciation) | (189,918) |
| Total | $— | | Total | $(170,448) |
|
| | | | | | | |
| CENTRALLY CLEARED TOTAL RETURN SWAP CONTRACTS OUTSTANDING at 10/31/21 (Unaudited) |
| Notional amount | Value | Upfront
premium
received
(paid) | Termination
date | Payments
received (paid)
by fund | Total return
received by
or paid by fund | Unrealized
appreciation/
(depreciation) |
| | $28,158,000 | $590,755 | $(3,319) | 9/21/26 | 2.725% — At maturity | USA Non-revised Consumer Price Index-Urban (CPI-U) — At maturity | $(594,074) |
| Total | $(3,319) | $(594,074) |
|
| |
Municipal Opportunities Trust 37 |
| ASC 820 establishes a three-level hierarchy for disclosure of fair value measurements. The valuation hierarchy is based upon the transparency of inputs to the valuation of the fund’s investments. The three levels are defined as follows: |
Level 1: Valuations based on quoted prices for identical securities in active markets.
Level 2: Valuations based on quoted prices in markets that are not active or for which all significant inputs are observable, either directly or indirectly.
Level 3: Valuations based on inputs that are unobservable and significant to the fair value measurement.
| The following is a summary of the inputs used to value the fund’s net assets as of the close of the reporting period: |
|
| | | |
| | Valuation inputs |
| Investments in securities: | Level 1 | Level 2 | Level 3 |
| Municipal bonds and notes | $— | $639,107,430 | $— |
| Short-term investments | — | 44,335,193 | — |
| Totals by level | $— | $683,442,623 | $— |
|
| | | |
| | Valuation inputs |
| Other financial instruments: | Level 1 | Level 2 | Level 3 |
| Futures contracts | $448,813 | $— | $— |
| Total return swap contracts | — | (761,203) | — |
| Totals by level | $448,813 | $(761,203) | $— |
The accompanying notes are an integral part of these financial statements.
| |
38 Municipal Opportunities Trust |
Statement of assets and liabilities 10/31/21 (Unaudited)
| |
| ASSETS | |
| Investment in securities, at value (Notes 1 and 10): | |
| Unaffiliated issuers (identified cost $597,363,465) | $640,307,099 |
| Affiliated issuers (identified cost $43,135,524) (Notes 1 and 6) | 43,135,524 |
| Cash | 119,173 |
| Interest and other receivables | 7,440,525 |
| Receivable for investments sold | 625,000 |
| Receivable for variation margin on centrally cleared swap contracts (Note 1) | 53,076 |
| Unrealized appreciation on OTC swap contracts (Note 1) | 19,470 |
| Prepaid assets | 36,761 |
| Total assets | 691,736,628 |
| |
| LIABILITIES | |
| Payable for investments purchased | 284 |
| Payable for purchases of delayed delivery securities (Note 1) | 24,743,436 |
| Payable for compensation of Manager (Note 2) | 869,070 |
| Payable for custodian fees (Note 2) | 3,793 |
| Payable for investor servicing fees (Note 2) | 39,437 |
| Payable for Trustee compensation and expenses (Note 2) | 197,733 |
| Payable for administrative services (Note 2) | 658 |
| Payable for floating rate notes issued (Note 1) | 57,602,173 |
| Payable for variation margin on futures contracts (Note 1) | 10,151 |
| Distributions payable to shareholders | 1,816,879 |
| Distributions payable to preferred shareholders (Note 1) | 2,750 |
| Unrealized depreciation on OTC swap contracts (Note 1) | 189,918 |
| Preferred share remarketing agent fees | 28,323 |
| Other accrued expenses | 90,603 |
| Total liabilities | 85,595,208 |
| Series B remarketed preferred shares : (2,876 shares authorized and issued at $25,000 per | |
| share) (Note 4) | 71,900,000 |
| Series C remarketed preferred shares: (2,673 shares authorized and issued at $25,000 per | |
| share) (Note 4) | 66,825,000 |
| Net assets | $467,416,420 |
| |
| REPRESENTED BY | |
| Paid-in capital — common shares (Unlimited shares authorized) (Notes 1 and 5) | $416,260,879 |
| Total distributable earnings (Note 1) | 51,155,541 |
| Total — Representing net assets applicable to common shares outstanding | $467,416,420 |
| |
| COMPUTATION OF NET ASSET VALUE | |
| Net asset value per common share ($467,416,420 divided by 34,127,342 shares) | $13.70 |
*Redemption price per share is equal to net asset value less any applicable contingent deferred sales charge.
The accompanying notes are an integral part of these financial statements.
|
| Municipal Opportunities Trust 39 |
Statement of operations Six months ended 10/31/21 (Unaudited)
| |
| INVESTMENT INCOME | |
| Interest (including interest income of $12,622 from investments in affiliated issuers) (Note 6) | $10,083,268 |
| Total investment income | 10,083,268 |
| |
| EXPENSES | |
| Compensation of Manager (Note 2) | 1,710,019 |
| Investor servicing fees (Note 2) | 119,704 |
| Custodian fees (Note 2) | 8,759 |
| Trustee compensation and expenses (Note 2) | 8,807 |
| Administrative services (Note 2) | 4,026 |
| Interest and fees expense (Note 2) | 185,778 |
| Preferred share remarketing agent fees | 106,356 |
| Other | 200,071 |
| Total expenses | 2,343,520 |
| Expense reduction (Note 2) | (24) |
| Net expenses | 2,343,496 |
| | |
| Net investment income | 7,739,772 |
| |
| REALIZED AND UNREALIZED GAIN (LOSS) | |
| Net realized gain (loss) on: | |
| Securities from unaffiliated issuers (Notes 1 and 3) | 4,648,003 |
| Futures contracts (Note 1) | (109,649) |
| Swap contracts (Note 1) | (1,090,526) |
| Total net realized gain | 3,447,828 |
| Change in net unrealized appreciation (depreciation) on: | |
| Securities from unaffiliated issuers | (9,020,596) |
| Futures contracts | 432,003 |
| Swap contracts | (467,192) |
| Total change in net unrealized depreciation | (9,055,785) |
| | |
| Net loss on investments | (5,607,957) |
| | |
| Net increase in net assets resulting from operations | 2,131,815 |
| |
| Distributions to Series B and C remarketed preferred shareholders ( Note 1): | |
| From ordinary income | |
| Tax exempt net investment income | (59,781) |
| Net increase in net assets resulting from operations (applicable to common shareholders) | $2,072,034 |
The accompanying notes are an integral part of these financial statements.
|
| 40 Municipal Opportunities Trust |
Statement of changes in net assets
| | |
| INCREASE (DECREASE) IN NET ASSETS | Six months ended 10/31/21* | Year ended 4/30/21 |
| Operations | | |
| Net investment income | $7,739,772 | $16,353,163 |
| Net realized gain on investments | 3,447,828 | 7,671,455 |
| Change in net unrealized appreciation (depreciation) | | |
| of investments | (9,055,785) | 52,364,668 |
| Net increase in net assets resulting from operations | 2,131,815 | 76,389,286 |
| |
| Distributions to Series B and C remarketed preferred shareholders (Note 1): | |
| From ordinary income | | |
| Tax exempt net investment income | (59,781) | (257,870) |
| Net increase in net assets resulting from operations | | |
| (applicable to common shareholders) | 2,072,034 | 76,131,416 |
| |
| Distributions to common shareholders (Note 1): | | |
| From ordinary income | | |
| Taxable net investment income | — | (941,521) |
| From tax exempt net investment income | (10,870,157) | (21,738,009) |
| From net realized short-term gains on investments | — | (596,920) |
| From net realized long-term gains on investments | — | (2,998,241) |
| Increase from issuance of common shares in connection | | |
| with reinvestment of distributions | 249,127 | — |
| Total increase (decrease) in net assets | (8,548,996) | 49,856,725 |
| |
| NET ASSETS | | |
| Beginning of period | 475,965,416 | 426,108,691 |
| End of period | $467,416,420 | $475,965,416 |
| |
| NUMBER OF FUND SHARES | | |
| Common shares outstanding at beginning of period | 34,109,686 | 34,109,686 |
| Shares issued in connection with reinvestment | | |
| of dividends (Note 5) | 17,656 | — |
| Common shares outstanding at end of period | 34,127,342 | 34,109,686 |
| |
| Series B Remarketed preferred shares outstanding at | | |
| beginning and end of period | 2,876 | 2,876 |
| |
| Series C Remarketed preferred shares outstanding at | | |
| beginning and end of period | 2,673 | 2,673 |
*Unaudited.
The accompanying notes are an integral part of these financial statements.
|
| Municipal Opportunities Trust 41 |
Statement of cash flows Six months ended 10/31/21
| |
| CASH FLOWS FROM OPERATING ACTIVITIES | |
| Net increase in net assets from operations | $2,131,815 |
| |
| Adjustments to reconcile net increase in net assets from operations to net cash used | |
| in operating activities: | |
| Purchase of investment securities | $(77,872,368) |
| Proceeds from disposition of investment securities | 93,338,357 |
| Purchase of short-term investment securities, net | (32,779,206) |
| Premium amortization | 2,664,877 |
| Accretion discount | (683,390) |
| (Increase) decrease in interest and other receivables | 784,610 |
| (Increase) decrease in receivable for investments sold | 217,109 |
| Increase (decrease) in payable for investments purchased | 18,472,218 |
| (Increase) decrease in prepaid asset | (4,435) |
| Increase (decrease) in payable for compensation of Manager | 14,087 |
| Increase (decrease) in payable for custodian fees | (3,952) |
| Increase (decrease) in payable for investor servicing | 54 |
| Increase (decrease) in payable for Trustee compensation and expenses | 6,751 |
| Increase (decrease) in payable for administrative services | (767) |
| Increase (decrease) in payable for preferred share remarketing fees | 9,248 |
| Increase (decrease) in payable for other accrued expenses | (30,907) |
| Net realized gain (loss) on investments | (4,648,003) |
| Net unrealized appreciation (depreciation) on OTC swap contracts during the year | 152,673 |
| Net unrealized appreciation (depreciation) on investments during the year | 9,020,596 |
| Net cash used in operating activities | 8,657,552 |
| |
| CASH FLOWS FROM FINANCING ACTIVITIES | |
| Increase from dividends reinvested | 249,127 |
| Distribution to common shareholders | (10,869,452) |
| Distribution to preferred shareholders | (57,943) |
| Net cash provided by financing activities | (10,678,268) |
| Net increase in cash | 111,099 |
| Cash balance, beginning of year | 8,074 |
| Cash balance, end of year | $119,173 |
| |
| Supplemental disclosure of cash flow information | |
| Interest expense during the period | $20,293 |
The accompanying notes are an integral part of these financial statements.
|
| 42 Municipal Opportunities Trust |
Financial highlights (For a common share outstanding throughout the period)
| | | | | | |
| PER-SHARE OPERATING PERFORMANCE | | | | | | |
| | Six months | | | Year ended | | |
| | ended** | | | | | |
| | 10/31/21 | 4/30/21 | 4/30/20 | 4/30/19 | 4/30/18 | 4/30/17 |
| Net asset value, beginning of period | | | | | | |
| (common shares) | $13.95 | $12.49 | $13.26 | $12.92 | $12.98 | $13.72 |
| Investment operations: | | | | | | |
| Net investment income a | .23 | .48 | .54 | .61 | .64 | .69 |
| Net realized and unrealized | | | | | | |
| gain (loss) on investments | (.16) | 1.76 | (.56) | .36 | (.14) | (.70) |
| Total from investment operations | .07 | 2.24 | (.02) | .97 | .50 | (.01) |
| Distributions to preferred shareholders: | | | | | |
| From net investment income | —f | (.01) | (.07) | (.07) | (.07) | (.05) |
| From capital gains | — | — | (.05) | (.03) | — | — |
| Total from investment operations | | | | | | |
| (applicable to common shareholders) | .07 | 2.23 | (.14) | .87 | .43 | (.06) |
| Distributions to common shareholders: | | | | | |
| From net investment income | (.32) | (.66) | (.28) | (.47) | (.63) | (.68) |
| From capital gains | — | (.11) | (.36) | (.17) | — | — |
| Total distributions | (.32) | (.77) | (.64) | (.64) | (.63) | (.68) |
| Increase from shares repurchased | — | — | .01 | .11 | .03 | —f |
| Increase from preferred shares | | | | | | |
| tender offer | — | — | — | — | .11 | — |
| Net asset value, end of period | | | | | | |
| (common shares) | $13.70 | $13.95 | $12.49 | $13.26 | $12.92 | $12.98 |
| Market price, end of period | | | | | | |
| (common shares) | $13.46 | $13.72 | $11.63 | $12.24 | $11.57 | $12.27 |
| Total return at market price (%) | | | | | | |
| (common shares)b | 0.36* | 24.88 | (0.19) | 11.74 | (0.80) | (1.19) |
| Total return at net asset value (%) | | | | | | |
| (common shares)b | 0.47* | 18.13 | (1.22) | 7.85 | 4.36 | (0.45) |
| |
| RATIOS AND SUPPLEMENTAL DATA | | | | | | |
| Net assets, end of period | | | | | | |
| (common shares)(in thousands) | $467,416 | $475,965 | $426,109 | $456,588 | $481,134 | $494,523 |
| Ratio of expenses to average | | | | | | |
| net assets (including interest | | | | | | |
| expense) (%)c,d,e | .49* | .97g | 1.02g | 1.14g | 1.12h | 1.12i |
| Ratio of net investment income | | | | | | |
| to average net assets (%)d | 1.60* | 3.46 | 3.51 | 4.13 | 4.31 | 4.80 |
| Portfolio turnover (%) | 12* | 22 | 48 | 41 | 38 | 22 |
The accompanying notes are an integral part of these financial statements.
|
| Municipal Opportunities Trust 43 |
Financial highlights cont.
* Not annualized.
** Unaudited.
a Per share net investment income has been determined on the basis of the weighted average number of shares outstanding during the period.
b Total return assumes dividend reinvestment.
c Includes amounts paid through expense offset arrangements, if any (Note 2).
d Ratios reflect net assets available to common shares only; net investment income ratio also reflects reduction for dividend payments to preferred shareholders.
e Includes interest and fee expense associated with borrowings which amounted to:
| |
| October 31, 2021 | 0.04% |
| April 30, 2021 | 0.08 |
| April 30, 2020 | 0.16 |
| April 30, 2019 | 0.25 |
| April 30, 2018 | 0.19 |
| April 30, 2017 | 0.10 |
f Amount represents less than $0.01 per share.
g Reflects waiver of certain fund expenses in connection with the fund’s remarketing preferred shares during the period. As a result of such waivers, the expenses of the fund for the periods noted below (Note 2):
| |
| April 30, 2021 | 0.03% |
| April 30, 2020 | 0.04 |
| April 30, 2019 | 0.01 |
h Includes 0.04% of increased proxy solicitation and legal fees related to the 2018 annual shareholder meeting.
i Includes 0.10% of increased proxy solicitation and legal fees related to the 2017 annual shareholder meeting.
The accompanying notes are an integral part of these financial statements.
|
| 44 Municipal Opportunities Trust |
Notes to financial statements 10/31/21 (Unaudited)
Within the following Notes to financial statements, references to “State Street” represent State Street Bank and Trust Company, references to “the SEC” represent the Securities and Exchange Commission, references to “Putnam Management” represent Putnam Investment Management, LLC, the fund’s manager, an indirect wholly-owned subsidiary of Putnam Investments, LLC and references to “OTC”, if any, represent over-the-counter. Unless otherwise noted, the “reporting period” represents the period from May 1, 2021 through October 31, 2021.
Putnam Municipal Opportunities Trust (the fund) is a Massachusetts business trust, which is registered under the Investment Company Act of 1940, as amended, as a non-diversified closed-end management investment company. The fund is currently operating as a diversified fund. In the future, the fund may operate as a non-diversified fund to the extent permitted by applicable law. Under current law, shareholder approval would be required before the fund could operate as a non-diversified fund. The goal of the fund is to seek as high a level of current income exempt from federal income tax as Putnam Management believes is consistent with the preservation of capital. The fund intends to achieve its objective by investing in a portfolio of investment-grade and some below investment-grade municipal bonds selected by Putnam Management. The fund also uses leverage, primarily by issuing preferred shares in an effort to enhance the returns for the common shareholders. The fund’s shares trade on a stock exchange at market prices, which may be lower than the fund’s net asset value. The fund also uses leverage which involves risk and may increase the volatility of the fund’s net asset value.
The fund’s shares trade on a stock exchange at market prices, which may be lower than the fund’s net asset value.
In the normal course of business, the fund enters into contracts that may include agreements to indemnify another party under given circumstances. The fund’s maximum exposure under these arrangements is unknown as this would involve future claims that may be, but have not yet been, made against the fund. However, the fund’s management team expects the risk of material loss to be remote.
The fund has entered into contractual arrangements with an investment adviser, administrator, transfer agent and custodian, who each provide services to the fund. Unless expressly stated otherwise, shareholders are not parties to, or intended beneficiaries of these contractual arrangements, and these contractual arrangements are not intended to create any shareholder right to enforce them against the service providers or to seek any remedy under them against the service providers, either directly or on behalf of the fund.
Under the fund’s Amended and Restated Agreement and Declaration of Trust, any claims asserted against or on behalf of the Putnam Funds, including claims against Trustees and Officers, must be brought in state and federal courts located within the Commonwealth of Massachusetts.
Note 1: Significant accounting policies
The following is a summary of significant accounting policies consistently followed by the fund in the preparation of its financial statements. The preparation of financial statements is in conformity with accounting principles generally accepted in the United States of America and requires management to make estimates and assumptions that affect the reported amounts of assets and liabilities in the financial statements and the reported amounts of increases and decreases in net assets from operations. Actual results could differ from those estimates. Subsequent events after the Statement of assets and liabilities date through the date that the financial statements were issued have been evaluated in the preparation of the financial statements.
Security valuation Portfolio securities and other investments are valued using policies and procedures adopted by the Board of Trustees. The Trustees have formed a Pricing Committee to oversee the implementation of these procedures and have delegated responsibility for valuing the fund’s assets in accordance with these procedures to Putnam Management. Putnam Management has established an internal Valuation Committee that is responsible for making fair value determinations, evaluating the effectiveness of the pricing policies of the fund and reporting to the Pricing Committee.
Tax-exempt bonds and notes are generally valued on the basis of valuations provided by an independent pricing service approved by the Trustees. Such services use information with respect to transactions in bonds, quotations from bond dealers, market transactions in comparable securities and various relationships between securities in determining value. These securities will generally be categorized as Level 2.
Investments in open-end investment companies (excluding exchange-traded funds), if any, which can be classified as Level 1 or Level 2 securities, are valued based on their net asset value. The net asset value of such investment companies equals the total value of their assets less their liabilities and divided by the number of their outstanding shares.
|
| Municipal Opportunities Trust 45 |
Certain investments, including certain restricted and illiquid securities and derivatives, are also valued at fair value following procedures approved by the Trustees. To assess the continuing appropriateness of fair valuations, the Valuation Committee reviews and affirms the reasonableness of such valuations on a regular basis after considering all relevant information that is reasonably available. Such valuations and procedures are reviewed periodically by the Trustees. These valuations consider such factors as significant market or specific security events such as interest rate or credit quality changes, various relationships with other securities, discount rates, U.S. Treasury, U.S. swap and credit yields, index levels, convexity exposures, recovery rates, sales and other multiples and resale restrictions. These securities are classified as Level 2 or as Level 3 depending on the priority of the significant inputs. The fair value of securities is generally determined as the amount that the fund could reasonably expect to realize from an orderly disposition of such securities over a reasonable period of time. By its nature, a fair value price is a good faith estimate of the value of a security in a current sale and does not reflect an actual market price, which may be different by a material amount.
Security transactions and related investment income Security transactions are recorded on the trade date (the date the order to buy or sell is executed). Gains or losses on securities sold are determined on the identified cost basis.
Interest income, net of any applicable withholding taxes, if any, and including amortization and accretion of premiums and discounts on debt securities, is recorded on the accrual basis.
Securities purchased or sold on a when-issued, forward commitment or delayed delivery basis may be settled at a future date beyond customary settlement time; interest income is accrued based on the terms of the securities. Losses may arise due to changes in the fair value of the underlying securities or if the counterparty does not perform under the contract.
Futures contracts The fund uses futures contracts for hedging treasury term structure risk and for yield curve positioning.
The potential risk to the fund is that the change in value of futures contracts may not correspond to the change in value of the hedged instruments. In addition, losses may arise from changes in the value of the underlying instruments, if there is an illiquid secondary market for the contracts, if interest or exchange rates move unexpectedly or if the counterparty to the contract is unable to perform. With futures, there is minimal counterparty credit risk to the fund since futures are exchange traded and the exchange’s clearinghouse, as counterparty to all exchange traded futures, guarantees the futures against default. Risks may exceed amounts recognized on the Statement of assets and liabilities. When the contract is closed, the fund records a realized gain or loss equal to the difference between the value of the contract at the time it was opened and the value at the time it was closed.
Futures contracts are valued at the quoted daily settlement prices established by the exchange on which they trade. The fund and the broker agree to exchange an amount of cash equal to the daily fluctuation in the value of the futures contract. Such receipts or payments are known as “variation margin.”
Futures contracts outstanding at period end, if any, are listed after the fund’s portfolio.
Total return swap contracts The fund entered into OTC and/or centrally cleared total return swap contracts, which are arrangements to exchange a market-linked return for a periodic payment, both based on a notional principal amount, for hedging and gaining exposure to term structure risk.
To the extent that the total return of the security, index or other financial measure underlying the transaction exceeds or falls short of the offsetting interest rate obligation, the fund will receive a payment from or make a payment to the counterparty. OTC and/or centrally cleared total return swap contracts are marked to market daily based upon quotations from an independent pricing service or market maker. Any change is recorded as an unrealized gain or loss on OTC total return swaps. Daily fluctuations in the value of centrally cleared total return swaps are settled through a central clearing agent and are recorded in variation margin on the Statement of assets and liabilities and recorded as unrealized gain or loss. Payments received or made are recorded as realized gains or losses. Certain OTC and/or centrally cleared total return swap contracts may include extended effective dates. Payments related to these swap contracts are accrued based on the terms of the contract. The fund could be exposed to credit or market risk due to unfavorable changes in the fluctuation of interest rates or in the price of the underlying security or index, the possibility that there is no liquid market for these agreements or that the counterparty may default on its obligation to perform. The fund’s maximum risk of loss from counterparty risk or central clearing risk is the fair value of the contract. This risk may be mitigated for OTC total return swap contracts by having a master netting arrangement between the fund and the counterparty and for centrally cleared total return swap contracts through the daily exchange of variation margin. There is minimal counterparty risk with respect to centrally cleared total return swap contracts due to the clearinghouse guarantee fund and
|
| 46 Municipal Opportunities Trust |
other resources that are available in the event of a clearing member default. Risk of loss may exceed amounts recognized on the Statement of assets and liabilities.
OTC and/or centrally cleared total return swap contracts outstanding, including their respective notional amounts at period end, if any, are listed after the fund’s portfolio.
Master agreements The fund is a party to ISDA (International Swaps and Derivatives Association, Inc.) Master Agreements (Master Agreements) with certain counterparties that govern OTC derivative and foreign exchange contracts entered into from time to time. The Master Agreements may contain provisions regarding, among other things, the parties’ general obligations, representations, agreements, collateral requirements, events of default and early termination. With respect to certain counterparties, in accordance with the terms of the Master Agreements, collateral pledged to the fund is held in a segregated account by the fund’s custodian and, with respect to those amounts which can be sold or repledged, is presented in the fund’s portfolio.
Collateral pledged by the fund is segregated by the fund’s custodian and identified in the fund’s portfolio. Collateral can be in the form of cash or debt securities issued by the U.S. Government or related agencies or other securities as agreed to by the fund and the applicable counterparty. Collateral requirements are determined based on the fund’s net position with each counterparty.
Termination events applicable to the fund may occur upon a decline in the fund’s net assets below a specified threshold over a certain period of time. Termination events applicable to counterparties may occur upon a decline in the counterparty’s long-term and short-term credit ratings below a specified level. In each case, upon occurrence, the other party may elect to terminate early and cause settlement of all derivative and foreign exchange contracts outstanding, including the payment of any losses and costs resulting from such early termination, as reasonably determined by the terminating party. Any decision by one or more of the fund’s counterparties to elect early termination could impact the fund’s future derivative activity.
At the close of the reporting period, the fund had a net liability position of $170,448 on open derivative contracts subject to the Master Agreements. Collateral pledged by the fund at period end for these agreements totaled $130,974 and may include amounts related to unsettled agreements.
Tender option bond transactions The fund may participate in transactions whereby a fixed-rate bond is transferred to a tender option bond trust (TOB trust) sponsored by a broker. The TOB trust funds the purchase of the fixed rate bonds by issuing floating-rate bonds to third parties and allowing the fund to retain the residual interest in the TOB trust’s assets and cash flows, which are in the form of inverse floating rate bonds. The inverse floating rate bonds held by the fund give the fund the right to (1) cause the holders of the floating rate bonds to tender their notes at par, and (2) to have the fixed-rate bond held by the TOB trust transferred to the fund, causing the TOB trust to collapse. The fund accounts for the transfer of the fixed-rate bond to the TOB trust as a secured borrowing by including the fixed-rate bond in the fund’s portfolio and including the floating rate bond as a liability in the Statement of assets and liabilities. At the close of the reporting period, the fund’s investments with a value of $95,371,254 were held by the TOB trust and served as collateral for $57,602,173 in floating-rate bonds outstanding. For the reporting period ended, the fund incurred interest expense of $20,293 for these investments based on an average interest rate of 0.07%.
Federal taxes It is the policy of the fund to distribute all of its income within the prescribed time period and otherwise comply with the provisions of the Internal Revenue Code of 1986, as amended (the Code), applicable to regulated investment companies. It is also the intention of the fund to distribute an amount sufficient to avoid imposition of any excise tax under Section 4982 of the Code.
The fund is subject to the provisions of Accounting Standards Codification 740 Income Taxes (ASC 740). ASC 740 sets forth a minimum threshold for financial statement recognition of the benefit of a tax position taken or expected to be taken in a tax return. The fund did not have a liability to record for any unrecognized tax benefits in the accompanying financial statements. No provision has been made for federal taxes on income, capital gains or unrealized appreciation on securities held nor for excise tax on income and capital gains. Each of the fund’s federal tax returns for the prior three fiscal years remains subject to examination by the Internal Revenue Service.
Tax cost of investments includes adjustments to net unrealized appreciation (depreciation) which may not necessarily be final tax cost basis adjustments, but closely approximate the tax basis unrealized gains and losses that may be realized and distributed to shareholders. The aggregate identified cost on a tax basis is $640,445,976, resulting in gross unrealized appreciation and depreciation of $49,805,610 and $7,121,353, respectively, or net unrealized appreciation of $42,684,257.
|
| Municipal Opportunities Trust 47 |
Distributions to shareholders Distributions to common and preferred shareholders from net investment income are recorded by the fund on the ex-dividend date. Distributions from capital gains, if any, are recorded on the ex-dividend date and paid at least annually. The fund used targeted distribution rates to its common shareholders. Distributions are sourced first from tax-exempt and ordinary income. The balance of the distributions, if any, comes next from capital gain and then will constitute a return of capital. A return of capital is not taxable; rather it reduces a shareholder’s tax basis in their shares of the fund. The fund may make return of capital distributions to achieve the targeted distribution rates. Dividends on remarketed preferred shares become payable when, as and if declared by the Trustees. Each dividend period for the remarketed preferred shares is generally a 7 day period. The applicable dividend rate for the remarketed preferred shares on October 31, 2021 was 0.079% for Series B and 0.088% for Series C shares. The amount and character of income and gains to be distributed are determined in accordance with income tax regulations, which may differ from generally accepted accounting principles. Dividend sources are estimated at the time of declaration. Actual results may vary. Any non-taxable return of capital cannot be determined until final tax calculations are completed after the end of the fund’s fiscal year. Reclassifications are made to the fund’s capital accounts to reflect income and gains available for distribution (or available capital loss carryovers) under income tax regulations.
During the reporting period, the fund has experienced unsuccessful remarketings of its remarketed preferred shares. As a result, dividends to the remarketed preferred shares have been paid at the“maximum dividend rate,” pursuant to the fund’s by-laws, which, based on the current credit quality of the remarketed preferred shares, equals 110% of the higher of the 30-day “AA” composite commercial paper rate and the taxable equivalent of the short-term municipal bond rate.
Determination of net asset value Net asset value of the common shares is determined by dividing the value of all assets of the fund, less all liabilities and the liquidation preference (redemption value of preferred shares, plus accumulated and unpaid dividends) of any outstanding remarketed preferred shares, by the total number of common shares outstanding as of period end.
Note 2: Management fee, administrative services and other transactions
The fund pays Putnam Management for management and investment advisory services quarterly based on the average net assets of the fund, including assets attributable to preferred shares. Such fee is based on the following annual rates based on the average weekly net assets attributable to common and preferred shares.
The lesser of (i) 0.550% of average net assets attributable to common and preferred shares outstanding, or (ii) the following rates:
| | | | |
| | of the first $500 million of average | | | of the next $5 billion of average weekly |
| 0.650% | weekly net assets, | | 0.425% | net assets, |
| | of the next $500 million of average | | | of the next $5 billion of average weekly |
| 0.550% | weekly net assets, | | 0.405% | net assets, |
| | of the next $500 million of average | | | of the next $5 billion of average weekly |
| 0.500% | weekly net assets, | | 0.390% | net assets and |
| | of the next $5 billion of average weekly | | 0.380% | of any excess thereafter. |
| 0.450% | net assets, | | | |
For the reporting period, the management fee represented an effective rate (excluding the impact from any expense waivers in effect) of 0.277% of the fund’s average net assets attributable to common and preferred shares outstanding.
If dividends payable on remarketed preferred shares during any dividend payment period plus any expenses attributable to remarketed preferred shares for that period exceed the fund’s gross income attributable to the proceeds of the remarketed preferred shares during that period, then the fee payable to Putnam Management for that period will be reduced by the amount of the excess (but not more than the effective management fees rate under the contract multiplied by the liquidation preference of the remarketed preferred shares outstanding during the period). Any amount in excess of the fee payable to Putnam Management for a given period will be used to reduce any subsequent fee payable to Putnam Management, as may be necessary. For the reporting period, Putnam Management did not reimburse monies to the fund.
Putnam Investments Limited (PIL), an affiliate of Putnam Management, is authorized by the Trustees to manage a separate portion of the assets of the fund as determined by Putnam Management from time to time. PIL did not manage any portion of the assets of the fund during the reporting period. If Putnam Management were to engage
|
| 48 Municipal Opportunities Trust |
the services of PIL, Putnam Management would pay a quarterly sub-management fee to PIL for its services at an annual rate of 0.40% of the average net assets of the portion of the fund managed by PIL.
The fund reimburses Putnam Management an allocated amount for the compensation and related expenses of certain officers of the fund and their staff who provide administrative services to the fund. The aggregate amount of all such reimbursements is determined annually by the Trustees.
Custodial functions for the fund’s assets are provided by State Street. Custody fees are based on the fund’s asset level, the number of its security holdings and transaction volumes.
Putnam Investor Services, Inc., an affiliate of Putnam Management, provides investor servicing agent functions to the fund. Putnam Investor Services, Inc. was paid a monthly fee for investor servicing at an annual rate of 0.05% of the fund’s average daily net assets. The amounts incurred for investor servicing agent functions during the reporting period are included in Investor servicing fees in the Statement of operations.
The fund has entered into expense offset arrangements with Putnam Investor Services, Inc. and State Street whereby Putnam Investor Services, Inc.’s and State Street’s fees are reduced by credits allowed on cash balances. For the reporting period, the fund’s expenses were reduced by $24 under the expense offset arrangements.
Each Independent Trustee of the fund receives an annual Trustee fee, of which $311, as a quarterly retainer, has been allocated to the fund, and an additional fee for each Trustees meeting attended. Trustees also are reimbursed for expenses they incur relating to their services as Trustees.
The fund has adopted a Trustee Fee Deferral Plan (the Deferral Plan) which allows the Trustees to defer the receipt of all or a portion of Trustees fees payable on or after July 1, 1995. The deferred fees remain invested in certain Putnam funds until distribution in accordance with the Deferral Plan.
The fund has adopted an unfunded noncontributory defined benefit pension plan (the Pension Plan) covering all Trustees of the fund who have served as a Trustee for at least five years and were first elected prior to 2004. Benefits under the Pension Plan are equal to 50% of the Trustee’s average annual attendance and retainer fees for the three years ended December 31, 2005. The retirement benefit is payable during a Trustee’s lifetime, beginning the year following retirement, for the number of years of service through December 31, 2006. Pension expense for the fund is included in Trustee compensation and expenses in the Statement of operations. Accrued pension liability is included in Payable for Trustee compensation and expenses in the Statement of assets and liabilities. The Trustees have terminated the Pension Plan with respect to any Trustee first elected after 2003.
Note 3: Purchases and sales of securities
During the reporting period, the cost of purchases and the proceeds from sales, excluding short-term investments, were as follows:
| | |
| | Cost of purchases | Proceeds from sales |
| Investments in securities (Long-term) | $77,872,368 | $93,338,357 |
| U.S. government securities (Long-term) | — | — |
| Total | $77,872,368 | $93,338,357 |
The fund may purchase or sell investments from or to other Putnam funds in the ordinary course of business, which can reduce the fund’s transaction costs, at prices determined in accordance with SEC requirements and policies approved by the Trustees. During the reporting period, purchases or sales of long-term securities from or to other Putnam funds, if any, did not represent more than 5% of the fund’s total cost of purchases and/or total proceeds from sales.
Note 4: Preferred Shares
The Series B (2,876) and C (2,673) Remarketed Preferred shares are redeemable at the option of the fund on any dividend payment date at a redemption price of $25,000 per share, plus an amount equal to any dividends accumulated on a daily basis but unpaid through the redemption date (whether or not such dividends have been declared) and, in certain circumstances, a call premium.
It is anticipated that dividends paid to holders of remarketed preferred shares will be considered tax-exempt dividends under the Internal Revenue Code of 1986. To the extent that the fund earns taxable income and capital gains by the conclusion of a fiscal year, it may be required to apportion to the holders of the remarketed preferred shares throughout that year additional dividends as necessary to result in an after-tax equivalent to the applicable dividend rate for the period.
|
| Municipal Opportunities Trust 49 |
Under the Investment Company Act of 1940, the fund is required to maintain asset coverage of at least 200% with respect to the remarketed preferred shares. Additionally, the fund’s bylaws impose more stringent asset coverage requirements and restrictions relating to the rating of the remarketed preferred shares by the shares’ rating agencies. Should these requirements not be met, or should dividends accrued on the remarketed preferred shares not be paid, the fund may be restricted in its ability to declare dividends to common shareholders or may be required to redeem certain of the remarketed preferred shares. At period end, no such restrictions have been placed on the fund.
Note 5: Shares repurchased
In September 2021, the Trustees approved the renewal of the repurchase program to allow the fund to repurchase up to 10% of its outstanding common shares over the 365 day period ending September 30, 2022 (based on shares outstanding as of September 30, 2021). Prior to this renewal, the Trustees had approved a repurchase program to allow the fund to repurchase up to 10% of its outstanding common shares over the 365 day period ending September 30, 2021 (based on shares outstanding as of September 30, 2020). Repurchases are made when the fund’s shares are trading at less than net asset value and in accordance with procedures approved by the fund’s Trustees. At Putnam’s recommendation, the share repurchase program was temporarily suspended on March 24, 2020 and reinstated July 1, 2020.
For the reporting period, the fund did not repurchase any of its outstanding common shares. For the previous fiscal year, the fund did not repurchase any of its outstanding common shares.
At the close of the reporting period, Putnam Investments, LLC owned approximately 1,491 shares of the fund (0.004% of the fund’s shares outstanding), valued at $20,427 based on net asset value.
Note 6: Affiliated transactions
Transactions during the reporting period with any company which is under common ownership or control were as follows:
| | | | | |
| | | | | | Shares |
| | | | | | outstanding |
| | | | | | and fair |
| | Fair value as | Purchase | Sale | Investment | value as |
| Name of affiliate | of 4/30/21 | cost | proceeds | income | of 10/31/21 |
| Short-term investments | | | | | |
| Putnam Short Term | | | | | |
| Investment Fund* | $9,451,627 | $84,139,542 | $50,455,645 | $12,622 | $43,135,524 |
| Total Short-term | | | | | |
| investments | $9,451,627 | $84,139,542 | $50,455,645 | $12,622 | $43,135,524 |
* Management fees charged to Putnam Short Term Investment Fund have been waived by Putnam Management. There were no realized or unrealized gains or losses during the period.
Note 7: Market, credit and other risks
In the normal course of business, the fund trades financial instruments and enters into financial transactions where risk of potential loss exists due to changes in the market (market risk) or failure of the contracting party to the transaction to perform (credit risk). The fund may be exposed to additional credit risk that an institution or other entity with which the fund has unsettled or open transactions will default. The fund may invest in higher-yielding, lower-rated bonds that may have a higher rate of default.
On July 27, 2017, the United Kingdom’s Financial Conduct Authority (“FCA”), which regulates LIBOR, announced a desire to phase out the use of LIBOR by the end of 2021. On March 5, 2021, the FCA and LIBOR’s administrator, ICE Benchmark Administration, announced that most LIBOR settings will no longer be published after the end of 2021 and a majority of U.S. dollar LIBOR settings will no longer be published after June 30, 2023. LIBOR has historically been a common benchmark interest rate index used to make adjustments to variable-rate loans. It is used throughout global banking and financial industries to determine interest rates for a variety of financial instruments and borrowing arrangements. The transition process might lead to increased volatility and illiquidity in markets that currently rely on LIBOR to determine interest rates. It could also lead to a reduction in the value of some LIBOR-based investments and reduce the effectiveness of new hedges placed against existing LIBOR-based investments. While some LIBOR-based instruments may contemplate a scenario where LIBOR is no
|
| 50 Municipal Opportunities Trust |
longer available by providing for an alternative rate-setting methodology, not all may have such provisions and there may be significant uncertainty regarding the effectiveness of any such alternative methodologies. Since the usefulness of LIBOR as a benchmark could deteriorate during the transition period, these effects could occur prior to the date on which the applicable rate ceases to be published.
Beginning in January 2020, global financial markets have experienced, and may continue to experience, significant volatility resulting from the spread of a virus known as Covid–19. The outbreak of Covid–19 has resulted in travel and border restrictions, quarantines, supply chain disruptions, lower consumer demand, and general market uncertainty. The effects of Covid–19 have adversely affected, and may continue to adversely affect, the global economy, the economies of certain nations, and individual issuers, all of which may negatively impact the fund’s performance.
Note 8: Summary of derivative activity
The volume of activity for the reporting period for any derivative type that was held during the period is listed below and was based on an average of the holdings at the end of each fiscal quarter:
| |
| Futures contracts (number of contracts) | 300 |
| OTC total return swap contracts (notional) | $22,300,000 |
| Centrally cleared total return swap contracts (notional) | $28,200,000 |
The following is a summary of the fair value of derivative instruments as of the close of the reporting period:
| | | | |
| Fair value of derivative instruments as of the close of the reporting period | |
| | ASSET DERIVATIVES | LIABILITY DERIVATIVES |
| Derivatives not | | | | |
| accounted for as | Statement of | | Statement of | |
| hedging instruments | assets and | | assets and | |
| under ASC 815 | liabilities location | Fair value | liabilities location | Fair value |
| Interest rate contracts | Receivables | $468,283* | Payables | $780,673* |
| Total | | $468,283 | | $780,673 |
* Includes cumulative appreciation/depreciation of futures contracts and/or centrally cleared swaps as reported in the fund’s portfolio. Only current day’s variation margin is reported within the Statement of assets and liabilities.
The following is a summary of realized and change in unrealized gains or losses of derivative instruments in the Statement of operations for the reporting period (Note 1):
| | | |
| Amount of realized gain or (loss) on derivatives recognized in net gain or (loss) on investments | |
| Derivatives not accounted for as hedging | | | |
| instruments under ASC 815 | Futures | Swaps | Total |
| Interest rate contracts | $(109,649) | $(1,090,526) | $(1,200,175) |
| Total | $(109,649) | $(1,090,526) | $(1,200,175) |
| |
| Change in unrealized appreciation or (depreciation) on derivatives recognized in net gain or (loss) |
| on investments | | | |
| Derivatives not accounted for as hedging | | | |
| instruments under ASC 815 | Futures | Swaps | Total |
| Interest rate contracts | $432,003 | $(467,192) | $(35,189) |
| Total | $432,003 | $(467,192) | $(35,189) |
Note 9: New accounting pronouncements
In March 2020, the Financial Accounting Standards Board (FASB) issued Accounting Standards Update (ASU) 2020–04, Reference Rate Reform (Topic 848) — Facilitation of the Effects of Reference Rate Reform on Financial Reporting. The amendments in ASU 2020–04 provide optional temporary financial reporting relief from the effect
|
| Municipal Opportunities Trust 51 |
of certain types of contract modifications due to the planned discontinuation of LIBOR and other interbank-offered based reference rates as of the end of 2021. The discontinuation of LIBOR was subsequently extended to June 30, 2023. ASU 2020–04 is effective for certain reference rate-related contract modifications that occur during the period March 12, 2020 through December 31, 2022. Management is currently evaluating the impact, if any, of applying this provision.
Note 10: Offsetting of financial and derivative assets and liabilities
The following table summarizes any derivatives, repurchase agreements and reverse repurchase agreements, at the end of the reporting period, that are subject to an enforceable master netting agreement or similar agreement. For securities lending transactions or borrowing transactions associated with securities sold short, if any, see Note 1. For financial reporting purposes, the fund does not offset financial assets and financial liabilities that are subject to the master netting agreements in the Statement of assets and liabilities.
| | | | |
| | Credit Suisse | | | |
| | Securities (USA), | | Morgan Stanley & | |
| | LLC (clearing | JPMorgan | Co. International | |
| | broker) | Securities LLC | PLC | Total |
| Assets: | | | | |
| OTC Total return swap contracts*# | $— | $— | $19,470 | $19,470 |
| Centrally cleared total return | 53,076 | — | — | 53,076 |
| swap contracts§ | | | | |
| Futures contracts§ | — | — | — | — |
| Total Assets | $53,076 | $— | $19,470 | $72,546 |
| Liabilities: | | | | |
| OTC Total return swap contracts*# | — | — | 189,918 | 189,918 |
| Centrally cleared total return | — | — | — | — |
| swap contracts§ | | | | |
| Futures contracts§ | — | 10,151 | — | 10,151 |
| Total Liabilities | $— | $10,151 | $189,918 | $200,069 |
| Total Financial and Derivative | $53,076 | $(10,151) | $(170,448) | $(127,523) |
| Net Assets | | | | |
| Total collateral received (pledged)†## | $— | $— | $(130,974) | |
| Net amount | $53,076 | $(10,151) | $(39,474) | |
| Controlled collateral received | | | | |
| (including TBA commitments)** | $— | $— | $— | $— |
| Uncontrolled collateral received | $— | $— | $— | $— |
| Collateral (pledged) (including | | | | |
| TBA commitments)** | $— | $— | $(130,974) | $(130,974) |
* Excludes premiums, if any. Included in unrealized appreciation and depreciation on OTC swap contracts on the Statement of assets and liabilities.
** Included with Investments in securities on the Statement of assets and liabilities.
† Additional collateral may be required from certain brokers based on individual agreements.
# Covered by master netting agreement (Note 1).
##Any over-collateralization of total financial and derivative net assets is not shown. Collateral may include amounts related to unsettled agreements.
§ Includes current day’s variation margin only as reported on the Statement of assets and liabilities, which is not collateralized. Cumulative appreciation/(depreciation) for futures contracts and centrally cleared swap contracts is represented in the tables listed after the fund’s portfolio. Collateral pledged for initial margin on futures contracts and centrally cleared swap contracts, which is not included in the table above, amounted to $255,943 and $716,785, respectively.
|
| 52 Municipal Opportunities Trust |
Shareholder meeting results (Unaudited)
April 20, 2021 annual meeting
At the meeting, a proposal to fix the number of Trustees at 11 was approved as follows:
| | |
| Votes for | Votes against | Abstentions |
| 27,410,769 | 724,663 | 538,893 |
At the meeting, each of the nominees for Trustees was elected as follows:
| | |
| | Votes for | Votes withheld |
| Liaquat Ahamed | 27,753,171 | 920,801 |
| Ravi Akhoury | 27,801,071 | 872,902 |
| Barbara M. Baumann | 23,790,395 | 4,883,578 |
| Catharine Bond Hill | 27,796,090 | 877,883 |
| Paul L. Joskow | 23,395,589 | 5,278,384 |
| Kenneth R. Leibler | 23,723,257 | 4,950,716 |
| Robert L. Reynolds | 27,973,517 | 700,456 |
| Manoj P. Singh | 27,837,219 | 836,754 |
| Mona K. Sutphen | 27,752,960 | 921,013 |
A quorum was not present with respect to the matter of electing two Trustees to be voted on by the preferred shareholders voting as a separate class. As a result, in accordance with the fund’s Declaration of Trust and Bylaws, independent Trustees Katinka Domotorffy and George Putnam III remain in office and continue to serve as Trustees.
All tabulations are rounded to the nearest whole number.
|
| Municipal Opportunities Trust 53 |
Putnam family of funds
The following is a list of Putnam’s open-end mutual funds offered to the public. Investors should carefully consider the investment objective, risks, charges, and expenses of a fund before investing. For a prospectus, or a summary prospectus if available, containing this and other information for any Putnam fund or product, contact your financial advisor or call Putnam Investor Services at 1-800-225-1581. Please read the prospectus carefully before investing.
| |
| Blend | Income |
| Emerging Markets Equity Fund | Convertible Securities Fund |
| Focused Equity Fund | Diversified Income Trust |
| Focused International Equity Fund | Floating Rate Income Fund |
| International Capital Opportunities Fund | Global Income Trust |
| International Equity Fund | Government Money Market Fund* |
| Multi-Cap Core Fund | High Yield Fund |
| Research Fund | Income Fund |
| Money Market Fund† |
| Global Sector | Mortgage Opportunities Fund |
| Global Health Care Fund | Mortgage Securities Fund |
| Global Technology Fund | Short Duration Bond Fund |
| Ultra Short Duration Income Fund |
| Growth | |
| Growth Opportunities Fund | Tax-free Income |
| Small Cap Growth Fund | Intermediate-Term Municipal Income Fund |
| Sustainable Future Fund | Short-Term Municipal Income Fund |
| Sustainable Leaders Fund | Strategic Intermediate Municipal Fund |
| Tax Exempt Income Fund |
| Value | Tax-Free High Yield Fund |
| International Value Fund | |
| Large Cap Value Fund | State tax-free income funds‡: |
| Small Cap Value Fund | California, Massachusetts, Minnesota, |
| | New Jersey, New York, Ohio, and Pennsylvania. |
|
| 54 Municipal Opportunities Trust |
| |
| Absolute Return | Asset Allocation (cont.) |
| Fixed Income Absolute Return Fund | Putnam Retirement Advantage Maturity Fund |
| Multi-Asset Absolute Return Fund | Putnam Retirement Advantage 2065 Fund |
| | Putnam Retirement Advantage 2060 Fund |
| Putnam PanAgora§ | Putnam Retirement Advantage 2055 Fund |
| Putnam PanAgora Risk Parity Fund | Putnam Retirement Advantage 2050 Fund |
| | Putnam Retirement Advantage 2045 Fund |
| Asset Allocation | Putnam Retirement Advantage 2040 Fund |
| Dynamic Risk Allocation Fund | Putnam Retirement Advantage 2035 Fund |
| George Putnam Balanced Fund | Putnam Retirement Advantage 2030 Fund |
| | Putnam Retirement Advantage 2025 Fund |
| Dynamic Asset Allocation Balanced Fund | |
| Dynamic Asset Allocation Conservative Fund | RetirementReady® Maturity Fund |
| Dynamic Asset Allocation Growth Fund | RetirementReady® 2065 Fund |
| | RetirementReady® 2060 Fund |
| | RetirementReady® 2055 Fund |
| | RetirementReady® 2050 Fund |
| | RetirementReady® 2045 Fund |
| | RetirementReady® 2040 Fund |
| | RetirementReady® 2035 Fund |
| | RetirementReady® 2030 Fund |
| | RetirementReady® 2025 Fund |
| | |
* You could lose money by investing in the fund. Although the fund seeks to preserve the value of your investment at $1.00 per share, it cannot guarantee it will do so. An investment in the fund is not insured or guaranteed by the Federal Deposit Insurance Corporation or any other government agency. The fund’s sponsor has no legal obligation to provide financial support to the fund, and you should not expect that the sponsor will provide financial support to the fund at any time.
† You could lose money by investing in the fund. Although the fund seeks to preserve the value of your investment at $1.00 per share, it cannot guarantee it will do so. The fund may impose a fee upon sale of your shares or may temporarily suspend your ability to sell shares if the fund’s liquidity falls below required minimums because of market conditions or other factors. An investment in the fund is not insured or guaranteed by the Federal Deposit Insurance Corporation or any other government agency. The fund’s sponsor has no legal obligation to provide financial support to the fund, and you should not expect that the sponsor will provide financial support to the fund at any time.
‡ Not available in all states.
§ Sub-advised by PanAgora Asset Management.
Check your account balances and the most recent month-end performance in the Individual Investors section at putnam.com.
|
| Municipal Opportunities Trust 55 |
Fund information
Founded over 80 years ago, Putnam Investments was built around the concept that a balance between risk and reward is the hallmark of a well-rounded financial program. We manage funds across income, value, blend, growth, sustainable, asset allocation, absolute return, and global sector categories.
| | |
| Investment Manager | Trustees | Jonathan S. Horwitz |
| Putnam Investment | Kenneth R. Leibler, Chair | Executive Vice President, |
| Management, LLC | Liaquat Ahamed | Principal Executive Officer, |
| 100 Federal Street | Ravi Akhoury | and Compliance Liaison |
| Boston, Massachusetts 02110 | Barbara M. Baumann | |
| | Katinka Domotorffy | Richard T. Kircher |
| Investment Sub-Advisor | Catharine Bond Hill | Vice President and BSA |
| Putnam Investments Limited | Paul L. Joskow | Compliance Officer |
| 16 St James’s Street | George Putnam, III | |
| London, England SW1A 1ER | Robert L. Reynolds | Susan G. Malloy |
| Manoj P. Singh | Vice President and |
| Marketing Services | Mona K. Sutphen | Assistant Treasurer |
| Putnam Retail Management | | |
| Limited Partnership | Officers | Denere P. Poulack |
| 100 Federal Street | Robert L. Reynolds | Assistant Vice President, |
| Boston, Massachusetts 02110 | President | Assistant Clerk, and |
| | | Assistant Treasurer |
| Custodian | James F. Clark | |
| State Street Bank | Vice President, Chief Compliance | Janet C. Smith |
| and Trust Company | Officer, and Chief Risk Officer | Vice President, |
| | Principal Financial Officer, |
| Legal Counsel | Nancy E. Florek | Principal Accounting Officer, |
| Ropes & Gray LLP | Vice President, Director of | and Assistant Treasurer |
| | Proxy Voting and Corporate | |
| | Governance, Assistant Clerk, | Stephen J. Tate |
| | and Assistant Treasurer | Vice President and |
| | | Chief Legal Officer |
| | Michael J. Higgins | |
| | Vice President, Treasurer, | Mark C. Trenchard |
| | and Clerk | Vice President |
|
| 56 Municipal Opportunities Trust |
Call 1-800-225-1581 Monday through Friday between 8:00 a.m. and 8:00 p.m. Eastern Time, or visit putnam.com anytime for up-to-date information about the fund’s NAV.
| |
| Item 3. Audit Committee Financial Expert: |
| |
| Item 4. Principal Accountant Fees and Services: |
| |
| Item 6. Schedule of Investments: |
| |
| The registrant’s schedule of investments in unaffiliated issuers is included in the report to shareholders in Item 1 above. |
| |
| Item 7. Disclosure of Proxy Voting Policies and Procedures For Closed-End Management Investment Companies: |
| |
| Item 8. Portfolio Managers of Closed-End Management Investment Companies |
| |
| (b) There have been no changes to the list of the registrant’s identified portfolio managers included in the registrant’s report on Form N-CSR for the most recent completed fiscal year. |
| |
| Item 9. Purchases of Equity Securities by Closed-End Management Investment Companies and Affiliated Purchasers: |
| |
| Registrant Purchase of Equity Securities |
| | | | | |
| | | | | Maximum |
| | | | Total Number | Number (or |
| | | | of Shares | Approximate |
| | | | Purchased | Dollar Value) |
| | | | as Part | of Shares |
| | | | of Publicly | that May Yet Be |
| | Total Number | Average | Announced | Purchased |
| | of Shares | Price Paid | Plans or | under the Plans |
| Period | Purchased | per Share | Programs* | or Programs** |
|
|
| | | | | |
| May 1 —
May 31, 2021 | — | — | — | 3,410,969 |
| June 1 —
June 30, 2021 | — | — | — | 3,410,969 |
| July 1 —
July 31, 2021 | — | — | — | 3,410,969 |
| August 1 —
August 31, 2021 | — | — | — | 3,410,969 |
| September 1 —
September 30, 2021 | — | — | — | 3,410,969 |
| October 1 —
October 31, 2021 | — | — | — | 3,412,734 |
| |
| * In October 2005, the Board of Trustees of the Putnam Funds initiated the closed-end fund share repurchase program, which, as subsequently amended, authorized the fund to repurchase of up to 10% of its fund’s outstanding common shares over the two-years ending October 5, 2007. The Trustees have subsequently renewed the program on an annual basis. The program renewed by the Board in September 2020, which was in effect between October 1, 2020 and September 30, 2021, allowed the fund to repurchase up to 3,410,969 of its shares. The program renewed by the Board in September 2021, which is in effect between October 1, 2021 and September 30, 2022, allows the fund to repurchase up to 3,412,734 of its shares. |
| |
| ** Information prior to October 1, 2021, is based on the total number of shares eligible for repurchase under the program, as amended through September 2020. Information from October 1, 2021 forward is based on the total number of shares eligible for repurchase under the program, as amended through September 2021. |
| |
| Item 10. Submission of Matters to a Vote of Security Holders: |
| |
| Item 11. Controls and Procedures: |
| |
| (a) The registrant’s principal executive officer and principal financial officer have concluded, based on their evaluation of the effectiveness of the design and operation of the registrant’s disclosure controls and procedures as of a date within 180 days of the filing date of this report, that the design and operation of such procedures are generally effective to provide reasonable assurance that information required to be disclosed by the registrant in this report is recorded, processed, summarized and reported within the time periods specified in the Commission’s rules and forms. |
| |
| (b) Changes in internal control over financial reporting: Not applicable |
| |
| Item 12. Disclosures of Securities Lending Activities for Closed-End Investment Companies: |
| |
| (a)(2) Separate certifications for the principal executive officer and principal financial officer of the registrant as required by Rule 30a-2(a) under the Investment Company Act of 1940, as amended, are filed herewith. |
| |
| (a)(3) 19(a) Notices to Beneficial Owners are filed herewith. |
| |
| (b) The certifications required by Rule 30a-2(b) under the Investment Company Act of 1940, as amended, are filed herewith. |
| |
| Pursuant to the requirements of the Securities Exchange Act of 1934 and the Investment Company Act of 1940, the registrant has duly caused this report to be signed on its behalf by the undersigned, thereunto duly authorized. |
| |
| Putnam Municipal Opportunities Trust |
| |
| By (Signature and Title): |
| |
| /s/ Janet C. Smith
Janet C. Smith
Principal Accounting Officer
|
| |
| Pursuant to the requirements of the Securities Exchange Act of 1934 and the Investment Company Act of 1940, this report has been signed below by the following persons on behalf of the registrant and in the capacities and on the dates indicated. |
| |
| By (Signature and Title): |
| |
| /s/ Jonathan S. Horwitz
Jonathan S. Horwitz
Principal Executive Officer
|
| |
| By (Signature and Title): |
| |
| /s/ Janet C. Smith
Janet C. Smith
Principal Financial Officer
|