UNITED STATES
SECURITIES AND EXCHANGE COMMISSION
Washington, D.C. 20549
Form 10-K
| x | ANNUAL REPORT PURSUANT TO SECTION 13 OR 15(d) OF THE SECURITIES EXCHANGE ACT OF 1934 |
For the fiscal year ended December 31, 2008
or
| ¨ | TRANSITION REPORT PURSUANT TO SECTION 13 OF 15(d) OF THE SECURITIES EXCHANGE ACT OF 1934 |
For the transition period from to
Commission file number: 0-21528

BELL MICROPRODUCTS INC.
(Exact name of registrant as specified in its charter)
| | |
| California | | 94-3057566 |
(State or other jurisdiction of incorporation or organization) | | (I.R.S. Employer Identification Number) |
1941 Ringwood Avenue, San Jose, California 95131-1721
(Address of principal executive offices, including zip code)
Registrant’s telephone number, including area code:
(408) 451-9400
Securities registered pursuant to Section 12(b) of the Act:
None.
(Name of Each Exchange on which Registered)
Securities registered pursuant to Section 12(g) of the Act:
Common Stock, $.01 par value
(Title of Class)
Indicate by check mark if the registrant is a well-known seasoned issuer, as defined in Rule 405 of the Securities Act. Yes ¨ No x
Indicate by check mark if the registrant is not required to file reports pursuant to Section 13 or Section 15(d) of the Act. Yes ¨ No x
Indicate by check mark whether the registrant (1) has filed all reports required to be filed by Section 13 or 15(d) of the Securities Exchange Act of 1934, during the preceding 12 months (or for such shorter period that the registrant was required to file such reports) and (2) has been subject to such filing requirements for the past 90 days. Yes ¨ No x
Indicate by check mark whether the registrant has submitted electronically and posted on its corporate Web site, if any, every Interactive Data File required to be submitted and posted pursuant to Rule 405 of Regulation S-T during the preceding 12 months (or for such shorter period as the registrant was required to submit and post such files). Yes ¨ No ¨
Indicate by check mark if disclosure of delinquent filers pursuant to Item 405 of Regulation S-K is not contained herein and will not be contained, to the best of the registrant’s knowledge, in definitive proxy or information statements incorporated by reference in Part III of this Form 10-K or any amendment to this Form 10-K. ¨
Indicate by check mark whether the registrant is a large accelerated filer, an accelerated filer, a non-accelerated filer or a smaller reporting company. See the definitions of “large accelerated filer,” “accelerated filer” and “smaller reporting company” in Rule 12b-2 of the Exchange Act. (Check one):
| | | | | | |
| Large accelerated filer | | ¨ | | Accelerated filer | | x |
| | | |
| Non-accelerated filer | | ¨ (Do not check if a smaller reporting company) | | Smaller reporting company | | ¨ |
Indicate by check mark whether the registrant is a shell company (as defined in Rule 12b-2 of the Exchange Act). Yes ¨ No x
The aggregate market value of the voting and non-voting common equity held by non-affiliates computed by reference to the price at which the common equity was last sold as of the last business day of the registrant’s most recently completed second fiscal quarter (June 30, 2008) was approximately $75.2 million for the registrant’s common stock, $0.01 par value per share. For purposes of this disclosure, shares of common stock held by executive officers, directors and greater than 10% shareholders of the registrant have been excluded because such persons may be deemed to be affiliates. This determination of affiliate status is not necessarily a conclusive determination for other purposes.
The number of shares of registrant’s Common Stock outstanding as of May 31, 2009 was 31,828,490.
BELL MICROPRODUCTS INC.
INDEX TO FORM 10-K
Throughout this Annual Report on Form 10-K, all references to the “Company,” “Bell Micro,” “we,” “us,” and “our” refer to Bell Microproducts Inc., a California corporation, and its subsidiaries, unless otherwise indicated or the context otherwise requires.
Explanatory Note
In accordance with relief granted to the Company by the Staff of the Securities and Exchange Commission (the “SEC”), we are filing this comprehensive Annual Report on Form 10-K for the year ended December 31, 2008 with expanded financial and other disclosures in lieu of filing a separate Annual Report on Form 10-K for the year ended December 31, 2007, and separate Quarterly Reports on Form 10-Q for the periods ended March 31, 2007, June 30, 2007, September 30, 2007, March 31, 2008, June 30, 2008 and September 30, 2008. This comprehensive report is being filed to facilitate the dissemination of current financial and other information to investors. The Company does not intend to file a separate Annual Report on Form 10-K for the year ended December 31, 2007 or Quarterly Reports on Form 10-Q for the quarterly periods in 2007 or 2008.
The Company’s delay in filing its annual and quarterly reports was due to the previously announced restatement of the Company’s consolidated financial statements for the years ended December 31, 2005, 2004 and prior years. For a summary of the investigations related to the restatement, seePart II — Item 7 — Management’s Discussion and Analysis of Financial Condition and Results of Operations in this Annual Report on Form 10-K. For a more detailed description of the restatement, see the Company’s Annual Report on Form 10-K for the year ended December 31, 2006, which was filed on December 30, 2008.
3
FORWARD-LOOKING STATEMENTS
This report contains forward-looking statements within the meaning of Section 27A of the Securities Act of 1933 and Section 21E of the Securities Exchange Act of 1934, as amended (the “Exchange Act”). You should not place undue reliance on these statements. These forward-looking statements include statements that reflect the current views of our senior management with respect to our financial performance and future events with respect to our business and our industry in general. Statements that include the words “expect,” “intend,” “plan,” “believe,” “project,” “forecast,” “estimate,” “may,” “should,” “anticipate” and similar statements of a future or forward-looking nature identify forward-looking statements. Forward-looking statements address matters that involve risks and uncertainties. Accordingly, there are or will be important factors that could cause our actual results to differ materially from those indicated in these statements. We believe that these factors include, but are not limited to, the following: our ability to comply with the financial covenants in our credit agreements; our ability to achieve cost reductions and other benefits in connection with our strategic initiatives; the circumstances resulting in the restatement of our consolidated financial statements for the years ended December 31, 2005 and 2004 and the material weaknesses in our internal control over financial reporting and in our disclosure controls and procedures; the fact that we are not presently current with the filing requirements of the Securities and Exchange Commission (“SEC”) with respect to our periodic reports; the delisting of our common stock and our ability to successfully regain a listing on a national securities exchange; loss or adverse effect on our supplier relationships, including the reduction or elimination of rebates offered by our manufacturers; our ability to accurately forecast customer demand and order sufficient product quantities; competition in the markets in which we operate; the fact that the products we sell may not satisfy shifting customer demand or compete successfully with our competitors’ products; our reliance on third parties to manufacture the products we sell; our reliance on credit provided by our manufacturers to finance our inventory purchases; risks related to our substantial indebtedness, including the inability to obtain additional financing for our operations on terms acceptable to us or at all; limitations on our operating and strategic flexibility under the terms of our debt agreements; our ability to attract and retain qualified personnel; risks associated with doing business abroad, including foreign currency risks; inability to identify, acquire and integrate acquired businesses; the outcome of any pending or future litigation or regulatory proceedings, including the current shareholder lawsuit and any claims or litigation related to the restatement of our consolidated financial statements; and the effects of a prolonged economic downturn.
The foregoing factors should not be construed as exhaustive and should be read together with the other cautionary statements included in this Annual Report on Form 10-K, including under the captionRisk Factors inItem 1A of this Annual Report on Form 10-K. If one or more events related to these or other risks or uncertainties materialize, or if our underlying assumptions prove to be incorrect, actual results may differ materially from what we anticipate.
4
PART I
General
Founded in 1987, Bell Microproducts, a California corporation, is a leading distributor and value-added reseller of data storage and server products and solutions, computer component products and peripherals, as well as a variety of software applications. We also design and integrate systems through our value-added division, and provide customers with a variety of services, such as system configuration, product installation, post-sale service and support and supply chain management. Bell Micro markets and distributes products at all levels of integration, from components to fully integrated, tested and certified systems. We carry over 400 brand name product lines worldwide, as well as our own proprietary Rorke® and Galaxy® data storage products and our Markvision consumer electronics and computer products. Across our product lines, we emphasize our ability to combine our extensive product portfolio with comprehensive value-added and supply chain services.
We offer component-level products that include disk, tape and optical drives, processors, memory, motherboard and computer I/O products, flat panel displays and related products and other data storage and custom-configured computer products. Our offerings also include value-added services such as system design, integration, installation, maintenance and other consulting services combined with a variety of data storage, server and other computer hardware and software products. We also offer supply chain services such as consignment, bonding and end-of-life management programs. In addition, at the system level, we offer a variety of data storage systems, including direct attached storage (“DAS”), network attached storage (“NAS”) and storage area network (“SAN”) systems, as well as servers and other computer platforms, tape drive systems, tape libraries and related software. Our access to a wide range of products and technologies, together with our extensive technical capabilities, allows us to tailor high-quality hardware, software and service solutions for each customer’s specific requirements. Customers can purchase our components or systems as stand-alone products, or in combination with our value-added and supply chain services. We are organized to service different customer needs with a specific sales team for each of the original equipment manufacturer (“OEM”), value-added reseller (“VAR”), contract manufacturer (“CM”), integration and end-user customer types.
Available Information
All reports filed electronically by us with the SEC, including our Annual Reports on Form 10-K, Quarterly Reports on Form 10-Q, Current Reports on Form 8-K, proxy statements and other information and amendments to those reports, are accessible at no cost on our web site at www.bellmicro.com and are available by contacting our Investor Relations Department at ir@bellmicro.com or (408) 451-9400. These filings are also accessible on the SEC’s website at www.sec.gov. The public may read, and copy at prescribed rates, any materials filed by us with the SEC at the SEC’s Public Reference Room located at 100 F Street, NE, Washington, DC 20549. The public may obtain information regarding the Public Reference Room by calling the SEC at (800) 732-0330.
Industry
The information technology (“IT”), OEM and consumer electronic markets for data storage, servers, personal computers (“PCs”) and computer components have experienced significant growth over the past several years. Market growth has been driven by increases in the demand for processing, storing, managing and the security of data; the reduced cost of higher performing enterprise servers and data storage systems; lower cost entry level servers, desktop and laptop computers; increasing needs to meet corporate and government compliance requirements; and in recent years, the storage of digital audio and video files in various consumer electronics.
Traditionally, suppliers have sold data storage, server and computer components directly to end-users and through both direct and indirect distribution channels. The use of distribution channels continues to grow as the computer products, IT and consumer electronics industries mature. Suppliers utilize distributors to not only increase their reach in the marketplace, but to also allow the suppliers to focus primarily on their core strengths, such as product design, development and marketing. Suppliers are increasingly relying on their partners in the distribution industry to manage customer relationships, create demand and execute the sales transaction. The indirect distribution channel has seen growth as the needs and demands of the suppliers’ OEMs, VARs, CMs, system integrators, and, most recently, major retailers, have increased. Suppliers are also driving the trend toward indirect distribution due to the value-added and supply chain services that distributors can often provide. The rapid growth of complex data processing and storage requirements and the need for
5
sophisticated server and networked storage systems have also increased the enterprise customer’s dependence on value-added service providers to assist in the design, integration, service and support of their data processing and storage needs. These changes in the industry provide opportunities for distributors to differentiate themselves in the market through product specialization and the value-added and supply chain services they offer.
The complexity of sophisticated server and storage solutions, combined with a shortage of qualified IT personnel, and the cost-benefit of outsourcing, often leads customers to outsource some or all of the research, design, implementation and support of their IT servers and data storage solutions.
To increase their efficiencies, suppliers are continually reducing the number of distributors they use. Distributors are also choosing to consolidate because of the competitive advantages derived from expanded product offerings and economies of scale. The rapidly changing nature of the data storage, server and computer components markets has required distributors to significantly expand both their customer base and product and service offerings to compete effectively. To be successful within these markets, we believe distributors must emphasize time-to-market and total cost reductions, in addition to focusing on specific markets through product offerings, technical expertise and value-added and supply chain service capability. Distributors need to distinguish themselves through a combination of value-added services, such as consulting, design, integration, implementation and maintenance, as well as more knowledgeable service and technical support resources and innovative supply chain programs.
Segment and geographic information for the Company is contained in Note 13 —Segment and Geographic Information in our notes to the consolidated financial statements included in this Annual Report on Form 10-K.
Our Strategy
Our goal is to expand our position as a leading distributor of storage and server solutions and systems, as well as computer component products and peripherals. We intend to achieve this goal by leveraging our strengths and implementing the following strategies as described in theProducts and TechnologiesandMarket Expansionsections, below.
Products and Technologies
Continue to Focus on the Storage Market.We plan to continue to take advantage of opportunities in the storage market by maintaining our strategic focus on providing complete storage solutions to our customers. For example, we have devoted significant resources to broadening our range of value-added services, expanding our marketing efforts, improving the expertise of our sales force and offering an extensive range of technologically advanced products in the data storage market. We believe that we are well-positioned to benefit from the future growth of the storage market. In the markets we serve, as user needs grow more sophisticated and cost efficiencies are demanded of storage infrastructure providers, additional opportunities will arise in the storage, management and security of data, benefiting our storage-centric strategy.
Expand our Storage and Complementary Product Lines.We believe that our ability to offer customers an extensive line of leading data storage, server, other computer components and software across technologies and suppliers will continue to be a strong competitive advantage for us, particularly as it relates to the storage infrastructure. Our selection of products and technologies, together with our technology expertise, allows us to reliably deliver appropriate hardware and software solutions and services to meet the demands of our customers. The addition of new product lines and application technology expertise is a continuous process at Bell Micro.
Enter Complementary Growth Markets.Our technology expertise, broad customer base and global operations enable us to identify emerging market opportunities that are based upon storage-centric applications. These opportunities are often based upon consumer demands, government regulations or cost efficiencies that require the processing and storage of substantial data. Two emerging markets are digital signage for information display and video surveillance. We offer product lines, application expertise and services to provide components, subsystems and complete solutions for these markets, leveraging our design, integration, installation, maintenance and supply chain capabilities. Our Rorke Data division is a specialist in the application of server and storage products in the video and health care vertical markets. The market growth of digitized video generally has opened new markets for these products and services in both broadcast and video surveillance.
Strengthen Relationships with Industry Leaders.We intend to utilize our position as a leading distributor of storage solutions to broaden our existing strategic relationships with industry leaders and to create new strategic relationships. We believe that distribution channels will continue to consolidate and leading suppliers will align with those distributors that are best able to offer value-added services and access to new customers in multiple countries and markets. We believe that being aligned with leading suppliers will allow us to identify innovative products, exchange critical information, gain access to new
6
technologies and create cross-marketing opportunities. We have developed strategic relationships with a number of suppliers, including Hewlett-Packard Company (“HP”), Seagate Technology (“Seagate”), Hitachi Global Storage Technologies, Inc. and Hitachi Data Systems Corporation, Microsoft Corporation (“Microsoft”), Western Digital Corporation (“WD”), International Business Machines Corporation (“IBM”), Cisco Systems, Inc. (“Cisco”), Symantec Corporation, Intel Corporation (“Intel”) and Quantum Corporation.
As a consequence of our existing strategic relationships with industry leaders, we tend to rely on a relatively small number of key suppliers for products that make up a significant portion of our sales. In 2008 and 2007, Seagate, our single largest supplier, provided products that represented approximately 8% and 10%, respectively, of our total sales. In 2006, HP, our single largest supplier, provided products that represented approximately 12% of our total sales. Our top five suppliers provided products that represented 24%, 26% and 36% of our total sales in 2008, 2007 and 2006, respectively. We believe that staying aligned with the industry leaders in the storage solutions market is an important part of our strategy.
Market Expansion
Our long-term market expansion goals include the following:
Capture New Market Opportunities.As profitable new market opportunities emerge that complement our storage-centric strategy, we will determine the applicability of our technology expertise and expand into these new markets organically or through acquisition. We continue to evaluate new market opportunities where the application of our products and technical expertise will differentiate us from the rest and afford sizable volume and profit opportunities. Our strategy is to gain early market share in new markets and leverage our position as the market grows.
Expand our Domestic and International Presence.We intend to increase our presence in North America and expand our coverage in the major international markets that we serve, primarily Latin America and Europe, through organic growth and strategic acquisitions. As we expand our global presence, we believe that we will be able to address the demands of multinational customers, gain further access to multinational suppliers and leverage our expertise.
Products and Services
We market and distribute more than 400 brand name product lines of other companies, as well as our own Rorke® and Galaxy® data storage products and our Markvision consumer electronics and computer products. We offer the following products and services as discrete components or as part of our solutions offering.
Storage, Server, Networking and Related Software Infrastructure Products
Our storage solutions include DAS, NAS and SAN offerings. These solutions are comprised of fibre channel and Ethernet networking products and systems, tape libraries, disk drive subsystems, tape subsystems and storage-related software products. Additionally, we offer custom and standard configurations of server products from various suppliers. We partner with leading storage and server suppliers in the industry to provide comprehensive cost-effective solutions to customers in the worldwide IT and OEM markets. Our customer base includes leading VARs and other resellers, independent software vendors (“ISVs”), major retailers, system builders and OEMs. Our ProSys and TotalTec divisions provide storage, server and network infrastructure solutions to Fortune 1000 end-user customers. Rorke Data provides data storage solutions in the video and health care markets.
Disk and Tape Drives, Motherboards, Processors, and Other Computer Components
We distribute a variety of computer components, including disk and tape drives, DRAM and flash memory modules, including our Markvision branded products, microprocessors, standard and custom motherboards, graphics and video devices, network interface cards (“NICs”) and other board level products, computer power supplies and chassis products.
Computer Peripherals, Monitor and Display Systems, Software and Other Computer Products
Our computer peripherals include flat panel displays, monitors, keyboards, scanners, laptops and other computer peripherals. Our software offerings include storage management, operating systems, data security, systems management, middleware, database and replication products.
7
Value-Added Services
We offer our customers a variety of value-added services. Customers employ these services to modify a variety of standard products to meet the needs of their specific application requirements. Additionally, we offer a wide range of supply chain services to support our customers’ logistical requirements.
Storage Server Solutions.Our storage server solution offerings include both hardware and support services necessary for the implementation and effective utilization of that hardware.
Data Storage and Server Subsystems.We provide standard and custom subsystem products to our customers. We integrate standard products to customize our Rorke® and Galaxy® data storage products. We also configure, build and test custom products to meet the needs of customers that cannot be served by industry-standard product offerings.
Solutions Configuration, Test, Installation and Support.We offer a broad range of professional services, including design and consultation, installation, training and on-site and remote managed service programs related to storage and server solutions. Networking solutions and services are offered through our ProSys division. We have established several dedicated enterprise storage system teams that address the challenges associated with data storage and management in the enterprise data center. Our service programs also offer customers feasibility testing and fully integrated turnkey storage solutions. For example, we integrate SANs with fibre channel-based technology including switches, bridges, archive libraries and network and data management software. For server and storage solutions, we offer a wide range of support services that include design support and product recommendations, testing services, training programs and maintenance. Much of this expertise lies in our ProSys, Rorke Data and TotalTec divisions, and is leveraged to support the needs of our distribution customers.
Component Product Services.We provide value-added services for a full range of storage and computer products, including modifying disk, tape and optical drives to meet specifications established by a customer’s specific application needs. For customers requiring supply chain services, we offer a full range of solutions, including automated quotations, bonded inventory, consignment and end-of-life management. We also provide image duplication, firmware modification, software downloading, special labeling and other hardware modification services. For other computer product components, we provide various configuration services, testing and packaging. We provide a variety of materials-management solutions, including e-procurement services, Internet-enabled real-time pricing and delivery quotations, electronic data interchange (“EDI”) programs, just-in-time (“JIT”) inventory programs, bonded inventories, on-site consignment inventory and end-of-life management services.
Board and Blade Level Building Blocks.We provide both standard and custom configured board and blade offerings geared for applications to include computers, servers, medical equipment, video/graphics, security, test and measurement and networking products. These solutions are offered in a variety of industry standard form factors. We also provide complete integration services, manufacturing, assembly, interoperability testing and application support.
Retail Packaging.In addition, we provide value-added services to storage suppliers, combining the strengths of our hard drive value capabilities with custom third-party packaging. Our retail packaging programs deliver consumer-ready storage products. These products are produced in high volume and require high-quality software duplication, testing and chassis assembly to meet demanding retail launch dates. The core materials planning and logistics capabilities of our distribution operations enable us to deliver retail-ready products to our customers’ distribution centers or directly to their retail outlets.
Flat Panel Integration.We offer a comprehensive portfolio of flat panel displays, technologies and integration services. These include off-the-shelf solutions for kiosks, point-of-sale (“POS”) displays, digital display signage and medical instrumentation. Our display solutions also include custom designs to support applications such as full sunlight readability and harsh environmental deployment.
Sales and Marketing
Our customer base primarily consists of OEMs, VARs, system integrators, CMs, storage, server and networking infrastructure, end-user customers and major retailers. For customers primarily seeking our solution offerings, our sales and
8
marketing activities often involve efforts by our salespeople and field application engineers over an extended period of time. Sales and technical personnel focusing on these customers tend to spend a significant amount of time assessing the customers’ needs and developing solutions supported by our technical capabilities and experience.
For customers seeking our components, servers, storage subsystems and other related product offerings, our sales and marketing efforts involve price and availability, augmented by our supply chain management programs, consignment and bonded inventory programs and end-of-life management programs tailored to specific customer needs. Sales of these offerings are principally driven by supply chain capabilities, our design and product recommendation services, product breadth and depth, pricing, on-time and on-demand availability, and, often, our hardware value-added capabilities.
For customers seeking end-user solutions, our ProSys, Rorke Data and TotalTec divisions work to determine their server, data storage, data management, data security and network needs to enable them to make decisions regarding their infrastructure, and to design systems to address these needs. Our consulting services draw from our core competencies in enterprise server, storage and networked integrated solutions. We perform tasks such as conduct storage audit and feasibility studies, as well as requirements analyses that lead to hardware and software system recommendations, complete implementation project management and manage supplemental subsets of customer-defined projects.
We also believe that our relationships with our suppliers provide us with significant opportunities to increase our sales and customer base. We work closely with many suppliers to develop strategies to penetrate both targeted markets and customers. In some cases, our sales presentations to customers are a joint effort with a supplier’s sales representative.
Electronic Commerce
Increasingly, customers rely on our electronic ordering and information systems as a source for product information, availability and price. Through our website, customers can gain remote access to our information systems to determine product availability and pricing and to place orders. We actively market our website capabilities to current and new customers, encouraging them to complete their purchases electronically. Some of our larger customers utilize our electronic ordering, such as EDI, extensible markup language (“XML”) or file transfer protocol (“FTP”) services, through which orders, order acknowledgments, invoices, inventory status reports, customized pricing information and other industry standard electronic transactions are consummated on line. With a broad suite of electronic commerce capabilities, we are able to increase efficiency and timeliness for ourselves, as well as for our customers.
Competition
In the distribution of storage, server and related products and services, as well as computer components and peripherals, we generally compete for customer relationships with numerous local, regional, national and international authorized and unauthorized distributors. We also compete for customer relationships with the suppliers we represent and with our own customers. Consistent with our sales and marketing efforts, we tend to view this competition, whether arising from the direct or indirect distribution channel, on a customer-category basis. We believe that our most significant competition for customers seeking both products and value-added services arises from Arrow Electronics, Inc. (“Arrow”), Avnet, Inc. (“Avnet”) and the Magirus Group (“Magirus”). We believe that our most significant competition for customers seeking commodity products comes from Ingram Micro Inc. (“Ingram Micro”), Tech Data Corporation (“Tech Data”), SYNNEX Corporation (“SYNNEX”), Actebis Group (“Actebis”) and Intcomex, Inc. (“Intcomex”). Many of our competitors possess superior brand recognition and financial resources. In the area of storage products and solutions, however, we believe that none of our competitors offer the full range of data storage products, combined with the solutions, expertise and services that we provide.
A key competitive factor in the electronic component and computer product distribution industry, as a whole, is the need to sustain a sufficient level of inventory to meet the rapid delivery requirements of customers. However, to minimize our exposure related to valuation of inventory on hand, the majority of our product lines are purchased pursuant to non-exclusive distributor agreements, which provide certain protections to us for product obsolescence and price erosion in the form of rights of return and price protection. Furthermore, these agreements are generally cancelable upon 30 to 180 days’ notice and, in most cases, provide for inventory return privileges upon cancellation.
9
We enhance our competitive position by offering a variety of value-added services tailored to individual customer specifications and business needs such as design support, testing, assembly, supply chain management and materials management.
Business Segments
We operate in one industry: the business of providing distribution and value-added services for storage products and systems, semiconductors and computer products and peripherals. Our seven reportable segments are U.S. Distribution, Europe, ProSys, TotalTec, Miami, Canada and Other (which primarily includes Rorke Data, Mexico, Brazil and Chile). Management designates the internal reporting used by the chief executive officer for making decisions and assessing performance as the source of our reportable segments. See Note 3 —Goodwill and Other Intangible Assetsand Note 13 —Segment and Geographic Information in our notes to the consolidated financial statements included in this Annual Report on Form 10-K for additional information.
Acquisitions
We have completed a number of strategic acquisitions. Through these acquisitions, we have gained additional expertise in storage solutions and greater access to international markets. In October 2006, we acquired substantially all of the assets and liabilities of ProSys Information Systems Inc. (“ProSys”) based in Atlanta, Georgia, which has broadened our position as a supplier of enterprise solutions to our customers. ProSys provides storage, server, networking and IT infrastructure and consulting services. ProSys’ strategic partners include HP, Cisco, Teradata Corporation, Microsoft and IBM, as well as a diverse group of other leading solution providers. ProSys will continue to focus on large enterprise accounts as a separate reportable segment.
In December 2005, we acquired certain assets and assumed certain liabilities of MCE Computer Peripherie GmbH, MCE Computer Vertriebs Products GmbH, MCE Computer Technology Inc. and MCE Limited (collectively, “MCE”). Based in Munich, Germany, MCE is a European distributor of disk drives and components, and IBM enterprise sales in Germany. MCE’s customer base includes the enterprise VARs, system builders and industrial customers. This acquisition has expanded our geographic footprint and enabled us to continue to expand our growth in value-added storage products and services in key markets in Continental Europe and the United Kingdom, and has also provided additional experienced management, sales and marketing resources as part of our Europe reportable segment.
In July 2005, we acquired Net Storage Computers, Ltda (“Net Storage”), a company headquartered in Alphaville, São Paulo, Brazil, with sales offices throughout Brazil. Net Storage is a distributor of computer components, storage products and peripherals to VARs and system integrators in Brazil. Net Storage’s strategic partners include Intel, Seagate, WD, Acer Inc. and Super Micro Computer, Inc. This acquisition enabled us to expand our presence in Latin America and provides the opportunity to strengthen our relationships with key suppliers and expand our overall product and service offerings as a part of our Other reportable segment.
Employees
As of May 31, 2009, we had a total of 1,973 employees, consisting of 909 in sales and marketing functions, 353 in general administrative functions, 327 in warehousing and operations and 384 in technical and value-add integration functions. Of our total employees, as of May 31, 2009, 922 were located at our facilities outside of the United States, including 403 in the United Kingdom, 134 in Germany, 98 in Mexico, 86 in Brazil and 201 in other locations. None of our employees are represented by a labor union. We have not experienced any work stoppages and consider our relations with our employees to be good.
In addition to the other information included in this Annual Report on Form 10-K, you should carefully consider the risk factors described below.
Risks Related to Our Internal Control Over Financial Reporting and the Restatement of Our Previously Issued Financial Statements
We have identified various material weaknesses in our internal control over financial reporting that resulted in material misstatements in our consolidated financial statements that were issued prior to December 31, 2006. These weaknesses could continue to adversely affect our ability to report our results of operations and financial condition accurately and in a timely manner.
10
Our management is responsible for maintaining internal control over financial reporting designed to provide reasonable assurance regarding the reliability of financial reporting and the preparation of consolidated financial statements for external purposes in accordance with GAAP. Our management assessed the effectiveness of our internal control over financial reporting as of December 31, 2008 and identified various material weaknesses, primarily related to our failure to maintain an effective control environment. As a result of these material weaknesses, our management concluded that our internal control over financial reporting was not effective as of December 31, 2008. Further, we believe that our internal control over financial reporting remains ineffective as of the date of the filing of this Annual Report on Form 10-K. See Item 9A —Controls and Procedures.
A material weakness is a deficiency, or combination of deficiencies, in internal control over financial reporting that creates a reasonable possibility that a material misstatement of our annual or interim consolidated financial statements will not be prevented or detected on a timely basis. We are in the process of implementing a plan to remediate the identified material weaknesses. Our efforts have been and will continue to be time-consuming and expensive. We cannot give any assurance that the measures we are taking to remediate the identified material weaknesses will be effective. We also cannot assure you that other material weaknesses will not arise as a result of our failure to maintain adequate disclosure controls and procedures or that circumvention of those controls and procedures will not occur. Additionally, even if we succeed in improving our controls and procedures, those controls and procedures may not be adequate to prevent or identify errors or irregularities or ensure that our financial statements are prepared in accordance with generally accepted accounting principles.
The investigations by the Board of Directors (the “Board”) into some of our historical accounting practices and the determination of various other accounting adjustments, which resulted in the restatement of our previously issued consolidated financial statements, have been time-consuming and expensive and have had a material adverse effect on our financial condition, results of operations and cash flows.
During 2007 and 2008, we devoted substantial internal and external resources to the completion of a restatement of certain of our historical consolidated financial statements. During 2009, we have devoted substantial additional resources to preparing the audited consolidated financial statements included in this Annual Report on Form 10-K. As a result of these efforts, as of May 31, 2009, we have incurred in excess of $90.0 million in fees and expenses, primarily for additional accounting, tax, legal and related consulting costs, and $11.1 million in fees related to obtaining covenant waivers, including an 8.5% special interest payment of a $9.4 million under our $110.0 million of outstanding convertible notes. We expect to continue to incur significant additional fees and expenses until we are in compliance with our SEC reporting requirements and have remediated the existing material weaknesses in our internal control over financial reporting. These costs, as well as the substantial management time devoted to address these issues, have materially adversely affected our financial condition, results of operations and cash flows.
We are the subject of an ongoing SEC non-public fact-finding inquiry relating to our historical accounting practices. This inquiry could result in penalties and/or other actions that could have a material adverse effect on our financial condition and results of operations.
In February 2008, independent counsel to the Board, accompanied by counsel for the Company, self-reported to the SEC the findings of the independent investigations conducted by special committees of the Board. As a result, the SEC commenced a non-public fact-finding inquiry into our historical accounting practices. We have cooperated with the SEC in connection with this inquiry and will continue to do so. We cannot predict the outcome of this inquiry or whether we will face additional government inquiries, investigations or other actions related to our historical accounting practices. An adverse ruling in any SEC enforcement action or other regulatory proceeding could impose upon us fines, penalties or other remedies, which could have a material adverse effect on our results of operations and financial condition.
We believe the delisting of our common stock from The NASDAQ Global Market has had an adverse effect on the liquidity and market price of our common stock. We cannot assure you as to when we will be able to relist our common stock on a national securities exchange.
In March 2008, our common stock was delisted from The NASDAQ Global Market, or Nasdaq, as a result of our failure to comply with SEC reporting obligations. Our common stock is currently quoted on the Pink OTC Market, or Pink Sheets, which is an over-the-counter securities market. We believe the delisting of our common stock has materially
11
adversely affected: (1) the liquidity of our common stock, (2) the market price of our common stock, (3) the number of institutional and other investors that will consider investing in our common stock, (4) the availability of information concerning the trading prices and volume of our common stock, (5) the number of broker-dealers willing to execute trades in shares of our common stock and (6) our ability to obtain equity financing.
Unless and until we are able to successfully relist our common stock on Nasdaq or another national securities exchange, you may not be able to sell shares of our common stock without a considerable delay or significant adverse effect on the sale price. Furthermore, we cannot assure you that we will be able to relist our common stock on Nasdaq or another national securities exchange once we are in compliance with SEC reporting obligations. We will still be required to comply with all other applicable listing standards. Recently, our common stock has consistently traded below $1.00 per share. A low per-share stock price may have an impact on our ability to relist our common stock on a national securities exchange.
We and certain of our current and former officers and directors have been named as parties to a purported shareholder derivative lawsuit relating to our historical stock option granting practices, and may be named in further litigation, including with respect to the restatement of our consolidated financial statements, all of which could require significant management time and attention, result in significant legal expenses or cause our business, financial condition, results of operations and cash flows to suffer.
On December 29, 2008, John R. Campbell, who alleges he is one of our shareholders, caused a purported shareholder’s derivative lawsuit to be filed in the Superior Court of California for the County of San Mateo, naming us as a nominal defendant, and naming 17 of our current and former directors and officers as defendants. The lawsuit seeks to recover damages purportedly sustained by us in connection with our historical stock option granting practices. We cannot predict the outcome of this matter, or any other matter related to our historical stock option granting practices.
Our historical stock option granting practices and the restatement of our consolidated financial statements have exposed us to greater risks associated with litigation, regulatory proceedings and government enforcement actions. We and our current and former officers and directors may, in the future, be subject to additional private and governmental actions relating to our historical stock option granting practices or the restatement of our consolidated financial statements. Subject to certain limitations, we are obligated to indemnify our current and former officers and directors in connection with such lawsuits and governmental investigations and any related litigation. We cannot predict the outcome of these investigations or lawsuits. Regardless of the outcome, these lawsuits, and any other litigation that may be brought against us or our officers and directors, could be time-consuming, result in significant expense and divert the attention and resources of our management and other key employees, which could have a material adverse effect on our business, financial condition, results of operations and cash flows. An unfavorable outcome in any of such litigation matters could exceed coverage provided under applicable insurance policies, which could have a material adverse effect on our business, financial condition, results of operations and cash flows.
Further, we could be required to pay damages or additional penalties or have other remedies imposed against us, our directors or officers, which could harm our reputation, business, financial condition, results of operations or cash flows.
Our failure to comply with SEC reporting obligations may have an adverse effect on our business.
As a result of our failure to comply with SEC reporting obligations, we are subject to a number of restrictions regarding the registration of our common stock under federal securities laws. Until such time as we have regained compliance with our SEC reporting obligations and meet certain other conditions, we will be unable to use shorter and less costly filings, such as Registration Statements on Forms S-3 and S-8. The requirement of using a Registration Statement on Form S-1 is likely to be more costly and time-consuming. These restrictions may reduce our access to capital markets, which may adversely affect our business.
Risks Related to Our Financial Condition
Our consolidated financial statements are presented on a going concern basis. Given our existing financial condition and current conditions in the global credit markets, if we are unable to comply with one or more of the covenants in our credit agreements, there would likely be uncertainties regarding our ability to continue as a going concern.
Our audited consolidated financial statements included in this Annual Report on Form 10-K have been prepared on a going concern basis, which assumes continuity of operations and realization of assets and satisfaction of liabilities in the ordinary course of business. Our ability to continue as a going concern is predicated upon, among other factors, our compliance with the provisions of our existing credit agreements and, when needed, our ability to renew such agreements or obtain alternative or additional financing.
12
We currently have a substantial amount of indebtedness outstanding. The agreements associated with our indebtedness include a number of financial covenants. If we do not satisfy the covenants in our credit agreements, including the covenant to file consolidated financial statements, and are unable to obtain related waivers or amendments, the lenders could declare a default under our credit agreements. Any default under our credit agreements will allow the respective lenders the option to demand repayment of the indebtedness outstanding, and would allow certain other lenders to exercise their rights and remedies under cross-default provisions. If these lenders were to exercise their rights to accelerate the indebtedness outstanding, there can be no assurance that we would be able to refinance or otherwise repay any amounts that may become accelerated under the agreements. The acceleration of a significant portion of our indebtedness would have a material adverse effect on our business, liquidity and financial condition.
If we do not satisfy the foregoing covenants and the lenders do not grant waivers and elect to exercise their remedies upon default, we would be required to refinance or otherwise repay this outstanding indebtedness. Given our existing financial condition and current conditions in the global credit markets, should these events occur, there would likely be uncertainties regarding our ability to continue as a going concern.
Restrictions in our debt agreements limit our operating and strategic flexibility.
Our debt agreements contain restrictions, covenants and default provisions that, among other factors, require us to satisfy financial covenant tests, including maintaining a minimum net worth for certain operating subsidiaries and meeting a consolidated fixed-charge coverage ratio. Among other things, these restrictions, covenants and default provisions limit our ability to, or do not permit us to:
| | • | | redeem and prepay certain debt; |
| | • | | pay cash dividends, make other distributions or repurchase stock; |
| | • | | engage in asset sales outside the ordinary course of business; |
| | • | | enter into certain transactions with affiliates; |
| | • | | engage in certain mergers and acquisitions; and |
| | • | | make certain capital expenditures. |
Events beyond our control could also affect our ability to comply with these restrictions and covenants, including the required financial covenant tests. Failure to comply with any of these debt covenants would result in a default under the applicable agreements and under our other debt agreements containing cross-default provisions. A default would permit lenders to accelerate the maturity of the debt under these agreements, foreclose upon our assets securing the debt and terminate any commitments to lend. Under these circumstances, we may not have sufficient funds or other resources to satisfy our debt and other obligations. In addition, the limitations imposed by these debt agreements on our ability to incur additional debt and to take other actions may significantly impair our ability to obtain other financing.
13
Our substantial leverage and related debt service obligations could adversely affect our cash flows and business. In addition, we have not generated consistent positive cash flows from operations in recent years. Our failure to generate positive cash flows from operations in the future would materially adversely affect our ability to meet our debt service obligations.
Among other things, our substantial indebtedness and debt service obligations:
| | • | | limit the availability of our cash flow to fund working capital, capital expenditures, acquisitions, investments and other general corporate purposes; |
| | • | | limit our flexibility in planning for, or reacting to, changes in our business and the industry in which we operate; |
| | • | | limit our ability to obtain additional financing for working capital, capital expenditures, strategic acquisitions, investments and other general corporate purposes; |
| | • | | limit our ability to refinance our indebtedness on terms acceptable to us or at all; |
| | • | | increase our exposure to fluctuating interest rates; |
| | • | | restrict our credit with suppliers, limiting our ability to purchase inventory; and |
| | • | | make us more vulnerable to economic downturns, increased competition and adverse industry conditions, which places us at a disadvantage compared to our competitors that have less indebtedness. |
In 2008 and 2007, we incurred significant losses. During the same periods, we used $10.9 million and $8.8 million, respectively, in cash to repay principal and pay interest on our outstanding debt. At May 31, 2009, our aggregate outstanding indebtedness was approximately $372 million. If we are unable to generate sufficient cash flows from operations in the future, it may be necessary for us to refinance all or a portion of our indebtedness, obtain additional financing or take other actions.
As a result of our failure to comply with SEC reporting obligations, we were required to obtain waivers in connection with the delivery of audited consolidated financial statements and related matters under our debt agreements. We may need to obtain additional waivers in the future. The failure to obtain the necessary waivers could have a material adverse effect on our business, liquidity and financial condition.
Under our debt agreements, our lenders have the right to notify us if they believe we have breached a representation or covenant and may declare an event of default. If we do not cure the events of default or obtain necessary waivers within the required time periods, our lenders would be permitted to accelerate the maturity of the debt under these agreements, foreclose upon our assets securing the debt and terminate any commitments to lend. In addition, our ability to incur additional indebtedness would be restricted. Moreover, material defaults under our debt agreements could trigger cross-default provisions under other debt arrangements.
In 2009, 2008 and 2007, we obtained agreements from our lenders to waive breaches under our debt agreements and establish extended deadlines for the delivery of our audited consolidated financial statements. If we are unable to provide audited consolidated financial statements on a timely basis in future periods or if we were to breach any other covenants, there can be no assurance that any additional waivers will be received on a timely basis, if at all, or that any waivers obtained will extend for a sufficient period of time to avoid an acceleration event, an event of default or other restrictions on our business. The failure to obtain the necessary modifications or waivers could have a material adverse effect on our business, liquidity and financial condition.
We may need additional funding to support our operations. Sufficient funding will be subject to conditions and may not be available to us, which would adversely affect our business.
We rely heavily on debt financing for our operations, which could become more and more difficult to obtain given the recent uncertainties in the global credit markets. Our debt financing arrangements are for terms that vary. Our primary revolving line of credit in the United States expires in September 2010 and our primary line of credit in Europe expires in October 2011. At the expiration of any credit facility, the lender is not obligated to renegotiate the terms of the loan and can
14
require full repayment at that time. In the past, we have successfully extended the term of each of our facilities on or before the time they expired. However, we cannot assure you that in the future our lenders will be willing to extend the terms of our existing loans, or extend the terms of those loans on terms that are acceptable to us. If we are unable to secure additional financing at the expiration of any our debt facilities, our business would be adversely impacted.
If the global credit market crisis continues, it may impact our ability to obtain debt financing for our operations and the unavailability of funding could adversely affect our business.
As a result of current economic uncertainties, including with respect to global capital and credit markets and overall economic growth, we may find it more difficult or expensive to secure additional capital or credit to pursue actions we would consider beneficial to us or our shareholders, such as acquisitions or capital investments. Our ability to continue operations could also be dependent on our ability to obtain alternative debt and/or equity financing. The inability to obtain such financing would have a material adverse effect on our operations and financial condition.
Our primary revolving credit facilities are subject to borrowing base limitations, which could adversely affect our liquidity and business.
The maximum amounts we can borrow under our primary revolving credit facilities are subject to borrowing base limitations, which are calculated as a percentage of our eligible inventory and accounts receivable. If our inventory or accounts receivable are deemed ineligible, because, for example, they are held outside certain geographical limitations or a receivable is older than 90 days, the amount we can borrow under the revolving credit facilities could be reduced. This reduction could have a material adverse impact on our liquidity and business.
A substantial part of our debt was financed by a bond offering we made in 2004. The bond indenture permits the bondholders to require us to redeem the bonds at face value in March 2011, which, if required, would materially adversely affect our liquidity and financial condition.
In 2004, we sold bonds to the public in the amount of $110 million. The bond indenture permits the bondholders to require us to redeem the bonds at face value in March 2011, March 2014 and March 2019. If the bondholders require us to redeem the bonds in March 2011, we would be required to pay to the bondholders $110 million. If we are unable to raise the funds necessary to pay the bondholders, which could be difficult in the current global credit market, we would be in default of our obligations under the indenture, which could lead to a cross-default of most of our other outstanding debt arrangements requiring all of that debt to be repaid. If we unable to cure the defaults, our lenders could exercise their contractual remedies, including the foreclosure on our inventory and accounts receivable.
We are subject to a proposed tax assessment in France that could have a material adverse effect on our financial condition, results of operations and cash flows.
On June 4, 2008, our export subsidiary in the United Kingdom received notification from the French tax authorities that they were proposing to issue a tax deficiency notice against our export subsidiary for the failure to pay value-added tax and corporate income tax in France during the period of January 1, 2002 to December 31, 2006, in an amount, including interest and penalties, of approximately €27.3 million ($38.2 million at an exchange rate of $1.40/€1.00 as of December 31, 2008). Subsequently, the French tax authorities issued a tax assessment against our U.K. export subsidiary. We intend to defend this matter vigorously and avail ourselves of all available defenses. The matter is in the preliminary stages and, therefore, we are not in a position to estimate a loss, if any, or a range of potential loss. As no amount of potential loss is both probable and estimable, no accrual has been made in the consolidated financial statements as of December 31, 2008 or 2007. However, a negative outcome of this matter could have a material adverse effect on our consolidated financial position, results of operations and cash flows.
The goodwill on our balance sheet may not be recoverable and may be impaired in future periods, reducing the carrying value of goodwill as an asset.
The value of goodwill on our balance sheet is evaluated, in part, based on the trading price of our common stock. On December 31, 2008 and 2007, the per-share closing price of our common stock was $0.60 and $6.01, respectively. During 2008 and 2007, we recorded aggregate goodwill impairment charges of $58.3 million. On May 29, 2009, our stock closed at $1.07 per share, but has traded below $1.00 in 2009. As a result, goodwill may be further impaired in 2009. As of December 31, 2008 and 2007, the carrying value of our goodwill was $19.2 million and $26.2 million, respectively.
15
We rely in large part on credit lines provided by manufacturers to finance our inventory purchases, which lines are subject to change by the manufacturer with little or no notice. Without such credit lines our ability to purchase and hold inventory could be negatively impacted, which could adversely affect our results of operations and business.
To finance our purchases of inventory, we rely in large part on credit lines provided by the product manufacturers. These manufacturers are under no obligation to provide these credit lines to us and have complete discretion in determining the size of the credit lines. Our manufacturers could determine to reduce or eliminate these credit lines because of their own financial condition, the global credit environment or their perception of our creditworthiness. In the event one or more credit lines is reduced or eliminated, our ability to purchase and hold inventory would be negatively impacted, and would likely have an adverse impact on our results of operations and business.
A portion of our profitability is based on rebates we receive from manufacturers. These rebates may be reduced by manufacturers or we may not be able to participate in rebate offers made by manufacturers.
Manufacturers have historically offered to their distribution partners, including us, rebates associated with the sale of their products. Recently, because of global economic issues, manufacturers have begun selectively reducing the rebates they offer. In addition, some rebates require us to qualify in order to receive the rebates by taking relatively large orders over a short period of time or paying invoices in significantly less time than what is commercially standard under the circumstances. Due to our financial condition, we may be unwilling or unable to take advantage of these rebate offers from manufacturers, thereby adversely impacting our profitability.
Risks Related to Our Business
We rely on a small number of suppliers for products that represent a significant portion of our inventory purchases. Any change in our relationships with these suppliers could have an adverse effect on our results of operations.
In 2008, 2007 and 2006, five suppliers accounted for approximately 24%, 26% and 36%, respectively, of our inventory purchases. These suppliers have a variety of other distributors to choose from, which allows them to make substantial demands of us. In addition, each of these suppliers may terminate its relationship with us on relatively short notice. A change in our relationships with these suppliers could have an adverse effect on our financial condition and results of operations.
Many suppliers have consolidated in recent years, resulting in fewer suppliers of the products in the markets we serve. Moreover, suppliers have been consolidating the number of distributors they utilize. Further consolidation in the industry could adversely affect our relationships with our suppliers, which could have an adverse effect on our business.
In addition, certain suppliers in our industry routinely purchase credit insurance from several major carriers to manage collection risks, and there can be no assurance that credit insurance will continue to be provided by those carriers. A reduction in credit insurance available to our suppliers could result in decreased credit lines from suppliers to us and, therefore, impact our ability to maintain sufficient inventory, all of which could have a material adverse effect on our financial condition and results of operations.
A reduction in the vendor allowances we collect from the manufacturers of the products we sell could adversely affect our results of operations.
We receive credits from manufacturers of the products we sell for price protection, product rebates, marketing, promotions and other competitive pricing programs. In some instances, these vendor allowances represent a significant contribution to our pricing decisions and, therefore, our profitability. If manufacturers reduce the amount of vendor allowances available to us, decide to terminate vendor allowance programs, or if we are unable to collect allowances that have been made available to us, it could have a material adverse effect on our results of operations.
We operate in an industry with significant pricing and margin pressure.
Our industry experiences intense competition in pricing. There are several distributors in each of the markets in which we operate that distribute products that are identical or similar to the products we distribute. As a result, we face pricing and margin pressure on a continual basis. Additionally, the mix of products we sell also affects overall margins. If we increase sales from products that are more widely distributed, we may reduce our overall gross profit margin, as those products typically have lower margins. Freight costs and foreign currency exchange exposure can also have an adverse effect on margins.
16
Our international operations trade in local currencies that subject us to risks related to the fluctuation of foreign currencies against the U.S. dollar.
Our international revenues represented 57%, 58% and 60% of our revenues in 2008, 2007 and 2006, respectively. We believe that international sales will represent a large percentage of our net sales for the foreseeable future. Because our international operations trade in the currencies of the jurisdictions in which they operate, we are subject to fluctuations in foreign currency exchange rates and face exposure to adverse changes in these rates. These exposures may be different over time as business practices change. For each of our foreign subsidiaries, the local currency is its functional currency. To the extent our revenues and expenses are denominated in currencies other than U.S. dollars, gains and losses on the conversion to U.S. dollars may contribute to fluctuations in our operating results. We have in the past entered, and expect in the future to enter into, hedging arrangements and local currency borrowing facilities to reduce this exposure, but these arrangements will not eliminate the significant effects these currency fluctuations may have on our results of operations. An increase in the value of the dollar could increase the real cost of our products to our customers in those markets outside the United States where we sell in dollars, and a weakened dollar could increase the cost of local operating expenses and procurement of product to the extent that we must purchase product in foreign currencies.
The products we sell may not satisfy shifting customer demand or compete successfully with our competitors’ products.
Our business is based on the demand for the products we sell, which are primarily used in the manufacture or configuration of electronic products. These end products typically have short life cycles and experience intense price competition. Our success depends upon our ability to identify new product lines that will achieve market acceptance and to establish relationships with suppliers that will develop these products on a timely basis in response to the rapid technological changes in our industry. If we misinterpret consumer preferences or fail to respond to changes in the marketplace, consumer demand for the products we sell could decrease. Furthermore, our suppliers must commit significant resources each time they develop a product. If they do not invest in the development of new products, then the range of products we offer may be reduced and the demand for the products we offer may decrease. If any of these events occur, our sales could decline.
A substantial portion of our sales consist of disk drives, which subjects us to the significant fluctuations in the overall disk drive market.
In 2008, 2007, and 2006, 26%, 31% and 31%, respectively, of our worldwide sales consisted of disk drives, and 37%, 41% and 42%, respectively, of our U.S. Distribution sales. In 2008, the disk drive market was impacted by the global economic crisis in terms of decreased volume and average selling prices, resulting in a year-over-year decrease in our disk drive revenue of 25% both worldwide and in the U.S. Distribution segment. The overall disk drive market is subject to significant fluctuations over time and, because a significant portion of our sales consist of disk drives, our revenue and our profitability are subject to those same significant fluctuations.
Our reliance on legacy information systems that are supported by a few individuals, as well as a lack of a fully integrated information system could materially adversely affect our business.
Some of our information systems consist of legacy applications that are supported by small internal and external IT teams. As a result, the expertise to maintain and upgrade these systems resides in a few individuals, which, given the legacy nature of the information systems, could make replacement of these individuals very difficult. These legacy IT systems may also not be compatible with commercially available software. In addition, our information systems are not consistent across our operations, making consolidation of financial information increasingly difficult. A loss of our internal or external IT teams or the ability to consolidate financial and other information across our operations could have a material adverse effect on our business and results of operations.
The value of our inventory may decline, which could have an adverse effect on our financial condition and results of operations.
Our business model requires that we purchase and maintain adequate levels of inventory in order to meet customer needs on a timely basis. The markets we serve are subject to rapid technological change, new and enhanced products and evolving industry standards. These changes, along with changes in customer demand, may cause our inventory on hand to
17
substantially decline in value. A majority of our suppliers provide protection from a loss in inventory values through price protection or the option to return products, in some circumstances. However, our suppliers may become unable or unwilling to fulfill these obligations.
Supply shortages could adversely affect our operating results and cash flows.
We are dependent on our suppliers for the products we sell. Historically, our industry has experienced periods of product shortages due to suppliers’ inability to accurately project demand. When these shortages occur, we typically receive an allocation of the available product from our suppliers. We cannot assure you that our suppliers will be able to maintain an adequate supply of products to fulfill all of our customers’ orders on a timely basis. If we are unable to enter into and maintain satisfactory distribution arrangements, it may delay the availability and shipment of products to our customers. This may lead to our customers purchasing products from our competitors, which could adversely affect our business.
If we do not control our operating expenses, we may not be able to successfully implement our strategy.
The successful implementation of our strategy depends, to a substantial degree, upon our ability to increase sales while, at the same time, reducing or controlling operating expenses. We have implemented initiatives intended to increase productivity and reduce costs. These initiatives include significant personnel reductions, reduction or elimination of non-personnel expenses, streamlining operations and consolidating business lines. We cannot assure you that our efforts will produce the expected cost savings and other benefits. Moreover, our cost reduction efforts may adversely affect our financial and operational controls and our ability to distribute products in volumes required to meet customer demand. These efforts may also result in disruptions that could adversely affect our ability to service customers.
Our ability to operate effectively could be impaired if we fail to attract and retain key personnel and qualified managers.
Our success largely depends on our ability to recruit and retain qualified managers and key personnel. If one or more of our key personnel, particularly W. Donald Bell, our Chief Executive Officer and President, resigns or otherwise terminates his or her employment with us, we could experience a loss of sales and supplier relationships and diversion of management resources. Competition for skilled employees in the technology industry is intense, especially in the San Francisco Bay Area, where many of our key employees are located. There can be no assurance that we will be able to recruit and retain such personnel.
In order to attract and retain personnel in a competitive marketplace, we have historically provided competitive compensation packages, including equity-based compensation. The decline in our stock price, or the expectation that our stock price may not increase over time, may adversely affect our ability to attract or retain key employees. In addition, our stock option plan expired in May 2008. As a result, we are currently unable to grant additional stock options or other equity awards to help attract and retain officers and other key employees. We have scheduled our next annual meeting of shareholders to be held on August 19, 2009, and intend to ask our shareholders to adopt a new equity incentive plan at that time. We can provide no assurance that our shareholders will vote to adopt a new equity incentive plan. Without an active equity incentive plan, our ability to attract and retain personnel will be impacted negatively. Further, the compensation expense that must be recognized in connection with the grant of stock options and other equity awards may limit the attractiveness of using equity-based compensation as a primary incentive and retention tool in the future. If we are unable to retain our existing key personnel or hire and integrate new management or employees, our business, financial condition and results of operations could be adversely affected.
Our international operations subject us to additional risks that may adversely affect our results of operations.
As described above, sales from our international operations in recent years have represented a significant percentage of our net sales, and we believe that international sales will continue to represent a significant portion of our business. Our international operations are subject to a number of risks, including:
| | • | | accounts receivable collection risks, longer payment cycles and unpredictable sales cycles; |
| | • | | costs and difficulty in staffing and managing foreign operations; |
| | • | | import and export license requirements, tariffs, taxes and other trade barriers; |
18
| | • | | potentially adverse tax consequences, including restrictions on repatriating earnings and the potential for “double taxation”; |
| | • | | the burden of complying with a wide variety of foreign laws, treaties and technical standards, and changes in those regulations; and |
| | • | | local political and economic instability. |
Our inability to adequately assess and monitor credit risks of our customers could have a material adverse effect on our financial condition, results of operations and liquidity.
We are subject to the credit risk of our customers. We use various methods to screen potential customers and establish appropriate credit limits; however, these methods cannot eliminate all potential bad credit risks and may not prevent us from approving applications that are fraudulently completed. Moreover, businesses that are good credit risks at the time of application may become bad credit risks over time and we may fail to detect this change. In times of economic recession, the number of our customers who default on payments owed to us tends to increase. If we fail to adequately assess and monitor our credit risks, we could experience longer payment cycles, increased collection costs and higher bad debt expense.
Most of our sales are on an open credit basis, with typical payment terms of 30 days in the United States and, because of local customs or conditions, longer periods in some markets outside the United States. We monitor individual customer payment capability in granting such open credit arrangements, seek to limit such open credit to amounts we believe the customers can pay, and maintain reserves we believe are adequate to cover exposure for doubtful accounts.
Our exposure to credit risks may increase if our customers are adversely affected by the current global economic downturn, or if there is a continuation or worsening of the downturn. Although we have programs in place that are designed to monitor and mitigate the associated risk, including monitoring of particular risks in certain geographic areas, there can be no assurance that such programs will be effective in reducing our credit risks.
In the past, there have been bankruptcies among customers, causing us to incur economic or financial losses. There can be no assurance that additional losses will not be incurred. Future losses, if incurred, could harm our business and have a material adverse effect on our operating results and financial condition. Additionally, to the degree that the ongoing turmoil in the credit markets makes it more difficult for some customers to obtain financing, those customers’ ability to pay could be adversely impacted, which, in turn, could have a material adverse impact on our business, operating results and financial condition.
In addition, our ability to borrow under our primary revolving credit facility and to incur additional indebtedness is subject to limits based on a percentage of our outstanding accounts receivable. A decrease in accounts receivable resulting from an increase in bad debt expense could adversely affect our liquidity.
If we are unable to effectively compete in our industry, our operating results may suffer.
The markets in which we compete are highly competitive. As a result, we face a variety of significant challenges, including rapid technological advances, price erosion, changing customer preferences and evolving industry standards. Our competitors continue to offer products with improved price and performance characteristics, and we will have to do the same in order to remain competitive. Increased competition could result in significant price competition, reduced revenues, lower profit margins or loss of market share, any of which would have a material adverse effect on our business. We cannot be certain that we will be able to compete successfully in the future.
We compete for customer relationships with numerous local, regional, national and international distributors. We also compete for customer relationships with suppliers, including some of our own suppliers and customers. We believe our most significant competition for customers seeking both products and services arises from Arrow, Avnet and Magirus. We believe our most significant competition for customers seeking only products arises from Ingram Micro, Tech Data, SYNNEX, Actebis and Intcomex. We also compete with regionalized distributors in North America, Europe and Latin America who use their localized knowledge and expertise as a competitive advantage. Some of our competitors have superior brand recognition and greater financial resources than we do, which may enable them to increase their market share at our expense. If we are unable to successfully compete, our operating results may suffer.
We also compete with other distributors for relationships with suppliers. In recent years, a growing number of suppliers have begun consolidating the number of distributors they use. This consolidation could result in fewer major
19
distributors in our industry. As a result of this consolidation, we may lose relationships with certain existing suppliers. In addition, suppliers have established, and may continue to establish, cooperative relationships with other suppliers and data storage solution providers. These cooperative relationships may enable suppliers to offer comprehensive solutions that compete with those we offer and the suppliers may have greater resources to devote to sales and marketing efforts. If we are unable to maintain our relationships with existing suppliers and not establish new relationships, it could harm our competitive position and adversely affect our operating results.
Our lack of long-term agreements with our customers could have a material adverse effect on our business.
Most of our sales are made on an order-by-order basis, rather than under long-term sales agreements. We make commitments to our suppliers based on our forecasts of future demand. A variety of conditions, both those specific to our customers and those generally affecting the economy in the markets in which we operate, may cause our customers to cancel, reduce or delay purchase orders that were previously made or anticipated. Generally, customers can cancel, reduce or delay purchase orders and commitments without penalty. We seek to mitigate these risks, in some cases, by entering into sales agreements that prohibit order cancellations and product returns. However, we cannot assure you that these agreements will adequately protect us or that the customer will honor the agreement. A significant number of cancellations, reductions or delays in orders by customers could materially adversely affect our business.
Failure to identify acquisition opportunities or to successfully integrate acquired businesses into our operations could reduce our revenues and profits and limit our growth.
Historically, a substantial part of our growth has been achieved through the acquisition of complementary businesses. An important component of our strategy is to continue to pursue selective acquisitions to develop and expand our business. The issues relating to the restatement of our consolidated financial statements, the inability to timely file periodic reports with the SEC and the delisting of our common stock have adversely affected our ability to pursue acquisition opportunities, in part, because of our inability to issue additional registered shares. Our identification of suitable acquisition candidates involves risks inherent in assessing the value, strengths, weaknesses, overall risks and profitability of acquisition candidates. We may be unable to identify suitable acquisition candidates in the future. If we do not make suitable acquisitions, we may find it more difficult to realize our growth objectives.
The process of integrating new businesses into our operations poses numerous risks, including:
| | • | | an inability to integrate acquired operations, accounting systems and processes, information systems and internal control systems; |
| | • | | exposure to unanticipated contingent liabilities of acquired companies; |
| | • | | use of substantial portions of our available cash to consummate an acquisition and/or to operate the acquired business; |
| | • | | diversion of management’s attention; |
| | • | | difficulties and uncertainties in transitioning the business relationships from the acquired entity to us; |
| | • | | the loss of key supplier relationships upon a change of ownership of the acquired business; and |
| | • | | the loss of key employees of acquired companies, which could lead to a loss of customers or supplier relationships. |
In addition, future acquisitions may be dilutive to our shareholders, cause us to incur additional indebtedness and large one-time expenses or create intangible assets that could result in significant amortization expense. If we expend significant amounts of cash or incur additional debt, our liquidity may decline and we may be more vulnerable to economic downturns and competitive pressures. We cannot assure you that we will be able to successfully complete any future acquisitions, that we will be able to finance acquisitions or that we will realize any anticipated benefits from any acquisitions that we do complete.
20
Our geographic coverage on the European continent is not as extensive as some of our competitors, which may lead manufacturers to select our competitors over us as their distributor.
Our geographic coverage on the European continent is not as extensive as some of our competitors. Manufacturers use a variety of criteria to select their distributors, whether for new products or in the event of distributor consolidation. Our smaller geographic coverage as compared to some of our competitors may cause manufacturers to select our competitors as their distributors rather than us, which could have an adverse impact on our operations.
If we cannot effectively manage our growth, our business may suffer.
Although our overall sales decreased from 2007 to 2008, we have historically experienced significant revenue growth each year. We intend to continue to pursue the growth of our business by increasing our sales efforts and completing selective acquisitions. Such growth places a significant strain on our managerial, financial, operational, technical, sales, marketing and administrative resources. To effectively manage our growth, we must, among other factors:
| | • | | engage, train and manage a larger sales and marketing force and additional service personnel; |
| | • | | expand the geographic coverage of our sales force; |
| | • | | expand our information systems; |
| | • | | identify and successfully integrate acquired businesses into our operations; |
| | • | | successfully develop and deploy competitive e-commerce and web-based technologies; and |
| | • | | enforce appropriate financial and administrative control procedures. |
Any failure to effectively manage our growth may adversely affect our business.
The current economic downturn has adversely affected customer spending patterns, which has affected our business and results of operations and may have further adverse effects on our business.
The disruptions in the financial markets and challenging economic conditions have adversely affected the United States and world economy and, in particular, reduced consumer spending and spending by businesses. Turmoil in global credit markets and recent turmoil in the geopolitical environment in many parts of the world and other disruptions, such as changes in energy costs, are and may continue to put pressure on global economic conditions. Our operating results in one or more segments may also be affected by uncertain or changing economic conditions particularly germane to that segment or to particular customer markets within that segment. If our customers delay or cancel spending on their IT infrastructure, that decision could result in reductions in sales of our products, longer sales cycles and increased price competition. There can be no assurances that government responses to the disruptions in the financial markets will restore spending to previous levels. If global economic and market conditions, or economic conditions in the United States or other key markets, remain uncertain or persist, spread, or deteriorate further, we may experience material impacts on our business, operating results and financial condition.
Our geographic reach requires that we have a significant amount of intercompany sales across international borders, which subject us to the risk that the transfer pricing between our subsidiaries will be subject to review by the local taxing authorities. A finding by the local taxing authorities that our transfer pricing is inadequate could subject us to significant liability.
We sell a significant amount of product to our local subsidiaries at a cost we believe is fair and reasonable based on the cost of the product plus a reasonable margin. Because these sales are significant, the sales are subject to review by local taxing authorities who may claim that we transferred the goods at a cost that is below that which is fair or reasonable. If we are subject to review, we may incur significant costs participating in and responding to such an investigation. In addition, if it is determined that we did not adequately set the transfer prices between our cross-border subsidiaries, we may be subject to tax assessments that could be significant and adversely impact our results of operations.
21
Some of our operations are located in areas that are subject to natural disasters that could result in a business stoppage and adversely affect our results of operations.
Our operations depend on our ability to maintain and protect our facilities, computer systems and personnel. Our corporate headquarters, including some of our business operations, computer systems and personnel, are located in the San Francisco Bay Area, which is in close proximity to known earthquake faults. In addition, a substantial portion of our IT infrastructure is located in Montgomery, Alabama, which is susceptible to tornados and hurricanes. Our backup systems only reside locally for each IT system. An earthquake or other catastrophe, communication failure or similar event, which disables our facilities requiring transportation of electronic backup media to an unaffected location, or impairs the transportation of our employees and causes a business interruption, may have an adverse effect on our results of operations.
Our business model requires us to hold inventory in a number of different locations, both internationally and domestically, and is subject to inventory theft.
We hold inventory of expensive high technology products in reasonable proximity to our customers around the world. From time to time in the past, we have experienced inventory theft, both in the United States and abroad. While we have safeguards in place to protect against theft, theft continues to occur. In addition, we purchase insurance to cover potential theft; however, the insurance policies require payment of high deductibles and may not cover every situation. If we were to experience a significant loss of inventory due to theft, it could have an adverse effect on our results of financial condition.
We operate in a number of jurisdictions and some of our personnel travel extensively, which may subject our employees to contagious airborne pathogens, including the H1N1 influenza virus or “swine flu.”
We operate in a number of jurisdictions, including a number of countries in Latin America. Our personnel also travel extensively by air and other modes of common commercial transportation. If a significant number of our personnel were to become exposed to one or more contagious pathogens, including the H1N1 influenza virus, or if one or more of the countries we operate in experiences a significant quarantine, our ability to sell products to our customers could be negatively impacted, which could have an adverse impact on our results of operations.
Risks Related to Our Common Stock
The price of our common stock has been and may continue to be volatile in the future, which could cause the value of an investment in our common stock to decline.
From January 1, 2009 through May 29, 2009, the high and low sales prices of our common stock were $1.21 and $0.36, respectively. The market price of our common stock may continue to fluctuate substantially in the future in response to a number of factors, including:
| | • | | fluctuations in our quarterly operating results or the operating results of our competitors; |
| | • | | continued operating losses or the inability to generate positive cash flows; |
| | • | | changes in general conditions in the economy, the financial markets or our industry; |
| | • | | the ability to timely file future consolidated financial statements; |
| | • | | the ability to remediate identified material weaknesses; |
| | • | | announcements of significant acquisitions, strategic alliances or joint ventures by our customers or our competitors; and |
| | • | | other developments affecting us, our industry, suppliers, customers or competitors. |
The stock market has recently experienced extreme price and volume fluctuations. This volatility has had a significant effect on the market prices of securities issued by many companies for reasons unrelated to their operating
22
performance. These broad market fluctuations may materially adversely affect the market price of our common stock, regardless of our operating results. In addition, as a result of its small public float and limited trading volume, our common stock may be more susceptible to volatility arising from any of these factors.
| Item 1B. | Unresolved Staff Comments |
None.
North America.In North America, our corporate headquarters are located in San Jose, California and we occupy approximately 77,000 square feet of leased office space for that purpose under two operating leases. The current terms of these leases expire on December 31, 2009; however, we have the option to extend the term of each of these leases to December 31, 2011. In addition, for our U.S. Distribution segment in North America we occupy approximately 14 sales offices that we lease pursuant to leases that expire through 2012. We also occupy two integration and service centers and three warehouses in San Jose, California, New Castle, Delaware and Elk Grove Village, Illinois, all of which together comprise approximately 218,000 square feet pursuant to leases that expire through 2011. We also maintain an approximately 27,000 square foot leased facility in Montgomery, Alabama, housing our corporate IT, data center and primary call center. The lease for this facility will expire in November 2012.
In connection with our acquisition of ProSys in October 2006, we added approximately 33,000 square feet of office space and approximately 60,000 square feet of warehouse space located near Atlanta, Georgia. These leases expire in January 2024 and November 2025, respectively. Our ProSys segment is also supported by four additional office space leases and a 32,500 square foot facility located in Kentucky which expires is 2010.
Our TotalTec segment is supported by three office space leases in New Jersey, Maryland and Florida, comprising 75,000 square feet in leases that expire through 2009.
Our Canada segment operates in three office and warehouse facilities in Quebec, British Columbia and Ontario, totaling 21,000 square feet under leases expiring through 2014.
The Rorke Data operation, which included in our Other segment, maintains a 46,000 square foot facility in Eden Prairie, Minnesota under a lease that expires in 2014.
Latin America.Our Latin America group leases its headquarters in Doral, Florida, which is comprised of approximately 120,000 square feet. The lease for this facility expires in 2014 and is related to our Miami segment. Throughout Latin America, we occupy 20 sales offices and distribution facilities totaling approximately 123,000 square feet. These properties are used by the portion of the Other segment related to in-country operations in Brazil, Chile and Mexico.
Europe.Our European group maintains its headquarters, comprised of approximately 38,000 square feet of leased office space, in Chessington, England. The lease for this facility expires in 2010. Our European group also leases approximately 55,000 square feet of unused warehouse space in Chessington pursuant to a lease that expires in 2010, and a distribution center in Birmingham, England, which we currently utilize at 60% of capacity, comprised of approximately 126,000 square feet of space under a lease that expires in 2019. Our value-added storage and solutions business servicing the United Kingdom and Ireland occupies approximately 23,000 square feet in Haslingden, England, in premises we own. We also maintain approximately 20,000 square feet of additional office and warehouse spaces under leases that terminate through 2019. We also maintain a sales office located in Neubiberg, Germany comprising of approximately 18,500 square feet under a lease that will expire in 2012, as well as other sales offices in Germany, totaling 6,600 square feet, under leases expiring through 2009. Our Continental European distribution center was relocated into a larger facility in Poing, Germany in August 2007, comprising approximately 93,000 square feet. The lease for this facility will expire in July 2012. We lease approximately 31,000 square feet of office and warehouse space in Almere and Hoogeveen, Netherlands, under leases expiring through 2014. We also occupy sales offices in Belgium, France, Italy and Spain comprising approximately 12,000 square feet under leases that expire through 2015. These properties are used by the Europe segment.
We believe that our existing facilities are adequate for our current operational needs.
23
We are involved in various claims, suits, investigations and legal proceedings that arise from time to time in the ordinary course of our business. As required by Statement of Financial Accounting Standards (“SFAS”) No. 5 of the Financial Accounting Standards Board (“FASB”),Accounting for Contingencies (“SFAS No. 5”), we accrue a liability when we believe that it is both probable that a liability has been incurred and we can reasonably estimate the amount of the loss. The following is a discussion of our significant legal matters.
On June 4, 2008, our export subsidiary in the United Kingdom received notification from theDirection Générale des Finances Publiquesthat the French tax authorities were proposing to issue a tax deficiency notice against our export subsidiary for the failure to pay value-added tax and corporate income tax in France during the period of January 1, 2002 to December 31, 2006, in an amount, including interest and penalties, of approximately €27.3 million ($38.2 million at an exchange rate of $1.40/€1.00 as of December 31, 2008). Subsequently, the French tax authorities issued a tax assessment against our U.K. export subsidiary. We are contesting the proposed assessment and intend to defend this matter vigorously and avail ourselves of all available defenses.
On December 29, 2008, John R. Campbell, who alleges he is one of our shareholders, caused a purported shareholder’s derivative lawsuit against us to be filed in the Superior Court of California for the County of San Mateo, as a nominal defendant, and 17 of our current and former officers and directors, seeking to recover unspecified damages purportedly sustained by us in connection with our historical stock option granting practices. Subject to certain limitations, we are obligated to indemnify our current and former officers and directors in connection with the investigation of our historical stock option practices and such lawsuits. Although the matter is in its preliminary stages and we have procured insurance coverage for these types of claims, the expense for us to defend this lawsuit may be significant.
In February 2008, independent counsel to the Board, accompanied by our counsel, self-reported to the SEC as to the findings of the independent investigations conducted by special committees of the Board. The SEC commenced a non-public fact-finding inquiry into our historical accounting practices. For a summary of the investigations and our internal reviews, see Part II — Item 7 — Management’s Discussion and Analysis of Financial Condition and Results of Operations —Restatement and Related Investigationsin this Annual Report on Form 10-K. For a description of the material weaknesses in internal control over financial reporting identified by management as a result of the investigations and our internal reviews, as well as those identified through December 31, 2008, and management’s plan to remediate those material weaknesses, see Part II — Item 9A —Controls and Procedures. The inquiry being conducted by the SEC is ongoing and we continue to cooperate with the SEC.
| Item 4. | Submission of Matters to a Vote of Security Holders |
No matters were submitted to a vote of security holders in 2008 or 2007.
PART II
| Item 5. | Market for Registrant’s Common Equity, Related Stockholder Matters and Issuer Purchases of Equity Securities |
Prior to March 19, 2008, our common stock traded on the NASDAQ Global Market under the symbol “BELM.” Effective March 19, 2008, our common stock was suspended from trading on the NASDAQ Global Market and currently trades on the Pink OTC Market, or Pink Sheets, under the symbol “BELM.PK.” For additional information related to the delisting of our common stock, see Item 7— Management’s Discussion and Analysis of Financial Condition and Results of Operations — NASDAQ.
The following table sets forth the high and low sale prices of our common stock as reported by the NASDAQ Global Market prior to March 19, 2008 for each of the periods indicated, and the high and low bid quotations for our common stock as reported by Pink Sheets on and after March 19, 2008 for each of the periods indicated. The over-the-counter quotations reflect inter-dealer prices, without retail mark-up, mark-down or commission and may not necessarily represent transactions.
24
| | | | | | |
| | | High | | Low |
2007 | | | | | | |
First quarter | | $ | 8.10 | | $ | 6.32 |
Second quarter | | | 7.26 | | | 6.05 |
Third quarter | | | 7.12 | | | 4.90 |
Fourth quarter | | | 6.62 | | | 5.25 |
2008 | | | | | | |
First quarter | | $ | 6.60 | | $ | 1.51 |
Second quarter | | | 3.05 | | | 1.92 |
Third quarter | | | 2.50 | | | 1.31 |
Fourth quarter | | | 1.95 | | | 0.27 |
The graph below matches the cumulative five-year total return to holders of Bell Microproducts Inc.’s common stock with the cumulative total returns of the S&P 500 index and the NYSE Arca Tech 100 index. The graph assumes that the value of the investment in our common stock and in each of the indexes (including reinvestment of dividends) was $100 on December 31, 2003 and tracks it through December 31, 2008.
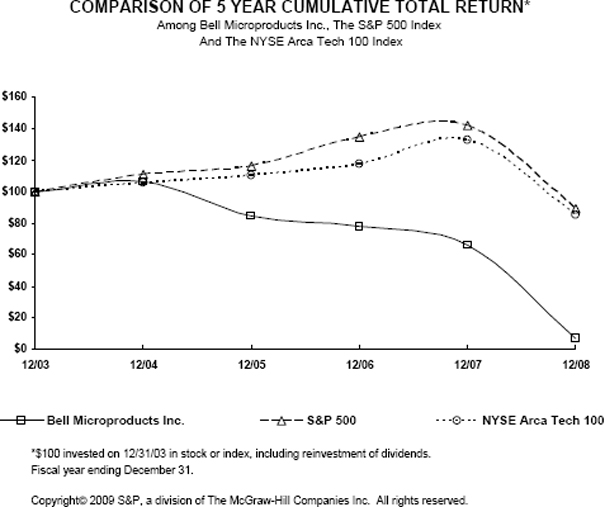
| | | | | | | | | | | | |
| | | 12/03 | | 12/04 | | 12/05 | | 12/06 | | 12/07 | | 12/08 |
| | | | | | |
Bell Microproducts Inc. | | 100.00 | | 106.18 | | 84.44 | | 77.81 | | 66.34 | | 6.62 |
S&P 500 | | 100.00 | | 110.88 | | 116.33 | | 134.70 | | 142.10 | | 89.53 |
NYSE Arca Tech 100 | | 100.00 | | 106.08 | | 110.39 | | 117.83 | | 132.84 | | 85.44 |
25
The stock price performance included in this graph is not necessarily indicative of future stock price performance.
As of May 31, 2009, there were approximately 313 holders of record of our common stock (not including shares held in street name).
To date, we have paid no cash dividends to our shareholders. We have no plans to pay cash dividends in the future. Our line of credit agreements prohibit the payment of dividends or other distributions on any of our shares except dividends payable in our capital stock.
We did not sell any unregistered shares of our common stock during 2008.
We did not repurchase any shares of our outstanding common stock during the years ended December 31, 2008 and 2007, except in the third and fourth quarters of 2008, as set forth in the table below.
Issuer Purchases of Equity Securities
| | | | | | | | | | | |
Period | | Total Number of
Shares Purchased | | | Average Price Paid
Per Share | | Total Number of
Shares Purchased
as Part of
Publicly
Announced Plans
or Programs | | Maximum Number
(or Approximate
Dollar Value)
of Shares That
May Yet Be
Purchased Under
Plans or
Programs |
July 1, 2008 – July 31, 2008 | | — | | | $ | — | | — | | $ | — |
August 1, 2008 – August 31, 2008 | | — | | | | — | | — | | | — |
September 1, 2008 – September 30, 2008 | | 405,736 | (1) | | | 4.93 | | — | | | — |
October 1, 2008 – October 31, 2008 | | — | | | | — | | — | | | — |
November 1, 2008 – November 30, 2008 | | — | | | | — | | — | | | — |
December 1, 2008 – December 31, 2008 | | 304,300 | (1) | | | 4.93 | | — | | | — |
| | | | | | | | | | | |
| | | | |
Total | | 710,036 | | | $ | 4.93 | | — | | $ | — |
| | | | | | | | | | | |
| (1) | On August 26, 2008, the Company and the former stockholders of ProSys (the “Holders”) entered into the Second Amendment to the Registration Rights Agreement which required the Company to purchase 710,036 shares of Company common stock (405,736 in September 2008 and 304,300 in December 2008) used as consideration in the acquisition of ProSys at the value agreed-upon at the time of the acquisition. |
| Item 6. | Selected Financial Data |
The following selected consolidated financial data as of December 31, 2008 and 2007 and for the years ended December 31, 2008, 2007 and 2006 are derived from our audited consolidated financial statements included elsewhere in this Annual Report on Form 10-K. The selected consolidated financial data as of December 31, 2006 and 2005 and for the years ended December 31, 2005 and 2004 are derived from our audited consolidated financial statements not contained herein. The selected consolidated financial data as of December 31, 2004 is derived from our unaudited consolidated financial statements not contained herein. The historical results do not necessarily indicate results to be expected for any future period.
26
Five-Year Selected Financial Highlights:
| | | | | | | | | | | | | | | | | | | | |
| | | Years Ended December 31, | |
| | | 2008(1)(2)(3) | | | 2007(1)(2)(3) | | | 2006(1)(2)(3) | | | 2005(2)(3) | | | 2004(3) | |
| | | (in thousands, except per share data) | |
Consolidated Statements of Operations Data: | | | | | | | | | | | | | | | | | | | | |
Net sales | | $ | 3,579,499 | | | $ | 3,949,905 | | | $ | 3,372,876 | | | $ | 3,139,250 | | | $ | 2,796,447 | |
Cost of sales | | | 3,244,053 | | | | 3,609,362 | | | | 3,098,135 | | | | 2,923,476 | | | | 2,582,915 | |
| | | | | | | | | | | | | | | | | | | | |
Gross profit | | | 335,446 | | | | 340,543 | | | | 274,741 | | | | 215,774 | | | | 213,532 | |
Selling, general and administrative expense | | | 307,046 | | | | 293,780 | | | | 238,166 | | | | 198,023 | | | | 189,506 | |
Investigation and restatement-related costs | | | 52,133 | | | | 26,328 | | | | 1,649 | | | | — | | | | — | |
Impairment of goodwill and other intangibles | | | 5,864 | | | | 52,445 | | | | 3,477 | | | | 7,296 | | | | — | |
Restructuring and impairment costs | | | 4,289 | | | | 1,404 | | | | — | | | | 1,275 | | | | — | |
| | | | | | | | | | | | | | | | | | | | |
Total operating expenses | | | 369,332 | | | | 373,957 | | | | 243,292 | | | | 206,594 | | | | 189,506 | |
| | | | | | | | | | | | | | | | | | | | |
Operating income (loss) | | | (33,886 | ) | | | (33,414 | ) | | | 31,449 | | | | 9,180 | | | | 24,026 | |
Interest expense, net | | | 29,898 | | | | 34,163 | | | | 29,456 | | | | 22,190 | | | | 17,144 | |
Other expense (income), net | | | 10,509 | | | | (2,426 | ) | | | (2,848 | ) | | | 1,373 | | | | (251 | ) |
| | | | | | | | | | | | | | | | | | | | |
Income (loss) before income taxes | | | (74,293 | ) | | | (65,151 | ) | | | 4,841 | | | | (14,383 | ) | | | 7,133 | |
Provision for income taxes | | | 527 | | | | 6,961 | | | | 27,948 | | | | 1,265 | | | | 4,298 | |
| | | | | | | | | | | | | | | | | | | | |
Net income (loss) | | $ | (74,820 | ) | | $ | (72,112 | ) | | $ | (23,107 | ) | | $ | (15,648 | ) | | $ | 2,835 | |
| | | | | | | | | | | | | | | | | | | | |
Net income (loss) per share: | | | | | | | | | | | | | | | | | | | | |
Basic | | $ | (2.32 | ) | | $ | (2.24 | ) | | $ | (0.75 | ) | | $ | (0.53 | ) | | $ | 0.10 | |
| | | | | | | | | | | | | | | | | | | | |
Diluted | | $ | (2.32 | ) | | $ | (2.24 | ) | | $ | (0.75 | ) | | $ | (0.53 | ) | | $ | 0.10 | |
| | | | | | | | | | | | | | | | | | | | |
Shares used in per share calculation: | | | | | | | | | | | | | | | | | | | | |
Basic | | $ | 32,299 | | | $ | 32,248 | | | $ | 30,772 | | | $ | 29,299 | | | $ | 27,678 | |
| | | | | | | | | | | | | | | | | | | | |
Diluted | | $ | 32,299 | | | $ | 32,248 | | | $ | 30,772 | | | $ | 29,299 | | | $ | 28,522 | |
| | | | | | | | | | | | | | | | | | | | |
| (1) | Includes the results of operations of ProSys Information Systems since the acquisition of substantially all of its assets on October 2, 2006. See Note 3 — Goodwill and Other Intangible Assetsand Note 4 — Acquisitions in our notes to the consolidated financial statements included in this Annual Report on Form 10-K for additional information. |
| (2) | Includes the results of operations of MCE Group since its acquisition on December 1, 2005 and Net Storage since its acquisition on July 8, 2005. See Note 4 — Acquisitions inour notes to the consolidated financial statements included in this Annual Report on Form 10-K for additional information. |
| (3) | Includes the results of operations of OpenPSL Holdings Limited since its acquisition on June 22, 2004. |
| | | | | | | | | | | | | | | | |
| | | As of December 31, |
| | | 2008 | | | 2007 | | 2006 | | 2005 | | 2004 |
| | | (In thousands) |
Consolidated Balance Sheet Data | | | | | | | | | | | |
Working capital | | $ | 117,681 | | | $ | 196,856 | | $ | 220,701 | | $ | 216,941 | | $ | 214,505 |
Goodwill | | | 19,211 | | | | 26,214 | | | 69,161 | | | 51,931 | | | 53,254 |
Total assets | | | 774,888 | | | | 1,101,826 | | | 1,044,815 | | | 890,753 | | | 807,950 |
Long-term debt | | | 183,547 | | | | 160,053 | | | 169,660 | | | 146,699 | | | 159,131 |
Shareholders’ equity (deficit) | | | (15,504 | ) | | | 96,436 | | | 162,110 | | | 155,327 | | | 172,048 |
| Item 7. | Management’s Discussion and Analysis of Financial Condition and Results of Operations |
SPECIAL NOTE: This section, Management’s Discussion and Analysis of Financial Condition and Results of Operations, contains forward-looking statements that are based on our current expectations. Actual results in future periods may differ materially from those expressed or implied by those forward-looking statements because of a number of risks and uncertainties. For a discussion of risk factors affecting our business and prospects, see Part 1 — Item 1A — Risk Factors.
Credit Agreement Covenants and Consolidated Financial Statement Presentation
Our audited consolidated financial statements included in this Annual Report on Form 10-K have been prepared on a going concern basis, which assumes continuity of operations and realization of assets and satisfaction of liabilities in the ordinary course of business. Our ability to continue as a going concern is dependent upon, among other factors, continuing to generate
27
positive cash flows from operations, maintaining compliance with the provisions of our existing credit agreements and, when necessary, our ability to renew such agreements and/or obtain alternative or additional financing. We have not generated consistent positive cash flows from operations in recent years. Accordingly, our compliance with the provisions of our existing credit agreements and our ability to obtain alternative or additional financing when needed are an important part of our ability to continue as a going concern.
In February 2009, we determined that, for the quarter ended December 31, 2008, we would not be in compliance with the fixed-charge coverage ratio covenant under the terms of the loan and security agreement that we entered into on May 14, 2001 with Congress Financial Corporation (Western), which is now known as Wachovia Capital Finance Corporation (Western), as agent for lenders under a revolving line of credit (the “Western Facility”). The lenders under the Western Facility agreed to waive this requirement by modifying the terms of the agreement to remove this obligation for the fourth quarter of 2008 and modify the requirement in subsequent quarters. In February 2009, we also determined that we would not be in compliance with a consolidated net worth covenant under the terms of our agreements with certain funds generally referred to as The Retirement Systems of Alabama (the “RSA”). The RSA agreed to waive this requirement, amend these agreements to delete the consolidated net worth covenant and replace them with the same minimum fixed-charge coverage ratio requirement of the current Western Facility. In addition, we determined in February 2009 that our ProSys subsidiary had failed to meet its financial covenants under its facility with GE Commercial Distribution Finance (“CDF”) for the 12 months ended June 30, 2007. In February 2009, we received a waiver of any default occurring under the CDF facility prior to January 1, 2008 and we entered into an amendment of the agreement with CDF in March 2009.
Our credit agreements currently include a number of financial covenants:
| | • | | Our agreement with Wachovia Capital Finance Corporation (Western) and the other lenders named therein and the credit agreements related to our 9% Senior Subordinated Notes payable to the RSA, principally financing our U.S. operations, both require that we satisfy a minimum fixed-charge coverage ratio that requires us to have earnings before interest, income taxes, depreciation, amortization and restructuring charges (“EBITDA”) greater than or equal to a specific percentage of the payments we make for income taxes, interest, capital expenditures and principal payments. We must satisfy the fixed-charge coverage ratio for the three-month periods ending March 31, 2009, June 30, 2009 and September 30, 2009 based upon a ratio of 35%, 75% and 110%, respectively. The measurement period extends to two quarters ending December 31, 2009, three quarters ending March 31, 2010, and the 12-month period ending on the last day of each subsequent fiscal quarter, each based upon a ratio of 110%. |
| | • | | Our agreement with Bank of America, National Association and the other lenders named therein, principally financing our European operations, requires that we maintain a minimum aggregate quarterly tangible net worth of £26.9 million ($39.3 million using the exchange rate on December 31, 2008 of $1.46/£1.00) for certain of our European subsidiaries. |
| | • | | Our CDF facility requires our ProSys subsidiary to maintain a tangible net worth and subordinated debt in the combined amount of not less than $9 million, a ratio of funded debt to earnings before interest, taxes, depreciation and amortization for the 12-month period ending on the last day of each fiscal quarter of not more than four-to-one (4:1), and a fixed-charge coverage ratio for the 12-month period ending on the last day of such fiscal quarter of not less than one-and-one-half-to-one (1.5:1). |
Further, our credit agreements contain certain non-financial covenants, such as restrictions on the incurrence of debt and liens, and restrictions on mergers, acquisitions, asset dispositions, capital contributions, payment of dividends, repurchases of stock and investments, as well as a requirement that we provide audited consolidated financial statements to lenders within a prescribed time period after the close of our fiscal year.
Although we have not completed our consolidated financial statements for periods subsequent to December 31, 2008, we believe that we have complied with all financial and non-financial covenants in our debt agreements, as amended, for the three months ended March 31, 2009, and we believe we are in compliance for the period ended June 30, 2009 and presently believe we will be able to maintain compliance for the foreseeable future. However, if we fail in the future to satisfy any of the covenants in our credit agreements and are unable to obtain waivers or amendments, the lenders could declare a default under our credit agreements. Any default under our credit agreements will allow the lenders under these agreements the option to demand repayment of the indebtedness outstanding under the applicable credit agreements, and would allow certain other lenders to exercise their rights and remedies under cross-default provisions. If these lenders were to exercise their rights to accelerate the indebtedness outstanding, there can be no assurance that we would be able to refinance or otherwise repay any amounts that may become accelerated under the agreements. The acceleration of a significant portion of our indebtedness
28
would have a material adverse effect on our business, liquidity and financial condition. Given our existing financial condition and current conditions in the global credit markets, should these events occur, there would likely be uncertainties regarding our ability to continue as a going concern. SeeLiquidity and Capital Resources, below, for additional information.
Restatement and Related Investigations
On November 9, 2006, we announced that we had determined that we would be required to restate our consolidated financial statements for the first, second, third and fourth quarters of 2005, the first and second quarters of 2006 and the annual periods ended December 31, 2005 and 2004, and that those consolidated financial statements should no longer be relied upon. In addition, we announced that we had identified a material weakness in our internal control over financial reporting. Those conclusions reflected errors that had been identified regarding: (1) the accounting treatment of earnout payments to certain former shareholders of OpenPSL, which we acquired in June 2004, (2) errors in accounting for the foreign currency translation of a portion of the goodwill resulting from certain foreign acquisitions, and (3) errors in the accounting for certain accrued employment benefits relating to tax liabilities of our Brazilian subsidiary. Additionally, after that time, various accounting adjustments were identified.
While we were analyzing these accounting errors, we announced on January 12, 2007, that a Special Committee of the Board of Directors had been appointed to conduct an investigation of our stock-based compensation practices with the assistance of independent counsel and independent forensic accounting consultants. On May 22, 2007, we announced that the Special Committee had completed its investigation and analysis and concluded that available evidence did not adequately support our use of some stock option grant dates and that non-cash compensation expense adjustments and related cash and non-cash tax adjustments would be required.
During the course of the stock-based compensation investigation, documents were identified that raised questions about our historical accounting for certain reserves, accruals and other accounting estimates. In August 2007, our Board of Directors appointed a second Special Committee to review the reserve and accrual issues. This second Special Committee retained independent counsel and independent forensic accounting consultants to assist with the investigation. On May 12, 2008, we announced that the second Special Committee had concluded its investigation and had determined that accounting errors and irregularities had occurred in connection with our historical accounting for certain reserves, accruals and other accounting estimates.
During the course of our restatement work, an issue was identified relating to the accounting for certain vendor allowances in connection with sales transactions that contemplated the repurchase of products at the time of sale by us. The Audit Committee oversaw an investigation of the vendor allowance issue by our Director of Internal Audit, assisted by an independent forensic accounting consultant. That investigation concluded that the purpose of the underlying transactions was to obtain vendor allowances and, due to the absence of documentation evidencing vendors’ approval, that the allowances were incorrectly recorded in our historical consolidated financial statements.
All of the investigations were completed and the results reported to the Board. For a more detailed description of the restatement and related investigations, see our Annual Report on Form 10-K for the year ended December 31, 2006.
Critical Accounting Policies and Estimates
Management is required to make judgments, assumptions and estimates that affect the amounts reported when we prepare consolidated financial statements and related disclosures in conformity with generally accepted accounting principles in the United States. Note 2 — Summary of Significant Accounting Policies in our notes to the consolidated financial statements included in this Annual Report on Form 10-K describes the significant accounting policies and methods used in the preparation of our consolidated financial statements. The following critical accounting policies require significant judgments regarding assumptions and estimates used in the preparation of our consolidated financial statements. Actual results could differ from these estimates.
Revenue Recognition
Generally, we recognize product revenue when the following conditions are met: (i) we have received a firm customer order, (ii) the goods have been shipped and title and risk of loss have passed to the buyer, (iii) the price to the buyer is fixed or determinable and (iv) collectibility is reasonably assured. Revenue is recorded net of estimated discounts, rebates and estimated returns. We recognize service revenue as the services are performed, and the related costs are expensed as incurred. If installation is essential to the functionality of the product, then product and service revenue is deferred until the service is completed.
29
Certain customer arrangements require evaluation of the criteria outlined in Issue No. 99-19 of the Emerging Issues Task Force (“EITF”),Reporting Revenue Gross as a Principal Versus Net as an Agent(“EITF 99-19”), in determining whether it is appropriate to record the gross amount of sales and related costs or the net amount earned as agent fees. Generally, when we are primarily obligated in a transaction, revenue is recorded on a gross basis. Other factors that we consider in determining whether to recognize revenue on a gross versus net basis include our assumption of general and physical inventory risk, our latitude in establishing prices, our discretion in selecting suppliers, our determination of product or service specifications, our involvement in the provision of services and our assumption of credit risk. When we conclude that we are not primarily obligated, we record the net amount earned as agent fees within net sales.
We enter into multiple-element revenue arrangements, as defined in EITF 00-21,Revenue Arrangements with Multiple Deliverables, which may include any combination of services, extended warranty and hardware. A multiple-element arrangement is separated into more than one unit of accounting if all of the following criteria are met:
| | • | | The delivered item(s) has value to the customer on a stand-alone basis; |
| | • | | There is objective and reliable evidence of the fair value of the undelivered item(s); and |
| | • | | If the arrangement includes a general right of return relative to the delivered item(s), delivery or performance of the undelivered item(s) is considered probable and substantially in our control. |
If these criteria are met for each element and there is objective and reliable evidence of fair value for all units of accounting in an arrangement, the arrangement consideration is allocated to the separate units of accounting based on each unit’s relative fair value. If these criteria are not met, product and service revenue is deferred and recognized upon delivery of the undelivered items.
Shipping and handling costs charged to customers are included in net sales and the associated expense is recorded in cost of sales for all periods, which may not be comparable to other companies’ presentations.
Accounts Receivable and Allowance for Doubtful Accounts
Trade accounts receivable are recorded at the invoiced amount and do not bear interest. We evaluate the collectibility of our accounts receivable based on a combination of factors. Collection risks are mitigated by (i) sales to well-established companies, (ii) ongoing credit evaluation of our customers and (iii) frequent contact with our customers, especially our most significant customers, which enables us to monitor changes in business operations and to respond accordingly. When we are aware of circumstances that may impair a specific customer’s ability to meet its financial obligations to us, we record a specific allowance against amounts due to us and thereby reduce the net receivable to the amount we reasonably believe is likely to be collected. For all other customers, we recognize allowances for doubtful accounts based on the length of time the receivables are outstanding, industry and geographic concentrations, the current business environment and our historical experience. If the financial condition of our customers deteriorates or if economic conditions worsen, additional allowances may be required. Based on management’s analysis of uncollectible accounts, reserves totaling $22.6 million or 4.9% of the gross accounts receivable balance were established at December 31, 2008, compared with $13.1 million or 2.4% of the gross accounts receivable balance at December 31, 2007. Historically, our estimates of the allowance for doubtful accounts have not deviated significantly from actual write-offs. If an additional 0.2% to 0.5% of our accounts receivable were determined to be uncollectible at December 31, 2008, then our 2008 operating income from continuing operations before income taxes would have decreased by $0.9 million and $2.3 million, respectively.
Customer credits pertaining to price protection programs, rebate programs, promotions and product returns are recorded to offset customer receivables. When applicable, credits are extinguished when a customer applies them to its related receivable or we are legally released from being the primary obligor under the liability.
30
Inventories
Inventories are stated at the lower of cost or market. Cost is generally determined by the first-in, first-out (“FIFO”) method. Market is based on estimated net realizable value. We assess the valuation of our inventory on a quarterly basis and periodically write down the value for estimated excess and obsolete inventory based on estimates about future demand, actual usage and current market value. Once inventory is written down, a new cost basis is established. If an additional 0.2% to 0.5% of our inventory were determined to be excess and obsolete at December 31, 2008, then our 2008 gross profit and operating income from continuing operations before income taxes would have decreased by $0.5 million and $1.3 million, respectively.
Stock-Based Compensation
We apply the provisions of FASB’s Statement of Financial Accounting Standards No. 123R,Share-Based Payment(“SFAS 123R”), which requires the measurement and recognition of compensation expense for all stock-based awards made to employees and directors, including employee stock options and restricted stock units (“RSUs”), based on estimated fair values. In March 2005, the SEC issued Staff Accounting Bulletin (“SAB”) No. 107,Share-Based Payment(“SAB 107”), as amended by SAB No. 110,Use of a Simplified Method in Developing an Estimate of Expected Term of “Plain Vanilla” Share Options(“SAB 110”), providing supplemental implementation guidance for SFAS 123R. We have applied the provisions of SAB 107 and SAB 110 in our application of SFAS 123R.
Compensation expense for all vested stock-based awards granted on or prior to December 31, 2005 is recognized under the provisions of the Accounting Principles Board (“APB”) No. 25,Accounting for Stock Issued to Employees (“APB 25”) using the accelerated multiple-option approach, while compensation expense for all stock-based awards, except performance-based RSU grants, unvested and granted on or prior to December 31, 2005 or granted subsequent to December 31, 2005, is recognized under SFAS 123R using the straight-line single option method. As stock-based compensation expense recognized in our results of operations is based on awards ultimately expected to vest, it has been reduced for estimated forfeitures. SFAS 123R requires forfeitures to be estimated at the time of grant and revised, if necessary, in subsequent periods if actual forfeitures differ from those estimates.
We utilize the Black-Scholes option pricing model for determining the estimated fair value for stock options. The fair values of RSUs generally equal their intrinsic value on the date of grant. The Black-Scholes valuation calculation requires us to estimate key assumptions such as future stock price volatility, expected terms, risk-free rates and dividend yield. Expected stock price volatility is based upon the historical volatility of our stock. Expected term is derived from an analysis of historical exercises and remaining contractual life of options. The risk-free rate is based on the U.S. Treasury yield curve in effect at the time of grant. We have never paid cash dividends and do not currently intend to pay cash dividends, thus we have assumed a 0% dividend yield. We must estimate potential forfeitures of stock grants and adjust compensation cost recorded accordingly. The estimate of forfeitures will be adjusted over the requisite service period to the extent that actual forfeitures differ, or are expected to differ, from such estimates. Changes in estimated forfeitures will be recognized through a cumulative catch-up adjustment in the period of change and will also impact the amount of stock compensation expense to be recognized in future periods. The following table summarizes the variables used in determining fair value of awards granted during the three years in the period ended December 31, 2008:
| | | | | | | | | |
| | | 2008 | | | 2007 | | | 2006 | |
Volatility * | | 41.4 | % | | 42.3 | % | | 51.8 | % |
Expected term (in years) ** | | 3.56 | | | 3.49 | | | 3.39 | |
Risk-free interest rate *** | | 2.3 | % | | 4.2 | % | | 4.6 | % |
| * | Volatility is measured using historical daily price changes of our common stock over the expected term of the option. |
| ** | The expected term represents the weighted average period the option is expected to be outstanding and is based on the historical exercise behavior of employees. |
| *** | The risk-free interest rate is based on the U.S. Treasury zero-coupon yield with a maturity that approximates the expected term of the option. |
Accounting for Income Taxes
The provision for tax liabilities and recognition of tax benefits involves evaluations and judgments of uncertainties in the interpretation of complex tax regulations by various taxing authorities. In situations involving uncertain tax positions related to income tax matters, we do not recognize a benefit unless it is more likely than not that our tax position will be
31
sustained. As additional information becomes available, or these uncertainties are resolved with the taxing authorities, revisions to these liabilities or benefits may be required, resulting in additional provision for or benefit from income taxes reflected in our consolidated statement of operations.
In order for us to realize our deferred tax assets, we must be able to generate sufficient taxable income in those jurisdictions where the deferred tax assets are located. When we assess the likelihood of realizing our deferred tax assets, we consider all available evidence, both positive and negative, including historical levels of income, future market growth, expectations and risks associated with estimates of future taxable income and ongoing prudent and feasible tax planning strategies. In the event we were to determine that we would not be able to realize all or part of our net deferred tax assets in the future, a valuation allowance would be provided against these deferred tax assets in the period in which we make such a determination. The most significant and objective negative evidence requiring us to record a valuation allowance would be cumulative losses in recent years. Projected losses in future years, while representing less objective, negative evidence, would also be considered. Conversely, positive evidence would include historical and future sources of taxable income, as well as prudent and feasible tax planning strategies. We exercise significant judgment in determining our provisions for income taxes, our deferred tax assets and liabilities and our future taxable income for purposes of assessing our ability to utilize any future tax benefit from our deferred tax assets.
In 2008 and 2007, we recorded valuation allowances on deferred tax assets in a number of tax jurisdictions, the most significant of which were the U.S., the Netherlands and Germany. The valuation allowances against the deferred tax assets in these jurisdictions were generally recorded based upon the full deferred tax assets recorded, less any amounts considered realizable due to loss carryback claims. The most significant tax jurisdictions with deferred tax assets and no valuation allowance included the U.K. and Brazil. Overall, amounts recorded for deferred tax assets, net of valuation allowance, were $7.1 million and $9.5 million at December 31, 2008 and 2007, respectively.
At December 31, 2008, there was no provision for U.S. income tax for undistributed earnings from foreign subsidiaries as it is currently our intention to reinvest these earnings indefinitely in operations outside the U.S. The Company believes it is not practicable to determine the Company’s tax liability that may arise in the event of a future repatriation. We expect to satisfy our anticipated cash needs for operations and capital requirements in all jurisdictions through December 31, 2009 using existing cash, anticipated cash flows generated from operations and borrowings under our existing lines of credit. Virtually all of our foreign subsidiaries need cash for day-to-day operations and expansion and, as such, we do not plan to repatriate any of the foreign earnings. If repatriated, these earnings could result in a tax expense at the current federal statutory tax rate of 35%, subject to available net operating losses and other factors. Subject to limitation, tax on undistributed earnings may also be reduced by foreign tax credits that may be generated in connection with the repatriation of earnings.
We calculate our current and deferred tax provision based on estimates and assumptions that could differ from the actual results reflected in income tax returns filed. Adjustments based on filed returns are generally recorded in the period when the tax returns are filed and the global tax implications are known.
We provide for potential income tax liabilities that could result from examinations of prior and current year tax returns if the incurrence of the income tax liability is probable and the amount of loss is reasonably estimable.
The amount of income tax we pay is subject to audits by federal, state and foreign tax authorities, which may result in proposed assessments. Our estimate of the potential outcome for any uncertain tax position requires significant judgment. We believe we have adequately provided for any reasonably foreseeable outcome related to these matters. However, our future results may include favorable or unfavorable adjustments to our estimated tax liabilities in the period the assessments are made or resolved, audits are closed or when statutes of limitation on potential assessments expire. Additionally, the jurisdictions in which our earnings or deductions are realized may differ from our current estimates. As a result, our effective tax rate may fluctuate significantly on a quarterly basis.
As part of our accounting for business combinations, some of the purchase price is allocated to goodwill and intangible assets. Impairment charges associated with goodwill are generally not tax deductible and result in an increased effective income tax rate in the quarter the impairment is recorded. Amortization expense associated with acquired intangible assets is not tax deductible; however, deferred tax liabilities have been recorded for non-deductible amortization expense as part of the purchase price allocations. In establishing the related deferred tax liabilities, we have taken into account the allocation of these identified intangibles among different taxing jurisdictions. Income tax contingencies existing as of the acquisition dates of the acquired companies are evaluated quarterly and any adjustments are recorded as an adjustment to goodwill.
32
Effective January 1, 2007, we adopted the provisions of FASB’s Interpretation No. 48,Accounting for Uncertainty in Income Taxes, an Interpretation of FASB Statement No. 109 (“FIN 48”). FIN 48 prescribes a more-likely-than-not threshold for financial statement recognition and measurement of a tax position taken or expected to be taken in a tax return. This interpretation also provides guidance on derecognition of income tax assets and liabilities, classification of current and deferred income tax assets and liabilities, accounting for interest and penalties associated with tax positions, accounting for income taxes in interim periods and income tax disclosures. The cumulative effect of applying this interpretation has been recorded as a decrease of $1.5 million to accumulated deficit. In conjunction with the adoption of FIN 48, we classified uncertain tax positions as non-current income tax liabilities unless expected to be paid in one year. We report penalties and interest expense as a component of the provision for income taxes and interest income from tax refunds as a component of other income in the consolidated statement of operations.
Goodwill, Intangible Assets and Other Long-Lived Assets
We apply the provisions of FASB’s Statement of Financial Accounting Standards No. 142,Goodwill and Other Intangible Assets(“SFAS 142”) in our evaluation of goodwill and other intangible assets. SFAS 142 eliminates the requirement to amortize goodwill, but requires that goodwill be reviewed at least annually for potential impairment.
At December 31, 2008 and 2007, we performed our annual goodwill impairment test. In performing this test and determining the appropriate goodwill impairment charge, management considered in part a valuation prepared by an independent valuation advisor.
Effective March 19, 2008, our common stock was suspended from trading on the Nasdaq Global Market. Consequently, in the first quarter of 2008, we experienced a significant decline in the market value of our stock. As a result, our market capitalization was significantly lower than our book value and we believed that this was an indicator of potential impairment of our goodwill.
In accordance with SFAS 142, we used a two-step process to test goodwill for impairment. The first step is to determine if there is an indication of impairment by comparing the estimated fair value of each reporting unit to its carrying value including existing goodwill. SFAS 142 states that the reporting unit is considered as an operating segment or one level below an operating segment (i.e., a component of an operating segment). A component of an operating segment can be a reporting unit if the component constitutes a business for which discrete financial information is available and management regularly reviews the operating results of that component. SFAS 142 provides that two or more components of an operating segment shall be aggregated and deemed a single reporting unit if the components have similar economic characteristics.
Using the criteria of FASB’S Statement of Financial Accounting Standards No. 131,Disclosures about Segments of an Enterprise and Related Information(“SFAS 131”), we determined that we had 12 operating segments and 12 reporting units as of December 31, 2006. The operating segments and reporting units determined at December 31, 2006 were as follows:
| | | | | | |
| U.S. Distribution | | Rorke Data | | Chile IQQ | | Europe Distribution |
| Canada | | Latin America Export | | Mexico | | Europe Enterprise |
| TotalTec | | Chile | | Net Storage Brazil | | ProSys |
During 2007 and in the three months ended March 31, 2008, we changed the presentation of the financial information used to determine operating segments under SFAS 131, by combining the financial results of Europe Distribution and Europe Enterprise into a combined operating segment, Europe. The change in operating segment determination required us to re-evaluate our historical SFAS 142 assumption of 12 reporting units for goodwill impairment analysis. As a result, we determined that we had the following 11 reporting units at December 31, 2007 and March 31, 2008 for goodwill impairment analysis:
| | | | | | |
| U.S. Distribution | | Rorke Data | | Chile IQQ | | Europe |
| Canada | | Latin America Export | | Mexico | | ProSys |
| TotalTec | | Chile | | Net Storage Brazil | | |
33
During the fourth quarter of 2008, we further changed the presentation of the financial information used to determine operating segments under SFAS 131 by combining the financial results of Chile and Chile IQQ into a combined operating segment, Chile. The change in operating segment determination required us to re-evaluate our historical SFAS 142 assumption of 11 reporting units for goodwill impairment analysis used at December 31, 2007 and March 31, 2008. As a result, we determined that we have ten reporting units at December 31, 2008 for goodwill impairment analysis, consisting of the 11 reporting units determined at both March 31, 2008 and December 31, 2007, less Chile IQQ.
Goodwill is considered impaired if the carrying value of a reporting unit exceeds the estimated fair value. We utilized a combination of income and market approaches to estimate the fair value of our reporting units in the first step. In our analysis, we weighted the income and market approaches 75% and 25%, respectively.
The income approach utilizes estimates of discounted cash flows of the reporting units, which requires assumptions of, among other factors, the reporting units’ expected long-term revenue trends, as well as estimates of profitability, changes in working capital and long-term discount rates, all of which require significant judgment. The income approach also requires the use of appropriate discount rates that take into account the current risks in the capital markets. The market approach evaluates comparative market multiples applied to our reporting units’ businesses to yield a second estimated value of each reporting unit.
We compared a weighted average of the output from the income and market approaches to the carrying value of each reporting unit, which yielded an indication of impairment in each of the TotalTec and Net Storage Brazil reporting units at December 31, 2008 and the Europe and ProSys reporting units at December 31, 2007. We also compared the aggregate of the estimated fair values of each of our four regional reporting units to our overall market capitalization, taking into account an acceptable control premium considered supportable based upon historical comparable transactions and current market conditions. At December 31, 2008, key assumptions used to determine the fair value of each reporting unit under the discounted fair value method were: (a) expected cash flow for the period from 2008 to 2013; and (b) a discount rate of 12.6%, which was based on management’s best estimate of the after-tax weighted average cost of capital (“WACC”). At March 31, 2008, key assumptions used to determine the fair value of each reporting unit under the discounted fair value method were: (i) expected cash flow for the period from 2008 to 2012; and (ii) a discount rate of 13.3%, which was based on a market participant’s assumption, which was based on management’s best estimate of a market participant’s assumption of the WACC. At December 31, 2007, key assumptions used to determine the fair value of each reporting unit under the discounted fair value method were: (1) expected cash flow for the period from 2008 to 2013; and (2) a discount rate of 12.8%, which was based on management’s best estimate of the after-tax WACC, which was based on management’s best estimate of a market participant’s assumption of WACC.
Step two of the impairment test requires us to compute a fair value of the assets and liabilities, including identifiable intangible assets, within each of the reporting units with indications of impairment, and compare the implied fair value of goodwill to its carrying value. The results of step two indicated that the goodwill for the TotalTec reporting unit was fully impaired and the goodwill for the Net Storage Brazil reporting unit was partially impaired at December 31, 2008. The TotalTec impairment was triggered by a reduction in customer base as a result of the recession that required us to decrease our forecast of future TotalTec cash flows. The Net Storage impairment was triggered by the decline of the overall economic environment in Brazil as a result of the recession, which required us to decrease our forecast of future Net Storage cash flows. As a result, in 2008, we recorded a goodwill impairment charge of $3.5 million in the TotalTec reporting unit and a goodwill impairment charge of $2.4 million in the Net Storage reporting unit, for a total goodwill charge of $5.9 million in 2008. This non-cash charge materially impacted our equity and results of operations in 2008, but does not impact our ongoing business operations, liquidity, cash flow or compliance with covenants for our credit facilities.
In addition, we recorded a charge of $52.4 million in the fourth quarter of 2007, which consisted of a $20.5 million goodwill charge in the ProSys reporting unit and a $31.9 million goodwill charge in the Europe reporting unit. The ProSys impairment was triggered by a decline in the overall economic environment resulting from the recession. The decline required us to decrease our estimate of future ProSys cash flows. The Europe impairment was triggered by the combining of the Europe Distribution and Europe Enterprise into a combined reporting unit, Europe. The change in reporting unit determination resulted in revised future cash flows that did not support the carrying value of goodwill of the combined reporting unit. This non-cash charge materially impacted our equity and results of operations in 2007, but does not impact our ongoing business operations, liquidity, cash flow or compliance with covenants for our credit facilities. No goodwill impairment charge was recorded at March 31, 2008 as there was no indication of impairment when we compared the fair value of each reporting unit to its carrying value including existing goodwill.
34
As of December 31, 2008, if forecasted cash flows had been 10% lower than estimated, the resulting goodwill impairment would have increased by $1.0 million.
We also assess potential impairment of our other identifiable intangible assets and other long-lived assets when there is evidence that recent events or changes in circumstances such as significant changes in the manner of use of the asset, negative industry or economic trends, and significant underperformance relative to historical or projected future operating results, have made recovery of an asset’s carrying value unlikely. The amount of an impairment loss would be recognized as the excess of the asset’s carrying value over its fair value. We conducted impairment tests of our intangible assets and other long-lived assets in the first quarter of 2008 and the fourth quarters of 2007 and 2008 prior to our assessment of goodwill. Our results indicated that the carrying value of these assets was recoverable from undiscounted cash flows and no impairment was indicated.
Acquisitions
In accordance with FASB’s Statement of Financial Accounting Standards No. 141,Business Combinations(“SFAS 141”), we account for business combinations using the purchase method of accounting. Accordingly, the assets and liabilities of the acquired entities are recorded at their estimated fair values at the date of acquisition. Goodwill represents the excess of the purchase price over the fair value of net assets acquired, including the amount assigned to identifiable intangible assets.
The purchase price allocation process requires an analysis of the fair values of the assets acquired and the liabilities assumed. When a business combination agreement provides for an adjustment to the cost of the combination contingent on future events, we include that adjustment in the cost of the combination when the contingent consideration is determinable beyond a reasonable doubt and can be reliably estimated and should not otherwise be expensed according to the provisions of SFAS 141. The results of operations of the acquired business are included in our consolidated financial statements from the date of acquisition.
Restructuring and Related Impairment Costs
Severance and benefit costs have been recorded in accordance with FASB’s Statement of Financial Accounting Standards No. 112,Employer’s Accounting for Postemployment Benefits (an Amendment of FASB Statements No. 5 and 43)(“SFAS 112”), as we have concluded that we had a substantive severance plan based on past restructuring actions in many of the geographic areas in which we operated. These costs are recognized when management has committed to a restructuring plan and the severance costs are probable and estimable. We apply the provisions of FASB’s Statement of Financial Accounting Standards No. 146,Accounting for Costs Associated with Exit or Disposal Activities(“SFAS 146”), relating to one-time termination benefits to both (1) severance activities in geographic areas where we do not have a substantive severance plan and (2) situations in which the severance benefits offered to employees within a given geographic area are in excess of those offered under prior restructuring plans. Severance costs accounted for under SFAS 146 are recognized when management, having the appropriate authorization, has committed to a restructuring plan and has communicated those actions to employees. Our estimate of severance and benefit costs assumptions are subjective as they are based on estimates of employee attrition and assumptions about future business opportunities.
In accordance with SFAS 146, the estimated loss accrued for leased facilities abandoned and subleased after December 31, 2002 represents the fair value of the lease liability as measured by the present value of future lease payments subsequent to abandonment, less the present value of any estimated sublease income. In order to estimate future sublease income, we engage real estate brokers to assist management in estimating the length of time to sublease a facility and the amount of rent we can expect to receive. Estimates of expected sublease income could change based on factors that affect our ability to sublease those facilities, such as general economic conditions and the real estate market, among others. Other exit costs include costs to consolidate facilities or close facilities and relocate employees. A liability for these costs is recorded at its fair value in the period in which the liability is incurred. At each reporting date, we evaluate our accruals for exit costs and employee separation costs to ensure the accruals are still appropriate.
35
Loss Contingencies
We are subject to the possibility of various loss contingencies arising in the ordinary course of business (such as, legal matters). We consider the likelihood of the loss occurring and our ability to reasonably estimate the amount of loss in determining the necessity for, and amount of, any loss contingencies. Estimated loss contingencies are accrued when it is probable that a liability has been incurred and the amount of loss can be reasonably estimated. We regularly evaluate information available to us to determine whether any such accruals should be adjusted. Such revisions in the estimates of the potential loss contingencies could have a material impact on our consolidated results of operations, financial position and cash flows.
Vendor Programs
We receive funds from vendors for price protection, product rebates, marketing, promotions and other competitive pricing programs. These amounts are recorded as a vendor receivable or as a reduction in accounts payable with a corresponding reduction to inventories, cost of sales or selling, general and administrative expense, depending on the nature of the program. Vendor receivables are generally collected through vendor authorized reductions to our accounts payable, and reserves are established for vendor receivables that are determined to be uncollectible. Actual rebates may vary based on volume or other sales achievement levels, which could result in an increase or reduction in the estimated amounts previously accrued. Historically, our rebate estimates have been within ±10% of actual rebates. Rebate estimates as of December 31, 2008 have not been negatively impacted by the recession in 2009, and are not expected to change in the near future.
RESULTS OF OPERATIONS
The following table sets forth certain operating data as a percentage of net sales for the periods indicated:
| | | | | | | | | |
| | | Years Ended December 31, | |
| | | 2008 | | | 2007 | | | 2006 | |
Net sales | | 100.0 | % | | 100.0 | % | | 100.0 | % |
Cost of sales | | 90.6 | | | 91.4 | | | 91.9 | |
| | | | | | | | | |
Gross profit | | 9.4 | | | 8.6 | | | 8.1 | |
Operating expenses: | | | | | | | | | |
Selling, general and administrative | | 8.6 | | | 7.4 | | | 7.0 | |
Investigation and restatement-related costs | | 1.5 | | | 0.7 | | | 0.1 | |
Impairment of goodwill and other intangibles | | 0.2 | | | 1.3 | | | 0.1 | |
Restructuring costs | | 0.1 | | | — | | | — | |
| | | | | | | | | |
Total operating expenses | | 10.4 | | | 9.4 | | | 7.2 | |
| | | | | | | | | |
Operating income (loss) | | (1.0 | ) | | (0.8 | ) | | 0.9 | |
Interest expense, net | | 0.8 | | | 0.9 | | | 0.9 | |
Other expense (income), net | | 0.3 | | | (0.1 | ) | | (0.1 | ) |
| | | | | | | | | |
Income (loss) before income taxes | | (2.1 | ) | | (1.6 | ) | | 0.1 | |
Provision for income taxes | | — | | | 0.2 | | | 0.8 | |
| | | | | | | | | |
Net loss | | (2.1 | )% | | (1.8 | )% | | (0.7 | )% |
| | | | | | | | | |
Major Customers
No customer accounted for more than 10% of consolidated net sales in 2008, 2007 or 2006. Our top ten customers accounted for 15% of consolidated net sales in 2008, 12% of consolidated net sales in 2007 and 11% of consolidated net sales in 2006. We cannot guarantee that these or any other customers will not increase or decrease as a percentage of our consolidated net sales either individually or as a group. Consequently, any material decrease in sales to these or other customers could materially harm our consolidated results of operations.
We believe our ability to grow depends on increasing sales to existing customers and on successfully attracting new customers. Customer contracts can be canceled and volume levels can be changed or delayed by our customers. The timely replacement of delayed, canceled or reduced orders with new business cannot be assured. In addition, we cannot assume that any of our current customers will continue to utilize our services. Consequently, our consolidated results of operations may be materially adversely affected.
36
SFAS 131 establishes standards for reporting information about operating segments, products and services, geographic areas of operations and major customers. Operating segments are defined as components of an enterprise about which separate financial information is available that is evaluated regularly by the chief operating decision-maker in determining allocation of resources and assessing performance. Under the criteria of SFAS 131, at December 31, 2007, we determined that we had 11 operating segments and seven reportable segments.
The Company’s segment information consists of the following reportable segments:
| | |
| U.S. Distribution | | Miami |
| Europe | | Canada |
| ProSys | | Other |
| TotalTec | | |
Our “Other” reportable segment includes certain operations in North America (Rorke Data) and certain in-country operations in Latin America (Brazil, Chile and Mexico).
During the fourth quarter of 2008, we changed the presentation of the financial information used to determine operating segments under SFAS 131 by combining the financial results of Chile and Chile IQQ into a combined operating segment, Chile. As a result, we determined that we had ten operating segments at December 31, 2008 and the same seven reportable segments, as were determined at December 31, 2007.
Year Ended December 31, 2008 Compared to Year Ended December 31, 2007
Net Sales
Net sales by segment, product and geographic region for the years ended December 31, 2008 and 2007 were as follows (dollars in thousands):
| | | | | | | | | | | | | | | | | | | |
| | | Years Ended December 31, | | | Change | |
Net Sales by Segment | | 2008 | | | 2007 | | | $ | | | % | |
U.S. Distribution | | $ | 864,480 | | 24.1 | % | | $ | 1,046,852 | | 26.5 | % | | $ | (182,372 | ) | | (17.4 | )% |
Europe | | | 1,459,128 | | 40.8 | | | | 1,699,732 | | 43.0 | | | | (240,604 | ) | | (14.2 | ) |
ProSys | | | 451,446 | | 12.6 | | | | 378,760 | | 9.6 | | | | 72,686 | | | 19.2 | |
TotalTec | | | 46,795 | | 1.3 | | | | 63,533 | | 1.6 | | | | (16,738 | ) | | (26.3 | ) |
Miami | | | 415,547 | | 11.6 | | | | 373,951 | | 9.5 | | | | 41,595 | | | 11.1 | |
Canada | | | 123,941 | | 3.5 | | | | 149,042 | | 3.8 | | | | 25,101 | | | (16.8 | ) |
Other | | | 218,162 | | 6.1 | | | | 238,035 | | 6.0 | | | | (19,873 | ) | | (8.3 | ) |
| | | | | | | | | | | | | | | | | | | |
Total | | $ | 3,579,499 | | 100.0 | % | | $ | 3,949,905 | | 100.0 | % | | $ | (370,406 | ) | | (9.4 | )% |
| | | | | | | | | | | | | | | | | | | |
| | | | | | | | | | | | | |
| | | Years Ended December 31, | | Change | |
Net Sales by Product | | 2008 | | 2007 | | $ | | | % | |
Computer platforms | | $ | 614,050 | | $ | 615,137 | | $ | (1,087 | ) | | (0.2 | )% |
Storage systems | | | 679,069 | | | 693,713 | | | (14,644 | ) | | (2.1 | ) |
Disk drives | | | 932,388 | | | 1,237,103 | | | (304,715 | ) | | (24.6 | ) |
All other products | | | 1,353,992 | | | 1,403,952 | | | (49,960 | ) | | (3.6 | ) |
| | | | | | | | | | | | | |
Total | | $ | 3,579,499 | | $ | 3,949,905 | | $ | (370,406 | ) | | (9.4 | )% |
| | | | | | | | | | | | | |
| | | | | | | | | | | | | | | | | | | |
| | | Years Ended December 31, | | | Change | |
Net Sales by Geographical Region | | 2008 | | | 2007 | | | $ | | | % | |
North America | | $ | 1,652,009 | | 46.2 | % | | $ | 1,809,571 | | 45.8 | % | | $ | (157,562 | ) | | (8.7 | )% |
Europe | | | 1,459,128 | | 40.7 | | | | 1,699,732 | | 43.0 | | | | (240,604 | ) | | (14.2 | ) |
Latin America(1) | | | 468,362 | | 13.1 | | | | 440,602 | | 11.2 | | | | 27,760 | | | 6.3 | |
| | | | | | | | | | | | | | | | | | | |
Total | | $ | 3,579,499 | | 100.0 | % | | $ | 3,949,905 | | 100.0 | % | | $ | (370,406 | ) | | (9.4 | )% |
| | | | | | | | | | | | | | | | | | | |
| (1) | Represents sales from Miami to Latin America and in-country Latin American sales. |
37
Consolidated net sales decreased 9.4% in 2008 to $3.6 billion from $3.9 billion in 2007, attributable to decreases in Europe segment sales of approximately $240.6 million and U.S. Distribution sales of $182.4 million, which were partially offset by increases in ProSys sales of $72.7 million and Miami segment sales of $41.6 million. As a result of the recession, the Europe segment experienced a decrease in demand for its computer platform and disk drive products, which resulted in a sales decrease of $240.6 million. Also, the translation of our Europe segment sales into U.S. dollars resulted in decreased sales of $20.3 million for the year ended December 31, 2008, when compared to 2007, due to a stronger U.S. dollar. The sales decrease in our U.S. Distribution segment of $182.4 million was primarily attributable to lower demand for products resulting from the global economic recession, mainly disk drives, storage system sales and computer platforms, which experienced a $172.1 million decrease in sales when comparing 2008 to 2007. The $41.6 million increase in our Miami segment sales was primarily due to an increase in sales of computer platform products of $63.6 million and an increase in all other products of $22.3 million. This increase was partially offset by a decrease in disk drive sales of $44.7 million. The sales decrease in our Canada segment of $25.1 million was primarily attributable to lower demand for products resulting from the recession, mainly disk drives, which experienced an $18.5 million decrease in sales when comparing 2008 to 2007. The translation of our Canada segment sales into U.S. dollars resulted in an increase in sales of $1.0 million for the year ended December 31, 2008, compared with 2007, due to the stronger U.S. dollar. The increase in our ProSys segment sales of $72.7 million was primarily attributable to an increase in sales of our computer platform products of $19.0 million and storage systems of $39.0 million when comparing 2008 to the corresponding period in 2007. The sales decrease in our Other segment of $19.9 million was primarily attributable to a decrease in sales of disk drives and all other products. Also, the translation of Other segment sales into U.S. dollars resulted in increased sales of $3.9 million for the year ended December 31, 2008, when compared to 2007, due to stronger foreign currencies against the U.S. dollar.
Gross Profit
The gross profit percentage was 9.4% of consolidated net sales in 2008, compared to 8.6% of consolidated net sales in 2007. The gross profit percentage in the ProSys segment increased by 0.4% when comparing 2008 to 2007. The increase in our ProSys segment gross profit percentage is attributable to increased sales of higher margin business. The ProSys segment experienced a $39.0 million increase in storage systems sales and a $19.0 million increase in computer platform sales, when comparing 2008 to 2007. The gross profit percentages in the Miami, Canada and Other segments increased cumulatively by 0.3%, which is also attributable to increased sales of higher margin business. Furthermore, we recorded approximately $10.0 million as a reduction to cost of sales resulting from the release of certain vendor allowances previously deferred. The release of deferred vendor allowances had a 0.3% impact on our gross profit percentage in 2008.
Selling, General and Administrative (SG&A) Expense
SG&A expense for the years ended December 31, 2008 and 2007 was as follows (dollars in thousands):
| | | | | | | | | | | | | | |
| | | Years Ended December 31, | | | Change | |
| | | 2008 | | | 2007 | | | $ | | % | |
SG&A expense | | $ | 307,046 | | | $ | 293,780 | | | $ | 13,266 | | 4.5 | % |
Percentage of net sales | | | 8.6 | % | | | 7.4 | % | | | | | | |
The increase in SG&A expense in 2008 over 2007 was primarily attributable to approximately $12.5 million in additional SG&A expenses in the ProSys segment and additional SG&A expenses of $3.6 million, $0.1 million and $0.5 million in the Miami, U.S. Distribution and Canada segments, respectively. These SG&A expense increases were partially offset by decreases in SG&A expenses in the Europe, TotalTec and Other segments of approximately $3.5 million due to decreases in salaries and wages expense, and commissions and bonus expense, resulting from higher headcount. The SG&A increase in our ProSys segment is attributable to approximately $16.1 million increase in commissions and bonus expenses, which were offset by a $3.5 million decrease in salaries and wages expenses. The SG&A increase in our Miami segment is attributable to approximately $2.7 million in additional bad debt expense and $0.5 million in additional advertising expense when comparing 2008 to 2007. The overall decrease of SG&A expense in our Europe segment was due to a $1.8 million decrease in salaries and wages expenses, a $1.4 million decrease in commissions and bonus expense and a $1.1 million decrease in employee benefit expense when comparing 2008 to 2007. The SG&A decreases in our Europe segment were offset by a $2.4 million increase in bad debt expense.
38
Investigation and Restatement-Related Costs
Approximately $52.1 million and $26.3 million of investigation and restatement-related costs were incurred in 2008 and 2007, respectively, as a result of fees paid to external auditors and outside advisors for investigation related activities and the restatement of our historical consolidated financial statements.
Impairment of Goodwill
In 2008, we recorded a goodwill impairment charge of $5.9 million, which consisted of a $3.5 million charge in the TotalTec reporting unit and a $2.4 million charge in the Net Storage reporting unit. In 2007, we recorded a goodwill impairment charge of $52.4 million, which consisted of a $20.5 million goodwill impairment charge in the ProSys reporting unit and a $31.9 million goodwill impairment charge in the Europe reporting unit.
From January 1, 2008 through May 31, 2009, our common stock traded as low as $0.27 per share. We will continue to monitor the estimates of fair value for our reporting units and there may be circumstances in future periods that will require us to recognize an impairment loss on all or a portion of our recorded goodwill or other intangible assets.
Restructuring and Impairment Costs
In 2008, we initiated a restructuring plan for our North American, European and Latin American operations, and, as a result, we incurred restructuring and impairment costs of $4.3 million. These costs consisted primarily of severance and benefit costs of $3.9 million for involuntary employee terminations and costs of $0.4 million related to the closure and impairment of certain leased facilities. We terminated 48 employees in North America, 105 employees in Latin America and 58 employees in the United Kingdom and continental Europe in sales, marketing, finance and support functions. See Note 7 —Restructuring and Impairment Costs in our notes to the consolidated financial statements included in this Form 10-K for additional information.
In 2007, we incurred and paid restructuring costs of approximately $1.4 million related to severance and benefit costs associated with involuntary employee terminations. We terminated 22 employees in North America, 56 employees in Latin America and 25 employees in Europe.
Interest Expense, Net
Interest expense, net for the years ended December 31, 2008 and 2007 was as follows (dollars in thousands):
| | | | | | | | | | | | | |
| | | Years Ended December 31, | | Change | |
| | | 2008 | | 2007 | | $ | | | % | |
Interest expense, net | | $ | 29,898 | | $ | 34,163 | | $ | (4,265 | ) | | (12.5 | )% |
The decrease in interest expense (income), net in 2008 over 2007 was primarily attributable to lower average interest rates in 2008. Our weighted average borrowings in 2008 were $427.0 million compared to $418.8 million in 2007. The weighted average interest rate in 2008 was 6.1% compared to 6.9% in 2007.
Other Expense (Income), Net
Other expense (income), net for the years ended December 31, 2008 and 2007 was as follows (dollars in thousands):
| | | | | | | | | | | | | |
| | | Years Ended December 31, | | | Change | |
| | | 2008 | | 2007 | | | $ | | % | |
Other expense (income), net | | $ | 10,509 | | $ | (2,426 | ) | | $ | 12,935 | | 533.2 | % |
Other expense (income), net primarily consists of foreign currency transaction gains and losses. The change in other expense (income), net in 2008 over 2007 was primarily attributable to a loss of $10.1 million due to foreign currency transactions in 2008 as compared to a foreign currency transaction gain of $2.1 million in 2007.
39
Income Taxes
The provision for income taxes for the years ended December 31, 2008 and 2007 was as follows (dollars in thousands):
| | | | | | | | |
| | | Years Ended December 31, | |
| | | 2008 | | | 2007 | |
Provision for income taxes | | $ | 527 | | | $ | 6,961 | |
Effective tax provision rate | | | (0.7 | )% | | | (10.7 | )% |
Our income tax provision of $0.5 million and $7.0 million for fiscal years 2008 and 2007, respectively, was primarily due to income taxes in certain foreign jurisdictions. During 2008 and 2007, we increased the valuation allowance by approximately $14.4 million and $7.6 million, respectively. In both 2008 and 2007, the Company continued to record a full valuation allowance against substantially all of its deferred tax assets in the U.S. and certain foreign jurisdictions.
Our gross deferred tax assets as of December 31, 2008 and 2007 were $61.5 million and $49.6 million, respectively, and consisted of reserve items and net operating losses. Of these amounts, a valuation allowance of $53.1 million and $38.7 million, respectively, were recorded against the assets. We recorded a valuation allowance against substantially all of the U.S. deferred tax assets in 2008 and 2007, as management does not believe it is more likely than not that the deferred tax assets will be realized.
We are subject to income taxes in the United States and in numerous foreign jurisdictions. Significant judgment is required in evaluating our tax positions and determining our provision for income taxes worldwide. During the ordinary course of business, there are many transactions and calculations for which the ultimate tax determination is uncertain. We establish reserves for tax-related uncertainties based on the extent to which additional reserves and interest will be due. These reserves are established when, despite our belief that our tax return positions are fully supportable, we believe that certain positions are likely to be challenged and may not be sustained upon review by certain tax authorities. We adjust these reserves in light of changing facts and circumstances, such as the closing of a tax audit. The provision for income taxes includes the impact of reserve provisions and changes to reserves that are considered appropriate, as well as the related net interest.
Our income tax provision and effective tax rate are primarily impacted by, among other factors, the statutory tax rates in the countries in which we operate and the related level of income generated by our global operations.
Year Ended December 31, 2007 Compared to Year Ended December 31, 2006
Net Sales
Net sales by segment, product and geographic region for the years ended December 31, 2007 and 2006 were as follows (dollars in thousands):
| | | | | | | | | | | | | | | | | | | |
| | | Years Ended December 31, | | | Change | |
Net Sales by Segment | | 2007 | | | 2006 | | | $ | | | % | |
U.S. Distribution | | $ | 1,046,852 | | 26.5 | % | | $ | 1,043,188 | | 30.9 | % | | $ | 3,644 | | | 0.3 | % |
Europe | | | 1,699,732 | | 43.0 | | | | 1,483,018 | | 44.0 | | | | 216,714 | | | 14.6 | |
ProSys | | | 378,760 | | 9.6 | | | | 73,206 | | 2.2 | | | | 305,554 | | | 417.4 | |
TotalTec | | | 63,533 | | 1.6 | | | | 83,851 | | 2.5 | | | | (20,318 | ) | | (24.2 | ) |
Miami | | | 373,951 | | 9.5 | | | | 325,082 | | 9.6 | | | | 48,869 | | | 15.0 | |
Canada | | | 149,042 | | 3.8 | | | | 147,334 | | 4.4 | | | | 1,708 | | | 1.2 | |
Other | | | 238,035 | | 6.0 | | | | 217,197 | | 6.4 | | | | 20,838 | | | 9.6 | |
| | | | | | | | | | | | | | | | | | | |
Total | | $ | 3,949,905 | | 100.0 | % | | $ | 3,372,876 | | 100.0 | % | | $ | 577,029 | | | 17.1 | % |
| | | | | | | | | | | | | | | | | | | |
40
| | | | | | | | | | | | |
| | | Years Ended December 31, | | Change | |
Net Sales by Product | | 2007 | | 2006 | | $ | | % | |
Computer platforms | | $ | 615,137 | | $ | 483,229 | | $ | 131,908 | | 27.3 | % |
Storage systems | | | 693,713 | | | 502,035 | | | 191,678 | | 38.2 | |
Disk drives | | | 1,237,103 | | | 1,037,072 | | | 200,031 | | 19.3 | |
All other products | | | 1,403,952 | | | 1,350,540 | | | 53,412 | | 4.0 | |
| | | | | | | | | | | | |
Total | | $ | 3,949,905 | | $ | 3,372,876 | | $ | 577,029 | | 17.1 | % |
| | | | | | | | | | | | |
| | | | | | | | | | | | | | | | | | |
| | | Years Ended December 31, | | | Change | |
Net Sales by Geographical Region | | 2007 | | | 2006 | | | $ | | % | |
North America | | $ | 1,809,571 | | 45.8 | % | | $ | 1,483,593 | | 44.0 | % | | $ | 325,978 | | 22.0 | % |
Europe | | | 1,699,732 | | 43.0 | | | | 1,483,018 | | 44.0 | | | | 216,714 | | 14.6 | |
Latin America(1) | | | 440,602 | | 11.2 | | | | 406,265 | | 12.0 | | | | 34,337 | | 8.5 | |
| | | | | | | | | | | | | | | | | | |
Total | | $ | 3,949,905 | | 100.0 | % | | $ | 3,372,876 | | 100.0 | % | | $ | 577,029 | | 17.1 | % |
| | | | | | | | | | | | | | | | | | |
| (1) | Represents sales from Miami to Latin America and in-country Latin American sales. |
Consolidated net sales increased 17.1% in 2007 to $3.9 billion from $3.4 billion in 2006, primarily attributable to increases in ProSys segment sales of approximately $305.6 million, Europe segment sales of $216.7 million, Miami segment sales of $48.9 million and Other segment sales of $20.8 million, partially offset by a decrease in TotalTec segment sales of $20.3 million. The increase in ProSys segment revenue in 2007, as compared to 2006, was due to the realization of a full year of ProSys revenue in 2007, as opposed to three months of revenue in 2006 due to the acquisition of ProSys on October 2, 2006. The sales increase in the Miami segment of $48.9 million was primarily attributable to an increase in Miami-based export business, mainly sales of computer platforms, disk drives and all other products. The increase in Europe segment sales of $216.7 million was primarily attributable to increased demand for computer platforms and disk drives, which resulted in an increase in sales of $167.8 million when comparing 2007 to 2006. The increase in Europe segment sales also resulted from increased sales of $102.3 million in storage systems products in 2007 when comparing to 2006. These sales increases in the Europe segment were offset by sales decreases in Europe of all other products of $53.3 million. The translation of Europe segment sales to U.S. dollars resulted in an increase of $138.0 million for the year ended December 31, 2007, compared with its translation in 2006, due to a weaker U.S. dollar. The increased sales in the Other segment were primarily attributable to an increase in sales of computer products, storage systems and disk drives of $24.9 million. The increase in Other segment sales was offset by a decrease in sales of all other products of $4.0 million. The increase in U.S. Distribution segment sales of $3.7 million was due to an increase in storage systems sales of $63.5 million and computer platform sales of $6.8 million, offset by disk drive sales and sales of all other products of, cumulatively, $66.6 million. The decrease in TotalTec segment sales of $20.3 million was primarily attributable to computer platform products sales of $14.6 million and a decrease of $4.9 million in storage systems sales.
Gross Profit
The gross profit percentage was 8.6% of consolidated net sales in 2007, compared to 8.1% of consolidated net sales in 2006. The 0.5% increase in gross profit percentage was primarily due to increased sales of all types of products with higher margins in the Europe segment in the amount of $217.0 million, in the ProSys segment in the amount of $306.0 million, in the Miami segment in the amount of $48.9 million and in the Other segment in the amount of $20.8 million. These sales increases were partially offset by decreased sales of the same product offerings in the TotalTec segment of $20.3 million.
Selling, General and Administrative (SG&A) Expense
SG&A expense for the years ended December 31, 2007 and 2006 was as follows (dollars in thousands):
| | | | | | | | | | | | | | |
| | | Years Ended December 31, | | | Change | |
| | | 2007 | | | 2006 | | | $ | | % | |
SG&A expense | | $ | 293,780 | | | $ | 238,166 | | | $ | 55,614 | | 23.4 | % |
Percentage of net sales | | | 7.4 | % | | | 7.0 | % | | | | | | |
The increase in SG&A expense in 2007 over 2006 was primarily attributable to approximately $36.2 million of administrative expense associated with the acquisition of our ProSys segment in October 2006. In addition, there was an increase in salaries and wages, commissions and bonuses and employee benefit expenses of $15.2 million, comprised of $8.1 million in our Europe segment, $5.5 million in our U.S. Distribution segment, $1.0 million in our Miami segment and $0.6 million in our Other segment, all of which were primarily attributable to increased headcount and higher sales volume.
41
Investigation and Restatement-Related Costs
Approximately $26.3 million and $1.6 million of investigation and restatement-related costs were incurred in 2007 and 2006, respectively, as a result of fees paid to external auditors and outside advisors for investigation-related activities and the restatement of our historical consolidated financial statements.
Impairment of Goodwill
In 2007, we recorded a goodwill impairment charge of $52.4 million, which consisted of a $20.5 million goodwill impairment charge in the ProSys reporting unit and a $31.9 million goodwill impairment charge in the Europe reporting unit. We recorded a goodwill impairment charge of $3.5 million in 2006 related primarily to the Canada reporting unit.
The carrying value of goodwill is based on fair value estimates on projected financial information that management believes to be reasonable. The valuation methodology used to estimate the fair value of the Company and our reporting units considers the market capitalization of the Company, and requires inputs and assumptions that reflect market conditions, as well as management judgment. We compute the fair value of the assets and liabilities, including identifiable intangible assets, within each of the reporting units, with indications of impairment, and compare the implied fair value of goodwill to its carrying value. If the implied fair value is less than its carrying value, a goodwill impairment charge is recorded.
The market value of our common stock was $6.01 per share on December 31, 2007, the last trading day in the year ended December 31, 2007. From January 1, 2008 through May 31, 2009, our common stock traded as low as $0.27 per share. We will continue to monitor the estimates of fair value for our reporting units and there may be circumstances in future periods that will require us to recognize an impairment loss on all or a portion of our recorded goodwill or other intangible assets.
Restructuring and Impairment Costs
In 2007, we incurred and paid restructuring and impairment costs of approximately $1.4 million related to severance and benefit costs associated with involuntary employee terminations. We terminated 22 employees in North America, 56 employees in Latin America and 25 employees in Europe. We had no restructuring activities or related expense in 2006.
Interest Expense, Net
Interest expense, net, for the years ended December 31, 2007 and 2006 was as follows (dollars in thousands):
| | | | | | | | | | | | |
| | | Years Ended December 31, | | Change | |
| | | 2007 | | 2006 | | $ | | % | |
Interest expense, net | | $ | 34,163 | | $ | 29,456 | | $ | 4,707 | | 16.0 | % |
The increase in interest expense, net in 2007 over 2006 was primarily attributable to higher average interest rates and increased borrowings in 2007 to finance working capital requirements and the acquisition of ProSys. Our weighted average borrowings in 2007 were $418.8 million compared to $391.8 million in 2006. The weighted average interest rate in 2007 was 6.9% compared to 6.5% in 2006.
Other Expense (Income), Net
Other expense (income), net for the years ended December 31, 2007 and 2006 was as follows (dollars in thousands):
| | | | | | | | | | | | | | | |
| | | Years Ended December 31, | | | Change | |
| | | 2007 | | | 2006 | | | $ | | | % | |
Other expense (income), net | | $ | (2,426 | ) | | $ | (2,848 | ) | | $ | (422 | ) | | (14.8 | )% |
The change in other expense (income), net in 2007 over 2006 was primarily attributable to approximately $2.0 million and $2.8 million of net foreign currency transaction gains in 2007 and 2006.
42
Income Taxes
The provision for income taxes for the years ended December 31, 2007 and 2006 was as follows (dollars in thousands):
| | | | | | | | |
| | | Years Ended December 31, | |
| | | 2007 | | | 2006 | |
Provision for income taxes | | $ | 6,961 | | | $ | 27,948 | |
Effective tax provision rate | | | (10.7 | )% | | | 577.3 | % |
Our income tax provision of $7.0 million for fiscal year 2007 was primarily attributable to income taxes in state, local, and foreign jurisdictions and an increase in FIN 48 liabilities. During 2006, we recognized an income tax expense of $23.1 million related to the establishment of a valuation allowance against substantially all of our U.S. deferred tax assets, contributing to an overall income tax provision of $27.9 million.
Our gross deferred tax assets as of December 31, 2007 and 2006, which were $49.6 million and $48.4 million, respectively, primarily consisted of reserve items and operating losses. Of these amounts, a valuation allowance of $38.7 million and $32.3 million, respectively, were recorded against the assets. We recorded a valuation allowance against substantially all of the U.S. deferred tax assets in 2007 and 2006, as management does not believe it is more likely than not that the deferred tax assets will be realized.
We are subject to income taxes in the United States and in numerous foreign jurisdictions. Significant judgment is required in evaluating our tax positions and determining our provision for income taxes worldwide. During the ordinary course of business, there are many transactions and calculations for which the ultimate tax determination is uncertain. We establish reserves for tax-related uncertainties based on the extent to which additional reserves and interest will be due. These reserves are established when, despite our belief that our tax return positions are fully supportable, we believe that certain positions are likely to be challenged and may not be sustained upon review by certain tax authorities. We adjust these reserves in light of changing facts and circumstances, such as the closing of a tax audit. The provision for income taxes includes the impact of reserve provisions and changes to reserves that are considered appropriate, as well as the related net interest.
Our income tax provision and effective tax rate are primarily impacted by, among other factors, the statutory tax rates in the countries in which we operate and the related level of income generated by our global operations.
LIQUIDITY AND CAPITAL RESOURCES
Our audited consolidated financial statements included in this Annual Report on Form 10-K have been prepared on a going concern basis, which assumes continuity of operations and realization of assets and satisfaction of liabilities in the ordinary course of business. We currently have a substantial amount of indebtedness outstanding. The related credit agreements require that we comply with a number of financial and other covenants, including a quarterly minimum fixed-charge coverage ratio based upon earnings. Our ability to continue as a going concern is dependent upon, among other factors, continuing to generate positive cash flows from operations, maintaining compliance with the provisions of our existing credit agreements and, when necessary, our ability to renew such agreements and/or obtain alternative or additional financing.
We have not generated consistent positive cash flows from operations in recent years. Although the current economic environment is challenging, we have recently taken significant steps to control costs and improve operating profitability, including staff reductions, facility consolidations, reductions in capital spending, reductions in discretionary spending and tighter management of working capital. We will take additional steps to control costs and improve operating profitability, as necessary, based upon various factors, such as future operating results and general economic conditions. Based upon our current projections, we believe we will generate sufficient cash flows from operations, maintain debt covenant compliance and obtain alternative or additional financing, if needed, for the foreseeable future. If we do not maintain compliance with our debt covenants and we are unable to obtain waivers or amendments from our lenders, the lenders may exercise their option to demand repayment of the outstanding indebtedness, which would have a material adverse effect on our business, liquidity and financial condition.
43
In recent years, we have funded our working capital requirements principally through borrowings under bank lines of credit and subordinated term loans. Working capital requirements have included the financing of inventory and accounts receivable and the financing of certain acquisitions.
Our cash and cash equivalents totaled $22.8 million and $40.3 million at December 31, 2008 and December 31, 2007, respectively. Our cash and cash equivalents totaled $37.3 million at April 30, 2009.
To date, we have not paid cash dividends to our shareholders and we do not plan to pay cash dividends in the future. Our credit agreements prohibit the payment of dividends or other distributions on any of our shares except dividends payable with our capital stock.
We expect to satisfy our anticipated cash needs for operations and capital requirements during the next 12 months using existing cash, anticipated cash flows generated from operations and borrowings under our existing lines of credit. Our ability to borrow under our lines of credit is dependent upon our ability to maintain compliance with the financial covenants in our credit agreements.
In February 2009, we determined that, for the quarter ended December 31, 2008, we would not be in compliance with the fixed-charge coverage ratio covenant under the Western Facility. The lenders under the Western Facility agreed to waive this requirement by modifying the terms of the agreement to remove this obligation for the fourth quarter of 2008 and modify the requirement in subsequent quarters. In February 2009, we also determined that we would not be in compliance with a consolidated net worth covenant under the terms of our agreements with the RSA. The RSA agreed to waive this requirement, amend these agreements to delete the consolidated net worth covenant and replace them with the same minimum fixed-charge coverage ratio requirement of the current Western Facility. In addition, we determined in February 2009 that our ProSys subsidiary had failed to meet its financial covenants under its facility with CDF for the 12 months ended June 30, 2007. In February 2009, we received a waiver of any default occurring under the CDF facility prior to January 1, 2008 and we entered into an amendment of the agreement with CDF in March 2009.
Our credit agreements include a number of financial covenants:
| | • | | Our agreement with Wachovia Capital Finance Corporation (Western) and the other lenders named therein and the credit agreements related to our 9% Senior Subordinated Notes payable to certain funds generally referred to as The Retirement Systems of Alabama (the “RSA”), principally financing our U.S. operations, both require that we satisfy a minimum fixed-charge coverage ratio that requires us to have earnings before interest, income taxes, depreciation, amortization and restructuring charges (“EBITDA”) greater than or equal to a specific percentage of the payments we make for income taxes, interest, capital expenditures and principal payments. The Company must satisfy the fixed-charge coverage ratio for the three-month periods ending March 31, 2009, June 30, 2009 and September 30, 2009 based upon a ratio of 35%, 75% and 110%, respectively. Thereafter, the measurement period extends to two quarters ending December 31, 2009, three quarters ending March 31, 2010, and the 12-month period ending on the last day of each subsequent fiscal quarter, each based upon a ratio of 110%. |
| | • | | Our agreement with Bank of America, National Association and the other lenders named therein, principally financing our European operations, requires that we maintain a minimum aggregate quarterly tangible net worth of £26.9 million ($39.3 million using the exchange rate on December 31, 2008 of $1.46/£1.00) for certain of our European subsidiaries. |
| | • | | Our CDF facility requires our ProSys subsidiary to maintain a tangible net worth and subordinated debt in the combined amount of not less than $9 million, a ratio of funded debt to earnings before interest, taxes, depreciation and amortization for the 12-month period ending on the last day of each fiscal quarter of not more than four-to-one (4:1), and a fixed-charge coverage ratio for the 12-month period ending on the last day of such fiscal quarter of not less than one-and-one-half-to-one (1.5:1). |
Further, our credit agreements contain certain non-financial covenants, such as restrictions on the incurrence of debt and liens, and restrictions on mergers, acquisitions, asset dispositions, capital contributions, payment of dividends, repurchases of stock and investments, as well as a requirement that we provide audited financial statements to lenders within a prescribed time period after the close of our fiscal year.
44
Although we have not completed our consolidated financial statements for periods subsequent to December 31, 2008, we believe that we have complied with all financial and non-financial covenants in our debt agreements, as amended, for the three months ended March 31, 2009, and we believe we are in compliance for the period ended June 30, 2009 and presently believe we will be able to maintain compliance for the foreseeable future. However, if we fail in the future to satisfy any of the covenants in our credit agreements and are unable to obtain waivers or amendments, the lenders could declare a default under our credit agreements. Any default under our credit agreements will allow the lenders under these agreements the option to demand repayment of the indebtedness outstanding under the applicable credit agreements, and would allow certain other lenders to exercise their rights and remedies under cross-default provisions. If these lenders were to exercise their rights to accelerate the indebtedness outstanding, there can be no assurance that we would be able to refinance or otherwise repay any amounts that may become accelerated under the agreements. The acceleration of a significant portion of our indebtedness would have a material adverse effect on our business, liquidity and financial condition. Given our existing financial condition and current conditions in the global credit markets, should these events occur, there would likely be uncertainties regarding our ability to continue as a going concern.
The following table presents the balances and certain terms of our indebtedness as of May 31, 2009 (amounts in thousands).
| | | | | | | | | | | | |
| | | Maximum
Facility
Amount | | Amount
Outstanding | | | Interest
Rate(g) | | | Maturity |
Lines of credit: | | | | | | | | | | | | |
Western Facility(a) | | $ | 204,000 | | $ | 78,305 | | | 5.00 | % | | September 2010 |
BOA Facility(a) | | £ | 76,000 | | $ | 42,857 | | | 2.78 | % | | October 2011 |
GE Facility(a) | | $ | 80,000 | | $ | 36,068 | (b) | | <1.00 | % | | — (c) |
IBM Kreditbank Facility Germany | | $ | 25,000 | | $ | 14,973 | | | 7.32 | % | | — (d) |
IBM Facility Holland | | $ | 5,000 | | $ | 0 | | | N/A | | | — (d) |
IBM Facility Europe | | $ | 0 | | $ | 0 | | | N/A | | | December 2008(e) |
Intel Facility | | $ | 2,500 | | $ | 2,000 | | | 0.00 | % | | March 2009 |
Notes: | | | | | | | | | | | | |
Convertible Notes | | $ | — | | $ | 110,985 | (f) | | 3.75 | % | | March 2024 |
2008 Notes — RSA | | $ | — | | $ | 54,577 | (f) | | 9.00 | % | | December 2013 |
2006 Notes — RSA | | $ | — | | $ | 31,930 | (b)(f) | | 9.00 | % | | August 2013 |
| (a) | The maximum borrowings under these lines of credit are limited to a percentage of the value of eligible accounts receivable and inventory (for the GE Facility, only eligible inventory). At May 31, 2009, our available borrowings under these lines of credit were $13.8 million in the United States and $49.3 million in Europe. Limitations exist on the transfer of funds between geographies. |
| (b) | Relates to the acquisition or outstanding obligations of ProSys, which was acquired in October 2006. |
| (c) | Facility may be terminated by either party upon 30 days’ notice. If the facility is terminated, all amounts outstanding would be due at the end of the 30-day notice period. |
| (d) | Facility may be terminated by either party upon six weeks’ notice. If the facility is terminated, all amounts outstanding would be due at the end of the six-week notice period. |
| (e) | Repayment of this loan was completed in February 2009. |
| (f) | Includes accrued interest. |
| (g) | Interest rates under the lines of credit represent the average interest rates for May 2009. |
Western Facility
On May 14, 2001, we entered into a loan and security agreement with Congress Financial Corporation (Western), which is now known as Wachovia Capital Finance Corporation (Western), as agent for lenders under a revolving line of credit (the “Western Facility”). On November 7, 2006, we entered into an amendment to the Western Facility, which increased the line of credit from $125.0 million to $150.0 million, and extended the maturity date to September 20, 2010. On September 29, 2008, we amended and restated the Western Facility and increased the line of credit to a maximum amount of $204.0 million, but did not change the maturity date. The maximum amount of borrowings under the amended Western Facility is primarily determined based on a percentage of eligible accounts receivable and inventory. On September 29, 2008, we utilized the Western Facility to pay the approximately $69.6 million outstanding under the Wachovia Facility. The Wachovia Facility was terminated at that time.
The Western Facility has been amended twice since September 29, 2008. The first amendment, on November 10, 2008, modified the level of intercompany receivables permitted to be outstanding at any time. The second amendment, on February 17, 2009, eliminated the minimum fixed-charge coverage ratio for the quarter ended December 31, 2008, and
45
reduced the fixed-charge coverage ratio criteria required in the quarters ending March 31 and June 30, 2009. The second amendment also extended the required delivery date of our audited consolidated financial statements for the year ended December 31, 2007, from March 31, 2009 to June 30, 2009, and modified the definition of Interest Rate and the calculation of Excess Availability, as those terms are utilized in the Western Facility. At various times prior to September 29, 2008, we sought and obtained modifications to the credit agreement extending the time by which we were required to deliver our audited consolidated financial statements to the lender for the 2006, 2007 and 2008 fiscal years.
Prior to February 17, 2009, borrowings under the Western Facility bore interest at Wachovia’s prime rate plus a margin of between 0.25% and 0.75%, based on unused availability. Effective February 17, 2009, borrowings under the Western Facility bear interest at the greater of (i) 5% or (ii) Wachovia’s prime rate plus a margin of between 0.25% and 0.75%, based on unused availability. At our option, all or any portion of the outstanding borrowings may be converted to a Eurodollar rate loan, which would bear interest at the greater of (i) 5% or (ii) the adjusted Eurodollar rate plus a margin of between 2.50% and 3.00%, based on a percentage of unused availability. We also pay an unused line fee equal to 0.25% per annum of the unused portion of the Western Facility, subject to certain adjustments. The weighted average interest rate on outstanding borrowings under the Western Facility during the years ended December 31, 2008 and 2007 was 5.07% and 7.24%, respectively.
Our obligations under the Western Facility are collateralized by substantially all of the assets of the Company and our North and South American subsidiaries, other than ProSys. The Western Facility requires us to meet certain financial covenant tests and to comply with certain other covenants, including restrictions on the incurrence of debt and liens, and restrictions on mergers, acquisitions, asset dispositions, capital contributions, payment of dividends, repurchases of stock and investments, achievement of a fixed-charge coverage ratio for certain fiscal periods (beginning in the first quarter of 2009, we are required to have earnings before interest, income taxes, depreciation, amortization and restructuring charges in the applicable period greater than or equal to 35% of payments we make for income taxes, interest, capital expenditures and principal payments during such quarter; that ratio increases to 75% for the second quarter of 2009, and to 110% thereafter; the applicable period is a single quarter during the first three quarters of 2009, extending to a two-quarter period as of December 31, 2009, a three-quarter period as of March 31, 2010, and a rolling four-quarter period thereafter) and the requirement that we provide audited consolidated financial statements to the lenders within a prescribed period of time after the close of our fiscal year. Upon any event of default, the lenders may demand immediate payment of the balance outstanding. An event of default includes the failure to pay any obligations when due or the failure to perform any of the terms, covenants, conditions or provisions of the agreement and such failure continues for 15 days.
Wachovia Facility
On September 20, 2004, we entered into a Credit and Security Agreement (the “Wachovia Facility”) with Wachovia Bank, National Association, as agent. On December 28, 2005, May 14, 2007 and September 26, 2007, we amended the Wachovia Facility. During the term of the Wachovia Facility, we sold or contributed all of our receivables to a consolidated special purpose bankruptcy-remote entity named Bell Microproducts Funding Corporation (“Funding”), a wholly owned subsidiary. Funding obtained financing from the lenders collateralized by these receivables. The maximum principal amount available under the Wachovia Facility was $120.0 million. The interest rate on advances made by the lenders was the cost of lenders’ commercial paper plus 80 basis points. Funding also paid an unused line fee ranging from 0.20% to 0.25% per annum of the unused portion of the Wachovia Facility. The cash flows from the collections of the receivables were used to purchase new receivables, to pay amounts to the lenders, to pay other amounts owed and to make dividend distributions (subject at all times to Funding maintaining a required capital amount). Including the program fee, the average interest rate on outstanding borrowings under the Wachovia Facility for the years ended December 31, 2008 and 2007 was 4.25% and 6.15%, respectively. On September 29, 2008, we terminated the Wachovia Facility and paid the outstanding balance with proceeds from the amended Western Facility.
Kreditbank Facilities
On December 1, 2005, in connection with the acquisition of MCE, we entered into a short-term financing agreement with IBM Deutschland Kreditbank GmbH (“Kreditbank”) for up to $25.0 million. The loan is collateralized by substantially all of the assets of our German subsidiary, as well as cross-company guarantees of certain of our European subsidiaries and bears interest at LIBOR plus 7.16%, effective January 12, 2009. In 2008 and 2007, the effective interest rate was US LIBOR plus 2.00%. The average interest rate on outstanding borrowings for the years ended December 31, 2008 and 2007 was 4.64% and 7.24%, respectively. The facility has no maturity date and continues indefinitely until terminated by either party upon six weeks’ notice. If the facility is terminated, all amounts would be due at the end of the six-week period. To date, neither party has given notice of intent to terminate this facility. The balance outstanding on this facility at December 31, 2008 and 2007 was $19.4 million and $14.6 million, respectively, including interest payable.
46
Also on December 1, 2005, we entered into another short-term financing agreement with Kreditbank for €6.5 million ($9.1 million using the exchange rate on December 31, 2008 of $1.40/€1.00). In May 2006, the agreement was amended to increase the available financing to €8.0 million ($11.2 million using the exchange rate on December 31, 2008 of $1.40/€1.00). The loan was collateralized by substantially all of the assets of our German subsidiary, as well as cross-company guarantees of certain of our European subsidiaries and bore interest at Euribor plus 3.85%. The average interest rates on outstanding borrowings for the years ended December 31, 2008 and 2007 were 8.23% and 7.98%, respectively. The facility has no maturity date and continues indefinitely until terminated by either party upon six weeks’ notice. The balance outstanding on this facility at December 31, 2008 and 2007 was $3.5 million and $11.8 million, respectively, including interest payable. On November 11, 2008, we received notice from Kreditbank that they would terminate this line of credit as of December 31, 2008, and all amounts due thereunder, which, as of November 11, 2008, totaled approximately €8.0 million, would be due on that date. Subsequently, on December 5, 2008, we entered into an agreement with Kreditbank permitting repayment of €4.0 million by December 31, 2008 and the remainder no later than February 28, 2009. As of February 28, 2009, all amounts outstanding under this facility had been repaid.
On December 10, 2004, we entered into a short-term financing agreement with IBM Nederland Financieringen B.V. for up to $5.0 million. The loan is collateralized by substantially all of the assets of our Dutch subsidiary, as well as cross-company guarantees of certain of our European subsidiaries and bears interest at the ABN Amro base rate plus 2.25%. The average interest rate on outstanding borrowings for the years ended December 31, 2008 and 2007 was 7.75% and 6.90%, respectively. The facility has no maturity date and continues indefinitely until terminated by either party upon six weeks’ notice. If the facility is terminated, all amounts would be due at the end of the six-week period. To date, neither party has given notice of intent to terminate this facility. There were no amounts outstanding under this facility at December 31, 2008 and 2007.
Bank of America Facility
On December 2, 2002, certain wholly owned subsidiaries of the Company based in Europe entered into a facility arranged by Bank of America, National Association, as agent, to provide a revolving line of credit facility of up to £75 million (the “Bank of America Facility”). The maximum amount of borrowings on the Bank of America Facility is determined based on a percentage of the borrower’s eligible accounts receivable. On October 20, 2005, the agreement was amended to extend the maturity date to October 20, 2008 and reduce the facility to £60 million ($87.6 million using the exchange rate on December 31, 2008 of $1.46/£1.00), increasing to £80 million ($116.8 million using the exchange rate on December 31, 2008 of $1.46/£1.00) at our option. On May 21, 2008, the agreement was amended to extend the termination date of the facility to October 20, 2011 and decrease the size of the facility from £80 million to £76 million ($111.0 million using the exchange rate on December 31, 2008 of $1.46/£1.00). At the borrower’s option, all or any portion of the outstanding borrowings may be converted to a LIBOR-based revolving loan. Borrowings under the line of credit bear interest at Bank of America’s reference rate or the LIBOR rate, as applicable, plus a margin of between 1.75% and 3.0%, based on certain financial measurements. The average interest rates on the outstanding borrowings under the revolving line of credit during the year ended December 31, 2008 and 2007 were 5.14% and 6.59%, respectively, and the balances outstanding at December 31, 2008 and 2007 were $23.2 million and $20.6 million, respectively. Obligations of the borrower under the revolving line of credit are collateralized by substantially all of the assets of the borrower. The revolving line of credit requires the borrower to meet certain financial covenant tests (including maintaining an Adjusted Tangible Net Worth at the end of each quarter of not less than £26.9 million ($39.3 million using the exchange rate on December 31, 2008 of $1.46/£1.00)) and to comply with certain other covenants, including restrictions on incurrence of debt and liens and restrictions on mergers, acquisitions, asset dispositions, capital contributions, payment of dividends, repurchases of stock, repatriation of cash and investments.
GE Commercial Distribution Finance Facility
In connection with the acquisition of ProSys on October 2, 2006, we entered into a credit facility arrangement managed by GE CDF, which currently permits borrowings of up to $80.0 million, including an accounts receivable facility, a supplemental inventory facility and a floorplan credit facility. ProSys is required to pay interest to CDF on the daily contract balance at a rate equal to LIBOR plus 3.10%. The floorplan facility contains an interest-free period and ProSys repays substantially all amounts within that time. Under these credit facilities, ProSys has granted CDF a lien on substantially all of
47
its assets. The credit facility has a two-year term with annual renewals thereafter but may be terminated by either party with notice. The balances outstanding at December 31, 2008 and 2007 were $44.2 million and $44.0 million, respectively, and were related solely to inventory floorplan financing. The facility contains a number of financial covenants, including covenants requiring the ProSys subsidiary to maintain an operating profit margin of not less than 0.5% of sales on a 12-month rolling basis, the maintenance of a ratio of debt to tangible net worth of not more than six-to-one (6:1) measured as of the last day of each fiscal quarter and maintenance of a ratio of funded debt to earnings before interest, taxes, depreciation and amortization for the 12-month period ending on the last day of each fiscal quarter of not more than four-to-one (4:1). The facility was amended effective March 31, 2009 to modify the financial covenants for all quarters ending on or after March 31, 2009 such that ProSys thereafter is required to (a) maintain a tangible net worth and subordinated debt of not less than $9.0 million; (b) maintain a ratio of Funded Debt to Adjusted EBITDA for the 12-month period ending on the last day of such fiscal quarter of not more than four-to-one (4:1); and (c) achieve, as of the last day of each fiscal quarter, a fixed-charge coverage ratio for the 12-month period ending on the last day of such fiscal quarter of at least one-and-one-half-to-one (1.5:1) (all capitalized terms are defined in the amendment).
Intel Corporation Facility
On March 30, 2006, we entered into the Working Capital Facility with Intel Corporation to provide a line of credit up to $3.0 million. The Working Capital Facility is non-interest bearing and has a one-year term with subsequent annual renewals, but may be terminated by Intel at any time. We are required to meet certain program eligibility requirements including compliance with our distribution agreement with Intel. The balances outstanding at December 31, 2008 and 2007 were $2.5 million and $3.0 million, respectively. In May 2008, the line of credit under the Working Capital Facility was reduced to $1.9 million, and subsequently increased to $2.5 million in November 2008.
Convertible Notes
On March 5, 2004, we completed a private offering of $110.0 million aggregate principal amount of 3.75% convertible subordinated notes due in 2024 (the “Old Notes”). On December 20, 2004, we completed our offer to exchange newly issued 3.75% convertible subordinated notes, Series B due 2024 (the “New Notes”) for an equal amount of our outstanding Old Notes. Approximately 99.9% of the total principal amount of Old Notes outstanding were tendered in exchange for an equal principal amount of New Notes.
The New Notes mature on March 5, 2024 and bear interest at the rate of 3.75% per year on the principal amount, payable semi-annually on March 5 and September 5, which began on March 5, 2005. Holders of the New Notes may convert the New Notes any time on or before the maturity date if certain conversion conditions are satisfied. Upon conversion of the New Notes, we will be required to deliver, in respect of each $1,000 principal of New Notes, cash in an amount equal to the lesser of (1) the principal amount of each New Note to be converted and (2) the conversion value, which is equal to (a) the applicable conversion rate, multiplied by (b) the applicable stock price. The initial conversion rate is 91.2596 shares of common stock per New Note with a principal amount of $1,000 and is equivalent to an initial conversion price of approximately $10.96 per share. The conversion rate is subject to adjustment upon the occurrence of certain events.
Under the terms of the New Notes, holders have the right to convert their notes upon the occurrence of certain events, including if the closing price of our common stock exceeds a certain threshold for at least 20 of the last 30 days in preceding fiscal quarters and upon specified corporate transactions, as described in more detail in the prospectus filed in connection with the exchange offer. The applicable stock price is the average of the closing sales prices of our common stock over the five-trading-day period starting the third trading day following the date the New Notes are tendered for conversion. If the conversion value is greater than the principal amount of each New Note, we will be required to deliver to holders upon conversion, at their option (1) a number of shares of its common stock, (2) cash or (3) a combination of cash and shares of our common stock in an amount calculated as described in the prospectus filed by us in connection with the exchange offer. In lieu of paying cash and shares of our common stock upon conversion, we may direct the conversion agent to surrender any New Notes tendered for conversion to a financial institution designated by us for exchange in lieu of conversion. The designated financial institution must agree to deliver, in exchange for the New Notes (1) a number of shares of our common stock equal to the applicable conversion rate, plus cash for any fractional shares or (2) cash or (3) a combination of cash and shares of our common stock. Any New Notes exchanged by the designated institution will remain outstanding.
We may redeem some or all of the New Notes for cash on or after March 5, 2009 and before March 5, 2011 at a redemption price of 100% of the principal amount of the New Notes, plus accrued and unpaid interest up to, but excluding,
48
the redemption date, but only if the closing price of the Company’s common stock has exceeded 130% of the conversion price then in effect for at least 20 trading days within a 30 consecutive trading day period ending on the trading day before the date the redemption notice is mailed. We may redeem some or all of the New Notes for cash at any time on or after March 5, 2011 at a redemption price equal to 100% of the principal amount of the New Notes, plus accrued and unpaid interest up to, but excluding, the redemption date.
We may be required to purchase for cash all or a portion of the New Notes on March 5, 2011, March 5, 2014 or March 5, 2019, or upon a change in control, at a purchase price equal to 100% of the principal amount of the New Notes being purchased, plus accrued and unpaid interest up to, but excluding, the purchase date. Upon any event of default, the lender may demand immediate payment of the balance outstanding. An event of default includes the failure to pay any interest or principal when due, failure to perform any of the terms, covenants, conditions or provisions of the agreement.
In December 2006, we obtained consents from holders of the New Notes for the waiver of certain defaults related to the late filing of our Form 10-Q for the period ended September 30, 2006 and certain proposed amendments to the indentures governing the New Notes eliminating covenants related to the filing of periodic reports with the SEC and the delivery of such reports to the trustee for the New Notes. The waiver and amendment required the consent of holders of a majority in aggregate principal amount of the New Notes outstanding. In exchange for the consent to the waiver and amendment, we paid holders of the New Notes an initial consent fee of $5.00 for each $1,000 principal amount of New Notes for which consents were obtained. The initial consent fee of $0.6 million was paid to holders of the New Notes in December 2006 and charged to interest expense. If we did not commence a cash tender offer for the New Notes on or before February 28, 2007 to redeem all validly tendered New Notes at a price of at least $1,000 for each $1,000 principal amount of New Notes, we were required to pay holders of the New Notes for which consents to the waiver and amendment were obtained, an additional fee of $85.00 for each $1,000 principal amount of New Notes. We did not initiate the tender offer and on March 4, 2007, an aggregate of $9.4 million was paid to the holders of the New Notes, which amount was capitalized and will be amortized to interest expense through March 2011.
Notes Payable to The Retirement Systems of Alabama (the “RSA”)
We have notes payable to the RSA (the “RSA Notes”) that consist of the following:
| | • | | 9% Senior Subordinated Notes Payable to the RSA Issued in 2000— On July 6, 2000, and, as amended on May 3, 2004, we entered into a facility under which we issued $180.0 million of subordinated debt to two of the RSA’s affiliated funds (the “2000 Notes”). The 2000 Notes were comprised of $80.0 million bearing interest at 9.125%, which was repaid in June 2001; and $100.0 million bearing interest at 9.0%, payable in semi-annual interest and principal payments with semi-annual principal installments commencing on December 31, 2000 of $3.5 million, $4.4 million commencing December 31, 2007, $5.1 million due December 31, 2009 and a final payment of $8.5 million on June 30, 2010. The 2000 Notes were collateralized by a second lien on substantially all of the Company’s and its subsidiaries’ North American and South American assets. Effective June 30, 2008, we entered into the 2008 Notes with the lenders that consolidated the 2000 Notes and the 2007 Notes. |
| | • | | 9% Senior Subordinated Notes Payable to the RSA Issued in 2006— On October 2, 2006, we borrowed $35.0 million from two of the RSA’s affiliated funds in connection with our acquisition of ProSys (the “2006 Notes”). The 2006 Notes bear interest at 9% and are in the form of two notes, one for $23.0 million and a second for $12.0 million, both due on various dates through August 1, 2013. The 2006 Notes are collateralized by ProSys shares and all tangible and intangible assets of the ProSys business, other than those assets pledged to CDF. The balances outstanding at December 31, 2008 and 2007 were $32.3 million and $34.0 million, respectively, with scheduled repayments of $2.5 million in 2009, $3.3 million in 2010, $4.0 million in 2011 and $22.5 million thereafter. Principal payments are due on August 1 and February 1 of each year and include accrued interest through that date. We must meet certain financial covenant tests on a quarterly basis (including, as provided by the amendment entered into on February 24, 2009, the same fixed-charge coverage ratio as required by the Western Facility; prior to the amendment we were required to maintain a consolidated net worth at the end of each quarter of not less than $87.5 million) and comply with certain other covenants, including restrictions of incurrence of debt and liens and restrictions on asset dispositions, payment of dividends and repurchase of stock. We are also required to be in compliance with the covenants of certain other borrowing agreements. Upon any event of default the lender may demand immediate payment of the balance outstanding. |
49
| | • | | 9% Senior Subordinated Notes Payable to the RSA Issued in 2007— On January 30, 2007, we entered into a revolving credit agreement with two of the RSA’s affiliated funds in the amount of $30.0 million (the “2007 Notes”). The 2007 Notes bear interest at 9%. Under the terms of the 2007 Notes, the availability of the revolving credit was set to expire on July 31, 2008 and thereafter payments would be made at the rate of $1.0 million per month beginning August 15, 2008, and the entire principal balance would be due on January 30, 2009. The 2007 Notes were collateralized by a second lien on substantially all of the Company’s and its subsidiaries’ North American and South American assets. Effective June 30, 2008, we entered into the 2008 Notes with the lenders that consolidated the 2000 Notes and the 2007 Notes. |
| | • | | 9% Senior Subordinated Notes Payable to the RSA Issued in 2008— On August 5, 2008, we entered into an Amended and Restated Credit Agreement effective as of June 30, 2008 (the “2008 Notes”) with several of the RSA’s affiliated funds, which consolidated and restructured the $56.7 million in outstanding indebtedness due under the 2000 Notes and 2007 Notes. The balance outstanding on the 2008 Notes at December 31, 2008 was $52.4 million. The 2008 Notes bear interest at 9% per annum payable in semi-annual installments, with principal payments due of $4.0 million semi-annually through June 1, 2011, $5.0 million semi-annually through June 1, 2013 and a final payment of $12.4 million due December 1, 2013. We granted a second priority security interest, subordinate to the Western Facility and the CDF facility, in substantially all of the property then owned or thereafter acquired by us in North or South America. We must meet certain financial covenant tests on a quarterly basis (including, as provided by the amendment entered into on February 24, 2009, the same fixed-charge coverage ratio as required by the Western Facility; prior to the amendment, we were required to maintain a consolidated net worth at the end of each quarter of not less than $87.5 million), and comply with certain other covenants, including restrictions of incurrence of debt and liens, restrictions on asset dispositions, payment of dividends and repurchase of stock. We are also required to be in compliance with the covenants of certain other borrowing agreements. Upon any event of default the lender may demand immediate payment of the balance outstanding. |
HSBC Bank plc Mortgage
On June 22, 2004, in connection with the acquisition of OpenPSL, we assumed a mortgage with HSBC for an original amount of £0.7 million ($1.0 million using the exchange rate on December 31, 2008 of $1.46/£1.00). The mortgage has a term of ten years and bears interest at HSBC’s rate plus 1.25%. The balance on the mortgage was $0.3 million and $0.5 million at December 31, 2008 and 2007, respectively.
Maturities
Maturities of term loans based on the amounts and terms outstanding at December 31, 2008 totaled $10.3 million in 2009, $11.1 million in 2010, $12.8 million in 2011, $14.8 million in 2012, $34.8 million in 2013 and $110.0 million thereafter.
Debt, Other Contractual Obligations and Off Balance Sheet Arrangements
The following is a summary of certain contractual obligations and commitments as of December 31, 2008 (in thousands):
| | | | | | | | | | | | | | | |
| | | Payments Due by Period |
| | | Less than
1 Year | | 1-3
Years | | 3-5
Years | | More Than
5 Years | | Total |
Long-term debt | | $ | 10,286 | | $ | 23,917 | | $ | 49,630 | | $ | 110,000 | | $ | 193,833 |
Interest expense on long-term debt | | | 11,353 | | | 19,662 | | | 13,890 | | | 41,938 | | | 86,843 |
Lines of credit | | | 69,620 | | | 118,629 | | | 23,156 | | | — | | | 211,405 |
Capital leases | | | 494 | | | — | | | — | | | — | | | 494 |
Operating leases | | | 12,952 | | | 16,798 | | | 9,643 | | | 12,451 | | | 51,844 |
Supplemental Executive Retirement Plan liability | | | — | | | 675 | | | 1,350 | | | 1,135 | | | 3,160 |
| | | | | | | | | | | | | | | |
Total | | $ | 104,705 | | $ | 179,681 | | $ | 97,669 | | $ | 165,524 | | $ | 547,579 |
| | | | | | | | | | | | | | | |
50
The table excludes unrecognized tax liabilities computed under FIN 48 of $8.9 million because a reasonable and reliable estimate of the timing of future tax payments or settlements, if any, cannot be determined. See Note 9 —Income Taxes in our notes to the consolidated financial statements included in this Annual Report on Form 10-K.
Long-Term Debt and Related Interest Expense
At December 31, 2008, we had various notes payable and other long-term debt with an outstanding balance of $193.8 million with interest rates ranging from 3.75% to 9.0%. The notes payable and other long-term debt mature at various dates through March 2024.
Lines of Credit
At December 31, 2008, we had amounts outstanding under various lines of credit based upon eligible accounts receivable and inventories. Payments due have been included in the table above based upon the maturity dates of the underlying facilities. All amounts have been classified as currently due in our consolidated balance sheets at December 31, 2008 and 2007.
Capital Leases
We lease certain equipment under capital lease agreements. The leases expire at various times through 2009.
Operating Leases
We lease our facilities under cancelable and non-cancelable operating lease agreements. The leases expire at various times through 2025 and contain renewal options. Certain of the leases require us to pay property taxes, insurance and maintenance costs.
Off-Balance Sheet Arrangements
We do not have any off-balance sheet arrangements.
Cash Flows from Operating Activities
Net cash provided by (used in) operating activities during the years ended December 31, 2008, 2007 and 2006 consisted of (in thousands):
| | | | | | | | | | | | |
| | | Years Ended December 31, | |
| | | 2008 | | | 2007 | | | 2006 | |
Cash flows from operating activities: | | | | | | | | | | | | |
Net loss | | $ | (74,820 | ) | | $ | (72,112 | ) | | $ | (23,107 | ) |
Adjustments to reconcile net loss to net cash provided by (used in) operating activities: | | | | | | | | | | | | |
Depreciation and amortization | | | 10,774 | | | | 10,968 | | | | 7,924 | |
Amortization of debt issuance costs | | | 3,546 | | | | 3,185 | | | | 867 | |
Amortization of debt discount | | | 422 | | | | 539 | | | | — | |
Stock-based compensation expense | | | 4,893 | | | | 1,418 | | | | 2,385 | |
Provision for bad debts | | | 16,375 | | | | 7,090 | | | | 8,506 | |
Non-cash compensation | | | 4,019 | | | | 372 | | | | — | |
Loss on property and equipment | | | 225 | | | | 610 | | | | 334 | |
Unrealized loss (gain) on currency remeasurement | | | 3,662 | | | | (274 | ) | | | 1,536 | |
Impairment of goodwill and other intangibles | | | 5,864 | | | | 52,445 | | | | 3,477 | |
Deferred taxes | | | (2,008 | ) | | | 2,588 | | | | 20,204 | |
Cash provided by (used in) working capital | | | 69,496 | | | | (11,348 | ) | | | (67,697 | ) |
| | | | | | | | | | | | |
Net cash provided by (used in) operating activities | | $ | 42,448 | | | $ | (4,519 | ) | | $ | (45,571 | ) |
| | | | | | | | | | | | |
Our accounts receivable decreased to $435.6 million at December 31, 2008 from $544.1 million at December 31, 2007, due primarily to lower sales volume and an increase in the allowance for bad debts. Our inventories decreased to
51
$230.7 million at December 31, 2008 from $424.1 million at December 31, 2007 also due to lower sales volume. Our accounts payable and cash overdraft decreased to $274.7 million in 2008 from $433.3 million in 2007 as a result of a change in the timing of inventory purchases and receipts as a result of lower sales volume and our efforts to manage working capital.
Our accounts receivable increased to $544.1 million at December 31, 2007 from $505.4 million at December 31, 2006, due primarily to higher sales volume. Our inventories increased to $424.1 million at December 31, 2007 from $374.0 million at December 31, 2006 due to our need to support projected sales growth. Our accounts payable and cash overdraft increased to $433.3 million in 2007 from $355.6 million at December 31, 2006 as a result of a change in the timing of inventory purchases and receipts and our efforts to manage working capital.
Cash Flows from Investing Activities
The net cash used in investing activities was $7.6 million in 2008, primarily related to the acquisition of property and equipment. The net cash used in investing activities was $11.4 million in 2007, resulting from the acquisition of property and equipment in the amount of $9.2 million. The net cash used in investing activities was $34.1 million in 2006, primarily related to the acquisition of ProSys for $26.3 million, net of cash acquired of $6.8 million, and $6.4 million for property and equipment.
Cash Flows from Financing Activities
The net amount of cash used in financing activities was $47.4 million in 2008, which primarily related to the repayment of $40.5 million under our short-term borrowing facilities and repayments of long-term notes of $10.9 million, offset by proceeds of $10.0 million from long-term notes payable. The net amount of cash provided by financing activities was $29.0 million in 2007, primarily related to borrowings under our short-term borrowing facilities of $47.5 million and proceeds from the issuance of common stock which were partially offset by payments under long-term notes payable and capital leases of $8.8 million. Further in 2007, we paid $9.8 million in debt issuance costs. The net amount of cash provided by financing activities was $74.8 million in 2006, which primarily related to $48.7 million for borrowings under our short-term borrowing facilities and proceeds of $35.0 million from long-term notes payable used for the acquisition of ProSys, offset primarily by repayments of long-term notes of $8.8 million
Contingent Put Option
In connection with the acquisition of ProSys, we and the former shareholders of ProSys (the “Holders”) entered into a registration rights agreement obligating us to file a registration statement with the SEC to allow for the resale of the 1.72 million shares of common stock, used as part of the consideration in the purchase transaction, within 60 days of the closing date of the acquisition. On April 30, 2007, we and the Holders entered into an amendment to the registration rights agreement which provided that in exchange for an extension to us of the time to register the shares, we would provide the Holders with cash necessary to make up the shortfall, if any, if following the sale thereof, the sales price of the shares held by the Holders on the open market is below $4.93 (the “Issue Price”), the price used to determine the share value for purposes of determining the consideration for the purchase transaction (“Price Protection”), as well as a put right to us at the Issue Price in certain circumstances. On February 5, 2008, we entered into a memorandum of understanding with the Holders that required us to pay an advance against potential contingent consideration due to the Holders in exchange for an extension on the previously granted put right through September 30, 2008. On August 26, 2008, we and the Holders entered into a second amendment to the registration rights agreement under which we agreed to purchase from the Holders all of the right, title and interest in 710,036 shares of the purchase consideration common stock at the Issue Price, in exchange for the Holders agreeing to retain the remaining 1,014,336 shares until such time as we are current in our periodic reports or October 2009, whichever occurs first. With respect to the remaining shares, the Holders continue to hold the Price Protection and put rights as described above and our maximum liability under these obligations is $5.0 million. As of December 31, 2008 we have accrued $4.4 million to cover the Price Protection and put right obligations.
Transactions with Related Parties
One director of the Company was a director of one of our customers, Pinnacle Systems, Inc. Another director of the Company is a director of one of our customers, Datalink Corporation. The consultant who manages our Brazilian operation has an ownership interest in two of our customers/vendors, Megaware Commercial Ltda and Megaware Industrial Ltda (collectively, “Megaware”).
During 2006, the employees who managed our Mexico operations had various ownership interests in the following customers/vendors of the Company: Import Mayoreo SA de CV, Trofel Computacion SA de CV, Verbatrade SA de CV, Importador Nacional Peninsular and Outsourcing Distribution SA de CV.
In 2006, as a part of our acquisition of ProSys, we entered into two long-term real property leases for office and warehouse space in Norcross, Georgia with Laurelwood Holdings, LLC (“Laurelwood Holdings”). The sellers of ProSys, who thereafter became our employees, have an ownership interest in Laurelwood Holdings. In 2008, 2007 and 2006, we paid $500,906, $497,693 and $124,423 respectively, under those lease agreements to Laurelwood Holdings.
Since October 2005, we have employed a stepson of Mr. Bell in the position of director of strategic markets. In 2008 and 2007, Mr. Bell’s stepson received total cash compensation of $246,217 and $238,307, respectively. On November 17, 2005, he was granted an option to purchase 15,000 shares of common stock, with an exercise price of $7.95 per share. On January 21, 2008, he was granted an option to purchase 10,000 shares of common stock, with an exercise price of $5.90 per share. In addition, he participates in all other benefits that we offer to all of our employees. The Audit Committee reviewed and ratified the employment of Mr. Bell’s stepson and his compensation.
52
Sales to and purchases from these parties for the three years ended December 31, 2008 and accounts receivable and accounts payable at December 31, 2008, 2007 and 2006 are summarized below (in thousands):
| | | | | | | | | |
| | | Years Ended December 31, |
| | | 2008 | | 2007 | | 2006 |
Sales: | | | | | | | | | |
Datalink Corporation | | $ | 60 | | $ | — | | $ | 783 |
Megaware | | | 45,111 | | | 37,939 | | | 23,808 |
Import Mayoreo SA de CV | | | — | | | 7,620 | | | — |
Verbatrade SA de CV | | | — | | | 4,027 | | | 20,452 |
Accounts receivable: | | | | | | | | | |
Datalink Corporation | | | — | | | — | | | 79 |
Megaware | | | 8,443 | | | 10,024 | | | 4,844 |
Import Mayoreo SA de CV | | | 5,615 | | | 6,451 | | | — |
Verbatrade SA de CV | | | 40 | | | 40 | | | 6,489 |
Purchases: | | | | | | | | | |
Megaware | | | — | | | — | | | 16,114 |
Importadora Naciónal Peninsular | | | — | | | — | | | 21,851 |
Accounts payable: | | | | | | | | | |
Megaware | | | — | | | — | | | 2,191 |
Import Mayorco SA de CV | | | — | | | — | | | 6,288 |
RECENT ACCOUNTING PRONOUNCEMENTS
In December 2007, FASB issued Statement of Financial Accounting Standards No. 141 (Revised 2007),Business Combinations(“SFAS 141R”). SFAS 141R will change the accounting for business combinations. Under SFAS 141R, an acquiring entity will be required to recognize all the assets acquired and liabilities assumed in a transaction at the acquisition-date fair value, with limited exceptions. SFAS 141R will change the accounting treatment and disclosure for certain specific items in a business combination. SFAS 141R applies prospectively to business combinations for which the acquisition date is on or after the beginning of the first annual reporting period beginning on or after December 15, 2008, and interim periods within those fiscal years. SFAS 141R will become effective for us beginning January 1, 2009. We will apply the provisions of SFAS 141R to any future acquisitions.
In November 2007, the EITF released Issue No. 07-01,Accounting for Collaborative Arrangements (“EITF 07-01”). EITF 07-01 requires collaborators to present the results of activities for which they act as the principal on a gross basis and report any payments received from (made to) other collaborators based on other applicable GAAP or, in the absence of other applicable GAAP, based on analogy to authoritative accounting literature or a reasonable, rational and consistently applied accounting policy election. EITF 07-01 also clarified the determination of whether transactions within a collaborative arrangement are part of a vendor-customer (or analogous) relationship that are subject to EITF Issue No. 01-9,Accounting for Consideration Given by a Vendor to a Customer. EITF 07-01 is effective for the Company beginning January 1, 2009. We do not expect the provisions of EITF 07-01 to have a material impact on our consolidated financial statements.
In December 2007, FASB issued Statement of Financial Accounting Standards No. 160,Noncontrolling Interests in Consolidated Financial Statements (an Amendment of ARB No. 51) (“SFAS 160”). SFAS 160 establishes new accounting and reporting standards for the non-controlling interest in a subsidiary and for the deconsolidation of a subsidiary. SFAS 160 is effective for us beginning January 1, 2009. Currently, we do not expect the adoption of SFAS 160 will have an impact on our consolidated financial statements.
In March 2008, FASB issued Statement of Financial Accounting Standards No. 161,Disclosures about Derivative Instruments and Hedging Activities (an Amendment of FASB Statement No. 133) (“SFAS 161”). SFAS 161 requires enhanced disclosures about derivative instruments and hedging activities and their effects on a company’s financial position, financial performance and cash flows. SFAS 161 is effective for us beginning January 1, 2009. We are evaluating the effect of the adoption of SFAS 161 on our consolidated financial statements including our disclosures.
In April 2008, FASB issued FASB’S Staff Position (“FSP”) Statement (“FAS”) No. 142-3,Determination of the Useful Life of Intangible Assets(“FSP 142-3”). FSP 142-3 amends the factors a company should consider in developing renewal or extension assumptions used in determining the useful life of recognized intangible assets under FASB’s Statement
53
of Financial Accounting Standards No. 142,Goodwill and Other Tangible Assets(“SFAS 142”). This new guidance applies prospectively to intangible assets that are acquired individually or with a group of other assets in business combinations and asset acquisitions. FSP 142-3 is effective for us beginning January 1, 2009. Early adoption is prohibited; therefore, this guidance will be applied prospectively. On adoption, we do not expect there will be any impact to our current consolidated financial statements.
In May 2008, FASB issued Accounting Principles Board No. 14-1,Accounting for Convertible Debt Instruments That May Be Settled in Cash upon Conversion (Including Partial Cash Settlement)(“APB 14-1”). APB 14-1 requires that the liability and equity components of convertible debt instruments that may be settled in cash upon conversion (including partial cash settlement) be separately accounted for in a manner that reflects an issuer’s non-convertible debt borrowing rate. APB 14-1 is effective for us beginning January 1, 2009. We are still evaluating the impact that the adoption of APB 14-1 will have on our consolidated financial statements.
In May 2008, FASB issued Statement of Financial Accounting Standards No. 162,The Hierarchy of Generally Accepted Accounting Principles(“SFAS 162”). The new standard is intended to improve financial reporting by identifying a consistent framework, or hierarchy, for selecting accounting principles to be used in preparing financial statements that are presented in conformity with GAAP for non-governmental entities. SFAS 162 is effective 60 days following the SEC’s approval of the Public Company Accounting Oversight Board Auditing amendments to AU Section 411,The Meaning of Present Fairly in Conformity with Generally Accepted Accounting Principles. We do not expect the adoption of this standard to have a material effect on our consolidated financial statements.
In April 2009, FASB issued Staff Position Statement No. 157-4,Determining Fair Value When the Volume and Level of Activity for the Asset or Liability Have Significantly Decreased and Identifying Transactions That Are Not Orderly (“FSP 157-4”). FSP 157-4 indicates that if an entity determines that either the volume and/or level of activity for an asset or liability has significantly decreased (from normal conditions for that asset or liability) or price quotations or observable inputs are not associated with orderly transactions, increased analysis and management judgment will be required to estimate fair value. FSP 157-4 is effective for interim and annual periods ending after June 15, 2009, with early adoption permitted. FSP 157-4 must be applied prospectively. FSP 157-4 is effective for us beginning January 1, 2009. We do not expect the provisions of FSP 157-4 to have a material impact on our consolidated financial position, results of operations or cash flows.
In April 2009, FASB issued Staff Position Statement No. 107-1 and Accounting Principles Board No. 28-1,Interim Disclosures about Fair Value of Financial Instruments(“FSP 107-1”). FSP 107-1 relates to fair value disclosures in public entity financial statements for financial instruments that are within the scope of FASB’s Statement of Financial Accounting Standards No. 107,Disclosures about Fair Value of Financial Instruments (“SFAS 107”). This guidance increases the frequency of those disclosures, requiring public entities to provide the disclosures on a quarterly basis (rather than just annually). The quarterly disclosures are intended to provide financial statement users with more timely information about the effects of current market conditions on an entity’s financial instruments that are not otherwise reported at fair value. FSP 107-1 is effective for interim and annual periods ending after June 15, 2009. FSP 107-1 must be applied prospectively. On adoption, we do not expect there will be any impact on our current consolidated financial statements.
In April 2009, the SEC issued Staff Accounting Bulletin No. 111 (“SAB 111”) on Other-Than-Temporary Impairments (“OTTI”). SAB 111 amends Topic 5.M. in the Staff Accounting Bulletin Series entitledOther-Than-Temporary Impairment of Certain Investments in Debt and Equity Securities (“Topic 5.M.”). SAB 111 maintains the SEC staff’s previous views related to equity securities and amends Topic 5.M. to exclude debt securities from its scope. We elected to adopt SAB 111 in the first quarter of 2009. SAB 111 is effective for us beginning January 1, 2009. On adoption, we do not expect there will be any impact on our current consolidated financial statements.
In May 2009, FASB issued Statement of Financial Accounting Standards No. 165,Subsequent Events (“SFAS 165”). SFAS 165 establishes general standards of accounting for and disclosure of events that occur after the balance sheet date but before financial statements are issued or are available to be issued. SFAS 165 requires the disclosure of the date through which an entity has evaluated subsequent events and the basis for that date – that is, whether the date represents the date the financial statements were issued or were available to be issued. SFAS 165 is effective for us in the first interim period beginning after June 15, 2009. We do not expect the adoption of this standard to have a material effect on our consolidated financial statements.
54
QUARTERLY RESULTS OF OPERATIONS
Net Sales
| | | | | | | | | | | | | |
| | | | | | | Quarterly Change
2008 from 2007 | |
| | | 2008 | | 2007 | | $ | | | % | |
| | | (dollars in thousands) | |
First Quarter | | $ | 993,362 | | $ | 972,287 | | $ | 21,075 | | | 2.2 | % |
Second Quarter | | | 936,601 | | | 920,681 | | | 15,920 | | | 1.7 | % |
Third Quarter | | | 880,730 | | | 988,497 | | | (107,767 | ) | | (10.9 | )% |
Fourth Quarter | | | 768,806 | | | 1,068,440 | | | (299,634 | ) | | (28.0 | )% |
Three Months Ended March 31, 2008 Compared to Three Months Ended March 31, 2007
Consolidated net sales increased 2.2% to $993.4 million in the three months ended March 31, 2008 from $972.3 million in the same period in 2007. This increase is attributable to increased ProSys segment sales of $32.7 million and an aggregate increase in TotalTec, Miami and Other segments sales of $11.0 million. The increases in sales in our ProSys and Miami segments were primarily attributable to increased sales of computer platforms, storage systems and all other products. These sales increases were partially offset by a $14.3 million sales decrease in Europe segment sales and an $8.4 million decrease in U.S. Distribution segment sales, attributable to lower demand for computer platforms, disk drives, storage systems and all other products resulting from the global recession. The translation of our consolidated financial statements into U.S. dollars resulted in increased sales of $36.4 million for the three months ended March 31, 2008, compared with same period in the previous year, which consists of sales translation gains of $26.0 million in our Europe segment, $5.3 million in our Canada segment and $5.2 million in our Other segment, due to a weaker U.S. dollar.
Three Months Ended June 30, 2008 Compared to Three Months Ended June 30, 2007
Consolidated net sales increased 1.7% to $936.6 million in the three months ended June 30, 2008 from $920.7 million in the same period in 2007. The increase in consolidated net sales in the three months ended June 30, 2008, compared to the three months ended June 30, 2007, is attributable to an increase in ProSys segment sales of $39.5 million due to increased sales of computer platforms, storage systems and all other products. The increase in consolidated net sales is also attributable to an increase in Miami segment sales of $24.2 million due to increased sales volume in the Miami-based export business, and an increase of $7.7 million in Europe segment sales primarily due to increased sales of storage systems. These increases were partially offset by a $45.0 million decrease in U.S. Distribution segment sales and, cumulatively, a $10.5 million decrease in TotalTec, Canada, and Other segments sales, primarily resulting from the global recession. The translation of our consolidated financial statements into U.S. dollars resulted in increased sales of $28.6 million for the three months ended March 31, 2008, compared with the same period in the previous year, which consists of sales translation gains of $21.1 million in the Europe segment, $2.5 million in the Canada segment and $5.0 million in the Other segment, due to a weaker U.S. dollar.
Three Months Ended September 30, 2008 Compared to Three Months Ended September 30, 2007
Consolidated net sales decreased 10.9% to $880.7 million in the three months ended September 30, 2008 from $988.5 million in the same period in 2007. The decrease is attributable to a $72.3 million decrease in Europe segment sales, a decrease of $39.2 million in U.S. Distribution segment sales and a $6.9 million decrease in ProSys segment sales. These sales decreases were attributable to lower demand for products such as computer platforms, disk drives and all other products due to the recession. Partially offsetting the sales decreases in the Europe, U.S. Distribution and ProSys segments was an increase in Miami segment sales of $30.5 million, which was due to increased growth of the Miami-based export business, whose sales consisted of computer platforms and storage systems. The translation of our consolidated financial statements into U.S. dollars resulted in decreased sales of $2.0 million for the three months ended September 30, 2008, when compared with the same period in the previous year, and was primarily attributable to the translation of the Other segment sales as a result of a stronger U.S. dollar.
Three Months Ended December 31, 2008 Compared to Three Months Ended December 31, 2007
Consolidated net sales decreased 28.0% to $768.8 million in the three months ended December 31, 2008 from $1,068.4 million in the same period of 2007. The decrease in consolidated net sales is attributable to a decrease of $161.7 million in Europe segment sales, a $90.0 million decrease in U.S. Distribution segment sales and a $2.3 million decrease in TotalTec segment sales, a $25.0 million decrease in Miami segment sales, a $12.1 million decrease in Canada segment sales, and a $15.7 million decrease in Other segment sales. These sales decreases were attributable to lower demand
55
for computer platforms, disk drives, storage systems and all other products due to the deepening recession. Partially offsetting the decrease in sales was an increase of $7.4 million in ProSys segment sales attributable to increased sales of computer platforms, storage systems and all other products. The translation of our consolidated financial statements into U.S. dollars resulted in decreased sales of $77.4 million for the three months ended December 31, 2008, compared with the same period in the previous year, due to a stronger U.S. dollar. The sales translation loss consisted of a $62.5 million loss attributable to Europe segment sales, a $6.1 million loss attributable to Canada sales and an $8.8 million loss attributable to Other segment sales.
Gross Profit
| | | | | | | | | | | | | | | |
| | | | | | Quarterly Change
2008 from 2007 | |
| | | 2008 | | | 2007 | | | $ | | | % | |
| | | (dollars in thousands) | |
First Quarter | | $ | 87,409 | | | $ | 81,764 | | | $ | 5,645 | | | 6.9 | % |
Second Quarter | | | 86,775 | | | | 75,785 | | | | 10,990 | | | 14.5 | % |
Third Quarter | | | 82,757 | | | | 90,617 | | | | (7,860 | ) | | (8.7 | )% |
Fourth Quarter | | | 78,505 | | | | 92,377 | | | | (13,872 | ) | | (15.0 | )% |
Gross Profit Margin: | | | | | | | | | | | | | | | |
First Quarter | | | 8.8 | % | | | 8.4 | % | | | | | | | |
Second Quarter | | | 9.3 | % | | | 8.2 | % | | | | | | | |
Third Quarter | | | 9.4 | % | | | 9.2 | % | | | | | | | |
Fourth Quarter | | | 10.2 | % | | | 8.7 | % | | | | | | | |
Three Months Ended March 31, 2008 Compared to Three Months Ended March 31, 2007
The gross profit percentage was 8.8% of consolidated net sales in the three months ended March 31, 2008, compared to 8.4% of consolidated net sales in the same period ended March 31, 2007. The change in the gross profit percentage was primarily due to the gross profit percentage changes in the ProSys, Canada, Miami and Other segments. The gross profit percentage in the ProSys segment increased by 0.4% when comparing the three months ended March 31, 2008 to the same period in 2007. The increase in our ProSys segment gross profit percentage is attributable to a $14.3 million increase in storage systems sales and a $21.8 million increase in all other products sales offset by a $4.1 million decrease in computer platform sales. The gross profit percentages in the TotalTec, Miami, Canada and Other segments increased cumulatively by 0.1%, primarily due to an increase in sales of computer platform products, storage systems, disk drives and all other products. Furthermore, in the three months ended March 31, 2008, we recorded a reduction of approximately $3.2 million to cost of sales resulting from the release of certain vendor allowances previously deferred. The release of deferred vendor allowances had a 0.4% impact on our gross profit percentage in the three months ended March 31, 2008.
Three Months Ended June 30, 2008 Compared to Three Months Ended June 30, 2007
The gross profit percentage was 9.3% of consolidated net sales in the three months ended June 30, 2008, compared to 8.2% of consolidated net sales in the same period ended June 30, 2007. The change in the gross profit percentage was because of gross profit percentage increases in the ProSys and Europe segments. The gross profit percentage in the ProSys segment increased by 0.8% when comparing the three months ended June 30, 2008 to the same period in 2007. The increase in our ProSys segment gross profit percentage is attributable to a $26.6 million increase in storage systems sales and a $6.3 million and $6.0 million increase in computer platforms and all other products sales, respectively. The gross profit percentage in the Europe segment increased by 0.3% in the three months ended June 30, 2008, when compared to the corresponding period in 2007.
Three Months Ended September 30, 2008 Compared to Three Months Ended September 30, 2007
The gross profit percentage was 9.4% of consolidated net sales in the three months ended September 30, 2008, compared to 9.2% of consolidated net sales in the same period ended September 30, 2007. The increase was primarily due to the gross profit percentage increase of 0.3% by the U.S. Distribution segment and the decrease of 0.5% in the Europe segment. The gross profit percentages in the TotalTec, Miami, Canada and Other segments increased cumulatively by 0.4% and were due to an increase in sales of computer platform products, storage systems and disk drives. Furthermore, in the three months ended September 30, 2008, we recorded a reduction of approximately $4.7 million to cost of sales resulting from the release of certain vendor allowances previously deferred. The release of deferred vendor allowances had a 0.6% impact on our gross profit percentage in the three months ended September 30, 2008.
56
Three Months Ended December 31, 2008 Compared to Three Months Ended December 31, 2007
The gross profit percentage was 10.2% of consolidated net sales in the three months ended December 31, 2008, compared to 8.7% of consolidated net sales in the same period ended December 31, 2007. The gross profit percentage in the ProSys segment increased by 0.8% when comparing the three months ended December 31, 2008 to the same period in 2007. The increase in our ProSys segment gross profit percentage is attributable to an $11.1 million increase in computer platform sales. The gross profit percentages in the TotalTec, Miami, Canada and Other segments increased cumulatively by 0.7%, primarily due to an increase in sales of computer platform products, storage systems and disk drives. Furthermore, in the three months ended December 31, 2008, we recorded a reduction of approximately $2.8 million to cost of sales resulting from the release of certain vendor allowances previously deferred. The release of deferred vendor allowances had a 0.4% impact on our gross profit percentage in the three months ended December 31, 2008.
Selling, General & Administrative (SG&A) Expense
| | | | | | | | | | | | | | | |
| | | | | | | | | Quarterly Change
2008 from 2007 | |
| | | 2008 | | | 2007 | | | $ | | | % | |
| | | (dollars in thousands) | |
First Quarter | | $ | 80,372 | | | $ | 70,992 | | | $ | 9,380 | | | 13.2 | % |
Second Quarter | | | 74,439 | | | | 72,917 | | | | 1,522 | | | 2.1 | % |
Third Quarter | | | 77,735 | | | | 72,290 | | | | 5,445 | | | 7.5 | % |
Fourth Quarter | | | 74,500 | | | | 77,581 | | | | (3,081 | ) | | (4.0 | )% |
As % of Net Revenue: | | | | | | | | | | | | | | | |
First Quarter | | | 8.1 | % | | | 7.3 | % | | | | | | | |
Second Quarter | | | 7.9 | % | | | 7.9 | % | | | | | | | |
Third Quarter | | | 8.8 | % | | | 7.3 | % | | | | | | | |
Fourth Quarter | | | 9.7 | % | | | 7.3 | % | | | | | | | |
Three Months Ended March 31, 2008 Compared to Three Months Ended March 31, 2007
SG&A expense increased $9.4 million or 13.2% in the three months ended March 31, 2008 compared to the three months ended March 31, 2007. The increase in SG&A expense was primarily attributable to an $8.4 million increase in administrative expenses associated with commissions and bonuses due to higher sales volume and an increase of $1.9 million in bad debt expense, partially offset by a reduction in miscellaneous SG&A expenses of $0.9 million.
Three Months Ended June 30, 2008 Compared to Three Months Ended June 30, 2007
SG&A expense increased $1.5 million or 2.1% in the three months ended June 30, 2008 compared to the three months ended June 30, 2007. The increase in SG&A expense was primarily attributable to an additional $0.9 million in commissions and bonus expense resulting from higher sales volume and headcount in the three months ended June 30, 2008 when compared to the corresponding period in 2007. The increase is further attributable to a $1.3 million in SG&A expenses associated with the cost of insurance, partially offset by a decrease in SG&A expenses associated with outside services of approximately $1.1 million.
Three Months Ended September 30, 2008 Compared to Three Months Ended September 30, 2007
SG&A expense increased $5.4 million or 7.5% in the three months ended September 30, 2008 compared to the three months ended September 30, 2007. The increase in SG&A expense was primarily attributable to increases of $3.2 million in bad debt expense, $1.6 million in advertising expense, and $0.8 million in salaries and wages resulting from higher headcount, partially offset by a $0.2 million decrease in miscellaneous SG&A expenses.
57
Three Months Ended December 31, 2008 Compared to Three Months Ended December 31, 2007
SG&A expense decreased $3.1 million or 4.0% in the three months ended December 31, 2008 compared to the three months ended December 31, 2007. The decrease in SG&A expense was primarily attributable to decreases of $5.9 million in salaries and wages and employee benefit expense resulting from lower headcount due to layoffs, $1.1 million in outside service expenses, and $0.3 million in miscellaneous SG&A expenses. These decreases were partially offset by an increase of $4.2 million in bad debt expense.
Investigation and Restatement-Related Costs
| | | | | | | | | | | | | | |
| | | | | | | | | Quarterly Change
2008 from 2007 | |
| | | 2008 | | | 2007 | | | $ | | % | |
| | | (dollars in thousands) | |
First Quarter | | $ | 9,013 | | | $ | 5,723 | | | $ | 3,290 | | 57.5 | % |
Second Quarter | | | 10,957 | | | | 7,307 | | | | 3,650 | | 50.0 | % |
Third Quarter | | | 16,134 | | | | 6,631 | | | | 9,503 | | 143.3 | % |
Fourth Quarter | | | 16,029 | | | | 6,667 | | | | 9,362 | | 140.4 | % |
As % of Net Revenue: | | | | | | | | | | | | | | |
First Quarter | | | 0.9 | % | | | 0.6 | % | | | | | | |
Second Quarter | | | 1.2 | % | | | 0.8 | % | | | | | | |
Third Quarter | | | 1.8 | % | | | 0.7 | % | | | | | | |
Fourth Quarter | | | 2.1 | % | | | 0.6 | % | | | | | | |
Three Months Ended March 31, 2008 Compared to Three Months Ended March 31, 2007
Investigation and restatement-related costs increased $3.3 million or 57.5% in the three months ended March 31, 2008 compared to the three months ended March 31, 2007. The increase in investigation and restatement-related costs was attributable to fees paid to external auditors and outside advisors for investigation-related activities and the restatement of our historical financial statements.
Three Months Ended June 30, 2008 Compared to Three Months Ended June 30, 2007
Investigation and restatement-related costs increased $3.7 million or 50.0% in the three months ended June 30, 2008 compared to the three months ended June 30, 2007. The increase in investigation and restatement-related costs was attributable to fees paid to external auditors and outside advisors for investigation-related activities and the restatement of our historical financial statements.
Three Months Ended September 30, 2008 Compared to Three Months Ended September 30, 2007
Investigation and restatement-related costs increased $9.5 million or 143.3% in the three months ended September 30, 2008 compared to the three months ended September 30, 2007. The increase in investigation and restatement-related costs was attributable to fees paid to external auditors and outside advisors for investigation-related activities and the restatement of our historical financial statements.
Three Months Ended December 31, 2008 Compared to Three Months Ended December 31, 2007
Investigation and restatement-related costs increased $9.4 million or 140.4% in the three months ended December 31, 2008 compared to the three months ended December 31, 2007. The increase in investigation and restatement-related costs was attributable to fees paid to external auditors and outside advisors for investigation-related activities and the restatement of our historical financial statements.
58
Impairment of Goodwill and Other Intangibles
Three Months Ended December 31, 2008 Compared to Three Months Ended December 31, 2007
We recorded a goodwill impairment charge of $5.9 million, which consisted of a $2.4 million goodwill impairment charge in the Net Storage segment and a $3.5 million goodwill impairment charge in the TotalTec segment for the three months ended December 31, 2008. We recorded a goodwill impairment charge of $52.4 million, which consisted of a $20.5 million goodwill impairment charge in the ProSys segment and a $31.9 million goodwill impairment charge in the Europe segment for the three months ended December 31, 2007.
From January 1, 2008 through May 31, 2009, our common stock traded as low as $0.27 per share. We will continue to monitor the estimates of fair value for our reporting units and there may be circumstances in future periods that will require us to recognize an impairment loss on all or a portion of our recorded goodwill or other intangible assets.
Restructuring and Impairment Costs
Three Months Ended March 31, 2008 Compared to Three Months Ended March 31, 2007
In the three months ended March 31, 2008, we initiated a restructuring plan for our North American, European and Latin American operations, and, as a result, we incurred restructuring costs and other charges of approximately $2.2 million. These costs consisted primarily of severance and benefit costs for involuntary employee terminations. Approximately, $1.8 million, $0.3 million and $0.1 million of these severance and benefit costs were incurred in the Europe, Other and U.S. Distribution reporting segments, respectively. We classified all of these charges to restructuring and impairment costs in the statement of operations in the three months ended March 31, 2008.
We completed the cash payments under this restructuring initiative in 2008.
There were no restructuring activities in the three months ended March 31, 2007.
Three Months Ended June 30, 2008 Compared to Three Months Ended June 30, 2007
In the three months ended June 30, 2008, we incurred restructuring and impairment costs of approximately $72,000, which were attributable to severance and benefit costs associated with involuntary employee terminations in the Other reportable segment.
In the three months ended June 30, 2007, we incurred restructuring and impairment costs of approximately $1.2 million related to severance and benefit costs associated with involuntary employee terminations in the Europe reportable segment.
The restructuring program for headcount reduction was initiated in the second quarter of 2007 and continued through December 2007.
Three Months Ended September 30, 2008 Compared to Three Months Ended September 30, 2007
In the three months ended September 30, 2008, we incurred restructuring and impairment costs of approximately $59,000, which were attributable to severance and benefit costs associated with involuntary employee terminations.
In the three months ended September 30, 2007, we incurred restructuring and impairment costs of approximately $129,000 related to severance and benefit costs associated with involuntary employee terminations.
Three Months Ended December 31, 2008 Compared to Three Months Ended December 31, 2007
In the three months ended December 31, 2008, we initiated a restructuring plan for our North American, European and Latin American operations and, as a result, the Company incurred restructuring costs and other charges of approximately $1.9 million. These costs consisted primarily of $1.5 million of severance and benefit costs for involuntary employee terminations and costs of $0.4 million related to the closure and impairment of certain leased facilities. Approximately $1.0 million, $0.2 million and $0.3 million of these severance and benefit costs were incurred in the Europe, ProSys and Other segments, respectively. The remaining amount of these severance and benefit costs of approximately $0.2 million were incurred in the U.S. Distribution, TotalTec and Miami reporting segments. Approximately $0.2 million and
59
$0.2 million of the costs associated with the closure and impairment of certain leased facilities were incurred in the TotalTec and U.S. Distribution reporting segments, respectively. We classified all of these charges to restructuring and impairment costs in the statement of operations in the three months ended December 31, 2008. We expect to make the remaining cash payments required by this restructuring initiative in 2009.
In the three months ended December 31, 2007, we incurred restructuring and impairment costs of approximately $72,000 related to severance and benefit costs associated with involuntary employee terminations in the U.S. Distribution reportable segment.
Interest Expense, Net
| | | | | | | | | | | | | |
| | | | | | | Quarterly Change
2008 from 2007 | |
| | | 2008 | | 2007 | | $ | | | % | |
| | | (dollars in thousands) | |
First Quarter | | $ | 8,017 | | $ | 9,102 | | $ | (1,085 | ) | | (11.9 | )% |
Second Quarter | | | 7,276 | | | 8,017 | | | (741 | ) | | (9.2 | )% |
Third Quarter | | | 7,247 | | | 8,701 | | | (1,454 | ) | | (16.7 | )% |
Fourth Quarter | | | 7,358 | | | 8,343 | | | (985 | ) | | (11.8 | )% |
Three Months Ended March 31, 2008 Compared to Three Months Ended March 31, 2007
Interest expense, net decreased $1.1 million or 11.9% in the three months ended March 31, 2008 compared to the three months ended March 31, 2007. The decrease in interest expense, net in 2008 over 2007 was primarily attributable to decreased interest rates in 2008. Our weighted average borrowings in the three months ended March 31, 2008 were $444.0 million compared to $440.3 million in the three months ended March 31, 2007. The weighted average interest rate in the three months ended March 31, 2008 was 6.1% compared to 6.8% in the three months ended March 31, 2007.
Three Months Ended June 30, 2008 Compared to Three Months Ended June 30, 2007
Interest expense, net decreased $0.7 million or 9.2% in the three months ended June 30, 2008 compared to the three months ended June 30, 2007. The decrease in interest expense, net was primarily attributable to decreased interest rates during the three months ended June 30, 2008. Our weighted average borrowings in the three months ended June 30, 2008 were $421.8 million compared to $403.8 million in the three months ended June 30, 2007. The weighted average interest rate in the three months ended June 30, 2008 was 6.2% compared to 6.8% in the three months ended June 30, 2007.
Three Months Ended September 30, 2008 Compared to Three Months Ended September 30, 2007
Interest expense, net decreased $1.5 million or 16.7% in the three months ended September 30, 2008 compared to the three months ended September 30, 2007. The decrease in interest expense, net was primarily attributable to decreased interest rates during the three months ended September 30, 2008. Our weighted average borrowings in the three months ended September 30, 2008 were $423.9 million compared to $406.6 million in the three months ended September 30, 2007. The weighted average interest rate in the three months ended September 30, 2008 was 6.1% compared to 6.9% in the three months ended September 30, 2007.
Three Months Ended December 31, 2008 Compared to Three Months Ended December 31, 2007
Interest expense, net decreased $1.0 million or 11.8% in the three months ended December 31, 2008 compared to the three months ended December 31, 2007. The decrease in interest expense, net was primarily attributable to decreased interest rates and decreased borrowings during the three months ended December 31, 2008. Our weighted average borrowings in the three months ended December 31, 2008 were $418.1 million compared to $424.5 million in the three months ended December 31, 2007. The weighted average interest rate in the three months ended December 31, 2008 was 5.9% compared to 7.0% in the three months ended December 31, 2007.
60
Other Expense (Income), Net
| | | | | | | | | | | | | | | |
| | | | | | | | | Quarterly Change
2008 from 2007 | |
| | | 2008 | | | 2007 | | | $ | | | % | |
| | | (dollars in thousands) | |
First Quarter | | $ | (2,329 | ) | | $ | (1,219 | ) | | $ | (1,110 | ) | | (91.1 | )% |
Second Quarter | | | (416 | ) | | | (1,753 | ) | | | 1,337 | | | 76.3 | % |
Third Quarter | | | 8,377 | | | | (1,253 | ) | | | 9,630 | | | 768.6 | % |
Fourth Quarter | | | 4,877 | | | | 1,799 | | | | 3,078 | | | 171.1 | % |
Three Months Ended March 31, 2008 Compared to Three Months Ended March 31, 2007
Other expense (income), net decreased $1.1 million or 91.1% in the three months ended March 31, 2008 compared to the three months ended March 31, 2007. The decrease was primarily attributable to an increase in foreign currency transaction gains of $2.0 million in the three months ended March 31, 2008. Foreign currency transaction gains were $2.7 million in the three months ended March 31, 2008 compared to $0.7 million in the three months ended March 31, 2007.
Three Months Ended June 30, 2008 Compared to Three Months Ended June 30, 2007
Other expense (income), net increased $1.3 million or 76.3% in the three months ended June 30, 2008 compared to the three months ended June 30, 2007. The increase was primarily attributable to a decrease in foreign currency transaction losses of $1.6 million in the three months ended June 30, 2008. Foreign currency transaction gains were $1.6 million in the three months ended June 30, 2007 and there was no foreign currency translation activity in the three months ended June 30, 2008.
Three Months Ended September 30, 2008 Compared to Three Months Ended September 30, 2007
Other expense (income), net increased $9.6 million or 768.6% in the three months ended September 30, 2008 compared to the three months ended September 30, 2007. The increase was primarily attributable to a decrease in foreign currency transaction losses of $9.2 million in the three months ended September 30, 2008. Foreign currency transaction losses were $8.1 million in the three months ended September 30, 2008 compared to $1.1 million of currency transaction gains in the three months ended September 30, 2007.
Three Months Ended December 31, 2008 Compared to Three Months Ended December 31, 2007
Other expense (income), net increased $3.1 million or 171.1% in the three months ended December 31, 2008 when compared to the three months ended December 31, 2007. The increase was primarily attributable to a decrease in foreign currency transaction losses of $3.5 million in the three months ended December 31, 2008. Foreign currency transaction losses were $4.7 million in the three months ended December 31, 2008 compared to $1.2 million in the three months ended December 31, 2007.
Income Taxes
Our income tax provision and effective tax rate are primarily impacted by, among other factors, the statutory tax rates in the countries in which we operate and the related level of income generated by our global operations.
61
The variance in quarterly tax expense between 2008 and 2007 is largely based upon differences in quarterly income and certain discrete items, including the recording of valuation allowances, impairment of intangible assets, and return to provision adjustments.
Three Months Ended March 31, 2008 Compared to Three Months Ended March 31, 2007
| | | | | | | | | | | | |
| | | 2008 | | | 2007 | | | Change | |
| | | (dollars in thousands) | |
Provision for income taxes | | $ | 246 | | | $ | 3,122 | | | $ | (2,876 | ) |
Effective tax rate | | | (2.5 | )% | | | (110.2 | )% | | | 107.7 | % |
The low negative effective tax rate for the three months ended March 31, 2008 was due to U.S. and certain other pre-tax losses for which the tax benefits were offset by full valuation allowances provided against the related deferred tax assets, and low pre-tax profits generated in other jurisdictions. For the three months ended March 31, 2007, we had an overall pre-tax loss for the quarter, which combined with pre-tax profits generated in the U.K. and Canada, where we have not provided a valuation allowance against the related deferred tax assets, yielded a high negative tax rate.
Three Months Ended June 30, 2008 Compared to Three Months Ended June 30, 2007
| | | | | | | | | | | | |
| | | 2008 | | | 2007 | | | Change | |
| | | (dollars in thousands) | |
Provision for (benefit from) income taxes | | $ | 1,375 | | | $ | (451 | ) | | $ | 1,826 | |
Effective tax rate | | | (24.8 | )% | | | 3.8 | % | | | (28.6 | )% |
The negative effective tax rate for the three months ended June 30, 2008 was due to U.S. and certain other pre-tax losses for which the tax benefits were offset by full valuation allowances provided against the related deferred tax assets, and pre-tax profits generated in the U.K. and Brazil where we have not provided valuation allowances against the related deferred tax assets. The tax benefit recorded for the three months ended June 30, 2007 was due to benefits recorded for pre-tax losses generated in the U.K.
Three Months Ended September 30, 2008 Compared to Three Months Ended September 30, 2007
| | | | | | | | | | | | |
| | | 2008 | | | 2007 | | | Change | |
| | | (dollars in thousands) | |
Provision for (benefit from) income taxes | | $ | (456 | ) | | $ | 3,464 | | | $ | (3,920 | ) |
Effective tax rate | | | 1.7 | % | | | 84.1 | % | | | (82.4 | )% |
The low effective tax rate for the three months ended September 30, 2008 was due to tax benefits recorded for pre-tax losses generated in the U.K., and due to U.S. and certain other pre-tax losses for which the tax benefits were offset by full valuation allowances provided against the related deferred tax assets. The high effective tax rate for the three months ended September 30, 2007 was due to taxes provided on pre-tax profits generated in the U.K.
Three Months Ended December 31, 2008 Compared to Three Months Ended December 31, 2007
| | | | | | | | | | | | |
| | | 2008 | | | 2007 | | | Change | |
| | | (dollars in thousands) | |
Provision for (benefit from) income taxes | | $ | (638 | ) | | $ | 826 | | | $ | (1,464 | ) |
Effective tax rate | | | 2.0 | % | | | (1.5 | )% | | | 3.5 | % |
The low effective tax rates for the three months ended December 31, 2008 and 2007 were due to U.S. and certain other pre-tax losses for which the tax benefits were offset by full valuation allowances provided against the related deferred tax assets.
62
Net Sales
| | | | | | | | | | | | |
| | | | | | | Quarterly Change
2007 from 2006 | |
| | | 2007 | | 2006 | | $ | | % | |
| | | (dollars in thousands) | |
First Quarter | | $ | 972,287 | | $ | 849,807 | | $ | 122,480 | | 14.4 | % |
Second Quarter | | | 920,681 | | | 764,168 | | | 156,513 | | 20.5 | % |
Third Quarter | | | 988,497 | | | 774,907 | | | 213,590 | | 27.6 | % |
Fourth Quarter | | | 1,068,440 | | | 983,994 | | | 84,446 | | 8.6 | % |
Three Months Ended March 31, 2007 Compared to Three Months Ended March 31, 2006
Consolidated net sales increased 14.4% to $972.3 million in the three months ended March 31, 2007 from $849.8 million in the same period in 2006. The increase in consolidated net sales in the three months ended March 31, 2007 compared to the three months ended March 31, 2006 was primarily attributable to increased ProSys segment sales of $92.4 million, which was acquired in October 2006. Our Miami segment sales increased by $17.3 million due to increased sales of computer platforms and storage systems. The translation of the Company’s consolidated financial statements into U.S. dollars resulted in increased sales of $39.3 million for the three months ended March 31, 2007, compared with the three months ended March 31, 2006, due to a weaker U.S. dollar. The sales translation gain for the three months ended March 31, 2007 consisted of a $40.1 million translation gain in the Europe segment, offset by translation losses in the Other segment of $0.3 million and the Canada segment of $0.5 million.
Three Months Ended June 30, 2007 Compared to Three Months Ended June 30, 2006
Consolidated net sales increased 20.5% to $920.7 million in the three months ended June 30, 2007 from $764.2 million in the same period in 2006. The increase in consolidated net sales in the three months ended June 30, 2007 compared to the three months ended June 30, 2006 is primarily attributable to sales of computer platforms, storage systems and all other products of $81.7 million in the ProSys segment, which was acquired in October 2006. Our Miami segment sales increased by $14.8 million due to increased sales of computer platforms and storage systems. The translation of the Company’s consolidated financial statements into U.S. dollars resulted in increased sales of $30.7 million for the three months ended June 30, 2007, compared with the three months ended June 30, 2006, due to a weaker U.S. dollar. The sales translation gain for the three months ended June 30, 2007 consisted of a $28.6 million translation gain in the Europe segment, a $0.8 million translation gain in the Canada segment and a translation gain in the Other segment of 1.3 million.
Three Months Ended September 30, 2007 Compared to Three Months Ended September 30, 2006
Consolidated net sales increased 27.6% to $988.5 million in the three months ended September 30, 2007 from $774.9 million in the same period in 2006. The increase in consolidated net sales in the three months ended September 30, 2007 compared to the three months ended September 30, 2006 is primarily attributable to computer platform and storage systems sales of $103.2 million made by the ProSys segment, which we acquired in October 2006. The U.S. Distribution segment and Canada segment net sales also increased due to higher sales of storage systems and disk drives. The Miami segment net sales increased primarily due to $11.0 million in increased sales of computer platforms, disk drives and all other products. The translation of the Company’s consolidated financial statements into U.S. dollars resulted in increased sales of $34.3 million for the three months ended September 30, 2007, compared with the three months ended September 30, 2006, due to a weaker U.S. dollar. The sales translation gain for the three months ended September 30, 2007 consisted of a $30.3 million translation gain in the Europe segment, a $2.6 million translation gain in the Canada segment and a translation gain in the Other segment of $1.4 million.
Three Months Ended December 31, 2007 Compared to Three Months Ended December 31, 2006
Consolidated net sales increased 8.6% to $1,068.4 million in the three months ended December 31, 2007 from $984.0 million in the same period of 2006. The increase in consolidated net sales is attributable primarily to increased ProSys segment sales of $28.2 million. The U.S. Distribution segment and Canada segment net sales also increased due to sales of storage systems and disk drives. The Miami segment net sales increased primarily due to $6.0 million in increased sales of computer platforms, disk drives and all other products. The translation of the Company’s consolidated financial statements into U.S. dollars resulted in increased sales of $49.0 million for the three months ended December 31, 2007, compared with the three months ended December 31, 2006, due to a weaker U.S. dollar. The sales translation gain for the three months ended December 31, 2007 consisted of a $40.4 million translation gain in the Europe segment, a $5.3 million translation gain in the Canada segment and a translation gain in the Other segment of $3.3 million.
63
Gross Profit
| | | | | | | | | | | | | | |
| | | | | | | | | Quarterly Change
2007 from 2006 | |
| | | 2007 | | | 2006 | | | $ | | % | |
| | | (dollars in thousands) | |
First Quarter | | $ | 81,764 | | | $ | 64,041 | | | $ | 17,723 | | 27.7 | % |
Second Quarter | | | 75,785 | | | | 63,991 | | | | 11,794 | | 18.4 | % |
Third Quarter | | | 90,617 | | | | 60,968 | | | | 29,649 | | 48.6 | % |
Fourth Quarter | | | 92,377 | | | | 85,741 | | | | 6,636 | | 7.7 | % |
Gross Profit Margin: | | | | | | | | | | | | | | |
First Quarter | | | 8.4 | % | | | 7.5 | % | | | | | | |
Second Quarter | | | 8.2 | % | | | 8.4 | % | | | | | | |
Third Quarter | | | 9.2 | % | | | 7.9 | % | | | | | | |
Fourth Quarter | | | 8.6 | % | | | 8.7 | % | | | | | | |
Three Months Ended March 31, 2007 Compared to Three Months Ended March 31, 2006
The gross profit percentage was 8.4% of consolidated net sales in the three months ended March 31, 2007, compared to 7.5% of consolidated net sales in the three months ended March 31, 2006. The 0.9% increase in the gross profit percentage was primarily due to increased consolidated net sales of computer platforms and storage systems of $122.5 million for the three months ended March 31, 2007, compared to the same period in 2006. The increase was mainly due to increased sales of computer platforms and storage systems in the Europe segment in the amount of $44.2 million, an increase in ProSys segment sales of all ProSys product lines in the amount of $92.4 million and an increase in Miami segment sales of computer platforms and storage systems in the amount of $17.3 million. These sales increases were partially offset by decreased sales in the U.S. Distribution, Canada and Other segments of $32.1 million.
Three Months Ended June 30, 2007 Compared to Three Months Ended June 30, 2006
The gross profit percentage was 8.2% of consolidated net sales in the three months ended June 30, 2007, compared to 8.4% of consolidated net sales in the three months ended June 30, 2006. The 0.2% decrease in the gross profit percentage was primarily due to a decrease in the gross profit in the U.S. Distribution, TotalTec and Other segments, which decreased cumulatively by 0.8% as a result of lower sales of computer platforms, storage systems and all other product offerings. This decrease was partially offset by a 1.0% increase in ProSys segment gross profit percentage resulting from increased sales of computer platforms, storage systems and all other product offerings.
Three Months Ended September 30, 2007 Compared to Three Months Ended September 30, 2006
The gross profit percentage was 9.2% of consolidated net sales in the three months ended September 30, 2007, compared to 7.9% of consolidated net sales in the same period ended September 30, 2006. The 1.3% increase in the gross profit percentage was primarily due to an increase of 0.4% and 0.1% in the U.S. Distribution and Europe segments, respectively, which sold larger amounts of storage systems and disk drives. The gross profit percentage in the ProSys segment increased by 1.6% due to increased sales of all ProSys product lines. The gross profit percentages in the TotalTec, Miami, Canada and Other segments decreased cumulatively by 0.8%, primarily due to an overall decrease in sales of computer platform products, storage systems, disk drives and all other products.
Three Months Ended December 31, 2007 Compared to Three Months Ended December 31, 2006
The gross profit percentage remained unchanged at 8.6% when comparing the three months ended December 31, 2007 to the corresponding period in 2006.
64
Selling, General & Administrative (SG&A) Expense
| | | | | | | | | | | | | | |
| | | | | | | | | Quarterly Change
2007 from 2006 | |
| | | 2007 | | | 2006 | | | $ | | % | |
| | | (dollars in thousands) | |
First Quarter | | $ | 70,992 | | | $ | 56,433 | | | $ | 14,559 | | 25.8 | % |
Second Quarter | | | 72,917 | | | | 53,343 | | | | 19,574 | | 36.7 | % |
Third Quarter | | | 72,290 | | | | 57,423 | | | | 14,867 | | 25.9 | % |
Fourth Quarter | | | 77,581 | | | | 70,967 | | | | 6,614 | | 9.3 | % |
SG&A as % of Net Revenue | | | | | | | | | | | | | | |
First Quarter | | | 7.3 | % | | | 6.6 | % | | | | | | |
Second Quarter | | | 7.9 | % | | | 7.0 | % | | | | | | |
Third Quarter | | | 7.3 | % | | | 7.4 | % | | | | | | |
Fourth Quarter | | | 7.3 | % | | | 7.2 | % | | | | | | |
Three Months Ended March 31, 2007 Compared to Three Months Ended March 31, 2006
SG&A expense increased $14.6 million or 25.8% in the three months ended March 31, 2007 compared to the three months ended March 31, 2006. The increase in SG&A expense was primarily attributable to the $10.0 million of administrative expense associated with the 2006 acquisition of ProSys. In addition, there was an increase in salaries and commission of $3.9 million in the three months ended March 31, 2007, primarily due to increased headcount and higher sales volume. There was also an increase in outside services of $1.9 million in the three months ended March 31, 2007 for consultants.
Three Months Ended June 30, 2007 Compared to Three Months Ended June 30, 2006
SG&A expense increased $19.6 million or 36.7% in the three months ended June 30, 2007 compared to the three months ended June 30, 2006. The increase in SG&A expense was primarily attributable to $11.7 million of administrative expense associated with the 2006 acquisitions of ProSys. In addition, there was an increase in salaries, commissions and employee benefits of $5.1 million, primarily attributable to increased headcount and higher sales volume. There was also an increase in bad debt expense of $2.0 million in the three months ended June 30, 2007, as well as an increase in outside services expense of $1.1 million in the three months ended June 30, 2007.
Three Months Ended September 30, 2007 Compared to Three Months Ended September 30, 2006
SG&A expense increased $14.9 million or 25.9% in the three months ended September 30, 2007 compared to the three months ended September 30, 2006. The increase in SG&A expense was primarily attributable to the $12.3 million of administrative expense associated with the 2006 acquisition of ProSys. There was also an increase in salaries and commissions of $3.0 million in the three months ended September 30, 2007, primarily due to increased headcount and higher sales volume.
Three Months Ended December 31, 2007 Compared to Three Months Ended December 31, 2006
SG&A expense increased $6.6 million or 9.3% in the three months ended December 31, 2007 compared to the three months ended December 31, 2006. The increase in SG&A expense was primarily attributable to additional salaries, commissions and employee benefits of $4.3 million in the three months ended December 31, 2007, primarily due to increased headcount and higher sales volume. There was also an increase of $0.6 million in rent and utilities expense in the three months ended December 31, 2007, as well as, an increase of $0.7 million in travel and entertainment expenses in the same three-month period in 2007.
Investigation and Restatement-Related Costs
Three Months Ended March 31, 2007 Compared to Three Months Ended March 31, 2006
Investigation and restatement-related costs were $5.7 million in the three months ended March 31, 2007. The investigation and restatement-related costs in 2007 were attributable to fees paid to external auditors and outside advisors for investigation-related activities and the restatement of our historical financial statements. There were no investigation- or restatement-related costs in the three months ended March 31, 2006.
65
Three Months Ended June 30, 2007 Compared to Three Months Ended June 30, 2006
Investigation and restatement-related costs were $7.3 million in the three months ended June 30, 2007. The investigation and restatement-related costs in 2007 were attributable to fees paid to external auditors and outside advisors for investigation related activities and the restatement of our historical financial statements. There were no investigation- or restatement-related costs in the three months ended June 30, 2006.
Three Months Ended September 30, 2007 Compared to Three Months Ended September 30, 2006
Investigation and restatement-related costs were $6.6 million in the three months ended September 30, 2007. The investigation and restatement-related costs in 2007 were attributable to fees paid to external auditors and outside advisors for investigation-related activities and the restatement of our historical financial statements. There were no investigation and restatement-related costs in the three months ended September 30, 2006.
Three Months Ended December 31, 2007 Compared to Three Months Ended December 31, 2006
Investigation and restatement-related costs were $6.7 million in the three months ended December 31, 2007, an increase of $5.0 million or 304.3% compared to the three months ended December 31, 2006. The increase in investigation and restatement-related costs were attributable to fees paid to external auditors and outside advisors for investigation-related activities and the restatement of our historical financial statements.
Impairment of Goodwill and Other Intangibles
Three Months Ended June 30, 2007 Compared to Three Months Ended June 30, 2006
We recorded a goodwill impairment charge of $3.2 million in the three months ended June 30, 2006 related primarily to the Canada segment.
Three Months Ended December 31, 2007 Compared to Three Months Ended December 31, 2006
In 2007, we recorded a goodwill impairment charge of $52.4 million, which consisted of a $20.5 million goodwill impairment charge in the ProSys segment and a $31.9 million goodwill impairment charge in the Europe segment.
Restructuring and Impairment Costs
Three Months Ended June 30, 2007 Compared to Three Months Ended June 30, 2006
In the three months ended June 30, 2007, we incurred restructuring and impairment costs of approximately $1.2 million related to severance and benefit costs associated with involuntary employee terminations. Approximately, $1.2 million of these severance and benefits costs were incurred in the Europe reporting segment.
The restructuring program was initiated in the second quarter of 2007 and continued through December 2007.
There were no restructuring-related activities in the three months ended June 30, 2006.
Three Months Ended September 30, 2007 Compared to Three Months Ended September 30, 2006
In the three months ended September 30, 2007, we incurred restructuring and impairment costs of approximately $129,000 related to severance and benefit costs associated with involuntary employee terminations.
There were no restructuring-related activities in the three months ended September 30, 2006.
66
Three Months Ended December 31, 2007 Compared to Three Months Ended December 31, 2006
In the three months ended December 31, 2007, we incurred restructuring and impairment costs of approximately $72,000 in the U.S. distribution reportable segment. These costs related to severance and benefit costs associated with involuntary employee terminations.
There were no restructuring-related activities in the three months ended December 31, 2006.
Interest Expense, Net
| | | | | | | | | | | | | |
| | | | | | | Quarterly Change
2007 from 2006 | |
| | | 2007 | | 2006 | | $ | | | % | |
| | | (dollars in thousands) | |
First Quarter | | $ | 9,102 | | $ | 6,447 | | $ | 2,655 | | | 41.2 | % |
Second Quarter | | | 8,017 | | | 7,490 | | | 527 | | | 7.0 | % |
Third Quarter | | | 8,701 | | | 6,876 | | | 1,825 | | | 26.5 | % |
Fourth Quarter | | | 8,343 | | | 8,643 | | | (300 | ) | | (3.5 | )% |
Three Months Ended March 31, 2007 Compared to Three Months Ended March 31, 2006
Interest expense, net increased $2.7 million or 41.2% in the three months ended March 31, 2007 compared to the three months ended March 31, 2006. The increase in interest expense, net primarily attributable to increased borrowings to finance working capital requirements and the acquisition of ProSys. Our weighted average borrowings in the three months ended March 31, 2007 were $440.3 million compared to $364.2 million in the three months ended March 31, 2006. The weighted average interest rate in the three months ended March 31, 2007 was 6.8% compared to 6.1% in the three months ended March 31, 2006.
Three Months Ended June 30, 2007 Compared to Three Months Ended June 30, 2006
Interest expense, net increased $0.5 million or 7.0% in the three months ended June 30, 2007 compared to the three months ended June 30, 2006. The increase in interest expense, net was primarily attributable to increased interest rates and increased borrowings to finance working capital requirements and the acquisition of ProSys. Our weighted average borrowings in the three months ended June 30, 2007 were $403.8 million compared to $393.1 million in the three months ended June 30, 2006. The weighted average interest rate in the three months ended June 30, 2007 was 6.8% compared to 6.5% in the three months ended June 30, 2006.
Three Months Ended September 30, 2007 Compared to Three Months Ended September 30, 2006
Interest expense, net increased $1.8 million or 26.5% in the three months ended September 30, 2007 compared to the three months ended September 30, 2006. The increase in interest expense, net was primarily attributable to increased interest rates and increased borrowings to finance working capital requirements and the acquisition of ProSys. Our weighted average borrowings in the three months ended September 30, 2007 were $406.6 million compared to $380.5 million in the three months ended September 30, 2006. The weighted average interest rate in the three months ended September 30, 2007 was 6.9% compared to 6.6% in the three months ended September 30, 2006.
Three Months Ended December 31, 2007 Compared to Three Months Ended December 31, 2006
Interest expense, net decreased $0.3 million or 3.5% in the three months ended December 31, 2007 compared to the three months ended December 31, 2006. The decrease in interest expense, net was primarily attributable to decreased borrowings in 2007. Our weighted average borrowings in the three months ended December 31, 2007 were $424.5 million compared to $429.3 million in the three months ended December 31, 2006. The weighted average interest rate in the three months ended December 31, 2007 was 7.0% compared to 6.7% in the three months ended December 31, 2006.
67
Other Expense (Income), Net
| | | | | | | | | | | | | | | |
| | | | | | | | | Quarterly Change
2007 from 2006 | |
| | | 2007 | | | 2006 | | | $ | | | % | |
| | | (dollars in thousands) | |
First Quarter | | $ | (1,219 | ) | | $ | 30 | | | $ | (1,249 | ) | | (4,163.3 | )% |
Second Quarter | | | (1,753 | ) | | | (2,424 | ) | | | 671 | | | 27.7 | % |
Third Quarter | | | (1,253 | ) | | | 1,220 | | | | (2,473 | ) | | (202.7 | )% |
Fourth Quarter | | | 1,799 | | | | (1,674 | ) | | | 3,473 | | | 207.5 | % |
Three Months Ended March 31, 2007 Compared to Three Months Ended March 31, 2006
Other expense (income), net decreased $1.2 million or 4,163.3% in the three months ended March 31, 2007 compared to the three months ended March 31, 2006. The decrease in other expense (income), net was primarily attributable to an increase in foreign currency gains of $0.8 million in the three months ended March 31, 2007. Foreign currency transaction gains were $0.7 million in the three months ended March 31, 2007 compared to foreign currency transaction losses of $0.1 million in the three months ended March 31, 2006.
Three Months Ended June 30, 2007 Compared to Three Months Ended June 30, 2006
Other expense (income), net decreased $0.7 million or 27.7% in the three months ended June 30, 2007 compared to the three months ended June 30, 2006. The decrease in other expense (income), net was primarily attributable to a decrease in foreign currency gains of $0.6 million in the three months ended June 30, 2007. Foreign currency transaction gains were $1.6 million in the three months ended June 30, 2007 compared to $2.2 million in the three months ended June 30, 2006.
Three Months Ended September 30, 2007 Compared to Three Months Ended September 30, 2006
Other expense (income), net increased $2.5 million or 202.7% in the three months ended September 30, 2007 compared to the three months ended September 30, 2006. The increase in other expense (income), net was primarily attributable to an increase in foreign currency transaction gains of $2.6 million in the three months ended September 30, 2007. Foreign currency transaction gains were $1.1 million in the three months ended September 30, 2007 compared to foreign currency transaction losses of $1.5 million in the three months ended September 30, 2006.
Three Months Ended December 31, 2007 Compared to Three Months Ended December 31, 2006
Other expense (income), net decreased $3.5 million or 207.5% in the three months ended December 31, 2007 compared to the three months ended December 31, 2006. The decrease in other expense (income), net was primarily attributable to a decrease in foreign currency transaction gains of $2.6 million in the three months ended December 31, 2007. Foreign currency transaction losses were $1.3 million in the three months ended December 31, 2007 compared to foreign currency transaction gains of $1.3 million in the three months ended December 31, 2006.
Income Taxes
The variance in quarterly tax expense between 2007 and 2006 is largely based upon differences in quarterly income and certain discrete items, including the recording of valuation allowances, impairment of intangible assets, and return to provision adjustments.
Three Months Ended March 31, 2007 Compared to Three Months Ended March 31, 2006
| | | | | | | | | | | | |
| | | 2007 | | | 2006 | | | Change | |
| | | (dollars in thousands) | |
Provision for income taxes | | $ | 3,122 | | | $ | 2,759 | | | $ | 363 | |
Effective tax rate | | | (110.2 | )% | | | 243.9 | % | | | (354.1 | )% |
68
The high negative effective tax rate for the three months ended March 31, 2007 was due to pre-tax profits generated in the U.K. and Canada where we have not provided a valuation allowance against the related deferred tax assets. The high positive effective tax rate for the three months ended March 31, 2006 was due to valuation allowances that offset the tax benefits on certain losses.
Three Months Ended June 30, 2007 Compared to Three Months Ended June 30, 2006
| | | | | | | | | | | | |
| | | 2007 | | | 2006 | | | Change | |
| | | (dollars in thousands) | |
Provision for (benefit from) income taxes | | $ | (451 | ) | | $ | 1,982 | | | $ | (2,433 | ) |
Effective tax rate | | | 3.8 | % | | | 84.3 | % | | | (80.6 | )% |
The tax benefit recorded in the three months ended June 30, 2007 was due to benefits recorded for pre-tax losses generated in the U.K. The high positive effective tax rate for the three months ended June 30, 2006 was due to valuation allowances that offset the tax benefits on certain losses.
Three Months Ended September 30, 2007 Compared to Three Months Ended September 30, 2006
| | | | | | | | | | | | |
| | | 2007 | | | 2006 | | | Change | |
| | | (dollars in thousands) | |
Provision for (benefit from) income taxes | | $ | 3,464 | | | $ | (4,849 | ) | | $ | 8,313 | |
Effective tax rate | | | 84.1 | % | | | 106.5 | % | | | (22.4 | )% |
The high effective tax rate for the three months ended September 30, 2007 was due to taxes provided on pre-tax profits generated in the U.K. The high effective tax rate for the three months ended September 30, 2006 was due to valuation allowances that utilized pre-tax income in certain jurisdictions.
Three Months Ended December 31, 2007 Compared to Three Months Ended December 31, 2006
| | | | | | | | | | | | |
| | | 2007 | | | 2006 | | | Change | |
| | | (dollars in thousands) | |
Provision for income taxes | | $ | 826 | | | $ | 28,056 | | | $ | (27,230 | ) |
Effective tax rate | | | (1.5 | )% | | | 474.6 | % | | | (476.2 | )% |
The low negative effective tax rate for the three months ended December 31, 2007 was due to U.S. and certain other pre-tax losses for which the tax benefits were offset by valuation allowances provided against the related deferred tax assets. The high effective tax rate for the three months ended December 31, 2006 was due to a valuation allowance on substantially all U.S. deferred tax assets.
| Item 7A. | Quantitative and Qualitative Disclosures about Market Risk |
We are subject to interest rate risk on our floating rate credit facilities and could be subjected to higher interest payments if interest rates increase. For the year ended December 31, 2008, average borrowings on floating rate credit facilities included $91.2 million under the Western Facility, $68.3 million under the Wachovia Facility, $54.9 million under the Bank of America Facility and $30.3 million under the Kreditbank Facility. These facilities have interest rates that are based on associated rates such as Eurodollar and base or prime rates that fluctuate based on market conditions. A one percentage point increase/decrease in the average interest rate would have impacted interest expense by approximately $2.4 million in 2008.
A substantial part of our revenue and capital expenditures are transacted in currencies other than the U.S. dollar, and the functional currencies for our foreign subsidiaries are generally not the U.S. dollar. We enter into foreign forward exchange contracts to hedge certain balance sheet exposures against future movements in foreign exchange rates. A sudden or significant change in foreign exchange rates could have a material impact on our net income or loss or cash flows. The fair value of foreign exchange contracts are estimated using market quotes. The notional amount of foreign exchange contracts at December 31, 2008 and 2007 were approximately $75.5 million and $52.1 million, respectively. The carrying amounts, which are nominal, approximated fair value at December 31, 2008 and 2007. Gains and (losses) from foreign currency transactions are included in our consolidated statements of operations in the amounts of $(10.1) million, 2.1 million and $2.0 million, for the years ended December 31, 2008, 2007 and 2006, respectively. The majority of these foreign exchange contracts mature in six months or less. These contracts will settle in British pounds, Euros, Chilean pesos, Mexican pesos and U.S. dollars.
69
The translation of the consolidated financial statements of the non-United States operations is impacted by fluctuations in foreign currency exchange rates. We recorded translation gains (losses) in the amounts of $(38.5) million, $6.5 million and 17.4 million, for the years ended December 31, 2008, 2007 and 2006, respectively. Sales and operating income would have decreased by approximately $143.1 million and $0.7 million, respectively, if average foreign exchange rates had declined by 10% against the U.S. dollar in 2008. This amount was determined by considering the impact of a hypothetical foreign exchange rate on sales and operating income of the Company’s international operations.
On June 30, 2006, we entered into a cross-currency interest rate swap agreement with Wachovia Bank, N.A. to hedge our net Euro denominated investments with a notional principal amount of €6.0 million ($8.4 million using the exchange rate on December 31, 2008 of $1.40/€1.00). We have designated the change in Euro spot rates as the hedged risk in our net Euro denominated investments. Since the contract is a hedge of our net Euro denominated investments, the change in the fair value of the contract attributable to changes in spot rates, which is the effective portion of the hedge, will be recorded as an offset to our net Euro denominated investments in the accumulated other comprehensive income account on our balance sheet. All other changes in the fair value are recorded in operating income or expense as ineffectiveness. Under the terms of the swap agreement, Wachovia will pay us an interest payment computed on the three-month USD LIBOR in exchange for an interest payment from us computed on the three-month Euro LIBOR. On both sides of the swap, our bank margin of 1.5% will be added. The interest payments are reset every three months and at maturity there will be a cash settlement between us and Wachovia, which will be dependant on the conversion rates at maturity in comparison to the original spot rate of $1.28/€1.00. The swap agreement has a three-year maturity and may be terminated by us for convenience at no cost. As a result of entering into this swap agreement, we will be exposed to credit losses from counter-party non-performance; however, we do not anticipate any such losses from this agreement. The agreement will expose us to interest rate risk should Euro and USD LIBOR rates move unfavorably and currency risk if the Euro appreciates in value. The fair value of the cross-currency interest rate swap agreement was a $0.7 million liability at December 31, 2008.
In August 2003, we entered into an interest rate swap agreement in order to gain access to the lower borrowing rates generally available on floating-rate debt, while avoiding prepayment and other costs that would be associated with refinancing long-term fixed-rate debt. The swap agreement purchased has a notional amount of $40.0 million, expiring in June 2010, with a six-month settlement period and provides for variable interest at LIBOR plus a set rate spread. The notional amount of the swap was $25.8 million at December 31, 2007. The notional amount decreases ratably as the underlying debt is repaid. The interest rate swap had a negative fair value of $73,516 at December 31, 2007. The counterparty terminated the interest rate swap on February 6, 2008. The counterparty paid the Company approximately $15,000 in connection with the termination of the swap representing the fair market value of the interest rate swap on the termination date. Historically, changes in the fair market value of the instrument were recorded in the statement of operations.
| Item 8. | Financial Statements and Supplementary Data |
Index to Consolidated Financial Statements:
All other schedules are omitted because they are not applicable or the required information is shown in the financial statements or notes thereto.
70
REPORT OF INDEPENDENT REGISTERED PUBLIC ACCOUNTING FIRM
The Board of Directors and Shareholders of
Bell Microproducts Inc.
San Jose, California
We have audited the accompanying consolidated balance sheets of Bell Microproducts Inc. and subsidiaries (the “Company”) as of December 31, 2008 and 2007, and the related consolidated statements of operations, shareholders’ equity (deficit) and comprehensive loss and cash flows for the years then ended. Our audits also included the financial statement schedule listed in the Index at Item 15 (a) (2) for the years ended December 31, 2008 and 2007. These financial statements and financial statement schedule are the responsibility of the Company’s management. Our responsibility is to express an opinion on the financial statements and financial statement schedule based on our audits.
We conducted our audits in accordance with the standards of the Public Company Accounting Oversight Board (United States). Those standards require that we plan and perform the audit to obtain reasonable assurance about whether the financial statements are free of material misstatement. An audit includes examining, on a test basis, evidence supporting the amounts and disclosures in the financial statements. An audit also includes assessing the accounting principles used and significant estimates made by management, as well as evaluating the overall financial statement presentation. We believe that our audits provide a reasonable basis for our opinion.
In our opinion, such 2008 and 2007 consolidated financial statements present fairly, in all material respects, the financial position of Bell Microproducts Inc. and subsidiaries as of December 31, 2008 and 2007, and the results of their operations and their cash flows for the years then ended, in conformity with accounting principles generally accepted in the United States of America. Also, in our opinion, such financial statement schedule, when considered in relation to the basic financial statements taken as a whole, presents fairly, in all material respects, the information set forth therein.
As discussed in Note 9 to the consolidated financial statements, on January 1, 2007, the Company adopted Financial Accounting Standards Board Interpretation No. 48, “Accounting for Uncertainty in Income Taxes.”
We have also audited, in accordance with the standards of the Public Company Accounting Oversight Board (United States), the effectiveness of the Company’s internal control over financial reporting as of December 31, 2008, based on the criteria established inInternal Control—Integrated Framework issued by the Committee of Sponsoring Organizations of the Treadway Commission and our report dated June 28, 2009 expressed an adverse opinion on the effectiveness of the Company’s internal control over financial reporting because of material weaknesses.
|
| /s/ Deloitte & Touche LLP |
|
| San Jose, California |
| June 28, 2009 |
71
REPORT OF INDEPENDENT REGISTERED PUBLIC ACCOUNTING FIRM
To Board of Directors and Shareholders of Bell Microproducts Inc.:
In our opinion, the consolidated statements of operations, shareholders’ equity (deficit) and comprehensive loss, and cash flows for the year ended December 31, 2006 present fairly, in all material respects, the results of operations and cash flows of Bell Microproducts Inc. and its subsidiaries for the year ended December 31, 2006, in conformity with accounting principles generally accepted in the United States of America. In addition, in our opinion, the financial statement schedule for the year ended December 31, 2006 presents fairly, in all material respects, the information set forth therein when read in conjunction with the related consolidated financial statements. These financial statements and financial statement schedule are the responsibility of the Company’s management. Our responsibility is to express an opinion on these financial statements and financial statement schedule based on our audit. We conducted our audit of these statements in accordance with the standards of the Public Company Accounting Oversight Board (United States). Those standards require that we plan and perform the audit to obtain reasonable assurance about whether the financial statements are free of material misstatement. An audit includes examining, on a test basis, evidence supporting the amounts and disclosures in the financial statements, assessing the accounting principles used and significant estimates made by management, and evaluating the overall financial statement presentation. We believe that our audit provides a reasonable basis for our opinion.
As discussed in Note 1 to the consolidated financial statements, the Company is subject to material risks and uncertainties related to maintaining compliance with the provisions of its existing credit agreements.
PricewaterhouseCoopers LLP
San Jose, California
December 29, 2008, except for the change in the composition of reportable segments discussed in Note 13 to the consolidated financial statements, as to which the date is June 24, 2009
72
BELL MICROPRODUCTS INC.
CONSOLIDATED BALANCE SHEETS
| | | | | | | | |
| | | December 31, | |
| | | 2008 | | | 2007 | |
| | | (in thousands, except per
share data) | |
| ASSETS | |
Current assets: | | | | | | | | |
Cash and cash equivalents | | $ | 22,775 | | | $ | 40,348 | |
Accounts receivable, net | | | 435,569 | | | | 544,137 | |
Inventories | | | 230,652 | | | | 424,117 | |
Prepaid expenses and other current assets | | | 19,779 | | | | 17,053 | |
| | | | | | | | |
Total current assets | | | 708,775 | | | | 1,025,655 | |
Property and equipment, net | | | 19,042 | | | | 20,672 | |
Goodwill | | | 19,211 | | | | 26,214 | |
Other intangibles, net | | | 9,315 | | | | 13,023 | |
Other long-term assets | | | 18,545 | | | | 16,262 | |
| | | | | | | | |
Total assets | | $ | 774,888 | | | $ | 1,101,826 | |
| | | | | | | | |
|
| LIABILITIES AND SHAREHOLDERS’ EQUITY (DEFICIT) | |
Current liabilities: | | | | | | | | |
Cash overdraft | | $ | 10,527 | | | $ | 21,627 | |
Accounts payable | | | 264,218 | | | | 411,713 | |
Borrowings under lines of credit | | | 211,405 | | | | 277,428 | |
Current portion of long-term debt | | | 10,286 | | | | 14,508 | |
Other accrued liabilities | | | 94,658 | | | | 103,523 | |
| | | | | | | | |
Total current liabilities | | | 591,094 | | | | 828,799 | |
Long-term debt, net of current portion | | | 183,547 | | | | 160,053 | |
Other long-term liabilities | | | 15,751 | | | | 16,538 | |
| | | | | | | | |
Total liabilities | | | 790,392 | | | | 1,005,390 | |
| | | | | | | | |
Commitments and contingencies (Note 10) | | | | | | | | |
Shareholders’ equity (deficit): | | | | | | | | |
Preferred stock, $0.01 par value, 10,000 shares authorized; none issued and outstanding | | | — | | | | — | |
Common stock, $0.01 par value, 80,000 shares authorized; 31,774 and 32,287 shares issued and outstanding at December 31, 2008 and 2007, respectively | | | 201,701 | | | | 200,308 | |
Accumulated deficit | | | (208,973 | ) | | | (134,153 | ) |
Accumulated other comprehensive income (loss) | | | (8,232 | ) | | | 30,281 | |
| | | | | | | | |
Total shareholders’ equity (deficit) | | | (15,504 | ) | | | 96,436 | |
| | | | | | | | |
Total liabilities and shareholders’ equity (deficit) | | $ | 774,888 | | | $ | 1,101,826 | |
| | | | | | | | |
The accompanying notes are an integral part of these consolidated financial statements.
73
BELL MICROPRODUCTS INC.
CONSOLIDATED STATEMENTS OF OPERATIONS
| | | | | | | | | | | | |
| | | Years Ended December 31, | |
| | | 2008 | | | 2007 | | | 2006 | |
| | | (in thousands, except per share data) | |
Net sales | | $ | 3,579,499 | | | $ | 3,949,905 | | | $ | 3,372,876 | |
Cost of sales | | | 3,244,053 | | | | 3,609,362 | | | | 3,098,135 | |
| | | | | | | | | | | | |
Gross profit | | | 335,446 | | | | 340,543 | | | | 274,741 | |
Selling, general and administrative expense | | | 307,046 | | | | 293,780 | | | | 238,166 | |
Investigation and restatement-related costs | | | 52,133 | | | | 26,328 | | | | 1,649 | |
Impairment of goodwill and other intangibles | | | 5,864 | | | | 52,445 | | | | 3,477 | |
Restructuring and impairment costs | | | 4,289 | | | | 1,404 | | | | — | |
| | | | | | | | | | | | |
Total operating expenses | | | 369,332 | | | | 373,957 | | | | 243,292 | |
| | | | | | | | | | | | |
Operating income (loss) | | | (33,886 | ) | | | (33,414 | ) | | | 31,449 | |
Interest expense, net | | | 29,898 | | | | 34,163 | | | | 29,456 | |
Other expense (income), net | | | 10,509 | | | | (2,426 | ) | | | (2,848 | ) |
| | | | | | | | | | | | |
Income (loss) before income taxes | | | (74,293 | ) | | | (65,151 | ) | | | 4,841 | |
Provision for income taxes | | | 527 | | | | 6,961 | | | | 27,948 | |
| | | | | | | | | | | | |
Net loss | | $ | (74,820 | ) | | $ | (72,112 | ) | | $ | (23,107 | ) |
| | | | | | | | | | | | |
Net loss per share: | | | | | | | | | | | | |
Basic | | $ | (2.32 | ) | | $ | (2.24 | ) | | $ | (0.75 | ) |
| | | | | | | | | | | | |
Diluted | | $ | (2.32 | ) | | $ | (2.24 | ) | | $ | (0.75 | ) |
| | | | | | | | | | | | |
Shares used in per share calculation: | | | | | | | | | | | | |
Basic | | | 32,299 | | | | 32,248 | | | | 30,772 | |
| | | | | | | | | | | | |
Diluted | | | 32,299 | | | | 32,248 | | | | 30,772 | |
| | | | | | | | | | | | |
The accompanying notes are an integral part of these consolidated financial statements.
74
BELL MICROPRODUCTS INC.
CONSOLIDATED STATEMENTS OF SHAREHOLDERS’ EQUITY (DEFICIT)
AND COMPREHENSIVE LOSS
(in thousands)
| | | | | | | | | | | | | | | | | | | | | | | | | | | |
| | | Common Stock | | | Deferred
Compensation | | | Accumulated
Deficit | | | Accumulated
Other
Comprehensive
Income (Loss) | | | Total
Shareholders’
Equity (Deficit) | | | Comprehensive
Loss | |
| | | | | | |
| | | Shares | | | Amount | | | | | | |
Balance at January 1, 2006 | | 30,062 | | | $ | 189,949 | | | $ | (3,289 | ) | | $ | (37,398 | ) | | $ | 6,065 | | | $ | 155,327 | | | | | |
Currency translation adjustment | | — | | | | — | | | | — | | | | — | | | | 17,372 | | | | 17,372 | | | $ | 17,372 | |
Net unrealized gain on available-for-sale security | | — | | | | — | | | | — | | | | — | | | | 37 | | | | 37 | | | | 37 | |
Changes in unrealized gain on derivative instruments, net of tax | | — | | | | — | | | | — | | | | — | | | | 287 | | | | 287 | | | | 287 | |
Net loss | | — | | | | — | | | | — | | | | (23,107 | ) | | | — | | | | (23,107 | ) | | | (23,107 | ) |
| | | | | | | | | | | | | | | | | | | | | | | | | | | |
Total comprehensive loss | | | | | | | | | | — | | | | | | | | | | | | | | | $ | (5,411 | ) |
| | | | | | | | | | | | | | | | | | | | | | | | | | | |
Exercise of stock options and vesting of restricted stock units | | 375 | | | | 597 | | | | — | | | | — | | | | — | | | | 597 | | | | | |
Issuance of shares related to acquisition | | 1,725 | | | | 8,830 | | | | — | | | | — | | | | — | | | | 8,830 | | | | | |
Issuance of warrants to the RSA | | — | | | | 382 | | | | — | | | | — | | | | — | | | | 382 | | | | | |
Adoption of FAS 123R | | — | | | | (3,289 | ) | | | 3,289 | | | | — | | | | — | | | | — | | | | | |
Stock-based compensation | | — | | | | 2,385 | | | | — | | | | — | | | | — | | | | 2,385 | | | | | |
| | | | | | | | | | | | | | | | | | | | | | | | | | | |
Balance at December 31, 2006 | | 32,162 | | | | 198,854 | | | | — | | | | (60,505 | ) | | | 23,761 | | | | 162,110 | | | | | |
Currency translation adjustment | | — | | | | — | | | | — | | | | — | | | | 7,408 | | | | 7,408 | | | | 7,408 | |
Net unrealized loss on available-for-sale security | | — | | | | — | | | | — | | | | — | | | | (18 | ) | | | (18 | ) | | | (18 | ) |
Changes in unrealized loss on derivative instruments, net of tax | | — | | | | — | | | | — | | | | — | | | | (870 | ) | | | (870 | ) | | | (870 | ) |
Net loss | | — | | | | — | | | | — | | | | (72,112 | ) | | | — | | | | (72,112 | ) | | | (72,112 | ) |
| | | | | | | | | | | | | | | | | | | | | | | | | | | |
Total comprehensive loss | | | | | | | | | | — | | | | | | | | | | | | | | | $ | (65,592 | ) |
| | | | | | | | | | | | | | | | | | | | | | | | | | | |
Exercise of stock options and vesting of RSUs | | 125 | | | | 36 | | | | — | | | | — | | | | — | | | | 36 | | | | | |
Tax benefit associated with exercise of stock options | | — | | | | 68 | | | | — | | | | — | | | | — | | | | 68 | | | | | |
Stock-based compensation | | — | | | | 1,350 | | | | — | | | | — | | | | — | | | | 1,350 | | | | | |
Adjustment for the cumulative effect of prior years of the adoption of FIN 48 | | — | | | | — | | | | — | | | | (1,536 | ) | | | — | | | | (1,536 | ) | | | | |
| | | | | | | | | | | | | | | | | | | | | | | | | | | |
Balance at December 31, 2007 | | 32,287 | | | | 200,308 | | | | — | | | | (134,153 | ) | | | 30,281 | | | | 96,436 | | | | | |
Currency translation adjustment | | — | | | | — | | | | — | | | | — | | | | (38,895 | ) | | | (38,895 | ) | | | (38,895 | ) |
Net unrealized loss on available-for-sale security | | — | | | | — | | | | — | | | | — | | | | (30 | ) | | | (30 | ) | | | (30 | ) |
Changes in unrealized loss on derivative instruments, net of tax | | — | | | | — | | | | — | | | | — | | | | 412 | | | | 412 | | | | 412 | |
Net loss | | — | | | | — | | | | — | | | | (74,820 | ) | | | — | | | | (74,820 | ) | | | (74,820 | ) |
| | | | | | | | | | | | | | | | | | | | | | | | | | | |
Total comprehensive loss | | | | | | | | | | — | | | | | | | | | | | | | | | $ | (113,333 | ) |
| | | | | | | | | | | | | | | | | | | | | | | | | | | |
Exercise of stock options and vesting of RSUs | | 197 | | | | — | | | | — | | | | — | | | | — | | | | — | | | | | |
Repurchase of shares | | (710 | ) | | | (1,562 | ) | | | — | | | | — | | | | — | | | | (1,562 | ) | | | | |
Stock-based compensation | | — | | | | 2,955 | | | | — | | | | — | | | | — | | | | 2,955 | | | | | |
| | | | | | | | | | | | | | | | | | | | | | | | | | | |
Balance at December 31, 2008 | | 31,774 | | | $ | 201,701 | | | $ | — | | | $ | (208,973 | ) | | $ | (8,232 | ) | | $ | (15,504 | ) | | | | |
| | | | | | | | | | | | | | | | | | | | | | | | | | | |
The accompanying notes are an integral part of these consolidated financial statements.
75
BELL MICROPRODUCTS INC.
CONSOLIDATED STATEMENTS OF CASH FLOWS
| | | | | | | | | | | | |
| | | Years Ended December 31, | |
| | | 2008 | | | 2007 | | | 2006 | |
| | | (in thousands) | |
Cash flows from operating activities: | | | | | | | | | | | | |
Net loss | | $ | (74,820 | ) | | $ | (72,112 | ) | | $ | (23,107 | ) |
Adjustments to reconcile net loss to net cash provided by (used in) operating activities: | | | | | | | | | | | | |
Depreciation and amortization | | | 10,774 | | | | 10,968 | | | | 7,924 | |
Amortization of debt issuance costs | | | 3,546 | | | | 3,185 | | | | 867 | |
Amortization debt discount | | | 422 | | | | 539 | | | | — | |
Stock-based compensation expense | | | 4,893 | | | | 1,418 | | | | 2,385 | |
Provision for bad debts | | | 16,375 | | | | 7,090 | | | | 8,506 | |
Non-cash compensation | | | 4,019 | | | | 372 | | | | — | |
Loss on property and equipment | | | 225 | | | | 610 | | | | 334 | |
Unrealized loss (gain) on currency remeasurement | | | 3,662 | | | | (274 | ) | | | 1,536 | |
Impairment of goodwill and other intangibles | | | 5,864 | | | | 52,445 | | | | 3,477 | |
Deferred taxes | | | (2,008 | ) | | | 2,588 | | | | 20,204 | |
Changes in assets and liabilities: | | | | | | | | | | | | |
Accounts receivable | | | 23,907 | | | | (23,575 | ) | | | (11,480 | ) |
Inventories | | | 178,225 | | | | (45,728 | ) | | | (41,930 | ) |
Prepaid expenses and other assets | | | (865 | ) | | | 5,885 | | | | (2,819 | ) |
Accounts payable and book overdrafts | | | (123,153 | ) | | | 59,500 | | | | (30,059 | ) |
Other accrued liabilities | | | (8,618 | ) | | | (7,430 | ) | | | 18,591 | |
| | | | | | | | | | | | |
Net cash provided by (used in) operating activities | | | 42,448 | | | | (4,519 | ) | | | (45,571 | ) |
Cash flows from investing activities: | | | | | | | | | | | | |
Proceeds from sale of property and equipment | | | 47 | | | | 124 | | | | 109 | |
Purchases of property and equipment | | | (7,604 | ) | | | (9,247 | ) | | | (6,357 | ) |
Payments associated with acquisitions of businesses, net of cash acquired | | | — | | | | (2,324 | ) | | | (27,882 | ) |
| | | | | | | | | | | | |
Net cash used in investing activities | | | (7,557 | ) | | | (11,447 | ) | | | (34,130 | ) |
Cash flows from financing activities: | | | | | | | | | | | | |
Net (repayments) borrowings under lines of credit | | | (40,513 | ) | | | 47,549 | | | | 48,714 | |
Debt issuance costs | | | (2,480 | ) | | | (9,770 | ) | | | (697 | ) |
Borrowings under long-term notes payable | | | 10,000 | | | | — | | | | 35,000 | |
Payments under long-term notes payable and capital lease obligations | | | (10,884 | ) | | | (8,781 | ) | | | (8,766 | ) |
Repurchases of common stock | | | (3,500 | ) | | | — | | | | — | |
Proceeds from issuances of common stock | | | — | | | | 36 | | | | 597 | |
| | | | | | | | | | | | |
Net cash (used in) provided by financing activities | | | (47,377 | ) | | | 29,034 | | | | 74,848 | |
Effect of exchange rate changes on cash | | | (5,087 | ) | | | 686 | | | | 1,267 | |
| | | | | | | | | | | | |
(Decrease) increase in cash and cash equivalents | | | (17,573 | ) | | | 13,754 | | | | (3,586 | ) |
Cash and cash equivalents, beginning of year | | | 40,348 | | | | 26,594 | | | | 30,180 | |
| | | | | | | | | | | | |
Cash and cash equivalents, end of year | | $ | 22,775 | | | $ | 40,348 | | | $ | 26,594 | |
| | | | | | | | | | | | |
Cash payments (receipts) during the year: | | | | | | | | | | | | |
Interest | | $ | 43,326 | | | $ | 36,418 | | | $ | 26,643 | |
Income taxes | | $ | 3,038 | | | $ | 4,935 | | | $ | 7,321 | |
Income tax receipts | | $ | 5,221 | | | $ | 1,186 | | | $ | — | |
Supplemental non-cash investing activities: | | | | | | | | | | | | |
Issuance of common stock for acquisitions | | $ | — | | | $ | — | | | $ | 8,830 | |
Purchase price adjustment-ProSys | | $ | — | | | $ | 5,694 | | | $ | — | |
Accrual of earnout payments associated with acquisitions | | $ | 1,151 | | | $ | 1,617 | | | $ | 1,509 | |
Settlement of earnout associated with acquisitions | | $ | 1,056 | | | $ | — | | | $ | — | |
Supplemental non-cash financing activities: | | | | | | | | | | | | |
Warrants issued in connection with debt issuances | | $ | — | | | $ | — | | | $ | 382 | |
The accompanying notes are an integral part of these consolidated financial statements.
76
BELL MICROPRODUCTS INC.
NOTES TO THE CONSOLIDATED FINANCIAL STATEMENTS
NOTE 1 — ORGANIZATION, BUSINESS OF COMPANY AND CREDIT AGREEMENT COVENANTS
Description of Operations
Bell Microproducts Inc., a California corporation, and its subsidiaries (collectively, the “Company”) is a distributor of storage products and systems, as well as computer products and peripherals to original equipment manufacturers (“OEMs”), value-added resellers (“VARs”) and dealers in the United States, Canada, Latin America and Europe.
Financial Statement Presentation and Liquidity
The Company’s consolidated financial statements have been prepared on a going concern basis, which assumes continuity of operations and realization of assets and satisfaction of liabilities in the ordinary course of business. The Company currently has a substantial amount of indebtedness outstanding. The related credit agreements require the Company to comply with a number of financial and other covenants, including a quarterly minimum fixed-charge coverage ratio based upon earnings. The Company’s ability to continue as a going concern is dependent upon, among other factors, continuing to generate positive cash flows from operations, maintaining compliance with the provisions of its existing credit agreements and, when necessary, its ability to renew such agreements and/or obtain alternative or additional financing.
The Company has not generated consistent positive cash flows from operations in recent years. Although the current economic environment is challenging, the Company has recently taken significant steps to control costs and improve operating profitability, including staff reductions, facility consolidations, reductions in capital spending, reductions in discretionary spending and tighter management of working capital. The Company will take additional steps to control costs and improve operating profitability, as necessary, based upon various factors, such as future operating results and general economic conditions. Based upon its current projections, the Company believes it will generate sufficient cash flows from operations, maintain debt covenant compliance and be able to obtain alternative or additional financing, if needed, for the foreseeable future. If the Company does not maintain compliance with its debt covenants and is unable to obtain waivers or amendments from its lenders, the lenders may exercise their option to demand repayment of the outstanding indebtedness, which would have a material adverse effect on the Company’s business, liquidity and financial condition.
NOTE 2 — SUMMARY OF SIGNIFICANT ACCOUNTING POLICIES
Principles of Consolidation and Basis of Preparation
The consolidated financial statements include the accounts of Bell Microproducts Inc. and its wholly owned subsidiaries. All intercompany transactions and balances have been eliminated in consolidation.
The preparation of consolidated financial statements in accordance with accounting principles generally accepted in the United States requires management to make estimates and assumptions that affect the amounts reported in the Company’s consolidated financial statements and accompanying notes. These estimates may affect the reported amounts of assets and liabilities and the disclosure of contingent assets at the date of the financial statements. They may also affect the reported amounts of revenues and expenses during the reporting period. Management bases its estimates on historical experience and various other assumptions that it believes to be reasonable. Although these estimates are based on management’s assessment of current events and actions that may impact the Company in the future, actual results may differ materially from the estimates. The Company’s critical accounting estimates are those that affect its consolidated financial statements materially and involve difficult, subjective or complex judgments by management.
Revenue Recognition
The Company principally generates revenues from distributing storage products and systems and computer products and peripherals. The Company also provides value-added services such as system design, integration, installation, maintenance and other consulting services, combined with a variety of storage and computer hardware and software products.
77
The Company recognizes product revenue when the following conditions are met: (1) a firm customer order has been received, (2) the goods have been shipped and title and risk of loss have been passed to the buyer, (3) the price to the buyer is fixed or determinable and (4) collectibility is reasonably assured. Revenue is recorded net of estimated discounts, rebates and estimated returns. The Company recognizes service revenue as the services are performed, and the related costs are expensed as incurred unless installation is essential to the functionality of the product, then product and service revenue is deferred until the service is completed. Service revenues have represented less than 10% of total net sales for 2008, 2007 and 2006.
Certain customer arrangements require evaluation of the criteria outlined in Issue No. 99-19 of the Emerging Issues Task Force (“EITF”),Reporting Revenue Gross as a Principal Versus Net as an Agentin determining whether it is appropriate to record the gross amount of sales and related costs or the net amount earned as agency fees. Generally, when the Company is primarily obligated in a transaction, revenue is recorded on a gross basis. Other factors that the Company considers in determining whether to recognize revenue on a gross versus net basis include the assumption of general and physical inventory risk, latitude in establishing prices, discretion in selecting suppliers, determination of product or service specifications, involvement in the provision of services and assumption of credit risk. When the Company concludes that it is not primarily obligated, the Company records the net amount earned as agency fees within net sales. The Company recognized net revenue in the amounts of $8.5 million, $10.5 million and $3.4 million during 2008, 2007 and 2006, respectively.
The Company enters into multiple-element revenue arrangements, as defined in EITF 00-21,Revenue Arrangements with Multiple Deliverables, which may include any combination of services, extended warranty and hardware. A multiple-element arrangement is separated into more than one unit of accounting if all of the following criteria are met:
| | • | | The delivered item(s) has value to the customer on a stand-alone basis; |
| | • | | There is objective and reliable evidence of the fair value of the undelivered item(s); and |
| | • | | If the arrangement includes a general right of return relative to the delivered item(s), delivery or performance of the undelivered item(s) is considered probable and substantially in the control of the Company. |
If these criteria are met for each element and there is objective and reliable evidence of fair value for all units of accounting in an arrangement, the arrangement consideration is allocated to the separate units of accounting based on each unit’s relative fair value. If these criteria are not met, revenue is deferred and recognized upon delivery of the undelivered items.
Shipping and handling costs charged to customers are included in net sales and the associated expense is recorded in cost of sales for all periods presented.
Cost of Sales
Cost of sales comprises all costs for products and services sold. The Company records warehouse costs to operating expenses as opposed to cost of sales.
Cash and Cash Equivalents and Cash Overdraft
Cash equivalents consist of highly liquid investments that are readily convertible into cash and have original maturities of three months or less. Cash overdraft represents payments recorded by the Company in excess of available bank funds. Changes in cash overdraft are recorded in cash provided by (used in) operating activities in the accompanying consolidated statements of cash flows.
Accounts Receivable and Allowance for Doubtful Accounts
Trade accounts receivable are recorded at the invoiced amount and do not bear interest. The Company evaluates the collectibility of its accounts receivable based on a combination of factors. Collection risks are mitigated by (i) sales to well-established companies; (ii) ongoing credit evaluation of its customers; and (iii) frequent contact with its customers, especially
78
its most significant customers, which enables the Company to monitor changes in business operations and to respond accordingly. When the Company is aware of circumstances that may impair a specific customer’s ability to meet its financial obligations, the Company records a specific allowance against amounts due to it and thereby reduces the net receivable to the amount the Company reasonably believes is likely to be collected. For all other customers, the Company recognizes allowances for doubtful accounts based on the length of time the receivables are outstanding, industry and geographic concentrations, the current business environment and its historical experience.
Customer credits pertaining to price protection programs, rebate programs, promotions and product returns are recorded to offset customer receivables. When applicable, credits are extinguished when a customer applies them to its related receivable or the Company is legally released from being the primary obligor under the liability.
Vendor Programs
The Company receives funds from vendors for price protection, product rebates, marketing, promotions and other competitive pricing programs. These amounts are recorded as a vendor receivable, as a reduction to accounts payable, with a corresponding reduction to inventories, cost of sales or selling, general and administrative expense, depending on the nature of the program. Vendor receivables are generally collected through vendor authorized reductions to the Company’s accounts payable, and reserves are established for vendor receivables that are determined to be uncollectible. Actual rebates may vary based on volume or other sales achievement levels, which could result in an increase or reduction in the estimated amounts previously accrued.
Financial Instruments, Concentration of Credit and Other Risks
Financial instruments consist of cash and cash equivalents, foreign exchange forward contracts, interest rate swap agreements, accounts receivable, accounts payable and short-term debt obligations. The fair value of these financial instruments approximates their carrying value as of December 31, 2008 and 2007, due to the nature of these instruments or their short-term maturity. Financial instruments also include long-term debt, the fair value of which is disclosed in Note 6 — Lines of Credit and Term Loans.
Financial instruments that potentially subject the Company to concentrations of credit risk consist principally of accounts receivable. The Company performs ongoing credit evaluations of its customers and generally does not require collateral. The Company maintains allowances for estimated collection losses. No customer accounted for more than 10% of net sales in any of the three years ended December 31, 2008, 2007 and 2006, or of accounts receivable at December 31, 2008 or 2007.
Five vendors accounted for 24% of the Company’s inventory purchases during 2008. Five vendors accounted for 26% of the Company’s inventory purchases during 2007 and five vendors accounted for 39% of the Company’s inventory purchases during 2006.
Inventories
Inventories are stated at the lower of cost or market. Cost is generally determined by the first-in, first-out (“FIFO”) method. Market is based on estimated net realizable value. The Company assesses the valuation of its inventory on a quarterly basis and periodically writes down the value for estimated excess and obsolete inventory based on estimates about future demand, actual usage and current market value. The Company’s only component of inventory is finished goods. When inventory is written down, a new cost basis is established.
Property and Equipment
Property and equipment are recorded at cost. Depreciation is computed using the straight-line method based upon the estimated useful lives of computer and other equipment, furniture and fixtures and warehouse equipment, which range from three to five years. Maintenance and repairs are charged to expense as incurred, and improvements are capitalized. Amortization of leasehold improvements is computed using the straight-line method over the shorter of the estimated life of the asset or the lease term.
79
Goodwill
The Financial Accounting Standards Board (“FASB”) Statement of Financial Accounting Standards (“SFAS”) No. 142,Goodwill and Other Intangible Assets(“SFAS 142”) requires goodwill to be tested for impairment and written down when impaired on an annual basis and between annual tests in certain circumstances. SFAS 142 also requires purchased intangible assets other than goodwill to be amortized over their useful lives unless these lives are determined to be indefinite.
In accordance with SFAS 142, a two-step impairment test is required to identify potential goodwill impairment and measure the amount of the goodwill impairment loss to be recognized. In the first step, the fair value of each reporting unit is compared to its carrying value to determine if the goodwill is impaired. If the fair value of the reporting unit exceeds the carrying value of the net assets assigned to that unit, then goodwill is not impaired and no further testing is required. If the carrying value of the net assets assigned to the reporting unit exceeds its fair value, then the second step is performed in order to determine the implied fair value of the reporting unit’s goodwill and an impairment loss is recorded for an amount equal to the difference between the implied fair value and the carrying value of the goodwill.
Long-Lived Assets and Other Intangible Assets
Long-lived assets and certain identifiable intangible assets to be held and used are reviewed for impairment whenever events or changes in circumstances indicate that the carrying amount of such assets may not be recoverable. Determination of recoverability is based on an estimate of undiscounted future cash flows resulting from the use of the asset and its eventual disposition. Measurement of any impairment loss for long-lived assets that management expects to hold and use is based on the fair value of the asset.
Other intangible assets consist of non-compete agreements, intellectual property and contractual and non-contractual customer relationships obtained in acquisitions. These assets are included within other intangibles, net within the consolidated balance sheets and are carried at cost less accumulated amortization. Amortization is computed over the estimated useful lives of the respective assets ranging from three to 20 years and using the straight-line method. Intangible assets are evaluated for impairment whenever events or changes in circumstances indicate the carrying value of an asset may not be recoverable. An impairment loss is recognized when estimated undiscounted cash flows expected to result from the use of the asset plus net proceeds expected from disposition of the asset (if any) are less than the carrying value of the asset. When an impairment loss is recognized, the carrying amount of the asset is reduced to its estimated fair value.
Other Expense (Income), Net
Other expense (income), net consists of the gains and losses arising from foreign currency transactions. The Company’s revenues and expenses are translated into U.S. dollars using the average exchange rates prevailing for each period presented.
Income Taxes
The Company’s provision for income taxes is comprised of its current tax liability and the change in deferred tax assets and liabilities. Deferred tax assets and liabilities are recorded for temporary differences between the tax basis of assets and liabilities and their reported amounts in the financial statements, using statutory tax rates in effect for the year in which the differences are expected to reverse. The effect on deferred tax assets and liabilities due to a change in tax rate(s) is recognized in the results of operations for the period that includes the enactment date. A valuation allowance is recorded to reduce the carrying value of deferred tax assets unless it is more likely than not that such assets will be realized. The Company’s effective tax rate includes the impact of certain undistributed foreign earnings for which no U.S. taxes have been provided because such earnings are planned to be indefinitely reinvested outside the United States. The Company’s income tax calculations are based on the applicable federal, state or foreign corporate income tax laws.
At December 31, 2008, there was no provision for U.S. income tax for undistributed earnings from foreign subsidiaries as it is currently the Company’s intention to reinvest these earnings indefinitely in operations outside the U.S. The Company believes it is not practicable to determine the Company’s tax liability that may arise in the event of a future repatriation of foreign earnings. If repatriated, these earnings could result in a tax expense at the current federal statutory tax rate of 35%, subject to available net operating losses and other factors. Tax on undistributed earnings may also be reduced by foreign tax
80
credits that may be generated in connection with the repatriation of earnings. The Company expects to satisfy its anticipated cash needs for operations and capital requirements in all jurisdictions through December 31, 2009 using existing cash, anticipated cash flows generated from operations and borrowings under its existing lines of credit. Virtually all of the Company’s foreign jurisdictions need cash for day-to-day operations and expansion and, as such, the Company does not plan to repatriate any of the foreign earnings. Subject to limitation, tax on undistributed earnings may also be reduced by foreign tax credits that may be generated in connection with the repatriation of earnings.
The Company calculates its current and deferred tax provision based on estimates and assumptions that could differ from the actual results reflected in income tax returns filed. Adjustments based on filed returns are generally recorded in the period when the tax returns are filed and the global tax implications are known.
The Company provides for potential income tax liabilities that could result from examination of prior and current year tax returns if the incurrence of the income tax liability is more likely than not and the amount of loss reasonably estimable.
The amount of income tax the Company pays is subject to audits by federal, state and foreign tax authorities, which may result in proposed assessments. The Company’s estimate of the potential outcome for any uncertain tax issue requires significant judgment. The Company believes it has adequately provided for any reasonably foreseeable outcome related to these matters. However, the Company’s future results may include favorable or unfavorable adjustments to its estimated tax liabilities in the period the assessments are made or resolved, audits are closed or when statutes of limitation on potential assessments expire. Additionally, the jurisdictions in which the Company’s earnings or deductions are realized may differ from its current estimates. As a result, the Company’s effective tax rate may fluctuate significantly on a quarterly basis.
As part of the Company’s accounting for business combinations, some of the purchase price is allocated to goodwill and intangible assets. Impairment charges associated with goodwill are generally not tax deductible and will result in an increased effective income tax rate in the quarter the impairment is recorded. Amortization expense associated with acquired intangible assets is not tax deductible; however, deferred tax liabilities have been recorded for non-deductible amortization expense as part of the purchase price allocations. In establishing the related deferred tax liabilities, the Company has taken into account the allocation of these identified intangibles among different taxing jurisdictions. Income tax contingencies existing as of the acquisition dates of the acquired companies are evaluated quarterly and any adjustments are recorded as an adjustment to goodwill.
Effective January 1, 2007, the Company adopted the provisions of FASB’s Interpretation No. 48,Accounting for Uncertainty in Income Taxes, an Interpretation of FASB Statement No. 109 (“FIN 48”). FIN 48 prescribes a more-likely-than-not threshold for financial statement recognition and measurement of a tax position taken or expected to be taken in a tax return. This interpretation also provides guidance on derecognition of income tax assets and liabilities, classification of current and deferred income tax assets and liabilities, accounting for interest and penalties associated with tax positions, accounting for income taxes in interim periods and income tax disclosures. The cumulative effect of applying this interpretation has been recorded as a decrease of $1.5 million to accumulated deficit. The Company reports penalties and interest expense as a component of the provision for income taxes and interest income from tax refunds as a component of other income in the consolidated statement of operations.
Net Loss Per Share
Basic and diluted loss per share is calculated using the weighted average number of common shares outstanding during the period. Potentially issuable shares of common stock and their effects on income were excluded from the diluted calculations as their effect was anti-dilutive.
Foreign Currency Translation and Transactions
The Company maintains its accounting records for subsidiaries located outside of the U.S. in the subsidiaries’ local currency, and, in each case, the local currency has been determined to be the functional currency under the provisions of FASB’s Statement of Financial Accounting Standards No. 52,Foreign Currency Translation (“SFAS 52”). Assets and liabilities of these subsidiaries are translated into U.S. dollars at the rates of exchange at the balance sheet date. Income and expense items are translated at weighted average monthly rates of exchange prevailing during the year. The resulting translation adjustments are included in accumulated other comprehensive income as a separate component of shareholders’
81
equity. Exchange gains and losses arising from transactions denominated in a currency other than the functional currency of the entity involved are included in the statements of operations. Gains and losses from foreign currency transactions are included in other expense (income), net in the consolidated financial statements of operations in the amounts of $10.1 million, $(2.0) million and $2.0 million for the years ended December 31, 2008, 2007 and 2006, respectively.
Comprehensive Income (Loss)
Comprehensive income (loss) is defined as the change in equity of a business enterprise during a period from transactions and other events and circumstances from non-owner sources. For the Company, comprehensive income (loss) consists of its net income (loss), the change in the currency translation adjustment and the change in unrealized gain (loss) on certain derivative instruments, net of tax.
Accumulated other comprehensive (loss) was $8.2 million at December 31, 2008, and accumulated other comprehensive income was $30.3 million at December 31, 2007. Foreign currency translation adjustments consist of adjustments to consolidate subsidiaries that use the local currency as their functional currency and transaction gains and losses related to intercompany dollar-denominated debt that is not expected to be repaid in the foreseeable future.
Stock-Based Compensation
On January 1, 2006, the Company adopted FASB’s Statement of Financial Accounting Standards No. 123.Accounting for Stock-Based Compensation— Revised 2004 (“SFAS 123R”) that requires the measurement and recognition of compensation expense for all stock-based awards made to employees and directors, including employee stock options and restricted stock units (“RSUs”) based on estimated fair values. In March 2005, the SEC issued Staff Accounting Bulletin (“SAB”) No. 107,Share-Based Payment (“SAB 107”), as amended by SAB No. 110,Use of a Simplified Method in Developing an Estimate of Expected Term of “Plain Vanilla” Share Options(“SAB 110”), which extended the period for certain exemptions included in SAB 107 and SFAS 123R. SAB 107 and SAB 110 provide supplemental implementation guidance for SFAS 123R. The Company has applied the provisions of SAB 107 in its application of SFAS 123R.
SFAS 123R requires companies to estimate the fair value of stock-based awards on the date of grant using an option pricing model. The value of the portion of the award that is ultimately expected to vest is recognized as expense over the requisite service periods in the Company’s consolidated statements of operations.
The Company adopted SFAS 123R using the modified prospective application transition method. Stock-based compensation expense recognized in fiscal 2006 includes compensation expense for stock-based awards based on the fair value on the grant date estimated in accordance with thepro forma provisions of SFAS 123, and compensation expense for stock-based awards granted subsequent to adoption was based on the fair value on the grant date estimated in accordance with the provisions of SFAS 123R. In conjunction with the adoption of SFAS 123R, the Company changed its method of attributing the value of stock-based compensation expense from the accelerated multiple-option method (for the purposes ofpro forma information under SFAS 123) to the straight-line single option method. For performance-based RSU grants with graded vesting terms, the Company uses the accelerated multiple option method as the attribution method. At each reporting period, the Company assesses the probability that the performance metrics will be achieved. If it is determined to be probable that the performance metrics will be achieved resulting in the RSU award starting to vest, then the Company records compensation expense. The performance metrics for the vesting of the RSU required the achievement of business unit or corporate profit in the period. Compensation expense for all stock-based awards granted on or prior to December 31, 2005 will continue to be recognized using the accelerated multiple-option approach, while compensation expense for all stock-based awards, except performance based RSU grants, granted subsequent to December 31, 2005 will be recognized using the straight-line single option method.
Upon adoption of SFAS 123R, the Company selected the Black-Scholes option pricing model as the most appropriate method for determining the estimated fair value for stock options. The Black-Scholes model requires the use of highly subjective and complex assumptions that determine the fair value of stock-based awards, including the option’s expected term and the price volatility of the underlying stock. For non-performance based RSUs, compensation expense is calculated based on the fair market value of the Company’s stock on the date of grant.
82
Business Segments
The Company operates in one industry, the business of providing distribution and value-added services for storage products and systems and computer products and peripherals. The Company’s reportable segments are U.S. Distribution, Europe, ProSys, TotalTec, Miami, Canada and Other. Management designates the internal reporting used by management for making decisions and assessing performance as the source of reportable segments. See Note 3 — Goodwill and Other Intangible Assets, as well as Note 13 — Segment and Geographic Information.
Derivative Financial Instruments
The Company accounts for derivative financial instruments in accordance with FASB’s Statement of Financial Accounting Standards No. 133,Accounting for Derivative Instruments and Hedging Activities (“SFAS 133”), SFAS 138,Accounting for Certain Derivative Instruments and Certain Hedging Activities (an Amendment of FASB Statement No. 133)(“SFAS 138”) and FASB’s Statement of Financial Accounting Standards No. 149,Amendment of Statement 133 on Derivative Instruments and Hedging Activities(“SFAS 149”). These pronouncements require that all derivative instruments be recognized on the balance sheet at fair value. In addition, these pronouncements provide that for derivative instruments that qualify for hedge accounting, changes in the fair value will either be offset against the change in fair value of the hedged assets, liabilities or firm commitments through earnings or recognized in shareholder’s equity as a component of accumulated other comprehensive income (loss), net of taxes, until the hedged item is recognized in earnings, depending on whether the derivative is being used to hedge changes in fair values of cash flows. The ineffective portion of a derivative’s change in fair value is immediately recognized in earnings. For derivative instruments that are not designated as accounting hedges, changes in fair value are recognized in earnings in the period of change. The Company uses derivative instruments principally to manage the risk associated with movements in foreign currency exchange rates and the risk that changes in interest rates will affect the fair value or cash flows of its debt obligations.
Acquisitions
In accordance with FASB’s Statement of Financial Accounting Standards No. 141,Business Combinations(“SFAS 141”), the Company accounts for business combinations using the purchase method of accounting. Accordingly, the assets and liabilities of the acquired entities are recorded at their estimated fair values at the date of acquisition. Goodwill represents the excess of the purchase price over the fair value of net assets, including the amount assigned to identifiable intangible assets.
The purchase price allocation process requires an analysis of the fair values of the assets acquired and the liabilities assumed. When a business combination agreement provides for an adjustment to the cost of the combination contingent on future events, the Company includes that adjustment in the cost of the combination when the contingent consideration is determinable beyond a reasonable doubt and can be reliably estimated and should not otherwise be expensed according to the provisions of SFAS 141. The results of operations of the acquired business are included in the Company’s consolidated financial statements from the date of acquisition. See Note 4 — Acquisitions.
Restructuring and Impairment Costs
Restructuring and impairment costs include employee severance and benefit costs, costs related to leased facilities abandoned and subleased, costs related to leased equipment that has been abandoned, and impairment of owned equipment to be disposed of. For owned facilities and equipment, the impairment loss recognized was based on the fair value less costs to sell, with fair value estimated based on existing market prices for similar assets.
Severance and benefit costs are recorded in accordance with FASB’s Statement of Financial Accounting Standards No. 112,Employer’s Accounting for Post-Employment Benefits (an Amendment of FASB Statements No. 5 and 43)(“SFAS 112”), as the Company has concluded in the past that it had a substantive severance plan based on prior restructuring actions in many of the geographic areas in which the Company operates. These costs are recognized when the Company’s management has committed to a formal restructuring plan and the severance costs are probable and estimable. The Company applies the provisions of FASB’s Statement of Financial Accounting Standards No. 146,Accounting for Costs Associated with Exit or Disposal Activities(“SFAS 146”) relating to one-time termination benefits to both (1) severance activities in geographic areas where it does not have a substantive severance plan and (2) situations in which the severance benefits offered to employees within a given geographic area are in excess of those offered under prior restructuring plans. Severance costs accounted for under SFAS 146 are recognized when the Company’s management with the proper level of authority has committed to a restructuring plan and communicated those actions to employees. The Company’s estimate of severance and benefit costs assumptions is subjective as it is based on estimates of employee attrition and assumptions about future business opportunities.
83
In accordance with SFAS 146, the estimated loss accrued for leased facilities abandoned and subleased after December 31, 2002 represents the fair value of the lease liability as measured by the present value of future lease payments subsequent to abandonment, less the present value of any estimated sublease income. In order to estimate future sublease income, the Company engages real estate brokers to estimate the length of time to sublease a facility and the amount of rent it can expect to receive. Estimates of expected sublease income could change based on factors that affect its ability to sublease those facilities, such as general economic conditions and the real estate market, among others.
Other exit costs include costs to consolidate facilities or close facilities and relocate employees. A liability for such costs is recorded at its fair value in the period in which the liability is incurred.
At each reporting date, the Company evaluates its accruals for exit costs and employee separation costs to ensure the accruals are still appropriate. See Note 7 — Restructuring and Impairment Costs.
Advertising
Costs related to advertising and product promotion expenditures are charged to selling, general and administrative expense as incurred, and are primarily offset by OEM marketing reimbursements. The Company incurred advertising and product promotion costs, net of reimbursement, in the amounts of $2.6 million, $2.0 million and $1.5 million for the years ended December 31, 2008, 2007 and 2006, respectively.
Recently Issued Accounting Standards
In December 2007, FASB issued Statement of Financial Accounting Standards No. 141 (Revised 2007),Business Combinations(“SFAS 141R”). SFAS 141R will change the accounting for business combinations. Under SFAS 141R, an acquiring entity will be required to recognize all the assets acquired and liabilities assumed in a transaction at the acquisition-date fair value, with limited exceptions. SFAS 141R will change the accounting treatment and disclosure for certain specific items in a business combination. SFAS 141R applies prospectively to business combinations for which the acquisition date is on or after the beginning of the first annual reporting period beginning on or after December 15, 2008, and interim periods within those fiscal years. SFAS 141R will become effective for the Company beginning January 1, 2009. The Company will apply the provisions of SFAS 141R to any future acquisitions.
In November 2007, EITF released Issue No. 07-01,Accounting for Collaborative Arrangements (“EITF 07-01”). EITF 07-01 requires collaborators to present the results of activities for which they act as the principal on a gross basis and report any payments received from (made to) other collaborators based on other applicable GAAP or, in the absence of other applicable GAAP, based on analogy to authoritative accounting literature or a reasonable, rational and consistently applied accounting policy election. EITF 07-01 also clarified the determination of whether transactions within a collaborative arrangement are part of a vendor-customer (or analogous) relationship that are subject to EITF Issue No. 01-9,Accounting for Consideration Given by a Vendor to a Customer. EITF 07-01 is effective for the Company beginning January 1, 2009. The Company does not expect the provisions of EITF 07-01 to have a material impact on its consolidated financial statements.
In December 2007, FASB issued Statement of Financial Accounting Standards No. 160,Noncontrolling Interests in Consolidated Financial Statements (an Amendment of ARB No. 51) (“SFAS 160”). SFAS 160 establishes new accounting and reporting standards for the non-controlling interest in a subsidiary and for the deconsolidation of a subsidiary. SFAS 160 is effective for the Company beginning January 1, 2009. Currently, the Company does not expect the adoption of SFAS 160 will have an impact on its consolidated financial statements.
In March 2008, FASB issued Statement of Financial Accounting Standards No. 161,Disclosures about Derivative Instruments and Hedging Activities (an Amendment of FASB Statement No. 133) (“SFAS 161”). SFAS 161 requires enhanced disclosures about derivative instruments and hedging activities and their effects on a company’s financial position, financial performance and cash flows. SFAS 161 is effective for the Company beginning January 1, 2009. The Company is evaluating the effect of the adoption of SFAS 161 on its consolidated financial statements including its disclosures.
In April 2008, FASB issued FSP No. 142-3,Determination of the Useful Life of Intangible Assets(“FSP 142-3”). FSP 142-3 amends the factors a company should consider in developing renewal or extension assumptions used in
84
determining the useful life of recognized intangible assets under SFAS 142. This new guidance applies prospectively to intangible assets that are acquired individually or with a group of other assets in business combinations and asset acquisitions. FSP 142-3 is effective for the Company beginning January 1, 2009. Early adoption is prohibited. On adoption, the Company does not expect there will be any impact to its current consolidated financial statements.
In May 2008, FASB issued Accounting Principles Board No. 14-1,Accounting for Convertible Debt Instruments That May Be Settled in Cash upon Conversion (Including Partial Cash Settlement)(“APB 14-1”). APB 14-1 requires that the liability and equity components of convertible debt instruments that may be settled in cash upon conversion (including partial cash settlement) be separately accounted for in a manner that reflects an issuer’s nonconvertible debt borrowing rate. APB 14-1 is effective for the Company beginning January 1, 2009. The Company is still evaluating the impact that the adoption of APB 14-1 will have on its consolidated financial statements.
In May 2008, FASB issued Statement of Financial Accounting Standards No. 162,The Hierarchy of Generally Accepted Accounting Principles(“SFAS 162”). The new standard is intended to improve financial reporting by identifying a consistent framework, or hierarchy, for selecting accounting principles to be used in preparing financial statements that are presented in conformity with GAAP for non-governmental entities. SFAS 162 is effective 60 days following the SEC’s approval of the Public Company Accounting Oversight Board Auditing amendments to AU Section 411,The Meaning of Present Fairly in Conformity with Generally Accepted Accounting Principles. The Company does not expect the adoption of this standard to have a material effect on its consolidated financial statements.
In April 2009, FASB issued FASB’S Staff Position Statement (“FAS”) No. 157-4,Determining Fair Value When the Volume and Level of Activity for the Asset or Liability Have Significantly Decreased and Identifying Transactions That Are Not Orderly (“FSP 157-4”). FSP 157-4 indicates that if an entity determines that either the volume and/or level of activity for an asset or liability has significantly decreased (from normal conditions for that asset or liability) or price quotations or observable inputs are not associated with orderly transactions, increased analysis and management judgment will be required to estimate fair value. FSP 157-4 is effective for interim and annual periods ending after June 15, 2009, with early adoption permitted. FSP 157-4 must be applied prospectively. FSP 157-4 is effective for the Company beginning January 1, 2009. The Company does not expect the provisions of FSP 157-4 to have a material impact on its consolidated financial position, results of operations or cash flows.
In April 2009, FASB issued Staff Position Statement FAS No. 107-1 and Accounting Principles Board No. 28-1,Interim Disclosures about Fair Value of Financial Instruments (“FSP 107-1”). FSP 107-1 relates to fair value disclosures in public entity financial statements for financial instruments that are within the scope of FASB’s Statement of Financial Accounting Standards No. 107,Disclosures about Fair Value of Financial Instruments (“SFAS 107”). This guidance increases the frequency of those disclosures, requiring public entities to provide the disclosures on a quarterly basis (rather than just annually). The quarterly disclosures are intended to provide financial statement users with more timely information about the effects of current market conditions on an entity’s financial instruments that are not otherwise reported at fair value. FSP 107-1 is effective for interim and annual periods ending after June 15, 2009. FSP 107-1 must be applied prospectively. On adoption, the Company does not expect there will be any impact on its current consolidated financial statements.
In April 2009, the U.S. Securities and Exchange Commission (“SEC”) issued Staff Accounting Bulletin No. 111 (“SAB 111”) on Other-Than-Temporary Impairments (“OTTI”). SAB 111 amends Topic 5.M. in the Staff Accounting Bulletin Series entitledOther-Than-Temporary Impairment of Certain Investments in Debt and Equity Securities (“Topic 5.M.”). SAB 111 maintains the SEC staff’s previous views related to equity securities and amends Topic 5.M. to exclude debt securities from its scope. The Company elected to adopt SAB 111 in the first quarter of 2009. SAB 111 is effective for the Company beginning January 1, 2009. On adoption, the Company does not expect there will be any impact on its current consolidated financial statements.
In May 2009, FASB issued Statement of Financial Accounting Standards (“SFAS”) No. 165,Subsequent Events (“SFAS 165”). SFAS 165 establishes general standards of accounting for and disclosure of events that occur after the balance sheet date but before financial statements are issued or are available to be issued. SFAS 156 requires the disclosure of the date through which an entity has evaluated subsequent events and the basis for that date – that is, whether the date represents the date the financial statements were issued or were available to be issued. SFAS 165 is effective for the Company in the first interim period beginning after June 15, 2009. The Company does not expect the adoption of this standard to have a material effect on its consolidated financial statements.
85
NOTE 3 — GOODWILL AND OTHER INTANGIBLE ASSETS
SFAS 142 defines a reporting unit as an operating segment or one level below an operating segment (i.e., a component of an operating segment). A component of an operating segment can be a reporting unit if the component constitutes a business for which discrete financial information is available and management regularly reviews the operating results of that component. SFAS 142 provides that two or more components of an operating segment shall be aggregated and deemed a single reporting unit if the components have similar economic characteristics.
Using the criteria of SFAS 131, the Company determined that it had 12 operating segments and 12 reporting units as of December 31, 2006. The operating segments and reporting units determined at December 31, 2006 were as follows:
| | | | | | |
| U.S. Distribution | | Rorke Data | | Chile IQQ | | Europe Distribution |
| Canada | | Latin America Export | | Mexico | | Europe Enterprise |
| TotalTec | | Chile | | Net Storage Brazil | | ProSys |
During 2007, and in the three months ended March 31, 2008, the Company changed the presentation of the financial information used to determine operating segments under SFAS 131, by combining the financial results of Europe Distribution and Europe Enterprise into a combined operating segment, Europe. The change in operating segment determination required the Company to re-evaluate its historical SFAS 142 assumption of 12 reporting units for goodwill impairment analysis. As a result, the Company determined that it had the following 11 reporting units at December 31, 2007 and March 31, 2008 for goodwill impairment analysis:
| | | | | | |
| U.S. Distribution | | Rorke Data | | Chile IQQ | | Europe |
| Canada | | Latin America Export | | Mexico | | ProSys |
| TotalTec | | Chile | | Net Storage Brazil | | |
During 2008, the Company further changed its presentation of the financial information used to determine operating segments under SFAS 131 by combining the financial results of Chile and Chile IQQ into a combined operating segment, Chile. The change in operating segment determination required the Company to re-evaluate its historical SFAS 142 assumption of 11 reporting units for goodwill impairment analysis. As a result, the Company determined that it had ten reporting units at December 31, 2008 for goodwill impairment analysis, consisting of the 11 reporting units determined at March 31, 2008 and December 31, 2007, less Chile IQQ.
Goodwill balances by year and by reportable segment and changes therein were as follows (in thousands):
| | | | | | | | | | | | | | | | | | | |
| | | U.S.
Distribution | | Europe | | | ProSys | | | Other | | | Total | |
Balance at January 1, 2007 | | $ | 8,347 | | $ | 30,546 | | | $ | 14,873 | | | $ | 15,395 | | | $ | 69,161 | |
Contingent purchase price adjustment | | | 140 | | | — | | | | 5,694 | | | | 1,093 | | | | 6,927 | |
Impairment charge | | | — | | | (31,878 | ) | | | (20,567 | ) | | | — | | | | (52,445 | ) |
Currency translation adjustment | | | — | | | 1,332 | | | | — | | | | 1,239 | | | | 2,571 | |
| | | | | | | | | | | | | | | | | | | |
Balance at December 31, 2007 | | | 8,487 | | | — | | | | — | | | | 17,727 | | | | 26,214 | |
Contingent purchase price adjustment | | | — | | | — | | | | — | | | | 1,151 | | | | 1,151 | |
Impairment charge | | | — | | | — | | | | — | | | | (5,864 | ) | | | (5,864 | ) |
Currency translation adjustment | | | — | | | — | | | | — | | | | (2,290 | ) | | | (2,290 | ) |
| | | | | | | | | | | | | | | | | | | |
Balance at December 31, 2008 | | $ | 8,487 | | $ | — | | | $ | — | | | $ | 10,724 | | | $ | 19,211 | |
| | | | | | | | | | | | | | | | | | | |
At December 31, 2008 and 2007, the Company performed its annual goodwill impairment test. Effective March 19, 2008, the Company’s common stock was suspended from trading on the Nasdaq Global Market. Consequently, in the first quarter of 2008, the Company experienced a significant decline in the market value of its stock. The Company’s market capitalization was significantly lower than its book value and the Company believed that it was more likely than not that the fair value of its reporting units had dropped below their respective carrying values. Consequently, the Company performed a goodwill impairment test at March 31, 2008.
In accordance with SFAS 142, the Company used a two-step process to test for goodwill impairment. The first step is to determine if there is an indication of impairment by comparing the estimated fair value of each reporting unit to its carrying value including existing goodwill. Goodwill is considered impaired if the carrying value of a reporting unit exceeds the estimated fair value. The Company utilized a combination of income and market approaches to estimate the fair value of its reporting units in the first step.
86
The income approach utilizes estimates of discounted cash flows of the reporting units, which requires assumptions of, among other factors, the reporting units’ expected long-term revenue trends, as well as estimates of profitability, changes in working capital and long-term discount rates, all of which require significant judgment. The income approach also requires the use of appropriate discount rates that take into account the current risks in the capital markets. The market approach evaluates comparative market multiples applied to the Company’s reporting units’ businesses to yield a second estimated value of each reporting unit. In its analysis, the Company weighted the income and market approaches 75% and 25%, respectively.
The Company compared a weighted average of the output from the income and market approaches to the carrying value of each reporting unit, which yielded an indication of impairment in each of the TotalTec and Net Storage Brazil reporting units at December 31, 2008 and the Europe and ProSys reportable segments at December 31, 2007. At March 31, 2008, there was no indication of impairment when the fair value of each reporting unit was compared to its carrying value, including existing goodwill. The Company also compared the aggregate of the estimated fair values of each of its four regional reporting units to its overall market capitalization, taking into account an acceptable control premium considered supportable based upon historical comparable transactions and current market conditions. At December 31, 2008, key assumptions used to determine the fair value of each reporting unit under the discounted fair value method were: (a) expected cash flow for the period from 2008 to 2013; and (b) a discount rate of 12.6%, which was based on management’s best estimate of the after-tax weighted average cost of capital (“WACC”). At March 31, 2008, key assumptions used to determine the fair value of each reporting unit under the discounted fair value method were: (i) expected cash flow for the period from 2008 to 2012; and (ii) a discount rate of 13.3%, which was based on a market participant’s assumption, which was based on management’s best estimate of a market participant’s assumption of the WACC. At December 31, 2007, key assumptions used to determine the fair value of each reporting unit under the discounted fair value method were: (1) expected cash flow for the period from 2008 to 2013; and (2) a discount rate of 12.8%, which was based on management’s best estimate of the after-tax WACC, which was based on management’s best estimate of a market participant’s assumption of WACC.
Step two of the impairment test requires the Company to compute a fair value of the assets and liabilities, including identifiable intangible assets, within each of the reporting units with indications of impairment, and compare the implied fair value of goodwill to its carrying value. The results of step two indicated that the goodwill for the TotalTec reporting unit was fully impaired and the goodwill for the Net Storage Brazil reporting unit was partially impaired at December 31, 2008. The TotalTec impairment was triggered by a reduction in customer base as a result of the recession that required us to decrease our forecast of future TotalTec cash flows. The Net Storage impairment was triggered by the decline of the overall economic environment in Brazil as a result of the recession, which required us to decrease our forecast of future Net Storage cash flows. As a result, in 2008, the Company recorded a goodwill impairment charge of $3.5 million in the TotalTec reporting unit and a goodwill impairment charge of $2.4 million in the Net Storage reporting unit, for a total goodwill charge of $5.9 million in 2008.
In addition, as a result of the step two test in 2007, the Company recorded a charge of $52.4 million in the fourth quarter of 2007, which consisted of $20.5 million goodwill impairment charge recorded in the ProSys reporting unit and a $31.9 million goodwill impairment charge recorded in the Europe reporting unit. The ProSys impairment was triggered by a decline in the overall economic environment resulting from the recession. The decline required us to decrease our estimate of future ProSys cash flows. The Europe impairment was triggered by the combining of Europe Distribution and Europe Enterprise into a combined reporting unit, Europe. The change in reporting unit determination resulted in revised future cash flows that did not support the carrying value of goodwill of the combined reporting unit.
The carrying value of goodwill is based on fair value estimates of projected financial information, which management believes to be reasonable. The valuation methodology used to estimate the fair value of the Company and its reporting units considers the market capitalization of the Company, and requires inputs and assumptions that reflect market conditions, as well as management judgment.
87
The carrying values and accumulated amortization of intangible assets at December 31, 2008 and 2007 were as follows (in thousands):
| | | | | | | | | | | |
| | | Estimated
Useful Life for
Amortization | | December 31, 2008 |
Intangible Assets | | | Gross
Amount | | Accumulated
Amortization | | Net
Amount |
Non-compete agreements | | 2-6 years | | $ | 3,008 | | $ | 2,055 | | $ | 953 |
Trade names | | 20 years | | | 2,500 | | | 355 | | | 2,145 |
Customer/supplier relationships | | 4-10 years | | | 13,996 | | | 8,109 | | | 5,887 |
Internally developed software | | 5 years | | | 600 | | | 270 | | | 330 |
| | | | | | | | | | | |
Total | | | | $ | 20,104 | | $ | 10,789 | | $ | 9,315 |
| | | | | | | | | | | |
| | | | | | | | | | | |
| | | Estimated
Useful Life for
Amortization | | December 31, 2007 |
Intangible Assets | | | Gross
Amount | | Accumulated
Amortization | | Net
Amount |
Non-compete agreements | | 2-6 years | | $ | 3,115 | | $ | 1,776 | | $ | 1,339 |
Trade names | | 20 years | | | 2,500 | | | 230 | | | 2,270 |
Customer/supplier relationships | | 4-10 years | | | 15,106 | | | 6,142 | | | 8,964 |
Internally developed software | | 5 years | | | 600 | | | 150 | | | 450 |
| | | | | | | | | | | |
Total | | | | $ | 21,321 | | $ | 8,298 | | $ | 13,023 |
| | | | | | | | | | | |
The weighted average amortization period of all intangible assets was approximately seven years for each of the years ended December 31, 2008, 2007 and 2006, respectively.
Amortization expense, using the straight line method, was $3.4 million, $3.6 million and $1.6 million for the years ended December 31, 2008, 2007 and 2006, respectively. The Company estimates future annual amortization expense for these intangibles over the next five years is as follows (in thousands):
| | | |
Years Ending December 31, | | Amount |
2009 | | $ | 3,144 |
2010 | | | 2,751 |
2011 | | | 1,417 |
2012 | | | 246 |
2013 | | | 164 |
Thereafter | | | 1,593 |
NOTE 4 — ACQUISITIONS
The acquisitions described below have been accounted for using the purchase method. Accordingly, the results of operations of the acquired businesses are included in the consolidated financial statements from the dates of acquisition.
2006
ProSys Information Systems Acquisition
On October 2, 2006, the Company acquired substantially all of the assets and liabilities of ProSys, a privately held company located in Atlanta, Georgia. ProSys is a value-added distributor of computer components with operations in 12 Southeastern U.S. locations, serving customers throughout the United States. The total consideration was $35.1 million, consisting of $26.3 million in cash (net of $6.8 million of cash acquired), 1,724,372 shares of Bell Microproducts’ common stock valued at $8.8 million and purchase expenses of $0.6 million. See Note 6 —Lines of Credit and Term Loansfor additional information regarding the 2006 issuance of subordinated notes issued to the RSA in connection with the acquisition of ProSys.
Under the purchase agreement, the former stockholders of ProSys (the “Holders”) may also be entitled to an additional payment related to the performance of the ProSys business unit for each of the three years ending September 30, 2007, 2008 and 2009. Each annual payment will be due in a combination of cash and shares of the Company’s common stock based on the profits generated, up to a three-year maximum additional payment of $13.0 million. In addition, the Company is subject to a potential additional payment in an amount equal to 20% of the profits of the ProSys business unit earned in excess of an aggregate of $26.0 million for the three-year period ending September 30, 2009. In 2007 and 2008,
88
the Company accrued, but did not pay, $1.2 million and $6.8 million, respectively, in contingent consideration. The contingent payments are accounted for as compensation expense, and are not included in the purchase price of ProSys, because continued employment at the Company was required.
The Company allocated $13.8 million of the purchase price to intangible assets relating to customer relationships, non-compete agreements, a trade name and software with weighted average useful lives of four, five, 20 and five years, respectively. The valuation of identifiable intangible assets acquired was based on management’s estimates and was based upon consideration of various information, including a third-party valuation.
The discounted cash flow method, or the income approach, was used to value the non-compete agreements, the trade name and customer relationships while the cost approach was used to value the software. The Company allocated $14.9 million to goodwill related to the acquisition of ProSys because of the meaningful presence the Company achieved through the acquisition in the value-added reseller market in the Southeastern region of the United States The Company amortizes goodwill for tax purposes. The final ProSys purchase price was allocated to the acquired assets and liabilities assumed, based upon management’s estimate of their fair market values as of the acquisition date, as follows (in thousands):
| | | | |
Accounts receivable | | $ | 57,880 | |
Inventories | | | 10,121 | |
Equipment and other assets | | | 2,979 | |
Goodwill | | | 14,873 | |
Intangibles | | | 13,750 | |
Short-term note payable | | | (33,989 | ) |
Accounts payable | | | (21,900 | ) |
Other accrued liabilities | | | (8,563 | ) |
| | | | |
Total consideration | | $ | 35,151 | |
| | | | |
Net Storage Computers, Ltda Acquisition
On July 8, 2005, the Company acquired all of the outstanding capital stock of Net Storage Computers, Ltda (“Net Storage”), a privately held company headquartered in Alphaville, São Paulo, Brazil, with sales offices throughout Brazil. The acquisition of Net Storage increased the Company’s presence in the Latin America marketplace and provided the opportunity to strengthen relationships with key suppliers and expand products and services offerings. Net Storage is a distributor of storage products and peripherals to VARs and system integrators in Brazil. Their strategic partners include Intel, Seagate, Western Digital, Acer Inc. and Super Micro Computer, Inc.
Net Storage was acquired for $3.1 million in cash, net of cash acquired of $267,000, and included acquisition costs and assumed liabilities, primarily trade accounts payable and other liabilities. The Company is obligated to pay an earnout based upon a percentage of the earnings of the Brazilian operation over a four-year period. In 2008 and 2007, the former owners earned $1.2 million and $1.6 million, respectively, under this earnout provision. The earnouts are accounted
89
for as additional purchase price of Net Storage, because continued employment at the Company was required. In addition, the Company also entered into a four-year Management Service Agreement, which obligates the Company to pay an additional $1.1 million. The Company allocated $421,000 of the purchase price to intangible assets relating to customer and supplier relationships and non-compete agreements, with estimated useful lives of seven years and six years, respectively.
NOTE 5 — BALANCE SHEET COMPONENTS
| | | | | | | | |
| | | December 31, | |
| | | 2008 | | | 2007 | |
| | | (in thousands) | |
Accounts receivable: | | | | | | | | |
Accounts receivable | | $ | 458,173 | | | $ | 557,281 | |
Less: allowance for doubtful accounts | | | (22,604 | ) | | | (13,144 | ) |
| | | | | | | | |
| | $ | 435,569 | | | $ | 544,137 | |
| | | | | | | | |
Property and equipment: | | | | | | | | |
Computer and other equipment | | $ | 47,682 | | | $ | 51,737 | |
Land and buildings | | | 3,720 | | | | 4,518 | |
Furniture and fixtures | | | 5,190 | | | | 5,905 | |
Warehouse equipment | | | 3,668 | | | | 4,240 | |
Leasehold improvements | | | 11,326 | | | | 12,202 | |
| | | | | | | | |
| | | 71,586 | | | | 78,602 | |
Less: accumulated depreciation and amortization | | | (52,544 | ) | | | (57,930 | ) |
| | | | | | | | |
| | $ | 19,042 | | | $ | 20,672 | |
| | | | | | | | |
Total depreciation expense was $7.4 million in 2008, $7.3 million in 2007 and $6.3 million in 2006.
NOTE 6 — LINES OF CREDIT AND TERM LOANS
Borrowing Under Lines of Credit
| | | | | | |
| | | December 31, |
| | | 2008 | | 2007 |
| | | (in thousands) |
Western Facility | | $ | 118,629 | | $ | 102,025 |
Wachovia Facility | | | — | | | 81,357 |
IBM and Kreditbank Facilities | | | 22,889 | | | 26,493 |
Bank of America Facility | | | 23,156 | | | 20,559 |
GE Commercial Distribution Finance Facility | | | 44,223 | | | 43,994 |
Intel Corporation Facility | | | 2,508 | | | 3,000 |
| | | | | | |
Amounts included in current liabilities | | $ | 211,405 | | $ | 277,428 |
| | | | | | |
Western Facility
On May 14, 2001, the Company entered into a loan and security agreement with Congress Financial Corporation (Western), which is now known as Wachovia Capital Finance Corporation (Western), as agent for lenders under a revolving line of credit (the “Western Facility”). On November 7, 2006, the Company entered into an amendment to the Western Facility, which increased the line of credit from $125.0 million to $150.0 million, and extended the maturity date to September 20, 2010. On September 29, 2008, the Company amended and restated the Western Facility and increased the line of credit to a maximum amount of $204.0 million, but did not change the maturity date. The maximum amount of borrowings under the amended Western Facility is primarily determined based on a percentage of eligible accounts receivable and inventory. On September 29, 2008, the Company utilized the Western Facility to pay the approximately $69.6 million outstanding under the Wachovia Facility. The Wachovia Facility was terminated at that time.
The Western Facility has been amended twice since September 29, 2008. The first amendment, on November 10, 2008, modified the level of intercompany receivables permitted to be outstanding at any time. The second amendment, on February 17, 2009, eliminated the minimum fixed-charge coverage ratio for the quarter ended December 31, 2008, and reduced the fixed-charge coverage ratio criteria required in the quarters ending March 31 and June 30, 2009. The second
90
amendment also extended the required delivery date of the Company’s audited consolidated financial statements for the year ended December 31, 2007, from March 31, 2009 to June 30, 2009, and modified the definition of Interest Rate and the calculation of Excess Availability, as those terms are utilized in the Western Facility. At various times prior to September 29, 2008, the Company sought and obtained modifications to the credit agreement extending the time by which the Company was required to deliver its audited consolidated financial statements to the lender for the 2006, 2007 and 2008 fiscal years.
Prior to February 17, 2009, borrowings under the Western Facility bore interest at Wachovia’s prime rate plus a margin of between 0.25% and 0.75%, based on unused availability. Effective February 17, 2009, borrowings under the Western Facility bear interest at the greater of (i) 5% or (ii) Wachovia’s prime rate plus a margin of between 0.25% and 0.75%, based on unused availability. At the Company’s option, all or any portion of the outstanding borrowings may be converted to a Eurodollar rate loan, which would bear interest at the greater of (i) 5% or (ii) the adjusted Eurodollar rate plus a margin of between 2.50% and 3.00%, based on a percentage of unused availability. The Company also pays an unused line fee equal to 0.25% per annum of the unused portion of the Western Facility, subject to certain adjustments. The weighted average interest rate on outstanding borrowings under the Western Facility during the years ended December 31, 2008 and 2007 was 5.07% and 7.24%, respectively.
The Company’s obligations under the Western Facility are collateralized by substantially all of the assets of the Company and its North and South American subsidiaries, other than ProSys. The Western Facility requires the Company to meet certain financial covenant tests and to comply with certain other covenants, including restrictions on the incurrence of debt and liens and restrictions on mergers, acquisitions, asset dispositions, capital contributions, payment of dividends, repurchases of stock and investments, achievement of a fixed-charge coverage ratio for certain fiscal periods (beginning in the first quarter of 2009, the Company is required to have earnings before interest, income taxes, depreciation, amortization and restructuring charges in the applicable period greater than or equal to 35% of payments the Company makes for income taxes, interest, capital expenditures and principal payments during such quarter; that ratio increases to 75% for the second quarter of 2009, and to 110% thereafter; the applicable period is a single quarter during the first three quarters of 2009, extending to a two-quarter period as of December 31, 2009, a three-quarter period as of March 31, 2010, and a rolling four-quarter period thereafter) and the requirement that the Company provide audited consolidated financial statements to the lenders within a prescribed period of time after the close of the fiscal year. Upon any event of default, the lenders may demand immediate payment of the balance outstanding. An event of default includes the failure to pay any obligations when due or the failure to perform any of the terms, covenants, conditions or provisions of the agreement and such failure continues for 15 days.
Wachovia Facility
On September 20, 2004, the Company entered into a Credit and Security Agreement (the “Wachovia Facility”) with Wachovia Bank, National Association, as agent. On December 28, 2005, May 14, 2007 and September 26, 2007, the Company amended the Wachovia Facility. During the term of the Wachovia Facility, the Company sold or contributed all of its receivables to a consolidated special purpose bankruptcy-remote entity named Bell Microproducts Funding Corporation (“Funding”), a wholly owned subsidiary. Funding obtained financing from the lenders collateralized by these receivables. The maximum principal amount available under the Wachovia Facility was $120.0 million. The interest rate on advances made by the lenders was the cost of lenders’ commercial paper plus 80 basis points. Funding also paid an unused line fee ranging from 0.20% to 0.25% per annum of the unused portion of the Wachovia Facility. The cash flows from the collections of the receivables were used to purchase new receivables, to pay amounts to the lenders, to pay other amounts owed, and to make dividend distributions (subject at all times to Funding maintaining a required capital amount). Including the program fee, the average interest rate on outstanding borrowings under the Wachovia Facility for the years ended December 31, 2008 and 2007 was 4.25% and 6.15%, respectively. On September 29, 2008, the Company terminated the Wachovia Facility and paid the outstanding balance with proceeds from the amended Western Facility.
Kreditbank Facilities
On December 1, 2005, in connection with the acquisition of MCE, the Company entered into a short-term financing agreement with IBM Deutschland Kreditbank GmbH (“Kreditbank”) for up to $25.0 million. The loan is collateralized by substantially all of the assets of the Company’s German subsidiary, as well as cross-company guarantees of certain of the Company’s European subsidiaries, and bears interest at LIBOR plus 7.16%, effective January 12, 2009. In 2008 and 2007, the effective interest rate was US LIBOR plus 2.00%. The average interest rate on outstanding borrowings for the years
91
ended December 31, 2008 and 2007 was 4.64% and 7.24%, respectively. The facility has no maturity date, and continues indefinitely until terminated by either party upon six weeks’ notice. If the facility is terminated, all amounts would be due at the end of the six-week period. To date, neither party has given notice of intent to terminate this facility. The balance outstanding on this facility at December 31, 2008 and 2007 was $19.4 million and $14.6 million, respectively, including interest payable.
Also on December 1, 2005, the Company entered into another short-term financing agreement with Kreditbank for €6.5 million ($9.1 million using the exchange rate on December 31, 2008 of $1.40/€1.00). In May 2006, the agreement was amended to increase the available financing to €8.0 million ($11.2 million using the exchange rate on December 31, 2008 of $1.40/€1.00). The loan was collateralized by substantially all of the assets of the Company’s German subsidiary, as well as cross-company guarantees of certain of the Company’s European subsidiaries and bore interest at Euribor plus 3.85%. The average interest rates on outstanding borrowings for the years ended December 31, 2008 and 2007 were 8.23% and 7.98%, respectively. The facility has no maturity date and continues indefinitely until terminated by either party upon six weeks’ notice. The balance outstanding on this facility at December 31, 2008 and 2007 was $3.5 million and $11.8 million, respectively, including interest payable. On November 11, 2008, the Company received notice from Kreditbank that they would terminate this line of credit as of December 31, 2008, and all amounts due thereunder, which, as of November 11, 2008, totaled approximately €8.0 million, would be due on that date. Subsequently, on December 5, 2008, the Company entered into an agreement with Kreditbank permitting repayment of €4.0 million by December 31, 2008 and the remainder no later than February 28, 2009. As of February 28, 2009, all amounts under this facility had been repaid.
On December 10, 2004, the Company entered into a short-term financing agreement with IBM Nederland Financieringen B.V. for up to $5.0 million. The loan is collateralized by substantially all of the assets of the Company’s Dutch subsidiary, as well as cross-company guarantees of certain of the Company’s European subsidiaries, and bears interest at the ABN Amro base rate plus 2.25%. The average interest rate on outstanding borrowings for the years ended December 31, 2008 and 2007 was 7.75% and 6.90%, respectively. The facility has no maturity date and continues indefinitely until terminated by either party upon six weeks’ notice. If the facility is terminated, all amounts would be due at the end of the six-week period. To date, neither party has given notice of intent to terminate this facility. There were no amounts outstanding under this facility at December 31, 2008 and 2007.
Bank of America Facility
On December 2, 2002, certain wholly owned subsidiaries of the Company, based in Europe, entered into a facility arranged by Bank of America, National Association, as agent, to provide a revolving line of credit facility of up to £75 million (the “Bank of America Facility”). The maximum amount of borrowings on the Bank of America Facility is determined based on a percentage of the borrower’s eligible accounts receivable. On October 20, 2005, the agreement was amended to extend the maturity date to October 20, 2008 and reduce the facility to £60 million ($87.6 million using the exchange rate on December 31, 2008 of $1.46/£1.00), increasing to £80 million ($116.8 million using the exchange rate on December 31, 2008 of $1.46/£1.00) at the Company’s option. On May 21, 2008, the agreement was amended to extend the termination date of the facility to October 20, 2011 and decrease the size of the facility from £80 million to £76 million ($111.0 million using the exchange rate on December 31, 2008 of $1.46/£1.00). At the borrower’s option, all or any portion of the outstanding borrowings may be converted to a LIBOR-based revolving loan. Borrowings under the line of credit bear interest at Bank of America’s reference rate, or the LIBOR rate, as applicable, plus a margin of between 1.75% and 3.0%, based on certain financial measurements. The average interest rates on the outstanding borrowings under the revolving line of credit during the year ended December 31, 2008 and 2007 were 5.14% and 6.59%, respectively, and the balances outstanding at December 31, 2008 and 2007 were $23.2 million and $20.6 million, respectively. Obligations of the borrower under the revolving line of credit are collateralized by substantially all of the assets of the borrower. The revolving line of credit requires the borrower to meet certain financial covenant tests (including maintaining an Adjusted Tangible Net Worth at the end of each quarter of not less than £26.9 million ($39.3 million using the exchange rate on December 31, 2008 of $1.46/£1.00)) and to comply with certain other covenants, including restrictions on incurrence of debt and liens and restrictions on mergers, acquisitions, asset dispositions, capital contributions, payment of dividends, repurchases of stock, repatriation of cash and investments.
GE Commercial Distribution Finance Facility
In connection with the acquisition of ProSys on October 2, 2006, the Company entered into a credit facility arrangement managed by GE Commercial Distribution Finance (“CDF”), which currently permits borrowings of up to
92
$80.0 million, including an accounts receivable facility, a supplemental inventory facility and a floorplan credit facility. ProSys is required to pay interest to CDF on the daily contract balance at a rate equal to LIBOR plus 3.10%. The floorplan facility contains an interest-free period and ProSys repays substantially all amounts within that time. Under these credit facilities, ProSys has granted CDF a lien on substantially all of its assets. The credit facility has a two-year term with annual renewals thereafter but may be terminated by either party with notice. The balances outstanding at December 31, 2008 and 2007 were $44.2 million and $44.0 million, respectively, and were related solely to inventory floorplan financing. The facility contains a number of financial covenants, including covenants requiring the ProSys subsidiary to maintain an operating profit margin of not less than 0.5% of sales on a 12-month rolling basis, the maintenance of a ratio of debt to tangible net worth of not more than six-to-one (6:1) measured as of the last day of each fiscal quarter and maintenance of a ratio of funded debt to earnings before interest, taxes, depreciation and amortization for the 12-month period ending on the last day of each fiscal quarter of not more than four-to-one (4:1). The facility was amended effective March 31, 2009 to modify the financial covenants for all quarters ending on or after March 31, 2009 such that ProSys thereafter is required to (a) maintain a tangible net worth and subordinated debt of not less than $9.0 million; (b) maintain a ratio of Funded Debt to Adjusted EBITDA for the 12-month period ending on the last day of such fiscal quarter of not more than four-to-one (4:1); and (c) achieve, as of the last day of each fiscal quarter, a fixed-charge coverage ratio for the 12-month period ending on the last day of such fiscal quarter of at least one-and-one-half-to-one (1.5:1) (all capitalized terms are defined in the amendment).
Intel Corporation Facility
On March 30, 2006, the Company entered into the Working Capital Facility with Intel Corporation to provide a line of credit up to $3.0 million. The Working Capital Facility is non-interest bearing and has a one-year term with subsequent annual renewals, but may be terminated by Intel at any time. The Company is required to meet certain program eligibility requirements including compliance with its distribution agreement with Intel. The balances outstanding at December 31, 2008 and 2007 were $2.5 million and $3.0 million, respectively. In May 2008, the line of credit under the Working Capital Facility was reduced to $1.9 million and subsequently increased to $2.5 million in November 2008.
Term Loans
| | | | | | | | |
| | | December 31, | |
| | | 2008 | | | 2007 | |
| | | (in millions) | |
3.75% convertible subordinated notes, fair value of $18.9 as of December 31, 2008 and $96.7 as of December 31, 2007, due 2024 | | $ | 110.0 | | | $ | 110.0 | |
9.0% senior subordinated 2008 notes, fair value of $44.7 as of December 31, 2008 and $53.4 as of December 31, 2007, due 2010 | | | 51.5 | | | | 30.3 | |
9.0% senior subordinated 2006 notes, fair value of $28.3 as of December 31, 2008 and $36.4 as of December 31, 2007, due 2013 | | | 32.0 | | | | 33.7 | |
Other, fair values approximate carrying value | | | 0.3 | | | | 0.6 | |
| | | | | | | | |
Total debt | | | 193.8 | | | | 174.6 | |
Less: current portion of debt | | | (10.3 | ) | | | (14.5 | ) |
| | | | | | | | |
Total long-term debt | | $ | 183.5 | | | $ | 160.1 | |
| | | | | | | | |
Convertible Notes
On March 5, 2004, the Company completed a private offering of $110.0 million aggregate principal amount of 3.75% convertible subordinated notes due in 2024 (the “Old Notes”). On December 20, 2004, the Company completed its offer to exchange newly issued 3.75% convertible subordinated notes, Series B due in 2024 (the “New Notes”) for an equal amount of the Company’s outstanding Old Notes. Approximately 99.9% of the total principal amount of Old Notes outstanding were tendered in exchange for an equal principal amount of New Notes.
The New Notes mature on March 5, 2024 and bear interest at the rate of 3.75% per year on the principal amount, payable semi-annually on March 5 and September 5, which began on March 5, 2005. Holders of the New Notes may convert the New Notes any time on or before the maturity date if certain conversion conditions are satisfied. Upon conversion of the New Notes, the Company will be required to deliver, in respect of each $1,000 principal of New Notes, cash in an amount equal to the lesser of (1) the principal amount of each New Note to be converted and (2) the conversion value, which is equal to (a) the applicable conversion rate, multiplied by (b) the applicable stock price. The initial conversion rate is 91.2596 shares of common stock per New Note with a principal amount of $1,000 and is equivalent to an initial conversion price of approximately $10.96 per share. The conversion rate is subject to adjustment upon the occurrence of certain events.
93
Under the terms of the New Notes, holders have the right to convert their notes upon the occurrence of certain events, including if the closing price of the Company’s common stock exceeds a certain threshold for at least 20 of the last 30 days in preceding fiscal quarters and upon specified corporate transactions, as described in more detail in the prospectus filed in connection with the exchange offer. The applicable stock price is the average of the closing sales prices of the Company’s common stock over the five trading-day period starting the third trading day following the date the New Notes are tendered for conversion. If the conversion value is greater than the principal amount of each New Note, the Company will be required to deliver to holders upon conversion, at their option (1) a number of shares of its common stock, (2) cash or (3) a combination of cash and shares of its common stock in an amount calculated as described in the prospectus filed by the Company in connection with the exchange offer. In lieu of paying cash and shares of its common stock upon conversion, the Company may direct the conversion agent to surrender any New Notes tendered for conversion to a financial institution designated by the Company for exchange in lieu of conversion. The designated financial institution must agree to deliver, in exchange for the New Notes (1) a number of shares of the Company’s common stock equal to the applicable conversion rate, plus cash for any fractional shares or (2) cash or (3) a combination of cash and shares of the Company’s common stock. Any New Notes exchanged by the designated institution will remain outstanding.
The Company may redeem some or all of the New Notes for cash on or after March 5, 2009 and before March 5, 2011 at a redemption price of 100% of the principal amount of the New Notes, plus accrued and unpaid interest up to, but excluding, the redemption date, but only if the closing price of the Company’s common stock has exceeded 130% of the conversion price then in effect for at least 20 trading days within a 30 consecutive trading-day period ending on the trading day before the date the redemption notice is mailed. The Company may redeem some or all of the New Notes for cash at any time on or after March 5, 2011 at a redemption price equal to 100% of the principal amount of the New Notes, plus accrued and unpaid interest up to, but excluding, the redemption date.
The Company may be required to purchase for cash all or a portion of the New Notes on March 5, 2011, March 5, 2014 or March 5, 2019, or upon a change in control, at a purchase price equal to 100% of the principal amount of the New Notes being purchased, plus accrued and unpaid interest up to, but excluding, the purchase date. Upon any event of default, the lender may demand immediate payment of the balance outstanding. An event of default includes the failure to pay any interest or principal when due, failure to perform any of the terms, covenants, conditions or provisions of the agreement.
In December 2006, the Company obtained consents from holders of the New Notes for the waiver of certain defaults related to the late filing of the Company’s Form 10-Q for the period ended September 30, 2006 and certain proposed amendments to the indentures governing the New Notes eliminating covenants related to the filing of periodic reports with the SEC and the delivery of such reports to the trustee for the New Notes. The waiver and amendment required the consent of holders of a majority in aggregate principal amount of the New Notes outstanding. In exchange for the consent to the waiver and amendment, the Company paid holders of the New Notes an initial consent fee of $5.00 for each $1,000 principal amount of New Notes for which consents were obtained. The initial consent fee of $0.6 million was paid to holders of the New Notes in December 2006 and charged to interest expense. If the Company did not commence a cash tender offer for the New Notes on or before February 28, 2007 to redeem all validly tendered New Notes at a price of at least $1,000 for each $1,000 principal amount of New Notes, the Company was required to pay holders of the New Notes for which consents to the waiver and amendment were obtained an additional fee of $85.00 for each $1,000 principal amount of New Notes. The Company did not initiate the tender and on March 4, 2007, an aggregate of $9.4 million was paid to the holders of the New Notes, which amount was capitalized and will be amortized to interest expense through March 2011.
Notes Payable to The Retirement Systems of Alabama (the “RSA”)
The Company has notes payable to the RSA (the “RSA Notes”) that consist of the following:
| | • | | 9% Senior Subordinated Notes Payable to the RSA Issued in 2000 — On July 6, 2000, and as amended on May 3, 2004, the Company entered into a facility under which it issued $180.0 million of subordinated debt to two of the RSA’s affiliated funds (the “2000 Notes”). The 2000 Notes were comprised of $80.0 million bearing interest at 9.125%, which was repaid in June 2001; and $100.0 million bearing interest at 9.0%, payable in semi-annual interest and principal payments with semi-annual principal installments commencing on December 31, 2000 of $3.5 million, $4.4 million commencing December 31, 2007, $5.1 million due |
94
| | December 31, 2009 and a final payment of $8.5 million on June 30, 2010. The 2000 Notes were collateralized by a second lien on substantially all of the Company’s and its subsidiaries’ North American and South American assets. Effective June 30, 2008, the Company entered into the 2008 Notes with the lenders that consolidated the 2000 Notes and the 2007 Notes. |
| | • | | 9% Senior Subordinated Notes Payable to the RSA Issued in 2006— On October 2, 2006, the Company borrowed $35.0 million from two of the RSA’s affiliated funds in connection with its acquisition of ProSys (the “2006 Notes”). The 2006 Notes bear interest at 9% and are in the form of two notes, one for $23.0 million and a second for $12.0 million, both due on various dates through August 1, 2013. The 2006 Notes are collateralized by ProSys shares and all tangible and intangible assets of the ProSys business, other than those assets pledged to CDF. The balances outstanding at December 31, 2008 and 2007 were $32.3 million and $34.0 million, respectively, with scheduled repayments of $2.5 million in 2009, $3.3 million in 2010, $4.0 million in 2011 and $22.5 million thereafter. Principal payments are due on August 1 and February 1 of each year and include accrued interest through that date. The Company must meet certain financial covenant tests on a quarterly basis (including, as provided by the amendment entered into on February 24, 2009, the same fixed-charge coverage ratio as required by the Western Facility; prior to the amendment, the Company was required to maintain a consolidated net worth at the end of each quarter of not less than $87.5 million), and comply with certain other covenants, including restrictions of incurrence of debt and liens and restrictions on asset dispositions, payment of dividends and repurchase of stock. The Company is also required to be in compliance with the covenants of certain other borrowing agreements. Upon any event of default the lender may demand immediate payment of the balance outstanding. |
| | • | | 9% Senior Subordinated Notes Payable to the RSA Issued in 2007— On January 30, 2007, the Company entered into a revolving credit agreement with two of the RSA’s affiliated funds in the amount of $30.0 million (the “2007 Notes”). The 2007 Notes bear interest at 9%. Under the terms of the 2007 Notes, the availability of the revolving credit was set to expire on July 31, 2008 and thereafter payments would be made at the rate of $1.0 million per month beginning August 15, 2008, and the entire principal balance would be due on January 30, 2009. The 2007 Notes were collateralized by a second lien on substantially all of the Company’s and its subsidiaries’ North American and South American assets. Effective June 30, 2008, the Company entered into the 2008 Notes with the lenders that consolidated the 2000 Notes and the 2007 Notes. |
| | • | | 9% Senior Subordinated Notes Payable to the RSA Issued in 2008— On August 5, 2008, the Company entered into an Amended and Restated Credit Agreement effective as of June 30, 2008 (the “2008 Notes”) with several of the RSA’s affiliated funds, which consolidated and restructured the $56.7 million in outstanding indebtedness due under the 2000 Notes and 2007 Notes. The balance outstanding on the 2008 Notes at December 31, 2008 was $52.4 million. The 2008 Notes bear interest at 9% per annum payable in semi-annual installments, with principal payments due of $4.0 million semi-annually through June 1, 2011, $5.0 million semi-annually through June 1, 2013 and a final payment of $12.4 million due December 1, 2013. The Company granted a second priority security interest, subordinate to the Western Facility and the CDF facility, in substantially all of the property then owned or thereafter acquired by the Company in North or South America. The Company must meet certain financial covenant tests on a quarterly basis (including, as provided by the amendment entered into on February 24, 2009, the same fixed-charge coverage ratio as required by the Western Facility; prior to the amendment, the Company was required to maintain a consolidated net worth at the end of each quarter of not less than $87.5 million), and comply with certain other covenants, including restrictions of incurrence of debt and liens, restrictions on asset dispositions, payment of dividends and repurchase of stock. The Company is also required to be in compliance with the covenants of certain other borrowing agreements. Upon any event of default the lender may demand immediate payment of the balance outstanding. |
HSBC Bank plc Mortgage
On June 22, 2004, in connection with the acquisition of OpenPSL, the Company assumed a mortgage with HSBC for an original amount of £0.7 million ($1.0 million using the exchange rate on December 31, 2008 of $1.46/£1.00). The mortgage has a term of ten years and bears interest at HSBC’s rate plus 1.25%. The balance on the mortgage was $0.3 million and $0.5 million at December 31, 2008 and 2007, respectively.
95
Maturities
Maturities of term loans based on the amounts and terms outstanding at December 31, 2008 totaled $10.3 million in 2009, $11.1 million in 2010, $12.8 million in 2011, $14.8 million in 2012, $34.8 million in 2013 and $110.0 million thereafter.
Covenant Modifications
In February 2009, the Company determined that it would not be in compliance with the fixed-charge coverage ratio covenant under the terms of the Western Facility for the quarter ended December 31, 2008. The lenders under the Western Facility agreed to waive this requirement by modifying the terms of the agreement to remove this obligation for the fourth quarter of 2008 and modify the requirement in subsequent quarters. In February 2009, the Company also determined that it would not be in compliance with a consolidated net worth covenant under the terms of its agreements with the RSA. The RSA agreed to waive this requirement, amend these agreements to delete the consolidated net worth covenant and replace them with the same minimum fixed-charge coverage ratio requirement of the current Western Facility. In addition, the Company determined in February 2009 that its ProSys subsidiary had failed to meet its financial covenants under its CDF facility for the 12 months ended June 30, 2007. In February 2009, ProSys received a waiver of any default occurring under the CDF facility prior to January 1, 2008 and ProSys entered into an amendment of the agreement with GE in March 2009.
Amendments to Lines of Credit and Long-Term Debt
On February 17, 2009, the Company entered into a Second Amendment to the Western Facility. The second amendment eliminated the minimum fixed-charge coverage ratio for the quarter ended December 31, 2008, and reduced the fixed-charge coverage ratio required in the quarters ending March 31, 2009 and June 30, 2009. The second amendment also extended the required delivery date of the Company’s audited consolidated financial statements for the year ended December 31, 2007, from March 31, 2009 to June 30, 2009, and modified the definition of Interest Rate and the calculation of Excess Availability, as those terms are utilized in the Western Facility.
On February 24, 2009, the Company entered into the First Amendment (the “First Amendment”) to the October 2, 2006 Securities Purchase Agreement (the “Securities Purchase Agreement”) with The Teachers’ Retirement System of Alabama (“TRSA”) and The Employees’ Retirement System of Alabama (“ERSA”) and the Second Amendment (the “Second Amendment”) to the June 30, 2008 Amended and Restated Credit Agreement with TRSA, ERSA, Judicial Retirement Fund, PEIRAF-Deferred Compensation Plan and Public Employees Individual Retirement Account Fund. Under the terms of these amendments, the previously existing covenant regarding the Company’s net worth was replaced by a fixed-charge coverage ratio covenant substantially similar to the fixed-charge coverage ratio covenant contained in the Company’s Amended and Restated Loan and Security Agreement as amended on February 17, 2009, between the Company and Wachovia Capital Finance Corporation (Western) and other lenders.
NOTE 7 — RESTRUCTURING AND IMPAIRMENT COSTS
From time to time, the Company has initiated a series of restructuring activities intended to realign the Company’s global capacity and infrastructure with demand by its customers so as to optimize the operational efficiency, which includes reducing excess workforce and capacity, and consolidating and relocating certain facilities to lower-cost regions.
The restructuring and impairment costs include employee severance, costs related to leased facilities and other costs associated with the exit of certain contractual agreements due to facility closures. The overall intent of these activities is that the Company shifts its distribution capacity to locations with higher efficiencies and, in most instances, lower costs, and better utilizes its overall existing distribution capacity. This would enhance the Company’s ability to provide cost-effective distribution service offerings, which may enable it to retain and expand the Company’s existing relationships with customers and attract new business.
In 2008, the Company initiated a restructuring plan for its North American, European and Latin American operations, and, as a result, the Company incurred restructuring costs and other charges of approximately $4.3 million. These costs consisted primarily of severance and benefit costs of $3.9 million for involuntary employee terminations and costs of $0.4 million related to the closure and impairment of certain leased facilities. The Company terminated 48 employees in North America, 105 employees in Latin America and 58 employees in the United Kingdom and continental Europe in sales,
96
marketing, finance and support functions. The Company classified all of these 2008 restructuring charges of approximately $4.3 million to restructuring and impairment costs in the consolidated statement of operations during 2008. The Company expects to substantially complete the entire 2008 restructuring plan in 2009 and does not anticipate incurring additional costs associated with this restructuring initiative going forward.
In 2007, the Company incurred and paid restructuring costs of approximately $1.4 million related to severance and benefit costs associated with involuntary employee terminations. The Company terminated 22 employees in North America, 56 employees in Latin America and 25 employees in Europe.
| | | | | | | | | | | | |
| | | Employee
Termination
Costs | | | Facility-
Related Costs | | | Total | |
| | | (in thousands) | |
Restructuring obligations at December 31, 2006 | | $ | — | | | $ | 141 | | | $ | 141 | |
Additional restructuring cost | | | 1,404 | | | | — | | | | 1,404 | |
Foreign currency impact | | | 31 | | | | — | | | | 31 | |
Cash payments | | | (1,422 | ) | | | (141 | ) | | | (1,563 | ) |
| | | | | | | | | | | | |
Restructuring obligations at December 31, 2007 | | | 13 | | | | — | | | | 13 | |
Additional restructuring cost | | | 3,903 | | | | 386 | | | | 4,289 | |
Foreign currency impact | | | (46 | ) | | | — | | | | (46 | ) |
Cash payments | | | (3,375 | ) | | | — | | | | (3,375 | ) |
| | | | | | | | | | | | |
Restructuring obligations at December 31, 2008 | | $ | 495 | | | $ | 386 | | | $ | 881 | |
| | | | | | | | | | | | |
NOTE 8 — STOCK-BASED COMPENSATION PLANS
Effective January 1, 2006, the Company implemented SFAS 123R, as interpreted by SAB 107 and amended by SAB 110. Prior to January 1, 2006, the Company accounted for stock-based compensation relating to options according to the provisions of APB 25 and its related interpretations. The Company adopted the modified prospective transition method provided under SFAS 123R, and consequently has not retroactively adjusted results from prior periods. Under this transition method, compensation cost associated with stock options now includes (1) amortization related to the remaining unvested portion of all stock option awards granted prior to December 31, 2005, based on the grant-date fair value estimated in accordance with the original provisions of SFAS 123; and (2) amortization related to all stock option awards granted subsequent to January 1, 2006, based on the grant-date fair value estimated in accordance with the provisions of SFAS 123R. The Company amortized stock-based compensation under SFAS 123 using multiple option attribution and under SFAS 123R using straight line attribution.
For performance-based RSU awards, the Company uses the accelerated multiple option method for expense attribution. As of the last day of each reporting period, the Company assesses the probability of achieving the performance targets applicable to the RSUs. When the Company determines that it is probable that performance targets will be achieved, compensation expense is recorded.
Compensation expense for stock-based awards includes an estimate for forfeitures and is recognized over the expected vesting period of the options using the straight-line method for APB 25 and accelerated attribution under SFAS 123R. Prior to adoption of SFAS 123R, benefits of tax deductions in excess of recognized compensation costs were reported as operating cash flows. SFAS 123R requires that they be recorded as a financing cash inflow rather than as a reduction of taxes paid. The Company has not recorded any excess tax benefits in additional paid-in capital since the adoption of SFAS 123R. To determine the excess tax benefit, the Company uses the long-form method as set forth in FASB Staff Position Statement FAS 123R-3,Transition Election Related to Accounting for the Tax Effects of Share-Based Payment Awards.
Total stock-based compensation expense for the years ended December 31, 2008, 2007 and 2006 of $3.0 million, $1.4 million and $2.4 million, respectively, was recorded as selling, general and administrative expenses in the accompanying consolidated statements of operations.
97
Stock Option Plans
The Company adopted the 1998 Stock Plan in 1998. The 1998 Stock Plan replaced the 1988 Amended and Restated Incentive Stock Plan and the 1993 Director Stock Option Plan. Under the terms of the 1998 Stock Plan (which expired as to future grants in May 2008), stock options were granted to directors and employees to purchase common stock at the fair market value of such shares on the grant date. Stock options granted to employees vest annually over a four-year period beginning on the one-year anniversary of the grant date. Stock options granted to directors vested immediately. Generally, the term of each employee option is five years from the date of grant and the term of each director option is ten years from the date of grant, as provided in each respective option agreement. For options granted to an optionee who owns stock representing more than 10% of the voting power of all classes of stock, the option term is five years. If an optionee ceases to be employed by the Company, the optionee may within 30 days (or such other period of time, as determined by the Board of Directors, but not exceeding three months) exercise vested stock options.
Stock Options and Restricted Stock Units
Effective upon the adoption of SFAS 123R, the fair value of each option award is estimated on the date of grant using the Black-Scholes valuation model and the assumptions noted in the following table. The expected life of options is based on observed historical exercise patterns. Groups of employees that have similar historical exercise patterns have been considered separately for valuation purposes. For the years ended December 31, 2008, 2007 and 2006, the expected volatility was based solely on historical volatility. The risk-free interest rate was based on the implied yield on a U.S. Treasury zero coupon issue with a remaining term equal to the expected term of the option. The dividend yield reflects that the Company has not paid any cash dividends since inception and does not intend to pay any cash dividends in the foreseeable future. Following are the key variables used to calculate the fair values of stock awards under SFAS 123R for the years ended December 31, 2008, 2007 and 2006:
| | | | | | | | | |
| | | Years Ended December 31, | |
| | | 2008 | | | 2007 | | | 2006 | |
Expected volatility | | 41.4 | % | | 42.3 | % | | 51.8 | % |
Dividend yield | | None | | | None | | | None | |
Expected life in years | | 3.56 | | | 3.49 | | | 3.39 | |
Risk-free rate | | 2.3 | % | | 4.2 | % | | 4.6 | % |
The weighted average per share fair value of the options granted in 2008, 2007 and 2006 were $1.87, $2.00 and $2.55, respectively.
The following table presents summarized stock option activity and weighted average per share exercise prices for stock options and the weighted average intrinsic value for RSUs granted, exercised and forfeited as of, and for the three years in the period ended, December 31, 2008:
| | | | | | | | | | | | | | | | | | | | | | | | | |
| | | | | | Options Outstanding | | Restricted Stock Units
Outstanding |
| | | Options
Available for
Grant | | | Shares | | | Weighted
Average
Exercise
Price Per
Share | | Weighted
Average
Remaining
Contractual
Life (in years) | | Aggregate
Intrinsic
Value | | Shares | | | Weighted
Average
Intrinsic
Value Per
RSU | | Weighted
Average
Remaining
Contractual
Life (in years) | | Aggregate
Intrinsic
Value |
Balance at December 31, 2005 | | 848,183 | | | 3,060,047 | | | $ | 7.32 | | | | | | | 690,304 | | | $ | 7.08 | | | | | |
Increase in options available for grant | | 600,000 | | | — | | | | — | | | | | | | — | | | | — | | | | | |
Options and awards forfeited | | 547,908 | | | (494,099 | ) | | $ | 8.96 | | | | | | | (53,809 | ) | | $ | 9.51 | | | | | |
Canceled options not available for grant | | (120,000 | ) | | — | | | | — | | | | | | | — | | | | — | | | | | |
Options and awards granted | | (895,000 | ) | | 777,500 | | | $ | 6.14 | | | | | | | 117,500 | | | $ | 6.10 | | | | | |
Options and awards exercised/vested | | — | | | (132,961 | ) | | $ | 4.46 | | | | | | | (241,671 | ) | | $ | 7.07 | | | | | |
| | | | | | | | | | | | | | | | | | | | | | | | | |
Balance at December 31, 2006 | | 981,091 | | | 3,210,487 | | | $ | 6.90 | | | | | | | 512,324 | | | $ | 6.84 | | | | | |
Increase in options available for grant | | 600,000 | | | — | | | | — | | | | | | | — | | | | — | | | | | |
Options and awards forfeited | | 201,825 | | | (196,825 | ) | | $ | 7.72 | | | | | | | (5,000 | ) | | $ | 8.01 | | | | | |
Canceled options not available for grant | | (24,750 | ) | | — | | | | — | | | | | | | — | | | | — | | | | | |
Options and awards granted | | (460,500 | ) | | 453,000 | | | $ | 5.65 | | | | | | | 7,500 | | | $ | 5.98 | | | | | |
Options and awards exercised/vested | | — | | | (5,108 | ) | | $ | 7.05 | | | | | | | (119,491 | ) | | $ | 7.01 | | | | | |
| | | | | | | | | | | | | | | | | | | | | | | | | |
Balance at December 31, 2007 | | 1,297,666 | | | 3,461,554 | | | $ | 6.69 | | | | | | | 395,333 | | | $ | 6.93 | | | | | |
Increase in options available for grant | | 600,000 | | | — | | | | — | | | | | | | — | | | | — | | | | | |
Options and awards forfeited | | 797,904 | | | (694,487 | ) | | $ | 6.78 | | | | | | | (103,417 | ) | | $ | 5.19 | | | | | |
Canceled options not available for grant | | (537,362 | ) | | — | | | | — | | | | | | | — | | | | — | | | | | |
Options and awards granted | | (2,158,208 | ) | | 1,232,500 | | | $ | 5.69 | | | | | | | 925,708 | | | $ | 4.25 | | | | | |
Options and awards exercised/vested | | — | | | — | | | | — | | | | | | | (197,541 | ) | | $ | 2.36 | | | | | |
| | | | | | | | | | | | | | | | | | | | | | | | | |
Balance at December 31, 2008 | | — | | | 3,999,567 | | | $ | 6.37 | | 2.09 | | | | | 1,020,083 | | | $ | 4.69 | | 0.79 | | | |
| | | | | | | | | | | | | | | | | | | | | | | | | |
Vested and expected to vest at December 31, 2008 | | | | | 3,803,744 | | | $ | 6.40 | | 2.02 | | $ | — | | 947,250 | | | $ | 0.60 | | 0.76 | | $ | 568,350 |
| | | | | | | | | | | | | | | | | | | | | | | | | |
98
Stock Options
The Company’s 1998 Stock Plan expired in May 2008. After May 2008, there were no equity awards available for grant under the 1998 Stock Plan. The Company has scheduled its next annual meeting of shareholders to be held on August 19, 2009, and intends to ask the shareholders to adopt a new equity incentive plan at that time.
There were no options exercised during the year ended December 31, 2008. The total pre-tax intrinsic value of options exercised during the years ended December 31, 2007 and 2006 was $3,348 and $0.2 million, respectively. The total pre-tax intrinsic value of the RSUs that vested was $0.5 million, $0.8 million and $1.5 million during the years ended December 31, 2008, 2007 and 2006, respectively.
As of December 31, 2008, the number of stock options outstanding and exercisable by range of exercise prices, the weighted average exercise prices, the intrinsic value and, for options outstanding, the weighted average remaining contractual life are as follows (in thousands, except for years and per share amounts):
| | | | | | | | | | | | | | | | | | | | |
| | | Options Outstanding | | Options Exercisable |
Range of Exercise Price | | Number
Outstanding | | Weighted-
Average
Remaining
Contractual
Life (in Years) | | Weighted-
Average
Exercise
Price per
Share | | Aggregate
Intrinsic
Value | | Number
Exercisable | | Weighted
Average
Remaining
Contractual
Life (in years) | | Weighted-
Average
Exercise
Price per
Share | | Aggregate
Intrinsic
Value |
$2.81 - $5.21 | | 811 | | 1.8 | | $ | 4.36 | | | | | 529 | | | | $ | 4.30 | | | |
$5.22 - $6.45 | | 1,845 | | 2.9 | | | 6.05 | | | | | 585 | | | | | 6.28 | | | |
$6.46 - $7.23 | | 649 | | 1.2 | | | 6.95 | | | | | 540 | | | | | 7.01 | | | |
$7.24 - $8.50 | | 403 | | 1.1 | | | 8.27 | | | | | 403 | | | | | 8.27 | | | |
$8.51 - $11.80 | | 271 | | 1.0 | | | 9.86 | | | | | 271 | | | | | 9.86 | | | |
$11.81 - $11.82 | | 21 | | 2.8 | | | 11.82 | | | | | 21 | | | | | 11.82 | | | |
| | | | | | | | | | | | | | | | | | | | |
$2.81 - $11.82 | | 4,000 | | 2.1 | | | 6.37 | | $ | — | | 2,349 | | 1.1 | | $ | 6.80 | | $ | — |
| | | | | | | | | | | | | | | | | | | | |
The aggregate intrinsic value in the preceding table represents the total pre-tax intrinsic value, based on the Company’s closing stock price of $0.60 per share as of December 31, 2008, which would have been received by the option holders had holders exercised all outstanding options as of that date. There were no in-the-money options exercisable as of December 31, 2008.
The Company recorded $1.2 million, $0.7 million and $1.1 million of compensation expense related to stock options for the years ended December 31, 2008, 2007 and 2006, respectively, in accordance with SFAS 123R.
As of December 31, 2008, there was $3.1 million of unrecognized compensation costs related to outstanding stock options. These costs are expected to be recognized over a weighted average period of 2.8 years.
As of December 31, 2008, there were options to purchase 1,654,001 shares that were outstanding, but not yet vested.
99
Restricted Stock Units
During 2008, 2007 and 2006, 925,708, 7,500 and 117,500 RSUs, respectively, were granted to certain eligible employees. Compensation expense under the fair value method for the years ended December 31, 2008, 2007 and 2006 of $1.6 million, $0.2 million and $1.3 million, respectively, is being amortized over the vesting periods of the underlying awards. Compensation expense for performance-based RSU grants with graded vesting terms was $0.3 million, $0.5 million and $0.6 million for the years ended December 31, 2008, 2007 and 2006, respectively. For compensation expense purposes, the intrinsic value of RSUs equals the fair market value of these awards on the date of grant.
The weighted-average fair value per unit of the RSUs granted during the year ended December 31, 2008, was $4.25 per share. At December 31, 2008, unrecognized compensation costs related to RSUs totaled approximately $2.5 million and are expected to be recognized over a weighted-average period of 1.2 years. The total fair value of RSUs vested was $0.5 million for the year ended December 31, 2008.
NOTE 9 — INCOME TAXES
The components of income (loss) before provision for income taxes attributable to domestic and foreign operations are as follows (in thousands):
| | | | | | | | | | | |
| | | Years Ended December 31, |
| | | 2008 | | | 2007 | | | 2006 |
Domestic | | $ | (47,608 | ) | | $ | (35,441 | ) | | $ | 3,331 |
Foreign | | | (26,685 | ) | | | (29,710 | ) | | | 1,510 |
| | | | | | | | | | | |
Total income (loss) before provision for income taxes | | $ | (74,293 | ) | | $ | (65,151 | ) | | $ | 4,841 |
| | | | | | | | | | | |
The provision for income taxes consists of the following (in thousands):
| | | | | | | | | | | | |
| | | Years Ended December 31, | |
| | | 2008 | | | 2007 | | | 2006 | |
Current provision: | | | | | | | | | | | | |
Federal | | $ | (651 | ) | | $ | (3,102 | ) | | $ | 5,314 | |
State | | | 335 | | | | 1,419 | | | | 896 | |
Foreign | | | 2,851 | | | | 6,056 | | | | 2,616 | |
| | | | | | | | | | | | |
Total current provision | | | 2,535 | | | | 4,373 | | | | 8,826 | |
| | | | | | | | | | | | |
| | | |
Deferred provision (benefit): | | | | | | | | | | | | |
Federal | | | — | | | | 37 | | | | 16,698 | |
State | | | — | | | | — | | | | 4,682 | |
Foreign | | | (2,008 | ) | | | 2,551 | | | | (2,258 | ) |
| | | | | | | | | | | | |
Total deferred provision | | | (2,008 | ) | | | 2,588 | | | | 19,122 | |
| | | | | | | | | | | | |
Total provision for income taxes | | $ | 527 | | | $ | 6,961 | | | $ | 27,948 | |
| | | | | | | | | | | | |
100
The provision for income taxes differed from the amount computed by applying the federal statutory rate to our income before provision for income taxes as follows (amounts in thousands):
| | | | | | | | | | | | |
| | | Years Ended December 31, | |
| | | 2008 | | | 2007 | | | 2006 | |
Tax at federal statutory rate | | $ | (26,002 | ) | | $ | (22,803 | ) | | $ | 1,696 | |
State tax expenses, net of federal tax benefit | | | (512 | ) | | | (1,082 | ) | | | 318 | |
Foreign taxes at other than United States rates | | | 2,196 | | | | 1,110 | | | | (173 | ) |
Net operating loss carryback claims | | | 2,578 | | | | 4,715 | | | | — | |
Changes in valuation allowances | | | 22,027 | | | | 13,238 | | | | 23,065 | |
Extraterritorial income tax exclusion | | | — | | | | — | | | | (61 | ) |
Meals and entertainment | | | — | | | | — | | | | 180 | |
Non-deductible compensation | | | — | | | | — | | | | 70 | |
Intercompany allocation | | | — | | | | — | | | | 816 | |
Income on entity conversion | | | — | | | | — | | | | 1,806 | |
Reserves | | | — | | | | — | | | | 50 | |
Non-deductible items | | | 1,060 | | | | 10,055 | | | | — | |
Other | | | (820 | ) | | | 1,728 | | | | 181 | |
| | | | | | | | | | | | |
Provision for income taxes | | $ | 527 | | | $ | 6,961 | | | $ | 27,948 | |
| | | | | | | | | | | | |
The Company’s income tax provision of $0.5 million and $7.0 million for fiscal years 2008 and 2007, respectively, was primarily due to income taxes in certain foreign jurisdictions. During 2006, the Company recognized an income tax expense of $23.1 million related to the establishment of a valuation allowance against substantially all of its U.S.-deferred tax assets. During 2008 and 2007, the Company increased the valuation allowance by approximately $14.4 million and $7.6 million. In both 2008 and 2007, the Company continued to record a valuation allowance against substantially all of its deferred tax assets in the U.S. and certain foreign jurisdictions.
For the years ended December 31, 2008 and 2007, the non-deductible items included $2.0 million and $9.1 million of tax expenses related to non-deductible goodwill impairment.
The Company carried back the 2007 federal net operating loss to 2005 and 2006 and expects to carry back a portion of the 2008 federal net operating loss to 2006. To the extent the Company had taxable income in the carryback period, the Company did not provide valuation allowance on that portion of the deferred tax assets related to tax carryback claims. As a result of the carryback claims for the years ended December 31, 2008 and 2007, the Company recognized income tax benefits of $2.6 million and $4.7 million applied to the years ended December 31, 2006 and 2005.
Deferred income taxes are provided for the effects of temporary differences between the tax basis of an asset or liability and its reported amount on the consolidated balance sheets. These temporary differences result in taxable or deductible amounts in future years. The significant components of deferred tax assets and liabilities are listed below.
101
Deferred tax assets (liabilities) was comprised of the following (in thousands):
| | | | | | | | |
| | | Years Ended December 31, | |
| | | 2008 | | | 2007 | |
Accruals and allowances | | $ | 21,031 | | | $ | 19,709 | |
Revenue recognition | | | 360 | | | | 99 | |
Capitalized inventory expenses | | | 924 | | | | 1,650 | |
Management earnout | | | 476 | | | | — | |
Deferred compensation | | | 1,270 | | | | 1,170 | |
Stock-based compensation | | | 1,648 | | | | 1,460 | |
Depreciation and amortization | | | 10,871 | | | | 12,237 | |
Tax credits and net operating loss carryforwards | | | 24,874 | | | | 12,435 | |
Unrealized gain / (loss) | | | — | | | | 824 | |
| | | | | | | | |
Gross deferred tax assets | | | 61,454 | | | | 49,584 | |
| | | | | | | | |
| | |
Unrealized gain / (loss) | | | (735 | ) | | | — | |
Other | | | (580 | ) | | | (1,419 | ) |
| | | | | | | | |
Gross deferred tax liabilities | | | (1,315 | ) | | | (1,419 | ) |
| | | | | | | | |
| | |
Valuation allowance | | | (53,085 | ) | | | (38,715 | ) |
| | | | | | | | |
| | |
Net deferred tax assets | | $ | 7,054 | | | $ | 9,450 | |
| | | | | | | | |
Valuation allowance reduces the deferred tax assets to the amounts that, based upon available evidence, are more likely than not to be realized. The valuation allowance at December 31, 2008 and 2007 is mostly attributable to the Netherlands, Germany, Sweden, Belgium, France, Chile, and the U.S. net operating loss (“NOL”) carryforwards, as well as federal foreign tax credits that do not meet the more likely than not standard of realizability.
The breakdown between current and long-term deferred tax assets and deferred tax liabilities was as follows (in thousands):
| | | | | | |
| | | Years Ended December 31, |
| | | 2008 | | 2007 |
Current deferred tax assets | | $ | 1,826 | | $ | 3,745 |
Non-current deferred tax assets | | | 5,228 | | | 5,705 |
| | | | | | |
Total deferred tax assets, net of deferred tax liabilities | | $ | 7,054 | | $ | 9,450 |
| | | | | | |
At December 31, 2008 and 2007, the Company reported federal NOLs in the amount of $54.3 million and $13.5 million, respectively, available to offset future taxable income. The Company is expected to carry back the full amount of the 2007 NOL to tax years 2005 and 2006 and $7.1 million of the 2008 NOL to tax year 2006. The remaining $47.1 million federal NOL at December 31, 2008 will be carried forward to offset future federal taxable income, and, if not utilized, will expire in 2028. At December 31, 2008 and 2007, the Company had state NOL carryforwards of approximately $73.4 million and $25.2 million, respectively, available to offset future state taxable income. The state NOL carryforwards, if not utilized, will expire between years 2013 and 2028. The federal and state NOL carryforwards disclosed herein do not reflect the impact of the limitation under IRC Section 382, which the Company estimates to be approximately $28.0 million and $38.2 million, respectively. See below for further discussion concerning the limitation under IRC Section 382. At December 31, 2008 and 2007, the Company had foreign NOL carryforwards of approximately $58.1 million and $37.8 million, respectively, available to offset future taxable income.
IRC Section 382 imposes limitations on a corporation’s ability to utilize its NOL carryforwards if the corporation experiences an ownership change, as defined in IRC Section 382. Based upon currently available information, the Company believes there was an ownership change in the fourth quarter of 2008. As a result, utilization of our federal NOL in future periods will likely be subject to an annual limitation under IRC Section 382 estimated to be approximately $1.1 million. A similar provision applies to various states that will result in various annual limitations. Accordingly, the
102
Company has reduced its deferred tax assets based upon the estimated statutory limitations in annual NOL carryforward recognition and loss carryforward time periods for both federal and state purposes. The amount of the annual limitation may, under certain circumstances, be increased by the recognized “built-in gains” that occur during the five-year period after the ownership change.
At December 31, 2008 and 2007, there was no provision for U.S. income taxes for undistributed earnings of the Company’s foreign subsidiaries as it is currently the Company’s intention to reinvest these earnings indefinitely in operations outside the United States. The Company believes it is not practicable to determine the Company’s tax liability that may arise in the event of a future repatriation of foreign earnings. If repatriated, these earnings could result in a tax expense at the current federal statutory tax rate of 35%, subject to available net operating losses and other factors. Tax on undistributed earnings may also be reduced by foreign tax credits that may be generated in connection with the repatriation of earnings.
The Company adopted Financial Accounting Standards Board Interpretation No. 48,Accounting for Uncertainties in Income Taxes, an Interpretation of FASB Statement No. 109 (“FIN 48”), effective January 1, 2007. FIN 48 requires the Company to recognize the financial statement effect of a tax position when it is more likely than not, based on the technical merits, that the position will be sustained upon examination. The cumulative effect of adopting FIN 48, if any, is required to be recorded in retained earnings and other accounts as applicable. At adoption, the Company recorded a decrease to accumulated deficit of $1.5 million.
A reconciliation of the beginning and ending amount of total gross unrecognized tax benefits is as follows (in thousands):
| | | | | | | | |
| | | Years Ended December 31, | |
| | | 2008 | | | 2007 | |
Balance at beginning of year | | $ | 14,371 | | | $ | 12,841 | |
Increase related to prior year tax positions | | | — | | | | 13 | |
Decrease related to prior year tax positions | | | (127 | ) | | | — | |
Increase related to current year tax positions | | | 927 | | | | 2,822 | |
Settlements with tax authorities | | | (81 | ) | | | — | |
Decrease related to lapse of statute of limitations | | | (1,033 | ) | | | (1,305 | ) |
| | | | | | | | |
Balance at end of year | | $ | 14,057 | | | $ | 14,371 | |
| | | | | | | | |
The unrecognized tax benefits, if recognized, would impact the tax provision by $7.1 million and $7.9 million at December 31, 2008 and 2007, respectively.
The Company has elected to include interest and penalties as a component of tax expense. Accrued interest and penalties at December 31, 2008 and 2007 were $1.9 million and $2.0 million, respectively. The Company does not anticipate that the amount of existing unrecognized tax benefits will significantly increase or decrease within the next 12 months.
The Company files federal income tax returns, as well as income tax returns in various states and foreign jurisdictions. The Company is currently under examination by tax authorities in France, Belgium, the United Kingdom, Germany, Chile, Mexico and various states in the U.S. for certain years between 2001 and 2008. Most state and foreign jurisdictions have three or four open tax years at any point in time. Although the outcome of any tax audit is uncertain, the Company believes that it has adequately provided in its financial statements for any additional taxes that it may be required to pay as a result of such examinations. If the payment ultimately proves to be unnecessary, the reversal of these tax liabilities would result in tax benefits being recognized in the period the Company determines such liabilities are no longer necessary. However, if an ultimate tax assessment exceeds our estimate of tax liabilities, an additional tax provision will be recorded.
NOTE 10 — COMMITMENTS AND CONTINGENCIES
The Company leases its facilities under cancelable and non-cancelable operating lease agreements. The leases expire at various times through 2025 and contain renewal options. Certain of the leases require the Company to pay property taxes, insurance and maintenance costs. The Company leases certain equipment under capital leases with such equipment amounting to $2.3 million at each of December 31, 2008 and 2007, less accumulated depreciation of $1.8 million and
103
$1.2 million at December 31, 2008 and 2007, respectively. Depreciation expense on assets subject to capital leases was $0.6 million for each of the years ended December 31, 2008, 2007 and 2006. The capital lease terms range from 24 months to 60 months.
The following is a summary of commitments under non-cancelable leases as of December 31, 2008 (in thousands):
| | | | | | |
| | | Capital
Leases | | Operating
Leases |
Years Ending December 31, | | | | | | |
2009 | | $ | 559 | | $ | 12,952 |
2010 | | | — | | | 10,072 |
2011 | | | — | | | 6,726 |
2012 | | | — | | | 5,638 |
2013 | | | — | | | 4,005 |
2014 and beyond | | | — | | | 12,451 |
| | | | | | |
Total minimum lease payments | | | 559 | | $ | 51,844 |
| | | | | | |
Less: amounts representing interest | | | 65 | | | |
| | | | | | |
Present value of minimum lease payments | | $ | 494 | | | |
| | | | | | |
Total rent expense was $20.1 million, $19.4 million and $14.2 million for the years ended December 31, 2008, 2007 and 2006, respectively. Subsequent to December 31, 2006, the Company entered into several extensions on current leases, or has entered into lease agreements for new or additional facilities to meet its operational needs.
On June 4, 2008, the Company’s export subsidiary in the United Kingdom received a notification from theDirection Générale des Finances Publiquesthat the French tax authorities were proposing to issue a tax deficiency notice against the Company’s export subsidiary for the failure to pay value-added tax and corporate income tax in France during the period of January 1, 2002 to December 31, 2008, in an amount, including interest and penalties, of approximately €27.3 million ($38.2 million using the exchange rate of $1.40/€1.00 as of December 31, 2008). Subsequently, the tax authorities issued a tax assessment against the Company’s U.K. export subsidiary. The Company is contesting the proposed assessment. The Company intends to defend this matter vigorously and avail itself of all available defenses. The matter is in the preliminary stages and, therefore, the Company is not in a position to estimate a loss, if any, or a range of potential loss. As no amount of potential loss is both probable and estimable, no accrual has been made in the consolidated financial statements as of December 31, 2008 or 2007. However, a negative outcome of this matter could have a material adverse impact on the Company’s consolidated financial position, results of operations and cash flows.
In February 2008, independent counsel to the Board of Directors (the “Board”), accompanied by counsel for the Company, self-reported to the SEC as to the findings of the independent investigations conducted by special committees of the Board. The SEC commenced a non-public fact-finding inquiry into the Company’s historical accounting practices. The inquiry being conducted by the SEC is ongoing and the Company continues to cooperate with the SEC.
On December 29, 2008, John R. Campbell, who alleges that he is a shareholder of the Company, caused a purported shareholder’s derivative lawsuit to be filed in the Superior Court of California for the County of San Mateo against the Company, as a nominal defendant, and 17 current and former officers and directors of the Company, seeking to recover damages purportedly sustained by the Company in connection with its historical stock option granting practices. Subject to certain limitations, the Company is obligated to indemnify its current and former officers and directors in connection with the investigation of the Company’s historical stock option practices and such lawsuits. Although the matter is in its preliminary stages and the Company has procured insurance coverage for these types of claims, the expense to the Company associated with this lawsuit may be significant.
In October 2008, the Company provided indemnification agreements to all members of the Board and the Company’s executive officers. Four members of the Board had pre-existing indemnification agreements that were entered into immediately prior to the Company’s initial public offering in 1993 and those agreements were amended in October 2008. The indemnification agreements require the Company to indemnify the directors and officers and pay their expenses if they become a party to, or are threatened with, any action, suit or proceeding arising out of their service to the Company.
104
The Company is a party to agreements pursuant to which it may be obligated to indemnify another party. Typically, these obligations arise in connection with sales agreements, under which the Company customarily agrees to hold the other party harmless against losses arising from a breach of warranties, representations or covenants related to such matters as title to assets sold, validity of certain intellectual property rights and non-infringement of third-party rights. In each of these circumstances, payment by the Company is typically subject to the other party making a claim and cooperating with the Company pursuant to the procedures specified in the particular agreement. This process usually allows the Company to challenge the other party’s claims or, in case of breach of intellectual property representations or covenants, to control the defense or settlement of any third-party claims brought against the other party. Further, the Company’s obligations under these agreements may be limited in terms of activity (typically to replace or correct the products or terminate the agreement with a refund to the other party), duration and/or amounts. In many instances, the Company has recourse against the suppliers of the products that will cover the payments made by the Company.
The Company is subject to legal proceedings and claims that arise in the normal course of business. Management believes that the ultimate resolution of such matters will not have a material adverse effect on the Company’s financial position, results of operations or cash flows.
NOTE 11 — TRANSACTIONS WITH RELATED PARTIES
One director of the Company was a director of one of the Company’s customers, Pinnacle Systems, Inc. Another director of the Company is a director of one of the Company’s customers, Datalink Corporation. The consultant who manages the Company’s Brazilian operation has an ownership interest in two of the Company’s customers/vendors, Megaware Commercial Ltda and Megaware Industrial Ltda (collectively, “Megaware”).
In 2006, the employees who managed the Company’s Mexico operations had various ownership interests in the following customers/vendors of the Company: Import Mayoreo SA de CV, Trofel Computacion SA de CV, Verbatrade SA de CV, Importador Nacional Peninsular and Outsourcing Distribution SA de CV.
In 2006, as a part of the Company’s acquisition of ProSys, the Company entered into two long-term real property leases for office and warehouse space in Norcross, Georgia with Laurelwood Holdings, LLC (“Laurelwood Holdings”). The sellers of ProSys, who thereafter became employees of the Company, have an ownership interest in Laurelwood Holdings. In 2008, 2007 and 2006, the Company paid $500,906, $497,693 and $124,423, respectively, under those lease agreements to Laurelwood Holdings.
Since October 2005, the Company has employed a stepson of Mr. Bell in the position of director of strategic markets. In 2008 and 2007, Mr. Bell’s stepson received a total cash compensation of $246,217 and $238,307, respectively. On November 17, 2005, he was granted an option to purchase 15,000 shares of common stock, with an exercise price of $7.95 per share. On January 21, 2008, he was granted an option to purchase 10,000 shares of common stock, with an exercise price of $5.90. In addition, he participates in all other benefits that the Company offers to all of its employees. The Audit Committee reviewed and ratified the employment of Mr. Bell’s stepson and his compensation.
105
Sales to and purchases from these parties for the three years ended December 31, 2008 and accounts receivable and accounts payable at December 31, 2008, 2007 and 2006, are summarized below (in thousands):
| | | | | | | | | |
| | | Years Ended December 31, |
| | | 2008 | | 2007 | | 2006 |
Sales: | | | | | | | | | |
Datalink Corporation | | $ | 60 | | $ | — | | $ | 783 |
Megaware | | | 45,111 | | | 37,939 | | | 23,808 |
Import Mayoreo SA de CV | | | — | | | 7,620 | | | — |
Verbatrade SA de CV | | | — | | | 4,027 | | | 20,452 |
Accounts receivable: | | | | | | | | | |
Datalink Corporation | | | — | | | — | | | 79 |
Megaware | | | 8,443 | | | 10,024 | | | 4,844 |
Import Mayoreo SA de CV | | | 5,615 | | | 6,451 | | | — |
Verbatrade SA DE CV | | | 40 | | | 40 | | | 6,489 |
Purchases: | | | | | | | | | |
Megaware | | | — | | | — | | | 16,114 |
Importadora Naciónal Peninsular | | | — | | | — | | | 21,851 |
Accounts payable: | | | | | | | | | |
Megaware | | | — | | | — | | | 2,191 |
Import Mayorco SA de CV | | | — | | | — | | | 6,288 |
NOTE 12 — SALARY SAVINGS PLAN AND RETIREMENT PLAN
The Company has a Section 401(k) Plan (the “Plan”), which provides participating U.S. employees an opportunity to accumulate funds for retirement and hardship. Participants may contribute up to 30% of their eligible earnings to the 1998 Stock Plan. Beginning in 2006, the Company began providing a matching contribution of 25% of the employee’s first 6% of contributions to the 1998 Stock Plan up to $2,000 per year. The Company’s expense for matching contributions for the years ended December 31, 2008, 2007 and 2006 was $1.5 million, $1.0 million and $0.5 million, respectively.
During 2002, the Board adopted the Supplemental Executive Retirement Plan (“SERP”), which was amended in November 2007. The SERP provides an annual income benefit to the Company’s Chief Executive Officer of $450,000 at retirement over his life. The SERP is unfunded and expenses related to the SERP were $0.3 million, $0.1 million and $1.6 million in the years ended December 31, 2008, 2007 and 2006, respectively. Included in the 2006 expense was a $1.2 million charge resulting from a SERP amendment that increased the annual retirement benefit from $250,000 per year to $450,000 per year. The actuarial estimate of the SERP liability amounted to $3.2 million and $2.9 million as of December 31, 2008 and 2007, respectively, and is included in “Other Long-term Liabilities” in these consolidated balance sheets.
The Company has purchased life insurance on its Chief Executive Officer and other key employees. As beneficiary of these insurance policies, the Company receives the cash surrender value if the policy is terminated, and upon death of an insured, receives all benefits payable. The Company estimates that the proceeds from the life insurance benefits will be sufficient to recover, over time, the full cost of the SERP and the death benefits being provided to the other key employees ($250,000 per employee), plus the cost of insurance. The “cash value of life insurance,” as reported in these consolidated balance sheets in “Other Long-term Assets” as of December 31, 2008 and 2007, is $1.7 million and $1.5 million, respectively.
NOTE 13 — SEGMENT AND GEOGRAPHIC INFORMATION
SFAS 131 establishes standards for reporting information about operating segments, products and services, geographic areas of operations and major customers. Operating segments are defined as components of an enterprise about which separate financial information is available, which the chief operating decision-maker evaluates regularly in determining allocation of resources and assessing performance. Under the criteria of SFAS 131, the Company has ten operating segments and seven reportable segments for the years ended December 31, 2008 and 2007.
106
The following are the Company’s reportable segments:
| | |
U.S. Distribution | | Miami |
Europe | | Canada |
ProSys | | Other |
TotalTec | | |
The reportable segment, U.S. Distribution, is determined based on geography and client base. The reportable segments, Europe, TotalTec, Miami, Canada and ProSys, represent operating segments that individually met the quantitative threshold reporting requirements of SFAS 131. The reportable segment, Other, represents operating segments that were combined as they share a majority of the reportable segment aggregation criteria of SFAS 131 and do not individually or in the aggregate meet the quantitative threshold reporting requirements of SFAS 131. The Other segment includes Rorke Data and certain in-country operations in Latin America (Brazil, Chile and Mexico).
Historically, the Company disclosed segment and geographic information using five reportable segments for the year ended December 31, 2006. For comparative purposes, the Company has presented in the table below the 2006 segment and geographic information as if it had used seven reportable segments.
Financial information for each of the Company’s seven reportable segments is summarized below (dollars in thousands):
| | | | | | | | | | | | | | | | | | | | | |
| | | Years Ended December 31, | |
| | | 2008 | | | 2007 | | | 2006 | |
| | | Amount | | | % | | | Amount | | | % | | | Amount | | | % | |
Net sales: | | | | | | | | | | | | | | | | | | | | | |
U.S. Distribution | | $ | 864,480 | | | 24.1 | % | | $ | 1,046,852 | | | 26.5 | % | | $ | 1,043,188 | | | 30.9 | % |
Europe | | | 1,459,128 | | | 40.8 | | | | 1,699,732 | | | 43.0 | | | | 1,483,018 | | | 44.0 | |
ProSys | | | 451,446 | | | 12.6 | | | | 378,760 | | | 9.6 | | | | 73,206 | | | 2.2 | |
TotalTec | | | 46,795 | | | 1.3 | | | | 63,533 | | | 1.6 | | | | 83,851 | | | 2.5 | |
Miami | | | 415,547 | | | 11.6 | | | | 373,951 | | | 9.5 | | | | 325,082 | | | 9.6 | |
Canada | | | 123,941 | | | 3.5 | | | | 149,042 | | | 3.8 | | | | 147,334 | | | 4.4 | |
Other | | | 218,162 | | | 6.1 | | | | 238,035 | | | 6.0 | | | | 217,197 | | | 6.4 | |
| | | | | | | | | | | | | | | | | | | | | |
Total net sales | | $ | 3,579,499 | | | 100.0 | % | | $ | 3,949,905 | | | 100.0 | % | | $ | 3,372,876 | | | 100.0 | % |
| | | | | | | | | | | | | | | | | | | | | |
Income (loss) from operations: | | | | | | | | | | | | | | | | | | | | | |
U.S. Distribution | | $ | (44,337 | ) | | (130.8 | )% | | $ | (12,517 | ) | | (37.5 | )% | | $ | 17,677 | | | 56.2 | % |
Europe | | | 1,920 | | | 5.7 | | | | (14,275 | ) | | (42.7 | ) | | | 5,829 | | | 18.5 | |
ProSys | | | 1,893 | | | 5.6 | | | | (17,909 | ) | | (53.6 | ) | | | 909 | | | 2.9 | |
TotalTec | | | (4,143 | ) | | (12.2 | ) | | | 1,871 | | | 5.6 | | | | 2,519 | | | 8.0 | |
Miami | | | 3,477 | | | 10.3 | | | | 5,784 | | | 17.3 | | | | 3,462 | | | 11.0 | |
Canada | | | 6,448 | | | 19.0 | | | | 4,398 | | | 13.2 | | | | (1,173 | ) | | (3.7 | ) |
Other | | | 856 | | | 2.4 | | | | (766 | ) | | (2.3 | ) | | | 2,226 | | | 7.1 | |
| | | | | | | | | | | | | | | | | | | | | |
Total income (loss) from operations | | $ | (33,886 | ) | | (100.0 | )% | | $ | (33,414 | ) | | (100.0 | )% | | $ | 31,449 | | | 100.0 | % |
| | | | | | | | | | | | | | | | | | | | | |
107
| | | | | | | | | | | | |
| | | Years Ended December 31, | |
| | | 2008 | | | 2007 | | | 2006 | |
Capital expenditures: | | | | | | | | | | | | |
U.S. Distribution | | $ | 1,421 | | | $ | 1,771 | | | $ | 2,262 | |
Europe | | | 2,631 | | | | 3,688 | | | | 2,468 | |
ProSys | | | 1,005 | | | | 1,518 | | | | 45 | |
TotalTec | | | 194 | | | | 270 | | | | 904 | |
Miami | | | 1,512 | | | | 867 | | | | 186 | |
Canada | | | 28 | | | | 177 | | | | 55 | |
Other | | | 813 | | | | 956 | | | | 437 | |
| | | | | | | | | | | | |
Total | | $ | 7,604 | | | $ | 9,247 | | | $ | 6,357 | |
| | | | | | | | | | | | |
Depreciation and amortization: | | | | | | | | | | | | |
U.S. Distribution | | $ | 1,498 | | | $ | 1,604 | | | $ | 1,663 | |
Europe | | | 3,779 | | | | 4,127 | | | | 3,861 | |
ProSys | | | 3,722 | | | | 3,390 | | | | 801 | |
TotalTec | | | 563 | | | | 577 | | | | 443 | |
Miami | | | 347 | | | | 361 | | | | 468 | |
Canada | | | 75 | | | | 75 | | | | 90 | |
Other | | | 790 | | | | 834 | | | | 598 | |
| | | | | | | | | | | | |
Total | | $ | 10,774 | | | $ | 10,968 | | | $ | 7,924 | |
| | | | | | | | | | | | |
Interest expense (income), net: | | | | | | | | | | | | |
U.S. Distribution | | $ | 15,700 | | | $ | 20,235 | | | $ | 15,354 | |
Europe | | | 13,758 | | | | 13,817 | | | | 13,871 | |
ProSys | | | (44 | ) | | | (326 | ) | | | (79 | ) |
TotalTec | | | 2 | | | | 54 | | | | — | |
Miami | | | — | | | | — | | | | (43 | ) |
Canada | | | 400 | | | | 392 | | | | 302 | |
Other | | | 82 | | | | (9 | ) | | | 51 | |
| | | | | | | | | | | | |
Total | | $ | 29,898 | | | $ | 34,163 | | | $ | 29,456 | |
| | | | | | | | | | | | |
| | | | | | |
| | | As of December 31, |
| | | 2008 | | 2007 |
Total assets: | | | | | | |
U.S. Distribution | | $ | 217,636 | | $ | 335,554 |
Europe | | | 274,110 | | | 396,685 |
ProSys | | | 106,793 | | | 126,815 |
TotalTec | | | 13,358 | | | 15,295 |
Miami | | | 99,474 | | | 128,966 |
Canada | | | 27,291 | | | 39,150 |
Other | | | 36,226 | | | 59,361 |
| | | | | | |
Total | | $ | 774,888 | | $ | 1,101,826 |
| | | | | | |
Long-lived assets: | | | | | | |
U.S. Distribution | | $ | 4,545 | | $ | 4,231 |
Europe | | | 5,806 | | | 8,385 |
ProSys | | | 3,303 | | | 3,354 |
TotalTec | | | 819 | | | 1,053 |
Miami | | | 2,297 | | | 1,114 |
Canada | | | 132 | | | 212 |
Other | | | 2,140 | | | 2,323 |
| | | | | | |
Total | | $ | 19,042 | | $ | 20,672 |
| | | | | | |
108
Net sales by geographic region based on shipped from location (except Miami, where net sales are based upon shipped to location) for the years ended December 31, 2008, 2007 and 2006 were as follows (dollars in thousands):
| | | | | | | | | | | | | | | | | | |
| | | Years Ended December 31, | |
| | | 2008 | | | 2007 | | | 2006 | |
| | | Amount | | % | | | Amount | | % | | | Amount | | % | |
North America(1) | | $ | 1,652,009 | | 46.2 | % | | $ | 1,809,571 | | 45.8 | % | | $ | 1,483,593 | | 44.0 | % |
Europe(2) | | | 1,459,128 | | 40.7 | | | | 1,699,732 | | 43.0 | | | | 1,483,018 | | 44.0 | |
Latin America(3) | | | 468,362 | | 13.1 | | | | 440,602 | | 11.2 | | | | 406,265 | | 12.0 | |
| | | | | | | | | | | | | | | | | | |
Total | | $ | 3,579,499 | | 100.0 | % | | $ | 3,949,905 | | 100.0 | % | | $ | 3,372,876 | | 100.0 | % |
| | | | | | | | | | | | | | | | | | |
| (1) | North America sales include sales in the United States of approximately $1,527,717, $1,679,700 and $1,336,259 for the years ended December 31, 2008, 2007 and 2006, respectively. |
| (2) | Europe sales include sales in the United Kingdom of approximately $810,934, $1,018,365 and $1,260,716 for the years ended December 31, 2008, 2007 and 2006, respectively. |
| (3) | Latin America net sales include sales from Miami to customers located in Latin America. The geographic net sales for Latin America does not include certain Miami sales made to customers located outside of Latin America. |
Net property and equipment by geographic area at December 31 is as follows (in thousands):
| | | | | | |
| | | December 31, |
| | | 2008 | | 2007 |
North America | | $ | 9,797 | | $ | 9,886 |
Europe | | | 5,806 | | | 8,385 |
Latin America | | | 3,439 | | | 2,401 |
| | | | | | |
Total | | $ | 19,042 | | $ | 20,672 |
| | | | | | |
NOTE 14 — DERIVATIVE INSTRUMENTS
The Company uses derivative instruments, principally forward and swap contracts, to manage the risk associated with changes in foreign currency exchange rates and the risk that changes in interest rates will affect the fair value or cash flows of its debt obligations. The Company monitors its positions with, and the credit quality of, the financial institutions that are party to these financial transactions. Counterparty credit risk related to derivative financial instruments has historically been considered low because the transactions have been entered into with a number of strong, creditworthy financial institutions. From time to time, the Company uses interest rate swap agreements to hedge the fair value of its fixed-rate debt obligations. Under an interest rate swap contract, the Company agrees to receive a fixed-rate payment (in most cases equal to the stated coupon rate of the debt being hedged) for a floating-rate payment.
Foreign Currency Risk Management
A substantial part of the Company’s revenue, inventory purchases and capital expenditures are transacted in U.S. dollars, but the functional currency for foreign subsidiaries is not the U.S. dollar. The Company enters into foreign forward exchange contracts to economically hedge certain balance sheet exposures against the impact of future changes in foreign exchange rates. The gains and losses on the forward exchange contracts are largely offset by gains and losses on the underlying transactions. To the extent the Company is unable to manage these risks, its consolidated financial position and cash flows could be materially adversely affected. The Company’s foreign exchange forward contracts related to current assets and liabilities are generally six months or less in original maturity.
At December 31, 2008 and 2007, the Company had outstanding foreign exchange forward contracts with a total notional amount of approximately $75.5 million and $52.1 million, respectively, which were not designated in hedging relationships. These contracts will settle in British pounds, Euros, Chilean pesos, Mexican pesos and U.S. dollars.
For all derivative transactions, the Company is exposed to counterparty credit risk to the extent that the counterparties may not be able to meet their obligations to the Company. To manage the counterparty risk, the Company enters into derivative transactions only with major financial institutions.
Interest Rate Risk Management
In August 2003, the Company entered into an interest rate swap agreement in order to gain access to the lower borrowing rates generally available on floating-rate debt, while avoiding prepayment and other costs that would be associated with refinancing long-term fixed-rate debt. The swap agreement purchased has a notional amount of $40.0 million, with a six-month settlement period and provides for variable interest at LIBOR plus a set rate spread. The notional amount
109
decreases ratably as the underlying debt is repaid. The value of the swap agreement was a liability of $73,516 at December 31, 2007. The interest rate swap agreement was scheduled to terminate in June 2010, subject to early termination at the counterparty’s discretion. The counterparty terminated the interest rate swap on February 6, 2008. The counterparty paid the Company approximately $15,000 in connection with the termination of the swap representing the fair market value of the interest rate swap on the termination date. Historically, changes in the fair market value of the instrument were recorded in the Statement of Operations. All other changes in fair value during the year are recorded to interest expense (income), net as ineffectiveness. The amount recorded to earnings due to ineffectiveness during the year ended December 31, 2008 was insignificant.
On June 30, 2006, the Company entered into a cross-currency interest rate swap agreement with Wachovia Bank, N.A. to hedge its investments in foreign operations in which the Euro is their functional currency (“Euro investments”). The principal notional amount of the swap was €6.0 million ($8.4 million using the exchange rate on December 31, 2008 of $1.40/€1.00 on June 30, 2006). Under the terms of the swap, Wachovia will pay the Company an interest payment computed on the 3-month USD LIBOR in exchange for an interest payment from the Company computed on the 3-month Euro LIBOR. On both sides of the swap, the Company’s bank margin of 1.5% will be added. The interest payments are reset every three months and at maturity there will be a cash settlement between the Company and Wachovia, which will be dependant on the conversion rates at maturity in comparison to the original spot rate of $1.28/€1. The swap has a three-year maturity and may be terminated by the Company for convenience at no cost. This swap agreement is accounted for as a net investment hedge under SFAS 133. Both at inception, and on an on-going basis, the Company performs an effectiveness test. Consistent with the Company’s policy with respect to derivative instruments and hedging activities and in accordance with SFAS 133, the Company will designate the change in Euro spot rates as the hedged risk in its Euro investments. Since the contract is a hedge of the Company’s Euro investments, the change in the fair value of the contract attributable to changes in spot rates, which is the effective portion of the hedge, will be recorded as an offset to the Company’s Euro investments in the cumulative translation account on the balance sheet. The fair value of the cross-currency interest rate swap agreement at December 31, 2008 was $0.7 million and is recorded as a liability on the consolidated balance sheet. The change in fair value of this contract due to exchange rate fluctuations was recorded to accumulated other comprehensive income (loss) in the amount of $0.4 million during 2008 and $0.9 million during 2007. All other changes in the fair value during the year are recorded to interest expense (income), net as ineffectiveness. The amount recorded to earnings due to ineffectiveness during the year ended December 31, 2008 was insignificant.
Contingent Put Option
In connection with the acquisition of ProSys, see Note 4 —Acquisitions, the Company and the former shareholders of ProSys (the “Holders”) entered into a registration rights agreement obligating the Company to file a registration statement with the SEC to allow for the resale of the 1.72 million shares of common stock, used as part of the consideration in the purchase transaction, within 60 days of the closing date of the acquisition. On April 30, 2007, the Company and the Holders entered into an amendment to the registration rights agreement which provided that in exchange for an extension to the Company of the time to register the shares, the Company would provide the Holders with cash necessary to make up the shortfall, if any, if, following the sale thereof, the sales price of the shares held by the Holders on the open market is below $4.93 (the “Issue Price”), the price used to determine the share value for purposes of determining the consideration for the purchase transaction (“Price Protection”), as well as a put right to the Company at the Issue Price in certain circumstances. On February 5, 2008, the Company entered into a memorandum of understanding with the Holders that required the Company to pay an advance against potential contingent consideration due to the Holders in exchange for an extension on the previously granted put right through September 30, 2008. On August 26, 2008, the Company and the Holders entered into a second amendment to the registration rights agreement under which the Company agreed to purchase from the Holders all of the right, title and interest in 710,036 shares of the purchase consideration common stock at the Issue Price, in exchange for the Holders agreeing to retain the remaining 1,014,336 shares until such time as the Company is current in its periodic reports or October 2009, whichever occurs first. With respect to the remaining shares, the Holders continue to hold the Price Protection and put rights as described above and the Company’s maximum liability under these obligations is $5.0 million.
The fair value of the put option was a liability in the amount of $4.4 million at December 31, 2008 and is included in “Other accrued liabilities” in the Company’s consolidated balance sheets. The related fair value changes are recorded as compensation expense in “Selling, general and administrative expense” in the consolidated statements of operations. As of December 31, 2008, the fair value of the Price Protection was equivalent to the fair value of the contingent put option.
The Company paid $3.5 million for the 710,036 shares purchased pursuant to the second amendment to the registration rights agreement. The amount paid in excess of the Company’s share price on August 26, 2008 totaled $1.9 million, which was recorded as compensation expense in “Selling, general and administrative expense.”
NOTE 15 — SHAREHOLDERS’ EQUITY (DEFICIT)
Loss Per Share
Basic and diluted loss per share (“EPS”) is computed by dividing net income (loss) (the numerator), by the weighted average number of common shares outstanding (the denominator), during the period. Diluted EPS does not give effect to potentially dilutive common shares outstanding during the period, including stock options and warrants using the treasury stock method, and convertible debt using the if-converted method as their effect would have been anti-dilutive.
The following is a reconciliation of the numerators and denominators of the basic and diluted EPS computations for the periods presented below (in thousands, except per share data):
| | | | | | | | | | | | |
| | | Years Ended December 31, | |
| | | 2008 | | | 2007 | | | 2006 | |
Basic loss per share: | | | | | | | | | | | | |
Net loss | | $ | (74,820 | ) | | $ | (72,112 | ) | | $ | (23,107 | ) |
Shares used in computation: | | | | | | | | | | | | |
Weighted average ordinary shares outstanding | | | 32,299 | | | | 32,248 | | | | 30,772 | |
| | | | | | | | | | | | |
Basic loss per share | | $ | (2.32 | ) | | $ | (2.24 | ) | | $ | (0.75 | ) |
| | | | | | | | | | | | |
Diluted loss per share: | | | | | | | | | | | | |
Net loss | | $ | (74,820 | ) | | $ | (72,112 | ) | | $ | (23,107 | ) |
Shares used in computation: | | | | | | | | | | | | |
Weighted average ordinary shares outstanding | | | 32,299 | | | | 32,248 | | | | 30,772 | |
Employee stock options | | | — | | | | — | | | | — | |
Restricted stock units | | | — | | | | — | | | | — | |
| | | | | | | | | | | | |
Weighted average number of shares | | | 32,299 | | | | 32,248 | | | | 30,772 | |
| | | | | | | | | | | | |
Diluted loss per share | | $ | (2.32 | ) | | $ | (2.24 | ) | | $ | (0.75 | ) |
| | | | | | | | | | | | |
110
At December 31, 2008, 1,020,083 RSU awards and options to purchase, 3,999,567 shares of the Company’s common stock and warrants to purchase 125,000 shares were excluded from the calculation of diluted EPS because they were anti-dilutive. At December 31, 2007, 395,333 RSU awards, options to purchase 3,461,554 shares of the Company’s common stock and warrants to purchase 125,000 shares were excluded from the calculation of diluted EPS because they were anti-dilutive. At December 31, 2006, 512,324 RSU awards, options to purchase 3,210,487 shares of the Company’s common stock and warrants to purchase 125,000 shares were excluded from the calculation of diluted EPS because they were anti-dilutive.
Warrants
In connection with the 2006 Notes used to finance the October 2, 2006 acquisition of ProSys, the Company issued warrants to the investors to purchase up to 125,000 shares of the Company’s common stock at an exercise price of $5.15 per share. These warrants had a fair value of $382,000 at December 31, 2006 and were recorded to equity at fair value on the date of grant. In accordance with EITF 00-19,Accounting for Derivative Financial Instruments Indexed to, and Potentially Settled in, a Company’s Own Stock, subsequent changes in fair value of the warrants are not recognized as long as they are classified as equity.
The warrants expire in October 2011 and the investor has the right to convert the warrant into common stock at any time prior to its expiration. Upon exercise of the warrant, the Company is required to deliver to the holder common stock equal to the quotient obtained by dividing the net value of all the warrant shares by the fair market value of a single warrant share.
The holder can also exercise the warrant right upon payment of any amount equal to the warrant exercise price in the form of cash or securities previously issued by the Company at such securities’ then fair market value. In the event of capital reorganizations such as a consolidation or merger of the Company with another corporation, the sale of all or substantially all of its assets in which the holders of the Company’s common stock shall be entitled to receive stock, securities or assets, the holders of the warrants would be entitled to receive stock, securities or assets as if it had exercised its rights under the warrant agreement.
The Company was required to file a registration statement for the warrant shares under the 1933 Act promptly after the date of the asset purchase agreement of October 2, 2006. The Company has not been able to do so because of the restatement and the resulting delay in filing its periodic reports with the SEC. As of May 31, 2009, the Company has not filed the registration statement for the warrant shares.
NOTE 16 — FAIR VALUE MEASUREMENTS
In September 2006, FASB issued Statement of Financial Accounting Standards No. 157,Fair Value Measurements (“SFAS 157”) that defines fair value, establishes a framework for measuring fair value and expands disclosures about fair value measurements. SFAS 157 applies to other accounting pronouncements that require or permit fair value measurements and does not require any new fair value measurements.
In February 2008, FASB issued Staff Position Statement FAS 157-2, which provides for a one-year deferral of the provisions of SFAS 157 for non-financial assets and liabilities that are recognized or disclosed at fair value in the consolidated financial statements on a non-recurring basis. The Company is currently evaluating the impact of adopting the provisions of SFAS 157 for non-financial assets and liabilities that are recognized or disclosed on a non-recurring basis.
Effective January 1, 2008, the Company adopted the provisions of SFAS 157 for financial assets and liabilities, as well as for any other assets and liabilities that are carried at fair value on a recurring basis. The adoption of the provisions of SFAS 157 related to financial assets and liabilities and other assets and liabilities that are carried at fair value on a recurring basis did not materially impact the Company’s consolidated financial position and results of operations.
SFAS 157 defines fair value as the exchange price that would be received for an asset or paid to transfer a liability (an exit price) in the principal or most advantageous market for the asset or liability in an orderly transaction between market participants on the measurement date. SFAS 157 also establishes a fair value hierarchy, which requires an entity to maximize the use of observable inputs and minimize the use of unobservable inputs when measuring fair value. SFAS 157 describes three levels of inputs that may be used to measure fair value:
| | |
| Level 1 | | Quoted prices are available in active markets for identical assets or liabilities as of the reporting date. Active markets are those in which transactions for the asset or liability occur in sufficient frequency and volume to provide pricing information on an ongoing basis. Level 1 primarily consists of financial instruments such as exchange-traded derivatives, listed equities and U.S. government treasury securities. |
111
| | |
| Level 2 | | Pricing inputs are other than quoted prices in active markets included in Level 1, which are either directly or indirectly observable as of the reporting date. Level 2 includes those financial instruments that are valued using models or other valuation methodologies. These models are primarily industry-standard models that consider various assumptions, including quoted forward prices for commodities, time value, volatility factors and current market and contractual prices for the underlying instruments, as well as other relevant economic measures. Substantially all of these assumptions are observable in the marketplace throughout the full term of the instrument, can be derived from observable data or are supported by observable levels at which transactions are executed in the marketplace. Instruments in this category include non-exchange-traded derivatives such as over-the-counter forwards, options and repurchase agreements. |
| |
| Level 3 | | Pricing inputs include significant inputs that are generally less observable from objective sources. These inputs may be used with internally developed methodologies that result in management’s best estimate of fair value from the perspective of a market participant. Level 3 instruments include those that may be more structured or otherwise tailored to customers’ needs. At each balance sheet date, the Company performs an analysis of all instruments subject to SFAS 157 and includes in Level 3 all of those whose fair value is based on significant unobservable input. |
Assets and liabilities measured at fair value on a recurring basis include the following at December 31, 2008 (in thousands):
| | | | | | | | | | | | | | | |
| | | Fair Value Measurements Using | | | Total | |
| | | Level 1 | | Level 2 | | | Level 3 | | |
Available-for-sale securities | | $ | 22 | | $ | — | | | $ | — | | | $ | 22 | |
Cross-currency interest rate swap | | | — | | | (744 | ) | | | — | | | | (744 | ) |
Contingent put option | | | — | | | — | | | | (4,391 | ) | | | (4,391 | ) |
| | | | | | | | | | | | | | | |
| | $ | 22 | | $ | (744 | ) | | $ | (4,391 | ) | | $ | (5,113 | ) |
| | | | | | | | | | | | | | | |
In accordance with the disclosure requirements of FASB’s Statement of Financial Accounting Standards No. 107, Disclosures about Fair Value of Financial Instruments (“SFAS 107”), the Company discloses the fair value of its term loans. (See Note 6— Lines of Credit and Term Loans.) The fair value of these term loans is measured using Level 2 inputs.
Available-For-Sale Securities
The Company has an equity ownership interest in CHDT Corporation, which is accounted for as an available-for-sale security. The fair value of the Company’s available security is as follows at December 31, 2008 and 2007 (in thousands):
| | | | | | | | |
| | | December 31, | |
| | | 2008 | | | 2007 | |
Cost basis | | $ | 80 | | | $ | 80 | |
| | |
Unrealized holding loss | | | (58 | ) | | | (28 | ) |
| | | | | | | | |
Fair value | | $ | 22 | | | $ | 52 | |
| | | | | | | | |
The fair value of this investment is included in “Other assets” in the Company’s consolidated balance sheets and the related net unrealized holding gains and losses are included in “Accumulated Other Comprehensive Income” in the shareholders’ equity section in the Company’s consolidated balance sheets.
Cross-Currency Interest Rate Swap
On June 30, 2006, the Company entered into a cross-currency interest rate swap agreement with Wachovia Bank, N.A. to hedge its investments in foreign operations in which the Euro is the functional currency. The notional amount of the swap at December 31, 2008 was €6.0 million. This swap agreement is accounted for as a net investment hedge under
112
SFAS 133. As the notional amount of the cross-currency interest rate swap is expected to equal a comparable amount of hedge assets. No material ineffectiveness is expected. The fair value of the cross-currency interest rate swap agreement at December 31, 2008 was $0.7 million and is recorded as a liability on the consolidated balance sheet. The fair value of the cross-currency interest rate swap is calculated using a discounted cash flow model which uses the forward yield curves of USD LIBOR interest rates and Euro LIBOR interest rates to arrive at the net present value of the expected cash flows of the cross-currency swap. This financial instrument is typically exchange-traded and is generally classified within Level 1 or Level 2 of the fair value hierarchy, depending on whether or not the exchange is deemed to be an active market. The cross-currency interest rate swap is traded in an active market and, therefore, is classified within Level 1.
Contingent Put Option
The Company utilizes the Black-Sholes option pricing model for determining the estimated fair value of the put option (Level 3). In the Black-Scholes valuation calculation the Company made estimates of key assumptions such as future stock price volatility, expected term and risk free rates. The expected stock price volatility is based on the historical volatility of the Company’s stock. The expected term is based upon the Company’s estimate of the life of the contingent put option. The risk-free rate is based on the U.S. Treasury yield curve in effect at each valuation date. As of December 31, 2008, the fair value of the Price Protection was equivalent to the fair value of the contingent put option. For further information regarding the contingent put option and Price Protection, see Note 14— Derivative Instruments.
Foreign Exchange Contracts
The Company enters into foreign exchange forward, option or swap contracts (collectively, the “foreign exchange contracts”) to mitigate the impact of changes in foreign currency exchange rates. These contracts are executed to facilitate the hedging of foreign currency exposures resulting from inventory purchases and sales and generally have terms of no more than six months. Gains or losses on these contracts are deferred and recognized when the underlying future purchase or sale is recognized or when the corresponding asset or liability is revalued. The Company does not enter into foreign exchange contracts for trading purposes. The risk of loss on a foreign exchange contract is the risk of nonperformance by the counterparties, which the Company minimizes by limiting its counterparties to major financial institutions. The fair value of the foreign exchange contracts is estimated using market quotes obtained from brokers (Level 2). The notional amount of the foreign exchange contracts at December 31, 2008 and 2007 was $75.5 million and $52.1 million, respectively. The fair value was nominal at December 31, 2008 and 2007.
NOTE 17 — SUBSEQUENT EVENT
Stock Option Extensions
As a result of the Company’s delay in filing its Exchange Act reports with the SEC, the Company’s Registration Statement on Form S-8 cannot be used. From 2007 to 2009, the Compensation Committee of the Board approved the extension of the exercisability of outstanding options to purchase 1,236,778 shares that were to expire during the period in which no Form S-8 was available to allow for a 30-day period to exercise options after the Company becomes current with its SEC filings.
NOTE 18 — SELECTED QUARTERLY FINANCIAL INFORMATION (UNAUDITED)
The tables below summarize unaudited quarterly financial data for the eight quarters in the two-year period ended December 31, 2008. In the Company’s opinion, the unaudited quarterly financial data has been prepared on the same basis as the audited consolidated financial statements and includes all adjustments (consisting only of normal recurring adjustments) necessary for a fair statement of the data for the periods presented. The Company’s results of operations varied and may continue to fluctuate significantly from quarter to quarter. The results of operations in any period should not necessarily be considered indicative of the results to be expected for any future period.
113
| | | | | | | | | | | | | | | | |
| | | 2008 | |
| | | March 31 | | | June 30 | | | September 30 | | | December 31 | |
| | | (in thousands, except per share data) | |
|
| ASSETS | |
| | | | |
Current assets: | | | | | | | | | | | | | | | | |
Cash and cash equivalents | | $ | 26,921 | | | $ | 36,489 | | | $ | 45,394 | | | $ | 22,775 | |
Accounts receivable, net | | | 524,909 | | | | 530,868 | | | | 482,329 | | | | 435,569 | |
Inventories | | | 354,125 | | | | 329,702 | | | | 315,502 | | | | 230,652 | |
Prepaid expenses and other current assets | | | 18,970 | | | | 21,900 | | | | 23,583 | | | | 19,779 | |
| | | | | | | | | | | | | | | | |
Total current assets | | | 924,925 | | | | 918,959 | | | | 866,808 | | | | 708,775 | |
Property and equipment, net | | | 19,827 | | | | 20,147 | | | | 19,335 | | | | 19,042 | |
Goodwill | | | 26,722 | | | | 28,001 | | | | 26,463 | | | | 19,211 | |
Other intangibles, net | | | 12,138 | | | | 11,289 | | | | 10,288 | | | | 9,315 | |
Other long-term assets | | | 16,403 | | | | 15,656 | | | | 15,482 | | | | 18,545 | |
| | | | | | | | | | | | | | | | |
Total assets | | $ | 1,000,015 | | | $ | 994,052 | | | $ | 938,376 | | | $ | 774,888 | |
| | | | | | | | | | | | | | | | |
|
| LIABILITIES AND SHAREHOLDERS’ EQUITY (DEFICIT) | |
| | | | |
Current liabilities: | | | | | | | | | | | | | | | | |
Cash overdraft | | $ | 25,645 | | | $ | 16,876 | | | $ | 8,896 | | | $ | 10,527 | |
Accounts payable | | | 330,571 | | | | 363,292 | | | | 345,118 | | | | 264,218 | |
Borrowings under lines of credit | | | 284,072 | | | | 215,654 | | | | 251,344 | | | | 211,405 | |
Current portion of long-term debt | | | 10,563 | | | | 8,395 | | | | 8,788 | | | | 10,286 | |
Other accrued liabilities | | | 86,173 | | | | 100,538 | | | | 79,372 | | | | 94,658 | |
| | | | | | | | | | | | | | | | |
Total current liabilities | | | 737,024 | | | | 704,755 | | | | 693,518 | | | | 591,094 | |
Long-term debt, net of current portion | | | 158,857 | | | | 190,544 | | | | 188,294 | | | | 183,538 | |
Other long-term liabilities | | | 16,870 | | | | 17,396 | | | | 17,375 | | | | 15,751 | |
| | | | | | | | | | | | | | | | |
Total liabilities | | | 912,751 | | | | 912,695 | | | | 899,187 | | | | 790,392 | |
Shareholders’ equity: | | | | | | | | | | | | | | | | |
Common stock | | | 200,019 | | | | 201,817 | | | | 201,661 | | | | 201,701 | |
Accumulated deficit | | | (144,272 | ) | | | (151,201 | ) | | | (177,540 | ) | | | (208,973 | ) |
Accumulated other comprehensive income (loss) | | | 30,517 | | | | 30,741 | | | | 15,068 | | | | (8,232 | ) |
| | | | | | | | | | | | | | | | |
Total shareholders’ equity (deficit) | | | 87,264 | | | | 81,357 | | | | 39,189 | | | | (15,504 | ) |
| | | | | | | | | | | | | | | | |
Total liabilities and shareholders’ equity | | $ | 1,000,015 | | | $ | 994,052 | | | $ | 938,376 | | | $ | 774,888 | |
| | | | | | | | | | | | | | | | |
114
| | | | | | | | | | | | | | | | |
| | | 2007 | |
| | | March 31 | | | June 30 | | | September 30 | | | December 31 | |
| | | (in thousands, except per share data) | |
|
| ASSETS | |
| | | | |
Current assets: | | | | | | | | | | | | | | | | |
Cash and cash equivalents | | $ | 15,854 | | | $ | 20,186 | | | $ | 15,296 | | | $ | 40,348 | |
Accounts receivable, net | | | 499,758 | | | | 499,658 | | | | 531,578 | | | | 544,137 | |
Inventories | | | 374,711 | | | | 329,902 | | | | 360,675 | | | | 424,117 | |
Prepaid expenses and other current assets | | | 21,954 | | | | 19,428 | | | | 20,606 | | | | 17,053 | |
| | | | | | | | | | | | | | | | |
Total current assets | | | 912,277 | | | | 869,174 | | | | 928,155 | | | | 1,025,655 | |
Property and equipment, net | | | 19,098 | | | | 20,126 | | | | 20,919 | | | | 20,672 | |
Goodwill | | | 75,251 | | | | 76,682 | | | | 78,006 | | | | 26,214 | |
Other intangibles, net | | | 15,657 | | | | 14,808 | | | | 13,956 | | | | 13,023 | |
Other long-term assets | | | 22,249 | | | | 22,013 | | | | 21,602 | | | | 16,262 | |
| | | | | | | | | | | | | | | | |
Total assets | | $ | 1,044,532 | | | $ | 1,002,803 | | | $ | 1,062,638 | | | $ | 1,101,826 | |
| | | | | | | | | | | | | | | | |
|
| LIABILITIES AND SHAREHOLDERS’ EQUITY | |
| | | | |
Current liabilities: | | | | | | | | | | | | | | | | |
Cash overdraft | | $ | 42,542 | | | $ | 39,969 | | | $ | 47,803 | | | $ | 21,627 | |
Accounts payable | | | 336,472 | | | | 305,537 | | | | 331,973 | | | | 411,713 | |
Borrowings under lines of credit | | | 216,276 | | | | 202,800 | | | | 225,886 | | | | 277,428 | |
Current portion of long-term debt | | | 8,811 | | | | 13,165 | | | | 10,080 | | | | 14,508 | |
Other accrued liabilities | | | 106,219 | | | | 117,398 | | | | 118,980 | | | | 103,523 | |
| | | | | | | | | | | | | | | | |
Total current liabilities | | | 710,320 | | | | 678,869 | | | | 734,722 | | | | 828,799 | |
Long-term debt, net of current portion | | | 169,449 | | | | 165,214 | | | | 164,404 | | | | 160,053 | |
Other long-term liabilities | | | 7,247 | | | | 7,213 | | | | 7,038 | | | | 16,538 | |
| | | | | | | | | | | | | | | | |
Total liabilities | | | 887,016 | | | | 851,296 | | | | 906,164 | | | | 1,005,390 | |
Common stock | | | 199,350 | | | | 199,759 | | | | 199,972 | | | | 200,308 | |
Accumulated deficit | | | (66,461 | ) | | | (77,916 | ) | | | (77,261 | ) | | | (134,153 | ) |
Accumulated other comprehensive income | | | 24,627 | | | | 29,664 | | | | 33,763 | | | | 30,281 | |
| | | | | | | | | | | | | | | | |
Total shareholders’ equity | | | 157,516 | | | | 151,507 | | | | 156,474 | | | | 96,436 | |
| | | | | | | | | | | | | | | | |
Total liabilities and shareholders’ equity | | $ | 1,044,532 | | | $ | 1,002,803 | | | $ | 1,062,638 | | | $ | 1,101,826 | |
| | | | | | | | | | | | | | | | |
115
| | | | | | | | | | | | | | | | |
| | | Year Ended December 31, 2008 | |
| | | First
Quarter | | | Second
Quarter | | | Third
Quarter | | | Fourth
Quarter | |
| | | (in thousands, except per share data) | |
Net sales | | $ | 993,362 | | | $ | 936,601 | | | $ | 880,730 | | | $ | 768,806 | |
Cost of sales | | | 905,953 | | | | 849,826 | | | | 797,973 | | | | 690,303 | |
| | | | | | | | | | | | | | | | |
Gross profit | | | 87,409 | | | | 86,775 | | | | 82,757 | | | | 78,505 | |
Selling, general and administrative expense | | | 80,372 | | | | 74,439 | | | | 77,735 | | | | 74,500 | |
Investigation and restatement-related costs | | | 9,013 | | | | 10,957 | | | | 16,134 | | | | 16,029 | |
Impairment of goodwill and other intangibles | | | — | | | | — | | | | — | | | | 5,864 | |
Restructuring and impairment costs | | | 2,209 | | | | 72 | | | | 59 | | | | 1,949 | |
| | | | | | | | | | | | | | | | |
Total operating expenses | | | 91,594 | | | | 85,468 | | | | 93,928 | | | | 98,342 | |
| | | | | | | | | | | | | | | | |
Operating income (loss) | | | (4,185 | ) | | | 1,307 | | | | (11,171 | ) | | | (19,837 | ) |
Interest expense, net | | | 8,017 | | | | 7,276 | | | | 7,247 | | | | 7,358 | |
Other expense (income), net | | | (2,329 | ) | | | (416 | ) | | | 8,377 | | | | 4,877 | |
| | | | | | | | | | | | | | | | |
Loss before income taxes | | | (9,873 | ) | | | (5,553 | ) | | | (26,795 | ) | | | (32,072 | ) |
Provision for (benefit from) income taxes | | | 246 | | | | 1,375 | | | | (456 | ) | | | (638 | ) |
| | | | | | | | | | | | | | | | |
Net loss | | $ | (10,119 | ) | | $ | (6,928 | ) | | $ | (26,339 | ) | | $ | (31,434 | ) |
| | | | | | | | | | | | | | | | |
Net loss per share: | | | | | | | | | | | | | | | | |
Basic | | $ | (0.31 | ) | | $ | (0.21 | ) | | $ | (0.81 | ) | | $ | (0.98 | ) |
| | | | | | | | | | | | | | | | |
Diluted | | $ | (0.31 | ) | | $ | (0. 21 | ) | | $ | (0.81 | ) | | $ | (0.98 | ) |
| | | | | | | | | | | | | | | | |
Shares used in per share calculation: | | | | | | | | | | | | | | | | |
Basic | | | 32,313 | | | | 32,434 | | | | 32,380 | | | | 32,070 | |
| | | | | | | | | | | | | | | | |
Diluted | | | 32,313 | | | | 32,434 | | | | 32,380 | | | | 32,070 | |
| | | | | | | | | | | | | | | | |
| | | | | | | | | | | | | | | | |
| | | Year Ended December 31, 2007 | |
| | | First
Quarter | | | Second
Quarter | | | Third
Quarter | | | Fourth
Quarter | |
| | | (in thousands, except per share data) | |
Net sales | | $ | 972,287 | | | $ | 920,681 | | | $ | 988,497 | | | $ | 1,068,440 | |
Cost of sales | | | 890,523 | | | | 844,896 | | | | 897,880 | | | | 976,063 | |
| | | | | | | | | | | | | | | | |
Gross profit | | | 81,764 | | | | 75,785 | | | | 90,617 | | | | 92,377 | |
Selling, general and administrative expense | | | 70,992 | | | | 72,917 | | | | 72,290 | | | | 77,581 | |
Investigation and restatement-related costs | | | 5,723 | | | | 7,307 | | | | 6,631 | | | | 6,667 | |
Impairment of goodwill and other intangibles | | | — | | | | — | | | | — | | | | 52,445 | |
Restructuring and impairment costs | | | — | | | | 1,203 | | | | 129 | | | | 72 | |
| | | | | | | | | | | | | | | | |
Total operating expenses | | | 76,715 | | | | 81,427 | | | | 79,050 | | | | 136,765 | |
| | | | | | | | | | | | | | | | |
Operating income (loss) | | | 5,049 | | | | (5,642 | ) | | | 11,567 | | | | (44,388 | ) |
Interest expense, net | | | 9,102 | | | | 8,017 | | | | 8,701 | | | | 8,343 | |
Other expense (income), net | | | (1,219 | ) | | | (1,753 | ) | | | (1,253 | ) | | | 1,799 | |
| | | | | | | | | | | | | | | | |
Income (loss) before income taxes | | | (2,834 | ) | | | (11,906 | ) | | | 4,119 | | | | (54,530 | ) |
Provision for (benefit from) income taxes | | | 3,122 | | | | (451 | ) | | | 3,464 | | | | 826 | |
| | | | | | | | | | | | | | | | |
Net income (loss) | | $ | (5,956 | ) | | $ | (11,455 | ) | | $ | 655 | | | $ | (55,356 | ) |
| | | | | | | | | | | | | | | | |
Net income (loss) per share: | | | | | | | | | | | | | | | | |
Basic | | $ | (0.18 | ) | | $ | (0.36 | ) | | $ | 0.02 | | | $ | (1.71 | ) |
| | | | | | | | | | | | | | | | |
Diluted | | $ | (0.18 | ) | | $ | (0.36 | ) | | $ | 0.02 | | | $ | (1.71 | ) |
| | | | | | | | | | | | | | | | |
Shares used in per share calculation: | | | | | | | | | | | | | | | | |
Basic | | | 32,212 | | | | 32,226 | | | | 32,270 | | | | 32,285 | |
| | | | | | | | | | | | | | | | |
Diluted | | | 32,212 | | | | 32,226 | | | | 32,740 | | | | 32,285 | |
| | | | | | | | | | | | | | | | |
| Item 9. | Changes In and Disagreements with Accountants on Accounting and Financial Disclosure |
None.
116
| Item 9A. | Controls and Procedures |
Introduction
During 2007 and 2008, we spent considerable time and resources preparing restated consolidated financial statements and supporting the audit processes pertaining to the periods January 1, 1996 to June 30, 2006. These restated financial statements were included in our Form 10-K for the year ended December 31, 2006, which was filed on December 30, 2008. Because of extensive efforts required, we were unable to remediate identified material weaknesses. We continue to invest significant time and resources in order to remediate weaknesses in our internal control over financial reporting.
Evaluation of Disclosure Controls and Procedures
Disclosure controls and procedures, as defined in Rules 13a-15(e) and 15(d)-15(e) under the Securities Exchange Act of 1934, as amended (the “Exchange Act”), are designed to ensure that information required to be disclosed in reports filed or submitted under the Exchange Act is recorded, processed, summarized and reported within the time periods specified by the rules promulgated by the SEC, and that such information is accumulated and communicated to management, including the Chief Executive Officer and the Chief Financial Officer, as appropriate, to allow timely decisions regarding required disclosure.
In connection with the preparation of this Annual Report on Form 10-K, the Company completed an evaluation, as of December 31, 2008, under the supervision of and with participation from the Company’s management, including the current Chief Executive and Chief Financial Officers, as to the effectiveness of the design and operation of the Company’s disclosure controls and procedures. Based upon this evaluation, management concluded that as of December 31, 2008, the Company’s disclosure controls and procedures were not effective because of the material weaknesses described below underManagement’s Report on Internal Control over Financial Reporting.
In light of the material weaknesses described below, additional analyses and other procedures were performed to ensure that the Company’s consolidated financial statements included in this Annual Report on Form 10-K were prepared in accordance with GAAP. These measures included expanded year-end closing procedures, the dedication of significant internal resources and external consultants to scrutinize account analyses and reconciliations and management’s own internal reviews and efforts to remediate the material weaknesses in internal control over financial reporting described below. As a result of these measures, management concluded that the Company’s consolidated financial statements included in this Annual Report on Form 10-K present fairly, in all material respects, the Company’s consolidated financial position, results of operations and cash flows as of the dates, and for the periods, presented in conformity with GAAP.
Management’s Report on Internal Control over Financial Reporting
Management is responsible for establishing and maintaining adequate internal control over financial reporting for the Company, as such term is defined in Rules 13a-15(f) and 15d-15(f) under the Exchange Act. The Company’s internal control over financial reporting is a process designed to provide reasonable assurance regarding the reliability of financial reporting and the preparation of consolidated financial statements for external reporting purposes in accordance with GAAP.
The Company’s internal control over financial reporting includes those policies and procedures that (1) pertain to the maintenance of records that, in reasonable detail, accurately and fairly reflect the transactions and dispositions of the assets of the Company; (2) provide reasonable assurance that transactions are recorded as necessary to permit preparation of consolidated financial statements in accordance with GAAP, and that receipts and expenditures of the Company are being made only in accordance with authorizations of management and directors of the Company; and (3) provide reasonable assurance regarding prevention or timely detection of unauthorized use, acquisition or disposition of the Company’s assets that could have a material effect on the consolidated financial statements.
Because of its inherent limitations, internal control over financial reporting may not prevent or detect every misstatement. Any evaluation of effectiveness is subject to the risk that the controls may become inadequate because of changes in conditions or that the degree of compliance with policies or procedures may decrease over time.
117
In making its assessment of the effectiveness of the Company’s internal control over financial reporting as of December 31, 2008, management used the criteria established in theInternal Control — Integrated Frameworkissued by the Committee of Sponsoring Organizations of the Treadway Commission (“COSO”). A “material weakness” is a deficiency, or a combination of deficiencies, in internal control over financial reporting, such that there is a reasonable possibility that a material misstatement of the Company’s annual or interim consolidated financial statements will not be prevented or detected on a timely basis. Based on the criteria established by COSO, management identified the following material weaknesses in the Company’s internal control over financial reporting as of December 31, 2008:
| | • | | Control Environment— The Company did not maintain an effective control environment, which is the foundation for the discipline and structure necessary for effective internal control over financial reporting, as evidenced by: (i) an insufficient number of personnel appropriately qualified to perform control monitoring activities, including the recognition of the risks and complexities of its business operations, (ii) insufficient resources for information and communication flows commensurate with the complexity of its organizational and entity structure and (iii) an insufficient number of personnel with an appropriate level of GAAP knowledge and experience or training in the application of GAAP commensurate with the Company’s financial reporting requirements, which resulted in erroneous or unsupported judgments regarding the proper application of GAAP. This control environment material weakness also contributed to the following additional material weaknesses. |
| | • | | Stock-Based Compensation— The Company did not have effective controls to ensure the completeness and accuracy of the accounting for, and the disclosure of, its stock-based compensation program. |
| | • | | Accrued Liabilities and Reserves— The Company did not have effective controls to ensure that accrued liabilities, including accruals for in-transit inventories, contingencies, insurance premiums, professional services and sponsorships, were valid, complete and accurate, and that reserves for accounts receivable, inventory and estimated uncollectible receivables from vendors for rebates and other pricing adjustments were valid, complete and accurately valued. |
| | • | | Account Reconciliations —The Company did not have effective controls to ensure that (i) journal entries and account reconciliations were supported by sufficient documentation and adequately reviewed on a timely basis for validity, completeness and accuracy and (ii) account reconciliations were performed, and reconciling items resolved, on a timely basis. |
| | • | | Accounts Receivable— The Company did not have effective controls to ensure the completeness and accuracy of accounts receivable such that (i) certain accounts receivable credits owed to customers would be identified, reviewed and recognized as income in the appropriate accounting periods and (ii) appropriate supporting documentation would be maintained to support adjustments to accounts receivable credits. |
| | • | | Vendor Allowances— The Company did not have effective controls to ensure the validity, completeness and accuracy of vendor allowances such that (i) vendor allowances would be recorded only in connection with final sales transactions and (ii) appropriate supporting documentation would exist for vendor allowances. |
| | • | | Revenue— The Company did not have effective controls to ensure that (i) adequate collectibility assessments were performed prior to recognizing revenue, (ii) revenue and the related costs were reported in the appropriate accounting period, (iii) revenue was completely and accurately recorded on a net basis with respect to certain third-party service contracts where the Company was not the primary obligor and (iv) intercompany sales were properly eliminated. |
| | • | | Income Taxes— The Company did not have effective controls to (i) review and monitor the accuracy of the components of its income tax provision calculations and related deferred income tax and income taxes payable related accounts and (ii) ensure that the rationale for certain tax positions and regulatory filings was adequately considered, documented and communicated. |
118
| | • | | Business Combinations, Goodwill Impairment and Segment Reporting— The Company did not have effective controls to (i) appropriately account for contingent consideration in business combinations and (ii) ensure that its reporting units were properly identified and goodwill was properly allocated when assessing goodwill for possible impairment. |
| | • | | Financing-Related Accounts— The Company did not have effective controls to ensure that (i) warrants issued inconjunction with certain debt transactions were properly valued and amortized; (ii) modifications to its debt instruments were accounted for appropriately; and (iii) derivative financial investments were accounted for in accordance with GAAP. |
| | • | | Post-Retirement Benefits— The Company did not have effective controls to ensure that certain information related to modifications of its Supplemental Executive Retirement Plan was appropriately communicated to its Finance Department and that the associated liability was completely and accurately recorded. |
| | • | | Fixed Asset Dispositions— The Company did not have effective controls to ensure that fixed assets that were either retired or decommissioned were removed from the Company’s fixed asset records on a timely basis. |
| | • | | Inventory in-Transit — The Company did not have effective controls to ensure the inventory in-transit and the related vendor liability was recorded in the appropriate period. |
| | • | | General Computer Controls — The Company did not have effective access or change management controls in one of its computer processing environments. |
These material weaknesses could result in misstatements of the Company’s consolidated financial statement accounts and disclosures, which would result in a material misstatement of future annual or interim consolidated financial statements that would not be prevented or detected on a timely basis.
As a result of these material weaknesses, management concluded that the Company did not maintain effective internal control over financial reporting as of December 31, 2008, based on the criteria established inInternal Control — Integrated Framework, issued by the COSO.
The Company’s assessment of the effectiveness of its internal control over financial reporting as of December 31, 2008 has been audited by Deloitte & Touche LLP, an independent registered public accounting firm, as stated in their report, which appears herein.
Completed and Planned Remediation Actions to Address the Internal Control Weaknesses
In response to the identified material weaknesses, the Company has dedicated significant resources to improving its control environment. Management believes that actions taken beginning in 2007, along with other improvements not yet fully implemented, will address the material weaknesses in the Company’s internal control over financial reporting noted above. Company management plans to continue to review and make changes to the overall design of its control environment, including the roles and responsibilities within the organization and reporting structure, as well as policies and procedures to improve the overall internal control over financial reporting. In particular, the Company has implemented, or plans to implement, the measures described below to remediate the material weaknesses described above.
| | • | | Control Environment— The Company is committed to improving its control environment. This commitment has been, and will continue to be, communicated to and reinforced with every Company employee. As part of this commitment, the Company has updated its code of conduct, and all employees will be required to acknowledge their commitment to adhering to its provisions. The Company will also regularly remind all employees of the availability of its whistleblower hotline, through which employees at all levels can anonymously submit information or express concerns regarding accounting, financial reporting and other irregularities they have become aware of or have observed. In addition, management has taken, or intends to take, the following actions to improve the Company’s control environment: |
| | • | | Personnel Matters— As part of the initiative to improve its control environment and in response to the issues identified in the investigation, the Company has made certain personnel and structural changes in the accounting, finance and administrative areas, including: |
| | • | | The hiring of a new Executive Vice President and Chief Financial Officer in August 2007. |
119
| | • | | The hiring of an employee in the newly created position of Chief Accounting Officer and Corporate Controller in March 2008, which replaced the position of Vice President of Finance and Corporate Controller. |
| | • | | The formation of a Legal Department, the hiring of a Vice President, General Counsel and Corporate Secretary in July 2007 and the hiring of additional personnel in the Legal Department. |
| | • | | The delegation to the General Counsel of the responsibility for managing and administering the Company’s equity award granting process. |
| | • | | The hiring of employees in the newly created positions of Director of GAAP and SEC Reporting and SEC Reporting Manager. |
| | • | | The addition of three professionals in its Internal Audit Department. |
| | • | | Employee Training— The Company is establishing Company-wide training to enhance awareness and understanding of standards and principles for accounting and financial reporting. This training will include: |
| | • | | Comprehensive training programs for all finance personnel at the manager level and above covering fundamental accounting and financial reporting matters, including GAAP accounting principles, revenue recognition, reserve and accrual accounting and purchase accounting. |
| | • | | Quarterly training programs for key finance personnel (led by the Chief Financial Officer, Chief Accounting Officer or Director of GAAP and SEC Reporting) covering accounting issues requiring substantial judgment, documentation requirements and accounting policies and procedures. |
| | • | | A financial leadership training program (led by the Chief Financial Officer) covering worldwide financial management issues, debriefings on all restatement items, financial issues requiring substantial judgment and new accounting policies and procedures. |
The Company expects that its training programs will be implemented during the latter part of 2009 and in early 2010.
| | • | | Policies and Procedures— The Company has implemented or will be implementing and/or enhancing a number of key accounting and finance-related policies and procedures, including with respect to foreign-currency translations, revenue recognition, reserve and accrual analysis, consignment inventory, accounts receivable, vendor allowances and the preparation of the statement of cash flows. The Company expects that these policies and procedures will be implemented during 2009. |
| | • | | Stock-Based Compensation— In 2007, the Board (i) amended the Charter of the Compensation Committee to clarify its duties and responsibilities and (ii) adopted, and the Company implemented, a new equity award policy defining the responsibilities of the Compensation Committee in its oversight of the Company’s stock option grant practices and clarifying the administration of equity awards. Key features of the equity award policy include: |
| | • | | All awards to employees will be granted by the Compensation Committee or recommended by the Compensation Committee to the Board. |
120
| | • | | All awards to directors (other than automatic awards under Company equity plans) will be granted by the Board. |
| | • | | Awards will normally be considered at regularly scheduled Committee or Board meetings, but may also be considered at special meetings or as action taken by unanimous written consent of the Compensation Committee or Board. |
| | • | | The exercise price of all stock options shall be equal to or greater than the closing price of the Company’s common stock on the grant date. |
| | • | | Minutes will be prepared and circulated promptly following all meetings of the Board and its Committees. |
| | • | | Accrued Liabilities and Reserves and Account Reconciliations— The Company is improving its implementing procedures to ensure that all required account balances, including accrued liabilities and reserves, are appropriately reconciled in a timely manner and that journal entries are properly prepared and approved. The Company expects that these improvements and procedures will be substantially implemented by December 31, 2009. |
| | • | | Accounts Receivable— The Company is implementing a revised policy regarding the accounting for accounts receivable credits. The Company expects this policy to be fully implemented in 2009. |
| | • | | Vendor Allowances— The Company is implementing a revised policy and related procedures to ensure: (i) vendor allowances are only recorded in connection with final sales transactions and (ii) supporting documentation is maintained for all vendor allowances recorded. The Company expects this policy and revised procedures to be fully implemented in 2009. |
| | • | | Revenue— The Company is updating and enhancing its policies and procedures related to revenue recognition. The Company expects that these policies and procedures will be implemented during 2009. |
| | • | | Income Taxes— The Company is establishing additional control processes for the accurate and timely accounting for income taxes. The Company expects that these improvements and procedures will be implemented during 2009. |
| | • | | Business Combinations, Goodwill Impairment and Segment Reporting— The Company is establishing additional control processes for the accurate and timely accounting for business combinations, goodwill and goodwill impairment analyses and segment reporting. The Company expects that these improvements and procedures will be implemented during 2009. |
| | • | | Financing-Related Accounts— The Company is implementing additional policies, procedures and documentation retention requirements to ensure appropriate accounting for financing-related transactions, such as warrant and derivative transactions and modifications to its debt instruments. The Company expects that these improvements and procedures will be implemented during 2009. |
| | • | | Post-Retirement Benefits— The Company is updating and enhancing its key accounting and finance policies and procedures related to post-retirement benefits. The Company expects that these policies and procedures will be implemented during 2009. |
| | • | | Fixed Asset Dispositions— The Company is implementing enhanced procedures in several locations to ensure that fixed assets that are either disposed of or decommissioned are removed from the Company’s fixed asset records and that the appropriate accounting entries are recorded on a timely basis. The Company expects that these policies and procedures will be implemented during 2009. |
| | • | | Inventory in-Transit— The Company is implementing additional procedures to ensure that inventory items shipped by vendors are recorded by the Company upon the passage of title. The Company expects these procedures to be fully implemented in 2009. |
| | • | | General Computer Controls— The Company is implementing access and change management controls in the affected environment. The Company expects these controls to be fully implemented in 2009. |
Management is committed to implementing its remediation action plan to remediate the material weaknesses discussed above. Management intends to continue to monitor the effectiveness of these actions and will make changes that management determines appropriate.
121
Changes in Internal Control over Financial Reporting
Except as described inManagement’s Report on Internal Control over Financial ReportingandCompleted and Planned Remediation Actions to Address the Internal Control Weaknesses, there were no changes in the Company’s internal control over financial reporting that occurred during any fiscal quarter in 2008 or 2007 that have materially affected, or are reasonably likely to materially affect, the Company’s internal control over financial reporting.
REPORT OF INDEPENDENT REGISTERED PUBLIC ACCOUNTING FIRM
ON INTERNAL CONTROL OVER FINANCIAL REPORTING
The Board of Directors and Shareholders of
Bell Microproducts Inc.
San Jose, California
We have audited Bell Microproducts Inc. and subsidiaries’ (the “Company’s”) internal control over financial reporting as of December 31, 2008, based on the criteria established inInternal Control—Integrated Framework issued by the Committee of Sponsoring Organizations of the Treadway Commission. The Company’s management is responsible for maintaining effective internal control over financial reporting and for its assessment of the effectiveness of internal control over financial reporting, included in the accompanying “Management’s Report on Internal Control over Financial Reporting.” Our responsibility is to express an opinion on the Company’s internal control over financial reporting based on our audit.
We conducted our audit in accordance with the standards of the Public Company Accounting Oversight Board (United States). Those standards require that we plan and perform the audit to obtain reasonable assurance about whether effective internal control over financial reporting was maintained in all material respects. Our audit included obtaining an understanding of internal control over financial reporting, assessing the risk that a material weakness exists, testing and evaluating the design and operating effectiveness of internal control based on that risk, and performing such other procedures as we considered necessary in the circumstances. We believe that our audit provides a reasonable basis for our opinion.
A company’s internal control over financial reporting is a process designed by, or under the supervision of, the company’s principal executive and principal financial officers, or persons performing similar functions, and effected by the company’s board of directors, management, and other personnel to provide reasonable assurance regarding the reliability of financial reporting and the preparation of financial statements for external purposes in accordance with generally accepted accounting principles. A company’s internal control over financial reporting includes those policies and procedures that (1) pertain to the maintenance of records that, in reasonable detail, accurately and fairly reflect the transactions and dispositions of the assets of the company; (2) provide reasonable assurance that transactions are recorded as necessary to permit preparation of financial statements in accordance with generally accepted accounting principles, and that receipts and expenditures of the company are being made only in accordance with authorizations of management and directors of the company; and (3) provide reasonable assurance regarding prevention or timely detection of unauthorized acquisition, use, or disposition of the company’s assets that could have a material effect on the financial statements.
Because of the inherent limitations of internal control over financial reporting, including the possibility of collusion or improper management override of controls, material misstatements due to error or fraud may not be prevented or detected on a timely basis. Also, projections of any evaluation of the effectiveness of the internal control over financial reporting to future periods are subject to the risk that the controls may become inadequate because of changes in conditions, or that the degree of compliance with the policies or procedures may deteriorate.
A material weakness is a deficiency, or a combination of deficiencies, in internal control over financial reporting, such that there is a reasonable possibility that a material misstatement of the company’s annual or interim financial statements will not be prevented or detected on a timely basis. The following material weaknesses have been identified and included in management’s assessment: control environment; stock-based compensation; accrued liabilities and reserves; account reconciliations; accounts receivable; vendor allowances; revenue; income taxes; business combinations, goodwill impairment and segment reporting; financing-related accounts; post-retirement benefits; fixed asset dispositions; inventory in-transit; and general computer controls. These material weaknesses were considered in determining the nature, timing, and
122
extent of audit tests applied in our audit of the consolidated financial statements and financial statement schedule as of and for the year ended December 31, 2008, of the Company and this report does not affect our report on such financial statements and financial statement schedule.
In our opinion, because of the effect of the material weaknesses identified above on the achievement of the objectives of the control criteria, the Company has not maintained effective internal control over financial reporting as of December 31, 2008, based on the criteria established inInternal Control—Integrated Frameworkissued by the Committee of Sponsoring Organizations of the Treadway Commission.
We have also audited, in accordance with the standards of the Public Company Accounting Oversight Board (United States), the consolidated financial statements and financial statement schedule as of and for the year ended December 31, 2008, of the Company and our report dated June 28, 2009 expressed an unqualified opinion on those financial statements and financial statement schedule.
/s/ Deloitte & Touche LLP
San Jose, California
June 28, 2009
| Item 9B. | Other Information |
N/A
PART III
| Item 10. | Directors, Executive Officers and Corporate Governance |
Executive Officers and Directors
The following table and descriptions identify and set forth information regarding our executive officers and directors as of May 31, 2009:
| | | | |
Name | | Age | | Position |
W. Donald Bell | | 71 | | President, Chief Executive Officer and Director |
Andrew S. Hughes | | 43 | | Vice President, General Counsel and Corporate Secretary |
Richard J. Jacquet | | 69 | | Senior Vice President, Human Resources |
William E. Meyer | | 47 | | Executive Vice President and Chief Financial Officer |
Robert J. Sturgeon | | 55 | | Vice President, Operations and Chief Information Officer |
Graeme Watt | | 48 | | President, Worldwide Distribution |
Gordon A. Campbell | | 65 | | Director |
Eugene B. Chaiken | | 68 | | Director |
David M. Ernsberger | | 63 | | Director |
Edward L. Gelbach | | 77 | | Director |
Peter G. Hanelt | | 64 | | Director |
James E. Ousley | | 63 | | Chairman of the Board |
Glenn E. Penisten | | 77 | | Director |
Mark L. Sanders | | 65 | | Director |
W. Donald Bellhas been the Company’s President and Chief Executive Officer and a member of the Board since the Company was founded in 1987. Mr. Bell has over forty years of experience in the electronics industry. He was formerly the President of Ducommun Inc. and its subsidiary, Kierulff Electronics Inc., as well as Electronic Arrays Inc. He has also held senior management positions at Texas Instruments Incorporated, American Microsystems and other electronics companies.
Andrew S. Hugheshas been our Vice President, General Counsel and Corporate Secretary since July 2007. Mr. Hughes previously served as Vice President, General Counsel and Corporate Secretary of LSI Logic Corporation, a provider of semiconductors and storage systems, from May 2006 to April 2007. He joined LSI Logic in November 2000 and was manager of LSI Logic’s commercial law group and assistant corporate secretary prior to being promoted to General Counsel. Prior to joining LSI Logic, Mr. Hughes was division counsel for Harris Corporation from 1998 to 2000.
123
Richard J. Jacquethas been our Senior Vice President, Human Resources since May 2003, prior to which he served as our Vice President, Human Resources since joining the Company in May 2000. From 1988 to May 2000, Mr. Jacquet served as Vice President of Administration of Ampex Corporation, an electronics manufacturing company. Prior to 1988, Mr. Jacquet served in various senior human resource positions with Harris Corporation and FMC Corporation.
William E. Meyerhas been our Executive Vice President and Chief Financial Officer since August 2007. Previously, he was a managing director of Financial Intelligence, LLC, a provider of project-based financial consulting services from June 2006 to August 2007. Prior to that, Mr. Meyer served as the Executive Vice President and Chief Financial Officer of BroadVision, Inc., a provider of enterprise web applications, from April 2003 until June 2006. Prior to joining BroadVision, Mr. Meyer was Chief Financial Officer of Mainsoft Corporation from April 2001 to March 2003, a publisher of cross-platform development software. Before Mainsoft, he held senior finance positions with Phoenix Technologies, inSilicon Corporation and Arthur Andersen & Co.
Robert J. Sturgeonhas been our Vice President, Operations and Chief Information Officer since July 2000, prior to which, he served as our Vice President of Operations since joining the Company in 1992. From January 1991 to February 1992, Mr. Sturgeon was Director of Information Services for Disney Home Video. Prior to that time, Mr. Sturgeon served as Management Information Services (“MIS”) Director for Paramount Pictures’ Home Video Division from June 1989 to January 1991 and as a Marketing Manager for MTI Systems, a division of Arrow Electronics, Inc., from January 1988 to June 1989. Other positions Mr. Sturgeon has held include Executive Director of MIS for Ducommun Inc. where he was responsible for ten divisions, including Kierulff Electronics.
Graeme Watthas been our President, Worldwide Distribution since May 2008. He served as President, Bell Micro Europe from April 2004 until his promotion in May 2008. Prior to joining the Company in April 2004, Mr. Watt served in several IT distribution companies from 1988 to 2004. He served with Tech Data Corporation, most recently as their President of Europe and Middle East, from August 2000 to October 2003. Previously he served as Tech Data’s Regional Managing Director in Europe. He was also previously employed at Computer 2000, Frontline Distribution and First Software.
Gordon A. Campbell has served as one of our directors since May 1988. Mr. Campbell is an executive director at Techfarm Ventures, a provider of private equity capital for new technology companies, and has been since he founded Techfarm in 1993. Mr. Campbell has founded and been involved in the start-up of numerous Silicon Valley companies, including SEEQ Technologies Inc., CHIPS and Technologies, Inc., a semiconductor and related device company, 3dfx Interactive and Cobalt Networks. Mr. Campbell currently serves as a director of Palm, Inc., a mobile products company.
Eugene B. Chaikenhas served as one of our directors since November 1998. Mr. Chaiken has served since 1973 as the Chairman and Chief Executive Officer of Almo Corporation, a major appliance, consumer electronics and wire and cable distribution company.
David M. Ernsbergerhas served as one of our directors since June 2002. Mr. Ernsberger has served as President of Ernsberger Partnerships, Inc., a consulting and investments company, since founding it in 2001. From 1994 to 2001, Mr. Ernsberger served as Group Vice President of Worldwide Sales and Support for IBM Technology Group. Mr. Ernsberger served as President and Chief Executive Officer of SkillSet Software, Inc. from 1993 to 1994. From 1967 to 1993, Mr. Ernsberger held various senior executive positions with IBM Corporation.
Edward L. Gelbachhas served as one of our directors since March 1993. Mr. Gelbach served as Senior Vice President and a director of Intel Corporation from 1971 to 1988. Mr. Gelbach has been an independent investor since 1989.
Peter G. Haneltwas elected as one of our directors in October 2008. Mr. Hanelt has been a self-employed business consultant since November 2003. He served as Chief Operating Officer of The Good Guys, a regional consumer electronics retailer, from December 2001 through July 2003 and, through October 2003, as a consultant. From October 1998 to June 2001, Mr. Hanelt served as Chief Executive Officer and director of Natural Wonders, Inc., a national specialty retailer of nature and science-related merchandise. Mr. Hanelt is also a director of publicly traded Silicon Image, Inc., a developer of semiconductor products, currently serving as its Chairman of the Board and Bidz.com, Inc. He is also a director of Andronico’s Markets, Inc., Coast Asset Management LLC and InterHealth Nutraceuticals, Inc., all privately held companies, and on the boards of Catholic Healthcare West and Patelco Credit Union, both not-for-profit entities.
124
James E. Ousleyhas served as one of our directors since February 1998 and was our Lead Independent Director from April 2007 to March 2009. In March 2009, he was appointed to serve as the Chairman of the Board. Mr. Ousley served as President and Chief Executive Officer of Vytek, Inc., a wireless integration company, from September 2000 until April 2004, when Vytek merged with California Amplifier Inc., now known as CalAmp Corp. From August 1999 to October 2000, Mr. Ousley was President, Chief Executive Officer and Chairman of Syntegra (U.S.A.) Inc. From August 1992 to August 1999, Mr. Ousley was President and Chief Executive Officer of Control Data Systems. From February 1990 to July 1992, Mr. Ousley was Executive Vice President of Ceridian Corporation. From May 1989 to February 1990, Mr. Ousley was President of Ceridian’s Computer Products business. From January 1989 to April 1989, Mr. Ousley was Vice President, Marketing and Sales for Ceridian’s Computer Products business. Mr. Ousley is currently a director of ActivIdentity, Inc., a security software company, and Datalink Corporation, an information storage company. Mr. Ousley also currently serves as Chairman of the Board of Directors of Savvis, Inc., an IT utility services provider.
Glenn E. Penistenhas served as one of our directors since May 1988 and served as our Lead Independent Director from February 2003 until April 2007. Since 1985, Mr. Penisten has served as General Partner of Alpha Venture Partners III, a venture capital fund.
Mark L. Sandershas served as one of our directors since August 2003. Mr. Sanders served as President and Chief Executive Officer of Pinnacle Systems, Inc. from January 1990 to July 2002 and as its Chairman of the Board from July 2002 to March 2004. Prior to that time, Mr. Sanders served in a variety of management positions, most recently as Vice President and General Manager of the Recording Systems Division of Ampex Corporation, a manufacturer of video broadcast equipment. Mr. Sanders is currently Chairman of the Board of Directors of LookSmart, Ltd., a search advertising network and management company.
Former Executive Officer
James E. Illsonserved as our Chief Operating Officer and President of Americas from November 2005 until his resignation from these positions in June 2008. He also served as our Chief Financial Officer from September 2002 until August 2007. Mr. Illson remained a full-time employee through August 2008 and served as a consultant to the Company through May 2009. Mr. Illson is no longer affiliated with the Company.
Audit Committee
As of May 31, 2009, our Audit Committee consisted of Peter G. Hanelt, Chairman, Eugene B. Chaiken, James E. Ousley and Glenn E. Penisten, each of whom satisfies the definition of “independence” as set forth in the Marketplace Rules of The NASDAQ Stock Market. As set forth in its charter, the Audit Committee was established to oversee our financial statements, accounting and other policies, accounting systems and system of internal controls. The Audit Committee has adopted a policy setting forth its procedures with respect to the independence, engagement, evaluation and rotation of our independent auditors, as well as the pre-approval of all audit and non-audit services to be provided by our independent auditors. The Board has determined that Mr. Hanelt is an “audit committee financial expert” as defined by Item 407(d)(5) of Regulation S-K under the Securities Act of 1933. We acknowledge that the designation of Mr. Hanelt as an audit committee financial expert does not impose on Mr. Hanelt any duties, obligations, or liabilities that are greater than the duties, obligations, or liabilities imposed on other members of the Audit Committee and the Board in the absence of such designation.
Section 16(a) Beneficial Ownership Reporting Compliance
Section 16(a) of the Exchange Act requires that our directors, certain of our officers, and beneficial owners of more than 10% of our common stock, file reports of their securities ownership and changes in their ownership with the SEC of our securities that are beneficially owned by them. Such persons are also required by SEC rules to furnish us with copies of all Section 16(a) forms they file.
Based solely on our review of copies of Forms 3 and 4 and amendments thereto furnished to us pursuant to Rule 16a-3(e), and Forms 5 and amendments thereto furnished to us with respect to the 2008 and 2007 fiscal years, and any written representations referred to in Item 405(b)(2)(i) of Regulation S-K stating that no Forms 5 were required, we believe that, during the year ended December 31, 2007, all Section 16(a) filing requirements applicable to our officers, directors and 10% shareholders were timely filed. During the year ending December 31, 2008, all Section 16(a) filing requirements
125
applicable to our officers, directors and 10% shareholders were complied with, except that in March 2008, through an oversight, each of Mr. Bell and Mr. Ousley filed a required Form 4 reporting one transaction for each individual two days late.
Code of Ethics and Code of Conduct
Code of Ethics.Our Chief Executive Officer, Chief Financial Officer and Corporate Controller have all signed our Code of Ethics. The Code of Ethics addresses such topics as acting with honesty and integrity, avoiding conflicts of interest, providing full, fair, timely and accurate disclosure in our public communications, including our filings with the SEC, and compliance with the rules and regulations of governmental and regulatory agencies. The Code of Ethics is available free of charge on our website at www.bellmicro.com and in print to any shareholder who sends a request for a paper copy to Bell Microproducts Inc., Attn: Investor Relations, 1941 Ringwood Avenue, San Jose, California 95131-1721. We intend to include on our website any amendment to, or waiver from, a provision of the Code of Ethics that applies to our Chief Executive Officer, Chief Financial Officer or Corporate Controller that relates to any elements of the code of ethics definition enumerated in Item 406 of Regulation S-K.
Code of Conduct.All employees, including our executive officers and directors, are provided a copy of our Code of Conduct. This Code of Conduct addresses protection and proper use of our assets, compliance with applicable laws and regulations, accuracy and preservation of records, accounting and financial reporting, conflicts of interest, insider trading and other related policies. The Code of Conduct is available free of charge on our website at www.bellmicro.com and in print to any shareholder who sends a request for a paper copy to the address set forth above.
Ethics Hot Line.We have a hot line, managed by a third party, that gives all employees a way to confidentially and anonymously report any actual or perceived unethical behavior or violations or suspected violations of our Code of Ethics or Code of Conduct. Until February 2009, the hot line was accessed by telephone only but, at that time, we upgraded the hot line to include both telephone and email communications in order to make it easier for employees to report suspected violations of our Code of Ethics or Code of Conduct.
Shareholder Nominations of Directors
There have been no material changes to the procedures by which shareholders may recommend nominees to the Board. Shareholders who wish to recommend one or more directors must provide a written recommendation to our Corporate Secretary. Pursuant to our bylaws, the notice for nomination of directors must include the following: (a) the shareholder’s intent to nominate one or more persons for election as a director of the Company, the name of each such nominee proposed by the shareholder giving the notice, and the reason for making such nomination, at the annual meeting; (b) the name and address, as they appear on the Company’s books, of the shareholder proposing such nomination and the beneficial owner, if any, on whose behalf the nomination is proposed; (c) the class and number of shares of the Company that are owned beneficially and of record by the shareholder proposing such nomination and by the beneficial owner, if any, on whose behalf the nomination is proposed; (d) any material interest of such shareholder proposing such nomination and the beneficial owner, if any, on whose behalf the proposal is made; (e) a description of all arrangements or understandings between or among any of (i) the shareholder giving the notice (ii) each nominee and (iii) any other person or persons (naming such person or persons) pursuant to which the nomination or nominations are to be made by the shareholder giving the notice; (f) such other information regarding each nominee proposed by the shareholder giving the notice as would be required to be included in a proxy statement filed in accordance with the proxy rules of the SEC had the nominee been nominated, or intended to be nominated, by the Board; and (g) the signed consent of each nominee proposed by the shareholder giving the notice to serve as a director of the Company if so elected. We may require any prospective nominee to furnish additional information that may be needed to determine the eligibility of the prospective nominee.
| Item 11. | Executive Compensation |
Compensation Discussion & Analysis
This section discusses the principles and objectives underlying our executive compensation policies and decisions, and the most important factors relevant to an analysis of these policies and decisions. It provides qualitative information regarding the manner and context in which compensation is awarded to and earned by our “named executive officers” (those officers listed in the summary compensation tables, below) as of December 31, 2007 and December 31, 2008, and places in perspective the data presented in the tables and narrative that follow.
126
For purposes of annual cash variable compensation, we compared unaudited financial performance for each quarter of 2007 and 2008 against the financial plan for the particular quarter. Participants were paid a portion of their annual incentive based on achievement of their financial goals for that quarter relative to plan. We did not make interim payments for achievement above 100% of plan. After the close of the fiscal year and completion of our financial audit with respect to such year, financial performance for the year was compared to the financial plan for the year to determine the amount of incentive each executive earned due to financial performance (which occurred immediately prior to the filing of this Annual Report on Form 10-K).
Compensation Philosophy and Guiding Principles and Objectives for Executive Compensation
We operate in an intensely competitive environment in which our success depends on assembling and maintaining a leadership team with the integrity, skills and dedication needed to manage a dynamic organization, and the vision to anticipate and respond quickly to market developments. We use our executive compensation program to help us meet these competitive challenges. As described below, portions of our executive compensation program have been designed to enable us to recruit and retain a group of executives who have the individual and collective abilities necessary to run our business successfully. Other portions of our compensation program are intended to focus our executives on achieving financial results that enhance the value of our shareholders’ investment. At the same time, we have structured the program to be flexible, so that we can meet the changing needs of our business over time.
Our overarching compensation philosophy is that our profit performance and execution must drive executive pay. In particular, we believe that rewards must reflect and reinforce our focus on financial management and bottom line performance. To this end, our executive compensation program is guided by the following three objectives:
1. We strive to link short-term rewards directly and substantially to measurable corporate and individual performance. Although we provide our executive officers with a competitive base salary, in order to motivate each of our executive officers to achieve his or her potential, certain components of our total cash compensation package are dependent on Company-wide or business unit profitability and individual performance, and are, therefore, at risk. Our annual variable cash compensation program primarily consists of our Management Incentive Plan and our Strategic Initiatives Plan. Each of our executive officers is eligible to participate in our Management Incentive Plan, which is designed to reward our executives for meeting and exceeding Company-wide and business unit quantitative financial and operational objectives, such as goals related to ourpro forma earnings,pro formaEPS, net income, business unit pre-tax profit (“BU Profit”), operating contribution, return on equity (net income divided by shareholders’ equity) (“ROE”), return on invested capital or return on working capital (this metric is calculated by dividing working capital, which is accounts receivable plus inventory minus accounts payable, by pre-tax profit) (“ROWC”). The Management Incentive Plan also encourages executives to improve qualitative aspects of individual and Company performance by providing financial incentives upon the satisfaction of management objectives (“MBOs”). In addition, our senior executive officers who have global responsibility within our Company and, therefore, have considerable influence on our strategic direction and long-term results, are eligible to participate in our Strategic Initiatives Plan, which is designed to reward these executives for the achievement of specified strategic objectives. We believe that our approach of linking short-term rewards to measurable corporate and individual performance increases the likelihood that we will experience sustained profitability and generate greater shareholder value over time, while providing our executive officers with the opportunity to be suitably and significantly rewarded.
2. We seek to provide long-term rewards based on creating shareholder value. In addition to base salary and annual cash incentives, we utilize long-term equity incentives to motivate our executives to increase shareholder value. We have historically provided long-term equity incentives in the form of stock options and restricted stock units (“RSU”), although we often tie the granting of RSUs to achievement of goals related to financial performance. Meaningful equity opportunities are provided to those executive officers who are most responsible for driving our financial and operating results. Actual awards reflect individual performance and our goal to retain valued employees. Generally, as an executive officer’s responsibility and ability to impact our financial performance increases, the individual’s at risk performance-based compensation increases as a portion of his or her total compensation. Moreover, the ratio of long-term to short-term compensation increases proportionately with job
127
responsibility. Ultimately, individuals with greater roles and responsibilities associated with achieving our performance targets should bear a greater proportion of the risk if those goals are not achieved and should receive a greater proportion of the reward if the goals are met or surpassed.
3. We strive to provide competitive compensation to attract, motivate and retain top talent. In order to attract, motivate and retain executives of outstanding ability, we establish salary levels and total compensation opportunities that are competitive with the market in which we compete for management talent. This supports our objective of attracting and retaining high-quality executives and ensures that the overall economic cost of compensation is reasonable and, therefore, sustainable in relation to our peers. The Compensation Committee of the Board (the “Compensation Committee”), which oversees our executive compensation program, worked with Compensia, Inc., an executive compensation consulting firm, in late 2007, to update and reaffirm our list of peer benchmark companies and to compare the level of compensation for our executives with executives holding similar positions at these peer benchmark companies. The Compensation Committee has determined that it will utilize the services of an outside consultant to analyze executive compensation every other year.
The Compensation Committee evaluates these three objectives regularly to ensure that they are consistent with our goals and needs. We believe that, by implementing these measures and programs, we are able to reinforce our goal of maintaining a results-oriented culture that provides above-target rewards only when performance is also above-target. Thus, we believe that the interests of our executives are directly aligned with those of our shareholders, as the financial success of both is contingent upon performance.
Oversight and Authority over Executive Compensation
The responsibility for matters relating to our executive compensation program has been delegated by the Board to the Compensation Committee, which is comprised of three independent directors, each of whom satisfies the definition of “independence” as set forth in the Marketplace Rules of The NASDAQ Stock Market. The members of the Compensation Committee as of May 31, 2009 were David M. Ernsberger, Chairman, Gordon A. Campbell and Mark L. Sanders.
Our compensation structure is designed so that W. Donald Bell, our President and Chief Executive Officer, evaluates the performance of each of our other executive officers, including the named executive officers (other than himself), and works with the Compensation Committee to help set the compensation for each of them. The Compensation Committee has the authority to adjust Mr. Bell’s recommendations as it deems appropriate after evaluating all of the information that the Compensation Committee believes is relevant to implementing the guiding objectives for compensation programs discussed above. In 2007 and 2008, the Compensation Committee approved substantially all of Mr. Bell’s recommendations regarding the compensation of the other executive officers. Mr. Bell does not give recommendations regarding his own salary or performance. Rather, the Compensation Committee determines his compensation after discussing with him his performance against his written goals for the year. In addition, the Compensation Committee is responsible for reviewing and recommending the compensation elements to the full Board for the non-employee members of our Board.
Peer Group and Benchmarking
The Compensation Committee worked with Compensia in late 2007 to review and make recommendations regarding our executive compensation program, including a review of the guiding objectives and the completion of a detailed competitive total direct compensation assessment. As part of this analysis, the Compensation Committee selected peer benchmark companies by identifying IT distributors, contract manufacturers and broad-based high-tech suppliers that had revenues between one-quarter and four times the level of our revenues. These peer benchmark companies were:
| | | | |
IT Distributors | | Contract Manufacturers | | Broad-Based High-Tech Suppliers |
| Arrow Electronics, Inc.* | | Benchmark Electronics, Inc. | | Advanced Micro Devices, Inc.* |
| Avnet, Inc. | | Jabil Circuit, Inc. | | Applied Materials, Inc.* |
| CDW Corporation* | | Plexus Corp. | | EMC Corporation* |
| Insight Enterprises, Inc.* | | Sanmina-SCI Corporation | | LSI Corporation* |
| PC Connection, Inc. | | | | Network Appliance, Inc.* |
| SYNNEX Corporation* | | | | SanDisk Corporation* |
| | | | Seagate Technology* |
| | | | Sun Microsystems, Inc.* |
| | | | Western Digital Corporation* |
| * | Denotes the custom data sort of the Company’s peers, as discussed in the paragraph below. |
128
In 2007, we benchmarked our executive compensation practices for our CEO and other named executive officers by evaluating the base salary, annual incentive awards and long-term incentives provided to our executives against these peer benchmark companies. We extracted the data from publicly available sources, including information contained in the proxy statements of these companies. In addition to analyzing the publicly available data for our peer benchmark companies, we also reviewed the results of the Radford September 2007 High Technology Industry Survey, which included a custom data sort of 13 of our 19 peer benchmark companies, and the Radford September 2007 High Technology Industry International Compensation Survey. We then compared the actual base salary and annual cash incentives for our executive officers to those of our peer benchmark companies.
The Compensation Committee targets cash and equity compensation for our named executive officers at the median of our peer benchmark companies. The benchmark analysis showed that, with respect to 2007 base salaries, our CEO and other named executive officers had a collective salary that was 101% of the 50th percentile of our peer benchmark companies. In other words, the collective base salaries of our named executive officers were 1% above the median level of our peer benchmark companies. The total target cash compensation (base salary plus bonus opportunity) of our named executive officers was at the 50th percentile of the total target cash compensation of the benchmark companies.
We did not analyze the compensation practices of the benchmark companies during 2008 as it has been the Compensation Committee’s practice to conduct this analysis every other year.
Elements of Executive Compensation Program
We have developed an executive compensation program consisting of four main elements: (1) base salary, (2) annual variable cash compensation, (3) long-term equity incentives and (4) other compensation and benefits, each of which is detailed below. We view the components of compensation as related but distinct, as we do not believe that significant compensation derived from one component of compensation should necessarily negate or reduce compensation from other components. Each element is intended to reward and motivate executives in different ways consistent with our overall guiding objectives for compensation. For example, in order to foster our belief in creating shareholder value, we provide long-term equity incentives that will encourage key executives to work to create lasting revenue and earnings growth. Similarly, we use annual variable cash compensation to motivate and reward executives for improvements to short-term organizational profits and other strategic objectives. The principles that total compensation should increase with position and responsibility, and that compensation should be tied to performance, are reflected by the fact that a portion of each element of our executive compensation program varies with position, level of responsibility and achievement of individual and Company performance targets.
Base Salary
We seek to provide our executive officers and other key executives with a base salary targeted at the median range of salary levels for equivalent positions at our peer benchmark companies in order to balance our ability to attract high performing individuals with our desire to keep compensation expenses in line with other companies. In setting base salaries each year, the Compensation Committee also considers the scope of responsibility for each position, individual contributions during the preceding year, changes in position or responsibility, internal equity for established pay levels, business factors and changes in our strategies and philosophies. Each executive officer’s actual salary ultimately depends on the individual’s performance, responsibilities, experience, leadership and potential future contribution.
The base salaries for our named executive officers in 2007 were as shown in the Summary Compensation Table for 2007. Except for Messrs. Illson and Sturgeon, the base salaries for our named executive officers in 2007 remained
129
unchanged from the salaries in effect at the end of 2006. In 2002, when Mr. Illson was hired by the Company, his initial compensation was reduced by $15,000 to pay for his commuting and lodging expenses associated with his travel to and from his home in Southern California and his office in Northern California. In July 2007, the $15,000 was added back to his base salary, thus increasing his salary from $450,000 per year to $465,000 per year. In the case of Mr. Sturgeon, his annual base salary was increased in 2007 by $15,000 from $215,000 to $230,000 to recognize his assumption of responsibility for operations outside of North America.
As a result of the benchmarking analysis conducted in 2007, it was determined that the base salaries for Messrs. Bell, Illson, Meyer, Jacquet, Sturgeon and Watt were 88%, 104%, 89%, 89%, 81% and 165%, respectively, of the 50th percentile of the base salaries of executives holding comparable positions at our peer benchmark companies. The Compensation Committee determined not to change the base salaries of these executive officers for 2008.
Annual Cash Variable Compensation
Our annual variable cash compensation program consists of our Management Incentive Plan and our Strategic Initiatives Plan. In addition, the Compensation Committee has the authority to award discretionary bonuses when they believe it is appropriate. The goal of our annual cash variable compensation program is to link short-term rewards directly and substantially to measurable corporate and individual performance.
Management Incentive Plan
We designed the Management Incentive Plan to provide cash incentives to our named executive officers and other key executives, based on the achievement of certain financial objectives, as well as individual performance goals. We believe it is important to provide cash incentives to motivate our executive officers and other key executives to attain specific short-term performance objectives that, in turn, further our long-term objectives. This plan ensures that a significant portion of each executive’s cash compensation is at risk and payable only when our shareholders have also benefited from their efforts.
The Compensation Committee, upon the recommendation of our Chief Executive Officer, is responsible for approving the annual Company-wide financial and individual goals under the Management Incentive Plan and establishing target incentive levels that will cause total compensation for each executive position to be in the median range of total compensation levels for equivalent positions at our peer benchmark companies.
A portion of the available award under the Management Incentive Plan is conditioned upon the achievement of Company financial objectives. As determined by the Compensation Committee, the financial objectives may be one or more of the following:
| | • | | Pro forma earnings per share (“EPS”); |
| | • | | Operating contribution; |
| | • | | Return on invested capital (at the business unit level, this metric is calculated by dividing investments and intercompany loans by pre-tax profit; at the corporate level, after-tax profit is used instead of pre-tax profit); or |
The remaining portion of the target incentive amount is conditioned upon the achievement of individual MBOs that vary among our executives based on their position. Each executive must submit his or her individual MBOs in writing at the beginning of the year. The submission must include a statement of the objective, the delivery date and the expected result. If there is more than one objective, each objective will be weighted equally unless the objective states otherwise. For 2007 and 2008, Mr. Bell reviewed and approved of each of the other named executives’ MBOs prior to their submission to the Compensation Committee. The Compensation Committee approved the MBOs of Mr. Bell and the other named executives.
For 2007, the Management Incentive Plan was an annual plan with possible payments to participants at the end of each fiscal quarter once financial results for the quarter had been finalized. We compared unaudited financial performance
130
for the quarter against the financial plan for the quarter. Participants were paid a portion of their annual incentive based on achievement of their financial goals for that quarter relative to plan; however, we did not make interim payments for achievement above 100% of plan. After the close of the fiscal year and completion of our financial audit with respect to such year, financial performance for the year was compared to the financial plan for the year to determine the amount of incentive each executive earned due to financial performance (which occurred immediately prior to the filing of this Annual Report on Form 10-K). The total incentives earned for the year based on an achievement of financial goals and completion of MBOs, less the amount of quarterly payments, was made to the participants following approval by the Compensation Committee. In the event the year-end reconciliation indicates an overpayment, because a goal was met for a particular quarter, but not the full year, we do not generally require reimbursement from the participant; however, that overpayment generally would be offset by any other sums due under the Management Incentive Plan for that year.
For 2008, the Management Incentive Plan operated in a similar manner to the 2007 plan, except that the Compensation Committee modified the plan to provide for a separate first half plan that allowed for possible payments at the end of the first quarter and a final reconciliation at the end of the first half, and a second-half plan that allowed for possible payments at the end of the third quarter and a final reconciliation at the end of the second half.
Typically, incentive payouts are in the form of cash. However, the Compensation Committee has discretion to make payments in cash, RSUs or a combination thereof.
For 2007, actual performance with respect to the EPS, BU Profit and ROWC goals resulted in payouts dependent on the percentage of achievement of such financial objectives, as shown here:
| | | | | | |
Percentage of Financial Metric Achieved | | Percentage of Incentive Earned (1) |
| Less than 80% | | | | 0% | | |
| 80% | | | | 25% | | |
| 90% | | | | 50% | | |
| 100% | | | | 100% | | |
| Greater than 100% | | | | Same percentage as overachievement of financial metrics |
| (1) | Use straight-line interpolation between metrics for calculations above 80% and below 100% achievement. |
In mid-2007, the Compensation Committee determined that it was appropriate to change the payout calculation chart to reflect a greater amount of incentive for achieving above 80% but below 100% of the financial metrics and allowed for payments of up to 200% of the target incentive for achievement that was 150% or above of the targeted financial performance. The Compensation Committee modified the payout percentages for the third and fourth quarters of 2007 as shown here:
| | | | | | |
Percentage of Financial Metric Achieved | | Percentage of Incentive Earned (1) |
| Less than 80% | | | | 0% | | |
| 80% | | | | 50% | | |
| 100% | | | | 100% | | |
| 150% | | or greater | | 200% | | |
| (1) | Use straight-line interpolation between metrics. |
Since the 2007 Management Incentive Plan was an annual plan with possible quarterly payments and at the close of the year the amount of incentive earned was based on the entire year, the Compensation Committee determined that it was appropriate to use the following chart for the 2007 year-end reconciliation of financial achievement:
| | | | | | |
Percentage of Financial Metric Achieved | | Percentage of Incentive Earned (1) |
| Less than 80% | | | | 0% | | |
| 80% | | | | 40% | | |
| 100% | | | | 100% | | |
| 150% | | or greater | | 180% | | |
| (1) | Use straight-line interpolation between metrics. |
131
For 2008, the Compensation Committee adopted the following payout calculation chart:
| | | | | | |
Percentage of Financial Metric Achieved | | Percentage of Incentive Earned (1) |
| Less than 80% | | | | 0% | | |
| 80% | | | | 50% | | |
| 100% | | | | 100% | | |
| 150% | | or greater | | 200% | | |
| (1) | Use straight-line interpolation between metrics. |
The following tables show, for each named executive officer, his target incentive opportunity for each component of the Management Incentive Plan for 2007 and 2008:
2007
| | | | | | | | | | | | | | | |
| | | EPS | | BU Profit | | ROWC | | MBOs | | Total
Target
Award |
W. Donald Bell | | $ | 253,000 | | $ | — | | $ | 253,000 | | $ | 126,500 | | $ | 632,500 |
James E. Illson | | | 108,000 | | | — | | | 108,000 | | | 54,000 | | | 270,000 |
William E. Meyer (1) | | | 40,174 | | | — | | | 40,174 | | | 20,087 | | | 100,434 |
Richard J. Jacquet | | | 22,200 | | | — | | | 22,200 | | | 66,600 | | | 111,000 |
Robert J. Sturgeon | | | — | | | 25,000 | | | 50,000 | | | 50,000 | | | 125,000 |
Graeme Watt (2) | | | — | | | 114,000 | | | 114,000 | | | 57,000 | | | 285,000 |
| (1) | Mr. Meyer’s target incentive for 2007 was prorated from his August 6, 2007 hire date. The Compensation Committee determined, as part of his offer of employment, that Mr. Meyer’s incentive compensation for 2007 would be paid at 100% of target, regardless of financial results. |
| (2) | All amounts for Mr. Watt have been converted from British pounds to U.S. dollars using an exchange rate of $2.00/£1.00, which was the average British pound to U.S. dollar exchange rate during 2007. |
2008
| | | | | | | | | | | | | | | |
| | | EPS | | BU
Profit | | ROWC | | MBOs | | Total
Target
Award |
W. Donald Bell | | $ | 253,000 | | $ | — | | $ | 253,000 | | $ | 126,500 | | $ | 632,500 |
William E. Meyer (1) | | | 80,000 | | | — | | | 80,000 | | | 40,000 | | | 200,000 |
James E. Illson | | | 108,000 | | | — | | | 108,000 | | | 54,000 | | | 270,000 |
Andrew S. Hughes (2) | | | 24,000 | | | — | | | 24,000 | | | 72,000 | | | 120,000 |
Richard J. Jacquet | | | 22,200 | | | — | | | 22,200 | | | 66,600 | | | 111,000 |
Graeme Watt (3) | | | — | | | 66,262 | | | 66,262 | | | 132,525 | | | 265,050 |
| (1) | Mr. Meyer was asked to devote the majority of his time on the restatement of the Company’s financial statements, and not on the Company’s financial objectives for 2008. Therefore, the Compensation Committee determined that Mr. Meyer’s incentive compensation for 2008 would be paid at 100% of target, regardless of financial results. |
| (2) | Mr. Hughes was asked to devote the majority of his time on the restatement of the Company’s financial statements, and not on the Company’s financial objectives for 2008. Therefore, the Compensation Committee determined that Mr. Hughes’ incentive compensation for 2008 would be paid at 100% of target, regardless of financial results. |
| (3) | In conjunction with Mr. Watt’s pending relocation from the U.K. to the U.S., the Compensation Committee made a one-time £4,500 adjustment to his second half management incentive. Additionally, for 2008 only, the Compensation Committee approved a one-time change in Mr. Watt’s incentive plan mix of performance metrics from 40% pre-tax profit performance, 40% ROWC performance, and 20% MBOs to 25% pre-tax profit performance, 25% ROWC performance, and 50% MBOs. All amounts for Mr. Watt have been converted from British pounds to U.S. dollars using an exchange rate of $1.86/£1.00, which was the average British pound to U.S. dollar exchange rate during 2008. |
The Company was unable to complete our audited financial statements for the years ended December 31, 2008 and 2007 in a timely manner because of issues related to the investigations that led to the restatement of the Company’s historical financial statements. As a result, the time necessary to complete the financial statements for 2007 took significantly longer than initially anticipated. Because of concerns regarding employee morale and related retention issues, the Compensation Committee decided in mid-2008 to make incentive payments for 2007, and other periods, to participants in the Management Incentive Plan, including our named executive officers. In determining these award payments, the Compensation Committee reviewed the then-available preliminary financial statements for 2007. In addition, due to the significant delay in the payment of incentive awards, the Compensation Committee approved additional payments in the nature of interest at a rate of
132
three percent per annum from the date the 2007 awards typically would have been paid to the actual date of the payments. The Compensation Committee also determined to review these incentive awards again following the completion of the Company’s consolidated financial statements for 2007.
When the Company’s financial statements for 2007 were completed (which occurred immediately prior to the filing of this Annual Report on Form 10-K), the Compensation Committee determined that payments related to the Company’s 2007 financial performance were made to certain employees, including to Mr. Watt, one of our named executive officers, in excess of the amounts earned under the 2007 Management Incentive Plan, resulting in an overpayment. Based upon these final financial results, Mr. Watt received an overpayment of £129,156, plus £699 in interest ($189,588 in the aggregate using an exchange rate of $1.46/£1.00 as of December 31, 2008). The Compensation Committee expects that it will review Mr. Watt’s award within 60 days of the filing of this Annual Report on Form 10-K to determine what action to take, if any.
When the Company’s financial statements for 2008 were completed (which occurred immediately prior to the filing of this Annual Report on Form 10-K), the Compensation Committee determined that no payments related to the Company’s 2008 financial performance to our named executive officers were in excess of the amounts earned under the 2008 Management Incentive Plan.
Payments were made in April 2008 and in March 2009 related to the achievement of individual MBOs for 2007 and 2008, respectively, as those amounts were not dependent on the Company’s consolidated financial results.
The following tables show for 2007 and 2008, the amount each named executive officer earned for each component of the Management Incentive Plan, as well as the total compensation he earned under the Management Incentive Plan and the percentage this represents of his target incentive.
2007
| | | | | | | | | | | | | | | | | | |
| | | EPS | | BU Profit | | ROWC | | MBO | | Total
Earned | | % of
Target | |
W. Donald Bell | | $ | — | | $ | — | | $ | — | | $ | 93,820 | | $ | 93,820 | | 14.8 | % |
James E. Illson | | | — | | | — | | | — | | | 28,404 | | | 28,404 | | 10.5 | % |
William E. Meyer (1) | | | 40,174 | | | — | | | 40,174 | | | 20,087 | | | 100,434 | | 100.0 | % |
Richard J. Jacquet | | | — | | | — | | | — | | | 58,275 | | | 58,275 | | 52.5 | % |
Robert J. Sturgeon | | | — | | | — | | | 63,158 | | | 38,400 | | | 101,558 | | 81.2 | % |
Graeme Watt (2) | | | — | | | 119,188 | | | 139,120 | | | 57,000 | | | 315,308 | | 110.6 | % |
| (1) | Mr. Meyer’s annual incentive compensation was prorated from his hire date. The Compensation Committee determined, as part of his offer of employment, that his annual incentive compensation would be paid at 100% of target for 2007. |
| (2) | All amounts for Mr. Watt have been converted from British pounds to U.S. dollars using an exchange rate of $2.00/£1.00, which was the average British pound to U.S. dollar exchange rate during 2007. |
2008
| | | | | | | | | | | | | | | | | | |
| | | EPS | | BU Profit | | ROWC | | MBO | | Total
Earned | | % of
Target | |
W. Donald Bell | | $ | — | | $ | — | | $ | — | | $ | 104,363 | | $ | 104,363 | | 16.5 | % |
William E. Meyer (1) | | | 80,000 | | | — | | | 80,000 | | | 40,000 | | | 200,000 | | 100.0 | % |
James E. Illson (2) | | | — | | | — | | | — | | | 50,000 | | | 50,000 | | 18.5 | % |
Andrew S. Hughes (3) | | | 24,000 | | | — | | | 24,000 | | | 72,000 | | | 120,000 | | 100.0 | % |
Richard J. Jacquet | | | — | | | — | | | — | | | 61,938 | | | 61,938 | | 55.8 | % |
Graeme Watt (4) | | | — | | | — | | | — | | | 109,089 | | | 109,089 | | 41.2 | % |
| (1) | Mr. Meyer was asked to devote the majority of his time on the restatement of the Company’s financial statements, and not on the Company’s financial objectives for 2008. Therefore, the Compensation Committee determined that Mr. Meyer’s incentive compensation for 2008 would be paid at 100% of target, regardless of financial performance. |
| (2) | Mr. Illson’s MBO payment was negotiated as part of the separation agreement he and the Company entered into with respect to his termination from the Company. |
| (3) | Mr. Hughes was asked to devote the majority of his time on the restatement of the Company’s financial statements, and not on the Company’s financial objectives, for 2008. Therefore, the Compensation Committee determined that Mr. Hughes’ incentive compensation for 2008 would be paid at 100% of target, regardless of financial performance. |
| (4) | All amounts for Mr. Watt have been converted from British pounds to U.S. dollars using an exchange rate of $1.86/£1.00, which was the average British pound to U.S. dollar exchange rate during 2008. |
133
In 2008, the Compensation Committee set the bonus opportunity parameters for each of our named executive officers after review of the compensation analysis completed by its third-party consultant, Compensia, along with the input of Mr. Bell for all executive officers other than himself.
In 2008, Messrs. Bell’s and Jacquet’s bonus opportunity for financial metrics was based on a corporate EPS target of $0.22 for the first half and $0.365 for the second half, and a ROWC target of 2.20% for the first half and 3.51% for the second half. Mr. Watt’s bonus opportunity for financial metrics was based on a European pretax profit target of £3.34 million ($6.21 million using the average exchange rate for 2008 of $1.86/£1.00) for the first half and £4.90 million ($9.11 million using the average exchange rate for 2008 of $1.86/£1.00) for the second half, and a Europe ROWC target of 3.17% for the first half and 4.84% for the second half. In 2008, we achieved a corporate EPS of $0.53 in the first half and $(1.79) in the second half, and a ROWC of (3.27)% for the first half and (14.74)% for the second half. For Europe, the pretax profit (loss) achieved was £0.36 million ($0.67 million using the average exchange rate for 2008 of $1.86/£1.00) for the first half and £(6.77) million ($(12.59) million using the average exchange rate for 2008 of $1.86/£1.00) for the second half and ROWC of 0.40% for the first half and (11.09)% for the second half.
In 2007, the bonus opportunity for Messrs. Bell, Illson and Jacquet with respect to financial metrics was based on a corporate EPS target of $0.69 and a ROWC target of 7.75%. Mr. Sturgeon’s bonus opportunity for financial metrics was based on an Americas pretax profit target of $41.38 million and a North America ROWC target of 8.85%. Mr. Watt’s bonus opportunity for financial metrics was based on a European pretax profit target of £7.06 million ($14.12 million at the average exchange rate for 2007 of $2.00/£1.00) and a Europe ROWC target of 6.68%. In 2007, we achieved a corporate EPS of $(2.24) and a ROWC of (13.43)%. For the Americas, we achieved a pretax profit of $(25.41) million and in North America an ROWC of 10.21%. For Europe, the pretax profit achieved was £(13.05) million ($26.10 million at the average exchange rate for 2007 of $2.00/£1.00) and ROWC of (13.71)%.
With respect to MBOs for our named executive officers in 2008, an average of 87% of all objectives were deemed completed by Mr. Bell and such determinations were ratified by the Compensation Committee. In 2007, an average of 76% of all MBOs for our named executive officers were deemed completed by Mr. Bell and such determinations were ratified by the Compensation Committee.
Strategic Initiative Plan
Our senior executive officers, who have global responsibility within our Company and, therefore, have considerable influence on our strategic direction and long-term results, are eligible to participate in our Strategic Initiatives Plan. The Strategic Initiatives Plan is designed to reward these executives for the achievement of specific strategic objectives. As with our Management Incentive Plan, we believe it is important to provide annual cash incentives under the Strategic Initiatives Plan to motivate our executive officers to attain specific strategic objectives that, in turn, further our long-term objectives. In addition, awards under the Strategic Initiatives Plan increase the earning potential of the participating executive officers and are, therefore, important for attracting and retaining key executives.
During 2007, Messrs. Bell, Illson and Jacquet, and, during 2008, Messrs. Bell, Jacquet and Watt, were each eligible to receive awards under the Strategic Initiatives Plan. The objectives under the Strategic Initiatives Plan generally relate to the improvement of certain business units, strengthening of the organization, strengthening internal financial controls and enhancement of shareholder value. These objectives are formulated by Mr. Bell and are approved by the Compensation Committee. Any payments under the Strategic Initiatives Plan are approved by the Compensation Committee.
2007 Strategic Initiative Plan Objectives. In 2007, Mr. Bell’s target incentive under the Strategic Initiative Plan was $375,000. Payment of the target incentive was contingent upon Mr. Bell’s achievement of strategic objectives, which were equally weighted and pertained to: (1) building a strong financial organization with processes and long-term effectiveness; (2) growing our strategic businesses; (3) positioning the Company with the right culture and management; and (4) enhancing the contributions of our European business unit. Mr. Bell earned a total of $295,875, or 79%, for his accomplishments in achieving these objectives.
In 2007, Mr. Illson’s target incentive under the Strategic Initiative Plan was $200,000. Payment of the target incentive was contingent upon Mr. Illson’s achievement of strategic objectives, which were weighted as shown below and pertained to: (1) strengthening the financial organization and filling several key financial positions (weight: 50%); (2) growing the profitability of our value-added reseller businesses (weight: 16.7%); (3) growing the strategic distribution businesses (weight: 16.7%); and (4) positioning the Company strategically in terms or our capital structure (weight: 16.6%). Mr. Illson earned a total of $110,833, or 55%, for his accomplishments in achieving these objectives.
134
In 2007, Mr. Jacquet’s target incentive under the Strategic Initiative Plan was $150,000. Payment of the target incentive was contingent upon Mr. Jacquet’s achievement of strategic objectives, which were weighted as shown below and pertained to: (1) addressing deficiencies identified in audits of the Company, including recruiting persons to fill a number of key financial positions (weight: 60%); (2) working closely with division presidents to strengthen management of several key functions (weight: 20%); and (3) reducing the Company’s overall voluntary employee turnover through improved employee communication and other employee relations programs (weight: 20%). Mr. Jacquet earned a total of $90,000, or 60%, for his accomplishments in achieving these objectives.
2008 Strategic Initiative Plan Objectives. In 2008, Mr. Bell’s target incentive under the Strategic Initiative Plan was $300,000. Payment of the target incentive was contingent upon Mr. Bell’s achievement of strategic objectives, which were equally weighted and pertained to: (1) bringing the Company back into full and timely compliance with SEC filing requirements and continuing to strengthen the financial organization; (2) leading the Company through the current audit, investigation and delisting to ensure a continuity of business and maintaining effective relationships with suppliers, customers, shareholders and employees; and (3) leading the establishment and implementation of the Company’s strategic objectives and effectively managing our banking and credit availability necessary to support our ongoing business. Mr. Bell earned a total of $255,000, or 85%, for his accomplishments in achieving these objectives. However, Mr. Bell’s incentive payment of $255,000 was reduced by $159,091 for a net payment of $95,909. The reduction was due to an overpayment of 2006 incentives previously made to Mr. Bell. This reduction represents 50% of the overpayment. The remaining amount of the overpayment will be considered when future incentives are earned.
In 2008, Mr. Jacquet’s target incentive under the Strategic Initiative Plan was $150,000. Payment of the target incentive was contingent upon Mr. Jacquet’s achievement of strategic objectives, which were weighted as shown below and pertained to: (1) providing the leadership and assistance to lead the organization through the various employee issues associated with the audit, investigation, delisting, stock price decline and personnel actions (weight: 57%); (2) recruiting and staffing a number of critical positions (weight: 24%); and (3) partnering with the CEO, CFO and General Counsel to update and improve specific corporate governance programs in the Company (weight: 19%). Mr. Jacquet earned a total of $140,571, or 94%, for his accomplishments in achieving these objectives. However, Mr. Jacquet’s incentive payment of $140,571 was reduced by $7,627 for a net payment of $132,944. The reduction was due to an overpayment of 2006 incentives previously made to Mr. Jacquet. This reduction represents 50% of the overpayment. The remaining amount of the overpayment will be considered when future incentives are earned.
In 2008, Mr. Watt’s target incentive under the Strategic Initiative Plan was $200,000. Payment of the target incentive was contingent upon Mr. Watt’s achievement of strategic objectives, which were equally weighted and pertained to: (1) managing the worldwide distribution businesses through the audit, investigation and delisting and maintaining effective relationships with our suppliers, customers and employees; (2) establishing the role of the President, Worldwide Distribution and making material contributions to the Company; (3) making significant progress in growing the profitability of Continental Europe; and (4) implementing specific global programs to grow gross profit, operating profit and ROWC in the worldwide distribution businesses. Mr. Watt earned a total of $180,000, or 90%, for his accomplishments in achieving these objectives.
Discretionary Bonuses
The Compensation Committee has the authority to award discretionary bonuses to our executives when they believe it to be appropriate. Mr. Meyer was awarded a $50,000 hire-on bonus in August 2007. There were no discretionary bonus payments made to our named executive officers for 2008.
Long-Term Equity Incentives
We utilize long-term equity incentives to ensure that our executive officers have a continuing stake in our long-term success and to align their interests with the interests of our shareholders. We have historically provided long-term equity incentives in the form of stock options and RSUs, although we generally tie the granting of RSUs to our achievement of specific financial-related goals. Meaningful equity opportunities are provided to those executive officers who are most responsible for driving our financial and operating results. Actual awards reflect individual performance and retention
135
objectives. In determining the number of stock options and/or RSUs to be granted, the Compensation Committee reviews each executive officer’s individual performance and outstanding equity awards and analyzes the retention value of the unvested stock options and/or RSUs. Generally, as an executive officer’s responsibility and ability to impact our financial performance grows, the individual’s at-risk, performance-based compensation increases as a portion of his or her total compensation. Moreover, the ratio of long-term to short-term compensation increases proportionately with job responsibility. Ultimately individuals with greater roles and responsibilities associated with achieving our performance targets should bear a greater proportion of the risk if those goals are not achieved and should receive a greater proportion of the reward if the goals are met or surpassed. Although the award of stock options and RSUs may accumulate sizeable value over time, we believe that the expected benefit to us and our shareholders outweigh the cost. We believe that the reward is an appropriate motivational tool and is necessary to retain critical team members for our Company.
In the past, we have made stock option grants to executives in connection with their joining the Company, and both awards of stock options and RSUs to our named executive officers in recognition of ongoing individual contributions to our performance. We do not have a policy that provides for automatic grants of stock options or RSUs to executive officers.
In May 2008, our 1998 Stock Plan expired. As a result, we are presently unable to make any stock-based compensation awards. At our annual meeting in 2009, we intend to ask our shareholders to approve a new equity incentive plan.
Stock Options
Stock options granted under our 1998 Stock Plan generally have a term of five years and vest at a rate of 25% on each anniversary of the grant date. The deferred vesting of stock options is designed to create an incentive for the executive to remain employed with us and build shareholder value. Accordingly, an executive is rewarded only if our shareholders receive the benefit of appreciation in the price of our common stock. We believe this promotes our executive compensation philosophy of providing long-term rewards based on creating shareholder value.
In July 2007, we granted Mr. Hughes an option to purchase 70,000 shares of our common stock at an exercise price of $6.13 per share. In August 2007, we granted Mr. Meyer an option to purchase 225,000 shares of our common stock at an exercise price of $5.15 per share. The stock option grants have a term of five years and vest at a rate of 25% on each anniversary of the grant date. These options were granted by our Compensation Committee when Mr. Hughes and Mr. Meyer were hired by the Company.
In January 2008, we granted Messrs. Hughes, Meyer and Watt an option to purchase 20,000, 30,000 and 60,000 shares, respectively, of our common stock at an exercise price of $5.90 per share. The stock option grants have a term of five years and vest at a rate of 25% on each anniversary of the grant date.
Restricted Stock Units
Our 1998 Stock Plan also enabled the Compensation Committee to award RSUs to our executive officers. RSUs are contractual rights that entitle the recipient to receive one share of our common stock per unit once the RSU has vested. In general, RSUs granted to our executive officers vest on the basis of length of service, the attainment of performance-based milestones or a combination of both, as determined by the Compensation Committee. RSUs granted to our executive officers typically vest at a rate of 25% on each anniversary of the grant date. As with stock options, the deferred vesting of RSUs is designed to create an incentive for the executive to remain employed with us and build shareholder value.
We often tie the grant of RSUs to our achievement of financial-related goals. During 2007, there were no RSUs granted to any of the named executive officers.
In January 2008, Messrs. Hughes, Meyer and Watt were granted RSUs, in the amounts of 15,000, 25,000 and 40,000, respectively. The vesting of these RSUs was initially based on the Company achieving its 2008 annual operating plan, with 50% vesting immediately and the remaining 50% vesting 12 months later. In May 2008, the Compensation Committee elected to change the vesting requirement to be based solely on length of service so that 50% of the award would vest in March 2009 and the remaining 50% in March 2010. In February 2009, the Compensation Committee decided to further extend the vesting requirement for the awards that would vest in March 2009 to August 2009, at the option of the named executive officers. Mr. Hughes elected to not change the vesting date and his RSUs vested in March 2009. Mr. Meyer and Mr. Watt elected to extend the vesting of their RSUs from March 2009 to August 2009.
136
In May 2008, the Compensation Committee granted RSUs to Messrs. Hughes, Jacquet, Meyer and Watt to strengthen the retention value of each executive’s outstanding equity awards. The total number and vesting of these RSUs is as follows:
| | | | | | | | | | |
| | | Shares Vested on
5/20/09 | | Shares Vesting on
8/28/09 | | Shares Vesting on
1/29/10 | | Shares Vesting on
5/20/10 | | Total RSUs
Granted |
Mr. Hughes | | 9,854 | | — | | — | | 9,854 | | 19,708 |
Mr. Jacquet | | 5,000 | | — | | 21,500 | | 5,000 | | 31,500 |
Mr. Meyer | | — | | 10,000 | | 42,500 | | 10,000 | | 62,500 |
Mr. Watt | | — | | 20,000 | | 42,500 | | 20,000 | | 82,500 |
In addition to the RSUs that were granted to certain named executive officers in December 2008 to improve employee retention, Mr. Hughes was given an additional cash retention incentive of $100,000 that will be payable to him if he is an active employee of the Company on December 31, 2009.
Other Elements
Deferred Compensation
We have adopted certain broad-based employee benefit plans, in which all employees, including our named executive officers, are permitted to participate on the same terms and conditions relating to eligibility and generally subject to the same limitations on the amounts that may be contributed or the benefits payable under those plans. Under our Section 401(k) plan, which is a defined contribution plan qualified under the Internal Revenue Code, participants, including our named executive officers who reside in the United States (which includes all of our named executive officers, other than Mr. Watt), can contribute a percentage of their annual compensation. In addition, we make a matching contribution; subject to a maximum of $2,000. For 2007, each of Messrs. Bell, Illson and Jacquet received the maximum matching contribution, and Mr. Sturgeon received a matching contribution of $817. Messrs. Meyer and Watt did not participate in the plan in 2007 and were not eligible for a matching contribution. For 2008, each of the named executive officers, except Mr. Watt, received a matching contribution of $2,000.
Pension Benefits
Effective July 1, 2002, the Board adopted a Supplemental Executive Retirement Program (the “SERP”), as amended in November 2007. Mr. Bell is, and has been, the only participant in the SERP. In 2005, in lieu of granting Mr. Bell additional stock options, the Board increased Mr. Bell’s annual benefit under the SERP from $250,000 per year to $450,000 per year. The SERP is intended to retain Mr. Bell as our Chief Executive Officer and provide supplemental income benefits to Mr. Bell upon his retirement, or to his survivors upon his death. The SERP is funded by way of Company-owned life insurance policies on the lives of Mr. Bell and other key current and former employees. While the payments due under the SERP are an obligation of the Company, we believe that the proceeds from these life insurance policies will be sufficient to cover, over time, the full cost of the benefits provided, plus the cost of the life insurance premiums.
Personal Benefits and Perquisites
We do not grant our named executive officers significant perquisites. However, we believe that benefits and perquisites are sometimes necessary in order to attract and retain talent. We have assessed competitive market factors to determine appropriate benefit levels. In addition to our Section 401(k) plan described above, our U.S.-based executive officers are eligible to participate in our health, dental and vision plans, life insurance and long- and short-term disability insurance plans, and each of the other benefit plans that we offer to our other U.S.-based employees. These are the same plans that all full-time U.S.-based employees are offered and our executive officers do not receive any different level of benefits.
Messrs. Jacquet and Sturgeon are participants in the executive death benefit program. Mr. Illson was also a participant in the program until his termination in 2008. In the event of a participant’s death while employed by the
137
Company, this program provides each participant’s beneficiary a benefit of $250,000 payable in equal installments over five years. While the payments due under the executive death benefit program are an obligation of the Company, we believe that the proceeds from Company-owned life insurance policies maintained on the executive will be sufficient to cover, over time, the full cost of the benefits provided plus the cost of the insurance premiums.
Pursuant to Mr. Watt’s employment agreement, in each of 2007 and 2008, the Company paid Mr. Watt £12,000 ($24,000 using an average exchange rate of $2.00/£1.00 during 2007 and $22,320 using an average exchange rate of $1.86/£1.00 during 2008) for the purchase and contribution of a private pension plan. Also, during 2007, the Company contributed £23,280 ($46,560 using an average exchange rate of $2.00/£1.00 during 2007) and, during 2008, £23,280 ($43,301 using an average exchange rate of $1.86/£1.00 during 2008) to Mr. Watt’s private life insurance and income protection plans.
In 2007, Messrs. Bell, Hughes, Illson and Meyer received a car allowance in the amount of $300 per month, and Mr. Watt received a car allowance in the amount of £500 per month (using an exchange of $2.00/£1.00 for 2007). In 2008 these car allowances continued except that Mr. Illson’s allowance stopped upon his termination date in August 2008.
In February 2007, the Compensation Committee authorized that Mr. Bell’s annual allowance for tax preparation and estate planning be increased from $5,000 per year to $15,000 per year. In 2007 and 2008, Messrs. Illson, Jacquet, Meyer and Sturgeon received an annual allowance for tax preparation and estate planning of up to $1,500.
Because of Mr. Bell’s extensive travel schedule, he is authorized to have his spouse accompany him on up to five trips per year, at the Company’s expense, and on any trips where he is required to be away from home for three or more consecutive weekends. Effective in September 2007, the Compensation Committee approved a policy reaffirming this practice for Mr. Bell, and extended the policy to allow the spouses of certain other Company executives, including the named executive officers, to have their spouse accompany them on up to two trips per year that are in addition to trips where the spouse is expected to attend. In 2007, the Company reimbursed Mr. Bell $61,293 for these travel-related expenses. Also during 2007, we reimbursed Messrs. Illson, Jacquet, Sturgeon and Watt $7,236, $9,236, $9,057 and $375, respectively, for their spouses’ travel. In 2008, Mr. Bell was reimbursed $44,627 for spousal travel, and Messrs. Hughes, Illson, Jacquet and Watt were reimbursed $2,602, $766, $3,703 and $16,751, respectively, for spousal travel.
During the first half of 2007, we reimbursed Mr. Illson $13,938, which was grossed up for tax purposes by an additional $11,755, for payment of his travel and lodging expenses associated with his commute from his home in Southern California and his office in Northern California. This reimbursement practice ceased effective July 1, 2007.
Tax Treatment
Section 162(m) of the Internal Revenue Code places a limit of $1,000,000 on the amount of compensation we may deduct for federal income tax purposes in any one year with respect to our Chief Executive Officer and the next four most highly compensated officers (excluding the principal financial officer) who were serving as executive officers as of the last day of the applicable year. There is an exemption from the $1 million limitation for performance-based compensation that meets certain requirements. All grants of stock options under our 1998 Stock Plan were intended to qualify for this exemption. Grants of RSUs under our 1998 Stock Plan may qualify for the exemption if vesting is contingent on the attainment of objectives based on the performance criteria set forth in the plan and if certain other requirements are met. Grants of RSUs that vest solely on the basis of length of service cannot qualify for the exemption. Our current cash incentive plan is not designed to qualify for the exemption.
To maintain flexibility in compensating officers in a manner designed to promote varying corporate goals, the Compensation Committee has not adopted a policy requiring all compensation to be deductible. Although tax deductions for some amounts that we pay to our named executive officers as compensation may be limited by Section 162(m), the increased amount of income tax is not significant. The Compensation Committee generally intends to comply with the requirements to exempt executive compensation from the $1 million deduction limitation under Section 162(m); however, the Compensation Committee may determine that such compliance in a given circumstance would not be in our best interests or those of our shareholders.
138
Employment and Change in Control Agreements
In March 2009, we entered into a new employment agreement with Mr. Bell. The agreement has a two-year term and automatically renews for one-year periods thereafter. In addition to establishing his salary, incentives and other benefits, the agreement provides for a non-solicitation covenant for a period of one year following his termination from the Company. In the event he is terminated by the Company for reasons other than cause, he will receive severance benefits equal to two times his annual base salary. In the event there is a change in control event and his employment is terminated by the Company without cause during the 12-month period following a change in control, Mr. Bell will receive the severance benefits mentioned above, and accelerated vesting of unvested equity awards.
We have also entered into employment agreements with Messrs. Jacquet, Meyer, Sturgeon and Watt that provide for covenants not to compete with us for 12 months following their termination of employment; and, in the case of termination without cause, severance payments equal to their base salary for periods ranging from six months to 12 months. These agreements are in effect unless either the Company or the executive officer provides the other party with notice of intent to terminate the employment agreement.
The Company has also entered into management retention agreements with our other named executive officers. The agreements generally provide severance benefits in the event that the executive officer’s employment is terminated for reasons other than cause during the 12-month period following a change in control. The management retention agreements have three-year terms and are automatically extended for successive one-year periods unless terminated, amended or modified by us. If the named executive officer is involuntarily terminated other than for cause, then he will receive a cash payment equal to his base annual salary, certain benefits for one year from the date of termination or until the date that the named executive officer becomes covered under another employer’s benefit plans, and accelerated vesting of any unvested equity awards. In the event that the named executive officer’s employment is terminated for any reason either prior to the occurrence of a change in control, or later than 12 months following a change in control, then he is entitled only to receive severance and other benefits under established severance and benefits plans and practices, or pursuant to another agreement with us.
The change of control payments we offer our named executive officers (currently, two years of base pay for Mr. Bell and the equivalent of one year of base pay for our other named executive officers) is at the lower end of the change in control practices in our industry. Many of our competitors offer 2.99 years of total target cash compensation as severance in the event of a change in control. The terms of the change in control agreements have not influenced any of our other compensation programs.
Stock Ownership Policy
In February 2009, the Board revised the Stock Ownership Guidelines for our Chief Executive Officer and for our other executive officers, to increase their required equity stake in the Company and more closely align their interests with those of our shareholders. The guidelines require our Chief Executive Officer to hold stock of the Company having a value equal to a minimum of 100% of his or her annual base salary, as of the last day of each fiscal year. With respect to our other executive officers, the guidelines require ownership of stock in the Company having a value equal to a minimum of 50% of his or her annual base salary, as of the last day of each fiscal year. The ownership guidelines are to be met by the later of five years following their appointment as an executive officer, or December 31, 2011.
The Board also revised the stock ownership guidelines for all non-employee directors, which are to be met by the later of five years following their appointment or election, or December 31, 2011. The guidelines require each of our non-employee directors to hold stock of the Company having a value equal to a minimum of 100% of his or her annual retainer as of the last day of each fiscal year.
139
Compensation Committee Report
The Compensation Committee of the Board has reviewed and discussed the Compensation Discussion and Analysis set forth above with management. Based on this review and discussion with management, the Compensation Committee recommended to the Board that the Compensation Discussion and Analysis be included in the Annual Report on Form 10-K for the fiscal year ended December 31, 2008.
| | |
| | Members of the Compensation Committee: |
| |
| | David M. Ernsberger, Chairman |
| | Gordon A. Campbell |
| | Mark L. Sanders |
140
Executive Compensation Tables
2007 Summary Compensation Table
The following table provides information with respect to the compensation earned during 2007 by our named executive officers for that year.
| | | | | | | | | | | | | | | | | | | |
Name and Principal Position | | Year | | Salary
($) | | Bonus
($) | | | Stock
Awards
($)(1) | | Option
Awards
($)(1) | | Non-Equity
Incentive Plan
Compensation
($)(2) | | Change in
Pension
Value
($)(3) | | All Other
Compensation
($)(4) | | Total
($) |
| | | | | | | | | |
W. Donald Bell
President & Chief Executive Officer | | 2007 | | 647,096 | | — | | | 96,585 | | 50,665 | | 389,695 | | — | | 77,192 | | 1,261,233 |
| | 2006 | | 632,500 | | 110,000 | | | 346,753 | | 39,561 | | 434,631 | | 2,027,890 | | 124,703 | | 3,716,038 |
| | | | | | | | | |
James E. Illson(5)
Chief Operating Officer, President of the Americas & Chief Financial Officer | | 2007 | | 467,657 | | — | | | 83,159 | | 47,549 | | 139,237 | | — | | 52,741 | | 790,543 |
| | 2006 | | 450,000 | | — | | | 166,936 | | 114,650 | | 221,057 | | — | | 103,517 | | 1,056,160 |
| | | | | | | | | |
William E. Meyer(6)
Executive Vice President & Chief Financial Officer | | 2007 | | 137,597 | | 50,000 | (7) | | — | | 41,786 | | 100,434 | | — | | 1,461 | | 331,278 |
| | | | | | | | | |
Richard J. Jacquet
Senior Vice President of Human Resources | | 2007 | | 229,169 | | — | | | 5,441 | | 17,945 | | 148,275 | | — | | 27,821 | | 428,651 |
| | 2006 | | 224,000 | | — | | | 56,363 | | 24,563 | | 133,250 | | — | | 21,408 | | 459,584 |
| | | | | | | | | |
Robert J. Sturgeon
Vice President, Operations & Chief Information Officer | | 2007 | | 232,462 | | — | | | 3,093 | | 17,678 | | 101,558 | | — | | 20,225 | | 375,016 |
| | | | | | | | | |
Graeme Watt(8)
President, Worldwide Distribution | | 2007 | | 570,000 | | — | | | 65,894 | | 87,411 | | 315,308 | | — | | 82,935 | | 1,121,548 |
| | 2006 | | 524,400 | | 64,410 | | | 99,682 | | 173,524 | | 41,952 | | — | | 75,955 | | 979,923 |
141
2008 Summary Compensation Table
The following table provides information with respect to the compensation earned during 2008 by our named executive officers for that year.
| | | | | | | | | | | | | | | | | | | |
Name and Principal Position | | Year | | Salary
($) | | Bonus
($) | | | Stock
Awards
($)(1) | | Option
Awards
($)(1) | | Non-Equity
Incentive Plan
Compensation
($)(2) | | Change in
Pension
Value
($)(3) | | All Other
Compensation
($)(4) | | Total
($) |
| | | | | | | | | |
W. Donald Bell
President & Chief Executive Officer | | 2008 | | 632,500 | | — | | | 20,965 | | 50,804 | | 200,272 | | — | | 89,730 | | 994,271 |
| | 2007 | | 647,096 | | — | | | 96,585 | | 50,665 | | 389,695 | | — | | 77,192 | | 1,261,233 |
| | 2006 | | 632,500 | | 110,000 | | | 346,753 | | 39,561 | | 434,631 | | 2,027,890 | | 124,703 | | 3,716,038 |
| | | | | | | | | |
James E. Illson(5)
Former Chief Operating Officer and President of the Americas | | 2008 | | 290,265 | | — | | | 37,174 | | 26,497 | | 50,000 | | — | | 608,540 | | 1,012,476 |
| | 2007 | | 467,657 | | — | | | 83,359 | | 47,549 | | 139,237 | | — | | 52,741 | | 790,543 |
| | 2006 | | 450,000 | | — | | | 166,936 | | 114,650 | | 221,057 | | — | | 103,517 | | 1,056,160 |
| | | | | | | | | |
William E. Meyer(6)
Executive Vice President & Chief Financial Officer | | 2008 | | 350,000 | | — | | | 117,136 | | 118,723 | | 200,000 | | — | | 6,500 | | 792,359 |
| | 2007 | | 137,597 | | 50,000 | (7) | | — | | 41,786 | | 100,434 | | — | | 1,461 | | 331,278 |
| | | | | | | | | |
Andrew S. Hughes
Vice President, General Counsel & Corporate Secretary | | 2008 | | 300,000 | | — | | | 55,750 | | 48,315 | | 120,000 | | — | | 8,202 | | 532,267 |
| | | | | | | | | |
Richard J. Jacquet
Senior Vice President of Human Resources | | 2008 | | 224,000 | | — | | | 25,729 | | 13,548 | | 194,882 | | — | | 23,319 | | 481,478 |
| | 2007 | | 229,169 | | — | | | 5,441 | | 17,945 | | 148,275 | | — | | 27,821 | | 428,651 |
| | 2006 | | 224,000 | | — | | | 56,363 | | 24,563 | | 133,250 | | — | | 21,408 | | 459,584 |
| | | | | | | | | |
Graeme Watt(8)
President, Worldwide Distribution | | 2008 | | 538,470 | | — | | | 206,366 | | 48,877 | | 289,089 | | — | | 93,118 | | 1,175,920 |
| | 2007 | | 570,000 | | — | | | 65,894 | | 87,411 | | 315,308 | | — | | 82,935 | | 1,121,548 |
| | 2006 | | 524,400 | | 64,410 | | | 99,682 | | 173,524 | | 41,952 | | — | | 75,955 | | 979,923 |
| (1) | Under SEC rules, the values reported in the “Stock Awards” and “Options Awards” columns of the Summary Compensation Table reflect the dollar amount of expense recognized for financial statement reporting purposes for 2008, 2007 and 2006 in accordance with SFAS 123(R), with the exception that estimated forfeitures related to service-based vesting were disregarded in these amounts. We calculate compensation expense related to stock options using the Black-Scholes valuation model. Assumptions used in the calculation of this amount for purposes of our financial statements are included in Note 8 —Stock-Based Compensation Plans in our notes to the consolidated financial statements included in this Annual Report on Form 10-K. |
| (2) | Amounts shown under the heading “Non-Equity Incentive Plan Compensation” for each of the named executive officers are the actual amounts paid under our Management Incentive and Strategic Initiative Plans. Mr. Illson’s 2008 award under the Management Incentive Plan was determined pursuant to a separation agreement into which he and the Company entered in connection with his termination. |
| (3) | Represents the year-to-year change in the present value of Mr. Bell’s benefits under our Supplemental Executive Retirement Plan. The change in pension value for Mr. Bell in 2007 was $(64,232) and in 2008 was $(72,803). In 2006, Mr. Bell’s SERP benefit was increased from $250,000 per year to $450,000 per year. See Item 11 – Executive Compensation – Pension Benefits for 2007and Item 11 – Executive Compensation – Pension Benefits for 2008 for additional information. |
| (4) | For a break-out of the amounts included in “All Other Compensation” see the table immediately following these footnotes. |
| (5) | Mr. Illson ceased to be an executive officer in June 2008 and terminated his employment in August 2008. |
| (6) | Mr. Meyer joined the Company in August 2007. |
| (7) | In 2007, Mr. Meyer received a one-time hire-on bonus of $50,000. |
| (8) | All amounts for Mr. Watt have been converted from British pounds to U.S. dollars using an exchange rate of $1.86/£1.00 for 2008, $2.00/£1.00 for 2007 and $1.80/£1.00 for 2006. These rates were the average British pound to U.S. dollar exchange rate during the years indicated. |
142
All Other Compensation – Detail
This table sets forth each of the elements comprising each named executive officer’s compensation reported in the “All Other Compensation” columns in the Summary Compensation Table, above.
| | | | | | | | | | | | | | | | |
Name | | Year | | Car
Allowance
($) | | 401(k) Match
or Pension
Contribution
($) | | Tax Prep.
Financial
Planning
($) | | Executive
Death
Benefit
($) | | Spousal or
Dependent
Travel
($) | | Other
(a)($) | | Total
($) |
| | | | | | | | |
W. Donald Bell | | 2008 | | 3,600 | | 2,000 | | 15,000 | | — | | 44,627 | | 24,503 | | 89,730 |
| | 2007 | | 3,600 | | 2,000 | | 10,300 | | — | | 61,293 | | — | | 77,193 |
| | | | | | | | |
James E. Illson | | 2008 | | 2,286 | | — | | 1,060 | | — | | 766 | | 604,428 | | 608,540 |
| | 2007 | | 3,600 | | 2,000 | | 3,530 | | 10,682 | | 7,236 | | 25,693 | | 52,741 |
| | | | | | | | |
William E. Meyer | | 2008 | | 3,600 | | 2,000 | | 900 | | — | | — | | — | | 6,500 |
| | 2007 | | 1,461 | | — | | — | | — | | — | | — | | 1,461 |
| | | | | | | | |
Andrew S. Hughes | | 2008 | | 3,600 | | 2,000 | | — | | — | | 2,602 | | — | | 8,202 |
| | | | | | | | |
Richard J. Jacquet | | 2008 | | — | | 2,000 | | 650 | | 15,935 | | 3,703 | | 1,031 | | 23,319 |
| | 2007 | | — | | 2,000 | | 650 | | 15,935 | | 9,236 | | — | | 27,821 |
| | | | | | | | |
Robert J. Sturgeon | | 2007 | | — | | 817 | | — | | 10,351 | | 9,057 | | — | | 20,225 |
| | | | | | | | |
Graeme Watt (b) | | 2008 | | 11,160 | | 22,320 | | — | | — | | 16,751 | | 44,887 | | 95,118 |
| | 2007 | | 12,000 | | 24,000 | | — | | — | | 375 | | 46,560 | | 82,935 |
| (a) (i) | For Mr. Bell, “Other” consists of $21,973 paid in 2008 as interest for the delay in paying 2006 incentives, $1,151 in 2008 for the cost of a medical examination, and $1,379 in 2008 of imputed income for computer equipment. |
| | (ii) | For Mr. Illson, “Other” consists of a housing and travel reimbursement and related tax gross-up totaling $25,693 in 2007, $1,379 in 2008 of imputed income for computer equipment, and in 2008, in connection with his termination from the Company, $465,000 in severance pay, $99,285 in consulting fees following his termination from the Company, and the payout of his accrued vacation in the amount of $38,764. |
| | (iii) | For Mr. Jacquet, “Other” consists of $1,031 paid in 2008 to compensate him for the delay in paying 2006 incentives. |
| | (iv) | For Mr. Watt, “Other” consists of an employee benefit allowance of $43,301 and $46,560 in 2008 and 2007, respectively, and a payment in 2008 of $1,586 as interest for the delay in paying 2007 incentives. |
| (b) | All amounts for Mr. Watt have been converted from British pounds to U.S. dollars using an exchange rate of $1.86/£1.00 for 2008 and $2.00/£1.00 for 2007. These rates were the average British pound to U.S. dollar exchange rate during the years indicated. |
143
Grants of Plan-Based Awards for Fiscal Year Ended December 31, 2007
The following table provides certain information with respect to grants of options to purchase shares of our common stock made to our named executive officers during 2007. The table also provides information with regard to cash bonuses under our performance-based, non-equity incentive plans to the named executive officers.
| | | | | | | | | | | | | | | | | | | |
| | | Date of Board | | Grant | | Estimated Future Payouts under
Non-Equity Incentive Plan Awards | | | All Other
Options
Awards:
Number of
Securities
Underlying | | Exercise
or Base
Price of
Option
Awards | | Grant
Date Fair
Value of
Stock and
Option
Awards |
Name | | Action | | Date | | Threshold | | | Target | | | Maximum | | | Options | | ($/Sh) | | (7) |
W. Donald Bell | | 4/11/2007 | | 7/1/2007 | | 316,250 | (1) | | 632,500 | (2) | | 1,138,500 | (3) | | — | | — | | — |
| | 4/24/2007 | | 4/24/2007 | | — | | | 375,000 | (4) | | — | | | — | | — | | — |
| | | | | | | | |
James E. Illson (5) | | 4/11/2007 | | 7/1/2007 | | 135,000 | (1) | | 270,000 | (2) | | 486,000 | (3) | | — | | — | | — |
| | 4/24/2007 | | 4/24/2007 | | — | | | 200,000 | (4) | | — | | | — | | — | | — |
| | | | | | | | |
William E. Meyer | | 7/20/2007 | | 8/6/2007 | | — | | | 100,434 | (2) | | — | | | — | | — | | — |
| | 7/20/2007 | | 8/6/2007 | | — | | | — | | | — | | | 225,000 | | 5.15 | | 415,305 |
| | | | | | | | |
Richard J. Jacquet | | 4/11/2007 | | 7/1/2007 | | 55,500 | (1) | | 111,000 | (2) | | 199,800 | (3) | | — | | — | | — |
| | 4/24/2007 | | 4/24/2007 | | — | | | 150,000 | (4) | | — | | | — | | — | | — |
| | | | | | | | |
Robert J. Sturgeon | | 4/11/2007 | | 7/1/2007 | | 62,500 | (1) | | 125,000 | (2) | | 225,000 | (3) | | — | | — | | — |
| | | | | | | | |
Graeme Watt (6) | | 4/11/2007 | | 7/1/2007 | | 142,500 | (1) | | 285,000 | (2) | | 513,000 | (3) | | — | | — | | — |
| (1) | This amount represents 50% of the target incentive under our Management Incentive Plan. Under this plan the minimum payout of incentives for financial performance metrics is 50% for achieving 80% of the financial-related target. |
| (2) | Represents target bonus award payments under the Company’s Management Incentive Plan for 2007 based on 100% achievement of goals. The Compensation Committee determined that Mr. Meyer’s incentive compensation for 2007 would be paid at 100% of target as part of his offer of employment. |
| (3) | Under the Company’s Management Incentive Plan, named executive officers can earn more than their target incentive for exceeding financial-related goals above 100% of target. For 2007, the named executive officers could earn up to 180% of their target incentive if they achieved at least 150% of their financial goals. |
| (4) | Under the Company’s Strategic Initiative Plan, named executive officers who participate can earn any amount up to the target incentive amount depending on achievement of their strategic initiative objectives. |
| (5) | Mr. Illson resigned from his position as an executive officer of the Company effective in June 2008, although he remained employed by the Company through August 2008. |
| (6) | Mr. Watt’s annual incentive targets under the Company’s Management Incentive Plan and the Strategic Initiative Plan for 2007 have been converted from British pounds to U.S. dollars using the average exchange rate of $2.00/£1.00 during 2007. |
| (7) | These amounts reflect the full grant date fair value of each equity award computed in accordance with SFAS 123(R). Assumptions used in the calculation of this amount for purposes of our consolidated financial statements are included in Note 8 —Stock-Based Compensation Plans in the notes to our consolidated financial statements included in this Annual Report on Form 10-K. |
144
Grants of Plan-Based Awards for Fiscal Year Ended December 31, 2008
The following table provides certain information with respect to grants of options to purchase shares of our common stock made to our named executive officers during 2008. The table also provides information with regard to cash bonuses under our performance-based, non-equity incentive plans to the named executive officers.
| | | | | | | | | | | | | | | | | | | | | |
| | | Date of Board | | | | Estimated Future Payouts under Non-
Equity Incentive Plan Awards | | | All Other
Stock
Awards:
Number
of Shares
of Stock
or Units | | All Other
Options
Awards:
Number of
Securities
Underlying | | Exercise
or Base
Price of
Option
Awards | | Grant Date
Fair Value
of Stock
and Option |
| | | | | | | |
| | | | | | | |
Name | | Action | | Grant Date | | Threshold ($) | | | Target ($) | | | Maximum ($) | | | (#) | | Options | | ($/Sh) | | Awards (7) |
W. Donald Bell | | 1/21/2008 | | 1/21/2008 | | 316,250 | (1) | | 632,500 | (2) | | 1,265,000 | (3) | | | | — | | — | | — |
| | 1/21/2008 | | 1/21/2008 | | — | | | 300,000 | (4) | | — | | | | | — | | — | | — |
| | | | | | | | | |
James E. Illson (5) | | 1/21/2008 | | 1/21/2008 | | 135,000 | | | 270,000 | (2) | | 540,000 | (3) | | | | — | | — | | — |
| | | | | | | | | |
William E. Meyer | | 1/21/2008 | | 1/21/2008 | | — | | | 200,000 | (2) | | — | | | | | | | | | |
| | 1/21/2008 | | 1/21/2008 | | | | | | | | | | | | | 30,000 | | 5.90 | | 62,181 |
| | 1/21/2008 | | 1/21/2008 | | | | | | | | | | | 25,000 | | | | | | 147,500 |
| | 5/20/2008 | | 5/20/2008 | | | | | | | | | | | 62,500 | | | | | | 165,625 |
| | | | | | | | | |
Andrew S. Hughes | | 1/21/2008 | | 1/21/2008 | | — | | | 120,000 | (2) | | — | | | | | | | | | |
| | 1/21/2008 | | 1/21/2008 | | | | | | | | | | | | | 20,000 | | 5.90 | | 41,454 |
| | 1/21/2008 | | 1/21/2008 | | | | | | | | | | | 15,000 | | | | | | 88,500 |
| | 5/20/2008 | | 5/20/2008 | | | | | | | | | | | 19,708 | | | | | | 52,226 |
| | | | | | | | | |
Richard J. Jacquet | | 1/21/2008 | | 1/21/2008 | | 55,500 | (1) | | 111,000 | (2) | | 222,000 | (3) | | | | | | | | |
| | 1/21/2008 | | 1/21/2008 | | — | | | 150,000 | (4) | | — | | | | | | | | | |
| | 5/20/2008 | | 5/20/2008 | | | | | | | | | | | 31,500 | | | | | | 83,475 |
| | | | | | | | | |
Graeme Watt (6) | | 1/21/2008 | | 1/21/2008 | | 132,525 | (1) | | 265,050 | (2) | | 530,100 | (3) | | | | | | | | |
| | 5/20/2008 | | 5/20/2008 | | — | | | 200,000 | (4) | | — | | | | | | | | | |
| | 1/21/2008 | | 1/21/2008 | | | | | | | | | | | | | 60,000 | | 5.90 | | 124,362 |
| | 1/21/2008 | | 1/21/2008 | | | | | | | | | | | 40,000 | | | | | | 236,000 |
| | 5/20/2008 | | 5/20/2008 | | | | | | | | | | | 82,500 | | | | | | 218,625 |
| (1) | This amount represents 50% of the target incentive under our Management Incentive Plan. Under this plan the minimum payout of incentives for financial performance metrics is 50% for achieving 80% of the financial-related target. |
| (2) | Represents target bonus award payments under our Management Incentive Plan for 2008 based on 100% achievement of goals. The Compensation Committee determined that Mr. Meyer’s and Mr. Hughes’ incentive compensation for 2008 would be paid at 100% of target. |
| (3) | Under the Company’s Management Incentive Plan, the named executive officers can earn more than their target incentive for exceeding financial-related goals above 100% of target. For 2008, the named executive officers could earn up to 200% of their target incentive if they achieved at least 150% of their financial goals. |
| (4) | Under the Company’s Strategic Initiative Plan, the named executive officers who participate can earn any amount up to their target incentive amount depending on achievement of their strategic initiative objectives. |
| (5) | Mr. Illson resigned from his position as an executive officer of the Company effective in June 2008, although he remained employed by the Company through August 2008. |
| (6) | In conjunction with Mr. Watt’s pending relocation from the U.K. to the U.S., the Compensation Committee made a one-time £4,500 adjustment to his second half management incentive. Additionally, for 2008 only, the Compensation Committee approved a one-time change in Mr. Watt’s incentive plan mix of performance metrics from 40% pre-tax profit performance, 40% ROWC performance, and 20% MBOs, to 25% pre-tax profit performance, 25% ROWC performance and 50% MBOs. Mr. Watt’s annual incentive target under the Company’s Management Incentive Plan and the Strategic Initiative Plan for 2008 has been converted from British pounds to U.S. dollars using the average exchange rate of $1.86/£1.00 during 2008. |
| (7) | These amounts reflect the full grant date fair value of each equity award computed in accordance with SFAS 123(R). Assumptions used in the calculation of this amount for purposes of our financial statements are included in Note 8 —Stock-Based Compensation Plans inthe notes to our consolidated financial statements included in this Annual Report on Form 10-K. |
Stock options granted to our named executive officers in 2007 and 2008 have a term of five years and vest at a rate of 25% on each anniversary of the grant date. RSUs granted to our named executive officers in 2007 and 2008 vest as described in Item 11,Executive Compensation – Compensation Discussion and Analysis – Restricted Stock Units.
145
Outstanding Equity Awards at 2008 Fiscal Year End
The following table provides information with respect to each unexercised stock option and unvested RSU awards held by each named executive officer for 2008 as of December 31, 2008.
| | | | | | | | | | | | | | | |
| | | Option Awards | | | Stock Awards |
Name | | Number of
Securities
Underlying
Unexercised
Options (#)
Exercisable | | Number of
Securities
Underlying
Unexercised
Options (#)
Unexercisable | | | Option
Exercise Price
($) | | Option
Expiration
Date | | | Number of
Shares or
Units of Stock
That Have Not
Vested
(#) | | | Market Value
of Shares or
Units of Stock
That Have Not
Vested
($) |
W. Donald Bell | | 100,000 | | 0 | | | 7.23 | | 8/27/2008 | (1) | | — | | | — |
| | 37,500 | | 37,500 | (3) | | 6.32 | | 3/21/2011 | | | — | | | — |
| | | | | | |
James E. Illson (2) | | 232,000 | | 0 | | | 3.90 | | 8/13/2007 | (1) | | | | | |
| | 50,000 | | 0 | | | 4.12 | | 5/22/2008 | | | | | | |
| | 25,000 | | 0 | | | 10.00 | | 2/19/2009 | | | | | | |
| | 60,000 | | 0 | | | 6.73 | | 8/9/2009 | | | | | | |
| | 16,000 | | 0 | | | 10.28 | | 8/3/2010 | | | | | | |
| | 12,500 | | 12,500 | (3) | | 6.32 | | 3/21/2011 | | | | | | |
| | | | | | | | | | | | 12,500 | (4) | | 7,500 |
| | | | | | |
William E. Meyer | | 56,250 | | 168,750 | (3) | | 5.15 | | 8/06/2012 | | | | | | |
| | 0 | | 30,000 | (3) | | 5.90 | | 1/21/2013 | | | | | | |
| | | | | | | | | | | | 87,500 | (4) | | 52,500 |
| | | | | | |
Andrew S. Hughes | | 17,500 | | 52,500 | (3) | | 6.13 | | 7/30/2012 | | | | | | |
| | 0 | | 20,000 | (3) | | 5.90 | | 1/21/2013 | | | | | | |
| | | | | | | | | | | | 34,708 | (4) | | 20,825 |
| | | | | | |
Richard J. Jacquet | | 50,000 | | 0 | | | 4.37 | | 7/07/2008 | (1) | | | | | |
| | 6,000 | | 0 | | | 10.28 | | 8/03/2010 | | | | | | |
| | 10,000 | | 10,000 | (3) | | 6.32 | | 3/21/2011 | | | | | | |
| | 15,000 | | 0 | | | 10.00 | | 5/22/2010 | | | | | | |
| | | | | | | | | | | | 31,500 | (4) | | 18,900 |
| | | | | | |
Graeme Watt | | 250,000 | | 0 | | | 6.45 | | 4/21/2009 | (1) | | | | | |
| | 0 | | 60,000 | (3) | | 5.90 | | 1/21/2013 | | | | | | |
| | | | | | | | | | | | 160,000 | (4) | | 96,000 |
| (1) | The expiration dates of the options scheduled to expire in 2007, 2008 and 2009 were extended by the Compensation Committee to expire generally 30 days after the Company is current in its SEC filings, which is currently expected to occur by the end of 2009. |
| (2) | Mr. Illson resigned from his position as an executive officer of the Company effective in June 2008, although he remained a service provider for purposes of our 1998 Stock Plan through May 2009. |
| (3) | The stock option grant date is five years prior to the expiration date for the grant. The stock option grant vests 25% per year on each anniversary of the grant date. |
| (4) | For Mr. Illson, the RSUs vested on May 17, 2009. For Mr. Meyer: 22,500 RSUs vest on August 28, 2009, 12,500 RSUs vest on March 1, 2010, 42,500 RSUs vest on January 29, 2010 and 10,000 RSUs vest on May 20, 2010. For Mr. Hughes: 7,500 RSUs vested on March 1, 2009, 9,854 RSUs vested on May 20, 2009, 7,500 RSUs vest on March 1, 2010, and 9,854 RSUs vest on May 20, 2010. For Mr. Jacquet: 5,000 RSUs vested on May 20, 2009, 21,500 RSUs vest on January 29, 2010 and 5,000 RSUs vest on May 20, 2010. For Mr. Watt: 77,500 RSUs vest on August 28, 2009, 42,500 RSUs vest on January 29, 2010, 20,000 RSUs vest on March 1, 2010, and 20,000 RSUs vest on May 20, 2010. |
146
Option Exercises and Stock Vested for Fiscal Year Ended December 31, 2007
The following table provides information with respect to the exercising of option awards and shares subject to RSU awards held by our named executive officers for 2007 that vested during 2007.
| | | | | | | | |
| | | Option Awards | | Stock Awards |
Name | | Number of
Shares Acquired
on Exercise (#) | | Value Realized
on Exercise ($) | | Number of
Shares Acquired
on Vesting (#) | | Value Realized
on Vesting ($) |
W. Donald Bell | | — | | — | | — | | — |
James E. Illson | | — | | — | | 22,500 | | 130,875 |
William E. Meyer | | — | | — | | — | | — |
Richard J. Jacquet | | — | | — | | 10,625 | | 69,856 |
Robert J. Sturgeon | | — | | — | | — | | — |
Graeme Watt | | — | | — | | — | | — |
Option Exercises and Stock Vested for Fiscal Year Ended December 31, 2008
The following table provides information with respect to the exercising of option awards and shares subject to RSU awards held by our named executive officers for 2008 that vested during 2008.
| | | | | | | | |
| | | Option Awards | | Stock Awards |
Name | | Number of
Shares Acquired
on Exercise (#) | | Value Realized
on Exercise ($) | | Number of
Shares Acquired
on Vesting (#) | | Value Realized
on Vesting ($) |
W. Donald Bell | | — | | — | | 100,000 | | 274,000 |
James E. Illson | | — | | — | | 22,500 | | 57,150 |
William E. Meyer | | — | | — | | — | | — |
Andrew S. Hughes | | — | | — | | — | | — |
Richard J. Jacquet | | — | | — | | — | | — |
Graeme Watt | | — | | — | | — | | — |
Pension Benefits for 2007
The following table provides information regarding the present value of benefits under our Supplemental Executive Retirement Plan (the “SERP”) as of December 31, 2007. Other than Mr. Bell, none of our named executive officers for 2007 are participants in the SERP or other post-employment benefit plans.
| | | | | | | | | | |
Name | | Plan Name | | Number of Years
Credited Service | | Present Value of
Accumulated Benefits
(1) | | Payments During
Last Fiscal Year |
| | | | |
W. Donald Bell | | SERP | | N/A | | $ | 4,117,112 | | $ | 0 |
James E. Illson | | — | | — | | | — | | | — |
William E. Meyer | | — | | — | | | — | | | — |
Richard J. Jacquet | | — | | — | | | — | | | — |
Robert J. Sturgeon | | — | | — | | | — | | | — |
Graeme Watt | | — | | — | | | — | | | — |
147
Pension Benefits for 2008
The following table provides information regarding the present value of benefits under the SERP as of December 31, 2008. Other than Mr. Bell, none of our named executive officers for 2008 are participants in the SERP or other post-employment benefit plans.
| | | | | | | | | | |
Name | | Plan Name | | Number of Years
Credited Service | | Present Value of
Accumulated Benefits
(1) | | Payments During
Last Fiscal Year |
W. Donald Bell | | SERP | | N/A | | $ | 4,044,309 | | $ | 0 |
James E. Illson | | — | | — | | | — | | | — |
William E. Meyer | | — | | — | | | — | | | — |
Andrew S. Hughes | | — | | — | | | — | | | — |
Richard J. Jacquet | | — | | — | | | — | | | — |
Graeme Watt | | — | | — | | | — | | | — |
| (1) | The present values have been calculated assuming Mr. Bell would have retired at age 70, the normal retirement age under the SERP. The present values also assume that the benefit is payable as a single life annuity. The discount rate assumptions for the 2007 and 2008 calculations are 5.75% and 5.50%, respectively. The mortality assumptions were based on the RP-2000 Mortality Tables. |
The SERP provides supplemental retirement benefits to certain executive officers designated by the Board. The Board establishes the amount of the annual retirement benefit, vesting schedule and other terms separately for each participant. Although benefits under the SERP are unsecured, we have purchased life insurance policies on Mr. Bell and other executives, the proceeds of which are payable to us. We expect that the proceeds from these policies will be sufficient to recover, over time, the full cost of the SERP, the cost of the insurance and certain death benefits payable to the other covered executives.
Mr. Bell is the only named executive officer who has been designated as a participant in the SERP. He is fully vested in his benefits, which entitle him to an annual income benefit of $450,000. Mr. Bell’s benefits are payable in the form of a life annuity unless he elects, in accordance with the terms of his award, an actuarially equivalent joint and survivor form of benefit prior to his termination of employment.
Payments upon Termination or Change in Control
The following table describes the potential payments and benefits upon termination of employment of our named executive officers for 2008, other than Mr. Illson, including in connection with a change in control of our Company, as if each named executive officer’s employment terminated as of December 31, 2008. For purposes of valuing the severance and vacation payments in the table below, we used each officer’s base salary rate in effect on December 31, 2008, and the number of accrued but unused vacation days on December 31, 2008. A summary of the employment and change in control agreements that provide severance benefits to our named executive officers is set forth in Item 11 —Executive Compensation — Compensation Discussion and Analysis — Employment and Change in Control Agreements.
Mr. Illson resigned from his position as an executive officer of the Company effective in June 2008, although he remained employed by the Company through August 2008. In connection with his termination, Mr. Illson received $465,000 in severance pay and $38,764 for accrued vacation. In 2008, Mr. Illson also received $99,285 in consulting fees following his termination from the Company.
The value of the acceleration of equity awards shown in the table below was calculated based on the assumption that the change in control, if applicable, occurred and the officer’s employment terminated on December 31, 2008, and that the fair market value per share of our common stock on that date was $0.60, which was the closing trading price of our common stock on December 31, 2008. The value of the accelerated vesting of RSUs was calculated by multiplying the number of unvested RSUs by $0.60.
148
| | | | | | | | | | | |
| | | | | As of December 31, 2008 |
Name | | Benefit | | Termination
of
Employment
Without
Cause (1) | | Involuntary
Termination
Without
Cause
Within
12 Months
after a
Change in
Control (2) | | Termination
Due to
Death (3) |
W. Donald Bell (4) | | Severance | | $ | 0 | | $ | 632,500 | | $ | — |
| | Accrued Vacation | | | 80,255 | | | 80,255 | | | 80,255 |
| | Stock Option Acceleration | | | — | | | 0 | | | — |
| | Restricted Stock Unit Acceleration | | | — | | | 0 | | | — |
| | Continued Employee Benefits | | | 0 | | | 12,949 | | | — |
| | Death Benefit | | | — | | | — | | | 1,125,000 |
| | | | | | | | | | | |
| | Total Value | | $ | 80,255 | | $ | 725,704 | | $ | 1,205,000 |
| | | | | | | | | | | |
| | | | |
William E. Meyer | | Severance | | $ | 350,000 | | $ | 350,000 | | $ | — |
| | Accrued Vacation | | | 3,374 | | | 3,374 | | | 3,374 |
| | Stock Option Acceleration | | | — | | | 0 | | | — |
| | Restricted Stock Unit Acceleration | | | — | | | 52,500 | | | — |
| | Continued Employee Benefits | | | — | | | 17,590 | | | — |
| | Death Benefit | | | — | | | — | | | — |
| | | | | | | | | | | |
| | Total Value | | $ | 353,374 | | $ | 423,464 | | $ | 3,374 |
| | | | | | | | | | | |
| | | | |
Andrew S. Hughes (5) | | Severance | | $ | 150,000 | | $ | 300,000 | | $ | — |
| | Accrued Vacation | | | 11,931 | | | 11,931 | | | 11,931 |
| | Stock Option Acceleration | | | — | | | 0 | | | — |
| | Restricted Stock Unit Acceleration | | | — | | | 20,825 | | | — |
| | Continued Employee Benefits | | | | | | 12,949 | | | — |
| | Death Benefit | | | — | | | — | | | — |
| | | | | | | | | | | |
| | Total Value | | $ | 161,931 | | $ | 345,705 | | $ | 11,931 |
| | | | | | | | | | | |
| | | | |
Richard J. Jacquet | | Severance | | $ | 112,000 | | $ | 224,000 | | $ | — |
| | Accrued Vacation | | | 19,815 | | | 19,815 | | | 19,815 |
| | Stock Option Acceleration | | | — | | | 0 | | | — |
| | Restricted Stock Unit Acceleration | | | — | | | 18,900 | | | — |
| | Continued Employee Benefits | | | — | | | 12,949 | | | — |
| | Death Benefit | | | — | | | — | | | 250,000 |
| | | | | | | | | | | |
| | Total Value | | $ | 131,815 | | $ | 275,664 | | $ | 269,815 |
| | | | | | | | | | | |
| | | | |
Graeme Watt (6) | | Severance | | $ | 538,470 | | $ | 538,470 | | $ | — |
| | Accrued Vacation | | | — | | | — | | | — |
| | Stock Option Acceleration | | | — | | | 0 | | | — |
| | Restricted Stock Unit Acceleration | | | — | | | 96,000 | | | — |
| | Continued Employee Benefits | | | | | | 9,430 | | | — |
| | Death Benefit | | | — | | | — | | | — |
| | | | | | | | | | | |
| | Total Value | | $ | 538,470 | | $ | 643,900 | | $ | — |
| | | | | | | | | | | |
| (1) | For Messrs. Hughes, Jacquet and Sturgeon, the severance payment under this column is the equivalent of six months of base salary. For Messrs. Meyer and Watt, the severance payment under this column is the equivalent of 12 months of base salary, payable under their respective employment agreements. The severance is payable in a lump-sum payment. |
| (2) | Pursuant to change in control agreements, the amounts in the table above represent a lump sum severance payment equal to 12 months of base salary, continuation of benefits for one year and acceleration of all outstanding equity awards. Under the change in control agreements, an “Involuntary Termination” occurs when the Company causes: (i) without the officer’s express written consent, the significant reduction of his duties, authority or responsibilities relative to his duties, authority or responsibilities in effect immediately prior to such reduction, or the assignment to the officer of such reduced duties, authority or responsibilities; (ii) without the officer’s express written consent, a substantial reduction, without good business reasons, of |
149
| | the facilities and perquisites (including office space and location) available to him immediately prior to such reduction; (iii) a reduction in the officer’s base salary; (iv) a material reduction in the kind or level of employee benefits, including bonuses, to which the officer is entitled with the result that the officer’s overall benefits package is significantly reduced; (v) the relocation of the officer to a facility or a location more than 35 miles from the officer’s then-present location, without the officer’s express written consent; (vi) any purported termination of the officer’s employment other than for disability or for cause, or any purported termination for which the grounds relied upon are not valid; (vii) the failure of the Company to obtain the assumption of the officer’s retention agreement by any successor; or (viii) any act or set of facts or circumstances, which would, under California law, constitute constructive termination. “Cause” means (a) any act of personal dishonesty taken by the officer in connection with his responsibilities as an employee and intended to result in substantial personal enrichment to the employee; (b) conviction of a felony; (c) a willful act by the officer that constitutes gross misconduct and that is injurious to the Company; and (d) following delivery to the officer of a written demand for performance from the Company that describes the basis for the Company’s belief that the officer has not substantially performed his duties, continued violations by the officer of his obligations to the Company that are demonstrably willful and deliberate on his part. “Change of Control” means the occurrence of any of the following events: (x) any “person” (as such term is used in Sections 13(d) and 14(d) of the Exchange Act) is or becomes the “beneficial owner” (as defined in Rule 13d-3 under this Act), directly or indirectly, of securities of the Company representing 50% or more of the total voting power represented by the Company; (y) a change in the composition of the Board occurring within a two-year period, as a result of which fewer than a majority of the directors are incumbent directors; (z) the stockholders of the Company approve a merger or consolidation of the Company with any other corporation, other than a merger or consolidation that would result in the voting securities of the Company outstanding immediately prior thereto continuing to represent at least 50% of the total voting power represented by the voting securities of the Company or such surviving entity outstanding immediately after such merger or consolidation, or the stockholders of the Company approve a plan of complete liquidation of the Company or an agreement for the sale or disposition by the Company of all or substantially all of its assets. |
| (3) | For Mr. Bell, represents his death benefit under the SERP, which entitles his spouse to 50% of the annual benefit he would have been to entitled over five years, payable in equal monthly installments. For Mr. Jacquet, represents the benefit under our executive death benefit program, payable in five equal annual installments. A description of this program is set forth in Item 11 – Executive Compensation — Compensation Discussion and Analysis — Other Element – Personal Benefits and Perquisites. |
| (4) | In March 2009, the Board approved a new employment agreement for Mr. Bell that provides, in the case of termination without cause or termination without cause within 12 months of a change in control, a severance payment of two times his annual base salary, payment of COBRA benefits for a period of 18 months and, in the case of or termination without cause within 12 months of a change in control, the acceleration of the vesting of all unvested equity awards. |
| (5) | Mr. Hughes was not a named executive officer in 2007. |
| (6) | This amount and others shown in the above table for Mr. Watt were converted from British pounds to U.S. dollars using an average exchange rate of $2.00/£1.00 during 2007 and $1.86/£1.00 during 2008. |
Director Compensation
In 2007 and 2008, our non-employee directors received an annual retainer of $30,000, a fee of $4,000 per day for each Board meeting attended in person, $2,000 for attendance at each telephonic Board meeting, and a fee of $2,000 for each in-person or telephonic Board committee meeting attended. In addition, the Lead Independent Director received an additional annual retainer of $15,000 prior to April 2007 (was increased to $50,000 per year effective April 2007), the Audit Committee Chair received an additional annual retainer of $15,000, the Compensation Committee Chair received an additional annual retainer of $12,000, and the Corporate Governance and Nominating Committee Chair received an additional annual retainer of $8,000 prior to April 2007 ($15,000 per year effective April 2007). During 2008 and 2007, many of our non-employee directors served on the special committees related to the investigations that led to our restatement. Directors serving on these special committees were compensated for meeting attendance consistent with attendance at meetings of standing committees. Effective November 15, 2007, the Board modified the compensation of our then-Lead Independent Director, Mr. Ousley, to $350,000 per year in lieu of all other monetary compensation, including meeting fees, in recognition of the additional work Mr. Ousley undertook during and after the financial restatement process. Effective March 1, 2009, the Board reduced Mr. Ousley’s compensation to $150,000 per year. In addition, the Board reduced by 30% the quarterly retainer and meeting fees earned by non-employee directors on or after January 1, 2009.
Under the terms of our 1998 Stock Plan, each non-employee director automatically receives a nonqualified option to purchase 22,500 shares of our common stock upon his or her initial election or appointment as a director and a nonqualified option to purchase 7,500 shares of common stock following each of the Company’s annual meetings of shareholders. As a result of the Company not holding an annual meeting of shareholders in 2007 and 2008, no option awards were granted to our non-employee directors in 2007 and 2008.
150
The following table provides information with respect to all compensation awarded to, earned by, or paid to each person who served as a non-employee director (Mr. Bell, our President and Chief Executive Officer, receives no additional compensation for his service on our Board) for some or all of fiscal 2007 or 2008. Other than as set forth in the table, for the periods presented, we did not pay any fees to our directors, made any equity or non-equity awards to our directors, or paid any other compensation to our directors.
| | | | | | | | | | | | |
| | | 2007 | | 2008 |
Name | | Fees
Earned
or
Paid in
Cash ($) | | Option
Awards
($)(1) | | Total ($) | | Fees
Earned
or
Paid in
Cash ($) | | Option
Awards
($)(1) | | Total ($) |
Gordon A. Campbell | | 76,000 | | — | | 76,000 | | 76,000 | | — | | 76,000 |
Eugene B. Chaiken | | 105,000 | | — | | 105,000 | | 99,500 | | — | | 99,500 |
David M. Ernsberger | | 138,000 | | — | | 138,000 | | 99,000 | | — | | 99,000 |
Edward L. Gelbach | | 96,000 | | — | | 96,000 | | 88,000 | | — | | 88,000 |
Michael J. Grainger (2) | | 202,000 | | — | | 202,000 | | 19,500 | | — | | 19,500 |
Peter G. Hanelt (3) | | — | | — | | — | | 25,500 | | — | | 25,500 |
James E. Ousley | | 177,375 | | — | | 177,375 | | 350,000 | | — | | 350,000 |
Glenn E. Penisten | | 103,500 | | — | | 103,500 | | 92,000 | | — | | 92,000 |
Mark L. Sanders | | 132,000 | | — | | 132,000 | | 97,500 | | — | | 97,500 |
| (1) | These amounts reflect the dollar amount of expense recognized for financial statement reporting purposes for 2007 or 2008, as appropriate, in accordance with SFAS 123(R), with the exception that estimated forfeitures related to service-based vesting were disregarded in these amounts. Assumptions used in the calculation of this amount for purposes of our financial statements are included in Note 8 —Stock-Based Compensation Plans inthe notes to our consolidated financial statements included in this Annual Report on Form 10-K. As of December 31, 2008, each non-employee director held the following number of stock options: Mr. Campbell (7,500), Mr. Chaiken (30,000), Mr. Ernsberger (45,000), Mr. Gelbach (45,000), Mr. Hanelt (0); Mr. Ousley (26,250), Mr. Penisten (37,500) and Mr. Sanders (15,000). |
| (2) | Mr. Grainger resigned from the Board on March 4, 2008. |
| (3) | Mr. Hanelt was appointed to the Board on October 29, 2008. |
| Item 12. | Security Ownership of Certain Beneficial Owners and Management and Related Stockholder Matters |
The following table presents information regarding the beneficial ownership of the shares of our common stock as of May 31, 2009 with respect to:
| | • | | each of the executive officers listed in the Summary Compensation Table for 2008 contained under the captionExecutive Compensationabove; |
| | • | | by all current directors and executive officers as a group; and |
| | • | | persons beneficially owning more than 5% of our common stock. |
Beneficial ownership is determined under the rules of the SEC and generally includes voting or investment power over securities. Except in cases where community property laws apply or as indicated in the footnotes to this table, we believe that each shareholder identified in the table possesses sole voting and investment power over all shares of common stock shown as beneficially owned by the shareholder. Shares of common stock subject to options that are currently exercisable or will become exercisable on or before July 30, 2009, are considered outstanding and beneficially owned by the person holding the options.
151
| | | | |
| | | Shares Beneficially Owned |
Name of Beneficial Owner(1) | | Number | | Percent(2) |
Greater than 5% Shareholders | | | | |
FMR LLC(3) | | 4,561,108 | | 14.3 |
Citigroup Global Markets, Inc.(4) | | 3,663,742 | | 11.5 |
State of Wisconsin Investment Board(5) | | 3,043,389 | | 9.6 |
Paradigm Capital Management, Inc.(6) | | 2,743,922 | | 8.6 |
Caisse de dépôt et placement du Québec (7) | | 2,300,000 | | 7.2 |
Dimensional Fund Advisors L.P.(8) | | 2,236,538 | | 7.0 |
Wells Fargo & Company (9) | | 2,229,723 | | 7.0 |
AQR Capital Management LLC and affiliated entity (10) | | 1,962,081 | | 5.8 |
Directors | | | | |
W. Donald Bell (11) | | 1,174,235 | | 3.7 |
Gordon A. Campbell (12) | | 20,500 | | * |
Eugene B. Chaiken (13) | | 34,264 | | * |
David M. Ernsberger (14) | | 52,039 | | * |
Edward L. Gelbach (15) | | 158,922 | | * |
Peter G. Hanelt | | 0 | | * |
James E. Ousley (16) | | 57,098 | | * |
Glenn E. Penisten (17) | | 80,909 | | * |
Mark L. Sanders (18) | | 16,264 | | * |
Named Executive Officers | | | | |
Andrew S. Hughes (19) | | 57,354 | | * |
James E. Illson (20) | | 86,845 | | * |
Richard J. Jacquet (21) | | 128,241 | | * |
William E. Meyer (22) | | 63,750 | | * |
Graeme Watt (23) | | 277,500 | | * |
All current directors and executive officers as a group (14 individuals)(24) | | 2,185,015 | | 6.9 |
| * | Less than 1% of our outstanding common stock. |
| (1) | Unless otherwise indicated, the address of each of the named individuals is c/o Bell Microproducts, 1941 Ringwood Avenue, San Jose, CA 95131. |
| (2) | Percentage of beneficial ownership is based on 31,828,490 shares of common stock outstanding as of May 31, 2009. |
| (3) | As reported in Schedule 13G filed February 14, 2008, with the SEC by FMR LLC (“FMR”) on behalf of itself and Edward C. Johnson 3d. The address for FMR is 82 Devonshire Street, Boston, MA 02109. FMR, a parent holding company, has sole voting power over 2,417 shares and sole dispositive power over all the shares. FMR did not file a Schedule 13G in 2009. |
| (4) | As reported in Schedule 13G/A filed May 8, 2009, with the SEC by Citigroup Global Markets Inc. (“CGM”), Citigroup Financial Products Inc. (“CFP”), Citigroup Global Market Holdings Inc. (“CGM Holdings”) and Citigroup Inc. (“Citigroup”). CFP is the sole stockholder of CGM. CGM Holdings is the sole stockholder of CFP. Citigroup is the sole stockholder of CGM Holdings. The address for each of CGM, CFP and CGM Holdings is 388 Greenwich Street, New York, NY 10013. The address for Citigroup is 399 Park Avenue, New York, NY 10043. CGM, CFP, CGM Holdings and Citigroup have shared voting and shared dispositive power over all the shares. |
| (5) | As reported in Schedule 13G filed January 30, 2009, with the SEC by the State of Wisconsin Investment Board (“Wisconsin Investment”). The address for Wisconsin Investment is P.O. Box 7842, Madison, WI 53707. Wisconsin Investment has sole voting power and sole dispositive power over all the shares. |
| (6) | As reported in Schedule 13G/A filed February 17, 2009, by Paradigm Management, Inc (“Paradigm”). The address for Paradigm is Nine Elk Street, Albany, NY 12207. Paradigm has sole voting power and sole dispositive power over all the shares. |
| (7) | As reported in Schedule 13G filed January 20, 2009, by Caisse de dépôt et placement du Québec (“Caisse”). The address for Caisse is 1000, place Jean-Paul Riopelle, Montréal, Québec, H2Z 2B3. Caisse has sole voting power and sole dispositive power over all the shares. |
| (8) | As reported in Schedule 13G/A filed February 9, 2009, with the SEC by Dimensional Fund Advisors L.P. (“Dimensional Fund”). The address for Dimensional Fund is Palisades West, Building One, 6300 Bee Cave Road, Austin, TX 78746. Dimensional Fund has sole voting and dispositive power over all the shares. |
| (9) | As reported in Schedule 13G filed January 27, 2009, with the SEC by Wells Fargo & Company (“Wells Fargo”). The address for Wells Fargo is 420 Montgomery Street, San Francisco, CA 94104. Wells Fargo has sole voting power over 2,223,048 shares and sole dispositive power over 2,146,423 shares. |
| (10) | As reported in a Schedule 13G/A filed February 17, 2009, with the SEC by AQR Absolute Return Master Account L.P. (“Absolute”) and a Schedule 13G/A filed with the SEC on February 17, 2009 by AQR Capital Management, LLC (“Management”). The address for both Absolute and Management is Two Greenwich Plaza, 3rd Floor, Greenwich, CT 06830. Each of Absolute and Management reported shared voting power and shared dispositive power over debt securities that are convertible into 1,962,081 shares of our common stock. Management is a registered investment adviser. |
| (11) | Includes options held by Mr. Bell to purchase 156,250 shares, which are currently exercisable or will become exercisable on or before July 30, 2009. |
| (12) | Includes options held by Mr. Campbell to purchase 7,500 shares, which are currently exercisable or will become exercisable on or before July 30, 2009. |
| (13) | Includes options held by Mr. Chaiken to purchase 30,000 shares, which are currently exercisable or will become exercisable on or before July 30, 2009. |
| (14) | Includes options held by Mr. Ernsberger to purchase 45,000 shares, which are currently exercisable or will become exercisable on or before July 30, 2009. |
| (15) | Includes options held by Mr. Gelbach to purchase 37,500 shares, which are currently exercisable or will become exercisable on or before July 30, 2009. |
152
| (16) | Includes options held by Mr. Ousley to purchase 22,500 shares, which are currently exercisable or will become exercisable on or before July 30, 2009. |
| (17) | Includes options held by Mr. Penisten to purchase 30,000 shares, which are currently exercisable or will become exercisable on or before July 30, 2009. |
| (18) | Includes options held by Mr. Sanders to purchase 15,000 shares, which are currently exercisable or will become exercisable on or before July 30, 2009. |
| (19) | Includes options held by Mr. Hughes to purchase 40,000 shares, which are currently exercisable or will become exercisable on or before July 30, 2009. |
| (20) | Mr. Illson is no longer employed with the Company. |
| (21) | Includes options held by Mr. Jacquet to purchase 86,000 shares, which are currently exercisable or will become exercisable on or before July 30, 2009. |
| (22) | Includes options held by Mr. Meyer to purchase 63,750 shares, which are currently exercisable or will become exercisable on or before July 30, 2009. |
| (23) | Includes options held by Mr. Watt to purchase 265,000 shares, which are currently exercisable or will become exercisable on or before July 30, 2009. |
| (24) | Includes options to purchase an aggregate of 862,439 shares held by six current executive officers and eight non-employee directors, which are currently exercisable or will become exercisable on or before July 30, 2009. |
The following table provides information concerning our equity compensation plans as of December 31, 2008:
| | | | | | | | |
| | | Equity Compensation Plan Information |
Plan Category | | Number of
Securities
to be Issued
Upon
Exercise of
Outstanding
Options,
Warrants
and Rights | | Weighted-
Average
Exercise
Price of
Outstanding
Options
Warrants
and Rights | | | Number of
Securities
Remaining
Available for
Future
Issuance
Under
Equity
Compensation
Plans
(Excluding
Securities
Reflected in
Column (a)) |
Equity compensation plans approved by security holders | | 3,767,567 | | $ | 6.52 | (1) | | — (2) |
Equity compensation plans not approved by security holders(3) | | 232,000 | | $ | 3.90 | | | — |
| | | | | | | | |
Total | | 3,999,567 | | $ | 6.37 | | | — |
| | | | | | | | |
| (1) | Weighted-average exercise price excludes 1,020,083 shares for RSUs with zero exercise price. |
| (2) | Our 1998 Stock Plan expired in May 2008. Therefore, no equity awards are available for grant under the 1998 Stock Plan. |
| (3) | Represents stock options that have been granted to employees outside of our 1998 Stock Plan, which options are represented by agreements substantially the same as agreements with respect to options under the 1998 Stock Plan and generally provide for a vesting period as determined by the Board and expire over terms not exceeding ten years from the date of grant. |
| Item 13. | Certain Relationships and Related Transactions and Director Independence |
Transaction with Related Persons
The Audit Committee of the Board monitors and reviews issues involving potential conflicts of interest and reviews and approves all transactions in which a related person has had or will have a direct or indirect material interest.
Since October 2005, the Company has employed a stepson of Mr. Bell in the position of director of strategic markets. In 2008 and 2007, Mr. Bell’s stepson received total cash compensation of $246,217 and $238,307, respectively. On November 17, 2005, he was granted an option to purchase 15,000 shares of common stock, with an exercise price of $7.95 per share. On January 21, 2008, he was granted an option to purchase 10,000 shares of common stock at an exercise price of $5.90. In addition, he participates in all other benefits that the Company offers to all of our employees. The Audit Committee reviewed and ratified the employment of Mr. Bell’s stepson and his compensation.
Director Independence
The Board has determined that each of Messrs. Campbell, Chaiken, Ernsberger, Gelbach, Hanelt, Ousley, Penisten and Sanders is independent of the Company and our management within the meaning of the Nasdaq listing standards.
| Item 14. | Principal Accountant Fees and Services |
Principal Accountant Fees
On December 30, 2008, the Audit Committee approved the engagement of Deloitte & Touche LLP as our independent registered public accounting firm for the fiscal years ended December 31, 2008 and 2007. Prior to
153
December 30, 2008, PricewaterhouseCoopers LLP was our independent registered public accounting firm for the fiscal year ended December 31, 2006 and the preceding fiscal years. We incurred the following fees to Deloitte & Touche LLP, the member firms of Deloitte Touche Tomatsu, and their respective subsidiaries and affiliates (collectively “Deloitte”), associated with their audits of fiscal years 2008 and 2007 (in thousands):
| | | | | | |
| | | Fiscal Year
2008 | | Fiscal Year
2007 |
Audit fees | | $ | 4,801 | | $ | 5,629 |
Audit-related fees | | | — | | | — |
Tax fees | | | — | | | — |
All other fees | | | — | | | — |
| | | | | | |
Total | | $ | 4,801 | | $ | 5,629 |
| | | | | | |
Audit fees are for professional services rendered by Deloitte for the audit of the Company’s annual financial statements and the internal control over financial reporting under Section 404 of the Sarbanes-Oxley Act for fiscal year 2008 and the audit of the financial statements for fiscal 2007, and services that are normally provided in connection with statutory and regulatory filings or engagements
Audit-related fees consist of fees reasonably related to the performance of the audit or review of the registrant’s financial statements and are not reported under “Audit fees.” The Company paid no fees in this category to Deloitte for the fiscal years ended December 31, 2008 and 2007.
Tax fees consist of fees for services related to tax compliance, tax advice, and tax planning. The Company paid no fees in this category to Deloitte for the fiscal years ended December 31, 2008 and 2007.
All other fees consist of fees for services other than the services reported above. The Company paid no fees in this category to Deloitte for the fiscal years ended December 31, 2008 and 2007.
Pre-Approval Policy
Pursuant to the Audit Committee’s pre-approval policy, the Audit Committee is responsible for pre-approving all audits and permitted non-audit services to be performed for the Company by our independent auditors or any other auditing or accounting firm. The Audit Committee has delegated to the Chairman of the Committee the authority to unilaterally approve any incremental service to be performed by the independent auditor, provided such service does not exceed $50,000. All audit and audit-related services for fiscal years 2008 and 2007 were pre-approved by the Audit Committee.
PART IV
| Item 15. | Exhibits and Financial Statement Schedules |
| | (a) | The following documents are filed as part of this Form 10-K: |
(1) Consolidated Financial Statements.
The financial statements (including the notes thereto) listed in the index to consolidated financial statements (set forth in Item 8 of this Form 10-K) are filed as part of this Annual Report on Form 10-K.
(2) Consolidated Financial Statement Schedule II — Valuation and Qualifying Accounts.
Schedules not listed above have been omitted because they are not required or the information required to be set forth therein is included in the consolidated financial statements or the notes to the consolidated financial statements included in this Annual Report on Form 10-K.
(3) Exhibits — See Exhibit Index following signature page.
| | (b) | Exhibits. See Item 15(a), above. |
| | (c) | Financial Statements and Schedule. See Item 15(a), above. |
154
Signatures
Pursuant to the requirements of Section 13 or 15(d) of the Securities Exchange Act of 1934, the Registrant has duly caused this Report to be signed on its behalf by the undersigned, thereunto duly authorized on June 28, 2009.
| | |
| BELL MICROPRODUCTS INC. |
| |
By: | | /s/ William E. Meyer |
| | William E. Meyer |
| | Executive Vice President and Chief Financial Officer |
Pursuant to the requirements of the Securities Exchange Act of 1934, this Report on Form 10-K has been signed below by the following persons on behalf of the Registrant and in the capacities and on the dates indicated:
| | | | |
Signature | | Title | | Date |
| | |
/s/ W. Donald Bell | | President and Chief Executive Officer (Principal Executive Officer) | | June 28, 2009 |
| (W. Donald Bell) | | |
| | |
/s/ William E. Meyer | | Executive Vice President and Chief Financial Officer (Principal Financial Officer and Principal Accounting Officer) | | June 28, 2009 |
| (William E. Meyer) | | |
| | |
/s/ Gordon A. Campbell | | Director | | June 28, 2009 |
| (Gordon A. Campbell) | | | | |
| | |
/s/ Eugene B. Chaiken | | Director | | June 28, 2009 |
| (Eugene B. Chaiken) | | | | |
| | |
/s/ David M. Ernsberger | | Director | | June 28, 2009 |
(David M. Ernsberger) | | | | |
| | |
/s/ Edward L. Gelbach | | Director | | June 28, 2009 |
| (Edward L. Gelbach) | | | | |
| | |
/s/ Peter G. Hanelt | | Director | | June 28, 2009 |
| (Peter G. Hanelt) | | | | |
| | |
/s/ James E. Ousley | | Chairman of the Board | | June 28, 2009 |
| (James E. Ousley) | | | | |
| | |
/s/ Glenn E. Penisten | | Director | | June 28, 2009 |
| (Glenn E. Penisten) | | | | |
| | |
/s/ Mark L. Sanders | | Director | | June 28, 2009 |
| (Mark L. Sanders) | | | | |
155
SCHEDULE II —
VALUATION AND QUALIFYING ACCOUNTS
| | | | | | | | | | | | | | | |
Years Ended December 31, | | Balance at
Beginning of
Period | | Additions
Charged (Credited)
to Costs and
Expenses | | Charged
to Other
Accounts(1) | | | Deductions-
Write-Offs | | | Balance at
End of Period |
| | | (in thousands) |
2006 | | | | | | | | | | | | | | | |
Allowance for doubtful accounts | | $ | 8,940 | | $ | 8,506 | | $ | — | | | (5,859 | ) | | 11,587 |
Allowance for deferred taxes | | | 8,041 | | | 23,065 | | | 1,223 | | | — | | | 32,330 |
2007 | | | | | | | | | | | | | | | |
Allowance for doubtful accounts | | | 11,587 | | | 7,090 | | | — | | | (5,533 | ) | | 13,144 |
Allowance for deferred taxes | | | 32,330 | | | 13,238 | | | (6,853 | ) | | — | | | 38,715 |
2008 | | | | | | | | | | | | | | | |
Allowance for doubtful accounts | | | 13,144 | | | 16,375 | | | — | | | (6,915 | ) | | 22,604 |
Allowance for deferred taxes | | | 38,715 | | | 22,027 | | | (7,657 | ) | | — | | | 53,085 |
| (1) | Amounts charged to deferred tax assets/liabilities. |
156
Index to Exhibits
| | |
Number | | Description of Document |
| 2.1 | | Asset Purchase Agreement, dated October 2, 2006, among the Company, New ProSys Corp., ProSys Information Systems, Inc., Michelle Clery and Bruce Keenan. Incorporated by reference to Exhibit 2.1 filed with the Company’s Current Report on Form 8-K filed with the SEC on October 4, 2006. |
| |
| 2.2 | | Stock Purchase Agreement, dated October 2, 2006, by and between New ProSys Corp. and Bruce Keenan. Incorporated by reference to Exhibit 2.2 filed with the Company’s Current Report on Form 8-K filed with the SEC on October 4, 2006. |
| |
| 3.1 | | Amended and Restated Articles of Incorporation of the Company. Incorporated by reference to Exhibit 4.1 filed with the Company’s Registration Statement on Form S-3 (File No. 333-117555) on July 21, 2004. |
| |
| 3.2 | | Amended and Restated Bylaws of the Company (as amended through May 21, 2009). Incorporated by reference to Exhibit 3.2 filed with the Company’s Current Report on Form 8-K on May 22, 2009. |
| |
| 4.1 | | Form of Indenture between the Company and Wells Fargo Bank, National Association, as Trustee, with respect to the Series B 3 3/4% Subordinated Convertible Notes due 2024. Incorporated by reference to Exhibit 4.1 filed with the Company’s Registration Statement on Form S-4 (File No. 333-120527) on November 16, 2004. |
| |
| 4.2 | | Indenture dated as of March 5, 2004 between the Company and Wells Fargo Bank, National Association as Trustee, with respect to the 3 3/4% Subordinated Convertible Notes due 2024. Incorporated by reference to Exhibit 4.1 filed with the Registrant’s Registration Statement on Form S-3 (File No. 333-116130) on June 3, 2004. |
| |
| 4.3 | | Form of Series B 3.75% Subordinated Convertible Notes due 2024 (contained in Exhibit 4.1). |
| |
| 4.4 | | Form of 3.75% Subordinated Convertible Notes due 2024 (contained in Exhibit 4.2). |
| |
| 4.5 | | Registration Rights Agreement dated March 5, 2004 by and among the Company, Merrill Lynch, Pierce, Fenner & Smith Incorporated and Raymond James & Associates, Inc. Incorporated by reference to Exhibit 4.2 filed with the Company’s Registration Statement on Form S-3 (File No. 333-116130) on June 3, 2004. |
| |
| 4.6 | | First Supplemental Indenture dated as of December 20, 2006 between the Company and Wells Fargo Bank, N.A. Incorporated by reference to Exhibit 4.1 filed with the Company’s Current Report on Form 8-K on December 21, 2006. |
| |
| 4.7 | | 9% Senior Subordinated Note in the Amount of $23,000,000 dated as of October 2, 2006 in connection with the Securities Purchase Agreement dated as of October 2, 2006 among the Company, The Teachers’ Retirement System of Alabama and the Employees’ Retirement System of Alabama. Incorporated by reference to Exhibit 10.2 filed with the Company’s Current Report on Form 8-K on October 4, 2006. |
| |
| 4.8 | | 9% Senior Subordinated Note in the Amount of $12,000,000 dated as of October 2, 2006 in connection with the Securities Purchase Agreement dated as of October 2, 2006 among the Company, The Teachers’ Retirement System of Alabama and the Employees’ Retirement System of Alabama. Incorporated by reference to Exhibit 10.3 filed with the Company’s Current Report on Form 8-K on October 4, 2006. |
| |
| 4.9 | | Warrant to Purchase 125,000 Shares of Bell Microproducts Inc. dated as of October 2, 2006. Incorporated by reference to Exhibit 10.4 filed with the Company’s Current Report on Form 8-K on October 4, 2006. |
| |
| 10.1 | | Employment Agreement dated as of July 1, 1999 between the Company and W. Donald Bell. Incorporated by reference to Exhibit 10.1 filed with the Company’s Quarterly Report on Form 10-Q/A (File No. 000-21528) for the quarter ended September 30, 1999, on January 10, 2000.* |
| |
| 10.2 | | Amendment to Employment Agreement between the Company and W. Donald Bell dated as of October 19, 2000. Incorporated by reference to Exhibit 10.1 filed with the Company’s Quarterly Report on Form 10-Q (File No. 000-21528) for the quarter ended March 31, 2001.* |
| |
| 10.3 | | Amendment No. 2 to Employment Agreement between the Company and W. Donald Bell dated as of April 30, 2002. Incorporated by reference to Exhibit 10.1 filed with the Company’s Quarterly Report on Form 10-Q (File No. 000-21528) for the quarter ended September 30, 2002.* |
| |
| 10.4 | | Executive Employment and Non-Compete Agreement dated as of August 13, 2002 between the Company and James E. Illson. Incorporated by reference to Exhibit 10.2 filed with the Company’s Quarterly Report on Form 10-Q (File No. 000-21528) for the quarter ended September 30, 2002.* |
157
| | |
| |
10.5 | | Syndicated Composite Guarantee and Debenture effective as of December 2, 2002 by and among Bell Microproducts Limited, certain other companies listed and Bank of America, N.A. Incorporated by reference to Exhibit 10.40 filed with the Company’s Annual Report on Form 10-K (File No. 000-21528) for the year ended December 31, 2002. |
| |
10.6 | | Form of Management Retention Agreement between the Company and certain executive officers of the Company. Incorporated by reference to Exhibit 10.1 filed with the Company’s Quarterly Report on Form 10-Q for the quarter ended September 30, 2005.* |
| |
10.7 | | Securities Purchase Agreement dated October 2, 2006 among the Company, The Teachers’ Retirement System of Alabama and The Employees’ Retirement System of Alabama. Incorporated by reference to Exhibit 10.1 filed with the Company’s Current Report on Form 8-K on October 4, 2006. |
| |
10.8 | | Bell Microproducts Inc. Supplemental Executive Retirement Program, effective July 1, 2002 and amended on November 13, 2007. Incorporated by reference to Exhibit 99.2 filed with the Company’s Current Report on Form 8-K on November 15, 2007.* |
| |
10.9 | | Bell Microproducts Inc. 2008 Management Incentive Plan. Incorporated by reference to Exhibit 10.1 filed with the Company’s Current Report on Form 8-K on January 25, 2008.* |
| |
10.10 | | Ninth Supplemental Agreement dated May 21, 2008 in relation to a Syndicated Credit Agreement dated December 2, 2002, among Bell Microproducts Limited, Bell Microproducts Europe Export Limited, Bell Microproducts Europe (Holdings) B.V., BM Europe Partners C.V., Bell Microproducts Europe B.V. and Bank of America, National Association. Incorporated by reference to Exhibit 10.1 filed with the Company’s Current Report on Form 8-K on May 28, 2008. |
| |
10.11 | | Separation Agreement dated May 12, 2008, by and between the Company and James E. Illson. Incorporated by reference to Exhibit 10.1 filed with the Company’s Current Report on Form 8-K on June 10, 2008.* |
| |
10.12 | | Consultant Agreement dated as of May 12, 2008, by and between the Company and James E. Illson. Incorporated by reference to Exhibit 10.2 filed with the Company’s Current Report on Form 8-K on June 10, 2008. |
| |
10.13 | | Amended and Restated Credit Agreement effective as of June 30, 2008 and executed on August 5, 2008, among the Company, the Teachers’ Retirement System of Alabama, the Employees’ Retirement System of Alabama, Judicial Retirement Fund, the PEIRAF-Deferred Compensation Plan and the Public Employee Individual Retirement Account Fund. Incorporated by reference to Exhibit 10.1 filed with the Company’s Current Report on Form 8-K on August 6, 2008. |
| |
10.14 | | Letter to Bell Microproducts Inc. dated August 4, 2008, from The Teachers’ Retirement System of Alabama and the Employees’ Retirement System of Alabama, amending the Securities Purchase Agreement dated October 2, 2006. Incorporated by reference to Exhibit 10.2 filed with the Company’s Current Report on Form 8-K on August 6, 2008. |
| |
10.15 | | Letter Agreement executed August 6, 2008 between Bell Microproducts Limited and Bank of America, N.A. as Agent for the Syndicated Credit Agreement dated December 2, 2002, as amended and restated effective May 21, 2008. Incorporated by reference to Exhibit 10.1 filed with the Company’s Current Report on Form 8-K on August 11, 2008. |
| |
10.16 | | Amended and Restated Loan and Security Agreement dated September 29, 2008, among Bell Microproducts Inc., Bell Microproducts — Future Tech, Inc., Rorke Data, Inc., Bell Microproducts Canada — Tenex Data ULC, TotalTec Systems, Inc., Forefront Graphics U.S. Inc. as Borrowers, Bell Microproducts Canada Inc. and Bell Microproducts Mexico Shareholder, LLC, as Guarantors and Wachovia Capital Finance Corporation (Western) (“Wachovia”) in its capacity as administrative agent for the financial institutions, Wachovia, Bank of America, N.A., The CIT Group/Business Credit, Inc. and Wells Fargo Foothill, LLC (the “Lenders”), Incorporated by reference to Exhibit 10.1 filed with the Company’s Current Report on Form 8-K on September 30, 2008. |
| |
10.17 | | Letter Agreement, dated September 29, 2008, terminating the Second Amended and Restated Credit and Security Agreement dated as of May 14, 2007, as amended, by and between the Company, Bell Microproducts Funding Corporation, Variable Funding Capital Company LLC, Wachovia Bank, National Association and General Electric Capital Corporation. Incorporated by reference to Exhibit 10.2 filed with the Company’s Current Report on Form 8-K on September 30, 2008. |
| |
10.18 | | Bell Microproducts Inc. form of Executive Officer Indemnification Agreement. Incorporated by reference to Exhibit 10.1 filed with the Company’s Current Report on Form 8-K on November 5, 2008.* |
| |
10.19 | | Bell Microproducts Inc. form of Director Indemnification Agreement. Incorporated by reference to Exhibit 10.2 filed with the Company’s Current Report on Form 8-K on November 5, 2008.* |
158
| | |
| |
10.20 | | Bell Microproducts Inc. form of Amended and Restated Director Indemnification Agreement. Incorporated by reference to Exhibit 10.3 filed with the Company’s Current Report on Form 8-K on November 5, 2008.* |
| |
10.21 | | 1998 Stock Plan, as amended through August 1, 2007, and form of option agreement. Incorporated by reference to Exhibit 10.22 filed with the Company’s Annual Report on Form 10-K for the year ended December 31, 2006.* |
| |
10.22 | | 1998 Stock Plan Form of Restricted Stock Unit Agreement. Incorporated by reference to Exhibit 10.23 filed with the Company’s Annual Report on Form 10-K for the year ended December 31, 2006.* |
| |
10.23 | | 2007 Management Incentive Plan Description, revised effective July 1, 2007. Incorporated by reference to Exhibit 10.25 filed with the Company’s Annual Report on Form 10-K for the year ended December 31, 2006.* |
| |
10.24 | | Executive Employment Agreement dated August 6, 2007, between the Company and William E. Meyer. Incorporated by reference to Exhibit 10.26 filed with the Company’s Annual Report on Form 10-K for the year ended December 31, 2006.* |
| |
10.25 | | Second Amendment to Amended and Restated Loan and Security Agreement dated February 17, 2009, among Bell Microproducts Inc., Bell Microproducts — Future Tech, Inc., Rorke Data, Inc., Bell Microproducts Canada — Tenex Data ULC, TotalTec Systems, Inc., Forefront Graphics U.S. Inc. as Borrowers, Bell Microproducts Canada Inc. and Bell Microproducts Mexico Shareholder, LLC, as Guarantors and Wachovia Capital Finance Corporation (Western) (“Wachovia”) in its capacity as administrative agent for the financial institutions, Wachovia, Bank of America, N.A., The CIT Group/Business Credit, Inc. and Wells Fargo Foothill, LLC (the “Lenders”). Incorporated by reference to Exhibit 10.1 filed with the Company’s Current Report on Form 8-K on February 20, 2009. |
| |
10.26 | | 2009 Management Incentive Plan. Incorporated by reference to Exhibit 10.1 filed with the Company’s Current Report on Form 8-K on February 24, 2009.* |
| |
10.27 | | First Amendment to the October 2, 2006 Securities Purchase Agreement dated as of February 24, 2009, among the Company, The Teachers’ Retirement System of Alabama (“TRSA”) and The Employees’ Retirement System of Alabama (“ERSA”). Incorporated by reference to Exhibit 10.1 filed with the Company’s Current Report on Form 8-K on March 2, 2009. |
| |
10.28 | | Second Amendment to the June 30, 2008 Amended and Restated Credit Agreement dated as of February 24, 2009, among the TRSA, ERSA, Judicial Retirement Fund, PEIRAF-Deferred Compensation Plan and Public Employees Individual Retirement Account Fund. Incorporated by reference to Exhibit 10.2 filed with the Company’s Current Report on Form 8-K on March 2, 2009. |
| |
10.29 | | Letter Agreement to Bell Microproducts Inc. dated February 25, 2009, among the Company, TRSA and ERSA. Incorporated by reference to Exhibit 10.1 filed with the Company’s Current Report on Form 8-K on March 3, 2009. |
| |
10.30 | | Employment Agreement dated as of March 12, 2009, between the Company and W. Donald Bell. Incorporated by reference to Exhibit 10.1 filed with the Company’s Current Report on Form 8-K on March 16, 2009.* |
| |
10.31 | | First Amendment to Amended and Restated Loan Agreement dated as of November 10, 2008, by and among Bell Microproducts Inc., Bell Microproducts — Future Tech, Inc., Rorke Data, Inc., Bell Microproducts Canada — Tenex Data ULC, TotalTec Systems, Inc., Forefront Graphics U.S. Inc. as Borrowers, Bell Microproducts Canada Inc. and Bell Microproducts Mexico Shareholder, LLC, as Guarantors and Wachovia Capital Finance Corporation (Western) (“Wachovia”) in its capacity as administrative agent for the financial institutions, Wachovia, Bank of America, N.A., The CIT Group/Business Credit, Inc. and Wells Fargo Foothill, LLC (the “Lenders”). |
| |
10.32 | | First Amendment to Amended and Restated Credit Agreement dated as of December 23, 2008, by and among the Company, TRSA, ERSA, Judicial Retirement Fund, the PEIRAF-Deferred Compensation Plan and the Public Employee Individual Retirement Account Fund. |
| |
21.1 | | Subsidiaries of the Company. |
| |
31.1 | | Certification of Chief Executive Officer Pursuant to Section 302 of Sarbanes-Oxley Act of 2002. |
| |
31.2 | | Certification of Chief Financial Officer Pursuant to Section 302 of Sarbanes-Oxley Act of 2002. |
| |
32.1 | | Certification of Chief Executive Officer Pursuant to Section 906 of Sarbanes-Oxley Act of 2002.** |
| |
32.2 | | Certification of Chief Financial Officer Pursuant to Section 906 of Sarbanes-Oxley Act of 2002.** |
| * | Denotes management contract or compensatory plan or arrangement. |
159