Exhibit 99.1
Bear Stearns Global Credit Conference May 18, 2005 |
Certain information in this presentation may be considered forward-looking information within the meaning of the Private Securities Litigation Reform Act of 1995. This information is based on the Company's current expectations and actual results could vary materially depending on numerous risks and uncertainties that may affect the Company's operations, markets and other factors as discussed in filings with the Securities and Exchange Commission (the "SEC"). These risks and uncertainties include, but are not limited to, economic conditions and operational, customer demand, competitive, legal and governmental factors. There is no assurance that the Company's expectations will be realized. The Company assumes no obligation to update any forward-looking information contained in this presentation should circumstances change, except as otherwise required by securities and other applicable laws. In addition, this presentation contains certain non-GAAP financial information. Reconciliation to GAAP measures and the reasons the Company presents this information is included in its most recent Current Report on Form 8-K filed with the SEC, which is available on the SEC's website at www.sec.gov. Forward-Looking Statements/Non-GAAP Measures |
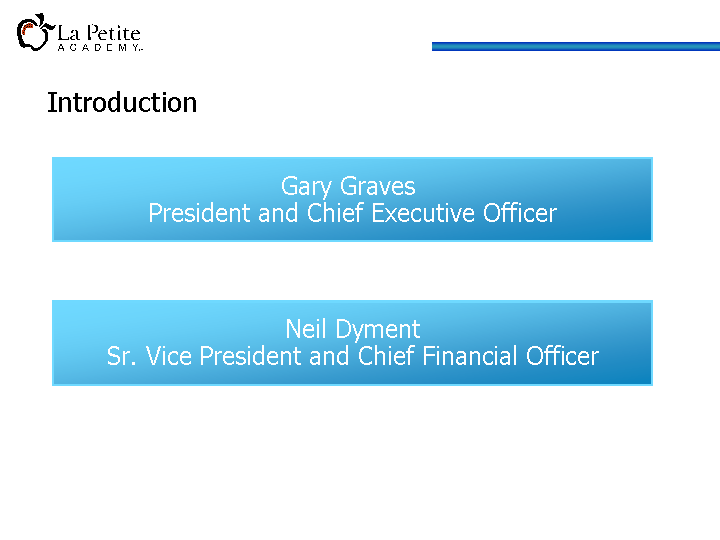
Introduction Gary Graves President and Chief Executive Officer Neil Dyment Sr. Vice President and Chief Financial Officer |
La Petite Overview Second largest for-profit pre-school provider Provides center-based educational services and child care to children between ages of six weeks and 12 years 651 Academies and Schools located in 36 states Licensed capacity to accommodate 84,700 children Operates under the Journey and Montessori Brands 2004 revenue of $376.5 million and EBITDA of $27.8 million (adjusted to 52 weeks) Founded in 1968 |
Company History-Timeline Vestar/LPA Investment Corp. purchased La Petite in 1993 In 1998, La Petite was purchased by LPA Investments, LLC, an entity controlled by JPMorgan Partners and Robert E. King In 2001-2002 La Petite completes recapitalization In 2003-early 2003 the Company enters into a series of waivers with senior lenders In February 2003, La Petite and senior lenders sign an amendment to: Waive existing defaults Extend the final maturity date to May 2006 Revise financial covenant JPMP extends $14.5 million equity commitment as part of amendment ($7.7 million remaining) |
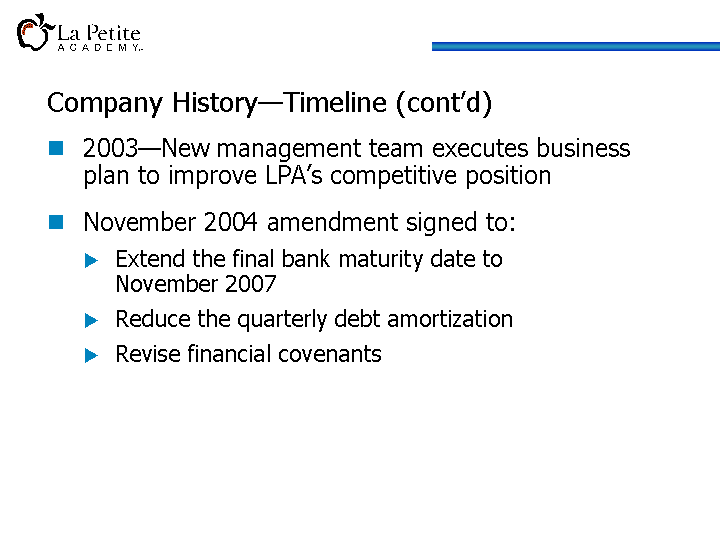
Company History-Timeline (cont'd) 2003-New management team executes business plan to improve LPA's competitive position November 2004 amendment signed to: Extend the final bank maturity date to November 2007 Reduce the quarterly debt amortization Revise financial covenants |
Executive Team Bill Van Huis Chief Revenue Officer Neil Dyment Sr. VP & CFO Paul Kreuser VP, Field Support Service Bill Buckland VP, People Larry Appell Divisional Vice President Western Gary Graves President and Chief Executive Officer Walt Tracy CIO Austin Griffin Director, Real Estate Greg Davis VP, General Counsel & Secretary Lisa Miskimins Divisional Vice President Central Steve Laudicino Divisional Vice President Eastern Stephanie Pasche VP, Operations Texas Leah Oliva VP, Operations Southeast Note: Red Text denotes new Management Team members since August 2002. |
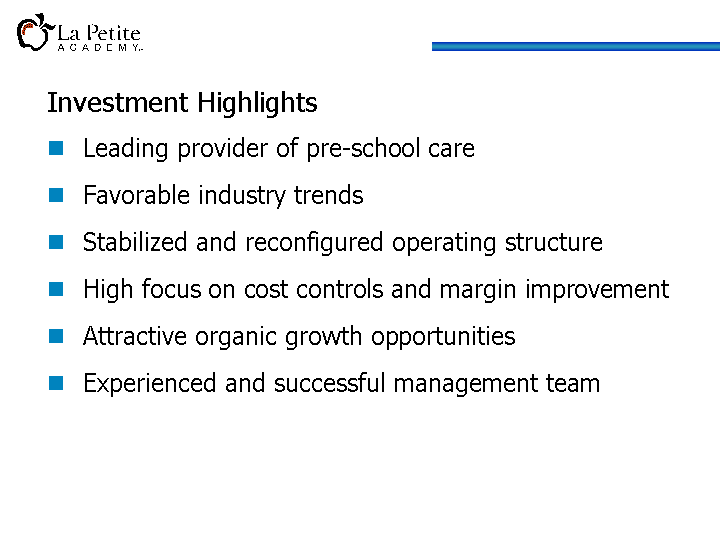
Investment Highlights Leading provider of pre-school care Favorable industry trends Stabilized and reconfigured operating structure High focus on cost controls and margin improvement Attractive organic growth opportunities Experienced and successful management team |
Industry Overview: Large and Growing Sector Source: MarketData Enterprises. Child care remains a very large, fragmented industry that shows no signs of losing GDP + price inflation ($ in billions) Estimated Child Care Industry Revenue |
Child Care Remains Fragmented and Highly Competitive on a Local Basis Competition For-profit, center-based Preschool, kindergarten and before- and after-school programs provided by public schools Local nursery schools and child care centers, including church-affiliated and other non-profit center Home-based providers Relatives, nannies and one parent caring full-time for a child |
Child Care Market Remains Fragmented (1) Care provided in parent's or caregiver's home. (2) Formalized day care centers. Family Day Care Providers(1) 304,958 Organized Group Day Care Facilities(2) 106,246 State & Federal Gov't Agencies 55,000 Churches 23,000 Hospitals 900 Employer Programs 6,000 U.S. Military Bases 639 Colleges & Universities 1,400 Community Service Organizations 2,000 Total 500,143 Estimated Number of Day Care Provider Sites in Year 2000 |
For-Profit Child Care Providers also Fragmented % of organized facilities 3.9% |
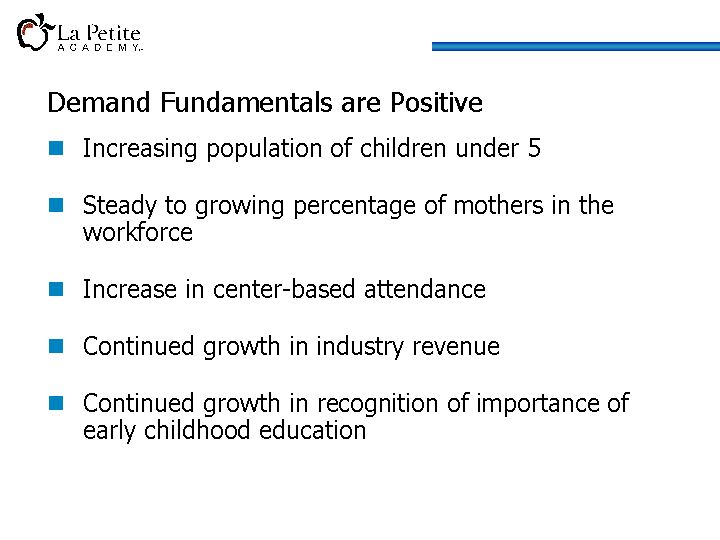
Demand Fundamentals are Positive Increasing population of children under 5 Steady to growing percentage of mothers in the workforce Increase in center-based attendance Continued growth in industry revenue Continued growth in recognition of importance of early childhood education |
La Petite Business Strategy Stabilize the business (completed) Protect and maximize the core (in process) People Place Program Process Add new locations (in process) |
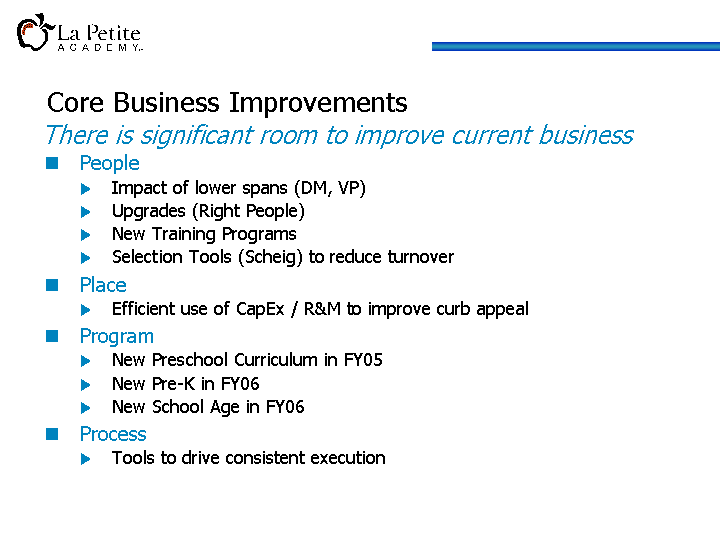
Core Business Improvements People Impact of lower spans (DM, VP) Upgrades (Right People) New Training Programs Selection Tools (Scheig) to reduce turnover Place Efficient use of CapEx / R&M to improve curb appeal Program New Preschool Curriculum in FY05 New Pre-K in FY06 New School Age in FY06 Process Tools to drive consistent execution There is significant room to improve current business |
Span of Control We have reduced the average span of control at all operating levels |
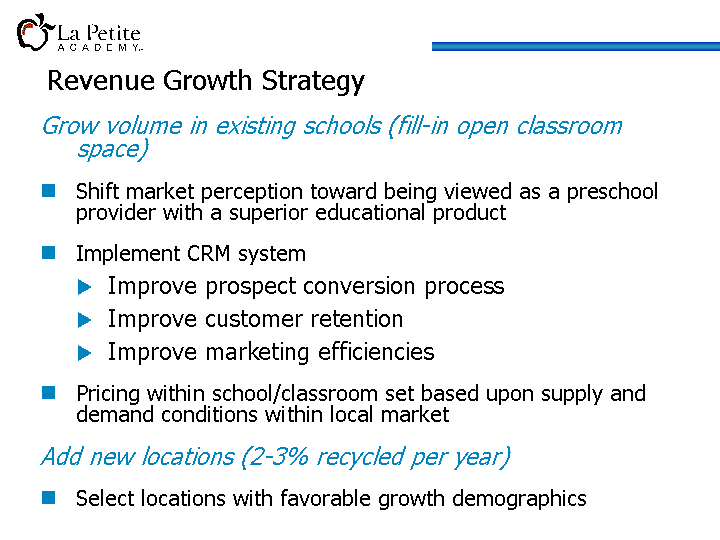
Revenue Growth Strategy Grow volume in existing schools (fill-in open classroom space) Shift market perception toward being viewed as a preschool provider with a superior educational product Implement CRM system Improve prospect conversion process Improve customer retention Improve marketing efficiencies Pricing within school/classroom set based upon supply and demand conditions within local market Add new locations (2-3% recycled per year) Select locations with favorable growth demographics |
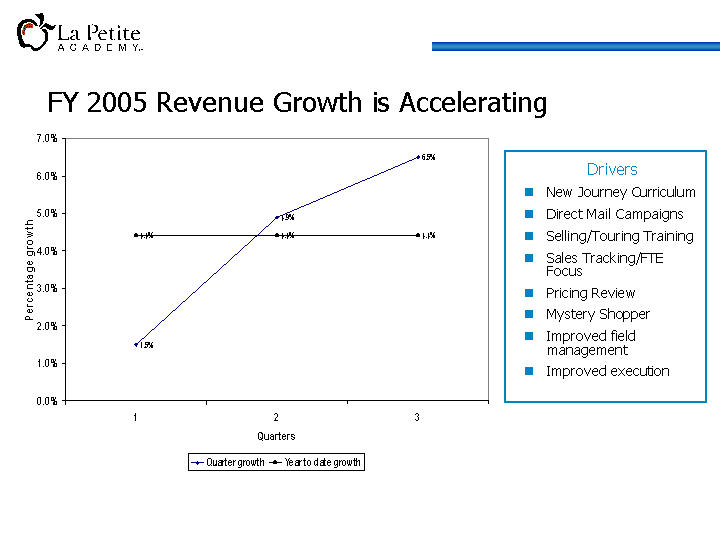
FY 2005 Revenue Growth is Accelerating Drivers New Journey Curriculum Direct Mail Campaigns Selling/Touring Training Sales Tracking/FTE Focus Pricing Review Mystery Shopper Improved field management Improved execution |
Locations (4 fiscal years) 13% of KC non-acquired assets are 5 years old or less |
School Portfolio Management Five year financial history is reviewed Demographics of location are reviewed Divisional VP and District Manager comment on: market conditions trends and future viability of school quality of Academy Director and staff Proforma cash flow prepared of closed facility vs. continuing to keep open Corporate Finance and Operations Visit location before closure decision is finalized Negative EBITDAR Schools are considered as potential closure candidates |
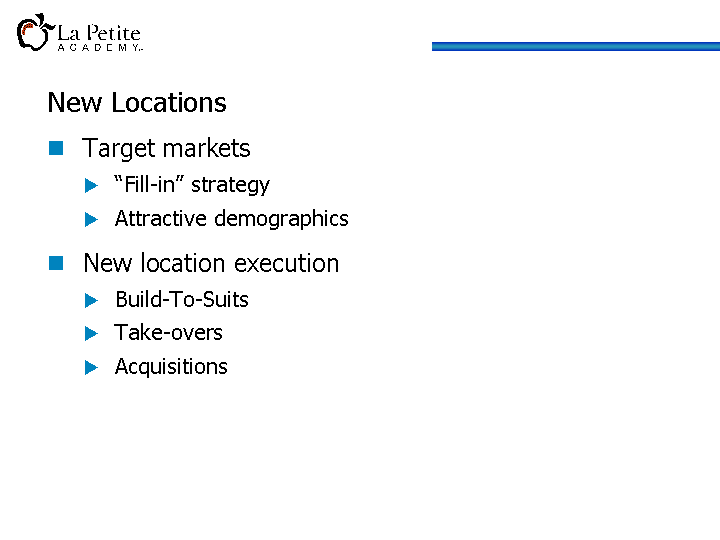
New Locations Target markets "Fill-in" strategy Attractive demographics New location execution Build-To-Suits Take-overs Acquisitions |
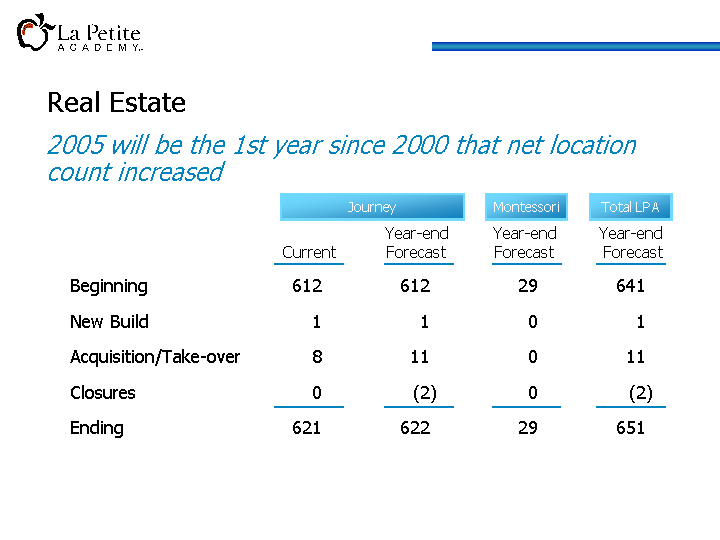
Real Estate 2005 will be the 1st year since 2000 that net location count increased Beginning 612 612 29 641 New Build 1 1 0 1 Acquisition/Take-over 8 11 0 11 Closures 0 (2) 0 (2) Ending 621 622 29 651 Year-end Year-end Year-end Current Forecast Forecast Forecast Journey Montessori Total LPA |
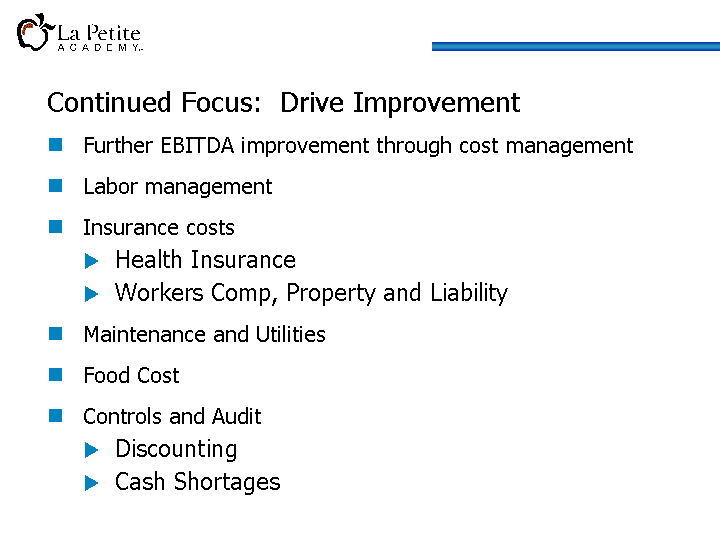
Continued Focus: Drive Improvement Further EBITDA improvement through cost management Labor management Insurance costs Health Insurance Workers Comp, Property and Liability Maintenance and Utilities Food Cost Controls and Audit Discounting Cash Shortages |
Financial Review Neil Dyment |
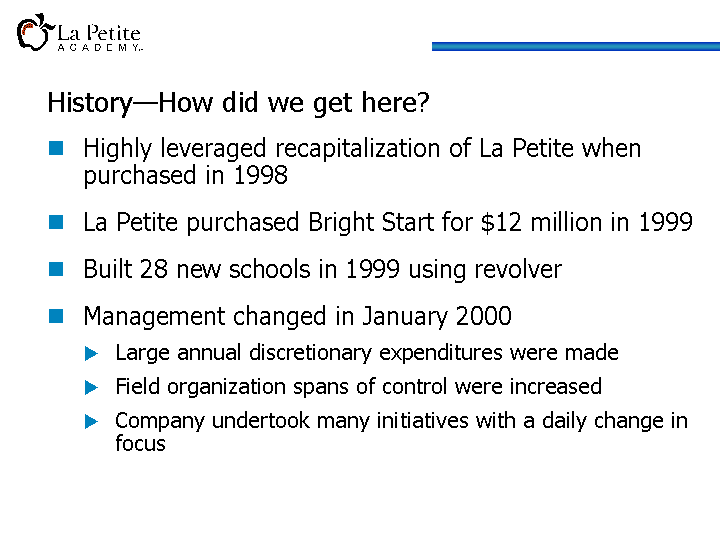
History-How did we get here? Highly leveraged recapitalization of La Petite when purchased in 1998 La Petite purchased Bright Start for $12 million in 1999 Built 28 new schools in 1999 using revolver Management changed in January 2000 Large annual discretionary expenditures were made Field organization spans of control were increased Company undertook many initiatives with a daily change in focus |
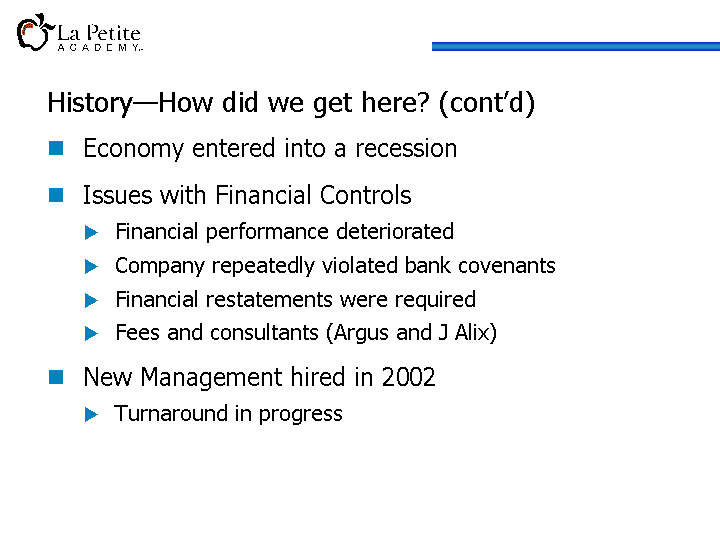
History-How did we get here? (cont'd) Economy entered into a recession Issues with Financial Controls Financial performance deteriorated Company repeatedly violated bank covenants Financial restatements were required Fees and consultants (Argus and J Alix) New Management hired in 2002 Turnaround in progress |
School Closures FY 03 Impact $16.7M FY 04 Impact $14.9M Revenue FY 2001-FY 2004 (amounts in millions) Growth W/O Closures (same school) FY 03 3.3% FY 04 0.0% |
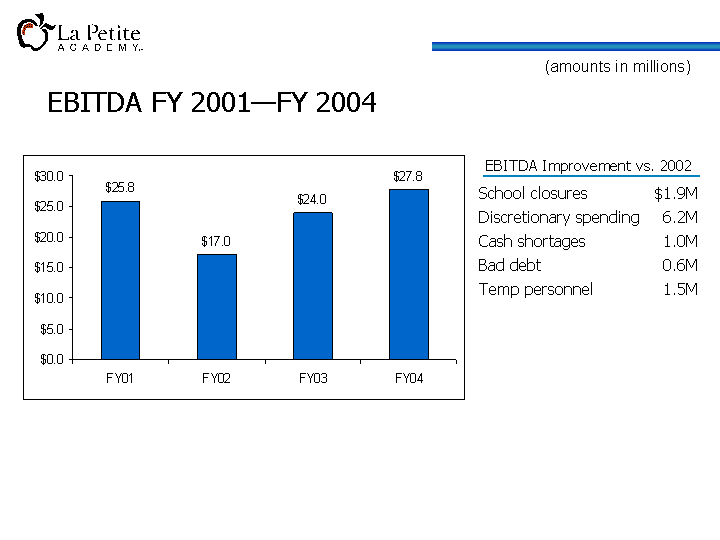
EBITDA FY 2001-FY 2004 (amounts in millions) EBITDA Improvement vs. 2002 School closures $1.9M Discretionary spending 6.2M Cash shortages 1.0M Bad debt 0.6M Temp personnel 1.5M |
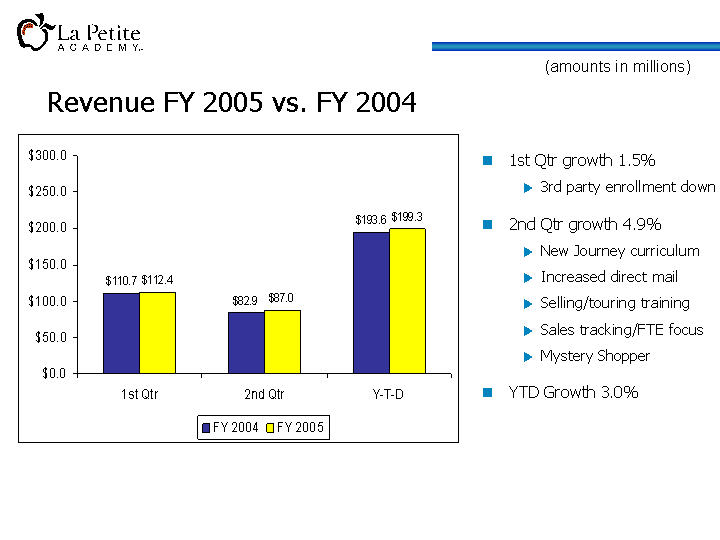
Revenue FY 2005 vs. FY 2004 1st Qtr growth 1.5% 3rd party enrollment down 2nd Qtr growth 4.9% New Journey curriculum Increased direct mail Selling/touring training Sales tracking/FTE focus Mystery Shopper YTD Growth 3.0% (amounts in millions) |
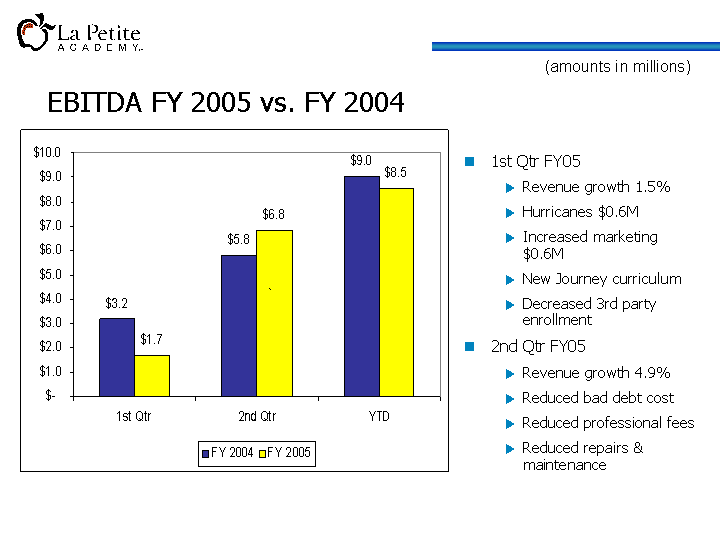
EBITDA FY 2005 vs. FY 2004 1st Qtr FY05 Revenue growth 1.5% Hurricanes $0.6M Increased marketing $0.6M New Journey curriculum Decreased 3rd party enrollment 2nd Qtr FY05 Revenue growth 4.9% Reduced bad debt cost Reduced professional fees Reduced repairs & maintenance (amounts in millions) |
Debt Repayment Schedule (amounts in millions) |
Summary The business has been stabilized The core is in the process of being optimized Core is growing again (same school net tuition growth in 3rd Qtr was 5.8%) Costs are being managed New locations are being added again Expect to add 11 locations this year Refinancing will need to occur before bank debt becomes current for financial reporting purposes in November 2006 |
Bear Stearns Global Credit Conference May 18, 2005 |