UNITED STATES
SECURITIES AND EXCHANGE COMMISSION
Washington, D.C. 20549
FORM N-CSR
CERTIFIED SHAREHOLDER REPORT OF REGISTERED
MANAGEMENT INVESTMENT COMPANIES
Investment Company Act file number 811-07644
Gabelli Capital Series Funds, Inc.
(Exact name of registrant as specified in charter)
One Corporate Center
Rye, New York 10580-1422
(Address of principal executive offices) (Zip code)
Bruce N. Alpert
Gabelli Funds, LLC
One Corporate Center
Rye, New York 10580-1422
(Name and address of agent for service)
registrant’s telephone number, including area code: 1-800-422-3554
Date of fiscal year end: December 31
Date of reporting period: December 31, 2005
Form N-CSR is to be used by management investment companies to file reports with the Commission not later than 10 days after the transmission to stockholders of any report that is required to be transmitted to stockholders under Rule 30e-1 under the Investment Company Act of 1940 (17 CFR 270.30e-1). The Commission may use the information provided on Form N-CSR in its regulatory, disclosure review, inspection, and policymaking roles.
A registrant is required to disclose the information specified by Form N-CSR, and the Commission will make this information public. A registrant is not required to respond to the collection of information contained in Form N-CSR unless the Form displays a currently valid Office of Management and Budget (“OMB”) control number. Please direct comments concerning the accuracy of the information collection burden estimate and any suggestions for reducing the burden to Secretary, Securities and Exchange Commission, 100 F Street, NE, Washington, DC 20549. The OMB has reviewed this collection of information under the clearance requirements of 44 U.S.C. § 3507.
| Item 1. | Reports to Stockholders. |
The Report to Shareholders is attached herewith.
| | |
n Gabelli Capital Asset Fund | | Annual Report
To Contractowners |

Mario Gabelli, CFA, Portfolio Manager
Objective:
Growth of capital. Current income is a secondary objective
Portfolio:
At least 80% common stocks and securities convertible into common stocks
Inception Date:
May 1, 1995
Net Assets at December 31, 2005:
$219,126,881
An Update from Fund Management
For the 12 months ended December 31, 2005, the Fund advanced 2.03% versus the S&P 500 Index’s 4.91% and Russell 2000 Index’s 4.55% gains. For the five and ten year periods ended December 31, 2005, the Fund’s total annualized return averaged 7.01% and 12.12%, respectively, versus average annual total returns of 0.54% and 9.07% for the S&P 500 Index and 8.22% and 9.26% for the Russell 2000 Index for the same periods, respectively. Since the Fund commenced investment operations on May 1, 1995 through December 31, 2005, the Fund’s cumulative total return was 240.07%, which equates to an average annual total return of 12.14%. This compares favorably to the S&P 500 Index and Russell 2000 Index annual total returns for the same period of 10.50% and 10.54%, respectively.
Strong merger and acquisition activity continued to surface value in the portfolio in 2005, with several portfolio companies in the Fund being taken over, most at substantial premiums to market price. In addition, with only a few exceptions, all of the Fund’s energy and utilities holdings were positively affected by the rising oil and natural gas prices.
On the downside, specialty chemicals and companies that use oil in their production disappointed. As the market attention shifted to new media companies and with the lack of significant political and sports advertisement dollars, old media stocks, such as publishers and broadcasters, were other weak sectors. Entertainment and cable and satellite stocks also affected the Fund negatively.
Business optimism improved in 2005 with the economy growing at a strong rate despite headwinds from: rising commodity prices and interest rates; continued fighting in Iraq and Afghanistan; and natural disasters striking the South. Fund holdings in the aviation parts and services and diversified industrial sectors benefited from this optimism and contributed positively to the Fund’s returns in 2005. Healthcare companies, in general, performed well due to a rise in demand for their products and services.
The Fund’s focus is on free cash flow: earnings before interest, taxes, depreciation, and amortization (“EBITDA”) minus the capital expenditures necessary to grow the business. We believe free cash flow is the best barometer of a business’ value. Rising free cash flow often foreshadows net earnings improvement. We also look at earnings per share trends and try to position ourselves in front of long term earnings uptrends. We analyze on and off balance sheet assets and liabilities such as plant and equipment, inventories, receivables, and legal, environmental, and health care issues. We want to know everything and anything that will add to, or detract from, our private market value (“PMV”) estimates. Finally, we look for a catalyst: something happening in the company’s industry or indigenous to the company itself that will surface value. Once we identify stocks that qualify as fundamental and conceptual bargains, we then become patient investors. This has been a proven long term method for preserving and enhancing wealth in the U.S. equity markets.
The views expressed above are those of the Fund’s portfolio manager as of December 31, 2005 and are subject to change without notice. They do not necessarily represent the views of Gabelli Funds. The views expressed herein are based on current market conditions and are not intended to predict or guarantee the future performance of any Fund, any individual security, any market or market segment. The composition of each Fund’s portfolio is subject to change. No recommendation is made with respect to any security discussed herein.
About information in this report:
| • | | It is important to carefully consider the Fund’s investment objectives, risks, fees and expenses before investing. All funds involve some risk, including possible loss of the principal amount invested. |
| • | | The S&P 500 Index is an index of 500 primarily large cap U.S. stocks that is generally considered to be representative of U.S. stock market activity. Index returns are provided for comparative purposes. Please note that the index is unmanaged and not available for direct investment and its returns do not reflect the fees and expenses that have been deducted from the Fund. |
| | |
| GABELLI CAPITAL ASSET FUND | | 1 |
| | |
n Gabelli Capital Asset Fund | | Annual Report
To Contractowners |
Top Ten Holdings (As of 12/31/2005)
| | | |
| Company | | Percentage of
Total Net Assets | |
American Express Co. | | 2.11 | % |
Dreyer’s Grand Ice Cream Holdings Inc., Cl. A | | 1.89 | % |
News Corp., Cl. A | | 1.77 | % |
Thomas & Betts Corp. | | 1.72 | % |
Honeywell International Inc. | | 1.61 | % |
Time Warner Inc. | | 1.59 | % |
Archer-Daniels-Midland Co. | | 1.58 | % |
General Mills Inc. | | 1.58 | % |
Cablevision Systems Corp., Cl. A | | 1.55 | % |
Grupo Televisa SA, ADR | | 1.54 | % |
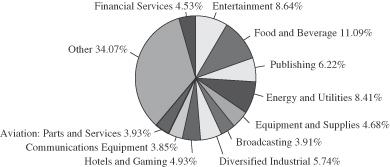
Sector Weightings as a % of Total Net Assets (As of 12/31/2005)
Average Annual Total Returns (For periods ended 12/31/2005)
| | | | | | | | |
| | | 1
Yr | | 5
Yrs | | 10
Yrs | | Since Inception 05/01/1995 |
Gabelli Capital Asset Fund | | 2.03% | | 7.01% | | 12.12% | | 12.14% |
S&P 500 Index | | 4.91% | | 0.54% | | 9.07% | | 10.50% |
All performance data quoted is historical and the results represent past performance and neither guarantee nor predict future investment results. To obtain performance data current to the most recent month (available within 7 business days of the most recent month end), please call us at (800) 221-3253 or visit our website at www.guardianinvestor.com. Current performance may be higher or lower than the performance quoted here. Investment return and principal value will fluctuate so that an investor’s shares, when redeemed, may be worth more or less than the original cost.
Total return figures are historical and assume the reinvestment of dividends and distributions and the deduction of all Fund expenses. The actual total returns for owners of variable annuity contracts or variable life insurance policies that provide for investment in the Fund will be lower to reflect separate account and contract/policy charges. The return figures shown do not reflect the deduction of taxes that a contractowner may pay on distributions or redemption of units.
| | |
| 2 | | GABELLI CAPITAL ASSET FUND |
| | |
n Gabelli Capital Asset Fund | | Annual Report
To Contractowners |
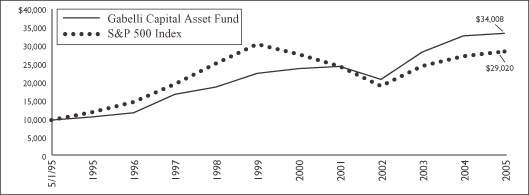
Growth of a Hypothetical $10,000 Investment (Unaudited)
To give you a comparison, this chart shows you the performance of a hypothetical $10,000 investment made in the Fund and in the S&P 500 Index. Index returns do not include the fees and expenses of the Fund, but do include the reinvestment of dividends.
The Fund files a complete schedule of portfolio holdings with the SEC for the first and third quarters of each fiscal year on Form N-Q, the last of which was filed for the quarter ended September 30, 2005. Shareholders may obtain this information at www.gabelli.com or by calling the Fund at 800-GABELLI (800-422-3554). The Fund’s Form N-Q is available on the SEC’s website at www.sec.gov and may also be reviewed and copied at the Commission’s Public Reference Room in Washington, D.C. Information on the operation of the Public Reference Room may be obtained by calling 1-800-SEC-0330.
Proxy Voting
The Fund files Form N-PX with its complete proxy voting record for the 12 months ended June 30th, no later than August 31st of each year. A description of the Fund’s proxy voting policies, procedures, and how the Fund voted proxies relating to portfolio securities are available without charge, upon request, (i) by calling 800-GABELLI (800-422-3554); (ii) by writing to The Gabelli Funds at One Corporate Center, Rye, NY 10580-1422; and (iii) by visiting the Securities and Exchange Commission’s website at www.sec.gov.
| | |
| GABELLI CAPITAL ASSET FUND | | 3 |
| | |
n Gabelli Capital Asset Fund | | Annual Report
To Contractowners |
Disclosure of Fund Expenses (Unaudited)
For the Six Month Period from July 1, 2005 through December 31, 2005
Expense Table
We believe it is important for you to understand the impact of fees and expenses regarding your investment. All mutual funds have operating expenses. As a shareholder of a fund, you incur ongoing costs, which include costs for portfolio management, administrative services, and shareholder reports (like this one), among others. Operating expenses, which are deducted from a fund’s gross income, directly reduce the investment return of a fund. When a fund’s expenses are expressed as a percentage of its average net assets, this figure is known as the expense ratio. The following examples are intended to help you understand the ongoing costs (in dollars) of investing in your Fund and to compare these costs with those of other mutual funds. The examples are based on an investment of $1,000 made at the beginning of the period shown and held for the entire period.
The Expense Table below illustrates your Fund’s costs in two ways:
Actual Fund Return: This section provides information about actual account values and actual expenses. You may use this section to help you to estimate the actual expenses that you paid over the period after any fee waivers and expense reimbursements. The “Ending Account Value” shown is derived from the Fund’s actual return during the past six months, and the “Expenses Paid During Period” shows the dollar amount that would have been paid by an investor who started with $1,000 in the Fund. You may use this information, together with the amount you invested, to estimate the expenses that you paid over the period.
To do so, simply divide your account value by $1,000 (for example, an $8,600 account value divided by $1,000 = 8.6), then multiply the result by the number given for your Fund under the heading “Expenses Paid During Period” to estimate the expenses you paid during this period.
Hypothetical 5% Return: This section provides information about hypothetical account values and hypothetical expenses based on the Fund’s actual expense ratio. It assumes a hypothetical annualized return of 5% before expenses during the period shown. In this case — because the hypothetical return used is not the Fund’s actual return — the results do not apply to your investment and you cannot use the hypothetical account value and expense to estimate the actual ending account balance or expenses you paid for the period. This example is useful in making comparisons of the ongoing costs of investing in the Fund and other funds. To do so, compare this 5% hypothetical example with the 5% hypothetical examples that appear in shareholder reports of other funds.
Please note that the expenses shown in the table are meant to highlight your ongoing costs only and do not reflect any transactional costs such as sales charges (loads), redemption fees, or exchange fees, if any, which are described in the Prospectus. If these costs were applied to your account, your costs would be higher. Therefore, the 5% hypothetical return is useful in comparing ongoing costs only, and will not help you determine the relative total costs of owning different funds. The “Annualized Expense Ratio” represents the actual expenses for the last six months and may be different from the expense ratio in the Financial Highlights which is for the year ended December 31, 2005.
| | | | | | | | | | | |
| | | Beginning
Account Value
07/01/2005 | | Ending
Account Value
12/31/2005 | | Annualized
Expense Ratio | | Expenses
Paid During
Period* |
Gabelli Capital Asset Fund | | | | | | | | | | | |
Actual Fund Return | | $ | 1,000.00 | | $ | 1,027.60 | | 1.10% | | $ | 5.62 |
Hypothetical 5% Return | | $ | 1,000.00 | | $ | 1,019.66 | | 1.10% | | $ | 5.60 |
| * | | Expenses are equal to the Fund’s annualized expense ratio for the last six months multiplied by the average account value over the period, multiplied by the number of days in the most recent fiscal half-year, then divided by 365. |
| | |
| 4 | | GABELLI CAPITAL ASSET FUND |
| n | | Gabelli Capital Asset Fund |
Schedule of Investments
December 31, 2005
| | | | | | | | |
| Common Stocks — 100.1% | | | |
| Shares | | | | Cost | | Market
Value |
| | | | | | | | | |
| Aerospace — 0.4% |
| 12,000 | | HEICO Corp. | | $ | 294,018 | | $ | 310,560 |
| 18,000 | | Herley Industries Inc.† | | | 346,784 | | | 297,180 |
| 30,000 | | Rolls-Royce Group plc† | | | 195,521 | | | 220,653 |
| 334,000 | | Rolls-Royce Group plc, Cl. B | | | 339 | | | 589 |
| | | | |
|
| |
|
|
| | | | | | 836,662 | | | 828,982 |
|
| Agriculture — 1.6% |
| 140,000 | | Archer-Daniels-Midland Co. | | | 1,674,009 | | | 3,452,400 |
|
| Automotive: Parts and Accessories — 2.8% |
| 15,000 | | BorgWarner Inc. | | | 450,032 | | | 909,450 |
| 58,000 | | CLARCOR Inc. | | | 548,692 | | | 1,723,180 |
| 170,000 | | Dana Corp. | | | 2,225,206 | | | 1,220,600 |
| 5,000 | | Midas Inc.† | | | 99,990 | | | 91,800 |
| 15,000 | | Modine Manufacturing Co. | | | 345,713 | | | 488,850 |
| 26,100 | | Navistar International Corp.† | | | 512,949 | | | 746,982 |
| 42,548 | | Proliance International Inc.† | | | 250,571 | | | 225,079 |
| 85,000 | | Scheib (Earl) Inc.† | | | 483,196 | | | 318,750 |
| 50,000 | | Standard Motor Products Inc. | | | 758,136 | | | 461,500 |
| | | | |
|
| |
|
|
| | | | | | 5,674,485 | | | 6,186,191 |
|
| Aviation: Parts and Services — 3.9% |
| 12,000 | | Aviall Inc.† | | | 164,382 | | | 345,600 |
| 27,000 | | Curtiss-Wright Corp. | | | 737,050 | | | 1,474,200 |
| 5,000 | | EDO Corp. | | | 142,443 | | | 135,300 |
| 133,000 | | Fairchild Corp., Cl. A† | | | 806,847 | | | 339,150 |
| 70,000 | | GenCorp Inc.† | | | 714,297 | | | 1,242,500 |
| 60,000 | | Kaman Corp. | | | 773,944 | | | 1,181,400 |
| 35,000 | | Precision Castparts Corp. | | | 769,766 | | | 1,813,350 |
| 30,000 | | Sequa Corp., Cl. A† | | | 1,048,824 | | | 2,071,500 |
| | | | |
|
| |
|
|
| | | | | | 5,157,553 | | | 8,603,000 |
|
| Broadcasting — 3.9% |
| 10,000 | | Cogeco Inc. | | | 195,072 | | | 206,460 |
| 49,000 | | Fisher Communications Inc.† | | | 2,755,665 | | | 2,030,070 |
| 215,000 | | Gray Television Inc. | | | 2,231,752 | | | 2,111,300 |
| 40,000 | | Liberty Corp. | | | 1,887,423 | | | 1,872,400 |
| 72,000 | | Lin TV Corp., Cl. A† | | | 1,367,199 | | | 802,080 |
| 30,000 | | Paxson Communications Corp.† | | | 107,419 | | | 27,000 |
| 155,000 | | Sinclair Broadcast Group
Inc., Cl. A | | | 1,595,655 | | | 1,426,000 |
| 35,000 | | Young Broadcasting
Inc., Cl. A† | | | 502,960 | | | 91,000 |
| | | | |
|
| |
|
|
| | | | | | 10,643,145 | | | 8,566,310 |
|
| Business Services — 0.3% |
| 80,000 | | Nashua Corp.† | | | 707,418 | | | 561,600 |
|
| Cable and Satellite — 3.8% |
| 5,000 | | Adelphia Communications Corp., Cl. A† | | | 5,250 | | | 200 |
| 145,000 | | Cablevision Systems Corp.,
Cl. A† | | | 1,823,828 | | | 3,403,150 |
| 80,000 | | DIRECTV Group Inc.† | | | 1,182,474 | | | 1,129,600 |
| 30,000 | | EchoStar Communications Corp., Cl. A† | | | 950,660 | | | 815,100 |
| 30,801 | | Liberty Global Inc., Cl. A† | | | 388,766 | | | 693,023 |
| 30,801 | | Liberty Global Inc., Cl. C† | | | 373,520 | | | 652,981 |
| 38,000 | | Rogers Communications
Inc., Cl. B | | | 784,271 | | | 1,605,880 |
| | | | |
|
| |
|
|
| | | | | | 5,508,769 | | | 8,299,934 |
|
| | | | | | | | |
| Shares | | | | Cost | | Market
Value |
| | | | | | | | | |
| Communications Equipment — 3.9% |
| 35,000 | | Agere Systems Inc.† | | $ | 451,794 | | $ | 451,500 |
| 100,000 | | Corning Inc.† | | | 679,650 | | | 1,966,000 |
| 140,000 | | Lucent Technologies Inc.† | | | 537,357 | | | 372,400 |
| 50,000 | | Motorola Inc. | | | 476,030 | | | 1,129,500 |
| 175,000 | | Nortel Networks Corp.† | | | 750,863 | | | 535,500 |
| 5,000 | | Scientific-Atlanta Inc. | | | 211,050 | | | 215,350 |
| 90,000 | | Thomas & Betts Corp.† | | | 1,712,243 | | | 3,776,400 |
| | | | |
|
| |
|
|
| | | | | | 4,818,987 | | | 8,446,650 |
|
| Computer Software and Services — 2.0% |
| 150,000 | | Siebel Systems Inc. | | | 1,564,700 | | | 1,587,000 |
| 110,000 | | Xanser Corp.† | | | 322,161 | | | 323,400 |
| 60,000 | | Yahoo! Inc.† | | | 2,046,942 | | | 2,350,800 |
| | | | |
|
| |
|
|
| | | | | | 3,933,803 | | | 4,261,200 |
|
| Consumer Products — 2.5% |
| 13,500 | | Alberto-Culver Co. | | | 427,626 | | | 617,625 |
| 4,000 | | Avon Products Inc. | | | 107,932 | | | 114,200 |
| 10,000 | | Clorox Co. | | | 557,423 | | | 568,900 |
| 5,000 | | Colgate-Palmolive Co. | | | 263,921 | | | 274,250 |
| 23,000 | | Gallaher Group plc, ADR | | | 552,606 | | | 1,383,680 |
| 9,000 | | National Presto Industries Inc. | | | 264,277 | | | 399,150 |
| 15,000 | | Pactiv Corp.† | | | 152,305 | | | 330,000 |
| 18,000 | | Procter & Gamble Co. | | | 697,553 | | | 1,041,840 |
| 120,000 | | Revlon Inc., Cl. A† | | | 323,516 | | | 372,000 |
| 63,000 | | Schiff Nutrition
International Inc.† | | | 161,680 | | | 320,670 |
| | | | |
|
| |
|
|
| | | | | | 3,508,839 | | | 5,422,315 |
|
| Consumer Services — 1.5% |
| 10,000 | | IAC/InterActiveCorp† | | | 84,906 | | | 283,100 |
| 145,600 | | Rollins Inc. | | | 1,126,823 | | | 2,869,776 |
| | | | |
|
| |
|
|
| | | | | | 1,211,729 | | | 3,152,876 |
|
| Diversified Industrial — 5.7% | | | | | | |
| 52,000 | | Ampco-Pittsburgh Corp. | | | 782,647 | | | 754,520 |
| 15,000 | | Baldor Electric Co. | | | 323,027 | | | 384,750 |
| 40,000 | | Cooper Industries Ltd., Cl. A | | | 2,142,825 | | | 2,920,000 |
| 30,000 | | Crane Co. | | | 623,766 | | | 1,058,100 |
| 16,000 | | Greif Inc., Cl. A | | | 427,317 | | | 1,060,480 |
| 13,500 | | Harbor Global Co. Ltd.† | | | 31,716 | | | 121,500 |
| 95,000 | | Honeywell International Inc. | | | 2,807,748 | | | 3,538,750 |
| 14,000 | | ITT Industries Inc. | | | 1,233,131 | | | 1,439,480 |
| 70,000 | | Katy Industries Inc.† | | | 853,440 | | | 217,000 |
| 75,000 | | Myers Industries Inc. | | | 647,077 | | | 1,093,500 |
| | | | |
|
| |
|
|
| | | | | | 9,872,694 | | | 12,588,080 |
|
| Electronics — 1.2% |
| 5,000 | | Intel Corp. | | | 131,250 | | | 124,800 |
| 80,000 | | Texas Instruments Inc. | | | 1,907,690 | | | 2,565,600 |
| | | | |
|
| |
|
|
| | | | | | 2,038,940 | | | 2,690,400 |
|
| Energy and Utilities — 8.4% |
| 95,000 | | Allegheny Energy Inc.† | | | 912,298 | | | 3,006,750 |
| 260,000 | | Aquila Inc.† | | | 967,243 | | | 936,000 |
| 17,574 | | Chevron Corp. | | | 1,098,024 | | | 997,676 |
| 20,000 | | CMS Energy Corp.† | | | 142,800 | | | 290,200 |
| 30,000 | | ConocoPhillips | | | 860,026 | | | 1,745,400 |
| 9,000 | | Cooper Cameron Corp.† | | | 260,717 | | | 372,600 |
| 8,000 | | Devon Energy Corp. | | | 193,677 | | | 500,320 |
| 32,000 | | Duquesne Light Holdings Inc. | | | 462,030 | | | 522,240 |
| 110,000 | | El Paso Corp. | | | 991,693 | | | 1,337,600 |
| 77,300 | | El Paso Electric Co.† | | | 694,566 | | | 1,626,392 |
See accompanying notes to financial statements.
| n | | Gabelli Capital Asset Fund |
Schedule of Investments (Continued)
December 31, 2005
| | | | | | | | |
| Shares | | | | Cost | | Market
Value |
| | | | | | | | | |
| Energy and Utilities (continued) | | | | | | |
| 18,000 | | Exxon Mobil Corp. | | $ | 654,381 | | $ | 1,011,060 |
| 6,699 | | Florida Public Utilities Co. | | | 52,922 | | | 91,441 |
| 7,299 | | Kerr-McGee Corp. | | | 388,635 | | | 663,187 |
| 20,000 | | Mirant Corp.† | | | 6,600 | | | 26,400 |
| 35,000 | | Northeast Utilities | | | 659,453 | | | 689,150 |
| 30,000 | | NSTAR | | | 681,900 | | | 861,000 |
| 17,000 | | Progress Energy Inc., CVO† | | | 7,800 | | | 1,233 |
| 15,000 | | Royal Dutch Shell plc,
Cl. A, ADR | | | 937,915 | | | 922,350 |
| 33,750 | | RPC Inc. | | | 271,742 | | | 888,975 |
| 30,000 | | Southwest Gas Corp. | | | 731,836 | | | 792,000 |
| 15,000 | | Transocean Inc.† | | | 880,771 | | | 1,045,350 |
| 2,000 | | Vintage Petroleum Inc. | | | 98,670 | | | 106,660 |
| | | | |
|
| |
|
|
| | | | | | 11,955,699 | | | 18,433,984 |
|
| Entertainment — 8.6% |
| 50,000 | | Discovery Holding Co., Cl. A† | | | 433,402 | | | 757,500 |
| 67,500 | | Dover Motorsports Inc. | | | 432,716 | | | 412,425 |
| 220,000 | | Gemstar-TV Guide
International Inc.† | | | 1,162,602 | | | 574,200 |
| 42,000 | | Grupo Televisa SA, ADR | | | 1,576,850 | | | 3,381,000 |
| 315,000 | | Liberty Media Corp., Cl. A† | | | 1,537,461 | | | 2,479,050 |
| 130,000 | | The Walt Disney Co. | | | 2,723,908 | | | 3,116,100 |
| 200,000 | | Time Warner Inc. | | | 3,362,397 | | | 3,488,000 |
| 50,000 | | Topps Co. Inc. | | | 460,778 | | | 371,500 |
| 85,000 | | Viacom Inc., Cl. A | | | 2,188,685 | | | 2,784,600 |
| 50,000 | | Vivendi Universal SA, ADR | | | 1,104,597 | | | 1,571,500 |
| | | | |
|
| |
|
|
| | | | | | 14,983,396 | | | 18,935,875 |
|
| Environmental Services — 1.9% |
| 90,000 | | Allied Waste Industries Inc.† | | | 882,698 | | | 786,600 |
| 108,000 | | Waste Management Inc. | | | 2,720,076 | | | 3,277,800 |
| | | | |
|
| |
|
|
| | | | | | 3,602,774 | | | 4,064,400 |
|
| Equipment and Supplies — 4.7% |
| 35,000 | | AMETEK Inc. | | | 350,000 | | | 1,488,900 |
| 50,000 | | Baldwin Technology Co. Inc.,
Cl. A† | | | 92,620 | | | 202,500 |
| 30,000 | | Belden CDT Inc. | | | 418,599 | | | 732,900 |
| 40,000 | | Capstone Turbine Corp.† | | | 70,880 | | | 119,600 |
| 10,000 | | CIRCOR International Inc. | | | 147,083 | | | 256,600 |
| 135,000 | | CTS Corp. | | | 1,520,311 | | | 1,493,100 |
| 14,000 | | Eastern Co. | | | 207,085 | | | 273,140 |
| 130,000 | | Fedders Corp. | | | 594,906 | | | 223,600 |
| 35,000 | | Flowserve Corp.† | | | 495,714 | | | 1,384,600 |
| 32,500 | | Franklin Electric Co. Inc. | | | 291,667 | | | 1,285,050 |
| 5,000 | | Gerber Scientific Inc.† | | | 34,500 | | | 47,850 |
| 50,000 | | GrafTech International Ltd.† | | | 480,979 | | | 311,000 |
| 20,000 | | IDEX Corp. | | | 340,195 | | | 822,200 |
| 9,000 | | L.S. Starrett Co., Cl. A | | | 161,875 | | | 139,860 |
| 20,000 | | Robbins & Myers Inc. | | | 460,643 | | | 407,000 |
| 35,000 | | Watts Water Technologies
Inc., Cl. A | | | 480,304 | | | 1,060,150 |
| | | | |
|
| |
|
|
| | | | | | 6,147,361 | | | 10,248,050 |
|
| Financial Services — 4.5% |
| 90,000 | | American Express Co. | | | 2,813,015 | | | 4,631,400 |
| 18,000 | | Ameriprise Financial Inc. | | | 406,119 | | | 738,000 |
| 36,000 | | Argonaut Group Inc.† | | | 787,578 | | | 1,179,720 |
| 18,000 | | Bank of New York Co. Inc. | | | 579,773 | | | 573,300 |
| 12,000 | | BKF Capital Group Inc. | | | 296,313 | | | 227,400 |
| 13,000 | | Deutsche Bank AG | | | 793,360 | | | 1,259,310 |
| 163,000 | | Epoch Holding Corp.† | | | 526,516 | | | 961,700 |
| 10,000 | | Midland Co. | | | 81,237 | | | 360,400 |
| | | | |
|
| |
|
|
| | | | | | 6,283,911 | | | 9,931,230 |
|
| | | | | | | | |
| Shares | | | | Cost | | Market
Value |
| | | | | | | | | |
| Food and Beverage — 11.1% |
| 20,000 | | Brown-Forman Corp., Cl. A | | $ | 477,226 | | $ | 1,418,800 |
| 5,000 | | Campbell Soup Co. | | | 113,482 | | | 148,850 |
| 74,000 | | Coca-Cola Co. | | | 3,429,706 | | | 2,982,940 |
| 20,000 | | Coca-Cola Enterprises Inc. | | | 391,996 | | | 383,400 |
| 7,000 | | Coca-Cola Femsa
SA de CV, ADR | | | 175,948 | | | 189,070 |
| 20,000 | | Corn Products International Inc. | | | 329,396 | | | 477,800 |
| 30,000 | | Del Monte Foods Co.† | | | 306,000 | | | 312,900 |
| 50,000 | | Diageo plc, ADR | | | 1,920,503 | | | 2,915,000 |
| 50,000 | | Dreyer’s Grand Ice Cream
Holdings Inc., Cl. A | | | 3,914,543 | | | 4,144,000 |
| 3,000 | | Fomento Economico Mexicano SA de CV, ADR | | | 166,458 | | | 217,530 |
| 70,000 | | General Mills Inc. | | | 3,322,849 | | | 3,452,400 |
| 100,000 | | Groupe Danone, ADR | | | 2,120,508 | | | 2,104,000 |
| 70,000 | | Heinz (H.J.) Co. | | | 2,562,477 | | | 2,360,400 |
| 45,000 | | PepsiAmericas Inc. | | | 611,712 | | | 1,046,700 |
| 21,218 | | Tootsie Roll Industries Inc. | | | 324,957 | | | 613,837 |
| 23,000 | | Wrigley (Wm.) Jr. Co. | | | 1,331,491 | | | 1,529,270 |
| | | | |
|
| |
|
|
| | | | | | 21,499,252 | | | 24,296,897 |
|
| Health Care — 3.5% |
| 80,000 | | Beverly Enterprises Inc.† | | | 1,011,930 | | | 933,600 |
| 1,000 | | Chemed Corp. | | | 23,900 | | | 49,680 |
| 10,000 | | Chiron Corp.† | | | 433,550 | | | 444,600 |
| 5,000 | | DENTSPLY International Inc. | | | 218,760 | | | 268,450 |
| 11,000 | | Henry Schein Inc.† | | | 315,925 | | | 480,040 |
| 15,000 | | INAMED Corp.† | | | 641,250 | | | 1,315,200 |
| 2,000 | | Invitrogen Corp.† | | | 69,870 | | | 133,280 |
| 4,000 | | Patterson Companies Inc.† | | | 88,120 | | | 133,600 |
| 130,000 | | Pfizer Inc. | | | 3,799,881 | | | 3,031,600 |
| 20,000 | | Renal Care Group Inc.† | | | 931,040 | | | 946,200 |
| 60,000 | | TL Administration Corp.† | | | 144,933 | | | 240 |
| | | | |
|
| |
|
|
| | | | | | 7,679,159 | | | 7,736,490 |
|
| Hotels and Gaming — 4.9% |
| 60,000 | | Aztar Corp.† | | | 500,789 | | | 1,823,400 |
| 10,000 | | Churchill Downs Inc. | | | 391,342 | | | 367,300 |
| 20,000 | | Dover Downs Gaming &
Entertainment Inc. | | | 224,187 | | | 283,000 |
| 18,000 | | Gaylord Entertainment Co.† | | | 465,545 | | | 784,620 |
| 500,000 | | Hilton Group plc | | | 3,042,128 | | | 3,126,989 |
| 50,000 | | Hilton Hotels Corp. | | | 588,092 | | | 1,205,500 |
| 12,000 | | International Game Technology | | | 326,747 | | | 369,360 |
| 10,000 | | Kerzner International Ltd.† | | | 484,849 | | | 687,500 |
| 30,000 | | La Quinta Corp.† | | | 329,250 | | | 334,200 |
| 7,000 | | Las Vegas Sands Corp.† | | | 258,250 | | | 276,290 |
| 42,000 | | MGM Mirage† | | | 951,505 | | | 1,540,140 |
| | | | |
|
| |
|
|
| | | | | | 7,562,684 | | | 10,798,299 |
|
| Machinery — 0.9% |
| 73,000 | | CNH Global NV | | | 1,431,896 | | | 1,353,420 |
| 10,000 | | Deere & Co. | | | 632,960 | | | 681,100 |
| | | | |
|
| |
|
|
| | | | | | 2,064,856 | | | 2,034,520 |
|
| Manufactured Housing and Recreational Vehicles — 1.1% |
| 2,000 | | Cavco Industries Inc.† | | | 44,644 | | | 76,560 |
| 130,000 | | Champion Enterprises Inc.† | | | 1,336,170 | | | 1,770,600 |
| 16,000 | | Skyline Corp. | | | 631,479 | | | 582,400 |
| | | | |
|
| |
|
|
| | | | | | 2,012,293 | | | 2,429,560 |
|
See accompanying notes to financial statements.
| n | | Gabelli Capital Asset Fund |
Schedule of Investments (Continued)
December 31, 2005
| | | | | | | | |
| Shares | | | | Cost | | Market
Value |
| | | | | | | | | |
| Metals and Mining — 0.8% |
| 34,000 | | Newmont Mining Corp. | | $ | 1,430,436 | | $ | 1,815,600 |
|
| Publishing — 6.2% |
| 6,000 | | Dow Jones & Co. Inc. | | | 212,506 | | | 212,940 |
| 10,000 | | Journal Communications
Inc., Cl. A | | | 175,200 | | | 139,500 |
| 5,000 | | Knight-Ridder Inc. | | | 327,384 | | | 316,500 |
| 6,000 | | Lee Enterprises Inc. | | | 170,932 | | | 221,460 |
| 23,000 | | McClatchy Co., Cl. A | | | 703,081 | | | 1,359,300 |
| 15,000 | | Media General Inc., Cl. A | | | 946,817 | | | 760,500 |
| 8,000 | | Meredith Corp. | | | 171,362 | | | 418,720 |
| 35,000 | | New York Times Co., Cl. A | | | 1,402,256 | | | 925,750 |
| 250,000 | | News Corp., Cl. A | | | 3,834,836 | | | 3,887,500 |
| 130,000 | | Penton Media Inc.† | | | 114,339 | | | 71,500 |
| 345,000 | | PRIMEDIA Inc.† | | | 1,010,992 | | | 555,450 |
| 60,000 | | Reader’s Digest
Association Inc. | | | 949,070 | | | 913,200 |
| 14,000 | | Scripps (E.W.) Co., Cl. A | | | 574,228 | | | 672,280 |
| 55,100 | | Thomas Nelson Inc. | | | 636,349 | | | 1,358,215 |
| 60,000 | | Tribune Co. | | | 2,559,680 | | | 1,815,600 |
| | | | |
|
| |
|
|
| | | | | | 13,789,032 | | | 13,628,415 |
|
| Real Estate — 0.6% |
| 47,000 | | Griffin Land & Nurseries Inc.† | | | 659,368 | | | 1,226,935 |
|
| Retail — 0.9% |
| 33,500 | | Aaron Rents Inc., Cl. A | | | 279,193 | | | 649,900 |
| 20,000 | | Albertson’s Inc. | | | 444,163 | | | 427,000 |
| 5,000 | | CSK Auto Corp.† | | | 79,600 | | | 75,400 |
| 12,000 | | Ingles Markets Inc., Cl. A | | | 150,950 | | | 187,800 |
| 25,000 | | Safeway Inc. | | | 514,183 | | | 591,500 |
| | | | |
|
| |
|
|
| | | | | | 1,468,089 | | | 1,931,600 |
|
| | | | | | | | | |
| Shares | | | | Cost | | Market
Value | |
| | | | | | | | | | |
| Specialty Chemicals — 2.5% | |
| 80,000 | | Ferro Corp. | | $ | 1,601,157 | | $ | 1,500,800 | |
| 13,000 | | Hawkins Inc. | | | 165,718 | | | 181,870 | |
| 87,000 | | Hercules Inc.† | | | 1,086,665 | | | 983,100 | |
| 20,000 | | MacDermid Inc. | | | 287,919 | | | 558,000 | |
| 10,000 | | Material Sciences Corp.† | | | 90,141 | | | 141,000 | |
| 140,000 | | Omnova Solutions Inc.† | | | 894,446 | | | 672,000 | |
| 5,000 | | Quaker Chemical Corp. | | | 87,062 | | | 96,150 | |
| 75,000 | | Sensient Technologies Corp. | | | 1,460,156 | | | 1,342,500 | |
| | | | |
|
| |
|
|
|
| | | | | | 5,673,264 | | | 5,475,420 | |
|
|
| Telecommunications — 2.8% | |
| 4,000 | | ALLTEL Corp. | | | 22,430 | | | 252,400 | |
| 270,000 | | Cincinnati Bell Inc.† | | | 1,669,770 | | | 947,700 | |
| 320,000 | | Qwest Communications International Inc.† | | | 1,158,840 | | | 1,808,000 | |
| 125,000 | | Sprint Nextel Corp. | | | 1,936,781 | | | 2,920,000 | |
| 5,000 | | Telephone & Data Systems
Inc., Special | | | 100,476 | | | 173,050 | |
| | | | |
|
| |
|
|
|
| | | | | | 4,888,297 | | | 6,101,150 | |
|
|
| Wireless Communications — 3.2% | |
| 900,000 | | O2 plc | | | 987,677 | | | 3,062,040 | |
| 25,000 | | Price Communications Corp.† | | | 322,481 | | | 371,750 | |
| 40,700 | | United States Cellular Corp.† | | | 1,462,353 | | | 2,010,580 | |
| 48,900 | | UNOVA Inc.† | | | 802,108 | | | 1,652,820 | |
| | | | |
|
| |
|
|
|
| | | | | | 3,574,619 | | | 7,097,190 | |
|
|
| | | Total Common Stocks | | | 170,861,523 | | | 219,245,553 | |
|
|
| | | | | | | | | | |
| Total Investments — 100.1% | | $ | 170,861,523 | | | 219,245,553 | |
| Other Assets and Liabilities (Net) — (0.1)% | | | (118,672 | ) |
|
|
| Net Assets — 100.0% | | | | | $ | 219,126,881 | |
|
|
| † | | Non-income producing security. |
ADR — American Depository Receipt
CVO — Contingent Value Obligation
See accompanying notes to financial statements.
| n | | Gabelli Capital Asset Fund |
Statement of Assets and Liabilities
December 31, 2005
| | | | |
ASSETS: | | | | |
Investments, at value (cost $170,861,523) | | $ | 219,245,553 | |
Dividends receivable | | | 185,642 | |
Receivable for Fund shares sold | | | 85,882 | |
Other assets | | | 8,446 | |
| | |
|
|
|
Total Assets | | | 219,525,523 | |
| | |
|
|
|
LIABILITIES: | | | | |
Payable to custodian | | | 126,967 | |
Payable for investment advisory fees | | | 189,187 | |
Payable for Fund shares redeemed | | | 40,640 | |
Payable for legal and audit fees | | | 23,398 | |
Other accrued expenses | | | 18,450 | |
| | |
|
|
|
Total Liabilities | | | 398,642 | |
| | |
|
|
|
Net Assets applicable to 12,595,815 shares outstanding | | $ | 219,126,881 | |
| | |
|
|
|
NET ASSETS CONSIST OF: | | | | |
Capital stock, at $0.001 par value | | $ | 12,596 | |
Additional paid-in capital | | | 175,309,102 | |
Undistributed net investment income | | | 9,050 | |
Distributions in excess of net realized gains on investments | | | (4,587,897 | ) |
Net unrealized appreciation on investments | | | 48,384,030 | |
| | |
|
|
|
Net Assets | | $ | 219,126,881 | |
| | |
|
|
|
| |
Net Asset Value, offering and redemption price per share ($219,126,881 ÷ 12,595,815 shares outstanding; 500,000,000 shares authorized) | | | $17.40 | |
| | |
|
|
|
Statement of Operations
For the Year Ended
December 31, 2005
| | | | |
INVESTMENT INCOME: | | | | |
Dividends (net of foreign taxes of $24,356) | | $ | 2,990,935 | |
Interest | | | 129,103 | |
| | |
|
|
|
Total Investment Income | | | 3,120,038 | |
| | |
|
|
|
Expenses: | | | | |
Management fees | | | 2,291,734 | |
Legal and audit fees | | | 60,899 | |
Custodian fees | | | 45,221 | |
Directors’ fees | | | 21,934 | |
Shareholder services fees | | | 9,947 | |
Miscellaneous expenses | | | 85,948 | |
| | |
|
|
|
Total Expenses | | | 2,515,683 | |
Less: Custodian fee credits | | | (2,686 | ) |
| | |
|
|
|
Net Expenses | | | 2,512,997 | |
| | |
|
|
|
Net Investment Income | | | 607,041 | |
| | |
|
|
|
NET REALIZED AND UNREALIZED GAIN (LOSS)
ON INVESTMENTS AND FOREIGN CURRENCY: | | | | |
Net realized gain on investments | | | 14,026,860 | |
Net realized loss on foreign currency transactions | | | (5,800 | ) |
Net change in unrealized appreciation/depreciation on investments | | | (10,201,407 | ) |
| | |
|
|
|
Net Realized and Unrealized Gain (Loss)
on Investments and Foreign Currency | | | 3,819,653 | |
| | |
|
|
|
NET INCREASE IN NET ASSETS
RESULTING FROM OPERATIONS | | $ | 4,426,694 | |
| | |
|
|
|
See accompanying notes to financial statements.
| n | | Gabelli Capital Asset Fund |
Statements of Changes in Net Assets
| | | | | | | | |
| | | Year Ended December 31,
| |
| | | 2005
| | | 2004
| |
OPERATIONS: | | | | | | | | |
Net investment income | | $ | 607,041 | | | $ | 748,614 | |
Net realized gain on investments and foreign currency transactions | | | 14,021,060 | | | | 8,751,408 | |
Net change in unrealized appreciation/depreciation on investments | | | (10,201,407 | ) | | | 23,026,405 | |
| | |
|
|
| |
|
|
|
Net Increase in Net Assets Resulting from Operations | | | 4,426,694 | | | | 32,526,427 | |
| | |
|
|
| |
|
|
|
DISTRIBUTIONS TO SHAREHOLDERS: | | | | | | | | |
Net investment income | | | (599,554 | ) | | | (746,505 | ) |
Net realized gain on investments | | | (14,154,173 | ) | | | (8,301,390 | ) |
| | |
|
|
| |
|
|
|
Total Distributions to Shareholders | | | (14,753,727 | ) | | | (9,047,895 | ) |
| | |
|
|
| |
|
|
|
CAPITAL SHARE TRANSACTIONS: | | | | | | | | |
Net increase (decrease) in net assets from capital share transactions | | | (10,581,004 | ) | | | 2,076,392 | |
| | |
|
|
| |
|
|
|
Net Increase (Decrease) in Net Assets | | | (20,908,037 | ) | | | 25,554,924 | |
| | |
NET ASSETS: | | | | | | | | |
| | |
Beginning of period | | | 240,034,918 | | | | 214,479,994 | |
| | |
|
|
| |
|
|
|
| | |
End of period (including undistributed net investment income of $9,050 and $0, respectively) | | $ | 219,126,881 | | | $ | 240,034,918 | |
| | |
|
|
| |
|
|
|
See accompanying notes to financial statements.
| n | | Gabelli Capital Asset Fund |
Notes to Financial Statements
December 31, 2005
1. Organization
The Gabelli Capital Asset Fund (the “Fund”) is a series of Gabelli Capital Series Funds, Inc. (the “Company”), which was organized on April 8, 1993 as a Maryland corporation. The Company is a diversified open-end management investment company registered under the Investment Company Act of 1940, as amended (the “1940 Act”). The Fund’s primary objective is growth of capital. Current income is a secondary objective. The Fund commenced investment operations on May 1, 1995. Shares of the Fund are available to the public only through the purchase of certain variable annuity and variable life insurance contracts issued by The Guardian Insurance & Annuity Company, Inc. (“Guardian”) and other selected insurance companies.
2. Significant Accounting Policies
The preparation of financial statements in accordance with U.S. generally accepted accounting principles requires management to make estimates and assumptions that affect the reported amounts and disclosures in the financial statements. Actual results could differ from those estimates. The following is a summary of significant accounting policies followed by the Fund in the preparation of its financial statements.
Security Valuation
Portfolio securities listed or traded on a nationally recognized securities exchange or traded in the U.S. over-the-counter market for which market quotations are readily available are valued at the last quoted sale price or a market’s official closing price as of the close of business on the day the securities are being valued. If there were no sales that day, the security is valued at the average of the closing bid and asked prices or, if there were no asked prices quoted on that day, then the security is valued at the closing bid price on that day. If no bid or asked prices are quoted on such day, the security is valued at the most recently available price or, if the Board of Directors (the “Board”) so determines, by such other method as the Board shall determine in good faith, to reflect its fair market value. Portfolio securities traded on more than one national securities exchange or market are valued according to the broadest and most representative market, as determined by Gabelli Funds, LLC (the “Adviser”).
Portfolio securities primarily traded on foreign markets are generally valued at the preceding closing values of such securities on their respective exchanges or if after the close of the foreign markets, but prior to the close of business on the day the securities are being valued, market conditions change significantly, certain foreign securities may be fair valued pursuant to procedures established by the Board. Debt instruments with remaining maturities of 60 days or less that are not credit impaired are valued at amortized cost, unless the Board determines such amount does not reflect the securities’ fair value, in which case these securities will be valued at their fair value as determined by the Board. Debt instruments having a maturity greater than 60 days for which market quotations are readily available are valued at the average of the latest bid and asked prices. If there were no asked prices quoted on such day, the security is valued using the closing bid price. Futures contracts are valued at the closing settlement price of the exchange or board of trade on which the applicable contract is traded.
Securities and assets for which market quotations are not readily available are valued at their fair value as determined in good faith under procedures established by and under the general supervision of the Board. Fair valuation methodologies and procedures may include, but are not limited to: analysis and review of available financial and non-financial information about the company; comparisons to the valuation and changes in valuation of similar securities, including a comparison of foreign securities to the equivalent U.S. dollar value ADR securities at the close of the U.S. exchange; and evaluation of any other information that could be indicative of the value of the security.
Foreign Currency Translations
The books and records of the Fund are maintained in United States (U.S.) dollars. Foreign currencies, investments, and other assets and liabilities are translated into U.S. dollars at the current exchange rates. Purchases and sales of investment securities, income, and expenses are translated at the exchange rate prevailing on the respective dates of such transactions. Unrealized gains and losses that result from changes in foreign exchange rates and/or changes in market prices of securities have been included in unrealized appreciation/depreciation on investments and foreign currency translations. Net realized foreign currency gains and losses resulting from changes in exchange rates include foreign currency gains and losses between trade date and settlement date on investment securities transactions, foreign currency transactions, and the difference between the amounts of interest and dividends recorded on the books of the Fund and the amounts actually received. The portion of foreign currency gains and losses
| n | | Gabelli Capital Asset Fund |
Notes to Financial Statements (Continued)
related to fluctuation in exchange rates between the initial trade date and subsequent sale trade date is included in realized gain/(loss) on investments.
Foreign Securities
The Fund may directly purchase securities of foreign issuers. Investing in securities of foreign issuers involves special risks not typically associated with investing in securities of U.S. issuers. The risks include possible revaluation of currencies, the ability to repatriate funds, less complete financial information about companies, and possible future adverse political and economic developments. Moreover, securities of many foreign issuers and their markets may be less liquid and their prices more volatile than those of securities of comparable U.S. issuers.
Foreign Taxes
The Fund may be subject to foreign taxes on income, gains on investments, or currency repatriation, a portion of which may be recoverable. The Fund will accrue such taxes and recoveries as applicable, based upon its current interpretation of tax rules and regulations that exist in the markets in which they invest.
Securities Transactions and Investment Income
Securities transactions are accounted for on the trade date with realized gain or loss on investments determined by using the identified cost method. Interest income (including amortization of premium and accretion of discount) is recorded on the accrual basis. Premiums and discounts on debt securities are amortized using the effective yield to maturity method. Dividend income is recorded on the ex-dividend date except for certain dividends which are recorded as soon as the Fund is informed of the dividend.
Expenses
Certain administrative expenses are common to, and allocated among, various affiliated funds. Such allocations are made on the basis of each Fund’s average net assets or other criteria directly affecting the expenses as determined by the Adviser pursuant to procedures established by the Board.
Custodian Fee Credits
When cash balances are maintained in the custody account, the Fund receives credits which are used to offset custodian fees. The gross expenses paid under the custody arrangement are included in custodian fees in the Statement of Operations with the corresponding expense offset shown as “custodian fee credits”.
Dividends and Distributions to Shareholders
Dividends and distributions to shareholders are recorded on the ex-dividend date. Distributions to shareholders are based on income and capital gains as determined in accordance with Federal income tax regulations, which may differ from income and capital gains as determined under U.S. generally accepted accounting principles. These differences are primarily due to differing treatments of income and gains on various investment securities held by the Fund, timing differences, and differing characterizations of distributions made by the Fund. These book/tax differences are either temporary or permanent in nature. To the extent these differences are permanent, adjustments are made to the appropriate equity accounts in the period when the differences arise. These reclassifications have no impact on the Net Asset Value (“NAV”) per share of the Fund and the calculation of net investment income per share in the Financial Highlights excludes these adjustments. For the year ended December 31, 2005, reclassifications were made to increase accumulated net investment income by $1,563 and to increase distributions in excess of net realized gains on investments by $9,636, with an offsetting adjustment to additional paid in capital.
The tax character of distributions paid during the fiscal years ended December 31, 2005 and December 31, 2004 were as follows:
| | | | | | |
| | | Year Ended December 31,
2005
| | Year Ended
December 31,
2004
|
Distributions paid from: | | | | | | |
Ordinary income (inclusive of short-term capital gains) | | $ | 2,018,422 | | $ | 2,456,201 |
Net long-term capital gains | | | 12,735,305 | | | 6,591,694 |
| | |
|
| |
|
|
Total Distributions Paid: | | $ | 14,753,727 | | $ | 9,047,895 |
| | |
|
| |
|
|
Provision for Income Taxes
The Fund intends to continue to qualify as a regulated investment company under Subchapter M of the Internal Revenue Code of 1986, as amended (the “Code”). It is the policy of the Fund to comply with the requirements of the Code applicable to regulated investment companies and to distribute substantially all of its net investment company taxable income and net capital gains. Therefore, no provision for Federal income taxes is required.
At December 31, 2005, the difference between book basis and tax basis unrealized appreciation was primarily attributable to the tax deferral of losses on wash sales.
| n | | Gabelli Capital Asset Fund |
Notes to Financial Statements (Continued)
As of December 31, 2005, the components of accumulated earnings/(losses) on a tax basis were as follows:
| | | |
Net unrealized appreciation | | $ | 43,805,183 |
| | |
|
|
Total accumulated earnings | | $ | 43,805,183 |
| | |
|
|
The following summarizes the tax cost of investments and the related unrealized appreciation/depreciation of investments at December 31, 2005:
| | | | | | | | | | | | | |
| | | Cost | | Gross
Unrealized
Appreciation | | Gross Unrealized
Depreciation | | | Net
Unrealized
Appreciation/
(Depreciation) |
Investments | | $ | 175,440,370 | | $ | 60,692,261 | | $ | (16,887,078 | ) | | $ | 43,805,183 |
3. Agreements with Affiliated Parties
Pursuant to a management agreement (the “Management Agreement”), the Fund will pay Guardian Investor Services Corporation (the “Manager”) a fee, computed daily and paid monthly, at the annual rate of 1.00% of the value of its average daily net assets. Pursuant to an Investment Advisory Agreement among the Fund, the Manager and the Adviser, the Adviser, under the supervision of the Company’s Board of Directors and the Manager, manages the Fund’s assets in accordance with the Fund’s investment objectives and policies, makes investment decisions for the Fund, places purchase and sale orders on behalf of the Fund, provides investment research, and provides facilities and personnel required for the Fund’s administrative needs. The Adviser may delegate its administrative role and currently has done so to PFPC Inc., the Fund’s sub-administrator (the “Sub-Administrator”). The Adviser will supervise the performance of administrative and professional services provided by others and pays the compensation of the Sub-Administrator and all officers and Directors of the Company who are its affiliates. As compensation for its services and the related expenses borne by the Adviser, the Manager pays the Adviser a fee, computed daily and paid monthly, at the annual rate of 0.75% of the value of the Fund’s average daily net assets.
4. Portfolio Securities
Purchases and proceeds from the sales of securities for the year ended December 31, 2005, other than short-term securities, aggregated $63,723,855 and $56,553,494, respectively.
5. Transactions with Affiliates
During the year ended December 31, 2005, the Fund paid brokerage commissions of $165,494 to Gabelli & Company, Inc.
The cost of calculating the Fund’s NAV is a Fund expense pursuant to the Investment Advisory Agreement. During the year ended December 31, 2005, the Fund reimbursed the Adviser $45,000 in connection with the cost of computing the Fund’s NAV, which is included in miscellaneous expenses in the Statement of Operations.
The Fund is assuming its allocated cost of the Gabelli Funds’ Chief Compliance Officer in the amount of $5,271 for the year ended December 31, 2005, which is included in miscellaneous expenses in the Statement of Operations.
6. Line of Credit
The Fund has access to an unsecured line of credit of up to $25,000,000 from the custodian for temporary borrowing purposes. Borrowings under this arrangement bear interest at 0.75% above the Federal Funds rate on outstanding balances. At December 31, 2005, there were no borrowings outstanding from the line of credit.
The average daily amount of borrowings outstanding from the line of credit within the year ended December 31, 2005 was $20,140, with a weighted average interest rate of 4.94%. The maximum amount borrowed at any time during the year ended December 31, 2005 was $1,445,000.
| n | | Gabelli Capital Asset Fund |
Notes to Financial Statements (Continued)
7. Capital Stock Transactions
Transactions in shares of capital stock were as follows:
| | | | | | | | | | | | | | |
| | | Year Ended December 31, | | | Year Ended December 31, | |
| | | 2005 | | | 2004 | | | 2005 | | | 2004 | |
| | | Shares | | | Amount | |
Shares sold | | 973,276 | | | 1,438,260 | | | $ | 17,612,039 | | | $ | 24,537,637 | |
Shares issued upon reinvestment of dividends and distributions | | 845,486 | | | 495,232 | | | | 14,753,726 | | | | 9,047,895 | |
Shares redeemed | | (2,355,773 | ) | | (1,844,209 | ) | | | (42,946,769 | ) | | | (31,509,140 | ) |
|
|
Net increase (decrease) | | (537,011 | ) | | 89,283 | | | $ | (10,581,004 | ) | | $ | 2,076,392 | |
|
|
8. Indemnifications
The Fund enters into contracts that contain a variety of indemnifications. The Fund’s maximum exposure under these arrangements is unknown. However, the Fund has not had prior claims or losses pursuant to these contracts and expects the risk of loss to be remote.
9. Other Matters
The Adviser and/or affiliates have received subpoenas from the Attorney General of the State of New York and the Securities and Exchange Commission (the “SEC”) requesting information on mutual fund trading practices involving certain funds managed by the Adviser. GAMCO Investors, Inc., the Adviser’s parent company, is responding to these requests for documents and testimony. On a separate matter, in September 2005, the Adviser was informed by the staff of the SEC that the staff may recommend to the Commission that an administrative remedy and a monetary penalty be sought from the Adviser in connection with the actions of two of seven closed-end funds managed by the Adviser relating to Section 19(a) and Rule 19a-1 of the 1940 Act. These provisions require registered investment companies to provide written statements to shareholders when a dividend is made from a source other than net investment income. While the two closed-end funds sent annual statements and provided other materials containing this information, the funds did not send written statements to shareholders with each distribution in 2002 and 2003. The Adviser believes that all of the funds are now in compliance. The Adviser believes that these matters would have no effect on the Fund or any material adverse effect on the Adviser or its ability to manage the Fund.
| n | | Gabelli Capital Asset Fund |
Financial Highlights
Selected data for a share of capital stock outstanding throughout the periods indicated:
| | | | | | | | | | | | | | | |
| | | Year Ended December 31,
| |
| | | 2005 | | | 2004 | | | 2003 | | | 2002 | | | 2001 | |
Operating performance: | | | | | | | | | | | | | | | |
Net asset value, beginning of period | | $18.28 | | | $16.44 | | | $12.16 | | | $14.23 | | | $14.71 | |
|
|
Net investment income | | 0.05 | | | 0.06 | | | 0.02 | | | 0.03 | | | 0.07 | |
Net realized and unrealized gain (loss) on investments | | 0.33 | | | 2.50 | | | 4.29 | | | (2.07 | ) | | 0.31 | |
|
|
Total from investment operations | | 0.38 | | | 2.56 | | | 4.31 | | | (2.04 | ) | | 0.38 | |
|
|
Distributions to shareholders: | | | | | | | | | | | | | | | |
Net investment income | | (0.05 | ) | | (0.06 | ) | | (0.02 | ) | | (0.03 | ) | | (0.08 | ) |
Net realized gain on investments | | (1.21 | ) | | (0.66 | ) | | (0.01 | ) | | (0.00 | )(a) | | (0.78 | ) |
|
|
Total distributions | | (1.26 | ) | | (0.72 | ) | | (0.03 | ) | | (0.03 | ) | | (0.86 | ) |
|
|
Net asset value, end of period | | $17.40 | | | $18.28 | | | $16.44 | | | $12.16 | | | $14.23 | |
|
|
Total return† | | 2.0 | % | | 15.5 | % | | 35.5 | % | | (14.3 | )% | | 2.6 | % |
|
|
Ratios to average net assets and supplemental data: | | | | | | | | | | | | | | | |
Net assets, end of period (in 000’s) | | $219,127 | | | $240,035 | | | $214,480 | | | $158,831 | | | $193,150 | |
Ratio of net investment income to average net assets | | 0.26 | % | | 0.34 | % | | 0.13 | % | | 0.20 | % | | 0.54 | % |
Ratio of operating expenses to average net assets | | 1.10 | % | | 1.10 | % | | 1.11 | % | | 1.12 | % | | 1.09 | % |
Portfolio turnover rate | | 25 | % | | 27 | % | | 39 | % | | 19 | % | | 29 | % |
|
|
| † | | Total return represents aggregate total return of a hypothetical $1,000 investment at the beginning of the period and sold at the end of the period including reinvestment of dividends. |
| (a) | | Amount represents less than $0.005 per share. |
See accompanying notes to financial statements.
| n | | Gabelli Capital Asset Fund |
Report of Independent Registered
Public Accounting Firm
To the Shareholders and Board of Directors of
the Gabelli Capital Asset Fund
We have audited the accompanying statement of assets and liabilities, including the schedule of investments, of the Gabelli Capital Asset Fund (the “Fund”), a series of Gabelli Capital Series Funds, Inc., as of December 31, 2005, and the related statement of operations for the year then ended, the statements of changes in net assets for each of the two years in the period then ended, and the financial highlights for each of the five years in the period then ended. These financial statements and financial highlights are the responsibility of the Fund’s management. Our responsibility is to express an opinion on these financial statements and financial highlights based on our audits.
We conducted our audits in accordance with the standards of the Public Company Accounting Oversight Board (United States). Those standards require that we plan and perform the audit to obtain reasonable assurance about whether the financial statements and financial highlights are free of material misstatement. We were not engaged to perform an audit of the Fund’s internal control over financial reporting. Our audits included consideration of internal control over financial reporting as a basis for designing audit procedures that are appropriate in the circumstances, but not for the purpose of expressing an opinion on the effectiveness of the Fund’s internal control over financial reporting. Accordingly, we express no such opinion. An audit also includes examining, on a test basis, evidence supporting the amounts and disclosures in the financial statements and financial highlights, assessing the accounting principles used and significant estimates made by management, and evaluating the overall financial statement presentation. Our procedures included confirmation of securities owned as of December 31, 2005, by correspondence with the Fund’s custodian. We believe that our audits provide a reasonable basis for our opinion.
In our opinion, the financial statements and financial highlights referred to above present fairly, in all material respects, the financial position of the Gabelli Capital Asset Fund, a series of Gabelli Capital Series Funds, Inc., at December 31, 2005, the results of its operations for the year then ended, the changes in its net assets for each of the two years in the period then ended, and the financial highlights for each of the five years in the period then ended, in conformity with U.S. generally accepted accounting principles.

Philadelphia, Pennsylvania
February 14, 2006
| n | | Gabelli Capital Asset Fund |
Additional Information (Unaudited)
The business and affairs of the Fund are managed under the direction of the Company’s Board of Directors. Information pertaining to the Directors and Officers of the Fund is set forth below. The Fund’s Statement of Additional Information includes additional information about Gabelli Capital Series Funds, Inc. Directors and is available, without charge, upon request, by writing to Gabelli Capital Series Funds, Inc. at One Corporate Center, Rye, NY 10580-1422.
| | | | | | | | |
Name, Position(s)
Address1 and Age | | Term of
Office and
Length of Time
Served2 | | Number of
Funds in
Fund
Complex
Overseen by
Director | | Principal Occupation(s)
During Past Five Years | | Other Directorships
Held by Director4 |
| | | | |
Interested Directors3 | | | | | | | | |
Mario J. Gabelli,
Director and Chief Investment Officer
Age: 63 | | Since 1995 | | 24 | | Chairman of the Board and Chief Executive Officer of GAMCO Investors, Inc. and Chief Investment Officer — Value Portfolios of Gabelli Funds, LLC and GAMCO Asset Management Inc.; Chairman and Chief Executive Officer of Lynch Interactive Corporation (multimedia and services) | | Director of Morgan Group
Holdings, Inc. (holding
company) |
| | | | |
Arthur V. Ferrara Director
Age: 75 | | Since 1995 | | 6 | | Formerly, Chairman of the Board and Chief Executive Officer of The Guardian Life Insurance Company of America from January 1993 to December 1995; President, Chief Executive Officer and a Director prior thereto | | Director/Trustee of 25
mutual funds within the
Guardian Fund Complex |
| | | | |
Non-Interested Directors: | | | | | | | | |
Anthony J. Colavita Director
Age: 70 | | Since 1995 | | 34 | | Partner in the law firm of
Anthony J. Colavita, P.C. | | — |
| | | | |
Anthony R. Pustorino Director
Age: 80 | | Since 1995 | | 14 | | Certified Public Accountant; Professor
Emeritus, Pace University | | Director of Lynch Corp.
(diversified
manufacturing) |
| | | | |
Werner J. Roeder, MD Director
Age: 65 | | Since 1995 | | 23 | | Medical Director of Lawrence Hospital and practicing private physician | | — |
| | | | |
Anthonie C. van Ekris Director
Age: 71 | | Since 1995 | | 18 | | Chairman of BALMAC International, Inc. (commodities and futures trading) | | — |
| | | | |
Officers: | | | | | | | | |
Bruce N. Alpert President and Treasurer Age: 54 | | Since 1995 | | — | | Executive Vice President and Chief Operating Officer of Gabelli Funds, LLC since 1988 and an officer of all of the registered investment companies in the Gabelli Funds complex. Director and President of Gabelli Advisers, Inc. since 1998. | | — |
| | | | |
James E. McKee Secretary
Age: 42 | | Since 1995 | | — | | Vice President, General Counsel and Secretary of GAMCO Investors, Inc. since 1999 and GAMCO Asset Management Inc. since 1993; Secretary of all of the registered investment companies in the Gabelli Funds complex. | | — |
| n | | Gabelli Capital Asset Fund |
Additional Information (Unaudited) (Continued)
| | | | |
Name, Position(s)
Address1 and Age | | Term of
Office and
Length of Time
Served2 | | Principal Occupation(s)
During Past Five Years |
| | |
Peter D. Goldstein Chief Compliance Officer Age: 52 | | Since 2004 | | Director of Regulatory Affairs at GAMCO
Investors, Inc. since 2004; Chief Compliance Officer of all of the registered investment companies in the Gabelli Funds Complex; Vice President of Goldman Sachs Asset Management from 2000 through 2004; Deputy General Counsel of GAMCO Investors, Inc. from 1998 through 2000. |
| 1. | | Address: One Corporate Center, Rye, NY 10580-1422, unless otherwise noted. |
| 2. | | Each Director will hold office for an indefinite term until the earliest of (i) the next meeting of shareholders, if any, called for the purposes of considering the election or re-election of such Director and until the election and qualification of his or her successor, if any, elected at such meeting, or (ii) the date a Director resigns or retires, or a Director is removed by the Board of Directors or shareholders, in accordance with the Fund’s Amended and Restated By-Laws and Articles of Amendment and Restatement. Each officer will hold office for an indefinite term until the date he or she resigns or retires or until his or her successor is elected and qualified. Effective November 16, 2005, Mr. Karl Otto Pöhl resigned from the Board of Directors and now serves as Director Emeritus. |
| 3. | | “Interested person” of the Fund as defined in the Investment Company Act of 1940. Mr. Gabelli is considered an “interested person” because of his affiliation with Gabelli Funds, LLC which acts as the Fund’s investment adviser. Mr. Ferrara is considered an interested person because of his affiliation with The Guardian Life Insurance Company of America, which is the parent company of the Fund’s Manager. |
| 4. | | This column includes only directorships of companies required to report to the SEC under the Securities Exchange Act of 1934, as amended (i.e. public companies) or other investment companies registered under the 1940 Act. |
| n | | Gabelli Capital Asset Fund |
2005 Tax Notice to Shareholders (Unaudited)
For the fiscal year ended December 31, 2005, the Fund paid to shareholders on December 28, 2005 an ordinary income dividend (comprised of net investment income and short-term capital gains) totaling $0.170 per share and a long-term capital gain distribution totaling $1.085 per share and is designated as a capital gain distribution. For the fiscal year ended December 31, 2005, 100% of the ordinary income dividend qualified for the dividend received deduction available to corporations, and 100% of the ordinary income distribution was qualified dividend income.
| | (a) | The registrant, as of the end of the period covered by this report, has adopted a code of ethics that applies to the registrant’s principal executive officer, principal financial officer, principal accounting officer or controller, or persons performing similar functions, regardless of whether these individuals are employed by the registrant or a third party. |
| | (c) | There have been no amendments, during the period covered by this report, to a provision of the code of ethics that applies to the registrant’s principal executive officer, principal financial officer, principal accounting officer or controller, or persons performing similar functions, regardless of whether these individuals are employed by the registrant or a third party, and that relates to any element of the code of ethics description. |
| | (d) | The registrant has not granted any waivers, including an implicit waiver, from a provision of the code of ethics that applies to the registrant’s principal executive officer, principal financial officer, principal accounting officer or controller, or persons performing similar functions, regardless of whether these individuals are employed by the registrant or a third party, that relates to one or more of the items set forth in paragraph (b) of this item’s instructions. |
| Item 3. | Audit Committee Financial Expert. |
As of the end of the period covered by the report, the registrant’s Board of Directors has determined that Anthony R. Pustorino is qualified to serve as an audit committee financial expert serving on its audit committee and that he is “independent,” as defined by Item 3 of Form N-CSR.
| Item 4. | Principal Accountant Fees and Services. |
Audit Fees
| | (a) | The aggregate fees billed for each of the last two fiscal years for professional services rendered by the principal accountant for the audit of the registrant’s annual financial statements or services that are normally provided by the accountant in connection with statutory and regulatory filings or engagements for those fiscal years are $38,800 in 2005 and $35,300 in 2004. |
Audit-Related Fees
| | (b) | The aggregate fees billed in each of the last two fiscal years for assurance and related services by the principal accountant that are reasonably related to the performance of the audit of the registrant’s financial statements and are not reported under paragraph (a) of this Item are $0 in 2005 and $0 in 2004. |
Tax Fees
| | (c) | The aggregate fees billed in each of the last two fiscal years for professional services rendered by the principal accountant for tax compliance, tax advice, and tax planning are $3,600 in 2005 and $3,400 in 2004. |
Tax fees represent tax compliance services provided in connection with the review of the Registrant’s tax returns.
All Other Fees
| | (d) | The aggregate fees billed in each of the last two fiscal years for products and services provided by the principal accountant, other than the services reported in paragraphs (a) through (c) of this Item are $0 in 2005 and $0 in 2004. |
| | |
(e)(1) | | Disclose the audit committee’s pre-approval policies and procedures described in paragraph (c)(7) of Rule 2-01 of Regulation S-X. |
| |
| | Pre-Approval Policies and Procedures. The Audit Committee (“Committee”) of the registrant is responsible for pre-approving (i) all audit and permissible non-audit services to be provided by the independent auditors to the registrant and (ii) all permissible non-audit services to be provided by the independent auditors to the Adviser, Gabelli Funds, LLC, and any affiliate of Gabelli Funds, LLC (“Gabelli”) that provides services to the registrant (a “Covered Services Provider”) if the independent auditors’ engagement related directly to the operations and financial reporting of the registrant. The Committee may delegate its responsibility to pre-approve any such audit and permissible non-audit services to the Chairperson of the Committee, and the Chairperson must report to the Committee, at its next regularly scheduled meeting after the Chairperson’s pre-approval of such services, his or her decision(s). The Committee may also establish detailed pre-approval policies and procedures for pre-approval of such services in accordance with applicable laws, including the delegation of some or all of the Committee’s pre-approval responsibilities to the other persons (other than Gabelli or the registrant’s officers). Pre-approval by the Committee of any permissible non-audit services is not required so long as: (i) the aggregate amount of all such permissible non-audit services provided to the registrant, Gabelli and any Covered Services Provider constitutes not more than 5% of the total amount of revenues paid by the registrant to its independent auditors during the fiscal year in which the permissible non-audit services are provided; (ii) the permissible non-audit services were not recognized by the registrant at the time of the engagement to be non-audit services; and (iii) such services are promptly brought to the attention of the Committee and approved by the Committee or Chairperson prior to the completion of the audit. |
| |
(e)(2) | | The percentage of services described in each of paragraphs (b) through (d) of this Item that were approved by the audit committee pursuant to paragraph (c)(7)(i)(C) of Rule 2-01 of Regulation S-X are as follows: |
| | (f) | The percentage of hours expended on the principal accountant’s engagement to audit the registrant’s financial statements for the most recent fiscal year that were attributed to work performed by persons other than the principal accountant’s full-time, permanent employees was zero percent (0%). |
| | (g) | The aggregate non-audit fees billed by the registrant’s accountant for services rendered to the registrant, and rendered to the registrant’s investment adviser (not including any sub-adviser whose role is primarily portfolio management and is subcontracted with or overseen by another investment adviser), and any entity controlling, controlled by, or under common control with the adviser that provides ongoing services to the registrant for each of the last two fiscal years of the registrant was $68,600 in 2005 and $68,400 in 2004. |
| | (h) | The registrant’s audit committee of the board of directors has considered whether the provision of non-audit services that were rendered to the registrant’s investment adviser (not including any sub-adviser whose role is primarily portfolio management and is subcontracted with or overseen by another investment adviser), and any entity controlling, controlled by, or under common control with the investment adviser that provides ongoing services to the registrant that were not pre-approved pursuant to paragraph (c)(7)(ii) of Rule 2-01 of Regulation S-X is compatible with maintaining the principal accountant’s independence. |
| Item 5. | Audit Committee of Listed registrants. |
Not applicable.
| Item 6. | Schedule of Investments. |
Schedule of Investments in securities of unaffiliated issuers as of the close of the reporting period is included as part of the report to shareholders filed under Item 1 of this form.
| Item 7. | Disclosure of Proxy Voting Policies and Procedures for Closed-End Management Investment Companies. |
Not applicable.
| Item 8. | Portfolio Managers of Closed-End Management Investment Companies. |
Not applicable.
| Item 9. | Purchases of Equity Securities by Closed-End Management Investment Company and Affiliated Purchasers. |
Not applicable.
| Item 10. | Submission of Matters to a Vote of Security Holders. |
There have been no material changes to the procedures by which the shareholders may recommend nominees to the registrant’s Board of Directors, where those changes were implemented after the registrant last provided disclosure in response to the requirements of Item 7(d)(2)(ii)(G) of Schedule 14A (17 CFR 240.14a-101), or this Item.
| Item 11. | Controls and Procedures. |
| | (a) | The registrant’s principal executive and principal financial officers, or persons performing similar functions, have concluded that the registrant’s disclosure controls and procedures (as defined in Rule 30a-3(c) under the Investment Company Act of 1940, as amended (the “1940 Act”) (17 CFR 270.30a-3(c))) are effective, as of a date within 90 days of the filing date of the report that includes the disclosure required by this paragraph, based on their evaluation of these controls and procedures required by Rule 30a-3(b) under the 1940 Act (17 CFR 270.30a-3(b)) and Rules 13a-15(b) or 15d-15(b) under the Securities Exchange Act of 1934, as amended (17 CFR 240.13a-15(b) or 240.15d-15(b)). |
| | (b) | There were no changes in the registrant’s internal control over financial reporting (as defined in Rule 30a-3(d) under the 1940 Act (17 CFR 270.30a-3(d)) that occurred during the registrant’s second fiscal quarter of the period covered by this report that has materially affected, or is reasonably likely to materially affect, the registrant’s internal control over financial reporting. |
| | |
(a)(1) | | Code of ethics, or any amendment thereto, that is the subject of disclosure required by Item 2 is attached hereto. |
| |
(a)(2) | | Certifications pursuant to Rule 30a-2(a) under the 1940 Act and Section 302 of the Sarbanes-Oxley Act of 2002 are attached hereto. |
| |
(a)(3) | | Not applicable. |
| |
(b) | | Certifications pursuant to Rule 30a-2(b) under the 1940 Act and Section 906 of the Sarbanes-Oxley Act of 2002 are attached hereto. |
SIGNATURES
Pursuant to the requirements of the Securities Exchange Act of 1934 and the Investment Company Act of 1940, the registrant has duly caused this report to be signed on its behalf by the undersigned, thereunto duly authorized.
| | |
| (registrant) | | Gabelli Capital Series Funds, Inc. |
| |
| By (Signature and Title)* | | /s/ Bruce N. Alpert |
| | Bruce N. Alpert, Principal Executive Officer |
Date March 8, 2006
Pursuant to the requirements of the Securities Exchange Act of 1934 and the Investment Company Act of 1940, this report has been signed below by the following persons on behalf of the registrant and in the capacities and on the dates indicated.
| | |
| |
| By (Signature and Title)* | | /s/ Bruce N. Alpert |
| | Bruce N. Alpert, Principal Executive Officer & Principal Financial Officer |
| * | Print the name and title of each signing officer under his or her signature. |