Exhibit 99.2

Second Quarter 2012 Financial Results
July 27, 2012
Safe Harbor Statement
This presentation may contain forward-looking statements within the meaning of the Private Securities Litigation Reform Act of 1995 regarding the future performance of NV Energy, Inc. and its subsidiaries, Nevada Power Company and Sierra Pacific Power Company both d/b/a NV Energy. Forward-looking statements include earnings guidance and estimates or forecasts of operating and financial metrics. These statements reflect current expectations of future conditions and events and as such are subject to a variety of risks, uncertainties and assumptions that could cause actual results to differ materially from current expectations. These risks, uncertainties and assumptions include, but are not limited to, NV Energy Inc.’s ability to maintain access to the capital markets, NV Energy Inc.’s ability to receive dividends from its subsidiaries, the financial performance of NV Energy Inc.’s subsidiaries, particularly Nevada Power Company and Sierra Pacific Power Company both d/b/a NV Energy, and the discretion of NV Energy Inc.’s Board of Directors with respect to the payment of future dividends based on its periodic review of factors that ordinarily affect dividend policy, such as current and prospective financial condition, earnings and liquidity, prospective business conditions, regulatory factors, and dividend restrictions in NV Energy Inc.’s and its subsidiaries’ financing agreements. For Nevada Power Company and Sierra Pacific Power Company both d/b/a NV Energy, these risks and uncertainties include, but are not limited to, future economic conditions both nationally and regionally, changes in the rate of industrial, commercial and residential growth in their service territories, their ability to procure sufficient renewable energy sources in each compliance year to satisfy the Nevada Renewable Energy Portfolio Standard, changes in environmental laws and regulations, construction risks, including but not limited to those associated with the ON Line project, their ability to maintain access to the capital markets for general corporate purposes and to finance construction projects, employee workforce factors, unseasonable weather, drought, wildfire and other natural phenomena, explosions, fires, accidents, mechanical breakdowns that may occur while operating and maintaining an electric and natural gas system, their ability to purchase sufficient fuel, natural gas and power to meet their power demands and natural gas demands for Sierra Pacific Power Company d/b/a NV Energy, financial market conditions, and unfavorable rulings in their pending and future regulatory filings. Further risks, uncertainties and assumptions that may cause actual results to differ from current expectations pertain to weather conditions, customer and sales growth, plant outages, operations and maintenance expense, depreciation and allowance for funds used during construction, interest rates and expense, cash flow and regulatory matters. Additional cautionary statements regarding other risk factors that could have an effect on the future performance of NV Energy, Inc., Nevada Power Company and Sierra Pacific Power Company both d/b/a NV Energy are contained in their Annual Reports on Form 10-K for the year ended December 31, 2011, and quarterly reports on Form 10-Q for the periods ended March 31, 2012 and June 30, 2012, each filed with the Securities and Exchange Commission. NV Energy Inc., Nevada Power Company and Sierra Pacific Power Company both d/b/a NV Energy undertake no obligation to release publicly the result of any revisions to these forward-looking statements that may be made to reflect events or circumstances after the date hereof or to reflect the occurrence of unanticipated events.
IR Contacts
Max Kuniansky
Executive, Investor Relations (702) 402-5627 mkuniansky@nvenergy.com
Britta Carlson
Manager, Investor and Shareholder Relations (702) 402-5624 bcarlson@nvenergy.com
2
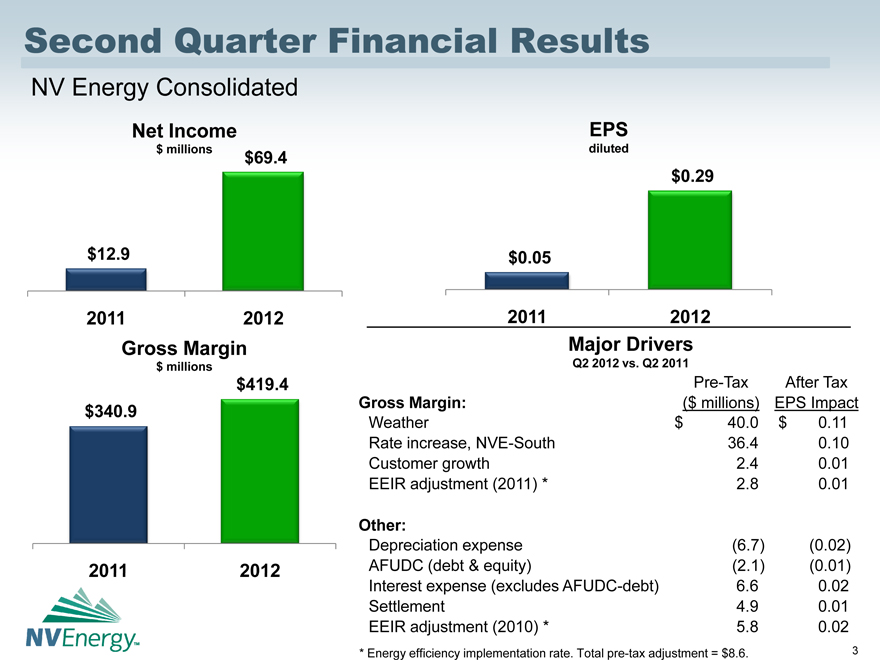
Second Quarter Financial Results
NV Energy Consolidated
Net Income
$ millions
$69.4
$12.9
2011 2012
EPS
diluted
$0.05
$0.29
2011 2012
Gross Margin
$ millions
$340.9
$419.4
2011
2012
Major Drivers
Q2 2012 vs. Q2 2011
Pre-Tax After Tax
Gross Margin:($ millions) EPS Impact
Weather $ 40.0 $ 0.11
Rate increase, NVE-South 36.4 0.10
Customer growth 2.4 0.01
EEIR adjustment (2011) * 2.8 0.01
Other:
Depreciation expense(6.7)(0.02)
AFUDC (debt & equity)(2.1)(0.01)
Interest expense (excludes AFUDC-debt) 6.6 0.02
Settlement 4.9 0.01
EEIR adjustment (2010) * 5.8 0.02
* Energy efficiency implementation rate. Total pre-tax adjustment = $8.6.
3
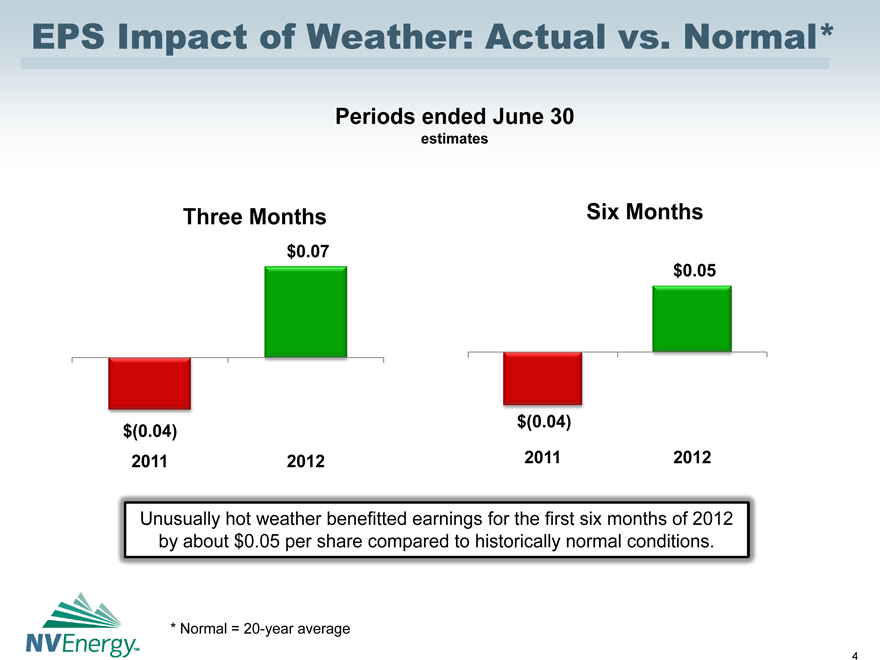
EPS Impact of Weather: Actual vs. Normal*
Periods ended June 30
estimates
Three Months
$0.07
$(0.04) 2011
2012
Six Months
$0.05
$(0.04)
2011
2012
Unusually hot weather benefitted earnings for the first six months of 2012 by about $0.05 per share compared to historically normal conditions.
* Normal = 20-year average
4

Favorable Weather in Second Quarter 2012
Cooling Degree-Days
NV Energy-South
731 623 639
494
393
241 192 121 121
April May June
2011 2012 Normal *
Cooling degree-days in southern Nevada were 44% greater than 2011, and 23% greater than normal.
* Normal = 20-year average
5
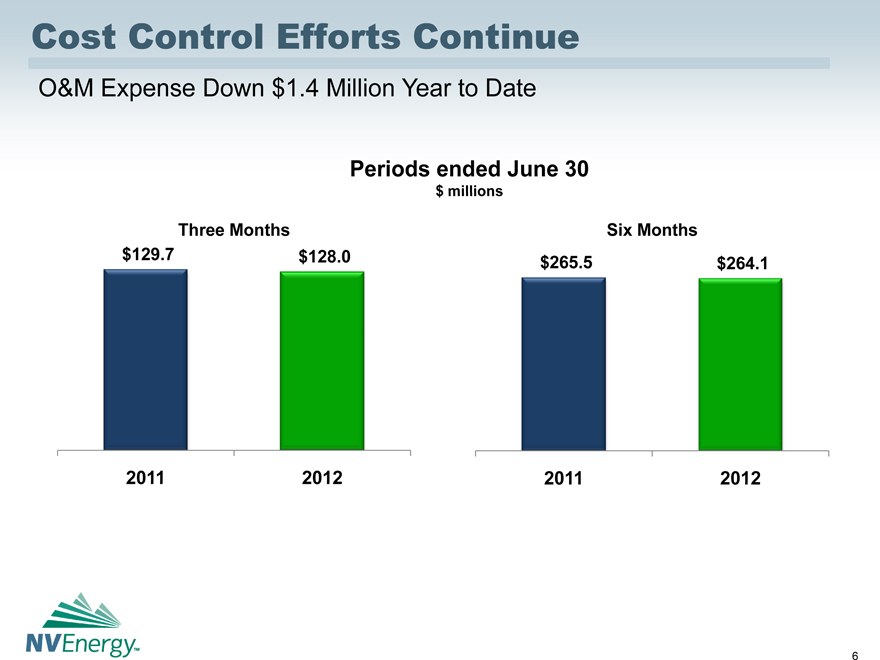
Cost Control Efforts Continue
O&M Expense Down $1.4 Million Year to Date
Periods ended June 30
$ millions
Three Months
$129.7
$128.0
Six Months
$265.5
$264.1
2011 2012
2011 2012
6
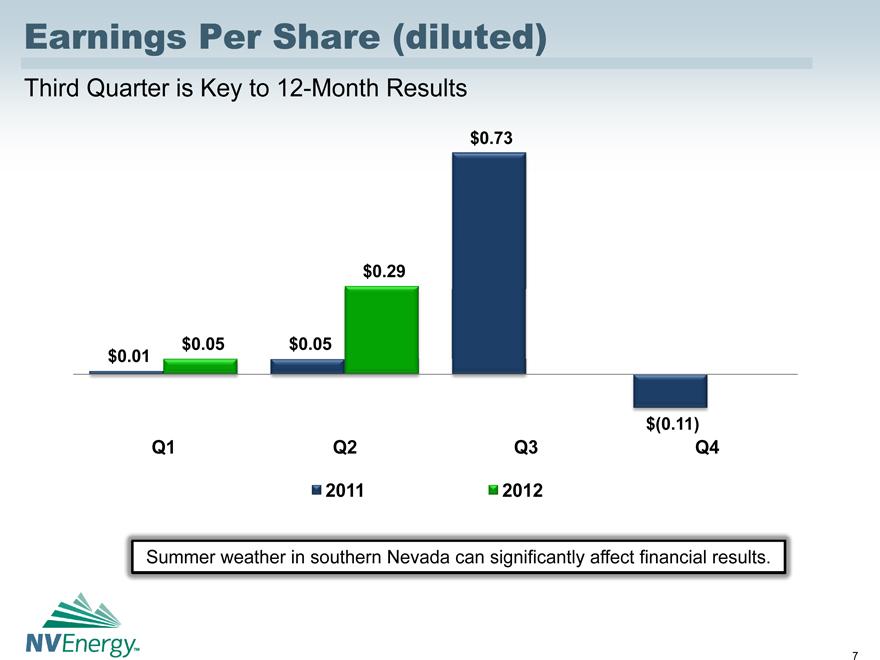
Earnings Per Share (diluted)
Third Quarter is Key to 12-Month Results
$0.73
$0.29
$0.05
$0.05
$0.01
Q1 Q2 Q3
$(0.11) Q4
2011 2012
Summer weather in southern Nevada can significantly affect financial results.
7
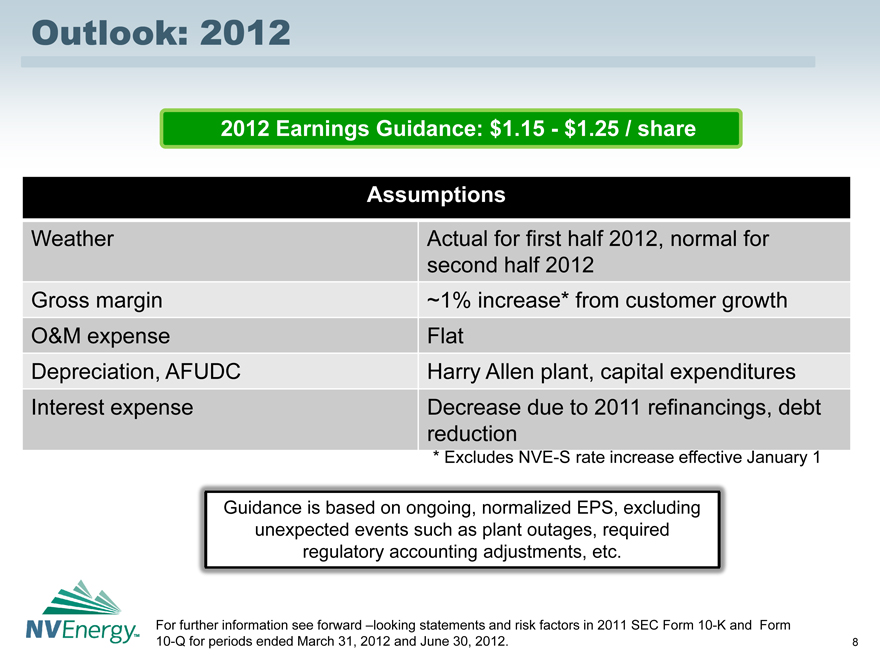
Outlook: 2012
2012 Earnings Guidance: $1.15 - $1.25 / share
Assumptions
Weather Actual for first half 2012, normal for second half 2012
Gross margin ~1% increase* from customer growth
O&M expense Flat
Depreciation, AFUDC Harry Allen plant, capital expenditures
Interest expense Decrease due to 2011 refinancings, debt reduction
* Excludes NVE-S rate increase effective January 1
Guidance is based on ongoing, normalized EPS, excluding unexpected events such as plant outages, required regulatory accounting adjustments, etc.
For further information see forward –looking statements and risk factors in 2011 SEC Form 10-K and Form
10-Q for periods ended March 31, 2012 and June 30, 2012.
8
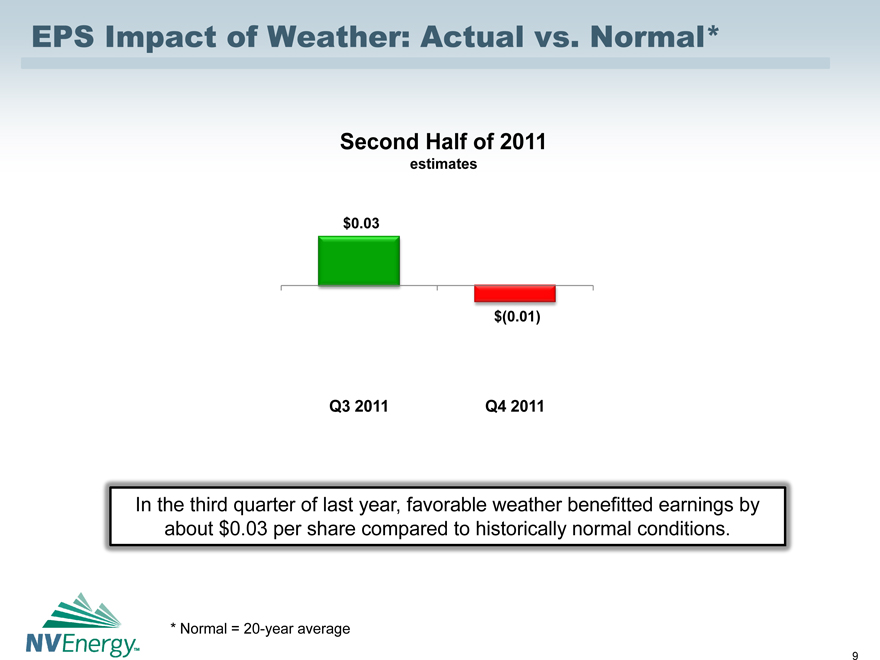
EPS Impact of Weather: Actual vs. Normal*
Second Half of 2011
estimates
$0.03
$(0.01)
Q3 2011 Q4 2011
In the third quarter of last year, favorable weather benefitted earnings by about $0.03 per share compared to historically normal conditions.
* Normal = 20-year average
9
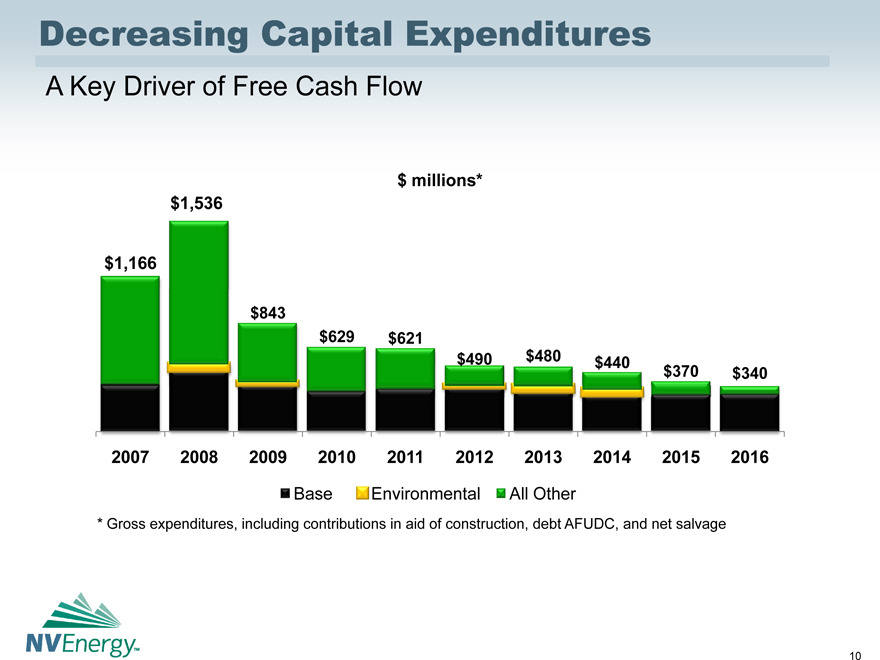
Decreasing Capital Expenditures
A Key Driver of Free Cash Flow
$ millions*
$1,536
$1,166
$843 $629 $621 $490 $480 $440 $370 $340
2007 2008 2009 2010 2011 2012 2013 2014 2015 2016
Base Environmental All Other
* Gross expenditures, including contributions in aid of construction, debt AFUDC, and net salvage
10
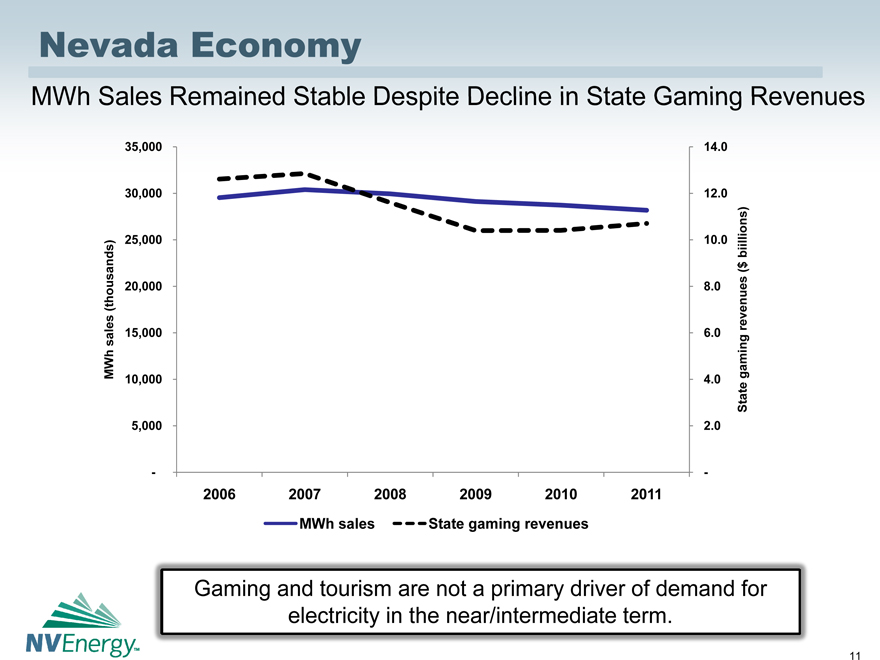
Nevada Economy
MWh Sales Remained Stable Despite Decline in State Gaming Revenues
MWh sales (thousands)
35,000 30,000 25,000 20,000 15,000
10,000 5,000 -
14.0
12.0
10.0 8.0 6.0 4.0 2.0
State gaming revenues ($ biillions)
2006 2007 2008 2009 2010 2011
MWh sales State gaming revenues
Gaming and tourism are not a primary driver of demand for electricity in the near/intermediate term.
11
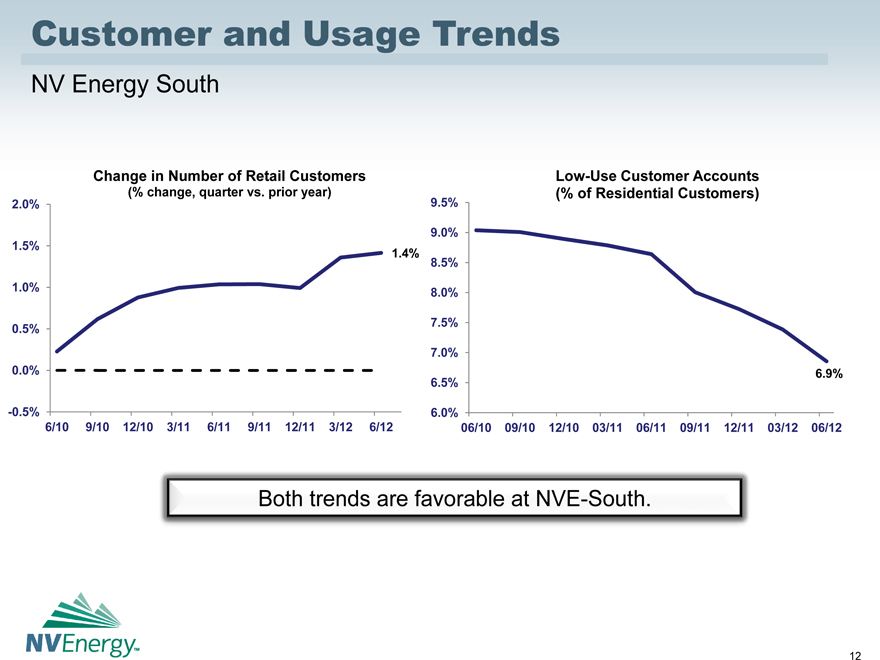
Customer and Usage Trends
NV Energy South
Change in Number of Retail Customers (% change, quarter vs. prior year)
2.0% 1.5% 1.0% 0.5% 0.0% -0.5%
1.4%
6/10 9/10 12/10 3/11 6/11 9/11 12/11 3/12 6/12
9.5% 9.0% 8.5% 8.0% 7.5% 7.0% 6.5% 6.0%
Low-Use Customer Accounts (% of Residential Customers)
06/10 09/10 12/10 03/11 06/11 09/11 12/11 03/12 06/12
Both trends are favorable at NVE-South.
12
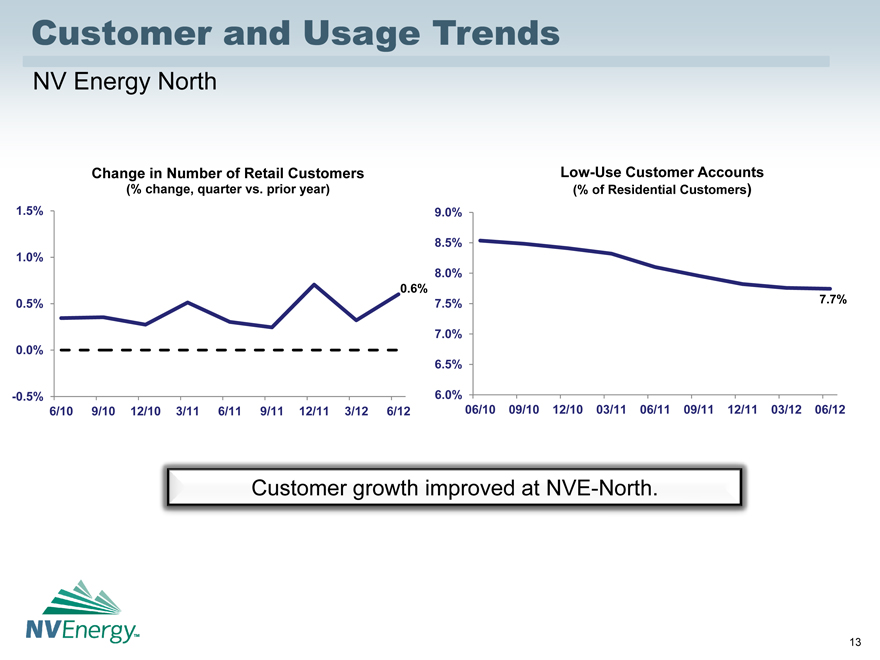
Customer and Usage Trends
NV Energy North
Change in Number of Retail Customers Low-Use Customer Accounts (% change, quarter vs. prior year) (% of Residential Customers)
1.5%
1.0%
0.5%
0.0% -0.5%
9.0%
8.5%
8.0%
7.5%
7.0%
6.5%
6.0%
6/10 9/10 12/10 3/11 6/11 9/11 12/11 3/12 6/12 06/10 09/10 12/10 03/11 06/11 09/11 12/11 03/12 06/12
Customer growth improved at NVE-North.
13
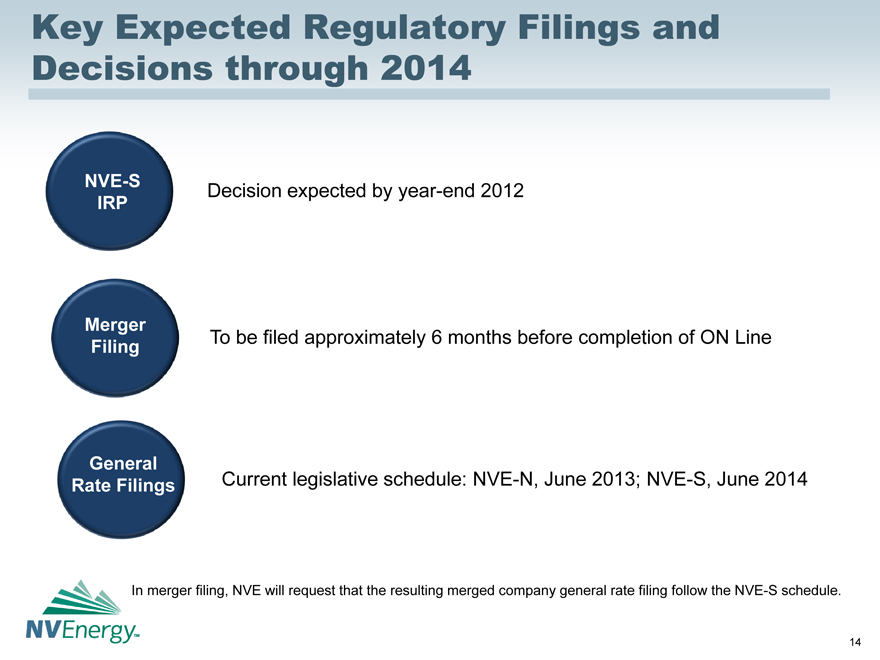
Key Expected Regulatory Filings and Decisions through 2014
NVE-S IRP
Merger Filing
Rate General Filings Rate Filings
Decision expected by year-end 2012
To be filed approximately 6 months before completion of ON Line
Current legislative schedule: NVE-N, June 2013; NVE-S, June 2014
In merger filing, NVE will request that the resulting merged company general rate filing follow the NVE-S schedule.
14