| 11 March 2011 |
Mr Jim Rosenberg
Senior Assistant Chief Accountant
Division of Corporation Finance
US Securities and Exchange Commission
Washington D.C. 20549
Re: AstraZeneca, Plc
Form 20-F for Fiscal Year Ended December 31, 2009
File No. 001-11960
Dear Mr Rosenberg,
Further to your letter of February 8, and telephone conference of March 4, please find attached our responses to the comments you have raised with respect to our Form 20-F for the fiscal year ended 31 December 2009. In making these responses, we acknowledge that:
| · | the Company is responsible for the adequacy and accuracy of the disclosure in the filing; |
| · | staff comments or changes to disclosure in response to staff comments do not foreclose the Commission from taking any action with respect to the filing; and |
| · | the Company may not assert staff comments as a defence in any proceeding initiated by the Commission or any person under the federal securities law of the United States. |
We trust that these responses provide you with the information you require.
Should you have any further queries, please do not hesitate to contact either Paul Kenyon, Senior Vice President Finance, on +44 207 604 8070, Andy Chard, Director of Financial Reporting, on +44 1625 517279 or me, on +44 207 604 8052.
Yours sincerely,
S Lowth
Chief Financial Officer
Directors’ Report: Resources Skills and Capabilities
Development Pipeline, page 196
| 1. | Please refer to prior comment one. Please expand your proposed disclosure to provide greater insight into the criteria used by your R&D Executive Committee/Portfolio Investment Board in its prioritization and funding of discovery and development projects. Please include the “factors and considerations”, particularly for later stage development projects, that have determined your “commercial decisions as to which projects should proceed and what level of investment (each of these) projects should receive.” In your proposed disclosure, describe the level of investment planned for later stage development projects, listed in the Development Pipeline table, for future periods. |
Criteria used by the Portfolio Investment Board in its prioritization and funding of discovery and development projects.
AstraZeneca’s strategy is to be a focused, integrated, innovation-driven, global, prescription-based biopharmaceutical company. The focus of our efforts to implement this strategy in 2010 was on making the transformational business changes needed to generate sustainable long-term value. At the heart of these changes was our single, global R&D organization in which internal discovery activities are focused on those diseases within AstraZeneca’s existing therapy areas where we believe that there is the greatest potential.
The Portfolio Investment Board (‘PIB’) is a senior-level management body which has overall responsibility for ensuring that the Group has a consistent, integrated and global approach to investment decisions in both the early and late stage development pipeline. Its remit is intended to ensure that the Group maximizes the value of its investments in both internal and external research and development. Its principal considerations in making these decisions are factors relating to the assessment of potential demand for medicines. These may include, but are not limited to, global unmet medical need, potential competitors, potential market penetration and market maturity.
Reflecting the changes detailed above, and as a result of our previous correspondence with you concerning our Form 20-F for the year ended December 31, 2009, we have expanded our disclosures in our 2010 Annual Report and Form 20-F Information (the ‘2010 Annual Report’) to provide greater details of the operations and responsibilities of the PIB, including enhanced insight in to the criteria used by the PIB in its prioritization and funding of discovery and development projects.
As an appendix to this letter, we have included examples of relevant extracts from our 2010 Annual Report describing the role of the PIB as well as, more generally, disclosure regarding the changes implemented across our R&D organization through 2010, the focus of our R&D operations, our R&D investment strategy and discussion as to the discontinuation of development of specific product candidates during the applicable year. For example, the appendix includes enhanced disclosure regarding the structural, operational and strategic changes made to AstraZeneca’s R&D organization and disease area strategy during the year, such as:
| a) | disclosure regarding the role and responsibilities of the newly established PIB at pages 28, 29 and 116; |
| b) | a detailed description of the scope and core focus of our transformed R&D operations, at pages 25 – 30; and |
| c) | a discussion of the changes to the R&D organization directly from the Board of Directors and executive management team, in the Chairman’s Statement at page 7 and CEO’s Review at page 9. |
We have also included in the appendix specific disclosure, highlighted in yellow at pages 9, 26 – 29, 96 and 116, of:
| a) | the range of factors that may affect development of individual pharmaceutical product candidates, including those that are taken into consideration by the PIB in effecting its mandate; |
| b) | the areas of R&D in which AstraZeneca decided to invest during 2010 in order to reshape R&D performance and the reasons underlying these strategic decisions; and |
| c) | examples of both internal and collaborative development candidates that were discontinued during the year. |
Further, please see our “Life-cycle of a medicine” section, at pages 20 and 21, which illustrates areas of relevance in the advancement of a development candidate, including safety and initial efficacy studies, stages of clinical studies, and regulatory submissions.
All of the disclosure included in the appendix to this letter will be included in our Form 20-F for the year ended December 31, 2010.
We believe that the disclosure contained in these extracts provides visibility to investors, in the most meaningful way, into the commercial decisions regarding our R&D made by the PIB and allows investors to view the financial and operating performance of, and strategic rationales underlying, AstraZeneca’s business in the same way as Group management.
This disclosure also satisfies the applicable requirements of Form 20-F Items 4 and 5 that registrants disclose the nature of their operations and a description of their R&D policies.
Investment levels
It is a feature of the pharmaceutical market that products at market generate significant returns (and margins) and hence once a product candidate has been identified as meeting the various factors discussed above that are used in evaluation of investment decisions, the considerations determining the future investment level are based on scientific considerations (i.e., the probability of success) rather than financial ones (such as Net Present Values). It is the case that the most significant portion of the cost of development of a compound occurs very early during its research.
Given the above, future development costs are only a significant factor in decisions with respect to a very small number of our late stage development projects. Such projects are not significant in terms of future revenues and, therefore, are not of the level of significance to warrant separate disclosure to the readers of our financial statements.
As detailed in our previous response letters, AstraZeneca manages its R&D expenditure on an integrated basis as part of its global budget. In our 2010 Annual Report, this single R&D operation is specifically discussed in several areas including pages 7, 8, 9 and 26 included in the appendix to this letter.
For the above reasons, the Group does not manage, and the PIB does not monitor, R&D expenditure (historic costs or forecast future expenditure) on a project by project, therapy area or stage of completion basis and the Group does not report, either internally or externally, in this way.
We have included in our 2010 Annual Report more detailed information on the global management of our R&D expenditure and the key metrics for our R&D expenditure including:
| a) | Disclosure regarding AstraZeneca’s global management of R&D expenditure, highlighted in orange in the attached appendix; |
| b) | Levels of AstraZeneca’s overall capital expenditures made during 2010, 2009 and 2008 and contracted capital expenditures for the next five-year period, at pages 84 and 141 and in accordance with Form 20-F Item 5; |
| c) | Detailed disclosure of Core R&D (being the definition of Core used in the Financial Review section of our Annual Report) investment made during the prior three years, highlighted in green and in accordance with Form 20-F Item 5; |
| d) | Enhanced detail regarding payments due under R&D collaboration and externalization arrangements, highlighted in green and in accordance with our recent letters to you (pages 30, 86 and 178); and |
| e) | AstraZeneca’s 2010-2014 planning assumptions regarding expected levels of reinvestment in internal and external R&D, targeted levels of external sourcing of the pipeline, highlighted in red, and the level of Core pre-R&D operating margin targeted by the business to generate appropriate available funds for our medium term investment in R&D activities and shareholder returns. |
We believe that our disclosure appropriately and adequately satisfies the applicable requirements of relevant accounting standards as well as Form 20-F Item 5 obligations to disclose material capital expenditure commitments as of the end of the financial year, certain known contractual obligations and, if significant, the amount spent on R&D activities during the last three financial years. This disclosure also addresses the SEC’s 2003 interpretive guidance regarding MD&A disclosure that MD&A disclosure should provide narrative explanation of a company’s financial statements that enables investors to see the company through the eyes of management.
As we recently discussed with you, given the above explanation, the breadth of disclosure included in our 2010 Annual Report such as that included in the appendix to this letter and the detailed discussions that we have had with you on this matter, we do not consider it necessary to include in our Annual Report or Form 20-F the additional disclosure regarding global management of our R&D reflected in our letter to you of January 27, 2011.
| 2. | In 2010, you replaced the R&D Executive Committee with the Portfolio Investment Board, which is charged with “delivering a pipeline of products capable of generating attractive returns on invested capital and driving shareholder value.” To the extent not included in your expanded proposed disclosures in response to comment one above, please provide us proposed disclosure that discusses this Board’s process for meeting its charge. Also, include in your proposed disclosure, the level of capital invested in your development pipeline at December 31, 2010, the amount of additional capital that you plan to invest in 2011, how you measure returns on this capital, the actual return achieved in 2010 and the target return for 2011. |
We refer you to the description of the PIB’s remit and operating procedures in our response to your first comment and believe that the enhanced disclosures already referred to address your request for disclosure of the process the PIB has for delivering a pipeline of products capable of generating attractive returns on invested capital and driving shareholder value.
Our financial statements are prepared under IFRS and we include a description of our accounting treatment of R&D expenditure in the Financial Review and Accounting Policies sections of our 2010 Annual Report, specifically, explaining that this type of expenditure is expensed as incurred and only capitalized if it meets the recognition criteria of IAS 38 (highlighted in blue in the attached appendix). As at 31 December 2009 and 31 December 2010, no internal development expenditure amounts had met the recognition criteria for capitalization. Consequently as at 31 December 2009 and 31 December 2010 we have no internal research and development costs capitalized on our balance sheet.
In order to produce our development pipeline, the principal expenditure incurred by the Group can be summarized as follows:
| · | Significant and speculative research cost, incurred and managed on a portfolio basis principally to support compounds in early stage development (expensed to income statement over many years); |
| · | Expenditure on non-product specific fixed assets and other general costs to support research, development and the supply of products; and |
| · | Expenditure to bring external opportunities into the Group. |
As the majority of this expenditure is not product-specific, it is therefore impossible to produce a meaningful analysis of the capital invested in the development pipeline and we do not use such measures in our internal management of R&D. The Group does not produce the product level or therapy area level balance sheets (or income/costs statements) required to support this type of analysis as it does not inform our internal decision making.
As noted in our earlier response above, because significant costs of early development are rewarded by significant revenues once a product reaches the market and the cost of production and selling costs are not significant (which manifests itself as high margins on launched products) when determining the true return, the Group targets demand (principally through revenues) as one of its principal indicators of returns on capital invested.
As illustrated in our ‘life-cycle of a medicine’ section at pages 20 and 21 of our 2010 Annual Report, the period of discovery and development of a medicine is significantly longer than one year and therefore short term measures of performance (e.g. the following year) are less relevant than medium term (five year) key performance indicators. There is no direct and measurable causal effect between individual product by product and yearly development costs incurred and return on that investment.
As a consequence of the above, returns on invested capital (and shareholder value) are measured on global, rather than a project or therapy area, basis. On pages 16 and 17 of our 2010 Annual Report (copies enclosed in the appendix to this document), we have include new disclosures clearly showing that our financial performance of ‘achieving target return on invested capital’ is measured by revenues and Core (Group) EPS rather than any individual project performance measure. As also detailed on pages 16 and 17, R&D productivity key performance indicators are the levels of product approvals, regulatory submissions, Phase III investment decisions and licensing deals/acquisitions rather than any individual project capital expenditure measures.
We believe that disclosure of the above measures details how we measure returns on invested capital, and our medium-term target return (which, as detailed above, is considered more relevant than a short-term one year outlook). As detailed in our response to comment number one, our disclosures also include details of amounts of R&D expenditure both capitalized and expensed in the year, and also provide details of our actual revenue and Core EPS performance in the year.
Appendix – extracts from AstraZeneca’s 2010 Annual Report
In the face of sustained pressures on the business, 2010 was a year in which AstraZeneca maintained its strong financial performance. We also made good progress in implementing our strategy to be a focused, integrated, innovation-driven, global, prescription-based biopharmaceutical business.
Group sales in 2010 were unchanged at $33,269 million. Reported operating profit was $11,494 million, down 1%. Reported earnings per share for the full year were up 7% at $5.60 (2009: $5.19). Within the unchanged revenue total there was strong sales growth for medicines such as Crestor, Symbicort and Seroquel XR, and revenue outside the US increased by 7%, including a 16% increase in Emerging Markets. On the other hand US revenue was down by 7%. As expected, revenue in the US was affected by generic competition for Arimidex, Pulmicort Respules and Toprol-XL, as well as the absence of the H1N1 influenza (swine flu) vaccine revenue that benefited 2009 revenues.
Pharmaceutical sector
Our performance in 2010 took place against a background of continued world pharmaceutical market growth. This growth is being driven by increasing and ageing populations, as well as expanding numbers of patients in emerging markets who can benefit from our medicines, together with the increasing prevalence of chronic diseases and advances in science and technology. On the other hand, the pharmaceutical sector, including AstraZeneca, faces a number of challenges in the form of competition, particularly from generic versions of medicines, and declining R&D productivity. In addition, most of our sales take place in highly regulated markets where cost containment by governments and other payers for healthcare is a priority, especially in the wake of the economic downturn. We expect this pressure to continue, most notably in the US and European markets and the Board will keep its plans under continuous review to ensure we are able to respond to changes.
AstraZeneca fully recognises the importance of its reputation. We are committed to doing business in an ethical and proper manner and take compliance with all laws seriously. Oversight of the pharmaceutical sector by regulators and competition authorities has intensified in recent years. The Board, assisted by the Audit Committee, plays an active role in monitoring performance.
Our strategy
Against this outlook, the Board believes its focused strategy is the most value-creating path for AstraZeneca. Our business model is based on using the best science and technology to invent and acquire, develop, produce and distribute innovative medicines that make a meaningful difference to patient health around the world.
Underpinning this model is the creation, protection and subsequent sharing of intellectual property. It is on this basis that we continue to invest in new medicines and work to protect and optimise our investments by rigorously defending our patent rights. We were therefore pleased with the court decision upholding the validity and enforceability of the Crestor US substance patent.
The focus of our efforts to implement our strategy in 2010 was on making the transformational changes to the business needed to generate sustainable long-term value. At the heart of these changes was the creation of a single R&D organisation which we are reshaping and in which we are investing to improve productivity and secure targeted levels of return. Complementing this is a single Commercial organisation which not only ensures that our medicines reach the doctors and patients who need them, but also works closely with R&D to ensure that our pipeline delivers the medicines most likely to deliver technical and commercial success. That includes working with payers to ensure that they value and are willing to purchase our medicines.
Also central to our strategy is a firm belief in external collaboration. We have a desire to access the best science, whatever its origins, and to act as a valued and trusted partner.
We have undertaken significant restructuring initiatives in furtherance of our strategy. The first phase of the restructuring programme is now complete, resulting in the realisation of annual benefits of $2.4 billion achieved to date at a cumulative cost of around $2.5 billion.
Outlook and cash returns to shareholders
We continue to plan on the basis that revenue will be in the range of $28-$34 billion a year over the 2010-14 period, as revenue growth from key franchises that retain exclusivity and continued growth in Emerging Markets are pressured by the loss of market exclusivity on a number of products.
In recognition of the Group’s strong balance sheet and sustainable significant cash flow, and the Board’s confidence in the strategic direction and long-term prospects for the business, we announced, in conjunction with the full year 2009 results, the adoption of a progressive dividend policy, intending to maintain or grow the dividend each year. After providing for business investment, funding the progressive dividend policy and meeting our debt service obligations, the Board will also keep under review the opportunity to return cash in excess of these requirements to shareholders through periodic share repurchases.
The Board has recommended a second interim dividend of $1.85, an 8% increase over the second interim dividend awarded in 2009. This brings the dividend for the full year to $2.55 (161.6 pence, SEK 17.11), an increase of 11% from 2009. In 2010, cash distributions to shareholders through dividends totalled $3,361 million and net share repurchases totalled $2,110 million.
Board changes
There were a number of Board changes during the year. John Buchanan and Bo Angelin both left the Board immediately after the 2010 AGM. John had been a Director for eight years and had also chaired the Audit Committee. His contribution to the work of the Board and the Audit Committee over those years was significant and we benefited greatly from his skills, experience and thoughtful approach. Bo was appointed as a Director in 2007 and stepped down in order to concentrate on his scientific work. He provided valuable insight to the Board and the Science Committee during his time as a Director. On behalf of their fellow Directors, I would like to thank both for their excellent service to AstraZeneca.
Bruce Burlington joined the Board in August. He brings with him a wealth of pharmaceutical industry experience following a career at the FDA and subsequently at Wyeth, now part of Pfizer Inc. In January 2011, Shriti Vadera joined the Board. Her experience of emerging markets, and knowledge of global finance and public policy, will be invaluable. I would like to welcome both Bruce and Shriti to the Board.
Appreciation
2010 was a successful and challenging year for AstraZeneca. We maintained our strong financial performance and took and implemented difficult decisions to ensure the future success of the Group. None of this would have been possible without the leadership of David Brennan and the other members of his executive team. My thanks, and those of the whole Board, go to them and all our employees who did so much in 2010 for the long-term success of AstraZeneca.
Louis Schweitzer
Chairman
AstraZeneca Annual Report and Form 20-F Information 2010 | Chairman’s Statement 7 |
8 Chief Executive Officer’s Review | AstraZeneca Annual Report and Form 20-F Information 2010 |
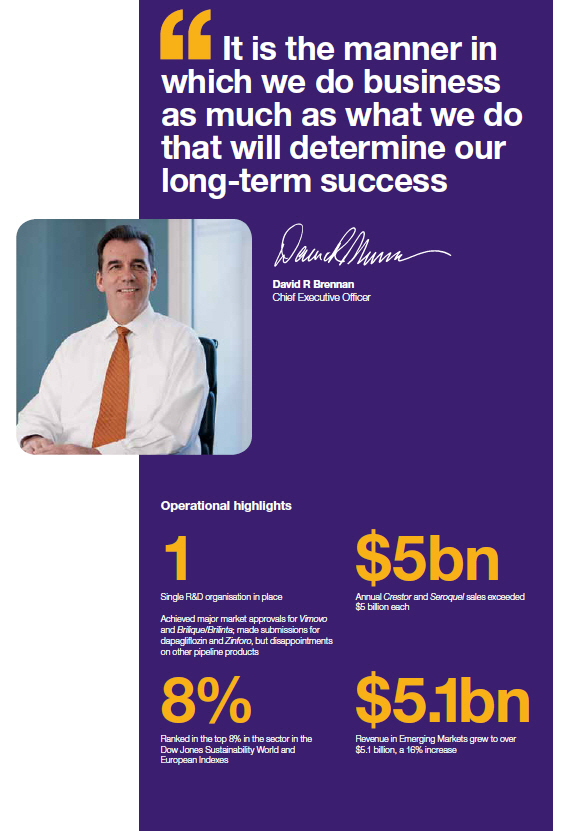
Chief Executive Officer’s Review
2010 emphasised that it is the manner in which we do business as much as what we do that will determine our long-term success. It told us that, if we are to deliver our strategy and make a meaningful difference to the health of patients through great medicines, then we need to act with integrity and remain true to our values. We need to behave as an integrated organisation and work in collaboration with patients, doctors, payers and our many other stakeholders.
Transforming R&D
That journey starts with an R&D organisation that delivers world-class performance and where increased externalisation means we can access diverse sources of innovation. We made significant progress in 2010 with the creation of a single R&D organisation and of a leadership team comprising the best internal and external leaders. This includes the appointment of Martin Mackay as President, Global R&D. We have also put in place a new global organisation structure and governance framework. We are consolidating our site footprint and have refocused our resources on a smaller number of high-potential activities.
The need for change is undiminished. Our R&D record over the past few years is disappointing and our results in 2010 were mixed. On the positive side, Vimovo, our medicine for arthritic pain, which we developed with Pozen Inc. was approved and launched in the EU and the US. Brilique/Brilinta, our treatment for acute coronary syndromes, has also been approved in the EU. Kombiglyze™ XR, a fixed dose combination of Onglyza™ and metformin, a further product in our BMS diabetes collaboration, was approved in the US.
In 2010, we made major regulatory submissions for vandetanib (for thyroid cancer), Zinforo (an anti-bacterial medicine), dapagliflozin (for diabetes) and Axanum (a cardiovascular medicine). We completed a deal with Rigel for the Phase III development of fostamatinib (for rheumatoid arthritis), and TC-5214, our neuroscience collaboration with Targacept, also entered Phase III development.
However, both Brilinta and Axanum received Complete Response Letters from the FDA during the year. We responded to the Brilinta letter in January 2011 and remain confident in our submission. Complete Response Letters were also received for motavizumab (for treating serious respiratory syncytial virus (RSV) disease) and Certriad (for the treatment of lipid abnormalities). Following these letters, we have withdrawn the biological license application relating to motavizumab and recorded an impairment charge of $445 million. In addition, we have ended our licence agreement with Abbott for the development of Certriad.
Leveraging our commercial assets
Hand in hand with transforming R&D is the need to leverage our commercial assets. Our key medicines, such as Crestor, Symbicort and Seroquel XR, achieved double digit growth in 2010. Both Crestor and Seroquel XR were helped by US and EU approvals for additional indications. Nexium is already approved in 120 countries and in 2010 we signed an agreement with Daiichi Sankyo for its co-promotion and supply in Japan after it is approved for use.
We are also focusing our efforts on ensuring that we have the right capabilities to successfully launch and commercialise the next wave of medicines from our pipeline, as well as to deliver our expansion plans in Emerging Markets, both through organic growth of products from our current portfolio and pipeline and also through selective additions of AstraZeneca branded generics. In 2010, we identified a portfolio of more than 100 generic products which we are currently licensing across 30 Emerging Markets. To help us license these dossiers and source the molecules, we are working with a number of companies in India, and have signed an agreement with Torrent to supply us with a portfolio of branded generic medicines.
We are creating a much stronger focus on those who pay for our medicines to help us ensure that our medicines get to the right patients, at the right time and at a price they can afford, while reflecting our investment. As part of this, we have signed a collaboration agreement with HealthCore, which maintains the largest commercially insured population data environment in the US. This will enable us to carry out ‘real world’ studies of health outcomes, which is of increasing importance to payers around the world.
In April 2010, we signed an agreement with the US Department of Justice to settle an investigation relating to the sales and marketing of Seroquel. The requirements of the associated Corporate Integrity Agreement include a number of active monitoring and self-reporting obligations which we have put in place.
Efficiency across the value chain
To be successful we need to be a lean and agile organisation. We continue to drive our operations strategy, simplifying and streamlining our infrastructure and reducing costs. Making changes to reshape the business and make it fit for purpose going forward affects a large number of people. In many parts of the business that has resulted in further reductions in our workforce. The executive team and I remain committed to ensuring that we manage these changes in the right way. This means dealing responsibly and sympathetically with affected individuals and the communities in which they live.
People acting with integrity
A good reputation is critical to our business success. We need to earn and maintain the trust of our customers, collaborators and all those with whom we do business. That means each of us needs to act with integrity and in accordance with our values. It explains why we set such great store by compliance with our Code of Conduct. During 2010, we reviewed our existing sales and marketing policies and standards and created a single new Global Policy on External Interactions which we aim to launch in the first quarter of 2011.
A good reputation also requires a commitment to acting responsibly and to the sustainable development of our business. To that end, our responsible business objectives are closely aligned to our business strategy and, in 2010, we reviewed and reshaped our corporate responsibility priority action plan.
Finally, I am grateful for the dedication and hard work of all our employees. The pace of change will not let up in 2011 but I remain confident that together we have the talent, motivation and commitment needed to improve patient health through great medicines.
David R Brennan
Chief Executive Officer
AstraZeneca Annual Report and Form 20-F Information 2010 | Chief Executive Officer’s Review 9 |
Our Strategy and Performance
Business objectives and key performance indicators
Within AstraZeneca, each business function is subject to an annual budget and target-setting process that includes developing fi nancial and business forecasts, conducting sensitivity and risk analyses, and setting relevant objectives. Regular reviews are undertaken in order to monitor and assess progress against business and budget targets, and to assess key risks and mitigating actions.
Quarterly reports provide the Board and the SET with shared insight into progress against current year objectives and milestones for longer-term strategic goals. Performance is assessed using quantitative, comparative market, operational and fi nancial measures, and qualitative analysis.
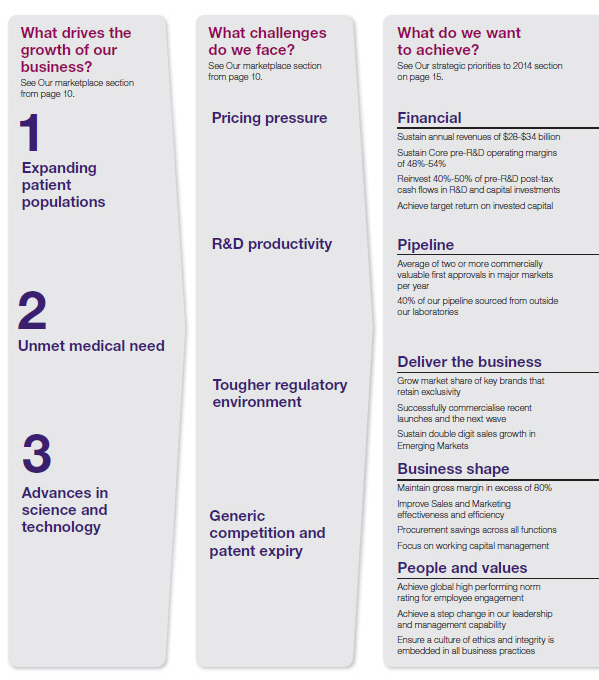
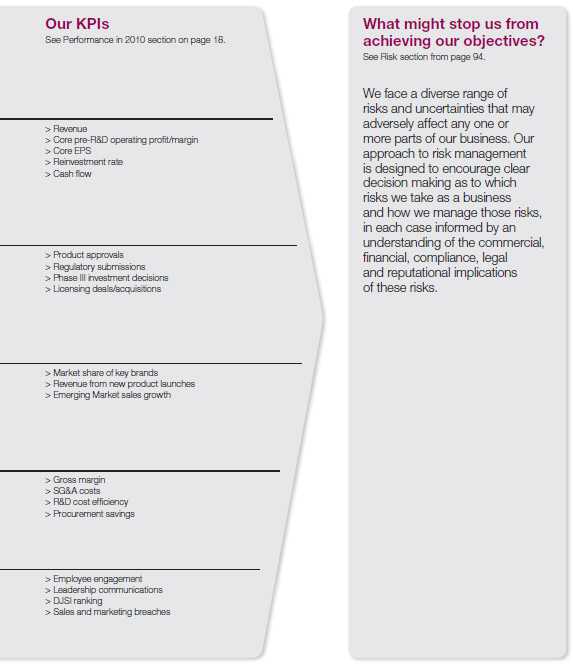
In setting our objectives we sought to ensure that they were aligned with our medium-term planning assumptions for the fi ve years to 2014. For each of our objectives we have developed KPIs by which
16 Our Strategy and Performance Performance in 2010 | AstraZeneca Annual Report and Form 20-F Information 2010 |
we have measured our success in delivering our strategy. During the year we also sought to ensure that we managed the business appropriately both to optimise our opportunities and mitigate the risks we faced. The chart below illustrates this relationship and summarises our objectives for 2010. The Performance in 2010 section that follows sets out our performance against our KPIs during the year.
AstraZeneca Annual Report and Form 20-F Information 2010 | Our Strategy and Performance Our Strategy 17 |
Our Strategy and Performance
Performance in 2010
| Financial | ||||
| Overall strong financial performance. Exceeded targets for revenue, Core EPS and cash flow | ||||
| > | Global revenue was unchanged at CER at $33.3 billion. This | > | Reinvestment rate was just below the medium-term planning | |
| was ahead of target primarily as a result of strong operational | assumption range of 40% to 50% due to the better than | |||
| performance, delayed generic entry and less generic erosion | expected pre-R&D post-tax cash flows. AstraZeneca | |||
| across the US and Europe than assumed in our targets. | continues to expect this range to hold over the planning | |||
| > | Core pre-R&D operating margin was 53.5%, near the top end | period although anticipates variances within any particular year. | ||
| of the medium-term planning assumption range of 48% to 54%. | > | Net cash inflow before financing activities of $8,340 million reflects | ||
| > | Core EPS increased by 5% at CER to $6.71. This was ahead | the strong business performance. | ||
| of target as a result of the above revenue performance and | ||||
| strong operational execution. | See Financial Review from page 78 for more information. | |||
| Pipeline | ||||
| Achieved major market approvals for Vimovo and Brilique; made submissions for dapagliflozin and Zinforo, but | ||||
| disappointments on other pipeline products | ||||
| > | Vimovo approved in the US and the EU; Brilique approved in | > | Dapagliflozin and vandetanib NDAs submitted in the US and the | |
the EU with Complete Response Letter received for Brilinta | EU; Zinforo and Axanum MAAs submitted in the EU; Recentin | |||
| in the US; Kombiglyze™ XR (Onglyza™/metformin combination) | trials data did not support regulatory submissions; no | |||
| approved in the US; additional indications approved for Crestor | submissions planned for zibotentan. | |||
in the US and the EU and for Seroquel XR in the EU; decisions | > | Completed deal with Rigel for the development of fostamatinib. | ||
| made in December to discontinue development of | > | Phase III trials started for fostamatinib and TC-5214. | ||
| motavizumab and Certriad. | ||||
| See Therapy Area Review from page 50 for more information. | ||||
| Deliver the business | ||||
| Global revenue was unchanged at $33.3 billion | ||||
| > | Strong double-digit sales growth for Crestor, Symbicort and | > | Achieved target of double-digit growth in Emerging Markets | |
Seroquel XR. Annual Crestor and Seroquel sales exceeded | with revenues over $5.1 billion, a 16% increase over 2009. | |||
| $5 billion each. | ||||
| > | Launches under way and planned for Brilinta/Brilique, Vimovo | See Financial Review from page 78 and Therapy Area Review | ||
| and Kombiglyze™ XR. | from page 50 for more information. | |||
| Business shape | ||||
| Achieved or exceeded targets | ||||
| > | Core gross margin of 81.2% slightly ahead of 80% target. | > | Achieved $541 million of procurement savings against a target | |
| > | Achieved planned improvement in Core SG&A costs with | of $500 million. | ||
| 2% reduction. | ||||
| > | Achieved Core R&D efficiency savings with spend of $4.2 billion. | See Financial Review from page 78 for more information. | ||
| People and values | ||||
| Improvement in senior leader communications, but slight decline in employee engagement. | ||||
| Continued focus on application of Code of Conduct | ||||
| > | Employee engagement score as measured by our global | > | Maintained position in the DJSI World Index (the top 10% of | |
| employee survey (FOCUS) reduced from 84% in 2009 to 83% | the largest 2,500 companies) as sustainability leader, as well | |||
| in 2010 | as listing on the DJSI STOXX European Index. | |||
| > | Improvement of 4% in senior leader communications measure | > | 11 confirmed breaches of external sales and marketing | |
| in 2010 over 2009 as measured by FOCUS. | regulations or codes globally (2009: 24). | |||
| See People section from page 36 and Responsible Business | ||||
| section from page 40 for more information. | ||||
18 Our Strategy and Performance Performance in 2010 | AstraZeneca Annual Report and Form 20-F Information 2010 |
Our Strategy and Performance
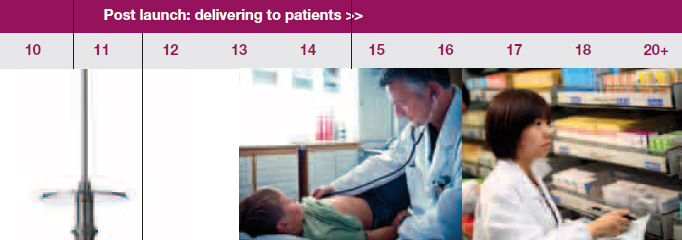
Life-cycle of a medicine
The discovery, development and commercialisation of a medicine is a complex process. This is a high level overview of the process. It is illustrative only. It is not intended to, nor does it, represent the life-cycle of any particular medicine or of every medicine discovered and/or developed by AstraZeneca.

1
Find potential medicine
Identify the unmet medical need and market opportunity, and undertake laboratory research to find a potential medicine that should be potent, selective and absorbed into and well tolerated by the body
Begin the process of seeking patent protection for the potential medicine
Collaborate with academia and external clinicians to access the best external science and medical opinion
2
Safety and initial efficacy studies
Undertake studies in the laboratory and in animals to understand if the potential medicine should be safe to introduce into humans and in what quantities
Determine likely efficacy, side effect profile and maximum dose estimate in humans
Regulatory authorities are informed of proposed trials which are then conducted within the framework of the regulations
3
Phase I studies
Studies typically in small groups of healthy human volunteers or, in certain cases, patients, to understand how the potential medicine is absorbed in the body, distributed around it and excreted; also determine an appropriate dosage and identify side effects
Begin to develop manufacturing route to ensure the manufacturing process is robust and costs are minimised
May involve external clinicians and organisations in the design and running of these studies
4
Phase II studies
Studies in small groups of patients to evaluate effectiveness of the medicine
During Phase II studies, design a Phase III programme to deliver data required for regulatory approval and pricing and/or reimbursement throughout the world
External advisory panels help define the attributes to test in studies to demonstrate whether the potential new medicine can be differentiated from the existing standard treatment of care
5
Phase III studies
Studies in a larger group of patients to gather information about effectiveness and safety of the medicine and evaluate the overall risk/benefit profile
Create appropriate branding for the new medicine in preparation for its launch
At any stage of the development process the medicine may have been acquired from a collaborating company. The collaborator may remain involved in the future development and commercialisation of the medicine
20 Our Strategy and Performance Life-cycle of a medicine | AstraZeneca Annual Report and Form 20-F Information 2010 |
6
Regulatory submission
Seek approval from regulatory authorities to manufacture, market and sell the medicine
Submit package of clinical data which demonstrates the safety profile and efficacy of the medicine to the regulatory authorities
Regulatory authorities decide whether to grant marketing authorisation based on the medicine’s safety profile, effectiveness and quality
Large numbers of national, regional and local payers grant approval for the pricing and/or reimbursement
7
Launch new medicine
Raise awareness of patient benefit and appropriate use
Market and sell medicine; continuously monitor, record and analyse reported side effects; review need to update the side effect warnings to ensure that patients’ wellbeing is maintained
Clinicians begin to prescribe medicine and patients begin to benefit
8
Post-launch clinical safety studies
Studies to further understand the safety profile of the medicine in larger populations
Conduct any required or indicated post-launch follow-up clinical trials
Sponsors and regulatory authorities monitor the safety of medicines post-approval and update the prescribing information as necessary
9
Life-cycle management
Broaden understanding of the full potential of the medicine
Work with external advisory groups and regulatory authorities to consider potential additional diseases which might be treated by the medicine or better ways of administering the medicine
Submit data packages with requests for line extensions
Regulatory authorities review the data to assess the risk/benefit of using the medicine in the new disease or population and issue a decision
10
Patent expiry
Typically, when patents protecting the medicine expire, generic versions of the medicine may enter the market
AstraZeneca Annual Report and Form 20-F Information 2010 | Our strategy and Performance Life-cycle of a medicine 21 |
1 An R&D function with
world-class productivity
focused on delivering a range of innovative, differentiated and commercially attractive medicines through collaboration, and underpinned by patent and intellectual property rights. See page 26
2 A sales and marketing activity
undertaken in the right way
and focused on our customers and their patients’ needs. See page 32
3 A reliable supply and
manufacturing operation
that ensures our customers and patients receive their medicines when they want and need them. See page 34
4 A diverse and talented
workforce
with the right skills, in the right place at the right time. See page 36
5 A commitment to responsible
development of our business
which delivers value for our shareholders and for our other stakeholders. See page 40
Business review
This section includes information that fulfills the requirements of a business review under the Companies Act 2006. The Our Strategy and Performance, Corporate Governance, Development Pipeline, Shareholder Information and Corporate Information sections from pages 10, 94, 206, 211 and 216, respectively, are incorporated into this section.
Details of the more significant risks to AstraZeneca are set out in the Principal risks and uncertainties section from page 96.
Many of our products are subject to litigation. Detailed information about material legal proceedings can be found in Note 25 to the Financial Statements from page 178.
References to prevalence of disease have been derived from a variety of sources and are not intended to be indicative of the current market or any potential market for AstraZeneca’s pharmaceutical products since, among other things, there may be no correlation between the prevalence of a disease and the number of individuals who are treated for such a disease.
The Glossary and the Market definitions table from page 217 are intended to provide a useful guide to terms and AstraZeneca’s definitions of markets, as well as to acronyms and abbreviations, used in this section.
In this Annual Report and Form 20-F Information, unless the context otherwise requires, ‘AstraZeneca’, ‘the Group’, ‘we’, ‘us’ and ‘our’ refer to AstraZeneca PLC and its consolidated entities and any reference to ‘this Annual Report’ is a reference to this Annual Report and Form 20-F Information.
Except as otherwise stated, references to days and/or months in this Annual Report are references to days and/or months in 2010.
Figures in parentheses in tables and in the Financial Statements are used to represent negative numbers.
AstraZeneca Annual Report and Form 20-F Information 2010 | Delivering our strategy 25 |
Delivering our strategy
Research and Development
Focused on delivering
innovative and
valued medicines
6
Focus on six areas of healthcare
92
92 projects in clinical development, including 9 in Phase III or under regulatory review. 34 withdrawn during the year
$4.2bn
Core investment of $4.2 billion in our R&D organisation

“…we are creating an environment that allows our scientists to drive innovation and collaborate successfully with internal and external partners to bring forward valued new medicines”
Martin Mackay
President, Global R&D
We are committed to using the best science and technology to invent and acquire, produce and distribute innovative medicines that make a meaningful difference to people’s health around the world. This commitment is matched by our recognition that a substantial improvement in R&D productivity is needed if we are to be certain of securing targeted levels of return on our investment.
We are transforming our single R&D organisation to meet this challenge. By appointing new world-class leaders and confirming the best internal people in leadership positions, we are creating an environment that allows our scientists to drive innovation and collaborate successfully with internal and external partners to bring forward valued new medicines. Our strategy for change comprises the following elements:
| > | prioritising our resources in those areas where we believe we can be most successful through a focused disease area strategy |
| > | ensuring shareholders’ funds are invested wisely, using an effective and flexible R&D operating model |
| > | building the capabilities we need to ensure delivery of our strategy |
| > | ensuring we access the best new opportunities, regardless of their origin. |
Disease area focus
We are prioritising our resources and focusing our internal discovery activities on those diseases within our existing therapy areas where we believe there is the greatest potential. This process of prioritisation is designed to ensure that, as we look ahead, the projects we have in our pipeline constitute the programmes which we believe are most likely to deliver technical and commercial success. The Disease areas table opposite indicates where we will be focusing our activities within our therapy areas. It also indicates those areas that we consider to be less attractive and where we will be decreasing our discovery investment or exiting an area altogether.
While we will be exiting in-house discovery research in some disease areas, we will continue to look at new therapeutic areas via externalisation, ensuring that we optimise our own assets and look at in-licensing or acquiring opportunities where we believe there is further value.
26 Delivering our strategy Research and Development | AstraZeneca Annual Report and Form 20-F Information 2010 |
Disease areas
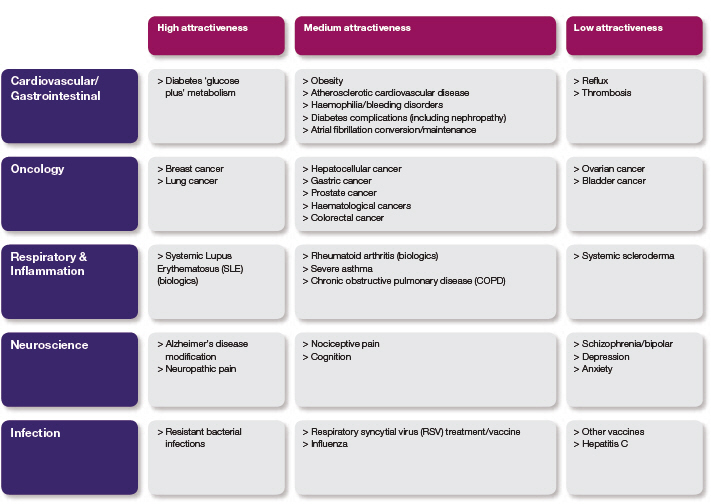
We have also reviewed the projects we are working on within this narrower portfolio. Our aim has been to ensure we put our effort behind those projects we believe are most likely to be successful. Our measure is not the number of candidate medicines, it is the number of de-risked, value adding, proof of concept medicines, that is where there is evidence that gives us a high degree of confidence of success. Our focus is on identifying and resourcing key projects that have the potential to deliver a differentiated, commercially attractive medicine to patients in the first wave for any given mechanism.
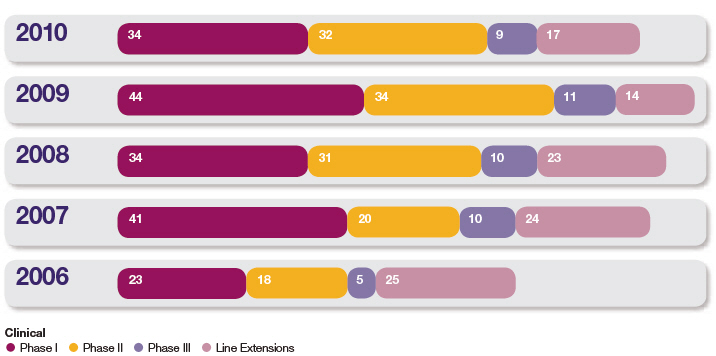
Our pipeline includes 921 projects in the clinical phase of development. As shown in the Development projects chart overleaf, we now have a total of 34 projects in Phase I, 32 projects in Phase II, 9 projects in late stage development, either in Phase III or under regulatory review, and we are running 17 significant life-cycle management projects. During 2010, across the clinical portfolio, 24 projects have successfully progressed to their next phase (including 14 projects entering first human testing); 34 projects have been withdrawn. Further details are set out in the Therapy Area Review from page 50 and in the Development Pipeline table from page 206.
Operating model
As demonstrated by the Life-cycle of a medicine overview on page 20, our R&D activities span the entire life-cycle of a medicine. To help our focus on quality and reimbursable medicines, we have created a new organisational structure which brings together drug discoverers and developers to focus and collaborate in specific disease areas. The operating model we have adopted is shown on page 29 and comprises the following key elements:
iMeds: We have formed nine innovative medicine units, or iMeds, which focus on particular disease areas and work across discovery and early development:
| > | Small molecule iMeds |
| > | Oncology |
| > | Infection |
| > | Respiratory & Inflammation |
| > | Aligned small molecule and biologics iMeds |
| > | Cardiovascular and Gastrointestinal |
| > | Neuroscience |
| > | Biologics iMeds |
| > | Oncology |
| > | Infection |
| > | Respiratory & Inflammation |
| > | A ninth, New Opportunities iMed, will focus on identifying opportunities in disease areas outside, or complementary to, our current research areas. This will be done by seeking to acquire commercially viable late stage assets as well as by generating additional value from existing internal assets through alternative uses of such assets in disease areas of high unmet medical need. |
All iMeds are responsible for sourcing innovation from both inside and outside AstraZeneca and are accountable for delivering de-risked, differentiated proof of concept potential medicines to Global Medicines Development that target the right area and show a medical benefit for patients.
AstraZeneca Annual Report and Form 20-F Information 2010 | Delivering our strategy Research and Development 27 |
Delivering our strategy
Development projects
Global Medicines Development (GMD): Later stage development is undertaken by GMD. It provides a single, global platform dedicated to conducting trials for small molecules and biologics of the highest quality. It is accountable for delivering the regulatory packages in support of new medicine launches that are commercially attractive and reimbursable.
Operation and governance: A key strength of our new R&D organisation is that it facilitates a more entrepreneurial climate, increases the transparency of risk and drives stronger links between early discovery activities and Phase II studies. This is complemented by rigorous oversight of Phase IIa/IIb studies to the launch of a new medicine and beyond. The Portfolio Investment Board (PIB) evaluates projects to help ensure AstraZeneca is developing the kind of medicines that will make a difference for patients and return shareholder value. The PIB provides the necessary focus for our R&D investment and provides appropriate oversight of investment opportunities across disease areas and modalities. It is also charged with delivering a pipeline of products capable of generating attractive returns on invested capital. Further information about the PIB can be found in the Corporate Governance Report section from page 109.
Investing in capabilities
The success of our R&D transformation rests in part on building industry leading capabilities to bring more valued and reimbursable medicines to market. In 2010, we announced an investment of more than $200 million over five years to develop the tools and people to help us reshape R&D performance. This investment supports scientific collaborations, development of existing staff, recruitment of new talent and provision of new infrastructure, including informatics platforms. We are making steady progress across all these areas.
Payer considerations: Our R&D and Commercial organisations are working together to deliver the best global reimbursement dossier for our medicines. Within GMD, we are building a Payer Evidence Group that supports both Commercial and R&D. In 2010, as part of our strategy to be an industry leader in demonstrating the value of medicines to payers, AstraZeneca signed a collaboration agreement with HealthCore, which maintains the largest commercially insured population data environment in the US. The collaboration enables us to significantly upscale our ‘real world’ studies of the key health outcomes that are increasingly important to payers. Additionally, through our membership in the European Healthcare Leadership Network, we are working with payers and other external stakeholders to define early on the basis for demonstrating value. An AstraZeneca diabetes drug in Phase I is the focus of one of the first pilots.
Personalised healthcare: Identifying patients most likely to benefit from our medicines is the goal of the newly formed Personalised Healthcare and Biomarker function. This group supports internal biomarker development and has established vital strategic alliances with external diagnostic companies to support our drug projects. We now have 25% of our clinical development portfolio progressing personalised healthcare strategies.
Predictive science: We are integrating modelling and simulation into many different aspects of R&D. Examples include safety screening models that enable rapid assessment of common toxicities and in silico modelling of human exposure which has guided the design of antibodies with differentiated properties and subsequently informed their clinical development.
New therapeutic modalities: In 2010, we continued to make significant investments in new biologics technologies to generate novel and highly differentiated biologic therapeutics. For example, in neurology, we have engineered a human protease to effectively degrade beta amyloid, which holds great potential for treating Alzheimer’s disease. We have also entered into external collaborations to develop new approaches in the areas of small interfering ribonucleic acids (siRNAs) and regenerative medicine.
28 Our Strategy and Performance Research and Development | AstraZeneca Annual Report and Form 20-F Information 2010 |
R&D operating model

Clinical trial design and interpretation: To ensure these capabilities are firmly integrated into our drug development programmes and that we realise the benefits of clear clinical decisions, we have also invested to improve the quality of our design capability for clinical trials.
Culture: We are progressing an integrated programme to drive cultural change throughout the R&D organisation. A significant first step was the appointment of new leadership teams, together with an evolution of our business systems to facilitate a move towards a more innovative, collaborative and creative culture.
External focus
We intend to increase our externalisation efforts to access the best, most cutting-edge science, whatever its origin, with a target of 40% of our pipeline sourced from outside our laboratories by 2014. By bringing together the best minds to address medical problems, we aim to facilitate ground-breaking discoveries, either within our organisation or through a public or private partnership focused on the problem. As part of this approach, we are involved in the Innovative Medicines Initiative (IMI) which brings together the European pharmaceutical industry and the European Commission with the aim of improving the tools, technologies, methodologies and knowledge management to bring new medicines to market. Over the next 10 years, IMI participants have pledged a total of $2.7 billion, half from the private sector and half from the public sector.
We are also committed to making our compounds available to organisations pursuing new therapies. In a collaboration with the UK’s Medical Research Council, we are sharing access to our compound libraries to aid the search for potential new treatments for serious diseases.
In all our collaborations, we recognise that ‘one size does not fit all’. We seek to partner and collaborate in novel ways that maximise not only the collective scientific knowledge of all participants, but also the unique knowledge that each partner brings to the process, including in Emerging Markets. It is this approach that underpins our exclusive worldwide licence agreement with Rigel for the global development and commercialisation of fostamatinib (formerly known as R788), Rigel’s late-stage investigational product for rheumatoid arthritis, and our collaboration with Dainippon Sumitomo for a potential asthma treatment.
Our resources
At the end of 2010, we had a global R&D organisation with approximately 15,700 people (12,400 full time equivalent employees) at 14 principal centres in eight countries.
As communicated last year, our plans for transforming R&D include a number of site changes which will result in a simplified site footprint with a clear role for each facility. These changes will affect approximately 3,500 employees, with a net reduction of 1,800 positions. In the UK, we have exited R&D activities in Avlon, KuDOS and Arrow Therapeutics, and we will exit all R&D activities in our Charnwood site during 2011. In North America, we have exited all
AstraZeneca Annual Report and Form 20-F Information 2010 | Delivering our strategy Research and Development 29 |
Delivering our strategy
pharmaceutical development activities from Newark, Delaware, and all drug discovery activities at Wilmington, Delaware. In January 2011, we signed an agreement to sell our site in Lund, Sweden, and we are on track to exit this site during 2011.
A number of our remaining sites will grow to accommodate activities from the sites we are closing. These sites include our main small molecule facilities in the UK (Alderley Park and Macclesfield); Sweden (MöIndal) and the US (Waltham, Massachusetts). Other sites that have a focus on research are in Sweden (Södertälje), Canada (Montreal, Quebec) and France (Reims). We have a
clinical development facility in Osaka, Japan. Our principal sites for biologics and vaccines are in the US (Gaithersburg, Maryland and Mountain View, California) and the UK (Cambridge).
As part of our strategic expansion in important Emerging Markets, we own research capabilities in Asia Pacific which include our ‘Innovation Centre China’ research facility in Shanghai and our research facility in Bangalore, India.
In 2010, there was Core investment of $4.2 billion in our R&D organisation (2009: $4.3 billion; 2008: $5 billion). In addition, $1,017 million was spent on acquiring product rights (such as in-licensing) (2009: $764 million; 2008: $2,743 million) and we invested around $284 million on the implementation of the R&D strategy and enhancing capabilities in the US. A further $283 million was approved during the year to further the support for the R&D strategy by facilitating the consolidation of resources at key locations and developing IT platforms.
R&D ethics
We recognise our responsibility to ensure that we underpin our continued drive for R&D excellence with sound ethical practice worldwide. We want to be recognised for our high quality science and for the impact we can make on serious diseases. We also want to continue to be trusted. This means setting and living up to high standards of ethical practice across all aspects of our research activity worldwide.
You can read more about our standards of ethical practice and 2010 performance in the Responsible Business section from page 40.
Intellectual Property
Protecting ownership of our inventions

“The principal economic safeguard in our industry is a well-functioning patent system that recognises our effort and rewards our innovation with appropriate protection”
Jeff Pott
General Counsel
The discovery and development of a new medicine requires a significant investment of resources by research-based pharmaceutical companies over a period of 10 or more years. For this to be a viable investment, the results – new medicines – must be safeguarded from being copied with a reasonable amount of certainty for a reasonable period of time.
The principal economic safeguard in our industry is a well-functioning patent system that recognises our effort and rewards our innovation with appropriate protection, allowing time to generate the revenue we need to reinvest in new pharmaceutical innovation. We have confidence in our inventions and commit significant resources both to establishing and defending the patent and related intellectual property protections for these inventions.
Patent process
Applications for patent protection are filed on our inventions to safeguard the large subsequent investment required to get potential new drugs approved for marketing. Further innovation means that we may seek additional patent protection as we develop a product and its uses. We apply for patents via patent offices around the world. In some countries, our competitors can challenge our patents in the patent offices, and, in all countries, competitors can challenge our patents in the courts. We can face challenges early in the patent application process and throughout the life of the patent. These challenges can be to the validity of a patent and/or to the effective scope of a patent and are based on ever-evolving legal precedents. There can be no guarantee of success for either party in patent proceedings. For information about third party challenges to the patents protecting our products, see Note 25 to the Financial Statements from page 178.
30 Delivering our strategy Research and Development | AstraZeneca Annual Report and Form 20-F Information 2010 |
| Financial Review |
| Cash flow and liquidity – 2010 |
| All data in this section is on a Reported basis. |
| Net funds/(debt) |
2010 $m | 2009 $m | 2008 $m | ||||||||||
| Net funds/(debt) brought forward at 1 January | 535 | (7,174 | ) | (9,112 | ) | |||||||
| Earnings before interest, tax, depreciation, amortisation and impairment | 14,235 | 13,630 | 11,764 | |||||||||
| Movement in working capital and provisions | 82 | 1,329 | (210 | ) | ||||||||
| Tax paid | (2,533 | ) | (2,381 | ) | (2,209 | ) | ||||||
| Interest paid | (641 | ) | (639 | ) | (690 | ) | ||||||
| Other non-cash movements | (463 | ) | (200 | ) | 87 | |||||||
| Net cash available from operating activities | 10,680 | 11,739 | 8,742 | |||||||||
| Purchase of intangibles (net) | (1,180 | ) | (355 | ) | (2,944 | ) | ||||||
| Other capital expenditure (net) | (708 | ) | (824 | ) | (1,057 | ) | ||||||
| Acquisitions | (348 | ) | – | – | ||||||||
| Investments | (2,236 | ) | (1,179 | ) | (4,001 | ) | ||||||
| Dividends | (3,361 | ) | (2,977 | ) | (2,739 | ) | ||||||
| Net share (repurchases)/issues | (2,110 | ) | 135 | (451 | ) | |||||||
| Distributions | (5,471 | ) | (2,842 | ) | (3,190 | ) | ||||||
| Other movements | 145 | (9 | ) | 387 | ||||||||
| Net funds/(debt) carried forward at 31 December | 3,653 | 535 | (7,174 | ) | ||||||||
| Comprised of: | ||||||||||||
| Cash, short-term investments and derivatives (net) | 12,875 | 11,598 | 4,674 | |||||||||
| Loans and borrowings | (9,222 | ) | (11,063 | ) | (11,848 | ) |
Cash generated from operating activities was $10,680 million in the year to 31 December 2010, compared with $11,739 million in 2009. The decline of $1,059 million is primarily driven by legal settlements of $709 million relating to Seroquel sales and marketing practices and product liability and Average Wholesale Price Litigation in the US, and the first instalment of $562 million (£350 million) in respect of the UK tax settlement (for which the second instalment of £155 million is due in March 2011).
Investments cash outflows of $2,236 million include the acquisition of Novexel ($348 million), the payment of $647 million to Merck (resulting in the Group acquiring Merck’s interest in certain AstraZeneca products) and a further $537 million paid out on other externalisation arrangements. Cash outflows on the purchase of tangible fixed assets amounted to $791 million in the year. Further details of the Novexel business acquisition and our arrangements with Merck are included in Note 22 and Note 25 to the Financial Statements respectively.
Net cash distributions to shareholders increased from $2,842 million in 2009 to $5,471 million in 2010 through dividend payments of $3,361 million and net share repurchases of $2,110 million.
At 31 December 2010, outstanding gross debt (interest-bearing loans and borrowings) was $9,222 million (2009: $11,063 million). The reduction in gross debt of $1,841 million during the year was principally due to the repayment on maturity of Euro bonds of Euro 500 million and Euro 750 million. The first repayment was the Euro 500 million 18 month bond issued in July 2008 and maturing in January 2010, and the second was the Euro 750 million 3 year bond issued in November 2007 and maturing in November 2010. Of the gross debt outstanding at 31 December 2010, $125 million is due within one year (2009: $1,926 million). Strong business cash flows have improved net funds by $3,118 million since 31 December 2009, resulting in net funds of $3,653 million at 31 December 2010.
Off-balance sheet transactions and commitments
We have no off-balance sheet arrangements and our derivative activities are non-speculative. The table below sets out our minimum contractual obligations at the year end.
| Payments due by period |
Less than 1 year | 1-3 years $m | 3-5 years $m | Over 5 years | Total $m | ||||||||||||||||
| Bank loans and other borrowings | 646 | 2,691 | 2,532 | 10,095 | 15,964 | |||||||||||||||
| Operating leases | 161 | 137 | 105 | 103 | 506 | |||||||||||||||
| Contracted capital expenditure | 259 | – | – | – | 259 | |||||||||||||||
| Total | 1,066 | 2,828 | 2,637 | 10,198 | 16,729 |
84 Financial Review Cash flow and liquidity – 2010 | AstraZeneca Annual Report and Form 20-F Information 2010 |
Research and development collaboration payments
Details of future potential research and development collaboration payments are also included in Note 25 to the Financial Statements from page 178. As detailed in Note 25, payments to our collaboration partners may not become payable because of the inherent uncertainty in achieving the development and revenue milestones linked to the future payments. As part of our overall externalisation strategy, we may enter into further collaboration projects in the future that may include milestone payments and, therefore, as certain milestone payments fail to crystallise due to, for example, development not proceeding, they may be replaced by potential payments under new collaborations.
Investments, divestments and capital expenditure
As detailed earlier in Research and Development from page 26, AstraZeneca views collaborations, including externalisation arrangements in the field of research and development, as a crucial element of the development of our business.
The Group has completed over 80 major externalisation transactions over the past three years, one of which was a business acquisition and all others were strategic alliances and collaborations. Details of our significant externalisation transactions are given below. The Group determines these to be significant using a range of factors. We look at the specific circumstances of the individual externalisation arrangement and apply several quantitative and qualitative criteria. Because we consider our externalisation strategy to be an extension of our research and development strategy, the expected total value of development payments under the transaction and its proportion in our annual R&D spend, both of which are proxies for overall research and development effort and cost, are important elements of the significance determination. Other quantitative criteria we apply include, without limitation, expected levels of future sales, the possible value of milestone payments and the resources used for commercialisation activities (for example, the number of staff). Qualitative factors we consider in our determination of whether an externalisation arrangement is significant include, without limitation, new market developments, new territories, new areas of research and strategic implications.
Based on the application of the quantitative and qualitative factors described above, we have determined that the following two externalisation arrangements are significant:
Capitalisation and shareholder return
Dividend for 2010
| > | In January 2007, AstraZeneca signed an exclusive co-development and co-promotion agreement with BMS for the development and commercialisation of saxagliptin, a dipeptidyl peptidase IV inhibitor (DPP-IV) for the treatment of Type 2 diabetes, and dapagliflozin, a selective sodium-glucose co-transporter 2 (SGLT2) inhibitor. The agreement is global (with the exception of Japan) for saxagliptin. Under each agreement the two companies jointly develop the clinical and marketing strategy and share development and commercialisation expenses on a global basis. To date, AstraZeneca has made upfront and milestone payments totalling $300 million for saxagliptin and $50 million for dapagliflozin and may make future milestone payments of $350 million on dapagliflozin contingent on achievement of regulatory milestones and launch in key markets. Following launch, profits and losses globally are shared equally and an additional $300 million of sales-related payments for each product may be triggered based on worldwide sales success. The Group made milestone payments to BMS of $50 million in 2010, $150 million in 2009 and $50 million in 2008. |
| > | In December 2009, AstraZeneca and Targacept entered into an in-licence agreement for AstraZeneca to obtain exclusive global development and commercialisation rights to Targacept’s investigational product for major depressive disorder (MDD), TC-5214. TC-5214, which recently completed a Phase IIb clinical trial, is a nicotinic channel blocker that is thought to treat depression by modulating the activity of various neuronal nicotinic receptor (NNR) subtypes. Under the deal, AstraZeneca made an upfront payment of $200 million and may make milestone payments to a maximum of $540 million up to launch. In addition, Targacept will be entitled to receive royalties on worldwide product sales and additional milestone payments linked to worldwide product sales. |
Details of our business acquisitions in the last three years are contained in Note 22 to the Financial Statements from page 167.
In aggregate, milestones capitalised under the Group’s other externalisation arrangements totalled $337 million in 2010, $306 million in 2009 and $62 million in 2008, and the Group recognised other income in respect of other externalisation arrangements totalling $82 million in 2010, $440 million in 2009 and $216 million in 2008.
Capitalisation and shareholder return
Dividend for 2010
| $ | Pence | SEK Payment date | ||||||||||||||||||
| First interim dividend | 0.70 | 44.9 | 5.12 | 13.09.10 | ||||||||||||||||
| Second interim dividend | 1.85 | 116.7 | 11.99 | 14.03.11 | ||||||||||||||||
| Total | 2.55 | 161.6 | 17.11 | |||||||||||||||||
| Summary of shareholder distributions |
Shares repurchased | Cost $m | Dividend per share | Dividend cost $m | Shareholder distributions | ||||||||||||||||
| 2000 | 9.4 | 352 | 0.70 | 1,236 | 1,588 | |||||||||||||||
| 2001 | 23.5 | 1,080 | 0.70 | 1,225 | 2,305 | |||||||||||||||
| 2002 | 28.3 | 1,190 | 0.70 | 1,206 | 2,396 | |||||||||||||||
| 2003 | 27.2 | 1,154 | 0.795 | 1,350 | 2,504 | |||||||||||||||
| 2004 | 50.1 | 2,212 | 0.94 | 1,555 | 3,767 | |||||||||||||||
| 2005 | 67.7 | 3,001 | 1.30 | 2,068 | 5,069 | |||||||||||||||
| 2006 | 72.2 | 4,147 | 1.72 | 2,649 | 6,796 | |||||||||||||||
| 2007 | 79.9 | 4,170 | 1.87 | 2,740 | 6,910 | |||||||||||||||
| 2008 | 13.6 | 610 | 2.05 | 2,971 | 3,581 | |||||||||||||||
| 2009 | – | – | 2.30 | 3,339 | 3,339 | |||||||||||||||
| 2010 | 53.7 | 2,604 | 2.55 | 3,617 | 1 | 6,221 | ||||||||||||||
| Total | 425.6 | 20,520 | 15.625 | 23,956 | 44,476 | |||||||||||||||
1 Total dividend cost estimated based upon number of shares in issue at 31 December 2010. | ||||||||||||||||||||
| 86 Financial Review Capitalisation and shareholder return | AstraZeneca Annual Report and Form 20-F Information 2010 |
Risk
Our compliance organisation is comprised of the Global Compliance function together with a wide range of specialist compliance functions. Global Compliance maintains our Code of Conduct and Global Policies and Standards and ensures that an effective compliance programme is in place to ensure compliance with the 16 Principles of our Code of Conduct and relevant policies and standards.
The specialist compliance functions support line management and SET to manage risk in specific regulated areas to ensure ongoing legal and regulatory compliance. These specialist groups include: Good Laboratory, Clinical and Manufacturing Compliance; Sales and Marketing Compliance; Medical and Regulatory Affairs; Financial Control and Compliance; Safety, Health and Environment; Information Security and Data Privacy; and Security.
When a potential compliance breach is identified, the compliance organisation undertakes an internal investigation. Should the investigation conclude that an actual compliance breach has occurred, the compliance organisation will consider whether the Company needs to make a disclosure and/or to report the findings to a regulatory or governmental authority. When appropriate, the compliance organisation will engage external advisers to conduct and/or advise on investigations.
Management reporting and assurance
The Audit Committee is comprised of five Non-Executive Directors and is accountable, among other things, for assessing the adequacy and effectiveness of the risk management systems and processes implemented by management. The Audit Committee receives regular reports from the external auditor and the following business functions:
| > | Group Internal Audit (GIA) – independent assurance reports on the Group’s risk management and control framework. |
| > | Global Compliance – compliance programme reports on key compliance risks, updates on key compliance initiatives, performance against the Global Compliance scorecard, compliance incidents and investigations including calls made by employees to the AZethics and MedImmune helplines. |
| > | Financial Control and Compliance Group – reports on Sarbanes-Oxley Act compliance and the financial control framework. |
| > | Management – the Group-level risk summary from the annual business planning process and QBRs and reports on the performance management and monitoring processes. |
The Audit Committee reviews and reports to the Board following each Audit Committee meeting on the overall framework of risk management and internal controls and is responsible for promptly bringing to the Board’s attention any significant concerns about the conduct, results or outcome of internal audits and other compliance matters. For further information on the Audit Committee, see the Audit Committee section from page 113.
GIA is an independent assurance and advisory function that reports to, and is accountable to, the Audit Committee. GIA’s budget, resources and programme of audits are approved by the Audit Committee on an annual basis and the findings from its audit work are reported to, and are discussed at, each Audit Committee meeting. A core part of the audit work carried out by GIA includes assessing how AstraZeneca is managing risk and reviewing the effectiveness of selected aspects of AstraZeneca’s risk control framework, including the effectiveness of other assurance and compliance functions within the business. During 2010, GIA assessed the effectiveness of a number of core compliance and operational processes operating within the business as well as the effectiveness of risk mitigation plans in a number of high risk and/or business critical areas.
Principal risks and uncertainties
The pharmaceutical sector is inherently risky and a variety of risks and uncertainties may affect our business. Here we summarise, under the headings: Product pipeline risks; Commercialisation and business execution risks; Supply chain and delivery risks; Legal, regulatory and compliance risks; and Economic and financial risks, the principal risks and uncertainties which we currently consider to be material to our business in that they may have a significant effect on our financial condition, results of operations and/or reputation.
These risks are not listed in any assumed order of priority. Other risks, unknown or not currently considered material, could have a similar effect. We believe that the forward-looking statements about AstraZeneca in this Annual Report, identified by words such as ‘anticipates’, ‘believes’, ‘expects’ and ‘intends’, are based on reasonable assumptions. However, forward-looking statements involve inherent risks and uncertainties such as those summarised below because they relate to events and depend on circumstances that will occur in the future, and may be influenced by factors beyond our control and/or may have actual outcomes materially different from our expectations.
Product pipeline risks
Failure to meet development targets
The development of any pharmaceutical product candidate is a complex, risky and time-intensive process involving significant financial, R&D and other resources, which may fail at any stage of the process due to a number of factors, including:
| > | Failure to obtain the required regulatory or marketing approvals for the product candidate or the facilities in which it is manufactured. |
| > | Unfavourable data from key studies. |
| > | Adverse reactions to the product candidate or indications of other safety concerns. |
| > | Failure of R&D to develop new and differentiated product candidates. |
| > | Failure to demonstrate adequately cost-effective benefits to regulators. |
| > | The emergence of competing products. |
A succession of negative drug project results and a failure to reduce development timelines effectively could adversely affect the reputation of our R&D capabilities. Furthermore, the failure of R&D to yield new products that achieve commercial success is likely to have a material adverse effect on our financial condition and results of operations.
Production and release schedules for biologics may be more significantly impacted by regulatory processes than other products due to more complex and stringent regulation on the manufacturing of biologics and their supply chain.
| 96 Risk | AstraZeneca Annual Report and Form 20-F Information 2010 |
Business organisation
Senior Executive Team
The CEO has established and chairs the SET. The SET normally meets once a month to consider and decide major business issues, or as otherwise required by business needs. Typically, it also reviews, in advance of submission to the Board, those matters that are to be submitted to the Board for review and decision.
In addition to the CEO, the SET’s members are: the CFO; the President, Global R&D; the Executive Vice-President, Global Commercial Operations; the General Counsel; the Executive Vice-President, Human Resources and Corporate Affairs; and the Executive Vice-President, Global Operations and Information Services. The Company Secretary acts as secretary to the SET.
Portfolio Investment Board (PIB)
The CEO has established and chairs the PIB, which is a senior-level, cross-functional governance body, which seeks to maximise the value of our internal and external R&D investments through robust, transparent and well-informed decisions that drive business performance and accountability.
Specifically, the PIB has responsibility for:
| > | Reviewing the R&D portfolio – by conducting an objective and transparent review of R&D performance, product launch profile and alignment with corporate strategy. The review is also an important step in reconfirming the R&D three-year budget. |
| > | Approving the business plans of the Innovative Medicines Units and the Global Medicines Development demand forecast – by confirming the allocation of resources across early- and late-stage elements of R&D as well as assessing licensing and acquisition opportunities. |
| > | Approving late-stage (internal and external) investment decisions. |
| > | Monitoring environmental events that could have a major transformational or disruptive impact on our business. |
In addition to the CEO, the PIB’s members are the CFO; the President, Global R&D; the Executive Vice-President, Global Commercial Operations; the Executive Vice-President, Innovative Medicines; the Senior Vice-President, R&D, MedImmune; the Executive Vice-President, Global Medicines Development; and the Vice-President, Strategic Partnering & Business Development. The PIB has a permanent secretary and typically meets at around the time of the monthly SET meetings, or as otherwise required by business needs.
Disclosure Committee
Our disclosure policy provides a framework for the handling and disclosure of inside information and other information of interest to shareholders and the investment community. It also defines the role of the Disclosure Committee. The members of the Committee are: the CFO, who chairs the Committee; the President, Global R&D; the General Counsel; the Vice-President, Corporate Affairs; the Vice-President, Investor Relations; and the Senior Vice-President, Group Finance. The Deputy Company Secretary acts as secretary to this Committee. The Committee meets regularly to assist and inform the decisions of the CEO concerning inside information and its disclosure. Periodically, it reviews our disclosure controls and procedures and its own operation as part of work carried out to enable management and the Board to assure themselves that appropriate processes are operating for our planned disclosures, such as our quarterly results announcements and scheduled investor relations events.
Disclosure of information to auditors
The Directors who held office at the date of approval of this Annual Report confirm that, so far as they are each aware, there is no relevant audit information of which the Company’s auditors are unaware; and each Director has taken all the steps that he or she ought to have taken as a Director to make himself or herself aware of any relevant audit information and to establish that the Company’s auditors are aware of that information.
Compliance and Group Internal Audit (GIA)
The role of the Global Compliance function is to manage and maintain the compliance programme infrastructure and to help embed a culture of ethics and integrity in the Group. Global Compliance works closely with GIA, with whom it provides joint assurance reporting to the Audit Committee. The key priorities for our Global Compliance function for 2010/2011 are closely aligned with the Group’s strategic priorities and include strengthening our efforts for oversight at all levels of our business, including third parties, anti-bribery and anti-corruption efforts, and data privacy. During 2011, the Global Compliance function will continue to focus on ensuring the delivery of an aligned approach to compliance that addresses key risk areas across the business.
During 2010, the Global Compliance function was restructured with a formal change to centralise the reporting of all globally-deployed compliance programme resources under the Global Compliance Officer who reports to the CEO. A new management structure, at the head of which is the Global Compliance leadership team, now incorporates all operational elements of the business. The remit of the team is to oversee and co-ordinate the implementation of an effective global compliance programme and evaluate its effectiveness. It does this by assessing key compliance risks within and across the SET functions; working with GIA to ensure co-ordination of compliance auditing and monitoring; reviewing results; addressing significant policy violations; and identifying trends.
Global Compliance provides direct assurance to the Audit Committee on matters concerning compliance issues, with a particular focus on compliance with anti-bribery and anti-corruption legislation as well as IFPMA, EFPIA and PhRMA codes. Complementing this, GIA carries out a range of audits that include compliance-related audits and reviews of the assurance activities of other Group assurance functions. The results from these activities are reported to the Audit Committee.
GIA is an independent appraisal function that derives its authority from the Board through the Audit Committee. Its primary role is to provide reasonable and objective assurance to the Directors regarding the adequacy and effectiveness of the Group’s risk management and control framework and the internal controls over key business risks, including financial controls and compliance with laws, regulations and policies.
GIA seeks to discharge the responsibilities set down in its charter by reviewing:
| > | The processes for ensuring that key business risks are effectively managed. |
| > | The financial and operational controls that help to ensure that the Group’s assets are properly safeguarded from losses, including fraud. |
| > | The controls that help to ensure the reliability and integrity of management information systems. |
| > | The processes for ensuring compliance with policies and procedures, external legislation and regulation. |
| 116 Corporate Governance Report | AstraZeneca Annual Report and Form 20-F Information 2010 |
| for the year ended 31 December |
| 2010 | 2009 | 2008 | ||||||||||||||
| Notes | $m | $m | $m | |||||||||||||
| Cash flows from operating activities | ||||||||||||||||
| Profit before tax | 10,977 | 10,807 | 8,681 | |||||||||||||
| Finance income and expense | 3 | 517 | 736 | 463 | ||||||||||||
| Depreciation, amortisation and impairment | 2,741 | 2,087 | 2,620 | |||||||||||||
| Decrease/(increase) in trade and other receivables | 10 | (256 | ) | (1,032 | ) | |||||||||||
| Decrease in inventories | 88 | 6 | 185 | |||||||||||||
| (Decrease)/increase in trade and other payables and provisions | (16 | ) | 1,579 | 637 | ||||||||||||
| Other non-cash movements | (463 | ) | (200 | ) | 87 | |||||||||||
| Cash generated from operations | 13,854 | 14,759 | 11,641 | |||||||||||||
| Interest paid | (641 | ) | (639 | ) | (690 | ) | ||||||||||
| Tax paid | (2,533 | ) | (2,381 | ) | (2,209 | ) | ||||||||||
| Net cash inflow from operating activities | 10,680 | 11,739 | 8,742 | |||||||||||||
| Cash flows from investing activities | ||||||||||||||||
| Acquisitions of business operations | 22 | (348 | ) | – | – | |||||||||||
| Movement in short-term investments and fixed deposits | (239 | ) | (1,371 | ) | 1 | |||||||||||
| Purchase of property, plant and equipment | (791 | ) | (962 | ) | (1,095 | ) | ||||||||||
| Disposal of property, plant and equipment | 83 | 138 | 38 | |||||||||||||
| Purchase of intangible assets | (1,390 | ) | (624 | ) | (2,944 | ) | ||||||||||
| Disposal of intangible assets | 210 | 269 | – | |||||||||||||
| Purchase of non-current asset investments | (34 | ) | (31 | ) | (40 | ) | ||||||||||
| Disposal of non-current asset investments | 5 | 3 | 32 | |||||||||||||
| Interest received | 174 | 113 | 149 | |||||||||||||
| Payments made by subsidiaries to non-controlling interests | (10 | ) | (11 | ) | (37 | ) | ||||||||||
| Net cash outflow from investing activities | (2,340 | ) | (2,476 | ) | (3,896 | ) | ||||||||||
| Net cash inflow before financing activities | 8,340 | 9,263 | 4,846 | |||||||||||||
| Cash flows from financing activities | ||||||||||||||||
| Proceeds from issue of share capital | 494 | 135 | 159 | |||||||||||||
| Repurchase of shares | (2,604 | ) | – | (610 | ) | |||||||||||
| Issue of loans | – | – | 787 | |||||||||||||
| Repayment of loans | (1,741 | ) | (650 | ) | – | |||||||||||
| Dividends paid | (3,361 | ) | (2,977 | ) | (2,739 | ) | ||||||||||
| Movement in short-term borrowings | (8 | ) | (137 | ) | (3,959 | ) | ||||||||||
| Net cash outflow from financing activities | (7,220 | ) | (3,629 | ) | (6,362 | ) | ||||||||||
| Net increase/(decrease) in cash and cash equivalents in the period | 1,120 | 5,634 | (1,516 | ) | ||||||||||||
| Cash and cash equivalents at the beginning of the period | 9,828 | 4,123 | 5,727 | |||||||||||||
| Exchange rate effects | 33 | 71 | (88 | ) | ||||||||||||
| Cash and cash equivalents at the end of the period | 13 | 10,981 | 9,828 | 4,123 | ||||||||||||
AstraZeneca Annual Report and Form 20-F Information 2010 | Financial Statements 141 |
Revenues comprise sales and income under co-promotion and co-development agreements.
Income under co-promotion and co-development agreements is recognised when it is earned as defined in the contract and can be reliably estimated. In general this is upon the sale of the co-promoted/ developed product or upon the delivery of a promotional or developmental service.
Revenues exclude inter-company revenues and value-added taxes and represent net invoice value less estimated rebates, returns and settlement discounts. Revenues are recognised when the significant risks and rewards of ownership have been transferred to a third party. In general, this is upon delivery of the products to wholesalers. In markets where returns are significant (currently only in the US), estimates of returns are accounted for at the point revenue is recognised. In markets where returns are not significant they are recorded when returned.
When a product faces generic competition particular attention is given to the possible levels of returns and, in cases where the circumstances are such that the level of returns (and, hence, revenue) cannot be measured reliably, revenues are only recognised when the right of return expires which is generally on ultimate prescription of the product to patients.
For the US market we estimate the quantity and value of goods which may ultimately be returned at the point of sale. Our returns accruals are based on actual experience over the preceding 12 months for established products together with market-related information such as estimated stock levels at wholesalers and competitor activity which we receive via third party information services. For newly launched products, we use rates based on our experience with similar products or a pre-determined percentage.
Research and development
Research expenditure is recognised in profit in the year in which it is incurred.
Internal development expenditure is capitalised only if it meets the recognition criteria of IAS 38 ‘Intangible Assets’. Where regulatory and other uncertainties are such that the criteria are not met, the expenditure is recognised in profit and this is almost invariably the case prior to approval of the drug by the relevant regulatory authority. Where, however, recognition criteria are met, intangible assets are capitalised and amortised on a straight-line basis over their useful economic lives from product launch. At 31 December 2010, no amounts have met recognition criteria.
Payments to in-licence products and compounds from external third parties for new research and development projects (in-process research and development), generally taking the form of up-front payments and milestones, are capitalised. Where payments made to third parties represent future research and development activities, an evaluation is made as to the nature of the payments. Such payments are expensed if they represent compensation for subcontracted research and development services not resulting in a transfer of intellectual property. By contrast, payments are capitalised if they represent compensation for the transfer of intellectual property developed at the risk of the third party. Since acquired products and compounds will only generate sales and cash inflows following launch, our policy is to minimise the period between final approval and launch if it is within AstraZeneca’s control to do so. Assets capitalised are amortised, generally on a straight-line basis, over their useful economic lives from product launch. Under this policy, it is not possible to determine precise economic lives for individual classes of intangible assets. However, lives range from three years to 20 years. These assets are not used in the research and development activities of other products.
Intangible assets relating to products in development (both internally generated and externally acquired) are subject to impairment testing annually. All intangible assets are tested for impairment when there are indications that the carrying value may not be recoverable. Any impairment losses are recognised immediately in profit. Intangible assets relating to products which fail during development (or for which development ceases for other reasons) are tested for impairment at the point of termination and are written down to their fair value (which is usually zero).
Business combinations and goodwill
On the acquisition of a business, fair values are attributed to the identifiable assets and liabilities and contingent liabilities unless the fair value cannot be measured reliably in which case the value is subsumed into goodwill. Where fair values of acquired contingent liabilities cannot be measured reliably, the assumed contingent liability is not recognised but is disclosed in the same manner as other contingent liabilities. Goodwill is the difference between the fair value of the consideration and the fair value of net assets acquired.
Goodwill arising on acquisitions is capitalised and subject to an impairment review, both annually and when there is an indication that the carrying value may not be recoverable. Between 1 January 1998 and 31 December 2002, goodwill was amortised over its estimated useful life; such amortisation ceased on 31 December 2002.
The Group’s policy up to and including 1997 was to eliminate goodwill arising upon acquisitions against reserves. Under IFRS 1 ‘First-time Adoption of International Financial Reporting Standards’ and IFRS 3 ‘Business Combinations’, such goodwill will remain eliminated against reserves.
Employee benefits
The Group accounts for pensions and other employee benefits (principally healthcare) under IAS 19 ‘Employee Benefits’. In respect of defined benefit plans, obligations are measured at discounted present value while plan assets are measured at fair value. The operating and financing costs of such plans are recognised separately in profit; current service costs are spread systematically over the lives of employees and financing costs are recognised in full in the periods in which they arise. Actuarial gains and losses are recognised immediately in other comprehensive income.
Where the calculation results in a benefit to the Group, the recognised asset is limited to the present value of any available future refunds from the plan or reductions in future contributions to the plan. Payments to defined contribution plans are recognised in profit as they fall due.
Taxation
The current tax payable is based on taxable profit for the year. Taxable profit differs from reported profit because it excludes items that are never taxable or tax deductible. The Group’s current tax assets and liabilities are calculated using tax rates that have been enacted or substantively enacted by the reporting date.
Deferred tax is provided using the balance sheet liability method, providing for temporary differences between the carrying amounts of assets and liabilities for financial reporting purposes and the amounts used for taxation purposes. Deferred tax assets are recognised to the extent that it is probable that taxable profit will be available against which the asset can be utilised. This requires judgements to be made in respect of the availability of future taxable income.
AstraZeneca Annual Report and Form 20-F Information 2010 | Financial Statements 143 |
the discovery and development of new products, which are then manufactured, marketed and sold. All of these functional activities take place (and are managed) globally on a highly integrated basis. We do not manage these individual functional areas separately.
We consider that the Senior Executive Team (SET) is AstraZeneca’s chief operating decision-making body (as defined by IFRS 8). The operation of the SET is principally driven by the management of the commercial operations, research and development, and manufacturing and supply. The SET also includes Finance, HR and General Counsel representation.
All significant operating decisions are taken by the SET. While members of the SET have responsibility for implementation of decisions in their respective areas, operating decision making is at SET level as a whole. Where necessary these are implemented through cross-functional sub-committees that consider the Group-wide impact of a new decision. For example, product launch
decisions would be initially considered by the SET and, on approval, passed to an appropriate sub-team for implementation. The impacts of being able to develop, produce, deliver and commercialise a wide range of pharmaceutical products drive the SET decision making process.
In assessing performance, the SET reviews financial information on an integrated basis for the Group as a whole, substantially in the form of, and on the same basis as, the Group’s IFRS Financial Statements. The high upfront cost of discovering and developing new products coupled with the relatively insignificant and stable unit cost of production means that there is not the clear link that exists in many manufacturing businesses between the revenue generated on an individual product sale and the associated cost and hence margin generated on a product. Consequently, the profitability of individual drugs or classes of drugs is not considered a key measure of performance for the business and is not monitored by the SET.
Resources are allocated on a Group-wide basis according to need. In particular, capital expenditure, in-licensing, and research and development resources are allocated between activities on merit, based on overall therapeutic considerations and strategy under the aegis of the Group’s Portfolio Investment Board to facilitate a Group-wide single combined discovery and development strategy.
The Group’s acquisitions in the biologics area, MedImmune and Cambridge Antibody Technology Group plc, have been integrated into the existing management structure of AstraZeneca both for allocation of resources and for assessment and monitoring of performance purposes. As such, although biologics is a relatively new technological area for the Group, it does not operate as a separate operating segment.
International accounting transition
On transition to using adopted IFRS in the year ended 31 December 2005, the Company took advantage of several optional exemptions available in IFRS 1 ‘First-time Adoption of International Financial Reporting Standards’. The major impacts which are of continuing importance are detailed below:
| > | Business combinations – IFRS 3 ‘Business Combinations’ has been applied from 1 January 2003, the date of transition, rather than being applied fully retrospectively. As a result, the combination of Astra and Zeneca is still accounted for as a merger, rather than through purchase accounting. If purchase accounting had been adopted, Zeneca would have been deemed to have acquired Astra. |
| > | Cumulative exchange differences – the Group chose to set the cumulative exchange difference reserve at 1 January 2003 to zero. |
Accounting standards and interpretations issued but not yet adopted
IFRS 9 ‘Financial Instruments’ was issued in November 2009. It is applicable to financial assets and financial liabilities. For financial assets it requires classification and measurement in either the amortised cost or the fair value category. For a company’s own debt held at fair value, the standard requires the movement in the fair value as a result of changes in the company’s own credit risk to be included in other comprehensive income. It is effective for accounting periods beginning on or after 1 January 2013. The standard has not yet been endorsed by the EU. The adoption of IFRS 9 is not expected to have a significant impact upon the Group’s net results or net assets.
Improvements to IFRS (issued in May 2010) is yet to be endorsed by the EU and contains amendments to several individual accounting standards which are effective for accounting periods beginning on or after 1 July 2010 or 1 January 2011. None of the amendments are expected to have a significant impact upon the Group’s net results, net assets or disclosures.
IAS 24 ‘Related Party Disclosures’ was revised by the IASB in 2009 and is effective for accounting periods beginning on or after 1 January 2011. The changes introduced relate mainly to disclosure requirements for government-related entities, and the definition of a related party, and are not expected to have a significant impact on the disclosures of AstraZeneca. The revised standard was endorsed by the EU during 2010.
The amendments to IAS 32 ‘Classification of Rights Issues’ (endorsed by the EU in 2009) and IFRS 7 ‘Disclosures – Transfer of Financial Assets’ and IAS 12 ‘Deferred Tax: Recovery of Underlying Assets’ (not yet endorsed by the EU) are effective for accounting periods beginning on or after 1 February 2010, 1 July 2011 and 1 January 2012 respectively. They are not expected to have a significant impact upon the Group’s net results, net assets or disclosures.
The following IFRIC amendments and interpretations have been issued but are not yet adopted by AstraZeneca:
| > | Amendments to IFRIC 13 ‘Customer Loyalty Programmes’ – Fair value of award credit |
| > | Amendments to IFRIC 14 ‘Prepayments of a Minimum Funding Requirement’ |
| > | IFRIC 19 ‘Extinguishing Financial Liabilities with Equity Instruments’. |
The amendments and interpretations are effective for accounting periods commencing on or after 1 January 2011, 1 January 2011 and 1 July 2010 respectively. None of the amendments or interpretations are expected to have a significant impact upon adoption.
There is no impact expected from any other standards that are available for early adoption but that have not been adopted.
| 146 Financial Statements | AstraZeneca Annual Report and Form 20-F Information 2010 |
| 2010 | 2009 | 2008 | ||||||||||
| Profit for the financial year attributable to equity holders ($m) | 8,053 | 7,521 | 6,101 | |||||||||
| Basic earnings per Ordinary Share | $5.60 | $5.19 | $4.20 | |||||||||
| Diluted earnings per Ordinary Share | $5.57 | $5.19 | $4.20 | |||||||||
| Weighted average number of Ordinary Shares in issue for basic earnings (millions) | 1,438 | 1,448 | 1,453 | |||||||||
| Dilutive impact of share options outstanding (millions) | 8 | 2 | – | |||||||||
| Diluted weighted average number of Ordinary Shares in issue (millions) | 1,446 | 1,450 | 1,453 | |||||||||
There are no options, warrants or rights outstanding in respect of unissued shares except for employee share option schemes. The number of options outstanding and the weighted average exercise price of these options is shown in Note 24. The earnings figures used in the calculations above are post-tax.
6 Segment information
AstraZeneca is engaged in a single business activity of pharmaceuticals and the Group does not have multiple operating segments. Our pharmaceuticals business consists of the discovery and development of new products, which are then manufactured, marketed and sold. All of these functional activities take place (and are managed) globally on a highly integrated basis. We do not manage these individual functional areas separately. We consider that the SET is AstraZeneca’s chief operating decision making body (as defined by IFRS 8). All significant operating decisions are taken by the SET. In assessing performance, the SET reviews financial information on an integrated basis for the Group as a whole, substantially in the form of, and on the same basis as, the Group’s IFRS Financial Statements. Resources are allocated on a Group-wide basis according to need. In particular, capital expenditure, in-licensing, and research and development resources are allocated between activities on merit, based on overall therapeutic considerations and strategy under the aegis of the Group’s Portfolio Investment Board to facilitate a Group-wide single combined discovery and development strategy.
Geographic areas
The tables below show information by geographic area and, for revenue and property, plant and equipment, material countries. The figures show the revenue, operating profit and profit before tax made by companies located in that area/country, together with segment assets, segment assets acquired, net operating assets and property, plant and equipment owned by the same companies; export sales and the related profit are included in the area/country from which those sales were made.
| Revenue | ||||||||||||
| 2010 | 2009 | 2008 | ||||||||||
| $m | $m | $m | ||||||||||
| UK | ||||||||||||
| External | 1,952 | 1,809 | 1,910 | |||||||||
| Intra-Group | 9,957 | 9,056 | 8,460 | |||||||||
| 11,909 | 10,865 | 10,370 | ||||||||||
| Continental Europe | ||||||||||||
| Belgium | 331 | 353 | 380 | |||||||||
| France | 1,929 | 1,880 | 1,945 | |||||||||
| Germany | 1,151 | 1,197 | 1,225 | |||||||||
| Italy | 1,000 | 1,012 | 1,145 | |||||||||
| Spain | 762 | 742 | 832 | |||||||||
| Sweden | 1,157 | 1,070 | 1,135 | |||||||||
| Others | 2,440 | 2,622 | 2,696 | |||||||||
| Intra-Group | 5,144 | 4,944 | 3,895 | |||||||||
| 13,914 | 13,820 | 13,253 | ||||||||||
| The Americas | ||||||||||||
| Canada | 1,492 | 1,188 | 1,269 | |||||||||
| US | 14,010 | 14,994 | 13,657 | |||||||||
| Others | 1,387 | 1,113 | 1,155 | |||||||||
| Intra-Group | 2,341 | 1,962 | 1,169 | |||||||||
| 19,230 | 19,257 | 17,250 | ||||||||||
| Asia, Africa & Australasia | ||||||||||||
| Australia | 981 | 790 | 763 | |||||||||
| Japan | 2,458 | 2,214 | 1,861 | |||||||||
| China | 1,047 | 811 | 627 | |||||||||
| Others | 1,172 | 1,009 | 1,001 | |||||||||
| Intra-Group | 67 | 80 | 78 | |||||||||
| 5,725 | 4,904 | 4,330 | ||||||||||
| Continuing operations | 50,778 | 48,846 | 45,203 | |||||||||
| Intra-Group eliminations | (17,509 | ) | (16,042 | ) | (13,602 | ) | ||||||
| 33,269 | 32,804 | 31,601 | ||||||||||
Export sales from the UK totalled $10,944m for the year ended 31 December 2010 (2009: $9,864m; 2008: $9,439m). Intra-Group pricing is determined on an arm’s length basis.
AstraZeneca Annual Report and Form 20-F Information 2010 | Financial Statements 151 |
| 25 Commitments and contingent liabilities |
2010 $m | 2009 $m | 2008 $m | ||||||||||
| Commitments | ||||||||||||
| Contracts placed for future capital expenditure on property, plant and equipment and | ||||||||||||
| software development costs not provided for in these accounts | 259 | 368 | 178 |
Guarantees and contingencies arising in the ordinary course of business, for which no security has been given, are not expected to result in any material financial loss.
Research and development collaboration payments
The Group has various ongoing collaborations including in-licensing and similar arrangements with development partners. Such collaborations may require the Group to make payments on achievement of stages of development, launch or revenue milestones although the Group generally has the right to terminate these agreements at no cost. The Group recognises research and development milestones as intangible assets once it is committed to payment, which is generally when the Group reaches set trigger points in the development cycle. Revenue-related milestones are recognised as intangible assets on product launch at a value based on the Group’s long-term revenue forecasts for the related product. The table below indicates potential development and revenue-related payments that the Group may be required to make under such collaborations.
Total $m | Under 1 year $m | Years 1 and 2 $m | Years 3 and 4 $m | Years 5 and greater $m | ||||||||||||||||
| Future potential research and development milestone payments | 3,106 | 115 | 711 | 646 | 1,634 | |||||||||||||||
| Future potential revenue milestone payments | 3,234 | – | 2 | 70 | 3,162 |
The table includes all potential payments for achievement of milestones under ongoing research and development arrangements. Revenue-related milestone payments represent the maximum possible amount payable on achievement of specified levels of revenue as set out in individual contract agreements, but exclude variable payments that are based on unit sales (e.g. royalty-type payments) which are recognised as the associated sale is recognised in the comprehensive income statement. The table excludes any payments already capitalised in the financial statements for the year ended 31 December 2010 and excludes payments under the Merck agreements (detailed below).
The future payments we disclose represent contracted payments and, as such, are not discounted and are not risk adjusted. As detailed in the Principal risks and uncertainties section from page 96, the development of any pharmaceutical product candidate is a complex and risky process that may fail at any stage in the development process due to a number of factors (including items such as failure to obtain regulatory approval, unfavourable data from key studies, adverse reactions to the product candidate or indications of other safety concerns). The timing of the payments is based on the Group’s current best estimate of achievement of the relevant milestone.
Arrangements with Merck
Introduction
In 1982, Astra AB set up a joint venture with Merck & Co., Inc. (now Merck Sharp & Dohme Corp., a subsidiary of the new Merck & Co., Inc. that resulted from the merger with Schering-Plough) (Merck) for the purposes of selling, marketing and distributing certain Astra products in the US. In 1998, this joint venture was restructured (Restructuring). Under the agreements relating to the Restructuring (Agreements), a US limited partnership (Partnership) was formed, in which Merck is the limited partner and AstraZeneca is the general partner, and AstraZeneca obtained control of the joint venture’s business subject to certain limited partner and other rights held by Merck and its affiliates. These rights provide Merck with safeguards over the activities of the Partnership and place limitations on AstraZeneca’s commercial freedom to operate. The Agreements provided for:
| > | A payment to Merck in the event of a business combination between Astra and a third party in order for Merck to relinquish certain claims to that third party’s products. |
| > | Annual contingent payments. |
| > | Termination arrangements which cause Merck to relinquish its interests in AstraZeneca’s products and activities in stages, some of which are mandatory and others optional. |
These elements are discussed in further detail below, together with a summary of their accounting treatments.
Payment in the event of a business combination
On the merger of Astra and Zeneca, a one-time lump sum payment of $809m was triggered. As a result of this payment, Merck relinquished any claims it may have had to Zeneca products.
This payment was expensed at the point of merger since it caused no incremental benefits over the prior years’ aggregate Astra and Zeneca performance to accrue to the merged AstraZeneca entity.
Annual contingent payments
AstraZeneca makes ongoing payments to Merck based on sales of certain of its products in the US (the ‘contingent payments’ on the ‘agreement products’). AstraZeneca will continue to make contingent payments to Merck until at least 2012. Contingent payments (excluding those in respect of Prilosec, Nexium and the authorised generic version of felodipine) ceased in 2010 as AstraZeneca exercised the First Option (as discussed under First Option below); contingent payments in respect of Prilosec and Nexium will cease in late 2012 if AstraZeneca exercises the Second Option that year (as discussed under Second Option below); contingent payments in respect of the authorised generic version of felodipine will continue at least until June 2011.
The annual contingent payments on agreement products are expensed as incurred.
Termination arrangements
The Agreements provided for arrangements and payments under which, subject to the exercise of certain options, the rights and interests in AstraZeneca’s activities and products held by Merck immediately prior to the merger would be terminated, including details of:
| > | the Advance Payment |
| > | the Partial Retirement |
| > | the True-Up |
| > | the Loan Note Receivable |
| > | the First Option |
| > | Second Option. |
| 178 Financial Statements | AstraZeneca Annual Report and Form 20-F Information 2010 |