Exhibit 15.1

What science can do
AstraZenecaAnnual Report and Form 20-F Information 2015

| | | | | | |
| | | | | | | |
| | | | | | |
| | |
Welcome to the AstraZeneca Annual Report and Form 20-F Information 2015. | | Learn about our main therapy areas: |
| |
We are a global, science-led
biopharmaceutical business and in
this Annual Report we report on
the progress we made in 2015 in
pushing the boundaries of science
to deliver life-changing medicines. AstraZeneca. What science can do. | |  |

From page 4, Pascal Soriot, our Chief Executive Officer, reviews the progress we made during the year in delivering our strategy. Our Chief Financial Officer, Marc Dunoyer, reviews our financial performance from page 62. From page 82, Leif Johansson, our Chairman, reviews how our governance and approach to remuneration support delivery of the strategy. | | | | | |
|
|
| | | |
Front cover: New approaches in the treatment of asthma AstraZeneca is developing a therapy aimed at producing long-term benefit in asthma by addressing imbalances in the immune system that may be an underlying cause of the disease. Rather than simply treating symptoms by relaxing airway constriction and dampening inflammation in the lung, this therapy aims to target toll-like receptor 9 in dendritic cells in the lung. This could potentially change the way immune cells communicate with each other and restore a healthy balance to the immune system. | | | | Important information for readers of this Annual Report For more information in relation to the inclusion of reported performance, Core financial measures and constant exchange rate (CER) growth rates as used in this Annual Report, please see the Financial Review on page 64. Throughout this Annual Report, growth rates are expressed at CER unless otherwise stated. Definitions The Glossary and the Market definitions table from page 247 are intended to provide a useful guide to terms and AstraZeneca’s definitions of markets, as well as to acronyms and abbreviations, used in this Annual Report. Use of terms In this Annual Report, unless the context otherwise requires, ‘AstraZeneca’, ‘the Group’, ‘we’, ‘us’ and ‘our’ refer to AstraZeneca PLC and its consolidated entities. Cautionary statement regarding forward-looking statements A cautionary statement regarding forward-looking statements and other essential information relating to this Annual Report can be found on page 251. | | Directors’ Report The following sections make up the Directors’ Report, which has been prepared in accordance with the requirements of the Companies Act 2006: > Business Review: Research and Development > Resources Review: Employees > Corporate Governance: including the Audit Committee Report and Corporate Governance Report > Directors’ Responsibility Statement > Development Pipeline > Sustainability: supplementary information > Shareholder Information > Corporate Information Strategic Report The following sections make up the Strategic Report, which has been prepared in accordance with the requirements of the Companies Act 2006: > AstraZeneca at a glance > Chief Executive Officer’s Review > Strategy > Therapy Area Review > Business Review > Resources Review > Financial Review |
Financial highlights
| | |
| | |
| |
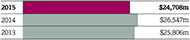
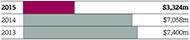
| Total Revenue* | | Net cash flow from operating activities |
| up 1% at CER to $24,708 million (down 7% at actual rate of exchange) | | down 53% (at actual rate of exchange) to $3,324 million |
| |
 | |  |
| |
| $24.7bn | | $3.3bn |
| | |
| | |
| | |
| |
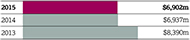
| Core operating profit | | Reported operating profit |
| up 6% at CER to $6,902 million (down 1% at actual rate of exchange) | | up 100% at CER to $4,114 million (up 93% at actual rate of exchange) |
| |
 | |  |
| |
| $6.9bn | | $4.1bn |
| | |
| | |
| |
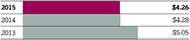
| Core EPS | | Reported EPS |
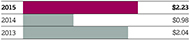
| for the full year up 7% at CER to $4.26 | | for the full year up 137% at CER to $2.23 |
| (unchanged at actual rate of exchange) | | (up 128% at actual rate of exchange) |
| |
 | |  |
| |
| $4.26 | | $2.23 |
 Financial Review from page 62
| * | As detailed on page 144, Total Revenue consists |
| | of Product Sales and Externalisation Revenue. |
| | | | | | |
 | | For more information within this Annual Report | |  | | For more information see
www.astrazeneca.com |

This Annual Report is also available on our website,
www.astrazeneca.com/annualreport2015
| | |
| AstraZenecaAnnual Report and Form 20-F Information 2015 | | 1 |
Strategic Report
AstraZeneca at a glance
| | |
| 2 | | AstraZenecaAnnual Report and Form 20-F Information 2015 |
| | |
| AstraZenecaAnnual Report and Form 20-F Information 2015 | | 3 |
Strategic Report
Chief Executive Officer’s Review
| | | | |
 | | |
2015 was an exceptional year for AstraZeneca as we made significant progress in meeting both our near- and longer-term strategic goals. Building on the solid foundations of the previous two years, our success during 2015 was based on a strong commitment to our values. It was this focus that made the year a great one for science and patients. | | importantly, offer patients a new treatment option in a disease where very few solutions exist. Another significant development in Oncology came with our agreement in December to invest in a majority equity stake in Acerta Pharma, a company focused on haematology which represents a natural fit with our existing Oncology pipeline. The acquisition provides us with access to acalabrutinib (ACP-196), a potential best-in-class small molecule oral BTK inhibitor, which is expected to transform the treatment landscape for B-cell malignancies, the most common forms of blood cancers, and has potential in solid tumours and autoimmune diseases. The acquisition of Acerta Pharma will also reinforce our growing position in haematology – building on our agreement with Celgene, in April, to develop durvalumab across a range of blood cancers. Innovation in Cardiovascular and Metabolic diseases Also in December, we completed our acquisition of ZS Pharma. This transaction provides access to the potassium-binding compound ZS-9, a potential best-in-class treatment for hyperkalaemia (high potassium levels in the bloodstream). The acquisition represents a good fit with our pipeline and portfolio in Cardiovascular and Metabolic diseases (CVMD), which focuses on reducing morbidity, mortality and organ damage by addressing multiple risk factors across cardiovascular disease, diabetes and chronic kidney disease. |
 It was this focus that made the year a great one for science and patients.” It was this focus that made the year a great one for science and patients.”
| | The first stage of our strategic journey involved strengthening our product pipeline and building our Growth Platforms. We are now well into the second stage of that journey, as we manage a transitional period of patent expiries, and are on track to continue driving our Growth Platforms and launch our new products. The increased momentum we built in 2015 was exemplified by a number of developments towards the end of the year in each of our main therapy areas that will help deliver our strategy. Leadership in Oncology The first of those events was the approval in November ofTagrisso in the US. This approval marks a significant milestone in AstraZeneca’s journey, and in our leadership in Oncology.Tagrisso is the first treatment approved for patients with a very specific form of non-small cell lung cancer who present with a genetic mutation in the epidermal growth factor receptor but also have a secondary mutation, T790M. Its story is remarkable and, as shown over, it demonstrates our ability to successfully deliver our pipeline and, even more | |
| | |
| 4 | | AstraZenecaAnnual Report and Form 20-F Information 2015 |
| | | | |
AstraZeneca:Values in action Tagrisso (osimertinib) highlights how living our values can ensure we achieve our goals. It started with inspiration and effort of our scientists to design a compound precisely targeting the biological dysfunction associated with a specific form of non-small cell lung cancer. And, by putting patients first, working collaboratively and following the science, we delivered the fastest development journey in our history: less than three years from first patient dosed to approval. It was then shipped to patients in less than six hours. | |  | | Artistic impression of
osimertinib binding to mutant EGFR. |
| | | | | | | | |
Transforming Respiratory treatment Another development in December, was our agreement to acquire Takeda’s core respiratory business. When completed, this agreement will expand our ownership of rights to roflumilast(Daliresp/Daxas), the only approved oral PDE4 inhibitor for the treatment of COPD. The agreement builds on our acquisition from Actavis, in March, of the rights to marketDaliresp in the US. This important agreement will also provide us with access to other marketed medicines that complement our growing portfolio. Importantly, it will support our return to growth after 2017 and our goal to transform the way respiratory disease is treated. Achieve scientific leadership In addition to these developments, in the week before Christmas, we received our sixth approval for the year from the FDA. Subsequently, in February 2016, we received approval from the EU forTagrisso for lung cancer. However, in what was a very busy and successful year, my Review can only give a flavour of what we achieved. The 2015 Strategic priorities overview, shown on the right, lists some of our other achievements, as well as the challenges we faced. All these are explored in more detail throughout our Strategic Report. So far as achieving scientific leadership is concerned, one measure of the distance we have come is in the recognition we have received through ‘high-impact’ publications in major relevant scientific journals. AstraZeneca people had 58 such articles published in 2015 compared with seven in 2010 – a more than eightfold increase. | | 2015 Strategic priorities overview | | |
| | Achieve scientific leadership > 6 approvals of NMEs or major LCM projects in major markets | |  | | Return to growth > 1% increase in Total Revenue to $24,708 million at CER; comprising | |  |
| | – Oncology:Iressa(US);Tagrisso (AZD9291/osimertinib) (US); Faslodex500mg (China) – CVMD:BydureonDual Pen (Japan); Brilinta(US for treatment of history of heart attack) – RIA:Zurampic(US) > 2 Phase III NME starts: – anifrolumab for lupus – PT010 for COPD > 12 NME or major LCM regulatory submissions in major markets > Accelerated reviews included – BrilintaFDA granted Priority Review for PEGASUS – TagrissoFDA and PMDA granted Priority Review. EMA accelerated assessment – FDA granted Fast Track status for anifrolumab for systemic lupus erythematosus; durvalumab for head and neck cancer; and tremelimumab for mesothelioma > 20 projects discontinued | | Product Sales of $23,641 million (down 1%) and Externalisation Revenue of $1,067 million (up 140%) – Based on actual exchange rates, Total Revenue declined by 7%, reflecting the particular weakness of key trading currencies against the US dollar > 11% increase in Growth Platforms revenue contributing 57% of Total Revenue – Respiratory: up 7%, before completion of the acquisition of Takeda’s respiratory business – Brilinta/Brilique: up 44% underpinned by a recently-extended US label and positive CHMP opinion – Diabetes: up 26%, including 76% in Emerging Markets; globalFarxiga/Forxiga growth of 137% – Emerging Markets: up 12%, including China and Latin America each growing by 15% – Japan revenue: up 4% – New Oncology: contributed $119 million, comprisingLynparza,Iressa(US) and Tagrisso > US revenue was down 6% to $9,474 million; Europe down 6% to $5,323 million; and Established ROW was stable at $3,022 million (at CER) |
| | Great place to work > Our quarterly employee survey (pulse) showed belief in our strategy stood at 89% (compared with 86% in our 2014 all-employee survey) > Exceeded our targets for senior leaders: women (42% versus 41%) and country of origin from an Emerging Market or Japan (15.6% versus 13%) > Exceeded our target by screening more than one million people in Kenya for hypertension as part of our Healthy Heart Africa programme | | 
|
| | | | | | | | |

| | |
| AstraZenecaAnnual Report and Form 20-F Information 2015 | | 5 |
Strategic Report
Chief Executive Officer’s Reviewcontinued
|
Strategic Report In this Strategic Report, we outline our business model, the marketplace in which we operate and the strategic priorities we decided upon in response to those conditions. We define our measures of success (our key performance indicators) and the risks we have identified to achieving our strategy. Subsequent sections explore our therapy areas as well as our business units and the resources we are able to deploy in their support. We also highlight how commitment to our values contributes to our success. |
Great people are central to our success and being a great place to work is at the heart of our efforts to release the talents of our employees.

A pipeline ahead of plan
Our pipeline is also a measure of our progress and 2015 was a year of considerable success. Of our six approvals for the year, the approval, in September, ofBrilinta in the US for the treatment of patients with a history of heart attack beyond the first year was particularly impressive: it took just nine months to move from the presentation of top-line PEGASUS TIMI-54 data to launch.
During the year we also made 12 major regulatory submissions. After our partner Amgen decided to terminate our collaboration on brodalumab in May, our subsequent collaboration with Valeant, with their specific expertise in dermatology, enabled submissions to be made in the US and EU by the end of the year. In July, results of a Phase III study for selumetinib did not meet its primary endpoint for uveal melanoma. As for saxagliptin/dapagliflozin, its submission in the EU and elsewhere remains on track despite a Complete Response Letter being received from the FDA in October.
External recognition of the strength of our pipeline was provided by the number of accelerated reviews received by our candidate drugs during the year, including those for cancer, respiratory diseases and lupus. Internally, six Phase III investment decisions and 11 Phase II starts stand testament to the quality of the projects in development which will help deliver sustainable growth.
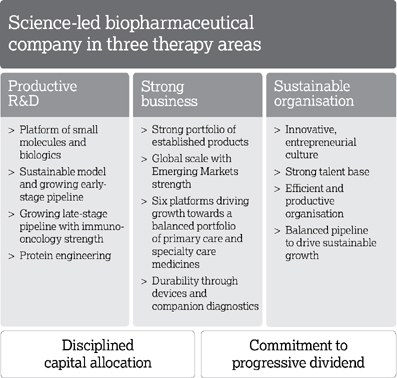
Even after the approvals we received during the year, and the 18 approvals of the last two years, we ended 2015 with 15 projects in late-stage development, including recently
acquired compounds. This exceeds the target set in 2013 of nine to 10 NMEs in Phase III/pivotal Phase II studies or under regulatory review by 2016.
Collaboration as a way of life
2015 was also a good year for collaborations which are an integral part of our business model and culture. They improve the productivity of our R&D and help maximise the value of our pipeline. With 10 deals we considerably exceeded our target. Some of these, such as our agreement with Celgene, are examples of strategic collaborations to broaden and accelerate the development of key pipeline assets. This is explained in more detail in the Business model on page 8.
As well as externalising some of our early development projects outside our main therapy areas, we also divest medicines that can be better deployed by a partner with a primary focus in that area. Examples in 2015 included the divestment ofEntocort, our gastrointestinal medicine. Both routes allow us to leverage the capabilities and expertise of others, focus our own resources and deliver the greatest benefit to patients and shareholders.
Scientific collaborations also help us push the boundaries of science. For example, during the year we announced four collaborations aimed at harnessing the power of CRISPR (clustered regularly-interspaced short palindromic repeats), including one with The Wellcome Trust Sanger Institute in Cambridge, UK – see over.
| | |
| 6 | | AstraZenecaAnnual Report and Form 20-F Information 2015 |
| | | | |
Values in action:We follow the science Genetic engineering is not new. The Human Genome Project produced a complete genetic blueprint for building a human in 2003 but, until now, scientists have been unable to manipulate genes simply and effectively. A new technology called CRISPR is changing that by allowing the genome of several different species to be edited precisely. We are using CRISPR to identify new targets for medicines and develop new models to test compounds which align more closely with human disease. | |  |
| | |
Return to growth We delivered a strong pipeline and financial performance in 2015 as we began the next phase in our strategic journey. As the 2015 Strategic priorities overview shows, Total Revenue in 2015 was up 1% at CER. The overview also shows the success we have had with our Growth Platforms where Product Sales grew by 11% and represented 57% of Total Revenue. Our top-line and gross-margin growth underpinned continued investment in R&D. Core R&D costs were up by 21% in the year which reflected the investment in the pipeline. Investing in China for the long term The extent of our ambition was demonstrated by our strategic investments, announced in December, to accelerate the delivery of innovative medicines to patients in China, the world’s second largest economy and our second largest market, and to support the delivery of our strategy. These initiatives will see AstraZeneca become the first multinational pharmaceutical company operating in China to commit to local development of its innovative global portfolio from research to commercialisation. Just as importantly, these initiatives will allow us to better integrate Chinese requirements into our global portfolio decisions. Great place to work Great people are central to our success and being a great place to work is at the heart of our efforts to release the talents of our employees. So, for example, during 2015, we held over 70 People Development Week | | events to help our staff take ownership of their personal development. A talented workforce is also diverse and I am pleased that we managed to exceed our targets for women and country of origin among our senior leaders. I take pride in the fact that our efforts are being increasingly recognised in external awards for the work environment we have instilled. That environment is nurtured by our investment in strategic R&D centres, such as Cambridge, UK where we now have more than 1,600 employees and where the construction of our R&D centre and global headquarters is progressing rapidly. These investments help create an environment of innovation and a focus on science and patients. They also attract a lot of talent from academia and other companies. A great place to work also has to be one where we do the right thing – for the patients who take our medicines, as well as the planet and society as a whole. If we are to deliver business success over the longer term, then sustainability has to be in our DNA. As the Chairman outlines in more detail in his Statement, the steps we are taking in this regard reflect a determination to do our fair share. Looking ahead The investments we made in 2015 were designed to ensure we achieved a balance between meeting our short-term goal of returning to growth and then delivering sustainable growth over the longer term as we build a sustainable, durable and more profitable business. | | As we face the transitional period of patent expiry forCrestor in the US, we’re confident that our strong execution on strategy, combined with the benefits of focused investments and new launches, keeps us on track to return to sustainable growth in line with our targets. The weakness of key trading currencies against the US dollar has continued. Based on average exchange rates in January 2016 and our published currency sensitivities, an adverse impact of around 3% from currency movements on Total Revenue and Core EPS in 2016 would be anticipated. Appreciation I am confident that in AstraZeneca we have the people who can overcome our short-term challenges and deliver longer-term sustainable growth. In that regard I would particularly like to welcome Pam Cheng and Sean Bohen who joined us during the year. In doing so, I would like to thank David Smith and Briggs Morrison whom Pam and Sean replaced, for the contributions they made to our strategic journey. In closing, I would like to pay tribute to everyone in AstraZeneca for making 2015 a tremendous year. I have every confidence in their ability to continue that success in the years ahead. 
Pascal Soriot Chief Executive Officer |
| | |
| AstraZenecaAnnual Report and Form 20-F Information 2015 | | 7 |
Strategic Report | Strategy
Business model
Our Purpose and Values drive what we do – and how we do it. This includes our
business model and our determination to create sustainable value across every
medicine’s life-cycle.
| | |
| AstraZeneca’s investor proposition | | How it works |
| | |
Externalisation Our business model includes externalisation as part of our portfolio management strategy and is a result of increasing R&D productivity and a focus on three main therapy areas. Externalisation activities relate to specific risk- and reward-sharing strategic collaborations that provide greater access to strong science and broaden, accelerate and maximise the development and commercialisation potential for some of our medicines and help bring those medicines to patients faster. Milestone payments and royalties arising from externalisation activities are included in the income statement as Externalisation Revenue. Externalisation allows us to leverage the capabilities and expertise of others, focus on our main therapy areas and deliver the greatest benefit to patients and shareholders. Externalisation activities in 2015 included our collaboration with Celgene, leveraging the expertise of AstraZeneca in immuno-oncology along with the experience of Celgene in the study and treatment of blood cancers, for the development and commercialisation of durvalumab across a range of haematological malignancies. Similarly, our collaboration with Lilly, entered into in 2014, combines the scientific expertise from our two organisations and, by sharing the risks and cost of late-stage development, aims to accelerate the advancement of AZD3293 and progress a new approach to support the treatment of Alzheimer’s disease patients around the world. AstraZeneca retains significant interest, and continued participation, in the key decision making undertaken within these strategic collaborations. | |  |
Financial Review on page 62 | | |
| | |
| | |
| 8 | | AstraZenecaAnnual Report and Form 20-F Information 2015 |
| | |
| AstraZenecaAnnual Report and Form 20-F Information 2015 | | 9 |
Strategic Report | Strategy
Life-cycle of a medicine
| | |
| As a global science-led biopharmaceutical company, our activities span the entire life-cycle of a medicine from Research and Development to Manufacturing and Supply to the global Sales and Marketing of primary care and specialty care medicines that transform lives. | | |
|
Research and development phases 10–15 years |
1
Find potential medicine
| > | | Identify unmet medical need aligned with our three therapy areas and undertake scientific research to identify potential new medicines |
| > | | Initiate process of seeking patent protection |
2
Pre-clinical studies
| > | | Conduct laboratory and animal studies to understand if the potential medicine is safe to introduce into humans and in what quantities |
| > | | Determine likely efficacy, side effect profile and maximum dose estimates |
3
Phase I studies
| > | | Begin clinical studies with small groups of healthy human volunteers (small molecules) or patients (biologics) to understand how the potential medicine is absorbed into the body, distributed around it and excreted |
| > | | Determine approximate dosage and identify side effects |
4
Phase II studies
| > | | Conduct studies on small- to medium-sized groups of patients to test effectiveness and tolerability of the medicine and determine optimal dose |
| > | | Design Phase III studies to generate data needed for regulatory approvals and pricing/reimbursement globally |
5
Phase III studies
| > | | Engage in studies in a larger group of patients to gather information about effectiveness and safety of the medicine and evaluate the overall benefit/risk profile |
| > | | Initiate branding for the new medicine in preparation for its launch |
6
Regulatory submission and pricing
| > | | Seek regulatory approvals for manufacturing, marketing and selling the medicine |
| > | | Submit clinical data to regulatory authorities (and, if requested, generate further data increasingly in real-world settings) to demonstrate the safety and efficacy of the medicine to enable them to decide on whether to grant regulatory approvals |
| | | | | | |
Launch phase 5–10 years | | | | Post-exclusivity 20+ years |
7
Launch new medicine
| > | | Raise awareness of patient benefit and appropriate use, market and sell medicine |
| > | | Clinicians begin to prescribe medicines and patients begin to benefit |
| > | | Continuously monitor, record and analyse reported side effects. Review need to update the side effect warnings to ensure that patients’ wellbeing is maintained |
| > | | Assess real-world effectiveness, and opportunities to support patients and prescribers, to achieve maximum benefit from the medicine |
8
Post-launch research and development
| > | | Conduct studies to further understand the benefit/risk profile of the medicine in larger and/or additional patient populations |
| > | | Life-cycle management activities to broaden understanding of a medicine’s full potential |
| > | | Consider additional diseases or aspects of disease to be treated by or better ways of administering the medicine |
| > | | Submit data packages with requests for life-cycle management to regulatory authorities for review and approval |
9
Post-exclusivity
| > | | Patent expiry and generic entry |
| > | | Reinvestment of returns |
Primary care and specialty care
Primary care is general healthcare provided by doctors who ordinarily have first contact with patients and who may have continuing care for them. Specialty care is specific healthcare provided by medical specialists who do not generally have first contact with patients. Specialty care medicines generally treat more severe diseases and an increasing number of specialty care medicines require a diagnostic test for patient eligibility or to achieve the best outcomes.
Small molecule drugs
| > | | Typically composed of 20 to 100 atoms with a well-defined chemical structure |
| > | | Potential for off target activity |
| > | | Manufactured through chemical synthesis. Identical copies can be made |
| > | | Wide variety of administration routes, such as oral, inhaled, injected or topical delivery |
Large molecule drugs (biologics)
| > | | Small biologics (eg peptides) typically 200 to 3,000 atoms. Large biologics (eg antibodies), typically 5,000 to 50,000 atoms |
| > | | High selectivity and specificity; potentially immunogenic |
| > | | Manufactured in a living system such as a microorganism, or plant or animal cells |
| > | | Administration route often intravenous, intramuscular or other parenteral route |
| | |
| 10 | | AstraZenecaAnnual Report and Form 20-F Information 2015 |

| | | | |
Research and Development from page 42 Manufacturing and Supply from page 46 Sales and Marketing from page 48 | | | | Note: This is a high-level overview of a medicine’s life-cycle and is illustrative only. It is neither intended to, nor does it, represent the life-cycle of any particular medicine or of every medicine discovered and/or developed by AstraZeneca, or the probability of success or approval of any AstraZeneca medicine. |
| | |
| AstraZenecaAnnual Report and Form 20-F Information 2015 | | 11 |
Strategic Report | Strategy
Marketplace
| | | | | | |
 | | |
Despite global economic, political and social challenges, the pharmaceutical industry is expected to enjoy long-term growth. This is due to favourable demographic trends and significant unmet medical need. | | The global context According to the International Monetary Fund (IMF), a return to robust and synchronised global expansion remains elusive six years after the world economy emerged from its broadest and deepest post-war recession. Moreover, downside risks to the world economy appear more pronounced, particularly for emerging market and developing economies, and including renewed concerns about China’s growth potential. |
| | |
Overview > Global pharmaceutical sales grew by 9.5% in 2015 > The sector remains highly competitive > Patient populations are expanding and ageing > Non-communicable diseases kill 38 million people each year > The costs of developing a new medicine continue to rise > Priority Reviews and Breakthrough Therapies are becoming more prevalent > A highly regulated sector reflects the demand for safe, effective and high-quality medicines > Pricing and reimbursement continue to be challenging > Patents are expiring on some of the biggest-selling drugs ever produced > The sector faces challenges in building and maintaining trust | | The demand for healthcare, however, continues to increase. While this is a favourable trend for long-term industry growth, challenges remain. These include expiring patents, competition from and growing use of generic medicines, obtaining regulatory approval, securing reimbursement for new medicines, improving R&D productivity and attaining pricing and sales sufficient to generate revenue and sustain the cycle of innovation. Expanding patient populations The number of people accessing healthcare is increasing, as is healthcare spending, particularly by the elderly. For example, WHO estimates that, by 2050, the world’s population aged 60 years and older is expected to total two billion, up from 900 million in 2015 and that, by then, 80% of all older people will live in low- and middle-income countries. As the diagram on pages 14 and 15 shows, we expect developing markets to continue to boost pharmaceutical growth. Unmet medical need The prevalence of non-communicable diseases (NCDs), such as cancer and cardiovascular, metabolic and respiratory diseases, is increasing worldwide. NCDs are |
| | | |
84.0% Generics constituted 84.0% of prescriptions dispensed in the US. | | 
| | $140bn Global investment in pharmaceutical R&D expected to reach an estimated $140 billion in 2015, a 30% increase from $108 billion in 2006. | |
| | | |
| | | | | |
| | | | | |
| | | | | |
| | | | | |
| | | | | | |
| | |
| 12 | | AstraZenecaAnnual Report and Form 20-F Information 2015 |
often associated with ageing populations and lifestyle choices, including smoking, diet and lack of exercise. Many NCDs require long-term management. WHO estimates that NCDs kill 38 million people each year and disproportionately affect low- and middle-income countries where nearly three-quarters of these deaths occur. For example, more than 60% of the world’s total new annual cancer cases occur in Africa, Asia and Central and South America. These regions account for 70% of the world’s cancer deaths.
The pharmaceutical sector: opportunities and challenges
As shown in the table on the right, global pharmaceutical sales grew by 9.5% in 2015. Established Markets saw average revenue growth of 9.3% and Emerging Markets revenue growth at 10.3%. The US, China, Japan, Germany and France are the world’s top five pharmaceutical markets. In 2015, the US had 45.7% of global sales (2014: 44.6%; 2013: 43.2%).
Science and technology
Innovation is critical to addressing unmet medical need. The delivery of new medicines will rely on a more advanced understanding of disease and the use of new technology and approaches, including personalised healthcare (PHC) and predictive science.
Technological breakthroughs in the design and testing of novel compounds present fresh opportunities for using small molecules as the basis for new medicines. The use of large molecules, or biologics, has also become an important source of innovation. Biologics are among the most commercially successful new products. By 2020, biologics are expected to account for 46% of the total sales revenue of the world’s top 100 pharmaceutical products, having risen from 21% in 2006. As such, most pharmaceutical companies now pursue R&D in both small molecules and biologics.
Priority Reviews and Breakthrough Therapies are becoming more prevalent with more than half the Center for Drug Evaluation and Research NME approvals in 2015 receiving a Priority Review and, almost a quarter having a Breakthrough Therapy designation. Between the inception of the Breakthrough Therapy designation programme in October 2012 and the end of 2015, the FDA has granted more than 100
such requests, and one-third of these have already resulted in product approvals.
The cost of developing new medicines continues to rise. Global R&D investment is expected to reach $140 billion in 2015. While the growth rate of R&D spend has slowed in recent years, pharmaceutical companies continue to deliver new medicines. In 2015 the FDA approved 45 NMEs compared with 41 in 2014 and 27 in 2013. The number of approvals in 2015 is the largest since 1996 when 59 NMEs were approved.
To ensure sustainable returns on R&D investment, the industry is working to increase its success rate in developing commercially viable new drugs while achieving a lower, more flexible cost base. Regulators and payers, however, are demanding greater evidence of comparative effectiveness of medicines. This increases development times and costs.
Fortunately, innovative technology is helping accelerate product approvals. A greater emphasis on Proof of Concept is also helping to improve productivity and reduce costs by showing the potential efficacy of drugs earlier in the development process.
Regulatory requirements
A highly regulated biopharmaceutical industry reflects the public’s expectation of safe, effective and high-quality medicines. Meeting this expectation requires responsible testing, manufacturing and marketing. It also relies on maintaining effective working relationships with health authorities worldwide, including the FDA in the US, the EMA in the EU, the PMDA in Japan, and the CFDA in China. Increasingly, regulation and governmental policy are being introduced to stimulate innovation in drug development. In the US, for example, the 21st Century Cures Act, passed by the House of Representatives in July 2015, and the related Senate Innovation for Healthier Americans Legislative Initiative, are focused on accelerating the discovery, development and delivery of promising new treatments for patients. Similarly, the PDUFA reauthorisation legislation considered by the US Congress in 2017 is anticipated to contain proposals aimed at accelerating innovation and modernising the regulatory environment. Additionally, the growing complexity and globalisation of clinical studies have led to an increase in public-private consortia. Such consortia, which include industry, academia
Global pharmaceutical sales
World $bn
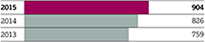
$904bn(9.5%)
US $bn
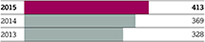
$413bn(12.0%)
Europe $bn
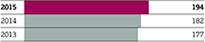
$194bn(6.3%)
Established ROW $bn
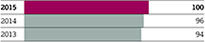
$100bn(4.3%)
Emerging Markets $bn

$198bn(10.3%)
Data based on world market sales using AstraZeneca market definitions as set out in the Market definitions on page 247. Source: IMS Health, IMS Midas Quantum Q3 2015 (including US data). Reported values and growth are based at CER. Value figures are rounded to the nearest billion and growth percentages are rounded to the nearest tenth.
| | |
| AstraZenecaAnnual Report and Form 20-F Information 2015 | | 13 |
Strategic Report | Strategy
Marketplacecontinued
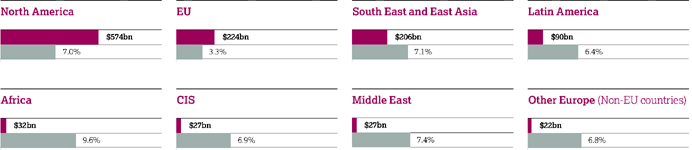
Estimated pharmaceutical sales and market growth – 2019
and government bodies, aim to drive innovation, streamline regulatory processes, and define and clarify approval requirements for innovative drug and biologic products.
Regulatory health authorities continue to implement programmes intended to address unmet medical need and to speed up patient access to transformative medicines. This is demonstrated by the Breakthrough Therapy programme employed by the FDA and the EMA’s piloting of a programme to implement ‘adaptive pathways’, or ‘staggered approval’, to improve timely patient access to new medicines. In Japan, the SAKIGAKE strategy is fostering a more favourable environment for drug development and accelerating the availability of currently unapproved medicines for serious and life-threatening diseases. The lengthy review process in China extends new medicine approval periods to as long as five years. This challenges the ability of pharmaceutical companies to deliver innovative medicines and treat unmet medical need in China. However, proposed revisions to China’s Drug Administration Law, which are under review, may help address this issue.
Greater transparency and public access to regulatory submissions that support approval of new medicines continues to be an area of interest. A recent example involves the EMA policy on publication of clinical data for medicinal products for human use, which provides guidance for the publication of clinical reports that underpin the EMA’s decision making. These clinical reports include the overviews, summaries and clinical study reports submitted by the applicant, together with documentation of statistical methods.
The study of paediatric populations continues to present challenges to the industry as differences between study requirements and timeframes may vary significantly among health authorities. However, there have been efforts to provide incentives to stimulate paediatric research. An example is EMA’s initiative offering free-of-charge meetings early in drug development. Increased interest in the availability of the paediatric rare disease voucher programme in the US is another noteworthy development.
Regulatory requirements for the registration of biosimilar products continue to be developed and become better defined. This includes the publication of a new pathway for China and the first biosimilar product approval in the US. However, significant areas of regulatory policy are still evolving. Among these are transparency of data to support approval of claims for biosimilarity in labelling, standards for interchangeability and pharmaceutical substitution, and traceability of pharmacovigilance reports through naming conventions that permit differentiation of products. For more information about biosimilars, please see Patent expiries and genericisation below.
Pricing of medicines
Pricing and reimbursement remain challenging in many markets. Most pharmaceutical sales are generated in highly regulated markets where governments, insurers and other private payers exert various controls on pricing and reimbursement. These include limitations on pharmaceutical spending and the cost of readmitting patients to hospital. Implementation of certain reforms and shifting market dynamics are further
constraining healthcare providers, while difficult economic conditions burden patients who pay out-of-pocket for medicines. Pharmaceutical companies are now expending significant resources to demonstrate the economic as well as therapeutic value of their medicines.
In the US, the Affordable Care Act (ACA) has had a direct impact on healthcare activities. It continues to reshape the market through various provisions designed to reduce cost and improve healthcare and patient outcomes. We, along with other pharmaceutical companies, are working with policymakers and regulators to help contain costs, improve outcomes and promote an environment that fosters medical and scientific innovation.
In Europe, governments continue to implement price control measures for medicines, including mandatory discounts, clawbacks and price referencing rules. These measures are decreasing drug prices, particularly in the challenged economies of Greece, Romania and Italy. In France, price negotiations are particularly challenging due to budget pressures. In Germany, Europe’s largest pharmaceutical market, manufacturers must now prove the added benefit of their drug over existing alternatives if they are to avoid relegation to a single reimbursement level (or reference) for each drug group.
In China, pricing practices remain a priority for regulators. Though free pricing has been introduced, provincial and hospital tenders continue to put increasing pricing pressures on pharmaceutical companies. In Russia and selected Middle East markets, governments are encouraging local manufacturing by offering more favourable
| | |
| 14 | | AstraZenecaAnnual Report and Form 20-F Information 2015 |
| | | | |
 | | 
· Estimated pharmaceutical sales – 2019. Ex-manufacturer prices at CER. Source: IMS Health. · Estimated pharmaceutical market growth – 2014 to 2019. Compound annual growth rate. Source: IMS Health. | | |
pricing legislation. In Japan, mandated biennial cuts are likely to continue. In Latin America, pricing is increasingly controlled by governments as, for example, in Colombia.
For more information about price controls, reductions and US healthcare reform, and price regulation in our major markets, please see Geographical Review from page 227 and Risk from page 212
Patent expiries and genericisation
Patent protection for pharmaceutical products is finite. Patents are expiring on some of the biggest-selling drugs ever produced and payers, physicians and patients have greater access to generic alternatives (both substitutable and analogue) in many important drug classes. These generic alternatives are primarily lower priced because generic manufacturers are largely spared the costs of R&D and market development. As a result, demand for generics is high. For prescriptions dispensed in the US in 2015, generics constituted 84.0% of the market by volume (2014: 83.4%).
Generic competition can also result from patent disputes or challenges before patent expiry. Increasingly, generics companies are launching products ‘at risk’, for example, before resolution of the relevant patent litigation. This trend, which is likely to continue, creates significant market presence for the generic version while the litigation remains unresolved. Given the unpredictable nature of patent litigation, some companies have settled such challenges on terms acceptable to the innovator and generic manufacturer. While competition authorities generally accept such agreements as a legitimate way to settle these disputes, they have questioned some settlements as being anti-competitive.
Biologics typically retain exclusivity for longer than traditional small molecule pharmaceuticals, with less generic competition. With limited experience to date, the substitution of biosimilars for the original branded product has not followed the same pattern as generic substitution in small molecule products and, as a result, erosion of the original biologic’s branded market share has not been as rapid. This is due to biologics’ complex manufacturing processes and the inherent difficulties in producing a biosimilar, which could require additional clinical trials. However, with regulatory authorities in Europe and the US continuing to implement abbreviated approval pathways for biosimilar versions, innovative biologics are likely to face increased competition. Similar to biologics, some small molecule pharmaceutical products are in complex formulations and/or require technically challenging manufacturing and thus may not follow the pattern of generic market erosion seen with traditional, tabletted pharmaceuticals. For those products, the introduction of generic alternatives (both substitutable and analogue) can be slower.
Building trust
The pharmaceutical industry faces challenges in building and maintaining trust, particularly with governments and regulators. This reflects the past decade’s legal disputes between pharmaceutical companies and governmental and regulatory authorities. To address this challenge, companies are strengthening a culture of ethics and integrity, adopting higher governance standards and improving relationships with employees, shareholders and other stakeholders.
Numerous companies, including those in the pharmaceutical industry, have been investigated by the China Public Security Bureau following allegations of bribery, and criminal and financial penalties have been imposed. Investigations by the DOJ and SEC under the Foreign Corrupt Practices Act are continuing as are investigations by the UK Serious Fraud Office under the UK Bribery Act. Information about material legal proceedings can be found in Note 27 to the Financial Statements from page 186.
Strategic responses
Our industry remains highly competitive. It includes large, research-based pharmaceutical companies (such as AstraZeneca) that discover, develop and sell innovative, patent-protected prescription medicines and vaccines, smaller biotechnology and vaccine businesses, and companies that produce generic medicines. While many of our peers face similar challenges, they tackle them in different ways. Some companies have pursued a strategy focused on branded prescription pharmaceuticals. Others have diversified by acquiring or building branded generics businesses or consumer portfolios. A number of companies are focused on improving R&D productivity and operational efficiency. Other companies have looked to geographic expansion, especially in Emerging Markets and Japan. Across the industry, business development deals (including licensing and collaborations), and competition for business development opportunities continued in 2015. It is estimated that the value of mergers announced in the healthcare sector during the year amounted to more than $650 billion, accounting for 14% of all merger and acquisition activity.
| | |
| AstraZenecaAnnual Report and Form 20-F Information 2015 | | 15 |
Strategic Report | Strategy
Strategic priorities
| | | | | | |
| We are focused on returning to growth in our chosen therapy areas through a science-led innovation strategy. This strategy is based on investing in three therapy areas, building a strong and balanced portfolio of primary care and specialty care medicines, and accelerating key R&D programmes. It also involves engaging in targeted business development and leveraging our strong global commercial presence, particularly in Emerging Markets. | | | | What do we need to do? | | |
| | Achieve scientific leadership 
| | Focus on innovative science in three therapy areas | | |
| | | Prioritise and accelerate our pipeline | | |
| | | Transform our innovation and culture model | | |
| | | Accelerate through business development | | |
| | Return to growth 
| | Focus on Growth Platforms | | |
| | | Transform through specialty care, devices and biologics | | |
| | Be a great place to work 
| | Evolve our culture | | |
| | | Simplify our business | | |
| | | Attract and retain the best talent | | |
| | | Deliver business success over the long term | | |
| | Achieve our Group financial targets 
| | Drive on-market value | | |
| | | Maintain a progressive dividend | | |
| | | Maintain a strong balance sheet | | |
| | |
| 16 | | AstraZenecaAnnual Report and Form 20-F Information 2015 |
| | | | |
| | | How are we implementing this? | | For more information |
| | | |
| | | Our focus is on Respiratory, Inflammation and Autoimmunity; Cardiovascular and Metabolic diseases; and Oncology. We are also taking an opportunity-driven approach to Infection, Neuroscience and Gastrointestinal disorders. We are working across small molecules, biologics, immunotherapies, protein engineering and devices. | | Therapy Area Review from page 24 |
| | | |
| | | We are accelerating and investing in key R&D programmes. 15 new molecular entities (NMEs) are in Phase III/pivotal Phase II or under regulatory review compared with our March 2013 target of nine to 10 by the end of 2016. | | Pipeline and Therapy Area Introduction from page 24 |
| | | |
| | | Between 2013 and the end of 2016, we have the potential for 12 to 16 Phase II starts; 14 to 16 NME and major line extension regulatory submissions; and eight to 10 NME and major line extension regulatory approvals. We are strengthening our early-stage pipeline through novel science and technology. | | Development Pipeline from page 205 |
| | | |
| | | Our two autonomous biotech units, MedImmune and IMED, drive science and innovation, and GMD drives our late-stage development unit. | | Research and Development from page 42 |
| | | |
| | | We are focusing on novel science, such as immune-mediated therapy combinations and personalised healthcare (PHC). | | |
| | | |
| | | To increase our proximity to bioscience clusters, we are co-locating around three strategic centres in Cambridge, UK; Gaithersburg, Maryland US; and Gothenburg, Sweden. These moves will leverage our capabilities and foster collaboration with leading scientists and research organisations. | | |
| | | |
| | | We are working to reinforce our therapy areas and are strengthening our portfolio and pipeline through targeted business development, including collaborations, in-licensing and acquisitions. | | In the wider world from page 55 |
| | | |
| | | We are collaborating strategically to broaden and accelerate the development of key pipeline assets (externalisation) and divesting non-core assets to realise value. | | |
| | | |
| | | Brilinta/Brilique– We are working to deliverBrilinta/Brilique’s potential to reduce cardiovascular deaths through ongoing clinical studies and plans for market leadership. | | Cardiovascular and Metabolic diseases from page 30 |
| | | |
| | | Diabetes – We are working to maximise the potential of our broad and innovative non-insulin, anti-diabetic portfolio to transform patient care. | | Cardiovascular and Metabolic diseases from page 30 |
| | | |
| | | Emerging Markets – We are focused on delivering innovative medicines by accelerating our investment in Emerging Markets capabilities, with a focus on China and other leading markets, such as Russia and Brazil. We are also expanding our commercial reach through multi-channel marketing and sales force excellence and building strong local medical and scientific affairs teams. Transformation of our capabilities is supporting new products and improving access and affordability. | | Sales and Marketing from page 48 |
| | | |
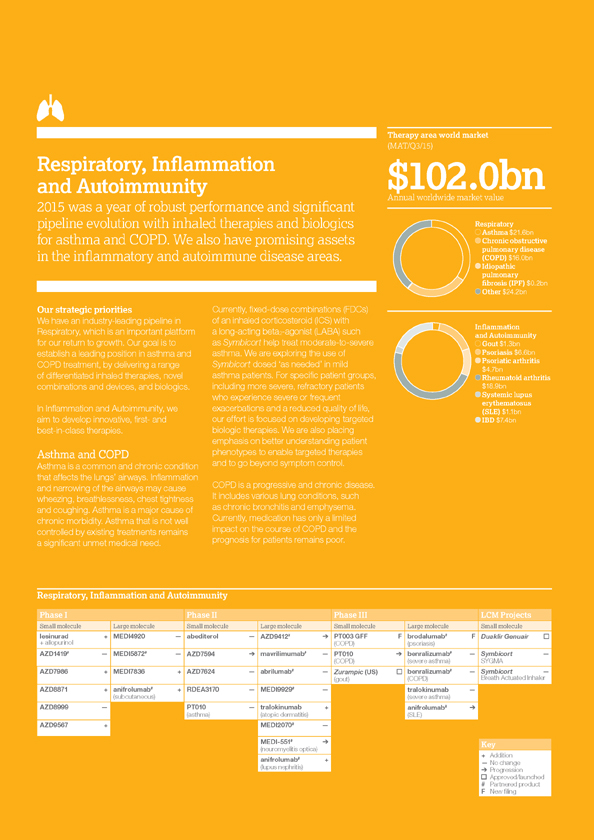
| | | Respiratory – We are working to maximise pipeline value, devices and medicines to fulfil unmet medical need and improve patient outcomes in asthma, chronic obstructive pulmonary disease (COPD) and idiopathic pulmonary fibrosis (IPF). | | Respiratory, Inflammation and Autoimmunity from page 26 |
| | | |
| | | Japan – We are strengthening our Oncology franchise and working to maximise the success of our Diabetes medicines and established brands:Symbicort,NexiumandCrestor. | | Sales and Marketing from page 48 |
| | | |
| | | New Oncology – Became our sixth Growth Platform in January 2015 and includesLynparza,Iressa(US) andTagrisso. We are aiming to deliver six new cancer medicines to patients by 2020. | | Oncology from page 34 |
| | | |
| | | We are transforming our business to become more sustainable, durable and profitable. This involves focusing on specialty care medicines, devices and biologics. Biologics now account for half of the NMEs in development, potentially enhancing asset longevity. A greater focus on innovative and differentiated delivery devices affords patient choice while ensuring product durability. Our new specialty care portfolio is expected to balance our strength in primary care medicines. | | Therapy Area Review from page 24 |
| | | |
| | | We are working to improve our employees’ identification with our Purpose and Values and to promote greater understanding of and belief in our strategy. We are investing in and implementing tailored leadership development programmes. | | Employees from page 52 |
| | | |
| | | We are developing simpler, more efficient processes and flattening our organisational structure to encourage accountability and improve decision making and communication. | | |
| | | |
| | | We are accelerating efforts to attract diverse, top talent with new capabilities. | | |
| | | |
| | | We are supporting the sustainable delivery of our business strategy while delivering wider benefits to society and the environment. | | In the wider world from page 55 |
| | | |
| | | We invest in R&D and on-market Growth Platforms to return to growth. Our aim is to deliver industry-leading productivity by restructuring to create scope for investment and a flexible cost base. | | Financial Review from page 62 |
| | | |
| | | Our policy is to maintain or grow dividend per share. | | |
| | | |
| | | Target a strong, investment-grade credit rating, operational cash balance and periodic share repurchases. | | |
| | |
| AstraZenecaAnnual Report and Form 20-F Information 2015 | | 17 |
Strategic Report | Strategy
Key performance indicators
How we performed against the indicators by which we measure our success.

| | |
| 18 | | AstraZenecaAnnual Report and Form 20-F Information 2015 |
| | |
| AstraZenecaAnnual Report and Form 20-F Information 2015 | | 19 |
Strategic Report | Strategy
Key performance indicatorscontinued

| | |
| 20 | | AstraZenecaAnnual Report and Form 20-F Information 2015 |
Risk overview
What may challenge the delivery of our strategic priorities.
|
Oversight and monitoring Board: defines the Group’s risk appetite, which enables the Group, in both quantitative and qualitative terms, to judge the level of risk it is prepared to take in achieving its overall objectives. SET:responsible for overseeing and monitoring the effectiveness of the risk management processes implemented by management. Management: Global Compliance, Finance and Internal Audit Services support SET by advising on policy and standard setting, monitoring and auditing, communication and training, as well as reporting on the adequacy of line management processes as they apply to risk management. |
Managing risk
As a global, science-led biopharmaceutical business, we face a diverse range of risks and uncertainties. These could adversely affect our business. Our approach to risk management is therefore designed to encourage clear decision making on which risks we take and how we manage these risks. Fundamental to this process is a sound understanding of every risk’s potential strategic, commercial, financial, compliance, legal and reputational implications.
We work to ensure that we have effective risk management processes in place to support the delivery of our strategic priorities. This enables us to meet the expectations of our stakeholders and upholds our Values. We monitor our business activities and external and internal environments for new, emerging and changing risks to ensure that these are managed appropriately.
The Board believes that existing robust processes and clear accountabilities, as described below, provide it with adequate information on the Principal Risks and uncertainties we face.
Risk management embedded in business processes
We strive to embed sound risk management in our strategy, planning, budgeting and performance management processes.
The Board has defined the Group’s risk appetite, expressing the acceptable levels of risk for the Group using three key dimensions. These are: (i) earnings and cash flow; (ii) return on investment; and (iii) ethics. Annually, the Group develops a long-term business plan to support the delivery of its strategy. The Board reviews this to ensure that the plan conforms to its risk appetite. Our risk management approach is aligned to our strategy and business planning processes. We cross-check financial risks and opportunities identified through the business planning process and integrate our findings into the overall risk management reporting. Line managers are accountable for identifying and managing risks and for delivering business objectives in accordance with the Group’s risk appetite.
Within each SET function, leadership teams discuss the risks the business faces. Every year, we map these risks to AstraZeneca’s risk ‘taxonomy’. This process provides a Group-wide assessment that is shared with the Board, Audit Committee and SET. Quarterly, each SET function identifies any changes to these risks, its mitigation plans and new and emerging risks. The quarterly updates are assimilated into a Group Risk Report for the Board, Audit Committee and SET. Supporting tools are in place to assist risk leaders and managers in managing, monitoring and planning for risk and we continue to work on developing our risk management standards and guidelines.
We also develop business continuity plans to address situations in which specific risks have the potential to severely impact our business. These plans include training and crisis simulation activities for business managers.
 More information about our Global Compliance function and the Code of Conduct can be found in the Corporate Governance Report from page 90
Viability statement
In accordance with provision C.2.2 of the 2014 UK Corporate Governance Code, the Board has determined that a three-year period to 31 December 2018 constitutes an appropriate period over which to provide its viability statement.
The Board considers annually and on a rolling basis, a three-year bottom-up detailed business plan. The Board also considers a 10-year long-term strategic plan but, given the inherent uncertainty involved, believes that the three-year statement presents readers of the Annual Report with a reasonable degree of assurance while still providing a longer-term perspective.
The three-year detailed business plan captures risks to the sales and cost forecasts at a market and SET function level and is used to perform central net debt and headroom profile analysis. This analysis considers a severe but plausible downside scenario incorporating the Principal Risks such as market pricing and access, delivery of pipeline and loss of IP. The resilience of the Group to absorb further Principal Risk events such as regulatory/litigious fines has also been analysed. The Group has adequate resilience against these and the other Principal Risks due to our diversified product portfolio; our global footprint; our robust supply infrastructure; our access to external financing, which includes committed facilities; and our ability to manage our cost base.
Based on the results of this analysis, the Directors have a reasonable expectation that the Company will be able to continue in operation and meet its liabilities as they fall due over the three-year period of their assessment.
| | |
| AstraZenecaAnnual Report and Form 20-F Information 2015 | | 21 |
Strategic Report | Strategy
Risk overviewcontinued
| | | | | | | | |
Principal Risks This table provides insight into the Principal Risks that could have a materially adverse effect on the business or results of operations. We outline why effective management of these risks is important and relevant to the business, how we are managing them and which risks are rising, falling or have remained static during the past 12 months. Trend key  Increasing risk Increasing risk
 Decreasing risk Decreasing risk
 Unchanged Unchanged
Strategy key  Achieve scientific leadership Achieve scientific leadership
 Return to growth Return to growth
 Be a great place to work Be a great place to work
 Achieve Group financial targets Achieve Group financial targets
Further information on our key risk management and assurance processes can be found in Risk from pages 212 to 226 which also includes a description of circumstances under which principal and other risks and uncertainties might arise in the course of our business and their potential impact | | | | Risk category and Principal Risks | | Context/potential impact | | |
| | | | Product pipeline and intellectual property | | |
| | | | Delivery of pipeline and new products | | The development of any pharmaceutical product candidate is a complex, risky and lengthy process involving significant financial, R&D and other resources. A project may fail or be delayed at any stage of the process due to a number of factors, which could reduce our long-term growth, revenue and profit | | |
| | | | Meet quality, regulatory and ethical drug approval and disclosure requirements | | Delays in regulatory reviews and approvals impact patients and market access, and can materially affect our business or financial results | | |
| | | | Secure and protect product IP | | Discovering and developing medicines requires a significant investment of resources. For this to be a viable investment, through generation of sufficient revenues, new medicines must be safeguarded from being copied with a reasonable amount of certainty for a reasonable amount of time | | |
| | | | Commercialisation | | |
| | | | Externally driven demand, pricing, access and competitive pressures | | Operating in over 100 countries, we are subject to political, socio-economic and financial factors both globally and in individual countries. There can be additional pressure from governments and other healthcare payers on medicine prices and sales in response to recessionary pressures, reducing our revenue, profits and cash flow | | |
| | | | Quality and execution of commercial strategies | | If commercialisation of a product does not succeed as anticipated, or its rate of sales growth is slower than anticipated, there is a risk that we may not be able to fully recoup the costs in launching it | | |
| | | | Supply chain and business execution | | |
| | | | Maintain supply of compliant, quality product | | Delays or interruptions in supply can lead to recalls, product shortages, regulatory action, reputational harm and lost sales | | |
| | | | Information technology and data security and privacy | | Significant disruption to our IT systems, including breaches of data security or failure to integrate new systems, could harm our reputation and materially affect our financial condition or results of operations. This could lead to regulatory penalties or non-compliance with laws and regulations | | |
| | | | Delivery of gains from productivity initiatives | | Inappropriately managed initiatives could lead to low employee engagement and reduced productivity; increased absence and attrition levels; or even industrial action. All could adversely impact the value of the initiative | | |
| | | | Attract, develop, engage and retain talented and capable employees at all levels | | Failure to attract and retain highly skilled personnel may weaken our succession plans for critical positions in the medium term. Failure to engage our employees could impact productivity and turnover. Both could adversely affect the achievement of our strategic objectives | | |
| | | | Legal, regulatory and compliance | | |
| | | | Safety and efficacy of marketed products | | Patient safety is very important to us and we strive to minimise the risks and maximise the benefits of our medicines. Failure to do this could adversely impact our reputation, our business and the results of operations, and could lead to product liability claims | | |
| | | | Defence of product, pricing and practices litigation | | Investigations or legal proceedings could be costly, divert management attention or damage our reputation and demand for our products. Unfavourable resolutions could subject us to criminal liability, fines or penalties, adversely affecting our financial results | | |
| | | | Meet regulatory and ethical expectations on commercial practices and scientific exchanges | | Any failure to comply with applicable laws, rules and regulations may result in civil and/or criminal legal proceedings and/or regulatory sanctions, fines or penalties, impacting financial results | | |
| | | | Economic and financial | | |
| | | | Achieve strategic plans and meet targets and expectations | | Failure to successfully implement our business strategy may frustrate the achievement of our financial or other targets or expectations. This failure could, in turn, damage our reputation and materially affect our business, financial position or results of operations | | |
| | |
| 22 | | AstraZenecaAnnual Report and Form 20-F Information 2015 |
| | | | | | | | |
| | | Management actions | | Trend versus prior year | | Link to strategy |
| | | | | |
| | | | | | | | | |
| | | | | |
| | | > Prioritise and accelerate our pipeline > Strengthen pipeline through acquisitions, licensing and collaborations > Focus on innovative science in three therapy areas | |  | | Increasing importance of pipeline contribution given loss of exclusivity on key brands | |  |
| | | | | |
| | | > Quality management systems incorporating monitoring, training and assurance activities > Collaborating with regulatory bodies and advocacy groups to monitor and respond to changes in the regulatory environment including revised process, timelines and guidance | |  | | | |  |
| | | | | |
| | | > Active management of IP rights | | | | | |  |
| | | | | |
| | | | | | | | | |
| | | | | |
| | | > Focus on Growth Platforms > Demonstrating value of medicines/health economics > Global footprint > Diversified portfolio | | | | Global economic conditions placing downwards pressure on healthcare spending and therefore revenue | |  |
| | | | | |
| | | > Focus on Growth Platforms > Accelerate through business development and strategic collaborations
and alliances | | | | Loss of exclusivity on key brands increases challenge to achieve our short- to medium-term targets | |  |
| | | | | |
| | | | | | | | | |
| | | | | |
| | | > Business continuity and resilience initiatives, disaster and data recovery
and emergency response plans > Contingency plans including dual sourcing, multiple suppliers and stock levels > Quality management systems | | | | Supply chain evolving to incorporate new supply chains and to support product launches | |  |
| | | | | |
| | | > Disaster and data recovery plans > Strategies to secure critical systems and processes | | | | Several key transformational programmes involving large IT-related aspects | |  |
| | | | | |
| | | > Appropriate project governance structure and oversight > Regular review of strategic initiatives by appropriate senior executive and Board level committees | | | | Ongoing restructuring and footprint projects including Cambridge relocation in the UK | |  |
| | | | | |
| | | > Evolve our culture > Focus on simplification > Development of our employees | | | | Ongoing restructuring and footprint projects including Cambridge relocation in the UK | |  |
| | | | | |
| | | | | | | | | |
| | | | | |
| | | > Robust processes and systems in place to manage patient safety and efficacy trends as well as externally reported risks through regulatory agencies and other parties. This includes a comprehensive pharmacovigilance programme supplemented by close monitoring and review of adverse events | | | | | |  |
| | | | | |
| | | > Combined internal and external counsel management | | | | | |  |
| | | | | |
| | | > Strong ethical and compliance culture > Established compliance framework in place including annual Code of Conduct training for all employees | | | | Increasing government and regulatory scrutiny and evolving compliance challenges as complexity of business relationships increases | |  |
| | | | | |
| | | | | | | | | |
| | | | | |
| | | > Focus on Growth Platforms > Focus on innovative science in three therapy areas > Strengthen pipeline through acquisitions, licensing and collaborations > Appropriate capital structure and balance sheet > Portfolio-driven decision making process governed by committees | | | | Increasing requirement to balancelong-and short-term investments as we navigate a period of loss of exclusivity on key brands | |  |
| | |
| AstraZenecaAnnual Report and Form 20-F Information 2015 | | 23 |
Strategic Report|Therapy Area Review
Pipeline and Therapy Area Introduction
Our business model describes how we create and sustain value over the life-cycle of a medicine across our therapy areas. In this section, we review our therapy areas, including our portfolio of marketed products, pipeline projects, strategic priorities, capabilities, resources and business development activities.
Overview
As outlined in Strategic priorities from page 16, a key element of our drive to achieve scientific leadership is our focus on innovative science in three therapy areas: Respiratory, Inflammation and Autoimmunity (RIA); Cardiovascular and Metabolic diseases (CVMD); and Oncology. We apply our distinctive capabilities to small molecules, biologics, immunotherapies,
protein engineering technologies and delivery devices across these therapy areas. Our goal is to deliver life-changing medicines to patients while creating value for shareholders. Our approach to Infection, Neuroscience and Gastrointestinal (ING) is opportunity-driven.
Our Global Product and Portfolio Strategy group (GPPS) leads our therapy area
| | | | |
Key pipeline progressions | | Product | | Achievement |
Phase III NME starts | | anifrolumab | | Phase III programme commenced for systemic lupus erythematosus |
| | | PT010 | | Phase III programme commenced for COPD |
Expedited review | | Brilinta | | FDA granted Priority Review for PEGASUS |
| | Tagrisso (AZD9291) | | FDA and PMDA granted Priority Review. EMA accelerated assessment |
| | anifrolumab | | FDA granted Fast Track status for systemic lupus erythematosus |
| | durvalumab | | FDA granted Fast Track status for head and neck cancer |
| | | tremelimumab | | FDA granted Fast Track status for mesothelioma |
Regulatory filings | | Brilinta | | Regulatory submissions accepted in US, EU and Japan forBrilintato reduce the rate of cardiovascular death, myocardial infarction (MI) and stroke in patients with acute coronary syndrome or a history of MI |
| | cediranib | | MAA accepted by EMA for treatment of recurrent platinum- sensitive ovarian cancer |
| | PT003 | | NDA accepted by FDA for treatment of COPD |
| | Tagrisso (AZD9291) | | Regulatory submission accepted by the FDA, EMA and PMDA for treatment of 2nd line or greater EGFRm T790M NSCLC |
| | CAZ AVI | | MAA accepted by EMA for treatment of serious bacterial infection, including complicated intra-abdominal infection and complicated urinary tract infection |
| | saxagliptin/ dapagliflozin FDC | | MAA accepted by EMA for treatment of Type 2 diabetes |
| | | brodalumab | | Regulatory submission accepted by EMA and FDA for psoriasis |
Regional approvals | | BydureonPen | | Japanese regulatory approval for treatment of Type 2 diabetes |
| | Iressa | | US regulatory approval for treatment of EGFRm NSCLC |
| | Brilinta | | Regulatory approval in US forBrilintato reduce the rate of cardiovascular death, MI and stroke in patients with acute coronary syndrome or a history of MI |
| | Tagrisso (AZD9291) | | Regulatory approval in US for treatment of 2nd line or greater EGFRm T790M NSCLC; CHMP issues Positive Opinion to EMA and EU approval received in February 2016 |
| | Zurampic(lesinurad) | | Regulatory approval in US; CHMP issues Positive Opinion to EMA |
| | | Faslodex 500mg | | Regulatory approval in China for breast cancer |
Discontinued projects | | | | 20 projects discontinued |
activities. GPPS also serves as the bridge between our R&D and Sales and Marketing functions and works to provide strategic direction from early-stage research to commercialisation. It also helps us to integrate our corporate, portfolio, therapy area and product strategies. This, in turn, drives scientific innovation, prioritises investment, supports the growth of our therapy areas, and accelerates business development. GPPS also works closely with healthcare providers, regulatory authorities and payers to ensure our medicines help to fulfil unmet medical need and provide economic as well as therapeutic benefits.
Putting patients first
In keeping with our value of putting patients first, we formed a Patient Centricity team in 2015 to better connect patients with our science and to help ensure we deliver medicines they value. In 2015, we connected with more than 30,000 patients through our new alliance with PatientsLikeMe, a virtual patient community, and are exploring similar partnerships with other organisations to ensure we understand our patients’ requirements better.
Our products
While this Therapy Area Review concentrates on our key marketed products, many of our other products are crucial to our business in certain countries in Emerging Markets.
For more information on our potential new products and product life-cycle developments, please see the therapy area pipeline tables on pages 26, 30, 34 to 35, and 39 and the Development Pipeline table from page 205. For information on patent expiries of our key marketed products, please see Patent Expiries from page 210.
Indications for each product described in this Therapy Area Review may vary among countries. Please see local prescribing information for country-specific indications for any particular product.
| | |
| 24 | | AstraZenecaAnnual Report and Form 20-F Information 2015 |
|
Development pipeline overview Our pipeline includes 146 projects of which 125 are in the clinical phase of development. 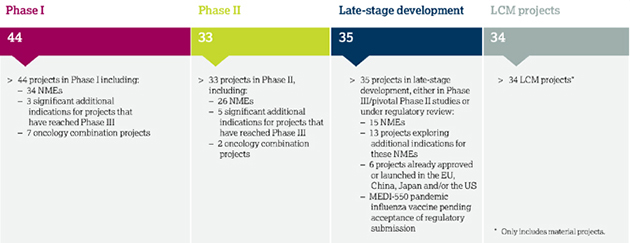
|
For those of our products subject to litigation, information about material legal proceedings can be found in Note 27 to the Financial Statements from page 186.
Details of relevant risks are set out in Risk from page 212
Development pipeline
The Development pipeline overview above summarises our development pipeline as at 31 December 2015.
We continue to maintain a clinical portfolio of more than 100 projects, and are making significant progress in advancing our late-stage programmes through regulatory approval. The portfolio has reached a steady state, with new project starts and progressions netted out against project
termination and rationalisation decisions. Twenty projects were discontinued in 2015, 11 for poorer than anticipated safety and efficacy results, eight as a result of strategic shift in the environment or portfolio prioritisation, and one because of a change in regulatory requirements.
During 2015, 18 NMEs progressed to their next phase of development. We also started a number of oncology trials during the course of the year, of which 12 were oncology combination trials. Importantly, many of our late-stage programmes achieved key milestones, with 12 NME or major LCM regulatory submissions within the year, and six major approvals. Expedited regulatory reviews indicate the degree of medical need that many of these programmes aim to address.
Progress against targets
We remain on track to meet the pipeline aspirations that we have previously communicated for the period from 2013 to the end of 2016: 12 to 16 Phase II starts; 14 to 16 NME and line extension regulatory submissions; and eight to 10 NME and line extension regulatory approvals. Moreover, we had 15 NME projects in pivotal studies or under regulatory review at the end of 2015, versus 13 at the end of 2014. This demonstrates the sustainability of our pipeline and our ability to deliver new medicines to patients.
For more information on the risks associated with biologics and our products, please see Risk from page 212
Global Product Sales by therapy area
| | | | | | | | | | | | | | | | | | | | | | | | | | | | | | | | | | | | | | | | |
| | | | | | | | | 2015 | | | | | | | | | | | 2014 | | | | | | | | | | | 2013 | |
| | | Sales $m | | | Actual growth % | | | CER growth % | | | | | Sales $m | | | Actual growth % | | | CER growth % | | | | | Sales $m | | | Actual growth % | | | CER growth % | |
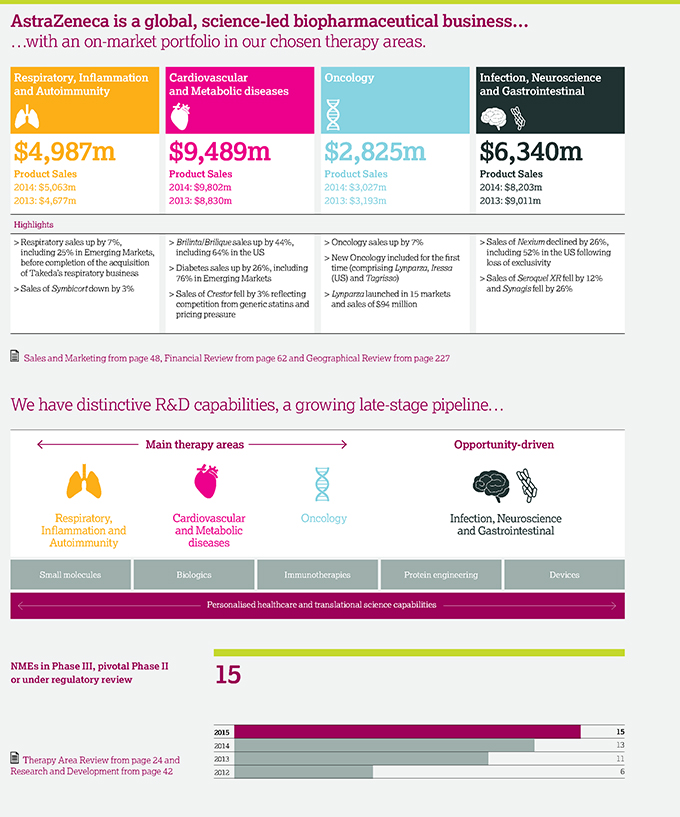
| Cardiovascular and Metabolic diseases | | | 9,489 | | | | (3 | ) | | | 4 | | | | | | 9,802 | | | | 11 | | | | 12 | | | | | | 8,830 | | | | (7 | ) | | | (6 | ) |
| Oncology | | | 2,825 | | | | (7 | ) | | | 7 | | | | | | 3,027 | | | | (5 | ) | | | (2 | ) | | | | | 3,193 | | | | (9 | ) | | | (2 | ) |
| Respiratory, Inflammation and Autoimmunity | | | 4,987 | | | | (2 | ) | | | 7 | | | | | | 5,063 | | | | 8 | | | | 10 | | | | | | 4,677 | | | | 6 | | | | 7 | |
| Infection, Neuroscience and Gastrointestinal | | | 6,340 | | | | (23 | ) | | | (16 | ) | | | | | 8,203 | | | | (9 | ) | | | (7 | ) | | | | | 9,011 | | | | (14 | ) | | | (13 | ) |
| Total | | | 23,641 | | | | (9 | ) | | | (1 | ) | | | | | 26,095 | | | | 1 | | | | 3 | | | | | | 25,711 | | | | (8 | ) | | | (6 | ) |
| | |
| AstraZenecaAnnual Report and Form 20-F Information 2015 | | 25 |
Strategic Report|Therapy Area Review
| | |
| 26 | | AstraZenecaAnnual Report and Form 20-F Information 2015 |

| | |
| AstraZenecaAnnual Report and Form 20-F Information 2015 | | 27 |
Strategic Report | Therapy Area Review
Respiratory, Inflammation
and Autoimmunitycontinued
| | |
| Our marketed products | | |
| | |
> Accolate (zafirlukast) > Bricanyl Respules (terbutaline) > Bricanyl Turbuhaler (terbutaline)1 > Daliresp/Daxas (roflumilast) > Duaklir Genuair (aclidinium/formoterol) > Eklira Genuair/Tudorza/Bretaris (aclidinium)1 > Oxis Turbuhaler (formoterol)1 > Pulmicort Turbuhaler/PulmicortFlexhaler (budesonide) > Pulmicort Respules (budesonide)2 > Rhinocort (budesonide) > SymbicortpMDI (budesonide/formoterol) > Symbicort Turbuhaler (budesonide/formoterol)1 | | |
| |
1 In a dry powder inhaler. 2 budesonide inhalation suspension. | | |
| |
| Full product information on page 203 | | |
329m
The global prevalence of COPD is estimated to be 329 million people and WHO predicts that COPD will become the third leading cause of death worldwide by 2030.
Source: Vos et al 2012 WHO.

Values in action:Follow the science
Patients with SLE or lupus have only seen one new treatment for their disease in almost 60 years and clinical development remains challenging. With anifrolumab, we followed the science behind the potential therapeutic benefits of blocking the interferon pathway as a new treatment strategy. Our Phase II data confirmed this approach and the FDA has granted the anifrolumab SLE programme Fast Track designation.
The aim of COPD treatments is to reduce symptoms and prevent exacerbations. A class of FDCs of a long-acting muscarinic antagonist (LAMA) and LABA, known as LAMA/LABAs, is likely to become a 1st line therapy for symptomatic moderate-to-severe COPD patients. For patients who have either experienced or have a high risk of experiencing exacerbations, an ICS/LABA FDC such as Symbicort is recommended.
Our 2015 focus
OurSymbicort products improve the health of COPD and asthma patients by providing rapid relief of symptoms and long-term anti-inflammatory control. We continue to invest in this brand and are exploring a new indication in mild asthma through the SYGMA trial programme, enhancing our inhaled devices and patient support programmes, and by expanding indications such as the recently approved change to theSymbicort Turbuhaler label in Europe to include more moderate COPD patients.Pulmicort is a leading ICS therapy for asthma. Despite generic competition in many Established Markets, sales continue to grow, driven by Emerging Markets. More information about litigation relating toPulmicort Respules can be found in Note 27 to the Financial Statements from page 186.
In 2015, we launchedDuaklir Genuair (a LAMA/LABA) for maintenance symptom control in COPD patients. Our portfolio also includesEklira Genuair (aclidinium, a LAMA) for patients with symptomatic mild-to-moderate COPD. In February 2015, we announced an agreement with Actavis to acquire the rights to its branded respiratory business in the US and Canada. This included the rights to develop and commercialise on-market productsTudorza Pressair (aclidinium, a LAMA) andDaliresp (a PDE4 inhibitor) for COPD. In December 2015, we announced that we had entered into a definitive agreement to acquire the core respiratory business of Takeda. The deal includes the acquisition of non-US rights toDaliresp, which is known asDaxas in certain countries. The transaction is anticipated to close in early 2016.
In the pipeline
We received positive results from the Phase III PINNACLE programme investigating the potential of PT003 to improve lung function in patients with COPD. PT003 is a twice-daily, fixed-dose
combination of glycopyrronium (a LAMA) and formoterol fumarate (a LABA). PT003 is the first LAMA/LABA combination to be delivered in a pressurised metered-dose inhaler (pMDI), using the proprietary porous particle co-suspension technology developed by Pearl Therapeutics. We are also developing PT010 as a twice-daily triple combination LAMA/LABA/ICS (composed of glycopyrronium, formoterol and budesonide, a key component ofSymbicort) in a pMDI device for severe COPD. It has progressed to Phase III in COPD and may be one of the first products to deliver the three therapeutic agents via one inhaler.
Benralizumab is a biologic (MAb) in Phase III development for the treatment of severe uncontrolled asthma and COPD. It targets the IL-5 receptor and depletes eosinophils, which play a key role in inflammatory respiratory disease. The global Phase III results for benralizumab in severe asthma are expected in 2016. We anticipate making US and European regulatory submissions later in 2016. Phase III results and regulatory filing in COPD are expected in 2018.
Tralokinumab is a MAb that binds to IL-13. Phase II data from tralokinumab suggest that IL-13 neutralisation can improve lung function and reduce asthma exacerbation rate in a subpopulation of moderate-to-severe asthma patients who are uncontrolled with standard of care therapy. In August 2014, we initiated a Phase III programme to evaluate the safety and efficacy of tralokinumab in reducing asthma exacerbations in adults and adolescents with severe, inadequately controlled asthma. The Phase III asthma programme is on track to deliver results in early 2017.
Inflammation and Autoimmunity
Gout is a serious, chronic, progressive, and debilitating form of inflammatory arthritis that affects more than 15.8 million people in major markets. The underlying cause of gout is hyperuricemia (elevated serum uric acid), which leads to the deposition of crystals primarily in the joints and in other tissues. This can result in recurrent attacks of inflammatory arthritis and, if left uncontrolled, can lead to chronic, progressive arthritis, and tophus (visible deposits of urate crystals) formation.
| | |
| 28 | | AstraZenecaAnnual Report and Form 20-F Information 2015 |

Systemic lupus erythematosus (SLE), or lupus, is an autoimmune disease. It occurs when the immune system produces antibodies that, instead of targeting viruses or other foreign invaders, attack healthy tissue in the body including skin, joints, kidney, the brain and blood vessels. SLE can cause a wide range of symptoms. Among these are pain, rashes, fatigue, swelling in joints, and fevers. SLE is associated with a greater risk of death from causes such as infection, nephritis and cardiovascular disease. Current treatment of SLE focuses on suppressing symptoms and controlling disease flares and, in the case of lupus nephritis, preventing renal failure.
Although a biologic medicine was launched for SLE in 2011, most therapies used are off-label and significant unmet medical need remains. Most emerging biologics are likely to be used in combination with standard therapies, such as corticosteroids and immunosuppressants.
Psoriasis is a chronic disease in which the immune system causes skin cells to grow rapidly. Instead of being shed, the skin cells pile up, causing painful and itchy, red, scaly patches that can bleed. Approximately 125 million people worldwide suffer from psoriasis. Despite available treatment options for moderate-to-severe plaque psoriasis, many patients do not experience a resolution of underlying inflammation, clearing of symptoms or an improved quality of life.
Rheumatoid arthritis is currently treated with generic disease-modifying anti-rheumatic agents and, where appropriate, biologics. There is a need for novel treatments, since only about a third of patients treated with biologics achieve their treatment goals. Although tumour necrosis factor (TNF) alpha-blockers are currently the primary treatment for rheumatoid arthritis, use of other biologic approaches is expected to increase. Novel oral drugs targeting intra-cellular signalling pathways may provide anti-TNF-like levels of efficacy and potentially more convenient dosing, especially in patients who do not use injectable biologics.
In the pipeline
We are strengthening our pipeline and improving treatment options and clinical outcomes for patients with inflammation and autoimmunity diseases. Completion of four Phase II trials (anifrolumab and
mavrilimumab, and two RDEA3170 trials in Japan and the US), two Phase III trial programmes (brodalumab and Zurampic) along with the initiation of various Phase II trials, demonstrates the success of our R&D efforts to deliver new medicines quickly.
In December 2015, the FDA approvedZurampic 200mg tablets in combination with a xanthine oxidase inhibitor (XOI) for the treatment of hyperuricemia associated with gout in patients who have not achieved target serum uric acid (sUA) levels with an XOI alone. Also in December 2015, the Committee for Medicinal Products for Human Use (CHMP) of the EMA adopted a Positive Opinion recommending the marketing authorisation ofZurampic 200mg tablets for the adjunctive treatment of hyperuricemia in adult gout patients (with or without tophi) who have not achieved target sUA levels with an adequate dose of an XOI alone.
Zurampic inhibits the urate transporter, URAT1, which is responsible for the majority of the renal reabsorption of uric acid. By inhibiting URAT1,Zurampic increases uric acid excretion and thereby lowers sUA.
RDEA3170 is a potent selective uric acid reabsorption inhibitor, also intended for use as a combination urate-lowering therapy with XOIs. RDEA3170 is our lead investigational urate-lowering therapy (ULT) in Asia and is entering Phase IIb in both Japan and the US.
Anifrolumab is a developmental MAb that targets the type I interferon (IFN) receptor inhibiting the activity of all type I IFNs, which play a central role in lupus. Phase II trial results presented in November demonstrated that anifrolumab significantly reduced disease activity in moderate-to-severe SLE patients as measured by several
| | |
|
| |
| 300m | |  |
| It is estimated that approximately 300 million people worldwide suffer from asthma. | | |
| |
| Source: Massoli et al, 2004. | | |
|
SLE composite endpoints. It also improved symptoms of lupus such as rash and arthritis. Anifrolumab is currently in Phase III development for SLE. A Phase II trial in lupus nephritis and Phase I subcutaneous administration study were initiated in late 2015. The FDA assigned anifrolumab Fast Track designation for SLE, which facilitates the development and expedites the review process of medicine candidates that treat serious conditions and fill an unmet medical need. Sifalimumab is a developmental MAb that specifically blocks the action of interferon alpha. Driven by data from the Phase II trials in SLE for both sifalimumab and anifrolumab, we have progressed anifrolumab into Phase III and therefore we do not intend to further develop sifalimumab in SLE.
Brodalumab is a human MAb that targets the interleukin-17 (IL-17) receptor to treat moderate-to-severe psoriasis. The Phase III programme in psoriasis included three studies evaluating treatment with brodalumab, two of which compared brodalumab with ustekinumab and/or placebo. Results from all three clinical trials showed that all primary and secondary endpoints were met. Brodalumab showed superiority to ustekinumab in both comparative studies. In May 2015, Amgen terminated its participation in the co-development and commercialisation of brodalumab. In September 2015, we announced a collaboration agreement with Valeant. This granted an exclusive licence for Valeant, as an expert in dermatology, to develop and commercialise brodalumab globally except in Japan and certain Asian countries. AstraZeneca submitted global regulatory filings on behalf of Valeant for brodalumab in psoriasis in late 2015. Valeant assumes decision making on future development and all development costs associated with the regulatory approval for brodalumab.
Mavrilimumab, an investigational MAb that inhibits a key pathway in the development of rheumatoid arthritis, achieved its primary endpoints in a Phase IIb study. Results, which were announced in May 2014, showed that mavrilimumab improved signs and symptoms of rheumatoid arthritis, measures of disability and patient-reported outcomes.
| | |
| AstraZenecaAnnual Report and Form 20-F Information 2015 | | 29 |
Strategic Report | Therapy Area Review

| | |
| 30 | | AstraZenecaAnnual Report and Form 20-F Information 2015 |

| | |
| AstraZenecaAnnual Report and Form 20-F Information 2015 | | 31 |
Strategic Report | Therapy Area Review
Cardiovascular
and Metabolic diseasescontinued
| | |
| Our marketed products | | |
| | |
Cardiovascular disease > Atacand1/Atacand HCT/Atacand Plus
(candesartan cilexetil) > Brilinta/Brilique(ticagrelor) > Crestor2(rosuvastatin calcium) > Plendil (felodipine) > Seloken/Toprol-XL (metoprolol succinate) > Tenormin3(atenolol) > Zestril4(lisinopril dihydrate) | | |
Metabolic disease > Bydureon (exenatide XR injectable
suspension) > Byetta (exenatide injection) > Farxiga/Forxiga (dapagliflozin) > Kombiglyze XR (saxagliptin and metformin
HCl) > Komboglyze (saxagliptin and metformin
HCl) > Onglyza (saxagliptin) > Symlin (pramlintide acetate) > Xigduo (dapagliflozin and metformin HCI) > Xigduo XR (dapagliflozin and metformin
HCI) Full product information on page 203 1 Licensed from Takeda Chemicals Industries Ltd. 2 Licensed from Shionogi. The extension of the global licence agreement with Shionogi forCrestorand the modification of the royalty structure became effective 1 January 2014. 3 Divested US rights toTenorminto Alvogen Pharma US Inc. effective 9 January 2015. 4 Licensed from Merck. Divested US rights toZestrilto Alvogen Pharma US Inc. effective 9 January 2015. | | |

Values in action: We play to win
Acquiring ZS Pharma gave us access to the potassium-binding compound ZS-9, a potential best-in-class treatment for hyperkalaemia (high potassium levels) which affects more than three million people in the US alone who suffer from chronic kidney disease and chronic heart disease. With submissions under way, we expect ZS-9 to accelerate our return to growth.
Our 2015 focus
Brilinta/Brilique, one of our Growth Platforms, is an oral antiplatelet treatment for ACS. It is approved in over 100 countries, including the US, Canada and Brazil under the trade name Brilinta, and in the EU, Iceland and Norway under the trade nameBrilique. It is currently under regulatory review in three additional countries. Since launch, more than one million patients have been treated withBrilinta/Brilique, and it has been included in 12 major ACS treatment guidelines globally. In August 2015, the European Society of Cardiology updated NSTE-ACS guidelines and continued to recommend ticagrelor over clopidogrel in ACS for all patients at moderate-to-high risk of ischaemic events, regardless of initial treatment strategy and including those pre-treated with clopidogrel.
The PEGASUS-TIMI 54 study investigated the efficacy and safety of ticagrelor at both 60mg and 90mg twice daily, plus low-dose aspirin, compared to placebo plus low-dose aspirin, for the long-term prevention of atherothrombotic events in patients who had suffered a heart attack one to three years prior to study enrolment. Both 90mg and 60mg study doses of ticagrelor with aspirin significantly reduced the primary composite endpoint of CV death, myocardial infarction (MI, also known as heart attack) or stroke compared to placebo and aspirin. The full results of the study were published in the New England Journal of Medicine in March 2015.
In September 2015, the FDA approved a new 60mg dosage strength forBrilinta to be used in patients with a history of heart attack beyond the initial one-year treatment withBrilinta 90mg to reduce the rate of cardiovascular death, MI and stroke in patients with ACS. In December, CHMP of the EMA adopted a Positive Opinion recommending approval ofBrilique 60mg for the treatment of patients with a history of heart attack and at high risk of having a further coronary event. The opinion states that treatment may be started as continuation therapy after an initial one-year treatment with dual anti-platelet therapy. In the US, we are in early stages of patent litigation against multiple generic companies after they sent so-called ‘Paragraph IV notices’ challenging patents listed in the FDA Orange Book with reference toBrilinta.
The SOCRATES trial evaluating the efficacy ofBrilinta/Brilique compared to aspirin in reducing thrombotic events in patients with acute ischaemic stroke and high-risk transient ischaemic attack, saw its last patient randomised in November 2015. This trial is scheduled to report data in the first half of 2016. SOCRATES involves 13,200 patients in 33 countries and is part of the broader PARTHENON life-cycle programme forBrilinta/Brilique(discussed further overleaf).
Crestor is approved in 109 countries for the treatment of dyslipidaemia and hypercholesterolaemia (elevated cholesterol). The medicine has been shown to effectively lower low-density lipoprotein cholesterol (LDL-C) and achieve LDL-C goals and to increase high-density lipoprotein cholesterol (HDL-C) and reduce atherosclerotic plaque.Crestor faces competition from atorvastatin (Lipitor) and other generic products. The substance patent protectingCrestor in the US expired on 8 January 2016 and the existing paediatric exclusivity period expires on 8 July 2016. Subsequently, generic competition from various companies is expected in the US market. Actavis is permitted to begin selling generic rosuvastatin in the US in May 2016 as the result of a litigation settlement with AstraZeneca. Patents protectingCrestor have been challenged in various jurisdictions. Details of these matters are included in Note 27 to the Financial Statements, from page 186.
Epanova (omega-3-carboxylic acids) is the first FDA approved prescription omega-3 fatty acid in free fatty acid form. It has the potential to help patients with severe hypertriglyceridaemia by reducing high
17.5m
An estimated 17.5 million people die annually from CV disease, representing 31% of all global deaths. More than three-quarters of these deaths occur in low- to middle-income countries.*
415 million people worldwide have diabetes; WHO projects that diabetes will be the seventh leading cause of death in 2030.**
| * | Source: WHO Factsheet 2015 (data from 2012). |
| ** | Source: IDF Atlas 2015 and WHO Factsheet 2015. |
| | |
| 32 | | AstraZenecaAnnual Report and Form 20-F Information 2015 |
| | |

| | |
triglycerides (TG) levels.Epanova is approved in the US as an adjunct to diet to reduce TG levels in adult patients with severe hypertriglyceridaemia (TG levels³500mg/dL).
Clinical studies
In addition to the PEGASUS and SOCRATES trial described above,Brilinta/Brilique is being studied in two other clinical trails under the PARTHENON programme. PARTHENON is AstraZeneca’s largest ever CV outcomes programme involving nearly 80,000 patients. It includes five key studies covering broad patient populations across varying timescales and aims to support four new indications forBrilinta/Brilique over the next four years.
AstraZeneca continues to explore the unmet medical need in cholesterol management, building on the well-established clinical trial programme forCrestor. Crestor has been studied in more than 120 ongoing or completed clinical trials and involving more than 67,000 patients worldwide over the past 13 years.
We are also committed to further evaluating the clinical profile ofEpanova and identifying other patient groups it may benefit. AstraZeneca recently commenced a large-scale CV outcomes trial, (STRENGTH),STatinResidual risk reduction with EpaNova in hiGh cardiovascular risk paTients withHypertriglyceridaemia, to evaluate the safety and efficacy ofEpanova on CV outcomes in combination with statin therapy for the treatment of patients with mixed dyslipidaemia who are at increased risk of cardiovascular disease.
Metabolic and renal diseases
Type 2 diabetes is a chronic progressive disease that accounts for more than 90% of diabetes cases worldwide. Disease prevalence continues to grow, particularly among those at a younger age, and many patients require multiple medications.
Various oral generic and branded treatments exist and newer classes of treatments continue to enter the market.
Our 2015 focus
AstraZeneca is focused on redefining the Type 2 diabetes treatment approach and harnessing complementary mechanisms of action, as well as evaluating potential cardiovascular outcomes benefit. Our current portfolio is well-positioned to enable combination treatment, and data from our Phase III programmes is expected to further
support the outcomes benefits of the new class.
We have a broad anti-diabetes portfolio with products in the three fastest growing classes of diabetes treatments (SGLT2, GLP-1 andDPP-4).
In 2015, we saw ongoing approvals and launches forFarxiga/Forxiga for the treatment of Type 2 diabetes. Starting with the EU in 2012, it is now approved in over 50 countries. It is under regulatory review in 20 additional countries.
Xigduo is approved in 33 countries, including the US withXigduo XR (ongoing approvals in 2016 expected). In 2015, we continued to see the approval and launch of theBydureonPen, which is now launched in 17 countries globally, including the US, Japan and key European countries. TheBydureon Pen is a pre-filled, single-use pen injector. In the US, we are engaged in patent litigation against multiple generic companies after they sent so-called ‘Paragraph IV notices’ challenging patents listed in the FDA Orange Book with reference toOnglyza.A trial is scheduled to take place during 2016.
In April 2015, an FDA Endocrinologic and Metabolic Drugs Advisory Committee voted 13 to one that the results of the Saxagliptin Assessment of Vascular Outcomes Recorded in Patients with Diabetes Mellitus (SAVOR) study demonstrated that the use of saxagliptin in patients with Type 2 diabetes has an acceptable cardiovascular risk profile. AstraZeneca will conduct further investigation to better understand the signal of hospitalisation for heart failure found in the SAVOR results.
In the pipeline
We are developing an FDC of saxagliptin and dapagliflozin, which combines two complementary mechanisms designed to help more patients with Type 2 diabetes reach their treatment goals. In October 2015, AstraZeneca received a Complete Response Letter (CRL) from the FDA regarding the NDA for the investigational FDC of saxagliptin and dapagliflozin for the treatment of adult patients with Type 2 diabetes. The CRL states that more clinical data are required to support the application. We are working closely with the FDA to determine the appropriate next steps for the NDA and remain committed to the development of saxagliptin and dapagliflozin. We will file additional clinical data from a study which is now completed and continue our conversations with the FDA.
This announcement does not affect interactions with other health authorities as part of these application procedures for the FDC, including an ongoing review by the EU for the FDC.
The Phase III programme for a once-weekly suspension of Bydureon continues to progress.
Through our strategic collaboration with FibroGen and Astellas, we continue to develop roxadustat, a potential first-in-class oral compound in Phase III development for the treatment of anaemia in patients with CKD, including those who are dialysis dependent and non-dialysis dependent. Roxadustat is in Phase III in the US, Europe and China, and is just completing Phase II in Japan. The Phase III programme consists of seven studies enrolling more than 7,000 patients worldwide. To date, roxadustat has been studied in over 1,100 subjects in completed Phase I and II studies.
In December 2015, we acquired ZS Pharma to strengthen our CVMD portfolio. This provided us access to ZS-9, a potential best-in-class treatment for hyperkalaemia which complements our increasing focus on CKD. ZS-9 has been submitted for approval in the US, EU and Australia. In November 2015, data presented at the American Society of Nephrology meeting showed positive interim results from ZS005, a long-term safety study of ZS-9.
For more information please see Financial Review from page 62
Clinical studies
The Dapagliflozin Effect on CardiovascuLAR Events (DECLARE) study, a large CV outcomes trial to assess the impact ofFarxiga/Forxiga on CV risk/benefit, when added to a patient’s current anti-diabetes therapy, continued in 2015.
The trial will enrol approximately 17,000 adult patients with Type 2 diabetes. DECLARE was fully enrolled in 2015 and is expected to be completed in 2019.
The Exenatide Study of Cardiovascular Event Lowering (EXSCEL) study also continued during 2015. This study, which began in 2010 and is expected to end in 2017 is evaluating the impact ofBydureon, in addition to usual care on CV outcomes in patients with Type 2 diabetes.
| | |
| AstraZenecaAnnual Report and Form 20-F Information 2015 | | 33 |
Strategic Report | Therapy Area Review

| | |
| 34 | | AstraZenecaAnnual Report and Form 20-F Information 2015 |

| | |
| AstraZenecaAnnual Report and Form 20-F Information 2015 | | 35 |
Strategic Report | Therapy Area Review
Oncologycontinued
| | |
| Our marketed products | | |
| | |
> Arimidex (anastrozole) > Casodex/Cosudex (bicalutamide) > Faslodex (fulvestrant) > Iressa (gefitinib) > Lynparza (olaparib) > Nolvadex (tamoxifen citrate) > Tagrisso (osimertinib) > Zoladex (goserelin acetate implant) Full product information on page 204 | | |

Values in action:We follow the science
The DNA inside our cells, our genetic blueprint, is continually being damaged by environmental factors, ultraviolet light and even natural growth and division. Cells contain multiple repair mechanisms to fix damage to DNA strands because, if this isn’t repaired, the cells die. Cancer cells very commonly have one repair mechanism missing or not functioning, which creates an ‘Achilles Heel’ – making them sensitive to being killed if another repair mechanism is targeted by a medicine. Our scientists are exploiting this ‘Achilles Heel’ of sensitivity to develop new medicines which specifically block DNA repair and cause cancer cells to die, while sparing the normal cells which have multiple repair mechanisms intact. One such treatment isLynparza which blocks PARP – a protein involved in DNA repair in cancer cells that already have loss of the BRCA protein which is a critical part of the ‘homologous repair’ pathway.
| > | Immunotherapy: Our ambition is to be a scientific leader in immunotherapy, a promising therapeutic approach that harnesses the patient’s own immune system to help fight cancer. We are working to understand how cancer evades the immune system and to identify approaches that enhance the immune system’s ability to fight cancer. |
| > | Tumour drivers and resistance mechanisms: Potent inhibition of genetic disease drivers is a clinically validated approach to shrink tumours and improve progression-free survival. Tumours, however, eventually develop resistance to these therapies. Our programmes seek to develop therapies that target resistance mechanisms and the mutations that cause cancer cells to proliferate. |
| > | DNA damage repair: Exploiting mechanisms that selectively damage tumour cell DNA is another clinically validated approach to shrink tumours and improve progression-free survival. Our programmes focus on identifying and exploiting vulnerabilities unique to tumour cells to kill the tumour cells while minimising toxicity to the patient. |
| > | Antibody-drug conjugates: The use of antibody-drug conjugates is a clinically validated, highly potent approach that selectively targets cancer cells. We seek to combine innovative antibody engineering capabilities with cytotoxic drug molecules to attack and kill the tumour while minimising toxicity to the patient. |
We are also focused on identifying and developing combination therapies. Our immuno-oncology portfolio, which we believe is one of the most comprehensive in our industry, enables us to explore and exploit scientific and biological synergies to pursue combinations that improve outcomes and maximise patient benefit.
Our 2015 focus
Our marketed oncology products generated sales of more than $2.8 billion worldwide in 2015. We continue to explore ways to maximise the benefit of our medicines for patients.
Iressa was the first EGFR-TKI to be approved in advanced NSCLC. Now approved in 90 countries, it is the leading EGFR-TKI for patients with advanced EGFRm NSCLC in Europe and Asia.
It received US approval in July 2015.Iressa is also the first EGFR-TKI to include blood-based diagnostic testing where a suitable tumour sample is not available in its European label.
Faslodex 500mg is approved in more than 80 countries, including the EU, the US and Japan. We are currently exploring the efficacy and safety of Faslodex 500mg compared withArimidex in the 1st line advanced breast cancer setting (hormone-naïve patients) in the Phase III FALCON trial. We are engaged in patent litigation, including in the US and Europe, in relation to generic challenges toFaslodex. Details of litigation relating toFaslodex are included in Note 27 to the Financial Statements from page 186.
Zoladex continues to be a significant asset to our in line portfolio and a driver of our prostate cancer and breast cancer portfolios.
Lynparza is an oral PARP inhibitor approved in 36 countries for the treatment of adult patients with platinum-sensitive relapsed BRCA-mutated (germline and/or somatic) high-grade serous epithelial ovarian, fallopian tube or primary peritoneal cancer.
Tagrisso is the first approved EGFR-TKI indicated for patients with metastatic EGFR T790M mutation-positive NSCLC. This indication was approved in November 2015 under the FDA’s Accelerated Approval Programme based on tumour response rate and duration of response. Conversion to full approval for this indication is contingent upon verification and description of clinical benefit in confirmatory trials.
In December 2015,Tagrisso received a Positive Opinion by CHMP for the treatment of adult patients with locally advanced or metastatic EGFR T790M mutation-positive NSCLC. In Japan,Tagrisso was granted Priority Review by the PMDA. Interactions with regulatory authorities in the rest of the world are ongoing.
| | |
| 36 | | AstraZenecaAnnual Report and Form 20-F Information 2015 |
| | |

| | |
| | | | |
In the pipeline Our Oncology pipeline continued to progress in 2015. It now includes five NMEs in late-stage development and another 26 NMEs in Phases I and II. We also expanded several of our projects to incorporate novel combinations and various types of cancer. Some of our projects from each of our platforms include: Immuno-oncology franchise > Durvalumab (MEDI4736) is an anti-PD-L1 antibody in Phase III development for NSCLC as a monotherapy and in combination with tremelimumab andTagrisso. The lung cancer programme includes studies in the 1st line, 2nd line and 3rd line setting. Additional registration studies are progressing in squamous cell carcinoma of the head and neck (1st and 2nd line), and bladder cancer (1st line). The development programme also includes additional Phase I and Phase II studies in a broad range of solid tumours and an extensive range of combination programmes. 14m Annual cancer cases are expected to rise from 14 million in 2012 to an estimated 22 million within the next two decades. Source: WHO Factsheet February 2014 (data from 2012). > Tremelimumab, an anti-Cytotoxic T-Lymphocyte-Associated protein 4 antibody, is being investigated as a monotherapy in a pivotal study for the treatment of malignant mesothelioma. > MEDI0680 is an antiprogrammed cell death protein 1 (PD-1) MAb that may help promote an effective anti-tumour immune response by blocking the interactions between PD-1 and its ligands. It could also improve the intrinsic functionality of T-cells by triggering internalisation of PD-1, a mechanism that may be unique to MEDI0680. MEDI0680 is in Phase I development for solid tumours as a monotherapy and in combination with durvalumab. | | > Other immuno-oncology agents in early development include: MEDI6383, a human tumour necrosis factor receptor superfamily, member 4 (OX40) agonist; MEDI9447 targeting ecto-5’-nucleotidase (CD73) and MEDI1873 targeting glucocorticoid-induced tumour necrosis factor receptor-ligand (GITRL). These agents are in Phase I development for a range of solid tumours and have the potential for combination with other molecules in the portfolio. > Some of our 2015 strategic collaborations include: – A collaboration with Immunocore, a UK-based biotechnology company, to combine durvalumab (PD-L1) with IMCgp100, Immunocore’s lead T-cell receptor-based investigational therapeutic, for the treatment of patients with metastatic myeloma. – A collaboration between MedImmune and Innate Pharma, a biopharmaceutical company focused on cancer and inflammation. The aim is to accelerate and broaden the development of Innate’s proprietary anti-NKG2A antibody (IPH2201), including in combination with durvalumab (PD-L1) across a broad range of solid tumours. – A collaboration between MedImmune and Mirati Therapeutics, an oncology company focused on genetic and epigenetic drivers of cancer. We are evaluating the safety and efficacy of durvalumab (PD-L1) in combination with mocetinostat, Mirati Therapeutics’ investigational spectrum-selective histone deacetylase inhibitor. – An agreement with Heptares under which AstraZeneca will acquire exclusive global rights to develop, manufacture and commercialise the adenosine A2A receptor antagonist,HTL-1071. | | Tumour drivers and resistance mechanisms franchise > Tagrisso (AZD9291) is a highly selective, irreversible inhibitor of the activating sensitising EGFR mutation and the resistance mutation T790M. The product is being investigated in Phase III studies in the adjuvant setting for the treatment of patients with EGFRm NSCLC and in the advanced setting as a 1st line treatment of EGFRm NSCLC and as a³2nd line treatment of EGFRm T790M NSCLC. Additionally, studies in combination with small molecules and immunotherapies are under investigation. > Selumetinib is a mitogen-activated protein kinase inhibitor in Phase III development for 2nd line Kirsten rat sarcoma viral oncogene homolog (KRAS) mutant NSCLC. The selumetinib programme also includes a Phase III study for adjuvant differentiated thyroid cancer and a Phase II study for 2nd line KRAS mutation not detected NSCLC. > AZD5363 is a protein kinase B (AKT) inhibitor in Phase II development for breast and prostate cancer. > Savolitinib (AZD6094) is a hepatocyte growth factor receptor (c-MET) inhibitor. It is in Phase II development for lung and renal cancer. > AZD2014 is an inhibitor of the mammalian target of rapamycin serine/threonine kinase (TORC1, TORC2) and is in Phase II development for the treatment of solid and haematological tumours. > AZD9496 is a selective oestrogen receptor down-regulator (SERD) in Phase I development for the treatment of breast cancer. |
| | 8.2m Cancer is a leading cause of death worldwide and accounted for 8.2 million deaths in 2012. Source: WHO Factsheet February 2014 (data from 2012). | |  |
| | |
| AstraZenecaAnnual Report and Form 20-F Information 2015 | | 37 |
Strategic Report | Therapy Area Review
| | |
Oncologycontinued | | |
DNA damage repair franchise
| > | Lynparza (olaparib) is being evaluated in a broad range of Phase III trials, including advanced gastric cancer, BRCAm adjuvant and metastatic breast cancer, gBRCAm pancreatic cancer, and gBRCAm ovarian cancer.Lynparza is also in Phase II development for prostate cancer. |
| > | AZD1775 is a Wee1 inhibitor in Phase II development for ovarian and other solid tumours. |
| > | Phase I clinical studies are progressing for the ATR inhibitor AZD6738 (2nd line gastric cancer withLynparza and also in combination with ionizing radiation in solid tumours) and the ATM inhibitor AZD0156 (for the treatment of gastric and colorectal cancers). |
Antibody-drug conjugates franchise
| > | Moxetumomab pasudotox, an anti-CD22 recombinant immunotoxin, is being investigated in a Phase III study for adult patients with hairy cell leukaemia who have relapsed after, or not responded to, standard therapy. |
| > | MEDI4276 is a HER2 bispecific ADC, which entered clinical development for a range of solid tumours. |
| > | A strategic collaboration with Tanabe Research Laboratories (TRL), a subsidiary of Mitsubishi Tanabe Pharma Corporation, is looking at ways to combine MedImmune’s pyrrolobenzodiazepine based cytotoxic molecules and linker technology with TRL’s antibodies. The aim is to generate monospecific and bispecific conjugates (ADCs) for a broad range of cancer types. |
Our Oncology collaborations
Collaboration is key to accessing the best science and technology, achieving scientific leadership and delivering innovative, life-changing medicines. In 2015, we continued to strengthen our portfolio and accelerate clinical programmes through acquisitions and collaborations.
In December 2015, we announced entry into an agreement to invest in a majority equity stake in Acerta Pharma. The transaction provides AstraZeneca with a potential best-in-class irreversible oral
Bruton’s tyrosine kinase (BTK) inhibitor, acalabrutinib (ACP-196), currently in Phase III development for B-cell blood cancers and in Phase I/II clinical trials in multiple solid tumours.
For more information please see Note 30 to the Financial Statements on page 193
Earlier in 2015, we established several collaborations that reflect the attractiveness of our immuno-oncology portfolio, as demonstrated by:
| > | Our externalisation agreement with Celgene, a global leader in haematological cancers, for the development and commercialisation of durvalumab, anti-programmed death-ligand 1 antibody (PD-L1) across a range of blood cancers, including non-Hodgkin lymphoma (NHL), myelodysplastic syndromes and multiple myeloma. |
| > | The expansion of our existing immuno- oncology collaboration with Lilly to further explore novel combinations across the companies’ complementary portfolios. This collaboration will include evaluations of the safety and efficacy of durvalumab (PD-L1), with select Lilly agents targeting the immune system or tumour drivers and resistance mechanisms. |
| > | Our collaboration with Juno Therapeutics, a biopharmaceutical company. This focuses on re-engaging the body’s immune system to treat cancer and to evaluate safety, assess tolerability, and preliminary efficacy of durvalumab combinations with CD19-directed chimeric antigen receptor (CAR) T-cell candidates for patients with NHL. |
In addition to the collaborations mentioned above, during 2015 we have also entered into a range of collaborations in early science with several scientific and research institutions and biotechnology and diagnostic companies. These additional collaborations include:
| > | Two Co-operative Research and Development Agreements between MedImmune and the National Cancer Institute (NCI), a part of the National |
Institutes of Health (NIH), to advance early-stage research and development in immunotherapy and tumour-targeted therapies for cancer.
| > | A five-year collaboration between MedImmune and the University of Cambridge’s Department of Chemical Engineering and Biotechnology (CEB) designed to generate breakthrough research in biopharmaceutical development, including activities in cell engineering and formulation and analytical science. |
| > | A five-year agreement with the University of Manchester to harness clinical bioinformatics to deliver personalised healthcare for cancer patients. The research will be carried out in partnership with the state-of-the-art clinical trials unit of The Christie National Health Service (NHS) Foundation Trust, which is at the forefront of experimental cancer medicine in the UK. |
| > | A licence agreement and collaboration between MedImmune and Inovio Pharmaceuticals, a biotechnology company developing DNA-based immunotherapies for cancer and infectious diseases, to acquire exclusive rights to Inovio’s INO-3112 immunotherapy. This agent targets cancers caused by the human papillomavirus (HPV) types 16 and 18 and is in Phase I/II development for cervical, and head and neck cancers. MedImmune intends to study INO-3112 in combination with selected immunotherapy molecules within its pipeline in HPV-driven cancers. |
60%
More than 60% of the world’s total new annual cancer cases occur in Africa, Asia and Central and South America. These regions account for 70% of the world’s cancer deaths.
Source: WHO Factsheet February 2014 (data from 2012).
| | |
| 38 | | AstraZenecaAnnual Report and Form 20-F Information 2015 |

| | |
| AstraZenecaAnnual Report and Form 20-F Information 2015 | | 39 |
Strategic Report | Therapy Area Review
Infection, Neuroscience and Gastrointestinalcontinued
|
Our marketed products |
Infection > Fluenz/FluMist1(influenza vaccine live) > Fluenz Tetra/FluMistQuadrivalent1,2 (influenza vaccine live) > Merrem/Meronem3(meropenem) > Synagis4(palivizumab) > Zinforo5(ceftaroline fosamil) Full product information on page 204 1 Intra-nasal. 2 Daiichi Sankyo holds rights toFluenzTetra/FluMist Quadrivalent in Japan. 3 Licensed from Dainippon Sumitomo Pharmaceuticals Co., Limited. 4 US rights only. AbbVie holds rights toSynagisoutside the US. 5 Licensed from Forest (now a wholly-owned subsidiary of Allergan). AstraZeneca holds global rights, excluding the US, Canada and Japan. |
Neuroscience > Diprivan (propofol) > EMLA (lidocaine and prilocaine) > Movantik/Moventig (naloxegol) > Naropin (ropivacaine) > SeroquelIR (quetiapine fumarate) > SeroquelXR (quetiapine fumarate) > Vimovo1(naproxen and esomeprazole magnesium) > Xylocaine (lidocaine) > Zomig (zolmitriptan) Full product information on page 204 1 Licensed from Pozen. Divested US rights to Horizon Pharma USA, Inc. effective 22 November 2013. |
Gastrointestinal > Losec/Prilosec (omeprazole) > Nexium (esomeprazole magnesium) Full product information on page 204 |
In 2015, we strengthened our leadership position in RSV, securing FDA Fast Track designation for MEDI8897, a MAb that may require dosing only once per RSV season. We also launched Phase IIa clinical trials. Additionally, we launched Phase II clinical trials to assess the efficacy of MEDI7510, MedImmune’s RSV sF antigen plus the synthetic molecule GLA, for the prevention of acute RSV-associated respiratory illness in older adults.
Serious bacterial infections
Governments increasingly recognise antibiotic or anti-microbial resistance as a major public health threat. We have a broad and innovative portfolio of medicines for serious Gram-positive and Gram-negative bacterial infections. We are now developing additional medicines to fight these infections. As bacteria develop resistance to current antibiotics, deadly infections could, again, become uncontrollable. In May 2015, AstraZeneca submitted a filing to the EMA for CAZ AVI, an innovative combination of ceftazidime and avibactam. We are seeking full approvals for complicated intra-abdominal infections (cIAI), complicated urinary tract infections (cUTI), and nosocomial pneumonia (NP) (including hospital-acquired pneumonia and ventilator-associated pneumonia). In April 2015, we announced full Phase III results from CAZ AVI pivotal studies RECLAIM-1, -2, and -3 and REPRISE, with positive Phase III cUTI results for RECAPTURE-1 and -2 announced in September. During the year, we launched antibioticZinforo in Mexico; the product is now available in 34 markets.
In addition to CAZ AVI in our late-stage pipeline, we are developing aztreonam avibactam (ATM AVI), a Phase I compound being developed jointly with Forest (now a wholly-owned subsidiary of Allergan). It targets Gram-negative bacteria with a metallo-beta-lactamase resistance mechanism. This bacteria is endemic in India and spreading throughout the world. In September 2015, AstraZeneca entered into a public-private partnership agreement with the US Department of Health and Human Services’ Office of the Assistant Secretary for Preparedness and Response (ASPR) to develop a portfolio of medicines, of which ATM AVI is the first candidate medicine in the portfolio, to combat bioterrorism threats and other life-
threatening bacterial infections. ASPR’s Biomedical Advanced Research and Development Authority (BARDA) and AstraZeneca will manage and fund the portfolio over the next five years. In the arrangement, BARDA initially will provide $50 million towards ATM AVI development and could provide up to a total of $170 million for development of additional products in the portfolio during the five-year period.
Neuroscience
Our strategic priorities
We have a long history in anaesthesia and analgesia, and a sizeable business in psychiatry rooted inSeroquel IR andSeroquel XR. The patent protecting the active ingredient inSeroquel IR andSeroquel XR, quetiapine, expired worldwide in 2012. However, in most European countries, the formulation patent coveringSeroquel XR does not expire until 2017. As such,Seroquel XR remains a key product. We are vigorously defending the patent protectingSeroquel XR. The patent, however, has been subject to various challenges and revocations. Details of litigation relating toSeroquel XR are included in Note 27 to the Financial Statements from page 186.

Values in action: We are entrepreneurial
The antibiotics organisation has been created with a clear vision – to be a global leader in the development and commercialisation of life-saving antibiotics by 2020. With the formation of this separate and dedicated unit, we will focus on the fast growing global health threat of multidrug resistant bacterial infections and continue to bring scientific innovation from our antibiotics portfolio to doctors and patients around the world.
| | |
| 40 | | AstraZenecaAnnual Report and Form 20-F Information 2015 |

Neurology
Alzheimer’s disease remains one of the largest areas of unmet medical need and continues to generate significant social and scientific interest. To address this, in addition to our BACE inhibitor, AZD3293, which is currently advancing in our externalisation collaboration with Lilly in Phase II/III clinical trials as a potential treatment for Alzheimer’s disease, we continued to develop MEDI1814 in Phase I clinical trials. We also entered into multiple collaborations with academic and scientific institutions to advance disease understanding and identify potential new medicines. For example, we started a collaboration with the University of Cambridge (focusing on advancing research in neurodegenerative diseases), and continued to work with the Karolinska Institutet (Sweden), the Banner Alzheimer’s Institute (US), the National Institute of Radiological Sciences (Japan) and Vanderbilt University (US), focusing on psychosis and other neuropsychiatric symptoms associated with major brain diseases, such as Alzheimer’s disease and schizophrenia. We also renewed or continued our collaborations with the Lieber Institute for Brain Development (US) and Tufts University (US), focusing on understanding brain diseases and disorders, including Alzheimer’s disease and autism spectrum disorders. In another collaboration, we joined the Medical Research Council Dementias Platform UK, a large public-private partnership, to accelerate and share dementia research. In addition, we are developing AZD3241, a myeloperoxidase inhibitor, to potentially delay progression of disability in patients with multiple system atrophy. The National Institute on Drug Abuse in the US is conducting and funding a Phase II trial of AZD8529 in smoking cessation. AZD7325 is in a clinical trial sponsored by the National Institute of Mental Health in the US to be tested as a potential treatment for autism spectrum disorders.
Pain control
Our anaesthesia portfolio consists of various compounds, including an intravenous general anaesthetic/ sedative and local anaesthetics available in different formulations. The portfolio includes injectables, creams, gels, sprays and suppositories.
Biologics are an emerging treatment for pain control. We are exploring treatments in focused pain areas, with patients selected on the basis of their characteristic symptoms.
Movantik/Moventig is the first orally administered, once-daily,peripherally-acting mu-opioid receptor antagonist to be approved for the treatment of opioid-induced constipation (OIC) in adult patients. The indication varies by jurisdiction. OIC is the most common side effect of chronic use of opioid pain medicines. These are taken by over 69 million people worldwide, and the incidence of OIC in patients with chronic pain varies and has been suggested to be as high as 81%. Of these patients, only about half achieve desired treatment outcomes with current options, such as OTC and prescription laxatives, which treat general constipation symptoms.Movantik/Moventig was developed using Nektar Therapeutics’ oral small molecule polymer conjugate technology as part of a 2009 licence agreement with Nektar Therapeutics.
In March 2015, AstraZeneca announced a co-commercialisation agreement with Daiichi Sankyo, forMovantik in the US, in line with delivering on our externalisation strategy to create value from the science that exists in the product pipeline. The brand launched in the US, UK, Canada, Sweden, Denmark, Norway, Finland and Germany in 2015. Additional launches will occur through the first half of 2016.
Gastrointestinal
Our strategic priorities
Nexium remains one of the most used therapies in the world. In 2015, its use continued to grow in markets including China and Japan. Demand forNexium in China is expected to grow significantly and will complement its position in Japan as the top-selling medicine in its class.
Nexium is generally subject to generic competition in Europe. In the US, we expected the first generic entry in 2014 but that did not occur. In January 2015, Teva received approval from the FDA to market a generic version ofNexium. Since then, Mylan, Hetero/Camber, Dr Reddy Labs and Torrent received approval for generic versions ofNexium. Nexium is also subject

Values in action:We play to win
In 2015, we madeMovantik/Moventig, the first peripherally-acting mu-opioid receptor antagonist (PAMORA), available to patients suffering from opioid-induced constipation in the US, Canada, UK, Germany, Ireland and the Nordic countries.
to generic competition in Australia, where the first generic entry occurred in August 2014. Patents protectingNexium have been subject to a number of challenges in different jurisdictions. Details of these matters are included in Note 27 to the Financial Statements from page 186.
Pfizer acquired the exclusive global rights to marketNexium for OTC indications worldwide in 2012, and launched OTCNexium 20mg in the US and Europe in 2014.
In July 2015, we announced the completion of an agreement with Tillotts Pharma, part of the Zeria Group. This covered the divestment of global rights, outside the US, toEntocort (budesonide), a gastroenterology medicine for patients with mild-to-moderate Crohn’s disease and ulcerative colitis. In December 2015, we entered into an agreement with Perrigo for the divestment of US rights toEntocort, granting Perrigo the rights to sellEntocort capsules and the authorised genericEntocort capsules marketed by Par Pharmaceuticals.
| | |
| AstraZenecaAnnual Report and Form 20-F Information 2015 | | 41 |
Strategic Report | Business Review
Research and Development
| | | | | | | | |
 | | |
| |
We are investing in key programmes and focused business development, as well as using our distinctive capabilities to push the boundaries of science to deliver life-changing medicines. Overview > Focused on science-led innovation across small molecules, biologics, immunotherapies, protein engineering and devices > Strengthened our pipeline, portfolio and capabilities in 2015 through focused investment and business development > Simplified programmes, processes and systems while prioritising resources towards late-stage development > Launched seven diagnostic tests linked to our products in line with our personalised healthcare (PHC) strategy > Promoted open innovation and collaboration by co-locating to strategic R&D centres and collaborating with leading research organisations > Published 58 articles in ‘high-impact’ publications compared to seven in 2010 > Committed to working responsibly and in accordance with our global bioethics standards | | Achieve scientific leadership As outlined in Strategic priorities from page 16, achieving scientific leadership is critical to our success. During 2015, we > continued to redeploy R&D spend towards late-stage development > further expanded our immuno-oncology research and development activities > entered into numerous strategic collaborations to access novel science and technology. Our biotech-style operating model enables us to access the best science, both internal and external, which is a prerequisite for achieving scientific leadership. Further, our productivity and pipeline continue to benefit from investments in key capabilities, such as payer partnering, PHC, predictive science and clinical trial design. In recent years, we have created a leaner, simpler and smaller organisation, focused on driving distinctive science across our key therapy areas. We have also made progress in co-locating our teams to our strategic R&D centres. The move to Gaithersburg, Maryland US is complete and the move to Cambridge, UK is progressing rapidly with 1,600 roles now located in Cambridge where the new R&D centre and corporate headquarters is under construction. Research and early clinical development Our two biotech units conduct innovative discovery research and early-stage development from initial target selection to Phase II trial completion. Our IMED biotech unit focuses on scientific advances in small |
| | | |
| 58 | | 
| | 7 | | 
| |
Record number of ‘high-impact’ publications entre | | | Launched seven diagnostic tests linked to our products | | |
| | | |
| | | | | | | | |
| | |
| 42 | | AstraZenecaAnnual Report and Form 20-F Information 2015 |
molecules, oligonucleotides and other emerging technologies and drug discovery platforms. The MedImmune biotech unit is responsible for global biologics research and early-stage development. Both units are responsible for delivering projects to our Global Medicines Development (GMD) unit for late-stage development.
Working collaboratively and fostering open innovation
In order to enhance our innovation capabilities and ensure that we have access to the best science, we are open to exploring new and different kinds of collaborations. Current small molecule partnership models include in-licensing of new chemical modalities and platforms; partnerships to leverage our compound collection to uncover novel target opportunities; and strategic collaborations designed to build our understanding of the mechanisms of disease. In biologics, we are actively engaged in strategic university research collaborations, clinical partnerships designed to explore the full potential of our immuno-oncology assets, and numerous in-licensing and joint development arrangements. In both biotech units our scientists work side-by-side with partner scientists, advancing science together as a single team.
In 2015, our IMED biotech unit announced several scientific collaborations. A number of collaborations enhanced the use of clustered regularly-interspaced short palindromic repeats (CRISPR) technologies across our discovery platforms, including those with the Innovative Genomics Initiative, the Whitehead Institute at the Massachusetts Centre for Technology, The Sanger Institute and Thermo Fisher Scientific. We also expanded our collaboration with Ionis Pharmaceuticals Inc. to discover and develop antisense therapies for cardiovascular, metabolic and renal diseases. MedImmune also forged several key collaborations in 2015, including a research collaboration with Joslin Diabetes Center to develop new medicines to treat diabetes, obesity, and related metabolic disorders. In addition, we launched a biotherapeutics research centre in collaboration with Cambridge Research UK. MedImmune was also very active in finalising collaborations to maximise the value of the immuno-oncology portfolio, such as through the externalisation
collaboration with Celgene to extend our extensive anti PD-L1 inhibitor programme, durvalumab, into trials for serious blood cancers. The recent exchange of chemical compounds with Sanofi is an example of our open innovation collaborations.
For more information on our collaborations please refer to the Oncology section from pages 34 to 38
To better understand the biology of disease, our biotech units announced the first wave of projects from our joint venture with the MRC Laboratory of Molecular Biology and have agreed to support more than 80 PhD scholarships and eight clinical lectureships with the University of Cambridge.
Additionally, and through our IMED open innovation portal, our teams reviewed more than 350 proposals for new drug projects in 2015.
For an analysis of our R&D spend, please see Infrastructure on page 61
Our personalised healthcare strategy
2015 saw us using the science of PHC to match many more patients to AstraZeneca medicines from which they are most likely to benefit. We launched seven diagnostic tests linked to our products – a total of 11 in two years. Three of our products (Iressa, Lynparza and Tagrisso) are now coupled with companion diagnostic tests that select patients for therapy based on their molecular profiles. PHC expanded in our clinical pipeline to over 80% – with over 60 planned drug launches by 2024 requiring a diagnostic test.
Our increasing investment in diagnostic partnerships achieved two world firsts: the EGFR mutation test for Tagrisso is the first diagnostic test for both circulating tumour DNA and tumour tissue (EU, with Roche Molecular Systems), while our PD-L1 Class I diagnostic (with Ventana) was the first immuno-oncology test launched in the US. In addition, we launched tests for tumour BRCA analysis for Lynparza (EU, with Myriad); for EGFR T790M for Tagrisso (US, with Roche Molecular Systems); for circulating tumour DNA EGFR for Iressa (EU, with Qiagen); and for PD-L1 (EU, with Ventana).
Scientific innovation is the life-blood of PHC. We are now expanding the benefits of PHC to patients in all core disease areas, such as asthma, where we are developing diagnostics for periostin and DPP-4 for potential use with tralokinumab (with Abbott) and lupus, where we are evaluating a type-I-IFN-inducible gene signature for use with anifrolumab (with Qiagen).
Oncology from page 34
Respiratory, Inflammation and Autoimmunity from page 26
Looking ahead, we announced a collaboration with the Montreal Heart Institute to search the genomes of up to 80,000 patients for genes associated with cardiovascular diseases and diabetes. Finally, our membership of the GENE Consortium, a public-private consortium with Genomics England in the UK, is aimed at accelerating the development of new diagnostics and treatments arising from the 100,000 Genomes Project.
Cardiovascular and Metabolic diseases from page 30
Late-stage development
GMD is our R&D function focused on large Phase III clinical trial programmes across our therapy areas that support the approval, launch and reimbursement of new medicines, as well as life-cycle management. GMD also delivers studies that demonstrate evidence of how our medicines work in the ‘real world’ to help healthcare professionals and payers understand the therapeutic as well as economic value of our medicines. During 2015, we have continued to sharpen focus on our three therapy areas by identifying opportunities to collaborate on developing assets within our late-stage pipeline – for example, an externalisation agreement for the development of brodalumab for patients with psoriasis and the divestment of one of our established productsCaprelsa, as a treatment for rare diseases.
Accelerating the pipeline and increasing efficiency
GMD is pushing boundaries to help ensure new treatments get to patients more quickly and still safely. Improvements include the development and use of smart clinical trials, data-modelling techniques and proactive
| | |
| AstraZenecaAnnual Report and Form 20-F Information 2015 | | 43 |
Strategic Report | Business Review
Research and Developmentcontinued
Values in action:We put patients first
Personalised healthcare aims to match medicines to patients who will benefit from them most. Advances in science mean we can now design diagnostic tests to tell us how individual patients are likely to respond to a medicine before prescribing it. We are also using new technology, such as blood-based tests in lung cancer, so that this science reaches more patients. Developing medicines in this way helps deliver the right medicine to the right patient and means better, more effective treatment.
regulatory approaches, as well as accelerating drug formulation and supply chain solutions. Examples in 2015 included presenting regulators with scientific rationale based on robust early clinical data in respect ofTagrisso, while fast delivery times to secure data from PEGASUS-TIMI 54, our 21,000-patient study forBrilinta, supported wider approvals in the US and additional regulatory submissions in the EU and US. GMD has created dedicated oncology delivery teams and recruited more medical expertise to bring potential new cancer treatments to patients more quickly, where there is significant unmet medical need.
See Therapy Area Review from page 24
GMD also pursues opportunities to simplify processes to increase efficiency and productivity. A new information management system for all regulatory submissions, registrations and product changes provides improved access to documentation. We have also completed the outsourcing of routine regulatory maintenance and publishing tasks to a data-handling provider, so our internal resources can focus solely on activities to support our regulatory submission priorities. In clinical operations, we are adopting new technology and approaches to improve monitoring of clinical trials and ensure patients are protected.
Investment in disease area and scientific capabilities
With the consolidation of R&D activities to strategic centres, we continue to hire new employees to strengthen our disease area expertise and technical capabilities. This helps to meet the needs of our expanded late-stage portfolio and support the increasing number of clinical trials.
Payer and real-world evidence capabilities are helping us to show how our medicines may improve outcomes compared to other treatments, and to demonstrate how they may reduce the need for hospital or specialist care, and make a difference to patients’ lives.
We continue to engage with medical experts to provide important insight into our drug programmes. Such engagements will
help ensure our medicines address the needs of patients as well as healthcare professionals. In support of this as detailed in the Pipeline and Therapy Area Introduction on page 24, we have signed an agreement with PatientsLikeMe.
Our scientific reputation
Demonstrating the quality of the research conducted in our laboratories, through publication in high-quality and ‘high-impact’ journals, is an essential element in building our scientific reputation and achieving scientific leadership. It is also critical for recruiting and retaining the best scientists from around the world. Scientists from IMED, MedImmune and GMD have published a record number of ‘high-impact’ publications with 58 manuscripts in peer-reviewed journals with impact factor exceeding 15 (Thomson Reuters 5yr IF score). This represents an eight-fold improvement since our drive to publish in ‘high-impact’ journals in 2010, and demonstrates recognition of the quality of our science by industry and academic peers.
Responsible research†
We are committed to achieving scientific leadership and delivering life-changing medicines in a trustworthy and ethical manner. Our global standards of bioethics apply to all our research activity, whether conducted by us or third parties on our behalf.
Patient safety
Patient safety is very important to us and we strive to minimise the risks and maximise the benefits of our medicines. Through a pharmacovigilance programme, we monitor our medicines to learn of any side effects not identified during the development process and provide information concerning the safety profile of our medicines to regulators, healthcare professionals and, where appropriate, patients. We also work with regulatory authorities worldwide to raise pharmacovigilance awareness.
Our patient safety team helps fulfil our commitment to patient safety. Each developing and marketed medicine is allocated a Global Safety Physician and a patient safety scientist. In addition, each market is supported by a dedicated patient
| | |
| 44 | | AstraZenecaAnnual Report and Form 20-F Information 2015 |
safety manager. Our Chief Medical Officer has accountability for the benefit/risk profiles of our products in development and on the market. He provides medical oversight and enforces risk assessment processes to facilitate efficient and informed safety decision making.
Clinical trials and transparency
In 2015, we conducted clinical trials at multiple sites in various countries and regions as shown in the chart over. This broad span helps ensure that study participants reflect the diversity of patients for whom our medicines are intended and identifies the patients for whom the medicine may be most beneficial. Our global governance process for determining where we locate clinical trials provides the framework for ensuring a consistent, high-quality approach worldwide. Protecting participants throughout the trial process is a priority and we have strict procedures to help ensure participants are not exposed to unnecessary risks.
All our clinical studies are designed and finally interpreted in-house but some are conducted by CROs on our behalf. In 2015, approximately 36% of patients in our small molecule studies and 56% of patients in our biologics studies were monitored by CROs. We require these organisations to comply with our global standards and we conduct risk-based audits to monitor compliance. We also engage and collaborate with external scientific experts to support the design and interpretation of these clinical studies. Committees oversee study execution and progress, and we frequently collaborate with academic research organisations, particularly for larger multicentre outcome trials.
We believe that transparency enhances the understanding of how our medicines work and benefit patients. We publish information about our clinical research, as well as the registration and results of our clinical trials – regardless of whether they are favourable – for all products and all phases, including marketed medicines, drugs in development and drugs where development has been discontinued.
 For more information, please see our website, www.astrazeneca.com, or our clinical trials website, www.astrazenecaclinicaltrials.com
During 2015, we implemented a number of changes in response to the new EU Clinical Trial Regulation, EMA’s Policy 70 and the EFPIA/PhRMA Responsible Data Sharing principles.
Clinical trials by region
| | | | | | | | |
| | | Small molecule | | | Biologics | |
| Europe | | | 16% | | | | 14% | |
| US/Canada | | | 26% | | | | 34% | |
| Asia Pacific | | | 15% | | | | 6% | |
| Central/Eastern Europe | | | 27% | | | | 25% | |
| Japan | | | 3% | | | | 12% | |
| Latin America | | | 10% | | | | 7% | |
| Middle East and Africa | | | 3% | | | | 2% | |
Research use of human biological samples
The use of human biological samples, such as solid tissue, biofluids and their derivatives, plays a vital role in developing a deeper understanding of human diseases and their underlying mechanisms, thereby helping to develop effective, new and personalised medicines.
In carrying out this important area of research, we maintain policies and processes to ensure that we both comply with the law and meet regulatory concerns. We place an emphasis on informed consent that protects the rights and expectations of donors and families throughout the process of acquisition, use, storage and disposal of the samples. Protecting the confidentiality of a donor’s identity is of the utmost importance and a key part of our process includes the coding of biological samples and associated data (including genetic data).
In rare circumstances, AstraZeneca may use human fetal tissue or embryonic stem cells. In these circumstances, an internal review of the scientific validity of the research proposal will be conducted and permission to use the tissue will be granted only when no other scientifically reasonable alternative is available. AstraZeneca also insists its third party vendors adopt the highest ethical standards and we rigorously assess the ability of tissue suppliers to meet our quality and ethical expectations. We are committed to minimising the use of fetal tissue by exploring technological alternatives.
Animal research
We are committed to helping the public understand our use of animals in research and our methods for reducing, refining, or replacing them. Our commitment is reflected in our Global Bioethics Policy, and along with other signatories, progress has been published in the 2015 Annual Report on the ‘Concordat on Openness in Animal Research in the UK’.
In response to a routine internal audit of our animal welfare assurance, we have improved our governance structure by providing a single point of accountability with oversight across AstraZeneca effective 1 January 2016. Our approach will provide consistent implementation of policies and procedures, and will ensure that all new organisations that join AstraZeneca have support in fulfilling their obligations under the Code of Conduct.
Further information on our governance structure can be found on our website, www.astrazeneca.com
Animal research use varies depending on numerous factors, including our amount of pre-clinical research, the complexity of the diseases under investigation and regulatory requirements. We believe that without our active commitment to reducing, refining, or replacing animals in research, our animal use would be much greater. In 2015, we used 182,055 animals in-house (2014: 194,162). In addition, 33,220 animals were used by CROs on our behalf (2014: 15,634).
| † | For further information on AstraZeneca’s approach to doing business sustainably please refer to In the wider world from page 55 and on our website, www.astrazeneca.com. |
| | |
| AstraZenecaAnnual Report and Form 20-F Information 2015 | | 45 |
Strategic Report | Business Review
Manufacturing and Supply
| | | | | | | | |
 | | |
| |
Our new strategic framework provides a focus for our investments to help ensure we are able to respond to patient and market needs for our medicines. Overview > Developed a new transformational operations 2020 strategy focused on helping AstraZeneca to achieve its strategic purpose > Opened our new facility in Russia to supply local markets better > Announced plans to invest more than $285 million in our Sweden biologics centre, and acquired a facility in the US to meet growing demand for manufacturing biologics > Continued to combine internal capabilities with cost-efficient external resources using established process for third party risk management including suppliers, their partners and local business development partners | | New operations strategy In 2015, we developed a new transformational strategic framework for Global Operations to help ensure we are fit for the future. Our strategy, which is focused around a set of strategic imperatives and strong foundations, will drive our thinking and actions in the years ahead as we strive to become more agile, flexible and able to respond to patient and market needs. New manufacturing facilities Following the successful introduction of our Taizhou facility in China at the end of 2014, regulatory validation work continues at our Vorsino facility in Russia, which opened in 2015. This marks the largest foreign investment in the construction of a new pharmaceutical plant in Russia. First commercial production is scheduled to commence in early 2016, improving our ability to supply local markets. Also during 2015, we announced major investment plans to develop our capability in biologics, including the acquisition of Amgen’s facility in Boulder, Colorado in the US, as well as a $285 million investment in a new manufacturing facility in Södertälje, Sweden. These projects, in addition to a previously announced expansion plan at Frederick, Maryland US, will increase production capacity to support the growing demand for biologics, which represents half of our development pipeline. Innovation Partnerships and innovation are playing an increasingly important role for Operations in delivering medicines to patients. New science, and ways of working are continually assessed, with pilots progressed to challenge established practices. During 2015, we have seen innovative practices |
$285m | | 11,236 | |
| Plan to invest more than $285 million in our Sweden biologics centre | |  | | Undertook 11,236 risk assessments in 2015 | |  | |
| | | |
| | | | | | | | |
| | |
| 46 | | AstraZenecaAnnual Report and Form 20-F Information 2015 |
| | |
Values in action:We put patients first We have established a secure and low-cost supply chain in support of our Healthy Heart Africa programme (see page 51). Understanding the patient’s circumstances was key as we worked to enable access to, and affordability of, high-quality anti-hypertensives to middle- and lower-income patients. We are working with our distributors and NGO partners to gather and share reliable data so that we can respond to changing patient needs. | |  |
employed around readiness for launch ofTagrisso, while our Healthy Heart Africa programme has been further developed as we aim to reach 10 million patients across Africa. Further pilots are already under development for 2016, as we look to improve the end-to-end supply chain performance.
Product quality and supply chain
We are committed to high product quality, which underpins the safety and efficacy of our medicines. To help assure compliance and quality, we maintain a comprehensive quality management system.
Our continuous improvement programme allows us to upgrade our systems and minimise environmental impact. By applying Lean methodology to our manufacturing plants and supply chain, we have been successful in reducing waste and inventory costs. We have also improved efficiency, quality, lead times, equipment effectiveness and overall customer responsiveness. We are continuing to establish more efficient processes, with global supply chain experts providing support throughout the organisation.
Regulation and compliance
Manufacturing facilities and processes are subject to rigorous regulatory standards. These continuously evolve and are not harmonised globally. They are also subject to inspections by regulatory authorities, who are authorised to mandate improvements to facilities and processes, halt production and impose conditions for production to resume.
In 2015, we hosted 38 independent inspections from 16 regulatory authorities. We reviewed observations from these inspections, together with the outcomes of internal audits, and, where necessary, implemented improvement actions.
Our strategy reflects our commitment to maintaining the highest ethical standards and compliance with internal policies, laws and regulations. We review and comment upon evolving national and international compliance regulations through our membership of industry associations including EFPIA and PhRMA.
Working with suppliers†
With most of our API manufacturing outsourced, we need an uninterrupted supply of high-quality raw materials. We therefore place great importance on our global procurement policies and integrated risk management processes. We purchase materials from a wide range of suppliers and work to mitigate supply risks, such as natural or man-made disasters that disrupt supply chains or the unavailability of raw materials. Contingency plans include using dual or multiple suppliers where appropriate, maintaining adequate stock levels and working to mitigate the effect of pricing fluctuations in raw materials.
We also seek to manage reputational risk. Our ethical standards are integral to our procurement and partnering activities and we continuously monitor compliance through assessments and improvement programmes. We work only with those suppliers whose standards of ethical behaviour are consistent with our own. We will not use suppliers who are unable to meet our standards.
To achieve this, we have an established process for third party risk management. This process, which consists of four steps and applies to all our suppliers, downstream supply chain partners and local business development partners, assesses risk based upon defined criteria. These include risks related to bribery and corruption, data privacy, the environment and wages. Each step of the process provides an additional level of assessment, and we conduct more detailed assessments on those relationships identified as higher risk. Through this risk-mitigation process we seek to better understand the partner’s risk approach and ensure the partner understands and can meet our standards. We conducted a total of 11,236 assessments in 2015, taking our total number of assessments to 13,845. Of these 4,613 were in the Asia Pacific region, followed by 4,115 in Europe and 3,538 in the Americas. The remaining 1,579 assessments relate to global suppliers and those based in the Middle East and Africa.
In addition, we conducted 49 audits on direct materials suppliers to ensure they employ appropriate quality, health and safety practices. 35% of suppliers met our expectations and 65% implemented improvements to address minor instances of non-compliance. During our due diligence process, we identified and rejected 326 suppliers, including 65 for reputational related concerns.
| † | For further information on AstraZeneca’s approach to doing business sustainably please refer to In the wider world from page 55 and on our website, www.astrazeneca.com. |
| | |
| AstraZenecaAnnual Report and Form 20-F Information 2015 | | 47 |
Strategic Report | Business Review
Sales and Marketing
| | | | | | | | |
 | | |
| |
Our return to growth strategy is built on maximising the potential of our strong portfolio of primary care and specialty care medicines by leveraging our global commercial presence, particularly in Emerging Markets. We are also investing in our Growth Platforms. Overview > Our Sales and Marketing teams operate in more than 100 countries > Sales increased by 15% in China, which is now our second largest market > In the US, declines in revenue fromNexium,Crestor andSynagis were offset by strong performance of our Growth Platforms > Despite an austere macroeconomic climate, we continued to launch innovative medicines in Europe > Japan continues as one of our Growth Platforms with revenue growth of 4% in 2015 > We worked closely with payers and providers to help deliver cost-effective medicines > We increased access to healthcare through programmes in Emerging Markets, serving some 3.5 million people > We reaffirmed our commitment to ethical sales and marketing activity through employee training, monitoring, corrective actions and reporting | | Organisation and approach To improve health and bring benefits to patients around the world, we need to ensure the right medicines are available and that patients have access to them. To that end, our Sales and Marketing teams, which comprised around 34,800 employees at the end of 2015, are active in more than 100 countries. In most countries, we sell our medicines through wholly-owned local marketing companies. We also sell through distributors and local representative offices. We market our products largely to primary care and specialty care physicians. We aim to meet their needs by having highly accountable local leaders who understand their customers and focus on business growth. We group our Sales and Marketing function into Japan, one of our Growth Platforms, and three Commercial Regions: North America (US and Canada); Europe; and International (Emerging Markets, Australia and New Zealand). Underpinning all our efforts is a commitment to operate responsibly and conduct sales and marketing activity in accordance with applicable laws and our Values. For more information on Product Sales in our markets, please see Geographical Review from page 227 US As the sixth largest prescription-based pharmaceutical company in the US, we have a 4.5% market share of US pharmaceuticals by sales value. In 2015, sales in the US decreased by 6% to $9,474 million (2014: $10,120 million). Declines in revenue fromNexium, Crestor |
| | | |
| 100 | | 
| | 3.5m | | 
| |
| Active in more than 100 countries | | | Patient access programmes in Emerging Markets reached 3.5 million people by the end of 2015 | | |
| | | |
| | | | | | | | |
| | |
| 48 | | AstraZenecaAnnual Report and Form 20-F Information 2015 |
andSynagis were partially offset by strong performance of our Growth Platforms, includingFarxiga,BydureonandBrilinta, the launches ofLynparza andTagrisso as well as the impact of completing the acquisition of Actavis’ rights toTudorza andDaliresp in the US.
The Affordable Care Act (ACA) has had, and is expected to continue to have, a significant impact on our US sales and the US healthcare industry. In 2015, the overall reduction in our profit before tax for the year, due to discounts on branded pharmaceutical sales to Medicare Part D beneficiaries and an industry-wide excise fee, was $786 million (2014: $714 million).
For more information on pricing pressure and the ACA, please see Marketplace from page 12 and Geographical Review from page 227
While there is no direct governmental price control for commercial prescription drug sales in the US, some publicly funded programmes, such as Medicaid and TRICARE (Department of Veterans Affairs), have statutorily mandated rebates and discounts. These effectively serve as price controls for such programmes. Other challenges include continuing pressure on pricing, and the availability and use of prescription drugs for commercial and public payers continues to increase. This is due to, among other things, an increased focus on generic alternatives. Increased generics use is also due to rising patient co-insurance or co-payments for branded pharmaceuticals and budgetary policies of healthcare systems and providers, including policies about the use of ‘generics only’ formularies. In 2015, 84.0% of prescriptions dispensed in the US were generic compared with 83.4% in 2014. While the adoption of a broad national price-control scheme in the near future is unlikely, increased focus on pharmaceutical prices and their impact on healthcare costs is likely to continue.
Europe
The total European pharmaceutical market was worth $194 billion in 2015. We are the twelfth largest prescription-based pharmaceutical company in Europe with a 2.5% market share of prescription sales by value. Europe comprises countries as defined in Market definitions on page 247.
In 2015, our sales in Europe decreased by 6% to $5,323 million (2014: $6,638 million). Key drivers of the decline were continued competition fromSymbicortanalogues, ongoing volume erosion ofAtacand andSeroquelXR following loss of exclusivity, pricing and volume pressure forCrestor andNexium, and lower net pricing onSynagis. The continued macroeconomic environment, increased government interventions (for example, on price and volume) and parallel trade across markets also affected sales. Despite these conditions, we continue to launch innovative medicines across Europe and saw significant progress within our Growth Platforms.
Established Rest of World (ROW)*: opportunities and challenges
In 2015, sales in Japan increased by 4% to $2,020 million (2014: $2,227 million). Strong performance ofNexiumandCrestor, and the Diabetes franchise helped to drive this, offsetting the headwinds from generic competition. In Japan, we hold ninth position in the ranking of pharmaceutical companies by sales of medicines. Despite biannual government price cuts and increased intervention from the government to rapidly increase the volume share of generic products, Japan remains an attractive market for innovative pharmaceuticals. The higher EGFR prevalence in Asian markets makes Japan a key market for the launch ofTagrisso expected in 2016.
Canada has a mixed public/private payer system for medicines that is funded by the provinces, insurers and individual patients. It has also now become common for public payers to negotiate lower non-transparent prices after they have gone through a review by the Canadian Agency for Drugs and Technology in Health (CADTH), a health technology assessment body. Most private insurers pay full price although there is increasing pressure to achieve lower pricing. Overall, the split for AstraZeneca’s portfolio is 66% funded by private payers and 34% with public plans.
Our sales in Australia and New Zealand declined by 19% in 2015. This was primarily due to the continued erosion of Crestor andAtacand by generic medicines.Nexium lost exclusivity in Australia in 2014 and generic medicines were launched.
| * | Established ROW comprises Australia, Canada, New Zealand and Japan. |
Emerging Markets: expansion and collaboration
Emerging Markets, as defined in Market definitions on page 247, comprises various countries with dynamic, growing economies. As outlined in Marketplace from page 12, these countries represent a major growth opportunity for the pharmaceutical industry due to strong demand and sound economic fundamentals.
Emerging Markets are not immune, however, to economic downturn. Market volatility is higher than in Established Markets and various political and economic challenges exist. These include regulatory and government interventions.
With revenues of $5,822 million, AstraZeneca was the eighth largest, as measured by prescription sales, and the fourth fastest-growing top 10 multinational pharmaceutical company in Emerging Markets in 2015.
In China, AstraZeneca is the second largest pharmaceutical company, as measured by sales. We are driving sustainable growth through strategic brands investment, expanded hospitals coverage and systematic organisational capability improvements. Sales in China in 2015 increased by 15% to $2,530 million (2014: $2,242 million). We delivered sales growth at above the growth rate of the market, and initiated several long-term market expansion programmes in therapy areas. The industry growth rate is expected to be moderated to high single digits, impacted by increased price pressure, hospital cost containment and delays in new product registration. Nevertheless, the healthcare environment in China remains dynamic. Opportunities are arising from incremental healthcare investment, strong underlying demand and the emergence of innovative medicines.
Growth drivers for Emerging Markets include our new medicines, notablyBrilinta, and our Diabetes, Respiratory, Oncology, CV and Gastrointestinal portfolios. To educate physicians about our broad portfolio, we are selectively investing in sales capabilities where opportunities from unmet medical need exist. We are also expanding our reach through multi-channel marketing and external partnerships.
| | |
| AstraZenecaAnnual Report and Form 20-F Information 2015 | | 49 |
Strategic Report | Business Review
Sales and Marketingcontinued
Innovative collaborations are giving us access to novel science, technology and medicines. These complement and strengthen our portfolio. One example is our collaboration with FibroGen in China to develop and commercialise roxadustat, a potential first-in-class oral compound for treating anaemia in patients with CKD.
Increasing access to healthcare†
We have made significant progress in broadening the access to our products by making medicines more affordable and we are working towards greatly increasing access, particularly in low income countries, through our patient access programmes. Our efforts to improve affordability are particularly focused on ability to pay based on disposable household income. We continue to grow our capabilities and build on the experience of wellbeing initiatives and patient access programmes which provide discounts on our medicines and other patient services, for example FazBem in Brazil, Disfruto Mi Salud in Central America and the Caribbean, MAZ Salud in Mexico and Karta Zdorovia in Russia. We have significantly expanded these initiatives across Latin America, the Middle East and Africa, and Asia Pacific, and the number of patient access programmes in Emerging Markets has more than doubled since 2013, reaching 3.5 million patients in total by the end of 2015.
Improved access is bringing down healthcare barriers, particularly in developing countries. In 2015, we expanded our efforts in Africa to enable greater access to hypertension medication and other essential services for patients who are otherwise unable to access medication or other forms of treatment.
For more information, please see the Healthy Heart Africa case study over
Pricing and delivering value
Our global pricing policy helps to ensure appropriate patient access while optimising the sustained profitability of our products. When setting the price of a medicine, we consider its full value to patients, payers and society generally. We also pursue a flexible pricing approach. For example, we support the concept of differential pricing, provided that appropriate safeguards are in place to
help ensure lower-priced products reach the patients who need them and are not diverted for sale and use in more affluent markets.
Our medicines help treat unmet medical need, improve health and create economic and therapeutic benefits. Effective treatments can lower healthcare costs by reducing the need for more expensive care, preventing more serious and costly diseases and increasing productivity by reducing or preventing days lost to illness. Nevertheless, pricing pressure remains, as outlined in Marketplace on page 12. We are acutely aware of the economic challenges faced by payers and remain committed to delivering value to payers and patients alike. We work closely with payers and providers to understand their priorities and requirements. We also conduct real-world evidence studies to demonstrate how our products improve health outcomes, offer value and support cost-effective healthcare.
Sales and marketing ethics†
We are committed to employing high ethical standards of sales and marketing practice worldwide. This is consistent with our Global Policy on Ethical Interactions. We report publicly on the number of
| > | confirmed breaches of external sales and marketing codes |
| > | breaches of our Code of Conduct or supporting policies by employees and contractors in our Commercial Regions, and associated corrective actions. |
During 2015, we continued to train employees on the global standards that govern the way we operate. We have comprehensive processes as well as dedicated compliance professionals who monitor adherence to our Code of Conduct and Global Policies. These professionals also support our line managers locally in supervising their staff. A network of nominated signatories review our promotional materials against applicable requirements. In 2015, audit professionals also conducted compliance audits on selected marketing companies.
We identified 11 confirmed breaches of external sales and marketing regulations or codes in 2015 (2014: six).
There were 1,749 instances, most of them minor, of non-compliance with our Code of Conduct, Global Policies or related control standards in our Commercial Regions, including instances by contract staff and other third parties (2014: 1,847).
We removed 339 employees or contractors from their roles as a result of these breaches (a single breach may involve more than one person). We also formally warned 490 others and provided further guidance or coaching on our policies to 1,476 more. The most serious breaches were raised with the Audit Committee.
US Corporate Integrity Agreement and The Physician Payments Sunshine Act reporting
In April 2010, AstraZeneca signed an agreement with the DOJ to settle an investigation relating to the sales and marketing ofSeroquel IR. The requirements of the associated Corporate Integrity Agreement (CIA) between AstraZeneca and the Office of the Inspector General of the US Department of Health and Human Services (OIG) included a number of monitoring and self-reporting obligations that differ from the self-reporting required by authorities in the rest of the world. To meet these obligations, AstraZeneca provided notices to the OIG describing the outcomes of particular investigations potentially relating to violations of certain laws. We also submitted an annual report to the OIG, summarising monitoring and investigation outcomes relevant to the CIA requirements. Under the CIA, AstraZeneca also disclosed, on a publicly available website, certain payments to US physicians and institutions. The CIA was for a period of five years and successfully concluded on 30 April 2015. AstraZeneca continues to maintain a robust compliance framework to ensure compliance with all applicable laws and regulations, and that the business is operating with high ethical standards. AstraZeneca also continues to report to the US government, detailed information relating to payments to physicians and teaching hospitals in the US, as required by The Physician Payments Sunshine Act.
| † | For further information on AstraZeneca’s approach to doing business sustainably please refer to In the wider world from page 55 and on our website, www.astrazeneca.com. |
| | |
| 50 | | AstraZenecaAnnual Report and Form 20-F Information 2015 |

| | | | |
Healthy Heart Africa Healthy Heart Africa (HHA) is our innovative programme to support African governments in reducing the burden of heart disease and, specifically, hypertension. This challenge is huge. According to WHO, Africa is home to the highest prevalence of adults living with hypertension and an estimated 46% have high blood pressure. | | > Created training materials for healthcare providers and community health workers on hypertension prevention, screening, diagnosis and treatment. In many cases, these community healthcare workers had never received training about hypertension before. To reach our objectives, HHA has adopted an innovative model: > Raising awareness by leveraging community health worker networks. > Training providers and driving care to lower levels in the healthcare system. > Ensuring access to and availability of treatment by ensuring that healthcare workers are equipped to provide screening and have a consistent supply of appropriate medicines.  We especially appreciate AstraZeneca’s approach to partnership in order to design and implement a leading programme that is integrated into healthcare platforms.” We especially appreciate AstraZeneca’s approach to partnership in order to design and implement a leading programme that is integrated into healthcare platforms.”
Dr Joseph Kibachio,Head of Division of Non-Communicable Diseases, Ministry of Health, Kenya |
| The programme was launched in October 2014 in collaboration with the Kenyan Ministry of Health and a portfolio of well-respected implementing partners. Addressing non-communicable diseases such as hypertension in middle- and low-income populations in a healthcare system that, historically, has prioritised communicable diseases and infections, remains a challenge. However, in a short space of time, the programme has achieved remarkable progress which will enable HHA to expand operations to other geographies in order to achieve our ambition of reaching 10 million hypertensive patients across sub-Saharan Africa by 2025 – in line with WHO’s goal of a 25% reduction in the prevalence of raised blood pressure by that date. | | By the end of 2015, we had: > Screened one million patients in Kenya. > Trained over 2,600 healthcare workers, including doctors, nurses, community health volunteers and pharmacists to provide education and awareness, screening and treatment services for hypertension. > Equipped at least 250 health facilities – ranging from small dispensaries staffed by a handful of people to large-scale facilities – to provide hypertension services, including the establishment of secure supply chains for low-cost, high-quality antihypertensive medicines. > Worked with the Ministry of Health and key scientific societies to develop a hypertension treatment protocol. | |
| | |
| | | | |
 | | 1m Screened one million patients in Kenya for hypertension in 2015 
Watch the video at www.astrazeneca.com |
| | | | |

| | |
| AstraZenecaAnnual Report and Form 20-F Information 2015 | | 51 |
Strategic Report | Resources Review
Employees
| | |
 | | |
| |
To achieve our strategic priorities, we continue to acquire, retain and develop a talented and diverse workforce united in the pursuit of our Purpose and Values. Overview > Hired 11,700 permanent employees to help us achieve our strategic priorities > Continued to offer customised leadership programmes through MIT > Established a global personal development campaign and defined associated targets > Increased the diversity of our leadership > Continued the STAR programme to teach emerging talent about enterprise leadership > Continued to simplify our organisational structure Gender diversity 
* For the purposes of section 414C(8)(c)(ii) of the Companies Act 2006, ‘Senior Managers’ are the SET, the directors of all of the subsidiaries of the Company and other individuals holding named positions within those subsidiaries. | | We value the talents and skills of our 61,500 employees in more than 100 countries. Our people strategy, which supports our strategic priority of being a great place to work, is built around four key pillars: Build and develop organisations and capabilities; Develop a strong and diverse pipeline of leaders; Drive a vibrant, high-performing culture; and Generate a passion for people development. Build and develop organisations and capabilities During 2015, we hired 11,700 permanent employees. Additional employees joined us through acquisitions, most notably the transition of 560 BMS employees at our Mount Vernon, Indiana US manufacturing site. We are committed to hiring and promoting talent ethically and in compliance with applicable laws. Our policies and procedures are designed to help protect against discrimination on any grounds (including disability) and cover recruitment and selection, performance management, career development and promotion, transfer, training, retraining (including retraining, if needed, for people who have become disabled) and reward. To help deliver our strategic priorities, we are identifying and recruiting emerging talent, as well as investing in internships and recruitment opportunities globally. For example, we conduct a global programme to hire recent graduates for our procurement, quality, engineering, IT and supply chain functions. We also have a graduate programme for IMED, which complements our established IMED Post Doctorate Programme for researcher recruitment. |
| | |
| 52 | | AstraZenecaAnnual Report and Form 20-F Information 2015 |
|
 |
Hiring over recent years means that employees with less than two years’ service now represent 36% of our global workforce (up from 20% in 2012). This provides a greater balance in terms of refreshing talent and retaining organisational experience. The composition of our international workforce has also changed with our business focus. This can be seen in the Sales and Marketing figures below, which shows an increasing concentration in Emerging Markets.
Voluntary employee turnover increased marginally to 9.2% in 2015 from 8.8% in 2014. However, the voluntary employee turnover rate among our high performers in 2015 reduced to 4.0% from 6.8% in 2014. We seek to reduce regretted turnover through more effective hiring and induction, high-level reviews of resignations, risk assessments and retention plans.
Develop a strong and diverse pipeline of leaders†
To foster innovation, we seek to harness different perspectives, talents and ideas as well as ensuring that our employees reflect the diversity of the communities in which we operate.
During 2015, we reviewed our talent management and succession planning processes, and implemented a revised approach which is focused on ensuring we have robust succession plans in place for our most business critical
roles. Embedded in this new approach is a focus on both external sourcing and the development of our people to ensure that we have the right capabilities and leaders in place to deliver our strategy.
As shown in the gender diversity figure on the previous page, women comprise 49.8% of our global workforce. There are currently four women on our Board (33%). Below Board level, the representation of women in senior roles (ie roles at Career Level F or above which constitute the six highest bands of our employee population) increased to 42.0% in 2015, which exceeded our Scorecard target of 41% for this measure. We continue to hire high-quality leaders: 13% of the approximately 130 leadership roles that report to our senior leadership team joined AstraZeneca in 2015. To ensure our senior leadership reflects our diverse geographic footprint, we track the country of origin of senior leaders and reflect this in our diversity targets. In 2015, 15.6% of leadership roles that report to our senior leadership team have a country of origin that is an Emerging Market or Japan (an increase from 5% in 2012), which exceeded our Scorecard target of 13% for this measure.
To maximise our employees’ potential, we use leadership programmes, both online and instructor-led, to help build the right capabilities and culture. In 2015, we continued our programme for emerging leaders with the Massachusetts Institute of Technology (MIT). These programmes aim to foster openness, inclusivity and innovation and are a part of a wider effort
| | | | |
Sales and Marketing workforce
composition (%) | |  |
l Emerging Markets | | 56% | |
l Established Markets | | 44% | |
to offer leaders at all levels of the organisation appropriate, globally consistent leadership development opportunities.
In 2015, a further 270 people participated in our various talent development programmes. We continued to offer the STAR programme which teaches our emerging talent about enterprise leadership and provides an opportunity to discuss AstraZeneca case studies and interact with senior leaders. We also continued our Insight Exchange programme to help foster diversity and inclusion, and strengthen our pool of emerging talent.
Our efforts received external recognition in 2015. AstraZeneca was ranked second among 400 businesses in Bloomberg’s inaugural survey of ‘The best place to work in corporate Britain’, while the National Association for Female Executives ranked us as one of its 50 leading companies for the seventh year running. We also featured among Working Mother Magazine’s 100 Best Companies.
Drive a vibrant, high-performing culture
Continuing our emphasis on high performance, in 2015 we implemented a single global performance management framework and approach. We require every employee to have been set high-quality objectives, aligned to our strategy, which we monitor closely. Managers are accountable for working with their employees to develop individual and team performance targets, and for ensuring employees understand how they contribute to our overall business objectives.
| | |
| AstraZenecaAnnual Report and Form 20-F Information 2015 | | 53 |
Strategic Report | Resources Review
Employeescontinued
Values in action:
We are entrepreneurial
People development is a key global priority. In order to encourage a growth mindset and connect individual development to achievement of our strategic ambitions, we held People Development Week events in 2015. AstraZeneca employees participated in more than 70 face-to-face events held in more than 50 countries. Engagement by staff was demonstrated by 6,600 comments on people development in our sample employee surveys.
Equally important are our performance-related bonus and incentive plans. We encourage participation in various employee share plans, some of which are described in the Directors’ Remuneration Report from page 103, and also in Note 26 to the Financial Statements, from page 182.
We regularly conduct employee surveys and an area of improvement highlighted by our FOCUS 2014 employee survey was the need to further simplify our organisation, and we use the scores for survey questions relating to simplification as a measure of our success towards achieving our Scorecard objective.
Across the Group, individuals, teams and departments are encouraged to identify opportunities for simplification by removing obstacles to efficiency and improving the way in which they work. In 2015, these efforts were highlighted and shared in a virtual ‘Simplification Week’ using our new global intranet, Nucleus, and our global social platform, Chatter.
To support our drive for simplification further, we continue to widen the average span of control (7.2 employees reporting to each manager in 2015, up from 6.3 in 2012) and limit the number of reporting layers in the organisation. We believe this will increase the speed of decision making, drive accountability and improve communication.
We continue to track our progress with these initiatives through our sample employee survey which shows an eight percentage point increase in the view that AstraZeneca has been successful at eliminating obstacles to efficiency when compared to FOCUS 2014.
Generate a passion for people development
We endeavour to ensure that all our employees use their talents and abilities to the full and are provided opportunities for development. In addition to simplification, another area of improvement highlighted by our FOCUS 2014 employee survey was career development. As a result, we are strengthening our efforts in this area. In 2015, for example, we conducted over 70 Development Week events covering almost all our sites globally.
We encourage employees to take ownership of their own development and encourage leaders to spend time discussing their employees’ development.
The ability of managers and leaders to develop their employees is critical, and is measured through our sample employee surveys. The scores for the survey questions pertaining to people development now contribute to our global Scorecard objective of being a great place to work.
Human rights†
We are committed to respecting and promoting international human rights – not only in our own operations, but also in our wider spheres of influence (such as our third party providers). To that end, we integrate human rights considerations into our policies, processes and practices.
We support the principles set out in the United Nations Universal Declaration of Human Rights and the International Labour Organization’s (ILO) standards on child labour and minimum wages. We are also members of the United Nations Global Compact on Human Rights.
In 2015, we completed a human rights labour review in all countries where we have a presence. The review focused on ILO core themes, including freedom of association and collective bargaining, child labour, discrimination, working hours and wages. In this second survey we added questions
on the living wage, data management and recruitment and the results have remained positive. Where a gap to ILO minimum standards was identified, we are putting in place local plans to close those gaps. As well as measuring living wage progress internally, we also conducted an independent external review so that we can assess developments in this area to inform our approach better. As a first step we are seeking accreditation from the Living Wage Foundation in the UK and will treat this as an experience to be evaluated alongside all other associated evidence in respect of seeking a global solution, for example, monitoring impact on our cost base.
Managing change
As outlined in Strategic priorities on page 16 and 17, in 2013, we announced plans to invest in three strategic R&D centres which are shown on the map on the previous page. This affected employees in the US and the UK. We encouraged and supported employees to relocate and have made good progress. For example, 1,600 employees now work in Cambridge and, of these employees, 500 have relocated from other sites in the UK. In addition to the 410 employees hired in 2015, over the next two years we expect to hire approximately a further 600 new employees to Cambridge. We are using interim infrastructure in and around Cambridge to house these employees until our new site is ready. For employees who do not accept offers to relocate to Cambridge we provide career support, outplacement support and competitive severance packages.
For more information on our restructuring programme, please see Financial Review from page 68
Employee relations
We seek to follow a global approach to employee relations guided by global employment principles and standards, local laws and good practice. We work to develop and maintain good relations with local workforces and work closely with our recognised national trade unions. We also regularly consult with employee representatives or, where applicable, trade unions, who share our aim of retaining key skills and mitigating job losses.
| † | For further information on AstraZeneca’s approach to doing business sustainably please refer to In the wider world from page 55 and on our website, www.astrazeneca.com. |
| | |
| 54 | | AstraZenecaAnnual Report and Form 20-F Information 2015 |
In the wider world
| | | | | | | | |
 | | |
Our employees are critical to achieving our strategic priorities. To realise our full potential, however, we also depend on a wider set of stakeholders and are committed to operating our business in a sustainable manner – that is, in a way that delivers real value for our company, our planet and society as a whole. Overview > Over 240 major or strategically important business development transactions over the past three years > Created external Sustainability Advisory Board to help confirm our sustainability priorities and shape our strategy > Undertaking a materiality assessment to identify the most significant sustainability issues for AstraZeneca > Met our aggressive 2010 to 2015 carbon footprint reduction target > Surpassed our 2015 reduction targets for lost time injury and illness rate and vehicle collision rate > Finalised, with SET and Board approval, a new 2016 to 2025 Safety, Health and Environment Strategy > Community investment strategy focuses on healthcare in the community and science education > Young Health Programme has reached over 1.4 million young people | | Our stakeholders include the patients and physicians for whom we provide medicines for some of the most serious diseases, and the universities and institutes that collaborate with our scientists. Governments, regulators, payers, suppliers, other commercial organisations and the communities in which we operate are among our other stakeholders. We outline our stakeholder relationships throughout our Business Review, including Research and Development from page 42 and Sales and Marketing from page 48. In Manufacturing and Supply from page 46, we examine our relationships with suppliers and our commitment to working only with those that embrace standards of ethical behaviour consistent with our own. This commitment extends to joint venture and co-promotion partners, and research and licensing partners. Partnering As outlined in Strategic priorities on page 16 and 17, business development, specifically partnering, is an important element of our business. It supplements and strengthens our pipeline and our efforts to achieve scientific leadership. As noted in Research and Development from page 42, we strive to access leading science from within and outside our laboratories. Our partners include academia, governments, industry, scientific organisations and patient groups. We pursue strategically aligned value-enhancing business development opportunities and focus on > increasing early-stage research transactions and academic alliances > exploring value-creating peer collaborations |
| | | |
| 240 | |  | | 1.4m | |  | |
| More than 240 major or strategically important business development transactions over the past three years | | Young Health Programme has reached over 1.4 million young people | |
| | | |
| | | | | | | |
| | |
| AstraZenecaAnnual Report and Form 20-F Information 2015 | | 55 |
Strategic Report | Resources Review
In the wider worldcontinued
Vehicle collisions
| | | | | | | | |
| Year | | Collisions
per million km | | | Target | |
| 2015 | | | 4.15 | | | | 5.60 | |
| 2014 | | | 4.66 | | | | 6.10 | |
Lost time injury/illness
| | | | | | | | |
| Year | | Lost time injury/illness rate per million hours worked | | | Target | |
| 2015 | | | 1.37 | | | | 1.91 | |
| 2014 | | | 1.59 | | | | 2.10 | |
| > | pursuing partnering, in-licensing and acquisitions to strengthen our therapy area portfolios. |
Our business model also encompasses externalisation as a component of our portfolio management strategy. This includes strategic collaborations to broaden and accelerate the development of key pipeline assets in our three therapy areas. We also leverage opportunities in other areas where we retain an interest in the future development of projects. Our collaborations with Lilly and Celgene are examples of this approach. For more information on these externalisation partnerships, see Business model on pages 8 and 9, and Financial Review from page 62. We also divest medicines that can be deployed better by a partner with a primary focus in the relevant area.
Over the past three years we have completed more than 240 major or strategically important business development transactions, including some 122 in 2015. Of these transactions, 24 were related to clinical stage assets or programmes, 48 to pre-clinical assets or programmes and 11 to PHC and biomarkers. Thirty-nine transactions helped expand our biologics capabilities. Approximately 30 agreements related to our expanding commitment to Open Innovation. Acquisitions completed in the year included the acquisition of Actavis’ respiratory franchise in the US and the acquisition of ZS Pharma. Agreements regarding the acquisition of Takeda’s respiratory portfolio and the acquisition of a controlling equity position in Acerta Pharma were signed in 2015. These were not, however, included in the 2015 data as the Takeda transaction is due to complete
| | |
| 56 | | AstraZenecaAnnual Report and Form 20-F Information 2015 |
in the first half of 2016 and the transaction with Acerta Pharma completed in February 2016. In addition, four transactions that contribute to Externalisation Revenue were completed in 2015 with a further 10 divestments or out-licences also completed.
For more information on our partnering activity in 2015, please see Therapy Area Review from page 24, Research and Development from page 42, Financial Review from page 62 and Note 24 to the Financial Statements from page 173
Sustainability
We want to be valued and trusted by our stakeholders as a source of great medicines over the long term. That means operating in a way that recognises the interconnection between business growth, the needs of society, and the limitations of our planet. Our sustainability efforts are aligned to, and support the delivery of, our business strategy in five core areas that are most relevant to our business
| > | Increasing access to healthcare (see page 50 and Healthy Heart Africa on page 51) |
| > | Natural resource efficiency (below) |
| > | Responsible research (from page 44) |
| > | Ethical business practices (see Working with suppliers, Sales and marketing ethics and Community investment on pages 47, 50 and 58 respectively) |
| > | Being a great place to work (see Develop a strong and diverse pipeline of leaders, Human rights and Safety, health and wellbeing on pages 53, 54 and 57 respectively). |
Further information about our sustainability agenda is available on the Sustainability pages on our website, www.astrazeneca.com
During 2015, we commissioned an independent think-tank to review our current focus areas, examine our areas of strength and weakness, and help identify our priorities going forward. An internal focus group meeting took place to refine and calibrate the high-level findings. This involved assessing risks and opportunities, as well as the current level of integration, for each issue. This assessment is continuing and, will become the foundation for the priorities and improvement targets that define the next stage of our journey. Our goal is to ensure that sustainability is effectively aligned to our business strategy and truly embedded into the way in which we operate and define success.
For more information on our approach to sustainability, benchmarking and assurance, see Sustainability: supplementary information from page 234 and the Sustainability pages on our website, www.astrazeneca.com
Safety, health and wellbeing
We work to promote a safe, healthy and energising work environment in which our employees and partners are able to express their talents, drive innovation and improve business performance. Our five-year target period ended in 2015. The targets for 2015 included
| > | lost time injury/illness rate per million hours worked of no more than 1.91 (a 25% reduction from the 2010 baseline) |
| > | no more than 5.6 collisions per million kilometres driven (40% reduction from 2008 baseline) |
| > | at least 80% of sites and marketing companies to offer six essential health activities. |
Our highest priority remains driver safety, particularly among our sales force who form the largest group of employees driving on AstraZeneca business. We monitor performance centrally to assess progress and identify areas for improvement. In 2015, we delivered our five-year target for reducing collisions per million kilometres driven, achieving a 55% reduction from baseline. We regret, however, that one employee was killed in a traffic accident while driving on AstraZeneca business. We carried out a detailed investigation into this accident and developed an action plan to address the findings. Actions were monitored and what was learnt from the incident was shared widely across the business. Having already achieved our 2015 lost time injury/illness rate target two years early, we achieved a further reduction in 2015. This equates to a 46% overall reduction from the 2010 baseline.
The 2015 health and wellbeing target was missed, with 60% of sites offering six essential health activities, compared to the 80% target. Although this is disappointing, 84% of sites now offer at least five activities, compared to only 28% in 2011.
Natural resource efficiency
Our 2015 targets1 included reducing
| > | operational greenhouse gas footprint to 714,375 tonnes CO2 |
Operational greenhouse gas footprint emissions (tonnes CO2)

Waste production(tonnes)

Water use(m3)

Note: Significant site purchases in 2014 and 2015 have been absorbed into the annual data without historical rebasing of data.
| > | hazardous waste to 0.633 tonnes/$m sales and non-hazardous waste to 0.473 tonnes per employee |
| > | water use to 3.4 million m3. |
We are working to reduce our greenhouse gas emissions by, among other things, improving energy and fuel efficiency and pursuing lower-carbon alternatives to fossil fuels. During 2015, our air and road travel and freight transport emissions decreased due to greater achievement in switching freighting of goods from air to sea and reducing business air travel significantly. Procurement of energy from certified renewable sources increased to represent 6.1% of total consumption.
Our pMDI inhaler therapy relies on hydrofluoroalkane (HFA) propellants which affects our carbon footprint. While HFAs have no ozone depletion potential and a third or less of the global warming potential than the chlorofluorocarbons they replace, they are still greenhouse gases. Excluding emissions from patient use of our inhaler therapy, our aim by 2015 was to reduce our operational greenhouse gas footprint by 20% from our 2010 level. We achieved this, with our operational greenhouse gas footprint totalling 704,073 metric tonnes in 2015, a reduction of 21.2% from our 2010 baseline.
For more information on carbon reporting, please see Sustainability: supplementary information from page 234
| | |
| AstraZenecaAnnual Report and Form 20-F Information 2015 | | 57 |
Strategic Report | Resources Review
In the wider worldcontinued

Values in action:Do the right thing
Michael Baldinger, CEO of RobecoSAM, said: “As one of the top-scoring companies in the pharmaceutical industry, AstraZeneca PLC has qualified for inclusion in the 2016 Sustainability Yearbook and has received the Silver Class distinction for its excellent sustainability performance.”
Waste management is another key aspect of our commitment to minimise environmental impact. We aimed to reduce our hazardous and non-hazardous waste by 15% from our 2010 levels, indexed appropriately. While waste prevention is an essential goal, we seek to maximise treatment by material recycling and avoiding landfill disposal when prevention is impractical. In 2015, our total waste was 38,452 metric tonnes with a tonnes/$m index of 1.56. We have reduced hazardous waste by 22% since 2010, due principally to changing production patterns and major investment at a UK manufacturing site in 2012 to enable recycling and reuse of solvent wastes. Hazardous waste generation indexed to $m revenues increased 5%, missing our 2015 target. We reduced non-hazardous waste by 14% since 2010, but when indexed against staff numbers the metric has not improved due to staff reductions since the baseline was set.
We recognise the need to use water responsibly and, where possible, to minimise water use in our facilities. To reach our 2015 water use reduction target of 25% from 2010 levels, we initiated water conservation plans at our largest sites. In 2015, our water use was 3.9 million m3, a reduction of 14% from our 2010 baseline. This fell some distance short of achieving our very ambitious five-year target. Water use indexed to revenues was 159 m3/$m (+16% from 2010 baseline).
We are also working on measuring and reporting the environmental impact of our external manufacturing activity and encourage setting of appropriate environmental targets with our suppliers. We believe we have captured data for more than 90% (based on spend) of the globally managed outsourced manufacture of key intermediates and APIs, formulation and packaging for our established brands. Understanding and management of our external supplier footprint will be a continued focus of our Safety, Health and Environment (SHE) improvement efforts going forward.
We continue to integrate environmental considerations across a medicine’s entire life-cycle, from discovery, research and development to manufacturing, commercialisation and disposal. We follow a progressive compliance programme to ensure that our manufacturing emissions
of APIs do not exceed our internal standards for safe discharges at our manufacturing sites and we periodically conduct compliance assessments. We also follow a progressive approach to ensure ecopharmacovigilance. This involves regularly reviewing emerging science and literature for new information that might impact the environmental risk management plans for our products.
Further information, including environmental risk assessment data for our medicines, is available on our website, www.astrazeneca.com
New Safety, Health and Environment Strategy
In 2015, we finalised a new 2016 to 2025 SHE Strategy to build on our 2010 to 2015 performance and ensure that we are protecting the health and safety of our people and doing our ‘fair share’ to protect the planet. As an output of this strategic initiative, we have established a set of targets aimed at keeping AstraZeneca among the sector leaders in SHE performance. Our targets for 2025 are shown over.
Achieving these targets during a period of expected strong business growth will require significant business engagement and investment in resource efficiency. In light of this challenge, and in recognition that we narrowly missed our 2010 to 2015 water and waste efficiency targets, we have established a dedicated fund for capital projects that can drive substantial improvement in natural resource efficiency. We disclose our carbon and water performance and targets to external indices including the Carbon Disclosure Project (CDP). In the build up to COP 21, the 2015 Paris Climate Conference, we signed up to the CDP commitments for science-based targets and public disclosure of information associated with climate change performance.
Community investment
Our global community investment strategy focuses on healthcare in the community and science education. We are committed to operating responsibly, which means supporting our community and maximising the benefit of our investment for all stakeholders. For example, 2015 was the fifth year of our partnership with the UK educational charity Career Ready to support
| | |
| 58 | | AstraZenecaAnnual Report and Form 20-F Information 2015 |
increased participation by 16 to 19 year-olds in science, technology, engineering and maths subjects.
In 2015, we spent a total of approximately $680 million (2014: approximately $880 million) on community investment sponsorships, partnerships and charitable donations worldwide, including our product donation and patient assistance programmes which make our medicines available free of charge or at reduced prices. Through our three patient assistance programmes4 in the US we donated products valued at an average wholesale price of over $617 million (2014: over $800 million). We also donated products worth over $17 million, valued at average wholesale price, to charitable organisation AmeriCares.
Young Health Programme
We continued to develop the three strands of our Young Health Programme (YHP): advocacy; research; and evidence generation. These on-the-ground programmes focus on the primary prevention of non-communicable diseases (NCDs) and associated adolescent risk behaviours. With over 1.4 million young people in communities across five continents directly provided with the skills and information they need to improve their health, we have well exceeded our Clinton Global Initiative Commitment to Action of reaching 250,000 young people directly by the end of 2015. Over 14,600 of these young people have been trained to share this health information with their peers and
the community. The programmes have also trained more than 12,000 frontline health workers in adolescent health.
We continue to support research evidencing the importance of adolescence in future health, and undertake advocacy activities to ensure adolescent health and the prevention of NCDs are global and local priorities. The engagement and involvement of youth is at the core of the YHP. Activities in 2015 included commissioning research on NCD risk behaviours and participation in the development of an NCD prevention chapter for UNICEF Facts for Life book. We also funded YHP side meetings at WHO Geneva (May 2015) and United Nations General Assembly in September 2015.
Further information on YHP can be found on its website, www.younghealthprogrammeyhp.com
| | | | | | |
New Safety, Health and Environment Strategy targets, 2016 to 2025 | |  | | Disaster relief The British Red Cross continues to act as our global disaster relief partner, channelling the bulk of our disaster relief donations. In addition to the charitable donations referenced in Community investment above, in April 2015 we donated £50,000 via British Red Cross to the Nepal Earthquake Appeal, $200,000 in July to fund the replenishment of the Kuala Lumpur Emergency Response Unit and £50,000 in September to Europe Refugee Crisis Appeal. In December, and as part of wider AstraZeneca support for those affected by the floods in Chennai, where over 1,000 AstraZeneca employees are based, we donated $30,000 to SEWA International. 1 Figures have been revised from those previously published to incorporate our biologics capabilities into our targets. Our targets for 2011 to 2015 were set in 2010. 2 Healthy Eating & Drinking, Tobacco Cessation, Physical Activity, Workplace Pressure Management. 3 Carbon target follows the science and uses the Science-Based Target Setting tool developed by the World Resources Institute. Operational footprint = energy and process emissions, business travel, waste incineration, freight/ logistics, 1st tier supply chain energy and patient use of inhalers. Carbon intensity = CO2 tonnes/$m sales. 4 For 2015 we have revised our reporting to reflect what was shipped from AstraZeneca for use in our Patient Assistance Programs as opposed to what was actually dispensed to patients, and have also moved to reporting the wholesale acquisition cost as opposed to average wholesale price. As a result, the 2015 numbers reported are lower than reported in 2014. |
Eliminate workplace accidents and illnesses Accidents: 75% 75% reduction in total injury rate from 2015 baseline Health and wellbeing: 80% 80% of sites/marketing companies have all four ‘Essential Health Activities’2 Driver safety: 55% 55% reduction in collisions per million kilometres driven | | Protect natural resources Carbon: 30% Compared to a 2015 baseline, operational carbon at the same level and reduce overall carbon intensity by 30%3 Waste: 10% 10% absolute reduction from 2015 baseline Water: Cap usage from 2015 baseline 90% 90% of API syntheses meet resource efficiency targets at launch and establish equivalent targets for biologics | |
Ensure the environmental safety of our products Ensure effective environmental management of our products from pre-launch through to product end-of-life | |

| | |
| AstraZenecaAnnual Report and Form 20-F Information 2015 | | 59 |
Strategic Report | Resources Review
Intellectual Property
Discovering and developing medicines requires a significant investment of resources by research-based pharmaceutical companies. The process can take a decade or more. For this to be a viable investment, new medicines must be safeguarded from being copied with a reasonable amount of certainty for a reasonable period of time.
Our industry’s principal economic safeguard is a well-functioning patent system that recognises our efforts and rewards innovation with appropriate protection – and allows time to generate the revenue we need to reinvest in pharmaceutical innovation. Patent rights are limited by territory and duration. A significant portion of a patent’s duration can be spent during R&D, before it is possible to launch the protected product. Therefore, we commit significant resources to establishing and defending our patent and related IP protections for inventions.
Patent process
We file patent protection applications for our inventions to safeguard the large investment required to obtain marketing approvals for potential new drugs. As we further develop a product and its uses, these new developments may necessitate new patent filings. We apply for patents through government patent offices around the world. These assess whether our inventions meet the strict legal requirements for a patent to be granted. Our competitors can challenge our patents in patent offices and/or courts. We may face challenges early in the patent application process and throughout a patent’s life. The grounds for these challenges could be the validity of a patent and/or its effective scope and are based on ever-evolving legal precedents. We are experiencing increased challenges in the US and elsewhere in the world (such as in Australia, Brazil, Canada, China, Europe and Japan) and there can be no guarantee of success for either party in patent proceedings. For information about third party challenges to patents protecting our products, see Note 27 to the Financial Statements from page 186. For more information on the risks relating to patent litigation and early loss and expiry of patents, please see Risk from page 212.
The basic term of a patent is typically 20 years from the filing of the patent application with the relevant patent office. However, a product protected by a pharmaceutical patent may not be marketed for several years after filing, due to the duration of
clinical trials and regulatory approval processes. Patent Term Extensions (PTE) are available in certain major markets, including the EU and the US, to compensate for these delays. The term of the PTE can vary from zero to five years, depending on the time taken to obtain any marketing approval. The maximum patent term, when including PTE, cannot exceed 15 years (EU) or 14 years (US) from the first marketing authorisation.
Patent expiries
The tables on pages 210 and 211 set out certain patent expiry dates and sales for our key marketed products.
Other exclusivities
In addition to patent protection, regulatory data protection (RDP or ‘data exclusivity’) is an important IP right, which arises in respect of data which is required to be submitted to regulatory authorities to obtain marketing approvals for our medicines. Significant investment is required to generate such data (for example, through conducting global clinical trials) and this proprietary data is protected from use by third parties (such as generic manufacturers) for a number of years in a limited number of countries. The period of such protection, and the extent to which it is respected, differs significantly among countries. RDP is an important protection for our products, and we strive to enforce our rights to it, particularly as patent rights are increasingly being challenged.
The RDP period starts from the date of the first marketing approval from the relevant regulatory authority and runs parallel to any pending patent protection. RDP generally expires prior to patent expiry in all major markets. If a product takes an unusually long time to secure marketing approval, or if patent protection has not been secured, has expired or has been lost, then RDP may be the sole IP right protecting a product from copying. Generic manufacturers should not be allowed to rely on AstraZeneca’s data to support the generic product’s approval or marketing until the RDP right has expired. In the EU, the RDP period is eight years followed by two years’ marketing exclusivity.
In the US, new chemical entities (NCEs) are entitled to a period of five years’ exclusivity under the Federal Food, Drug and Cosmetic Act. This period of exclusivity runs parallel to any pending or granted patent protection and starts at the approval of the new application. As with RDP, there are circumstances where this protection could be the sole IP right protecting a product from being copied. Further, under the Biologics License Application process, the FDA will grant 12 years’ data exclusivity for a new biologic to an innovator manufacturer.
Under Orphan Drug laws in the EU and US, exclusivity is granted to an innovator who gains approval for a pharmaceutical product developed to treat a rare disease. What qualifies as a rare condition differs between the EU and US. Qualifying Orphan Drugs are granted 10 years’ market exclusivity in the EU and seven years’ market exclusivity in the US.
Under the Generating Antibiotics Incentives Now Act, the FDA may grant Qualified Infectious Disease Product (QIDP) status. An antibiotic achieving QIDP status is granted five years’ exclusivity while QIDPs that are also NCEs are entitled to 10 years’ exclusivity, extending to 12 years’ if the disease state is an orphan. The period of exclusivity granted to a product with QIDP status runs concurrently with any pending or granted patent protection.
Compulsory licensing
Compulsory licensing (where a Patent Authority imposes a licence on the Patentee) is on the increase in certain markets in which we operate. We recognise the right of developing countries to use the flexibilities in the World Trade Organization’s Agreement on Trade-Related Aspects of Intellectual Property Rights (including the Doha amendment) in certain circumstances, such as a public health emergency. We believe this should apply only when all other ways of meeting the emergency needs have been considered and where healthcare frameworks and safeguards exist to ensure the medicines reach those who need them.
| | |
| 60 | | AstraZenecaAnnual Report and Form 20-F Information 2015 |
Infrastructure
The Group owns and operates R&D and production facilities and conducts sales and marketing activities around the world. Significant information technology and information services resources support these activities.
R&D resources
We have approximately 8,900 employees in our R&D organisation, working in various sites around the world. Our small molecule sites are located in the UK (Alderley Park, Cambridge and Macclesfield), Sweden (Gothenburg), the US (Gaithersburg, Maryland and Waltham, Massachusetts), Japan (Osaka) and China (Shanghai). Our biologics sites are located in the UK (Cambridge) and in the US (Gaithersburg, Maryland and Mountain View, California). Our Gaithersburg, Maryland, US; Cambridge, UK; and Warsaw, Poland sites focus on late-stage development for small molecules and biologics across our entire portfolio. Our strategic expansion in Emerging Markets continues and includes the ongoing growth of our R&D facility in China (Shanghai).
R&D spend analysis
| | | | | | | | | | | | |
| | | 2015 | | | 2014 | | | 2013 | |
| Discovery and early-stage development | | | 39% | | | | 47% | | | | 55% | |
| Late-stage development | | | 61% | | | | 53% | | | | 45% | |
| Core R&D expenditure1 | | | $5,603m | | | | $4,941m | | | | $4,269m | |
| 1 | Reported R&D expenditure was $6.0 billion |
| | (2014: $5.6 billion; 2013: $4.8 billion). |
In 2015, Core R&D expenditure was $5.6 billion in our R&D organisation (2014: $4.9 billion; 2013: $4.3 billion). In addition, we spent $1,341 million on acquiring product rights (such as in-licensing) (2014: $907 million; 2013: $635 million). We also invested $258 million on the implementation of our R&D restructuring strategy (2014: $497 million; 2013: $490 million). The allocations of spend by early-stage and late-stage development are presented in the R&D spend analysis table above.
Manufacturing and supply resources
Our principal small molecule manufacturing facilities are in the UK (Avlon and Macclesfield), Sweden (Gärtuna and Södertälje), the US (Newark, Delaware;
Westborough, Massachusetts; West Chester, Ohio; Mount Vernon, Indiana and Coppell, Texas), China (Wuxi and Taizhou), Russia (Vorsino), France (Reims and Dunkerque), Japan (Maihara), Australia (North Ryde), Indonesia (Jakarta), Egypt (Cairo), India (Bangalore), Puerto Rico (Canóvanas), Germany (Wedel), Mexico (Lomas Verdes), Brazil (Cotia) and Argentina (Buenos Aires). Our Taizhou supply site won the 2015 Facility of the Year award in the category of Project Execution by the International Society for Pharmaceutical Engineering.
We operate sites for the manufacture of APIs in the UK and Sweden, complemented by the efficient use of external sourcing. Our principal tablet and capsule formulation sites are in the UK, Sweden, Puerto Rico and the US. We also have major formulation sites for the global supply of parenteral and/or inhalation products in Sweden, France, Australia and the UK.
For biologics, our principal commercial manufacturing facilities are in the US (Frederick, Maryland, Greater Philadelphia, Pennsylvania and Boulder, Colorado), the UK (Speke), and the Netherlands (Nijmegen) with capabilities in process development, manufacturing and distribution of biologics, including global supply of MAbs and influenza vaccines.
At the end of 2015, approximately 12,500 people at 29 sites in 17 countries were working on the manufacture and supply of our products.
Information technology and information services resources
At the end of 2015, our IT organisation comprised approximately 2,800 people across our sites in the UK (Alderley Park and Macclesfield), Sweden (Södertälje and Gothenburg), the US (Wilmington, Delaware and Gaithersburg, Maryland), and our new technology centre in India (Chennai). A further 250 IT people worked in our R&D and operations sites and key marketing companies.
In the beginning of 2014, we launched a wide-ranging IT Transformation Programme to better support our business priorities. Since then, we have made various changes to our operating model and organisational structure to improve efficiency, responsiveness and innovation.
Our IT vision is to deliver world-class performance in terms of speed, quality, cost and innovation. At the same time, we are relying on IT to enable simplification of our business processes. To achieve this we need to improve our current performance significantly while reducing our overall spend. We will measure our success by tracking customer satisfaction and recording the number and severity of incidents with business impacts as well as the speed with which we respond to and mitigate such incidents. We will also take into account project delivery and cost (absolute and as a percentage of revenue) as compared to industry benchmarks.
Protecting our IT systems, IP and confidential information against cyberattacks is a key concern. Our IT organisation is constantly developing and implementing robust, effective and agile risk-based approaches to protect our resources and keep pace with the rapidly evolving cybersecurity risk landscape. To help guard against cybercrime, we have adopted a comprehensive cybersecurity process and policy, which we regularly review and update. We are equally vigilant in monitoring our systems and data with sophisticated technology. This includes educating our employees about cybercrime, internet use and best practices to mitigate the risk of attack.

| | |
| AstraZenecaAnnual Report and Form 20-F Information 2015 | | 61 |
Strategic Report
Financial Review
| | | | |

In 2015, a double-digit increase in our Growth Platforms helped our top-line to remain resilient, despite headwinds that included the loss of exclusivity ofNexium in the US. This, combined with a strong gross margin and disciplined cost management, allowed us to continue to make important long-term investment in our three main therapy areas, while delivering a 7% growth in Core earnings. | | Core Other Operating Income was $1.5 billion in the year and included $380 million to divest US and $215 million for Rest of World rights to Entocort. Core Operating Profit increased by 6% to $6.9 billion and Core Earnings per Share increased by 7% to $4.26. Reported Operating Profit, at $4.1 billion, included fair value adjustments to contingent consideration, which reduced SG&A costs by $432 million, primarily in relation to the acquisition of BMS’s share of the Global Diabetes Alliance. We generated a cash inflow from operating activities of $3.3 billion in the year with a continued improvement in working capital investment. We maintained a strong, investment-grade credit rating and, in November, issued a total of $6 billion of bonds to fund corporate and business development activity, repay certain outstanding commercial paper obligations and for general corporate purposes. We ended the year with net debt of $7.8 billion. As we look to the future, we expect a low to mid single-digit percentage decline in Total Revenue at CER in 2016. A low to mid single-digit percentage decline in Core EPS at CER is also expected. This guidance incorporates the dilutive effects arising from the Acerta Pharma and ZS Pharma transactions announced in 2015. The guidance also assumes the loss of exclusivity forCrestor in the US from May 2016. Externalisation Revenue is expected to be ahead of that in 2015, including an increasing element of recurring income arising from prior agreements. This is in line with our long-term business model. Core R&D costs are expected to be at a similar level to 2015 while we are committed to materially reducing Core SG&A costs in 2016. The weakness of key trading currencies against the US dollar has continued. Based on average exchange rates in January 2016 and our published currency sensitivities, an adverse impact of around 3% from currency movements on Total Revenue and Core EPS in 2016 would be anticipated. 
Marc Dunoyer Chief Financial Officer |
In 2015, our financial performance reflected continued progress from our Growth Platforms, which grew by 11% in the year and now contribute 57% of Total Revenue, which increased by 1% to $24.7 billion in the year. Our Respiratory franchise grew by 7% during 2015, driven by a strengthening portfolio, our Emerging Markets business and the availability of new products in the US and EU.Brilinta/Brilique grew by 44% in the year, with particular strength in the US and Emerging Markets, led by China, and Diabetes delivered an impressive performance, with encouraging growth driven byFarxiga/Forxiga and theBydureon Pen. Strong growth in Emerging Markets continued throughout the year with China, Brazil and Russia all delivering double-digit increases and our Japan business maintained solid growth, withSymbicort,Crestor andNexium all maintaining leading market share positions in a competitive market environment. For the first time, New Oncology, which includes the launches ofLynparza, Iressa (US) andTagrisso, was included as a Growth Platform, given our belief in its long-term importance for our future growth. The performance of the Growth Platforms was supplemented by over $1 billion of Externalisation Revenue arising from entering into collaborations including the | | strategic collaboration in haematology with Celgene Corporation and the co-development and co-commercialisation arrangement with Daiichi Sankyo forMovantik in the US. These offset the headwinds from ongoing patent expiries, including that ofNexium in the US in February 2015, as well as the adverse impacts fromSynagis guideline changes in the second half of 2014. Excluding the impact of Externalisation Revenue, the Core Gross Profit margin increased by one percentage point, helped by the mix of Product Sales and manufacturing efficiencies, and Core SG&A costs declined by 2% to $9.3 billion. We have progressed a number of ongoing programmes designed to address Core SG&A costs including targeting sales, marketing and medical cost effectiveness, improving efficiencies across support functions and IT, and optimising the global footprint. This allowed us to continue to focus on our pipeline and Core R&D costs were up 21% in the year to $5.6 billion as Oncology attracted over 40% of total Core R&D expenditure in the year, reflecting a number of active trials. | |
| | | |
| | | |
| | | |
| | | |
| | |
| 62 | | AstraZenecaAnnual Report and Form 20-F Information 2015 |
The purpose of this Financial Review is to provide a balanced and comprehensive analysis of the financial performance of the business during 2015, the financial position as at the end of the year, and the main business factors and trends which could affect the future financial performance of the business.
All growth rates in this Financial Review are expressed at CER unless noted otherwise.
Business background and results overview
The business background is covered in the Marketplace section from page 12, the Therapy Area Review from page 24 and the Geographical Review from page 227, and describes in detail the developments in both our products and the geographical regions in which we operate.
As described earlier in this Annual Report, sales of our products are directly influenced by medical need and are generally paid for by health insurance schemes or national healthcare budgets. Our operating results can be affected by a number of factors other than the delivery of operating plans and normal competition, such as:
| > | The risk of competition from generics following loss of patent protection or patent expiry of one of our products or an ‘at risk’ launch by a competitor or the launch of a generic competitor in the same class as one of our products, with the potential adverse effects on sales volumes and prices. Details of patent expiries for our key marketed products are included in the Patent expiries section on page 60. |
| > | The adverse impact on pharmaceutical prices as a result of the macroeconomic |
| | and regulatory environment. For instance, although there is no direct governmental control on prices in the US, action from federal and individual state programmes and health insurance bodies is leading to downward pressures on realised prices. In other parts of the world, there are a variety of price and volume control mechanisms and retrospective rebates based on sales levels that are imposed by governments. |
| > | The timings of new product launches, which can be influenced by national regulators, and the risk that such new products do not succeed as anticipated, together with the rate of sales growth and costs following new product launches. |
| > | Currency fluctuations. Our functional and reporting currency is the US dollar, but we have substantial exposures to other currencies, in particular the euro, Japanese yen, pounds sterling, Chinese renminbi and Swedish krona. |
| > | Macro factors such as greater demand from an ageing population and increasing requirements of Emerging Markets. |
Over the longer term, the success of our R&D is crucial and we devote substantial resources to this area. The benefits of this investment are expected to emerge over the long term and there is considerable inherent uncertainty as to whether and when it will generate future products.
The most significant features of our financial results in 2015 are
| > | Total Revenue up 1% at CER to $24,708 million (Actual: down 7%). |
| > | Revenues of our Growth Platforms increased 11% at CER and constituted 57% of our Total Revenue, with |
| | – | Respiratory up 7% at CER ahead of the proposed acquisition of Takeda’s respiratory business |
| | – | Brilinta/Brilique up 44% at CER, underpinned by a recently-extended US label and positive CHMP opinion |
| | – | Diabetes up 26% at CER, including 76% in Emerging Markets and globalFarxiga/Forxiga growth of 137% |
| | – | Emerging Markets up 12% at CER, including China and Latin America |
| | – | each growing by 15% at CER |
| | – | Japan up 4% at CER, including 8% in the fourth quarter |
| | – | New Oncology $119 million, comprisingLynparza, Iressa (US) andTagrisso. |
| > | Core operating profit was up 6% at CER (Actual: down 1%) to $6,902 million. The increase reflected a reduction in our Core SG&A costs and an increase in Externalisation Revenue and Core other operating income. We are continuing to invest in our pipeline and Growth Platforms. |
| > | Reported operating profit was up 100% at CER (Actual: 93%) to $4,114 million. Total restructuring costs associated with the global programme to reshape the cost base of our business were $1,034 million in 2015. |
| > | Our Core operating margin of 27.9% of Total Revenue was up 1.3 percentage points (Actual: 1.8 percentage points). Reported operating margin was 16.7% of Total Revenue. |
| > | Core EPS for the full year was $4.26, up 7% at CER (Actual: flat). Reported EPS was up 137% at CER (Actual: 128%) to $2.23. |
| > | Dividends paid amounted to $3,486 million (2014: $3,521 million). |
| | |
| AstraZenecaAnnual Report and Form 20-F Information 2015 | | 63 |
Strategic Report
Financial Reviewcontinued
Measuring performance
The following measures are referred to in this Financial Review when reporting on our performance both in absolute terms, but more often in comparison to earlier years:
| > | Reported performance. Reported performance takes into account all the factors (including those which we cannot influence, principally currency exchange rates) that have affected the results of our business, as reflected in our Group Financial Statements prepared in accordance with IFRSs as adopted by the EU and as issued by the IASB (‘IFRS’). |
| > | Core financial measures. These are non-GAAP measures because, unlike Reported performance, they cannot be derived directly from the information in the Group Financial Statements. These measures are adjusted to exclude certain significant items, such as |
| | – | amortisation and impairment of intangibles, including impairment reversals but excluding any charges relating to IT assets |
| | – | charges and provisions related to our global restructuring programmes (this will include such charges that relate to the impact of our global restructuring programmes on our capitalised IT assets) |
| | – | other specified items, principally comprising legal settlements and acquisition-related costs which include fair value adjustments and the imputed finance charge relating to contingent consideration. |
In determining the adjustments to arrive at the Core result, we use a set of established principles relating to the nature and materiality of individual items or groups of items, excluding, for example, events which (i) are outside the normal course of business, (ii) are incurred in a pattern that is unrelated to the trends in the underlying financial performance of our ongoing business, or (iii) are related to major acquisitions, to ensure that investors’ ability to evaluate and analyse the underlying financial performance of our ongoing business is enhanced. See the 2015 Reconciliation of Reported results to Core results table on the opposite page for a reconciliation of Reported to Core performance.
| > | Constant exchange rate (CER) growth rates. These are also non-GAAP measures. These measures remove the effects of currency movements |
| | (by retranslating the current year’s performance at previous year’s exchange rates and adjusting for other exchange effects, including hedging). A reconciliation of the Reported results adjusted for the impact of currency movements is provided in the 2015 Reported operating profit table on the page opposite. |
| > | Gross and operating margin percentages. These measures set out the progression of key performance margins and illustrate the overall quality of the business. |
| > | Prescription volumes and trends for key products. These measures can represent the real business growth and the progress of individual products better and more immediately than invoiced sales. |
| > | Net funds/debt. This represents our cash and cash equivalents, current investments and derivative financial instruments less interest-bearing loans and borrowings. |
We strongly encourage readers of the Annual Report not to rely on any single financial measure but to review our financial statements, including the notes thereto, and our other publicly filed reports, carefully and in their entirety.
CER measures allow us to focus on the changes in revenues and expenses driven by volume, prices and cost levels relative to the prior period. Revenues and cost growth expressed in CER allows management to understand the true local movement in revenues and costs, in order to compare recent trends and relative return on investment. CER growth rates can be used to analyse revenues in a number of ways but, most often, we consider CER growth by products and groups of products, and by countries and regions. CER revenues growth can be further analysed into the impact of revenues volumes and selling price. Similarly, CER cost growth helps us to focus on the real local change in costs so that we can manage the cost base effectively.
We believe that disclosing Core financial and growth measures, in addition to our Reported financial information, enhances investors’ ability to evaluate and analyse the underlying financial performance of our ongoing business and the related key business drivers. The adjustments made to our Reported financial information in order to show Core financial measures illustrate clearly, on a year-on-year or period-by-period basis, the impact on our
performance caused by factors such as changes in revenues and expenses driven by volume, prices and cost levels relative to such prior years or periods.
Readers of the Annual Report should note that Core results cannot be achieved without incurring the following costs that the Core measures exclude:
| | – | Amortisation of intangible assets which generally arise from business combinations and individual licence acquisitions. A significant part of our revenues could not be generated without owning the associated acquired intangible assets. |
| | – | Charges and provisions related to our global restructuring programmes. Our Core financial measures do not include such costs but our Core results do reflect the benefits of such restructuring initiatives. |
It should also be noted that other costs excluded from our Core results, such as finance charges related to contingent consideration will recur in future years and other excluded items such as impairments and legal settlement costs, along with other acquisition-related costs may recur in the future.
As shown in the 2015 Reconciliation of Reported results to Core results table on the page opposite, our reconciliation of Reported financial information to Core financial measures includes a breakdown of the items for which our Reported financial information is adjusted and a further breakdown by specific line item as such items are reflected in our Reported income statement. This illustrates the significant items that are excluded from Core financial measures and their impact on our Reported financial information, both as a whole and in respect of specific line items.
Management presents these results externally to meet investors’ requirements for transparency and clarity. Core financial measures are also used internally in the management of our business performance, in our budgeting process and when determining compensation.
Core financial measures are non-GAAP measures. All items for which Core financial measures are adjusted are included in our
| | |
| 64 | | AstraZenecaAnnual Report and Form 20-F Information 2015 |
Reported financial information as they represent actual costs of our business in the periods presented. As a result, Core financial measures merely allow investors to differentiate between different kinds of costs and they should not be used in isolation. You should also refer to our Reported financial information in the 2015 Reported operating profit table below, our reconciliation of Core financial measures to Reported financial information in the Reconciliation of Reported results to Core
results table below, and to the Results of operations – summary analysis of year ended 31 December 2014 section from page 236 for our discussion of comparative Actual growth measures that reflect all factors that affect our business.
Our determination of non-GAAP measures, and our presentation of them within this financial information, may differ from similarly titled non-GAAP measures of other companies.
The SET retains strategic management of the costs excluded from Reported financial information in arriving at Core financial measures, tracking their impact on Reported operating profit and EPS, with operational management being delegated on a case-by-case basis to ensure clear accountability and consistency for each cost category.
Results of operations –summary analysis of year ended 31 December 2015
2015 Reported operating profit
| | | | | | | | | | | | | | | | | | | | | | | | | | | | | | | | | | | | | | |
| | | 2015 | | | | | 2014 | | | | | Percentage of Total Revenue | | | | | 2015 compared with 2014 | |
| |
| Reported
$m |
| |
| CER
growth
$m |
| |
| Growth
due to
exchange
effects $m |
| | | |
| Reported
Restated$m |
1 | | | |
| Reported
2015 % |
| |
| Reported
2014Restated % |
1 | | | |
| CER
growth% |
2 | |
| Actual
growth
% |
|
| Product Sales | | | 23,641 | | | | (387 | ) | | | (2,067 | ) | | | | | 26,095 | | | | | | | | | | | | | | | | (1 | ) | | | (9 | ) |
| Externalisation Revenue | | | 1,067 | | | | 631 | | | | (16 | ) | | | | | 452 | | | | | | | | | | | | | | | | 140 | | | | 136 | |
| Total Revenue | | | 24,708 | | | | 244 | | | | (2,083 | ) | | | | | 26,547 | | | | | | | | | | | | | | | | 1 | | | | (7 | ) |
| Cost of sales | | | (4,646 | ) | | | 700 | | | | 496 | | | | | | (5,842 | ) | | | | | (18.8 | ) | | | (22.0 | ) | | | | | (12 | ) | | | (20 | ) |
| Gross profit | | | 20,062 | | | | 944 | | | | (1,587 | ) | | | | | 20,705 | | | | | | 81.2 | | | | 78.0 | | | | | | 5 | | | | (3 | ) |
| Distribution costs | | | (339 | ) | | | (56 | ) | | | 41 | | | | | | (324 | ) | | | | | (1.4 | ) | | | (1.2 | ) | | | | | 17 | | | | 5 | |
| Research and development expense | | | (5,997 | ) | | | (850 | ) | | | 432 | | | | | | (5,579 | ) | | | | | (24.3 | ) | | | (21.0 | ) | | | | | 15 | | | | 7 | |
| Selling, general and administrative costs | | | (11,112 | ) | | | 1,008 | | | | 880 | | | | | | (13,000 | ) | | | | | (44.9 | ) | | | (49.0 | ) | | | | | (8 | ) | | | (15 | ) |
| Other operating income and expense | | | 1,500 | | | | 1,189 | | | | (24 | ) | | | | | 335 | | | | | | 6.1 | | | | 1.2 | | | | | | 355 | | | | 348 | |
| Operating profit | | | 4,114 | | | | 2,235 | | | | (258 | ) | | | | | 2,137 | | | | | | 16.7 | | | | 8.0 | | | | | | 100 | | | | 93 | |
| Net finance expense | | | (1,029 | ) | | | | | | | | | | | | | (885 | ) | | | | | | | | | | | | | | | | | | | | |
| Share of after tax losses of joint ventures | | | (16 | ) | | | | | | | | | | | | | (6 | ) | | | | | | | | | | | | | | | | | | | | |
| Profit before tax | | | 3,069 | | | | | | | | | | | | | | 1,246 | | | | | | | | | | | | | | | | | | | | | |
| Taxation | | | (243 | ) | | | | | | | | | | | | | (11 | ) | | | | | | | | | | | | | | | | | | | | |
| Profit for the period | | | 2,826 | | | | | | | | | | | | | | 1,235 | | | | | | | | | | | | | | | | | | | | | |
| | | | | | | | | | | | | | | | | | | | | | | | | | | | | | | | | | | | | | | |
| Basic earnings per share ($) | | | 2.23 | | | | | | | | | | | | | | 0.98 | | | | | | | | | | | | | | | | | | | | | |
1 2014 comparatives have been restated to reflect the reclassification of Externalisation Revenue from other operating income and expense as detailed in Group Accounting Policies from page 144. 2 As detailed on page 64, CER growth is calculated using prior year actual results adjusted for certain exchange effects including hedging. 2015 Reconciliation of Reported results to Core results | |
| | | | | | | | | Intangible | | | | | | | | | | | | | | | | | | | | | | |
| | | | | | | | | amortisation | | | | | BMS’s share | | | | | Legal | | | | | | | | Core12015 | |
| | | 2015 | | | Restructuring | | | and | | | | | of diabetes | | | | | provisions | | | 2015 | | | | | CER | | | Actual | |
| | | Reported | | | | costs | | | | impairments | | | | | | alliance | | | | | | and other | | | | Core | 1 | | | | | growth | | | | growth | |
| | | $m | | | $m | | | $m | | | | | $m | | | | | $m | | | $m | | | | | % | | | % | |
| Gross profit | | | 20,062 | | | | 158 | | | | 369 | | | | | | – | | | | | | – | | | | 20,589 | | | | | | 2 | | | | (5 | ) |
| Product Sales gross margin %2 | | | 80.3% | | | | | | | | | | | | | | | | | | | | | | | | 82.6% | | | | | | | | | | | |
| Total Revenue gross margin % | | | 81.2% | | | | | | | | | | | | | | | | | | | | | | | | 83.3% | | | | | | | | | | | |
| Distribution costs | | | (339 | ) | | | – | | | | – | | | | | | – | | | | | | – | | | | (339 | ) | | | | | 17 | | | | 5 | |
| Research and development expense | | | (5,997 | ) | | | 258 | | | | 136 | | | | | | – | | | | | | – | | | | (5,603 | ) | | | | | 21 | | | | 13 | |
| Selling, general and administrative costs | | | (11,112 | ) | | | 618 | | | | 921 | | | | | | 54 | | | | | | 254 | | | | (9,265 | ) | | | | | (2 | ) | | | (9 | ) |
| Other operating income and expense | | | 1,500 | | | | – | | | | 178 | | | | | | – | | | | | | (158 | ) | | | 1,520 | | | | | | 104 | | | | 100 | |
| Operating profit | | | 4,114 | | | | 1,034 | | | | 1,604 | | | | | | 54 | | | | | | 96 | | | | 6,902 | | | | | | 6 | | | | (1 | ) |
| Operating margin as a % of Total Revenue | | | 16.7% | | | | | | | | | | | | | | | | | | | | | | | | 27.9% | | | | | | | | | | | |
| Net finance expense | | | (1,029 | ) | | | – | | | | – | | | | | | 409 | | | | | | 115 | | | | (505 | ) | | | | | | | | | | |
| Taxation | | | (243 | ) | | | (217 | ) | | | (344 | ) | | | | | (152 | ) | | | | | (34 | ) | | | (990 | ) | | | | | | | | | | |
| Basic earnings per share ($) | | | 2.23 | | | | 0.65 | | | | 1.00 | | | | | | 0.24 | | | | | | 0.14 | | | | 4.26 | | | | | | | | | | | |
| 1 | Each of the measures in the Core column in the above table are non-GAAP measures. |
| 2 | Gross margin as a % of Product Sales reflects gross profit derived from Product Sales, divided by Product Sales. |
| | |
| AstraZenecaAnnual Report and Form 20-F Information 2015 | | 65 |
Strategic Report
Financial Reviewcontinued
As detailed above, all growth rates in this section are expressed at CER unless noted otherwise.
Total Revenue
Total Revenue for the year was up 1% at CER to $24,708 million, comprising Product Sales of $23,641 million (down 1%) and Externalisation Revenue of $1,067 million (up 140%). Based on actual exchange rates, Total Revenue declined by 7% in the year reflecting the particular weakness of key trading currencies against the US dollar.
Product Sales
The decline in Product Sales was driven by the US market entry ofNexium generic products from February 2015 as well as an adverse impact fromSynagis guideline changes in 2014 and the change in accounting for the US Branded Pharmaceutical Fee, following issuance of final regulations in 2014. Further details of the effect of these regulations are contained in the Financials (Prior year) section of the Annual Report from page 236.
US Product Sales were down 6% to $9,474 million, with Europe down 6% at $5,323 million. Established Markets were flat at $3,022 million and Emerging Markets were up 12% to $5,822 million, mainly driven by
growth in China of 15% to $2,530 million. Further details of our product performance are contained in the Geographical Review from page 227.
Our Growth Platforms, which include New Oncology, grew by 11%, representing 59% of total Product Sales.
Product Sales of Respiratory medicines were up 7% ahead of the proposed acquisition of Takeda’s respiratory business (as detailed on page 28). Sales ofBrilinta/Brilique in the year were $619 million, an increase of 44%. The FDA approvedBrilinta tablets at a new 60mg dose to be used by patients with a history of heart attack beyond the first year of treatment in 2015. Our Diabetes Product Sales were 26% higher than in 2014, which included growth of 137% onFarxiga/Forxiga with global sales of $492 million and several successful launches in the year in a number of international markets. Product Sales in Emerging Markets increased by 12% to $5,822 million in 2015 as we continued to focus on delivering innovative medicines to these markets in the year, with a particular focus on China and other leading markets such as Russia and Brazil. Product Sales in Japan increased by 4% to $2,020 million, withCrestor continuing to grow strongly in the year, up 8% to $468 million. Global
Product Sales ofCrestor declined in the year by 3% to $5,017 million, which primarily reflected ongoing competition from generic statins.Symbicort global Product Sales declined by 3% to $3,394 million, with sales in Europe down 14% to $1,076 million, with a modest volume decline and a significant price decline reflecting increased competition from recently-launched analogue medicines. Global Product Sales ofSeroquel XRdeclined by 12% to $1,025 million, as a result of generic product competition.
Externalisation Revenue
The Group updated its revenue accounting policy with effect from 1 January 2015. As detailed earlier in the Annual Report, the Group’s business model now includes an increasing level of externalisation activity to broaden and accelerate the development and commercialisation of, as well as maximising patient access to, key pipeline assets in our three main therapy areas. Historically, our Reported revenue reflected only Product Sales, with Externalisation Revenue forming part of other operating income presented below gross profit. Reflecting the increased level of externalisation activity, Externalisation Revenue, alongside Product Sales, is now included in Total Revenue. Externalisation Revenue includes development, commercialisation and collaboration
Growth Platforms
| | | | | | | | | | | | |
| | | 2015
Product Sales
$m | | | 2014
Product Sales
$m | | | CER growth
% | |
| Respiratory | | | 4,987 | | | | 5,063 | | | | 7 | |
| Brilinta/Brilique | | | 619 | | | | 476 | | | | 44 | |
| Diabetes | | | 2,224 | | | | 1,870 | | | | 26 | |
| Emerging Markets | | | 5,822 | | | | 5,827 | | | | 12 | |
| Japan | | | 2,020 | | | | 2,227 | | | | 4 | |
| New Oncology | | | 119 | | | | – | | | | n/m | |
| Total Growth Platform Product Sales1 | | | 14,003 | | | | 13,928 | | | | 11 | |
1 Certain Product Sales are included in more than one Growth Platform. Total Growth Platform sales represents the net total sales for all Growth Platforms. Externalisation Revenue | |
| Milestones | | | | | 2015 $m | | | 2014 $m | |
| Durvalumab (Celgene) | | | | | | | 450 | | | | – | |
| Movantik (Daiichi Sankyo) | | | | | | | 200 | | | | – | |
| Brodalumab (Valeant Pharmaceuticals) | | | | | | | 100 | | | | – | |
| Nexium (Daiichi Sankyo) | | | | | | | 123 | | | | – | |
| Nexium OTC (Pfizer) | | | | | | | – | | | | 250 | |
| Forxiga (Ono Pharmaceuticals) | | | | | | | – | | | | 80 | |
| Others | | | | | | | 107 | | | | 69 | |
| Total milestones | | | | | | | 980 | | | | 399 | |
| Royalties | | | | | | | 87 | | | | 53 | |
| Total Externalisation Revenue | | | | | | | 1,067 | | | | 452 | |
| | |
| 66 | | AstraZenecaAnnual Report and Form 20-F Information 2015 |
revenue, such as royalties and milestone receipts. Income is recorded as Externalisation Revenue when the Group has a significant ongoing interest in the product and/or it is repeatable business and there is no derecognition of an intangible asset. Disposals of assets and businesses, where the Group does not retain an interest, continue to be recorded in other operating income. The updated financial presentation was adopted to reflect the Group’s expanded entrepreneurial approach and is considered to provide a clearer picture of this important additional revenue stream. The updated revenue accounting policy results in a presentational change to the results of operations only, and has no impact on the Group’s net results or net assets. Prior year comparatives have been restated to reflect this change, resulting in $452 million of income being reclassified from other operating income to Externalisation Revenue for 2014.
Further details of the arrangements giving rise to the above revenues are included in the Investments, divestments and capital expenditure section of this Financial Review from page 72.
Gross margin, operating margin and earnings per share
Core gross margin as a percentage of Product Sales was 82.6% in the year, 0.8 percentage points higher than last year at CER due to the mix of Product Sales and manufacturing efficiencies.
Core R&D expense in the year was up 21% to $5,603 million, as the Group continued its focused investment in the pipeline. Oncology attracted over 40% of total Core R&D expenditure in the year, reflecting a number of active trials.
Core SG&A costs declined by 2% to $9,265 million. Core SG&A costs declined in the year by 1.1 percentage points as a proportion of Total Revenue. A number of ongoing programmes to reduce SG&A costs are progressing. These initiatives are centred on: sales, marketing and medical cost effectiveness; centralisation of selected functions and process improvements; reduced third party spend; additional efficiencies gained across support functions; and IT and continued footprint optimisation, including presence in the UK and US. Resources are being deployed more selectively to meet changing
customer needs and the evolving portfolio, while driving top-line growth more efficiently.
Core other operating income in the year was up 104% at $1,520 million which, in addition to royalty income of $322 million, includes $380 million of income on the disposal of the US rights toEntocort, $215 million on the disposal of Rest of World rights toEntocort, $193 million on the disposal ofMyalept and $165 million on the disposal ofCaprelsa. As these elements of our income arose from product divestments, where AstraZeneca no longer retains a significant element of continued interest, in accordance with our Externalisation Revenue definition and the requirements of IFRS, proceeds from these divestments continue to be recorded as other operating income.
Core operating profit increased by 6% to $6,902 million in the year. The Core operating margin increased by 1.3 percentage points to 27.9% of Total Revenue. The increase reflected the reduction in Core SG&A costs and the increase in Externalisation Revenue and Core other operating income, while we continued to invest in our pipeline and Growth Platforms.
Core EPS was $4.26, up 7% compared with last year (Actual: flat).
Pre-tax adjustments to arrive at Core profit before tax amounted to $3,312 million in 2015 (2014: $5,192 million), comprising $2,788 million adjustments to operating profits (2014: $4,800 million) and $524 million to net finance expenses (2014: $392 million). Excluded from Core results were:
| > | Restructuring costs totalling $1,034 million (2014: $1,558 million), incurred as the Group continued the fourth phase of restructuring announced in March 2013 and subsequently expanded. |
| > | Amortisation totalling $1,460 million (2014: $1,784 million) relating to intangible assets, except those related to IT and to our acquisition of BMS’s share of our Global Diabetes Alliance (which are separately detailed below). The decrease was driven by reduced amortisation charges arising from our Merck exit arrangements (which commenced in 1998) as certain associated intangible assets became fully amortised. Further information on our intangible assets is contained in Note 9 to the Financial Statements from page 158. |
| > | Intangible impairment charges of $143 million (2014: $99 million) excluding those related to IT. Further details relating to intangible asset impairments are included in Note 9 to the Financial Statements from page 158. |
| > | Net cost associated with our acquisition of BMS’s share of our Global Diabetes Alliance in February 2014 amounting to $463 million (2014: $1,423 million). Included within this are $432 million of amortisation charges and $409 million of interest charges relating to a discount unwind on contingent consideration arising on the acquisition in 2014, offset by a contingent consideration fair value decrease of $378 million reflecting lower expected Diabetes portfolio revenues in line with latest forecasts. |
| > | Net legal provisions and other charges of $211 million (2014: $328 million), including $115 million discount unwind charges, offset by $54 million of net fair value adjustments relating to contingent consideration arising on our other business combinations as detailed in Note 18 to the Financial Statements from page 164. The net charge of $211 million also included legal charges relating to patent proceedings in the US forPulmicortRespules, charges relating to the unsuccessful defence of the validity ofCrestor-related patents in Australia, and damages paid to AbbVie following a contract dispute overSynagis. Further details of legal proceedings the Group is currently involved in are contained within Note 27 to the Financial Statements from page 186. |
Reported operating profit of $4,114 million was $1,977 million higher than in 2014. Fair value adjustments to contingent consideration reduced SG&A costs and increased Reported operating profit by $432 million in the current year (2014: fair value adjustments to contingent consideration reduced Reported operating profit by $512 million). These fair value movements reflected estimates for future liabilities that can change materially over time. In addition, restructuring costs of $1,034 million in 2015 were significantly lower than restructuring costs of $1,558 million in 2014.
Reported net finance expense was $1,029 million (2014: $885 million). The increase of $144 million was driven by increased charges related to the discount unwind
| | |
| AstraZenecaAnnual Report and Form 20-F Information 2015 | | 67 |
Strategic Report
Financial Reviewcontinued
on contingent consideration arising on business combinations driven by underlying increases in the contingent consideration value held on the balance sheet in 2014 (including a full year’s discount unwind on the contingent consideration arising from our acquisition of BMS’s share of our Global Diabetes Alliance).
The Reported taxation charge for the year of $243 million (2014: $11 million) consisted of a current tax charge of $633 million (2014: $872 million) and a credit arising from movements on deferred tax of $390 million (2014: $861 million). The current tax charge included a prior period current tax credit of $404 million (2014: $109 million).
The Reported tax rate for the year was 8%. This Reported tax rate was impacted by a one-off benefit of $186 million following agreement of US federal tax liabilities of open years up to 2008, other net reductions in provisions for tax contingencies partially offset by the impact of internal transfers of intellectual property resulting in a net credit of $181 million and non-Core revaluations of contingent consideration arising on business combinations (credit of $432 million with related tax charge of $39 million). Excluding these effects, the Reported tax rate for the year would have been 22%. The Core tax rate for the year was 16%. Excluding the benefit following agreement of US federal tax liabilities of open years up to 2008 and other net reductions in provisions for tax contingencies partially offset by the impact of internal transfers of intellectual property, the Core tax rate would have been 21%.
The tax paid for the year was $1,354 million (44% of Reported profit and 21% of Core profit). The cash tax paid for the year was $1,111 million higher than the tax charge for the year as a result of certain items with no cash impact including the benefit of $186 million following agreement of US federal tax liabilities of open years up to 2008, other net reductions in provisions for tax contingencies of $259 million, $390 million of deferred tax credits, cash payments made in respect of audit settlements of $240 million and other cash tax timing differences.
Reported post-tax profit for the year was $2,826 million, an increase of 137%. Reported earnings per share was up 137% to $2.23.
Total comprehensive income increased by $2,759 million from the prior year, resulting in a net income of $2,488 million for 2015. This was driven by the increase in profit for the year of $1,591 million and an increase of $1,168 million in other comprehensive income. The increase in other comprehensive income arose principally from gains recorded on the remeasurement of our defined benefit pension liability of $652 million (2014: losses of $766 million) due to an increase in the discount rate applied to our pension liabilities reflecting an increase in corporate bond yields and other reference interest rate instruments.
Restructuring
Since 2007, we have undertaken significant efforts to restructure and reshape our business to improve long-term competitiveness, the first two phases of which were completed in 2011.
Further to the announcement in 2012 of a third phase of the programme, we announced another restructuring programme in 2013, which was combined with the third phase to create a combined Phase 4 programme. This combined programme initially entailed an estimated global headcount reduction of about 5,050 over the 2013 to 2016 period. The combined programme of changes is estimated to incur $2.5 billion in one-time restructuring charges, of which $1.7 billion were expected to be cash costs, and deliver $800 million of annualised benefits by the end of 2016.
The Phase 4 programme was expanded in 2013 to include additional activities such as a transformation of our IT organisation and infrastructure, the exit of R&D activities in Bangalore, India, and the exit from branded generics in certain Emerging Markets to further reduce costs and increase flexibility. When completed, the expanded restructuring programme is expected to deliver a further $300 million in annual benefits by the end of 2016, bringing total anticipated annualised benefits of the Phase 4 programme to $1.1 billion, and to affect a further approximately 550 positions, bringing the total global headcount reduction under the Phase 4 programme to around 5,600 over the 2013 to 2016 period. Total incremental programme costs from these new initiatives, together with revisions to cost estimates for the original programme, are estimated to be $700 million, of which $600 million is cash,
bringing the total anticipated cost of our Phase 4 programme to $3.2 billion by the end of 2016.
In addition to this programme, we announced an additional $600 million of restructuring costs which are estimated to be incurred by the end of 2016 (of which $494 million were incurred by the end of 2015), associated with previously-announced site exits (including Avlon in the UK) and the integration of the Diabetes and Respiratory businesses acquired from BMS and Almirall, respectively. We anticipate that, once completed, the total annualised benefits of these additional actions will be $200 million.
During the latter part of 2015, the Company implemented further targeted restructuring of our commercial business, principally in Venezuela (in response to challenging economic conditions) and Europe. This resulted in $102 million of restructuring costs and is expected to deliver $30 million of annualised benefit in 2016. Furthermore, as part of the Company’s ongoing commitment to improve productivity, we are initiating multi-year transformation programmes within our G&A functions (principally Finance and HR) with anticipated costs by the end of 2018 of $270 million. Once complete, we expect these transformation programmes to deliver annualised benefits of $100 million by the end of 2018.
The aggregate restructuring charges incurred in 2015 across all our restructuring programmes was $1,034 million, as we continued to make progress in implementing our restructuring plans.
Final estimates for programme costs, benefits and headcount impact in all functions are subject to completion of the requisite consultation in the various areas. Our priority as we undertake these restructuring initiatives is to work with our affected employees on the proposed changes, acting in accordance with relevant local consultation requirements and employment law.
Earnings before interest, tax, depreciation, amortisation and impairments includes adjustments for amortisation and depreciation charges of $2,676 million (2014: $3,160 million) and interest of $1,029 million (2014: $885 million) including $570 million (2014: $453 million) for discount unwinds.
| | |
| 68 | | AstraZenecaAnnual Report and Form 20-F Information 2015 |
Cash flow and liquidity – 2015
All data in this section is on a Reported basis.
Summary cash flows
| | | | | | | | | | | | |
| | | 2015 $m | | | 2014 $m | | | 2013 $m | |
| Net (debt)/funds brought forward at 1 January | | | (3,223 | ) | | | 39 | | | | (1,369 | ) |
| Earnings before interest, tax, depreciation, amortisation and impairment (EBITDA) | | | 6,966 | | | | 5,419 | | | | 8,295 | |
| Movement in working capital and short-term provisions | | | (49 | ) | | | 2,508 | | | | 166 | |
| Tax paid | | | (1,354 | ) | | | (1,201 | ) | | | (844 | ) |
| Interest paid | | | (496 | ) | | | (533 | ) | | | (475 | ) |
| Gains on disposal of intangible assets | | | (961 | ) | | | – | | | | – | |
| Non-cash and other movements | | | (782 | ) | | | 865 | | | | 258 | |
| Net cash available from operating activities | | | 3,324 | | | | 7,058 | | | | 7,400 | |
| Purchase of intangibles (net) | | | (330 | ) | | | (1,740 | ) | | | (1,281 | ) |
| Upfront payments on business acquisition | | | (2,446 | ) | | | (3,804 | ) | | | (1,158 | ) |
| Payment of contingent consideration on business acquisitions | | | (579 | ) | | | (657 | ) | | | – | |
| Other capital expenditure (net) | | | (1,326 | ) | | | (924 | ) | | | (673 | ) |
| Investments | | | (4,681 | ) | | | (7,125 | ) | | | (3,112 | ) |
| Dividends | | | (3,486 | ) | | | (3,521 | ) | | | (3,461 | ) |
| Share proceeds | | | 43 | | | | 279 | | | | 482 | |
| Distributions | | | (3,443 | ) | | | (3,242 | ) | | | (2,979 | ) |
| Other movements | | | 261 | | | | 47 | | | | 99 | |
| Net (debt)/funds carried forward at 31 December | | | (7,762 | ) | | | (3,223 | ) | | | 39 | |
Net debt/funds reconciliation | | | | | | | | | | | | |
| | | 2015 $m | | | 2014 $m | | | 2013 $m | |
| Cash and cash equivalents | | | 6,240 | | | | 6,360 | | | | 9,217 | |
| Short-term investments | | | 613 | | | | 795 | | | | 796 | |
| Net derivative financial instruments | | | 438 | | | | 465 | | | | 402 | |
| Cash, short-term investments and derivatives | | | 7,291 | | | | 7,620 | | | | 10,415 | |
| Overdraft and short-term borrowings | | | (849 | ) | | | (1,486 | ) | | | (992 | ) |
| Finance leases | | | (95 | ) | | | (108 | ) | | | (102 | ) |
| Current instalments of loans | | | – | | | | (912 | ) | | | (766 | ) |
| Loans due after one year | | | (14,109 | ) | | | (8,337 | ) | | | (8,516 | ) |
| Loans and borrowings | | | (15,053 | ) | | | (10,843 | ) | | | (10,376 | ) |
| Net (debt)/funds | | | (7,762 | ) | | | (3,223 | ) | | | 39 | |
Net cash generated from operating activities was $3,324 million in the year ended 31 December 2015, compared with $7,058 million in 2014. Working capital increased by $49 million in the year. This compared to a decline of $2,508 million in 2014 which was driven by a significantly higher level of rebate accruals in the US, the phasing of costs increasing accruals in the fourth quarter of 2014 and the accrual of an additional year’s US Branded Pharmaceutical Drug Fee following the change of regulations in 2014. In the current year, the liabilities in relation to these items normalised and, in addition, rebate accruals were further reduced following the loss of exclusivity forNexium.
Gains on disposal of intangible assets of $961 million includes $380 million on the disposal of US rights toEntocort, $215 million on the disposal of Rest of World rights toEntocort, $193 million on the disposal of global rights toMyalept and $165 million on the disposal of global rights toCaprelsa. Non-cash and other movements decreased operating cash by $782 million and included $432 million relating to fair value adjustments on contingent consideration arising on business combinations (2014: increased operating cash by $865 million including $512 million increase on contingent consideration arising on business combinations).
Investment cash outflows of $4,681 million (2014: $7,125 million) included $2,446 million relating to the acquisition of ZS Pharma. This compared to cash payments relating to business acquisitions in 2014 of $4,461 million, primarily related to the BMS diabetes alliance and Almirall acquisitions. Further details of business combination acquisitions and their impact on our cash flows and balance sheet are given in the table on page 72. Investment cash outflows also include $579 million (2014: $657 million) of payments against contingent consideration arising on business combinations and $1,460 million (2014: $1,740 million) for the purchase of other intangible assets, which included $684 million on the acquisition of the rights to Actavis’ branded respiratory portfolio in the US and Canada. The comparative
| | |
| AstraZenecaAnnual Report and Form 20-F Information 2015 | | 69 |
Strategic Report
Financial Reviewcontinued
Bonds issued in 2015
| | | | | | | | | | | | |
| | | Repayment
dates | | | Face value
of bond
$m | | | Net book value
of bond at
31 December
2015 $m | |
| Floating rate notes | | | 2018 | | | | 400 | | | | 399 | |
| 1.750% Callable bond | | | 2018 | | | | 1,000 | | | | 997 | |
| 2.375% Callable bond | | | 2020 | | | | 1,600 | | | | 1,586 | |
| 3.375% Callable bond | | | 2025 | | | | 2,000 | | | | 1,971 | |
| 4.375% Callable bond | | | 2045 | | | | 1,000 | | | | 976 | |
| Total | | | | | | | 6,000 | | | | 5,929 | |
period of 2014 included a $409 million payment to Merck on the consummation of our Second Option and $310 million on the settlement of pre-existing launch and sales-related milestones with BMS. Investment cash inflows include $1,130 million (2014: $nil) from the sale of intangible assets, including the divestments of Entocort in the US for $380 million, and in the Rest of World for $215 million and of Myalept for $325 million. Further details of the divestments giving rise to our investment cash inflows are included in the Investments, divestments and capital expenditure section of this Financial Review from page 72.
Net cash distributions to shareholders were $3,443 million (2014: $3,242 million) including dividends of $3,486 million (2014: $3,521 million). Proceeds from the issue of shares on the exercise of share options amounted to $43 million (2014: $279 million).
In November 2015, the Group issued bonds worth $6 billion to fund the acquisition of ZS Pharma, to repay certain of our outstanding commercial paper obligations and for general corporate purposes. The bonds are listed in the table above.
In 2015, the Group repaid a 5.125% non-callable euro bond which had a 31 December 2014 carrying value of $912 million.
At 31 December 2015, outstanding gross debt (interest-bearing loans and borrowings) was $15,053 million (2014: $10,843 million). Of the gross debt outstanding at 31 December 2015, $916 million is due within one year (2014: $2,446 million). Net debt at 31 December 2015 was $7,762 million, compared to $3,223 million at the beginning of the year, as a result of the net cash outflow as described above.
Off-balance sheet transactions and commitments
We have no off-balance sheet arrangements and our derivative activities are non-speculative. The table below sets out our minimum contractual obligations at the year end.
In 2015, net assets decreased by $1,137 million to $18,509 million. The decrease in net assets is broadly as a result of dividends of $3,537 million and adverse movements on exchange taken to reserves of $861 million, partially offset by the Group profit of $2,826 million.
Business combinations
In 2015, we completed the acquisition of ZS Pharma. In 2014, we completed the acquisition of BMS’s share of our Global Diabetes Alliance, the acquisition of the rights to Almirall’s respiratory franchise and the acquisition of the Definiens Group.
Payments due by period
| | | | | | | | | | | | | | | | | | | | | | | | |
| | | Less than
1 year $m | | | 1-3 years
$m | | | 3-5 years
$m | | | Over
5 years
$m | | | 2015 Total
$m | | | 2014 Total
$m | |
| Bank loans and other borrowings1 | | | 1,419 | | | | 4,183 | | | | 3,469 | | | | 14,192 | | | | 23,263 | | | | 17,261 | |
| Finance leases | | | 66 | | | | 63 | | | | 12 | | | | – | | | | 141 | | | | 130 | |
| Operating leases | | | 95 | | | | 148 | | | | 97 | | | | 69 | | | | 409 | | | | 438 | |
| Contracted capital expenditure | | | 518 | | | | – | | | | – | | | | – | | | | 518 | | | | 438 | |
| Total | | | 2,098 | | | | 4,394 | | | | 3,578 | | | | 14,261 | | | | 24,331 | | | | 18,267 | |
| 1 | Bank loans and other borrowings include interest charges payable in the period, as detailed in Note 25 to the Financial Statements on page 177. |
| | |
| 70 | | AstraZenecaAnnual Report and Form 20-F Information 2015 |
Financial position – 31 December 2015
All data in this section is on a Reported basis.
Summary statement of financial position
| | | | | | | | | | | | | | | | | | | | |
| | | 2015 $m | | | Movement
$m | | | 2014 $m | | | Movement
$m | | | 2013 $m | |
| Property, plant and equipment | | | 6,413 | | | | 403 | | | | 6,010 | | | | 192 | | | | 5,818 | |
| Goodwill and intangible assets | | | 34,514 | | | | 1,983 | | | | 32,531 | | | | 6,503 | | | | 26,028 | |
| | | | | | | | | | | | | | | | | | | | | |
| Inventories | | | 2,143 | | | | 183 | | | | 1,960 | | | | 51 | | | | 1,909 | |
| Trade and other receivables | | | 7,529 | | | | (815 | ) | | | 8,344 | | | | (1,402 | ) | | | 9,746 | |
| Trade and other payables | | | (19,120 | ) | | | 757 | | | | (19,877 | ) | | | (7,163 | ) | | | (12,714 | ) |
| Provisions | | | (1,242 | ) | | | (135 | ) | | | (1,107 | ) | | | 282 | | | | (1,389 | ) |
| | | | | | | | | | | | | | | | | | | | | |
| Net income tax payable | | | (1,096 | ) | | | 929 | | | | (2,025 | ) | | | 557 | | | | (2,582 | ) |
| Net deferred tax liabilities | | | (1,439 | ) | | | (862 | ) | | | (577 | ) | | | 1,045 | | | | (1,622 | ) |
| | | | | | | | | | | | | | | | | | | | | |
| Retirement benefit obligations | | | (1,974 | ) | | | 977 | | | | (2,951 | ) | | | (690 | ) | | | (2,261 | ) |
| | | | | | | | | | | | | | | | | | | | | |
| Non-current other investments | | | 458 | | | | (44 | ) | | | 502 | | | | 221 | | | | 281 | |
| Investment in joint ventures | | | 85 | | | | 26 | | | | 59 | | | | 59 | | | | – | |
| Net (debt)/funds | | | (7,762 | ) | | | (4,539 | ) | | | (3,223 | ) | | | (3,262 | ) | | | 39 | |
| | | | | | | | | | | | | | | | | | | | | |
| Net assets | | | 18,509 | | | | (1,137 | ) | | | 19,646 | | | | (3,607 | ) | | | 23,253 | |
Further information on our business combinations can be found in the Investments, divestments and capital expenditure section of the Financial Review from page 72.
Property, plant and equipment
Property, plant and equipment increased by $403 million to $6,413 million. Additions of $1,422 million (2014: $1,607 million), including $21 million (2014: $515 million) arising from business combinations, were offset by depreciation of $677 million (2014: $776 million), impairments of $28 million (2014: $nil) and disposals of $70 million (2014: $582 million).
Goodwill and intangible assets
The Group’s goodwill of $11,868 million (2014: $11,550 million) principally arose on the acquisition of MedImmune in 2007, the restructuring of our US joint venture with Merck in 1998 and the acquisition of BMS’s share of the Global Diabetes Alliance. Goodwill of $456 million arising on the acquisition of ZS Pharma was capitalised in 2015.
Intangible assets amounted to $22,646 million at 31 December 2015 (2014: $20,981 million). Intangible asset additions were $4,640 million in 2015 (2014: $8,548 million), including product rights acquired in the acquisition of ZS Pharma of $3,162 million
(2014: $7,501 million on 2014 business combinations). Amortisation in the year was $1,999 million (2014: $2,384 million). Impairment charges in the year amounted to $148 million (2014: $122 million), including $64 million for AMP-110 and $35 million for Ardelyx. Disposals of intangible assets totalled $169 million in the year (2014: $nil) including $123 million on the sale of global rights toMyalept.
Further details of our additions to intangible assets, and impairments recorded, are included in Note 9 to the Financial Statements from page 158.
Receivables, payables and provisions
Trade and other receivables decreased by $815 million with trade receivables reduced by $129 million to $4,633 million and prepayments and accrued income increasing by $20 million. Non-current other receivables decreased by $205 million to $907 million driven by a reduction in the Shionogi Crestor royalty prepayment as detailed in Note 13 to the Financial Statements on page 162.
Trade and other payables decreased by $757 million in 2015 to $19,120 million, including $223 million lower rebates and chargebacks, and $571 million in other non-current payables. Non-current payables
includes the long-term element of contingent consideration, which as indicated above, included an adjustment of $432 million to the total fair value in 2015, and the accrual for our minimum committed ShionogiCrestor royalty payments.
The increase in provisions of $135 million in 2015 included $706 million of additional charges recorded in the year, partially offset by $557 million of cash payments. Included within the $706 million of charges for the year were $338 million for our global restructuring initiatives and $313 million in respect of legal charges. Cash payments included $408 million for our global restructuring programmes. Further details of the charges made against provisions are contained in Notes 19 and 27 to the Financial Statements on page 165, and 186 to 192, respectively.
Tax payable and receivable
Net income tax payable has decreased by $929 million to $1,096 million, principally due to a $186 million adjustment following agreement of US federal tax liabilities of open years up to 2008, other net reductions in provisions for tax contingencies ($259 million), cash payments made in respect of audit settlements ($240 million) and foreign exchange ($194 million). The tax receivable balance of $387 million (2014: $329 million)
| | |
| AstraZenecaAnnual Report and Form 20-F Information 2015 | | 71 |
Strategic Report
Financial Reviewcontinued
comprises tax owing to AstraZeneca from certain governments expected to be received on settlements of transfer pricing audits and disputes ($192 million) (see Note 27 to the Financial Statements from page 186) and cash tax timing differences ($195 million). Net deferred tax liabilities increased by $862 million in the year mainly due to deferred tax liabilities arising from the acquisition of ZS Pharma. Additional information on the movement in deferred tax balances is contained in Note 4 to the Financial Statements from page 151.
Retirement benefit obligations
Net retirement benefit obligations decreased by $977 million in 2015 (2014: increase of $690 million). Employer contributions to the pension scheme of $402 million, net remeasurement adjustments of $652 million driven by an increase in the discount rate applied to our pension liabilities under IAS 19 and beneficial exchange movements of $182 million were offset by service cost charges of $167 million and net financing costs of $77 million. Benefits paid amounted to $580 million (2014: $571 million).
Approximately 97% of the Group’s obligations are concentrated in the UK, the US, Sweden and Germany. In recent years, the Group has undertaken several initiatives to reduce its net pension obligation exposure. For the UK defined benefit pension scheme, which is AstraZeneca’s largest defined benefit scheme, these initiatives have included agreeing funding
principles for cash contributions to be paid into the UK pension scheme to target a level of assets in excess of the current expected cost of providing benefits, and, in 2010, amendments to the scheme to freeze pensionable pay at 30 June 2010 levels. In addition to the cash contributions to be paid into the UK pension scheme, AstraZeneca makes contributions to an escrow account which is held outside the pension scheme. The escrow account assets are payable to the fund in agreed circumstances, for example, in the event of AstraZeneca and the pension fund trustee agreeing a change to the current long-term investment strategy.
Further details of the Group’s pension schemes are included in Note 20 to the Financial Statements from page 166.
Commitments and contingencies
The Group has commitments and contingencies which are accounted for in accordance with the accounting policies described in the Financial Statements in the Group Accounting Policies section from page 144. The Group also has taxation contingencies. These are described in the Taxation section in the Critical accounting policies and estimates section on page 81 and in Note 27 to the Financial Statements from page 186.
Research and development collaboration payments
Details of future potential R&D collaboration payments are also included in Note 27 to
the Financial Statements from page 186. As detailed in Note 27 to the Financial Statements, payments to our collaboration partners may not become payable due to the inherent uncertainty in achieving the development and revenue milestones linked to the future payments. As part of our overall externalisation strategy, we may enter into further collaboration projects in the future that may include milestone payments and, therefore, as certain milestone payments fail to crystallise due to, for example, development not proceeding, they may be replaced by potential payments under new collaborations.
Investments, divestments and capital expenditure
The Group has completed over 240 major or strategically important business development transactions over the past three years, eight of which were accounted for as business acquisitions under IFRS 3 ‘Business Combinations’, being the acquisition of ZS Pharma in 2015, the acquisition of BMS’s share of our Global Diabetes Alliance, the rights to Almirall’s respiratory franchise and the acquisition of Definiens in 2014; and Pearl Therapeutics, Omthera, Amplimmune and Spirogen in 2013, and all others being in-licences, strategic alliances and collaborations.
Fair values of assets and liabilities acquired, and consideration for the acquisitions in 2015 and 2014, as at the acquisition date, are summarised below.
Business combinations
| | | | | | | | | | | | | | | | | | | | | | |
| | | 2015 | | | | | 2014 | |
| | | ZS Pharma
$m | | | | | BMS’s share of
diabetes
alliance $m | | | Rights to
Almirall’s
respiratory
franchise $m | | | Definiens
Group $m | | | 2014
total $m | |
| Assets acquired: | | | | | | | | | | | | | | | | | | | | | | |
| Non-current assets | | | | | | | | | | | | | | | | | | | | | | |
| Property, plant and equipment | | | 21 | | | | | | 478 | | | | 37 | | | | – | | | | 515 | |
| Goodwill | | | 456 | | | | | | 1,530 | | | | 311 | | | | – | | | | 1,841 | |
| Intangible assets | | | 3,162 | | | | | | 5,746 | | | | 1,400 | | | | 355 | | | | 7,501 | |
| Current assets | | | 169 | | | | | | 480 | | | | 24 | | | | – | | | | 504 | |
| Current liabilities | | | (50 | ) | | | | | (278 | ) | | | (2 | ) | | | – | | | | (280 | ) |
| Non-current liabilities | | | (1,058 | ) | | | | | (84 | ) | | | (11 | ) | | | (117 | ) | | | (212 | ) |
| Total assets | | | 2,700 | | | | | | 7,872 | | | | 1,759 | | | | 238 | | | | 9,869 | |
| Consideration: | | | | | | | | | | | | | | | | | | | | | | |
| Upfront consideration | | | 2,700 | | | | | | 2,703 | | | | 878 | | | | 150 | | | | 3,731 | |
| Contingent consideration | | | – | | | | | | 5,169 | | | | 881 | | | | 88 | | | | 6,138 | |
| Total consideration | | | 2,700 | | | | | | 7,872 | | | | 1,759 | | | | 238 | | | | 9,869 | |
| | |
| 72 | | AstraZenecaAnnual Report and Form 20-F Information 2015 |
Contingent consideration arising on business combinations
| | | | | | | | | | | | | | | | | | | | | | | | | | |
| | | 2015 | | | | | 2014 | |
| | | Acquisition of | | | | | | | | | | | Acquisition of | | | | | | | |
| | | BMS’s share | | | Other | | | | | | | | BMS’s share of | | | Other | | | | |
| | | of diabetes | | | business | | | Total | | | | | diabetes | | | business | | | Total | |
| | | alliance | | | combinations | | | 2015 | | | | | alliance | | | combinations | | | 2014 | |
| | | $m | | | $m | | | $m | | | | | $m | | | $m | | | $m | |
| At 1 January | | | 5,386 | | | | 1,513 | | | | 6,899 | | | | | | – | | | | 514 | | | | 514 | |
| Acquisitions | | | – | | | | – | | | | – | | | | | | 5,169 | | | | 969 | | | | 6,138 | |
| Settlements | | | (325 | ) | | | (254 | ) | | | (579 | ) | | | | | (657 | ) | | | – | | | | (657 | ) |
| Fair value adjustments | | | (378 | ) | | | (54 | ) | | | (432 | ) | | | | | 529 | | | | (17 | ) | | | 512 | |
| Discount unwind | | | 409 | | | | 115 | | | | 524 | | | | | | 345 | | | | 46 | | | | 391 | |
| Foreign exchange | | | – | | | | (1 | ) | | | (1 | ) | | | | | – | | | | 1 | | | | 1 | |
| At 31 December | | | 5,092 | | | | 1,319 | | | | 6,411 | | | | | | 5,386 | | | | 1,513 | | | | 6,899 | |
Contingent consideration
The majority of our acquisitions in recent years have included elements of consideration that are contingent on future development and/or sales milestones, with both the diabetes and respiratory acquisitions in 2014 also including royalty payments linked to future revenues. The acquisition of ZS Pharma in the year had no contingent consideration element.
Our agreement with BMS provides for potential further payments of up to $0.7 billion for future regulatory, launch and sales-related milestones, and various sales-related royalty payments up until 2025. Our transaction with Almirall includes further payments of up to $1.2 billion for future development, launch, and sales-related milestones and various other sales-related payments. All these future payments are treated as contingent consideration on our balance sheet, and are fair-valued using decision-tree analyses, with key assumptions including the probability of success, the potential for delays and the expected levels of future revenues. The fair value is updated at each balance sheet reporting date to reflect our latest estimate of the probabilities of these key assumptions. Given the long-term nature of our contingent consideration payments, the fair value calculation includes the discounting of future potential payments to their present value using discount rates appropriate to the period over which payments are likely to be made. Over time, as the target date of a consideration payment approaches, the discount in absolute terms of such future potential payment to its present value decreases. Therefore, in each period we take a corresponding charge reflecting the passage of time. We refer to this charge as ‘discount unwind’.
Both the discount unwind and any movements of the fair value of the underlying future payments can result in significant income statement movements. As detailed in the Results of operations section above, these movements are treated as non-Core items in our income statement analysis. In 2015, we recorded an interest charge of $524 million on the discount unwind on contingent consideration arising on our business combinations, and a net fair value decrease on contingent consideration of $432 million (which resulted in a credit to our income statement for the same amount) driven, principally, by revised forecasts for revenues for our Diabetes franchise. At 31 December 2015, our contingent consideration balance held on the balance sheet amounted to $6,411 million (2014: $6,899 million) with the movements of the balance detailed in the table above.
Further details of our business acquisitions in the past three years are contained in Note 24 to the Financial Statements from page 173. Details of our significant business development transactions are given below:
| > | In September 2015, AstraZeneca announced that it had entered into a collaboration agreement with Valeant under which it will grant an exclusive licence for Valeant to develop and commercialise brodalumab. Under the agreement, Valeant will hold the exclusive rights to develop and commercialise brodalumab globally, except in Japan and certain other Asian countries where rights are held by Kyowa Hakko Kirin under a prior arrangement with Amgen Inc. Valeant will assume all development costs associated with the regulatory approval for brodalumab. Under the terms of the agreement, Valeant made an upfront payment to AstraZeneca of $100 million |
| | and may also pay pre-launch milestones of up to $170 million and further sales related milestone payments of up to $175 million. If approved, AstraZeneca and Valeant will share profits. |
| > | In April 2015, AstraZeneca entered into two oncology agreements with Innate Pharma S.A (Innate), firstly, a licence which provides AstraZeneca with exclusive global rights to co-develop and commercialise IPH2201 in combination with durvalumab, and secondly, an option to license exclusive global rights to co-develop and commercialise IPH2201 in monotherapy and other combinations in certain treatment areas. Currently in Phase II development, IPH2201 is a potential first-in-class humanised IgG4 antibody. Under the terms of the combination licence, AstraZeneca assumed exclusive Global rights to research, develop, and commercialise IPH2201 in combination with durvalumab. AstraZeneca and Innate jointly fund Phase II studies and AstraZeneca leads the execution of these studies. Under the terms of the agreements, AstraZeneca made an initial payment to Innate of $250 million, which included the consideration for exclusive global rights to co-develop and commercialise IPH2201 in combination with durvalumab, as well as access to IPH2201 in monotherapy and other combinations in certain treatment areas. The agreement includes a Phase III initiation milestone of $100 million, as well as additional regulatory and sales-related milestones. AstraZeneca records all sales and will pay Innate double-digit royalties on net sales. The arrangement includes the right for Innate to co-promote in Europe for a 50% profit share in the territory. |
| > | In April 2015, AstraZeneca signed a Collaboration and License Agreement with Celgene Corporation, a global leader |
| | |
| AstraZenecaAnnual Report and Form 20-F Information 2015 | | 73 |
Strategic Report | Strategy
Financial Reviewcontinued
| | in haematological cancers, to develop and commercialise durvalumab across a range of blood cancers including non-Hodgkin lymphoma, myelodysplastic syndromes and multiple myeloma. Durvalumab is an investigational immune checkpoint inhibitor, directed against programmed cell death ligand 1 (PD-L1). Signals from PD-L1 help tumours avoid detection by the immune system. Durvalumab blocks these signals, countering the tumour’s immune-evading tactics. Under the terms of the agreement, Celgene made an upfront payment of $450 million to AstraZeneca in relation to durvalumab, which is recorded within Externalisation Revenue. Celgene will lead on development across all clinical trials within the collaboration and have taken on all research and development costs until the end of 2016, after which they will take on 75% of these costs. Celgene will also be responsible for global commercialisation of approved treatments. AstraZeneca will manufacture and record all sales of durvalumab and will pay a royalty to Celgene on worldwide sales in haematological indications. The royalty rate will start at 70% and will decrease to approximately half of the sales of durvalumab in haematological indications over a period of four years. |
| > | In March 2015, AstraZeneca announced a co-commercialisation agreement with Daiichi Sankyo, Inc. forMovantik in the US.Movantik is a first-in-class once-daily oral peripherally-acting mu-opioid receptor antagonist (PAMORA) for opioid-induced constipation (OIC). Opioids play an important role in chronic pain relief and work by binding to mu-receptors in the central nervous system, but they also bind to mu-receptors in the gastrointestinal tract, which can result in patients suffering from OIC. The drug was launched on 31 March 2015. Under the terms of the agreement, Daiichi Sankyo Inc. paid a $200 million upfront fee and will pay subsequent sales-related payments of up to $625 million. $200 million was recorded in Externalisation Revenue in 2015. AstraZeneca will be responsible for manufacturing, will record all sales and will make sales-related commission payments to Daiichi Sankyo, Inc. Both companies will be jointly responsible for commercial activities. |
| > | In March 2015, AstraZeneca completed the acquisition of the rights to Actavis Plc’s branded respiratory business in the US |
| | and Canada. The deal gave AstraZeneca the ownership of the development and commercial rights in the US and Canada toTudorzaPressair(aclidinium bromide inhalation powder), a twice-daily long-acting muscarinic antagonist (LAMA) for COPD, and toDaliresp (roflumilast), the only once-daily oral PDE4 inhibitor currently on the market for COPD, in the US. AstraZeneca also owns the development rights in the US and Canada for LAS40464, a combination of a fixed dose of aclidinium with formoterol long-acting beta-agonist (LAMA/LABA) in a dry powder inhaler, which is approved in the EU under the brand nameDuaklir Genuair. On completion of the acquisition, AstraZeneca paid Actavis $600 million and agreed to pay low single-digit royalties above a certain revenue threshold. |
| > | In September 2014, AstraZeneca and Lilly entered into an agreement to jointly develop and commercialise AZD3293, an oral beta secretase cleaving enzyme (BACE) inhibitor currently in development as a potential treatment for Alzheimer’s disease. AZD3293 is an oral, potent and selective small molecule inhibitor of BACE that has been shown in Phase I studies to significantly and dose- dependently reduce levels of amyloid beta in the cerebro-spinal fluid of Alzheimer’s patients and healthy volunteers. Under the terms of the agreement, Lilly will pay AstraZeneca up to $500 million in development and regulatory milestone payments. AstraZeneca received the first milestone payment of $50 million in 2015. The companies will equally share all future costs for the development and commercialisation of AZD3293, as well as net global revenues post-launch. Lilly will lead clinical development, working with researchers from AstraZeneca’s Innovative Medicines Unit for neuroscience, while AstraZeneca will be responsible for manufacturing. The companies will take joint responsibility for commercialisation of AZD3293. |
| > | In July 2013, AstraZeneca entered into a strategic collaboration with FibroGen to develop and commercialise roxadustat (FG-4592), a first-in-class oral compound in late-stage development for the treatment of anaemia associated with CKD and ESRD. This broad collaboration focuses on the US, China and all major markets excluding Japan, Europe, the CIS, the Middle East and |
| | South Africa, which are covered by an existing agreement between FibroGen and Astellas. The AstraZeneca-FibroGen joint effort will be focused on the development of roxadustat to treat anaemia in CKD and ESRD, and may be extended to other anaemia indications. AstraZeneca and FibroGen plan to undertake an extensive roxadustat Phase III development programme for the US, and to initiate Phase III trials in China, with anticipated regulatory filings in China in 2016 and in the US in 2018. Under the arrangement, AstraZeneca agreed to pay FibroGen upfront and subsequent non-contingent payments totalling $350 million, as well as potential development-related milestone payments of up to $465 million, and potential future sales-related milestone payments, in addition to tiered royalty payments on future sales of roxadustat in the low 20% range. Additional development milestones will be payable for any subsequent indications which the companies choose to pursue. AstraZeneca will be responsible for the US commercialisation of roxadustat, with FibroGen undertaking specified promotional activities in the ESRD segment in this market. The companies will also co-commercialise roxadustat in China where FibroGen will be responsible for clinical trials, regulatory matters, manufacturing and medical affairs, and AstraZeneca will oversee promotional activities and commercial distribution. |
| > | In March 2013, AstraZeneca signed an exclusive agreement with Moderna Therapeutics to discover, develop and commercialise pioneering medicines based onmessenger RNATherapeuticsfor the treatment of serious cardiovascular, metabolic and renal diseases as well as cancer. Under the terms of the agreement, AstraZeneca made an upfront payment of $240 million. AstraZeneca will have exclusive access to select any target of its choice in cardiometabolic and renal diseases, as well as selected targets in oncology, over a period of up to five years for subsequent development ofmessenger RNA Therapeutics. In addition, Moderna Therapeutics is entitled to an additional $180 million for the achievement of three technical milestones. Through this agreement, AstraZeneca has the option to select up to 40 drug products for clinical development and Moderna |
| | |
| 74 | | AstraZenecaAnnual Report and Form 20-F Information 2015 |
| | Therapeutics will be entitled to development and commercial milestone payments as well as royalties on drug sales. AstraZeneca will lead the pre-clinical, clinical development and commercialisation of therapeutics resulting from the agreement and Moderna Therapeutics will be responsible for designing and manufacturingthe messenger RNA Therapeutics against selected targets. AstraZeneca is currently progressing 19 projects across CVMD and Oncology. Utilising both companies expertise, significant progress has also been made to the technology platform, with the focus on formulation, safety, and drug metabolism and pharmacokinetics. |
The Group determines the above business development transactions to be significant using a range of factors. We look at the specific circumstances of the individual externalisation arrangement and apply several quantitative and qualitative criteria. Because we consider business development transactions to be an extension of our R&D strategy, the expected total value of development payments under the transaction and its proportion of our annual R&D spend, both of which are proxies for overall R&D effort and cost, are important elements of the significance determination. Other quantitative criteria we apply include, without limitation, expected levels of future sales, the possible value of milestone payments and the resources used for commercialisation activities (for example, the number of staff). Qualitative factors we consider include, without limitation, new market developments, new territories, new areas of research and strategic implications.
In aggregate, payments capitalised under the Group’s externalisation arrangements, other than those detailed above, amounted to $1,401 million in 2015 (2014: $201 million), including $684 million on the acquisition of the Actavis branded respiratory portfolio in the US and Canada.
Details of our significant divestments are given below:
| > | In November 2015, AstraZeneca signed an agreement with Elan Pharma International Limited, part of the Perrigo Group (Perrigo), for the divestment of rights to theEntocortbusiness in US. TheEntocortbusiness in the US consisted of |
| | a branded product marketed by AstraZeneca (Entocort EC) and an authorised generic marketed by PAR Pharmaceuticals under an exclusive distribution agreement. Under the terms of the agreement, Perrigo paid AstraZeneca $380 million upon completion of the transaction to acquire the rights to sellEntocortcapsules and the authorised genericEntocort capsules marketed by Par Pharmaceuticals. The transaction involved the full divestment of US rights inEntocort, including relevant clinical data, regulatory documentation and contracts, and inventory of finished packEntocortEC and authorised generic capsules. The transaction did not include the transfer of any AstraZeneca employees or facilities. |
| > | In September 2015, AstraZeneca completed an agreement with Genzyme Corporation (Genzyme), part of Sanofi S.A., for the divestment ofCaprelsa, a rare-disease medicine. Caprelsa was granted Orphan Drug Designation by the US FDA in 2005 and is currently available in 28 countries for the treatment of aggressive and symptomatic medullary thyroid carcinoma. Under the terms of the agreement, Genzyme paid an upfront payment of $165 million to acquire the global rights to sell and developCaprelsa, and further development and sales milestone payments of up to $135 million. The transaction did not include the transfer of any AstraZeneca employees or facilities. |
| > | In July 2015, AstraZeneca signed an agreement with Tillotts Pharma AG for the divestment of global rights, outside the US, toEntocort(budesonide).Entocort is a gastroenterology medicine for patients with mild to moderate Crohn’s disease and ulcerative colitis.Entocort is currently available in over 40 countries, with total Product Sales of $53 million outside the US in 2014. Under the terms of the agreement, Tillotts paid AstraZeneca $215 million upon completion of the transaction to acquire the rights to sell and developEntocort capsules and enema formulations outside the US. The transaction did not include the transfer of any AstraZeneca employees or facilities. |
| > | In January 2015, AstraZeneca completed an agreement with Aegerion Pharmaceuticals, to divestMyalept (metreleptin for injection).Myalept was originally developed by Amylin and |
| | acquired by BMS in collaboration with AstraZeneca in July 2012 and subsequently acquired in whole by AstraZeneca in February 2014. Aegerion paid AstraZeneca $325 million, in a single upfront payment, to acquire the global rights to develop, manufacture and commercialiseMyalept, subject to an existing distributor licence with Shionogi covering Japan, South Korea, and Taiwan. On completion, theMyaleptintangible was $123 million, which was derecognised along with inventory of $9 million, resulting in a gain on disposal of $193 million being recognised as other operating income. |
Capitalisation
The total number of shares in issue at 31 December 2015 was 1,264 million (2014: 1,263 million). One million Ordinary Shares were issued in consideration of share option exercises for a total of $43 million. Shareholders’ equity decreased by $1,137 million to $18,490 million at the year end. Non-controlling interests were $19 million (2014: $19 million).
Dividend and share repurchases
The Board has recommended a second interim dividend of $1.90 (131.0 pence, 16.26 SEK) to be paid on 21 March 2016. This brings the full year dividend to $2.80 (188.5 pence, 23.97 SEK). Based on a measure of Core earnings per share against Core operating profit, the Group has a dividend cover ratio of 1.5 with respect to 2015 (2014: 1.5).
This dividend is consistent with the progressive dividend policy, by which the Board intends to maintain or grow the dividend each year.
The Board regularly reviews its distribution policy and its overall financial strategy to continue to strike a balance between the interests of the business, our financial creditors and our shareholders. Having regard for business investment, funding the progressive dividend policy and meeting our debt service obligations, the Board currently believes it is appropriate to continue the suspension of the share repurchase programme which was announced in October 2012.
| | |
| AstraZenecaAnnual Report and Form 20-F Information 2015 | | 75 |
Strategic Report | Strategy
Financial Reviewcontinued
Capitalisation and shareholder return
Dividends for 2015
| | | | | | | | | | | | | | | | |
| | | $ | | | Pence | | | SEK | | | Payment date | |
| First interim dividend | | | 0.90 | | | | 57.5 | | | | 7.71 | | | | 14 September 2015 | |
| Second interim dividend | | | 1.90 | | | | 131.0 | | | | 16.26 | | | | 21 March 2016 | |
| Total | | | 2.80 | | | | 188.5 | | | | 23.97 | | | | | |
Summary of shareholder distributions
| | | | | | | | | | | | | | | | | | | | |
| | | Shares | | | | | | Dividend per | | | Dividend | | | Shareholder | |
| | | repurchased | | | Cost | | | share | | | cost | | | distributions | |
| | | (million) | | | $m | | | $ | | | $m | | | $m | |
| 2000 | | | 9.4 | | | | 352 | | | | 0.70 | | | | 1,236 | | | | 1,588 | |
| 2001 | | | 23.5 | | | | 1,080 | | | | 0.70 | | | | 1,225 | | | | 2,305 | |
| 2002 | | | 28.3 | | | | 1,190 | | | | 0.70 | | | | 1,206 | | | | 2,396 | |
| 2003 | | | 27.2 | | | | 1,154 | | | | 0.795 | | | | 1,350 | | | | 2,504 | |
| 2004 | | | 50.1 | | | | 2,212 | | | | 0.94 | | | | 1,555 | | | | 3,767 | |
| 2005 | | | 67.7 | | | | 3,001 | | | | 1.30 | | | | 2,068 | | | | 5,069 | |
| 2006 | | | 72.2 | | | | 4,147 | | | | 1.72 | | | | 2,649 | | | | 6,796 | |
| 2007 | | | 79.9 | | | | 4,170 | | | | 1.87 | | | | 2,740 | | | | 6,910 | |
| 2008 | | | 13.6 | | | | 610 | | | | 2.05 | | | | 2,971 | | | | 3,581 | |
| 2009 | | | – | | | | – | | | | 2.30 | | | | 3,339 | | | | 3,339 | |
| 2010 | | | 53.7 | | | | 2,604 | | | | 2.55 | | | | 3,604 | | | | 6,208 | |
| 2011 | | | 127.4 | | | | 6,015 | | | | 2.80 | | | | 3,653 | | | | 9,668 | |
| 2012 | | | 57.8 | | | | 2,635 | | | | 2.80 | | | | 3,496 | | | | 6,131 | |
| 2013 | | | – | | | | – | | | | 2.80 | | | | 3,522 | | | | 3,522 | |
| 2014 | | | – | | | | – | | | | 2.80 | | | | 3,537 | | | | 3,537 | |
| 2015 | | | – | | | | – | | | | 2.80 | | | | 3,539 | 1 | | | 3,539 | |
| Total | | | 610.8 | | | | 29,170 | | | | 29.625 | | | | 41,690 | | | | 70,860 | |
| 1 | Total dividend cost estimated based upon number of shares in issue at 31 December 2015. |
Future prospects
As outlined earlier in this Annual Report, our strategy is focused on innovation, returning to growth and building a sustainable, durable and more profitable business. In support of this, we made certain choices around our three strategic priorities.
As we experience a period of patent expiries:
| > | Our immediate priorities are to continue to drive Product Sales of our on-market medicines through investment in our Growth Platforms and our portfolio of legacy medicines outside of the Growth Platforms. The Growth Platforms include products in our three main therapy areas, and a focus on the Emerging Markets and Japan. We are also pursuing business development and investment in R&D. We have already accelerated a number of projects and progressed them into Phase III development. |
| > | Our late-stage pipeline is progressing ahead of plans. Our science-driven, collaborative culture is driving increased R&D productivity. |
| > | Our long-term aspiration, in line with our strategic ambition, is to achieve scientific leadership and sustainable growth, and to achieve $45 billion Total Revenue by 2023 (based on constant exchange rates). |
We expect 2016 Total Revenue to decline by low to mid single-digit percent at CER compared to 2015. Core R&D costs as a percentage of Total Revenue are expected to be broadly in line with 2015. We are also committed to reducing Core SG&A costs in 2016 versus 2015. Core earnings per share is expected to decrease in 2016 by low to mid single-digit percent at CER. This guidance incorporates the dilutive effects arising from recent transactions.
Financial risk management
Financial risk management policies
Insurance
Our risk management processes are described in Risk overview from page 21. These processes enable us to identify risks that can be partly or entirely mitigated through the use of insurance. We negotiate the best available premium rates with
insurance providers on the basis of our extensive risk management procedures. We focus our insurance resources on the most critical areas, or where there is a legal requirement, and where we can get best value for money. Risks to which we pay particular attention include business interruption, Directors’ and Officers’ liability, and property damage. Insurance for product liability has not been available on commercially acceptable terms for several years and the Group has not purchased in the market product liability insurance since February 2006.
Taxation
Tax risk management forms an integrated part of the Group’s risk management processes. Our tax strategy is to manage tax risks and tax costs in a manner consistent with shareholders’ best long-term interests, taking into account both economic and reputational factors. We draw a distinction between tax planning using artificial structures and optimising tax treatment of business transactions, and we engage only in the latter.
| | |
| 76 | | AstraZenecaAnnual Report and Form 20-F Information 2015 |
Treasury
The principal financial risks to which the Group is exposed are those arising from liquidity, interest rate, foreign currency and credit. The Group has a centralised treasury function to manage these risks in accordance with Board-approved policies. Specifically, liquidity risk is managed through maintaining access to a number of sources of funding to meet anticipated funding requirements, including committed bank facilities and cash resources. Interest rate risk is managed through maintaining a debt portfolio that is weighted towards fixed rates of interest. Accordingly, the Group’s net interest charge is not significantly affected by movements in floating rates of interest. We monitor the impact of currency on a portfolio basis (to recognise correlation effect), and may hedge to protect against significant adverse impacts on cash flow over the short- to medium-term. We also hedge the currency exposure that arises between the booking and settlement dates on non-local currency purchases and sales by subsidiaries and the external dividend.
Credit risk is managed through setting and monitoring credit limits appropriate for the assessed risk of the counterparty.
Our capital and risk management objectives and policies are described in further detail in Note 25 to the Financial Statements from page 177 and in Risk overview from page 21.
Sensitivity analysis of the Group’s exposure to exchange rate and interest rate movements is also detailed in Note 25 to the Financial Statements from page 177.
Critical accounting policies and estimates
Our Financial Statements are prepared in accordance with IFRSs as adopted by the EU (adopted IFRS) and as issued by the IASB, and the accounting policies employed are set out in the Group Accounting Policies section in the Financial Statements from page 144. In applying these policies, we make estimates and assumptions that affect the reported amounts of assets and liabilities and disclosure of contingent assets and liabilities. The actual outcome could differ from those estimates. Some of these policies require a high level of judgement because the areas are especially subjective or complex. We believe that the most critical
accounting policies and significant areas of judgement and estimation are in
| > | research and development |
| > | impairment testing of goodwill and intangible assets |
| > | post-retirement benefits |
Revenue recognition
Product Sales are recorded at the invoiced amount (excluding inter-company sales and value-added taxes) less movements in estimated accruals for rebates and chargebacks given to managed-care and other customers and product returns – a particular feature in the US. It is the Group’s policy to offer a credit note for all returns and to destroy all returned stock in all markets. Cash discounts for prompt payment are also deducted from sales. Revenue is recognised at the point of delivery, which is usually when title passes to the customer, either on shipment or on receipt of goods by the customer depending on local trading terms. Income from royalties and from disposals of IP, brands and product lines is included in other operating income.
Rebates, chargebacks and returns in the US
When invoicing Product Sales in the US, we estimate the rebates and chargebacks that we expect to pay. These rebates typically arise from sales contracts with third party managed-care organisations, hospitals, long-term care facilities, group purchasing organisations and various federal or state programmes (Medicaid contracts, supplemental rebates etc). They can be classified as follows:
| > | Chargebacks, where we enter into arrangements under which certain parties, typically hospitals, long-term care facilities, group purchasing organisations, the Department of Veterans Affairs, Public Health Service Covered Entities and the Department of Defense, are able to buy products from wholesalers at the lower prices we have contracted with them. The chargeback is the difference between the price we invoice to the wholesaler and the contracted price charged by the wholesaler. Chargebacks are paid directly to the wholesalers. |
| > | Regulatory, including Medicaid and other federal and state programmes, where we pay rebates based on the specific terms of agreements with the US Department of Health and Human Services and with individual states, which include product usage and information on best prices and average market prices benchmarks. |
| > | Contractual, under which entities such as third party managed-care organisations are entitled to rebates depending on specified performance provisions, which vary from contract to contract. |
The effects of these deductions on our US pharmaceuticals revenue and the movements on US pharmaceuticals revenue provisions are set out overleaf.
Accrual assumptions are built up on a product-by-product and customer-by-customer basis, taking into account specific contract provisions coupled with expected performance, and are then aggregated into a weighted average rebate accrual rate for each of our products. Accrual rates are reviewed and adjusted on a monthly basis. There may be further adjustments when actual rebates are invoiced based on utilisation information submitted to us (in the case of contractual rebates) and claims/invoices are received (in the case of regulatory rebates and chargebacks). We believe that we have made reasonable estimates for future rebates using a similar methodology to that of previous years. Inevitably, however, such estimates involve judgements on aggregate future sales levels, segment mix and the customers’ contractual performance.
Overall adjustments between gross and net US Product Sales amounted to $13,993 million in 2015 (2014: $13,181 million) with increases in adjustments for regulatory and chargebacks, and sales initiatives recorded within other, driving the movement.
Cash discounts are offered to customers to encourage prompt payment. Accruals are calculated based on historical experience and are adjusted to reflect actual experience.
| | |
| AstraZenecaAnnual Report and Form 20-F Information 2015 | | 77 |
Strategic Report | Strategy
Financial Reviewcontinued
Gross to net Product Sales – US pharmaceuticals
| | | | | | | | | | | | | | | | | | | | |
| | | | | | | | | 2015 | | | 2014 | | | 2013 | |
| | | | | | | | | $m | | | $m | | | $m | |
| Gross Product Sales | | | | | | | | | | | 23,467 | | | | 23,301 | | | | 21,345 | |
| Chargebacks | | | | | | | | | | | (2,985 | ) | | | (2,794 | ) | | | (2,449 | ) |
| Regulatory – US government and state programmes | | | | | | | | | | | (1,714 | ) | | | (1,389 | ) | | | (1,435 | ) |
| Contractual – Managed-care and group purchasing organisation rebates | | | | | | | | | | | (7,543 | ) | | | (7,730 | ) | | | (6,918 | ) |
| Cash and other discounts | | | | | | | | | | | (472 | ) | | | (436 | ) | | | (399 | ) |
| Customer returns | | | | | | | | | | | (333 | ) | | | (295 | ) | | | (112 | ) |
| Other | | | | | | | | | | | (946 | ) | | | (537 | ) | | | (341 | ) |
| Net Product Sales | | | | | | | | | | | 9,474 | | | | 10,120 | | | | 9,691 | |
Movement in provisions – US pharmaceuticals | |
| | | Brought | | | | | | | | | | | | Carried | |
| | | forward at | | | | | | Adjustment in | | | | | | forward at | |
| | | 1 January | | | Provision for | | | respect of | | | Returns and | | | 31 December | |
| | | 2015 | | | current year | | | prior years | | | payments | | | 2015 | |
| | | $m | | | $m | | | $m | | | $m | | | $m | |
| Chargebacks | | | 457 | | | | 3,019 | | | | (34 | ) | | | (3,118 | ) | | | 324 | |
| Regulatory – US government and state programmes | | | 707 | | | | 1,809 | | | | (95 | ) | | | (1,644 | ) | | | 777 | |
| Contractual – Managed-care and group purchasing organisation rebates | | | 2,366 | | | | 7,666 | | | | (123 | ) | | | (7,703 | ) | | | 2,206 | |
| Cash and other discounts | | | 33 | | | | 464 | | | | 8 | | | | (461 | ) | | | 44 | |
| Customer returns | | | 318 | | | | 349 | | | | (16 | ) | | | (184 | ) | | | 467 | |
| Other | | | 163 | | | | 947 | | | | (1 | ) | | | (923 | ) | | | 186 | |
| Total | | | 4,044 | | | | 14,254 | | | | (261 | ) | | | (14,033 | ) | | | 4,004 | |
| | | | | | | | | | | | | | | | | | | | | |
| | | Brought | | | | | | | | | | | | Carried | |
| | | forward at | | | | | | Adjustment in | | | | | | forward at | |
| | | 1 January | | | Provision for | | | respect of | | | Returns and | | | 31 December | |
| | | 2014 | | | current year | | | prior years | | | payments | | | 2014 | |
| | | $m | | | $m | | | $m | | | $m | | | $m | |
| Chargebacks | | | 355 | | | | 2,838 | | | | (44 | ) | | | (2,692 | ) | | | 457 | |
| Regulatory – US government and state programmes | | | 784 | | | | 1,544 | | | | (155 | ) | | | (1,466 | ) | | | 707 | |
| Contractual – Managed-care and group purchasing organisation rebates | | | 1,714 | | | | 7,703 | | | | 27 | | | | (7,078 | ) | | | 2,366 | |
| Cash and other discounts | | | 32 | | | | 436 | | | | – | | | | (435 | ) | | | 33 | |
| Customer returns | | | 222 | | | | 295 | | | | – | | | | (199 | ) | | | 318 | |
| Other | | | 74 | | | | 537 | | | | – | | | | (448 | ) | | | 163 | |
| Total | | | 3,181 | | | | 13,353 | | | | (172 | ) | | | (12,318 | ) | | | 4,044 | |
| | | | | | | | | | | | | | | | | | | | | |
| | | Brought | | | | | | | | | | | | Carried | |
| | | forward at | | | | | | Adjustment in | | | | | | forward at | |
| | | 1 January | | | Provision for | | | respect of | | | Returns and | | | 31 December | |
| | | 2013 | | | current year | | | prior years | | | payments | | | 2013 | |
| | | $m | | | $m | | | $m | | | $m | | | $m | |
| Chargebacks | | | 313 | | | | 2,439 | | | | 10 | | | | (2,407 | ) | | | 355 | |
| Regulatory – US government and state programmes | | | 825 | | | | 1,447 | | | | (12 | ) | | | (1,476 | ) | | | 784 | |
| Contractual – Managed-care and group purchasing organisation rebates | | | 1,348 | | | | 6,951 | | | | (33 | ) | | | (6,552 | ) | | | 1,714 | |
| Cash and other discounts | | | 33 | | | | 399 | | | | – | | | | (400 | ) | | | 32 | |
| Customer returns | | | 211 | | | | 99 | | | | 13 | | | | (101 | ) | | | 222 | |
| Other | | | 45 | | | | 341 | | | | – | | | | (312 | ) | | | 74 | |
| Total | | | 2,775 | | | | 11,676 | | | | (22 | ) | | | (11,248 | ) | | | 3,181 | |
| | |
| 78 | | AstraZenecaAnnual Report and Form 20-F Information 2015 |
Industry practice in the US allows wholesalers and pharmacies to return unused stocks within six months of, and up to 12 months after, shelf-life expiry. The customer is credited for the returned product by the issuance of a credit note. Returned products are not exchanged for products from inventory and once a return claim has been determined to be valid and a credit note has been issued to the customer, the returned products are destroyed. At the point of sale in the US, we estimate the quantity and value of products which may ultimately be returned. Our returns accruals in the US are based on actual experience. Our estimate is based on the preceding 12 months for established products together with market-related information, such as estimated stock levels at wholesalers and competitor activity, which we receive via third party information services. For newly launched products, we use rates based on our experience with similar products or a pre-determined percentage.
For products facing generic competition, we may lose the ability to estimate the levels of returns from wholesalers with the same degree of precision that we can for products still subject to patent protection. This is because we may have limited or no insight into a number of areas: the actual timing of the generic launch (for example, a generic manufacturer may or may not have produced adequate pre-launch inventory); the pricing and marketing strategy of the competitor; the take-up of the generic; and (in cases where a generic manufacturer has approval to launch only one dose size in a market of several dose sizes) the likely level of switching from one dose to another. Under our accounting policy, revenue is recognised only when the amount of the revenue can be measured reliably. Our approach in meeting this condition for products facing generic competition will vary from product to product depending on the specific circumstances.
The adjustment in respect of prior years increased 2015 net US pharmaceuticals revenue by 2.8% (2014: 1.7%; 2013: 0.2%). However, taking into account the adjustments affecting both the current and the prior year, 2014 revenue would have been increased by 0.9% and 2013 revenue would have been increased by 1.5%, by adjustments between years.
We have distribution service agreements with major wholesaler buyers which serve to reduce the speculative purchasing behaviour of the wholesalers and reduce short-term fluctuations in the level of inventory they hold. We do not offer any incentives to encourage wholesaler speculative buying and attempt, where possible, to restrict shipments to underlying demand when such speculation occurs.
Component revenue accounting
A consequence of charging all internal R&D expenditure to the income statement in the year in which it is incurred (which is normal practice in the pharmaceutical industry) is that we own valuable intangible assets which are not recorded on the balance sheet. We also own acquired intangible assets which are included on the balance sheet. As detailed on page 66, the Group’s externalisation business model means that, from time to time, we sell such assets and generate income. Sales of product lines are often accompanied by an agreement on our part to continue manufacturing the relevant product for a reasonable period (often about two years) while the purchaser constructs its own manufacturing facilities. The contracts typically involve the receipt of an upfront payment, which the contract attributes to the sale of the intangible assets, and ongoing receipts, which the contract attributes to the sale of the product we manufacture. In cases where the transaction has two or more components, we account for the delivered item (for example, the transfer of title to the intangible asset) as a separate unit of accounting and record revenue on delivery of that component, provided that we can make a reasonable estimate of the fair value of the undelivered component. Where the fair market value of the undelivered component (for example, a manufacturing agreement) exceeds the contracted price for that component, we defer an appropriate element of the upfront consideration and amortise this over the performance period. However, where the fair market value of the undelivered component is equal to or lower than the contracted price for that component, we treat the whole of the upfront amount as being attributable to the delivered intangible assets and recognise that part of the revenue upon delivery. No element of the contracted revenue related to the undelivered component is allocated to
the sale of the intangible asset. This is because the contracted revenue relating to the undelivered component is contingent on future events (such as sales) and so cannot be anticipated.
Research and development
Our business is underpinned by our marketed products and development portfolio. The R&D expenditure on internal activities to generate these products is generally charged to profit in the year that it is incurred. Purchases of IP and product rights to supplement our R&D portfolio are capitalised as intangible assets. Further details of this policy are included in the Group Accounting Policies section of our Financial Statements from page 144. Such intangible assets are amortised from the launch of the underlying products and are tested for impairment both before and after launch. This policy is in line with practice adopted by major pharmaceutical companies.
Impairment testing of goodwill and intangible assets
We have significant investments in goodwill and intangible assets as a result of acquisitions of businesses and purchases of assets, such as product development and marketing rights.
Details of the estimates and assumptions we make in our annual impairment testing of goodwill are included in Note 8 to the Financial Statements on page 157. The Group, including acquisitions, is considered a single cash-generating unit for impairment purposes. No impairment of goodwill was identified.
Impairment reviews have been carried out on all intangible assets that are in development (and not being amortised), all major intangible assets acquired during the year and all intangible assets that have had indications of impairment during the year. Sales forecasts and specific allocated costs (which have both been subject to appropriate senior management sign-off) are discounted using appropriate rates based on AstraZeneca’s risk-adjusted, pre-tax weighted average cost of capital. Our weighted average cost of capital reflects factors such as our capital structure and our costs of debt and equity. In building to the range of rates used in our internal investment appraisal of future projects and
| | |
| AstraZenecaAnnual Report and Form 20-F Information 2015 | | 79 |
Strategic Report
Financial Reviewcontinued
capital investment decisions, we adjust our weighted average cost of capital for other factors which reflect, without limitation, local matters such as risk on a case-by-case basis.
A significant portion of our investments in intangible assets and goodwill arose from the restructuring of the joint venture with Merck in 1998, the acquisition of MedImmune in 2007, and the payments arising from the restructuring of the joint venture with Merck in the US. In addition, our recent business combinations, as detailed in Note 24 to the Financial Statements from page 173, have added significant product, marketing and distribution intangible rights to our intangible asset portfolio. We are satisfied that the carrying values of our intangible assets as at 31 December 2015 are fully justified by estimated future cash flows. The accounting for our intangible assets is fully explained in Note 9 to the Financial Statements from page 158.
Further details of the estimates and assumptions we make in impairment testing of intangible assets are included in Note 9 to the Financial Statements.
Litigation
In the normal course of business, contingent liabilities may arise from product-specific and general legal proceedings, from guarantees or from environmental liabilities connected with our current or former sites. Where we believe that potential liabilities have a less than 50% probability of crystallising, or where we are unable to make a reasonable estimate of the liability, we treat them as contingent liabilities. These are not provided for but are disclosed in Note 27 to the Financial Statements from page 186.
In cases that have been settled or adjudicated, or where quantifiable fines and penalties have been assessed and which are not subject to appeal (or other similar forms of relief), or where a loss is probable (more than 50% assessed probability) and we are able to make a reasonable estimate of the loss, we indicate the loss absorbed or the amount of the provision accrued.
Where it is considered that the Group is more likely than not to prevail, or in the rare circumstances where the amount of the legal liability cannot be estimated reliably, legal costs involved in defending the claim are charged to profit as they are incurred. Where it is considered that the Group has a valid contract which provides the right to reimbursement (from insurance or otherwise) of legal costs and/or all or part of any loss incurred or for which a provision has been established and we consider recovery to be virtually certain, then the best estimate of the amount expected to be received is recognised as an asset.
Assessments as to whether or not to recognise provisions or assets and of the amounts concerned usually involve a series of complex judgements about future events and can rely heavily on estimates and assumptions. AstraZeneca believes that the provisions recorded are adequate based on currently available information and that the insurance recoveries recorded will be received. However, given the inherent uncertainties involved in assessing the outcomes of these cases and in estimating the amount of the potential losses and the associated insurance recoveries, we could in future periods incur judgments or insurance settlements that could have a material adverse effect on our results in any particular period.
The position could change over time, and there can, therefore, be no assurance that any losses that result from the outcome of any legal proceedings will not exceed the amount of the provisions that have been booked in the accounts.
Although there can be no assurance regarding the outcome of legal proceedings, we do not currently expect them to have a material adverse effect on our financial position, but they could significantly affect our financial results in any particular period.
Post-retirement benefits
We offer post-retirement benefit plans which cover many of our employees around the world. In keeping with local terms and conditions, most of these plans are defined contribution in nature, where the resulting income statement charge is fixed at a set
level or is a set percentage of employees’ pay. However, several plans, mainly in the UK (which has by far the largest single scheme), the US, Sweden and Germany are defined benefit plans where benefits are based on employees’ length of service and final salary (typically averaged over one, three or five years). The UK and US defined benefit schemes were closed to new entrants in 2000. All new employees in these countries are offered defined contribution schemes.
In applying IAS 19 ‘Employee Benefits’, we recognise all actuarial gains and losses immediately through Other Comprehensive Income. Investment decisions in respect of defined benefit schemes are based on underlying actuarial and economic circumstances with the intention of ensuring that the schemes have sufficient assets to meet liabilities as they fall due, rather than meeting accounting requirements. The trustees follow a strategy of awarding mandates to specialist, active investment managers, which results in a broad diversification of investment styles and asset classes. The investment approach is intended to produce less volatility in the plan asset returns.
In assessing the discount rate applied to the obligations, we have used rates on AA corporate bonds with durations corresponding to the maturities of those obligations, except in Sweden where we have used rates on mortgage bonds as the market in high quality corporate bonds is insufficiently deep.
In all cases, the pension costs recorded in the Financial Statements are assessed in accordance with the advice of independent qualified actuaries, but require the exercise of significant judgement in relation to assumptions for long-term price inflation and, future salary and pension increases.
Further details of our accounting for post-retirement benefit plans are included in Note 20 to the Financial Statements from page 166.
| | |
| 80 | | AstraZenecaAnnual Report and Form 20-F Information 2015 |
Taxation
Accruals for tax contingencies require management to make judgements and estimates in relation to tax audit issues and exposures. Amounts accrued are based on management’s interpretation of country-specific tax law and the likelihood of settlement. Tax benefits are not recognised unless the tax positions are probable of being sustained. Once considered to be probable, management reviews each material tax benefit to assess whether a provision should be taken against full recognition of the benefit on the basis of potential settlement through negotiation and/or litigation. Any recorded exposure to interest on tax liabilities is provided for in the tax charge.
AstraZeneca faces a number of transfer pricing audits in jurisdictions around the world and, in some cases, is in dispute with the tax authorities. These disputes usually result in taxable profits being increased in one territory and correspondingly decreased in another. Our balance sheet positions for these matters reflect appropriate corresponding relief in the territories affected.
Further details of the estimates and assumptions we make in determining our recorded liability for transfer pricing audits and other tax contingencies are included in the Tax section of Note 27 to the Financial Statements on page 192.
Sarbanes-Oxley Act Section 404
As a consequence of our NYSE listing, AstraZeneca is required to comply with those provisions of the Sarbanes-Oxley Act applicable to foreign issuers. Section 404 of the Sarbanes-Oxley Act requires companies annually to assess and make public statements about the quality and effectiveness of their internal control over financial reporting. As regards Sarbanes-Oxley Act Section 404, our approach is based on the Committee of Sponsoring Organizations (COSO) 2013 framework.
Our approach to the assessment has been to select key transaction and financial reporting processes in our largest operating units and a number of specialist areas, such as financial consolidation and reporting,
treasury operations and taxation, so that, in aggregate, we have covered a significant proportion of the key lines in our Financial Statements. Each of these operating units and specialist areas has ensured that its relevant processes and controls are documented to appropriate standards, taking into account, in particular, the guidance provided by the SEC. We have also reviewed the structure and operation of our ‘entity level’ control environment. This refers to the overarching control environment, including structure of reviews, checks and balances that are essential to the management of a well-controlled business.
The Directors have concluded that our internal control over financial reporting is effective at 31 December 2015 and the assessment is set out in the Directors’ Responsibilities for, and Report on, Internal Control over Financial Reporting on page 135. KPMG LLP has audited the effectiveness of our internal control over financial reporting at 31 December 2015 and, as noted in the Auditor’s Reports on the Financial Statements and on Internal Control over Financial Reporting (Sarbanes-Oxley Act Section 404) on page 136, their report is unqualified.
Strategic Report
The Strategic Report, which has been prepared in accordance with the requirements of the Companies Act 2006, comprises the following sections
> AstraZeneca at a glance
> Chief Executive Officer’s Review
> Strategy
> Therapy Area Review
> Business Review
> Resources Review
> Financial Review
and has been approved and signed on behalf of the Board.
A C N Kemp
Company Secretary
4 February 2016
| | |
| AstraZenecaAnnual Report and Form 20-F Information 2015 | | 81 |
Corporate Governance
Chairman’s Statement
| | | | |
 | | …we are integrating sustainability into how we measure the success with which we are delivering our strategic priorities.” |
The Board of Directors has sought to ensure that AstraZeneca’s achievements in 2015 were underpinned by strong corporate governance. Our efforts were also focused on ensuring that the Group’s future success is supported by corporate governance best practice. | | John Varley had also undertaken the important role of Senior independent Non-Executive Director. I am grateful to Rudy Markham for taking on this role. Transparent reporting Rudy also chairs the Audit Committee which has a crucial role in reviewing our financial reporting, risk management and financial controls. We aim to be as transparent as we can in our reporting and, with that in mind, in preparing our viability statement which is on page 21 of this Annual Report, we also reviewed our principal risks, how we describe them and the information we provide about them. I am grateful to the members of the Audit Committee for their thorough work in undertaking a competitive tender process for our external audit services in line with best practice. As a result of this, the Board will be recommending the appointment of PricewaterhouseCoopers LLP at our AGM in 2017. A sustainable business Geneviève Berger is another valued member of the Board and the Science Committee. She also performs a vital role in overseeing AstraZeneca’s sustainability framework and reporting to the Board. For AstraZeneca, sustainability means implementing our strategy and delivering the targets we have set ourselves in a way that promotes the long-term health of AstraZeneca, the societies in which we work, and the planet. Employees and external stakeholders expect it and AstraZeneca’s future ability to get new medicines to patients in the most efficient |
Governance in support of our strategy In his introduction to the Strategic Report, our Chief Executive Officer, Pascal Soriot, outlined a successful year for AstraZeneca in implementing our strategy. The chart overleaf summarises the governance structure we have in place to ensure that the Board is able properly to discharge its responsibilities in setting that strategy, as well as monitoring and reviewing its progress, and ensuring that we manage our risks and carry out business responsibly. Another important part of our work is listening to the views of external stakeholders, whether they are medical practitioners and clinical researchers, or representatives of investors and financial institutions. We also maintain an active dialogue with shareholders about executive remuneration. Looking ahead, we will be spending more time considering succession planning to ensure we have the leaders we need to deliver our goal of sustainable growth over the longer term. Committees of the Board The Board’s work is supported by four principal Committees and I am grateful to their members, and especially their Chairmen, for the role they play in the robust governance of AstraZeneca. | | I would like to thank Graham Chipchase for assuming the role of Chairman of the Remuneration Committee after John Varley stood down at last year’s AGM, having spent nine years as a Non-Executive Director. The Directors’ Remuneration Report can be found from page 103 and Graham’s Committee plays an essential role in ensuring that the interests of the Executive Directors and other senior leaders are aligned with the interests of shareholders over the short, medium and longer term. Thanks are also due to Bruce Burlington who became Chairman of the Science Committee during the year, in succession to Nancy Rothwell, who also stood down at last year’s AGM, having spent nine years as a Board member. This Committee provides assurance to the Board on the quality, competitiveness and integrity of our science. Both of these Committees were strengthened further during the year when Shriti Vadera and Cori Bargmann (who was elected for the first time as a Non-Executive Director at our AGM in 2015) became members respectively of the Remuneration Committee and the Science Committee. | |
| | |
| 82 | | AstraZenecaAnnual Report and Form 20-F Information 2015 |
| | | | |
Compliance with the UK Corporate Governance Code | | |
We have prepared this Annual Report with reference to the UK Corporate Governance Code published by the UK Financial Reporting Council (FRC) in September 2014. This Corporate Governance Report (together with other sections of this Annual Report) describes how we apply the main principles of good governance in the UK Corporate Governance Code. | | We have complied throughout the accounting period with the provisions of the UK Corporate Governance Code, which is available on the FRC’s website. www.frc.co.uk | | |
| | |
way depends on it. Moreover, it helps attract and retain talented employees and enhances trust in our business and our reputation. In acting in this way, we not only protect our licence to operate but also deliver value to those who benefit from our medicines, our shareholders, society and the environment. Achievements recognised AstraZeneca has been working for over a decade to achieve business success in a responsible manner. For example, we have delivered safety, health and environment improvements and created a diverse workforce; we have promoted the development of our products in an ethical way; and taken steps to broaden access to our medicines. I am also pleased to report that, in 2015, we met all our obligations under our five-year Corporate Integrity Agreement in the US, which has now come to an end. Maintaining high ethical standards in the way we conduct our business remains a priority. Our achievements were once again recognised in 2015 with an improved score of 84% (79% in 2014) in the Dow Jones Sustainability Index. Our score contributed to the ‘Silver Class’ rating awarded to us for our sustainability performance by RobecoSAM, the respected sustainability investment specialist. Looking ahead, if we are to be among the best performers, there is more we need to do. We have refreshed and strengthened our governance arrangements, as outlined in the section, In the wider world from page 55, and we are integrating sustainability into | | how we measure the success with which we are delivering our strategic priorities. We need to build on that by focusing our work and ensuring that sustainability thinking is part of our culture and embedded into the way we do business. A challenging business environment In his Financial Review on page 62, our Chief Financial Officer, Marc Dunoyer, reported on the accelerating performance of our Growth Platforms. He also reported on the continued impact of the loss of exclusivity as medicines such asNexium andCrestor continue to lose exclusivity in key markets, including the US and Europe. Such a loss of exclusivity is a normal part of an innovative medicine’s life-cycle. It is expected and we plan for it. Even as we plan for loss of exclusivity, we continue to face challenging market conditions. The world pharmaceutical market is growing and underlying demographic trends remain favourable. Nonetheless, many of the drivers of demand and supply in the sector are under pressure. On the demand side, we face increased competition from generic drugs. In addition, securing an appropriate level of reward for our medicines is becoming more difficult in the face of pricing pressures. On the supply side, the industry faces an ongoing R&D productivity challenge. Costs have risen and, although in 2015 the FDA approved the highest number of new medicines since 1996, we still need to improve the probability of success of our projects. | | Return to shareholders Consistent with our progressive dividend policy, the Board has recommended a second interim dividend of $1.90 per Ordinary Share. This brings the dividend for the full year to $2.80 per Ordinary Share. The Board’s aim is to continue to strike a balance between the interests of the business, financial creditors and our shareholders. After providing for investment in the business, supporting the progressive dividend policy and maintaining a strong investment-grade credit rating, the Board will keep under review investment in earnings-accretive opportunities. Appreciation Before closing, and on behalf of the Board, I want to thank the employees of AstraZeneca. Their outstanding efforts helped make 2015 a great year for science and patients. In particular, I want to express my appreciation to Pascal and all the members of the Senior Executive Team for their leadership in delivering a successful year. 
Leif Johansson Chairman |

| | |
| AstraZenecaAnnual Report and Form 20-F Information 2015 | | 83 |
Corporate Governance
Corporate Governance Overview
How our governance supports the delivery of our strategy.
| | | | | | | | |
Board Chairman: Leif Johansson Senior independent Non-Executive Director: Rudy Markham All Directors are collectively responsible for the success of the Group. The Non-Executive Directors exercise independent, objective judgement in respect of Board decisions, and scrutinise and challenge management. They also have various responsibilities concerning the integrity of financial information, internal controls and risk management. The Board is responsible for setting our strategy and policies, overseeing risk and corporate governance, and monitoring progress towards meeting our objectives and annual plans. It is accountable to our shareholders for the proper conduct of the business and our long-term success, and represents the interests of all stakeholders. The Board conducts an annual review of the Group’s overall strategy. The CEO, CFO and SET take the lead in developing our strategy, which is then reviewed, constructively challenged and approved by the Board. The Board has delegated some of its powers to the CEO and operates with the assistance of four Committees. Members of the Board and their biographies are shown on pages 86 and 87. | | | | Audit Committee Chairman: Rudy Markham The Audit Committee provides assurance to the Board in the following areas: the integrity of our financial reporting and internal controls over financial matters; our internal controls over non-financial matters; compliance with laws and our Code of Conduct; the quality of the Company’s relationship with its external auditor; the role, resources and effectiveness of the Company’s internal audit function; and the effectiveness of the Company’s risk management framework, in each case with the ultimate aim of protecting our shareholders’ interests. | | | | Remuneration Committee Chairman: Graham Chipchase The Remuneration Committee considers and sets, on behalf of the Board, the remuneration (including pension rights and compensation payments) of Executive Directors and other senior executives. No Director is involved in deciding his or her own remuneration. |
| Corporate Governance Report from page 90 | | | | Audit Committee Report from page 98 | | | | Directors’ Remuneration Report from page 103 |
Board Committee membership
| | | | | | | | | | | | | | | | | | | | |
| Name | | Audit | | | Remuneration | | | Nomination and
Governance | | | Science | | | Independent1 | |
| Cori Bargmann2 | | | | | | | | | | | | | | | ü2 | | | | ü | |
| Geneviève Berger | | | | | | | | | | | | | | | ü | | | | ü | |
| Bruce Burlington | | | ü | | | | | | | | ü3 | | | | Chairman4 | | | | ü | |
| Ann Cairns | | | ü | | | | | | | | | | | | | | | | ü | |
| Graham Chipchase | | | | | | | Chairman | 5 | | | ü3 | | | | | | | | ü | |
| Jean-Philippe Courtois | | | ü | | | | | | | | | | | | | | | | ü | |
| Marc Dunoyer | | | | | | | | | | | | | | | | | | | n/a | |
| Leif Johansson | | | | | | | ü | | | | Chairman | | | | | | | | n/a | 6 |
| Rudy Markham | | | Chairman | | | | ü | | | | ü | | | | | | | | ü | |
| Nancy Rothwell7 | | | | | | | ü | 7 | | | ü7 | | | | Chairman4 | | | | ü | |
| Pascal Soriot | | | | | | | | | | | | | | | | | | | n/a | |
| Shriti Vadera | | | ü | | | | ü | 8 | | | | | | | | | | | ü | |
| John Varley9 | | | | | | | Chairman | 5 | | | ü9 | | | | | | | | ü | |
| Marcus Wallenberg | | | | | | | | | | | | | | | ü | | | | | |
| 1 | As determined by the Board for the purposes of the UK Corporate Governance Code. |
| 2 | Cori Bargmann was elected as a Non-Executive Director and became a member of the Science Committee with effect from 24 April 2015. |
| 3 | Bruce Burlington and Graham Chipchase became members of the Nomination and Governance Committee with effect from 24 April 2015. |
| 4 | Bruce Burlington succeeded Nancy Rothwell as Chairman of the Science Committee with effect from 24 April 2015. |
| 5 | Graham Chipchase succeeded John Varley as Chairman of the Remuneration Committee with effect from 24 April 2015. |
| 6 | Leif Johansson was considered by the Board to be independent upon his appointment as Chairman. In accordance with the UK Corporate Governance Code, the test of independence is not appropriate in relation to the Chairman after his appointment. |
| 7 | Nancy Rothwell retired from the Board with effect from 24 April 2015. |
| 8 | Shriti Vadera became a member of the Remuneration Committee with effect from 17 February 2015. |
| 9 | John Varley retired from the Board with effect from 24 April 2015. |
| | |
| 84 | | AstraZenecaAnnual Report and Form 20-F Information 2015 |
| | | | | | | | | | | | |
Nomination and Governance Committee Chairman: Leif Johansson The Nomination and Governance Committee recommends new Board appointments for decision by the Board and, more broadly, considers succession planning for senior executive management and Board positions. The Nomination and Governance Committee also advises the Board on significant developments in corporate governance. | | | | Science Committee Chairman: Bruce Burlington The Science Committee provides assurance to the Board regarding the Group’s R&D activities by reviewing and assessing our approaches in our chosen therapy areas; the scientific technology and R&D capabilities we deploy; the quality and development of our scientists; and our decision making. | | | | Senior Executive Team The members of the SET are > CEO > CFO > Nine Executive Vice- Presidents (EVPs) from across the organisation, representing the three science units, the four commercial units (including GPPS), Operations & IT and HR > General Counsel > Chief Compliance Officer The Senior Executive Team (SET) is the body through which the CEO exercises the authority delegated to him by the Board. It usually meets monthly and considers major business issues and makes recommendations to the CEO, and typically reviews matters that are to be submitted to the Board for its consideration. The CEO is responsible for establishing and chairing the SET. | | | | Key governance roles Chairman Leadership, operation and governance of the Board, ensuring Board effectiveness CEO Responsible to the Board for the management, development and performance of the business Senior independentNon-Executive Director Acts as a sounding board for the Chairman and an intermediary for other Directors and shareholders when necessary |
Nomination and Governance Committee from page 93 | | | | Science Committee on page 94 | | | | The biographies of SET members are shown on pages 88 and 89 | | | | |

| | |
| AstraZenecaAnnual Report and Form 20-F Information 2015 | | 85 |
Corporate Governance
Board of Directors
as at 31 December 2015

1 Leif Johansson (64)
Non-Executive Chairman of the Board (April 2012*)
Committee membership Chairman of the Nomination and Governance Committee and member of the Remuneration Committee
Skills and experience From 1997 to 2011, Leif was Chief Executive Officer of AB Volvo. Prior to that, he served at AB Electrolux, latterly as Chief Executive Officer from 1994 to 1997. He was a Non-Executive Director of BMS from 1998 to September 2011, serving on the Board’s Audit Committee, and Compensation and Management Development Committee. He holds an MSc in engineering from Chalmers University of Technology, Gothenburg.
Other appointments Leif is Chairman of global telecommunications company, LM Ericsson. He holds board positions at Svenska Cellulosa Aktiebolaget SCA and Ecolean AB. He has been a member of the Royal Swedish Academy of Engineering Sciences since 1994, serving as Chairman since 2012. Leif is also a member of the European Round Table of Industrialists and Chairman of the International Advisory Board of the Nobel Foundation.
2 Pascal Soriot (56)
Executive Director and CEO (October 2012)
Skills and experience Pascal brings significant experience in established and emerging markets, strength of strategic thinking, a successful track record of managing change and executing strategy, and the ability to lead a diverse organisation. He served as Chief Operating Officer of Roche’s pharmaceuticals division from 2010 to September 2012 and, prior to that, Chief Executive Officer of Genentech, a biologics business, where he led its successful merger with Roche. Pascal joined the pharmaceutical industry in 1986 and has worked in senior management roles in numerous major companies around the world. He is a doctor of veterinary medicine (École Nationale Vétérinaire d’Alfort, Maisons-Alfort) and holds an MBA from HEC, Paris.
3 Marc Dunoyer (63)
Executive Director and CFO (November 2013)
Skills and experience Marc’s career in pharmaceuticals, which has included periods with Roussel Uclaf, Hoechst Marion Roussel and GlaxoSmithKline (GSK), has given him extensive industry experience, including finance and accounting; corporate strategy and planning; research and development; sales and marketing; business reorganisation; and business development. Marc is a qualified accountant and joined AstraZeneca in 2013, serving as Executive Vice-President, GPPS from June to October 2013. Prior to that, he served as Global Head of Rare Diseases at GSK and (concurrently) Chairman, GSK Japan. He holds an MBA from HEC, Paris and a Bachelor of Law degree from Paris University.
| | |
| 86 | | AstraZenecaAnnual Report and Form 20-F Information 2015 |
4 Rudy Markham (69)
Senior independent Non-Executive Director (April 2015. Member of the Board since September 2008)
Committee membership Chairman of the Audit Committee and member of the Remuneration Committee and Nomination and Governance Committee
Skills and experience Rudy has significant international business and financial experience, having formerly held various senior commercial and financial positions with Unilever, culminating in his appointment as its Chief Financial Officer.
Other appointments Rudy is Chairman and a Non-Executive Director of Moorfields Eye Hospital NHS Foundation Trust and a non-executive member of the Boards of United Parcel Services Inc. and Legal & General plc. He is also Vice Chairman of the Supervisory Board of Corbion NV (formerly CSM NV), a Fellow of the Chartered Institute of Management Accountants and a Fellow of the Association of Corporate Treasurers. He served as a Non-Executive Director of the UK Financial Reporting Council from 2007 to 2012.
5 Dr Cornelia Bargmann (54)
Non-Executive Director (April 2015)
Committee membership Member of the Science Committee
Skills and experience Cornelia (Cori) is the Torsten N. Wiesel Professor and head of the Lulu and Anthony Wang Laboratory of Neural Circuits and Behavior at The Rockefeller University, New York. She has held this position since 2004. Cori holds a degree in biochemistry from the University of Georgia and a PhD from the Massachusetts Institute of Technology (MIT). She pursued a postdoctoral fellowship with H. Robert Horvitz at MIT until 1991, when she accepted a faculty position in the Department of Anatomy at the University of California, San Francisco, spending 13 years there, before moving to Rockefeller. She has been a Howard Hughes Medical Institute investigator since 1995. Cori was awarded the Benjamin Franklin Medal in Life Science in 2015.
6 Geneviève Berger (60)
Non-Executive Director (April 2012)
Committee membership Member of the Science Committee and oversees sustainability matters on behalf of the Board
Skills and experience Geneviève was Chief Science Officer at Unilever PLC and a member of the Unilever Leadership Executive from 2008 to April 2014. She holds three doctorates – in physics, human biology and medicine – and was appointed Professor of Medicine atl’Université Pierre et Marie Curie,Paris in 2006.Her previous positions include Professor and Hospital Practitioner atl’Hôpital de la Pitié-Salpêtrière in Paris; Director of the Biotech and Agri-Food Department; Head of the Technology Directorate at the French Ministry of Research and Technology; Director General, at theCentre National de la Recherche Scientifique; and Chairman of the Health Advisory Board of the EU Commission.
Other appointments In May 2015, Geneviève was appointed as a Director of Air Liquide S.A. for a term of four years. She is currently Chief Research Officer at Firmenich SA, Geneva, Switzerland.
7 Bruce Burlington (67)
Non-Executive Director (August 2010)
Committee membership Chairman of the Science Committee and member of the Audit Committee and the Nomination and Governance Committee
Skills and experience Bruce is a pharmaceutical product development and regulatory affairs consultant and brings extensive experience in these areas. He spent 17 years with the FDA, serving as Director of its Center for Devices and Radiological Health, as well as holding various senior roles in the Center for Drug Evaluation and Research. After leaving the FDA, he held various senior executive positions at Wyeth (now part of Pfizer).
Other appointments Bruce is a Non-Executive Director of the International Partnership for Microbicides.
8 Ann Cairns (58)
Non-Executive Director (April 2014)
Committee membership Member of the Audit Committee
Skills and experience Ann has more than 20 years’ in-depth financial and international business experience and currently serves as President, International Markets, for MasterCard. Before joining MasterCard in 2011, Ann oversaw the European liquidation of Lehman Brothers Holdings International and was the Chief Executive, Transaction Banking at ABN AMRO. At the start of her career, Ann was an award-winning research engineer, culminating as the head of Offshore Engineer-Planning for British Gas. She holds a BSc in pure mathematics from Sheffield University and an MSc with research into medical statistics from Newcastle University in the UK.
9 Graham Chipchase (52)
Non-Executive Director (April 2012)
Committee membership Chairman of the Remuneration Committee and member of the Nomination and Governance Committee
Skills and experience Graham has served as Chief Executive Officer of global consumer packaging company, Rexam PLC since 2010 after serving at Rexam as Group Director, Plastic Packaging and Group Finance Director. Previously, he was Finance Director of Aerospace Services at the global engineering group GKN PLC from 2001 to 2003. After starting his career with Coopers & Lybrand Deloitte, he held various finance roles in the industrial gases company The BOC Group PLC (now part of The Linde Group). He is a Fellow of the Institute of Chartered Accountants in England and Wales and holds an MA (Hons) in chemistry from Oriel College, Oxford.
10 Jean-Philippe Courtois (55)
Non-Executive Director (February 2008)
Committee membership Member of the Audit Committee
Skills and experience Jean-Philippe has more than 30 years’ experience in the global technology industry. He is President of Microsoft International and previously served as Chief Executive Officer and President of Microsoft EMEA. Jean-Philippe has also served as Co-Chairman of the World Economic Forum’s Global Digital Divide Initiative Task Force and on the European Commission Information and Communication Technology Task Force. In 2009, he served as an EU Ambassador for the Year of Creativity and Innovation and, in 2011, was named one of ‘Tech’s Top 25’ by The Wall Street Journal Europe.
Other appointments Jean-Philippe is a board member of PlaNet Finance, a leading international microfinance organisation.
11 Shriti Vadera (53)
Non-Executive Director (January 2011)
Committee membership Member of the Audit Committee and the Remuneration Committee
Skills and experience Shriti has significant knowledge of global finance, emerging markets and public policy. She has advised governments, banks and investors on the eurozone crisis, the banking sector, debt restructuring and markets. She has served as a G20 Adviser and a Minister in the UK Cabinet Office and Business Department and International Development Department. She has also served on the Council of Economic Advisers, HM Treasury, where she focused on business and international economic issues. Prior to that, Shriti spent 14 years in investment banking with SG Warburg/UBS.
Other appointments Shriti is Chairman of Santander UK plc and Senior Independent Director of BHP Billiton.
12 Marcus Wallenberg (59)
Non-Executive Director (April 1999)
Committee membership Member of the Science Committee
Skills and experience Marcus has international business experience across various industry sectors, including the pharmaceutical industry from his directorship with Astra prior to 1999.
Other appointments Marcus is Chairman of Skandinaviska Enskilda Banken AB, Saab AB and FAM AB. He is a member of the boards of Investor AB, Temasek Holdings Limited, and the Knut and Alice Wallenberg Foundation.
| | |
| AstraZenecaAnnual Report and Form 20-F Information 2015 | | 87 |
Corporate Governance
Senior Executive Team
as at 31 December 2015

1 Pascal Soriot
CEO
See page 86.
3 Katarina Ageborg
Chief Compliance Officer
Katarina was appointed Chief Compliance Officer and a member of the SET on 1 July 2011. She has overall responsibility for the delivery, design and implementation of the Company’s compliance programme and since her appointment has driven increased efficiency and effectiveness in compliance. She has also assumed responsibility for Safety, Health & Environment, and most recently in 2015 for the Company’s sustainability programme. Katarina led the Global IP function from 2008 to 2011, during which time she streamlined the organisation and launched a new patent filing strategy. After joining AstraZeneca in 1998, she held a series of senior legal roles supporting Commercial, Regulatory and IP. Prior to AstraZeneca, Katarina established her own law firm and worked as a lawyer on both civil and criminal cases. Katarina holds a Master of Law Degree from Uppsala University School of Law in Sweden.
2 Marc Dunoyer
CFO
See page 86.
4 Dr Sean Bohen
Executive Vice-President,
Global Medicines Development and
Chief Medical Officer
Sean was appointed Executive Vice-President, GMD in September 2015 and leads our global late-stage development organisation for both small molecules and biologics. He is also the Company’s Chief Medical Officer. He joined AstraZeneca from Genentech, where he was most recently Senior Vice President of Early Development. Before joining Genentech, Sean was a Clinical Instructor in Oncology at Stanford University School of Medicine, a research associate at the Howard Hughes Medical Institute and a postdoctoral fellow at the National Cancer Institute. He is a graduate of the University of Wisconsin and later earned his doctorate in biochemistry and his medical degree at the University of California, San Francisco.
| | |
| 88 | | AstraZenecaAnnual Report and Form 20-F Information 2015 |
5 Pam Cheng
Executive Vice-President, Operations and Information Technology
Pam joined AstraZeneca in June 2015 after having spent 14 years in Global Manufacturing and Supply Chain roles at Merck/MSD. Pam was the Head of Global Supply Chain Management & Logistics for Merck from 2006 to 2011 and led the transformation of Merck supply chains across the global supply network. More recently, Pam was President of MSD China, responsible for MSD’s entire business in China. Prior to joining Merck, Pam held various engineering and project management positions at Universal Oil Products, Union Carbide Corporation and GAF Chemicals. Pam holds Bachelor’s and Master’s degrees in chemical engineering from Stevens Institute of Technology in New Jersey and an MBA in marketing from Pace University in New York.
6 Fiona Cicconi
Executive Vice-President, Human Resources
Fiona joined AstraZeneca in September 2014 as Executive Vice-President, Human Resources. She started her career at General Electric, where she held various human resources roles within the oil and gas business, which included experience in major global acquisitions and driving change. Subsequently, Fiona spent a number of years at Cisco, before joining Roche in 2006. There, she was most recently responsible for global human resources for Pharma Technical Operations, where her primary focus was to build one culture between Roche and Genentech and identify and develop a sustainable supply of leadership and talent from within the organisation.
7 Dr Ruud Dobber
Executive Vice-President, Europe
Ruud was appointed Executive Vice-President, Europe in January 2013 and is responsible for sales, marketing and commercial operations across AstraZeneca’s businesses in the 28 EU member states. In addition to his European accountabilities, Ruud is responsible for the development of our late-stage, small molecule antibiotic pipeline as well as its global commercialisation. Ruud joined AstraZeneca in 1997 and has held various senior commercial and leadership roles, including Regional Vice-President of AstraZeneca’s European, Middle East and African division, Regional Vice-President for the Asia Pacific region and Interim Executive Vice-President, GPPS. Since 2012, Ruud has been an Executive Committee Member of the European Federation of Pharmaceutical Industries and Associations (EFPIA) and was earlier Chairman of the Asia division of Pharmaceutical Research and Manufacturers of America. Holding a doctorate in immunology from the University of Leiden in the Netherlands, Ruud began his career as a scientist, researching in the field of immunology and ageing.
8 Paul Hudson
President, AstraZeneca, US and Executive Vice-President, North America
Paul was appointed Executive Vice-President, North America in January 2013 and is accountable for driving growth and maximising the contribution of the commercial operations in North America to AstraZeneca’s global business. Paul joined AstraZeneca in 2006 as Vice-President and Primary Care Director, UK and was later appointed President of AstraZeneca’s subsidiary companies in Japan and Spain. He has served as a Standing Board Member of the Japan Pharmaceuticals Manufacturers Association and EFPIA in Japan. Before joining AstraZeneca, Paul worked for Schering-Plough, where he held senior global marketing roles. He received a degree in economics from Manchester Metropolitan University and a DipM from the UK’s Chartered Institute of Marketing.
9 Dr Bahija Jallal
Executive Vice-President, MedImmune
Bahija was appointed Executive Vice-President, MedImmune in January 2013 and is responsible for biologics research activities. Bahija is tasked with advancing the biologic pipeline of drugs. She joined MedImmune in 2006 as Vice-President, Translational Sciences and has held roles of increasing responsibility at AstraZeneca. Prior to joining AstraZeneca, Bahija worked with Chiron Corporation, where she served as Vice-President, Drug Assessment and Development. Bahija received a Master’s degree in biology froml’Université de Paris VII and her doctorate in physiology froml’Université Pierre et Marie Curie, Paris VI. She conducted her post-doctoral research at the Max-Planck Institute of Biochemistry in Martinsried, Germany. She is a member of the American Association of Science and the Pharmacogenomics Working Group and is on the Board of Directors of the Association of Women in Science. She is also on the Board of Trustees of the Johns Hopkins University.
10 Mark Mallon
Executive Vice-President, International
Mark was appointed Executive Vice-President, International in January 2013 and is responsible for the growth and performance of AstraZeneca’s commercial businesses in various regions, including Asia Pacific, Russia, Latin America, the Middle East and Africa. Since joining AstraZeneca in 1994, Mark has held multiple senior sales and marketing roles, including Regional Vice-President for Asia Pacific, President of AstraZeneca’s Chinese and Italian subsidiaries, Chief Operating Officer of AstraZeneca’s Japanese subsidiary and Vice-President of AstraZeneca’s US gastrointestinal and respiratory businesses. He has served as a member of the Board of Directors for Christiana Care, the largest hospital system in Delaware. He has also been an Executive Committee Member for R&D-based Pharmaceutical Association Committee, the China industry association for innovative pharmaceutical companies. Mark began his career in the pharmaceutical industry in management consulting. He holds a degree in chemical engineering from the University of Pennsylvania and an MBA in marketing and finance from the Wharton School of Business.
11 Luke Miels
Executive Vice-President, Global Product and Portfolio Strategy, Global Medical Affairs and Corporate Affairs
Luke was appointed Executive Vice-President, Global Product and Portfolio Strategy (GPPS) in May 2014, leading AstraZeneca’s global marketing, business development and commercial portfolio strategy operations. AstraZeneca’s Global Medical Affairs and Global Corporate Affairs functions also report to him. Luke joined AstraZeneca from Roche, where he was Regional Vice-President Asia Pacific for the Pharmaceuticals Division, and before that Head of Metabolism for Global Marketing. Before then, he was at Aventis where he held roles of increasing seniority, including Country Manager positions in Asia Pacific, Head of US Analytics and Commercial Effectiveness, and US Vice-President of Sales for Metabolism. He also led the US integration of Sanofi and Aventis while he was there. Luke began his career in 1995 with AstraZeneca in Australia as a Sales Representative and Product Manager. Luke holds a BSc in biology from Flinders University in Adelaide and an MBA from the Macquarie University, Sydney.
12 Dr Menelas Pangalos
Executive Vice-President, Innovative Medicines and Early Development
Menelas (Mene) was appointed Executive Vice-President, IMED Biotech Unit in January 2013 and leads AstraZeneca’s small molecule research and early development activities. Mene joined AstraZeneca from Pfizer, where he was Senior Vice-President and Chief Scientific Officer of Neuroscience Research. Previously, he held senior discovery and neuroscience roles at Wyeth and GSK. He completed his undergraduate degree in biochemistry at the Imperial College of Science and Technology, London and earned a doctorate in neurochemistry from the University of London. He is a Visiting Professor of Neuroscience at King’s College London and is a Fellow of Clare Hall at the University of Cambridge. Mene is a Fellow of the Academy of Medical Sciences and of the Royal Society of Biology. In the UK, Mene serves on the Medical Research Council, is on the Board of the National Centre for Universities and Business (NCUB), and a Non-Executive Director of the UK Precision Medicine Catapult.
13 Jeff Pott
General Counsel
Jeff was appointed General Counsel in January 2009 and has overall responsibility for all aspects of AstraZeneca’s Legal and IP function. He joined AstraZeneca in 1995 and has worked in various litigation roles, where he has had responsibility for IP, anti-trust and product liability litigation. Before joining AstraZeneca, he spent five years at the US legal firm Drinker Biddle and Reath LLP, where he specialised in pharmaceutical product liability litigation and anti-trust advice and litigation. He received his bachelor’s degree in political science from Wheaton College and his Juris Doctor Degree from Villanova University School of Law.
| | |
| AstraZenecaAnnual Report and Form 20-F Information 2015 | | 89 |
Corporate Governance
Corporate Governance Report
Board composition
The membership of the Board at 31 December 2015 and information about individual Directors is contained in the Board of Directors section on pages 86 and 87.
Corporate governance
We have prepared this Annual Report with reference to the UK Corporate Governance Code published by the UK Financial Reporting Council (FRC) in September 2014.
This Corporate Governance Report (together with other sections of this Annual Report) describes how we apply the main principles of good governance in the UK Corporate Governance Code. We have complied throughout the accounting period with the provisions of the UK Corporate Governance Code, which is available on the FRC’s website, www.frc.co.uk.
Leadership and responsibilities
The roles of Chairman and CEO are split. Leif Johansson, our Non-Executive Chairman, is responsible for leadership of the Board. Our CEO, Pascal Soriot, leads the SET and has executive responsibility for running our business. The Board comprises 10 Non-Executive Directors, including the Chairman, and two Executive Directors – the CEO, Pascal Soriot, and the CFO, Marc Dunoyer. Its responsibilities are set out in the Corporate Governance overview on pages 84 and 85.
Rudy Markham, who joined the Board as a Non-Executive Director in 2008, was appointed as our Senior independent Non-Executive Director in April 2015. The role of the Senior independent Non-Executive Director is to serve as a sounding board for the Chairman and as an intermediary for the other Directors when necessary. The Senior independent Non-Executive Director is also available to shareholders if they have concerns that contact through the normal channels of Chairman or Executive Directors has failed to resolve, or for which such contact is inappropriate.
As shown in the Corporate Governance overview, there are four principal Board Committees. The membership and work of these Committees is described on the following pages. In addition, there may from time to time be constituted ad hoc Board Committees for specific projects or tasks.
In these cases, the scope and responsibilities of the Committee are
documented. The Board provides adequate resources to enable each Committee to undertake its duties.
Reserved matters and delegation of authority
The Board maintains and periodically reviews a list of matters that are reserved to, and can only be approved by, the Board. These include: the appointment, termination and remuneration of any Director; approval of the annual budget; approval of any item of fixed capital expenditure or any proposal for the acquisition or disposal of an investment or business which exceeds $150 million; the raising of capital or loans by the Company (subject to certain exceptions); the giving of any guarantee in respect of any borrowing of the Company; and allotting shares of the Company. The matters that have not been expressly reserved to the Board are delegated by the Board to its Committees or the CEO.
The CEO is responsible to the Board for the management, development and performance of our business for those matters for which he has been delegated authority from the Board. Although the CEO retains full responsibility for the authority delegated to him by the Board, he has established, and chairs, the SET, which is the vehicle through which he exercises that authority in respect of our business.
The roles of the Board, Board Committees, Chairman and CEO are documented, as are the Board’s reserved powers and delegated authorities.
Operation of the Board
The Board discharges its responsibilities as set out in the Corporate Governance overview on pages 84 and 85 through a programme of meetings that includes regular reviews of financial performance and critical business issues, and the formal annual strategy review day. The Board also aims to ensure that a good dialogue with our shareholders is maintained and that their issues and concerns are understood and considered.
The Board held six meetings in 2015, including its usual annual strategy review. Five took place in London, UK and one was held at the offices of AstraZeneca’s French marketing company in Rueil-Malmaison, near Paris. The Board is currently scheduled to meet six times in 2016, and will meet at such other times as may be required to conduct business.
As part of the business of each Board meeting, the CEO typically submits a progress report, giving details of business performance and progress against the goals the Board has approved. To ensure that the Board has good visibility of the key operating decisions of the business, members of the SET attend Board meetings regularly and Board members meet other senior executives throughout the year. The Board also receives accounting and other management information about our resources, and presentations from internal and external speakers on legal, governance and regulatory developments. At the end of Board meetings, the Non-Executive Directors meet without the Executive Directors present to review and discuss any matters that have arisen during the meeting and/or such other matters as may appear to the Non-Executive Directors to be relevant in properly discharging their duty to act independently.
Board effectiveness
Composition of the Board, succession planning and diversity
The Nomination and Governance Committee and, where appropriate, the full Board, regularly review the composition of the Board and the status of succession to both senior executive management and Board level positions. Directors have regular contact with, and access to, succession candidates for senior executive management positions.
The Board aims to maintain a balance in terms of the range of experience and skills of individual Board members, which includes relevant international business, pharmaceutical industry and financial experience, as well as appropriate scientific and regulatory knowledge. The biographies of Board members set out on pages 86 and 87 give more information about current Directors in this respect. The Board views gender, nationality and cultural diversity among Board members as important considerations when reviewing the composition of the Board. The Board recognises, in particular, the importance of gender diversity. Currently, 40% of the Company’s Non-Executive Directors are women and women make up 33% of the full Board. Although it has not set any specific measurable objectives, the Board intends to continue with its current approach to diversity in all its aspects, while at the same time seeking Board members of the highest calibre, and with the necessary experience and skills to meet the needs of the
| | |
| 90 | | AstraZenecaAnnual Report and Form 20-F Information 2015 |
Company and its shareholders. Information about our approach to diversity in the organisation below Board level can be found in Employees from page 52.
The following changes to the composition of the Board and its Committees have occurred during the period covered by this Annual Report:
| > | Shriti Vadera became a member of the Remuneration Committee with effect from 17 February 2015. |
| > | John Varley and Nancy Rothwell, both Non-Executive Directors, retired from the Board on 24 April 2015, each having served as a Board member for nine years. |
| > | With effect from 24 April 2015: |
| | – | Cori Bargmann was elected for the first time as a Non-Executive Director and became a member of the Science Committee. |
| | – | Rudy Markham became Senior independent Non-Executive Director. |
| | – | Graham Chipchase became Chairman of the Remuneration Committee and a member of the Nomination and Governance Committee. |
| | – | Bruce Burlington became Chairman of the Science Committee and a member of the Nomination and Governance Committee. |
| | – | Geneviève Berger was nominated to oversee sustainability matters on behalf of the Board. |
Independence of the Non-Executive Directors
During 2015, the Board considered the independence of each Non-Executive Director for the purposes of the UK Corporate Governance Code and the corporate governance listing standards of the NYSE (Listing Standards). With the exception of Marcus Wallenberg, the Board considers that all of the Non-Executive Directors are independent. Leif Johansson was considered by the Board to be independent upon his appointment as Chairman. In accordance with the UK Corporate Governance Code, the test of independence is not appropriate in relation to the Chairman after his appointment.
Marcus Wallenberg was appointed as a Director of Astra in May 1989 and subsequently became a Director of the Company in 1999. He is a Non-Executive Director of Investor AB, which has a 4.1% interest in the issued share capital of the Company as at 4 February 2016. Mr Wallenberg, Investor AB and a number
of Wallenberg charitable foundations are connected. For these reasons, the Board does not believe that he can be determined independent under the UK Corporate Governance Code. However, the Board believes that he has brought, and continues to bring, considerable business experience and makes a valuable contribution to the work of the Board. In April 2010, he was appointed as a member of the Science Committee, reflecting his interest in innovation and R&D, knowledge of the history of the Company and its scientific heritage and culture, and his broad experience of other industries and businesses in which innovation and R&D are important determinants of success.
Conflicts of interest
The Articles enable the Directors to authorise any situation in which a Director has an interest that conflicts or has the potential to conflict with the Company’s interests and which would otherwise be a breach of the Director’s duty, under Section 175 of the Companies Act 2006. The Board has a formal system in place for Directors to declare such situations to be considered for authorisation by those Directors who have no interest in the matter being considered. In deciding whether to authorise a situation, the non-conflicted Directors must act in the way they consider, in good faith, would be most likely to promote the success of the Company, and they may impose limits or conditions when giving the authorisation, or subsequently, if they think this is appropriate. Situations considered by the Board and authorisations given are recorded in the Board minutes and in a register of conflicts maintained by the Company Secretary, and are reviewed annually by the Board. The Board believes that this system operates effectively.
Appointments to the Board
The Nomination and Governance Committee section from page 93 provides information about the appointment process for new Directors.
Newly appointed Directors are provided comprehensive information about the Group and their role as Non-Executive Directors. They also typically attend tailored induction programmes that take account of their individual skills and experience.
Time commitment
Our expectation is that Non-Executive Directors should be prepared to commit 15 days a year, as an absolute minimum, to the
Group’s business. In practice, Board members’ time commitment exceeds this minimum expectation when all the work that they undertake for the Group is considered, particularly in the case of the Chairman of the Board and the Chairmen of the Board Committees. As well as their work in relation to formal Board and Board Committee meetings, the Non-Executive Directors also commit time throughout the year to meetings and telephone calls with various levels of executive management, visits to AstraZeneca’s sites throughout the world and, for new Non-Executive Directors, induction sessions and site visits.
On occasions when a Director is unavoidably absent from a Board or Board Committee meeting, for example where a meeting clashes with their existing commitments, they still receive and review the papers for the meeting and typically provide verbal or written input ahead of the meeting, usually through the Chairman of the Board or the Chairman of the relevant Board Committee, so that their views are made known and considered at the meeting. Given the nature of the business to be conducted, some Board meetings are convened at short notice, which can make it difficult for some Directors to attend due to prior commitments.
Information and support
The Company Secretary is responsible to the Chairman for ensuring that all Board and Board Committee meetings are properly conducted, that the Directors receive appropriate information prior to meetings to enable them to make an effective contribution, and that governance requirements are considered and implemented.
The Company maintained Directors’ and Officers’ Liability Insurance cover throughout 2015. The Directors are also able to obtain independent legal advice at the expense of the Company, as necessary, in their capacity as Directors.
The Company has entered into a deed of indemnity in favour of each Board member since 2006. These deeds of indemnity are still in force and provide that the Company shall indemnify the Directors to the fullest extent permitted by law and the Articles, in respect of all losses arising out of, or in connection with, the execution of their powers, duties and responsibilities as Directors of the Company or any of its subsidiaries. This is in line with current
| | |
| AstraZenecaAnnual Report and Form 20-F Information 2015 | | 91 |
Corporate Governance
Corporate Governance Reportcontinued
Board and Board Committee meeting attendance in 2015
| | | | | | | | | | | | | | | | | | | | |
| | | Board meetings | | | Board Committee meetings | |
| Name | | | | | Audit | | | Remuneration | | | Nomination
and Governance | | | Science | |
| Cori Bargmann1 | | | 4(4 | ) | | | – | | | | – | | | | – | | | | 4(4 | ) |
| Geneviève Berger | | | 5(6 | ) | | | – | | | | – | | | | – | | | | 3(6 | ) |
| Bruce Burlington2 | | | 6(6 | ) | | | 5(5 | ) | | | – | | | | 1(1 | ) | | | 6(6 | ) |
| Ann Cairns | | | 5(6 | ) | | | 5(5 | ) | | | – | | | | – | | | | – | |
| Graham Chipchase3 | | | 6(6 | ) | | | – | | | | 7(7 | ) | | | 1(1 | ) | | | – | |
| Jean-Philippe Courtois | | | 6(6 | ) | | | 5(5 | ) | | | – | | | | – | | | | – | |
| Marc Dunoyer | | | 6(6 | ) | | | – | | | | – | | | | – | | | | – | |
| Leif Johansson | | | 6(6 | ) | | | – | | | | 6(7 | ) | | | 2(2 | ) | | | – | |
| Rudy Markham | | | 6(6 | ) | | | 5(5 | ) | | | 7(7 | ) | | | 2(2 | ) | | | – | |
| Nancy Rothwell4 | | | 2(2 | ) | | | – | | | | 3(3 | ) | | | 1(1 | ) | | | 2(2 | ) |
| Pascal Soriot | | | 6(6 | ) | | | – | | | | – | | | | – | | | | – | |
| Shriti Vadera5 | | | 6(6 | ) | | | 5(5 | ) | | | 6(6 | ) | | | – | | | | – | |
| John Varley6 | | | 2(2 | ) | | | – | | | | 3(3 | ) | | | 1(1 | ) | | | – | |
| Marcus Wallenberg | | | 6(6 | ) | | | – | | | | – | | | | – | | | | 5(6 | ) |
Note: number in brackets denotes number of meetings during the year that Board members were entitled to attend.
| 1 | Cori Bargmann was elected as a Non-Executive Director and became a member of the Science Committee with effect from 24 April 2015. |
| 2 | Bruce Burlington became a member of the Nomination and Governance Committee with effect from 24 April 2015. |
| 3 | Graham Chipchase became a member of the Nomination and Governance Committee with effect from 24 April 2015. |
| 4 | Nancy Rothwell retired from the Board with effect from 24 April 2015. |
| 5 | Shriti Vadera became a member of the Remuneration Committee with effect from 17 February 2015. |
| 6 | John Varley retired from the Board with effect from 24 April 2015. |
market practice and helps us attract and retain high-quality, skilled Directors.
Performance evaluation
During the year, the Board conducted the annual evaluation of its own performance and that of its Committees and individual Directors. The 2015 evaluation involved each Board member responding to a web-based questionnaire prepared by Lintstock Ltd (Lintstock), a London-based corporate advisory firm that provides objective and independent counsel to leading European companies. Lintstock supplies software and services to the Company Secretary’s team for Board evaluation questionnaires and for the management of insider lists but has no other commercial relationship with the Company.
In respect of the 2015 evaluation, overall it was concluded that the Board continues to operate effectively and in an open manner and no significant problems were raised. The main themes arising from the responses to the questionnaire were discussed between the Chairman and individual Directors, and collectively at the Board meeting in December 2015. These included:
| > | Board members’ wish to spend more time as a full Board considering succession planning for the key senior Board and executive roles in the Company – Chairman, CEO and CFO |
– in addition to the work done on CEO and CFO succession planning during 2014 and 2015 by the Nomination and Governance Committee.
| > | Increasing the opportunities for Board members to meet executives immediately below SET-level, primarily to facilitate the Board’s assessment of high-potential people and their capabilities, and for succession planning purposes. |
| > | The importance of the continuing dialogue with shareholders about executive remuneration, particularly that of the Executive Directors and SET members, its link to individual and Company performance and the scope for simplification. |
| > | Board members’ wish to continue to hear from external stakeholders (during 2015, the Board met and received presentations from, for example, medical practitioners and clinical researchers in the oncology field, representatives of major institutional shareholders and financial analysts covering the Company and the pharmaceutical sector). |
| > | Board members’ suggestions for areas for further review by the Board during 2016, such as the supply chain for biologics and the Company’s productivity and efficiency programmes. |
| > | Various practical matters, such as the format and content of Board papers and whether more than one Board meeting each year should be held outside the UK. |
As part of each Director’s individual discussion with the Chairman, his or her contribution to the work of the Board and personal development needs were considered. Each Director continues to perform effectively and to demonstrate commitment to his or her role. In addition, led by the Senior independent Non-Executive Director, the other Directors (absent the Chairman) evaluated the performance of the Chairman. The reviews of the Board’s Committees did not raise any significant problems and concluded that the Committees are operating effectively.
The Board intends to continue to comply with the UK Corporate Governance Code guidance that the evaluation should be externally facilitated at least every three years and expects to commission the next externally facilitated review in 2017.
Re-election of Directors
In accordance with Article 66 of the Articles, all Directors retire at each AGM and may offer themselves for re-election by shareholders. Accordingly, all of the Directors will retire at the AGM in April 2016. The Notice of AGM will give details of those Directors seeking re-election.
Accountability
Risk management and internal control
The Board has overall responsibility for our system of internal controls and risk management policies and has an ongoing responsibility for reviewing their
| | |
| 92 | | AstraZenecaAnnual Report and Form 20-F Information 2015 |
effectiveness. During 2015, the Directors continued to review the effectiveness of our system of controls, risk management and high level internal control processes. These reviews included an assessment of internal controls and, in particular, financial, operational and compliance controls, and risk management and their effectiveness, supported by management assurance of the maintenance of controls reports from IA, as well as the external auditor on matters identified in the course of its statutory audit work. The system is designed to manage rather than eliminate the risk of failure to achieve business objectives and can only provide reasonable (not necessarily absolute) assurance of effective operation and compliance with laws and regulations.
The internal control framework was in operation throughout 2015 and continues to operate up to the date of the approval of this Annual Report. The Directors believe that the Group maintains an effective, embedded system of internal controls and complies with the FRC’s guidance entitled ‘Guidance on Risk Management, Internal Control and Related Financial and Business Reporting’ and, in the view of the Directors, no significant deficiencies have been identified in the system.
More information about the ways in which we manage our business risks and describe our principal risks and uncertainties is set out in the Risk overview from page 21 and Risk from page 212.
Remuneration
Information about our approach to remuneration and the role and work of the Remuneration Committee, including our policy on executive remuneration, is set out in the Directors’ Remuneration Report.
Policy on external appointments and retention of fees
Subject to specific Board approval in each case, Executive Directors and other SET members may accept external appointments as non-executive directors of other companies, and retain any related fees paid to them, provided that such appointments are not considered by the Board to prevent or reduce the ability of the executive to perform his or her role within the Group to the required standard.
Relations with shareholders
In our quarterly, half yearly and annual financial and business reporting to shareholders and other interested parties,
we aim to present a balanced and understandable assessment of our strategy, financial position and prospects.
We make information about the Group available to shareholders through a range of media, including our corporate website, www.astrazeneca.com, which contains a wide range of data of interest to institutional and private investors. We consider our website to be an important means of communication with our shareholders.
The Company has been authorised by shareholders to place shareholder communications (such as the Notice of AGM and this Annual Report) on the corporate website in lieu of sending paper copies to shareholders (unless specifically requested). While recognising and respecting that some shareholders may have different preferences about how they receive information from us, we will continue to promote the benefits of electronic communication given the advantages that this has over traditional paper-based communications, both in terms of the configurability and accessibility of the information provided and the consequent cost savings and reduction in environmental impact.
We have frequent discussions with institutional shareholders on a range of issues. In addition to holding discussions with groups of shareholders, we also hold individual meetings with some of our largest institutional shareholders to seek their views. Board members are kept informed of any issues, and receive regular reports and presentations from executive management and our brokers to assist them to develop an understanding of major shareholders’ views about the Group. From time to time, including in 2015, we conduct an audit of institutional shareholders to ensure that we are communicating clearly with them and that a high-quality dialogue is being maintained. The results of this audit are reported to, and discussed by, the full Board. We also respond to individual ad hoc requests for discussions from institutional shareholders and analysts. Our Investor Relations team acts as the main point of contact for investors throughout the year. As discussed above, the Senior independent Non-Executive Director, Rudy Markham, is also available to shareholders if they have concerns that contact through the normal channels of Chairman, CEO and/or CFO has failed to resolve, or in relation
to which such contact is inappropriate. All shareholders, including private investors, have an opportunity at the AGM to put questions to members of the Board about our operation and performance. Formal notification of the AGM is sent to shareholders at least one month in advance. All Board members ordinarily attend the AGM to answer questions raised by shareholders. In line with the UK Corporate Governance Code, details of proxy voting by shareholders, including votes withheld, are given at the AGM and are posted on our website following the AGM.
Nomination and Governance Committee
The Nomination and Governance Committee’s role is to recommend to the Board any new Board appointments and to consider, more broadly, succession plans at Board level. It reviews the composition of the Board using a matrix that records the skills and experience of current Board members, comparing this with the skills and experience it believes are appropriate to the Company’s overall business and strategic needs, both now and in the future. Any decisions relating to the appointment of Directors are made by the entire Board based on the merits of the candidates and the relevance of their background and experience, measured against objective criteria, with care taken to ensure that appointees have enough time to devote to our business.
The Nomination and Governance Committee also advises the Board periodically on significant developments in corporate governance and the Company’s compliance with the UK Corporate Governance Code.
During 2015, the Chairman of the Nomination and Governance Committee was Leif Johansson. The members of the Nomination and Governance Committee were Rudy Markham; Nancy Rothwell and John Varley until their retirement from the Board on 24 April 2015; and Bruce Burlington and Graham Chipchase with effect from the same date. Each member is a Non-Executive Director and considered independent by the Board. The Company Secretary acts as secretary to the Nomination and Governance Committee.
The Nomination and Governance Committee considers both planned and unplanned (unanticipated) succession
| | |
| AstraZenecaAnnual Report and Form 20-F Information 2015 | | 93 |
Corporate Governance
Corporate Governance Reportcontinued
scenarios and met twice in 2015, spending the majority of its time on routine succession planning (internal and external) for the roles of CEO and CFO, with the assistance respectively of the search firms, Spencer Stuart and Hoggett Bowers, both of whom periodically undertake executive search assignments for the Company. In addition, the Committee concluded the search that commenced in 2014 by recommending to the Board that Cori Bargmann be proposed for election by shareholders as a new Non-Executive Director at the AGM in 2015. The Zygos Partnership, a search firm that has no other connection to the Company, assisted the Committee with this work. The Committee also considered and made a number of recommendations to the Board concerning the membership of Board Committees to reflect the changes in Board membership that occurred during the year.
The attendance record of the Nomination and Governance Committee’s members is set out on page 92.
The Nomination and Governance
Committee’s terms of reference are available on our website, www.astrazeneca.com.
Science Committee
The Science Committee’s core role is to provide assurance to the Board regarding the quality, competitiveness and integrity of the Group’s R&D activities by way of meetings and dialogue with our R&D leaders and other scientist employees; visits to our R&D sites throughout the world; and review and assessment of
| > | the approaches we adopt in respect of our chosen therapy areas |
| > | the scientific technology and R&D capabilities we deploy |
| > | the decision-making processes for R&D projects and programmes |
| > | the quality of our scientists and their career opportunities and talent development |
| > | benchmarking against industry and scientific best practice, where appropriate. |
The Science Committee periodically reviews important bioethical issues that we face, and assists in the formulation of, and agrees on behalf of the Board, appropriate policies in relation to such issues. It may also consider, from time to time, future trends in medical science and technology. The Science Committee does not review
individual R&D projects but does review, on behalf of the Board, the R&D aspects of specific business development or acquisition proposals and advises the Board on its conclusions.
During 2015, the members of the Science Committee, all of whom have a knowledge of, or an interest in, life sciences, were Nancy Rothwell (Chairman of the Science Committee) until her retirement from the Board on 24 April 2015, Bruce Burlington (Chairman of the Science Committee with effect from 24 April 2015), Cori Bargmann with effect from 24 April 2015, Geneviève Berger and Marcus Wallenberg. As usual, the EVP, GMD; the EVP, IMED; and the EVP, MedImmune, participated in meetings of the Science Committee as co-opted members in 2015. The Vice-President, IMED Operations acts as secretary to the Science Committee.
The Science Committee met twice in person in 2015, in London, UK and Cambridge, UK and held four other meetings, all of which were by telephone, to review specific business development or acquisition proposals.
The Science Committee’s terms of reference are available on our website, www.astrazeneca.com.
US corporate governance requirements
Our ADSs are traded on the NYSE and, accordingly, we are subject to the reporting and other requirements of the SEC applicable to foreign private issuers. Section 404 of the Sarbanes-Oxley Act requires companies to include in their annual report on Form 20-F filed with the SEC, a report by management stating its responsibility for establishing internal control over financial reporting and to assess annually the effectiveness of such internal control. We have complied with those provisions of the Sarbanes-Oxley Act applicable to foreign private issuers. The Board continues to believe that the Group has a sound corporate governance framework, good processes for the accurate and timely reporting of its financial position and results of operations, and an effective and robust system of internal controls. We have established a Disclosure Committee, further details of which can be found in the Disclosure Committee section opposite.
The Directors’ assessment of the effectiveness of internal control over financial reporting is set out in Directors’ Responsibilities for, and Report on, Internal
Control over Financial Reporting in the Financial Statements on page 135.
We are required to disclose any significant ways in which our corporate governance practices differ from those followed by US companies under the Listing Standards. In addition, we must comply fully with the provisions of the Listing Standards relating to the composition, responsibilities and operation of audit committees, applicable to foreign private issuers. These provisions incorporate the rules concerning audit committees implemented by the SEC under the Sarbanes-Oxley Act. We have reviewed the corporate governance practices required to be followed by US companies under the Listing Standards and our corporate governance practices are generally consistent with those standards.
Business organisation
Early Stage Product Committees (ESPCs) and Late Stage Product Committee (LSPC)
The ESPCs and the LSPC were established in 2013.
Early Stage Product Committees
The ESPCs are senior level, cross-functional governance bodies with accountability for oversight of our early-stage small molecule and biologics portfolio to Proof of Concept stage. The EVPs of our two science units, IMED and MedImmune, chair our ESPCs. The ESPCs seek to deliver a flow of products to GMD for Phase III development through to launch. The ESPCs also seek to maximise the value of our internal and external R&D investments through robust, transparent and well-informed decision making that drives business performance and accountability.
Specifically, the ESPCs have responsibility for the following
| > | approving early-stage investment decisions |
| > | prioritising the respective portfolios |
| > | licensing activity for products in Phase I and earlier |
| > | delivering internal and external opportunities |
| > | reviewing allocation of R&D resources. |
Late Stage Product Committee
The LSPC is also a senior level governance body, accountable for the quality of the portfolio post-Phase III investment decision. It was formed in early 2013, replacing three committees, in a move to streamline
| | |
| 94 | | AstraZenecaAnnual Report and Form 20-F Information 2015 |
development project governance. Jointly chaired by the EVPs of GMD and GPPS, members include, as appropriate, members of the SET, including the CEO and CFO, and members of the GMD and GPPS leadership teams.
The LSPC seeks to maximise the value of our investments in the late-stage portfolio, also ensuring well-informed and robust decision making. Specific accountabilities include
| > | approval of the criteria supporting Proof of Concept |
| > | decision to invest in Phase III development based on agreement of commercial opportunity and our plans to develop the medicine |
| > | evaluation of the outcome of the development programme and decision to proceed to regulatory filing |
| > | decision to invest in life-cycle management activities for the late-stage assets |
| > | decision to invest in late-stage business development opportunities. |
Disclosure Committee
Our disclosure policy provides a framework for the handling and disclosure of inside information and other information of interest to shareholders and the investment community. It also defines the role of the Disclosure Committee. The members of the Disclosure Committee in 2015 were: the CFO, who chaired the Disclosure Committee; the EVP, GMD (who is also the Company’s Chief Medical Officer); the EVP, GPPS; the General Counsel; the Vice-President, Corporate Affairs; the Vice-President, Investor Relations; and the Vice-President Finance, Group Controller. The Deputy Company Secretary acted as secretary to the Disclosure Committee. The Disclosure Committee meets regularly to assist and inform the decisions of the CEO concerning inside information and its disclosure. Periodically, it reviews our disclosure controls and procedures and its own operation as part of work carried out to enable management and the Board to assure themselves that appropriate processes are operating for our planned disclosures, such as our quarterly results announcements and scheduled investor relations events.
Disclosure of information to auditors
The Directors who held office at the date of approval of this Annual Report confirm that,
so far as they are each aware, there is no relevant audit information of which the Company’s auditors are unaware; and each Director has taken all the steps that he or she ought to have taken as a Director to make himself or herself aware of any relevant audit information and to establish that the Company’s auditors are aware of that information.
Global Compliance and Internal Audit Services (IA)
The role of the Global Compliance function is to help the Group achieve its strategic priorities by doing business the right way, with integrity and high ethical standards. During 2016, Global Compliance will continue to focus on ensuring the delivery of an aligned approach to compliance that addresses key risk areas across the business, including risks relating to external parties and anti-bribery/anti-corruption. Our priorities include improving compliance behaviours through effective training; monitoring compliance with our policies; and ensuring that employees can raise any concerns. Through the Group Compliance Council, Global Compliance and IA work with various specialist compliance functions throughout our organisation to co-ordinate compliance activities.
When a potential compliance breach is identified, an internal investigation is undertaken by staff from our Global Compliance, HR and/or Legal teams. When appropriate, external advisers are engaged to conduct and/or advise on investigations. Should an investigation conclude that a significant breach has occurred, management, in consultation with our Legal function, will consider whether the Group needs to disclose and/or report the findings to a regulatory or governmental authority.
Risk from page 212
Global Compliance provides direct assurance to the Audit Committee on matters concerning compliance issues, including an analysis of compliance breaches. Complementing this, IA carries out a range of audits that include compliance-related audits and reviews of the assurance activities of other Group assurance functions. The results from these activities are reported to the Audit Committee.
IA is established by the Audit Committee on behalf of the Board and acts as an
independent and objective assurance function guided by a philosophy of adding value to improve the operations of the Group. The scope of IA’s responsibilities encompasses, but is not limited to, the examination and evaluation of the adequacy and effectiveness of the Group’s governance, risk management, and internal control processes in relation to the Group’s defined goals and objectives.
Internal control objectives considered by IA include
| > | consistency of operations or programmes with established objectives and goals and effective performance |
| > | effectiveness and efficiency of operations and employment of resources |
| > | compliance with significant policies, plans, procedures, laws, and regulations |
| > | reliability and integrity of management and financial information processes, including the means to identify, measure, classify, and report such information |
Based on its activity, IA is responsible for reporting significant risk exposures and control issues identified to the Board and to senior management, including fraud risks, governance issues, and other matters needed or requested by the Audit Committee. It may also evaluate specific operations at the request of the Audit Committee or management, as appropriate.
Code of Conduct
Our Code of Conduct (the Code), which is available on our website, www.astrazeneca.com, applies worldwide to all full-time and part-time Directors, officers, employees and temporary staff, in all companies within our Group. A Finance Code complements the Code and applies to the CEO, the CFO, the Group’s principal accounting officers (including key Finance staff in major overseas subsidiaries) and all Finance function employees. This reinforces the importance of the integrity of the Group’s Financial Statements, the reliability of the accounting records on which they are based and the robustness of the relevant controls and processes.
The Code is at the core of our compliance programme. It has been translated into over 40 languages and provides clear direction as to how our commitment to honesty and integrity is to be realised in consistent actions across all areas of the business.
| | |
| AstraZenecaAnnual Report and Form 20-F Information 2015 | | 95 |
Corporate Governance
Corporate Governance Reportcontinued
Compliance with the Code is mandatory and every employee receives annual training on it. The Code is reviewed periodically and updated to take account of changing legal and regulatory obligations. Our Global Policies supplement the Code and provide clear guidance in key risk areas.
The Code contains information on how to report possible violations through our Helpline, which includes the AZethics telephone lines, the AZethics website, and the Global Compliance e-mail and postal addresses described in the Code. Anyone who raises a potential breach in good faith is fully supported by management. We take all alleged compliance breaches and concerns extremely seriously, and investigate them and report the outcome of such investigations to the Audit Committee, as appropriate.
In 2015, 326 reports of alleged compliance breaches or other ethical concerns were made through the Helpline, including reports made by any anonymous route that could be considered whistleblowing; in 2014 there were 247 reports. The majority of cases come to our attention through management and self-reporting, which can be seen as an indication that employees are more comfortable in raising their concerns with line managers, local HR, Legal or Compliance, as recommended in the Code and reinforced in the 2015 Code training.
Other matters
Corporate governance statement under the UK Disclosure and Transparency Rules (DTR)
The disclosures that fulfil the requirements of a corporate governance statement under the DTR can be found in this section and in other parts of this Annual Report as listed below, each of which is incorporated into this section by reference
Shareholder Information from page 240 and Corporate Information on page 245
Subsidiaries and principal activities
The Company is the holding company for a group of subsidiaries whose principal activities are described in this Annual Report. The Group’s principal subsidiaries and their locations are given in Group Subsidiaries and Holdings in the Financial Statements on page 194.
Branches and countries in which the Group conducts business
In accordance with the Companies Act 2006, we disclose below our subsidiary companies that have representative or scientific branches/offices outside the UK
| > | AstraZeneca UK Limited: Algeria (scientific office), Angola, Belarus, Bulgaria, Chile, Costa Rica, Croatia, Cuba, Dubai (branch office), Georgia, Ghana (scientific office), Jordan, Kazakhstan, Nigeria, Romania, Russia, Saudi Arabia (scientific office), Serbia and Montenegro, Slovenia (branch office), Syria and Ukraine |
| > | AstraZeneca AB: Egypt (scientific office) and Slovakia (branch office) |
| > | AstraZeneca Singapore Pte Limited: Vietnam. |
Distributions to shareholders – dividends for 2015
Details of our distribution policy are set out in the Financial Review on page 178 and Notes 22 and 23 to the Financial Statements on page 172.
The Company’s dividend for 2015 of $2.80 (188.5 pence, SEK 23.97) per Ordinary Share amount to, in aggregate, a total dividend payment to shareholders of $3,539 million. An employee share trust, AstraZeneca Share Trust Limited, waived its right to a dividend on the Ordinary Shares that it holds and instead received a nominal dividend.
A shareholders’ resolution was passed at the 2015 AGM authorising the Company to purchase its own shares. The Company did not repurchase any of its own shares in 2015. On 31 December 2015, the Company did not hold any shares in treasury.
Going concern accounting basis
Information on the business environment in which AstraZeneca operates, including the factors underpinning the industry’s future growth prospects, is included in the Strategic Report. Details of the product portfolio of the Group are contained in both the Strategic Report (in the Therapy Area Review from page 24) and the Directors’ Report. Information on patent expiry dates for key marketed products is included in Patent Expiries from page 210. Our approach to product development and our development pipeline are also covered in detail with additional information by therapy area in the Strategic Report.
The financial position of the Group, its cash flows, liquidity position and borrowing facilities are described in the Financial Review from page 62. In addition, Note 25 to the Financial Statements from page 177 includes the Group’s objectives, policies and processes for managing capital; financial risk management objectives; details of its financial instruments and hedging activities; and its exposures to credit, market and liquidity risk. Further details of the Group’s cash balances and borrowings are included in Notes 16 and 17 to the Financial Statements from page 163.
The Group has considerable financial resources available. As at 31 December 2015 the Group has $8.3 billion in financial resources (cash balances of $6.2 billion and undrawn committed bank facilities of $3.0 billion which are available until April 2020, with only $0.9 billion of debt due within one year). Although no liability was recognised at 31 December 2015, the Group has entered into an agreement to invest in a majority equity stake in Acerta Pharma for an upfront payment of $2.5 billion that was paid on 2 February 2016 and a further unconditional payment of $1.5 billion to be paid either on receipt of the first regulatory approval for acalabrutinib for any indication in the US, or the end of 2018, depending on which is first. The Group’s revenues are largely derived from sales of products which are covered by patents which provide a relatively high level of resilience and predictability to cash inflows, although our revenue is expected to continue to be significantly impacted by the expiry of patents over the medium term. In addition, government price interventions in response to budgetary constraints are expected to continue to adversely affect revenues in many of our mature markets. However, we anticipate new revenue streams from both recently launched medicines and products in development, and the Group has a wide diversity of customers and suppliers across different geographic areas. Consequently, the Directors believe that, overall, the Group is well placed to manage its business risks successfully.
After making enquiries, the Directors have a reasonable expectation that the Company and the Group have adequate resources to continue in operational existence for the foreseeable future. Accordingly, they continue to adopt the going concern basis in preparing the Annual Report and Financial Statements.
| | |
| 96 | | AstraZenecaAnnual Report and Form 20-F Information 2015 |
Changes in share capital
Changes in the Company’s Ordinary Share capital during 2015, including details of the allotment of new shares under the Company’s share plans, are given in Note 22 to the Financial Statements on page 172.
Directors’ shareholdings
The Articles require each Director to be the beneficial owner of Ordinary Shares in the Company with an aggregate nominal value of $125 (which currently represents at least 500 shares because each Ordinary Share has a nominal value of $0.25). Such holding must be obtained within two months of the date of the Director’s appointment. At 31 December 2015, all of the Directors complied with this requirement and full details of each Director’s interests in shares of the Company are set out in Directors’ interests in shares on page 114 and 115. Information about the shareholding expectations of the Remuneration Committee (in respect of Executive Directors and SET members) and the Board (in respect of Non-Executive Directors) is also set out in Directors’ interests in shares on pages 114 and 115.
Political donations
Neither the Company nor its subsidiaries made any EU political donations or incurred any EU political expenditure in 2015 and they do not intend to do so in the future in respect of which shareholder authority is required, or for which disclosure in this Annual Report is required, under the Companies Act 2006. However, to enable the Company and its subsidiaries to continue to support interest groups or lobbying organisations concerned with the review of government policy or law reform without inadvertently breaching the Companies Act 2006, which defines political donations and other political expenditure in broad terms, a resolution will be put to shareholders at the 2016 AGM, similar to that passed at the 2015 AGM, to authorise the Company and its subsidiaries to
| > | make donations to political parties or independent election candidates |
| > | make donations to political organisations other than political parties |
| > | incur political expenditure, up to an aggregate limit of $250,000. |
Corporate political contributions in the US are permitted in defined circumstances under the First Amendment of the US Constitution and are subject to both federal and state laws and regulations. In 2015, the
Group’s US legal entities made contributions amounting in aggregate to $1,224,550 (2014: $1,650,200) to national political organisations, state-level political party committees and to campaign committees of various state candidates. No corporate donations were made at the federal level and all contributions were made only where allowed by US federal and state law. We publicly disclose details of our corporate US political contributions, which can be found on our website, www.astrazeneca-us.com/ responsibility/transparency. The annual corporate contributions budget is reviewed and approved by the Deputy General Counsel, North America, the US Vice-President, Corporate Affairs and the President of our US business to ensure robust governance and oversight. US citizens or individuals holding valid green cards exercised decision making over the contributions and the funds were not provided or reimbursed by any non-US legal entity. Such contributions do not constitute political donations or political expenditure for the purposes of the Companies Act 2006 and were made without any involvement of persons or entities outside the US.
Significant agreements
There are no significant agreements to which the Company is a party that take effect, alter or terminate on a change of control of the Company following a takeover bid. There are no persons with whom we have contractual or other arrangements, who are deemed by the Directors to be essential to our business.
Use of financial instruments
The Notes to the Financial Statements, including Note 25 from page 177, include further information on our use of financial instruments.
Annual General Meeting
The Company’s AGM will be held on 29 April 2016. The meeting place will be in London, UK. A Notice of AGM will be sent to all registered holders of Ordinary Shares and, where requested, to the beneficial holders of shares.
External auditor
A resolution will be proposed at the AGM on 29 April 2016 for the reappointment of KPMG LLP as auditor of the Company. The external auditor has undertaken various non-audit work for us during 2015. More information about this work and the audit and non-audit fees that we have paid are set
out in Note 29 to the Financial Statements on page 192. The external auditor is not engaged by us to carry out any non-audit work in respect of which it might, in the future, be required to express an audit opinion. As explained more fully in the Audit Committee Report from page 98, the Audit Committee has established pre-approval policies and procedures for audit and non-audit work permitted to be carried out by the external auditor and has carefully monitored the objectivity and independence of the external auditor throughout 2015.
On 23 December 2015, we announced a proposal to appoint PricewaterhouseCoopers LLP (PwC) as our external auditor for the financial year ending 31 December 2017. The proposed change of auditor follows a recommendation by the Audit Committee to the Board based on a formal tender in line with best practice. More information about the tender process is set out in the Audit Committee Report from page 98. A resolution to approve the appointment of PwC will be put to shareholders at the Company’s AGM in 2017.
Directors’ Report
The Directors’ Report, which has been prepared in accordance with the requirements of the Companies Act 2006, comprises the following sections
| > | Business Review: Research and Development |
| > | Resources Review: Employees |
| > | Corporate Governance: Including the Audit Committee Report and Corporate Governance Report |
| > | Directors Responsibility Statement |
| > | Sustainability: supplementary information |
and has been signed on behalf of the Board.
The Board considers this Annual Report, taken as a whole, to be fair, balanced and understandable, and provides the necessary information for shareholders to assess AstraZeneca’s position and performance, business model and strategy.
A C N Kemp
Company Secretary
4 February 2016
| | |
| AstraZenecaAnnual Report and Form 20-F Information 2015 | | 97 |
Corporate Governance
Audit Committee Report
| | | | |
 | | The quality of AstraZeneca’s financial reporting is underpinned by well-designed internal controls, appropriate accounting practices and policies, and good judgement.” |
Dear shareholder In this Report, we describe the work of the Audit Committee during the year and the significant issues considered. In 2015, our priorities were to receive assurance on sound financial reporting, effective risk management and compliance with the AstraZeneca Code of Conduct. | | completed, and in December, on the recommendation of the Committee, the Board announced its decision to recommend the appointment of PricewaterhouseCoopers LLP (PwC) to shareholders at the Company’s 2017 AGM. The Committee were advised that the Public Company Accounting Oversight Board (PCAOB) and the Financial Reporting Council (FRC) had both undertaken a review of certain aspects of KPMG LLP’s audit of AstraZeneca PLC’s financial statements for the year ended 31 December 2014. We have discussed the review and its findings with KPMG and are satisfied with the responses to be implemented by KPMG. The PCAOB Report is not yet available. Risk management During the year the Committee reviewed the Company’s approach to risk management, its risk reporting framework, and the focus of the Group Risk Team. These discussions also provided the context for the Committee’s consideration of the development of the form and content of the Directors’ viability statement and the analysis that underpins the assurance provided by that statement. Further information on the Company’s Principal Risks and the Directors’ viability statement are on pages 21 to 23. Compliance with the Code of Conduct Compliance with our Code of Conduct in Emerging Markets continued to be an area of focus for the Committee, which considered reports on matters in China, Russia, the Middle East and Africa, and India for example. In October, members of the Committee visited the Company’s commercial and IT operations in Bangalore and Chennai respectively. We talked to |
The principal duties of the Audit Committee (the Committee) are to provide assurance to the Board, as part of the Board’s stewardship and protection of our shareholders’ interests, ensuring > the integrity of our financial reporting, internal controls of financial matters and financial disclosures > the effectiveness of our internal controls over non-financial matters, and compliance with laws and the AstraZeneca Code of Conduct > the quality of the Company’s relationship with its external auditor and the effectiveness of the external audit > the role, resources and effectiveness of the Company’s internal audit function > the effectiveness of the Company’s risk management framework. Financial reporting The quality of AstraZeneca’s financial reporting is underpinned by well-designed internal controls, appropriate accounting practices and policies, and good judgement. The Committee reviews, at least quarterly, the Company’s significant accounting matters and, where appropriate, challenges management’s decisions before | | approving the accounting policies applied. During 2015, the Committee has looked at the changes to AstraZeneca’s revenue accounting policy to include Externalisation Revenue in its Statement of Comprehensive Income. For more information on Externalisation Revenue, please refer to the Financial Review from page 62. This change in accounting policy increases the transparency of the income generated by the Company’s externalisation activities and reflects changes over the past two years to the Company’s strategy and business model to realise the full value of assets and technology and provide for optimal investment in R&D. We also looked closely at intangible asset impairment reviews; restructuring, legal provisions and other related charges, to ensure that items are appropriately accounted for in ‘Reported’ and ‘Core’ results. We also scrutinised revenue recognition together with the associated selling and marketing investments. During 2015 the Committee oversaw a competitive tender of the Company’s external audit services. A thorough selection process in line with best practice was | |
| | |
| 98 | | AstraZenecaAnnual Report and Form 20-F Information 2015 |
| | | | | | |
members of local and regional management including our compliance officers about AstraZeneca’s performance and its approach to diversity, risk management, business resilience and operating ethically, within the law and in accordance with our Code of Conduct. I am pleased to report that in 2015, the Company had met all of its obligations under its five-year Corporate Integrity Agreement in the US, which terminated in April 2015. Naturally, maintaining compliance with the Company’s Code of Conduct and high ethical standards in all countries where we conduct business or have interactions will continue to be a priority for the Committee. Engagement with senior leaders The Committee considers it important to extend its interactions with members of management below the SET. In addition to the meetings with local and regional management in India, the Committee met informally with members of Internal Audit Services (IA), Compliance, IS/IT and Finance teams. In July 2015, the Chairman of the Committee participated in a conference with the Finance team on the subject of ‘Finance as Leaders’. We take a special interest in the strength and depth of the finance organisation and talent development within that function. We value dialogue with our shareholders and welcome your feedback on this report. Yours sincerely 
Rudy Markham Chairman of the Audit Committee | | | | Audit Committee membership and attendance The Audit Committee members are Rudy Markham (Committee Chairman), Bruce Burlington, Ann Cairns, Jean-Philippe Courtois and Shriti Vadera – all Non-Executive Directors. The Board considers each member to be independent under the UK Corporate Governance Code and under the general guidance and specific criteria of the Listing Standards concerning the composition of audit committees applicable to non-US companies listed on the NYSE. In April 2015, we submitted the required annual written affirmation to the NYSE confirming our full compliance with those standards. For the purposes of the UK Corporate Governance Code, the Board remains satisfied that at least one member of the Audit Committee has recent and relevant financial experience. At its meeting in December 2015, the Board determined that Rudy Markham and Ann Cairns are Audit Committee financial experts for the purposes of the Sarbanes-Oxley Act. For more information regarding the experience of the Audit Committee members, see the Board of Directors’ biographies on pages 86 and 87. The Deputy Company Secretary acts as secretary to the Audit Committee. Meetings of the Audit Committee are routinely attended by the CFO; the General Counsel; the Chief Compliance Officer; the Vice-President, IA; the Vice-President Finance, Group Controller; and our external auditor. The CEO attends on an agenda-driven basis. In line with its normal practice, the Audit Committee also held a number of private meetings, without management present, with the Chief Compliance Officer; the General Counsel; the Vice-President, IA; and the Company’s external auditor. These meetings were held between Audit Committee members and those individuals, separately from the main sessions of the Audit Committee. Number of meetings and attendance The Audit Committee held five scheduled meetings in 2015. The attendance record of the Audit Committee members is set out in the Board and Board Committee meeting attendance in 2015 table on page 92. Following each Audit Committee meeting, the Committee Chairman reported to the Board on the principal matters covered at the meeting and minutes of the meetings were circulated to all Board members. | | In addition, the Chairman of the Audit Committee held regular scheduled calls between Audit Committee meetings with each of the CFO; the Chief Compliance Officer; the Vice-President, IA; and the lead partner of the external auditor. The Audit Committee is currently scheduled to meet five times in 2016 and will meet at such other times as may be required. Terms of reference The terms of reference of the Audit Committee, which are available on our website, www.astrazeneca.com, include reviewing and reporting to the Board on: > Matters relating to the audit plans of the external auditor and IA as well as oversight of the work of the Global Compliance function. > The effectiveness of our overall framework for internal control over financial reporting and for other internal controls and processes. > Our overall framework for risk management. > The appropriateness of our accounting policies and practices. > Our annual and quarterly financial reporting, including the critical estimates and judgements contained in our reporting. > Our internal control over financial reporting. > Our Code of Conduct and whistleblower procedures. The Audit Committee is responsible for notifying the Board of any significant concerns of the external auditor or the Vice-President, IA arising from their audit work; any matters that may materially affect or impair the independence of the external auditor; any significant deficiencies or material weaknesses in the design or operation of our internal control over financial reporting or other internal controls; any serious issues of non-compliance; and how the Audit Committee has discharged its responsibilities. It oversees the establishment, implementation and maintenance of our Code of Conduct and other related policies. It monitors the Company’s response to letters requesting information and investigations initiated by regulatory and governmental authorities such as the SEC, the DOJ and the FRC pertaining to matters within the remit of the |
| | |
| AstraZenecaAnnual Report and Form 20-F Information 2015 | | 99 |
Corporate Governance
Audit Committee Reportcontinued
| | | | |
Audit Committee’s work. It has established procedures for the receipt and handling of complaints concerning accounting or audit matters. It recommends to the Board the appointment of the external auditor, subject to the approval of the Company’s shareholders at a general meeting. Shareholders authorise the Directors to fix the remuneration of the external auditor at a general meeting. The Audit Committee reviews and approves the appointment and dismissal of the Vice-President, IA. Activities of the Audit Committee in 2015 The Audit Committee has an annual calendar of topics, developed from its terms of reference, with standing items which it considers in accordance with its schedule at each quarterly meeting or, in some cases, annually. During 2015 and in February 2016, the Audit Committee considered and discussed the following standing items: > The key elements of the Financial Statements, and the estimates and judgements contained in our financial disclosures. Various accounting matters were considered. These included the areas described in the Financial Review under ‘Critical accounting policies and estimates’ (with a focus on accounting issues relevant to revenue recognition, litigation and taxation matters and; goodwill and intangible asset impairment) from page 77 and other important matters such as considering and approving a change to revenue accounting to include Externalisation Revenue in the Company’s Statement of Consolidated Income, and subsequently monitoring the application of the same. Discussion of these matters was supported by papers prepared by management and the external auditor. > The reports received from the external auditor concerning its audit of the Financial Statements of the Group and from management, IA, Global Compliance and the external auditor on the effectiveness of our system of internal controls and, in particular, our internal control over financial reporting. The Audit Committee also reviewed quarterly activity reports of audit work carried out by IA and the status of follow-up actions with management, as well as reports from Global Compliance. | | > Risk management review and update of the Company’s risk management approach, its risk reporting framework and the focus of the Group Risk Team. > Compliance with the applicable provisions of the Sarbanes-Oxley Act. In particular, the status of compliance with the programme of internal controls over financial reporting implemented pursuant to Section 404 of the Sarbanes-Oxley Act. The Audit Committee remained focused on IT controls in the context of the changes to the Group’s IT environment, described below. More information about this is set out in the Sarbanes-Oxley Act Section 404 section of the Financial Review on page 81. > Data about reports made by employees via the AZethics helpline, online facilities and other routes regarding potential breaches of the Code of Conduct, together with the results of inquiries into those matters. > Reports from Global Compliance confirming compliance with and the successful completion of the Company’s obligations under the Corporate Integrity Agreement that had been in place for five years in the US. > Reports from the Group Treasury function, in particular, concerning the Company’s liquidity and cash position and the appropriateness of its investment management policy in the context of the current economic situation. > Going concern assessment and adoption of the going concern basis in preparing this Annual Report and the Financial Statements. > Other reports, on a quarterly basis, concerning IA, Global Compliance and Finance, including the internal audit plan and progress and plans of Global Compliance. > Quarterly reports from the General Counsel on the status of certain litigation matters and governmental investigations. > The amount of audit and non-audit fees of the external auditor throughout 2015. The Audit Committee was satisfied throughout the year that the objectivity and independence of the external auditor were not in any way impaired by the nature of the non-audit work undertaken by the external auditor during the year, the level of non-audit fees charged for such | | work or any other facts or circumstances. Further information about the audit and non-audit fees for 2015 is disclosed in Note 29 to the Financial Statements on page 192. > A review and assessment of the Audit Committee’s performance. Matters considered by the Audit Committee in addition to its usual business as described above included: > Receiving regular updates from the IT team in connection with the transformation of AstraZeneca’s IT infrastructure, with particular attention to cybersecurity, business continuity and transitioning into new payroll software. The Audit Committee also reviewed the performance of the Chennai IT Centre which included a site visit in October 2015. > Considering the opportunity for AstraZeneca in the Indian pharmaceutical market which included a site visit to Bangalore in October 2015, noting in particular local management’s focus on driving a strong compliance culture. > Considering and reviewing compliance in China, noting in particular improvements in policy and controls and the importance of training for new employees. > Considering the execution and outcomes of significant capital expenditure on the construction of a plant in Russia. > Post-investment reviews of a recent major business development transaction, a capital expenditure project, and the integration of the BMS diabetes business acquired at the start of 2014. > Reviewing the preparation of the Directors’ proposed viability statement and the adequacy of the analysis supporting the assurance provided by that statement. > Reviewing the operation and effectiveness of the Company’s third party risk management framework which supports the management of key risks important to AstraZeneca’s integrity and reputation such as bribery and corruption, data privacy, employment principles and product security. |
| | |
| 100 | | AstraZenecaAnnual Report and Form 20-F Information 2015 |
| | | | |
> The FRC’s review of certain aspects of KPMG LLP’s audit of AstraZeneca PLC’s financial statements for the year ended 31 December 2014. The Audit Committee discussed the review and its findings with KPMG. The Audit Committee was satisfied with the responses to be implemented by KPMG. > Considering the external quality assessment review of IA conducted by Ernst & Young LLP during 2015. In the course of carrying out its work, the Audit Committee has taken the opportunity to meet individual or groups of managers to discuss and gain a deeper insight into relevant areas of interest. Significant financial reporting issues considered by the Audit Committee in 2015 The Audit Committee determined that the significant matters considered during the year were > revenue recognition > impairment of intangible assets > litigation and contingent liabilities > tax accounting > post-retirement benefits > allocation of Core and non-Core revenues > Externalisation Revenue accounting. Revenue recognition The US is our largest single market and sales accounted for 40.1% of our Product Sales in 2015. Revenue recognition, particularly in the US, is impacted by rebates, chargebacks, cash discounts and returns (for more information, please see the Financial Review from page 62). The Audit Committee pays particular attention to management’s estimates of these items, its analysis of any unusual movements and their impact on revenue recognition informed by commentary from the external auditor. Impairment of intangible assets The Group carries significant intangible assets on its Balance Sheet arising from the acquisition of businesses and IP rights to medicines in development and on the market. Each quarter the CFO outlines the carrying value of the Group’s intangible | | assets and, in respect of those intangible assets that are identified as at risk of impairment, the difference between the carrying value and management’s current estimate of discounted future cash flows for ‘at risk’ products (the headroom). Products will be identified as ‘at risk’ because the headroom is small or, for example, in the case of a medicine in development, a significant development milestone such as the publication of clinical trial results which could significantly alter management’s forecasts for the product. In 2015, there were no significant impairments of intangible assets. Litigation and contingent liabilities Litigation, particularly that relating to the enforcement and defence of IP rights protecting medicines, is a significant feature of the pharmaceutical industry. In addition to IP litigation, the Group is involved in a number of government investigations and is a defendant in certain product liability actions. The Audit Committee receives regular updates from the General Counsel, and is informed by commentary from the external auditor, on the status of those litigation matters that might result in fines or damages against the Company, to assess whether provisions should be taken and, if so, when and in what amounts. Of the matters the Audit Committee considered in 2015 the Pulmicort Respules patent litigation and Nexium anti-trust litigation, both in the US, were among the most significant. The Company took a reserve in thePulmicort Respules case after the US Court of Appeals for the Federal Circuit affirmed certain claims in thePulmicortRespules sterility patent were invalid and lifted the preliminary injunction. Notwithstanding the Company’s success defending the claims in theNexium anti-trust case, the plaintiffs continue to seek opportunities to assert their claims. Further information about the Company’s litigation and contingent liabilities is set out in Note 27 to the Financial Statements from page 186. Tax accounting The Audit Committee considered the overall tax affairs of the Group in 2015, noting that the exposure associated with significant tax contingencies has continued to reduce but remains significant. The Audit Committee | | considered the key tax developments at OECD and in key jurisdictions, including proposed requirements for country-by-country reporting. The Audit Committee was informed that the Company was on track to meet such additional requirements. Post-retirement benefits Pension accounting continues to be a significant area of focus. The Audit Committee considered the investment performance and financing of significant pension plans. Internal controls At each quarterly meeting, the Audit Committee receives a report of the matters considered by the Disclosure Committee during the quarter. At the February 2016 meeting, the CFO presented to the Audit Committee the conclusions of the CEO and the CFO following the evaluation of the effectiveness of our disclosure controls and procedures required by Item 15(a) of Form 20-F at 31 December 2015. Based on their evaluation, the CEO and the CFO concluded that, as at that date, we maintain an effective system of disclosure controls and procedures. There was no change in our internal control over financial reporting that occurred during the period covered by this Annual Report that has materially affected, or is reasonably likely to materially affect, our internal control over financial reporting. Appointing the auditor and safeguards on non-audit services We noted in our 2012 Annual Report that, having reviewed the changes to the UK Corporate Governance Code with regard to putting the external audit contract out to tender at least every 10 years, and cognisant of the fact that the lead audit partner at KPMG rotated in 2013, the Audit Committee determined that the audit would be put out to tender by 2018 in accordance with the transitional guidance issued by the FRC. KPMG was first appointed as sole external auditor to Zeneca Group PLC in 1993 and to AstraZeneca PLC in 2001 following a competitive tender. The six largest audit firms were invited to participate in the process, three of which |
| | |
| AstraZenecaAnnual Report and Form 20-F Information 2015 | | 101 |
Corporate Governance
Audit Committee Reportcontinued
| | | | |
declined. We agreed with KPMG that given they would be prohibited from being our auditor post 2020 they would not participate. No contractual obligations restricted the Audit Committee’s choice of external auditor. Having concluded a competitive tender process in December the Audit Committee recommended to the Board that PwC be appointed as the Group’s statutory auditor for the 2017 financial year. A resolution to approve the appointment of PwC will be put to shareholders at the Company’s AGM in 2017. The Audit Committee considers that the Company has complied with the Competition and Markets Authority’s Statutory Audit Services for Large Companies Market Investigation (Mandatory Use of Competitive Tender Processes and Audit Committee Responsibilities) Order 2014 in respect of its financial year commencing 1 January 2015. Non-audit services The Audit Committee maintains a policy (the Non-Audit Services Policy) and procedures for the pre-approval of all audit services and permitted non-audit services undertaken by the external auditor, the principal purpose of which is to ensure that the independence of the external auditor is not impaired. The policies and procedures cover three categories of work: audit services; audit-related services; and tax services. The policies define the type of work that falls within each of these categories and the non-audit services that the external auditor is prohibited from performing under the rules of the SEC and other relevant UK and US professional and regulatory requirements. The pre-approval procedures permit certain audit, audit-related and tax services to be performed by the external auditor during the year, subject to fee limits agreed with the Audit Committee in advance. The CFO (supported by the Vice-President Finance, Group Controller), monitors the status of all services being provided by the external auditor. The procedures also deal with placing non-audit work out for tender, where appropriate. Authority to approve work in excess of the pre-agreed fee limits is delegated to the | | Chairman of the Audit Committee together with one other Audit Committee member in the first instance. A standing agenda item at Audit Committee meetings covers the operation of the pre-approval procedures and regular reports are provided to the full Audit Committee. In 2015, non-audit services provided to the Company by KPMG included tax compliance services and audit services in relation to employee benefit funds, within the scope of the pre-approved services set out in the Non-Audit Services Policy. All such services were presented to the Audit Committee for pre-approval. Fees paid to the auditor for audit, audit-related and other services are analysed in Note 29 to the Financial Statements on page 192. Fees for non-audit services amounted to 30% of the fees paid to KPMG for audit, audit-related and other services in 2015. Assessing external audit effectiveness In accordance with its normal practice, the Audit Committee considered the performance of KPMG and its compliance with the independence criteria under the relevant statutory, regulatory and ethical standards applicable to auditors. Having considered all these factors, the Audit Committee recommended to the Board that a resolution for the reappointment of KPMG as the Company’s external auditor for the year ending 31 December 2016 be proposed to shareholders at the AGM in April 2016. Consistent with current market practice, KPMG’s services to the Company are provided pursuant to terms of engagement, which are reviewed by the Audit Committee. Neither these terms of engagement nor any other agreement include any contractual obligations under which the Board would be prevented from appointing a different audit firm were they to consider this to be in the best interests of the Group. | | |
| | |
| 102 | | AstraZenecaAnnual Report and Form 20-F Information 2015 |
Directors’ Remuneration Report

Dear shareholder
As Chairman of the Remuneration Committee (the Committee), I am pleased to present AstraZeneca’s 2015 Directors’ Remuneration Report incorporating our Annual Report on Remuneration for 2015 (the Implementation Report). Our Remuneration Policy, approved by shareholders at the 2014 AGM, is reproduced from page 122.
In 2015, I succeeded John Varley as Chairman of the Committee. I would like to offer thanks from the Committee to John Varley and Nancy Rothwell, both of whom retired following the 2015 AGM, for their leadership and valued contribution to the Committee.
Although the Committee is not proposing material changes to remuneration within policy this year, we have evolved the format of this report by including an At a glance section on page 106, as well as a brief table of contents below. We hope shareholders will find these improvements helpful.
2015 performance
The Company delivered a strong pipeline and financial performance in 2015 as we continued to implement our strategy to achieve scientific leadership, return to growth, and achieve Group financial targets. The majority of the elements of our performance-related pay are directly aligned to the business plan based on these three strategic pillars with the intention of driving performance that promotes the long-term success of the Company.
This year our continued focus on our three main therapy areas delivered further R&D progress, supported by key agreements with Acerta Pharma and Celgene in Oncology, and ZS Pharma in CVMD.
We continued to make strong progress towards achieving scientific leadership and our ability to deliver innovation to the market with a number of opportunities accelerated and our pipeline progressed significantly above expectations. To highlight two achievements, the FDA’s accelerated approval of Tagrisso provided an important
| | |
| AstraZenecaAnnual Report and Form 20-F Information 2015 | | 103 |
Corporate Governance
Directors’ Remuneration Reportcontinued
| | | | |
new treatment option for lung cancer patients, as did the FDA’s approval of the expanded indication forBrilinta for patients with a history of heart attack beyond the first year. In addition, we completed a number of strategic business development transactions this year, such as the agreement with Takeda in Respiratory, theMovantik collaboration and theEntocort andCaprelsa divestments, which have enabled the business to realise the full value of assets and technology to reinvest in support of our accelerated pipeline and Growth Platforms. The Committee noted that two acquisitions were made close to the year end and the Committee will take into account any dilutive effect attributable to the transactions on the Company’s LTIs in due course. In terms of financial performance, our six Growth Platforms delivered an 11% rise in sales representing 57% of our Total Revenue demonstrating continued delivery of our return to growth strategy. Overall, the performance of our Growth Platforms was strong, particularlyBrilinta/Brilique; Farxiga/Forxiga in Diabetes; and Emerging Markets. Despite the market slowdown in China, sales growth was 15%, with Oncology and Respiratory performing particularly well. Although our Product Sales declined by 1% in 2015, reflecting the impact of the entry ofNexium generic products in the US, the performance of our Growth Platforms demonstrates the impact that our return to growth strategy is having on the business, complementing our established products. AstraZeneca remains focused on the delivery of our strategy and aligns reward to the creation of sustained value for our shareholders.” | | Overall, our financial performance during 2015 continues to reflect the life-cycle challenges which we have faced and the substantial investment and progress which we have made in developing our pipeline over recent years. As a result of the actions taken by our leadership team during this phase in our strategy, our Core EPS has risen by 7% during 2015 to $4.26 at actual rate of exchange. In addition, Total Revenue increased by 1% during the year to $24.7 billion. At actual exchange rates, Total Revenue declined by 7% in the year reflecting the particular weakness of key trading currencies against the US dollar. 2015 remuneration outcomes Performance measures are closely aligned with Company strategy, ensuring the Executive Directors only receive significant reward for delivery of appropriately balanced financial, non-financial and individual performance. In evaluating reward the Committee has ensured that the outcomes reflect the actual performance of the business and shareholder experience. Valuable additional insight is provided by the two members of the Committee who are also members of the Audit Committee. As I have outlined above, the Company performed well against the components of the global Scorecard (see page 107 for further information). When assessing business performance the Committee noted that some achievements were enabled by additional investment which was not originally budgeted when the Scorecard targets were set. As a consequence, the Committee has taken care to ensure that Scorecard performance has been appropriately evaluated by reference to the original budgeted investment. When considering business performance together with the Executive Directors’ performance against their individual objectives, annual bonus awards of 175% and 149.3% of base salary were awarded to Mr Soriot and Mr Dunoyer respectively. In line with commitments made last year, we have provided the targets and outcomes under the achieve Group financial targets | | performance measure. We continue to provide appropriate disclosure of the other measures, return to growth and achieve scientific leadership, while being mindful that the target ranges themselves remain commercially sensitive at this time. As highlighted last year, we will disclose the targets when they are deemed no longer to be sensitive, which we currently envisage being in two years’ time. Consistent with this approach, this year’s report includes disclosure of the targets that were used for the 2013 annual bonus. The 2013 PSP award was tested for performance following the end of 2015. In the return to growth measure, the Diabetes performance targets were set prior to the acquisition of the remaining 50% interest in the Global Diabetes Alliance Assets and therefore the Committee has evaluated performance consistently against the original targets. As a result of our performance over the last three years, the timeframe of which coincides with implementation of the new strategy which Mr Soriot set out for AstraZeneca, the 2013 PSP award vested at 78% of maximum. Disclosure of the 2013 PSP targets and outcome can be found on page 109. Remuneration in 2016 As set out in more detail on page 117, we are not proposing to make material changes to our remuneration arrangements for 2016. Executive Directors will receive salary increases of 2%, effective from 1 January 2016, in line with those for the wider employee population. There are no changes proposed to their benefit or pension provision. Target incentive opportunity levels attached to the 2016 annual bonus and 2016 PSP and AZIP awards will also remain unchanged. The performance measures under these plans will also remain unchanged, albeit with the introduction of a simplified approach to how we measure performance under the return to growth measure in our PSP, further details of which are provided opposite. |
| | |
| 104 | | AstraZenecaAnnual Report and Form 20-F Information 2015 |
| | | | |
Shareholder engagement The Committee was pleased to note that shareholders’ approval of our 2014 Implementation Report increased significantly from 2013. Nevertheless, the outcome was still lower than we would like it to be. As such, over the course of 2015, on behalf of the Committee, I have spoken with a number of our major shareholders and I would like to take this opportunity to thank them for the input and feedback they provided. I would like to address three key areas raised by shareholders. Simplifying our LTI arrangements While it was recognised that our arrangements are wholly aligned with our strategy, some shareholders felt that there may be an opportunity to simplify the framework. During 2016, we intend to continue discussions with our major shareholders on this area, with a view to ensuring that Executive Director reward at AstraZeneca remains focused on the delivery of our strategy and aligns reward to the creation of sustained value for our shareholders. In addition, for 2016, we have decided to simplify one of the elements of our PSP by changing the return to growth measures to one single measure consolidating the existing six Growth Platforms in aggregate. This change allows us to disclose the aggregate target for this measure at the start of the performance period, in contrast to the individual targets for each Growth Platform which remain commercially sensitive, and assists in striking the right balance between transparency in our reporting on executive pay and protecting our commercially sensitive information. In addition, in relation to our LTIs, we are aware that at times some shareholders may have found our use of expected values unclear. As such, while we continue to use | | expected values internally to allow us to allocate awards between the PSP and AZIP, from 2016 onwards we will disclose the value of LTI awards in terms of their face value only. More transparent link between the financial targets communicated in May 2014 and executive pay Some shareholders questioned whether there could be a more transparent link between the financial targets which we communicated in May 2014 and executive pay, and in particular whether a target based on the 2023 revenue figure ($45 billion at 2013 exchange rates) could be incorporated within our incentive plans. This has some attraction, although there is a clear balance to be struck given the need to ensure that our arrangements are simple, practicable and aligned to our business. Ultimately, following discussions, the Committee’s view is that the best way to achieve line of sight to the 2023 revenue target is by ensuring that the financial and operational measures under the PSP are directly linked to the long-term business plan. However, the Committee will continue to consider ways in which a more transparent link between the 2023 revenue target and executive pay may be achieved. Above-target LTI awards The use of ‘above-target’ awards at AstraZeneca has been noted by some shareholders. While we are aware that the use of ‘target’ awards may be less common in the wider market, at AstraZeneca we find that operating a ‘target’ award level, with the flexibility to go above or below this level, can be helpful in setting and communicating award levels internally, allowing the Committee to differentiate performance appropriately. | | Mr Soriot has received ‘above-target’ awards in recent years due to the outstanding contribution he has made to the business since his appointment. The Committee values the ability to recognise this progress. In considering Mr Soriot’s remuneration, we reference practice within UK quoted companies, but we also remain mindful of the fact that our peers are mainly US or Swiss-based companies. Individuals with the capability which Mr Soriot brings to the CEO role are extremely valuable and he is undoubtedly a sought-after individual within our sector, particularly given the re-invigoration of the Company which he has led over the last three years. In this context, the Committee aims to ensure that Mr Soriot is appropriately rewarded within our Remuneration Policy. Next steps We remain committed to ensuring that our remuneration arrangements support our strategy and the delivery of value to our shareholders. As such, I hope that you find this report clear, helpful and informative. Our ongoing dialogue with shareholders is valued greatly and, as always, we welcome your feedback on this Directors’ Remuneration Report. Yours sincerely 
Graham Chipchase Chairman of the Remuneration Committee 4 February 2016 |
| | |
| AstraZenecaAnnual Report and Form 20-F Information 2015 | | 105 |
Corporate Governance
Directors’ Remuneration Reportcontinued
At a glance summary
Looking ahead to 2016 – our remuneration framework
| | | | | | |
Element | | Structure | | Opportunity | | Change from 2015 |
| | | | |
| Salary | | Base salary, paid monthly | | CEO – £1,190,000 | | 2% increase |
| | | | | CFO – £707,000 | | 2% increase |
| | | | |
| Pension | | Salary supplement in lieu of pension participation | | CEO – 30% of salary CFO – 24% of salary | | No change No change |
| | | | |
| Annual bonus | | Assessed by performance against one-year financial, non-financial and individual performance targets, with one-third of any award deferred into Ordinary Shares or ADSs, which will vest after three years | | CEO – maximum 180% of salary CFO – maximum 150% of salary | | No change No change |
| | | | |
| Performance Share Plan (PSP) | | Assessed on three-year performance against four equally-weighted measures: | | CEO – 427.7% of salary CFO – 300% of salary | | No change 4.76% decrease |
| | | | |
| | | > Relative TSR > Cash flow > Return to growth > Achieve scientific leadership (5 individual measures) | | | | |
| | | | |
| | | Additional two-year holding period | | | | |
| | | | |
| AstraZeneca Investment Plan (AZIP) | | Assessed on four-year performance against two measures: | | CEO – 71.3% of salary CFO – 50% of salary | | No change 4.76% decrease |
| | | | |
| | | > Dividend level > Dividend cover | | | | |
| | | | |
| | | Additional four-year holding period | | | | |
| | | | | | | |
Our variable remuneration – 2015
2015 Annual bonus (see page 107 for further details)
| | | | | | | | |
Measure | | Target (one-year) | | Weighting | | Performance | | Level of award |
| | | | | |
| Achieve Group financial targets | | Cash flow Core EPS Revenue | | 10% 20% 10% | | Met target Exceeded target Exceeded target | | CEO – 97.2% of maximum (175% of salary) |
| | | | | |
| Achieve scientific leadership | | 5 measures | | 6% each | | Exceeded target | | CFO – 99.5% of maximum (149.3% of salary) |
| | | | | |
| Return to growth | | 6 measures | | 5% each | | Exceeded target | | |
| | | | | | | | | |
2013-2015 PSP (see page 109 for further details)
| | | | | | | | |
Measure | | Target (three-year) | | Weighting | | Performance | | Level of award |
| | | | | |
| Relative TSR | | TSR performance relative to peer group | | 25% each | | 58% of maximum | | 78% of maximum |
| Cash flow | | Cumulative free cash flow | | | 100% of maximum | |
| Achieve scientific leadership | | 5 key measures | | | 100% of maximum | |
| | | | | |
| Return to growth | | 5 measures | | | | 55% of maximum | | |
| | | | | | | | | |
| | |
| 106 | | AstraZenecaAnnual Report and Form 20-F Information 2015 |
Annual Report on Remuneration
(the Implementation Report)
What did we pay our Directors?
Executive Directors’ single total figure remuneration (Audited)
| | | | | | | | | | | | | | | | | | | | | | | | | | | | | | | | | | | | | | | | | | | | | | | | |
| | | 2015
Base
salary
£’000 | | | 2014
Base
salary
£’000 | | | 2015
Taxable
benefits
£’000 | | | 2014
Taxable
benefits
£’000 | | | 2015
Annual
bonus
£’000 | | | 2014
Annual
bonus
£’000 | | | 2015 Long-term incentives
vesting
£’000 | | | 2014
Long-term
incentives
vesting
£’000 | | | 2015
Pension allowance
£’000 | | | 2014
Pension
allowance
£’000 | | | 2015 Total £’000 | | | 2014
Total
£’000 | |
| | | | | | | | | | | | |
| Pascal Soriot | | | 1,167 | | | | 1,133 | | | | 115 | | | | 108 | | | | 2,042 | | | | 1,926 | | | | 4,723 | | | | – | | | | 350 | | | | 340 | | | | 8,397 | | | | 3,507 | |
| | | | | | | | | | | | |
| Marc Dunoyer | | | 694 | | | | 680 | | | | 65 | | | | 62 | | | | 1,036 | | | | 1,016 | | | | 3,993 | | | | – | | | | 167 | | | | 163 | | | | 5,955 | | | | 1,921 | |
| | | | | | | | | | | | |
| Total | | | 1,861 | | | | 1,813 | | | | 180 | | | | 170 | | | | 3,078 | | | | 2,942 | | | | 8,716 | | | | – | | | | 517 | | | | 503 | | | | 14,352 | | | | 5,428 | |
Notes to the Executive Directors’ single total figure remuneration table
Taxable benefits
Executive Directors may select benefits within the Company’s UK Flexible Benefits Programme or can select to take all, or any remaining allowance after the selection of benefits, in cash. In 2015, the Executive Directors principally took the allowance in cash (£96,000 in respect of Mr Soriot, and £49,000 in respect of Mr Dunoyer) and selected other benefits including healthcare insurance, death-in-service provision and advice in relation to tax.
Annual bonus – 2015
The CEO had a target annual bonus of 100% of base salary (range 0-180%) and the CFO had a target annual bonus of 90% of base salary (range 0-150%).
One-third of the pre-tax bonuses shown will be deferred into Ordinary Shares which will vest three years from the date of deferral, subject to continued employment. The bonus is not pensionable.
The precise targets or target ranges set at the beginning of the performance period are closely aligned to the Company’s strategic priorities, set out in the global Scorecard. As with 2014, we have set out below the targets for 2015 in respect of the achieve Group financial targets element of the annual bonus and Company performance against those targets. In addition, we have provided the outcomes under each of the achieve scientific leadership and return to growth measures. While, in the judgement of the Board, the targets themselves under these areas remain commercially sensitive, we remain committed to making retrospective disclosure of these when we no longer consider the targets to be commercially sensitive, which we currently anticipate to be two years after the end of the performance period (as we have done for the 2013 annual bonus targets which are set out on page 114).
When assessing business performance the Remuneration Committee noted that some achievements were enabled by additional investment which was not originally budgeted when the Scorecard targets were set. As a consequence, the Remuneration Committee has taken care to ensure that Scorecard performance has been appropriately evaluated by reference to the original budgeted investment. The global Scorecard outcome was 160% and the Remuneration Committee determined that Mr Soriot’s annual bonus should amount to 175% of base salary, representing 97.2% of his potential maximum, and that Mr Dunoyer’s bonus should amount to 149.3% of base salary, representing 99.5% of his potential maximum. This includes the application of the Scorecard outcome and a further performance uplift to reflect the Remuneration Committee’s view of Mr Soriot’s and Mr Dunoyer’s individual contributions beyond the achievements underpinning the Scorecard outcome.
1. Achieve Group financial targets
These targets are based on the Company’s key financial measures. The annual bonus outcomes reflect the strong revenue and Core EPS performance delivered in 2015, exceeding the targets set at the beginning of the year. Cash flow performance was also on target.
| | | | | | | | | | | | | | | | | | | | | | | | |
| Performance measures for 2015 | | Weighting | | | Target | | | Outcome | | | Performance | | | Pascal
Soriot
level of
award | | | Marc
Dunoyer
level of
award | |
| Achieve cash flow from operating activities target | | | 10% | | | | $3.4bn1 | | | | $3.6bn1 | | | | Met target | | | | 13% | | | | 11.7% | |
| Achieve Core EPS target | | | 20% | | | | $4.412 | | | | $4.672 | | | | Exceeded target | | | | 40% | | | | 36% | |
| Achieve overall revenue target | | | 10% | | | | $24.8bn2 | | | | $26.2bn2 | | | | Exceeded target | | | | 20% | | | | 18% | |
| Pascal Soriot level of award | | | £852,000 (representing 41.7% of total annual bonus outcome) | |
| Marc Dunoyer level of award | | | £456,000 (representing 44% of total annual bonus outcome) | |
| 1 | The cash flow target, and the performance against that target, is evaluated by reference to net cash flow before distributions and other adjustments required by the performance conditions. |
| 2 | The Core EPS and revenue targets, and the performance against those targets, are evaluated by reference to budget exchange rates such that beneficial or adverse movements in currency, which are outside the Company’s control, do not impact reward outcomes. |
| | |
| AstraZenecaAnnual Report and Form 20-F Information 2015 | | 107 |
Corporate Governance
Annual Report on Remuneration
(the Implementation Report)continued
2. Achieve scientific leadership
These measures reflect the Company’s ability to deliver innovation to the market. In 2015, we continued to make significant progress towards achieving scientific leadership and exceeded two out of five of our pipeline targets.
The AstraZeneca pipeline now includes 146 projects, of which 125 are in the clinical phase of development. There are 15 NME projects currently in late-stage development, either in Phase III/pivotal Phase II studies or under regulatory review. During 2015, across the portfolio, 56 projects successfully progressed to their next phase. This includes three first launches and three first approvals in a major market, and 18 NME progressions. In addition, 18 projects have entered Phase I and 20 projects have been discontinued.
| | | | | | | | | | | | | | | | | | | | | | |
Performance measures for 2015 | | Weighting | | | Target | | | Outcome | | | Performance | | Pascal Soriot aggregate level of award | | | Marc Dunoyer aggregate level of award | |
| Phase II starts/progressions | |
| 6% per
measure |
| |
| Commercially
sensitive until March 2018 |
| | | 11 | | | Met target | | | | | | | | |
| Positive Phase III investment decisions | | | | | 6 | | | Met target | | | | | | | | |
| NME and major life-cycle management submissions | | | | | 12 | | | Met target | | | 42% | | | | 37.8% | |
| NME and major life-cycle management approvals | | | | | 5 | | | Exceeded target | | | | | | | | |
| Clinical-stage external licensing and partnering opportunities | | | | | | | | | | | 10 | | | Exceeded target | | | | | | | | |
| Pascal Soriot level of award | | | £490,000 (representing 24% of total annual bonus outcome) | |
| Marc Dunoyer level of award | | | £262,000 (representing 25.3% of total annual bonus outcome) | |
3. Return to growth1
These measures are based on quantitative sales targets for 2015 relating to the Company’s Growth Platforms:Brilinta/Brilique, Diabetes, Respiratory, New Oncology, Emerging Markets, and Japan. In 2015, we met or exceeded all of our return to growth targets. Our Growth Platforms contributed 57% of Total Revenue, an increase of 11% from 2014.
| | | | | | | | | | | | | | | | | | | | | | |
Performance measures for 2015 | | Weighting | | | Target | | | Outcome | | | Performance | | Pascal Soriot aggregate level of award | | | Marc Dunoyer aggregate level of award | |
| DeliverBrilinta/Brilique target | |
| 5% per
measure |
| |
| Commercially
sensitive until March 2018 |
| | | $668m | | | Met target | | | 45% | | | | 40.5% | |
| Build Diabetes franchise | | | | | $2,323m | | | Met target | | |
| Deliver Respiratory goals | | | | | $5,014m | | | Exceeded target | | |
| Deliver New Oncology growth target | | | | | $123m | | | Exceeded target | | |
| Deliver sales growth in Emerging Markets | | | | | $6,314m | | | Met target | | |
| Deliver Japan target | | | | | | | | | | | $2,191m | | | Met target | | | | | | | | |
| Pascal Soriot level of award | | | £525,000 (representing 25.7% of total annual bonus outcome) | |
| Marc Dunoyer level of award | | | £281,000 (representing 27.1% of total annual bonus outcome) | |
| 1 | In respect of the return to growth measures only, the targets are set at budget exchange rates at the beginning of the performance period and evaluated at those rates at the end of the performance period. |
4. Individual performance
Although the performance targets in the global Scorecard drive prima facie bonus outcomes, the Remuneration Committee also applies judgement to assess the Executive Director’s individual performance.
For 2015, the Remuneration Committee has determined that following the application of the Scorecard outcome, Mr Soriot’s bonus will be increased by £175,000 from 160% of base salary to 175% and, in respect of Mr Dunoyer, by £37,000 from 144% of base salary to 149.3%.
The Remuneration Committee awarded an individual performance uplift of 15% to Mr Soriot’s award, which recognises his leadership qualities in driving the Company through a period of transitional change as we continue to return the Company to growth. The Remuneration Committee in particular wished to recognise his continued focus on the Company’s longer-term strategy by unlocking the value of non-core assets and technology to support our accelerated pipeline and Growth Platforms in the near term, and the acquisitions of ZS Pharma and Acerta Pharma and business development deals which have the potential to generate sustainable returns for our shareholders. In addition, under Mr Soriot’s leadership we have achieved excellent three-year TSR performance against our peers and the Company was ranked as second best employer in the UK in an independent survey commissioned by Bloomberg.
The Remuneration Committee awarded an individual performance uplift of 5.3% to Mr Dunoyer’s award, which recognises in particular his role in delivering financial performance in line with guidance despite significant foreign currency headwinds, the successful $6 billion bond issue and the execution of the Company’s business development activities.
| | |
| 108 | | AstraZenecaAnnual Report and Form 20-F Information 2015 |
Long-term incentives: 2013 Performance Share Plan (PSP)
The vesting of the PSP awards is contingent on continued employment and performance against four equally-weighted performance measures over the three-year performance period. 78% of the PSP awards granted to Mr Soriot and Mr Dunoyer in 2013 in respect of the 2013-2015 performance period will vest in 2016. This is the first vesting of LTIs for Mr Soriot and Mr Dunoyer since joining the Company.
| | | | | | | | | | | | |
| | | Number of shares awarded | | | Number of shares vesting | | | Value of shares vesting1
£’000 | |
| Pascal Soriot | | | 125,113 | | | | 97,588 | | | | 4,723 | |
| Marc Dunoyer | | | 90,853 | | | | 70,865 | | | | 3,993 | |
| 1 | Based on average closing share price over the three-month period to 31 December 2015 plus accrued dividends over the vesting period. |
The TSR and cash flow targets were disclosed at the time of the award. The Remuneration Committee has determined that the 2013 targets relating to the achieve scientific leadership and return to growth elements of the PSP are no longer commercially sensitive. The targets, outcomes and relative weighting of each of the PSP’s performance measures are set out in the tables below.
More information about the PSP is set out in the Share interests awarded in 2015 section from page 110.
1. Relative TSR
| | | | | | | | | | | | | | | | | | | | |
| Performance measure for 2013–2015 | | Weighting | | | Threshold target:
25% vesting | | | Maximum target:
100% vesting | | | Outcome | | | Vesting (% of
maximum) | |
| AstraZeneca’s rank against peer group | | | 25% | | | | Median (6th) | | |
| Above upper quartile
(2nd or above, at the
discretion of the
Remuneration
Committee) |
| | | 4th | | | | 58% | |
More information about the TSR performance of the Company, including the Company’s peer group, is set out in the Total shareholder return section on page 113.
2. Cumulative cash flow
| | | | | | | | | | | | | | | | | | | | |
Performance measure for 2013–2015 | | Weighting | | | Threshold target: 25% vesting | | | Maximum target: 100% vesting | | | Outcome | | | Vesting (% of maximum) | |
| Adjusted cumulative cash flow1 | | | 25% | | | | $9bn | | | | $13bn | | | | $14.1bn | | | | 100% | |
| 1 | The cash flow target, and the performance against that target, is evaluated by reference to net cash flow before distributions and other adjustments required by the performance conditions. |
3. Achieve scientific leadership
| | | | | | | | | | | | | | | | | | | | |
| Performance measures for 2013–2015 | | Weighting | | | Threshold target:
25% vesting | | | Maximum target:
100% vesting | | | Outcome | | | Vesting (% of
maximum) | |
| NME approvals | | | | | | | 2 | | | | 4 | | | | 6 | | | | 100% | |
| Major life-cycle management approvals | | | | | | | 3 | | | | 5 | | | | 5 | | | | 100% | |
| Phase III registration/NME volume | |
| 5% per
measure |
| | | 7 | | | | 10 | | | | 14 | | | | 100% | |
| Prospective peak-year sales from NME and major life-cycle management approvals | | | | $1bn | | | | $3bn | | | | $5.6bn | | | | 100% | |
| Phase II starts | | | | | | | 9 | | | | 12 | | | | 34 | | | | 100% | |
4. Return to growth1
| | | | | | | | | | | | | | | | | | | | |
Performance measures for 2013–2015 | | Weighting | | | Threshold target: 25% vesting | | | Maximum target: 100% vesting | | | Outcome | | | Vesting (% of maximum) | |
| DeliverBrilinta/Brilique target | | | | | | | $1bn | | | | $1.4bn | | | | $0.7bn | | | | 0% | |
| Build Diabetes franchise2 | | | | | | | $1.3bn | | | | $1.9bn | | | | $1.1bn | | | | 0% | |
| Deliver Respiratory goals | | | 5% per | | | | $3.2bn | | | | $4.6bn | | | | $5.6bn | | | | 100% | |
| Deliver sales growth in Emerging Markets | | | measure | | | | $5bn | | | | $7.1bn | | | | $6.6bn | | | | 88% | |
| Deliver Japan target | | | | | | | $2.4bn | | | | $3.4bn | | | | $3.2bn | | | | 88% | |
| 1 | In respect of the return to growth measures only, the targets are set at budget exchange rates at the beginning of the performance period and evaluated at those rates at the end of the performance period. |
| 2 | The Diabetes performance targets were set prior to the acquisition of the remaining 50% interest in the Global Diabetes Alliance Assets and therefore the Remuneration Committee has evaluated performance consistently against the original targets. |
| | |
| AstraZenecaAnnual Report and Form 20-F Information 2015 | | 109 |
Corporate Governance
Annual Report on Remuneration
(the Implementation Report)continued
Pension allowance
Mr Soriot’s annual pension allowance is 30% of base salary and Mr Dunoyer’s is 24% of base salary. Both Executive Directors took their pension allowance as a cash alternative to participation in a defined contribution pension scheme.
Non-Executive Directors’ single total figure remuneration (Audited)
| | | | | | | | | | | | | | | | | | | | | | | | | | | | | | | | | | | | | | | | | | | | | | | | |
| | | 2015
Fees
£’000 | | | 2014
Fees
£’000 | | | 2015
Taxable
benefits
£’000 | | | 2014
Taxable
benefits
£’000 | | | 2015
Annual
bonus
£’000 | | | 2014
Annual
bonus
£’000 | | | 2015 Long-term incentives
vesting
£’000 | | | 2014
Long-term
incentives
vesting
£’000 | | | 2015
Pension allowance
£’000 | | | 2014
Pension
allowance
£’000 | | | 2015
Total
£’000 | | | 2014
Total
£’000 | |
| Leif Johansson | | | 609 | | | | 572 | | | | – | | | | – | | | | – | | | | – | | | | – | | | | – | | | | – | | | | – | | | | 609 | | | | 572 | |
| Cori Bargmann | | | 59 | | | | – | | | | – | | | | – | | | | – | | | | – | | | | – | | | | – | | | | – | | | | – | | | | 59 | | | | – | |
| Geneviève Berger | | | 87 | | | | 85 | | | | – | | | | – | | | | – | | | | – | | | | – | | | | – | | | | – | | | | – | | | | 87 | | | | 85 | |
| Bruce Burlington | | | 114 | | | | 105 | | | | – | | | | – | | | | – | | | | – | | | | – | | | | – | | | | – | | | | – | | | | 114 | | | | 105 | |
| Ann Cairns | | | 95 | | | | 65 | | | | – | | | | – | | | | – | | | | – | | | | – | | | | – | | | | – | | | | – | | | | 95 | | | | 65 | |
| Graham Chipchase | | | 107 | | | | 92 | | | | – | | | | – | | | | – | | | | – | | | | – | | | | – | | | | – | | | | – | | | | 107 | | | | 92 | |
| Jean-Philippe Courtois | | | 95 | | | | 95 | | | | – | | | | – | | | | – | | | | – | | | | – | | | | – | | | | – | | | | – | | | | 95 | | | | 95 | |
| Rudy Markham | | | 156 | | | | 130 | | | | – | | | | – | | | | – | | | | – | | | | – | | | | – | | | | – | | | | – | | | | 156 | | | | 130 | |
| Shriti Vadera | | | 108 | | | | 95 | | | | – | | | | – | | | | – | | | | – | | | | – | | | | – | | | | – | | | | – | | | | 108 | | | | 95 | |
| Marcus Wallenberg | | | 87 | | | | 85 | | | | – | | | | – | | | | – | | | | – | | | | – | | | | – | | | | – | | | | – | | | | 87 | | | | 85 | |
| Former Non-Executive Directors | | | | | | | | | | | | | | | | | | | | | | | | | | | | | | | | | | | | | | | | | | | | | | | | |
| Nancy Rothwell | | | 35 | | | | 107 | | | | – | | | | – | | | | – | | | | – | | | | – | | | | – | | | | – | | | | – | | | | 35 | | | | 107 | |
| John Varley | | | 46 | | | | 140 | | | | – | | | | – | | | | – | | | | – | | | | – | | | | – | | | | – | | | | – | | | | 46 | | | | 140 | |
| Total | | | 1,598 | | | | 1,571 | | | | – | | | | – | | | | – | | | | – | | | | – | | | | – | | | | – | | | | – | | | | 1,598 | | | | 1,571 | |
Notes to the Non-Executive Directors’ single total figure remuneration table
Board fees and office costs
The Chairman’s fee includes office costs (invoiced in Swedish krona) of £34,000 for 2015, and £34,500 for 2014. Further information on the Non-Executive Directors’ fees can be found in the Summary of Non-Executive Directors’ remuneration for 2016 section on page 119.
Board changes
Cori Bargmann was elected as a Director, and Nancy Rothwell and John Varley retired as Directors, at the Company’s AGM on 24 April 2015.
Share interests awarded in 2015 (Audited)
Deferred Bonus Plan
| | | | |
| | | Pascal Soriot | | Marc Dunoyer |
| Interest awarded | | 13,482 Ordinary Shares awarded on 27 March 2015 at a grant price of 4762 pence per share. | | 7,111 Ordinary Shares awarded on 27 March 2015 at a grant price of 4762 pence per share. |
| Description of interest | | Award over shares equal to one-third of the pre-tax annual bonus based on the prevailing market share price on the award date. |
| Basis of award | | Automatic deferral of one-third of annual bonus into Ordinary Shares or ADSs. |
| Face value of award | | £642,000 | | £339,000 |
| Vesting level at threshold performance1 | | 100% |
| End of performance period2 | | 27 March 2018 |
| Summary of performance measures and targets | | No performance conditions apply, but vesting is ordinarily subject to continued employment. |
| 1 | No performance conditions apply under the Deferred Bonus Plan, other than continued employment. |
| 2 | As no performance conditions apply, this date represents the end of the holding period. |
| | |
| 110 | | AstraZenecaAnnual Report and Form 20-F Information 2015 |
Performance Share Plan (PSP)
| | | | |
| | | Pascal Soriot | | Marc Dunoyer |
| Interest awarded | | 104,764 Ordinary Shares awarded on 27 March 2015 at a grant price of 4762 pence per share. | | 45,880 Ordinary Shares awarded on 27 March 2015 at a grant price of 4762 pence per share. |
| Description of interest | | An award over shares. The vesting date is the fifth anniversary of the date of grant, subject to performance over a three-year period commencing on 1 January in the year of the award and a two-year holding period commencing three years from the date of grant, and continued employment. |
| |
| | | The award is expressed as a percentage of base salary. Awards are weighted 75% in favour of the PSP and 25% in favour of the AZIP. |
| Basis of award | | 427.5% of base salary. | | 315% of base salary. |
| Face value of award | | £4,989,000 | | £2,185,000 |
| Vesting level at threshold performance | | 25% |
| End of performance period | | 31 December 2017 |
| End of holding period | | 27 March 2020 |
Summary of performance measures and targets | | A combination of measures focused on our scientific, commercial and financial performance assessed over the relevant three-year performance period: Twenty-five percent of the award is based on the relative TSR performance of the Company against a predetermined peer group of global pharmaceutical companies. The rank which the Company’s TSR achieves over the performance period will determine how many shares will vest under the part of the award subject to the TSR performance measure. Payouts against performance in relation to TSR for PSP awards are expressed as a percentage of the maximum award currently payable, shown within a range of 0% to 100%, as shown in the table below. |
| | | TSR ranking of the Company – PSP awards made in 2015 | | % of award under TSR performance measure that vests |
| | Below median | | 0% |
| | Median | | 25% |
| | Between median and upper quartile | | Pro rata |
| | Upper quartile | | 75% |
| | Above upper quartile | | 75% to 100% at the Remuneration Committee’s discretion |
| | More information about the TSR performance of the Company, including the Company’s peer group, is set out in the Total shareholder return section on page 113. Twenty-five percent of the award is based on the achievement of a cumulative free cash flow target. The measure for the cash flow target for the PSP awards made in 2015 is net cash flow before distributions and other adjustments required by the performance conditions (subject to any further adjustments the Remuneration Committee chooses to make using its judgement) and thus referred to as ‘adjusted cumulative cash flow’, over the same three-year performance period as the TSR performance measure, and the level of vesting for the part of the award subject to the cash flow performance measure is based on a sliding scale between a threshold cash flow target and an upper target. Vesting levels in relation to the threshold target and the upper target are shown in the table below. |
| | | Adjusted cumulative cash flow – PSP awards made in 2015 | | % of award under cash flow performance measure that vests |
| | Less than $9 billion | | 0% |
| | $9 billion | | 25% |
| | Between $9 billion and $11 billion | | Pro rata |
| | $11 billion | | 75% |
| | Between $11 billion and $13 billion | | Pro rata |
| | $13 billion and above | | 100% |
| | Twenty-five percent of the award is based on achieve scientific leadership measures covering five areas: an NME target, which reflects the Company’s ability to deliver innovation to the market; major life-cycle management approvals, which represent a good proxy for near-to-mid term growth; the volume of NMEs in Phase III and their registration; a target for peak-year sales, to track the value of pipeline output; and delivery from our research and early development organisation, assessed by Phase II starts. Twenty-five percent of the award is based on return to growth measures based on quantitative sales targets relating to the Company’s six Growth Platforms:Brilinta/Brilique, Diabetes, Respiratory, New Oncology, Emerging Markets, and Japan. As the PSP performance measures related to achieve scientific leadership and return to growth are an indicator of the Company’s longer-term strategic priorities, we believe that the targets/target ranges associated with them are commercially sensitive. We will make retrospective disclosure when the targets are deemed to be no longer commercially sensitive, which we currently anticipate to be immediately following the end of the performance period. More information about the PSP’s performance measures is set out on page 126 of the Remuneration Policy Report. |
| | |
| AstraZenecaAnnual Report and Form 20-F Information 2015 | | 111 |
Corporate Governance
Annual Report on Remuneration
(the Implementation Report)continued
AstraZeneca Investment Plan (AZIP)
| | | | |
| | | Pascal Soriot | | Marc Dunoyer |
| Interest awarded | | 17,460 Ordinary Shares awarded on 27 March 2015 at a grant price of 4762 pence per share. | | 7,646 Ordinary Shares awarded on 27 March 2015 at a grant price of 4762 pence per share. |
Description of interest | | An award over shares. The vesting date is the eighth anniversary of the start of the performance period (being 1 January in any given year), subject to performance and continued employment. The award is expressed as a percentage of base salary. Awards are weighted 75% in favour of the PSP and 25% in favour of the AZIP. |
| Basis of award | | 71.25% of base salary. | | 52.5% of base salary. |
| Face value of award | | £831,000 | | £364,000 |
| Vesting level at threshold performance | | 100% |
| End of performance period | | 31 December 2018 |
| End of holding period | | 31 December 2022 |
Summary of performance measures and targets | | Dividend and dividend cover hurdles, assessed over the relevant four-year performance period > dividend per share of $2.80 maintained, or increased, over the performance period > dividend cover of 1.5 maintained over the performance period, calculated on the basis of Core EPS. Both performance hurdles must be achieved in each year of the performance period for the award to vest. More information about the AZIP’s performance hurdles is set out on page 127 of the Remuneration Policy Report. |
AstraZeneca 2012 Savings Related Share Option Scheme (SAYE)
| | |
| | | Marc Dunoyer |
| Interest | | An option granted over 544 Ordinary Shares on 28 September 2015 at a grant price of 3307 pence per share. The grant price is set at 80% of the average market value of an Ordinary Share over the three consecutive trading days immediately preceding the offer date. |
| Description of interest | | The SAYE provides for the grant of options over Ordinary Shares. |
| Basis of award | | £500 monthly payroll deductions over three years. |
| Face value of award | | £18,000 |
| Vesting level at threshold performance1 | | 100% |
| End of performance period2 | | 1 December 2018 |
| Summary of performance measures and targets | | No performance conditions apply, but vesting is ordinarily subject to continued employment. More information about the SAYE is set out on page 128 of the Remuneration Policy Report. |
| 1 | No performance conditions apply under the SAYE, other than continued employment. |
| 2 | As no performance conditions apply, this date represents the first date on which the option may normally be exercised. |
Payments to former Directors (Audited)
No payments were made during 2015 to former Directors.
Payments for loss of office (Audited)
No payments were made for loss of office during 2015.
Remuneration context and our past performance
Statement of change in remuneration of CEO compared to other employees
| | | | |
| | | Percentage change of CEO against 2014 | | Average percentage change for employees against 2014 |
| Salary | | 3% | | 3.6% |
| Taxable benefits | | 6.5% | | 3.6% |
| Annual bonus | | 6% | | 9.4% |
The employee comparator group comprises employees in the UK, US and Sweden. We consider this to be an appropriate comparator group because it is representative of the Group’s major science, business and enabling units, and the employee populations are well balanced in terms of seniority and demographics. To provide a meaningful comparison of salary increases, a consistent employee comparator group is used by which the same individuals appear in the 2014 and 2015 group.
| | |
| 112 | | AstraZenecaAnnual Report and Form 20-F Information 2015 |
CEO total remuneration table
| | | | | | | | | | | | | | | | | | | | | | |
| Year | | CEO | | CEO single total figure
remuneration £’000 | | | Annual bonus
£’000 | | | Annual bonus payout
against maximum
opportunity % | | | Value of LTIs
at vest £’000 | | | LTI vesting rates
against maximum
opportunity % | |
| 2015 | | Pascal Soriot | | | 8,397 | | | | 2,042 | | | | 97 | | | | 4,723 | 1 | | | 78 | |
| 2014 | | Pascal Soriot | | | 3,507 | | | | 1,926 | | | | 94 | | | | – | | | | – | |
| 2013 | | Pascal Soriot | | | 3,344 | | | | 1,870 | | | | 94 | | | | – | | | | – | |
| 2012 | | Pascal Soriot2 | | | 3,693 | 3 | | | 335 | | | | 68 | | | | – | | | | – | |
| 2012 | | Simon Lowth4 | | | 3,289 | | | | 1,034 | | | | 86 | | | | 1,301 | 5 | | | 38 | 5 |
| 2012 | | David Brennan6 | | | 4,147 | 7 | | | – | | | | – | 8 | | | 2,538 | | | | 38 | |
| 2011 | | David Brennan | | | 7,863 | | | | 1,326 | | | | 74 | | | | 5,386 | | | | 62 | |
| 2010 | | David Brennan | | | 9,690 | | | | 1,583 | | | | 90 | | | | 6,937 | | | | 100 | |
| 2009 | | David Brennan | | | 5,767 | | | | 1,751 | | | | 100 | | | | 2,795 | | | | 62 | |
| 1 | Based on average closing share price over the three-month period to 31 December 2015 plus accrued dividends over the vesting period. |
| 2 | Mr Soriot was appointed CEO with effect from 1 October 2012. |
| 3 | This figure includes £991,000 paid to compensate Mr Soriot in respect of his forfeited bonus opportunity for 2012 and an award of £2,000,000 to compensate him for his loss of LTI awards, both in respect of his previous employment. |
| 4 | Mr Lowth acted as Interim CEO from June to September 2012 inclusive. |
| 5 | Mr Lowth’s LTI awards which vested during 2012 were not awarded or received in respect of his performance as Interim CEO. |
| 6 | Mr Brennan ceased to be a Director on 1 June 2012. |
| 7 | This figure includes Mr Brennan’s pay in lieu of notice of £914,000. |
| 8 | Mr Brennan informed the Remuneration Committee that he did not wish to be considered for a bonus in respect of that part of 2012 in which he was CEO. The Remuneration Committee determined that no such bonus would be awarded and also that there should be no bonus award relating to his contractual notice period. |
Total shareholder return (TSR)
The graph below compares the TSR performance of the Company over the past seven years with the TSR of the FTSE100 Index. This graph is re-based to 100 at the start of the relevant period. As a constituent of the FTSE100, this index represents an appropriate reference point for the Company. We have also included a ‘Pharmaceutical peers average’, which reflects the TSR of the current comparator group and provides shareholders with additional context.
The charts below show how the Company’s TSR performance has compared with the TSR for the relevant companies in the comparator group from the first day in the three-year performance period in respect of the PSP awards made in 2013, 2014 and 2015, and how the Company ranks against those other companies on this basis.
To alleviate any short-term volatility, the return index is averaged in the TSR calculations for each company over the three months prior to the start of the relevant performance period (as stipulated in the PSP rules) and, for the purposes of the charts below, over the last three months of 2015.

| | |
| AstraZenecaAnnual Report and Form 20-F Information 2015 | | 113 |
Corporate Governance
Annual Report on Remuneration
(the Implementation Report)continued
Relative importance of spend on remuneration
The table below shows the overall spend on employee remuneration and expenditure on shareholder distributions through dividends.
The figures below have been calculated in accordance with the Group Accounting Policies and drawn from either the Company’s Consolidated Statement of Comprehensive Income on page 140, or its Consolidated Statement of Cash Flows on page 143. Further information on the Group’s Accounting Policies can be found from page 144.
| | | | | | | | | | | | | | | | |
| | | 2015 $m | | | 2014 $m | | | Difference in spend between years $m | | | Difference in spend between years % | |
| Total employee remuneration1 | | | 6,128 | | | | 6,279 | | | | (151 | ) | | | (2.4 | ) |
Distributions to shareholders: – Dividends paid | | | 3,486 | | | | 3,521 | | | | (35 | ) | | | (0.99 | ) |
| 1 | This figure includes the remuneration paid to all employees in the Group, including the Executive Directors but excluding the Non-Executive Directors, who are not employees. |
Disclosure of historic performance targets
2013 Annual bonus
In accordance with the Remuneration Committee’s commitment to disclosure as set out in the 2014 Directors’ Remuneration Report, the Remuneration Committee has determined that the 2013 targets relating to the achieve scientific leadership and return to growth elements of the annual bonus are no longer commercially sensitive and can therefore be disclosed. The achieve Group financial targets were disclosed in last year’s report. Mr Soriot’s 2013 annual bonus award was 170% of base salary, and Mr Dunoyer’s award was 129%. The level of award for the Executive Directors in respect of the achieve scientific leadership performance measures was 44% of the total bonus outcome, with the return to growth measures contributing 12%. These figures reflect the outcome of the global Scorecard and the Executive Directors’ individual performance against it.
1. Achieve scientific leadership
| | | | | | | | | | | | |
| Performance measures for 2013 | | Target | | | Outcome | | | Performance | |
| Positive Phase III investment decisions | | | 2 | | | | 3 | | | | Exceeded target | |
| NME major submissions | | | 2 | | | | 3 | | | | Exceeded target | |
| External licensing opportunities in Phase I/II | | | 2 | | | | 4 | | | | Exceeded target | |
| Late-stage external opportunities | | | 1 | | | | 3 | | | | Exceeded target | |
| Phase II starts | | | 8 | | | | 11 | | | | Exceeded target | |
2. Return to growth1
| | | | | | | | | | | | |
| Performance measures for 2013 | | Target | | | Outcome | | | Performance | |
| DeliverBrilinta/Brilique target | | | $380m | | | | $280m | | | | Below target | |
| Build Diabetes franchise2 | | | $979m | | | | $788m | | | | Below target | |
| Deliver sales growth in Emerging Markets | | | $5,624m | | | | $5,396m | | | | Below target | |
| Deliver Respiratory goals | | | $4,597m | | | | $4,716m | | | | Exceeded target | |
| Deliver Japan growth target | | | $3,221m | | | | $3,158m | | | | Below target | |
| 1 | In respect of the return to growth measures only, the targets are set at budget exchange rates at the beginning of the performance period and evaluated at those rates at the end of the performance period. |
| 2 | The Diabetes performance targets were set prior to the acquisition of the remaining 50% interest in the Global Diabetes Alliance Assets and therefore the Remuneration Committee has evaluated performance consistently against the original targets. |
Directors’ interests in shares (Audited)
Under the Company’s Articles all Directors must, within two months of their appointment, acquire a beneficial interest in at least 500 shares in the Company. All of the Directors fulfil this requirement at the date of this Directors’ Remuneration Report.
In addition to this mandatory requirement, the Board imposes minimum shareholding requirements on the Executive Directors and SET members. The CEO is required to build a shareholding and hold shares amounting to 300% of base salary, and the CFO is required to hold shares amounting to 200% of base salary, each within five years of their dates of appointment. In the period since his appointment on 1 October 2012, Mr Soriot has acquired 250,100 Ordinary Shares using his own resources which he gifted to family members for nil consideration on 31 December 2015. As at 31 December 2015, Mr Soriot beneficially held Ordinary Shares amounting to 237% of his 2015 base salary, and it is anticipated that Mr Soriot will reach or exceed the minimum shareholding requirement within the time limit imposed by the Board. Mr Dunoyer has fulfilled his requirement. All other SET members are required to build a shareholding over time and hold 125% of base salary as shares while in office.
| | |
| 114 | | AstraZenecaAnnual Report and Form 20-F Information 2015 |
The Board also encourages each Non-Executive Director to build up, over a period of three years, a shareholding in the Company with a value approximately equivalent to the basic annual fee for a Non-Executive Director (£75,000) or, in the case of the Chairman, approximately equivalent to his basic annual fee (£575,000). All of the Non-Executive Directors, including the Chairman, had fulfilled this expectation as at 31 December 2015.
The tables below show the interests of the Directors (including the interests of their Connected Persons, as such term is defined in the Financial Services and Markets Act 2000) in Ordinary Shares as at 31 December 2015, as well as details of any Director’s interests in options over the Company’s shares. All such interests were beneficial except as otherwise stated. No Director or senior executive beneficially owns, or has options over, 1% or more of the issued share capital of the Company, nor do they have different voting rights from other shareholders. None of the Directors has a beneficial interest in the shares of any of the Company’s subsidiaries. Between 31 December 2015 and 4 February 2016, there was no change in the interests in Ordinary Shares shown in the tables below.
Executive Directors
| | | | | | | | | | | | | | | | | | | | | | | | | | | | | | | | | | | | | | |
| | | Shares held | | | | | Options held | | | | |
| Executive Director | | Beneficially
held | | | Value of shares
held beneficially
as percentage
of base salary | | | Shareholding
requirement
(to be built up within
5 years of date of
appointment) | | | Subject to
performance
conditions | | | Subject to
deferral | | | | | Unvested | | | Vested but
unexercised | | | Exercised during the year | | | Total | |
| Pascal Soriot | | | 59,951 | | | | 237% | | | | 300% | | | | 482,040 | | | | 33,247 | | | | | | – | | | | – | | | | – | | | | 575,238 | |
| Marc Dunoyer | | | 57,304 | | | | 381% | | | | 200% | | | | 228,448 | | | | 9,790 | | | | | | 544 | | | | – | | | | – | | | | 296,086 | |
The value of shares is based on the London Stock Exchange closing price of 4616.5 pence per Ordinary Share on 31 December 2015.
Non-Executive Directors
The Non-Executive Directors are not eligible to receive shares in the Company that are the subject of performance conditions, and have acquired their beneficial interests in the Company’s shares using their own resources.
| | | | | | | | | | | | |
| Non-Executive Directors | | Beneficial interest in
Ordinary Shares at 31 December 2014 or
(if later) appointment date | | | Change to beneficial interest | | | Beneficial interest in
Ordinary Shares at 31 December 2015 or
(if earlier) date of retirement | |
| Leif Johansson | | | 39,009 | | | | – | | | | 39,009 | |
| Cori Bargmann | | | – | | | | 1,959 | | | | 1,959 | |
| Geneviève Berger | | | 2,090 | | | | – | | | | 2,090 | |
| Bruce Burlington | | | 2,749 | | | | 600 | | | | 3,349 | |
| Ann Cairns | | | 1,225 | | | | 1,100 | | | | 2,325 | |
| Graham Chipchase | | | 1,900 | | | | 1,100 | | | | 3,000 | |
| Jean-Philippe Courtois | | | 2,635 | | | | 3,400 | | | | 6,035 | |
| Rudy Markham | | | 2,452 | | | | – | | | | 2,452 | |
| Shriti Vadera | | | 6,500 | | | | 3,500 | | | | 10,000 | |
| Marcus Wallenberg | | | 63,646 | | | | – | | | | 63,646 | |
| Former Directors | | | | | | | | | | | | |
| Nancy Rothwell | | | 2,643 | | | | – | | | | 2,643 | |
| John Varley | | | 13,000 | | | | – | | | | 13,000 | |
Governance
Remuneration Committee membership
The Remuneration Committee members are Graham Chipchase (Chairman of the Remuneration Committee), Leif Johansson, Rudy Markham and Shriti Vadera. Nancy Rothwell and John Varley were members of the Remuneration Committee until their retirement at the Company’s AGM held on 24 April 2015. Shriti Vadera became a member of the Remuneration Committee with effect from 17 February 2015. The Deputy Company Secretary acts as the secretary to the Remuneration Committee.
How did the Remuneration Committee spend its time during 2015?
The Remuneration Committee met seven times in 2015. The individual attendance record of Remuneration Committee members is set out on page 92. At the invitation of the Remuneration Committee, except where their own remuneration was being discussed, the CEO; the EVP, Human Resources; the Vice-President, People Practices and Services; the Human Resources Vice-President, Centre of Excellence; the Executive Compensation Director; and the Company Secretary attended one or more Remuneration Committee meetings in 2015 and provided services that materially assisted the Remuneration Committee. In addition, all meetings of the Remuneration Committee were attended by Nicki Demby, representing Deloitte LLP (Deloitte), the Remuneration Committee’s independent adviser.
| | |
| AstraZenecaAnnual Report and Form 20-F Information 2015 | | 115 |
Corporate Governance
Annual Report on Remuneration
(the Implementation Report)continued
The Remuneration Committee focused on the following principal matters at its meetings held in 2015 and in February 2016:
| > | The terms of senior executives’ remuneration packages on appointment, promotion or termination. |
| > | The assessment of Group and individual performance against targets to determine the level of annual bonuses for performance during 2014 and to set executive bonus targets during 2015 and LTI awards to be granted during 2015. |
| > | The assessment of performance against targets to determine the level of vesting in 2015 under the PSP and AZIP, and the setting of PSP and AZIP performance thresholds for awards made in 2015. |
| > | The determination of individual awards made to SET members and other participants under the Group’s main LTI plans: the PSP; the AZIP; and the AstraZeneca Global Restricted Stock Plan. |
| > | The determination of restricted share awards to a number of senior executives under the AstraZeneca Restricted Share Plan. |
| > | A review of shareholder voting in respect of the Directors’ Remuneration Report 2013 and 2014 (including dialogue with major shareholders). |
| > | Consultation with major shareholders and shareholder representative bodies regarding proposals to adjust CEO remuneration during 2015 and the potential simplification of future LTI plans. |
| > | A review of a report providing an analysis of key aspects of reward across the wider Group. |
| > | The determination of the Executive Directors’ and other SET members’ remuneration for 2015 and for 2016. |
| > | The assessment and setting of executive bonus targets during 2016 and LTI awards to be granted in 2016. |
| > | The annual review of the performance of the Remuneration Committee. |
| > | The review of the terms of reference of the Remuneration Committee. |
| > | The preparation, review and approval of this Directors’ Remuneration Report. |
Independent Adviser to the Remuneration Committee
The Remuneration Committee reappointed Deloitte as its independent adviser following a tender process undertaken in 2013, which involved interviews with both the Company’s management and the Chairman of the Remuneration Committee. Deloitte’s service to the Remuneration Committee was provided on a time-spent basis at a cost to the Company of £176,000 (excluding VAT). During the year, Deloitte also provided taxation advice and other specific non-audit advisory services to the Group. The Remuneration Committee reviewed the potential for conflicts of interest and judged that there were no conflicts. Deloitte is a member of the Remuneration Consultants’ Group, which is responsible for the stewardship and development of the voluntary code of conduct in relation to executive remuneration consulting in the UK. The principles on which the code is based are transparency, integrity, objectivity, competence, due care and confidentiality. Deloitte adheres to the code.
Shareholder context
At the Company’s AGM held in April 2015, the resolution to approve the Annual Report on Remuneration for the year ended 31 December 2014 (the 2014 Implementation Report) was passed.
| | | | | | | | | | | | | | | | | | | | | | | | | | | | |
| Resolution text | | Votes for | | | % for | | | Votes against | | | %
against | | | Total votes
cast | | | % of Issued Share
Capital voted | | | Votes
withheld | |
| Ordinary Resolution to approve the Annual Report on Remuneration | | | 739,049,685 | | | | 84.11 | | | | 139,601,566 | | | | 15.89 | | | | 878,651,251 | | | | 69.54 | | | | 12,522,725 | |
| for the year ended 31 December 2014 | | | | | | | | | | | | | | | | | | | | | | | | | | | | |
The Remuneration Committee has carefully considered shareholders’ comments about the 2013 and 2014 Directors’ Remuneration Reports. Before and after the 2015 AGM, John Varley and Graham Chipchase, each of whom has been the Remuneration Committee Chairman during 2015, met and/or spoke with the Company’s major shareholders, the Investment Association and Institutional Shareholder Services to clearly understand their views. Key areas arising from these discussions were the desire to see a clearer link between executive pay and the achievement of the Company’s 2023 $45 billion revenue target (based on 2013 exchange rates), and the desire for greater simplicity and transparency in the design of executive remuneration, particularly with respect to the Company’s LTI plans.
This year we have simplified the PSP for awards made in 2016 by replacing the six return to growth performance targets with one aggregate sales target for our Growth Platforms. This will reflect performance across our Growth Platforms as a whole. Further we have disclosed the target for this measure now, at the start of the performance period. This is in line with our aim to strike the right balance between transparency in our reporting on executive pay and protecting our commercially sensitive information.
We gave careful consideration to whether there could be a more transparent link between the financial targets which we communicated in May 2014 and executive pay. This has some attraction, although there is a clear balance to be struck given the need to ensure that our arrangements are simple, practicable and aligned to our business. Ultimately, following discussions, the Remuneration Committee’s view is that the best way to achieve line of sight to the 2023 revenue target is by ensuring that the financial and operational measures under the PSP are directly linked to the long-term business plan (including the 2023 $45 billion revenue target, which we announced in May 2014). However, the Remuneration Committee will continue to consider ways in which a more transparent link between the 2023 revenue target and executive pay may be achieved.
We intend to continue to consult with our major shareholders and shareholder representative bodies during the course of 2016 on proposals to further simplify our LTI plans for the future.
| | |
| 116 | | AstraZenecaAnnual Report and Form 20-F Information 2015 |
Service contracts
The notice periods and unexpired terms of Executive Directors’ service contracts at 31 December 2015 are shown in the table below.
AstraZeneca or the Executive Director may terminate the service contract on 12 months’ notice.
| | | | | | |
| Executive Director | | Date of service contract | | Unexpired term at 31 December 2015 | | Notice period |
| Pascal Soriot | | 27 August 2012 | | 12 months | | 12 months |
| Marc Dunoyer | | 15 March 2013 | | 12 months | | 12 months |
Terms of reference
A copy of the Remuneration Committee’s terms of reference is available on our website, www.astrazeneca.com. The Remuneration Committee conducted a review of its terms of reference during 2015 but no changes were recommended to the Board as the terms of reference were considered to remain appropriate.
Basis of preparation of this Directors’ Remuneration Report
This Directors’ Remuneration Report has been prepared in accordance with the Large and Medium-sized Companies and Groups (Accounts and Reports) (Amendment) Regulations 2013 (the Regulations) and meets the relevant requirements of the Financial Conduct Authority’s Listing Rules. As required by the Regulations, a resolution to approve the Implementation Report of this Directors’ Remuneration Report will be proposed at the AGM on 29 April 2016.
Implementation of Remuneration Policy in 2016
This section sets out how the Remuneration Committee intends to implement our Remuneration Policy during 2016.
Effective from 1 January 2016, Mr Soriot’s base salary was increased, in line with increases in the UK employee population, by 2% to £1,190,000. Mr Soriot’s target annual bonus opportunity will remain unchanged at 100% of salary and his LTI plan target will remain unchanged at 437.5% of base salary. However, the Remuneration Committee has granted an above-target LTI award for 2016 of 499% of base salary.
Effective from 1 January 2016, Mr Dunoyer’s base salary was increased, in line with increases in the UK employee population, by 2% to £707,000. Mr Dunoyer’s target annual bonus opportunity will remain unchanged at 90% of base salary and his LTI plan target award will remain unchanged at 350% of base salary.
The annual bonus measures and weightings for 2016 are set out in the table overleaf and are consistent with those applicable in 2015. Individual performance for each of the Executive Directors will be assessed by reference to individual objectives in line with the Company’s objectives for the year.
The performance measures and weightings for 2016 in respect of the LTI plans (AZIP and PSP) are set out in the tables overleaf and are broadly consistent with those applicable in 2015. However, for 2016 we have decided to simplify one of the elements of the PSP by changing the return to growth measure from six key individual measures to one aggregate measure. This will reflect performance across our Growth Platforms as a whole. Furthermore, this change allows us to disclose the aggregate target for this measure at the start of the performance period, in contrast to the individual targets for each Growth Platform which remain commercially sensitive. This is in line with our aim to strike the right balance between transparency in our reporting on executive pay and protecting our commercially sensitive information.
Summary of Executive Directors’ remuneration for 2016
Executive Directors’ remuneration opportunity
| | | | |
| | | Pascal Soriot | | Marc Dunoyer |
| Base salary | | £1,190,000 | | £707,000 |
| Pension provision | | 30% of base salary | | 24% of base salary |
| Annual bonus target | | 100% of base salary (normal range 0%-180%) | | 90% of base salary (normal range 0%-150%) |
| LTI plan award | | 499% of base salary1 | | 350% of base salary |
| 1 | LTI plan target remains at 437.5% of base salary. |
| | |
| AstraZenecaAnnual Report and Form 20-F Information 2015 | | 117 |
Corporate Governance
Annual Report on Remuneration
(the Implementation Report)continued
Annual bonus
| | | | | | | | | | |
Return to growth performance measures | | Weighting | | Achieve scientific leadership performance measures | | Weighting | | Achieve Group financial targets performance measures | | Weighting |
| DeliverBrilinta/Brilique target | | | | NME Phase II starts | | | | Achieve cash flow from operating activities target | | 10% |
| | | | | | | | |
| Deliver CVMD target | | | | NME and major life-cycle management Phase III investment decisions | | | | Achieve Core EPS target | | 20% |
| | | | | | | | |
| Deliver sales growth in Emerging Markets | | 5% per measure | | NME and major life-cycle management regional submissions | | 6% per measure | | Achieve overall revenue target | | 10% |
| | | | | | | | |
| Deliver Respiratory goals | | | | NME and major life-cycle management regional approvals | | | | | | |
| | | | | | | | |
| Deliver Japan growth target | | | | Acquisition, licensing and divestment opportunities | | | | | | |
| | | | | | | | |
| Deliver New Oncology growth target | | | | | | | | | | |
LTI plans
PSP
| | |
| TSR ranking of the Company – 25% weighting | | % of award under TSR performance measure that vests |
| Below median | | 0% |
| Median | | 25% |
| Between median and upper quartile | | Pro rata |
| Upper quartile | | 75% |
| Above upper quartile | | 75% to 100% at the Remuneration Committee’s discretion |
| | |
| Adjusted cumulative cash flow – 25% weighting | | % of award under cash flow performance measure that vests |
| Less than $9 billion | | 0% |
| $9 billion | | 25% |
| Between $9 billion and $11 billion | | Pro rata |
| $11 billion | | 75% |
| Between $11 billion and $13.5 billion | | Pro rata |
| $13.5 billion and above | | 100% |
| | |
| Achieve scientific leadership – 25% weighting | | Weighting |
| NME approvals | | |
| Major life-cycle management approvals | | 5% per |
| Phase III registration/NME volume | | measure |
| Prospective peak-year sales from NME and major life-cycle management approvals | | |
| Phase II starts | | |
| | | | | | | | |
| Return to growth1– 25% weighting | | Threshold target 25% vesting | | | Maximum target 100% vesting | |
| Growth Platform revenue | | | $17bn | | | | $20bn | |
| 1 | In respect of the return to growth measure only, the targets are set at budget exchange rates at the beginning of the performance period and evaluated at those rates at the end of the performance period. |
AZIP
Dividend and dividend cover hurdles, assessed over the relevant four-year performance period
| > | dividend per share of $2.80 maintained, or increased, over the performance period |
| > | dividend cover of 1.5 maintained over the performance period, calculated on the basis of Core EPS. |
Both performance hurdles must be achieved, in each year of the performance period, for the award to vest.
| | |
| 118 | | AstraZenecaAnnual Report and Form 20-F Information 2015 |
Summary of Non-Executive Directors’ remuneration for 2016
Board and Committee fees for the Non-Executive Directors, including the Chairman, were not reviewed in 2015 and, accordingly, there are no changes to the level of fees proposed for 2016 at the date of this report. The fees will be reviewed during 2016 and, should any changes be considered appropriate, changes may become effective during the 2016 financial year. The Non-Executive Director fees as at 4 February 2016 (together with those for 2015) are set out below. Further information on the Non-Executive Directors’ Board and Committee fees can be found on page 134 of the Remuneration Policy Report.
| | | | | | | | |
| Non-Executive Director fees in 2015 and as at 4 February 2016 | | 2015 £ | | | At 4 February
2016 £ | |
| Chairman’s fee1 | | | 575,000 | | | | 575,000 | |
| Basic Non-Executive Director’s fee | | | 75,000 | | | | 75,000 | |
| Senior independent Non-Executive Director | | | 30,000 | | | | 30,000 | |
| Membership of the Audit Committee | | | 20,000 | | | | 20,000 | |
| Membership of the Remuneration Committee | | | 15,000 | | | | 15,000 | |
| Chairman of the Audit Committee or the Remuneration Committee2 | | | 25,000 | | | | 25,000 | |
| Membership of the Science Committee | | | 12,000 | | | | 12,000 | |
| Chairman of the Science Committee2 | | | 10,000 | | | | 10,000 | |
| 1 | The Chairman does not receive any additional fees for chairing, or being a member of, a Committee. |
| 2 | This fee is in addition to the fee for membership of the relevant Committee. |
Additional information: Executive Directors’ share plans
Deferred Bonus Plan
The interests of Directors at 31 December 2015 in Ordinary Shares that are the subject of awards under the deferred bonus plan are shown below.
| | | | | | | | | | | | | | | | |
| | | Number of shares | | | Award price
(pence) | | | Grant date1 | | | Vesting date1 | |
| Pascal Soriot | | | | | | | | | | | | | | | | |
| Award in respect of 2012 performance period | | | 3,799 | | | | 2939 | | | | 25.02.13 | | | | 25.02.16 | |
| Award in respect of 2013 performance period | | | 15,966 | | | | 3904 | | | | 28.03.14 | | | | 28.03.17 | |
| Total at 1 January 2015 | | | 19,765 | | | | | | | | | | | | | |
| Award in respect of 2014 performance period | | | 13,482 | | | | 4762 | | | | 27.03.15 | | | | 27.03.18 | |
| Total at 31 December 2015 | | | 33,247 | | | | | | | | | | | | | |
| Marc Dunoyer | | | | | | | | | | | | | | | | |
| Award in respect of 2013 performance period | | | 2,679 | | | | 3904 | | | | 28.03.14 | | | | 28.03.17 | |
| Total at 1 January 2015 | | | 2,679 | | | | | | | | | | | | | |
| Award in respect of 2014 performance period | | | 7,111 | | | | 4762 | | | | 27.03.15 | | | | 27.03.18 | |
| Total at 31 December 2015 | | | 9,790 | | | | | | | | | | | | | |
| 1 | UK date convention applies. |
Performance Share Plan (PSP)
The interests of Directors at 31 December 2015 in Ordinary Shares that are the subject of awards under the PSP are shown below.
| | | | | | | | | | | | | | | | | | | | |
| | | Number of shares | | | Award price (pence) | | | Grant date1 | | | Vesting date1 | | | Performance period1 | |
| Pascal Soriot | | | | | | | | | | | | | | | | | | | | |
| 2013 award | | | 125,113 | | | | 3297 | | | | 11.06.13 | | | | 11.06.16 | | | | 01.01.13 – 31.12.15 | |
| 2014 award | | | 124,066 | | | | 3904 | | | | 28.03.14 | | | | 28.03.17 | | | | 01.01.14 – 31.12.16 | |
| Total at 1 January 2015 | | | 249,179 | | | | | | | | | | | | | | | | | |
| 2015 award | | | 104,764 | | | | 4762 | | | | 27.03.15 | | | | 27.03.20 | | | | 01.01.15 – 31.12.17 | |
| Total at 31 December 2015 | | | 353,943 | | | | | | | | | | | | | | | | | |
| Marc Dunoyer | | | | | | | | | | | | | | | | | | | | |
| 2013 award | | | 90,853 | | | | 3302 | | | | 01.08.13 | | | | 01.08.16 | | | | 01.01.13 – 31.12.15 | |
| 2014 award | | | 52,254 | | | | 3904 | | | | 28.03.14 | | | | 28.03.17 | | | | 01.01.14 – 31.12.16 | |
| Total at 1 January 2015 | | | 143,107 | | | | | | | | | | | | | | | | | |
| 2015 award | | | 45,880 | | | | 4762 | | | | 27.03.15 | | | | 27.03.20 | | | | 01.01.15 – 31.12.17 | |
| Total at 31 December 2015 | | | 188,987 | | | | | | | | | | | | | | | | | |
| 1 | UK date convention applies. |
| | |
| AstraZenecaAnnual Report and Form 20-F Information 2015 | | 119 |
Corporate Governance
Annual Report on Remuneration
(the Implementation Report)continued
AstraZeneca Investment Plan (AZIP)
The interests of Directors at 31 December 2015 in Ordinary Shares that are the subject of awards under the AZIP are shown below.
| | | | | | | | | | | | | | | | | | | | |
| | | Number of
shares | | | Award price
(pence) | | | Grant date1 | | | Vesting date1 | | | Performance period1 | |
| Pascal Soriot | | | | | | | | | | | | | | | | | | | | |
| 2013 award2 | | | 89,960 | | | | 3297 | | | | 11.06.13 | | | | 01.01.21 | | | | 01.01.13 – 31.12.16 | |
| 2014 award | | | 20,677 | | | | 3904 | | | | 28.03.14 | | | | 01.01.22 | | | | 01.01.14 – 31.12.17 | |
| Total at 1 January 2015 | | | 110,637 | | | | | | | | | | | | | | | | | |
| 2015 award | | | 17,460 | | | | 4762 | | | | 27.03.15 | | | | 01.01.23 | | | | 01.01.15 – 31.12.18 | |
| Total at 31 December 2015 | | | 128,097 | | | | | | | | | | | | | | | | | |
| Marc Dunoyer | | | | | | | | | | | | | | | | | | | | |
| 2013 award | | | 8,176 | | | | 3302 | | | | 01.08.13 | | | | 01.01.21 | | | | 01.01.13 – 31.12.16 | |
| 2014 award | | | 8,709 | | | | 3904 | | | | 28.03.14 | | | | 01.01.22 | | | | 01.01.14 – 31.12.17 | |
| Total at 1 January 2015 | | | 16,885 | | | | | | | | | | | | | | | | | |
| 2015 award | | | 7,646 | | | | 4762 | | | | 27.03.15 | | | | 01.01.23 | | | | 01.01.15 – 31.12.18 | |
| Total at 31 December 2015 | | | 24,531 | | | | | | | | | | | | | | | | | |
| 1 | UK date convention applies. |
| 2 | The AZIP award of 89,960 shares comprises a regular 2013 award of 20,852 shares and a previously announced award which replaces that originally made when Mr Soriot joined the Company in October 2012. |
Restricted share award
On 26 October 2012, Mr Soriot was granted an award of 69,108 restricted shares at an award price of 2894 pence per share. When Mr Soriot joined AstraZeneca, he forfeited awards made to him by his previous employer. The Remuneration Committee determined that it was appropriate to compensate him for the value of those forfeited awards. AstraZeneca received an independent assessment of their value. The restricted shares vested as follows
| > | 27,644 vested on 31 October 2013 |
| > | 20,732 vested on 1 October 2014 |
| > | 20,732 vested on 1 October 2015. |
The interests of Mr Soriot at 31 December 2015 in Ordinary Shares that are the subject of awards under this arrangement are shown below.
| | | | | | | | |
| | | Number of shares | | | Price on vesting date (pence) | |
| Pascal Soriot | | | | | | | | |
| Total at 1 January 2015 | | | 20,732 | | | | | |
| Final vesting of 2012 award | | | (20,732 | )1 | | | 4181.5 | |
| Total at 31 December 2015 | | | – | | | | | |
| 1 | Following certain mandatory tax deductions, Mr Soriot became beneficially interested in a net number of 17,985 Ordinary Shares. |
Restricted Share Plan
On 1 August 2013, Mr Dunoyer was granted an award of 65,505 restricted shares at an award price of 3302 pence per share. When Mr Dunoyer joined AstraZeneca as EVP, GPPS, he forfeited awards made to him by his previous employer. The Remuneration Committee determined that it was appropriate to compensate him for the value of those forfeited awards. AstraZeneca received an independent assessment of their value. The restricted shares vested, or will vest, as follows
| > | 9,103 shares vested on 15 June 2014 |
| > | 41,472 shares vested on 15 June 2015 |
| > | 14,930 shares will vest on 1 August 2016. |
| | |
| 120 | | AstraZenecaAnnual Report and Form 20-F Information 2015 |
The interests of Mr Dunoyer at 31 December 2015 in Ordinary Shares that are the subject of awards under this arrangement are shown below.
| | | | | | | | |
| | | Number of shares | | | Price on vesting date (pence) | |
| Marc Dunoyer | | | | | | | | |
| Total at 1 January 2015 | | | 56,402 | | | | | |
| Partial vesting of 2013 award | | | (41,472 | )1 | | | 4211 | |
| Total at 31 December 2015 | | | 14,930 | | | | | |
| 1 | Following certain mandatory tax deductions, Mr Dunoyer became beneficially interested in a net number of 21,980 Ordinary Shares. |
AstraZeneca 2012 Savings Related Share Option Scheme (SAYE)
The interests of Mr Dunoyer at 31 December 2015 in options to subscribe for Ordinary Shares that are the subject of awards under the SAYE are shown below.
| | | | | | | | | | | | | | | | | | | | |
| |
| Number of
shares under
option |
| |
| Exercise price
(pence) |
| | | Grant date1 | | |
| First date
exercisable |
1 | |
| Last date
exercisable |
1 |
| Marc Dunoyer | | | | | | | | | | | | | | | | | | | | |
| Total at 1 January 2015 | | | – | | | | | | | | | | | | | | | | | |
| 2015 award | | | 544 | | | | 3307 | | | | 28.09.15 | | | | 01.12.18 | | | | 31.05.19 | |
| Total at 31 December 2015 | | | 544 | | | | | | | | | | | | | | | | | |
| 1 | UK date convention applies. |
| | |
| AstraZenecaAnnual Report and Form 20-F Information 2015 | | 121 |
Corporate Governance
Remuneration Policy Report
This section sets out the Remuneration Policy (the Policy) that was approved by shareholders at the Company’s AGM in April 2014. It is intended that the Policy shall remain in effect for a period of three years from 1 January 2015.
The Policy set out below has not been amended since its approval by shareholders in April 2014, other than to show changes to individual remuneration in 2016 in the Remuneration scenarios for Executive Directors section on page 129 and the notes to those scenarios, which remain within Policy. However, mindful of shareholder commentary on the Policy since its approval, the Remuneration Committee sought to clarify certain aspects of the Policy in relation to its approach to recruitment remuneration for Executive Directors and, in 2014, it adopted ‘Operating guidelines’ with effect from 1 January 2015 identified on page 130, which do not form part of the Company’s Policy as approved by shareholders. These clarifications are marked in bold in this Policy Report.
Setting the Company’s Policy
The Remuneration Committee is responsible for setting overall remuneration policy and makes decisions about specific remuneration arrangements in the broader context of employee remuneration throughout the Group. All roles within the organisation are benchmarked against comparable roles in similar organisations and in the employee’s local market to ensure the Company is paying fairly at all levels. Executive Directors’ remuneration arrangements are benchmarked against a global pharmaceutical peer group and the FTSE30. Each year the Company actively engages with its employees, either on a Group-wide basis or in the context of smaller focus groups, in order to solicit feedback generally and on a wide range of specified issues, including pay.
While the Remuneration Committee did not consult with employees when determining the Executive Directors’ remuneration policy, it does annually review Group remuneration data including ratios of average pay to senior executive pay; bonus data; gender and geographical data in relation to base salaries and variable compensation; and aggregate data about the shareholding levels of senior managers. Many employees are also shareholders in the Company and therefore had the opportunity to vote at the 2014 AGM on this Remuneration Policy Report. In reviewing the base salaries of Executive Directors, the Remuneration Committee considers the overall level of any salary increases being awarded to employees in the Executive Director’s local market in the relevant year.
In all aspects of its work, the Remuneration Committee considers both the external environment in which the Company operates and the guidance issued by organisations representing institutional shareholders. It consults the Company’s largest investors on general and specific remuneration matters and provides an annual opportunity for representatives of those investors to meet the Chairman of the Remuneration Committee and other Remuneration Committee and Board members. It is the Company’s policy to seek input from major shareholders on anad hoc basis where significant changes to remuneration arrangements are proposed. The Company’s shareholders are encouraged to attend the Company’s AGM and any views expressed will be considered by the Remuneration Committee’s members. The Remuneration Committee works with the Audit Committee to ensure that the Group’s remuneration policies and practices achieve the right balance between appropriate incentives to reward good performance, managing risk, and the pursuit of the Company’s business objectives.
Legacy arrangements
The Remuneration Committee may approve remuneration payments and payments for loss of office where the terms of the payment were agreed before the Policy came into effect, or at a time when the relevant individual was not a Director of the Company (provided that, in the opinion of the Remuneration Committee, the agreement was not in consideration for the individual becoming a Director of the Company). This includes the exercise of any discretion available to the Remuneration Committee in connection with such payments.
For these purposes, payments include the Remuneration Committee satisfying awards of variable remuneration including awards over shares, on the basis of the terms agreed at the time the award is granted.
Minor amendments
The Remuneration Committee may make minor amendments to the arrangements for the Directors as described in this Remuneration Policy Report (for regulatory, exchange control, tax or administrative purposes, or to take account of a change in legislation).
| | |
| 122 | | AstraZenecaAnnual Report and Form 20-F Information 2015 |
Remuneration Policy for Executive Directors
Fixed elements of remuneration: base salary, benefits and pension
The Company’s approach to determining and reviewing the salaries of the Executive Directors and the employee population as a whole is the same. On an annual basis, the salaries for individual roles are reviewed in the context of individual sustained performance and the external market. AstraZeneca participates in annual global compensation surveys, which provide benchmarking data for all roles within the organisation, ensuring a robust salary review process for all employees.
The Company seeks to provide an appropriate range of competitive benefits, including pension, to all employees (including Directors) in the context of their local market.
Base salary
| | | | |
| Purpose and link to strategy | | Operation | | Maximum opportunity |
| Base salary is intended to be sufficient (but no more than necessary) to attract, retain and develop high-calibre individuals in order to deliver the Company’s strategy. | | The Remuneration Committee determines base salary based on a number of factors, including (but not limited to): > Recognition of the value of an individual’s sustained personal performance and contribution to the business > The individual’s skills and experience > Internal relativities > Conditions in the relevant external market. Base salaries are normally reviewed annually to ensure they remain competitive, with any change usually taking effect from 1 January. There are no contractual provisions for clawback ormalus of base salary. | | The current base salaries can be found on page 107 of the Implementation Report. While there is no formal maximum, annual base salary increases, if any, for the Executive Directors will normally be in line with the percentage increases awarded to the employee population within the individual’s country location. Higher increases may be made if the Remuneration Committee in its discretion considers it appropriate. For example, this may include: > Increase in the scope and/or responsibility of the individual’s role > Development of the individual within the role. |
Benefits | | | | |
| Purpose and link to strategy | | Operation | | Maximum opportunity |
To provide market competitive benefits. Non-cash benefits are designed to be sufficient (but no more generous than necessary) to attract, retain and develop high-calibre individuals in order to deliver the Company’s strategy. . | | UK-based Executive Directors are provided with a fund under the UK Flexible Benefits Programme. The fund value is based on a range of benefits including: > Private Medical Insurance for partner and children > Life assurance > Permanent health insurance > Company car > Additional holidays > Other additional benefits made available by the Company from time to time that the Remuneration Committee considers appropriate based on the Executive Director’s circumstances. A Director may choose to take a proportion of, or the entire fund, as cash. Non-UK-based Executive Directors will receive a range of benefits (or a fund of equivalent value) comparable to those typically offered in their local market. They can elect to take the fund as cash or elect one or more of these benefits and take the balance as cash. At its discretion, for Executive Directors on an international assignment or relocating to take up other Company duties, the Remuneration Committee may consider support towards the reasonable costs of relocation. At its discretion, the Remuneration Committee may provide an allowance towards the reasonable fees for professional services such as legal, tax, property and financial advice. The Company may also fund the cost of a driver and car for Executive Directors. The Company also provides Directors’ and Officers’ Liability Insurance and an indemnity to the fullest extent permitted by the law and the Company’s Articles. There are no contractual provisions for clawback ormalus of benefits. | | The current value of benefits available can be found on page 107 of the Implementation Report. The maximum value of the fund available under the UK Flexible Benefits Programme will be equivalent to the cost to the Company of the suite of benefits at the time. The maximum value of the suite of benefits for non-UK-based Executive Directors will be equivalent to the cost of the suite of benefits at the time. The value of the support towards the costs of relocation will be the reasonable costs associated with the Executive Director’s particular circumstances. The value of the support towards the costs of professional fees and other costs will be the reasonable costs associated with the Executive Director’s particular circumstances. The maximum value of the Directors’ and Officers’ Liability Insurance and third party indemnity insurance is the cost at the relevant time. While the Remuneration Committee has not set an overall level of benefit provision, the Remuneration Committee keeps the benefit policy and benefit levels under review. |
Pension | | | | |
| Purpose and link to strategy | | Operation | | Maximum opportunity |
| Provision of retirement benefits to attract, retain and develop high-calibre individuals in order to deliver the Company’s strategy. | | Company allocations for Executive Directors’ pensions will be a proportion of the individual’s base salary and is in line with local market practice. As part of the UK Flexible Benefits Programme, the Company provides an allocation consisting of a percentage of the UK-based Executive Director’s base salary, which the Executive Director can elect to pay into a pension scheme or take as cash. The Company will allocate an amount benchmarked to the local market. There are no contractual provisions for clawback ormalus of pension. | | Currently the CEO and CFO receive an allocation equivalent to 30% and 24% of their base salaries respectively as a contribution towards the cost of their pension provisions. The maximum annual allocation that may be provided to UK-based Executive Directors is 35% of base salary. Non-UK-based Executive Directors will receive a fund for the purpose of providing retirement benefits in line with the local market practice. The maximum value of that fund will be a sum equivalent to local market practice. The Executive Director may elect to take some or all of the fund as cash. |
| | |
| AstraZenecaAnnual Report and Form 20-F Information 2015 | | 123 |
Corporate Governance
Remuneration Policy for Executive Directorscontinued
Variable elements of remuneration
Annual bonus
All employee bonuses are determined by reference to the Group scorecard and an assessment of individual performance. The Group scorecard is designed to reflect the Company’s strategy and the focus of its business activity and priorities in the performance year. The performance measures are recommended by the CEO and determined by the Remuneration Committee at the beginning of each year. They are designed to ensure that all eligible employees receive an element of reward based on the Group’s overall financial and non-financial performance. A scorecard approach ensures that all employees across functions and geographies are focused on the activities critical to delivering the business strategy. The performance measures and weightings underlying the annual bonus plan will be disclosed in advance. The outcomes against targets, for reasons of commercial sensitivity, will be disclosed in arrears. The Implementation Report will identify, in arrears, the performance versus the objectives and the consequent levels of remuneration deemed appropriate by the Remuneration Committee.
For Executive Directors, one-third of their pre-tax annual bonus is delivered in shares, which are deferred for three years, under the Deferred Bonus Plan. Employees below SET level receive a bonus in cash and are not required to defer a proportion in shares.
| | | | |
Annual bonus: cash | | | | |
| Purpose and link to strategy | | Operation and framework used to assess performance | | Maximum opportunity |
The annual cash bonus rewards short-term performance against specific annual Group and individual objectives. These objectives are designed to facilitate the delivery of the Company’s short-term strategy and thereby create value for our shareholders over time. | | The annual cash bonus is based on Group and individual performance in the relevant performance year. Scorecard measures and targets are set annually by the Remuneration Committee based on the key strategic objectives for the year. Payout levels are determined by the Remuneration Committee after the year end, based on performance against targets. The performance period is one year. The performance measures form a Group scorecard which is closely aligned to business strategy, and rewards scientific, commercial and financial success. While we expect the performance measures to be largely unchanged each year, the Remuneration Committee believes it is inadvisable to commit to a fixed set of measures in advance in order to retain flexibility to align incentives with the focus of corporate strategy in the relevant year. The greatest weighting is typically placed on the achievement of financial targets, with an equal weighting between the scientific and commercial growth metrics reflecting the importance of both sales and R&D success. The actual annual weighting will depend on the strategic priorities for the performance year. The Group scorecard is made up of a number of separate metrics within each performance measure. Each metric has a payout range associated with it (including a target which is intended to be stretching). In relation to each metric, a threshold level of performance is specified. If performance falls below this level there will be no payout for that proportion of the award. Each metric has a different weighting. If none of the metrics attributable to a performance measure is met then a bonus payout will not be made in respect of that performance measure. If none of the metrics is met in any of the performance measures, then no bonus payout will be made. The Board will consider Company performance against the Group scorecard objectives as well as the Executive Director’s individual performance in order to determine the value of the bonus award. Individual performance will be assessed by the Remuneration Committee on the basis of objective criteria established by the Chairman in the case of the CEO, and by the CEO in the case of the CFO. The Remuneration Committee has the discretion to move the theoretical award up or down subject to the annual bonus award being no greater than the maximum percentage of base salary applicable to that award in the year in question. The Remuneration Committee will use its discretion to ensure that a fair and balanced outcome is achieved, taking into account the overall performance of the Company and the experience of its shareholders. Two-thirds of the annual bonus is delivered in cash and one-third is delivered in shares, which are deferred for three years as explained opposite. The annual bonus, including the deferred share element, payable for target performance for the CEO is currently 100% of base salary and for the CFO is currently 90% of base salary. For bonuses awarded in respect of 2015 and subsequent years, the Remuneration Committee will have discretion, for up to six years from the payment date, to claw back from individuals some or all of the cash bonus award in certain circumstances including (i) material restatement of the results of the Group, (ii) significant reputational damage to the Group, or (iii) serious misconduct by the individual. However, in the case of (i) and (ii) the Remuneration Committee may only exercise its discretion for up to two years from the payment date. | | The maximum annual amount payable to an Executive Director is 250% of base salary. If the Remuneration Committee ever felt that it would be in the interests of shareholders to grant an annual bonus of an amount exceeding the historical maximum opportunity of 180% of base salary in the case of the CEO and 150% of base salary in the case of the CFO, it would consult major shareholders in advance. |
| | |
| 124 | | AstraZenecaAnnual Report and Form 20-F Information 2015 |
Annual bonus: Deferred Bonus Plan
| | | | |
| Purpose and link to strategy | | Operation and framework used to assess performance | | Maximum opportunity |
| The deferred share element of the annual cash bonus under the Deferred Bonus Plan is designed to align Executive Directors’ interests with those of shareholders. | | Executive Directors are required to defer one-third of their pre-tax annual cash bonus into shares. On vesting, the cash value equivalent to dividends that would have been paid during the three-year holding period will be paid subject to continued employment. Directors must normally remain in employment for three years from grant for deferred shares to vest. Once performance measures have been applied to determine the value of the total bonus, no further performance measures apply to the deferred share element. For deferred share elements relating to bonuses awarded in respect of 2015 and subsequent years, the Remuneration Committee has discretion: > to reduce or cancel any portion of an unvested deferred bonus award in certain circumstances (malus), including (i) material restatement of the results of the Group, (ii) significant reputational damage to the Group, or (iii) serious misconduct by the individual > for up to six years from the vesting date, to claw back from individuals some or all of the deferred bonus award in certain circumstances, including (i) material restatement of the results of the Group, (ii) significant reputational damage to the Group, or (iii) serious misconduct by the individual. However, in the case of (i) and (ii) the Remuneration Committee may only exercise its discretion for up to two years from the vesting date. | | The maximum deferred bonus for Executive Directors is one-third of the maximum pre-tax bonus as detailed in the Annual bonus: cash section on page 124. |
Long Term Incentives (LTIs)
Overview: An Executive Director’s target LTI award is considered annually and set at a level which takes account of market analysis. The Remuneration Committee has discretion to grant awards above or below target based on individual performance and potential. The CEO’s current LTI target is 250% of base salary on an expected value basis, and the CFO’s current LTI target is 200% of base salary on an expected value basis. An illustration of the expected value basis can be found in the Remuneration scenarios for Executive Directors section on page 129.
The Company’s variable long-term arrangements for Executive Directors currently comprise two LTI plans: the PSP and the AZIP. Under each of these plans the maximum market value of shares that may be awarded is 500% of a participant’s base salary. If the Remuneration Committee ever felt that it would be in the interests of shareholders to grant annual variable awards to an Executive Director with values exceeding the historical range of up to 500% in aggregate under the LTI plans, it would consult major shareholders in advance. Currently when LTI awards are granted to Executive Directors, the split between the two plans is weighted in the proportion: 75% PSP and 25% AZIP.
When granting LTI awards the Remuneration Committee applies a target as a percentage of base salary on an expected value basis. For the AZIP, the expected value on vesting is 100% of the value of the award at grant. For the PSP, the expected value on vesting is 50% of the value of the award at grant.
The table overleaf explains the operation, minimums and maximums payable under each of these LTI plans.
Performance measures: Performance measures are recommended by the CEO and determined by the Remuneration Committee. The performance measures in respect of the PSP are designed to drive long-term performance against the Company’s strategic objectives, in terms of commercial, scientific and financial success.
In respect of the AZIP, dividend-based performance hurdles motivate the generation of returns for shareholders on a sustainable basis over an extended period of time, and will be set by the Remuneration Committee at a level it considers appropriate at the start of the performance period. The combined eight-year performance and holding period is designed to reflect the development cycle of a medicine and therefore to align executive reward with successful product development.
When setting the performance measures at the start of the performance period, the Remuneration Committee will also determine an appropriate payout curve (if any), for each measure. The Remuneration Committee will assess performance against the performance measures to determine the level of payout. The Remuneration Committee may exercise its discretion to increase or decrease the payout should it consider it appropriate, subject to the maximum percentage of base salary applicable in the year in question. The intention of the Remuneration Committee is to exercise judgement appropriately, in particular so that the experience of shareholders over time is taken into account. As a matter of good practice, certain major shareholders would be consulted before any material change to the performance measures for the PSP or AZIP are implemented.
The Remuneration Committee seeks to ensure that, on the one hand, reward outcomes are not purely mechanistic; but on the other, that in exercising its discretion, that exercise is not seen by employees to be arbitrary or unfair. The Remuneration Committee’s objective is to use reward arrangements to drive performance by employees which supports the creation of value for shareholders.
Cessation of employment and other circumstances: The LTI plans are governed by plan rules, which define how individual awards should be treated upon termination of an Executive Director’s employment (see Principles of payment for loss of office for Executive Directors section on page 132). Provision is also made for the treatment of awards in respect of corporate activity including rights issues, sale of a business outside the Group and a change of control. The treatment of awards in these circumstances is also subject to Remuneration Committee discretion. In the event of a change of control an award will vestpro rata to the time elapsed between the date of grant of the award and the date of the event to the extent that the performance measures have been met up to the date of the event, subject to the Remuneration Committee’s discretion to make an alternative determination.
Other employees: Other employees at mid to senior levels globally are eligible for LTI awards in the form of PSP and/or Restricted Stock Units. The occupants of approximately 700 senior roles in the Company are currently eligible for PSP awards – these are the leaders who have the ability directly to influence the delivery of the Company’s strategic goals. Awards under the AZIP are currently granted to SET members only (including the Executive Directors).
| | |
| AstraZenecaAnnual Report and Form 20-F Information 2015 | | 125 |
Corporate Governance
Remuneration Policy for Executive Directorscontinued
AstraZeneca Performance Share Plan (PSP)
| | | | |
| Purpose and link to strategy | | Operation and framework used to assess performance | | Maximum opportunity |
| The PSP is an LTI plan designed to align the variable pay of our Executive Directors directly to the delivery of our medium-term business strategy. | | The PSP provides for the grant of awards over Ordinary Shares or ADSs. Vesting is dependent on the achievement of stretching three-year performance targets and continued employment. Performance measures and targets under the PSP are determined by the Remuneration Committee at the start of the relevant three-year performance period and consist of a range of measures designed to incentivise performance in furtherance of the Company’s business strategy. The performance measures (currently a combination of four measures: TSR; cumulative cash flow; sales of medicines in key therapy areas and territories; and innovation metrics) are closely aligned to business strategy, and reward commercial, scientific and financial success. Currently each of the four measures has an equal weighting. When setting the performance measures at the start of the performance period, the Remuneration Committee will allocate weightings to those measures as it considers appropriate, taking into account strategic and business priorities. The three-year performance period commences on 1 January in the year of the award. The vesting date is the third anniversary of the date on which the award is granted. A two-year holding period commencing three years from the date of grant for Executive Directors will be included in the new PSP rules which are being put to shareholders for approval at the AGM in 2014 and, if approved, will be effective for awards made after the AGM. These awards will vest at the end of the holding period. During the holding period, no further performance measures will apply as performance has already been assessed. All the performance measures have a payout curve. The payout curves are structured in different ways depending on the overall objective they are intended to measure. Typically, performance measures are structured such that 25% of the award will vest for threshold level of performance. The relationship between threshold, target and out-performance will be determined by the Remuneration Committee at each grant of the PSP and is dependent on whether the performance measure is science, commercial or finance based. An award will typically vest at 100% if the target (usually set at upper quartile performance) is achieved and threshold level of performance associated with any metric will be at or above a median level. There will be other vesting points between the threshold and maximum of 100% vesting, typically on a straight-line basis where the performance measures permit. The Remuneration Committee may (acting fairly and reasonably) adjust or waive a performance target if an event occurs that causes it to believe that the performance target is no longer appropriate. Payouts can range from 0% to 100% of the original award. On vesting, the cash value equivalent to dividends accrued during the vesting period will be paid. Subject to shareholder approval of the renewal of the PSP at the 2014 AGM, for awards granted under the PSP after the AGM and in subsequent years, the Remuneration Committee will have discretion: > to reduce or cancel any portion of an unvested award in certain circumstances (malus), including (i) material restatement of the results of the Group, (ii) significant reputational damage to the Group, or (iii) serious misconduct by the individual > for up to six years from the third anniversary of the date of grant, to claw back from individuals some or all of the award in certain circumstances, including (i) material restatement of the results of the Group, (ii) significant reputational damage to the Group, or (iii) serious misconduct by the individual. However, in the case of (i) and (ii) the Remuneration Committee may only exercise its discretion for up to two years from the third anniversary of the date of grant. | | Under the PSP plan rules, the maximum market value of shares that may be awarded at the date of grant in respect of any year is 500% of a participant’s annual base salary. If each aspect of all of the performance measures is met and exceeded, the Remuneration Committee currently has the discretion to pay out a maximum of 125% of the value of the original award. However, the Remuneration Committee has determined that it will not exercise this discretion in relation to outstanding or future awards. This feature has therefore been removed from the new PSP rules which are being put to shareholders for approval at the AGM in 2014. |
| | |
| 126 | | AstraZenecaAnnual Report and Form 20-F Information 2015 |
AstraZeneca Investment Plan (AZIP)
| | | | |
| Purpose and link to strategy | | Operation and framework used to assess performance | | Maximum opportunity |
| The combined eight-year performance and holding periods of the AZIP are influenced by the Group’s medicine development cycle, reflecting the long-term investment horizons that are a feature of the pharmaceutical industry. | | The AZIP provides for the grant of awards over Ordinary Shares or ADSs. Vesting is dependent on achievement of two performance measures over a four-year performance period. The award is then subject to a further four-year holding period. Payout of the award is subject to continued employment. Performance measures and targets under the AZIP are determined by the Remuneration Committee at the start of the relevant four-year performance period. Currently, two performance measures apply: dividend level and dividend cover. Both measures must be achieved for the award to vest. If an event occurs which causes the Remuneration Committee (acting fairly and reasonably) to consider that a performance measure is no longer appropriate it may adjust that measure. The AZIP is operated over a four-year performance period, with a subsequent four-year holding period. Performance periods commence on 1 January in the year of the award. Holding periods run for a period of four years starting from the end of the performance period, and end on the eighth anniversary of the start of the performance period. During the holding period, no further performance measures apply as performance has already been assessed. If both measures are achieved in each year of the performance period, the award will vest in full at the end of the holding period. If either or both of the measures are not achieved, the award will lapse. On vesting, the cash value equivalent to dividends paid during the performance and holding periods will be paid. For awards granted under the AZIP prior to the AGM in 2014, the Company may reduce or cancel some or all of the shares that are the subject of a participant’s award at any time during the performance or the holding period if, in the opinion of the Remuneration Committee (acting fairly and reasonably), this is warranted by the underlying performance of the Company, the occurrence of an event that causes, or is very likely to cause, reputational damage to the Company, or serious misconduct by the participant. In order to ensure consistency between our LTI plans, for awards granted under the AZIP on or after the AGM and in subsequent years, the Remuneration Committee will have discretion: > to reduce or cancel any portion of an unvested award in certain circumstances (malus), including (i) material restatement of the results of the Group, (ii) significant reputational damage to the Group, or (iii) serious misconduct by the individual > for up to six years from the end of the performance period, to claw back from individuals some or all of the award in certain circumstances, including (i) in the case of material restatement of the results of the Group, (ii) significant reputational damage to the Group, or (iii) serious misconduct by the individual. However, in the case of (i) and (ii) the Remuneration Committee may only exercise its discretion for up to two years from the end of the performance period. | | Under the AZIP plan rules the maximum market value of shares that may be awarded at the date of grant in respect of any year is 500% of a participant’s annual base salary. |
| | |
| AstraZenecaAnnual Report and Form 20-F Information 2015 | | 127 |
Corporate Governance
Remuneration Policy for Executive Directorscontinued
Restricted shares
In certain circumstances, as part of the recruitment arrangements, an Executive Director may be awarded restricted shares. There are no performance measures attached to awards of restricted shares because typically they will be awarded for the purpose of compensating newly recruited Executive Directors for loss of entitlements on leaving a previous employment. However, the Remuneration Committee will consider whether the lost incentives were subject to performance measures and their likely vesting. If foregone awards were subject to performance testing, then the compensatory AstraZeneca award will normally be granted under the PSP and/or AZIP in order to align the performance conditions attaching to the award to the delivery of the Company’s strategy. Restricted share awards will generally be used only when the foregone compensation was not subject to performance testing.
The Remuneration Committee may divide an award of restricted shares into tranches vesting at different points and may apply performance measures bespoke to the individual if it considers it appropriate. If it decides to attach performance conditions, the performance conditions and period will be defined at grant.
In most instances, there are no performance conditions attached to these awards. They will therefore vest in full if the individual remains in office on the vesting date.
On vesting, the cash value equivalent to dividends accrued during the vesting period will be paid.
There are no contractual provisions for clawback ormalus of awards of restricted shares.
Restricted shares may be used for the same purpose on the recruitment of other employees.
AstraZeneca also operates another restricted share plan (the AstraZeneca Global Restricted Stock Plan) to provide LTI awards to eligible employees globally. Currently Executive Directors and other senior executives are not eligible to participate in this plan.
Award of restricted shares
| | | | |
| Purpose and link to strategy | | Operation and framework used to assess performance | | Maximum opportunity |
| In certain circumstances, as part of recruitment arrangements, an Executive Director may be made awards of restricted shares. This would ordinarily be to compensate for loss of remuneration opportunities suffered on leaving previous employment. | | See above. | | There is no maximum value of an award which may be granted. The Remuneration Committee will determine the value of the award at grant, as it considers appropriate in all the circumstances. |
Restricted Share Plan (RSP) | | |
| Purpose and link to strategy | | Operation and framework used to assess performance | | Maximum opportunity |
| The RSP is a LTI plan designed to align the variable pay of our key employees, excluding Executive Directors, directly to the delivery of our business strategy. | | The RSP provides for the granting of restricted share awards to key employees, excluding Executive Directors. Mr Dunoyer, who was appointed as an Executive Director subsequent to his appointment as EVP, GPPS, was granted an award of restricted shares to compensate for loss of entitlements as a result of leaving his previous employment. | | Under the RSP plan rules the maximum market value of shares that may be awarded at the date of grant in respect of any year is 500% of a participant’s annual base salary. The Remuneration Committee will determine the value of the award at grant, as it considers appropriate in all the circumstances. In the case of Mr Dunoyer, the maximum payable is 100% of the shares awarded (65,505 shares). |
UK employee share plans
All UK-based employees, including the Executive Directors, are eligible to participate in the SAYE Option Scheme and Share Incentive Plan, which are HM Revenue & Customs (HMRC) approved plans.
Share Incentive Plan (SIP)
| | | | |
| Purpose and link to strategy | | Operation and framework used to assess performance | | Maximum opportunity |
| Encouraging share ownership | | The Company operates an HMRC-approved SIP whereby UK employees, including Executive Directors, may save a regular amount over one year with which to purchase Partnership shares and for which, currently, a Matching share is granted for every four shares purchased. | | Partnership shares up to £125 per month from pre-tax pay or such other maximum amount as determined by the Company within the parameters of applicable legislation. |
SAYE Option Scheme (SAYE) | | |
| Purpose and link to strategy | | Operation and framework used to assess performance | | Maximum opportunity |
| Encouraging share ownership | | The Company operates an HMRC-approved save as you earn option scheme whereby UK employees, including Executive Directors, may save a regular amount over three or five years with which to purchase shares. Currently, shares are acquired at a 10% discount to the market price prevailing at the date of the commencement of the scheme. A maximum discount of 20% may be made available under the scheme. | | Up to £250 per month from post-tax pay or such other maximum amount as determined by the Company within the parameters of applicable legislation. |
| | |
| 128 | | AstraZenecaAnnual Report and Form 20-F Information 2015 |
Remuneration scenarios for Executive Directors
The charts below illustrate how much the current Executive Directors could receive under different performance scenarios in 2016, assuming a constant share price. In order to compile the charts, the following assumptions have been made:
| | | | |
Minimum remuneration | | Consists of the fixed elements of remuneration only: base salary, taxable benefits and pension |
| | > | | base salary is that applicable in 2016 |
| | > | | taxable benefits are taken from the corresponding figure in the Executive Directors’ single total figure remuneration table for 2015 as set out on page 107 |
| | > | | pension measured as a cash payment equivalent to 30% of base salary in the case of the CEO and 24% of base salary in the case of the CFO. |
| | | | | | | | | | | | | | | | |
| | | Base salary £’000 | | | Taxable benefits £’000 | | | Pension £’000 | | | Total £’000 | |
| Pascal Soriot | | | 1,190 | | | | 115 | | | | 357 | | | | 1,662 | |
| Marc Dunoyer | | | 707 | | | | 70 | | | | 170 | | | | 947 | |
| | | | |
Remuneration for on-plan performance (target) | | Based on what the Executive Director would receive if performance were in line with the Company’s expectations |
| | > | | on-target annual bonus payout of 100% of base salary for the CEO, and 90% for the CFO |
| | > | | LTI shares, which vest at an on-target expected value of 250% of base salary for the CEO, and 200% in the case of the CFO. |
Remuneration for outperformance (above target/ maximum) | | Based on what the Executive Director would receive at stretch performance and maximum vesting of the performance shares |
| | > | | an annual bonus payout of 180% of base salary for the CEO, and 150% for the CFO |
| | > | | maximum vesting of the awards made under the Company’s LTI plans (representing 100% of the face value of the PSP and AZIP awards where the PSP has an expected value of 50% and the AZIP an expected value of 100%). |

When granting LTI awards the Remuneration Committee applies a target as a percentage of base salary weighted 25% in favour of the AZIP and 75% in favour of the PSP.
The face value of the AZIP and PSP awards for the CEO at target is 437.5% of base salary. For 2015, the Remuneration Committee awarded an above-target award at a face value of 499% which is taken into account in the figures provided in the outperformance row of the chart above.
The face value of the AZIP and PSP awards for the CFO at target is 350% of base salary.
Approach to recruitment remuneration for Executive Directors
The Company seeks to pay no more than necessary to recruit the best candidate available for a role as an Executive Director. On the recruitment of a new Executive Director, the Company seeks to put in place a remuneration package which is broadly in line with the remuneration package applicable to relevant incumbent Executive Directors. However, in order to offer a competitive package to the most capable candidate, the Company may consider providing remuneration arrangements that exceed those of existing Executive Directors. The Remuneration Committee may also agree to pay allowances to expatriates in line with the Company’s international assignment policy which provides for support towards housing, schooling and other relocation or assignment related costs.
The remuneration package offered to new recruits may include any element listed in the policy table above, or any other element which the Remuneration Committee considers is appropriate given the particular circumstances, with due respect to the interests of the Company’s shareholders.
| | |
| AstraZenecaAnnual Report and Form 20-F Information 2015 | | 129 |
Corporate Governance
Remuneration Policy for Executive Directorscontinued
Operating guidelines: The Remuneration Committee is aware that the pharmaceutical industry is global and that future Executive Directors might come from organisations with very different pay structures and practices. The Remuneration Committee believes that it is in the interests of shareholders to retain an element of flexibility in the recruitment policy to enable it to recruit the best candidates. However, this flexibility is limited. As described below, our intention is to use buy-out awards on recruitment only to compensate a new recruit for awards which are forfeited at the previous employer. All other aspects of the compensation opportunity of a new recruit will be subject to the maxima contained in the Policy.
In considering which elements to include, and in determining the approach for all relevant elements, the Remuneration Committee will take into account a number of different factors, including typical market practice, existing arrangements for the other Executive Directors and internal relativities and market positioning.
The Company may reimburse the costs of financial planning and tax advice to Executive Directors. The Company also provides Directors’ and Officers’ Liability Insurance and an indemnity to the fullest extent permitted by the law and the Company’s Articles to all Executive Directors.
The Company may find it necessary to compensate a new recruit for forfeiture of entitlements from a previous employer. The value of such compensation cannot be anticipated and will depend upon a range of factors including the circumstances of the individual in question. In such circumstances, the Company will seek to offer a package weighted towards equity in the Company. However, the precise nature of the compensation package will depend on the type of entitlement that the recruit is foregoing and which the Company will generally seek to compensate in kind; the buyout might therefore comprise cash and/or restricted shares and/or LTI. The Remuneration Committee will obtain and take into account independent valuations of the entitlements to determine the appropriate level of compensation.
Shares which could be offered to the new recruit would be granted under LTI plans available at the time or under a plan specific to that individual as permitted under the Financial Conduct Authority’s Listing Rules. Performance measures may apply to such share awards. The Company’s policy seeks to link the performance of the Executive Director to the performance of the Company in any given period. The precise targets and measures will depend on the objectives of the Company and the individual at that time and will be determined by the Remuneration Committee.
The Company will not offer cash or shares to newly recruited Executive Directors as a bonus, or ‘golden hello’ on joining other than to compensate for the loss of a previous remuneration opportunity. Where compensation is offered to a new recruit on his or her hire, the Company will explain the reasons for this to shareholders in a timely manner, and will provide details of the payments.
Operating guidelines: The Remuneration Committee will not grant cash or share awards as a ‘golden hello’. As described above, cash or share awards granted on joining the Company will be to compensate a new recruit for loss of previous remuneration awards only.
Ongoing annual variable remuneration will not exceed an award which comprises up to 250% of base salary under the annual bonus, and up to 500% of base salary under the PSP and up to 500% of base salary under the AZIP. If the Remuneration Committee ever felt that it would be in the interests of shareholders to grant annual variable awards to a new Executive Director with values exceeding the historical range of 0 – 680% of base salary (comprising up to 180% under the annual bonus and up to 500% in aggregate under the LTI plans), it would consult major shareholders in advance.
The Company intends to honour all remuneration arrangements previously entered into in the case of Group employees who are promoted to the position of an Executive Director.
| | |
| 130 | | AstraZenecaAnnual Report and Form 20-F Information 2015 |
Service contracts for Executive Directors
Save as noted below, it is not intended that service contracts for new Executive Directors will contain terms that are materially different from those summarised below or contained in the Policy set out in this Remuneration Policy Report. The contractual obligations below are applicable to each of the current Executive Directors unless stated otherwise, and to the Executive Directors only.
| | |
| Notice period | | The Company may terminate the employment of an Executive Director by giving not less than 12 months’ written notice. The Company may agree, on the appointment of a new Executive Director, that any notice given by the Company will not expire prior to the second anniversary of the commencement date of the Executive Director’s appointment. The Company agreed to such a provision in the case of Mr Dunoyer. An Executive Director may terminate his employment on 12 months’ written notice. |
Payment in lieu of notice | | The Company may terminate an Executive Director’s contract at any time with immediate effect and pay him a sum in lieu of notice. This sum will consist of (i) the base salary that the relevant Executive Director would have been entitled to receive during the notice period and (ii) the cost to the Company of funding the Executive Director’s flexible benefit arrangements for this period, including the Company’s contribution in respect of pension. The payment in lieu of notice may be paid as a lump sum or the Company may decide to pay the first six months of the payment in lieu in equal monthly instalments, with the balance paid within 30 days of the final instalment being paid. |
| Garden leave | | If an Executive Director has given or been given notice of termination, the Company has the right to place the Executive Director on ‘garden leave’. |
Summary termination | | The Company may terminate an Executive Director’s employment summarily, in particular defined circumstances such as gross misconduct, with no further payment. |
Payments in lieu of holiday | | If, on termination, the relevant Executive Director has exceeded his accrued holiday entitlement, the value of this excess may be deducted by the Company from any sums payable. If the Executive Director has unused holiday entitlement, the Remuneration Committee has discretion to require the Executive Director to take such unused holiday during any notice period, or make a payment in lieu of it calculated in the same way as the value of any excess holiday. |
Directors’ and Officers’ Liability Insurance | | Directors’ and Officers’ Liability Insurance and an indemnity to the fullest extent permitted by the law and the Company’s Articles is provided to the Executive Directors for the duration of their employment and for a minimum of five years following termination. |
Deemed treatment under AZIP and restricted share award | | In respect of awards made to compensate Mr Soriot for loss of remuneration opportunity at his previous employer, if Mr Soriot gives notice of termination of his employment after the end of the performance period under the AZIP but before the end of the holding period, the award under the AZIP will vest on the earlier of the end of the holding period and the end of the period of 24 months from the date of cessation of employment, unless the Remuneration Committee determines otherwise. If Mr Soriot’s employment is terminated by the Company (other than in the event of prescribed misconduct events), his restricted share award will continue to subsist. |
| | |
| AstraZenecaAnnual Report and Form 20-F Information 2015 | | 131 |
Corporate Governance
Remuneration Policy for Executive Directorscontinued
Principles of payment for loss of office for Executive Directors
The Company does not make additional payments for loss of office, other than, as appropriate, payments in lieu of notice as described above or payments in respect of damages if the Company terminates an Executive Director’s service contract in breach of contract (taking into account, as appropriate, the Director’s ability to mitigate his loss). The Remuneration Committee has discretion to award payments in certain circumstances, as set out below, depending on the nature of the termination and the Executive Director’s performance. The LTI plans are governed by plan rules, which define how individual awards under those plans should be treated upon termination of employment. Provision is also made for the treatment of awards in respect of corporate activity including sale of a business outside the Group. The treatment of awards in these circumstances may also be subject to Remuneration Committee discretion. Generally, awards under LTI plans will only be allowed to vest for those Executive Directors who leave the Company by mutual agreement, for example in circumstances of ill-health, injury, disability, redundancy or retirement, or where employment terminates by reason of the Executive Director’s death (see the table opposite for further information). In addition to any payment in lieu of notice, the individual components of remuneration and other payments which may be payable on loss of office are set out below, subject to the terms of any applicable bonus rules or share incentive plan rules:
An Executive Director may receive a bonus for the performance year in which he leaves the Company. Typically this sum will reflect an on-target bonus pro-rated for the part of the year in which he worked. This is at the discretion of the Remuneration Committee and will depend on the circumstances, including an assessment of the Executive Director’s performance in the relevant period and the circumstances of his departure. The deferred share element of previous bonuses granted, and any deferred share element of the bonus awarded in respect of the departing year, may still vest for the benefit of the departing Executive Director at the end of the period of deferral despite the fact that the Executive Director did not work for the entirety of this period. The Remuneration Committee has the discretion to accelerate and/or retain the deferral period and allow shares to vest for the benefit of the Executive Director on his departure and/or in accordance with the vesting schedule as the case may be. The Remuneration Committee will decide whether it is appropriate in the circumstances for these shares to vest for the benefit of the departing Executive Director.
The rules of the LTI plans envisage circumstances under which some, all or none of an Executive Director’s shares held under LTI plans will vest in connection with his departure. The exact timing and number of shares vesting will depend on the circumstances, including the Executive Director’s reason for leaving (as set out in the table opposite) and may be subject to Remuneration Committee discretion, depending on what it considers to be fair and reasonable in the circumstances.
| > | Restricted share awards and awards under the RSP |
The treatment on termination will depend upon the terms of the individual Executive Director’s awards on recruitment. The Remuneration Committee has discretion to determine the treatment at the time of departure based on what it considers to be fair and reasonable in the circumstances.
| > | Non-statutory redundancy payment |
Executive Directors are not entitled to non-statutory redundancy payments.
| > | Pension contributions and other benefits |
Pension contributions and other benefits for Executive Directors will be payable up to the termination date or as part of a payment in lieu of notice as described on page 131.
| > | Payments in relation to statutory rights |
The amount considered reasonable to pay by the Remuneration Committee in respect of statutory rights may be included in the overall termination payment.
| > | Payments required by law |
The Company may pay damages, awards, fines or other compensation awarded to or in respect of an Executive Director by any competent court or tribunal or other payments required to be made on termination of employment by any applicable law, regulator or collective labour agreement.
The departing Executive Director will be required to mitigate his loss by using reasonable efforts to secure new employment.
The Company may pay an amount considered reasonable by the Remuneration Committee in respect of fees for legal and tax advice, and outplacement support for the departing Executive Director.
| | |
| 132 | | AstraZenecaAnnual Report and Form 20-F Information 2015 |
Treatment of LTI and Deferred Bonus Plan awards on cessation of employment
| | | | |
| Plan | | Termination by mutual agreement (broadly in circumstances of ill-health, injury, disability,
redundancy or retirement and in the case of death and certain corporate events eg sale of
a business outside the Group) | | Other leaver scenarios |
| Deferred Bonus Plan (Annual Bonus Plan) | | Awards will vest at the end of the relevant deferral period, unless the Remuneration Committee decides otherwise. | | Ordinarily awards will lapse unless the Remuneration Committee exercises its discretion to apply the treatment for leavers by mutual agreement. |
| PSP | | Where cessation of employment occurs within three years of the date of grant awards will vest, pro rata to the time elapsed between the date of grant of the award and the date of cessation of employment, at the end of the performance period after performance has been assessed, to the extent that the performance target(s) measured over the performance period has been met. Where cessation of employment occurs during any holding period the award will vest in respect of all the shares that continue to be subject to the award as soon as practicable following the cessation of employment. However, the Remuneration Committee has discretion to permit the award to vest immediately on cessation of employment where that cessation occurred as a result of one of the events mentioned above to the extent that the performance target(s) has, in the opinion of the Remuneration Committee, been satisfied from the date of grant to the date of cessation of employment. However, if the Remuneration Committee believes that exceptional circumstances warrant this, it may exercise its discretion to vest the award on another basis. | | Ordinarily awards will lapse unless the Remuneration Committee exercises its discretion to preserve all or part of an award and apply the default treatment for leavers by mutual agreement as described in this table. This discretion will not be exercised in the case of dismissal for gross misconduct. |
| AZIP | | Death, ill-health, injury or disability: > in the performance period: the award will vest as soon as practicable following the cessation of employment, pro-rated to take into account the period elapsed between the date of grant and the date of cessation of employment relative to the performance period and pro-rated to take into account the satisfaction of any performance measure(s), as agreed by the Remuneration Committee > in the holding period: the award will vest in respect of all the shares that continue to be subject to the award as soon as practicable following the cessation of employment. Redundancy, retirement or certain corporate events (eg sale of a business outside the Group): > in the performance period: the award will vest at the later of the end of the performance period and the end of the period of 24 months from the date of cessation of employment, to the extent any performance measures have been met by the end of the performance period and pro-rated to take into account the period elapsed between the date of grant and the date of cessation of employment relative to the performance period > in the holding period: the award will vest in respect of all shares that continue to be subject to the award at the earlier of the end of the holding period and the end of the period of 24 months from the date of cessation of employment. Where the Remuneration Committee terminates an Executive Director’s employment (other than for gross misconduct) during the holding period, the awards will vest on the same basis. In each case described above, the Remuneration Committee has discretion to vest the award or part of the award on a different basis. | | Ordinarily awards will lapse unless the Remuneration Committee exercises its discretion to apply the default treatment for leavers by reason of redundancy or retirement described in this table. |
| Restricted shares and awards under the RSP | | Awards will lapse unless the Remuneration Committee exercises its discretion to preserve all or part of an award. In relation to awards granted on or after 3 February 2014 and, where that award was granted at the time of the Executive Director’s recruitment to the Company in compensation for any awards or bonuses forfeited at his previous employer, the award will vest on the date his employment ceases, pro-rated to take into account the period elapsed between the date of grant and the date of cessation of employment, unless the Remuneration Committee decides not to pro-rate or to pro-rate on some other basis. | | Ordinarily awards will lapse unless the Remuneration Committee exercises its discretion to preserve all or part of an award. |
| | |
| AstraZenecaAnnual Report and Form 20-F Information 2015 | | 133 |
Corporate Governance
Remuneration Policy for Non-Executive Directors
Non-Executive Directors, including the Chairman, receive annual Board fees. Additional fees are also payable for membership and chairmanship of a Board Committee. Non-Executive Directors are not eligible for performance-related bonuses or the grant of share awards or options. No pension contributions are made on their behalf. The annual Board fees applicable to Non-Executive Directors during 2013 are set out below. Fees applicable in future years will be set out in the corresponding year’s Implementation Report. The remuneration of Non-Executive Directors is determined by the Chairman and the Executive Directors. The remuneration of the Chairman is determined by the other members of the Remuneration Committee and the Senior independent Non-Executive Director.
No Director is involved in any decision relating to his or her own remuneration.
Annual Board and Committee fees
| | | | |
| Purpose and link to strategy | | Operation | | Maximum opportunity |
| The annual fees are intended to be sufficient (but no more than necessary) to attract, retain and develop high-calibre individuals. | | Non-Executive Directors, including the Chairman, receive annual Board fees and additional fees for membership and chairmanship of a Board Committee. The individual fees paid to a Non-Executive Director are subject to periodic review and may be increased in the future to ensure that they remain sufficient to attract high-calibre individuals while remaining fair and proportionate. While Non-Executive Directors currently receive their fees in cash, the Company reserves the right to award part, or all, of their fees in shares. There are no contractual provisions for clawback or malus of fees. Non-Executive Director fees in 2013: | | The maximum fees payable in aggregate to the Non-Executive Directors may not exceed £2,250,000 per year under the Company’s Articles, as approved by the Company’s shareholders. |
| | | | |
| | | £ | |
| Chairman’s fee | | | 500,000 | |
| Basic Non-Executive Director’s fee | | | 75,000 | |
| Senior independent Non-Executive Director | | | 30,000 | |
| Membership of the Audit Committee | | | 20,000 | |
| Membership of the Remuneration Committee | | | 15,000 | |
| Chairman of the Audit Committee or the Remuneration Committee1 | | | 20,000 | |
| Membership of the Science Committee | | | 10,000 | |
| Chairman of the Science Committee1 | | | 7,000 | |
| |
1 This fee is in addition to the fee for membership of the relevant Committee. | | | | |
| | | | |
Benefits | | | | |
| Purpose and link to strategy | | Operation | | Maximum opportunity |
| Intended to attract and retain high-calibre individuals. | | The Company also provides Directors’ and Officers’ Liability Insurance and an indemnity to the fullest extent permitted by the law and the Company’s Articles and may also reimburse the costs of financial planning and tax advice. | | The maximum amount payable in respect of these costs and cost of insurance will be the reimbursement of the Directors’ benefits grossed up for any tax payable by the individual. |
Other costs and expenses | | | | |
| Purpose and link to strategy | | Operation | | Maximum opportunity |
| Intended to reimburse individuals for legitimately incurred costs and expenses. | | In addition to the Chairman’s fee, a proportion of the office costs of the Chairman are reimbursed. In 2013, this amounted to £40,000. The amount of office costs to be reimbursed each year will be determined at the discretion of the Remuneration Committee, based on an assessment of the reasonable requirements of the Chairman. The Remuneration Committee has the discretion to approve contributions by the Company to office costs of other Non-Executive Directors in circumstances where such payments are deemed proportionate and reasonable. The Company will pay for all travel (including travel to the Company’s offices), hotel and other expenses reasonably incurred by Non-Executive Directors in the course of the Company’s business, for example, professional fees such as secretarial support, and reimbursement for domestic security arrangements such as lights and alarms following a security assessment. There are no contractual provisions for clawback or malus of other costs and expenses. | | The maximum amounts payable in respect of these costs and expenses will be the reimbursement of the Directors’ costs and expenses grossed up for any tax payable by the individual. |
Letters of appointment
None of the Non-Executive Directors has a service contract but all have letters of appointment. In accordance with the Articles, following their appointment, all Directors must retire at each AGM and may present themselves for election or re-election. The Company is mindful of the independence provisions of the UK Corporate Governance Code and, in this regard, it is anticipated that Non-Executive Directors’ overall tenure will not normally exceed nine years. The Chairman may terminate his appointment at any time, with three months’ notice. None of the Non-Executive Directors has a notice period or any provision in his or her letter of appointment giving him, or her, a right to compensation payable upon early termination of appointment.
On behalf of the Board
A C N Kemp
Company Secretary
4 February 2016
| | |
| 134 | | AstraZenecaAnnual Report and Form 20-F Information 2015 |
Preparation of the Financial Statements
and Directors’ Responsibilities
The Directors are responsible for preparing this Annual Report and Form 20-F Information and the Group and Parent Company Financial Statements in accordance with applicable law and regulations.
Company law requires the Directors to prepare Group and Parent Company Financial Statements for each financial year. Under that law they are required to prepare the Group Financial Statements in accordance with IFRSs as adopted by the EU and applicable law and have elected to prepare the Parent Company Financial Statements in accordance with UK Accounting Standards, including FRS 101 ‘Reduced Disclosure Framework’ and applicable law.
Under company law, the Directors must not approve the Financial Statements unless they are satisfied that they give a true and fair view of the state of affairs of the Group and Parent Company and of their profit or loss for that period. In preparing each of the Group and Parent Company Financial Statements, the Directors are required to:
| > | select suitable accounting policies and then apply them consistently |
| > | make judgements and estimates that are reasonable and prudent |
| > | for the Group Financial Statements, state whether they have been prepared in accordance with IFRSs as adopted by the EU |
| > | for the Parent Company Financial Statements, state whether FRS 101 has been followed, subject to any material departures disclosed and explained in the Parent Company Financial Statements |
| > | prepare the Financial Statements on the going concern basis unless it is inappropriate to presume that the Group and the Parent Company will continue in business. |
The Directors are responsible for keeping adequate accounting records that are sufficient to show and explain the Parent Company’s transactions and disclose with reasonable accuracy at any time the financial position of the Parent Company and enable them to ensure that its Financial Statements comply with the Companies Act 2006. They have general responsibility for taking such steps as are reasonably open to them to safeguard the assets of the Group and to prevent and detect fraud and other irregularities.
Under applicable law and regulations, the Directors are also responsible for preparing a Directors’ Report, Strategic Report, Directors’ Remuneration Report, Corporate Governance Report and Audit Committee Report that comply with that law and those regulations.
The Directors are responsible for the maintenance and integrity of the corporate and financial information included on our website. Legislation in the UK governing the preparation and dissemination of Financial Statements may differ from legislation in other jurisdictions.
Directors’ responsibility statement pursuant to DTR 4
The Directors confirm that to the best of our knowledge:
| > | The Financial Statements, prepared in accordance with the applicable set of accounting standards, give a true and fair view of the assets, liabilities, financial position and profit or loss of the Company and the undertakings included in the consolidation taken as a whole. |
| > | The Directors’ Report includes a fair review of the development and performance of the business and the position of the issuer and the undertakings included in the consolidation taken as a whole, together with a description of the principal risks and uncertainties that they face. |
On behalf of the Board of Directors on 4 February 2016
Pascal Soriot
Director
Directors’ Responsibilities for, and Report on, Internal Control over Financial Reporting
The Directors are responsible for establishing and maintaining adequate internal control over financial reporting. AstraZeneca’s internal control over financial reporting is designed to provide reasonable assurance over the reliability of financial reporting and the preparation of consolidated Financial Statements in accordance with generally accepted accounting principles.
Due to its inherent limitations, internal control over financial reporting may not prevent or detect misstatements. Projections of any
evaluation of effectiveness to future periods are subject to the risks that controls may become inadequate because of changes in conditions or that the degree of compliance with the policies or procedures may deteriorate.
The Directors assessed the effectiveness of AstraZeneca’s internal control over financial reporting as at 31 December 2015 based on the criteria set forth by the Committee of Sponsoring Organizations of the Treadway Commission in Internal Control-Integrated Framework (2013). Based on this assessment,
the Directors believe that, as at 31 December 2015, the internal control over financial reporting is effective based on those criteria.
KPMG LLP, an independent registered public accounting firm, has audited the effectiveness of internal control over financial reporting as at 31 December 2015 and, as explained on page 136, has issued an unqualified report thereon.

| | |
| AstraZenecaAnnual Report and Form 20-F Information 2015 | | 135 |
Financial Statements
Auditor’s Reports on the Financial Statements
and on Internal Control over Financial Reporting
(Sarbanes-Oxley Act Section 404)
The report set out below is provided in compliance with International Standards on Auditing (UK and Ireland). KPMG LLP has also issued reports in accordance with standards of the Public Company Accounting Oversight Board in the US, which will be included in the Annual Report on Form 20-F to be filed with the US Securities and
Exchange Commission. Those reports are unqualified and include opinions on the Group Financial Statements and on the effectiveness of internal control over financial reporting as at 31 December 2015 (Sarbanes-Oxley Act Section 404). The Directors’ statement on internal control over financial reporting is set out on page 135.
KPMG LLP has also reported separately on the Company Financial Statements of AstraZeneca PLC and on the information in the Directors’ Remuneration Report that is described as having been audited. This audit report is set out on page 196.
Independent Auditor’s Report to the Members
of AstraZeneca PLC only
Opinions and conclusions arising from our audit
| 1. | Our opinion on the Group Financial Statements is unmodified |
We have audited the Group Financial Statements of AstraZeneca PLC for the year ended 31 December 2015 set out on pages 140 to 195. In our opinion the Group Financial Statements:
| > | give a true and fair view of the state of the Group’s affairs as at 31 December 2015 and of its profit for the year then ended; |
| > | have been properly prepared in accordance with International Financial Reporting Standards (IFRSs) as adopted by the European Union (EU); and |
| > | have been prepared in accordance with the requirements of the Companies Act 2006 and Article 4 of the IAS Regulation. |
| 2. | Separate opinion in relation to IFRSs as issued by the International Accounting Standards Board (IASB) |
As explained in the Group accounting policies section of the Group Financial Statements set out on pages 140 to 195, the Group, in addition to complying with its legal obligation to apply IFRSs as adopted by the EU, has also applied IFRSs as issued by the IASB.
In our opinion, the Group Financial Statements comply with IFRSs as issued by the IASB.
| 3. | Our assessment of risks of material misstatement |
We summarise below the risks of material misstatement that had the greatest effect on our audit, our key audit procedures to address those risks and our findings from those procedures in order that the Company’s members as a body may better understand the process by which we arrived at our audit opinion. Our findings are the result of procedures undertaken in the context of and solely for the purpose of our statutory audit opinion on the Group Financial Statements as
a whole and consequently are incidental to that opinion, and we do not express discrete opinions on separate elements of the Group Financial Statements.
Rebates, discounts, allowances and returns in the US ($3,307m)
Refer to page 101 (Audit Committee Report), page 145 (accounting policy) and page 77 (financial risk management).
The risk
Rebates, chargebacks and returns under contractual and regulatory requirements in the United States of America (‘US’), which are deducted in arriving at revenue, are complex and require significant judgement and estimation by management in establishing an appropriate accrual.
Our response
Our principal audit procedures included: testing the Group’s controls surrounding the deductions made to revenue for rebates, chargebacks and returns and key manual and systems-based controls in the order-to-cash transaction cycle. Our audit work involved testing key controls including reconciliations between sales systems and the general ledger and those over claims, credits and system accrual rates. We also assessed the accuracy of the calculation of the accrual, corroborated inputs and key assumptions, both to internal and independent sources including sales contracts with customers; performed an analysis of the accrual balance and deductions to sales year on year, corroborating movements compared with expectations and payment claims and considered the historical accuracy of the accrual. We also assessed the adequacy of the Group’s disclosure of its rebates, chargebacks and returns policy, the judgement involved and other related disclosures.
Our findings
In determining the appropriateness of the rebates, chargebacks and returns deductions in accordance with contractual and regulatory requirements, there is room for judgement and we found that within that, the Group’s judgement was balanced (2014: balanced). We found the assumptions used and the resulting estimates to be balanced (2014: balanced). We also found no errors in the year-end rebate accrual calculations.
We found the disclosures on rebates, chargebacks and returns to be proportionate.
Carrying value of intangible assets ($22,646m)
Refer to page 101 (Audit Committee Report), page 147 (accounting policy), page 158 (financial disclosures) and page 79 (financial risk management).
The risk
The Group has significant intangible assets arising from the acquisition of products both launched and in development. Recoverability of these assets is based on forecasting and discounting future cash flows, which are inherently highly judgemental. For products in development the main risk is achieving successful trial results and obtaining required clinical and regulatory approvals. For launched products, the key risk is the ability to successfully commercialise the individual product concerned.
Our response
In this area our principal audit procedures included testing the Group’s controls surrounding intangible asset impairments and evaluating the Group’s assumptions used in assessing the recoverability of intangible assets, in particular, revenue and cash flow projections and useful economic lives. We also performed sensitivity analysis over individual intangible asset models, where we considered there to be a higher risk of
| | |
| 136 | | AstraZenecaAnnual Report and Form 20-F Information 2015 |
impairment, to assess the level of sensitivity to key assumptions and focus our work in those areas. Our procedures for products in development included assessing the reasonableness of the Group’s assumptions regarding probability of obtaining regulatory approval through comparison to industry practice and consideration of trial readouts, regulatory announcements and the Group’s internal governance and approval process. We also interviewed a range of key Research, Development and Commercial personnel to corroborate these assumptions. For launched products we discussed key assumptions including the size of the therapeutic area market, the product’s projected share of this and expected pricing and associated costs. Our procedures also included challenging internally generated evidence by reviewing analyst commentaries, consensus forecasts and retrospective assessment of the accuracy of the Group’s projections. We also assessed the adequacy of related disclosures in the Group’s financial statements.
Our findings
We found the Group’s assumptions and the resulting estimates to be balanced (2014: balanced). We found that the disclosures proportionately describe the inherent degree of subjectivity in the estimates and the potential impact on future periods of revisions to these estimates.
Litigation and contingent liabilities (provisions of $357m)
Refer to page 101 (Audit Committee Report), page 147 (accounting policy), page 186 (financial disclosures) and page 80 (financial risk management).
The risk
In the normal course of business, litigation and contingent liabilities may arise from product-specific and general legal proceedings, from guarantees or from government investigations. The amounts involved are potentially material and the application of accounting standards to determine the amount, if any, to be provided as a liability, is inherently subjective.
Our response
Having made enquiries of Directors and in-house legal counsel to obtain their view on the status of significant legal matters, our principal audit procedures included: testing the Group’s controls surrounding litigation and contingent liabilities, obtaining formal confirmations from the Group’s external counsel for all significant legal cases and discussions with external counsel where necessary. In addition we used our own forensic and compliance specialists to assess the Group’s compliance logs and reports to identify actual and potential non-compliance with laws and regulations, both those specific to the Group’s business and those relating to the conduct of business generally. We then analysed correspondence with regulators, considered legal expenses incurred during
the year, monitored external sources and considered assessments made of the probability of defending any litigation and the reliability of estimating any obligation. We also assessed whether the Group’s disclosures detailing significant legal proceedings adequately disclose the potential liabilities of the Group.
Our findings
Whilst the outcome of these litigation matters is inherently uncertain in each case, we found that the Group applied balanced judgements (2014: balanced), on a case by case basis, in assessing whether or not a provision should be recognised. We found that the assumptions used and the resulting liability recorded to be balanced (2014: balanced). We found that the Group gives extensive disclosure on the potential liability in excess of that recognised in the Financial Statements and the significant but unquantifiable contingent liability in respect of these litigation matters.
Tax provisioning ($1,734m)
Refer to page 101 (Audit Committee Report), page 146 (accounting policy), page 192 (financial disclosures) and page 81 (financial risk management).
The risk
Due to the Group operating in a number of different tax jurisdictions and the complexities of transfer pricing and other international tax legislation, accruals for tax contingencies require the Directors to make judgements and estimates in relation to tax issues and exposures.
Our response
In this area our principal audit procedures included: testing the Group’s controls surrounding tax provisioning, assessment of correspondence with the relevant tax authorities and the use of our own local and international tax specialists to analyse and challenge the assumptions used by management to determine tax provisions, based on our knowledge and experiences of the application of the relevant legislation by authorities and courts. We also assessed the adequacy of the Group’s disclosures in respect of tax and uncertain tax positions.
Our findings
We found the Group’s estimate of the amounts to be recognised as tax liabilities to be conservative (2014: conservative) and that the disclosures provide a proportionate description of the current status of uncertain tax positions.
Post-retirement benefits ($1,974m)
Refer to page 101 (Audit Committee Report), page 145 (accounting policy), page 166 (financial disclosures) and page 80 (financial risk management).
The risk
Significant estimates are made in valuing the Group’s post-retirement defined benefit plans. Small changes in assumptions and estimates
used to value the Group’s net pension deficit could have a significant effect on the results and financial position of the Group.
Our response
Our principal audit procedures included the testing of the Group’s controls surrounding the post-retirement defined benefit plans valuations and the challenge of key assumptions, being the discount rate, inflation rate and mortality/ life expectancy, which are included in the valuation calculations of the Group’s retirement benefit obligations in countries with significant defined benefit pension plans, with the support of our own actuarial specialists. This involved a comparison of these key assumptions used against our own internal benchmarks and externally derived data. We obtained and assessed third party assurance reports on controls over the valuation of pension assets held by key custodians and compared asset values to third party confirmations. Additionally, we assessed the adequacy of the Group’s disclosures in respect of post-retirement benefits.
Our findings
Overall, we found the key assumptions used in, and the resulting estimate of, the valuation of retirement benefit obligations within the Group to be mildly optimistic (2014: balanced). The third party assurance reports did not identify significant deviations in the operation of controls over the valuation of assets which caused us to change the scope or extent of our procedures and we found no errors in our comparison of asset values to third party confirmations. We found the disclosures in respect of post-retirement benefits to be proportionate.
Overall findings
In reaching our audit opinion on the Group Financial Statements we took into account the findings that we describe above and those for other, lower risk areas. Overall the findings from across the whole audit are that, although the Group Financial Statements use estimates that are mainly balanced, there is one conservative estimate and one mildly optimistic estimate. However, compared with materiality and considering the qualitative aspects of the Group Financial Statements as a whole, our opinion on the Group Financial Statements is unmodified.
| 4. | Our application of materiality and an overview of the scope of our audit |
The materiality for the Group Financial Statements as a whole was set at $140m (2014: $94m), determined with reference to a benchmark of Group profit before taxation, normalised to exclude this year’s asset impairments and fair value movement on contingent consideration as disclosed in Notes 9 and 18, which are specifically audited, of which it represents 5.0% (2014: 5.0%).
| | |
| AstraZenecaAnnual Report and Form 20-F Information 2015 | | 137 |
Financial Statements
We report to the Audit Committee any corrected or uncorrected identified misstatements exceeding $7.0m (0.25% of normalised Group profit before taxation), in addition to other identified misstatements that warranted reporting on qualitative grounds.
The Group operates a significant number of trading entities, each of which is determined to be a reporting component, located in 65 countries around the globe. The Operating Segment disclosures in Note 6 set out the individual significance of each geographical region.
We performed audits for group reporting purposes at nine components and specified risk-focused audit procedures at two standalone components as well as at 33 components serviced by the Group’s shared service centres. The latter 35 components were not individually financially significant enough to require an audit for group reporting purposes, but were included in the scope of our audit in order to provide further coverage over relevant account balances.
The Group operates four principal shared service centres (both in-house and outsourced) in the UK, Malaysia, Romania and India, which process a substantial proportion of the Group’s transactions. The outputs from the shared service centres are included in the financial information of the reporting components they service and therefore they are not separate reporting components. Each of the service centres is subject to specified risk-focused audit procedures, predominantly the testing of transaction processing and review controls. Additional procedures are performed by component audit teams at certain reporting components to address the audit risks not covered by the work performed over the shared service centres. These procedures are designed to address the risk of material misstatement identified through our group risk assessment processes.
This resulted in the coverage shown in the neighbouring charts. For the remaining components, we performed analysis at the Group level to re-examine our assessment that there were no significant risks of material misstatement within them.
The Group audit team instructed component and shared service centre auditors as to the significant areas to be covered, including the relevant risks detailed above and the information to be reported back. The Group audit team approved the component materiality levels, which ranged from $4m to $100m, having regard to the mix of size and risk profile of the Group across the components.
Materiality for the Group Financial Statements

The work on all components in scope of our work, other than on the Parent Company, was performed by component and shared service centre auditors. The audit of the Parent Company and consolidation was performed by the Group audit team.
The Group audit team visited five component locations, during the year, in the UK, Sweden, Japan, France and Germany to discuss and challenge key risks and audit strategy. Video or telephone conference meetings were also held with all group reporting component auditors throughout the audit and the majority of the other component and shared service centre auditors that were not physically visited. At these visits and meetings, the audit approach, findings and observations reported to the Group audit team were discussed in more detail, and any further work required by the Group audit team was then performed by the component auditor.
| 5. | Our opinion on the other matter prescribed by the Companies Act 2006 is unmodified |
In our opinion the information given in the Strategic Report and the Directors’ Report for the financial year for which the Financial Statements are prepared is consistent with the Group Financial Statements.
| 6. | We have nothing to report on the disclosures of principal risks |
Based on the knowledge we acquired during our audit, we have nothing material to add or draw attention to in relation to:
| > | the Directors’ statement of Risk overview from page 21, concerning the principal risks, their management, and, based on that, the Directors’ assessment and expectations of the Group’s continuing in operation over the three years to 31 December 2018; or |
| > | the disclosures in the Group Accounting Policies concerning the use of the going concern basis of accounting. |
Scoping and coverage

| | |
| 138 | | AstraZenecaAnnual Report and Form 20-F Information 2015 |
| 7. | We have nothing to report in respect of the matters on which we are required to report by exception |
Under ISAs (UK and Ireland) we are required to report to you if, based on the knowledge we acquired during our audit, we have identified other information in this Annual Report that contains a material inconsistency with either that knowledge or the Financial Statements, a material misstatement of fact, or that is otherwise misleading.
In particular, we are required to report to you if:
| > | we have identified material inconsistencies between the knowledge we acquired during our audit and the Directors’ statement that they consider that the annual report and Financial Statements taken as a whole is fair, balanced and understandable and provides the information necessary for shareholders to assess the Group’s position and performance, business model and strategy; or |
| > | the Audit Committee Report does not appropriately address matters communicated by us to the Audit Committee. |
Under the Companies Act 2006 we are required to report to you if, in our opinion:
| > | certain disclosures of Directors’ remuneration specified by law are not made; or |
| > | we have not received all the information and explanations we require for our audit. |
Under the Listing Rules we are required to review:
| > | the Directors’ statements, set out on pages 96 and 21, in relation to going concern and longer-term viability respectively; and |
| > | the part of the Corporate Governance Report on pages 82 to 97 relating to the Group’s compliance with the eleven provisions of the 2014 UK Corporate Governance Code specified for our review. |
We have nothing to report in respect of the above responsibilities.
| 8. | Other matter – we have reported separately on the Parent Company Financial Statements |
We have reported separately on the Parent Company Financial Statements of AstraZeneca PLC for the year ended 31 December 2015 and on the information in the Directors’ Remuneration Report that is described as having been audited.
Scope and responsibilities
As explained more fully in the Directors’ Responsibilities Statement set out on page 135, the Directors are responsible for the preparation of the Financial Statements and for being satisfied that they give a true and fair view. A description of the scope of an audit of financial statements is provided on the Financial Reporting Council’s website at www.frc.org. uk/auditscopeukprivate. This report is made solely to the Company’s members as a body and is subject to important explanations and disclaimers regarding our responsibilities, published on our website at www.kpmg.com/ uk/auditscopeukco2014b, which are incorporated into this report as if set out in full and should be read to provide an understanding of the purpose of this report, the work we have undertaken and the basis of our opinions.
Antony Cates (Senior Statutory Auditor)
for and on behalf of KPMG LLP,
Statutory Auditor
Chartered Accountants
15 Canada Square
London
E14 5GL
4 February 2016
| | |
| AstraZenecaAnnual Report and Form 20-F Information 2015 | | 139 |
Financial Statements
Consolidated Statement of Comprehensive Income
for the year ended 31 December
| | | | | | | | | | | | | | | | |
| | | Notes | | | 2015 $m | | | 2014
Restated*
$m | | | 2013
Restated*
$m | |
| Product Sales | | | 1 | | | | 23,641 | | | | 26,095 | | | | 25,711 | |
| Externalisation Revenue | | | 1 | | | | 1,067 | | | | 452 | | | | 95 | |
| Total Revenue | | | | | | | 24,708 | | | | 26,547 | | | | 25,806 | |
| Cost of sales | | | | | | | (4,646 | ) | | | (5,842 | ) | | | (5,261 | ) |
| Gross profit | | | | | | | 20,062 | | | | 20,705 | | | | 20,545 | |
| Distribution costs | | | | | | | (339 | ) | | | (324 | ) | | | (306 | ) |
| Research and development expense | | | 2 | | | | (5,997 | ) | | | (5,579 | ) | | | (4,821 | ) |
| Selling, general and administrative costs | | | 2 | | | | (11,112 | ) | | | (13,000 | ) | | | (12,206 | ) |
| Other operating income and expense | | | 2 | | | | 1,500 | | | | 335 | | | | 500 | |
| Operating profit | | | | | | | 4,114 | | | | 2,137 | | | | 3,712 | |
| Finance income | | | 3 | | | | 46 | | | | 78 | | | | 50 | |
| Finance expense | | | 3 | | | | (1,075 | ) | | | (963 | ) | | | (495 | ) |
| Share of after tax losses in joint ventures | | | 10 | | | | (16 | ) | | | (6 | ) | | | – | |
| Profit before tax | | | | | | | 3,069 | | | | 1,246 | | | | 3,267 | |
| Taxation | | | 4 | | | | (243 | ) | | | (11 | ) | | | (696 | ) |
| Profit for the period | | | | | | | 2,826 | | | | 1,235 | | | | 2,571 | |
| | | | |
| Other comprehensive income: | | | | | | | | | | | | | | | | |
| Items that will not be reclassified to profit or loss: | | | | | | | | | | | | | | | | |
| | | | |
Remeasurement of the defined benefit pension liability | | | 20 | | | | 652 | | | | (766 | ) | | | 8 | |
Tax on items that will not be reclassified to profit or loss | | | 4 | | | | (199 | ) | | | 216 | | | | (82 | ) |
| | | | | | | | 453 | | | | (550 | ) | | | (74 | ) |
| Items that may be reclassified subsequently to profit or loss: | | | | | | | | | | | | | | | | |
| | | | |
Foreign exchange arising on consolidation | | | 21 | | | | (528 | ) | | | (823 | ) | | | (166 | ) |
Foreign exchange arising on designating borrowings in net investment hedges | | | 21 | | | | (333 | ) | | | (529 | ) | | | (58 | ) |
Fair value movements on derivatives designated in net investment hedges | | | 21 | | | | 14 | | | | 100 | | | | 111 | |
Amortisation of loss on cash flow hedge | | | | | | | 1 | | | | 1 | | | | 1 | |
Net available for sale (losses)/gains taken to equity | | | | | | | (32 | ) | | | 245 | | | | 69 | |
Tax on items that may be reclassified subsequently to profit or loss | | | 4 | | | | 87 | | | | 50 | | | | 4 | |
| | | | | | | | (791 | ) | | | (956 | ) | | | (39 | ) |
| Other comprehensive income for the period, net of tax | | | | | | | (338 | ) | | | (1,506 | ) | | | (113 | ) |
| Total comprehensive income for the period | | | | | | | 2,488 | | | | (271 | ) | | | 2,458 | |
| | | | |
| Profit attributable to: | | | | | | | | | | | | | | | | |
| Owners of the Parent | | | | | | | 2,825 | | | | 1,233 | | | | 2,556 | |
| Non-controlling interests | | | | | | | 1 | | | | 2 | | | | 15 | |
| | | | | | | | | | | | | | | | | |
| | | | |
| Total comprehensive income attributable to: | | | | | | | | | | | | | | | | |
| Owners of the Parent | | | | | | | 2,488 | | | | (266 | ) | | | 2,470 | |
| Non-controlling interests | | | | | | | – | | | | (5 | ) | | | (12 | ) |
| | | | | | | | | | | | | | | | | |
| Basic earnings per $0.25 Ordinary Share | | | 5 | | | | $2.23 | | | | $0.98 | | | | $2.04 | |
| Diluted earnings per $0.25 Ordinary Share | | | 5 | | | | $2.23 | | | | $0.98 | | | | $2.04 | |
| Weighted average number of Ordinary Shares in issue (millions) | | | 5 | | | | 1,264 | | | | 1,262 | | | | 1,252 | |
| Diluted weighted average number of Ordinary Shares in issue (millions) | | | 5 | | | | 1,265 | | | | 1,264 | | | | 1,254 | |
| | | | | | | | | | | | | | | | | |
| Dividends declared and paid in the period | | | 23 | | | | 3,537 | | | | 3,532 | | | | 3,499 | |
| * | 2013 and 2014 comparatives have been restated to reflect the reclassification of Externalisation Revenue from other operating income and expense as detailed in Group Accounting Policies. |
All activities were in respect of continuing operations.
$m means millions of US dollars.
| | |
| 140 | | AstraZenecaAnnual Report and Form 20-F Information 2015 |
Consolidated Statement of Financial Position
at 31 December
| | | | | | | | | | | | | | | | |
| | | Notes | | | 2015 $m | | | 2014 $m | | | 2013 $m | |
| Assets | | | | | | | | | | | | | | | | |
| | | | |
| Non-current assets | | | | | | | | | | | | | | | | |
| Property, plant and equipment | | | 7 | | | | 6,413 | | | | 6,010 | | | | 5,818 | |
| Goodwill | | | 8 | | | | 11,868 | | | | 11,550 | | | | 9,981 | |
| Intangible assets | | | 9 | | | | 22,646 | | | | 20,981 | | | | 16,047 | |
| Investments in joint ventures | | | 10 | | | | 85 | | | | 59 | | | | – | |
| Other investments | | | 11 | | | | 458 | | | | 502 | | | | 281 | |
| Derivative financial instruments | | | 12 | | | | 446 | | | | 465 | | | | 365 | |
| Other receivables | | | 13 | | | | 907 | | | | 1,112 | | | | 1,867 | |
| Deferred tax assets | | | 4 | | | | 1,294 | | | | 1,219 | | | | 1,205 | |
| | | | | | | | 44,117 | | | | 41,898 | | | | 35,564 | |
| | | | |
| Current assets | | | | | | | | | | | | | | | | |
| Inventories | | | 14 | | | | 2,143 | | | | 1,960 | | | | 1,909 | |
| Trade and other receivables | | | 15 | | | | 6,622 | | | | 7,232 | | | | 7,879 | |
| Other investments | | | 11 | | | | 613 | | | | 795 | | | | 796 | |
| Derivative financial instruments | | | 12 | | | | 2 | | | | 21 | | | | 40 | |
| Income tax receivable | | | | | | | 387 | | | | 329 | | | | 494 | |
| Cash and cash equivalents | | | 16 | | | | 6,240 | | | | 6,360 | | | | 9,217 | |
| | | | | | | | 16,007 | | | | 16,697 | | | | 20,335 | |
| Total assets | | | | | | | 60,124 | | | | 58,595 | | | | 55,899 | |
| Liabilities | | | | | | | | | | | | | | | | |
| | | | |
| Current liabilities | | | | | | | | | | | | | | | | |
| Interest-bearing loans and borrowings | | | 17 | | | | (916 | ) | | | (2,446 | ) | | | (1,788 | ) |
| Trade and other payables | | | 18 | | | | (11,663 | ) | | | (11,886 | ) | | | (10,362 | ) |
| Derivative financial instruments | | | 12 | | | | (9 | ) | | | (21 | ) | | | (2 | ) |
| Provisions | | | 19 | | | | (798 | ) | | | (623 | ) | | | (823 | ) |
| Income tax payable | | | | | | | (1,483 | ) | | | (2,354 | ) | | | (3,076 | ) |
| | | | | | | | (14,869 | ) | | | (17,330 | ) | | | (16,051 | ) |
| | | | |
| Non-current liabilities | | | | | | | | | | | | | | | | |
| Interest-bearing loans and borrowings | | | 17 | | | | (14,137 | ) | | | (8,397 | ) | | | (8,588 | ) |
| Derivative financial instruments | | | 12 | | | | (1 | ) | | | – | | | | (1 | ) |
| Deferred tax liabilities | | | 4 | | | | (2,733 | ) | | | (1,796 | ) | | | (2,827 | ) |
| Retirement benefit obligations | | | 20 | | | | (1,974 | ) | | | (2,951 | ) | | | (2,261 | ) |
| Provisions | | | 19 | | | | (444 | ) | | | (484 | ) | | | (566 | ) |
| Other payables | | | 18 | | | | (7,457 | ) | | | (7,991 | ) | | | (2,352 | ) |
| | | | | | | | (26,746 | ) | | | (21,619 | ) | | | (16,595 | ) |
| Total liabilities | | | | | | | (41,615 | ) | | | (38,949 | ) | | | (32,646 | ) |
| Net assets | | | | | | | 18,509 | | | | 19,646 | | | | 23,253 | |
| Equity | | | | | | | | | | | | | | | | |
| | | | |
| Capital and reserves attributable to equity holders of the Company | | | | | | | | | | | | | | | | |
| Share capital | | | 22 | | | | 316 | | | | 316 | | | | 315 | |
| Share premium account | | | | | | | 4,304 | | | | 4,261 | | | | 3,983 | |
| Capital redemption reserve | | | | | | | 153 | | | | 153 | | | | 153 | |
| Merger reserve | | | | | | | 448 | | | | 448 | | | | 433 | |
| Other reserves | | | 21 | | | | 1,435 | | | | 1,420 | | | | 1,380 | |
| Retained earnings | | | 21 | | | | 11,834 | | | | 13,029 | | | | 16,960 | |
| | | | | | | | 18,490 | | | | 19,627 | | | | 23,224 | |
| Non-controlling interests | | | | | | | 19 | | | | 19 | | | | 29 | |
| Total equity | | | | | | | 18,509 | | | | 19,646 | | | | 23,253 | |
The Financial Statements from page 140 to 195 were approved by the Board on 4 February 2016 and were signed on its behalf by
| | |
| Pascal Soriot | | Marc Dunoyer |
| Director | | Director |
| | |
| AstraZenecaAnnual Report and Form 20-F Information 2015 | | 141 |
Financial Statements
Consolidated Statement of Changes in Equity
for the year ended 31 December
| | | | | | | | | | | | | | | | | | | | | | | | | | | | | | | | | | | | |
| | | Share
capital
$m | | | Share premium account $m | | | Capital redemption reserve $m | | | Merger reserve
$m | | | Other reserves $m | | | Retained earnings $m | | | Total attributable to owners $m | | | Non- controlling interests $m | | | Total equity $m | |
| At 1 January 2013 | | | 312 | | | | 3,504 | | | | 153 | | | | 433 | | | | 1,374 | | | | 17,955 | | | | 23,731 | | | | 215 | | | | 23,946 | |
| Profit for the period | | | – | | | | – | | | | – | | | | – | | | | – | | | | 2,556 | | | | 2,556 | | | | 15 | | | | 2,571 | |
| Other comprehensive income | | | – | | | | – | | | | – | | | | – | | | | – | | | | (86 | ) | | | (86 | ) | | | (27 | ) | | | (113 | ) |
| Transfer to other reserves1 | | | – | | | | – | | | | – | | | | – | | | | 6 | | | | (6 | ) | | | – | | | | – | | | | – | |
| | | | | | | | | |
| Transactions with owners | | | | | | | | | | | | | | | | | | | | | | | | | | | | | | | | | | | | |
| Dividends | | | – | | | | – | | | | – | | | | – | | | | – | | | | (3,499 | ) | | | (3,499 | ) | | | – | | | | (3,499 | ) |
| Issue of Ordinary Shares | | | 3 | | | | 479 | | | | – | | | | – | | | | – | | | | – | | | | 482 | | | | – | | | | 482 | |
| Share-based payments | | | – | | | | – | | | | – | | | | – | | | | – | | | | (57 | ) | | | (57 | ) | | | – | | | | (57 | ) |
| Transfer from non-controlling interests to payables | | | – | | | | – | | | | – | | | | – | | | | – | | | | – | | | | – | | | | (6 | ) | | | (6 | ) |
| Dividend paid by subsidiary to non-controlling interests | | | – | | | | – | | | | – | | | | – | | | | – | | | | – | | | | – | | | | (3 | ) | | | (3 | ) |
| Net acquisition of non-controlling interests2 | | | – | | | | – | | | | – | | | | – | | | | – | | | | 97 | | | | 97 | | | | (165 | ) | | | (68 | ) |
| Net movement | | | 3 | | | | 479 | | | | – | | | | – | | | | 6 | | | | (995 | ) | | | (507 | ) | | | (186 | ) | | | (693 | ) |
| At 31 December 2013 | | | 315 | | | | 3,983 | | | | 153 | | | | 433 | | | | 1,380 | | | | 16,960 | | | | 23,224 | | | | 29 | | | | 23,253 | |
| Profit for the period | | | – | | | | – | | | | – | | | | – | | | | – | | | | 1,233 | | | | 1,233 | | | | 2 | | | | 1,235 | |
| Other comprehensive income | | | – | | | | – | | | | – | | | | – | | | | – | | | | (1,499 | ) | | | (1,499 | ) | | | (7 | ) | | | (1,506 | ) |
| Transfer to other reserves1 | | | – | | | | – | | | | – | | | | – | | | | 40 | | | | (40 | ) | | | – | | | | – | | | | – | |
| | | | | | | | | |
| Transactions with owners | | | | | | | | | | | | | | | | | | | | | | | | | | | | | | | | | | | | |
| Dividends | | | – | | | | – | | | | – | | | | – | | | | – | | | | (3,532 | ) | | | (3,532 | ) | | | – | | | | (3,532 | ) |
| Issue of Ordinary Shares | | | 1 | | | | 278 | | | | – | | | | – | | | | – | | | | – | | | | 279 | | | | – | | | | 279 | |
| Share-based payments | | | – | | | | – | | | | – | | | | – | | | | – | | | | (93 | ) | | | (93 | ) | | | – | | | | (93 | ) |
| Transfer from non-controlling interests to payables | | | – | | | | – | | | | – | | | | – | | | | – | | | | – | | | | – | | | | (5 | ) | | | (5 | ) |
| True-up to Astra AB non-controlling interest buy out | | | – | | | | – | | | | – | | | | 15 | | | | – | | | | – | | | | 15 | | | | – | | | | 15 | |
| Net movement | | | 1 | | | | 278 | | | | – | | | | 15 | | | | 40 | | | | (3,931 | ) | | | (3,597 | ) | | | (10 | ) | | | (3,607 | ) |
| At 31 December 2014 | | | 316 | | | | 4,261 | | | | 153 | | | | 448 | | | | 1,420 | | | | 13,029 | | | | 19,627 | | | | 19 | | | | 19,646 | |
| Profit for the period | | | – | | | | – | | | | – | | | | – | | | | – | | | | 2,825 | | | | 2,825 | | | | 1 | | | | 2,826 | |
| Other comprehensive income | | | – | | | | – | | | | – | | | | – | | | | – | | | | (337 | ) | | | (337 | ) | | | (1 | ) | | | (338 | ) |
| Transfer to other reserves1 | | | – | | | | – | | | | – | | | | – | | | | 15 | | | | (15 | ) | | | – | | | | – | | | | – | |
| | | | | | | | | |
| Transactions with owners | | | | | | | | | | | | | | | | | | | | | | | | | | | | | | | | | | | | |
| Dividends | | | – | | | | – | | | | – | | | | – | | | | – | | | | (3,537 | ) | | | (3,537 | ) | | | – | | | | (3,537 | ) |
| Issue of Ordinary Shares | | | – | | | | 43 | | | | – | | | | – | | | | – | | | | – | | | | 43 | | | | – | | | | 43 | |
| Share-based payments | | | – | | | | – | | | | – | | | | – | | | | – | | | | (131 | ) | | | (131 | ) | | | – | | | | (131 | ) |
| Net movement | | | – | | | | 43 | | | | – | | | | – | | | | 15 | | | | (1,195 | ) | | | (1,137 | ) | | | – | | | | (1,137 | ) |
| At 31 December 2015 | | | 316 | | | | 4,304 | | | | 153 | | | | 448 | | | | 1,435 | | | | 11,834 | | | | 18,490 | | | | 19 | | | | 18,509 | |
| 1 | Amounts charged or credited to other reserves relate to exchange adjustments arising on goodwill. |
| 2 | Net acquisition of non-controlling interests in 2013 includes acquisitions with cash payments of $110m due in 2014 and disposals with cash of $42m received in 2013. |
| | |
| 142 | | AstraZenecaAnnual Report and Form 20-F Information 2015 |
Consolidated Statement of Cash Flows
for the year ended 31 December
| | | | | | | | | | | | | | | | |
| | | Notes | | | 2015 $m | | | 2014 $m | | | 2013 $m | |
| Cash flows from operating activities | | | | | | | | | | | | | | | | |
| Profit before tax | | | | | | | 3,069 | | | | 1,246 | | | | 3,267 | |
| Finance income and expense | | | 3 | | | | 1,029 | | | | 885 | | | | 445 | |
| Share of after tax losses of joint ventures | | | 10 | | | | 16 | | | | 6 | | | | – | |
| Depreciation, amortisation and impairment | | | | | | | 2,852 | | | | 3,282 | | | | 4,583 | |
| Decrease/(increase) in trade and other receivables | | | | | | | 152 | | | | 311 | | | | (383 | ) |
| (Increase)/decrease in inventories | | | | | | | (315 | ) | | | 108 | | | | 135 | |
| Increase in trade and other payables and provisions | | | | | | | 114 | | | | 2,089 | | | | 414 | |
| Gains on disposal of intangible assets | | | 2 | | | | (961 | ) | | | – | | | | – | |
| Non-cash and other movements | | | | | | | (782 | ) | | | 865 | | | | 258 | |
| Cash generated from operations | | | | | | | 5,174 | | | | 8,792 | | | | 8,719 | |
| Interest paid | | | | | | | (496 | ) | | | (533 | ) | | | (475 | ) |
| Tax paid | | | | | | | (1,354 | ) | | | (1,201 | ) | | | (844 | ) |
| Net cash inflow from operating activities | | | | | | | 3,324 | | | | 7,058 | | | | 7,400 | |
| | | | |
| Cash flows from investing activities | | | | | | | | | | | | | | | | |
| Upfront payments on business acquisitions | | | 24 | | | | (2,446 | ) | | | (3,804 | ) | | | (1,158 | ) |
| Payment of contingent consideration on business acquisitions | | | 18 | | | | (579 | ) | | | (657 | ) | | | – | |
| Purchase of property, plant and equipment | | | | | | | (1,328 | ) | | | (1,012 | ) | | | (742 | ) |
| Disposal of property, plant and equipment | | | | | | | 47 | | | | 158 | | | | 69 | |
| Purchase of intangible assets | | | | | | | (1,460 | ) | | | (1,740 | ) | | | (1,316 | ) |
| Disposal of intangible assets | | | | | | | 1,130 | | | | – | | | | 35 | |
| Purchase of non-current asset investments | | | | | | | (57 | ) | | | (130 | ) | | | (91 | ) |
| Disposal of non-current asset investments | | | | | | | 93 | | | | 59 | | | | 38 | |
| Movement in short-term investments and fixed deposits | | | | | | | 283 | | | | 34 | | | | 130 | |
| Payments to joint ventures | | | 10 | | | | (45 | ) | | | (70 | ) | | | – | |
| Interest received | | | | | | | 123 | | | | 140 | | | | 114 | |
| Payments made by subsidiaries to non-controlling interests | | | | | | | – | | | | (10 | ) | | | (10 | ) |
| Payments received by subsidiaries from non-controlling interests | | | | | | | – | | | | – | | | | 42 | |
| Net cash outflow from investing activities | | | | | | | (4,239 | ) | | | (7,032 | ) | | | (2,889 | ) |
| Net cash (outflow)/inflow before financing activities | | | | | | | (915 | ) | | | 26 | | | | 4,511 | |
| | | | |
| Cash flows from financing activities | | | | | | | | | | | | | | | | |
| Proceeds from issue of share capital | | | | | | | 43 | | | | 279 | | | | 482 | |
| Repayment of obligations under finance leases | | | | | | | (42 | ) | | | (36 | ) | | | (27 | ) |
| Issue of loans | | | | | | | 5,928 | | | | 919 | | | | – | |
| Repayment of loans | | | | | | | (884 | ) | | | (750 | ) | | | – | |
| Dividends paid | | | | | | | (3,486 | ) | | | (3,521 | ) | | | (3,461 | ) |
| Hedge contracts relating to dividend payments | | | | | | | (51 | ) | | | (14 | ) | | | (36 | ) |
| Payments to acquire non-controlling interest | | | | | | | – | | | | (102 | ) | | | – | |
| Movement in short-term borrowings | | | | | | | (630 | ) | | | 520 | | | | (5 | ) |
| Net cash inflow/(outflow) from financing activities | | | | | | | 878 | | | | (2,705 | ) | | | (3,047 | ) |
| Net (decrease)/increase in cash and cash equivalents in the period | | | | | | | (37 | ) | | | (2,679 | ) | | | 1,464 | |
| Cash and cash equivalents at the beginning of the period | | | | | | | 6,164 | | | | 8,995 | | | | 7,596 | |
| Exchange rate effects | | | | | | | (76 | ) | | | (152 | ) | | | (65 | ) |
| Cash and cash equivalents at the end of the period | | | 16 | | | | 6,051 | | | | 6,164 | | | | 8,995 | |
| | |
| AstraZenecaAnnual Report and Form 20-F Information 2015 | | 143 |
Financial Statements
Group Accounting Policies
Basis of accounting and preparation of financial information
The Consolidated Financial Statements have been prepared under the historical cost convention, modified to include revaluation to fair value of certain financial instruments as described below, in accordance with the Companies Act 2006 and International Financial Reporting Standards (IFRSs) as adopted by the EU (adopted IFRSs) in response to the IAS regulation (EC 1606/2002). The Consolidated Financial Statements also comply fully with IFRSs as issued by the International Accounting Standards Board (IASB).
The Group updated its revenue accounting policy with effect from 1 January 2015. Historically, reported revenue reflected only Product Sales, with Externalisation Revenue forming part of other operating income presented below gross profit. From 1 January 2015, Externalisation Revenue, alongside Product Sales, is included in Total Revenue. Externalisation Revenue includes development, commercialisation and collaboration revenue, such as royalties and milestone receipts, together with income from services or repeatable licences. Income is recorded as Externalisation Revenue when the Group has a significant ongoing interest in the product and/or it is repeatable business and there is no derecognition of an intangible asset. Disposals of assets and businesses, where the Group does not retain an interest, will continue to be recorded in other operating income. The updated revenue accounting policy results in a presentational change to the Statement of Comprehensive Income only, and has no impact on the Group’s net results or net assets. The prior periods included in the Group’s Consolidated Statement of Comprehensive Income have been restated accordingly, resulting in $452m of income being reclassified from other operating income to Externalisation Revenue for 2014 and $95m of income being reclassified from other operating income to Externalisation Revenue in 2013.
During the year, the Group has adopted the amendments to IAS 19 ‘Employee Benefits’, issued by the IASB in November 2013 and effective for periods beginning on or after 1 July 2014. The adoption has not had a significant impact on the Group’s profit for the period, net assets or cash flows.
The Company has elected to prepare the Company Financial Statements in accordance with UK Accounting Standards, including FRS 101 ‘Reduced Disclosure Framework’. These are presented on pages 197 to 201 and the Accounting Policies in respect of Company information are set out on page 199.
The Consolidated Financial Statements are presented in US dollars, which is the Company’s functional currency.
In preparing their individual Financial Statements, the accounting policies of some overseas subsidiaries do not conform with IASB issued IFRSs. Therefore, where appropriate, adjustments are made in order to present the Consolidated Financial Statements on a consistent basis.
Basis for preparation of Financial
Statements on a going concern basis
Information on the business environment AstraZeneca operates in, including the factors underpinning the pharmaceutical industry’s future growth prospects, is included in the Strategic Report. Details of the product portfolio of the Group (including patent expiry dates for key marketed products), our approach to product development and our development pipeline are covered in detail with additional information by Therapy Area in the Strategic Report and Directors’ Report.
The financial position of the Group, its cash flows, liquidity position and borrowing facilities are described in the Financial Review from page 62. In addition, Note 25 to the Financial Statements includes the Group’s objectives, policies and processes for managing its capital, its financial risk management objectives, details of its financial instruments and hedging activities and its exposures to credit, market and liquidity risk. Further details of the Group’s cash balances and borrowings are included in Notes 16 and 17 to the Financial Statements.
The Group has considerable financial resources available. As at 31 December 2015, the Group has $8.3bn in financial resources (cash balances of $6.2bn and undrawn committed bank facilities of $3.0bn that are available until April 2020, with only $0.9bn of debt due within one year). Although no liability was recognised at 31 December 2015, the Group had entered into an agreement to invest in a majority equity stake in Acerta with an upfront payment of $2.5bn which was paid on 2 February 2016 (see Note 30 to the Financial Statements). The Group’s revenues are largely derived from sales of products which are covered by patents which provide a relatively high level of resilience and predictability to cash inflows, although our revenue is expected to continue to be significantly impacted by the expiry of patents over the medium term. In addition, government price interventions in response to budgetary constraints are expected to continue to adversely affect revenues in many of our
mature markets. However, we anticipate new revenue streams from both recently launched medicines and products in development, and the Group has a wide diversity of customers and suppliers across different geographic areas. Consequently, the Directors believe that, overall, the Group is well placed to manage its business risks successfully.
After making enquiries, the Directors have a reasonable expectation that the Company and the Group have adequate resources to continue in operational existence for the foreseeable future. Accordingly, they continue to adopt the going concern basis in preparing the Annual Report and Financial Statements.
Estimates and judgements
The preparation of the Financial Statements in conformity with generally accepted accounting principles requires management to make estimates and judgements that affect the reported amounts of assets and liabilities at the date of the Financial Statements and the reported amounts of revenues and expenses during the reporting period. Actual results could differ from those estimates.
Judgements include matters such as the determination of operating segments while estimates focus on areas such as carrying values, estimated useful lives, potential obligations and contingent consideration.
AstraZeneca’s management considers the following to be the most important accounting policies in the context of the Group’s operations.
The accounting policy descriptions set out the areas where judgements and estimates need exercising, the most significant of which are revenue recognition, research and development (including impairment reviews of associated intangible assets), business combinations and goodwill, litigation and environmental liabilities, employee benefits and taxation.
Further information on estimates and critical judgements made in applying accounting policies, including details of significant methods and assumptions used, is detailed in the Financial Review from page 62 and is included in Notes 4, 8, 9, 20, 24 and 27 to the Financial Statements. Financial risk management policies are detailed in Note 25.
Revenue
Revenues comprise Product Sales and Externalisation Revenue.
Revenues exclude inter-company revenues and value-added taxes.
| | |
| 144 | | AstraZenecaAnnual Report and Form 20-F Information 2015 |
Product Sales
Product sales represent net invoice value less estimated rebates, returns and chargebacks. Sales are recognised when the significant risks and rewards of ownership have been transferred to a third party. In general, this is upon delivery of the products to wholesalers. In markets where returns are significant (currently only in the US), estimates of returns are accounted for at the point revenue is recognised. In markets where returns are not significant, they are recorded when returned.
For the US market, we estimate the quantity and value of goods which may ultimately be returned at the point of sale. Our returns accruals are based on actual experience over the preceding 12 months for established products together with market-related information such as estimated stock levels at wholesalers and competitor activity which we receive via third party information services. For newly launched products, we use rates based on our experience with similar products or a predetermined percentage.
When a product faces generic competition, particular attention is given to the possible levels of returns and, in cases where the circumstances are such that the level of returns (and, hence, revenue) cannot be measured reliably, revenues are only recognised when the right of return expires, which is generally on ultimate prescription of the product to patients.
Externalisation Revenue
Externalisation Revenue includes income from collaborative arrangements on the Group’s products where the Group retains a significant ongoing interest and there is no derecognition of an intangible asset. These may include development arrangements, commercialisation arrangements and collaborations.
Income may take the form of upfront access fees, milestones and/or sales royalties. Generally, upfront access fees are recognised upon delivery of the access. Where the Group provides ongoing services, revenue will be recognised over the duration of those services. Milestones and sales royalties are recognised when the amount can be reliably estimated.
Further detail on key judgements and estimates is included in the Financial Review from page 62.
Research and development
Research expenditure is recognised in profit in the year in which it is incurred.
Internal development expenditure is capitalised only if it meets the recognition criteria of IAS 38 ‘Intangible Assets’. Where regulatory and other uncertainties are such that the criteria are not met, the expenditure is recognised in profit and this is almost invariably the case prior to approval of the drug by the relevant regulatory authority. Where, however,
recognition criteria are met, intangible assets are capitalised and amortised on a straight-line basis over their useful economic lives from product launch. At 31 December 2015, no amounts have met recognition criteria.
Payments to in-licence products and compounds from third parties for new research and development projects (in process research and development), generally taking the form of upfront payments and milestones, are capitalised. Where payments made to third parties represent future research and development activities, an evaluation is made as to the nature of the payments. Such payments are expensed if they represent compensation for subcontracted research and development services not resulting in a transfer of intellectual property. By contrast, payments are capitalised if they represent compensation for the transfer of intellectual property developed at the risk of the third party. Since acquired products and compounds will only generate sales and cash inflows following launch, our policy is to minimise the period between final approval and launch if it is within AstraZeneca’s control to do so. Assets capitalised are amortised, on a straight-line basis, over their useful economic lives from product launch. Under this policy, it is not possible to determine precise economic lives for individual classes of intangible assets. However, lives do not exceed 25 years.
Intangible assets relating to products in development are subject to impairment testing annually. All intangible assets are tested for impairment when there are indications that the carrying value may not be recoverable. Any impairment losses are recognised immediately in profit. Intangible assets relating to products which fail during development (or for which development ceases for other reasons) are tested for impairment at the point of termination and are written down to their recoverable amount (which is usually zero).
If, subsequent to an impairment loss being recognised, development restarts or other facts and circumstances change indicating that the impairment is less or no longer exists, the value of the asset is re-estimated and its carrying value is increased to the recoverable amount, but not exceeding the original value, by recognising an impairment reversal in profit.
Business combinations and goodwill
On the acquisition of a business, fair values are attributed to the identifiable assets and liabilities and contingent liabilities unless the fair value cannot be measured reliably, in which case the value is subsumed into goodwill. Where the Group fully acquires, through a business combination, assets that were previously held in joint operations, the Group has elected not to uplift the book value of the existing interest in the asset held in the joint operation to fair value at the date full control is taken. Where fair values of acquired
contingent liabilities cannot be measured reliably, the assumed contingent liability is not recognised but is disclosed in the same manner as other contingent liabilities.
Future contingent elements of consideration, which may include development and launch milestones, revenue threshold milestones and revenue-based royalties, are fair valued at the date of acquisition using decision-tree analysis with key inputs including probability of success, consideration of potential delays and revenue projections based on the Group’s internal forecasts. Unsettled amounts of consideration are held at fair value within payables with changes in fair value recognised immediately in profit.
Goodwill is the difference between the fair value of the consideration and the fair value of net assets acquired.
Goodwill arising on acquisitions is capitalised and subject to an impairment review, both annually and when there is an indication that the carrying value may not be recoverable. Between 1 January 1998 and 31 December 2002, goodwill was amortised over its estimated useful life; such amortisation ceased on 31 December 2002.
The Group’s policy up to and including 1997 was to eliminate goodwill arising upon acquisitions against reserves. Under IFRS 1 ‘First-time Adoption of International Financial Reporting Standards’ and IFRS 3 ‘Business Combinations’, such goodwill will remain eliminated against reserves.
Joint arrangements
The Group has arrangements over which it has joint control and which qualify as joint operations or joint ventures under IFRS 11 ‘Joint Arrangements’. For joint operations, the Group recognises its share of revenue that it earns from the joint operations and its share of expenses incurred. The Group also recognises the assets associated with the joint operations that it controls and the liabilities it incurs under the joint arrangement. For joint ventures, the Group recognises its interest in the joint venture as an investment and uses the equity method of accounting.
Employee benefits
The Group accounts for pensions and other employee benefits (principally healthcare) under IAS 19 ‘Employee Benefits’ issued in 2011. In respect of defined benefit plans, obligations are measured at discounted present value while plan assets are measured at fair value. The operating and financing costs of such plans are recognised separately in profit; current service costs are spread systematically over the lives of employees and financing costs are recognised in full in the periods in which they arise. Remeasurements of the net defined pension liability, including actuarial gains and losses, are recognised immediately in other comprehensive income.
| | |
| AstraZenecaAnnual Report and Form 20-F Information 2015 | | 145 |
Financial Statements
Where the calculation results in a surplus to the Group, the recognised asset is limited to the present value of any available future refunds from the plan or reductions in future contributions to the plan. Payments to defined contribution plans are recognised in profit as they fall due.
Taxation
The current tax payable is based on taxable profit for the year. Taxable profit differs from reported profit because taxable profit excludes items that are either never taxable or tax deductible or items that are taxable or tax deductible in a different period. The Group’s current tax assets and liabilities are calculated using tax rates that have been enacted or substantively enacted by the reporting date.
Deferred tax is provided using the balance sheet liability method, providing for temporary differences between the carrying amounts of assets and liabilities for financial reporting purposes and the amounts used for taxation purposes. Deferred tax assets are recognised to the extent that it is probable that taxable profit will be available against which the asset can be utilised. This requires judgements to be made in respect of the availability of future taxable income.
No deferred tax asset or liability is recognised in respect of temporary differences associated with investments in subsidiaries and branches where the Group is able to control the timing of reversal of the temporary differences and it is probable that the temporary differences will not reverse in the foreseeable future.
The Group’s deferred tax assets and liabilities are calculated using tax rates that are expected to apply in the period when the liability is settled or the asset realised based on tax rates that have been enacted or substantively enacted by the reporting date.
Accruals for tax contingencies require management to make judgements and estimates of exposures in relation to tax audit issues. Tax benefits are not recognised unless the tax positions will probably be sustained. Once considered to be probable, management reviews each material tax benefit to assess whether a provision should be taken against full recognition of that benefit on the basis of potential settlement through negotiation and/ or litigation. Any liability to interest on tax liabilities is provided for in the tax charge. See Note 27 to the Financial Statements for further details.
Share-based payments
All plans are assessed and have been classified as equity settled. The grant date fair value of employee share plan awards is calculated using a modified version of the binomial model. In accordance with IFRS 2 ‘Share-based Payment’, the resulting cost is recognised in profit over the vesting period of the awards, being the period in which the services are
received. The value of the charge is adjusted to reflect expected and actual levels of awards vesting, except where the failure to vest is as a result of not meeting a market condition. Cancellations of equity instruments are treated as an acceleration of the vesting period and any outstanding charge is recognised in profit immediately.
Property, plant and equipment
The Group’s policy is to write off the difference between the cost of each item of property, plant and equipment and its residual value over its estimated useful life on a straight-line basis. Assets under construction are not depreciated.
Reviews are made annually of the estimated remaining lives and residual values of individual productive assets, taking account of commercial and technological obsolescence as well as normal wear and tear. Under this policy it becomes impractical to calculate average asset lives exactly. However, the total lives range from approximately 10 to 50 years for buildings, and three to 15 years for plant and equipment. All items of property, plant and equipment are tested for impairment when there are indications that the carrying value may not be recoverable. Any impairment losses are recognised immediately in profit.
Borrowing costs
The Group has no borrowing costs with respect to the acquisition or construction of qualifying assets. All other borrowing costs are recognised in profit as incurred and in accordance with the effective interest rate method.
Leases
Leases are classified as finance leases if they transfer substantially all the risks and rewards incidental to ownership, otherwise they are classified as operating leases. Assets and liabilities arising on finance leases are initially recognised at fair value or, if lower, the present value of the minimum lease payments. The discount rate used in calculating the present value of the minimum lease payments is the interest rate implicit in the lease. Finance charges under finance leases are allocated to each reporting period so as to produce a constant periodic rate of interest on the remaining balance of the finance liability. Rentals under operating leases are charged to profit on a straight-line basis.
Subsidiaries
A subsidiary is an entity controlled, directly or indirectly, by AstraZeneca PLC. Control is regarded as the exposure or rights to the variable returns of the entity when combined with the power to affect those returns.
The financial results of subsidiaries are consolidated from the date control is obtained until the date that control ceases.
Inventories
Inventories are stated at the lower of cost and net realisable value. The first in, first out or an average method of valuation is used.
For finished goods and work in progress, cost includes directly attributable costs and certain overhead expenses (including depreciation). Selling expenses and certain other overhead expenses (principally central administration costs) are excluded. Net realisable value is determined as estimated selling price less all estimated costs of completion and costs to be incurred in selling and distribution.
Write-downs of inventory occur in the general course of business and are recognised in cost of sales.
Trade and other receivables
Financial assets included in trade and other receivables are recognised initially at fair value. Subsequent to initial recognition they are measured at amortised cost using the effective interest rate method, less any impairment losses. Trade receivables that are subject to debt factoring arrangements are derecognised if they meet the conditions for derecognition detailed in IAS 39 ‘Financial Instruments: Recognition and Measurement’.
Trade and other payables
Financial liabilities included in trade and other payables are recognised initially at fair value. Subsequent to initial recognition they are measured at amortised cost using the effective interest rate method.
Financial instruments
The Group’s financial instruments include interests in leases, trade and other receivables and payables, liabilities for contingent consideration under business combinations, and rights and obligations under employee benefit plans which are dealt with in specific accounting policies.
The Group’s other financial instruments include:
| > | cash and cash equivalents |
| > | bank and other borrowings |
Cash and cash equivalents
Cash and cash equivalents comprise cash in hand, current balances with banks and similar institutions and highly liquid investments with maturities of three months or less when acquired. They are readily convertible into known amounts of cash and are held at amortised cost.
Fixed deposits
Fixed deposits, principally comprising funds held with banks and other financial institutions, are initially measured at fair value, plus direct transaction costs, and are subsequently remeasured to amortised cost using the effective interest rate method at each reporting date. Changes in carrying value are recognised in profit.
| | |
| 146 | | AstraZenecaAnnual Report and Form 20-F Information 2015 |
Other investments
Where investments have been classified as held for trading, they are measured initially at fair value and subsequently remeasured to fair value at each reporting date. Changes in fair value are recognised in profit.
In all other circumstances, the investments are classified as ‘available for sale’, initially measured at fair value (including direct transaction costs) and subsequently remeasured to fair value at each reporting date. Changes in carrying value due to changes in exchange rates on monetary available for sale investments or impairments are recognised in profit. All other changes in fair value are recognised in other comprehensive income.
Impairments are recorded in profit when there is a decline in the value of an investment that is deemed to be other than temporary. On disposal of the investment, the cumulative amount recognised in other comprehensive income is recognised in profit as part of the gain or loss on disposal.
Bank and other borrowings
The Group uses derivatives, principally interest rate swaps, to hedge the interest rate exposure inherent in a portion of its fixed interest rate debt. In such cases the Group will either designate the debt as fair value through profit or loss when certain criteria are met or as the hedged item under a fair value hedge.
If the debt instrument is designated as fair value through profit or loss, the debt is initially measured at fair value (with direct transaction costs being included in profit as an expense) and is remeasured to fair value at each reporting date with changes in carrying value being recognised in profit (along with changes in the fair value of the related derivative). Such a designation has been made where this significantly reduces an accounting mismatch which would result from recognising gains and losses on different bases.
If the debt is designated as the hedged item under a fair value hedge, the debt is initially measured at fair value (with direct transaction costs being amortised over the life of the bonds), and is remeasured for fair value changes in respect of the hedged risk at each reporting date with changes in carrying value being recognised in profit (along with changes in the fair value of the related derivative).
Other interest-bearing loans are initially measured at fair value (with direct transaction costs being amortised over the life of the bond) and are subsequently remeasured to amortised cost using the effective interest rate method at each reporting date. Changes in carrying value are recognised in profit.
Derivatives
Derivatives are initially measured at fair value (with direct transaction costs being included in profit as an expense) and are subsequently remeasured to fair value at each reporting date. Changes in carrying value are recognised in profit.
Foreign currencies
Foreign currency transactions, being transactions denominated in a currency other than an individual Group entity’s functional currency, are translated into the relevant functional currencies of individual Group entities at average rates for the relevant monthly accounting periods, which approximate to actual rates.
Monetary assets and liabilities, arising from foreign currency transactions, are retranslated at exchange rates prevailing at the reporting date. Exchange gains and losses on loans and on short-term foreign currency borrowings and deposits are included within finance expense. Exchange differences on all other foreign currency transactions are recognised in operating profit in the individual Group entity’s accounting records.
Non-monetary items arising from foreign currency transactions are not retranslated in the individual Group entity’s accounting records.
In the Consolidated Financial Statements, income and expense items for Group entities with a functional currency other than US dollars are translated into US dollars at average exchange rates, which approximate to actual rates, for the relevant accounting periods. Assets and liabilities are translated at the US dollar exchange rates prevailing at the reporting date. Exchange differences arising on consolidation are recognised in other comprehensive income.
If certain criteria are met, non-US dollar denominated loans or derivatives are designated as net investment hedges of foreign operations. Exchange differences arising on retranslation of net investments, and of foreign currency loans which are designated in an effective net investment hedge relationship, are recognised in other comprehensive income in the Consolidated Financial Statements. Foreign exchange derivatives hedging net investments in foreign operations are carried at fair value. Effective fair value movements are recognised in other comprehensive income, with any ineffectiveness taken to the income statement. Gains and losses accumulated in the translation reserve will be recycled to profit when the foreign operation is sold.
Litigation and environmental liabilities
AstraZeneca is involved in legal disputes, the settlement of which may involve cost to the Group. Provision is made where an adverse outcome is probable and associated costs, including related legal costs, can be estimated reliably. In other cases, appropriate disclosures are included.
Where it is considered that the Group is more likely than not to prevail, or in the rare circumstances where the amount of the legal liability cannot be estimated reliably, legal costs involved in defending the claim are charged to profit as they are incurred.
Where it is considered that the Group has a valid contract which provides the right to reimbursement (from insurance or otherwise) of legal costs and/or all or part of any loss incurred or for which a provision has been established, the best estimate of the amount expected to be received is recognised as an asset only when it is virtually certain.
AstraZeneca is exposed to environmental liabilities relating to its past operations, principally in respect of soil and groundwater remediation costs. Provisions for these costs are made when there is a present obligation and where it is probable that expenditure on remedial work will be required and a reliable estimate can be made of the cost. Provisions are discounted where the effect is material.
Impairment
The carrying values of non-financial assets, other than inventories and deferred tax assets, are reviewed at least annually to determine whether there is any indication of impairment. For goodwill, intangible assets under development and for any other assets where such indication exists, the asset’s recoverable amount is estimated based on the greater of its value in use and its fair value less cost to sell. In assessing value in use, the estimated future cash flows, adjusted for the risks specific to each asset, are discounted to their present value using a discount rate that reflects current market assessments of the time value of money, the general risks affecting the pharmaceutical industry and other risks specific to each asset. For the purpose of impairment testing, assets are grouped together into the smallest group of assets that generates cash inflows from continuing use that are largely independent of the cash flows of other assets. Impairment losses are recognised immediately in profit.
International accounting transition
On transition to using adopted IFRSs in the year ended 31 December 2005, the Group took advantage of several optional exemptions available in IFRS 1 ‘First-time Adoption of International Financial Reporting Standards’. The major impacts which are of continuing importance are detailed below:
| > | Business combinations – IFRS 3 ‘Business Combinations’ has been applied from 1 January 2003, the date of transition, rather than being applied fully retrospectively. As a result, the combination of Astra and Zeneca is still accounted for as a merger, rather than through purchase accounting. If purchase accounting had been adopted, Zeneca would have been deemed to have acquired Astra. |
| > | Cumulative exchange differences – the Group chose to set the cumulative exchange difference reserve at 1 January 2003 to zero. |
| | |
| AstraZenecaAnnual Report and Form 20-F Information 2015 | | 147 |
Financial Statements
Applicable accounting standards and interpretations issued but not yet adopted
IFRS 9 ‘Financial Instruments’ was finalised by the IASB in July 2014 and is effective for accounting periods beginning on or after 1 January 2018. The new standard will replace existing accounting standards. It is applicable to financial assets and liabilities, and will introduce changes to existing accounting concerning classification and measurement, impairment (introducing an expected-loss method), hedge accounting, and on the treatment of gains arising from the impact of credit risk on the measurement of liabilities held at fair value. The standard has not yet been endorsed by the EU. The adoption of IFRS 9 is not expected to have a significant impact on the Group’s net results or net assets, although the full impact will be subject to further assessment.
IFRS 15 ‘Revenue from Contracts with Customers’ was issued by the IASB in May 2014. It is effective for accounting periods beginning on or after 1 January 2018. The new standard will replace existing accounting standards, and provides enhanced detail on the principle of recognising revenue to reflect the transfer of goods and services to customers at a value which the company expects to be entitled to receive. The standard also updates revenue disclosure requirements. The standard has yet to be endorsed by the EU. The Group is continuing to assess the impact of IFRS 15 on the results of the Group and including, but not limited to, the impact on licence income and milestone revenues.
IFRS 16 ‘Leases’ was issued by the IASB in January 2016 and is effective for accounting periods beginning on or after 1 January 2019. The new standard will replace IAS 17 ‘Leases’ and will eliminate the classification of leases as either operating leases or finance leases and, instead, introduce a single lessee accounting model. The standard has yet to be endorsed by the EU. The adoption of IFRS 16 is not expected to have a significant impact on the Group’s net results or net assets, although the full impact will be subject to further assessment.
In addition, the following amendments have been issued:
| > | Amendments to IFRS 11 Accounting for Acquisitions of Interests in Joint Operations, effective for periods beginning on or after 1 January 2016. |
| > | Amendments to IAS 16 ‘Property, Plant and Equipment’ and IAS 38 ‘Intangible Assets’ Clarification of Acceptable Methods of Depreciation and Amortisation, effective for periods beginning on or after 1 January 2016. |
| > | Amendments to IFRS 10 ‘Consolidated Financial Statements’ and IAS 28 ‘Investments in Associates and Joint Ventures (2011)’ Sale or Contribution of Assets between an Investor and its Associate or Joint Venture. The IASB has deferred those amendments until a date to be determined by the IASB, although early application is permitted. |
| > | Amendments to IAS 1 (Disclosure Initiative), effective for periods beginning on or after 1 January 2016. |
The above amendments are not expected to have a significant impact on the Group’s net results, net assets or disclosures. The amendments to IFRS 11 were endorsed by the EU on 24 November 2015, the amendments to IAS 16 and IAS 38 were endorsed by the EU on 2 December 2015 and the amendments to IAS 1 were endorsed by the EU on 18 December 2015. The amendments to IFRS 10 and IAS 28 have yet to be endorsed by the EU.
| | |
| 148 | | AstraZenecaAnnual Report and Form 20-F Information 2015 |
Notes to the Group Financial Statements
1 Revenue
Product Sales
| | | | | | | | | | | | |
| | | 2015 $m | | | 2014 $m | | | 2013 $m | |
| Respiratory, Inflammation and Autoimmunity: | | | | | | | | | | | | |
| Symbicort | | | 3,394 | | | | 3,801 | | | | 3,483 | |
| Pulmicort | | | 1,014 | | | | 946 | | | | 867 | |
| Tudorza/Eklira | | | 190 | | | | 13 | | | | – | |
| Daliresp | | | 104 | | | | – | | | | – | |
| Duaklir | | | 27 | | | | – | | | | – | |
| Others | | | 258 | | | | 303 | | | | 327 | |
| | | | 4,987 | | | | 5,063 | | | | 4,677 | |
| | | |
| Cardiovascular and Metabolic Diseases: | | | | | | | | | | | | |
| Onglyza | | | 786 | | | | 820 | | | | 378 | |
| Brilinta/Brilique | | | 619 | | | | 476 | | | | 283 | |
| Bydureon | | | 580 | | | | 440 | | | | 151 | |
| Farxiga/Forxiga | | | 492 | | | | 225 | | | | 10 | |
| Byetta | | | 316 | | | | 327 | | | | 206 | |
| Legacy: | | | | | | | | | | | | |
| Crestor | | | 5,017 | | | | 5,512 | | | | 5,622 | |
| Seloken/Toprol-XL | | | 710 | | | | 758 | | | | 750 | |
| Atacand | | | 358 | | | | 501 | | | | 611 | |
| Plendil | | | 234 | | | | 249 | | | | 260 | |
| Others | | | 377 | | | | 494 | | | | 559 | |
| | | | 9,489 | | | | 9,802 | | | | 8,830 | |
| | | |
| Oncology: | | | | | | | | | | | | |
| Iressa | | | 543 | | | | 623 | | | | 647 | |
| Lynparza | | | 94 | | | | – | | | | – | |
| Tagrisso | | | 19 | | | | – | | | | – | |
| Legacy: | | | | | | | | | | | | |
| Zoladex | | | 816 | | | | 924 | | | | 996 | |
| Faslodex | | | 704 | | | | 720 | | | | 681 | |
| Casodex | | | 267 | | | | 320 | | | | 376 | |
| Arimidex | | | 250 | | | | 298 | | | | 351 | |
| Others | | | 132 | | | | 142 | | | | 142 | |
| | | | 2,825 | | | | 3,027 | | | | 3,193 | |
| | | |
| Infection, Neuroscience and Gastrointestinal: | | | | | | | | | | | | |
| Nexium | | | 2,496 | | | | 3,655 | | | | 3,872 | |
| Seroquel XR | | | 1,025 | | | | 1,224 | | | | 1,337 | |
| Synagis | | | 662 | | | | 900 | | | | 1,060 | |
| Local Anaesthetics | | | 404 | | | | 488 | | | | 510 | |
| Losec/Prilosec | | | 340 | | | | 422 | | | | 486 | |
| FluMist/Fluenz | | | 288 | | | | 295 | | | | 245 | |
| Seroquel IR | | | 250 | | | | 178 | | | | 345 | |
| Merrem | | | 241 | | | | 253 | | | | 293 | |
| Diprivan | | | 200 | | | | 252 | | | | 265 | |
| Movantik/Moventig | | | 29 | | | | – | | | | – | |
| Others | | | 405 | | | | 536 | | | | 598 | |
| | | | 6,340 | | | | 8,203 | | | | 9,011 | |
| Product Sales | | | 23,641 | | | | 26,095 | | | | 25,711 | |
Externalisation Revenue
Externalisation Revenue in 2015 was $1,067m (2014: $452m; 2013: $95m).
In 2015, Externalisation Revenue incudes $450m on entering into a collaboration with Celgene on durvalumab, $200m on entering into a collaboration with Daiichi Sankyo on Movantik and $100m on entering into a collaboration with Valeant on brodalumab.
In 2014, Externalisation Revenue includes $250m from a licence agreement with Pfizer onNexium OTC.
Royalty income of $87m (2014: $53m; 2013: $60m) is included in Externalisation Revenue.
| | |
| AstraZenecaAnnual Report and Form 20-F Information 2015 | | 149 |
Financial Statements
2 Operating profit
Operating profit includes the following significant items:
Research and development expense
In 2013, research and development included a reversal of the intangible asset impairment charge of $285m, booked in 2011 for Lynparza (olaparib).
Selling, general and administrative costs
In 2015, selling, general and administrative costs includes a credit of $378m (2014: charge of $529m) resulting from changes in the fair value of contingent consideration arising from the acquisition of the diabetes alliance with BMS. These adjustments reflect revised estimates for future sales performance for the products acquired and, as a result, revised estimates for future royalties payable.
In 2015, selling, general and administrative costs also include a total of $313m of legal provisions relating to a number of legal proceedings in various jurisdictions in relation to several marketed products.
In July 2014, the US Internal Revenue Service issued final regulations that affected the recognition of the annual Branded Pharmaceutical Fee, imposed by the health care reform legislation in 2010. As a result, entities covered by the legislation now accrue for the obligation as each sale occurs. AstraZeneca recorded a catch-up charge of $226m in 2014 to reflect this new basis, $113m of which was recorded in selling, general and administrative costs and $113m as a deduction from revenue.
In 2013, selling, general and administrative costs included an intangible asset impairment charge of $1,620m against Bydureon following revised estimates for future sales performance.
Further details of impairment charges and reversals for 2015, 2014 and 2013 are included in Notes 7 and 9.
Other operating income and expense
| | | | | | | | | | | | |
| | | 2015 $m | | | 2014 Restated* $m | | | 2013 Restated* $m | |
| Royalties | | | | | | | | | | | | |
Income | | | 322 | | | | 533 | | | | 561 | |
Amortisation | | | (114 | ) | | | (212 | ) | | | (157 | ) |
| Impairment of intangible assets | | | (64 | ) | | | (18 | ) | | | – | |
| Gains on disposal of intangible assets | | | 961 | | | | – | | | | – | |
| Net gains/(losses) on disposal of other non-current assets | | | 85 | | | | (235 | ) | | | 13 | |
| Other income | | | 310 | | | | 267 | | | | 105 | |
| Other expense | | | – | | | | – | | | | (22 | ) |
| Other operating income and expense | | | 1,500 | | | | 335 | | | | 500 | |
| * | 2013 and 2014 comparatives have been restated to reflect the reclassification of Externalisation Revenue from other operating income and expense as detailed in Group Accounting Policies. |
Royalty amortisation and impairment relates to income streams acquired with MedImmune and amounts relating to our arrangements with Merck. Gains on disposal of intangible assets in 2015 includes $380m on the disposal of US rights to Entocort, $215m on the disposal of Rest of World rights to Entocort, $193m on the disposal of global rights to Myalept and $165m on the disposal of global rights to Caprelsa.
Net losses on disposal of non-current assets in 2014 included a loss of $292m on disposal of Alderley Park.
Restructuring costs
The tables below show the costs that have been charged in respect of restructuring programmes by cost category and type. Severance provisions are detailed in Note 19.
| | | | | | | | | | | | |
| | | 2015 $m | | | 2014 $m | | | 2013 $m | |
| Cost of sales | | | 158 | | | | 107 | | | | 126 | |
| Research and development expense | | | 258 | | | | 497 | | | | 490 | |
| Selling, general and administrative costs | | | 618 | | | | 662 | | | | 805 | |
| Other operating income and expense | | | – | | | | 292 | | | | – | |
| Total charge | | | 1,034 | | | | 1,558 | | | | 1,421 | |
| | | | | | | | | | | | |
| | | 2015
$m | | | 2014 $m | | | 2013 $m | |
| Severance costs | | | 298 | | | | 246 | | | | 632 | |
| Accelerated depreciation and impairment | | | 81 | | | | 153 | | | | 399 | |
| Relocation costs | | | 34 | | | | 209 | | | | – | |
| Loss on disposal of Alderley Park | | | – | | | | 292 | | | | – | |
| Other | | | 621 | | | | 658 | | | | 390 | |
| Total charge | | | 1,034 | | | | 1,558 | | | | 1,421 | |
Other costs are those incurred in designing and implementing the Group’s various restructuring initiatives including costs of decommissioning sites impacted by changes to our global footprint, temporary leave costs during relocation, internal project costs, and external consultancy fees.
| | |
| 150 | | AstraZenecaAnnual Report and Form 20-F Information 2015 |
2 Operating profit continued
Financial instruments
Included within operating profit are the following net gains and losses on financial instruments:
| | | | | | | | | | | | |
| | | 2015
$m | | | 2014
$m | | | 2013
$m | |
| (Losses)/gains on forward foreign exchange contracts | | | (22 | ) | | | (98 | ) | | | 102 | |
| Losses on receivables and payables | | | (36 | ) | | | (64 | ) | | | (136 | ) |
| Gains and losses on available for sale current investments | | | 74 | | | | 31 | | | | 13 | |
| Total | | | 16 | | | | (131 | ) | | | (21 | ) |
Gains and losses on available for sale current investments includes gains of $43m (2014: gains of $9m; 2013: gains of $19m) which have been reclassified from other comprehensive income.
3 Finance income and expense
| | | | | | | | | | | | |
| | | 2015 $m | | | 2014 $m | | | 2013 $m | |
| Finance income | | | | | | | | | | | | |
| Returns on fixed deposits and equity securities | | | 8 | | | | 10 | | | | 9 | |
| Returns on short-term deposits | | | 28 | | | | 23 | | | | 23 | |
| Fair value gains on debt and interest rate swaps | | | 10 | | | | 16 | | | | 18 | |
| Net exchange gains | | | – | | | | 29 | | | | – | |
| Total | | | 46 | | | | 78 | | | | 50 | |
| | | |
| Finance expense | | | | | | | | | | | | |
| Interest on debt and commercial paper | | | (361 | ) | | | (383 | ) | | | (388 | ) |
| Interest on overdrafts, finance leases and other financing costs | | | (31 | ) | | | (35 | ) | | | (25 | ) |
| Net interest on post-employment defined benefit plan net liabilities (Note 20) | | | (77 | ) | | | (92 | ) | | | (79 | ) |
| Net exchange losses | | | (36 | ) | | | – | | | | (3 | ) |
| Discount unwind on contingent consideration arising on business combinations (Note 18) | | | (524 | ) | | | (391 | ) | | | – | |
| Discount unwind on other long-term liabilities | | | (46 | ) | | | (62 | ) | | | – | |
| Total | | | (1,075 | ) | | | (963 | ) | | | (495 | ) |
| Net finance expense | | | (1,029 | ) | | | (885 | ) | | | (445 | ) |
Financial instruments
Included within finance income and expense are the following net gains and losses on financial instruments:
| | | | | | | | | | | | |
| | | 2015
$m | | | 2014
$m | | | 2013
$m | |
| Interest and fair value adjustments in respect of debt designated at fair value through profit or loss, net of derivatives | | | 6 | | | | (7 | ) | | | (4 | ) |
| Interest and changes in carrying values of debt designated as hedged items, net of derivatives | | | (10 | ) | | | 8 | | | | 5 | |
| Interest and fair value changes on fixed and short-term deposits, equity securities and other derivatives | | | 46 | | | | 45 | | | | 42 | |
| Interest on debt, overdrafts, finance leases and commercial paper held at amortised cost | | | (384 | ) | | | (415 | ) | | | (406 | ) |
Fair value losses of $30m (2014: $29m fair value losses; 2013: $43m fair value losses) on interest rate fair value hedging instruments and $30m fair value gains (2014: $29m fair value gains; 2013: $42m fair value gains) on the related hedged items have been included within interest and changes in carrying values of debt designated as hedged items, net of derivatives. All fair value hedge relationships were effective during the year.
Fair value losses of $5m (2014: $4m fair value losses; 2013: $77m fair value losses) on derivatives related to debt instruments designated at fair value through profit or loss and $15m fair value gains (2014: $3m fair value gains; 2013: $82m fair value gains) on debt instruments designated at fair value through profit or loss have been included within interest and fair value adjustments in respect of debt designated at fair value through profit or loss, net of derivatives. Ineffectiveness on the net investment hedge taken to profit was $nil (2014: $nil; 2013: $nil).
4 Taxation
Taxation recognised in the profit for the period in the consolidated statement of comprehensive income is as follows:
| | | | | | | | | | | | |
| | | 2015 $m | | | 2014 $m | | | 2013 $m | |
| | | |
| Current tax expense | | | | | | | | | | | | |
| Current year | | | 1,037 | | | | 981 | | | | 1,352 | |
| Adjustment to prior years | | | (404 | ) | | | (109 | ) | | | 46 | |
| | | | 633 | | | | 872 | | | | 1,398 | |
| | | |
| Deferred tax expense | | | | | | | | | | | | |
| Origination and reversal of temporary differences | | | (482 | ) | | | (833 | ) | | | (699 | ) |
| Adjustment to prior years | | | 92 | | | | (28 | ) | | | (3 | ) |
| | | | (390 | ) | | | (861 | ) | | | (702 | ) |
| Taxation recognised in the profit for the period | | | 243 | | | | 11 | | | | 696 | |
| | |
| AstraZenecaAnnual Report and Form 20-F Information 2015 | | 151 |
Financial Statements
4 Taxation continued
Taxation relating to components of other comprehensive income is as follows:
| | | | | | | | | | | | |
| | | 2015
$m | | | 2014
$m | | | 2013
$m | |
| | | |
| Current and deferred tax | | | | | | | | | | | | |
| | | |
| Items that will not be reclassified to profit or loss: | | | | | | | | | | | | |
Remeasurement of the defined benefit liability | | | (133 | ) | | | 182 | | | | (7 | ) |
Deferred tax impact of reduction in Sweden and UK tax rates | | | (58 | ) | | | – | | | | (92 | ) |
Share-based payments | | | (8 | ) | | | 34 | | | | 17 | |
| Total | | | (199 | ) | | | 216 | | | | (82 | ) |
| | | |
| Items that may be reclassified subsequently to profit or loss: | | | | | | | | | | | | |
Foreign exchange arising on consolidation | | | (8 | ) | | | (39 | ) | | | 19 | |
Foreign exchange arising on designating borrowings in net investment hedges | | | 80 | | | | 150 | | | | – | |
Net available for sale losses/(gains) recognised in other comprehensive income | | | 14 | | | | (64 | ) | | | (16 | ) |
Other | | | 1 | | | | 3 | | | | 1 | |
| Total | | | 87 | | | | 50 | | | | 4 | |
| Taxation relating to components of other comprehensive income | | | (112 | ) | | | 266 | | | | (78 | ) |
The reported tax rate of 8% for the year ended 31 December 2015 benefited from a $186m adjustment following agreement of US federal tax liabilities of open years up to 2008, other net reductions in provisions for tax contingencies partially offset by the impact of internal transfers of intellectual property resulting in a net credit of $181m and revaluations of contingent consideration arising on business combinations (credit of $432m with related tax charge of $39m). Excluding these effects, the reported tax rate for the year was 22%.
The cash tax paid for the year was $1,354m which was 44% of profit before tax.
Taxation has been provided at current rates on the profits earned for the periods covered by the Group Financial Statements. The 2015 prior period current tax adjustment relates mainly to a $186m tax benefit following agreement of US federal tax liabilities of open years to 2008, net reductions in provisions for tax contingencies totalling $259m and tax accrual to tax return adjustments. The 2014 prior period current tax adjustment relates mainly to a reduction in provisions for tax contingencies, including a benefit of $117m arising from the inter-governmental agreement of a transfer pricing matter, partially offset by tax accrual to tax return adjustments. The 2013 prior period current tax adjustment relates mainly to an increase in provisions for tax contingencies partially offset by tax accrual to tax return adjustments.
The 2015, 2014 and 2013 prior period deferred tax adjustments relate mainly to tax accrual to tax return adjustments.
To the extent that dividends remitted from overseas subsidiaries, joint ventures and associates are expected to result in additional taxes, appropriate amounts have been provided for. No deferred tax has been provided for unremitted earnings of Group companies overseas as these are considered permanently employed in the business of these companies. Unremitted earnings may be liable to overseas taxes and/or UK taxation (after allowing for double tax relief) if distributed as dividends. The aggregate amount of temporary differences associated with investments in subsidiaries and branches for which deferred tax liabilities have not been recognised totalled approximately $6,957m at 31 December 2015 (2014: $6,128m; 2013: $6,196m).
Factors affecting future tax charges
As a group with worldwide operations, AstraZeneca is subject to several factors that may affect future tax charges, principally the levels and mix of profitability in different jurisdictions, transfer pricing regulations, tax rates imposed and tax regime reforms. In 2015, the UK Government substantively enacted legislation to reduce the main rate of UK Statutory Corporation Tax to 18% by 2020. Details of material tax exposures and items currently under audit and negotiation are set out in Note 27.
Tax reconciliation to UK statutory rate
The table below reconciles the UK statutory tax charge to the Group’s total tax charge.
| | | | | | | | | | | | |
| | | 2015 $m | | | 2014 $m | | | 2013 $m | |
| Profit before tax | | | 3,069 | | | | 1,246 | | | | 3,267 | |
| Notional taxation charge at UK corporation tax rate of 20.25% (2014: 21.5%; 2013: 23.25%) | | | 621 | | | | 268 | | | | 760 | |
| Differences in effective overseas tax rates | | | (144 | ) | | | (195 | ) | | | (29 | ) |
| Deferred tax (credit)/charge relating to reduction in UK and other tax rates1 | | | (25 | ) | | | 23 | | | | (59 | ) |
| Unrecognised deferred tax asset | | | 149 | | | | 34 | | | | (20 | ) |
| Items not deductible for tax purposes | | | 29 | | | | 50 | | | | 11 | |
| Items not chargeable for tax purposes | | | – | | | | (39 | ) | | | (10 | ) |
| Other items2 | | | (75 | ) | | | 7 | | | | – | |
| Adjustments in respect of prior periods3 | | | (312 | ) | | | (137 | ) | | | 43 | |
| Total tax charge for the year | | | 243 | | | | 11 | | | | 696 | |
| 1 | The 2015 item relates to the reduction in the UK Statutory Corporation Tax rate from 20% to 18% effective from 1 April 2020. The 2014 and 2013 items relate to the reduction in the UK Statutory Corporation Tax rate from 23% to the rate of tax of 20% effective from 1 April 2015. |
| 2 | Other items in 2015 included the impact of internal transfers of intellectual property (tax charge of $181m) and the release of certain tax contingencies following the expiry of the relevant statute of limitations (tax credit of $256m). Other items in 2014 included the impact of internal transfers of intellectual property including recognition of deferred tax benefits acquired as part of a business combination (tax charge of $304m), and the release of certain tax contingencies following the expiry of the relevant statute of limitations (tax credits of $297m). |
| 3 | Further detail explaining the adjustments in respect of prior periods is set out above. |
AstraZeneca is domiciled in the UK but operates in other countries where the tax rates and tax laws are different to those in the UK. The impact of differences in effective overseas tax rates on the Group’s overall tax charge is noted above. Profits arising from our manufacturing operation in Puerto Rico are granted special status and are taxed at a reduced rate compared with the normal rate of tax in that territory under a tax incentive grant continuing until 2031.
| | |
| 152 | | AstraZenecaAnnual Report and Form 20-F Information 2015 |
4 Taxation continued
Deferred tax
The movements in the net deferred tax balance during the year are as follows:
| | | | | | | | | | | | | | | | | | | | | | | | | | | | |
| |
| Intangibles,
property, plant
& equipment1
$m |
| |
| Pension and
post-retirement
benefits
$m |
| |
| Intercompany
inventory
transfers
$m |
| |
| Untaxed
reserves2 $m |
| |
| Losses and
tax credits carried forward $m |
3 | |
| Accrued
expenses and other $m |
| |
| Total
$m |
|
| Net deferred tax balance at 1 January 2013 | | | (2,688 | ) | | | 553 | | | | 921 | | | | (1,284 | ) | | | 411 | | | | 622 | | | | (1,465 | ) |
| Taxation expense | | | 441 | | | | 26 | | | | (154 | ) | | | 183 | | | | 81 | | | | 125 | | | | 702 | |
| Other comprehensive income | | | – | | | | (90 | ) | | | – | | | | – | | | | – | | | | (7 | ) | | | (97 | ) |
| Additions through business combinations4 | | | (812 | ) | | | – | | | | – | | | | – | | | | 81 | | | | 5 | | | | (726 | ) |
| Exchange | | | (5 | ) | | | 21 | | | | (31 | ) | | | (13 | ) | | | – | | | | (8 | ) | | | (36 | ) |
| Net deferred tax balance at 31 December 2013 | | | (3,064 | ) | | | 510 | | | | 736 | | | | (1,114 | ) | | | 573 | | | | 737 | | | | (1,622 | ) |
| Taxation expense | | | 543 | | | | (4 | ) | | | (6 | ) | | | 368 | | | | (44 | ) | | | 4 | | | | 861 | |
| Other comprehensive income | | | 150 | | | | 215 | | | | – | | | | – | | | | – | | | | (35 | ) | | | 330 | |
| Additions through business combinations5 | | | (147 | ) | | | – | | | | (35 | ) | | | – | | | | – | | | | 37 | | | | (145 | ) |
| Exchange | | | 40 | | | | (93 | ) | | | (65 | ) | | | 168 | | | | (4 | ) | | | (47 | ) | | | (1 | ) |
| Net deferred tax balance at 31 December 2014 | | | (2,478 | ) | | | 628 | | | | 630 | | | | (578 | ) | | | 525 | | | | 696 | | | | (577 | ) |
| Taxation expense | | | 355 | | | | 30 | | | | 156 | | | | (156 | ) | | | 58 | | | | (53 | ) | | | 390 | |
| Other comprehensive income | | | 80 | | | | (198 | ) | | | – | | | | – | | | | – | | | | (9 | ) | | | (127 | ) |
| Additions through business combinations6 | | | (1,206 | ) | | | – | | | | – | | | | – | | | | 161 | | | | – | | | | (1,045 | ) |
| Exchange | | | (12 | ) | | | (33 | ) | | | (48 | ) | | | 42 | | | | (8 | ) | | | (21 | ) | | | (80 | ) |
| Net deferred tax balance at 31 December 20157 | | | (3,261 | ) | | | 427 | | | | 738 | | | | (692 | ) | | | 736 | | | | 613 | | | | (1,439 | ) |
| 1 | Includes deferred tax on contingent liabilities in respect of intangibles. |
| 2 | Untaxed reserves relate to taxable profits where the tax liability is deferred to later periods. |
| 3 | Includes losses and tax credits carried forward which will expire within 13 to 20 years. |
| 4 | The deferred tax liability of $726m relates to the acquisition of Pearl Therapeutics ($319m), Omthera ($198m), Amplimmune ($205m) and Spirogen ($4m) as detailed in Note 24. |
| 5 | The deferred tax liability of $145m relates to the acquisition of BMS’s share of Global Diabetes Alliance Assets ($28m) and the acquisition of Definiens Group ($117m). |
| 6 | The deferred tax liability of $1,045m relates to the acquisition of ZS Pharma. |
| 7 | The UK had a net deferred tax asset of $273m as at 31 December 2015, mainly in respect of the pension and post-retirement benefits, which has been recognised on the basis of sufficient forecast future taxable profits against which the deductible temporary differences can be utilised. |
The net deferred tax balance, before the offset of balances within countries, consists of:
| | | | | | | | | | | | | | | | | | | | | | | | | | | | |
| | | Intangibles,
property, plant
& equipment
$m | | | Pension and
post-retirement
benefits $m | | | Intercompany
inventory
transfers $m | | | Untaxed reserves $m | | | Losses and
tax credits carried forward
$m | | | Accrued expenses and other $m | | | Total $m | |
| Deferred tax assets at 31 December 2013 | | | 347 | | | | 518 | | | | 775 | | | | – | | | | 573 | | | | 855 | | | | 3,068 | |
| Deferred tax liabilities at 31 December 2013 | | | (3,411 | ) | | | (8 | ) | | | (39 | ) | | | (1,114 | ) | | | – | | | | (118 | ) | | | (4,690 | ) |
| Net deferred tax balance at 31 December 2013 | | | (3,064 | ) | | | 510 | | | | 736 | | | | (1,114 | ) | | | 573 | | | | 737 | | | | (1,622 | ) |
| Deferred tax assets at 31 December 2014 | | | 1,212 | | | | 631 | | | | 657 | | | | – | | | | 525 | | | | 838 | | | | 3,863 | |
| Deferred tax liabilities at 31 December 2014 | | | (3,690 | ) | | | (3 | ) | | | (27 | ) | | | (578 | ) | | | – | | | | (142 | ) | | | (4,440 | ) |
| Net deferred tax balance at 31 December 2014 | | | (2,478 | ) | | | 628 | | | | 630 | | | | (578 | ) | | | 525 | | | | 696 | | | | (577 | ) |
| Deferred tax assets at 31 December 2015 | | | 1,055 | | | | 430 | | | | 780 | | | | – | | | | 736 | | | | 732 | | | | 3,733 | |
| Deferred tax liabilities at 31 December 2015 | | | (4,316 | ) | | | (3 | ) | | | (42 | ) | | | (692 | ) | | | – | | | | (119 | ) | | | (5,172 | ) |
| Net deferred tax balance at 31 December 2015 | | | (3,261 | ) | | | 427 | | | | 738 | | | | (692 | ) | | | 736 | | | | 613 | | | | (1,439 | ) |
Analysed in the statement of financial position, after offset of balances within countries, as:
| | | | | | | | | | | | |
| | | 2015 $m | | | 2014 $m | | | 2013 $m | |
| Deferred tax assets | | | 1,294 | | | | 1,219 | | | | 1,205 | |
| Deferred tax liabilities | | | (2,733 | ) | | | (1,796 | ) | | | (2,827 | ) |
| Net deferred tax balance | | | (1,439 | ) | | | (577 | ) | | | (1,622 | ) |
Unrecognised deferred tax assets
Deferred tax assets of $414m have not been recognised in respect of deductible temporary differences (2014: $216m; 2013: $214m) because it is not probable that future taxable profit will be available against which the Group can utilise the benefits therefrom.
5 Earnings per $0.25 Ordinary Share
| | | | | | | | | | | | |
| | | 2015 | | | 2014 | | | 2013 | |
| Profit for the year attributable to equity holders ($m) | | | 2,825 | | | | 1,233 | | | | 2,556 | |
| Basic earnings per Ordinary Share | | | $2.23 | | | | $0.98 | | | | $2.04 | |
| Diluted earnings per Ordinary Share | | | $2.23 | | | | $0.98 | | | | $2.04 | |
| Weighted average number of Ordinary Shares in issue for basic earnings (millions) | | | 1,264 | | | | 1,262 | | | | 1,252 | |
| Dilutive impact of share options outstanding (millions) | | | 1 | | | | 2 | | | | 2 | |
| Diluted weighted average number of Ordinary Shares in issue (millions) | | | 1,265 | | | | 1,264 | | | | 1,254 | |
The earnings figures used in the calculations above are post-tax.
| | |
| AstraZenecaAnnual Report and Form 20-F Information 2015 | | 153 |
Financial Statements
6 Segment information
AstraZeneca is engaged in a single business activity of biopharmaceuticals and the Group does not have multiple operating segments. AstraZeneca’s biopharmaceuticals business consists of the discovery and development of new products, which are then manufactured, marketed and sold. All of these functional activities take place (and are managed) globally on a highly integrated basis. These individual functional areas are not managed separately.
The SET, established and chaired by the CEO, is the vehicle through which he exercises the authority delegated to him from the Board for the management, development and performance of our business. It is considered that the SET is AstraZeneca’s chief operating decision making body (as defined by IFRS 8 ‘Operating Segments’). The operation of the SET is principally driven by the management of the commercial operations, R&D, and manufacturing and supply. In addition to the CEO, CFO, the General Counsel and the Chief Compliance Officer, the SET comprises nine Executive Vice-Presidents representing IMED, MedImmune, Global Medicines Development, North America, Europe, International, GPPS, Operations & Information Services, and Human Resources. All significant operating decisions are taken by the SET. While members of the SET have responsibility for implementation of decisions in their respective areas, operating decision making is at SET level as a whole. Where necessary, these are implemented through cross-functional sub-committees that consider the Group-wide impact of a new decision. For example, product launch decisions would be initially considered by the SET and, on approval, passed to an appropriate sub-team for implementation. The impacts of being able to develop, produce, deliver and commercialise a wide range of pharmaceutical products drive the SET decision making process.
In assessing performance, the SET reviews financial information on an integrated basis for the Group as a whole, substantially in the form of, and on the same basis as, the Group’s IFRS Financial Statements. The high upfront cost of discovering and developing new products coupled with the relatively insignificant and stable unit cost of production means that there is not the clear link that exists in many manufacturing businesses between the revenue generated on an individual product sale and the associated cost and hence margin generated on a product. Consequently, the profitability of individual drugs or classes of drugs is not considered a key measure of performance for the business and is not monitored by the SET.
Resources are allocated on a Group-wide basis according to need. In particular, capital expenditure, in-licensing, and R&D resources are allocated between activities on merit, based on overall therapeutic considerations and strategy under the aegis of the Group’s Early Stage Product Committees and a single Late Stage Product Committee.
Geographic areas
The following tables show information by geographic area and, for Total Revenue and property, plant and equipment, material countries. The figures show the Total Revenue, operating profit and profit before tax made by companies located in that area/country, together with segment assets, segment assets acquired, net operating assets, and property, plant and equipment owned by the same companies; export sales and the related profit are included in the area/country where the legal entity resides and from which those sales were made.
| | | | | | | | | | | | |
| | | | | | | | | Total Revenue | |
| | | 2015 $m | | | 2014 Restated* $m | | | 2013 Restated* $m | |
| | | |
| UK | | | | | | | | | | | | |
| External | | | 2,176 | | | | 1,878 | | | | 1,854 | |
| Intra-Group | | | 6,001 | | | | 4,718 | | | | 5,041 | |
| | | | 8,177 | | | | 6,596 | | | | 6,895 | |
| | | |
| Continental Europe | | | | | | | | | | | | |
| Belgium | | | 176 | | | | 260 | | | | 265 | |
| France | | | 1,015 | | | | 1,325 | | | | 1,303 | |
| Germany | | | 608 | | | | 687 | | | | 624 | |
| Italy | | | 544 | | | | 688 | | | | 729 | |
| Spain | | | 426 | | | | 495 | | | | 497 | |
| Sweden | | | 645 | | | | 639 | | | | 464 | |
| Others | | | 1,448 | | | | 1,794 | | | | 1,830 | |
| Intra-Group | | | 4,664 | | | | 4,763 | | | | 4,930 | |
| | | | 9,526 | | | | 10,651 | | | | 10,642 | |
| | | |
| The Americas | | | | | | | | | | | | |
| Canada | | | 530 | | | | 583 | | | | 607 | |
| US | | | 9,949 | | | | 10,692 | | | | 10,198 | |
| Others | | | 1,018 | | | | 1,165 | | | | 1,177 | |
| Intra-Group | | | 2,167 | | | | 2,346 | | | | 2,005 | |
| | | | 13,664 | | | | 14,786 | | | | 13,987 | |
| | | |
| Asia, Africa & Australasia | | | | | | | | | | | | |
| Australia | | | 435 | | | | 657 | | | | 811 | |
| China | | | 2,548 | | | | 2,228 | | | | 1,836 | |
| Japan | | | 1,985 | | | | 2,202 | | | | 2,403 | |
| Others | | | 1,205 | | | | 1,254 | | | | 1,208 | |
| Intra-Group | | | 46 | | | | 56 | | | | 52 | |
| | | | 6,219 | | | | 6,397 | | | | 6,310 | |
| Continuing operations | | | 37,586 | | | | 38,430 | | | | 37,834 | |
| Intra-Group eliminations | | | (12,878 | ) | | | (11,883 | ) | | | (12,028 | ) |
| Total Revenue | | | 24,708 | | | | 26,547 | | | | 25,806 | |
| * | 2013 and 2014 comparatives have been restated to reflect the reclassification of Externalisation Revenue from other operating income and expense as detailed in Group Accounting Policies. |
| | |
| 154 | | AstraZenecaAnnual Report and Form 20-F Information 2015 |
6 Segment information continued
Export sales from the UK totalled $6,851m for the year ended 31 December 2015 (2014: $5,709m; 2013: $6,192m). Intra-Group pricing is determined on an arm’s length basis.
| | | | | | | | | | | | | | | | | | | | | | | | | | |
| | | Operating (loss)/profit | | | | | (Loss)/profit before tax | |
| | | 2015 $m | | | 2014 $m | | | 2013 $m | | | | | 2015 $m | | | 2014 $m | | | 2013 $m | |
| UK | | | (743 | ) | | | (851 | ) | | | (171 | ) | | | | | (1,113 | ) | | | (1,174 | ) | | | (467 | ) |
| Continental Europe | | | 3,412 | | | | 1,780 | | | | 3,055 | | | | | | 3,023 | | | | 1,477 | | | | 3,016 | |
| The Americas | | | 1,101 | | | | 818 | | | | 591 | | | | | | 821 | | | | 549 | | | | 477 | |
| Asia, Africa & Australasia | | | 344 | | | | 390 | | | | 237 | | | | | | 338 | | | | 394 | | | | 241 | |
| Continuing operations | | | 4,114 | | | | 2,137 | | | | 3,712 | | | | | | 3,069 | | | | 1,246 | | | | 3,267 | |
| | | | | | | | | | | | | | | | | | | | | | | | | | |
| | | Non-current assets1 | | | | | Total assets | |
| | | 2015 $m | | | 2014 $m | | | 2013 $m | | | | | 2015 $m | | | 2014 $m | | | 2013 $m | |
| UK | | | 6,251 | | | | 5,826 | | | | 4,525 | | | | | | 14,712 | | | | 14,926 | | | | 16,199 | |
| Continental Europe | | | 8,690 | | | | 8,764 | | | | 4,102 | | | | | | 10,636 | | | | 11,184 | | | | 6,924 | |
| The Americas | | | 26,499 | | | | 24,750 | | | | 24,535 | | | | | | 31,604 | | | | 29,324 | | | | 29,146 | |
| Asia, Africa & Australasia | | | 937 | | | | 874 | | | | 832 | | | | | | 3,172 | | | | 3,161 | | | | 3,630 | |
| Continuing operations | | | 42,377 | | | | 40,214 | | | | 33,994 | | | | | | 60,124 | | | | 58,595 | | | | 55,899 | |
| | | | | | | | | | | | | | | | | | | | | | | | | | |
| | | Assets acquired2 | | | | | Net operating assets3 | |
| | | 2015 $m | | | 2014 $m | | | 2013 $m | | | | | 2015 $m | | | 2014 $m | | | 2013 $m | |
| UK | | | 1,478 | | | | 2,703 | | | | 637 | | | | | | 3,713 | | | | 3,002 | | | | 2,400 | |
| Continental Europe | | | 653 | | | | 6,362 | | | | 747 | | | | | | 3,704 | | | | 4,110 | | | | 4,168 | |
| The Americas | | | 4,215 | | | | 2,732 | | | | 2,490 | | | | | | 22,334 | | | | 20,190 | | | | 21,583 | |
| Asia, Africa & Australasia | | | 172 | | | | 199 | | | | 236 | | | | | | 1,458 | | | | 1,570 | | | | 2,002 | |
| Continuing operations | | | 6,518 | | | | 11,996 | | | | 4,110 | | | | | | 31,209 | | | | 28,872 | | | | 30,153 | |
| 1 | Non-current assets exclude deferred tax assets and derivative financial instruments. |
| 2 | Included in Assets acquired are those assets that are expected to be used during more than one period (property, plant and equipment, goodwill and intangible assets). |
| 3 | Net operating assets exclude short-term investments, cash, short-term borrowings, loans, derivative financial instruments, retirement benefit obligations and non-operating receivables and payables. |
| | | | | | | | | | | | |
| | | Property, plant and equipment | |
| | | 2015 $m | | | 2014 $m | | | 2013 $m | |
| UK | | | 1,024 | | | | 824 | | | | 1,226 | |
| Sweden | | | 1,023 | | | | 971 | | | | 1,158 | |
| US | | | 2,986 | | | | 2,830 | | | | 2,048 | |
| Rest of the world | | | 1,380 | | | | 1,385 | | | | 1,386 | |
| Continuing operations | | | 6,413 | | | | 6,010 | | �� | | 5,818 | |
Geographic markets
The table below shows Product Sales in each geographic market in which customers are located.
| | | | | | | | | | | | |
| | | 2015 $m | | | 2014 $m | | | 2013 $m | |
| UK | | | 588 | | | | 773 | | | | 685 | |
| Continental Europe | | | 5,180 | | | | 6,394 | | | | 6,521 | |
| The Americas | | | 11,031 | | | | 11,892 | | | | 11,515 | |
| Asia, Africa & Australasia | | | 6,842 | | | | 7,036 | | | | 6,990 | |
| Continuing operations | | | 23,641 | | | | 26,095 | | | | 25,711 | |
Product Sales are recognised when the significant risks and rewards of ownership have been transferred to a third party. In general this is upon delivery of the products to wholesalers. Transactions with two wholesalers (2014: two; 2013: one) individually represented greater than 10% of Product Sales. The value of these transactions recorded as Product Sales were $3,458m and $2,757m (2014: $3,261m and $2,674m; 2013: $3,166m).
| | |
| AstraZenecaAnnual Report and Form 20-F Information 2015 | | 155 |
Financial Statements
7 Property, plant and equipment
| | | | | | | | | | | | | | | | |
| | | Land and buildings $m | | | Plant and equipment $m | | | Assets in course of construction $m | | | Total property,
plant and
equipment $m | |
| | | | |
| Cost | | | | | | | | | | | | | | | | |
| At 1 January 2013 | | | 5,850 | | | | 8,645 | | | | 576 | | | | 15,071 | |
| Capital expenditure | | | 21 | | | | 222 | | | | 565 | | | | 808 | |
| Additions through business combinations (Note 24) | | | 1 | | | | 3 | | | | 4 | | | | 8 | |
| Transfer of assets into use | | | 67 | | | | 295 | | | | (362 | ) | | | – | |
| Disposals and other movements | | | (275 | ) | | | (773 | ) | | | (7 | ) | | | (1,055 | ) |
| Exchange adjustments | | | 19 | | | | 61 | | | | (5 | ) | | | 75 | |
| At 31 December 2013 | | | 5,683 | | | | 8,453 | | | | 771 | | | | 14,907 | |
| Capital expenditure | | | 34 | | | | 184 | | | | 874 | | | | 1,092 | |
| Additions through business combinations (Note 24) | | | 213 | | | | 206 | | | | 96 | | | | 515 | |
| Transfers in from other non-current assets | | | 156 | | | | 124 | | | | 70 | | | | 350 | |
| Transfer of assets into use | | | 136 | | | | 405 | | | | (541 | ) | | | – | |
| Disposals and other movements | | | (976 | ) | | | (962 | ) | | | (27 | ) | | | (1,965 | ) |
| Exchange adjustments | | | (334 | ) | | | (698 | ) | | | (123 | ) | | | (1,155 | ) |
| At 31 December 2014 | | | 4,912 | | | | 7,712 | | | | 1,120 | | | | 13,744 | |
| Capital expenditure | | | 23 | | | | 223 | | | | 1,155 | | | | 1,401 | |
| Additions through business combinations (Note 24) | | | 21 | | | | – | | | | – | | | | 21 | |
| Transfer of assets into use | | | 269 | | | | 359 | | | | (628 | ) | | | – | |
| Disposals and other movements | | | (239 | ) | | | (442 | ) | | | (3 | ) | | | (684 | ) |
| Exchange adjustments | | | (174 | ) | | | (384 | ) | | | (76 | ) | | | (634 | ) |
| At 31 December 2015 | | | 4,812 | | | | 7,468 | | | | 1,568 | | | | 13,848 | |
| | | | |
| Depreciation | | | | | | | | | | | | | | | | |
| At 1 January 2013 | | | 2,668 | | | | 6,314 | | | | – | | | | 8,982 | |
| Charge for year | | | 331 | | | | 575 | | | | – | | | | 906 | |
| Impairment | | | 7 | | | | 94 | | | | – | | | | 101 | |
| Disposals and other movements | | | (73 | ) | | | (900 | ) | | | – | | | | (973 | ) |
| Exchange adjustments | | | 19 | | | | 54 | | | | – | | | | 73 | |
| At 31 December 2013 | | | 2,952 | | | | 6,137 | | | | – | | | | 9,089 | |
| Charge for year | | | 252 | | | | 524 | | | | – | | | | 776 | |
| Disposals and other movements | | | (639 | ) | | | (744 | ) | | | – | | | | (1,383 | ) |
| Exchange adjustments | | | (214 | ) | | | (534 | ) | | | – | | | | (748 | ) |
| At 31 December 2014 | | | 2,351 | | | | 5,383 | | | | – | | | | 7,734 | |
| Charge for year | | | 198 | | | | 479 | | | | – | | | | 677 | |
| Impairment | | | 9 | | | | 19 | | | | – | | | | 28 | |
| Disposals and other movements | | | (203 | ) | | | (411 | ) | | | – | | | | (614 | ) |
| Exchange adjustments | | | (102 | ) | | | (288 | ) | | | – | | | | (390 | ) |
| At 31 December 2015 | | | 2,253 | | | | 5,182 | | | | – | | | | 7,435 | |
| | | | |
| Net book value | | | | | | | | | | | | | | | | |
| At 31 December 2013 | | | 2,731 | | | | 2,316 | | | | 771 | | | | 5,818 | |
| At 31 December 2014 | | | 2,561 | | | | 2,329 | | | | 1,120 | | | | 6,010 | |
| At 31 December 2015 | | | 2,559 | | | | 2,286 | | | | 1,568 | | | | 6,413 | |
Impairment charges in 2015 were attributable to assets dedicated to the production and manufacture of Caprelsa, for which global product rights were divested during the year and to strategy changes affecting manufacturing operations in the US. These charges have been recognised in cost of sales.
Impairment charges in 2013 were attributable to strategy changes affecting manufacturing operations in China and the impact of restructuring our site footprint in the US. These charges were recognised in cost of sales.
| | | | | | | | | | | | |
| | | 2015 $m | | | 2014 $m | | | 2013 $m | |
| | | |
| The net book value of land and buildings comprised: | | | | | | | | | | | | |
| Freeholds | | | 2,432 | | | | 2,489 | | | | 2,656 | |
| Leaseholds | | | 127 | | | | 72 | | | | 75 | |
Included within plant and equipment are Information Technology assets held under finance leases with a net book value of $70m (2014: $74m; 2013: $86m).
| | |
| 156 | | AstraZenecaAnnual Report and Form 20-F Information 2015 |
8 Goodwill
| | | | | | | | | | | | |
| | | 2015 $m | | | 2014 $m | | | 2013 $m | |
| | | |
| Cost | | | | | | | | | | | | |
| At 1 January | | | 11,868 | | | | 10,307 | | | | 10,223 | |
| Additions through business combinations (Note 24) | | | 456 | | | | 1,841 | | | | 77 | |
| Exchange and other adjustments | | | (143 | ) | | | (280 | ) | | | 7 | |
| At 31 December | | | 12,181 | | | | 11,868 | | | | 10,307 | |
| | | |
| Amortisation and impairment losses | | | | | | | | | | | | |
| At 1 January | | | 318 | | | | 326 | | | | 325 | |
| Exchange and other adjustments | | | (5 | ) | | | (8 | ) | | | 1 | |
| At 31 December | | | 313 | | | | 318 | | | | 326 | |
| Net book value at 31 December | | | 11,868 | | | | 11,550 | | | | 9,981 | |
For the purpose of impairment testing of goodwill, the Group is regarded as a single cash-generating unit.
The recoverable amount is based on value in use using discounted risk-adjusted projections of the Group’s pre-tax cash flows over 10 years which is considered by the Board as a reasonable period given the long development and life-cycle of a medicine. The projections include assumptions about product launches, competition from rival products and pricing policy as well as the possibility of generics entering the market. In setting these assumptions we consider our past experience, external sources of information (including information on expected increases and ageing of the populations in our established markets and the expanding patient population in newer markets), our knowledge of competitor activity and our assessment of future changes in the pharmaceutical industry. The 10-year period is covered by internal budgets and forecasts. Given that internal budgets and forecasts are prepared for all projections, no general growth rates are used to extrapolate internal budgets and forecasts for the purposes of determining value in use. No terminal value is included as these cash flows are more than sufficient to establish that an impairment does not exist. The methods used to determine recoverable amounts have remained consistent with the prior year.
In arriving at value in use, we disaggregate our projected pre-tax cash flows into groups reflecting similar risks and tax effects. For each group of cash flows we use an appropriate discount rate reflecting those risks and tax effects. In arriving at the appropriate discount rate for each group of cash flows, we adjust AstraZeneca’s post-tax weighted average cost of capital (7.0% for 2015, 2014 and 2013) to reflect the impact of risks relevant to that group of assets, the time value of money and tax effects. The weighted average pre-tax discount rate we used was approximately 10% (2014: 10%; 2013: 10%).
As a further check, we compare our market capitalisation to the book value of our net assets and this indicates significant surplus at 31 December 2015 (and 31 December 2014 and 31 December 2013).
No goodwill impairment was identified.
The Group has also performed sensitivity analysis calculations on the projections used and discount rate applied. The Directors have concluded that, given the significant headroom that exists, and the results of the sensitivity analysis performed, there is no significant risk that reasonable changes in any key assumptions would cause the carrying value of goodwill to exceed its value in use.
| | |
| AstraZenecaAnnual Report and Form 20-F Information 2015 | | 157 |
Financial Statements
9 Intangible assets
| | | | | | | | | | | | | | | | |
| | | Product, marketing and distribution rights $ m | | | Other intangibles $m | | | Software development costs $m | | | Total $m | |
| | | | |
| Cost | | | | | | | | | | | | | | | | |
| At 1 January 2013 | | | 22,862 | | | | 2,135 | | | | 1,905 | | | | 26,902 | |
| Additions through business combinations (Note 24) | | | 2,045 | | | | 371 | | | | – | | | | 2,416 | |
| Additions – separately acquired | | | 635 | | | | – | | | | 166 | | | | 801 | |
| Disposals | | | (46 | ) | | | – | | | | – | | | | (46 | ) |
| Exchange and other adjustments | | | 57 | | | | (7 | ) | | | 19 | | | | 69 | |
| At 31 December 2013 | | | 25,553 | | | | 2,499 | | | | 2,090 | | | | 30,142 | |
| Additions through business combinations (Note 24) | | | 6,926 | | | | 575 | | | | – | | | | 7,501 | |
| Additions – separately acquired | | | 907 | | | | 25 | | | | 115 | | | | 1,047 | |
| Disposals | | | (23 | ) | | | – | | | | (41 | ) | | | (64 | ) |
| Exchange and other adjustments | | | (1,464 | ) | | | (287 | ) | | | (138 | ) | | | (1,889 | ) |
| At 31 December 2014 | | | 31,899 | | | | 2,812 | | | | 2,026 | | | | 36,737 | |
| Additions through business combinations (Note 24) | | | 3,162 | | | | – | | | | – | | | | 3,162 | |
| Additions – separately acquired | | | 1,341 | | | | 60 | | | | 77 | | | | 1,478 | |
| Disposals | | | (198 | ) | | | (4 | ) | | | (14 | ) | | | (216 | ) |
| Exchange and other adjustments | | | (886 | ) | | | (73 | ) | | | (70 | ) | | | (1,029 | ) |
| At 31 December 2015 | | | 35,318 | | | | 2,795 | | | | 2,019 | | | | 40,132 | |
| | | | |
| Amortisation and impairment losses | | | | | | | | | | | | | | | | |
| At 1 January 2013 | | | 7,659 | | | | 1,578 | | | | 1,217 | | | | 10,454 | |
| Amortisation for year | | | 1,498 | | | | 93 | | | | 188 | | | | 1,779 | |
| Impairment | | | 2,025 | | | | – | | | | 57 | | | | 2,082 | |
| Impairment reversals | | | (285 | ) | | | – | | | | – | | | | (285 | ) |
| Disposals | | | (11 | ) | | | – | | | | – | | | | (11 | ) |
| Exchange and other adjustments | | | 58 | | | | 11 | | | | 7 | | | | 76 | |
| At 31 December 2013 | | | 10,944 | | | | 1,682 | | | | 1,469 | | | | 14,095 | |
| Amortisation for year | | | 2,008 | | | | 193 | | | | 183 | | | | 2,384 | |
| Impairment | | | 81 | | | | 18 | | | | 23 | | | | 122 | |
| Disposals | | | (23 | ) | | | – | | | | (41 | ) | | | (64 | ) |
| Exchange and other adjustments | | | (465 | ) | | | (240 | ) | | | (76 | ) | | | (781 | ) |
| At 31 December 2014 | | | 12,545 | | | | 1,653 | | | | 1,558 | | | | 15,756 | |
| Amortisation for year | | | 1,718 | | | | 174 | | | | 107 | | | | 1,999 | |
| Impairment | | | 143 | | | | – | | | | 5 | | | | 148 | |
| Disposals | | | (31 | ) | | | (2 | ) | | | (14 | ) | | | (47 | ) |
| Exchange and other adjustments | | | (271 | ) | | | (52 | ) | | | (47 | ) | | | (370 | ) |
| At 31 December 2015 | | | 14,104 | | | | 1,773 | | | | 1,609 | | | | 17,486 | |
| | | | |
| Net book value | | | | | | | | | | | | | | | | |
| At 31 December 2013 | | | 14,609 | | | | 817 | | | | 621 | | | | 16,047 | |
| At 31 December 2014 | | | 19,354 | | | | 1,159 | | | | 468 | | | | 20,981 | |
| At 31 December 2015 | | | 21,214 | | | | 1,022 | | | | 410 | | | | 22,646 | |
Other intangibles consist mainly of licensing and rights to contractual income streams.
| | |
| 158 | | AstraZenecaAnnual Report and Form 20-F Information 2015 |
9 Intangible assets continued
Amortisation charges are recognised in profit as follows:
| | | | | | | | | | | | | | | | |
| | | Product,
marketing and
distribution rights $m | | | Other
intangibles $m | | | Software
development costs $m | | | Total $m | |
| | | | |
| Year ended 31 December 2013 | | | | | | | | | | | | | | | | |
| Cost of sales | | | 502 | | | | – | | | | – | | | | 502 | |
| Research and development expense | | | – | | | | 30 | | | | – | | | | 30 | |
| Selling, general and administrative costs | | | 898 | | | | 4 | | | | 188 | | | | 1,090 | |
| Other operating income and expense | | | 98 | | | | 59 | | | | – | | | | 157 | |
| Total | | | 1,498 | | | | 93 | | | | 188 | | | | 1,779 | |
| | | | |
| Year ended 31 December 2014 | | | | | | | | | | | | | | | | |
| Cost of sales | | | 701 | | | | – | | | | – | | | | 701 | |
| Research and development expense | | | – | | | | 60 | | | | – | | | | 60 | |
| Selling, general and administrative costs | | | 1,203 | | | | 25 | | | | 183 | | | | 1,411 | |
| Other operating income and expense | | | 104 | | | | 108 | | | | – | | | | 212 | |
| Total | | | 2,008 | | | | 193 | | | | 183 | | | | 2,384 | |
| | | | |
| Year ended 31 December 2015 | | | | | | | | | | | | | | | | |
| Cost of sales | | | 369 | | | | – | | | | – | | | | 369 | |
| Research and development expense | | | – | | | | 57 | | | | – | | | | 57 | |
| Selling, general and administrative costs | | | 1,321 | | | | 31 | | | | 107 | | | | 1,459 | |
| Other operating income and expense | | | 28 | | | | 86 | | | | – | | | | 114 | |
| Total | | | 1,718 | | | | 174 | | | | 107 | | | | 1,999 | |
| | | | |
Impairment charges are recognised in profit as follows: | | | | | | | | | | | | | | | | |
| | | Product, marketing and distribution rights $m | | | Other intangibles $m | | | Software development costs $m | | | Total $m | |
| | | | |
| Year ended 31 December 2013 | | | | | | | | | | | | | | | | |
| Research and development expense | | | 335 | | | | – | | | | – | | | | 335 | |
| Selling, general and administrative costs | | | 1,690 | | | | – | | | | 57 | | | | 1,747 | |
| Total | | | 2,025 | | | | – | | | | 57 | | | | 2,082 | |
| | | | |
| Year ended 31 December 2014 | | | | | | | | | | | | | | | | |
| Research and development expense | | | 81 | | | | – | | | | – | | | | 81 | |
| Selling, general and administrative costs | | | – | | | | – | | | | 23 | | | | 23 | |
| Other operating income and expense | | | – | | | | 18 | | | | – | | | | 18 | |
| Total | | | 81 | | | | 18 | | | | 23 | | | | 122 | |
| | | | |
| Year ended 31 December 2015 | | | | | | | | | | | | | | | | |
| Research and development expense | | | 79 | | | | – | | | | – | | | | 79 | |
| Selling, general and administrative costs | | | – | | | | – | | | | 5 | | | | 5 | |
| Other operating income and expense | | | 64 | | | | – | | | | – | | | | 64 | |
| Total | | | 143 | | | | – | | | | 5 | | | | 148 | |
The impairment reversal of $285m booked in 2013 was recorded in research and development expense.
Impairment charges and reversals
In 2015 and 2014, impairment charges relate to the termination, or reassessment of the likelihood of success, of several individual projects, none of which had significant capitalised values.
In 2013, AstraZeneca commenced enrolment of the first patient in the first of several Phase III clinical programmes forLynparza (olaparib). As a result of the initiation of this programme, an impairment charge of $285m, taken in 2011, was reversed and the full historic carrying value of the asset restored to the balance sheet. There are several indications currently under development forLynparza (olaparib) and, at the date of the reversal of the impairment, the recoverable value of the intangible asset relating toLynparza (olaparib) determined using value in use calculations as detailed below, was estimated to be at least $650m above its carrying value. The 2013 impairment charge of product, marketing and distribution rights included a charge of $1,758m against the intangible asset forBydureon, acquired as part of the 2012 collaboration with BMS on Amylin products, following revised estimates for future sales performance that were below AstraZeneca’s commercial expectations at that time of entering into the collaboration. Impairment charges also included $136m following AstraZeneca’s decision not to proceed with regulatory filings for fostamatinib.
| | |
| AstraZenecaAnnual Report and Form 20-F Information 2015 | | 159 |
Financial Statements
9 Intangible assets continued
The write downs in value of intangible assets, other than those arising from termination of R&D activities, were determined based on value in use calculations using discounted risk-adjusted projections of the products’ expected post-tax cash flows over a period reflecting the patent-protected lives of the individual products. The full period of projections is covered by internal budgets and forecasts. In arriving at the appropriate discount rate to use for each product, we adjust AstraZeneca’s post-tax weighted average cost of capital (7.0% for 2015, 2014 and 2013) to reflect the impact of risks and tax effects specific to the individual products. The weighted average pre-tax discount rate we used was approximately 13% (2014: 13%; 2013: 13%).
By their nature, the value in use calculations are sensitive to the underlying methods, assumptions and estimates. Consistent with prior years, as part of the impairment review process, management has identified that reasonably possible changes in certain key assumptions may cause the carrying amount of the intangible assets to exceed the recoverable amount. At 31 December 2015, the Group held intangible assets for products in development of $8,732m (2014: $6,598m; 2013: $5,457m), for which the most sensitive assumption is the probability of technical success, and intangible assets for launched products of $13,504m (2014: $13,915m; 2013: $9,969m), for which the most sensitive assumptions are the projected market share of the therapeutic area and expected pricing. In addition, we consider the sensitivity of our 2015 impairment conclusions to possible changes to the post tax discount rate and noted that a change of 1% would have no effect on the level of impairment recorded in 2015. Given their nature, impairment adjustments triggered by future events that have yet to occur may be material. In addition, there is a significant risk that impairments recognised in any one period may be subject to material adjustments in future periods.
Significant assets
| | | | | | | | | | |
| | | Description | | Carrying value
$m | | | Remaining amortisation
period | |
| Intangible assets arising from the restructuring of a joint venture with Merck | | Product, marketing and distribution rights | | | 1,858 | | | | 1-15 years | |
| RSV franchise assets arising from the acquisition of MedImmune | | Product, marketing and distribution rights | | | 2,781 | | | | 10 years | |
| FluMist intangible assets arising from the acquisition of MedImmune | | Product, marketing and distribution rights | | | 445 | | | | 16 years | |
| Onglyza intangible assets acquired from BMS | | Product, marketing and distribution rights | | | 1,308 | | | | 8 years | |
| Forxiga/Farxiga intangible assets acquired from BMS | | Product, marketing and distribution rights | | | 1,718 | | | | 12 years | |
| Bydureon intangible assets acquired from BMS | | Product, marketing and distribution rights | | | 1,248 | | | | 15 years | |
| Other diabetes intangible assets acquired from BMS | | Product, marketing and distribution rights | | | 1,420 | | | | 7-18 years | |
| Movantik/Moventig asset acquired from Nektar Therapeutics | | Product, marketing and distribution rights | | | 395 | | | | 16 years | |
| Intangible assets acquired from Almirall and Actavis | | Product, marketing and distribution rights | | | 1,778 | | | | 4-23 years | |
| Intangible assets arising from the acquisition of Definiens | | Research technology rights | | | 302 | | | | 14 years | |
| Intangible assets arising from the acquisition of Ardea1 | | Product, marketing and distribution rights | | | 1,434 | | | | Not amortised | |
| Intangible assets arising from the acquisition of Pearl Therapeutics1 | | Product, marketing and distribution rights | | | 951 | | | | Not amortised | |
| Intangible assets arising from the acquisition of Omthera1 | | Product, marketing and distribution rights | | | 533 | | | | Not amortised | |
| Intangible assets arising from the acquisition of Amplimmune1 | | Product, marketing and distribution rights | | | 470 | | | | Not amortised | |
| Intangible assets arising from the acquisition of ZS Pharma1 | | Product, marketing and distribution rights | | | 3,162 | | | | Not amortised | |
| 1 | Assets in development are not amortised but are tested annually for impairment. |
10 Investments in joint ventures
| | | | | | | | | | | | |
| | | 2015 $m | | | 2014 $m | | | 2013 $m | |
| At 1 January | | | 59 | | | | – | | | | – | |
| Additions | | | 45 | | | | 70 | | | | – | |
| Share of after tax losses | | | (16 | ) | | | (6 | ) | | | – | |
| Exchange adjustments | | | (3 | ) | | | (5 | ) | | | – | |
| At 31 December | | | 85 | | | | 59 | | | | – | |
On 1 December 2015, AstraZeneca entered into a joint venture agreement with Fujifilm Kyowa Kirin Biologics Co., Ltd. to develop a biosimilar using the combined capabilities of the two parties. The agreement resulted in the formation of a joint venture entity based in the UK, Centus Biotherapeutics Limited. AstraZeneca contributed $45m in cash to the joint venture entity and has a 50% interest in the joint venture.
On 30 April 2014, AstraZeneca entered into a joint venture agreement with Samsung Biologics Co., Ltd. to develop a biosimilar using the combined capabilities of the two parties. The agreement resulted in the formation of a joint venture entity based in the UK, Archigen Biotech Limited, with a branch in South Korea. AstraZeneca contributed $70m in cash to the joint venture entity and has a 50% interest in the joint venture.
Both investments are accounted for using the equity method.
Aggregated summarised financial information for the joint venture entities is set out below.
| | | | | | | | | | | | |
| | | 2015 $m | | | 2014 $m | | | 2013 $m | |
| Non-current assets | | | 123 | | | | 76 | | | | – | |
| Current assets | | | 75 | | | | 58 | | | | – | |
| Current liabilities | | | (11 | ) | | | (6 | ) | | | – | |
| Net assets | | | 187 | | | | 128 | | | | – | |
| Amount attributable to AstraZeneca | | | 93 | | | | 64 | | | | – | |
| Exchange adjustments | | | (8 | ) | | | (5 | ) | | | – | |
| Carrying value of investments in joint ventures | | | 85 | | | | 59 | | | | – | |
| | |
| 160 | | AstraZenecaAnnual Report and Form 20-F Information 2015 |
11 Other investments
| | | | | | | | | | | | |
| | | 2015 $m | | | 2014 $m | | | 2013 $m | |
| Non-current investments | | | | | | | | | | | | |
| Equity securities available for sale | | | 458 | | | | 502 | | | | 281 | |
| Total | | | 458 | | | | 502 | | | | 281 | |
| | | |
| Current investments | | | | | | | | | | | | |
| Equity securities and bonds available for sale | | | 548 | | | | 775 | | | | 735 | |
| Equity securities held for trading | | | – | | | | – | | | | 46 | |
| Fixed deposits | | | 65 | | | | 20 | | | | 15 | |
| Total | | | 613 | | | | 795 | | | | 796 | |
The equity securities and bonds available for sale in current investments include $467m (2014: $775m; 2013: $735m) held in a custody account. Further details of this custody account are included in Note 20.
Impairment charges of $17m in respect of available for sale securities are included in other operating income and expense (2014: $23m; 2013: $22m).
Equity securities and bonds available for sale, and equity securities held for trading, are held at fair value. The fair value of listed investments is based on year end quoted market prices. For unlisted investments whose fair value cannot be reliably measured, cost is considered to approximate to fair value. Fixed deposits are held at amortised cost with carrying value being a reasonable approximation of fair value given their short-term nature.
None of the financial assets or liabilities have been reclassified in the year.
Fair value hierarchy
The table below analyses financial instruments, contained within other investments and carried at fair value, by valuation method. The different levels have been defined as follows:
| | |
| > Level 1: | | quoted prices (unadjusted) in active markets for identical assets or liabilities. |
| > Level 2: | | inputs other than quoted prices included within Level 1 that are observable for the asset or liability, either directly (ie as prices) or indirectly (ie derived from prices). |
| > Level 3: | | inputs for the asset or liability that are not based on observable market data (unobservable inputs). |
| | | | | | | | | | | | | | | | |
| | | Level 1
$m | | | Level 2
$m | | | Level 3
$m | | | Total
$m | |
| | | | |
| 2013 | | | | | | | | | | | | | | | | |
| Equity securities and bonds available for sale | | | 807 | | | | – | | | | 209 | | | | 1,016 | |
| Equity securities held for trading | | | 46 | | | | – | | | | – | | | | 46 | |
| Total | | | 853 | | | | – | | | | 209 | | | | 1,062 | |
| | | | |
| 2014 | | | | | | | | | | | | | | | | |
| Equity securities and bonds available for sale | | | 927 | | | | – | | | | 350 | | | | 1,277 | |
| Total | | | 927 | | | | – | | | | 350 | | | | 1,277 | |
| | | | |
| 2015 | | | | | | | | | | | | | | | | |
| Equity securities and bonds available for sale | | | 654 | | | | – | | | | 352 | | | | 1,006 | |
| Total | | | 654 | | | | – | | | | 352 | | | | 1,006 | |
Equity securities available for sale that are analysed at Level 3 include investments in private biotech companies. In the absence of specific market data, these unlisted investments are held at cost, adjusted as necessary for impairments, which approximates to fair value. Movements in Level 3 investments are detailed below.
| | | | | | | | | | | | |
| | | 2015
$m | | | 2014
$m | | | 2013
$m | |
| At 1 January | | | 350 | | | | 209 | | | | 138 | |
| Additions | | | 49 | | | | 107 | | | | 70 | |
| Revaluations | | | – | | | | 95 | | | | – | |
| Transfers out | | | (22 | ) | | | (35 | ) | | | – | |
| Disposals | | | (6 | ) | | | – | | | | (8 | ) |
| Impairments and exchange adjustments | | | (19 | ) | | | (26 | ) | | | 9 | |
| At 31 December | | | 352 | | | | 350 | | | | 209 | |
Assets are transferred in or out of Level 3 on the date of the event or change in circumstances that caused the transfer.
| | |
| AstraZenecaAnnual Report and Form 20-F Information 2015 | | 161 |
Financial Statements
12 Derivative financial instruments
Derivative financial instruments consist of interest rate swaps (included in instruments designated at fair value if related to debt designated at fair value, or instruments in a fair value hedge relationship if formally designated as in a fair value hedge relationship), cross-currency swaps (included in instruments designated in net investment hedges), currency options and forward foreign exchange contracts (included below in other derivatives).
| | | | | | | | | | | | | | | | | | | | |
| | | Non-current
assets $m | | | Current assets $m | | | Current liabilities
$m | | | Non-current liabilities $m | | | Total
$m | |
| Designated in a fair value hedge | | | 108 | | | | – | | | | – | | | | – | | | | 108 | |
| Related to instruments designated at fair value through profit or loss | | | 69 | | | | 16 | | | | – | | | | – | | | | 85 | |
| Designated as a net investment hedge | | | 188 | | | | – | | | | – | | | | (1 | ) | | | 187 | |
| Other derivatives | | | – | | | | 24 | | | | (2 | ) | | | – | | | | 22 | |
| 31 December 2013 | | | 365 | | | | 40 | | | | (2 | ) | | | (1 | ) | | | 402 | |
| | | | | | | | | | | | | | | | | | | | | |
| | | Non-current
assets $m | | | Current assets $m | | | Current liabilities
$m | | | Non-current liabilities $m | | | Total $m | |
| Designated in a fair value hedge | | | 79 | | | | – | | | | – | | | | – | | | | 79 | |
| Related to instruments designated at fair value through profit or loss | | | 82 | | | | – | | | | – | | | | – | | | | 82 | |
| Designated as a net investment hedge | | | 304 | | | | – | | | | – | | | | – | | | | 304 | |
| Other derivatives | | | – | | | | 21 | | | | (21 | ) | | | – | | | | – | |
| 31 December 2014 | | | 465 | | | | 21 | | | | (21 | ) | | | – | | | | 465 | |
| | | | | | | | | | | | | | | | | | | | | |
| | | Non-current
assets $m | | | Current assets $m | | | Current liabilities
$m | | | Non-current liabilities $m | | | Total $m | |
| Designated in a fair value hedge | | | 49 | | | | – | | | | – | | | | – | | | | 49 | |
| Related to instruments designated at fair value through profit or loss | | | 77 | | | | – | | | | – | | | | – | | | | 77 | |
| Designated as a net investment hedge | | | 320 | | | | – | | | | – | | | | – | | | | 320 | |
| Other derivatives | | | – | | | | 2 | | | | (9 | ) | | | (1 | ) | | | (8 | ) |
| 31 December 2015 | | | 446 | | | | 2 | | | | (9 | ) | | | (1 | ) | | | 438 | |
All derivatives are held at fair value and fall within Level 2 of the fair value hierarchy as defined in Note 11. None of the derivatives have been reclassified in the year.
The fair value of interest rate swaps and cross-currency swaps is estimated using appropriate zero coupon curve valuation techniques to discount future contractual cash flows based on rates at current year end.
The fair value of forward foreign exchange contracts and currency options are estimated by cash flow accounting models using appropriate yield curves based on market forward foreign exchange rates at the year end. The majority of forward foreign exchange contracts for existing transactions had maturities of less than one month from year end.
The interest rates used to discount future cash flows for fair value adjustments, where applicable, are based on market swap curves at the reporting date, and were as follows.
| | | | | | | | | | | | |
| | | 2015 | | | 2014 | | | 2013 | |
| Derivatives | | | 1.2% to 2.1% | | | | 1.2% to 2.3% | | | | 0.3% to 3.2% | |
13 Non-current other receivables
Non-current other receivables of $907m (2014: $1,112m; 2013: $1,867m) include a prepayment of $617m (2014: $906m; 2013: $1,276m) which represents the long-term element of minimum contractual royalties payable to Shionogi under the global licence agreement forCrestor,which was renegotiated in December 2013. The resulting modified royalty structure, which includes fixed minimum and maximum payments in years until 2020, has resulted in the Company recognising liabilities, and corresponding prepayments, for the discounted value of total minimum payments. The current portion of the prepayment is $260m (2014: $323m; 2013: $350m) and is reported in amounts due within one year (see Note 15). Non-current other receivables also include prepayments in relation to our research collaboration with Moderna Therapeutics.
14 Inventories
| | | | | | | | | | | | |
| | | 2015
$m | | | 2014
$m | | | 2013
$m | |
| Raw materials and consumables | | | 960 | | | | 663 | | | | 570 | |
| Inventories in process | | | 545 | | | | 501 | | | | 659 | |
| Finished goods and goods for resale | | | 638 | | | | 796 | | | | 680 | |
| Inventories | | | 2,143 | | | | 1,960 | | | | 1,909 | |
The Group recognised $2,942m (2014: $3,214m; 2013: $2,981m) of inventories as an expense within cost of sales during the year.
Inventory write-offs in the year amounted to $112m (2014: $126m; 2013: $91m).
| | |
| 162 | | AstraZenecaAnnual Report and Form 20-F Information 2015 |
15 Current trade and other receivables
| | | | | | | | | | | | | | | | | | | | |
| | | | | | | | | 2015
$m | | | 2014
$m | | | 2013
$m | |
| | | | | |
| Amounts due within one year | | | | | | | | | | | | | | | | | | | | |
| Trade receivables | | | | | | | | | | | 4,685 | | | | 4,816 | | | | 5,578 | |
| Less: Amounts provided for doubtful debts (Note 25) | | | | | | | | | | | (52 | ) | | | (54 | ) | | | (64 | ) |
| | | | | | | | | | | | 4,633 | | | | 4,762 | | | | 5,514 | |
| Other receivables | | | | | | | | | | | 543 | | | | 1,050 | | | | 684 | |
| Prepayments and accrued income | | | | | | | | | | | 1,268 | | | | 1,262 | | | | 1,420 | |
| | | | | | | | | | | | 6,444 | | | | 7,074 | | | | 7,618 | |
| | | | | |
| Amounts due after more than one year | | | | | | | | | | | | | | | | | | | | |
| Other receivables | | | | | | | | | | | 28 | | | | 22 | | | | 110 | |
| Prepayments and accrued income | | | | | | | | | | | 150 | | | | 136 | | | | 151 | |
| | | | | | | | | | | | 178 | | | | 158 | | | | 261 | |
| Trade and other receivables | | | | | | | | | | | 6,622 | | | | 7,232 | | | | 7,879 | |
All financial assets included within current trade and other receivables are held on the consolidated statement of financial position at amortised costs with carrying value being a reasonable approximation of fair value. 16 Cash and cash equivalents | |
| | | | | | | | | 2015
$m | | | 2014
$m | | | 2013
$m | |
| Cash at bank and in hand | | | | | | | | | | | 1,250 | | | | 1,009 | | | | 1,094 | |
| Short-term deposits | | | | | | | | | | | 4,990 | | | | 5,351 | | | | 8,123 | |
| Cash and cash equivalents | | | | | | | | | | | 6,240 | | | | 6,360 | | | | 9,217 | |
| Unsecured bank overdrafts | | | | | | | | | | | (189 | ) | | | (196 | ) | | | (222 | ) |
| Cash and cash equivalents in the cash flow statement | | | | | | | | | | | 6,051 | | | | 6,164 | | | | 8,995 | |
The Group holds $110m (2014: $114m; 2013: $119m) of cash and cash equivalents which is required to meet insurance solvency, capital and security requirements, and which, as a result, is not readily available for the general purposes of the Group. Cash and cash equivalents are held on the consolidated statement of financial position at amortised cost. Fair value approximates to carrying value. 17 Interest-bearing loans and borrowings | |
| | | | | | Repayment
dates | | | 2015 $m | | | 2014 $m | | | 2013 $m | |
| | | | | |
| Current liabilities | | | | | | | | | | | | | | | | | | | | |
| Bank overdrafts | | | | | | | On demand | | | | 189 | | | | 196 | | | | 222 | |
| Finance leases | | | | | | | | | | | 67 | | | | 48 | | | | 30 | |
| 5.4% Callable bond | | | US dollars | | | | 2014 | | | | – | | | | – | | | | 766 | |
| 5.125% Non-callable bond | | | euros | | | | 2015 | | | | – | | | | 912 | | | | – | |
| Other loans (Commercial paper) | | | | | | | Within one year | | | | 660 | | | | 1,290 | | | | 770 | |
| Total | | | | | | | | | | | 916 | | | | 2,446 | | | | 1,788 | |
| | | | | |
| Non-current liabilities | | | | | | | | | | | | | | | | | | | | |
| Finance leases | | | | | | | | | | | 28 | | | | 60 | | | | 72 | |
| 5.125% Non-callable bond | | | euros | | | | 2015 | | | | – | | | | – | | | | 1,035 | |
| 5.9% Callable bond | | | US dollars | | | | 2017 | | | | 1,796 | | | | 1,825 | | | | 1,854 | |
| Floating rate notes | | | US dollars | | | | 2018 | | | | 399 | | | | – | | | | – | |
| 1.75% Callable bond | | | US dollars | | | | 2018 | | | | 997 | | | | – | | | | – | |
| 1.95% Callable bond | | | US dollars | | | | 2019 | | | | 997 | | | | 996 | | | | 996 | |
| 2.375% Callable bond | | | US dollars | | | | 2020 | | | | 1,586 | | | | – | | | | – | |
| 0.875% Non-callable bond | | | euros | | | | 2021 | | | | 812 | | | | 902 | | | | – | |
| 7% Guaranteed debentures | | | US dollars | | | | 2023 | | | | 355 | | | | 370 | | | | 356 | |
| 3.375% Callable bond | | | US dollars | | | | 2025 | | | | 1,971 | | | | – | | | | – | |
| 5.75% Non-callable bond | | | pounds sterling | | | | 2031 | | | | 515 | | | | 540 | | | | 573 | |
| 6.45% Callable bond | | | US dollars | | | | 2037 | | | | 2,719 | | | | 2,718 | | | | 2,717 | |
| 4% Callable bond | | | US dollars | | | | 2042 | | | | 986 | | | | 986 | | | | 985 | |
| 4.375% Callable bond | | | US dollars | | | | 2045 | | | | 976 | | | | – | | | | – | |
| Total | | | | | | | | | | | 14,137 | | | | 8,397 | | | | 8,588 | |
All loans and borrowings above are unsecured, except for finance leases which are secured against the Information Technology assets to which they relate (see Note 7).
| | |
| AstraZenecaAnnual Report and Form 20-F Information 2015 | | 163 |
Financial Statements
17 Interest-bearing loans and borrowingscontinued
Set out below is a comparison by category of carrying values and fair values of all the Group’s interest-bearing loans and borrowings.
| | | | | | | | | | | | | | | | | | | | |
| |
| Instruments in a
fair value hedge relationship $m |
1 | |
| Instruments
designated at fair value $m |
2 | | | Amortised cost $m | 3 | |
| Total
carrying value $m |
| | | Fair value $m | |
| | | | | |
| 2013 | | | | | | | | | | | | | | | | | | | | |
| Overdrafts | | | – | | | | – | | | | 222 | | | | 222 | | | | 222 | |
| Finance leases due within one year | | | – | | | | – | | | | 30 | | | | 30 | | | | 30 | |
| Finance leases due after more than one year | | | – | | | | – | | | | 72 | | | | 72 | | | | 72 | |
| Loans due within one year | | | – | | | | 766 | | | | 770 | | | | 1,536 | | | | 1,536 | |
| Loans due after more than one year | | | 856 | | | | 356 | | | | 7,304 | | | | 8,516 | | | | 9,296 | |
| Total at 31 December 2013 | | | 856 | | | | 1,122 | | | | 8,398 | | | | 10,376 | | | | 11,156 | |
| | | | | |
| 2014 | | | | | | | | | | | | | | | | | | | | |
| Overdrafts | | | – | | | | – | | | | 196 | | | | 196 | | | | 196 | |
| Finance leases due within one year | | | – | | | | – | | | | 48 | | | | 48 | | | | 48 | |
| Finance leases due after more than one year | | | – | | | | – | | | | 60 | | | | 60 | | | | 60 | |
| Loans due within one year | | | – | | | | – | | | | 2,202 | | | | 2,202 | | | | 2,202 | |
| Loans due after more than one year | | | 828 | | | | 370 | | | | 7,139 | | | | 8,337 | | | | 9,662 | |
| Total at 31 December 2014 | | | 828 | | | | 370 | | | | 9,645 | | | | 10,843 | | | | 12,168 | |
| | | | | |
| 2015 | | | | | | | | | | | | | | | | | | | | |
| Overdrafts | | | – | | | | – | | | | 189 | | | | 189 | | | | 189 | |
| Finance leases due within one year | | | – | | | | – | | | | 67 | | | | 67 | | | | 67 | |
| Finance leases due after more than one year | | | – | | | | – | | | | 28 | | �� | | 28 | | | | 28 | |
| Loans due within one year | | | – | | | | – | | | | 660 | | | | 660 | | | | 660 | |
| Loans due after more than one year | | | 1,398 | | | | 355 | | | | 12,356 | | | | 14,109 | | | | 15,132 | |
| Total at 31 December 2015 | | | 1,398 | | | | 355 | | | | 13,300 | | | | 15,053 | | | | 16,076 | |
| 1 | Instruments designated as hedged items in fair value hedge relationships with respect to interest rate risk include a designated portion of the US dollar 5.9% callable bond repayable in 2017, and a portion of the US dollar 1.75% callable bond repayable in 2018. |
| 2 | Instruments designated at fair value through profit or loss include the US dollar 7% guaranteed debentures repayable in 2023. |
| 3 | Included within borrowings held at amortised cost are amounts designated as hedges of net investments in foreign operations of $1,327m (2014: $1,453m; 2013: $1,608m) held at amortised cost. The fair value of these borrowings was $1,516m at 31 December 2015 (2014: $1,641m; 2013: $1,769m). |
The fair value of fixed-rate publicly traded debt is based on year end quoted market prices; the fair value of floating rate debt is nominal value, as mark to market differences would be minimal given the frequency of resets. The carrying value of loans designated at fair value through profit or loss is the fair value; this falls within the Level 1 valuation method as defined in Note 11. For loans designated in a fair value hedge relationship, carrying value is initially measured at fair value and remeasured for fair value changes in respect of the hedged risk at each reporting date. All other loans are held at amortised cost. Fair values, as disclosed in the table above, are all determined using the Level 1 valuation method as defined in Note 11, with the exception of overdrafts and finance leases, where fair value approximates to carrying values.
A gain of $10m was made during the year on the fair value of bonds designated at fair value through profit or loss, due to increased credit risk. A gain of $48m has been made on these bonds since designation due to increased credit risk. Changes in credit risk had no material effect on any other financial assets and liabilities recognised at fair value in the Group Financial Statements. The change in fair value attributable to changes in credit risk is calculated as the change in fair value not attributable to market risk. The amount payable at maturity on bonds designated at fair value through profit or loss is $288m.
The interest rates used to discount future cash flows for fair value adjustments, where applicable, are based on market swap curves at the reporting date, and were as follows.
| | | | | | | | | | | | |
| | | 2015 | | | 2014 | | | 2013 | |
| Loans and borrowings | | | 1.2% to 2.1% | | | | 1.2% to 2.3% | | | | 0.3% to 3.2% | |
18 Trade and other payables | |
| | | 2015 $m | | | 2014 $m | | | 2013 $m | |
| | | |
| Current liabilities | | | | | | | | | | | | |
| Trade payables | | | 3,469 | | | | 3,492 | | | | 2,499 | |
| Value added and payroll taxes and social security | | | 207 | | | | 201 | | | | 207 | |
| Rebates and chargebacks | | | 3,307 | | | | 3,530 | | | | 2,853 | |
| Accruals | | | 2,983 | | | | 3,231 | | | | 3,606 | |
| Other payables | | | 1,697 | | | | 1,432 | | | | 1,197 | |
| Total | | | 11,663 | | | | 11,886 | | | | 10,362 | |
| | | |
| Non-current liabilities | | | | | | | | | | | | |
| Accruals | | | 256 | | | | 219 | | | | 126 | |
| Other payables | | | 7,201 | | | | 7,772 | | | | 2,226 | |
| Total | | | 7,457 | | | | 7,991 | | | | 2,352 | |
| | |
| 164 | | AstraZenecaAnnual Report and Form 20-F Information 2015 |
18 Trade and other payablescontinued
With the exception of contingent consideration payables of $6,411m (2014: $6,899m; 2013: $514m) held within other payables, that arose on business combinations (see Note 24), and which are held at fair value within Level 3 of the fair value hierarchy as defined in Note 11, all other financial liabilities are held at amortised cost with carrying value being a reasonable approximation of fair value.
Contingent consideration
| | | | | | | | | | | | |
| | | 2015
$m | | | 2014
$m | | | 2013
$m | |
| At 1 January | | | 6,899 | | | | 514 | | | | – | |
| Additions arising on business combinations (Note 24) | | | – | | | | 6,138 | | | | 532 | |
| Settlements | | | (579 | ) | | | (657 | ) | | | – | |
| Revaluations | | | (432 | ) | | | 512 | | | | (18 | ) |
| Discount unwind | | | 524 | | | | 391 | | | | – | |
| Foreign exchange | | | (1 | ) | | | 1 | | | | – | |
| At 31 December | | | 6,411 | | | | 6,899 | | | | 514 | |
As detailed in Note 24, contingent consideration arising from business combinations is fair valued using decision-tree analysis, with key inputs including the probability of success, consideration of potential delays and the expected levels of future revenues.
Revaluations of contingent consideration are recognised in selling, general and administrative costs and include a decrease of $378m in 2015 (2014: an increase of $529m) based on revised milestone probabilities, and revenue and royalty forecasts, relating to the acquisition of BMS’s share of the Global Diabetes Alliance.
Further details of the potential future payments on our business combinations, including details of the possible ranges of payments, are included in Note 24. Management has identified that reasonably possible changes in certain key assumptions including the likelihood of achieving successful trial results, obtaining regulatory approval, the projected market share of the therapeutic area and expected pricing for launched products may cause the calculated fair value of the above contingent consideration to vary materially in future years.
19 Provisions
| | | | | | | | | | | | | | | | | | | | | | | | |
| | | Severance
$m | | | Environmental
$m | | | Employee
benefits
$m | | | Legal $m | | | Other
provisions
$m | | | Total $m | |
| At 1 January 2013 | | | 637 | | | | 88 | | | | 148 | | | | 100 | | | | 371 | | | | 1,344 | |
| Charge for year | | | 652 | | | | 27 | | | | 20 | | | | 23 | | | | 49 | | | | 771 | |
| Cash paid | | | (532 | ) | | | (28 | ) | | | (19 | ) | | | (78 | ) | | | (24 | ) | | | (681 | ) |
| Reversals | | | (20 | ) | | | – | | | | – | | | | (5 | ) | | | (78 | ) | | | (103 | ) |
| Exchange and other movements | | | 34 | | | | – | | | | 3 | | | | 19 | | | | 2 | | | | 58 | |
| At 31 December 2013 | | | 771 | | | | 87 | | | | 152 | | | | 59 | | | | 320 | | | | 1,389 | |
| Additions arising on business acquisitions | | | 39 | | | | – | | | | – | | | | – | | | | – | | | | 39 | |
| Charge for year | | | 254 | | | | 15 | | | | 8 | | | | 91 | | | | 66 | | | | 434 | |
| Cash paid | | | (472 | ) | | | (17 | ) | | | (16 | ) | | | (71 | ) | | | (57 | ) | | | (633 | ) |
| Reversals | | | (21 | ) | | | – | | | | – | | | | (4 | ) | | | (39 | ) | | | (64 | ) |
| Exchange and other movements | | | (45 | ) | | | (1 | ) | | | 19 | | | | (1 | ) | | | (30 | ) | | | (58 | ) |
| At 31 December 2014 | | | 526 | | | | 84 | | | | 163 | | | | 74 | | | | 260 | | | | 1,107 | |
| Additions arising on business acquisitions | | | – | | | | – | | | | – | | | | – | | | | 10 | | | | 10 | |
| Charge for year | | | 338 | | | | 8 | | | | 7 | | | | 313 | | | | 40 | | | | 706 | |
| Cash paid | | | (408 | ) | | | (25 | ) | | | (12 | ) | | | (69 | ) | | | (43 | ) | | | (557 | ) |
| Reversals | | | (40 | ) | | | – | | | | – | | | | – | | | | (12 | ) | | | (52 | ) |
| Exchange and other movements | | | (13 | ) | | | – | | | | – | | | | 39 | | | | 2 | | | | 28 | |
| At 31 December 2015 | | | 403 | | | | 67 | | | | 158 | | | | 357 | | | | 257 | | | | 1,242 | |
| | | | | | | | | | | | | | | | | | | | | | | | | |
| | | | | | | | | | | | 2015
$m | | | 2014 $m | | | 2013
$m | |
| Due within one year | | | | | | | | | | | | | | | 798 | | | | 623 | | | | 823 | |
| Due after more than one year | | | | | | | | | | | | | | | 444 | | | | 484 | | | | 566 | |
| Total | | | | | | | | | | | | | | | 1,242 | | | | 1,107 | | | | 1,389 | |
AstraZeneca is undergoing a global restructuring initiative which involves rationalisation of the global supply chain, the sales and marketing organisation, IT and business support infrastructure, and R&D. Employee costs in connection with the initiatives are recognised in severance provisions.
Details of the environmental and legal provisions are provided in Note 27.
Employee benefit provisions include the Deferred Bonus Plan. Further details are included in Note 26.
Other provisions comprise amounts relating to specific contractual or constructive obligations and disputes.
No provision has been released or applied for any purpose other than that for which it was established.
| | |
| AstraZenecaAnnual Report and Form 20-F Information 2015 | | 165 |
Financial Statements
20 Post-retirement benefits
Pensions
Background
The Company and most of its subsidiaries offer retirement plans which cover the majority of employees in the Group. Many of these plans are ‘defined contribution’, where AstraZeneca’s contribution and resulting charge is fixed at a set level or is a set percentage of employees’ pay. However, several plans, mainly in the UK, the US, Sweden and Germany, are ‘defined benefit’, where benefits are based on employees’ length of service and average final salary (typically averaged over one, three or five years). The major defined benefit plans, apart from the collectively bargained Swedish plan (which is still open to employees born before 1979), have been closed to new entrants since 2000. During 2010, following consultation with its UK employees’ representatives, AstraZeneca introduced a freeze on pensionable pay at 30 June 2010 levels for defined benefit members of the UK Pension Fund.
The major defined benefit plans are funded through separate, fiduciary-administered funds. The cash funding of the plans, which may from time to time involve special payments, is designed, in consultation with independent qualified actuaries, to ensure that the assets together with future contributions should be sufficient to meet future obligations. The funding is monitored rigorously by AstraZeneca and appropriate fiduciaries specifically with reference to AstraZeneca’s credit rating, market capitalisation, cash flows and the solvency of the relevant pension scheme.
Financing Principles
97% of the Group’s defined benefit obligations at 31 December 2015 are in schemes within the UK, the US, Sweden or Germany. In these countries, the pension obligations are funded with reference to the following financing principles:
| > | The Group has a fundamental belief in funding the benefits it promises to employees. |
| > | The Group considers its pension arrangements in the context of its broader capital structure. In general, it does not believe in committing excessive capital for funding while it has better uses of capital within the business nor does it wish to generate surpluses. |
| > | The pension funds are not part of the Group’s core business. The Group believes in taking some rewarded risks with the investments underlying the funding, subject to a medium to long-term plan to reduce those risks if opportunities arise. |
| > | The Group recognises that deciding to hold certain investments may cause volatility in the funding position. The Group would not wish to amend its contribution level for relatively small deviations from its preferred funding level, because it is expected that there will be short-term volatility, but it is prepared to react appropriately to more significant deviations. |
| > | In the event that local regulations require an additional level of financing, the Group would consider the use of alternative methods of providing this that do not require immediate cash funding but help mitigate exposure of the pension arrangement to the credit risk of the Group. |
These principles are appropriate to AstraZeneca’s business at the present date; should circumstances change they may require review.
AstraZeneca has developed a funding framework to implement these principles. This determines the cash contributions payable to the pension funds, but does not affect the IAS 19 liabilities. To reduce the risk of committing excess capital to pension funds, liability valuations are based on the expected return on the actual pension assets, rather than a corporate bond yield. At present, this puts a different, lower value on the liabilities than IAS 19.
UK
With regard to the Group’s UK defined benefit fund, the above principles are modified in light of the UK regulatory requirements (summarised below) and resulting discussions with the Pension Fund Trustee.
Role of Trustees (UK)
The UK Pension Fund is managed by a corporate Trustee which is legally separate from the Company. The Trustee Directors are composed of representatives appointed by both the employer and employees, and include an independent professional Trustee Director. The Trustee Directors are required by law to act in the interest of all relevant beneficiaries and are responsible in particular for the asset investment policy plus the day to day administration of the benefits. They are also responsible for jointly agreeing with the employer the level of contributions due to the UK Pension Fund (see below).
Funding requirements (UK)
UK legislation requires that pension schemes are funded prudently (ie to a level in excess of the current expected cost of providing benefits). On a triennial basis the Trustee and the Company must agree the contributions required (if any) to ensure the Fund is fully funded over time on a suitable prudent measure. The last funding valuation of the AstraZeneca Pension Fund was carried out by a qualified actuary as at 31 March 2013. An updated funding valuation is due as at 31 March 2016.
In addition, AstraZeneca makes contributions to a separate account which is held outside the UK Pension Fund. The assets held in this account will be payable to the AstraZeneca Pension Fund in agreed circumstances, for example, in the event of AstraZeneca and the Pension Fund Trustee agreeing on a change to the current long-term investment strategy. At 31 December 2015, £315m ($467m) of assets held in this separate account are included within other investments (see Note 11). The structure of this separate account is a custody account held by AstraZeneca with HSBC. There is a charge in favour of the Pension Fund Trustee over the assets held in this custody account.
Under the current funding plan, a lump sum contribution of £196m ($305m) was made towards the deficit in January 2015, with a further contribution of £51m ($76m) due before 31 March 2016. Contributions are made by transferring assets from the custody account described above. The Company and the UK Pension Fund are currently exploring revised funding plans and extended target dates for full funding.
Under the agreed funding principles used to set the statutory funding target, the key assumptions as at 31 March 2013 were as follows: long-term UK price inflation set at 3.55% per annum, salary increases at 0% per annum (as a result of pensionable pay levels being frozen in 2010), pension increases at 3.2% per annum and investment returns at 4.86% per annum. The resulting valuation of the Fund’s liabilities on that basis were £4,887m ($7,241m) compared to a market value of assets at 31 March 2013 of £4,394m ($6,510m).
| | |
| 166 | | AstraZenecaAnnual Report and Form 20-F Information 2015 |
20 Post-retirement benefitscontinued
Under the governing documentation of the UK Pension Fund, any future surplus in the Fund would be returnable to AstraZeneca by refund assuming gradual settlement of the liabilities over the lifetime of the fund. As such, there are no adjustments required in respect of IFRIC 14 ‘IAS 19 – The Limit on a Defined Benefit Asset, Minimum Funding Requirements and their Interaction’.
Regulation (UK)
The UK pensions market is regulated by the Pensions Regulator whose statutory objectives and regulatory powers are described on its website, www.thepensionsregulator.gov.uk.
Rest of Group
The IAS 19 positions as at 31 December 2015 are shown below for each of the other countries with significant defined benefit plans. These plans account for 90% of the Group’s defined benefit obligations outside the UK. The US and Sweden pension funds are managed by fiduciary bodies with responsibility for the investment policies of those funds. These plans are funded in line with the financing principles and contributions paid as prescribed by the funding framework.
| > | The US defined benefits programme was actuarially revalued at 31 December 2015, when plan obligations were $1,794m and plan assets were $1,566m. This includes obligations in respect of the non-qualified plan which is largely unfunded. |
| > | The Swedish defined benefits programme was actuarially revalued at 31 December 2015, when plan obligations were estimated to amount to $1,423m and plan assets were $1,045m. |
| > | The German defined benefits programme was actuarially revalued at 31 December 2015. In accordance with practice in Germany, the plan has a low level of funding; plan obligations amounted to $345m and plan assets were $19m. |
On current bases, it is expected that contributions (excluding those in respect of past service deficit contributions) during the year ending 31 December 2016 for the four main countries will be $173m.
Post-retirement benefits other than pensions
In the US, and to a lesser extent in certain other countries, AstraZeneca’s employment practices include the provision of healthcare and life assurance benefits for retired employees. As at 31 December 2015, some 3,433 retired employees and covered dependants currently benefit from these provisions and some 10,582 current employees will be eligible on their retirement. AstraZeneca accrues for the present value of such retiree obligations over the working life of the employee. In practice, these benefits will be funded with reference to the financing principles.
The cost of post-retirement benefits other than pensions for the Group in 2015 was $23m (2014: $20m; 2013: $16m). Plan assets were $293m and plan obligations were $318m at 31 December 2015. These benefit plans have been included in the disclosure of post-retirement benefits under IAS 19.
Financial assumptions
Qualified independent actuaries have updated the actuarial valuations under IAS 19 of the major defined benefit schemes operated by the Group to 31 December 2015. The assumptions used by the actuaries are chosen from a range of possible actuarial assumptions which, due to the long-term nature of the schemes, may not necessarily be borne out in practice. These assumptions were as follows:
| | | | | | | | | | | | | | | | | | |
| | | | | | 2015 | | | | | | | | 2014 | |
| | | UK | | | Rest of Group | | | | | UK | | | Rest of Group | |
| Inflation assumption | | | 3.0% | | | | 2.1% | | | | | | 3.1% | | | | 2.0% | |
| Rate of increase in salaries | | | – | 1 | | | 3.0% | | | | | | – | 1 | | | 3.2% | |
| Rate of increase in pensions in payment | | | 3.0% | | | | 0.8% | | | | | | 3.0% | | | | 0.8% | |
| Discount rate | | | 3.8% | | | | 3.8% | | | | | | 3.5% | | | | 3.0% | |
| 1 | Pensionable pay frozen at 30 June 2010 levels following UK fund changes. |
Demographic assumptions
The mortality assumptions are based on country-specific mortality tables. These are compared to actual AstraZeneca experience and adjusted where sufficient data is available. Additional allowance for future improvements in life expectancy is included for all major schemes where there is credible data to support this continuing trend.
The table below illustrates life expectancy assumptions at age 65 for male members retiring in 2015 and members expected to retire in 2035 (2014: 2014 and 2034 respectively).
| | | | | | | | | | | | | | | | |
| | | Life expectancy assumption for a male member retiring at age 65 | |
| Country | | 2015 | | | 2035 | | | 2014 | | | 2034 | |
| UK | | | 23.2 | | | | 24.5 | | | | 23.7 | | | | 25.3 | |
| US | | | 22.9 | | | | 24.4 | | | | 23.1 | | | | 24.7 | |
| Sweden | | | 20.5 | | | | 22.4 | | | | 20.5 | | | | 22.4 | |
| Germany | | | 18.7 | | | | 21.5 | | | | 18.7 | | | | 21.5 | |
The UK life expectancy has fallen over the year due to a higher-than-expected number of pensioner-age deaths in the UK over 2014/15, compared to the prior year assumptions. This has created the expectation of a less rapid rate of longevity improvement in future years, which has been reflected by the Company by adopting the CMI 2015 Mortality Projections Model with a 1% long-term improvement rate in 2015.
| | |
| AstraZenecaAnnual Report and Form 20-F Information 2015 | | 167 |
Financial Statements
20 Post-retirement benefitscontinued
Risks associated with the Company’s defined benefit pensions
The UK defined benefit plan accounts for 65% of the Group’s defined benefit obligations and exposes the Company to a number of risks, the most significant of which are:
| | | | |
| Risk | | Description | | Mitigation |
| Volatile asset returns | | The Defined Benefit Obligation (DBO) is calculated using a discount rate set with reference to corporate bond yields; asset returns that differ from the discount rate will create an element of volatility in the solvency ratio. The UK Pension Fund holds a significant proportion (over 40%) in growth assets. The largest allocation within the growth asset portfolio is held in equities (approximately 23%). Although these growth assets are expected to outperform corporate bonds in the long term, they can lead to volatility and mismatching risk in the short term. The allocation to growth assets is monitored to ensure it remains appropriate given the UK Pension Fund’s long-term objectives. | | The Company and Trustee have put in place an equity option hedging strategy for the UK Pension Fund to reduce the volatility of equity investment returns. This strategy covers over 60% of the equity exposure. In addition, changes to the investment strategy have been adopted over the course of the year which further diversify the growth portfolio and which are expected to reduce investment risk and increase expected returns. The investment strategy will continue to evolve to further improve the expected risk/return profile over 2016. The Company and Trustee have hedged the vast majority (over 90%) of unintended non-sterling, overseas currency risk within the UK Pension Fund assets. |
| Changes in bond yields | | A decrease in corporate bond yields will increase the present value placed on the DBO for accounting purposes, although this will be partially offset by an increase in the value of the UK Pension Fund’s bond holdings. | | The UK Pension Fund holds a significant proportion of its assets (around 35%) in corporate bonds, which provide a hedge against falling bond yields (falling yields which increase the DBO will also increase the value of the bond assets). This interest rate hedge is further extended by investments in gilts and the use of interest rate derivatives, so that overall the UK Pension Fund liabilities are approximately 45% hedged against falling interest rates on an economic value basis. Note that there are some differences in the credit quality of bonds held by the UK Pension Fund and the bonds analysed to decide the DBO discount rate, such that there remains some risk should yields on different quality bond/ swap assets diverge. |
| Inflation risk | | A significant proportion of the DBO is indexed in line with price inflation (specifically inflation in the UK Retail Price Index) and higher inflation will lead to higher liabilities (although, in most cases, this is capped at an annual increase of 5%). | | The UK Pension Fund holds some inflation-linked assets which provide a hedge against higher-than-expected inflation increases on the DBO. This is augmented by inflation swaps, such that overall the UK Pension Fund assets hedge approximately 50% of the liability exposure to changes in expected inflation on an economic value basis. |
| Life expectancy | | The majority of the UK Pension Fund’s obligations are to provide benefits for the life of the member, so increases in life expectancy will result in an increase in the liabilities. | | The UK Pension Fund entered into a longevity swap during 2013 which provides hedging against the longevity risk of increasing life expectancy over the next 78 years for around 10,000 of the Pension Fund’s current pensioners and covers $3.4bn of the Pension Fund’s liabilities. A one year increase in life expectancy will result in $207m increase in pension fund assets. |
Other risks
There are a number of other risks of running the UK Pension Fund including operational risks (such as paying out the wrong benefits) and legislative risks (such as the government increasing the burden on pension through new legislation).
| | |
| 168 | | AstraZenecaAnnual Report and Form 20-F Information 2015 |
20 Post-retirement benefits continued
Post-retirement scheme deficit
The assets and obligations of the defined benefit schemes operated by the Group at 31 December 2015, as calculated in accordance with IAS 19, are shown below. The fair values of the schemes’ assets are not intended to be realised in the short term and may be subject to significant change before they are realised. The present value of the schemes’ obligations is derived from cash flow projections over long periods and is therefore inherently uncertain.
| | | | | | | | | | | | | | | | | | | | | | | | | | |
| | | | | | | | | 2015 | | | | | | | | | | | 2014 | |
| | | UK $m | | | Rest of Group
$m | | | Total $m | | | | | UK $m | | | Rest of Group
$m | | | Total $m | |
| | | | | | | |
| Scheme assets | | | | | | | | | | | | | | | | | | | | | | | | | | |
| Equity: Global (exc. Emerging markets) | | | 1,362 | | | | 770 | | | | 2,132 | | | | | | 1,700 | | | | 1,005 | | | | 2,705 | |
| Equity: Emerging markets | | | 140 | | | | 1 | | | | 141 | | | | | | 320 | | | | 21 | | | | 341 | |
| Government bonds: Global (exc. Emerging markets) | | | 1,614 | | | | 421 | | | | 2,035 | | | | | | 1,373 | | | | 255 | | | | 1,628 | |
| Government bonds: Emerging markets | | | 3 | | | | 59 | | | | 62 | | | | | | 74 | | | | 63 | | | | 137 | |
| Investment grade corporate bonds (AAA-BBB): Global (exc. Emerging markets) | | | 2,273 | | | | 940 | | | | 3,213 | | | | | | 3,112 | | | | 1,563 | | | | 4,675 | |
| Investment grade corporate bonds (AAA-BBB): Emerging markets | | | 30 | | | | – | | | | 30 | | | | | | 106 | | | | 9 | | | | 115 | |
| Other corporate bonds: Global (exc. Emerging markets) | | | 61 | | | | 6 | | | | 67 | | | | | | 33 | | | | 78 | | | | 111 | |
| Other corporate bonds: Emerging markets | | | 23 | | | | 2 | | | | 25 | | | | | | – | | | | – | | | | – | |
| Derivatives: Interest rate contracts | | | (111 | ) | | | (32 | ) | | | (143 | ) | | | | | (94 | ) | | | 30 | | | | (64 | ) |
| Derivatives: Inflation rate contracts | | | (92 | ) | | | 9 | | | | (83 | ) | | | | | (63 | ) | | | – | | | | (63 | ) |
| Derivatives: Foreign exchange contracts | | | (84 | ) | | | 3 | | | | (81 | ) | | | | | (14 | ) | | | (26 | ) | | | (40 | ) |
| Derivatives: Other | | | (140 | ) | | | – | | | | (140 | ) | | | | | 16 | | | | – | | | | 16 | |
| Derivatives: Longevity swap | | | (37 | ) | | | – | | | | (37 | ) | | | | | – | | | | – | | | | – | |
| Investment funds: Private equity funds (no quoted market price) | | | – | | | | – | | | | – | | | | | | – | | | | 38 | | | | 38 | |
| Investment funds: Hedge funds | | | 531 | | | | 154 | | | | 685 | | | | | | 335 | | | | 111 | | | | 446 | |
| Investment funds: Hedge funds (no quoted market price) | | | 390 | | | | 373 | | | | 763 | | | | | | 1 | | | | – | | | | 1 | |
| Cash and cash equivalents | | | 436 | | | | 159 | | | | 595 | | | | | | 302 | | | | 76 | | | | 378 | |
| Others | | | 68 | | | | 89 | | | | 157 | | | | | | 110 | | | | 12 | | | | 122 | |
| Total fair value of scheme assets1 | | | 6,467 | | | | 2,954 | | | | 9,421 | | | | | | 7,311 | | | | 3,235 | | | | 10,546 | |
| | | | | | | |
| Scheme obligations | | | | | | | | | | | | | | | | | | | | | | | | | | |
| Present value of scheme obligations in respect of: | | | | | | | | | | | | | | | | | | | | | | | | | | |
| Active membership | | | (1,094 | ) | | | (1,420 | ) | | | (2,514 | ) | | | | | (1,168 | ) | | | (1,763 | ) | | | (2,931 | ) |
| Deferred membership | | | (1,862 | ) | | | (986 | ) | | | (2,848 | ) | | | | | (2,474 | ) | | | (1,125 | ) | | | (3,599 | ) |
| Pensioners | | | (4,495 | ) | | | (1,538 | ) | | | (6,033 | ) | | | | | (5,200 | ) | | | (1,767 | ) | | | (6,967 | ) |
| Total value of scheme obligations | | | (7,451 | ) | | | (3,944 | ) | | | (11,395 | ) | | | | | (8,842 | ) | | | (4,655 | ) | | | (13,497 | ) |
| Deficit in the scheme as recognised in the statement of financial position | | | (984 | ) | | | (990 | ) | | | (1,974 | ) | | | | | (1,531 | ) | | | (1,420 | ) | | | (2,951 | ) |
1 Included in scheme assets is $nil (2014: $nil) of the Company’s own assets. Fair value of scheme assets | |
| | | | | | | | | 2015 | | | | | | | | | | | 2014 | |
| | | UK $m | | | Rest of Group $m | | | Total $m | | | | | UK $m | | | Rest of Group $m | | | Total $m | |
| At beginning of year | | | 7,311 | | | | 3,235 | | | | 10,546 | | | | | | 7,021 | | | | 3,248 | | | | 10,269 | |
| Interest income on scheme assets | | | 257 | | | | 100 | | | | 357 | | | | | | 307 | | | | 133 | | | | 440 | |
| Expenses | | | (5 | ) | | | (10 | ) | | | (15 | ) | | | | | (5 | ) | | | (4 | ) | | | (9 | ) |
| Actuarial (losses)/gains | | | (375 | ) | | | (64 | ) | | | (439 | ) | | | | | 670 | | | | 274 | | | | 944 | |
| Exchange adjustments | | | (311 | ) | | | (97 | ) | | | (408 | ) | | | | | (426 | ) | | | (291 | ) | | | (717 | ) |
| Employer contributions | | | 360 | | | | 42 | | | | 402 | | | | | | 88 | | | | 96 | | | | 184 | |
| Participant contributions | | | 5 | | | | – | | | | 5 | | | | | | 6 | | | | – | | | | 6 | |
| Settlements | | | (447 | ) | | | – | | | | (447 | ) | | | | | – | | | | – | | | | – | |
| Benefits paid | | | (328 | ) | | | (252 | ) | | | (580 | ) | | | | | (350 | ) | | | (221 | ) | | | (571 | ) |
| Scheme assets’ fair value at end of year | | | 6,467 | | | | 2,954 | | | | 9,421 | | | | | | 7,311 | | | | 3,235 | | | | 10,546 | |
The actual return on the plan assets was a loss of $82m (2014: gain of $1,384m).
| | |
| AstraZenecaAnnual Report and Form 20-F Information 2015 | | 169 |
Financial Statements
20 Post-retirement benefits continued
Movement in post-retirement scheme obligations
| | | | | | | | | | | | | | | | | | | | | | | | | | |
| | | | | | | | | 2015 | | | | | | | | | | | 2014 | |
| | | UK $m | | | Rest of Group
$m | | | Total $m | | | | | UK
$m | | | Rest of Group $m | | | Total $m | |
| Present value of obligation in scheme at beginning of year | | | (8,842 | ) | | | (4,655 | ) | | | (13,497 | ) | | | | | (8,403 | ) | | | (4,127 | ) | | | (12,530 | ) |
| Current service cost | | | (34 | ) | | | (105 | ) | | | (139 | ) | | | | | (33 | ) | | | (103 | ) | | | (136 | ) |
| Past service cost | | | (44 | ) | | | 16 | | | | (28 | ) | | | | | (63 | ) | | | (22 | ) | | | (85 | ) |
| Participant contributions | | | (5 | ) | | | – | | | | (5 | ) | | | | | (6 | ) | | | – | | | | (6 | ) |
| Benefits paid | | | 328 | | | | 252 | | | | 580 | | | | | | 350 | | | | 221 | | | | 571 | |
| Interest expense on post-retirement scheme obligations | | | (301 | ) | | | (133 | ) | | | (434 | ) | | | | | (369 | ) | | | (163 | ) | | | (532 | ) |
| Actuarial gains/(losses) | | | 613 | | | | 478 | | | | 1,091 | | | | | | (841 | ) | | | (869 | ) | | | (1,710 | ) |
| Obligations arising on acquisitions | | | – | | | | – | | | | – | | | | | | (4 | ) | | | (50 | ) | | | (54 | ) |
| Settlements | | | 447 | | | | – | | | | 447 | | | | | | – | | | | – | | | | – | |
| Exchange adjustments | | | 387 | | | | 203 | | | | 590 | | | | | | 527 | | | | 458 | | | | 985 | |
| Present value of obligations in scheme at end of year | | | (7,451 | ) | | | (3,944 | ) | | | (11,395 | ) | | | | | (8,842 | ) | | | (4,655 | ) | | | (13,497 | ) |
| | | | | | | |
The obligations arise from the following plans: | | | | | | | | | | | | | | | | | | | | | | | | | | |
| | | | | | | |
| | | | | | | | | 2015 | | | | | | | | | | | 2014 | |
| | | UK $m | | | Rest of Group $m | | | Total $m | | | | | UK $m | | | Rest of Group
$m | | | Total $m | |
| Funded – pension schemes | | | (7,429 | ) | | | (3,142 | ) | | | (10,571 | ) | | | | | (8,815 | ) | | | (3,694 | ) | | | (12,509 | ) |
| Funded – post-retirement healthcare | | | – | | | | (281 | ) | | | (281 | ) | | | | | – | | | | (360 | ) | | | (360 | ) |
| Unfunded – pension schemes | | | – | | | | (506 | ) | | | (506 | ) | | | | | – | | | | (586 | ) | | | (586 | ) |
| Unfunded – post-retirement healthcare | | | (22 | ) | | | (15 | ) | | | (37 | ) | | | | | (27 | ) | | | (15 | ) | | | (42 | ) |
| Total | | | (7,451 | ) | | | (3,944 | ) | | | (11,395 | ) | | | | | (8,842 | ) | | | (4,655 | ) | | | (13,497 | ) |
The weighted average duration of the post-retirement scheme obligations in the UK is 16 years and 14 years in the Rest of Group. Consolidated Statement of Comprehensive Income disclosures The amounts that have been charged to the consolidated statement of comprehensive income, in respect of defined benefit schemes for the year ended 31 December 2015, are set out below. | |
| | | | | | | | | 2015 | | | | | | | | | | | 2014 | |
| | | UK $m | | | Rest of Group $m | | | Total $m | | | | | UK $m | | | Rest of Group $m | | | Total $m | |
| Operating profit | | | | | | | | | | | | | | | | | | | | | | | | | | |
| Current service cost | | | (34 | ) | | | (105 | ) | | | (139 | ) | | | | | (33 | ) | | | (103 | ) | | | (136 | ) |
| Past service cost | | | (44 | ) | | | 16 | | | | (28 | ) | | | | | (63 | ) | | | (22 | ) | | | (85 | ) |
| Expenses | | | (5 | ) | | | (10 | ) | | | (15 | ) | | | | | (5 | ) | | | (4 | ) | | | (9 | ) |
| Total charge to operating profit | | | (83 | ) | | | (99 | ) | | | (182 | ) | | | | | (101 | ) | | | (129 | ) | | | (230 | ) |
| | | | | | | |
| Finance expense | | | | | | | | | | | | | | | | | | | | | | | | | | |
| Interest income on scheme assets | | | 257 | | | | 100 | | | | 357 | | | | | | 307 | | | | 133 | | | | 440 | |
| Interest expense on post-retirement scheme obligations | | | (301 | ) | | | (133 | ) | | | (434 | ) | | | | | (369 | ) | | | (163 | ) | | | (532 | ) |
| Net interest on post-employment defined benefit plan liabilities | | | (44 | ) | | | (33 | ) | | | (77 | ) | | | | | (62 | ) | | | (30 | ) | | | (92 | ) |
| Charge before taxation | | | (127 | ) | | | (132 | ) | | | (259 | ) | | | | | (163 | ) | | | (159 | ) | | | (322 | ) |
| | | | | | | |
| Other comprehensive income | | | | | | | | | | | | | | | | | | | | | | | | | | |
| Difference between the actual return and the expected return on the post-retirement scheme assets | | | (375 | ) | | | (64 | ) | | | (439 | ) | | | | | 670 | | | | 274 | | | | 944 | |
| Experience gains/(losses) arising on the post-retirement scheme obligations | | | 3 | | | | 56 | | | | 59 | | | | | | (8 | ) | | | (13 | ) | | | (21 | ) |
| Changes in financial assumptions underlying the present value of the post-retirement scheme obligations | | | 370 | | | | 386 | | | | 756 | | | | | | (848 | ) | | | (725 | ) | | | (1,573 | ) |
| Changes in demographic assumptions | | | 240 | | | | 36 | | | | 276 | | | | | | 15 | | | | (131 | ) | | | (116 | ) |
| Remeasurement of the defined benefit liability | | | 238 | | | | 414 | | | | 652 | | | | | | (171 | ) | | | (595 | ) | | | (766 | ) |
Included in total assets and obligations for the UK is $nil (2014: $473m) in respect of the Investment Account (defined contribution) section of the UK Pension Fund. In 2015, AstraZeneca decided to no longer convert assets held in the Investment Account section into the defined benefit section, as members reached retirement. As a result, settlements within the year include $447m relating to the Investment Account being removed from both the UK assets and liabilities with a net impact of $nil on the overall deficit.
Past service cost in 2015 includes a credit to operating income of $21m arising from the reduction of the pre-65 maximum annual cost of medical coverage in the US retiree health plans.
Group costs in respect of defined contribution schemes during the year were $302m (2014: $238m). Past service cost relates predominantly to enhanced pensions on early retirement in the UK and Sweden.
| | |
| 170 | | AstraZenecaAnnual Report and Form 20-F Information 2015 |
20 Post-retirement benefits continued
Rate sensitivities
The following table shows the US dollar effect of a change in the significant actuarial assumptions used to determine the retirement benefits obligations in our four main defined benefit pension obligation countries.
| | | | | | | | | | | | | | | | | | |
| | | | | | 2015 | | | | | | | | 2014 | |
| | | +0.5% | | | -0.5% | | | | | +0.5% | | | -0.5% | |
| | | | | |
| Discount rate | | | | | | | | | | | | | | | | | | |
| UK ($m) | | | 530 | | | | (600 | ) | | | | | 622 | | | | (676 | ) |
| US ($m) | | | 111 | | | | (118 | ) | | | | | 119 | | | | (125 | ) |
| Sweden ($m) | | | 143 | | | | (164 | ) | | | | | 201 | | | | (232 | ) |
| Germany ($m) | | | 32 | | | | (37 | ) | | | | | 39 | | | | (45 | ) |
| Total ($m) | | | 816 | | | | (919 | ) | | | | | 981 | | | | (1,078 | ) |
| | | | | | | | | | | | | | | | | | | |
| | | | | | 2015 | | | | | | | | 2014 | |
| | | +0.5% | | | -0.5% | | | | | +0.5% | | | -0.5% | |
| | | | | |
| Inflation rate1 | | | | | | | | | | | | | | | | | | |
| UK ($m) | | | (525 | ) | | | 517 | | | | | | (457 | ) | | | 520 | |
| US ($m) | | | (14 | ) | | | 15 | | | | | | (19 | ) | | | 19 | |
| Sweden ($m) | | | (159 | ) | | | 140 | | | | | | (229 | ) | | | 200 | |
| Germany ($m) | | | (21 | ) | | | 19 | | | | | | (25 | ) | | | 23 | |
| Total ($m) | | | (719 | ) | | | 691 | | | | | | (730 | ) | | | 762 | |
| | | | | | | | | | | | | | | | | | | |
| | | | | | 2015 | | | | | | | | 2014 | |
| | | +0.5% | | | -0.5% | | | | | +0.5% | | | -0.5% | |
| | | | | |
| Rate of increase in salaries | | | | | | | | | | | | | | | | | | |
| UK ($m) | | | – | | | | – | | | | | | – | | | | – | |
| US ($m) | | | (12 | ) | | | 12 | | | | | | (15 | ) | | | 15 | |
| Sweden ($m) | | | (66 | ) | | | 58 | | | | | | (82 | ) | | | 72 | |
| Germany ($m) | | | (1 | ) | | | 1 | | | | | | (1 | ) | | | 1 | |
| Total ($m) | | | (79 | ) | | | 71 | | | | | | (98 | ) | | | 88 | |
| | | | | | | | | | | | | | | | | | | |
| | | | | | 2015 | | | | | | | | 2014 | |
| | | +1 year | | | -1 year | | | | | +1 year | | | -1 year | |
| | | | | |
| Mortality rate | | | | | | | | | | | | | | | | | | |
| UK ($m) | | | (313 | )2 | | | 314 | 3 | | | | | (318 | ) | | | 324 | |
| US ($m) | | | (24 | ) | | | 25 | | | | | | (25 | ) | | | 26 | |
| Sweden ($m) | | | (63 | ) | | | 62 | | | | | | (105 | ) | | | 105 | |
| Germany ($m) | | | (13 | ) | | | 13 | | | | | | (15 | ) | | | 15 | |
| Total ($m) | | | (413 | ) | | | 414 | | | | | | (463 | ) | | | 470 | |
| 1 | Rate of increase in pensions in payment follows inflation. |
| 2 | Of the $313m increase, $207m is covered by the longevity swap. |
| 3 | Of the $314m decrease, $214m is covered by the longevity swap. |
The sensitivity to the financial assumptions shown above has been estimated taking into account the approximate duration of the liabilities and the overall profile of the plan membership. The sensitivity to the life expectancy assumption has been estimated based on the distribution of the plan cash flows.
| | |
| AstraZenecaAnnual Report and Form 20-F Information 2015 | | 171 |
Financial Statements
21 Reserves
Retained earnings
The cumulative amount of goodwill written off directly to reserves resulting from acquisitions, net of disposals, amounted to $624m (2014: $639m; 2013: $679m) using year end rates of exchange. At 31 December 2015, 49,105 shares, at a cost of $4m, have been deducted from retained earnings (2014: 168,388 shares, at a cost of $10m; 2013: 99,341 shares, at a cost of $2m).
There are no significant statutory or contractual restrictions on the distribution of current profits of subsidiaries; undistributed profits of prior years are, in the main, permanently employed in the businesses of these companies. The undistributed income of AstraZeneca companies overseas might be liable to overseas taxes and/or UK taxation (after allowing for double taxation relief) if they were to be distributed as dividends (see Note 4).
| | | | | | | | | | | | | | | | | | | | | | | | |
| | | | | | | | | | | | 2015 $m | | | 2014 $m | | | 2013 $m | |
| | | | |
| Cumulative translation differences included within retained earnings | | | | | | | | | | | | | | | | | |
| Balance at beginning of year | | | | | | | | | | | | | | | 490 | | | | 1,782 | | | | 1,901 | |
| Foreign exchange arising on consolidation | | | | | | | | (528 | ) | | | (823 | ) | | | (166 | ) |
| Exchange adjustments on goodwill (recorded against other reserves) | | | | | | | | (15 | ) | | | (40 | ) | | | (6 | ) |
| Foreign exchange arising on designating borrowings in net investment hedges | | | | | | | | (333 | ) | | | (529 | ) | | | (58 | ) |
| Fair value movement on derivatives designated in net investment hedges | | | | | | | | 14 | | | | 100 | | | | 111 | |
| Net exchange movement in retained earnings | | | | | | | | (862 | ) | | | (1,292 | ) | | | (119 | ) |
| Balance at end of year | | | | | | | | (372 | ) | | | 490 | | | | 1,782 | |
Other reserves The other reserves arose from the cancellation of £1,255m of share premium account by the Company in 1993 and the redenomination of share capital ($157m) in 1999. The reserves are available for writing off goodwill arising on consolidation and, subject to guarantees given to preserve creditors at the date of the court order, are available for distribution. 22 Share capital of the Company | |
| | | | | | | | | | | | | | | Allotted, called-up and fully paid | |
| | | | | | | | | | | | 2015 $m | | | 2014 $m | | | 2013 $m | |
| Issued Ordinary Shares ($0.25 each) | | | | | | | | | | | | | | | 316 | | | | 316 | | | | 315 | |
| Redeemable Preference Shares (£1 each – £50,000) | | | | | | | | | | | | | | | – | | | | – | | | | – | |
| At 31 December | | | | | | | | | | | | | | | 316 | | | | 316 | | | | 315 | |
The Redeemable Preference Shares carry limited class voting rights and no dividend rights. This class of shares is capable of redemption at par at the option of the Company on the giving of seven days’ written notice to the registered holder of the shares. The movements in the number of Ordinary Shares during the year can be summarised as follows: | |
| | | | | | | | | | | | | | | | | | No. of shares | |
| | | | | | | | | | | | 2015 | | | 2014 | | | 2013 | |
| At 1 January | | | | | | | | | | | | | | | 1,263,143,338 | | | | 1,257,170,087 | | | | 1,246,779,548 | |
| Issues of shares | | | | | | | | | | | | | | | 979,332 | | | | 5,973,251 | | | | 10,390,539 | |
| At 31 December | | | | | | | | | | | | | | | 1,264,122,670 | | | | 1,263,143,338 | | | | 1,257,170,087 | |
Share repurchases No Ordinary Shares were repurchased by the Company in 2015 (2014: nil; 2013: nil). Share option schemes A total of 1.0m Ordinary Shares were issued during the year in respect of share option schemes (2014: 6.0m Ordinary Shares; 2013: 10.4m Ordinary Shares). Details of Directors’ interests in shares are shown in the Directors’ Remuneration Report from page 103. Shares held by subsidiaries No shares in the Company were held by subsidiaries in any year. 23 Dividends to shareholders | |
| | | 2015
Per share | | | 2014
Per share | | | 2013
Per share | | | 2015 $m | | | 2014 $m | | | 2013 $m | |
| Final | | | $1.90 | | | | $1.90 | | | | $1.90 | | | | 2,400 | | | | 2,395 | | | | 2,372 | |
| Interim | | | $0.90 | | | | $0.90 | | | | $0.90 | | | | 1,137 | | | | 1,137 | | | | 1,127 | |
| Total | | | $2.80 | | | | $2.80 | | | | $2.80 | | | | 3,537 | | | | 3,532 | | | | 3,499 | |
The second interim dividend, to be confirmed as final, is $1.90 per Ordinary Share and $2,402m in total. This will be payable on 21 March 2016.
On payment of the dividends, exchange gains of $2m (2014: losses of $3m; 2013: gains of $1m) arose. These exchange gains are included in Note 3.
| | |
| 172 | | AstraZenecaAnnual Report and Form 20-F Information 2015 |
24 Acquisitions of business operations
2015 Acquisitions
ZS Pharma
On 17 December, AstraZeneca completed the acquisition of ZS Pharma, a biopharmaceutical company based in San Mateo, California. ZS Pharma uses its proprietary ion-trap technology to develop novel treatments for hyperkalaemia, a serious condition of elevated potassium in the bloodstream, typically associated with chronic kidney disease (CKD) and chronic heart failure (CHF).
The acquisition gives AstraZeneca access to the potassium-binding compound ZS-9, a potential best-in-class treatment for hyperkalaemia, which is under regulatory review by the US Food and Drug Administration with a Prescription Drug User Fee Act goal date of 26 May 2016. A submission for European Marketing Application Authorisation was made late in 2015.
ZS Pharma represents a strong fit with AstraZeneca’s pipeline and portfolio in Cardiovascular and Metabolic disease, one of the Company’s three main therapy areas. AstraZeneca’s strategy focuses on reducing morbidity, mortality and organ damage by addressing multiple risk factors across cardiovascular disease, diabetes and chronic kidney disease. ZS-9 complements the Company’s increasing focus on CKD and CHF, including the investigational medicine roxadustat, which is currently in Phase III development for patients with anaemia associated with CKD, as well as its leading diabetes portfolio.
Under the terms of the agreement, AstraZeneca has acquired 100% of the share capital of ZS Pharma for $90 per share in an all-cash transaction, or approximately $2.7bn in aggregate transaction value.
ZS Pharma has around 200 employees across three sites in California, Texas and Colorado. The combination of intangible product rights with an established workforce and their associated operating processes, principally those related to research and development and manufacturing, requires that the transaction is accounted for as a business combination in accordance with IFRS 3.
Goodwill is principally attributable to the commercial synergies AstraZeneca expects to be able to realise upon launch of ZS-9, the value of the specialist knowhow inherent in the acquired workforce and the accounting for deferred taxes. Goodwill is not expected to be deductible for tax purposes.
ZS Pharma’s results have been consolidated into the Group’s results from 17 December 2015. From the period from acquisition to 31 December 2015, ZS Pharma’s revenues and loss were immaterial.
If the acquisition had taken effect at the beginning of the reporting period in which the acquisition occurred (1 January 2015), on apro forma basis, the revenue of the combined Group for 2015 would have been unchanged and the profit after tax would have been $2,702m. Thispro forma information does not purport to represent the results of the combined Group that actually would have occurred had the acquisition taken place on 1 January 2015 and should not be taken to be representative of future results.
Given the proximity of the completion of the transaction to the date the Financial Statements were approved, the finalisation of the accounting entries for this transaction has yet to be completed. Our provisional assessment of the fair values of the assets and liabilities acquired is detailed below. Our assessment will be completed in 2016.
| | | | |
| | | Fair value
$m | |
| Non-current assets | | | | |
| Intangible assets (Note 9) | | | 3,162 | |
| Property, plant and equipment (Note 7) | | | 21 | |
| | | | 3,183 | |
| Current assets | | | 169 | |
| Current liabilities | | | (50 | ) |
| Non-current liabilities | | | | |
| Deferred tax liabilities | | | (1,045 | ) |
| Other liabilities | | | (13 | ) |
| | | | (1,058 | ) |
| Total net assets acquired | | | 2,244 | |
| Goodwill (Note 8) | | | 456 | |
| Total upfront consideration | | | 2,700 | |
| Less: cash and cash equivalents acquired | | | (73 | ) |
| Less: upfront consideration settled in January 2016 | | | (181 | ) |
| Net cash outflow | | | 2,446 | |
Acquisition costs were immaterial.
| | |
| AstraZenecaAnnual Report and Form 20-F Information 2015 | | 173 |
Financial Statements
2014 Acquisitions
BMS’s share of Global Diabetes Alliance Assets
On 1 February 2014, AstraZeneca completed the acquisition of BMS’s interests in the companies’ diabetes alliance. The acquisition provided AstraZeneca with 100% ownership of the intellectual property and global rights for the development, manufacture and commercialisation of the diabetes business, includingOnglyza (saxagliptin),Kombiglyze XR (saxagliptin and metformin HCl extended release),Komboglyze (saxagliptin and metformin HCl),Farxiga (dapagliflozin, marketed asForxiga outside the US),Byetta (exenatide),Bydureon (exenatide extended release for injectable suspension),Myalept (metreleptin) andSymlin (pramlintide acetate).
The transaction consolidated worldwide ownership of the diabetes business within AstraZeneca, leveraging its primary and specialty care capabilities and its geographical reach, especially in emerging markets. The transaction included the acquisition of 100% of the share capital of Amylin Pharmaceuticals, LLC, and the asset purchase of the additional intellectual property and global rights not already owned by AstraZeneca, for the development, manufacture and commercialisation ofOnglyza, Kombiglyze XR,Komboglyze andFarxiga, including associated BMS employees. This combination of intangible product rights and manufacturing assets with an established workforce and their associated operating processes, principally those related to the global manufacturing and selling and marketing operations, required that the acquisition be accounted for as a business combination in accordance with IFRS 3.
Upfront consideration for the acquisition of $2.7bn was paid on 1 February 2014, with further payments of up to $1.4bn being payable for future regulatory, launch and sales-related milestones as well as various sales-related royalty payments up until 2025. The amount of royalties payable under the agreement is inherently uncertain and difficult to predict, given the direct link to future sales and the range of outcomes cannot be reliably estimated. The maximum amount payable in each year is with reference to net sales. AstraZeneca also agreed to make payments up to $225m when certain additional assets are transferred. Contingent consideration was fair valued using decision-tree analysis, with key inputs including the probability of success, consideration of potential delays and the expected levels of future revenues. In accordance with IFRS 3, the fair value of contingent consideration, including future royalties, was recognised immediately as a liability.
The acquiring entity within the Group was a Swedish krona functional currency subsidiary. Foreign currency risk arises from the retranslation of the US dollar denominated contingent consideration. To manage this foreign currency risk the contingent consideration liability has been designated as the hedge instrument in a net investment hedge of the Group’s underlying US dollar net investments. Exchange differences on the retranslation of the contingent consideration liability are recognised in other comprehensive income to the extent that the hedge is effective. Any ineffectiveness is taken to profit.
In addition to the acquired interests, AstraZeneca entered into certain agreements with BMS to maintain the manufacturing and supply chain of the full portfolio of diabetes products and to deliver specified clinical trials with an agreed number of R&D and manufacturing employees dedicated to diabetes remaining with BMS to progress the diabetes portfolio and support the transition for these areas. Payments by AstraZeneca to BMS in relation to these arrangements are expensed as incurred. No amounts were recognised in the initial acquisition accounting in relation to these arrangements but were separated, at fair value, from the business combination accounting.
The terms of the agreement partially reflected settlement of the launch and sales-related milestones under the pre-existingOnglyza andFarxiga collaboration agreements, which were terminated in relation to the acquisition. The expected value of those pre-existing milestones was $0.3bn and was recognised as a separate component of consideration and excluded from the business combination accounting. Subsequently, these separate intangible assets have been recognised.
Goodwill of $1,530m arising on the transaction is underpinned by a number of elements, which individually cannot be quantified. Most significant among these are the synergies AstraZeneca expects to be able to generate through more efficient manufacturing processes and the incremental value accessible through strategic and operational independence upon taking full control of the alliance. Goodwill of $1.5bn is expected to be deductible for tax purposes.
The fair value of receivables acquired as part of the acquisition approximated the gross contractual amounts receivable. There were no significant amounts which were not expected to be collected.
The results from the additional acquired interests in the diabetes alliance were consolidated into the Group’s results from 1 February 2014, which added revenue of $895m in the period to 31 December 2014. Due to the highly integrated nature of the diabetes alliance, and the fact that it is not operated through a separate legal entity, the incremental direct costs associated with the additional acquired interest are not separately identifiable and it is impracticable therefore to disclose the profit or loss recognised in the period since acquisition.
If the acquisition had taken effect at the beginning of the reporting period in which the acquisition occurred (1 January 2014), on apro formabasis, the revenue of the combined Group for 2014 would have been $26,174m. As detailed above, it is impracticable to disclose apro formaprofit after tax. Thispro forma information does not purport to represent the results of the combined Group that actually would have occurred had the acquisition taken place on 1 January 2014 and should not be taken to be representative of future results.
Almirall
On 31 October 2014, the Group completed the agreement with Almirall to transfer the rights to Almirall’s respiratory franchise to AstraZeneca.
The transaction provided AstraZeneca with 100% of the rights for the development and commercialisation of Almirall’s existing proprietary respiratory business, including rights to revenues from Almirall’s existing collaborations, as well as its pipeline of investigational novel therapies. The franchise includesEklira (aclidinium);Duaklir Genuair, the combination of aclidinium with formoterol which had been filed for registration in the EU and developed in the US (EU approval received in November 2014); LAS100977 (abediterol), a once-daily long-acting beta2-agonist (LABA) in Phase II; an M3 antagonist beta2-agonist (MABA) platform in pre-clinical development (LAS191351, LAS194871) and Phase I (LAS190792); and multiple pre-clinical programmes. Almirall Sofotec, an Almirall subsidiary focused on the development of innovative proprietary devices, also transferred to AstraZeneca. In addition, Almirall employees dedicated to the respiratory business, including Almirall Sofotec employees, transferred to AstraZeneca.
| | |
| 174 | | AstraZenecaAnnual Report and Form 20-F Information 2015 |
24 Acquisitions of business operations continued
Upfront consideration for the acquisition of $878m was paid in November 2014, with further payments of up to $1.22bn being payable for future development, launch, and sales-related milestones. AstraZeneca also agreed to make various sales-related payments. The amount of royalties payable under the agreement is inherently uncertain and difficult to predict, given the direct link to future sales and the range of outcomes cannot be reliably estimated. The maximum amount payable in each year is with reference to net sales. Contingent consideration was fair valued using decision-tree analysis, with key inputs including the probability of success, consideration of potential delays and the expected levels of future revenues.
The acquiring entity within the Group was a pounds sterling functional currency subsidiary. Foreign currency risk arises from the retranslation of the contingent consideration. To manage this foreign currency risk the contingent consideration liability has been designated as the hedge instrument in a net investment hedge. Exchange differences on the retranslation of the contingent consideration liability are recognised in other comprehensive income to the extent that the hedge is effective. Any ineffectiveness is taken to profit.
Almirall’s pipeline of novel respiratory assets and its device capabilities further strengthen AstraZeneca’s Respiratory portfolio, which includesSymbicort andPulmicort, as well as the investigational medicines in development. The addition of aclidinium and the combination of aclidinium with formoterol, both in proprietaryGenuair device, allows AstraZeneca to offer patients a choice between dry powder inhaler and metered-dose inhaler devices across a range of molecules and combinations.
The combination of intangible product rights with an established workforce and their associated operating processes, principally those related to the selling and marketing operations, requires that the transaction is accounted for as a business combination in accordance with IFRS 3.
Goodwill of $311m is underpinned by a number of elements, which individually cannot be quantified. Most significant among these is the premium attributable to the significant competitive advantage associated with AstraZeneca’s complementary portfolio and that attributable to a highly skilled workforce. Goodwill of $0.3bn is expected to be deductible for tax purposes.
Almirall’s respiratory franchise results were consolidated into the Group’s results from 31 October 2014. For the period from acquisition to 31 December 2014, Almirall’s respiratory franchise revenues were $13m. Due to the highly integrated nature of the respiratory franchise, and the fact that it is not operated through a separate legal entity, the incremental direct costs associated with the acquired interest are not separately identifiable and it is impracticable therefore to disclose the profit or loss recognised in the period since acquisition.
If the acquisition had taken effect at the beginning of the reporting period in which the acquisition occurred (1 January 2014), on apro forma basis, the revenue of the combined Group for 2014 would have been $26,198m. As detailed above, it is impracticable to disclose apro forma profit after tax. Thispro forma information does not purport to represent the results of the combined Group that actually would have occurred had the acquisition taken place on 1 January 2014 and should not be taken to be representative of future results.
Definiens
On 25 November 2014, AstraZeneca completed the acquisition of Definiens Group, a privately-held German company focused on imaging and data analysis technology, known as Tissue Phenomics™, which dramatically improves the identification of biomarkers in tumour tissue.
Definiens technology provides detailed cell-by-cell readouts from target structures on tissue slides and allows the correlation of this information with data derived from other sources, generating new knowledge and supporting better decisions in research, diagnostics and therapy.
AstraZeneca acquired 100% of Definiens shares for an upfront consideration of $150m and contingent consideration of up to $150m based on reaching three predetermined development milestones. Contingent consideration was fair valued using decision-tree analysis, with key inputs including the probability of success and consideration of potential delays.
The acquiring entity within the Group was a pounds sterling functional currency subsidiary. Foreign currency risk arises from the retranslation of the US dollar denominated contingent consideration. To manage this foreign currency risk the contingent consideration liability has been designated as the hedge instrument in a net investment hedge of the Group’s underlying US dollar net investments. Exchange differences on the retranslation of the contingent consideration liability are recognised in other comprehensive income to the extent that the hedge is effective. Any ineffectiveness is taken to profit.
Definiens’ results were consolidated into the Group’s results from 25 November 2014. For the period from acquisition to 31 December 2014, Definiens’ revenues were immaterial, in the context of the Group’s revenues, and its loss after tax was immaterial.
If the acquisition had taken effect at the beginning of the reporting period in which the acquisition occurred (1 January 2014), on apro forma basis, the revenue of the combined Group for 2014 would have been unchanged and the change in profit after tax would have been immaterial. Thispro forma information does not purport to represent the results of the combined Group that actually would have occurred had the acquisition taken place on 1 January 2014 and should not be taken to be representative of future results.
| | |
| AstraZenecaAnnual Report and Form 20-F Information 2015 | | 175 |
Financial Statements
24 Acquisitions of business operations continued
The fair values assigned to the business combinations completed in 2014 were:
| | | | | | | | | | | | | | | | |
| 2014 acquisitions | | BMS’s share of
Global Diabetes
Alliance Assets $m | | | Almirall $m | | | Definiens $m | | | Total $m | |
| | | | |
| Non-current assets | | | | | | | | | | | | | | | | |
| Intangible assets (Note 9) | | | 5,746 | | | | 1,400 | | | | 355 | | | | 7,501 | |
| Property, plant and equipment (Note 7) | | | 478 | | | | 37 | | | | – | | | | 515 | |
| | | | 6,224 | | | | 1,437 | | | | 355 | | | | 8,016 | |
| Current assets | | | 480 | | | | 24 | | | | – | | | | 504 | |
| Current liabilities | | | (278 | ) | | | (2 | ) | | | – | | | | (280 | ) |
| Non-current liabilities | | | (84 | ) | | | (11 | ) | | | (117 | ) | | | (212 | ) |
| Total net assets acquired | | | 6,342 | | | | 1,448 | | | | 238 | | | | 8,028 | |
| Goodwill (Note 8) | | | 1,530 | | | | 311 | | | | – | | | | 1,841 | |
| Fair value of total consideration | | | 7,872 | | | | 1,759 | | | | 238 | | | | 9,869 | |
| Less: fair value of contingent consideration (Note 18) | | | (5,169 | ) | | | (881 | ) | | | (88 | ) | | | (6,138 | ) |
| Total upfront consideration | | | 2,703 | | | | 878 | | | | 150 | | | | 3,731 | |
| Less: cash and cash equivalents acquired | | | – | | | | (2 | ) | | | – | | | | (2 | ) |
| Net cash outflow | | | 2,703 | | | | 876 | | | | 150 | | | | 3,729 | |
Acquisition costs arising on acquisitions in 2014 were immaterial.
2013 acquisitions
Pearl Therapeutics
On 27 June 2013, AstraZeneca completed the acquisition of Pearl Therapeutics. Pearl Therapeutics is based in Redwood City, California, and is focused on the development of inhaled small molecule therapeutics for respiratory disease. AstraZeneca acquired 100% of Pearl Therapeutics’ shares for an upfront consideration of $569m. In addition, consideration of up to $450m is payable if specified development and regulatory milestones in respect of any triple combination therapies and selected future products that AstraZeneca develops using Pearl Therapeutics’ technology platform are achieved. Sales-related payments of up to a further $140m are payable if pre-agreed cumulative sales thresholds are exceeded. Contingent consideration was fair valued using decision-tree analysis, with key inputs including the probability of success and consideration of potential delays.
Goodwill of $44m was recorded for the acquisition and is underpinned by a number of elements, which individually cannot be quantified. Most significant among these is the synergistic benefit generated by acquiring Pearl Therapeutics’ workforce, whose skills and knowhow are critical to the best and most efficient completion of the ongoing development programmes.
Pearl Therapeutics’ results were consolidated into the Group’s results from 27 June 2013. For the period from acquisition to 31 December 2013, Pearl Therapeutics’ revenues were immaterial, in the context of the Group’s revenue, and its loss after tax was $49m.
Omthera Pharmaceuticals
On 18 July 2013, AstraZeneca completed the acquisition of Omthera Pharmaceuticals, Inc. Omthera is a specialty pharmaceutical company based in Princeton, New Jersey, focused on the development and commercialisation of new therapies for abnormal levels of lipids in the blood, referred to as dyslipidaemia.
AstraZeneca acquired 100% of Omthera’s shares for an upfront consideration of $323m with up to $120m in future development and approval milestones. Contingent consideration was fair valued using decision-tree analysis, with key inputs including the probability of success and consideration of potential delays.
Omthera’s results were consolidated into the Group’s results from 18 July 2013. For the period from acquisition to 31 December 2013, Omthera’s revenues were immaterial, in the context of the Group’s revenue, and its loss after tax was $10m.
Amplimmune
On 4 October 2013, AstraZeneca completed the acquisition of Amplimmune, a privately-held, Maryland, US-based biologics company focused on developing novel therapeutics in cancer immunology. Under the terms of the agreement, AstraZeneca acquired 100% of Amplimmune’s shares for an initial consideration of $225m and deferred consideration of up to $275m based on reaching predetermined development milestones. Contingent consideration was fair valued using decision-tree analysis, with key inputs including the probability of success and consideration of potential delays.
The acquisition bolsters AstraZeneca’s Oncology pipeline by obtaining multiple early-stage assets for its immune-mediated cancer therapy (IMT-C) portfolio, including AMP-514, an anti-programmed cell death 1 (PD-1) monoclonal antibody (MAb). Other Amplimmune assets include multiple preclinical molecules targeting the B7 pathways.
Goodwill of $33m arising on the acquisition is underpinned by a number of elements, which individually cannot be quantified, but include Amplimmune’s very early programmes of potential interest for oncology, immunology and infectious diseases, as well as research tools and animal models.
Amplimmune’s results were consolidated into the Group’s results from 4 October 2013. For the period from acquisition to 31 December 2013, Amplimmune’s revenues were immaterial, in the context of the Group’s revenue, and its loss after tax was $5m.
| | |
| 176 | | AstraZenecaAnnual Report and Form 20-F Information 2015 |
24 Acquisitions of business operations continued
Spirogen
On 15 October 2013, AstraZeneca completed the acquisition of Spirogen, a privately-held biotech company focused on antibody drug conjugate technology for use in oncology. AstraZeneca acquired 100% of Spirogen’s shares for an initial consideration of $200m and deferred consideration of up to $240m based on reaching predetermined development milestones. Existing out-licensing agreements and associated revenue streams were excluded from this acquisition. Contingent consideration was fair valued using decision-tree analysis, with key inputs including the probability of success and consideration of potential delays.
AstraZeneca also entered into a collaboration agreement with ADC Therapeutics to jointly develop two of ADC Therapeutics’ antibody-drug conjugate programmes in preclinical development. AstraZeneca also made an equity investment in ADC Therapeutics, which has an existing licensing agreement with Spirogen.
Spirogen’s results were consolidated into the Group’s results from 15 October 2013. For the period from acquisition to 31 December 2013, Spirogen’s revenues were immaterial, in the context of the Group’s revenue, and its loss after tax was immaterial.
The fair values assigned to the business combinations completed in 2013 were:
| | | | | | | | | | | | | | | | | | | | |
| 2013 acquisitions | | Pearl Therapeutics
$m | | | Omthera
$m | | | Amplimmune
$m | | | Spirogen
$m | | | Total $m | |
| | | | | |
| Non-current assets | | | | | | | | | | | | | | | | | | | | |
| Intangible assets (Note 9) | | | 985 | | | | 526 | | | | 534 | | | | 371 | | | | 2,416 | |
| Property, plant and equipment (Note 7) | | | – | | | | – | | | | 7 | | | | 1 | | | | 8 | |
| Deferred tax assets | | | 60 | | | | 18 | | | | 14 | | | | – | | | | 92 | |
| | | | 1,045 | | | | 544 | | | | 555 | | | | 372 | | | | 2,516 | |
| Current assets | | | 12 | | | | 67 | | | | 17 | | | | – | | | | 96 | |
| Current liabilities | | | (4 | ) | | | (10 | ) | | | (8 | ) | | | – | | | | (22 | ) |
| Non-current liabilities | | | | | | | | | | | | | | | | | | | | |
| Deferred tax liabilities | | | (379 | ) | | | (216 | ) | | | (219 | ) | | | (4 | ) | | | (818 | ) |
| Total net assets acquired | | | 674 | | | | 385 | | | | 345 | | | | 368 | | | | 1,772 | |
| Goodwill (Note 8) | | | 44 | | | | – | | | | 33 | | | | – | | | | 77 | |
| Fair value of total consideration | | | 718 | | | | 385 | | | | 378 | | | | 368 | | | | 1,849 | |
| Less: fair value of contingent consideration (Note 18) | | | (149 | ) | | | (62 | ) | | | (153 | ) | | | (168 | ) | | | (532 | ) |
| Total upfront consideration | | | 569 | | | | 323 | | | | 225 | | | | 200 | | | | 1,317 | |
| Less: cash and cash equivalents acquired | | | (4 | ) | | | (63 | ) | | | (17 | ) | | | – | | | | (84 | ) |
| Less: deferred upfront consideration | | | – | | | | – | | | | (75 | ) | | | – | | | | (75 | ) |
| Net cash outflow | | | 565 | | | | 260 | | | | 133 | | | | 200 | | | | 1,158 | |
Acquisition costs arising on acquisitions in 2013 were immaterial.
If the 2013 acquisitions had taken effect at the beginning of the reporting period in which the acquisitions occurred (1 January 2013), on apro forma basis, the revenue of the combined Group for 2013 would have been unchanged and the profit after tax would have been $2,458m. Thispro forma information has been prepared taking into account any amortisation, interest costs and related tax effects but does not purport to represent the results of the combined Group that actually would have occurred had the acquisition taken place on 1 January 2013 and should not be taken to be representative of future results.
25 Financial risk management objectives and policies
The Group’s principal financial instruments, other than derivatives, comprise bank overdrafts, finance leases, loans, current and non-current investments, cash and short-term deposits. The main purpose of these financial instruments is to manage the Group’s funding and liquidity requirements. The Group has other financial assets and liabilities such as trade receivables and trade payables, which arise directly from its operations.
The principal financial risks to which the Group is exposed are those of liquidity, interest rate, foreign currency and credit. Each of these is managed in accordance with Board-approved policies. These policies are set out below.
The Group uses foreign currency borrowings, foreign currency forwards and swaps, currency options, cross-currency swaps and interest rate swaps for the purpose of hedging its foreign currency and interest rate risks. The Group may designate certain financial instruments as either fair value hedges or net investment hedges in accordance with IAS 39. Key controls applied to transactions in derivative financial instruments are: to use only instruments where good market liquidity exists, to revalue all financial instruments regularly using current market rates and to sell options only to offset previously purchased options or as part of a risk management strategy. The Group is not a net seller of options, and does not use derivative financial instruments for speculative purposes.
Capital management
The capital structure of the Group consists of shareholders’ equity (Note 22), debt (Note 17) and cash (Note 16). For the foreseeable future, the Board will maintain a capital structure that supports the Group’s strategic objectives through:
| > | managing funding and liquidity risk |
| > | optimising shareholder return |
| > | maintaining a strong, investment-grade credit rating. |
The Group utilises factoring arrangements for selected trade receivables. These factoring arrangements qualify for full derecognition of the associated trade receivables under IAS 39.
Funding and liquidity risk are reviewed regularly by the Board and managed in accordance with policies described below.
| | |
| AstraZenecaAnnual Report and Form 20-F Information 2015 | | 177 |
Financial Statements
25 Financial risk management objectives and policies continued
The Board’s distribution policy comprises a regular cash dividend and, subject to business needs, a share repurchase component. The Board regularly reviews its shareholders’ return strategy, and in 2012 decided to suspend share repurchases in order to retain strategic flexibility.
The Group’s net debt position (loans and borrowings net of cash and cash equivalents, current investments and derivative financial instruments) has increased from a net debt position of $3,223m at the beginning of the year to a net debt position of $7,762m at 31 December 2015, primarily as a result of increased outflows from investing activities, including acquisitions.
Liquidity risk
The Board reviews the Group’s ongoing liquidity risks annually as part of the planning process and on anad hoc basis. The Board considers short-term requirements against available sources of funding, taking into account forecast cash flows. The Group manages liquidity risk by maintaining access to a number of sources of funding which are sufficient to meet anticipated funding requirements. Specifically, the Group uses US commercial paper, committed bank facilities and cash resources to manage short-term liquidity and manages long-term liquidity by raising funds through the capital markets. The Group is assigned short-term credit ratings of P-2 by Moody’s and A-2 by Standard and Poor’s. The Group’s long-term credit rating is A3 stable outlook by Moody’s and A- stable outlook by Standard and Poor’s.
In addition to cash and cash equivalents of $6,240m, fixed deposits of $65m, less overdrafts of $189m at 31 December 2015, the Group has committed bank facilities of $3bn available to manage liquidity. At 31 December 2015, the Group has issued $1,327m under a Euro Medium Term Note programme and $12,782m under a SEC-registered programme. The Group regularly monitors the credit standing of the banking group and currently does not anticipate any issue with drawing on the committed facilities should this be necessary. The committed facilities of $3bn mature in April 2020 and were undrawn at 31 December 2015.
The maturity profile of the anticipated future contractual cash flows including interest in relation to the Group’s financial liabilities, on an undiscounted basis and which, therefore, differs from both the carrying value and fair value, is as follows:
| | | | | | | | | | | | | | | | | | | | | | | | | | | | | | | | | | | | |
| | | Bank | | | | | | | | | | | | Total | | | | | | | | | Total | | | | |
| | | overdrafts | | | | | | | | | Trade | | | non-derivative | | | | | | Cross- | | | derivative | | | | |
| | | and other | | | | | | Finance | | | and other | | | financial | | | Interest | | | currency | | | financial | | | | |
| | | loans | | | Bonds | | | leases | | | payables | | | instruments | | | rate swaps | | | swaps | | | instruments | | | Total | |
| | | $m | | | $m | | | $m | | | $m | | | $m | | | $m | | | $m | | | $m | | | $m | |
| Within one year | | | 993 | | | | 1,217 | | | | 34 | | | | 10,370 | | | | 12,614 | | | | (70 | ) | | | (16 | ) | | | (86 | ) | | | 12,528 | |
| In one to two years | | | – | | | | 1,482 | | | | 33 | | | | 1,044 | | | | 2,559 | | | | (70 | ) | | | (16 | ) | | | (86 | ) | | | 2,473 | |
| In two to three years | | | – | | | | 393 | | | | 31 | | | | 660 | | | | 1,084 | | | | (51 | ) | | | (16 | ) | | | (67 | ) | | | 1,017 | |
| In three to four years | | | – | | | | 2,143 | | | | 18 | | | | 285 | | | | 2,446 | | | | (51 | ) | | | (16 | ) | | | (67 | ) | | | 2,379 | |
| In four to five years | | | – | | | | 290 | | | | 3 | | | | 230 | | | | 523 | | | | (51 | ) | | | (15 | ) | | | (66 | ) | | | 457 | |
| In more than five years | | | – | | | | 10,497 | | | | – | | | | 1,010 | | | | 11,507 | | | | (77 | ) | | | (229 | ) | | | (306 | ) | | | 11,201 | |
| | | | 993 | | | | 16,022 | | | | 119 | | | | 13,599 | | | | 30,733 | | | | (370 | ) | | | (308 | ) | | | (678 | ) | | | 30,055 | |
| Effect of interest | | | (1 | ) | | | (6,872 | ) | | | (17 | ) | | | – | | | | (6,890 | ) | | | 370 | | | | 97 | | | | 467 | | | | (6,423 | ) |
| Effect of discounting, fair values and issue costs | | | – | | | | 132 | | | | – | | | | (885 | ) | | | (753 | ) | | | (193 | ) | | | 24 | | | | (169 | ) | | | (922 | ) |
| 31 December 2013 | | | 992 | | | | 9,282 | | | �� | 102 | | | | 12,714 | | | | 23,090 | | | | (193 | ) | | | (187 | ) | | | (380 | ) | | | 22,710 | |
| | | | | | | | | | | | | | | | | | | | | | | | | | | | | | | | | | | | | |
| | | Bank | | | | | | | | | | | | Total | | | | | | | | | Total | | | | |
| | | overdrafts | | | | | | | | | Trade | | | non-derivative | | | | | | Cross- | | | derivative | | | | |
| | | and other | | | | | | Finance | | | and other | | | financial | | | Interest | | | currency | | | financial | | | | |
| | | loans | | | Bonds | | | leases | | | payables | | | instruments | | | rate swaps | | | swaps | | | instruments | | | Total | |
| | | $m | | | $m | | | $m | | | $m | | | $m | | | $m | | | $m | | | $m | | | $m | |
| Within one year | | | 1,488 | | | | 1,490 | | | | 45 | | | | 11,909 | | | | 14,932 | | | | (52 | ) | | | (16 | ) | | | (68 | ) | | | 14,864 | |
| In one to two years | | | – | | | | 401 | | | | 45 | | | | 1,720 | | | | 2,166 | | | | (52 | ) | | | (16 | ) | | | (68 | ) | | | 2,098 | |
| In two to three years | | | – | | | | 2,151 | | | | 31 | | | | 936 | | | | 3,118 | | | | (52 | ) | | | (16 | ) | | | (68 | ) | | | 3,050 | |
| In three to four years | | | – | | | | 298 | | | | 8 | | | | 924 | | | | 1,230 | | | | (16 | ) | | | (19 | ) | | | (35 | ) | | | 1,195 | |
| In four to five years | | | – | | | | 1,298 | | | | 1 | | | | 1,323 | | | | 2,622 | | | | (16 | ) | | | (325 | ) | | | (341 | ) | | | 2,281 | |
| In more than five years | | | – | | | | 10,135 | | | | – | | | | 7,002 | | | | 17,137 | | | | (62 | ) | | | – | | | | (62 | ) | | | 17,075 | |
| | | | 1,488 | | | | 15,773 | | | | 130 | | | | 23,814 | | | | 41,205 | | | | (250 | ) | | | (392 | ) | | | (642 | ) | | | 40,563 | |
| Effect of interest | | | (2 | ) | | | (6,461 | ) | | | (22 | ) | | | – | | | | (6,485 | ) | | | 250 | | | | 83 | | | | 333 | | | | (6,152 | ) |
| Effect of discounting, fair values and issue costs | | | – | | | | (63 | ) | | | – | | | | (3,937 | ) | | | (4,000 | ) | | | (161 | ) | | | 5 | | | | (156 | ) | | | (4,156 | ) |
| 31 December 2014 | | | 1,486 | | | | 9,249 | | | | 108 | | | | 19,877 | | | | 30,720 | | | | (161 | ) | | | (304 | ) | | | (465 | ) | | | 30,255 | |
| | |
| 178 | | AstraZenecaAnnual Report and Form 20-F Information 2015 |
25 Financial risk management objectives and policies continued
| | | | | | | | | | | | | | | | | | | | | | | | | | | | | | | | | | | | |
| | | Bank | | | | | | | | | | | | Total | | | | | | | | | Total | | | | |
| | | overdrafts | | | | | | | | | Trade | | | non-derivative | | | | | | Cross- | | | derivative | | | | |
| | | and other | | | | | | Finance | | | and other | | | financial | | | Interest | | | currency | | | financial | | | | |
| | | loans | | | Bonds | | | leases | | | payables | | | instruments | | | rate swaps | | | swaps | | | instruments | | | Total | |
| | | $m | | | $m | | | $m | | | $m | | | $m | | | $m | | | $m | | | $m | | | $m | |
| Within one year | | | 851 | | | | 568 | | | | 66 | | | | 11,701 | | | | 13,186 | | | | (54 | ) | | | (17 | ) | | | (71 | ) | | | 13,115 | |
| In one to two years | | | – | | | | 2,318 | | | | 41 | | | | 1,522 | | | | 3,881 | | | | (54 | ) | | | (17 | ) | | | (71 | ) | | | 3,810 | |
| In two to three years | | | – | | | | 1,865 | | | | 22 | | | | 1,110 | | | | 2,997 | | | | (19 | ) | | | (26 | ) | | | (45 | ) | | | 2,952 | |
| In three to four years | | | – | | | | 1,444 | | | | 10 | | | | 1,277 | | | | 2,731 | | | | (15 | ) | | | (330 | ) | | | (345 | ) | | | 2,386 | |
| In four to five years | | | – | | | | 2,025 | | | | 2 | | | | 2,187 | | | | 4,214 | | | | (15 | ) | | | – | | | | (15 | ) | | | 4,199 | |
| In more than five years | | | – | | | | 14,192 | | | | – | | | | 5,313 | | | | 19,505 | | | | (44 | ) | | | – | | | | (44 | ) | | | 19,461 | |
| | | | 851 | | | | 22,412 | | | | 141 | | | | 23,110 | | | | 46,514 | | | | (201 | ) | | | (390 | ) | | | (591 | ) | | | 45,923 | |
| Effect of interest | | | (2 | ) | | | (8,194 | ) | | | (46 | ) | | | – | | | | (8,242 | ) | | | 201 | | | | 67 | | | | 268 | | | | (7,974 | ) |
| Effect of discounting, fair values and issue costs | | | – | | | | (109 | ) | | | – | | | | (3,990 | ) | | | (4,099 | ) | | | (126 | ) | | | 3 | | | | (123 | ) | | | (4,222 | ) |
| 31 December 2015 | | | 849 | | | | 14,109 | | | | 95 | | | | 19,120 | | | | 34,173 | | | | (126 | ) | | | (320 | ) | | | (446 | ) | | | 33,727 | |
Where interest payments are on a floating rate basis, it is assumed that rates will remain unchanged from the last business day of each year ended 31 December.
It is not expected that the cash flows in the maturity profile could occur significantly earlier or at significantly different amounts, with the exception of $6,411m of contingent consideration held within other payables at fair value (see Note 18).
Market risk
Interest rate risk
The Group maintains a mix of fixed and floating rate debt. The portion of fixed rate debt was approved by the Board and any variation requires Board approval.
A significant portion of the long-term debt entered into in 2007 in order to finance the acquisition of MedImmune and entered into in 2015 in order to finance the acquisition of ZS Pharma has been held at fixed rates of interest. The Group uses interest rate swaps and forward rate agreements to manage this mix.
At 31 December 2015, the Group held interest rate swaps with a notional value of $1.6bn, converting the 7% guaranteed debentures payable in 2023 to floating rates, partially converting the 5.9% callable bond maturing in 2017 to floating rates and partially converting the 1.75% callable bond maturing in 2018 to floating rates. The interest rate swap on the 2018 bond was entered into in 2015. No new interest rate swaps were entered into during 2014 or 2013. At 31 December 2015, swaps with a notional value of $1.35bn were designated in fair value hedge relationships and swaps with a notional value of $0.29bn related to debt designated as fair value through profit or loss. Designated hedges are expected to be effective and therefore the impact of ineffectiveness on profit is not expected to be material. The accounting treatment for fair value hedges and debt designated as fair value through profit or loss is disclosed in the Group Accounting Policies section from page 144. The majority of surplus cash is currently invested in US dollar liquidity funds earning floating rates of interest.
The interest rate profile of the Group’s interest-bearing financial instruments, as at 31 December 2015, 31 December 2014 and 31 December 2013, is set out below. In the case of current and non-current financial liabilities, the classification includes the impact of interest rate swaps which convert the debt to floating rate.
| | | | | | | | | | | | | | | | | | | | | | | | | | | | | | | | | | | | | | | | |
| | | 2015 | | | | | 2014 | | | | | 2013 | |
| | | Fixed rate Floating rate | | | Total | | | | | Fixed rate | | | Floating rate | | | Total | | | | | Fixed rate | | | Floating rate | | | Total | |
| | | $m | | | $m | | | $m | | | | | $m | | | $m | | | $m | | | | | $m | | | $m | | | $m | |
| | | | | | | | | | | |
| Financial liabilities | | | | | | | | | | | | | | | | | | | | | | | | | | | | | | | | | | | | | | | | |
| Interest-bearing loans and borrowings | | | | | | | | | | | | | | | | | | | | | | | | | | | | | | | | | | | | | | | | |
| Current | | | 67 | | | | 849 | | | | 916 | | | | | | 960 | | | | 1,486 | | | | 2,446 | | | | | | 30 | | | | 1,758 | | | | 1,788 | |
| Non-current | | | 11,986 | | | | 2,151 | | | | 14,137 | | | | | | 7,199 | | | | 1,198 | | | | 8,397 | | | | | | 7,376 | | | | 1,212 | | | | 8,588 | |
| Total | | | 12,053 | | | | 3,000 | | | | 15,053 | | | | | | 8,159 | | | | 2,684 | | | | 10,843 | | | | | | 7,406 | | | | 2,970 | | | | 10,376 | |
| | | | | | | | | | | |
| Financial assets | | | | | | | | | | | | | | | | | | | | | | | | | | | | | | | | | | | | | | | | |
| Fixed deposits | | | – | | | | 65 | | | | 65 | | | | | | – | | | | 20 | | | | 20 | | | | | | – | | | | 15 | | | | 15 | |
| Cash and cash equivalents | | | – | | | | 6,240 | | | | 6,240 | | | | | | – | | | | 6,360 | | | | 6,360 | | | | | | – | | | | 9,217 | | | | 9,217 | |
| Total | | | – | | | | 6,305 | | | | 6,305 | | | | | | – | | | | 6,380 | | | | 6,380 | | | | | | – | | | | 9,232 | | | | 9,232 | |
In addition to the financial assets above, there are $6,494m (2014: $7,576m; 2013: $7,772m) of other current and non-current asset investments and other financial assets on which no interest is received.
| | |
| AstraZenecaAnnual Report and Form 20-F Information 2015 | | 179 |
Financial Statements
25 Financial risk management objectives and policies continued
Foreign currency risk
The US dollar is the Group’s most significant currency. As a consequence, the Group results are presented in US dollars and exposures are managed against US dollars accordingly.
Translational
Approximately 60% of Group external sales in 2015 were denominated in currencies other than the US dollar, while a significant proportion of manufacturing, and research and development costs were denominated in pounds sterling and Swedish krona. Surplus cash generated by business units is substantially converted to, and held centrally in, US dollars. As a result, operating profit and total cash flow in US dollars will be affected by movements in exchange rates.
This currency exposure is managed centrally, based on forecast cash flows. The impact of movements in exchange rates is mitigated significantly by the correlations which exist between the major currencies to which the Group is exposed and the US dollar. Monitoring of currency exposures and correlations is undertaken on a regular basis and hedging is subject to pre-execution approval.
Where there is non-US dollar debt and an underlying net investment of that amount in the same currency, the Group applies net investment hedging. As at 31 December 2015, 3.4% of interest-bearing loans and borrowings were denominated in pound sterling and 5.4% of interest-bearing loans and borrowings were denominated in euros. Exchange differences on the retranslation of debt designated as net investment hedges are recognised in other comprehensive income to the extent that the hedge is effective. Any ineffectiveness is taken to profit. Exchange differences on foreign currency borrowings not designated in a hedge relationship are taken to profit.
During 2013, the Group entered into a cross-currency swap to convert the remaining un-hedged $250m of the 1.95% 2019 maturing bond into fixed Japanese yen debt. This instrument was designated in a net investment hedge against the foreign currency risk of the Group’s Japanese yen net assets. In 2014, $125m of the Japanese yen cross-currency swap was de-designated from the net investment hedge in order to maintain hedge effectiveness.
Also in 2013, the Group entered into a cross-currency swap to convert $151m into fixed Chinese renminbi debt maturing in 2018. This instrument was designated in a net investment hedge against the foreign currency risk of the Group’s Chinese renminbi net assets. Fair value movements on the revaluation of the cross-currency swaps are recognised in other comprehensive income to the extent that the hedge is effective. Any ineffectiveness would be taken to profit.
Foreign currency risk arises where the Group has intercompany funding and investments in certain subsidiaries operating in countries with exchange controls. The most significant risk in this respect is Venezuela, where the Group has approximately $98m equivalent of local currency cash, on which there have been delays in obtaining approval for remittance outside the country.
The official exchange rate for essential goods and services is VEF 6.3/$ as published by CENCOEX (the National Foreign Trade Center). However, alternative exchange rates exist and these include the SICAD (Supplementary Foreign Currency Administration System) rate and the SIMADI (Sistema Marginal de Divisas) rate, which was introduced in 2015. At 31 December 2015, the SICAD rate was VEF 13.5/$ (31 December 2014: VEF 12.0/$) and the SIMADI rate was VEF 199.7/$.
For the period to 31 December 2015, the Group used the SICAD rate for the consolidation of the financial statements of the Venezuelan subsidiaries. The Group believes that the SICAD rate represents the most appropriate rate for consolidation as it reflects their best expectation of the rate at which profits will be remitted. Factors such as future uncertainty and significant delays experienced in remitting cash at the CENCOEX rate, as well as management actions in dealing with the government to settle a portion of the overdue receivables at the SICAD rate were taken into account.
If the Group were to use the SIMADI rate for the consolidation of the financial statements of the Venezuelan subsidiaries, the Group would be exposed to a potential income statement devaluation loss of $163m on its total intercompany balances with the subsidiaries in Venezuela and the local currency cash would be reduced to $7m on consolidation.
Transactional
One hundred percent of the Group’s major transactional currency exposures on working capital balances, which typically extend for up to three months, are hedged, where practicable, using forward foreign exchange contracts against individual Group companies’ reporting currency. In addition, the Group’s external dividend, which is paid principally in pounds sterling and Swedish krona, is fully hedged from announcement to payment date. Foreign exchange gains and losses on forward contracts transacted for transactional hedging are taken to profit.
Sensitivity analysis
The sensitivity analysis set out below summarises the sensitivity of the market value of our financial instruments to hypothetical changes in market rates and prices. The range of variables chosen for the sensitivity analysis reflects our view of changes which are reasonably possible over a one-year period. Market values are the present value of future cash flows based on market rates and prices at the valuation date. For long-term debt, an increase in interest rates results in a decline in the fair value of debt.
The sensitivity analysis assumes an instantaneous 100 basis point change in interest rates in all currencies from their levels at 31 December 2015, with all other variables held constant. Based on the composition of our long-term debt portfolio as at 31 December 2015, a 1% increase in interest rates would result in an additional $30m in interest expense being incurred per year. The exchange rate sensitivity analysis assumes an instantaneous 10% change in foreign currency exchange rates from their levels at 31 December 2015, with all other variables held constant. The +10% case assumes a 10% strengthening of the US dollar against all other currencies and the -10% case assumes a 10% weakening of the US dollar.
| | |
| 180 | | AstraZenecaAnnual Report and Form 20-F Information 2015 |
25 Financial risk management objectives and policies continued
Each incremental 10% movement in foreign currency exchange rates would have approximately the same effect as the initial 10% detailed in the table below and each 1% change in interest rates would have approximately the same effect as the 1% detailed in the table below.
| | | | | | | | | | | | | | | | | | |
| | | Interest rates | | | | | Exchange rates | |
| 31 December 2013 | | +1% | | | -1% | | | | | +10% | | | -10% | |
| Increase/(decrease) in fair value of financial instruments ($m) | | | 669 | | | | (839 | ) | | | | | (12 | ) | | | 12 | |
| Impact on profit: (loss)/gain ($m) | | | – | | | | – | | | | | | (274 | ) | | | 274 | |
| Impact on equity: gain/(loss) ($m) | | | – | | | | – | | | | | | 262 | | | | (262 | ) |
| | | | | | | | | | | | | | | | | | | |
| | | Interest rates | | | | | Exchange rates | |
| 31 December 2014 | | +1% | | | -1% | | | | | +10% | | | -10% | |
| Increase/(decrease) in fair value of financial instruments ($m) | | | 844 | | | | (856 | ) | | | | | 85 | | | | (85 | ) |
| Impact on profit: (loss)/gain ($m) | | | – | | | | – | | | | | | (247 | ) | | | 247 | |
| Impact on equity: gain/(loss) ($m) | | | – | | | | – | | | | | | 332 | | | | (332 | ) |
| | | | | | | | | | | | | | | | | | | |
| | | Interest rates | | | | | Exchange rates | |
| 31 December 2015 | | +1% | | | -1% | | | | | +10% | | | -10% | |
| Increase/(decrease) in fair value of financial instruments ($m) | | | 997 | | | | (1,150 | ) | | | | | 136 | | | | (136 | ) |
| Impact on profit: (loss)/gain ($m) | | | – | | | | – | | | | | | (91 | ) | | | 91 | |
| Impact on equity: gain/(loss) ($m) | | | – | | | | – | | | | | | 227 | | | | (227 | ) |
There has been no change in the methods and assumptions used in preparing the above sensitivity analysis over the three-year period.
Credit risk
The Group is exposed to credit risk on financial assets, such as cash balances (including fixed deposits and cash and cash equivalents), derivative instruments, trade and other receivables. The Group is also exposed in its net asset position to its own credit risk in respect of the 2023 debentures which are accounted for at fair value through profit or loss.
Trade and other receivables
Trade receivable exposures are managed locally in the operating units where they arise and credit limits are set as deemed appropriate for the customer. The Group is exposed to customers ranging from government-backed agencies and large private wholesalers to privately owned pharmacies, and the underlying local economic and sovereign risks vary throughout the world. Where appropriate, the Group endeavours to minimise risks by the use of trade finance instruments such as letters of credit and insurance. The Group establishes an allowance for impairment that represents its estimate of incurred losses in respect of specific trade and other receivables where it is deemed that a receivable may not be recoverable. When the debt is deemed irrecoverable, the allowance account is written off against the underlying receivable.
In the US, sales to three wholesalers accounted for approximately 84% of US sales (2014: three wholesalers accounted for approximately 75%; 2013: three wholesalers accounted for approximately 77%).
The ageing of trade receivables at the reporting date was:
| | | | | | | | | | | | |
| | | 2015 | | | 2014 | | | 2013 | |
| | | $m | | | $m | | | $m | |
| Not past due | | | 4,388 | | | | 4,316 | | | | 5,059 | |
| Past due 0-90 days | | | 189 | | | | 354 | | | | 330 | |
| Past due 90-180 days | | | 21 | | | | 75 | | | | 78 | |
| Past due > 180 days | | | 35 | | | | 17 | | | | 47 | |
| | | | 4,633 | | | | 4,762 | | | | 5,514 | |
| | | | | | | | | | | | | |
| | | 2015 | | | 2014 | | | 2013 | |
| | | $m | | | $m | | | $m | |
| Movements in provisions for trade receivables | | | | | | | | | | | | |
| At 1 January | | | 54 | | | | 64 | | | | 64 | |
| Income statement | | | 2 | | | | (2 | ) | | | (5 | ) |
| Amounts utilised, exchange and other movements | | | (4 | ) | | | (8 | ) | | | 5 | |
| At 31 December | | | 52 | | | | 54 | | | | 64 | |
The allowance for impairment has been calculated based on past experience and is in relation to specific customers. Given the profile of our customers, including large wholesalers and government-backed agencies, no further credit risk has been identified with the trade receivables not past due other than those balances for which an allowance has been made.
| | |
| AstraZenecaAnnual Report and Form 20-F Information 2015 | | 181 |
Financial Statements
25 Financial risk management objectives and policies continued
Other financial assets
The Group may hold significant cash balances as part of its normal operations, with the amount of cash held at any point reflecting the level of cash flow generated by the business and the timing of the use of that cash. The majority of excess cash is centralised within the Group treasury entity and is subject to counterparty risk on the principal invested. This risk is mitigated through a policy of prioritising security and liquidity over return, and as such cash is only invested in high credit quality investments. Counterparty limits are set according to the assessed risk of each counterparty and exposures are monitored against these limits on a regular basis. The majority of the Group’s cash is invested in US dollar AAA-rated liquidity funds, fully collateralised repurchase agreements and short-term bank deposits.
The most significant concentration of financial credit risk at 31 December 2015 was $4,389m invested in five AAA-rated liquidity funds. The liquidity fund portfolios are managed by the related external third party fund managers to maintain the AAA rating. No more than 15% of fund value is invested within each individual fund. There were no other significant concentrations of financial credit risk at the reporting date.
At 31 December 2015, the Group had investments of $1,050m (2014: $300m; 2013: $nil) in short-term repurchase agreements, which are fully collateralised investments. In the event of any default, ownership of the collateral would revert to the Group and would be readily convertible to cash. The value of the collateral held at 31 December 2015 was $1,098m (2014: $316m; 2013: $nil).
All financial derivatives are transacted with commercial banks, in line with standard market practice. The Group has agreements with some bank counterparties whereby the parties agree to post cash collateral, for the benefit of the other, equivalent to the market valuation of the derivative positions above a predetermined threshold. The carrying value of such cash collateral held by the Group at 31 December 2015 was $451m (2014: $457m; 2013: $326m).
26 Employee costs and share plans for employees
Employee costs
The average number of people, to the nearest hundred, employed by the Group is set out in the table below. In accordance with the Companies Act 2006, this includes part-time employees.
| | | | | | | | | | | | |
| | | 2015 | | | 2014 | | | 2013 | |
| Employees | | | | | | | | | | | | |
| UK | | | 7,100 | | | | 7,200 | | | | 7,200 | |
| Continental Europe | | | 14,800 | | | | 13,800 | | | | 14,000 | |
| The Americas | | | 17,500 | | | | 16,800 | | | | 14,600 | |
| Asia, Africa & Australasia | | | 20,700 | | | | 18,100 | | | | 15,800 | |
| Continuing operations | | | 60,100 | | | | 55,900 | | | | 51,600 | |
Geographical distribution described in the table above is by location of legal entity employing staff. Certain staff will spend some or all of their activity in a different location.
The number of people employed by the Group at the end of 2015 was 61,500 (2014: 57,500; 2013: 51,500).
The costs incurred during the year in respect of these employees were:
| | | | | | | | | | | | |
| | | 2015 | | | 2014 | | | 2013 | |
| | | $m | | | $m | | | $m | |
| Salaries | | | 4,603 | | | | 4,657 | | | | 3,833 | |
| Social security costs | | | 567 | | | | 664 | | | | 622 | |
| Pension costs | | | 484 | | | | 459 | | | | 445 | |
| Other employment costs | | | 474 | | | | 499 | | | | 376 | |
| | | | 6,128 | | | | 6,279 | | | | 5,276 | |
Severance costs of $338m are not included above (2014: $254m; 2013: $652m).
The Directors believe that, together with the basic salary system, the Group’s employee incentive schemes provide competitive and market-related packages to motivate employees. They should also align the interests of employees with those of shareholders, as a whole, through long-term share ownership in the Company. The Group’s current UK, Swedish and US schemes are described below; other arrangements apply elsewhere.
| | |
| 182 | | AstraZenecaAnnual Report and Form 20-F Information 2015 |
26 Employee costs and share plans for employeescontinued
Bonus plans
The AstraZeneca UK Performance Bonus Plan
Employees of participating AstraZeneca UK companies are invited to participate in this bonus plan, which rewards strong individual performance. Bonuses are paid in cash. The Company also offers UK employees the opportunity to buy Partnership Shares (Ordinary Shares). Employees may invest up to £1,800 over a 12 month accumulation period and purchase Partnership Shares in the Company with the total proceeds at the end of the period. The purchase price for the shares is the lower of the price at the beginning or the end of the 12-month period. In 2010, the Company introduced a Matching Share element in respect of Partnership Shares, the first award of which was made in 2011. Partnership Shares and Matching Shares are held in the HM Revenue & Customs (HMRC)-approved All-Employee Share Plan. At the Company’s AGM in 2002, shareholders approved the issue of new shares for the purposes of the All-Employee Share Plan.
The AstraZeneca Executive Annual Bonus Scheme
This scheme is a performance bonus scheme for Directors and senior employees who do not participate in the AstraZeneca UK Performance Bonus Plan. Annual bonuses are paid in cash and reflect both corporate and individual performance measures. The Remuneration Committee has discretion to reduce or withhold bonuses if business performance falls sufficiently short of expectations in any year such as to make the payment of bonuses inappropriate.
The AstraZeneca Deferred Bonus Plan
This plan was introduced in 2006 and is used to defer a portion of the bonus earned under the AstraZeneca Executive Annual Bonus Scheme into Ordinary Shares in the Company for a period of three years. The plan currently operates only in respect of Executive Directors and members of the SET. Awards of shares under this plan are typically made in March each year, the first award having been made in February 2006.
Sweden
In Sweden, an all-employee performance bonus plan is in operation, which rewards strong individual performance. Bonuses are paid 50% into a fund investing in AstraZeneca equities and 50% in cash. The AstraZeneca Executive Annual Bonus Scheme, the AstraZeneca Performance Share Plan and the AstraZeneca Global Restricted Stock Plan all operate in respect of relevant AstraZeneca employees in Sweden.
US
In the US, there are two all-employee short-term or annual performance bonus plans in operation to differentiate and reward strong individual performance. Annual bonuses are paid in cash. There is also one senior staff long-term incentive scheme, under which 93 participants may be eligible for awards granted as AstraZeneca ADSs. AstraZeneca ADSs necessary to satisfy the awards are purchased in the market or funded via a share trust. The AstraZeneca Performance Share Plan and the AstraZeneca Global Restricted Stock Plan operate in respect of relevant employees in the US.
Share plans
The charge for share-based payments in respect of share plans is $211m (2014: $178m; 2013: $156m). The plans are equity settled.
The AstraZeneca Performance Share Plan
This plan was approved by shareholders in 2005 for a period of 10 years. Generally, awards could be granted at any time, but not during a close period of the Company. The first grant of awards was made in June 2005. Awards granted under the plan vest after three years and can be subject to the achievement of performance conditions. The Remuneration Committee has responsibility for agreeing any awards under the plan and for setting the policy for the way in which the plan should be operated, including agreeing performance targets and which employees would be invited to participate. There were no grants of awards under this plan in 2015. The plan has been replaced by the AstraZeneca 2014 Performance Share Plan. Further details of this plan can be found in the Directors’ Remuneration Report from page 103.
| | | | | | | | | | | | |
| | | Shares | | | WAFV1 | | | WAFV1 | |
| | | ’000 | | | pence | | | $ | |
| Shares awarded in June 2013 | | | 2,867 | | | | 1649 | | | | 25.73 | |
| Shares awarded in August 2013 | | | 197 | | | | 1649 | | | | 25.12 | |
| Shares awarded in November 2013 | | | 30 | | | | 1649 | | | | 26.38 | |
| Shares awarded in February 2014 | | | 37 | | | | n/a | | | | 30.55 | |
| Shares awarded in March 2014 | | | 2,368 | | | | 1952 | | | | 32.34 | |
| 1 | Weighted average fair value. |
| | |
| AstraZenecaAnnual Report and Form 20-F Information 2015 | | 183 |
Financial Statements
26 Employee costs and share plans for employeescontinued
The AstraZeneca 2014 Performance Share Plan
This plan was approved by shareholders in 2014 for a period of 10 years and replaces the AstraZeneca Performance Share Plan. Generally, awards can be granted at any time, but not during a close period of the Company. The first grant of awards was made in May 2014. Awards granted under the plan vest after three years, or in the case of Executive Directors, after an additional two-year holding period, and can be subject to the achievement of performance conditions. For awards to all participants in 2015, vesting is subject to a combination of measures focused on scientific leadership, revenue growth and financial performance. The Remuneration Committee has responsibility for agreeing any awards under the plan and for setting the policy for the way in which the plan should be operated, including agreeing performance targets and which employees should be invited to participate. Further details of this plan can be found in the Directors’ Remuneration Report from page 103. The main grant of awards in 2015 under the plan was in March with further grants in June, August, September and November.
| | | | | | | | | | | | |
| | | Shares | | | WAFV | | | WAFV | |
| | | ‘000 | | | pence | | | $ | |
| Shares awarded in May 2014 | | | 12 | | | | 2133 | | | | 35.75 | |
| Shares awarded in August 2014 | | | 141 | | | | 2156 | | | | 35.79 | |
| Shares awarded in September 2014 | | | 40 | | | | 2250 | | | | n/a | |
| Shares awarded in November 2014 | | | 2 | | | | n/a | | | | 36.62 | |
| Shares awarded in March 2015 | | | 2,223 | | | | 2381 | | | | 35.29 | |
| Shares awarded in June 2015 | | | 36 | | | | 2087 | | | | 33.05 | |
| Shares awarded in August 2015 | | | 152 | | | | 2123 | | | | 33.21 | |
| Shares awarded in September 2015 | | | 8 | | | | n/a | | | | 32.32 | |
| Shares awarded in November 2015 | | | 7 | | | | 2178 | | | | 33.31 | |
The AstraZeneca Investment Plan
This plan was introduced in 2010 and approved by shareholders at the 2010 AGM. The main grant of awards in 2015 under the plan was in March, with a further, smaller grant in August. Awards granted under the plan vest after eight years and are subject to performance conditions measured over a period of between three and eight years. For awards granted in 2015, the performance conditions relate to the annual dividend paid to shareholders and dividend cover over a four-year performance period. The awards are then subject to a four-year holding period before they can vest. The Remuneration Committee has responsibility for agreeing any awards under the plan and for setting the policy for the way in which the plan should be operated, including agreeing performance targets and which employees should be invited to participate. Further details of this plan can be found in the Directors’ Remuneration Report from page 103.
| | | | | | | | | | | | |
| | | Shares | | | WAFV | | | WAFV | |
| | | ’000 | | | pence | | | $ | |
| Shares awarded in June 2013 | | | 157 | | | | 3297 | | | | 51.45 | |
| Shares awarded in August 2013 | | | 8 | | | | 3302 | | | | n/a | |
| Shares awarded in March 2014 | | | 67 | | | | 3904 | | | | 64.68 | |
| Shares awarded in September 2014 | | | 7 | | | | 4499 | | | | n/a | |
| Shares awarded in March 2015 | | | 64 | | | | 4762 | | | | 70.58 | |
| Shares awarded in August 2015 | | | 4 | | | | n/a | | | | 66.42 | |
The AstraZeneca Global Restricted Stock Plan
This plan was introduced in 2010. The main grant of awards in 2015 under the plan was in March, with a further, smaller grant in August. This plan provides for the grant of restricted stock unit (RSU) awards to selected below SET-level employees and is used in conjunction with the AstraZeneca Performance Share Plan to provide a mix of RSUs and performance shares. Awards typically vest on the third anniversary of the date of grant and are contingent on continued employment with the Company. The Remuneration Committee has responsibility for agreeing any awards under the plan and for setting the policy for the way in which the plan should be operated.
| | | | | | | | | | | | |
| | | Shares | | | WAFV | | | WAFV | |
| | | ’000 | | | pence | | | $ | |
| Shares awarded in March 2013 | | | 1,417 | | | | 3254 | | | | 49.42 | |
| Shares awarded in June 2013 | | | 986 | | | | 3297 | | | | 51.45 | |
| Shares awarded in August 2013 | | | 13 | | | | 3206 | | | | 50.23 | |
| Shares awarded in March 2014 | | | 2,076 | | | | 3904 | | | | 64.68 | |
| Shares awarded in August 2014 | | | 25 | | | | 4312 | | | | 71.57 | |
| Shares awarded in March 2015 | | | 1,966 | | | | 4762 | | | | 70.58 | |
| Shares awarded in August 2015 | | | 17 | | | | 4245 | | | | 66.42 | |
| | |
| 184 | | AstraZenecaAnnual Report and Form 20-F Information 2015 |
26 Employee costs and share plans for employeescontinued
The AstraZeneca Restricted Share Plan
This plan was introduced in 2008 and provides for the grant of restricted share awards to key employees, excluding Executive Directors. Awards are made on an ad hoc basis with variable vesting dates. The plan has been used five times in 2015 to make awards to 365 employees. The Remuneration Committee has responsibility for agreeing any awards under the plan and for setting the policy for the way in which the plan should be operated.
| | | | | | | | | | | | |
| | | Shares | | | WAFV | | | WAFV | |
| | | ’000 | | | pence | | | $ | |
| Shares awarded in February 2013 | | | 2 | | | | 3125 | | | | n/a | |
| Shares awarded in March 2013 | | | 144 | | | | n/a | | | | 49.23 | |
| Shares awarded in June 2013 | | | 25 | | | | n/a | | | | 51.45 | |
| Shares awarded in August 2013 | | | 119 | | | | 3302 | | | | 50.23 | |
| Shares awarded in September 2013 | | | 85 | | | | n/a | | | | 49.21 | |
| Shares awarded in November 2013 | | | 739 | | | | 3297 | | | | 52.76 | |
| Shares awarded in February 2014 | | | 115 | | | | 4042 | | | | 61.10 | |
| Shares awarded in March 2014 | | | 155 | | | | n/a | | | | 64.68 | |
| Shares awarded in May 2014 | | | 134 | | | | 4265 | | | | 71.50 | |
| Shares awarded in August 2014 | | | 72 | | | | 4312 | | | | 71.57 | |
| Shares awarded in September 2014 | | | 64 | | | | 4499 | | | | 74.05 | |
| Shares awarded in November 2014 | | | 9 | | | | 4672 | | | | 73.23 | |
| Shares awarded in March 2015 | | | 164 | | | | 4762 | | | | 70.58 | |
| Shares awarded in June 2015 | | | 69 | | | | 4174 | | | | 66.09 | |
| Shares awarded in August 2015 | | | 31 | | | | 4245 | | | | 66.42 | |
| Shares awarded in September 2015 | | | 41 | | | | 4199 | | | | 64.64 | |
| Shares awarded in November 2015 | | | 41 | | | | 4355 | | | | 66.62 | |
The fair values were determined using a modified version of the binomial model. This method incorporated expected dividends but no other features into the measurements of fair value. The grant date fair values of share awards disclosed in this section do not take account of service and non-market related performance conditions.
| | |
| AstraZenecaAnnual Report and Form 20-F Information 2015 | | 185 |
Financial Statements
27 Commitments and contingent liabilities
| | | | | | | | | | | | |
| | | 2015 | | | 2014 | | | 2013 | |
| | | $m | | | $m | | | $m | |
| Commitments | | | | | | | | | | | | |
| Contracts placed for future capital expenditure on property, plant and equipment and software development costs not provided for in these accounts | | | 518 | | | | 438 | | | | 481 | |
Guarantees and contingencies arising in the ordinary course of business, for which no security has been given, are not expected to result in any material financial loss.
Research and development collaboration payments
The Group has various ongoing collaborations, including in-licensing and similar arrangements with development partners. Such collaborations may require the Group to make payments on achievement of stages of development, launch or revenue milestones, although the Group generally has the right to terminate these agreements at no cost. The Group recognises research and development milestones as intangible assets once it is committed to payment, which is generally when the Group reaches set trigger points in the development cycle. Revenue-related milestones are recognised as intangible assets on product launch at a value based on the Group’s long-term revenue forecasts for the related product. The table below indicates potential development and revenue-related payments that the Group may be required to make under such collaborations.
| | | | | | | | | | | | | | | | | | | | |
| | | | | | | | | | | | | | | Years 5 | |
| | | Total | | | Under 1 year | | | Years 1 and 2 | | | Years 3 and 4 | | | and greater | |
| | | $m | | | $m | | | $m | | | $m | | | $m | |
| Future potential research and development milestone payments | | | 8,818 | | | | 428 | | | | 1,464 | | | | 1,952 | | | | 4,974 | |
| Future potential revenue milestone payments | | | 4,754 | | | | 3 | | | | 279 | | | | 1,270 | | | | 3,202 | |
The table includes all potential payments for achievement of milestones under ongoing research and development arrangements. Revenue-related milestone payments represent the maximum possible amount payable on achievement of specified levels of revenue as set out in individual contract agreements, but exclude variable payments that are based on unit sales (eg royalty-type payments) which are expensed as the associated sale is recognised. The table excludes any payments already capitalised in the Financial Statements for the year ended 31 December 2015.
The future payments we disclose represent contracted payments and, as such, are not discounted and are not risk adjusted. As detailed in the Risk section from page 212, the development of any pharmaceutical product candidate is a complex and risky process that may fail at any stage in the development process due to a number of factors (including items such as failure to obtain regulatory approval, unfavourable data from key studies, adverse reactions to the product candidate or indications of other safety concerns). The timing of the payments is based on the Group’s current best estimate of achievement of the relevant milestone.
Environmental costs and liabilities
The Group’s expenditure on environmental protection, including both capital and revenue items, relates to costs that are necessary for implementing internal systems and programmes, and meeting legal and regulatory requirements for processes and products.
They are an integral part of normal ongoing expenditure for carrying out the Group’s research, manufacturing and commercial operations and are not separated from overall operating and development costs. There are no known changes in legal, regulatory or other requirements resulting in material changes to the levels of expenditure for 2013, 2014 or 2015.
In addition to expenditure for meeting current and foreseen environmental protection requirements, the Group incurs costs in investigating and cleaning up land and groundwater contamination. In particular, AstraZeneca has environmental liabilities at some currently or formerly owned, leased and third party sites.
In the US, Zeneca Inc., and/or its indemnitees, have been named as potentially responsible parties (PRPs) or defendants at approximately 15 sites where Zeneca Inc. is likely to incur future environmental investigation, remediation, operation and maintenance costs under federal, state, statutory or common law environmental liability allocation schemes (together, US Environmental Consequences). Similarly, Stauffer Management Company LLC (SMC), which was established in 1987 to own and manage certain assets of Stauffer Chemical Company acquired that year, and/or its indemnitees, have been named as PRPs or defendants at 33 sites where SMC is likely to incur US Environmental Consequences. AstraZeneca has also given indemnities to third parties for a number of sites outside the US. These environmental liabilities arise from legacy operations that are not currently part of the Group’s business and, at most of these sites, remediation, where required, is either completed or nearing completion.
AstraZeneca has made provisions for the estimated costs of future environmental investigation, remediation, operation and maintenance activity beyond normal ongoing expenditure for maintaining the Group’s R&D and manufacturing capacity and product ranges, where a present obligation exists, it is probable that such costs will be incurred and they can be estimated reliably. With respect to such estimated future costs, there were provisions at 31 December 2015 in the aggregate of $67m (2014: $84m; 2013: $87m), mainly relating to the US. Where we are jointly liable or otherwise have cost-sharing agreements with third parties, we reflect only our share of the obligation. Where the liability is insured in part or in whole by insurance or other arrangements for reimbursement, an asset is recognised to the extent that this recovery is virtually certain.
It is possible that AstraZeneca could incur future environmental costs beyond the extent of our current provisions. The extent of such possible additional costs is inherently difficult to estimate due to a number of factors, including: (1) the nature and extent of claims that may be asserted in the future; (2) whether AstraZeneca has or will have any legal obligation with respect to asserted or unasserted claims; (3) the type of remedial action, if any, that may be selected at sites where the remedy is presently not known; (4) the potential for recoveries from or allocation of liability to third parties; and (5) the length of time that the environmental investigation, remediation and liability allocation process can take. Notwithstanding and subject to the foregoing, we estimate the potential additional loss for future environmental investigation, remediation, remedial operation and maintenance activity above and beyond our provisions to be, in aggregate, between $71m and $119m (2014: $50m and $80m; 2013: $50m and $90m), which relates mainly to the US.
| | |
| 186 | | AstraZenecaAnnual Report and Form 20-F Information 2015 |
27 Commitments and contingent liabilitiescontinued
Legal proceedings
AstraZeneca is involved in various legal proceedings considered typical to its business, including actual or threatened litigation and/or actual or potential government investigations relating to employment matters, product liability, commercial disputes, pricing, sales and marketing practices, infringement of IP rights, and the validity of certain patents and competition laws. The more significant matters are discussed below.
Most of the claims involve highly complex issues. Often these issues are subject to substantial uncertainties and, therefore, the probability of a loss, if any, being sustained and an estimate of the amount of any loss is difficult to ascertain. Consequently, for a majority of these claims, it is not possible to make a reasonable estimate of the expected financial effect, if any, that will result from ultimate resolution of the proceedings. In these cases, AstraZeneca discloses information with respect to the nature and facts of the cases.
With respect to each of the legal proceedings described below, other than those for which provision has been made, we are unable to make estimates of the possible loss or range of possible losses at this stage, other than as set forth in this section. We also do not believe that disclosure of the amount sought by plaintiffs, if known, would be meaningful with respect to those legal proceedings. This is due to a number of factors, including (1) the stage of the proceedings (in many cases trial dates have not been set) and the overall length and extent of pre-trial discovery; (2) the entitlement of the parties to an action to appeal a decision; (3) clarity as to theories of liability, damages and governing law; (4) uncertainties in timing of litigation; and (5) the possible need for further legal proceedings to establish the appropriate amount of damages, if any.
While there can be no assurance regarding the outcome of any of the legal proceedings referred to in this Note 27, based on management’s current and considered view of each situation, we do not currently expect them to have a material adverse effect on our financial position. This position could of course change over time, not least because of the factors referred to above.
In cases that have been settled or adjudicated, or where quantifiable fines and penalties have been assessed and which are not subject to appeal (or other similar forms of relief), or where a loss is probable and we are able to make a reasonable estimate of the loss, we generally indicate the loss absorbed or make provision for our best estimate of the expected loss.
Where it is considered that the Group is more likely than not to prevail, legal costs involved in defending the claim are charged to profit as they are incurred.
Where it is considered that the Group has a valid contract which provides the right to reimbursement (from insurance or otherwise) of legal costs and/or all or part of any loss incurred or for which a provision has been established, and we consider recovery to be virtually certain, the best estimate of the amount expected to be received is recognised as an asset.
Assessments as to whether or not to recognise provisions or assets, and of the amounts concerned, usually involve a series of complex judgements about future events and can rely heavily on estimates and assumptions. AstraZeneca believes that the provisions recorded are adequate based on currently available information and that the insurance recoveries recorded will be received. However, given the inherent uncertainties involved in assessing the outcomes of these cases, and in estimating the amount of the potential losses and the associated insurance recoveries, we could in the future incur judgments or insurance settlements that could have a material adverse effect on our results in any particular period.
IP claims include challenges to the Group’s patents on various products or processes and assertions of non-infringement of patents. A loss in any of these cases could result in loss of patent protection on the related product. The consequences of any such loss could be a significant decrease in product sales, which could have a material adverse effect on our results. The lawsuits filed by AstraZeneca for patent infringement against companies that have filed ANDAs in the US, seeking to market generic forms of products sold by the Group prior to the expiry of the applicable patents covering these products, typically also involve allegations of non-infringement, invalidity and unenforceability of these patents by the ANDA filers. In the event that the Group is unsuccessful in these actions or the statutory 30-month stay expires before a ruling is obtained, the ANDA filers involved will also have the ability, subject to FDA approval, to introduce generic versions of the product concerned.
AstraZeneca has full confidence in, and will vigorously defend and enforce, its IP.
Over the course of the past several years, including in 2015, a significant number of commercial litigation claims in which AstraZeneca is involved have been resolved, particularly in the US, thereby reducing potential contingent liability exposure arising from such litigation. Similarly, in
part due to patent litigation and settlement developments, greater certainty has been achieved regarding possible generic entry dates with respect to some of our patented products. At the same time, like other companies in the pharmaceutical sector and other industries, AstraZeneca continues to be subject to government investigations around the world.
Patent litigation
Brilinta(ticagrelor)
US patent litigation
In September and October 2015, AstraZeneca received Paragraph IV notices challenging patents listed in the FDA Orange Book with reference toBrilinta. AstraZeneca has received notice from 15 companies that each submitted an ANDA seeking to market ticagrelor. In October and November 2015, in the US District Court for the District of Delaware, AstraZeneca filed patent infringement lawsuits in response to these Paragraph IV notices from the ANDA filers. Litigation is at an early stage and no trial dates have been set.
Byetta(exenatide)
US patent litigation
In December 2014, AstraZeneca commenced patent litigation in response to a Paragraph IV notice from Teva Pharmaceuticals USA, Inc. (Teva). Trial is scheduled for December 2016 in the US District Court for the District of Delaware (the District Court). In December 2015, AstraZeneca commenced patent litigation in response to a Paragraph IV notice from Amneal Pharmaceuticals LLC (Amneal) in the District Court. The Amneal proceedings are at an early stage and no trial date has been set.
In November 2015, Sanofi-Aventis U.S. LLC and Sanofi-Aventis Deutschland GmbH (together, Sanofi) served AstraZeneca with a complaint for declaratory judgment that Sanofi’s proposed lixisenatide product would not infringe three AstraZeneca patents. Sanofi also alleges invalidity of the patents. In December 2015, AstraZeneca filed an answer including counterclaims that Sanofi’s proposed lixisenatide product would infringe several AstraZeneca patents. Certain patents-at-issue are listed in the FDA Orange Book with reference toByetta. Proceedings are in the early stages in the US District Court for the District of Delaware. No trial date has been set in the proceedings against Sanofi.
Separately, in December 2015, Sanofi filed petitions in the US Patent Trial and Appeals Board forinter partes review of certain patents that are also at issue in the above-referenced District Court litigation against Sanofi. Proceedings are at an early stage.
| | |
| AstraZenecaAnnual Report and Form 20-F Information 2015 | | 187 |
Financial Statements
27 Commitments and contingent liabilities continued
Crestor (rosuvastatin calcium)
US patent litigation
AstraZeneca is defending three patent infringement lawsuits in the US District Court for the District of South Carolina (the District Court) which, among other things, claim that AstraZeneca’sCrestor sales induce infringement of the plaintiffs’ patents. The first was filed in April 2011 by plaintiff Palmetto Pharmaceuticals, LLC (Palmetto), and the other two, which have been consolidated, were filed in July and December 2013 by co-plaintiffs Medical University of South Carolina Foundation for Research Development and Charleston Medical Therapeutics, Inc. In December 2015, the District Court issued an order dismissing the first of these cases, filed by Palmetto, and entered judgment in AstraZeneca’s favour. In January 2015, Palmetto filed notice that it intends to appeal.
Patent proceedings outside the US
In Australia, in 2011 and 2012, AstraZeneca instituted proceedings against Actavis Australia Pty Ltd, Apotex Pty Ltd and Watson Pharma Pty Ltd asserting infringement of three formulation and method patents for Crestor. AstraZeneca was unsuccessful in defending the validity of these patents, at trial and on appeal. This patent litigation concluded in September 2015 when the High Court of Australia dismissed an appeal filed by AstraZeneca. Relevant parties could pursue damages claims against AstraZeneca. A provision has been taken in respect of generic entities which were prevented by court order from launching their products in Australia before AstraZeneca’s patents were subsequently found invalid.
In Japan, in 2014, Teva Pharma Japan Inc. (Teva) filed a patent invalidation request with the Japanese Patent Office (JPO) in relation to theCrestor substance patent. In June 2015, the JPO dismissed Teva’s request. Teva appealed the decision but subsequently withdrew the appeal. A second invalidation action relating to the same patent has been filed by an individual.
In the Netherlands, in 2014, AstraZeneca received a letter from Resolution Chemicals Ltd. (Resolution) indicating that it had sought marketing authorisation for a rosuvastatin zinc product. In April 2014, AstraZeneca received a writ of summons from Resolution alleging partial invalidity and non-infringement of the supplementary protection certificate (SPC) related to theCrestorsubstance patent. In July 2015, the DistrictCourt of the Hague determined that the SPC does not extend to zinc salts of rosuvastatin and that Resolution’s product does not infringe the SPC. AstraZeneca appealed and the appeal was heard in November 2015. A decision is expected in the first quarter of 2016.
In the UK, in October 2015, Resolution Chemicals Ltd., commenced an action alleging partial invalidity and non-infringement of the supplementary protection certificate related to theCrestor substance patent. AstraZeneca has responded.
Daliresp(roflumilast)
US patent litigation
In April 2015, AstraZeneca received Paragraph IV notices challenging patents listed in the FDA Orange Book with reference toDaliresp. AstraZeneca has received notice from 11 companies that each submitted an ANDA seeking to market roflumilast. In May 2015 and subsequently, in the US District Court for the District of New Jersey, AstraZeneca filed patent infringement lawsuits in response to these Paragraph IV notices from the ANDA filers. Litigation is at an early stage and no trial dates have been set.
Faslodex(fulvestrant)
US patent litigation
In 2014, 2015 and 2016, AstraZeneca filed patent infringement lawsuits in the US District Court in New Jersey relating to four patents listed in the FDA Orange Book with reference toFaslodex, after AstraZeneca received seven Paragraph IV notices relating to six ANDAs seeking FDA approval to market generic versions of Faslodex prior to the expiration of AstraZeneca’s patents. The first trial is expected to be scheduled for the second half of 2016.
In September 2015, AstraZeneca also filed a patent infringement lawsuit relating to one of the seven Paragraph IV notices in the US District Court in West Virginia which is currently stayed by the West Virginia court.
Patent proceedings outside the US
In Brazil, in February 2013, Eurofarma Laboratorios S.A. (Eurofarma) filed a nullity action against a formulation patent forFaslodex in the 31st Specialized Intellectual Property Federal Court of Rio de Janeiro (the Court). In October 2015, the Court ruled in Eurofarma’s favour and invalidated AstraZeneca’s patent. In November 2015, AstraZeneca appealed the decision.
In Germany, in July 2015, AstraZeneca was served with a nullity complaint by Hexal AG (Hexal), commencing invalidity proceedings before the Federal Patent Court, and requesting revocation of the German part of theFaslodex formulation use patent, European Patent No. 1,250,138 (the ‘138 patent). In September 2015, AstraZeneca filed a request for a provisional injunction against Hexal in the Regional Court of Düsseldorf after Hexal threatened to launch a genericFaslodex product in the fourth quarter of 2015. The provisional injunction request was denied in November 2015. AstraZeneca filed an appeal against this decision in November 2015. In December 2015, AstraZeneca filed an infringement suit against Hexal in the Regional Court of Mannheim referring to their threatened launch of a genericFaslodex product.
In October 2015, Hexal filed a notice of opposition against European Patent No. 2,266,573 (the ‘573 Patent) granted in June 2015. The ‘573 Patent is related to the ‘138 patent referred to above.
Losec/Prilosec(omeprazole)
US patent litigation
In 2008, Apotex Inc. (Apotex) was found to infringe AstraZeneca’s US Patent Nos. 4,786,505 and 4,853,230. In 2013, the US District Court for the Southern District of New York (the District Court) ordered Apotex to pay $76 million in damages with an additional sum of $28 million in pre-judgment interest, and an unspecified amount of post-judgment interest. Apotex appealed. In April 2015, the US Court of Appeals for the Federal Circuit affirmed the bulk of the damages award, with the exception of a small portion of the award which related to sales post patent expiration during a portion of the paediatric exclusivity period. In July 2015, the District Court ordered Apotex to pay approximately $99m to AstraZeneca. The proceeding is now closed and AstraZeneca has recognised the income.
Patent proceedings outside the US
In Canada, in 2004, AstraZeneca brought proceedings against Apotex Inc. (Apotex) for infringement of several patents related toLosec. In February 2015, the Federal Court of Canada found that Apotex had infringed AstraZeneca’s Canadian Patent No. 1,292,693. Apotex has appealed.
Movantik/Moventig(naloxegol)
US patent litigation
In October 2015, Neptune Generics LLC, an affiliate of Gerchen Keller Capital LLC, filed forinter partes review (IPR) with the US Patent Office challenging the validity of one of the six patents listed in the FDA Orange Book with reference toMovantik. The IPR relates to US Patent No. 7,786,133, which is licensed to AstraZeneca from Nektar Therapeutics. AstraZeneca is considering its response.
Patent proceedings outside the US
In Europe, in October 2014, Generics UK Ltd. (trading as Mylan) filed an opposition to the grant of European Patent No. 1,694,363. This matter is scheduled for oral proceedings on 25 February 2016.
Nexium(esomeprazole magnesium)
US patent litigation
In September 2015, AstraZeneca received a Paragraph IV notice from Zydus Pharmaceuticals (USA) Inc. and Cadila Healthcare Ltd. (together, Zydus) challenging certain patents listed in the FDA Orange Book with reference toNexium oral suspension. Zydus submitted an ANDA seeking to market esomeprazole magnesium oral suspension. In October 2015, in response to Zydus’ notice, AstraZeneca filed a patent infringement lawsuit against Zydus in the US District Court for the District of New Jersey (the District Court). TheNexium oral suspension litigation
| | |
| 188 | | AstraZenecaAnnual Report and Form 20-F Information 2015 |
27 Commitments and contingent liabilities continued
is at an early stage and no trial date has been set. Separately, severalNexium andNexium 24HR (OTC) patent litigations are ongoing in the District Court. Proceedings are at various stages and no trial dates have been set.
Patent proceedings outside the US
In Canada, in July 2014, the Federal Court found Canadian Patent No. 2,139,653 invalid and not infringed by Apotex Inc. On 6 July 2015, AstraZeneca’s appeal was dismissed. AstraZeneca has sought leave to appeal to the Supreme Court of Canada.
In Canada, in July 2014, AstraZeneca received a notice of allegation from Teva Canada Limited (Teva) alleging either that Teva’s esomeprazole magnesium product would not infringe the patents listed on the Canadian Patent Register in relation to Nexium or, alternatively, that certain of the patents were invalid. AstraZeneca commenced a proceeding in 2014, but has now discontinued its application pursuant to a settlement agreement.
In Canada, in July 2015, Pharmascience Inc. commenced an action for damages allegedly suffered during the period while it was unable to launch its esomeprazole product due to ongoing proceedings under the Patented Medicines (Notice of Compliance) Regulations. AstraZeneca is defending the claim.
Onglyza(saxagliptin) and Kombiglyze XR(saxagliptin and metformin)
US patent litigation
Beginning April 2014 and continuing into 2015, a number of generics companies sent notices that they had submitted ANDAs for saxagliptin hydrochloride 2.5mg and 5mg tablets containing a Paragraph IV Certification alleging that US Patent Nos. 7,951,400 (the ‘400 Patent) and RE44,186 (the ‘186 Patent), listed in the FDA Orange Book with reference toOnglyza, are invalid, unenforceable and/or will not be infringed by the products as described in the ANDAs. Several of these companies also sent notices that they had submitted ANDAs for saxagliptin hydrochloride and metformin 2.5mg/1000mg, 5mg/1000mg, and 5mg/500mg tablets containing a Paragraph IV Certification alleging that US Patent Nos. 8,628,799 (the ‘799 Patent) and/ or the ‘186 Patent listed in the FDA Orange Book with reference toKombiglyze XR, are invalid, unenforceable and/or will not be infringed by the products as described in the ANDAs. AstraZeneca initiated patent infringement proceedings asserting the ‘400 Patent, the ‘186 Patent and the ‘799 Patent in the US District Court for the District of Delaware (District Court) against all of the above-referenced patent challenges. The District Court dismissed without prejudice all claims and counterclaims with respect to the ‘799 Patent and the ‘400 Patent.
Following the District Court’s denial of Mylan Pharmaceuticals, Inc.’s (Mylan) motion to dismiss for lack of jurisdiction in 2014, Mylan was granted the right to appeal that decision to the US Court of Appeals for the Federal Circuit and argument was heard on that appeal in January 2016.
In June 2015, Mylan filed a petition for aninter partes review (IPR) with the US Patent and Trademark Office (USPTO) challenging the validity of the ‘186 Patent. In December 2015, the USPTO declined to institute the IPR (the December Decision). In January 2016, Mylan filed a Request for Rehearing with the USPTO seeking reconsideration of the December Decision.
Pulmicort Respules(budesonide inhalation suspension)
US patent litigation
In February 2015, the US District Court for the District of New Jersey (the District Court) determined that the asserted claims of US Patent No. 7,524,834 were invalid and denied AstraZeneca’s motion for an injunction against Apotex, Inc. and Apotex Corp., Breath Limited, Sandoz, Inc. and Watson Laboratories, Inc. (together, the Generic Challengers) pending an appeal of the District Court’s decision. AstraZeneca appealed that decision to the US Court of Appeals for the Federal Circuit (the Court of Appeals) and filed an Emergency Motion for an Injunction Pending Appeal. The Court of Appeals granted AstraZeneca’s motion and issued an injunction against the Generic Challengers pending appeal. In May 2015, the Court of Appeals affirmed the District Court’s decision and lifted the injunction that was issued. Since 2009, various injunctions were issued in this matter. Damages claims based on those injunctions have been filed and a provision has been taken.
Seroquel XR(quetiapine fumarate)
US patent litigation
In February 2015, AstraZeneca settled patent infringement litigation against Pharmadax, Inc. and Pharmadax USA, Inc. (together, Pharmadax) that was pending in the US District Court for the District of New Jersey by granting Pharmadax a licence to theSeroquelXRproduct patent effective from 1 November 2016, or earlier in certain circumstances.
In February 2015, AstraZeneca filed a patent infringement lawsuit against Macleods Pharmaceuticals, Ltd., Macleods Pharma USA, Inc. and AB Pharmaceuticals, LLC. (together, Macleods) in the US District Court for the District of New Jersey. In June 2015, AstraZeneca settled the patent infringement litigation by granting Macleods a licence to theSeroquel XR product patent effective from 1 November 2016, or earlier in certain circumstances.
Patent proceedings outside the US
In Canada, in April 2015, AstraZeneca and Teva Canada Limited (Teva) entered into a settlement agreement ending the ongoing patent litigation between the parties, as well as a claim for section 8 damages, and allowing Teva to continue selling genericSeroquel XR in Canada.
In Italy, in June 2015, following a challenge to the validity of the formulation patent coveringSeroquel XR by Sandoz S.p.A. and Sandoz A/S, the Court of Turin found theSeroquel XR formulation patent invalid.
In Germany, generic entities have claimed, or could claim, damages relating to the preliminary injunction issued in April 2012 that prevented genericSeroquel XR sales by those entities until the injunction was lifted following a November 2012 Federal Patent Court decision that held that theSeroquel XR patent was invalid. A provision has been taken.
In France, in April 2015, Mylan SAS (Mylan) brought a patent invalidation action against AstraZeneca’s French designation of theSeroquel XR formulation patent, European Patent No. 0,907,364 (the ‘364 Patent). AstraZeneca is defending that action and has brought a claim against Mylan for infringement of the ‘364 Patent. In the third quarter of 2015, Mylan launched its genericSeroquel XR product at-risk. In November 2015, AstraZeneca obtained a preliminary injunction against Mylan, which was overturned on appeal in December 2015. AstraZeneca had a similar litigation pending against Accord Healthcare France SAS and Accord Healthcare Limited that was settled in January 2016.
Vimovo(naproxen/esomeprazole magnesium)
Patent proceedings outside the US
In Canada, in January 2015, AstraZeneca received two notices of allegation from Mylan Pharmaceuticals ULC. In response, AstraZeneca and Pozen Inc. (the licensee and patent holder, respectively), commenced proceedings in relation to Canadian Patent No. 2,449,098.
Product liability litigation
Byetta/Bydureon(exenatide)
Amylin Pharmaceuticals, LLC, a wholly owned subsidiary of AstraZeneca, and/or AstraZeneca are among multiple defendants in various lawsuits filed in federal and state courts in the US involving approximately 2,500 claims of physical injury from treatment withByettaand/orBydureon. The lawsuits allege multiple types of injuries including pancreatitis, pancreatic cancer, thyroid cancer, and kidney cancer. A multi-district litigation has been established in the US District Court for the Southern District of California (the District Court) in regard to the alleged pancreatic cancer cases in federal courts. Further, a co-ordinated proceeding has been established in Los Angeles, California in regard to the various lawsuits in California state courts.
| | |
| AstraZenecaAnnual Report and Form 20-F Information 2015 | | 189 |
Financial Statements
27 Commitments and contingent liabilities continued
In November 2015, the District Court granted the defendants’ motion for summary judgment and dismissed all claims alleging pancreatic cancer that accrued prior to 11 September 2015. The plaintiffs have appealed that ruling. A similar motion was granted in favour of the defendants in the California state co-ordinated proceeding, and judgment has not yet been entered.
A single case pending in Alabama state court has been set for trial on 21 June 2016. A motion for summary judgment is pending.
Crestor(rosuvastatin calcium)
AstraZeneca is defending a number of lawsuits alleging multiple types of injuries caused by the use ofCrestor, including diabetes mellitus, various cardiac injuries, rhabdomyolysis, and/or liver and kidney injuries. The claims of approximately 600 plaintiffs, comprising approximately 100 California residents and approximately 500 non-California residents, were aggregated in one co-ordinated proceeding in Los Angeles, California. The claims of approximately 600 additional plaintiffs are waiting to be added to the co-ordination. In October 2014, the co-ordination judge dismissed the claims of the non-California plaintiffs whose claims were in the co-ordinated proceeding. The plaintiffs have appealed the October 2014 order dismissing the non-California plaintiffs from the proceeding. There are now approximately 700 plaintiffs remaining with claims pending in California state court. The claims that were pending in the Eastern District of Kentucky have been dismissed, and the two plaintiffs involved are seeking to have their claims reinstated in California.
Farxiga(dapagliflozin)
AstraZeneca has been named as one of multiple defendants in a lawsuit filed in the US District Court for the Western District of Kentucky involving one plaintiff claiming physical injury, including diabetic ketoacidosis and kidney failure, from treatment withFarxiga.
Nexium(esomeprazole magnesium)
AstraZeneca has been defending product liability lawsuits brought in federal and state courts by approximately 1,900 plaintiffs who alleged thatNexium caused osteoporotic injuries, such as bone deterioration, loss of bone density and/or bone fractures, but all such claims have now been dismissed with judgment entered in AstraZeneca’s favour. Approximately 270 plaintiffs have appealed the dismissal of their claims to the US Court of Appeals for the Ninth Circuit, and fewer than 40 plaintiffs have appealed the dismissal of their claims to the California Second Appellate Division.
Onglyza(saxagliptin)
Amylin Pharmaceuticals, LLC, a wholly owned subsidiary of AstraZeneca, and/or AstraZeneca are among multiple defendants in various lawsuits filed in federal and state courts in the US involving multiple plaintiffs claiming physical injury from treatment withOnglyza. The lawsuits allege injuries including pancreatic cancer. The lawsuit that was pending claiming congestive heart failure from treatment withOnglyza has been dismissed.
Seroquel IR(quetiapine fumarate)
With regard to the Seroquel product liability litigation in the US, AstraZeneca is currently defending one case in active litigation involving a single plaintiff.
With regard to insurance coverage for the legal defence costs and settlements that have been incurred in connection with theSeroquel IR product liability claims in the US related to alleged diabetes and/or other related alleged injuries, all disputes with insurers have now been settled.
Commercial litigation
Crestor(rosuvastatin calcium)
Qui tam litigation
In January and February 2014, AstraZeneca was served with lawsuits filed in the US District Court for the District of Delaware under thequi tam (whistleblower) provisions of the federal False Claims Act and related state statutes, alleging that AstraZeneca directed certain employees to promoteCrestor off-label and provided unlawful remuneration to physicians in connection with the promotion ofCrestor. The DOJ and all US states have declined to intervene in the lawsuits. This litigation has been stayed pending trial court disposition or earlier resolution of the Texas Attorney General litigation involvingCrestor disclosed below.
Texas Attorney General litigation
In January 2015, following a previously disclosed investigation by the State of Texas into AstraZeneca’s sales and marketing activities involvingCrestor, AstraZeneca was served with a lawsuit in which the Texas Attorney General’s Office intervened in a state whistleblower action pending in Travis County Court, Texas. The lawsuit alleges that AstraZeneca engaged in inappropriate promotion ofCrestor and improperly influenced the formulary status ofCrestor.
Israel
In November 2012, a Motion to Certify a Claim as a Class Action and Statement of Claim were filed in Israel in the District Court in Tel Aviv, Jaffa, against AstraZeneca and four other pharmaceutical companies for alleged deception and failure to disclose material facts to consumers regarding potential adverse events associated with certain drugs, including
Crestor. In July 2013, an amended Motion to Certify a Claim as a Class Action and Statement of Claim containing similar allegations to those in the first action were filed in the same court against the same defendants. The court has not yet ruled on the Motion to Certify.
Nexium(esomeprazole magnesium)
Consumer litigation
AstraZeneca is a defendant in a class action filed in Delaware State Court alleging that AstraZeneca’s promotion, advertising and pricing ofNexium to physicians, consumers and third party payers was unfair, unlawful and deceptive. This action is the last of a number of similar, previously resolved lawsuits. In July 2015, the court granted AstraZeneca’s motion to dismiss and entered judgment in AstraZeneca’s favour. The plaintiffs are appealing to the Delaware Supreme Court.
Settlement anti-trust litigation
AstraZeneca is a defendant in a multi-district litigation class action and individual lawsuit alleging that AstraZeneca’s settlements of certain patent litigation in the US relating toNexium violated US anti-trust law and various state laws. A trial in the US District Court for the District of Massachusetts commenced in October 2014 and, in December 2014, a jury returned a verdict in favour of AstraZeneca. Following the court’s denial of plaintiffs’ motion for a new trial and preliminary injunction, the court entered judgment in favour of AstraZeneca in September 2015. The plaintiffs have appealed that judgment.
Nexium/Prilosectrademark litigation
AstraZeneca filed separate complaints in the US District Court for the District of Delaware (the Delaware District Court) against Camber Pharmaceuticals, Inc. (Camber) and Dr. Reddy’s Laboratories, Inc. (Dr. Reddy’s) to enforce certain AstraZeneca trademark rights related toNexium andPrilosec. Dr. Reddy’s has filed its own separate claims against AstraZeneca in both the Delaware District Court and the US District Court for the District of New Jersey. The Delaware District Court has issued preliminary injunctions against Camber’s and Dr. Reddy’s sales of generic esomeprazole magnesium in purple capsules. Dr. Reddy’s has appealed the decision of the Delaware District Court to the US Court of Appeals for the Third Circuit, and the appeal is pending. All cases related to this matter have been stayed pending this appeal.
Seroquel IR(quetiapine fumarate) andSeroquel XR(quetiapine fumarate)
In relation to the state law claims brought by state Attorneys General generally alleging that AstraZeneca made false and/or misleading statements in marketing and promotingSeroquel, AstraZeneca remains in litigation with the Attorney General of Mississippi.
| | |
| 190 | | AstraZenecaAnnual Report and Form 20-F Information 2015 |
27 Commitments and contingent liabilities continued
Qui tam litigation in New York
In September 2015, AstraZeneca was served with a lawsuit filed in US Federal Court in New York under thequi tam(whistleblower) provisions of the federal and certain state False Claims Acts. The lawsuit alleges that AstraZeneca misrepresented the safety profile of, and improperly promoted,Seroquel IR andSeroquel XR. The US government and the named states have declined to intervene in this case.
Qui tam litigation in Delaware
In January and February 2014, AstraZeneca was served with lawsuits filed in the US District Court for the District of Delaware under thequi tam (whistleblower) provisions of the federal False Claims Act and related state statutes, alleging that AstraZeneca directed certain employees to promoteSeroquel off-label and provided unlawful remuneration to physicians in connection with the promotion ofSeroquel. The DOJ and all US states have declined to intervene in the lawsuits. This litigation has been stayed pending trial court disposition or earlier resolution of the Texas Attorney General litigation involvingSeroquel disclosed below.
Texas Attorney General litigation
In October 2014, following a previously disclosed investigation by the State of Texas into AstraZeneca’s sales and marketing activities involvingSeroquel, the Texas Attorney General’s Office intervened in a state whistleblower action pending in Travis County Court, Texas. The lawsuit alleges that AstraZeneca engaged in inappropriate promotion ofSeroquel and made improper payments intended to influence the formulary status ofSeroquel.
Synagis(palivizumab)
In September 2011, MedImmune filed an action against AbbVie, Inc. (AbbVie) (formerly Abbott International, LLC) in the Circuit Court of Montgomery County, Maryland, seeking a declaratory judgment in a contract dispute. AbbVie’s motion to dismiss was granted. In September 2011, AbbVie filed a parallel action against MedImmune in Illinois State Court and trial began in August 2015. In September 2015, a jury returned a verdict in favour of AbbVie and awarded AbbVie damages in the amount of approximately $94 million. In December 2015, MedImmune and AbbVie reached a settlement of this matter bringing this litigation to a conclusion.
Toprol-XL(metoprolol succinate)
In March 2015, AstraZeneca was served with a state court complaint filed by the Attorney General for the State of Louisiana alleging that, in connection with enforcement of its patents forToprol-XL, it had engaged in unlawful monopolisation and unfair trade practices,
causing the state government to pay increased prices forToprol-XL. The complaint is very similar to prior class action complaints filed by private parties against AstraZeneca relating toToprol-XL in 2006 and resolved by settlement in 2012. The State seeks an unspecified amount of trebled damages and pre-judgment interest.
Other commercial litigation
Average Manufacturer’s Pricequitamlitigation (Streck)
AstraZeneca was one of several manufacturers named as a defendant in a lawsuit filed in the US Federal Court in Philadelphia under thequi tam (whistleblower) provisions of the federal and certain state False Claims Acts alleging inaccurate reporting of Average Manufacturer’s prices to the Centers for Medicare and Medicaid Services. The action was initially filed in October 2008 but remained under seal until May 2011. In July 2015, AstraZeneca agreed upon a negotiated settlement to resolve the dispute. This matter is now concluded.
Medcoqui tam litigation (Schumann)
AstraZeneca had been named as a defendant in a lawsuit filed in the Federal Court in Philadelphia (the Federal Court) under the qui tam (whistleblower) provisions of the federal and certain state False Claims Acts alleging overpayments by federal and state governments resulting from alleged false pricing information reported to the government and alleged improper payments intended to influence the formulary status ofPrilosec andNexium to Medco and its customers. In January 2013, the Federal Court granted AstraZeneca’s motion and dismissed the case with prejudice. The plaintiff appealed. In October 2014, the US Court of Appeals for the Third Circuit affirmed the Federal Court’s decision to dismiss AstraZeneca from the litigation with prejudice. The matter is now concluded.
Ocimum Lawsuit
In December 2015, AstraZeneca was served with a complaint filed by Ocimum Biosciences, Ltd. (Ocimum) in the Superior Court for the State of Delaware that alleges, among other things, breaches of contractual obligations and misappropriation of trade secrets, relating to a now terminated 2001 licensing agreement between AstraZeneca and Gene Logic, Inc. (Gene Logic), the rights to which Ocimum purports to have acquired from Gene Logic.
Government investigations/proceedings
Crestor(rosuvastatin calcium)
The DOJ and all US states have declined to intervene in the civil component of an investigation regardingCrestor. Prior to September 2015, one additional component of the investigation remained. In September 2015, AstraZeneca was informed that the additional component of the investigation has been closed, bringing this matter to a conclusion.
Synagis(palivizumab)
In June 2011, MedImmune received a demand from the US Attorney’s Office for the Southern District of New York requesting certain documents related to the sales and marketing activities ofSynagis. In July 2011, MedImmune received a similar court order to produce documents from the Office of the Attorney General for the State of New York Medicaid and Fraud Control Unit pursuant to what the government attorneys advised was a joint investigation. MedImmune is co-operating with these inquiries.
In May 2012, MedImmune received a subpoenaduces tecum from the Office of Attorney General for the State of Florida Medicaid and Fraud Control Unit requesting certain documents related to the sales and marketing activities ofSynagis. MedImmune has accepted receipt of the request and has co-ordinated with the Florida government to provide the appropriate responses and co-operate with any related investigation. AstraZeneca is unaware of the nature or focus of the investigation, however, based on the nature of the requests, it appears to be similar to the inquiries from the State of New York and DOJ (which are described above).
Other government investigations/ proceedings
Foreign Corrupt Practices Act
In connection with investigations into anti-bribery and corruption issues in the pharmaceutical industry, AstraZeneca has received inquiries from enforcement agencies, including the DOJ and the SEC, regarding, among other things, sales practices, internal controls, certain distributors and interactions with healthcare providers and other government officials in several countries. AstraZeneca is co-operating with these inquiries. AstraZeneca’s investigation has involved indications of inappropriate conduct in certain countries, including China. Resolution of these matters could involve the payment of fines and/or other remedies.
Good Manufacturing Practices subpoena
In March 2013, AstraZeneca received a subpoenaduces tecum from the US Attorney’s Office in Boston seeking documents and information relating to products manufactured or packaged at AstraZeneca’s Macclesfield facility in the UK. AstraZeneca co-operated with this inquiry which is now closed.
Additional government inquiries
As is true for most, if not all, major prescription pharmaceutical companies operating in the US, AstraZeneca is currently involved in multiple US federal and state inquiries into drug marketing and pricing practices. In addition to the investigations described above, various federal and state law enforcement offices have, from time to time, requested information from the Group. There have been no material developments in those matters.
| | |
| AstraZenecaAnnual Report and Form 20-F Information 2015 | | 191 |
Financial Statements
27 Commitments and contingent liabilities continued
Tax
Where tax exposures can be quantified, an accrual is made based on best estimates and management’s judgement. Details of the movements in relation to material tax exposures are discussed below. As accruals can be built up over a long period of time but the ultimate resolution of tax exposures usually occurs at a point in time, and given the inherent uncertainties in assessing the outcomes of these exposures (which sometimes can be binary in nature), we could, in future periods, experience adjustments to these accruals that have a material positive or negative effect on our results in any particular period.
Transfer pricing and other international tax contingencies
The total net accrual included in the Group Financial Statements to cover the worldwide exposure to transfer pricing audits is $361m, a decrease of $234m compared to 2014 mainly due to releases following tax authority agreement and exchange rate effects.
AstraZeneca faces a number of transfer pricing audits in jurisdictions around the world and, in some cases, is in dispute with the tax authorities. The issues under discussion are
often complex and can require many years to resolve. Accruals for tax contingencies require management to make estimates and judgements with respect to the ultimate outcome of a tax audit, and actual results could vary from these estimates. The international tax environment presents increasingly challenging dynamics for the resolution of transfer pricing disputes. These disputes usually result in taxable profits being increased in one territory and correspondingly decreased in another. Our balance sheet positions for these matters reflect appropriate corresponding relief in the territories affected. Management considers that at present such corresponding relief will be available, but given the challenges in the international tax environment will keep this aspect under careful review.
Management continues to believe that AstraZeneca’s positions on all its transfer pricing audits and disputes are robust and that AstraZeneca is appropriately provided.
For transfer pricing audits where AstraZeneca and the tax authorities are in dispute, AstraZeneca estimates the potential for reasonably possible additional losses above and beyond the amount provided to be up to $357m (2014: $521m; 2013: $529m), however, management believes that it is unlikely that these additional losses will arise. It is possible that some of these contingencies may reduce
in the future to the extent that any tax authority challenge is unsuccessful, or matters lapse following expiry of the relevant statutes of limitation resulting in a reduction in the tax charge in future periods.
Other tax contingencies
Included in the tax accrual is $1,373m relating to a number of other tax contingencies, a decrease of $307m mainly due to releases following expiry of statute of limitations and exchange rate effects offset by the impact of an additional year of transactions relating to contingencies for which accruals had already been established. For these tax exposures, AstraZeneca does not expect material additional losses. It is, however, possible that some of these contingencies may reduce in the future if any tax authority challenge is unsuccessful or matters lapse following expiry of the relevant statutes of limitation resulting in a reduction in the tax charge in future periods.
Timing of cash flows and interest
It is not possible to estimate the timing of tax cash flows in relation to each outcome, however, it is anticipated that a number of significant disputes may be resolved over the next one to two years. Included in the provision is an amount of interest of $174m (2014: $227m; 2013: $344m). Interest is accrued as a tax expense.
28 Operating leases
Total rentals under operating leases charged to profit were as follows:
| | | | | | | | | | | | |
| | | 2015 | | | 2014 | | | 2013 | |
| | | $m | | | $m | | | $m | |
| Operating leases | | | 185 | | | | 185 | | | | 188 | |
The future minimum lease payments under operating leases that have initial or remaining terms in excess of one year at 31 December 2015 were as follows: | |
| | | 2015 | | | 2014 | | | 2013 | |
| | | $m | | | $m | | | $m | |
| Obligations under leases comprise: | | | | | | | | | | | | |
| Not later than one year | | | 95 | | | | 100 | | | | 92 | |
| Later than one year and not later than five years | | | 245 | | | | 247 | | | | 248 | |
| Later than five years | | | 69 | | | | 91 | | | | 110 | |
| Total future minimum lease payments | | | 409 | | | | 438 | | | | 450 | |
| | | |
| 29 Statutory and other information | | | | | | | | | | | | |
| | | 2015 | | | 2014 | | | 2013 | |
| | | $m | | | $m | | | $m | |
Fees payable to KPMG LLP and its associates:
Group audit fee | | | 3.2 | | | | 2.5 | | | | 2.2 | |
| | | |
Fees payable to KPMG LLP and its associates for other services:
The audit of subsidiaries pursuant to legislation | | | 5.4 | | | | 5.0 | | | | 5.0 | |
Audit-related assurance services | | | 2.5 | | | | 2.5 | | | | 2.6 | |
Tax compliance services | | | 0.1 | | | | 0.3 | | | | 0.6 | |
Tax advisory services | | | – | | | | – | | | | – | |
Other assurance services | | | 0.5 | | | | 0.5 | | | | 0.6 | |
Corporate finance services | | | – | | | | – | | | | 0.5 | |
| | | |
Fees payable to KPMG LLP in respect of the Group’s pension schemes:
The audit of subsidiaries’ pension schemes | | | 0.6 | | | | 0.5 | | | | 0.4 | |
| | | | 12.3 | 1 | | | 11.3 | 1 | | | 11.9 | 1 |
| 1 | 2015 and 2014 fees payable to KPMG LLP (2013: Fees payable to KPMG Audit Plc). |
Audit-related assurance services include fees of $1.8m (2014: $1.8m; 2013: $1.7m) in respect of section 404 of the Sarbanes-Oxley Act.
| | |
| 192 | | AstraZenecaAnnual Report and Form 20-F Information 2015 |
Related party transactions
The Group had no material related party transactions which might reasonably be expected to influence decisions made by the users of these Financial Statements.
Key management personnel compensation
Key management personnel are defined for the purpose of disclosure under IAS 24 ‘Related Party Disclosures’ as the members of the Board and the members of the SET.
| | | | | | | | | | | | |
| | | 2015 | | | 2014 | | | 2013 | |
| | | $’000 | | | $’000 | | | $’000 | |
| Short-term employee benefits | | | 29,265 | | | | 30,252 | | | | 25,029 | |
| Post-employment benefits | | | 2,636 | | | | 2,265 | | | | 2,323 | |
| Termination benefits | | | – | | | | – | | | | 3,855 | |
| Share-based payments | | | 17,885 | | | | 20,253 | | | | 16,509 | |
| | | | 49,786 | | | | 52,770 | | | | 47,716 | |
Total remuneration is included within employee costs (see Note 26). Further details of Directors’ emoluments are included in the Directors’ Remuneration Report from pages 103 to 134.
30 Subsequent events
On 2 February 2016, AstraZeneca completed an agreement to invest in a majority equity stake in Acerta Pharma B.V. (Acerta), a privately-owned biopharmaceutical company based in the Netherlands and US. The transaction provides AstraZeneca with a potential best-in-class irreversible oral Bruton’s tyrosine kinase (BTK) inhibitor, acalabrutinib (ACP-196), currently in Phase III development for B-cell blood cancers and in Phase I/II clinical trials in multiple solid tumours.
Under the terms of the agreement, AstraZeneca has acquired 55% of the issued share capital of Acerta for an upfront payment of $2.5bn. A further payment of $1.5bn will be paid either on receipt of the first regulatory approval for acalabrutinib for any indication in the US, or the end of 2018, depending on which is first. The agreement also includes options which, if exercised, provide the opportunity for Acerta shareholders to sell, and AstraZeneca to buy, the remaining 45% of shares in Acerta. The options can be exercised at various points in time, conditional on the first approval of acalabrutinib in both the US and Europe and when the extent of the commercial opportunity has been fully established, at a price of approximately $3bn net of certain costs and payments incurred by AstraZeneca and net of agreed future adjusting items, using a pre-agreed pricing mechanism. Acerta has approximately 150 employees.
AstraZeneca’s 55% holding is a controlling interest and Acerta’s combination of intangible product rights with an established workforce and their operating processes requires that the transaction is accounted for as a business combination in accordance with IFRS 3. Acerta’s results and net assets will be consolidated into the Company’s results from 2 February 2016.
Given the close proximity of the completion of the transaction to the date the Financial Statements were approved, the accounting entries for this transaction have not yet been determined. Our provisional assessment of the fair values of the assets and liabilities acquired will be completed in 2016.
| | |
| AstraZenecaAnnual Report and Form 20-F Information 2015 | | 193 |
Financial Statements
Group Subsidiaries and Holdings
In accordance with Section 409 of the Companies Act 2006 a full list of subsidiaries, partnerships, associates and joint ventures, the country of incorporation and the effective percentage of equity owned as at 31 December 2015 are disclosed below. Unless otherwise stated the share capital disclosed comprises ordinary shares which are indirectly held by AstraZeneca PLC.
Unless otherwise stated the accounting year ends of subsidiaries are 31 December. Products are manufactured in 17 countries worldwide and are sold in over 100 countries. The Group Financial Statements consolidate the Financial Statements of the Company and its subsidiaries at 31 December 2015.
| | | | | | |
| | | | | Percentage of | |
| | | | | voting share | |
| At 31 December 2015 | | Country | | capital held | |
| Wholly owned subsidiaries | | | | | | |
| Aktiebolaget Hässle | | Sweden | | | 100 | |
| AlphaCore Pharma Limited | | England | | | 100 | |
| AlphaCore Pharma, LLC1 | | United States | | | 100 | |
| Amylin Ohio LLC1 | | United States | | | 100 | |
| Amylin Pharmaceuticals LLC1 | | United States | | | 100 | |
| Ardea Biosciences Limited | | England | | | 100 | |
| Ardea Biosciences, Inc. | | United States | | | 100 | |
| Arrow Therapeutics Limited | | England | | | 100 | |
| Astra Alpha Produtos Farmaceuticos Lda | | Portugal | | | 100 | |
| Astra Export & Trading Aktiebolag | | Sweden | | | 100 | |
| Astra Läkemedel Aktiebolag | | Sweden | | | 100 | |
| Astra Pharmaceuticals (Pty) Limited | | South Africa | | | 100 | |
| Astra Pharmaceuticals Limited | | England | | | 100 | |
| Astra Tech International Aktiebolag | | Sweden | | | 100 | |
| AstraPharm2 | | England | | | 100 | |
| AstraZeneca A/S | | Denmark | | | 100 | |
| AstraZeneca do Brasil Limitada | | Brazil | | | 100 | |
| AstraZeneca (Thailand) Limited | | Thailand | | | 100 | |
| AstraZeneca (Wuxi) Trading Co. Ltd | | China | | | 100 | |
| AstraZeneca AB | | Sweden | | | 100 | |
| AstraZeneca AG | | Switzerland | | | 100 | |
| AstraZeneca AS | | Norway | | | 100 | |
AstraZeneca Asia-Pacific Business Services SDN BHD | | Malaysia | | | 100 | |
| AstraZeneca B.V. | | Netherlands | | | 100 | |
| AstraZeneca Biotech AB | | Sweden | | | 100 | |
| AstraZeneca BioVentureHub AB | | Sweden | | | 100 | |
| AstraZeneca Bulgaria EOOD | | Bulgaria | | | 100 | |
| AstraZeneca CAMCAR Costa Rica, S.A. | | Costa Rica | | | 100 | |
| AstraZeneca CAMCAR, S.A. | | Panama | | | 100 | |
| AstraZeneca Canada Inc.3 | | Canada | | | 100 | |
| AstraZeneca China UK Limited | | England | | | 100 | |
| AstraZeneca Collaboration Ventures LLC1 | | United States | | | 100 | |
| AstraZeneca Colombia S.A. | | Colombia | | | 100 | |
| AstraZeneca Continent B.V. | | Netherlands | | | 100 | |
| AstraZeneca Czech Republic, s.r.o. | | Czech Republic | | | 100 | |
| AstraZeneca d.o.o. | | Croatia | | | 100 | |
| AstraZeneca Death In Service Trustee Limited | | England | | | 100 | |
| AstraZeneca Dunkerque Production SCS | | France | | | 100 | |
| AstraZeneca Eesti OÜ | | Estonia | | | 100 | |
AstraZeneca Egypt for Pharmaceutical Industries JSC | | Egypt | | | 100 | |
| AstraZeneca Egypt for Trading LLC | | Egypt | | | 100 | |
| AstraZeneca Employee Share Trust Limited | | England | | | 100 | |
| AstraZeneca Farmaceutica Chile Limitada | | Chile | | | 100 | |
| AstraZeneca Farmaceutica Holding Spain, S.A. | | Spain | | | 100 | |
| AstraZeneca Farmaceutica Spain S.A. | | Spain | | | 100 | |
| AstraZeneca Finance Coöperatief WA | | Netherlands | | | 100 | |
| AstraZeneca Finance Limited | | England | | | 100 | |
| AstraZeneca Finance S.A.S. | | France | | | 100 | |
| AstraZeneca FZ-LLC | | United Arab Emirates | | | 100 | |
| AstraZeneca Gamma B.V. | | Netherlands | | | 100 | |
| | | | | | |
| | | | | Percentage of | |
| | | | | voting share | |
| At 31 December 2015 | | Country | | capital held | |
| AstraZeneca GmbH | | Germany | | | 100 | |
| AstraZeneca Health Care S.A. de C.V. | | Mexico | | | 100 | |
| AstraZeneca Holding Aktiebolag4 | | Sweden | | | 100 | |
| AstraZeneca Holding France S.A.S. | | France | | | 100 | |
| AstraZeneca Holding GmbH | | Germany | | | 100 | |
| AstraZeneca Holdings B.V. | | Netherlands | | | 100 | |
| AstraZeneca Holdings Pty Limited | | Australia | | | 100 | |
| AstraZeneca Hong Kong Limited | | Hong Kong | | | 100 | |
| AstraZeneca Ilac Sanayi ve Ticaret Limited Sirketi | | Turkey | | | 100 | |
| AstraZeneca India Private Limited5 | | India | | | 100 | |
| AstraZeneca Industries, LLC | | Russia | | | 100 | |
| AstraZeneca Insurance Company Limited | | England | | | 100 | |
| AstraZeneca Intermediate Holdings Limited4 | | England | | | 100 | |
| AstraZeneca International Holdings Aktiebolag2 | | Sweden | | | 100 | |
| AstraZeneca Investment (China) Co., Ltd | | China | | | 100 | |
| AstraZeneca Investments Limited | | England | | | 100 | |
| AstraZeneca Israel Ltd | | Israel | | | 100 | |
| AstraZeneca Japan Limited | | England | | | 100 | |
| AstraZeneca Jota B.V. | | Netherlands | | | 100 | |
| AstraZeneca K.K. | | Japan | | | 100 | |
| AstraZeneca Kft | | Hungary | | | 100 | |
| AstraZeneca Korea Co. Ltd | | Republic of Korea | | | 100 | |
| AstraZeneca Latvija SIA | | Latvia | | | 100 | |
| AstraZeneca Lietuva UAB | | Lithuania | | | 100 | |
| AstraZeneca Limited | | New Zealand | | | 100 | |
| AstraZeneca Luxembourg S.A. | | Luxembourg | | | 100 | |
| AstraZeneca Maroc SARLAU | | Morocco | | | 100 | |
| AstraZeneca Nigeria Limited | | Nigeria | | | 100 | |
| AstraZeneca Nominees Limited | | England | | | 100 | |
| AstraZeneca Nordic AB | | Sweden | | | 100 | |
| AstraZeneca Österreich GmbH | | Austria | | | 100 | |
| AstraZeneca OY. | | Finland | | | 100 | |
| AstraZeneca Peru S.A. | | Peru | | | 100 | |
| AstraZeneca Pharma Poland Sp.z.o.o. | | Poland | | | 100 | |
| AstraZeneca Pharma S.R.L. | | Romania | | | 100 | |
| AstraZeneca Pharmaceutical (China) Co. Ltd | | China | | | 100 | |
| AstraZeneca Pharmaceuticals (Phils.) Inc. | | Philippines | | | 100 | |
| AstraZeneca Pharmaceuticals (Pty) Limited | | South Africa | | | 100 | |
| AstraZeneca Pharmaceuticals Aktiebolag | | Sweden | | | 100 | |
| AstraZeneca Pharmaceuticals Co., Limited. | | China | | | 100 | |
| AstraZeneca Pharmaceuticals Ireland Limited | | Ireland | | | 100 | |
| AstraZeneca Pharmaceuticals Limited | | Kenya | | | 100 | |
| AstraZeneca Pharmaceuticals, LLC | | Russia | | | 100 | |
AstraZeneca Pharmaceuticals Pakistan (Private) Limited | | Pakistan | | | 100 | |
| AstraZeneca Pharmaceuticals, LP6 | | United States | | | 100 | |
| AstraZeneca Produtos Farmaceuticos Lda | | Portugal | | | 100 | |
| AstraZeneca PTY Limited | | Australia | | | 100 | |
| AstraZeneca Quest Limited | | England | | | 100 | |
| AstraZeneca Reims S.A.S. | | France | | | 100 | |
| AstraZeneca Rho B.V. | | Netherlands | | | 100 | |
| AstraZeneca S.A. | | Greece | | | 100 | |
| AstraZeneca S.A. | | Chile | | | 100 | |
| | |
| 194 | | AstraZenecaAnnual Report and Form 20-F Information 2015 |
| | | | | | |
| | | | | Percentage of | |
| | | | | voting share | |
| At 31 December 2015 | | Country | | capital held | |
| AstraZeneca S.A. | | Argentina | | | 100 | |
| AstraZeneca S.A. / N.V. | | Belgium | | | 100 | |
| AstraZeneca S.A.S. | | France | | | 100 | |
| AstraZeneca S.A.3 | | Uruguay | | | 100 | |
| AstraZeneca Sdn Bhd | | Malaysia | | | 100 | |
| AstraZeneca Share Trust Limited | | England | | | 100 | |
| AstraZeneca Sigma B.V. | | Netherlands | | | 100 | |
| AstraZeneca Singapore Pte Limited | | Singapore | | | 100 | |
| AstraZeneca Södertalje 1 AB | | Sweden | | | 100 | |
| AstraZeneca Södertalje 2 AB | | Sweden | | | 100 | |
| AstraZeneca SpA | | Italy | | | 100 | |
| AstraZeneca Sweden Investments Limited | | England | | | 100 | |
| AstraZeneca Taiwan Limited3 | | Taiwan | | | 100 | |
| AstraZeneca Treasury Limited2 | | England | | | 100 | |
| AstraZeneca Tunisie SaRL | | Tunisia | | | 100 | |
| AstraZeneca UK Limited | | England | | | 100 | |
| AstraZeneca Ukraina LLC | | Ukraine | | | 100 | |
| AstraZeneca US Investments Limited4 | | England | | | 100 | |
| | Bolivarian Republic | | | | |
| AstraZeneca Venezuela S.A. | | of Venezuela | | | 100 | |
| AstraZeneca Zeta B.V. | | Netherlands | | | 100 | |
| AstraZeneca, LP6 | | United States | | | 100 | |
| AstraZeneca, S.A. de C.V. | | Mexico | | | 100 | |
| Atkemix Nine Inc. | | United States | | | 100 | |
| Atkemix Ten Inc. | | United States | | | 100 | |
| Ayzee 1 Limited | | England | | | 100 | |
| AYZEE 2 Limited | | England | | | 100 | |
| AYZEE 3 Limited | | England | | | 100 | |
| AYZEE 4 Limited | | England | | | 100 | |
| AZ Reinsurance Limited | | Cayman Islands | | | 100 | |
| AZENCO2 Limited | | England | | | 100 | |
| AZLP Holdings LLC1 | | United States | | | 100 | |
| AZ-Mont Insurance Company | | United States | | | 100 | |
| BMS Holdco Inc. | | United States | | | 100 | |
| Cambridge Antibody Technology Group Limited | | England | | | 100 | |
| Corpus Christi Holdings Inc. | | United States | | | 100 | |
| Cresco Ti Systems GmbH | | Germany | | | 100 | |
| Definiens AG | | Germany | | | 100 | |
| Definiens Inc. | | United States | | | 100 | |
| Drimex LLC | | Egypt | | | 100 | |
| Entasis Therapeutics Inc. | | United States | | | 100 | |
| Entasis Therapeutics Limited7 | | England | | | 100 | |
| | Bolivarian Republic | | | | |
| Gotland Pharma S.A. | | of Venezuela | | | 100 | |
| IPR Pharmaceuticals, Inc. | | Puerto Rico | | | 100 | |
| KuDOS Horsham Limited | | England | | | 100 | |
| KuDOS Pharmaceuticals Limited | | England | | | 100 | |
| Laboratorio Beta, S.A. | | Spain | | | 100 | |
| Laboratorio Icaro S.A. | | Spain | | | 100 | |
| Laboratorio Lailan, S.A. | | Spain | | | 100 | |
| Laboratorio Odin, S.A. | | Spain | | | 100 | |
| Laboratorio Tau S.A. | | Spain | | | 100 | |
| MedImmune Biologics Inc. | | United States | | | 100 | |
| MedImmune Limited | | England | | | 100 | |
| MedImmune Pharma B.V. | | Netherlands | | | 100 | |
| MedImmune U.K. Limited | | England | | | 100 | |
| MedImmune Ventures, Inc. | | United States | | | 100 | |
| MedImmune, LLC1 | | United States | | | 100 | |
| Meronem Group Limited | | England | | | 100 | |
| Novastra Promoção e Comércio Farmacêutico Lda | | Portugal | | | 100 | |
| Novastuart Produtos Farmaceuticos Lda | | Portugal | | | 100 | |
| Omthera Pharmaceuticals Inc. | | United States | | | 100 | |
| Optein, Inc. | | United States | | | 100 | |
| Pearl Therapeutics, Inc. | | United States | | | 100 | |
| | | | | | |
| | | | | Percentage of | |
| | | | | voting share | |
| At 31 December 2015 | | Country | | capital held | |
| Pharmaceutical Manufacturing | | | | | | |
| Company Pty Limited | | Australia | | | 100 | |
| Pharmaceutical Manufacturing | | | | | | |
| Division Pty Limited | | Australia | | | 100 | |
| Simesa SpA | | Italy | | | 100 | |
| Sofotec GmbH | | Germany | | | 100 | |
| Spirogen Sarl2 | | Switzerland | | | 100 | |
| Stauffer Management Company LLC1 | | United States | | | 100 | |
| Stuart-Produtos Farmacêuticos Lda | | Portugal | | | 100 | |
| Stuart Pharma Aktiebolag | | Sweden | | | 100 | |
| Symbicom Aktiebolag2 | | Sweden | | | 100 | |
| Tika Läkemedel Aktiebolag | | Sweden | | | 100 | |
| Zenco (No 8) Limited | | England | | | 100 | |
| Zeneca Epsilon – Produtos Farmacêuticos Lda | | Portugal | | | 100 | |
| Zeneca Finance (Netherlands) Company | | England | | | 100 | |
| Zeneca Holdings Inc. | | United States | | | 100 | |
| Zeneca Ilac Sanayi Ve Ticaret Anonim Sirketi | | Turkey | | | 100 | |
| Zeneca Inc. | | United States | | | 100 | |
| Zeneca Wilmington Inc.4 | | United States | | | 100 | |
| Zenecapharma Produtos Farmaceuticos Lda | | Portugal | | | 100 | |
| ZS Pharma Inc. | | United States | | | 100 | |
| Subsidiaries where the effective interest is less than 100% | | | | |
| AstraZeneca Pharma India Limited5 | | India | | | 75 | |
| I.C. Insurance Holdings Limited | | England | | | 51 | |
| P.T. AstraZeneca Indonesia | | Indonesia | | | 95 | |
| SPA AstraZeneca Al Djazair8 | | Algeria | | | 65.77 | |
| Joint ventures | | | | | | |
| Archigen Biotech Limited8 | | England | | | 50 | |
| Centus Biotherapeutics Limited8 | | England | | | 50 | |
| Montrose Chemical Corporation of California | | United States | | | 50 | |
| Significant holdings | | | | | | |
| Albireo Limited9 | | England | | | 23.5 | |
| C.C.Global Chemicals Company | | United States | | | 37.5 | |
| Other holdings | | | | | | |
| ADC Therapeutics Sàrl10 | | Switzerland | | | 8.84 | |
| Adherium Limited | | New Zealand | | | 5.6 | |
| Affinita Biotech, Inc.11 | | United States | | | 16.22 | |
| Armaron Bio Pty Ltd12 | | Australia | | | 17.43 | |
| BlinkBio Inc.12 | | United States | | | 18.49 | |
| Catabasis Pharmaceuticals, Inc. | | United States | | | 10.7 | |
| Cerapedics, Inc.13 | | United States | | | 8.61 | |
| Elusys Therapeutics, Inc.14 | | United States | | | 7.2 | |
| Fibrogen, Inc. | | United States | | | 1.8 | |
| G1 Therapeutics, Inc.15 | | United States | | | 18.03 | |
| Hydra Biosciences Inc. | | United States | | | 4.27 | |
| Inotek Pharmaceuticals Corporation | | United States | | | 7.3 | |
| Moderna Therapeutics Inc.16 | | United States | | | 7 | |
| PhaseBio Pharmaceuticals, Inc.13 | | United States | | | 14.5 | |
| Regulus Therapeutics Inc. | | United States | | | 6.7 | |
| Silence Therapeutics PLC | | England | | | 0.17 | |
| VentiRx Pharmaceuticals, Inc.17 | | United States | | | 12 | |
| 1 | Ownership held as membership interest. |
| 2 | Ownership held in class A and B shares. |
| 3 | Ownership held in ordinary and special shares. |
| 4 | Directly held by AstraZeneca PLC. |
| 5 | Accounting year end is 31 March. |
| 6 | Ownership held as partnership interest. |
| 7 | Ownership held in preference, deferred and ordinary shares. |
| 8 | Ownership held in class A shares. |
| 9 | Ownership held in class A voting preference shares, class A non-voting preference shares, and class B voting preference shares. |
| 10 | Ownership held in class B ordinary shares and class C ordinary shares. |
| 11 | Ownership held in class A voting and class A non-voting shares. |
| 12 | Ownership held in class B preference shares. |
| 13 | Ownership held in class C preference shares. |
| 14 | Ownership held in class D preference shares. |
| 15 | Ownership held in class A preference shares and class B preference shares. |
| 16 | Ownership held in class D preference shares and class E preference shares. |
| 17 | Ownership held in class A preference shares. |
| | |
| AstraZenecaAnnual Report and Form 20-F Information 2015 | | 195 |
Financial Statements
Independent Auditor’s Report to the Members of AstraZeneca PLC only
Opinions and conclusions arising from our audit
| 1 | Our opinion on the Parent Company Financial Statements is unmodified |
We have audited the Parent Company Financial Statements of AstraZeneca PLC for the year ended 31 December 2015 set out on pages 197 to 201. In our opinion the Parent Company Financial Statements:
| > | give a true and fair view of the state of the Company’s affairs as at 31 December 2015 |
| > | have been properly prepared in accordance with UK Accounting Standards, including FRS 101 ‘Reduced Disclosure Framework’; and |
| > | have been prepared in accordance with the requirements of the Companies Act 2006. |
| 2 | Our opinion on other matters prescribed by the Companies Act 2006 is unmodified |
In our opinion:
| > | the part of the Directors’ Remuneration Report to be audited has been properly prepared in accordance with the Companies Act 2006; and |
| > | the information given in the Strategic Report and the Directors’ Report for the financial year for which the Financial Statements are prepared is consistent with the Parent Company Financial Statements. |
| 3 | We have nothing to report in respect of the matters on which we are required to report by exception |
The Companies Act 2006 requires us to report to you if, in our opinion:
| > | adequate accounting records have not been kept by the Parent Company, or returns adequate for our audit have not been received from branches not visited by us; or |
| > | the Parent Company Financial Statements and the part of the Directors’ Remuneration Report to be audited are not in agreement with the accounting records and returns; or |
| > | certain disclosures of Directors’ remuneration specified by law are not made; or |
| > | we have not received all the information and explanations we require for our audit. |
We have nothing to report in respect of the above responsibilities.
| 4 | Other matter – we have reported separately on the Group Financial Statements |
We have reported separately on the Group Financial Statements of AstraZeneca PLC for the year ended 31 December 2015.
Scope and responsibilities
As explained more fully in the Directors’ Responsibilities Statement set out on page 135, the Directors are responsible for the preparation of the Parent Company Financial Statements and for being satisfied that they give a true and fair view. A description of the scope of an audit of Financial Statements is provided on the Financial Reporting Council’s website at www.frc.org.uk/auditscopeukprivate. This report is made solely to the Company’s members as a body and is subject to important explanations and disclaimers regarding our responsibilities, published on our website www.kpmg.com/uk/auditscopeukco2014a, which are incorporated into this report as if set out in full and should be read to provide an understanding of the purpose of this report, the work we have undertaken and the basis of our opinions.
Antony Cates (Senior Statutory Auditor)
for and on behalf of KPMG LLP,
Statutory Auditor
Chartered Accountants
15 Canada Square, London, E14 5GL
4 February 2016
| | |
| 196 | | AstraZenecaAnnual Report and Form 20-F Information 2015 |
Company Balance Sheet
at 31 December
AstraZeneca PLC
| | | | | | | | | | | | |
| | | | | | 2015 | | | 2014 | |
| | | Notes | | | $m | | | $m | |
| Fixed assets | | | | | | | | | | | | |
| Fixed asset investments | | | 1 | | | | 30,047 | | | | 27,426 | |
| | | |
| Current assets | | | | | | | | | | | | |
| Debtors – other | | | | | | | 15 | | | | 15 | |
| Debtors – amounts owed by Group undertakings | | | | | | | 7,283 | | | | 7,303 | |
| | | | | | | | 7,298 | | | | 7,318 | |
| | | |
| Creditors: Amounts falling due within one year | | | | | | | | | | | | |
| Non-trade creditors | | | 2 | | | | (814 | ) | | | (1,467 | ) |
| Interest-bearing loans and borrowings | | | 3 | | | | – | | | | (912 | ) |
| | | | | | | | (814 | ) | | | (2,379 | ) |
| Net current assets | | | | | | | 6,484 | | | | 4,939 | |
| Total assets less current liabilities | | | | | | | 36,531 | | | | 32,365 | |
| | | |
| Creditors: Amounts falling due after more than one year | | | | | | | | | | | | |
| Amounts owed to Group undertakings | | | 3 | | | | (283 | ) | | | (283 | ) |
| Interest-bearing loans and borrowings | | | 3 | | | | (13,705 | ) | | | (7,889 | ) |
| | | | | | | | (13,988 | ) | | | (8,172 | ) |
| Net assets | | | | | | | 22,543 | | | | 24,193 | |
| | | |
| Capital and reserves | | | | | | | | | | | | |
| Called-up share capital | | | 4 | | | | 316 | | | | 316 | |
| Share premium account | | | | | | | 4,304 | | | | 4,261 | |
| Capital redemption reserve | | | | | | | 153 | | | | 153 | |
| Other reserves | | | | | | | 2,623 | | | | 2,754 | |
| Profit and loss account | | | | | | | 15,147 | | | | 16,709 | |
| Shareholders’ funds | | | | | | | 22,543 | | | | 24,193 | |
$m means millions of US dollars.
The Company Financial Statements from page 197 to 201 were approved by the Board on 4 February 2016 and were signed on its behalf by
| | | | |
| Pascal Soriot | | Marc Dunoyer | | |
| Director | | Director | | |
|
| Company’s registered number 2723534 |
| | |
| AstraZenecaAnnual Report and Form 20-F Information 2015 | | 197 |
Financial Statements
Statement of Changes in Equity
for the year ended 31 December
| | | | | | | | | | | | | | | | | | | | | | | | |
| | | Share
capital
$m | | | Share
premium
account
$m | | | Capital
redemption
reserve $m | | | Other
reserves
$m | | | Profit and
loss account
$m | | | Total
equity $m | |
| At 1 January 2014 | | | 315 | | | | 3,983 | | | | 153 | | | | 2,847 | | | | 17,656 | | | | 24,954 | |
| | | | | | |
| Total comprehensive income for the period | | | | | | | | | | | | | | | | | | | | | | | | |
| Profit for the period | | | – | | | | – | | | | – | | | | – | | | | 2,584 | | | | 2,584 | |
| Amortisation of loss on cash flow hedge | | | – | | | | – | | | | – | | | | – | | | | 1 | | | | 1 | |
| Total comprehensive income for the period | | | – | | | | – | | | | – | | | | – | | | | 2,585 | | | | 2,585 | |
| | | | | | |
| Transactions with owners, recorded directly in equity | | | | | | | | | | | | | | | | | | | | | | | | |
| Dividends | | | – | | | | – | | | | – | | | | – | | | | (3,532 | ) | | | (3,532 | ) |
| Equity-settled share-based payment transactions | | | – | | | | – | | | | – | | | | (93 | ) | | | – | | | | (93 | ) |
| Issue of Ordinary Shares | | | 1 | | | | 278 | | | | – | | | | – | | | | – | | | | 279 | |
| Total contributions by and distributions to owners | | | 1 | | | | 278 | | | | – | | | | (93 | ) | | | (3,532 | ) | | | (3,346 | ) |
| At 31 December 2014 | | | 316 | | | | 4,261 | | | | 153 | | | | 2,754 | | | | 16,709 | | | | 24,193 | |
| | | | | | |
| Total comprehensive income for the period | | | | | | | | | | | | | | | | | | | | | | | | |
| Profit for the period | | | – | | | | – | | | | – | | | | – | | | | 1,974 | | | | 1,974 | |
| Amortisation of loss on cash flow hedge | | | – | | | | – | | | | – | | | | – | | | | 1 | | | | 1 | |
| Total comprehensive income for the period | | | – | | | | – | | | | – | | | | – | | | | 1,975 | | | | 1,975 | |
| | | | | | |
| Transactions with owners, recorded directly in equity | | | | | | | | | | | | | | | | | | | | | | | | |
| Dividends | | | – | | | | – | | | | – | | | | – | | | | (3,537 | ) | | | (3,537 | ) |
| Equity-settled share-based payment transactions | | | – | | | | – | | | | – | | | | (131 | ) | | | – | | | | (131 | ) |
| Issue of Ordinary Shares | | | – | | | | 43 | | | | – | | | | – | | | | – | | | | 43 | |
| Total contributions by and distributions to owners | | | – | | | | 43 | | | | – | | | | (131 | ) | | | (3,537 | ) | | | (3,625 | ) |
| At 31 December 2015 | | | 316 | | | | 4,304 | | | | 153 | | | | 2,623 | | | | 15,147 | | | | 22,543 | |
At 31 December 2015, $15,147m (31 December 2014: $16,709m) of the profit and loss account reserve was available for distribution. Included in other reserves is a special reserve of $157m, arising on the redenomination of share capital in 1999.
Included within other reserves at 31 December 2015 is $782m (31 December 2014: $913m) in respect of cumulative share-based payment awards. These amounts are not available for distribution.
| | |
| 198 | | AstraZenecaAnnual Report and Form 20-F Information 2015 |
Company Accounting Policies
| | | | |
Basis of presentation of financial information These financial statements were prepared in accordance with FRS 101 ‘Reduced Disclosure Framework’. The amendments to FRS 101 (2014/15 Cycle) issued in July 2015 and effective immediately have been applied. In preparing these financial statements, the Company applied the recognition, measurement and disclosure requirements of International Financial Reporting Standards as adopted by the EU (“Adopted IFRSs”), but makes amendments where necessary in order to comply with Companies Act 2006 and has set out below where advantage of the FRS 101 disclosure exemptions has been taken. In the transition to FRS 101, the Company has applied IFRS 1 while ensuring that its assets and liabilities are measured in compliance with FRS 101. On transition to IFRS no GAAP differences arose. In these financial statements, the Company has applied the exemptions available under FRS 101 in respect of the following disclosures > Statement of Cash Flows and related notes > comparative period reconciliations for share capital > disclosures in respect of transactions with wholly owned subsidiaries > disclosures in respect of capital management > the effects of new but not yet effective IFRSs > disclosures in respect of the compensation of Key Management Personnel. As the Group Financial Statements (presented on pages 140 to 195) include the equivalent disclosures, the Company has also taken the exemptions under FRS 101 available in respect of the following disclosures > IFRS 2 Share-based Payment in respect of group settled share-based payments. No individual profit and loss account is prepared as provided by Section 408 of the Companies Act 2006. The Company proposes to continue to adopt the reduced disclosure framework of FRS 101 in its next financial statements. The accounting policies set out below have, unless otherwise stated, been applied consistently to all periods presented in these financial statements. | | Basis of accounting The Company Financial Statements are prepared under the historical cost convention, modified to include revaluation to fair value of certain financial instruments as described below, in accordance with the Companies Act 2006. The Group Financial Statements are presented on pages 140 to 195 and have been prepared in accordance with IFRSs as adopted by the EU and as issued by the IASB and in accordance with the Group Accounting Policies set out on pages 144 to 148. The following paragraphs describe the main accounting policies, which have been applied consistently. Foreign currencies Profit and loss account items in foreign currencies are translated into US dollars at average rates for the relevant accounting periods. Assets and liabilities are translated at exchange rates prevailing at the date of the Company Balance Sheet. Exchange gains and losses on loans and on short-term foreign currency borrowings and deposits are included within net interest payable. Exchange differences on all other transactions, except relevant foreign currency loans, are taken to operating profit. Taxation The current tax payable is based on taxable profit for the year. Taxable profit differs from reported profit because taxable profit excludes items that are either never taxable or tax deductible or items that are taxable or tax deductible in a different period. The Company’s current tax assets and liabilities are calculated using tax rates that have been enacted or substantively enacted by the reporting date. Deferred tax is provided using the balance sheet liability method, providing for temporary differences between the carrying amounts of assets and liabilities for financial reporting purposes and the amounts used for taxation purposes. Deferred tax assets are recognised to the extent that it is probable that taxable profit will be available against which the asset can be utilised. This requires judgements to be made in respect of the availability of future taxable income. No deferred tax asset or liability is recognised in respect of temporary differences associated with investments in subsidiaries and branches where the Company is able to control the timing of reversal of the temporary differences and it is probable that the temporary differences will not reverse in the foreseeable future. | | The Company’s deferred tax assets and liabilities are calculated using tax rates that are expected to apply in the period when the liability is settled or the asset realised based on tax rates that have been enacted or substantively enacted by the reporting date. Accruals for tax contingencies require management to make judgements and estimates of exposures in relation to tax audit issues. Tax benefits are not recognised unless the tax positions will probably be sustained. Once considered to be probable, management reviews each material tax benefit to assess whether a provision should be taken against full recognition of that benefit on the basis of potential settlement through negotiation and/ or litigation. Any liability to interest on tax liabilities is provided for in the tax charge. Investments Fixed asset investments, including investments in subsidiaries, are stated at cost and reviewed for impairment if there are indications that the carrying value may not be recoverable. Share-based payments The issuance by the Company to employees of its subsidiaries of a grant of awards over the Company’s shares, represents additional capital contributions by the Company to its subsidiaries. An additional investment in subsidiaries results in a corresponding increase in shareholders’ equity. The additional capital contribution is based on the fair value of the grant issued, allocated over the underlying grant’s vesting period, less the market cost of shares charged to subsidiaries in settlement of such share awards. Financial instruments Loans and other receivables are held at amortised cost. Long-term loans payable are held at amortised cost. Litigation Through the normal course of business, the AstraZeneca Group is involved in legal disputes, the settlement of which may involve cost to the Company. Provision is made where an adverse outcome is probable and associated costs can be estimated reliably. In other cases, appropriate descriptions are included. |
| | |
| AstraZenecaAnnual Report and Form 20-F Information 2015 | | 199 |
Financial Statements
Notes to the Company Financial Statements
1 Fixed asset investments
| | | | | | | | | | | | | | | | |
| | | | | | | | | Investments in subsidiaries | |
| | | | | | Shares $m | | | Loans $m | | | Total $m | |
| At 1 January 2015 | | | | | | | 16,186 | | | | 11,240 | | | | 27,426 | |
| Additions | | | | | | | – | | | | 5,934 | | | | 5,934 | |
| Disposals | | | | | | | – | | | | (3,069 | ) | | | (3,069 | ) |
| Capital reimbursement | | | | | | | (133 | ) | | | – | | | | (133 | ) |
| Exchange | | | | | | | – | | | | (116 | ) | | | (116 | ) |
| Amortisation | | | | | | | – | | | | 5 | | | | 5 | |
| At 31 December 2015 | | | | | | | 16,053 | | | | 13,994 | | | | 30,047 | |
A list of subsidiaries is included on pages 194 and 195. 2 Non-trade creditors | |
| | | | | | | | | 2015
$m | | | 2014 $m | |
| | | | |
| Amounts due within one year | | | | | | | | | | | | | | | | |
| Short-term borrowings | | | | | | | | | | | 679 | | | | 1,309 | |
| Other creditors | | | | | | | | | | | 128 | | | | 150 | |
| Amounts owed to Group undertakings | | | | | | | | | | | 7 | | | | 8 | |
| | | | | | | | | | | | 814 | | | | 1,467 | |
3 Loans | | | | | | | | | | | | | | | | |
| | | | | | Repayment
dates | | | 2015 $m | | | 2014 $m | |
| | | | |
| Amounts due within one year | | | | | | | | | | | | | | | | |
| Interest-bearing loans and borrowings | | | | | | | | | | | | | | | | |
5.125% Non-callable bond | | | euros | | | | 2015 | | | | – | | | | 912 | |
| | | | | | | | | | | | – | | | | 912 | |
| | | | |
| Amounts due after more than one year | | | | | | | | | | | | | | | | |
| Amounts owed to subsidiaries | | | | | | | | | | | | | | | | |
7.2% Loan | | | US dollars | | | | 2023 | | | | 283 | | | | 283 | |
| Interest-bearing loans and borrowings | | | | | | | | | | | | | | | | |
5.9% Callable bond | | | US dollars | | | | 2017 | | | | 1,747 | | | | 1,747 | |
Floating rate notes | | | US dollars | | | | 2018 | | | | 399 | | | | – | |
1.75% Callable bond | | | US dollars | | | | 2018 | | | | 997 | | | | – | |
1.95% Callable bond | | | US dollars | | | | 2019 | | | | 997 | | | | 996 | |
2.375% Callable bond | | | US dollars | | | | 2020 | | | | 1,586 | | | | – | |
0.875% Non-callable bond | | | euros | | | | 2021 | | | | 812 | | | | 902 | |
3.375% Callable bond | | | US dollars | | | | 2025 | | | | 1,971 | | | | – | |
5.75% Non-callable bond | | | pounds sterling | | | | 2031 | | | | 515 | | | | 540 | |
6.45% Callable bond | | | US dollars | | | | 2037 | | | | 2,719 | | | | 2,718 | |
4% Callable bond | | | US dollars | | | | 2042 | | | | 986 | | | | 986 | |
4.375% Callable bond | | | US dollars | | | | 2045 | | | | 976 | | | | – | |
| | | | | | | | | | | | 13,705 | | | | 7,889 | |
All loans and borrowings are unsecured. | |
| | | | | | | | | 2015 $m | | | 2014 $m | |
| Loans or instalments thereof are repayable: | | | | | | | | | | | | | | | | |
After five years from balance sheet date | | | | | | | | | | | 8,262 | | | | 5,429 | |
From two to five years | | | | | | | | | | | 3,979 | | | | 2,743 | |
From one to two years | | | | | | | | | | | 1,747 | | | | – | |
Within one year | | | | | | | | | | | – | | | | 912 | |
| Total unsecured | | | | | | | | | | | 13,988 | | | | 9,084 | |
With the exception of the 2018 floating rate notes, all loans are at fixed interest rates. Accordingly, the fair values of the loans will change as market rates change. However, since the loans are held at amortised cost, changes in interest rates and the credit rating of the Company do not have any effect on the Company’s net assets.
| | |
| 200 | | AstraZenecaAnnual Report and Form 20-F Information 2015 |
4 Share capital
Details of share capital movements in the year and share option schemes are included in Note 22 to the Group Financial Statements.
5 Contingent liabilities
In addition to the matter disclosed below, there are other cases where the Company is named as a party to legal proceedings. These include theByetta andFarxiga product liability litigations, each of which are described more fully in Note 27 to the Group Financial Statements.
Foreign Corrupt Practices Act
In connection with investigations into anti-bribery and corruption issues in the pharmaceutical industry, AstraZeneca has received inquiries from enforcement agencies, including the DOJ and the SEC, regarding, among other things, sales practices, internal controls, certain distributors and interactions with healthcare providers and other government officials in several countries. AstraZeneca is co-operating with these inquiries. AstraZeneca’s investigation has involved indications of inappropriate conduct in certain countries, including China. Resolution of these matters could involve the payment of fines and/or other remedies.
Other
The Company has guaranteed the external borrowing of a subsidiary in the amount of $288m.
6 Statutory and other information
The Directors were paid by another Group company in 2015 and 2014.
| | |
| AstraZenecaAnnual Report and Form 20-F Information 2015 | | 201 |
Financial Statements
Group Financial Record
| | | | | | | | | | | | | | | | | | | | |
| For the year ended 31 December | |
| 2011
Restated$m |
* | |
| 2012
Restated$m |
* | |
| 2013
Restated$m |
* | |
| 2014
Restated$m |
* | |
| 2015
$m |
|
| | | | | |
| Revenue and profits | | | | | | | | | | | | | | | | | | | | |
| Product Sales | | | 33,591 | | | | 27,973 | | | | 25,711 | | | | 26,095 | | | | 23,641 | |
| Externalisation Revenue | | | 29 | | | | 451 | | | | 95 | | | | 452 | | | | 1,067 | |
| Cost of sales | | | (6,026 | ) | | | (5,393 | ) | | | (5,261 | ) | | | (5,842 | ) | | | (4,646 | ) |
| Distribution costs | | | (346 | ) | | | (320 | ) | | | (306 | ) | | | (324 | ) | | | (339 | ) |
| Research and development expense | | | (5,523 | ) | | | (5,243 | ) | | | (4,821 | ) | | | (5,579 | ) | | | (5,997 | ) |
| Selling, general and administrative costs | | | (11,161 | ) | | | (9,839 | ) | | | (12,206 | ) | | | (13,000 | ) | | | (11,112 | ) |
| Profit on disposal of subsidiary | | | 1,483 | | | | – | | | | – | | | | – | | | | – | |
| Other operating income and expense | | | 748 | | | | 519 | | | | 500 | | | | 335 | | | | 1,500 | |
| Operating profit | | | 12,795 | | | | 8,148 | | | | 3,712 | | | | 2,137 | | | | 4,114 | |
| Finance income | | | 50 | | | | 42 | | | | 50 | | | | 78 | | | | 46 | |
| Finance expense | | | (562 | ) | | | (544 | ) | | | (495 | ) | | | (963 | ) | | | (1,075 | ) |
| Share of after tax losses of joint ventures | | | – | | | | – | | | | – | | | | (6 | ) | | | (16 | ) |
| Profit before tax | | | 12,283 | | | | 7,646 | | | | 3,267 | | | | 1,246 | | | | 3,069 | |
| Taxation | | | (2,333 | ) | | | (1,376 | ) | | | (696 | ) | | | (11 | ) | | | (243 | ) |
| Profit for the period | | | 9,950 | | | | 6,270 | | | | 2,571 | | | | 1,235 | | | | 2,826 | |
| Other comprehensive income for the period, net of tax | | | (480 | ) | | | 135 | | | | (113 | ) | | | (1,506 | ) | | | (338 | ) |
| Total comprehensive income for the period | | | 9,470 | | | | 6,405 | | | | 2,458 | | | | (271 | ) | | | 2,488 | |
| Profit attributable to: | | | | | | | | | | | | | | | | | | | | |
| Equity holders of the Company | | | 9,917 | | | | 6,240 | | | | 2,556 | | | | 1,233 | | | | 2,825 | |
| Non-controlling interests | | | 33 | | | | 30 | | | | 15 | | | | 2 | | | | 1 | |
| | | | | |
| Earnings per share | | | | | | | | | | | | | | | | | | | | |
| Earnings per $ 0.25 Ordinary Share (basic) | | | $7.29 | | | | $4.95 | | | | $2.04 | | | | $0.98 | | | | $2.23 | |
| Earnings per $ 0.25 Ordinary Share (diluted) | | | $7.25 | | | | $4.94 | | | | $2.04 | | | | $0.98 | | | | $2.23 | |
| Dividends | | | $2.70 | | | | $2.85 | | | | $2.80 | | | | $2.80 | | | | $2.80 | |
| | | | | |
| Return on revenues | | | | | | | | | | | | | | | | | | | | |
| Operating profit as a percentage of Total Revenue | | | 38.1% | | | | 28.7% | | | | 14.4% | | | | 8.0% | | | | 16.7% | |
| Ratio of earnings to fixed charges | | | 29.5 | | | | 19.9 | | | | 9.9 | | | | 6.1 | | | | 11.3 | |
| | | | | |
| | | | | | | | | | | | | | | | | | | | |
At 31 December | | 2011 $m | | | 2012 $m | | | 2013 $m | | | 2014 $m | | | 2015 $m | |
| | | | | |
| Statement of Financial Position | | | | | | | | | | | | | | | | | | | | |
| Property, plant and equipment, goodwill and intangible assets | | | 27,267 | | | | 32,435 | | | | 31,846 | | | | 38,541 | | | | 40,927 | |
| Other investments and non-current receivables | | | 543 | | | | 940 | | | | 2,513 | | | | 2,138 | | | | 1,896 | |
| Deferred tax assets | | | 1,514 | | | | 1,111 | | | | 1,205 | | | | 1,219 | | | | 1,294 | |
| Current assets | | | 23,506 | | | | 19,048 | | | | 20,335 | | | | 16,697 | | | | 16,007 | |
| Total assets | | | 52,830 | | | | 53,534 | | | | 55,899 | | | | 58,595 | | | | 60,124 | |
| Current liabilities | | | (15,752 | ) | | | (13,903 | ) | | | (16,051 | ) | | | (17,330 | ) | | | (14,869 | ) |
| Non-current liabilities | | | (13,612 | ) | | | (15,685 | ) | | | (16,595 | ) | | | (21,619 | ) | | | (26,746 | ) |
| Net assets | | | 23,466 | | | | 23,946 | | | | 23,253 | �� | | | 19,646 | | | | 18,509 | |
| Share capital | | | 323 | | | | 312 | | | | 315 | | | | 316 | | | | 316 | |
| Reserves attributable to equity holders of the Company | | | 22,917 | | | | 23,419 | | | | 22,909 | | | | 19,311 | | | | 18,174 | |
| Non-controlling interests | | | 226 | | | | 215 | | | | 29 | | | | 19 | | | | 19 | |
| Total equity and reserves | | | 23,466 | | | | 23,946 | | | | 23,253 | | | | 19,646 | | | | 18,509 | |
| | | | | |
| | | | | | | | | | | | | | | | | | | | |
| For the year ended 31 December | | 2011 $m | | | 2012 $m | | | 2013 $m | | | 2014 $m | | | 2015 $m | |
| | | | | |
| Cash flows | | | | | | | | | | | | | | | | | | | | |
| Net cash inflow/(outflow) from: | | | | | | | | | | | | | | | | | | | | |
| Operating activities | | | 7,821 | | | | 6,948 | | | | 7,400 | | | | 7,058 | | | | 3,324 | |
| Investing activities | | | (2,022 | ) | | | (1,859 | ) | | | (2,889 | ) | | | (7,032 | ) | | | (4,239 | ) |
| Financing activities | | | (9,321 | ) | | | (4,923 | ) | | | (3,047 | ) | | | (2,705 | ) | | | 878 | |
| | | | (3,522 | ) | | | 166 | | | | 1,464 | | | | (2,679 | ) | | | (37 | ) |
| * | Comparatives have been restated to reflect the reclassification of externalisation revenue from other operating income and expense as detailed in Group Accounting Policies. |
For the purpose of computing the ratio of earnings to fixed charges, earnings consist of the income from continuing ordinary activities before taxation of Group companies and income received from companies owned 50% or less, plus fixed charges. Fixed charges consist of interest on all indebtedness, amortisation of debt discount and expense, and that portion of rental expense representative of the interest factor.
| | |
| 202 | | AstraZenecaAnnual Report and Form 20-F Information 2015 |
Marketed Products
| | |
Respiratory, Inflammation and Autoimmunity | |  |
| > | Accolate (zafirlukast) is an oral leukotriene receptor antagonist for the treatment of asthma. |
| > | Bricanyl Respules (terbutaline) is a short-acting beta2-agonist administered via a nebuliser for acute treatment of asthma and COPD in both children and adults. |
| > | Bricanyl Turbuhaler (terbutaline) is a short-acting beta2-agonist for the acute treatment of bronchial-obstructive symptoms in asthma and COPD. |
| > | Daliresp (roflumilast) is an oral PDE4 (phosphodiesterase-4) inhibitor for adults with severe COPD to decrease their number of exacerbations (US only). |
| > | Duaklir Genuair (aclidinium/formoterol in a dry powder inhaler) is a fixed dose combination of a long-acting muscarinic antagonist (LAMA) and a long-acting beta2-adrenergic receptor agonist (LABA) for the maintenance treatment of COPD. |
| > | Eklira Genuair/Tudorza/Bretaris(aclidinium in a dry powder inhaler) is a LAMA for the maintenance treatment of COPD. |
| > | Oxis Turbuhaler (formoterol) is a fast onset, long-acting beta2-agonist for the treatment of bronchial-obstructive symptoms in asthma and COPD. |
| > | Pulmicort Turbuhaler/Pulmicort Flexhaler (budesonide) is an inhaled corticosteroid for maintenance treatment of asthma. |
| > | Pulmicort Respules (budesonide) is a corticosteroid, administered via a nebuliser, for the treatment of asthma in both children and adults. |
| > | Rhinocort (budesonide) is a nasal steroid treatment for allergic rhinitis (hay fever), perennial rhinitis and nasal polyps. |
| > | SymbicortpMDI (budesonide/ formoterol in a pressurised metered-dose inhaler) is a combination of an inhaled corticosteroid and a fast onset, long- acting beta2-agonist for maintenance treatment of asthma and COPD, including chronic bronchitis and emphysema in the US, Australia and some other markets. |
| > | Symbicort Turbuhaler (budesonide/ formoterol in a dry powder inhaler) is a combination of an inhaled corticosteroid and a fast onset, long-acting beta2-agonist for the maintenance treatment of asthma and COPD. In asthma, it is also approved forSymbicort Maintenance And Reliever Therapy (Symbicort SMART).Symbicort Turbuhaler is approved in Europe, Japan and many other countries excluding the US. |
| | |
Cardiovascular and Metabolic diseases | |  |
Cardiovascular disease
| > | Atacand1/Atacand HCT/Atacand Plus (candesartan cilexetil) is an angiotensin II antagonist for the 1st line treatment of hypertension and symptomatic heart failure. |
| > | Brilinta/Brilique (ticagrelor) is an oral antiplatelet for acute coronary syndromes (ACS). |
| > | Crestor2 (rosuvastatin calcium) is a statin for dyslipidaemia and hypercholesterolemia. |
| > | Plendil (felodipine) is a calcium antagonist for hypertension and angina. |
| > | Seloken/Toprol-XL (metoprolol succinate) is a beta-blocker once-daily tablet for control of hypertension, heart failure and angina. |
| > | Tenormin3 (atenolol) is a beta-blocker for hypertension, angina pectoris and other CV disorders. |
| > | Zestril4 (lisinopril dihydrate) is an angiotensin converting enzyme inhibitor for a wide range of CV diseases, including hypertension. |
Metabolic disease
| > | Bydureon (exenatide extended-release for injectable suspension) is a once-weekly injectable glucagon-like peptide-1 (GLP-1) receptor agonist available as a single-dose tray or a single-dose pen indicated to improve glycaemic control, in adults with Type 2 diabetes. |
| > | Byetta (exenatide injection) is a twice-daily injectable GLP-1 receptor agonist indicated to improve glycaemic control in adults with Type 2 diabetes. |
| > | Farxiga/Forxiga (dapagliflozin) is a selective inhibitor of human sodium-glucose co-transporter 2 (SGLT2 inhibitor) indicated as an adjunct to diet and exercise to improve glycaemic control in adult patients with Type 2 diabetes. |
| > | Kombiglyze XR (saxagliptin and metformin hydrochloride extended release) combines saxagliptin(Onglyza) and extended release metformin (metformin XR) in a once-daily tablet for Type 2 diabetes. |
| > | Komboglyze (saxagliptin and metformin hydrochloride) combines saxagliptin(Onglyza) and metformin immediate release (metformin IR) in a twice-daily tablet for Type 2 diabetes. |
| > | Onglyza (saxagliptin) is an oral dipeptidyl peptidase 4 (DPP-4) inhibitor for Type 2 diabetes. |
| > | Symlin (pramlintide acetate) is an injected amylin analogue for Type 1 and Type 2 diabetes in patients with inadequate glycaemic control. |
| > | Xigduo (dapagliflozin and metformin hydrochloride) combines dapagliflozin(Farxiga/Forxiga), an SGLT2 inhibitor, and metformin IR, in a twice-daily tablet to improve glycaemic control in adult patients with Type 2 diabetes who are inadequately controlled by metformin alone. |
| > | Xigduo XR (dapagliflozin and metformin hydrochloride extended-release) combines dapagliflozin(Farxiga/Forxiga), an SGLT2 inhibitor, and metformin XR, in a once-daily tablet to improve glycaemic control in adult patients with Type 2 diabetes who are inadequately controlled by metformin alone. |
| 1 | Licensed from Takeda Chemicals Industries Ltd. |
| 2 | Licensed from Shionogi. The extension of the global licence agreement with Shionogi forCrestor and the modification of the royalty structure became effective 1 January 2014. |
| 3 | Divested US rights toTenormin to Alvogen Pharma US Inc. effective 9 January 2015. |
| 4 | Licensed from Merck. Divested US rights toZestril to Alvogen Pharma US Inc. effective 9 January 2015. |

| | |
| AstraZenecaAnnual Report and Form 20-F Information 2015 | | 203 |
Additional Information
Marketed Productscontinued
| | |
| Oncology | |  |
| > | Arimidex (anastrozole) is an aromatase inhibitor used to treat breast cancer. It has been shown to be significantly superior to tamoxifen at preventing breast cancer recurrence during and beyond the five-year treatment course. |
| > | Casodex, Cosudex (bicalutamide) is an anti-androgen therapy used to treat prostate cancer. A 50mg tablet is used for advanced prostate cancer; a 150mg tablet is used for locally advanced prostate cancer. |
| > | Faslodex (fulvestrant) is an injectable estrogen receptor antagonist. It is used for the treatment of hormone receptor positive advanced breast cancer for post-menopausal women whose disease has progressed following treatment with prior endocrine therapy. |
| > | Iressa (gefitinib) is an epidermal growth factor receptor-tyrosine kinase inhibitor (EGFR-TKI) that acts to block signals for cancer cell growth and survival in advanced non-small cell lung cancer (NSCLC). |
| > | Lynparza (olaparib) is an oral poly ADP-ribose polymerase (PARP) inhibitor. It is approved in the EU for the treatment of adult patients with platinum-sensitive relapsed BRCA-mutated (germline and/or somatic) high-grade serous epithelial ovarian, fallopian tube or primary peritoneal cancer. It is approved in the US for the treatment of patients with germline BRCA-mutated advanced ovarian cancer who have been treated with three or more prior lines of chemotherapy. |
| > | Nolvadex (tamoxifen citrate) is a widely used breast cancer treatment outside the US. |
| > | Tagrisso (osimertinib) is an EGFR-TKI indicated for patients with metastatic EGFR T790M mutation-positive NSCLC. |
| > | Zoladex (goserelin acetate implant) in one and three month subcutaneous or intra-muscular injections, is a luteinising hormone-releasing hormone (LHRH) agonist used to treat prostate cancer, breast cancer and certain benign gynaecological disorders. |
| | |
| Infection, Neuroscience and Gastrointestinal | |  |
Infection
| > | Fluenz/FluMist (influenza vaccine live, intra-nasal) is an intra-nasal, live, attenuated, trivalent influenza vaccine. |
| > | Fluenz Tetra/FluMist Quadrivalent1 (influenza vaccine live, intra-nasal) is an intra-nasal, live, attenuated, quadrivalent influenza vaccine. |
| > | Merrem/Meronem2 (meropenem) is a carbapenem anti-bacterial used to treat serious infections in hospitalised patients. |
| > | Synagis3 (palivizumab) is a humanised MAb used to prevent serious lower respiratory tract disease caused by respiratory syncytial virus (RSV) in paediatric patients at high risk of acquiring RSV disease. |
| > | Zinforo4 (ceftaroline fosamil) is a novel injectable cephalosporin used in community-acquired pneumonia and complicated skin and soft tissue infections. |
| 1 | Daiichi Sankyo holds rights toFluenz Tetra/FluMistQuadrivalent in Japan. |
| 2 | Licensed from Dainippon Sumitomo Pharmaceuticals Co., Limited. |
| 3 | US rights only. AbbVie holds rights toSynagis outside the US. |
| 4 | Licensed from Forest (now a wholly-owned subsidiary of Allergan). AstraZeneca holds global rights, excluding the US, Canada and Japan. |
Neuroscience
| > | Diprivan (propofol) is an intravenous general anaesthetic used to induce and maintain general anaesthesia, intensive care sedation and conscious sedation for surgical and diagnostic procedures. |
| > | EMLA (lidocaine and prilocaine) is a local anaesthetic for topical application (cream and patch) to prevent pain associated with injections and minor surgical procedures, and to facilitate cleansing/debridement of leg ulcers. |
| > | Movantik/Moventig (naloxegol) is a once-daily, peripherally-acting mu-opioid receptor antagonist approved for the treatment of opioid-induced constipation (OIC) in adult patients. The indication varies by jurisdiction. |
| > | Naropin (ropivacaine) is a long-acting local anaesthetic for surgical anaesthesia and acute pain management. |
| > | SeroquelIR (an immediate release formulation of quetiapine fumarate) is an atypical anti-psychotic generally approved for the treatment of schizophrenia and bipolar disorder (mania, depression and maintenance). |
| > | Seroquel XR (an extended release formulation of quetiapine fumarate) is generally approved for the treatment of schizophrenia, bipolar disorder, major depressive disorder and, on a more limited basis, for generalised anxiety disorder. |
| > | Vimovo1 (naproxen/esomeprazole magnesium) is generally approved for symptomatic relief in the treatment of rheumatoid arthritis, osteoarthritis and ankylosing spondylitis in patients at risk of developing NSAID-associated gastric and/or duodenal ulcers. |
| > | Xylocaine (lidocaine) is a short-acting local anaesthetic for topical and regional anaesthesia. |
| > | Zomig (zolmitriptan) is used for the acute treatment of migraine, plus for the acute treatment of cluster headache in the EU.Zomig is available in three formulations: oral tablet; orally dispersible tablet; and nasal spray. |
| 1 | Licensed from Pozen. Divested US rights to Horizon Pharma USA, Inc. effective 22 November 2013. |
Gastrointestinal
| > | Losec/Prilosec (omeprazole) is a proton pump inhibitor used to treat acid-related diseases. |
| > | Nexium (esomeprazole magnesium) is a proton pump inhibitor used to treat acid-related diseases. |
| | |
| 204 | | AstraZenecaAnnual Report and Form 20-F Information 2015 |
Development Pipeline
as at 31 December 2015
Includes AstraZeneca sponsored or directed studies only.
Phase III/Pivotal Phase II/Registration
NMEs and significant additional indications
Regulatory submission dates shown for assets in Phase III and beyond. As disclosure of compound information is balanced by the business need to maintain confidentiality, information in relation to some compounds listed here has not been disclosed at this time.
| | | | | | | | | | | | | | | | | | | | | | |
| | | | | | | Date | | | Estimated Regulatory Submission/Submission Acceptance† |
| Compound | | Mechanism | | Area Under Investigation | | Commenced
Phase | | | US | | | EU | | | Japan | | | China |
| Respiratory, Inflammation and Autoimmunity |
| anifrolumab#TULIP | | IFN-alphaR MAb | | systemic lupus erythematosus | | | Q3 2015 | | | | 2019 | | | | 2019 | | | | 2019 | | | |
| | | | | | | | | | | | (Fast Track | ) | | | | | | | | | | |
benralizumab#CALIMA SIROCCO ZONDA BISE BORA GREGALE | | IL-5R MAb | | severe asthma | | | Q4 2013 | | | | H2 2016 | | | | H2 2016 | | | | N/A | | | N/A |
benralizumab# TERRANOVA GALATHEA | | IL-5R MAb | | COPD | | | Q3 2014 | | | | 2018 | | | | 2018 | | | | N/A | | | N/A |
brodalumab# AMAGINE-1,2,3 | | IL-17R MAb | | psoriasis | | | Q3 2012 | | | | Accepted | 1 | | | Accepted | | | | N/A | | | N/A |
Zurampic (lesinurad) CLEAR 1,2 CRYSTAL | | selective uric acid reabsorption inhibitor | | chronic treatment of hyperuricemia in patients | | | Q4 2011 | | | | Approved | | | | Accepted | 2 | | | | | | |
| | | (URAT-1) | | with gout | | | | | | | | | | | | | | | | | | |
| PT003 GFF PINNACLE | | LABA/LAMA | | COPD | | | Q2 2013 | | | | Accepted | | | | H2 2016 | | | | 2017 | | | 2017 |
| PT010 | | LABA/LAMA/ICS | | COPD | | | Q3 2015 | | | | 2018 | | | | 2018 | | | | 2017 | | | 2019 |
tralokinumab STRATOS 1,2 TROPOS MESOS | | IL-13 MAb | | severe asthma | | | Q3 2014 | | | | 2018 | | | | 2018 | | | | 2018 | | | |
| Cardiovascular and Metabolic diseases |
| Brilinta/Brilique3 | | P2Y12 receptor antagonist | | arterial thrombosis | | | | | | | Launched | | | | Launched | | | | Accepted | | | Launched |
| Epanova# | | omega-3 carboxylic acids | | severe hypertriglyceridemia | | | | | | | Approved | | | | | | | | 2018 | | | 2019 |
| Farxiga/Forxiga4 | | SGLT2 inhibitor | | Type 2 diabetes | | | | | | | Launched | | | | Launched | | | | Launched | | | Accepted |
roxadustat#OLYMPUS ROCKIES | | hypoxia-inducible factor prolyl hydroxylase inhibitor | | anaemia in CKD/ESRD | | | Q3 2014 | | | | 2018 | | | | N/A | | | | N/A | | | H2 20165 |
| ZS-9 (sodium zirconium cyclosilicate) | | potassium binder | | hyperkalaemia | | | | | | | Accepted | | | | Accepted | | | | | | | |
| Oncology |
| acalabrutinib#6 | | Bruton’s tyrosine kinase (BTK) inhibitor | | B-cell blood cancers | | | | | | | H2 2016 | | | | | | | | | | | |
| cediranib ICON 6 | | VEGFR tyrosine kinase inhibitor | | PSR ovarian cancer | | | Q2 2007 | | | | | | |
| Accepted
(Orphan
Drug) |
| | | | | | |
| durvalumab#PACIFIC | | PD-L1 MAb | | stage III NSCLC | | | Q2 2014 | | | | 2017 | | | | 2020 | | | | 2020 | | | |
| durvalumab#HAWK¶ | | PD-L1 MAb | | 2nd line SCCHN (PD-L1 positive) | | | Q1 2015 | | |
| 2017
(Fast Track |
) | | | 2019 | | | | 2019 | | | |
| | | | | | | | | | | | | | | | | | | | |
durvalumab# + tremelimumab ALPS¶ | | PD-L1 MAb + CTLA-4 MAb | | metastatic pancreatic ductal carcinoma | | | Q4 2015 | | | | 2017 | | | | 2017 | | | | 2017 | | | |
durvalumab#+ tremelimumab ARCTIC | | PD-L1 MAb + CTLA-4 MAb | | 3rd line NSCLC | | | Q2 2015 | | | | 2017 | | | | 2017 | | | | 2017 | | | |
durvalumab#+ tremelimumab CONDOR¶ | | PD-L1 MAb + CTLA-4 MAb | | 2nd line SCCHN (PD-L1 negative) | | | Q2 2015 | | | | 2017 | | | | 2019 | | | | 2019 | | | |
durvalumab#+ tremelimumab DANUBE | | PD-L1 MAb + CTLA-4 MAb | | 1st line bladder | | | Q4 2015 | | | | 2018 | | | | 2018 | | | | 2018 | | | |
durvalumab#+ tremelimumab EAGLE | | PD-L1 MAb + CTLA-4 MAb | | 2nd line SCCHN | | | Q4 2015 | | | | 2019 | | | | 2019 | | | | 2019 | | | |
durvalumab#+ tremelimumab KESTREL | | PD-L1 MAb + CTLA-4 MAb | | 1st line SCCHN | | | Q4 2015 | | | | 2018 | | | | 2018 | | | | 2018 | | | |
durvalumab#+ tremelimumab MYSTIC | | PD-L1 MAb + CTLA-4 MAb | | 1st line NSCLC | | | Q3 2015 | | | | 2017 | | | | 2017 | | | | 2017 | | | |
durvalumab#+ tremelimumab NEPTUNE | | PD-L1 MAb + CTLA-4 MAb | | 1st line NSCLC | | | Q4 2015 | | | | 2019 | | | | 2019 | | | | 2019 | | | |
| moxetumomab pasudotox# | | anti-CD22 recombinant | | hairy cell leukaemia | | | Q2 2013 | | | | 2017 | | | | 2018 | | | | | | | |
| PLAIT | | immunotoxin | | | | | | | | | (Orphan Drug | ) | | | | | | | | | | |
| selumetinib#ASTRA | | MEK inhibitor | | differentiated thyroid cancer | | | Q3 2013 | | | | 2018 | | | | 2018 | | | | | | | |
| selumetinib#SELECT-1 | | MEK inhibitor | | 2nd line KRASm NSCLC | | | Q4 2013 | | | | 2017 | | | | 2017 | | | | | | | |
| Tagrisso (AZD9291) AURA, AURA 2 | | EGFR tyrosine kinase inhibitor | | ³2nd line advanced EGFRm T790M NSCLC | | | Q2 2014 | | |
| Launched
(Breakthrough
designation,
Priority Review,
Orphan Drug) |
| |
| Approved
(Accelerated assessment) | 7
| |
| Accepted
(Priority Review) |
| | 2017 |
| | |
| AstraZenecaAnnual Report and Form 20-F Information 2015 | | 205 |
Additional Information
Development Pipelinecontinued
| | | | | | | | | | | | | | | | | | | | | | | | |
| | | | | | | Date | | | Estimated Regulatory Submission/Submission Acceptance† | |
| Compound | | Mechanism | | Area Under Investigation | | Commenced
Phase | | | US | | | EU | | | Japan | | | China | |
| Tagrisso (AZD9291) AURA 3 | | EGFR tyrosine kinase inhibitor | | >2nd line advanced EGFRm T790M NSCLC | | | Q3 2014 | | | | 2017 | | | | 2017 | | | | 2017 | | | | | |
| tremelimumab¶ DETERMINE | | CTLA-4 MAb | | mesothelioma | | | Q2 2014 | | |
| H2 2016
(Orphan
Drug, Fast
Track) |
| | | H2 2016 | | | | H2 2016 | | | | | |
| Infection, Neuroscience and Gastrointestinal | |
| CAZ AVI# | | cephalosporin/beta lactamase inhibitor | | serious infections, complicated intra-abdominal infection, complicated urinary tract infection | | | Q1 2012 | | | | N/A | | | | Accepted | | | | | | | | 2017 | |
| CAZ AVI# | | cephalosporin/beta lactamase inhibitor | | hospital-acquired pneumonia/ ventilator-associated pneumonia | | | Q2 2013 | | | | N/A | | | | Accepted | | | | | | | | 2017 | |
| MEDI-550 | | pandemic influenza virus vaccine | | pandemic influenza prophylaxis | | | | | | | N/A | | | | H1 2016 | 8 | | | N/A | | | | N/A | |
| Zinforo# | | extended spectrum cephalosporin with affinity to penicillin-binding proteins | | pneumonia/skin infections | | | | | | | N/A | | | | Launched | | | | N/A | | | | Submitted | |
| | | | |
† US and EU dates correspond to anticipated acceptance of the regulatory submission. | | 1 US regulatory submission accepted in Q1 2016. | | 6 Completion of the agreement with Acerta Pharma Q1 2016. |
| | 2 CHMP Positive Opinion received December 2015. | | 7 CHMP Positive Opinion received December 2015. Approval received Q1 2016. |
# Partnered and/or in collaboration. | | 3 Brilintain the US;Briliquein rest of world. | |
¶ Registrational Phase II/III trial. | | 4 Farxigain the US;Forxigain rest of world. | | 8 MAA submitted December 2015. Regulatory acceptance |
| | 5 Rolling NDA submission to be initiated in H2 2016. | | anticipatedH1 2016. |
Phases I and II
NMEs and significant additional indications
| | | | | | | | |
| | | | | | | | | Date |
| | | | | | | | | Commenced |
| Compound | | Mechanism | | Area Under Investigation | | Phase | | Phase |
| Respiratory, Inflammation and Autoimmunity | | | | | | |
| abediterol (AZD0548) | | LABA | | asthma/COPD | | II | | Q4 2007 |
| anifrolumab# | | IFN-alphaR MAb | | lupus nephritis | | II | | Q4 2015 |
| AZD7594 | | inhaled SGRM | | asthma/COPD | | II | | Q3 2015 |
| AZD7624 | | inhaled P38 inhibitor | | COPD | | II | | Q4 2014 |
| AZD9412# | | inhaled interferon beta | | asthma/COPD | | II | | Q3 2015 |
| mavrilimumab# | | GM-CSFR MAb | | rheumatoid arthritis | | II | | Q1 2010 |
| MEDI-551# | | CD19 MAb | | neuromyelitis optica1 | | II | | Q1 2015 |
| MEDI2070# | | IL-23 MAb | | Crohn’s disease | | II | | Q1 2013 |
| abrilumab# | | alpha(4)beta(7) MAb | | Crohn’s disease/ulcerative colitis | | II | | Q4 2012 |
| MEDI9929# | | TSLP MAb | | asthma/atopic dermatitis | | II | | Q2 2014 |
| PT010 | | LABA/LAMA/ICS | | asthma | | II | | Q2 2014 |
| RDEA3170 | | selective uric acid reabsorption inhibitor | | chronic treatment of hyperuricemia in patients | | II | | Q3 2013 |
| | | (URAT-1) | | with gout | | | | |
| tralokinumab | | IL-13 MAb | | atopic dermatitis | | II | | Q1 2015 |
| anifrolumab# | | IFN-alphaR MAb | | systemic lupus erythematosus (subcutaneous) | | I | | Q4 2015 |
| AZD1419# | | TLR9 agonist | | asthma | | I | | Q3 2013 |
| AZD7986 | | DPP1 | | COPD | | I | | Q4 2014 |
| AZD8871 | | MABA | | COPD | | I | | Q4 2015 |
| AZD8999 | | MABA | | COPD | | I | | Q4 2013 |
| AZD9567 | | oral SGRM | | rheumatoid arthritis | | I | | Q4 2015 |
| lesinurad+allopurinol | | selective uric acid reabsorption inhibitor | | chronic treatment of hyperuricemia in patients | | I | | Q4 2015 |
| | | (URAT-1)+xanthine oxidase inhibitor | | with gout | | | | |
| MEDI4920 | | anti-CD40L-Tn3 fusion protein | | primary Sjögren’s syndrome | | I | | Q2 2014 |
| MEDI5872# | | B7RP1 MAb | | systemic lupus erythematosus | | I | | Q4 2008 |
| MEDI7836 | | IL-13 MAb-YTE | | asthma | | I | | Q1 2015 |
| Cardiovascular and Metabolic diseases | | | | | | | | |
| MEDI6012 | | LCAT | | ACS | | II | | Q4 2015 |
| AZD4076 | | anti-miR103/107 oligonucleotide | | non-alcoholic fatty liver disease/non-alcoholic | | I | | Q4 2015 |
| | | | | steatohepatitis (NASH) | | | | |
| MEDI0382 | | GLP-1/glucagon dual agonist | | diabetes/obesity | | I | | Q1 2015 |
| MEDI4166 | | PCSK9/GLP-1 MAb + peptide fusion | | diabetes/cardiovascular | | I | | Q4 2015 |
| MEDI8111 | | Rh-factor II | | trauma/bleeding | | I | | Q1 2014 |
| | |
| 206 | | AstraZenecaAnnual Report and Form 20-F Information 2015 |
| | | | | | | | |
| | | | | | | | | Date |
| | | | | | | | | Commenced |
| Compound | | Mechanism | | Area Under Investigation | | Phase | | Phase |
| Oncology | | | | | | | | |
| AZD1775# | | WEE-1 inhibitor | | ovarian cancer | | II | | Q4 2012 |
| AZD2014 | | mTOR serine/threonine kinase inhibitor | | solid tumours | | II | | Q1 2013 |
| AZD3759 BLOOM | | EGFR tyrosine kinase inhibitor | | brain metastases in advanced | | | | |
| Tagrisso (AZD9291) BLOOM | | EGFR tyrosine kinase inhibitor | | EGFRm NSCLC | | II | | Q4 2015 |
| AZD4547 | | FGFR tyrosine kinase inhibitor | | solid tumours | | II | | Q4 2011 |
| AZD5069 + durvalumab# | | CXCR2 + PD-L1 MAb | | SCCHN | | II | | Q3 2015 |
| | | | | | |
| AZD9150#+ durvalumab# | | STAT3 inhibitor + PD-L1 MAb | | | | | | |
| AZD5363# | | AKT kinase inhibitor | | breast cancer | | II | | Q1 2014 |
| durvalumab# | | PD-L1 MAb | | solid tumours | | II | | Q3 2014 |
| durvalumab#+ tremelimumab | | PD-L1 MAb + CTLA-4 MAb | | gastric cancer | | II | | Q2 2015 |
| MEDI-551# | | CD19 MAb | | diffuse B-cell lymphoma | | II | | Q1 2012 |
| MEDI-573# | | IGF MAb | | metastatic breast cancer | | II | | Q2 2012 |
| savolitinib/volitinib# | | MET tyrosine kinase inhibitor | | papillary renal cell carcinoma | | II | | Q2 2014 |
| selumetinib# | | MEK inhibitor | | 2nd line KRAS wt NSCLC | | II | | Q1 2013 |
| AZD0156 | | ATM serine/threonine kinase inhibitor | | solid tumours | | I | | Q4 2015 |
| AZD2811 | | Aurora B kinase inhibitor | | solid tumours | | I | | Q4 2015 |
| AZD5312# | | androgen receptor inhibitor | | solid tumours | | I | | Q2 2014 |
| AZD6738 | | ATR serine/threonine kinase inhibitor | | solid tumours | | I | | Q4 2013 |
| AZD8186 | | PI3 kinase beta inhibitor | | solid tumours | | I | | Q2 2013 |
| AZD8835 | | PI3 kinase alpha inhibitor | | solid tumours | | I | | Q4 2014 |
| AZD9150# | | STAT3 inhibitor | | haematological malignancies | | I | | Q1 2012 |
| Tagrisso (AZD9291) + (durvalumab#or | | EGFR tyrosine kinase inhibitor + (PD-L1 MAb or | | advanced EGFRm NSCLC | | I | | Q3 2014 |
| selumetinib#or savolitinib#) TATTON | | MEK inhibitor or MET tyrosine kinase inhibitor) | | | | | | |
| AZD9496 | | selective oestrogen receptor downregulator (SERD) | | ER+ breast cancer | | I | | Q4 2014 |
| durvalumab# | | PD-L1 MAb | | solid tumours | | I | | Q3 2014 |
| durvalumab#+ MEDI0680 | | PD-L1 MAb + PD-1 MAb | | solid tumours | | I | | Q2 2014 |
| durvalumab#+ MEDI6383# | | OX40 agonist + PD-L1 MAb | | solid tumours | | I | | Q2 2015 |
| durvalumab#+ dabrafenib + trametinib2 | | PD-L1 MAb + BRAF inhibitor + MEK inhibitor | | melanoma | | I | | Q1 2014 |
| durvalumab#+ tremelimumab | | PD-L1 MAb + CTLA-4 MAb | | solid tumours | | I | | Q4 2013 |
| Iressa + durvalumab# | | PD-L1 MAb + EGFR tyrosine kinase inhibitor | | NSCLC | | I | | Q2 2014 |
| MEDI0562# | | humanised OX40 agonist | | solid tumours | | I | | Q1 2015 |
| MEDI-551#+ rituximab | | CD19 MAb + CD20 MAb | | haematological malignancies | | I | | Q2 2014 |
| MEDI-565# | | CEA BiTE MAb | | solid tumours | | I | | Q1 2011 |
| MEDI0639# | | DLL-4 MAb | | solid tumours | | I | | Q2 2012 |
| MEDI0680 | | PD-1 MAb | | solid tumours | | I | | Q4 2013 |
| MEDI1873 | | GITR agonist fusion protein | | solid tumours | | I | | Q4 2015 |
| MEDI3617# | | ANG-2 MAb | | solid tumours | | I | | Q4 2010 |
| MEDI4276 | | HER2 bispecific ADC MAb | | solid tumours | | I | | Q4 2015 |
| MEDI6383# | | OX40 agonist | | solid tumours | | I | | Q3 2014 |
| MEDI9197# | | TLR 7/8 agonist | | solid tumours | | I | | Q4 2015 |
| MEDI9447 | | CD73 MAb | | solid tumours | | I | | Q3 2015 |
| Infection, Neuroscience and Gastrointestinal | | | | | | | | |
| AZD3241 | | myeloperoxidase inhibitor | | multiple system atrophy | | II | | Q2 2015 (Orphan Drug) |
| AZD3293# | | beta-secretase inhibitor | | Alzheimer’s disease | | II | | Q4 2014 |
| CXL# | | beta lactamase inhibitor/cephalosporin | | methicillin-resistant S.aureus | | II | | Q4 2010 |
| MEDI7510 | | RSV sF+GLA-SE | | prevention of RSV disease in older adults | | II | | Q3 2015 |
| MEDI8852 | | influenza A MAb | | influenza A treatment | | II | | Q4 2015 |
| MEDI8897# | | RSV MAb-YTE | | passive RSV prophylaxis | | II | | Q1 2015 (FDA Fast Track) |
| MEDI4893 | | MAb binding to S.aureus toxin | | hospital-acquired pneumonia/serious S. aureusinfection | | II | | Q4 2014 (FDA Fast Track) |
| ATM AVI# | | monobactam/beta lactamase inhibitor | | targeted serious bacterial infections | | I | | Q4 2012 |
AZD8108 | | NMDA antagonist | | suicidal ideation | | I | | Q4 2014 |
| MEDI1814 | | amyloid beta MAb | | Alzheimer’s disease | | I | | Q2 2014 |
| MEDI3902 | | anti-Psl/PcrV | | prevention of nosocomial pseudomonas pneumonia | | I | | Q3 2014 (FDA Fast Track) |
| # | Partnered and/or in collaboration. |
| 1 | Neuromyelitis optica: Now lead indication. Multiple sclerosis trial completed in 2015. |
| 2 | MedImmune-sponsored trial in collaboration with Novartis AG. |
| | |
| AstraZenecaAnnual Report and Form 20-F Information 2015 | | 207 |
Additional Information
Development Pipelinecontinued
Significant Life-Cycle Management
| | | | | | | | | | | | | | | | | | | | | | | | |
| | | | | | | Date | | | Estimated Regulatory Submission Acceptance† | |
| Compound | | Mechanism | | Area Under Investigation | | Commenced
Phase | | | US | | | EU | | | Japan | | | China | |
| Respiratory, Inflammation and Autoimmunity | | | | | | | | | | | | | | | | | |
| Duaklir Genuair# | | LAMA/LABA | | COPD | | | | | | | 2018 | | | | Launched | | | | 2018 | | | | 2018 | |
| SymbicortSYGMA | | ICS/LABA | | as-needed use in mild asthma | | | Q4 2014 | | | | N/A | | | | 2018 | | | | | | | | 2019 | |
| Symbicort | | ICS/LABA | | breath actuated inhaler asthma/COPD | | | | | | | 2018 | | | | | | | | | | | | | |
| Cardiovascular and Metabolic diseases | | | | | | | | | | | | | | | | | |
| Brilinta/Brilique1EUCLID | | P2Y12 receptor antagonist | | outcomes trial in patients with peripheral artery disease | | | Q4 2012 | | | | 2017 | | | | 2017 | | | | 2017 | | | | 2018 | |
| Brilinta/Brilique1HESTIA | | P2Y12 receptor antagonist | | prevention of vaso-occlusive crises in paediatric patients with sickle cell disease | | | Q4 2014 | | | | 2020 | | | | 2020 | | | | | | | | | |
Brilinta/Brilique1 PEGASUS-TIMI 54 | | P2Y12 receptor antagonist | | outcomes trial in patients with prior myocardial infarction | | | Q4 2010 | | |
| Launched
(Priority
Review) |
| | | Accepted | 2 | | | Accepted | | | | H2 2016 | |
| Brilinta/Brilique1SOCRATES | | P2Y12 receptor antagonist | | outcomes trial in patients with stroke or TIA | | | Q1 2014 | | | | H1 2016 | | | | H1 2016 | | | | H2 2016 | | | | 2017 | |
| Brilinta/Brilique1THEMIS | | P2Y12 receptor antagonist | | outcomes trial in patients with Type 2 diabetes and CAD, but without a previous history of MI or stroke | | | Q1 2014 | | | | 2018 | | | | 2018 | | | | 2018 | | | | 2019 | |
| BydureonEXSCEL | | GLP-1 receptor agonist | | Type 2 diabetes outcomes trial | | | Q2 2010 | | | | 2018 | | | | 2018 | | | | 2018 | | | | | |
| Bydureonweekly suspension | | GLP-1 receptor agonist | | Type 2 diabetes | | | Q1 2013 | | | | 2017 | | | | 2017 | | | | | | | | | |
| EpanovaSTRENGTH | | omega-3 carboxylic acids | | outcomes trial in statin-treated patients at high CV risk, with persistent hypertriglyceridemia plus low HDL-cholesterol | | | Q4 2014 | | | | 2020 | | | | 2020 | | | | 2020 | | | | 2020 | |
| Epanova/Farxiga/Forxiga3 | | omega-3 carboxylic acids/ SGLT2 inhibitor | | non-alcoholic fatty liver disease/ non-alcoholic steatohepatitis (NASH) | | | Q1 2015 | | | | | | | | | | | | | | | | | |
Farxiga/Forxiga3 DECLARE-TIMI 58 | | SGLT2 inhibitor | | Type 2 diabetes outcomes trial | |
| Q2 2013
|
| |
| 2020
|
| |
| 2020
|
| | | | | | | | |
| Farxiga/Forxiga3 | | SGLT2 inhibitor | | Type 1 diabetes | | | Q4 2014 | | | | 2018 | | | | 2017 | | | | 2018 | | | | | |
| KombiglyzeXR/Komboglyze4 | | DPP-4 inhibitor/metformin FDC | | Type 2 diabetes | | | | | | | Launched | | | | Launched | | | | | | | | Submitted | |
| OnglyzaSAVOR-TIMI 53 | | DPP-4 inhibitor | | Type 2 diabetes outcomes trial | | | Q2 2010 | | | | Accepted | | | | Launched | | | | | | | | H2 2016 | 5 |
saxagliptin/dapagliflozin FDC | | DPP-4 inhibitor/SGLT2 inhibitor FDC | | Type 2 diabetes | |
| Q2 2012
|
| |
| Accepted
| 6
| |
| Accepted
|
| | | | | | | | |
| XigduoXR/Xigduo7 | | SGLT2 inhibitor/metformin FDC | | Type 2 diabetes | | | | | | | Launched | | | | Launched | | | | | | | | | |
| Oncology | | | | | | | | | | | | | | | | | | | | | | | | |
| FaslodexFALCON | | oestrogen receptor antagonist | | 1st line hormone receptor +ve advanced breast cancer | | | Q4 2012 | | | | H2 2016 | | | | H2 2016 | | | | H2 2016 | | | | 2020 | |
| Lynparza(olaparib) SOLO-1 | | PARP inhibitor | | 1st line BRCAm ovarian cancer | | | Q3 2013 | | | | 2017 | | | | 2017 | | | | 2017 | | | | | |
| Lynparza(olaparib) SOLO-2 | | PARP inhibitor | | 2nd line or greater BRCAm PSR ovarian cancer, maintenance monotherapy | | | Q3 2013 | | | | H2 2016 | | | | 2017 | | | | 2017 | | | | | |
| Lynparza(olaparib) SOLO-3 | | PARP inhibitor | | gBRCA PSR ovarian cancer | | | Q1 2015 | | | | 2018 | | | | | | | | | | | | | |
| Lynparza(olaparib) GOLD | | PARP inhibitor | | 2nd line gastric cancer | | | Q3 2013 | | | | | | | | | | | | 2017 | | | | | |
| Lynparza(olaparib) OlympiA | | PARP inhibitor | | gBRCA adjuvant breast cancer | | | Q2 2014 | | | | 2020 | | | | 2020 | | | | 2020 | | | | | |
| Lynparza(olaparib) OlympiAD | | PARP inhibitor | | gBRCA metastatic breast cancer | | | Q2 2014 | | | | H2 2016 | | | | 2017 | | | | 2017 | | | | | |
| Lynparza(olaparib) POLO | | PARP inhibitor | | pancreatic cancer | | | Q1 2015 | | | | 2018 | | | | 2018 | | | | 2018 | | | | | |
| Lynparza(olaparib) | | PARP inhibitor | | prostate cancer | | | Q3 2014 | | |
| (Breakthrough
Therapy
designation) |
8 | | | | | | | | | | | | |
| Tagrisso(AZD9291) ADAURA | | EGFR tyrosine kinase inhibitor | | adjuvant EGFRm NSCLC | | | Q4 2015 | | | | 2022 | | | | 2022 | | | | | | | | | |
| Tagrisso(AZD9291) FLAURA | | EGFR tyrosine kinase inhibitor | | 1st line advanced EGFRm NSCLC | | | Q1 2015 | | | | 2017 | | | | 2017 | | | | 2017 | | | | 2020 | |
| Tagrisso(AZD9291) | | EGFR tyrosine kinase inhibitor | | ³2nd line advanced EGFRm T790M | | | Q3 2015 | | | | | | | | | | | | | | | | | |
| + durvalumab#CAURAL9 | | + PD-L1 MAb | | NSCLC | | | | | | | | | | | | | | | | | | | | |
| | |
| 208 | | AstraZenecaAnnual Report and Form 20-F Information 2015 |
| | | | | | | | | | | | | | | | | | | | | | |
| | | | | | | Date | | Estimated Regulatory Submission
Acceptance† | |
| Compound | | Mechanism | | Area Under Investigation | | Commenced
Phase | | US | | | EU | | | Japan | | | China | |
| Infection, Neuroscience and Gastrointestinal | | | | | | | | | | | | | | | | | | |
| Diprivan# | | sedative and anaesthetic | | conscious sedation | | | | | N/A | | | | Launched | | | | Accepted | | | | Launched | |
| linaclotide# | | GC-C receptor peptideagonist | | irritable bowel syndrome with constipation (IBS-C) | | | | | N/A | | | | N/A | | | | N/A | | | | Accepted | 10 |
| Nexium | | proton pump inhibitor | | stress ulcer prophylaxis | | | | | | | | | | | | | | | | | H2 2016 | |
| Nexium | | proton pump inhibitor | | paediatrics | | | | | Launched | | | | Launched | | | | H2 2016 | | | | Accepted | |
| † | US and EU dates correspond to anticipated acceptance of the regulatory submission. |
| # | Partnered and/or in collaboration. |
| 1 | Brilintain the US;Briliquein rest of world. |
| 2 | CHMP Positive Opinion received December 2015. |
| 3 | Farxigain the US;Forxigain rest of world. |
| 4 | Kombiglyze XR in the US;Komboglyze in the EU. |
| 5 | Timing of China submission dependent on US regulatory approval. |
| 6 | CRL received October 2015. |
| 7 | XigduoXR in the US;Xigduoin the EU. |
| 8 | Breakthrough Therapy designation granted for prostate cancer patients with BRCA1/2 or ATM gene mutated mCRPC who have received previous taxane-based chemotherapy and one newer hormonal agent (abiraterone or enzalutamide). |
| 9 | Temporarily closed to enrolment. |
| 10 | Submission accepted January 2016. |
Terminations
| | | | | | |
NME/Line Extension | | Compound | | Reason for Discontinuation | | Area Under Investigation |
| NME | | AZD2115# | | Strategic | | COPD |
| NME | | AZD5213 | | Safety/efficacy | | Tourette’s syndrome/neuropathic pain |
| NME | | AZD5847 | | Safety/efficacy | | tuberculosis |
| NME | | AZD9977 | | Safety/efficacy | | diabetic kidney disease |
| NME | | durvalumab#ATLANTIC | | Strategic | | 3rd line NSCLC (PD-L1 positive) |
| NME | | durvalumab#+ MEDI6469# | | Strategic | | solid tumours |
| NME | | selumetinib#SUMIT | | Safety/efficacy | | uveal melanoma |
| NME | | sifalimumab# | | Strategic | | systemic lupus erythematosus1 |
| NME | | tenapanor (AZD1722)# | | Safety/efficacy | | ESRD-Pi/CKD with T2DM |
| NME | | MEDI-551#+ MEDI0680 | | Safety/efficacy | | diffuse large B-cell lymphoma |
| NME | | MEDI-559 | | Safety/efficacy | | passive RSV prophylaxis |
| NME | | MEDI6469# | | Strategic | | solid tumours |
| NME | | MEDI6469#+ rituximab | | Strategic | | solid tumours |
| NME | | MEDI6469#+ tremelimumab | | Strategic | | solid tumours |
| LCM | | brodalumab# | | Lack of efficacy | | asthma |
| LCM | | durvalumab# after (Tagrisso (AZD9291) or Iressa or (selumetinib#+docetaxel) or tremelimumab) | | Strategic | | NSCLC |
| LCM | | MEDI-551# | | Safety/efficacy | | chronic lymphocytic leukaemia |
| LCM | | moxetumomab pasudotox# | | Safety/efficacy | | paediatric acute lymphoblastic leukaemia |
| LCM | | Nexium | | Regulatory | | refractory reflux oesphagitis (JP) |
| LCM | | tralokinumab | | Safety/efficacy | | idiopathic pulmonary fibrosis |
| # | Partnered and/or in collaboration. |
| ¹ | SLE project stopped but molecule under evaluation for alternative indications. |
Completed Projects/Divestitures
| | | | | | | | | | | | | | | | | | | | | | | | |
| | | | | | | Completed/ | | | Estimated Regulatory Submission
Acceptance† | |
| Compound | | Mechanism | | Area Under Investigation | | Divested | | | US | | | EU | | | Japan | | | China | |
| Myalept | | leptin analogue | | lipodystrophy | | | Completed | | | | Launched | | | | | | | | | | | | | |
| Lynparza (olaparib) capsule | | PARP inhibitor | | BRCAm PSR ovarian cancer | | | Completed | | | | Launched | | | | Launched | | | | | | | | | |
| AZD0914 | | GyrAR | | serious bacterial infections (Phase III) | |
| Divested in
Phase II |
| | | | | | | | | | | | | | | | |
| Movantik/Moventig#1 | | oral peripherally-acting mu-opioid receptor antagonist | | opioid-induced constipation | | | Completed | | | | Launched | | | | Launched | | | | | | | | | |
| Bydureon Dual Chamber Pen | | GLP-1 receptor agonist | | Type 2 diabetes | | | Completed | | | | Launched | | | | Launched | | | | Launched | | | | | |
| brodalumab AMVISION-1,22 | | IL-17R MAb | | psoriatic arthritis | | | Partnered | | | | | | | | | | | | | | | | | |
| Caprelsa3 | | VEGFR/EGFR tyrosine kinase inhibitor with RET kinase activity | | medullary thyroid cancer | | | Divested | | | | Launched | | | | Launched | | | | Approved | 4 | | | Accepted | |
| Caprelsa3 | | VEGFR/EGFR tyrosine kinase inhibitor with RET kinase activity | | differentiated thyroid cancer | | | Divested | | | | | | | | | | | | | | | | | |
| Entocort5 | | glucocorticoid steroid | | Crohn’s disease/ulcerative colitis | |
| Completed/
Divested |
| | | Launched | | | | Launched | | | | Q4 2015 | | | | N/A | |
| Iressa | | EGFR tyrosine kinase inhibitor | | EGFRm NSCLC | | | Completed | | | | Launched | 6 | | | Launched | | | | Launched | | | | Launched | |
| AZD49017 | | NK3 receptor antagonist | | polycystic ovarian syndrome | |
| Divested in
Phase II |
| | | | | | | | | | | | | | | | |
| † | US and EU dates correspond to anticipated acceptance of the regulatory submission. |
| # | Partnered and/or in collaboration. |
| 1 | Movantik in the US;Moventigin EU. |
| 2 | AstraZeneca has granted Valeant an exclusive licence to develop and commercialise brodalumab. |
| 3 | Divested to Genzyme (deal completed October 2015). |
| 4 | Approved in Japan in September 2015. |
| 5 | Global rights, outside the US, divested to Tillotts Pharma AG in July 2015. AstraZeneca continues to support the Japanese regulatory submission. |
| 6 | Launched in US Q3 2015. |
| 7 | Divested to Millendo Therapeutics, Inc. Agreement announced January 2016. |
| | |
| AstraZenecaAnnual Report and Form 20-F Information 2015 | | 209 |
Additional Information
Patent Expiries
Patent expiries for our key marketed products
AstraZeneca is exposed to third party challenges of its patents and products. Generic products may be launched at risk and our patents may be revoked, circumvented or found not to be infringed. For more information, please see Risk from page 212. Many of our products are subject to challenges by third parties. Details of material challenges by third parties can be found in Note 27 to the Financial Statements from page 186. The expiry dates shown below do not include any granted SPC/PTE and/or Paediatric Exclusivity periods unless asterisked; see key in footnotes. (In Europe, the exact SPC situation may vary by country as different Patent Offices may grant SPC at different rates.) A number of our products are subject to generic competition in one or more markets. Further information can be found in the Geographical Review from page 227.
US
| | | | | | | | | | | | | | | | | | |
| | | US patent expiry | | | | | | | US Product Sales ($m) | |
| Key marketed products | | New Chemical Entity patent(s) | | Expiry dates of other patents (such as the FDA Orange Book) | | 2015 | | | 2014 | | | 2013 | |
| Atacand3 | | | | | | | | | 34 | | | | 44 | | | | 72 | |
| Brilinta | | 2018, 2019 | | 2021, 2030 | | | | | 240 | | | | 146 | | | | 73 | |
| Bydureon | | | | 20161, 2017, 2018, 2020, 2021, 2022, 2024, 2025, 2026, 2028 | | | 482 | | | | 374 | | | | 131 | |
| Byetta | | | | 20161, 2017, 2018, 2020 | | | | | 209 | | | | 199 | | | | 152 | |
| Crestor4 | | 20161,2 | | 20182, 20212, 20222 | | | | | 2,844 | | | | 2,918 | | | | 2,912 | |
| Daliresp | | 20201 | | 2023, 2024 | | | | | 104 | | | | – | | | | – | |
| Faslodex | | | | 20212 | | | | | 356 | | | | 340 | | | | 324 | |
| Farxiga | | 2020 | | 2020, 2027, 2028, 2029, 2030 | | | | | 261 | | | | 122 | | | | – | |
| Iressa | | 2017 (20225) | | | | | | | 6 | | | | – | | | | – | |
| KombiglyzeXR | | 20231 | | 2025 | | | | | – | 6 | | | – | 6 | | | – | 6 |
| Lynparza | | 2022, 2024 | | 2024, 2027, 2028, 2031 | | | | | 70 | | | | – | | | | – | |
| Nexium | | | | 20162, 20182, 20192, 20202,7 | | | | | 902 | | | | 1,876 | | | | 2,123 | |
| Onglyza | | 20231 | | 2028 | | | | | 420 | | | | 481 | | | | 265 | |
| Pulmicort8 | | | | 2018, 20192 | | | | | 200 | | | | 211 | | | | 224 | |
| Seloken/Toprol-XL | | | | | | | | | 89 | | | | 91 | | | | 131 | |
| Seroquel XR9 | | | | 2017 | | | | | 716 | | | | 738 | | | | 743 | |
| Symbicort | | | | 2017, 2018, 2021, 2023, 2024, 2026, 2028, 2029 | | | 1,520 | | | | 1,511 | | | | 1,233 | |
| Synagis | | | | 2023 | | | | | 285 | | | | 499 | | | | 617 | |
| Tudorza | | 2020 | | 2016, 2022, 2027 | | | | | 103 | | | | – | | | | – | |
| Zoladex | | | | 2021, 2022 | | | | | 28 | | | | 26 | | | | 23 | |
| | | | |
| China, EU and Japan | | | | | | | | | | | | | | |
| | | | | | | |
| China, EU and Japan
combined Product Sales ($m)10 |
|
| Key marketed products | | China patent expiry | | EU patent expiry11 | | Japan patent expiry | | 2015 | | | 2014 | | | 2013 | |
| Atacand | | | | | | | | | | | | | | | | | | |
| Patents | | 12 | | Expired | | 12 | | | 91 | | | | 151 | | | | 200 | |
| Brilique | | | | | | | | | 255 | | | | 232 | | | | 155 | |
| NCE Patents | | 2018, 2019 | | 2018, 20241 | | 2018, 2019 | | | | | | | | | | | | |
| Non-NCE Patents | | 2021 | | 202113 | | 2021, 2027 | | | | | | | | | | | | |
| Bydureon | | | | | | | | | 82 | | | | 59 | | | | 17 | |
| Non-NCE Patents | | 2020, 202114, 202514 | | 2017, 2020, 2021, 20211, 2022, 2024, | | 2018, 2021, 2024, 2025, | | | | | | | | | | | | |
| | | | | 2026, 202715 | | 2026, 2027, 2028 | | | | | | | | | | | | |
| Byetta | | | | | | | | | 84 | | | | 105 | | | | 46 | |
| Non-NCE Patents | | 2020 | | 2017, 2018, 2020, 20211,15 | | 2018, 20201 | | | | | | | | | | | | |
| Crestor | | | | | | | | | 1,585 | | | | 1,877 | | | | 1,864 | |
| NCE Patent | | | | 20171,2 | | 20171 | | | | | | | | | | | | |
| Non-NCE Patents | | 2020, 2021 | | 2020 | | 2021, 20231 | | | | | | | | | | | | |
| Duaklir Genuair | | | | | | | | | 21 | | | | – | | | | – | |
| NCE Patent | | 2020 | | 20251 | | 20251 | | | | | | | | | | | | |
| Non-NCE Patents | | 2016, 2022, 2025, 2027 | | 2016, 2022, 2025, 2027, 2028, 2029 | | 2016, 2022, 2025, 2027, 2028 | | | | | | | | | | | | |
| Eklira Genuair | | | | | | | | | 61 | | | | 12 | | | | – | |
| NCE Patent | | 2020 | | 20251 | | 20251 | | | | | | | | | | | | |
| Non-NCE Patents | | 2016, 2022, 2025, 2027 | | 2016, 2022, 2025, 2027, 2028, 2029 | | 2016, 2022, 2025, 2027, 2028 | | | | | | | | | | | | |
| Faslodex | | | | | | | | | 259 | | | | 295 | | | | 272 | |
| Non-NCE Patents | | 202116 | | 2021 | | 20261 | | | | | | | | | | | | |
| | |
| 210 | | AstraZenecaAnnual Report and Form 20-F Information 2015 |
| | | | | | | | | | | | | | | | | | |
| | | | | | | |
| China, EU and Japan combined
Product Sales ($m)10 |
|
| Key marketed products | | China patent expiry | | EU patent expiry11 | | Japan patent expiry | | 2015 | | | 2014 | | | 2013 | |
| Forxiga | | | | | | | | | 134 | | | | 74 | | | | 10 | |
| NCE Patent | | 2023 | | 20271 | | 2023 | | | | | | | | | | | | |
| Non-NCE Patents | | 2027, 2028 | | 2027, 2028 | | 20281, 2028 | | | | | | | | | | | | |
| Iressa | | | | | | | | | 389 | | | | 459 | | | | 489 | |
| NCE Patent | | 2016 | | 201917 | | 2018 | | | | | | | | | | | | |
| KombiglyzeXR | | | | | | | | | – | 6 | | | – | 6 | | | – | 6 |
| NCE Patent | | 2021 | | 20261 | | – | | | | | | | | | | | | |
| Non-NCE Patents | | 2025 | | 2025 | | – | | | | | | | | | | | | |
| Komboglyze | | | | | | | | | – | 6 | | | – | 6 | | | – | 6 |
| NCE Patent | | 2021 | | 20261 | | – | | | | | | | | | | | | |
| Non-NCE Patents | | 2025 | | 2025 | | – | | | | | | | | | | | | |
| Lynparza | | | | | | | | | 23 | | | | – | | | | – | |
| NCE Patent | | 2021, 2024 | | 2021, 20291 | | 2021, 2024 | | | | | | | | | | | | |
| Non-NCE Patents | | 2024, 2027 | | 2024, 2027 | | 2024, 2027 | | | | | | | | | | | | |
| Nexium | | | | | | | | | 950 | | | | 966 | | | | 828 | |
| NCE Patent | | Expired | | Expired | | 20181 | | | | | | | | | | | | |
| Non-NCE Patents | | 2018, 2019 | | 2018 | | 2018, 2019 | | | | | | | | | | | | |
| Onglyza | | | | | | | | | 168 | | | | 164 | | | | 62 | |
| NCE Patent | | 2021 | | 20241 | | – | | | | | | | | | | | | |
| Non-NCE Patents | | 2025 | | 2025 | | – | | | | | | | | | | | | |
| Pulmicort18 | | | | | | | | | 653 | | | | 564 | | | | 481 | |
| Non-NCE Patents | | 2018 | | 2018 | | 2018 | | | | | | | | | | | | |
| Seloken/Toprol-XL | | | | | | | | | 428 | | | | 428 | | | | 400 | |
| Non-NCE Patents | | Expired | | Expired | | Expired | | | | | | | | | | | | |
| Seroquel XR | | | | | | | | | 176 | | | | 306 | | | | 381 | |
| Non-NCE Patents | | 2017 | | 2017 | | 19 | | | | | | | | | | | | |
| Symbicort | | | | | | | | | 1,310 | | | | 1,666 | | | | 1,634 | |
| Non-NCE Patents | | 2018 | | 2018, 2019 | | 2017, 2019, 2020 | | | | | | | | | | | | |
| Synagis | | | | | | | | | 377 | | | | 401 | | | | 443 | |
| Non-NCE Patents | | – | | 2023 | | 2023 | | | | | | | | | | | | |
| Zoladex | | | | | | | | | 468 | | | | 526 | | | | 581 | |
| Non-NCE Patents | | 2021 | | 2021 | | 2021 | | | | | | | | | | | | |
| 1 | Date represents expiry of granted PTE; or expiry of granted SPC where SPC has been granted in several or all countries. |
| 2 | Date includes Paediatric Exclusivity. |
| 4 | A settlement agreement permits Watson Laboratories, Inc. and Actavis, Inc. (together, Watson) to begin selling its generic version ofCrestorand its rosuvastatin zinc product beginning 2 May 2016. |
| 5 | Date in brackets reflects seven years’ Orphan Drug exclusivity to 13 July 2022. |
| 6 | Komboglyze/KombiglyzeXR Product Sales are included in theOnglyzaProduct Sales figure. |
| 7 | Licence agreements with Teva and Ranbaxy Pharmaceuticals Inc. and other generic companies allow each to launch a generic version in the US from May 2014, subject to regulatory approval. |
| 8 | A licence agreement with Teva permits their ongoing sale in the US of a generic version from December 2009. The 2018 expiry relates to theFlexhalerdevice, while the 2019 expiry relates to the formulation in theFlexhalerpresentation and also toRespules. |
| 9 | Licence agreements with various generics companies allow launches of generic versions ofSeroquel XRin the US from 1 November 2016 or earlier upon certain circumstances, subject to regulatory approval. |
| 10 | Aggregate revenue for China, the EU and Japan. |
| 11 | Expiry in major EU markets. |
| 12 | Takeda retained rights. |
| 13 | The patent was revoked during opposition proceedings at the European Patent Office. The patentee has appealed that decision. |
| 14 | Regulatory approval for the product is pending in China. |
| 15 | There is eight years’ data exclusivity and two years’ market exclusivity forByettaandBydureonto 2016. |
| 16 | Decision of the Patent Reexamination Board invalidating the patent suspended pending outcome of appeal process. |
| 17 | SPC expires 2 March 2019. There is eight years’ data exclusivity and two years’ market exclusivity forIressain the EU to 24 June 2019. |
| 18 | The 2018 expiry relates to the formulation in theTurbuhalerpresentation and to a process useful for theRespulesproduct. |
| 19 | Rights licensed to Astellas. |
| | |
| AstraZenecaAnnual Report and Form 20-F Information 2015 | | 211 |
Additional Information
Risk
Risks and uncertainties
Operating in the pharmaceutical sector carries various inherent risks and uncertainties that may affect our business. In this section, we describe the risks and uncertainties that we consider material to our business in that they may have a significant effect on our financial condition, results of operations, and/or reputation.
These risks are not listed in any particular order of priority and have been categorised consistently with the Principal risks detailed from page 21. Other risks, unknown or not currently considered material, could have a similar effect. We believe that the forward-looking statements about AstraZeneca in this Annual Report, identified by words such as ‘anticipates’, ‘believes’, ‘expects’ and ‘intends’, and that include, among other things, Future prospects in the Financial Review on page 76, are based on reasonable assumptions. However, forward-looking statements involve inherent risks and uncertainties such as those summarised below. They relate to events that may occur in the future, that may be influenced by factors beyond our control and that may have actual outcomes materially different from our expectations.
| | |
Product pipeline and IP risks | | Impact |
|
Failure to meet development targets |
The development of any pharmaceutical product candidate is a complex, risky and lengthy process involving significant financial, R&D and other resources, which may fail at any stage of the process due to various factors. These include failure to obtain the required regulatory or marketing approvals for the product candidate or its manufacturing facilities; unfavourable clinical efficacy data; safety concerns; failure of R&D to develop new product candidates; failure to demonstrate adequate cost-effective benefits to regulatory authorities and/or payers; and the emergence of competing products. | | A succession of negative drug project results and a failure to reduce development timelines effectively, or produce new products that achieve the expected commercial success, could frustrate the achievement of development targets, adversely affect the reputation of our R&D capabilities, and is likely to materially adversely affect our business and results of operations. See also Failure to achieve strategic priorities or to meet targets or expectations on page 225. |
| | |
| Because our business model and strategy rely on the success of relatively few compounds, the failure of any in line production may have a significant negative effect on our business or results of operations. | | |
| | |
Production and release schedules for biologics may be more significantly impacted by regulatory processes than other products. This is due to more complex and stringent regulation on the manufacturing of biologics and their supply chain. | | |
|
Delay to new product launches |
Our continued success depends on the development and successful launch of innovative new drugs. The anticipated launch dates of major new products significantly affect our business, including investment in large clinical studies; the manufacture of pre-launch product stocks; investment in marketing materials pre-launch; sales force training; and the timing of anticipated future revenue streams from new Product Sales. Launch dates are primarily driven by our development programmes and the demands from various factors, including adverse findings in pre-clinical or clinical studies, regulatory demands, price negotiation, competitor activity and technology transfer. | | Significant delays to anticipated launch dates of new products could have a material adverse effect on our financial condition and/or results of operations. For example, for the launch of products that are seasonal in nature, delays in regulatory approvals or manufacturing difficulties may delay launch to the next season which, in turn, may significantly reduce the return on costs incurred in preparing for the launch for that season. In addition, a delayed launch may lead to increased costs if, for example, marketing and sales efforts need to be rescheduled or performed for longer than expected. |
| | |
| 212 | | AstraZenecaAnnual Report and Form 20-F Information 2015 |
| | |
Product pipeline and IP risks | | Impact |
|
Acquisitions and strategic alliances, including licensing and collaborations, may be unsuccessful |
We seek licensing arrangements and strategic collaborations to expand our product portfolio and geographical presence as part of our business strategy. Such licensing arrangements and strategic collaborations are key, enabling us to grow and strengthen the business. The success of such arrangements is largely dependent on the technology and other IP rights we acquire, and the resources, efforts and skills of our partners. Also, under many of our licensing arrangements and strategic collaborations, we make milestone payments well in advance of the commercialisation of the products, with no assurance that we will recoup these payments. We may also seek to acquire complementary businesses or enter into other strategic transactions. The integration of an acquired business could involve incurring significant debt and unknown or contingent liabilities, as well as having a negative effect on our reported results of operations from acquisition-related charges, amortisation of expenses related to intangibles and charges for the implementation of long-term assets. We may also experience difficulties in integrating geographically separated organisations, systems and facilities, and personnel with different organisational cultures. Furthermore, we experience strong competition from other pharmaceutical companies in respect of licensing arrangements, strategic collaborations, and acquisition targets, and therefore, we may be unsuccessful in implementing some of our intended projects or we may have to pay a significant premium over book or market values for our acquisitions. | | If we fail to complete these types of collaborative projects in a timely manner, on a cost-effective basis, or at all, this may limit our ability to access a greater portfolio of products, IP technology and shared expertise. Additionally, disputes or difficulties in our relationship with our collaborators or partners may arise, often due to conflicting priorities or conflicts of interest between parties, which may erode or eliminate the benefits of these alliances. The incurrence of significant debt or liabilities due to the integration of an acquired business could cause deterioration in our credit rating and result in increased borrowing costs and interest expense. We may issue additional shares to pay for acquired businesses, which would result in the dilution of our then existing shareholders. Further, if liabilities are uncovered in an acquired business, an acquired business fails to perform in line with expectations, or a strategic transaction does not deliver the results we intended, then the Group or our shareholders may suffer losses and may not have adequate remedies against the seller or third parties. Integration processes may also result in business disruption, diversion of management resources, the loss of key employees and other issues, such as a failure to integrate IT and other systems. |
| | |
| AstraZenecaAnnual Report and Form 20-F Information 2015 | | 213 |
Additional Information
Riskcontinued
| | |
Product pipeline and IP risks | | Impact |
|
Difficulties obtaining and maintaining regulatory approvals for new products |
We are subject to strict controls on the commercialisation processes for our pharmaceutical products, including their development, manufacture, distribution and marketing. Safety, efficacy and quality must be established before a drug can be marketed for a given indication. The criteria for establishing safety, efficacy and quality may vary by country or region and the submission of an application to regulatory authorities may or may not lead to the grant of marketing approval. Regulators can refuse to grant approval or may require additional data before approval is given, even though the medicine may already be launched in other countries. Approved products are also subject to regulations, and a failure to comply can potentially result in losing regulatory approval to market our products. Regulations may require a company to conduct additional clinical trials after a drug’s approval, which can result in increased costs, labelling challenges or loss of regulatory approval. | | Delays in regulatory reviews and approvals impact patient and market access. In addition, post-approval requirements result in increased costs and may impact the labelling and approval status of currently marketed products. |
| | |
| Factors, including advances in science and technology, evolving regulatory science, and different approaches to benefit/risk tolerance by regulatory authorities, the general public, and other third party public interest groups influence the initial approvability of new drugs. Existing marketed products are also subject to these same forces, and new data and meta-analyses have the potential to drive changes in the approval status or labelling. Recent years have seen an increase in post-marketing regulatory requirements and commitments, and an increased call for third party access to regulatory and clinical trial data packages for independent analysis and interpretation, and broader data transparency. | | |
| | |
| Unanticipated and unpredictable policy making by governments and regulators can adversely influence regulatory decision making, often leading to severe delays in regulatory approval. The predictability of the outcome and timing of review processes remains challenging due to evolving regulatory science, competing regulatory priorities, unpredictable policy making and limits placed on regulatory authority resources. | | |
|
Failure to obtain and enforce effective IP protection |
Our ability to obtain and enforce patents and other IP rights in relation to our products is an important element in protecting our investment in R&D and creating long-term value for the business. Some countries in which we operate are still developing their IP laws, others are limiting the applicability of their IP laws to certain pharmaceutical inventions. Certain countries may seek to limit or deny effective IP protection for pharmaceuticals because of adverse political perspectives around the desirability of appropriate IP protection for pharmaceuticals. | | Limitations on the availability of patent protection or the use of compulsory licensing in certain countries in which we operate could have a material adverse effect on the pricing and sales of our products and, consequently, could materially adversely affect our revenues from those products. More information about protecting our IP, the risk of patent litigation and the early loss of IP rights is contained in the Intellectual Property section on page 60, the Effects of patent litigation in respect of IP rights risk on page 218 and the Expiry or loss of, or limitations to, IP rights and consequential pressure from generic competition risk on page 215. |
| | |
| 214 | | AstraZenecaAnnual Report and Form 20-F Information 2015 |
| | |
Commercialisation risks | | Impact |
|
Expiry or loss of, or limitations to, IP rights and consequential pressure from generic competition |
| | |
| A pharmaceutical product is protected from being copied for the limited period of protection under patent rights and/or related IP rights such as Regulatory Data Protection or Orphan Drug status. This period of protection helps us recoup our overall R&D investment. Early loss of IP rights may threaten our ability to recoup our investment in a patent product. Expiry or loss of these rights can materially adversely affect our revenues and financial condition due to the launch of generic copies of the product in the country where the rights have expired or been lost (see the Patent Expiries section on pages 210 and 211, which contains a table of certain patent expiry dates for our key marketed products). Products protected by our IP account for a significant proportion of our revenues. For example, in 2015, US Product Sales for Crestor andSeroquel XR were $2,844 million (2014: $2,918 million) and $716 million (2014: $738 million), respectively. Additionally, the expiry or loss of patents covering other innovator companies’ products may also lead to increased competition and pricing pressure for our own, still-patented, products in the same product class due to the availability of lower priced generic products in that product class. Typically, products under patent protection or within the period of Regulatory Data Protection generate significantly higher revenues than those not protected by such rights. | | If challenges to our IP by generic drug manufacturers succeed and generic products are launched, or generic products are launched ‘at risk’ on the expectation that challenges to our IP will be successful, this may materially adversely affect our revenues and financial condition. Furthermore, if limitations on the availability, scope or enforceability of patent protection are implemented in jurisdictions in which we operate, generic manufacturers in these countries may be increasingly able to introduce competing products to the market earlier than they would have been able to, had more robust patent protection or Regulatory Data Protection been available. |
| | |
| A pharmaceutical product competes with other products marketed by research-based pharmaceutical companies and approved for the same condition, as well as with generic drugs for that condition marketed by generic drug manufacturers. Generic versions of products are often sold at lower prices than branded products, as the manufacturer does not have to recoup the significant cost of R&D investment and market development. The majority of our patented products, includingNexium, CrestorandSeroquel XR, are subject to pricing pressures due to competition from generic copies of these products and from generic forms of other drugs in the same product class (for example, generic forms ofLosec/Prilosec, Lipitor andSeroquel IR). Additionally, generic manufacturers are often able to invest more resources in the marketing of their products than we do, due to their lack of R&D expenses. | | |
| | |
As well as facing generic competition upon expiry or loss of IP rights, we also face the risk that generic drug manufacturers seek to market generic versions of our products prior to expiries of our patents and/or the Regulatory Exclusivity periods. For example, as detailed in Note 27 to the Financial Statements from page 186, we are currently facing challenges from numerous generic drug manufacturers regarding our patents relating to key products, includingBrilinta, Faslodex, Seroquel XR, Byetta, Daliresp, Onglyza andCrestor (which goes off-patent in the US in May 2016). Patent challenges are also discussed in the Effects of patent litigation in respect of IP rights risk on page 218. Generic manufacturers may also take advantage of the failure of certain countries to properly enforce Regulatory Data Protection and may launch generics during this protected period. This is a particular risk in some Emerging Markets where appropriate patent protection may be difficult to obtain or enforce. | | |
| | |
| AstraZenecaAnnual Report and Form 20-F Information 2015 | | 215 |
Additional Information
Riskcontinued
| | |
Commercialisation risks | | Impact |
|
Abbreviated approval processes for biosimilars |
| | |
| While no application for a biosimilar has been made in relation to an AstraZeneca biologic, various regulatory authorities are implementing or considering abbreviated approval processes for biosimilars that would compete with patented biologics. | | The extent to which biosimilars would differ from patented biologics on price is unclear. However, due to their complex nature, it is uncertain whether biosimilars would have the same impact on patented biologics that generic products have had on patented small molecule products. |
| | |
| For example, in 2010, the US enacted the Biologics Price Competition and Innovation Act within the ACA, which contains general directives for biosimilar applications. The FDA issued final guidance in April 2015 on implementing an abbreviated biosimilar approval pathway. In March 2015, the FDA approved the first biosimilar product submitted under the abbreviated biosimilar pathway. However, significant questions remain, including standards for designation of interchangeability and data collection requirements to support extrapolation of indications. In addition, due to the recent submissions and approvals of abbreviated biosimilar applications, a number of legal challenges construing the requirements of the abbreviated biosimilar pathway are under review. For example, in July 2015, the US Court of Appeals for the Federal Circuit held that biosimilar applicants were not required to provide copies of the biosimilar application or manufacturing information but needed to provide 180-day commercial marketing notice to the reference sponsor. Although this decision and other ongoing legal challenges do not directly impact an AstraZeneca biologic, uncertainty regarding the abbreviated biosimilar approval pathway may remain until these initial legal challenges reach final conclusion. | | In addition, it is uncertain when any such abbreviated approval processes may be fully realised, particularly for more complex protein molecules such as MAbs. Such processes may materially and adversely affect the future commercial prospects for patented biologics, such as the ones that we produce. |
| | |
In Europe, the EMA published final guidelines on similar biologics containing MAbs and in May 2012, the first MAb biosimilar application was submitted with recommendation for approval made by the EMA. Notably, various jurisdictions have adopted either the EMA guidelines or those set forth by WHO to enable biosimilars to enter the market after discrete periods of data exclusivity. | | |
|
Political and socio-economic conditions |
| | |
| We operate in over 100 countries around the world, some of which may be subject to political and social instability. There may be disruption to our business if there is instability in a particular geographic region, including as a result of war, terrorism, riot, unstable governments, civil insurrection or social unrest. For instance, our operational risks in Ukraine have increased due to growing political and economic uncertainty in the region. | | Deterioration of, or failure to improve, socio-economic conditions, and situations and/or resulting events, depending on their severity, could adversely affect our supply and/or distribution chain in the affected countries and the ability of customers or ultimate payers to purchase our medicines. This could adversely affect our business or results of operations. Broader economic developments, such as potential international sanctions and global oil price developments, could exacerbate this effect in the Ukrainian and Russian markets. |
| | |
| 216 | | AstraZenecaAnnual Report and Form 20-F Information 2015 |
| | |
Commercialisation risks | | Impact |
|
Developing our business in Emerging Markets |
| | |
| The development of our business in Emerging Markets is a critical factor in determining our future ability to sustain or increase our global Product Sales. This poses various challenges including: more volatile economic conditions and/or political environments; competition from multinational and local companies with existing market presence; the need to identify and to leverage appropriate opportunities for sales and marketing; poor IP protection; inadequate protection against crime (including counterfeiting, corruption and fraud); inadequate infrastructure to address disease outbreaks (such as the Ebola virus); the need to impose developed market compliance standards; the need to meet a more diverse range of national regulatory, clinical and manufacturing requirements; inadvertent breaches of local and international law; not being able to recruit appropriately skilled and experienced personnel; identification of the most effective sales and marketing channels and route to market; and interventions by national governments or regulators restricting market access and/or introducing adverse price controls. | | The failure to exploit potential opportunities appropriately in Emerging Markets or materialisation of the risks and challenges of doing business in such markets, including inadequate protection against crime (including counterfeiting, corruption and fraud) or inadvertent breaches of local and international law may materially adversely affect our reputation, business or results of operations. |
|
Challenges to achieving commercial success of new products |
| | |
| The successful launch of a new pharmaceutical product involves substantial investment in sales and marketing activities, launch stocks and other items. The commercial success of our new medicines is particularly important to replace lost Product Sales following patent expiry. We may ultimately be unable to achieve commercial success for any number of reasons. These include difficulties in manufacturing sufficient quantities of the product candidate for development or commercialisation in a timely manner, the impact of price control measures imposed by governments and healthcare authorities, the outcome of negotiations with third party payers, erosion of IP rights, including infringement by third parties, failure to show a differentiated product profile and changes in prescribing habits. | | If a new product does not succeed as anticipated or its rate of sales growth is slower than anticipated, there is a risk that we may be unable to fully recoup the costs incurred in launching it, which could materially adversely affect our business or results of operations. Due to the complexity of the commercialisation process for biologics, the methods of distributing and marketing biologics could materially adversely impact our revenues from the sales of biologics medicines, such asSynagis andFluMist/Fluenz. |
| | |
| As a result, we cannot be certain that compounds currently under development will achieve success, and our ability to accurately assess, prior to launch, the eventual efficacy or safety of a new product once in broader clinical use can only be based on data available at that time, which is inherently limited due to relatively short periods of product testing and relatively small clinical study patient samples. | | |
| | |
| The commercialisation of biologics is often more complex than for small molecule pharmaceutical products, primarily due to differences in the mode of administration, technical aspects of the product, and rapidly changing distribution and reimbursement environments. | | |
| | |
Our products are subject to competition by other products approved for the same or similar indication, and the approval of a competitive product that is considered superior, or equivalent to, one of our products may result in immediate and significant decreases in our revenues. | | |
| | |
| AstraZenecaAnnual Report and Form 20-F Information 2015 | | 217 |
Additional Information
Riskcontinued
| | |
Commercialisation risks | | Impact |
|
Effects of patent litigation in respect of IP rights |
| | |
Any of the IP rights protecting our products may be asserted or challenged in IP litigation and/or patent office proceedings initiated against or by external parties. We expect our most valuable products to receive the greatest number of challenges. Despite our efforts to establish and defend robust patent protection for our products, we may not succeed in protecting or enforcing our patents in such litigation or other challenges. We bear the risk that courts may decide that third parties do not infringe our asserted IP rights. This may result in AstraZeneca losing exclusivity and/or erosion of revenues. Where we assert our IP rights but are ultimately unsuccessful, third parties may seek damages, alleging, for example, that they have been inappropriately restrained from entering the market. In such cases, we bear the risk that we incur liabilities to those third parties. We also bear the risk that we may be found to infringe patents owned or licensed exclusively by third parties, including research-based and generic pharmaceutical companies and individuals. Third parties may seek damages for alleged patent infringement. In the US, they may also seek enhanced (ie up to treble) damages for alleged wilful infringement of their patents. Details of material patent litigation matters can be found in Note 27 to the Financial Statements from page 186. | | Managing or litigating infringement disputes over so-called ‘freedom to operate’ can be costly. We may be subject to injunctions against our products or processes and be liable for damages or royalties. We may need to obtain costly licences. These risks may be greater in relation to biologics and vaccines, where patent infringement claims may relate to discovery or research tools, and manufacturing methods and/or biological materials. While we seek to manage such risks by, for example, acquiring licences, forgoing certain activities or uses, or modifying processes to avoid infringement claims and permit commercialisation of our products, such steps can entail significant cost and there is no guarantee that they will be successful. If we are not successful in maintaining exclusive rights to market one or more of our major products, particularly in the US where we achieve our highest Product Sales, our revenue and margins could be materially adversely affected. Unfavourable resolution of such current and similar future patent litigation matters could subject us to damages (including enhanced damages), require us to make significant provisions in our accounts relating to legal proceedings and/or could materially adversely affect our financial condition or results of operations. |
|
Price controls and reductions |
| | |
Most of our key markets have experienced the implementation of various cost control or reimbursement mechanisms for pharmaceutical products. For example, in the US, prices are being depressed through restrictive reimbursement policies and cost control tools such as restricted lists and formularies, which employ ‘generic first’ strategies and/or require physicians to obtain prior approval for the use of a branded medicine where a generic alternative exists. These mechanisms can be used by payers to limit the use of branded products and put pressure on manufacturers to reduce net prices. In addition, payers are shifting a greater proportion of the cost of branded medicines to the patient via out-of-pocket payments at the pharmacy counter. The patient out-of-pocket spend is generally in the form of a co-payment or, in some cases, a co-insurance, which is designed, principally, to encourage patients to use generic medicines. | | Due to these pricing pressures, there can be no certainty that we will be able to charge prices for a product that, in a particular country or in the aggregate, enable us to earn an adequate return on our product investment. These pressures, including the increasingly restrictive reimbursement policies to which we are subject, as well as potential legislation that expands the commercial importation of medicines into the US, could materially adversely affect our business or results of operations. We expect these pricing pressures will continue, and may increase. |
| | |
In Emerging Markets, governments are increasingly controlling pricing in the self-pay sector and favouring locally manufactured drugs. | | |
A summary of the principal aspects of price regulation and how pricing pressures are affecting our business in our most important markets is set out in Pricing of medicines in the Market place section on page 14 and overleaf in the following risk factor. | | |
| | |
| 218 | | AstraZenecaAnnual Report and Form 20-F Information 2015 |
| | |
Commercialisation risks | | Impact |
|
Economic, regulatory and political pressures |
We face continued economic, regulatory and political pressures to limit or reduce the cost of our products. In 2010, the US enacted the ACA, a comprehensive health reform law that expands insurance coverage, implements delivery system reforms and places a renewed focus on cost and quality. In terms of specific provisions impacting our industry, the law mandates higher rebates and discounts on branded drugs for certain Medicare and Medicaid patients as well as an industry-wide excise fee. Implementation of several health system delivery reforms included in the ACA has commenced and will continue through 2018. The ACA expands the patient population eligible for Medicaid and provides new insurance coverage for individuals through state and federally operated health insurance exchanges. In general, patients enrolled in the exchanges are subject to higher cost sharing obligations and may not have as robust access to prescription drugs as compared to patients enrolled in Medicare Part D or commercial plans. Based, in part, on the impact of ACA to other healthcare sectors, there is ongoing scrutiny of the US pharmaceutical industry that could result in further government intervention and financial constraint. Many stakeholders, including some in Congress and others in the broader healthcare system, such as health plans, have dramatically increased their criticism over the value of medicines in the US and have placed a stronger emphasis on innovative therapies. Such criticism and focus on the value of medicines has resulted in proposed policy and legislative changes at the state and federal levels aimed at imposing price controls on medicines and increasing price transparency. For more information, please see Regulatory requirements and Pricing of medicines in the Marketplace section from page 13 and page 14, respectively. In the EU, efforts by the EC to reduce inconsistencies and improve standards in the disparate national pricing and reimbursement systems met with little immediate success as Member States guard their right to make healthcare budget decisions. The industry continues to be exposed in Europe to variousad hoc cost-containment measures and reference pricing mechanisms, which impact prices. There is a trend towards increasing transparency and comparison of prices among EU Member States. Recent controversy regarding the high price of a drug marketed by one of our competitors for chronic hepatitis C may provoke further EU collaboration and may eventually lead to a change in the overall pricing and reimbursement landscape. Concurrently, many markets are adopting the use of Health Technology Assessment (HTA) to provide a rigorous evaluation of the clinical efficacy of a product, at, or post, launch. HTA evaluations are also increasingly being used to assess the clinical effect, as well as cost- effectiveness, of products in a particular health system. This comes as payers and policymakers attempt to increase efficiencies in the use and choice of pharmaceutical products. Further information regarding these pressures is contained in Regulatory requirements and Pricing of medicines in the Marketplace section from page 13 and page 14, respectively. | | While new patients entering the US healthcare system due to the ACA may lead to a slight increase in prescription drug utilisation, we expect that our financial and other costs resulting from the ACA, many of which we are unable to accurately estimate, will far outweigh any increase in Product Sales. The continued disparities in EU and US pricing systems could lead to marked price differentials between markets, which, by way of the implementation of existing or new reference pricing mechanisms, increases the pricing pressure affecting the industry. The importation of pharmaceutical products from countries where prices are low due to government price controls, or other market dynamics, to countries where prices for those products are higher, is already prevalent and may increase. Increased transparency of net prices and strengthened collaboration by governments may accelerate the development of further cost containment policies (such as procurement or the comparison of net prices etc). |
|
Illegal trade in our products |
The illegal trade in pharmaceutical products is widely recognised by industry, non-governmental organisations and governmental authorities to be increasing. Illegal trade includes counterfeiting, theft and illegal diversion (that is, when our products are found in a market where we did not send them and where they are not approved or not permitted/allowed to be sold). There is a risk to public health when illegally traded products enter the supply chain, as well as associated financial risk. Authorities and the public expect us to help reduce opportunities for illegal trade in our products through securing the integrity of our supply chain, surveillance, investigation and supporting legal action against those found to be engaged in illegal trade. | | Public loss of confidence in the integrity of pharmaceutical products as a result of illegal trade could materially adversely affect our reputation and financial performance. In addition, undue or misplaced concern about this issue may cause some patients to stop taking their medicines, with consequential risks to their health. Authorities may take action, financial or otherwise, if they believe we are liable for breaches in our own supply chains. There is also a direct financial loss when counterfeit and/or illegally diverted products replace sales of genuine products; or genuine products are recalled following discovery of counterfeit products; or products which have been the subject of theft or illegal diversion are recalled; or illegally diverted products replace sales of products which are approved/allowed for sale in a market. |
| | |
| AstraZenecaAnnual Report and Form 20-F Information 2015 | | 219 |
Additional Information
Riskcontinued
| | |
Commercialisation risks | | Impact |
|
Increasing implementation and enforcement of more stringent anti-bribery and anti-corruption legislation |
There is an increasing global focus on the implementation and enforcement of anti-bribery and anti-corruption legislation. For example, in the UK, the Bribery Act 2010 has extensive extra-territorial application, and imposes organisational liability for any bribe paid by persons or entities associated with an organisation where the organisation failed to have adequate preventative controls in place at the time of the offence. In the US, there has been significant enforcement activity in respect of the Foreign Corrupt Practices Act by the SEC and DOJ against US companies and non-US companies listed in the US. China and other countries are also enforcing their own anti-bribery laws more aggressively and/or adopting tougher new measures. We are the subject of current anti-corruption investigations and there can be no assurance that we will not, from time to time, continue to be subject to informal inquiries and formal investigations from governmental agencies. In the context of our business, governmental officials interact with us in various roles that are important to our operations, such as in the capacity of a regulator, partner or healthcare payer, reimburser or prescriber, among others. Details of these matters are included in Note 27 to the Financial Statements from page 186. | | Despite taking measures to prevent breaches of applicable anti-bribery and anti-corruption laws by our personnel and associated third parties, breaches may still occur, potentially resulting in the imposition of significant penalties, such as fines, the requirement to comply with monitoring or self-reporting obligations, or debarment or exclusion from government sales or reimbursement programmes, any of which could materially adversely affect our reputation, business or results of operations. |
|
Failure to adhere to applicable laws, rules and regulations |
Any failure to comply with applicable laws, rules and regulations may result in civil and/or criminal legal proceedings being filed against us, or in us becoming subject to regulatory sanctions. Regulatory authorities have wide-ranging administrative powers to deal with any failure to comply with continuing regulatory oversight and this could affect us, whether such failure is our own or that of our contractors or external partners. | | Failure to comply with applicable laws, including ongoing control and regulation, could materially adversely affect our business or results of operations. For example, once a product has been approved for marketing by the regulatory authorities, it is subject to continuing control and regulation, such as the manner of its manufacture, distribution, marketing and safety surveillance. For example, if regulatory issues concerning compliance with current Good Manufacturing Practice or safety monitoring regulations for pharmaceutical products (often referred to as pharmacovigilance) arise, this could lead to loss of product approvals, product recalls and seizures, and interruption of production, which could create product shortages and delays in new product approvals, and negatively impact patient access and our reputation. |
|
Failure of information technology and cybercrime |
We are dependent on effective IT systems. These systems support key business functions such as our R&D, manufacturing, supply chain and sales capabilities and are an important means of safeguarding and communicating data, including critical or sensitive information, the confidentiality and integrity of which we rely on. Examples of sensitive information that we protect include loss of clinical trial records (patient names and treatments), personal information (employee bank details, home address), intellectual property of manufacturing process and compliance, key research science techniques, AstraZeneca property (theft) and privileged access (rights to perform IT tasks). The size and complexity of our IT systems, and those of our third party vendors (including outsource providers) with whom we contract, have significantly increased over the past decade and makes such systems potentially vulnerable to service interruptions and security breaches from attacks by malicious third parties, or from intentional or inadvertent actions by our employees or vendors. | | Any significant disruption to these IT systems, including breaches of data security or cybersecurity, or failure to integrate new and existing IT systems, could harm our reputation and materially adversely affect our financial condition or results of operations. While we have invested heavily in the protection of our data and IT, we may be unable to prevent breakdowns or breaches in our systems that could result in disclosure of confidential information, damage to our reputation, regulatory penalties, financial losses and/or other costs. Significant changes in the business footprint and the implementation of the IT strategy, including the creation and use of captive offshore Global Technology Centres, could lead to temporary loss of capability. The inability to effectively backup and restore data could lead to permanent loss of data that could result in non-compliance with applicable laws and regulations. We and our vendors could be susceptible to third party attacks on our information security systems. Such attacks are of ever-increasing levels of sophistication and are made by groups and individuals with a wide range of motives and expertise, including criminal groups, ‘hacktivists’ and others. From time to time we experience intrusions, including as a result of computer-related malware. |
| | |
| 220 | | AstraZenecaAnnual Report and Form 20-F Information 2015 |
| | |
Commercialisation risks | | Impact |
|
Any expected gains from productivity initiatives are uncertain |
We continue to implement various productivity initiatives and restructuring programmes with the aim of enhancing the long-term efficiency of the business. However, anticipated cost savings and other benefits from these programmes are based on estimates and the actual savings may vary significantly. In particular, these cost-reduction measures are often based on current conditions and cannot always take into account any future changes to the pharmaceutical industry or our operations, including new business developments or wage or price increases. | | If inappropriately managed, the expected value of these initiatives could be lost through low employee engagement and hence productivity, increased absence and attrition levels, and industrial action. Our failure to successfully implement these planned cost-reduction measures, either through the successful conclusion of employee relations processes (including consultation, engagement, talent management, recruitment and retention), or the possibility that these efforts do not generate the level of cost savings we anticipate, could materially adversely affect our business or results of operations. |
|
Failure of outsourcing |
We have outsourced various business-critical operations to third party providers. This includes certain R&D processes, IT systems, HR and finance, tax and accounting services. | | The failure of outsource providers to deliver timely services, and to the required level of quality, and the failure of outsource providers to co-operate with each other, could materially adversely affect our financial condition or results of operations. In addition, such failures could adversely impact our ability to meet business targets, maintain a good reputation within the industry and with stakeholders, and result in non-compliance with applicable laws and regulations. A failure to successfully manage and implement the integration of IT infrastructure services provided by our outsource providers could create disruption, which could materially adversely affect our business or results of operations. In addition, failure to manage outsourcing or insourcing transition processes may disrupt our business. For instance, as we transition services that previously were outsourced to our service centre in Chennai (India), incumbent outsource providers may cease to continue to provide the same level of resources and quality of service. |
|
Failure to attract and retain key personnel and failure to successfully engage with our employees |
We rely heavily on recruiting and retaining talented employees with a diverse range of skills and capabilities to meet our strategic objectives. For example, the success of our science activities depends largely on our ability to attract and retain sufficient numbers of high-quality researchers and development specialists. We face intense competition for well-qualified individuals, as the supply of people with specific skills and significant leadership potential or in specific geographic regions may be limited. Our ability to achieve high levels of employee engagement in the workforce, and hence benefit from strong commitment and motivation, is key to the successful delivery of our business objectives. | | The inability to attract and retain highly skilled personnel, in particular those in key scientific and leadership positions and those in our talent pools, may weaken our succession plans for critical positions in the medium term, may materially adversely affect the implementation of our strategic objectives and could ultimately impact our business or results of operations. Failure to engage effectively with our employees could lead to business disruption in our day-to-day operations, reduce levels of productivity and/or increase levels of voluntary turnover, all of which could ultimately adversely impact our business or results of operations. While we are committed to working on improving drivers of engagement, such as increasing our employees’ understanding of our strategy and our ongoing efforts to reduce organisational complexity, our efforts may be unsuccessful. |
| | |
| AstraZenecaAnnual Report and Form 20-F Information 2015 | | 221 |
Additional Information
Riskcontinued
| | |
Supply chain and business execution risks | | Impact |
|
Difficulties and delays in the manufacturing, distribution and sale of our products |
We may experience difficulties and delays in manufacturing our products, such as: > Supply shortages associated with gaps between forecasted and actual demand for products. > Supply chain disruptions, including those due to natural or man-made disasters at one of our facilities or at a critical supplier or vendor. > Delays related to the construction of new facilities or the expansion of existing facilities, including those intended to support future demand for our products. > Inability to supply products due to a product quality failure or regulatory agency compliance action such as licence withdrawal, product recall or product seizure. > Other manufacturing or distribution problems, including changes in manufacturing production sites, limits to manufacturing capacity due to regulatory requirements, changes in the types of products produced, or physical limitations or other business interruptions that could impact continuous supply. | | Manufacturing, forecasting, distribution and sales difficulties may result in product shortages and significant delays, which may lead to lost Product Sales and materially adversely affect our business, financial condition or results of operations. |
|
Reliance on third party goods and services |
We increasingly rely on third parties for the timely supply of goods, such as raw materials (for example, the API in some of our medicines), equipment, formulated drugs and packaging, and services, all of which are key to our operations. Many of these goods are difficult to substitute in a timely manner or at all. Unexpected events and/or events beyond our control could result in the failure of the supply of goods and services. For example, suppliers of key goods may cease to trade or experience supply chain failures such as those described under the risk above. In addition, we may experience limited supply of biological materials, such as cells, animal products or by-products. Furthermore, government regulations could result in restricted access to, use or transport of such materials. | | Third party supply failure could lead to significant delays and/or difficulties in obtaining goods and services on commercially acceptable terms and/or adversely affect AstraZeneca’s reputation. This may materially adversely affect our business, financial condition or results of operations. Loss of access to sufficient sources of key goods and biological materials or services may interrupt or prevent planned research activities and/or increase our costs. Further information is contained in Working with suppliers in Manufacturing and Supply on page 47. |
|
Manufacturing biologics |
Manufacturing biologics, especially in large quantities, is complex and may require the use of innovative technologies to handle living micro-organisms and facilities specifically designed and validated for this purpose, with sophisticated quality assurance and control procedures. Final market release of a biologic depends on a number of in-process manufacturing and supply chain parameters to ensure the product conforms with its safety, identity and strength requirements and meets its quality and purity characteristics. Biologics production facilities, especially for drug substance manufacture, are very specialised and can take years to develop and bring on line as licensed facilities. Predicting demand for certain classes of biologics, especially prior to launch, can be challenging. We expect that external capacity for biologics drug substance production will remain constrained for the next several years and, accordingly, may not be readily available for supplementary production in the event that we experience unforeseen need for such capacity. | | Slight variations in any part of the manufacturing process or components may lead to a product that does not meet its stringent design specifications. Failure to meet these specifications may lead to recalls, spoilage, drug product shortages, regulatory action and/or reputational harm. |
| | |
| 222 | | AstraZenecaAnnual Report and Form 20-F Information 2015 |
| | |
Legal; regulatory and compliance risks | | Impact |
|
Adverse outcome of litigation and/or governmental investigations |
We may be subject to various product liability, consumer commercial, anti-trust, environmental, employment or tax litigation or other legal proceedings and governmental investigations. Litigation, particularly in the US, is inherently unpredictable and unexpectedly high awards for damages can result from an adverse verdict. In many cases, plaintiffs may claim enhanced damages in extremely high amounts. In particular, the marketing, promotional, clinical and pricing practices of pharmaceutical manufacturers, as well as the manner in which manufacturers interact with purchasers, prescribers and patients, are subject to extensive regulation, litigation and governmental investigation. Many companies, including AstraZeneca, have been subject to claims related to these practices asserted by federal and state governmental authorities and private payers and consumers, which have resulted in substantial expense and other significant consequences. Note 27 to the Financial Statements from page 186 describes the material legal proceedings in which we are currently involved. | | Governmental investigations for example, under the Foreign Corrupt Practices Act or federal or state False Claims Acts or legal proceedings, regardless of their outcome, could be costly, divert management attention, or damage our reputation and demand for our products. Unfavourable resolution of current and similar future proceedings against us could subject us to criminal liability, fines, penalties or other monetary or non-monetary remedies, including enhanced damages, require us to make significant provisions in our accounts relating to legal proceedings and could materially adversely affect our business or results of operations. |
|
Failure to adhere to applicable laws, rules and regulations relating to anti-competitive behaviour |
Any failure to comply with laws, rules and regulations relating to anti-competitive behaviour may expose us to regulatory sanctions and/or lawsuits from governmental authorities and private, non- governmental entities. Certain of our commercial arrangements with generics companies, which have sought to settle patent challenges on terms acceptable to both innovator and generics manufacturer, may be subject to challenge by competition authorities. Details of material litigation matters which raise allegations of anti- competitive behaviour can be found in Note 27 to the Financial Statements from page 186. | | Where a government authority investigates our adherence to competition laws, or we become subject to private party lawsuits, this may result in inspections of our sites or requests for documents and other information. Competition investigations or legal proceedings could be costly, divert management attention or damage our reputation and demand for our products. Unfavourable resolution of such current and similar future proceedings against us could subject us to fines and penalties, including enhanced (ie up to treble) damages, require us to make significant provisions in our accounts relating to legal proceedings and could materially adversely affect our business results of operations, including, by requiring us to change our commercial practice. |
|
Substantial product liability claims |
Any failure to comply with laws, rules and regulations relating to the manufacturing, design, and provision of appropriate warnings concerning the dangers and risks of our medicines that result in injuries allegedly caused by the use of our medicines could expose us to large product liability damages claims, settlements and awards, particularly in the US. Adverse publicity relating to the safety of a product or of other competing products may increase the risk of product liability claims. Details of material product liability litigation matters can be found in Note 27 to the Financial Statements from page 186. | | Significant product liability claims can result in requests for documents and other information. These legal proceedings could be costly, divert management attention or damage our reputation and demand for our products. Unfavourable resolution of such current and similar future product liability claims could subject us to enhanced damages, require us to make significant provisions in our accounts relating to legal proceedings and could materially adversely affect our financial condition or results of operations, particularly where such circumstances are not covered by insurance. For more information, see the Limited third party insurance coverage risk on page 226. |
| | |
| AstraZenecaAnnual Report and Form 20-F Information 2015 | | 223 |
Additional Information
Riskcontinued
| | |
Legal; regulatory and compliance risks | | Impact |
|
Failure to adhere to applicable laws, rules and regulations relating to environment, health and safety; environmental and occupational health and safety liabilities |
Any failure to comply with laws, rules and regulations relating to the environment or occupational health or safety may expose us to regulatory sanctions and/or lawsuits from governmental authorities and private, non-governmental entities. Additionally, the failure to adequately anticipate and proactively manage emerging policy and legal developments associated with the environment, health and safety could adversely affect our licence to operate and/or reputation. We have environmental and/or occupational health and safety-related liabilities at some currently and formerly owned, leased and third party sites, the most significant of which are detailed in Note 27 to the Financial Statements from page 186. | | While we carefully manage compliance and any known liabilities, and work to stay ahead of policy and legislative developments, if a significant compliance issue, environmental, occupational health or safety incident or legal requirement for which we are responsible were to arise, this could result in us being responsible for fines and penalties, damages, and other costs. In some circumstances, such liability could materially adversely affect our business or results of operations. In addition, our financial provisions for any obligations that we may have relating to environmental or occupational health and safety liabilities may be insufficient if the assumptions underlying the provisions, including for example our assumptions regarding the portion of waste at a site for which we are responsible, prove incorrect or if we are held responsible for additional contamination or occupational health and safety-related claims. |
|
Misuse of social media platforms and new technology |
We increasingly use the internet, digital content, social media, mobile applications and other forms of new technology to communicate internally and externally. The accessibility and instantaneous nature of interactions with such media may facilitate or exacerbate the risk of data leakages from within AstraZeneca or false or misleading statements being made about AstraZeneca, which may damage our reputation. As existing social media platforms expand and evolve, and new social media platforms emerge, it becomes increasingly challenging to identify new points of entry and to put structures in place to secure and protect information. | | Inappropriate use of certain media vehicles could lead to the unauthorised or unintentional public disclosure of sensitive information (such as personally identifiable information on employees, healthcare professionals or patients, for example, those enrolled in our clinical trials), which may damage our reputation, adversely affect our business or results of operations and expose us to legal risks, as well as additional legal obligations. Similarly, the involuntary public disclosure of commercially sensitive information, such as trade secrets through external media channels, or an information loss could adversely affect our business or results of operations. In addition, negative posts or comments on social media websites or other digital channels or new forms of technology about us or, for example, the safety of our products, could harm our reputation. |
| | |
| 224 | | AstraZenecaAnnual Report and Form 20-F Information 2015 |
| | |
Economic and financial risks | | Impact |
|
Failure to achieve strategic priorities or to meet targets or expectations |
We may from time to time communicate our business strategy or our targets or expectations regarding our future financial or other performance (for example, the expectations described in Future prospects in the Financial Review on page 76). All such statements are of a forward-looking nature and are based on assumptions and judgements we make, all of which are subject to significant inherent risks and uncertainties, including risks and uncertainties that we are unaware of and/or that are beyond our control. Any failure to successfully implement our business strategy may frustrate the achievement of our financial or other targets or expectations and, in turn, materially damage our brand and materially adversely affect our business, financial position or results of operations. | | There can be no guarantee that our financial targets or expectations will materialise on the expected timeline or at all. Actual results may deviate materially and adversely from any such target or expectation, including if one or more of the assumptions or judgements underlying any such target or expectation proves to be incorrect in whole or in part. |
|
Adverse impact of a sustained economic downturn |
A variety of significant risks may arise from a sustained global economic downturn including for example the economic slowdown in China, our second largest market. Additional pressure from governments and other healthcare payers on medicine prices and volumes of sales in response to recessionary pressures on budgets may cause a slowdown or a decline in growth in some markets. In some cases, those governments most severely impacted by the economic downturn may seek alternative ways to settle their debts through, for example, the issuance of government bonds which might trade at a discount to the face value of the debt. In addition, our customers may cease to trade, which may result in losses from writing off debts, or the sustained economic downturn may unfavourably affect the spending patterns of the consumers of our products. We are highly dependent on being able to access a sustainable flow of liquid funds due to the high fixed costs of operating our business and the long and uncertain development cycles of our products. In a sustained economic downturn, financial institutions with whom we deal may cease to trade and there can be no guarantee that we will be able to access monies owed to us without a protracted, expensive and uncertain process, if at all. More than 95% of our cash investments are managed centrally and are invested in collateralised bank deposits or AAA credit rated institutional money market funds. Money market funds are backed by institutions in the US and the EU, which, in turn, invest in other funds, including sovereign funds. This means our credit exposure is a mix of US and EU sovereign default risk and financial institution default risk. | | While we have adopted cash management and treasury policies to manage this risk (see the Financial risk management policies section of the Financial Review on page 76), we cannot be certain that these will be as effective as they are intended to be, in particular in the event of a global liquidity crisis. In addition, open positions where we are owed money and investments we have made in financial institutions or money market funds cannot be guaranteed to be recoverable. Additionally, if we need access to external sources of financing to sustain and/or grow our business, such as the debt or equity capital financial markets, this may not be available on commercially acceptable terms, if at all, in the event of a severe and/or sustained economic downturn. This may, for instance, be the case in the event of any default by the Group on its debt obligations, which may materially adversely affect our ability to secure debt funding in the future or our financial condition in general. Further information on debt funding arrangements is contained in the Financial risk management policies section of the Financial Review on page 76. |
|
Fluctuations in exchange rates |
As a global business, currency fluctuations can significantly affect our results of operations, which are reported in US dollars. Approximately 40% of our global 2015 Product Sales were in the US, which is expected to remain our largest single market for the foreseeable future. Product Sales in other countries are predominantly in currencies other than the US dollar, including the euro, Japanese yen, Chinese renminbi, Australian dollar and Canadian dollar. We have a growing exposure to Emerging Market currencies, some of which are subject to exchange controls, and these currencies, such as that of Venezuela, may be subject to material devaluations against the US dollar. Major components of our cost base are located in the UK and Sweden, where an aggregate of approximately 20% of our employees are based. | | Movements in the exchange rates used to translate foreign currencies into US dollars may materially adversely affect our financial condition or results of operations. Additionally, some of our subsidiaries import and export goods and services in currencies other than their own functional currency, and so the financial results of such subsidiaries could be affected by currency fluctuations arising between the transaction dates and the settlement dates for these transactions. In addition, there are foreign exchange differences arising on the translation of equity investments in subsidiaries. |
| | |
| AstraZenecaAnnual Report and Form 20-F Information 2015 | | 225 |
Additional Information
Riskcontinued
| | |
Economic and financial risks | | Impact |
|
Limited third party insurance coverage |
In recent years, the costs associated with product liability litigation have increased the cost of, and narrowed the coverage afforded by, pharmaceutical companies’ product liability insurance. To contain insurance costs in recent years, we have continued to adjust our coverage profile, accepting a greater degree of uninsured exposure. The Group has not held any material product liability insurance since February 2006. In addition, where claims are made under insurance policies, insurers may reserve the right to deny coverage on various grounds. For example, product liability litigation cases relating toCrestor andNexium in the US are not covered by third party product liability insurance. See Note 27 to the Financial Statements from page 186 for details. | | If we are found to have a financial liability due to product liability or other litigation, in respect of which we do not have insurance coverage, or if an insurer’s denial of coverage is ultimately upheld, this could require us to make significant provisions in our accounts relating to legal proceedings and could materially adversely affect our business or results of operations. For more information, please see the Substantial product liability claims risk on page 223. |
|
Taxation |
The integrated nature of our worldwide operations can produce conflicting claims from revenue authorities as to the profits to be taxed in individual countries. The majority of the jurisdictions in which we operate have double tax treaties with other foreign jurisdictions, which provide a framework for mitigating the incidence of double taxation on our revenues and capital gains. AstraZeneca’s worldwide operations are taxed under laws in the jurisdictions in which they operate. International standards governing the global tax environment regularly change. The Organisation for Economic Co-operation and Development (OECD) has proposed a number of changes under the Base Erosion and Profit Shifting (BEPS) Action Plans. | | The resolution of these disputes can result in a reallocation of profits between jurisdictions and an increase or decrease in related tax costs, and has the potential to affect our cash flows and EPS. Claims, regardless of their merits or their outcome, are costly, divert management attention and may adversely affect our reputation. If any of these double tax treaties should be withdrawn or amended, especially in a territory where a member of the Group is involved in a taxation dispute with a tax authority in relation to cross-border transactions, such withdrawal or amendment could materially adversely affect our business or results of operations, as could a negative outcome of a tax dispute or a failure by the tax authorities to agree through competent authority proceedings. See the Financial risk management policies section of the Financial Review on page 76 for tax risk management policies and Note 27 to the Financial Statements on page 186 for details of current tax disputes. Changes in tax regimes could result in a material impact on the Group’s cash tax liabilities and tax charge, resulting in either an increase or a reduction in financial results depending upon the nature of the change. We represent views to OECD, governments and tax authorities through public consultations to ensure international institutions and governments understand the business implications of law changes. Specific OECD BEPS recommendations that we expect to impact the Group include changes to patent box regimes, restrictions of interest deductibility and revised transfer pricing guidelines. |
|
Pensions |
Our pension obligations are largely backed by assets invested across the broad investment market. Our most significant obligations relate to the UK pension fund. | | Sustained falls in these asset values could reduce pension fund solvency levels, which may result in requirements for additional cash, restricting the cash available for business growth. Similarly, if the present value of the liabilities increase due to a sustained low interest rate environment, an increase in expectations of future inflation, or an improvement in member longevity (above that already assumed), this could also reduce pension fund solvency ratios. The likely increase in the IAS 19 accounting deficit generated by any of these factors may cause the credit rating agencies to review our credit rating, with the potential to negatively affect our ability to raise debt. See Note 20 to the Financial Statements from page 166 for further details of the Group’s pension obligations. |
| | |
| 226 | | AstraZenecaAnnual Report and Form 20-F Information 2015 |
Geographical Review
This section contains further information about the performance of our products within the geographical areas in which our sales and marketing efforts are focused. Sales relates to Product Sales.
Our financial performance – Product Sales
| | | | | | | | | | | | | | | | | | | | | | | | | | | | | | | | | | | | | | | | | | | | | | | | | | | | | | | | | | | | | | | | | | | | | | |
| | | | | | | | | | | | | | | | | | | | | | | | | | | | | | | | | 2015 | | | | | 2014 | | | | | 2013 | |
| | | | | | | | | | | | | | | | | | | | | | | | | | | | | | | | | Sales $m | | | Actual growth % | | | CER growth % | | | | | Sales $m | | | Actual growth % | | | CER growth % | | | | | Sales $m | |
| US | | | | | | | | | | | | | | | | | | | | | | | | | | | | | | | | | | | | | | | | | 9,474 | | | | (6 | ) | | | (6 | ) | | | | | 10,120 | | | | 4 | | | | 4 | | | | | | 9,691 | |
| Europe | | | | | | | | | | | | | | | | | | | | | | | | | | | | | | | | | | | | | | | | | 5,323 | | | | (20 | ) | | | (6 | ) | | | | | 6,638 | | | | – | | | | (1 | ) | | | | | 6,658 | |
| Established ROW | | | | | | | | | | | | | | | | | | | | | | | | | | | | | | | | | | | | | | 3,022 | | | | (14 | ) | | | – | | | | | | 3,510 | | | | (12 | ) | | | (4 | ) | | | | | 3,973 | |
| Emerging Markets | | | | | | | | | | | | | | | | | | | | | | | | | | | | | | | | | | | | | | 5,822 | | | | – | | | | 12 | | | | | | 5,827 | | | | 8 | | | | 12 | | | | | | 5,389 | |
| Total | | | | | | | | | | | | | | | | | | | | | | | | | | | | | | | | | | | | | | | | | 23,641 | | | | (9 | ) | | | (1 | ) | | | | | 26,095 | | | | 1 | | | | 3 | | | | | | 25,711 | |
Respiratory, Inflammation and Autoimmunity | |
| | | World | | | | | US | | | | | Europe | | | | | Established ROW | | | | | Emerging Markets | | | | | Prior year | |
2015 | | Sales $m | | | Actual growth % | | | CER growth % | | | | | Sales $m | | | Actual growth % | | | | | Sales $m | | | Actual growth % | | | CER growth % | | | | | Sales $m | | | Actual growth % | | | CER growth % | | | | | Sales $m | | | Actual growth % | | | CER growth % | | | | | World sales $m | |
| Symbicort | | | 3,394 | | | | (11 | ) | | | (3 | ) | | | | | 1,520 | | | | 1 | | | | | | 1,076 | | | | (26 | ) | | | (14 | ) | | | | | 404 | | | | (12 | ) | | | 2 | | | | | | 394 | | | | 6 | | | | 22 | | | | | | 3,801 | |
| Pulmicort | | | 1,014 | | | | 7 | | | | 15 | | | | | | 200 | | | | (5 | ) | | | | | 117 | | | | (28 | ) | | | (13 | ) | | | | | 88 | | | | (9 | ) | | | 4 | | | | | | 609 | | | | 28 | | | | 35 | | | | | | 946 | |
| Tudorza/Eklira | | | 190 | | | | n/m | | | | n/m | | | | | | 103 | | | | n/m | | | | | | 76 | | | | n/m | | | | n/m | | | | | | 9 | | | | n/m | | | | n/m | | | | | | 2 | | | | n/m | | | | n/m | | | | | | 13 | |
| Daliresp | | | 104 | | | | n/m | | | | n/m | | | | | | 104 | | | | n/m | | | | | | – | | | | – | | | | – | | | | | | – | | | | – | | | | – | | | | | | – | | | | – | | | | – | | | | | | – | |
| Duaklir | | | 27 | | | | n/m | | | | n/m | | | | | | – | | | | – | | | | | | 26 | | | | n/m | | | | n/m | | | | | | 1 | | | | n/m | | | | n/m | | | | | | – | | | | – | | | | – | | | | | | – | |
| Others | | | 258 | | | | (15 | ) | | | (5 | ) | | | | | 18 | | | | (31 | ) | | | | | 88 | | | | (20 | ) | | | (6 | ) | | | | | 25 | | | | (7 | ) | | | 4 | | | | | | 127 | | | | (9 | ) | | | (1 | ) | | | | | 303 | |
| Total | | | 4,987 | | | | (2 | ) | | | 7 | | | | | | 1,945 | | | | 11 | | | | | | 1,383 | | | | (21 | ) | | | (7 | ) | | | | | 527 | | | | (9 | ) | | | 5 | | | | | | 1,132 | | | | 15 | | | | 25 | | | | | | 5,063 | |
| | | | | | | | | | | | | | | | | | | | | | | | | | | | | | | | | | | | | | | | | | | | | | | | | | | | | | | | | | | | | | | | | | | | | | |
| | | World | | | | | US | | | | | Europe | | | | | Established ROW | | | | | Emerging Markets | | | | | Prior year | |
2014 | | Sales $m | | | Actual growth % | | | CER growth % | | | | | Sales $m | | | Actual growth % | | | | | Sales $m | | | Actual growth % | | | CER growth % | | | | | Sales $m | | | Actual growth % | | | CER growth % | | | | | Sales $m | | | Actual growth % | | | CER growth % | | | | | World sales $m | |
| Symbicort | | | 3,801 | | | | 9 | | | | 10 | | | | | | 1,511 | | | | 23 | | | | | | 1,462 | | | | (3 | ) | | | (4 | ) | | | | | 458 | | | | 8 | | | | 17 | | | | | | 370 | | | | 14 | | | | 22 | | | | | | 3,483 | |
| Pulmicort | | | 946 | | | | 9 | | | | 11 | | | | | | 211 | | | | (6 | ) | | | | | 162 | | | | (5 | ) | | | (6 | ) | | | | | 97 | | | | (13 | ) | | | (6 | ) | | | | | 476 | | | | 32 | | | | 35 | | | | | | 867 | |
| Tudorza/Eklira | | | 13 | | | | n/m | | | | n/m | | | | | | – | | | | – | | | | | | 13 | | | | n/m | | | | n/m | | | | | | – | | | | – | | | | – | | | | | | – | | | | – | | | | – | | | | | | – | |
| Others | | | 303 | | | | (7 | ) | | | (6 | ) | | | | | 26 | | | | (55 | ) | | | | | 110 | | | | (4 | ) | | | (5 | ) | | | | | 27 | | | | (18 | ) | | | (15 | ) | | | | | 140 | | | | 16 | | | | 19 | | | | | | 327 | |
| Total | | | 5,063 | | | | 8 | | | | 10 | | | | | | 1,748 | | | | 15 | | | | | | 1,747 | | | | (2 | ) | | | (4 | ) | | | | | 582 | | | | 2 | | | | 11 | | | | | | 986 | | | | 22 | | | | 27 | | | | | | 4,677 | |
| | |
| AstraZenecaAnnual Report and Form 20-F Information 2015 | | 227 |
Additional Information
Geographical Reviewcontinued
Cardiovascular and Metabolic diseases
| | | | | | | | | | | | | | | | | | | | | | | | | | | | | | | | | | | | | | | | | | | | | | | | | | | | | | | | | | | | | | | | | | | | | | |
| | | World | | | | | US | | | | | Europe | | | | | Established ROW | | | | | Emerging Markets | | | | | Prior year | |
2015 | | Sales $m | | | Actual growth % | | | CER growth % | | | | | Sales $m | | | Actual growth % | | | | | Sales $m | | | Actual growth % | | | CER growth % | | | | | Sales $m | | | Actual growth % | | | CER growth % | | | | | Sales $m | | | Actual growth
% | | | CER growth % | | | | | World sales $m | |
| Crestor | | | 5,017 | | | | (9 | ) | | | (3 | ) | | | | | 2,844 | | | | (3 | ) | | | | | 916 | | | | (24 | ) | | | (9 | ) | | | | | 571 | | | | (14 | ) | | | (1 | ) | | | | | 686 | | | | (6 | ) | | | 2 | | | | | | 5,512 | |
| Onglyza/KombiglyzeXR/ | | | | | | | | | | | | | | | | | | | | | | | | | | | | | | | | | | | | | | | | | | | | | | | | | | | | | | | | | | | | | | | | | | | | | | |
| Komboglyze | | | 786 | | | | (4 | ) | | | 2 | | | | | | 420 | | | | (13 | ) | | | | | 141 | | | | (9 | ) | | | 8 | | | | | | 66 | | | | 12 | | | | 27 | | | | | | 159 | | | | 27 | | | | 41 | | | | | | 820 | |
| Seloken/Toprol-XL | | | 710 | | | | (6 | ) | | | 4 | | | | | | 89 | | | | (2 | ) | | | | | 97 | | | | (22 | ) | | | (6 | ) | | | | | 12 | | | | (37 | ) | | | (26 | ) | | | | | 512 | | | | (2 | ) | | | 9 | | | | | | 758 | |
| Brilinta/Brilique | | | 619 | | | | 30 | | | | 44 | | | | | | 240 | | | | 64 | | | | | | 230 | | | | – | | | | 18 | | | | | | 37 | | | | 12 | | | | 33 | | | | | | 112 | | | | 70 | | | | 91 | | | | | | 476 | |
| Bydureon | | | 580 | | | | 32 | | | | 35 | | | | | | 482 | | | | 29 | | | | | | 81 | | | | 42 | | | | 65 | | | | | | 8 | | | | 60 | | | | 80 | | | | | | 9 | | | | 125 | | | | 150 | | | | | | 440 | |
| Farxiga/Forxiga | | | 492 | | | | 119 | | | | 137 | | | | | | 261 | | | | 114 | | | | | | 126 | | | | 91 | | | | 126 | | | | | | 32 | | | | 88 | | | | 124 | | | | | | 73 | | | | n/m | | | | n/m | | | | | | 225 | |
| Atacand | | | 358 | | | | (29 | ) | | | (15 | ) | | | | | 34 | | | | (23 | ) | | | | | 105 | | | | (38 | ) | | | (26 | ) | | | | | 26 | | | | (40 | ) | | | (30 | ) | | | | | 193 | | | | (21 | ) | | | (4 | ) | | | | | 501 | |
| Byetta | | | 316 | | | | (3 | ) | | | 2 | | | | | | 209 | | | | 5 | | | | | | 62 | | | | (23 | ) | | | (11 | ) | | | | | 22 | | | | (19 | ) | | | (7 | ) | | | | | 23 | | | | 15 | | | | 30 | | | | | | 327 | |
| Plendil | | | 233 | | | | (6 | ) | | | (2 | ) | | | | | – | | | | – | | | | | | 13 | | | | (32 | ) | | | (16 | ) | | | | | 7 | | | | (22 | ) | | | (11 | ) | | | | | 213 | | | | (4 | ) | | | – | | | | | | 249 | |
| Tenormin | | | 118 | | | | (27 | ) | | | (15 | ) | | | | | 1 | | | | (88 | ) | | | | | 37 | | | | (23 | ) | | | (8 | ) | | | | | 40 | | | | (26 | ) | | | (15 | ) | | | | | 40 | | | | (22 | ) | | | (10 | ) | | | | | 161 | |
| Others | | | 260 | | | | (22 | ) | | | (14 | ) | | | | | 54 | | | | (21 | ) | | | | | 93 | | | | (30 | ) | | | (17 | ) | | | | | 13 | | | | (28 | ) | | | (17 | ) | | | | | 100 | | | | (12 | ) | | | (5 | ) | | | | | 333 | |
| Total | | | 9,489 | | | | (3 | ) | | | 4 | | | | | | 4,634 | | | | 4 | | | | | | 1,901 | | | | (17 | ) | | | (1 | ) | | | | | 834 | | | | (12 | ) | | | 1 | | | | | | 2,120 | | | | – | | | | 11 | | | | | | 9,802 | |
| | | | | | | | | | | | | | | | | | | | | | | | | | | | | | | | | | | | | | | | | | | | | | | | | | | | | | | | | | | | | | | | | | | | | | |
| | | World | | | | | US | | | | | Europe | | | | | Established ROW | | | | | Emerging Markets | | | | | Prior year | |
2014 | | Sales $m | | | Actual growth % | | | CER growth % | | | | | Sales $m | | | Actual growth % | | | | | Sales $m | | | Actual growth % | | | CER growth % | | | | | Sales $m | | | Actual growth % | | | CER growth % | | | | | Sales $m | | | Actual growth
% | | | CER growth % | | | | | World sales $m | |
| Crestor | | | 5,512 | | | | (2 | ) | | | (1 | ) | | | | | 2,918 | | | | – | | | | | | 1,200 | | | | (2 | ) | | | (3 | ) | | | | | 667 | | | | (17 | ) | | | (10 | ) | | | | | 727 | | | | 7 | | | | 11 | | | | | | 5,622 | |
| Onglyza/KombiglyzeXR/ | | | | | | | | | | | | | | | | | | | | | | | | | | | | | | | | | | | | | | | | | | | | | | | | | | | | | | | | | | | | | | | | | | | | | | |
| Komboglyze | | | 820 | | | | 117 | | | | 119 | | | | | | 481 | | | | 82 | | | | | | 155 | | | | 177 | | | | 175 | | | | | | 59 | | | | 195 | | | | 210 | | | | | | 125 | | | | 238 | | | | 251 | | | | | | 378 | |
| Seloken/Toprol-XL | | | 758 | | | | 1 | | | | 4 | | | | | | 91 | | | | (31 | ) | | | | | 124 | | | | (5 | ) | | | (4 | ) | | | | | 19 | | | | (21 | ) | | | (13 | ) | | | | | 524 | | | | 13 | | | | 17 | | | | | | 750 | |
| Brilinta/Brilique | | | 476 | | | | 68 | | | | 70 | | | | | | 146 | | | | 100 | | | | | | 231 | | | | 42 | | | | 40 | | | | | | 33 | | | | 94 | | | | 106 | | | | | | 66 | | | | 120 | | | | 133 | | | | | | 283 | |
| Bydureon | | | 440 | | | | 191 | | | | 191 | | | | | | 374 | | | | 185 | | | | | | 57 | | | | 235 | | | | 235 | | | | | | 5 | | | | n/m | | | | n/m | | | | | | 4 | | | | 100 | | | | 100 | | | | | | 151 | |
| Farxiga/Forxiga | | | 225 | | | | n/m | | | | n/m | | | | | | 122 | | | | 100 | | | | | | 66 | | | | n/m | | | | n/m | | | | | | 17 | | | | n/m | | | | n/m | | | | | | 20 | | | | n/m | | | | n/m | | | | | | 10 | |
| Atacand | | | 501 | | | | (18 | ) | | | (16 | ) | | | | | 44 | | | | (39 | ) | | | | | 169 | | | | (25 | ) | | | (26 | ) | | | | | 43 | | | | (39 | ) | | | (35 | ) | | | | | 245 | | | | 1 | | | | 5 | | | | | | 611 | |
| Byetta | | | 327 | | | | 59 | | | | 59 | | | | | | 199 | | | | 31 | | | | | | 81 | | | | 125 | | | | 119 | | | | | | 27 | | | | 145 | | | | 164 | | | | | | 20 | | | | 186 | | | | 200 | | | | | | 206 | |
| Plendil | | | 249 | | | | (4 | ) | | | (4 | ) | | | | | – | | | | – | | | | | | 19 | | | | (10 | ) | | | (10 | ) | | | | | 9 | | | | (10 | ) | | | (10 | ) | | | | | 221 | | | | (3 | ) | | | (3 | ) | | | | | 260 | |
| Tenormin | | | 161 | | | | (18 | ) | | | (15 | ) | | | | | 8 | | | | (47 | ) | | | | | 48 | | | | (6 | ) | | | (6 | ) | | | | | 54 | | | | (30 | ) | | | (23 | ) | | | | | 51 | | | | (6 | ) | | | (4 | ) | | | | | 197 | |
| Others | | | 333 | | | | (8 | ) | | | (7 | ) | | | | | 68 | | | | 36 | | | | | | 133 | | | | (19 | ) | | | (19 | ) | | | | | 18 | | | | (28 | ) | | | (24 | ) | | | | | 114 | | | | (7 | ) | | | (5 | ) | | | | | 362 | |
| Total | | | 9,802 | | | | 11 | | | | 12 | | | | | | 4,451 | | | | 17 | | | | | | 2,283 | | | | 9 | | | | 8 | | | | | | 951 | | | | (11 | ) | | | (3 | ) | | | | | 2,117 | | | | 13 | | | | 17 | | | | | | 8,830 | |
| | | | | | | | | | | | | | | | | | | | |
Oncology | | | | | | | | | | | | | | | | | | | | | | | | | | | | | | | | | | | | | | | | | | | | | | | | | | | | | | | | | | | | | | | | | | | | | | |
| | | World | | | | | US | | | | | Europe | | | | | Established ROW | | | | | Emerging Markets | | | | | Prior year | |
2015 | | Sales $m | | | Actual growth % | | | CER growth % | | | | | Sales $m | | | Actual growth % | | | | | Sales $m | | | Actual growth % | | | CER growth % | | | | | Sales $m | | | Actual growth % | | | CER growth % | | | | | Sales $m | | | Actual growth
% | | | CER growth % | | | | | World sales $m | |
| Zoladex | | | 816 | | | | (12 | ) | | | 7 | | | | | | 28 | | | | 8 | | | | | | 171 | | | | (24 | ) | | | (12 | ) | | | | | 272 | | | | (16 | ) | | | (2 | ) | | | | | 345 | | | | (2 | ) | | | 27 | | | | | | 924 | |
| Faslodex | | | 704 | | | | (2 | ) | | | 9 | | | | | | 356 | | | | 5 | | | | | | 207 | | | | (15 | ) | | | 2 | | | | | | 54 | | | | (8 | ) | | | 5 | | | | | | 87 | | | | 14 | | | | 49 | | | | | | 720 | |
| Iressa | | | 543 | | | | (13 | ) | | | (2 | ) | | | | | 6 | | | | n/m | | | | | | 128 | | | | (22 | ) | | | (8 | ) | | | | | 137 | | | | (23 | ) | | | (10 | ) | | | | | 272 | | | | (3 | ) | | | 4 | | | | | | 623 | |
| Casodex | | | 267 | | | | (17 | ) | | | (6 | ) | | | | | 1 | | | | (80 | ) | | | | | 30 | | | | (29 | ) | | | (14 | ) | | | | | 131 | | | | (22 | ) | | | (11 | ) | | | | | 105 | | | | 1 | | | | 9 | | | | | | 320 | |
| Arimidex | | | 250 | | | | (16 | ) | | | (5 | ) | | | | | 19 | | | | 27 | | | | | | 49 | | | | (36 | ) | | | (24 | ) | | | | | 79 | | | | (27 | ) | | | (17 | ) | | | | | 103 | | | | 4 | | | | 16 | | | | | | 298 | |
| Lynparza | | | 94 | | | | n/m | | | | n/m | | | | | | 70 | | | | n/m | | | | | | 23 | | | | n/m | | | | n/m | | | | | | – | | | | – | | | | – | | | | | | 1 | | | | n/m | | | | n/m | | | | | | – | |
| Tagrisso | | | 19 | | | | n/m | | | | n/m | | | | | | 15 | | | | n/m | | | | | | 4 | | | | n/m | | | | n/m | | | | | | – | | | | – | | | | – | | | | | | – | | | | – | | | | – | | | | | | – | |
| Others | | | 132 | | | | (7 | ) | | | 6 | | | | | | 19 | | | | (24 | ) | | | | | 23 | | | | (30 | ) | | | (18 | ) | | | | | 60 | | | | 25 | | | | 44 | | | | | | 30 | | | | (17 | ) | | | – | | | | | | 142 | |
| Total | | | 2,825 | | | | (7 | ) | | | 7 | | | | | | 514 | | | | 25 | | | | | | 635 | | | | (19 | ) | | | (4 | ) | | | | | 733 | | | | (17 | ) | | | (4 | ) | | | | | 943 | | | | – | | | | 18 | | | | | | 3,027 | |
| | | | | | | | | | | | | | | | | | | | | | | | | | | | | | | | | | | | | | | | | | | | | | | | | | | | | | | | | | | | | | | | | | | | | | |
| | | World | | | | | US | | | | | Europe | | | | | Established ROW | | | | | Emerging Markets | | | | | Prior year | |
2014 | | Sales $m | | | Actual growth % | | | CER growth % | | | | | Sales $m | | | Actual growth % | | | | | Sales $m | | | Actual growth % | | | CER growth % | | | | | Sales $m | | | Actual growth % | | | CER growth % | | | | | Sales $m | | | Actual growth
% | | | CER growth % | | | | | World sales $m | |
| Zoladex | | | 924 | | | | (7 | ) | | | (4 | ) | | | | | 26 | | | | 13 | | | | | | 226 | | | | (10 | ) | | | (12 | ) | | | | | 322 | | | | (13 | ) | | | (6 | ) | | | | | 350 | | | | – | | | | 4 | | | | | | 996 | |
| Faslodex | | | 720 | | | | 6 | | | | 7 | | | | | | 340 | | | | 5 | | | | | | 245 | | | | 11 | | | | 10 | | | | | | 59 | | | | (5 | ) | | | 3 | | | | | | 76 | | | | 3 | | | | 14 | | | | | | 681 | |
| Iressa | | | 623 | | | | (4 | ) | | | (1 | ) | | | | | – | | | | – | | | | | | 166 | | | | (6 | ) | | | (7 | ) | | | | | 177 | | | | (12 | ) | | | (4 | ) | | | | | 280 | | | | 4 | | | | 6 | | | | | | 647 | |
| Casodex | | | 320 | | | | (15 | ) | | | (10 | ) | | | | | 5 | | | | – | | | | | | 42 | | | | (21 | ) | | | (21 | ) | | | | | 169 | | | | (25 | ) | | | (18 | ) | | | | | 104 | | | | 12 | | | | 14 | | | | | | 376 | |
| Arimidex | | | 298 | | | | (15 | ) | | | (12 | ) | | | | | 15 | | | | 150 | | | | | | 76 | | | | (18 | ) | | | (19 | ) | | | | | 108 | | | | (30 | ) | | | (24 | ) | | | | | 99 | | | | 1 | | | | 5 | | | | | | 351 | |
| Others | | | 142 | | | | – | | | | 4 | | | | | | 25 | | | | – | | | | | | 33 | | | | 14 | | | | 14 | | | | | | 48 | | | | (20 | ) | | | (13 | ) | | | | | 36 | | | | 29 | | | | 36 | | | | | | 142 | |
| Total | | | 3,027 | | | | (5 | ) | | | (2 | ) | | | | | 411 | | | | 7 | | | | | | 788 | | | | (4 | ) | | | (6 | ) | | | | | 883 | | | | (18 | ) | | | (11 | ) | | | | | 945 | | | | 4 | | | | 8 | | | | | | 3,193 | |
| | |
| 228 | | AstraZenecaAnnual Report and Form 20-F Information 2015 |
Infection, Neuroscience and Gastrointestinal
Infection
| | | | | | | | | | | | | | | | | | | | | | | | | | | | | | | | | | | | | | | | | | | | | | | | | | | | | | | | | | | | | | | | | | | | | | |
| | | World | | | | | US | | | | | Europe | | | | | Established ROW | | | | | Emerging Markets | | | | | Prior year | |
| | | | | | Actual | | | CER | | | | | | | | Actual | | | | | | | | Actual | | | CER | | | | | | | | Actual | | | CER | | | | | | | | Actual | | | CER | | | | | World | |
| | | Sales | | | growth | | | growth | | | | | Sales | | | growth | | | | | Sales | | | growth | | | growth | | | | | Sales | | | growth | | | growth | | | | | Sales | | | growth | | | growth | | | | | sales | |
| 2015 | | $m | | | % | | | % | | | | | $m | | | % | | | | | $m | | | % | | | % | | | | | $m | | | % | | | % | | | | | $m | | | % | | | % | | | | | $m | |
| Synagis | | | 662 | | | | (26 | ) | | | (26 | ) | | | | | 285 | | | | (43 | ) | | | | | 377 | | | | (6 | ) | | | (6 | ) | | | | | – | | | | – | | | | – | | | | | | – | | | | – | | | | – | | | | | | 900 | |
| FluMist/Fluenz | | | 288 | | | | (2 | ) | | | – | | | | | | 206 | | | | (6 | ) | | | | | 76 | | | | 9 | | | | 16 | | | | | | 7 | | | | – | | | | 14 | | | | | | (1 | ) | | | (100 | ) | | | (100 | ) | | | | | 295 | |
| Merrem/Meronem | | | 241 | | | | (5 | ) | | | 11 | | | | | | 16 | | | | 167 | | | | | | 24 | | | | (23 | ) | | | (10 | ) | | | | | 2 | | | | (50 | ) | | | (50 | ) | | | | | 199 | | | | (6 | ) | | | 10 | | | | | | 253 | |
| Others | | | 59 | | | | (24 | ) | | | (17 | ) | | | | | 24 | | | | (41 | ) | | | | | 6 | | | | (25 | ) | | | (25 | ) | | | | | 3 | | | | (67 | ) | | | (22 | ) | | | | | 26 | | | | 13 | | | | 40 | | | | | | 78 | |
| Total | | | 1,250 | | | | (18 | ) | | | (15 | ) | | | | | 531 | | | | (30 | ) | | | | | 483 | | | | (5 | ) | | | (4 | ) | | | | | 12 | | | | (40 | ) | | | (15 | ) | | | | | 224 | | | | (4 | ) | | | 13 | | | | | | 1,526 | |
| | | | | | | | | | | | | | | | | | | | | | | | | | | | | | | | | | | | | | | | | | | | | | | | | | | | | | | | | | | | | | | | | | | | | | | |
| | | | | | World | | | | | | | | US | | | | | | | | Europe | | | | | Established ROW | | | | | Emerging Markets | | | | | Prior year | |
| 2014 | | Sales
$m | | | Actual
growth
% | | | CER growth % | | | | | Sales
$m | | | Actual
growth
% | | | | | Sales
$m | | | Actual
growth
% | | | CER
growth
% | | | | | Sales
$m | | | Actual
growth
% | | | CER
growth
% | | | | | Sales
$m | | | Actual
growth
% | | | CER
growth
% | | | | | World
sales $m | |
| Synagis | | | 900 | | | | (15 | ) | | | (15 | ) | | | | | 499 | | | | (19 | ) | | | | | 401 | | | | (9 | ) | | | (9 | ) | | | | | – | | | | – | | | | – | | | | | | – | | | | – | | | | – | | | | | | 1,060 | |
| FluMist/Fluenz | | | 295 | | | | 20 | | | | 20 | | | | | | 218 | | | | 10 | | | | | | 70 | | | | 67 | | | | 64 | | | | | | 7 | | | | 75 | | | | 100 | | | | | | – | | | | – | | | | – | | | | | | 245 | |
| Merrem/Meronem | | | 253 | | | | (14 | ) | | | (10 | ) | | | | | 6 | | | | (45 | ) | | | | | 32 | | | | (35 | ) | | | (35 | ) | | | | | 4 | | | | (20 | ) | | | (20 | ) | | | | | 211 | | | | (7 | ) | | | (3 | ) | | | | | 293 | |
| Others | | | 78 | | | | (13 | ) | | | (10 | ) | | | | | 41 | | | | (27 | ) | | | | | 5 | | | | – | | | | (20 | ) | | | | | 9 | | | | (31 | ) | | | (8 | ) | | | | | 23 | | | | 64 | | | | 50 | | | | | | 89 | |
| Total | | | 1,526 | | | | (10 | ) | | | (9 | ) | | | | | 764 | | | | (13 | ) | | | | | 508 | | | | (6 | ) | | | (6 | ) | | | | | 20 | | | | (9 | ) | | | 9 | | | | | | 234 | | | | (4 | ) | | | – | | | | | | 1,687 | |
| | | | | | | | | | | | | | | | |
Neuroscience | | | | | | | | | | | | | | | | | | | | | | | | | | | | | | | | | | | | | | | | | | | | | | | | | | | | | | | | |
| | | World | | | | | US | | | | | Europe | | | | | Established ROW | | | | | Emerging Markets | | | | | Prior year | |
| 2015 | | Sales
$m | | | Actual
growth
% | | | CER
growth
% | | | | | Sales
$m | | | Actual
growth
% | | | | | Sales
$m | | | Actual
growth
% | | | CER
growth
% | | | | | Sales
$m | | | Actual
growth
% | | | CER
growth
% | | | | | Sales
$m | | | Actual
growth
% | | | CER
growth
% | | | | | World
sales $m | |
| SeroquelXR | | | 1,025 | | | | (16 | ) | | | (12 | ) | | | | | 716 | | | | (3 | ) | | | | | 202 | | | | (41 | ) | | | (30 | ) | | | | | 25 | | | | (43 | ) | | | (34 | ) | | | | | 82 | | | | (18 | ) | | | (1 | ) | | | | | 1,224 | |
| Seroquel IR | | | 250 | | | | 40 | | | | 56 | | | | | | 46 | | | | n/m | | | | | | 63 | | | | (29 | ) | | | (18 | ) | | | | | 34 | | | | (6 | ) | | | 8 | | | | | | 107 | | | | (14 | ) | | | (5 | ) | | | | | 178 | |
| Local Anaesthetics | | | 392 | | | | (20 | ) | | | (6 | ) | | | | | – | | | | – | | | | | | 136 | | | | (31 | ) | | | (17 | ) | | | | | 142 | | | | (15 | ) | | | (1 | ) | | | | | 114 | | | | (7 | ) | | | 6 | | | | | | 488 | |
| Vimovo | | | 84 | | | | (13 | ) | | | 2 | | | | | | 1 | | | | (90 | ) | | | | | 35 | | | | 6 | | | | 27 | | | | | | 24 | | | | 4 | | | | 22 | | | | | | 24 | | | | (20 | ) | | | (10 | ) | | | | | 96 | |
| Movantik/Moventig | | | 29 | | | | n/m | | | | n/m | | | | | | 28 | | | | n/m | | | | | | 1 | | | | n/m | | | | n/m | | | | | | – | | | | – | | | | – | | | | | | – | | | | – | | | | – | | | | | | – | |
| Others | | | 332 | | | | (21 | ) | | | (10 | ) | | | | | 22 | | | | (12 | ) | | | | | 84 | | | | (24 | ) | | | (10 | ) | | | | | 65 | | | | (22 | ) | | | (11 | ) | | | | | 161 | | | | (20 | ) | | | (10 | ) | | | | | 420 | |
| Total | | | 2,112 | | | | (12 | ) | | | (3 | ) | | | | | 813 | | | | 16 | | | | | | 521 | | | | (32 | ) | | | (20 | ) | | | | | 290 | | | | (18 | ) | | | (5 | ) | | | | | 488 | | | | (16 | ) | | | (4 | ) | | | | | 2,406 | |
| | | | | | | | | | | | | | | | | | | | | | | | | | | | | | | | | | | | | | | | | | | | | | | | | | | | | | | | | | | | | | | | | | | | | | | |
| | | World | | | | | US | | | | | Europe | | | | | Established ROW | | | | | Emerging Markets | | | | | Prior year | |
| 2014 | | Sales
$m | | | Actual
growth
% | | | CER
growth
% | | | | | Sales
$m | | | Actual
growth
% | | | | | Sales
$m | | | Actual
growth
% | | | CER
growth
% | | | | | Sales
$m | | | Actual
growth
% | | | CER
growth
% | | | | | Sales
$m | | | Actual
growth
% | | | CER
growth
% | | | | | World
sales $m | |
| Seroquel XR | | | 1,224 | | | | (9 | ) | | | (8 | ) | | | | | 738 | | | | (1 | ) | | | | | 343 | | | | (18 | ) | | | (18 | ) | | | | | 44 | | | | (39 | ) | | | (35 | ) | | | | | 99 | | | | (7 | ) | | | – | | | | | | 1,337 | |
| SeroquelIR | | | 178 | | | | (48 | ) | | | (46 | ) | | | | | (72 | ) | | | n/m | | | | | | 89 | | | | (15 | ) | | | (16 | ) | | | | | 36 | | | | (66 | ) | | | (63 | ) | | | | | 125 | | | | (17 | ) | | | (13 | ) | | | | | 345 | |
| Local Anaesthetics | | | 488 | | | | (4 | ) | | | – | | | | | | – | | | | – | | | | | | 197 | | | | (4 | ) | | | (5 | ) | | | | | 168 | | | | (8 | ) | | | (1 | ) | | | | | 123 | | | | 1 | | | | 9 | | | | | | 510 | |
| Vimovo | | | 96 | | | | 5 | | | | 9 | | | | | | 10 | | | | (50 | ) | | | | | 33 | | | | 3 | | | | 3 | | | | | | 23 | | | | 15 | | | | 25 | | | | | | 30 | | | | 58 | | | | 63 | | | | | | 91 | |
| Others | | | 420 | | | | (7 | ) | | | (4 | ) | | | | | 25 | | | | (24 | ) | | | | | 110 | | | | (4 | ) | | | (5 | ) | | | | | 84 | | | | (14 | ) | | | (7 | ) | | | | | 201 | | | | (3 | ) | | | 1 | | | | | | 452 | |
| Total | | | 2,406 | | | | (12 | ) | | | (10 | ) | | | | | 701 | | | | (10 | ) | | | | | 772 | | | | (12 | ) | | | (12 | ) | | | | | 355 | | | | (26 | ) | | | (20 | ) | | | | | 578 | | | | (5 | ) | | | 1 | | | | | | 2,735 | |
| | | | | | | | | | | | | | | | |
Gastrointestinal | | | | | | | | | | | | | | | | | | | | | | | | | | | | | | | | | | | | | | | | | | | | | | | | | | | | | | | | |
| | | World | | | | | US | | | | | Europe | | | | | Established ROW | | | | | Emerging Markets | | | | | Prior year | |
| | | | | | Actual | | | CER | | | | | | | | Actual | | | | | | | | Actual | | | CER | | | | | | | | Actual | | | CER | | | | | | | | Actual | | | CER | | | | | World | |
2015 | | Sales $m | | | growth % | | | growth % | | | | | Sales $m | | | growth % | | | | | Sales $m | | | growth % | | | growth % | | | | | Sales $m | | | growth % | | | growth % | | | | | Sales $m | | | growth % | | | growth % | | | | | sales $m | |
| Nexium | | | 2,496 | | | | (32 | ) | | | (26 | ) | | | | | 902 | | | | (52 | ) | | | | | 284 | | | | (23 | ) | | | (7 | ) | | | | | 549 | | | | (9 | ) | | | 5 | | | | | | 761 | | | | (6 | ) | | | 3 | | | | | | 3,655 | |
| Losec/Prilosec | | | 340 | | | | (19 | ) | | | (10 | ) | | | | | 18 | | | | (32 | ) | | | | | 97 | | | | (25 | ) | | | (10 | ) | | | | | 74 | | | | (30 | ) | | | (19 | ) | | | | | 151 | | | | (5 | ) | | | (1 | ) | | | | | 422 | |
| Others | | | 142 | | | | (27 | ) | | | (24 | ) | | | | | 117 | | | | (17 | ) | | | | | 19 | | | | (56 | ) | | | (47 | ) | | | | | 3 | | | | (57 | ) | | | (57 | ) | | | | | 3 | | | | – | | | | 33 | | | | | | 194 | |
| Total | | | 2,978 | | | | (30 | ) | | | (24 | ) | | | | | 1,037 | | | | (49 | ) | | | | | 400 | | | | (26 | ) | | | (11 | ) | | | | | 626 | | | | (13 | ) | | | 1 | | | | | | 915 | | | | (5 | ) | | | 2 | | | | | | 4,271 | |
| | | | | | | | | | | | | | | | | | | | | | | | | | | | | | | | | | | | | | | | | | | | | | | | | | | | | | | | | | | | | | | | | | | | | | | |
| | | World | | | | | US | | | | | Europe | | | | | Established ROW | | | | | Emerging Markets | | | | | Prior year | |
| | | | | | Actual | | | CER | | | | | | | | Actual | | | | | | | | Actual | | | CER | | | | | | | | Actual | | | CER | | | | | | | | Actual | | | CER | | | | | World | |
2014 | | Sales $m | | | growth % | | | growth % | | | | | Sales $m | | | growth % | | | | | Sales $m | | | growth % | | | growth % | | | | | Sales $m | | | growth % | | | growth % | | | | | Sales $m | | | growth % | | | growth % | | | | | sales $m | |
| Nexium | | | 3,655 | | | | (6 | ) | | | (4 | ) | | | | | 1,876 | | | | (12 | ) | | | | | 368 | | | | 2 | | | | 2 | | | | | | 606 | | | | 2 | | | | 9 | | | | | | 805 | | | | 2 | | | | 5 | | | | | | 3,872 | |
| Losec/Prilosec | | | 422 | | | | (13 | ) | | | (11 | ) | | | | | 28 | | | | (7 | ) | | | | | 129 | | | | (2 | ) | | | (2 | ) | | | | | 106 | | | | (36 | ) | | | (30 | ) | | | | | 159 | | | | (1 | ) | | | 1 | | | | | | 486 | |
| Others | | | 194 | | | | (16 | ) | | | (16 | ) | | | | | 141 | | | | (21 | ) | | | | | 43 | | | | – | | | | – | | | | | | 7 | | | | – | | | | – | | | | | | 3 | | | | – | | | | 33 | | | | | | 231 | |
| Total | | | 4,271 | | | | (7 | ) | | | (5 | ) | | | | | 2,045 | | | | (12 | ) | | | | | 540 | | | | 1 | | | | 1 | | | | | | 719 | | | | (7 | ) | | | 1 | | | | | | 967 | | | | 1 | | | | 5 | | | | | | 4,589 | |

| | |
| AstraZenecaAnnual Report and Form 20-F Information 2015 | | 229 |
Additional Information
Geographical Reviewcontinued
Growth rates in this Geographical Review are expressed at CER unless otherwise stated. All commentary in this section relates to Product Sales.
2015 in brief
| > | AstraZeneca is the sixth largest prescription-based pharmaceutical company in the US, with a 4.5% market share of US pharmaceuticals by sales value. |
| > | AstraZeneca is the twelfth largest prescription-based pharmaceutical company in Europe, with a 2.5% market share of sales by value. |
| > | In 2015, sales in the US decreased by 6% to $9,474 million (2014: $10,120 million; 2013: $9,691 million). Declines in revenue fromNexium,Crestor andSynagis were partially offset by strong performance of our Growth Platforms, includingFarxiga, Bydureon andBrilinta, the launches ofLynparza andTagrisso as well as the impact of completing the acquisition of Actavis’s rights toTudorza andDaliresp in the US. |
| > | Sales in Europe declined by 6% to $5,323 million in the year (2014: $6,638 million; 2013: $6,658 million). Strong growth from the Diabetes portfolio was more than offset by pricing pressure and continued generic competition facingCrestor, Nexium andSeroquel XR. A 14% decline inSymbicort sales to $1,076 million (2014: $1,462 million; 2013: $1,502 million) reflected adverse pricing movements driven by competition from analogues in key markets.Duaklirmore than doubled its first-half sales in the final quarter andLynparza was launched in Europe in 2015. |
| > | Sales in the Established Rest of World (ROW) were stable in the year at $3,022 million (2014: $3,510 million; 2013: $3,973 million). Japan sales increased 4% at CER to $2,020 million (2014: $2,227 million; 2013: $2,485 million) driven by strong growth ofCrestor andNexium, though there was a decline in the sales ofSymbicort. Canada sales grew by 4% to $533 million at CER (2014: $590 million; 2013: $637 million) in the year driven by increased sales ofOnglyza andSymbicort. |
| > | Emerging Markets sales in the year increased by 12% to $5,822 million (2014: $5,827 million; 2013: $5,389 million) with contributions to growth emanating from across the region. Around 60% of Emerging Markets sales were derived outside of China in the year. |
| > | China sales in the year increased by 15% to $2,530 million (2014: $2,242 million; 2013: $1,840 million), while Brazil sales grew by 16% at CER to $381 million (2014: $451 million; 2013: $447 million) and Russia sales grew by 21% at CER to $231 million (2014: $312 million; 2013: $310 million). |
2014 in brief
| > | AstraZeneca was the fourth largest prescription-based pharmaceutical company in the US, with a 5.2% market share of US pharmaceuticals by sales value. |
| > | AstraZeneca was the tenth largest prescription-based pharmaceutical company in Europe, with a 2.8% market share of sales by value. |
| > | In the US, sales increased by 4% to $10,120 million (2013: $9,691 million; 2012: $10,655 million), driven by an increase in Diabetes franchise sales, aided by the acquisition of BMS’s 50% interest in the diabetes alliance, as well as strong performance across our Growth Platforms, includingSymbicort andBrilinta, offset by declines in revenue fromNexium,Seroquel IR andSynagis. Sales from our Diabetes franchise increased by $644 million or 109% to $1,234 million. |
| > | Sales in Europe decreased by 1% to $6,638 million (2013: $6,658 million; 2012: $7,143 million). Key drivers of the decline were the ongoing volume erosion onAtacand andSeroquel XR following generic entry and the negative price and volume impacts primarily related to government pricing interventions.Crestor volumes declined 3% due to increased pressure from generic statins in a number of markets.Symbicort sales decreased to $1,462 million (2013: $1,502 million; 2012: $1,465 million) due to pricing pressure and the impact ofSymbicort analogues. These challenges were partially offset by our Growth Platforms, includingBrilique growth and the expansion of our Diabetes portfolio following the acquisition of BMS’s interest in the joint diabetes alliance plus continued strong demand forFluenz (2014: $70 million; 2013: $42 million; 2012: $3 million). |
| > | Established Rest of World sales decreased by 4% to $3,510 million (2013: $3,973 million; 2012: $5,080 million). Canada continued to be negatively impacted by erosion ofCrestor andNexium sales due to generic competition, with total sales down 1%. Sales in Australia were also lower due to generic |
| | competition toCrestor andAtacand. Sales growth in Japan declined by 3% to $2,227 million (2013: $2,485 million; 2012: $2,904 million), as a result of generic pressure on oncology products,Casodex andArimidex, and the impact of the April 2014 mandated biennial price cut. Strong demand in Japan continued forNexium andCrestor, with sales increasing to $860 million (2013: $815 million; 2012: $665 million). |
| > | Emerging Markets sales increased by 12% to $5,827 million (2013: $5,389 million; 2012: $5,095 million), with sales growth in China of 22%. Volume growth onBrilinta, our Diabetes and Respiratory franchises,Nexium andCrestor, was partially offset by pricing pressure, predominantly in China and Asia Pacific. |
US
In 2015, sales in the US decreased by 6% to $9,474 million (2014: $10,120 million; 2013: $9,691 million). Declines in revenue fromNexium, Crestor andSynagis were partially offset by strong performance of our Growth Platforms, includingFarxiga,Bydureon andBrilinta, the launches ofLynparza andTagrisso as well as the impact of completing the acquisition of Actavis’s rights toTudorza andDaliresp in the US. Sales from our Diabetes franchise increased by $187 million or 15% to $1,421 million (2014: $1,234 million; 2013: $590 million).
Brilinta sales of $240 million (2014: $146 million; 2013: $73 million) increased 64% in 2015.Brilinta continued its strong momentum with significant 2015 growth in hospital units purchased volume (+58% November 2015), new-to-brand prescriptions (39%) and total prescriptions (48%), supported with our expanded indication to include long-term use in patients with a history of heart attack. The new label nearly doubles the number of patients indicated forBrilinta in the US and is highlighted with language that demonstratesBrilinta’s superiority overPlavix.Brilinta grew its US branded leadership in oral antiplatelet (OAP) new-to-brand retail prescription share which increased by 2.7 percentage points over 2014 to 10.9% in 2015, andBrilinta also achieved US branded market leadership in share of all OAP new prescriptions for the first time in 2015.
Crestor continued to demonstrate resilience in the highly competitive statin market, 89.0% of which is generic. In 2015,Crestor was the highest branded retail prescription
| | |
| 230 | | AstraZenecaAnnual Report and Form 20-F Information 2015 |
pill in the US and more than a million new patients started therapy onCrestor in 2015.Crestor achieved sales of $2,844 million (2014: $2,918 million; 2013: $2,912 million) and a total prescription share within the statin market of 8.9% in December 2015.Crestor sales in 2015 were 3% below 2014 sales, with a decrease in volume of 6% partially offset by higher average net prices (+3%).Crestor continued to maintain its strong formulary access, with Commercial/ Medicare preferred access of 85% at the end of 2015 (2014: 84%; 2013: 84%).
Symbicort pMDI sales at $1,520 million were in line with 2014 (2014: $1,511 million; 2013: $1,233 million), with volume increases of 10% and prescription growth of 14.0% versus 2014 offset by pricing pressures.Symbicort achieved a 34.0% total prescription share in the month of December 2015, up 1.08 percentage points over the month of December 2014 in the ICS/LABA market.
In March 2015, we completed our acquisition ofDaliresp andTudorzafrom Forest Laboratories Holdings Ltd (owned by Actavis). The acquisition granted AstraZeneca US rights for manufacturing and commercialisation of these products.Daliresp achieved sales of $104 million andTudorza achieved sales of $103 million for the 10 months of ownership in 2015.
In February 2014, we completed our acquisition of BMS’s 50% interest in our joint diabetes alliance. The acquisition gave us ownership of the IP and global rights for the development, manufacturing and commercialisation of the diabetes business, which includesOnglyza,Komboglyze,KombiglyzeXR,Farxiga/Forxiga,Xigduo, Xigduo XR,Byetta, Bydureon andSymlin.Onglyza/Kombiglyze XR sales in the US declined by 13% to $420 million (2014: $481 million; 2013: $265 million) primarily driven by lower average net price.
Bydureon sales in the US were $482 million (2014: $374 million; 2013: $131 million).Bydureon prescription market share remained static in 2015, with a total prescription market share of 19.4% of the rapidly growing GLP-1 market in December 2015.Byetta achieved sales of $209 million (2014: $199 million; 2013: $152 million).
Farxiga (launched February 2014) andXigduo XR (launched November 2014) accelerated the overall growth of the SGLT2
class of medicines by 79% post-launch1 and by the end of December 2015, over 407,000 patients were onFarxiga orXigduo XR since launch and theFarxiga family captured nearly one in four new SGLT2 patient treatment decisions. Our SGLT2 franchise sales grew by 114% from 2014 to 2015.
Lynparza reached $70 million (2014: $nil) following the launch of the medicine at the end of 2014. Growth was driven by the pool of eligible patients awaiting treatment as well as patients newly tested for BRCA mutation.
Tagrisso, the only approved medicine indicated for patients with metastatic EGFR T790M mutation-positive NSCLC, had sales of $15 million following the launch in November 2015.
In 2015, sales ofSynagis were down 43% to $285 million (2014: $499 million; 2013: $617 million). A key driver of the decline was the continued adoption of guidelines from the American Academy of Pediatrics Committee on Infectious Disease that restricted patients eligible for preventive therapy withSynagis.FluMist Quadrivalent launched in the US in 2013 as the first and only FDA-approved nasal spray flu vaccine to help protect against four strains of influenza.FluMist revenues in the US were down 6% to $206 million (2014: $218 million; 2013: $199 million) driven by delays in supply.
Nexium was the seventh most prescribed branded pharmaceutical in the US.Nexium sales in the US declined 52% to $902 million (2014: $1,876 million; 2013: $2,123 million) due primarily to volume erosion, pricing pressure, and recognition of an unfavourable returns provision following loss of exclusivity. Despite the entrance of multiple generic competitors,Nexiumremains the branded market leader retaining significant prescription market share and volume within the proton pump inhibitor class, and maintains greater than 65% share of the esomeprozole molecule market.
Seroquel IR 2015 sales were $46 million (2014: negative $72 million; 2013: negative $17 million). The loss of exclusivity forSeroquel IR in March 2012 and unfavourable reserve adjustments for Medicaid liabilities and provisions taken on channel inventories resulted in negative sales in 2014 and 2013. No further adjustments were required in 2015. The presence of generic competition has also impacted the prescription volume ofSeroquel XR. Sales ofSeroquel XR were
down 3% to $716 million (2014: $738 million; 2013: $743 million) driven by lower volume.
Movantik launched in March 2015 and achieved US sales of $28 million. In March 2015, the Company announced a co-commercialisation agreement with Daiichi Sankyo forMovantik in the US.Movantik share among chronic opioid patients starting a new branded Rx laxative (NBRx) in the final quarter of 2015 was 29%.
The Affordable Care Act (ACA), which was enacted in March 2010, has had, and is expected to continue to have, a significant impact on our US sales and the US healthcare industry as a whole. In 2015, the overall measurable reduction in our profit before tax for the year due to discounts on branded pharmaceutical sales to Medicare Part D beneficiaries and an industry-wide excise fee was $786 million (2014: $714 million; 2013: $557 million). This amount reflects only those effects of the ACA that we know have had or will have a direct impact on our financial condition or results of operations and which we are therefore able to quantify based on known and isolatable resulting changes in individual financial items within our Financial Statements. There are other potential indirect or associated consequences of the implementation of the ACA, which continue to evolve and which cannot be estimated but could have similar impacts. These include broader changes in access to, or eligibility for, coverage under Medicare, Medicaid or similar government programmes. These could indirectly impact our pricing or sales of prescription products within the private sector. By their nature and the fact that these potentially numerous consequences are not directly linked to a corresponding and quantifiable impact on our Financial Statements, it is not possible to accurately estimate the financial impact of these potential consequences of the ACA or related legislative changes when taken together with the number of other market; and industry-related factors that can also result in similar impacts. Further details on the impact of the ACA are contained in Pricing of medicines from page 14 and in Risk from page 212.
Currently, there is no direct governmental control of prices for commercial prescription drug sales in the US. However, some publicly funded programmes, such as Medicaid and TRICARE (Department of Defense), have statutorily mandated rebates
| | |
| AstraZenecaAnnual Report and Form 20-F Information 2015 | | 231 |
Additional Information
Geographical Reviewcontinued
and discounts that have the effect of price controls for these programmes. Additionally, pressure on pricing, availability and use of prescription drugs for both commercial and public payers continues to increase. This is driven by, among other things, an increased focus on generic alternatives. Budgetary policies within healthcare systems and providers, including the use of generics only formularies, and increases in patient co-insurance or co-payments, are the primary drivers of increased generics use. In 2015, 84.0% of prescriptions dispensed in the US were generic. While widespread adoption of a broad national price-control scheme in the near future is unlikely, increased focus on pharmaceutical prices and their impact on healthcare costs is likely to continue for the foreseeable future.
Rest of World
Sales of $14,167 million (2014: $15,975 million; 2013: $16,020 million) outside the US in 2015 was up by 2% at CER but negatively impacted on a Reported basis by movements in underlying currencies. Emerging Markets delivered a strong performance, up 12% with sales of $5,822 million (2014: $5,827 million; 2013: $5,389 million), with Japan and Canada also generating increased sales at CER. Europe and Other Established ROW sales were down at 6% and 19% respectively reflecting the competition from generic products and the continuing challenging economic environment, partially offset by the performance of Growth Platforms.
Europe
AstraZeneca is the twelfth largest pharmaceutical company in Europe, with a 2.5% market share of prescription sales by value.
Despite a slight improvement in conditions, the macroeconomic environment remains challenging, with the ongoing impact of austerity measures leading to increased pressure on healthcare budgets. Many governments in Europe intervene directly to control the price, volume and reimbursement of medicines. Several governments have imposed price reductions and increased the use of generic medicines as part of healthcare expenditure controls. A number of countries are applying strict criteria for cost-effectiveness evaluations of medicines, which contributes
to a difficult environment for branded pharmaceuticals in Europe.
Total sales in Europe were down 6% to $5,323 million (2014: $6,638 million; 2013: $6,658 million). Volume erosion onSeroquel XR andAtacand following generic entries resulted in a decrease in sales of 29% to $307 million (2014: $512 million; 2013: $641 million).Crestor sales declined 9%, with a 7% reduction in volumes and 2% reduction in prices as a result of increased competition from generic statins in a number of countries, including France and Italy. Government interventions continue to impact both price and volume negatively.
Our Growth Platform sales partially offset these trends.Brilique sales increased 18% at CER to $230 million (2014: $231 million; 2013: $163 million). Our Diabetes franchise generated sales of $410 million (2014: $359 million; 2013: $119 million). Respiratory sales were negatively impacted by pricing pressure onSymbicortand the impact ofSymbicort analogues, with sales declining to $1,076 million (2014: $1,462 million; 2013: $1,502 million), as volumes fell by 3% and prices fell by 11%.
In Germany, sales increased by 4% to $601 million (2014: $693 million; 2013: $657 million), driven by strong growth across the Diabetes portfolio and continued growth withBrilique. Total Diabetes sales reached $126 million in 2015 (2014: $108 million; 2013: $32 million). Overall growth was partly offset by the ongoing impact of pricing and generic versions ofAtacand andSeroquel XR.
In the UK and Ireland, sales decreased by 18% to $633 million (2014: $832 million; 2013: $766 million), driven by ongoing volume erosion onSeroquel XR following generic entries and a decline inZoladex sales to $58 million (2014: $83 million; 2013: $94 million). Diabetes sales decreased to $61 million in 2015 (2014: $68 million; 2013: $27 million) andBriliquesales marginally decreased to $28 million (2014: $30 million; 2013: $18 million).
Sales in France decreased by 9% to $922 million (2014: $1,213 million; 2013: $1,212 million), driven by price and volume erosion onAtacand andZoladex, following generic entries and subsequent government pricing interventions. Increased pressure from
generic statins has adversely affectedCrestor, with sales down 12% to $298 million (2014: $404 million; 2013: $428 million). At constant exchange rates, France experienced growth ofBrilique with $29 million of sales (2014: $30 million; 2013: $18 million) and Diabetes with $50 million of sales (2014: $52 million; 2013: $20 million).
Sales in Italy decreased by 5% to $544 million (2014: $688 million; 2013: $737 million), mainly driven by generic entries, pricing intervention and the implementation of volume prescription controls associated with existing and new austerity measures.
Sales in Spain increased by 3% at CER to $426 million (2014: $497 million; 2013: $507 million), mainly driven by strong growth across the Growth Platforms.
Established ROW2
Established ROW sales of $3,022 million were flat at CER (2014: $3,510 million; 2013: $3,973 million). The key products with sales growth in Established ROW in 2015 wereNexium, Symbicort, Brilinta, andOnglyza.
Japan
Sales in Japan were $2,020 million, increasing by 4% at CER but negatively impacted on a Reported basis by the revaluation of the Japanese yen (2014: $2,227 million; 2013: $2,485 million).
Nexium achieved sales of $405 million (2014: $358 million; 2013: $278 million).
Crestor sales grew by 8% at CER to $468 million (2014: $502 million; 2013: $537 million), retaining its position as the number one brand in the statin market in Japan.Symbicort sales at $176 million (2014: $207 million; 2013: $175 million) decreased by 2%, achieving a market share of 39.4%.
Sales were also negatively impacted by generic competition for our non-promoted oncology products.
Canada
Canada returned to growth in 2015 driven by the strong performance ofSymbicortand the Diabetes portfolio (including the launch ofForxiga in January 2015). Canadian sales increased by 4% at CER to $533 million (2014: $590 million; 2013: $637 million).
| | |
| 232 | | AstraZenecaAnnual Report and Form 20-F Information 2015 |
Other Established ROW3
Sales in Other Established ROW declined by 19% to $469 million (2014: $693 million; 2013: $851 million). Sales in Australia declined by 21% to $435 million (2014: $658 million; 2013: $817 million) due to continued volume erosion onCrestor andAtacandfollowing generic entries in 2013 and pricing pressure on other mature brands (Seroquel andArimidex).Nexium sales in Australia declined following the loss of exclusivity in Australia in August 2014.
Emerging Markets
In Emerging Markets, sales increased by 12% to $5,822 million (2014: $5,827 million; 2013: $5,389 million), which was principally driven by growth in China, Russia, Brazil and Argentina, and growth across a broad range of markets in our strategic Growth Platforms –Brilinta, and our Diabetes and Respiratory franchises.
In many of the larger markets, such as Brazil and Mexico, patients tend to pay directly for prescription medicines and consequently, these markets are at less risk of direct government interventions on pricing and reimbursement. In other markets, such as South Korea, Taiwan and Turkey, where governments pay for medicines, we are seeing continued efforts to reduce the cost of prescriptions in line with the efforts in Europe, Canada and Australia.
China
Sales in China (excluding Hong Kong) grew by 15% to $2,530 million (2014: $2,242 million; 2013: $1,840 million). AstraZeneca remained the second largest multinational pharmaceutical company in China during 2015. Despite the market slowdown, we saw continued strong sales of Oncology and Respiratory in particular, with sales growth of 17% and 38% respectively. We have continued to make strong progress on the listing ofBrilinta, Byetta andOnglyza into key hospitals.Brilinta has reached $38 million in sales. We continue to have the largest sales force among multinational pharmaceutical companies in China. The number of hospitals covered grew by 34%.
Other Emerging Markets4
We continued to build our presence in Russia, with sales growing by 21% to $231 million (2014: $312 million; 2013: $310 million) from strong performance in the retail segment. To increase access to our medicines, we established patient affordability programmes in 50 regions of
the Russian Federation. The Russian market grew by 12% during 2015. AstraZeneca’s growth came fromIressa, Pulmicort andBrilinta. We have 559 clinical trial sites in 46 cities. Our new production facility in Vorsino is expected to commence commercial production in early 2016.
The Latin American pharmaceutical market continues to grow. However, in many countries, growth is being predominantly captured by generics, branded generics and private label product offerings. Sales were up 15% to $1,024 million (2014: $1,181 million; 2013: $1,188 million) driven principally by Brazil, which grew by 16% to $381 million (2014: $451 million; 2013: $447 million), following successful launch ofForxiga and continued strong uptake ofBrilinta. Sales in Argentina also grew rapidly by 37% driven by strong growth in Diabetes,Brilinta and Respiratory. The Mexico prescription drug market continues to grow. Sales grew by 11% at CER to $195 million (2014: $210 million; 2013: $206 million), driven by the Diabetes and Respiratory Growth Platforms.
In the Middle East and Africa, despite political challenges arising from geopolitical and broader political conflict, sales grew by 13%, driven by strong growth in Egypt, Saudi Arabia, the Gulf States, and several Emerging Markets in Africa as well as steady growth in Turkey. Sales in South Africa were flat and declined by 13% in Tunisia reflecting local market conditions. Sales of $889 million in Asia were in line with 2014 at CER (2014: $948 million; 2013: $900 million). Double digit growth in Vietnam, Indonesia, Malaysia and India were offset by sales decreases due to price erosions incurred by loss of exclusivity in Taiwan and Korea.
Launches in Emerging Markets in 2015 included:Forxiga in India, Colombia, Ecuador, and Taiwan;Bydureon in Mexico; andZinforo in Mexico.
| 1 | Growth based on Invokana trend preFarxiga launch, and the composition ofFarxiga and Invokana to 18 December 2015 (excluding holidays) to derive the impact on SGLT2 class. |
| 2 | Canada, Japan, Australia and New Zealand. |
| 3 | Australia and New Zealand. |
| 4 | Emerging Markets excluding China. |
| | |
| AstraZenecaAnnual Report and Form 20-F Information 2015 | | 233 |
Additional Information
Sustainability: supplementary information
Summary information about our commitment and performance in key areas is integrated into the relevant sections of this Annual Report. Further information about these and other areas is available on our website, www.astrazeneca.com.
The Strategy section from page 8 describes how we create value across the life-cycle of a medicine and highlights our distinctive capabilities and our strategy. Our commitment to operating responsibly underpins all of these efforts. This helps to ensure the future sustainability of the Group in a way that adds value for our stakeholders. The Sustainability section from page 57 reviews our sustainability governance and commitments. These encompass:
| > | Environmental sustainability: managing our impact on the environment, across all our operations, with a particular focus on carbon emissions, waste and water use (see page 57). |
| > | Access to healthcare: as we expand our geographic footprint, exploring ways of increasing access to healthcare for more people, tailored locally to different patient needs (see page 50). |
| > | Responsible research: underpinning our accelerated drive for innovation with sound bioethics worldwide and maintaining a strong focus on patient safety in everything we do, minimising the risks and maximising the benefits of all our medicines throughout R&D, and after launch (see page 44). |
| > | Ethical business practices: |
| | – | Working to consistent global standards of ethical sales and marketing practices in all our markets as we work to restore growth (see page 50). |
| | – | Working only with suppliers who have standards consistent with our own as we increase our outsourcing to drive business efficiency (see page 47). |
| | – | Making a positive contribution to our local communities around the world, through community support programmes consistent with improving health and promoting science (see page 58). |
| > | Being a great place to work: |
| | – | Ensuring that diversity in its broadest sense is reflected in our leadership and people strategies (see pages 52 and 53). |
| | – | Continuing to develop and embed a consistent approach to human rights across our worldwide activities (see page 54). |
| | – | Promoting the safety, health and wellbeing of all our people worldwide as we continue to drive a high-performance culture and the achievement of our business goals (see page 57). |
A core element of our business strategy is value-creating business development activity that strengthens our pipeline and accelerates growth. This includes targeted acquisitions. When we acquire companies we aim to align standards of responsible business and incorporate the companies in the setting of targets and measurement of performance.
Benchmarking
As expectations of stakeholders evolve, we continue to engage with them and use the feedback to inform the development of our sustainability strategy and risk management planning.
We also use the insights gained from external surveys to develop our approach in line with global best practice. A member of the Dow Jones Sustainability Index (DJSI) since 2001, we were once again listed in the 2015 World Index (the top 10% of the largest 2,500 companies). We also retained our listing on the DJSI STOXX – European Index (the top 20% of the 600 largest European companies) for the eighth year running (one of four pharmaceutical companies to do so out of 14 assessed). We achieved a total score of 84% (2014: 79%) compared with a sector best score of 88% (2014: 87%). We increased individual scores for 14 out of 24 criteria for 2015 (compared to seven out of 24 criteria in 2014). These included corporate governance, code of conduct, marketing practices, supply chain management, customer relationship management, innovation management, environmental policy management system, climate strategy, labour practice indicators and human rights, human capital development, talent attraction and retention, occupational health and safety, bioethics and health outcomes contribution. While these scores are encouraging, we lost ground in some areas, including risk and crisis management, social reporting,
environmental reporting and operational eco-efficiency, strategy to improve access to drugs or products, and addressing cost burden. To understand these lower scores better, we commissioned an in-depth external benchmark survey. We will use the analysis to plan ways to improve in these areas.
External assurance
Bureau Veritas has provided independent external assurance to a limited level on the following sustainability information contained within this Annual Report
| > | Clinical trials and transparency, page 45 |
| > | Research use of human biological samples, page 45 |
| > | Animal research, page 45 |
| > | Increasing access to healthcare, page 50 |
| > | Sales and marketing ethics, page 50 |
| > | Working with suppliers, page 47 |
| > | Natural resource efficiency, page 57 |
| > | Develop a strong and diverse pipeline of leaders, page 53 |
| > | Safety, health and wellbeing, page 57 |
| > | Community investment, page 58 |
| > | Sustainability, page 57. |
Based on the evidence provided and subject to the scope, objectives and limitations defined in the full assurance statement, nothing has come to the attention of Bureau Veritas causing us to believe that the sustainability information contained within this Annual Report is materially misstated. Bureau Veritas is a professional services company that has a long history of providing independent assurance services in environmental, health, safety, social and ethical management and disclosure.
The full assurance statement, which includes Bureau Veritas’s scope of work, methodology, overall opinion, and limitations and exclusions, is available on our website, www.astrazeneca.com.
| | |
| 234 | | AstraZenecaAnnual Report and Form 20-F Information 2015 |
Carbon reporting
Global greenhouse gas emissions data for the period 1 January 2015 to 31 December 2015
| | | | | | | | | | | | | | | | |
| | | Tonnes of CO2e | |
| | | 2015 | | | 2014 | | | 20131 | | | 2012 | |
| Emissions from: | | | | | | | | | | | | | | | | |
| Combustion of fuel and operation of facilities2 | | | 324,300 | | | | 328,700 | | | | 318,600 | | | | 318,700 | |
| Electricity, heat, steam and cooling purchased for own use3 | | | 273,500 | | | | 290,300 | | | | 274,400 | | | | 277,100 | |
| Company’s chosen intensity measurement: | | | | | | | | | | | | | | | | |
| Emissions reported above normalised to million US dollar revenue | | | 24.2 | | | | 23.7 | | | | 23.1 | | | | 21.3 | |
| Supplemental information: | | | | | | | | | | | | | | | | |
| Net electricity, heat, steam and cooling emissions, after write down due to voluntary purchase of electricity supplied under certified low carbon supply contracts or carbon certificates4 | | | 223,700 | | | | 238,600 | | | | 238,200 | | | | 250,800 | |
| Supply chain emissions: | | | | | | | | | | | | | | | | |
| Upstream emissions from personnel air travel, goods transport and waste incineration | | | 156,000 | | | | 167,900 | | | | 155,400 | | | | 169,800 | |
| Downstream emissions from HFA propellants released during patient use of our inhaled medicines | | | 508,800 | | | | 448,900 | | | | 352,000 | | | | 299,600 | |
| 1 | Regular review of the data is carried out to ensure accuracy and consistency. This has led to slight changes in the data for previous years. None of the changes are statistically significant. The data quoted in this Annual Report are generated from the revised data. |
| 2 | Included in this section are greenhouse gases from direct fuel combustion, process and engineering emissions at our sites and from fuel use in our vehicle fleet. |
| 3 | Greenhouse gases from electricity are calculated using a location-based approach as described in GHG Protocol Scope 2 Guidance (January 2015). Market instruments (US Renewable Energy Certificates, UK Renewable Energy Guarantees of Origin) are then discounted. This approach is consistent with previous years. In future years Scope 2 emissions reporting will follow the dual reporting approach. |
| 4 | Some electricity supplied to our UK sites has been provided under a green power contract and is backed up with an equivalent quantity of Renewable Energy Guarantees of Origin and some of the electricity consumed at our US sites is covered by purchase of Renewable Energy Certificates. |
The above table provides data on our global greenhouse gas emissions for 2015.
We have reported on all of the emission sources required under the Quoted Companies Greenhouse Gas Emissions (Directors’ Reports) Regulations 2013.
These sources fall within our consolidated Financial Statements. We do not have responsibility for any emission sources that are not included in our consolidated Financial Statements.
We have used the GHG Protocol Corporate Accounting and Reporting Standard (revised edition). Emission factors for electricity have been derived from the International Energy Agency and USEPA eGRID databases and for all other fuels and emission sources from the 2006 IPCC Guidelines for National Greenhouse Gas Inventories.
Bureau Veritas has undertaken a limited assurance on the 2015 GHG emissions data. The assurance statement, including scope, methodology, overall opinion, and limitations and exclusions, is available on our website, www.astrazeneca.com.
| | |
| AstraZenecaAnnual Report and Form 20-F Information 2015 | | 235 |
Additional Information
Financials (Prior year)
Results of operations – summary analysis of year ended 31 December 2014
2014 Reported operating profit – restated
| | | | | | | | | | | | | | | | | | | | | | | | | | | | | | | | | | | | | | |
| | | 2014 Restated1 | | | | |
| 2013
Restated |
1 | | | | | Percentage of Total Revenue | | | | | | 20141 compared with 20131 | |
| | | | | | | | | Growth | | | | | | | | | | | | | | | | | | | | | | |
| | | | | | | | | due to | | | | | | | | | | | | | | | | | | | | | | |
| | | | | | CER | | | exchange | | | | | | | | | | Reported | | | Reported | | | | | CER | | | Actual | |
| | | Reported | | | growth | | | effects | | | | | Reported | | | | | 2014 | | | 2013 | | | | | growth2 | | | growth | |
| | | $m | | | $m | | | $m | | | | | $m | | | | | % | | | % | | | | | % | | | % | |
| Product Sales | | | 26,095 | | | | 833 | | | | (449 | ) | | | | | 25,711 | | | | | | | | | | | | | | | | 3 | | | | 1 | |
| Externalisation Revenue | | | 452 | | | | 354 | | | | 3 | | | | | | 95 | | | | | | | | | | | | | | | | 375 | | | | 378 | |
| Total Revenue | | | 26,547 | | | | 1,187 | | | | (446 | ) | | | | | 25,806 | | | | | | | | | | | | | | | | 5 | | | | 3 | |
| Cost of sales | | | (5,842 | ) | | | (572 | ) | | | (9 | ) | | | | | (5,261 | ) | | | | | (22.0 | ) | | | (20.4 | ) | | | | | 11 | | | | 11 | |
| Gross profit | | | 20,705 | | | | 615 | | | | (455 | ) | | | | | 20,545 | | | | | | 78.0 | | | | 79.6 | | | | | | 3 | | | | 1 | |
| Distribution costs | | | (324 | ) | | | (23 | ) | | | 5 | | | | | | (306 | ) | | | | | (1.2 | ) | | | (1.2 | ) | | | | | 7 | | | | 6 | |
| Research and development expense | | | (5,579 | ) | | | (716 | ) | | | (42 | ) | | | | | (4,821 | ) | | | | | (21.0 | ) | | | (18.7 | ) | | | | | 15 | | | | 16 | |
| Selling, general and administrative costs | | | (13,000 | ) | | | (896 | ) | | | 102 | | | | | | (12,206 | ) | | | | | (49.0 | ) | | | (47.3 | ) | | | | | 7 | | | | 7 | |
| Other operating income and expense | | | 335 | | | | (136 | ) | | | (29 | ) | | | | | 500 | | | | | | 1.2 | | | | 2.0 | | | | | | (27 | ) | | | (33 | ) |
| Operating profit | | | 2,137 | | | | (1,156 | ) | | | (419 | ) | | | | | 3,712 | | | | | | 8.0 | | | | 14.4 | �� | | | | | (31 | ) | | | (42 | ) |
| Net finance expense | | | (885 | ) | | | | | | | | | | | | | (445 | ) | | | | | | | | | | | | | | | | | | | | |
| Share of after tax losses of joint ventures | | | (6 | ) | | | | | | | | | | | | | – | | | | | | | | | | | | | | | | | | | | | |
| Profit before tax | | | 1,246 | | | | | | | | | | | | | | 3,267 | | | | | | | | | | | | | | | | | | | | | |
| Taxation | | | (11 | ) | | | | | | | | | | | | | (696 | ) | | | | | | | | | | | | | | | | | | | | |
| Profit for the period | | | 1,235 | | | | | | | | | | | | | | 2,571 | | | | | | | | | | | | | | | | | | | | | |
| | | | | | | | | | | | | | | | | | | | | | | | | | | | | | | | | | | | | | | |
| Basic earnings per share ($) | | | 0.98 | | | | | | | | | | | | | | 2.04 | | | | | | | | | | | | | | | | | | | | | |
1 2014 and 2013 results have been restated to reflect the reclassification of Externalisation Revenue from other operating income and expense as detailed in Group Accounting Policies from page 144. 2 CER growth is calculated using prior year actual results adjusted for certain exchange effects including hedging. 2014 Reconciliation of Reported results to Core results | |
| | | | | | | | | | | | | | | | | | | | | | | | | | | Core220141 | |
| | | | | | | | | | | | | | | | | | | | | | | | | | | compared with 20131 | |
| | | | | | | | | Intangible | | | | | Acquisition of | | | | | | | | | | | | | | | | | |
| | | | | | | | | amortisation | | | | | BMS’s share | | | | | Legal | | | | | | | | | | | | |
| | | 2014 | | | Restructuring | | | and | | | | | of diabetes | | | | | provisions | | | 2014 | | | | | CER | | | Actual | |
| | | Reported | | | costs | | | impairments | | | | | alliance | | | | | and other | | | Core2 | | | | | growth | | | growth | |
| | | $m | | | $m | | | $m | | | | | $m | | | | | $m | | | $m | | | | | % | | | % | |
| Gross profit | | | 20,705 | | | | 107 | | | | 701 | | | | | | 146 | | | | | | – | | | | 21,659 | | | | | | 4 | | | | 2 | |
| | | | | | | | | | | |
| Product Sales gross margin %3 | | | 77.6% | | | | | | | | | | | | | | | | | | | | | | | | 81.3% | | | | | | | | | | | |
| | | | | | | | | | | |
| Total Revenue gross margin % | | | 78.0% | | | | | | | | | | | | | | | | | | | | | | | | 81.6% | | | | | | | | | | | |
| Distribution costs | | | (324 | ) | | | – | | | | – | | | | | | – | | | | | | – | | | | (324 | ) | | | | | 7 | | | | 6 | |
| Research and development | | | (5,579 | ) | | | 497 | | | | 141 | | | | | | – | | | | | | – | | | | (4,941 | ) | | | | | 15 | | | | 16 | |
| Selling, general and administrative costs | | | (13,000 | ) | | | 662 | | | | 811 | | | | | | 932 | | | | | | 379 | | | | (10,216 | ) | | | | | 16 | | | | 15 | |
| Other operating income and expense | | | 335 | | | | 292 | | | | 230 | | | | | | – | | | | | | (98 | ) | | | 759 | | | | | | 19 | | | | 15 | |
| Operating profit | | | 2,137 | | | | 1,558 | | | | 1,883 | | | | | | 1,078 | | | | | | 281 | | | | 6,937 | | | | | | (13 | ) | | | (17 | ) |
| | | | | | | | | | | |
| Operating margin as a % of Total Revenue | | | 8.0% | | | | | | | | | | | | | | | | | | | | | | | | 26.1% | | | | | | | | | | | |
| | | | | | | | | | | | | | | | | | | | | | | | | | | | | | | | | | | | | | | |
| Net finance expense | | | (885 | ) | | | – | | | | – | | | | | | 345 | | | | | | 47 | | | | (493 | ) | | | | | | | | | | |
| Taxation | | | (11 | ) | | | (255 | ) | | | (376 | ) | | | | | (356 | ) | | | | | (42 | ) | | | (1,040 | ) | | | | | | | | | | |
| Basic earnings per share ($) | | | 0.98 | | | | 1.03 | | | | 1.19 | | | | | | 0.85 | | | | | | 0.23 | | | | 4.28 | | | | | | | | | | | |
| 1 | 2014 and 2013 results have been restated to reflect the reclassification of Externalisation Revenue from other operating income and expense as detailed in Group Accounting Policies from page 144. |
| 2 | Each of the measures in the Core column in the above table is a non-GAAP measure. |
| 3 | Gross margin as a % of Product Sales reflects gross profit derived from Product Sales, divided by Product Sales. |
| | |
| 236 | | AstraZenecaAnnual Report and Form 20-F Information 2015 |
All growth rates in this section are expressed at CER unless otherwise stated.
2014 Product Sales increased 3% compared with 2013. Accelerating performance of the Group’s Growth Platforms more than offset the impact of volume erosion on mature brands includingNexium in the US and pricing pressures in Established Markets. 2014 Product Sales in the US were up 4% with Europe down 1%. Established ROW Product Sales were down 4%. Emerging Markets Product Sales were up 12%, mainly driven by growth in China of 22%. China became our second largest market in 2014. Further details of our sales performance are contained in the Geographical Review from page 227.
Externalisation Revenue
As detailed in the Financial Review from page 66, the Group has updated its revenue accounting policy. Reflecting the increased level of externalisation activity, Externalisation Revenue, alongside Product Sales, are now included in Total Revenue. 2014 and 2013 results have been restated to reflect this change, resulting in $452 million of income being reclassified from other operating income to Externalisation Revenue in 2014 (2013: $95 million).
In mid-2014, the US Internal Revenue Service issued final regulations that affected how the annual US Branded Pharmaceutical Fee, imposed by the health care reform legislation in 2010, is recognised. Under the new regulations, the fee is based on actual sales in the current year which necessitated an additional year’s charge to be recognised in 2014. In line with other pharmaceutical industry peers, we previously accrued for this charge based on prior year’s sales and recorded the charge as a cost in SG&A. The final regulation had two impacts on the Group’s results in 2014:
| > | As the fee is now calculated on actual sales in the current year, AstraZeneca considers it more appropriate to account for the fee as a deduction from revenue rather than a charge to SG&A. The new legislation was effective from July 2014 and, therefore, AstraZeneca treated the charge for the period since July 2014 as a deduction from revenue rather than as a cost in SG&A. In 2014 this had the effect of reducing revenue by $113 million. This presentational change to the income statement had no impact on earnings for 2014. |
| > | We recorded a catch-up full annual charge to SG&A, reflecting this new basis, in 2014. The additional year’s charge was excluded from Core financial measures as detailed below. |
Core gross margin as a percentage of Product Sales in 2014 was 81.3%, 0.4 percentage points lower than 2013 at CER as the effect of an unfavourable product mix, including additional costs associated with the Diabetes brands, more than offset the benefit of a lowerCrestor royalty.
Core R&D expense in 2014 was up 15% reflecting increased spend on our late-stage pipeline.
Expenditures in core SG&A in 2014 were 16% higher than 2013, driven by investments in sales and marketing dedicated to the Group’s Growth Platforms. The acquisitions of BMS’s share of the diabetes alliance and the rights to Almirall’s respiratory franchise in 2014 added approximately 4,100 employees. The selective investment in our Growth Platforms was partially funded by a decline in G&A costs during 2014.
Core other income in 2014 was up 19% which included royalty income of $533 million.
The 2014 Core operating profit was down 13%. Core operating margin in 2014 was 26.1% of Total Revenue, down 6.4 percentage points from 2013. The decline in Core operating profit was greater than the decline in Total Revenue primarily due to expenditure associated with the Group’s key Growth Platforms and strengthened pipeline.
Core EPS was $4.28 in 2014, down 8% compared with 2013. The smaller decline in Core EPS compared with Core operating profit was largely due to a lower tax rate. This favourable tax effect was partially offset by an increase in the number of shares outstanding and a marginally higher Core finance expense in 2014 compared with 2013.
Pre-tax adjustments in 2014 to arrive at Core profit before tax amounted to $5,192 million in 2014 (2013: $4,678 million). Excluded from Core results were:
| > | Restructuring costs totalling $1,558 million (2013: $1,421 million), incurred as the Group continued the fourth phase of restructuring announced in March 2013. Restructuring costs included in 2014 included a $292 million loss on disposal of our Alderley Park site. |
| > | Amortisation totalling $1,784 million (2013: $1,591 million) relating to intangible assets, except those related to IT and to our acquisition of BMS’s share of our Global Diabetes Alliance (which are separately detailed below). The increase was driven by amortisation charges in connection with payments in respect of our final Merck exit arrangements. |
| > | Intangible impairment charges of $99 million (2013: net $1,712 million, including a $1,758 million impairment relating toBydureon). Further details relating to intangible asset impairments are included in Note 9 to the Financial Statements from page 158. |
| > | Costs associated with our acquisition of BMS’s share of our Global Diabetes Alliance amounting to $1,423 million. Included within this are $407 million of amortisation charges, a contingent consideration fair value uplift charge of $529 million reflecting higher expected Diabetes portfolio revenues following the successful integration of the newly acquired elements, and $345 million of interest charges relating to a discount unwind on contingent consideration arising on the acquisition (as detailed in Note 18 to the Financial Statements from page 164). |
| > | Net legal provisions and other charges of $328 million (2013: income of $46 million), including a $201 million charge for the additional year’s US Branded Pharmaceutical Fee and $47 million discount unwind charges relating to contingent consideration arising on our other business combinations as detailed in Note 18 to the Financial Statements from page 164). |
2014 Reported operating profit was down 31% at CER to $2,137 million. The larger declines compared with the respective Core financial measures are mainly the result of our enhanced business acquisition activities including our acquisition of BMS’s share of our Global Diabetes Alliance, offset by reduced impairment charges in 2014.
| | |
| AstraZenecaAnnual Report and Form 20-F Information 2015 | | 237 |
Additional Information
Financials (Prior year)continued
Net finance expense in 2014 was $885 million (2013: $445 million). The increase was driven by $453 million (2013: $nil) related to the discount unwind on both contingent consideration arising on business combinations ($391 million) and other long-term liabilities ($62 million).
The 2014 Reported taxation charge of $11 million (2013: $696 million), consisted of a current tax charge of $872 million (2013: $1,398 million) and a credit arising from movements on deferred tax of $861 million (2013: $702 million). The current tax charge in 2014 included a prior period current tax credit of $109 million (2013: charge of $46 million).
The tax paid in 2014 was $1,201 million, which was 96% of Reported profit and 19% of Core profit.
The Reported tax rate for 2014 was 0.9% compared with 21.3% for 2013. The Reported tax rate of 0.9% was impacted by a one-off benefit of $117 million in respect of the inter-governmental agreement of a transfer pricing matter, the non-Core impact of the revaluation of the fair value of contingent consideration arising on business combinations (charge of $512 million with related tax credit of $157 million), and the benefit of the UK Patent Box legislation ($35 million). Excluding these effects, the Reported tax rate for 2014 would have been 18.2%. The Core tax rate for 2014 was 16.2%. Excluding the benefit from the transfer pricing agreement and Patent Box, the Core tax rate would have been 18.5%. Further details relating to movements in our taxation balances are included in Note 4 to the Financial Statements from page 151.
Reported post tax profit for 2014 was $1,235 million, a decrease of 34%. Reported EPS was down 34% to $0.98.
Total comprehensive income in 2014 decreased by $2,729 million from the prior year, resulting in a loss of $271 million. This was driven by the decrease in profit of $1,336 million, and a decrease of $1,393 million in other comprehensive income driven by movements in exchange rates in our consolidated results of $1,352 million, principally due to the strengthening of the
US dollar against sterling, the euro and krona, and losses on the remeasurement of our defined benefit pension liability of $766 million in accordance with the requirements of IAS 19 ‘Employee Benefits’ (driven by a reduction in the discount rate applied to our pension liabilities partially offset by actuarial gains on our scheme assets).
Cash flow and liquidity – 2014
All data in this section is on a Reported basis.
Net cash generated from operating activities was $7,058 million in the year ended 31 December 2014, compared with $7,400 million in 2013. Reductions in working capital partially offset the lower operating profit and higher tax payments.
Working capital movements in 2014 were principally driven by general increases in trade payables and accruals, as a result of our increased R&D and SG&A spend, an increase in the US Managed Markets liabilities, an additional year’s Branded Pharmaceutical levy and a reduction in trade receivables principally in Japan and the US.
Non-cash and other movements included $512 million relating to fair value adjustments on contingent consideration arising on business combinations.
Investment cash outflows in 2014 of $7,125 million (2013: $3,112 million) included $3,804 million (2013: $1,158 million) on completion of business acquisitions, inclusive of BMS’s share of our Global Diabetes Alliance ($2,703 million), the rights to Almirall’s respiratory franchise ($876 million) and the acquisition of Definiens ($150 million). The 2013 comparative period included payments on the completion of the acquisitions of Pearl Therapeutics, Omthera, Amplimmune and Spirogen. Investment cash outflows in 2014 also include $657 million (2013: $nil) of payments against contingent consideration arising on business combinations and $1,740 million (2013: $1,316 million) for the purchase of other intangible assets, which included a $409 million payment to Merck on the consummation of our Second Option and $310 million on the settlement of pre-existing launch- and sales-related milestones with BMS.
Net cash distributions to shareholders in 2014 were $3,242 million (2013: $2,979 million), through dividends of $3,521 million (2013: $3,461 million) partially offset by proceeds from the issue of shares of $279 million (2013: $482 million) due to the exercise of share options.
At 31 December 2014, outstanding gross debt (interest-bearing loans and borrowings) was $10,843 million (2013: $10,376 million). Of the gross debt outstanding at 31 December 2014, $2,446 million was due within one year (2013: $1,788 million).
Net debt at 31 December 2014 was $3,223 million, compared to a net funds position of $39 million at the beginning of 2014, as a result of the net cash outflow as described above.
Financial position – 2014
All data in this section is on a Reported basis.
In 2014, net assets decreased by $3,607 million to $19,646 million. The decrease in net assets was broadly as a result of dividends of $3,532 million and adverse movements on exchange taken to reserves of $1,352 million, partially offset by the 2014 Group profit of $1,235 million.
Property, plant and equipment
Property, plant and equipment increased by $192 million to $6,010 million in 2014. Additions of $1,607 million (2013: $816 million), including $515 million (2013: $8 million) arising on business combinations, were offset by depreciation of $776 million (2013: $906 million) and disposals of $582 million (2013: $82 million). Property, plant and equipment also increased due to the transfer of a prepayment balance of $350 million, which related to amounts paid to BMS for fixed assets under our previous joint operation with BMS; with the acquisition of BMS’s interest in the diabetes franchise we acquired the underlying property, plant and equipment to which this prepayment related.
| | |
| 238 | | AstraZenecaAnnual Report and Form 20-F Information 2015 |
Goodwill and intangible assets
The Group’s goodwill of $11,550 million as at 31 December 2014 (2013: $9,981 million) principally arose on the acquisition of MedImmune in 2007 and the restructuring of our US joint venture with Merck in 1998. Goodwill of $1,841 million arising on our acquisitions of BMS’s share of our Global Diabetes Alliance ($1,530 million) and the rights to Almirall’s respiratory franchise ($311 million) was capitalised in 2014.
Intangible assets amounted to $20,981 million at 31 December 2014 (2013: $16,047 million). Intangible asset additions were $8,548 million in 2014 (2013: $3,217 million), including product rights acquired in our acquisitions of $7,501 million (2013: $2,416 million). Amortisation in 2014 was $2,384 million (2013: $1,779 million). Impairment charges in the year amounted to $122 million (2013: $2,082 million).
Further details of our additions to intangible assets, and impairments recorded, are included in Note 9 to the Financial Statements from page 158.
Receivables, payables and provisions
Trade receivables decreased by $752 million to $4,762 million principally in Japan and the US.
In 2014, prepayments and accrued income decreased by $928 million. As detailed in our 2013 Annual Report, in 2013, we modified the royalty structure under our global licence agreement forCrestor, which was amended to include fixed minimum and maximum annual royalty payments to Shionogi. These future royalties were recognised within payables and as a prepayment. The reduction in prepayments in 2014 was driven by the payment of one year’s royalties under this revised agreement, along with a transfer of $350 million from prepayments to property, plant and equipment as detailed above.
Trade and other payables increased by $7,163 million in 2014 to $19,877 million, with increases of $993 million in trade payables, $677 million of rebates and chargebacks, and $5,781 million in other payables, including $6,385 million in contingent consideration offset by a
reduction of one year’s Shionogi royalty payments. The increase in trade payables was driven by our increased in year R&D and SG&A spend in the later part of 2014. The rebates and chargebacks balance includes an additional year’s US Branded Pharmaceutical levy.
The decrease in provisions of $282 million in 2014 included $633 million of cash payments, partially offset by $434 million of additional charges recorded in 2014. Included within the $434 million of charges for 2014 were $254 million for our global restructuring initiative and $91 million in respect of legal charges. Cash payments in 2014 included $472 million for our global restructuring programme.
Tax payable and receivable
Net income tax payable decreased by $557 million in 2014 to $2,025 million, principally due to cash tax timing differences, foreign exchange and a $117 million adjustment in respect of prior periods following the settlement of the inter-governmental agreement of a transfer pricing matter. The 31 December 2014 tax receivable balance of $329 million comprised tax owing to AstraZeneca from certain governments expected to be received on settlements of transfer pricing audits and disputes and cash tax timing differences. Net deferred tax liabilities increased by $1,045 million in 2014, mainly due to a reversal of taxable temporary differences.
Retirement benefit obligations
Net retirement benefit obligations decreased by $690 million in 2014. Employer contributions to the pension scheme of $184 million and beneficial exchange movements of $268 million were offset by service cost charges of $221 million, net financing costs of $92 million and net remeasurement adjustments of $766 million.
| | |
| AstraZenecaAnnual Report and Form 20-F Information 2015 | | 239 |
Additional Information
Shareholder Information
AstraZeneca PLC share listings and prices
| | | | | | | | | | | | | | | | | | | | |
| | | 2011 | | | 2012 | | | 2013 | | | 2014 | | | 2015 | |
| Ordinary Shares in issue – millions | | | | | | | | | | | | | | | | | | | | |
| At year end | | | 1,292 | | | | 1,247 | | | | 1,257 | | | | 1,263 | | | | 1,264 | |
| Weighted average for year | | | 1,361 | | | | 1,261 | | | | 1,252 | | | | 1,262 | | | | 1,264 | |
| Stock market price – per Ordinary Share | | | | | | | | | | | | | | | | | | | | |
| Highest (pence) | | | 3194.0 | | | | 3111.5 | | | | 3612.0 | | | | 4823.5 | | | | 4863.0 | |
| Lowest (pence) | | | 2543.5 | | | | 2591.0 | | | | 2909.5 | | | | 3549.5 | | | | 3903.5 | |
| At year end (pence) | | | 2975.0 | | | | 2909.5 | | | | 3574.5 | | | | 4555.5 | | | | 4616.5 | |
| | | | | |
Percentage analysis of issued share capital at 31 December | | | | | | | | | | | | | | | | | | | | |
By size of account Number of Ordinary Shares | | 2011 % | | | 2012 % | | | 2013 % | | | 2014 % | | | 2015 % | |
| 1 – 250 | | | 0.6 | | | | 0.6 | | | | 0.5 | | | | 0.5 | | | | 0.5 | |
| 251 – 500 | | | 0.7 | | | | 0.7 | | | | 0.6 | | | | 0.6 | | | | 0.6 | |
| 501 – 1,000 | | | 0.8 | | | | 0.8 | | | | 0.8 | | | | 0.7 | | | | 0.7 | |
| 1,001 – 5,000 | | | 1.2 | | | | 1.1 | | | | 1.1 | | | | 1.0 | | | | 0.9 | |
| 5,001 – 10,000 | | | 0.2 | | | | 0.2 | | | | 0.2 | | | | 0.2 | | | | 0.2 | |
| 10,001 – 50,000 | | | 1.0 | | | | 1.0 | | | | 1.0 | | | | 1.0 | | | | 0.9 | |
| 50,001 – 1,000,000 | | | 13.8 | | | | 12.6 | | | | 12.3 | | | | 13.3 | | | | 13.0 | |
| Over 1,000,0001 | | | 81.7 | | | | 83.0 | | | | 83.5 | | | | 82.7 | | | | 83.2 | |
| 1 | Includes Euroclear and ADR holdings. |
At 31 December 2015, the Company had 97,260 registered holders of 1,264,122,670 Ordinary Shares. There were 104,150 holders of Ordinary Shares held under the Euroclear Services Agreement, representing 10.8% of the issued share capital of the Company and approximately 172,000 holders of ADSs, representing 10.8% of the issued share capital of the Company. With effect from 27 July 2015, the Company’s ADS ratio changed to two ADSs per one Ordinary Share. The former ratio was one ADS per one Ordinary Share. With effect from 6 February 2015, Citibank, N.A. (Citibank) succeeded JPMorgan Chase Bank (JPMorgan) as depositary of the ADSs.
In 1999, in connection with the merger between Astra and Zeneca through which the Company was formed, the Company’s share capital was redenominated in US dollars. On 6 April 1999, Zeneca shares were cancelled and US dollar shares issued, credited as fully paid on the basis of one dollar share for each Zeneca share then held. This was achieved by a reduction of
capital under section 135 of the Companies Act 1985. Upon the reduction of capital becoming effective, all issued and unissued Zeneca shares were cancelled and the sum arising as a result of the share cancellation credited to a special reserve, which was converted into US dollars at the rate of exchange prevailing on the record date. This US dollar reserve was then applied in paying up, at par, newly created US dollar shares.
At the same time as the US dollar shares were issued, the Company issued 50,000 Redeemable Preference Shares for cash, at par. The Redeemable Preference Shares carry limited class voting rights, no dividend rights and are capable of redemption, at par, at the option of the Company on the giving of seven days’ written notice to the registered holder of the Redeemable Preference Shares.
A total of 826 million Ordinary Shares were issued to Astra shareholders who accepted the merger offer before the final closing date, 21 May 1999. The Company received acceptances from Astra shareholders
representing 99.6% of Astra’s shares and the remaining 0.4% was acquired in 2000, for cash.
Since April 1999, following the merger of Astra and Zeneca, the principal markets for trading in the shares of the Company are the LSE, the SSE and the NYSE. The table overleaf sets out, for 2014 and 2015, the reported high and low share prices of the Company, on the following bases:
| > | For shares listed on the LSE, the reported high and low middle market closing quotations are derived from the Daily Official List. |
| > | For shares listed on the SSE, the high and low closing sales prices are as stated in the Official List. |
| > | For ADSs listed on the NYSE, the reported high and low sales prices are as reported by Dow Jones (ADR quotations). |
| | |
| 240 | | AstraZenecaAnnual Report and Form 20-F Information 2015 |
| | | | | | | | | | | | | | | | | | | | | | | | | | | | | | |
| | | | | Ordinary LSE | | | | | Ordinary SSE | | | | | ADS | |
| | | | | High (pence) | | | Low (pence) | | | | | High (SEK) | | | Low (SEK) | | | | | High (US$) | | | Low (US$) | |
| 2014 | | – Quarter 1 | | | 4103.0 | | | | 3549.5 | | | | | | 446.3 | | | | 380.5 | | | | | | 68.38 | | | | 58.51 | |
| | | – Quarter 2 | | | 4823.5 | | | | 3723.0 | | | | | | 532.5 | | | | 409.7 | | | | | | 81.09 | | | | 62.45 | |
| | | – Quarter 3 | | | 4597.0 | | | | 4092.5 | | | | | | 536.0 | | | | 467.3 | | | | | | 76.31 | | | | 68.49 | |
| | | – Quarter 4 | | | 4780.0 | | | | 4169.5 | | | | | | 558.5 | | | | 484.5 | | | | | | 75.38 | | | | 67.15 | |
| 2015 | | – Quarter 1 | | | 4847.0 | | | | 4272.0 | | | | | | 625.0 | | | | 538.0 | | | | | | 72.22 | | | | 64.44 | |
| | | – Quarter 2 | | | 4863.0 | | | | 4019.0 | | | | | | 638.0 | | | | 522.5 | | | | | | 73.35 | | | | 63.71 | |
| | | – Quarter 3 | | | 4424.5 | | | | 3903.5 | | | | | | 603.0 | | | | 508.5 | | | | | | 34.54 | 1 | | | 30.28 | 1 |
| | | – Quarter 4 | | | 4627.5 | | | | 3947.0 | | | | | | 597.5 | | | | 509.0 | | | | | | 34.77 | | | | 30.47 | |
| | | – July | | | 4347.5 | | | | 4120.5 | | | | | | 584.5 | | | | 538.0 | | | | | | 67.89 | 1 | | | 64.33 | 1 |
| | | – August | | | 4424.5 | | | | 3903.5 | | | | | | 603.0 | | | | 508.5 | | | | | | 34.54 | | | | 30.28 | |
| | | – September | | | 4379.0 | | | | 4033.5 | | | | | | 567.0 | | | | 523.5 | | | | | | 34.37 | | | | 30.69 | |
| | | – October | | | 4247.5 | | | | 3947.0 | | | | | | 548.0 | | | | 509.0 | | | | | | 32.39 | | | | 30.47 | |
| | | – November | | | 4520.0 | | | | 4075.0 | | | | | | 597.5 | | | | 538.0 | | | | | | 34.11 | | | | 30.85 | |
| | | – December | | | 4627.5 | | | | 4285.5 | | | | | | 597.0 | | | | 550.5 | | | | | | 34.77 | | | | 32.80 | |
| 1 | With effect from 27 July 2015, the Company’s ADS ratio was changed to two ADSs per one Ordinary Share. The former ratio was one ADS per one Ordinary Share. |
Major shareholdings
At 31 December 2015, the following had disclosed an interest in the issued Ordinary Share capital of the Company in accordance with the requirements of rules 5.1.2 or 5.1.5 of the UK Listing Authority’s Disclosure and Transparency Rules:
| | | | | | | | | | | | |
| Shareholder | | Number of Ordinary Shares | | | Date of disclosure to Company1 | | | Percentage of issued share
capital | |
| BlackRock, Inc. | | | 100,885,181 | | | | 8 December 2009 | | | | 7.98 | |
| Investor AB | | | 51,587,810 | | | | 2 February 2012 | | | | 4.08 | |
| The Capital Group Companies, Inc. | | | 37,925,813 | | | | 17 July 2015 | | | | 3.00 | |
| 1 | Since the date of disclosure to the Company, the interest of any person listed above in Ordinary Shares may have increased or decreased. No requirement to notify the Company of any increase or decrease would have arisen unless the holding moved up or down through a whole number percentage level. The percentage level may increase (on the cancellation of shares following a repurchase of shares under the Company’s share repurchase programme) or decrease (on the issue of new shares under any of the Company’s share plans). |
So far as the Company is aware, no other person held a notifiable interest in the issued Ordinary Share capital of the Company.
No changes to major shareholdings were disclosed to the Company between 31 December 2015 and 31 January 2016. Any changes between 31 January 2016 and 29 February 2016 will be set out in the Notice of Annual General Meeting 2016 and Shareholders’ Circular.
Changes in the percentage ownership held by major shareholders during the past three years are set out below. Major shareholders do not have different voting rights.
| | | | | | | | | | | | | | | | |
| Shareholder | | 31 January
2016 | | | 31 January
2015 | | | 31 January
2014 | | | 2 February
2013 | |
| BlackRock, Inc. | | | 7.98 | | | | 7.99 | | | | 8.01 | | | | 8.08 | |
| Investor AB | | | 4.08 | | | | 4.08 | | | | 4.09 | | | | 4.13 | |
| The Capital Group Companies, Inc. | | | 3.00 | | | | < 3.00 | | | | 3.01 | | | | < 3.00 | |
| Invesco Limited | | | < 5.00 | | | | < 5.00 | | | | 5.78 | | | | 5.83 | |
| Axa SA | | | < 3.00 | | | | < 3.00 | | | | 4.52 | | | | 4.57 | |
| Legal & General Investment Management Limited | | | < 3.00 | | | | < 3.00 | | | | < 3.00 | | | | 4.62 | |
ADSs evidenced by ADRs issued by Citibank, as depositary, are listed on the NYSE. At 31 January 2016, the proportion of Ordinary Shares represented by ADSs was 11.07% of the Ordinary Shares outstanding.
Number of registered holders of Ordinary Shares at 31 January 2016:
Number of record holders of ADRs at 31 January 2016:
| | |
| AstraZenecaAnnual Report and Form 20-F Information 2015 | | 241 |
Additional Information
Shareholder Informationcontinued
So far as the Company is aware, it is neither directly nor indirectly owned or controlled by one or more corporations or by any government.
The Company does not know of any arrangements, the operation of which might result in a change in the control of the Company.
At 31 January 2016, the total amount of the Company’s voting securities owned by Directors and officers of the Company was:
| | | | | | | | |
| Title of class | | Amount
owned | | | Percentage
of class | |
| Ordinary Shares | | | 500,191 | | | | 0.04 | |
Related party transactions
During the period 1 January 2015 to 31 January 2016, there were no transactions, loans, or proposed transactions between the Company and any related parties which were material to either the Company or the related party, or which were unusual in their nature or conditions (see also Note 29 to the Financial Statements from page 192).
Options to purchase securities from registrant or subsidiaries
(a) At 31 January 2016, options outstanding to subscribe for Ordinary Shares were:
| | | | | | | | |
| Number of shares | | Subscription
price (pence) | | | Normal
expiry date | |
| 3,725,301 | | | 1882 – 3599 | | | | 2016 – 2021 | |
The weighted average subscription price of options outstanding at 31 January 2016 was 2713 pence. All options were granted under Company employee share schemes.
(b) Included in paragraph (a) are options granted to officers of the Company as follows:
| | | | | | | | |
| Number of shares | | Subscription
price (pence) | | | Normal
expiry date | |
| 40,343 | | | 2280 – 3599 | | | | 2017 – 2021 | |
(c) At 31 January 2016, none of the Directors of the Company held options to subscribe for Ordinary Shares.
During the period 1 January 2015 to 31 January 2016, no Director exercised any options.
Dividend payments
For Ordinary Shares listed on the LSE and the SSE, the record date for the second interim dividend for 2015, payable on 21 March 2016, is 19 February 2016 and the ex-dividend date is 18 February 2016. For ADRs listed on the NYSE, the record date is 19 February 2016 and the ex-dividend date is 17 February 2016.
The record date for the first interim dividend for 2016, payable on 12 September 2016, is 12 August 2016.
Future dividends will normally be paid as follows:
| > | First interim: Announced in July/August and paid in September. |
| > | Second interim: Announced in January/ February and paid in March. |
Shareview
The Company’s shareholders with internet access may visit the website, www.shareview.co.uk, and register their details to create a portfolio. Shareview is a free and secure online service from the Company’s registrar, Equiniti Limited, which gives access to shareholdings, including balance movements, indicative share prices and information about recent dividends.
ShareGift
The Company welcomes and values all of its shareholders, no matter how many or how few shares they own. However, shareholders who have only a small number of shares whose value makes it uneconomic to sell them, either now or at some stage in the future, may wish to consider donating them to charity through ShareGift, an independent charity share donation scheme. One feature of the scheme is that there is no gain or loss for UK capital gains tax purposes on gifts of shares through ShareGift, and it may now also be possible to obtain UK income tax relief on the donation. Further information about ShareGift can be found on its website, www.sharegift.org, or by contacting ShareGift on 020 7930 3737 or at 17 Carlton House Terrace, London SW1Y 5AH. ShareGift is administered by The Orr Mackintosh Foundation, registered charity number 1052686. More information about the UK tax position on gifts of shares to ShareGift can be obtained from HM Revenue & Customs on its website, www.hmrc.gov.uk.
The Unclaimed Assets Register
The Company supplies unclaimed dividend data to the Unclaimed Assets Register (UAR), which provides investors who have lost track of shareholdings with an opportunity to search the UAR’s database of unclaimed financial assets on payment of a small fixed fee. The UAR donates part of the search fee to charity. The UAR can be contacted on 0844 481 8180 or at uarenquiries@uk.experian.com.
Results
Unaudited trading results of AstraZeneca in respect of the first three months of 2016 will be published on 29 April 2016 and results in respect of the first six months of 2016 will be published on 28 July 2016.
Documents on display
The Articles and other documents concerning the Company which are referred to in this Annual Report may be inspected at the Company’s registered office at 2 Kingdom Street, London W2 6BD.
Taxation for US persons
The following summary of material UK and US federal income tax consequences of ownership of Ordinary Shares or ADRs held as capital assets by the US holders described below is based on current UK and US federal income tax law, including the US/UK double taxation convention relating to income and capital gains, which entered into force on 31 March 2003 (the Convention). This summary does not describe all of the tax consequences that may be relevant in light of the US holders’ particular circumstances and tax consequences applicable to US holders subject to special rules (such as certain financial institutions, entities treated as partnerships for US federal income tax purposes, persons whose functional currency for US federal income tax purposes is not the US dollar, tax-exempt entities, persons subject to alternative minimum tax, persons subject to the Medicare contribution tax on ‘net investment income’, or persons holding Ordinary Shares or ADRs in connection with a trade or business conducted outside of the US). US holders are urged to consult their tax advisers regarding the UK and US federal income tax consequences of the ownership and disposition of Ordinary Shares or ADRs in their particular circumstances.
| | |
| 242 | | AstraZenecaAnnual Report and Form 20-F Information 2015 |
This summary is based in part on representations of Citibank as depositary for ADRs and assumes that each obligation in the deposit agreement among the Company and the depositary and the holders from time to time of ADRs and any related agreements will be performed in accordance with its terms. The US Treasury has expressed concerns that parties to whom American depositary shares are released before shares are delivered to the depositary (pre-release), or intermediaries in the chain of ownership between holders and the issuer of the security underlying the American depositary shares, may be taking actions that are inconsistent with the claiming, by US holders of American depositary shares, of foreign tax credits for US federal income tax purposes. Such actions would also be inconsistent with the claiming of the reduced tax rates, described below, applicable to dividends received by certain non-corporate US holders. Accordingly, the availability of the reduced tax rates for dividends received by certain non-corporate US holders could be affected by actions that may be taken by parties to whom ADRs are pre-released.
For the purposes of this summary, the term ‘US holder’ means a beneficial owner of Ordinary Shares or ADRs that is, for US federal income tax purposes, a citizen or resident of the US, a corporation (or other entity taxable as a corporation) created or organised in or under the laws of the US, any state in the US or the District of Columbia, or an estate or trust, the income of which is subject to US federal income taxation regardless of its source.
This summary assumes that we are not, and will not become, a passive foreign investment company, as discussed below.
UK and US income taxation of dividends
The UK does not currently impose a withholding tax on dividends paid by a UK company, such as the Company.
For US federal income tax purposes, distributions paid by the Company to a US holder are included in gross income as foreign source ordinary dividend income to the extent paid out of the Company’s current or accumulated earnings and profits, calculated in accordance with US federal income tax principles. The Company does
not maintain calculations of its earnings and profits under US federal income tax principles and so it is expected that distributions generally will be reported to US holders as dividends. The amount of the dividend will be the US dollar amount received by the depositary for US holders of ADRs (or, in the case of Ordinary Shares, the US dollar value of the foreign currency payment, determined at the spot rate of the relevant foreign currency on the date the dividend is received by the US holders, regardless of whether the dividend is converted into US dollars), and it will not be eligible for the dividends received deduction generally available to US corporations. If the dividend is converted into US dollars on the date of receipt, US holders of Ordinary Shares generally should not be required to recognise foreign currency gains or losses in respect of the dividend income. They may have foreign currency gain or loss (taxable at the rates applicable to ordinary income) if the amount of such dividend is converted into US dollars after the date of its receipt.
Subject to applicable limitations and the discussion above regarding concerns expressed by the US Treasury, dividends received by certain non-corporate US holders of Ordinary Shares or ADRs may be taxable at favourable US federal income tax rates. US holders should consult their own tax advisers to determine whether they are subject to any special rules which may limit their ability to be taxed at these favourable rates.
Taxation on capital gains
Under present English law, individuals who are neither resident nor ordinarily resident in the UK, and companies which are not resident in the UK, will not be liable for UK tax on capital gains made on the disposal of their Ordinary Shares or ADRs, unless such Ordinary Shares or ADRs are held in connection with a trade, profession or vocation carried on in the UK through a branch or agency or other permanent establishment.
A US holder will generally recognise US source capital gains or losses for US federal income tax purposes on the sale or exchange of Ordinary Shares or ADRs in an amount equal to the difference between the US dollar amount realised and such holder’s US dollar tax basis in the Ordinary Shares or ADRs. US holders should consult their own
tax advisers about the treatment of capital gains, which may be taxed at lower rates than ordinary income for non-corporate US holders and capital losses, the deductibility of which may be subject to limitations.
Passive Foreign Investment Company (PFIC) rules
We believe that we were not a PFIC for US federal income tax purposes for the year ended 31 December 2015. However, since PFIC status depends on the composition of our income and assets, and the market value of our assets (including, among others, less than 25% owned equity investments), from time to time, there can be no assurance that we will not be considered a PFIC for any taxable year. If we were treated as a PFIC for any taxable year during which Ordinary Shares or ADRs were held, certain adverse tax consequences could apply to US holders.
Information reporting and backup withholding
Payments of dividends and sales proceeds that are made within the US or through certain US-related financial intermediaries may be subject to information reporting and backup withholding, unless: (i) the US holder is a corporation or other exempt recipient; or (ii) in the case of backup withholding, the US holder provides a correct taxpayer identification number and certifies that it is not subject to backup withholding. The amount of any backup withholding from a payment to a US holder will be allowed as a credit against the holder’s US federal income tax liability and may entitle the holder to a refund, provided that the required information is timely supplied to the US Internal Revenue Service (IRS).
Certain US holders who are individuals (and under proposed US Treasury regulations, certain entities), may be required to report information relating to securities issued by non-US persons (or foreign accounts through which the securities are held), generally on IRS Form 8938, subject to certain exceptions (including an exception for securities held in accounts maintained by US financial institutions). US holders should consult their tax advisers regarding their reporting obligations with respect to the Ordinary Shares or ADRs.
| | |
| AstraZenecaAnnual Report and Form 20-F Information 2015 | | 243 |
Additional Information
Shareholder Informationcontinued
UK inheritance tax
Under the current Double Taxation (Estates) Convention (the Estate Tax Convention) between the US and the UK, Ordinary Shares or ADRs held by an individual shareholder who is domiciled for the purposes of the Estate Tax Convention in the US, and is not for the purposes of the Estate Tax Convention a national of the UK, will generally not be subject to UK inheritance tax on the individual’s death or on a chargeable gift of the Ordinary Shares or ADRs during the individual’s lifetime, provided that any applicable US federal gift or estate tax liability is paid, unless the Ordinary Shares or ADRs are part of the business property of a permanent establishment of the individual in the UK or, in the case of a shareholder who performs independent personal services, pertain to a fixed base situated in the UK. Where the Ordinary Shares or ADRs have been placed in trust by a settlor who, at the time of settlement, was a US domiciled shareholder, the Ordinary Shares or ADRs will generally not be subject to UK inheritance tax unless the settlor, at the time of settlement, was a UK national, or the Ordinary Shares or ADRs are part of the business property of a permanent establishment of the individual in the UK or, in the case of a shareholder who performs independent personal services, pertain to a fixed base situated in the UK. In the exceptional case where the Ordinary Shares or ADRs are subject to both UK inheritance tax and US federal gift or estate tax, the Estate Tax Convention generally provides for double taxation to be relieved by means of credit relief.
UK stamp duty reserve tax and stamp duty
A charge to UK stamp duty or UK stamp duty reserve tax (SDRT) may arise on the deposit of Ordinary Shares in connection with the creation of ADRs. The rate of stamp duty or SDRT will generally be 1.5% of the value of the consideration or, in some circumstances, the value of the Ordinary Shares. There is no 1.5% SDRT charge on the issue of Ordinary Shares (or, where it is integral to the raising of new capital, the transfer of Ordinary Shares) into the ADR arrangement.
No UK stamp duty will be payable on the acquisition or transfer of existing ADRs provided that any instrument of transfer or written agreement to transfer is executed outside the UK and remains at all times outside the UK. An agreement for the transfer of ADRs will not give rise to a liability for SDRT.
A transfer of, or an agreement to, transfer Ordinary Shares will generally be subject to UK stamp duty or SDRT at 0.5% of the amount or value of any consideration, provided, in the case of stamp duty, it is rounded to the nearest £5.
Transfers of Ordinary Shares into CREST will generally not be subject to stamp duty or SDRT, unless such a transfer is made for a consideration in money or money’s worth, in which case a liability to SDRT will arise,
usually at the rate of 0.5% of the value of the consideration. Paperless transfers of Ordinary Shares within CREST are generally liable to SDRT at the rate of 0.5% of the value of the consideration. CREST is obliged to collect SDRT from the purchaser on relevant transactions settled within the system.
Exchange controls and other limitations affecting security holders
There are no governmental laws, decrees or regulations in the UK restricting the import or export of capital or affecting the remittance of dividends, interest or other payments to non-resident holders of Ordinary Shares or ADRs.
There are no limitations under English law or the Articles on the right of non-resident or foreign owners to be the registered holders of, or to exercise voting rights in relation to, Ordinary Shares or ADRs or to be registered holders of notes or debentures of Zeneca Wilmington Inc. or the Company.
Exchange rates
The following information relating to average and spot exchange rates used by AstraZeneca is provided for convenience:
| | | | | | | | |
| | | SEK/US$ | | | US$/GBP | |
| Average rates (statement of comprehensive income, statement of cash flows) | | | | | | | | |
| 2013 | | | 6.5089 | | | | 1.5621 | |
| 2014 | | | 6.7901 | | | | 1.6532 | |
| 2015 | | | 8.395033 | | | | 1.53567 | |
| End of year spot rates (statement of financial position) | | | | | | | | |
| 2013 | | | 6.4233 | | | | 1.6502 | |
| 2014 | | | 7.7451 | | | | 1.5559 | |
| 2015 | | | 8.41140 | | | | 1.48165 | |
Compliance requirements under Listing Rule 9.8.4
Other than as set out below, the Company has nothing to report under Listing Rule 9.8.4
| | |
Item | | Location of details in Annual Report |
| Details of any long-term incentive schemes | | Note 26 of the Financial Statements and Directors’ Remuneration Report |
| Shareholder waiver of dividends | | Page 96 in the Corporate Governance Report |
| | |
| 244 | | AstraZenecaAnnual Report and Form 20-F Information 2015 |
Corporate Information
History and development of the Company
AstraZeneca PLC was incorporated in England and Wales on 17 June 1992 under the Companies Act 1985. It is a public limited company domiciled in the UK. The Company’s registered number is 2723534 and its registered office is at 2 Kingdom Street, London W2 6BD (telephone +44 (0)20 7604 8000). From February 1993 until April 1999, the Company was called Zeneca Group PLC. On 6 April 1999, the Company changed its name to AstraZeneca PLC.
The Company was formed when the pharmaceutical, agrochemical and specialty chemical businesses of Imperial Chemical Industries PLC were demerged in 1993. In 1999, the Company sold the specialty chemical business. Also in 1999, the Company merged with Astra of Sweden. In 2000, it demerged the agrochemical business and merged it with the similar business of Novartis to form a new company called Syngenta AG.
In 2007, the Group acquired MedImmune, a biologics and vaccines business based in the US.
The Group’s corporate office is at 2 Kingdom Street, London W2 6BD.
Articles
The current Articles were adopted by shareholders at the Company’s AGM held on 24 April 2015.
Objects
The Company’s objects are unrestricted.
Any amendment to the Articles requires the approval of shareholders by a special resolution at a general meeting of the Company.
Directors
The Board has the authority to manage the business of the Company, for example, through powers to allot and repurchase its shares, subject where required to shareholder resolutions. Subject to certain exceptions, Directors do not have power to vote at Board meetings on matters in which they have a material interest.
The quorum for meetings of the Board is a majority of the full Board, of whom at least four must be Non-Executive Directors. In the absence of a quorum, the Directors do not have power to determine compensation arrangements for themselves or any member of the Board.
The Board may exercise all the powers of the Company to borrow money. Variation of these borrowing powers would require the passing of a special resolution of the Company’s shareholders.
All Directors must retire from office at the Company’s AGM each year and may present themselves for election or re-election. Directors are not prohibited, upon reaching a particular age, from submitting themselves for election or re-election.
Within two months of the date of their appointment, Directors are required to beneficially own Ordinary Shares of an aggregate nominal amount of at least $125, which currently represents 500 shares.
Rights, preferences and restrictions attaching to shares
As at 31 December 2015, the Company had 1,264,122,670 Ordinary Shares and 50,000 Redeemable Preference Shares in issue. The Ordinary Shares represent 99.98% and the Redeemable Preference Shares represent 0.02% of the Company’s total share capital (these percentages have been calculated by reference to the closing mid-point US$/GBP exchange rate on 31 December 2015 as published in the London edition of the Financial Times newspaper).
As agreed by the shareholders at the Company’s AGM held on 29 April 2010, the Articles were amended with immediate effect to remove the requirement for the Company to have an authorised share capital, the concept of which was abolished under the Companies Act 2006. Each Ordinary Share carries the right to vote at general meetings of the Company. The rights and restrictions attaching to the Redeemable Preference Shares differ from those attaching to Ordinary Shares as follows:
| > | The Redeemable Preference Shares carry no rights to receive dividends. |
| > | The holders of Redeemable Preference Shares have no rights to receive notices of, attend or vote at general meetings except in certain limited circumstances. They have one vote for every 50,000 Redeemable Preference Shares held. |
| > | On a distribution of assets of the Company, on a winding-up or other return of capital (subject to certain exceptions), the holders of Redeemable Preference Shares have priority over the holders of Ordinary Shares to receive the capital paid up on those shares. |
| > | Subject to the provisions of the Companies Act 2006, the Company has the right to redeem the Redeemable Preference Shares at any time on giving not less than seven days’ written notice. |
There are no specific restrictions on the transfer of shares in the Company, which is governed by the Articles and prevailing legislation.
The Company is not aware of any agreements between holders of shares that may result in restrictions on the transfer of shares or that may result in restrictions on voting rights. The Company is also not aware of any arrangements under which financial rights are held by a person other than the holder of the shares.
Action necessary to change the rights of shareholders
In order to vary the rights attached to any class of shares, the consent in writing of the holders of three-quarters in nominal value of the issued shares of that class or the sanction of an extraordinary resolution passed at a general meeting of such holders is required.
General meetings
AGMs and other general meetings, as from time to time may be required, where a special resolution is to be passed or a Director is to be appointed, require 21 clear days’ notice to shareholders. Subject to the Companies Act 2006, other general meetings require 14 clear days’ notice.
For all general meetings, a quorum of two shareholders present in person or by proxy, and entitled to vote on the business transacted, is required unless each of the two persons present is a corporate representative of the same corporation; or each of the two persons present is a proxy of the same shareholder.
Shareholders and their duly appointed proxies and corporate representatives are entitled to be admitted to general meetings.
Limitations on the rights to own shares
There are no limitations on the rights to own shares.
Property
Substantially all of our properties are held freehold, free of material encumbrances and are fit for their purpose.
For more information please refer to Note 7 to the Group Financial Statements on page 156.
| | |
| AstraZenecaAnnual Report and Form 20-F Information 2015 | | 245 |
Additional Information
Trade Marks
AstraZeneca, the AstraZeneca logotype and the AstraZeneca symbol are all trade marks of the Group.
The following brand names which appear in italics in this Annual Report are trade marks of the Group:
| | | | | | |
Trade mark |
| Accolate | | Farxiga | | Nolvadex | | Symlin |
| Arimidex | | Faslodex | | Onglyza | | Synagis2 |
| Atacand | | Fluenz | | Oxis Turbuhaler | | Tagrisso |
| Atacand HCT | | FluMist | | Plendil | | Tenormin3 |
| Atacand Plus | | Forxiga | | Pressair | | Toprol-XL |
| Axanum | | Genuair | | Prilosec | | Turbuhaler |
| Bricanyl | | Iressa | | Pulmicort | | Vimovo |
| Brilinta | | Kombiglyze | | Pulmicort Flexhaler | | Xigduo |
| Brilique | | Komboglyze | | Pulmicort Respules | | Xylocaine |
| Bydureon | | Losec | | Pulmicort Turbuhaler | | Zestril3 |
| Byetta | | Lynparza | | Respules | | Zoladex |
| Caprelsa | | Meronem | | Rhinocort | | Zomig |
| Casodex | | Merrem | | Seloken | | Zurampic |
| Cosudex | | Movantik | | Seroquel | | |
| Crestor | | Moventig | | Seroquel XR | | |
| Diprivan | | Myalept1 | | Symbicort | | |
| EMLA | | Naropin | | Symbicort SMART | | |
| Entocort | | Nexium | | Symbicort Turbuhaler | | |
| 1 | AstraZeneca assigned this trade mark to Aegerion effective 9 January 2015. |
| 2 | AstraZeneca owns this trade mark in the US only. AbbVie owns it in the rest of the world. |
| 3 | AstraZeneca assigned these trade marks in the US to Alvogen effective 9 January 2015. |
The following brand names which appear in italics in this Annual Report are trade marks licensed to the Group by the entities set out below:
| | | | | | |
Trade mark | | Licensor or Owner | | | | |
| Bretaris | | Almirall, S.A. | | | | |
| Cubicin | | Cubist Pharmaceuticals, Inc. | | | | |
| Daliresp/Daxas | | Takeda GmbH | | | | |
| Duaklir | | Almirall, S.A. | | | | |
| Eklira | | Almirall, S.A. | | | | |
| Epanova | | Chrysalis Pharma AG | | | | |
| Tudorza | | Almirall, S.A. | | | | |
| Zinforo | | Forest Laboratories Holdings Limited | | | | |
| Zytiga1 | | Janssen Pharmaceutical K.K. | | | | |
| 1 | AstraZeneca has been licensed this trade mark for use in Japan only. |
The following brand names which appear in italics throughout this Annual Report are not owned by or licensed to the Group and are owned by the entities set out below:
| | | | | | |
Trade mark | | Owner | | | | |
| Plavix | | SANOFI S.A. | | | | |
| Invokana | | Johnson & Johnson Corporation | | | | |
| Lipitor | | Pfizer Ireland Pharmaceuticals | | | | |
| messenger RNA Therapeutics | | Moderna Therapeutics, Inc. | | | | |
| | |
| 246 | | AstraZenecaAnnual Report and Form 20-F Information 2015 |
Market definitions
| | | | | | | | | | |
Region | | Country | | | | | | | | |
| US | | US | | | | | | | | |
| Europe | | Albania* | | Czech Republic | | Hungary | | Luxembourg* | | Serbia and Montenegro* |
| | | Austria | | Denmark | | Iceland* | | Malta* | | Slovakia |
| | | Belgium | | Estonia* | | Ireland | | Netherlands | | Slovenia* |
| | | Bosnia and Herzegovina* | | Finland | | Israel* | | Norway | | Spain |
| | | Bulgaria | | France | | Italy | | Poland | | Sweden |
| | | Croatia | | Germany | | Latvia* | | Portugal* | | Switzerland |
| | | Cyprus* | | Greece | | Lithuania* | | Romania | | UK |
| Established ROW | | Australia | | Japan | | | | | | |
| | | Canada | | New Zealand | | | | | | |
| Emerging Markets | | Algeria | | Costa Rica | | Iraq* | | Other Africa* | | Sudan* |
| | | Argentina | | Cuba* | | Jamaica* | | Pakistan* | | Syria* |
| | | Aruba* | | Dominican Republic* | | Jordan* | | Palestine* | | Taiwan |
| | | Bahamas* | | Ecuador | | Kazakhstan | | Panama | | Thailand |
| | | Bahrain* | | Egypt | | Kuwait* | | Peru | | Trinidad and Tobago* |
| | | Barbados* | | El Salvador | | Lebanon* | | Philippines | | Tunisia* |
| | | Belarus* | | Georgia* | | Libya* | | Qatar* | | Turkey |
| | | Belize* | | Guatemala | | Malaysia | | Russia | | Ukraine* |
| | | Bermuda* | | Honduras | | Mexico | | Saudi Arabia | | United Arab Emirates |
| | | Brazil | | Hong Kong | | Morocco* | | Singapore | | Uruguay* |
| | | Chile | | India | | Netherlands Antilles* | | South Africa | | Venezuela |
| | | China | | Indonesia | | Nicaragua | | South Korea | | Vietnam* |
| | | Colombia | | Iran* | | Oman* | | Sri Lanka* | | Yemen* |
| * | IMS Health, IMS Midas Quantum Q3 2015 data is not available or AstraZeneca does not subscribe for IMS Health quarterly data for these countries. |
The above table is not an exhaustive list of all the countries in which AstraZeneca operates, and excludes countries with revenue in 2015 of less than $1 million.
Established Markets means US, Europe and Established ROW.
North America means US and Canada.
Other Established ROW means Australia and New Zealand.
Other Emerging Markets means all Emerging Markets except China.
Other Africa includes Angola, Botswana, Ethiopia, Ghana, Kenya, Mauritius, Mozambique, Namibia, Nigeria, Swaziland, Tanzania, Uganda, Zambia and Zimbabwe.
Asia Area comprises India, Indonesia, Malaysia, Philippines, Singapore, South Korea, Sri Lanka, Taiwan, Thailand and Vietnam.
US equivalents
| | |
Terms used in this Annual Report | | US equivalent or brief description |
| Accruals | | Accrued expenses |
| Allotted | | Issued |
| Called-up share capital | | Issued share capital |
| Creditors | | Liabilities/payables |
| Debtors | | Receivables and prepaid expenses |
| Earnings | | Net income |
| Employee share schemes | | Employee stock benefit plans |
| Fixed asset investments | | Non-current investments |
| Freehold | | Ownership with absolute rights in perpetuity |
| Interest payable | | Interest expense |
| Loans | | Long-term debt |
| Prepayments | | Prepaid expenses |
| Profit | | Income |
| Profit and loss account | | Income statement/consolidated statement of comprehensive income |
| Share premium account | | Premiums paid in excess of par value of Ordinary Shares |
| Short-term investments | | Redeemable securities and short-term deposits |
| | |
| AstraZeneca Annual Report and Form 20-F Information 2015 | | 247 |
Additional Information
Glossarycontinued
The following abbreviations and expressions have the following meanings when used in this Annual Report:
Abbott – Abbott Laboratories.
AbbVie – AbbVie Inc.
ACA (Affordable Care Act) – the Patient Protection and Affordable Care Act which was signed into law on 23 March 2010 as amended by the Health Care and Education Reconciliation Act which was signed into law on 30 March 2010.
Acerta Pharma – Acerta Pharma B.V.
ACS – Acute Coronary Syndrome.
Actavis – Actavis plc.
ADC Therapeutics – ADC Therapeutics Sàrl.
ADR – an American Depositary Receipt evidencing title to an ADS.
ADS – an American Depositary Share representing one underlying Ordinary Share.
AGM – an Annual General Meeting of the Company.
Aegerion – Aegerion Pharmaceuticals, Inc.
Almirall – Almirall, S.A.
Amgen – Amgen, Inc.
Amplimmune – Amplimmune, Inc.
Amylin – Amylin Pharmaceuticals, LLC (formerly Amylin Pharmaceuticals, Inc.).
ANDA – an abbreviated new drug application, which is a marketing approval application for a generic drug submitted to the FDA.
Annual Report – this Annual Report and Form 20-F Information 2015.
API – active pharmaceutical ingredient.
Ardea – Ardea Biosciences, Inc.
Articles – the Articles of Association of the Company.
Astellas – Astellas Pharma Inc.
Astra – Astra AB, being the company with whom the Company merged in 1999.
AstraZeneca – the Company and its subsidiaries.
AZIP – AstraZeneca Investment Plan.
BACE – beta secretase cleaving enzyme.
biologic(s) – a class of drugs that are produced in living cells.
biosimilars – a copy of a biologic that is sufficiently similar to meet regulatory requirements.
BMS – Bristol-Myers Squibb Company.
Board – the Board of Directors of the Company.
Bureau Veritas – Bureau Veritas UK Limited.
Celgene – Celgene International Sàrl.
CEO – the Chief Executive Officer of the Company.
CER – constant exchange rates.
CFDA – China Food and Drug Administration.
CFO – the Chief Financial Officer of the Company.
CHMP – the Committee for Medicinal Products for Human Use.
CIS – Commonwealth of Independent States.
Code of Conduct – the Group’s Code of Conduct.
Company or Parent Company – AstraZeneca PLC (formerly Zeneca Group PLC (Zeneca)).
COPD – chronic obstructive pulmonary disease.
Corporate Integrity Agreement (CIA) – the agreement described in the US Corporate Integrity Agreement reporting section on page 50.
CROs – contract research organisations.
CVMD – Cardiovascular and Metabolic diseases.
CV – cardiovascular.
Daiichi Sankyo – Daiichi Sankyo, Inc.
Definiens – Definiens AG.
Director – a director of the Company.
DOJ – the United States Department of Justice.
earnings per share (EPS) – profit for the year after tax and non-controlling interests, divided by the weighted average number of Ordinary Shares in issue during the year.
EC – European Commission.
EFPIA – European Federation of Pharmaceutical Industries and Associations.
EGFR – epidermal growth factor receptor.
EMA – European Medicines Agency.
EPO – European Patent Office.
EVP – Executive Vice-President.
EU – the European Union.
FDC – fixed-dose combination.
FDA – the US Food and Drug Administration, which is part of the US Department of Health and Human Services Agency, which is the regulatory authority for all pharmaceuticals (including biologics and vaccines) and medical devices in the US.
FibroGen – FibroGen, Inc.
Forest – Forest Laboratories Holdings Limited.
FRC – Financial Reporting Council.
GAAP – Generally Accepted Accounting Principles.
GMD – Global Medicines Development.
GPPS – Global Product and Portfolio Strategy.
gross margin – the margin, as a percentage, by which sales exceed the cost of sales, calculated by dividing the difference between the two by the sales figure.
Group – AstraZeneca PLC and its subsidiaries.
GSK – GlaxoSmithKline plc.
Gulf – Bahrain, Kuwait, Oman, Pakistan, Qatar and the United Arab Emirates.
Heptares – Heptares Ltd.
HHA – Healthy Heart Africa programme.
HR – human resources.
IA – the Group’s Internal Audit Services function.
IAS – International Accounting Standards.
IAS 19 – IAS 19 ‘Employee Benefits’.
IAS 32 – IAS 32 ‘Financial Instruments: Presentation’.
IAS 39 – IAS 39 ‘Financial Instruments: Recognition and Measurement’.
IASB – International Accounting Standards Board.
IFRS – International Financial Reporting Standards or International Financial Reporting Standard, as the context requires.
IFRS 8 – IFRS 8 ‘Operating Segments’.
IMED – Innovative Medicines and Early Development.
Immunocore – Immunocore Limited.
InnatePharma – Innate Pharma S.A.
IP – intellectual property.
IS – information services.
ISAs – International Standards on Auditing.
IT – information technology.
KPI – key performance indicator.
Krona or SEK – references to the currency of Sweden.
Kyowa Hakko Kirin – Kyowa Hakko Kirin Co., Ltd.
LCM projects – significant life-cycle management projects (as determined by potential revenue generation), or line extensions.
Lean – means enhancing value for customers with fewer resources.
Lilly – Eli Lilly and Company.
LTI – long-term incentive, in the context of share plan remuneration arrangements.
MAA – a marketing authorisation application, which is an application for authorisation to place medical products on the market. This is a specific term used in the EU and European Economic Area markets.
MAb – monoclonal antibody, a biologic that is specific, that is, it binds to and attacks one particular antigen.
| | |
| 248 | | AstraZenecaAnnual Report and Form 20-F Information 2015 |
major market – US, EU, Japan and China.
MAT – moving annual total.
MedImmune – MedImmune, LLC (formerly MedImmune, Inc.).
Merck– Merck Sharp & Dohme Corp. (formerly Merck & Co., Inc.).
MI – myocardial infarction.
Moderna Therapeutics – Moderna Therapeutics, Inc.
Myriad – Myriad Genetics, Inc.
NDA– a new drug application to the FDA for approval to market a new medicine in the US.
NME – new molecular entity.
Novartis – Novartis Pharma AG.
NSAID– a non-steroidal anti-inflammatory drug.
NSCLC – non-small cell lung cancer.
NSTE-ACS – non-ST-Elevation acute coronary syndromes.
NYSE– the New York Stock Exchange.
n/m – not meaningful.
Omthera – Omthera Pharmaceuticals, Inc.
operating profit – sales, less cost of sales, less operating costs, plus operating income.
Ordinary Share – an ordinary share of $0.25 each in the share capital of the Company.
Orphan Drug – a drug which has been approved for use in a relatively low-incidence indication (an orphan indication) and has been rewarded with a period of market exclusivity; the period of exclusivity and the available orphan indications vary between markets.
OTC – over-the-counter.
Paediatric Exclusivity – in the US, a six-month period of exclusivity to market a drug which is awarded by the FDA in return for certain paediatric clinical studies using that drug. This six-month period runs from the date of relevant patent expiry. Analogous provisions are available in certain other territories (such as European Supplementary Protection Certificate (SPC) paediatric extensions).
PD-L1 – an anti-programmed death-ligand 1.
Pearl Therapeutics – Pearl Therapeutics, Inc.
Pfizer – Pfizer, Inc.
PhRMA – Pharmaceutical Research and Manufacturers of America.
Phase I – the phase of clinical research where a new drug or treatment is tested in small groups of people (20 to 80) to check that the drug can achieve appropriate concentrations in the body, determine a safe dosage range and identify side effects. This phase includes healthy volunteer studies.
Phase II – the phase of clinical research which includes the controlled clinical activities conducted to evaluate the effectiveness of the drug in patients with the disease under study and to begin to determine the safety profile of the drug. Phase II studies are typically conducted in small or medium sized groups of patients and can be divided into Phase IIa studies, which tend to be designed to assess dosing requirements, and Phase IIb studies, which tend to assess safety and efficacy.
Phase III– the phase of clinical research which is performed to gather additional information about effectiveness and safety of the drug, often in a comparative setting, to evaluate the overall benefit/risk profile of the drug. Phase III studies usually include between several hundred and several thousand patients.
PHC – personalised healthcare.
PMDA – Pharmaceuticals and Medical Devices Agency of Japan.
pMDI – pressurised metered-dose inhaler.
pound sterling, £, GBP or pence – references to the currency of the UK.
Pozen – POZEN, Inc.
primary care – general healthcare provided by physicians who ordinarily have first contact with patients and who may have continuing care for them.
Proof of Concept– data demonstrating that a candidate drug results in a clinical change on an acceptable endpoint or surrogate in patients with the disease.
PSP – AstraZeneca Performance Share Plan.
PTE – Patent Term Extension, an extension of up to five years in the term of a US patent relating to a drug which compensates for delays in marketing resulting from the need to obtain FDA approval. The analogous right in the EU is an SPC.
Qiagen – Qiagen Manchester Limited.
R&D– research and development.
Redeemable Preference Share – a redeemable preference share of £1 each in the share capital of the Company.
Regulatory Data Protection (RDP) – see the Intellectual Property section on page 60.
Regulatory Exclusivity – any of the IP rights arising from generation of clinical data and includes Regulatory Data Protection, Paediatric Exclusivity and Orphan Drug status.
Roche – F. Hoffmann-La Roche AG.
RSV – respiratory syncytial virus.
Sanofi – SANOFI S.A.
Sarbanes-Oxley Act – the US Sarbanes-Oxley Act of 2002.
SEC – the US Securities and Exchange Commission, the governmental agency that regulates the US securities industry and stock markets.
Seroquel –Seroquel IR andSeroquel XR.
SET – Senior Executive Team.
SG&A costs – selling, general and administrative costs.
SGLT2 – sodium-glucose co-transporter 2.
Shionogi – Shionogi & Co. Ltd.
SLE – systemic lupus erythematosus.
SPC – supplementary protection certificate.
specialty care – specific healthcare provided by medical specialists who do not generally have first contact with patients.
Spirogen – Spirogen Sàrl.
Takeda – Takeda Pharmaceutical Company Limited.
Teva – Teva Pharmaceuticals USA, Inc.
Total Revenue – the sum of Product Sales and Externalisation Revenue.
TSR – total shareholder return, being the total return on a share over a period of time, including dividends reinvested.
UK – United Kingdom of Great Britain and Northern Ireland.
UK Corporate Governance Code – the UK Corporate Governance Code published by the FRC in September 2014 that sets out standards of good practice in corporate governance for the UK.
US – United States of America.
US dollar, US$, USD or $ – references to the currency of the US.
Valeant – Valeant Holdings Ireland/Valeant Pharmaceutical International Inc.
Ventana – Ventana Medical Systems, Inc.
WHO – World Health Organization, the United Nations’ specialised agency for health.
YHP – Young Health Programme.
ZS Pharma – ZS Pharma, Inc.
| | |
| AstraZeneca Annual Report and Form 20-F Information 2015 | | 249 |
Additional Information
Index
| | | | |
Accounting policies | | | 144, 199 | |
Acerta Pharma | | | 4, 56-57, 193 | |
Acquisitions | | | 173-177 | |
Affordable Care Act | | | 14, 49, 231 | |
Almirall | | | 68-73, 160, 174-176, 237-239 | |
Animal research | | | 45 | |
Annual General Meeting | | | 82, 97, 245 | |
Articles of Association | | | 245 | |
AstraZeneca at a glance | | | 2 | |
Audit Committee | | | 84, 86-87, 98-102 | |
Audit Committee Report | | | 98-102 | |
Bioethics | | | 44-45, 234 | |
Biologics | | | 10, 13 | |
BMS | | | 70-73, 174 | |
Board of Directors | | | 86-87 | |
Brilinta/Brilique | | | 30-33 | |
Business model | | | 8-9 | |
Cambridge | | | 7, 42, 53-54 | |
Capitalisation and shareholder return | | | 76 | |
Cardiovascular and Metabolic diseases | | | 30-33 | |
Cash and cash equivalents | | | 69, 146, 163 | |
Chairman’s Statement | | | 82 | |
Chief Executive Officer’s Review | | | 4 | |
Clinical trials | | | 45 | |
Code of Conduct | | | 95-98 | |
Commitments and contingent liabilities | | | 186-192 | |
Community investment | | | 58-59 | |
Company history | | | 245 | |
Compliance and Internal Audit Services | | | 95 | |
Consolidated Statements | | | 140-143 | |
Corporate Information | | | 245 | |
Corporate Integrity Agreement | | | 50 | |
Corporate Governance | | | 82-135 | |
Definiens | | | 72, 175-176 | |
Development pipeline | | | 25, 205-209 | |
Diabetes | | | 30-33 | |
Directors’ interest in shares | | | 114-115 | |
Directors’ responsibility statement | | | 135 | |
Diversity | | | 52-53, 90-91 | |
Dividends | | | 76, 96, 172 | |
Earnings per Ordinary Share | | | 153 | |
Employee costs and share plans for employees | | | 182-185 | |
Employees | | | 52-54 | |
Ethics | | | 50, 96 | |
Environmental impact | | | 58 | |
Finance income and expense | | | 151 | |
Financial instruments | | | 146, 151, 161-162 | |
Financial position 2014 | | | 238-239 | |
Financial position 2015 | | | 71 | |
Financial Review | | | 62-81 | |
Financial risk management | | | 76-77, 177-182 | |
Financial Statements 2015 | | | 135-202 | |
Financial summary | | | 2 | |
Financials 2014 | | | 236-239 | |
Gender diversity | | | 52-53 | |
Geographical Review | | | 227-233 | |
Global pharmaceutical sales | | | 12-13 | |
Glossary | | | 247-249 | |
Group Financial Record | | | 202 | |
Group Subsidiaries and Holdings | | | 194-195 | |
Growth Platforms | | | 7, 16-17 | |
Healthy Heart Africa programme | | | 51 | |
Human Rights | | | 54 | |
Independent auditor’s report | | | 136-139 | |
Infection, Neuroscience and Gastrointestinal | | | 39-41 | |
Inflammation | |
| see Respiratory, Inflammation
and Autoimmunity |
|
| | | | |
Information Technology | | | 22, 61, 220 | |
Infrastructure | | | 61 | |
Intangible assets | | | 71, 79-80, 101, 136, 145, 158-160, 239 | |
Intellectual Property | | | 60 | |
Interest-bearing loans and borrowings | | | 163-164 | |
Key performance indicators | | | 18-20 | |
Leases | | | 146, 148, 192 | |
Life-cycle of a medicine | | | 10-11 | |
Litigation | | | 22, 80-81, 101, 137, 147, 186-191, 199, | |
| | | | 214-215, 218, 223 | |
Lynparza | | | 34-38 | |
Manufacturing and Supply | | | 46 | |
Market definitions | | | 247 | |
Marketplace | | | 12-15 | |
Oncology | | | 34-38 | |
Operating profit | | | 1, 62-67, 150-151, 236 | |
Operational overview | | | 2 | |
Other investments | | | 147, 161 | |
PARTHENON programme | | | 33 | |
Patent Expiries | | | 15 | |
Patents | | | see Intellectual Property | |
Patient safety | | | 22, 44-45 | |
Personalised healthcare | | | 43-44 | |
Physician Payments Sunshine Act | | | 50 | |
Pipeline and Therapy Area Introduction | | | 24-41 | |
Political donations | | | 97 | |
Post-retirement benefits | | | 80, 101, 137, 166-171 | |
Primary care | | | 10 | |
Product revenue information | | | 227-233 | |
Property, plant and equipment | | | 71, 146, 156, 238 | |
Provisions | | | 165 | |
Regulatory requirements | | | 13-14 | |
Related party transactions | | | 193, 242 | |
Relations with shareholders | | | 93 | |
Remuneration | | | 107-116 | |
Remuneration Policy | | | 117-134 | |
Research and Development | | | 42-45 | |
Reserves | | | 172 | |
Respiratory, Inflammation and Autoimmunity | | | 26-29 | |
Restructuring | | | 68, 150 | |
Results of operations 2014 | | | 238 | |
Results of operations 2015 | | | 65 | |
Risk | | | 21, 212-226 | |
Sales and Marketing | | | 48-50 | |
Sales by geographical area | | | 227-233 | |
Sales by therapy area | | | 24-41, 227-233 | |
Sarbanes-Oxley Act | | | 81 | |
Science Committee | | | 85, 94 | |
Segment information | | | 154-155 | |
Senior management (SET) | | | 88-89 | |
Share capital | | | 172 | |
Share repurchase | | | 75, 172 | |
Shareholder distributions | | | 76, 96 | |
Shareholder information | | | 240-244 | |
Specialty care | | | 10 | |
Strategic priorities | | | 16-17 | |
Sustainability: supplementary information | | | 234-235 | |
Tagrisso | | | 4, 34, 36 | |
Takeda | | | 5, 28 | |
Taxation | | | 68, 76, 81, 146, 151-153, 199 | |
Taxation information for shareholders | | | 242-244 | |
Trade and other payables | | | 71, 146, 164-165, 239 | |
Trade and other receivables | | | 71, 146, 163, 181 | |
Trade marks | | | 246 | |
Values and purpose | | | 8-9 | |
Young Health Programme | | | 59 | |
ZS Pharma | | | 4, 72, 173 | |
| | |
| 250 | | AstraZenecaAnnual Report and Form 20-F Information 2015 |
Important information for readers of this Annual Report
Cautionary statement regarding forward-looking statements
The purpose of this Annual Report is to provide information to the members of the Company. The Company and its Directors, employees, agents and advisers do not accept or assume responsibility to any other person to whom this Annual Report is shown or into whose hands it may come and any such responsibility or liability is expressly disclaimed. In order, among other things, to utilise the ‘safe harbour’ provisions of the US Private Securities Litigation Reform Act of 1995 and the UK Companies Act 2006, we are providing the following cautionary statement: This Annual Report contains certain forward-looking statements with respect to the operations, performance and financial condition of the Group, including, among other things, statements about expected revenues, margins, earnings per share or other financial or other measures. Forward-looking statements are statements relating to the future which are based on information available at the time such statements are made, including information relating to risks and uncertainties. Although we believe that the forward-looking statements in this Annual Report are based on reasonable assumptions, the matters discussed in the forward-looking statements may be influenced by factors that could cause actual outcomes and results to be materially different from those expressed or implied by these statements. The forward-looking statements reflect knowledge and information available at the date of the preparation of this Annual Report and the Company undertakes no obligation to update these forward-looking statements. We identify the forward-looking statements by using the words ‘anticipates’, ‘believes’, ‘expects’, ‘intends’ and similar expressions in such statements. Important factors that could cause actual results to differ materially from those contained in forward-looking statements, certain of which are beyond our control, include, among other things, those factors identified in the Risk section from page 212 of this Annual Report. Nothing in this Annual Report should be construed as a profit forecast.
Inclusion of Reported performance, Core financial measures and constant exchange rate growth rates
AstraZeneca’s determination of non-GAAP measures together with our presentation of them within our financial information may differ from similarly titled non-GAAP measures of other companies.
Statements of competitive position, growth rates and sales
In this Annual Report, except as otherwise stated, market information regarding the position of our business or products relative to its or their competition is based upon published statistical sales data for the 12 months ended 30 September 2015 obtained from IMS Health, a leading supplier of statistical data to the pharmaceutical industry. Unless otherwise noted, for the US, dispensed new or total prescription data and audited sales data are taken, respectively, from IMS Health National Prescription Audit and IMS National Sales Perspectives for the 12 months ended 31 December 2015; such data is not adjusted for Medicaid and similar rebates. Except as otherwise stated, these market share and industry data from IMS Health have been derived by comparing our sales revenue with competitors’ and total market sales revenues for that period. Except as otherwise stated, growth rates are given at CER. For the purposes of this Annual Report, unless otherwise stated, references to the world pharmaceutical market or similar phrases are to the 54 countries contained in the IMS Health database, which amounted to approximately 97% (in value) of the countries audited by IMS Health.
AstraZeneca websites
Information on or accessible through our websites, including www.astrazeneca.com, www.astrazenecaclinicaltrials.com and www.medimmune.com, does not form part of and is not incorporated into this Annual Report.
External/third party websites
Information on or accessible through any third party or external website does not form part of and is not incorporated into this Annual Report.
Figures
Figures in parentheses in tables and in the Financial Statements are used to represent negative numbers.
| | |
| AstraZeneca Annual Report and Form 20-F Information 2015 | | 251 |
Additional Information
| | | | |
Registered office and corporate headquarters AstraZeneca PLC 2 Kingdom Street London W2 6BD UK Tel: +44 (0)20 7604 8000 Investor relations UK: as above US: Investor Relations AstraZeneca Pharmaceuticals LP One MedImmune Way Gaithersburg MD 20878 US Tel: +1 (301) 398 0000 | | Registrar Equiniti Limited Aspect House Spencer Road Lancing West Sussex BN99 6DA UK Tel: (freephone in the UK) 0800 389 1580 Tel: (outside the UK) +44 (0)121 415 7033 Swedish Central Securities Depository Euroclear Sweden AB PO Box 191 SE-101 23 Stockholm Sweden Tel: +46 (0)8 402 9000 US Depositary Citibank Shareholder Services PO Box 43077 Providence RI 02940-3077 US Tel: (toll free in the US) +1 (888) 697 8018 Tel: (outside the US) +1 (781) 575 4555 citibank@shareholders-online.com |
| | For more information please see www.astrazeneca.com | |
| | |
| 252 | | AstraZenecaAnnual Report and Form 20-F Information 2015 |
| | | | |
Designed and produced by | | This Annual Report is printed on Heaven 42 which is FSC® | |  |
| CONRAN DESIGN GROUP | | certified virgin fibre. The pulp is a mix; partly bleached using | |
| | an Elemental Chlorine Free (ECF) process and partly bleached | |
| Board and SET photography | | using a Totally Chlorine Free process. It is printed in the UK | |
| by Marcus Lyon | | by Pureprint using itsalcofree® andpureprint® environmental | |
| | printing technology, and vegetable inks were used throughout. | |
| | Pureprint is a CarbonNeutral® company. Both the manufacturing | |
| | mill and the printer are registered to the Environmental | |
| | Management System ISO 14001 and are Forest Stewardship | |
| | Council® chain-of-custody certified. | |
AstraZeneca PLC
2 Kingdom Street
London W2 6BD
UK
T: +44 (0)20 7604 8000
| | | | | | |
| | | |
| | | | | | |
| | | | |
| |  | | This Annual Report is also available on our website, www.astrazeneca.com/annualreport2015 | | |
| | | | | | |
| | | | | | |


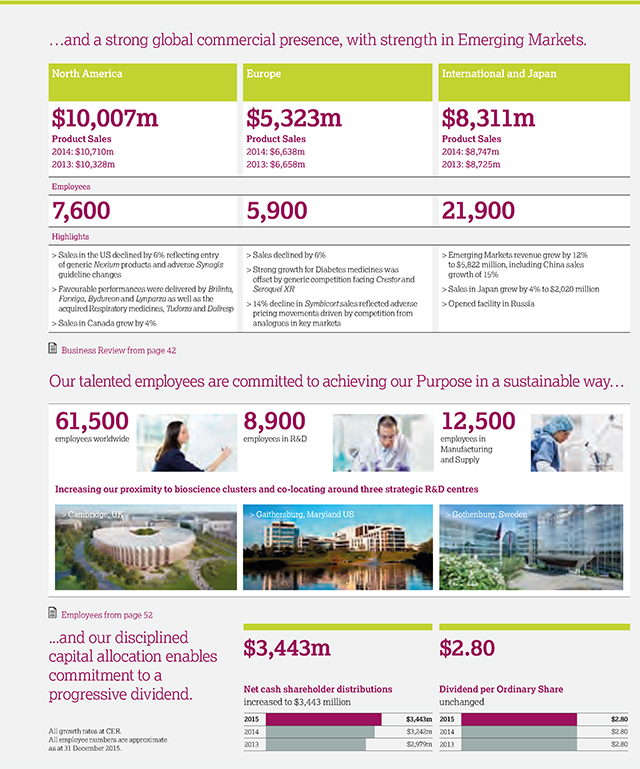
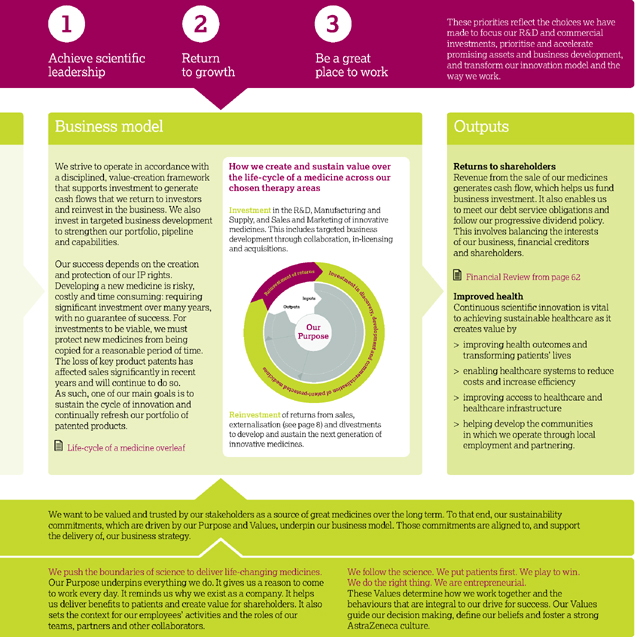


 Our financial performance in 2015 reflected continued progress from our Growth Platforms, which grew 11% in the year and now contribute 57% of Total Revenue.”