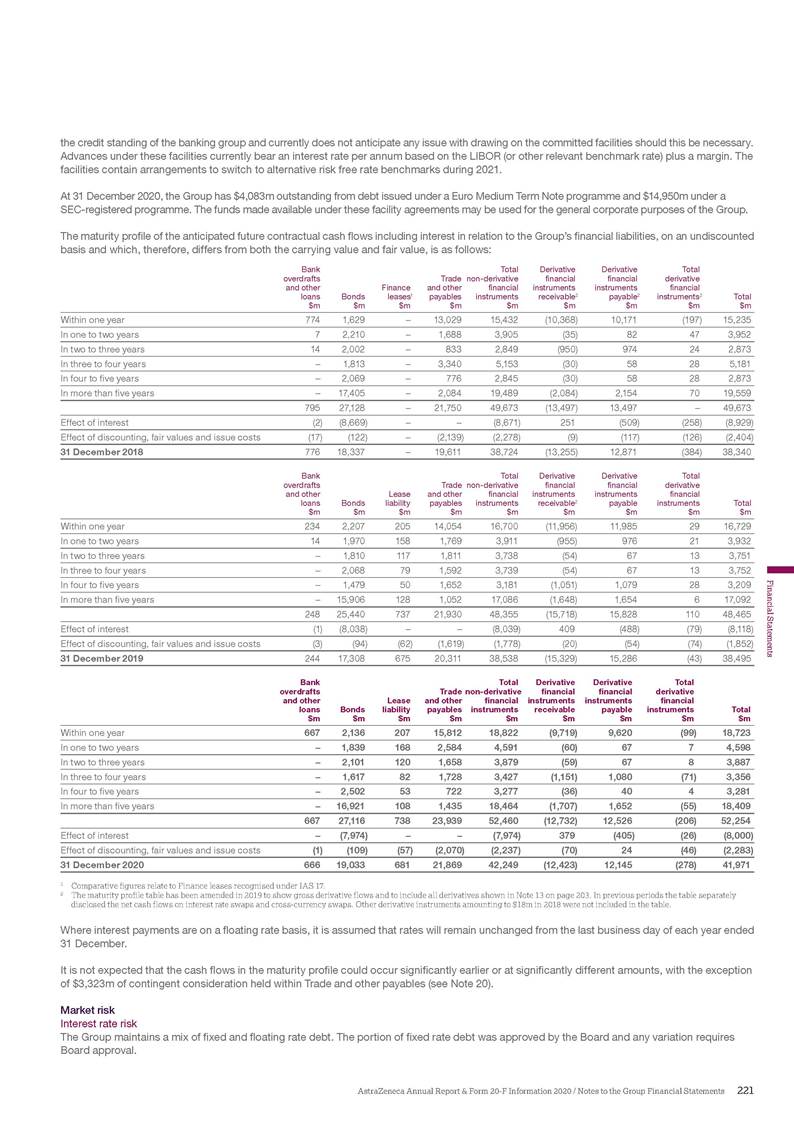
the credit standing of the banking group and currently does not anticipate any issue with drawing on the committed facilities should this be necessary. Advances under these facilities currently bear an interest rate per annum based on the LIBOR (or other relevant benchmark rate) plus a margin. The facilities contain arrangements to switch to alternative risk free rate benchmarks during 2021. At 31 December 2020, the Group has $4,083m outstanding from debt issued under a Euro Medium Term Note programme and $14,950m under a SEC-registered programme. The funds made available under these facility agreements may be used for the general corporate purposes of the Group. The maturity profile of the anticipated future contractual cash flows including interest in relation to the Group’s financial liabilities, on an undiscounted basis and which, therefore, differs from both the carrying value and fair value, is as follows: Bank overdrafts and other loans $m Total Trade non-derivative Derivative financial instruments receivable2 $m Derivative financial instruments payable2 $m Total derivative financial instruments2 $m Finance leases1 $m and other payables financial instruments $m Bonds $m Total $m $m Within one year 774 1,629 – 13,029 15,432 (10,368) 10,171 (197) 15,235 In one to two years 7 2,210 – 1,688 3,905 (35) 82 47 3,952 In two to three years 14 2,002 – 833 2,849 (950) 974 24 2,873 In three to four years – 1,813 – 3,340 5,153 (30) 58 28 5,181 In four to five years – 2,069 – 776 2,845 (30) 58 28 2,873 In more than five years – 17,405 – 2,084 19,489 (2,084) 2,154 70 19,559 795 27,128 – 21,750 49,673 (13,497) 13,497 – 49,673 Effect of interest (2) (8,669) – – (8,671) 251 (509) (258) (8,929) Effect of discounting, fair values and issue costs (17) (122) – (2,139) (2,278) (9) (117) (126) (2,404) 31 December 2018 776 18,337 – 19,611 38,724 (13,255) 12,871 (384) 38,340 Bank overdrafts and other loans $m Total Trade non-derivative Derivative financial instruments receivable2 $m Derivative financial instruments payable $m Total derivative financial instruments $m Lease liability $m and other payables financial instruments $m Bonds $m Total $m $m Within one year 234 2,207 205 14,054 16,700 (11,956) 11,985 29 16,729 In one to two years 14 1,970 158 1,769 3,911 (955) 976 21 3,932 In two to three years – 1,810 117 1,811 3,738 (54) 67 13 3,751 In three to four years – 2,068 79 1,592 3,739 (54) 67 13 3,752 In four to five years – 1,479 50 1,652 3,181 (1,051) 1,079 28 3,209 In more than five years – 15,906 128 1,052 17,086 (1,648) 1,654 6 17,092 248 25,440 737 21,930 48,355 (15,718) 15,828 110 48,465 Effect of interest (1) (8,038) – – (8,039) 409 (488) (79) (8,118) Effect of discounting, fair values and issue costs (3) (94) (62) (1,619) (1,778) (20) (54) (74) (1,852) 31 December 2019 244 17,308 675 20,311 38,538 (15,329) 15,286 (43) 38,495 Bank overdrafts and other loans $m Total Trade non-derivative Derivative financial instruments receivable $m Derivative financial instruments payable $m Total derivative financial instruments $m Lease liability $m and other financial instruments $m Bonds $m payables $m Total $m Within one year 667 2,136 207 15,812 18,822 (9,719) 9,620 (99) 18,723 In one to two years – 1,839 168 2,584 4,591 (60) 67 7 4,598 In two to three years – 2,101 120 1,658 3,879 (59) 67 8 3,887 In three to four years – 1,617 82 1,728 3,427 (1,151) 1,080 (71) 3,356 In four to five years – 2,502 53 722 3,277 (36) 40 4 3,281 In more than five years – 16,921 108 1,435 18,464 (1,707) 1,652 (55) 18,409 667 27,116 738 23,939 52,460 (12,732) 12,526 (206) 52,254 Effect of interest – (7,974) – – (7,974) 379 (405) (26) (8,000) Effect of discounting, fair values and issue costs (1) (109) (57) (2,070) (2,237) (70) 24 (46) (2,283) 31 December 2020 666 19,033 681 21,869 42,249 (12,423) 12,145 (278) 41,971 1 2 Comparative figures relate to Finance leases recognised under IAS 17. The maturity profile table has been amended in 2019 to show gross derivative flows and to include all derivatives shown in Note 13 on page 203. In previous periods the table separately disclosed the net cash flows on interest rate swaps and cross-currency swaps. Other derivative instruments amounting to $18m in 2018 were not included in the table. Where interest payments are on a floating rate basis, it is assumed that rates will remain unchanged from the last business day of each year ended 31 December. It is not expected that the cash flows in the maturity profile could occur significantly earlier or at significantly different amounts, with the exception of $3,323m of contingent consideration held within Trade and other payables (see Note 20). Market risk Interest rate risk The Group maintains a mix of fixed and floating rate debt. The portion of fixed rate debt was approved by the Board and any variation requires Board approval. AstraZeneca Annual Report & Form 20-F Information 2020 / Notes to the Group Financial Statements 221 Financial Statements