
© 2013 Sigma-Aldrich Co. LLC. All rights reserved. Sigma-Aldrich Corporation February 2013 Investor Information

© 2013 Sigma-Aldrich Co. LLC. All rights reserved. 2 Cautionary Statements • The earnings call and this presentation contain “forward-looking statements” regarding future sales, earnings, return on equity, cost savings, process improvements, free cash flow, share repurchases, capital expenditures, acquisitions and other matters. Such statements can be identified by words such as: “market drivers,” “guidance,” “expects,”, “enhances,” “anticipates,” “believes,” “can,” “expects,” “likely,” “should,” “will” and similar references to future periods. Forward-looking statements are neither historical facts nor assurances of future performance. Instead, they are based only on our current beliefs, expectations and assumptions regarding the future of our business, future plans and strategies, projections, anticipated events and trends, the economy and other future conditions. Because forward- looking statements relate to the future, they are subject to inherent uncertainties, risks and changes in circumstances that are difficult to predict and many of which are outside of our control. Our actual results and financial condition may differ materially from those indicated in the forward-looking statements. For a list of factors, risks and uncertainties which could make our actual results differ from expected results, please see the accompanying earnings release posted to the investor relations’ section of our website at www.sigma-aldrich.com and Item 1A of Part I of our latest Annual Report on Form 10-K. We undertake no obligation to publicly update any forward-looking statement, whether written or oral, as a result of new information, future developments or otherwise. • The earnings call and this presentation also contain non-GAAP financial information. Management uses this information in its internal analysis of results and believes this information may be informative to investors in gauging the quality of our financial performance, identifying trends in our results and providing meaningful period-to-period comparisons. For a reconciliation of non-GAAP measures presented on the earnings call and in this presentation, see the accompanying earnings release and the Appendix to this presentation – Reconciliation of GAAP to Non-GAAP Financial Measures.

© 2013 Sigma-Aldrich Co. LLC. All rights reserved. Sigma-Aldrich Overview 3 Delivering Value Through A Diversified Portfolio No customer comprises more than 2% of sales, no product more than 1% GLOBALLY BALANCED 43% Total Americas 37% Europe, Middle East, Africa 20% Asia Pacific DIVERSE END-MARKETS 53% Research 23% Applied 24% SAFC Commercial PRODUCTS 170,000 chemicals (50,000 manufactured) 45,000 Laboratory Equipment Items 43% 37% 20% 53% 23% 24% 79% 21% $2.6Bn Revenue OUR MISSION Enabling Science to Improve the Quality of Life OUR VISION To be the trusted and preeminent global provider to the research laboratory and targeted commercial markets $2.6Bn Revenue 215,000 Products YTD – Twelve months ending 12/31/2012

© 2013 Sigma-Aldrich Co. LLC. All rights reserved. (1) See Slide 22 for Reconciliation of Net Cash Provided by Operating Activities to Free Cash Flow. (2) Special items include one-time extraordinary tax charges and restructuring charges. 4 Fourth Quarter 2012 Financial Results ($ in millions, except per share amounts) YEAR-OVER-YEAR Q4 2012 As Reported Excluding Currency and Acquisition Impacts Sales $ 655 7% 3% As Reported Q4 2012 As Reported Excluding Special Items (2) Operating Income $ 164 3% 3% Net Income $ 116 7% 5% Diluted EPS $0.96 8% 5% Free Cash Flow (1) $163 79% Changes in FX Rates Reduced Operating Income by $10 Million, or $0.06 of Adjusted EPS

© 2013 Sigma-Aldrich Co. LLC. All rights reserved. 5 Full Year 2012 Financial Results ($ in millions, except per share amounts) YEAR-OVER-YEAR 2012 As Reported Excluding Currency and Acquisition Impacts Sales $ 2,623 5% 3% 2012 As Reported Excluding Special Items (2) Operating Income $ 659 2% 3% Net Income $ 460 1% 2% Diluted EPS $3.77 1% 2% Free Cash Flow (1) $453 16% (1) See Slide 22 for Reconciliation of Net Cash Provided by Operating Activities to Free Cash Flow. (2) Special items include one-time restructuring charges and acquisition related transaction costs. Changes in FX Rates Reduced Operating Income by $38 Million, or $0.22 of Adjusted EPS

© 2013 Sigma-Aldrich Co. LLC. All rights reserved. 6 2012 Sales Growth Reconciliation 2012 Overall Organic Sales Growth of 3% SAFC Q4 2012 5 % 5 % (1)% (3)% 17 % 15 % 21 % 17 % Research Q4 2012 2 % 2 % (2)% (4)% 1 % 1 % 1% (1)% Total Customer Sales Q4 2012 3 % 3 % (2)% (3)% 6 % 5 % 7 % 5 % Sales Growth Organic FX Acquisitions Reported

© 2013 Sigma-Aldrich Co. LLC. All rights reserved. 7 2012 Sales Performance Highlight vs. PY Q1 Q2 Q3 Q4 Full Year Business Unit: > 5% Research: Analytical 0-5% Biology < 0% Chemistry Lab Essentials/Labware SAFC: Hitech Bioscience Custom Pharma Supply Solutions Geographic: United States & Canada EMEA APLA Organic Sales Growth % 2012
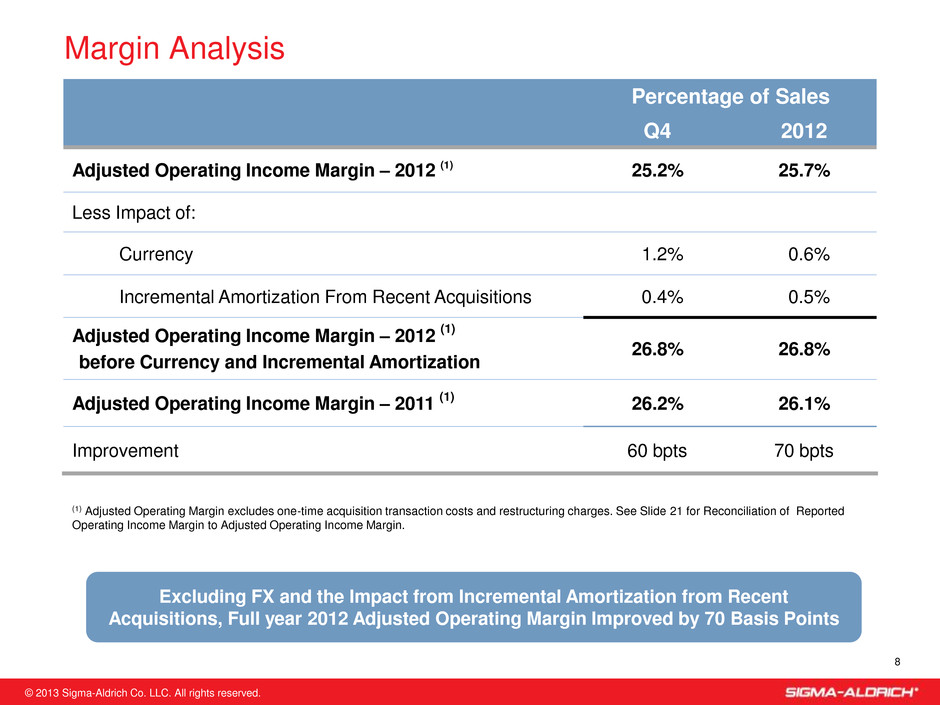
© 2013 Sigma-Aldrich Co. LLC. All rights reserved. 8 Margin Analysis Percentage of Sales Q4 2012 Adjusted Operating Income Margin – 2012 (1) 25.2% 25.7% Less Impact of: Currency 1.2% 0.6% Incremental Amortization From Recent Acquisitions 0.4% 0.5% Adjusted Operating Income Margin – 2012 (1) before Currency and Incremental Amortization 26.8% 26.8% Adjusted Operating Income Margin – 2011 (1) 26.2% 26.1% Improvement 60 bpts 70 bpts (1) Adjusted Operating Margin excludes one-time acquisition transaction costs and restructuring charges. See Slide 21 for Reconciliation of Reported Operating Income Margin to Adjusted Operating Income Margin. Excluding FX and the Impact from Incremental Amortization from Recent Acquisitions, Full year 2012 Adjusted Operating Margin Improved by 70 Basis Points
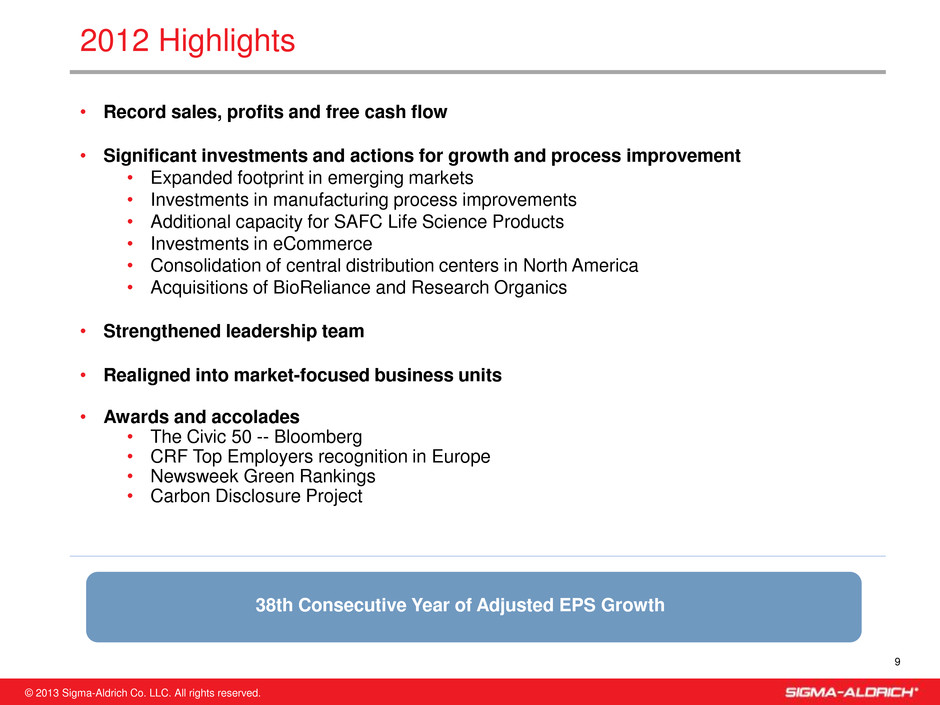
© 2013 Sigma-Aldrich Co. LLC. All rights reserved. • Record sales, profits and free cash flow • Significant investments and actions for growth and process improvement • Expanded footprint in emerging markets • Investments in manufacturing process improvements • Additional capacity for SAFC Life Science Products • Investments in eCommerce • Consolidation of central distribution centers in North America • Acquisitions of BioReliance and Research Organics • Strengthened leadership team • Realigned into market-focused business units • Awards and accolades • The Civic 50 -- Bloomberg • CRF Top Employers recognition in Europe • Newsweek Green Rankings • Carbon Disclosure Project 9 2012 Highlights 38th Consecutive Year of Adjusted EPS Growth

© 2013 Sigma-Aldrich Co. LLC. All rights reserved. History of the Company 38 Consecutive Years of Increasing EPS and Annual Dividends 10
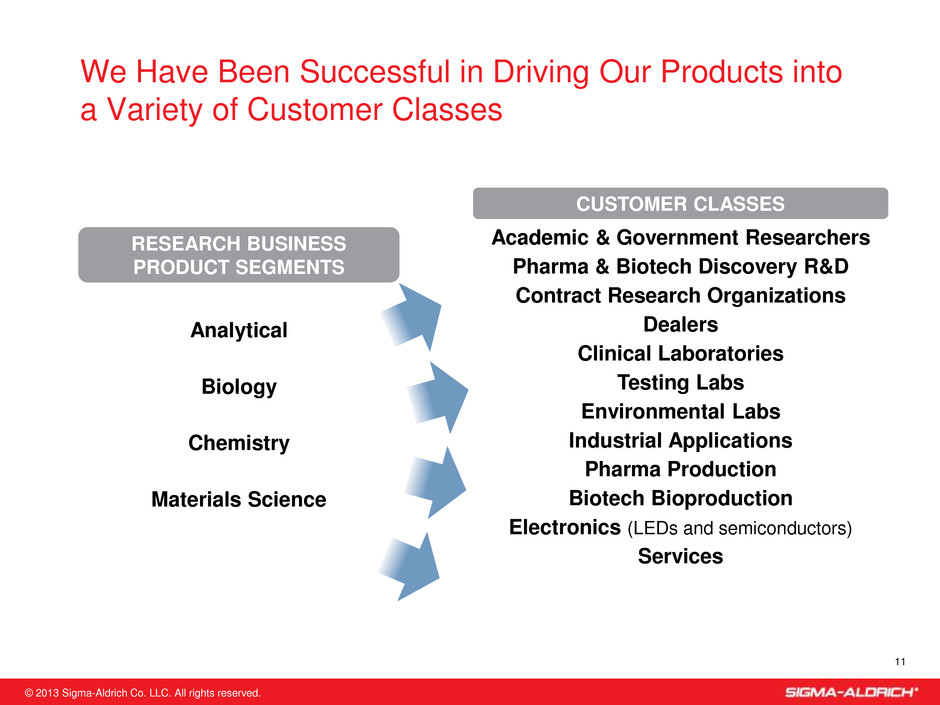
© 2013 Sigma-Aldrich Co. LLC. All rights reserved. We Have Been Successful in Driving Our Products into a Variety of Customer Classes 11 Academic & Government Researchers Pharma & Biotech Discovery R&D Contract Research Organizations Dealers Clinical Laboratories Testing Labs Environmental Labs Industrial Applications Pharma Production Biotech Bioproduction Electronics (LEDs and semiconductors) Services CUSTOMER CLASSES RESEARCH BUSINESS PRODUCT SEGMENTS Analytical Biology Chemistry Materials Science
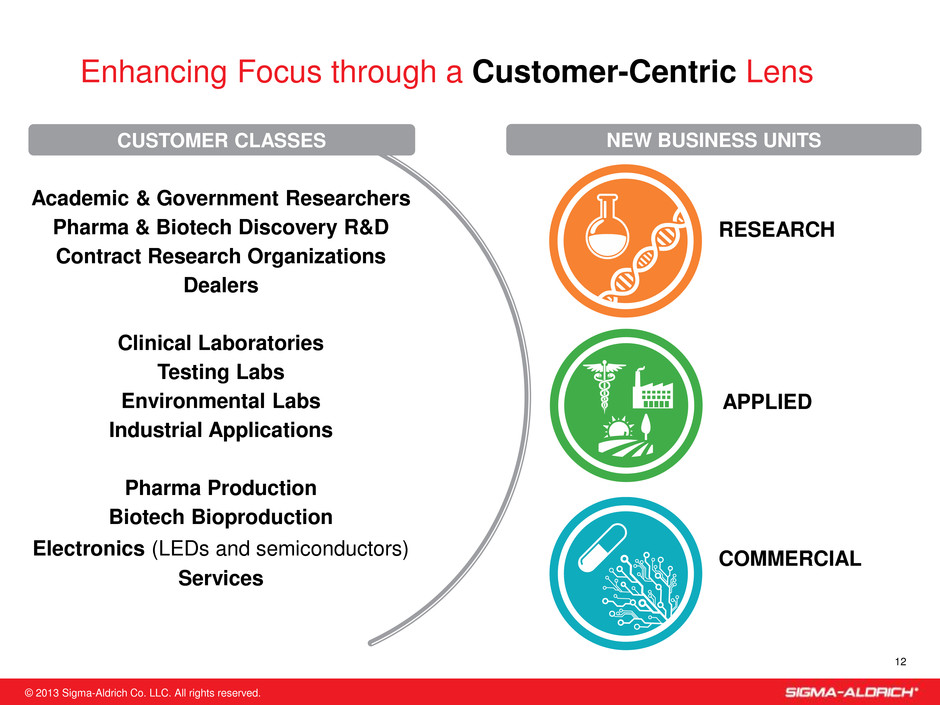
© 2013 Sigma-Aldrich Co. LLC. All rights reserved. APPLIED COMMERCIAL RESEARCH Enhancing Focus through a Customer-Centric Lens 12 Academic & Government Researchers Pharma & Biotech Discovery R&D Contract Research Organizations Dealers Clinical Laboratories Testing Labs Environmental Labs Industrial Applications Pharma Production Biotech Bioproduction Electronics (LEDs and semiconductors) Services NEW BUSINESS UNITS CUSTOMER CLASSES
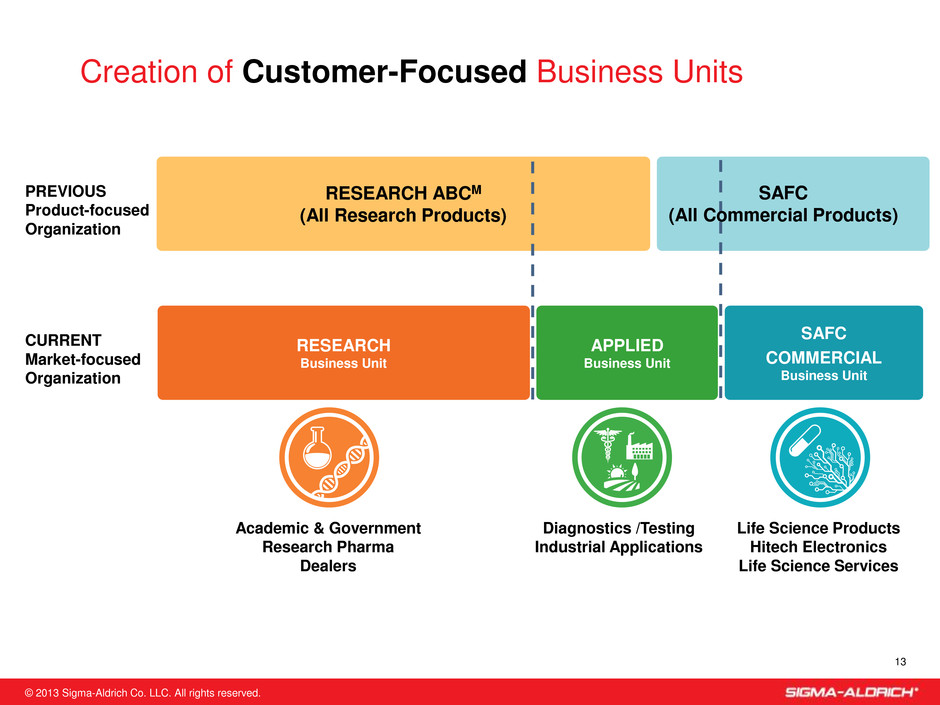
© 2013 Sigma-Aldrich Co. LLC. All rights reserved. Creation of Customer-Focused Business Units 13 Life Science Products Hitech Electronics Life Science Services Diagnostics /Testing Industrial Applications Academic & Government Research Pharma Dealers PREVIOUS Product-focused Organization RESEARCH ABCM (All Research Products) CURRENT Market-focused Organization SAFC COMMERCIAL Business Unit RESEARCH Business Unit APPLIED Business Unit SAFC (All Commercial Products)

© 2013 Sigma-Aldrich Co. LLC. All rights reserved. 14 Description Reagents and consumables to life sciences and non-profit research organizations Raw materials and solutions for testing in clinical and industrial applications Critical raw materials, APIs and services for commercial products Customer Market Segments Market Drivers Product breadth Simplicity, accuracy & speed Application specificity Product Offering “A la carte” portfolio Standard and customized solutions Customized solutions Regulatory Level Low (IRB, NIH) High (FDA, USDA, CE) High (FDA,ISO, GMP) Academia & Government Research Pharma Source: Industry report and team analysis Realigning Into Three Customer-Focused Business Units Dealers Diagnostics/ Testing Industrial Applications • Diagnostic Manufacturers • Hospital Labs • Reference Labs • Environmental Labs • Food & Beverage Testing • Industrial Raw Materials Life Science Products Electronics Life Science Services APPLIED SAFC COMMERCIAL RESEARCH
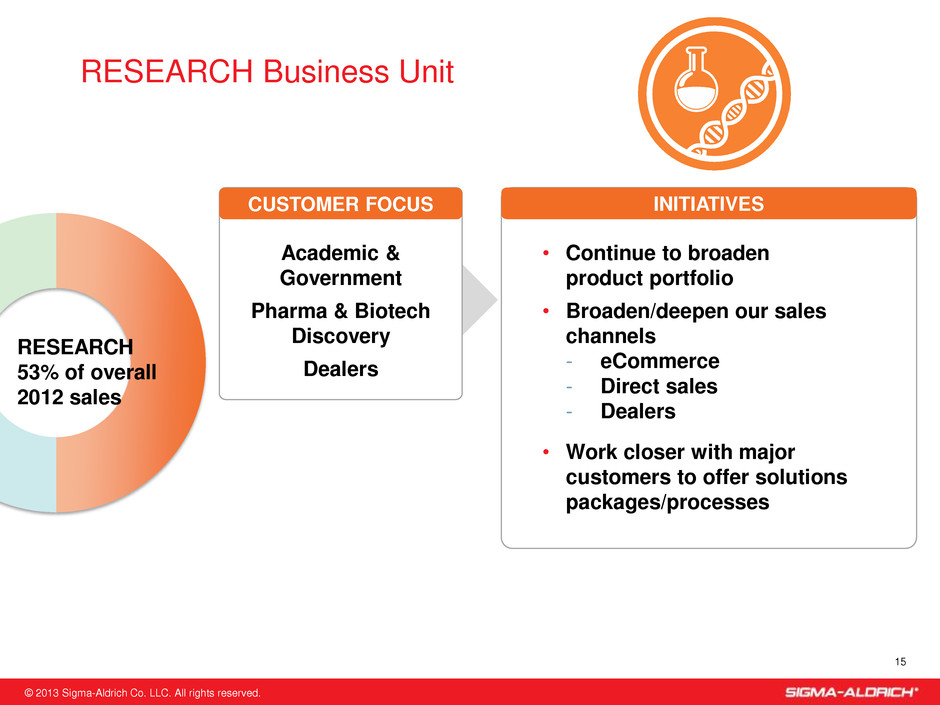
© 2013 Sigma-Aldrich Co. LLC. All rights reserved. RESEARCH Business Unit 15 Academic & Government Pharma & Biotech Discovery Dealers INITIATIVES CUSTOMER FOCUS • Continue to broaden product portfolio • Broaden/deepen our sales channels - eCommerce - Direct sales - Dealers • Work closer with major customers to offer solutions packages/processes RESEARCH 53% of overall 2012 sales

© 2013 Sigma-Aldrich Co. LLC. All rights reserved. 16 Description Reagents and consumables to life sciences and non-profit research organizations Raw materials and solutions for testing in clinical and industrial applications Critical raw materials, APIs and services for commercial products Customer Market Segments Market Drivers Product breadth Simplicity, accuracy & speed Application specificity Product Offering “A la carte” portfolio Standard and customized solutions Customized solutions Regulatory Level Low (IRB, NIH) High (FDA, USDA, CE) High (FDA,ISO, GMP) Academia & Government Research Pharma Source: Industry report and team analysis Realigning Into Three Customer-Focused Business Units Dealers • Diagnostic Manufacturers • Hospital Labs • Reference Labs • Environmental Labs • Food & Beverage Testing • Industrial Raw Materials Life Science Products Hitech Electronics Life Science Services APPLIED SAFC COMMERCIAL RESEARCH Diagnostics/ Testing Industrial Applications

© 2013 Sigma-Aldrich Co. LLC. All rights reserved. SAFC Life Science Products Hitech Electronics SAFC Life Science Services SAFC COMMERCIAL Business Unit 17 INITIATIVES CUSTOMER FOCUS • SAFC Top-100 Customer Strategy • Strengthen our leading position in cell culture media • Leverage our High Potency Compound (HPC) capacity • Broaden our customer base for organic metallic precursors • Continue to integrate and grow BioReliance COMMERCIAL 24% of overall 2012 sales

© 2013 Sigma-Aldrich Co. LLC. All rights reserved. 18 Description Reagents and consumables to life sciences and non-profit research organizations Raw materials and solutions for testing in clinical and industrial applications Critical raw materials, APIs and services for commercial products Customer Market Segments Market Drivers Product breadth Simplicity, accuracy & speed Application specificity Product Offering “A la carte” portfolio Standard and customized solutions Customized solutions Regulatory Level Low (IRB, NIH) High (FDA, USDA, CE) High (FDA,ISO, GMP) Academia & Government Research Pharma Source: Industry report and team analysis Realigning Into Three Customer-Focused Business Units Dealers • Diagnostic Manufacturers • Hospital Labs • Reference Labs • Environmental Labs • Food & Beverage Testing • Industrial Raw Materials Life Science Products Electronics Life Science Services APPLIED SAFC COMMERCIAL RESEARCH Diagnostics/ Testing Industrial Applications

© 2013 Sigma-Aldrich Co. LLC. All rights reserved. Clinical Diagnostics Environmental Labs Industrial Applications APPLIED Business Unit 19 MOVING UP THE VALUE CHAIN CUSTOMER FOCUS COMPONENTS • Antibodies • Lab Essentials • Standards • Sample Prep • Oligos • Enzymes • LC/GC Columns • Solvents • Buffers • Cell Culture APPLIED 23% of overall 2012 sales SOLUTIONS • Labeled pyruvic acid used in the detection of prostate cancer. • Seppro used to isolate low abundance proteins for cancer detection • Cerilliant standards used in instruments to monitor pain medication use • Sample prep for Vitamin D isoform detection

© 2013 Sigma-Aldrich Co. LLC. All rights reserved. 20 Overall 2012 Organic Growth was Driven by the Applied and SAFC Commercial Business Units Customer-Focused Business Units Organic Sales Growth (unaudited) Business Unit: Research 3% 1% Applied 6% 4% SAFC Commercial 11% 5% Total 5% 3% Research 57% 53% Applied 23% 23% SAFC Commercial 20% 24% 2011 2012 20122011 Organic Growth % % of Total Sales

© 2013 Sigma-Aldrich Co. LLC. All rights reserved. 21 2013 Guidance Organic Sales Growth 2013 full-year adjusted EPS expected to be $4.10 - 4.20 1st Half 2nd Half Full Year Research Low-single digit Low-single digit Low-to-mid single digit Applied Mid-single digit Mid-single digit SAFC Commercial Mid-single digit Mid-to-high single digit

© 2013 Sigma-Aldrich Co. LLC. All rights reserved. Key Considerations for 2013 22 Positioning for continued growth in 2013 • Macro-economic environment • Pharma consolidation / site closures • Increased presence in Applied & Industrial Markets • SAFC Growth • Emerging Market Growth • Capital deployment

© 2013 Sigma-Aldrich Co. LLC. All rights reserved. 22.4 22.5 22.9 23.2 24.3 25.8 25.1 2006 2012 1 ,7 9 8 2 ,0 3 9 2 ,2 0 1 2 ,1 4 8 2 ,2 7 1 2 ,5 0 5 2 ,6 2 3 2006 2012 Proven Formula for Value Creation +7% CAGR +270bps +260bps 23 17.5 17.9 18.7 19.8 22.4 23.2 20.1 2006 2012 SALES GROWTH STRONG ROIC GAAP MARGIN EXPANSION Has resulted in consistently higher returns to our shareholders. Peers: Life Technologies, Qiagen, Techne, Thermo-Fisher, Waters, Agilent, Becton Dickinson, Bio-Rad, PerkinElmer, Lonza $100.00 $141.69 $110.96 $134.32 $178.56 $169.49 $201.84 $0 $50 $100 $150 $200 $250 2006 2007 2008 2009 2010 2011 31-Dec-12 SIAL PEERS Nasdaq 100 S&P 500 DJIA
© 2013 Sigma-Aldrich Co. LLC. All rights reserved. QUESTIONS? 24

© 2013 Sigma-Aldrich Co. LLC. All rights reserved. Appendix •Reconciliation of GAAP to Non-GAAP Financial Measures

© 2013 Sigma-Aldrich Co. LLC. All rights reserved. 2012 2011 2012 2011 Reported net income 116$ 108$ 0.96$ 0.89$ Extraordinary tax charge — 2 — 0.02 Adjusted net income 116$ 110$ 0.96$ 0.91$ 2012 2011 2012 2011 Reported net income 460$ 457$ 3.77$ 3.72$ Acquisition transaction costs 4 — 0.03 — Restructuring costs 6 5 0.05 0.04 Adjusted net income 470$ 462$ 3.85$ 3.76$ Three Months Ended Three Months Ended December 31, December 31, Net Income Diluted Earnings (in millions) Per Share December 31, December 31, Net Income Diluted Earnings (in millions) Per Share Twelve Months Ended Twelve Months Ended Reconciliation of Reported Net Income and Diluted Earnings Per Share to Adjusted Net Income and Adjusted Diluted Earnings Per Share (Unaudited) 26

© 2013 Sigma-Aldrich Co. LLC. All rights reserved. Reconciliation of Reported Operating Income to Adjusted Operating Income (Unaudited) 27 2012 2011 2012 2011 Reported operating income 164$ 160$ 659$ 647$ Acquisition transaction costs — — 5 — Restructuring costs 1 — 9 8 Adjusted operating income 165$ 160$ 673$ 655$ 2012 2011 2012 2011 Reported operating income margin 25.0% 26.2% 25.1% 25.8% Acquisition transaction costs —% —% 0.2% —% R structuring costs 0.2% —% 0.4% 0.3% Adjusted operating income margin 25.2% 26.2% 25.7% 26.1% Currency 1.2% n/a 0.6% n/a Incremental amortization from recent acquisitions 0.4% n/a 0.5% n/a 26.8% 26.2% 26.8% 26.1% Adjusted operating income margin before currency and incremental amortization Three Months Ended Twelve Months Ended December 31, December 31, Three Months Ended Twelve Months Ended December 31, December 31, In millions
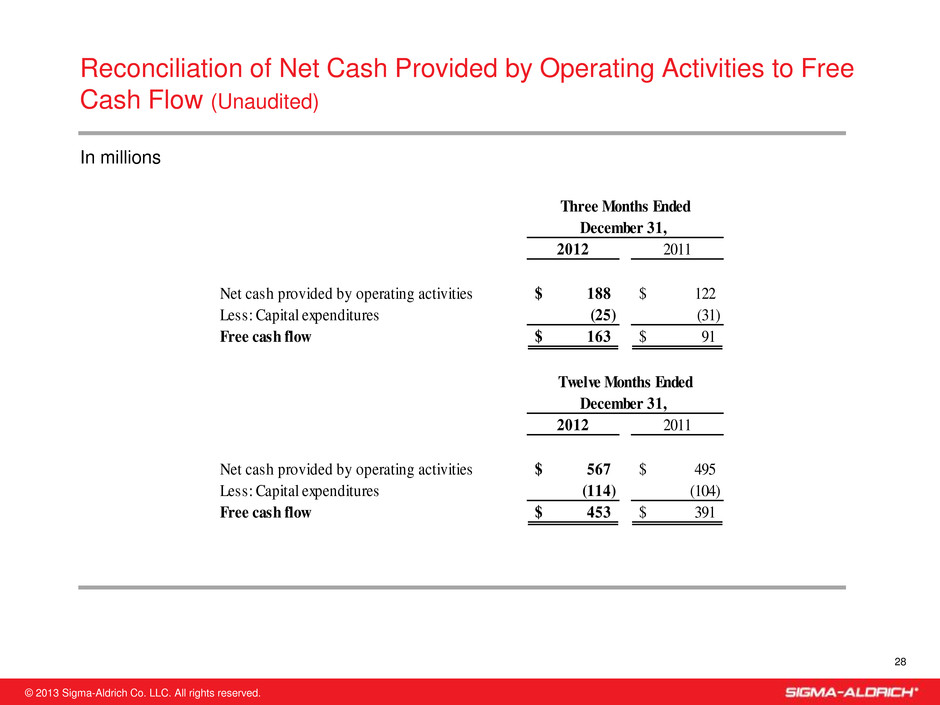
© 2013 Sigma-Aldrich Co. LLC. All rights reserved. Reconciliation of Net Cash Provided by Operating Activities to Free Cash Flow (Unaudited) 28 2012 2011 Net cash provided by operating activities 188$ 122$ Less: Capital expenditures (25) (31) Free cash flow 163$ 91$ 2012 2011 Net cash provided by operating activities 567$ 495$ Less: Capital expenditures (114) (104) Free cash flow 453$ 391$ December 31, Three Months Ended Twelve Months Ended December 31, In millions