 Sigma-Aldrich Corporation • Enabling Science to Improve the Quality of Life sigma-aldrich.com Exhibit 99.2 Q4 and Full Year 2011 Earnings Review & 2012 Outlook |
 Cautionary Statements February 9, 2012 earnings release posted on its website, www.sigma-aldrich.com, and in the Appendix – Reconciliation of GAAP to Non-GAAP Financial Measures beginning on Slide 18. Our presentation today may be deemed to include or incorporate forward-looking statements within the meaning of Section 27A of the Securities Act of 1933 and Section 21E of the Securities Exchange Act of 1934 that involve risks and uncertainties, including financial, business environment and projections, as well as statements that are preceded by, followed by, or that include the words “believes,” “can,” “expects,” “plans,” “anticipates,” “should”, “will” or similar expressions, and other statements regarding matters that are not historical facts. Additionally, the release contains forward-looking statements relating to future performance, goals, strategic actions and initiatives and similar intentions and beliefs, including, without limitation, statements with respect to Sigma-Aldrich Corporation’s (the “Company,” “we,” “us” or “our”) expectations, goals, beliefs, intentions and the like regarding future sales, earnings, return on equity, cost savings, process improvements, free cash flow, share repurchases, capital expenditures, acquisitions and other matters. These statements are based on assumptions regarding the Company operations, investments and acquisitions and conditions in the markets the Company serves. The Company believes these assumptions are reasonable and well founded. The statements in this release are subject to risks and uncertainties, including, among others, certain economic, political and technological factors. Actual results could differ materially from those stated or implied in the release, due to, but not limited to, such factors as (1) global economic conditions, (2) changes in pricing and the competitive environment and the global demand for our products, (3) fluctuations in foreign currency exchange rates, (4) changes in research funding and the success of research and development activities, (5) failure of planned sales initiatives in our Research and SAFC business units, (6) dependence on uninterrupted manufacturing operations, (7) changes in the regulatory environment in which the Company operates, (8) changes in worldwide tax rates or tax benefits from domestic and international operations, including the matters described in Note 10 – Income Taxes to the Consolidated Financial Statements in the Company’s Annual Report on Form 10-K for the year ended December 31, 2010 (the “10-K”), (9) exposure to litigation including product liability claims, (10) the ability to maintain adequate quality standards, (11) reliance on third party package delivery services, (12) an unanticipated increase in interest rates, (13) other changes in the business environment in which the Company operates, (14) the outcome of the outstanding matters described in Note 11 – Contingent Liabilities and Commitments, to the to the 10-K and (15) acquisitions or divestitures of businesses. A further discussion of the Company’s risk factors can be found in Item 1A of Part I of the 10-K. The Company does not undertake any obligation to update these forward-looking statements. With over 60 percent of sales denominated in currencies other than the U.S. dollar, management uses currency adjusted growth, and believes it is useful to investors, to judge the Company’s local currency performance. Organic sales growth data presented herein excludes currency impacts, and where indicated, acquisition impacts. The Company calculates the impact of changes in foreign currency exchange rates by multiplying current period activity by the difference between current period exchange rates and prior period exchange rates, the result is the defined impact of “changes in foreign currency exchange rates” or “changes in FX.” While we are able to report currency impacts after the fac we are unable to estimate changes that may occur in 2012 to applicable exchange rates. Any significant changes in currency exchange rates would likely have a significant impact on our reported growth rates due to the volume of our sales denominated in foreign currencies. Management also uses free cash flow, a non-GAAP measure, to judge its performance and ability to pursue opportunities that enhance shareholder value. Free cash flow is defined as net cash provided by operating activities less capital expenditures. Management believes this non-GAAP information is useful to investors as well. Reconciliations of GAAP to non-GAAP information are included in the Company’s 2 |
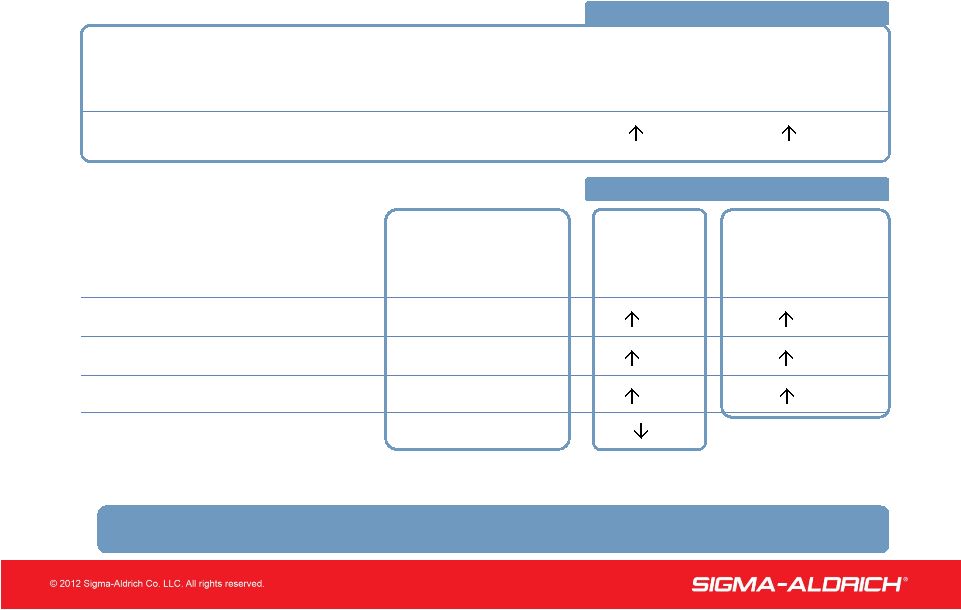
 3 Performance versus Guidance (1) Adjusted EPS for one-time tax item (1) Q4 2011 Full Year 2011 Solid Achievement in 2011 Guidance Actual Guidance Actual Sales Growth Low to 3% 5% Diluted Adjusted EPS $0.85 - $0.93 $0.91 $3.73 - $3.81 $3.76 Free Cash Flow N/A N/A ~$400M $391M Mid-Single Digit Mid-Single digit |
 Fourth Quarter 2011 Financial Results ($ in millions, except per share amounts) YEAR-OVER-YEAR Operating Income up Double Digits in Q4 As Reported Q4 2011 As Reported Excluding Restructuring Operating Income $ 160 23% 14% Net Income $ 108 15% 6% Diluted EPS $0.89 17% 7% Free Cash Flow $ 91 1% Q4 2011 As Reported Excluding Currency and Acquisition Impacts Sales $ 610 5% 3% YEAR-OVER-YEAR (1) (1) See page 23 for Reconciliation of Net Cash Provided by Operating Activities to Free Cash Flow 4 |
 5 Full Year 2011 Financial Results ($ in millions, except per share amounts) 5 YEAR-OVER-YEAR Year-to-Date Sales and Earnings Up 10% and 19% from Prior Year. 13% 19% $ 462 $ 457 Net Income 14% 19% $ 3.76 $ 3.72 Diluted EPS 8% $ 391 Free Cash Flow Excluding Restructuring As Reported Excluding Restructuring and Impairment Operating Income $ 647 $ 655 17% 13% 2011 Year-To-Date As Reported Excluding Currency and Acquisition Impacts Sales $2,505 10% 5% YEAR-OVER-YEAR Twelve Months 2011 (2) See page 23 for Reconciliation of Net Cash Provided by Operating Activities to Free Cash Flow (2) (1) See page 19 for Reconciliation of Reported Net Income and Diluted Earnings Per Share to Adjusted Net Income and Adjusted Diluted Earnings Per Share. (1) |
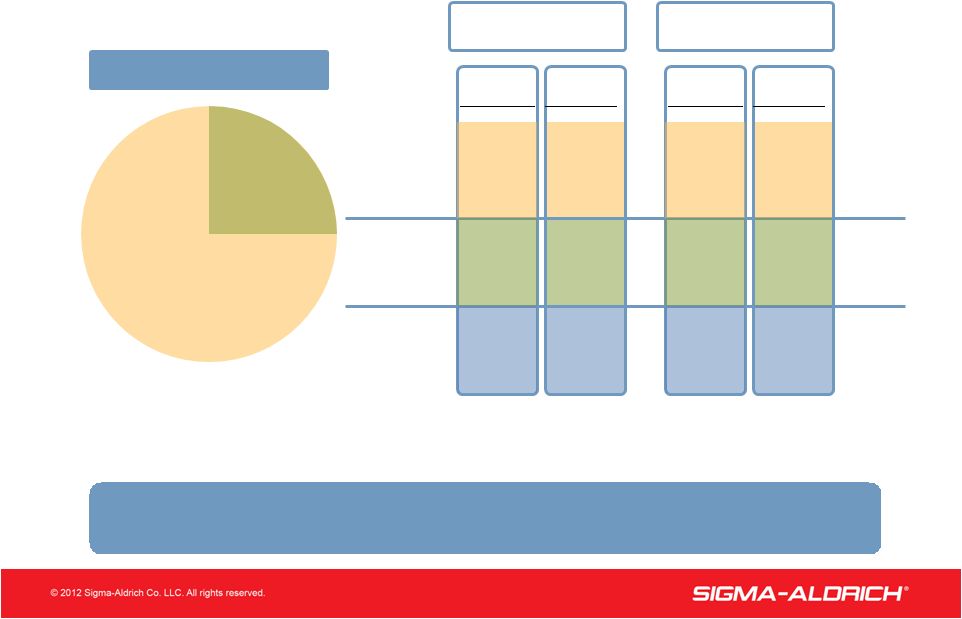 6 6 2011 Sales Growth RESEARCH 71% 29% SAFC Macroeconomic Uncertainty Impacted Research Growth in Q4 1% 7% 3% Research SAFC Total Company Organic* *See page 22 for Reconciliation of Reported Sales Growth to Adjusted (Organic) Sales Growth. Reported 3% 8% 5% 3% 9% 5% Organic* Reported 9% 13% 10% Q4 2011 / Q4 2010 Full Year 2011/ Full Year 2010 Sales Mix (2011) |
 7 24.2% 50 basis points 7 Margin Analysis Q4 & Full Year Adjusted Operating Margins Improved PERCENTAGE OF SALES 26.2% - Full Year 2011 25.8% 0.3 Reported Operating Income Margin - 2011 Q4 2011 25.6% Restructuring Costs Adjusted Operating Income Margin - 2011 26.2% 26.1% Adjusted Operating Income Margin - 2010 Improvement (1) (1) (1) See page 20 for Reconciliation of Reported Operating Income Margin Adjusted Operating Income Margin. 200 basis points |
 8 8 Free Cash Flow (in millions) 2011 $457 106 (75) 7 495 (104) $391 Net Income Free Cash Flow Net Cash Provided by Operating Activities Less Capital Expenditures Other Changes in Performance Working Capital* Depreciation & Amortization 2010 $384 93 17 29 523 (99) $424 *Accounts Receivable + Inventory – Accounts Payable YEAR ENDED DECEMBER 31 Working Capital Increase to Support Sales Growth |
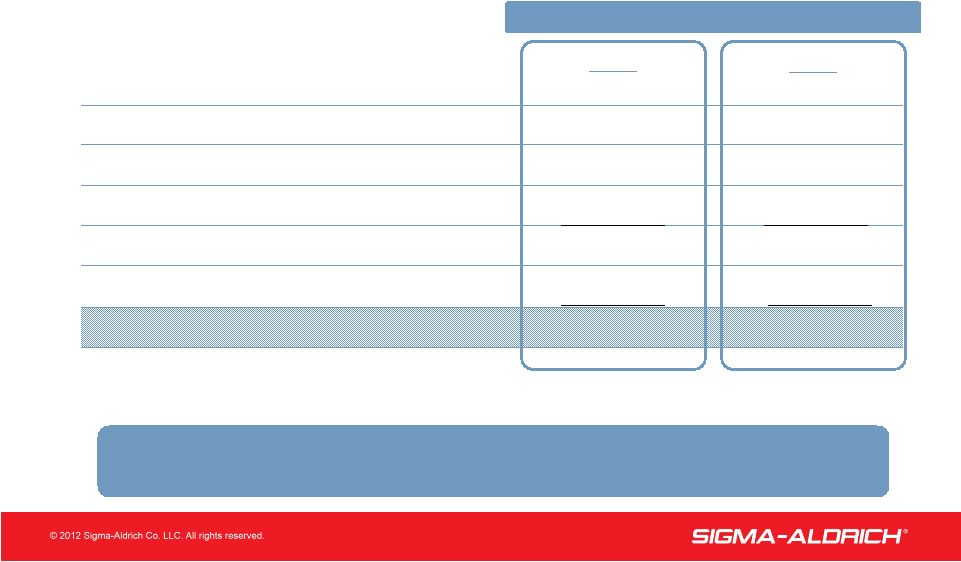
 9 9 Q4 2011 Sales Performance Innovation Reported Organic (1) • Analytical, Biology, Materials Science Sales Growth (2) 2-18% 2-6% SAFC Sales • Build on momentum in key product segments 8% 7% Geographic Growth • North America 4% 1% • Europe 1% 2% • Asia Pacific/Latin America 12% 7% • Focus Markets – India, China, Brazil 25% 17% eCommerce Sales • Increase in sales through channel 14% 10% Initiatives Collectively on Track (2) Varies for individual product lines. (1) Adjusted for currency and acquisitions. See pages 21 & 22 for Reconciliation of Reported Sales Growth to Adjusted (Organic) Sales Growth. |
 10 10 • Localization strategy made strong strides in 2011 in emerging markets • Q2 Vetec acquisition in Brazil • Q3 Bangalore, India expansion • Q4 new facility in Wuxi, China completed December 2011 • Q1 2012 Taiwan SAFC Hitech facility to open • All time high service levels in International Region SAFC and Emerging Markets Continue to Deliver Full Year 2011 Highlights • SafeBridge Certification for commercial scale HPAPI in Wisconsin • Innovation in ZFN and eCommerce |
 11 Strategic Priorities • Achieve double-digit organic growth in faster growing markets of Research • Protect and enhance financial performance of core Research business • Grow SAFC business in high single-digit by leveraging customer focus, unique manufacturing capabilities and adjacent services • Expand in emerging markets • Drive operational excellence • Strategic acquisitions leveraging strong cash flow Driving Above Market Growth |
 12 BioReliance Overview 2011 Revenue by Segment Biologics Toxicology Animal Health Services Global Facilities Tokyo, Japan Bangalore, India Glasgow, Scotland Stirling, Scotland Rockville, USA Total Employees: ~650 2011 Revenue: $126M • Global biopharmaceutical services organization • Biologics Testing: global market leader for safety testing and support services for manufacturers of biologic therapeutics • Specialized Toxicology Studies: global market leader for genetic toxicology testing; leader in transgenic model studies for oncogenicity • Animal Health Services: broad spectrum of laboratory animal diagnostic and analytical services for health monitoring and disease outbreak BioReliance Currently Performs Testing for ~75% of the Top Pharma Companies and ~90% of the Top Biotech Companies in the World. |
 13 BioReliance Strategic Rationale and Transaction Benefits • Strategic Context • Combination creates one of the broadest product and services offerings for the development and manufacturing of biological drugs • Benefits biopharmaceutical customers with a broad portfolio of product solutions and services • Provides platform from which to expand across laboratory and biological services • Financial Impact • Purchase price of approximately $350M in cash • Expected to be accretive to growth rate and earnings in 2012 • Opportunity to drive incremental revenue growth and returns over time through cross- selling, geographic expansion, expansion of technology platform Sigma-Aldrich and BioReliance Provide an Expanded Value Proposition for Biopharmaceutical Customers |
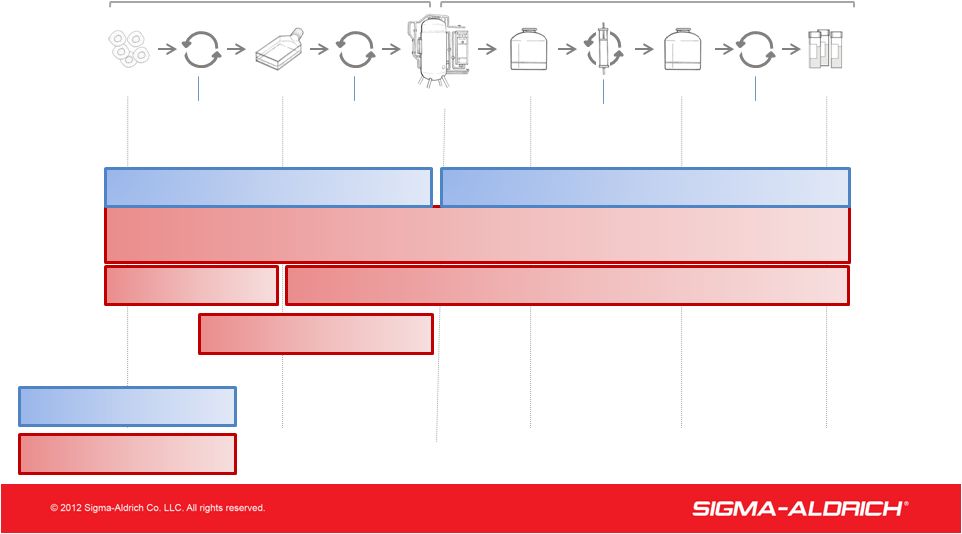 14 Complementary Offering for Biologic Development & Manufacturing 14 Bioreactor Purified Bulk Drug Substance Final Drug Product Unprocessed Bulk Product Research Cell Line Production Cell Line (“Cell Bank”) Cloning, cell selection & expansion Media development, upstream process optimization (“scale up”) Process Chromatography Formulation development, stability testing, fill & finish Upstream Bioprocessing Downstream Bioprocessing Legend: Raw Material Testing Raw Material Manufacturing & Supply Lot Release & Downstream Process Testing Expression System and Cell Line Development Contract Biologic Manufacturing Upstream Process Development BioReliance Sigma-Aldrich/SAFC |
 15 2012 Guidance Organic Sales Growth 1st Half Mid Single-digit 2nd Half Full Year Low Double-digits Low Single-digit Low to Mid Single-digit Research SAFC Mid Single-digit Total Company Growth Expected To Be Mid Single-Digit |
 16 2012 Guidance Diluted Adjusted EPS Diluted Earnings Per Share $ 4.10 - 4.23 FX Tax BioReliance EPS Range $ 3.90 - 4.05 (0.15) (0.10) 0.05 - 0.07 Free Cash Flow In Excess of $400M |
 17 17 QUESTIONS? Sigma-Aldrich Corporation Q4 and Full Year 2011 Earnings Review |
 Appendix Reconciliation of GAAP to Non-GAAP Financial Measures 18 |
 19 Reconciliation of Reported Net Income and Diluted Earnings Per Share to Adjusted Net Income and Adjusted Diluted Earnings Per Share (Unaudited) 2011 2010 2011 2010 Reported net income 108 $ 94 $ 0.89 $ 0.76 $ Restructuring costs - 8 - 0.07 Extraordinary tax charge 2 - 0.02 - Adjusted net income 110 $ 102 $ 0.91 $ 0.83 $ 2011 2010 2011 2010 Reported net income 457 $ 384 $ 3.72 $ 3.12 $ Restructuring costs 5 17 0.04 0.14 Impairment costs - 7 - 0.05 Adjusted net income 462 $ 408 $ 3.76 $ 3.31 $ Three Months Ended Three Months Ended December 31, December 31, Net Income Diluted Earnings Net Income Diluted Earnings (in millions) Per Share December 31, December 31, (in millions) Per Share Twelve Months Ended Twelve Months Ended |
 20 Reconciliation of Reported Operating Income to Adjusted Operating Income (Unaudited) 2011 2010 2011 2010 Reported operating income 160 $ 130 $ 647 $ 551 $ Restructuring costs - 11 8 24 Impairment costs - - - 7 Adjusted operating income 160 $ 141 $ 655 $ 582 $ 2011 2010 2011 2010 Reported operating income margin 26.2% 22.3% 25.8% 24.3% Restructuring costs - 1.9% 0.3% 1.0% Impairment costs - - - 0.3% Adjusted operating income margin 26.2% 24.2% 26.1% 25.6% Three Months Ended Twelve Months Ended December 31, December 31, Three Months Ended Twelve Months Ended December 31, December 31, |
 21 Reconciliation of Reported Sales Growth to Adjusted (Organic) Sales Growth (Unaudited) Three Months Ended December 31, 2011 Reported FX Impact Acquisitions Organic • Analytical, Biology, Materials Science Sales Growth Geographic Growth • North America • Europe • Asia Pacific/Latin America • Focus Markets – India, China, Brazil *Varies for individual product areas 2-18% * 0-(1)% * 0-13% * 2-6% * 4% -% 3% 1% 1% (1)% -% 2% 12% 1% 4% 7% 25% (4)% 12% 17% |
 22 Reconciliation of Reported Sales Growth to Adjusted (Organic) Sales Growth (Unaudited) Sales Growth by Business Unit Currency Acquisition Adjusted Reported Benefit Benefit (Organic) Research Essentials 3% - 3% - Research Specialties 3% - 2% 1% Research Biotech 5% - - 5% Total Research 3% - 2% 1% SAFC 8% - 1% 7% Total Customer Sales 5% - 2% 3% Currency Acquisition Adjusted Reported Benefit Benefit (Organic) Research Essentials 10% 4% 2% 4% Research Specialties 9% 4% 3% 2% Research Biotech 9% 4% - 5% Total Research 9% 4% 2% 3% SAFC 13% 3% 1% 9% Total Customer Sales 10% 4% 1% 5% Ended December 31, 2011 Twelve Months Three Months Ended December 31, 2011 |
 23 Reconciliation of Net Cash Provided by Operating Activities to Free Cash Flow (Unaudited) In millions 2011 2010 Net cash provided by operating activities 122 $ 126 $ Less: Capital expenditures (31) (34) Free cash flow 91 $ 92 $ 2011 2010 Net cash provided by operating activities 495 $ 523 $ Less: Capital expenditures (104) (99) Free cash flow 391 $ 424 $ Three Months Ended December 31, December 31, Twelve Months Ended |