UNITED STATES
SECURITIES AND EXCHANGE COMMISSION
Washington, D.C. 20549
FORM N-CSR
CERTIFIED SHAREHOLDER REPORT OF REGISTERED
MANAGEMENT INVESTMENT COMPANIES
Investment Company Act File Number: 811-07059
| T. Rowe Price Blue Chip Growth Fund, Inc. |
| (Exact name of registrant as specified in charter) |
| 100 East Pratt Street, Baltimore, MD 21202 |
| (Address of principal executive offices) |
| David Oestreicher |
| 100 East Pratt Street, Baltimore, MD 21202 |
| (Name and address of agent for service) |
Registrant’s telephone number, including area code: (410) 345-2000
Date of fiscal year end: December 31
Date of reporting period: December 31, 2016
Item 1. Report to Shareholders
 |
| Blue Chip Growth Fund | December 31, 2016 |

The views and opinions in this report were current as of December 31, 2016. They are not guarantees of performance or investment results and should not be taken as investment advice. Investment decisions reflect a variety of factors, and the managers reserve the right to change their views about individual stocks, sectors, and the markets at any time. As a result, the views expressed should not be relied upon as a forecast of the fund’s future investment intent. The report is certified under the Sarbanes-Oxley Act, which requires mutual funds and other public companies to affirm that, to the best of their knowledge, the information in their financial reports is fairly and accurately stated in all material respects.
REPORTS ON THE WEB
Sign up for our Email Program, and you can begin to receive updated fund reports and prospectuses online rather than through the mail. Log in to your account at troweprice.com for more information.
Manager’s Letter
Fellow Shareholders
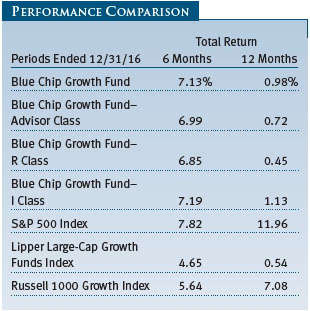
Global equity markets produced gains in 2016, with more substantial returns in the second half of the year. Stocks overcame several challenges, including higher energy prices, rising interest rates, and uncertainty surrounding the U.S. presidential election. There were considerable differences in the returns of various types of stocks—value stocks outperformed growth stocks, and small-caps substantially outperformed large-caps. Although our results outperformed the Lipper peer group for the past six and 12 months and the style-specific Russell 1000 Growth Index in the second half of the year, our results trailed the S&P 500 Index by a wide margin in both periods. Most of that decrement occurred in the first quarter of 2016. However, large-cap growth stocks also lagged value and small-cap stocks following the election of President Donald Trump.
PERFORMANCE REVIEW
The Blue Chip Growth Fund returned 7.13% for the last six months and 0.98% for the year ended December 31, 2016. Our performance was slightly better than the Lipper peer group of large-cap growth funds but trailed the performance of the benchmark S&P 500 Index. (Returns for the Advisor, R, and I Class shares varied slightly, reflecting their different fee structures.)
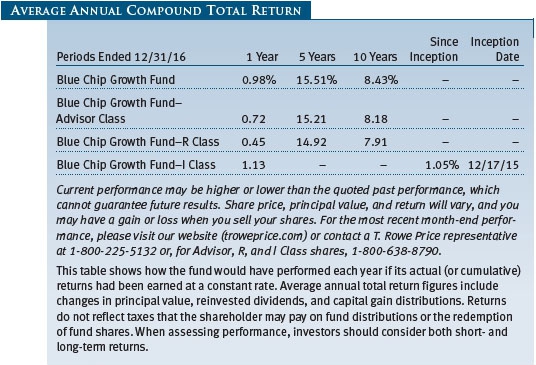
As shown in the Growth of $10,000 chart on page 19, your fund has a substantial 10-year performance advantage over the S&P 500 and its Lipper peer group. Lipper ranked the Blue Chip Growth Fund in the top 14% of its large-cap growth funds universe for the 10-year period and in the top 5% for the past five years ended December 31, 2016. (Based on cumulative total return, Lipper ranked the Blue Chip Growth Fund 418 of 666, 166 of 596, 26 of 531, and 51 of 383 funds for the 1-, 3-, 5-, and 10-year periods ended December 31, 2016, respectively. Past performance cannot guarantee future results.)
Strong but mixed performance in global financial markets reinforces that there not only ongoing challenges, but also new and substantial opportunities. Investors remain concerned about the breadth and sustainability of global economic growth. Energy prices have rebounded to a degree. However, manufacturing and certain commodity-related industrial businesses continue to struggle, and overall growth in gross domestic product (GDP) and personal income has been lackluster.
Many developed and emerging markets economies have slowed. China’s economy is transitioning from a manufacturing- and export-based economy to one that emphasizes services and domestic consumption. However, the transition cannot be managed seamlessly and has led to dislocation in certain areas of the economy. Brazil’s economy has also struggled.
However, resolving the U.S. presidential election uncertainty and also some of the actions proposed by the new administration appear to be having some effect on expectations for U.S. growth and the performance of stocks. Specifically, President Trump’s proposals to lower corporate and personal tax rates, moderate regulation, pursue a significant infrastructure spending program, and allow for repatriation of cash held overseas by U.S. corporations have generated expectations for corporate earnings improvement. There is also some anecdotal and real evidence of improved confidence and spending by consumers and businesses.
President Trump’s proposals and related tax reforms being evaluated by Congress should create the most relative benefit for the earnings of companies that have high effective tax rates, a high percentage of earnings generated within the U.S., low levels of debt (as interest may no longer be fully tax-deductible), and large cash holdings outside the U.S. There are other nuances involving expensing of capital expenditures, a potential border control tax levied on any costs of components sourced outside the U.S., and also tax advantages for U.S. exports.
Investors reacted to the election and these proposals by bidding up the prices of various stocks. Because small-cap companies generally have more domestic income and pay more U.S. tax (in percentage terms), they performed well. Industrial stocks, especially those that are more cyclical, soared as they were perceived to be advantaged by policies that would bolster growth. Energy stocks also responded to expectations of stronger growth as well as policies that could favor more development of domestic energy reserves. Financial stocks rallied due to the belief that regulation might be less restrictive. Many banks also pay a relatively full corporate tax rate and should benefit from rising interest rates. Energy and financial stocks represent much larger weightings in the value benchmarks, contributing to their advantage over growth this year. These factors help to explain why small-caps and value stocks outperformed in 2016.
Many health care and tech company stocks initially lagged following the election. Health care has been a controversial sector as investors worried about pricing pressure, but investors also avoided the sector because of its lack of leverage to an improving economy. Typically, large-cap tech companies pay tax rates below the corporate average, and some investors also worried that the Trump administration’s immigration policies or stance toward these companies would be unfavorable. At least some of this concern was lessened by Mr. Trump’s meetings with the chief executives of many of these companies. Health care and tech have a larger representation in the growth benchmarks, and this also helps explain why growth stocks generally underperformed their value counterparts.
Geopolitical risks have become so substantial that they constitute a more important risk factor for global financial markets. The large and tragic terrorist actions in Paris and more recent events underscore that terrorism can create significant economic disruption in addition to the regrettable loss of life and property damage being inflicted. We recognize that the recent vote by the United Kingdom to exit the European Union (Brexit) also constitutes greater uncertainty for global growth.
However, there are reasons to be constructive and even optimistic. Although it is certain that there will be some periods of angst and uncertainty as new policies are pursued, we hope that the political process and our interactions with trading partners can be positive and productive. On balance, we think that many of the new policy initiatives could drive more rapid and sustained growth. Even excluding new actions, there are unmistakable signs of improvement in some sectors of the U.S. economy. There are also selected stocks that are not particularly dependent on robust economic growth to generate strong profitability. A backdrop of slow but sustained growth can sometimes be quite supportive for these types of stocks and the overall market. Improving corporate profits could offset various risks and drive continued positive stock performance.
MARKET ENVIRONMENT
The U.S. economy continues to grow, with housing, auto, and retail sales evidencing a recovery that appears to be slow but sustainable. GDP growth has been tepid, but gains in the labor market are now resulting in wage growth. Even though the December jobs report was slightly disappointing with 156,000 jobs added—missing the consensus expectation by approximately 20,000 jobs—year-over-year wage growth is now approximately 3%. This will give the Federal Reserve greater impetus to continue raising interest rates, and policymakers have indicated that rates could be hiked three or more times in 2017.
The U.S. economy is on sounder footing than the economies of many other developed countries, including most European nations. Although Europe appeared to be showing more broad improvement, the Brexit vote introduces a new and potentially prolonged period of uncertainty surrounding European and, possibly, global growth. China’s growth could remain inconsistent given stock market and foreign exchange volatility. Brazil and other resource-based emerging economies are stabilizing as commodity prices, especially oil and gas, firm. China and Brazil must be carefully monitored, as their size and influence on the global economy is noteworthy.
As noted previously, the U.S. presidential election could have a profound effect on financial markets. Policy measures, such as a reduction in corporate and personal tax rates, more balanced regulation, significant infrastructure spending, and repatriation of cash held overseas by U.S. corporations, will be pursued. On balance, we tend to agree that most of the actions being proposed could stimulate growth and drive strong earnings improvement at many companies. We have significant holdings in financials and other stocks that have risen in the wake of the election. However, we should convey at least some caution regarding the euphoria that has caused investors to think that we will have a synchronized global economic boom—a rising tide that lifts all boats:
1. While we are supportive of most of Mr. Trump’s proposals and constructive on the market, we would caution that many programs will not be adopted easily, quickly, or in their entirety. Indeed, some of the proposals are complex and will require congressional involvement and negotiation before being fully formulated and implemented. Some of the infrastructure spending will involve projects taking considerable time to design and several years to complete.
2. Renegotiation of trade deals and other actions influencing trade policy, such as border control taxes levied on imports used in production, must be pursued skillfully. There is certainly a risk of retaliation or some form of trade war that could be quite unproductive and ultimately disrupt global growth.
3. The proposals could succeed in stoking stronger U.S. growth and, perhaps, result in less favorable growth outside the U.S. To be clear, we believe this outcome can and should be avoided. Ultimately, a stronger U.S. economy could be quite favorable for exports from China and other trading partners. Indeed, this will need to be a key part of the rationale for persuading trading partners to agree to changes being pursued in trade negotiations.
We should also emphasize that all of the actions being taken to foster more rapid growth are already resulting in higher interest rates. We have noted in past letters that rising rates should not preclude stocks from performing well. In our opinion, the increase in rates is being viewed properly as affirmation that economic growth is now on sounder footing and likely to improve. We have studied this issue, and there is strong empirical evidence that stocks can perform well when rates increase, especially if the 10-year Treasury yield is less than 5%. However, the rise in rates and several increases contemplated by the Federal Reserve for 2017 have already resulted in a much stronger U.S. dollar. Because other central banks are generally more in neutral or even easing mode, the dollar could continue to strengthen. This will also make it more challenging to drive stronger U.S. export growth. Of course, if interest rates increase more sharply than anticipated, this could also crimp auto and housing sales and overall economic growth.
Unfortunately, geopolitical risks are probably as great as we have seen in the last few decades. Egypt; Syria; Turkey; and countries in the Western Hemisphere, such as Brazil, have experienced a notable amount of internal strife. There have been a number of terrorist actions in the last several months, including recent tragic mass murders in several developed countries.
While recognizing the many challenges facing investors, we also want to be clear that there are several powerful positives and also solid potential rewards in many stocks. Solid revenue growth, improved efficiency and margins, and, ultimately, robust corporate earnings are being generated despite capital expenditures that remain subdued. As overall demand improves, corporate earnings could be quite vibrant. Many companies have free cash flow yields approaching 10%, which is very favorable relative to the yield on 10-year Treasury notes. Also, companies are repurchasing their shares consistently, leading to a rare decline in the net overall amount of stock outstanding. However, some stocks have performed well, and we want to be clear that the opportunity for continued gains is necessarily less substantial for selected stocks at current price levels.
PORTFOLIO REVIEW
Although we had some notable detractors in the information technology, industrials and business services, financials, and consumer discretionary sectors, these areas provided several of the largest contributors that drove performance in the second half of 2016.
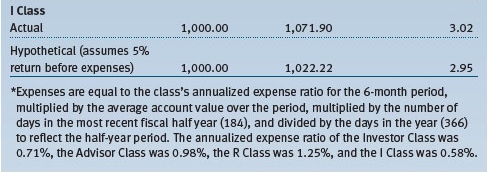
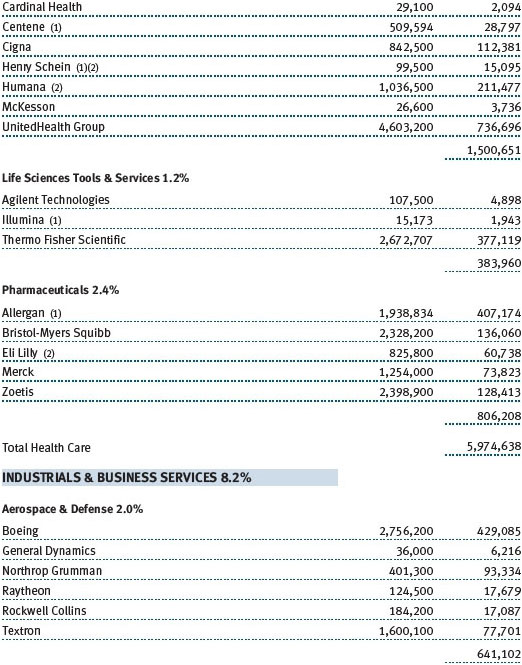
In the technology area, Microsoft was among our largest contributors for the year and in the second half. The company is well positioned to continue generating strong growth in its Office 365 suite of products, corporate cloud, and Azure (public cloud computing platform). Alphabet (formerly Google) also produced meaningful second-half gains as YouTube is experiencing strong growth in minutes of use and advertising monetization. MasterCard and Visa are longtime holdings that are dominant in the credit card processing area. Both companies are generating strong growth in earnings and free cash flow that led to solid performance. NXP Semiconductors is a leading provider of semiconductor solutions used in automotive connectivity and infotainment as well as in smartphone near-field communications payment applications. The company has been generating strong results, and it has agreed to be purchased by Qualcomm at a premium. ServiceNow has been a holding for several years, and it continued to thrive as the company grows beyond its dominant position in cloud-based solutions used in clients’ information technology management. (Please refer to the portfolio of investments for a complete list of holdings and the amount each represents in the portfolio.)
Alibaba Group Holding is a leading Chinese e-commerce services provider, with Taobao (consumer-to-consumer) and T-Mall (business-to-consumer) possessing dominant market share. Alibaba is also a leader in cloud processing services (it meets a substantial amount of the Chinese government’s processing needs). Tencent Holdings has been a large holding for many years, with leading positions in gaming, messaging, and WeChat social networking, which again generated solid gains in users and profits. Both stocks have been volatile but produced solid second-half gains. Facebook was also a top contributor. Investors began to appreciate how well the company’s advertising products, video strategy, and Instagram photo sharing are being received. Its investment in WhatsApp and Messenger also provides solid positioning in the messaging market, which is growing in popularity. We are particularly excited by the company’s efforts to promote the use of video in its offerings and to better monetize Instagram and video.
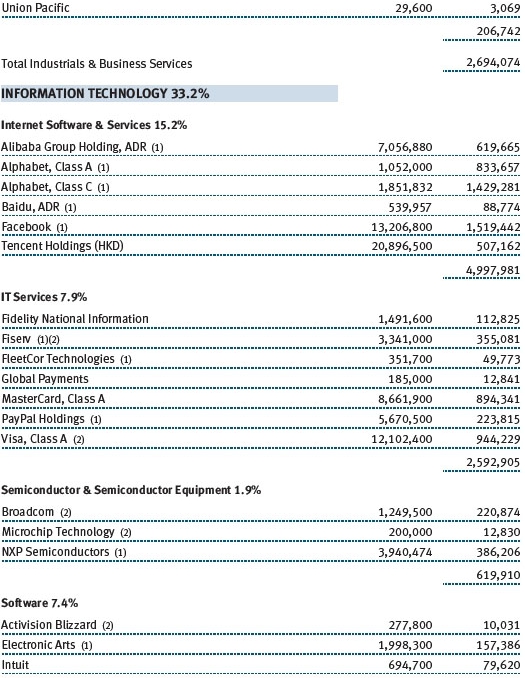
American Airlines was our largest contributor in the industrials and business services area and a top second-half performer overall. We have made the case that a consolidated airline industry would be highly profitable and that the company would generate substantial free cash flow. After being volatile performers due to capacity concerns, the Zika virus, global terrorism, and less-than-robust economic growth, the airlines have shown renewed focus on capacity discipline. This is beginning to foster improvement in passenger revenue per average seat mile. United Continental and Alaska Air Group were also solid contributors. Alaska’s favorable cost structure and strong balance sheet have been rewarded by investors over time. United’s new management team is driving improved operating efficiency and yield management. Our patience with Boeing also paid off, thanks to improvements in aerospace margins and free cash flow generation. Fortive, the industrial business spinoff from Danaher, is well managed, produced solid organic growth, and had good stock performance. FedEx also continued to drive strong improvement in efficiency and shook off concerns regarding Amazon.com’s greater involvement in delivery.

In the consumer discretionary area, our large position in Priceline posted a top contribution for the past six months and for the year. The stock has been buffeted periodically by terrorist actions and other factors influencing travel, but the company’s results have been quite strong and consistent. After posting stellar performance in 2015, Amazon declined sharply in early 2016, but the stock rallied off the February lows and provided the portfolio’s best contribution for the year. Third-party sales and Amazon Web Services (AWS), which provides cloud processing services for other companies, generated above-average profit margins for the company. Both businesses have grown rapidly, propelling a meaningful recovery in Amazon’s gross margin. The company also provided greater disclosure for AWS, demonstrating that this business is far more profitable than many had thought. Netflix has been a strong performer for several years, and it shined in the second half of the year as improved prospects for some of its original programming and rebounding subscriber growth contributed to its solid performance.
Ross Stores, a leading retailer in the off-price segment, has also produced consistent long-term growth for the fund. Its strong same-store sales growth was very favorably differentiated in a challenging retail environment. Gaming and lodging giants MGM Resorts International, Las Vegas Sands, and Marriott were all important contributors to second-half performance. MGM’s National Harbor in the Washington, D.C., area, Las Vegas Sands, Parisian Macau, and Marriott’s acquisition of Starwood all appear to be proceeding successfully. Other important contributors in the consumer discretionary area included Charter Communications, which appears to be integrating its purchase of Time Warner Cable quite effectively, and Royal Caribbean Cruises, which arguably has the best-positioned fleet of large, relatively new cruise ships.
Financial stocks performed well, particularly following the U.S. presidential election, as investors perceived that many financial companies would benefit from lower corporate tax rates, increasing interest rates, and less restrictive regulation. Morgan Stanley was a top-five contributor to 6- and 12-month performance as it continued to post margin improvement in its wealth management business. TD Ameritrade Holding and Charles Schwab were also outstanding performers. Both companies have significant earnings leverage to rising interest rates and also have experienced solid growth in client assets under management. Trust bank holdings State Street and Bank of New York Mellon also produced solid gains. These companies have shown consistent improvement in efficiency and should also benefit from increases in interest rates. Banking giant JPMorgan Chase has also executed well, and this longtime holding rallied nicely after the presidential election. Intercontinental Exchange, which provides a wide array of risk management products, has flourished and again performed well. It is one of our largest capital markets holdings and owns several exchanges, including the New York Stock Exchange. The company has become much stronger in providing market data and related services, a business that should be relatively durable over time.
The health care sector was quite challenging throughout 2016. Selected health care stocks, including some major first-half biotech detractors, showed improved performance in the second half. However, several of our largest second-half detractors were health care stocks, and the sector was the poorest performer for the full year. Bristol-Myers Squibb was our largest detractor in the health care sector and for the fund in the second half of 2016. Opdivo, its compound designed to treat various cancers, proved to be less effective than some alternatives as a first-line treatment for lung cancer. While the company believes that its ongoing trial, which combines Opdivo with Yervoy—another compound produced by the company—will provide compelling evidence of efficacy and because several competitors are also working on combination products, we reduced our position. Allergan was a large detractor in 2016. In our view, the company has an improving product pipeline and has executed fairly well. The company also sold its Actavis generics business for $40 billion, which we believe was a favorable strategic and financial move. However, earnings expectations were simply set too high, and this stock performed poorly until recently. Some investors may also recall that Pfizer’s proposed acquisition of the company was not consummated due to changes in the proposed treatment of some key tax aspects of the deal.
Leading biotech Alexion Pharmaceuticals was another large detractor for the year. It recently completed an internal investigation of its sales practices and also replaced its senior management. However, the investigation resulted in no material change to its financial statements, and the stock rebounded in the second half. Celgene also produced solid second-half gains, as this biotech leader continued to develop an impressive array of drugs used to treat cancer and inflammatory conditions. Biogen released somewhat disappointing clinical data regarding its Alzheimer’s disease treatment, but its remedy for spinal muscular atrophy—a condition affecting the muscles surrounding the spine—received early approval and appears on track to become a major success. Biogen has also reined in expense growth, and the stock performed well in the second half of 2016. UnitedHealth Group continued to be a standout performer. Optum, the company’s data services subsidiary, is growing rapidly, possesses less reimbursement and regulatory risk, and now constitutes over 50% of the company’s operating income. Despite the fact that the proposed acquisition of Humana by Aetna has not been approved by regulators, both companies performed well.
In addition to health care, our major detractors came from a variety of sectors. American Tower is the leading owner of telecommunication towers, with a strong presence in the U.S., Latin America, and India. The company’s financial results have been strong, but the stock has been pressured because it and other real estate investment trusts are considered bond proxies that would be disadvantaged by rising interest rates. Volatility in the exchange rates for many foreign currencies has also affected financial results to a degree and weighed on the stock, but we do not perceive these concerns as significant. Salesforce.com is a leading provider of software and cloud-based services used by clients in the management of their sales, services, marketing, and analytics functions. The company pursued several acquisitions including LinkedIn, which was ultimately successfully acquired by Microsoft. Concerns about these potential acquisitions, as well as some modest slowing in its business, contributed to its underperformance. While we recently trimmed a modest amount of the stock, recent visits with its management have been reassuring regarding the growth outlook for the company. Lowe’s was also among the major detractors to second-half performance. The company has been frustrating because it has produced periods of strong financial performance, but it lacks the consistency we would like in merchandising and expense control. The company’s execution has been reasonably good at times but not nearly as stellar as Home Depot. While we own more Home Depot and have also reduced the Lowe’s position, management has recently committed to improved performance in certain areas. We are likely to keep a position in Lowe’s given its attractive valuation, but we will be vigilant to ensure that operating performance does in fact improve.
STRATEGY
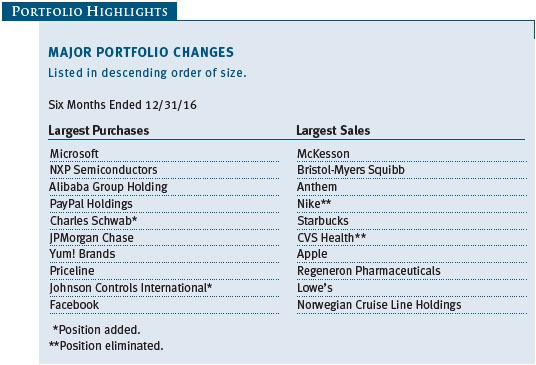
Additions to existing holdings such as Microsoft, NXP Semiconductors, Alibaba, PayPal Holdings, JPMorgan Chase, Yum! Brands, Priceline, and Facebook were substantial enough to be included in the 10 largest purchases for the past six months. New positions large enough to be included in the top 10 purchases included Charles Schwab, the leading brokerage and banking company. As noted earlier, the company has an outstanding record of growing customer assets under management. Its earnings should benefit substantially from rising interest rates. This leverage is enhanced by the fact that Schwab has a significant bank embedded within the company, and it is able to sweep brokerage deposits into the bank, creating more net interest income. We also established a position in Johnson Controls International, a leader in building efficiency solutions as well as power management solutions, including advanced batteries. Johnson recently merged with Tyco International, which provides capabilities in fire control and security that should mesh quite well with the building efficiency operations. The company has just spun out its auto-related assets, including the global automotive seating and interiors business. The overall profile of the company has improved considerably, in our view, and could be rerated over time.
There were two eliminations large enough to be included in the top 10 sales for the second half of 2016. Nike has experienced less consistent growth as several competitors, including Adidas, improved their product offerings. Under Armour, Asics, Brooks, and other shoe manufacturers are also making athletic shoes and, in some cases, apparel, which is competitive with the Nike product offerings. The company’s quarterly results have slowed, and we decided to redeploy our relatively modest position into other holdings. CVS Health was eliminated after several inconsistent quarterly reports and the loss of several large accounts. In general, the entire drug distribution and retailing area has been quite competitive, with certain operators designing specialized or narrow networks to maintain or take market share. CVS should reestablish growth after the recent downward revision in earnings, and we could reestablish a position in time. However, we currently favor other companies in this sector.
OUTLOOK
The market was volatile in 2016, but stocks performed better than many expected given the challenges. Global growth has been lackluster, and Brexit increases the risk of dislocation, especially in the eurozone. The energy and commodity complex remains under considerable stress, although there are signs of improvement. Terrorism has also emerged as a factor that could have a more frequent and injurious effect on global markets. Some stocks have appreciated substantially, and the valuations of selected stocks we believe are no longer attractive.
However, we believe the issue that has most influenced investors’ views (which could have broad effects for several years) is the results of the recent U.S. elections. President Trump’s victory, especially with the strong down-ballot performance that provided Republican control of the House and Senate, could allow for significant policy changes. We understand that many did not support President Trump, and we realize that there will be challenges and risks related to the formulation and implementation of certain policies.
On balance, we believe that many of the Trump proposals to lower and simplify corporate and personal taxes, reduce regulation, and increase infrastructure spending should drive stronger economic growth and corporate earnings. Consequently, we are generally supportive of these proposals and constructive on the market. However, we would reemphasize that many programs will not be adopted easily, quickly, or in their entirety. Renegotiation of trade deals and other actions influencing trade policy, such as border control taxes levied on imports used in production, must be pursued very skillfully. There is certainly a risk of retaliation or some form of trade war that could be quite unproductive and ultimately disrupt global growth. We would be remiss if we did not include a caveat that policy must be pursued in a way that does not cause large increases in the budget deficit or the national debt, especially given a rising interest rate backdrop.
Slow economic growth, a relatively high level of unemployment, or weak income growth in many developed countries represent key concerns. While we have seen improvement in reducing budget deficits and growth in Europe and the U.S., structural reform and spending reductions are almost certainly necessary. In addition to these fiscal actions, central banks have begun to pursue less accommodative monetary policies. The latest data and developments suggest that the Federal Reserve will probably be increasing rates more substantially than many foreign central banks. As a result, the U.S. dollar could remain strong relative to other currencies. This will make the goal of driving strong U.S. manufacturing and export growth perhaps more challenging.
We would also be quick to acknowledge that policymaking to address all of these situations is complex, risky, and unlikely to yield results that are unequivocally favorable. Said another way, all of the solutions have costs and, perhaps, unintended consequences. One unintended and undesirable side effect could be a sharp or persistent rise in inflation. However, we must acknowledge that gold and energy prices would support the argument that inflation is not a major problem at this juncture. There are other complicating factors that may weigh on markets for some time. Aside from the rising risk posed by terrorism, longstanding but intensifying unrest in the Middle East could affect general global stability. Cyberattacks represent an evolving challenge for businesses and possibly financial markets, whether they are pursued by governments or terrorists. A possible downgrade of U.S. government debt, instability in the U.S. dollar or other major currencies, and a sharp increase in interest rates constitute threats that must be carefully monitored. For these reasons (and several others), we regard the current environment as having more complexity and risk than is typical.
On balance, we remain constructive on the long-term performance of stocks. While the challenges we have outlined will require time to resolve and will test the patience of policymakers and investors, corporate earnings at selected companies could continue to impress, interest rates and inflation should remain at acceptable levels, and the valuations of many high-quality companies are reasonable.
Despite the uncertainty surrounding how effective fiscal and monetary actions will be in addressing various risks, there are several things working in our favor:
1. Stocks historically have performed quite well following a lackluster period of performance. Essentially, we have experienced two bear markets since 2000.
2. Recent market strength over the past few years does temper the amount of potential appreciation. However, given the recent correction, the valuations of stocks are attractive, especially in relation to the very low level of interest rates. The spread between the earnings yield on stocks and the 10-year Treasury rate is attractive in any historical context. The free cash flow yield of many companies exceeds 10% and implies attractive valuation, especially in the context of 10-year Treasury note yields of approximately 2.4%.
3. We believe that the high-quality, consistent-growth companies that we seek to purchase are especially attractive and could conceivably do well even if the economy only experiences modest growth. Stringent expense management could also support rapid earnings growth if revenues begin to accelerate.
4. Many large-cap growth companies have strong balance sheets with record amounts of cash and strong capitalization. This should allow them to opportunistically invest in new products or businesses or make acquisitions as change creates dislocation.
5. Many of our holdings generate significant free cash flow. Shareholder-oriented management can use this cash to pay dividends, repurchase shares, or make value-added acquisitions. Several of our holdings have reduced shares outstanding by a meaningful amount over time.
We continue to strive to enhance returns in a difficult environment by investing in quality companies with durable, sustainable earnings and cash flow growth. We appreciate your continued confidence in this endeavor.
Respectfully submitted,

Larry J. Puglia
President and chairman of the Investment Advisory Committee
January 12, 2017
The committee chairman has day-to-day responsibility for managing the portfolio and works with committee members in developing and executing the fund’s investment program.
RISKS OF STOCK INVESTING
The fund’s share price can fall because of weakness in the stock markets, a particular industry, or specific holdings. Stock markets can decline for many reasons, including adverse political or economic developments, changes in investor psychology, or heavy institutional selling. The prospects for an industry or company may deteriorate because of a variety of factors, including disappointing earnings or changes in the competitive environment. In addition, the investment manager’s assessment of companies held in a fund may prove incorrect, resulting in losses or poor performance even in rising markets. Growth stocks can be volatile because these companies usually invest a high portion of earnings in their businesses, and earnings disappointments often lead to sharply falling prices. The value approach carries the risk that a security’s intrinsic value may not be recognized for a long time or that the stock may actually be appropriately priced.
GLOSSARY
Free cash flow: The excess cash a company is generating from its operations that can be taken out of the business for the benefit of shareholders, such as dividends, share repurchases, investments, and acquisitions.
Lipper indexes: Fund benchmarks that consist of a small number (10 to 30) of the largest mutual funds in a particular category as tracked by Lipper Inc.
Price/book ratio: A valuation measure that compares a stock’s market price with its book value, i.e., the company’s net worth divided by the number of outstanding shares.
Russell 1000 Growth Index: Market capitalization-weighted index of those firms in the Russell 1000 Index with higher price-to-book ratios and higher forecast growth values.
Russell 1000 Index: A market capitalization-weighted index that tracks the performance of the 1,000 largest U.S. companies.
S&P 500 Index: An unmanaged index that tracks the stocks of 500 primarily large-cap U.S. companies.
Note: Russell Investment Group is the source and owner of the trademarks, service marks, and copyrights related to the Russell indexes. Russell® is a trademark of Russell Investment Group.

Performance and Expenses
| Growth of $10,000 |
This chart shows the value of a hypothetical $10,000 investment in the fund over the past 10 fiscal year periods or since inception (for funds lacking 10-year records). The result is compared with benchmarks, which may include a broad-based market index and a peer group average or index. Market indexes do not include expenses, which are deducted from fund returns as well as mutual fund averages and indexes.
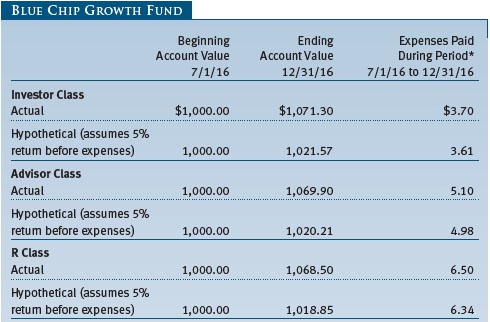
| Fund Expense Example |
As a mutual fund shareholder, you may incur two types of costs: (1) transaction costs, such as redemption fees or sales loads, and (2) ongoing costs, including management fees, distribution and service (12b-1) fees, and other fund expenses. The following example is intended to help you understand your ongoing costs (in dollars) of investing in the fund and to compare these costs with the ongoing costs of investing in other mutual funds. The example is based on an investment of $1,000 invested at the beginning of the most recent six-month period and held for the entire period.
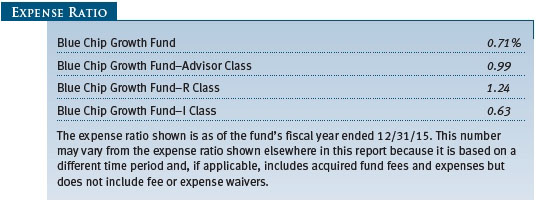
Please note that the fund has four share classes: The original share class (Investor Class) charges no distribution and service (12b-1) fee, Advisor Class shares are offered only through unaffiliated brokers and other financial intermediaries and charge a 0.25% 12b-1 fee, R Class shares are available to retirement plans serviced by intermediaries and charge a 0.50% 12b-1 fee, and I Class shares are available to institutionally oriented clients and impose no 12b-1 or administrative fee payment. Each share class is presented separately in the table.
Actual Expenses
The first line of the following table (Actual) provides information about actual account values and expenses based on the fund’s actual returns. You may use the information on this line, together with your account balance, to estimate the expenses that you paid over the period. Simply divide your account value by $1,000 (for example, an $8,600 account value divided by $1,000 = 8.6), then multiply the result by the number on the first line under the heading “Expenses Paid During Period” to estimate the expenses you paid on your account during this period.
Hypothetical Example for Comparison Purposes
The information on the second line of the table (Hypothetical) is based on hypothetical account values and expenses derived from the fund’s actual expense ratio and an assumed 5% per year rate of return before expenses (not the fund’s actual return). You may compare the ongoing costs of investing in the fund with other funds by contrasting this 5% hypothetical example and the 5% hypothetical examples that appear in the shareholder reports of the other funds. The hypothetical account values and expenses may not be used to estimate the actual ending account balance or expenses you paid for the period.
Note: T. Rowe Price charges an annual account service fee of $20, generally for accounts with less than $10,000. The fee is waived for any investor whose T. Rowe Price mutual fund accounts total $50,000 or more; accounts electing to receive electronic delivery of account statements, transaction confirmations, prospectuses, and shareholder reports; or accounts of an investor who is a T. Rowe Price Preferred Services, Personal Services, or Enhanced Personal Services client (enrollment in these programs generally requires T. Rowe Price assets of at least $100,000). This fee is not included in the accompanying table. If you are subject to the fee, keep it in mind when you are estimating the ongoing expenses of investing in the fund and when comparing the expenses of this fund with other funds.
You should also be aware that the expenses shown in the table highlight only your ongoing costs and do not reflect any transaction costs, such as redemption fees or sales loads. Therefore, the second line of the table is useful in comparing ongoing costs only and will not help you determine the relative total costs of owning different funds. To the extent a fund charges transaction costs, however, the total cost of owning that fund is higher.

The accompanying notes are an integral part of these financial statements.

The accompanying notes are an integral part of these financial statements.

The accompanying notes are an integral part of these financial statements.

The accompanying notes are an integral part of these financial statements.


The accompanying notes are an integral part of these financial statements.

The accompanying notes are an integral part of these financial statements.

The accompanying notes are an integral part of these financial statements.

The accompanying notes are an integral part of these financial statements.
| Notes to Financial Statements |
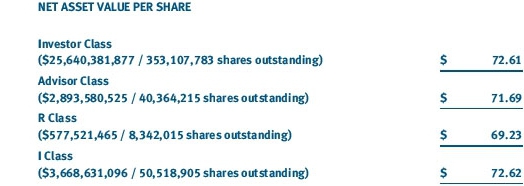
T. Rowe Price Blue Chip Growth Fund, Inc. (the fund), is registered under the Investment Company Act of 1940 (the 1940 Act) as a diversified, open-end management investment company. The fund seeks to provide long-term capital growth. Income is a secondary objective. The fund has four classes of shares: the Blue Chip Growth Fund (Investor Class), the Blue Chip Growth Fund–Advisor Class (Advisor Class), the Blue Chip Growth Fund–R Class (R Class), and the Blue Chip Growth Fund–I Class (I Class). Advisor Class shares are sold only through unaffiliated brokers and other unaffiliated financial intermediaries, and R Class shares are available to retirement plans serviced by intermediaries. I Class shares generally are available only to investors meeting a $1,000,000 minimum investment or certain other criteria. The Advisor Class and R Class each operate under separate Board-approved Rule 12b-1 plans, pursuant to which each class compensates financial intermediaries for distribution, shareholder servicing, and/or certain administrative services; the Investor and I Classes do not pay Rule 12b-1 fees. Each class has exclusive voting rights on matters related solely to that class; separate voting rights on matters that relate to all classes; and, in all other respects, the same rights and obligations as the other classes.
NOTE 1 - SIGNIFICANT ACCOUNTING POLICIES
Basis of Preparation The fund is an investment company and follows accounting and reporting guidance in the Financial Accounting Standards Board (FASB) Accounting Standards Codification Topic 946 (ASC 946). The accompanying financial statements were prepared in accordance with accounting principles generally accepted in the United States of America (GAAP), including, but not limited to, ASC 946. GAAP requires the use of estimates made by management. Management believes that estimates and valuations are appropriate; however, actual results may differ from those estimates, and the valuations reflected in the accompanying financial statements may differ from the value ultimately realized upon sale or maturity.
Investment Transactions, Investment Income, and Distributions Income and expenses are recorded on the accrual basis. Dividends received from mutual fund investments are reflected as dividend income; capital gain distributions are reflected as realized gain/loss. Dividend income and capital gain distributions are recorded on the ex-dividend date. Income tax-related interest and penalties, if incurred, would be recorded as income tax expense. Investment transactions are accounted for on the trade date. Realized gains and losses are reported on the identified cost basis. Distributions from REITs are initially recorded as dividend income and, to the extent such represent a return of capital or capital gain for tax purposes, are reclassified when such information becomes available. Income distributions are declared and paid by each class annually. Distributions to shareholders are recorded on the ex-dividend date. Capital gain distributions are generally declared and paid by the fund annually.
Currency Translation Assets, including investments, and liabilities denominated in foreign currencies are translated into U.S. dollar values each day at the prevailing exchange rate, using the mean of the bid and asked prices of such currencies against U.S. dollars as quoted by a major bank. Purchases and sales of securities, income, and expenses are translated into U.S. dollars at the prevailing exchange rate on the date of the transaction. The effect of changes in foreign currency exchange rates on realized and unrealized security gains and losses is reflected as a component of security gains and losses.
Class Accounting Shareholder servicing, prospectus, and shareholder report expenses incurred by each class are charged directly to the class to which they relate. Expenses common to all classes, investment income, and realized and unrealized gains and losses are allocated to the classes based upon the relative daily net assets of each class. The Advisor Class and R Class each pay Rule 12b-1 fees, in an amount not exceeding 0.25% and 0.50%, respectively, of the class’s average daily net assets.
Rebates Subject to best execution, the fund may direct certain security trades to brokers who have agreed to rebate a portion of the related brokerage commission to the fund in cash. Commission rebates are reflected as realized gain on securities in the accompanying financial statements and totaled $248,000 for the year ended December 31, 2016.
In-Kind Redemptions In accordance with guidelines described in the fund’s prospectus, and when considered to be in the best interest of all shareholders, the fund may distribute portfolio securities rather than cash as payment for a redemption of fund shares (in-kind redemption). Gains and losses realized on in-kind redemptions are not recognized for tax purposes and are reclassified from undistributed realized gain (loss) to paid-in capital. During the year ended December 31, 2016, the fund realized $37,015,000 of net gain on $63,910,000 of in-kind redemptions.
New Accounting Guidance In October 2016, the Securities and Exchange Commission (SEC) issued a new rule, Investment Company Reporting Modernization, which, among other provisions, amends Regulation S-X to require standardized, enhanced disclosures, particularly related to derivatives, in investment company financial statements. Compliance with the guidance is required for financial statements filed with the SEC on or after August 1, 2017; adoption will have no effect on the fund’s net assets or results of operations.
NOTE 2 - VALUATION
The fund’s financial instruments are valued and each class’s net asset value (NAV) per share is computed at the close of the New York Stock Exchange (NYSE), normally 4 p.m. ET, each day the NYSE is open for business. However, the NAV per share may be calculated at a time other than the normal close of the NYSE if trading on the NYSE is restricted, if the NYSE closes earlier, or as may be permitted by the SEC.
Fair Value The fund’s financial instruments are reported at fair value, which GAAP defines as the price that would be received to sell an asset or paid to transfer a liability in an orderly transaction between market participants at the measurement date. The T. Rowe Price Valuation Committee (the Valuation Committee) is an internal committee that has been delegated certain responsibilities by the fund’s Board of Directors (the Board) to ensure that financial instruments are appropriately priced at fair value in accordance with GAAP and the 1940 Act. Subject to oversight by the Board, the Valuation Committee develops and oversees pricing-related policies and procedures and approves all fair value determinations. Specifically, the Valuation Committee establishes procedures to value securities; determines pricing techniques, sources, and persons eligible to effect fair value pricing actions; oversees the selection, services, and performance of pricing vendors; oversees valuation-related business continuity practices; and provides guidance on internal controls and valuation-related matters. The Valuation Committee reports to the Board and has representation from legal, portfolio management and trading, operations, risk management, and the fund’s treasurer.
Various valuation techniques and inputs are used to determine the fair value of financial instruments. GAAP establishes the following fair value hierarchy that categorizes the inputs used to measure fair value:
Level 1 – quoted prices (unadjusted) in active markets for identical financial instruments that the fund can access at the reporting date
Level 2 – inputs other than Level 1 quoted prices that are observable, either directly or indirectly (including, but not limited to, quoted prices for similar financial instruments in active markets, quoted prices for identical or similar financial instruments in inactive markets, interest rates and yield curves, implied volatilities, and credit spreads)
Level 3 – unobservable inputs
Observable inputs are developed using market data, such as publicly available information about actual events or transactions, and reflect the assumptions that market participants would use to price the financial instrument. Unobservable inputs are those for which market data are not available and are developed using the best information available about the assumptions that market participants would use to price the financial instrument. GAAP requires valuation techniques to maximize the use of relevant observable inputs and minimize the use of unobservable inputs. When multiple inputs are used to derive fair value, the financial instrument is assigned to the level within the fair value hierarchy based on the lowest-level input that is significant to the fair value of the financial instrument. Input levels are not necessarily an indication of the risk or liquidity associated with financial instruments at that level but rather the degree of judgment used in determining those values.
Valuation Techniques Equity securities listed or regularly traded on a securities exchange or in the over-the-counter (OTC) market are valued at the last quoted sale price or, for certain markets, the official closing price at the time the valuations are made. OTC Bulletin Board securities are valued at the mean of the closing bid and asked prices. A security that is listed or traded on more than one exchange is valued at the quotation on the exchange determined to be the primary market for such security. Listed securities not traded on a particular day are valued at the mean of the closing bid and asked prices for domestic securities and the last quoted sale or closing price for international securities.
For valuation purposes, the last quoted prices of non-U.S. equity securities may be adjusted to reflect the fair value of such securities at the close of the NYSE. If the fund determines that developments between the close of a foreign market and the close of the NYSE will, in its judgment, materially affect the value of some or all of its portfolio securities, the fund will adjust the previous quoted prices to reflect what it believes to be the fair value of the securities as of the close of the NYSE. In deciding whether it is necessary to adjust quoted prices to reflect fair value, the fund reviews a variety of factors, including developments in foreign markets, the performance of U.S. securities markets, and the performance of instruments trading in U.S. markets that represent foreign securities and baskets of foreign securities. The fund may also fair value securities in other situations, such as when a particular foreign market is closed but the fund is open. The fund uses outside pricing services to provide it with quoted prices and information to evaluate or adjust those prices. The fund cannot predict how often it will use quoted prices and how often it will determine it necessary to adjust those prices to reflect fair value. As a means of evaluating its security valuation process, the fund routinely compares quoted prices, the next day’s opening prices in the same markets, and adjusted prices.
Actively traded equity securities listed on a domestic exchange generally are categorized in Level 1 of the fair value hierarchy. Non-U.S. equity securities generally are categorized in Level 2 of the fair value hierarchy despite the availability of quoted prices because, as described above, the fund evaluates and determines whether those quoted prices reflect fair value at the close of the NYSE or require adjustment. OTC Bulletin Board securities, certain preferred securities, and equity securities traded in inactive markets generally are categorized in Level 2 of the fair value hierarchy.
Investments in mutual funds are valued at the mutual fund’s closing NAV per share on the day of valuation and are categorized in Level 1 of the fair value hierarchy. Assets and liabilities other than financial instruments, including short-term receivables and payables, are carried at cost, or estimated realizable value, if less, which approximates fair value.
Thinly traded financial instruments and those for which the above valuation procedures are inappropriate or are deemed not to reflect fair value are stated at fair value as determined in good faith by the Valuation Committee. The objective of any fair value pricing determination is to arrive at a price that could reasonably be expected from a current sale. Financial instruments fair valued by the Valuation Committee are primarily private placements, restricted securities, warrants, rights, and other securities that are not publicly traded.
Subject to oversight by the Board, the Valuation Committee regularly makes good faith judgments to establish and adjust the fair valuations of certain securities as events occur and circumstances warrant. For instance, in determining the fair value of an equity investment with limited market activity, such as a private placement or a thinly traded public company stock, the Valuation Committee considers a variety of factors, which may include, but are not limited to, the issuer’s business prospects, its financial standing and performance, recent investment transactions in the issuer, new rounds of financing, negotiated transactions of significant size between other investors in the company, relevant market valuations of peer companies, strategic events affecting the company, market liquidity for the issuer, and general economic conditions and events. In consultation with the investment and pricing teams, the Valuation Committee will determine an appropriate valuation technique based on available information, which may include both observable and unobservable inputs. The Valuation Committee typically will afford greatest weight to actual prices in arm’s length transactions, to the extent they represent orderly transactions between market participants, transaction information can be reliably obtained, and prices are deemed representative of fair value. However, the Valuation Committee may also consider other valuation methods such as market-based valuation multiples; a discount or premium from market value of a similar, freely traded security of the same issuer; or some combination. Fair value determinations are reviewed on a regular basis and updated as information becomes available, including actual purchase and sale transactions of the issue. Because any fair value determination involves a significant amount of judgment, there is a degree of subjectivity inherent in such pricing decisions, and fair value prices determined by the Valuation Committee could differ from those of other market participants. Depending on the relative significance of unobservable inputs, including the valuation technique(s) used, fair valued securities may be categorized in Level 2 or 3 of the fair value hierarchy.
Valuation Inputs The following table summarizes the fund’s financial instruments, based on the inputs used to determine their fair values on December 31, 2016:
There were no material transfers between Levels 1 and 2 during the year ended December 31, 2016.
NOTE 3 - OTHER INVESTMENT TRANSACTIONS
Consistent with its investment objective, the fund engages in the following practices to manage exposure to certain risks and/or to enhance performance. The investment objective, policies, program, and risk factors of the fund are described more fully in the fund’s prospectus and Statement of Additional Information.
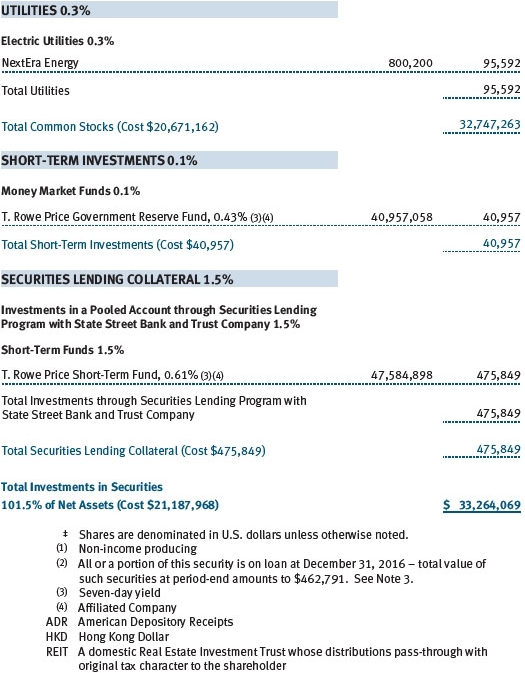
Securities Lending The fund may lend its securities to approved brokers to earn additional income. Its securities lending activities are administered by a lending agent in accordance with a securities lending agreement. Security loans generally do not have stated maturity dates, and the fund may recall a security at any time. The fund receives collateral in the form of cash or U.S. government securities, valued at 102% to 105% of the value of the securities on loan. Collateral is maintained over the life of the loan in an amount not less than the value of loaned securities; any additional collateral required due to changes in security values is delivered to the fund the next business day. Cash collateral is invested by the lending agent(s) in accordance with investment guidelines approved by fund management. Additionally, the lending agent indemnifies the fund against losses resulting from borrower default. Although risk is mitigated by the collateral and indemnification, the fund could experience a delay in recovering its securities and a possible loss of income or value if the borrower fails to return the securities, collateral investments decline in value, and the lending agent fails to perform. Securities lending revenue consists of earnings on invested collateral and borrowing fees, net of any rebates to the borrower, compensation to the lending agent, and other administrative costs. In accordance with GAAP, investments made with cash collateral are reflected in the accompanying financial statements, but collateral received in the form of securities is not. At December 31, 2016, the value of loaned securities was $462,791,000; the value of cash collateral and related investments was $475,849,000.
Other Purchases and sales of portfolio securities other than short-term securities aggregated $11,308,295,000 and $10,204,969,000, respectively, for the year ended December 31, 2016.
NOTE 4 - FEDERAL INCOME TAXES
No provision for federal income taxes is required since the fund intends to continue to qualify as a regulated investment company under Subchapter M of the Internal Revenue Code and distribute to shareholders all of its taxable income and gains. Distributions determined in accordance with federal income tax regulations may differ in amount or character from net investment income and realized gains for financial reporting purposes. Financial reporting records are adjusted for permanent book/tax differences to reflect tax character but are not adjusted for temporary differences.
The fund files U.S. federal, state, and local tax returns as required. The fund’s tax returns are subject to examination by the relevant tax authorities until expiration of the applicable statute of limitations, which is generally three years after the filing of the tax return but which can be extended to six years in certain circumstances. Tax returns for open years have incorporated no uncertain tax positions that require a provision for income taxes.
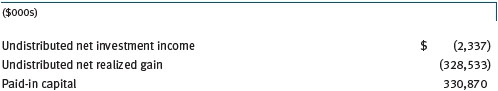
Reclassifications to paid-in capital relate primarily to redemptions in kind and a tax practice that treats a portion of the proceeds from each redemption of capital shares as a distribution of taxable net investment income or realized capital gain. Reclassifications between income and gain relate primarily to the character of net currency losses. For the year ended December 31, 2016, the following reclassifications were recorded to reflect tax character (there was no impact on results of operations or net assets):
Distributions during the years ended December 31, 2016 and December 31, 2015, were characterized for tax purposes as follows:

At December 31, 2016, the tax-basis cost of investments and components of net assets were as follows:
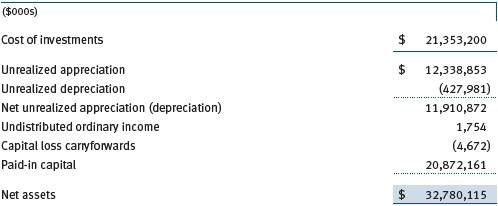
The difference between book-basis and tax-basis net unrealized appreciation (depreciation) is attributable to the deferral of losses from wash sales for tax purposes.
The fund intends to retain realized gains to the extent of available capital loss carryforwards. Net realized capital losses may be carried forward indefinitely to offset future realized capital gains. All or a portion of the capital loss carryforwards may be from losses realized between November 1 and the fund’s fiscal year-end, which are deferred for tax purposes until the subsequent year but recognized for financial reporting purposes in the year realized. During the year ended December 31, 2016, the fund utilized $32,423,000 of capital loss carryforwards.
NOTE 5 - RELATED PARTY TRANSACTIONS
The fund is managed by T. Rowe Price Associates, Inc. (Price Associates), a wholly owned subsidiary of T. Rowe Price Group, Inc. (Price Group). The investment management agreement between the fund and Price Associates provides for an annual investment management fee, which is computed daily and paid monthly. The fee consists of an individual fund fee and a group fee. The individual fund fee is equal to 0.30% of the fund’s average daily net assets up to $15 billion and 0.255% of the fund’s average daily net assets in excess of $15 billion. The group fee rate is calculated based on the combined net assets of certain mutual funds sponsored by Price Associates (the group) applied to a graduated fee schedule, with rates ranging from 0.48% for the first $1 billion of assets to 0.270% for assets in excess of $500 billion. The fund’s group fee is determined by applying the group fee rate to the fund’s average daily net assets. At December 31, 2016, the effective annual group fee rate was 0.29%.
The I Class is subject to an operating expense limitation (I Class limit) pursuant to which Price Associates is contractually required to pay all operating expenses of the I Class, excluding management fees, interest, expenses related to borrowings, taxes, and brokerage, and other non-recurring expenses permitted by the investment management agreement, to the extent such operating expenses, on an annualized basis, exceed 0.05% of average net assets. This agreement will continue until April 30, 2018, and may be renewed, revised, or revoked only with approval of the fund’s Board. The I Class is required to repay Price Associates for expenses previously paid to the extent the class’s net assets grow or expenses decline sufficiently to allow repayment without causing the class’s operating expenses to exceed the I Class limit in effect at the time of the waiver. However, no repayment will be made more than three years after the date of a payment or waiver. Pursuant to this agreement, less than $1,000 of expenses were waived/paid by Price Associates during the year ended December 31, 2016.
In addition, the fund has entered into service agreements with Price Associates and two wholly owned subsidiaries of Price Associates (collectively, Price). Price Associates provides certain accounting and administrative services to the fund. T. Rowe Price Services, Inc., provides shareholder and administrative services in its capacity as the fund’s transfer and dividend-disbursing agent. T. Rowe Price Retirement Plan Services, Inc., provides subaccounting and recordkeeping services for certain retirement accounts invested in the Investor Class, R Class and I Class. For the year ended December 31, 2016, expenses incurred pursuant to these service agreements were $67,000 for Price Associates; $5,049,000 for T. Rowe Price Services, Inc.; and $5,568,000 for T. Rowe Price Retirement Plan Services, Inc. The total amount payable at period-end pursuant to these service agreements is reflected as Due to Affiliates in the accompanying financial statements.
Additionally, the fund is one of several mutual funds in which certain college savings plans managed by Price Associates may invest. As approved by the fund’s Board of Directors, shareholder servicing costs associated with each college savings plan are borne by the fund in proportion to the average daily value of its shares owned by the college savings plan. For the year ended December 31, 2016, the fund was charged $1,276,000 for shareholder servicing costs related to the college savings plans, of which $909,000 was for services provided by Price. The amount payable at period-end pursuant to this agreement is reflected as Due to Affiliates in the accompanying financial statements. At December 31, 2016, approximately 3% of the outstanding shares of the Investor Class were held by college savings plans.
The fund is also one of several mutual funds sponsored by Price Associates (underlying Price funds) in which the T. Rowe Price Spectrum Funds (Spectrum Funds), may invest. The Spectrum Funds do not invest in the underlying Price funds for the purpose of exercising management or control. Pursuant to a special servicing agreements, expenses associated with the operation of the Spectrum Funds are borne by each underlying Price fund to the extent of estimated savings to it and in proportion to the average daily value of its shares owned by the Spectrum Funds.
Expenses allocated under these agreements are reflected as shareholder servicing expense in the accompanying financial statements. For the year ended December 31, 2016, the fund was allocated $524,000 of Spectrum Funds’ expenses. Of these amounts, $355,000 related to services provided by Price. At period-end, the amount payable to Price pursuant to these agreements is reflected as Due to Affiliates in the accompanying financial statements. At December 31, 2016 approximately 2% of the outstanding shares of the Investor Class were held by the Spectrum Funds.
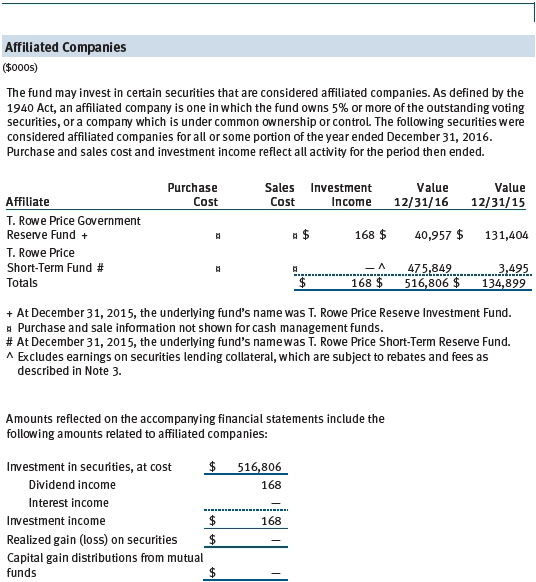
The fund may invest in the T. Rowe Price Government Reserve Fund, the T. Rowe Price Treasury Reserve Fund, or the T. Rowe Price Short-Term Fund (collectively, the Price Reserve Funds), open-end management investment companies managed by Price Associates and considered affiliates of the fund. The Price Reserve Funds are offered as short-term investment options to mutual funds, trusts, and other accounts managed by Price Associates or its affiliates and are not available for direct purchase by members of the public. The Price Reserve Funds pay no investment management fees.
The fund may participate in securities purchase and sale transactions with other funds or accounts advised by Price Associates (cross trades), in accordance with procedures adopted by the fund’s Board and Securities and Exchange Commission rules, which require, among other things, that such purchase and sale cross trades be effected at the independent current market price of the security. During the year ended December 31, 2016, the aggregate value of purchases and sales cross trades with other funds or accounts advised by Price Associates was less than 1% of the fund’s net assets as of December 31, 2016.
| Report of Independent Registered Public Accounting Firm |
To the Board of Directors and Shareholders of
T. Rowe Price Blue Chip Growth Fund, Inc.
In our opinion, the accompanying statement of assets and liabilities, including the portfolio of investments, and the related statements of operations and of changes in net assets and the financial highlights present fairly, in all material respects, the financial position of T. Rowe Price Blue Chip Growth Fund, Inc. (the “Fund”) as of December 31, 2016, the results of its operations, the changes in its net assets and the financial highlights for each of the periods indicated therein, in conformity with accounting principles generally accepted in the United States of America. These financial statements and financial highlights (hereafter referred to as “financial statements”) are the responsibility of the Fund’s management. Our responsibility is to express an opinion on these financial statements based on our audits. We conducted our audits of these financial statements in accordance with the standards of the Public Company Accounting Oversight Board (United States). Those standards require that we plan and perform the audit to obtain reasonable assurance about whether the financial statements are free of material misstatement. An audit includes examining, on a test basis, evidence supporting the amounts and disclosures in the financial statements, assessing the accounting principles used and significant estimates made by management, and evaluating the overall financial statement presentation. We believe that our audits, which included confirmation of securities as of December 31, 2016 by correspondence with the custodian and brokers, and confirmation of the underlying funds by correspondence with the transfer agent, provide a reasonable basis for our opinion.
PricewaterhouseCoopers LLP
Baltimore, Maryland
February 16, 2017
| Tax Information (Unaudited) for the Tax Year Ended 12/31/16 |
We are providing this information as required by the Internal Revenue Code. The amounts shown may differ from those elsewhere in this report because of differences between tax and financial reporting requirements.
The fund’s distributions to shareholders included $490,541,000 from long-term capital gains, subject to a long-term capital gains tax rate of not greater than 20%.
For taxable non-corporate shareholders, $28,964,000 of the fund’s income represents qualified dividend income subject to a long-term capital gains tax rate of not greater than 20%.
For corporate shareholders, $28,964,000 of the fund’s income qualifies for the dividends-received deduction.
| Information on Proxy Voting Policies, Procedures, and Records |
A description of the policies and procedures used by T. Rowe Price funds and portfolios to determine how to vote proxies relating to portfolio securities is available in each fund’s Statement of Additional Information. You may request this document by calling 1-800-225-5132 or by accessing the SEC’s website, sec.gov.
The description of our proxy voting policies and procedures is also available on our corporate website. To access it, please visit the following Web page:
https://www3.troweprice.com/usis/corporate/en/utility/policies.html
Scroll down to the section near the bottom of the page that says, “Proxy Voting Policies.” Click on the Proxy Voting Policies link in the shaded box.
Each fund’s most recent annual proxy voting record is available on our website and through the SEC’s website. To access it through T. Rowe Price, visit the website location shown above, and scroll down to the section near the bottom of the page that says, “Proxy Voting Records.” Click on the Proxy Voting Records link in the shaded box.
| How to Obtain Quarterly Portfolio Holdings |
The fund files a complete schedule of portfolio holdings with the Securities and Exchange Commission for the first and third quarters of each fiscal year on Form N-Q. The fund’s Form N-Q is available electronically on the SEC’s website (sec.gov); hard copies may be reviewed and copied at the SEC’s Public Reference Room, 100 F St. N.E., Washington, DC 20549. For more information on the Public Reference Room, call 1-800-SEC-0330.
| About the Fund’s Directors and Officers |
Your fund is overseen by a Board of Directors (Board) that meets regularly to review a wide variety of matters affecting or potentially affecting the fund, including performance, investment programs, compliance matters, advisory fees and expenses, service providers, and business and regulatory affairs. The Board elects the fund’s officers, who are listed in the final table. At least 75% of the Board’s members are independent of T. Rowe Price Associates, Inc. (T. Rowe Price), and its affiliates; “inside” or “interested” directors are employees or officers of T. Rowe Price. The business address of each director and officer is 100 East Pratt Street, Baltimore, Maryland 21202. The Statement of Additional Information includes additional information about the fund directors and is available without charge by calling a T. Rowe Price representative at 1-800-638-5660.
Independent Directors
| Name | ||
| (Year of Birth) | ||
| Year Elected* | ||
| [Number of T. Rowe Price | Principal Occupation(s) and Directorships of Public Companies and | |
| Portfolios Overseen] | Other Investment Companies During the Past Five Years | |
| William R. Brody, M.D., Ph.D. | President and Trustee, Salk Institute for Biological Studies (2009 to | |
| (1944) | present); Director, BioMed Realty Trust (2013 to 2016); Chairman | |
| 2009 | of the Board, Mesa Biotech, a molecular diagnostic company | |
| [187] | (March 2016 to present); Director, Radiology Partners, an integrated | |
| radiology practice management company (June 2016 to present); | ||
| Director, Novartis, Inc. (2009 to 2014); Director, IBM (2007 | ||
| to present) | ||
| Anthony W. Deering | Chairman, Exeter Capital, LLC, a private investment firm (2004 to | |
| (1945) | present); Director, Brixmor Real Estate Investment Trust (2012 to | |
| 2001 | present); Director and Advisory Board Member, Deutsche Bank | |
| [187] | North America (2004 to present); Director, Under Armour (2008 | |
| to present); Director, Vornado Real Estate Investment Trust (2004 | ||
| to 2012) | ||
| Bruce W. Duncan | Chief Executive Officer and Director (2009 to present), Chairman | |
| (1951) | of the Board (January 2016 to present), and President (2009 | |
| 2013 | to September 2016), First Industrial Realty Trust, an owner and | |
| [187] | operator of industrial properties; Chairman of the Board (2005 to | |
| May 2016) and Director (1999 to May 2016), Starwood Hotels & | ||
| Resorts, a hotel and leisure company; Director, Boston Properties | ||
| (May 2016 to present) | ||
| Robert J. Gerrard, Jr. | Advisory Board Member, Pipeline Crisis/Winning Strategies, a | |
| (1952) | collaborative working to improve opportunities for young African | |
| 2012 | Americans (1997 to present) | |
| [187] | ||
| Paul F. McBride | Advisory Board Member, Vizzia Technologies (2015 to present) | |
| (1956) | ||
| 2013 | ||
| [187] | ||
| Cecilia E. Rouse, Ph.D. | Dean, Woodrow Wilson School (2012 to present); Professor and | |
| (1963) | Researcher, Princeton University (1992 to present); Director, MDRC, | |
| 2012 | a nonprofit education and social policy research organization (2011 | |
| [187] | to present); Member of National Academy of Education (2010 to | |
| present); Research Associate of Labor Program (2011 to present) | ||
| and Board Member (2015 to present), National Bureau of Economic | ||
| Research (2011 to present); Chair of Committee on the Status of | ||
| Minority Groups in the Economic Profession (2012 to present) and | ||
| Vice President (2015 to present), American Economic Association | ||
| John G. Schreiber | Owner/President, Centaur Capital Partners, Inc., a real estate | |
| (1946) | investment company (1991 to present); Cofounder, Partner, and | |
| 2001 | Cochairman of the Investment Committee, Blackstone Real Estate | |
| [187] | Advisors, L.P. (1992 to 2015); Director, General Growth Properties, | |
| Inc. (2010 to 2013); Director, Blackstone Mortgage Trust, a real | ||
| estate finance company (2012 to 2016); Director and Chairman of | ||
| the Board, Brixmor Property Group, Inc. (2013 to present); Director, | ||
| Hilton Worldwide (2013 to present); Director, Hudson Pacific | ||
| Properties (2014 to 2016) | ||
| Mark R. Tercek | President and Chief Executive Officer, The Nature Conservancy | |
| (1957) | (2008 to present) | |
| 2009 | ||
| [187] | ||
| *Each independent director serves until retirement, resignation, or election of a successor. | ||
Inside Director
| Name | ||
| (Year of Birth) | ||
| Year Elected* | ||
| [Number of T. Rowe Price | Principal Occupation(s) and Directorships of Public Companies and | |
| Portfolios Overseen] | Other Investment Companies During the Past Five Years | |
| Edward C. Bernard | Director and Vice President, T. Rowe Price; Vice Chairman of the | |
| (1956) | Board, Director, and Vice President, T. Rowe Price Group, Inc.; | |
| 2006 | Chairman of the Board, Director, and President, T. Rowe Price | |
| [187] | Investment Services, Inc.; Chairman of the Board and Director, | |
| T. Rowe Price Retirement Plan Services, Inc., and T. Rowe Price | ||
| Services, Inc.; Chairman of the Board, Chief Executive Officer, | ||
| Director, and President, T. Rowe Price International and T. Rowe | ||
| Price Trust Company; Chairman of the Board, all funds | ||
| Brian C. Rogers, CFA, CIC | Chief Investment Officer, Director, and Vice President, T. Rowe | |
| (1955) | Price; Chairman of the Board, Chief Investment Officer, Director, and | |
| 2006 | Vice President, T. Rowe Price Group, Inc.; Vice President, T. Rowe | |
| [131] | Price Trust Company; Director, United Technologies (January 2016 | |
| to present) | ||
| *Each inside director serves until retirement, resignation, or election of a successor. | ||
| Officers | ||
| Name (Year of Birth) | ||
| Position Held With Blue Chip Growth Fund | Principal Occupation(s) | |
| Ziad Bakri, M.D. CFA (1980) | Vice President, T. Rowe Price and T. Rowe Price | |
| Vice President | Group, Inc. | |
| Peter J. Bates, CFA (1974) | Vice President, T. Rowe Price and T. Rowe Price | |
| Vice President | Group, Inc. | |
| Darrell N. Braman (1963) | Vice President, Price Hong Kong, Price | |
| Vice President and Secretary | Singapore, T. Rowe Price, T. Rowe Price Group, | |
| Inc., T. Rowe Price International, T. Rowe Price | ||
| Investment Services, Inc., and T. Rowe Price | ||
| Services, Inc. | ||
| Ryan N. Burgess CFA (1974) | Vice President, T. Rowe Price and T. Rowe Price | |
| Vice President | Group, Inc. | |
| Eric L. DeVilbiss, CFA (1983) | Vice President, T. Rowe Price and T. Rowe Price | |
| Vice President | Group, Inc. | |
| Shawn T. Driscoll (1975) | Vice President, T. Rowe Price, T. Rowe Price | |
| Vice President | Group, Inc., and T. Rowe Price Trust Company | |
| John R. Gilner (1961) | Chief Compliance Officer and Vice President, | |
| Chief Compliance Officer | T. Rowe Price; Vice President, T. Rowe Price | |
| Group, Inc., and T. Rowe Price Investment | ||
| Services, Inc. | ||
| Paul D. Greene II (1978) | Vice President, T. Rowe Price and T. Rowe Price | |
| Vice President | Group, Inc. | |
| Ryan S. Hedrick, CFA (1980) | Vice President, T. Rowe Price and T. Rowe | |
| Vice President | Price Group, Inc.; formerly, Analyst, Davidson | |
| Kempner Capital Management (to 2013) | ||
| Thomas J. Huber, CFA (1966) | Vice President, T. Rowe Price, T. Rowe Price | |
| Vice President | Group, Inc., and T. Rowe Price Trust Company | |
| Paul J. Krug, CPA (1964) | Vice President, T. Rowe Price, T. Rowe Price | |
| Vice President | Group, Inc., and T. Rowe Price Trust Company | |
| George A. Marzano (1980) | Vice President, T. Rowe Price and T. Rowe Price | |
| Vice President | Group, Inc. | |
| Catherine D. Mathews (1963) | Vice President, T. Rowe Price, T. Rowe Price | |
| Treasurer and Vice President | Group, Inc., and T. Rowe Price Trust Company | |
| David Oestreicher (1967) | Director, Vice President, and Secretary, T. Rowe | |
| Vice President | Price Investment Services, Inc., T. Rowe | |
| Price Retirement Plan Services, Inc., T. Rowe | ||
| Price Services, Inc., and T. Rowe Price Trust | ||
| Company; Chief Legal Officer, Vice President, | ||
| and Secretary, T. Rowe Price Group, Inc.; Vice | ||
| President and Secretary, T. Rowe Price and | ||
| T. Rowe Price International; Vice President, | ||
| Price Hong Kong and Price Singapore | ||
| Larry J. Puglia, CFA, CPA (1960) | Vice President, T. Rowe Price, T. Rowe Price | |
| President | Group, Inc., and T. Rowe Price Trust Company | |
| Vivek Rajeswaran (1985) | Vice President, T. Rowe Price and T. Rowe | |
| Vice President | Price Group, Inc.; formerly, student, Columbia | |
| Business School (to 2012) | ||
| John W. Ratzesberger (1975) | Vice President, T. Rowe Price, T. Rowe Price | |
| Vice President | Group, Inc., and T. Rowe Price Trust Company; | |
| formerly, North American Head of Listed | ||
| Derivatives Operation, Morgan Stanley | ||
| (to 2013) | ||
| Shannon H. Rauser (1987) | Employee, T. Rowe Price | |
| Assistant Secretary | ||
| Deborah D. Seidel (1962) | Vice President, T. Rowe Price, T. Rowe Price | |
| Vice President | Group, Inc., T. Rowe Price Investment Services, | |
| Inc., and T. Rowe Price Services, Inc. | ||
| Robert W. Sharps, CFA, CPA (1971) | Vice President, T. Rowe Price, T. Rowe Price | |
| Vice President | Group, Inc., and T. Rowe Price Trust Company | |
| Taymour R. Tamaddon, CFA (1976) | Vice President, T. Rowe Price and T. Rowe Price | |
| Vice President | Group, Inc. | |
Unless otherwise noted, officers have been employees of T. Rowe Price or T. Rowe Price International for at least 5 years. | ||
Item 2. Code of Ethics.
The registrant has adopted a code of ethics, as defined in Item 2 of Form N-CSR, applicable to its principal executive officer, principal financial officer, principal accounting officer or controller, or persons performing similar functions. A copy of this code of ethics is filed as an exhibit to this Form N-CSR. No substantive amendments were approved or waivers were granted to this code of ethics during the period covered by this report.
Item 3. Audit Committee Financial Expert.
The registrant’s Board of Directors/Trustees has determined that Mr. Bruce W. Duncan qualifies as an audit committee financial expert, as defined in Item 3 of Form N-CSR. Mr. Duncan is considered independent for purposes of Item 3 of Form N-CSR.
Item 4. Principal Accountant Fees and Services.
(a) – (d) Aggregate fees billed for the last two fiscal years for professional services rendered to, or on behalf of, the registrant by the registrant’s principal accountant were as follows:

Audit fees include amounts related to the audit of the registrant’s annual financial statements and services normally provided by the accountant in connection with statutory and regulatory filings. Audit-related fees include amounts reasonably related to the performance of the audit of the registrant’s financial statements and specifically include the issuance of a report on internal controls and, if applicable, agreed-upon procedures related to fund acquisitions. Tax fees include amounts related to services for tax compliance, tax planning, and tax advice. The nature of these services specifically includes the review of distribution calculations and the preparation of Federal, state, and excise tax returns. All other fees include the registrant’s pro-rata share of amounts for agreed-upon procedures in conjunction with service contract approvals by the registrant’s Board of Directors/Trustees.
(e)(1) The registrant’s audit committee has adopted a policy whereby audit and non-audit services performed by the registrant’s principal accountant for the registrant, its investment adviser, and any entity controlling, controlled by, or under common control with the investment adviser that provides ongoing services to the registrant require pre-approval in advance at regularly scheduled audit committee meetings. If such a service is required between regularly scheduled audit committee meetings, pre-approval may be authorized by one audit committee member with ratification at the next scheduled audit committee meeting. Waiver of pre-approval for audit or non-audit services requiring fees of a de minimis amount is not permitted.
(2) No services included in (b) – (d) above were approved pursuant to paragraph (c)(7)(i)(C) of Rule 2-01 of Regulation S-X.
(f) Less than 50 percent of the hours expended on the principal accountant’s engagement to audit the registrant’s financial statements for the most recent fiscal year were attributed to work performed by persons other than the principal accountant’s full-time, permanent employees.
(g) The aggregate fees billed for the most recent fiscal year and the preceding fiscal year by the registrant’s principal accountant for non-audit services rendered to the registrant, its investment adviser, and any entity controlling, controlled by, or under common control with the investment adviser that provides ongoing services to the registrant were $2,146,000 and $2,158,000, respectively.
(h) All non-audit services rendered in (g) above were pre-approved by the registrant’s audit committee. Accordingly, these services were considered by the registrant’s audit committee in maintaining the principal accountant’s independence.
Item 5. Audit Committee of Listed Registrants.
Not applicable.
Item 6. Investments.
(a) Not applicable. The complete schedule of investments is included in Item 1 of this Form N-CSR.
(b) Not applicable.
Item 7. Disclosure of Proxy Voting Policies and Procedures for Closed-End Management Investment Companies.
Not applicable.
Item 8. Portfolio Managers of Closed-End Management Investment Companies.
Not applicable.
Item 9. Purchases of Equity Securities by Closed-End Management Investment Company and Affiliated Purchasers.
Not applicable.
Item 10. Submission of Matters to a Vote of Security Holders.
Not applicable.
Item 11. Controls and Procedures.
(a) The registrant’s principal executive officer and principal financial officer have evaluated the registrant’s disclosure controls and procedures within 90 days of this filing and have concluded that the registrant’s disclosure controls and procedures were effective, as of that date, in ensuring that information required to be disclosed by the registrant in this Form N-CSR was recorded, processed, summarized, and reported timely.
(b) The registrant’s principal executive officer and principal financial officer are aware of no change in the registrant’s internal control over financial reporting that occurred during the registrant’s second fiscal quarter covered by this report that has materially affected, or is reasonably likely to materially affect, the registrant’s internal control over financial reporting.
Item 12. Exhibits.
(a)(1) The registrant’s code of ethics pursuant to Item 2 of Form N-CSR is attached.
(2) Separate certifications by the registrant's principal executive officer and principal financial officer, pursuant to Section 302 of the Sarbanes-Oxley Act of 2002 and required by Rule 30a-2(a) under the Investment Company Act of 1940, are attached.
(3) Written solicitation to repurchase securities issued by closed-end companies: not applicable.
(b) A certification by the registrant's principal executive officer and principal financial officer, pursuant to Section 906 of the Sarbanes-Oxley Act of 2002 and required by Rule 30a-2(b) under the Investment Company Act of 1940, is attached.
SIGNATURES
Pursuant to the requirements of the Securities Exchange Act of 1934 and the Investment Company Act of 1940, the registrant has duly caused this report to be signed on its behalf by the undersigned, thereunto duly authorized.
T. Rowe Price Blue Chip Growth Fund, Inc.
| By | /s/ Edward C. Bernard | |
| Edward C. Bernard | ||
| Principal Executive Officer | ||
| Date February 16, 2017 | ||
Pursuant to the requirements of the Securities Exchange Act of 1934 and the Investment Company Act of 1940, this report has been signed below by the following persons on behalf of the registrant and in the capacities and on the dates indicated.
| By | /s/ Edward C. Bernard | |
| Edward C. Bernard | ||
| Principal Executive Officer | ||
| Date February 16, 2017 | ||
| By | /s/ Catherine D. Mathews | |
| Catherine D. Mathews | ||
| Principal Financial Officer | ||
| Date February 16, 2017 | ||