UNITED STATES
SECURITIES AND EXCHANGE COMMISSION
Washington, D.C. 20549
FORM N-CSR
CERTIFIED SHAREHOLDER REPORT OF REGISTERED
MANAGEMENT INVESTMENT COMPANIES
Investment Company Act file number 811-07678
American Municipal Income Portfolio Inc.
(Exact name of registrant as specified in charter)
| | |
| 800 Nicollet Mall, Minneapolis, MN | | 55402 |
| (Address of principal executive offices) | | (Zip code) |
Jill M. Stevenson, 800 Nicollet Mall, Minneapolis, MN 55402
(Name and address of agent for service)
Registrant’s telephone number, including area code: 800-677-3863
| | |
Date of fiscal year end: | | August 31 |
| |
Date of reporting period: | | February 29, 2012 |
Form N-CSR is to be used by management investment companies to file reports with the Commission not later than 10 days after the transmission to stockholders of any report that is required to be transmitted to stockholders under Rule 30e-1 under the Investment Company Act of 1940 (17 CFR 270.30e-1). The Commission may use the information provided on Form N-CSR in its regulatory, disclosure review, inspection, and policymaking roles.
A registrant is required to disclose the information specified by Form N-CSR, and the Commission will make this information public. A registrant is not required to respond to the collection of information contained in Form N-CSR unless the Form displays a currently valid Office of Management and Budget (“OMB”) control number. Please direct comments concerning the accuracy of the information collection burden estimate and any suggestions for reducing the burden to Secretary, Securities and Exchange Commission, 450 Fifth Street, NW, Washington, DC 20549-0609. The OMB has reviewed this collection of information under the clearance requirements of 44 U.S.C. Section 3507.

SEMIANNUAL REPORT
February 29, 2012

| | | | |
| XAA | | | | American Municipal Income Portfolio |
American Municipal Income Portfolio
OUR IMAGE–GEORGE WASHINGTON
His rich legacy as patriot and leader is widely recognized as embodying the sound judgment, reliability, and strategic vision that are central to our brand. Fashioned in a style reminiscent of an 18th century engraving, the illustration conveys the symbolic strength and vitality of Washington, which are attributes that we value at First American.

|
| NOT FDIC INSURED NO BANK GUARANTEE MAY LOSE VALUE |
EXPLANATION OF FINANCIAL STATEMENTS
As a shareholder in the fund, you receive shareholder reports semiannually. We strive to present this financial information in an easy-to-understand format; however, for many investors, the information contained in this shareholder report may seem very technical. So, we would like to take this opportunity to explain several sections of the shareholder report.
The Schedule of Investments details all of the securities held in the fund and their related dollar values on the last day of the reporting period. Securities are usually presented by type (bonds, common stock, etc.) and by industry classification (healthcare, education, etc.). This information is useful for analyzing how your fund’s assets are invested and seeing where your portfolio manager believes the best opportunities exist to meet your objectives. Holdings are subject to change without notice and do not constitute a recommendation of any individual security. The Notes to Financial Statements provide additional details on how the securities are valued.
The Statement of Assets and Liabilities lists the assets and liabilities of the fund on the last day of the reporting period and presents the fund’s net asset value (“NAV”) and market price per share. The NAV is calculated by dividing the fund’s net assets (assets minus liabilities) by the number of shares outstanding. The market price is the closing price on the exchange on which the fund’s shares trade. This price, which may be higher or lower than the fund’s NAV, is the price an investor pays or receives when shares of the fund are purchased or sold. The investments, as presented in the Schedule of Investments, comprise substantially all of the fund’s assets. Other assets include cash and receivables for items such as income earned by the fund but not yet received. Liabilities include payables for items such as fund expenses incurred but not yet paid.
The Statement of Operations details the dividends and interest income earned from investments as well as the expenses incurred by the fund during the reporting period. Fund expenses may be reduced through fee waivers or reimbursements. This statement reflects total expenses before any waivers or reimbursements, the amount of waivers and reimbursements (if any), and the net expenses. This statement also shows the net realized and unrealized gains and losses from investments owned during the period. The Notes to Financial Statements provide additional details on investment income and expenses of the fund.
The Statement of Changes in Net Assets describes how the fund’s net assets were affected by its operating results and distributions to shareholders during the reporting period. This statement is important to investors because it shows exactly what caused the fund’s net asset size to change during the period.
The Statement of Cash Flows is required when a fund has a substantial amount of illiquid investments, a substantial amount of the fund’s securities are internally fair valued, or the fund carries some amount of debt. When presented, this statement explains the change in cash during the reporting period. It reconciles net cash provided by and used for operating activities to the net increase or decrease in net assets from operations and classifies cash receipts and payments as resulting from operating, investing, and financing activities.
The Financial Highlights provide a per-share breakdown of the components that affected the fund’s NAV for the current and past reporting periods. It also shows total return, net investment income ratios, expense ratios, and portfolio turnover rates. The net investment income ratios summarize the income earned less expenses, divided by the average net assets. The expense ratios represent the percentage of average net assets that were used to cover operating expenses during the period. The portfolio turnover rate represents the percentage of the fund’s holdings that have changed over the course of the period, and gives an idea of how long the fund holds onto a particular security. A 100% turnover rate implies that an amount equal to the value of the entire portfolio is turned over in a year through the purchase or sale of securities.
The Notes to Financial Statements disclose the organizational background of the fund, its significant accounting policies, federal tax information, fees and compensation paid to affiliates, and significant risks and contingencies.
We hope this guide to your shareholder report will help you get the most out of this important resource.
| | | | | | |
| AMERICAN MUNICIPAL INCOME PORTFOLIO | | 2012 SEMIANNUAL REPORT | | | 1 | |
Fund Overview
Portfolio Allocation1
As a percentage of total investments on February 29, 2012
| | | | |
Health Care Revenue | | | 38 | % |
General Obligations | | | 22 | |
Education Revenue | | | 11 | |
Utility Revenue | | | 8 | |
Tax Revenue | | | 5 | |
Pre-refunded Issues2 | | | 4 | |
Housing Revenue | | | 4 | |
Economic Development Revenue | | | 2 | |
Leasing Revenue | | | 2 | |
Transportation Revenue | | | 2 | |
Pollution Control | | | 1 | |
Short-Term Investments | | | 1 | |
| | | 100 | % |
1Portfolio allocations are subject to change and are not recommendations to buy or sell any security.
2Within the Schedule of Investments, pre-refunded issues are classified under their applicable industries.
Bond Credit Quality Breakdown3
As a percentage of long-term investments on February 29, 2012
| | | | |
AAA | | | 4 | % |
AA | | | 37 | |
A | | | 25 | |
BBB | | | 18 | |
BB | | | 1 | |
NR | | | 15 | |
| | | 100 | % |
3Individual security ratings are based on information from Moody’s Investors Service, Standard & Poor’s, and/or Fitch. If there are multiple ratings for a security, the lowest rating is used unless ratings are provided by all three agencies, in which case the middle rating is used.
| | | | |
| 2 | | AMERICAN MUNICIPAL INCOME PORTFOLIO | | 2012 SEMIANNUAL REPORT |
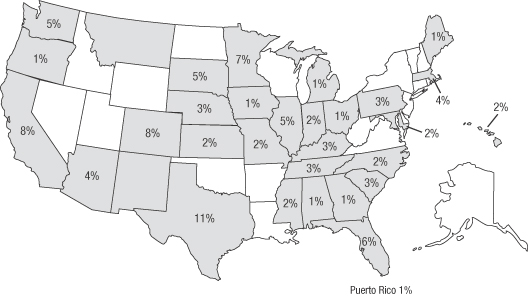
Geographical Distribution
As a percentage of long-term investments on February 29, 2012. Shaded areas without values indicate states in which the fund has invested less than 0.50% of its assets.
| | | | | | |
| AMERICAN MUNICIPAL INCOME PORTFOLIO | | 2012 SEMIANNUAL REPORT | | | 3 | |
| | |
| Schedule of Investments | | February 29, 2012 (unaudited) |
American Municipal Income Portfolio (XAA)
| | | | | | | | |
DESCRIPTION | | PAR | | | FAIR
VALUE ¶ | |
| | |
(Percentages of each investment category relate to total net assets applicable to outstanding common shares) | | | | | | | | |
| | |
Municipal Long-Term Investments — 147.4% | | | | | | | | |
Alabama — 0.8% | | | | | | | | |
Revenue Bond — 0.8% | | | | | | | | |
Camden Industrial Development Board, Weyerhaeuser, Series B (AMT) (Pre-refunded 12/1/13 @ 100), 6.38%, 12/1/24 ¯ | | $ | 650,000 | | | $ | 719,245 | |
| | | | | | | | |
Arizona — 5.5% | | | | | | | | |
Revenue Bond — 2.4% | | | | | | | | |
Maricopa County Industrial Development Authority, Health Facilities, Catholic Healthcare West, Series A, 5.25%, 7/1/32 | | | 2,000,000 | | | | 2,098,420 | |
| | | | | | | | |
General Obligation — 3.1% | | | | | | | | |
Pima County Unified School District Number 1, Tucson (FGIC) (NATL), 8.38%, 7/1/13 | | | 2,450,000 | | | | 2,694,412 | |
| | | | | | | | |
| | | | | | | 4,792,832 | |
| | | | | | | | |
California — 12.1% | | | | | | | | |
Revenue Bonds — 2.9% | | | | | | | | |
Los Angeles County Metropolitan Transportation Authority, Series B, 5.00%, 6/1/18 | | | 750,000 | | | | 927,570 | |
Pollution Control Financing Authority, Solid Waste Disposal, Waste Management Incorporated Project, Series A-2 (AMT), 5.40%, 4/1/25 | | | 1,000,000 | | | | 1,038,760 | |
State Communities Development Authority, Henry Mayo Newhall Memorial Hospital, Series A (CMI), 5.00%, 10/1/27 | | | 500,000 | | | | 530,715 | |
Ventura County Area Housing Authority, Mira Vista Senior Apartments, Series A (AMBAC) (AMT), 5.00%, 12/1/22 ¥ | | | 100,000 | | | | 91,112 | |
| | | | | | | | |
| | | | | | | 2,588,157 | |
| | | | | | | | |
General Obligations — 8.2% | | | | | | | | |
Los Rios Community College District, Series D, 5.38%, 8/1/34 | | | 2,000,000 | | | | 2,245,980 | |
Poway Unified School District, Series B, Zero Coupon Bond, 5.44%, 8/1/41 ° | | | 2,000,000 | | | | 412,040 | |
Rialto Unified School District, Election 2010, Series A, Convertible (CAB) (AGM), 0.00% through 8/1/26, thereafter, 7.35%, 8/1/41 X | | | 5,000,000 | | | | 2,478,550 | |
West Contra Costa Unified School District, Election 2010, Series A-1, 5.00%, 8/1/41 | | | 2,000,000 | | | | 2,097,980 | |
| | | | | | | | |
| | | | | | | 7,234,550 | |
| | | | | | | | |
Tax Allocation Bonds — 1.0% | | | | | | | | |
Davis Redevelopment Agency, Series A, 7.00%, 12/1/36 | | | 260,000 | | | | 306,116 | |
Lynwood Redevelopment Agency, Series A, 7.00%, 9/1/31 | | | 250,000 | | | | 288,898 | |
Santee Community Development Commission, Series A, 7.00%, 8/1/31 | | | 220,000 | | | | 253,572 | |
| | | | | | | | |
| | | | | | | 848,586 | |
| | | | | | | | |
| | | | | | | 10,671,293 | |
| | | | | | | | |
Colorado — 11.3% | | | | | | | | |
Revenue Bonds — 11.3% | | | | | | | | |
State Health Facilities Authority, Covenant Retirement Communities, Series B, 6.13%, 12/1/33 | | | 1,000,000 | | | | 1,022,280 | |
State Health Facilities Authority, Evangelical Lutheran, | | | | | | | | |
5.90%, 10/1/27 | | | 650,000 | | | | 657,410 | |
5.00%, 6/1/29 | | | 1,000,000 | | | | 1,016,780 | |
State Health Facilities Authority, Poudre Valley, Series B (AGM), 5.25%, 3/1/36 | | | 2,085,000 | | | | 2,252,718 | |
State Health Facilities Authority, Valley View Hospital Association, 5.50%, 5/15/28 | | | 750,000 | | | | 796,035 | |
State Health Facilities Authority, Volunteers of America Care, Series A, 5.00%, 7/1/15 | | | 280,000 | | | | 291,729 | |
State Housing & Finance Authority, Solid Waste Disposal, Waste Management Incorporated Project (AMT), 5.70%, 7/1/18 | | | 1,000,000 | | | | 1,134,870 | |
State Housing & Finance Authority, Multifamily Housing Project, Series A-3, Class II (AMT), 5.70%, 10/1/42 | | | 2,745,000 | | | | 2,747,031 | |
Water Reserve & Power Development Authority, Clean Water, Series A, 5.90%, 9/1/16 | | | 25,000 | | | | 25,121 | |
| | | | | | | | |
| | | | | | | 9,943,974 | |
| | | | | | | | |
Florida — 8.7% | | | | | | | | |
Revenue Bonds — 8.7% | | | | | | | | |
City of Cape Coral, Water & Sewer, Series 2011 (AGM), 5.00%, 10/1/41 | | | 1,000,000 | | | | 1,081,440 | |
Miami-Dade County Educational Facilities Authority, University of Miami, Series A, 5.20%, 4/1/24 | | | 1,000,000 | | | | 1,077,960 | |
Miami-Dade County Water & Sewer Systems, (AGM), 5.00%, 10/1/39 | | | 1,000,000 | | | | 1,084,150 | |
Palm Beach County Health Facilities Authority, Abbey Delray South, 5.45%, 10/1/15 | | | 1,100,000 | | | | 1,148,631 | |
Palm Beach County Health Facilities Authority, ACTS Retirement — Life Communities, Series A, 4.50%, 11/15/36 | | | 2,120,000 | | | | 1,945,079 | |
The accompanying notes are an integral part of the financial statements.
| | | | |
| 4 | | AMERICAN MUNICIPAL INCOME PORTFOLIO | | 2012 SEMIANNUAL REPORT |
American Municipal Income Portfolio (XAA)
| | | | | | | | |
DESCRIPTION | | PAR | | | FAIR
VALUE ¶ | |
| | |
Palm Beach County Health Facilities Authority, Waterford Project, 5.88%, 11/15/37 | | $ | 1,300,000 | | | $ | 1,335,659 | |
| | | | | | | | |
| | | | | | | 7,672,919 | |
| | | | | | | | |
Georgia — 0.8% | | | | | | | | |
Revenue Bond — 0.8% | | | | | | | | |
Fulton County Development Authority, Maxon Atlantic Station, Fulton Cooling, Series A (AMT) (Optional Put 3/1/15 @ 100), 5.13%, 3/1/26 | | | 700,000 | | | | 705,943 | |
| | | | | | | | |
Hawaii — 3.6% | | | | | | | | |
Revenue Bond — 3.6% | | | | | | | | |
State Department of Budget & Finance, Kahala Nui Project, Series A, 8.00%, 11/15/33 | | | 3,000,000 | | | | 3,130,050 | |
| | | | | | | | |
Illinois — 6.6% | | | | | | | | |
Revenue Bonds — 4.8% | | | | | | | | |
Metropolitan Pier & Exposition Authority, Capital Appreciation, McCormick, Series A (NATL), Zero Coupon Bond, 5.11%, 12/15/34 ° | | | 5,000,000 | | | | 1,582,900 | |
State Finance Authority, Capital Appreciation, Clare Water Tower, Series B, Zero Coupon Bond, 17.32%, 5/15/50 ¥ °¿ | | | 187,500 | | | | 328 | |
State Finance Authority, Clare Water Tower, Series A, 6.00%, 5/15/28 ¥¿ | | | 437,500 | | | | 65,551 | |
State Finance Authority, Landing at Plymouth Place Project, Series A, 6.00%, 5/15/37 ¥ | | | 575,000 | | | | 484,702 | |
State Finance Authority, Rush University Medical Center, Series B (NATL), 5.25%, 11/1/35 | | | 1,000,000 | | | | 1,043,340 | |
State Finance Authority, Three Crowns Park Plaza, Series A, 5.88%, 2/15/26 ¥ | | | 500,000 | | | | 501,945 | |
State Health Facility Authority, Lutheran General Hospital, Series C, 7.00%, 4/1/14 | | | 475,000 | | | | 504,597 | |
| | | | | | | | |
| | | | | | | 4,183,363 | |
| | | | | | | | |
General Obligation — 1.8% | | | | | | | | |
McCook, 5.20%, 12/1/30 | | | 1,500,000 | | | | 1,630,515 | |
| | | | | | | | |
| | | | | | | 5,813,878 | |
| | | | | | | | |
Indiana — 3.3% | | | | | | | | |
Revenue Bonds — 3.3% | | | | | | | | |
State Health & Educational Facility Financing Authority, Sisters of St. Francis (AGM), | | | | | | | | |
5.25%, 11/1/25 | | | 475,000 | | | | 527,582 | |
5.25%, 11/1/29 | | | 530,000 | | | | 577,377 | |
State Health Facility Financing Authority, Columbus Regional Hospital (AGM), 7.00%, 8/15/15 | | | 1,675,000 | | | | 1,836,688 | |
| | | | | | | | |
| | | | | | | 2,941,647 | |
| | | | | | | | |
Iowa — 1.2% | | | | | | | | |
Revenue Bonds — 1.2% | | | | | | | | |
Sheldon Health Care Facilities, Northwest Iowa Health Center Project, 6.15%, 3/1/16 | | | 755,000 | | | | 757,401 | |
State Higher Education Loan Authority, Wartburg College (ACA) (Pre-refunded 10/1/12 @ 100), 5.50%, 10/1/33 ¯ | | | 250,000 | | | | 257,762 | |
| | | | | | | | |
| | | | | | | 1,015,163 | |
| | | | | | | | |
Kansas — 3.2% | | | | | | | | |
Revenue Bonds — 3.2% | | | | | | | | |
Olathe Health Facilities, Olathe Medical Center, 5.00%, 9/1/29 | | | 1,000,000 | | | | 1,054,030 | |
State Development Finance Authority, Hospital, Adventist Health, 5.50%, 11/15/29 | | | 1,540,000 | | | | 1,776,852 | |
| | | | | | | | |
| | | | | | | 2,830,882 | |
| | | | | | | | |
Kentucky — 4.7% | | | | | | | | |
Revenue Bonds — 4.7% | | | | | | | | |
Louisville & Jefferson County Metropolitan Government, College, Bellarmine University, Series A, 6.00%, 5/1/38 | | | 2,500,000 | | | | 2,683,250 | |
Pikeville Medical Center, 6.50%, 3/1/41 | | | 1,250,000 | | | | 1,443,450 | |
| | | | | | | | |
| | | | | | | 4,126,700 | |
| | | | | | | | |
Maine — 1.2% | | | | | | | | |
Revenue Bond — 1.2% | | | | | | | | |
State Health & Higher Educational Facilities Authority, General Medical Center, 6.75%, 7/1/41 | | | 1,000,000 | | | | 1,084,920 | |
| | | | | | | | |
Maryland — 2.8% | | | | | | | | |
General Obligation — 2.8% | | | | | | | | |
Maryland State, 2nd Series, 5.00%, 7/15/20 | | | 2,000,000 | | | | 2,422,180 | |
| | | | | | | | |
| | | | | | |
| AMERICAN MUNICIPAL INCOME PORTFOLIO | | 2012 SEMIANNUAL REPORT | | | 5 | |
| | |
| Schedule of Investments | | February 29, 2012 (unaudited) |
American Municipal Income Portfolio (XAA)
| | | | | | | | |
DESCRIPTION | | PAR | | | FAIR
VALUE ¶ | |
| | |
Massachusetts — 6.1% | | | | | | | | |
Revenue Bonds — 6.1% | | | | | | | | |
State Development Financing Agency, Adventcare Project, ¥ | | | | | | | | |
6.75%, 10/15/37, Series A | | $ | 650,000 | | | $ | 652,639 | |
7.63%, 10/15/37 | | | 880,000 | | | | 932,290 | |
State Development Financing Agency, Education Facility, Academy of the Pacific Rim, Series A (ACA), 5.13%, 6/1/31 | | | 1,825,000 | | | | 1,697,067 | |
State Development Financing Agency, Senior Living Facility, Groves — Lincoln, Series A, 7.88%, 6/1/44 ¥ | | | 1,000,000 | | | | 996,330 | |
State Health & Educational Facilities Authority, Suffolk University, Series A, 5.75%, 7/1/39 | | | 1,000,000 | | | | 1,049,910 | |
| | | | | | | | |
| | | | | | | 5,328,236 | |
| | | | | | | | |
Michigan — 1.5% | | | | | | | | |
Revenue Bond — 1.5% | | | | | | | | |
State Strategic Fund, Michigan House of Representatives, Series A (AGC), 5.25%, 10/15/23 | | | 1,165,000 | | | | 1,293,931 | |
| | | | | | | | |
Minnesota — 10.4% | | | | | | | | |
Revenue Bonds — 10.4% | | | | | | | | |
Cuyuna Range Hospital District, | | | | | | | | |
5.00%, 6/1/29 | | | 1,000,000 | | | | 1,000,840 | |
5.50%, 6/1/35 | | | 1,000,000 | | | | 1,004,930 | |
Maplewood Multifamily, Carefree Cottages II (AMT) (FNMA) (Mandatory Put 4/15/19 @ 100), 4.80%, 4/15/34 | | | 1,000,000 | | | | 1,022,600 | |
Marshall Medical Center, Avera Marshall Regional Medical Center Project, Series A (Pre-refunded 11/1/13 @100), 6.00%, 11/1/28 ¯ | | | 500,000 | | | | 542,545 | |
St. Louis Park Health Care Facilities, Nicollet Health Services, 5.75%, 7/1/39 | | | 2,000,000 | | | | 2,200,540 | |
St. Paul Housing & Redevelopment Authority, Community Peace Academy Project, Series A, 5.00%, 12/1/36 | | | 875,000 | | | | 749,805 | |
St. Paul Housing & Redevelopment Authority, Health Care Facility, HealthPartners Obligation Group Project, 5.25%, 5/15/36 | | | 495,000 | | | | 506,558 | |
St. Paul Housing & Redevelopment Hospital Authority, Health East Project, 5.00%, 11/15/17 | | | 1,400,000 | | | | 1,420,720 | |
State Agricultural & Economic Development Board, Fairview Health Care System, Series A, 6.38%, 11/15/29 | | | 30,000 | | | | 30,057 | |
Worthington Housing Authority, Meadows Worthington Project, Series A, 5.25%, 11/1/28 ¥ | | | 675,000 | | | | 650,970 | |
| | | | | | | | |
| | | | | | | 9,129,565 | |
| | | | | | | | |
Mississippi — 2.9% | | | | | | | | |
General Obligations — 2.9% | | | | | | | | |
State Development Bank Special Obligation, Jackson, | | | | | | | | |
5.50%, 1/1/23 | | | 1,325,000 | | | | 1,540,829 | |
5.80%, 1/1/24 | | | 850,000 | | | | 994,985 | |
| | | | | | | | |
| | | | | | | 2,535,814 | |
| | | | | | | | |
Missouri — 3.0% | | | | | | | | |
Revenue Bonds — 3.0% | | | | | | | | |
Boone County, Boone Hospital Center, 5.63%, 8/1/38 | | | 1,500,000 | | | | 1,595,730 | |
North Central Regional Water System, 5.00%, 1/1/37 ¥ | | | 1,000,000 | | | | 1,016,250 | |
| | | | | | | | |
| | | | | | | 2,611,980 | |
| | | | | | | | |
Montana — 0.6% | | | | | | | | |
Revenue Bond — 0.6% | | | | | | | | |
Forsyth Pollution Control, Northwestern Corporation (AMBAC), 4.65%, 8/1/23 | | | 500,000 | | | | 536,640 | |
| | | | | | | | |
Nebraska — 4.6% | | | | | | | | |
Revenue Bonds — 4.2% | | | | | | | | |
University of Nebraska, Omaha Health & Recreation Project, | | | | | | | | |
5.00%, 5/15/33 | | | 1,250,000 | | | | 1,372,075 | |
5.00%, 5/15/38 | | | 2,100,000 | | | | 2,263,422 | |
| | | | | | | | |
| | | | | | | 3,635,497 | |
| | | | | | | | |
General Obligation — 0.4% | | | | | | | | |
City of Omaha Various Purpose, Series 2011-A, 4.13%, 11/15/31 | | | 350,000 | | | | 376,827 | |
| | | | | | | | |
| | | | | | | 4,012,324 | |
| | | | | | | | |
New Hampshire — 0.7% | | | | | | | | |
Revenue Bond — 0.7% | | | | | | | | |
State Health and Education Facilities Authority, Speare Memorial Hospital, 5.88%, 7/1/34 | | | 600,000 | | | | 617,400 | |
| | | | | | | | |
The accompanying notes are an integral part of the financial statements.
| | | | |
| 6 | | AMERICAN MUNICIPAL INCOME PORTFOLIO | | 2012 SEMIANNUAL REPORT |
American Municipal Income Portfolio (XAA)
| | | | | | | | |
DESCRIPTION | | PAR | | | FAIR
VALUE ¶ | |
| | |
New Mexico — 0.3% | | | | | | | | |
Revenue Bond — 0.3% | | | | | | | | |
State Mortgage Finance Authority, Series A (FHA) (FMHA) (VA), 6.88%, 1/1/25 | | $ | 215,000 | | | $ | 224,974 | |
| | | | | | | | |
North Carolina — 3.1% | | | | | | | | |
Revenue Bond — 1.8% | | | | | | | | |
State Capital Facilities Finance Agency, Meredith College, 6.13%, 6/1/35 | | | 1,500,000 | | | | 1,626,390 | |
| | | | | | | | |
General Obligation — 1.3% | | | | | | | | |
Mecklenburg County Public Improvement, Series B, 4.00%, 2/1/23 | | | 1,000,000 | | | | 1,111,930 | |
| | | | | | | | |
| | | | | | | 2,738,320 | |
| | | | | | | | |
Ohio — 1.6% | | | | | | | | |
Revenue Bonds — 1.6% | | | | | | | | |
Miami County Hospital Facilities, Upper Valley Medical Center, 5.25%, 5/15/26 | | | 1,000,000 | | | | 1,050,040 | |
Richland County Hospital Facilities, Medcentral Health System, Series B, 6.38%, 11/15/30 | | | 335,000 | | | | 338,404 | |
| | | | | | | | |
| | | | | | | 1,388,444 | |
| | | | | | | | |
Oregon — 1.3% | | | | | | | | |
Revenue Bond — 1.3% | | | | | | | | |
City of Portland, Sewer System, Second Lien, Series B (NATL), 5.00%, 6/15/24 | | | 1,000,000 | | | | 1,108,780 | |
| | | | | | | | |
Pennsylvania — 4.7% | | | | | | | | |
Revenue Bonds — 4.7% | | | | | | | | |
Chartiers Valley Industrial and Commercial Development Authority, Friendship Village South, Series A, 5.75%, 8/15/20 | | | 1,000,000 | | | | 1,001,350 | |
Delaware County College Authority, Neumann College, 6.00%, 10/1/30 | | | 1,000,000 | | | | 1,072,880 | |
Montgomery County Industrial Development Authority, Whitemarsh Continuing Care, 6.25%, 2/1/35 | | | 1,000,000 | | | | 919,180 | |
State Economic Development Financing Authority, Allegheny Energy Supply Company, 7.00%, 7/15/39 | | | 1,000,000 | | | | 1,149,990 | |
| | | | | | | | |
| | | | | | | 4,143,400 | |
| | | | | | | | |
Puerto Rico — 1.8% | | | | | | | | |
Revenue Bond — 1.8% | | | | | | | | |
Puerto Rico Sales Tax Financing Corporation, Series 2011 A-1, 5.00%, 8/1/43 | | | 1,500,000 | | | | 1,593,735 | |
| | | | | | | | |
South Carolina — 4.2% | | | | | | | | |
Revenue Bonds — 4.2% | | | | | | | | |
Environmental Improvement, Georgetown County, International Paper, Series A (AMT), 5.55%, 12/1/29 | | | 650,000 | | | | 660,712 | |
State Educational Facilities Authority, Wofford College, Series A, 4.50%, 4/1/30 | | | 750,000 | | | | 776,520 | |
State Jobs Economic Development Authority, Hospital Facilities, Palmetto Health, | | | | | | | | |
6.13%, 8/1/23, Series A | | | 250,000 | | | | 261,985 | |
6.38%, 8/1/34, Series C (Pre-refunded 8/1/13 @ 100) ¯ | | | 40,000 | | | | 43,410 | |
State Public Service Authority, Santee Cooper, Series A (NATL), 5.00%, 1/1/30 | | | 1,800,000 | | | | 1,991,502 | |
| | | | | | | | |
| | | | | | | 3,734,129 | |
| | | | | | | | |
South Dakota — 7.2% | | | | | | | | |
Revenue Bonds — 7.2% | | | | | | | | |
City of Deadwood, Sales Tax, Series B, 6.25%, 12/1/28 ¥ | | | 1,300,000 | | | | 1,453,764 | |
Sioux Falls Health Facilities, Dow Rummel Village Project, Series A (Pre-refunded 11/15/12 @ 100), 6.63%, 11/15/23 ¯ | | | 620,000 | | | | 644,936 | |
State Economic Development Finance Authority, Pooled Loan Program, Davis Family (AMT), 6.00%, 4/1/29 | | | 1,000,000 | | | | 1,037,220 | |
State Economic Development Finance Authority, Pooled Loan Program, McEleeg, Series B (AMT), 5.95%, 4/1/24 | | | 2,000,000 | | | | 2,088,840 | |
State Health & Educational Facilities Authority, Vocational Education Program (AGC), 5.50%, 8/1/38 | | | 1,000,000 | | | | 1,102,630 | |
| | | | | | | | |
| | | | | | | 6,327,390 | |
| | | | | | | | |
Tennessee — 4.6% | | | | | | | | |
Revenue Bonds — 1.5% | | | | | | | | |
Johnson City Health and Educational Facilities, Mountain States Health, Series A (Pre-refunded 7/1/12 @ 103), 7.50%, 7/1/33 ¯ | | | 1,000,000 | | | | 1,049,090 | |
Shelby County Health, Educational and Housing Facility Board, Methodist Healthcare (Pre-refunded 9/1/12 @ 100), 6.50%, 9/1/21 ¯ | | | 240,000 | | | | 247,620 | |
| | | | | | | | |
| | | | | | | 1,296,710 | |
| | | | | | | | |
| | | | | | |
| AMERICAN MUNICIPAL INCOME PORTFOLIO | | 2012 SEMIANNUAL REPORT | | | 7 | |
| | |
| Schedule of Investments | | February 29, 2012 (unaudited) |
American Municipal Income Portfolio (XAA)
| | | | | | | | |
DESCRIPTION | | PAR/
SHARES | | | FAIR
VALUE ¶ | |
| | |
General Obligations — 3.1% | | | | | | | | |
Shelby County, Series A, | | | | | | | | |
5.00%, 4/1/20 | | $ | 1,805,000 | | | $ | 2,217,424 | |
5.00%, 4/1/20 (Pre-refunded 4/01/19 @ 100) ¯ | | | 445,000 | | | | 558,208 | |
| | | | | | | | |
| | | | | | | 2,775,632 | |
| | | | | | | | |
| | | | | | | 4,072,342 | |
| | | | | | | | |
Texas — 16.3% | | | | | | | | |
Revenue Bonds — 9.2% | | | | | | | | |
Abilene Health Facilities Development, Sears Methodist Retirement, Series A, 5.88%, 11/15/18 | | | 795,000 | | | | 740,686 | |
Dallas-Fort Worth International Airport Facilities Improvement Corp., Series B, 5.00%, 11/1/35 | | | 300,000 | | | | 326,832 | |
Houston Health Facilities Development, Retirement Facility, Buckingham Senior Living, Series A (Pre-refunded 2/15/14 @ 101), 7.00%, 2/15/26 ¯ | | | 1,500,000 | | | | 1,702,020 | |
North Texas Tollway Authority, First Tier, Series E-3 (Mandatory Put 1/1/16 @ 100), 5.75%, 1/1/38 | | | 500,000 | | | | 580,395 | |
North Texas Tollway Authority, Second Tier, Series F, 5.75%, 1/1/38 | | | 1,000,000 | | | | 1,077,310 | |
Tarrant County Cultural Education, Hendrick Medical Center Project, Series B (AGC), 5.25%, 9/1/26 | | | 1,250,000 | | | | 1,405,837 | |
Tarrant County Cultural Education, Northwest Senior Housing, Edgemere Project, Series A, 6.00%, 11/15/26 ¥ | | | 600,000 | | | | 614,490 | |
Travis County Health Facilities Development Authority, Retirement Facility, Querencia Barton Creek Project, ¥ | | | | | | | | |
5.50%, 11/15/25 | | | 200,000 | | | | 191,444 | |
5.65%, 11/15/35 | | | 1,600,000 | | | | 1,448,304 | |
| | | | | | | | |
| | | | | | | 8,087,318 | |
| | | | | | | | |
General Obligations — 7.1% | | | | | | | | |
Humble Independent School District, Series A (AGC), 5.25%, 2/15/22 | | | 1,000,000 | | | | 1,178,570 | |
Plano Independent School District, Series A, 5.25%, 2/15/34 | | | 3,500,000 | | | | 3,904,635 | |
Round Rock Independent School District, 5.00%, 8/1/27 | | | 1,000,000 | | | | 1,143,890 | |
| | | | | | | | |
| | | | | | | 6,227,095 | |
| | | | | | | | |
| | | | | | | 14,314,413 | |
| | | | | | | | |
Washington — 6.7% | | | | | | | | |
Revenue Bonds — 3.6% | | | | | | | | |
Skagit County Public Hospital District, 6.00%, 12/1/23 | | | 900,000 | | | | 932,634 | |
State Health Care Facilities Authority, Central Washington Health Services, 6.25%, 7/1/24 | | | 2,000,000 | | | | 2,242,420 | |
| | | | | | | | |
| | | | | | | 3,175,054 | |
| | | | | | | | |
General Obligation — 3.1% | | | | | | | | |
State Various Purpose, Series 2011-A, 5.00%, 8/1/30 | | | 2,300,000 | | | | 2,751,582 | |
| | | | | | | | |
| | | | | | | 5,926,636 | |
| | | | | | | | |
| | |
Total Municipal Long-Term Investments
(Cost: $120,130,132) | | | | | | | 129,510,079 | |
| | | | | | | | |
| | |
Short-Term Investment — 0.8% | | | | | | | | |
Fixed Rate — 0.8% | | | | | | | | |
First American Tax Free Obligations Fund, Class Z , 0.00% W
(Cost: $743,908) | | | 743,908 | | | | 743,908 | |
| | | | | | | | |
| | |
Total Investments p — 148.2%
(Cost: $120,874,040) | | | | | | | 130,253,987 | |
| | | | | | | | |
Preferred Shares at Liquidation Value — (49.5)% | | | | | | | (43,500,000 | ) |
| | | | | | | | |
Other Assets and Liabilities, Net — 1.3% | | | | | | | 1,179,926 | |
| | | | | | | | |
| | |
Total Net Assets Applicable to Outstanding Common Shares — 100.0% | | | | | | $ | 87,933,913 | |
| | | | | | | | |
The accompanying notes are an integral part of the financial statements.
| | | | |
| 8 | | AMERICAN MUNICIPAL INCOME PORTFOLIO | | 2012 SEMIANNUAL REPORT |
American Municipal Income Portfolio (XAA)
| ¶ | Securities are valued in accordance with procedures described in note 2 in Notes to Financial Statements. |
| ¯ | Pre-refunded issues are typically backed by U.S. Government obligations, which secure the timely payment of principal and interest. These bonds mature at the call date and price indicated. |
| ¥ | Security considered illiquid. As of February 29, 2012, the fair value of these investments was $9,100,119 or 10.3% of total net assets applicable to outstanding common shares. See note 2 in Notes to Financial Statements. |
| ¿ | Loan is currently in default with regards to scheduled interest and/or principal payments. |
| ° | Zero coupon bonds make no periodic interest payments, but are issued at deep discounts from par value. The rate shown is the effective yield as of February 29, 2012. |
| X | Convertible Capital Appreciation Bonds (Convertible CABs) initially pay no interest but accrete in value from the date of issuance through the conversion date, at which time the bonds start to accrue and pay interest on a semiannual basis until final maturity. |
| W | Investment in affiliated security. This money market fund is advised by U.S. Bancorp Asset Management, Inc., which also serves as advisor for the fund. The rate shown is the annualized seven-day effective yield as of February 29, 2012. |
| p | On February 29, 2012, the cost of investments for federal income tax purposes was approximately $120,874,040. The approximate aggregate gross unrealized appreciation and depreciation of investments, based on this cost, were as follows: |
| | | | |
Gross unrealized appreciation | | $ | 10,484,744 | |
Gross unrealized depreciation | | | (1,104,797 | ) |
| | | | |
Net unrealized appreciation | | $ | 9,379,947 | |
| | | | |
ACA–ACA Financial Guaranty Corporation
AGC–Assured Guaranty Corporation
AGM–Assured Guaranty Municipal Corporation
AMBAC–American Municipal Bond Assurance Corporation
AMT–Alternative Minimum Tax. As of February 29, 2012, the aggregate fair value of securities subject to the AMT was $11,246,333, which represents 12.8% of total net assets applicable to common shares.
CAB–Capital Appreciation Bond
CMI–California Mortgage Insurance Program
FGIC–Financial Guaranty Insurance Corporation
FHA–Federal Housing Administration
FMHA–Farmers Home Administration
FNMA–Federal National Mortgage Association
NATL–National Public Finance Guarantee Corporation
VA–Veterans Administration
| | | | | | |
| AMERICAN MUNICIPAL INCOME PORTFOLIO | | 2012 SEMIANNUAL REPORT | | | 9 | |
| | |
| Statement of Assets and Liabilities | | February 29, 2012 (unaudited) |
| | | | |
Assets: | | | | |
Unaffiliated investments, at fair value (Cost: $120,130,132) (note 2) | | $ | 129,510,079 | |
Affiliated money market fund, at fair value (Cost: $743,908) (note 5) | | | 743,908 | |
Receivable for accrued interest | | | 1,679,586 | |
Receivable for investments sold | | | 55,041 | |
Prepaid expenses and other assets | | | 29,645 | |
| | | | |
Total assets | | | 132,018,259 | |
| | | | |
| |
Liabilities: | | | | |
Payable for investments purchased | | | 324,972 | |
Payable for preferred share distributions (note 3) | | | 1,008 | |
Payable for investment advisory fees | | | 36,046 | |
Payable for administration fees | | | 20,598 | |
Payable for audit fees | | | 12,408 | |
Payable for legal fees | | | 7,981 | |
Payable for remarketing agent fees | | | 139,520 | |
Payable for transfer agent fees | | | 27,913 | |
Payable for other expenses | | | 13,900 | |
| | | | |
Total liabilities | | | 584,346 | |
| | | | |
Preferred shares, at liquidation value (note 3) | | | 43,500,000 | |
| | | | |
Net assets applicable to outstanding common shares | | $ | 87,933,913 | |
| | | | |
| |
Net assets applicable to outstanding common shares consist of: | | | | |
Common shares and additional paid-in capital | | $ | 80,009,101 | |
Undistributed net investment income | | | 721,006 | |
Accumulated net realized loss on investments | | | (2,176,141 | ) |
Net unrealized appreciation of investments | | | 9,379,947 | |
| | | | |
| |
Net assets applicable to outstanding common shares | | $ | 87,933,913 | |
| | | | |
| |
Net asset value and market price of common shares: | | | | |
Net assets applicable to outstanding common shares | | $ | 87,933,913 | |
Common shares outstanding (authorized 200 million shares of $0.01 par value) | | | 5,756,267 | |
Net asset value per share | | $ | 15.28 | |
Market price per share | | $ | 15.39 | |
| |
Liquidation preference of preferred shares (note 3): | | | | |
Net assets applicable to preferred shares | | $ | 43,500,000 | |
Preferred shares outstanding (authorized one million shares) | | | 1,740 | |
Liquidation preference per share | | $ | 25,000 | |
The accompanying notes are an integral part of the financial statements.
| | | | |
| 10 | | AMERICAN MUNICIPAL INCOME PORTFOLIO | | 2012 SEMIANNUAL REPORT |
| | |
| Statement of Operations | | For the six-month period ended February 29, 2012 (unaudited) |
| | | | |
Investment Income: | | | | |
Interest from unaffiliated investments | | $ | 3,376,334 | |
| | | | |
Total investment income | | | 3,376,334 | |
| | | | |
| |
Expenses (note 5): | | | | |
Investment advisory fees | | | 222,604 | |
Administration fees | | | 127,202 | |
Remarketing agent fees | | | 54,937 | |
Custodian fees | | | 3,185 | |
Postage and printing fees | | | 13,102 | |
Transfer agent fees | | | 15,567 | |
Listing fees | | | 11,819 | |
Directors’ fees | | | 46,292 | |
Legal fees | | | 19,216 | |
Audit fees | | | 22,936 | |
Insurance fees | | | 12,523 | |
Pricing fees | | | 3,403 | |
Other expenses | | | 23,192 | |
| | | | |
Total expenses | | | 575,978 | |
| | | | |
Less: Fee reimbursements (note 5) | | | (478 | ) |
| | | | |
Total net expenses | | | 575,500 | |
| | | | |
| |
Net investment income | | | 2,800,834 | |
| | | | |
| |
Net realized and unrealized gains (losses) on investments (notes 2 and 4) | | | | |
Net realized gain on investments | | | 175,063 | |
Net change in unrealized appreciation or depreciation of investments | | | 5,743,896 | |
| | | | |
| |
Net gain on investments | | | 5,918,959 | |
| | | | |
| |
Distributions to preferred shareholders (note 2): | | | | |
From net investment income | | | (43,785 | ) |
| |
Net increase in net assets applicable to outstanding common shares resulting from operations | | $ | 8,676,008 | |
| | | | |
The accompanying notes are an integral part of the financial statements.
| | | | | | |
| AMERICAN MUNICIPAL INCOME PORTFOLIO | | 2012 SEMIANNUAL REPORT | | | 11 | |
Statements of Changes in Net Assets
| | | | | | | | |
| | | Six-Month
Period Ended
2/29/12
(unaudited) | | | Year Ended
8/31/11 | |
Operations: | | | | | | | | |
Net investment income | | $ | 2,800,834 | | | $ | 5,618,740 | |
Net realized gain (loss) on investments | | | 175,063 | | | | (13,937 | ) |
Net change in unrealized appreciation or depreciation of investments | | | 5,743,896 | | | | (2,878,352 | ) |
Distribution to preferred shareholders from net investment income (note 2) | | | (43,785 | ) | | | (154,037 | ) |
| | | | | | | | |
| | |
Net increase in net assets applicable to outstanding common shares resulting from operations | | | 8,676,008 | | | | 2,572,414 | |
| | | | | | | | |
| | |
Distributions to common shareholders (note 2): | | | | | | | | |
From net investment income | | | (2,676,664 | ) | | | (5,497,235 | ) |
| | | | | | | | |
| | |
Total increase (decrease) in net assets applicable to outstanding common shares | | | 5,999,344 | | | | (2,924,821 | ) |
| | | | | | | | |
| | |
Net assets applicable to outstanding common shares at beginning of period | | | 81,934,569 | | | | 84,859,390 | |
| | | | | | | | |
| | |
Net assets applicable to outstanding common shares at end of period | | $ | 87,933,913 | | | $ | 81,934,569 | |
| | | | | | | | |
| | |
Undistributed net investment income | | $ | 721,006 | | | $ | 640,621 | |
| | | | | | | | |
The accompanying notes are an integral part of the financial statements.
| | | | |
| 12 | | AMERICAN MUNICIPAL INCOME PORTFOLIO | | 2012 SEMIANNUAL REPORT |
Financial Highlights
Per-share data for an outstanding common share throughout each period and selected information for each period are as follows:
| | | | | | | | | | | | | | | | | | | | | | | | |
| | | Six-Month
Period Ended
2/29/12
(unaudited) | | | Year Ended August 31, | |
| | | | 2011 | | | 2010 | | | 2009 | | | 2008 | | | 2007 | |
Per-Share Data | | | | | | | | | | | | | | | | | | | | | | | | |
Net asset value, common shares, beginning of period | | $ | 14.23 | | | $ | 14.74 | | | $ | 13.05 | | | $ | 13.55 | | | $ | 14.40 | | | $ | 15.46 | |
| | | | | | | | | | | | | | | | | | | | | | | | |
Operations: | | | | | | | | | | | | | | | | | | | | | | | | |
Net investment income | | | 0.49 | | | | 0.98 | | | | 0.99 | | | | 0.99 | | | | 0.96 | | | | 1.02 | |
Net realized and unrealized gain (losses) on investments and futures contracts | | | 1.03 | | | | (0.50 | ) | | | 1.71 | | | | (0.55 | ) | | | (0.54 | ) | | | (0.82 | ) |
Distributions to preferred shareholders: | | | | | | | | | | | | | | | | | | | | | | | | |
From net investment income | | | (0.01 | ) | | | (0.03 | ) | | | (0.03 | ) | | | (0.13 | ) | | | (0.21 | ) | | | (0.25 | ) |
From net realized gain (loss) on investments | | | — | | | | — | | | | — | | | | — | | | | (0.08 | ) | | | (0.03 | ) |
| | | | | | | | | | | | | | | | | | | | | | | | |
Total from operations | | | 1.51 | | | | 0.45 | | | | 2.67 | | | | 0.31 | | | | 0.13 | | | | (0.08 | ) |
| | | | | | | | | | | | | | | | | | | | | | | | |
Distributions to common shareholders: | | | | | | | | | | | | | | | | | | | | | | | | |
From net investment income | | | (0.46 | ) | | | (0.96 | ) | | | (0.98 | ) | | | (0.81 | ) | | | (0.75 | ) | | | (0.86 | ) |
From net realized gain on investments | | | — | | | | — | | | | — | | | | — | | | | (0.23 | ) | | | (0.12 | ) |
| | | | | | | | | | | | | | | | | | | | | | | | |
Total distributions to common shareholders | | | (0.46 | ) | | | (0.96 | ) | | | (0.98 | ) | | | (0.81 | ) | | | (0.98 | ) | | | (0.98 | ) |
| | | | | | | | | | | | | | | | | | | | | | | | |
Net asset value, common shares, end of period | | $ | 15.28 | | | $ | 14.23 | | | $ | 14.74 | | | $ | 13.05 | | | $ | 13.55 | | | $ | 14.40 | |
| | | | | | | | | | | | | | | | | | | | | | | | |
Market value, common shares, end of period | | $ | 15.39 | | | $ | 13.60 | | | $ | 14.89 | | | $ | 12.37 | | | $ | 12.84 | | | $ | 14.74 | |
| | | | | | | | | | | | | | | | | | | | | | | | |
Selected Information | | | | | | | | | | | | | | | | | | | | | | | | |
Total return, common shares, net asset value 1 | | | 10.87 | % 5 | | | 3.47 | % | | | 21.27 | % | | | 3.13 | % | | | 0.95 | % | | | (0.72 | )% |
Total return, common shares, market value 2 | | | 16.90 | % 5 | | | (1.97 | )% | | | 29.07 | % | | | 4.11 | % | | | (6.22 | )% | | | 2.56 | % |
Net assets applicable to outstanding common shares at end of period
(in millions) | | $ | 88 | | | $ | 82 | | | $ | 85 | | | $ | 75 | | | $ | 78 | | | $ | 83 | |
Ratio of expenses to average weekly net assets
applicable to outstanding common shares before fee reimbursements 3 | | | 1.37 | % 6 | | | 1.38 | % | | | 1.27 | % | | | 1.37 | % | | | 1.28 | % | | | 1.18 | % |
Ratio of expenses to average weekly net assets
applicable to outstanding common shares after fee reimbursements 3 | | | 1.37 | % 6 | | | 1.37 | % | | | 1.26 | % | | | 1.37 | % | | | 1.28 | % | | | 1.17 | % |
Ratio of net investment income to average weekly net assets
applicable to outstanding common shares before fee reimbursements 3 | | | 6.69 | % 6 | | | 7.09 | % | | | 7.15 | % | | | 8.37 | % | | | 6.87 | % | | | 6.67 | % |
Ratio of net investment income to average weekly net assets
applicable to outstanding common shares after fee reimbursements 3 | | | 6.69 | % 6 | | | 7.10 | % | | | 7.16 | % | | | 8.37 | % | | | 6.87 | % | | | 6.68 | % |
Portfolio turnover rate | | | 7 | % | | | 9 | % | | | 10 | % | | | 22 | % | | | 71 | % | | | 24 | % |
Net assets applicable to remarketed preferred shares, end of period
(in millions) | | $ | 44 | | | $ | 44 | | | $ | 44 | | | $ | 44 | | | $ | 44 | | | $ | 44 | |
Asset coverage per remarketed preferred share (in thousands) 4 | | $ | 76 | | | $ | 72 | | | $ | 74 | | | $ | 68 | | | $ | 70 | | | $ | 73 | |
Liquidation preference and market value per remarketed preferred share
(in thousands) | | $ | 25 | | | $ | 25 | | | $ | 25 | | | $ | 25 | | | $ | 25 | | | $ | 25 | |
| 1 | Assumes reinvestment of distributions at net asset value. |
| 2 | Assumes reinvestment of distributions at actual prices pursuant to the fund’s dividend reinvestment plan. |
| 3 | Ratios do not reflect the effect of dividend payments to preferred shareholders; income ratios reflect income earned on assets attributable to preferred shares, where applicable. |
| 4 | Represents net assets applicable to outstanding common shares plus preferred shares at liquidation value divided by preferred shares outstanding. |
| 5 | Total return has not been annualized. |
The accompanying notes are an integral part of the financial statements.
| | | | | | |
| AMERICAN MUNICIPAL INCOME PORTFOLIO | | 2012 SEMIANNUAL REPORT | | | 13 | |
| | |
| Notes to Financial Statements | | (unaudited as to February 29, 2012) |
American Municipal Income Portfolio Inc. (the “fund”) is registered under the Investment Company Act of 1940 (as amended) as a diversified, closed-end management investment company. The fund invests primarily in a diverse range of municipal securities that, at the time of purchase, are rated investment grade or are unrated and deemed to be of comparable quality by one of the fund’s sub-advisors Nuveen Asset Management, LLC (“NAM”). The fund may invest up to 20% of its total assets in municipal securities that, at the time of purchase, are rated lower than investment grade or are unrated and deemed to be of comparable quality by NAM. Municipal securities in which the fund invests may include municipal derivative securities, such as inverse floating rate and inverse interest-only municipal securities, which may be more volatile than traditional municipal securities in certain market conditions. The fund’s investments also may include repurchase agreements, futures contracts, options on futures contracts, options, and interest rate swaps, caps, and floors. Fund shares are listed on the New York Stock Exchange under the symbol XAA.
| (2) | Summary of
Significant
Accounting
Policies |
Security Valuations
Security valuations for the fund’s investments are furnished generally by an independent pricing service that has been approved by the fund’s board of directors. Debt obligations exceeding 60 days to maturity are valued by an independent pricing service that has been approved by the fund’s board of directors. The pricing service may employ methodologies that utilize actual market transactions, broker-dealer supplied valuations, or other formula-driven valuation techniques. These techniques generally consider such factors as yields or prices of bonds of comparable quality, type of issue, coupon, maturity, ratings, and general market conditions. Securities for which prices are not available from an independent pricing service but where an active market exists are valued using market quotations obtained from one or more dealers that make markets in the securities or from a widely-used quotation system. Debt obligations with 60 days or less remaining until maturity may be valued at their amortized cost, which approximates fair value. Investments in open-end funds are valued at their respective net asset values on the valuation date.
The following investment vehicles, when held by the fund, are priced as follows: exchange listed futures and options on futures are priced at their last sale price on the exchange on which they are principally traded, as determined by the fund’s investment advisor, U.S. Bancorp Asset Management, Inc. (“USBAM”), on the day the valuation is made. If there were no sales on that day, futures and options on futures will be valued at the last reported bid price. Options on securities, indices, and currencies traded on Nasdaq or listed on a stock exchange are valued at the last sale price on Nasdaq or on any exchange on the day the valuation is made. If there were no sales on that day, the options will be valued at the last sale price on the previous valuation date. Last sale prices are obtained from an independent pricing service. Swaps and over-the-counter options on securities and indices, are valued at the quotations received from an independent pricing service, if available.
When market quotations are not readily available, securities are internally valued at fair value as determined in good faith by procedures established and approved by the fund’s board of directors. Some of the factors that may be considered in determining fair value are fundamental analytical data relating to the investment; the nature and duration of any restrictions on disposition; trading in similar securities of the same issuer or comparable companies; information from broker-dealers; and an evaluation of the forces that influence the market in which the securities are purchased or sold. If events occur that materially affect the value of securities between the close of trading in those securities and the close of regular trading on the New York Stock Exchange, the securities will be valued at fair value. The use of fair value pricing by the fund may cause the net asset value of its shares to differ significantly from the net asset value that would be calculated without fair value pricing. As of February 29, 2012, the fund held no internally fair valued securities.
Generally accepted accounting principles (“GAAP”) require disclosures regarding the inputs and valuation techniques used to measure fair value and any changes in valuation inputs or technique. These principles establish a three-tier fair value hierarchy for inputs used in measuring fair value. Fair value inputs are summarized in the three broad levels listed below:
Level 1 - Quoted prices in active markets for identical securities.
| | | | |
| 14 | | AMERICAN MUNICIPAL INCOME PORTFOLIO | | 2012 SEMIANNUAL REPORT |
Level 2 - Other significant observable inputs (including quoted prices for similar securities, with similar interest rates, prepayment speeds, credit risk, etc.).
Level 3 - Significant unobservable inputs (including the fund’s own assumptions in determining the fair value of investments). Generally, the types of securities included in Level 3 of the fund are securities for which there is limited or no observable fair value inputs available, and as such the fair value is determined through independent broker quotations or management’s fair value procedures established by the fund’s board of directors.
The fair value levels are not necessarily an indication of the risk associated with investing in these investments.
As of February 29, 2012, the fund’s investments were classified as follows:
| | | | | | | | | | | | | | | | |
| | | Level 1 | | | Level 2 | | | Level 3 | | | Total
Fair Value | |
Investments | | | | | | | | | | | | | | | | |
Municipal Long-Term Investments | | $ | — | | | $ | 129,510,079 | | | $ | — | | | $ | 129,510,079 | |
Short-Term Investments | | | 743,908 | | | | — | | | | — | | | | 743,908 | |
| | | | | | | | | | | | | | | | |
Total Investments | | $ | 743,908 | | | $ | 129,510,079 | | | $ | — | | | $ | 130,253,987 | |
| | | | | | | | | | | | | | | | |
Refer to the Schedule of Investments for further security classification.
During the six-month period ended February 29, 2012 the fund recognized no transfers between fair value levels.
Security Transactions and Investment Income
For financial statement purposes, the fund records security transactions on the trade date of the security purchase or sale. Dividend income is recorded on the ex-dividend date. Interest income, including accretion of bond discounts and amortization of bond premiums, is recorded on an accrual basis. Security gains and losses are determined on the basis of identified cost, which is the same basis used for federal income tax purposes. The resulting gain/loss is calculated as the difference between the sales price and the underlying cost of the security on the transaction date.
Distributions to Shareholders
Distributions from net investment income are made monthly for common shareholders and weekly for preferred shareholders. Common share distributions are recorded as of the close of business on the ex-dividend date and preferred share dividends are accrued daily. Net realized gain distributions, if any, will be made at least annually. Distributions are payable in cash or, for common shareholders pursuant to the fund’s dividend reinvestment plan, reinvested in additional common shares of the fund. Under the dividend reinvestment plan, common shares will be purchased in the open market.
Federal Taxes
The fund intends to continue to qualify as a regulated investment company (“RIC”) as provided in Subchapter M of the Internal Revenue Code, as amended, and to distribute all taxable income, if any, to its shareholders. Accordingly, no provision for federal income taxes is required.
As of February 29, 2012, the fund did not have any tax positions that did not meet the “more-likely-than-not” threshold of being sustained by the applicable taxing authority. Generally, tax authorities can examine all the tax returns filed for the last three years.
Net investment income and net realized gains and losses may differ for financial statement and tax purposes because of temporary or permanent book/tax differences. These differences are primarily due to deferred straddle losses. To the extent these differences are permanent, reclassifications are made to the appropriate capital accounts in the fiscal period in which the differences arise.
The character of distributions made during the fiscal period from net investment income or net realized gains may differ from its ultimate characterization for federal income tax purposes. In addition, due to the timing of dividend
| | | | | | |
| AMERICAN MUNICIPAL INCOME PORTFOLIO | | 2012 SEMIANNUAL REPORT | | | 15 | |
Notes to Financial Statements
distributions, the fiscal period in which amounts are distributed may differ from the fiscal period that the income or realized gains or losses were recorded by the fund.
The character of common and preferred share distributions paid during the six-month period ended February 29, 2012 (estimated) and the fiscal year ended August 31, 2011, were as follows:
| | | | | | | | |
| | | 2/29/12 | | | 8/31/11 | |
Distributions paid from: | | | | | | | | |
Tax exempt income | | $ | 2,720,449 | | | $ | 5,644,035 | |
Ordinary income | | | — | | | | 9,198 | |
| | | | | | | | |
| | $ | 2,720,449 | | | $ | 5,653,233 | |
| | | | | | | | |
As of August 31, 2011, the fund’s most recently completed fiscal year-end, the components of accumulated earnings on a tax basis were as follows:
| | | | |
Undistributed ordinary income | | $ | 6,792 | |
Undistributed tax-exempt income | | | 640,323 | |
Accumulated capital and post-October losses | | | (2,330,580 | ) |
Unrealized appreciation | | | 3,615,426 | |
Other accumulated loss | | | (6,493 | ) |
| | | | |
Accumulated earnings | | $ | 1,925,468 | |
| | | | |
For federal income tax purposes, the fund had capital loss carryovers at August 31, 2011, the fund’s most recently completed fiscal year-end, which, if not offset by subsequent capital gains, will expire on the fund’s fiscal year-ends as follows:
| | | | | | |
Capital Loss
Carryover | | | Expiration | |
| $ | 732,181 | | | | 2017 | |
| | 1,496,362 | | | | 2018 | |
| | 79,991 | | | | 2019 | |
| | | | | | |
| $ | 2,308,534 | | | | | |
| | | | | | |
The fund incurred losses of $22,046 for the period from November 1, 2010 to August 31, 2011. As permitted by tax regulations, the fund intends to elect to defer and treat those losses as arising in the fiscal year ended August 31, 2012.
Derivatives
The fund may invest in derivative financial instruments in order to manage risk or gain exposure to various other investments or markets. The fund’s investment objective allows the fund to enter into various types of derivative contracts, including, but not limited to, futures contracts, options on futures contracts, options, and interest rate swaps, caps, and floors. Derivatives may contain various risks including the potential inability of the counterparty to fulfill their obligations under the terms of the contract, the potential for an illiquid secondary market, and the potential for market movements that may expose the fund to gains or losses in excess of the amounts shown on the Statement of Assets and Liabilities. As of February 29, 2012, the fund had no outstanding derivative contracts.
Futures Transactions
In order to protect against changes in interest rates, the fund may buy and sell interest rate futures contracts. Upon entering into a futures contract, the fund is required to deposit cash or pledge U.S. Government securities. The margin required for a futures contract is set by the exchange on which the contract is traded. Subsequent payments, which are dependent on the daily fluctuations in the value of the underlying security or securities, are made or received by the fund each day (daily variation margin) and recorded as unrealized gains (losses) until the contract is closed. When the contract is closed, the fund records a realized gain (loss) equal to the difference between the proceeds from (or cost of) the closing transaction and the fund’s basis in the contract.
| | | | |
| 16 | | AMERICAN MUNICIPAL INCOME PORTFOLIO | | 2012 SEMIANNUAL REPORT |
Risks of entering into futures contracts, in general, include the possibility that there will not be a perfect price correlation between the futures contracts and the underlying securities. Second, it is possible that a lack of liquidity for futures contracts could exist in the secondary market, resulting in an inability to close a futures position prior to its maturity date. Third, the purchase of a futures contract involves the risk that the fund could lose more than the original margin deposit required to initiate a futures transaction. These contracts involve market risk in excess of the amount reflected in the fund’s Statement of Assets and Liabilities. Unrealized gains (losses) on outstanding positions in futures contracts held at the close of the period will be recognized as capital gains (losses) for federal income tax purposes. As of and for the six-month period ended February 29, 2012, the fund had no outstanding futures contracts.
Securities Purchased on a When-Issued Basis
Delivery and payment for securities that have been purchased by the fund on a when-issued or forward-commitment basis can take place a month or more after the transaction date. Such securities do not earn interest, are subject to market fluctuation, and may increase or decrease in value prior to their delivery. The fund segregates assets with a market value equal to or greater than the amount of its purchase commitments. The purchase of securities on a when-issued or forward-commitment basis may increase the volatility of the fund’s net asset value if the fund makes such purchases while remaining substantially fully invested. As of February 29, 2012, the fund had no outstanding when-issued or forward-commitment securities.
In connection with the ability to purchase securities on a when-issued basis, the fund may also enter into dollar rolls in which the fund sells securities purchased on a forward-commitment basis and simultaneously contracts with a counterparty to repurchase similar (same type, coupon, and maturity), but not identical securities on a specified future date. As an inducement for the fund to “rollover” its purchase commitments, the fund receives negotiated amounts in the form of reductions of the purchase price of the commitment. Dollar rolls are considered a form of leverage. As of February 29, 2012, the fund had no dollar roll transactions.
Illiquid or Restricted Securities
A security may be considered illiquid if it lacks a readily available market. Securities are generally considered liquid if they can be sold or disposed of in the ordinary course of business within seven days at approximately the value at which the security is valued by the fund. Illiquid securities may be valued under methods approved by the fund’s board of directors as reflecting fair value. Illiquid securities may include restricted securities, which are often purchased in private placement transactions, are not registered under the Securities Act of 1933, and may have contractual restrictions on resale.
| | | | | | |
| AMERICAN MUNICIPAL INCOME PORTFOLIO | | 2012 SEMIANNUAL REPORT | | | 17 | |
Notes to Financial Statements
As of February 29, 2012, the fund held 14 illiquid securities, the fair value of which was $9,100,119, which represents 10.3% of total net assets applicable to outstanding common shares. As of February 29, 2012, there were no restricted securities. Information concerning illiquid securities, including restricted securities considered to be illiquid, is as follows:
| | | | | | | | | | | | |
Security | | Par | | | Date
Acquired | | | Cost
Basis | |
City of Deadwood, Sales Tax, Series B, 6.25%, 12/1/28 | | $ | 1,300,000 | | | | 06/09 | | | $ | 1,280,003 | |
North Central Regional Water System, 5.00%, 1/1/37 | | | 1,000,000 | | | | 12/06 | | | | 997,156 | |
State Development Financing Agency, Adventcare Project, Series A,
6.75%, 10/15/37, Series A | | | 650,000 | | | | 10/07 | | | | 648,405 | |
State Development Financing Agency, Adventcare Project, 7.63%, 10/15/37 | | | 880,000 | | | | 07/10 | | | | 867,673 | |
State Development Financing Agency, Senior Living Facility, Groves — Lincoln, Series A, 7.88%, 6/1/44 | | | 1,000,000 | | | | 11/09 | | | | 985,584 | |
State Finance Authority, Capital Appreciation, Clare Water Tower, Series B, Zero Coupon Bond, 15.33%, 5/15/50 | | | 187,500 | | | | 11/05 | | | | 6,061 | |
State Finance Authority, Clare Water Tower, Series A, 6.00%, 5/15/28 | | | 437,500 | | | | 11/05 | | | | 601,421 | |
State Finance Authority, Landing at Plymouth Place Project, Series A, 6.00%, 5/15/37 | | | 575,000 | | | | 11/05 | | | | 572,011 | |
State Finance Authority, Three Crowns Park Plaza, Series A, 5.88%, 2/15/26 | | | 500,000 | | | | 12/08 | | | | 359,096 | |
Tarrant County Cultural Education, Northwest Senior Housing, Edgemere Project, Series A, 6.00%, 11/15/26 | | | 600,000 | | | | 04/06 | | | | 612,275 | |
Travis County Health Facilities Development Authority, Retirement Facility, Querencia Barton Creek Project, 5.50%, 11/15/25 | | | 200,000 | | | | 10/05 | | | | 195,305 | |
Travis County Health Facilities Development Authority, Retirement Facility, Querencia Barton Creek Project, 5.65%, 11/15/25 | | | 1,600,000 | | | | 09/05 | | | | 1,146,525 | |
Ventura County Area Housing Authority, Mira Vista Senior Apartments, Series A (AMBAC) (AMT), 5.00%, 12/1/22 | | | 100,000 | | | | 07/06 | | | | 100,000 | |
Worthington Housing Authority, Meadows Worthington Project, Series A,
5.25%, 11/1/28 | | | 675,000 | | | | 05/07 | | | | 675,000 | |
Inverse Floaters
As part of its investment strategy, the fund may invest in certain securities for which the potential income return is inversely related to changes in a floating interest rate (“inverse floaters”). In general, income on inverse floaters will decrease when short-term interest rates increase and increase when short-term interest rates decrease. Inverse floaters may be characterized as derivative securities and may subject the fund to the risks of reduced or eliminated interest payments and losses of invested principal. In addition, inverse floaters may provide investment leverage. The market values of inverse floaters will generally be more volatile than those of fixed-rate, tax-exempt securities. Therefore, to the extent the fund invests in inverse floaters, the net asset value of the fund’s shares may be more volatile than if the fund did not invest in such securities. As of February 29, 2012, the fund had no outstanding investments in inverse floaters.
Repurchase Agreements
For repurchase agreements entered into with certain broker-dealers, the fund, along with other affiliated registered investment companies, may transfer uninvested cash balances into a joint trading account, the daily aggregate balance of which is invested in repurchase agreements secured by U.S. Government or agency obligations. Securities pledged as collateral for all individual and joint repurchase agreements are held by the fund’s custodian bank until maturity of the repurchase agreement. All agreements require that the daily market value of the collateral be in excess of the repurchase amount, including accrued interest, to protect the fund in the event of a default. As of February 29, 2012, the fund had no outstanding repurchase agreements.
Deferred Compensation Plan
Prior to January 1, 2011, non-interested directors of the First American Family of Funds were able to defer receipt of part or all of their annual compensation under a Deferred Compensation Plan (the “Plan”). Deferred amounts were treated as though equivalent dollar amounts had been invested in shares of open-end First American Funds, as designated by each director. The Plan was terminated effective December 31, 2010. All amounts held in the
| | | | |
| 18 | | AMERICAN MUNICIPAL INCOME PORTFOLIO | | 2012 SEMIANNUAL REPORT |
Plan are 100% vested and outstanding account balances under the Plan are obligations of the funds into which amounts were deferred. Deferred amounts remain in the funds until distributed in accordance with the Plan.
Use of Estimates in the Preparation of Financial Statements
The preparation of financial statements, in conformity with GAAP, requires management to make estimates and assumptions that affect the reported amount of assets and liabilities and disclosure of contingent assets and liabilities at the date of the financial statements and the results of operations during the reporting period. Actual results could differ from these estimates.
Events Subsequent to Period End
Management has evaluated fund-related events and transactions that occurred subsequent to February 29, 2012, through the date of issuance of the fund’s semiannual financial statements. There were no events or transactions that occurred during this period that materially impacted the amounts or disclosures in the fund’s financial statements.
| (3) | Remarketed
Preferred
Shares |
As of February 29, 2012, the fund had 1,740 remarketed preferred shares (870 shares in Class “T” and 870 shares in Class “TH”) (“RP® shares”) outstanding with a liquidation preference of $25,000 per share. The dividend rate on the RP® shares is adjusted every seven days (on Tuesdays for Class “T” and on Thursdays for Class “TH”), as determined by the remarketing agent, agent, Merrill Lynch & Co. Inc (the “Remarketing Agent”).
Normally, the dividend rates on the RP® shares are set at the market clearing rate determined through a remarketing process that brings together bidders who wish to buy RP® shares and holders of RP® shares who wish to sell. Since February 14, 2008, however, sell orders have exceeded bids and the regularly scheduled remarketings for the fund’s RP® shares have failed. When a remarketing fails, the fund is required to pay the maximum applicable rate on the RP® shares to holders of such shares for successive dividend periods until such time as the shares are successfully remarketed. The maximum applicable rate on the RP® shares is 110% of the higher of (1) the applicable AA Composite Commercial Paper Rate or (2) 90% of the Taxable Equivalent of the Short-Term Municipal Bond Rate.
During any dividend period, the maximum applicable rate may be higher than the dividend rate that would have been set had the remarketing been successful. This increases the fund’s cost of leverage and reduces the fund’s common share earnings. On February 29, 2012, the maximum applicable rates were 0.23% for Class “T” and 0.24% for Class “TH”.
In the event of a failed remarketing, holders of RP® shares will continue to receive dividends at the maximum applicable rate, but generally will not be able to sell their shares until the next successful remarketing. There is no way to predict when or if future remarketings might succeed in attracting sufficient buyers for the shares offered.
RP® is a registered trademark of the Remarketing Agent.
| (4) | Investment
Security
Transactions |
Cost of purchases and proceeds from sales of securities, other than temporary investments in short-term securities, for the six-month period ended February 29, 2012, aggregated $9,161,504 and $9,412,723, respectively.
Investment Advisory Fees
Pursuant to an investment advisory agreement, USBAM, a subsidiary of U.S. Bank National Association (“U.S. Bank”), manages the fund’s assets and furnishes related office facilities, equipment, research, and personnel. The agreement provides USBAM with a monthly investment advisory fee in an amount equal to an annualized rate of 0.35% of the fund’s average weekly net assets including preferred shares. For its fee, USBAM provides investment advice and, in general, conducts the management and investment activities of the fund.
The fund may invest in related money market funds that are series of First American Funds, Inc., subject to certain limitations. In order to avoid the payment of duplicative investment advisory fees to USBAM, which acts as the investment advisor to both the fund and the related money market funds, USBAM will reimburse the fund an
| | | | | | |
| AMERICAN MUNICIPAL INCOME PORTFOLIO | | 2012 SEMIANNUAL REPORT | | | 19 | |
Notes to Financial Statements
amount equal to the investment advisory fee received from the related money market funds that is attributable to the assets of the fund. These reimbursements, if any, are disclosed as “Fee reimbursements” in the Statement of Operations.
NAM and Nuveen Fund Advisors, Inc. (“NFA”) each serve as investment sub-advisor to the fund pursuant to separate investment sub-advisory agreements with USBAM. NAM makes investment decisions for the fund, places purchase and sale orders for the fund’s portfolio transactions, and employs the fund’s portfolio managers and the securities analysts that provide research services relating to the fund. NFA provides certain other investment sub-advisory services to the fund, including assisting in the supervision of the fund’s investment program, risk monitoring, managing the forms and level of leverage employed by the fund, assisting in dividend and distribution level determinations, providing tax advice on issues arising in connection with management of the fund’s portfolio, and assisting with pricing of the fund’s portfolio securities. USBAM pays monthly fees to NAM and NFA for the services provided under their respective sub-advisory agreements with USBAM. USBAM pays NAM and NFA a monthly fee at an annual rate of 0.25% and 0.05%, respectively, based upon average weekly net assets.
Administration Fees
USBAM serves as the fund’s administrator pursuant to an administration agreement between USBAM and the fund. Under this agreement, USBAM receives a monthly administration fee in an amount equal to an annualized rate of 0.20% of the fund’s average weekly net assets including preferred shares. For its fee, USBAM provides numerous services to the fund including, but not limited to, handling the general business affairs, financial and regulatory reporting, and various other services.
Pursuant to a sub-administration agreement between USBAM and NFA, USBAM also pays NFA an annual fee, calculated weekly and paid monthly, equal to 0.05% of the average weekly net assets of the fund for certain administrative and other services that NFA provides to the fund.
Remarketing Agent Fees
The fund has entered into a remarketing agreement with the Remarketing Agent. The remarketing agreement provides the Remarketing Agent with a monthly fee in an amount equal to an annualized rate of 0.25% of the fund’s average amount of RP® outstanding. For its fee, the Remarketing Agent will remarket shares of RP® tendered to it on behalf of shareholders and will determine the applicable dividend rate for each seven-day dividend period.
Custodian Fees
U.S. Bank serves as the fund’s custodian pursuant to a custodian agreement with the fund. The custodian fee charged to the fund is equal to an annual rate of 0.005% of average weekly net assets, including preferred shares. These fees are computed weekly and paid monthly.
Under this agreement, interest earned on uninvested cash balances is used to reduce a portion of the fund’s custodian expenses. These credits, if any, are disclosed as “Indirect payments from custodian” in the Statement of Operations. Conversely, the custodian charges a fee for any cash overdrafts incurred, which will increase the fund’s custodian expenses.
For the six-month period ended February 29, 2012, custodian fees were increased by $165 as a result of overdrafts and reduced by $8 as a result of interest earned.
Other Fees and Expenses
In addition to the investment advisory, administrative, remarketing agent, and custodian fees, the fund is responsible for paying most other operating expenses, including: outside directors’ fees and expenses, listing fees, postage and printing of shareholder reports, transfer agent fees and expenses, legal, auditing and accounting services, insurance, pricing, interest, taxes, and other miscellaneous expenses.
For the six-month period ended February 29, 2012, legal fees and expenses of $3,971 were paid to a law firm of which an Assistant Secretary of the fund is a partner.
| | | | |
| 20 | | AMERICAN MUNICIPAL INCOME PORTFOLIO | | 2012 SEMIANNUAL REPORT |
Expenses that are directly related to the fund are charged directly to the fund. Other operating expenses of the First American Family of Funds are allocated to the fund on several bases, including evenly across all funds, allocated based on relative net assets of all funds within the First American Family of Funds, or a combination of both methods.
The fund enters into contracts that contain a variety of indemnifications. The fund’s maximum exposure under these arrangements is unknown. However, the fund has not had prior claims or losses pursuant to these contracts and expects the risk of loss to be remote.
| (7) | New Accounting
Pronouncements |
In May 2011, the Financial Accounting Standards Board issued Accounting Standards Update (“ASU”) No. 2011-04 “Amendments to Achieve Common Fair Value Measurement and Disclosure Requirements in U.S. GAAP and IFRSs.” ASU No. 2011-04 requires additional disclosures regarding fair value measurements. Effective for fiscal years beginning after December 15, 2011, and for interim periods within those fiscal years, entities will need to disclose the following:
| | 1) | the amounts of any transfers between Level 1 and Level 2 and the reasons for those transfers, and |
| | 2) | for Level 3 fair value measurements, quantitative information about the significant unobservable inputs used, a description of the entity’s valuation processes, and a narrative description of the sensitivity of the fair value measurement to changes in the unobservable inputs and the interrelationship between inputs. |
On December 31, 2010, USBAM and its parent company, U.S. Bank, sold a portion of USBAM’s asset management business to Nuveen Investments, Inc. (“Nuveen”). Included in the sale was that part of USBAM’s asset management business that advised the First American equity, fixed income, and asset allocation open-end funds, not including the First American money market funds or the First American closed-end funds (the “Closed-End Funds”). USBAM continues to serve as investment advisor to the First American money market funds and the Closed-End Funds.
On October 7, 2010, the Closed-End Funds’ board of directors considered and approved new investment subadvisory agreements between USBAM and each of NAM and NFA, under which NAM and NFA provide certain investment advisory services to the Closed-End Funds. The sub-advisory agreements were submitted to their respective fund’s shareholders for their approval and took effect on January 1, 2011. There were no changes in the funds’ investment objectives, policies, or expenses as a result of the sub-advisory arrangements between USBAM and NAM and NFA. Douglas J. White, CFA, of Nuveen, continues to serve as lead portfolio manager of American Municipal Income Portfolio.
| (9) | Regulated
Investment
Company
Modernization
Act |
On December 22, 2010, the Regulated Investment Company Modernization Act of 2010 (the “Modernization Act”) became effective. The Modernization Act is the first major piece of legislation affecting RICs since 1986, and it modernizes several of the federal income and excise tax provisions related to RICs. Some highlights of the enacted provisions are as follows:
New capital losses may now be carried forward indefinitely, and retain the character of the original loss. Under preenactment law, capital losses could be carried forward for eight years, and carried forward as short-term capital, irrespective of the character of the original loss.
The Modernization Act contains simplification provisions, which are aimed at preventing disqualification of a RIC for “inadvertent” failures of the asset diversification and/or qualifying income tests. Additionally, the Modernization Act exempts RICs from the preferential dividend rule and repealed the 60-day designation requirement for certain types of pay-through income and gains.
Finally, the Modernization Act contains several provisions aimed at preserving the character of distributions made by a fiscal year RIC during the portion of its taxable year ending after October 31 or December 31, reducing the circumstances under which a RIC might be required to file amended Forms 1099 to restate previously reported distributions.
| | | | | | |
| AMERICAN MUNICIPAL INCOME PORTFOLIO | | 2012 SEMIANNUAL REPORT | | | 21 | |
| | |
| Notice to Shareholders | | (unaudited) |
ANNUAL MEETING RESULTS
An annual meeting of the fund’s shareholders was held on December 6, 2011. Each matter voted upon at the meeting, as well as the number of votes cast for, against or withheld, the number of abstentions, and the number of broker non-votes (if any) with respect to such matters, are set forth below.
| (1) | The fund’s preferred shareholders were asked to elect two nominees for director at the meeting – Roger A. Gibson and Leonard W. Kedrowski. A quorum of the preferred shares required to vote on this matter was not represented in person or by proxy at the meeting held on December 6, 2011. Because Roger A. Gibson and Leonard W. Kedrowski were previously elected by the preferred shareholders to serve until their successors were elected and qualify, they will continue to serve as directors until they or their successors are elected. |
| (2) | The fund’s common and preferred shareholders, voting as a single class, elected the following directors: |
| | | | | | | | |
| | | Shares
Voted “For” | | | Shares Withholding
Authority to Vote | |
John P. Kayser | | | 4,693,830 | | | | 219,560 | |
Richard K. Riederer | | | 4,690,891 | | | | 222,499 | |
Joseph D. Strauss | | | 4,693,755 | | | | 219,635 | |
James M. Wade | | | 4,711,683 | | | | 201,707 | |
| (3) | The fund’s common and preferred shareholders, voting as a single class, ratified the selection by the fund’s board of directors of Ernst & Young LLP as the independent registered public accounting firm for the fund for the fiscal period ending August 31, 2012. The following votes were cast regarding this matter: |
| | | | | | | | | | | | | | |
Shares
Voted “For” | | | Shares
Voted “Against” | | | Abstentions | | | Broker
Non-Votes | |
| | 4,796,567 | | | | 29,074 | | | | 87,749 | | | | — | |
HOW TO OBTAIN A COPY OF THE FUND’S PROXY VOTING POLICIES AND PROXY VOTING RECORD
A description of the policies and procedures that the fund uses to determine how to vote proxies relating to portfolio securities, as well as information regarding how the fund voted proxies relating to portfolio securities is available at firstamericanfunds.com and on the Securities and Exchange Commission’s website at www.sec.gov. A description of the fund’s policies and procedures is also available without charge, upon request, by calling 800.677.3863.
FORM N-Q HOLDINGS INFORMATION
The fund is required to file its complete schedule of portfolio holdings for the first and third quarters of each fiscal year with the Securities and Exchange Commission on Form N-Q. The fund’s Form N-Q is available (1) without charge upon request by calling 800.677.3863 and (2) on the Securities and Exchange Commission’s website at www.sec.gov. In addition, you may review and copy the fund’s Form N-Q at the Commission’s Public Reference Room in Washington D.C. You may obtain information on the operation of the Public Reference Room by calling 800.SEC.0330.
QUARTERLY PORTFOLIO HOLDINGS
The fund will make portfolio holdings information publicly available by posting the information at firstamericanfunds.com on a quarterly basis. The fund will attempt to post such information within 10 business days of the calendar quarter-end.
| | | | |
| 22 | | AMERICAN MUNICIPAL INCOME PORTFOLIO | | 2012 SEMIANNUAL REPORT |
First American Funds’ Privacy Policy
We want you to understand what information we collect and how it’s used.
“Nonpublic personal information” is nonpublic information that we obtain while providing financial products or services to you.
How we collect your information
We obtain nonpublic information about you during the account opening process from the applications and other forms you are asked to complete and from the transactions you make with us. We may also receive nonpublic information about you from companies affiliated with us or from other companies that provide services to you. We do not use nonpublic information received from our affiliates for marketing purposes.
Why we collect your information
We gather nonpublic personal information about you and your accounts so that we can:
| • | | Know who you are and prevent unauthorized access to your information. |
| • | | Comply with the laws and regulations that govern us. |
The types of information we collect
We may collect the following nonpublic personal information about you:
| • | | Information about your identity, such as your name, address, and social security number. |
| • | | Information about your transactions with us. |
| • | | Information you provide on applications, such as your beneficiaries and banking information, if provided to us. |
Confidentiality and security
To protect nonpublic personal information about you, we restrict access to such information to only those employees and authorized agents who need to use the information. We maintain physical, electronic, and procedural safeguards to maintain the confidentiality and security of nonpublic information about you. In addition, we require our service providers to restrict access to nonpublic personal information about you to those employees who need that information in order to provide products or services to you. We also require them to maintain physical, electronic, and procedural safeguards that comply with applicable federal standards and regulations to guard your information.
What information we disclose
We may share some or all of the nonpublic personal information that we collect about you with our affiliated providers of financial services, including our family of funds and their advisor, and with companies that perform marketing services on our behalf.
We’re permitted by law to disclose nonpublic personal information about you to other third parties in certain circumstances. For example, we may disclose nonpublic personal information about you to affiliated and nonaffiliated third parties to assist us in servicing your account (e.g., mailing of fund-related materials) and to government entities (e.g., IRS for tax purposes).
We’ll continue to adhere to the privacy policies and practices described here even after your account is closed or becomes inactive.
Additional rights and protections
You may have other privacy protections under applicable state laws. To the extent that these state laws apply, we will comply with them when we share information about you. This privacy policy does not apply to your relationship with other financial service providers, such as broker-dealers. We may amend this privacy notice at any time, and we will inform you of changes as required by law.
Our pledge applies to products and services offered by
| | |
• First American Funds, Inc. • American Strategic Income Portfolio Inc. • American Strategic Income Portfolio Inc. II • American Strategic Income Portfolio Inc. III • American Select Portfolio Inc. | | • American Municipal Income Portfolio Inc. • Minnesota Municipal Income Portfolio Inc. • First American Minnesota Municipal Income Fund II, Inc. • American Income Fund Inc. |
|
| NOT FDIC INSURED NO BANK GUARANTEE MAY LOSE VALUE |
| | | | | | |
| AMERICAN MUNICIPAL INCOME PORTFOLIO | | 2012 SEMIANNUAL REPORT | | | 23 | |
BOARD OF DIRECTORS
Leonard Kedrowski
Chairperson of American Municipal Income Portfolio
Owner and President of Executive and Management Consulting, Inc.
Roger Gibson
Director of American Municipal Income Portfolio
Director of Charterhouse Group, Inc.
John Kayser
Director of American Municipal Income Portfolio
Retired; former Principal of William Blair & Company, LLC
Richard Riederer
Director of American Municipal Income Portfolio
Owner and Chief Executive Officer of RKR Consultants, Inc.
Joseph Strauss
Director of American Municipal Income Portfolio
Owner and President of Strauss Management Company
James Wade
Director of American Municipal Income Portfolio
Owner and President of Jim Wade Homes
American Municipal Income Portfolio’s Board of Directors is comprised entirely of independent directors.
P.O. Box 1330
Minneapolis, MN 55440-1330
American Municipal Income Portfolio
2012 Semiannual Report
U.S. Bancorp Asset Management, Inc., is a wholly owned subsidiary of U.S. Bank National Association, which is a wholly owned subsidiary of U.S. Bancorp.

| This document is printed on paper containing 10% postconsumer waste. |
4/2012 0021-12 XAA-SAR
Item 2—Code of Ethics
Not applicable to the semi-annual report.
Item 3—Audit Committee Financial Expert
Not applicable to the semi-annual report.
Item 4—Principal Accountant Fees and Services
Not applicable to the semi-annual report.
Item 5—Audit Committee of Listed Registrants
Not applicable to the semi-annual report.
Item 6—Schedule of Investments
The schedule is included as part of the report to shareholders filed under Item 1 of this Form.
Item 7—Disclosure of Proxy Voting Policies and Procedures for Closed-End Management Investment Companies
Not applicable to the semi-annual report.
Item 8—Portfolio Managers of Closed-End Management Investment Companies
Not applicable to the semi-annual report.
Item 9—Purchases of Equity Securities by Closed-End Management Investment Company and Affiliated Purchasers
Neither the registrant nor any “affiliated purchaser,” as defined in Rule 10b-18(a)(3) under the Exchange Act, purchased any shares or other units of any class of the registrant’s equity securities that is registered pursuant to Section 12 of the Exchange Act.
Item 10—Submission of Matters to a Vote of Security Holders
There have been no material changes to the procedures by which shareholders may recommend nominees to the registrant’s board of directors, where those changes were implemented after the registrant last provided disclosure in response to the requirements of Item 7(d)(2)(ii)(G) of Schedule 14A, or this item.
Item 11—Controls and Procedures
| (a) | The registrant’s principal executive officer and principal financial officer have evaluated the effectiveness of the registrant’s disclosure controls and procedures within 90 days of the date of this filing and have concluded that the registrant’s disclosure controls and procedures were effective, as of that date, in ensuring that information required to be disclosed by the registrant in this Form N-CSR was recorded, processed, summarized and reported timely. |
| (b) | There were no changes in the registrant’s internal control over financial reporting that occurred during the second fiscal quarter of the period covered by this report that have materially affected, or are reasonably likely to materially affect, the registrant’s internal control over financial reporting. |
Item 12—Exhibits
| (a)(2) | Certifications of the principal executive officer and principal financial officer of the registrant as required by Rule 30a-2(a) under the Investment Company Act of 1940 are filed as exhibits hereto. |
| (b) | Certifications of the principal executive officer and principal financial officer of the registrant as required by Rule 30a-2(b) under the Investment Company Act of 1940 are filed as exhibits hereto. |
Signatures
Pursuant to the requirements of the Securities Exchange Act of 1934 and the Investment Company Act of 1940, the registrant has duly caused this report to be signed on its behalf by the undersigned, thereunto duly authorized.
| | |
| American Municipal Income Portfolio Inc. |
| |
| By: | | /s/ Joseph M. Ulrey III |
| | Joseph M. Ulrey III |
| | President |
Date: April 30, 2012
Pursuant to the requirements of the Securities Exchange Act of 1934 and the Investment Company Act of 1940, this report has been signed below by the following persons on behalf of the registrant and in the capacities and on the dates indicated.
| | |
| |
| By: | | /s/ Joseph M. Ulrey III |
| | Joseph M. Ulrey III |
| | President |
Date: April 30, 2012
| | |
|
| |
| By: | | /s/ Jill M. Stevenson |
| | Jill M. Stevenson |
| | Treasurer |
Date: April 30, 2012