Exhibit 99.1
Strategy Update Investor Meeting June 25, 2018 Proprietary © Gentherm 2018
Forward-Looking Statement Except for historical information contained herein, statements in this presentation are forward-looking statements that are made pursuant to the safe harbor provisions of the Private Securities Litigation Reform Act of 1995. These forward-looking statements represent Gentherm Incorporated’s goals, beliefs, plans and expectations about its prospects for the future and other future events. The forward-looking statements included in this presentation are made as of the date hereof or as of the date specified and are based on management’s current expectations and beliefs. Such statements are subject to a number of important assumptions, risks, uncertainties and other factors that may cause the Company’s actual performance to differ materially from that described in or indicated by the forward looking statements. Those risks include, but are not limited to, risks that new products may not be feasible, sales may not increase, additional financing requirements may not be available, new competitors may arise or customers may develop their own products to replace the Company’s products, currency exchange rates may change unfavorably, pricing pressures from customers may increase, the Company’s workforce and operations could be disrupted by civil or political unrest in the countries in which the Company operates, free trade agreements may be altered in a manner adverse to the Company, medical device regulations could change in an unfavorable manner, oil and gas prices could fluctuate causing adverse consequences, and other adverse conditions in the industries in which the Company operates may negatively affect its results. The business outlook discussed in this presentation does not include the potential impact of any business combinations, acquisitions, divestitures, strategic investments and other significant transactions that may be completed after the date hereof. The foregoing risks should be read in conjunction with the Company’s annual report on Form 10-K for the year ended December 31, 2017 and subsequent reports filed with the Securities and Exchange Commission. Except as required by law, the Company expressly disclaims any obligation or undertaking to update any forward-looking statements to reflect any change in its expectations with regard thereto or any change in events, conditions or circumstances on which any such statement is based. Proprietary © Gentherm 2018 2
Market and Industry Data Certain information contained in this presentation concerning our industry and the markets in which we operate is based on information from publicly available independent industry and research organizations and other third-party sources, and management estimates. Management estimates are derived from publicly available information released by independent industry and research analysts and third-party sources, as well as data from our internal research, and are based on assumptions made by us upon reviewing such data and our knowledge of such industry and markets, which we believe to be reasonable. We also believe the data from these third-party sources is reliable. This data involves a number of assumptions and limitations, and you are cautioned not to give undue weight to such estimates. Use of Non-GAAP Financial Measures In addition to the results reported in accordance with GAAP throughout this presentation, the Company has provided information regarding “earnings before interest, taxes, depreciation and amortization, deferred financing cost amortization, transaction expenses, debt retirement expenses, unrealized currency gain or loss and unrealized revaluation of derivatives” (Adjusted EBITDA), “free cash flow” and “Return on Invested Capital (ROIC)” (each, a non-GAAP financial measure). Free cash flow represents net cash provided by operating activities less adjusted capital expenditures, and we define ROIC as tax-affected operating income, prior to the effect of extraordinary or unusual items, divided by Invested Capital. Invested Capital is defined as shareholders’ equity and total debt, less cash and cash equivalents. In evaluating its business, the Company considers and uses Adjusted EBITDA as a supplemental measure of its operating performance. Management provides an Adjusted EBITDA measure so that investors will have the same financial information that management uses with the belief that it will assist investors in properly assessing the Company’s performance on a period-over-period basis. Additionally, management believes that free cash flow is useful to both management and investors in their analysis of the Company’s ability to service and repay its debt, and that ROIC provides a useful measure of how effectively the Company uses capital to generate profits. Other companies in our industry may calculate these non-GAAP financial measures differently than we do and those calculations may not be comparable to our metrics. These non-GAAP measures have limitations as analytical tools, and when assessing the Company’s operating performance, investors should not consider Adjusted EBITDA or ROIC in isolation, or as a substitute for net income or other consolidated income statement data prepared in accordance with GAAP. Discussion and reconciliations of historical Adjusted EBITDA financial measures to the comparable GAAP financial measure are disclosed in a Form 8-K filed by the Company with the SEC on February 20, 2018, included on the SEC’s website, www.sec.gov. Non-GAAP measures referenced in this presentation may include estimates of future Adjusted EBITDA, ROIC and free cash flow. Such forward-looking non-GAAP measures may differ significantly from the corresponding GAAP measures, due to depreciation and amortization, tax expense, and/or interest expense, some or all of which management has not quantified for the future periods. Attached as an appendix to this presentation is a reconciliation of Operating Income to ROIC for the year ended December 31, 2017. Proprietary © Gentherm 2018 3
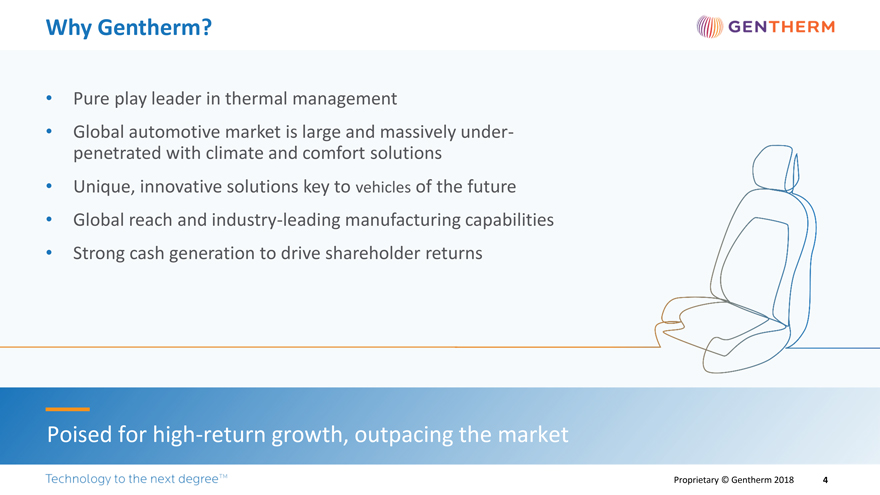
Why Gentherm? • Pure play leader in thermal management • Global automotive market is large and massively under-penetrated with climate and comfort solutions • Unique, innovative solutions key to vehicles of the future • Global reach and industry-leading manufacturing capabilities • Strong cash generation to drive shareholder returns Poised for high-return growth, outpacing the market Proprietary © Gentherm 2018 4
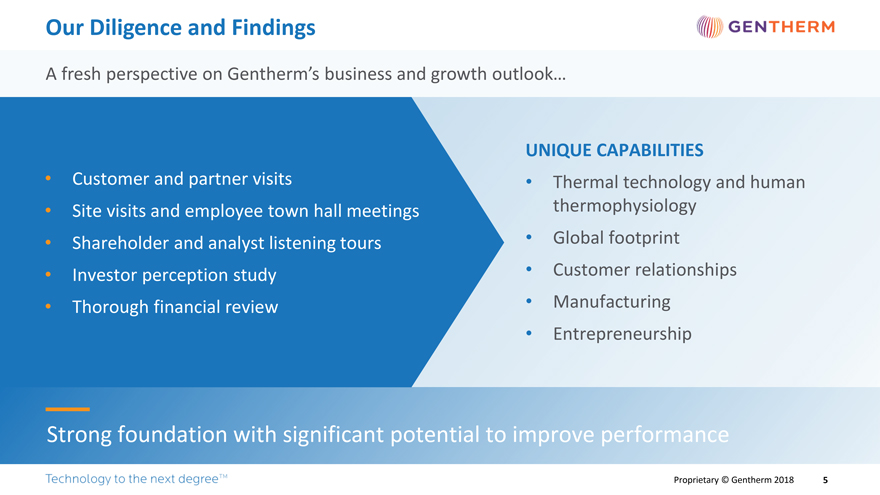
Our Diligence and Findings A fresh perspective on Gentherm’s business and growth outlook… UNIQUE CAPABILITIES • Customer and partner visits • Thermal technology and human • Site visits and employee town hall meetings thermophysiology • Shareholder and analyst listening tours • Global footprint • Investor perception study • Customer relationships • Thorough financial review • Manufacturing • Entrepreneurship Strong foundation with significant potential to improve performance Proprietary © Gentherm 2018 5
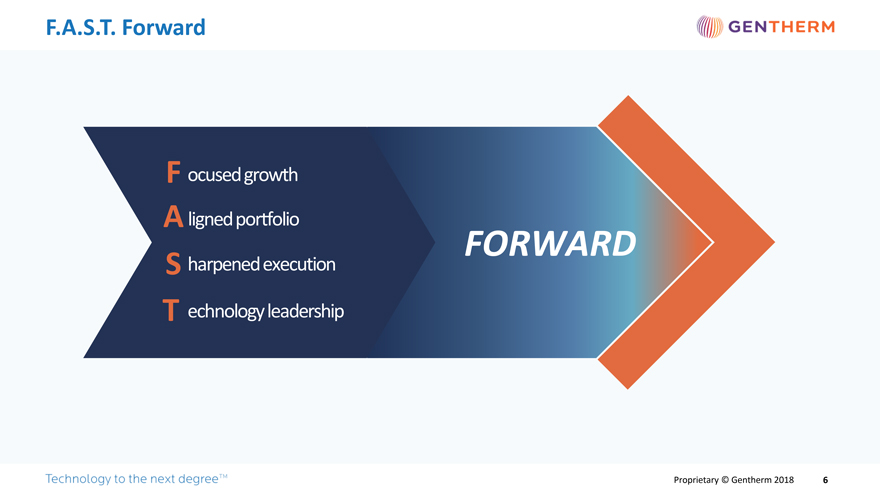
F.A.S.T. Forward F ocused growth Aligned portfolio FORWARD S harpened execution T echnology leadership Proprietary © Gentherm 2018 6
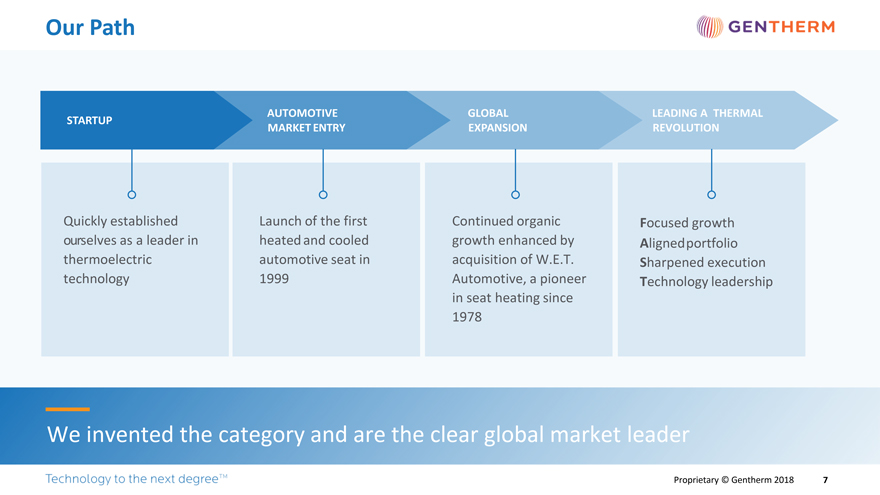
Our Path AUTOMOTIVE GLOBAL LEADING A THERMAL STARTUP MARKET ENTRY EXPANSION REVOLUTION Quickly established Launch of the first Continued organic Focused growth ourselves as a leader in heated and cooled growth enhanced by Alignedportfolio thermoelectric automotive seat in acquisition of W.E.T. Sharpened execution technology 1999 Automotive, a pioneer Technology leadership in seat heating since 1978 We invented the category and are the clear global market leader Proprietary © Gentherm 2018 7
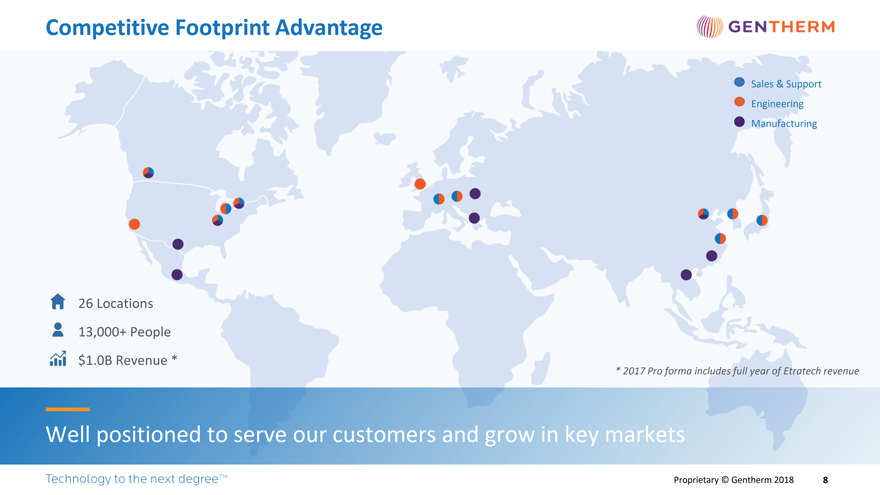
Competitive Footprint Advantage Sales & Support Engineering Manufacturing 26 Locations 13,000+ People $1.0B Revenue * * 2017 Pro forma includes full year of Etratech revenue Well positioned to serve our customers and grow in key markets Proprietary © Gentherm 2018 8

Market Segments 2017 Automotive ($926M) * Core Thermal Products Battery Thermal Electronics Products Industrial ($106M) Medical Products Global Power Technology TestChambers * Pro forma includes full year of Etratech revenue Proprietary © Gentherm 2018 9
40+ Global Automotive Customers Established Customers Emerging Customers Proprietary © Gentherm 2018 10
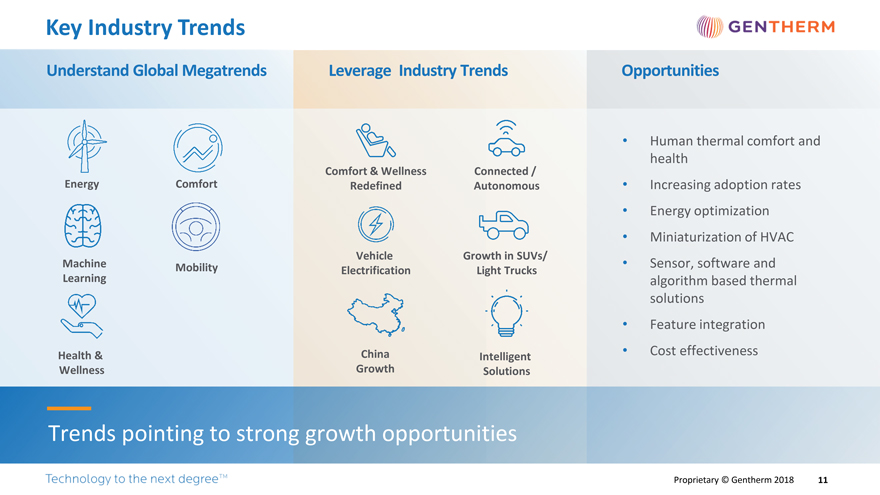
Key Industry Trends Understand Global Megatrends Leverage Industry Trends Opportunities • Human thermal comfort and health Comfort & Wellness Connected / Energy Comfort Redefined Autonomous • Increasing adoption rates • Energy optimization • Miniaturization of HVAC Vehicle Growth in SUVs/ Machine Mobility • Sensor, software and Electrification Light Trucks Learning algorithm based thermal solutions • Feature integration Health & China • Cost effectiveness Intelligent Wellness Growth Solutions Trends pointing to strong growth opportunities Proprietary © Gentherm 2018 11
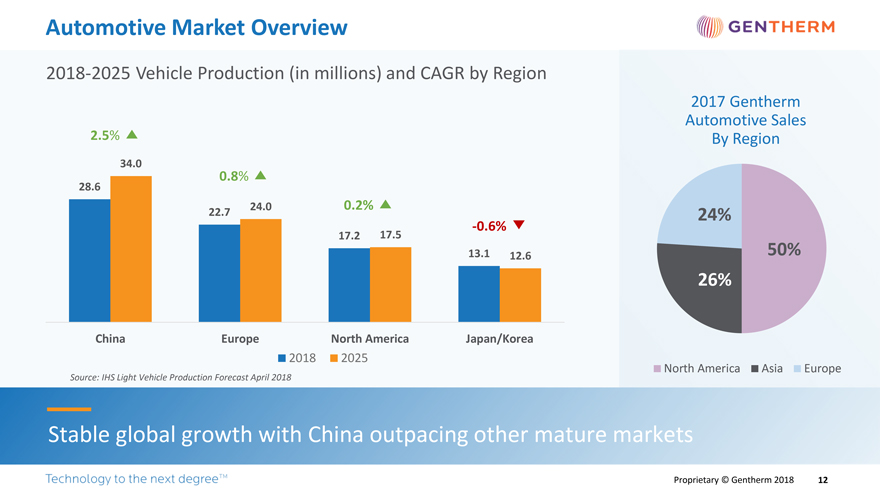
Automotive Market Overview 2018-2025 Vehicle Production (in millions) and CAGR by Region 2017 Gentherm Automotive Sales 2.5% By Region 34.0 0.8% 28.6 24.0 0.2% 22.7 24% -0.6% 17.2 17.5 13.1 12.6 50% 26% China Europe North America Japan/Korea 2018 2025 North America Asia Europe Source: IHS Light Vehicle Production Forecast April 2018 Stable global growth with China outpacing other mature markets Proprietary © Gentherm 2018 12
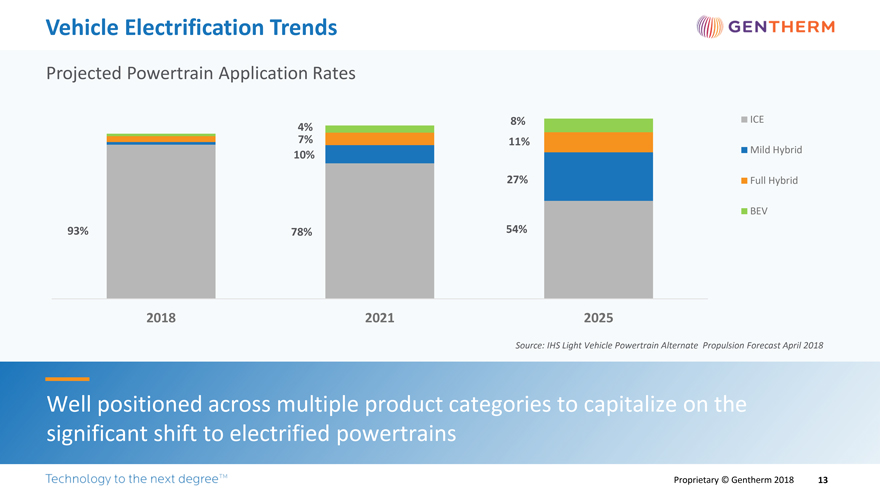
Vehicle Electrification Trends Projected Powertrain Application Rates 8% ICE 4% 7% 11% Mild Hybrid 10% 27% Full Hybrid BEV 93% 78% 54% 2018 2021 2025 Source: IHS Light Vehicle Powertrain Alternate Propulsion Forecast April 2018 Well positioned across multiple product categories to capitalize on the significant shift to electrified powertrains Proprietary © Gentherm 2018 13
Our Strategy Focused Extend Technology Expand Margins Optimize Capital Growth Leadership and ROIC Allocation Proprietary © Gentherm 2018 14
Strategy 1 Focused Growth Proprietary © Gentherm 2018 15
Strategy 1: Focused Growth Divest and minimize non-core investments • Divest Global Power Technologies • Divest CSZ® Industrial Chambers • Eliminate / Minimize Investment — Furniture — Aviation — Battery Management Electronics — Industrial Battery Packs — Automotive Thermoelectric Generator — Non-core Electronics Reset focus to higher-growth and higher-return opportunities Proprietary © Gentherm 2018 16
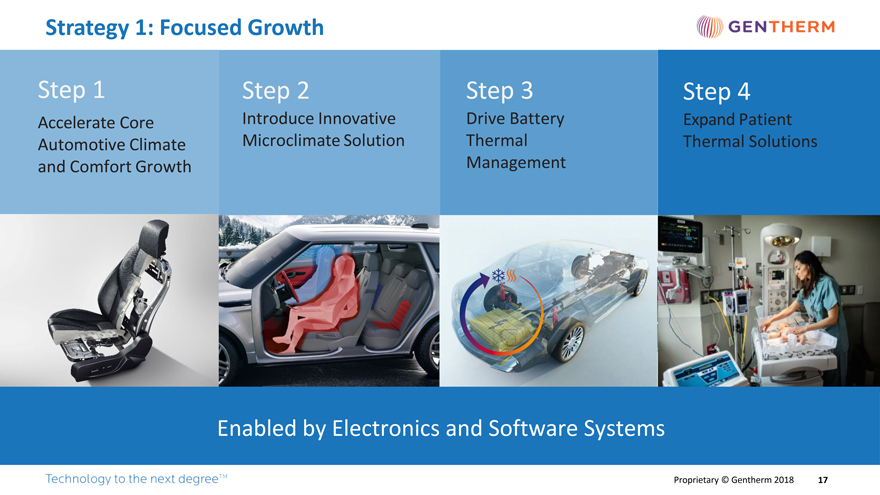
Strategy 1: Focused Growth Step 1 Step 2 Step 3 Step 4 Accelerate Core Introduce Innovative Drive Battery Expand Patient Automotive Climate Microclimate Solution Thermal Thermal Solutions and Comfort Growth Management Enabled by Electronics and Software Systems Proprietary © Gentherm 2018 17
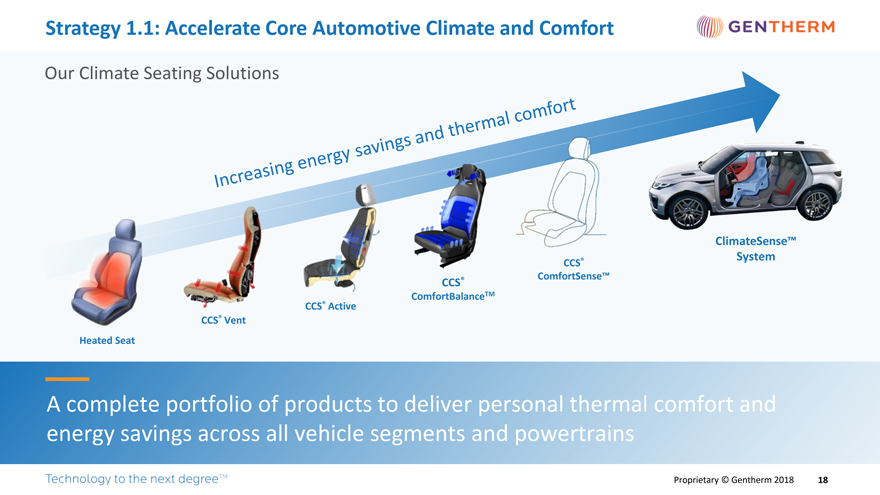
Strategy 1.1: Accelerate Core Automotive Climate and Comfort Our Climate Seating Solutions ClimateSense™® System CCS ComfortSense™ CCS® ComfortBalanceTM CCS® Active CCS® Vent Heated Seat A complete portfolio of products to deliver personal thermal comfort and energy savings across all vehicle segments and powertrains Proprietary © Gentherm 2018 18
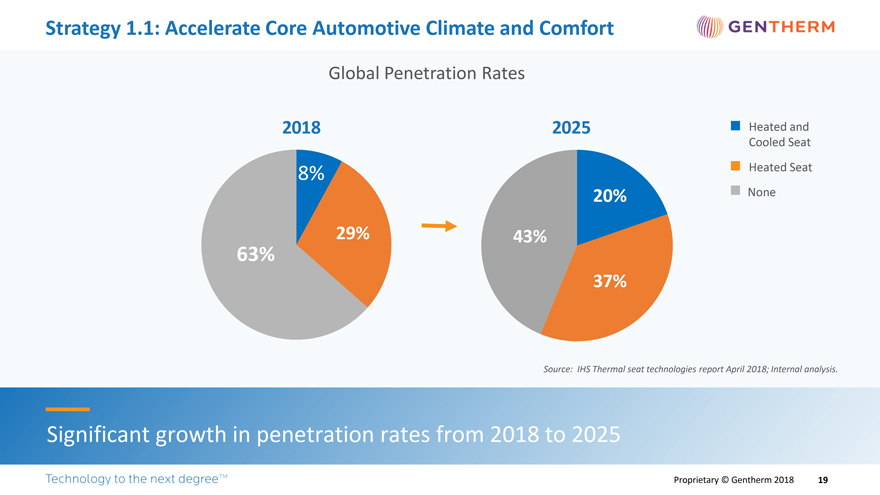
Strategy 1.1: Accelerate Core Automotive Climate and Comfort Global Penetration Rates 2018 2025 Heated and Cooled Seat 8% Heated Seat 20% None 29% 43% 63% 37% Source: IHS Thermal seat technologies report April 2018; Internal analysis. Significant growth in penetration rates from 2018 to 2025 Proprietary © Gentherm 2018 19
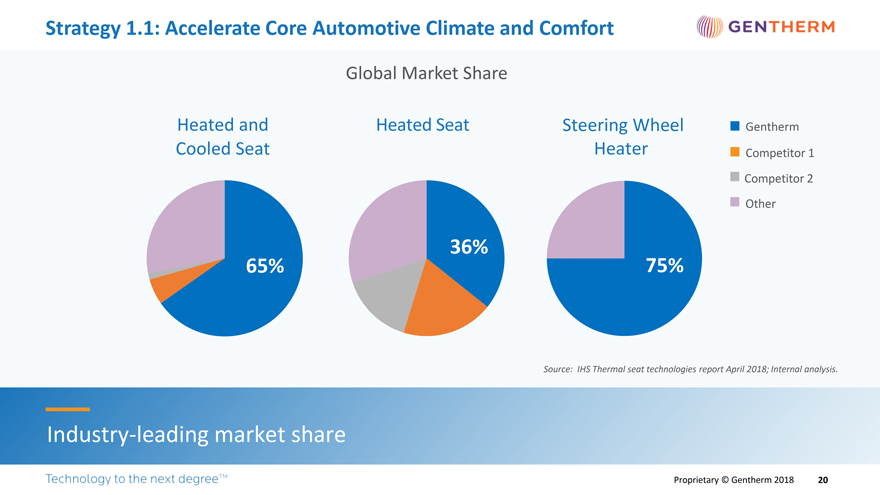
Strategy 1.1: Accelerate Core Automotive Climate and Comfort Global Market Share Heated and Heated Seat Steering Wheel Gentherm Cooled Seat Heater Competitor 1 Competitor 2 Other 36% 65% 75% Source: IHS Thermal seat technologies report April 2018; Internal analysis. Industry-leading market share Proprietary © Gentherm 2018 20
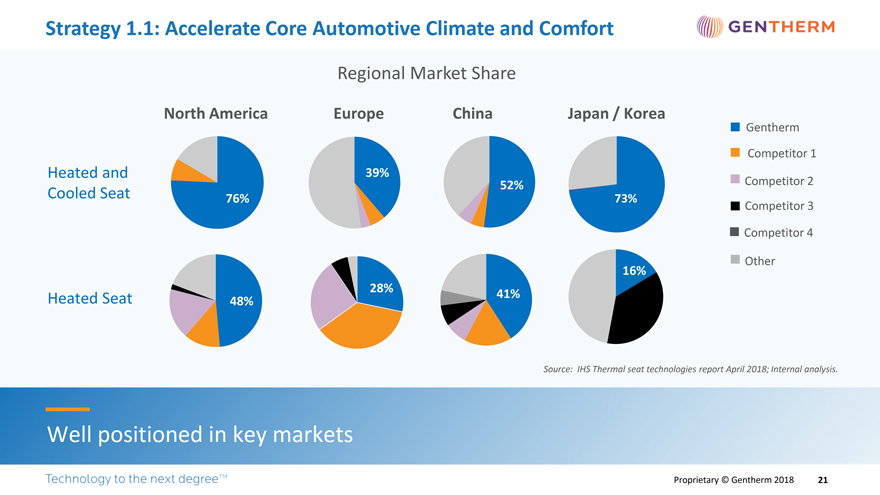
Strategy 1.1: Accelerate Core Automotive Climate and Comfort Heated and Cooled Seat Heated Seat Regional Market Share North America Europe China Japan / Korea 39% 52% 76% 73% 39% 52% 76% 73% Gentherm Competitor 1 Competitor 2 Competitor 3 Competitor 4 Other Source: IHS Thermal seat technologies report April 2018; Internal analysis. Proprietary © Gentherm 2018 21
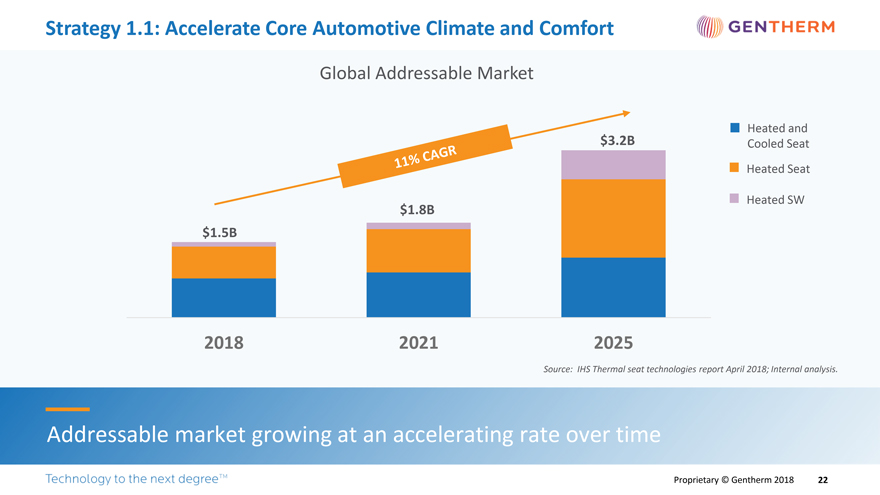
Strategy 1.1: Accelerate Core Automotive Climate and Comfort Global Addressable Market $1.5B 2018 $1.8B 2021 $3.2B 2025 11% CAGR Heated and Cooled Seat Heated Seat Heated SW Source: IHS Thermal seat technologies report April 2018; Internal analysis. Addressable market growing at an accelerating rate over time Proprietary © Gentherm 2018 22
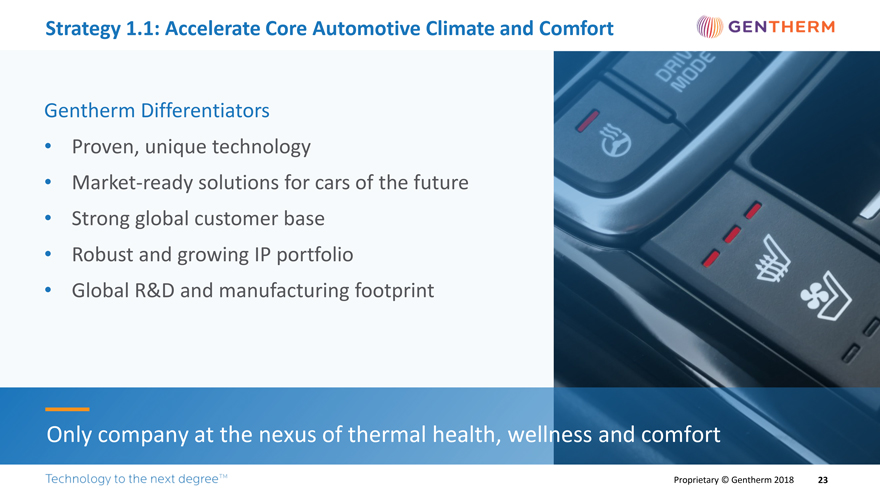
Strategy 1.1: Accelerate Core Automotive Climate and Comfort Gentherm Differentiators • Proven, unique technology • Market-ready solutions for cars of the future • Strong global customer base • Robust and growing IP portfolio • Global R&D and manufacturing footprint Only company at the nexus of thermal health, wellness and comfort Proprietary © Gentherm 2018 23
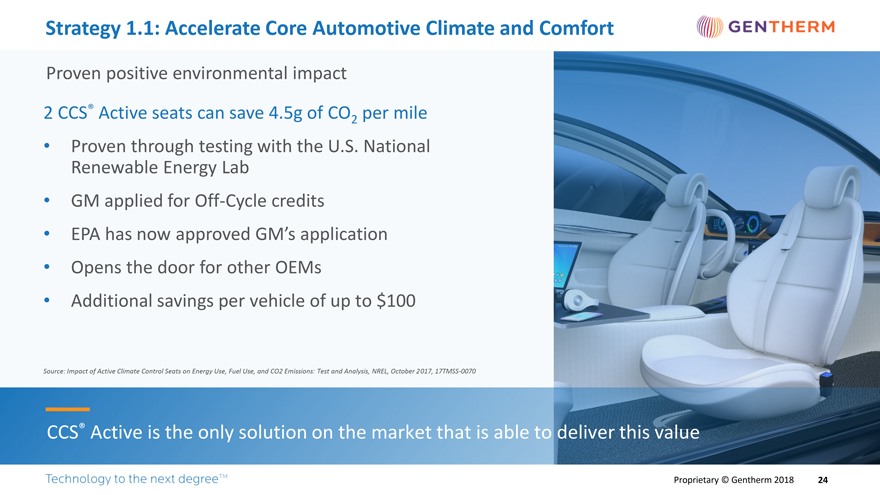
Strategy 1.1: Accelerate Core Automotive Climate and Comfort Proven positive environmental impact 2 CCS® Active seats can save 4.5g of CO per mile 2 • Proven through testing with the U.S. National Renewable Energy Lab • GM applied forOff-Cycle credits • EPA has now approved GM’s application • Opens the door for other OEMs • Additional savings per vehicle of up to $100 Source: Impact of Active Climate Control Seats on Energy Use, Fuel Use, and CO2 Emissions: Test and Analysis, NREL, October 2017, 17TMSS-0070 CCS® Active is the only solution on the market that is able to deliver this value Proprietary © Gentherm 2018 24
Strategy 1.1: Accelerate Core Automotive Climate and Comfort Key Initiatives • Increase take rate and content per vehicle • Build on strong key customer relationships • Expand with European customers • Capture China growth • Collaboration, partnerships and prudent acquisitions Aspiration: grow core revenue to over $2B by 2025 Proprietary © Gentherm 2018 25

Strategy 1.2: Introduce Innovative Microclimate Solution ClimateSense™ Delivers •Best-in-class thermal comfort • Intelligent climate zones for each occupant •30-50% reduction in central HVAC size • Full-electricpre-conditioning • Greater styling freedom and weight improvement • Self-regulating control through advanced sensing and algorithms Gentherm ClimateSense™: Ready for the Future, Today Energy efficiency and perfect thermal comfort in one, intelligent, integrated system Proprietary © Gentherm 2018 26
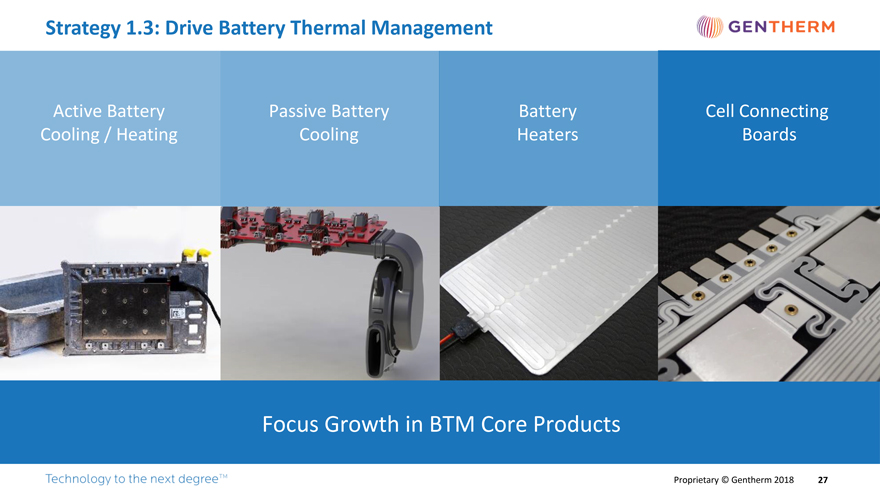
Proprietary © Gentherm 2018 Active Battery Passive Battery Battery Cell Connecting Cooling / Heating Cooling Heaters Boards Focus Growth in BTM Core Products Proprietary © Gentherm 2018 27
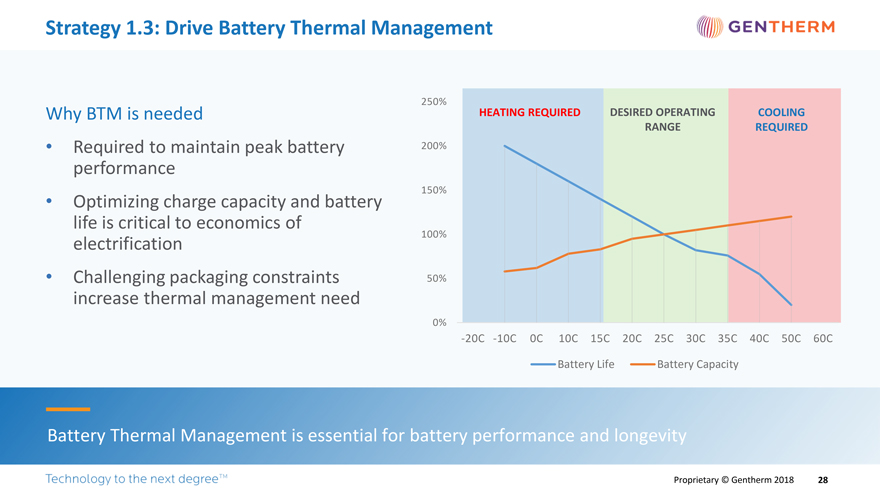
Strategy 1.3: Drive Battery Thermal Management Why BTM is needed • Required to maintain peak battery performance • Optimizing charge capacity and battery life is critical to economics of electrification • Challenging packaging constraints increase thermal management need 250% 200% 150% 100% 50% 0% HEATING REQUIRED DESIRED OPERATING COOLING RANGE REQUIRED-20C-10C 0C 10C 15C 20C 25C 30C 35C 40C 50C 60C Battery Life Battery Capacity Battery Thermal Management is essential for battery performance and longevity Proprietary © Gentherm 2018 28
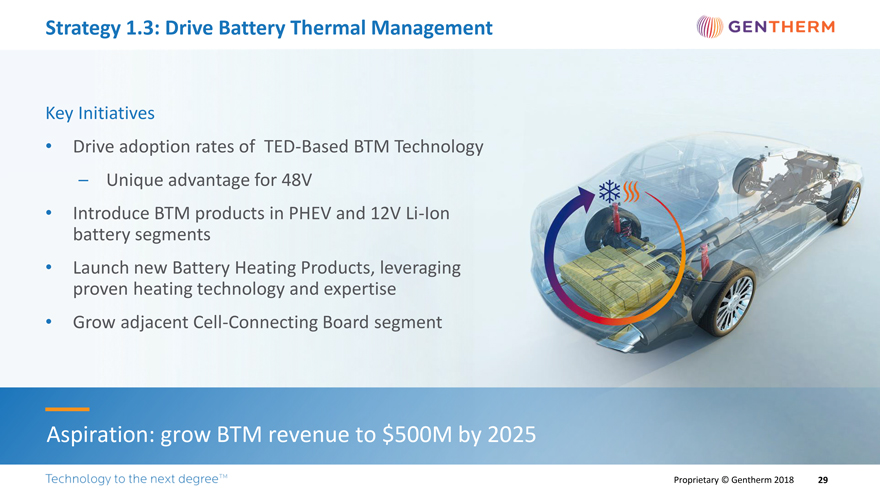
Strategy 1.3: Drive Battery Thermal Management Key Initiatives • Drive adoption rates ofTED-Based BTM Technology – Unique advantage for 48V • Introduce BTM products in PHEV and 12VLi-Ion battery segments • Launch new Battery Heating Products, leveraging proven heating technology and expertise • Grow adjacent Cell-Connecting Board segment Aspiration: grow BTM revenue to $500M by 2025 Proprietary © Gentherm 2018 29
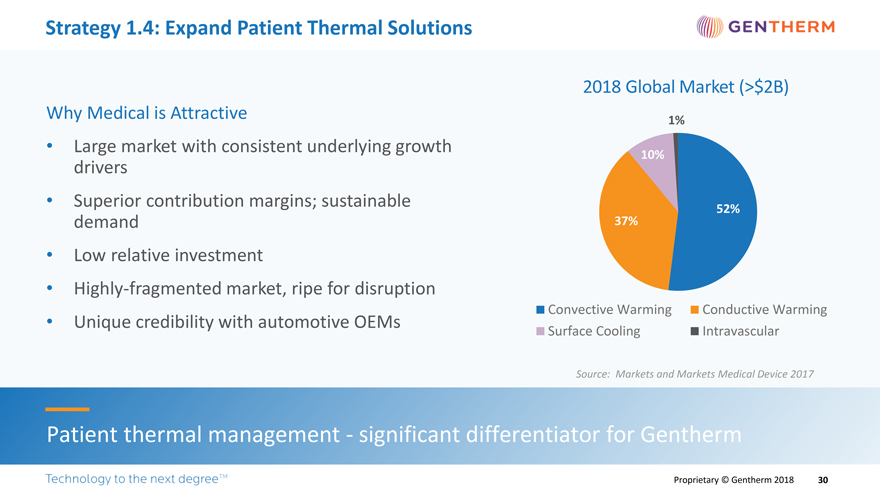
Strategy 1.4: Expand Patient Thermal Solutions Why Medical is Attractive • Large market with consistent underlying growth drivers • Superior contribution margins; sustainable demand • Low relative investment • Highly-fragmented market, ripe for disruption • Unique credibility with automotive OEMs 2018 Global Market (>$2B) 1% 10% 52% 37% Convective Warming Conductive Warming Surface Cooling Intravascular Source: Markets and Markets Medical Device 2017 Patient thermal management - significant differentiator for Gentherm Proprietary © Gentherm 2018 30
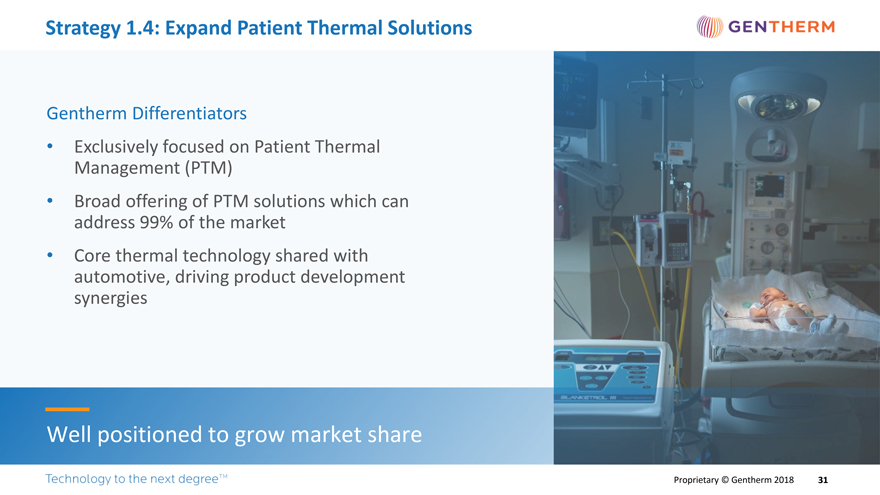
Strategy 1.4: Expand Patient Thermal Solutions Gentherm Differentiators • Exclusively focused on Patient Thermal Management (PTM) • Broad offering of PTM solutions which can address 99% of the market • Core thermal technology shared with automotive, driving product development synergies Well positioned to grow market share 31
Strategy 1.4: Expand Patient Thermal Solutions Key Initiatives • Continued product enhancement • Leverage direct sales force • Expand globally • Differentiate on superior human thermophysiology and thermal technology Aspiration: grow medical revenue to $200M by 2025 with company-leading margins Proprietary © Gentherm 2018 32
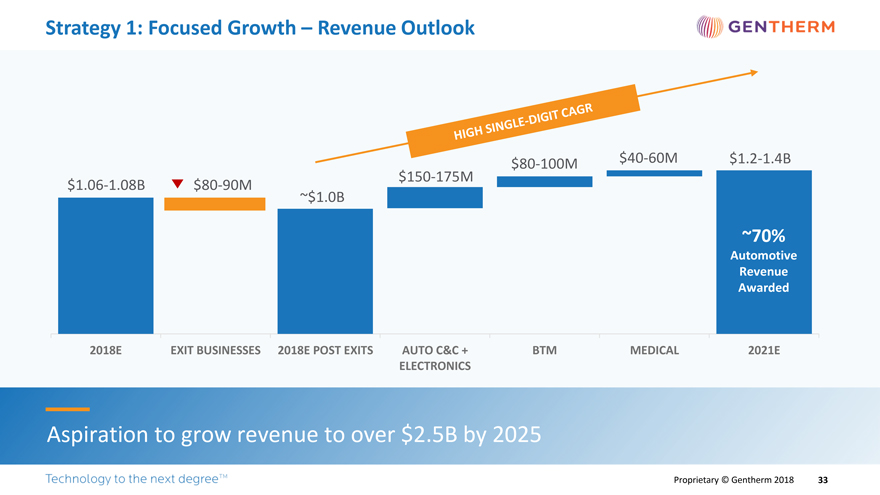
Strategy 1: Focused Growth – Revenue Outlook$80-100M$40-60M$1.2-1.4B$150-175M$1.06-1.08B$80-90M ~$1.0B ~70% Automotive Revenue Awarded 2018E EXIT BUSINESSES 2018E POST EXITS AUTO C&C + BTM MEDICAL 2021E ELECTRONICS Aspiration to grow revenue to over $2.5B by 2025 Proprietary © Gentherm 2018 HIGH SINGLE-DIGIT CAGR 33

Strategy 2 Extend Technology Leadership Proprietary © Gentherm 2018 34
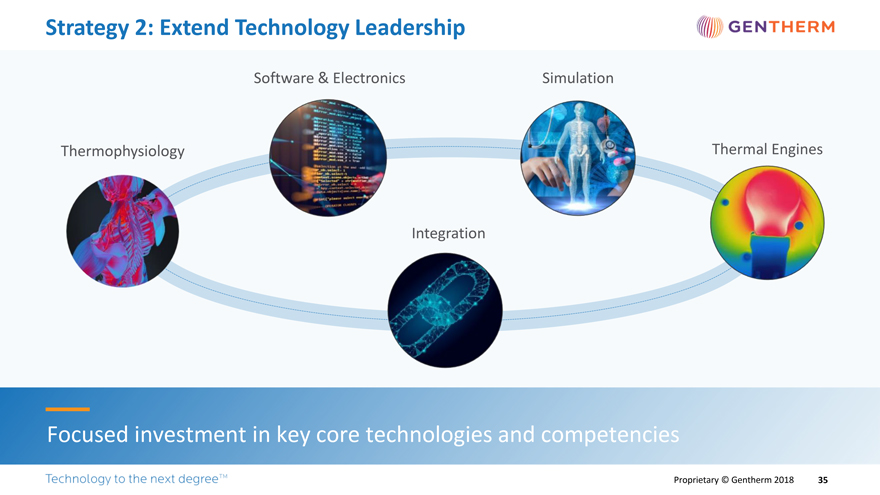
Strategy 2: Extend Technology Leadership Software & Electronics Simulation Thermophysiology Thermal Engines Integration Focused investment in key core technologies and competencies Proprietary © Gentherm 2018 35

Strategy 3 Expand Margins and ROIC Proprietary © Gentherm 2018 36
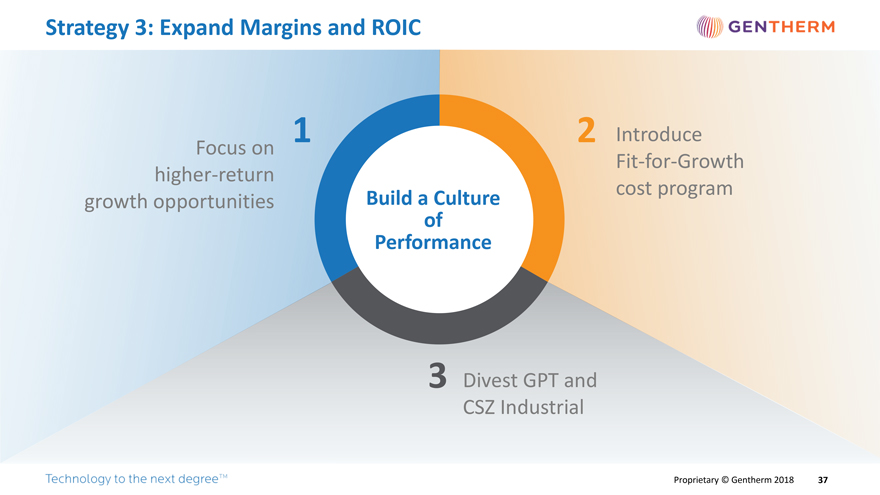
Strategy 3: Expand Margins and ROIC 1 Focus on higher-return growth opportunities Build a Culture of Performance IntroduceFit-for-Growth cost program 3 Divest GPT and CSZ Industrial Proprietary © Gentherm 2018 37
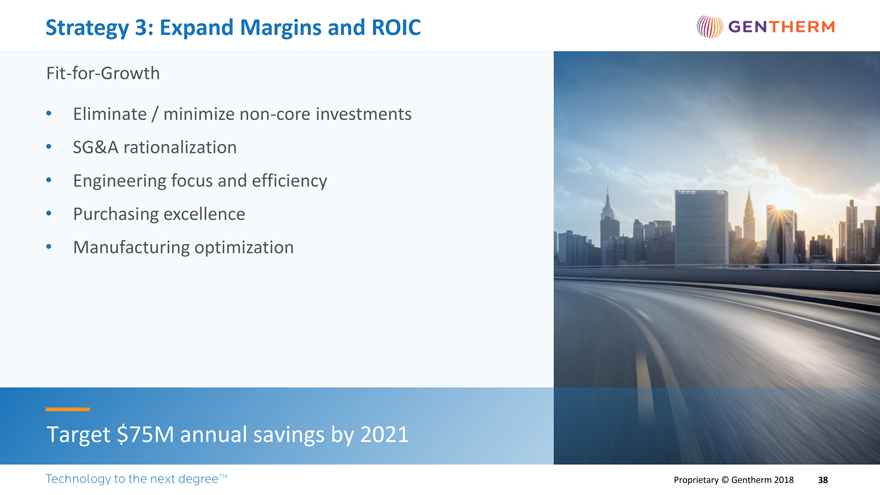
Strategy 3: Expand Margins and ROICFit-for-Growth • Eliminate / minimizenon-core investments • SG&A rationalization • Engineering focus and efficiency • Purchasing excellence • Manufacturing optimization Target $75M annual savings by 2021 Proprietary © Gentherm 2018 38
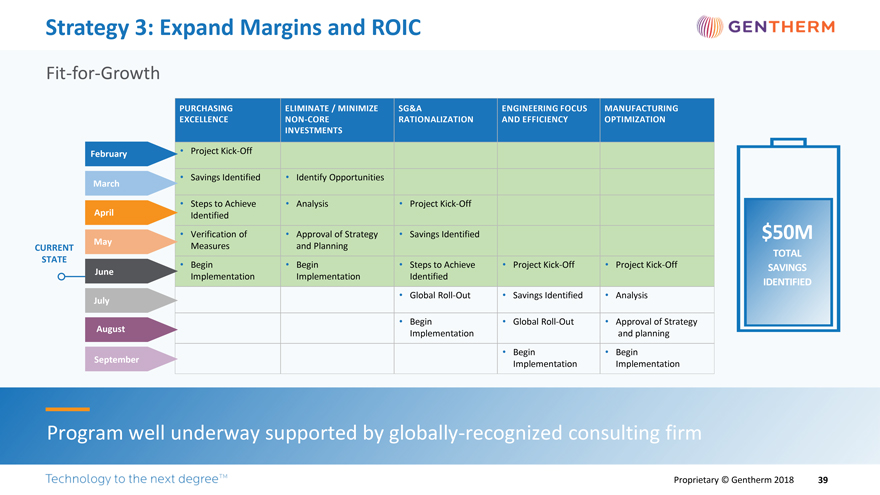
Strategy 3: Expand Margins and ROICFit-for-Growth Strategy 3: Expand Margins and ROICFit-for-Growth February March April May June July August September PURCHASING ELIMINATE / MINIMIZE SG&A ENGINEERING FOCUS MANUFACTURING EXCELLENCENON-CORE RATIONALIZATION AND EFFICIENCY OPTIMIZATION INVESTMENTS • ProjectKick-Off • Savings Identified• Identify Opportunities • Steps to Achieve• Analysis• ProjectKick-Off Identified • Verification of• Approval of Strategy• Savings Identified Measuresand Planning • Begin• Begin• Steps to Achieve• ProjectKick-Off• ProjectKick-Off ImplementationImplementation Identified • GlobalRoll-Out• Savings Identified• Analysis • Begin• GlobalRoll-Out• Approval of Strategy Implementationand planning • Begin• Begin ImplementationImplementation $50M TOTAL SAVINGS IDENTIFIED Program well underway supported by globally-recognized consulting firm Proprietary © Gentherm 2018 39
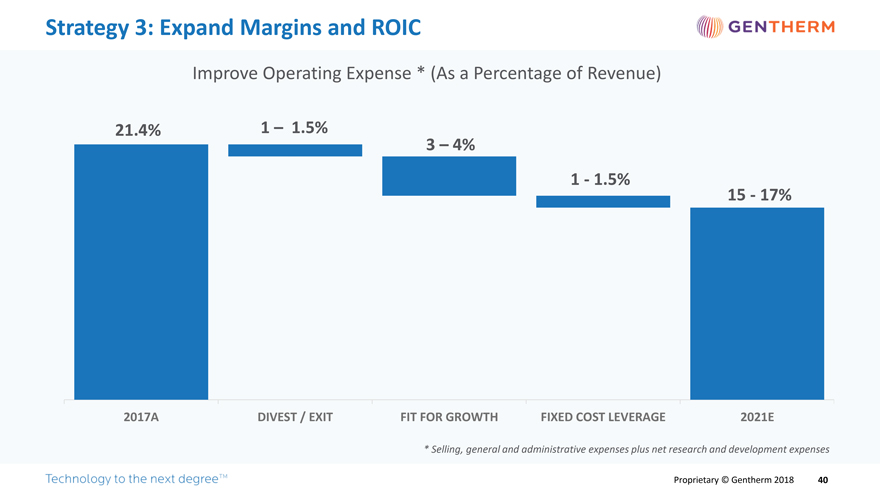
Strategy 3: Expand Margins and ROIC Improve Operating Expense * (As a Percentage of Revenue) 21.4% 1 – 1.5% 3 – 4% 1 - 1.5% 15 - 17% 2017A DIVEST / EXIT FIT FOR GROWTH FIXED COST LEVERAGE 2021E * Selling, general and administrative expenses plus net research and development expenses Proprietary © Gentherm 2018 40
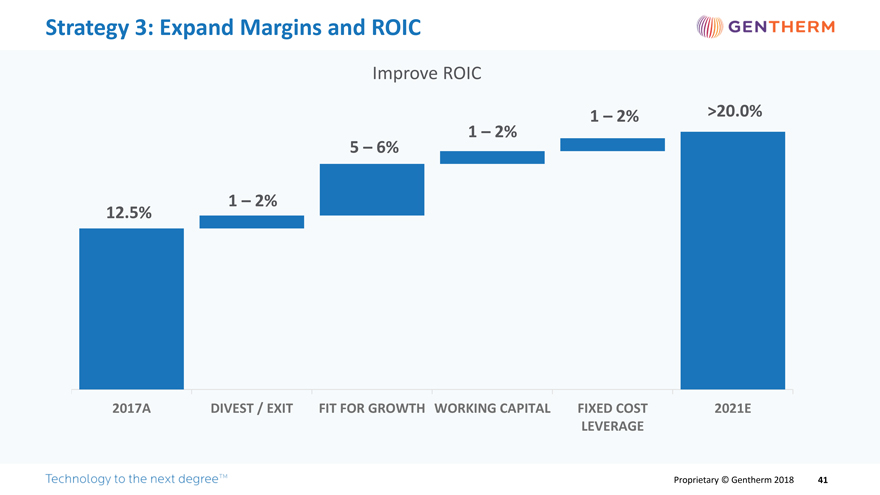
Strategy 3: Expand Margins and ROIC Improve ROIC 1 – 2% >20.0% 1 – 2% 5 – 6% 1 – 2% 12.5% 2017A DIVEST / EXIT FIT FOR GROWTH WORKING CAPITAL FIXED COST 2021E LEVERAGE Proprietary © Gentherm 2018 41
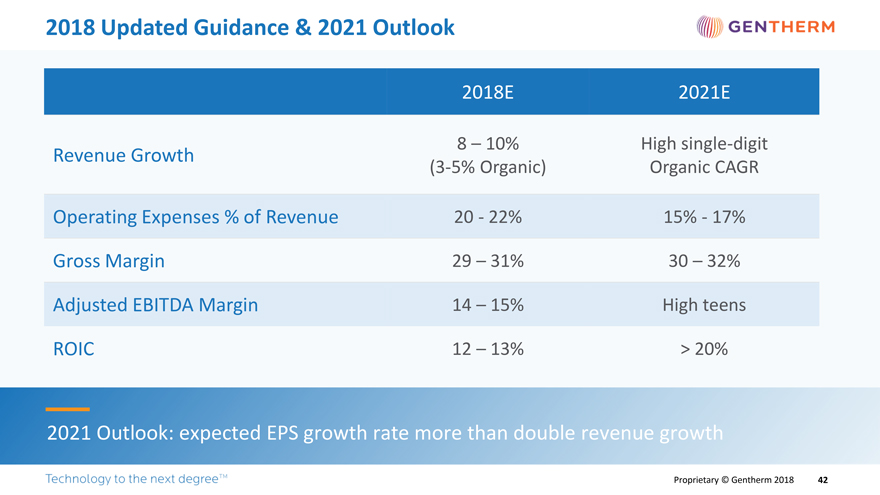
2018 Updated Guidance & 2021 Outlook Revenue Growth Operating Expenses % of Revenue Gross Margin Adjusted EBITDA Margin ROIC 2018E 8 – 10%(3-5% Organic) 20 - 22% 29 – 31% 14 – 15% 12 – 13% 2021E High single-digit Organic CAGR 15% - 17% 30 – 32% High teens > 20% 2021 Outlook: expected EPS growth rate more than double revenue growth Proprietary © Gentherm 2018 42

Strategy 4 Optimize Capital Allocation to Drive Shareholder Returns Proprietary © Gentherm 2018 43
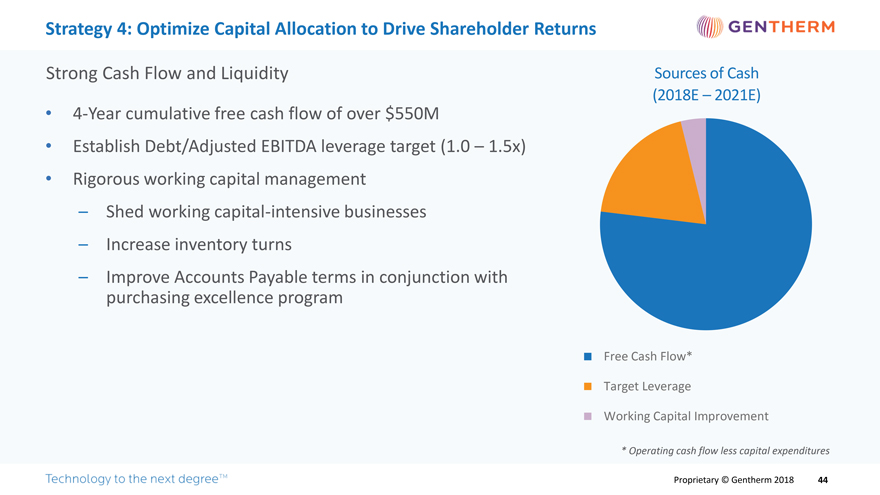
Strategy 4: Optimize Capital Allocation to Drive Shareholder Returns Strong Cash Flow and Liquidity •4-Year cumulative free cash flow of over $550M • Establish Debt/Adjusted EBITDA leverage target (1.0 – 1.5x) • Rigorous working capital management – Shed working capital-intensive businesses – Increase inventory turns – Improve Accounts Payable terms in conjunction with purchasing excellence program Sources of Cash (2018E – 2021E) Free Cash Flow* Target Leverage Working Capital Improvement * Operating cash flow less capital expenditures Proprietary © Gentherm 2018 44
Strategy 4: Optimize Capital Allocation to Drive Shareholder Returns Disciplined Capital Allocation • Opportunistic share repurchases – $300 million Board authorization • CAPEX projects to drive organic growth • Invest in core innovation • Prudentbolt-on acquisitions to accelerate core growth Proprietary © Gentherm 2018 45
Our Strategy Focused Growth Extend Technology Leadership Expand Margins and ROIC Optimize Capital Allocation Proprietary © Gentherm 2018 46
Our Mission Creating and delivering extraordinary thermal solutions that make meaningful differences in everyday life, by improving health, wellness, comfort and energy efficiency. Positively impacting people’s lives around the world Proprietary © Gentherm 2018 47
Why Gentherm? • Pure play leader in thermal management • Global automotive market is large and massively under-penetrated with climate and comfort solutions • Unique, innovative solutions key to cars of the future • Global reach and industry-leading manufacturing capabilities • Strong cash generation to drive shareholder returns Poised for high return growth, outpacing the market Proprietary © Gentherm 2018 48
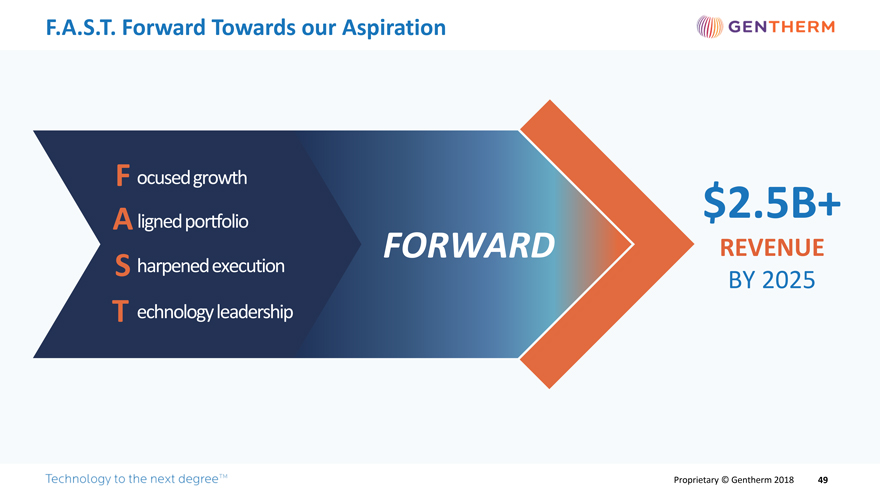
F.A.S.T. Forward Towards our Aspiration F ocused growth Aligned portfolio S harpened execution T echnology leadership FORWARD $2.5B+ REVENUE BY 2025 Proprietary © Gentherm 2018 49
GENTHERM Technology to the next degree TM

Appendix Proprietary © Gentherm 2018 51
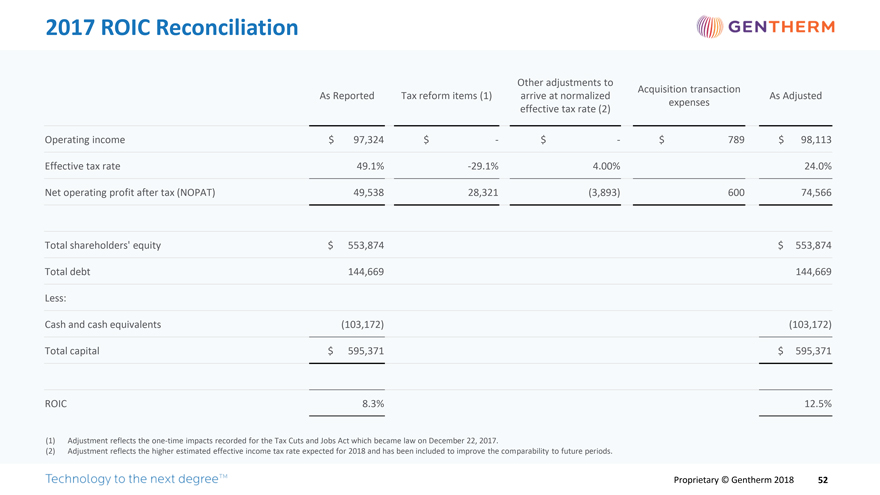
2017 ROIC Reconciliation Operating income Effective tax rate Net operating profit after tax (NOPAT) Total shareholders’ equity Total debt Less: Cash and cash equivalents Total capital ROIC As Reported $ 97,324 49.1% 49,538 $ 553,874 144,669 (103,172) $ 595,371 8.3% Tax reform items (1) $--29.1% 28,321 Other adjustments to arrive at normalized effective tax rate (2) $-4.00% (3,893) Acquisition transaction expenses $ 789 600 As Adjusted $ 98,113 24.0% 74,566 $ 553,874 144,669 (103,172) $ 595,371 12.5% (1) Adjustment reflects theone-time impacts recorded for the Tax Cuts and Jobs Act which became law on December 22, 2017. (2) Adjustment reflects the higher estimated effective income tax rate expected for 2018 and has been included to improve the comparability to future periods. Proprietary © Gentherm 2018 52
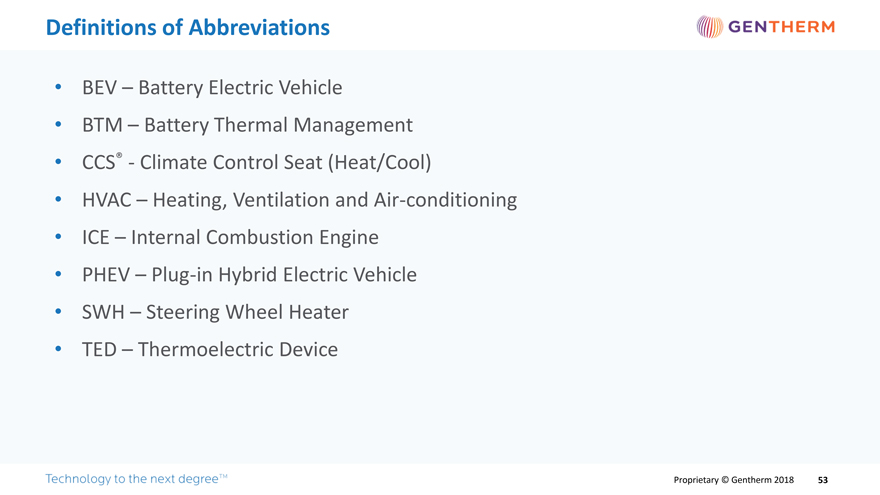
Proprietary © Gentherm 2018 Proprietary © Gentherm 2018 53


