
2018 Fourth Quarter Results Gentherm, Inc. February 21, 2019 Exhibit 99.2
Forward-Looking Statement Except for historical information contained herein, statements in this presentation are forward-looking statements that are made pursuant to the safe harbor provisions of the Private Securities Litigation Reform Act of 1995. These forward-looking statements represent Gentherm Incorporated's goals, beliefs, plans and expectations about its prospects for the future and other future events. The forward-looking statements included in this presentation are made as of the date hereof or as of the date specified and are based on management's current expectations and beliefs. Such statements are subject to a number of important assumptions, risks, uncertainties and other factors that may cause the Company's actual performance to differ materially from that described in or indicated by the forward-looking statements. Those risks include, but are not limited to, risks that new products may not be feasible, sales may not increase, additional financing requirements may not be available, new competitors may arise or customers may develop their own products to replace the Company’s products, customer preferences for end products may shift, the Company may lose suppliers or customers, market acceptance of the Company’s existing or new products may decrease, currency exchange rates may change unfavorably, pricing pressures from customers may increase, the Company’s workforce and operations could be disrupted by civil or political unrest in the countries in which the Company operates, free trade agreements may be altered in a manner adverse to the Company, our customers may not accept pass-through of new tariff costs, additional tariffs may be implemented, cost-savings measures may not be achievable or may need to be reversed, assets held for sale may not be sold quickly or at all, the Company may be unable to repurchase its shares of common stock at favorable prices or at all, due to market conditions, applicable legal requirements, debt covenants or other restrictions, compliance with covenants and other restrictions under the Company’s credit facility, medical device regulations could change in an unfavorable manner, oil and gas prices could fluctuate causing adverse consequences, and other adverse conditions in the industries in which the Company operates may negatively affect its results. You should review the Company's filings with the Securities and Exchange Commission (the “SEC”), including “Risk Factors”, in its most recent Annual Report on Form 10-K and subsequent quarterly reports, for a discussion of these and other risks and uncertainties. The business outlook discussed in this presentation does not include the potential impact of any business combinations, acquisitions, divestitures, strategic investments and other significant transactions that may be completed after the date hereof. Except as required by law, the Company expressly disclaims any obligation or undertaking to update any forward-looking statements to reflect any change in its expectations with regard thereto or any change in events, conditions or circumstances on which any such statement is based.
In addition to the results reported in accordance with GAAP throughout this presentation, the Company has provided information regarding “earnings before interest, taxes, depreciation and amortization, deferred financing cost amortization, transaction expenses, debt retirement expenses, impairment loss, restructuring expenses, unrealized currency gain or loss and unrealized revaluation of derivatives” (Adjusted EBITDA) and “Return on Invested Capital (ROIC)” (each, a non-GAAP financial measure). We define ROIC as tax-affected operating income, prior to the effect of extraordinary or unusual items, divided by Invested Capital. Invested Capital is defined as shareholders’ equity and total debt, less cash and cash equivalents. In evaluating its business, the Company considers and uses Adjusted EBITDA as a supplemental measure of its operating performance. Management provides an Adjusted EBITDA measure so that investors will have the same financial information that management uses with the belief that it will assist investors in properly assessing the Company's performance on a period-over-period basis. Additionally, management believes that ROIC provides a useful measure of how effectively the Company uses capital to generate profits. Other companies in our industry may calculate these non-GAAP financial measures differently than we do and those calculations may not be comparable to our metrics. These non-GAAP measures have limitations as analytical tools, and when assessing the Company's operating performance, investors should not consider Adjusted EBITDA or ROIC in isolation, or as a substitute for net income or other consolidated income statement data prepared in accordance with GAAP. Non-GAAP measures referenced in this presentation may include estimates of future Adjusted EBITDA and ROIC. Such forward-looking non-GAAP measures may differ significantly from the corresponding GAAP measures, due to depreciation and amortization, tax expense, and/or interest expense, some or all of which management has not quantified for the future periods. Use of Non-GAAP Financial Measures * See Appendix for a reconciliation of GAAP to non-GAAP financial measures
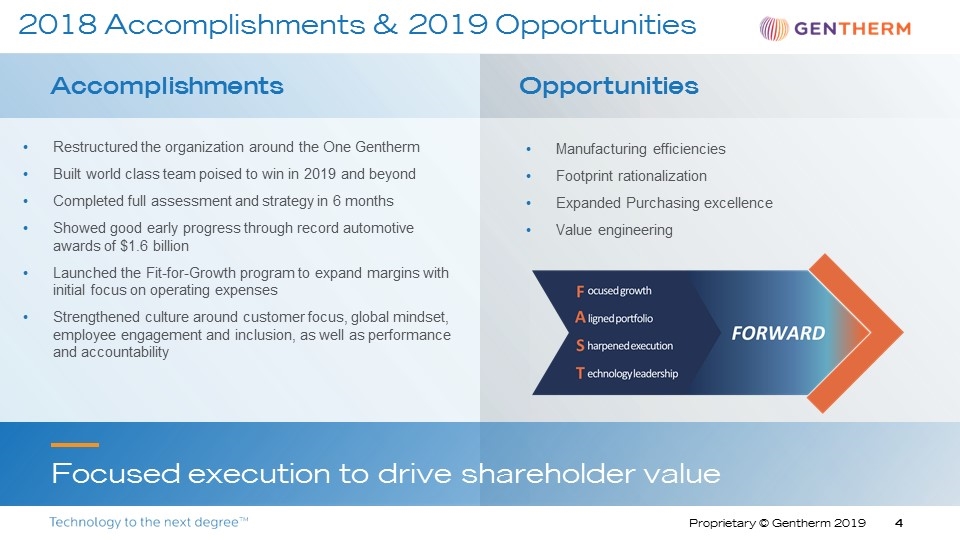
Accomplishments Opportunities Manufacturing efficiencies Footprint rationalization Expanded Purchasing excellence Value engineering 2018 Accomplishments & 2019 Opportunities Restructured the organization around the One Gentherm Built world class team poised to win in 2019 and beyond Completed full assessment and strategy in 6 months Showed good early progress through record automotive awards of $1.6 billion Launched the Fit-for-Growth program to expand margins with initial focus on operating expenses Strengthened culture around customer focus, global mindset, employee engagement and inclusion, as well as performance and accountability Focused execution to drive shareholder value
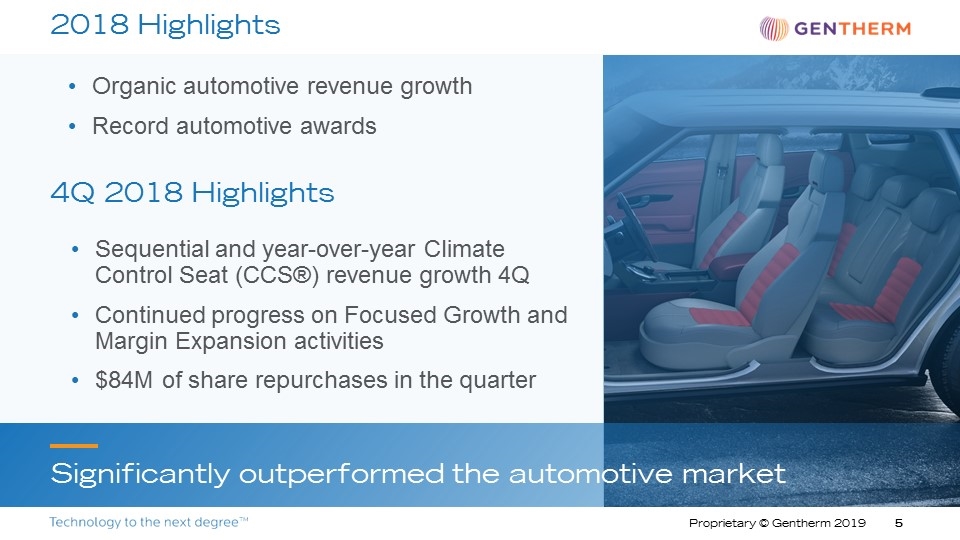
Significantly outperformed the automotive market 2018 Highlights Sequential and year-over-year Climate Control Seat (CCS®) revenue growth 4Q Continued progress on Focused Growth and Margin Expansion activities $84M of share repurchases in the quarter Organic automotive revenue growth Record automotive awards 4Q 2018 Highlights

17 Vehicle launches with 13 OEMs 9 CCS® product launches with 6 OEMs Chevrolet Blazer Geely NL-5 Hyundai Santa Fe Kia Telluride Launched joint development partnership with Lear Showcased thermal solutions in Rinspeed’s microSNAP at CES and the Detroit Auto Show Partnering with ThermoAnalytics to improve thermal prediction modeling Launch momentum and expanded partnerships Automotive 4Q 2018 Highlights
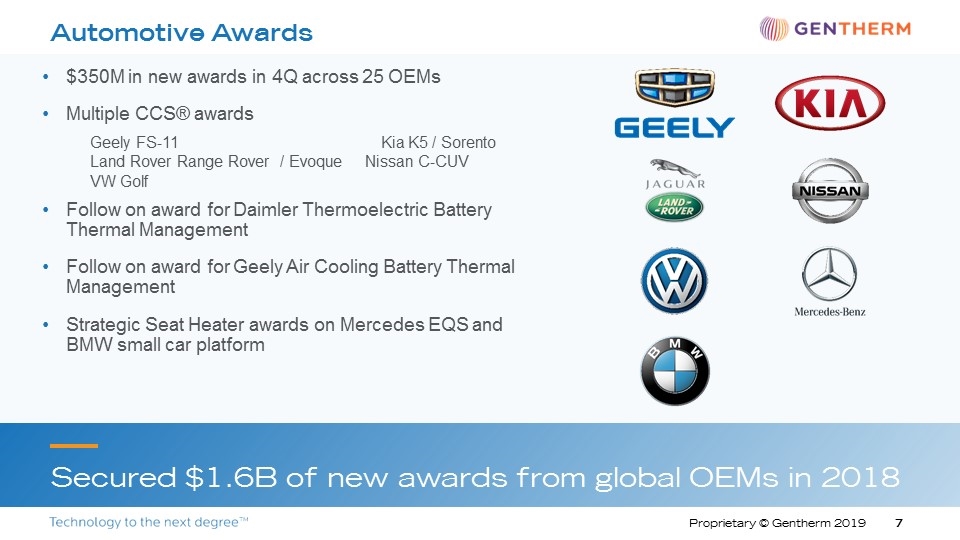
$350M in new awards in 4Q across 25 OEMs Multiple CCS® awards Geely FS-11 Kia K5 / Sorento Land Rover Range Rover / Evoque Nissan C-CUV VW Golf Follow on award for Daimler Thermoelectric Battery Thermal Management Follow on award for Geely Air Cooling Battery Thermal Management Strategic Seat Heater awards on Mercedes EQS and BMW small car platform Automotive Awards Secured $1.6B of new awards from global OEMs in 2018
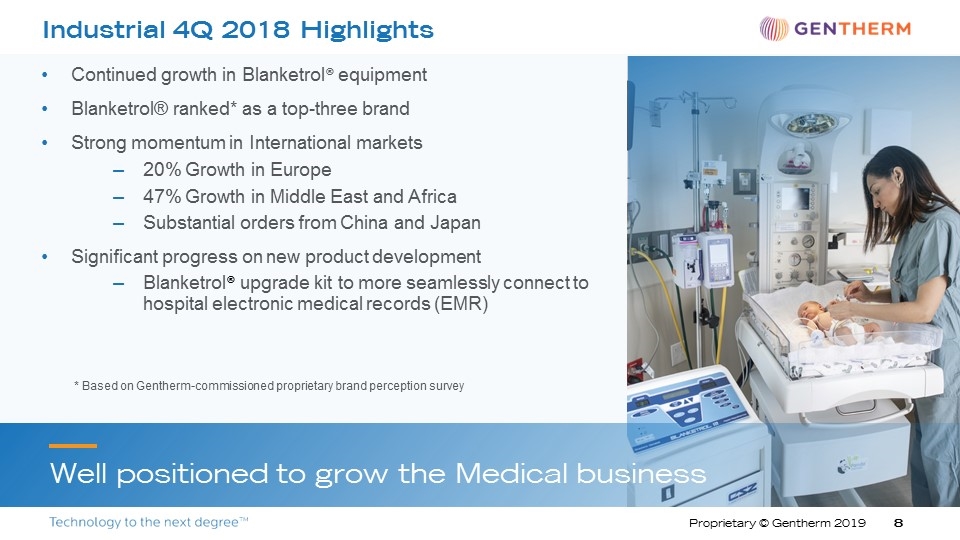
Industrial 4Q 2018 Highlights Well positioned to grow the Medical business Continued growth in Blanketrol® equipment Blanketrol® ranked* as a top-three brand Strong momentum in International markets 20% Growth in Europe 47% Growth in Middle East and Africa Substantial orders from China and Japan Significant progress on new product development Blanketrol® upgrade kit to more seamlessly connect to hospital electronic medical records (EMR) * Based on Gentherm-commissioned proprietary brand perception survey
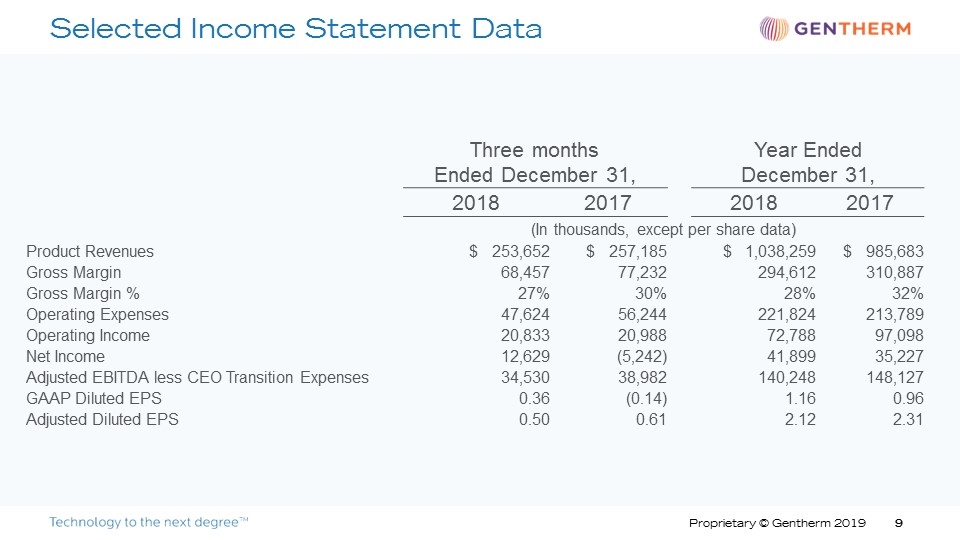
Selected Income Statement Data Three months Ended December 31, Year Ended December 31, 2018 2017 2018 2017 (In thousands, except per share data) Product Revenues $ 253,652 $ 257,185 $ 1,038,259 $ 985,683 Gross Margin 68,457 77,232 294,612 310,887 Gross Margin % 27% 30% 28% 32% Operating Expenses 47,624 56,244 221,824 213,789 Operating Income 20,833 20,988 72,788 97,098 Net Income 12,629 (5,242) 41,899 35,227 Adjusted EBITDA less CEO Transition Expenses 34,530 38,982 140,248 148,127 GAAP Diluted EPS 0.36 (0.14) 1.16 0.96 Adjusted Diluted EPS 0.50 0.61 2.12 2.31
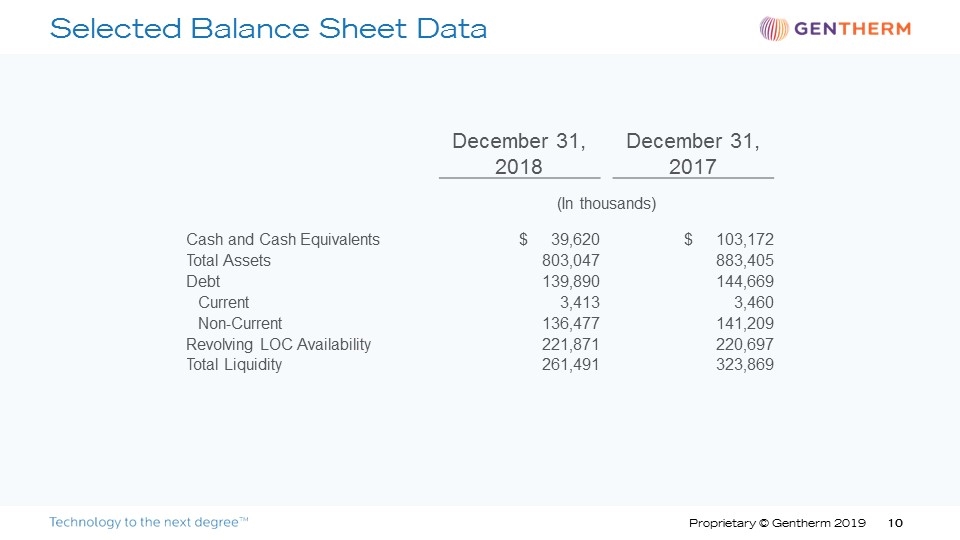
Selected Balance Sheet Data December 31, 2018 December 31, 2017 (In thousands) Cash and Cash Equivalents $ 39,620 $ 103,172 Total Assets 803,047 883,405 Debt 139,890 144,669 Current 3,413 3,460 Non-Current 136,477 141,209 Revolving LOC Availability 221,871 220,697 Total Liquidity 261,491 323,869
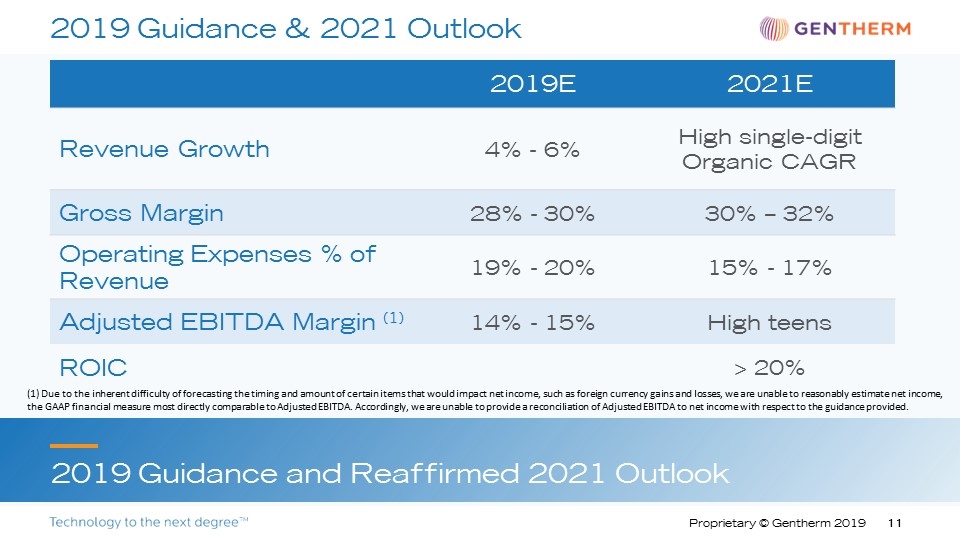
2019 Guidance & 2021 Outlook 2019E 2021E Revenue Growth 4% - 6% High single-digit Organic CAGR Gross Margin 28% - 30% 30% – 32% Operating Expenses % of Revenue 19% - 20% 15% - 17% Adjusted EBITDA Margin (1) 14% - 15% High teens ROIC > 20% 2019 Guidance and Reaffirmed 2021 Outlook (1) Due to the inherent difficulty of forecasting the timing and amount of certain items that would impact net income, such as foreign currency gains and losses, we are unable to reasonably estimate net income, the GAAP financial measure most directly comparable to Adjusted EBITDA. Accordingly, we are unable to provide a reconciliation of Adjusted EBITDA to net income with respect to the guidance provided.

Appendix
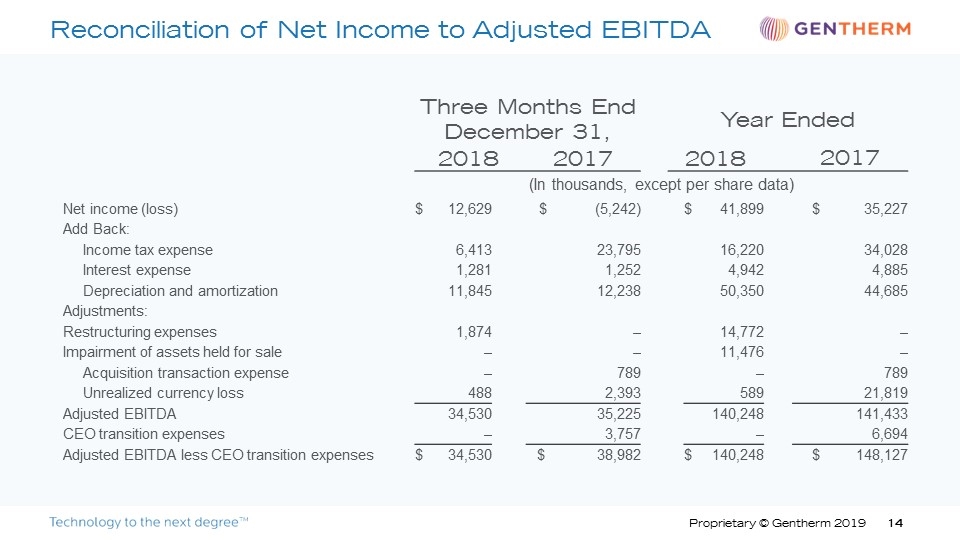
Reconciliation of Net Income to Adjusted EBITDA Three Months Ended December 31, Year Ended December 31, Year Ended December 31, 2018 2017 2017 2018 2018 2017 2017 (In thousands, except per share data) Net income (loss) $ 12,629 $ (5,242) $ 41,899 $ 35,227 Add Back: Income tax expense 6,413 23,795 16,220 34,028 Interest expense 1,281 1,252 4,942 4,885 Depreciation and amortization 11,845 12,238 50,350 44,685 Adjustments: Restructuring expenses 1,874 – 14,772 – Impairment of assets held for sale – – 11,476 – Acquisition transaction expense – 789 – 789 Unrealized currency loss 488 2,393 589 21,819 Adjusted EBITDA 34,530 35,225 140,248 141,433 CEO transition expenses – 3,757 – 6,694 Adjusted EBITDA less CEO transition expenses $ 34,530 $ 38,982 $ 140,248 $ 148,127
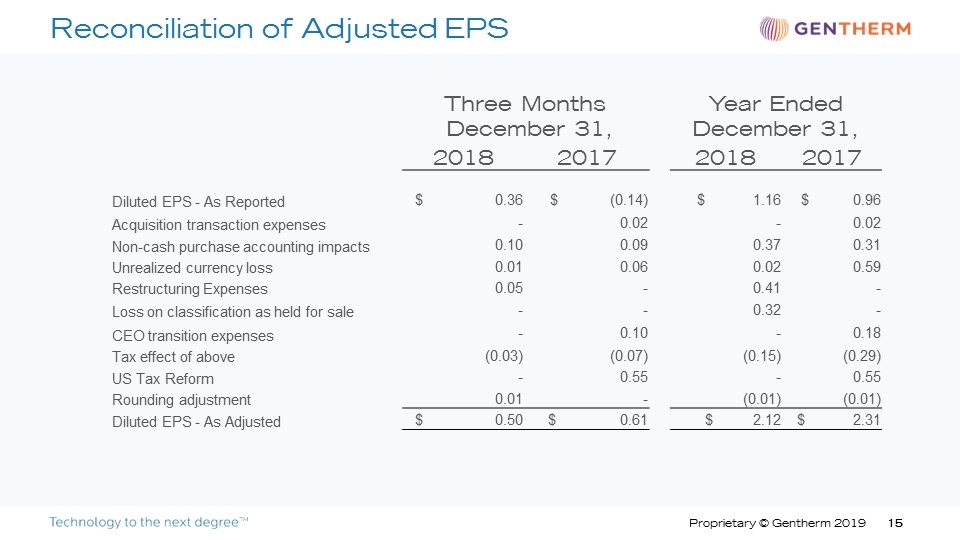
Reconciliation of Adjusted EPS Three Months Ended December 31, Year Ended December 31, 2018 2017 2018 2017 Diluted EPS - As Reported $ 0.36 $ (0.14) $ 1.16 $ 0.96 Acquisition transaction expenses - 0.02 - 0.02 Non-cash purchase accounting impacts 0.10 0.09 0.37 0.31 Unrealized currency loss 0.01 0.06 0.02 0.59 Restructuring Expenses 0.05 - 0.41 - Loss on classification as held for sale - - 0.32 - CEO transition expenses - 0.10 - 0.18 Tax effect of above (0.03) (0.07) (0.15) (0.29) US Tax Reform - 0.55 - 0.55 Rounding adjustment 0.01 - (0.01) (0.01) Diluted EPS - As Adjusted $ 0.50 $ 0.61 $ 2.12 $ 2.31


