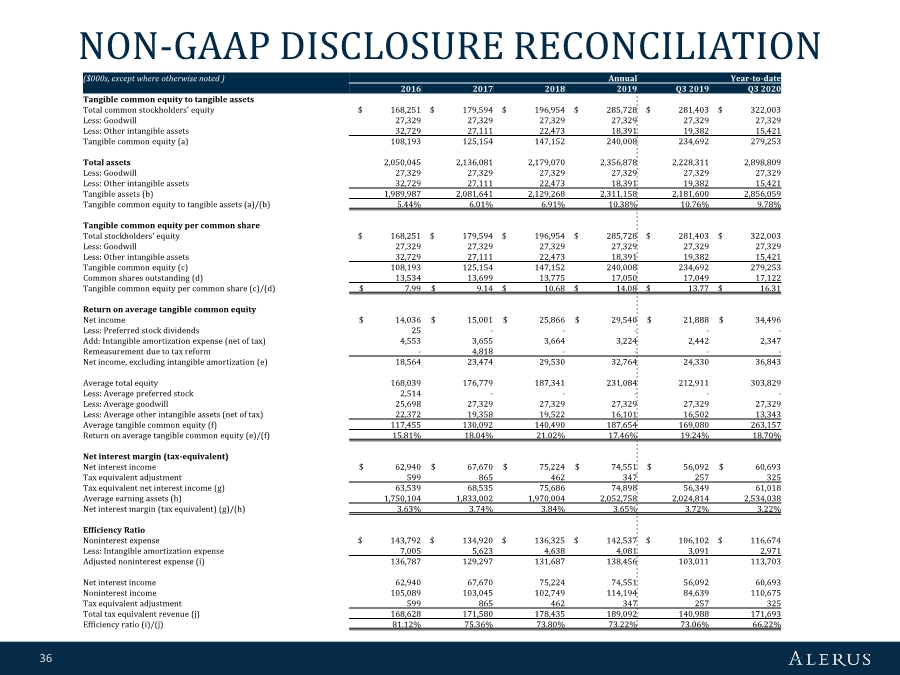
| 36 NON-GAAP DISCLOSURE RECONCILIATION ($000s, except where otherwise noted ) Annual Year-to-date 2016 2017 2018 2019 Q3 2019 Q3 2020 Tangible common equity to tangible assets Total common stockholders' equity $ 168,251 $ 179,594 $ 196,954 $ 285,728 $ 281,403 $ 322,003 Less: Goodwill 27,329 27,329 27,329 27,329 27,329 27,329 Less: Other intangible assets 32,729 27,111 22,473 18,391 19,382 15,421 Tangible common equity (a) 108,193 125,154 147,152 240,008 234,692 279,253 Total assets 2,050,045 2,136,081 2,179,070 2,356,878 2,228,311 2,898,809 Less: Goodwill 27,329 27,329 27,329 27,329 27,329 27,329 Less: Other intangible assets 32,729 27,111 22,473 18,391 19,382 15,421 Tangible assets (b) 1,989,987 2,081,641 2,129,268 2,311,158 2,181,600 2,856,059 Tangible common equity to tangible assets (a)/(b) 5.44% 6.01% 6.91% 10.38% 10.76% 9.78% Tangible common equity per common share Total stockholders' equity $ 168,251 $ 179,594 $ 196,954 $ 285,728 $ 281,403 $ 322,003 Less: Goodwill 27,329 27,329 27,329 27,329 27,329 27,329 Less: Other intangible assets 32,729 27,111 22,473 18,391 19,382 15,421 Tangible common equity (c) 108,193 125,154 147,152 240,008 234,692 279,253 Common shares outstanding (d) 13,534 13,699 13,775 17,050 17,049 17,122 Tangible common equity per common share (c)/(d) $ 7.99 $ 9.14 $ 10.68 $ 14.08 $ 13.77 $ 16.31 Return on average tangible common equity Net income $ 14,036 $ 15,001 $ 25,866 $ 29,540 $ 21,888 $ 34,496 Less: Preferred stock dividends 25 ----- Add: Intangible amortization expense (net of tax) 4,553 3,655 3,664 3,224 2,442 2,347 Remeasurement due to tax reform - 4,818 ---- Net income, excluding intangible amortization (e) 18,564 23,474 29,530 32,764 24,330 36,843 Average total equity 168,039 176,779 187,341 231,084 212,911 303,829 Less: Average preferred stock 2,514 ----- Less: Average goodwill 25,698 27,329 27,329 27,329 27,329 27,329 Less: Average other intangible assets (net of tax) 22,372 19,358 19,522 16,101 16,502 13,343 Average tangible common equity (f) 117,455 130,092 140,490 187,654 169,080 263,157 Return on average tangible common equity (e)/(f) 15.81% 18.04% 21.02% 17.46% 19.24% 18.70% Net interest margin (tax-equivalent) Net interest income $ 62,940 $ 67,670 $ 75,224 $ 74,551 $ 56,092 $ 60,693 Tax equivalent adjustment 599 865 462 347 257 325 Tax equivalent net interest income (g) 63,539 68,535 75,686 74,898 56,349 61,018 Average earning assets (h) 1,750,104 1,833,002 1,970,004 2,052,758 2,024,814 2,534,038 Net interest margin (tax equivalent) (g)/(h) 3.63% 3.74% 3.84% 3.65% 3.72% 3.22% Efficiency Ratio Noninterest expense $ 143,792 $ 134,920 $ 136,325 $ 142,537 $ 106,102 $ 116,674 Less: Intangible amortization expense 7,005 5,623 4,638 4,081 3,091 2,971 Adjusted noninterest expense (i) 136,787 129,297 131,687 138,456 103,011 113,703 Net interest income 62,940 67,670 75,224 74,551 56,092 60,693 Noninterest income 105,089 103,045 102,749 114,194 84,639 110,675 Tax equivalent adjustment 599 865 462 347 257 325 Total tax equivalent revenue (j) 168,628 171,580 178,435 189,092 140,988 171,693 Efficiency ratio (i)/(j) 81.12% 75.36% 73.80% 73.22% 73.06% 66.22% |