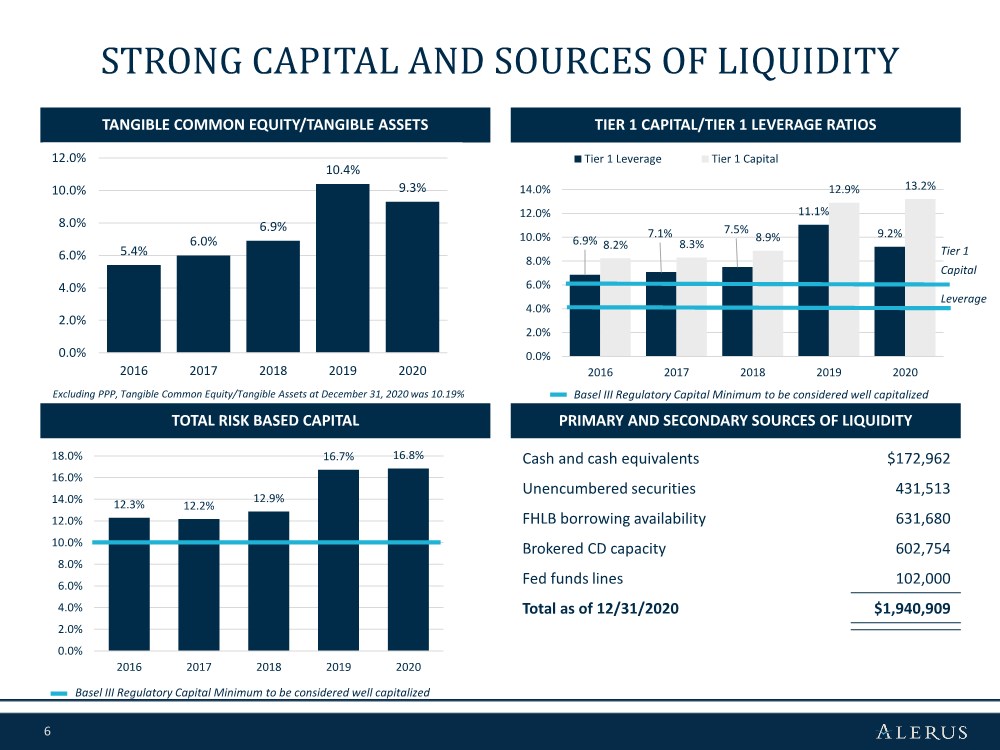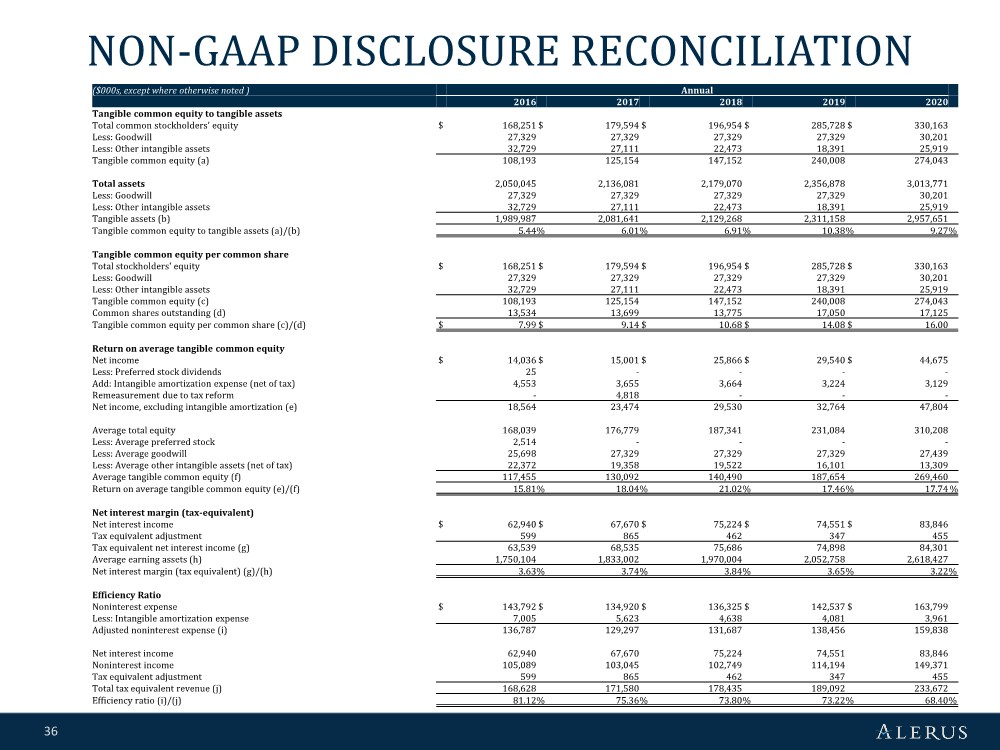
| 36 NON-GAAP DISCLOSURE RECONCILIATION ($000s, except where otherwise noted ) Annual 2016 2017 2018 2019 2020 Tangible common equity to tangible assets Total common stockholders' equity $ 168,251 $ 179,594 $ 196,954 $ 285,728 $ 330,163 Less: Goodwill 27,329 27,329 27,329 27,329 30,201 Less: Other intangible assets 32,729 27,111 22,473 18,391 25,919 Tangible common equity (a) 108,193 125,154 147,152 240,008 274,043 Total assets 2,050,045 2,136,081 2,179,070 2,356,878 3,013,771 Less: Goodwill 27,329 27,329 27,329 27,329 30,201 Less: Other intangible assets 32,729 27,111 22,473 18,391 25,919 Tangible assets (b) 1,989,987 2,081,641 2,129,268 2,311,158 2,957,651 Tangible common equity to tangible assets (a)/(b) 5.44 % 6.01 % 6.91 % 10.38 % 9.27 % Tangible common equity per common share Total stockholders' equity $ 168,251 $ 179,594 $ 196,954 $ 285,728 $ 330,163 Less: Goodwill 27,329 27,329 27,329 27,329 30,201 Less: Other intangible assets 32,729 27,111 22,473 18,391 25,919 Tangible common equity (c) 108,193 125,154 147,152 240,008 274,043 Common shares outstanding (d) 13,534 13,699 13,775 17,050 17,125 Tangible common equity per common share (c)/(d) $ 7.99 $ 9.14 $ 10.68 $ 14.08 $ 16.00 Return on average tangible common equity Net income $ 14,036 $ 15,001 $ 25,866 $ 29,540 $ 44,675 Less: Preferred stock dividends 25 ---- Add: Intangible amortization expense (net of tax) 4,553 3,655 3,664 3,224 3,129 Remeasurement due to tax reform - 4,818 --- Net income, excluding intangible amortization (e) 18,564 23,474 29,530 32,764 47,804 Average total equity 168,039 176,779 187,341 231,084 310,208 Less: Average preferred stock 2,514 ---- Less: Average goodwill 25,698 27,329 27,329 27,329 27,439 Less: Average other intangible assets (net of tax) 22,372 19,358 19,522 16,101 13,309 Average tangible common equity (f) 117,455 130,092 140,490 187,654 269,460 Return on average tangible common equity (e)/(f) 15.81 % 18.04 % 21.02 % 17.46 % 17.74% Net interest margin (tax-equivalent) Net interest income $ 62,940 $ 67,670 $ 75,224 $ 74,551 $ 83,846 Tax equivalent adjustment 599 865 462 347 455 Tax equivalent net interest income (g) 63,539 68,535 75,686 74,898 84,301 Average earning assets (h) 1,750,104 1,833,002 1,970,004 2,052,758 2,618,427 Net interest margin (tax equivalent) (g)/(h) 3.63 % 3.74 % 3.84 % 3.65 % 3.22 % Efficiency Ratio Noninterest expense $ 143,792 $ 134,920 $ 136,325 $ 142,537 $ 163,799 Less: Intangible amortization expense 7,005 5,623 4,638 4,081 3,961 Adjusted noninterest expense (i) 136,787 129,297 131,687 138,456 159,838 Net interest income 62,940 67,670 75,224 74,551 83,846 Noninterest income 105,089 103,045 102,749 114,194 149,371 Tax equivalent adjustment 599 865 462 347 455 Total tax equivalent revenue (j) 168,628 171,580 178,435 189,092 233,672 Efficiency ratio (i)/(j) 81.12 % 75.36 % 73.80 % 73.22 % 68.40 % |