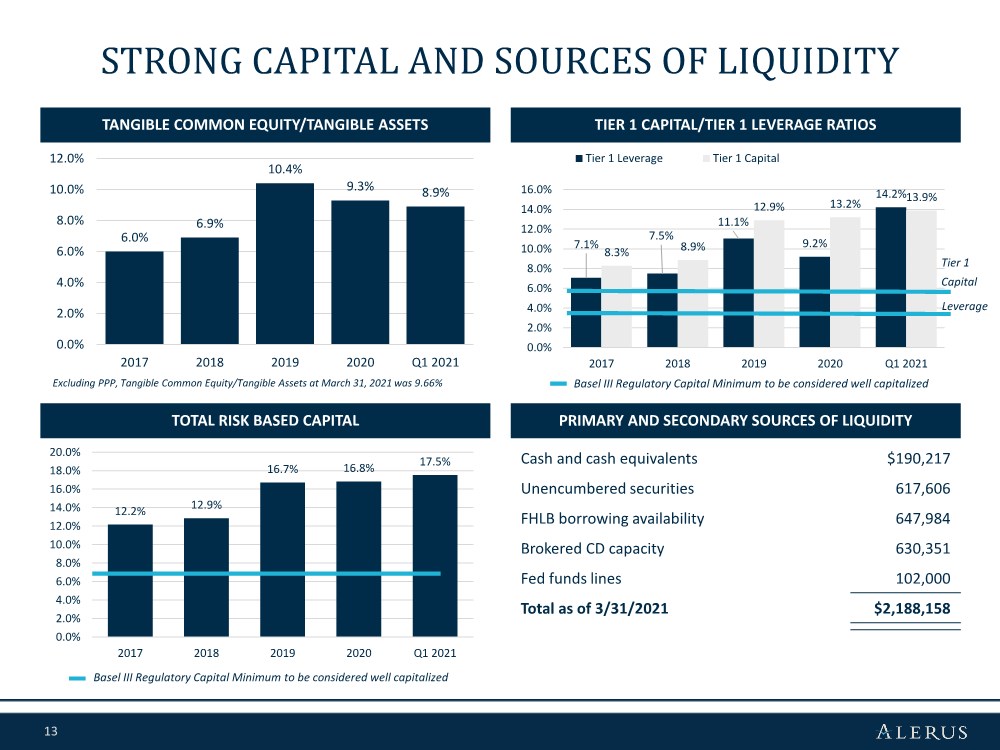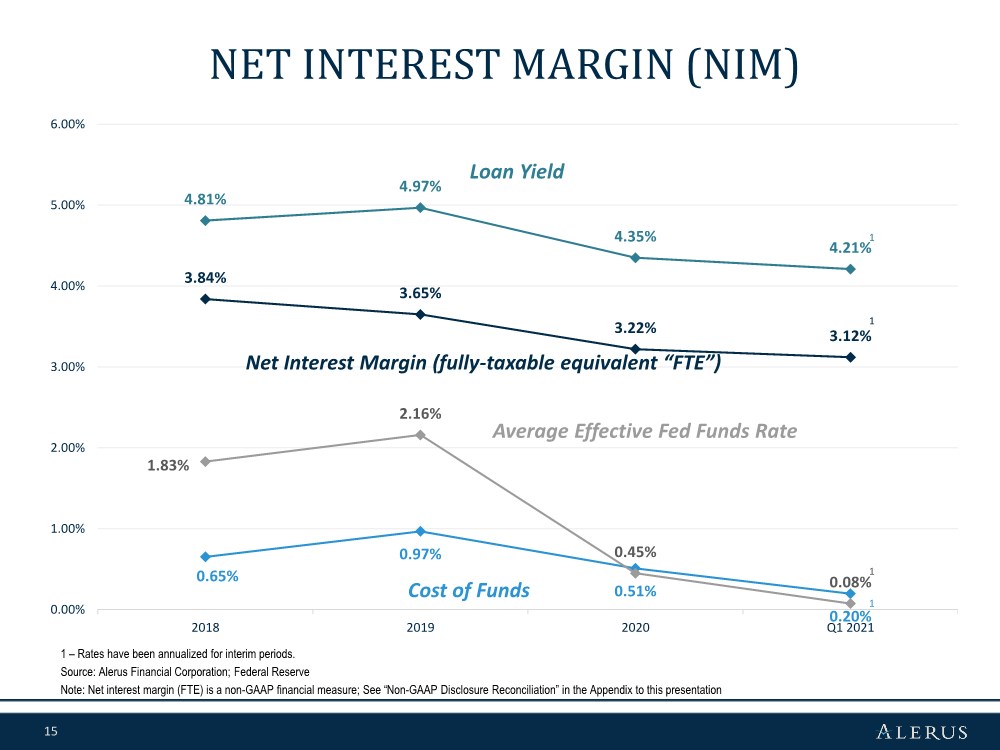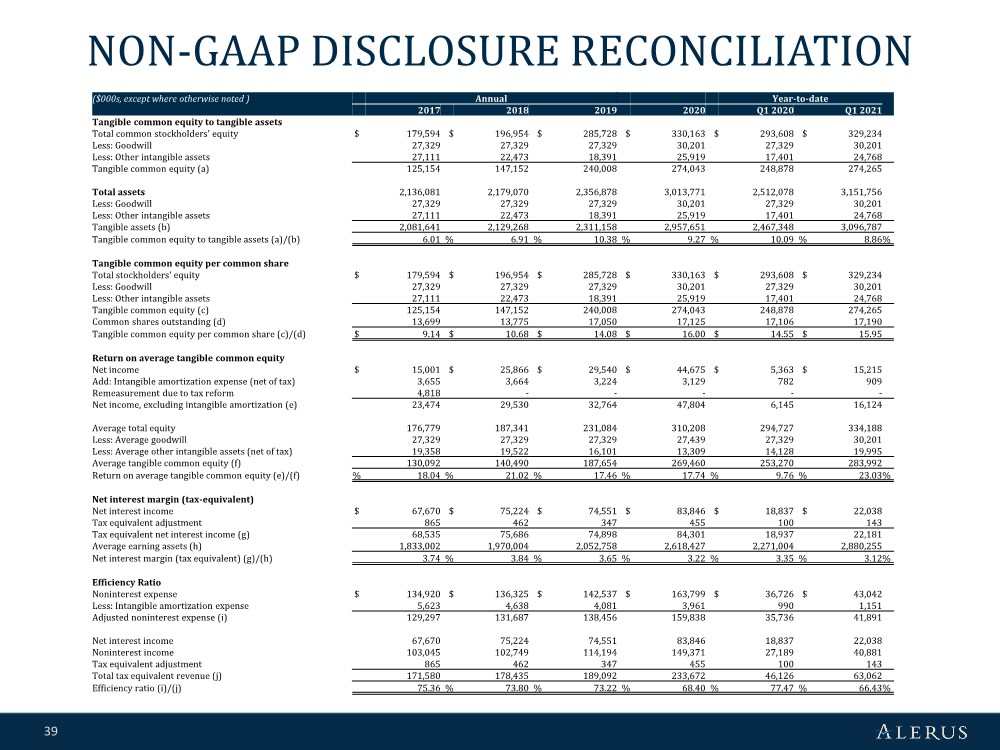
| 39 NON-GAAP DISCLOSURE RECONCILIATION ($000s, except where otherwise noted ) Annual Year-to-date 2017 2018 2019 2020 Q1 2020 Q1 2021 Tangible common equity to tangible assets Total common stockholders' equity $ 179,594 $ 196,954 $ 285,728 $ 330,163 $ 293,608 $ 329,234 Less: Goodwill 27,329 27,329 27,329 30,201 27,329 30,201 Less: Other intangible assets 27,111 22,473 18,391 25,919 17,401 24,768 Tangible common equity (a) 125,154 147,152 240,008 274,043 248,878 274,265 Total assets 2,136,081 2,179,070 2,356,878 3,013,771 2,512,078 3,151,756 Less: Goodwill 27,329 27,329 27,329 30,201 27,329 30,201 Less: Other intangible assets 27,111 22,473 18,391 25,919 17,401 24,768 Tangible assets (b) 2,081,641 2,129,268 2,311,158 2,957,651 2,467,348 3,096,787 Tangible common equity to tangible assets (a)/(b) 6.01 % 6.91 % 10.38 % 9.27 % 10.09 % 8.86 % Tangible common equity per common share Total stockholders' equity $ 179,594 $ 196,954 $ 285,728 $ 330,163 $ 293,608 $ 329,234 Less: Goodwill 27,329 27,329 27,329 30,201 27,329 30,201 Less: Other intangible assets 27,111 22,473 18,391 25,919 17,401 24,768 Tangible common equity (c) 125,154 147,152 240,008 274,043 248,878 274,265 Common shares outstanding (d) 13,699 13,775 17,050 17,125 17,106 17,190 Tangible common equity per common share (c)/(d) $ 9.14 $ 10.68 $ 14.08 $ 16.00 $ 14.55 $ 15.95 Return on average tangible common equity Net income $ 15,001 $ 25,866 $ 29,540 $ 44,675 $ 5,363 $ 15,215 Add: Intangible amortization expense (net of tax) 3,655 3,664 3,224 3,129 782 909 Remeasurement due to tax reform 4,818 ----- Net income, excluding intangible amortization (e) 23,474 29,530 32,764 47,804 6,145 16,124 Average total equity 176,779 187,341 231,084 310,208 294,727 334,188 Less: Average goodwill 27,329 27,329 27,329 27,439 27,329 30,201 Less: Average other intangible assets (net of tax) 19,358 19,522 16,101 13,309 14,128 19,995 Average tangible common equity (f) 130,092 140,490 187,654 269,460 253,270 283,992 Return on average tangible common equity (e)/(f) % 18.04 % 21.02 % 17.46 % 17.74 % 9.76 % 23.03 % Net interest margin (tax-equivalent) Net interest income $ 67,670 $ 75,224 $ 74,551 $ 83,846 $ 18,837 $ 22,038 Tax equivalent adjustment 865 462 347 455 100 143 Tax equivalent net interest income (g) 68,535 75,686 74,898 84,301 18,937 22,181 Average earning assets (h) 1,833,002 1,970,004 2,052,758 2,618,427 2,271,004 2,880,255 Net interest margin (tax equivalent) (g)/(h) 3.74 % 3.84 % 3.65 % 3.22 % 3.35 % 3.12 % Efficiency Ratio Noninterest expense $ 134,920 $ 136,325 $ 142,537 $ 163,799 $ 36,726 $ 43,042 Less: Intangible amortization expense 5,623 4,638 4,081 3,961 990 1,151 Adjusted noninterest expense (i) 129,297 131,687 138,456 159,838 35,736 41,891 Net interest income 67,670 75,224 74,551 83,846 18,837 22,038 Noninterest income 103,045 102,749 114,194 149,371 27,189 40,881 Tax equivalent adjustment 865 462 347 455 100 143 Total tax equivalent revenue (j) 171,580 178,435 189,092 233,672 46,126 63,062 Efficiency ratio (i)/(j) 75.36 % 73.80 % 73.22 % 68.40 % 77.47 % 66.43 % |