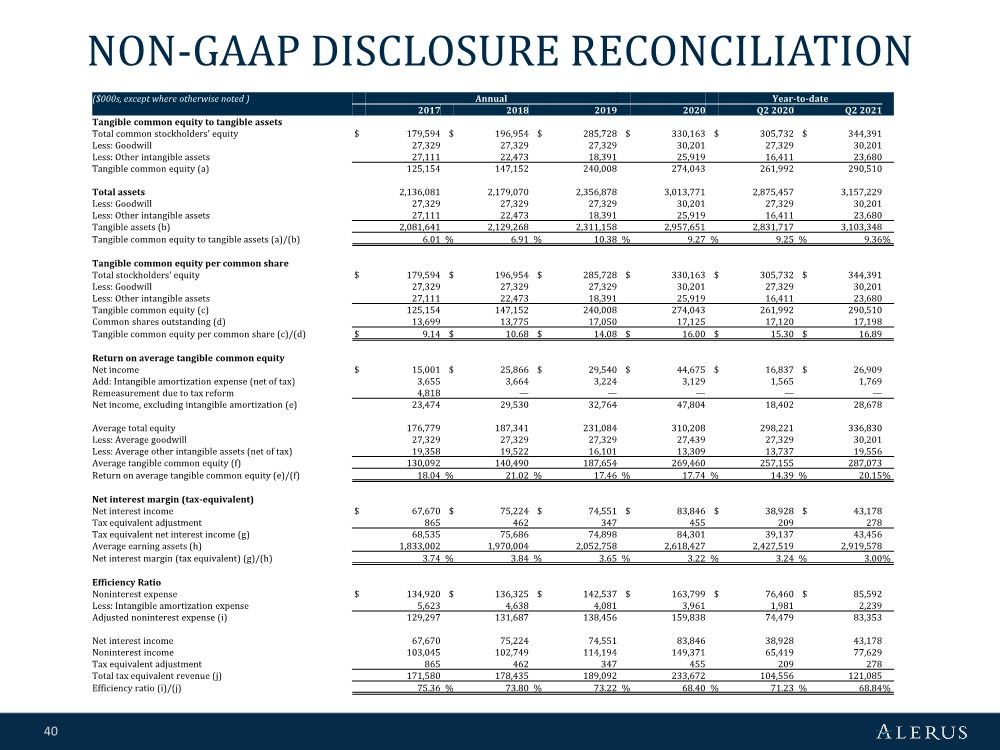
| 40 NON-GAAP DISCLOSURE RECONCILIATION ($000s, except where otherwise noted ) Annual Year-to-date 2017 2018 2019 2020 Q2 2020 Q2 2021 Tangible common equity to tangible assets Total common stockholders' equity $ 179,594 $ 196,954 $ 285,728 $ 330,163 $ 305,732 $ 344,391 Less: Goodwill 27,329 27,329 27,329 30,201 27,329 30,201 Less: Other intangible assets 27,111 22,473 18,391 25,919 16,411 23,680 Tangible common equity (a) 125,154 147,152 240,008 274,043 261,992 290,510 Total assets 2,136,081 2,179,070 2,356,878 3,013,771 2,875,457 3,157,229 Less: Goodwill 27,329 27,329 27,329 30,201 27,329 30,201 Less: Other intangible assets 27,111 22,473 18,391 25,919 16,411 23,680 Tangible assets (b) 2,081,641 2,129,268 2,311,158 2,957,651 2,831,717 3,103,348 Tangible common equity to tangible assets (a)/(b) 6.01 % 6.91 % 10.38 % 9.27 % 9.25 % 9.36 % Tangible common equity per common share Total stockholders' equity $ 179,594 $ 196,954 $ 285,728 $ 330,163 $ 305,732 $ 344,391 Less: Goodwill 27,329 27,329 27,329 30,201 27,329 30,201 Less: Other intangible assets 27,111 22,473 18,391 25,919 16,411 23,680 Tangible common equity (c) 125,154 147,152 240,008 274,043 261,992 290,510 Common shares outstanding (d) 13,699 13,775 17,050 17,125 17,120 17,198 Tangible common equity per common share (c)/(d) $ 9.14 $ 10.68 $ 14.08 $ 16.00 $ 15.30 $ 16.89 Return on average tangible common equity Net income $ 15,001 $ 25,866 $ 29,540 $ 44,675 $ 16,837 $ 26,909 Add: Intangible amortization expense (net of tax) 3,655 3,664 3,224 3,129 1,565 1,769 Remeasurement due to tax reform 4,818 ————— Net income, excluding intangible amortization (e) 23,474 29,530 32,764 47,804 18,402 28,678 Average total equity 176,779 187,341 231,084 310,208 298,221 336,830 Less: Average goodwill 27,329 27,329 27,329 27,439 27,329 30,201 Less: Average other intangible assets (net of tax) 19,358 19,522 16,101 13,309 13,737 19,556 Average tangible common equity (f) 130,092 140,490 187,654 269,460 257,155 287,073 Return on average tangible common equity (e)/(f) 18.04 % 21.02 % 17.46 % 17.74 % 14.39 % 20.15 % Net interest margin (tax-equivalent) Net interest income $ 67,670 $ 75,224 $ 74,551 $ 83,846 $ 38,928 $ 43,178 Tax equivalent adjustment 865 462 347 455 209 278 Tax equivalent net interest income (g) 68,535 75,686 74,898 84,301 39,137 43,456 Average earning assets (h) 1,833,002 1,970,004 2,052,758 2,618,427 2,427,519 2,919,578 Net interest margin (tax equivalent) (g)/(h) 3.74 % 3.84 % 3.65 % 3.22 % 3.24 % 3.00 % Efficiency Ratio Noninterest expense $ 134,920 $ 136,325 $ 142,537 $ 163,799 $ 76,460 $ 85,592 Less: Intangible amortization expense 5,623 4,638 4,081 3,961 1,981 2,239 Adjusted noninterest expense (i) 129,297 131,687 138,456 159,838 74,479 83,353 Net interest income 67,670 75,224 74,551 83,846 38,928 43,178 Noninterest income 103,045 102,749 114,194 149,371 65,419 77,629 Tax equivalent adjustment 865 462 347 455 209 278 Total tax equivalent revenue (j) 171,580 178,435 189,092 233,672 104,556 121,085 Efficiency ratio (i)/(j) 75.36 % 73.80 % 73.22 % 68.40 % 71.23 % 68.84 % |