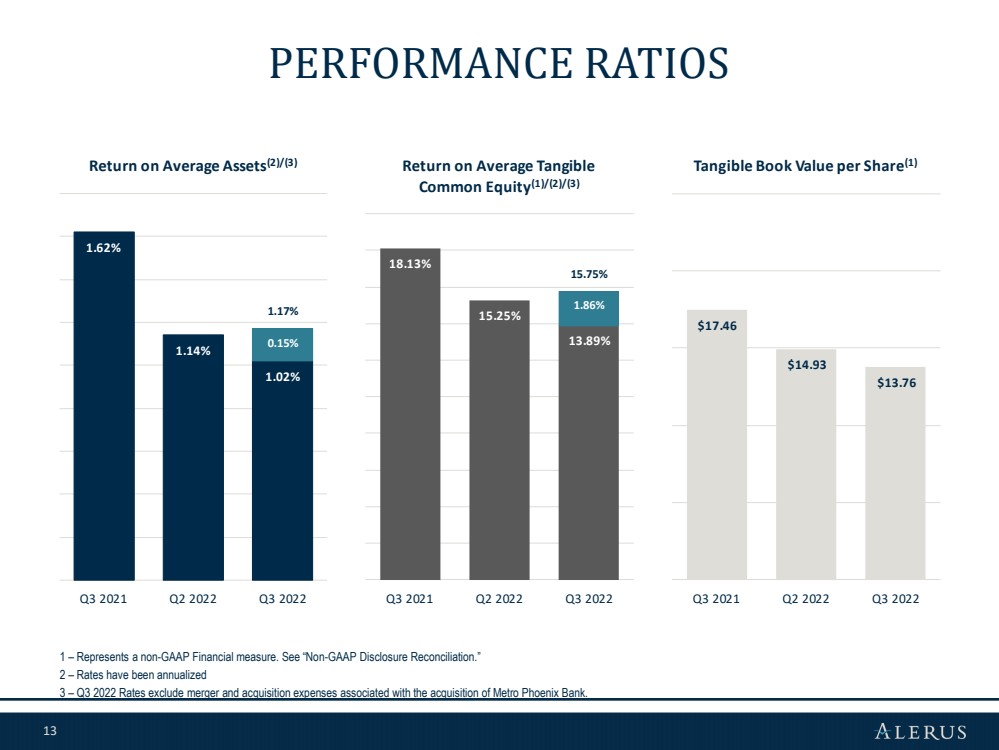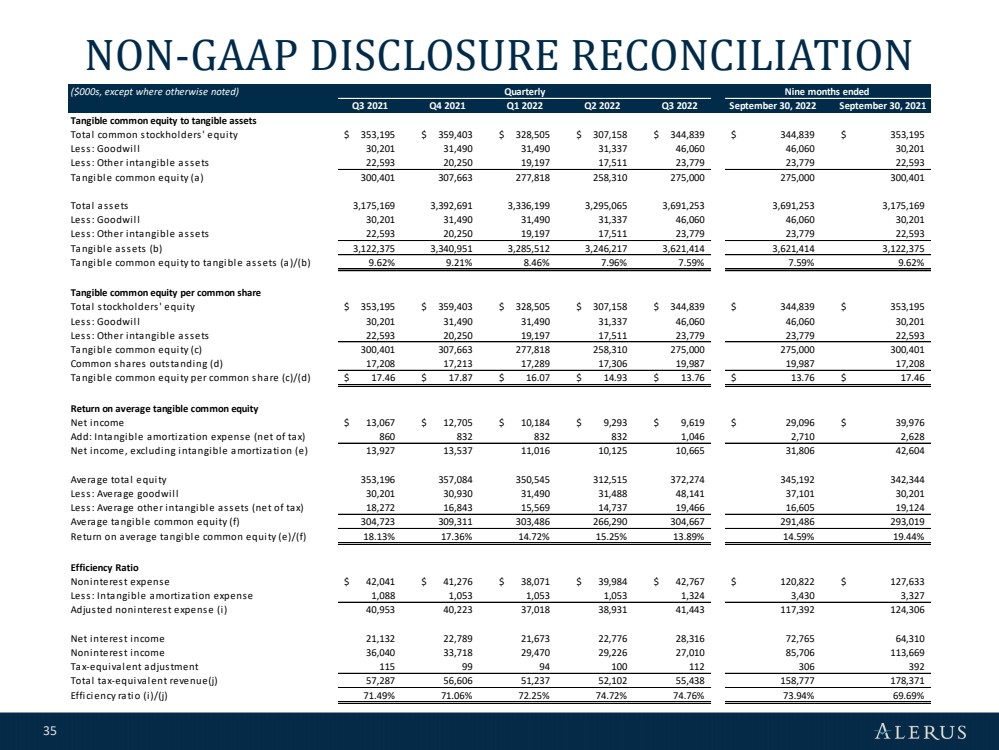
| 35 NON - GAAP DISCLOSURE RECONCILIATION ($000s, except where otherwise noted) Q3 2021 Q4 2021 Q1 2022 Q2 2022 Q3 2022 September 30, 2022 September 30, 2021 Tangible common equity to tangible assets Total common stockholders' equity 353,195 $ 359,403 $ 328,505 $ 307,158 $ 344,839 $ 344,839 $ 353,195 $ Less: Goodwill 30,201 31,490 31,490 31,337 46,060 46,060 30,201 Less: Other intangible assets 22,593 20,250 19,197 17,511 23,779 23,779 22,593 Tangible common equity (a) 300,401 307,663 277,818 258,310 275,000 275,000 300,401 Total assets 3,175,169 3,392,691 3,336,199 3,295,065 3,691,253 3,691,253 3,175,169 Less: Goodwill 30,201 31,490 31,490 31,337 46,060 46,060 30,201 Less: Other intangible assets 22,593 20,250 19,197 17,511 23,779 23,779 22,593 Tangible assets (b) 3,122,375 3,340,951 3,285,512 3,246,217 3,621,414 3,621,414 3,122,375 Tangible common equity to tangible assets (a)/(b) 9.62% 9.21% 8.46% 7.96% 7.59% 7.59% 9.62% Tangible common equity per common share Total stockholders' equity 353,195 $ 359,403 $ 328,505 $ 307,158 $ 344,839 $ 344,839 $ 353,195 $ Less: Goodwill 30,201 31,490 31,490 31,337 46,060 46,060 30,201 Less: Other intangible assets 22,593 20,250 19,197 17,511 23,779 23,779 22,593 Tangible common equity (c) 300,401 307,663 277,818 258,310 275,000 275,000 300,401 Common shares outstanding (d) 17,208 17,213 17,289 17,306 19,987 19,987 17,208 Tangible common equity per common share (c)/(d) 17.46 $ 17.87 $ 16.07 $ 14.93 $ 13.76 $ 13.76 $ 17.46 $ Return on average tangible common equity Net income 13,067 $ 12,705 $ 10,184 $ 9,293 $ 9,619 $ 29,096 $ 39,976 $ Add: Intangible amortization expense (net of tax) 860 832 832 832 1,046 2,710 2,628 Net income, excluding intangible amortization (e) 13,927 13,537 11,016 10,125 10,665 31,806 42,604 Average total equity 353,196 357,084 350,545 312,515 372,274 345,192 342,344 Less: Average goodwill 30,201 30,930 31,490 31,488 48,141 37,101 30,201 Less: Average other intangible assets (net of tax) 18,272 16,843 15,569 14,737 19,466 16,605 19,124 Average tangible common equity (f) 304,723 309,311 303,486 266,290 304,667 291,486 293,019 Return on average tangible common equity (e)/(f) 18.13% 17.36% 14.72% 15.25% 13.89% 14.59% 19.44% Efficiency Ratio Noninterest expense 42,041 $ 41,276 $ 38,071 $ 39,984 $ 42,767 $ 120,822 $ 127,633 $ Less: Intangible amortization expense 1,088 1,053 1,053 1,053 1,324 3,430 3,327 Adjusted noninterest expense (i) 40,953 40,223 37,018 38,931 41,443 117,392 124,306 Net interest income 21,132 22,789 21,673 22,776 28,316 72,765 64,310 Noninterest income 36,040 33,718 29,470 29,226 27,010 85,706 113,669 Tax-equivalent adjustment 115 99 94 100 112 306 392 Total tax-equivalent revenue(j) 57,287 56,606 51,237 52,102 55,438 158,777 178,371 Efficiency ratio (i)/(j) 71.49% 71.06% 72.25% 74.72% 74.76% 73.94% 69.69% Nine months ended Quarterly |