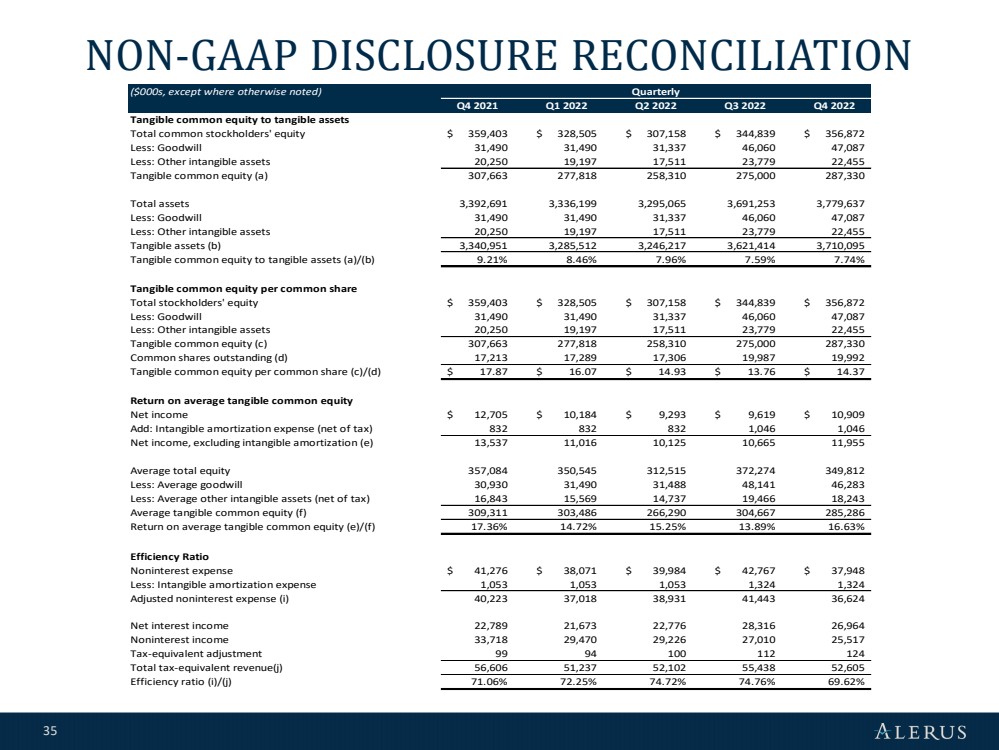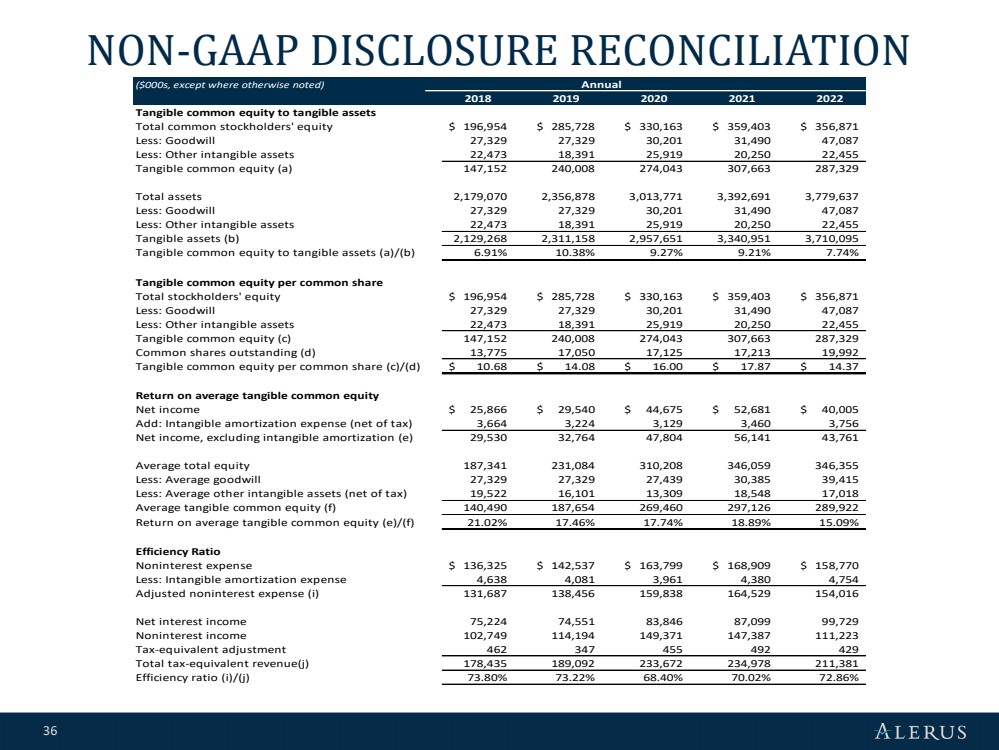
| 36 NON - GAAP DISCLOSURE RECONCILIATION ($000s, except where otherwise noted) 2018 2019 2020 2021 2022 Tangible common equity to tangible assets Total common stockholders' equity 196,954 $ 285,728 $ 330,163 $ 359,403 $ 356,871 $ Less: Goodwill 27,329 27,329 30,201 31,490 47,087 Less: Other intangible assets 22,473 18,391 25,919 20,250 22,455 Tangible common equity (a) 147,152 240,008 274,043 307,663 287,329 Total assets 2,179,070 2,356,878 3,013,771 3,392,691 3,779,637 Less: Goodwill 27,329 27,329 30,201 31,490 47,087 Less: Other intangible assets 22,473 18,391 25,919 20,250 22,455 Tangible assets (b) 2,129,268 2,311,158 2,957,651 3,340,951 3,710,095 Tangible common equity to tangible assets (a)/(b) 6.91% 10.38% 9.27% 9.21% 7.74% Tangible common equity per common share Total stockholders' equity 196,954 $ 285,728 $ 330,163 $ 359,403 $ 356,871 $ Less: Goodwill 27,329 27,329 30,201 31,490 47,087 Less: Other intangible assets 22,473 18,391 25,919 20,250 22,455 Tangible common equity (c) 147,152 240,008 274,043 307,663 287,329 Common shares outstanding (d) 13,775 17,050 17,125 17,213 19,992 Tangible common equity per common share (c)/(d) 10.68 $ 14.08 $ 16.00 $ 17.87 $ 14.37 $ Return on average tangible common equity Net income 25,866 $ 29,540 $ 44,675 $ 52,681 $ 40,005 $ Add: Intangible amortization expense (net of tax) 3,664 3,224 3,129 3,460 3,756 Net income, excluding intangible amortization (e) 29,530 32,764 47,804 56,141 43,761 Average total equity 187,341 231,084 310,208 346,059 346,355 Less: Average goodwill 27,329 27,329 27,439 30,385 39,415 Less: Average other intangible assets (net of tax) 19,522 16,101 13,309 18,548 17,018 Average tangible common equity (f) 140,490 187,654 269,460 297,126 289,922 Return on average tangible common equity (e)/(f) 21.02% 17.46% 17.74% 18.89% 15.09% Efficiency Ratio Noninterest expense 136,325 $ 142,537 $ 163,799 $ 168,909 $ 158,770 $ Less: Intangible amortization expense 4,638 4,081 3,961 4,380 4,754 Adjusted noninterest expense (i) 131,687 138,456 159,838 164,529 154,016 Net interest income 75,224 74,551 83,846 87,099 99,729 Noninterest income 102,749 114,194 149,371 147,387 111,223 Tax-equivalent adjustment 462 347 455 492 429 Total tax-equivalent revenue(j) 178,435 189,092 233,672 234,978 211,381 Efficiency ratio (i)/(j) 73.80% 73.22% 68.40% 70.02% 72.86% Annual |