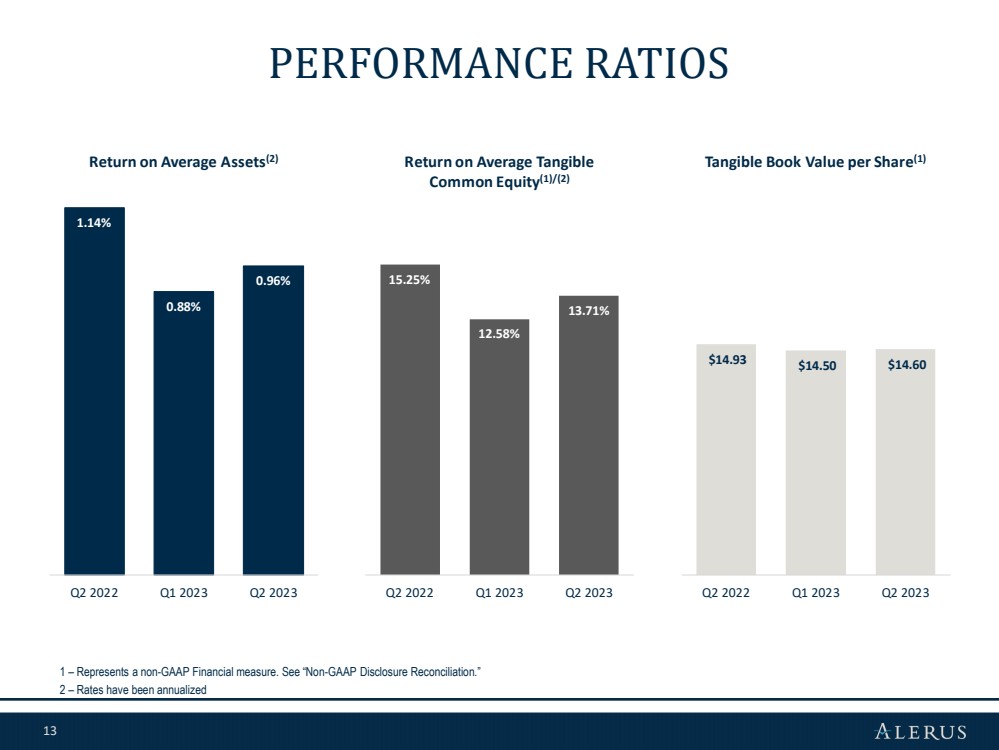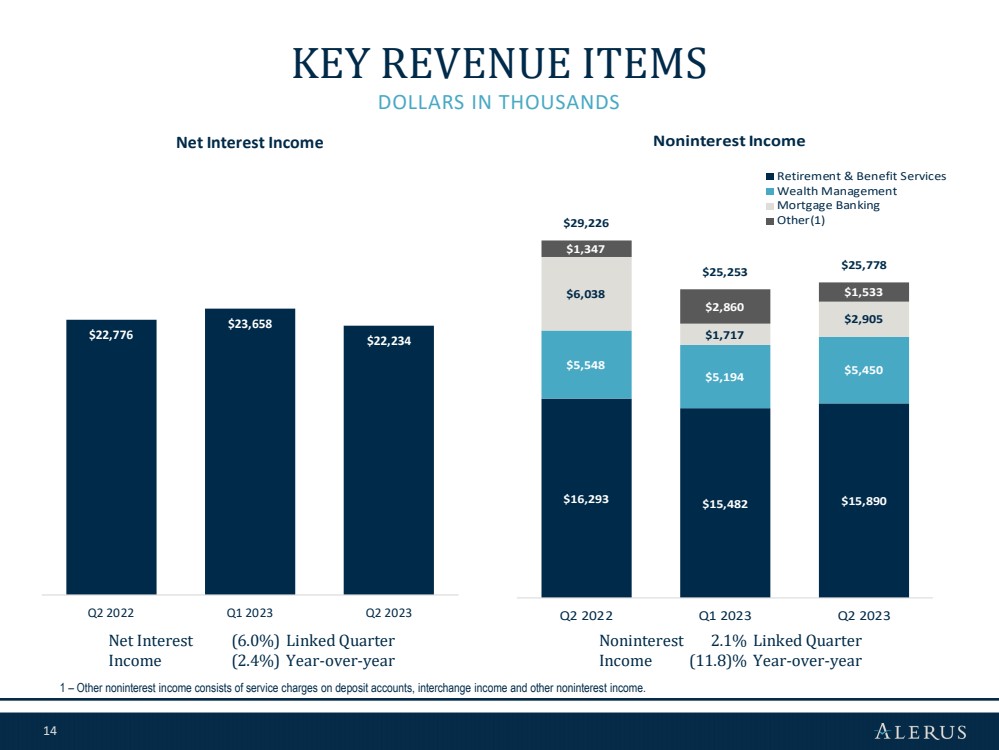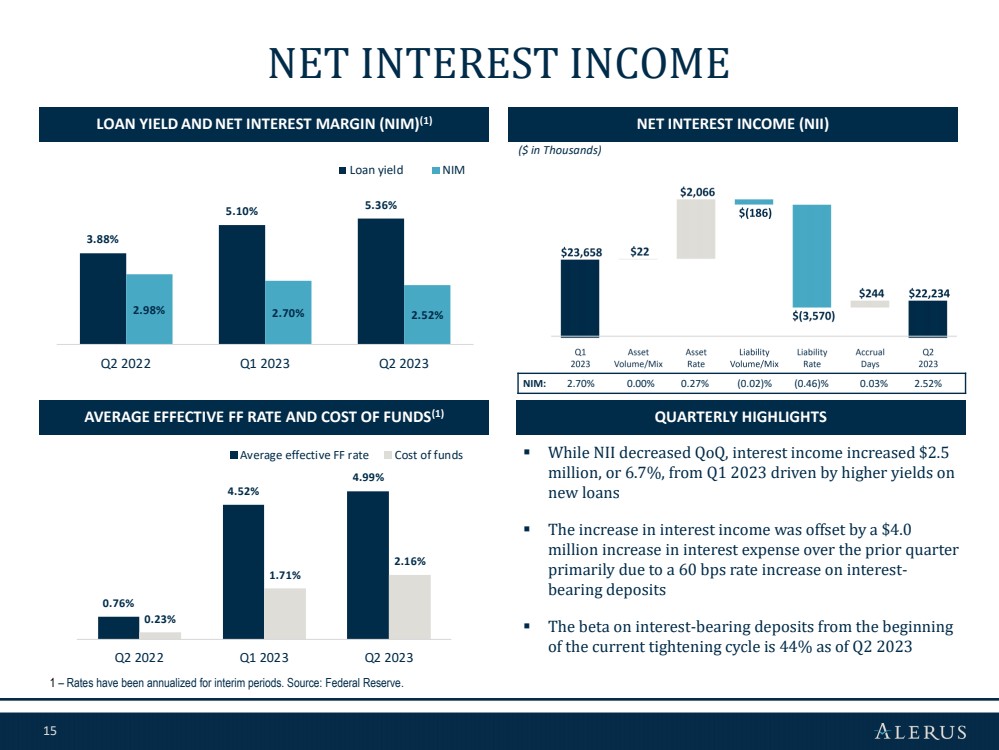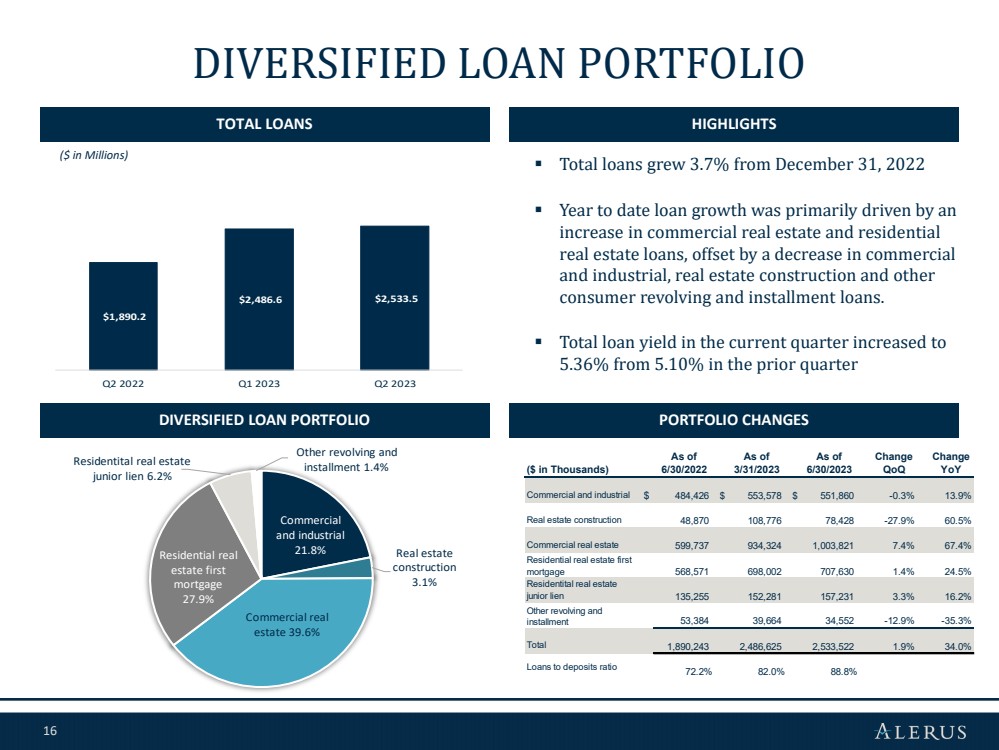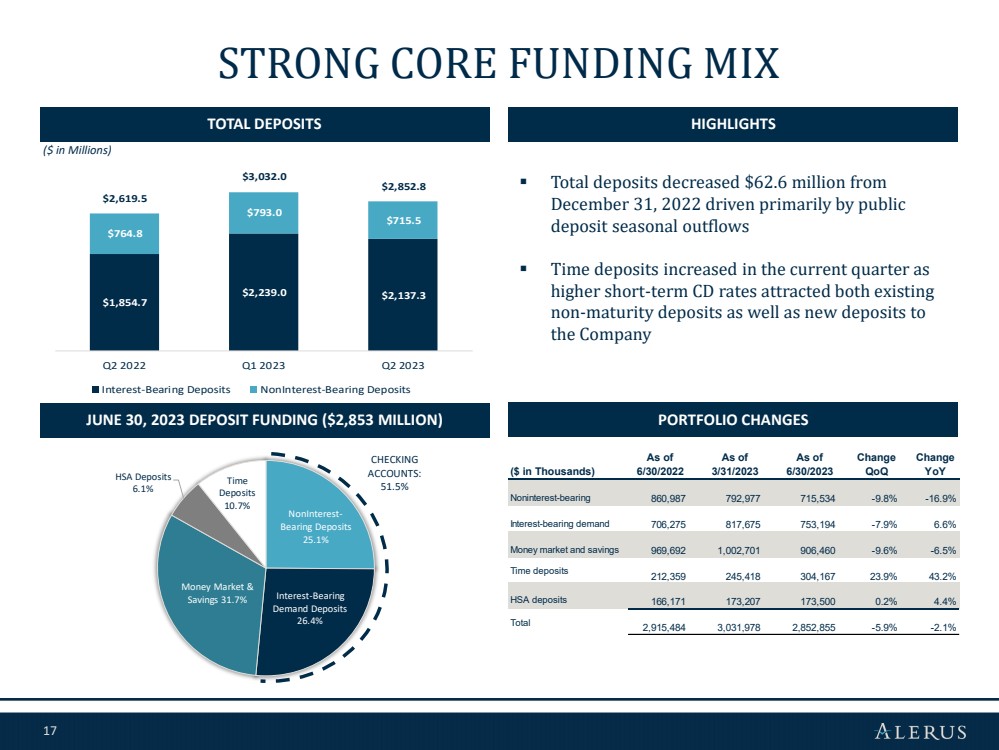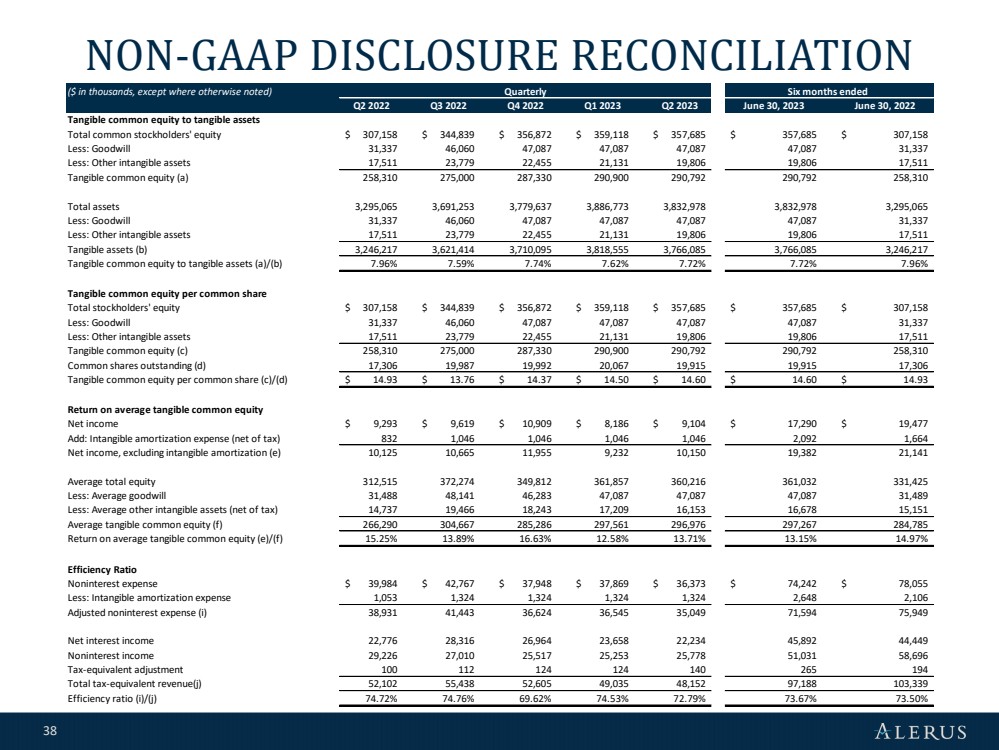
| 38 NON-GAAP DISCLOSURE RECONCILIATION ($ in thousands, except where otherwise noted) Q2 2022 Q3 2022 Q4 2022 Q1 2023 Q2 2023 June 30, 2023 June 30, 2022 Tangible common equity to tangible assets Total common stockholders' equity $ 307,158 $ 344,839 $ 356,872 $ 359,118 $ 357,685 $ 357,685 $ 307,158 Less: Goodwill 31,337 46,060 47,087 47,087 47,087 47,087 31,337 Less: Other intangible assets 17,511 23,779 22,455 21,131 19,806 19,806 17,511 Tangible common equity (a) 258,310 275,000 287,330 290,900 290,792 290,792 258,310 Total assets 3,295,065 3,691,253 3,779,637 3,886,773 3,832,978 3,832,978 3,295,065 Less: Goodwill 31,337 46,060 47,087 47,087 47,087 47,087 31,337 Less: Other intangible assets 17,511 23,779 22,455 21,131 19,806 19,806 17,511 Tangible assets (b) 3,246,217 3,621,414 3,710,095 3,818,555 3,766,085 3,766,085 3,246,217 Tangible common equity to tangible assets (a)/(b) 7.96% 7.59% 7.74% 7.62% 7.72% 7.72% 7.96% Tangible common equity per common share Total stockholders' equity $ 307,158 $ 344,839 $ 356,872 $ 359,118 $ 357,685 $ 357,685 $ 307,158 Less: Goodwill 31,337 46,060 47,087 47,087 47,087 47,087 31,337 Less: Other intangible assets 17,511 23,779 22,455 21,131 19,806 19,806 17,511 Tangible common equity (c) 258,310 275,000 287,330 290,900 290,792 290,792 258,310 Common shares outstanding (d) 17,306 19,987 19,992 20,067 19,915 19,915 17,306 Tangible common equity per common share (c)/(d) $ 14.93 $ 13.76 $ 14.37 $ 14.50 $ 14.60 $ 14.60 $ 14.93 Return on average tangible common equity Net income $ 9,293 $ 9,619 $ 10,909 $ 8,186 $ 9,104 $ 17,290 $ 19,477 Add: Intangible amortization expense (net of tax) 832 1,046 1,046 1,046 1,046 2,092 1,664 Net income, excluding intangible amortization (e) 10,125 10,665 11,955 9,232 10,150 19,382 21,141 Average total equity 312,515 372,274 349,812 361,857 360,216 361,032 331,425 Less: Average goodwill 31,488 48,141 46,283 47,087 47,087 47,087 31,489 Less: Average other intangible assets (net of tax) 14,737 19,466 18,243 17,209 16,153 16,678 15,151 Average tangible common equity (f) 266,290 304,667 285,286 297,561 296,976 297,267 284,785 Return on average tangible common equity (e)/(f) 15.25% 13.89% 16.63% 12.58% 13.71% 13.15% 14.97% Efficiency Ratio Noninterest expense $ 39,984 $ 42,767 $ 37,948 $ 37,869 $ 36,373 $ 74,242 $ 78,055 Less: Intangible amortization expense 1,053 1,324 1,324 1,324 1,324 2,648 2,106 Adjusted noninterest expense (i) 38,931 41,443 36,624 36,545 35,049 71,594 75,949 Net interest income 22,776 28,316 26,964 23,658 22,234 45,892 44,449 Noninterest income 29,226 27,010 25,517 25,253 25,778 51,031 58,696 Tax-equivalent adjustment 100 112 124 124 140 265 194 Total tax-equivalent revenue(j) 52,102 55,438 52,605 49,035 48,152 97,188 103,339 Efficiency ratio (i)/(j) 74.72% 74.76% 69.62% 74.53% 72.79% 73.67% 73.50% Quarterly Six months ended |