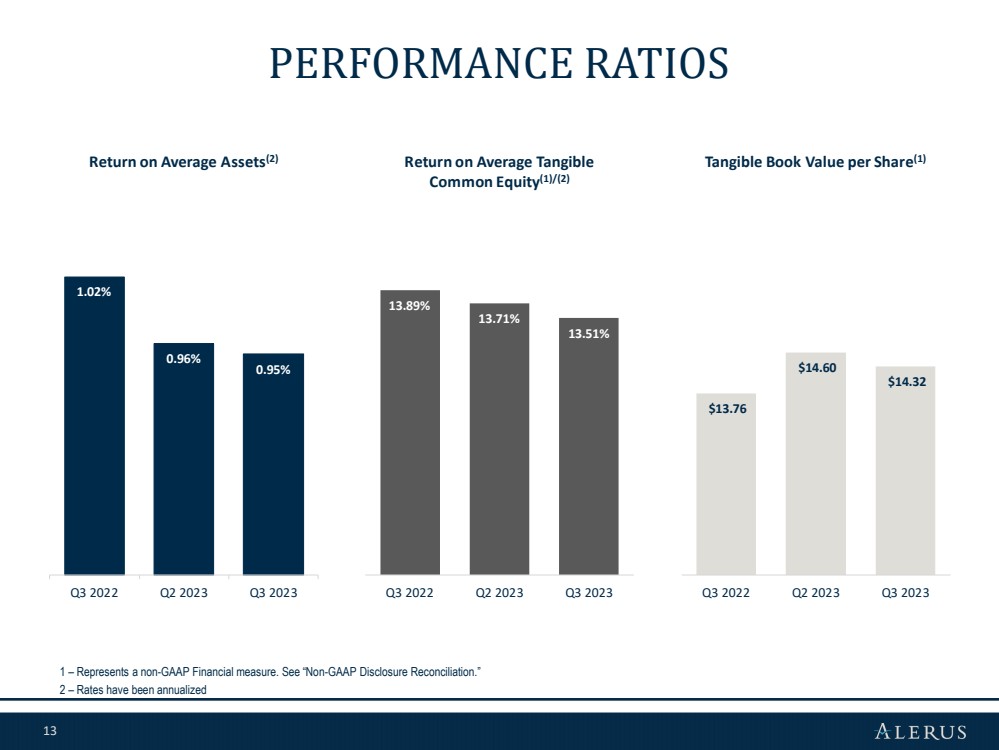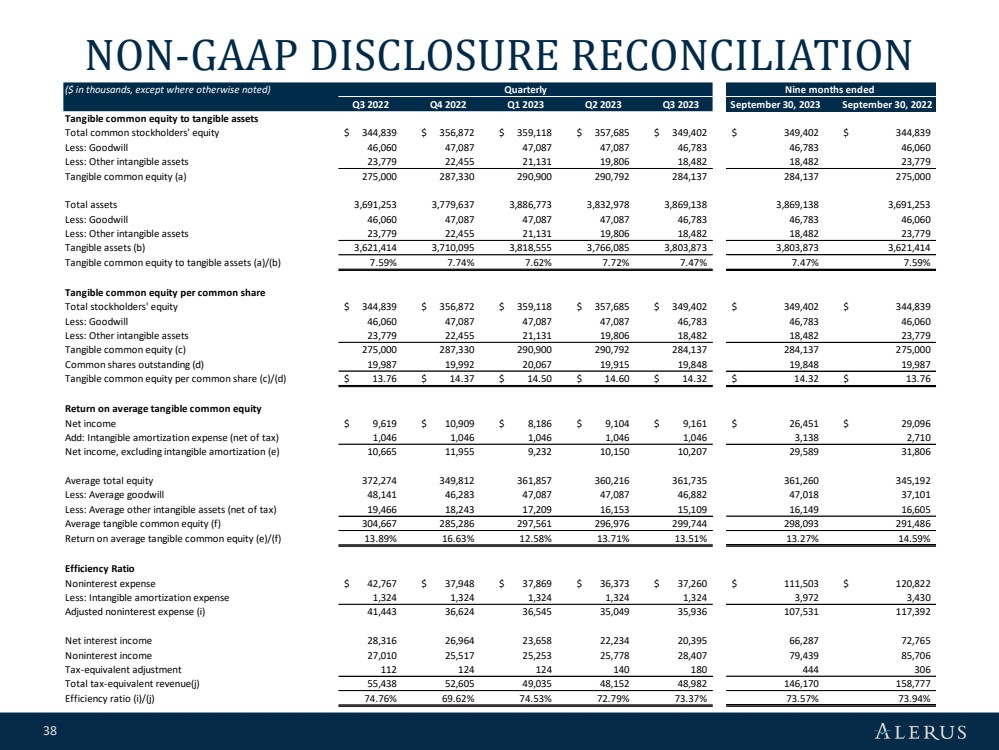
| 38 NON-GAAP DISCLOSURE RECONCILIATION ($ in thousands, except where otherwise noted) Q3 2022 Q4 2022 Q1 2023 Q2 2023 Q3 2023 September 30, 2023 September 30, 2022 Tangible common equity to tangible assets Total common stockholders' equity $ 344,839 $ 356,872 $ 359,118 $ 357,685 $ 349,402 $ 349,402 $ 344,839 Less: Goodwill 46,060 47,087 47,087 47,087 46,783 46,783 46,060 Less: Other intangible assets 23,779 22,455 21,131 19,806 18,482 18,482 23,779 Tangible common equity (a) 275,000 287,330 290,900 290,792 284,137 284,137 275,000 Total assets 3,691,253 3,779,637 3,886,773 3,832,978 3,869,138 3,869,138 3,691,253 Less: Goodwill 46,060 47,087 47,087 47,087 46,783 46,783 46,060 Less: Other intangible assets 23,779 22,455 21,131 19,806 18,482 18,482 23,779 Tangible assets (b) 3,621,414 3,710,095 3,818,555 3,766,085 3,803,873 3,803,873 3,621,414 Tangible common equity to tangible assets (a)/(b) 7.59% 7.74% 7.62% 7.72% 7.47% 7.47% 7.59% Tangible common equity per common share Total stockholders' equity $ 344,839 $ 356,872 $ 359,118 $ 357,685 $ 349,402 $ 349,402 $ 344,839 Less: Goodwill 46,060 47,087 47,087 47,087 46,783 46,783 46,060 Less: Other intangible assets 23,779 22,455 21,131 19,806 18,482 18,482 23,779 Tangible common equity (c) 275,000 287,330 290,900 290,792 284,137 284,137 275,000 Common shares outstanding (d) 19,987 19,992 20,067 19,915 19,848 19,848 19,987 Tangible common equity per common share (c)/(d) $ 13.76 $ 14.37 $ 14.50 $ 14.60 $ 14.32 $ 14.32 $ 13.76 Return on average tangible common equity Net income $ 9,619 $ 10,909 $ 8,186 $ 9,104 $ 9,161 $ 26,451 $ 29,096 Add: Intangible amortization expense (net of tax) 1,046 1,046 1,046 1,046 1,046 3,138 2,710 Net income, excluding intangible amortization (e) 10,665 11,955 9,232 10,150 10,207 29,589 31,806 Average total equity 372,274 349,812 361,857 360,216 361,735 361,260 345,192 Less: Average goodwill 48,141 46,283 47,087 47,087 46,882 47,018 37,101 Less: Average other intangible assets (net of tax) 19,466 18,243 17,209 16,153 15,109 16,149 16,605 Average tangible common equity (f) 304,667 285,286 297,561 296,976 299,744 298,093 291,486 Return on average tangible common equity (e)/(f) 13.89% 16.63% 12.58% 13.71% 13.51% 13.27% 14.59% Efficiency Ratio Noninterest expense $ 42,767 $ 37,948 $ 37,869 $ 36,373 $ 37,260 $ 111,503 $ 120,822 Less: Intangible amortization expense 1,324 1,324 1,324 1,324 1,324 3,972 3,430 Adjusted noninterest expense (i) 41,443 36,624 36,545 35,049 35,936 107,531 117,392 Net interest income 28,316 26,964 23,658 22,234 20,395 66,287 72,765 Noninterest income 27,010 25,517 25,253 25,778 28,407 79,439 85,706 Tax-equivalent adjustment 112 124 124 140 180 444 306 Total tax-equivalent revenue(j) 55,438 52,605 49,035 48,152 48,982 146,170 158,777 Efficiency ratio (i)/(j) 74.76% 69.62% 74.53% 72.79% 73.37% 73.57% 73.94% Quarterly Nine months ended |