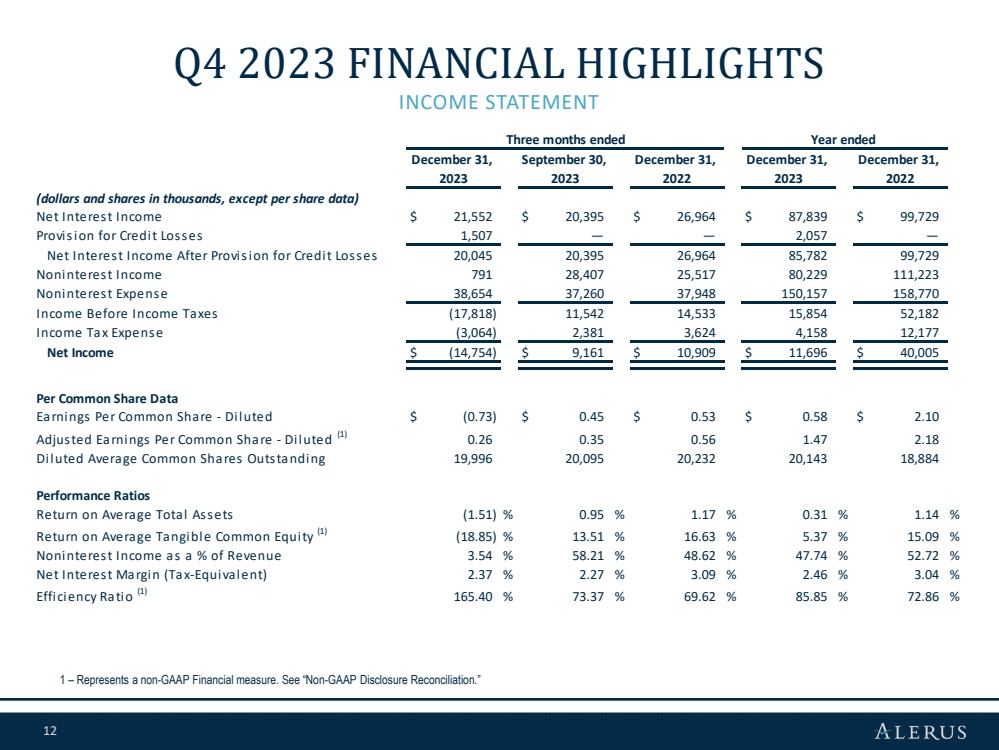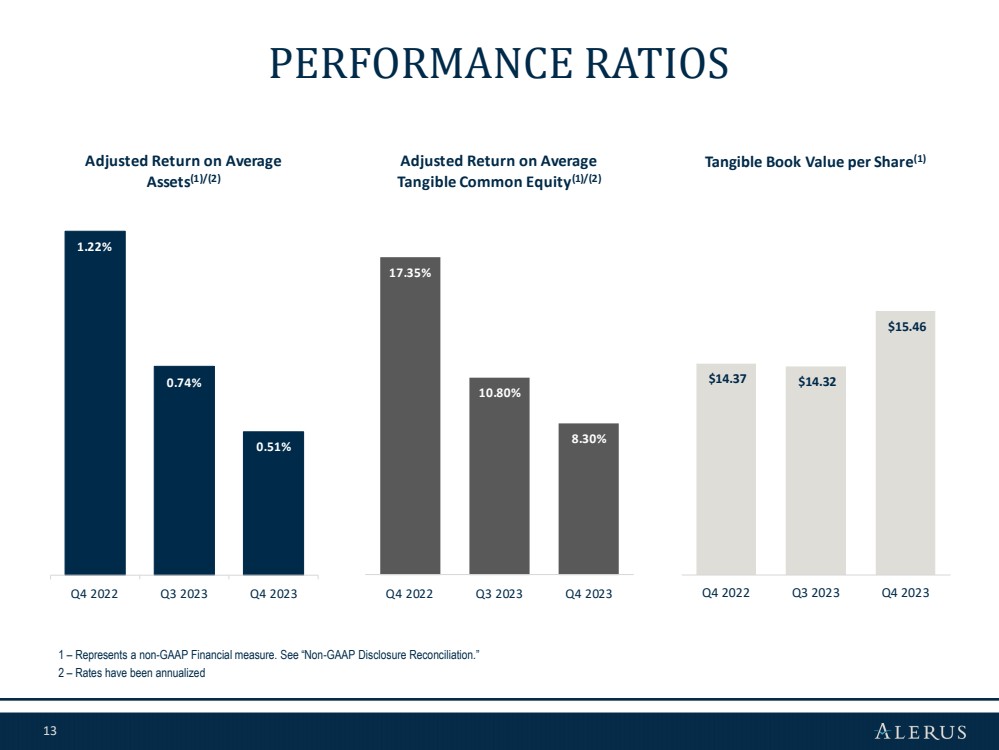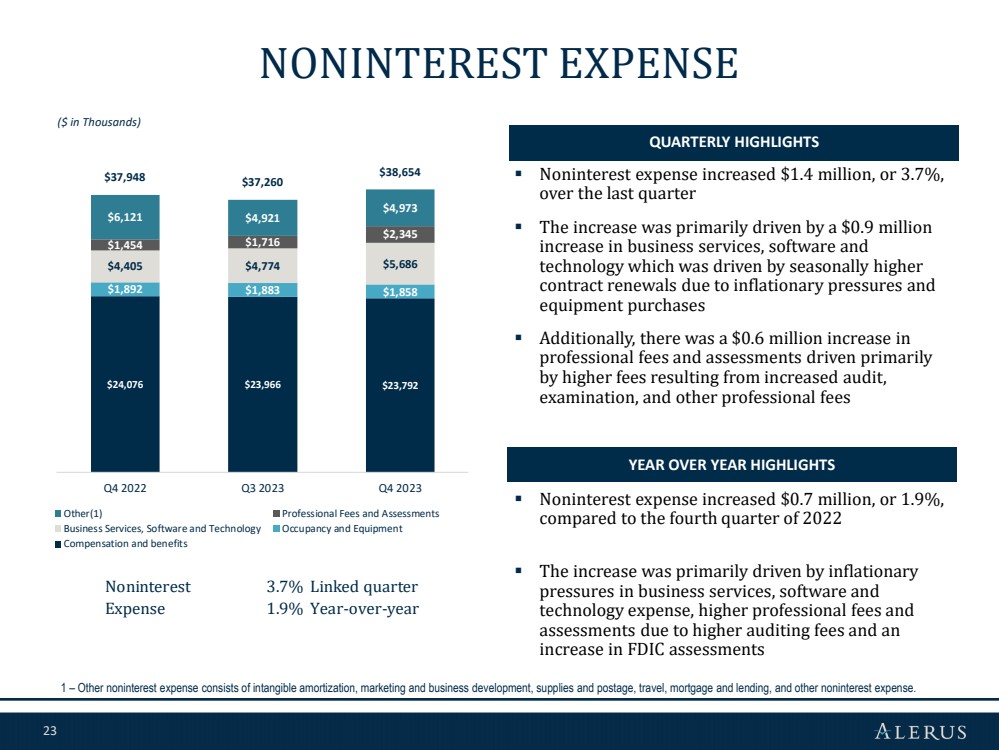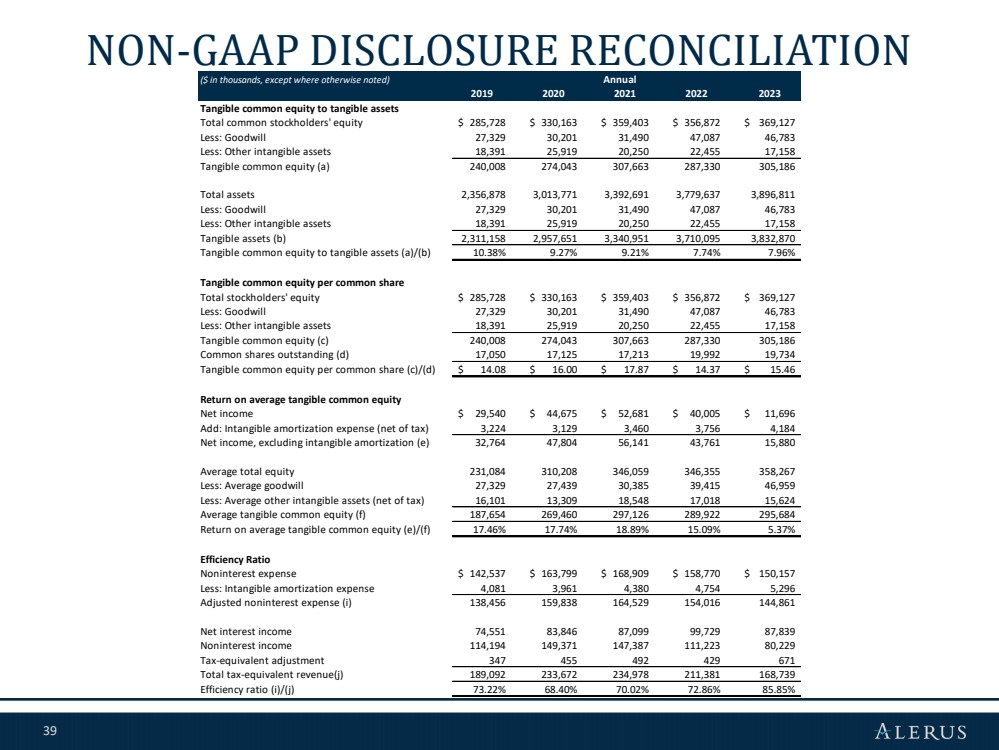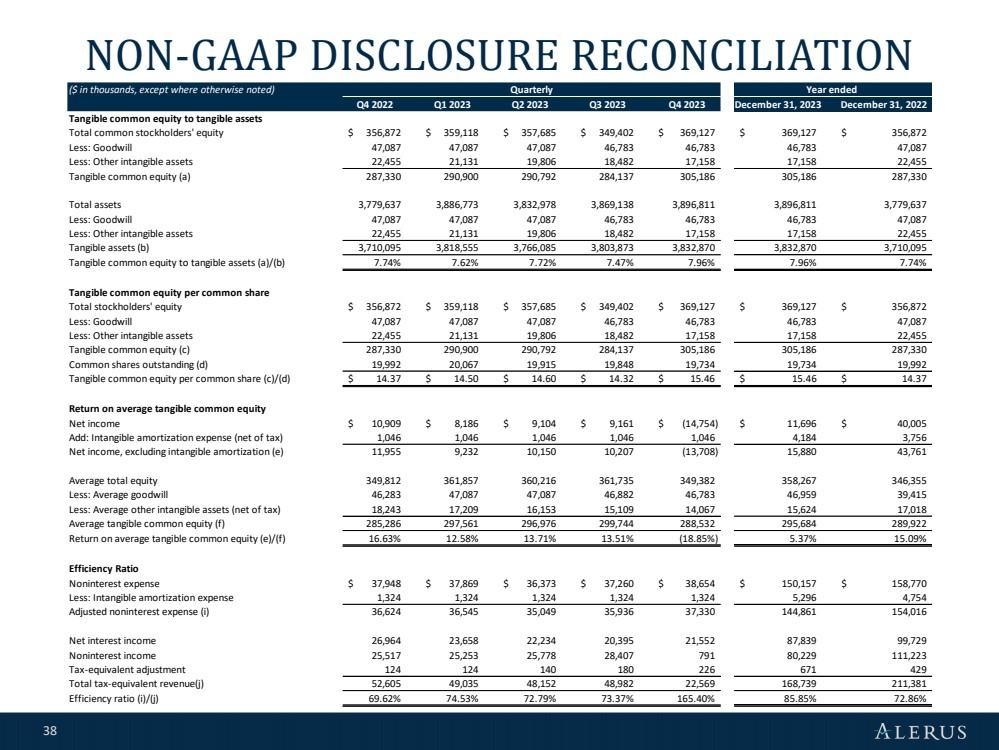
| 38 NON-GAAP DISCLOSURE RECONCILIATION ($ in thousands, except where otherwise noted) Q4 2022 Q1 2023 Q2 2023 Q3 2023 Q4 2023 December 31, 2023 December 31, 2022 Tangible common equity to tangible assets Total common stockholders' equity $ 356,872 $ 359,118 $ 357,685 $ 349,402 $ 369,127 $ 369,127 $ 356,872 Less: Goodwill 47,087 47,087 47,087 46,783 46,783 46,783 47,087 Less: Other intangible assets 22,455 21,131 19,806 18,482 17,158 17,158 22,455 Tangible common equity (a) 287,330 290,900 290,792 284,137 305,186 305,186 287,330 Total assets 3,779,637 3,886,773 3,832,978 3,869,138 3,896,811 3,896,811 3,779,637 Less: Goodwill 47,087 47,087 47,087 46,783 46,783 46,783 47,087 Less: Other intangible assets 22,455 21,131 19,806 18,482 17,158 17,158 22,455 Tangible assets (b) 3,710,095 3,818,555 3,766,085 3,803,873 3,832,870 3,832,870 3,710,095 Tangible common equity to tangible assets (a)/(b) 7.74% 7.62% 7.72% 7.47% 7.96% 7.96% 7.74% Tangible common equity per common share Total stockholders' equity $ 356,872 $ 359,118 $ 357,685 $ 349,402 $ 369,127 $ 369,127 $ 356,872 Less: Goodwill 47,087 47,087 47,087 46,783 46,783 46,783 47,087 Less: Other intangible assets 22,455 21,131 19,806 18,482 17,158 17,158 22,455 Tangible common equity (c) 287,330 290,900 290,792 284,137 305,186 305,186 287,330 Common shares outstanding (d) 19,992 20,067 19,915 19,848 19,734 19,734 19,992 Tangible common equity per common share (c)/(d) $ 14.37 $ 14.50 $ 14.60 $ 14.32 $ 15.46 $ 15.46 $ 14.37 Return on average tangible common equity Net income $ 10,909 $ 8,186 $ 9,104 $ 9,161 $ (14,754) $ 11,696 $ 40,005 Add: Intangible amortization expense (net of tax) 1,046 1,046 1,046 1,046 1,046 4,184 3,756 Net income, excluding intangible amortization (e) 11,955 9,232 10,150 10,207 (13,708) 15,880 43,761 Average total equity 349,812 361,857 360,216 361,735 349,382 358,267 346,355 Less: Average goodwill 46,283 47,087 47,087 46,882 46,783 46,959 39,415 Less: Average other intangible assets (net of tax) 18,243 17,209 16,153 15,109 14,067 15,624 17,018 Average tangible common equity (f) 285,286 297,561 296,976 299,744 288,532 295,684 289,922 Return on average tangible common equity (e)/(f) 16.63% 12.58% 13.71% 13.51% (18.85%) 5.37% 15.09% Efficiency Ratio Noninterest expense $ 37,948 $ 37,869 $ 36,373 $ 37,260 $ 38,654 $ 150,157 $ 158,770 Less: Intangible amortization expense 1,324 1,324 1,324 1,324 1,324 5,296 4,754 Adjusted noninterest expense (i) 36,624 36,545 35,049 35,936 37,330 144,861 154,016 Net interest income 26,964 23,658 22,234 20,395 21,552 87,839 99,729 Noninterest income 25,517 25,253 25,778 28,407 791 80,229 111,223 Tax-equivalent adjustment 124 124 140 180 226 671 429 Total tax-equivalent revenue(j) 52,605 49,035 48,152 48,982 22,569 168,739 211,381 Efficiency ratio (i)/(j) 69.62% 74.53% 72.79% 73.37% 165.40% 85.85% 72.86% Quarterly Year ended |