

Profile
Our Business
Russel Metals is one of the largest metals distribution and processing companies in North America based on revenues, profits and tons sold. The Company conducts its distribution business primarily in three metals segments: service centers; energy sector pipe, tube, valves and fittings; and import/export. Russel Metals is one of the few metals distribution companies in the world to operate a significant international trading operation in conjunction with service centers.
Service CentersPurchases metal in large volumes from producers principally in North America, adds value by providing a wide range of value added services, and then distributes the product to a broad base of approximately 15,000 end users through a network of 42 Canadian and 4 U.S. locations.
Energy SectorThe business units distribute pipe, tube, valves and fittings, chiefly to the energy sector in Western Canada and the Western United States from 5 Canadian and 2 U.S. locations.
Import/ExportImports foreign steel products into Canada and the United States for customers that include both steel mills and metals distribution companies and also exports North American steel products to international end users.
Our Values
Management looks to maintain superior returns throughout the current and future economic cycles. Both short and long-term success in any business depends on the development and retention of strong relationships. At Russel Metals, these relationships include our customers, suppliers, employees, community, and, of course, our shareholders.
Our CustomersCritical to our relationship with our customers is providing competitively priced, quality product with on-time delivery. Our geographically diverse network of locations throughout Canada and various areas in the United States enables us to store our product close to our customer locations and respond to their needs on a timely basis. We at Russel Metals strive to meet our customers’ quality expectations by promoting high quality standards throughout the organization. The vast majority of our locations are ISO 9000 certified and our Regional Quality Leaders strive to enhance Best Practices in their region.
Our SuppliersWithout the support of our suppliers, the Company would not be successful. We endeavor to pay fair market value for those goods we buy for either resale or for further processing. We look upon our suppliers as partners, and we reward those suppliers who we feel support us with the majority of our purchases.
Our EmployeesRussel Metals has approximately 1,900 employees with offices and operations throughout North America. The Company continues to elevate awareness of Health & Safety throughout the organization from the shop floor to the Board of Directors. In 2002, as a result of proactive initiatives in this area, the number of accidents decreased by 33% and the accident severity as measured by the number of days lost improved 63% over the previous year.
The Company encourages the implementation of results oriented bonus plans at all levels of the organization. This helps to ensure that the interests of the employees and the shareholders are aligned. In addition, our Value Sharing Plan provides financial incentives to every employee to participate in the ownership of our Company.
Our CommunityOur management does not administer social responsibility, including charitable donations, at the corporate level. Rather branch management, in our diverse locations throughout North America, are encouraged to sponsor community-based local initiatives both in donations of cash and in employee time.
Our EnvironmentThe business practices involved in the metals distribution business of the Company present minimal environmental exposure. The Company has implemented rigorous environmental standards and an ongoing audit process. The Environmental Manager proactively reports to both management and our Board of Directors on any changes in legislation and the effect, if any, on our continuing operations.
The ongoing environmental cleanup costs expended by the Company relate to non-metals operations previously sold or discontinued, not the metals operations. The Company has actively honoured its legacy environmental costs for non-metals operations and over the last 10 years has spent in excess of $18 million on environmental cleanups.
Our ShareholdersThe above, coupled with our emphasis on bottom line performance and effective asset management throughout the organization enables us to be a sector leader in dividend yield and share appreciation.
| Management Priorities | Accomplishments |
Be a sector leader in return on capital throughout the steel cycle | - 2002 was a recovery year for the steel sector. Generated a top decile return on ending capital of 15.3%.
- 2001 was a weak year for the steel sector. Generated a top decile 11.4% return on ending capital.
|
| Grow the Company’s foundation through prudent acquisitions | - Acquired Williams Steel in Milwaukee, Wisconsin – a steel service center.
- Acquired Arrow Steel in Houston, Texas – a cut to length coil processor.
|
| Optimize the Company’s application of capital | - Restructured British Columbia and Wisconsin service center operations, closing two unprofitable locations.
- The A. J. Forsyth acquisition in British Columbia generated an operating profit of $4.9 million and a return on the incremental investment of 24.5%. A similar turnaround is expected for the Wisconsin operations.
|
| Provide leadership for employees through progressive health and safety practices | - Continued proactive management of health and safety issues resulted in a 33% reduction in lost time accidents in 2002.
- The accident severity measured by the number of days lost improved by 63% over the previous year.
|
| Provide shareholders with superior common share yields | - Dividends of $0.17 were paid, which was a yield of 3.3% based on year-end price. Dividends have increased by 40% to $0.28 per year during the past year, which will yield 5.1%.
- Common share market value has appreciated 76% since January 2001.
|
Report to ShareholdersPerformance
 | Edward M. Siegel, Jr.
President and Chief Executive Officer As the Chief Executive Officer, I am always cognizant of the comparison of our performance against that of other companies. |
These comparisons include both companies in the steel sector and others against which we compete with for attention in the capital markets. This is essentially all the companies traded on the Toronto Stock Exchange (TSX). By the investment industry definition, Russel Metals is not a blue chip company due to our small market capitalization. We do, however, fit the New York Stock Exchange definition of a blue chip company, which is “a company known nationally for the quality of its products or services and its reliability to operate profitably in good and bad economic times.” We fit that definition perfectly with our diverse portfolio of companies providing nationwide distribution services throughout Canada and select regions in the United States, coupled with our strong financial performance over the last six years.
Share price is not only a function of past success; it is also a function of future potential. Management’s primary goal is to maximize bottom line earnings not only in the short term but also throughout the cycle.
Russel Metals has delivered an excellent performance in 2002 compared with virtually every significant performance metric, such as share appreciation, dividend yield, return on common equity, and return on market capitalization. The strong operational performance of the Company has not gone unnoticed in the capital markets as illustrated by the 76% appreciation in our common share price over the last two years.
The past year was an excellent one as we achieved record earnings. This is especially gratifying since it occurred in a year characterized by static demand with strong pressure on our cost of goods. Furthermore, 2002 was an economic environment fraught with business failures and governmental intervention. We operate in a cyclical industry and our business model is predicated on principles intended to minimize significant earnings volatility. As I have often stressed, we will make an acquisition only if it makes good business sense, not simply because it will generate top-line growth. Our 2002 adjusted earnings per share of $0.75 and 2001 adjusted earnings per share of $0.37, in an extremely difficult environment, demonstrate that our philosophy of fiscal restraint in the era of consolidation in the steel service center industry was justified. Our record pre-tax earnings in 2002 were attributable to the higher gross margins, particularly in the import/export operations, overall focus on cost containment and tight working capital management of the balance sheet.
We could not have achieved these excellent results without the extraordinary effort of our entire employee group, and to them I want to extend my heart-felt appreciation. I would also like to welcome the employees of both Arrow Steel Processors and Williams Steel to the organization. On behalf of the Board, I would like to acknowledge the contribution of Mr. Martin Freedman who retired as a Director of our Company due to his appointment to the Manitoba Court of Appeal after 16 years of valuable service. Replacing Mr. Freedman on our Board is Mr. James Dinning, Executive Vice President – TransAlta Corporation. Mr. Dinning brings to our Board a wealth of business expertise primarily in the energy sector and we look forward to a long association.
We feel that our performance measures up very well against other companies. In order to demonstrate this, we have chosen a few quality companies, which we have called the Performance Group, whom we consider to be strong companies in their own right to compare to our performance.
Dofasco – In the steel sector, Dofasco Inc. is considered to be the preeminent steel mill. It is listed on the TSX.
Royal Bank – We have chosen the Royal Bank of Canada because it is the largest component of the TSX and is considered to be the premier financial institution in Canada.
Magna – We chose Magna International Inc. since it is a TSX listed industrial company that is also preeminent in its field.
Reliance – The publicly traded company that is the most like us, from an operations point of view, is Reliance Steel & Aluminum Co. Reliance is a successful NYSE listed steel distribution company with operations primarily in the United States.
Performance – Stock AppreciationTheoretically, consistently strong earnings should lead to corresponding share appreciation. In the late 1990s this was not the case, as capital flowed to companies with ’a story’ and away from companies, like ours, with conservative profiles and a strong earnings base. As the ’bubble’ burst, investors looked to companies with real assets whose performance justified an inflow of capital. As demonstrated by our share price appreciation, investors have realized the value of Russel Metals. In 2001 our stock appreciated 24%, and in 2002 it rose from $3.60 to $5.10, an appreciation of 42%.
Our share appreciation over the last two years has also been a result of our strong earnings history. We have been profitable in each of the last six years throughout turbulent times in the steel industry. In a cyclical industry, we have managed to remain profitable through the troughs in the cycle, even the severe trough experienced in 2001. Share price is not only a function of past success; it is also a function of future potential. Management’s primary goal is to maximize bottom line earnings not only in the short term but also throughout the cycle.
Performance – Dividend YieldRussel Metals’ dividend yield ranks first in our Performance Group. Dividends are a direct reflection of earnings. Our ability to pay dividends is constrained by restrictions on our U.S. Note Indenture. Russel Metals considers it prudent to distribute a high level of earnings to its shareholders as it adds discipline to the management of shareholder funds. Cash flow from operations of $55.7 million, free cash flow of $13.8 million and net earnings of $29.2 million were significant contributors in our ability to increase our dividend. The Company manages its operations based on return on net assets and thus reduces its working capital when revenues decline, resulting in strong cash flow at all points in the cycle. The management of this counter cyclical cash flow is critical to the generation of superior earnings over the entire cycle and is an area in which Russel Metals excels.
The Company has increased the dividend by 40% during the past year. Russel Metals increased its quarterly dividend by $0.01 to $0.06 per common share during 2002, and on February 17, 2003, based on strong earnings, the Company was able to further increase the dividend to $0.07. This dividend yields approximately a 5.1% return to our shareholders in addition to stock appreciation.
Performance – Return on Market CapitalizationIn a cyclical industry, management believes that the key to success is to maintain a flexible enough balance sheet that can be contracted during the troughs and expanded during the peaks. By not encumbering our balance sheet with unnecessary debt due to unsustainable goodwill, we maintain the financial flexibility to maintain profitability throughout the cycle. Even after accounting for the stock appreciation that has occurred over the last two years, our return on year-end market capitalization of 15.8% is the strongest of our Performance Group.
This strong return on market capitalization has been achieved in part through balance sheet management and debt reduction, which lowered interest expense. Book value per share has increased 64% over the last five years to $5.84. During that same period the Company has reduced debt levels by $84 million, repurchased $51.9 million in equity and paid common share dividends of $19.9 million.
Performance – Return on Common EquityOur return on common equity improved to 13.8% for 2002. We rank number 2 in the Performance Group on this measure. Our ability to reduce net assets when operating earnings decline has resulted in lower interest expense and correspondingly higher net earnings. The return on common equity has averaged 14.0% during the last five years.
The Company actively manages its inventory and accounts receivable, which represent 76.4% of its total assets. As a market leader, we strive to maintain service center inventory turns at significantly higher levels than the industry norm. Our service center inventory turns for the last quarter of 2002 were 4.2 times, compared to the industry at 3.2 times. In 2001 and 2002, the Company made sizable acquisitions in the service center sector and still was able to report inventory turns approximately one turn better than the industry.
We look at an acquisition opportunity seriously when we deem it to be in the best strategic interest of the Company and if it will be accretive immediately. Our 2001 acquisition of A. J. Forsyth and the subsequent restructuring of our British Columbia operations has generated incremental operating profit of $4.9 million in 2002. We have replicated this strategy to strengthen our Wisconsin operation by purchasing the operating assets of Williams Steel in October 2002. The restructuring of Williams Steel with the Bahcall operations started in November 2002. It will be accretive to earnings in 2003.
The key to success is to maintain a flexible enough balance sheet that can be contracted during the troughs and expanded during the peaks.
Management strongly believes that it is more prudent to be profitable throughout a cycle, without the spikes in earnings caused by less emphasis on asset management, and have average earnings over the full range of the cycle in the top decile of the industry.
In the future, the length of the steel-based economic cycle will continue to shorten and a management structure that allows the fastest reaction to the changes will be most successful.
We carefully manage the Company portfolio to continue to optimize our return on capital. If an operation is not producing consistently, we will make changes, as we did with the rationalizations after the purchase of Forsyth and Williams. In addition, we will not hesitate to divest ourselves of under-performing operations, such as we did with Total Distributors in 2001.
Performance – Corporate GovernanceThere has been significant emphasis over the last year on strong corporate governance. Regulators have been struggling with balancing a rule-based system with the significant costs associated with more regulations. To date, regulators have strengthened rules for the independence of the audit function, both through auditor independence and the maintenance of a strong audit committee. Companies have also been criticized for not separating the office of Chairman from the CEO and for their aggressive accounting policies. We, at Russel Metals, already have within our corporate governance structure many of the new requirements being suggested now and have always discharged our corporate responsibilities with a keen awareness of the spirit of strong governance standards. The members of our Audit Committee, whose diverse backgrounds include a strong financial knowledge base, are all independent. Our CEO and Chairman functions have been separated since the new management took office in 1997. Our accounting policies are conservative, reflecting the conventional nature of our industry as a whole. While the Company continues to use the intrinsic value method for stock options, we have focused on this issue since it gained prominence almost a year ago. We intend to expense these options as soon as the new Canadian accounting rules have been finalized to ensure that we meet all of the new requirements.
Our performance emphasis coupled with a strong corporate governance ethos and our remarkable employee group should lay the framework for Russel to position itself to continue to outperform competitors over the course of the cycle both operationally and in the capital markets. We look forward to the challenge.
/s/Edward M. Siegel, Jr.
President and Chief Executive Officer
Operating Performance
| Service Centers | Energy | Import/Export |
| Purchases metal in large volumes from producers principally in North America, adds value by providing a wide range of reliable services, and then distributes the product to a broad base of 15,000 end users in a wide variety of industries through a network of 42 Canadian and 4 U.S. locations. | The business units distribute pipe, tube, valves and fittings, chiefly to the energy sector in Western Canada and the Western United States from 5 Canadian and 2 U.S. locations. | Imports foreign steel products into Canada and the United States for customers that include both steel mills and metals distribution companies and exports North American steel products to international end users. |
Strong Performance in 2002Service Center Performance
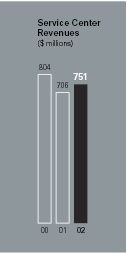
- 6% sales increase to $750.9 million
- 63% increase in operating profits to $31.5 million
- Cash flow from operations of $53.9 million generated
- Industry leading inventory turns
- Restructured British Columbia operations. Generated $4.9 million incremental operating profit
- Strengthened Wisconsin operations with Williams Steel acquisition
Russel Metals’ service center segment was a strong performer in 2002, delivering increased operating profits and increased return on net assets over the previous year.
Service Centers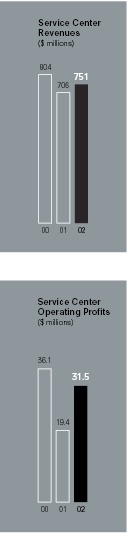
Through a strong network of service centers, Russel Metals provides processing and distribution services to a broad base of approximately 15,000 end users in a wide variety of industries, including machinery and equipment manufacturing, construction, shipbuilding and natural resources, such as mining and petroleum. The service center network includes 42 Canadian and 4 U.S. locations.
Russel Metals’ network of service centers carries a full line of metal products in a wide range of sizes, shapes and specifications, including carbon hot rolled and cold finished steel, pipe and tubular products, stainless steel and aluminum. Russel Metals purchases these products primarily from steel producers in North America and packages them for end users who typically require steel products in quantities that are smaller than the economic minimum order available from steel producers.
Russel Metals service center operations provide specialized processing services to satisfy specifications established by end users. By providing these services, as well as by offering inventory management and just-in-time delivery, Russel Metals enables end users to reduce their overall production costs and decrease capital required for raw materials and metals processing equipment.
Canadian OperationsRussel Metals operates one of the two largest steel service center operations in Canada based on revenue and tons sold. Russel Metals’ Canadian service centers sell plate, flat rolled carbon and general line steel products, as well as some stainless steel, aluminum and other non-ferrous specialty metal products.
Within Canada, the steel service centers operate under the names Russel Metals, Métaux Russel, Drummond McCall, A. J. Forsyth and Vantage Laser. Heavy gauge flat rolled operations are conducted by B&T Steel and McCabe Steel, both located in Hamilton, Ontario.
U.S. OperationsRussel Metals’ U.S. service centers sell primarily general line carbon steel products. General line steel products consist of plate, structurals, bars, sheet, pipe, tubing and hollow structural steel tubing.
In 2002, to strengthen Russel Metals’ Wisconsin operations, the Company purchased the operating assets of a leading service center located in Milwaukee, Wisconsin formerly known as Williams Steel. This operation had annual sales of approximately $49 million. The Bahcall and Williams operations initiated a restructuring process in the fourth quarter of 2002.
Russel Metals’ U.S. service center operations are conducted under the name Russel Metals Williams Bahcall and Baldwin International. Russel Metals Williams Bahcall focuses primarily on the distribution of general line carbon products through three facilities in Wisconsin. Baldwin International distributes specialty alloy products through its facility in Ohio.
| Energy Performance | - 20% sales decrease to $289.6 million
- 26% decline in operating profits to $13.6 million
- Cash flow from operations of $6.2 million generated
- 4.7% segment operating profit to revenues maintained on lower revenues
|
The flexibility of our oil and gas operations produced a healthy operating profit despite revenue declines in 2002 due to lower rig activity.
Energy 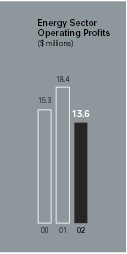
Each business unit within the Company’s energy sector distribution operations occupies strong geographic niches and carries a more specialized and limited product line than the service centers. This segment distributes pipe, tube, valves and fittings primarily to the energy sector, from 5 Canadian and 2 U.S. locations.
Products are sourced from either the pipe processing arms of North American steel mills or from independent manufacturers of pipe and its accessories.
Each business in this segment sells a distinct line of products. These businesses include:
Fedmet TubularsA distributor of oil country tubular goods (which includes casing and tubing) and line pipe and related products, with its sales office in Calgary, Alberta.
Comco Pipe and Supply CompanyA distributor of pipe, valve and fitting products, specializing in the supply and distribution of pipe and fluid handling products to various industries. Distribution facilities are located in Calgary and Edmonton, Alberta; Stonewall, Manitoba; and Guelph and Sarnia, Ontario.
Pioneer PipeA distributor and processor of steel pipe products to the construction, oil and gas and ski industries in the Western United States. Pioneer Pipe has facilities in Aurora, Colorado and Lindon, Utah. These operations include Spartan Steel, headquartered in Evergreen, Colorado.
Triumph Tubular & SupplyAn established distributor of oil country tubular goods. Triumph’s sales office is located in Calgary, Alberta.
| Import/Export Performance | - 8% sales increase to $348.1 million
- Record operating profits of $28.1 million, an increase of 98%
- Cash flow used in operations of $9.7 million to support higher working capital
- Acquired Arrow Steel Processors, a coil processor of customer owned material, in Houston, Texas
|
This operation delivered a strong performance in 2002, benefiting from higher steel pricing following resolution of the U.S. trade rulings.
Import/Export 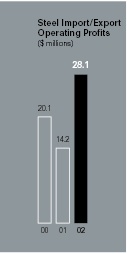
Russel Metals’ import/export operations, through Wirth Steel located in Canada and the Sunbelt Group located in the U.S., imports foreign steel products into Canada and the United States and exports steel from Canada and the United States. These operations also provide the Company’s other business segments with valuable insight regarding international pricing trends and their potential impact in North America.
Revenues from these operations may vary substantially from year to year, depending largely on general economic conditions and trade actions both in North America and in the export markets served. In 2002, the Company purchased the operations of Arrow Steel Processors, a coil processor of customer owned material, which is located at the port in Houston, Texas.
This segment specializes in the import into North America of carbon steel, plate, beams, channel, flat rolled products, rail and pipe products. Sales commitments for a significant portion of these products are generally obtained prior to their purchase or while the product is in transit. Products for which sales commitments have not been obtained are held in public warehouses for sale to North American service centers and other customers.
Management’s Discussion and Analysis
For the Year Ended December 31, 2002
The following management’s discussion and analysis of financial condition and results of operations of Russel Metals Inc. and its subsidiaries (Russel Metals or the Company) provides information to assist the reader and should be read in conjunction with the audited Consolidated Financial Statements for the year ended December 31, 2002, including the notes thereto. Statements contained in this document that relate to Russel Metals’ beliefs or expectations as to certain future events are not statements of historical fact and are forward-looking statements. Russel Metals cautions readers that there are important factors, risks and uncertainties, including but not limited to economic, competitive and governmental factors affecting Russel Metals’ operations, markets, products, services and prices that could cause the Company’s actual results, performance or achievements to be materially different from those forecasted or anticipated by Russel Metals in such forward-looking statements. All dollar references in this report are in Canadian dollars unless otherwise stated.
Russel Metals is one of the largest metal distribution companies in North America based on revenues and tons sold. The Company conducts business primarily in three metals distribution business segments: service centers; energy sector related pipe, tube, valves and fittings; and steel import/export.
 | Brian R. Hedges
Executive Vice President and Chief Financial Officer 2002 was a year of contradictions in the steel sector, and was as unique as 2001, but for different reasons. Several factors contributed to the record $0.75 net earnings from operations before other costs of Russel Metals. |
Summary
2001 was one of the toughest years the steel industry experienced with record steel mill and service center bankruptcy levels, declining prices and soft demand. Russel Metals was an exception in the industry, demonstrating the ability to remain profitable while at the same time making investments to advance its corporate objectives through prudent acquisitions, divestitures, and excellent working capital management.
2002 was a year of contradictions in the steel sector, and was as unique as 2001, but for different reasons. Several factors contributed to the record $0.75 net earnings from operations before other costs of Russel Metals. The North American dumping actions, coupled with the financial weakness of North American steel mills, led to an unprecedented 40% price increase in flatroll products, including plate. The supply side driven price increases were at odds with the demand side fundamentals, which remained static in 2002. The rapid price increases resulted in inventory holding gains and higher gross margin dollars per ton. In the case of Russel Metals, these higher per ton margins, despite the relatively flat demand, enabled the service center segment to generate stronger earnings than the previous year. In addition, the import/export operations experienced higher volumes and increasingly strong margins under the umbrella of the aforementioned higher steel prices.
Political uncertainty and merger and acquisition activity influenced energy sector exploration and development and caused weak drilling activity in 2002, despite very strong oil and gas prices. This decline in activity led to lower revenues, gross margins and operating profits in our energy sector distribution businesses.
Strong balance sheet management continued in 2002, which resulted in lower borrowings and lower interest expense. Inventories did climb in the import/export operations during the later months of the year due to strong activity in our import/export operations. These elevated inventory levels will be reduced during the first quarter of 2003.
The following analysis provides a more detailed discussion of our results of operations.
Results of Operations
The following table provides a summary of revenues, gross margins (revenue minus cost of sales) as a percentage of revenues and operating profits (revenue minus cost of sales and operating expenses excluding corporate expenses and interest expense) for Russel Metals’ operating segments. The table shows the segments as they are reported to management and they are consistent with the segmented reporting in Note 13 to the 2002 Consolidated Financial Statements.
Service Center Distribution
a) Description of operationsThe Company provides processing and distribution services to a broad base of approximately 15,000 end users through a network of 42 Canadian and four U.S. locations. The Company’s network of service centers carries a full line of products in a wide range of sizes, shapes and specifications, including carbon hot rolled and cold finished steel, pipe and tubular products, stainless steel and aluminum. Russel Metals purchases these products primarily from steel producers in North America and packages them in accordance with end user specifications. The Company services all major geographic regions of Canada and selected regions in the United States. Within Canada, the service centers operate under the names Russel Metals, Métaux Russel, Drummond McCall, A. J. Forsyth and Vantage Laser. Heavy gauge flat rolled operations are conducted by B&T Steel and McCabe Steel, both located in Hamilton, Ontario. Russel Metals’ U.S. service center operations are conducted under the names Russel Metals Williams Bahcall and Baldwin International. The Williams Bahcall operations focus primarily on the distribution of general line carbon products through three facilities in Wisconsin. Baldwin International distributes specialty alloy products through its facility in Ohio.
In September 2002, the Company purchased the operating assets of a service center located in Milwaukee, Wisconsin formerly known as Williams Steel. This operation will add strength to the Russel Metals Bahcall operations. Williams Steel had sales of approximately $49 million for the year prior to the acquisition date. The acquisition is anticipated to be accretive to earnings in 2003. The Bahcall and Williams operations have substantially completed the process of restructuring which commenced during November 2002.
In October 2001, the Company purchased the shares of A. J. Forsyth and Company Limited, a service center operation with six locations in British Columbia and one in the Yukon. The A. J. Forsyth operations strengthen Russel Metals’ operations within the British Columbia region. A. J. Forsyth had sales of approximately $66 million for the year prior to the acquisition date.
 b) Factors affecting results
External –
- steel pricing fluctuates significantly throughout the cycle. Steel prices are influenced by overall demand and by product availability.
- demand is significantly affected by economic cycles with revenues and operating profit fluctuating with the level of general business activity in the markets served.
- product availability is affected by supply side management practiced by steel producers in North America and international supply and demand which impacts steel imports.
- trade sanctions initiated either by steel mills or the public sector in North America, and less directly worldwide.
- Canadian steel service centers, which represent a large portion of the service center distribution segment operations, are particularly affected by general economic conditions and the manufacturing sector in Ontario and Quebec, and by pulp and paper, agriculture and resource sector activities in Western Canada, where demand for steel by the construction and capital goods sectors fluctuates considerably during the economic cycle.
Internal –
- the Company has a strong strategic network of branches across Canada, encompassing all provinces, thus declines in demand in one region may be countered by higher demands in other regions.
- many employees, including management, receive bonuses based on bottom line results; thus a portion of their compensation is variable and employees are motivated to maximize profitability.
- a large portion of the service center costs are fixed and are not reduced as volume declines, which can negatively impact results when demand weakens.
- the Company monitors its inventory levels and endeavors to achieve above average inventory turns in order to position itself to react to pricing and supply changes in the market and to minimize holding losses. The above average turns mean the Company is able to reduce the impact of price changes and stabilize its earnings stream, which results in stronger earnings in a downturn and compared to our competitors slightly lower earnings increases when prices increase.
- knowledge of international pricing trends obtained by the steel import/export operations provides insight for pricing and buying decisions.
c) Service center segment results – 2002 compared to 2001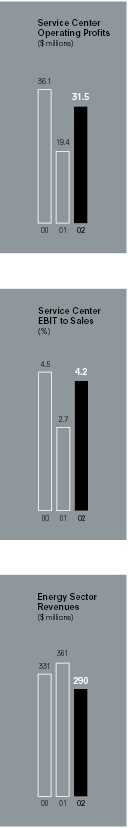
Revenues for 2002 increased 6.3% due to higher selling prices and acquisitions compared to 2001. Revenue increases were most significant in British Columbia region due to the acquisition of A. J. Forsyth in October 2001. Volume declines occurred in Alberta due to lower oil and gas activity and at our U.S. operation, Williams Bahcall, due to general lower customer demand in the Wisconsin region and customer facility closures. Increased revenues, from the acquisition of Williams Steel effective September 9, 2002, are offset by the sale of the Eagan, Minnesota location in October 2001.
The average selling price per ton was approximately 5% higher in 2002 compared to 2001. The average selling price started to increase during the second quarter of 2002, reflecting price increases implemented by the North American steel mills. The average selling price plateaued in the last half of 2002.
Gross margins improved from 24.9% for 2001 to 26.8% for 2002, mainly a result of rising selling prices during 2002 and inventory holding gains. Gross margins decreased in the fourth quarter of 2002 and the Company expects them to decrease further in 2003.
Service center operating profits for 2002 increased by 62.9% compared to 2001. This increase is a result of selling price increases and corresponding higher gross margins, and the acquisition of A. J. Forsyth. Operating expenses for 2002 were $13.6 million, or 8.7% higher than 2001. Approximately $10.2 million of the increase in operating costs relates to the British Columbia region due to the acquisition of A. J. Forsyth.
Operating profits as a percentage of revenues for 2002 were 4.2%, a significant improvement over 2001 at 2.7% in one of the weakest years on record for the industry.
d) Service center segment results – 2001 compared to 2000Revenues for 2001 decreased 12.2% due to lower volume and selling prices. Volume declines were most significant in British Columbia due to weaker demand in the pulp and paper industry and Ontario due to weaknesses in the manufacturing sector. Alberta was the only region with increased volume due to the strength of the oil and gas industry. Excess inventory positions at both the mills and our competitors affected market pricing in the first half of 2001. Selling prices declined in all regions excluding Alberta with the most significant declines in British Columbia, Ontario and the U.S. operations of Bahcall. Selling prices for Alberta showed a slight improvement.
Gross margins improved from 24.3% in 2000 to 24.9% in 2001. By maintaining lower inventory levels than our competitors, Russel Metals was able to capitalize on low-priced purchases resulting in gross margin improvements compared to 2000.
The recession affecting the U.S. Midwest resulted in significant losses at Bahcall during 2001. In an effort to reduce costs and minimize losses, the Company disposed of the inventory and fixed assets of the Eagan, Minnesota operation for book value in October 2001.
Service center operating profits for the year ended 2001 decreased by 46.3% compared to 2000. This decline was a result of the significant volume and selling price declines. Operating expenses for 2001, adjusted for expenses of A. J. Forsyth in 2001, were $6.6 million, or 4.1% lower than 2000.
Operating profits as a percentage of revenues for 2001 were 2.7% compared to 4.5% for 2000 due to operating expenses not declining as significantly as revenues, a result of the significant portion of operating expenses being fixed.
Energy Sector Distribution
a) Description of operationsThese operations distribute pipe, tube, valves and fittings, primarily to the energy sector in Western Canada and the Western United States, from five Canadian and two U.S. locations. Russel Metals purchases these products either from the pipe processing arms of North American steel mills or from independent manufacturers of pipe and its accessories. The energy sector operates under the names Comco Pipe and Supply Company, Fedmet Tubulars, Triumph Tubular & Supply, Pioneer Pipe and Spartan Steel.
In August 2001, the Company purchased Spartan Steel, a pipe distributor in the midwest and southern United States. The Spartan operations complement the Pioneer Pipe business. Spartan had sales of approximately US $15 million for the year prior to the acquisition date.
In June 2001, the Company sold the operations of Total Distributors Supply Corporation, its U.S. operation serving the petrochemical and heat exchanger industries. The decision to sell the Total Distributors’ assets was based on the significant losses that had occurred in this operation due to the very competitive heat exchanger tubing market it served.
b) Factors affecting results
External –
- affected by economic cycles.
- significantly affected by oil and gas pricing, which impacts oil rig count and subsequent drilling activities particularly in Western Canada.
- Canadian operations affected by U.S. dollar since some products are sourced outside Canada and are priced in U.S. dollars.
- pricing is influenced by overall demand and by product availability.
- trade sanctions initiated either by steel mills or the public sector in North America.
Internal –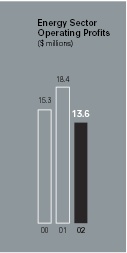
- low fixed costs due to a large portion of inventory stored at locations rented on a usage basis.
- employees’ compensation is highly variable as it is based on profits, allowing the Company to be profitable throughout the cycle.
c) Energy sector distribution results – 2002 compared to 2001 Energy sector revenues decreased 19.7% for 2002 compared to 2001. Lower rig activity for 2002 compared to 2001 has resulted in volume declines for the oil country tubular operations in Western Canada and the United States. Although oil pricing is comparable to 2001 levels, the consolidation of some large players and the restructuring to income trusts have impacted investment in capital and contributed to lower drilling levels in 2002.Comco Pipe, which distributes pipe, valves and fittings to other fluid handling industries as well as the energy sector, had increased revenues of 28.9% in 2002 compared to 2001. Comco Pipe’s revenue is more project oriented and as such is not as dependent on drilling levels.
Energy sector operating profits declined $4.8 million, or 26.0%, in 2002 compared to 2001. The decline is related to the drop in volume in the oil country tubular goods operations, partially offset by increased operating profits at Comco Pipe due to higher volumes from large projects.
d) Energy sector distribution results – 2001 compared to 2000
Energy sector revenues increased 8.8% for 2001 compared to 2000. The increase in revenue for the businesses excluding Total Distributors, which was divested in June 2001, is 13.7%. Approximately 60% of the revenue increase relates to the acquisition of Triumph Tubular effective September 1, 2000 and Spartan Steel effective August 15, 2001. The strong oil and gas prices experienced through the first three quarters of 2001 resulted in higher volumes in 2001 compared to 2000 for the other businesses. The oil country tubular operations in Western Canada and Western United States both had significant declines in volume during the fourth quarter of 2001 due to general economic uncertainty, a late winter freeze and weaker oil and gas pricing. 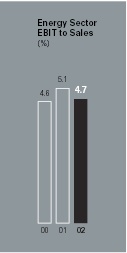
Energy sector operating profits improved by 20.2% in 2001 compared to 2000. Total Distributors, our U.S. operation serving the petrochemical and the heat exchanger industries, was sold in June 2001, which had a negative impact on revenue; however, it positively impacted operating profits. The operating profits increased 1.3% for the businesses, excluding Total Distributors’ losses from each year. The operating profits for the first nine months of 2001 were stronger than those for the same period in 2000; however, the fourth quarter was significantly lower than the fourth quarter of 2000 as drilling activity declined.
Steel Import/Export
a) Description of operationsRussel Metals’ steel import/export business primarily imports foreign steel products into Canada and the United States. It also exports steel from Canada and the United States. The international presence provides the Company’s other business segments with valuable insight regarding international pricing trends and their potential impact on steel markets in North America.
The main steel products sourced by the import/export operations are structural beam, heavy-wall plate, heavy-wall coils, pipe and tubing. The operations in this sector are Wirth Steel and Sunbelt Group.
Effective March 1, 2002, the Company purchased the operations of Arrow Steel Processors, a coil processor of customer owned material, located at the port in Houston, Texas. Arrow had sales of approximately US $2 million for the year prior to the acquisition date. Arrow Steel provides processing to Sunbelt as well as other customers.
b) Factors affecting results
External –
- trade sanctions initiated either by steel mills or the public sectors in North America.
- mill capacity by product line in North America.
- Canadian operations affected by movement in the U.S. dollar since purchases are mainly in U.S. dollars.
- steel pricing is influenced by overall demand and by product availability both domestically and worldwide.
- demand is affected by economic cycles.
- supply side management practiced by steel producers in North America and international supply and demand, which impacts steel imports and significantly affects product availability.

Internal –
- operating costs are variable with volume, since inventory is stored in public warehouses and employees are significantly compensated based on earnings.
- inventory is sourced throughout the world, including North America, providing flexibility for sourcing supply.
c) Steel import/export results – 2002 compared to 2001Steel import/export revenues increased 8.3% in 2002 compared to 2001. A decline in revenue was experienced during the first quarter of 2002 compared to the first quarter of 2001, when uncertainty existed related to the resolution of the U.S. and Canadian trade rulings. The U.S. made its ruling in March 2002, while the Canadian Safeguard initiative is still under review. This resulted in increased steel pricing. Revenues during the remainder of 2002 were significantly higher than 2001 due to a slight improvement in customer demand and higher selling prices.
Steel price increases initiated by North American steel mills contributed to higher selling prices resulting in a stronger gross margin of 14.3% for 2002 compared to 9.4% for 2001. The gross margin as a percentage of revenue of 14.3% for 2002 is higher than normal and is expected to decline in 2003.
Steel import/export operating profits increased 98.2% to $28.1 million for 2002 compared to 2001. The increase is mainly related to higher gross margin. This higher gross margin resulted in operating profits as a percentage of revenues of 8.1% for 2002 compared to 4.4% for 2001.
d) Steel import/export results – 2001 compared to 2000Steel import/export revenues decreased 16.6% for 2001 compared to 2000. The oversupply of carbon products in North America and the weakness in demand at the service center level impacted 2001 revenues. Volumes and selling prices for 2001 were lower than 2000.
Steel import/export operating profits decreased by 29.6% in 2001 compared to 2000. The lower volume was the most significant contributor to this; however, a bad debt write-off of $1.3 million related to a large U.S. service center which filed for Chapter 11 also impacted expenses for 2001.
Other – 2002 compared to 2001 and 2000
Other revenue and income represents the results of Thunder Bay Terminals, our coal handling terminal in Thunder Bay. Revenue for 2002 was 2.5% higher than 2001 due to increased volumes of coal handled. The revenues in 2001 had increased 40.9% compared to 2000. Operating profits for 2002 at $5.7 million are slightly less than 2001; however, 2002 and 2001 represent a significant increase over 2000, which is attributable to higher volumes handled. Approximately 37% of the 2002 revenues were a result of a short-term contract with one large customer. Revenues for 2003 may vary based on renewing this contract.
Consolidated Results – 2002 compared to 2001
Earnings from operations were $70.4 million, an increase of 39.1% compared to 2001 at $50.6 million. This increase in operating profits for 2002 relates to higher volumes and margins in service center and import/export operations offset by lower volumes in the energy operations. Consolidated revenues for 2002 approximate revenues for 2001.
During the second quarter of 2001, the Company reported a number of items that are not representative of the Company’s ongoing business and thus were disclosed separately. The loss on sale of business related to the sale of the inventory and fixed assets of Total Distributors and the acquisition costs related to the cost of due diligence and legal expense of an unsuccessful acquisition attempt. These items are referred to as unusual items.
The following table discloses earnings from ongoing operations net of income taxes, other costs net of income taxes and unusual items net of income taxes. Earnings per common share are also disclosed to assist the reader in determining results from ongoing operations.
 |  |
The acquisition of Williams Steel was completed in September 2002. Similar to the acquisition of A. J. Forsyth in 2001, the Williams Steel operation was a strategic acquisition and the rationalization of the Williams Steel and Bahcall operations is expected to strengthen the Wisconsin operations. Williams Steel had one large operation in Milwaukee, which serviced most of Wisconsin and other nearby states. The restructuring with Bahcall will result in the closure of the Bahcall location near Milwaukee in the first quarter of 2003. The closing of this location as well as employee terminations related to eliminating duplicate functions has been estimated to cost $3.1 million, pre-tax. The first steps in the plan commenced in November 2002. The cost of restructuring the Williams Bahcall operations was anticipated at the time of acquisition.
The 2001 reserve, which provided for the restructuring of A. J. Forsyth with the Russel Metals operation in British Columbia, was reduced in the fourth quarter of 2002 by $392,000, pre-tax. The restructuring related to all operations other than those on Vancouver Island have been completed, and facility closure costs were less than originally anticipated.
During 2002, the Company recorded a foreign exchange gain of $0.3 million related to U.S. denominated debt that was not designated as a hedge of the Company’s net investment in foreign subsidiaries. The movement in the Canadian dollar against the U.S. dollar caused the gain for 2002 versus the loss for 2001.
Consolidated interest expense decreased $2.7 million to $20.3 million for 2002 compared to 2001. This decrease is due to lower borrowing levels to fund working capital and lower U.S. denominated debt in 2002 due to the purchases of US $9.4 million of the U.S. Note in September and October 2001. The majority of the interest expense relates to the fixed term 10% Senior Notes and, therefore, no benefit was experienced from lower prime borrowing rates available through the bank credit facility.
Income taxes for 2002 were $18.4 million compared to $7.1 million for 2001. This dollar increase relates to higher operating earnings before tax for 2002 compared to 2001 and the unusual items recorded in 2001.
Basic earnings per share for 2002 was $0.71 compared to $0.17 for 2001. Earnings per share before other costs and unusual items was $0.75 for 2002 compared to $0.37 in 2001.
The weighted average number of common shares outstanding for 2002 was 38,024,034 compared to 37,981,501 for 2001. The increase relates to stock options exercised. The number of common shares outstanding at December 31, 2002 is 38,057,001.
Consolidated Results – 2001 compared to 2000
Earnings from operations were $50.6 million, a decline of 23.5% from $66.1 million in 2000. The lower volumes and selling prices in the service center and import/export operations were partially offset by increased volumes in the energy sector. In addition, Thunder Bay Terminals had a very strong year. Consolidated revenues for the entire Company decreased by 8.4%, to $1,402.5 million, in 2001 compared to 2000.
The acquisition of A. J. Forsyth in October 2001 was completed to strengthen the Russel Metals’ operations in British Columbia. The cost of restructuring the Russel Metals’ operations, including employee termination costs, relocation of equipment and closure of plants, was estimated at $2.4 million, based on the plan prepared by management. The first steps in the plan commenced in December 2001. The cost of restructuring the A. J. Forsyth operations was anticipated at the time of acquisition.
During 2001, the Company recorded a foreign exchange loss of $1.4 million related to U.S. denominated debt that was not designated as a hedge of the Company’s net investment in foreign subsidiaries.
Debt repurchase costs relate to the repurchase of US $9.4 million of 10% Senior Notes in 2001. This cost includes $0.3 million for the write-off of deferred issue costs recorded at the time of the issue of the Senior Notes.
In June 2001, the Company sold the inventory and fixed assets of Total Distributors, its Tulsa-based energy sector operation, for cash of $9.6 million. This transaction resulted in a pre-tax operating loss on the sale of the business of $6.0 million. The decision to sell these assets below book value was based on the significant losses that had occurred in this operation due to the very competitive heat exchanger tubing market it served.
In May 2001, the Company announced that it had been unsuccessful in finalizing an agreement for the acquisition of a U.S. service center operation. The due diligence process and legal expenses resulted in a write-off of costs of $1.7 million.
Consolidated interest expense decreased $0.8 million to $23.0 million for 2001 compared to 2000. This decrease is due to lower debt outstanding offset by higher exchange rates on U.S. denominated long-term debt for 2001 compared to 2000. The majority of the interest expense relates to the fixed term 10% Senior Notes and, therefore, no benefit was experienced from lower prime borrowing rates available through the bank credit facility.
Income taxes for 2001 were $7.1 million compared to $18.4 million for 2000. This decrease relates primarily to lower earnings. In the second quarter of 2001, the Company recorded income taxes recovered of $0.4 million relating to an Ontario tax rate adjustment enacted in 2001, applicable to timing differences on the balance sheet.
Basic earnings per share for 2001 was $0.17 compared to $0.53 for 2000. Earnings per share before other costs and unusual items was $0.37 for 2001 compared to $0.53 in 2000.
The weighted average number of common shares outstanding for 2001 was 37,981,501 compared to 41,068,870 for 2000. The reduction relates to common shares purchased under a substantial issuer bid on March 31, 2000 and under normal course issuer bids during 2000. 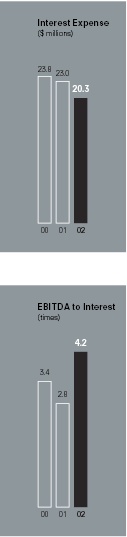
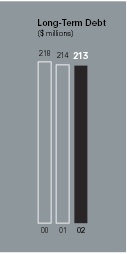
Interest Expense
The following table shows the components of interest expense.
The long-term debt interest expense relates to the 10% Senior Notes and the 8% Debentures. The Company currently has no floating rate long-term debt. The decrease in the long-term debt interest relates to lower interest costs due to the repurchase of 10% Senior Notes in 2001 offset by higher foreign exchange on the U.S. denominated debt interest of approximately $0.2 million. In September and October 2001, the Company used cash on hand to repurchase US $9.4 million of Senior Notes.
The Company had cash on hand and no short-term borrowings for most of 2002, resulting in net interest income of $0.2 million. The Company experienced a lower cash on hand position during the fourth quarter of 2002 due to increased working capital caused by price increases in steel inventory, higher revenues and the acquisition of Williams Steel.
Coverage Ratio
Russel Metals’ interest coverage ratio for 2002 improved to the best ratio experienced in the last ten years and is significantly higher than 2001 and 2000 due to the higher earnings from operations and lower interest expense. The Company’s ability to meet interest payments for the next two years remains strong. The coverage ratios set forth below are calculated using earnings from operations before interest, income taxes, depreciation and amortization (EBITDA) excluding restructuring costs and foreign exchange gain (loss) and, for 2001, debt repurchase costs and unusual items.
Coverage Ratio
Accounting Policies and Estimates
a) GoodwillThe Company adopted the Canadian Institute of Chartered Accountants’ new accounting standard for goodwill and other intangible assets effective January 1, 2002. Goodwill on acquisitions is not amortized but is subject to an impairment test. Under the new standard, all goodwill is subject to an initial impairment test as of January 1, 2002 and generally annually thereafter.
The Company’s initial impairment test as of January 1, 2002 indicated that the value of the goodwill was less than its carrying value in each reporting unit containing goodwill. The impairment loss of $15.1 million has been charged to opening retained earnings as at January 1, 2002.
Under the previous standard, the Company was required to write down goodwill when there was a permanent impairment in value based on a recoverability test using undiscounted cash flows. The new standard requires a “point in time” evaluation of goodwill at the reporting unit level. The initial evaluation of goodwill required at January 1, 2002, was at a point when the sector of the economy that the Company services and the steel industry were depressed. The Company’s evaluation of goodwill at the various reporting units required assumptions on the impact of the safeguard actions on imported steel in the U.S. and Canada, the effect of the softwood lumber tariffs on the British Columbia market, how oil and gas pricing would impact drilling, and the general economy. These factors significantly influence operations on a discounted cash flow basis, even though the Company believes these operations will contribute positively to its results subsequent to January 1, 2002.
The acquisition of Williams Steel in September 2002 resulted in goodwill of $2.7 million.
b) OtherThe preparation of the Company’s financial statements requires management to make estimates and judgements that affect the reported amounts. On an ongoing basis, the Company evaluates its estimates, including those related to bad debts, inventories, fixed asset lives, income taxes, restructuring costs, pensions and other post-retirement benefits, environmental, contingencies and litigation. The Company bases its estimates on historical experience and on various other assumptions that are believed to be reasonable under the circumstances, the results of which form the basis for making judgements about the carrying values of assets and liabilities that are not readily apparent from other sources. Actual results may differ from these estimates under different assumptions or conditions.
The Company’s most significant assets consist of accounts receivable and inventory. The Company maintains allowances for doubtful accounts for estimated losses resulting from the inability of its customers to make required payments. If the financial condition of the Company’s customers were to deteriorate, resulting in an impairment of their ability to make payments, additional allowances may be required. The Company reviews its inventory for obsolescence and to ensure that the cost of inventory is not in excess of the estimated market value. Inventory reserves or write downs are recorded if required.
The Company continues to use the intrinsic value-based method for stock-based compensation. If the Company had adopted the fair value-based accounting method effective January 1, 2002 and expensed stock options issued in 2002, the amount expensed would have been $136,000 or less than $0.01 per share. The Company has considered changing its policy to the fair value-based accounting method; however, since the change would not be material, the Company is waiting for the proposed new Canadian pronouncements to be finalized.
Capital Expenditures
Capital expenditures during 2002 were $12.8 million compared to $8.2 million in 2001. Russel Metals’ capital expenditures are mainly related to maintenance capital, the purchase of additional processing equipment across a broad base of the operations and upgrades to its existing facilities and computer systems.
In 2002, capital expenditures of $5.3 million were incurred in the British Columbia region to consolidate the Russel Metals operations with the A. J. Forsyth operations primarily to expand the Vancouver location to consolidate both operations.
Depreciation expense was $14.0 million for 2002 and $13.0 million for 2001. Depreciation expense has increased in 2002 mainly related to assets acquired from the A. J. Forsyth acquisition in October 2001. It will increase slightly in 2003 due to the Williams Steel acquisition.
Liquidity
Russel Metals stresses working capital management to ensure working capital is minimized and leverage reduced in an economic downturn. The Company reduced working capital employed significantly over the five quarters to March 31, 2002 as economic conditions deteriorated in the steel sector. Revenue increased in the last half of 2002 and working capital employed by Russel Metals has also increased. The amount of cash used for additional working capital in 2002 was $29.1 million.
Inventory and accounts receivable represent 76.4% of total assets, at December 31, 2002, compared to 72.7% at December 31, 2001. The increase relates to the expansion of inventory and accounts receivable levels to support the increased revenues. Property, plant and equipment utilized in the operations of the Company are very stable and are not expected to vary significantly. During 2002 capital spending was less than depreciation expense. Acquisitions in 2002 added $6.3 million to fixed assets.
The balances disclosed in the consolidated cash flow statements are adjusted to remove the non-cash component related to foreign exchange rate changes impacting inventory, accounts receivable and accounts payable of the U.S. operations. Assets purchased as part of the Williams Steel and Arrow Steel Processors acquisitions are also shown separately based on balances at the date of the transactions.
The Company’s net cash position, cash less bank indebtedness, at December 31, 2002 is $3.9 million. This balance is approximately $13.2 million lower than December 31, 2001.
For 2002, cash generated from operations was $55.7 million and cash utilized for changes in working capital was $29.1 million. Revenue increases have resulted in increased inventories utilizing cash of $55.8 million for 2002. However, accounts payable increases, related to increased volumes, generated cash of $23.9 million.
Inventory levels for 2002 increased $64.0 million from December 31, 2001. Inventory turns declined to 3.5 in the fourth quarter, as inventory levels increased more than cost of sales.
Inventory Turns

The inventory turns are calculated using the cost of sales for the quarter annualized and the ending inventory position.
The service center inventory turns are lower in the last half of 2002 compared to the first half due to higher inventory levels. The turns for the last half of 2002 are consistent with the last half of 2001. This can be compared with the industry turns estimated to be 3.2 for the three months ended November 30, 2002 as derived from the monthly Business Conditions Report published for the United States by the Metals Service Center Institute. It is management’s goal to maintain service center inventory turns at significantly higher levels than the industry norm.
Steel import/export inventory levels are significantly higher at December 31, 2002 compared to December 31, 2001 and the first three quarters of 2002. The inventory position at December 31, 2001 and during the first half of 2002 was intentionally lower than normal due to concerns about the impending dumping actions, steel pricing and profitability.
The level of inventory held by the import/export sector at December 31, 2002 has significantly reduced inventory turns for the quarter ended December 31, 2002 for the steel import/export sector and the total company. At December 31, 2002, approximately one third of the inventory was either pre-sold and not yet delivered to the customer or was in transit from the mill. The Company anticipates that the steel import/export sector will reduce its inventory during the first quarter of 2003.
The other major component of working capital is accounts payable and accrued liabilities, which increased to support higher inventory purchases in the last half of 2002, generating cash of $23.9 million. For 2001, accounts payable decreased utilizing cash of $46.3 million.
The Company acquired the operations including the fixed assets of Arrow Steel Processors, a coil processor of customer owned material, for $4.4 million in March 2002 and the operating assets of Williams Steel, a service center operation, for $17.0 million in September 2002.
During 2002, the Company utilized cash of $12.8 million on capital expenditures and $8.7 million on common and preferred share dividends.
For several years, the Company’s cash flow has been positively impacted by its ability to utilize income tax losses. In 2003, the Company will be required to make payments related to 2002 as well as instalments for 2003. The Company estimates income tax payments of $3.8 million will be required in the first quarter of 2003. Payments for the remainder of the year are estimated to be $5.8 million; however, this amount may vary based on earnings.
The Company will be relocating its flat rolled operation in Hamilton, Ontario during the fourth quarter of 2003. The Company anticipates spending $29 million for land, building, machinery and equipment for the new location. These commitments will result in periodic payments throughout 2003.
For 2001, overall cash generated was $46.7 million, determined by adding the decrease in bank indebtedness to the increase in cash. Cash generated from operations before working capital changes was $38.2 million. The improvement in net working capital generated by lower revenues resulted in cash generated from working capital of $54.9 million in 2001.
The sale of businesses in 2001 generated $10.4 million in cash.
The acquisition of A. J. Forsyth in October 2001 and Spartan Steel in August 2001, including assumed bank debt, consumed $42.4 million in cash.
In addition, during 2001 the Company utilized cash of $14.8 million to repurchase Senior Notes in September and October 2001, $8.2 million for capital expenditures and $9.8 million for common and preferred share dividends.
 Debt and Credit Facilities
The Company manages its cash position based on bank borrowings net of cash. The bank credit facilities table provides the split between loans and cash on deposit.
Bank Credit Facilities
The Company has two long-term debt instruments outstanding. The $30 million 8% Subordinated Debentures mature in 2006. The 10% Senior Notes mature in 2009. The balance outstanding at December 31, 2002 is US $115.6 million, unchanged from December 31, 2001. The Canadian dollar equivalent of the Senior Notes fluctuates with the exchange rate.
Russel Metals has a bank credit facility with a syndicate of Canadian and U.S. banks. The $253.8 million facility may be extended for an additional one year period on each anniversary, with the consent of the banks. Russel Metals has extended the facility to June 19, 2005. Russel Metals is entitled to borrow under this facility, on a revolving basis, up to an amount equal to the sum of specified percentages of eligible accounts receivable and inventories, to a maximum of $253.8 million. At December 31, 2002, Russel Metals was entitled to borrow $231.3 million, including letters of credit. At December 31, 2002, Russel Metals had borrowings of $5.8 million and $8.0 million in letters of credit under this facility. At December 31, 2001, Russel Metals had no borrowings and had $10.5 million in letters of credit under this facility.
In addition, certain U.S. subsidiaries of Russel Metals have their own one year bank credit facility. The maximum borrowing under this facility is US $35.0 million. At December 31, 2002, these subsidiaries had borrowings of US $11.8 million and letters of credit of US $5.6 million compared to borrowings of US $0.5 million and letters of credit of US $1.8 million at December 31, 2001.
Based on Russel Metals’ current financial position, operating results and absence of scheduled debt maturities, Russel Metals believes that it will generate a sufficient amount of cash flow to pay all of its preferred share dividends, interest obligations and operating costs as they become due during the next two years.
Contractual Obligations
The Company is contractually obligated to payments under its long-term debt agreements and lease obligations that come due during the following periods.

The Company does not have any off-balance sheet arrangements other than the letters of credit referred to in the bank credit facilities table.
Dividends and Share Capital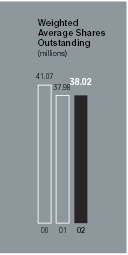
The ability to pay dividends on common shares is impacted by restrictions associated with the 10% Senior Notes due June 2009. Dividends on common shares and the repurchase of common and preferred shares are considered to be restricted payments under the Note Indenture. Due to these restrictions, the quarterly dividend on common shares was not declared for payment during the first quarter of 2002. The quarterly dividend on common shares of $0.05 per common share was resumed in the second quarter. A decision was made to increase the $0.05 per share quarterly dividend on common shares to $0.06 per share, in the third quarter of 2002. Dividends totaling $6.5 million were paid in 2002 to common shareholders compared to $7.6 million 2001. The Senior Notes do not restrict preferred share dividends. At December 31, 2002, the Company had $10.1 million available for restricted payments.
The ability to make restricted payments is adjusted quarterly by 50% of the quarterly net income or loss. Net income is adjusted for certain exclusions that include: extraordinary items, gains or losses on asset dispositions and unrealized foreign exchange gains and losses.
As at December 31, 2002, the Company had 38,057,001 common shares and 1,200,000 class II preferred shares outstanding. During 2002, 75,500 common shares were issued upon the exercise of stock options at an average exercise price of $3.35. At February 17, 2003, the Company has 38,059,301 common shares and 1,200,000 class II preferred shares outstanding.
Vision and Strategy
The metals distribution business is a segment of a mature, cyclical industry – steel. The use of distributors by both manufacturers and end users of steel continues to grow. This is evidenced by the growth in the percentage of total steel shipments from steel producers to distributors. As the distribution segment continues to grow its share of steel industry shipments, steel distributors such as Russel Metals can grow their business over the course of a cycle.
Russel Metals strives to deal with the cyclical nature of the business by operating with the lowest possible net assets throughout the course of a cycle. In addition, its aim is to be more profitable through the various successive peaks and troughs as the steel cycles progress. In order to achieve this, management emphasizes profitability rather than revenue growth. This intensive asset management reduces borrowings and therefore interest expense in declining periods in the economic cycle and creates much more stable returns on net assets over the course of the cycle. Our conservative management approach creates relatively stronger trough earnings but could cause peak earnings to be somewhat muted. In periods of rapid price increases, as was experienced in 2002, strong inventory management led to lower inventory holding gains due to lower inventory levels.
Management strongly believes that it is more prudent to be profitable throughout a cycle, without the spikes in earnings caused by less emphasis on asset management, and have average earnings over the full range of the cycle in the top decile of the industry.
Growth from selective acquisitions is also a core management philosophy. The Company focuses on investment opportunities in businesses that have dominant market niches or provide mass to existing Russel Metals operations. The acquisition of A. J. Forsyth and Williams Steel, and the subsequent rationalization of the new businesses with existing Russel Metals businesses, has enabled the Company to establish a stronger market presence in both British Columbia and Wisconsin. The Company believes it requires stronger market positions in the Quebec and Ontario service center marketplace and is looking to make meaningful acquisitions in those markets.
In the energy and import/export segments, all of the companies in the Russel Metals group have significant operations in the market niche that they service. Consistent with our acquisition philosophy, any new acquisitions in these areas could likely be either major stand alone operations or complements to existing operations.
In the future, the length of the steel-based economic cycle will continue to shorten and a management structure that allows the fastest reaction to the changes will be the most successful. The Company will continue to invest in business systems to enable faster reaction times to changing business conditions. In addition, management believes the high level of service and flexibility provided by service centers will enable this distribution channel to capture an increasing percentage of total steel revenues to end users, allowing for increased growth within the sector.
Outlook
We expect the current demand experienced in the service center and import/export operations in the previous three quarters of 2002 to continue, although we anticipate pricing will weaken. We expect the decline in gross margins that was experienced in the fourth quarter of 2002 to continue in 2003.
At the current oil and gas price levels we would anticipate a seasonal pickup in demand in the energy sector in 2003; however, we believe it will be very modest based on indications at this time.
Management's Report to the Shareholders
The accompanying consolidated financial statements, management’s discussion and analysis and all information in the Annual Report have been prepared by management and approved by the Board of Directors of the Company. The consolidated financial statements were prepared in accordance with Canadian generally accepted accounting principles and, where appropriate, reflect management’s best estimates and judgements. Management is responsible for the accuracy, integrity and objectivity of the consolidated financial statements and management’s discussion and analysis within reasonable limits of materiality and for the consistency of financial data included in the text of the Annual Report with that contained in the consolidated financial system.
To assist management in the discharge of these responsibilities, the Company maintains a system of internal controls designed to provide reasonable assurance that its assets are safeguarded; that only valid and authorized transactions are executed; and that accurate, timely and comprehensive financial information is prepared.
The Company’s Audit Committee is appointed annually by the Board of Directors and is comprised of Directors, all of whom are neither employees nor officers of the Company. The Audit Committee meets with management as well as with external auditors to satisfy itself that management is properly discharging its financial reporting responsibilities and to review the consolidated financial statements, the independent auditors’ report and the management’s discussion and analysis. The Audit Committee reports its findings to the Board of Directors for consideration in approving the consolidated financial statements and management’s discussion and analysis for presentation to the shareholders. The external auditors have direct access to the Audit Committee of the Board of Directors.
The consolidated financial statements have been independently audited by Deloitte & Touche LLP. Their report outlines the nature of their audits and expresses their opinion on the consolidated financial statements of the Company.
/s/ E. M. Siegel, Jr.
President and
Chief Executive Officer | /s/ Brian R. Hedges
Executive Vice President and
Chief Financial Officer |
Auditors’ Report
To the Shareholders of Russel Metals Inc.
We have audited the consolidated balance sheets of Russel Metals Inc. as at December 31, 2002 and 2001 and the consolidated statements of earnings and retained earnings and cash flows for each of the years in the three year period ended December 31, 2002. These financial statements are the responsibility of the Company’s management. Our responsibility is to express an opinion on these financial statements based on our audits.
We conducted our audits in accordance with Canadian generally accepted auditing standards. Those standards require that we plan and perform an audit to obtain reasonable assurance whether the financial statements are free of material misstatement. An audit includes examining, on a test basis, evidence supporting the amounts and disclosures in the financial statements. An audit also includes assessing the accounting principles used and significant estimates made by management, as well as evaluating the overall financial statement presentation.
In our opinion, these consolidated financial statements present fairly, in all material respects, the financial position of the Company as at December 31, 2002 and 2001 and the results of its operations and its cash flows for each of the years in the three year period ended December 31, 2002 in accordance with Canadian generally accepted accounting principles.
/s/ Deloitte Touche LLP
Chartered Accountants
Toronto, Ontario
January 31, 2003
Comments by Auditors on Canada – U.S. Reporting Differences
In the United States of America, reporting standards for auditors require the addition of an explanatory paragraph (following the opinion paragraph) when there is a change in accounting principles that have a material effect on the comparability of the Company’s financial statements, such as the changes described in Note 2 (a) to the financial statements. Our report to the Shareholders, dated January 31, 2003, is expressed in accordance with Canadian reporting standards, which does not require a reference to such a change in accounting principles in the auditors’ report when the change is properly accounted for and adequately disclosed in the financial statements.
/s/ Deloitte Touche LLP
Chartered Accountants
Toronto, Ontario
January 31, 2003
Consolidated Balance Sheets
On Behalf of the Board,
| /s/ A.C. Thorsteinson | /s/ C.R. Fiora |
| Director | Director |
Consolidated Statements of Earnings and Retained Earnings
Consolidated Cash Flow Statements
Notes to the Consolidated Financial Statements
1. Summary of Significant Accounting Policies
a) Principles of consolidationThe consolidated financial statements include the accounts of Russel Metals Inc. and its subsidiary companies herein referred to as the Company. The reporting currency is Canadian dollars unless otherwise noted. All material inter-company balances, transactions and profits have been eliminated.
These consolidated financial statements have been prepared in accordance with Canadian generally accepted accounting principles. Material differences from accounting principles generally accepted in the U.S. are disclosed in Note 16.
b) InventoriesInventories are recorded at the lower of cost and net realizable value. Cost is determined on either an average cost basis or an actual cost basis depending on the business unit.
c) Property, plant, equipment and depreciationProperty, plant, equipment and leasehold improvements are recorded at cost. Depreciation is provided on a straight-line basis at rates that charge the original cost of such assets to operations over their estimated useful lives. The rates used are 20 years for buildings, 10 years for machinery and equipment, 2 to 5 years for computer equipment and over the lease term for leasehold improvements. Depreciation expense was $13,973,000 in 2002 (2001: $12,993,000; 2000: $11,863,000).
d) Deferred financing charges and amortizationCosts incurred that relate to financing are deferred and amortized over the period of the related financing. Deferred financing charges are recorded at cost less accumulated amortization. Amortization of deferred financing charges was $1,219,000 in 2002 (2001: $1,243,000; 2000: $1,314,000).
e) Goodwill and amortizationGoodwill represents the excess purchase price paid on acquisitions over the value assigned to identifiable net assets acquired. Goodwill on acquisitions subsequent to July 1, 2001 is not amortized but is subject to an annual permanent impairment test (see Note 2). Goodwill on acquisitions prior to July 1, 2001 was amortized on a straight-line basis over a period not exceeding 40 years or written down when there has been a permanent impairment in value. Effective January 1, 2002 all goodwill ceased to be amortized and is subject to an annual permanent impairment test. Amortization recorded in 2001 was $427,000 and in 2000 was $1,068,000. For 2000 goodwill was amortized over a period not exceeding 20 years.
f) PensionsThe cost of pension benefits earned by employees covered under defined benefit plans is determined using the projected benefit method prorated on service and is charged to expense as services are rendered. Aggregate gains and losses are amortized on a straight-line basis over the estimated average remaining service lives of the employee groups, using the corridor approach. The cost of post-retirement benefits other than pensions is recognized on an accrual basis over the working lives of employees.
g) Income taxesThe Company uses the liability method of income tax allocation. Under this method, future tax assets and liabilities are determined based on differences between the financial accounting and tax bases of assets and liabilities and are measured using the substantively enacted tax rates and laws that will be in effect when the differences are expected to reverse. The Company adopted the new Canadian accounting standards for income taxes effective January 1, 2000 (see Note 2).
h) Foreign currency translationThe accounts of foreign subsidiaries are translated into Canadian dollars at the noon spot rates in effect at the balance sheet date. For 2002, the U.S. dollar published exchange rate was 1.5796 (2001: 1.5926). Revenues and expenses are translated at the average rate of exchange for the year. For 2002, the U.S. dollar published average exchange rate was 1.5703 (2001: 1.5489). The resulting gains or losses are accumulated as a separate component of shareholders’ equity.
Effective January 1, 2001, the Company adopted the new Canadian accounting standards on foreign currency translation and accordingly, exchange gains or losses on long-term debt denominated in foreign currencies not designated as a hedge are expensed as incurred (see Note 2). Exchange gains or losses on the translation of long-term debt denominated in a foreign currency designated as a hedge of the Company’s net investment in foreign subsidiaries are included in the separate component of shareholders’ equity.
i) Earnings per shareBasic earnings per common share are calculated using the weighted daily average number of common shares outstanding. The weighted average number of common shares for 2002 was 38,024,034 (2001: 37,981,501; 2000: 41,068,870). After the effect of an adjustment for stock options, the diluted weighted average number of common shares for 2002 was 39,972,976 (2001: 38,443,168; 2000: 41,068,870).
j) Stock-based compensationIn 2001, the Company adopted the new accounting standards for stock-based compensation and other stock-based payments. The Company has chosen to account for the employee stock-based compensation plans using the intrinsic value-based method as allowed by the new standard. As required by the standard, pro forma net income and earnings per share have been provided as if the fair value-based accounting method had been used (see Note 11).
k) Revenue recognitionRevenue is recognized when the goods are shipped to the customer. Revenue on certain sales in the energy segment, where the Company acts as an agent, is presented on a net basis.
l) Derivative financial instrumentsThe Company uses foreign exchange contracts to manage foreign exchange risk on certain committed cash outflows. Realized and unrealized foreign exchange gains and losses not designated as a hedge are included in income. Derivatives are not entered into for speculative purposes and the use of derivative contracts is governed by documented risk management policies.
m) Use of estimatesThe preparation of consolidated financial statements in conformity with Canadian generally accepted accounting principles requires management to make estimates and assumptions that affect the reported assets and liabilities and disclosure of contingent assets and liabilities at the date of the financial statements and the reported amounts of revenue and expenses during the reporting periods. In particular, provisions for environmental cleanup costs of previously discontinued operations, inventories, accounts receivable and other contingencies represent management’s best estimates. Actual results could differ from these estimates.
2. Change in Accounting Policies
a)Effective January 1, 2002, the Company adopted the entire provisions of the new Canadian accounting standard for goodwill and other intangibles. Under this standard, goodwill is no longer amortized but is subject to an impairment test at least annually. As required by the standard, the Company has performed a transitional goodwill impairment evaluation based on discounted cash flows in each reporting unit as at January 1, 2002. The transitional impairment loss of $15,123,000 as a result of this evaluation has been charged to retained earnings at January 1, 2002.
The following table presents the impact on comparative net earnings and earnings per share had the new standard been in effect January 1, 2000.
b)Effective July 1, 2001, the Company adopted the new accounting standard for business combinations. The Company has applied this new standard in its acquisitions subsequent to July 1, 2001 (see Note 3) and the goodwill generated from these acquisitions was not amortized as required by the transitional provisions of the goodwill standard.
c)Effective January 1, 2001, the Company adopted the new Canadian accounting standards for earnings per share, foreign currency translation and stock-based payments. Under the new earnings per share standard, the treasury stock method is used for determining the dilutive effect of stock options issued. Under the new accounting standard for foreign currency translation, foreign exchange gains and losses on long-term debt are no longer deferred and amortized. The new accounting standard on stock-based compensation permits the intrinsic value-based method of accounting for stock-based compensation. The implementation of these standards does not have a material effect on the Company’s results of operations, financial position or cash flows.
d)Effective January 1, 2000, the Company adopted the liability method of tax allocation for accounting for income taxes as provided under the new Canadian accounting standards. Under the liability method, future tax assets and liabilities are determined based on differences between the financial accounting and tax bases of assets and liabilities and are measured using the substantively enacted tax rates and laws that will be in effect when the differences are expected to reverse.
The Company elected to adopt these standards retroactively without restatement. The cumulative effect of adopting the standard was an increase in net tax assets of $17,767,000, cumulative translation adjustment of $898,000 and retained earnings of $18,665,000 as of January 1, 2000.
3. Business Acquisitions
a)Effective September 9, 2002, the Company purchased substantially all of the assets of the Milwaukee, Wisconsin service center operation formerly known as Williams Steel for $17.0 million in cash. This acquisition is intended to strengthen the existing Bahcall operations in Wisconsin and has led to the restructuring of these operations. Costs associated with the restructuring of the Williams Steel location of $0.2 million were included in goodwill.
Effective March 1, 2002, the Company purchased the operations and the fixed assets of Arrow Steel Processors, a coil processor of customer owned material located in Texas for $4.4 million cash.
Effective October 15, 2001, the Company purchased 100% of the shares of A. J. Forsyth and Company Limited, a Canadian service center operation located in British Columbia, for cash consideration of $22.0 million and assumed bank debt of $13.9 million. The acquisition was made to strengthen the B.C. Region and led to the restructuring of the B.C. service center operations. Costs of $1.2 million associated with the restructuring of the A. J. Forsyth locations were included in goodwill on acquisition, which totaled $7.6 million.
Effective August 16, 2001, the Company purchased 100% of the shares of Spartan Steel Products, Inc., a U.S. distributor of energy sector pipe, for cash consideration of $3.0 million and assumed bank debt of $3.3 million.
Effective October 9, 2001, the Company purchased 100% of the shares of 1377804 Ontario Inc., a Canadian service center operation located in Ontario, for cash consideration of $255,000.
Effective September 1, 2000, the Company purchased Triumph Tubular & Supply Ltd., a Calgary, Alberta distributor of oil country tubular goods, for $4.5 million cash and assumed bank debt of $5.3 million. Additional amounts under an earnout based on results may be paid over five years and will be incremental to goodwill. The additional amount related to 2002 is $nil (2001: $102,000; 2000: $509,000).
These acquisitions have been accounted for using the purchase method and their results of operations have been consolidated since their respective acquisition dates.
Net assets acquired, at assigned values at acquisition dates:

The tax deductible portion of goodwill is $2.7 million (2001: $0.8 million; 2000: $nil).
In May 2001, the Company announced that it had been unsuccessful in finalizing an agreement for the acquisition of a U.S. service center operation. The due diligence process and legal expenses resulted in a write-off of costs of $1.7 million.
b)In 2002, costs of restructuring the Bahcall locations, including the closure of the Waukeshau location and employee terminations, of $3.1 million have been charged to income.
In 2001, the costs of restructuring the Russel Metals B.C. locations of $2.4 million have been charged to income. During 2002, $0.4 million of this provision, not required for restructuring, was included in income.
4. DivestituresDivestitures include the sale of the inventory and fixed assets of Total Distributors, the Company’s Tulsa-based energy sector operation for cash of $9.6 million on June 15, 2001. This sale resulted in a loss on sale of business of $6.0 million.
5. Property, Plant and Equipment
6. Other Assets
Other assets includes a demand loan to an officer at interest rates prescribed by tax authorities for the purchase of Company shares in the amount of $710,820 (2001: $741,670). Repayment of these loans is not tied to the value of the underlying stock and qualifies for asset treatment.
7. Revolving Credit Facilities
The Company has a credit facility with a syndicate of banks which provides a line of credit to a maximum of $253.8 million, including letters of credit. The Company has extended the facility to June 19, 2005. Borrowings under this facility are restricted by certain financial covenants with which the Company was in compliance at December 31, 2002. The obligations of the Company under this Agreement are secured by a pledge of trade accounts receivable and inventories of a significant portion of the Company’s operations. At December 31, 2002 and 2001, the Company had borrowings of $5.8 million (2001: $nil) and letters of credit of $8.0 million (2001: $10.5 million) under this facility.
In addition, certain U.S. subsidiaries of the Company have their own credit facility. The maximum borrowing under this facility is US $35.0 million. At December 31, 2002, these subsidiaries had borrowings of US $11.8 million (2001: US $0.5 million) and letters of credit of US $5.6 million (2001: US $1.8 million).
8. Long-Term Debt
a) 10% Senior NotesDuring the year ended December 31, 2001, the Company repurchased US $9.4 million of the 10% Senior Notes for US $9.4 million in cash.
During 2002 and 2001, US $69.4 million of these are notes of Russel Metals Inc., legal entity, and have been designated as a hedge of the Company’s net investment in foreign subsidiaries. The remaining US $46.2 million are notes of RMI USA LLC, a U.S. subsidiary of Russel Metals Inc.
The notes are redeemable, as units, in whole or in part, at the joint option of the Company and the U.S. Subsidiary, on or after June 1, 2004 at 105% of the principal amount, declining rateably to 100% of the principal amount on or after June 1, 2007. In addition, the notes are also redeemable, in whole, at the option of the Company at any time at 100% of the principal amount in the event of certain changes affecting Canadian withholding taxes. The notes contain certain restrictions on the payment of common share dividends.
b) 8% Subordinated DebenturesThe 8% Subordinated Debentures, which are unsecured and mature in June 2006, are redeemable at face value subject to certain conditions being met.
9. Interest expense
Total interest paid by the Company in 2002 was $20,298,000 (2001: $23,272,000; 2000: $23,654,000).
10. Income taxes
a) The non-current future income tax balances consist of:
b)The Company’s effective income tax rate is derived as follows:
c)The details of the income tax provision are as follows:
d)Income taxes paid in 2002 were $5,942,000 (2001: $2,058,000; 2000: $3,838,000).
e)The Company has Canadian net operating losses carried forward for tax purposes for which a valuation allowance has been recorded that expire as follows:
In addition, the Company has recorded a valuation allowance for timing differences of approximately $7.7 million (2001: $3.7 million).
11. Shareholders’ Equity
a) The components of shareholders’ equity are as follows:
b)At December 31, 2002, the authorized share capital of the Company consists of:
| (i) | an unlimited number of common shares without nominal or par value; |
| (ii) | an unlimited number of Class I preferred shares without nominal or par value, issuable in series; and |
| (iii) | an unlimited number of Class II preferred shares without nominal or par value, issuable in series. |
The Company has 1,200,000 cumulative, redeemable Class II preferred shares, Series C with annual cash dividends of $1.875 per share payable in quarterly instalments authorized, issued and outstanding as of December 31, 2002 and 2001. This series of Class II preferred shares is non-voting and is redeemable at a price of $25 per share without condition.
The Directors have the authority to issue the Class I and Class II preferred shares in series and fix the designation, rights, privileges and conditions to be attached to each series, except the Class I shares shall be entitled to preference over the Class II shares with respect to the payment of dividends and the distribution of assets in the event of liquidation, dissolution or winding-up of the Company.
c)The number of common shares issued and outstanding at December 31 was as follows:
During 2000, the Company purchased 7,143,935 shares pursuant to a substantial issuer bid and 2,384,000 shares pursuant to a normal course issuer bid. The stated capital has been removed from the common share account and the remainder charged to retained earnings.
The common shares purchased were cancelled.
d)The Company has a shareholder approved share option plan, the purpose of which is to provide the Directors and employees of the Company and its subsidiaries with the opportunity to participate in the growth and development of the Company. The number of common shares that may be issued under the share option plan is 4,500,000. The options are exercisable on a cumulative basis to the extent of either 33 1/ 3% or 20% per year of total options granted, except that under certain specified conditions the options become exercisable immediately. The consideration paid by employees for purchase of common shares is added to share capital.
The following is a continuity schedule of options outstanding:

The outstanding options at December 31, 2002 have exercise prices ranging from $3.00 to $6.375. These options expire in the years 2005 to 2012 and have a weighted average remaining contractual life of 7.7 years.
At January 1, 2001, the Company adopted the new accounting standard for stock-based compensation. As permitted by the standard, the Company has elected to account for stock options using the intrinsic value-based method.
Pro forma net earnings and earnings per share, as calculated under the fair value-based method are as follows:
The Black Scholes option-pricing model assumptions used to compute compensation expense under the fair value-based method are as follows:
12. Financial Instruments
a) Fair valueThe estimated fair value of long-term debt as at December 31, 2002 and 2001 is estimated based on the last quoted trade price, where they exist, or on the current rates available to the Company for similar debt of the same remaining maturities.
As at December 31, 2002 and 2001, the estimated fair value of financial assets, liabilities and off balance sheet instruments approximates their carrying values.
b) Credit riskThe Company, in the normal course of business, is exposed to credit risk from its customers. This risk is mitigated by the fact that its customer base is geographically diverse and in different industries. The Company is also exposed to credit risk from the potential default by any of its counterparties on its foreign exchange forward contracts. The Company mitigates this risk by entering into forward contracts with Canadian chartered banks only.
c) Interest rate riskThe Company is not exposed to significant interest rate risk. The Company’s long-term debt is at fixed rates. The Company’s bank debt that is used to finance working capital, which is short-term in nature, is at floating interest rates.
d) Foreign exchange riskThe Company uses foreign exchange contracts to manage foreign exchange risk on certain future committed cash outflows. As at December 31, 2002, the Company had outstanding forward foreign exchange contracts in the amounts of US $3.0 million (2001: US $6.0 million) and € nil (2001: € 0.4 million).
The Company has designated US $69.4 million of the Senior Notes and other U.S. borrowings as a hedge of its net investment in foreign subsidiaries. The exchange gains and losses on U.S. borrowing not designated as a hedge of its net investment are charged to income as incurred. This resulted in a foreign exchange gain of $261,000 (2001 loss: $1.4 million).
13. Segmented Information
The Company conducts business primarily in three metals business segments.
i) Service center distributionThe Company’s network of service centers carries a full line of metal products in a wide range of sizes, shapes and specifications, including carbon hot rolled and cold finished steel, pipe and tubular products, stainless steel and aluminum. The Company services all major geographic regions of Canada and selected regions in the United States.
ii) Energy sector distributionThe Company’s energy sector distribution operations carry a more specialized and limited product line than the service centers. These operations distribute pipe, tube, valves and fittings, primarily to the energy sector in Western Canada and the Western United States.
iii) Steel import/exportThe Company’s steel import/export business primarily imports foreign steel products into Canada and the United States for sale to third party steel service centers and other customers.
The Company has segmented its operations on the basis of management reporting and geographic segments in which it operates.
a) Results by business segment:
b) Results by geographic segment:
14. Pensions and Benefits
The Company maintains defined benefit pension plans, post retirement benefit plans and defined contribution pension plans in Canada and 401(k) defined contribution pension plans in the United States.
The components for the Company’s pension and benefit expense include the following:

The actuarial determinations were based on the following assumptions in each year:
The health care cost trend rates used were 5% for dental and 9% (2001: 8%; 2000: 9%) graded out for medical, which is reduced 1% per year until 5% and 5% thereafter. A 1% change in trend rates would result in an increase in the accrued benefit obligation for post retirement benefits of $762,000 or a decrease of $661,000 and an increase in net periodic cost of $65,000 or a decrease of $55,000.
The following information pertains to the Company’s defined benefit pension and other benefit plans, excluding those which are in the process of being wound up.
As at December 31, 2002, five (2001: five) of the Company’s pension plans, included in the previous table, had a projected benefit obligation of $42,814,000 (2001: $43,247,000), a fair value of plan assets of $37,186,000 (2001: $38,460,000) and an unfunded obligation of $5,628,000 (2001: $4,787,000).
Also at December 31, 2002, the Company has certain unfunded executive arrangements with an accrued benefit obligation of $4,524,000 (2001: $4,954,000).
The other benefit plans primarily represent obligations to retired employees of sold or closed businesses. Approximately 4.5% of all active employees are entitled to retirement benefits.
The plans in the process of being wound up relate to previously discontinued operations. The resolution of the surplus may result in sharing arrangements with employees of those operations. During 2002, the surplus in one of these plans was distributed to the employees and the Company.
As at December 31, 2002, approximately 37% of all pension plan assets were invested in equities, 37% in fixed income securities, and 26% in cash.
15. Contingencies and Commitments
a)The Company and certain of its subsidiaries have been named defendants in a number of legal actions. Although the outcome of these claims cannot be determined, management intends to defend all claims and has recorded provisions based on its best estimate of the potential losses. In the opinion of management the resolution of these matters is not expected to have a materially adverse effect on the Company’s financial position, cash flows or operations.
b)The Company and its subsidiary companies have operating lease commitments, with varying terms, requiring approximate annual payments as follows: 2003: $10,108,000; 2004: $10,029,000; 2005: $7,415,000; 2006: $5,658,000; 2007: $4,224,000; 2008 and beyond: $11,091,000. Rental expense on operating leases were as follows: 2002: $9,753,000; 2001: $10,645,000; 2000: $12,741,000.
c)The Company is incurring site cleanup and restoration costs related to properties held for resale. Remedial actions are currently underway at several sites. The estimated costs of these cleanups have been provided for based on management’s best estimates. Additional costs may be incurred at these or other sites, as site cleanup and restoration progress, but the amounts cannot be quantified at this time.
16. United States Generally Accepted Accounting Principles
The following table represents the material differences between Canadian and U.S. Generally Accepted Accounting Principles (GAAP):
a)Effective January 1, 2000, the Company adopted the new Canadian accounting standards for accounting for income taxes. Canadian standards require an adjustment to income when changes in income tax rates have been substantively enacted. A proposed change in income tax rates resulted in a charge to income of $360,000 for the year ended December 31, 2000. As at December 31, 2000, this tax rate change had not been enacted as required by the U.S. standards. In 2001, this proposed change was enacted.
b)Statement of Financial Accounting Standards No. 87, Employer’s Accounting for Pensions, requires that the transitional obligation be amortized over the expected average service lives of the employee group rather than charged to retained earnings immediately as allowed under the Canadian standards. In addition, the U.S. standard requires the recognition of an additional minimum pension liability. Four of the Company’s plans have a minimum liability, which has been charged to other comprehensive income under U.S. GAAP.
c)In June 2001, the Financial Accounting Standards Board (“FASB”) issued Statement of Financial Accounting Standards (“SFAS”) No. 141, Business Combinations and SFAS 142, Goodwill and Other Intangible Assets. The effect of adopting these standards is not materially different from the adoption of the Canadian standards (see Note 2) except that the transitional impairment loss is charged to earnings as a cumulative effect of a change in accounting principle under U.S. GAAP.
d)Other cumulative comprehensive income also includes changes in the cumulative translation account and the taxes thereon. This account represents a reduction in the Company’s shareholders’ equity and represents unrealized translation adjustments, which arise on the translation to Canadian dollars of foreign denominated assets and liabilities.
e)During 2002, FASB issued SFAS 145, Rescission of FASB statements No. 4, 44 and 64 and FASB Interpretation No. 45, Guarantor’s Accounting and Disclosure Requirements for Guarantees, Including Indirect Guarantees of Indebtedness of Others, which are not expected to have a material impact on the Company’s consolidated results of operations, financial position or cash flows. Also, during 2002, FASB issued SFAS 146, Accounting for Costs Associated with Exit or Disposal Activities. The Company plans to implement this standard for transactions entered into subsequent to December 31, 2002, and accordingly this new standard has not been used for recording the costs associated with restructuring the Williams Bahcall operations.
f)On January 1, 2001, the Company adopted SFAS 133, Accounting for Derivative Instruments and Hedging Activities and the corresponding amendments under SFAS 138. SFAS 133, as amended by SFAS 138, did not have a material impact on the Company’s consolidated results of operations, financial position or cash flows. During 2001, FASB issued SFAS 143, Accounting for Asset Retirement Obligations and SFAS 144, Accounting for the Impairment or Disposal of Long-Lived Assets, which did not have a material impact on the Company’s consolidated results of operations, financial position or cash flows.
17. Subsequent Event
In December 2003, the Company plans to relocate its flat rolled operation in Hamilton, Ontario to a new facility. The projected cost of the land, building and machinery is expected to be $29 million. The move to the new facility is not expected to disrupt the Company’s operations.
Summarized Quarterly Financial Information
Definitions
Adjusted interest – Interest for 1998 and 1999 includes pre-tax interest on the 9% Convertible Debentures recorded as dividends.
Adjusted net earnings– Earnings from continuing operations before other costs and unusual items net of taxes.
Adjusted pre-tax earnings– Earnings from continuing operations before taxes, other costs and unusual items.
Dividend yield– Indicated dividend over market price of common shares both at February 28, 2003.
EBIT– Earnings from continuing operations before deduction of interest, taxes, other costs and unusual items.
EBITDA– Earnings from continuing operations before deduction of interest, taxes, other costs, unusual items, depreciation and amortization.
Free cash flow– Cash from operating activities less capital expenditures.
Market capitalization– Outstanding common shares times market price of a common share at December 31.
Return on market capitalization– Adjusted net earnings over market capitalization.
Return on common equity– Adjusted net earnings over shareholders’ equity less preferred shares.
Share appreciation– Return on change in closing share price from December 31, 2001 to December 31, 2002.
Corporate Governance Practices
The members of the Board of Directors are:
James F. Dinning
Executive Vice President
TransAlta Corporation | Robbert Hartog
President
Robhar Investments Ltd. | Edward M. Siegel, Jr.
President and Chief Executive Officer
Russel Metals Inc. |
| | | |
Carl R. Fiora
Corporate Director,
steel industry executive | Lise Lachapelle
Corporate Director | Arni C. Thorsteinson
President
Shelter Canadian Properties Limited |
| | | |
Anthony F. Griffiths
Corporate Director,
Chairman of the Board
Russel Metals Inc. | John W. Robinson
Corporate Director,
steel industry executive | |
Russel Metals’ Board of Directors places high value on the responsible fulfilment of its duties to the Company and its shareholders. The Board has considered and modified, where changes have been identified, its corporate governance practices in light of the guidelines set out in the 1994 Toronto Stock Exchange Committee on Corporate Governance and current advances in corporate governance and is satisfied it operates effectively and independently of management.
Mandate of the BoardThe Board’s mandate is to supervise the management of the business and affairs of the Company. Through the Board’s stewardship of the Company, the goal is to enhance long-term value for the shareholders. The Board discharges its responsibility by delegating to management responsibility for day-to-day operations of the business, by monitoring the Company’s performance and by considering and approving the Company’s strategic direction. The Board has implemented a number of practices to promote effective governance, including a written job description for the CEO, an annual written questionnaire to all directors and at least two annual Board meetings where management is not present for portions of the meeting.
Composition of the BoardThe Directors bring to the Company a balance of industry and operational expertise as well as backgrounds in other areas which the Board believes are of benefit. The Board has concluded that all of the Directors of the Company, other than Mr. Siegel, are unrelated within the meaning of the Toronto Stock Exchange Guidelines.
Committees of the BoardThe Board delegates certain of its functions to four committees of the Board to facilitate more detailed consideration of certain issues. Each of the committees is comprised entirely of unrelated directors.
Audit CommitteeThe Audit Committee meets quarterly to review the Company’s financial statements, management’s discussion and analysis and press releases. The Audit Committee monitors the integrity of internal control and management information through discussions with management and regular meetings with the external auditors. In addition, the Committee reviews other public disclosure documents, including the annual information forms, registrations and prospectuses. The members are: J. F. Dinning, C. R. Fiora, R. Hartog (chair) and A. C. Thorsteinson.
Corporate Governance CommitteeThe Corporate Governance Committee develops comprehensive written mandates for each of the Board committees, monitors and evaluates the corporate governance system, recommends candidates for election to the Board and serves as a forum for concerns of directors which may not be appropriate for discussion in full Board meetings. The members are: J. F. Dinning, C. R. Fiora and A. F. Griffiths (chair).
Management Resources and Compensation CommitteeThe Management Resources and Compensation Committee reviews compensation policies for the Company’s executive officers and is responsible for succession planning for the most senior members of management. The members are: A. F. Griffiths, R. Hartog, L. Lachapelle (chair) and J. W. Robinson.
Environmental Management and Health & Safety CommitteeThe Company has established an Environmental Management and Health & Safety Committee for the purpose of reviewing compliance policies and procedures in accordance with legislative and regulatory requirements with regard to Environmental and Health and Safety issues. The members are: L. Lachapelle, J. W. Robinson (chair) and A. C. Thorsteinson.
Additional information about the Company’s governance practices may be found in the Management Proxy Circular.
Russel Metals Inc. Directory
Head Office
1900 Minnesota Court, Ste. 210
Mississauga, Ontario, Canada
L5N 3C9
Tel: (905) 819-7777
Fax: (905) 819-7409
E-mail: info@russelmetals.com
Internet: www.russelmetals.comOfficers Anthony F. Griffiths
Chairman of the Board
Toronto Edward M. Siegel, Jr.
President and Chief Executive Officer
Mississauga Brian R. Hedges
Executive Vice President and
Chief Financial Officer
Mississauga Marion E. Britton
Vice President, Controller and
Assistant Secretary
Mississauga Elaine G. Hillis
Assistant Secretary
Mississauga William M. O’Reilly
Secretary
Davies Ward Phillips & Vineberg, LLP
Toronto Metal Operations Service Centers Operating under the name RUSSEL METALS, unless otherwise noted below Canada British Columbia
Operating under the name
A. J. Forsyth throughout B.C. Delta (Vancouver)
830 Carlisle Road,
V3M 5P4
Tel: (604) 525-0544 Campbell River
2710 Vigar Road,
V9W 6A3
Tel: (250) 287-8841 Fort St. John
Mile 49-1/2 Alaska Highway,
V1J 4M6
Tel: (250) 785-5641 Kelowna
668 Willow Park Road,
V1X 5C4
Tel: (250) 765-3123 Kitimat
815 Enterprise Avenue,
V8C 2P1
Tel: (250) 632-4702 Nanaimo
2555 McCullough Road,
V9S 4M9
Tel: (250) 758-2454 1125B Farquhar Street,
V9R 2G2
Tel: (250) 753-1555 Prince George
1154 Pacific Street,
V2N 5S3
Tel: (250) 563-1274 990 Industrial Way,
V2N 5S1
(Specializing in flat rolled)
Tel: (250) 563-1274 Alberta Calgary
5724 – 40th Street S.E.,
T2C 2A1
Tel: (403) 279-6600 Edmonton
7016 – 99th Street,
T6E 4T2
Tel: (780) 439-2051 Russel Drilling & Industrial Supply
3751 – 69th Avenue,
T6B 3G4
Tel: (780) 440-0779 Grande Prairie
11035 – 89th Avenue,
T8V 5B9
Tel: (780) 539-3193 Red Deer
6724 Golden West Avenue,
T4P 1A8
Tel: (403) 346-2096 Saskatchewan Regina
445 – 1st Avenue East,
S4N 4Z3
Tel: (306) 721-6411 Russel Drilling & Industrial Supply
475 – 1st Avenue East,
S4N 4Z3
Tel: (306) 721-9355 Saskatoon
922 – 51st Street East,
S7K 5C7
Tel: (306) 931-3338 Manitoba Winnipeg
Drummond McCall
1359 St. James St.,
R3H 0K9
Tel: (204) 772-0321 Russel Metals
1510 Clarence Avenue,
R3T 1T6
Tel: (204) 475-8584 | Ontario Mississauga (Toronto)
1900 Minnesota Court, Ste. 210,
L5N 3C9
(Ontario General Line Sales)
Tel: (905) 819-7777 Burlington
3455 N. Service Road,
L7N 3G2
Tel: (905) 819-7777 Milspec Industries
5036 South Service Road,
L7L 5Y7
(Specializing in strapping)
Tel: (905) 333-0646 Cambridge
Vantage Laser Cutting
1600 Industrial Road, Unit #10
N3H 4W5
Tel: (519) 653-1588 Hamilton
175 Shaw Street,
L8N 3S2
(Specializing in non-ferrous sales)
Tel: (905) 522-5930
(Specializing in chain)
Tel: (905) 522-1130 B&T Steel
400 Gage Ave. North,
L8L 7B2
(Specializing in flat rolled)
Tel: (905) 544-6866 Kingston
191 Dalton Avenue,
K7K 6C2
Tel: (613) 546-1281 London
685 Hale Street,
N5W 1J1
Tel: (519) 451-1140 Milton
York Steel
8725 Holgate Crescent,
L9T 2X7
(Specializing in structurals)
Tel: (905) 875-1447 Ottawa
3101 Hawthorne Road,
K1G 3V8
Tel: (613) 247-7700 Stoney Creek
McCabe Steel
687 Arvin Ave.,
L8E 5R2
Tel: (905) 643-8284 Thunder Bay
Drummond McCall
620 Norah Crescent,
P7C 5V8
Tel: (807) 622-8898 Windsor
3702 Walker Road,
N8W 3S8
Tel: (519) 250-3788 Quebec Lachine
Métaux Russel
5205 Fairway Street,
H8T 1C1
Tel: (514) 631-4861
Métaux Russel Express
Tel: (514) 633-6000 Arvida
Métaux Russel
2420 Bauman St.,
G7S 4S4
Tel: (418) 548-3103 New Brunswick Edmundston
25 Rue Richards Street,
E3V 4H4
Tel: (506) 739-9561 Moncton
1133 St. George Blvd., Ste.
310 E1E 4E1
Tel: (506) 859-4485 Saint John
37 McIlveen Drive,
McAllister Industrial Park,
E2L 4B3
Tel: (506) 635-0005 Nova Scotia Halifax
28 Lakeside Park Drive,
B3T 1A3
Tel: (902) 876-7861 Newfoundland Mount Pearl
Donovans Industrial Estates,
A1N 5B7
Tel: (709) 364-3300 United States Russel Metals Williams Bahcall
Appleton, Wisconsin
975 N. Meade Street,
54912
Green Bay, Wisconsin
875 N. Bahcall Court,
53186
Toll Free: 1-800-875-7624 Milwaukee, Wisconsin
999 W. Armour Avenue,
53221
Tel: (414) 481-7100 Baldwin International Solon, Ohio
30403 Bruce Industrial Parkway
44139
Tel: (440) 248-9500 | Energy Canada Comco Pipe and Supply Company
Edmonton, Alberta
5910 – 17th Street,
T6P 1S5
Tel: (780) 440-2000 Calgary, Alberta
9307 – 48th St. S.E.,
T2C 2R1
Tel: (403) 203-0766 Stonewall, Manitoba
116 – 4th Street East,
R0C 2Z0
Tel: (204) 467-8797 Guelph, Ontario
Kerr Industrial Park,
N1H 6H9
Tel: (519) 763-1114 Sarnia, Ontario
1018 Gladwish Drive North,
N7T 7H3
Tel: (519) 332-6666 Dollard des Ormeaux, Quebec
65 Brunswick Ave., Ste. 106,
J6W 5H9
Tel: (514) 421-2455 Fedmet Tubulars
Calgary, Alberta
700 – 9th Avenue South West, Ste. 2200,
T2P 3V4
Tel: (403) 237-0955 Triumph Tubular & Supply
Calgary, Alberta
441 – 5th Avenue South West, Ste. 875,
T2P 2V1
Tel: (403) 262-3777 United States Pioneer Pipe
Denver, Colorado
1660 Lincoln Street, Ste. 2300,
80264
Tel: (303) 289-3201 Lindon, Utah (Provo)
1610 West 200 South,
84042
Tel: (801) 224-8739 Houston, Texas
2203 Timberloch Place, Ste. 125-1
The Woodlands, 77380
Tel: (281) 292-2875 Spartan Steel Products
Evergreen, Colorado
2942 Evergreen Pkwy, Ste. 207,
80439
Tel: (303) 670-9048 Import/Export Canada Wirth Steel
Montreal, Quebec
1 Westmount Square, Ste. 200
H3Z 2P9
Tel: (514) 939-5555 Burnaby, British Columbia
4603 Kingsway, Ste. 308
V5H 4M4
Tel: (604) 436-1741 United States Sunbelt Group
Houston, Texas
1990 Post Oak Blvd., Ste. 1550
77056-3813
Tel: (713) 840-0550 Continental Wood Trading
Houston, Texas
1990 Post Oak Blvd., Ste. 1550
77056
Tel: (713) 629-1701 Arrow Steel Processors
Houston, Texas
8710 Clinton Drive,
77530
Tel: (713) 673-0666 Sunbelt Trading (Kansas)
Overland Park, Kansas
7300 W. 110th Street, Ste. 660
66210
Tel: (913) 491-6660 Other Thunder Bay Terminals Ltd.
Station F, McKellar Island,
Thunder Bay, Ontario,
P7C 5J7
Tel: (807) 625-7800 Shareholder Information Stock Symbols:
The Toronto Stock Exchange –
RUS; RUS.PR.C Transfer Agent and Registrar CIBC Mellon Trust Company
P.O. Box 7010, Adelaide Street Postal Stn.
Toronto, Ontario, Canada M5G 2W9
Answer line: Toronto (416) 643-5500
Toll Free: 1-800-387-0825
E-mail: inquiries@cibcmellon.ca
Internet: www.cibcmellon.ca |